Embed Size (px)
Citation preview
Origin of Hydroxylated BrominatedDiphenyl Ethers: Natural Compoundsor Man-Made Flame Retardants?Y I W A N , * , † S T E V E W I S E M A N , †
H O N G C H A N G , † X I A O W E I Z H A N G , †
P A U L D . J O N E S , † M A R K U S H E C K E R , † , ‡
K U R U N T H A C H A L A M K A N N A N , §
S H I N S U K E T A N A B E , | J I A N Y I N G H U , ⊥
M I C H A E L H . W . L A M , ∇ A N DJ O H N P . G I E S Y † , # , ∇ , O
Department of Biomedical Veterinary Sciences and ToxicologyCentre, University of Saskatchewan, Saskatoon,Saskatchewan S7N 5B3, Canada, ENTRIX, Inc., Saskatoon,Saskatchewan S7N 5B3, Canada, Wadsworth Center, NewYork State Department of Health and Department ofEnvironmental Health Sciences, School of Public Health, StateUniversity of New York, Empire State Plaza,Albany, New York 12201-0509, Center for MarineEnvironmental Studies, Ehime University, Matsuyama, Japan,College of Urban and Environmental Sciences, PekingUniversity, Beijing, 100871 China, Department of Zoology andCenter for Integrative Toxicology, Michigan State University,East Lansing, Michigan, Centre for Coastal Pollution andConservation and Department of Biology and Chemistry, CityUniversity of Hong Kong, Kowloon, Hong Kong, SAR China,and State Key Laboratory of Marine Environmental Science,College of Oceanography and Environmental Science, XiamenUniversity, Xiamen, P. R. China
Received May 6, 2009. Revised manuscript received August5, 2009. Accepted August 6, 2009.
Polybrominated diphenyl ethers (PBDEs) have been widelyused as flame retardants. The structurally related hydroxylatedPBDEs (OH-PBDEs) and methoxylated PBDEs (MeO-PBDEs)occur in precipitation, surface water, wildlife, and humans. Theformation of OH-PBDEs in wildlife and humans is of considerableconcern due to their greater toxicities relative to PBDEsand MeO-PBDEs. Research to date suggests that OH-PBDEsare formed by hydroxylation of PBDEs, and MeO-PBDEs are thenformed by methylation of the OH-PBDEs. Here we showsignificant metabolic production of OH-PBDEs from MeO-PBDEs while hydroxylation of synthetic PBDEs to OH-PBDEswas negligible. Concentrations of PBDEs, OH-PBDEs, and MeO-PBDEs were analyzed in tuna, albatross, and polar bearscollected from marine environments worldwide, and we founda closer relationship between OH-PBDEs and MeO-PBDEsthan had been previously reported. Furthermore, for the first
time the metabolic relationships between PBDEs, OH-PBDEs,and MeO-PBDEs were elucidated in vitro using rainbow trout,chicken, and rat microsomes. We propose the production of OH-PBDEs from naturally occurring MeO-PBDEs as a previouslyunidentified mechanism that could be an important contributorfor the occurrence of OH-PBDEs found in wildlife fromremote areas. Our results suggest that risk assessmentparadigms for PBDEs and their metabolites need reevaluationand that human exposure to MeO-PBDEs that occur naturallyin marine organisms should be considered.
IntroductionBrominated flame retardants (BFRs) have emerged ascontaminants of concern due to their widespread use,ubiquitous environmental distribution, great bioaccumu-lation potential, and toxicity. Polybrominated diphenyl ethers(PBDEs) are one of the most widely used BFRs with an annualglobal consumption of 70,000 t in 1999 (1). Over the last 30years concentrations of PBDEs in human blood, breast milk,and other body tissues have been increasing with doublingtimes of approximately 4-6 years (2, 3).
Hydroxylated (OH-) and methoxylated (MeO-) PBDEs,which are analogous to PBDEs in structure, have been foundin wildlife tissues (4-8), and laboratory studies have shownthe formation of OH-PBDEs after exposure to PBDEs (9-13).There is considerable interest in the origin of OH-PBDEsand MeO-PBDEs in biota and abiotic environmental matrices.The concern over OH-PBDEs is of particular interest sincethey elicit a variety of effects on exposed organisms includingdisruption of thyroid hormone homeostasis, oxidative phos-phorylation disruption, altered estradiol synthesis, andneurotoxic effects (14-20). The fact that OH-PBDEs werefound at greater concentrations than PBDEs in marine algaeled to the suggestion that OH-PBDEs can be formed naturallyin marine algae or by their associated microorganisms (4, 8).It has also been shown that OH-PBDEs are biotransformationproducts of PBDEs. This conversion has been reported infish, rat, and human cell cultures (9, 12, 13). However, theexposure concentrations of PBDEs in these in vitro or in vivostudies were generally great (µg/g level), and the resultantproducts, OH-PBDEs, occurred at trace concentrations(<0.01-1% of PBDEs) (9, 12, 13). In contrast, environmentalconcentrations of PBDEs in marine organisms are in the pg/gto ng/g range, which suggests that OH-PBDEs concentra-tions should be much smaller if they were the metabolicproducts of PBDEs. However, relatively great concentrationsof OH-PBDEs have been found in marine organisms,suggesting the existence of other sources of these compounds.MeO-PBDEs have also been found in various animals atconcentrations sometimes greater than those of PBDEcongeners (21, 22), and two abundant congeners (6-MeO-BDE-47 and 2′-MeO-BDE-68) have been found to be naturalproducts in marine organisms (21). Since bacterial methy-lation of phenols might be a significant alternative tobiodegradation in the environment (23), it has also beensuggested that some MeO-PBDEs are formed via methylationof OH-PBDEs (5, 21).
Bromophenols (BRPs) are a group of compounds relatedto PBDEs, which have been identified as key natural flavorcomponents of marine fish (24, 25). Some BRPs have beenreported to be metabolites of OH-PBDEs (26), while someare widely used as flame retardants (2,4,6-triBRP) with aworldwide production of 9500 t in 2001 (27). The metabolicrelationships among PBDEs, MeO-PBDEs, OH-PBDEs, and
* Corresponding author tel: (306) 966-4978; fax: (306) 966-4796;e-mail: [email protected].
† University of Saskatchewan.‡ ENTRIX, Inc.§ Wadsworth Center, New York State Department of Health and
Department of Environmental Health Sciences, School of PublicHealth, State University of New York.| Ehime University.⊥ Peking University.# Michigan State University.∇ City University of Hong Kong.O Xiamen University.
Environ. Sci. Technol. 2009, 43, 7536–7542
7536 9 ENVIRONMENTAL SCIENCE & TECHNOLOGY / VOL. 43, NO. 19, 2009 10.1021/es901357u CCC: $40.75 2009 American Chemical SocietyPublished on Web 08/21/2009
Dow
nloa
ded
by U
NIV
OF
SASK
AT
CH
EW
AN
on
Oct
ober
23,
200
9 | h
ttp://
pubs
.acs
.org
P
ublic
atio
n D
ate
(Web
): A
ugus
t 21,
200
9 | d
oi: 1
0.10
21/e
s901
357u
BRPs in organisms have not been studied in detail. Thecurrent hypothesis on the origin of OH-PBDEs and MeO-PBDEs has been based on metabolism studies with highdosing concentrations (9, 12, 13) and on studies of chemicalswith similar structure, e.g., polychlorinated biphenyls (PCBs)and their hydroxylated metabolites (28).
In this study, concentrations of PBDEs, OH-PBDEs, MeO-PBDEs, and BRPs were quantified in livers of tuna (Katsu-wonus pelamis), five albatross species (Thalassarche chlo-rorhynchos, Phoebetria palpebrata, Thalassarche chrysostoma,Thalassarche cauta, and Thalassarche melanophrys), andpolar bear (Ursus maritimus) collected from remote marinelocations. In addition, in vitro biotransformation of PBDEs,MeO-PBDEs, and OH-PBDEs was investigated in microsomalfractions of liver from rainbow trout (Oncorhynchus mykiss),chicken (Gallus gallus), and rat (Rattus norvegicus). The aimof this study was to investigate the relationships amongPBDEs, MeO-PBDEs, OH-PBDEs, and BRPs in marine wildlifetissues and gain insight into sources and pathways oftransformation.
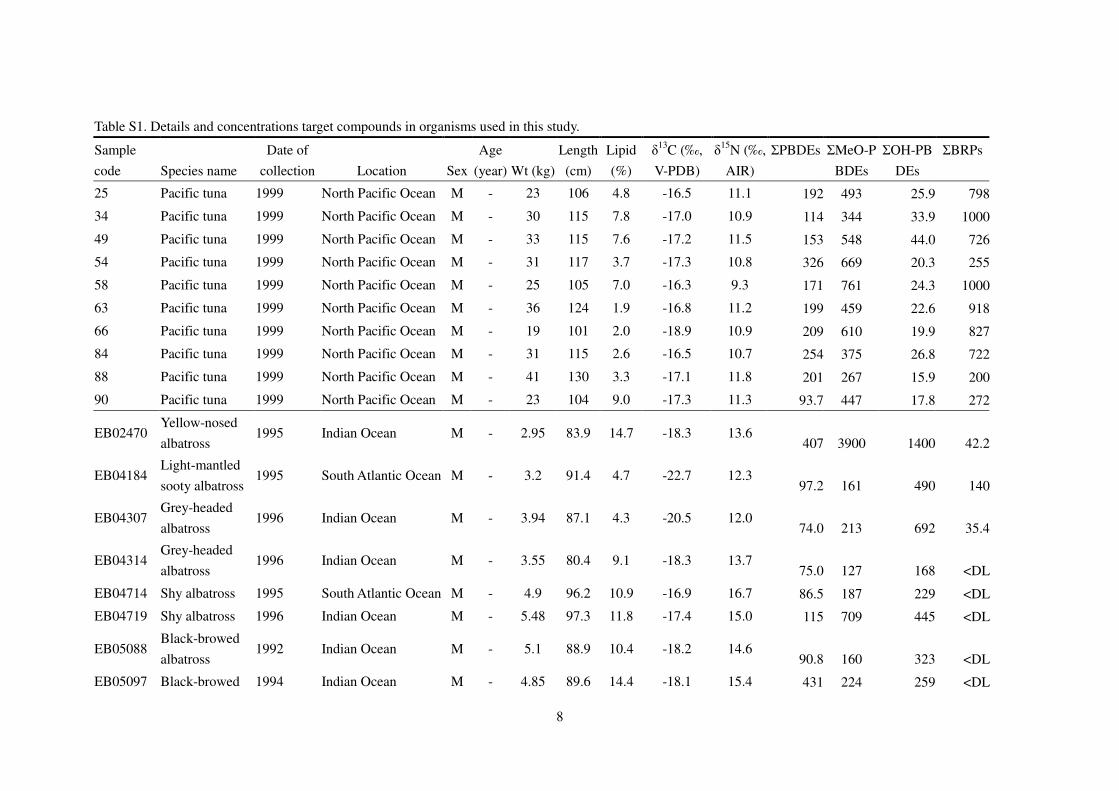
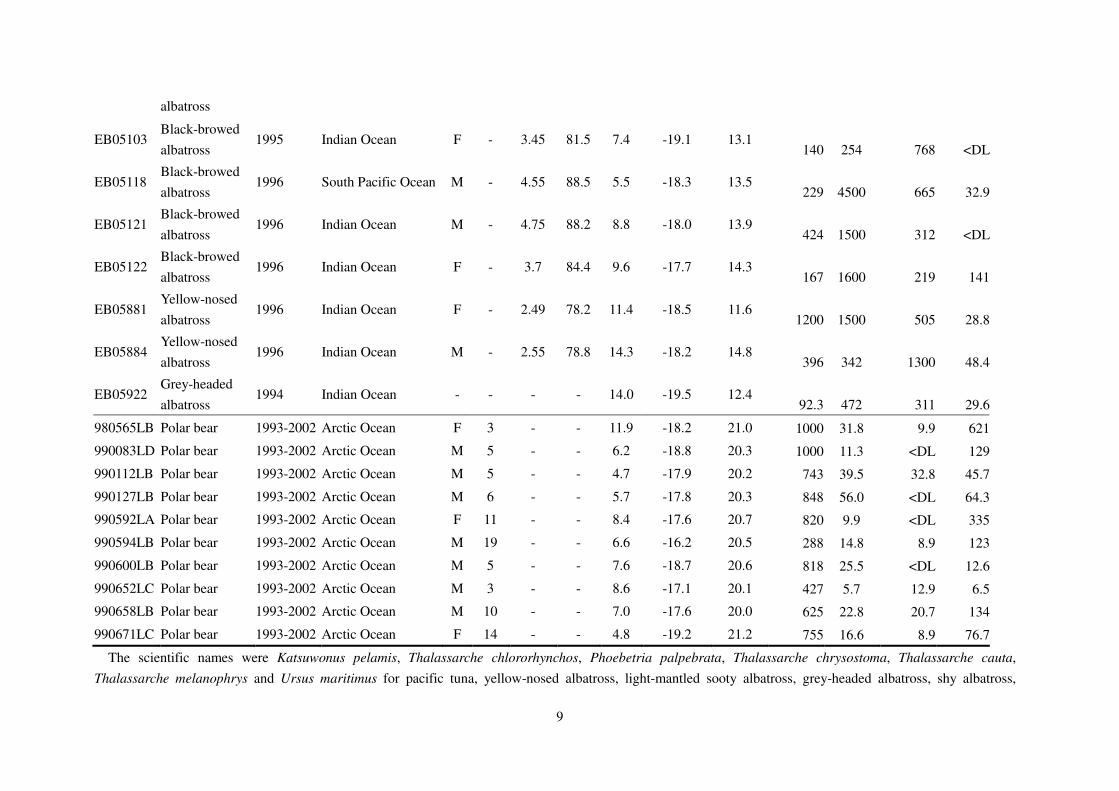
Materials and MethodsTissue Collection. Livers from fifteen albatross, ten tuna,and ten polar bear were used for PBDEs, OH-PBDEs, MeO-PBDEs, and BRPs quantification. Albatross were collectedfrom the Indian and South Atlantic Oceans, polar bear werecollected in Northern and Western Alaska, and tuna werecollected from the North Pacific Ocean in 1992-2002 (TableS1 in Supporting Information). All samples were kept frozenat -20 °C until analysis.
Extraction and Cleanup of Liver Tissue. Samples (ap-proximately 5-10 g wet weight (ww)) were first freeze-dried,spiked with a mixture of 13C-labeled PBDE and BRP sur-rogates, and extracted by accelerated solvent extraction(Dionex ASE-200, Sunnyvale, CA). Extraction was conductedwith n-hexane/dichloromethane (DCM) (1:1) as the firstextraction solvent at a temperature of 100 °C and pressureof 1500 psi, and then the samples were extracted withn-hexane/methyl tert-butyl ether (MTBE) (1:1) as the secondextraction solvent at a temperature of 60 °C and pressure of1000 psi. Two cycles (10 min) were performed for each solventper sample, and the two extraction fractions were combinedfor subsequent cleanup. Extracts were rotary evaporated tonear dryness at 35 °C. Lipid content of each extract wasdetermined gravimetrically by evaporating the entire extractto constant weight. Extracts were then dissolved in 8 mL ofhexane, and 4 mL of 0.5 M potassium hydroxide (KOH) in50% ethanol was added. Phenolic compounds were separatedfrom the neutrals by partitioning with KOH (29). The aqueouslayer (KOH) was extracted with 8 mL of n-hexane three times(neutral fraction), followed by acidification with 1.5 mL of2 M hydrochloric acid. Then phenolic compounds wereextracted with n-hexane/MTBE (9:1; v/v) three times (phe-nolic fraction).
The neutral fraction was concentrated to approximately2 mL and sequentially subjected to acidified silica gel andneutral alumina column chromatography. The acidified silicagel column was packed with 2 g of sodium sulfate and 8 gof acidified silica (50 g of silica gel mixed with 27 mL ofconcentrated sulfuric acid). After application of the sample,the column was eluted with 15 mL of n-hexane and 10 mLof DCM. The eluate was concentrated and passed througha neutral alumina column (4 g of sodium sulfate, 4 g of neutralalumina, 4 g of sodium sulfate), eluted with 20 mL of n-hexaneand then with 25 mL of 60% DCM in n-hexane. The secondfraction was concentrated and fortified with 13C-PBDE 138for analysis of PBDEs and MeO-PBDEs.
The phenolic fraction was evaporated to dryness undera gentle stream of nitrogen. A 480 µL aliquot of thederivatization solvent (acetonitrile/methanol/water/pyridine
(5:2:2:1; v/v/v/v)) was added, and then 40 µL of methylchloroformate (MCF) was added. The reaction mixture wasshaken on a vortex at room temperature for 1 h before itwas diluted with 1.2 mL of pure water. The aqueous solutionwas extracted with 6 mL of n-hexane three times, and theextracts were subjected to acidified silica gel chromatographyas described above. The column was eluted with 30 mL ofn-hexane and 30 mL of DCM, and the eluate was concentratedto 40 µL for OH-PBDE and BRP analysis. In this study theMCF derivatization products of OH-PBDEs and BRPs weredesignated as MCFO-PBDEs and MCFO-BRPs.
Identification and quantification of all target compoundswas performed using a Hewlett-Packard 5890 series II high-resolution gas chromatograph interfaced to a MicromassAutospec high-resolution mass spectrometer (HRGC-HRMS)(Micromass, Beverly, MD). The chemicals and instrumentcondition are provided in the Supporting Information.
Extraction and Cleanup of Microsome Reaction Mix-tures. Prior to extraction, each of the microsomal reactionmixture samples was spiked with a mixture of 13C-labeledPBDE and BRP surrogates followed by addition of 2 mL ofpure water, 0.25 mL of concentrated hydrochloric acid, and3 mL of 2-propanol. The aqueous layer was extracted with5 mL of n-hexane/MTBE (1:1; v/v) two times. The extractswere washed with 4 mL of pure water four times, followedby addition of 4 mL of 0.5 M KOH in 50% ethanol. Theseparation of phenolic and neutral compounds closelymirrored that of the tissue samples except that the neutralfraction was only subjected to an acidified silica gel columneluted with 15 mL of n-hexane and 10 mL of DCM. Thephenolic fraction was dried and derivatized with MCF asdescribed above however the acidified silica gel columnfollowing the derivatization was packed with 2 g of sodiumsulfate and 4 g of acidified silica and samples were elutedwith 15 mL of n-hexane and 15 mL of DCM.
In Vitro Microsomal Incubations. To investigate whetherMeO-PBDEs are more readily metabolized to OH-PBDEs thansynthetic PBDEs, we used microsomes isolated from severalsurrogate species, namely rainbow trout, chicken, and rat,that represent the different classes of species used for tissuechemistry analysis. Rat S9 fraction was purchased from MPBiomedicals (Solon, OH) and was isolated from Aroclor 1254exposed individuals. Microsomes were isolated from rainbowtrout exposed to PCB-126 and microsomes were isolated fromchicken exposed to 2,3,7,8-tetrachlorodibenzo-p-dioxin(TCDD). These microsomes were previously isolated as partof other studies in our laboratory. Previous studies haveclearly demonstrated that exposure to either Aroclor 1254,PCB126, or TCDD induces the microsomal activity of thesame CYP450 1A homologues in exposed organisms (30).Rainbow trout and chicken microsomes were preparedaccording to the method of Kennedy and Jones (31), and thedetails are provided in the Supporting Information. Allreactions were performed in 0.1 M NaH2PO4 buffer (pH 7.4)containing 1 mM ethylenediaminetetraacetic acid (EDTA),10 mM dithiothreitol (DTT), and 100 µM NADPH. The finalreaction volume was 100 µL and contained either 50 µL(rainbow trout and chicken) or 25 µL (rat) of the microsomalpreparation and 3 uL of exposure chemicals. Individualcongeners (BDE-99, 6-MeO-BDE-47, and 6-OH-BDE-47) andmixtures of compounds (PBDEs mix, MeO-PBDEs mix, andOH-PBDEs mix) were used, and the concentrations in theincubation mixture were 1.5 × 10³ and 1.2 × 10² to 1.5 × 10²
ng/mL for individual congeners and mixtures of compounds,respectively (Table 1). The protein concentrations in thereaction vial were 5.5, 6.4, and 9.0 mg/mL for rainbow trout,chicken, and rat, respectively. Reactions were performed at37 °C for 20 h with constant agitation. Incubations withoutchemicals and without microsomes were used as negativecontrols to assess background contaminants and the pos-
VOL. 43, NO. 19, 2009 / ENVIRONMENTAL SCIENCE & TECHNOLOGY 9 7537
Dow
nloa
ded
by U
NIV
OF
SASK
AT
CH
EW
AN
on
Oct
ober
23,
200
9 | h
ttp://
pubs
.acs
.org
P
ublic
atio
n D
ate
(Web
): A
ugus
t 21,
200
9 | d
oi: 1
0.10
21/e
s901
357u
sibility of nonenzyme mediated changes in chemical struc-ture. After the incubation, the samples were extractedimmediately for chemical analysis.
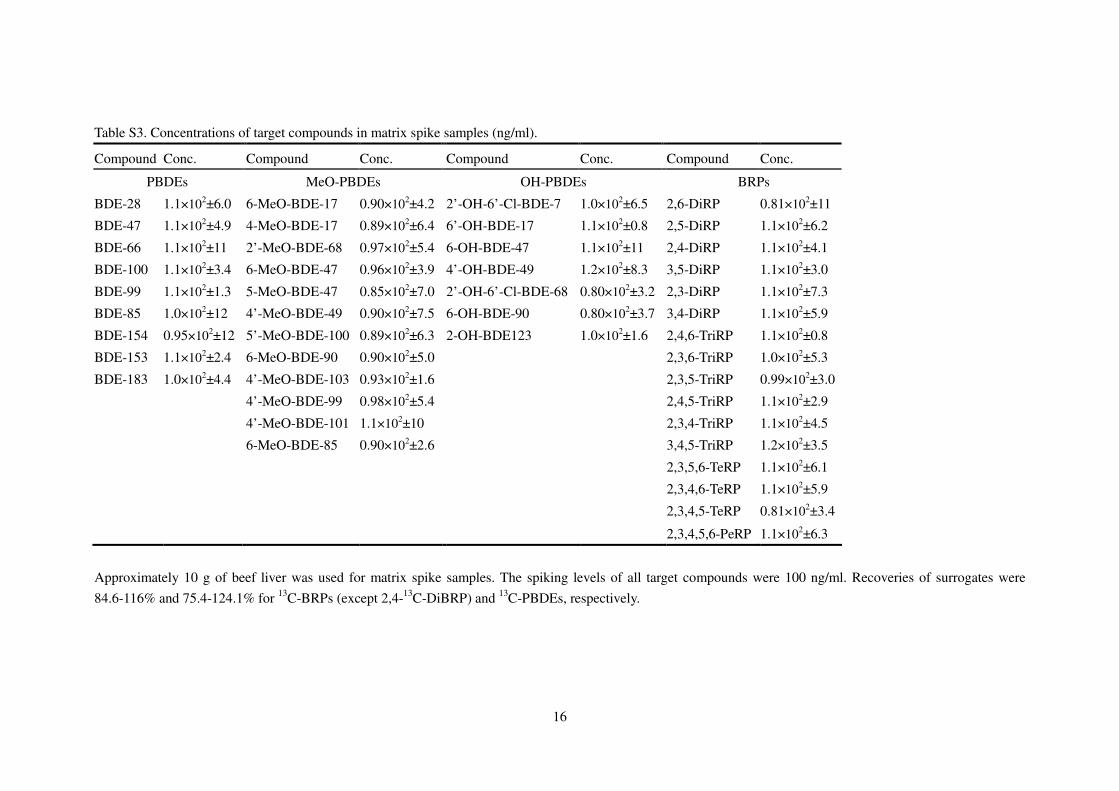
Quality Assurance and Quality Control (QA/QC). Con-centrations of all congeners were quantified by the internalstandard isotope-dilution method using mean relative re-sponse factors determined from standard calibration runs.All equipment rinses were carried out with acetone andhexane to avoid sample contamination. The proceduredescribed above was validated by analyzing spiked beef liver(matrix spike samples). The spiking concentrations were atleast three times the original basal concentrations in thematrix medium. During the sample analysis, a laboratoryblank and a matrix spike were incorporated in the analyticalprocedures for every batch of 15 samples. Recoveries forspiked samples were 81-126%, 87-128%, 81-123%, and65-126% for MeO-PBDEs, PBDEs, OH-PBDEs, and BRPs(except DiBRPs) respectively. The recoveries of DiBRPs inthe spiked samples were slightly high (71-213%) possiblydue to matrix-induced ionization enhancement. The con-centrations of DiBRPs in matrix spike samples corrected bythe surrogates were within the acceptable range. Concentra-tions of all target compounds corrected by surrogates inmatrix spike samples are shown in Table S3 in the SI.Concentrations quantified in the spiked beef liver variedwithin 20% of the spiked concentrations, showing theaccuracy and precision of the tissue analysis. PBDEs andBRPs were quantified in sample extracts relative to 13C-PBDEs
and 13C-BRPs, respectively. OH-PBDEs were quantifiedrelative to 2,3,4,6-13C-TeBRPs, and MeO-PBDEs were quanti-fied relative to 13C-PBDEs with same number of bromines.Recoveries of 13C-PBDEs and 13C-BRPs (except 2,4-13C-DiBRP:70-300%) were in the range of 50-130% in all samples. Themethod detection limits (MDL) were set to be the mean ofthe concentration plus three times the standard deviation inthe blank samples, in which BDE-28, BDE-49, BDE-47, BDE-66, BDE-100, BDE-99, BDE-85, BDE-154, BDE-153, 2,4-DiBRP,and 2,4,6-TriBRP were detected. The MDLs for the othercompounds, which were not detected in blank samples, wereset to the instrumental minimum detectable amounts. Thedetection limits were 0.4 pg/g ww for MeO-PBDEs; 0.2 pg/gww for PBDEs except for BDE-28 (0.7 pg/g ww), BDE-49 (0.6pg/g ww), BDE-47 (10.1 pg/g ww), BDE-66 (0.6 pg/g ww),BDE-100 (3.5 pg/g ww), BDE-99 (5.6 pg/g ww), BDE-85 (0.6pg/g ww), BDE-154 (2.5 pg/g ww), BDE-153 (1.4 pg/g ww);2.0 pg/g ww for 2′-OH-6′-Cl-BDE-7 and 6′-OH-BDE-17, and4.0 pg/g ww for 3-OH-BDE-47, 5-OH-BDE-47, 2’OH-BDE-68, 6-OH-BDE-47, 4′-OH-BDE-49, 2′-OH-6′-Cl-BDE-68, 6-OH-BDE-90, 2-OH-BDE-123; 2.0 pg/g ww for DiBRPs except for2,4-DiBRP (2.5 pg/g ww), 4.0 pg/g ww for TriBRPs except for2,4,6-BRP (6.4 pg/g ww), 8 pg/g ww for TeBRPs, and 10 pg/gww for PeBRP. For those results less than the MDL, half ofthe MDL was assigned to avoid missing values in statisticalanalyses.
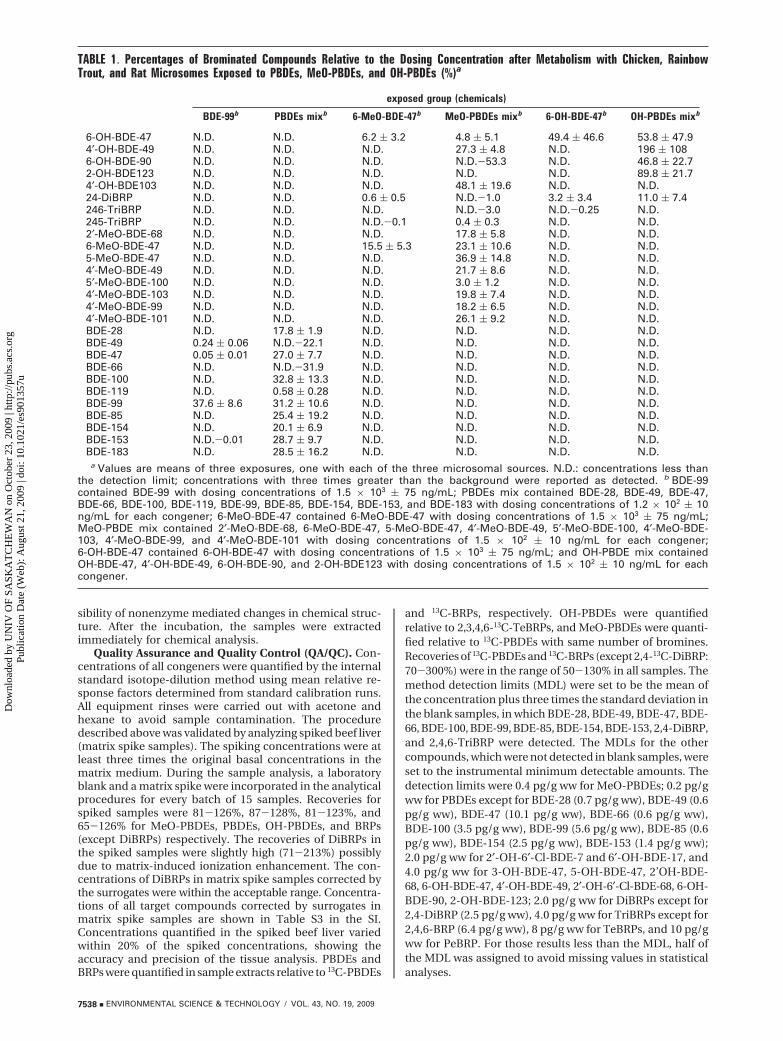
TABLE 1. Percentages of Brominated Compounds Relative to the Dosing Concentration after Metabolism with Chicken, RainbowTrout, and Rat Microsomes Exposed to PBDEs, MeO-PBDEs, and OH-PBDEs (%)a
exposed group (chemicals)
BDE-99b PBDEs mixb 6-MeO-BDE-47b MeO-PBDEs mixb 6-OH-BDE-47b OH-PBDEs mixb
6-OH-BDE-47 N.D. N.D. 6.2 ( 3.2 4.8 ( 5.1 49.4 ( 46.6 53.8 ( 47.94′-OH-BDE-49 N.D. N.D. N.D. 27.3 ( 4.8 N.D. 196 ( 1086-OH-BDE-90 N.D. N.D. N.D. N.D.-53.3 N.D. 46.8 ( 22.72-OH-BDE123 N.D. N.D. N.D. N.D. N.D. 89.8 ( 21.74′-OH-BDE103 N.D. N.D. N.D. 48.1 ( 19.6 N.D. N.D.24-DiBRP N.D. N.D. 0.6 ( 0.5 N.D.-1.0 3.2 ( 3.4 11.0 ( 7.4246-TriBRP N.D. N.D. N.D. N.D.-3.0 N.D.-0.25 N.D.245-TriBRP N.D. N.D. N.D.-0.1 0.4 ( 0.3 N.D. N.D.2′-MeO-BDE-68 N.D. N.D. N.D. 17.8 ( 5.8 N.D. N.D.6-MeO-BDE-47 N.D. N.D. 15.5 ( 5.3 23.1 ( 10.6 N.D. N.D.5-MeO-BDE-47 N.D. N.D. N.D. 36.9 ( 14.8 N.D. N.D.4′-MeO-BDE-49 N.D. N.D. N.D. 21.7 ( 8.6 N.D. N.D.5′-MeO-BDE-100 N.D. N.D. N.D. 3.0 ( 1.2 N.D. N.D.4′-MeO-BDE-103 N.D. N.D. N.D. 19.8 ( 7.4 N.D. N.D.4′-MeO-BDE-99 N.D. N.D. N.D. 18.2 ( 6.5 N.D. N.D.4′-MeO-BDE-101 N.D. N.D. N.D. 26.1 ( 9.2 N.D. N.D.BDE-28 N.D. 17.8 ( 1.9 N.D. N.D. N.D. N.D.BDE-49 0.24 ( 0.06 N.D.-22.1 N.D. N.D. N.D. N.D.BDE-47 0.05 ( 0.01 27.0 ( 7.7 N.D. N.D. N.D. N.D.BDE-66 N.D. N.D.-31.9 N.D. N.D. N.D. N.D.BDE-100 N.D. 32.8 ( 13.3 N.D. N.D. N.D. N.D.BDE-119 N.D. 0.58 ( 0.28 N.D. N.D. N.D. N.D.BDE-99 37.6 ( 8.6 31.2 ( 10.6 N.D. N.D. N.D. N.D.BDE-85 N.D. 25.4 ( 19.2 N.D. N.D. N.D. N.D.BDE-154 N.D. 20.1 ( 6.9 N.D. N.D. N.D. N.D.BDE-153 N.D.-0.01 28.7 ( 9.7 N.D. N.D. N.D. N.D.BDE-183 N.D. 28.5 ( 16.2 N.D. N.D. N.D. N.D.a Values are means of three exposures, one with each of the three microsomal sources. N.D.: concentrations less than
the detection limit; concentrations with three times greater than the background were reported as detected. b BDE-99contained BDE-99 with dosing concentrations of 1.5 × 10³ ( 75 ng/mL; PBDEs mix contained BDE-28, BDE-49, BDE-47,BDE-66, BDE-100, BDE-119, BDE-99, BDE-85, BDE-154, BDE-153, and BDE-183 with dosing concentrations of 1.2 × 10² ( 10ng/mL for each congener; 6-MeO-BDE-47 contained 6-MeO-BDE-47 with dosing concentrations of 1.5 × 10³ ( 75 ng/mL;MeO-PBDE mix contained 2′-MeO-BDE-68, 6-MeO-BDE-47, 5-MeO-BDE-47, 4′-MeO-BDE-49, 5′-MeO-BDE-100, 4′-MeO-BDE-103, 4′-MeO-BDE-99, and 4′-MeO-BDE-101 with dosing concentrations of 1.5 × 10² ( 10 ng/mL for each congener;6-OH-BDE-47 contained 6-OH-BDE-47 with dosing concentrations of 1.5 × 10³ ( 75 ng/mL; and OH-PBDE mix containedOH-BDE-47, 4′-OH-BDE-49, 6-OH-BDE-90, and 2-OH-BDE123 with dosing concentrations of 1.5 × 10² ( 10 ng/mL for eachcongener.
7538 9 ENVIRONMENTAL SCIENCE & TECHNOLOGY / VOL. 43, NO. 19, 2009
Dow
nloa
ded
by U
NIV
OF
SASK
AT
CH
EW
AN
on
Oct
ober
23,
200
9 | h
ttp://
pubs
.acs
.org
P
ublic
atio
n D
ate
(Web
): A
ugus
t 21,
200
9 | d
oi: 1
0.10
21/e
s901
357u
Results and DiscussionLevels of PBDEs, MeO-PBDEs, OH-PBDEs, and BRPs inMarine Organisms. Marine species at higher trophic con-centrations have been reported to accumulate relatively greatconcentrations of PBDEs and related compounds (32, 33).Three top marine predator species (tuna, albatross, and polarbear) collected from the Pacific, Atlantic, Indian, and ArcticOceans were selected for this study, and were analyzed forPBDEs, MeO-PBDEs, OH-PBDEs, and BRPs. Besides thegenerally analyzed PBDEs, MeO-PBDEs, and OH-PBDEs, 2′-OH-6′-Cl-BDE-47 and 2′-OH-6′-Cl-BDE-68 were selected astarget compounds due to their potential steroidogenic effects(34) and identification in previous investigations (6). BRPswere included because of the previous detection of thesecompounds in PBDE metabolism studies (26).
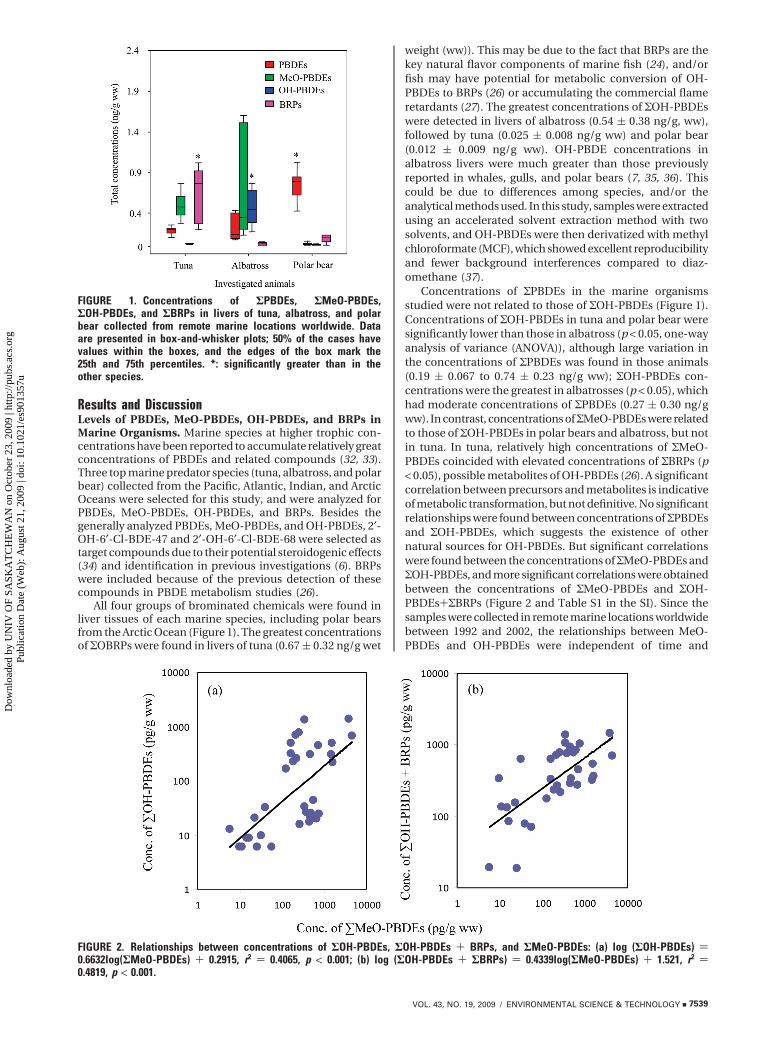
All four groups of brominated chemicals were found inliver tissues of each marine species, including polar bearsfrom the Arctic Ocean (Figure 1). The greatest concentrationsof ΣOBRPs were found in livers of tuna (0.67 ( 0.32 ng/g wet
weight (ww)). This may be due to the fact that BRPs are thekey natural flavor components of marine fish (24), and/orfish may have potential for metabolic conversion of OH-PBDEs to BRPs (26) or accumulating the commercial flameretardants (27). The greatest concentrations of ΣOH-PBDEswere detected in livers of albatross (0.54 ( 0.38 ng/g, ww),followed by tuna (0.025 ( 0.008 ng/g ww) and polar bear(0.012 ( 0.009 ng/g ww). OH-PBDE concentrations inalbatross livers were much greater than those previouslyreported in whales, gulls, and polar bears (7, 35, 36). Thiscould be due to differences among species, and/or theanalytical methods used. In this study, samples were extractedusing an accelerated solvent extraction method with twosolvents, and OH-PBDEs were then derivatized with methylchloroformate (MCF), which showed excellent reproducibilityand fewer background interferences compared to diaz-omethane (37).
Concentrations of ΣPBDEs in the marine organismsstudied were not related to those of ΣOH-PBDEs (Figure 1).Concentrations of ΣOH-PBDEs in tuna and polar bear weresignificantly lower than those in albatross (p < 0.05, one-wayanalysis of variance (ANOVA)), although large variation inthe concentrations of ΣPBDEs was found in those animals(0.19 ( 0.067 to 0.74 ( 0.23 ng/g ww); ΣOH-PBDEs con-centrations were the greatest in albatrosses (p < 0.05), whichhad moderate concentrations of ΣPBDEs (0.27 ( 0.30 ng/gww). In contrast, concentrations of ΣMeO-PBDEs were relatedto those of ΣOH-PBDEs in polar bears and albatross, but notin tuna. In tuna, relatively high concentrations of ΣMeO-PBDEs coincided with elevated concentrations of ΣBRPs (p< 0.05), possible metabolites of OH-PBDEs (26). A significantcorrelation between precursors and metabolites is indicativeof metabolic transformation, but not definitive. No significantrelationships were found between concentrations of ΣPBDEsand ΣOH-PBDEs, which suggests the existence of othernatural sources for OH-PBDEs. But significant correlationswere found between the concentrations of ΣMeO-PBDEs andΣOH-PBDEs, and more significant correlations were obtainedbetween the concentrations of ΣMeO-PBDEs and ΣOH-PBDEs+ΣBRPs (Figure 2 and Table S1 in the SI). Since thesamples were collected in remote marine locations worldwidebetween 1992 and 2002, the relationships between MeO-PBDEs and OH-PBDEs were independent of time and
FIGURE 1. Concentrations of ΣPBDEs, ΣMeO-PBDEs,ΣOH-PBDEs, and ΣBRPs in livers of tuna, albatross, and polarbear collected from remote marine locations worldwide. Dataare presented in box-and-whisker plots; 50% of the cases havevalues within the boxes, and the edges of the box mark the25th and 75th percentiles. *: significantly greater than in theother species.
FIGURE 2. Relationships between concentrations of ΣOH-PBDEs, ΣOH-PBDEs + BRPs, and ΣMeO-PBDEs: (a) log (ΣOH-PBDEs) )0.6632log(ΣMeO-PBDEs) + 0.2915, r2 ) 0.4065, p < 0.001; (b) log (ΣOH-PBDEs + ΣBRPs) ) 0.4339log(ΣMeO-PBDEs) + 1.521, r2 )0.4819, p < 0.001.
VOL. 43, NO. 19, 2009 / ENVIRONMENTAL SCIENCE & TECHNOLOGY 9 7539
Dow
nloa
ded
by U
NIV
OF
SASK
AT
CH
EW
AN
on
Oct
ober
23,
200
9 | h
ttp://
pubs
.acs
.org
P
ublic
atio
n D
ate
(Web
): A
ugus
t 21,
200
9 | d
oi: 1
0.10
21/e
s901
357u
location, which indicates that MeO-PBDEs and OH-PBDEsshare a common source or metabolic pathway in marineanimals.
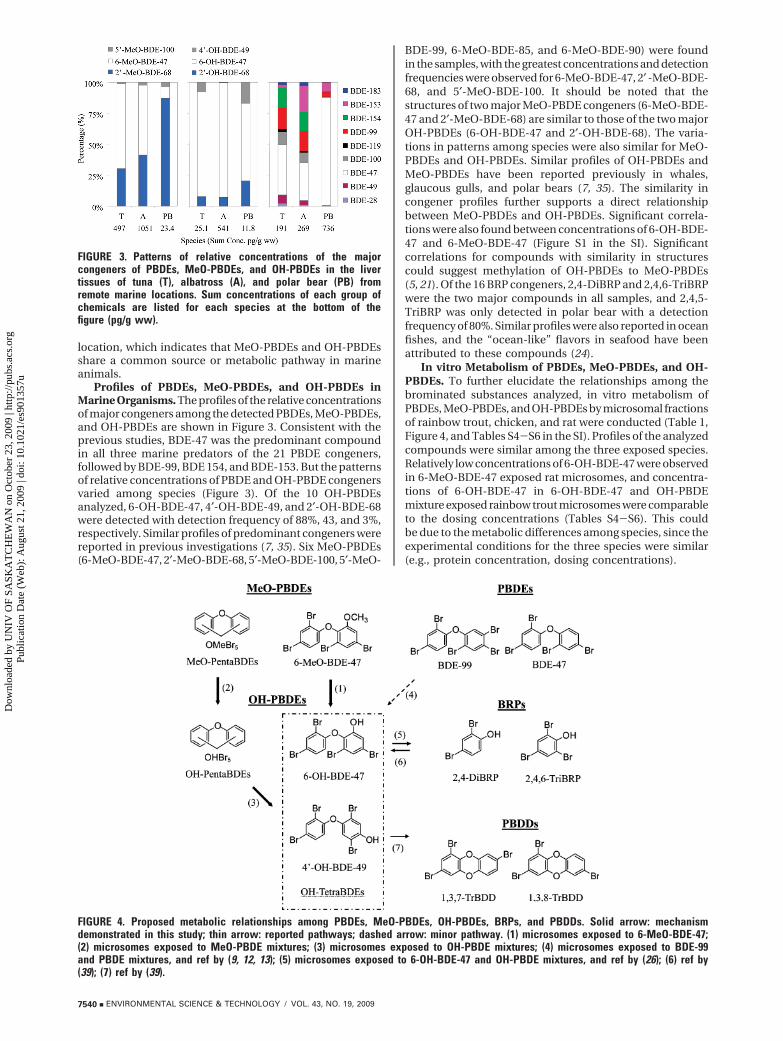
Profiles of PBDEs, MeO-PBDEs, and OH-PBDEs inMarine Organisms. The profiles of the relative concentrationsof major congeners among the detected PBDEs, MeO-PBDEs,and OH-PBDEs are shown in Figure 3. Consistent with theprevious studies, BDE-47 was the predominant compoundin all three marine predators of the 21 PBDE congeners,followed by BDE-99, BDE 154, and BDE-153. But the patternsof relative concentrations of PBDE and OH-PBDE congenersvaried among species (Figure 3). Of the 10 OH-PBDEsanalyzed, 6-OH-BDE-47, 4′-OH-BDE-49, and 2′-OH-BDE-68were detected with detection frequency of 88%, 43, and 3%,respectively. Similar profiles of predominant congeners werereported in previous investigations (7, 35). Six MeO-PBDEs(6-MeO-BDE-47, 2′-MeO-BDE-68, 5′-MeO-BDE-100, 5′-MeO-
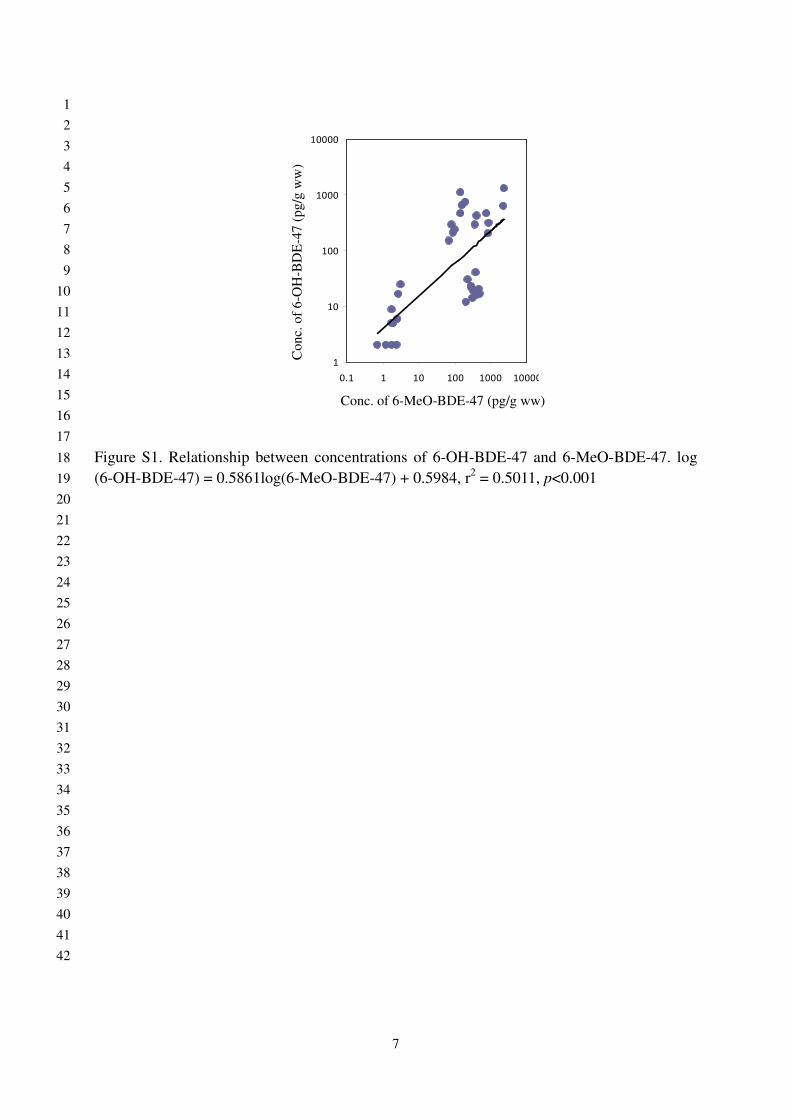
BDE-99, 6-MeO-BDE-85, and 6-MeO-BDE-90) were foundin the samples, with the greatest concentrations and detectionfrequencies were observed for 6-MeO-BDE-47, 2′ -MeO-BDE-68, and 5′-MeO-BDE-100. It should be noted that thestructures of two major MeO-PBDE congeners (6-MeO-BDE-47 and 2′-MeO-BDE-68) are similar to those of the two majorOH-PBDEs (6-OH-BDE-47 and 2′-OH-BDE-68). The varia-tions in patterns among species were also similar for MeO-PBDEs and OH-PBDEs. Similar profiles of OH-PBDEs andMeO-PBDEs have been reported previously in whales,glaucous gulls, and polar bears (7, 35). The similarity incongener profiles further supports a direct relationshipbetween MeO-PBDEs and OH-PBDEs. Significant correla-tions were also found between concentrations of 6-OH-BDE-47 and 6-MeO-BDE-47 (Figure S1 in the SI). Significantcorrelations for compounds with similarity in structurescould suggest methylation of OH-PBDEs to MeO-PBDEs(5, 21). Of the 16 BRP congeners, 2,4-DiBRP and 2,4,6-TriBRPwere the two major compounds in all samples, and 2,4,5-TriBRP was only detected in polar bear with a detectionfrequency of 80%. Similar profiles were also reported in oceanfishes, and the “ocean-like” flavors in seafood have beenattributed to these compounds (24).
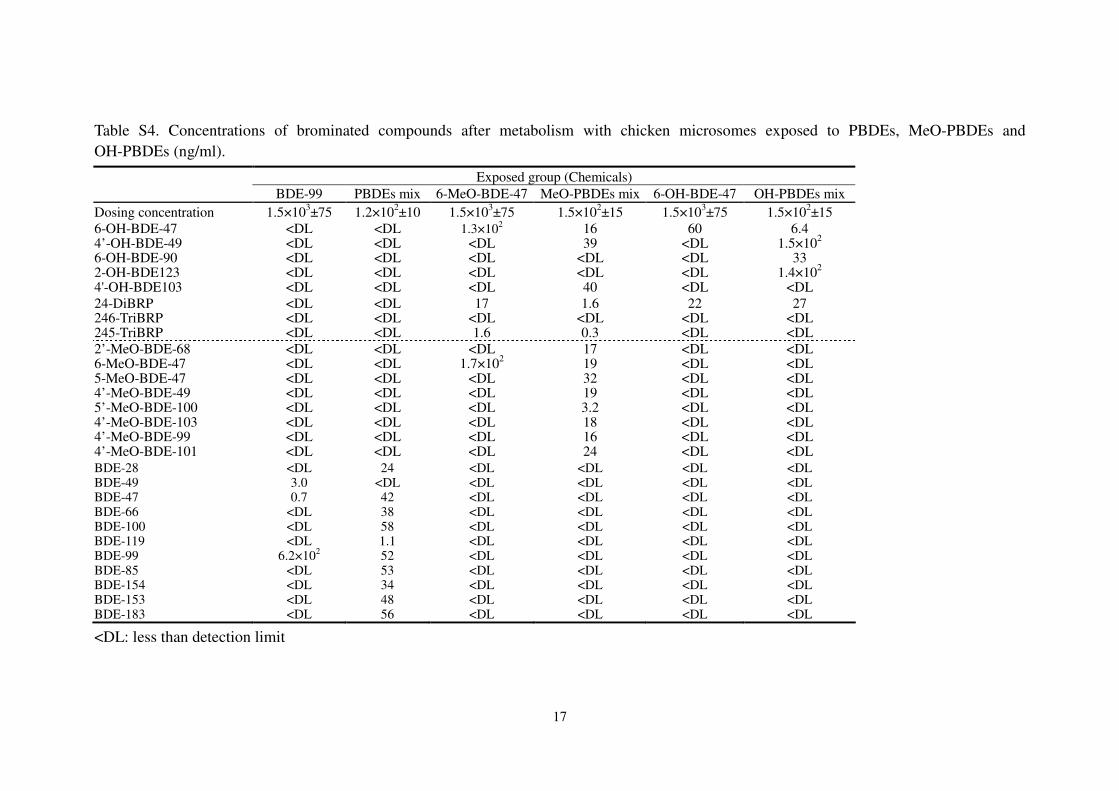
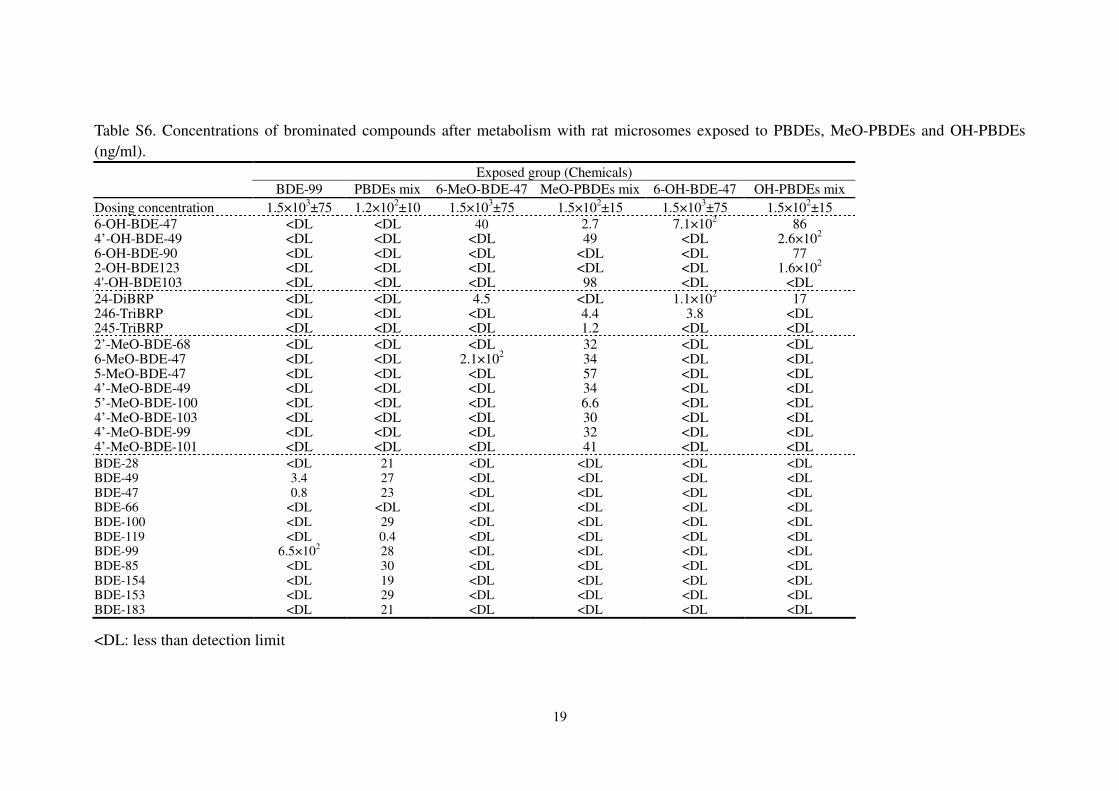
In vitro Metabolism of PBDEs, MeO-PBDEs, and OH-PBDEs. To further elucidate the relationships among thebrominated substances analyzed, in vitro metabolism ofPBDEs, MeO-PBDEs, and OH-PBDEs by microsomal fractionsof rainbow trout, chicken, and rat were conducted (Table 1,Figure 4, and Tables S4-S6 in the SI). Profiles of the analyzedcompounds were similar among the three exposed species.Relatively low concentrations of 6-OH-BDE-47 were observedin 6-MeO-BDE-47 exposed rat microsomes, and concentra-tions of 6-OH-BDE-47 in 6-OH-BDE-47 and OH-PBDEmixture exposed rainbow trout microsomes were comparableto the dosing concentrations (Tables S4-S6). This couldbe due to the metabolic differences among species, since theexperimental conditions for the three species were similar(e.g., protein concentration, dosing concentrations).
FIGURE 3. Patterns of relative concentrations of the majorcongeners of PBDEs, MeO-PBDEs, and OH-PBDEs in the livertissues of tuna (T), albatross (A), and polar bear (PB) fromremote marine locations. Sum concentrations of each group ofchemicals are listed for each species at the bottom of thefigure (pg/g ww).
FIGURE 4. Proposed metabolic relationships among PBDEs, MeO-PBDEs, OH-PBDEs, BRPs, and PBDDs. Solid arrow: mechanismdemonstrated in this study; thin arrow: reported pathways; dashed arrow: minor pathway. (1) microsomes exposed to 6-MeO-BDE-47;(2) microsomes exposed to MeO-PBDE mixtures; (3) microsomes exposed to OH-PBDE mixtures; (4) microsomes exposed to BDE-99and PBDE mixtures, and ref by (9, 12, 13); (5) microsomes exposed to 6-OH-BDE-47 and OH-PBDE mixtures, and ref by (26); (6) ref by(39); (7) ref by (39).
7540 9 ENVIRONMENTAL SCIENCE & TECHNOLOGY / VOL. 43, NO. 19, 2009
Dow
nloa
ded
by U
NIV
OF
SASK
AT
CH
EW
AN
on
Oct
ober
23,
200
9 | h
ttp://
pubs
.acs
.org
P
ublic
atio
n D
ate
(Web
): A
ugus
t 21,
200
9 | d
oi: 1
0.10
21/e
s901
357u
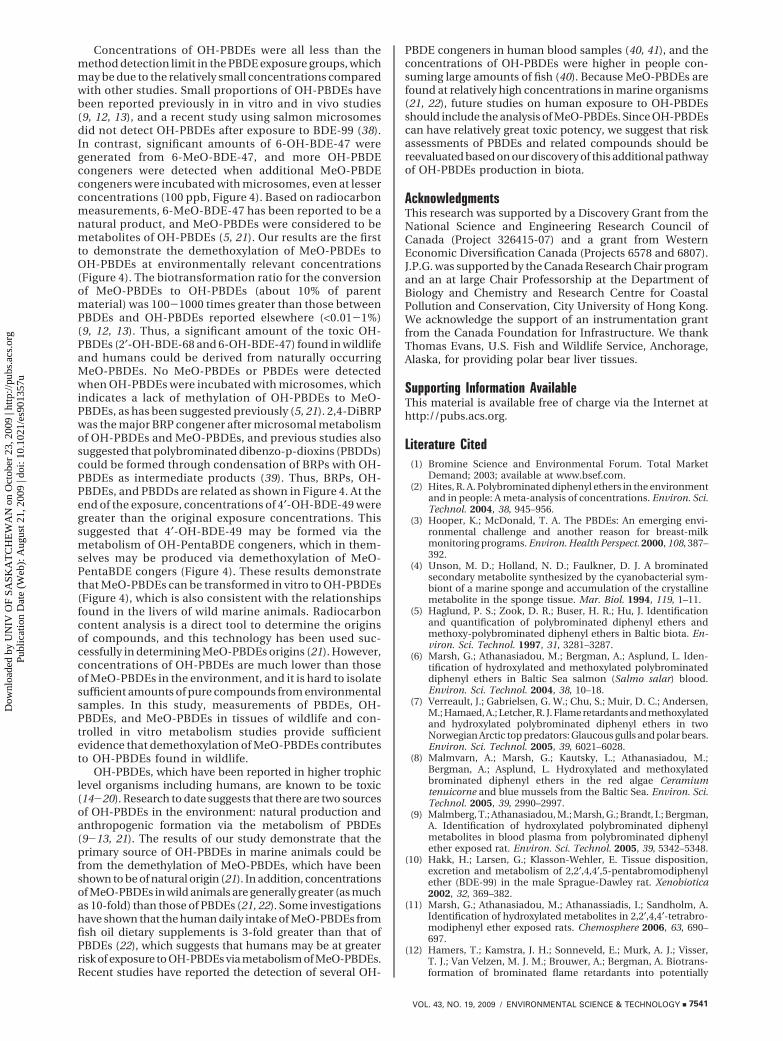
Concentrations of OH-PBDEs were all less than themethod detection limit in the PBDE exposure groups, whichmay be due to the relatively small concentrations comparedwith other studies. Small proportions of OH-PBDEs havebeen reported previously in in vitro and in vivo studies(9, 12, 13), and a recent study using salmon microsomesdid not detect OH-PBDEs after exposure to BDE-99 (38).In contrast, significant amounts of 6-OH-BDE-47 weregenerated from 6-MeO-BDE-47, and more OH-PBDEcongeners were detected when additional MeO-PBDEcongeners were incubated with microsomes, even at lesserconcentrations (100 ppb, Figure 4). Based on radiocarbonmeasurements, 6-MeO-BDE-47 has been reported to be anatural product, and MeO-PBDEs were considered to bemetabolites of OH-PBDEs (5, 21). Our results are the firstto demonstrate the demethoxylation of MeO-PBDEs toOH-PBDEs at environmentally relevant concentrations(Figure 4). The biotransformation ratio for the conversionof MeO-PBDEs to OH-PBDEs (about 10% of parentmaterial) was 100-1000 times greater than those betweenPBDEs and OH-PBDEs reported elsewhere (<0.01-1%)(9, 12, 13). Thus, a significant amount of the toxic OH-PBDEs (2′-OH-BDE-68 and 6-OH-BDE-47) found in wildlifeand humans could be derived from naturally occurringMeO-PBDEs. No MeO-PBDEs or PBDEs were detectedwhen OH-PBDEs were incubated with microsomes, whichindicates a lack of methylation of OH-PBDEs to MeO-PBDEs, as has been suggested previously (5, 21). 2,4-DiBRPwas the major BRP congener after microsomal metabolismof OH-PBDEs and MeO-PBDEs, and previous studies alsosuggested that polybrominated dibenzo-p-dioxins (PBDDs)could be formed through condensation of BRPs with OH-PBDEs as intermediate products (39). Thus, BRPs, OH-PBDEs, and PBDDs are related as shown in Figure 4. At theend of the exposure, concentrations of 4′-OH-BDE-49 weregreater than the original exposure concentrations. Thissuggested that 4′-OH-BDE-49 may be formed via themetabolism of OH-PentaBDE congeners, which in them-selves may be produced via demethoxylation of MeO-PentaBDE congers (Figure 4). These results demonstratethat MeO-PBDEs can be transformed in vitro to OH-PBDEs(Figure 4), which is also consistent with the relationshipsfound in the livers of wild marine animals. Radiocarboncontent analysis is a direct tool to determine the originsof compounds, and this technology has been used suc-cessfully in determining MeO-PBDEs origins (21). However,concentrations of OH-PBDEs are much lower than thoseof MeO-PBDEs in the environment, and it is hard to isolatesufficient amounts of pure compounds from environmentalsamples. In this study, measurements of PBDEs, OH-PBDEs, and MeO-PBDEs in tissues of wildlife and con-trolled in vitro metabolism studies provide sufficientevidence that demethoxylation of MeO-PBDEs contributesto OH-PBDEs found in wildlife.
OH-PBDEs, which have been reported in higher trophiclevel organisms including humans, are known to be toxic(14-20). Research to date suggests that there are two sourcesof OH-PBDEs in the environment: natural production andanthropogenic formation via the metabolism of PBDEs(9-13, 21). The results of our study demonstrate that theprimary source of OH-PBDEs in marine animals could befrom the demethylation of MeO-PBDEs, which have beenshown to be of natural origin (21). In addition, concentrationsof MeO-PBDEs in wild animals are generally greater (as muchas 10-fold) than those of PBDEs (21, 22). Some investigationshave shown that the human daily intake of MeO-PBDEs fromfish oil dietary supplements is 3-fold greater than that ofPBDEs (22), which suggests that humans may be at greaterrisk of exposure to OH-PBDEs via metabolism of MeO-PBDEs.Recent studies have reported the detection of several OH-
PBDE congeners in human blood samples (40, 41), and theconcentrations of OH-PBDEs were higher in people con-suming large amounts of fish (40). Because MeO-PBDEs arefound at relatively high concentrations in marine organisms(21, 22), future studies on human exposure to OH-PBDEsshould include the analysis of MeO-PBDEs. Since OH-PBDEscan have relatively great toxic potency, we suggest that riskassessments of PBDEs and related compounds should bereevaluated based on our discovery of this additional pathwayof OH-PBDEs production in biota.
AcknowledgmentsThis research was supported by a Discovery Grant from theNational Science and Engineering Research Council ofCanada (Project 326415-07) and a grant from WesternEconomic Diversification Canada (Projects 6578 and 6807).J.P.G. was supported by the Canada Research Chair programand an at large Chair Professorship at the Department ofBiology and Chemistry and Research Centre for CoastalPollution and Conservation, City University of Hong Kong.We acknowledge the support of an instrumentation grantfrom the Canada Foundation for Infrastructure. We thankThomas Evans, U.S. Fish and Wildlife Service, Anchorage,Alaska, for providing polar bear liver tissues.
Supporting Information AvailableThis material is available free of charge via the Internet athttp://pubs.acs.org.
Literature Cited(1) Bromine Science and Environmental Forum. Total Market
Demand; 2003; available at www.bsef.com.(2) Hites, R. A. Polybrominated diphenyl ethers in the environment
and in people: A meta-analysis of concentrations. Environ. Sci.Technol. 2004, 38, 945–956.
(3) Hooper, K.; McDonald, T. A. The PBDEs: An emerging envi-ronmental challenge and another reason for breast-milkmonitoring programs. Environ. Health Perspect. 2000, 108, 387–392.
(4) Unson, M. D.; Holland, N. D.; Faulkner, D. J. A brominatedsecondary metabolite synthesized by the cyanobacterial sym-biont of a marine sponge and accumulation of the crystallinemetabolite in the sponge tissue. Mar. Biol. 1994, 119, 1–11.
(5) Haglund, P. S.; Zook, D. R.; Buser, H. R.; Hu, J. Identificationand quantification of polybrominated diphenyl ethers andmethoxy-polybrominated diphenyl ethers in Baltic biota. En-viron. Sci. Technol. 1997, 31, 3281–3287.
(6) Marsh, G.; Athanasiadou, M.; Bergman, A.; Asplund, L. Iden-tification of hydroxylated and methoxylated polybrominateddiphenyl ethers in Baltic Sea salmon (Salmo salar) blood.Environ. Sci. Technol. 2004, 38, 10–18.
(7) Verreault, J.; Gabrielsen, G. W.; Chu, S.; Muir, D. C.; Andersen,M.; Hamaed, A.; Letcher, R. J. Flame retardants and methoxylatedand hydroxylated polybrominated diphenyl ethers in twoNorwegian Arctic top predators: Glaucous gulls and polar bears.Environ. Sci. Technol. 2005, 39, 6021–6028.
(8) Malmvarn, A.; Marsh, G.; Kautsky, L.; Athanasiadou, M.;Bergman, A.; Asplund, L. Hydroxylated and methoxylatedbrominated diphenyl ethers in the red algae Ceramiumtenuicorne and blue mussels from the Baltic Sea. Environ. Sci.Technol. 2005, 39, 2990–2997.
(9) Malmberg, T.; Athanasiadou, M.; Marsh, G.; Brandt, I.; Bergman,A. Identification of hydroxylated polybrominated diphenylmetabolites in blood plasma from polybrominated diphenylether exposed rat. Environ. Sci. Technol. 2005, 39, 5342–5348.
(10) Hakk, H.; Larsen, G.; Klasson-Wehler, E. Tissue disposition,excretion and metabolism of 2,2′,4,4′,5-pentabromodiphenylether (BDE-99) in the male Sprague-Dawley rat. Xenobiotica2002, 32, 369–382.
(11) Marsh, G.; Athanasiadou, M.; Athanassiadis, I.; Sandholm, A.Identification of hydroxylated metabolites in 2,2′,4,4′-tetrabro-modiphenyl ether exposed rats. Chemosphere 2006, 63, 690–697.
(12) Hamers, T.; Kamstra, J. H.; Sonneveld, E.; Murk, A. J.; Visser,T. J.; Van Velzen, M. J. M.; Brouwer, A.; Bergman, A. Biotrans-formation of brominated flame retardants into potentially
VOL. 43, NO. 19, 2009 / ENVIRONMENTAL SCIENCE & TECHNOLOGY 9 7541
Dow
nloa
ded
by U
NIV
OF
SASK
AT
CH
EW
AN
on
Oct
ober
23,
200
9 | h
ttp://
pubs
.acs
.org
P
ublic
atio
n D
ate
(Web
): A
ugus
t 21,
200
9 | d
oi: 1
0.10
21/e
s901
357u
endocrine-disrupting metabolites, with special attention to2,2′,4,4′-tetrabromodiphenyl ether (BDE-47). Mol. Nutr. FoodRes. 2008, 52, 284–298.
(13) Stapleton, H. M.; Kelly, S. M.; Pei, R.; Letcher, R. J.; Gunsch, C.Metabolism of polybrominated diphenyl ethers (PBDEs) byhuman hepatocytes in vitro. Environ. Health Perspect. 2009,117, 197–202.
(14) Meerts, I. A. T. M.; Letcher, R. J.; Hoving, S.; marsh, G.; Bergman,Å.; Lemmen, J. G.; van der Burg, B.; Brouwer, A. In vitroestrogenicity of polybrominated diphenyl ethers, hydroxylatedPBDEs, and polybrominated bisphenol A compounds. Environ.Health Perspect. 2001, 109, 399–407.
(15) Hallgren, S.; Darnerud, P. O. Polybrominated diphenyl ethers(PBDEs), polychlorinated biphenyls (PCBs) and chlorinatedparaffins (CPs) in rats-testing interactions and mechanisms forthyroid hormone effects. Toxicology 2002, 227–243.
(16) Dingemans, M. M. L.; de Groot, A.; van Kleef, R. G. D. M.; Berman,Å.; van den Berg, M.; Vijverberg, H. P. M.; Westerink, R. H. S.Hydroxylation increase the neurotoxic potential of BDE-47 toaffect exocytosis and calcium homeostasis in PC12 cells. Environ.Health Perspect. 2008, 116, 637–643.
(17) Boxtel, A. L. V.; Kamstra, J. H.; Cenijn, P. H.; Pieterse, B.; Wagner,M. J.; Antink, M.; Krab, K.; Van Der Burg, B.; Marsh, G.; Brouwer,A.; Legler, J. Microarray analysis reveals a mechanism of phenolicpolybrominated diphenylether toxicity in zebrafish. Environ.Sci. Technol. 2008, 42, 1773–1779.
(18) Canton, R. F.; Sanderson, J. T.; Letcher, R. J.; Bergman, A.; vanden Berg, M. Inhibition and induction of aromatase (CYP19)activity by brominated flame retardants in H295R humanadrenocortical carcinoma cells. Toxicol. Sci. 2005, 88 (2), 447–455.
(19) Canton, R. F.; Sanderson, J. T.; Nijmeijer, S.; Bergman, A.; Letcher,R. J.; van den Berg, M. In vitro effects of brominated flameretardants and metabolites on CYP17 catalytic activity: A novelmechanism of action. Toxicol. Appl. Pharmacol. 2006, 216, 274–281.
(20) Harju, M.; Hamers, T.; Kamstra, J. H.; Sonneveld, E.; Boon, J. P.;Tysklind, M.; Andersson, P. L. Quantitative structure-activityrelationship modeling on in vitro endocrine effects andmetabolic stablitiy involving 26 selected brominated flameretardants. Environ. Toxicol. Chem. 2007, 26, 816–826.
(21) Teuten, E. L.; Xu, L.; Reddy, C. M. Two abundant bioaccumulatedhalogenated compounds are natural products. Science 2005,307, 917–920.
(22) Covaci, A.; Voorspoels, S.; Vetter, W.; Gelbin, A.; Jorens, P. G.;Blust, R.; Neels, H. Anthropogenic and naturally occurringorganobrominated compounds in fish oil dietary supplements.Environ. Sci. Technol. 2007, 41, 5237–5244.
(23) Allard, A. S.; Remberger, M.; Neilson, A. H. Bacterial O-methylation of halogen-substituted phenols. Appl. Environ.Microbiol. 1987, 53, 839–845.
(24) Whitefield, F. B.; Helidoniotis, F.; Shaw, K. J.; Svoronos, D.Distribution of bromophenols in species of ocean fish fromEastern Australia. J. Agric. Food Chem. 1998, 46, 3750–3757.
(25) Hassenklover, T.; Predehl, S.; Pilli, J.; Ledwolorz, J.; Assmann,M.; Bickmeyer, U. Bromophenols, both present in marineorganisms and in industrial flame retardants, disturb celluarCa2+ signaling in neuroendocrine cells (PC12). Aquat. Toxicol.2006, 73, 37–45.
(26) Qiu, X. H.; Mercado-Feliciano, M.; Bigsby, R. M.; Hites, R. A.Measurement of polybrominated diphenyl ethers and metabo-lites in mouse plasma after exposure to a commercial pent-abromodiphenyl ether mixture. Environ. Health Perspect. 2007,115, 1052–1058.
(27) IUCLID. Data set for 2,4,6-tribromophenol; Ispra, EuropeanChemicals Bureau, International Uniform Chemicals Informa-tion Database, 2003.
(28) Letcher, R. J.; Wehler, E. K.; Bergman, A. Methyl sulfone andhydroxylated metabolites of polychlorinated biphenyls. TheHandbook of Environmental Chemistry, vol. 3 Part K, New Typesof Persistent Halogenated Compounds; Springer: New York,2000; pp 315-359.
(29) Hovander, L.; Athanasiadou, M.; Asplund, L.; Jensen, S.; Wehler,E. K. Extraction and cleanup methods for analysis of phenolicand neutral organohalogens in plasma. J. Anal. Toxicol. 2000,24, 696–703.
(30) Silkworth, J. B.; Koganti, A.; Illouz, K.; Possolo, A.; Zhao, M.;Hamilton, S. B. Comparison of TCDD and PCB CYP1A inductionsensitivities in fresh hepatocytes from human donors, sprague-dawley rats, and rhesus monkeys and HepG2 cells. Toxicol. Sci.2005, 87 (2), 508–519.
(31) Kennedy, S. W.; Jones, S. P. Simultaneous measurement ofcytochrome P4501A catalytic activity and total protein-concentration with a fluorescence plate reader. Anal. Biochem.1994, 222, 217–233.
(32) Johnson-Restrepo, B.; Kannan, K.; Addink, R.; Adams, D. H.Polybrominated diphenyl ethers (PBDEs) and polychlorinatedbiphenyls (PCBs) in a pelagic foodweb of Florida Coastal Waters.Environ. Sci. Technol. 2005, 39, 8243–8250.
(33) Wan, Y.; Hu, J. Y.; Zhang, K.; An, L. H. Trophodynamics ofpolybrominated diphenyl ethers in the marine food web of BohaiBay, North China. Environ. Sci. Technol. 2008, 42, 1078–1083.
(34) He, Y. H.; Murphy, M. B.; Yu, R. M. K.; Lam, M. H. W.; Hecker,M.; Giesy, J. P.; Wu, R. S. S. Effects of 20 PBDE metabolites onsteroidogenesis in the H295R cell line. Toxicol. Lett. 2008, 176,230–238.
(35) Kelly, B. C.; Ikonomou, M. G.; Blair, J. D.; Gobas, F. A. P. C.Hydroxylated and methoxylated polybrominated diphenylethers in a Canadian arctic marine food web. Environ. Sci.Technol. 2008, 42, 7069–7077.
(36) Gebbink, W. A.; Sonne, C.; Dietz, R.; Kirkegaard, M.; Riget, F. F.;Born, E. W.; Muir, D. C. G.; Letcher, R. J. Tissue-specific congenercomposition of organohalogen and metabolite contaminantsin East Greenland polar bears (Ursus maritimus). Environ. Pollut.2008, 152, 621–629.
(37) Berger, U.; Herzke, D.; Sandanger, T. M. Two trace analyticalmethods for determination of hydroxylated PCBs and otherhalogenated phenolic compounds in eggs from Norwegian birdsof prey. Anal. Chem. 2004, 76, 441–452.
(38) Browne, E. P.; Stapleton, H. M.; Kelly, S. M.; Tilton, S. C.;Gallagher, E. P. In vitro hepatic metabolism of 2,2′,4,4′,5-pentabromodiphenyl ether (BDE 99) in Chinook Salmon(Onchorhynchus tshawytscha). Aquat. Toxicol. 2009, 92, 281-287.
(39) Haglund, P.; Malmvarn, A.; Bergek, S.; Bignert, A.; Kaustky, L.;Nakano, T.; Wiberg, K.; Asplund, L. Brominated dibenzo-p-dioxins: a new class of marine toxins. Environ. Sci. Technol.2007, 41, 3069–3074.
(40) Athanasiadou, M.; Cuadra, S. N.; Marsh, G.; Bergman, A.;Jakobsson, K. Polybrominated diphenyl ethers (PBDEs) andbioaccumulative hydroxylated PBDE metabolites in younghumans from Managua, Nicaragua. Environ. Health Perspect.2008, 116, 400–408.
(41) Qiu, X. H.; Bigsby, R. M.; Hites, R. A. Hydroxylated metabolitesof polybrominated diphenyl ethers in human blood samplesfrom the United States. Environ. Health Perspect. 2009, 117,93–98.
ES901357U
7542 9 ENVIRONMENTAL SCIENCE & TECHNOLOGY / VOL. 43, NO. 19, 2009
Dow
nloa
ded
by U
NIV
OF
SASK
AT
CH
EW
AN
on
Oct
ober
23,
200
9 | h
ttp://
pubs
.acs
.org
P
ublic
atio
n D
ate
(Web
): A
ugus
t 21,
200
9 | d
oi: 1
0.10
21/e
s901
357u
1
Supporting Information for 1
Origin of Hydroxylated Brominated Diphenyl Ethers: Natural Compounds or 2
Man-made Flame Retardants? 3
Yi Wan1*, Steve Wiseman1, Hong Chang1, Xiaowei Zhang1, Paul D. Jones1, Markus Hecker1,2, 4
Kurunthachalam Kannan 3, Shinsuke Tanabe4, Jianying Hu5, 5
Michael H. W. Lam7, John P. Giesy1,6,7,8 6
7
1 Dept. Biomedical Veterinary Sciences and Toxicology Centre, University of Saskatchewan, 8
Saskatoon, Saskatchewan S7N 5B3, Canada 9 2 ENTRIX, Inc., Saskatoon, Saskatchewan S7N 5B3, Canada 10 3 Wadsworth Center, New York, NY, State Department of Health and Department of 11
Environmental Health Sciences, School of Public Health, State University of New York, 12
Empire State Plaza, Albany, NY 12201-0509, USA 13 4 Center for Marine Environmental Studies, Ehime University, Matsuyama, Japan 14 5 College of Urban and Environmental Sciences, Peking University, Beijing, 100871 China 15 6Department of Zoology and Center for Integrative Toxicology, Michigan State University, 16
East Lansing, MI, USA 17 7Centre for Coastal Pollution and Conservation and Department of Biology and Chemistry, 18
City University of Hong Kong, Kowloon, Hong Kong, SAR China 19 8State Key Laboratory of Marine Environmental Science, College of Oceanography and 20
Environmental Science, Xiamen University, Xiamen, P. R. China 21
*To whom correspondence should be addressed. E-mail: [email protected] 22
23
This file includes: 24
Chemicals 25
Microsomal Preparation 26
Instrument Condition 27
Statistical Analysis 28
Fig. S1 29
Table S1 30
Table S2 31
Table S3 32
Table S4 33
Table S5 34
Table S6 35
36
2
Chemicals. 1
Twenty-one PBDEs (BDE-7, BDE-15, BDE-30, BDE-17, BDE-28, BDE-49, BDE-71, 2
BDE-47, BDE-66, BDE-77, BDE-100, BDE-119, BDE-99, BDE-85, BDE-126, BDE-154, 3
BDE-153, BDE-139, BDE-140, BDE-138, and BDE-183), twelve MeO-PBDEs 4
(6-MeO-BDE-17, 4-MeO-BDE-17, 2’ -MeO-BDE-68, 6-MeO-BDE-47, 5-MeO-BDE-47, 4’ 5
-MeO-BDE-49, 5’-MeO-BDE-100, 4’-MeO-BDE-103, 5’-MeO-BDE-99, 4’-MeO-BDE-101, 6
6-MeO-BDE-90, and 6-MeO-BDE-85), ten OH-PBDEs (2’-OH-6’-Cl-BDE-7, 7
6’-OH-BDE-17, 6-OH-BDE-47, 3-OH-BDE-47, 5-OH-BDE-47, 2’-OH-BDE-68, 8
4’-OH-BDE-49, 2’-OH-6’-Cl-BDE-68, 6-OH-BDE-90, 2-OH-BDE-123) and sixteen 9
bromophenols (BRPs, including 2,6-DiBRP, 2,5-DiBRP, 2,4-DiBRP, 2,3-DiBRP, 3,5-DiBRP, 10
3,4-DiBRP, 2,4,6-TriBRP, 2,3,6-TriBRP, 2,3,5-TriBRP, 2,4,5-TriBRP, 2,3,4-TriBRP, 11
3,4,5-TriBRP, 2,3,5,6-TeBRP, 2,3,4,6-TeBRP, 2,3,4,5-TeBRP, and 2,3,4,5,6-PeBRP) were 12
selected as target compounds. 13C-BRPs (2,4-13C-DiBRP, 2,4,6-13C-TriBRPs, 13
2,3,4,6-13C-TeBRPs and 2,3,4,5,6-13C-PeBRPs) were used as surrogate standards for 14
OH-PBDEs and BRPs, and 13C-PBDEs (13C-BDE-28, 13C-BDE-47, 13C-BDE-100, 15
13C-BDE-99, 13C-BDE-154, 13C-BDE-153 and 13C-BDE-183) were used as surrogate standard 16
for PBDEs and MeO-PBDEs. 17
PBDEs, 13C-PBDEs, BRPs, 13C-BRPs and eight MeO-PBDEs standards were obtained 18
from Wellington Laboratories Inc. (Guelph, Ontario, Canada). 3-OH-BDE-47, 19
5-OH-BDE-47 and 2’-OH-BDE-68 were obtained from AccuStandard (New Haven, 20
Connecticut, USA). 6-MeO-BDE-17, 4-MeO-BDE-17, 6-MeO-BDE-90, 6-MeO-BDE-85 21
and the remaining seven OH-PBDEs were synthesized in the Department of Biology and 22
3
Chemistry, City University of Hong Kong, and purities of all metabolites were >98% (1). 1
Dichloromethane (DCM), n-hexane, methyl tert-butyl ether (MTBE), acetonitrile and 2
methanol were pesticide residue grade obtained from OmniSolv (EM Science, Lawrence, KS, 3
USA). Sodium sulfate, silica gel (60-100 mesh size), aluminum oxide (neutral, 150 mesh 4
size), pyridine (anhydrous, 99.8%), methyl chloroformate (MCF), hydrochloric acid (37%, 5
A.C.S. reagent), 2-propanol, and potassium hydroxide (KOH) were purchased from 6
Sigma-Aldrich (St. Louis, MO, USA). For biochemical analyses, 7-ethoxyresorufin (7-ER) 7
was obtained from Molecular Probes (Eugene, OR,USA), sodium phosphate dibasic 8
(Na2HPO4), sodium phosphate monobasic (NaH2PO4) and potassium phosphate monobasic 9
(KH2PO4), resorufin, ethylenediaminetetraacetic acid (EDTA), and dithiothreitol (DTT) were 10
obtained from Sigma-Aldrich (St. Louis, MO, USA). All other biochemical reagents, 11
including NADPH, were obtained from Sigma-Aldrich and were reagent grade or better 12
unless stated otherwise. 13
14
Microsomal Preparation. 15
Approximately 200 mg of tissue was homogenized in cold phosphate buffer (200 mL 0.1 16
M Na2HPO4 mixed with 800 mL 0.1 M KH2PO4 with pH adjusted to 7.4) and samples were 17
centrifuged for 15 min at 9000 g. Following centrifugation the supernatant (S9 fraction) was 18
removed and then centrifuged at 100,000 g for 60 min. The resulting pellet was dissolved in 19
phosphate buffer and stored at -80 °C until analysis. All centrifugation steps were carried 20
out at 4 °C and samples were kept on ice throughout the procedure. Sample protein 21
concentrations were determined using the bichinchoninic acid (BCA) method using bovine 22
4
serum albumin (BSA) as a standard and according to the manufacturers protocol 1
(Sigma-Aldrich Corp., St Louis, MO). Prior to PBDE and MeO-PBDE exposure studies all 2
microsomal fractions were assayed for ethoxyresorufin O-deethylase (EROD) activity (31). 3
Briefly, resorufin and BSA standards were added to the first 12 wells of the plate. These 4
wells did not contain microsomes and were used to establish resorufin and protein standard 5
curves. All wells containing micosomes received 50 µL of 7-ER working solution (final 6
concentration 5 µM) and sodium phosphate buffer to a final volume of 175 µL. Following a 7
5 min incubation at 37 °C, the enzymatic reaction was started by adding 25 µL of NADPH 8
(1.2 mg/mL in sodium phosphate buffer) to each well. Exactly 10 min later, the reaction was 9
stopped with the addition of 150 µL of cold acetonitrile (0.15 mg/mL). Cells were incubated 10
for 10 min at room temperature, after which fluorescence values for resorufin were read on a 11
fluorescence plate reader (CytoFluor 2350, Millipore, Bedford, MA, USA). Resorufin was 12
read with a 530-nm excitation filter and a 630-nm emission filter. 13
14
Instrumental Conditions. 15
Identification and quantification of all target compounds was performed using a 16
Hewlett-Packard 5890 series II high-resolution gas chromatograph interfaced to a 17
Micromass® Autospec® high-resolution mass spectrometer (HRGC-HRMS) (Micromass®, 18
Beverly, MD). Chromatographic separation was achieved on a DB-5MS fused silica 19
capillary column for all target compounds (30 m length, 0.25 mm ID, 0.1 µm film thickness, 20
Agilent, Carlsbad, CA), helium was used as carrier gas. The GC temperature program and 21
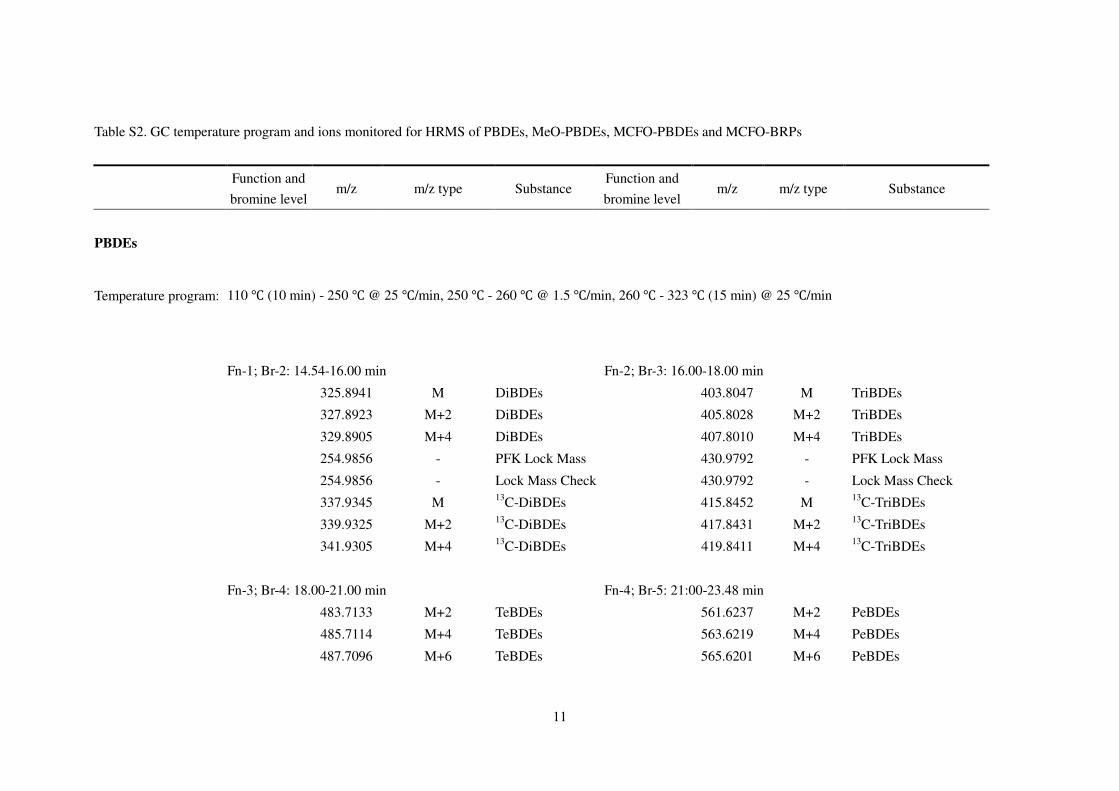
ions monitored for PBDEs, MeO-PBDEs, OH-PBDEs and BRPs are shown in Table S2 in 22
5
Supporting Information. The mass spectrometer was operated in a Selected Ion-Monitoring 1
(SIM) mode. The resolution for all reference gas peaks in all time windows was more than 2
7,000. The injector temperature was held at 285 °C and the ion source was kept at 285 °C. 3
The electron ionization energy was 37 eV and the ion current was 750 µA. 4
5
Statistical Analysis. 6
Correlations between the target compounds were examined by Pearson’s rank correlation test, 7
and when the p value was less than 0.05, the linear regression was regarded as significant. 8
Differences in concentrations of target compounds among species were compared using 9
one-way analysis of variance (ANOVA) (2). Levene’s test was used to check the equality of 10
variances. Where variances were equal, data were analyzed by the F test. Where the 11
equality of variances could not be assumed, Welch’s and Brown-Forsythe's robust tests were 12
used to perform one-way ANOVA analysis. Multiple paired comparisons were used to 13
determine which means differed from one another. Tukey’s Honestly Significant 14
Differences (HSD) was used where variances were presumed to be equal, and the 15
Games-Howell test was used where equality of variances could not be assumed (SPSS 11, 16
SPSS Inc., Chicago, IL). The software used was SPSS 11.0 (SPSS Inc., Chicago, IL, 17
USA). 18
19
20
21
22
23
Reference 24
25
1. He, Y.H.; Murphy, M.B.; Yu, R.M.K.; Lam, M.H.W.; Hecker, M.; Giesy, J.P.; Wu, R.S.S. 26

6
Effects of 20 PBDE metabolites on steroidogenesis in the H295R cell line. Toxicol. Lett. 1
2008, 176, 230-238. 2
2. Wan, Y.; Hu, J.Y.; An, W.; Zhang, Z.B.; An, L.H.; Hattori, T.; Itoh, M.; Masunaga, S. 3
Congener-specific tissue distribution and hepatic sequestration of PCDD/Fs in wild 4
herring gulls from Bohai Bay, North China: Comparison to coplanar PCBs. Environ. Sci. 5
Technol. 2006, 36, 1462-1468. 6
7
7
1
2
3
4
5
6
7
8
9
10
11
12
13
14
15
16
17
Figure S1. Relationship between concentrations of 6-OH-BDE-47 and 6-MeO-BDE-47. log 18
(6-OH-BDE-47) = 0.5861log(6-MeO-BDE-47) + 0.5984, r2 = 0.5011, p<0.001 19
20
21
22
23
24
25
26
27
28
29
30
31
32
33
34
35
36
37
38
39
40
41
42
1
10
100
1000
10000
0.1 1 10 100 1000 10000
Conc. of 6-MeO-BDE-47 (pg/g ww)
Co
nc.
of
6-O
H-B
DE
-47
(p
g/g
ww
)
8
Table S1. Details and concentrations target compounds in organisms used in this study.
Sample
code Species name
Date of
collection Location Sex
Age
(year) Wt (kg)
Length
(cm)
Lipid
(%)
δ13
C (‰,
V-PDB)
δ15
N (‰,
AIR)
ΣPBDEs ΣMeO-P
BDEs
ΣOH-PB
DEs
ΣBRPs
25 Pacific tuna 1999 North Pacific Ocean M - 23 106 4.8 -16.5 11.1 192 493 25.9 798
34 Pacific tuna 1999 North Pacific Ocean M - 30 115 7.8 -17.0 10.9 114 344 33.9 1000
49 Pacific tuna 1999 North Pacific Ocean M - 33 115 7.6 -17.2 11.5 153 548 44.0 726
54 Pacific tuna 1999 North Pacific Ocean M - 31 117 3.7 -17.3 10.8 326 669 20.3 255
58 Pacific tuna 1999 North Pacific Ocean M - 25 105 7.0 -16.3 9.3 171 761 24.3 1000
63 Pacific tuna 1999 North Pacific Ocean M - 36 124 1.9 -16.8 11.2 199 459 22.6 918
66 Pacific tuna 1999 North Pacific Ocean M - 19 101 2.0 -18.9 10.9 209 610 19.9 827
84 Pacific tuna 1999 North Pacific Ocean M - 31 115 2.6 -16.5 10.7 254 375 26.8 722
88 Pacific tuna 1999 North Pacific Ocean M - 41 130 3.3 -17.1 11.8 201 267 15.9 200
90 Pacific tuna 1999 North Pacific Ocean M - 23 104 9.0 -17.3 11.3 93.7 447 17.8 272
EB02470 Yellow-nosed
albatross 1995 Indian Ocean M - 2.95 83.9 14.7 -18.3 13.6
407 3900 1400 42.2
EB04184 Light-mantled
sooty albatross 1995 South Atlantic Ocean M - 3.2 91.4 4.7 -22.7 12.3
97.2 161 490 140
EB04307 Grey-headed
albatross 1996 Indian Ocean M - 3.94 87.1 4.3 -20.5 12.0
74.0 213 692 35.4
EB04314 Grey-headed
albatross 1996 Indian Ocean M - 3.55 80.4 9.1 -18.3 13.7
75.0 127 168 <DL
EB04714 Shy albatross 1995 South Atlantic Ocean M - 4.9 96.2 10.9 -16.9 16.7 86.5 187 229 <DL
EB04719 Shy albatross 1996 Indian Ocean M - 5.48 97.3 11.8 -17.4 15.0 115 709 445 <DL
EB05088 Black-browed
albatross 1992 Indian Ocean M - 5.1 88.9 10.4 -18.2 14.6
90.8 160 323 <DL
EB05097 Black-browed 1994 Indian Ocean M - 4.85 89.6 14.4 -18.1 15.4 431 224 259 <DL
9
albatross
EB05103 Black-browed
albatross 1995 Indian Ocean F - 3.45 81.5 7.4 -19.1 13.1
140 254 768 <DL
EB05118 Black-browed
albatross 1996 South Pacific Ocean M - 4.55 88.5 5.5 -18.3 13.5
229 4500 665 32.9
EB05121 Black-browed
albatross 1996 Indian Ocean M - 4.75 88.2 8.8 -18.0 13.9
424 1500 312 <DL
EB05122 Black-browed
albatross 1996 Indian Ocean F - 3.7 84.4 9.6 -17.7 14.3
167 1600 219 141
EB05881 Yellow-nosed
albatross 1996 Indian Ocean F - 2.49 78.2 11.4 -18.5 11.6
1200 1500 505 28.8
EB05884 Yellow-nosed
albatross 1996 Indian Ocean M - 2.55 78.8 14.3 -18.2 14.8
396 342 1300 48.4
EB05922 Grey-headed
albatross 1994 Indian Ocean - - - - 14.0 -19.5 12.4
92.3 472 311 29.6
980565LB Polar bear 1993-2002 Arctic Ocean F 3 - - 11.9 -18.2 21.0 1000 31.8 9.9 621
990083LD Polar bear 1993-2002 Arctic Ocean M 5 - - 6.2 -18.8 20.3 1000 11.3 <DL 129
990112LB Polar bear 1993-2002 Arctic Ocean M 5 - - 4.7 -17.9 20.2 743 39.5 32.8 45.7
990127LB Polar bear 1993-2002 Arctic Ocean M 6 - - 5.7 -17.8 20.3 848 56.0 <DL 64.3
990592LA Polar bear 1993-2002 Arctic Ocean F 11 - - 8.4 -17.6 20.7 820 9.9 <DL 335
990594LB Polar bear 1993-2002 Arctic Ocean M 19 - - 6.6 -16.2 20.5 288 14.8 8.9 123
990600LB Polar bear 1993-2002 Arctic Ocean M 5 - - 7.6 -18.7 20.6 818 25.5 <DL 12.6
990652LC Polar bear 1993-2002 Arctic Ocean M 3 - - 8.6 -17.1 20.1 427 5.7 12.9 6.5
990658LB Polar bear 1993-2002 Arctic Ocean M 10 - - 7.0 -17.6 20.0 625 22.8 20.7 134
990671LC Polar bear 1993-2002 Arctic Ocean F 14 - - 4.8 -19.2 21.2 755 16.6 8.9 76.7
The scientific names were Katsuwonus pelamis, Thalassarche chlororhynchos, Phoebetria palpebrata, Thalassarche chrysostoma, Thalassarche cauta,
Thalassarche melanophrys and Ursus maritimus for pacific tuna, yellow-nosed albatross, light-mantled sooty albatross, grey-headed albatross, shy albatross,

10
black-browed albatross and polar bear, respectively.
11
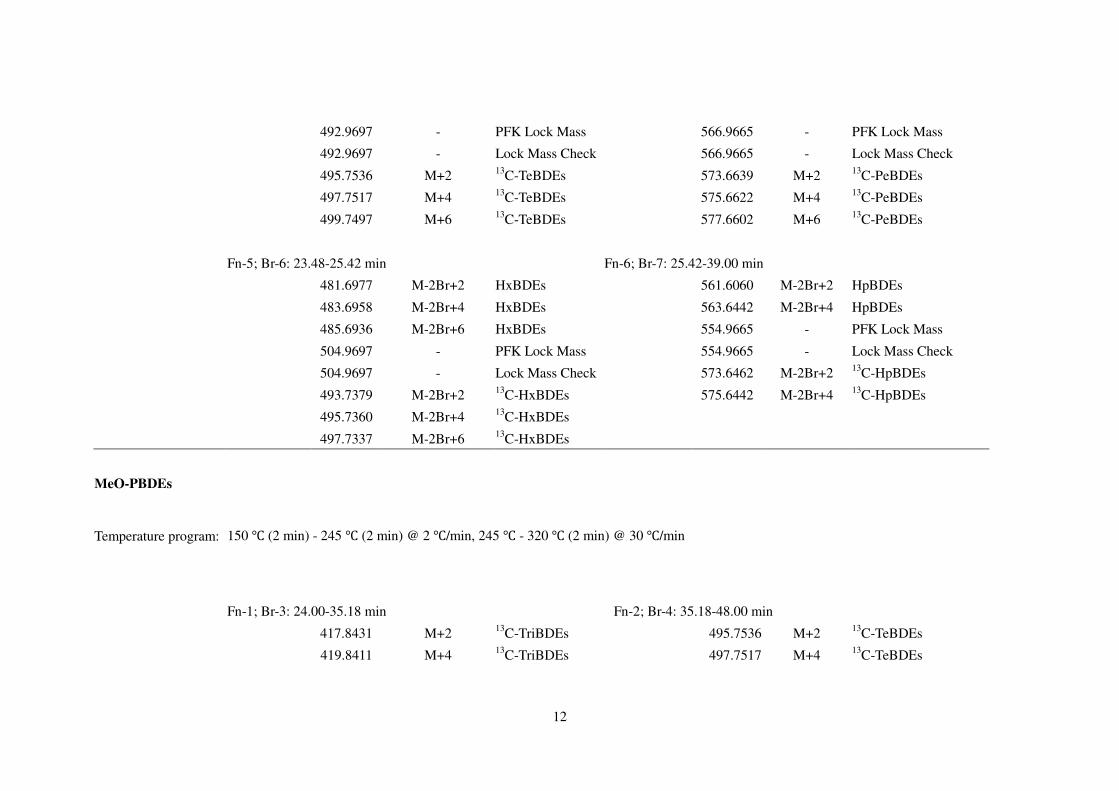
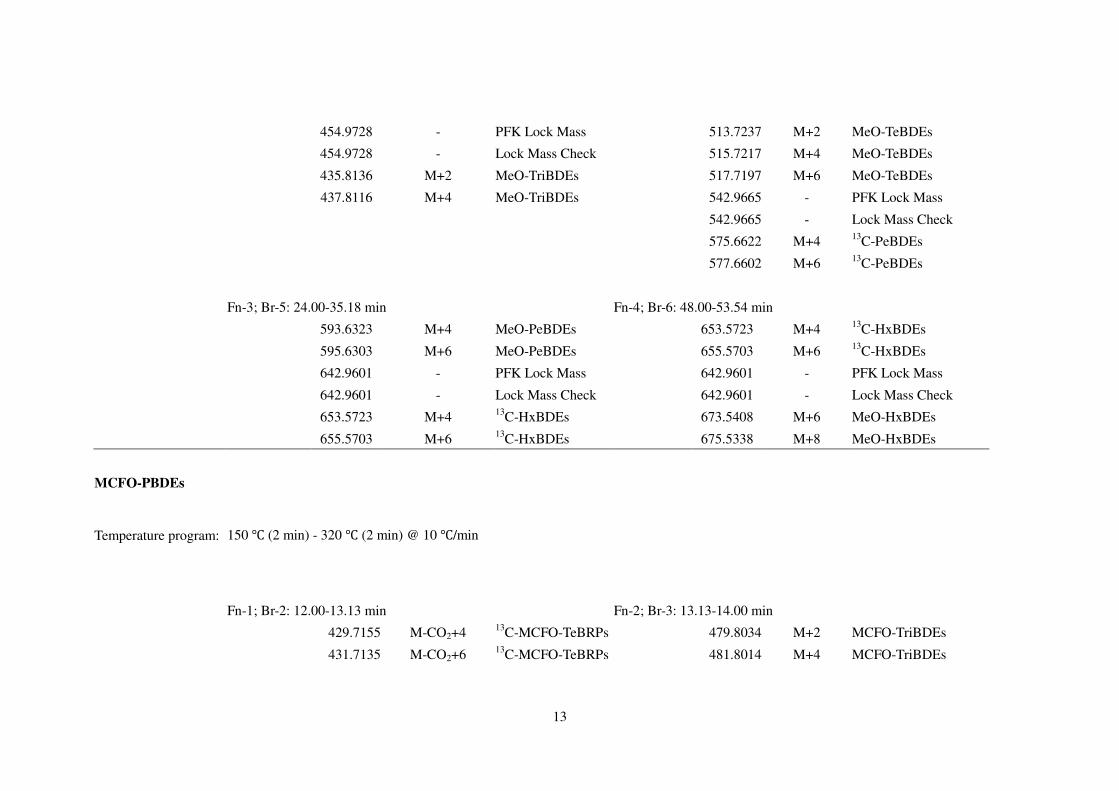
Table S2. GC temperature program and ions monitored for HRMS of PBDEs, MeO-PBDEs, MCFO-PBDEs and MCFO-BRPs
Function and
bromine level m/z m/z type Substance
Function and
bromine level m/z m/z type Substance
PBDEs
Temperature program: 110 ℃ (10 min) - 250 ℃ @ 25 ℃/min, 250 ℃ - 260 ℃ @ 1.5 ℃/min, 260 ℃ - 323 ℃ (15 min) @ 25 ℃/min
Fn-1; Br-2: 14.54-16.00 min Fn-2; Br-3: 16.00-18.00 min
325.8941 M DiBDEs 403.8047 M TriBDEs
327.8923 M+2 DiBDEs 405.8028 M+2 TriBDEs
329.8905 M+4 DiBDEs 407.8010 M+4 TriBDEs
254.9856 - PFK Lock Mass 430.9792 - PFK Lock Mass
254.9856 - Lock Mass Check 430.9792 - Lock Mass Check
337.9345 M 13C-DiBDEs 415.8452 M 13
C-TriBDEs
339.9325 M+2 13C-DiBDEs 417.8431 M+2 13
C-TriBDEs
341.9305 M+4 13C-DiBDEs 419.8411 M+4 13
C-TriBDEs
Fn-3; Br-4: 18.00-21.00 min Fn-4; Br-5: 21:00-23.48 min
483.7133 M+2 TeBDEs 561.6237 M+2 PeBDEs
485.7114 M+4 TeBDEs 563.6219 M+4 PeBDEs
487.7096 M+6 TeBDEs 565.6201 M+6 PeBDEs
12
492.9697 - PFK Lock Mass 566.9665 - PFK Lock Mass
492.9697 - Lock Mass Check 566.9665 - Lock Mass Check
495.7536 M+2 13C-TeBDEs 573.6639 M+2 13
C-PeBDEs
497.7517 M+4 13C-TeBDEs 575.6622 M+4 13
C-PeBDEs
499.7497 M+6 13C-TeBDEs 577.6602 M+6 13
C-PeBDEs
Fn-5; Br-6: 23.48-25.42 min Fn-6; Br-7: 25.42-39.00 min
481.6977 M-2Br+2 HxBDEs 561.6060 M-2Br+2 HpBDEs
483.6958 M-2Br+4 HxBDEs 563.6442 M-2Br+4 HpBDEs
485.6936 M-2Br+6 HxBDEs 554.9665 - PFK Lock Mass
504.9697 - PFK Lock Mass 554.9665 - Lock Mass Check
504.9697 - Lock Mass Check 573.6462 M-2Br+2 13C-HpBDEs
493.7379 M-2Br+2 13C-HxBDEs 575.6442 M-2Br+4 13
C-HpBDEs
495.7360 M-2Br+4 13C-HxBDEs
497.7337 M-2Br+6 13C-HxBDEs
MeO-PBDEs
Temperature program: 150 ℃ (2 min) - 245 ℃ (2 min) @ 2 ℃/min, 245 ℃ - 320 ℃ (2 min) @ 30 ℃/min
Fn-1; Br-3: 24.00-35.18 min Fn-2; Br-4: 35.18-48.00 min
417.8431 M+2 13C-TriBDEs 495.7536 M+2 13
C-TeBDEs
419.8411 M+4 13C-TriBDEs 497.7517 M+4 13
C-TeBDEs
13
454.9728 - PFK Lock Mass 513.7237 M+2 MeO-TeBDEs
454.9728 - Lock Mass Check 515.7217 M+4 MeO-TeBDEs
435.8136 M+2 MeO-TriBDEs 517.7197 M+6 MeO-TeBDEs
437.8116 M+4 MeO-TriBDEs 542.9665 - PFK Lock Mass
542.9665 - Lock Mass Check
575.6622 M+4 13C-PeBDEs
577.6602 M+6 13C-PeBDEs
Fn-3; Br-5: 24.00-35.18 min Fn-4; Br-6: 48.00-53.54 min
593.6323 M+4 MeO-PeBDEs 653.5723 M+4 13C-HxBDEs
595.6303 M+6 MeO-PeBDEs 655.5703 M+6 13C-HxBDEs
642.9601 - PFK Lock Mass 642.9601 - PFK Lock Mass
642.9601 - Lock Mass Check 642.9601 - Lock Mass Check
653.5723 M+4 13C-HxBDEs 673.5408 M+6 MeO-HxBDEs
655.5703 M+6 13C-HxBDEs 675.5338 M+8 MeO-HxBDEs
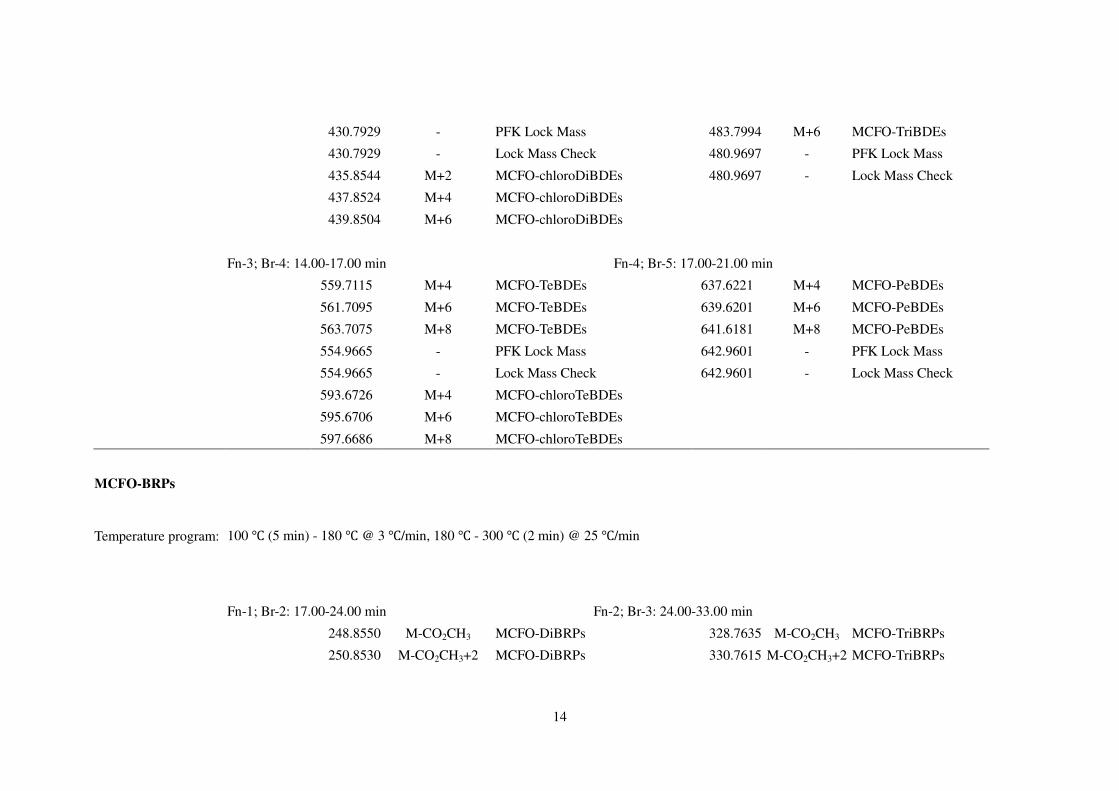
MCFO-PBDEs
Temperature program: 150 ℃ (2 min) - 320 ℃ (2 min) @ 10 ℃/min
Fn-1; Br-2: 12.00-13.13 min Fn-2; Br-3: 13.13-14.00 min
429.7155 M-CO2+4 13C-MCFO-TeBRPs 479.8034 M+2 MCFO-TriBDEs
431.7135 M-CO2+6 13C-MCFO-TeBRPs 481.8014 M+4 MCFO-TriBDEs
14
430.7929 - PFK Lock Mass 483.7994 M+6 MCFO-TriBDEs
430.7929 - Lock Mass Check 480.9697 - PFK Lock Mass
435.8544 M+2 MCFO-chloroDiBDEs 480.9697 - Lock Mass Check
437.8524 M+4 MCFO-chloroDiBDEs
439.8504 M+6 MCFO-chloroDiBDEs
Fn-3; Br-4: 14.00-17.00 min Fn-4; Br-5: 17.00-21.00 min
559.7115 M+4 MCFO-TeBDEs 637.6221 M+4 MCFO-PeBDEs
561.7095 M+6 MCFO-TeBDEs 639.6201 M+6 MCFO-PeBDEs
563.7075 M+8 MCFO-TeBDEs 641.6181 M+8 MCFO-PeBDEs
554.9665 - PFK Lock Mass 642.9601 - PFK Lock Mass
554.9665 - Lock Mass Check 642.9601 - Lock Mass Check
593.6726 M+4 MCFO-chloroTeBDEs
595.6706 M+6 MCFO-chloroTeBDEs
597.6686 M+8 MCFO-chloroTeBDEs
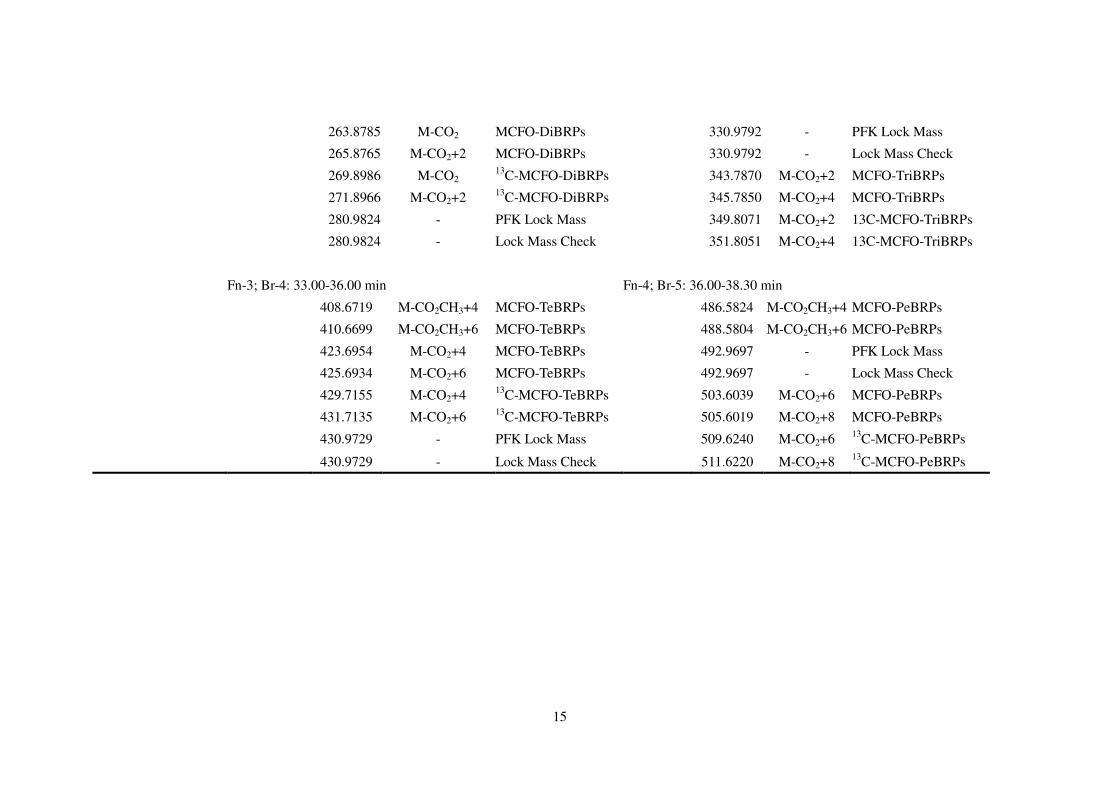
MCFO-BRPs
Temperature program: 100 ℃ (5 min) - 180 ℃ @ 3 ℃/min, 180 ℃ - 300 ℃ (2 min) @ 25 ℃/min
Fn-1; Br-2: 17.00-24.00 min Fn-2; Br-3: 24.00-33.00 min
248.8550 M-CO2CH3 MCFO-DiBRPs 328.7635 M-CO2CH3 MCFO-TriBRPs
250.8530 M-CO2CH3+2 MCFO-DiBRPs 330.7615 M-CO2CH3+2 MCFO-TriBRPs
15
263.8785 M-CO2 MCFO-DiBRPs 330.9792 - PFK Lock Mass
265.8765 M-CO2+2 MCFO-DiBRPs 330.9792 - Lock Mass Check
269.8986 M-CO2 13
C-MCFO-DiBRPs 343.7870 M-CO2+2 MCFO-TriBRPs
271.8966 M-CO2+2 13C-MCFO-DiBRPs 345.7850 M-CO2+4 MCFO-TriBRPs
280.9824 - PFK Lock Mass 349.8071 M-CO2+2 13C-MCFO-TriBRPs
280.9824 - Lock Mass Check 351.8051 M-CO2+4 13C-MCFO-TriBRPs
Fn-3; Br-4: 33.00-36.00 min Fn-4; Br-5: 36.00-38.30 min
408.6719 M-CO2CH3+4 MCFO-TeBRPs 486.5824 M-CO2CH3+4 MCFO-PeBRPs
410.6699 M-CO2CH3+6 MCFO-TeBRPs 488.5804 M-CO2CH3+6 MCFO-PeBRPs
423.6954 M-CO2+4 MCFO-TeBRPs 492.9697 - PFK Lock Mass
425.6934 M-CO2+6 MCFO-TeBRPs 492.9697 - Lock Mass Check
429.7155 M-CO2+4 13C-MCFO-TeBRPs 503.6039 M-CO2+6 MCFO-PeBRPs
431.7135 M-CO2+6 13C-MCFO-TeBRPs 505.6019 M-CO2+8 MCFO-PeBRPs
430.9729 - PFK Lock Mass 509.6240 M-CO2+6 13C-MCFO-PeBRPs
430.9729 - Lock Mass Check 511.6220 M-CO2+8 13C-MCFO-PeBRPs
16
Table S3. Concentrations of target compounds in matrix spike samples (ng/ml).
Compound Conc. Compound Conc. Compound Conc. Compound Conc.
PBDEs MeO-PBDEs OH-PBDEs BRPs
BDE-28 1.1×10²±6.0 6-MeO-BDE-17 0.90×10²±4.2 2’-OH-6’-Cl-BDE-7 1.0×10²±6.5 2,6-DiRP 0.81×10²±11
BDE-47 1.1×10²±4.9 4-MeO-BDE-17 0.89×10²±6.4 6’-OH-BDE-17 1.1×10²±0.8 2,5-DiRP 1.1×10²±6.2
BDE-66 1.1×10²±11 2’-MeO-BDE-68 0.97×10²±5.4 6-OH-BDE-47 1.1×10²±11 2,4-DiRP 1.1×10²±4.1
BDE-100 1.1×10²±3.4 6-MeO-BDE-47 0.96×10²±3.9 4’-OH-BDE-49 1.2×10²±8.3 3,5-DiRP 1.1×10²±3.0
BDE-99 1.1×10²±1.3 5-MeO-BDE-47 0.85×10²±7.0 2’-OH-6’-Cl-BDE-68 0.80×10²±3.2 2,3-DiRP 1.1×10²±7.3
BDE-85 1.0×10²±12 4’-MeO-BDE-49 0.90×10²±7.5 6-OH-BDE-90 0.80×10²±3.7 3,4-DiRP 1.1×10²±5.9
BDE-154 0.95×10²±12 5’-MeO-BDE-100 0.89×10²±6.3 2-OH-BDE123 1.0×10²±1.6 2,4,6-TriRP 1.1×10²±0.8
BDE-153 1.1×10²±2.4 6-MeO-BDE-90 0.90×10²±5.0 2,3,6-TriRP 1.0×10²±5.3
BDE-183 1.0×10²±4.4 4’-MeO-BDE-103 0.93×10²±1.6 2,3,5-TriRP 0.99×10²±3.0
4’-MeO-BDE-99 0.98×10²±5.4 2,4,5-TriRP 1.1×10²±2.9
4’-MeO-BDE-101 1.1×10²±10 2,3,4-TriRP 1.1×10²±4.5
6-MeO-BDE-85 0.90×10²±2.6 3,4,5-TriRP 1.2×10²±3.5
2,3,5,6-TeRP 1.1×10²±6.1
2,3,4,6-TeRP 1.1×10²±5.9
2,3,4,5-TeRP 0.81×10²±3.4
2,3,4,5,6-PeRP 1.1×10²±6.3
Approximately 10 g of beef liver was used for matrix spike samples. The spiking levels of all target compounds were 100 ng/ml. Recoveries of surrogates were
84.6-116% and 75.4-124.1% for 13
C-BRPs (except 2,4-13
C-DiBRP) and 13
C-PBDEs, respectively.
17
Table S4. Concentrations of brominated compounds after metabolism with chicken microsomes exposed to PBDEs, MeO-PBDEs and
OH-PBDEs (ng/ml).
<DL: less than detection limit
Exposed group (Chemicals)
BDE-99 PBDEs mix 6-MeO-BDE-47 MeO-PBDEs mix 6-OH-BDE-47 OH-PBDEs mix
Dosing concentration 1.5×10³±75 1.2×10
2±10 1.5×10
3±75 1.5×10
2±15 1.5×10
3±75 1.5×10
2±15
6-OH-BDE-47 4’-OH-BDE-49 6-OH-BDE-90 2-OH-BDE123 4'-OH-BDE103
<DL <DL <DL <DL <DL
<DL <DL <DL <DL <DL
1.3×10² <DL <DL <DL <DL
16 39
<DL <DL 40
60 <DL <DL <DL <DL
6.4 1.5×10
2
33 1.4×10
2
<DL
24-DiBRP 246-TriBRP 245-TriBRP
<DL <DL <DL
<DL <DL <DL
17 <DL 1.6
1.6 <DL 0.3
22 <DL <DL
27 <DL <DL
2’-MeO-BDE-68 6-MeO-BDE-47 5-MeO-BDE-47 4’-MeO-BDE-49 5’-MeO-BDE-100 4’-MeO-BDE-103 4’-MeO-BDE-99 4’-MeO-BDE-101
<DL <DL <DL <DL <DL <DL <DL <DL
<DL <DL <DL <DL <DL <DL <DL <DL
<DL 1.7×10
2
<DL <DL <DL <DL <DL <DL
17 19 32 19 3.2 18 16 24
<DL <DL <DL <DL <DL <DL <DL <DL
<DL <DL <DL <DL <DL <DL <DL <DL
BDE-28 BDE-49 BDE-47 BDE-66 BDE-100 BDE-119 BDE-99 BDE-85 BDE-154 BDE-153 BDE-183
<DL 3.0 0.7
<DL <DL <DL
6.2×10² <DL <DL <DL <DL
24 <DL 42 38 58 1.1 52 53 34 48 56
<DL <DL <DL <DL <DL <DL <DL <DL <DL <DL <DL
<DL <DL <DL <DL <DL <DL <DL <DL <DL <DL <DL
<DL <DL <DL <DL <DL <DL <DL <DL <DL <DL <DL
<DL <DL <DL <DL <DL <DL <DL <DL <DL <DL <DL

18
Table S5. Concentrations of brominated compounds after metabolism with rainbow trout microsomes exposed to PBDEs, MeO-PBDEs and
OH-PBDEs (ng/ml).
<DL: less than detection limit
Exposed group (Chemicals)
BDE-99 PBDEs mix 6-MeO-BDE-47 MeO-PBDEs mix 6-OH-BDE-47 OH-PBDEs mix
Dosing concentration 1.5×10³±75 1.2×10
2±10 1.5×10
3±75 1.5×10
2±15 1.5×10
3±75 1.5×10
2±15
6-OH-BDE-47 4’-OH-BDE-49 6-OH-BDE-90 2-OH-BDE123 4'-OH-BDE103
<DL <DL <DL <DL <DL
<DL <DL <DL <DL <DL
1.1×10² <DL <DL <DL <DL
3.0 35 80
<DL 79
1.5×10³
<DL <DL <DL <DL
1.5×10²
4.7×10²
1.0×10²
1.0×10²
<DL
24-DiBRP 246-TriBRP 245-TriBRP
<DL <DL <DL
<DL <DL <DL
5.2 <DL 0.7
<DL 3.3 0.3
16 <DL <DL
5.2 <DL <DL
2’-MeO-BDE-68 6-MeO-BDE-47 5-MeO-BDE-47 4’-MeO-BDE-49 5’-MeO-BDE-100 4’-MeO-BDE-103 4’-MeO-BDE-99 4’-MeO-BDE-101
<DL <DL <DL <DL <DL <DL <DL <DL
<DL <DL <DL <DL <DL <DL <DL <DL
<DL 3.2×10
2
<DL <DL <DL <DL <DL <DL
31 50 76 45 3.8 40 34 52
<DL <DL <DL <DL <DL <DL <DL <DL
<DL <DL <DL <DL <DL <DL <DL <DL
BDE-28 BDE-49 BDE-47 BDE-66 BDE-100 BDE-119 BDE-99 BDE-85 BDE-154 BDE-153 BDE-183
<DL 4.6 0.7
<DL 0.1
<DL 4.2×10²
<DL <DL 0.2
<DL
19 <DL 32 34 32 0.6 33 7.5 20 27 25
<DL <DL <DL <DL <DL <DL <DL <DL <DL <DL <DL
<DL <DL <DL <DL <DL <DL <DL <DL <DL <DL <DL
<DL <DL <DL <DL <DL <DL <DL <DL <DL <DL <DL
<DL <DL <DL <DL <DL <DL <DL <DL <DL <DL <DL
19
Table S6. Concentrations of brominated compounds after metabolism with rat microsomes exposed to PBDEs, MeO-PBDEs and OH-PBDEs
(ng/ml).
Exposed group (Chemicals)
BDE-99 PBDEs mix 6-MeO-BDE-47 MeO-PBDEs mix 6-OH-BDE-47 OH-PBDEs mix
Dosing concentration 1.5×10³±75 1.2×10
2±10 1.5×10
3±75 1.5×10
2±15 1.5×10
3±75 1.5×10
2±15
6-OH-BDE-47 4’-OH-BDE-49 6-OH-BDE-90 2-OH-BDE123 4'-OH-BDE103
<DL <DL <DL <DL <DL
<DL <DL <DL <DL <DL
40 <DL <DL <DL <DL
2.7 49
<DL <DL 98
7.1×10²
<DL <DL <DL <DL
86 2.6×10
2
77 1.6×10
2
<DL
24-DiBRP 246-TriBRP 245-TriBRP
<DL <DL <DL
<DL <DL <DL
4.5 <DL <DL
<DL 4.4 1.2
1.1×10²
3.8 <DL
17 <DL <DL
2’-MeO-BDE-68 6-MeO-BDE-47 5-MeO-BDE-47 4’-MeO-BDE-49 5’-MeO-BDE-100 4’-MeO-BDE-103 4’-MeO-BDE-99 4’-MeO-BDE-101
<DL <DL <DL <DL <DL <DL <DL <DL
<DL <DL <DL <DL <DL <DL <DL <DL
<DL 2.1×10
2
<DL <DL <DL <DL <DL <DL
32 34 57 34 6.6 30 32 41
<DL <DL <DL <DL <DL <DL <DL <DL
<DL <DL <DL <DL <DL <DL <DL <DL
BDE-28 BDE-49 BDE-47 BDE-66 BDE-100 BDE-119 BDE-99 BDE-85 BDE-154 BDE-153 BDE-183
<DL 3.4 0.8
<DL <DL <DL
6.5×10² <DL <DL <DL <DL
21 27 23
<DL 29 0.4 28 30 19 29 21
<DL <DL <DL <DL <DL <DL <DL <DL <DL <DL <DL
<DL <DL <DL <DL <DL <DL <DL <DL <DL <DL <DL
<DL <DL <DL <DL <DL <DL <DL <DL <DL <DL <DL
<DL <DL <DL <DL <DL <DL <DL <DL <DL <DL <DL
<DL: less than detection limit