Embed Size (px)
Citation preview

Daron et al. Genome Biology 2014, 15:546http://genomebiology.com/2014/15/12/546
RESEARCH Open Access
Organization and evolution of transposableelements along the bread wheat chromosome 3BJosquin Daron1,2, Natasha Glover1,2, Lise Pingault1,2, Sébastien Theil1,2, Véronique Jamilloux3, Etienne Paux1,2,Valérie Barbe4, Sophie Mangenot4, Adriana Alberti4, Patrick Wincker4,5,6, Hadi Quesneville3, Catherine Feuillet1,2
and Frédéric Choulet1,2*
Abstract
Background: The 17 Gb bread wheat genome has massively expanded through the proliferation of transposableelements (TEs) and two recent rounds of polyploidization. The assembly of a 774 Mb reference sequence ofwheat chromosome 3B provided us with the opportunity to explore the impact of TEs on the complexwheat genome structure and evolution at a resolution and scale not reached so far.
Results: We develop an automated workflow, CLARI-TE, for TE modeling in complex genomes. We delineateprecisely 56,488 intact and 196,391 fragmented TEs along the 3B pseudomolecule, accounting for 85% of thesequence, and reconstruct 30,199 nested insertions. TEs have been mostly silent for the last one million years,and the 3B chromosome has been shaped by a succession of bursts that occurred between 1 to 3 millionyears ago. Accelerated TE elimination in the high-recombination distal regions is a driving force towardschromosome partitioning. CACTAs overrepresented in the high-recombination distal regions are significantlyassociated with recently duplicated genes. In addition, we identify 140 CACTA-mediated gene capture eventswith 17 genes potentially created by exon shuffling and show that 19 captured genes are transcribed andunder selection pressure, suggesting the important role of CACTAs in the recent wheat adaptation.
Conclusion: Accurate TE modeling uncovers the dynamics of TEs in a highly complex and polyploid genome.It provides novel insights into chromosome partitioning and highlights the role of CACTA transposons in thehigh level of gene duplication in wheat.
BackgroundFirst discovered in maize [1], transposable elements (TEs)are ubiquitous components of almost every eukaryoticgenome investigated so far and their impact on genomestructure and evolution is now well established (reviewedin [2]). Two classes of TEs have been defined: class I, orretrotransposons that use the element-encoded mRNA asa transposition intermediate; and class II, or DNA trans-posons that excise from their insertion site and transposethrough a DNA intermediate. Among sequenced plant ge-nomes, TE abundance ranges from 20% in Arabidopsisthaliana [3] to 85% in maize (Zea mays) [4]. Genome
* Correspondence: [email protected] UMR1095 Genetics, Diversity and Ecophysiology of Cereals, 5 cheminde Beaulieu, 63039 Clermont-Ferrand, France2University Blaise Pascal UMR1095 Genetics, Diversity and Ecophysiology ofCereals, 5 chemin de Beaulieu, 63039 Clermont-Ferrand, FranceFull list of author information is available at the end of the article
© 2014 Daron et al.; licensee BioMed Central.Commons Attribution License (http://creativecreproduction in any medium, provided the orDedication waiver (http://creativecommons.orunless otherwise stated.
expansion is mainly mediated by the activity of class I ele-ments, while the content of DNA transposons is muchmore constant [5-7]. Furthermore, TEs are non-randomlydistributed along the genome due to insertions [8,9] and de-letions [7,10] that trigger genome expansion/contraction.Hence, in rice (Oryza sativa) [11], sorghum (Sorghum bi-color) [12] and maize, long terminal repeat retrotransposons(LTR-RTs) accumulate preferentially in heterochromatin,such as centromeric regions, and are less abundant in therecombinogenic distal parts of chromosomes. A molecularmechanism responsible for the targeted integration of TEsin heterochromatin has begun to be understood [13]. Akey component of the TE integration complex is a chro-modomain present at the carboxy-terminal part of theelement-encoded integrase in some gypsy elements [14]that drives preferential insertion by targeting specificchromatin modifications [15]. Deletion of TEs can beidentified by the identification of solo LTRs and truncated
This is an Open Access article distributed under the terms of the Creativeommons.org/licenses/by/4.0), which permits unrestricted use, distribution, andiginal work is properly credited. The Creative Commons Public Domaing/publicdomain/zero/1.0/) applies to the data made available in this article,
Daron et al. Genome Biology 2014, 15:546 Page 2 of 15http://genomebiology.com/2014/15/12/546
elements [6]. Presumably, solo LTRs are formed by unequalintra-chromosomal homologous recombination betweentwo LTRs of an intact element [16]. In contrast, truncatedelements are thought to be the outcome of illegitim-ate (nonhomologous) recombination. In rice, 190 Mbof LTR-RT DNA have been removed recently by thesetwo processes, leaving a current genome of approximately400 Mb that contains <100 Mb of detectable LTR-RTs[17]. In sorghum and rice, DNA transposons are localizedessentially in the telomeric regions of the chromosome[11,12]. However, no evidence for a direct relationship be-tween genetic recombination rate and DNA transposonabundance has been provided so far in plant genomes[18], whereas it was observed in Caenorhabditis elegans[19]. A key aspect of DNA transposons is their interactionwith host genes [20]. For instance, they were shown tobe involved in the creation of new genes through ‘exonshuffling’. In maize, 60% of the 20,000 Helitrons containcaptured gene fragments [21,22]. Similarly, in rice, 2,809Pack-Mutator-like elements (Pack-MULEs) containinghost gene fragments were identified [23].Identification of transposable elements in large and
complex genomes is a daunting task, even in high qualityassembled genomes. As an example, since 2001, in the ricegenome, the number of miniature inverted-repeat TEs(MITEs) discovered has steadily increased over time from6,641 to 179,415 [24-28]. A high-quality TE predictionand annotation is essential to prevent mis-annotation offunctional genes and to understand the biology of ge-nomes [29]. Different strategies have been developed, in-cluding similarity search against databanks of known TEsequences, de novo repeat detection, k-mer-based count-ing, and structural motif detection (reviewed in [30]). Des-pite the development of many dedicated bioinformatictools, precise TE modeling in complex (>1 Gb) genomes,such as in wheat or maize, is a tour de force. During themaize genome sequencing project (approximately 2 Gb),TEs were predicted with a variety of approaches: LTR-RTsand Helitrons were identified by structural criteria,while the rest of the TEs were annotated by similarity witha library built by de novo detection [4]. One of the main lim-itations to identifying TEs, and especially large TEs (>5 kb),was the fragmentation of the assembly with many gaps anda short median contig size (approximately 7 kb).The wheat genome is large and highly complex (17 Gb,
allohexaploid 2n = 6x = 42 with 3 closely related subge-nomes, AABBDD). Previous small-scale analyses revealedthat the wheat genome is composed of about 80% TE-derived sequences, mainly nested into each other and with afew families representing 50% of the TE fraction [31]. Early,manually curated TE modeling was performed on selectedbacterial artificial chromosome (BAC) sequences duringmap-based cloning projects or using plasmid or BAC endsequences [32-36]. At a larger scale, analyses of 18 Mb of
long BAC contig sequences spread along the 3B chromo-some [31] led to precise delineation of 3,222 TEs. Togetherwith the public Triticeae REPeat sequence database (TREP)[37], this provided a representative high quality reference li-brary of wheat TEs. Beyond the identification of TEs, thereconstruction of the nested insertion pattern is a computa-tional challenge that requires fine tuning of dedicated algo-rithms and knowledge of TE structure and evolution.Recently, a number of genome scale sequences were
produced from different wheat genomes. Whole genomeshotgun sequencing using short read sequencing tech-nologies has been performed on bread wheat and diploidspecies related to the homoeologous A and D genomes[38-40]. While these sequences have been useful tocharacterize the gene space, the assemblies were highlyfragmented and therefore had only limited value for study-ing TEs. Moreover, they do not provide sufficient se-quence contiguity to assemble pseudomolecules,precluding the analysis of any TE feature distribution alonga chromosome. To obtain a reference genome sequence ofbread wheat, the International Wheat Genome SequencingConsortium (IWGSC) [41] has established an approachbased on flow sorting of individual chromosomes and theconstruction and sequencing of chromosome-specificphysical maps. Recently, we produced a pseudomoleculefor the largest wheat chromosome (3B), which represents774 Mb, carrying 7,264 genes and 85% of TE-derived se-quences [42]. Gene annotation and comparative analysesindicated that chromosome 3B, and the wheat genome ingeneral [43], carries a higher number of genes than relatedgrass species. Moreover, the results showed that about35% of the 3B genes share similarity with genes located onnon-orthologous chromosomes in other grasses [42].These ‘nonsyntenic’ genes likely originate from interchro-mosomal duplications triggered by diverse mechanismssuch as double strand break repair or TE mobilization.In this study, a strategy dedicated to TE-modeling in a
complex genome was developed to decipher the complexorganization of TEs along a wheat chromosome. Analysesof the distribution of the abundance, diversity and dynam-ics of TEs revealed a striking partitioning of the chromo-some, as observed for other features on chromosome 3B[42]. In addition, we observed a massive amplification ofCACTA DNA transposons compared with other relatedgrass species with a significant association between someCACTA families and recently duplicated genes, suggestinga role for CACTA transposons in gene duplications, genecapture, and genome plasticity in wheat.
ResultsAn improved procedure for predicting transposable elementmodels and their nested pattern in a complex genomePredicting TE features in complex genomes where re-peated elements represent more than 80% of the sequence
Table 1 Comparison of the accuracy of transposableelement modeling on a 1 Mb scaffold of wheatchromosome 3B
Reference RM TEannot CLARI-TE
Number of predictions 196 590 345 286
Coverage 91% 90% 90% 91%
Nucleotide Sn - 93% 95% 96%
Sp - 96% 97% 95%
Feature Sn - 54% 45% 66%
Sp - 26% 27% 52%
Nested feature Sn - NA 17% 41%
Sp - NA 14% 58%
The reference annotation was curated manually. Similarity search was performedusing RepeatMasker (RM) and automated TE modeling based on the RM resultswas performed using either TEannot or CLARI-TE. The sensitivity (Sn) and specificity(Sp) were calculated at three different levels: nucleotide, feature and nested feature(see Materials and methods). NA, not applicable.
Daron et al. Genome Biology 2014, 15:546 Page 3 of 15http://genomebiology.com/2014/15/12/546
remains a computational challenge, and obtaining a highquality annotation still requires manual curation. Typically,TE prediction is performed by similarity search with a setof known TE sequences. A major prerequisite to achieve ahigh quality annotation is the availability of a curated TEreference library. This is essential to identify most transpo-sons via similarity search-based approaches and to restrictthe de novo detection of repeats to the unassigned portionof the genome sequence. In wheat, two curated librariesdedicated to Triticeae (wheat, barley and rye) TEs areavailable: TREP, which contains 1,717 TEs representing323 families, and an additional set of 3,212 TEs manuallyannotated in a previous pilot study of chromosome 3B[31]. For most of them, the borders of the mobile elementhave been defined precisely and their completeness - thatis, ‘complete element’ versus ‘fragmented element’ - is alsoavailable. However, there are incongruencies in the classifi-cation of the TEs; most of the TEs were assigned a familyname based on their best BLAST hit, which can lead to anoverestimation of the family numbers [44].To ensure proper TE modeling of the 774 Mb of se-
quence from chromosome 3B, we first built a classified TElibrary (ClariTeRep; see Materials and methods) using the3,050 complete TE sequences from these two libraries. Intotal, 525 families, comprising 1 to 266 copies each, wereclustered based on their sequence similarity. Among thefamilies described in TREP, 40% (277/700) have a one-to-one relationship with the ClariTeRep classification whilethe others were mostly aggregated into a single familyand, sometimes, split into different families. More than80% of the TREP families comprise one to two TE copiesonly versus 57% for ClariTeRep, confirming that thesimilarity-based classification increases the number of fam-ilies compared with the clustering-based approach [44].In the second step, we automated two things: (i) cor-
rection of the over-fragmentation of TE predictions, thatis, the fact that a TE is not detected as a single featurebut rather split into several neighboring ones; and (ii)the reconstruction of nested TE insertions. To this aim,we developed a program called CLARI-TE, which allowsmerging neighboring predictions that belong to the samefamily (see Materials and methods). Then, nested clus-ters were automatically reconstructed by joining remotepredictions belonging to a single element. We estimatedthe accuracy of the automated annotation by analyzing amanually annotated sequence of approximately 1 Mb(scaffold v443_0137) containing 196 TEs and 47 nestedinsertions that was manually annotated for this purpose.We compared the annotation produced by RepeatMasker(using ClariTeRep) with that from CLARI-TE and anotherannotation pipeline, TEannot (part of the REPET package[45]) (Table 1). At the nucleotide level, RepeatMasker cor-rectly assigned approximately 90% of nucleotides that be-long to TEs, showing that our TE library is comprehensive
enough to detect the vast majority of TEs in a wheat gen-omic sequence. However, the 196 TEs were predicted as590 separated features with RepeatMasker, illustrating theover-fragmentation problem. The improvement was sig-nificant when using both TEannot and CLARI-TE, whichdetected 345 and 286 features, respectively (Table 1).CLARI-TE was more accurate than TEannot in predictingthe correct borders of the TEs (sensitivity of 66% versus45%, respectively) and in limiting the number of false posi-tives (specificity of 52% versus 27%, respectively). Inaddition, CLARI-TE was able to perform the reconstruc-tion of nested clusters much more accurately than TEan-not (Table 1). The accuracy of nested insertion miningwas in fact highly dependent on the type of TEs: sensitivityand specificity were much higher for gypsy and copia ele-ments (53% and 68%, respectively) than for CACTAs (13%and 40%, respectively). This suggests that CACTAs exhibita higher level of sequence variability and that CACTA-typical short tandem repeats limit our ability to identifythem through fully automated procedures.
Transposable element content and distribution alongchromosome 3BWe used CLARI-TE to predict TE models along the833 Mb of chromosome 3B (a sequence correspondingto the 3B pseudomolecule (774 Mb) and unanchoredscaffolds (59 Mb)) in order to study the organization anddynamics of TEs along a wheat chromosome. In total,523,233 RepeatMasker-detected features were combinedwith CLARI-TE to obtain a final set of 56,488 completeTEs (that is, with two borders corresponding to the bordersof a reference element) and 196,391 truncated or partiallyassembled elements. Given the estimates of the sensitivityand specificity of our approach to predict complete TEs, wecan extrapolate to approximately 73,000 the number ofintact TEs carried by the 3B chromosome. Thus, using

Daron et al. Genome Biology 2014, 15:546 Page 4 of 15http://genomebiology.com/2014/15/12/546
CLARI-TE we are able to reduce the fragmentation of theannotation by two-fold and detect the largest set of full-length TEs and nested clusters ever observed on a plantchromosome so far. The number of large TEs (>5 kb) wasdoubled (from 16,988 to 30,894) when using CLARI-TE.Moreover, 30,199 nested insertions were reconstructed,comprising up to 8 layers and 320 clusters larger than100 kb (and up to 301 kb). Overall, TEs represent 85% ofthe 833 Mb of chromosome 3B scaffolds. In addition, thede novo identification revealed 3% of previously uncharac-terized TEs [42]. We applied the same approach to anno-tate the draft genome sequences of the A- and D-relateddiploid progenitors: Triticum urartu (approximately 3 Gb)[39] and Aegilops tauschii (approximately 2.6 Gb) [40].TEs account for 77% and 74% of the A and D diploidgenome assemblies, respectively (Table S1 in Add-itional file 1). We also found the proportion of completeTEs to be 12% and 11%, respectively, that is, two timeslower than on chromosome 3B (22%).The annotation revealed that class I and II TEs repre-
sent 67% and 18% of the 3B sequence, respectively, witha vast majority of the chromosome corresponding to
Figure 1 Transposable element content and copy number of the wheatof the main TE superfamilies. (B) Cumulative sum of the number of TEs familirepresent 50% of the TE fraction (in number of nucleotides). (C) Distribution o(D) Box plot of the distance (in kilobases) of TEs to the closest gene. The five3B chromosome.
LTR-RTs (529 Mb, 66% of the chromosome; Table S1 inAdditional file 1). Three superfamilies (gypsy, 47%; CACTA,16%; copia, 16%) account for more than 79% of the totalTE fraction (Figure 1A). This proportion of CACTAs ismuch higher than in the other sequenced grasses: 3.2% inmaize [4], 4.7% in sorghum [12], 3.4% in rice [11], and2.2% in Brachypodium distachyon [46]. We also found ahigher proportion of CACTAs in the draft genome se-quences of T. urartu and Ae. tauschii (12.3% and 15.6%,respectively; Table S1 in Additional file 1), suggesting thatmost of the CACTA amplification occurred before thedivergence of the A, B and D genomes. Other DNAtransposons are less abundant in terms of proportion butsome correspond to small size elements found in veryhigh copy numbers. For example, 17,479 MITEs (clusteredinto 95 families) of, on average, 142 bp, mostly from theMariner superfamily, were detected along the 3B chromo-some sequence.In total, 485 families were detected along the 3B chromo-
some with only 6 families representing 50% of the TEfraction, and 143 representing 99% of the TE fraction(Figure 1B). The most abundant element was the LTR-RT
chromosome 3B sequence. (A) Pie graph of the relative compositiones among the TE fraction. The N50 is 6, meaning that six TE familiesf the number of copies per family (considering complete copies only).categories represent TE families with different numbers of copies on the
Daron et al. Genome Biology 2014, 15:546 Page 5 of 15http://genomebiology.com/2014/15/12/546
RLG_famc1 (Fatima) family with 7,036 complete and8,003 fragmented copies that account on their own for12% of the TE fraction. Fifteen percent (74) of thefamilies are represented by a single copy element on theentire chromosome 3B sequence while 2% (7) have ampli-fied into more than 1,000 copies. Therefore, most of theTE families are not single copy member families but haverather amplified at a medium copy number (between 11and 100) within this chromosome (Figure 1C). This pat-tern is different from what has been described for relatedgrasses where single copy member families represent be-tween 66% and 81% of the families in rice, Brachypodium,sorghum, and maize [44]. We evaluated the impact of theclassification methods on these findings by comparingthe average percentage of identity between membersof the LTR-RT families for the different grass genomes(Figure S1 in Additional file 1). Our clustering approachresulted in an average of 77% identity over the full lengthof TEs while this percentage was higher (ranging between86% and 89%) in the classification of El Baidouri et al. [44]for Brachypodium, rice, sorghum, and maize. Applying acutoff at 77% identity showed that the proportion of singlecopy member families decreases drastically in the relatedgrasses (16%, 52%, 25%, and 17% in rice, Brachypodium,sorghum and maize, respectively), leading to a distributionsimilar to that observed in wheat. When calculating thedistance between each TE and its neighboring genes weobserved that low-copy number families are significantlycloser to genes than highly repeated families (one-wayANOVA, P-values <4.5e-11; Figure 1D). Indeed, familieswith less than 100 copies were found to be significantlycloser to genes than families having more than 100 copies(Bonnferroni/Dunn test, P-values <4e-4).Overall, the TE distribution along the chromosome is
strongly correlated with that of the gypsy elements (R =0.97) and is negatively correlated with the recombinationrate (R = -0.82, P-values <10e-10) (Table S2 in Additionalfile 1). The CACTA superfamily exhibits the exact op-posite pattern, with a significant increase of 23% in the distalregions (18 to 19%) compared with the proximal region(15%; Figure 2). Similar to CACTAs, but at a lower level,class II transposons - Harbingers, hATs, Mariners, Mutators,and Helitrons - are twice as abundant in the distal regionscompared with the proximal region and their distributionis strongly correlated with both the gene density (R = 0.63)and recombination rate (R = 0.71).The distribution of TE diversity - that is, the number
of different families per 10 Mb - along the chromosomewas also investigated. It revealed a higher diversity in thedistal regions (210 different TE families per 10 Mb onaverage, maximum of 244 families within 10 Mb) than inthe central part of the chromosome (134 different familiesper 10 Mb; Figure S3 in Additional file 1). The diversity ofDNA transposons increases by 2.6-fold in the distal region
compared with the centromere whereas the diversity inLTR-RTs is homogeneous along the chromosome (106 ± 7families per 10 Mb; Figure S3 in Additional file 1). It isworth noting that the patterns of distribution of TE diver-sity and TE density are opposite. Thus, the increase in theamount of TEs in the centromeric regions is due to theaccumulation of several copies from the same families.Segmentation analysis (see Materials and methods) of
TE density variations along the chromosome showed thepresence of five distinct regions. The two chromosomeends, representing 18% of the chromosome (63 Mb and73 Mb on the short and long arms, respectively), exhibitthe lowest TE content (71%). The 122 Mb (16% of thechromosome region) encompassing the centromere [42]has the highest TE content (93%). Finally, the two coreparts of the chromosome arms (66% of the chromosome;200 Mb and 316 Mb for the short and long arms, re-spectively) exhibit an average TE content of 88%. Theborders of the two distal TE-poor regions correspond al-most exactly to the regions (R1 and R3) defined by therecombination pattern in [42].
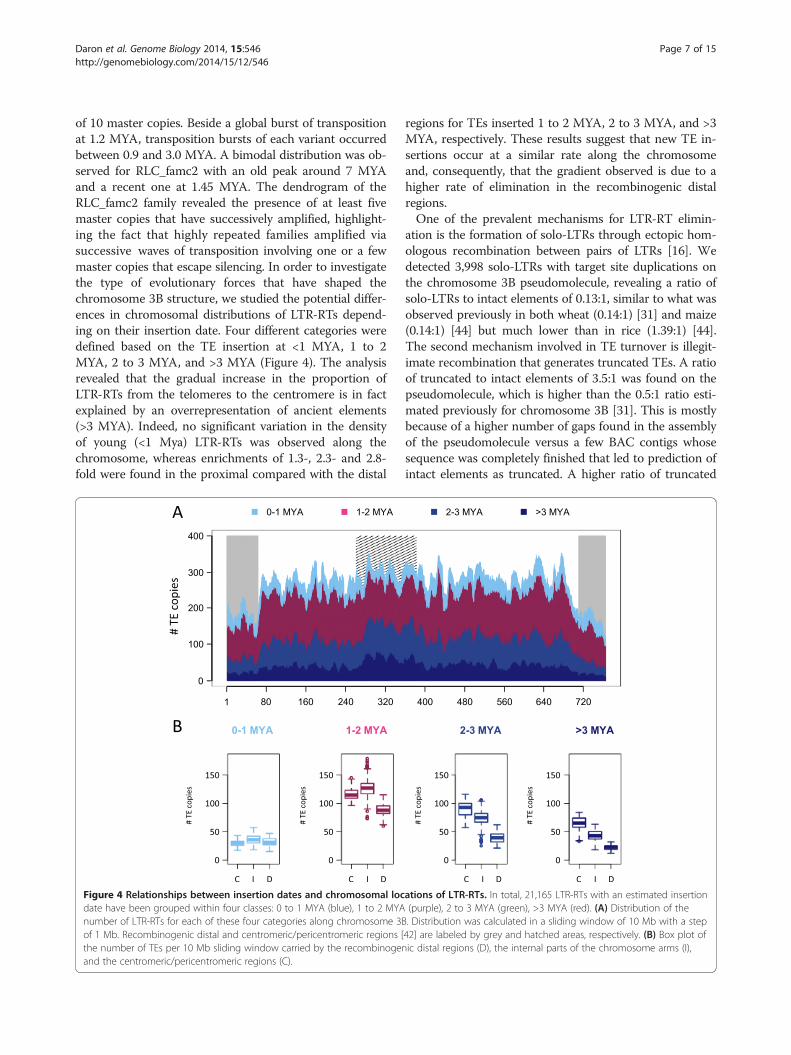
Uneven distribution and impact of transposable elementson the evolution of the chromosome structureTo investigate the evolutionary dynamics of LTR-RTs inchromosome 3B, we estimated the insertion dates of21,165 intact copies. We analyzed the distribution ofinsertion dates of individual copies for each of the 43families with at least 20 copies in order to retrieve afamily-specific burst date and period of activity (Figure 3A).Our analysis revealed that 93% of the TE bursts occurredbetween 1 and 3 million years ago (MYA; Figure 3B),confirming at the whole chromosome scale that TE amp-lification has slowed down and/or that TE deletion hasincreased for the last 1 million years [31]. The activetransposition periods (Figure 3B) lasted from 1 to 3 millionyears and correspond to a succession of bursts every40,000 years on average. This indicates that the wheatgenome has been shaped by successive waves of TEactivation quickly followed by silencing. Indeed, 69% ofthe families were estimated to have been active over pe-riods ranging from 1.5 to 2.5 million years. Only a fewfamilies were active for a longer period of time, suggestingthey have escaped silencing. Not surprisingly, the intensityof the burst was negatively correlated with the amplifica-tion period (R = -0.4, P-values = 0.007), suggesting that thehigher the level of activity the faster the silencing wasestablished. Moreover, we performed in-depth analyses togain deeper insight into the transpositional activity amongwidely expanded LTR-RT families. Dendrograms based onthe multiple alignments of the full length LTR-RTs werecomputed for the RLG_famc1 and RLC_famc2 families(Figure S2 in Additional file 1). For RLG_famc1, this re-vealed the presence of 10 clusters indicating the presence
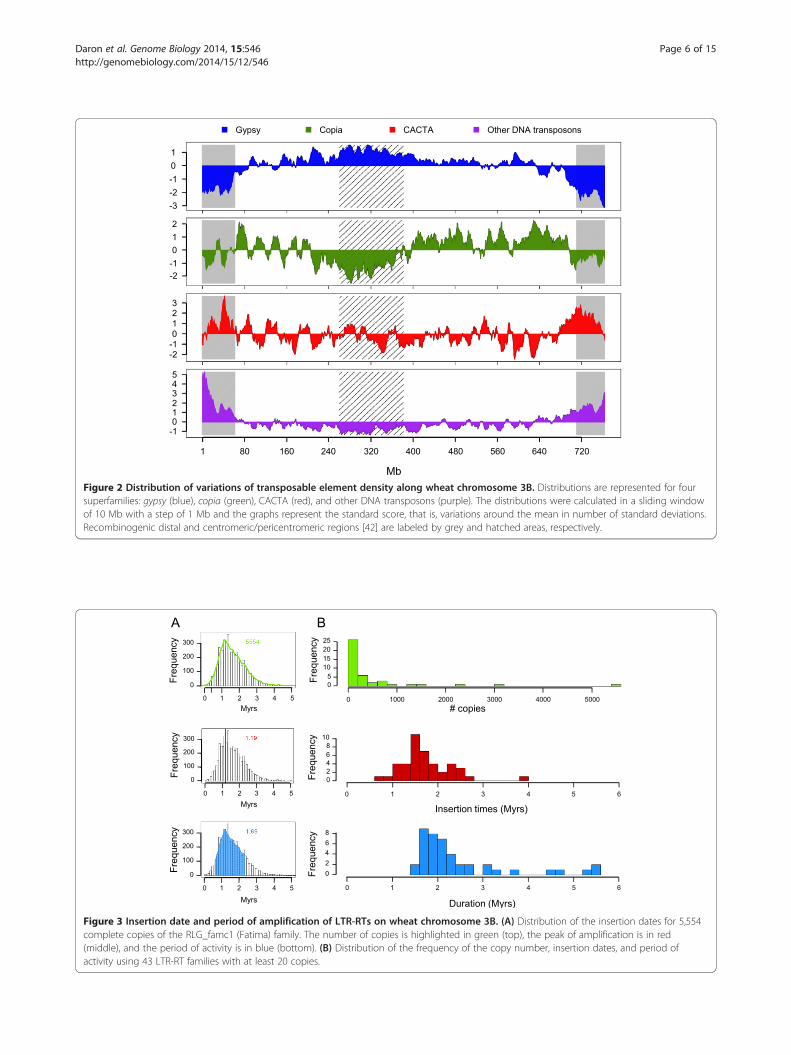
Figure 2 Distribution of variations of transposable element density along wheat chromosome 3B. Distributions are represented for foursuperfamilies: gypsy (blue), copia (green), CACTA (red), and other DNA transposons (purple). The distributions were calculated in a sliding windowof 10 Mb with a step of 1 Mb and the graphs represent the standard score, that is, variations around the mean in number of standard deviations.Recombinogenic distal and centromeric/pericentromeric regions [42] are labeled by grey and hatched areas, respectively.
Figure 3 Insertion date and period of amplification of LTR-RTs on wheat chromosome 3B. (A) Distribution of the insertion dates for 5,554complete copies of the RLG_famc1 (Fatima) family. The number of copies is highlighted in green (top), the peak of amplification is in red(middle), and the period of activity is in blue (bottom). (B) Distribution of the frequency of the copy number, insertion dates, and period ofactivity using 43 LTR-RT families with at least 20 copies.
Daron et al. Genome Biology 2014, 15:546 Page 6 of 15http://genomebiology.com/2014/15/12/546
Daron et al. Genome Biology 2014, 15:546 Page 7 of 15http://genomebiology.com/2014/15/12/546
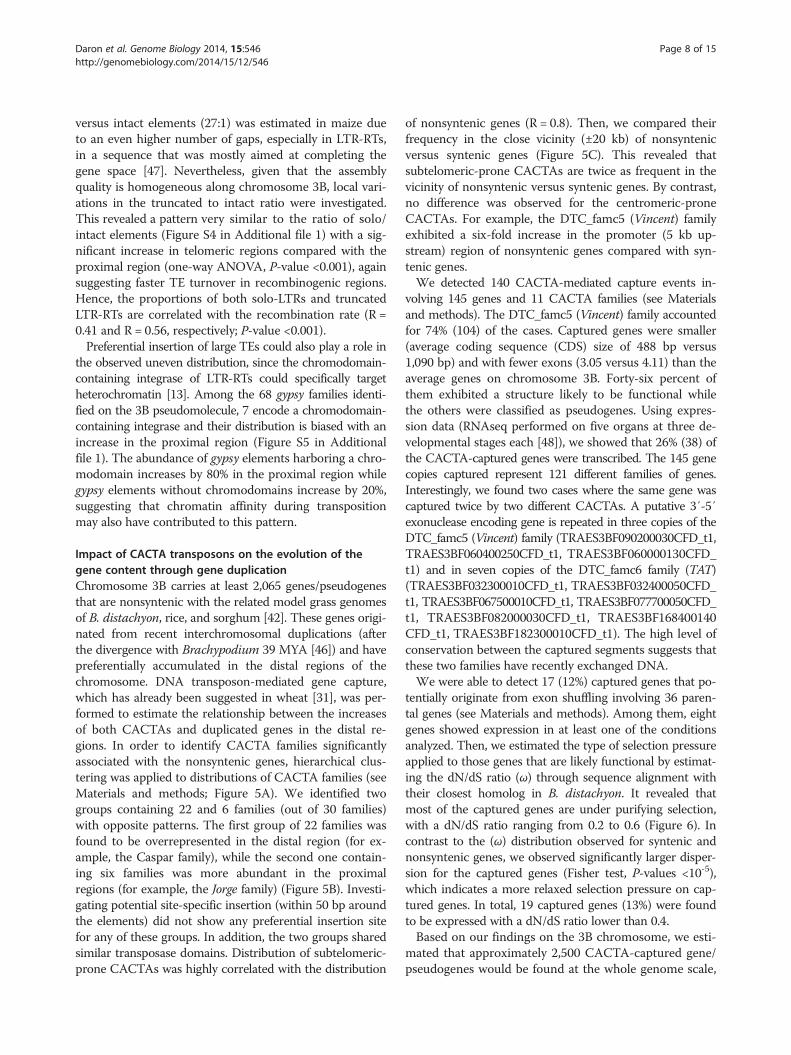
of 10 master copies. Beside a global burst of transpositionat 1.2 MYA, transposition bursts of each variant occurredbetween 0.9 and 3.0 MYA. A bimodal distribution was ob-served for RLC_famc2 with an old peak around 7 MYAand a recent one at 1.45 MYA. The dendrogram of theRLC_famc2 family revealed the presence of at least fivemaster copies that have successively amplified, highlight-ing the fact that highly repeated families amplified viasuccessive waves of transposition involving one or a fewmaster copies that escape silencing. In order to investigatethe type of evolutionary forces that have shaped thechromosome 3B structure, we studied the potential differ-ences in chromosomal distributions of LTR-RTs depend-ing on their insertion date. Four different categories weredefined based on the TE insertion at <1 MYA, 1 to 2MYA, 2 to 3 MYA, and >3 MYA (Figure 4). The analysisrevealed that the gradual increase in the proportion ofLTR-RTs from the telomeres to the centromere is in factexplained by an overrepresentation of ancient elements(>3 MYA). Indeed, no significant variation in the densityof young (<1 Mya) LTR-RTs was observed along thechromosome, whereas enrichments of 1.3-, 2.3- and 2.8-fold were found in the proximal compared with the distal
Figure 4 Relationships between insertion dates and chromosomal locdate have been grouped within four classes: 0 to 1 MYA (blue), 1 to 2 MYAnumber of LTR-RTs for each of these four categories along chromosome 3Bof 1 Mb. Recombinogenic distal and centromeric/pericentromeric regions [the number of TEs per 10 Mb sliding window carried by the recombinogenand the centromeric/pericentromeric regions (C).
regions for TEs inserted 1 to 2 MYA, 2 to 3 MYA, and >3MYA, respectively. These results suggest that new TE in-sertions occur at a similar rate along the chromosomeand, consequently, that the gradient observed is due to ahigher rate of elimination in the recombinogenic distalregions.One of the prevalent mechanisms for LTR-RT elimin-
ation is the formation of solo-LTRs through ectopic hom-ologous recombination between pairs of LTRs [16]. Wedetected 3,998 solo-LTRs with target site duplications onthe chromosome 3B pseudomolecule, revealing a ratio ofsolo-LTRs to intact elements of 0.13:1, similar to what wasobserved previously in both wheat (0.14:1) [31] and maize(0.14:1) [44] but much lower than in rice (1.39:1) [44].The second mechanism involved in TE turnover is illegit-imate recombination that generates truncated TEs. A ratioof truncated to intact elements of 3.5:1 was found on thepseudomolecule, which is higher than the 0.5:1 ratio esti-mated previously for chromosome 3B [31]. This is mostlybecause of a higher number of gaps found in the assemblyof the pseudomolecule versus a few BAC contigs whosesequence was completely finished that led to prediction ofintact elements as truncated. A higher ratio of truncated
ations of LTR-RTs. In total, 21,165 LTR-RTs with an estimated insertion(purple), 2 to 3 MYA (green), >3 MYA (red). (A) Distribution of the. Distribution was calculated in a sliding window of 10 Mb with a step42] are labeled by grey and hatched areas, respectively. (B) Box plot ofic distal regions (D), the internal parts of the chromosome arms (I),
Daron et al. Genome Biology 2014, 15:546 Page 8 of 15http://genomebiology.com/2014/15/12/546
versus intact elements (27:1) was estimated in maize dueto an even higher number of gaps, especially in LTR-RTs,in a sequence that was mostly aimed at completing thegene space [47]. Nevertheless, given that the assemblyquality is homogeneous along chromosome 3B, local vari-ations in the truncated to intact ratio were investigated.This revealed a pattern very similar to the ratio of solo/intact elements (Figure S4 in Additional file 1) with a sig-nificant increase in telomeric regions compared with theproximal region (one-way ANOVA, P-value <0.001), againsuggesting faster TE turnover in recombinogenic regions.Hence, the proportions of both solo-LTRs and truncatedLTR-RTs are correlated with the recombination rate (R =0.41 and R = 0.56, respectively; P-value <0.001).Preferential insertion of large TEs could also play a role in
the observed uneven distribution, since the chromodomain-containing integrase of LTR-RTs could specifically targetheterochromatin [13]. Among the 68 gypsy families identi-fied on the 3B pseudomolecule, 7 encode a chromodomain-containing integrase and their distribution is biased with anincrease in the proximal region (Figure S5 in Additionalfile 1). The abundance of gypsy elements harboring a chro-modomain increases by 80% in the proximal region whilegypsy elements without chromodomains increase by 20%,suggesting that chromatin affinity during transpositionmay also have contributed to this pattern.
Impact of CACTA transposons on the evolution of thegene content through gene duplicationChromosome 3B carries at least 2,065 genes/pseudogenesthat are nonsyntenic with the related model grass genomesof B. distachyon, rice, and sorghum [42]. These genes origi-nated from recent interchromosomal duplications (afterthe divergence with Brachypodium 39 MYA [46]) and havepreferentially accumulated in the distal regions of thechromosome. DNA transposon-mediated gene capture,which has already been suggested in wheat [31], was per-formed to estimate the relationship between the increasesof both CACTAs and duplicated genes in the distal re-gions. In order to identify CACTA families significantlyassociated with the nonsyntenic genes, hierarchical clus-tering was applied to distributions of CACTA families (seeMaterials and methods; Figure 5A). We identified twogroups containing 22 and 6 families (out of 30 families)with opposite patterns. The first group of 22 families wasfound to be overrepresented in the distal region (for ex-ample, the Caspar family), while the second one contain-ing six families was more abundant in the proximalregions (for example, the Jorge family) (Figure 5B). Investi-gating potential site-specific insertion (within 50 bp aroundthe elements) did not show any preferential insertion sitefor any of these groups. In addition, the two groups sharedsimilar transposase domains. Distribution of subtelomeric-prone CACTAs was highly correlated with the distribution
of nonsyntenic genes (R = 0.8). Then, we compared theirfrequency in the close vicinity (±20 kb) of nonsyntenicversus syntenic genes (Figure 5C). This revealed thatsubtelomeric-prone CACTAs are twice as frequent in thevicinity of nonsyntenic versus syntenic genes. By contrast,no difference was observed for the centromeric-proneCACTAs. For example, the DTC_famc5 (Vincent) familyexhibited a six-fold increase in the promoter (5 kb up-stream) region of nonsyntenic genes compared with syn-tenic genes.We detected 140 CACTA-mediated capture events in-
volving 145 genes and 11 CACTA families (see Materialsand methods). The DTC_famc5 (Vincent) family accountedfor 74% (104) of the cases. Captured genes were smaller(average coding sequence (CDS) size of 488 bp versus1,090 bp) and with fewer exons (3.05 versus 4.11) than theaverage genes on chromosome 3B. Forty-six percent ofthem exhibited a structure likely to be functional whilethe others were classified as pseudogenes. Using expres-sion data (RNAseq performed on five organs at three de-velopmental stages each [48]), we showed that 26% (38) ofthe CACTA-captured genes were transcribed. The 145 genecopies captured represent 121 different families of genes.Interestingly, we found two cases where the same gene wascaptured twice by two different CACTAs. A putative 3′-5′exonuclease encoding gene is repeated in three copies of theDTC_famc5 (Vincent) family (TRAES3BF090200030CFD_t1,TRAES3BF060400250CFD_t1, TRAES3BF060000130CFD_t1) and in seven copies of the DTC_famc6 family (TAT)(TRAES3BF032300010CFD_t1, TRAES3BF032400050CFD_t1, TRAES3BF067500010CFD_t1, TRAES3BF077700050CFD_t1, TRAES3BF082000030CFD_t1, TRAES3BF168400140CFD_t1, TRAES3BF182300010CFD_t1). The high level ofconservation between the captured segments suggests thatthese two families have recently exchanged DNA.We were able to detect 17 (12%) captured genes that po-
tentially originate from exon shuffling involving 36 paren-tal genes (see Materials and methods). Among them, eightgenes showed expression in at least one of the conditionsanalyzed. Then, we estimated the type of selection pressureapplied to those genes that are likely functional by estimat-ing the dN/dS ratio (ω) through sequence alignment withtheir closest homolog in B. distachyon. It revealed thatmost of the captured genes are under purifying selection,with a dN/dS ratio ranging from 0.2 to 0.6 (Figure 6). Incontrast to the (ω) distribution observed for syntenic andnonsyntenic genes, we observed significantly larger disper-sion for the captured genes (Fisher test, P-values <10-5),which indicates a more relaxed selection pressure on cap-tured genes. In total, 19 captured genes (13%) were foundto be expressed with a dN/dS ratio lower than 0.4.Based on our findings on the 3B chromosome, we esti-
mated that approximately 2,500 CACTA-captured gene/pseudogenes would be found at the whole genome scale,

A B
0 +10 +20-20 -10
0
2
10
8
6
4
0
2
10
8
6
4
0 +10 +20-20 -10
C
kbkb
% o
f TE
% o
f TE
% o
f TE
frac
tion
Mb
1 720640560480400320240160800
5
10
15
20
0
5
10
15
Subtelomeric-prone CACTAsCentromeric-prone CACTAs
Figure 5 Relationships between CACTA families and nonsyntenic genes. (A) Tree based on the clustering of the distribution patterns of 30CACTA families found along the 3B chromosome. The branches represented in purple and green correspond to subtelomeric-prone CACTA familiesand centromeric-prone CACTA families, respectively. (B) Distribution of the 6 centromeric-prone CACTA families (top) and 22 subtelomeric-proneCACTA families (bottom) showing opposite patterns along the 3B chromosome sequence. The gray curves represent the distribution ofindividual families and the top purple or green curves represent the cumulative sum of all families. (C) Abundance of centromeric-prone(left panel) and subtelomeric-prone (right panel) CACTAs in the vicinity (±20 kb) of syntenic (blue) and non-syntenic genes (red), respectively. 0represents the position of the coding sequences (start and stop codons) and the average abundance of CACTAs was calculated for each nucleotide ina -20/+20 kb window encompassing the coding sequences.
Daron et al. Genome Biology 2014, 15:546 Page 9 of 15http://genomebiology.com/2014/15/12/546
a range similar to the 1,194 genes captured by Helitronin maize [21] and 2,809 by Pack-MULE in rice [23].
DiscussionA fine-tuned strategy for constructing accurate models oftransposable elements in a highly complex genomeAnnotating TEs automatically and precisely in complexgenomes is a challenge. However, high-quality TE anno-tations are necessary, not only for performing evolution-ary analyses and better understanding the impact of TEson genome organization and expression, but also to pre-vent mis-prediction of genes with cellular functions [29].Here, we developed a strategy to overcome some of theproblems due to the over-fragmentation of the predic-tions usually observed during TE modeling in large ge-nomes. We used the knowledge accumulated during thepast decades [31,34,36,49] to fine-tune our algorithmand automatically reconstruct nested clusters that can
still be identified. With CLARI-TE, we were able to pre-dict a set of 56,488 intact TEs on chromosome 3B. Halfof the large intact TEs (>5 kb) were initially predicted asseveral truncated fragments through similarity search,revealing that for the time being curation is absolutelyrequired to precisely delineate TEs in complex genomes.Moreover, among the 21,165 insertions of LTR-RTs thatwere used to study the dynamics of insertion/deletion alongchromosome 3B, 30% were nested and, thus, would havebeen missed without automated joining by CLARI-TE. Theuse of our program prevented biasing the data towards re-cent TE insertions as usually observed in signature-basedapproaches [10,44]. Finally, with a curated TE library, thisapproach can be applied to any complex genomes (>50%TEs) with nested TEs.The proportion of complete elements was lower than
estimated previously in our pilot study on selected BACsfrom chromosome 3B [31]: they represent 22% and 6%

Figure 6 Selection pressure estimated by the dN/dS ratio forCACTA-captured genes. Distribution of the frequency of the dN/dSratio for 2,964 syntenic genes (blue), 1,179 nonsyntenic genes (red)and 127 CACTA-captured genes on chromosome 3B (green).
Daron et al. Genome Biology 2014, 15:546 Page 10 of 15http://genomebiology.com/2014/15/12/546
for LTR-RTs and CACTAs, respectively, compared with59% and 47% in the previous manually curated annota-tion. Similar observations have already been reported inmaize, where the ratio of truncated to intact elementswas estimated to be 0.5:1 [50], while it was 27:1 in theannotation of the reference genome sequence [47]. Inboth cases, the proportion of gaps, which is a reflectionof the quality of the assembly, is the main limiting fac-tor. Indeed, there are still 40,459 gaps in the chromo-some 3B pseudomolecule, of which 57% were includedin a TE by CLARI-TE, while the others prevented recoveryof the surrounding TE structure. About 85% of the TEs sur-rounding a gap were annotated as truncated. In addition,CACTAs are the largest wheat TEs (up to 30 kb), are highlyvariable, and contain tandem repeated motifs, featuresthat make them the most challenging superfamily to iden-tify automatically.Estimations of TE composition or organization of com-
plex genomes are highly dependent on the reference TE li-brary used as a basis for similarity search. In this study,similarity search-based annotation led us to assign 85% ofthe 3B sequence to TEs. Then, a de novo repeat identifica-tion allowed us to classify an additional 3% of the se-quence to newly discovered repeats. Such a low valuerevealed that the ClariTeRep library is an almost exhaust-ive representation of the TE diversity present on the 3Bchromosome, suggesting that downstream analyses werenot biased by a lack of knowledge regarding the TE com-position of the chromosome. Although the three homoeo-logous wheat subgenomes are similar in size and, thus,have similar proportions of TEs, this proportion appearedsubstantially higher on chromosome 3B than the 66%and 67% estimates obtained for the diploid genomes ofT. urartu (AA) [39] and Ae. tauschii (DD) [40]. Such a
difference highlights the strong impact of the method-ology used to annotate TEs, rather than biological signifi-cance. This is supported by the results obtained afterapplying our TE modeling approach to these two draftgenome sequences and the finding that TEs represent 77%and 74% of them, respectively, that is, proportions that arecloser to what we have found for chromosome 3B. Themain difference is related to the lack of knowledge regard-ing CACTAs in the reference TE library. Here, we pre-dicted two to three times more CACTAs than previouslysuggested (5.44% for T. urartu, and 6.01% for Ae. tauschii),confirming the impact of the reference TE library on thebiological interpretations. Finally, differences in TE propor-tions found between the diploid genomes and chromo-some 3B are probably due to lack of sequence in the A andD draft genome sequences. With estimated sizes of 5.5 Gband 5 Gb for T. urartu [39] and Ae. tauschii [40,51],respectively, TEs should represent 80 to 82% of the gen-ome, considering that low copy DNA represents 1 Gb ofthe genome [42].
Transposable element organization and dynamicsThe 774 Mb 3B pseudomolecule represents the largestchromosome sequence ever assembled into one pseudo-molecule. The uneven distribution of recombination rate,gene density, gene expression pattern, and TEs along thechromosome highlighted a striking partitioning with fivedistinct regions: a centromeric/pericentromeric regionwith the highest TE density and in which recombinationis suppressed; two subtelomeric regions with the lowestTE density and where recombination mainly occurs; andtwo internal parts of chromosomal arms with intermediatefeatures [42]. Behind the static view, the detailed study ofTEs provided a dynamic view and novel insights into theevolutionary forces that have shaped this partitioning.First, we observed that LTR-RTs are the main contributorsto the uneven distribution of TEs along the chromosome,a common feature of complex genomes like that of maize[47]. In contrast to other grass genomes where TEs havemainly transposed recently, we found a major amplifica-tion period 1.5 MYA that has been followed by a period ofsilencing and/or of increased loss from 1.0 MYA untilnow, confirming that the two hybridization events that ledto hexaploid wheat did not trigger massive activation oftransposition. Previous studies in wheat have shown a TEtransposition burst immediately after allopolyploidization[36,52], but as suggest by Parisod et al. [53], this is prob-ably a phenomenon restricted to specific TE families, andto mostly young, active TE populations. The availability of21,165 complete LTR-RTs allowed us to study the TE ac-tivity at a scale not reached so far, revealing that each fam-ily had its own period of activity. Thus, overall, the Bgenome has been shaped by a succession of transpositionwaves from different families, some of which have escaped
Daron et al. Genome Biology 2014, 15:546 Page 11 of 15http://genomebiology.com/2014/15/12/546
silencing, rather than by massive reactivation of all TEssimultaneously. Similar waves of amplification have alreadybeen described, such as in soybean [44], and are obviouslyobserved in genomes where LTR-RTs have not been quicklyeliminated.The distribution of the TE insertion time along the
chromosome showed an uneven pattern that is mainlydue to the differential location of old LTR-RTs (those >3MYA). In contrast, recently inserted elements (<1 MYA)exhibited a much more even distribution, suggesting thattransposition occurred at similar rates along the chromo-some and that the decrease of TE density towards thetelomeres rather reflects a rapid elimination in the recom-binogenic distal regions. Similar conclusions were suggestedfor the sorghum [12] and maize [47] genomes, while formore compact genomes, such as that of Arabidopsis, theenrichment of LTR-RTs in the centromeric regions hasbeen explained by selection against the insertion of dis-ruptive TEs in gene-rich regions [54]. Additional evidencefor the more rapid elimination of TEs at the chromosomeends includes the overrepresentation of solo-LTRs andtruncated LTR-RTs. This suggests that unequal homolo-gous recombination (generating solo-LTRs) and illegitim-ate recombination (generating truncated TEs) are morefrequent in the distal recombinogenic regions, as observedin rice [18]. In contrast to LTR-RTs, the density of class IIDNA transposons increased in the distal regions andis positively correlated with both gene density and re-combination rate. Such correlation was also observedin sorghum [12] and maize [4] but not in rice [18]. Non-autonomous DNA transposons are well known to be asso-ciated with genes [55,56] and their role in the regulationof gene expression has been suggested [8,57]. In wheat,with the exception of CACTAs, DNA transposons areshorter than class I elements and their insertion intogene-rich regions might be counter-selected at a lower fre-quency. In addition, the faster TE turnover in the distal re-gions suggested above could also explain the increase inDNA transposon density in these regions as a simple con-sequence of the compaction of the intergenic space that ismostly shaped by LTR-RTs. This differential deletion ratemay also explain the increased TE diversity. Such a pat-tern was described in maize where the centromere wasperceived as an environment settled only by ‘individuals’that were most adapted to proliferate, creating a diversity-poor ecosystem [47]. Finally, preferential TE insertionseems to be a potential driving force towards the partition-ing of chromosome 3B, with seven gypsy families having achromodomain-containing integrase [13] significantly con-centrated in the proximal region.
Impact of CACTA transposons on gene duplication in wheatDNA transposons represent 18% of the 3B chromosomesequence, which is the highest proportion observed among
the sequenced grass genomes so far. CACTAs are the maincontributors, representing 16% while they account for only2.2% to 5.9% in sorghum, rice, Brachypodium, maizeand barley [4,11,46,58]. This supports the hypothesisthat CACTAs have been amplified specifically in the wheatlineage. Generally, genome size is mainly correlated withclass I elements - for example, LINEs in human [59] andLTR-RTs in plants [60,61] - because of their copy-and-pastetransposition mechanism allowing an increase in numberin a short time period [62,63]. Thus, among plants, thewheat genome appears as a rare example of a massiveamplification of cut-and-paste transposons.Interestingly, 22 CACTA families were found to be pref-
erentially associated with nonsyntenic genes, that is, genesthat have been relocated via recent duplication events toa new chromosomal location. Previous studies in soy-bean [64], sorghum [12], and Ipomoea tricolor [65] haveshown that CACTAs can capture genes and gene frag-ments. Here, we identified 145 CACTA-captured geneson chromosome 3B (2% of the gene content). Althoughmost of them were gene fragments, as already observed ata smaller scale [66], 13% were both transcribed and underpurifying selection, suggesting they are functional, and12% likely originating from exon shuffling. Beyond genecapture mechanisms, CACTAs were proven to mediategene duplication in wheat through double strand break re-pair created at the time of insertion [66]. Preferential asso-ciation of CACTAs with nonsyntenic genes might reflect ahigher rate of gene duplication, due to the high frequencyof CACTA insertion. This study highlights the importanceof CACTAs for gene duplication and the creation of newgenes that may be associated with the adaptation of wheatto various environments [42]. Similar examples involvingclass II transposons have been described with Mutators inrice [23,67] and Helitrons in maize [21,22]. Therefore, itseems that superfamilies involved in gene capture have atendency to proliferate and to be evolutionarily successful.
ConclusionIn this study, we annotated TEs and their nested patternin one of the most complex genomes. Our automated pro-cedure significantly improved the accuracy of TE predic-tions compared with a classical similarity-search approach.Such a high quality annotation enabled us to determineand analyze the pattern of TE insertion, diversity and in-sertion time and revealed that the partitioning of thechromosome is mainly governed by higher deletion ratesthat are faster in recombining regions. We unraveled anunexpected abundance of CACTAs, and found a signifi-cant association with recently duplicated genes, suggestinga major impact of these elements on genome plasticity viathe creation of genes. Such a mechanism may have pro-vided wheat with an advantageous capability of adaptingto a wide range of environments.
Daron et al. Genome Biology 2014, 15:546 Page 12 of 15http://genomebiology.com/2014/15/12/546
Materials and methodsEstablishment of a classified library of Triticeaetransposable element sequencesA library of TE sequences dedicated to similarity search-based annotation of TEs in the wheat genome was builtas described in Choulet et al. [42]. Briefly, we retrieved3,159 known full-length TE sequences, that is, elementshaving terminal repeats (terminal inverted repeats orLTRs) and/or features typical of complete LINEs/SINEs.We built 16 groups corresponding to each superfamily, andsmall non-autonomous MITEs were grouped separatelyfrom their autonomous counterparts to avoid computingmultiple alignments with sequences of very different sizes.For each of the resulting 16 groups, an all-by-all BLAST[68] comparison (without filtering out low complexity se-quences) was performed. BLAST output was analyzed withMCL (option -I 1.2) [69] in order to build clusters of se-quences sharing similarity. The -I option, controlling thecluster granularity, was set to 1.2 for ‘very coarse grainedclustering’, meaning that large clusters were built at thatstage. These clusters were used to define the family level.Families of three or more members were considered forcomputing a multiple alignment using MAFFT (defaultparameter) [70]. A manual curation step was then applied.We used Jalview [71] as a visualization tool for the manualcuration of the multiple alignments and their correspond-ing neighbor joining tree. Sequences introducing mistakesin the multiple alignments (due to inversions, deletions,or insertions) were identified and discarded so that allalignments were corrected. In addition, since MCL groupedsequences within large clusters, we identified the clearlyseparated monophyletic groups (according to the neighborjoining tree) among each individual family and, there-fore, defined variants within the family; for instance,family RLG_famc8 is composed of three variants calledRLG_famc8.1, RLG_famc8.2, and RLG_famc8.3. We namedthe library ClariTeRep and it is available upon request.
Estimating the accuracy of transposable elementpredictionWe used a scaffold of 904 kb from the wheat chromosome3B that does not correspond to a previously known regionof the genome as a test sequence to estimate the accuracyof the TE modeling. This reference scaffold carries 196TEs covering 91% of the sequence, with 47 nested inser-tions. To automate the comparison of the automated ver-sus manually curated TE predictions and the calculationof sensitivity and specificity values, we developed com-pareAnnotTE.pl. Sensitivity and specificity were bothestimated at three different levels: nucleotide, feature, andnested feature. At the nucleotide level, each nucleotide wasconsidered to calculate sensitivity and specificity. At thefeature level, only TE borders (all segments of TEs splitinto several pieces by nested insertions) were considered.
At the nested feature level, the program considers bordersof nested TEs to estimate the accuracy of the reconstruc-tion of nested clusters. At the feature and nested featurelevels, a predicted feature was considered as true positive ifits borders correspond to the manually curated TE posi-tions in a range of 10 bp.
Similarity search and automated curation using CLARI-TEWe applied our procedure to the 2,808 scaffolds assembledfor the 3B chromosome (HG670306 and CBUC010000001-CBUC010001450), and the T. urartu [39] and Ae. tauschiigenomes [40]. Each sequence was investigated for TEcontent using RepeatMasker (cross_match engine withdefault parameters) [72] with ClariTeRep. We developedCLARI-TE, a perl program [73,74], to correct the rawsimilarity search results. It performs the three followingsteps. First, resolution of overlapping predictions. To solvethe overlap between two predictions, priority was given tokeep the prediction that covers an extremity of a TE. Ifnone or both of the predictions cover a TE extremity, pri-ority was given to keep the longest prediction and recalcu-late the positions of the other one. Second, mergingpredictions. Fragmentation of the TE models is due to thepresence of gaps in the scaffolds and to the fact that anewly identified TE copy may diverge from the referenceelement so that one element is not predicted as a singlepiece but is rather split into several pieces matching differ-ent parts of elements from the same family. In that case,all neighbor pieces related to the same family were mergedinto a single feature if the collinearity of the matching seg-ments was respected, except for LTR matching segments.LTR positions of reference TEs were annotated in our li-brary and this information was considered during themerging process. Third, reconstruction of nested TEs. Wedeveloped a procedure to join separated features that arepart of the same TE and have been split by nested inser-tions. Joining was allowed when two segments matchingthe same family (with respect of the collinearity betweenthe prediction and the reference TE) are separated by amaximum of 10 predicted TEs. The final stage of theannotation is the assignment of intact full-length versusfragmented TEs. Intact full-length TEs are predictionscovering at least 90% of the reference complete TE in thelibrary and for which both extremities were identified (in arange of 50 nucleotides). Moreover, PFAM domains weresearched for every complete element to detect chromodo-mains and transposase-like domains.
Estimation of LTR-RT insertion date and phylogenyWe used the program TRsearch from REPET [45] to findthe positions of both 5′ and 3′ LTRs from a completeelement. We discarded predicted LTRs that did not cor-respond to the extremity of an element (in a range of50 bp). Pairs of LTRs were aligned using MUSCLE [75]
Daron et al. Genome Biology 2014, 15:546 Page 13 of 15http://genomebiology.com/2014/15/12/546
and insertion dates of LTR-RTs were estimated consider-ing a mutation rate of 1.3 × 10⁻⁸ substitutions/site/year[76]. Finally, using R, the distribution of insertion dateswas plotted for each family with 20 or more copies withan estimated date. For each distribution, a burst peak datewas determined and a period of activity was calculatedby considering the shortest period of time containingmore than 80% of the dated insertions. Phylogeny wasestablished by computing multiple alignments of all intactLTR-RTs belonging to families RLG_famc1 and RLC_famc2using MAFFT [70]. A neighbor-joining tree was thenbuilt using FasTree [77]. The tree was drawn using figtree1.4.2 [78].
Distribution of transposable elements along thechromosomeThe distribution of TEs along the chromosome 3B se-quence was computed by calculating the proportion (insize) and number of TEs in a sliding window of 10 Mbwith a step of 1 Mb. The distribution of the TE diversityalong the chromosome was computed using the samewindow by calculating the number of families per window.To prevent drastic variations due to mis-predictions, weconsidered the number of families representing 99% of theTE fraction per window (N99).
Prediction of solo-LTRsBased on of the 30,406 intact LTR-RTs predicted onchromosome 3B, we built a library of LTR sequences byextracting 18,928 LTRs flanked by canonical 5′-TG and3′-CA dinucleotides. This library was used for an add-itional round of similarity searching using RepeatMaskeron the full chromosome 3B. To distinguish solo LTRsfrom truncated LTR-RTs, we searched specifically for thepresence of a 5 bp target site duplication (one nucleotidevariation tolerated) flanking the matching region.
Hierarchical clustering of distributionsIn order to identify CACTA families with similar distri-butions along the chromosome, we performed a hierarch-ical clustering of the distributions calculated in a slidingwindow of 10 Mb (step of 1 Mb) by using the R package‘pvclust’ [79]. We considered only families representing atleast 0.01% in at least one 10 Mb window. The Pearsoncorrelations were calculated between each pair of distribu-tion and a clustering was applied by the agglomerativemethod ‘average’ (N = 10,000 bootstrap resampling).
Transposable element abundance in the vicinity of genesThe CDS positions of the annotated chromosome 3Bprotein-coding genes were used to estimate the relativeabundance of TE families in the 20 kb upstream anddownstream regions. The average proportion of a givenTE family was calculated for each nucleotide position in
the CDS surrounding sequence by considering the orien-tation of the genes.
Detection of transposable element-captured gene andexon shuffling eventsIn order to detect TE-captured genes, we isolated genesflanked by two elements belonging to the same family, as atrace of a potential capture event. A total of 558 potentialgene capture events were detected, 235 (42%) involving aCACTA, 104 (19%) involving a gypsy, and 219 (39%) involv-ing other superfamilies. We manually checked the presenceof target site duplications as evidence of gene capture.To decipher potential exon shuffling events, we searched
for the presence of chimeric genes. A similarity searchusing BLASTP against the B. distachyon proteome wasperformed for each captured gene product. Wheat proteinsaligning over 70% of their length to a B. distachyon proteinwere filtered out. For the others, we develop a parsingprocedure to solve the overlapping regions of similar-ity between a B. distachyon protein and our query se-quence and to detect chimeric proteins, that is, proteinsshowing non-overlapping segments of similarity with dif-ferent B. distachyon proteins.
Data availabilitySequences and annotations of the reference pseudomole-cule and unassigned scaffolds have been deposited in theEuropean Nucleotide Archive (ENA; project PRJEB4376)under accession numbers HG670306 and CBUC010000001to CBUC010001450, respectively. The source code of theCLARI-TE program is available at [74].
Additional file
Additional file 1: The following additional data are available withthe online version of this paper. Table S1. TE composition (inpercentage of the sequence) of bread wheat chromosome 3B and ofthe draft genome sequences of Triticum urartu and Aegilops tauschii.Table S2. Correlation between TE content, genetic recombinationrate and gene density. Figure S1. Distribution of the average percentageof similarity shared among LTR-RT families for Brachypodium (bd), rice (os)sorghum (sb), maize (zm) and wheat (ta). Figure S2. Dendrograms of twofamilies of LTR-RTs: RLG_famc1 (A,B) and RLC_famc2 (C,D). Figure S3.Distribution of the number of different TE families found in a 10 Mbwindow sliding along the wheat chromosome 3B (in Mb). Figure S4.Proportions of solo-LTRs, truncated TEs, and recombination rates inthree different regions of chromosome 3B. Figure S5. Preferential locationof gypsy families along the 3B chromosome.
AbbreviationsBAC: bacterial artificial chromosome; CDS: coding sequence; LINE: longinterspersed nuclear element; LTR: long terminal repeat; LTR-RT: longterminal repeat retrotransposon; MITE: miniature inverted-repeat transposableelement; MYA: million years ago; SINE: short interspersed nuclear element;TE: transposable element; TREP: Triticeae REPeat sequence database.
Competing interestsThe authors declare that they have no competing interests.
Daron et al. Genome Biology 2014, 15:546 Page 14 of 15http://genomebiology.com/2014/15/12/546
Authors’ contributionsJD performed programming, conducted data analyses and wrote the paper.NG undertook the nonsyntenic gene detection. LP collected and analyzedRNAseq expression data and carried out the cluster analysis. ST made thegene annotation and genome assembly. VJ participated in the TE annotationprocess. EP and HQ participated in the design of the study and criticalrevision of the manuscript. VB, SM, AA, and PW were involved in producingthe sequence of chromosome 3B. CF participated in the design of the project,data interpretation, coordination of the project, and critical revision of themanuscript. FC designed the research, supervised this work, participated in dataanalyses and finalized the paper. All authors read and approved the finalmanuscript.
AcknowledgementsThis project was supported by grants from the French National ResearchAgency (ANR-09-GENM-025 3BSEQ), a grant from France Agrimer, and agrant (project DL-BLE) from the INRA BAP division. JD is funded by a grantfrom the French Ministry of Research. NG is funded by a grant from theEuropean Commission research training program Marie-Curie Actions(FP7-MC-IIF-NoncollinearGenes). LP is funded by a grant from the RegionAuvergne.
Author details1INRA UMR1095 Genetics, Diversity and Ecophysiology of Cereals, 5 cheminde Beaulieu, 63039 Clermont-Ferrand, France. 2University Blaise PascalUMR1095 Genetics, Diversity and Ecophysiology of Cereals, 5 chemin deBeaulieu, 63039 Clermont-Ferrand, France. 3INRA-URGI, Centre de Versailles,Route de Saint Cyr, 78026 Versailles, France. 4CEA/DSV/IG/Genoscope, 2 rueGaston Cremieux, 91000 Evry, France. 5CNRS UMR 8030, 2 rue GastonCrémieux, 91000 Evry, France. 6Université d’Evry, P5706 Evry, France.
Received: 25 July 2014 Accepted: 17 November 2014
References1. McClintock B: The origin and behavior of mutable loci in maize. Proc Natl
Acad Sci U S A 1950, 36:344–355.2. Feschotte C, Jiang N, Wessler SR: Plant transposable elements: where
genetics meets genomics. Nat Rev Genet 2002, 3:329–341.3. Arabidopsis GI: Analysis of the genome sequence of the flowering plant
Arabidopsis thaliana. Nature 2000, 408:796.4. Schnable PS, Ware D, Fulton RS, Stein JC, Wei F, Pasternak S, Liang C, Zhang J,
Fulton L, Graves TA: The B73 maize genome: complexity, diversity, anddynamics. Science 2009, 326:1112–1115.
5. Devos KM: Grass genome organization and evolution. Curr Opin Plant Biol2010, 13:139–145.
6. Bennetzen JL, Ma J, Devos KM: Mechanisms of recent genome sizevariation in flowering plants. Ann Bot 2005, 95:127–132.
7. Tenaillon MI, Hollister JD, Gaut BS: A triptych of the evolution of planttransposable elements. Trends Plant Sci 2010, 15:471–478.
8. Naito K, Zhang F, Tsukiyama T, Saito H, Hancock CN, Richardson AO,Okumoto Y, Tanisaka T, Wessler SR: Unexpected consequences of asudden and massive transposon amplification on rice gene expression.Nature 2009, 461:1130–1134.
9. Li B, Choulet F, Heng Y, Hao W, Paux E, Liu Z, Yue W, Jin W, Feuillet C,Zhang X: Wheat centromeric retrotransposons: the new ones take amajor role in centromeric structure. Plant J 2013, 73:952–965.
10. Vitte C, Bennetzen JL: Analysis of retrotransposon structural diversityuncovers properties and propensities in angiosperm genome evolution.Proc Natl Acad Sci U S A 2006, 103:17638–17643.
11. Matsumoto T, Wu J, Kanamori H, Katayose Y, Fujisawa M, Namiki N, Mizuno H,Yamamoto K, Antonio BA, Baba T: The map-based sequence of the ricegenome. Nature 2005, 436:793–800.
12. Paterson AH, Bowers JE, Bruggmann R, Dubchak I, Grimwood J, Gundlach H,Haberer G, Hellsten U, Mitros T, Poliakov A: The Sorghum bicolor genomeand the diversification of grasses. Nature 2009, 457:551–556.
13. Gao X, Hou Y, Ebina H, Levin HL, Voytas DF: Chromodomains directintegration of retrotransposons to heterochromatin. Genome Res 2008,18:359–369.
14. Marín I, Lloréns C: Ty3/Gypsy retrotransposons: description of newArabidopsis thaliana elements and evolutionary perspectives derivedfrom comparative genomic data. Mol Biol Evol 2000, 17:1040–1049.
15. Chatterjee AG, Leem YE, Kelly FD, Levin HL: The chromodomain of Tf1integrase promotes binding to cDNA and mediates target site selection.J Virol 2009, 83:2675–2685.
16. Devos KM, Brown JK, Bennetzen JL: Genome size reduction throughillegitimate recombination counteracts genome expansion inArabidopsis. Genome Res 2002, 12:1075–1079.
17. Ma J, Devos KM, Bennetzen JL: Analyses of LTR-retrotransposon structuresreveal recent and rapid genomic DNA loss in rice. Genome Res 2004,14:860–869.
18. Tian Z, Rizzon C, Du J, Zhu L, Bennetzen JL, Jackson SA, Gaut BS, Ma J: Dogenetic recombination and gene density shape the pattern of DNAelimination in rice long terminal repeat retrotransposons? Genome Res2009, 19:2221–2230.
19. Duret L, Marais G, Biémont C: Transposons but not retrotransposons arelocated preferentially in regions of high recombination rate inCaenorhabditis elegans. Genetics 2000, 156:1661–1669.
20. Long M, Betrán E, Thornton K, Wang W: The origin of new genes: glimpsesfrom the young and old. Nat Rev Genet 2003, 4:865–875.
21. Yang L, Bennetzen JL: Distribution, diversity, evolution, and survivalof Helitrons in the maize genome. Proc Natl Acad Sci U S A 2009,106:19922–19927.
22. Morgante M, Brunner S, Pea G, Fengler K, Zuccolo A, Rafalski A: Geneduplication and exon shuffling by helitron-like transposons generateintraspecies diversity in maize. Nat Genet 2005, 37:997–1002.
23. Hanada K, Vallejo V, Nobuta K, Slotkin RK, Lisch D, Meyers BC, Shiu S-H,Jiang N: The functional role of pack-MULEs in rice inferred from purifyingselection and expression profile. Plant Cell 2009, 21:25–38.
24. Jiang N, Wessler SR: Insertion preference of maize and rice miniatureinverted repeat transposable elements as revealed by the analysis ofnested elements. Plant Cell 2001, 13:2553–2564.
25. Juretic N, Bureau TE, Bruskiewich RM: Transposable element annotation ofthe rice genome. Bioinformatics 2004, 20:155–160.
26. Jiang N, Feschotte C, Zhang X, Wessler SR: Using rice to understand theorigin and amplification of miniature inverted repeat transposableelements (MITEs). Curr Opin Plant Biol 2004, 7:115–119.
27. Lu C, Chen J, Zhang Y, Hu Q, Su W, Kuang H: Miniature inverted–repeattransposable elements (MITEs) have been accumulated throughamplification bursts and play important roles in gene expressionand species diversity in Oryza sativa. Mol Biol Evol 2012, 29:1005–1017.
28. Chen J, Hu Q, Zhang Y, Lu C, Kuang H: P-MITE: a database for plantminiature inverted-repeat transposable elements. Nucleic Acids Res 2014,42:D1176–D1181.
29. Bennetzen JL, Coleman C, Liu R, Ma J, Ramakrishna W: Consistent over-estimationof gene number in complex plant genomes. Curr Opin Plant Biol 2004, 7:732–736.
30. Lerat E: Identifying repeats and transposable elements in sequencedgenomes: how to find your way through the dense forest of programs.Heredity 2009, 104:520–533.
31. Choulet F, Wicker T, Rustenholz C, Paux E, Salse J, Leroy P, Schlub S, LePaslier M-C, Magdelenat G, Gonthier C: Megabase level sequencing revealscontrasted organization and evolution patterns of the wheat gene andtransposable element spaces. Plant Cell 2010, 22:1686–1701.
32. SanMiguel PJ, Ramakrishna W, Bennetzen JL, Busso CS, Dubcovsky J:Transposable elements, genes and recombination in a 215-kb contigfrom wheat chromosome 5Am. Funct Integr Genomics 2002, 2:70–80.
33. Li W, Zhang P, Fellers JP, Friebe B, Gill BS: Sequence composition, organization,and evolution of the core Triticeae genome. Plant J 2004, 40:500–511.
34. Sabot F, Guyot R, Wicker T, Chantret N, Laubin B, Chalhoub B, Leroy P,Sourdille P, Bernard M: Updating of transposable element annotationsfrom large wheat genomic sequences reveals diverse activities and geneassociations. Mol Genet Genomics 2005, 274:119–130.
35. Paux E, Roger D, Badaeva E, Gay G, Bernard M, Sourdille P, Feuillet C:Characterizing the composition and evolution of homoeologousgenomes in hexaploid wheat through BAC‐end sequencing onchromosome 3B. Plant J 2006, 48:463–474.
36. Charles M, Belcram H, Just J, Huneau C, Viollet A, Couloux A, Segurens B,Carter M, Huteau V, Coriton O: Dynamics and differential proliferation oftransposable elements during the evolution of the B and A genomes ofwheat. Genetics 2008, 180:1071–1086.
Daron et al. Genome Biology 2014, 15:546 Page 15 of 15http://genomebiology.com/2014/15/12/546
37. TREP, the Triticeae REPeat Sequence Database. [http://wheat.pw.usda.gov/ITMI/Repeats/]
38. Brenchley R, Spannagl M, Pfeifer M, Barker GL, D’Amore R, Allen AM,McKenzie N, Kramer M, Kerhornou A, Bolser D: Analysis of the bread wheatgenome using whole-genome shotgun sequencing. Nature 2012,491:705–710.
39. Ling HQ, Zhao S, Liu D, Wang J, Sun H, Zhang C, Fan H, Li D, Dong L, Tao Y,Gao C, Wu H, Li Y, Cui Y, Guo X, Zheng S, Wang B, Yu K, Liang Q, Yang W,Lou X, Chen J, Feng M, Jian J, Zhang X, Luo G, Jiang Y, Liu J, Wang Z, Sha Y,et al: Draft genome of the wheat A-genome progenitor Triticum urartu.Nature 2013, 496:87–90.
40. Jia J, Zhao S, Kong X, Li Y, Zhao G, He W, Appels R, Pfeifer M, Tao Y, ZhangX, Jing R, Zhang C, Ma Y, Gao L, Gao C, Spannagl M, Mayer KF, Li D, Pan S,Zheng F, Hu Q, Xia X, Li J, Liang Q, Chen J, Wicker T, Gou C, Kuang H, He G,Luo Y, et al: Aegilops tauschii draft genome sequence reveals a generepertoire for wheat adaptation. Nature 2013, 496:91–95.
41. International Wheat Genome Sequencing Consortium. [http://www.wheatgenome.org/]
42. Choulet F, Alberti A, Theil S, Glover N, Barbe V, Daron J, Pingault L, Sourdille P,Couloux A, Paux E, Leroy P, Mangenot S, Guilhot N, Le Gouis J, Balfourier F,Alaux M, Jamilloux V, Poulain J, Durand C, Bellec A, Gaspin C, Safar J, Dolezel J,Rogers J, Vandepoele K, Aury JM, Mayer K, Berges H, Quesneville H, Wincker P,et al: Structural and functional partitioning of bread wheat chromosome3B. Science 2014, 345:1249721.
43. IWGSC: A chromosome-based draft sequence of the hexaploid breadwheat (Triticum aestivum) genome. Science 2014, 345:1251788.
44. El Baidouri M, Panaud O: Comparative genomic paleontology across plantkingdom reveals the dynamics of TE-driven genome evolution.Genome Biol Evol 2013, 5:954–965.
45. Flutre T, Duprat E, Feuillet C, Quesneville H: Considering transposableelement diversification in de novo annotation approaches. PLoS One2011, 6:e16526.
46. Vogel JP, Garvin DF, Mockler TC, Schmutz J, Rokhsar D, Bevan MW, Barry K,Lucas S, Harmon-Smith M, Lail K: Genome sequencing and analysis of themodel grass Brachypodium distachyon. Nature 2010, 463:763–768.
47. Baucom RS, Estill JC, Chaparro C, Upshaw N, Jogi A, Deragon J-M, Westerman RP,SanMiguel PJ, Bennetzen JL: Exceptional diversity, non-random distribution,and rapid evolution of retroelements in the B73 maize genome. PLoS Genet2009, 5:e1000732.
48. Rustenholz C, Choulet F, Laugier C, Šafář J, Šimková H, Doležel J, Magni F,Scalabrin S, Cattonaro F, Vautrin S: A 3,000-loci transcription map ofchromosome 3B unravels the structural and functional features of geneislands in hexaploid wheat. Plant Physiol 2011, 157:1596–1608.
49. Wicker T, Guyot R, Yahiaoui N, Keller B: CACTA transposons in Triticeae. Adiverse family of high-copy repetitive elements. Plant Physiol 2003,132:52–63.
50. Liu R, Vitte C, Ma J, Mahama AA, Dhliwayo T, Lee M, Bennetzen JL: AGeneTrek analysis of the maize genome. Proc Natl Acad Sci U S A 2007,104:11844–11849.
51. Rees H, Walters M: Nuclear DNA and the evolution of wheat. Heredity 1965,20:73–82.
52. Kashkush K, Feldman M, Levy AA: Transcriptional activation ofretrotransposons alters the expression of adjacent genes in wheat.Nat Genet 2002, 33:102–106.
53. Parisod C, Alix K, Just J, Petit M, Sarilar V, Mhiri C, Ainouche M, Chalhoub B,Grandbastien MA: Impact of transposable elements on the organizationand function of allopolyploid genomes. New Phytol 2010, 186:37–45.
54. Wright SI, Agrawal N, Bureau TE: Effects of recombination rate and genedensity on transposable element distributions in Arabidopsis thaliana.Genome Res 2003, 13:1897–1903.
55. Yang G, Lee YH, Jiang Y, Shi X, Kertbundit S, Hall TC: A two-edged role forthe transposable element Kiddo in the rice ubiquitin2 promoter.Plant Cell 2005, 17:1559–1568.
56. Han Y, Qin S, Wessler SR: Comparison of class 2 transposable elements atsuperfamily resolution reveals conserved and distinct features in cerealgrass genomes. BMC Genomics 2013, 14:71.
57. Kuang H, Padmanabhan C, Li F, Kamei A, Bhaskar PB, Ouyang S, Jiang J,Buell CR, Baker B: Identification of miniature inverted-repeattransposable elements (MITEs) and biogenesis of their siRNAs inthe Solanaceae: new functional implications for MITEs. Genome Res2009, 19:42–56.
58. Consortium IBGS: A physical, genetic and functional sequence assemblyof the barley genome. Nature 2012, 491:711–716.
59. Batzer MA, Deininger PL: Alu repeats and human genomic diversity.Nat Rev Genet 2002, 3:370–379.
60. Hawkins JS, Kim H, Nason JD, Wing RA, Wendel JF: Differential lineage-specificamplification of transposable elements is responsible for genome sizevariation in Gossypium. Genome Res 2006, 16:1252–1261.
61. Piegu B, Guyot R, Picault N, Roulin A, Saniyal A, Kim H, Collura K, Brar DS,Jackson S, Wing RA: Doubling genome size without polyploidization:dynamics of retrotransposition-driven genomic expansions in Oryzaaustraliensis, a wild relative of rice. Genome Res 2006, 16:1262–1269.
62. Vitte C, Panaud O: LTR retrotransposons and flowering plant genomesize: emergence of the increase/decrease model. Cytogenet Genome Res2005, 110:91–107.
63. Hawkins JS, Proulx SR, Rapp RA, Wendel JF: Rapid DNA loss as acounterbalance to genome expansion through retrotransposonproliferation in plants. Proc Natl Acad Sci U S A 2009, 106:17811–17816.
64. Zabala G, Vodkin LO: The wp mutation of Glycine max carries agene-fragment-rich transposon of the CACTA superfamily. Plant Cell2005, 17:2619–2632.
65. Takahashi S, Inagaki Y, Satoh H, Hoshino A, Iida S: Capture of agenomic HMG domain sequence by the En/Spm-related transposableelement Tpn1 in the Japanese morning glory. Mol Gen Genet 1999,261:447–451.
66. Wicker T, Buchmann JP, Keller B: Patching gaps in plant genomesresults in gene movement and erosion of colinearity. Genome Res2010, 20:1229–1237.
67. Jiang N, Bao Z, Zhang X, Eddy SR, Wessler SR: Pack-MULE transposableelements mediate gene evolution in plants. Nature 2004, 431:569–573.
68. Altschul SF, Madden TL, Schaffer AA, Zhang J, Zhang Z, Miller W, Lipman DJ:Gapped BLAST and PSI-BLAST: a new generation of protein databasesearch programs. Nucleic Acids Res 1997, 25:3389–3402.
69. Enright AJ, Van Dongen S, Ouzounis CA: An efficient algorithm for large-scaledetection of protein families. Nucleic Acids Res 2002, 30:1575–1584.
70. Katoh K, Kuma K-i, Toh H, Miyata T: MAFFT version 5: improvement inaccuracy of multiple sequence alignment. Nucleic Acids Res 2005,33:511–518.
71. Waterhouse AM, Procter JB, Martin DM, Clamp M, Barton GJ: JalviewVersion 2–a multiple sequence alignment editor and analysisworkbench. Bioinformatics 2009, 25:1189–1191.
72. Smit AFA, Hubley R, Green P: RepeatMasker Open-3.0. [http://www.repeatmasker.org/]
73. Stajich JE, Block D, Boulez K, Brenner SE, Chervitz SA, Dagdigian C, FuellenG, Gilbert JG, Korf I, Lapp H: The Bioperl toolkit: Perl modules for the lifesciences. Genome Res 2002, 12:1611–1618.
74. Daron J: CLARI-TE. [https://github.com/jdaron/CLARI-TE]75. Edgar RC: MUSCLE: multiple sequence alignment with high accuracy and
high throughput. Nucleic Acids Res 2004, 32:1792–1797.76. SanMiguel P, Gaut BS, Tikhonov A, Nakajima Y, Bennetzen JL: The
paleontology of intergene retrotransposons of maize. Nat Genet 1998,20:43–45.
77. Price MN, Dehal PS, Arkin AP: FastTree 2–approximately maximum-likelihoodtrees for large alignments. PLoS One 2010, 5:e9490.
78. Rambaut A: FigTree-v1.4.2. [http://tree.bio.ed.ac.uk/software/figtree/]79. Suzuki R, Shimodaira H: Pvclust: an R package for assessing the uncertainty
in hierarchical clustering. Bioinformatics 2006, 22:1540–1542.
doi:10.1186/s13059-014-0546-4Cite this article as: Daron et al.: Organization and evolution oftransposable elements along the bread wheat chromosome 3B. GenomeBiology 2014 15:546.