Embed Size (px)
Citation preview
BASIC SCIENCES
COMPUTER SCIENCES
Optimum Fourier Filtering of Cardiac Data: A Minimum-Error Method:
Concise Communication
Stephen L. Bacharach, Michael V. Green, DiñoVitale, Gale White, Margaret A. Douglas,Robert 0. Bonow, and Steven M. Larson
National Institutes of Health, Bethesda, Maryland
Random fluctuations limit the accuracy of quantities derived from cardiac time-
activity curves (TACs). To overcome this problem, TACs are often fitted with atruncated Fourier series giving rise to two sources of error: (a) the truncated seriesmay not adequately describe the TAC shape, causing errors in parameters calculated from the fit: and (b) successive TACs acquired from the same subject underidentical circumstances will fluctuate due to limited counts, causing the Fourier fits(and parameters derived from them) to fluctuate. These two errors, respectively,decrease and increase as the number of harmonics increases, suggesting the existence of a minimum in total error. This number of harmonics for minimum error(NHME) was calculated for each of six common parameters used to describe LVTACs. The "true" value of each parameter was determined from TACs of very high
statistical precision. Poisson noise was added to simulate lower count rates. Forlow-count TACs, use of either a smaller or a larger number of harmonics resulted
in significantly greater error. NHME was found to occur at two harmonics for thesystolic parameters studied, regardless of the noise level present in the TAC. Fordiastolic parameters, however, NHME was a strong function of the noise presentin the TAC, varying from three harmonics for noise levels typical of regional TACs,to five or six harmonics for high-count global TACs.
J NucÃMed 24: 1176-1184,1983
The analysis of cardiac left-ventricular (LV) time- due to limited counts, the truncated Fourier series mayactivity curves (TACs) yields useful data concerning LV not adequately describe the shape of the TAC, causingfunction. The reliability of this information, however, errors in parameters calculated from the fit; and (b) independs on the statistical precision of measurement. In the presence of "noise" caused by counting fluctuations,
an effort to improve statistical precision, the LV TAC TACs acquired from the same subject under identicalcan be fitted with a truncated Fourier series, i.e., one circumstances will fluctuate, causing the Fourier fitsfiltered with an abrupt high-frequency cut off (1-4). (and parameters derived from them) to fluctuate. TheseParameters such as ejection fraction, filling rate etc., two sources of error, respectively, decrease and increasemay then be calculated from the resulting smooth Fou- as a function of harmonic number, suggesting the exis-rier-series approximation to the LV TAC, rather than tence of a minimum for the total combined error. Thefrom the more "noisy" TAC itself. Such calculations are number of harmonics at which such a minimum occurs
subject to two sources of error that depend on the number can be considered the optimum number to be used inof harmonics used in the fit: (a) in the absence of "noise" fitting a TAC. Use of either fewer or more harmonics to
describe the TAC would be expected to increase the totalReceived June 3, 1983; revision accepted Aug. 17, 1983.
errorFor reprints contact: Stephen L. Bacharach, Nuclear Medicine
Dept., Building 10, Room 1C401, National Institutes of Health, Be- Thc g°al of tms PaPer was to Predict the number Ol
thcsda, MD 20205. harmonics for minimum error for each of six parameters
1176 THE JOURNAL OF NUCLEAR MEDICINE

BASIC SCIENCESCOMPUTER SCIENCES
descriptive of LV TACs: ejection fraction (EF), time toend-systole (TES), peak ejection and filling rates (PER,
PFR), and their times of occurrence (TPER, TPFR). Toachieve this goal, two separate experiments were necessary.
First, an investigation was carried out to determinethe "shape" error, that is, the error caused by the in
ability of a truncated Fourier series to describe adequately the shape of a TAC. To this end, 16 TACs ofextraordinarily high statistical precision were obtained.Because these TACs contained so many counts, parameters derived directly from them (such as EF, PER,etc.) could be computed with negligible random fluctuations. These parameters could then be compared withparameters calculated from Fourier fits to the sameTACs. The difference between the value of a parametercalculated directly from the TAC and one calculatedfrom its Fourier fit would then be a measure of the abilityof the truncated Fourier series to describe adequately theshape of the TAC. The high total counts in each TACensured that these measurements would be uninfluencedby counting fluctuations.
In the second experiment, the influence that countingfluctuations have on the Fourier fits to the TACs wasinvestigated. In particular, it was desired to discover howthe Fourier fits to a TAC might vary due to countingfluctuations in the TAC. To accomplish this, TACs ofsuccessively decreasing total counts were simulated byadding successively increasing amounts of Poisson noiseto each of the high-count TACs. In this way the degree
to which counting fluctuations influenced the Fourierfits (and the parameters derived from them) could bemeasured.
Each of the above experiments produced a measurement of one of the two errors caused by calculating parameters from the Fourier fit to a TAC, rather than fromthe TAC itself. The first experiment yielded the errorcaused by the inability of the Fourier fit to describe theshape of the TAC, the second experiment yielded theerror in the fit due to counting fluctuations present in theoriginal TAC. These two independent errors were thencombined to allow prediction of the number of harmonicsfor minimum error (NHME) as a function of the relativeamount of statistical noise due to counting fluctuationspresent in the TAC. Finally, a single, easily calculable,index of random noise present in a TAC was developedand tested, in order to make the prediction of NHMEgenerally applicable. By computing this noise index fora particular TAC, one is able to determine the optimumnumber of harmonics that should be used in fitting thatTAC with a partial Fourier series.
METHODS
Eighty-two subjects were studied. They were dividedinto two groups: a "probe group" of 16 subjects in whom
TACs with very high count rates were produced usinga nonimaging probe, and a "camera group" of 66
subjects studied only with a conventional Anger camera.The probe group consisted of seven subjects with angi-
ographically documented coronary artery disease(CAD), five subjects with aortic régurgitation(AR), onewith mitral régurgitation (MR), and three normalsubjects with no evidence of heart disease. The cameragroup consisted of 16 subjects with CAD, 14 withasymmetric septal hypertrophy, 15 with AR, 15 withMR, and six with aortic stenosis. In all subjects, theblood pool was labeled in vivo with 15-20 mCi Tc-99m,
and all were studied at rest.The subjects in the camera group underwent equi
librium gated blood-pool ventriculography, using a 35°LAO view with a 15°caudad tilt. The sampling rate for
the camera group was either 50 or 100 images per second, depending on heart rate. Each of the 66 studies inthe camera group was analyzed to produce an LV TAC.The average total counts in the LV TAC of the cameragroup was 930,000.
The sixteen subjects comprising the probe group werestudied using a nonimaging detector (7.5-cm diameterfield of view), equipped with a parallel-hole collimator,
placed over the LV. In order to position the probeproperly, each probe study was immediately precededby a gamma camera study performed in the mannerdescribed above. The resulting images were than usedto position the probe over the LV with the same orientation as for the camera. The high-sensitivity collimator
used with the nonimaging probe, coupled with long acquisition times (512 beats) resulted in gated LV TACsof very high statistical precision (mean total counts of~40 million) for the probe group. Each of the 16 probe
TACs was sampled at 10 msec per point.The TACs from both the probe and camera groups
were produced only from cardiac cycles lying within anarrow range of cycle lengths (average temporal windowof ±80 msec about the mean R-R interval). Within thisbeat-length window, the technique of "reverse gating"
(5) was used to prevent count falloff at the end of thecardiac cycle. For the purposes of this study, it was notnecessary to correct the TACs for background activity.The algorithms used to calculate each of the six parameters of interest and their associated randomcounting errors have been described in detail elsewhere(6). Briefly, for the unfitted TACs, TES was found fromthe time to minimum counts of the smoothed (50-msecunweighted sliding smooth) TAC. End-systolic counts
were obtained from the raw data by averaging the countsin a 30-msec window about TES. PFR, TPFR, PER, andTPER were found by repeatedly fitting a third-order
polynomial to a successively narrower range of LVpoints. Despite the high total counts in the probe groupTACs, PER, PFR, and their times of occurrence couldnot be calculated from a direct point-by-point derivative
Volume 24, Number 12 1177

BACHARACH, GREEN, VITALE, WHITE, DOUGLAS. BONOW, AND LARSON
Original TAC
FIG. 1. Typical LV time-activity curve, and approximations to it using 1 through 6 harmonics in Fourier series.
without incurring too much fluctuation. The Fourier Titsto each TAC, on the other hand, were perfectly smooth,permitting cither direct point-by-point calculation of thesix parameters or calculation by the methods used for theunfitted TAC. Both methods, when applied to the Fourier-fitted TACs, gave similar results, differing only byan amount consistent with the expected calculationalerrors.
RESULTS
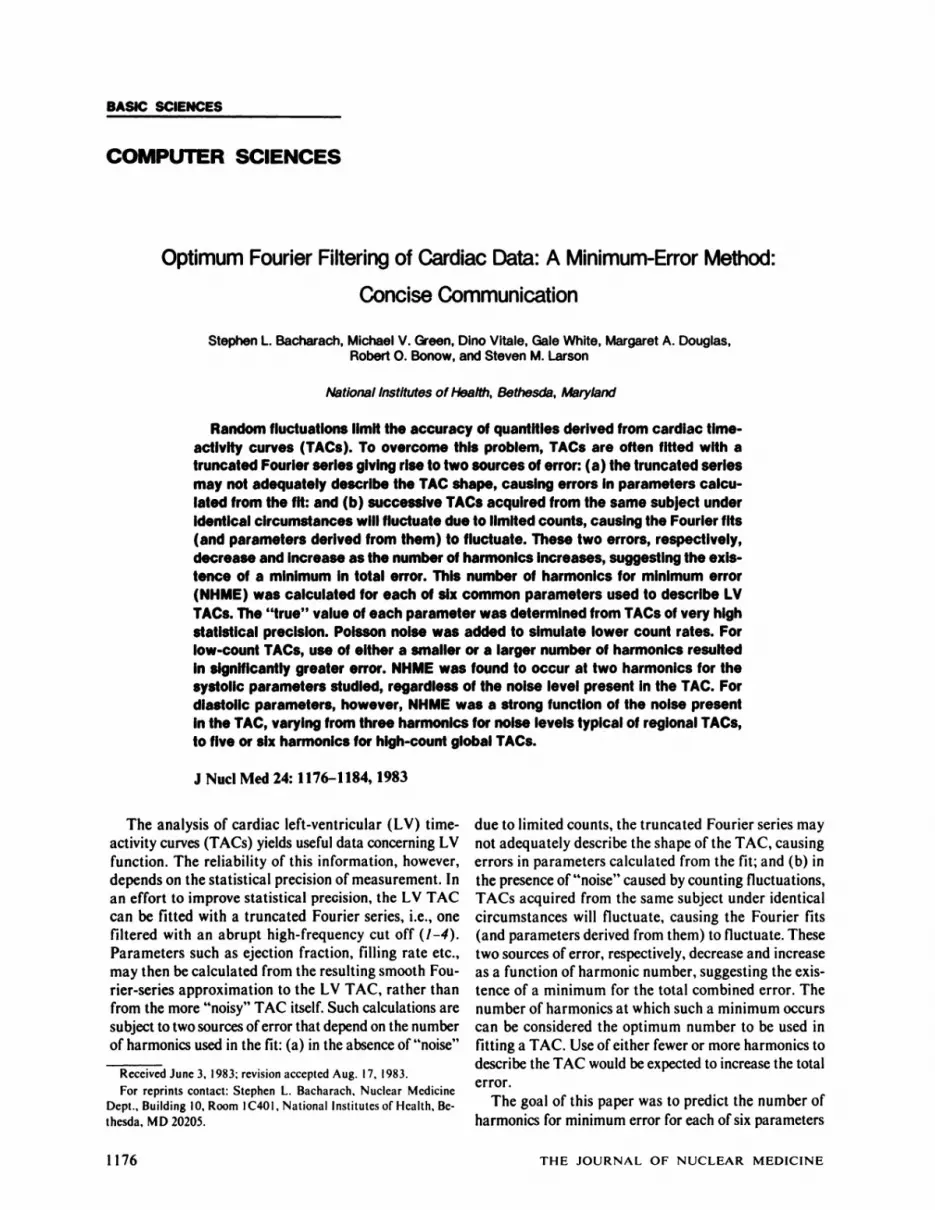
Adequacy of Fourierfits. The first experiment investigated the ability of a truncated Fourier series to fit theLV TAC adequately, i.e., to describe its shape. Initially,only the 16 subjects in the probe group were studied inthis experiment. From each of the very-high-count-rateprobe TACs, six additional TACs were produced: aone-harmonic Fourier fit to the TAC, a two-harmonicfit, etc., up to six harmonics. Figure 1 illustrates thisprocedure. The ability of a truncated Fourier series todescribe a TAC adequately is a function of the particularparameter one wishes to calculate from that TAC. Fora particular parameter the adequacy of fit can be determined by comparing the parameter calculated fromthe original TAC with the same parameter calculatedfrom the Fourier fit to the TAC. This comparison isshown in Fig. 2. Each ordinate of this plot is the meanabsolute difference (expressed as a percentage) betweena parameter value obtained from the original TAC and
a value obtained from a Fourier fit to that TAC for all16 subjects. In the absence of counting fluctuations, theordinate gives the mean "mistake" one makes in calcu
lating a parameter from a Fourier fit to a TAC, and istherefore referred to as "percent error due to fit" in the
figure. The I-beams surrounding each point in Fig. 2show the spread (1 s.d.) in this "percentage error due tofit" caused by subject-to-subject variations. For example,
referring to the PFR panel of Fig. 2, the average errorin PFR due to using a one-harmonic fit is about 23 percent, while for some subjects (those whose TACs closelyresemble a single cosine in shape) the error may be muchlower. The ordinate values of Fig. 2 are assumed to bedue only to the inadequacies of the Fourier fit, an assumption that is true only if the original TACs are freefrom counting fluctuations. It is for this reason that thedata for Fig. 2 were produced from the 16subjects in thehigh-count probe group. The probe-group TACs, whilecontaining many counts, are not statistically perfect. Thisimperfection is shown in each panel of Fig. 2 as the smallresidual error due to counting fluctuations (referred toas "residual error" in the figure). As harmonic number
increases, the percentage error due to fit is expected togo to zero in the absence of counting fluctuations. In Fig.2, as harmonic number increases the ordinate values andthe width of the error brackets will not approach zero,but rather will approach the "residual error."
The analysis necessary to produce Fig. 2 was alsocarried out for the 66 camera subjects. The data for low
1178 THE JOURNAL OF NUCLEAR MEDICINE
EF
105
0-
'-<
Residuai Errbr>=0.7%LLrn
TES<
ResidualError>=
Ii
i i
lili0.5%i
*1
1
f;so3§20D
10?
0PER<
Residual Error>=0.7%T
T1
1n »,
20
10
TRE R
< Residual Error>= 0.8%
ili Iff
30
20
10
O
PFR
< Residual Error>= 2.5%
TPFR
< Residuai Error>= 0.6%
123456
20
10
01 23456
No. of Harmonics—»
FIG. 2. Errors caused by using too few Fourier harmonics to describe adequately the shape of time-activity curve (TAC), plotted
as function of harmonic number, for each of six parameters of interest. Vertical bars indicate intersubject fluctuations (1 s.d.). Valuesshown assume TAC with no random counting fluctuations. Alsoshown are actual residual errors due to counting fluctuations. Parameters are ejection fraction (EF) time to end-systole (TES), peak
filling and ejection rates (PFR, PER), and their times of occurrence(TPFR, TPER).
harmonics overlayed those shown in Fig. 2, whereas forhigh harmonic numbers the ordinate values and errorbrackets did not decrease below the much larger "residual error" resulting from the comparatively low total
counts in the camera TACs.Fluctuations in Fourier fits. One might be tempted to
conclude from Fig. 2 that the larger the number of harmonics used, the better. The presence of counting fluctuations in a real TAC makes this an erroneous conclusion. To investigate the effects of counting fluctuations,a second experiment was carried out using the 16subjects in the probe group. Ideally this experimentwould entail performing repeated low-count studies on
a given subject. Thus from a single subject one wouldproduce a large number of TACs each of which is identical to every other except for the effects of countingfluctuations. Each TAC would then be fitted with aFourier series. Because of the effects of counting fluc-
BAS1C SCIENCESCOMPUTER SCIENCES
tuations, each Fourier fit would be slightly different,resulting in fluctuations in the parameters (such as EF,PER, etc.) calculated from the Fourier fits to theseotherwise identical TACs. By measuring these fluctuations, one could determine the magnitude of the secondtype of error that results from the use of Fourier fit—the
error due to counting fluctuations. The ideal experimentdescribed above was simulated, initially using only the16 probe subjects. The simulation was performed in thefollowing manner. Each probe TAC was replicated 64times. Poisson noise (corresponding to a certain level oftotal counts) was then added to each of these TACs,resulting in 64 TACs differing from one another only aswould be expected on the basis of counting statistics. TheTAC was made noisy by replacing each point on theTAC with one drawn at random from a Poisson distribution. The mean of the Poisson distribution corresponded to the count level desired at that point. A one-
harmonic Fourier fit was then made to each of the 64noisy TACs. Although the underlying curve shape wasidentical for each TAC, the presence of random noisecaused each of these one-harmonic Fourier fits to differ
from the others. The six parameters of interest werecalculated from each of the 64 Fourier fits, and they alsoscattered, for the same reason. By measuring the fluctuations in the 64 calculated values of each parameter,the influence of limited counts on the Fourier fittingprocess could be assessed. The observed standard deviation of these fluctuations for each parameter wastaken as the error in the Fourier fit due to countingfluctuations. Henceforth, this error will be referred toas "the error in the fits due to noise." Similarly two-,
three-, four-, five-, and six-harmonic fits were evaluated.
This entire process was repeated for seven levels of random noise, i.e., for seven different levels of counts. Figure3 shows the results of this computation (mean of all 16subjects in the probe group) as a function of harmonicnumber at three levels (of the seven levels studied) ofrandom counting noise. Note that the percentage errordue to counting fluctuations increases with increasingharmonic number. That is, although a single harmonicmay not adequately describe the shape of a TAC (e.g.as in Fig. 2), a single-harmonic fit is less sensitive to thepresence of counting fluctuations than is a higher-har
monic fit.Signal-to-noise index. In order for the results of this
study to be generally applicable, we sought a single indexthat could describe how the counting fluctuations presentin a TAC would produce error in all of the parameterscalculated from the original TAC. Such an index wouldbe useful. It would permit the results of this paper to beapplied to TACs produced in other subjects, as will bedemonstrated below. Unfortunately, there is no singleindex that will precisely predict the error in every parameter. Each parameter's error has its own unique de
pendence on counting fluctuations and on curve shape.
Volume 24, Number 12 179

BACHARACH, GREEN. VITALE, WHITE, DOUGLAS, BONOW. AND LARSON
TES
_d O Ü
FIG. 3. Ordinate: error due to countingfluctuations in parameters calculated fromFourier fits to TACs. Abscissa: number ofharmonics used in fit. Squares, circles, andtriangles indicate data from TACs withsuccessively increasing noise (defined bysignal-to-noise index, SNI, described in
text). Parameter abbreviations as in Fig.2.
It was postulated, however, that an index similar to thestandard "signal to noise" ratio would at least approxi
mately describe the magnitude of the errors due tocounting statistics. This postulate was empirically testedfor the index referred to here as the signal-to-noise index(SNI), defined as:
where A, = amplitude of first Fourier harmonic,c = mean counts in TAC,
N = number of points in TAC.Note that this expression is similar, but not identical
to the usual approximation to the quantity called signal-to-noise ratio. The numerator of SNI is simply thefirst-harmonic amplitude —which is a reasonable approximation to the signal, since it has been reported(8,10) that usually 80%or 90% of the power is in the firstharmonic. The denominator for SNI contains the standard error (SE), defined as:
£{LV(i)-C(i)P
N= (standard deviation)/\/N,
(2)
where: LV(i) are the "true" counts at point i,
C(i) are the measured counts at i andc is the mean counts over all N points.
Using standard error rather than standard deviation
in the denominator of SNI makes the resultant expression independent of sampling frequency (i.e., of framerate). Note that one samples the LV time-activity curveby integrating the counts over the duration of eachframe. Thus, doubling the frame rate causes the amplitude of the TAC curve to fall 50% (each frame willcontain half the counts). The standard error will also fallby a factor of 2 (as seen from Eq. (2), noting that c fallsby a factor of 2 and N increases by a factor of 2), henceSNI will remain unchanged by frame rate. Mathematically this is seen by realizing that one is sampling withan aperture equal to T/N where T is the cardiac periodand N the number of points. Thus, because we increasesampling rate only by increasing or decreasing thesampling aperture, the total information content remainsthe same (provided the sampling is sufficiently above theNyquist value).
It was postulated that SNI would allow a rough estimation of error in each parameter when calculated froman unprocessed TAC. This postulate was tested in the66 subjects comprising the camera group. All six parameters of interest were calculated from each of the 66original TACs. In addition, using the usual propoga-tion-of-errors formulae, the uncertainty (one s.d.) in eachof these values (due to counting fluctuations) could beestimated. Note that all parameters and error estimateswere calculated from the original TACs—no Fourierfitting was performed in this experiment. The value ofSNI was also computed from each of the 66 TACs. Toput the SNI values into clinical perspective, a value of17 might correspond to a TAC with 30K-40K total
1180 THE JOURNAL OF NUCLEAR MEDICINE
BASIC SCIENCESCOMPUTER SCIENCES
.10, EF
.08-
.06-
.04-
.02-
0-
.20-1
.16-
.12-
.08-
.04-
0-
PFR
•'¿-.
3000 60 120 180 240Signal to Noise Index (SNI)—*•
FIG. 4. Fractional errors in computing ejection fraction (EF) andpeak filling rate (PFR) from unprocessed time-activity curve, asfunction of signal-to-noise index.
counts (depending on TAC shape), while a value of SNI= 88 might correspond to a TAC with 1-2-miIlion
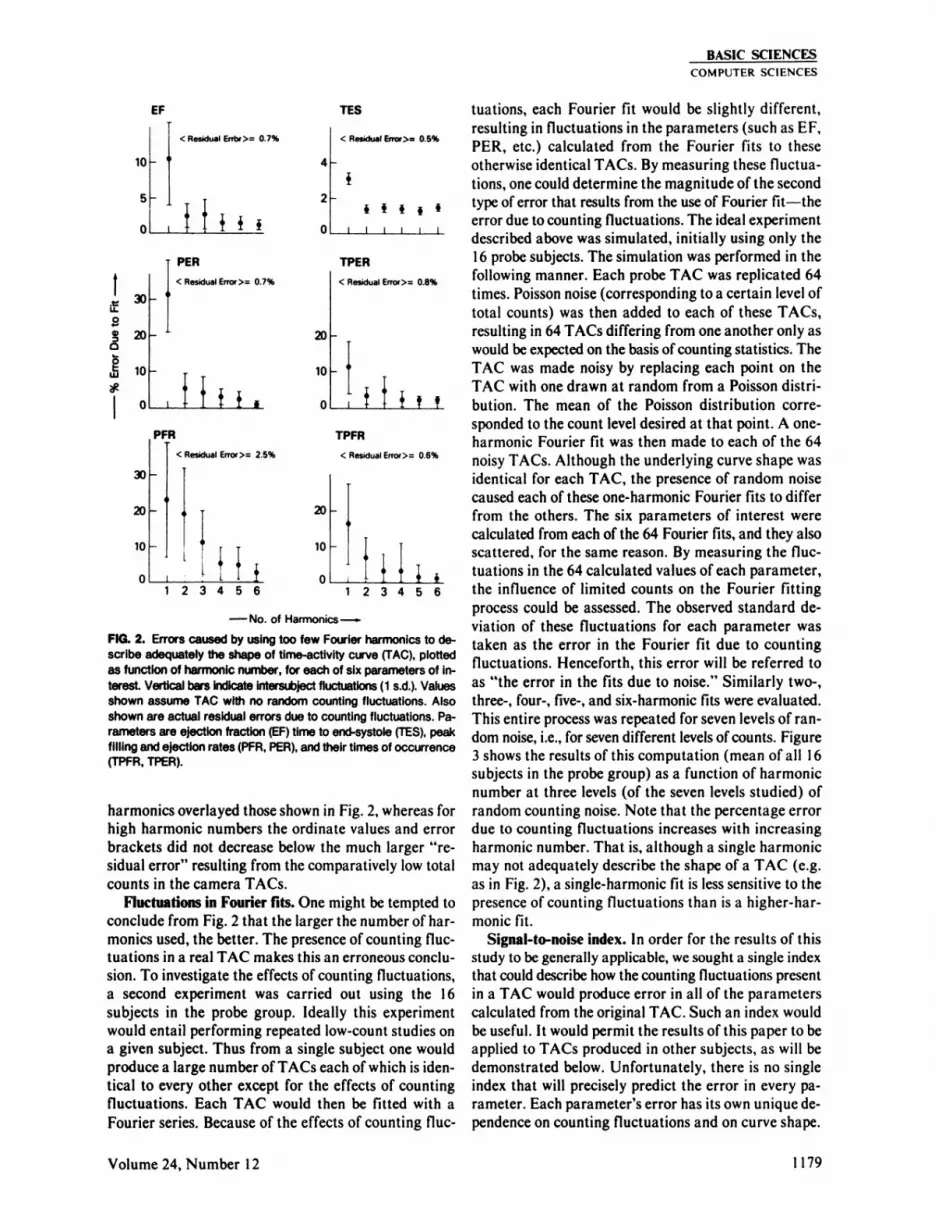
counts.The percentage error in each parameter, as calculated
from the original TACs, was plotted as a function ofSNI. It was found that measurement of SNI allows arough estimation of the error in a parameter when theparameter is computed from the raw TAC. Figure 4 illustrates this for two typical parameters. From these dataone can conclude that SNI is an approximate descriptorof the "noise" in a TAC as it affects the error in a pa
rameter. For this reason, in Fig. 3 the level of countingfluctuations present in a TAC is given by the value ofSNI.
Number of harmonics for minimumerror. The datafrom Fig. 2 show the error made by using only a finitenumber of Fourier harmonics to describe the shape ofa TAC that has negligible counting fluctuations. Thedata of Fig. 3 show the additional error that is made ifthe TAC being fitted contains counting fluctuations. Thetotal error can be calculated by assuming the two errors
TES
I
30
20
10
O
PER
,-0--
20
15
10
5
O
r TPER
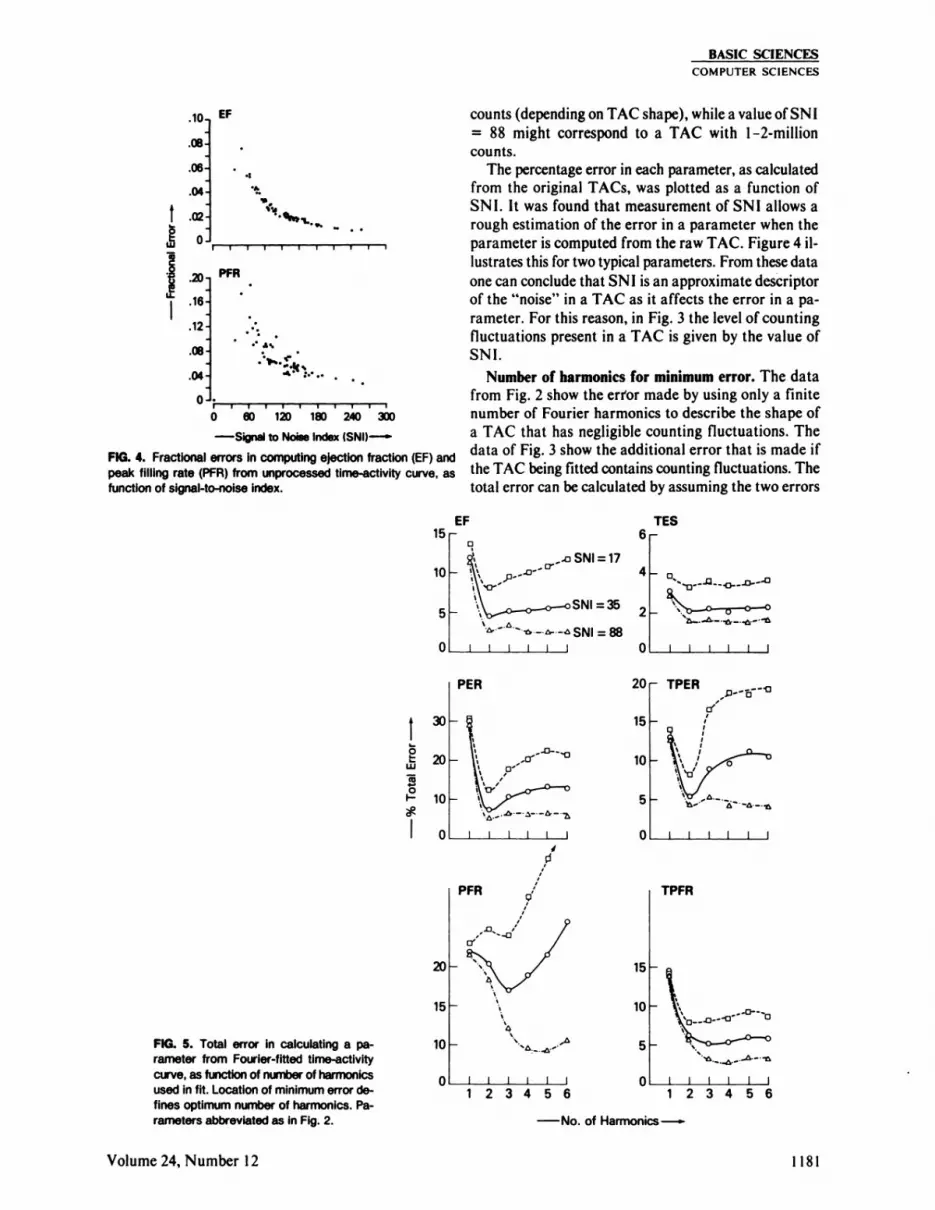
FIG. 5. Total error in calculating a parameter from Fourier-fitted time-activity
curve, as function of number of harmonicsused in fit. Location of minimum error defines optimum number of harmonics. Parameters abbreviated as in Fig. 2.
20
15
10
PFR
J I I I I123456
15
10
5
TPFR
Û.--0
J I123456
-No. of Harmonics-
Volume 24, Number 12 181
BACHARACH, GREEN, VITALE. WHITE, DOUGLAS, BONOW, AND LARSON
are independent. Thus:
Total error = VE,2 + E22,
where E| = error due to the inability of Fourier series to describe a TAC (Fig. 2), and
£2= errors in Fourier fit due to countingfluctuations (Fig. 3).
In Fig. 5 this total error is plotted as a function of harmonic number, for three different levels of countingfluctuations (defined by the SNI value). The levels ofcounting fluctuations shown range from values typicalof low-count TACs (e.g., gated over only one or a fewbeats, SNI = 17.5) to values typical of global TACs from6-min rest studies (SNI = 88). Note that a local minimum in total error is evident in most of these plots,especially for "noisy" TACs (low SNI values).
It is seen that EF, TES, PER, and TPER all have theirminimum error at two harmonics, regardless of SNI. Atlow SNI (e.g., for low-count TACs) the penalty in totalerror is heavy for using either too few or too many harmonics. At high SNI the curves no longer increase muchas harmonic number increases. Thus one may computethese four parameters using larger number of harmonicswithout significant increase in total error, providing SNIis 88 or greater. At still higher SNI values, the curves forEF, TES, PER, and TPER do not differ significantly inform from the curves at the highest SNI valuesshown.
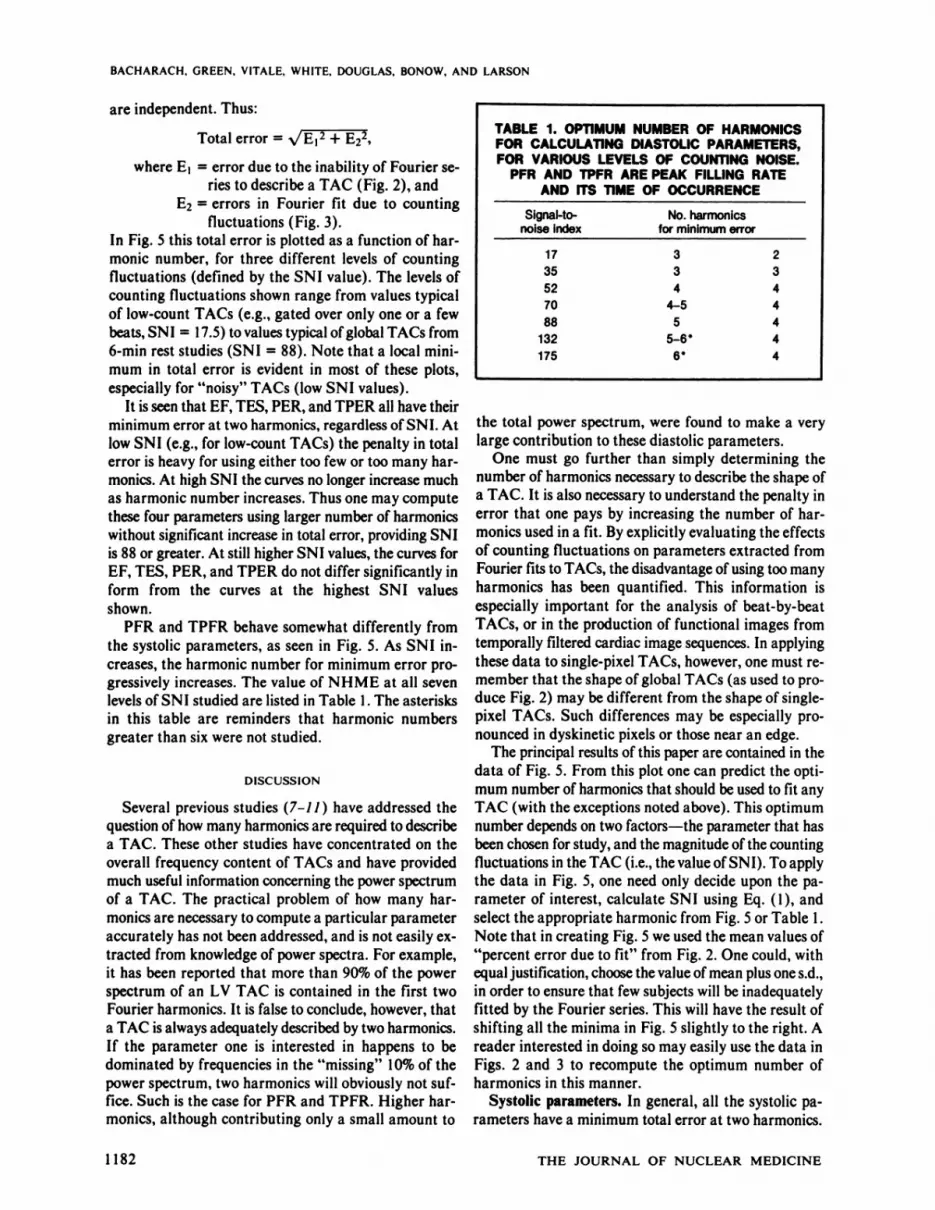
PFR and TPFR behave somewhat differently fromthe systolic parameters, as seen in Fig. 5. As SNI increases, the harmonic number for minimum error progressively increases. The value of NHME at all sevenlevels of SNI studied are listed in Table 1. The asterisksin this table are reminders that harmonic numbersgreater than six were not studied.
DISCUSSION
Several previous studies (7-11) have addressed thequestion of how many harmonics are required to describea TAC. These other studies have concentrated on theoverall frequency content of TACs and have providedmuch useful information concerning the power spectrumof a TAC. The practical problem of how many harmonics are necessary to compute a particular parameteraccurately has not been addressed, and is not easily extracted from knowledge of power spectra. For example,it has been reported that more than 90% of the powerspectrum of an LV TAC is contained in the first twoFourier harmonics. It is false to conclude, however, thata TAC is always adequately described by two harmonics.If the parameter one is interested in happens to bedominated by frequencies in the "missing" 10% of the
power spectrum, two harmonics will obviously not suffice. Such is the case for PFR and TPFR. Higher harmonics, although contributing only a small amount to
TABLE 1. OPTIMUM NUMBER OF HARMONICSFOR CALCULATING DIASTOLIC PARAMETERS,FOR VARIOUS LEVELS OF COUNTING NOISE.
PFR AND TPFR ARE PEAK FILLING RATEAND ITS TIME OFOCCURRENCESignal-to-
noiseindex1735527088132175No.harmonics
for minimumerror3344-555-6"6*2344444
the total power spectrum, were found to make a verylarge contribution to these diastolic parameters.
One must go further than simply determining thenumber of harmonics necessary to describe the shape ofa TAC. It is also necessary to understand the penalty inerror that one pays by increasing the number of harmonics used in a fit. By explicitly evaluating the effectsof counting fluctuations on parameters extracted fromFourier fits to TACs, the disadvantage of using too manyharmonics has been quantified. This information isespecially important for the analysis of beat-by-beatTACs, or in the production of functional images fromtemporally filtered cardiac image sequences. In applyingthese data to single-pixel TACs, however, one must remember that the shape of global TACs (as used to produce Fig. 2) may be different from the shape of single-pixel TACs. Such differences may be especially pronounced in dyskinetic pixels or those near an edge.
The principal results of this paper are contained in thedata of Fig. 5. From this plot one can predict the optimum number of harmonics that should be used to fit anyTAC (with the exceptions noted above). This optimumnumber depends on two factors—theparameter that hasbeen chosen for study, and the magnitude of the countingfluctuations in the TAC (i.e., the value of SNI ). To applythe data in Fig. 5, one need only decide upon the parameter of interest, calculate SNI using Eq. (1), andselect the appropriate harmonic from Fig. 5 or Table 1.Note that in creating Fig. 5 we used the mean values of"percent error due to fit" from Fig. 2. One could, with
equal justification, choose the value of mean plus one s.d.,in order to ensure that few subjects will be inadequatelyfitted by the Fourier series. This will have the result ofshifting all the minima in Fig. 5 slightly to the right. Areader interested in doing so may easily use the data inFigs. 2 and 3 to recompute the optimum number ofharmonics in this manner.
Systolic parameters. In general, all the systolic parameters have a minimum total error at two harmonics.
1182 THE JOURNAL OF NUCLEAR MEDICINE

BASIC SCIENCESCOMPUTER SCIENCES
This is probably a reflection of the fact that the systolicportion of the cardiac cycle is quite cosine-like in shape.
The only deviation from this occurs in TACs with apronounced pre-ejection period. It is probable that more
than two harmonics would have been required to describea parameter indicative of the TAC shape during thepre-ejection period. Indeed, visually, the modest pre-
ejection volume relation shown in Fig. 1 is poorly reproduced by even a six-harmonic fit.
Examining EF, PER, and TPER in Fig. 5, we see thatat low SNI values (i.e., under poor counting statistics)the minimum is quite pronounced. That is, using eitherfewer or more harmonics than the "optimum" gives
markedly larger errors. As SNI increases (i.e., bettercounting statistics) the curves of Fig. 5 become flatterat high harmonic numbers: there is less penalty in usingmore harmonics than the optimum. In fact, as SNI approaches infinity (i.e., as the effects of counting fluctuations go to zero) one expects Fig. 5 to approach theshape of Fig. 2. Thus, for high-count data, systolic pa
rameters may be more accurately measured using moreharmonics. The difference between using two harmonicsand (for example) six is, however, seen to be insignificantat large SNI.
Diastolic parameters. The two diastolic parameterschosen for study (PFR, TPFR) have minimum totalerror at progressively higher harmonic number as SNIincreases. Thus, unlike the systolic parameters, the di-astolics are not adequately described by two harmonicsexcept for TACs with low SNI (large counting fluctuations). The reason for this may be twofold: (a) peakfilling rate is frequently greater than the peak emptyingrate, and (b) more importantly, the diastolic portion ofa resting TAC is distinctly more complex in shape thanis the systolic portion. It is not surprising that PFR andTPFR require higher harmonics, occurring as they doin close proximity to the flat, diastasis period and theatrial contraction portion of the TAC. One may speculate that other diastolic parameters might similarly require more than two harmonics at rest.
These data emphasize that there is no single "best"
Fourier fit to an LV TAC. Instead, each portion of theTAC may be described optimally by a harmonic fit ofa different order. This optimum is a balance betweenusing few enough harmonics to smooth out statisticalfluctuations while maintaining sufficient harmonics toapproximate the underlying signal. Such a balance willdepend on the specific information to be extracted fromthe fitted TAC (i.e., on the parameters with which onewishes to describe the TAC). These considerations mustbe kept in mind when creating functional images of parameters derived from regional or limited-count TACs.Ideally, the SNI of the limited-count TAC (e.g., from
a single cardiac cycle) would be computed, and the appropriate number of harmonics selected from Fig. 5.Fortunately, for the systolic parameters studied, two
harmonics are optimum overa wide range of SN Is. Fordiastolic parameters, however, the situation is morecomplex, requiring different numbers of harmonics forthe different SNIs of each TAC.
It should be emphasized that only resting TACs werestudied. At exercise it is known that much of the complexity in shape of the resting TAC disappears: the diastasis period shrinks, atrial contraction blends togetherwith passive filling, and the pre-ejection period shortens.
In all, the distinctive features that require higher harmonics at rest are diminished during exercise. It isprobable, therefore, that fewer harmonics would benecessary under exercise than at rest. Further workwould be necessary to test this assertion.
CONCLUSION
We find that a truncated Fourier series will describea cardiac left-ventricular TAC optimally only when the
effects of counting fluctuations are balanced against thenecessity for adequately describing the underlying signal.For the systolic parameters investigated here (EF, TES,PER, TPER) two harmonics are optimum over a widerange of noise levels (i.e., SNI values). For TACs withlarge fluctuations (e.g., single-beat TACs) a large source
of error is introduced by fitting with cither fewer or morethan two harmonics. With TACs containing more totalcounts (i.e., larger SNI values), increasing the numberof harmonics above two changes the total error onlynegligibly. Diastolic parameters require from two to sixharmonics for optimum Fourier fitting, depending on thenoise and signal content of the TAC.
REFERENCES
/. BRIANDET PA, GORIS ML, KRISS JP: Decomposition ofthe information content of first harmonic phase images. JNucÃMed 21:P(i\, 1982 (abst)
2. MILLER TR, SAMPATMKUMARAN KS, GOLDMAN KJ,etal: Quantitation of diastolic function in Fourier analysis ofcardiac studies. J NucÃMed 23:P62, 1982 (abst)
3. GEFFERS H, ADAM WE, BITTER F, et al: Data processingand functional imaging in radionuclide ventriculography. InProceedings of the Fifth International Conference on Information Processing in Medical Imaging, Brill AB, Price RR,McClain WJ, Landay MW, eds. Oak Ridge, NationalTechnical Information Service, (ORNL/BCTIC-2), 1977
4. BOSSUYT A, DECONINCK F, LEPOUDRI-: R, et al: Thetemporal Fourier transform applied to functional isotopieimaging. In Information Processing in Medical Imaging, vol.88, /nw/w:397-407, Paris, 1979, 397-407
5. BACHARACH SL, GREEN MV, BORER JS, et al: ECG-gated scintillation probe measurement of left ventricularfunction. J NucÃMed 18:1176-1183, 1977
6. BACHARACHSL, GREEN MV: Data-processing in nuclearcardiology: Measurement of ventricular function. IEEE Trans/Vue 5c; NS-29:1343-1354, 1982
7. FISCHER P, KNOPPR, BREUEL HP, et al: Zuramwendungder harmonischen Analyse bei der Funktionsszintigraphie desHerzens. NucÃMed 18:167, 1979
Volume 24, Number 12 1183

BACHARACH, GREEN, VITALE, WHITE, DOUGLAS, BONOW, AND LARSON
8. SPILLER P: Quantitative Laevokardiographie, Urban and rate requirements for recording time activity curves by ra-Schwarzberg. Munich, 1978 dionuclide angiocardiography. In Nuclear Cardiology: Se-
9. DOUGLASMA, BAILEY JJ, VAN RIJK PP,et al: Analysis lected Computer Aspects. New York, Society Nuclearof regional function in radionuclide ventriculography: Phys- Medicine, pp 75-83, 1979iological signal, scintillation noise and regional size. Com- //. VERBAJ, BORNSTEINI: The application of three-dimen-puters in cardiology, 1982. IEEE:in press sional Fourier filtering techniques to nuclear cardiac studies.
10. HAMILTON GW, WILLIAMS DL.CALDWELLJH: Frame J NucÃMed 20:658, 1979(abst)
Mideastern ChapterSociety of Nuclear Medicine
14th Annual MeetingApril 12-14, 1984 Sheraton Inn and Conference Center Fredericksburg, Virginia
Announcement and Call for Abstracts
The Scientific Program Committee of the Mideastern Chapter of the Society of Nuclear Medicine solicits the submissionof abstracts from members and nonmembers of the Society of Nuclear Medicine for the 14th Annual Meeting to be heldApril 12-14,1984 in Fredericksburg, Virginia. The program will include submitted papers, invited speakers, teaching sessions,
and exhibits.
Abstracts should not exceed 300 words and should contain a statement of purpose, the method used, results, and conclusions. The name of the author presenting the paper must be underlined.
Original abstracts and four copies should be sent to:
Andrew Keenan, MDDept. of Nuclear Medicine
Clinical Center, N.I.H.9000 Rockville Pike
Bethesda, Maryland 20205Tel: (301)496-5675
The program will be approved for credit toward the AMA Physician's Recognition Award under Continuing Medical Education
Category 1 through the Society of Nuclear Medicine.
For further information concerning the program, please write or telephone Dr. Keenan, Program Chairman, (301)496-5675.
Abstracts must be received by January 16, 1984.
Announcement of Berson-Yalow AwardThe Society of Nuclear Medicine invites abstracts for consideration for the Sixth Annual Berson-Yalow Award. Work will
be judged on originality and contribution to the fields of basic or clinical radioassay. The abstract will be presented atthe 31st Annual Meeting of the Society of Nuclear Medicine in Los Angeles, CA, June 5-8, 1984, and a suitably engraved
plaque will be awarded to the authors by the Education and Research Foundation of the Society of Nuclear Medicine.
The abstract should be submitted on the official abstract form with a letter requesting consideration for the award.
Deadline for receipt of manuscripts: Thursday, January 12, 1984.
The abstract form may be obtained from the November 1983 issue of the JNM or by calling or writing:
Society of Nuclear MedicineAttn: Abstracts
475 Park Avenue SouthNew York, NY 10016
(212)889-0717
l 184 THE JOURNAL OF NUCLEAR MEDICINE


