Embed Size (px)
Citation preview
Nanoscale
PAPER
aUniversite Paris 13, Sorbonne Paris Cite, La
avenue M. Cachin, 93017 Bobigny, France.
Fax: +33 1 41 08 85 28bDepartment of Nuclear Medecine, Avicenne
Paris Cite, 74 avenue M. Cachin, 93017 BobcINSERM, U698, 46 rue Henri Huchard, 758dUniversite Paris Descartes, Sorbonne Paris
8638), 4 avenue de l'observatoire, 75240 Pa
† Electronic supplementary informationdistribution of gFe2O3@CA nanoplatformnanoparticle, dye R123, NH2–PEG–CObiological stability, SPR analysis – theophase binding assay – determinat10.1039/c3nr03763k
Cite this: Nanoscale, 2013, 5, 11478
Received 21st July 2013Accepted 25th September 2013
DOI: 10.1039/c3nr03763k
www.rsc.org/nanoscale
11478 | Nanoscale, 2013, 5, 11478–1
Optimized multimodal nanoplatforms for targetingavb3 integrins†
Julie Bolley,a Yoann Lalatonne,ab Oualid Haddad,c Didier Letourneur,c
Michael Soussan,b Joelle Perard-Viretd and Laurence Motte*a
Magnetic Resonance Imaging (MRI) using contrast agents is a very powerful technique for diagnosis in
clinical medicine and biomedical research. The synthesis of ultrasmall superparamagnetic iron oxide
(USPIO) nanoparticles targeting avb3 integrins and acting as new MRI contrast agents seems to be a
promising way for cancer diagnosis. Indeed, it is well established that avb3 integrin plays a key role in
tumor angiogenesis acting like a receptor for the extracellular matrix proteins like vitronectin,
fibronectin through the arginine-glycine-aspartic acid (RGD) sequence. Up-regulation of avb3 has been
found to be associated with a wide range of cancers, making it a broad-spectrum tumor-marker. In this
study, USPIO nanocrystals were synthesized and surface passivated with caffeic acid. The large number
of the carboxylic acid functions at the outer surface of the nanoplatforms was used for the covalent
coupling of Rhodamine123, polyethylene glycol (PEG) and cyclic RGD. Soluble carbodiimide (EDC) and
N-hydroxysuccinimide (NHS) were used to crosslink carboxylic acid with the amino group of the ligands.
We examined the design of the nanoplatforms with each individual entity and then the combination of
two and three of them. Several methods were used to characterize the nanoparticle surface
functionalization and the magnetic properties of these contrast agents were studied using a 1.5 T
clinical MRI scanner. The affinity towards integrins was evidenced by surface plasmon resonance and
solid-phase receptor-binding assay.
Introduction
Targeted superparamagnetic iron oxide nanoparticles1 (SPIONs)are an exciting class of materials that are undergoing clinicaldevelopment as diagnostic,2,3 molecular imaging probes4 andtherapeutic delivery vehicles.5 The use of these nanomaterials inbiomedicine requires the ability to nely tune the surfacefunctionality to provide the selective or specic recognitionrequired for bio sensing.
Active targeting methods generally involve covalentlyattaching a targeting ligand to the surface of a biocompatible
boratoire CSPBAT, CNRS (UMR 7244), 74
E-mail: [email protected];
Hospital, Universite Paris 13, Sorbonne
igny, France
77 Paris Cedex 18, France
Cite, Faculte de Pharmacie, CNRS (UMR
ris cedex 06, France
(ESI) available: TEM image and sizes, determination of CA number per
OH and cRGD derivative coupling,retical analyte binding capacity, solidion of echistatin Kd. See DOI:
1489
coating.6,7 This facilitates for instance the active targeting of acancer cell biomarker and allows SPIONs to accumulate in thecancer cells. The result is a better contrast between the tumorand healthy tissues on a MR image. In addition, multivalentinteractions between the nanoparticles and their targets canincrease the affinity of target binding (avidity).8
Integrin avb3 are cell adhesion molecules known to beinvolved in multiple steps of cancer angiogenesis, in cancer cellproliferation and metastatic diffusion, in angiogenesis inischemic tissues, in atherosclerotic damage and in vascularrestenosis, as well as in osteoporosis.9,10 The high expression ofintegrin avb3 during tumor growth, invasion and metastasismakes it an interesting molecular target for the development ofavb3 targeted therapeutic drugs and molecular imaging probes.It is also highly expressed by several solid tumors such asglioblastomas, melanomas, and ovarian, breast, and prostatecancers, where it is involved in processes governing metas-tasis.11,12 Monoclonal antibodies, cyclic RGD (Arg-Gly-Asp)peptides and peptidomimetic antagonists have been shown fortheir potential as therapeutic pharmaceuticals, inhibitingendothelium-specic integrin survival signaling.13,14 RGD hasbeen recognized as the minimal integrin sequence for thepreferential binding to avb3 integrin. The cyclization iscommonly employed to improve the binding properties of RGDpeptides, conferring rigidity to the structure and preventing
This journal is ª The Royal Society of Chemistry 2013

Paper Nanoscale
chemical degradation. cRGDfK and cRGDyK with lysine andtyrosine residues respectively can be used for further chemicalconjugation reactions.9 It has also been shown that the bindingof multivalent cyclic RGD peptides using dendrimers,15–17
polymers,18 liposomes,19 and nanoparticles20 as substratesenhances the integrin avb3 affinity, inducing better targetingcapability and higher cellular uptake through the integrindependant endocytosis. Thus, by increasing the peptide multi-plicity, they signicantly enhance the avidity of the multipleligands for the avb3 integrin with a trend that is frequentlyproportional to the number of RGD moieties.20,21
One important challenge for nanomedicine is the develop-ment of targeted multimodal medical imaging that could beused for MRI, for quantication of the integrin avb3 expressionlevel before and during the anti-angiogenic therapy or in thecase of surgical removal of the tumour, capable of achievinghigh specicity and sensitivity by in vivo IR uorescent imagingfor guided surgery. To achieve these goals, particle surfaceengineering remains a key step for the bioactive nanoparticledesign.
In this article, the development of functionalized iron oxidenanoparticles that orchestrate the dual imaging with magneticresonance, uorescence imaging and avb3 targeting throughmultivalent cRGDfK or cRGDfK–PEG2–NH2 linked to iron oxidenanoparticles, is reported. We focused on several characteriza-tion methods in order to qualitatively or quantitatively charac-terize the nanoparticle surface functionalization. The effect ofthe multivalency for the interactions between the cRGD ligandand the target avb3 receptor is studied by means of a SurfacePlasmon Resonance (SPR) and a solid-phase receptor-bindingassay. The inuence of PEG linker and the contribution of thenumber of graed cRGD per nanoparticle are discussed.
For this purpose, iron oxide nanoparticles (NPs) were surfacefunctionalized with caffeic acid (CA), a catechol derivative.Caffeic acid is one of the principal sources of biomass.22 Thisnanoplatform was rst designed with each individual entity:uorescent Rhodamine, PEG chain and cyclic cRGD with orwithout PEG chain. In a second step the combination of variousfunctionalities onto the nanoparticle surface was performed.
To our knowledge, multimodal nanoplatforms elaboratedwith caffeic acid have never been reported.
Rhodamine was used as the uorescent moiety for conju-gation considering low cost and remarkable stability of theoptical properties under pH modication compared tocommercially near infrared imaging agents.
Experimental sectionChemical and apparatus
The dye Rhodamine123 (R123), cRGD derivatives, cyclo(Arg-Gly-Asp-d-Phe-Lys) (cRGDfK) and cyclo(Arg-Gly-Asp-d-Phe-Lys(PEG–PEG)) (cRGDfK–(PEG)2–NH2), and integrin avb3 were purchasedfrom Acros, Peptides International and Merck respectively.Carboxyl-(tetraethyleneglycol)ethylamine (H2N–(PEG)4–COOH)and uoraldehyde OPA reagent solution were purchased fromThermoscientic. Fluoraldehyde OPA reagent solution contains0.8 mg mL�1 of o-phthalaldehyde (OPA), pH 10. Other
This journal is ª The Royal Society of Chemistry 2013
commercially available reagents for particles' synthesis andanalyses were purchased from Sigma-Aldrich. For affinitymeasurements, the sensor chip CM5 was purchased from GEHealthcare.
The chemical coupling under microwaves was performedusing a Monowave 300 (Anton Paar).
The infrared (IR) spectra of the caffeic acid (CA) and ofthe nanoplatforms gFe2O3@CA, gFe2O3@CA-R123, andgFe2O3@CA–PEG–COOH were recorded as thin lms on KBrpellets on a thermo scientic Nicolet 380 FTIR and are reportedin frequency of absorption (cm�1). The infrared spectra ofcRGDfK before and aer microwaves were recorded as a liquidsample using a Tensor 27 spectrophotometer (Bruker, Karls-ruhe, Germany) at a 1 cm�1 resolution.
UV-visible spectra were recorded on a Varian Cary 50 ScanUV-Visible spectrophotometer. The size and the zeta potentialof the nanocomplex were determined by dynamic laser lightscattering (DLS) on a Nano-ZS (Red Badge) ZEN 3600 device(Malvern Instruments, Malvern, UK).
TEM images were obtained using a FEI CM10 Microscope(Philips) and samples were prepared by depositing a drop ofnanoparticle suspension on carbon coated copper grids placedon a lter paper. The median diameter was deduced from TEMdata measurements, simulating the diameter distribution witha lognormal function.
The magnetic behavior of the as-synthesized nanoparticleswas characterized at room temperature using a vibratingsample magnetometer, VSM (Quantum Design, Versalab) and aMIAplex� reader (Magnisense SA). The VSM measures themagnetization by cycling the applied eld from �2300 to+2300 kA m�1 for two times with a step rate of 8 kA s�1.Measurements were performed on powder samples and thetemperature was set to 298 K (25 �C) to study the behavior of theparticles at room temperature. The Miaplex reader is a minia-turized chip detector system, measuring a signal correspondingto the second derivative of the magnetization around zeroeld.23 With this sensor, measurements are performed onmicroliter sample volumes, in a handled portable device,without liquid helium cooling to operate. Moreover, MIAplex�signal measurement (�30 s) is about 102 times shorter than theVSM (�1 h) and the sample quantity is 103 times lower (1 mg).
The MRI analyses were performed using a 1.5 T MRI scanner(Philips intera 1.5T/Philips healthcare) at room temperature forvarious iron concentrations. The longitudinal nuclear relaxa-tion times T1 were obtained from an inversion recoverysequence with a time repetition (TR) of 2000 ms, a time echo(TE) of 16 ms and increasing time inversions (TIs) of 50, 100,200, 300, 450, 600, 750, 900, 1,100, 1500 and 1800 ms. Thetransverse nuclear relaxation times, T2, were measured fromaxial T2-weighted SE images obtained with a TR of 2000 ms andincreasing TEs of 20, 40, 60, and 80 ms.
The thermogravimetric analysis (TGA) curves were recordedusing a LabsSys evo TG-DTA-DSC 16000 device from SetaramInstrumentation.
The uorescence measurements were performed with a SpexFluoroMax spectrouorometer (HORIBA Jobin–Yvon, France)equipped with a Hamamatsu 928 photomultiplier.
Nanoscale, 2013, 5, 11478–11489 | 11479

Nanoscale Paper
Surface plasmon resonance measurements were carried outusing a BIAcore X100 (GE Healthcare) with a sensor chip CM5(GE Healthcare).
The 125I echistatin radioactivity was counted in a gammacounter Wizard 1470 (Perkin Elmer).
Superparamagnetic nanoparticle preparation
Synthesis of gFe2O3 nanocrystals. The maghemite NPs,gFe2O3 nanocrystals24,25 (average diameter 9 nm and sizedistribution s ¼ 0.2, see ESI Fig. S1†) were synthesizedaccording to the following procedure. Dimethylamine((CH3)2NH) was added to an aqueous solution of ferrousdodecyl sulfate (Fe(DS)2). The nal concentrations aer thereactants mixed were 2.7 � 10�2 mol L�1 and 2.8 � 10�1 molL�1 for Fe(DS)2 and dimethylamine, respectively. The solutionwas then stirred vigorously for 2 h at 28.5 �C. 2 mL of HCl (1 M)were then added, in order to reach the isoelectric point (aroundpH 7), inducing nanoparticle precipitation. The precipitate wasisolated from the supernatant using magnetic separation. Aer10 washings at neutral pH, the nanoparticles were thendispersed at pH 2 in distilled water. At this stage uncoatedg-Fe2O3 nanocrystals were produced.
Synthesis of gFe2O3@CA nanocrystals. Aer synthesis, thenanoparticle surface was directly functionalized with caffeicacid. 10 mL of an aqueous caffeic acid solution (10 mg mL�1) atpH 10 was directly mixed with 10 mL of bare g-Fe2O3 particlesuspension (6 mg mL�1) at pH 10. Aer mixing for two hours atroom temperature, the functionalized magnetic particles werewashed 5 times using magnetic separation at pH 2. Then, themagnetic gFe2O3@CA particles were dispersed in distilled waterand adjusted to pH 7. The average number of molecules of CAper nanocrystal was measured by thermogravimetric analysis.
Coupling onto gFe2O3@CA nanocrystals and characteriza-tion. In the following procedures, the coupling of the molecule(R123 dye, H2N–(PEG)4–COOH or cRGD derivatives) onto thecaffeic acid functionalized maghemite was performed in waterin a two-step procedure (activation and conjugation) at roomtemperature or assisted by microwaves (see ESI† for thecomparison of coupling efficiency with and without micro-waves). Firstly, the carboxylic acid functions at the outer surfaceof the nanocrystals were activated using 1-ethyl-3-(3-dimethy-laminopropyl) carbodiimide (EDC, nEDC ¼ 5nCOOH) and N-hydroxysuccinimide (NHS, nNHS ¼ 5nCOOH) at pH 4. The secondstep was the linkage of the amine function of the interestmolecule with the activated carboxylic acid functions on thenanocrystals. The pH of the gFe2O3@CA ferrouid was adjustedto 9 with N,N-diisopropylethylamine. The ligand was dissolvedin water at pH 9 and then added to the ferrouid.
The procedure was carried out with various molar ratios R ¼nCOOH/nNH2
. The modied particles were isolated with a magnetat pH 2 and washed several times with deionized water. Theparticles were re-dispersed in water at physiological pH forvarious physicochemical characterizations.
The coupling efficiency of the dye R123 conjugation wasinvestigated qualitatively using various measurement methods:infrared spectroscopy, dynamic light scattering, derivative
11480 | Nanoscale, 2013, 5, 11478–11489
magnetization (Miaplex�), and quantitatively using uores-cence spectroscopy. The number of dyes per nanoparticle wasdetermined aer molecule desorption with an alkaline medium(pH 12 for 24 h) using a previously described procedure.26
The magnetic particles were then separated from the superna-tant by magnetic decantation. The pH of the supernatant wasadjusted to physiological pH and the concentration of R123 wasdeduced from uorescence measurements (see ESI Fig. S4†).
The average number of molecules of H2N–(PEG)4–COOH pernanocrystal was measured by several methods: infrared spec-troscopy and OPA method. For the infrared spectroscopymethod, infrared spectra in KBr pellets of various proportionsof H2N–(PEG)4–COOH mixed with a constant amount ofgFe2O3@CA were recorded. Then, the normalized 1110 cm�1
band was used for the establishment of the calibration curveand the average number of H2N–(PEG)4–COOH per nanoparticlewas deduced from this curve. For the OPA method, 50 mL of thesample was diluted in 50 mL of NaOH 2 N and le overnight at60 �C. 1 mL of OPA reagent was added to the mixture anduorescence measurement was recorded. The average numberof H2N–(PEG)4–COOH per nanoparticle was deduced from acalibration curve (see ESI Fig. S6†).
The average number of cRGD derivatives was measured bythe OPA method aer calibration curve establishment (see ESIFig. S10†).
MRI measurements. The 1H NMR relaxometric character-ization was performed by measuring the longitudinal relaxationtimes T1 and the transverse nuclear relaxation times T2, on a1.5 T MRI scanner. The measurements were performed at roomtemperature for various iron concentrations between 0.061 and0.25 mM. The efficiency of MRI contrast agents was determinedby measuring the relaxivity r1 dened as r1 ¼ (1/T1)meas/C andthe relaxivity r2 dened as r2 ¼ (1/T2)meas/C, where (1/T1)meas or(1/T2)meas was the value measured with the sample at concen-tration C of iron.
Biological stability. The biological stability of gFe2O3@CA-R123 and gFe2O3@CA-PEG-R123 was evaluated by uorescencespectroscopy using a previously described method.27 Briey, theparticles were dispersed in 10% or 50% of FBS (Fetal BovineSerum) at an iron concentration of 0.1 mM. The uorescenceintensity was recorded as a function of time.
avb3 targeting efficiency by surface plasmon resonance.Surface plasmon resonance measurements were used to inves-tigate the efficiency of the interaction between the integrin avb3and the cRGD derivatives coupled to gFe2O3@CA. The nano-particles on the surface of carboxymethyldextran (CMD)-coatedgold were immobilized by electrostatic interactions. Briey, theow channel of BIAcore was equilibrated with Hepes buffer. ThecRGD derivative nanoparticles were immobilized on the secondchannel of the sensor chip using a ow rate of 5 mL min�1 andthe gFe2O3@CA used as a reference was immobilized on therst channel. Integrin avb3 solutions were injected into theBIAcore ow channels at a ow rate of 30 mL min�1 and allowedto interact with the immobilized receptor. The specic inter-action with the cRGD derivatives shied the wavelength atwhich the surface plasmon resonance occurred. This shi wasregistered as response units (RU).
This journal is ª The Royal Society of Chemistry 2013

Paper Nanoscale
avb3 targeting efficiency by solid phase receptor bindingassay. The receptor binding assay was performed as describedpreviously.28,29 avb3 was diluted at 500 ng mL�1 in coating buffer(20 mM tris, pH 7.4, 150 mM NaCl, 2 mM CaCl2, 1 mM MgCl2,1 mM MnCl2) and an aliquot of 100 mL per well was added to a96-well microtiter plate (Microlite 2+, Thermo Scientic) andincubated overnight at 4 �C. The plate was washed once withblocking/binding buffer (20 mM tris, pH 7.4, 150 mM NaCl,2 mM CaCl2, 1 mM MgCl2, 1 mM MnCl2, 1% bovine serumalbumin) and incubated for an additional 2 h at room temper-ature. The plate was rinsed twice with the same buffer andincubated with the radiolabeled ligand at the indicatedconcentrations for 3 h at room temperature. For co-incubations,an unlabeled competitor was included at the concentrationsdescribed. Aer three additional washes with blocking/bindingbuffer, counts were obtained with boiling in 2 N NaOH andsubjected to g-counting. Non-specic binding of the ligand tothe receptor was determined with molar excess (200-fold) of theunlabeled ligand. Each data point was a result of the average oftriplicate wells.
Results and discussiongFe2O3@CA nanoplatform
Infrared spectroscopy is a very useful and direct technique forstudying the nature of surface complexation functions. Cate-chol and carboxylic groups are well known as highly chelatingagents for the metal oxide surface. The CA coating on gFe2O3
NPs caused major changes in the spectra compared to free CA(Fig. 1).
The infrared spectra of free CA (red curve, Fig. 1) is charac-terized by different vibration bands (i) the alkene C]Cstretching vibration band at 1639 cm�1, (ii) the aromatic ringC]C stretching vibration bands at 1602 and 1522 cm�1, (iii) thestretching vibrations of the phenolic group C–OH at 1417, 1376and 978 cm�1 and bending vibrations of the phenolic groupC–OH at 1280, 1522 and 1117 cm�1 and (iv) the stretching and/or bending vibration of CO or OH in COOH at 1293, 1208 and1163 cm�1.30,31 Upon adsorption of CA onto gFe2O3 NPs (greencurve, Fig. 1) the difference between infrared spectra of free andadsorbed CA appears, indicating surface complexation withcatechol bound to the oxide surface via two adjacent phenolic
Fig. 1 (A) IR spectra of CA (red) and gFe2O3@CA (green); (B) coordination modeof iron surface NPs with a catechol complex.
This journal is ª The Royal Society of Chemistry 2013
groups. The most notable modication on an IR spectrum ofgFe2O3@CA, in addition to the appearance of a strong Fe–Ostretching vibration band at 600 cm�1 (inset Fig. 1), is thecomplete disappearance of the bands at 978 cm�1, the decreaseof the intensity band at 1417 cm�1, while the band at 1280 cm�1
shi to 1267 cm�1. These bands, assigned to stretching andbending vibrations of phenolic OH groups, are likely thoseparticipating in the nanoparticle surface complexation withcatechol bound to the oxide surface in a bidentate form(Fig. 1B). The binding of CA to iron oxide even affects thestretching of the aromatic ring (bands > 1400 cm�1). The mostnoticeable is the appearance of the strong characteristic band ofa conjugated aromatic ketone (�1605 cm�1),32 which conrmsthe bidentate bonding of the catechol to the surface of thenanoparticles.
Similar results were obtained on various nanocrystallinemetal oxides such as TiO2, Fe2O3, Fe3O4 and ZrO2, surfacefunctionalized with various enediol ligands33–35 and with 5-hydroxy-5,5-bis(phosphono)pentanoic acid onto gFe2O3 NPs:24
the interaction with the surface takes place through thehydroxymethylene bisphosphonate group, and the pendantcarboxylate is free and exposed to solution.
Hence, adding CA results in the replacement of nanoparticlesurface OH groups and the coordination of surface Fe atomswith both OH groups of catechol.
The average number of CA molecules was deduced usingthermogravimetric analysis and was found to be of 1100 pernanoparticle which corresponds to a surface area of 23.1 A2
occupied by each CA ligand molecule (see ESI, Fig. S2†). Thissurface area is comparable to the results obtained on surfacemodication of anatase particles with dopamine ligands.36
The gFe2O3@CA NPs formed highly stable ferrouid in alarge range of pH, from pH 4 to pH 11 (Fig. 2A). At physiologicalpH, the hydrodynamic diameter and zeta potential surface arefound equal to 12.5 nm and �45 � 5 mV respectively. Consid-ering the mean crystalline core (9 nm in diameter) and a layer ofabout 0.9 nm for the coating of CA molecules,37 this suggestedvery low aggregation.
Concerning magnetic measurements, the magnetizationcurve (Fig. 2B) and the second derivative of magnetization (insetFig. 2B, measured with MIAplex� detector) are characteristic ofsuperparamagnetic behavior. It has to be noticed that 11months aer synthesis no decomposition of the iron oxide NPsand consequently alteration of the magnetic properties hasbeen observed (see ESI Fig. S3†). The degradation of iron oxidenanoparticles has been reported for other catechol derivativessuch as dopamine.32,38 Caffeic acid can be compared to nitro-dopamine, another catechol derivative, which has irreversiblehigh affinity binding under physiologic conditions.39 Indeed theterminal conjugated COOH group from caffeic acid is a highelectron withdrawing group as the NO2 group from nitro-dopamine.
Once these nanoparticles gFe2O3@CA characterized, thecarboxylic acid functions at the outer surface were then used forthe covalent coupling of different ligands (R123, H2N–(PEG)4–COOH or cRGD derivatives) using carbodiimide chemistry witha microwave assisted procedure. We recently showed that in the
Nanoscale, 2013, 5, 11478–11489 | 11481

Fig. 3 (A) IR spectra of gFe2O3@CA (green curve), free R123 (pink curve), andgFe2O3@CA-R123 R ¼ 2 (blue curve) and R ¼ 20 (black curve); (B) absorptionspectra of free R123 (pink curve C ¼ 3 � 10�6 M), gFe2O3@CA (green curve CFe ¼1.2� 10�4 M) and gFe2O3@CA-R123 R¼ 20 (black curve CFe¼ 2.9� 10�4 M); (C)emission fluorescence spectra (lexc ¼ 500 nm) of gFe2O3@CA-R123 CFe ¼ 2 �10�4 M, R ¼ 2 (blue) and R ¼ 20 (black) before (blue) and after R123 desorption(pink) (R ¼ nR123/nCOOH).
Fig. 2 (A) Hydrodynamic diameter (blue) and zeta potential (red) ofgFe2O3@CA; (B) the gFe2O3@CA magnetization curve and the second derivativeof magnetization in the inset.
Nanoscale Paper
case of amide bond formation, the functionalization yield couldbe increased using micro-wave energy.26 As described above, theultimate goal is to obtain a multimodal nanoplatform. Ourapproach was to study each coupling and then various combi-nations to optimize the nanosystem.
Coupling efficiency study on a gFe2O3@CA nanoplatform
Dye R123 coupling: gFe2O3@CA-R123. For the dye R123coupling onto a gFe2O3@CA nanoplatform, microwave condi-tions were used. High coverage of the surface of the NPs by R123was obtained by this method26 as demonstrated by infrared,UV-Visible and uorescence spectroscopies (see ESI Table S1†for comparison of conventional versus microwave covalentcoupling). The microwave treatment conditions have beendened to tmax ¼ 3 min and Tmax ¼ 150 �C. Several molar ratiosfor R123 versus COOH functions were tested (R ¼ nR123/nCOOH).
Fig. 3A shows the infrared spectra of the nanoplatformgFe2O3@CA (green curve), R123 (pink curve) and aer couplingcorresponding to R ¼ 2 (blue curve) and R ¼ 20 (black curve).
For a low ratio (R ¼ 2), the infrared spectrum (blue curve) isvery similar to the native nanoplatform gFe2O3@CA (greencurve) whereas increasing the molar ratio to R¼ 20 (black curve)leads to large changes all over the spectrum range suggestingsuccessful tailoring of the nanoparticle surface with R123(Fig. 3A). The characteristic vibration bands of the functional-ized nanoparticles Fe–O (600 cm�1), C–O (1267 cm�1), as well asR123 (between 1000 and 1800 cm�1) appeared on the spectrum,indicating efficient binding of R123 onto the nanoparticlesurface. A new band appears around 1634 cm�1 arising from theamide bonding between R123 and gFe2O3@CA nanocrystalswhich shows the successful derivatization of carboxylic acid atthe outer surface with the amine group of R123.
Similar to infrared characterization, the efficiency of R123coupling on a nanoplatform is only detectable for a ratio R ¼ 20
11482 | Nanoscale, 2013, 5, 11478–11489
with UV-Visible spectroscopy (Fig. 3B). Under this condition, asmall bump around 520 nm appears due to graing of R123 ontothe NP surface, which is red-shied compared to free R123(500 nm). Successful graing is highlighted by emission uores-cence spectroscopy. The uorescence emission spectrum of thegFe2O3@CA-R123 gave amaximumwavelength at 518 nm, slightlyblue-shied compared to free R123 (around 4 nm), Fig. 3C.
The uorescence emission intensity increases with the ratioR, due to the large number of R123 graed onto the NP surface.It is well known that quenching occurs due to both an energytransfer process between the iron oxide and the uorophoreand intermolecular quenching.25,40–42 The average number ofrhodamine per nanoparticle, quenching factor and yieldcoupling are reported in Table 1. These values are deduced aera 24 h treatment of gFe2O3@CA-R123 ferrouid in an alkalinemedium. Under this condition the coating is removed from thesurface of the nanoparticles and the supernatant is titrated byuorescence.25 Hence increasing the ratio R increases theaverage number of R123 per nanoparticle and the emission isdecreased by a factor 5 (Table 1).
Dynamic light scattering also revealed that the efficiency ofcoupling is correlated with the excess of R123 (ratio R).Compared to gFe2O3@CA nanocrystals, the synthesized uo-rescent particles with a constant zeta potential displayed anincrease of the mean hydrodynamic diameter (see Table 1).Increasing the number of R123 molecules per nanoparticlefavours steric hindrance as well as p–p stacking between R123of neighboring nanoparticles and induces aggregation states.Magnetic measurements show that superparamagneticbehavior is maintained for these R ratios (see ESI, Fig. S5†).
H2N–(PEG)4–COOH coupling: gFe2O3@CA–PEG–COOH. Inorder to covalently link PEG chains on the gFe2O3@CA nano-platform, the approach, described for dye coupling, was appliedusing H2N–(PEG)4–COOH. Several stoichiometric ratios weretested (R ¼ nPEG/nCOOH) under microwaves.
This journal is ª The Royal Society of Chemistry 2013
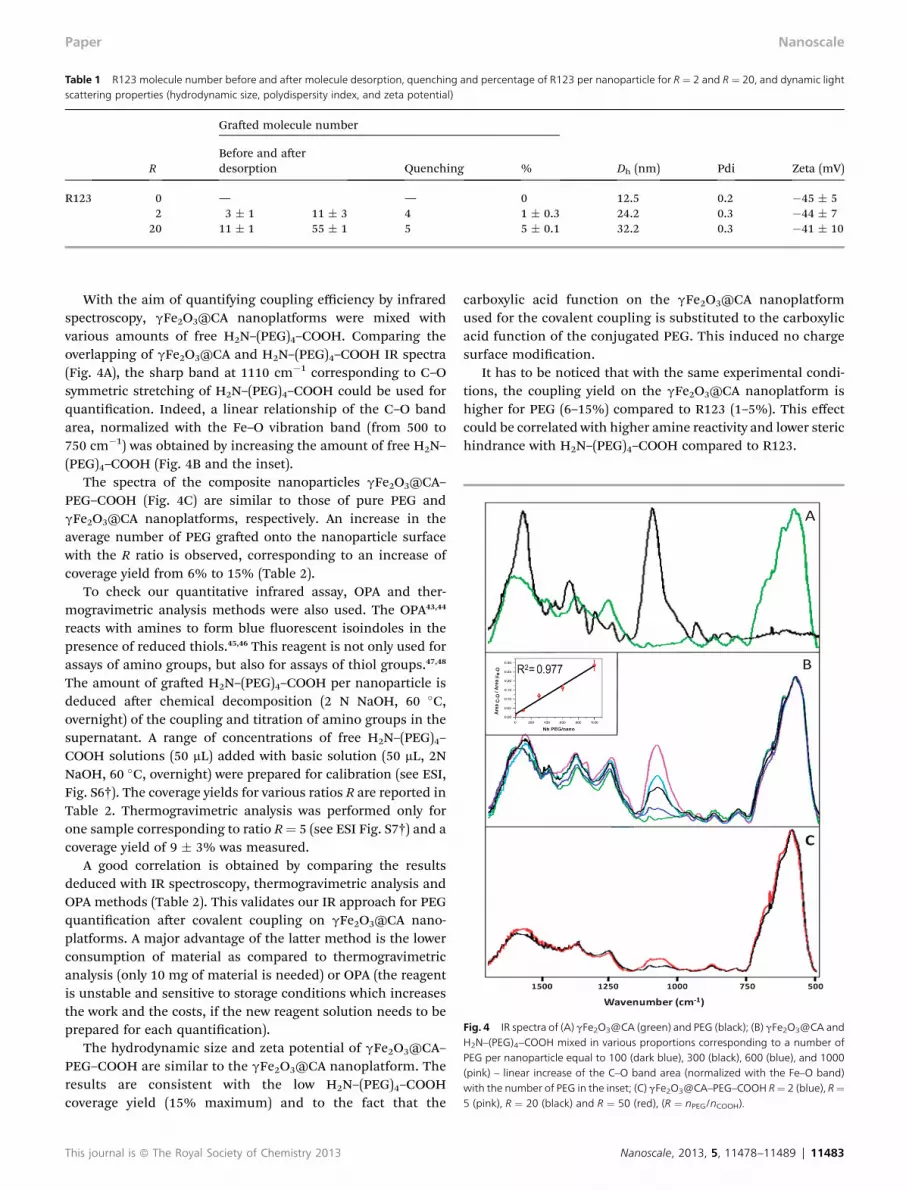
Table 1 R123 molecule number before and after molecule desorption, quenching and percentage of R123 per nanoparticle for R ¼ 2 and R ¼ 20, and dynamic lightscattering properties (hydrodynamic size, polydispersity index, and zeta potential)
R
Graed molecule number
Dh (nm) Pdi Zeta (mV)Before and aerdesorption Quenching %
R123 0 — — 0 12.5 0.2 �45 � 52 3 � 1 11 � 3 4 1 � 0.3 24.2 0.3 �44 � 7
20 11 � 1 55 � 1 5 5 � 0.1 32.2 0.3 �41 � 10
Fig. 4 IR spectra of (A) gFe2O3@CA (green) and PEG (black); (B) gFe2O3@CA andH2N–(PEG)4–COOH mixed in various proportions corresponding to a number ofPEG per nanoparticle equal to 100 (dark blue), 300 (black), 600 (blue), and 1000(pink) – linear increase of the C–O band area (normalized with the Fe–O band)with the number of PEG in the inset; (C) gFe2O3@CA–PEG–COOH R¼ 2 (blue), R¼5 (pink), R ¼ 20 (black) and R ¼ 50 (red), (R ¼ nPEG/nCOOH).
Paper Nanoscale
With the aim of quantifying coupling efficiency by infraredspectroscopy, gFe2O3@CA nanoplatforms were mixed withvarious amounts of free H2N–(PEG)4–COOH. Comparing theoverlapping of gFe2O3@CA and H2N–(PEG)4–COOH IR spectra(Fig. 4A), the sharp band at 1110 cm�1 corresponding to C–Osymmetric stretching of H2N–(PEG)4–COOH could be used forquantication. Indeed, a linear relationship of the C–O bandarea, normalized with the Fe–O vibration band (from 500 to750 cm�1) was obtained by increasing the amount of free H2N–(PEG)4–COOH (Fig. 4B and the inset).
The spectra of the composite nanoparticles gFe2O3@CA–PEG–COOH (Fig. 4C) are similar to those of pure PEG andgFe2O3@CA nanoplatforms, respectively. An increase in theaverage number of PEG graed onto the nanoparticle surfacewith the R ratio is observed, corresponding to an increase ofcoverage yield from 6% to 15% (Table 2).
To check our quantitative infrared assay, OPA and ther-mogravimetric analysis methods were also used. The OPA43,44
reacts with amines to form blue uorescent isoindoles in thepresence of reduced thiols.45,46 This reagent is not only used forassays of amino groups, but also for assays of thiol groups.47,48
The amount of graed H2N–(PEG)4–COOH per nanoparticle isdeduced aer chemical decomposition (2 N NaOH, 60 �C,overnight) of the coupling and titration of amino groups in thesupernatant. A range of concentrations of free H2N–(PEG)4–COOH solutions (50 mL) added with basic solution (50 mL, 2NNaOH, 60 �C, overnight) were prepared for calibration (see ESI,Fig. S6†). The coverage yields for various ratios R are reported inTable 2. Thermogravimetric analysis was performed only forone sample corresponding to ratio R¼ 5 (see ESI Fig. S7†) and acoverage yield of 9 � 3% was measured.
A good correlation is obtained by comparing the resultsdeduced with IR spectroscopy, thermogravimetric analysis andOPA methods (Table 2). This validates our IR approach for PEGquantication aer covalent coupling on gFe2O3@CA nano-platforms. A major advantage of the latter method is the lowerconsumption of material as compared to thermogravimetricanalysis (only 10 mg of material is needed) or OPA (the reagentis unstable and sensitive to storage conditions which increasesthe work and the costs, if the new reagent solution needs to beprepared for each quantication).
The hydrodynamic size and zeta potential of gFe2O3@CA–PEG–COOH are similar to the gFe2O3@CA nanoplatform. Theresults are consistent with the low H2N–(PEG)4–COOHcoverage yield (15% maximum) and to the fact that the
This journal is ª The Royal Society of Chemistry 2013
carboxylic acid function on the gFe2O3@CA nanoplatformused for the covalent coupling is substituted to the carboxylicacid function of the conjugated PEG. This induced no chargesurface modication.
It has to be noticed that with the same experimental condi-tions, the coupling yield on the gFe2O3@CA nanoplatform ishigher for PEG (6–15%) compared to R123 (1–5%). This effectcould be correlated with higher amine reactivity and lower sterichindrance with H2N–(PEG)4–COOH compared to R123.
Nanoscale, 2013, 5, 11478–11489 | 11483

Table 2 H2N–(PEG)4–COOH number and percentage per nanoparticle for various ratios (R ¼ nPEG/nCOOH) deduced from infrared spectroscopy and OPA reagentmethods, and dynamic light scattering properties (hydrodynamic size, polydispersity index, and zeta potential)
R
Graed molecule number
Dh (nm) Pdi Zeta (mV)IR % OPA %
PEG 2 68 � 7 6 � 1 88 � 13 8 � 1 11.8 0.3 �41 � 75 70 � 8 6 � 1 80 � 20 7 � 2 9.2 0.3 �41 � 7
20 140 � 15 13 � 1 120 � 6 11 � 1 17.7 0.3 �34 � 950 170 � 18 15 � 2 142 � 7 13 � 1 11.6 0.3 �47 � 7
Nanoscale Paper
cRGD derivative coupling: gFe2O3@CA-cRGD andgFe2O3@CA–(PEG–cRGD). The lysine residue (K) of c(RGDfK) orthe amine function of c(RGDfK)–PEG2–NH2 was used to cova-lently link cRGD derivatives on the gFe2O3@CA nanoplatform,under microwaves. The microwave treatment conditions havebeen set to tmax ¼ 3 min and Tmax ¼ 65 �C. Indeed, the structureand properties of biomolecules such as peptides or proteins arevery sensitive to time and temperature. The infrared spectra ofc(RGDfK) before and aer this microwave treatment show nomodication, suggesting the stability of the cyclic peptideunder microwaves (see ESI, Fig. S8†). The coupling procedureswere applied for various ratios (RcRGD ¼ ncRGD/nCOOH).Compared to the gFe2O3@CA nanoplatform, the infraredspectra aer cRGD derivative coupling show no evidence ofefficient conjugation (see ESI Fig. S9†). As highlighted with theOPA assay (below), this is due to the weak coverage yield. Theamount of cRGD ligand graed per nanoparticle was deducedusing the OPA method (Table 3).
As observed previously for dye and H2N–(PEG)4–COOHcoupling, the coupling enhancement increases with the ratio R.The coverage yield is lower using c(RGDfK) compared toc(RGDfK)–PEG2–NH2. The cRGDfK steric hindrance is reducedby the presence of PEG linkers.
DLS measurements (Table 3) indicate that for a samenumber of cRGD per nanoparticle the hydrodynamic size islargest for gFe2O3@CA–PEG–cRGD than gFe2O3@CA-cRGD inaccordance with the increase of coverage yield.
Finally, comparing H2N–(PEG)4–COOH and c(RGDfK)–PEG2–
NH2 coupling, for the same R value (R ¼ 2 and 20, Tables 2 and3), the coverage yield is similar.
Toward multimodal nanoplatform. To implement the func-tionalization of the gFe2O3@CA nanoplatform with R123, H2N–(PEG)4–COOH and cRGD derivatives, different moieties were
Table 3 c(RGDfK) and c(RGDfK)–PEG2–NH2 numbers and percentage per nanoparand dynamic light scattering properties (hydrodynamic size, polydispersity index, an
R
Graed molecule num
OPA
cRGD 0.2 25 � 22 43 � 4
20 59 � 9c(RGD)–PEG2–NH2 0.2 35 � 8
2 61 � 320 130 � 30
11484 | Nanoscale, 2013, 5, 11478–11489
sequentially introduced by successive carboxyl group activation.The cRGD peptide presenting carboxyl groups in the asparticacid side chain is introduced in the last step.
First, we studied the 2 step functionalization with R123and H2N–(PEG)4–COOH using gFe2O3@CA–PEG–COOH andgFe2O3@CA-R123 nanoplatforms respectively. The averagenumber of graed molecules is reported in Table 4. It canbe observed that the second step surface functionalizationinduces lower coverage efficiency as compared to the twonanoplatforms.
Moreover aer addition of H2N–(PEG)4–COOH (R ¼ 50) ontothe gFe2O3@CA-R123 nanoplatform, an increase of uores-cence quenching factor from 4 to 7 was observed (Table 5). Thesame quenching factor was obtained aer graing R123 (R ¼ 2)onto the gFe2O3@CA–PEG–COOH nanoplatform. DLSmeasurements performed before and aer the second stepsurface functionalization show an increase of hydrodynamicdiameter and decrease of zeta potential. This indicates thatsome aggregation occurs during the second step that couldexplain the increase of quenching factor due to intermolecularquenching.26 Considering R123 coupling on the gFe2O3@CA–PEG–COOH nanoplatform, the dye could be linked with COOHof CA (around 960) or PEG chains (142). In the latter case, adecrease of quenching factor due to the PEG linker spacer couldbe expected by decreasing the dye-NP surface interaction. Thissuggests that R123 coupling occurs with COOH of CA.
The coupling efficiency of c(RGDfK)–PEG2–NH2 (R ¼ 2) issimilar compared to the coupling on the gFe2O3@CA-R123nanoplatform (two step functionalization, 64 c(RGDfK)–PEG2–
NH2, Table 4) with the gFe2O3@CA nanoplatform (one stepfunctionalization, 61 c(RGDfK)–PEG2–NH2, Table 3). The samequantity of cRGDfK was calculated with the three step func-tionalization consisting in sequential addition of R123 (R ¼ 2),
ticle for various ratios (R ¼ ncRGD/nCOOH) deduced with the OPA reagent method,d zeta potential)
ber
Dh (nm) Pdi Zeta (mV)%
2 � 0.2 16 0.3 �44 � 124 � 0.4 18 0.2 �43 � 125 � 1 15 0.3 �44 � 83 � 1 22 0.3 �36 � 126 � 0.3 18 0.2 �39 � 7
12 � 3 30 0.3 �40 � 10
This journal is ª The Royal Society of Chemistry 2013
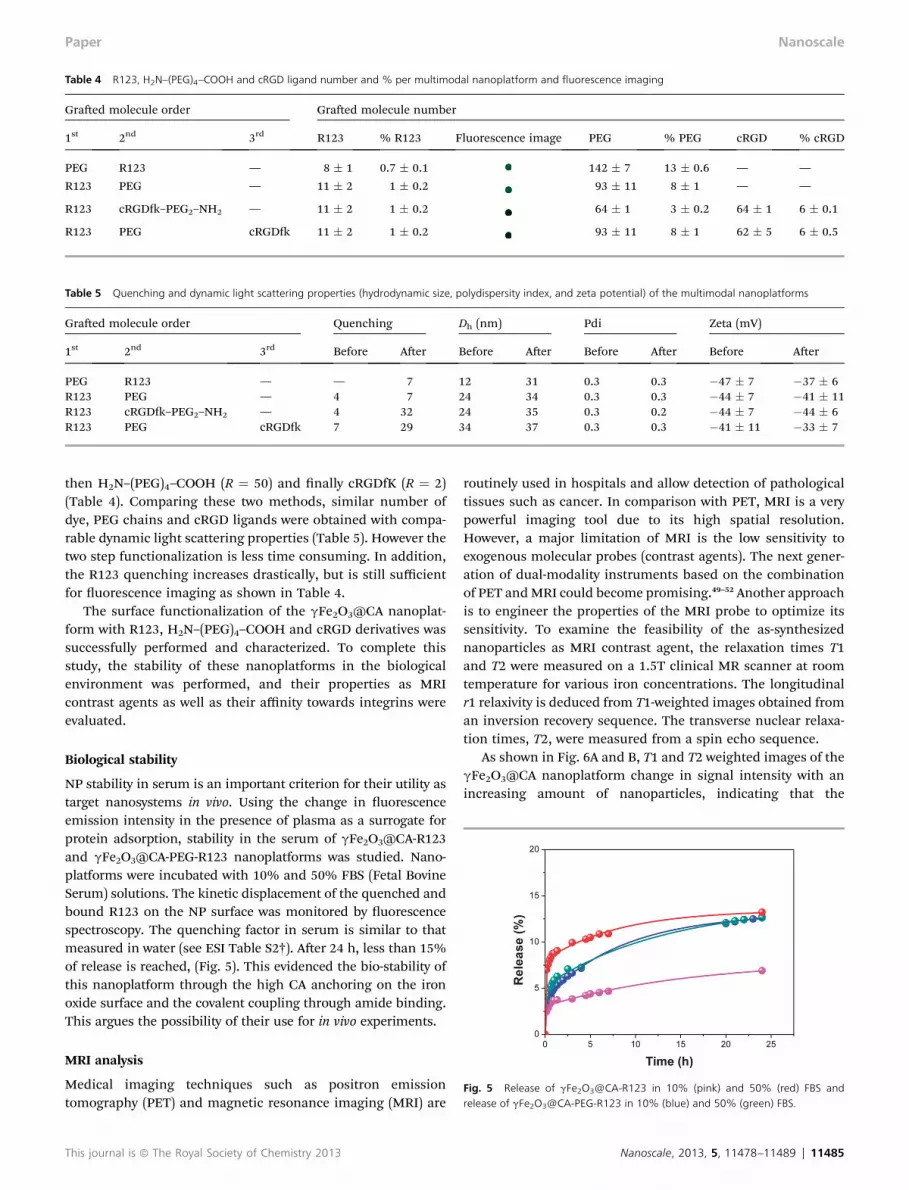
Table 4 R123, H2N–(PEG)4–COOH and cRGD ligand number and % per multimodal nanoplatform and fluorescence imaging
Graed molecule order Graed molecule number
1st 2nd 3rd R123 % R123 Fluorescence image PEG % PEG cRGD % cRGD
PEG R123 — 8 � 1 0.7 � 0.1 142 � 7 13 � 0.6 — —
R123 PEG — 11 � 2 1 � 0.2 93 � 11 8 � 1 — —
R123 cRGD–PEG2–NH2 — 11 � 2 1 � 0.2 64 � 1 3 � 0.2 64 � 1 6 � 0.1
R123 PEG cRGD 11 � 2 1 � 0.2 93 � 11 8 � 1 62 � 5 6 � 0.5
Table 5 Quenching and dynamic light scattering properties (hydrodynamic size, polydispersity index, and zeta potential) of the multimodal nanoplatforms
Graed molecule order Quenching Dh (nm) Pdi Zeta (mV)
1st 2nd 3rd Before Aer Before Aer Before Aer Before Aer
PEG R123 — — 7 12 31 0.3 0.3 �47 � 7 �37 � 6R123 PEG — 4 7 24 34 0.3 0.3 �44 � 7 �41 � 11R123 cRGD–PEG2–NH2 — 4 32 24 35 0.3 0.2 �44 � 7 �44 � 6R123 PEG cRGD 7 29 34 37 0.3 0.3 �41 � 11 �33 � 7
Fig. 5 Release of gFe2O3@CA-R123 in 10% (pink) and 50% (red) FBS andrelease of gFe2O3@CA-PEG-R123 in 10% (blue) and 50% (green) FBS.
Paper Nanoscale
then H2N–(PEG)4–COOH (R ¼ 50) and nally cRGDfK (R ¼ 2)(Table 4). Comparing these two methods, similar number ofdye, PEG chains and cRGD ligands were obtained with compa-rable dynamic light scattering properties (Table 5). However thetwo step functionalization is less time consuming. In addition,the R123 quenching increases drastically, but is still sufficientfor uorescence imaging as shown in Table 4.
The surface functionalization of the gFe2O3@CA nanoplat-form with R123, H2N–(PEG)4–COOH and cRGD derivatives wassuccessfully performed and characterized. To complete thisstudy, the stability of these nanoplatforms in the biologicalenvironment was performed, and their properties as MRIcontrast agents as well as their affinity towards integrins wereevaluated.
Biological stability
NP stability in serum is an important criterion for their utility astarget nanosystems in vivo. Using the change in uorescenceemission intensity in the presence of plasma as a surrogate forprotein adsorption, stability in the serum of gFe2O3@CA-R123and gFe2O3@CA-PEG-R123 nanoplatforms was studied. Nano-platforms were incubated with 10% and 50% FBS (Fetal BovineSerum) solutions. The kinetic displacement of the quenched andbound R123 on the NP surface was monitored by uorescencespectroscopy. The quenching factor in serum is similar to thatmeasured in water (see ESI Table S2†). Aer 24 h, less than 15%of release is reached, (Fig. 5). This evidenced the bio-stability ofthis nanoplatform through the high CA anchoring on the ironoxide surface and the covalent coupling through amide binding.This argues the possibility of their use for in vivo experiments.
MRI analysis
Medical imaging techniques such as positron emissiontomography (PET) and magnetic resonance imaging (MRI) are
This journal is ª The Royal Society of Chemistry 2013
routinely used in hospitals and allow detection of pathologicaltissues such as cancer. In comparison with PET, MRI is a verypowerful imaging tool due to its high spatial resolution.However, a major limitation of MRI is the low sensitivity toexogenous molecular probes (contrast agents). The next gener-ation of dual-modality instruments based on the combinationof PET andMRI could become promising.49–52 Another approachis to engineer the properties of the MRI probe to optimize itssensitivity. To examine the feasibility of the as-synthesizednanoparticles as MRI contrast agent, the relaxation times T1and T2 were measured on a 1.5T clinical MR scanner at roomtemperature for various iron concentrations. The longitudinalr1 relaxivity is deduced from T1-weighted images obtained froman inversion recovery sequence. The transverse nuclear relaxa-tion times, T2, were measured from a spin echo sequence.
As shown in Fig. 6A and B, T1 and T2 weighted images of thegFe2O3@CA nanoplatform change in signal intensity with anincreasing amount of nanoparticles, indicating that the
Nanoscale, 2013, 5, 11478–11489 | 11485

Nanoscale Paper
synthesized nanoparticles generated MR contrast on protonrelaxation times weighted sequences. As expected, relaxationrates varied linearly with the iron concentration (see ESIFig. S11†). The longitudinal and transverse relaxivities (r1 andr2) were deduced from the slope of the curves and were 9(�2)and 233(�7) mM�1 s�1 respectively. The high r2/r1 relaxivityratio of 25.9 suggests a high T2-effect. This demonstrates thatgFe2O3@CA nanoparticles can be efficient T2 contrast agents.
Fig. 6C shows the relaxivities r2 for different synthesizednanoplatforms. r2 constants varied from 185 up to 242 mM�1
s�1, depending on their functionalization. This evidenced thatthe r2 value is not too sensitive to the functionalization of theparticle by small molecules. Moreover these r2 values areslightly higher than commercial MRI contrasts agents such asthe Endorem� from Guerbet (98 mM�1 s�1) and the Resovist�from Bayer Healthcare (151 mM�1 s�1).53 Such values for r2suggest that CA coated nanoparticles can act as T2 contrastagents due to their r2 value.
Binding investigation
Surface plasmon resonance evaluation of interactionbetween various nanoplatforms with avb3 integrins. The avail-ability of the cRGD ligand on the nanoparticles was rstinvestigated using surface plasmon resonance. SPR is a verysensitive technique to study biomolecular events in the nano-molar range. In a rst series of experiments, the CMD sensorchip was coupled with avb3 by the amine groups. To ensure alow non-specic binding of the nanoplatforms gFe2O3@CA
Fig. 6 (A) T1 weighted (TR ¼ 2000 ms, TE ¼ 16 ms, TI ¼ 200 ms) and (B) T2weighted (TR ¼ 2000 ms, TE ¼ 20 ms) MR images of gFe2O3@CA at CFe ¼ 0.061;0.093; 0.125; 0.188; 0.25 mM; (C) r2 relaxivity values of various nanoplatforms (1)gFe2O3@CA; (2) gFe2O3@CA-R123 R¼ 2; (3) gFe2O3@CA–PEG–COOH R¼ 50; (4)gFe2O3@CA-cRGD R ¼ 2; (5) gFe2O3@CA-(PEG-cRGD) R ¼ 2; multimodal nano-platforms (6) 2 step and (7) 3 step strategy.
11486 | Nanoscale, 2013, 5, 11478–11489
nanoparticles were used as a blank. The nanoparticles wereinjected into the SPR instrument containing the avb3-coatedsensor ship. Aer injection, an immediate change in responsewas observed indicating a non-specic binding. In order tostudy the potential affinity, the previous standard procedurewas changed, using the direct immobilization of nanoplatformson CMD.
Fig. 7 shows the sensorgram of time depending on thebinding of various nanoplatforms gFe2O3@CA, gFe2O3@CA-cRGD (R ¼ 2, 43 cRGDfK/NP) and gFe2O3@CA-(PEG-cRGD) (R ¼2, 61 c(RGDfK)–PEG2–NH2/NP) to the CMD coated surface of theBiacore chip.
The response values (RU) for gFe2O3@CA (black curveFig. 7A) and gFe2O3@CA-cRGD (green curve Fig. 7A) are high,1500 and 1800 respectively, indicating a strong interactionbetween these nanoplatforms and CMD. The RU signal is lowerwith the gFe2O3@CA-(PEG-cRGD) nanoplatform (red curveFig. 7A) and increases to 230 aer 3 injections. It has to benoticed that despite various washings and drastic procedures
Fig. 7 (A) Immobilization of gFe2O3@CA (black), gFe2O3@CA-cRGD (green) andgFe2O3@CA-(PEG cRGD) (red, after 3 injections of gFe2O3@CA-(PEG-cRGD) inorder to increase the immobilization) onto the CMD chip and (B) response afteravb3 injection of 200 nM on gFe2O3@CA (black), 1 nM on gFe2O3@CA-cRGD(green, R¼ 2) and 30 nM on gFe2O3@CA-(PEG-cRGD), R¼ 2 (red). (C) Steady stateaffinity of successive growing avb3 concentrations (1.23 nM, 3.7 nM, 11.1 nM and33 nM) injected on gFe2O3@CA-cRGD.
This journal is ª The Royal Society of Chemistry 2013

Fig. 8 125I-echistatin was added to a final concentration of 0.05 nM in thepresence of various competing ligands at the indicated concentrations. After 3 h,the wells were washed and radioactivity was determined by gamma-counting.The ligands studied were (A) gFe2O3@CA (purple), cRGDfK (green) gFe2O3@CA-cRGD for a ratio R ¼ 0.2 (black), R ¼ 2 (blue), R ¼ 20 (red); (B) cRGDfK–PEG2–NH2
(green), gFe2O3@CA-(PEG-cRGD) for a ratio R ¼ 0.2 (black), R ¼ 2 (blue), R ¼ 20(red); (C) two step (red) and three step (black) strategies of multimodal nano-platforms and their blanks (green) and (blue) respectively; (D) evolution of thebeta factor as a function of the cRGD number.
Paper Nanoscale
tested using NaOH or HCl (100 nM), following the interactionphase, the constant signal demonstrates a strong interactionbetween these nanoplatforms and CMD. Such interaction couldbe due to the formation of hydrogen bonds between the largenumber of hydroxyl groups of CA (1100) and CMD. The inter-action is largely switched off by the introduction of thec(RGDfK)–PEG2–NH2 spacer that reduces hydrogen bonding,resulting in a signicant decrease of the signal. Fig. 7B showsthe response of various nanoplatforms aer avb3 injection,using each nanoplatform as a negative control (reference) onthe rst channel. The RU signal is nearly constant for thegFe2O3@CA nanoplatform (black curve Fig. 7B) indicating noaffinity with avb3 integrins. The RU signal increases for theother two nanoplatforms, going from gFe2O3@CA-(PEG-cRGD)(RU ¼ 14, red curve Fig. 7B) to gFe2O3@CA-cRGD (RU ¼ 100,green curve Fig. 7B) nanoplatforms, indicating increasing effi-cient binding.
Assuming the molecular weight of 150 kDa for integrin avb3and around 1300 kg mol�1 for immobilized nanoparticles thetheoretical avb3 binding capacity (see ESI† SPR analysis) isaround 25 RU and 200 RU for gFe2O3@CA-(PEG-cRGD) andgFe2O3@CA-cRGD nanoplatforms respectively. These values arein rather good agreement with experimental ones. It is worthmentioning that below 30 nM of avb3 concentration injection,no signicant surface plasmon resonance signal change wasobserved with the gFe2O3@CA-(PEG-cRGD) nanoplatformmodied SPR chip surface. These results could be explained bytaking into account the lower interaction of gFe2O3@CA-(PEG-cRGD) compared to gFe2O3@CA-cRGD nanoplatforms with aCMD chip.
A signicant surface plasmon resonance binding kineticassay was obtained aer injection of various concentrations ofavb3 over the gFe2O3@CA-cRGD nanoplatform modied SPRchip surface (Fig. 7C). An affinity constant of 9 nM is deducedfrom steady state affinity. This value is several orders lower thanthe affinity constant of free cRGDfK published in the literature,1.3 mM,54 suggesting a much better affinity of cRGDfK conju-gated to the nanoplatform. Such difference could be due to amultivalence effect induced by the large number of cRGDfKgraed onto the gFe2O3@CA nanoplatform.
Competition binding assay for avb3 integrin affinity. Todetermine the affinity and specicity of our various nanoplat-forms to avb3 integrins, radioactive
125I-labeled echistatin solidphase binding assay was used.29 A puried avb3 receptor wascoated on Microlite-2+ plates at a concentration of 50 ng perwell as described in Materials and methods. 125I-Echistatin wasadded to the wells to a nal concentration of 0.05 nM in thepresence of various competing ligands. cRGDfK, c(RGDfK)–PEG2–NH2 peptides and gFe2O3@CA labeled nanoplatforms atindicated concentrations were added to the wells before theaddition of radio-ligand (Fig. 8).
We rst tested the gFe2O3@CA nanoplatform for non-specic binding to avb3 and no binding was observed (Fig. 8A).The concentrations of free ligands cRGDfK and c(RGDfK)–PEG2–NH2 required for half-maximal competitions are 93 nMand 32 nM respectively, Table 6. Such a decrease in IC50 values,comparing cRGDfK and c(RGDfK)–PEG2–NH2 ligands, has to be
This journal is ª The Royal Society of Chemistry 2013
attributed to higher hydrophilicity introducing a PEG linker onthe cRGDfK ligand.
Incubation of the avb3 receptor with increasing concentra-tions of 125I-echistatin led to a saturable binding (see ESIFig. S12†). Non-specic binding was evaluated in the presenceof 200-fold molar excess of echistatin and was negligible.Scatchard analysis of the binding gave a linear t with a Kd of0.22 nM. As described previously,29 echistatin binds to avb3 in anon-dissociable manner and hence only an apparent Kd valuecan be assigned. Then the Ki values for various RGD nano-platforms are deduced from the IC50 values following eqn 1(ref. 55):
Ki ¼ IC50
1þ L*
Kd
(1)
As expected, Ki values for the multivalent nanoparticles aremarkedly decreased relative to the corresponding free ligand(Table 6). Nanoparticles bearing cRGDfK or cRGDfK–PEG2–NH2
ligands demonstrate equivalent affinity (Ki) for an equivalentamount of peptides per nanoparticle (Table 6): compare R ¼ 20for gFe2O3@CA-cRGD and R ¼ 2 for gFe2O3@CA-(PEG-cRGD).Hence, the addition of PEG linker onto the nanoplatform,increasing the distance between the nanoparticle surface andthe cRGD ligand, does not induce better affinity as observedwith free molecules. This could be related to the short length ofthe PEG linker (MW 300). However, as previously described,better coverage yield is obtained with cRGDfK–PEG2–NH2 (seeR ¼ 20 Table 5) leading to a subnanomolar affinity of 0.8 nM.
Concerning the multimodal nanoplatforms, Fig. 8C showsthat the two multimodal nanoplatforms present similar IC50
Nanoscale, 2013, 5, 11478–11489 | 11487
Table 6 IC50, Ki and b factor towards avb3, obtained by competition bindingassay, of gFe2O3@CA-cRGD and gFe2O3@CA-(PEG-cRGD) nanoplatforms for aratio R ¼ 0, R ¼ 0.2, R ¼ 2 and R ¼ 20
R
Graed moleculenumber
IC50(nM)
Ki
(nM) bOPA %
cRGD 0 — — 93 76 —0.2 25 � 2 2 � 0.2 30 24 3.12 43 � 4 4 � 0.4 16 13 5.8
20 59 � 9 5 � 1 6 5 16c(RGD)–PEG2–NH2
0 — — 32 26 —0.2 35 � 8 3 � 1 17 14 1.92 61 � 3 6 � 0.3 5 4 6.4
20 130 � 30 12 � 3 0.8 0.7 40
Nanoscale Paper
values (3 nM and 7 nM for the two and three step strategyrespectively). Moreover, the presence of the dye has no effect onIC50 values (nanoplatform with cRGDfK–PEG2–NH2, R ¼ 2(61 cRGDfK–PEG2–NH2) IC50 ¼ 5 nM).
To relate Ki (multivalent) to Ki (free) where the precisenumber of ligand–target interactions is not known, Whitesidesand colleagues dened an enhancement factor b, whichincreases as the relative affinity of a multivalent interactionincreases: b ¼ Ki (free)/Ki (multivalent).56 For the multivalentnanoparticles tested here, b ranges from approximately 1 to 40and vary linearly with the number of cRGD binding sites on thesurface of the nanoparticle (Fig. 8D). This is in close agreementwith observations of Piletska et al.57 with biotinylated nano-particles and Soukka et al.58 with antibody nanoparticles whostated that the avidity of the nanoplatform toward theirrespective targets is directly correlated with the number ofbinding sites on the nanoparticle surface.
Conclusions
A new nanoplatform has been elaborated as a dual imagingmagnetic resonance/uorescence contrast agent targeting avb3integrins. For this purpose, the iron oxide NP for MR imaginghas been surface functionalized with caffeic acid as a greenrobust anchoring agent. The free carboxylic moieties are usedfor the covalent coupling of various functionalities: uorescentRhodamine for uorescence imaging, PEG chain as linkers andcyclic cRGD for integrin targeting. The different multimodalnanoplatforms are characterized in detail in order to controltheir design. We showed that the synthesized particles presentT2 MR and uorescence contrast depending on their concen-tration. The specic targeting to the avb3 receptor has beendemonstrated with a surface plasmon resonance and a solid-phase receptor-binding assay. The affinity was directly corre-lated with the amount of cRGD per nanoparticle and was notdisturbed with dyes or PEG linker functionalities. The PEGspacer allows conjugation of a larger amount of cRGD leading toan optimized subnanomolar affinity of 0.8 nM compared to76 nM for the free cRGD. These results added to the biostabilityand the PEG chains for long time blood circulation pave the way
11488 | Nanoscale, 2013, 5, 11478–11489
for their in vivo uses in dual imaging. For the in vivo study thedescribed coating process will be extended to NIR dye. In futurestudies, the nanoparticle size and PEG chain length shouldbe optimized. Other specic peptides could also be conjugatedto the dual MR/uorescent probe for targeting variouspathologies.
Acknowledgements
This work was supported by ANR 2010-BLAN-1007-1 funding.We are grateful to N. Lievre (University of Paris 13, Bobigny,France) for TEM observations, Magnisense Corporation forproviding MIAplex Reader and to Pr. P.Y. Brillet for MRI accessandMr Steven Gressin for technical assistance (Hosp. Avicenne,Radiology department).
Notes and references
1 X.-H. Peng, X. Qian, H. Mao, A. Y. Wang, Z. (Georgia) Chen,S. Nie and D. M. Shin, Int. J. Nanomed., 2008, 3, 311–321.
2 B. Basly, D. Felder-Flesch, P. Perriat, G. Pourroy and S. Begin-Colin, Contrast Media Mol. Imaging, 2011, 6, 132–138.
3 S. Mornet, S. Vasseur, F. Grasset and E. Duguet, J. Mater.Chem., 2004, 14, 2161.
4 D. L. Thorek, A. K. Chen, J. Czupryna and A. Tsourkas, Ann.Biomed. Eng., 2006, 34, 23–38.
5 Q. Quan, J. Xie, H. Gao, M. Yang, F. Zhang, G. Liu, X. Lin,A. Wang, H. S. Eden and S. Lee, Mol. Pharmaceutics, 2011,8, 1669–1676.
6 N. T. K. Thanh and L. A. W. Green, Nano Today, 2010, 5, 213–230.
7 S. Chen, L. Wang, S. L. Duce, S. Brown, S. Lee, A. Melzer,S. A. Cuschieri and P. Andre, J. Am. Chem. Soc., 2010, 132,15022–15029.
8 X. Montet, M. Funovics, K. Montet-Abou, R. Weissleder andL. Josephson, J. Med. Chem., 2006, 49, 6087–6093.
9 F. Danhier, A. L. Breton and V. Preat, Mol. Pharmaceutics,2012, 9, 2961–2973.
10 D. Arosio, C. Casagrande and L. Manzoni, Curr. Med. Chem.,2012, 19, 3128–3151.
11 R. Max, R. R. Gerritsen, P. T. Nooijen, S. L. Goodman,A. Sutter, U. Keilholz, D. J. Ruiter and R. M. De Waal, Int. J.cancer, 1997, 71, 320–324.
12 D. Arosio, L. Manzoni, E. M. Araldi and C. Scolastico,Bioconjugate Chem., 2011, 22, 664–672.
13 K. Temming, R. M. Schiffelers, G. Molema and R. J. Kok,Drug Resist. Updates, 2005, 8, 381–402.
14 W. Cai and X. Chen, Anti-Cancer Agents Med. Chem., 2006, 6,407–428.
15 G. Thumshirn, U. Hersel, S. L. Goodman and H. Kessler,Chem.–Eur. J., 2003, 9, 2717–2725.
16 Z. Cheng, Y. Wu, Z. Xiong, S. S. Gambhir and X. Chen,Bioconjugate Chem., 2005, 16, 1433–1441.
17 J. R. Baker Jr, Chem. Commun., 2005, 5739–5741.18 U. Hersel, C. Dahmen and H. Kessler, Biomaterials, 2003, 24,
4385–4415.
This journal is ª The Royal Society of Chemistry 2013

Paper Nanoscale
19 E. Kluza, D. W. van der Scha, P. A. Hautvast, W. J. Mulder,K. H. Mayo, A. W. Griffioen, G. J. Strijkers and K. Nicolay,Nano Lett, 2009, 10, 52–58.
20 Y.-H. Kim, J. Jeon, S. H. Hong, W.-K. Rhim, Y.-S. Lee,H. Youn, J.-K. Chung, M. C. Lee, D. S. Lee and K. W. Kang,Small, 2011, 7, 2052–2060.
21 E. Garanger, D. Boturyn, J.-L. Coll, M.-C. Favrot and P. Dumy,Org. Biomol. Chem., 2006, 4, 1958–1965.
22 W. Boerjan, J. Ralph and M. Baucher, Annu. Rev. Plant Biol.,2003, 54, 519–546.
23 C. de Montferrand, Y. Lalatonne, D. Bonnin, N. Lievre,M. Lecouvey, P. Monod, V. Russier and L. Motte, Small,2012, 8, 1945–1956.
24 Y. Lalatonne, C. Paris, J. M. Serfaty, P. Weinmann,M. Lecouvey and L. Motte, Chem. Commun., 2008, 2553–2555.
25 F. Benyettou, Y. Lalatonne, I. Chebbi, M. Di Benedetto,J. M. Serfaty, M. Lecouvey and L. Motte, Phys. Chem. Chem.Phys., 2011, 13, 10020–10027.
26 F. Benyettou, E. Guenin, Y. Lalatonne and L. Motte,Nanotechnology, 2011, 22, 055102.
27 F. Geinguenaud, I. Souissi, R. Fagard, L. Motte andY. Lalatonne, Nanomedicine, 2012, 8, 1106–1115.
28 R. A. Orlando and D. A. Cheresh, J. Biol. Chem., 1991, 266,19543–19550.
29 C. C. Kumar, C. P. R. Huiming-Nie, M. Malkowski,E. Maxwell, J. J. Catino and L. Armstrong, J. Pharmacol.Exp. Ther., 1997, 283, 843–853.
30 I. A. Jankovic, Z. V. Saponjic, E. S. Dvzunuzovic andJ. M. Nedeljkovic, Nanoscale Res. Lett., 2010, 5, 81–88.
31 W. J. Barreto, R. A. Ando, B. M. Estev~ao and K. P. daS. Zanoni, Spectrochim. Acta, Part A, 2012, 92, 16–20.
32 M. D. Shultz, J. U. Reveles, S. N. Khanna and E. E. Carpenter,J. Am. Chem. Soc., 2007, 129, 2482–2487.
33 P. Z. Araujo, P. J. Morando and M. A. Blesa, Langmuir, 2005,21, 3470–3474.
34 S. T. Martin, J. M. Kesselman, D. S. Park, N. S. Lewis andM. R. Hoffmann, Environ. Sci. Technol., 1996, 30, 2535–2542.
35 C. De Montferrand, L. Hu, I. Milosevic, V. Russier,D. Bonnin, L. Motte, A. Brioude and Y. Lalatonne, ActaBiomater., 2013, 9, 6150–6157.
36 T. Rajh, L. X. Chen, K. Lukas, T. Liu, M. C. Thurnauer andD. M. Tiede, J. Phys. Chem. B, 2002, 106, 10543–10552.
This journal is ª The Royal Society of Chemistry 2013
37 A. M. Andersen, Acta Chem. Scand., 1975, 29, 239–244.38 E. Amstad, A. U. Gehring, H. Fischer, V. V. Nagaiyanallur,
G. Hahner, M. Textor and E. Reimhult, J. Phys. Chem. C,2011, 115, 683–691.
39 E. Amstad, T. Gillich, I. Bilecka, M. Textor and E. Reimhult,Nano Lett., 2009, 9, 4042–4048.
40 F. Bertorelle, C. Wilhelm, J. Roger, F. Gazeau, C. Menagerand V. Cabuil, Langmuir, 2006, 22, 5385–5391.
41 S. K. Mandal, N. Lequeux, B. Rotenberg, M. Tramier,J. Fattaccioli, J. Bibette and B. Dubertret, Langmuir, 2005,21, 4175–4179.
42 J. M. Perez, T. O'Loughin, F. J. Simeone, R. Weissleder andL. Josephson, J. Am. Chem. Soc., 2002, 124, 2856–2857.
43 A. Lorenzen and S. W. Kennedy, Anal. Biochem., 1993, 214,346–348.
44 J. R. Benson and P. E. Hare, Proc. Natl. Acad. Sci. U. S. A.,1975, 72, 619–622.
45 S. S. Simons Jr and D. F. Johnson, J. Org. Chem., 1978, 43,2886–2891.
46 S. S. Simons Jr and D. F. Johnson, Anal. Biochem., 1978, 90,705–725.
47 K. Mopper and D. Delmas, Anal. Chem., 1984, 56, 2557–2560.48 H. Nakamura and Z. Tamura, Anal. Chem., 1981, 53, 2190–
2193.49 H.-Y. Lee, Z. Li, K. Chen, A. R. Hsu, C. Xu, J. Xie, S. Sun and
X. Chen, J. Nucl. Med., 2008, 49, 1371–1379.50 W. Cai and X. Chen, J. Nucl. Med., 2008, 49, 113S–128S.51 L. W. Dobrucki, E. D. de Muinck, J. R. Lindner and
A. J. Sinusas, J. Nucl. Med., 2010, 51, 66S–79S.52 X. Yang, H. Hong, J. J. Grailer, I. J. Rowland, A. Javadi,
S. A. Hurley, Y. Xiao, Y. Yang, Y. Zhang and R. J. Nickles,Biomaterials, 2011, 32, 4151–4160.
53 Y.-X. J. Wang, Quant. Imaging Med. Surg., 2011, 1, 35.54 Y. Liu, Y. Pan and Y. Xu, J. Biomol. Screening, 2010, 15, 131–
137.55 K. A. Krohn and J. M. Link, Nucl. Med. Biol., 2003, 30, 819–
826.56 M. Mammen, S.-K. Choi and G. M. Whitesides, Angew.
Chem., Int. Ed., 1998, 37, 2754–2794.57 E. V. Piletska and S. A. Piletsky, Langmuir, 2010, 26, 3783–
3785.58 T. Soukka, H. Harma, J. Paukkunen and T. Lovgren, Anal.
Chem., 2001, 73, 2254–2260.
Nanoscale, 2013, 5, 11478–11489 | 11489


