Embed Size (px)
Citation preview
OR
MS
a
ARR2A
KRARCO
1
Tdcdr[d
uAbo[clirgs[
t
c
1d
Chemical Engineering Journal 168 (2011) 280–285
Contents lists available at ScienceDirect
Chemical Engineering Journal
journa l homepage: www.e lsev ier .com/ locate /ce j
ptimization of rambutan peel based activated carbon preparation conditions foremazol Brilliant Blue R removal
ohd Azmier Ahmad ∗, Rasyidah Alrozichool of Chemical Engineering, Engineering Campus, Universiti Sains Malaysia, 14300 Nibong Tebal, Penang, Malaysia
r t i c l e i n f o
rticle history:eceived 19 November 2010eceived in revised form4 December 2010
a b s t r a c t
The optimal conditions for preparation of rambutan peel based activated carbon (RPAC) for removal ofRemazol Brilliant Blue R (RBBR) reactive dye from aqueous solution were investigated. The RPAC wasprepared using physiochemical activation method which consisted of potassium hydroxide (KOH) treat-ment and carbon dioxide (CO2) gasification. The central composite design (CCD) was used to determine
ccepted 4 January 2011
eywords:ambutan peelctivated carbon
the effects of the preparation variable, activation temperature, activation time and KOH impregnationratio on RBBR percentage removal and RPAC yield. Two quadratic models were developed to correlate thepreparation variables for both responses. The significant factors on each experimental design responsewere identified from the analysis of variance (ANOVA). The optimum conditions for RPAC preparation
ctiva ◦
R rem
emazol Brilliant Blue Rentral composite designptimizationwere obtained by using aresulted in 78.38% of RBB
. Introduction
Reactive dyes are used extensively for dyeing cellulosic fibre.hey consist of a chromophore and a functional group that binds theyestuff to the fibre [1]. The functional group also bonds to water,reating hydrolysis and hence 10–50% of the dye is remains in theye bath waste. In fact, the expanded uses of reactive dyes and theireaction products such as aromatic amines are highly carcinogenic2]. Discharge of these wastewaters into receiving streams causeamage not only to aquatic life but also to human beings [3].
Adsorption is an effective treatment method that is widelysed in the removal of contaminants from water and wastewater.dsorption process with activated carbon (AC) as an adsorbent haseen proved to be superior compared to other techniques in termsf its simplicity of design, high efficiency and ease of operation4]. From the literature, adsorption of reactive dyes on coal-basedommercial AC has been studied [5,6]. However, its usage has beenimited due to the expensive starting material [7]. As such, theres a need to produce AC from alternative material that is cheaper,enewable and readily available. In recent years, focus has beeniven on the preparation of low cost AC from agricultural wastes
uch as coir pith [8], sugar beet pulp [9], sugarcane bagasse pith10] and jute fibre [11] for the adsorption of reactive dyes.In this work, an attempt was made in preparing AC from rambu-an peel (RP) precursor. Native to South-Eastern Asia, rambutan
∗ Corresponding author. Tel.: +6 04 5996459; fax: +6 04 5941013.E-mail addresses: [email protected],
[email protected] (M.A. Ahmad).
385-8947/$ – see front matter © 2011 Elsevier B.V. All rights reserved.oi:10.1016/j.cej.2011.01.005
tion temperature of 789 C, activation time of 1.8 h and IR of 3.5, whichoval and 18.02% of RPAC yield.
© 2011 Elsevier B.V. All rights reserved.
(Nephelium lappaceum L.) is a popular tropical fruit which belongsto Sapindaceae family [12]. In Malaysia, an average rambutan treemay produce 5000–6000 or more fruits (60–70 kg per tree). Nor-mally, after consuming the rambutan fruit, the peel is thrown awayand disposal of the peel usually poses environmental problem inthe community. Therefore, conversion of RP into AC reduces thecost of waste disposal and provides a potentially cheap alternativeresource for AC production.
Response surface methodology (RSM) is a useful tool to studythe interactions of two or more factors. A standard RSM designcalled a central composite design (CCD) is suitable for fitting aquadratic surface and it helps to optimize the effective parameterswith a minimum number of experiments, as well as to analyze theinteraction between the parameters [13]. CCD has been used for theoptimization of AC production from rattan sawdust [4], tamarindwood [14] and Turkish lignite [15] by chemical activation whereascoconut husk [13] and oil palm empty fruit bunch [16] by physio-chemical activation method. The goal of this work was to optimizethe RPAC preparation variables; activation temperature, activationtime and impregnation ratio for the removal of Remazol BrilliantBlue R (RBBR) dye from aqueous solution.
2. Materials and methods
2.1. Adsorbate
Remazol Brilliant Blue R (RBBR) supplied by Sigma–Aldrich (M)Sdn Bhd, Malaysia was used as an adsorbate. Deionized waterwas used to prepare all solutions. RBBR has a chemical formula
M.A. Ahmad, R. Alrozi / Chemical Engineering Journal 168 (2011) 280–285 281
oc
2
lwmoprpr
I
wwt
rtwflpT(
2
221tswc
r
ws
2
y
ww
Table 1Independent variables and their coded levels for the CCD.
Variables (factors) Code Coded variable levels
−˛ −1 0 +1 +˛
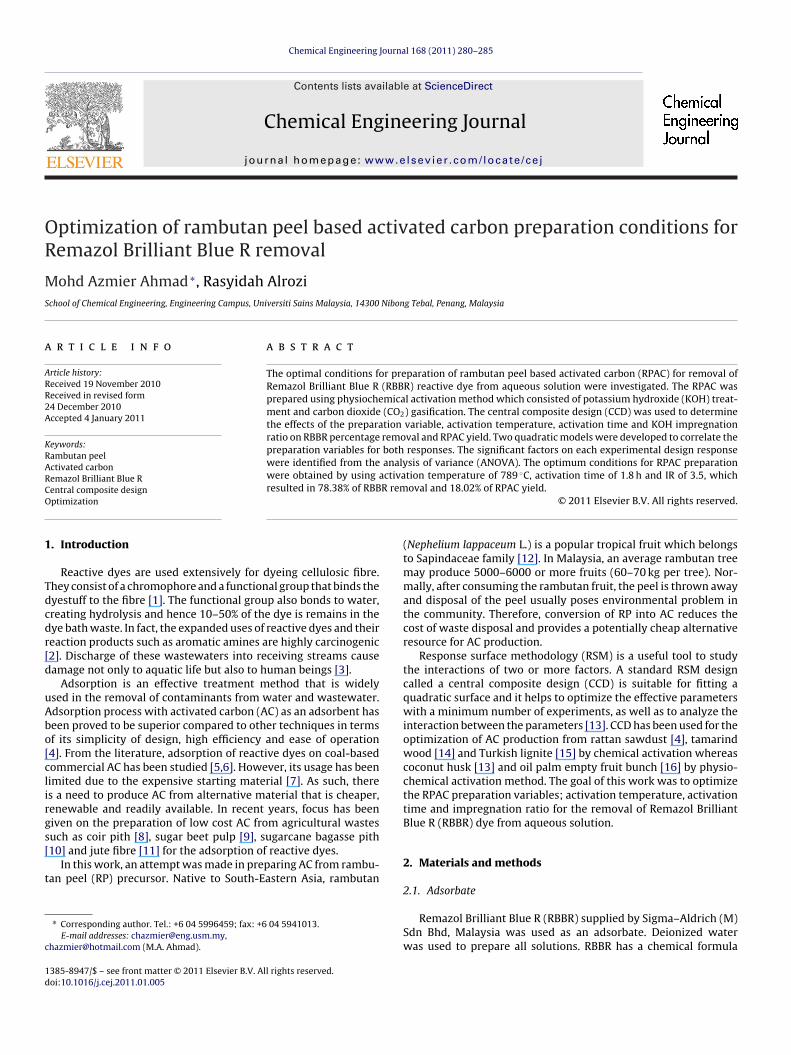
Fig. 1. Chemical structure of RBBR dye.
f C22H16N2Na2O11S3 with molecular weight of 626.54 g/mol. Thehemical structure of RBBR is shown in Fig. 1.
.2. Preparation of RPAC
Rambutan peel (RP) used as precursor was obtained from theocal market in Nibong Tebal, Penang, Malaysia. RP was firstly
ashed and subsequently dried at 105 ◦C for 24 h to remove theoisture content. The dried RP were ground and sieved to the size
f 1–2 mm and loaded in a stainless steel vertical tubular reactorlaced in a tube furnace. Carbonization step of the dried RP was car-ied out at 700 ◦C for 2 h under purified nitrogen (99.99%). The charroduced was mixed with KOH pellets with different impregnationatio (IR), as calculated using following equation:
R = WKOH
Wchar(1)
here WKOH is the dry weight (g) of KOH pellets and is the dryeight (g) of char. Deionized water was then added to dissolve all
he KOH pellets.The mixture was then dehydrated in an oven at 105 ◦C for 24 h to
emove moisture. The activation step was done using similar reac-or as in carbonization step. Once the final activation temperatureas reached, the gas flow was switched from nitrogen to CO2 atowrate of 150 mL/min for different period of time. The activatedroduct was then cooled to room temperature under nitrogen flow.hen, the sample was washed with hot deionized water and HCl0.1 M) until the pH of the washed solution reached 6.5–7.
.3. Adsorption studies
For batch adsorption studies, 0.3 g of RPAC were mixed with00 mL aqueous dye solutions of 100 mg/L initial concentration in0 sets of 250 mL Erlenmeyer flasks. The mixture was agitated at20 rpm at 30 ◦C until equilibrium was attained. The concentra-ion of RBBR dye solution was determined using a double UV–vispectrophotometer (UV-1800 Shimadzu, Japan) at it maximumavelength of 590 nm. The percentage removal at equilibrium was
alculated as follows:
emoval (%) = C0 − Ce
C0× 100 (2)
here C0 and Ce are the liquid-phase dye concentrations at initialtate and at equilibrium (mg/L), respectively.
.4. RPAC yield
The RPAC yield was calculated based on the following equation:
ield (%) = Wc
W0× 100 (3)
here Wc and W0 are the dry weight of final RPAC (g) and the dryeight of precursor (g), respectively.
Activation temperature (◦C) x1 648.87 700.00 775.00 850.00 901.13Activation time (h) x2 0.32 1.00 2.00 3.00 3.68Impregnation ratio (IR) x3 0.15 1.00 2.25 3.50 4.35
2.5. Experimental design
Response surface methodology (RSM) is a collection of statisti-cal and mathematical techniques that uses quantitative data fromappropriate experiments to determine regression model equationsand operating conditions [14]. It can reduce the number of exper-imental trials needed to evaluate multiple parameters and theirinteractions [4]. In this work, CCD was used to study the effects ofthe RPAC preparation variables; activation temperature (x1), acti-vation time (x2) and IR (x3) towards their responses; RBBR removal(Y1) and RPAC yield (Y2). These three variables together with theirrespective ranges were chosen based on preliminary studies asgiven in Table 1. CCD requires three kinds of runs which are 2n fac-torial runs, 2n axial runs and 6 center runs, where n is the numberof process variables [16,17]. For three variables; 8 factorial points,6 axial points and 6 replicates at the center points were employed,indicating that altogether 20 experiments for this procedure, ascalculated from Eq. (4) [14]:
N = 2n + 2n + nc = 23 + 2(3) + 6 = 20 (4)
where N is the total number of experiments required.The center points are used to determine the experimental error
and the reproducibility of the data. The axial points are locatedat (±˛, 0, 0), (0, ±˛, 0) and (0, 0, ±˛) where ˛ is the distance ofthe axial point from center and makes the design rotatable. In thisstudy, the ˛ value was fixed at 1.682 (rotatable) [13,14]. The exper-imental sequence was randomized in order to minimize the effectsof the uncontrolled factor. Each response was used to develop anempirical model which correlated the response to the three RPACpreparation variables using a second-degree polynomial equationas given by Eq. (5) [17]:
Y = b0 +n∑
i=1
bixi + (n∑
i=1
biixi)
2
+n−1∑
i=1
n∑
j=i+1
bijxixj (5)
where Y is the predicted response, b0 the constant coefficient, bi thelinear coefficients, bij the interaction coefficients, bii the quadraticcoefficients and xi, xj are the coded values of the activated carbonpreparation variables.
2.6. Model fitting and statistical analysis
The experimental data were analyzed using a statistical soft-ware Design Expert software version 6.0.6 (STAT-EASE Inc.,Minneapolis, USA) for regression analysis to fit the second-degreepolynomial equation and also for the evaluation of the statisticalsignificance of the equations developed [13].
2.7. Characterization of the RPAC
The surface area, pore volume and average pore diameter of the
RPAC prepared under optimum preparation conditions were deter-mined by using Micromeritics ASAP 2020 volumetric adsorptionanalyzer. The BET surface area was measured from the adsorp-tion isotherms using Brunauer–Emmett–Teller equation. The totalpore volume was estimated to be the liquid volume of nitrogen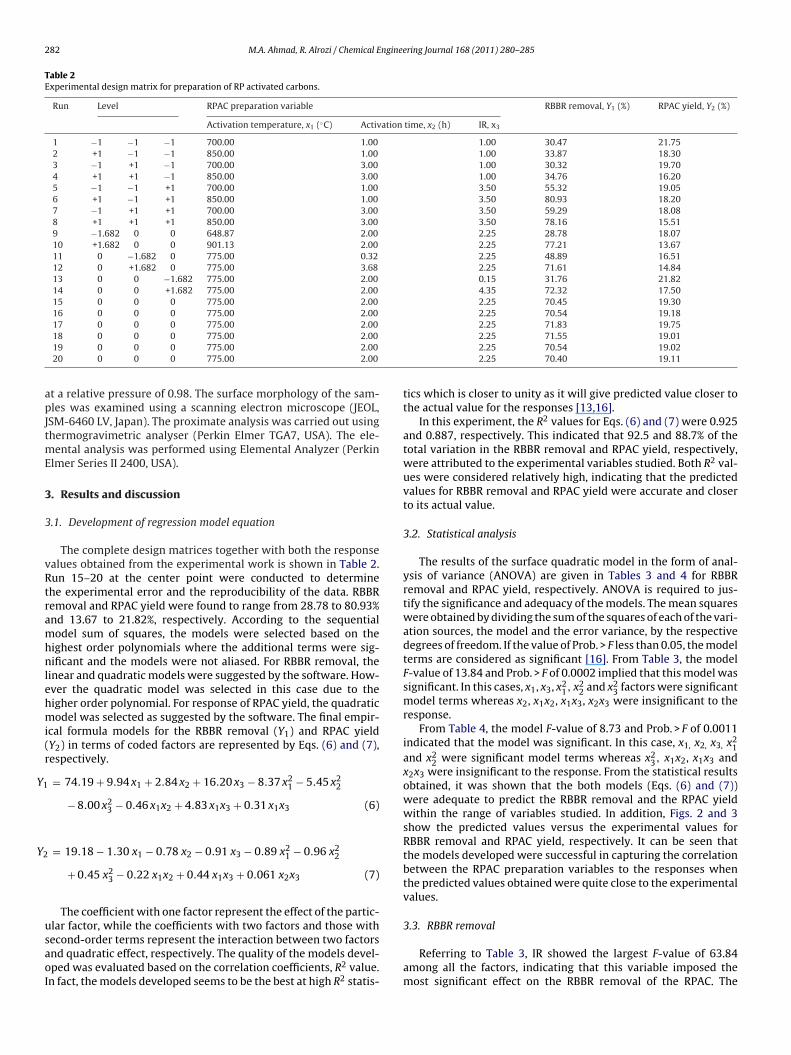
282 M.A. Ahmad, R. Alrozi / Chemical Engineering Journal 168 (2011) 280–285
Table 2Experimental design matrix for preparation of RP activated carbons.
Run Level RPAC preparation variable RBBR removal, Y1 (%) RPAC yield, Y2 (%)
Activation temperature, x1 (◦C) Activation time, x2 (h) IR, x3
1 −1 −1 −1 700.00 1.00 1.00 30.47 21.752 +1 −1 −1 850.00 1.00 1.00 33.87 18.303 −1 +1 −1 700.00 3.00 1.00 30.32 19.704 +1 +1 −1 850.00 3.00 1.00 34.76 16.205 −1 −1 +1 700.00 1.00 3.50 55.32 19.056 +1 −1 +1 850.00 1.00 3.50 80.93 18.207 −1 +1 +1 700.00 3.00 3.50 59.29 18.088 +1 +1 +1 850.00 3.00 3.50 78.16 15.519 −1.682 0 0 648.87 2.00 2.25 28.78 18.0710 +1.682 0 0 901.13 2.00 2.25 77.21 13.6711 0 −1.682 0 775.00 0.32 2.25 48.89 16.5112 0 +1.682 0 775.00 3.68 2.25 71.61 14.8413 0 0 −1.682 775.00 2.00 0.15 31.76 21.8214 0 0 +1.682 775.00 2.00 4.35 72.32 17.5015 0 0 0 775.00 2.00 2.25 70.45 19.3016 0 0 0 775.00 2.00 2.25 70.54 19.18
apJtmE
3
3
vRtramhnlehmi(r
Y1
Y2
usaoI
17 0 0 0 775.00 2.0018 0 0 0 775.00 2.0019 0 0 0 775.00 2.0020 0 0 0 775.00 2.00
t a relative pressure of 0.98. The surface morphology of the sam-les was examined using a scanning electron microscope (JEOL,
SM-6460 LV, Japan). The proximate analysis was carried out usinghermogravimetric analyser (Perkin Elmer TGA7, USA). The ele-
ental analysis was performed using Elemental Analyzer (Perkinlmer Series II 2400, USA).
. Results and discussion
.1. Development of regression model equation
The complete design matrices together with both the responsealues obtained from the experimental work is shown in Table 2.un 15–20 at the center point were conducted to determinehe experimental error and the reproducibility of the data. RBBRemoval and RPAC yield were found to range from 28.78 to 80.93%nd 13.67 to 21.82%, respectively. According to the sequentialodel sum of squares, the models were selected based on the
ighest order polynomials where the additional terms were sig-ificant and the models were not aliased. For RBBR removal, the
inear and quadratic models were suggested by the software. How-ver the quadratic model was selected in this case due to theigher order polynomial. For response of RPAC yield, the quadraticodel was selected as suggested by the software. The final empir-
cal formula models for the RBBR removal (Y1) and RPAC yieldY2) in terms of coded factors are represented by Eqs. (6) and (7),espectively.
= 74.19 + 9.94 x1 + 2.84 x2 + 16.20 x3 − 8.37 x21 − 5.45 x2
2
− 8.00 x23 − 0.46 x1x2 + 4.83 x1x3 + 0.31 x1x3 (6)
= 19.18 − 1.30 x1 − 0.78 x2 − 0.91 x3 − 0.89 x21 − 0.96 x2
2
+ 0.45 x23 − 0.22 x1x2 + 0.44 x1x3 + 0.061 x2x3 (7)
The coefficient with one factor represent the effect of the partic-
lar factor, while the coefficients with two factors and those withecond-order terms represent the interaction between two factorsnd quadratic effect, respectively. The quality of the models devel-ped was evaluated based on the correlation coefficients, R2 value.n fact, the models developed seems to be the best at high R2 statis-2.25 71.83 19.752.25 71.55 19.012.25 70.54 19.022.25 70.40 19.11
tics which is closer to unity as it will give predicted value closer tothe actual value for the responses [13,16].
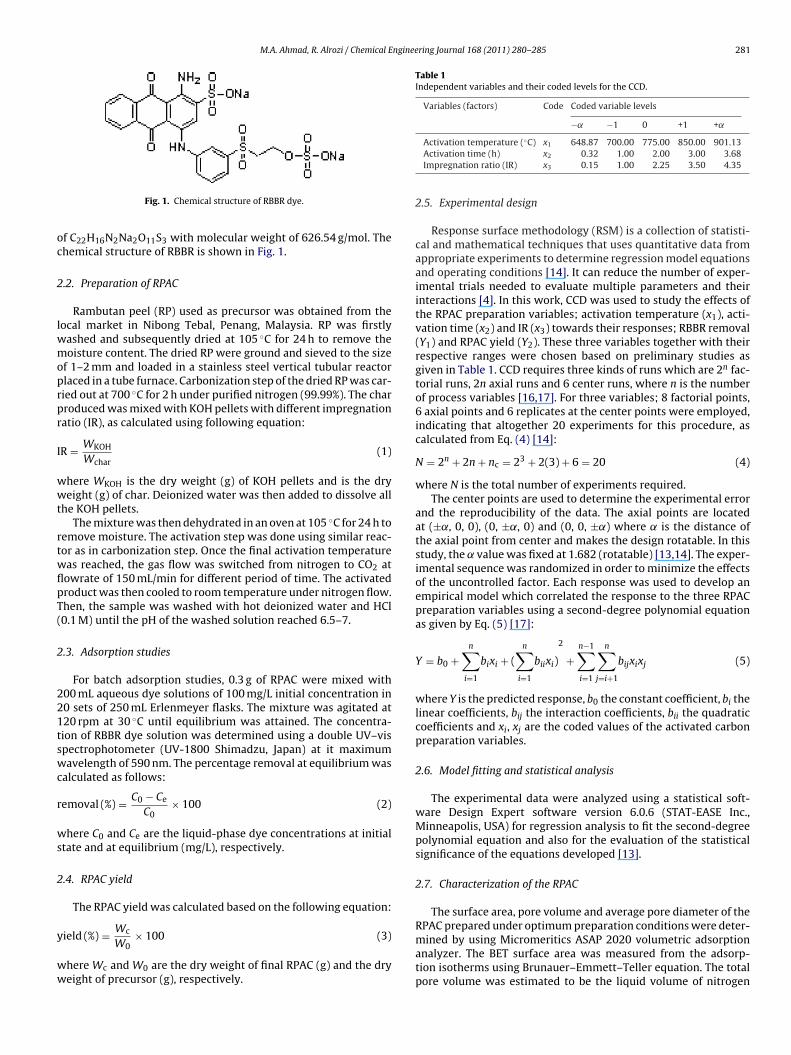
In this experiment, the R2 values for Eqs. (6) and (7) were 0.925and 0.887, respectively. This indicated that 92.5 and 88.7% of thetotal variation in the RBBR removal and RPAC yield, respectively,were attributed to the experimental variables studied. Both R2 val-ues were considered relatively high, indicating that the predictedvalues for RBBR removal and RPAC yield were accurate and closerto its actual value.
3.2. Statistical analysis
The results of the surface quadratic model in the form of anal-ysis of variance (ANOVA) are given in Tables 3 and 4 for RBBRremoval and RPAC yield, respectively. ANOVA is required to jus-tify the significance and adequacy of the models. The mean squareswere obtained by dividing the sum of the squares of each of the vari-ation sources, the model and the error variance, by the respectivedegrees of freedom. If the value of Prob. > F less than 0.05, the modelterms are considered as significant [16]. From Table 3, the modelF-value of 13.84 and Prob. > F of 0.0002 implied that this model wassignificant. In this cases, x1, x3, x2
1, x22 and x2
3 factors were significantmodel terms whereas x2, x1x2, x1x3, x2x3 were insignificant to theresponse.
From Table 4, the model F-value of 8.73 and Prob. > F of 0.0011indicated that the model was significant. In this case, x1, x2, x3, x2
1and x2
2 were significant model terms whereas x23, x1x2, x1x3 and
x2x3 were insignificant to the response. From the statistical resultsobtained, it was shown that the both models (Eqs. (6) and (7))were adequate to predict the RBBR removal and the RPAC yieldwithin the range of variables studied. In addition, Figs. 2 and 3show the predicted values versus the experimental values forRBBR removal and RPAC yield, respectively. It can be seen thatthe models developed were successful in capturing the correlationbetween the RPAC preparation variables to the responses whenthe predicted values obtained were quite close to the experimentalvalues.
3.3. RBBR removal
Referring to Table 3, IR showed the largest F-value of 63.84among all the factors, indicating that this variable imposed themost significant effect on the RBBR removal of the RPAC. The
M.A. Ahmad, R. Alrozi / Chemical Engineering Journal 168 (2011) 280–285 283
Table 3Analysis of variance (ANOVA) for response surface quadratic model for RBBR removal of RPAC.
Source Sum of squares Degree of freedom Mean square F-value Prob. > F Comment
Model 6452.31 9 716.92 13.84 0.0002 Significantx1 1310.27 1 1310.27 25.30 0.0005x2 118.04 1 118.04 2.28 0.1621x3 3306.29 1 3306.29 63.84 <0.0001x2
1 729.71 1 729.71 14.09 0.0038x2
2 298.45 1 298.45 5.76 0.0373x2
3 800.61 1 800.61 15.46 0.0028x1x2 4.06 1 4.06 0.078 0.7852x1x3 167.81 1 167.81 3.24 0.1021x2x3 0.026 1 0.026 0.0005 0.9824
Residual 517.93 10 51.79 – –
Table 4Analysis of variance (ANOVA) for response surface quadratic model for RPAC yield.
Source Sum of squares Degree of freedom Mean square F-value Prob. > F Comment
Model 72.59 9 8.07 8.73 0.0011 Significantx1 23.12 1 23.12 25.02 0.0005x2 8.26 1 8.26 8.94 0.0136x3 11.21 1 11.21 12.14 0.0059x2
1 11.40 1 11.40 12.34 0.0056x2
2 13.24 1 13.24 14.33 0.0036x2
3 2.92 1 2.92 3.16 0.1056x1x2 0.39 1 0.39 0.42 0.5297x1x3 1.56 1 1.56 1.69 0.2233x2x3 0.030 1 0.030 0.032 0.8606
Residual 9.24 10 0.92 – –
R² = 0.925
20
30
40
50
60
70
80
90
100
1009080706050403020
Pred
icte
d R
BB
R re
mov
al (%
)
Experimental RBBR removal (%)
eeiIefiaaLatdat[
R² = 0.887
12
14
16
18
20
22
24
12 14 16 18 20 22 24
Pred
icte
d R
PAC
yie
ld (%
)
Experimental RPAC yield (%)
Fig. 3. Predicted vs. experimental RPAC yield.
35.66 48.33 61.01 73.69 86.37
RB
BR
rem
oval
(%)
737.50775.00
812.50850.00
1.63 2.25
2.88 3.50
A: Temperature
C: IR
Fig. 2. Predicted vs. experimental RBBR removal of RPAC.
ffect of activation temperature was significant as well. How-ver, the effect of activation time on the response was relativelynsignificant. The quadratic effect of activation temperature andR showed almost similar effects on the response. The interactionffects between the variables were insignificant. As can be seenrom Fig. 4, the RBBR removal generally increases with increasen activation temperature and IR. Higher activation temperaturend IR were favorable for enhancing the RBBR adsorption removals more pores are developed on the sample surface [18]. In fact,u et al. [19] have observed that at higher activation temperature,ll KOH has been transformed into K2O and K that play an impor-ant role in the pore development of the AC, thereby improve theye uptake. During KOH activation, some surface metal complexes
re produced, which are responsible for further carbon gasifica-ion and release of gaseous products such as CO2, CO and H220,21].700.001.00
Fig. 4. Three-dimensional response surface plot of RBBR removal (effect of activa-tion temperature and IR, t = 2 h) of RPAC.
284 M.A. Ahmad, R. Alrozi / Chemical Engineering Journal 168 (2011) 280–285
19.52 20.58 21.63 22.68 23.73
700.00737.50
775.00812.50
850.00
1.00 1.63
2.25 2.88
3.50
A: Temperature C: IR
RPA
Cyi
eld
(%)
17.72 19.16 20.61 22.05 23.49
RPA
Cyi
eld
(%)
700.00737.50
775.00812.50
850.00
1.00 1.50
2.00 2.50
3.00
A: Temperature B: Time
a
b
FtI
3
otTsesoFo(wt[lCiiCa
3
Rofv
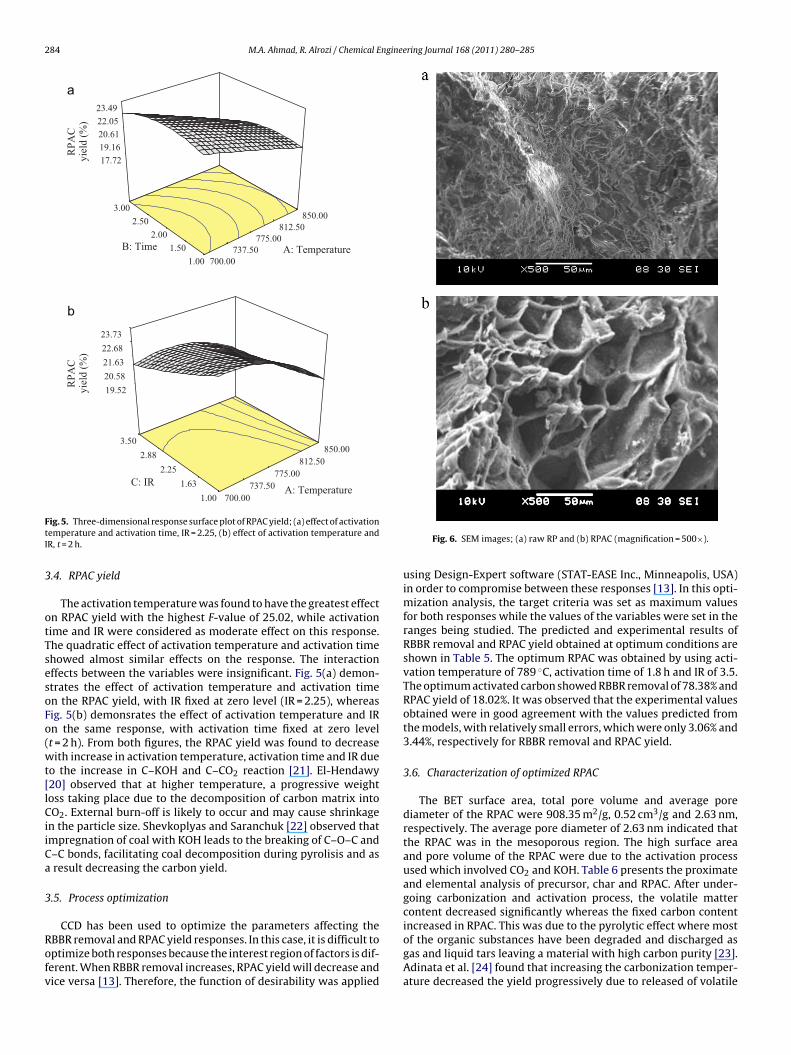
ig. 5. Three-dimensional response surface plot of RPAC yield; (a) effect of activationemperature and activation time, IR = 2.25, (b) effect of activation temperature andR, t = 2 h.
.4. RPAC yield
The activation temperature was found to have the greatest effectn RPAC yield with the highest F-value of 25.02, while activationime and IR were considered as moderate effect on this response.he quadratic effect of activation temperature and activation timehowed almost similar effects on the response. The interactionffects between the variables were insignificant. Fig. 5(a) demon-trates the effect of activation temperature and activation timen the RPAC yield, with IR fixed at zero level (IR = 2.25), whereasig. 5(b) demonsrates the effect of activation temperature and IRn the same response, with activation time fixed at zero levelt = 2 h). From both figures, the RPAC yield was found to decreaseith increase in activation temperature, activation time and IR due
o the increase in C–KOH and C–CO2 reaction [21]. El-Hendawy20] observed that at higher temperature, a progressive weightoss taking place due to the decomposition of carbon matrix intoO2. External burn-off is likely to occur and may cause shrinkage
n the particle size. Shevkoplyas and Saranchuk [22] observed thatmpregnation of coal with KOH leads to the breaking of C–O–C and–C bonds, facilitating coal decomposition during pyrolisis and asresult decreasing the carbon yield.
.5. Process optimization
CCD has been used to optimize the parameters affecting theBBR removal and RPAC yield responses. In this case, it is difficult toptimize both responses because the interest region of factors is dif-erent. When RBBR removal increases, RPAC yield will decrease andice versa [13]. Therefore, the function of desirability was applied
Fig. 6. SEM images; (a) raw RP and (b) RPAC (magnification = 500×).
using Design-Expert software (STAT-EASE Inc., Minneapolis, USA)in order to compromise between these responses [13]. In this opti-mization analysis, the target criteria was set as maximum valuesfor both responses while the values of the variables were set in theranges being studied. The predicted and experimental results ofRBBR removal and RPAC yield obtained at optimum conditions areshown in Table 5. The optimum RPAC was obtained by using acti-vation temperature of 789 ◦C, activation time of 1.8 h and IR of 3.5.The optimum activated carbon showed RBBR removal of 78.38% andRPAC yield of 18.02%. It was observed that the experimental valuesobtained were in good agreement with the values predicted fromthe models, with relatively small errors, which were only 3.06% and3.44%, respectively for RBBR removal and RPAC yield.
3.6. Characterization of optimized RPAC
The BET surface area, total pore volume and average porediameter of the RPAC were 908.35 m2/g, 0.52 cm3/g and 2.63 nm,respectively. The average pore diameter of 2.63 nm indicated thatthe RPAC was in the mesoporous region. The high surface areaand pore volume of the RPAC were due to the activation processused which involved CO2 and KOH. Table 6 presents the proximateand elemental analysis of precursor, char and RPAC. After under-going carbonization and activation process, the volatile mattercontent decreased significantly whereas the fixed carbon content
increased in RPAC. This was due to the pyrolytic effect where mostof the organic substances have been degraded and discharged asgas and liquid tars leaving a material with high carbon purity [23].Adinata et al. [24] found that increasing the carbonization temper-ature decreased the yield progressively due to released of volatile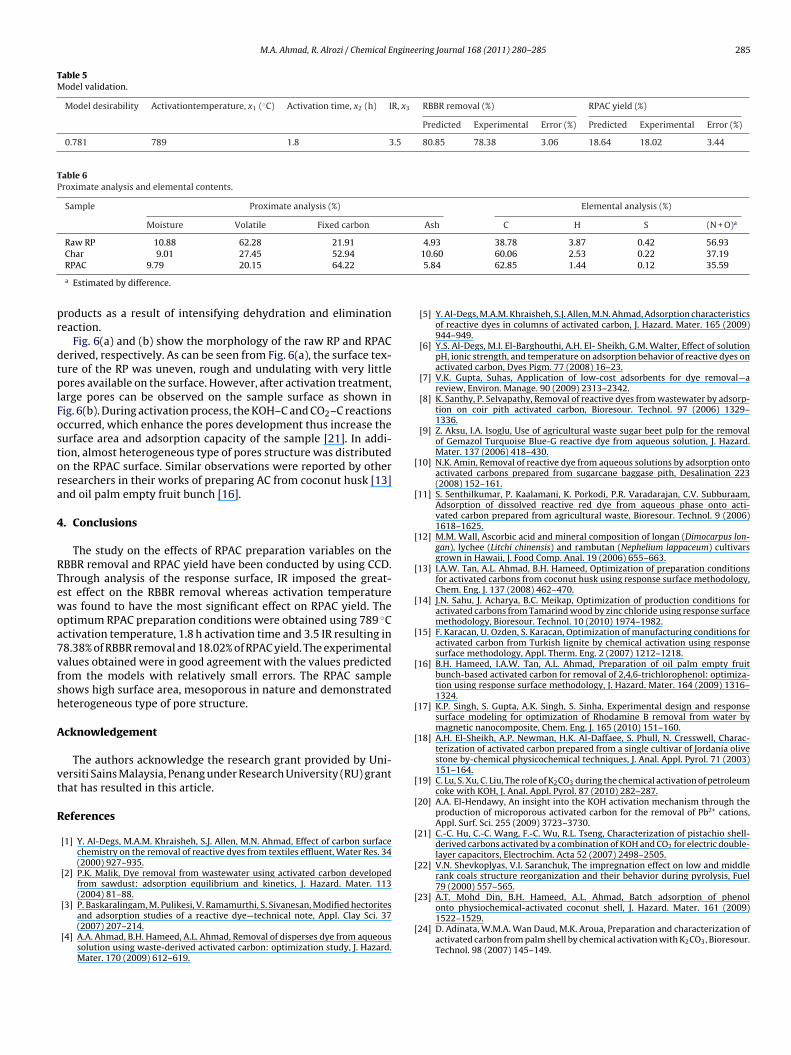
M.A. Ahmad, R. Alrozi / Chemical Engineering Journal 168 (2011) 280–285 285
Table 5Model validation.
Model desirability Activationtemperature, x1 (◦C) Activation time, x2 (h) IR, x3 RBBR removal (%) RPAC yield (%)
Predicted Experimental Error (%) Predicted Experimental Error (%)
0.781 789 1.8 3.5 80.85 78.38 3.06 18.64 18.02 3.44
Table 6Proximate analysis and elemental contents.
Sample Proximate analysis (%) Elemental analysis (%)
Moisture Volatile Fixed carbon Ash C H S (N + O)a
Raw RP 10.88 62.28 21.91 4.93 38.78 3.87 0.42 56.93
pr
dtplFostora
4
RTewoa7vfsh
A
vt
R
[
[
[
[
[
[
[
[
[
[
[
[
[
[23] A.T. Mohd Din, B.H. Hameed, A.L. Ahmad, Batch adsorption of phenol
Char 9.01 27.45 52.94RPAC 9.79 20.15 64.22
a Estimated by difference.
roducts as a result of intensifying dehydration and eliminationeaction.
Fig. 6(a) and (b) show the morphology of the raw RP and RPACerived, respectively. As can be seen from Fig. 6(a), the surface tex-ure of the RP was uneven, rough and undulating with very littleores available on the surface. However, after activation treatment,
arge pores can be observed on the sample surface as shown inig. 6(b). During activation process, the KOH–C and CO2–C reactionsccurred, which enhance the pores development thus increase theurface area and adsorption capacity of the sample [21]. In addi-ion, almost heterogeneous type of pores structure was distributedn the RPAC surface. Similar observations were reported by otheresearchers in their works of preparing AC from coconut husk [13]nd oil palm empty fruit bunch [16].
. Conclusions
The study on the effects of RPAC preparation variables on theBBR removal and RPAC yield have been conducted by using CCD.hrough analysis of the response surface, IR imposed the great-st effect on the RBBR removal whereas activation temperatureas found to have the most significant effect on RPAC yield. The
ptimum RPAC preparation conditions were obtained using 789 ◦Cctivation temperature, 1.8 h activation time and 3.5 IR resulting in8.38% of RBBR removal and 18.02% of RPAC yield. The experimentalalues obtained were in good agreement with the values predictedrom the models with relatively small errors. The RPAC samplehows high surface area, mesoporous in nature and demonstratedeterogeneous type of pore structure.
cknowledgement
The authors acknowledge the research grant provided by Uni-ersiti Sains Malaysia, Penang under Research University (RU) granthat has resulted in this article.
eferences
[1] Y. Al-Degs, M.A.M. Khraisheh, S.J. Allen, M.N. Ahmad, Effect of carbon surfacechemistry on the removal of reactive dyes from textiles effluent, Water Res. 34(2000) 927–935.
[2] P.K. Malik, Dye removal from wastewater using activated carbon developedfrom sawdust: adsorption equilibrium and kinetics, J. Hazard. Mater. 113(2004) 81–88.
[3] P. Baskaralingam, M. Pulikesi, V. Ramamurthi, S. Sivanesan, Modified hectoritesand adsorption studies of a reactive dye—technical note, Appl. Clay Sci. 37(2007) 207–214.
[4] A.A. Ahmad, B.H. Hameed, A.L. Ahmad, Removal of disperses dye from aqueoussolution using waste-derived activated carbon: optimization study, J. Hazard.Mater. 170 (2009) 612–619.
[
10.60 60.06 2.53 0.22 37.195.84 62.85 1.44 0.12 35.59
[5] Y. Al-Degs, M.A.M. Khraisheh, S.J. Allen, M.N. Ahmad, Adsorption characteristicsof reactive dyes in columns of activated carbon, J. Hazard. Mater. 165 (2009)944–949.
[6] Y.S. Al-Degs, M.I. El-Barghouthi, A.H. El- Sheikh, G.M. Walter, Effect of solutionpH, ionic strength, and temperature on adsorption behavior of reactive dyes onactivated carbon, Dyes Pigm. 77 (2008) 16–23.
[7] V.K. Gupta, Suhas, Application of low-cost adsorbents for dye removal—areview, Environ. Manage. 90 (2009) 2313–2342.
[8] K. Santhy, P. Selvapathy, Removal of reactive dyes from wastewater by adsorp-tion on coir pith activated carbon, Bioresour. Technol. 97 (2006) 1329–1336.
[9] Z. Aksu, I.A. Isoglu, Use of agricultural waste sugar beet pulp for the removalof Gemazol Turquoise Blue-G reactive dye from aqueous solution, J. Hazard.Mater. 137 (2006) 418–430.
10] N.K. Amin, Removal of reactive dye from aqueous solutions by adsorption ontoactivated carbons prepared from sugarcane baggase pith, Desalination 223(2008) 152–161.
11] S. Senthilkumar, P. Kaalamani, K. Porkodi, P.R. Varadarajan, C.V. Subburaam,Adsorption of dissolved reactive red dye from aqueous phase onto acti-vated carbon prepared from agricultural waste, Bioresour. Technol. 9 (2006)1618–1625.
12] M.M. Wall, Ascorbic acid and mineral composition of longan (Dimocarpus lon-gan), lychee (Litchi chinensis) and rambutan (Nephelium lappaceum) cultivarsgrown in Hawaii, J. Food Comp. Anal. 19 (2006) 655–663.
13] I.A.W. Tan, A.L. Ahmad, B.H. Hameed, Optimization of preparation conditionsfor activated carbons from coconut husk using response surface methodology,Chem. Eng. J. 137 (2008) 462–470.
14] J.N. Sahu, J. Acharya, B.C. Meikap, Optimization of production conditions foractivated carbons from Tamarind wood by zinc chloride using response surfacemethodology, Bioresour. Technol. 10 (2010) 1974–1982.
15] F. Karacan, U. Ozden, S. Karacan, Optimization of manufacturing conditions foractivated carbon from Turkish lignite by chemical activation using responsesurface methodology, Appl. Therm. Eng. 2 (2007) 1212–1218.
16] B.H. Hameed, I.A.W. Tan, A.L. Ahmad, Preparation of oil palm empty fruitbunch-based activated carbon for removal of 2,4,6-trichlorophenol: optimiza-tion using response surface methodology, J. Hazard. Mater. 164 (2009) 1316–1324.
17] K.P. Singh, S. Gupta, A.K. Singh, S. Sinha, Experimental design and responsesurface modeling for optimization of Rhodamine B removal from water bymagnetic nanocomposite, Chem. Eng. J. 165 (2010) 151–160.
18] A.H. El-Sheikh, A.P. Newman, H.K. Al-Daffaee, S. Phull, N. Cresswell, Charac-terization of activated carbon prepared from a single cultivar of Jordania olivestone by-chemical physicochemical techniques, J. Anal. Appl. Pyrol. 71 (2003)151–164.
19] C. Lu, S. Xu, C. Liu, The role of K2CO3 during the chemical activation of petroleumcoke with KOH, J. Anal. Appl. Pyrol. 87 (2010) 282–287.
20] A.A. El-Hendawy, An insight into the KOH activation mechanism through theproduction of microporous activated carbon for the removal of Pb2+ cations,Appl. Surf. Sci. 255 (2009) 3723–3730.
21] C.-C. Hu, C.-C. Wang, F.-C. Wu, R.L. Tseng, Characterization of pistachio shell-derived carbons activated by a combination of KOH and CO2 for electric double-layer capacitors, Electrochim. Acta 52 (2007) 2498–2505.
22] V.N. Shevkoplyas, V.I. Saranchuk, The impregnation effect on low and middlerank coals structure reorganization and their behavior during pyrolysis, Fuel79 (2000) 557–565.
onto physiochemical-activated coconut shell, J. Hazard. Mater. 161 (2009)1522–1529.
24] D. Adinata, W.M.A. Wan Daud, M.K. Aroua, Preparation and characterization ofactivated carbon from palm shell by chemical activation with K2CO3, Bioresour.Technol. 98 (2007) 145–149.


