Embed Size (px)
Citation preview

This article was downloaded by: [North Dakota State University]On: 06 December 2014, At: 10:25Publisher: Taylor & FrancisInforma Ltd Registered in England and Wales Registered Number: 1072954 Registeredoffice: Mortimer House, 37-41 Mortimer Street, London W1T 3JH, UK
International Journal of ProductionResearchPublication details, including instructions for authors andsubscription information:http://www.tandfonline.com/loi/tprs20
On the role of value systems topromote the sustainability ofcollaborative environmentsA. Abreu a & L. M. Camarinha-Matos aa New University of Lisbon , Quinta da Torre, 2829-516 MonteCaparica, PortugalPublished online: 22 Nov 2007.
To cite this article: A. Abreu & L. M. Camarinha-Matos (2008) On the role of value systems topromote the sustainability of collaborative environments, International Journal of ProductionResearch, 46:5, 1207-1229, DOI: 10.1080/00207540701224244
To link to this article: http://dx.doi.org/10.1080/00207540701224244
PLEASE SCROLL DOWN FOR ARTICLE
Taylor & Francis makes every effort to ensure the accuracy of all the information (the“Content”) contained in the publications on our platform. However, Taylor & Francis,our agents, and our licensors make no representations or warranties whatsoever as tothe accuracy, completeness, or suitability for any purpose of the Content. Any opinionsand views expressed in this publication are the opinions and views of the authors,and are not the views of or endorsed by Taylor & Francis. The accuracy of the Contentshould not be relied upon and should be independently verified with primary sourcesof information. Taylor and Francis shall not be liable for any losses, actions, claims,proceedings, demands, costs, expenses, damages, and other liabilities whatsoever orhowsoever caused arising directly or indirectly in connection with, in relation to or arisingout of the use of the Content.
This article may be used for research, teaching, and private study purposes. Anysubstantial or systematic reproduction, redistribution, reselling, loan, sub-licensing,systematic supply, or distribution in any form to anyone is expressly forbidden. Terms &Conditions of access and use can be found at http://www.tandfonline.com/page/terms-and-conditions

International Journal of Production Research,Vol. 46, No. 5, 1 March 2008, 1207–1229
On the role of value systems to promote the sustainability of
collaborative environments
A. ABREU and L. M. CAMARINHA-MATOS*
New University of Lisbon, Quinta da Torre, 2829-516 Monte Caparica, Portugal
(Revision received January 2007)
The establishment of a common value system is an important element for thesustainability of collaborative networks. However, since the networks aretypically formed by heterogeneous and autonomous entities, it is natural thateach member has its own set of values and effort to align the various valuesystems is therefore necessary. In this context, the role of value systems in thevirtual organization breeding environment is discussed under the assumption thatthe promotion of cooperation is based on the reciprocity mechanism. Examplescenarios are included in the discussion and illustrations are given based on datafrom real networks.
Keywords: Value systems; Collaboration benefits; Virtual organization breedingenvironment; Collaborative network
1. Introduction
In today’s society, collaborative networks manifest themselves in a large varietyof forms such as virtual organizations (VOs), virtual enterprises (VEs), dynamicsupply chains, professional associations, industry clusters, virtual communities(e.g. Linux developers), collaborative virtual laboratories, virtual organizationbreeding environments (VBEs), etc. where most of these collaborative environmentsimply some kind of organization over the activities of their constituents. Therefore,these manifestations can be called collaborative networked organizations (CNOs)in opposition to more spontaneous forms of collaborative patterns that cantake place in virtual communities, namely those that are not business oriented –e.g. Wikipedia contributors in which people may volunteer and come togetherhoping to improve the general aim, but there is no prior plan how their activitiesshould go.
On the other hand, the behaviour of an individual, society, or collaborativenetworked organization (CNO) is, in addition to the constraints imposed by thesurrounding environment, strongly determined by the underlying value system(Smith 1997, Hebel 2000, Abreu and Camarinha-Matos 2006). In general,the structure of a value system, and therefore the drivers of the CNObehaviour, includes multiple variables/aspects (Porter 1985, Osterman 1995,
*Corresponding author. Email: [email protected]
International Journal of Production Research
ISSN 0020–7543 print/ISSN 1366–588X online � 2008 Taylor & Francis
http://www.tandf.co.uk/journals
DOI: 10.1080/00207540701224244
Dow
nloa
ded
by [
Nor
th D
akot
a St
ate
Uni
vers
ity]
at 1
0:25
06
Dec
embe
r 20
14
Baron and Spanca 1997, Anderson and Narus 1999, Parolini 1999, Schultz andZelezny 1999). Complementarily, there are other elements that influence ordetermine the behaviour of the CNO and its members, such as the schema ofincentives, trust building and management mechanisms (De Leede and Looise 2001),ethical code, the CNO culture, and the contracts and collaboration agreements. Onthe other hand, it is intuitively understood that the values considered in a business-oriented CNO (e.g. network of companies) are different from those adopted in anon-profit context (e.g. disaster rescue network).
It is commonly assumed that the participation in a collaborative processbrings benefits to the involved entities (Porter 1980, Carlton and Perloff 2000).These expected benefits include not only an increase of the ‘survival capability’ in thecontext of market turbulence, but also the possibility to better achieve common goals,(Fujlly and Kaiharaz 2000, Huang and Wu 2003). On the basis of these expectationsthere are, among others, the following factors: sharing of risks and resources, joiningof complementary skills and capacities, acquisition of an apparent higher dimension,access to new/wider markets and new knowledge. However, collaboration alsoinvolves additional overheads (e.g. transaction costs) and risks (Williamson 1975,1998). In a CNO conflicts frequently arise when the participating members havedifferent and not aligned value systems. The establishment of a common value systemor an effort to align the value systems of the various participants can therefore play animportant role in the sustainability of a collaborative spirit.
The evolution of collaborative forms (Jagdev and Thoben 2001), the emergenceof new roles, new actors (Katzy 1999, Selz 1999, Mejıa and Molina 2002, D’Atri2003) and the possibility of having repetitive interactions among partners result inthe value generated by a collaboration process being no more determined only by itstangible assets (given by products/services supplied), but also by its intangible assets(e.g. relationships’ value, or ‘social capital’) (Belack et al. 2002).
The following sections of this article discuss the value system role in the contextof a virtual organization breeding environment (VBE), discussing the concept ofvalue system, the nature of the collaborative benefits, and their role in thesustainability of a ‘collaborative spirit’ based on the reciprocity mechanism.
2. Value systems
What is a value system? A value system is frequently understood as: the ordering andprioritization of a set of values (principles, standards or qualities consideredworthwhile or desirable) that an actor or a society of actors holds. However, thevalues that a group or an actor hold may fall into several different categories sincethe concept of value is multifaceted. In the related research literature, e.g. Porter(1985), Collins (1993), Osterman (1995), Piaget (1995), several definitions for themeaning of value are suggested and two main focuses for these definitions arereferred to as economic values and ethical/ideological values:
Notion of economic value:
. An amount, as of goods, services, or money, considered to be a fair andsuitable equivalent for something else; a fair price or return, what a customerreceives in exchange for the price paid.
1208 A. Abreu and L. M. Camarinha-Matos
Dow
nloa
ded
by [
Nor
th D
akot
a St
ate
Uni
vers
ity]
at 1
0:25
06
Dec
embe
r 20
14
. To make a judgment as to the worth of something, in the sense of appraise,assay, assess, calculate, estimate, evaluate, gauge, judge.
Notion of socio-ethical value:
. Ethical values are those values that serve to distinguish between good andbad, right and wrong, and moral and immoral. At a societal level, thesevalues frequently form a basis for what is permitted and what is prohibited.
. Ideological values deal with the broader or more abstract areas of politics,religion, economics, and social morals.
A number of characteristics can be considered for the values in a value system:
Subjective – For an identical context, distinct members may apply different valuesand might have different perceptions of a value.Personal vs. social – The personal values can be applied to one member only(e.g. assets, capacity, and price) and social values can be applied to a set ofmembers (e.g. ethical code, cooperation agreements and contracts).Normative vs. exchange – The purpose of normative values is to define a set ofrules (‘rights/duties’) that contribute to assure the stability and the cohesion of thegroup since they convey norms in a persuasive way (e.g. trust, ethical code, andlaw). The purpose of exchange values is to ‘measure’ the objects exchanged amongpartners in a certain context and moment.Dynamic – The values can change along the time. They can fade out, increase theirworth or appear for the first time.Measurable – The values can be measured using a quantitative or aqualitative scale.
The concept of a value system in a CNO context can be based on thenotion that each product/service requires a set of value activities that areperformed by a number of the network members forming a ‘value creationsystem’ through a VO (this definition includes economic and ethical/ideologicalvalue as well). As a result, a value system is important in terms ofproviding a:
. Regulatory role – for instance, to assure social cohesion, to understandmembers’ behaviour, and to build performance indicators.
. Transactions mechanism between partners – such as, assuring an equalityutility between the exchanged objects.
The notion of benefit: From the traditional literature on virtual enterprises/virtualorganizations, a number of variables related to the identification ofcollaboration benefits and a set of related target goals have been suggested(table 1) (Camarinha-Matos and Abreu 2004).
Table 2 shows, for each target goal, some examples of associated (intuitive)advantages of collaboration.
Considering a simplified view under which the goal of a CNO is themaximization of some ‘component’ of its value system, in a business contextthe dominant value is the profit (in economic sense), while in the other cases theobjectives are altruistic and valued by the amount of prestige or socialrecognition.
Value systems to promote the sustainability of collaborative environments 1209
Dow
nloa
ded
by [
Nor
th D
akot
a St
ate
Uni
vers
ity]
at 1
0:25
06
Dec
embe
r 20
14
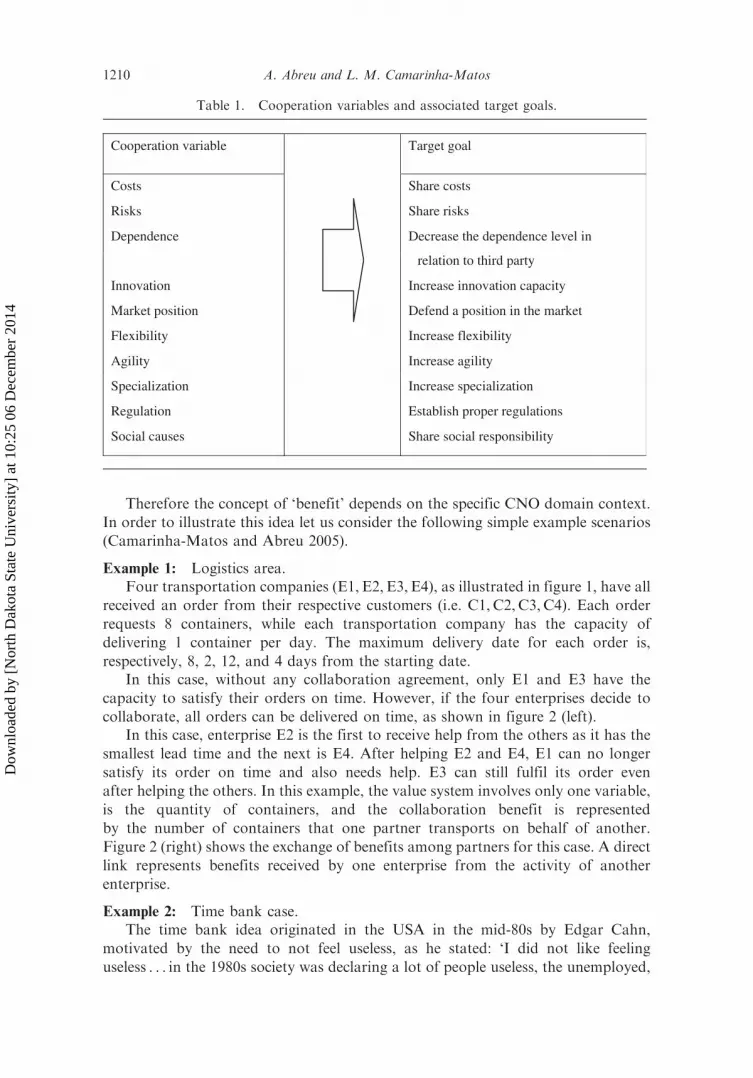
Therefore the concept of ‘benefit’ depends on the specific CNO domain context.
In order to illustrate this idea let us consider the following simple example scenarios
(Camarinha-Matos and Abreu 2005).
Example 1: Logistics area.Four transportation companies (E1, E2, E3, E4), as illustrated in figure 1, have all
received an order from their respective customers (i.e. C1, C2, C3, C4). Each order
requests 8 containers, while each transportation company has the capacity of
delivering 1 container per day. The maximum delivery date for each order is,
respectively, 8, 2, 12, and 4 days from the starting date.In this case, without any collaboration agreement, only E1 and E3 have the
capacity to satisfy their orders on time. However, if the four enterprises decide to
collaborate, all orders can be delivered on time, as shown in figure 2 (left).In this case, enterprise E2 is the first to receive help from the others as it has the
smallest lead time and the next is E4. After helping E2 and E4, E1 can no longer
satisfy its order on time and also needs help. E3 can still fulfil its order even
after helping the others. In this example, the value system involves only one variable,
is the quantity of containers, and the collaboration benefit is represented
by the number of containers that one partner transports on behalf of another.
Figure 2 (right) shows the exchange of benefits among partners for this case. A direct
link represents benefits received by one enterprise from the activity of another
enterprise.
Example 2: Time bank case.The time bank idea originated in the USA in the mid-80s by Edgar Cahn,
motivated by the need to not feel useless, as he stated: ‘I did not like feeling
useless . . . in the 1980s society was declaring a lot of people useless, the unemployed,
Table 1. Cooperation variables and associated target goals.
Cooperation variable Target goal
Costs Share costs
Risks Share risks
Dependence Decrease the dependence level in
relation to third party
Innovation Increase innovation capacity
Market position Defend a position in the market
Flexibility Increase flexibility
Agility Increase agility
Specialization Increase specialization
Regulation Establish proper regulations
Social causes Share social responsibility
1210 A. Abreu and L. M. Camarinha-Matos
Dow
nloa
ded
by [
Nor
th D
akot
a St
ate
Uni
vers
ity]
at 1
0:25
06
Dec
embe
r 20
14
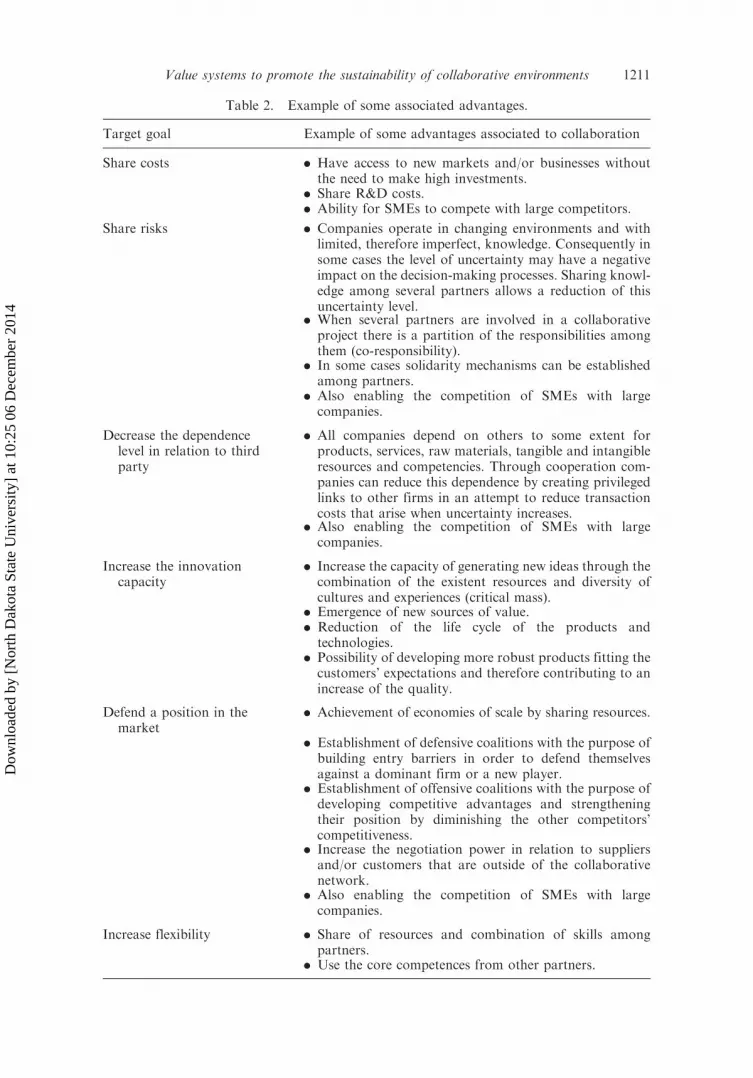
Table 2. Example of some associated advantages.
Target goal Example of some advantages associated to collaboration
Share costs . Have access to new markets and/or businesses withoutthe need to make high investments.
. Share R&D costs.
. Ability for SMEs to compete with large competitors.
Share risks . Companies operate in changing environments and withlimited, therefore imperfect, knowledge. Consequently insome cases the level of uncertainty may have a negativeimpact on the decision-making processes. Sharing knowl-edge among several partners allows a reduction of thisuncertainty level.
. When several partners are involved in a collaborativeproject there is a partition of the responsibilities amongthem (co-responsibility).
. In some cases solidarity mechanisms can be establishedamong partners.
. Also enabling the competition of SMEs with largecompanies.
Decrease the dependencelevel in relation to thirdparty
. All companies depend on others to some extent forproducts, services, raw materials, tangible and intangibleresources and competencies. Through cooperation com-panies can reduce this dependence by creating privilegedlinks to other firms in an attempt to reduce transactioncosts that arise when uncertainty increases.
. Also enabling the competition of SMEs with largecompanies.
Increase the innovationcapacity
. Increase the capacity of generating new ideas through thecombination of the existent resources and diversity ofcultures and experiences (critical mass).
. Emergence of new sources of value.
. Reduction of the life cycle of the products andtechnologies.
. Possibility of developing more robust products fitting thecustomers’ expectations and therefore contributing to anincrease of the quality.
Defend a position in themarket
. Achievement of economies of scale by sharing resources.
. Establishment of defensive coalitions with the purpose ofbuilding entry barriers in order to defend themselvesagainst a dominant firm or a new player.
. Establishment of offensive coalitions with the purpose ofdeveloping competitive advantages and strengtheningtheir position by diminishing the other competitors’competitiveness.
. Increase the negotiation power in relation to suppliersand/or customers that are outside of the collaborativenetwork.
. Also enabling the competition of SMEs with largecompanies.
Increase flexibility . Share of resources and combination of skills amongpartners.
. Use the core competences from other partners.
Value systems to promote the sustainability of collaborative environments 1211
Dow
nloa
ded
by [
Nor
th D
akot
a St
ate
Uni
vers
ity]
at 1
0:25
06
Dec
embe
r 20
14

Table 2. Continued.
Target goal Example of some advantages associated to collaboration
. Increase the adaptation capacity towards several businessenvironments simultaneously.
. Offer a broader range of products/services.
. Grow for new segments in a stable way reaching a largerstability.
Increase agility . React in a short period of time to a business opportunitythrough the establishment of more agile procedures.
. Increase the interoperability between several processesand products (establishment of norms).
Increase specialization . Let companies concentrate their resources on the criticalactivities.
Establish proper regulations . Definition of rules to avoid opportunistic behaviours andto avoid conflicts.
. Increase common culture of trust.
Share social responsibilities . Obtain recognition from others (intangible value).. Develop social responsibility.. Altruism.. Reinforce values that are common.
C2
(LT=2 days)
(LT=4 days)
(LT=8 days)
(LT=12 days)
C1
E1 E2
E3
E4
C3C4
Figure 1. Collaboration in transportation.
E3
E4
E1
E24 2
2
2
22
2
E4
E3
E1
4
E2
E3
E1 2
2
2
E3
E4
E1 2
2
2
0 2 4 8 12Time (days)
E2
C2
2
8
E4
C4
C1
C3
2
4
Figure 2. Transportation collaboration over time and benefits exchanged among partners.
1212 A. Abreu and L. M. Camarinha-Matos
Dow
nloa
ded
by [
Nor
th D
akot
a St
ate
Uni
vers
ity]
at 1
0:25
06
Dec
embe
r 20
14
the elderly and the young’. Thus he came up with the idea: ‘why not reward decencyand caring?’ His initiative turned into a ‘movement’ that gained rapid acceptance notonly in the USA, but also in various other countries.
The time bank concept is very simple: people are entitled to ‘deposit’ time whenthey contributed to the community by giving practical help and support to others;in exchange they may ‘withdraw’ time when they need something done themselves byothers. One key principle here is that one hour of activity is equal for everybody.One hour of helping out with gardening is equal to an hour of baby-sitting.
In the time bank concept the value system involves only one variable, is thequantity of time that is exchanged among people, and the collaboration benefit isgiven by the number of hours that one person spends helping another.
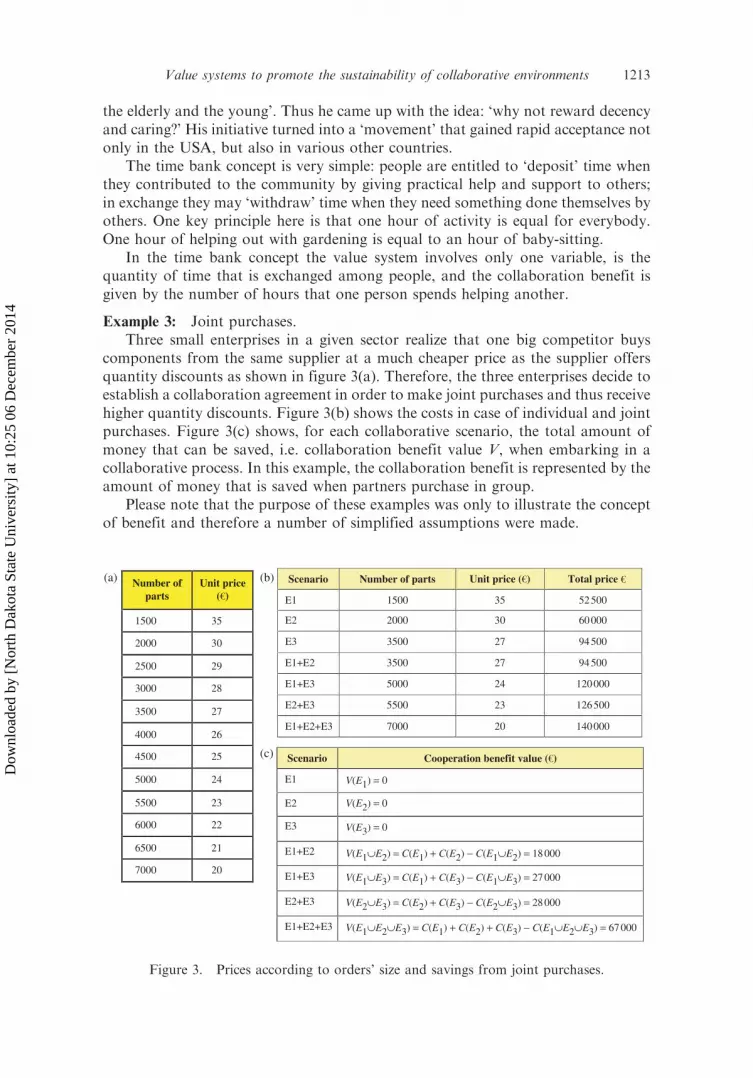
Example 3: Joint purchases.Three small enterprises in a given sector realize that one big competitor buys
components from the same supplier at a much cheaper price as the supplier offersquantity discounts as shown in figure 3(a). Therefore, the three enterprises decide toestablish a collaboration agreement in order to make joint purchases and thus receivehigher quantity discounts. Figure 3(b) shows the costs in case of individual and jointpurchases. Figure 3(c) shows, for each collaborative scenario, the total amount ofmoney that can be saved, i.e. collaboration benefit value V, when embarking in acollaborative process. In this example, the collaboration benefit is represented by theamount of money that is saved when partners purchase in group.
Please note that the purpose of these examples was only to illustrate the conceptof benefit and therefore a number of simplified assumptions were made.
Number ofparts
1500 35
2000 30
2500 29
3000 28
3500 27
4000 26
4500 25
5000 24
5500 23
6000 22
6500 21
7000 20
Scenario Number of parts Total price
E1 1500 35 52500
E2 2000 30 60000
E3 3500 27 94500
E1+E2 3500 27 94500
E1+E3 5000 24 120000
E2+E3 5500 23 126500
E1+E2+E3 7000 20 140000
Scenario
E1 V(E1) = 0
E2 V(E2) = 0
E3 V(E3) = 0
E1+E2 V(E1∪E2) = C(E1) + C(E2) − C(E1∪E2) = 18000
E1+E3 V(E1∪E3) = C(E1) + C(E3) − C(E1∪E3) = 27000
E2+E3 V(E2∪E3) = C(E2) + C(E3) − C(E2∪E3) = 28000
E1+E2+E3 V(E1∪E2∪E3) = C(E1) + C(E2) + C(E3) − C(E1∪E2∪E3) = 67000
(a) (b)
(c)
Figure 3. Prices according to orders’ size and savings from joint purchases.
Value systems to promote the sustainability of collaborative environments 1213
Dow
nloa
ded
by [
Nor
th D
akot
a St
ate
Uni
vers
ity]
at 1
0:25
06
Dec
embe
r 20
14

In general the concept of benefit for the context of networks of enterprises most
likely represents a measure of the economic benefits (in the sense of net profit), while
in the context of a not-for-profit organizations it could represent a more abstract
notion of acquired social prestige or peer recognition. Nevertheless, in most cases
this concept could be expressed as a combination of multiple variables, as illustrated
in figure 4.To illustrate this case, let us consider the following example:
Example 4: Benefits as a combined abstract value.An enterprise needs to find a partner in order to accomplish a goal. For that
purpose, it announces to the set of potential partners what its needs are. When
selecting a partner, the enterprise considers a specific value system, in this case
composed of lead time, unit price, guarantee, and references. It also decides on the
relative importance of each variable and defines two reference levels – neutral and
good (figure 5a); values worse than the neutral level are classified as ‘bad’. Consider
now that the enterprise receives bids from three other enterprises E2, E3, and E4,
as shown in figure 5(b).In order to determine the benefits V of each offer, consider that the enterprise
applies the following criteria:
V Ekð Þ ¼Xnj¼1
kj � vjðEkÞ withXnj¼1
kj ¼ 1 and kj0 and
vjðgoodjÞ ¼ 100vjðneutraljÞ ¼ 0vjðbadjÞ ¼ �100:
8<:
Value system
Reciprocity
Price
Trust
(…)
Partial benefits value
Total benefitsvalue
Figure 4. Example of benefit as a combined abstract value.
vj
(a) Reference levels (b) Received offers
Value system Value system E2 E3 E4Reference level
Good Neutral
Weight kj
Lead time
Unit price
Guarantee
References
0,2 9 days
4 days 1 day
5 members none
10 days
10 days 8 days 8 days
5 days 4 days 3 days
7 members 6 members 6 members
0,4
0,2
0,2
Lead time
Unit price
Guarantee
References
Figure 5. Value system.
1214 A. Abreu and L. M. Camarinha-Matos
Dow
nloa
ded
by [
Nor
th D
akot
a St
ate
Uni
vers
ity]
at 1
0:25
06
Dec
embe
r 20
14

where:
V(Ek) total benefits value from the bid of enterprise Ek;vj(Ek) partial benefits value resulting from variable j of the value system for the
bid of enterprise Ek;kj relative importance of variable j.
As a result, the potential benefit of each offer is given in table 3.Unlike the previous examples, in this case the concept of benefit is represented as
an abstract aggregated value. Since the enterprise that contributes with higher benefitvalue is E4, then on this occasion E4 is likely to be selected.
3. Contributed and received benefits
A collaborative process is understood as a set of tasks performed by the collaborativenetwork members towards the achievement of a common goal (e.g. the business goalthat motivates the creation of a virtual enterprise) (Camarinha-Matos and Abreu2005, Abreu and Camarinha-Matos 2006). For reasons of simplicity we considera level of granularity of tasks such that each task is performed by a single member ofthe network (single actor).
For the purpose of the following discussion, let us consider task performancebenefits (TB) as the benefits that result from the performance of a task in the contextof a collaborative process. The term benefit is used with the same meaning as netprofit and in this model benefits are assumed as abstract quantifiable measurements.As discussed in the previous section the actual meaning of a benefit depends on theunderlying value system.
Let tlj be a task tl performed by an actor aj and TBji(tlj) the benefits for anotheractor ai as a result of the performance of this task.
When i 6¼ j this represents a received benefit (RB) (perspective of actor ai) or acontributed benefit (CB) (perspective of actor aj) (figure 6); otherwise it is aself-benefit, a case that is not considered in this discussion.
Table 3. Benefit from each offer.
Value System Weight kj vj (E2) vj (E3) vj (E4)
Lead time 0,2 0 20 20Unit price 0,4 0 �40 40Guarantee 0,2 20 0 �20References 0,2 20 20 20Collaboration benefits value V(Ek) 40 0 60
ai aj
TBji (tli)
RBij CBji
Figure 6. Actor ai receives benefits from the action of actor aj.
Value systems to promote the sustainability of collaborative environments 1215
Dow
nloa
ded
by [
Nor
th D
akot
a St
ate
Uni
vers
ity]
at 1
0:25
06
Dec
embe
r 20
14

The total benefits an actor ai receives as a result of the performance of anotheractor aj is given by:
received benefits ðRBijÞ ¼XLl¼1
TBjiðtjlÞ, i 6¼ j:
where:
tjl task tl performed by actor aj;L number of tasks performed by actor aj.
Similarly, from the contributor’s point of view, we can define benefits contributed byan actor ai to its partner aj as a result of all tasks performed by ai:
contributed benefits ðCBijÞ ¼XLl¼1
TBijðtilÞ, i 6¼ j:
where:
til task tl performed by actor ai;L total tasks performed by actor ai.
4. Mechanisms for evolution of collaboration
Several principles and mechanisms to promote a collaborative behaviour in asustainable way have been suggested in the literature, as illustrated in table 4.
5. Reciprocity as a mechanism to promote collaboration in a VBE context
In the following discussion a VO breeding environment (VBE) is assumed as thetarget context. A VBE represents an association of organizations and their relatedsupporting institutions, adhering to a long term base cooperation agreement, andadoption of common operating principles and infrastructures, with the main goal ofincreasing their preparedness towards rapid configuration of temporary alliances forcollaboration in potential virtual organizations. Namely, when a businessopportunity is identified by one member (acting as a broker), a subset of VBEorganizations can be selected to form a VE/VO (Camarinha-Matos andAfsarmanesh 2003).
As discussed in the previous section, based on representation of the benefitsmodel (see, Camarinha-Matos and Abreu 2004, 2005 for more details), a reciprocitymechanism can be implemented, by analysing the balance between ‘social’ benefitscredit (the sum of benefits contributed by an actor aj to all its partners) and ‘social’benefits debit (the sum of benefits received by an actor aj as a result of theperformance of all actors involved in the collaborative process). The reciprocityvalue (Rj) for an actor aj is given by:
Rj ¼XNi¼1
CBji �XNi¼1
RBij, i 6¼ j
1216 A. Abreu and L. M. Camarinha-Matos
Dow
nloa
ded
by [
Nor
th D
akot
a St
ate
Uni
vers
ity]
at 1
0:25
06
Dec
embe
r 20
14

Table 4. Collaboration mechanisms.
Collaboration mechanism Short description
Direct reciprocity This mechanism suggests that actors should reciprocate help tothose that have intentionally helped them in the past. Thismodel can explain social phenomena like for instance thelive-and-let-live system in trench warfare in World War I,friendships, gratitude, sympathy, trustworthiness and ingeneral all social dilemmas. In the biological field it canexplain the symbioses mechanism.
The mathematical model of collaboration via direct reciprocityis based on the game theory and much of the workdeveloped applies the prisoner’s dilemma, stag hunt andchicken game metaphor (Axelroad 1984, Roberts andSherratt 1998, Ernst and Simon 2000).
Indirect reciprocity This mechanism suggests that an actor should provide help ifthe recipient has helped others in the past. This mechanismis a common practice in human societies like, for instance, inthe social welfare principle and insurance principle, wherethe donor does not obtain a return from the recipient, butfrom a third party (Alexander 1987, Nowak and Sigmund1998).
Kin selection Kin selection leads to the concept that an individual shouldsacrifice itself in order to save ‘two siblings, four nephews oreight cousins’. Kin selection has been used to explain theevolution of humanity’s social structure, social insects suchas ants and termites (Hamilton 1963, 1964).
Group selection This mechanism describes the process by which groups developadaptive traits that improve their fitness in their environ-ment compared to other groups. According to this approachthe selection mechanism can operate not only at theindividual level, but also at the group level where it ispossible to explain the existence of altruistic behaviours.Altruists may be less fit than non-altruists within a singlegroup, but groups of altruists are better fitted than groupsof non-altruists.
An approach similar to this process was the propagandacampaigns in the Great Depression ‘We’re all in it together’.According to the social psychology, humans form coalitionson the basis of virtually any commonality of interest and allhumans are in the ‘in-group’ where the information‘in-group’ members is processed in more favourable waysthan information about out-group members (Eshel 1972).
Social learning According to this approach individuals learn the mostdominant behaviours in their embedded social network.Based on this principle collaboration can evolve based oncultural transmission. The common metaphor, when agroup of actors decide to solve problems that none of theactors alone could solve, leads to scenarios where colla-borative behaviour is created among many individualswithout conscious control are collaboration examples viasocial learning (Boyd and Richerson 1982, Simon 1991).
Value systems to promote the sustainability of collaborative environments 1217
Dow
nloa
ded
by [
Nor
th D
akot
a St
ate
Uni
vers
ity]
at 1
0:25
06
Dec
embe
r 20
14
where:
N number of actors involved in the collaborative process;CBji benefits contributed by aj to ai;RBij benefits received by aj from ai.
When Rj50, the actor aj may be seen, by its partners, as having a potentially ‘selfish’
behaviour in the period of time under analysis, in the sense that it received more
benefits than it contributed. If this balance remains negative in the long term,
the actor would most likely be considered selfish and probably not an appreciated
partner. On the other hand, when Rj40, the actor aj might be seen, by its partners, as
having a potentially ‘altruistic’ behaviour and it would be considered altruist if it
holds this behaviour in the long term.In order to discuss the role of the value systems when the promotion of
collaboration is based on a reciprocity mechanism, let us consider the two scenarios
in subsections 5.1 and 5.2.
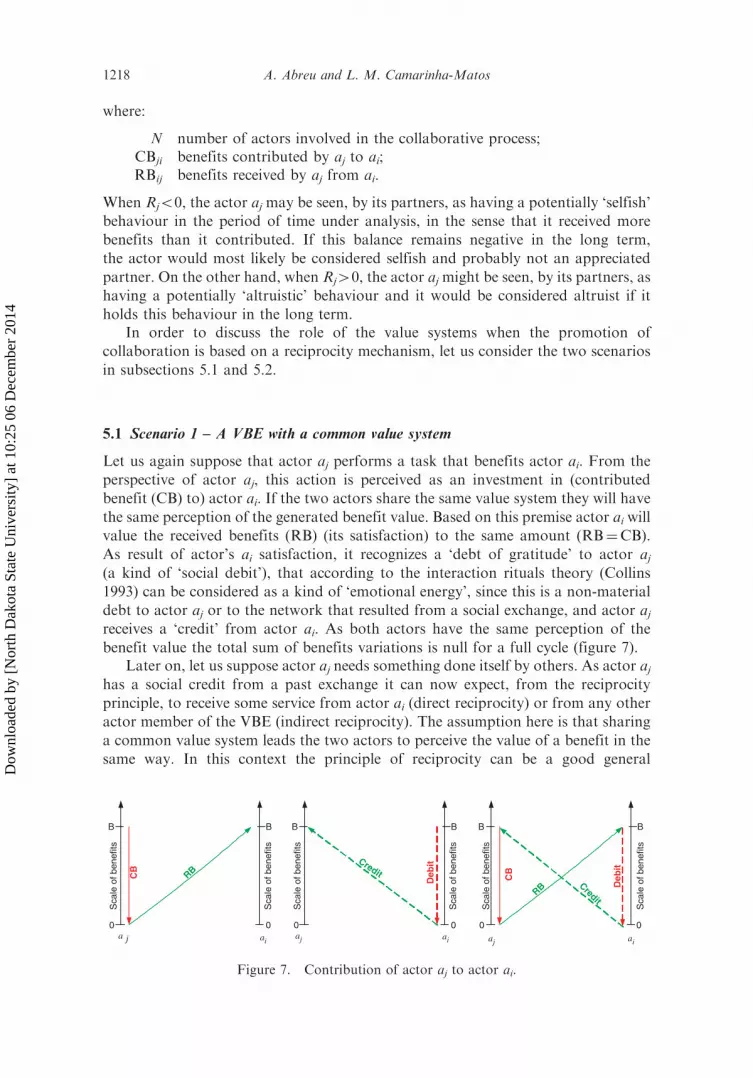
5.1 Scenario 1 – A VBE with a common value system
Let us again suppose that actor aj performs a task that benefits actor ai. From the
perspective of actor aj, this action is perceived as an investment in (contributed
benefit (CB) to) actor ai. If the two actors share the same value system they will have
the same perception of the generated benefit value. Based on this premise actor ai will
value the received benefits (RB) (its satisfaction) to the same amount (RB¼CB).
As result of actor’s ai satisfaction, it recognizes a ‘debt of gratitude’ to actor aj(a kind of ‘social debit’), that according to the interaction rituals theory (Collins
1993) can be considered as a kind of ‘emotional energy’, since this is a non-material
debt to actor aj or to the network that resulted from a social exchange, and actor ajreceives a ‘credit’ from actor ai. As both actors have the same perception of the
benefit value the total sum of benefits variations is null for a full cycle (figure 7).Later on, let us suppose actor aj needs something done itself by others. As actor aj
has a social credit from a past exchange it can now expect, from the reciprocity
principle, to receive some service from actor ai (direct reciprocity) or from any other
actor member of the VBE (indirect reciprocity). The assumption here is that sharing
a common value system leads the two actors to perceive the value of a benefit in the
same way. In this context the principle of reciprocity can be a good general
aija
CB
RB
B
0
B
Sca
le o
f ben
efits
0
Sca
le o
f ben
efits
Deb
itCredit
B
0
B
0
Sca
le o
f ben
efits
Sca
le o
f ben
efits
aj ai
CB
RB
B
0
B
0
Deb
it
Credit
Sca
le o
f ben
efits
Sca
le o
f ben
efits
aiaj
Figure 7. Contribution of actor aj to actor ai.
1218 A. Abreu and L. M. Camarinha-Matos
Dow
nloa
ded
by [
Nor
th D
akot
a St
ate
Uni
vers
ity]
at 1
0:25
06
Dec
embe
r 20
14

governance rule for promoting collaboration. In order to illustrate this idea let us
consider the following example.
5.1.1 Example 1 – The time bank case. The time bank concept induces mutuallyhelping communities whose value system consists of only one variable, the
quantity of time exchanged among people. The collaboration benefit is measured
as the number of hours that one person spends helping another. One key
principle here is that one hour of activity is equal for everybody. One hour
of helping out with gardening is equal to an hour of baby-sitting. As an illustration,
figure 8 shows some exchanges of services among members in a Portuguese
time bank agency.The reciprocity principle is applied in the time bank in the following way: people
‘deposit’ time they when they contribute to the community by giving practical help
and support to someone; in exchange they are able to ‘withdraw’ time when they
need something done themselves by others.Based on real data from a Portuguese time bank agency, figure 9 (using Ucinet,
Borgatti et al. 2002) shows the evolution of collaboration from the perspective of
contributed benefits through two consecutive years. From the perspective of the
reciprocity mechanism in 2002, for instance, we have direct reciprocity between
nodes 2000 and 2029, and indirect reciprocity among nodes 2014, 2005 and 2003.
The nodes’ size represents the level of contribution of each actor and the link’s width
represents the value of benefit supplied.
2000
2012
20052056
2010
2031 2008
2045
2029
2055
2006
2014
2009
2007
2039
2011
2044
Baby-sitting
Baby-sitting
Baby-sitting
Baby-sitting
Baby-sitting
Baby-sitting
Domestic help
Baby-sitting
Englishlessons
Gardening
Gardening
Legal advice
Baby-sitting Gardening
English lessons
Legal advice
English lessons
First-aid-assistence help
Englishlessons
Gardening
Englishlessons
Englishlessons
English Lessons
Legal advice
2003
Domestic help
Figure 8. Exchanges of services in a time bank agency.
Value systems to promote the sustainability of collaborative environments 1219
Dow
nloa
ded
by [
Nor
th D
akot
a St
ate
Uni
vers
ity]
at 1
0:25
06
Dec
embe
r 20
14

One interesting advantage of using a social network analysis approach is the
possibility to analyse in detail the ‘sub-structures’ that may be present in
a collaborative network. Divisions of members into cliques, i.e. sub-structures of
a network in which the members are more closely and intensely linked to one another
than they are to other members of the network, can be important to understand how
the network as a whole is likely to behave.On the other hand, at micro level the knowledge how a member is embedded in
a sub-structure within a network, may be important to understand its behaviour.
For instance, some members can act as ‘bridges’ between groups. In 2002 the node
2009 acts as a bridge between the sub-structure made by nodes 2011 and 2044 and
the other members of the network. Some nodes may have all of their contributions
within a single clique, while others are completely isolated from the main group such
as node 2013 in 2002.Analysing the two graphs at the same time we can verify that some nodes are
predominant as having a potentially ‘altruistic’ behaviour such as node 2000, some
have a potentially ‘selfish’ behaviour such as node 2039 and others may have a
‘transitory’ behaviour such as node 2031. In 2002 there are two nodes (2000 and
2014) that are the major contributors. In 2003 the situation changed; in that year
there are more ‘big contributors’ and the number of links also increased, showing
that a stronger collaboration level was achieved.This increase in the level of collaboration, and the proliferation of time banks
in many countries, depends in our opinion, among others factors (such as the
leadership of the time bank promoter), on the existence of this simple and common
Figure 9. Example of evolution of contributed benefits over time in a time bank agency.
1220 A. Abreu and L. M. Camarinha-Matos
Dow
nloa
ded
by [
Nor
th D
akot
a St
ate
Uni
vers
ity]
at 1
0:25
06
Dec
embe
r 20
14
value system and the application of the principle of reciprocity (mostly indirect
reciprocity in this case).
5.2 Scenario 2 – A VBE without a common value system
Let us now discuss a scenario where actors involved in an exchange have distinct
perceptions of the value of a benefit.In this case, the perception of the contributed and received benefits may have
different values (CBij 6¼RBji). An actor may show an opportunistic behaviour when
it does not acknowledge, as a receiver of a benefit, its ‘social debt’ to the same
amount the contributor valued that benefit. It may also be the case that thecontributor over-values its contribution. On the other hand, a receiver may also
show an over-gratitude when it acknowledges a ‘social debt’ higher than the value of
the received benefit. In other words, the lack of a common value system is likely tolead to situations in which there is an imbalance between the social credits and social
debts resulting from a transaction (Cij 6¼Dji). In this section, and to facilitate the
discussion, these situations and their impact on the collaborative behaviour areanalysed in the context of direct reciprocity.
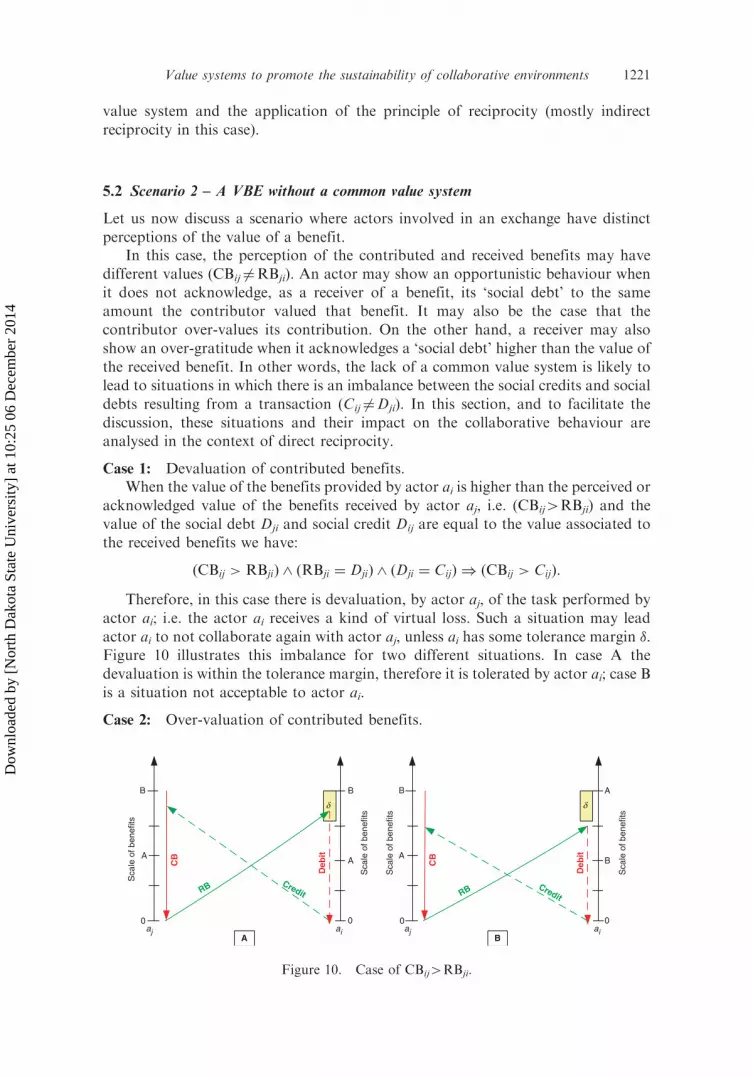
Case 1: Devaluation of contributed benefits.When the value of the benefits provided by actor ai is higher than the perceived or
acknowledged value of the benefits received by actor aj, i.e. (CBij4RBji) and the
value of the social debt Dji and social credit Dij are equal to the value associated tothe received benefits we have:
ðCBij > RBjiÞ ^ ðRBji ¼ DjiÞ ^ ðDji ¼ CijÞ ) ðCBij > CijÞ:
Therefore, in this case there is devaluation, by actor aj, of the task performed by
actor ai; i.e. the actor ai receives a kind of virtual loss. Such a situation may lead
actor ai to not collaborate again with actor aj, unless ai has some tolerance margin �.Figure 10 illustrates this imbalance for two different situations. In case A the
devaluation is within the tolerance margin, therefore it is tolerated by actor ai; case B
is a situation not acceptable to actor ai.
Case 2: Over-valuation of contributed benefits.
CB
RB
B
0 0
B
Sca
le o
f ben
efits
Sca
le o
f ben
efits
Deb
it
Credit
A A
aj aiA
δ
CB
RB
B
0
A
Sca
le o
f ben
efits
Sca
le o
f ben
efits
0
Deb
it
Credit
A B
aj aiB
δ
Figure 10. Case of CBij4RBji.
Value systems to promote the sustainability of collaborative environments 1221
Dow
nloa
ded
by [
Nor
th D
akot
a St
ate
Uni
vers
ity]
at 1
0:25
06
Dec
embe
r 20
14

When the value of the benefits contributed by actor ai is lower than the valueacknowledged for received benefits by actor aj, then CBij5RBji and the value of thesocial debt Dji and social credit Cij are equal to the value associated to the receivedbenefits, then:
ðCBij < RBjiÞ ^ ðRBji ¼ DjiÞ ^ ðDji ¼ CijÞ ) ðCBij < CijÞ:
In this case there is an over-valuation, by actor aj, of the task performed by actorai; i.e. actor ai receives a kind of moral profit. This case may lead actor ai to classifyactor aj as a privileged actor to collaborate with. Figure 11 illustrates this imbalancein two distinct situations. In case A the over-valuation is perceived by actor ai sinceits exceeds the tolerance margin for the social credit �; in case B, although there issome over-valuation, actor ai does not perceive it.
Case 3: Interaction with an actor with opportunistic behaviour.When the value of the benefits contributed by actor ai is equal to the value of the
received benefits acknowledged by actor aj, i.e. CBij¼RBji, but actor aj assumes asocial debt in relation to actor ai, Dji, that is lower than the value of the receivedbenefits, RBji4Dji, we have:
ðCBij ¼ RBjiÞ ^ ðRBji > DjiÞ ^ ðDji ¼ CijÞ ) ðCBij > CijÞ:
This case shows the presence of an opportunistic behaviour from actor ajregarding actor ai. When, on a later occasion, actor ai invokes the principle of(direct) reciprocity it will realize that there is a loss of the assumed commitments byactor aj, that may lead to a conflict in the relationship between the two actors.Figure 12 illustrates this case for two distinct situations. In case A, actor aj isconsidered as opportunist by actor ai, in spite of actor aj not having a deliberateintention of breaking its commitments since it contributes back according to itsperception of the received benefits, under a tolerance margin �. In case B there is adeliberate break of commitments by actor aj.
Case 4: Interaction with an actor that shows over-gratitude.When the benefits provided by actor ai are equal to the benefits received by actor
aj, i.e. CBij¼RBji, but actor aj assumes a social debt regarding actor ai, Dji, that ishigher than the value of the received benefits RBji5Dji, we have:
ðCBij ¼ RBjiÞ ^ ðRBji < DjiÞ ^ ðDji ¼ CijÞ ) ðCBij < CijÞ:
ai aiaj aj
Sca
le o
f ben
efits
Sca
le o
f ben
efits
Deb
it
Deb
it
CB
CB
RBRB
Credit
Credit
B
A
A B0
Sca
le o
f ben
efits
B
A
0
B
A
0
b
bb
Sca
le o
f ben
efits
B
A
0
Figure 11. Case of CBij5RBji.
1222 A. Abreu and L. M. Camarinha-Matos
Dow
nloa
ded
by [
Nor
th D
akot
a St
ate
Uni
vers
ity]
at 1
0:25
06
Dec
embe
r 20
14
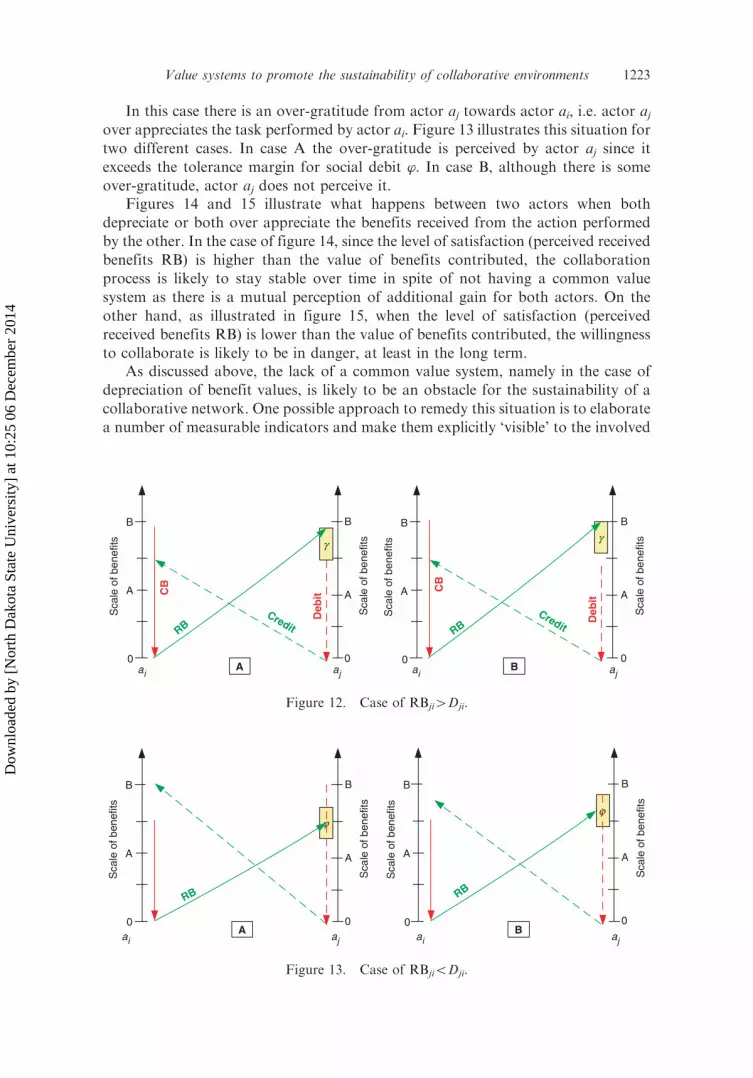
In this case there is an over-gratitude from actor aj towards actor ai, i.e. actor ajover appreciates the task performed by actor ai. Figure 13 illustrates this situation for
two different cases. In case A the over-gratitude is perceived by actor aj since it
exceeds the tolerance margin for social debit ’. In case B, although there is some
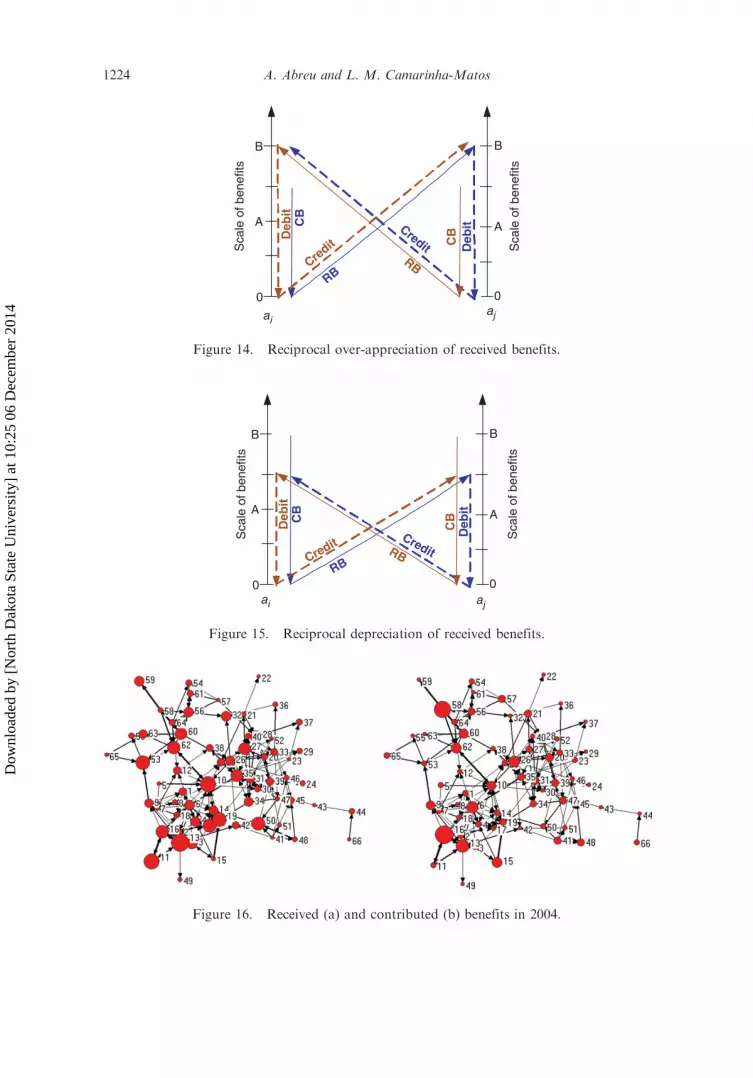
over-gratitude, actor aj does not perceive it.Figures 14 and 15 illustrate what happens between two actors when both
depreciate or both over appreciate the benefits received from the action performed
by the other. In the case of figure 14, since the level of satisfaction (perceived received
benefits RB) is higher than the value of benefits contributed, the collaboration
process is likely to stay stable over time in spite of not having a common value
system as there is a mutual perception of additional gain for both actors. On the
other hand, as illustrated in figure 15, when the level of satisfaction (perceived
received benefits RB) is lower than the value of benefits contributed, the willingness
to collaborate is likely to be in danger, at least in the long term.As discussed above, the lack of a common value system, namely in the case of
depreciation of benefit values, is likely to be an obstacle for the sustainability of a
collaborative network. One possible approach to remedy this situation is to elaborate
a number of measurable indicators and make them explicitly ‘visible’ to the involved
γ γ
Deb
it
Deb
it
CB CB
RB RBCredit
Credit
A B
Sca
le o
f ben
efits
B
A
0
Sca
le o
f ben
efits
B
A
0
Sca
le o
f ben
efits
B
A
0
Sca
le o
f ben
efits
B
A
0ai aj ai aj
Figure 12. Case of RBji4Dji.
ϕ
ϕ
RB RB
A B
Sca
le o
f ben
efits
B
A
0
Sca
le o
f ben
efits
B
A
0
Sca
le o
f ben
efits
B
A
0
Sca
le o
f ben
efits
B
A
0
ai aj ajai
Figure 13. Case of RBji5Dji.
Value systems to promote the sustainability of collaborative environments 1223
Dow
nloa
ded
by [
Nor
th D
akot
a St
ate
Uni
vers
ity]
at 1
0:25
06
Dec
embe
r 20
14
CB
RB
B
0
B
0
Deb
it
Credit
A A
Deb
it
CB
RBCredit
Sca
le o
f ben
efits
Sca
le o
f ben
efits
ajai
Figure 15. Reciprocal depreciation of received benefits.
CB
RB
B
0
B
0
Deb
itCredit
A A
CBDeb
it
RBCreditS
cale
of b
enef
its
Sca
le o
f ben
efits
ajai
Figure 14. Reciprocal over-appreciation of received benefits.
Figure 16. Received (a) and contributed (b) benefits in 2004.
1224 A. Abreu and L. M. Camarinha-Matos
Dow
nloa
ded
by [
Nor
th D
akot
a St
ate
Uni
vers
ity]
at 1
0:25
06
Dec
embe
r 20
14
partners. In this way transparency is promoted and hopefully will contribute to a
convergence towards alignment of the different perceptions of value.The development of graphical tools that allows the visualization of some
indicators of collaboration for all actors could be a good approach to increase the
transparency among distinct partners and in that way contribute to building-up
a common value system, thus assuring network cohesion and simultaneouslythe feeling of fairness inside the VBE. As an illustration, let us consider the
following example.
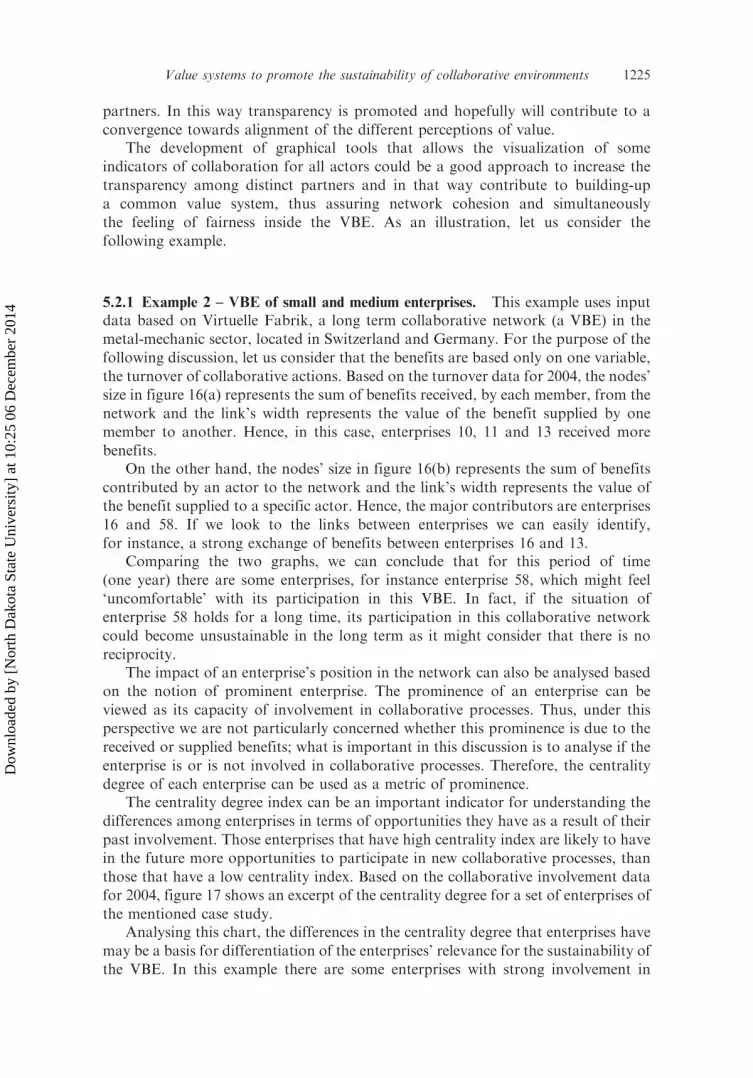
5.2.1 Example 2 – VBE of small and medium enterprises. This example uses inputdata based on Virtuelle Fabrik, a long term collaborative network (a VBE) in themetal-mechanic sector, located in Switzerland and Germany. For the purpose of the
following discussion, let us consider that the benefits are based only on one variable,
the turnover of collaborative actions. Based on the turnover data for 2004, the nodes’size in figure 16(a) represents the sum of benefits received, by each member, from the
network and the link’s width represents the value of the benefit supplied by onemember to another. Hence, in this case, enterprises 10, 11 and 13 received more
benefits.On the other hand, the nodes’ size in figure 16(b) represents the sum of benefits
contributed by an actor to the network and the link’s width represents the value ofthe benefit supplied to a specific actor. Hence, the major contributors are enterprises
16 and 58. If we look to the links between enterprises we can easily identify,
for instance, a strong exchange of benefits between enterprises 16 and 13.Comparing the two graphs, we can conclude that for this period of time
(one year) there are some enterprises, for instance enterprise 58, which might feel
‘uncomfortable’ with its participation in this VBE. In fact, if the situation ofenterprise 58 holds for a long time, its participation in this collaborative network
could become unsustainable in the long term as it might consider that there is no
reciprocity.The impact of an enterprise’s position in the network can also be analysed based
on the notion of prominent enterprise. The prominence of an enterprise can be
viewed as its capacity of involvement in collaborative processes. Thus, under thisperspective we are not particularly concerned whether this prominence is due to the
received or supplied benefits; what is important in this discussion is to analyse if the
enterprise is or is not involved in collaborative processes. Therefore, the centralitydegree of each enterprise can be used as a metric of prominence.
The centrality degree index can be an important indicator for understanding the
differences among enterprises in terms of opportunities they have as a result of their
past involvement. Those enterprises that have high centrality index are likely to havein the future more opportunities to participate in new collaborative processes, than
those that have a low centrality index. Based on the collaborative involvement datafor 2004, figure 17 shows an excerpt of the centrality degree for a set of enterprises of
the mentioned case study.Analysing this chart, the differences in the centrality degree that enterprises have
may be a basis for differentiation of the enterprises’ relevance for the sustainability ofthe VBE. In this example there are some enterprises with strong involvement in
Value systems to promote the sustainability of collaborative environments 1225
Dow
nloa
ded
by [
Nor
th D
akot
a St
ate
Uni
vers
ity]
at 1
0:25
06
Dec
embe
r 20
14
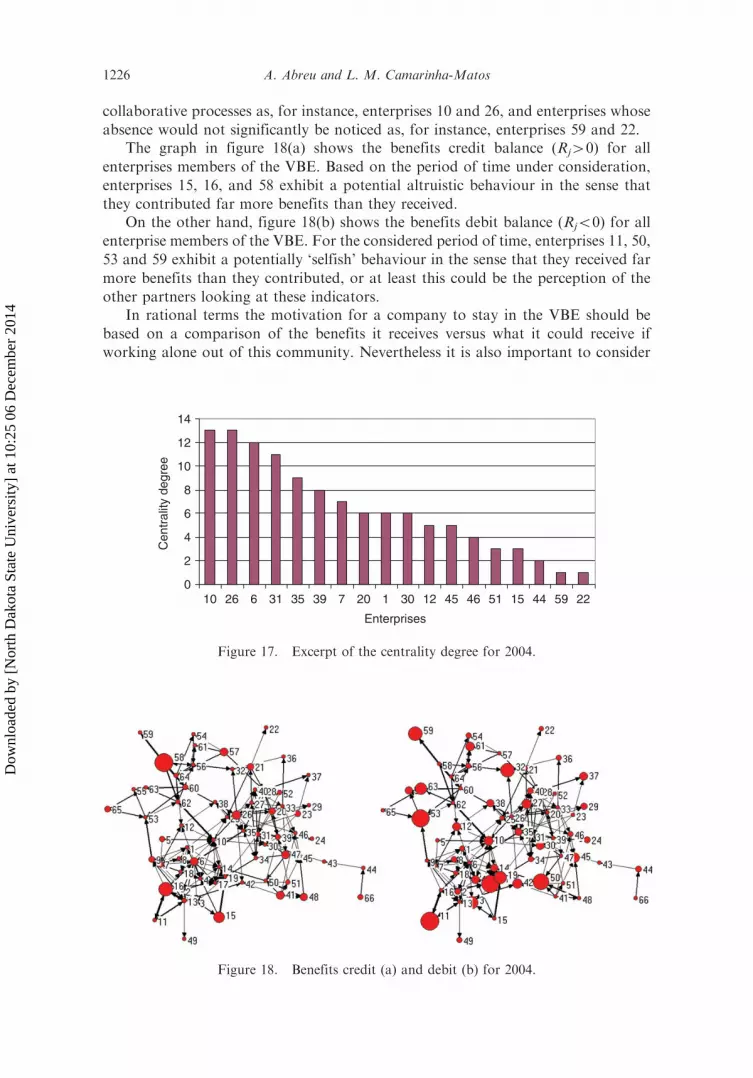
collaborative processes as, for instance, enterprises 10 and 26, and enterprises whose
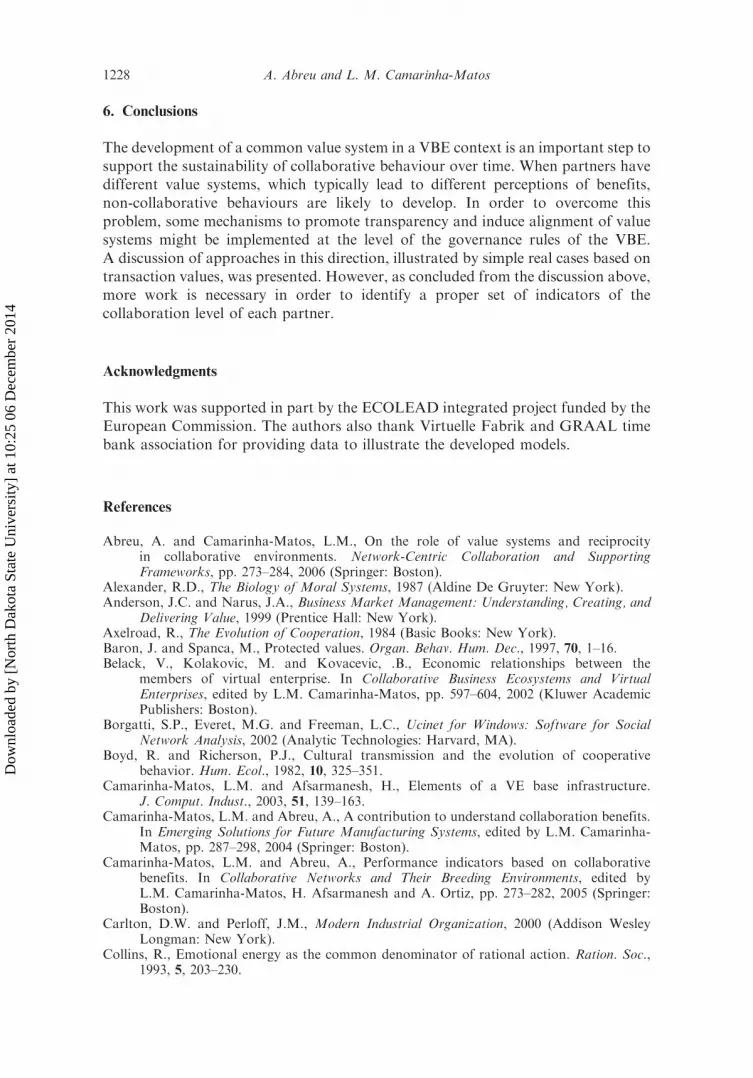
absence would not significantly be noticed as, for instance, enterprises 59 and 22.The graph in figure 18(a) shows the benefits credit balance (Rj40) for all
enterprises members of the VBE. Based on the period of time under consideration,
enterprises 15, 16, and 58 exhibit a potential altruistic behaviour in the sense that
they contributed far more benefits than they received.On the other hand, figure 18(b) shows the benefits debit balance (Rj50) for all
enterprise members of the VBE. For the considered period of time, enterprises 11, 50,
53 and 59 exhibit a potentially ‘selfish’ behaviour in the sense that they received far
more benefits than they contributed, or at least this could be the perception of the
other partners looking at these indicators.In rational terms the motivation for a company to stay in the VBE should be
based on a comparison of the benefits it receives versus what it could receive if
working alone out of this community. Nevertheless it is also important to consider
0
2
4
6
8
10
12
14
10 26 6 31 35 39 7 20 1 30 12 45 46 51 15 44 59 22
Enterprises
Cen
tral
ity d
egre
e
Figure 17. Excerpt of the centrality degree for 2004.
Figure 18. Benefits credit (a) and debit (b) for 2004.
1226 A. Abreu and L. M. Camarinha-Matos
Dow
nloa
ded
by [
Nor
th D
akot
a St
ate
Uni
vers
ity]
at 1
0:25
06
Dec
embe
r 20
14

the natural tendency of people to make comparisons with their partners andtherefore it is very important to avoid the emergence of any feeling of unfairness.
In order to reduce the problems discussed above it is necessary to implementmechanisms that act as incentives for collaboration such as, for instance, honorificrecognitions, higher chances to gain access to business opportunities, more access tosome assets and even punishment of ‘selfish’ behaviours (e.g. less accessto opportunities, higher cost in the access to common services/assets). Perhaps onechallenge is to create, at the VBE level, a kind of indicator of the level ofcollaboration that lets members accumulate and use ‘credits’ in a similar way as inthe time bank.
For instance, in the social network analysis area there is an indicator of ‘prestige’of a member in a network. Applying this concept here, figure 19 relates actors’prestige to the sum of received benefits. Although in a broad sense it could makesense that the total of received benefits (RB) would grow with prestige, in the sensethat actors that are more prestigious tend to receive more external benefits links,we can notice that for the same level of prestige different companies received quitedifferent levels of benefits.
Different reasons can be considered for this situation, for instance: the amount ofbenefits an actor receives depends on several other factors belonging to the valuesystem that were not taken into account in this example. Therefore, although explicitrepresentations of the ‘status’ of collaboration according to some indicators canincrease the transparency of the network, it might also have a negative effect if the setof indicators is not properly defined and a good set of indicators is not introduced inthe governance principles of the VBE.
Figure 19. Relationship between prestige and received benefits for 2004.
Value systems to promote the sustainability of collaborative environments 1227
Dow
nloa
ded
by [
Nor
th D
akot
a St
ate
Uni
vers
ity]
at 1
0:25
06
Dec
embe
r 20
14
6. Conclusions
The development of a common value system in a VBE context is an important step tosupport the sustainability of collaborative behaviour over time. When partners havedifferent value systems, which typically lead to different perceptions of benefits,non-collaborative behaviours are likely to develop. In order to overcome thisproblem, some mechanisms to promote transparency and induce alignment of valuesystems might be implemented at the level of the governance rules of the VBE.A discussion of approaches in this direction, illustrated by simple real cases based ontransaction values, was presented. However, as concluded from the discussion above,more work is necessary in order to identify a proper set of indicators of thecollaboration level of each partner.
Acknowledgments
This work was supported in part by the ECOLEAD integrated project funded by theEuropean Commission. The authors also thank Virtuelle Fabrik and GRAAL timebank association for providing data to illustrate the developed models.
References
Abreu, A. and Camarinha-Matos, L.M., On the role of value systems and reciprocityin collaborative environments. Network-Centric Collaboration and SupportingFrameworks, pp. 273–284, 2006 (Springer: Boston).
Alexander, R.D., The Biology of Moral Systems, 1987 (Aldine De Gruyter: New York).Anderson, J.C. and Narus, J.A., Business Market Management: Understanding, Creating, and
Delivering Value, 1999 (Prentice Hall: New York).Axelroad, R., The Evolution of Cooperation, 1984 (Basic Books: New York).Baron, J. and Spanca, M., Protected values. Organ. Behav. Hum. Dec., 1997, 70, 1–16.Belack, V., Kolakovic, M. and Kovacevic, .B., Economic relationships between the
members of virtual enterprise. In Collaborative Business Ecosystems and VirtualEnterprises, edited by L.M. Camarinha-Matos, pp. 597–604, 2002 (Kluwer AcademicPublishers: Boston).
Borgatti, S.P., Everet, M.G. and Freeman, L.C., Ucinet for Windows: Software for SocialNetwork Analysis, 2002 (Analytic Technologies: Harvard, MA).
Boyd, R. and Richerson, P.J., Cultural transmission and the evolution of cooperativebehavior. Hum. Ecol., 1982, 10, 325–351.
Camarinha-Matos, L.M. and Afsarmanesh, H., Elements of a VE base infrastructure.J. Comput. Indust., 2003, 51, 139–163.
Camarinha-Matos, L.M. and Abreu, A., A contribution to understand collaboration benefits.In Emerging Solutions for Future Manufacturing Systems, edited by L.M. Camarinha-Matos, pp. 287–298, 2004 (Springer: Boston).
Camarinha-Matos, L.M. and Abreu, A., Performance indicators based on collaborativebenefits. In Collaborative Networks and Their Breeding Environments, edited byL.M. Camarinha-Matos, H. Afsarmanesh and A. Ortiz, pp. 273–282, 2005 (Springer:Boston).
Carlton, D.W. and Perloff, J.M., Modern Industrial Organization, 2000 (Addison WesleyLongman: New York).
Collins, R., Emotional energy as the common denominator of rational action. Ration. Soc.,1993, 5, 203–230.
1228 A. Abreu and L. M. Camarinha-Matos
Dow
nloa
ded
by [
Nor
th D
akot
a St
ate
Uni
vers
ity]
at 1
0:25
06
Dec
embe
r 20
14
D’Atri, A., Organizing and managing virtual enterprises: the ECB framework. In Processesand Foundations for Virtual Organizations, edited by L.M. Camarinha-Matos andH. Afsarmanesh, pp. 171–178, 2003 (Kluwer Academic Publishers: Boston).
De Leede, J. and Looise, J.C., Demanding more than people can deliver: exploring the issuesof loyalty and commitment in enterprise collaboration. Prod. Plan. Cont., 2001, 12,504–513.
Ernst, F. and Simon, G., Fairness and retaliation: the economics of reciprocity. J. Econ.Perspect., 2000, 14, 159–181.
Eshel, I., On the neighbor effect and the evolution of altruistic traits. Theor. Popul. Biol., 1972,3, 258–77.
Fujlly, S. and Kaiharaz, T., A distributed virtual factory in agile manufacturing environment.Int. J. Prod. Res., 2000, 38, 4113–4128.
Hamilton, W.D., The evolution of altruistic behavior. Amer. Natural., 1963, 97, 354–356.Hamilton, W.D., The genetic evolution of social behavior. J. Theor. Biol., 1964, 7, 1–52.Hebel, M., Human values and the management of technology change. Cog., Techn. Work,
2000, 2, 106–115.Huang, C.-Y. and Wu, Y.-W., Decision model for partnership development in virtual
enterprises. Int. J. Prod. Res., 2003, 41, 1855–1872.Jagdev, H.S. and Thoben, K.-D., Anatomy of enterprise collaborations. Prod. Plan. Cont.,
2001, 12, 437–451.Katzy, B., The value system designer–an infrastructure for building the virtual enterprise.
In Infrastructures for Virtual Enterprises Networking Industrial Enterprises, edited byL.M. Camarinha-Matos and H. Afsarmanesh, pp. 409–420, 1999 (Kluwer AcademicPublishers: Deventer).
Mejıa, R. and Molina, A., Virtual enterprise broker: processes, methods and tools.In Collaborative Business Ecosystems and Virtual Enterprises, edited byL.M. Camarinha-Matos, pp. 81–90, 2002 (Kluwer Academic Publishers: Boston).
Nowak, M. and Sigmund, K., Evolution of indirect reciprocity by image scoring. Nature,1998, 393, 573–577.
Osterman, B.B., Value and Requirements: An Enquiry Concerning the Origin of Value, 1995(Avebury: Brookfield, VT).
Parolini, C., The Value Net: A tool for Competitive Strategy, 1999 (Wiley: Chichester).Piaget, J., Sociological Studies, 1995 (Routledge: London).Porter, M.E., Competitive Strategy. Techniques for Analyzing Industries and Competitors, 1980
(Free Press: New York).Porter, M.E., Competitive Advantage: Creating and Sustaining Superior Performance, 1985
(Free Press: New York).Roberts, G. and Sherratt, T.N., Development of cooperative relationships through increasing
investment. Nature, 1998, 394, 175–179.Schultz, P.W. and Zelezny, L., Values as predictors of environmental attitudes: evidence for
consistency across 14 countries. J. Environ. Psychol., 1999, 19, 255–265.Selz, D., Value webs, emerging forms of fluid and flexible organizations: Thinking, organizing,
communicating and delivering value on the internet. Dissertation at the University of St.Gallen, Bamberg, Switzerland, 1999.
Simon, H.A., Organizations and markets. J. Econ. Perspect., 1991, 5, 25–44.Smith, M.P., Values, culture, content: three keys to journalism in a strategic newspaper, 1997
(Newspaper Management Center, media management library: NorthwesternUniversity).
Williamson, O.E., Markets and Hierarchies, 1975 (Free Press: New York).Williamson, O.E., Transaction cost economics: how it works; where it is headed.
De Economist, 1998, 146, 23–58.
Value systems to promote the sustainability of collaborative environments 1229
Dow
nloa
ded
by [
Nor
th D
akot
a St
ate
Uni
vers
ity]
at 1
0:25
06
Dec
embe
r 20
14


