Embed Size (px)
Citation preview
ON ANALYSIS OF SEDIMENT SOURCES TOWARDS PROPER CHARACTERIZATION OF HYDRO-GEOLOGICAL
HAZARD FOR MOUNTAIN ENVIRONMENTS
D. BRAMBILLA, L.LONGONI, M. PAPINI, E.GIORGETTI, A. RADICE Dept. of Environmental, Hydraulic, Infrastructures and Surveying Engineering., Politecnico di Milano, Italy.
ABSTRACT
Event-induced sediment yield from mountain valley slopes to rivers may represent a problem for landscape safety if the total sediment volume supplied is larger than the transport capacity of the water courses, leading to riverbed aggradation and to increased water levels. Multiple sediment sources are normally present in mountain basins; the former are characterized by different spatial and temporal scales, which makes a global analysis hardly possible. On the other hand, modelling of sediment yield furnishes the necessary boundary condition for that of sediment transport in rivers. In this study, several types of sediment sources were separately analyzed with reference to the Tartano basin, located in Northern Italy. A detailed analysis of the sediment volume from soil erosion and some preliminary analyses of a faulted valley were performed. The transport capacity of the major water courses was computed around the confluence among them, for comparison with the estimated yields. The analysis showed that not all the sediment sources contribute significantly to the solid volumes that must then be transported by the rivers. This enables simplified models to be used considering only the yields that are expected to represent a major load. It is hypothesized that such finding be valid for other basins, of course considering the specific features of each. Keywords: mountain basin, sediment yield, sediment transport, hydro-geological risk.
1 INTRODUCTION Sediments are key components of the life of river basins. Apart from the use made of rock and soil for a number of purposes, the “natural” behaviour of sediments is being eroded from the valley slopes by exogenous and endogenous agents and successively involved in migration processes, such as landslides, debris flows, or solid transport in water courses.
The sediment production in a basin depends on multiple processes. The conceptual description proposed by De Vente and Poesen [1] involves several types of sediments source (splash erosion, sheet erosion, rill erosion, gully erosion, bank erosion and mass movements) whose counterpart includes some sink terms (depression, parcel, footslope and floodplain storage). Combination of all these processes finally determines the total sediment yield at a certain downstream section. It is needless to say that the complexity of both process mechanics and interaction makes detailed modelling in time and space hardly possible. For these reason, semi-empirical models have been often proposed for evaluation of basin-scale sediment production, with reference to both the long term and the events with short duration.
Typically sediment transport processes have a negative impact on the functional or safety conditions of basins: for example, sediments contribute to reservoir silting (e.g., Chikita [2]; Lajczak [3]; De Cesare et al. [4]; Elçi et al. [5]), reducing possibility of using river water for hydro-power purposes; in addition, the sediment transport intensity is typically largest during floods, where the consequent morphologic evolution of riverbeds may lead to increased water levels and flood hazard. The second aspect is within the perspective of this manuscript and is then described in a complete way here. A connection between river geomorphology, possible channel aggradation and water levels has been proved, mostly with reference to the long time scales: see, for example, Lane et al. [6] and Reid et al. [7]. Indeed Sear et al. [8] had already suggested to
combine geomorphologic methods with hydraulic models to support the territorial planning, but such call has not been widely followed. Moreover, this aspect has not been put in evidence with reference to the short time scales characteristic of floods. Such choice appears reasonable in cases presenting a sharp distinction between the characteristic time scales of the flood event and those of the morphological evolution of the riverbed, as may be expected in lowland. In mountain environments, as argued, for example, by Klaassen [9], this separation may not be so clear or, in the worst case, could not exist, due to the swift response of small and steep basins.
A proper knowledge of the sediment production is necessary as boundary condition for morphologic models of rivers, demonstrating the importance of yield evaluation to assess the safety level of mountainous regions. The discussion above underlines the need to analyze processes with reference to short time scales. In addition, is important to remark that landslides and debris flows, which have been above mentioned within the migration phenomena, may act as sediment inputs for the load in the rivers and should therefore be taken into account as sources of solid volume. The difficulty to combine the sediment production by the different sources has been already mentioned and is further complicated by the last consideration. On the other hand, it may be however useful to properly characterize the specific phenomenology of the different sediment sources, which may indeed be expected to contribute differently to the total sediment yield (different volumes supplied, different temporal scales, and possibly other issues). Therefore, identification of the more relevant contributions for the morphologic evolution of riverbeds or, more in general, for any evaluation to be successively made based on the yield modelled, seems to be a significant achievement. Furthermore, a crucial aspect of the evaluation of the sediment yield is the spatial scale with reference to which the model is made. The reviews of De Vente and Poesen [1] and Wasson [10] span several orders of scales, from the small basin to the global scale. Respect to this topic it should be noticed that the spatial scale used for modelling determines the consequent possibility to model off-site and on-site processes, with the latter requiring larger spatial detail than the former.
This manuscript presents an analysis of the different sources of sediment yield for the Tartano basin, which is located in the Italian Alps. First, the basin is described and some data for past events are provided, proving the relevance of sediments for site safety. Then, sediment production by soil erosion and fault yield is analyzed. In addition, relevance of the two sediment sources in terms of the possibility for the river to convey the solid volume supplied is discussed. Finally, arguments are provided about the potential fallouts of the findings for modelling flood hazard in this basin.
2 THE HYDROGRAPHIC BASIN The Tartano river, located in the Northern Italy, is a left tributary of the Adda river. The valley is composed by two areas characterized by different values of slope: the upstream area with an average slope of 7% and the downstream one with a high slope down to the Adda river. Elevation ranges between 950 and 2250 m a.m.s.l.
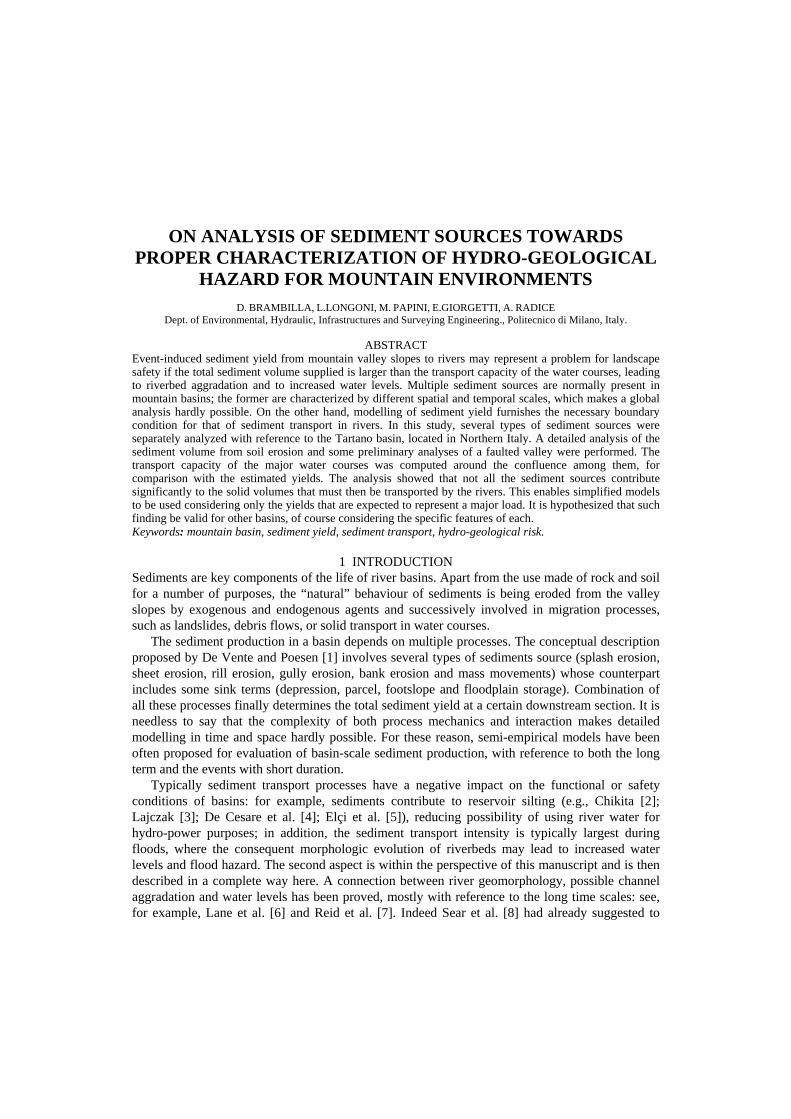
The higher part of the hydrographic network consists of two branches as shown in Figure 1: the Val Lunga stream, coming from SE, and the Val Corta, coming from SO, which is itself originated by the confluence of two small streams that flow through Val di Budria and Val di Lemma. Val Lunga and Val Corta streams merge into the Tartano river at Biorca, near the small town of Tartano at an altitude of 1140 m a.m.s.l. This confluence is a weak point of the system because the Val Corta flows into the Val Lunga with an angle only slightly lower than 90° and a road bridge is present just downstream of the confluence.
Figure 1: Aerial map of the river basin with indication of the main streams and of the principal unstable areas.
Table 1: Annual sediment yield (SY) into the reservoir at Campo Dam. Year 1991 1992 1993 1994 1995 1996 1997 1998
SY (m3) 34073 43504 53605 36737 26264 39749 35314 32800
Year 1999 2000 2001 2002 2003 2004 2005 2006
SY (m3) 41876 57299 43187 42022 22957 50083 21287 27844
Mean annual SY value (m3) 38038
After the confluence, the Tartano river flows between steep rocky walls up to Colombera
village, where it is blocked by the Campo Dam. Downstream of the dam, located at 955 m a.m.s.l., after a short steep reach, the Tartano river flows through a 2.16 km2 wide alluvial fan. The whole basin covers an area of 56 km2 but, for the present study, only the part of the basin upstream of Campo Dam (46 km2) was considered, because the annual data of reservoir silting at the dam (Table 1) were used for a comparison with estimated sediment yields described in the following.
The basin is characterized by a lot of faults and fractures, which have clearly influenced the geometry of the hydrographic network. The faults belong to two main systems: the first with a NE-SO direction (i.e. Val Corta and Val Budria), the other one with ONO-ESE direction (i.e. Val Lunga and Piscino Valley, shown in Figure 1). Four categories of outcropping rock formations are present in the valley: massive metamorphic rocks, schistose metamorphic rocks, strongly fractured metamorphic rocks and sedimentary rocks presenting both Paleozoic and Triassic lithological features. Rock basement is largely covered by talus and debris such as: alluvial deposits, colluvial deposits, landslide material, glacial deposits. A great accumulation of material is present along
faults and, during strong meteorological events, this mass can rapidly move along the slopes, feeding solid transport into the water courses.
The anthropic presence is quite low in Tartano valley; indeed, 40% of the entire area is covered with woods, 25% with grass and the last 20% with natural vegetation. Finally, 5% of the basin is covered with sediments and debris without vegetation, while the anthropic areas are less than 1% of the whole valley.
The basin is characterized by an Alpine continental climate. Rainfall distribution data, relative to the period between 1891-1990, show a maximum during summer and a minimum during winter. Mean annual rainfall values range between a minimum of 588 mm/year and a maximum of 2607 mm/year, with an average value of 1376 mm/year. Snow represents 17% of annual precipitation. 2.1 Sources of sediments A study committed by the Morbegno Mountain Community showed that areas with high risk correspond to 2.9% of the Tartano basin, while 7.1% is potentially unstable. Moreover, some parts of the main stream (about 40% of the total length of Tartano river) flow through or are quite near to unstable or potentially unstable areas.
Two main landslides are present in the area: the “Pruna”, located on the left bank downstream of the Campo dam, and the “Foppa dell’Orso”, located on the left bank at the end of Val Lunga. Other sediment sources are represented by the fault zones; for example, the lateral fault located just downstream of Biorca that generated the Piscino Valley that is going to be discussed in the following. The Piscino Valley, as well as “Pruna” and “Foppa dell’Orso” landslides, is indicated in Figure 1. In the following, a detailed analysis of yield by soil erosion and some preliminary evaluations for the Piscino Valley will be presented. The “Foppa dell’Orso” has been quiescent for a long time and not enough data are available for proper analysis; therefore the sediment yield from landslides will not be considered here. 2.2 Previous events Catastrophic floods are documented in the Tartano Valley since the middle of the 1800, with the events of 1855 and 1885. After these are documented the events of 1911 and 1912, that determined the actual hydrological arrangement of the fan, and the floods of 1927, 1937, 1939 and 1968. More recent events are those of July 1987, November 2000, November 2002, 2005 and July 2008. The event of July 1987 was probably the worst one: the high rainfall combined with other climatic conditions originated a flood that caused destructions and upheavals overall the hydrographic network. The bank protections were destroyed or seriously damaged; a lot of erosion phenomena were triggered both on the slopes and on stream beds; huge quantities of solid material were brought to the fan by water. The total sediment yield to the fan during the flood was evaluated as 1-1.5 millions of m3. The road bridge, situated just downstream of Biorca, was seriously damaged and bypassed by the flow. Moreover some debris flows detached from the slopes and flowed into the river Tartano; at least two of these caused major damage to buildings and also some casualties, highlighting the consequences that uncontrolled erosion may bring to the human society.
3 MODELLING SEDIMENT YIELD BY SOIL EROSION The first source of sediment analyzed was soil erosion. Scientific literature on the evaluation of this kind of sediment yield provides empirical, semi-quantitative and quantitative models. The choice of the most appropriate method must take into account: (i) the temporal scale of the study, since either the annual value of sediment yield or the
sediment yield provided by a single rainfall event may be of interest. (ii) The spatial scale, as different parts of the river basin may contribute very differently to the
average sediment yield and the largest volumes of sediments may come from small definable areas, both for annual and event-related temporal scales.
Indeed, the description by De Vente and Poesen [1], according to which the dominant sediment source and sink terms vary with the basin dimension, holds also for different homogeneous areas within a river catchment. As argued by De Vente and Poesen [1], an evaluation of sediment yield at a basin scale is suitable for the analysis of off-site processes (e.g., the silting regime of a reservoir situated downstream of basin closing section), but there are several on-site processes that are conditioned by local sediment yields (e.g., sediment transport, debris flow).
The case study analysed here concerns the risk due to solid transport in the Tartano river related to single rainfall events. Therefore, a model with short temporal scale must be used. Moreover, since solid transport is an on-site process the spatial scale must be discussed. For this case study, the most proper model to be used would be an event-scale model calibrated on a basin similar to the Tartano catchments. To the best of the authors’ knowledge, the most used event-related model is MUSLE (Williams and Berndt [11]), that has been developed and calibrated for farmland basins in the U.S.A., so for a completely different environment. On the other hand, Gavrilovic [12] model was developed for basins in Southern Yugoslavia and may be therefore expected to be valid for the Tartano basin as well, but it furnishes the annual sediment yield. A succession of steps has been followed to assess applicability of MUSLE to the present basin. Results for the annual yield provided by USLE (Wischmeier and Smith [13]) were compared with those obtained through Gavrilovic model and with data for silting at the Campo dam (Table 1). After this validation of USLE-like models, MUSLE was applied first to the entire basin with the aim of discuss time scale; later, both USLE and MUSLE were applied to some parts of the basin in order to explain the space scale. All the results refers to Mandelli et al. [14] and Ballio et al. [15].
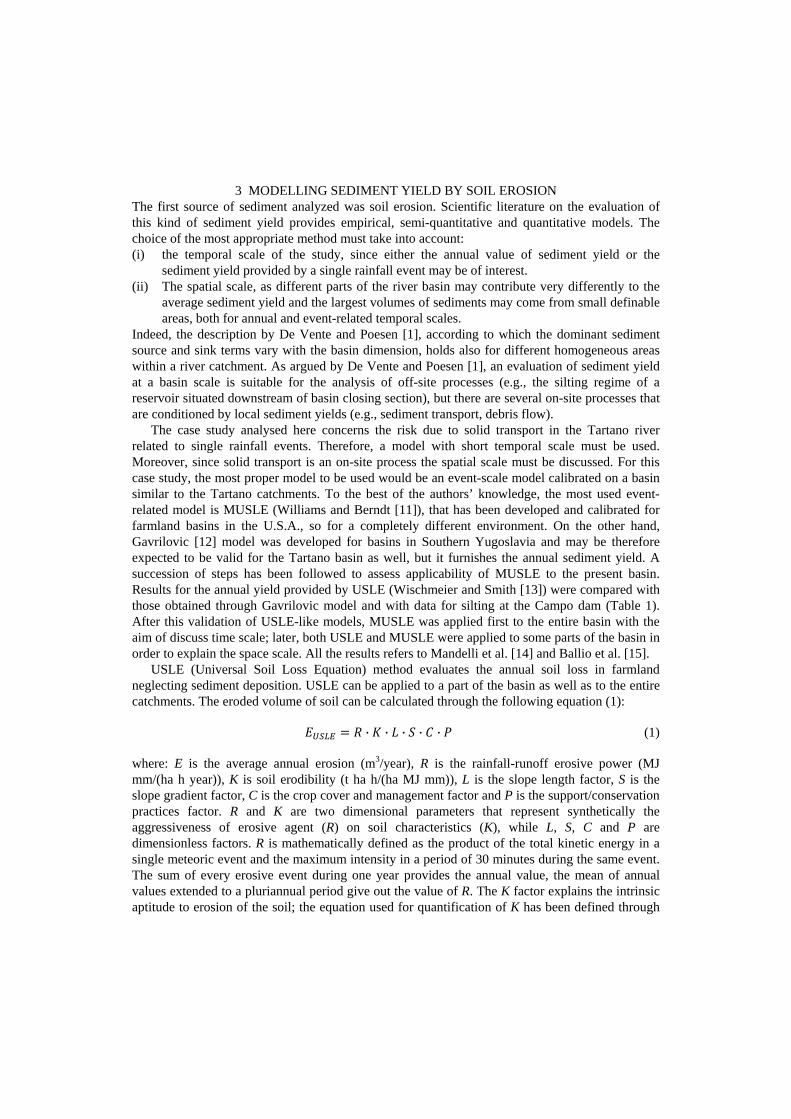
USLE (Universal Soil Loss Equation) method evaluates the annual soil loss in farmland neglecting sediment deposition. USLE can be applied to a part of the basin as well as to the entire catchments. The eroded volume of soil can be calculated through the following equation (1):
· · · · · (1)
where: E is the average annual erosion (m3/year), R is the rainfall-runoff erosive power (MJ mm/(ha h year)), K is soil erodibility (t ha h/(ha MJ mm)), L is the slope length factor, S is the slope gradient factor, C is the crop cover and management factor and P is the support/conservation practices factor. R and K are two dimensional parameters that represent synthetically the aggressiveness of erosive agent (R) on soil characteristics (K), while L, S, C and P are dimensionless factors. R is mathematically defined as the product of the total kinetic energy in a single meteoric event and the maximum intensity in a period of 30 minutes during the same event. The sum of every erosive event during one year provides the annual value, the mean of annual values extended to a pluriannual period give out the value of R. The K factor explains the intrinsic aptitude to erosion of the soil; the equation used for quantification of K has been defined through
some experimental analysis conducted on different geological conditions. The total yield obtained by USLE model is illustrated in Table 2.
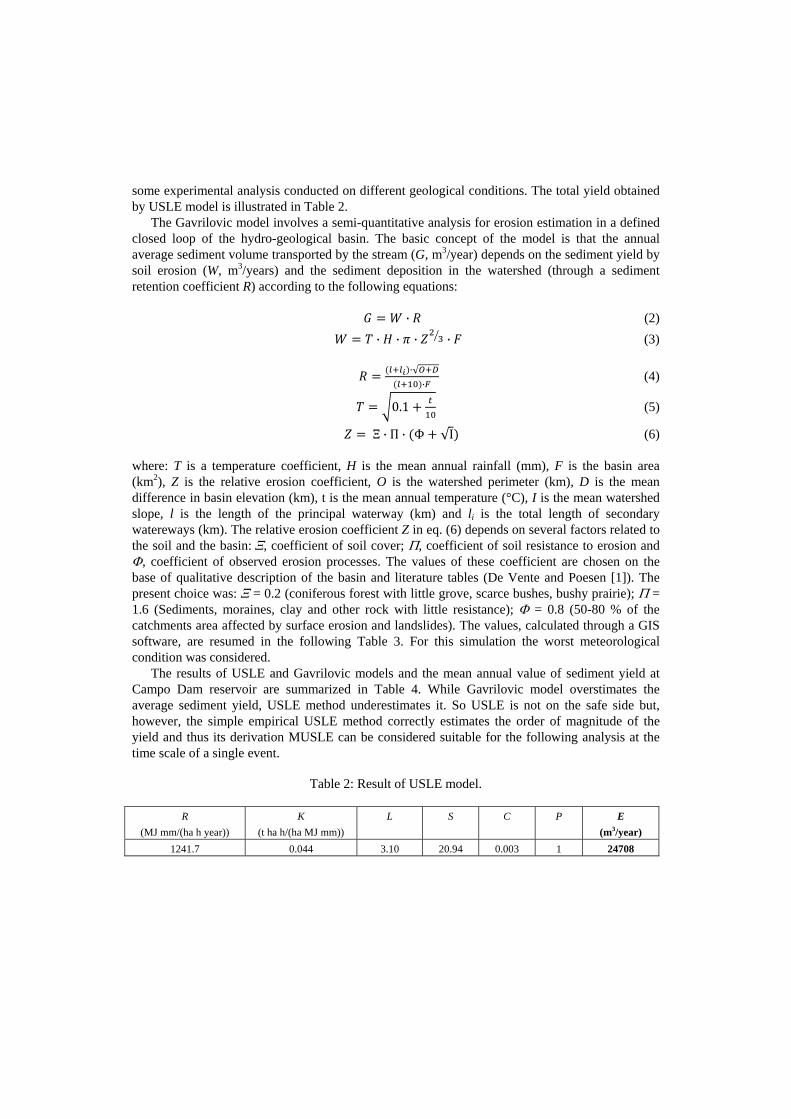
The Gavrilovic model involves a semi-quantitative analysis for erosion estimation in a defined closed loop of the hydro-geological basin. The basic concept of the model is that the annual average sediment volume transported by the stream (G, m3/year) depends on the sediment yield by soil erosion (W, m3/years) and the sediment deposition in the watershed (through a sediment retention coefficient R) according to the following equations:
· (2)
· · · · (3)
·√·
(4)
0.1
(5)
Ξ · Π · Φ √I
(6)
where: T is a temperature coefficient, H is the mean annual rainfall (mm), F is the basin area (km2), Z is the relative erosion coefficient, O is the watershed perimeter (km), D is the mean difference in basin elevation (km), t is the mean annual temperature (°C), I is the mean watershed slope, l is the length of the principal waterway (km) and li is the total length of secondary watereways (km). The relative erosion coefficient Z in eq. (6) depends on several factors related to the soil and the basin: Ξ, coefficient of soil cover; Π, coefficient of soil resistance to erosion and Φ, coefficient of observed erosion processes. The values of these coefficient are chosen on the base of qualitative description of the basin and literature tables (De Vente and Poesen [1]). The present choice was: Ξ = 0.2 (coniferous forest with little grove, scarce bushes, bushy prairie); Π = 1.6 (Sediments, moraines, clay and other rock with little resistance); Φ = 0.8 (50-80 % of the catchments area affected by surface erosion and landslides). The values, calculated through a GIS software, are resumed in the following Table 3. For this simulation the worst meteorological condition was considered.
The results of USLE and Gavrilovic models and the mean annual value of sediment yield at Campo Dam reservoir are summarized in Table 4. While Gavrilovic model overstimates the average sediment yield, USLE method underestimates it. So USLE is not on the safe side but, however, the simple empirical USLE method correctly estimates the order of magnitude of the yield and thus its derivation MUSLE can be considered suitable for the following analysis at the time scale of a single event.
Table 2: Result of USLE model.
R
(MJ mm/(ha h year)) K
(t ha h/(ha MJ mm)) L S C P E
(m3/year) 1241.7 0.044 3.10 20.94 0.003 1 24708
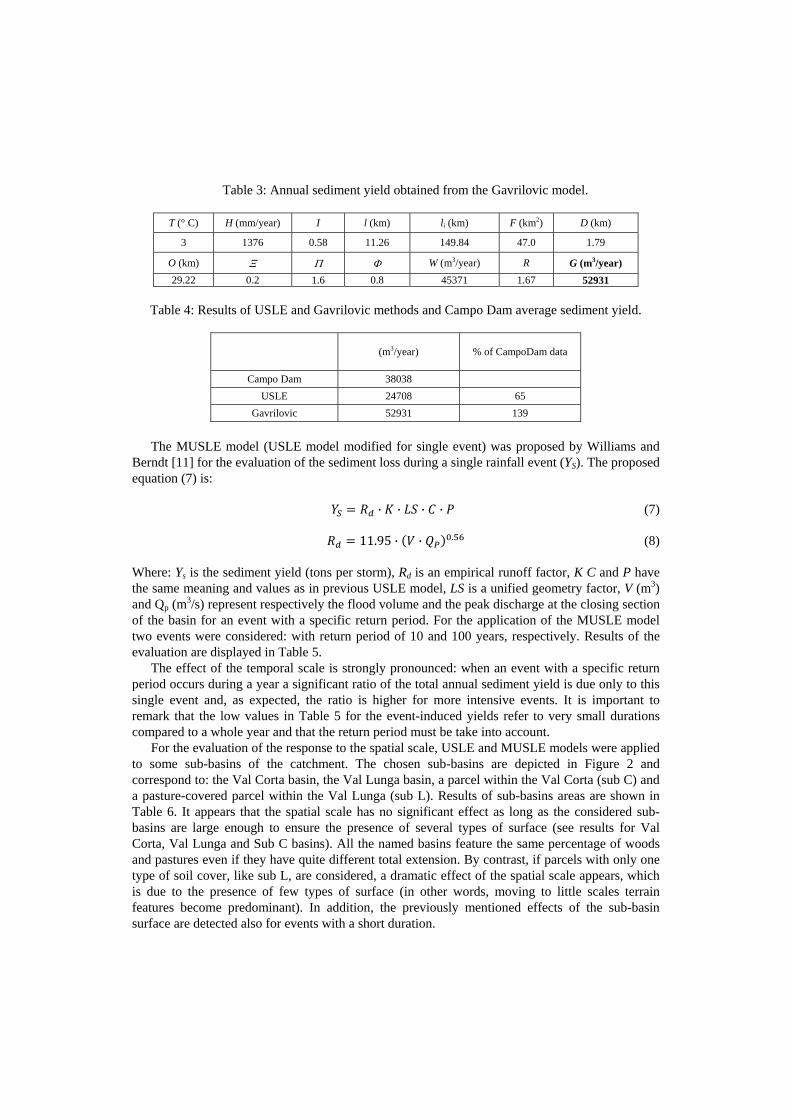
Table 3: Annual sediment yield obtained from the Gavrilovic model.
T (° C) H (mm/year) I l (km) li (km) F (km2) D (km)
3 1376 0.58 11.26 149.84 47.0 1.79
O (km) Ξ Π Φ W (m3/year) R G (m3/year) 29.22 0.2 1.6 0.8 45371 1.67 52931
Table 4: Results of USLE and Gavrilovic methods and Campo Dam average sediment yield.
(m3/year)
% of CampoDam data
Campo Dam 38038 USLE 24708 65
Gavrilovic 52931 139
The MUSLE model (USLE model modified for single event) was proposed by Williams and
Berndt [11] for the evaluation of the sediment loss during a single rainfall event (YS). The proposed equation (7) is:
· · · · (7)
11.95 · · . (8)
Where: Ys is the sediment yield (tons per storm), Rd is an empirical runoff factor, K C and P have the same meaning and values as in previous USLE model, LS is a unified geometry factor, V (m3) and Qp (m3/s) represent respectively the flood volume and the peak discharge at the closing section of the basin for an event with a specific return period. For the application of the MUSLE model two events were considered: with return period of 10 and 100 years, respectively. Results of the evaluation are displayed in Table 5.
The effect of the temporal scale is strongly pronounced: when an event with a specific return period occurs during a year a significant ratio of the total annual sediment yield is due only to this single event and, as expected, the ratio is higher for more intensive events. It is important to remark that the low values in Table 5 for the event-induced yields refer to very small durations compared to a whole year and that the return period must be take into account.
For the evaluation of the response to the spatial scale, USLE and MUSLE models were applied to some sub-basins of the catchment. The chosen sub-basins are depicted in Figure 2 and correspond to: the Val Corta basin, the Val Lunga basin, a parcel within the Val Corta (sub C) and a pasture-covered parcel within the Val Lunga (sub L). Results of sub-basins areas are shown in Table 6. It appears that the spatial scale has no significant effect as long as the considered sub-basins are large enough to ensure the presence of several types of surface (see results for Val Corta, Val Lunga and Sub C basins). All the named basins feature the same percentage of woods and pastures even if they have quite different total extension. By contrast, if parcels with only one type of soil cover, like sub L, are considered, a dramatic effect of the spatial scale appears, which is due to the presence of few types of surface (in other words, moving to little scales terrain features become predominant). In addition, the previously mentioned effects of the sub-basin surface are detected also for events with a short duration.
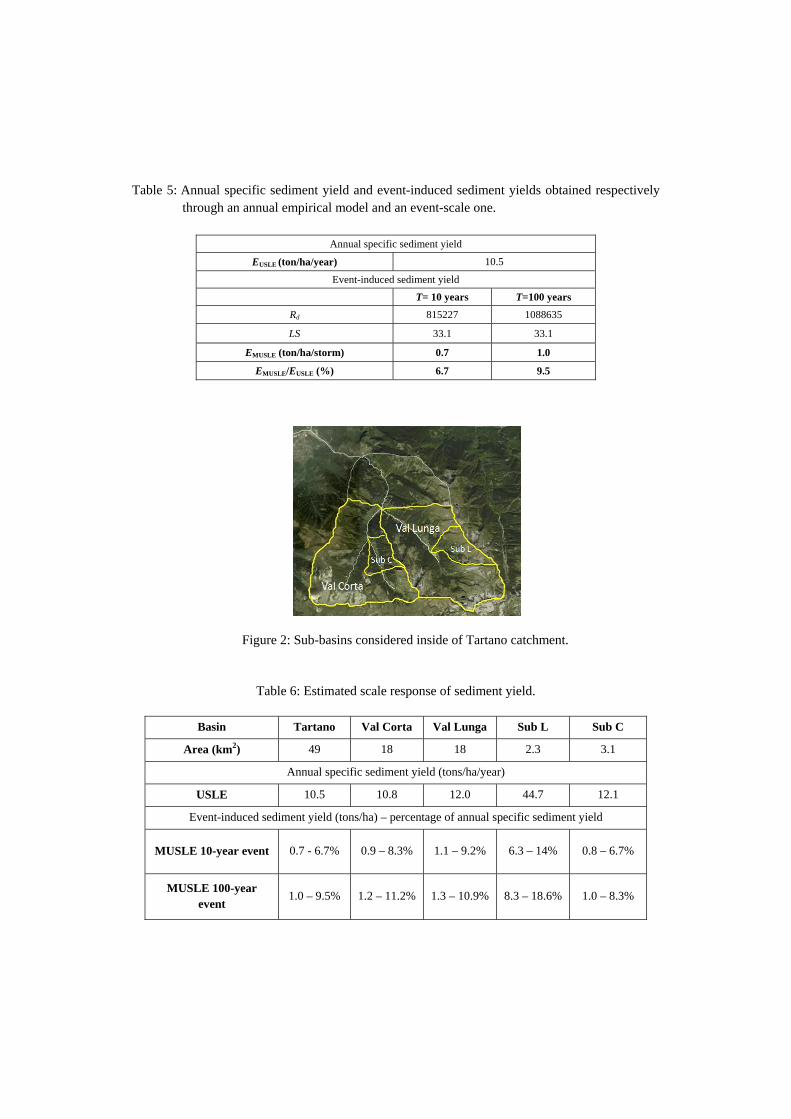
Table 5: Annual specific sediment yield and event-induced sediment yields obtained respectively through an annual empirical model and an event-scale one.
Annual specific sediment yield
EUSLE (ton/ha/year) 10.5
Event-induced sediment yield
T= 10 years T=100 years
Rd 815227 1088635
LS 33.1 33.1
EMUSLE (ton/ha/storm) 0.7 1.0
EMUSLE/EUSLE (%) 6.7 9.5
Figure 2: Sub-basins considered inside of Tartano catchment.
Table 6: Estimated scale response of sediment yield.
Basin Tartano Val Corta Val Lunga Sub L Sub C
Area (km2) 49 18 18 2.3 3.1
Annual specific sediment yield (tons/ha/year)
USLE 10.5 10.8 12.0 44.7 12.1
Event-induced sediment yield (tons/ha) – percentage of annual specific sediment yield
MUSLE 10-year event 0.7 - 6.7% 0.9 – 8.3% 1.1 – 9.2% 6.3 – 14% 0.8 – 6.7%
MUSLE 100-year event
1.0 – 9.5% 1.2 – 11.2% 1.3 – 10.9% 8.3 – 18.6% 1.0 – 8.3%
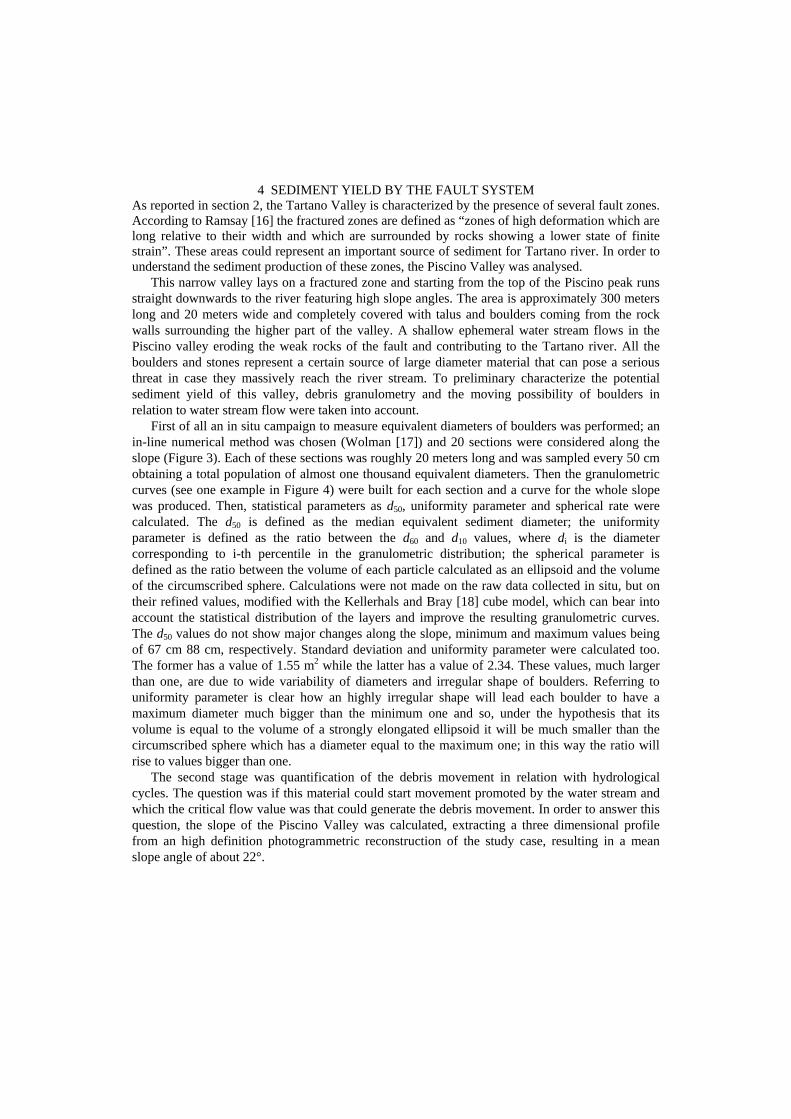
4 SEDIMENT YIELD BY THE FAULT SYSTEM As reported in section 2, the Tartano Valley is characterized by the presence of several fault zones. According to Ramsay [16] the fractured zones are defined as “zones of high deformation which are long relative to their width and which are surrounded by rocks showing a lower state of finite strain”. These areas could represent an important source of sediment for Tartano river. In order to understand the sediment production of these zones, the Piscino Valley was analysed.
This narrow valley lays on a fractured zone and starting from the top of the Piscino peak runs straight downwards to the river featuring high slope angles. The area is approximately 300 meters long and 20 meters wide and completely covered with talus and boulders coming from the rock walls surrounding the higher part of the valley. A shallow ephemeral water stream flows in the Piscino valley eroding the weak rocks of the fault and contributing to the Tartano river. All the boulders and stones represent a certain source of large diameter material that can pose a serious threat in case they massively reach the river stream. To preliminary characterize the potential sediment yield of this valley, debris granulometry and the moving possibility of boulders in relation to water stream flow were taken into account.
First of all an in situ campaign to measure equivalent diameters of boulders was performed; an in-line numerical method was chosen (Wolman [17]) and 20 sections were considered along the slope (Figure 3). Each of these sections was roughly 20 meters long and was sampled every 50 cm obtaining a total population of almost one thousand equivalent diameters. Then the granulometric curves (see one example in Figure 4) were built for each section and a curve for the whole slope was produced. Then, statistical parameters as d50, uniformity parameter and spherical rate were calculated. The d50 is defined as the median equivalent sediment diameter; the uniformity parameter is defined as the ratio between the d60 and d10 values, where di is the diameter corresponding to i-th percentile in the granulometric distribution; the spherical parameter is defined as the ratio between the volume of each particle calculated as an ellipsoid and the volume of the circumscribed sphere. Calculations were not made on the raw data collected in situ, but on their refined values, modified with the Kellerhals and Bray [18] cube model, which can bear into account the statistical distribution of the layers and improve the resulting granulometric curves. The d50 values do not show major changes along the slope, minimum and maximum values being of 67 cm 88 cm, respectively. Standard deviation and uniformity parameter were calculated too. The former has a value of 1.55 m2 while the latter has a value of 2.34. These values, much larger than one, are due to wide variability of diameters and irregular shape of boulders. Referring to uniformity parameter is clear how an highly irregular shape will lead each boulder to have a maximum diameter much bigger than the minimum one and so, under the hypothesis that its volume is equal to the volume of a strongly elongated ellipsoid it will be much smaller than the circumscribed sphere which has a diameter equal to the maximum one; in this way the ratio will rise to values bigger than one.
The second stage was quantification of the debris movement in relation with hydrological cycles. The question was if this material could start movement promoted by the water stream and which the critical flow value was that could generate the debris movement. In order to answer this question, the slope of the Piscino Valley was calculated, extracting a three dimensional profile from an high definition photogrammetric reconstruction of the study case, resulting in a mean slope angle of about 22°.
Figure 3: The Piscino Valley with sampling sections highlighted.
Figure 4: Granulometric curve of a sample section.
The next step was the calculation of the peak values of water flow in the Valley during rainfall events that was made applying the Nash [19] model with N=2 and CN= 73 (N is number of reservoirs and CN is the curve number as defined by the USGS). The Giandotti [20] formula was used to determine the time of concentration of a basin tc (hours) as:
·√ . ·. ·
(9)
where: A is the basin area (km2), L is the length of the longest hydraulic path (km), Hm is the mean elevation of the basin (a.m.s.l.) and H0 is the elevation of the downstream section (a.m.s.l.). Peak flows for different return periods (between 20 and 500 years) were estimated using statistical parameters for rainfall distribution given by the AIPo, an Italian Governative Environmental Agency (web site http://www.agenziainterregionalepo.it/). A 20-year return period was chosen since the authors were interested in evaluating movements that can be considered as ordinary and not extra-ordinary movements promoted by extreme events. Considering a 20-year return period the peak flow calculated was 180 l\s, hence a critical diameter was estimated. This value was calculated using the Schoklitsch [21] formula, that was calibrated on high slope rivers and seemed applicable in this case. A critical diameter of 1.75 meters for the mean slope of Piscino Valley (22°) was obtained. Huge critical diameters were estimated due to the large slope of the valley, that makes calculations not fully reliable. However, since the real debris diameter is smaller than the 20-year return period critical one, the minimal stream value that could induce significant movement on the slope was computed. This value was estimated using again the Schoklitsch [21] formula. The result was that, using d50 as the diameter of stones (corrected neglecting boulders with diameter larger than 1024 mm, as there were only a few and were unmovable for so small return period) the critical flow to create movement was lower than that for 1 year return period, although varying as a function of the slope. This fact suggested that even ordinary events can induce a movement of boulders and cause them sliding and rolling downwards into the Tartano River.
In the end it was possible to state that normal events should not represent a risk for the Valley and the town of Tartano, but is important to notice that intense events, even with short return period, could create a critical situation promoting the movement of a big mass of stones and boulders which will roll into the Tartano bed causing problems to normal water stream and a possible disaster. In support of this hypothesis it can be recalled that in 2005 an intense event triggered a proper, although small, debris flow in Piscino Valley and the local administration is designing some protective structures to avoid future risks.
5 SEDIMENT TRANSPORT IN WATER STREAMS In this section, some sample computations of sediment transport are documented with reference to the reaches around the confluence between the Val Lunga and Val Corta streams. The intent of the computation was to estimate some values representing the order of magnitude of the sediment volume conveyable by the rivers, to be compared with that obtained from the yield analysis above. Cross-section data provided by Franzetti and Ballio [22] were used. Even though the river geometry has been modified by natural and human action after the survey by the mentioned authors, it was assumed that this would not reduce validity of the results presented here, in light of the intent declared above.
Computations were made with reference to a 100-year return period, for which an estimation of the peak discharge was available as 115 m3/s for the two tributaries and 230 m3/s for the Tartano.
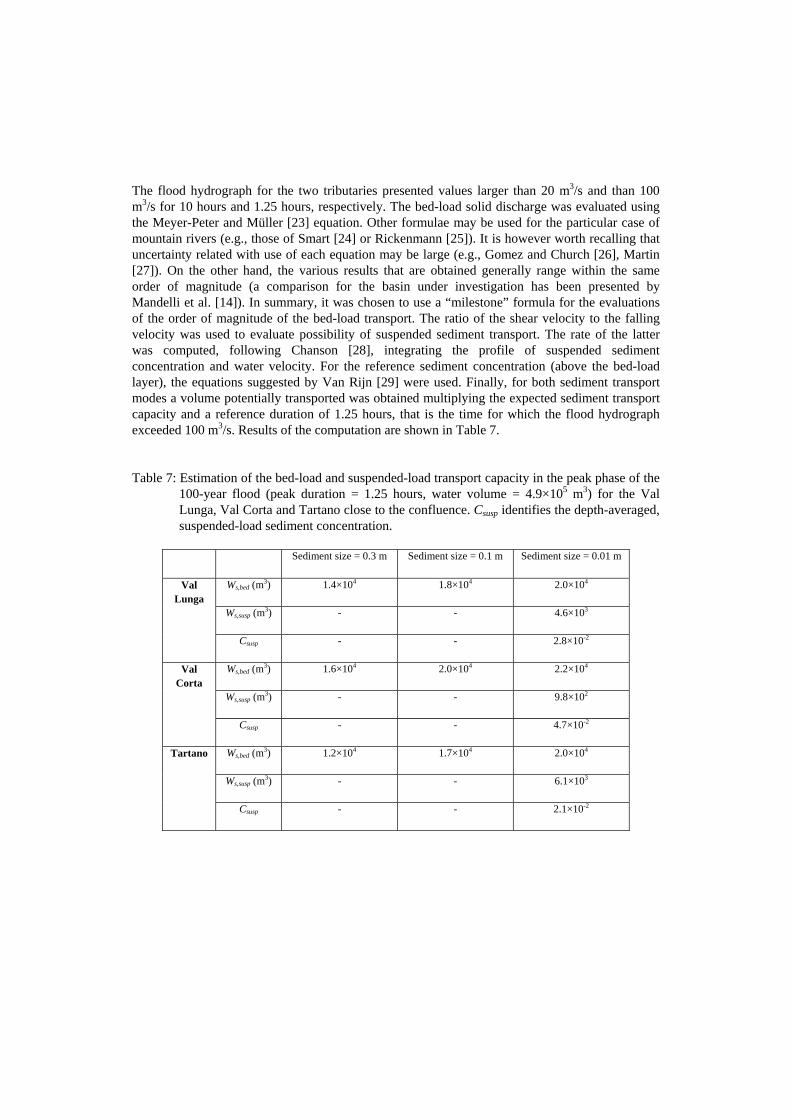
The flood hydrograph for the two tributaries presented values larger than 20 m3/s and than 100 m3/s for 10 hours and 1.25 hours, respectively. The bed-load solid discharge was evaluated using the Meyer-Peter and Müller [23] equation. Other formulae may be used for the particular case of mountain rivers (e.g., those of Smart [24] or Rickenmann [25]). It is however worth recalling that uncertainty related with use of each equation may be large (e.g., Gomez and Church [26], Martin [27]). On the other hand, the various results that are obtained generally range within the same order of magnitude (a comparison for the basin under investigation has been presented by Mandelli et al. [14]). In summary, it was chosen to use a “milestone” formula for the evaluations of the order of magnitude of the bed-load transport. The ratio of the shear velocity to the falling velocity was used to evaluate possibility of suspended sediment transport. The rate of the latter was computed, following Chanson [28], integrating the profile of suspended sediment concentration and water velocity. For the reference sediment concentration (above the bed-load layer), the equations suggested by Van Rijn [29] were used. Finally, for both sediment transport modes a volume potentially transported was obtained multiplying the expected sediment transport capacity and a reference duration of 1.25 hours, that is the time for which the flood hydrograph exceeded 100 m3/s. Results of the computation are shown in Table 7.
Table 7: Estimation of the bed-load and suspended-load transport capacity in the peak phase of the
100-year flood (peak duration = 1.25 hours, water volume = 4.9×10⁵ m3) for the Val Lunga, Val Corta and Tartano close to the confluence. Csusp identifies the depth-averaged, suspended-load sediment concentration.
Sediment size = 0.3 m Sediment size = 0.1 m Sediment size = 0.01 m
Val Lunga
Ws,bed (m3) 1.4×10⁴ 1.8×10⁴ 2.0×10⁴
Ws,susp (m3) - - 4.6×10³
Csusp - - 2.8×10⁻²
Val Corta
Ws,bed (m3) 1.6×10⁴ 2.0×10⁴ 2.2×10⁴
Ws,susp (m3) - - 9.8×10²
Csusp - - 4.7×10⁻²
Tartano Ws,bed (m3) 1.2×10⁴ 1.7×10⁴ 2.0×10⁴
Ws,susp (m3) - - 6.1×10³
Csusp - - 2.1×10⁻²

From Table 7 it is obtained that the river confluence is a critical reach, where the sediment transport capacity of the Tartano is approximately half of that of the tributaries. Indeed, as previously mentioned, during the event of 1987 a huge aggradation occurred at the confluence. In addition, the estimated values show that the sediment volume from soil erosion does not represent a problem for the rivers: the yield estimated for 100-year return period in the Val Lunga and Val Corta sub-basins (Table 5) is, respectively, 936 and 864 m3. Such values are much lower than the sediment transport capacity by suspended mode (it is assumed that this contribution will be mostly transported in suspension given the expected granulometry of the yielded material). Therefore, the present computations show that soil erosion may be excluded from the computation of yields affecting the aggradation regime of the water courses during high-flow events.
6 DISCUSSION Multiple processes are involved in event-induced solid transport in mountain basins. As mentioned above, a detailed model of sediment transport in rivers would need equally detailed knowledge of the sediment supply. For example, a proper boundary condition for morphologic models of riverbeds would be assessment of a time-yield curve at a certain section. Complexity of processes involved makes such a detailed modeling hardly possible. Even for relatively small basins like the one analyzed here, a number of sediment sources are present. In addition, each type of sediment source is characterized by different spatial and temporal scales. Finally, many models of sediment production furnish an integral value of sediment volume through the event considered, but not a temporal distribution.
On the other hand, it may be hypothesized that the different sediment sources be not needed to be modeled with equal detail for reliable prediction of the solid transport. In the sections above it was shown that, for example, the sediment yield from soil erosion is expected to represent a negligible fraction of the sediment transport capacity of the rivers. In addition, even if the models for soil erosion do not furnish the characteristic size of the supplied material, it is reasonable to assume that such size should be much less than that of sediments within the riverbeds and thus the sediment yield from soil erosion should feed the suspended sediment transport, with minor consequences for the morphologic evolution of the rivers. By contrast, even if the second analysis was much more preliminary than the first one, it was shown that sediment supply from the fault system are likely to constitute a large amount of sediments compared with the transport capacity of rivers. Furthermore, in this case it was possible to estimate the granulometric distribution of the material supplied to the river by on-site survey of the material deposited on slopes of the faulted valley.
The considerations above are beneficial in terms of developing integrated models to join geologic and hydraulic aspects. It is expected that a phenomenological chain of events can be chosen to represent the solid transport processes and their consequences, acknowledging that not all the contributions involved are accounted for but, on the other hand, assuming that the neglected phenomena correspond to a minor part of the process. It is however undoubted that much more work is needed for proper characterization of sediment yields during short-term events.
7 CONCLUSIONS
The paper has analyzed different sources of sediment production with reference to a test case, represented by the Tartano basin in northern Italy. The analysis has been carried on considering short-term events and where (i) the sediments represent a source of debris for the hydrographic
network and (ii) if the sediment yield is larger than the transport capacity of the water courses, increased hydraulic hazard may be expected.
At least three major sources of sediments have been identified, namely soil erosion, landslides and fault rocks. A detailed study has been performed for the soil erosion, using a variety of models which led to assess that this kind of sediment yield should not represent a problem for the sediment transport conditions within the rivers. By contrast, a preliminary study of one lateral valley of the basin showed that the amount of debris supplied by fault rocks to the rivers may be considerable.
The obtained results show that, with reference to this basin, it should be possible to simplify models of sediment transport within the watershed oriented to evaluation of the hydro-geological risk by considering only selected sources of sediments. The latter should be chosen as those supposed to influence in a major way the solid transport in rivers as well as the possible fallouts for landscape safety. It is expected that the general concept may be extended to other mountain basins, of course taking into account the specific features of the sediment sources.
ACKNOWLEDGMENTS The work was partially supported by Regione Lombardia through the project RISSME – RIsk by Sediment Sources in Mountain Environments. The authors gratefully acknowledge Federica Bonacina for having contributed to the analysis within her M.Sc. Thesis. References [1] De Vente, J., and Poesen, J., Predicting soil erosion and sediment yield at the basin scale:
Scale issues and semi-quantitative models. Earth-Science Reviews, Vol. 71, 95-125, 2005. [2] Chikita, K., Sedimentation by river-induced turbudity currents: field measurements and
interpretation. Sedimentology, 37(5),891-905, 1990. [3] Lajczak, A., Modelling the long-term course of non-flushed reservoir sedimentation and
estimating the life of dams. Earth Surface Processes and Landforms, 21(12), 1091-1107, 1996.
[4] De Cesare, G., Schleiss, A., and Hermann, F., Impact of turbudity currents on reservoir sedimentation. Journal of Hydraulic Engineering, 127(1), 6-16, 2001
[5] Elçi, S., Work, P.A., and Hayter, E.J. Influence of stratification and shoreline erosion on reservoir sedimentation patterns. Journal of Hydraulic Engineering, 133(3), 255-266, 2007.
[6] Lane, S.N., Tayefi, V., Reid, S.C., Yu, D., and Hardy, R.J., Interactions between sediment delivery, channel change, climate change and flood risk in a temperate upland environment. Earth Surface Processes and Landforms, 32, 429-446, 2007.
[7] Reid, S.C., Lane, S.N., Berney, J.M., and Holden, J.,The timing and magnitude of coarse sediment transport events within an upland, temperate gravel-bed river. Geomorphology, 83, 152-182, 2007.
[8] Sear, D.A., Newson, M.D., and Brookes, A., Sediment-related river maintenance: the role of fluvial geomorphology. Earth Surface Processes and Landforms, 20, 629-647, 1995.
[9] Klaassen, G.J., FRIMAR: Flooding RIsks in Mountain AReas. Available at the web address http://www.hrwallingford.co.uk/Mitch/papers/klaassen.pdf, 1997.
[10] Wasson, R.J., What approach to the modelling of catchments scale erosion and sediment transport should be adopted? Modelling erosion, sediment transport and sediment yield, eds. W. Summer & D.E. Walling, Technical Documents in Hydrology, n. 60, UNESCO, Paris, 1-11, 2002.
[11] Williams, J.R., and Berndt, H.D., Sediment Yield production with the universal equation using runoff Energy factor. Present and Prospective Technology for Predicting Sediment Yield and Sources, USDA, ARS-S-40, pp. 244-252, 1975.
[12] Gavrilovic, S., Bujicni tokovi i erozija, Gradevinski kalendar, Beograd, Serbia, 1976. [13] Wischmeier, W.H., and Smith, D.D., Predicting rainfall erosion losses, Agric. handb. 537,
USDA, Agricultural Research Service, Washington, DC, 1978. [14] Mandelli, M., Longoni, L., Papini, M., Roncoroni, F., and Radice A., Modellazione del
trasporto di sedimenti sul bacino del Tartano (Valtellina). GEAM, Anno XLVI, n. 2, 53-63, 2009.
[15] Ballio, F., Brambilla, D., Giorgetti, E., Longoni, L., Papini, M., and Radice, A., Evaluation of sediment yield from valley slopes: a case study. Proc. Debris Flow, Milan, Italy, 2010.
[16] Ramsay, J.G., Huber, M.I., The Techniques of Modern Structural Geology. Volume 2: Folds and Fractures. Academic Press, London, 1987.
[17] Wolman, G.., A method of sampling coarse river bed material. Transactions, American Geophysical Union, Volume 35, Number 6, 1954
[18] Kellerhals, R., and Bray, D. I., Sampling Procedures for Coarse Fluvial Sediments. Journal of the Hydraulics Division, American Society of Civil Engineers, 97(HY8), 1165-1180, 1971.
[19] Nash, E., Systematic determination of unit hydrograph parameters. Journal of Geophysical Research, 64, 111-115, 1957
[20] Giandotti, M., Previsione delle piene e delle magre dei corsi d’acqua italiani. Memorie e studi idrografici, Pubb.2 del Servizio Idrografico Italiano, Vol. VIII, 107, 1934.
[21] Schoklitsch, A., Handbuch des Wasserbauers, 3rd Edition, Springer- Verlag, Vienna, 1962. [22] Franzetti S., and Ballio F., Studio su modello fisico della confluenza dei torrenti Val Lunga e
Val Corta in comune di Tartano. Modello idraulico: relazione finale, Politecnico di Milano, 2004.
[23] Meyer-Peter, E., and Müller R., Formulas for bed-load transport. Proc. II Meeting of IAHR, Stockholm, Sweden, 1948.
[24] Smart, G., Sediment transport formula for steep channels. Journal of Hydraulic Engineering, 110,267-276, 1984.
[25] Rickenmann, D., Comparison of bed load transport in torrents and gravel bedstreams. Water Resources Research, 37, 3295-3305, 2001.
[26] Gomez, B., and Church, M., An assessment of bed load sediment transport formulae for gravel bed rivers. Water Resources Research, 25, 1161-1186, 1989
[27] Martin, Y., Evaluation of bed load transport formulae using field evidence from the Vedder River, British Columbia. Geomorphology, 53, 75-95, 2003
[28] Chanson, H., The Hydraulics of open channel flow: An introduction. Elsevier Butterworth-Heinemann, 1999.
[29] Van Rijn, L.C., Sediment transport, part I: Bed load transport, Journal of Hydraulic Engineering, 110, 1431-1456, 1984.


