Embed Size (px)
Citation preview

This article appeared in a journal published by Elsevier. The attachedcopy is furnished to the author for internal non-commercial researchand education use, including for instruction at the authors institution
and sharing with colleagues.
Other uses, including reproduction and distribution, or selling orlicensing copies, or posting to personal, institutional or third party
websites are prohibited.
In most cases authors are permitted to post their version of thearticle (e.g. in Word or Tex form) to their personal website orinstitutional repository. Authors requiring further information
regarding Elsevier’s archiving and manuscript policies areencouraged to visit:
http://www.elsevier.com/authorsrights

Author's personal copy
Observational relations between potential vorticity intrusionsand pre-monsoon rainfall over Indian sector
M. Sandhya, S. Sridharan⁎National Atmospheric Research Laboratory, Gadanki 517 112, Pakala Mandal, Chittoor District, India
a r t i c l e i n f o a b s t r a c t
Article history:Received 10 June 2013Received in revised form 6 September 2013Accepted 16 September 2013
The climatology of potential vorticity (PV) intrusion events to low latitudes, identified fromthe ECMWF (European Centre for Medium Range Weather Forecasting) reanalysis (ERA)interim data for the years 1982–2012, shows that the intrusion events occur, though less innumber, over African and Indian sectors (0°–90°E) also, in addition to the well knownintrusions over Eastern Pacific and Atlantic sectors. The seasonal variation of the PV intrusionevents over Indian sector (50°E–90°E) shows that the intrusion events are more duringpre-monsoon months, in particular during March and April contrary to the case over EasternPacific and Atlantic sectors, where the intrusions are more during winter. It is interesting tonote that no intrusion events occur during the Indian monsoon months (June–September) dueprobably to the presence of tropical easterly jet. Though the number of PV intrusions is less, itplays a profound role in triggering deep convection and associated precipitation over Indiansector. Four cases are presented to show that these PV intrusions are clearly associated withdeep convection and precipitation over Indian sector during the pre-monsoon months.
© 2013 Elsevier B.V. All rights reserved.
Keywords:Potential vorticityDeep convectionPre-monsoon rainfall
1. Introduction
Deep convection and associated latent heat release drivethe general circulation of the tropical atmosphere. Over tropics,deep convection is often influenced by changes in heat andmoisture surface fluxes in the boundary layer. The tropicalconvection may also be influenced by lateral forcing. Inparticular during Northern Hemispheric (NH) winter, thepresence of upper tropospheric eastward winds provides apath for the Rossby waves to propagate cross equatorially(Webster and Holton, 1982). When the wave amplitudes arelarger, the wave breaking occurs producing stratospheric airwith high potential vorticity (PV) into the tropical uppertroposphere (Waugh and Polvani, 2000). The PV intrusions arenearly always accompanied by deep convection. Hoskins et al.(1985) and Thorpe (1985) showed that a positive (cyclonic)upper-level PV has a less stable potential temperature dis-tribution within and immediately below the anomaly. This
decrease in the static stability, together with the translationalmotion of the anomaly itself, results in a vertical motion in lowlevels. The upper level PV triggers convection by destabilizinglower troposphere and by causing upward and polewardmotions ahead of the PV tongues and the poleward motiontransports tropical moist air to northern higher latitudes(Kiladis, 1998). Waugh (2005) using space based uppertropospheric humidity measurements and trajectory-basedsimulations showed high relative humidity (RH N 80%) ahead(east) of potential vorticity intrusions into the northernsubtropics. This is consistent with the known deep convectionand poleward flow ahead of these intrusions (Kiladis, 1998;Waugh and Funatsu, 2003). Ryoo et al. (2008) also showed thatupper level humidity during the NH wintertime is controlledby PV intrusions over the eastern Pacific and Atlantic Ocean.During the period of 6–8 January 2009 western Washingtonexperienced a rainfall of about 3–8 in., which led to flood(Neiman et al., 2011). Associated with this event there wasreported an intrusion of subtropical air with PV ~ 7 PVU(1 PVU, potential vorticity unit is 10−6 Ks2/kg). Earlier,Martín et al. (2006) linked a heavy rainfall event of November
Atmospheric Research 137 (2014) 80–90
⁎ Corresponding author. Tel.: +91 8585 272124; fax: +91 8585 272018.E-mail address: [email protected] (S. Sridharan).
0169-8095/$ – see front matter © 2013 Elsevier B.V. All rights reserved.http://dx.doi.org/10.1016/j.atmosres.2013.09.013
Contents lists available at ScienceDirect
Atmospheric Research
j ourna l homepage: www.e lsev ie r .com/ locate /atmos

Author's personal copy
2011 in the Western Mediterranean sea with the PV intrusion.Shuai et al. (2009) attributed a heavy rainfall event overNorthern China to non-uniformly saturated instability inducedby a dry intrusion. Graf et al. (2011) observed the formationof most European tornadoes within 200 km of a distinctupper-level PV anomaly.
There are also differences in the ascent of moist, boundarylayer air ahead of the PV tongues in mid-latitudes and tropics.In mid-latitude systems, this ascending air is typically partof a warm conveyor belt (Browning, 1990), where advectionaids in the ascent up a frontal surface and the upwardtransport can occur over large distances (e.g., 30° latitude)(e.g., Wernli, 1997). However over tropics, the ascent ahead ofthe PV intrusions results in deep convection within a localizedregion. The intrusions are strongly dependent on the back-ground flow. The presence of equatorial westerly ducts overPacific and Atlantic during northern fall through spring favoursthe wave-like disturbances to propagate. These disturbancescompress zonally and amplify meridionally generating a thintongue of high PV air to intrude into the tropical eastern Pacificpredominantly duringwinter. The PV intrusions to tropics havebeen linked with transient deep convection in the tropicaleastern Pacific andAtlantic (e.g., Kiladis andWeickmann, 1992;Kiladis, 1998;Waugh and Funatsu, 2003). Though the influenceof these intrusions on the weather of Eastern Pacific andAtlantic has been studied in detail, less attention has been paidto the intrusion events in other sectors due to the less numberof events. Over tropics, Roca et al. (2005) showed themodulationof extra-tropical dry-air intrusions on the occurrence andduration of convective systems and hence the mode ofvariability of rainfall over West Africa during the Africanmonsoon. Vialard et al. (2011) studied a rainfall event overIndia during March 2008. However, they related the rainfallwith the equatorial eastward propagation, characteristic of theMadden Julian Oscillation (MJO). Recently, Ullah and Shouting(2013) observed that highmid-tropospheric potential vorticityanomaly was conducive for the development of strong meso-scale convective vortex and large-scale cyclonic circulationover Pakistan during summer monsoon of 2010.
In this paper, the climatology of PV intrusions is studiedover Indian sector (50°E–90°E) and a few cases are shownrelating clearly these intrusion events with deep convectionand precipitation.
2. Data sets
2.1. Potential vorticity
For this study European Centre for Medium RangeWeatherForecasting (ECMWF) reanalysis (ERA) interim potential vor-ticity and zonal wind data are used. The first real-timemedium-range forecasts through this centre were made inJune 1979 and the centre has been producing operationalmedium-range weather forecasts since 01 August 1979. Thedata sets are currently available for the period January 1979 toJanuary 2013 in the website data-portal.ecmwf.int/data/d/interim_daily/for 15 isentropic levels. These data were pre-pared by ECMWF using their variational data assimilationsystem (Berrisford et al., 2009). The ERA-interim data setconsists of results from analysis conducted at 6-h intervalsavailable for a 1.5° latitude–longitude grid.
In the present study, potential vorticity at 350 K isentropiclevel is used and the value of PV N 1.5 PVU (represents strato-spheric air) is used to identify the intrusion events. Each eventis manually checked and identified in the time-longitude crosssection of PV at particular latitude, as it varies spatially andtemporally from case to case.
2.2. Outgoing Long-wave Radiation (OLR)
OLR data for this study is obtained from National Oceanicand Atmospheric Administration-National Centres for Envi-ronmental Prediction (NOAA-NCEP). The data are interpolat-ed in time and space from NOAA twice-daily OLR valuesand averaged to once daily. The data sets are available in2.5° × 2.5° latitude–longitude grid since 01 June 1974. Lowvalue of OLR represents high cloud top heights and it hasbeen used as an indicator for deep convection (Liebmann andHartmann, 1982).
2.3. Precipitation
Daily precipitation data has been taken from GlobalPrecipitation Climatology Project (GPCP). At present, the dataset contains daily global gridded values of precipitations for theperiod October1996 to April 2009 in 1° × 1° latitude–longitudegrid. The GPCP daily precipitation is produced at the NASAGoddard Space Flight Centre. The GPCP data are satellitederived precipitation productswith higher temporal and spatialscales and differentmethods are used for deriving precipitationin the tropics and the extra-tropics. It is a component of theGlobal Energy and Water Cycle Experiment of the WorldClimate Research Program (Gebremichael et al., 2005).
2.4. MJO indices
MJO indices are obtained from the website of NOAAclimate Prediction Center (http://www.cpc.noaa.gov). Theseindices are computed by applying an extended empiricalorthogonal function analysis to the 200 hPa velocity poten-tial. The first function consists of ten time-lagged patternswith each pattern separated by 5 days and ten MJO indicesare formed through regression analysis of daily data on tothese patterns. Each index is associated with the phase whenthe equatorial velocity potential anomalies have propagatedto a particular longitude. More details about the MJO indicescan be found in the website.
3. Results
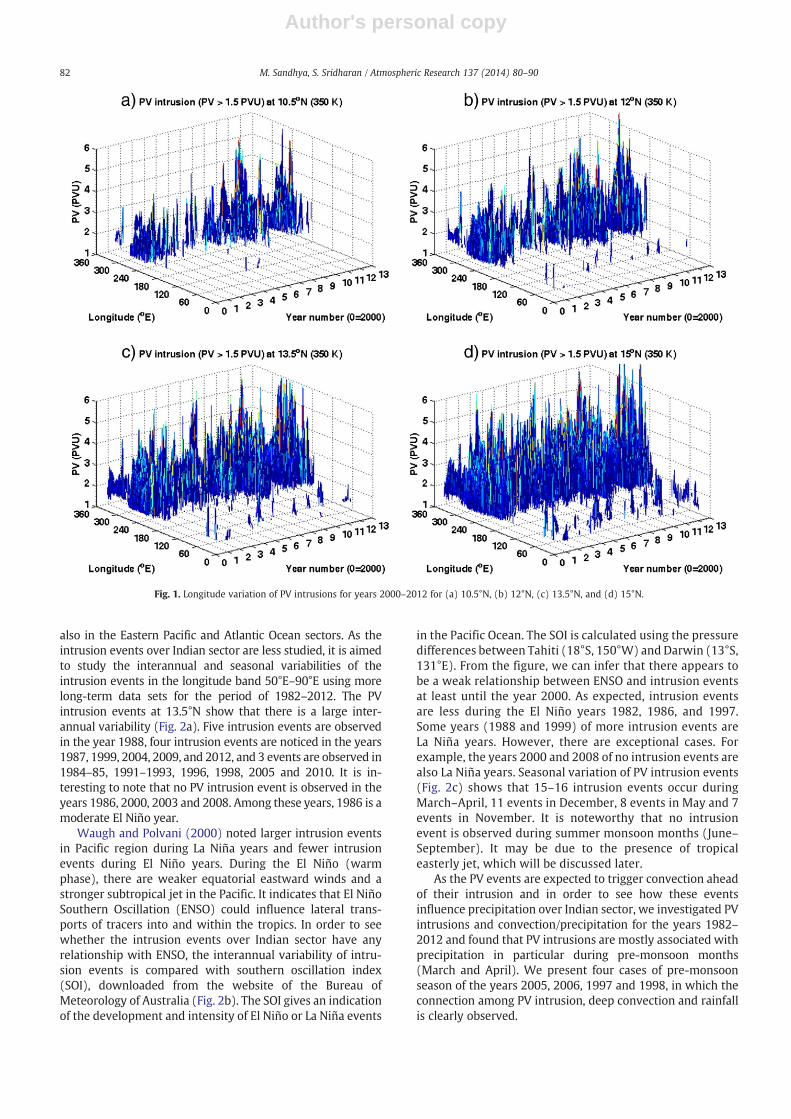
Fig. 1 shows longitude–time cross section of PV intrusionsat 10.5°N, 12°N, 13.5°N and 15°N for the years 2000–2012. At10°N, the intrusion events are more in the longitude bands180°–270°E and 300–360°E. The longitude of more intrusionsis around 250°E during winter and it gradually shifts to around180°E during summer and it again proceeds towards 250°Eduring fall equinox and winter. There is a large interannualvariability in the number of intrusions with more eventsoccurring during winter and spring equinoxes of 2000, 2006,2008, 2009, 2011 and 2012. As latitude increases, intrusionevents are noticed in the African and Indian sectors (0°E–90°E)also, though the number of intrusion events increase largely
81M. Sandhya, S. Sridharan / Atmospheric Research 137 (2014) 80–90
Author's personal copy
also in the Eastern Pacific and Atlantic Ocean sectors. As theintrusion events over Indian sector are less studied, it is aimedto study the interannual and seasonal variabilities of theintrusion events in the longitude band 50°E–90°E using morelong-term data sets for the period of 1982–2012. The PVintrusion events at 13.5°N show that there is a large inter-annual variability (Fig. 2a). Five intrusion events are observedin the year 1988, four intrusion events are noticed in the years1987, 1999, 2004, 2009, and 2012, and 3 events are observed in1984–85, 1991–1993, 1996, 1998, 2005 and 2010. It is in-teresting to note that no PV intrusion event is observed in theyears 1986, 2000, 2003 and 2008. Among these years, 1986 is amoderate El Niño year.
Waugh and Polvani (2000) noted larger intrusion eventsin Pacific region during La Niña years and fewer intrusionevents during El Niño years. During the El Niño (warmphase), there are weaker equatorial eastward winds and astronger subtropical jet in the Pacific. It indicates that El NiñoSouthern Oscillation (ENSO) could influence lateral trans-ports of tracers into and within the tropics. In order to seewhether the intrusion events over Indian sector have anyrelationship with ENSO, the interannual variability of intru-sion events is compared with southern oscillation index(SOI), downloaded from the website of the Bureau ofMeteorology of Australia (Fig. 2b). The SOI gives an indicationof the development and intensity of El Niño or La Niña events
in the Pacific Ocean. The SOI is calculated using the pressuredifferences between Tahiti (18°S, 150°W) and Darwin (13°S,131°E). From the figure, we can infer that there appears tobe a weak relationship between ENSO and intrusion eventsat least until the year 2000. As expected, intrusion eventsare less during the El Niño years 1982, 1986, and 1997.Some years (1988 and 1999) of more intrusion events areLa Niña years. However, there are exceptional cases. Forexample, the years 2000 and 2008 of no intrusion events arealso La Niña years. Seasonal variation of PV intrusion events(Fig. 2c) shows that 15–16 intrusion events occur duringMarch–April, 11 events in December, 8 events in May and 7events in November. It is noteworthy that no intrusionevent is observed during summer monsoon months (June–September). It may be due to the presence of tropicaleasterly jet, which will be discussed later.
As the PV events are expected to trigger convection aheadof their intrusion and in order to see how these eventsinfluence precipitation over Indian sector, we investigated PVintrusions and convection/precipitation for the years 1982–2012 and found that PV intrusions are mostly associated withprecipitation in particular during pre-monsoon months(March and April). We present four cases of pre-monsoonseason of the years 2005, 2006, 1997 and 1998, in which theconnection among PV intrusion, deep convection and rainfallis clearly observed.
Fig. 1. Longitude variation of PV intrusions for years 2000–2012 for (a) 10.5°N, (b) 12°N, (c) 13.5°N, and (d) 15°N.
82 M. Sandhya, S. Sridharan / Atmospheric Research 137 (2014) 80–90

Author's personal copy
Fig. 2. Interannual variability of PV intrusions at 13.5°N in the longitude band 50°E–90°E for the years 1982–2012, (b) yearly averaged SOI and (c) seasonalvariability of PV intrusion at 13.5°N in the longitude band 50°E–90°E.
Fig. 3. Longitude–time cross section of (a) potential vorticity at 350 K isentropic level and at 16.5°N, (b) OLR averaged over 17.5°–20°N, and (c) rainfall at 18.5°Nfor the days 60–120 of year 2005.
83M. Sandhya, S. Sridharan / Atmospheric Research 137 (2014) 80–90

Author's personal copy
Fig. 3a shows a PV intrusion event of 2005 and the eventbegins on day number 65 (06 March 2005) at 16.5°N and51°E. The event could extend up to day number 72 (13 March2005). Maximum PV of 3.2 PVU can be seen during theintrusion event. Before and after the event, PV value is veryless, which indicates the presence of normal tropospheric air.As the day progresses, the event moves towards east and upto nearly 76°E. Fig. 3b shows OLR averaged over 17.5°N–20°N. There is a clear reduction in OLR remarkably movingtowards east tracking the path of PV intrusions. The OLRdecreases from 240 W/m2 on day number 65 to 200 W/m2
on day number 72 around 80°E. Both PV and OLR are com-pared with precipitation data also. There is a maximum
precipitation of nearly 26 mm/day. It is noteworthy that theprecipitation pattern also moves eastward, as day progresses,tracking the PV intrusion indicating clearly that it is triggeredby the intrusions. As per Indian Meteorological Department(IMD) this rain comes under moderate rain category. Table 1shows classification of rainfall by IMD.
Similarly, another event starts on day number 104 (14April 2005) at nearly same longitude around 52°E with thePV value of 1.8 PVU and moves eastward and lasts up today number 110 (20 April 2005), when it shows 1.6 PVU.Decrease of OLR can be observed from ~300 W/m2 on daynumber 104 (14 April 2005) at 50°E to 230 W/m2 on daynumber 106 at 65°E and further to 200 W/m2 at 80°E on daynumber 108. In association with the intrusion event, the lowOLR also moves eastward. Precipitation of 22 mm/day isnoticed on day number 107 at 83.5°E. One more event alsooccurs subsequent to this event beginning on day number109. It also clearly shows eastward movement of PV intrusionof 2.2 PVU at 52.5°E on day number 112 to 1.5 PVU at 72.5°Eon day number 114. Eastward movement of low OLR canbe noticed clearly in associated with the intrusion event.Notably, low OLR of 168 W/m2 and 197 W/m2 is observedrespectively at 57.5°E and 80°E on day numbers 110 and 114respectively. The precipitation pattern at 18.5°N also moveseastward with large rainfall values of 8, 11, and 12 mm/dayrespectively at 57.5°E, 61.5°E, and 69.5°E on day numbers110–112 respectively (Fig. 3c).
Fig. 4a shows that a strong PV intrusion event is observedin the year 2006. The event starts with 2.2 PVU on day
Table 1Classification of rainfall by IMD.
Term used to describe Rain fall in mm
No rain 0.0Very light rain 2.4Light rain 2.5–7.5Moderate rain 7.6–35.5Rather heavy rain 35.6–64.4Heavy rain 64.5–124.4Very heavy rain 124.4–244.4Extremely heavy rain N244.5Exceptionally heavy rain When the amount is a value near about
the highest recorded rainfall or near thestation for the month or season(actually used when R N 12 cm).
Fig. 4. Longitude–time cross section of (a) potential vorticity at 350 K isentropic level and at 22.5°N, (b) OLR averaged over 15°–25°N, and (c) rainfall at 22.5°N forthe days 60–120 of year 2006.
84 M. Sandhya, S. Sridharan / Atmospheric Research 137 (2014) 80–90

Author's personal copy
Fig. 5. Longitude–time cross section of (a) potential vorticity at 350 K isentropic level and at 22.5°N, (b) OLR averaged over 15°–25°N, and (c) rainfall at 22.5°N forthe days 90–130 of year 1997.
Fig. 6. Longitude–time cross section of (a) potential vorticity at 350 K isentropic level and at 16.5°N, (b) OLR averaged over 15°–25°N, and (c) rainfall at 16.5°N forthe days 60–90 of year 1998.
85M. Sandhya, S. Sridharan / Atmospheric Research 137 (2014) 80–90

Author's personal copy
number 66 (07 March 2006) at 22.5°N and 58.5°E and moveseastward and a maximum PV of 7 PVU is observed on daynumber 67 (08 March 2006) at 64.5°E. The event extendsnearly up to 82.5°E on day number 71. Beyond that longitudealso large PV values are observed, however they are lessthan threshold of 1.5 PVU, which has been considered for theidentification of PV intrusion event. The deep convection istriggered as a well response to this intrusion event, as OLR at77.5°E is reduced to 197 W/m2 on day number 69 (Fig. 4b). Therainfall is 48 mm/day on day number 68 (09 March) around76.5°E and it continues next day also showing maximumprecipitation of 37 mm/day at 81.5°E (Fig. 4c). This rainfallevent is declared as moderate rain by IMD. Compared to 2005event the extent of this intrusion is small both temporally andspatially. Another event also started on day number 107 (17April) propagating eastward from 66°E to 84°E on 19 April.Deep convection is also observed tracking the intrusion eventwith OLR values b190 W/m2 spreading in the longitude region77°E–87°E. Rainfall of N25 mm/day is observed in the longi-tude region.
An interesting case of year 1997 is presented in Fig. 5a, inwhich several PV intrusions at 22.5°N are observed with largelongitude extents (80°E–90°E, 50°E–90°E and again 50°E–90°E during day numbers 99–102, 109–112, and 111–127).Low OLR can be noticed closely tracking these intrusions
Table 2Temporal correlation coefficients between PV and OLR, PV and rainfall andOLR and rainfall for the years 2005, 2006, 1997 and 1998. The results ofsignificant test (p) are also given in brackets. If p b 0.05, the correlation issignificant.
Year PV vs OLR PV vs rainfall OLR vs rainfall
2005 −0.76 (0.00) 0.68 (0.00) −0.73 (0.00)2006 −0.90 (0.00) 0.80 (0.00) −0.94 (0.00)1997 0.61 (0.00) 0.35 (0.02) −0.69 (0.00)1998 −0.12 (0.00) 0.58 (0.01) −0.28 (0.21)
Table 3Spatial correlation coefficients between PV and OLR, PV and rainfall and OLRand rainfall for the years 2005, 2006, 1997 and 1998. The results ofsignificant test (p) are given in brackets. If p b 0.05, the correlationcoefficient is significant.
PV vs OLR PV vs rainfall OLR vs rainfall
2005 Co-located 0.32 (0.02) −0.44 (0.00) −0.55 (0.00)Shifted by 20°E −0.59 (0.00) 0.72 (0.00) −0.55 (0.00)
2006 Co-located 0.46 (0.04) −0.43 (0.06) −0.95 (0.00)Shifted by 10°E −0.98 (0.00) 0.86 (0.00) −0.91 (0.00)
1997 Co-located 0.76 (0.00) 0.54 (0.00) 0.14 (0.38)Shifted by 10°E −0.66 (0.00) 0.47 (0.00) −0.24 (0.13)
1998 Co-located 0.73 (0.00) −0.27 (0.06) −0.53 (0.00)Shifted by 20°E −0.57 (0.00) 0.31 (0.04) 0.42 (0.00)
Fig. 7. Time–lag correlation coefficients between PV and OLR, PV and rainfall and OLR and rainfall for the years 2005, 2006, 1997 and 1998.
86 M. Sandhya, S. Sridharan / Atmospheric Research 137 (2014) 80–90

Author's personal copy
(Fig. 5b). In particular, the PV intrusion in the extendedlongitude range 50°E–90°E is accompanied by low OLR,which is also propagating eastward with values less than190 W/m2 on day number 115 around 65°E and less than210 W/m2 on day numbers 119 and 125 around 77.5°E and85°E respectively. Patches of rainfall, however less than10 mm/day, tracking these intrusion events can be inferredfrom the figure, except that there is a slightly more rainfall of15 mm/day on day number 112 at 56.5°E. Besides, rainfall ofN10 mm/day is observed around 90°E on day numbers 99and 115 respectively (Fig. 5c).
In the case of 1998, large PV intrusion at 16.5°N pro-pagates eastward from day number 75 around 42°E to 77around 51°E and with a small break, it extends further to75°E on day number 89 (Fig. 6a). Low OLR can be observed inthe longitude band 60°E–70°E and 80°E–90°E during the daynumbers 75–80 and 86–89 respectively (Fig. 6b). Rainfalloccurs in the low OLR region with maximum values of15 mm/day at 60°E and 85°E on day numbers 78 and 98respectively (Fig. 6c). It is interesting to note that rainfall andOLR also show a break in their longitudinal extension, asshown by PV.
In order to express the relationship among PV intrusion,OLR and rainfall quantitatively, temporal and spatial correla-tion analyses are employed. Significance of the correlation isobtained by testing the hypothesis of no correlation against the
alternative that there is a non-zero correlation. The correlationcoefficients and the results of the significant test are given inTables 2 and 3. If the value is less than 0.05, the correlation issignificant. The OLR and PV data sets are interpolated for every1° to have equal sampling with precipitation data sets. Forthe temporal correlation analysis, the data sets for 15, 20 or40 days centred around each event are taken depending onthe temporal extent of the particular event and the resultsare shown in Fig. 7. For the case of 2005, intrusions occurduring day numbers 65–72 over the longitudes 50°E–80°E. Thecorrelation coefficient between temporal variations of PV andOLR for the day numbers 60–74 averaged for the longitude50°E–80°E is −0.76, that between PV and rainfall is 0.68 andthat between OLR and rainfall is −0.73. In the case of 2006,intrusion is identified during the day numbers 66–70 overthe region 65°E–75°E. The PV, OLR and rainfall averaged overthis longitude region are used for correlation analysis. Thecorrelation coefficient between PV and OLR is −0.9 and thatbetween PV and rainfall is 0.8 and that between OLR andrainfall is −0.94. In the years 1998 and 1997, weaker, butsignificant correlation coefficients are obtained. In the year1998, PV value is maximum between 72°E and 76.5°E duringday numbers 114–119 and in the case of 1997, the PVintrusion event persists for a long duration (day numbers:96–127). The 1997 event extends spatially also largely overthe longitude region 50°E–90°E. The correlation coefficients
Fig. 8. Space–lag correlation coefficients between PV and OLR, PV and rainfall and OLR and rainfall for the years 2005, 2006, 1997 and 1998.
87M. Sandhya, S. Sridharan / Atmospheric Research 137 (2014) 80–90

Author's personal copy
between PV and rainfall averaged for the longitude regionsare 0.58 and 0.35 respectively for the years 1998 and 1997.
For the spatial correlation analysis, the data sets for 15°,20°, and 40° longitudes centred around the event dependingon the zonal extent of the particular event are considered.The spatial correlation between PV and OLR improves andexpected anticorrelation is obtained, if OLR is shifted by 10°E inthe cases of 2006 and 1996 and 20°E in the cases of 2005 and1998. It is in agreement with the fact that PV induces con-vection east of their intrusions. The results of the correlationanalysis are shown in Fig. 8. The correlation coefficients for theshifted cases are−0.59,−0.98,−0.66 and−0.57 respectivelyfor the years 2005, 2006, 1997 and 1998. The correlationsbetween PV and rainfall are insignificant, if the parameters arespatially co-located. However, the correlation improves dras-tically, if spatial variation of rainfall is found by shifting rainfallparameter by 20°E or 10°E. The correlation between PV andrainfall is 0.72, 0.86, 0.47 and 0.31 for the cases 2005, 2006,1998 and 1997 respectively.
Ryoo et al. (2008) showed that low-frequency variability,such as MJO can be a potential cause of the change ofmeridional velocity, which can influence subtropical humid-ity. As the MJO is one of the dominant variabilities of thetropical troposphere, it is probable that the pre-monsoonconvection and rainfall could be influenced by the MJO. Inorder to analyse this, MJO indices described in Section 2.0, areused. A negative index corresponds to a time with enhancedrainfall. From Fig. 9, we can infer that the decreased OLR andrainfall observed during day numbers 60–90 of 2005 and
2006 are not coinciding with the negative index. For example,the index is positive around day number 70 of 2005 and 2006and around day number 110 of 2005. The enhanced rainfall isobserved during the day numbers 70–80 of 1998, when theMJO index is positive. Similarly deep convection and en-hanced rainfall occur during the day numbers 110–120, whenthe MJO index is positive. Hence it appears that MJO does notplay a major role in causing variabilities in tropical rainfallduring monsoon season. Besides, both temporal and spatialextents of OLR and precipitation closely follow the PVintrusions as shown in Figs. 3–6.
4. Discussion
The climatology of ERA-interim potential vorticity intru-sions for the years 2000–2012 shows that the intrusion eventsoccur, though less in number in African and Indian sectors (0–90°E) also, in addition to the well known intrusions overEastern Pacific and Atlantic sectors. The seasonal variation ofthe PV intrusion events over Indian sector (50°E–90°E) showsthat the intrusion events are more during pre-monsoonmonths (March–May) contrary to the case over Eastern Pacificand Atlantic sectors, where more number of intrusion eventsis observed during winter months (December–February). It isinteresting to note that no intrusion events occur over Indiansector during monsoon months (June–September) due prob-ably to the presence of tropical easterly jet (TEJ), as theequatorial westerlies are preferable locations for these PV
Fig. 9. Comparison of longitude–time cross section of OLR and MJO index for different longitudes for the pre-monsoon season of the years 2005, 2006, 1997 and1998.
88 M. Sandhya, S. Sridharan / Atmospheric Research 137 (2014) 80–90

Author's personal copy
intrusions. From the dailymean zonal winds for a few intrusionand non-intrusion years shown in Fig. 10, it can be inferredthat the winds are mainly eastward during January–May andOctober–December. However, during summer months, thewinds are largely westward due to the presence of the TEJ,which is an upper level westward wind that starts in late Juneand continues until early September. This strong flowof air thatdevelops in the upper troposphere during the Asian monsooncentred around 15°N, 50°E–80°E and extends from South–EastAsia to Africa. The strongest development of the jet is at about15 kmheightwithwind speeds of up to 40 m/s over the IndianOcean. Since upper tropospheric westerlywinds are favourablelocations for the mid-latitude stratospheric air to enter intotropical troposphere (Waugh and Polvani, 2000), the presenceof TEJ during the summer months may be preventing theintrusion to further southward to lower latitudes. The seasonalvariation of PV intrusions to the northern tropics over Pacificand Atlantic sectors also shows less number of events duringnorthern summer (Waugh and Polvani, 2000). Though morewave breaking events occur during sub-tropical tropopause(Postel and Hitchman, 1999), the transport of air that containshigh PV to tropics due to these wave breaking events occurspredominantly during northern winter, when equatorial east-ward winds prevail. Kiladis (1998) also demonstrated thatthere is a substantial interannual variability of wave activity,which suggests that thewave activity is sensitive to the changes
in the large-scale basic-state circulation and reorganization oftransient activity through basic-state variations. Besides, in thepresent study, no intrusion events occurred during the years2008, 2003, 2000 and 1986. The daily mean zonal winds forthose non-intrusion years shown in Fig. 10e–h, we can inferthat during the pre-monsoon months the zonal winds areweaker (b20 m/s), when compared to intrusion years, whenthe winds are around 35–40 m/s and in particular 60 m/s in1997. It clearly suggests that background winds play a crucialrole for the intrusions to occur.
Though the number of PV intrusions is small, it plays aprofound role in triggering deep convection and associatedprecipitation over Indian sector. Four cases are presented toshow that these PV intrusions are clearly associated withdeep convection and precipitation over Indian sector duringpre-monsoon months. The pre-monsoon rains are called‘Mango showers’, which help to ripen mangoes whichprevent them from prematurely dropping from trees and,hence, are crucial for managing mango harvests. As India isthe largest producer ofmangoes, it is important to understandthe factors influencing the pre-monsoon rainfall. All the fourcases presented here show high OLR (N300 W/m2) value andno precipitation before and after the intrusion events. Duringthe intrusion, OLR is drastically reducing to 200 W/m2 orbelow. During some years it is observed that corresponding toPV intrusion, OLR value is reducing but it is not leading to
Fig. 10. Longitude–time cross section of daily mean zonal winds at 350 K isentropic level and at 16.5°N for years 2005 and 1998, 22.5°N for years 2006 and 1997,and at 13.5°N for the no intrusion years (2008, 2003, 2000, 1986).
89M. Sandhya, S. Sridharan / Atmospheric Research 137 (2014) 80–90

Author's personal copy
precipitation. In particular, even though the PV intrusions leadto rainfall in March and April, irrespective of the occurrenceof intrusions, there is more rainfall during May due to theformation cyclones. Over Indian Ocean, the cyclones tend tospin up in May and November, the months immediatelypreceding and following the summer monsoon, whichdominates the circulation patterns during June–October,making tropical cyclones rare in the Northern Indian Oceanduring those months. As precipitation is common duringMay due to tropical cyclones and local convection, it isdifficult to isolate the rainfall events relating only to PVintrusions.
There are some cases (March 2001, 2003 and April 2004and 2008 to state a few) in which the relation betweenPV intrusion and OLR is relatively weaker. Allen et al. (2008)and Russell et al. (2008) showed that PV intrusions maylead to either convective inhibition or rainfall. When thePV intrusions occur, they bring to tropics dry air, whichhave high potential vorticity and hence high static stability,leading to convective inhibition. Convective promotionscan occur at the leading edges of the descending dry airand where there is sufficient low-level forcing. Similarly,no precipitation is observed in association with a few PVintrusions also and in these cases, no enhancement in relativehumidity is observed ahead of the intrusions (not shown).Waugh (2005) reported high relative humidity ahead of PVintrusions, which however are observed also in the four casespresented in this paper. The absence of precipitation in somecases may be due to the absence of sufficient water vapourto form cumulonimbus clouds. This may partly be due tointrusion with lower PV value, which has rarely crossed3.5 PVU over the longitude band 50°E–90°E considered inthe present work, whereas over central and eastern Pacificregions, the value is more than even 6 PVU.
5. Conclusions
In the present study, interannual and seasonal variabilitiesof PV intrusions over Indian sector are presented. The inter-annual variability of PV intrusions shows weaker correlationwith ENSO. The seasonal variability of PV intrusions showslarger intrusions during March–April and it is quite differentfrom that over Eastern Pacific. These intrusions greatly in-fluence the temporal and spatial extents of pre-monsoonrainfall over Indian sector. The intensity of the pre-monsoonrainfall over Indian sector can range from light showers toheavy thunderstorms and the prediction of the rain is verydifficult. More observational studies are required to under-stand the behaviour of different PV intrusions and theirinfluence on tropical weather over Indian sector, which isessential to develop better numerical weather predicationmodels to provide more accurate prediction about pre-monsoon rains.
References
Allen, G., Vaughan, G., Brunner, D., May, P.T., Heyes, W., Minnis, P., Ayers, J.K.,2008. Modulation of tropical convection by breaking Rossby waves.Q. J. R. Meteorol. Soc. http://dx.doi.org/10.1002/qj.349.
Berrisford, P., Dee, D., Fielding, K., Fuentes, M., Kallberg, P., Kobayashi, S.,Uppala, S., 2009. ‘The ERA-interim Archive. European Centre for MediumRange Weather Forecasts’, Shinfield Park, Reading, Berkshire RG2 9AX,United Kingdom. 1–16.
Browning, K., 1990. Organization of clouds and precipitation in extratropicalcyclones. Extra-tropical cyclones. In: Newton, C.W., Holopainen, E.O. (Eds.),The Erik Palmen Memorial Volume. Amer. Meteor. Soc. , pp. 129–153.
Gebremichael, M., Krajewski, W.F., Morrissey, M.L., Huffman, R.F., Adler, R.F.,2005. A detailed evaluation of GPCP 1° daily rainfall estimates over theMississippi River Basin. J. Appl. Meteorol. 44, 665–681.
Graf, M.A., Sprenger, M., Moore, R.W., 2011. Central European tornadoenvironments as viewed from a potential vorticity and Lagrangianperspective. Atmos. Res. 101, 31–45.
Hoskins, B.J., McIntyre, M.E., Robertson, A.W., 1985. On the use andsignificance of isentropic potential vorticity maps. Q. J. R. Meteorol. Soc.111, 877–946.
Kiladis, G.N., 1998. Observations of Rossby waves linked to convection overthe eastern tropical Pacific. J. Atmos. Sci. 55, 321–339.
Kiladis, G.N., Weickmann, K.M., 1992. Extratropical forcing of tropicalPacific convection during northern winter. Mon. Weather Rev. 120,1924–1938.
Liebmann, B., Hartmann, D.L., 1982. Interannual variations of outgoing IRassociated with tropical circulation changes during 1974–78. J. Atmos.Sci. 39, 1153–1162.
Martín, M.L., Santos-Muñoz, D., Morata, A., Luna, M.Y., Valero, F., 2006. Anobjectively selected case study of a heavy rain event in the MediterraneanBasin: a diagnosis using numerical simulation. Atmos. Res. 81, 187–205.
Neiman, P.J., Schick, L.J., Ralph, F.M., Hughes, M., Wick, G.A., 2011.Flooding in western Washington, the connection to atmospheric rivers.J. Hydrometeorol. 12, 1337–1358.
Postel, G.A., Hitchman, M.H., 1999. A climatology of breaking along thesubtropical tropopause. J. Atmos. Sci. 56, 359–373.
Roca, R., Lafore, J., Piriou, C., Redelsperger, J., 2005. Extratropical dry-airintrusions into the West African monsoon midtroposphere. An impor-tant factor for the convective activity over the Sahel. J. Atmos. Sci. 62,390–407.
Russell, A., Vaughan, G., Norton, E.G., Morcrette, C.J., Browning, K.A., Blyth,A.M., 2008. Convective inhibition beneath an upper-level PV anomaly.Q. J. R. Meteorol. Soc. 134, 371–383.
Ryoo, J.M., Waugh, D.W., Gettelman, A., 2008. Variability of subtropical uppertropospheric humidity. Atmos. Chem. Phys. 8, 2643–2655.
Shuai, Y., Xiaopeng, C., Lingkun, R., 2009. Analyses of dry intrusion andinstability during a heavy rainfall event that occurred in Northern China.Atmos. Ocean. Sci. Lett. 2, 108–112.
Thorpe, A.J., 1985. Diagnosis of balanced vortex structure using potentialvorticity. J. Atmos. Sci. 42, 397–406.
Ullah, K., Shouting, G., 2013. A diagnostic study of convective environmentleading to heavy rainfall during the summer monsoon 2010 overPakistan. Atmos. Res. 120–121, 226–233.
Vialard, J., Terray, P., Duvel, J.P., Nanjundiah, R.S., Shenoi, S.S.C., Shankar, D.,2011. Factors controlling January–April rainfall over southern India andSri Lanka. Clim. Dyn. 37, 493–507.
Waugh, D.W., 2005. Impact of potential vorticity intrusions on subtropicalupper tropospheric humidity. J. Geophys. Res. 110 (D11305). http://dx.doi.org/10.1029/2004JD005664.
Waugh, D.W., Funatsu, B.M., 2003. Intrusions into the tropical uppertroposphere: three-dimensional structure and accompanying ozone andOLR distributions. J. Atmos. Sci. 60, 637–653.
Waugh, D.W., Polvani, L.M., 2000. Climatology of intrusions into the tropicalupper troposphere. Geophys. Res. Lett. 27, 3857–3860.
Webster, P.J., Holton, J.R., 1982. Cross-equatorial response to middle-latitudeforcing in a zonally varying basic state. J. Atmos. Sci. 39, 722–733.
Wernli, H., 1997. Lagrangian based analysis of extra-tropical cyclones. 1: Themethod and its applications. Q. J. R. Meteorol. Soc. 123, 467–489.
90 M. Sandhya, S. Sridharan / Atmospheric Research 137 (2014) 80–90


