Embed Size (px)
Citation preview

University of Alberta
OBJECTIVE SURGICAL SKILL EVALUATION
by
Fraser Anderson
A thesis submitted to the Faculty of Graduate Studies and Researchin partial fulfillment of the requirements for the degree of
Master of Science
Department of Computing Science
c©Fraser AndersonFall 2010
Edmonton, Alberta
Permission is hereby granted to the University of Alberta Libraries to reproduce singlecopies of this thesis and to lend or sell such copies for private, scholarly or scientific
research purposes only. Where the thesis is converted to, or otherwise made available indigital form, the University of Alberta will advise potential users of the thesis of these
terms.
The author reserves all other publication and other rights in association with the copyrightin the thesis, and except as herein before provided, neither the thesis nor any substantialportion thereof may be printed or otherwise reproduced in any material form whatever
without the author’s prior written permission.

Examining Committee
Walter F. Bischof, Computing Science
Pierre Boulanger, Computing Science
Daniel W. Birch, Surgery
Joerg Sander, Computing Science

To Mom and Dad
For teaching me how to read, letting me push buttons, and supporting me for a
quarter-century and counting.

Abstract
It is essential for surgeons to have their skill evaluated prior to entering the oper-
ating room. Most evaluation methods currently in use are subjective, relying on
human judgment to assess trainees. Recently, sensors have been used to track the
positions of instruments and the forces applied to them by surgeons, opening up
the possibility of automated skill analysis. This thesis presents a newly developed
recording system, and novel methods used to automatically analyze surgical skill
within the context of laparoscopic procedures. The evaluation methods are tested
using an empirical study involving a number of participants with a wide range of
surgical skill.

Acknowledgements
Thanks for everything, Michelle. For keeping me on track over the last 2 years,
answering the phone in the middle of the night, for being a travel-buddy, and every-
thing else you’ve done. Thanks for the help with the thesis as well, from looking at
all of my wonderful graphs, reading over the thesis, helping with the experiments,
building the obviously-too-good-to-be-done-by-me force calibration figure.
Thanks Walter, for going far above and beyond what a supervisor should do.
From the 5 minute response times to 2am emails, same day turn around on paper
reviews, and the box of red pens you used on my thesis. I apologize for soiling your
summer vacation with these drafts. You are an incredible mentor.
Pierre, thank you for all your advice, knowledge, and house parties. You go out
of your way to make people feel part of the lab and create a friendly atmosphere.
To Dr. Birch, thanks for the surgical knowledge and interest in the project. Both
you and the CAMIS staff were extremely helpful in helping me get set up, getting
the ethics approval, finding participants and refining the study. The opportunity to
watch live surgical procedures was also incredibly interesting and useful.

Table of Contents
1 Introduction 11.1 Surgical Techniques . . . . . . . . . . . . . . . . . . . . . . . . . . 21.2 Skill Evaluation . . . . . . . . . . . . . . . . . . . . . . . . . . . . 4
1.2.1 Subjective Surgical Skill Evaluation . . . . . . . . . . . . . 41.2.2 Automated Objective Surgical Skill Evaluation . . . . . . . 5
1.3 Contributions and Organization . . . . . . . . . . . . . . . . . . . . 71.3.1 Contributions . . . . . . . . . . . . . . . . . . . . . . . . . 71.3.2 Thesis Organization . . . . . . . . . . . . . . . . . . . . . 8
2 Objective Evaluation of Surgical Skill 92.1 Experimental Methods . . . . . . . . . . . . . . . . . . . . . . . . 9
2.1.1 Experiments In Vivo . . . . . . . . . . . . . . . . . . . . . 92.1.2 Experiments with Synthetic Trainers . . . . . . . . . . . . . 11
2.2 Recording Systems . . . . . . . . . . . . . . . . . . . . . . . . . . 132.2.1 Electromagnetic Motion Capture . . . . . . . . . . . . . . . 142.2.2 Optical Motion Capture . . . . . . . . . . . . . . . . . . . 152.2.3 Mechanical Motion Capture . . . . . . . . . . . . . . . . . 172.2.4 Force Transducers . . . . . . . . . . . . . . . . . . . . . . 18
2.3 Measures of Skill . . . . . . . . . . . . . . . . . . . . . . . . . . . 202.3.1 Global Measures . . . . . . . . . . . . . . . . . . . . . . . 202.3.2 Local Analysis . . . . . . . . . . . . . . . . . . . . . . . . 23
3 Data Capture System 293.1 System Design . . . . . . . . . . . . . . . . . . . . . . . . . . . . 293.2 Motion Tracking . . . . . . . . . . . . . . . . . . . . . . . . . . . 30
3.2.1 Marker Placement . . . . . . . . . . . . . . . . . . . . . . 323.2.2 Instrument Tracking Using Templates . . . . . . . . . . . . 343.2.3 Filtering . . . . . . . . . . . . . . . . . . . . . . . . . . . . 35
3.3 Force and Torque Data . . . . . . . . . . . . . . . . . . . . . . . . 383.3.1 Force and Torque Transducer . . . . . . . . . . . . . . . . . 39
3.4 Coordinate Systems . . . . . . . . . . . . . . . . . . . . . . . . . . 403.4.1 Alignment of Template with Force and Torque . . . . . . . 413.4.2 Alignment of Template with Tracker . . . . . . . . . . . . . 41
3.5 Video and Audio . . . . . . . . . . . . . . . . . . . . . . . . . . . 423.5.1 Video . . . . . . . . . . . . . . . . . . . . . . . . . . . . . 423.5.2 Audio . . . . . . . . . . . . . . . . . . . . . . . . . . . . . 43
3.6 Data Processing . . . . . . . . . . . . . . . . . . . . . . . . . . . . 433.6.1 Curvature . . . . . . . . . . . . . . . . . . . . . . . . . . . 433.6.2 Mechanical Energy . . . . . . . . . . . . . . . . . . . . . . 47

4 Experimental Methodology 514.1 Procedure . . . . . . . . . . . . . . . . . . . . . . . . . . . . . . . 51
4.1.1 Questionnaire . . . . . . . . . . . . . . . . . . . . . . . . . 524.1.2 Stereo Vision Test . . . . . . . . . . . . . . . . . . . . . . 524.1.3 Manual Dexterity Pegboard . . . . . . . . . . . . . . . . . 534.1.4 Fundamental Laparoscopic Skills Pegboard . . . . . . . . . 544.1.5 Simple Interrupted Sutures . . . . . . . . . . . . . . . . . . 554.1.6 Continuous Running Suture . . . . . . . . . . . . . . . . . 564.1.7 Second Questionnaire . . . . . . . . . . . . . . . . . . . . 57
4.2 Subjective Data Analysis . . . . . . . . . . . . . . . . . . . . . . . 574.2.1 Segmentation . . . . . . . . . . . . . . . . . . . . . . . . . 574.2.2 Expert Evaluation . . . . . . . . . . . . . . . . . . . . . . . 59
5 Analysis and Results 605.1 Questionnaire and Non-surgical Tasks . . . . . . . . . . . . . . . . 605.2 Global Measures . . . . . . . . . . . . . . . . . . . . . . . . . . . 61
5.2.1 Movement Quantity . . . . . . . . . . . . . . . . . . . . . 615.2.2 Movement Quality . . . . . . . . . . . . . . . . . . . . . . 67
5.3 Local Analysis . . . . . . . . . . . . . . . . . . . . . . . . . . . . 735.3.1 Local Curvature . . . . . . . . . . . . . . . . . . . . . . . 735.3.2 Local Energy . . . . . . . . . . . . . . . . . . . . . . . . . 82
6 Conclusions and Future Work 866.1 Conclusions . . . . . . . . . . . . . . . . . . . . . . . . . . . . . . 866.2 Future Work . . . . . . . . . . . . . . . . . . . . . . . . . . . . . . 87
Bibliography 88
A Pre-trial Questionnaire 94
B Post-trial Questionnaire 96

List of Figures
2.1 ICSAD system used in the evaluation of open surgical skills [20]. . . 152.2 Upper body motion capture system from Emam et al. [26] . . . . . 162.3 LapSim system from Surgical Science [35] . . . . . . . . . . . . . 182.4 Systems employing mechanical motion capture for instrument track-
ing. . . . . . . . . . . . . . . . . . . . . . . . . . . . . . . . . . . 182.5 Components of force sensor mounted inline with instrument shaft,
from Lamata et al. [34]. . . . . . . . . . . . . . . . . . . . . . . . . 192.6 Strain gauge mounted on the handle of the surgical tool to capture
grasping forces, from Brown et al. [9]. . . . . . . . . . . . . . . . . 202.7 Sample Hidden Markov model with three states and two observa-
tion vectors. . . . . . . . . . . . . . . . . . . . . . . . . . . . . . . 28
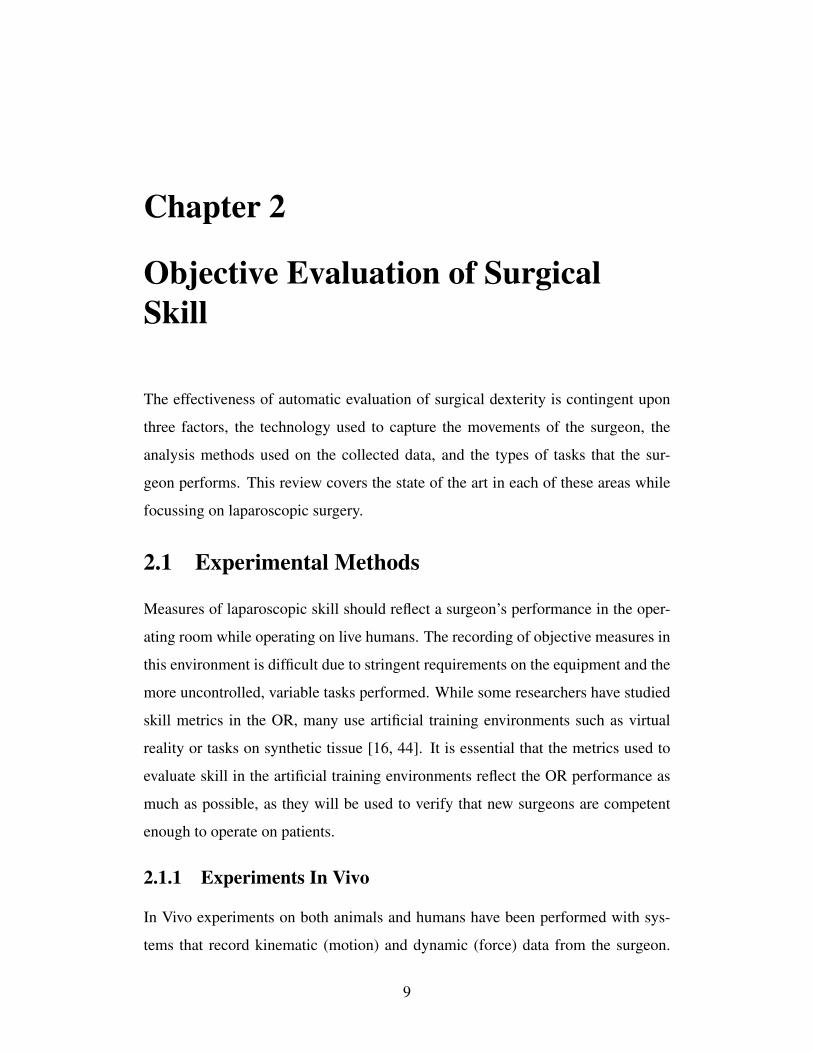
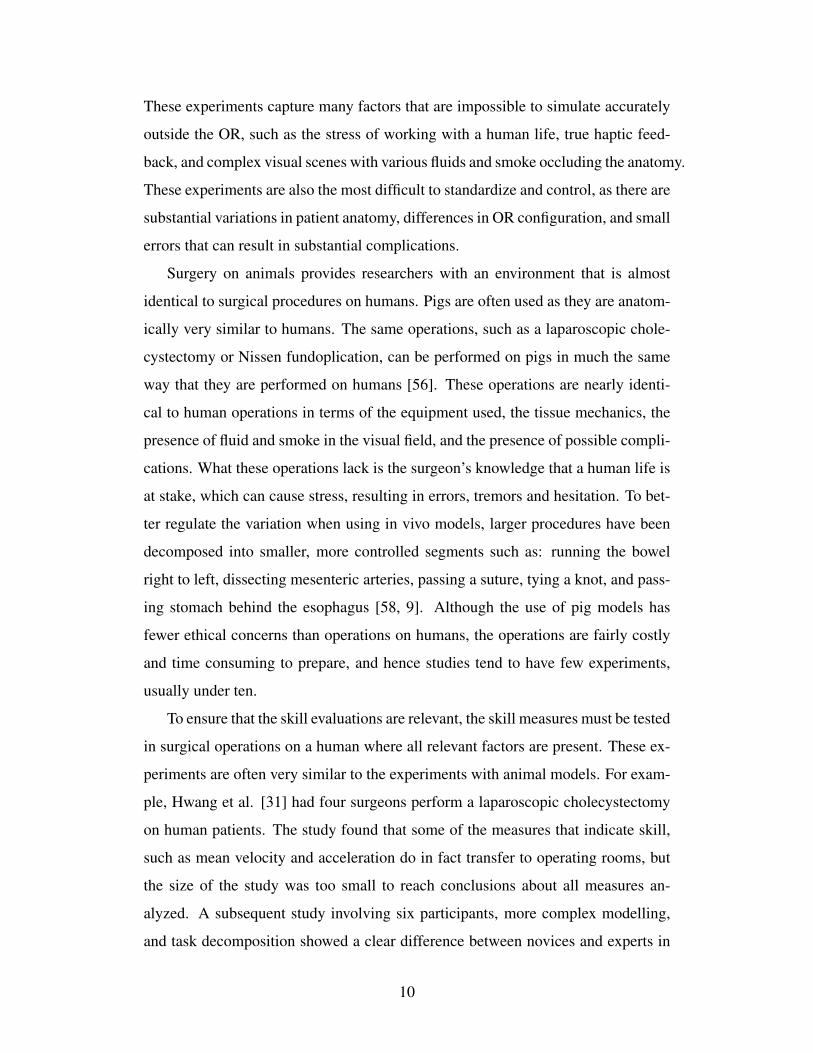
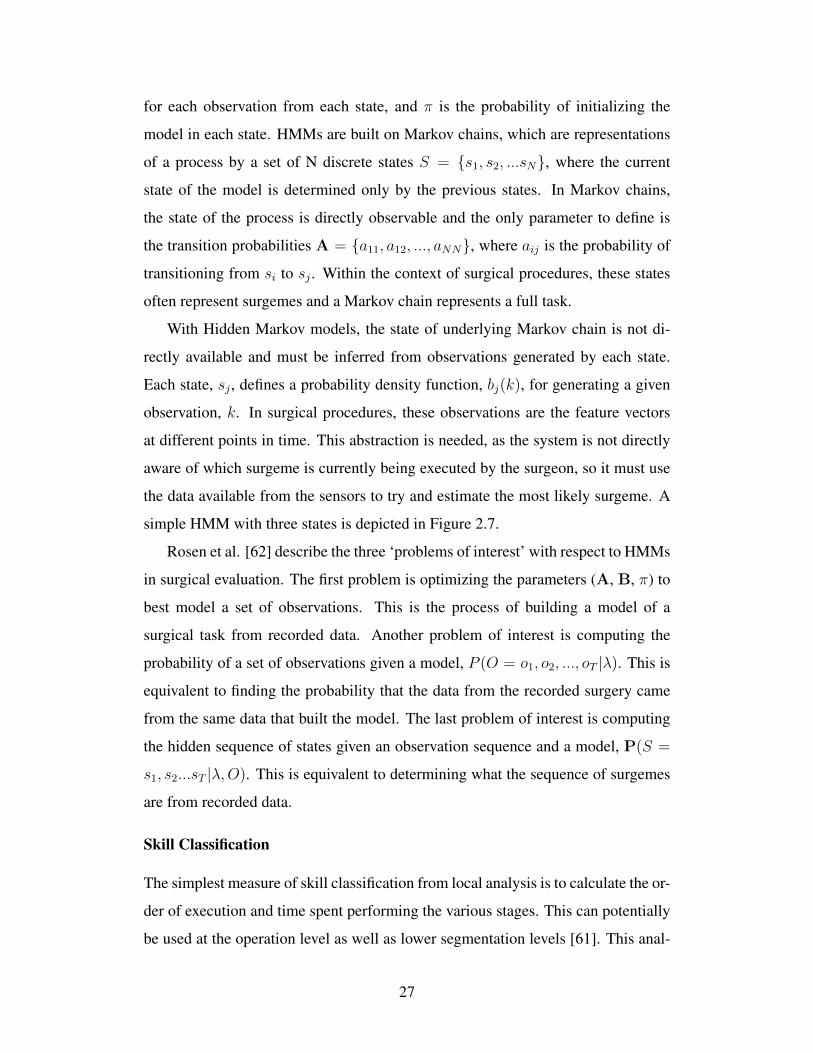
3.1 Schematic overview of system components. . . . . . . . . . . . . . 303.2 Endo-trainer from 3D-Med used in the studies. . . . . . . . . . . . 313.3 Infrared markers with wireless transponder unit. . . . . . . . . . . . 313.4 Diagram of marker placements. . . . . . . . . . . . . . . . . . . . . 323.5 Collar with infrared markers and force sensor mounted on laparo-
scopic needle driver. . . . . . . . . . . . . . . . . . . . . . . . . . 333.6 Example of an instrument template constructed from the measured
data. . . . . . . . . . . . . . . . . . . . . . . . . . . . . . . . . . . 353.7 Filtering outliers. . . . . . . . . . . . . . . . . . . . . . . . . . . . 373.8 Filtering operations used to compute the final position of each tooltip. 383.9 Configuration used to calculate the rotation needed to align the tem-
plate and force coordinate systems. . . . . . . . . . . . . . . . . . . 423.10 The vectors T, N and B of the Frenet-Serret frame. . . . . . . . . . 453.11 Plots of the curvature calculated from the insertion segment. . . . . 483.12 3D plots of the insertion segment, with curvature shown as colour.
Trajectories have been smoothed with Gaussian filters with the wsand σ values of the corresponding scale. . . . . . . . . . . . . . . . 49
3.13 Example energy signal, and the force and position signals used inits computation. . . . . . . . . . . . . . . . . . . . . . . . . . . . . 50
4.1 RanDOT stereo vision test, used to measure stereoacuity. . . . . . . 534.2 Purdue Pegboard, used to measure manual dexterity. . . . . . . . . 544.3 Pegboard task from the FLS program. . . . . . . . . . . . . . . . . 554.4 View from laparoscopic camera during simple interrupted suture task. 564.5 View from laparoscopic camera during continuous running suture
task. . . . . . . . . . . . . . . . . . . . . . . . . . . . . . . . . . . 57
5.1 Completion time for the performed tasks. . . . . . . . . . . . . . . 645.2 Path length for the performed tasks. . . . . . . . . . . . . . . . . . 655.3 Total energy for the performed tasks. . . . . . . . . . . . . . . . . . 665.4 Mean curvature for the performed tasks. . . . . . . . . . . . . . . . 68

5.5 Median curvature for the performed tasks. . . . . . . . . . . . . . . 695.6 Mean absolute force for the performed tasks. . . . . . . . . . . . . 705.7 Peak absolute force for the performed tasks. . . . . . . . . . . . . . 715.8 Mean energy for the performed tasks. . . . . . . . . . . . . . . . . 725.9 Histogram of curvature noise model calculated from Scale 3. . . . . 745.10 Example curvature signals and the resulting cross correlation. . . . . 765.11 Curvature signal of the trajectory of the left instrument for the pull-
through segment of the top-ranked participant. . . . . . . . . . . . . 775.12 Plots of the trajectory of the left instrument for the pull-through seg-
ment of the top-ranked participant with colour indicating curvature. 795.13 Curvature signal of the trajectory of the left instrument for the pull-
through segment of the lowest ranked participant. . . . . . . . . . . 805.14 Curvature signal of the trajectory of the left instrument for the in-
sertion segment of the highest ranked participant. . . . . . . . . . . 805.15 Mean curvature correlation for each participant. . . . . . . . . . . . 815.16 Histogram of energy noise model. . . . . . . . . . . . . . . . . . . 825.17 Energy signal of the trajectory of the left instrument for the ‘double-
loop’ segment of the second-highest ranked participant. . . . . . . . 835.18 Energy signal of the trajectory of the left instrument for the ‘inser-
tion’ segment of the third-worst ranked participant. . . . . . . . . . 845.19 Mean energy correlation for each participant. . . . . . . . . . . . . 84

Chapter 1
Introduction
Before surgeons enter the operating room for the first time, it is essential that they
have the necessary skills. Without the proper skill set, surgeons can cause severe
complications that cost time, patient suffering and death. Prior to performing live
surgical procedures, surgeons must undergo a rigorous training and evaluation pro-
cess to ensure they are competent and able to perform procedures on patients.
Evaluating a surgeon’s knowledge can be achieved through written examina-
tions, but evaluating surgical dexterity is more difficult. Current methods of evalu-
ating surgical dexterity are quite subjective, and rely on expert judgment. The expert
typically watches a trainee perform a number of surgical maneuvers and assigns the
trainee a proficiency score. These scores can vary widely between experts and are
thus unreliable. Checklists and scoring sheets, such as the Objective Structured As-
sessment of Technical Skill rating system (OSATS) [40], are attempts to remove this
subjectivity by providing a standardized scoring sheet for surgical tasks. However,
this still requires an expert to assess a surgeon’s movement, interpret the scoring
sheet, and assign a relevant score.
In recent years, technology has been adopted to address the problem of eval-
uating surgical dexterity [55]. Motion capture and force sensing devices allow a
computer to record and analyze the movements made by a surgeon. By relying
solely on the data from the sensors, the computer can produce an evaluation of sur-
gical skill that is free from human subjectivity. This method of evaluation has the
possibility of being more reliable and accurate than an expert surgeon, but further
research is needed.
1

1.1 Surgical Techniques
Techniques for performing surgery have developed substantially in recent years,
providing patients with an unprecedented level of care while introducing new chal-
lenges for the surgeon.
Open surgery is the ‘simplest’ surgical technique. This approach involves creat-
ing a large incision in the patient through which the surgeon can directly manipulate
internal organs. This method is the most traumatic for the patient, as the incision
often results in substantial scarring and increased risk of infection. This type of
surgery is the least complicated for the surgeon to perform. There is direct access
to the tissues, allowing for palpation and the use of the surgeon’s hands and a direct
view of the tissue.
Minimally invasive surgery (MIS) is a collection of surgical techniques that
offer a reduced-trauma alternative to open surgical procedures. MIS is characterized
by its use of unique tools, small incisions, and limited access to the tissues being
operated on. Most MIS procedures involve the use of a camera inserted into the
patient’s body through a small incision. Long, thin, surgical tools are also inserted
into the patient through small incisions. The surgeon views the output of the camera
on a video monitor as he manipulates the tissue with various instruments. This
approach is more difficult for the surgeon, as there is not direct access to the tissue
and the view is through a 2D screen resulting in limited depth perception. Patients
benefit from MIS techniques however, as there is less trauma, scarring, and risk of
infection with the smaller incisions.
Laparoscopic surgery is a type of MIS in which the camera is part of a rigid
instrument called a laparoscope. At the beginning of laparoscopic procedures, the
patient is prepared for surgery by creating a number of small incisions in the ab-
domen that are then filled with trocars. Trocars are small, rubber channels that the
camera and instrument are later inserted into. The trocars’ function is to seal the
abdomen, as it is inflated with carbon dioxide to lift the abdominal wall off the
tissues that are being operated on. The trocars also introduce friction between the
surgical instruments and the surgeon’s hands, dampening the haptic feedback from
2

the tool-tissue interactions.
Laparoscopic surgery can be more difficult than open surgery for a number of
reasons. The instruments are quite long, causing movements made at the handle to
be amplified at the tool tip. The movements are also reversed due to the lever effect
of the trocar. Moving the handle to the left moves the tool tip to the right within
the surgical field. The operating field is shown on a monitor that is typically placed
high above the patient, making it difficult to watch the surgical field and monitor
hand position at the same time. The surgical instruments are also limited to five
degrees of freedom, thus restricting the movements of the surgeon.
Further developments in surgical technique continue to require more advanced
surgical skill. One technique that is gaining momentum is Natural Orifice Translu-
menal Endoscopic Surgery (NOTES). With this technique, the camera and instru-
ments are embedded in a flexible hose that is inserted through a patient’s existing
orifices. All incisions are made inside the body, eliminating the scars produced by
traditional MIS and open procedures. This approach is quite difficult, as the surgeon
has all of the restrictions of existing MIS procedures in addition to the constraints
of using a single, fixed point of entry.
Robotic surgery has also gained favour in recent years as an alternative to tra-
ditional MIS procedures. This type of surgery is performed with a robotic system,
such as the da Vinci system from Intuitive Medical [66]. In this system, the sur-
geon sits across the room from the patient at a surgical console, and manipulates
the robotic arms using a pair of scissor-like devices. These devices currently do
not provide haptic feedback or any indication of the amount of force they are ap-
plying. The workspace of the devices is also quite small, requiring the surgeon
to use a clutching technique to maneuver the instruments. As with other surgical
techniques, substantial skill is required to perform operations effectively with the
robotic system.
3

1.2 Skill Evaluation
Accurate evaluation of surgical skill is necessary to ensure surgeons have adequate
skills to operate on live patients. As part of the training process, an evaluation
informs trainees of what skills they need to improve on. Periodic evaluations can
be useful to surgeons throughout their careers as well. Evaluation can also be used
in research, to examine what factors affect surgical proficiency. The effect of drugs,
lack of sleep, stress, or time away from the operating room (OR) can all benefit
from a reliable metric for surgical skill.
As surgeons get older and their surgical skills can decrease [6, 74], and they
should be re-certified periodically through an evaluation to ensure they are still ca-
pable of performing the necessary tasks. This re-certification would involve a test
of both psychomotor skills and cognitive ability. An automated, objective evalua-
tion would be ideal for this scenario, as it would eliminate any bias that would come
from a peer evaluation among experts.
1.2.1 Subjective Surgical Skill Evaluation
Current methods for evaluating surgical skill are still largely subjective. Some ef-
forts have been made, such as the development of the OSATS rating system that
attempt to standardize evaluation, but these still involve subjective expert evalua-
tion. With this system, an expert must assign scores, e.g., using a Likert scale from
1 to 5, in areas such as ‘respect for tissue’, ‘time and motion’, and ‘knowledge
of instruments’. Each of these areas has associated anchors, for example, a stu-
dent would score 1 if they ‘frequently used unnecessary force on tissue or caused
damage by inappropriate use of instruments’, 3 if they performed ’careful handling
of tissue but occasionally caused inadvertent damage’, and 5 if they ‘consistently
handled tissues appropriately with minimal damage’. This scale still leaves much
room for the expert to interpret what is meant by ‘unnecessary force’, and what
constitutes ‘frequent’ or ‘occasional’. The lack of clear definitions can lead to large
variation in the scores assigned by different experts.
The Global Operative Assessment of Laparoscopic Skills (GOALS) [71] is a
4

similar scoring system that consists of three rating criteria. The first are a number
of rating scales that have an expert assessing the psychomotor skills of the partic-
ipant, such as depth perception, bimanual dexterity, etc. There is also a checklist
component to assess aspects of certain operations. Finally, there are two scales for
the expert to rate task difficulty, and overall perceived competency. This measuring
device is quite useful and reliable in assessing skill, but it requires an evaluator to
provide feedback, and there are a number of items requiring subjective analysis.
The Fundamental Laparoscopic Skills (FLS) program [21] includes a set of stan-
dardized training and evaluation tasks that can be used to assess a novice’s laparo-
scopic dexterity. These tasks include a pegboard drill, a suturing task, and a cutting
task. For the cutting task, the measures are purely objective taking into account
only the time to completion and the deviation from the ideal path. Other tasks, such
as the suturing task require subjective opinion to assess knot quality. Evaluation
using this system also gives very poor feedback to the participants by way of what
they could do to improve their skills.
1.2.2 Automated Objective Surgical Skill Evaluation
Automated analysis of surgical movements by computers has the potential to assess
surgical skill without any human subjectivity. With this approach, the movements
of the surgeon are digitized using special equipment and processed on a computer.
This type of evaluation is not yet widely used, as there are still a number of
issues with its implementation. Foremost is the use of specialized recording equip-
ment. This equipment is often expensive and difficult to construct. Some ap-
proaches use custom fabricated mechanical systems that attach directly to surgical
instruments making it difficult to switch instruments and restricting the movements
allowed by the surgeon. Other systems track the surgical instruments using optical
or electromagnetic motion capture systems, but these systems often place restric-
tions on the environment they can be used in. In all cases, additional equipment
must be added to the laparoscopic instruments, restricting their use to research en-
vironments and virtual reality (VR) trainers.
Another issue preventing widespread adoption of automated evaluation is the
5

lack of clear, reliable metrics for surgical skill. Most research in the area of surgical
skill evaluation area focuses on the development and testing of measures that may
correlate with surgical skill. Some of these measures are simple measures that
quantify the amount of instrument motion, or the length of time taken to complete
the task. These measures can be reliably used to distinguish between experts and
novices, but they provide only very coarse measures of skill and do not speak to
the quality of the movements. Measures that do assess movement quality, such as
motion smoothness or peak force tend to be less reliable when used to distinguish
amongst skill levels, though they may provide more useful feedback to trainees.
More complex analyses have been performed on the recorded movements at
a local level. These approaches use mathematical tools such as Hidden Markov
Models to represent and compare gestures. This local analysis has the benefit of
being able to provide feedback on the various stages of the task being performed,
as well as providing feedback on the quality of the movements. With this method,
a model must be extensively trained by expert surgeons on the system that is being
used to test on, so it is not possible to transfer models between systems and create
one reference ‘expert model’ that can be widely used.
Experiments in the area of surgical skill evaluation take place in a number of en-
vironments. Some studies have taken place in the operating room, getting valuable
data from experts performing live surgeries. Others take place in a laboratory or
classroom setting, using synthetic tissue or virtual reality trainers. The classroom
setting is where most training and evaluation will take place. It is important that
students are able to get feedback in this environment, and that they can be assessed
before entering an OR. The studies in the OR are essential as well, as the surgical
skill metrics must not only apply to the skills demonstrated in classroom tasks, but
they must predict performance in the OR as well.
6

1.3 Contributions and Organization
1.3.1 Contributions
This thesis provides several contributions to the field of surgical skill evaluation.
First, a novel system design is presented. This system is capable of recording the
position and orientation of laparoscopic instruments as well as the force and torque
applied to them. All measurements are synchronized and stored for offline process-
ing. The system was implemented and used in an empirical evaluation, demonstrat-
ing its effectiveness.
The empirical user study includes several novel elements. The data set recorded
is very rich including two video streams, the movements of the instruments, the
forces and torques applied to the laparoscopic instruments, the kinematics of each
participant’s upper body, and an audio recording of each trial. The participant pool
was diverse as well, including at least one participant from each of the five years
of surgical residency, surgical fellows, and expert surgeons. While only a subset of
the data was analyzed in this thesis (instrument position and forces), the rest of the
data will be analyzed in the future to determine what information can be obtained
from the surgeon’s upper body kinematics and the tool orientation.
Two novel global measures are presented, and their relation to surgical skill is
evaluated. Total energy used in manipulating the surgical instrument is computed
from the data and is found to correlate with surgical skill for many tasks. Mean and
peak energy are also computed, but they do not appear to relate to surgical skill. A
number of previously investigated measures are also computed from the data and
compared. The usefulness of some of these measures, such as motion smoothness
and force features have been debated in the literature, and we find that they do not
correlate with surgical skill.
Two novel methods of local analysis are proposed, as well as the use of consis-
tency as an indicator of surgical skill. The analyses are based on the curvature of
the trajectory in 3D space, and the energy that is applied during the execution of the
tasks. While neither of the analyses demonstrates a clear differentiation between
expert and novice, they do show promise, and further research may show them to
7

be valuable. This analysis is unique in that it does not reduce each gesture to a
single number, but compares the trajectories and energy signals of entire gestures
to one another. This type of analysis is essential to creating a system that is able to
give valuable feedback to trainees.
1.3.2 Thesis Organization
Chapter 2 introduces the existing research in the field of surgical evaluation. The
systems that are used to record the surgical movements, the measures used to evalu-
ate the participants, and the environments that the experiments are performed in are
detailed. Particular attention is paid to laparoscopic surgical evaluation, but relevant
work that has been conducted within general surgery and robotic surgery is included
as well. Chapter 3 describes the system that was designed and implemented. The
hardware and software used to capture the data, as well as the algorithms used to
filter and process the data are presented. The experimental procedure used in the
empirical study is presented in Chapter 4. The analysis of the data and the discus-
sion of the results are provided in Chapter 5.
8
Chapter 2
Objective Evaluation of SurgicalSkill
The effectiveness of automatic evaluation of surgical dexterity is contingent upon
three factors, the technology used to capture the movements of the surgeon, the
analysis methods used on the collected data, and the types of tasks that the sur-
geon performs. This review covers the state of the art in each of these areas while
focussing on laparoscopic surgery.
2.1 Experimental Methods
Measures of laparoscopic skill should reflect a surgeon’s performance in the oper-
ating room while operating on live humans. The recording of objective measures in
this environment is difficult due to stringent requirements on the equipment and the
more uncontrolled, variable tasks performed. While some researchers have studied
skill metrics in the OR, many use artificial training environments such as virtual
reality or tasks on synthetic tissue [16, 44]. It is essential that the metrics used to
evaluate skill in the artificial training environments reflect the OR performance as
much as possible, as they will be used to verify that new surgeons are competent
enough to operate on patients.
2.1.1 Experiments In Vivo
In Vivo experiments on both animals and humans have been performed with sys-
tems that record kinematic (motion) and dynamic (force) data from the surgeon.
9
These experiments capture many factors that are impossible to simulate accurately
outside the OR, such as the stress of working with a human life, true haptic feed-
back, and complex visual scenes with various fluids and smoke occluding the anatomy.
These experiments are also the most difficult to standardize and control, as there are
substantial variations in patient anatomy, differences in OR configuration, and small
errors that can result in substantial complications.
Surgery on animals provides researchers with an environment that is almost
identical to surgical procedures on humans. Pigs are often used as they are anatom-
ically very similar to humans. The same operations, such as a laparoscopic chole-
cystectomy or Nissen fundoplication, can be performed on pigs in much the same
way that they are performed on humans [56]. These operations are nearly identi-
cal to human operations in terms of the equipment used, the tissue mechanics, the
presence of fluid and smoke in the visual field, and the presence of possible compli-
cations. What these operations lack is the surgeon’s knowledge that a human life is
at stake, which can cause stress, resulting in errors, tremors and hesitation. To bet-
ter regulate the variation when using in vivo models, larger procedures have been
decomposed into smaller, more controlled segments such as: running the bowel
right to left, dissecting mesenteric arteries, passing a suture, tying a knot, and pass-
ing stomach behind the esophagus [58, 9]. Although the use of pig models has
fewer ethical concerns than operations on humans, the operations are fairly costly
and time consuming to prepare, and hence studies tend to have few experiments,
usually under ten.
To ensure that the skill evaluations are relevant, the skill measures must be tested
in surgical operations on a human where all relevant factors are present. These ex-
periments are often very similar to the experiments with animal models. For exam-
ple, Hwang et al. [31] had four surgeons perform a laparoscopic cholecystectomy
on human patients. The study found that some of the measures that indicate skill,
such as mean velocity and acceleration do in fact transfer to operating rooms, but
the size of the study was too small to reach conclusions about all measures an-
alyzed. A subsequent study involving six participants, more complex modelling,
and task decomposition showed a clear difference between novices and experts in
10

the kinematics of their dominant hand, but not their non-dominant hand [18].
2.1.2 Experiments with Synthetic Trainers
Synthetic trainers offer a highly controlled, somewhat realistic environment that
can be easily used in a laboratory environment. Synthetic trainers can take many
forms, including box trainers, such as the Endo-trainer, or Virtual Reality trainers,
such as the LapMentor [1, 67]. Each of these trainers offers both dexterity tasks and
tissue simulation, providing several testbeds to evaluate surgical skill. In order for
objective evaluation to be useful, it is essential that skill can be judged from tasks
on synthetic tissue. Surgeons will use these synthetic tasks to demonstrate their
competency before performing operations on real patients.
Experiments with Synthetic Tissue
Synthetic tissue comes in various forms, e.g., bowels, arteries or skin pads. It mim-
ics the properties of real tissue and provides highly realistic haptic and visual feed-
back. It is used extensively in surgical training because it is cheap, risk free, and
allows surgeons to learn and practice their skills at their own convenience. For the
training of laparoscopic operations, the synthetic tissue is typically placed inside
a box trainer and manipulated with real laparoscopic instruments. Suturing is the
most common operation performed with synthetic tissue, but the tissue can also be
cut and manipulated to simulate more complex tasks. While suturing is not an ex-
tremely common operation in the operating room, as surgeons often use staples to
close wounds, it is still very useful to analyze surgical skill. It challenges the manual
dexterity of the surgeon, as manipulating the needle and thread require substantial
dexterity with the laparoscopic instruments. It is also cognitively challenging, as
the surgeon has to plan his movements carefully, think about the type of knot used,
and the movements required to complete the task.
Within the context of laparoscopic skill evaluation, synthetic skin offers a method
to conduct controlled, repeatable experiments so that measurements can be more
easily compared within groups. Each participant performs the same tasks on the
same tissue with the same instruments, eliminating many of the variations that occur
11

with in vivo operations, such as anatomical variations, complications and varying
procedures. The low cost and high availability of synthetic tissues make it practical
to have studies with large numbers of participants, often more than 50 [19].
Various types of sutures on synthetic tissue have been used in research [69, 25].
Bann et al. had participants perform four types of sutures on a synthetic skin pad
using open surgery techniques [4]. The suture types (e.g., simple interrupted, ver-
tical mattress, continuous running, and figure of eight) represent tasks of varying
difficulty. On all tasks, entry and exit points were marked on the tissue to provide
greater standardization between participants. Estimating skill from various mea-
sures was more successful with the more difficult suturing tasks.
Experiments with non-Surgical Dexterity Tasks
Non-surgical tasks have also been used to predict laparoscopic proficiency. These
include standardized tasks, such as the FLS McGill Inanimate System for Training
and Evaluation of Laparoscopic Skills (MISTELS) [21] as well as ad-hoc tasks re-
quiring laparoscopic dexterity. The FLS MISTELS consist of a set of simple tasks
with standardized benchmarks to evaluate laparoscopic dexterity. The most popular
task within this set is the pegboard task which requires participants to transfer col-
lars from peg to peg through a laparoscopic interface. An evaluator records the task
time and the number of collars dropped. These measures are then used to compute
a proficiency score. By recording the kinematics of participants as they performed
the pegboard task, Ritter et al. were able to correlate motion-based measurements
with the standard FLS proficiency score [57].
A variety of ad-hoc tasks have been used to evaluate laparoscopic dexterity,
such as the balls, ring, and elastic band tasks used by Chmarra et al. [15]. Carefully
crafted tasks allow researchers to examine very specific movements or exercise spe-
cific skills, but they are often not representative of real operating room actions. To
study a surgeon’s use of the laparoscopic camera, Chmarra devised a task that re-
quired participants to touch a number of cylinders spread out inside a training box
using laparoscopic instruments [16]. Standardized tests could not be used in this
study, as they can be completed without manipulating the camera at all.
12

Virtual Reality Simulators
In recent years, Virtual Reality (VR) simulators have gained popularity as alterna-
tives to traditional training on synthetic tissue or animal models. These trainers
usually consist of simulated laparoscopic instruments with various sensors, actua-
tors, and a 2D display that simulates the view from a laparoscopic camera. Users
can practice entire virtual operations or perform a number of practice drills aimed
at improving specific techniques. The sensors and actuators on the instruments
provide force feedback and an immersive experience. Simulators provide a simple
method to gather and analyze movement data, as the devices are fitted with sen-
sors that allow the simulator to track position and orientation of the instruments.
The computer-driven graphics also allow the experimenter to precisely control the
tasks, permitting greater repeatability and consistency in the experiments.
Both full operations as well as simple dexterity tasks are supported with the
software provided with most VR systems. The convenient and affordable nature of
these systems makes it possible to use large numbers of subjects, with some studies
reporting over 150 [50]. Other studies have made use of the virtual camera interface
and have had participants manoeuver the camera inside of a virtual abdomen, allow-
ing researchers to analyze camera movement in a more realistic environment [44].
The majority of reports using VR systems have not used full operation simulations,
but used only simple dexterity tasks [70, 72, 68].
2.2 Recording Systems
Several systems have been developed to capture the movements of a surgeon’s tools
(kinematics) and the forces and torques that are applied to them (dynamics). Each
system is unique in the accuracy of the data that it captures, the range of motions
it allows, its suitability for different environments, and many other factors. Within
each system, the underlying technologies have a substantial influence on these fac-
tors and provide a convenient categorization to analyze the systems. Systems that
completely record the movement of laparoscopic instruments must be able to mea-
sure five degrees of freedom: opening and closing of the handle, translation along
13

the shaft, and rotation around the insertion point in all three dimensions. A re-
view of a number of recording systems can be found in Chmarra et al. [14] which
focusses primarily on mechanical motion capture systems.
2.2.1 Electromagnetic Motion Capture
Electromagnetic (EM) tracking systems consist of a device that emits an electro-
magnetic field and a set of sensors whose position and orientation is recorded within
that electromagnetic field. In contrast to optical tracking systems, these systems are
robust to occlusions, resulting in a continuous stream of data. The sensors are quite
small, hence they can be attached to a variety of existing surgical tools. These sys-
tems are, however, quite cumbersome to use because each of the sensors is attached
to the recording unit by long wires and the emitter must be quite close to the sen-
sors. The magnetic field is also heavily distorted by metallic objects, resulting in
noisy and distorted measurements in a clinical environment.
EM tracking was used in one of the first systems designed for skill evaluation,
the Imperial College Surgical Assessment Device (ICSAD) (Figure 2.1) [20]. The
ICSAD used the Polhemus Isotrak II tracking system and required a sensor placed
on the back of each hand to track the movements of surgeons performing open
surgery tasks [4, 19, 64], but has since been adapted to laparoscopic procedures
[75, 23]. The ICSAD system captures position information at a rate of 20Hz, a
resolution of 1mm and does not use orientation information.
Feng et al. describe a tracking system that uses the MicroBIRD sensors from
Ascension Technology to track laparoscopic instruments [28]. These sensors cap-
ture the position and orientation of the tip of the instrument within 1.4 mm and 0.5
degrees respectively. While this system was only used in laboratory testing, Dubois
et al. describe an EM-based system capable of being deployed in an OR [24]. The
position and orientation of the instrument were tracked to an accuracy of 1.8 mm
and 0.5 degrees. In their experiments with pig models, Dubois et al. constructed a
custom operating table made out of PVC. While this table eliminated a large source
of magnetic interference, the use of PVC made it impractical for deployment in
operations on humans. Both Feng et al. and Dubois et al.’s systems had a tracking
14

Figure 2.1: ICSAD system used in the evaluation of open surgical skills [20].
volume of less than one cubic meter. A small number of studies have used EM
tracking systems in the OR with humans, but no details were presented with respect
to the accuracy of the systems [18, 29].
2.2.2 Optical Motion Capture
Optical motion capture systems can track objects in 3D space by locating markers
in video streams. Most optical motion capture systems, such as the MotionAnalysis
[2] or Vicon [73] systems, track objects using a number of cameras in conjunction
with reflective passive markers placed on the objects. Other systems, such as the
OptoTrak [46] and the VisualEyez [51] use active markers, (i.e. infrared LEDs) to
locate the objects. Systems using active markers require wires to power the markers.
This can impact the movements of the tracked subject, but these systems are often
more accurate than their passive counterparts. Optical tracking systems differ with
respect to frame rates, accuracies and physical constraints, but all require a line of
sight between the camera and markers. This susceptibility to occlusion makes it
difficult to use optical tracking systems in operating settings because the tool tip
is occluded by the body and operating rooms are often crowded with people and
equipment.
15

Emam et al. used a set of reflective markers placed on the upper body (Figure
2.2) to monitor the motions of the shoulders and elbows of novices and experts
[26]. Their system was accurate to 2 mm, but was too bulky to be used in an oper-
ating environment. The same system was also used in other studies that analyzed
ergonomic factors in laparoscopy [27].
Optical tracking can be combined with electromagnetic tracking to add redun-
dancy and improve the quality of data, as in Hwang et al.’s study [31]. In this
system, sensors were placed on a single laparoscopic grasper, which was used in
a number of laparoscopic cholecystectomy operations on human subjects. While
data on the accuracy in the operating room setting was not provided, the data was
accurate enough to distinguish between novices and experts using a number of mea-
sures.
Figure 2.2: Upper body motion capture system from Emam et al. [26]
The ProMIS simulator from Haptica [50] is a training system that uses the video
stream from a laparoscopic camera to locate the position of markers placed on the
tip on the surgical instrument. Although this approach cannot be used in a surgical
environment in its current form, the use of the laparoscopic camera view to track
tool positions has great potential. No additional equipment would be needed and
the surgeon’s movements could be monitored during all operations. The availability
and ease of use of the ProMIS system has led to numerous studies [57, 44].
16

2.2.3 Mechanical Motion Capture
Surgical motions can also be tracked using instrumented mechanical links attached
directly to surgical tools. The joints of the mechanical links are fitted with angle
encoders, usually rotational potentiometers or optical encoders. From these joint
angles, the system can accurately reconstruct the position and orientation of the
attached instrument using forward kinematics. Usually, the tools are placed inside
a gimbal mechanism to provide extra degrees of freedom. A fairly comprehensive
review of the various mechanical motion capture devices used in both research and
commercial applications can be found in Chmarra et al. [14].
Mechanical motion capture devices most commonly appear as part of a virtual
reality training package, such as the LapSim (Figure 2.3) or LapMentor (Figure
2.4a) [35]. The workspace for these virtual trainers is inherently small, instruments
do not need to be interchanged, and the mechanical linkages allow for force feed-
back to the user. This type of tracking has low noise, very little drift, and is not
affected by the presence of metallic objects. The TrEndo system [13] uses the
sensors from optical computer mice to sense four degrees of freedom (all but the
opening and closing of the handle) of a laparoscopic instrument. While not suitable
for use in the OR, the accuracy of 0.06 mm in position and 1.27 degrees in rotation
make these devices suitable for recording surgical movements on synthetic tissue
and virtual trainers with a high degree of precision [15, 16].
The bulky and cumbersome nature of these systems makes them difficult to use
in an operating environment. To date, no systems with mechanical motion capture
have been used in operations on humans, but the Blue DRAGON system by Rosen
et al. (Figure 2.4b) was used to record movements during laparoscopic operations
on animal models [58]. The Blue DRAGON is composed of a laparoscopic in-
strument mounted on a standard four-bar mechanism. Each joint in the four-bar
mechanism are fitted with potentiometers to locate the tooltip and a linear poten-
tiometer in the handle to measure the grasping angle. The successor of the Blue
DRAGON, the Red DRAGON, uses a spherical mechanism instead of the four-bar
linkages used in the Blue DRAGON, making it more compact and portable [30].
Both systems are able to record all five degrees of freedom at 30Hz.
17

Figure 2.3: LapSim system from Surgical Science [35]
(a) LapMentor systemfrom Simbionix [67].
(b) CAD drawing of the Blue DRAGON sys-tem from Rosen et al. [58].
Figure 2.4: Systems employing mechanical motion capture for instrument tracking.
2.2.4 Force Transducers
Regardless of the mechanism used to capture the instrument’s motion, all systems
that record forces and torques do so using strain gauges. Strain gauges are small
electronic sensors that modify their voltage output based on the mechanical strain.
By combining and calibrating several strain gauges, one can build a sensor capa-
ble of measuring the forces and torques applied to them in multiple axes. Most
18

commonly, force and torque sensors are mounted on the shaft of the laparoscopic
instrument (Figure 2.5) to capture the dynamics between the surgeon’s hand and the
tool tip [24, 31, 34, 56, 30]. The majority of these sensors are 6 DOF force/torque
sensors from ATI Industrial [3]. The use of these sensors requires irreversibly mod-
ifying the laparoscopic instruments, thus preventing their widespread use. Sensors
in this configuration are able to record forces in a range of approximately ± 20 N
and torques in a range of ± 1 Nmm.
Figure 2.5: Components of force sensor mounted inline with instrument shaft, fromLamata et al. [34].
In other approaches, force and torque sensors are placed underneath the tissue
that is being operated on [25]. This configuration is easier to construct as the laparo-
scopic instruments do not need to be modified. Such a configuration is, however,
impossible to use in the operating room as sensors would have to be implanted into
the patient. The data recorded from such sensors is a combination of both the left
and right instruments which makes it more difficult to analyze.
In addition to the forces and torques between the tool tip and hand, the grasping
force that is applied to the handle during the closing of the surgical tool has also
been recorded [56, 9]. This force is captured by strain gauges on the handle of the
instrument between the thumb position and the instrument shaft (Figure 2.6). The
strain gauges do not add any burden to the surgeon, but the difficulty of installing
and calibrating the strain gauge has prevented their widespread adoption.
19

Figure 2.6: Strain gauge mounted on the handle of the surgical tool to capturegrasping forces, from Brown et al. [9].
2.3 Measures of Skill
Raw data from the systems is complex and must be processed to provide a useful
analysis of movements and forces. The most common analysis is the use of global
measures, or descriptive statistics, which reduce an entire procedure into a single
number. Some of these measures, such as total time and total path length, can
be used to distinguish novices from experts but they cannot be used to describe
qualitatively how the movements differ. A local analysis can provide a qualitative
description by comparing motion paths, or other signatures, such as force.
2.3.1 Global Measures
To date, most research into objective surgical skill evaluation has focused on global
measures. These measures are usually simple to compute and to compare between
groups. Some measures can be used more reliably than others to discriminate be-
tween groups regardless of the task and the hand being analyzed. Chmarra et al.
provide a brief overview of measures used in assessment, such as path length, mo-
tion smoothness, movement economy, deviation from ideal path and other measures
from the 3D kinematics of the surgical tool [12].
20

Movement Quantity
The total time taken to complete a task is often the most reliable discriminator of
surgical skill. This measurement requires no special recording equipment and can
be applied to nearly any surgical task. Intuitively, the total time to completion is
higher in novices, as they make more errors, perform more inefficient movements,
and are generally more hesitant than experts. Total time has been shown to correlate
with expertise in virtual reality, box trainers, and in the OR [17, 20].
The path length, L, of the instrument’s trajectory, p(t) = {x(t), y(t), z(t)}, is
calculated as L =∑tdist(p(t),p(t − 1)), and is widely used in the assessment
of surgical skill. This measure is highly correlated with the total time, as a longer
completion time tends to involve more movements of the instrument.
The ICSAD system introduced another measure, the number of movements,
which was defined as a ‘change in velocity’ but the authors did not provide a defini-
tion of what constitutes a change [20]. Oostema et al. define “motion smoothness”
in the same manner, but no additional details are given [44]. For example, one
method may be to segment the movement based on some thresholds on the speed,
e.g., a change in speed of 10% over the period of a few samples is considered to
be a separate movement. Another method may be based on substantial changes in
the direction of movement. Regardless of the method, the number of movements is
likely to be correlated with the duration of the task. No attempts at normalizing this
measure with respect to duration have been reported.
Another measure used by Chmarra et al. [16] is the movement of the instrument
along the main axis of its shaft. This measure attempts to quantify the difficulty that
novice surgeons have in determining depth information from the laparoscopic cam-
era view, as they tend to misjudge depth and have to repeatedly reattempt grasping
tasks. This measure increases as the duration of the operation increases, and no re-
ports have been made with respect to normalizing this measure with respect to time.
Cotin et al. [17] describe an equivalent measure for estimating a participant’s abil-
ity to judge orientation by summing the angular rotations around the instrument’s
shaft. There was a visible difference in this measure when comparing novice and
expert groups, but the difference was not confirmed statistically.
21

Movement Quality
In many tasks, experts tend to have smoother motions than novices [17]. This
could be caused by novices making hesitant movements, having shaky hands, and
a number of other factors. Several measures have been used to calculate smooth-
ness. Chmarra et al. uses the third derivative of the position at time t, p(t) =
{x(t), y(t), z(t)} to represent the changes in acceleration [16],
smoothChmarra =
√√√√1
2
∫ t
0
(∂3x
∂t3
)2
+
(∂3y
∂t3
)2
+
(∂3z
∂t3
)2
dt . (2.1)
Motion smoothness can also be calculated from the curvature of the signal, as in
Judkins et al. [32]. The curvature of a motion path represents the tendency of the
trajectory to maintain a straight line at every point in time and is calculated as
κ(t) =
∣∣∣∣∣∣˙p(t)× ¨p(t)
˙p(t)
∣∣∣∣∣∣ . (2.2)
A point along a straight line has κ = ∞, and a point inside an abrupt change
in direction would have a very small κ value. Significant differences were found
between novices and experts, in a comparison of the median values and 95% con-
fidence intervals of curvature in a robotic surgery environment. Pellen et al. [50]
and Ritter et al. [57] found significant differences between novices and experts
with the ProMIS measure of motion smoothness, defined as the ‘cumulative num-
ber of instrument accelerations’. This measure may be more related to the ICSAD’s
number of movements measure, but it is difficult to tell in the absence of detailed
descriptions.
Virtual Reality trainers offer additional evaluation measures, as they can pre-
cisely monitor and control the simulated virtual objects and tissues. Buzink et al.
[10] describe experiments performed with the GI Mentor II training system, and
they found differences between novices and experts in the number of collisions
with tissue walls and the proportion of time a virtual patient was in pain. In ex-
periments with the LapSim system, Kundhal and Grancharov [33] found significant
correlations between the amount of tissue damage in the virtual trainer and the
tissue damage during a live procedure on humans. They also found correlations
22

between economy of motion scores such as angular path and path length in virtual
environments and similar measures in live surgical procedures. These results show
that these measures, while being artificial constructions and difficult to standardize,
have the potential to be useful predictors of skills in the OR.
Force Based Measures
Attempts to discriminate skill levels using global measures of force have met little
success. By placing a 6 DOF force/torque sensor underneath a synthetic artery,
Dubrowski et al. [25] found that experts apply significantly higher average forces
than novices, but this study lacked specific details on how the average force was
calculated, whether it was the mean value or mean absolute value, and which axes
were included. The higher average force may be explained by the fact that experts
were likely in contact with the tissue and thus applying force for a greater proportion
of the time, as it has been shown that novices spend more time in an idle state [62].
Another study also found that novices apply a higher average force, but this claim
was substantiated only by a plot of a single stitch from an novice and an expert
[69]. These findings are in contradiction to a study by Hwang et al. that found no
significant difference between experts and novices when looking at the mean force
recorded from a 3-axis sensor mounted inline with the surgical instrument [31].
Brown et al. [9] analyzed the grasping mechanics of novices and expert sur-
geons during operations on animal models, but were unable to find a clear dis-
tinction between the groups. The authors of the paper suggest that more complex
modelling techniques, e.g., Hidden Markov Models, are needed to analyze grasping
force data.
2.3.2 Local Analysis
Local analyses of surgical movements provide a more detailed comparison between
operations as they consider the paths of the trajectories and the movement patterns.
This level of analysis can be used to differentiate between skill levels and to provide
more detailed feedback to trainees on their performance. Reiley et al. [55] provides
an overview of these techniques in their review of surgical skill evaluation.
23

Movement Segmentation
Complete medical operations are often too complex to analyze as a whole and must
be decomposed and segmented into smaller, more manageable units. Different ap-
proaches have been taken to segmentation depending on the complexity and type
of the activity being analyzed. A single procedure can be segmented into a num-
ber of tasks, and each task further segmented into a number of movements, called
surgemes [54]. It is possible to further reduce each surgeme into a combination of
dexemes, which are individual motor movements, but a clear taxonomy is not avail-
able for the movements at this level. This structure closely mimics natural language,
where paragraphs (operations) are composed of sentences (tasks), and sentences are
composed of words (surgemes) that are in turn composed of phonemes (dexemes).
Automatic segmentation of a full operation into its constituent tasks allows the
workflow of an operation to be monitored by a computer [8, 48]. The constituent
tasks of each full operation vary depending on the type of operation. Bouarfa,
Jonker and Dankelman [7] proposed a decomposition of the laparoscopic chole-
cystectomy (gall bladder removal) operation into 13 tasks: incision and hasson-
trocars insertion, trocars insertion, laparoscopic instruments insertion, gallbladder
preparation, neck release, clipping, cutting, gallbladdder removing, optics displace-
ment, gallbladder packaging in endobag, instruments and trocars removing, en-
dobag and hasson-trocars removing, and suturing. These steps are not standardized
and vary between institutions, and a number of alternative models have been pro-
posed [47, 8].
The segmentation of a task into surgemes is the most prevalent approach to
modelling surgical skills. Typically, a few representative tasks such as suturing or
positioning of the gallbladder are chosen to be further segmented into surgemes.
Rosen et al. [59, 60] use a vocabulary of 15 surgemes to describe the movements in
three separate tasks within a laparoscopic cholecystectomy: idle, closing, opening,
pushing, rotating, closing - pulling, closing - pushing, closing - rotating, pushing -
opening, pushing - rotating, rotating - opening, closing - pulling - rotating, closing
- pushing - rotating, pushing - rotating - opening and closing - spinning. Some of
these may be better classified as dexemes, but there is no formal taxonomy that pro-
24

vides a clear distinction between surgemes and dexemes. A detailed decomposition
of the motions involved with a typical suturing operation can be found in a study
by Cao and MacKenzie [11]. This study identified 13 surgemes that are involved
in the suturing process, e.g., ‘position needle’, ‘bite tissue’, ‘pull suture through’,
‘form loops’. This classification distinguishes between surgemes and dexemes more
clearly, as each of the surgemes involves a number of smaller movements. The po-
sition needle surgeme, for instance, requires several movements to orient the needle
in the grasper and align it with the tissue.
Only one study has explicitly examined the use of dexemes for modelling min-
imally invasive surgery [53]. This study compares the performance of a Hidden
Markov Model (HMM) trained on labelled surgemes with a model trained on un-
labelled dexemes during a robotic suturing task. The HMM trained on the labelled
surgemes performed slightly better (100% compared to 95%), but required manual
labelling of the input data.
Movement Features
The data used to model surgical operations has a tremendous impact on the effec-
tiveness of the resulting model. Kinematic and dynamic data from the sensors is
complex, and these high-dimensional data sets often contain redundant informa-
tion. To make use of the data, it must be simplified into a more manageable form
that represents the movements performed. This lower-dimensional form is referred
to as a set of features.
At the coarsest level of analysis, e.g., full procedures, the input data is usually
quite simple and the most common signals are the tools that are currently in use.
These signals can be acquired either through offline video analysis or through sen-
sors placed on the instruments. With this approach, the feature vector at every point
in time consists of an N-dimensional binary vector, where N is the total number of
instruments used in the operation and each value represents whether or not that tool
is in use [5].
Analyzing movements at the surgeme and dexeme level requires more data than
just the tools used, as numerous movements and tasks can be completed with the
25

same instruments. The data used at this level comes from the motions of the tools
and the forces applied to them [65, 36, 63]. Studies with the Blue DRAGON system
use a 13-dimensional feature vector containing angular velocities, forces, torques
and a binary value specifying whether the tool is in contact with the tissue [59].
Larger feature vectors are found in studies analyzing robotic surgeries, where veloc-
ities, angles, and positions are known for both the surgeon-robot and patient-robot
interface, resulting in feature vectors that can exceed 70 values per sample [37].
Large feature vectors typically contain a substantial amount of redundant data
that can negatively impact the modelling of the surgical process. A variety of data
reduction techniques are used to project the high dimensional feature vectors into a
lower dimensional space. Some data reduction processes are quite complex, in-
volving a multi-stage operation that replace a number of dimensions with their
combined magnitude, perform a vector quantization operation and then builds a
codebook from the resulting vector [59]. Other approaches have applied a Short
Time Fourier Transform to the kinematic data followed by vector quantization [65]
or have used a Linear Discriminant Analysis [37]. Simpler techniques, such as us-
ing the centroid distance function (CDF) have been used to map 3D positional data
to a 1D representation [36]. The CDF replaces each value with its distance from
the centroid of the motion trajectory. No single technique has been shown to be
generally applicable to all data sets.
Modelling
Building a model of the surgical process involves finding a pattern that relates the
feature vector to each of the segments. The most successful modelling tool has been
Hidden Markov models (HMMs) [59, 63, 36, 65]. HMMs are statistical models
that have been very successful in modelling human speech and gestures, processes
which are very similar in nature to the movements of a surgeon. An introduction to
Hidden Markov models within the context of laparoscopic surgery modelling can
be found in Rosen et al. [62].
An HMM is defined as λ(A,B, π), with A being the transition probabilities to
and from each of the N states, with B being the set of probability density functions
26
for each observation from each state, and π is the probability of initializing the
model in each state. HMMs are built on Markov chains, which are representations
of a process by a set of N discrete states S = {s1, s2, ...sN}, where the current
state of the model is determined only by the previous states. In Markov chains,
the state of the process is directly observable and the only parameter to define is
the transition probabilities A = {a11, a12, ..., aNN}, where aij is the probability of
transitioning from si to sj . Within the context of surgical procedures, these states
often represent surgemes and a Markov chain represents a full task.
With Hidden Markov models, the state of underlying Markov chain is not di-
rectly available and must be inferred from observations generated by each state.
Each state, sj , defines a probability density function, bj(k), for generating a given
observation, k. In surgical procedures, these observations are the feature vectors
at different points in time. This abstraction is needed, as the system is not directly
aware of which surgeme is currently being executed by the surgeon, so it must use
the data available from the sensors to try and estimate the most likely surgeme. A
simple HMM with three states is depicted in Figure 2.7.
Rosen et al. [62] describe the three ‘problems of interest’ with respect to HMMs
in surgical evaluation. The first problem is optimizing the parameters (A, B, π) to
best model a set of observations. This is the process of building a model of a
surgical task from recorded data. Another problem of interest is computing the
probability of a set of observations given a model, P (O = o1, o2, ..., oT |λ). This is
equivalent to finding the probability that the data from the recorded surgery came
from the same data that built the model. The last problem of interest is computing
the hidden sequence of states given an observation sequence and a model, P(S =
s1, s2...sT |λ,O). This is equivalent to determining what the sequence of surgemes
are from recorded data.
Skill Classification
The simplest measure of skill classification from local analysis is to calculate the or-
der of execution and time spent performing the various stages. This can potentially
be used at the operation level as well as lower segmentation levels [61]. This anal-
27

Figure 2.7: Sample Hidden Markov model with three states and two observationvectors.
ysis is similar to the global measures of movement quantity as novices spend more
time in each state. Local analysis can also provide a more qualitative assessment
of skill. For example, Rosen et al. [61] found that novices spent much more time
in the idle state than experts, indicating that they may take more time to transition
between movements and plan out their actions.
Another method of quantifying the surgical skill based on a local analysis is
the comparison of models built from novice training data with models built from
expert training data [59]. The model of each novice is compared against the model
of each expert using a statistical distance function. This distance function sums
the probability that the expert’s movement came from a model trained on novice
movements, and the probability that the novice’s movements came from a model
trained on expert movements. The distance between each novice and expert was
then compared against the average inter-expert distance. A strong correlation (r =
0.86) was found between the statistical distance and a subjective evaluation by an
expert. This result suggests that there is some similarity between experts not only
in the time taken to perform tasks but also in the movements used to complete the
tasks, as the inter-expert distance was lower than the average novice-expert distance.
28

Chapter 3
Data Capture System
3.1 System Design
A data capture system was developed to record all of the data from the motion track-
ing system, the force and torque sensors, the video streams, and the microphone.
The central component of the system consisted of the PC with four gigabytes of
RAM and a quad-core CPU to process the large quantity of data. The PC ran Win-
dows XP which was required for compatibility with the motion tracker and force
and torque sensor. A schematic diagram of the system is depicted in Figure 3.1. A
multi-threaded C++ program interfaced with all of the devices.
Synchronization of the data was achieved through the use of the Windows sys-
tem time as a global clock. This clock has a resolution of 15ms, which is not suffi-
cient for directly time-stamping all of the force measurements, but it does allow for
interpolation of the values for intermediate samples. The position measurements
and video were recorded at 20 Hz and 30 Hz respectively, and the physical move-
ments that were recorded are relatively slow (a few centimetres per second), so this
synchronization method did not pose a problem.
Participants performed the required surgical tasks in an Endo-trainer from 3D-
Med [1] (Figure 3.2). This trainer simulates a laparoscopic surgery environment
with a small movable camera to simulate a laparoscope, and rubber holes that sim-
ulate the trocars used in real laparoscopy. Synthetic tissue or other items are placed
inside the Endo-trainer to be manipulated by the participants using laparoscopic in-
struments. The only modification to the Endo-trainer was the placement of a video
29

Computer
Motion Capture Camera
Laparoscopic Camera
Webcam
Microphone
Force Sensors
Motion Capture Markers
Figure 3.1: Schematic overview of system components.
splitter on the camera output to allow the video to be recorded.
3.2 Motion Tracking
The Visualeyez II VZ3000 optical motion tracker from PTI Phoenix [51] was used
to capture the participants’ movements. Three cameras placed linearly on a tripod
were used to triangulate the position of each of the infrared markers. The VZ3000 is
able to uniquely identify up to 64 points by sequentially flashing each marker so the
cameras only capture a single marker in each frame. While using fewer markers can
achieve higher frame rates, the effective capture rate was 20 Hz with the required
64 markers.
The markers were tracked with 0.7 mm root mean square error [51]. The track-
ing volume was defined by a horizontal and vertical angle of 45◦, extending out
approximately 7 m. Though the tracking volume can be increased through the use
of multiple camera units, the experiments were conducted with a single camera unit.
Each of the markers was connected to the wireless transponder module (Figure
3.3) of the VZ3000 system. This module synchronized the activation of the infrared
markers with the camera unit using an RF signal, and provided the participant more
comfort and freedom than the wired version. Each participant wore the transponder
30
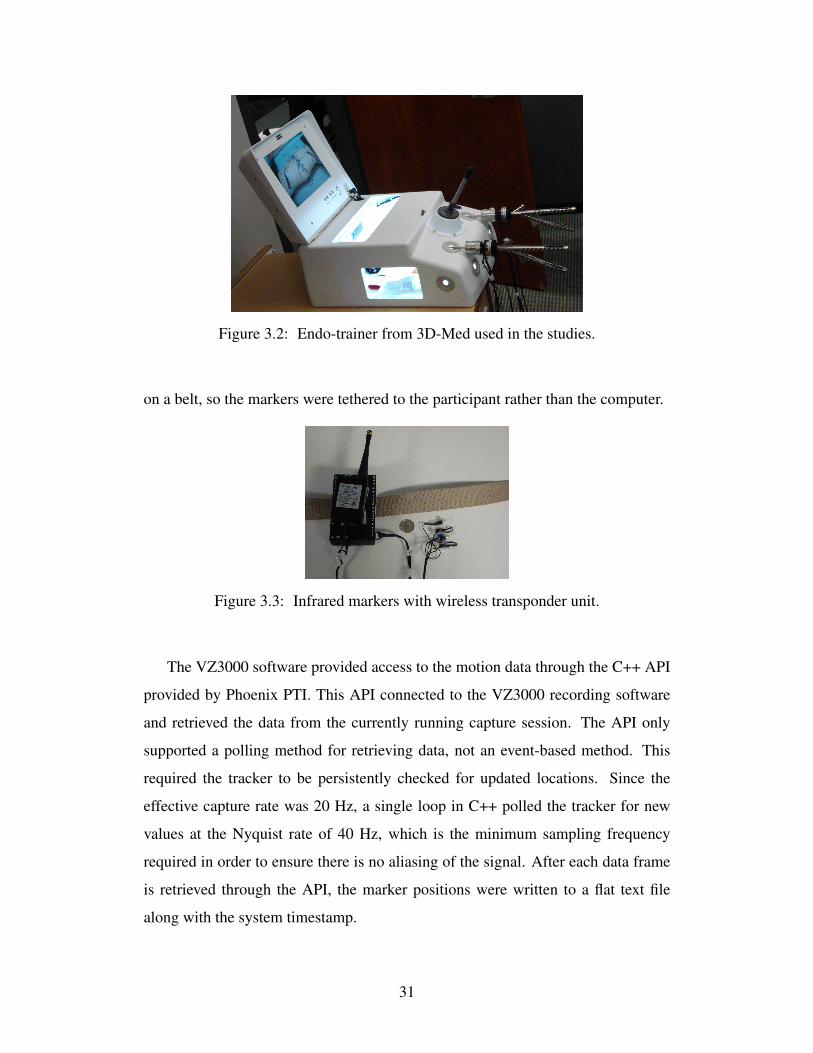
Figure 3.2: Endo-trainer from 3D-Med used in the studies.
on a belt, so the markers were tethered to the participant rather than the computer.
Figure 3.3: Infrared markers with wireless transponder unit.
The VZ3000 software provided access to the motion data through the C++ API
provided by Phoenix PTI. This API connected to the VZ3000 recording software
and retrieved the data from the currently running capture session. The API only
supported a polling method for retrieving data, not an event-based method. This
required the tracker to be persistently checked for updated locations. Since the
effective capture rate was 20 Hz, a single loop in C++ polled the tracker for new
values at the Nyquist rate of 40 Hz, which is the minimum sampling frequency
required in order to ensure there is no aliasing of the signal. After each data frame
is retrieved through the API, the marker positions were written to a flat text file
along with the system timestamp.
31

Figure 3.4: Diagram of marker placements.
3.2.1 Marker Placement
In total, 64 markers were fixed to the equipment and the participant for each trial.
This configuration was chosen so the position and orientation of the needle drivers,
which are the laparoscopic instruments used in the trials, as well as the participants’
hands, wrists, elbows, shoulders, and the Endo-trainer could be tracked. A diagram
of the marker placements on the participants is shown in Figure 3.4.
The position and orientation of the needle drivers was computed from the loca-
tions of the markers that were fixed to each tool. Twelve markers were attached to
an aluminum collar (32 mm diameter, 48 mm height) (Figure 3.5) in two equally
spaced rings. Each of the two rings contained six markers, spaced 11 mm apart;
the rings were 16 mm apart. The collar was attached to the shaft of the needle
driver using plastic screws. The marker configuration allowed the instrument to be
tracked as it was moved through the tracking volume, as the tracking unit needs to
only see three of the markers to accurately determine the tool tip location using the
templating process described in Section 3.2.2.
Four markers were secured to the dorsum of each of the participants’ hands
on the skin above the second metacarpal using a double-sided carbon fiber adhesive
tape. The position of these markers allowed the system to resolve the two degrees of
freedom of the hand (radial/ulnar deviation, and elevation/depression). While only
two markers were necessary to capture this motion, additional markers provided
32

Figure 3.5: Collar with infrared markers and force sensor mounted on laparoscopicneedle driver.
redundancy in cases of occlusion or tracker malfunction. The markers also come
bundled in groups of four, making it inconvenient and cumbersome to place the
additional markers elsewhere.
The position and orientation of each forearm was tracked using eight markers
fixed to an elastic strap worn over the wrist. The markers were arranged uniformly
in a similar fashion to the collar used for the needle drivers, and a templating process
similar to the one described in Section 3.2.2 was applied to determine the position
and orientation of the forearm.
Each elbow and shoulder joint was tracked using two markers. The elbow
markers were secured to the medial side of the elbow using double-sided carbon
fibre adhesive tape. The markers on the shoulders were secured using a velcro
strap in conjunction with a harness to prevent the markers from slipping. While
only one marker is needed to track the position of each joint, a second marker
provides redundancy. Most of the movement of the upper body, including shoul-
der abduction/adduction, elevation/depression, protraction/retraction, elbow flex-
ion/extension, and pronation/supination can be captured from the shoulder, elbow,
and wrist markers.
The position and orientation of the head was tracked using four markers attached
to the participants’ head using a velcro strap. Three of the markers were arranged
in an equilateral triangle, with the fourth marker placed in the centre. The normal
to the plane intersecting the three markers in the triangle can be used to represent
the orientation of the head. The location of the fourth marker in the centre of the
triangle can be used as the position of the head. The distance between this marker
and the centroid of the triangle can be used to estimate tracking error.
33

Four markers were fixed to the Endo-trainer in an identical arrangement to those
used to track the head. These markers allowed the surgical field to be located within
the tracking system’s reference frame.
3.2.2 Instrument Tracking Using Templates
The Endo-trainer occludes the surgical field from the viewpoint of the tracking unit
making the tool tip impossible to track directly, so the position of the tool tip was
extrapolated from the positions of the markers on the collar around the tool. Prior
to the trials, a template was created that relates the positions of the markers on
the collar to the position of the tool tip. The resulting template had a total of 13
positions, 12 for the collar, and 1 for the tool tip.
In order to track the tool tip relative to the collar when building the template, an
additional marker was required on the tip. The instrument was then moved around
the tracking volume and rotated to ensure that all markers were made visible to the
camera tracking unit. During this process, all position data was recorded to disk for
offline processing.
The templates were initialized by finding the frame that has the largest num-
ber of markers visible and storing this as the reference frame for the instrument’s
coordinate system. Subsequent markers were added to the template by finding ad-
ditional frames that included ‘unseen’ markers, as well as at least three markers that
were included in the reference frame. The markers that are visible in both frames
were used to find a rigid-body transformation, which is a rotation and translation,
Ttrk→ins = Rtrk→ins · p + ttrk→ins by finding a least-squares solution to minimize
the Euclidean distance between corresponding points. The resulting transformation
was then applied to the unseen point to transform it from the tracker coordinate
system to the instrument coordinate system. This process was repeated until all
thirteen markers had been moved into the instrument coordinate system.
Pseudo-code for templating process is given in Algorithm 1. The algorithm
is run on a recording of N samples of each of the 13 marker positions in tracker
space, Trk. The algorithm produces an array of 13 marker positions in template
space, Tpl. The variable unseen stores boolean values to track which markers have
34

−2
0
2 −2
−1
0
1
20
10
20
30
y (cm)x (cm)
z (
cm
)
Figure 3.6: Example of an instrument template constructed from the measureddata.
been added to the template. The isV isible(i, n) function returns true if marker i is
visible in frame n of the recording, the findAlignment(A,B) function returns a
rotation and translation [R, t], that aligns the corresponding points in A and B. An
example of a resulting instrument template is depicted in Figure 3.6. The ring of
the twelve markers on the collar is visible at the top of the image, and the tool tip
position is visible at the bottom, at (0,0,0).
3.2.3 Filtering
The raw data retrieved from the VZ3000 system contained a substantial amount
of erroneous data due to the physical connections on the wired markers becoming
loose. A sample of these errors is shown in Figure 3.7. In addition, there are frames
with insufficient data, e.g., when only two markers on an instrument are visible.
To mitigate the impact of the erroneous and missing data, a number of filtering
operations were performed. The filtering operations are shown in Figure 3.8 and
described below.
The process for constructing the templates was quite sensitive to errors, so a
strict approach to filtering this data was taken. This filter was very similar to a
median filter in that it first sorts the data within a window of ws = 19 around
each data point. Then, if all three axes of each of the N data points, p(t)[1 : 3] =
35

Algorithm 1 Instrument templating algorithm
maxIndex← n that maximizes∑iisV isible(i, n))
% Use the found frame to initialize the template.for i = 1 to 13 do
if isV isible(i,maxIndex) thenTpl[i]← Trk[i]unseen[i]← 0
end ifend for
% Add all of the unseen markers to the template.for x = 1 to 13 do
if unseen[x] = 1 thenmaxV isibleWith,maxV isibleIndex← −1
% Find the frame with the most markers visible and already in the template.for n = 1 to N dovisibleWith← 0for y = 1 to 13 do
if unseen[y] = 0 and isV isible(y, n) thenvisibleWith← visibleWith+ 1
end ifend forif visibleWith > maxV isibleWith thenmaxV isibleWith← visibleWithmaxV isibleIndex← n
end ifend for
% Find alignment between the frame and the template.templatePos, trackerPos← {}for i = 1 to 13 do
if unseen(y) = 0 and isV isible(i,maxV isibleIndex) thentemplatePos← templatePos ∪ Tpl[i]trackerPos← trackerPos ∪ Trk[i]
end ifend for
% Apply alignment to the marker to move it into template space.[R, t]← findAlignment(templatePositions, trackerPositions)Tpl(x)← R · Trk[x] + tunseen[x]← 0
end ifend for
36

0 100 200 300 400−100
0
100
x (
cm
)Sample index
0 100 200 300 40050
100
150
y (
cm
)
Sample index
0 100 200 300 4000
50
100
z (
cm
)
Sample index
(a) Raw position data, with outliers visible.
0 100 200 300 400−30
−25
−20
x (
cm
)
Sample index
0 100 200 300 400110
120
130
y (
cm
)
Sample index
0 100 200 300 400
−20
0
20
z (
cm
)
Sample index
(b) Position data with outliers removed.
Figure 3.7: Filtering outliers.
[x(t), y(t), z(t)] were not sorted into one of the three centermost positions, the point
was considered an outlier and thus discarded. This approach resulted in many data
points being discarded, but few data points were actually needed and it was essential
that all data be accurate. The pseudo-code for this algorithm is given in Algorithm
2.
Algorithm 2 Median discard filter
for i = ws/2 to N − ws/2 dowindow = p(i− ws/2 : i+ ws/2)[1 : 3]error ← 0for k = 1 to 3 dos← sort(p[i− ws/2 : i+ ws/2][k])if (p(i)[k] < s[bws/2c − 1]) or (p(i)[k] > s[dws/2e] + 1) thenerror ← error + 1
end ifend forif error == 2 thenp(i)[1 : 3]← NULL
end ifend for
When filtering the data from the participant’s movements, the system was less
sensitive to noise and data was filtered using an ad-hoc filtering method. This filter
iterates over each sample point, and discards the point if it is more than half the
37

Templating Positions
Median with Discard
Build Template
Templates
Trial Positions
Ad-hoc Error Filter
Calculate Tooltips
Impute Data
Median Filter
Figure 3.8: Filtering operations used to compute the final position of each tooltip.
variance from the mean of the signal. Following this, a standard median filter with a
window size of ws = 15 filters the resulting signals for each marker. This approach
removed most, but not all of the noise from the signal, and preserved the majority
of the signal.
In order to obtain a relatively smooth and continuos signal, data was imputed at
locations where data was unavailable due to occlusion, or had been discarded by the
filtering process. This data was imputed using a simple linear interpolation opera-
tion, generating samples in a straight line between the two neighbouring positions
where data was available. This imputed data is over-simplistic and not representa-
tive of the true movements, but it makes up a very small portion of the final data
and has little effect on the outcome.
3.3 Force and Torque Data
Each needle driver was instrumented with a force and torque sensor (Figure 3.5)
positioned between the tool tip and the handle of the tool to capture the interaction
between participant and tissue. The force detected by the sensor was the sum of the
38

tool tip-tissue forces, the force generated by the friction on the rubber trocar, and
the weight of the shaft of the needle driver and motion capture markers.
3.3.1 Force and Torque Transducer
The Mini40 force and torque sensor from ATI Industrial [3] contains six strain
gauges that respond to the load that is applied to the instrument. The voltages from
the strain gauges are recorded by the computer, and later processed into calibrated
force and torque readings. This sensor was calibrated to provide accurate force
sensing in the range of -35 N to 35 N in the x and y axes, and -106 N to 106 N
in the z axis, with less than 0.3 N error in all axes. The torque was calibrated to a
range of -1.5 Nm to 1.5 Nm in all axes with less than 0.008Nm error. The z axis
is aligned with the instrument shaft, the x and y axes are perpendicular to this axis
and each other.
The sensor was sampled using the NI-PCI 6224 data acquisition card from Na-
tional Instruments [43], with a sampling rate of 1000 HZ and 16 bits of resolution
using the NI-DAQmx C interface provided by the manufacturer. Data was stored in
a buffer on the card, and read into the CPU 100 samples at a time. To accurately
timestamp each of the 100 recordings, linear interpolation operation detailed in Al-
gorithm 3 was used. This timestamping allows for the synchronization of force data
with the video and position data.
Algorithm 3 Force timestamp interpolation
curT ime← globalClock()readSamples()for i = 1 to 100 dotimestamp(i)← prevT ime+ i ∗ (curT ime− prevT ime)/100
end forprevT ime← curT ime
The voltages from the strain gauges in each of the force transducers were trans-
formed into force and torque measurements at the tip of the instrument using a 6x6
matrix provided by the manufacturer. This matrix converts the raw voltages to cal-
ibrated force measurements, and transforms the location of the force and torque
39

measurements from the centre of the force sensor to the tool tip. This matrix was
applied to the voltages during the post-processing of the data, so the system was not
additionally taxed during the data acquisition. The resulting values are the force and
torque recordings in the force coordinate system, Ff .
Due to the mechanics of the sensor and its position on the needle driver, the
force generated by closing the handle on the instrument saturates the recordings
along the length of the shaft. This makes it impossible to measure the true force
applied by the participant in the z axis, but there is likely very little information
in this data for the particular tasks that were analyzed. The z component of the
force was thus eliminated before analyzing the applied forces. The benefit of this
configuration is that the large spikes in the force can be used to detect when the
participant opens and closes the handle.
3.4 Coordinate Systems
There are three separate coordinate systems that needed to be unified in order to pro-
vide a meaningful analysis of the data: tracking system, template, and force sensor.
The tracking coordinate system was the native reference frame of the motion cap-
ture system and had its origin about the centre of the camera unit and measured x,
y, and z in cm. The template coordinate system was similar to the tracking coordi-
nate system, but the location of the origin varied with the data used to construct the
template. In that coordinate system, only the relative positions between the markers
were important. The force sensor reference frame was centred around the tool tip
with forces in x, y, and z measured in N, torques around those axes measured in
Nm.
The common coordinate system was chosen to be the tracking coordinate sys-
tem. In order to unify all coordinate systems, the template of the instrument was
first aligned with the force and torque coordinate system following the template
construction. Then, a rigid body transform was computed to align transform mea-
surements from that coordinate system into the tracking coordinate system.
40

3.4.1 Alignment of Template with Force and Torque
To be able to transform the force and torque measurements from their local coor-
dinate system into the tracker coordinate system, the instrument coordinate system
was aligned with the force and torque coordinate system. Since the measurements
use different units, only the orientation of the axes were considered. Since the force
reported in the z axis was already calibrated to respond to force along the instru-
ment’s shaft, only the x and y axes were aligned.
Aligning the two coordinate systems involved translating the tool tip position to
the origin (0,0,0) and aligning the z axis with the shaft of the instrument. Alignment
of the z axis was achieved by rotating the instrument about the origin such that the
centroid of all of the markers on the collar was in line with the positive z axis, i.e.,
the x and y components of the centroid were 0.
To complete the alignment, the instrument template needed to be rotated around
the z-axis. The angle of rotation was found by securing the instrument parallel to
the ground, recording the force measurements in this position and then hanging a
weight on the tool tip as depicted in Figure 3.9. Subtracting the initial measurement
from the measurements when the force was applied gives the direction of the force
in the force reference frame. Since only the x and y axes needed to be aligned,
placing the instrument parallel to the ground ensures that the z axis component of
the force applied by gravity is zero. The instrument, as well as the position of
the weight, was motion-captured and forces were recorded during this procedure,
providing the direction of the force applied in tracker space, Ftrk, and the direc-
tion of the force in force space Ffrc. The dot product of Ftrk and Ffrc represents
the angular offset between the force sensor and instrument template. By rotating
the template by the resulting angle, the axes of the instrument coordinate system
become aligned with those of the force coordinate system.
3.4.2 Alignment of Template with Tracker
The application of the template to compute the tool tip position used a process
similar to the template construction. On every frame, correspondences between
41

Figure 3.9: Configuration used to calculate the rotation needed to align the templateand force coordinate systems.
the visible instrument markers and the markers in the force-aligned template were
found. A rigid body transform Tins→trk = Rins→trk · p + tins→trk] that minimized
the distance between these correspondences was computed using a least-squares
method. If less than three markers were visible in the given frame, it was marked
as having no data and filtering operations were used to impute data for it.
To compute the tool tip position in tracker coordinate system, the transform
Tins→trk was applied to the tool tip position in the force-aligned template. To com-
pute the force in the tracker coordinate system only Rins→trk was applied to the
force and torque recordings. The translation was omitted, as the force and position
are aligned only in the orientation of their reference axes, not in the scale and units
of the axes.
3.5 Video and Audio
3.5.1 Video
Two separate video streams were captured to provide a reference for later analy-
sis. Videos were captured using the OpenCV library [45], encoded using the DivX
encoder [22], and written directly onto the disk. In addition, a flat text file was
created that stored the timestamp for each frame to provide a means to synchronize
the video with the motion and force data. Both video streams were recorded and
processed on the same thread in the CPU.
One video stream was recorded using a standard web camera, the Logitech
42

QuickCam Orbit MP [39]. This camera recorded video at 30 frames per second
with a resolution of 320x240 pixels. The camera was focussed on the participant’s
upper body and hands. This information was useful for the expert surgeon eval-
uating the performance of the participant and as reference when comparing the
movements to the recorded trajectories.
The second video stream recorded the view from the laparoscopic camera lo-
cated in the Endo-trainer. This was accomplished by splitting the signal from the
laparoscopic camera and routing it to a Syntek STK 1135 USB video capture card.
The use of the splitter allowed the video to be captured by the PC while still dis-
playing on the screen of the Endo-trainer. The USB capture card generated video at
a resolution of 640x480 pixels, at 30 frames per second.
3.5.2 Audio
Audio of the recording events was captured using a standard desktop microphone
and the LiveInCode [38] program. The audio was not significant for the analysis of
the participant, but was captured to ensure that the entire process was recorded as
completely as possible.
3.6 Data Processing
Several of the measures used in the analysis require further processing of the data.
All data processing was performed offline using MATLAB 2009b [41].
3.6.1 Curvature
The curvature of a 3D trajectory is a 1D signal that describes how the trajectory
changes direction in space. This is a useful representation of the data, as it is of
lower dimension than the original signal and is invariant to rotation and translation.
The curvature is used to estimate motion smoothness, as well as perform a local
analysis on the movements.
43

Curvature Background
Let f(t) = {x(t), y(t), z(t)} be a function that defines a trajectory in 3D space with
respect to time, t. The parametrization of the path by time means that motion paths
are not time invariant, and paths that follow identical trajectories at different speeds
are substantially different. To avoid this problem the path can be reparameterized
by arc length, s, allowing trajectories of identical paths to be represented identically,
even if executed at different speeds. This new representation of the trajectory, p(s)
can be calculated with the following mapping from time to arc length,
s =
t∫0
√√√√(∂x∂t
)2
+
(∂y
∂t
)2
+
(∂z
∂t
)2
dt . (3.1)
This conversion to arc length also prevents large spikes in the curvature calculation
when the instruments are relatively still. These spikes introduce large variation into
the resulting signal, and make analysis and signal comparison very difficult. The
conversion to arc length should not remove information that is contained in the
time-domain representation of the signal, as this conversion is similar to a time-
normalization operation. Because of this, computations of motion smoothness, and
gesture comparison using the curvature signals should not be affected.
The derivative of the trajectory, T = ∂p∂s
, is the tangent vector and represents
the direction of the trajectory. The second derivative of this function is the normal
vector, N = ∂2p∂s2
, and is perpendicular to the tangent vector. The cross product
of these two vectors, B = T × N is the binormal vector, and is perpendicular to
both. These three vectors (Figure 3.10) form the Frenet-Serret frame, which is a
mathematical construct that describes a trajectory in 3D space. Within this frame,
one can define the intrinsic parameters of curvature and torsion.
The curvature, κ, of a trajectory in space is a one dimensional signal that de-
scribes how the tangent vector changes direction within the spanning plane of T
and N. The magnitude of the curvature is
κ =||∂p∂s× ∂2p
∂s2||
||∂p∂s||3
. (3.2)
In the simplest case of a 2D trajectory with the curvature constant and equal to
zero, the path is a straight line. When the curvature of a path is constant and non-
44

Figure 3.10: The vectors T, N and B of the Frenet-Serret frame.
zero, then the path is a circle with a radius of κ−1. Complex curves have κ values
varying between−∞ and∞. Extending this concept of 2D curvature into 3D space
requires torsion, denoted τ . The torsion of a trajectory represents the tendency of
the curve to leave the plane spanned by T and N. The magnitude of the torsion is
τ =||(∂p∂s× ∂2p
∂s2
)· ∂3p∂s3||
||∂p∂s× ∂2p
∂s2||2
. (3.3)
A path with constant curvature and constant torsion is a helix, an arbitrary path in
3D space has −∞ ≤ κ, τ ≤ ∞.
Curvature and torsion are intrinsic properties of the trajectory, and as such are
invariant to rotation and translation. These factors as well as the time invariance
from the arc length parameterization make curvature and torsion robust descriptors
of the curve geometry. Curvature has been proven useful in analyzing real-world
gestures from sensors [42]. Torsion is less useful, however, as each derivative from
sensed data increases the noise in the signal, and the torsion calculation requires a
third derivative. Most trajectories are relatively co-planar as well, so torsion was
not used in the analysis of the recorded data.
Calculation of Curvature from Recorded Signal
Calculation of the curvature from the filtered data positions involves a multi-stage
process. The first stage is the conversion from the time-domain to the arc length
domain. Next, the positions are uniformly resampled within the arc length domain.
The positions are further filtered with derivatives of a Gaussian low-pass filter which
45

serve to smooth the data and compute the derivative in a single step. The resulting
smoothed positions are then used to calculate the curvature signal. This process is
executed four times with different window sizes for the Gaussian low-pass filter so
the trajectories can be analyzed at a number of scales.
Each of the recorded positions was assigned an arc length index using a dis-
cretized version of Equation 3.1. This parameterization produced a non-uniform
sampling in the arc length domain, as fast movements produce much greater changes
in arc length than slow movements when sampled at constant time. A uniform sam-
pling was required for the derivative calculations, so the resulting arc length domain
signals were then resampled at a uniform interval of 5 mm, using linear interpola-
tion where required. This resampling interval preserved the majority of the signal.
Resampling was performed by applying Algorithm 4 to each of the instrument tip
positions, with parc being the Winsorizing domain trajectory with N samples and
Winsorizing indices sarc, puni the trajectory with uniform Winsorizing with M
samples and Winsorizing indices suni:
Algorithm 4 Uniform resampling of trajectory in arc length
M ← totalPathLength/5mmfor i = 1 to M dosuni(i)← (i− 1) · 5mmbelow ← max(sarc < suni(i))above← min(sarc > suni(i))ratio← (suni(i)− sarc(below))/(sarc(above)− sarc(below))puni(i)← parc(below) + ratio · (parc(above)− parc(below))
end for
The derivatives of the instrument trajectory were calculated and low-pass fil-
tered in a single, efficient operation. The filtered first derivative of the trajectories,∂p∂s
was calculated by convolving each of the dimensions (x, y and z) with the first
derivative of a Gaussian kernel with a window size of ws and standard deviation of
σ. The filtered second derivative of the trajectories, ∂2p∂s2
was calculated by convolv-
ing each of the dimensions with the second derivative of a Gaussian kernel with a
window size of ws and a standard deviation of σ.
46

∂p
∂s= puni ∗ s · e
−s22·σ2 , (3.4)
∂2p
∂s2= puni ∗
s2 − σ2
σ4· e
−s22·σ2 . (3.5)
The parameters ws and σ were left as free parameters so the trajectories could
be analyzed at different scales. Four scales were used in the analysis: Scale 1 with
ws = 31, σ = 3, Scale 2 with ws = 31, σ = 9, Scale 3 with ws = 51, σ = 19,
Scale 4 with ws = 99, σ = 35. The finest scale, σ = 3, was chosen as it smoothed
out most of the noise in the signal while preserving the majority of the movements.
With smaller values of σ, the noise overwhelmed the signal. The largest scale,
σ = 35, filtered out the smaller movements, leaving only the larger, more deliberate
motions. Any larger values of σ resulted in over-smoothing and loss of important
data. These values were chosen using an ad-hoc visual inspection of their effects
on a sample of recorded data.
The curvature value used in the analysis was calculated as
κp = ln
||∂p∂s × ∂2p∂s2||
||∂p∂s||3
. (3.6)
Each scale was calculated using the same equation, resulting in four curvature sig-
nals for each of the instrument trajectories. The logarithm function was used to
compress the range of the curvature values, as it is unbounded. Without it, very
small changes in the velocity (∂p∂s
) result in extremely large curvature values that
prohibit a meaningful analysis. Examples of the calculated curvature values are
shown in Figure 3.11, and are overlaid on the 3D trajectories in Figure 3.12.
3.6.2 Mechanical Energy
The measure of mechanical energy combines the force and position information
to estimate the energy applied by the surgeon during the tasks. This measure is
referred to as work within the context of physics, but can be thought of as the energy
used in the manipulation of the tissue. This does not represent all energy expended
by the surgeon, as only the energy measured at the instrument is considered, not the
kinetic energy of movement through free-space, or any other energy exerted by the
47

0 10 20 30 40 50−8
−6
−4
−2
0
2
4
6
Cumulative Arc Length (cm)
Cu
rva
ture
(1/c
m)
(a) Scale 1, ws = 31, σ = 3
0 10 20 30 40 50−2
0
2
4
6
8
10
Cumulative Arc Length (cm)
Cu
rva
ture
(1/c
m)
(b) Scale 2, ws = 31, σ = 9
0 5 10 15 20 25 30 35 400
1
2
3
4
5
6
7
8
9
Cumulative Arc Length (cm)
Cu
rvatu
re (
1/c
m)
(c) Scale 3, ws = 51, σ = 19
0 10 20 30 40 50−1
0
1
2
3
4
5
6
Cumulative Arc Length (cm)
Cu
rvatu
re (
1/c
m)
(d) Scale 4, ws = 99, σ = 35
Figure 3.11: Plots of the curvature calculated from the insertion segment.
surgeon. This measure was meant to capture the movement economy of a surgeon,
as expert surgeons should execute more efficient maneuvers as they develop their
skill. It should also capture the care in which the tissue is handled, as peaks in the
energy used may damage delicate tissue.
Energy was computed from the force and tool tip position value in the tracker
coordinate system. Before computation, the position data was smoothed with a
Gaussian filter with a window size of ws = 31 and a standard deviation of σ = 4
to remove measurement noise. The change in energy between sample points was
computed as
Et = (Ft − Ft−1) · (pt − pt−1) . (3.7)
Examples of the signals used to compute the energy, and the resulting energy signals
are shown in Figure 3.13.
48

−24
−22
−20
−18
−16 116
118
120
122
124−17
−16
−15
−14
−13
−12
y (cm)x (cm)
z (
cm
)
−5
−4
−3
−2
−1
0
1
2
3
4
(a) Scale 1, ws = 31, σ = 3
−24
−22
−20
−18
−16 117
118
119
120
121
122−17
−16
−15
−14
−13
−12
y (cm)x (cm)
z (
cm
)
2
3
4
5
6
7
8
(b) Scale 2, ws = 31, σ = 9
−24
−22
−20
−18
−16 117
118
119
120
121
122−17
−16
−15
−14
−13
y (cm)x (cm)
z (
cm
)
2
3
4
5
6
7
(c) Scale 3, ws = 51, σ = 19
−25
−20
−15 120.5
121
121.5
122
122.5−16
−15
−14
−13
−12
y (cm)x (cm)
z (
cm
)
0
1
2
3
4
5
(d) Scale 4, ws = 99, σ = 35
Figure 3.12: 3D plots of the insertion segment, with curvature shown as colour.Trajectories have been smoothed with Gaussian filters with the ws and σ values ofthe corresponding scale.
49

0 1000 2000 3000 4000−10
0
10
x (
N)
Sample index
0 1000 2000 3000 4000−10
0
10
y (
N)
Sample index
0 1000 2000 3000 4000−10
0
10
z (
N)
Sample index
(a) Force signal from a simple inter-rupted suture.
0 1000 2000 3000 4000−20
−10
0
x (
cm
)
Sample index
0 1000 2000 3000 4000110
120
130
y (
cm
)
Sample index
0 1000 2000 3000 4000−20
−10
0
z (
cm
)Sample index
(b) Position signals from a simple in-terrupted suture.
0 1000 2000 3000 40000
0.5
1
1.5
2
2.5
3
Sample index
Energ
y (
J)
(c) Energy signal from a simple inter-rupted suture.
0 50 100 1500
0.2
0.4
0.6
0.8
1
1.2
1.4
Sample index
Energ
y (
J)
(d) Energy signal from the ’pullthrough’ segment of a simple inter-rupted suture.
Figure 3.13: Example energy signal, and the force and position signals used in itscomputation.
50

Chapter 4
Experimental Methodology
4.1 Procedure
An empirical study using the system was conducted at the Center for the Advance-
ment of Minimally Invasive Surgery in Edmonton, Alberta. Ethics approval for the
study was obtained from the University of Alberta and Alberta Health Services.
Thirteen participants were involved in the study, each receiving $50 for their par-
ticipation. Participants were recruited through an email sent to all general surgery
and urology residents, as well as in person during their regular surgical training
sessions.
The data from three participants was removed due to technical problems (ex-
cess sunlight on the infrared markers and a miscalibrated tool template), leaving
complete datasets from ten participants. The participants represented a broad range
of skill levels (residents from all five years of residency, surgical fellows, and staff
surgeons). All participants were male.
After signing a written consent form, participants were asked to complete a
questionnaire, a stereo vision test, and a manual dexterity pegboard task. Then
participants were fitted with the motion capture equipment and asked to complete
the Fundamental Laparoscopic Skills pegboard task, a series of simple interrupted
sutures, and a continuous running suture. Finally, participants were asked to fill out
a second questionnaire requesting a self-evaluation of their performance.
51

4.1.1 Questionnaire
Participants completed a two page questionnaire that included questions relating to
demographics, training level, and other factors that may affect performance. Ques-
tions relating to demographics and training included age, gender, dominant hand,
vision, and current training status (year of residency, fellowship, staff surgeon).
Self-assessments of their own skills in open surgical procedures and in laparo-
scopic surgical procedures was recorded on a five point Likert scale with relevant
‘anchors’ for each of the five points. For example, in self-assessing their skills in
open surgery, participants could select 1 - No experience, 2 - I have practiced on
synthetic tissue; I have learned the basic skills, 3 - I am confident with my skills;
ready to suture in the OR on patients, 4 - Experience performing full operations, or
5 - Expert surgeon. These anchors were developed in conjunction with an expert
surgeon to ensure they reflected a reasonable set of responses.
Participants were also asked about surgical training their and recent events which
may have impacted their surgical dexterity. Regarding their training, they were
asked to estimate the number of times they had performed a laparoscopic cholecys-
tectomy or a laparoscopic fundoplication (common laparoscopic operations), and
the number of days since they had practiced laparoscopic surgery. They were also
asked if they play video games or regularly perform other tasks requiring fine mo-
tor skills, the number of hours of sleep they had missed in the last week, and the
number of caffeinated drinks they had consumed in the last 24 hours.
4.1.2 Stereo Vision Test
The stereoacuity of each participant was assessed using the RanDOT stereo vision
test [52]. For this test, participants were asked to wear polarized glasses and view
a series of ten images (Figure 4.1). In each of the images, there were three circles,
one of which is comprised of two separate circles separated by a small (varying)
distance. Through the polarizing glasses, these two circles appeared as a single
circle that stood out from the other two. Participants were asked to identify which
of the three circles appeared to stand out from the others. The images are presented
52

with decreasing disparity, making it more difficult to perceive which circle stood
out. The first incorrect response was taken to be the participant’s stereoacuity limit.
Figure 4.1: RanDOT stereo vision test, used to measure stereoacuity.
4.1.3 Manual Dexterity Pegboard
Manual dexterity was assessed using the Purdue Pegboard [49]. This is a standard-
ized test that is used to assess fine motor skill in a variety of domains including in-
dustrial work and rehabilitation. Participants complete the task by placing as many
pins as possible into the holes on the pegboard (Figure 4.2) within 30 seconds. The
test was administered according to the instructions provided for the ‘left’, ‘right’
and ‘simultaneous’ conditions, as described below.
For the first subtask, the ‘right’ condition, participants were instructed to pick
up a single pin from the small bowl at the top of the board with their right hand,
and place it into the first hole on the right hand column of the board, and repeat
the process as quickly as possible. They then placed 3-5 pins for practice before
the experimental trial was performed. The ‘left’ condition was administered simi-
larly, but with the left hand and left column on the board. For the ‘simultaneous’
condition, participants used both hands in tandem, picking a pin from both the left
and right bowl at the same time, and placing them into both columns on the board.
The conditions were executed in the same order (left, right, simultaneous) for all
participants.
53

Figure 4.2: Purdue Pegboard, used to measure manual dexterity.
4.1.4 Fundamental Laparoscopic Skills Pegboard
The Fundamental Laparoscopic Skills pegboard is a standardized task that is cur-
rently used to assess the laparoscopic dexterity of surgeons. The FLS pegboard task
consists of moving a number of coloured, rubber collars from one side of the board
(Figure 4.3) to the other using laparoscopic instruments. Evaluation is completed
by an observer who records the event duration and the number of pegs that are ir-
retrievably dropped. These two measures can be used to calculate a very coarse
measure of laparoscopic skill.
The FLS pegboard task was used as it is a very simple task that participants of
all skill levels can understand and complete. Participants were instructed to com-
plete the task as it is normally administered, i.e., lifting a collar off a peg with
the left instrument, transferring to the right instrument, and placing the collar on a
peg on the right hand side of the board. Participants used the instrumented needle
drivers described in Section 3.3 instead of the curved laparoscopic graspers that are
typically used for the task. This made the task slightly more difficult, but allowed
the force and torque to be recorded while the task was completed.
Participants were given the opportunity to practice by transferring a few pegs
from left to right and back again before completing the trial. They were given
no specific instructions e.g., to focus on speed or accuracy, and no time limit was
imposed.
54

Figure 4.3: Pegboard task from the FLS program.
4.1.5 Simple Interrupted Sutures
A simple interrupted suture is a type of knot used in surgical procedures to connect
tissue. It is composed of two bites (when a needle enters the tissue) and a number of
throws (the individual ‘knots’ used to secure the suture). It is a relatively common
operation used for training laparoscopic skills, and all participants were familiar
with this type of suture. This task requires a fair bit of coordination to place and
secure the suture properly. It is substantially more difficult than the pegboard task
but easier than the continuous running suture.
The sutures were placed in a piece of synthetic bowel tissue. Participants were
asked to close a small hole that had been cut in the bowel by inserting five simple
interrupted sutures at marked points around the hole. The marked points were 5 mm
from the edge of the hole, and 1cm away from the neighbouring holes. A template
was used to mark the points and the hole. All participants performed one warmup
suture before completing the five trial sutures. Figure 4.4 shows the synthetic tissue
with the markings before and after the simple interrupted sutures were inserted.
Participants were provided with 15 cm of 5-0 braided silk thread for each of
the five sutures. This type of thread does not have ‘memory’ like the synthetic
monofilament suture that is also used for laparoscopic procedures, so it is easier to
work with.
Participants were instructed to insert the needle into the tissue with their domi-
nant hand. They were also asked to complete the knot using three throws. The first
throw was a double throw (two loops of thread around the instrument), the second
55

and third throws were single throws (one loop of thread around the instrument).
This is a standard method of the simple interrupted suture. After each suture, par-
ticipants removed the needle and excess thread using laparoscopic scissors before
beginning the next suture.
(a) Synthetic tissue prior to the task. (b) Stitches placed in the synthetic tissue.
Figure 4.4: View from laparoscopic camera during simple interrupted suture task.
4.1.6 Continuous Running Suture
In the final task, the participants were asked to perform a continuous running suture.
The continuous running suture is used to close a hole using a single thread. In the
first step, the thread is secured with a knot at one end of the hole. After the thread
is secured at the top, it is repeatedly inserted into the tissue along the hole to join
the two edges, as depicted in Figure 4.5. At the end of the hole, the thread is tied
back on itself to secure the entire suture in place.
This type of suture is quite difficult for a number of reasons. The longer thread
(30 cm instead of 15 cm) is more difficult to manipulate laparoscopically. Partici-
pants must also plan their stitch more carefully, ensuring that there is enough thread
left at the end to complete the final knot. Further, the final knot is tied to thread
that is already inserted into the tissue, and it is thus more difficult to perform. Most
participants were also less familiar with this type of suture, as it is not as commonly
used as the simple interrupted suture.
Before beginning the task, participants were given the opportunity to view a
video of an expert surgeon performing a continuous running suture. This was done
to ensure that participants knew how to complete the task, as some had forgotten
56

the required steps. Participants were not given the opportunity to practice this type
of stitch, as it was performed after the simple interrupted sutures and participants
had already had a chance to perform laparoscopic sutures.
(a) Participant is midway through the task. (b) Participant has completed the task.
Figure 4.5: View from laparoscopic camera during continuous running suture task.
4.1.7 Second Questionnaire
Following the continuous running suture, participants were asked to self-evaluate
their performance on all of the tasks they had just performed using a five point
Likert scale.
4.2 Subjective Data Analysis
4.2.1 Segmentation
Suturing is a complex procedure and is difficult to analyze without decomposing
it into smaller movements. This decomposition was done by analyzing the time-
stamped videos from the laparoscopic camera view. First, the videos of the simple
interrupted suturing from all participants were analyzed in order to determine what
movements are involved in laparoscopic suturing. The following movements were
identified for simple interrupted sutures:
1. Insertion - This is the process of inserting the needle through the tissue. This
movement involves penetrating one side of the hole that is being closed,
pulling the thread through, and penetrating the other side of the hole. De-
pending on the surgeon and the location of the suture, the process of pulling
57

the thread through after the first penetration is sometimes omitted, and both
penetrations were done with a single movement. The start of the segment is
when the needle first makes contact with the tissue. The segment ends when
the non-dominant hand grasps the needle after penetrating both sides of the
tissue.
2. Pull through - This movement is defined as pulling the thread through the
synthetic tissue. The segment starts when the non-dominant hand grasps the
needle after penetration, i.e., the end of the insertion segment. The segment
ends when the thread is completely pulled through the tissue and there is
noticeable slack.
3. Double throw - In this movement, one instrument grasps the needle and uses it
to loop the thread around the other instrument twice. The instrument without
the needle then grasps the tail of the thread to prepare the throw to be locked
in place. The segment starts at the end of the pull through segment. The
segment ends when the instrument with the thread looped around it grasps
the tail of the thread.
4. Tighten suture - This movement involves pulling the tail through the loops on
the instrument and moving both ends of the thread away from each other to
tighten the throw and lock it in place. The start of the segment is the end of a
throw (either single or double). The segment ends when one end of the thread
is released from the instrument.
5. Single throw - This is similar to the double throw, except that it only involves
a single loop of thread around the instrument and occurs after a tighten suture
movement.
6. Collect tails - This movement is used by the participant to arrange the ends
of the thread and hold them upright so they can be cut. Sometimes a single
instrument is used to grasp each of the tails sequentially, and sometimes both
instruments are used. The segment begins following the last tighten suture
movement and ends when the tails of the thread are held taut ready to be cut.
58

This taxonomy was applied to the videos using the defined criteria with a frame-
by-frame analysis. An ideal suture would require each of the 6 sub-movements to
be executed in the following order: Insertion, Pull through, Double throw, Tighten
suture, Single throw, Tighten suture, Single throw, Tighten suture, Collect tails.
Some of the non-experts were not able to properly complete all stages of the suture
on the first attempt, and so some movements (e.g., Double throw and Tighten suture)
were thus repeated several times in a single suture.
4.2.2 Expert Evaluation
After all participants had been recorded, the videos from the view of laparoscopic
camera were provided to Dr. Daniel Birch, an expert surgeon, for evaluation. He
viewed all of the videos and ranked them in order of perceived skill. No instruc-
tions were given, so the resulting evaluation was based solely on the expert’s judg-
ment. While only the instruments and tissue were visible in the video to provide
anonymity, the expert was able to identify his own performance.
59

Chapter 5
Analysis and Results
Results from the questionnaire were analyzed, global measures were computed,
and a local analysis was performed on the data recorded from the experimental tri-
als. Previously established global measures, such as path length, total time, motion
smoothness, and force features were compared to the newly defined energy-based
measures. Local analyses of the curvature of the trajectory in space, and the energy
signal were also performed.
5.1 Questionnaire and Non-surgical Tasks
Responses from the questionnaire were analyzed to check for any relation to expert-
assessed surgical skill on the simple interrupted suturing task. All questions having
numeric or Likert scale responses were considered. Data from all thirteen partici-
pants were included in this analysis, which was performed using Spearman’s rank
correlation coefficient. No significant correlations were found between expert as-
sessed skill and any of the questionnaire responses.
The relationship between performance on non-surgical tasks and expert as-
sessed surgical skill was analyzed using the Spearman’s rank correlation coefficient
as well. There was no relationship between performance on the stereoacuity test
and surgical skill. There was also no relationship between surgical skill the number
of pegs placed in the Purdue Pegboard under the ‘right’ and ‘simultaneous’ condi-
tions. The number of pegs placed during the ‘left’ condition did show a positive
correlation with surgical skill, but this was not significant (ρ = 0.59, p = 0.08)
60

5.2 Global Measures
Several global measures were computed from the three laparoscopic tasks, and their
relation to surgical skill analyzed. Correlations were calculated between the mea-
sures and the expert-assessed ranking on the simple interrupted suture task. Expert
assessments were not made for the FLS task or the continuous running suture task,
but it was assumed that skill on the simple interrupted suture task would be indica-
tive of skill on the other tasks. Correlations were computed using Spearman’s rank
correlation coefficient for non-parametric data.
5.2.1 Movement Quantity
Several measures of movement quantity were analyzed including total time, total
path length, and total energy. The total time and path length are measures that
have been previously shown to correlate with skill, and were used as a baseline to
compare the new measure, total energy.
Total Time
The time required to complete a task has been shown to be a reliable measure of
skill. Novices take more time than experts as they are more hesitant, less efficient,
and are forced to repeat more movements due to errors. This metric is applicable
to nearly all surgical tasks and can be computed without sophisticated measuring
equipment. A drawback of this measure is that it is a very general assessment of
skill, giving no feedback on how a surgeon can improve other than to ‘go faster’.
Total completion time for each task was determined from a manual analysis of
the captured video. For the FLS task, the start time was considered to be when
the instrument touched the first collar, the end time was considered to be when
the instrument released the last collar. For each of the simple interrupted sutures, as
well as the continuous running suture, the start time was the beginning of the needle
insertion, the end time was the end of the clip tails segment.
Completion time significantly correlated with expert-assessed skill (p < 0.05)
on all three tasks. The strongest correlation was with the simple interrupted sutures,
61

(ρ = −0.84, p = 0.01), the weakest with the FLS tasks (ρ = −0.74, p = 0.02).
Figures 5.1a-c depict the total time for each task plotted against expert-assessed
skill. These results are consistent with other studies in surgical skill evaluation.
The strong correlation suggests that the expert evaluations of the participants are
accurate, and that skill on the simple interrupted suture task is indicative of skill on
the other tasks.
Path Length
The path length represents the distance that each tool tip travels through space as the
task is performed. This measure can reflect the movement efficiency of the surgeon,
as shorter paths indicate more economical movements. It can also reflect mistakes
that are made, as repeating a number of movements will substantially increase the
path length.
The path length for each task is independently computed from the positions of
each tool tip using the data resulting from the filtering process described in Section
3.2.3. The length is computed as the cumulative sum of the Euclidean distances
between sample points:
l =∑t
√(x(t)− x(t− 1))2 + (y(t)− y(t− 1))2 + (z(t)− z(t− 1))2. (5.1)
The start and end time points were the same as were used when calculating total
time.
A significant correlation was found between cumulative path length of the in-
strument in the dominant hand and expert-assessed skill for all tasks (p < 0.05).
The path length of the instrument in the non-dominant hand was found to be sig-
nificant for only the simple interrupted suturing task, not the FLS pegboard or the
continuous running suture. This is consistent with other studies that have shown that
measures of skill computed from the dominant hand are generally more discrimi-
natory. The strongest correlation was found in the path length of the instrument
in the dominant hand during the simple interrupted sutures (ρ = −0.84, p < 0.01).
Computed path lengths for both instruments of all tasks are shown in Figures 5.2a-f.
62

Total Energy
The total energy measured should reflect the efficiency of the surgeon’s movements,
not only with respect to minimizing the path length, but the application of force as
well. As with the other quantitative measures, total energy tends to increase as task
duration increases. The calculation used for this measure is simply E =∑tEt.
Contrary to most other measures in the literature and the ones analyzed in this
study, total energy had a greater correlation with skill when analyzing the non-
dominant hand, rather than the dominant hand. Both the FLS task and the simple
interrupted sutures showed a significant negative correlation (ρ = −0.79,−0.68,
p < 0.05) between expert-assessed skill and total energy for the non-dominant
hand (Figures 5.3 b, d). A negative correlation was also found when analyzing the
continuous running suture (Figures 5.3 e, f), as well as the dominant hand on all
tasks (Figures 5.3 a, c, e), but these correlations were not significant. Total energy
may not have the same discriminatory power as the other quantitative measures, but
it appears to have some unique information not captured by the path length measure.
Further tests with a larger sample size may reveal a stronger effect.
63

0 2 4 6 8 1030
40
50
60
70
80
90
Skill levelC
om
ple
tion tim
e (
s)
(a) Total time to complete FLS pegboardtask.
0 5 1020
40
60
80
100
120
140
Skill level
Com
ple
tion tim
e (
s)
(b) Mean time to complete one sim-ple interrupted suture, error bars indicatestandard deviation.
0 5 10200
250
300
350
400
450
Skill level
Com
ple
tion tim
e (
s)
(c) Total time to complete continuousrunning suture.
Figure 5.1: Completion time for the performed tasks.
64
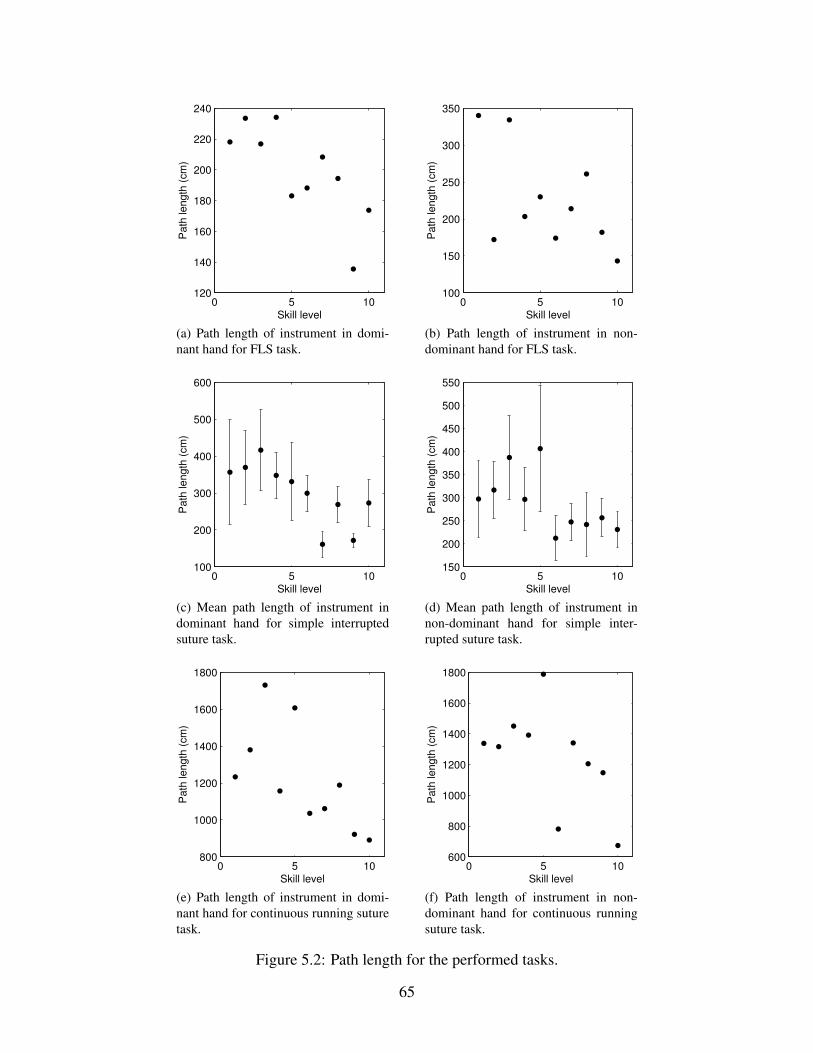
0 5 10120
140
160
180
200
220
240
Skill level
Path
length
(cm
)
(a) Path length of instrument in domi-nant hand for FLS task.
0 5 10100
150
200
250
300
350
Skill level
Path
length
(cm
)
(b) Path length of instrument in non-dominant hand for FLS task.
0 5 10100
200
300
400
500
600
Skill level
Path
length
(cm
)
(c) Mean path length of instrument indominant hand for simple interruptedsuture task.
0 5 10150
200
250
300
350
400
450
500
550
Skill level
Path
length
(cm
)
(d) Mean path length of instrument innon-dominant hand for simple inter-rupted suture task.
0 5 10800
1000
1200
1400
1600
1800
Skill level
Path
length
(cm
)
(e) Path length of instrument in domi-nant hand for continuous running suturetask.
0 5 10600
800
1000
1200
1400
1600
1800
Skill level
Path
length
(cm
)
(f) Path length of instrument in non-dominant hand for continuous runningsuture task.
Figure 5.2: Path length for the performed tasks.
65

0 5 10100
150
200
250
300
Skill level
Tota
l E
nerg
y (
J)
(a) Total energy from the dominant handfor FLS task.
0 5 10100
200
300
400
500
600
700
800
Skill level
Tota
l E
nerg
y (
J)
(b) Total energy from the non-dominanthand for FLS task.
0 5 100
200
400
600
800
1000
Skill level
Tota
l E
nerg
y (
j)
(c) Mean total energy from the dominanthand for simple interrupted suturing.
0 5 100
500
1000
1500
2000
Skill level
Tota
l E
nerg
y (
J)
(d) Mean total energy from the non-dominant hand for simple interruptedsuture.
0 5 10800
1000
1200
1400
1600
1800
Skill level
Tota
l E
nerg
y (
J)
(e) Total energy from the dominant handfor continuous running suture task.
0 5 101000
2000
3000
4000
5000
6000
7000
Skill level
Tota
l E
nerg
y (
J)
(f) Total energy from the non-dominanthand for continuous running suture task.
Figure 5.3: Total energy for the performed tasks.
66

5.2.2 Movement QualityMotion Smoothness
Motion smoothness should reflect tremors in the hand and abrupt changes in the
instrument’s trajectory. It has been shown in prior studies that expert surgeons tend
to have smoother motion paths. The motion smoothness was computed from the
curvature signatures described in Section 3.6.1. From each curvature signature, the
mean and median values are computed for each task.
No correlation was found between expert-assessed skill and the calculated mo-
tion smoothness for either hand. Both the mean and median and values were ana-
lyzed (Figures 5.4a-f and 5.5a-f), at all four scales of curvature. These findings are
contrary to prior studies that did find a relation between motion smoothness from
curvature in the dominant hand of some tasks [32].
Force and Torque
The forces applied by the participant can vary widely depending on the particular
movements being executed. Low forces may be applied when manipulating tissue
and high forces when tightening a suture. The variation makes it difficult to extract
a reliable global measure that accurately reflects surgical skill. Both the mean and
maximum of the magnitude of the force and torque values were computed.
No correlation was found between expert-assessed skill and the mean and peak
force for each hand (Figure 5.6a-f and 5.7a-f). Similar results were found in the
torque values. The results demonstrate the difficulty in extracting global measures
from the complex force data.
Energy
To analyze the applied energy as a global measure of skill quality, the mean and
peak of the energy signal were computed. Similar to the force measurement, no
correlation was found between expert-assessed skill and the mean (Figures 5.8a-f)
and peak of the energy signals. Given that the force and energy measures are quite
similar, this is not surprising.
67

0 5 102
2.5
3
3.5
Skill level
Mean C
urv
atu
re (
1/c
m)
(a) Mean curvature of dominant handfor FLS task.
0 5 101.8
2
2.2
2.4
2.6
2.8
3
3.2
Skill level
Mean C
urv
atu
re (
1/c
m)
(b) Mean curvature of non-dominanthand for FLS task.
0 5 102
2.5
3
3.5
Skill level
Mean C
urv
atu
re (
1/c
m)
(c) Mean curvature of dominant handfor simple interrupted suturing.
0 5 101.5
2
2.5
3
3.5
Skill level
Mean C
urv
atu
re (
1/c
m)
(d) Mean curvature of non-dominanthand for simple interrupted suture.
0 5 102
2.5
3
3.5
Skill level
Mean C
urv
atu
re (
1/c
m)
(e) Mean curvature of dominant handfor continuous running suture task.
0 5 101.5
2
2.5
3
3.5
Skill level
Mean C
urv
atu
re (
1/c
m)
(f) Mean curvature of non-dominanthand for continuous running suture task.
Figure 5.4: Mean curvature for the performed tasks.
68

0 5 101.8
2
2.2
2.4
2.6
2.8
3
3.2
Skill level
Media
n C
urv
atu
re (
1/c
m)
(a) Median curvature of dominant handfor FLS task.
0 5 101.6
1.8
2
2.2
2.4
2.6
2.8
3
Skill level
Media
n C
urv
atu
re (
1/c
m)
(b) Median curvature of non-dominanthand for FLS task.
0 5 101.8
2
2.2
2.4
2.6
2.8
3
3.2
Skill level
Media
n C
urv
atu
re (
1/c
m)
(c) Median curvature of dominant handfor simple interrupted suturing.
0 5 101
1.5
2
2.5
3
3.5
Skill level
Media
n C
urv
atu
re (
1/c
m)
(d) Median curvature of non-dominanthand for simple interrupted suture.
0 5 101.8
2
2.2
2.4
2.6
2.8
3
Skill level
Media
n C
urv
atu
re (
1/c
m)
(e) Median curvature of dominant handfor continuous running suture task.
0 5 101.5
2
2.5
3
Skill level
Media
n C
urv
atu
re (
1/c
m)
(f) Median curvature of non-dominanthand for continuous running suture task.
Figure 5.5: Median curvature for the performed tasks.
69

0 5 100.4
0.6
0.8
1
1.2
1.4
Skill level
Mean F
orc
e (
N)
(a) Mean absolute force of dominanthand for FLS task.
0 5 100.8
1
1.2
1.4
1.6
1.8
2
2.2
Skill level
Mean F
orc
e (
N)
(b) Mean absolute force of non-dominanthand for FLS task.
0 5 100.5
1
1.5
2
2.5
3
Skill level
Mean F
orc
e (
N)
(c) Mean absolute force of dominanthand for simple interrupted suturing.
0 5 10
0.8
1
1.2
1.4
1.6
1.8
2
2.2
Skill level
Mean F
orc
e (
N)
(d) Mean absolute force of non-dominant hand for simple interruptedsuture.
0 5 100.5
1
1.5
2
2.5
3
Skill level
Mean F
orc
e (
N)
(e) Mean absolute force of dominanthand for continuous running suture task.
0 5 101
1.5
2
2.5
3
3.5
4
Skill level
Mean F
orc
e (
N)
(f) Mean absolute force of non-dominant hand for continuous runningsuture task.
Figure 5.6: Mean absolute force for the performed tasks.
70

0 2 4 6 8 100
5
10
15
20
Skill level
Peak F
orc
e (
N)
(a) Peak absolute force of dominanthand for FLS task.
0 2 4 6 8 103
4
5
6
7
8
9
10
11
Skill level
Peak F
orc
e (
N)
(b) Peak absolute force of non-dominanthand for FLS task.
0 5 10−5
0
5
10
15
20
25
Skill level
Peak F
orc
e (
N)
(c) Peak absolute force of dominanthand for simple interrupted suturing.
0 2 4 6 8 100
5
10
15
20
Skill level
Peak F
orc
e (
N)
(d) Peak absolute force of non-dominanthand for simple interrupted suture.
0 2 4 6 8 105
10
15
20
Skill level
Peak F
orc
e (
N)
(e) Peak absolute force of dominanthand for continuous running suture task.
0 2 4 6 8 106
8
10
12
14
16
18
20
22
Skill level
Peak F
orc
e (
N)
(f) Peak absolute force of non-dominanthand for continuous running suture task.
Figure 5.7: Peak absolute force for the performed tasks.
71

0 5 100.04
0.05
0.06
0.07
0.08
0.09
0.1
Skill level
Mean E
nerg
y (
J)
(a) Mean energy of dominant hand forFLS task.
0 5 100.08
0.1
0.12
0.14
0.16
0.18
0.2
0.22
0.24
Skill level
Mean E
nerg
y (
J)
(b) Mean energy of non-dominant handfor FLS task.
0 5 100.06
0.08
0.1
0.12
0.14
0.16
0.18
0.2
Skill level
Mean E
nerg
y (
j)
(c) Mean energy of dominant hand forsimple interrupted suturing.
0 5 100
0.1
0.2
0.3
0.4
0.5
Skill level
Mean E
nerg
y (
J)
(d) Mean energy of non-dominant handfor simple interrupted suture.
0 5 100.05
0.06
0.07
0.08
0.09
0.1
Skill level
Mean E
nerg
y (
J)
(e) Mean energy of dominant hand forcontinuous running suture task.
0 5 100
0.1
0.2
0.3
0.4
0.5
0.6
0.7
Skill level
Mean E
nerg
y (
J)
(f) Mean energy of non-dominant handfor continuous running suture task.
Figure 5.8: Mean energy for the performed tasks.
72

5.3 Local Analysis
Local analysis was performed on the simple interrupted sutures using both curva-
ture and energy signals. The analysis measured how each surgeme was executed
by the participant. This method took advantage of the fact that experts are more
consistent and perform their movements more reliably. Currently, the surgemes are
isolated using a manual segmentation process, which does remove some objectiv-
ity. However, other researchers are tackling the problem of automatic segmentation
which will eliminate all subjective input.
5.3.1 Local Curvature
The curvature of the trajectories contains information that can be used to measure
the similarity between two gestures. The similarity between trajectories was mea-
sured using a cross correlation operation on the curvature signals of those trajec-
tories. The peak of the cross correlation was compared to a noise model which is
described below to determine its significance. All four scales, described in Section
3.6.1 were analyzed empirically, and Scale 3 provided the most consistent results.
Scales 1 and 2 typically contained many small spikes that did not represent the true
movements of the surgeon. Scale 4 oversimplified the data and removed some of
the useful signal. Only the results from Scale 3 are presented here.
Noise Model
Significance of the cross correlation operation was determined by comparing the
cross correlation to a noise model. The noise model represents the cross correlation
value that one might get when correlating two gestures that are unrelated. This
model provides a baseline to compare other correlation values and test for their
significance. If the cross correlation values for two gestures is higher than most that
are generated by random correlations, then they can be said to be similar.
The noise model is a set of cross-correlation values of random segments gen-
erated using a bootstrapping technique. Ten thousand cross correlation operations
were performed on pairs of random segments. Each segment of the pair could be
73

from a different participant, or the same participant, and the only restriction on the
pairs of segments was that they be from different surgemes. This ensured that the
noise model represented the cross correlation of unrelated motions.
The set of cross correlation peaks is plotted in a histogram (Figure 5.9) that
shows an approximate Gaussian distribution centered around 0. The standard de-
viation of the model is 0.29, and 95% of the values fall within -0.58 to 0.58. Any
cross correlations larger than 0.58 were considered to be significant.
−1 −0.5 0 0.5 10
100
200
300
400
500
600
700
800
Cross correlation peak
Num
ber
of cro
ss c
orr
ela
tions
Figure 5.9: Histogram of curvature noise model calculated from Scale 3.
Curvature Correlation
Similarity between two segments is computed by calculating the peak of the nor-
malized cross correlation between the curvature signals (κa, κb) of the gestures. The
shorter of the two signals is padded with zeros so that both signals have the same
length N. The curvature correlation value is calculated as
ρκ =0.9·Nmax
s=−0.9·N
(1
N − 1·N∑i=1
(κa(i)− κa) · (κb(i+ s)− κb)σκa · σκb
). (5.2)
Outliers in the resulting noise model were generated when very small portions of the
two signals were used (e.g, less than ten samples). A Winsorizing technique elim-
inated these outliers by ignoring any cross correlation peaks that occurred within
74

10% of either end of the signal. If the Winsorizing technique is not used, small seg-
ments of the signal (two samples, for instance) could correlate highly even when
the gestures are very dissimilar. This outlier elimination does not reduce the cor-
relations of gestures that are truly similar, as the peaks are near the center of the
cross-correlation signal. This is because the center of the cross correlation signal
is the value that results when the two gestures are correlated without any offset.
The threshold of 10% was chosen empirically after constructing a noise model with
increasing thresholds until the noise model was centered around 0. The value of
0.9 in the calculation represents the 90% of the signal that is considered after the
Winsorizing process. For all indices outside the range of [0, N], the curvature value
is considered to be 0. That is, for i < 0 or i > N , κa(i) = 0, and κb(i) = 0.
The cross correlation process for computing gesture similarity is illustrated in
Figure 5.10. The two signals to be correlated are shown in Figure 5.10a and Fig-
ure 5.10d. The un-normalized cross correlation is shown in Figure 5.10b. After
discarding the first 10% and the last 10% of this cross correlation signal, the index
with the peak value is found, in this case it is around sample index 175. This index
gives the optimal alignment of the two signals, shown in Figures 5.10c and 5.10e.
Segments that are simple and performed quite similarly have highly correlated
curvature signals such as the left instrument of the ‘pull-through’ segment per-
formed by the top-ranked participant, shown in Figure 5.11a-e. As can be seen from
the 3D plots (Figure 5.12a-e), the segment is very similar in the first four stitches,
but the fifth stitch contains extra movements due to an error. This similarity and
dissimilarity is reflected in the correlation values, with the correlation between all
pairs of the first four stitches being significant (ρκ > 0.58), and all similarities
between the first four stitches and the last stitch being insignificant (ρκ < 0.58).
The curvature correlation is also relatively low with novices whose movements
are highly varied. The instrument in the left hand of the ‘pull-through’ segment is
moved very differently by the participant ranked lowest (see Section 4.2.2 and Fig-
ure 5.13a-e). The length of these movements and the trajectories are quite different.
These movements are of highly varying lengths, and the trajectories are quite dif-
ferent. Only two of the ten pairs of stitches have significant correlation, the rest are
75

50 100 150 200 250−2
0
2
4
Sample Index
Curv
atu
re (
1/c
m)
(a) Signal A
200 400−200
−100
0
100
200
Sample Index
Raw
Corr
ela
tion
(b) Un-normalized crosscorrelation of signal A andsignal B
50 100 150−2
0
2
4
Sample Index
Curv
atu
re (
1/c
m)
(c) Portion of signal A usedin normalized correlation
50 100 150 200 250−2
−1
0
1
2
3
Sample Index
Cu
rvatu
re (
1/c
m)
(d) Signal B
50 100 150−2
−1
0
1
2
3
Sample Index
Cu
rvatu
re (
1/c
m)
(e) Portion of signal B usedin normalized correlation
Figure 5.10: Example curvature signals and the resulting cross correlation.
insignificant.
The use of curvature correlation as an indicator of skill is limited, however.
There are several examples of novices performing movements that have high mea-
sures of similarity, such as the left hand of the insertion segment for the third lowest
ranked participant. These trajectories are quite different but the resulting correla-
tions are high, with eight of the ten pairs of stitches having significant correlations
(ρκ > 0.6). A similar problem occurs with some expert movements, as in the left
hand of the insertion segment of the top-ranked participant, shown in Figure 5.14a-
e. Though these movements are very similar, the correlation values are low, with
only one of the ten pairs of stitches having a significant correlation. These difficul-
ties prevent a meaningful aggregation of data to use as a metric for surgical skill.
No clear relationship is found between the mean of all of the self correlation values
and the skill level, shown in Figure 5.15a-b.
76

0 10 200
5
10
Arc−length (cm)C
urv
atu
re (
1/c
m)
(a) Stitch 1.
0 10 200
2
4
6
Arc−length (cm)
Curv
atu
re (
1/c
m)
(b) Stitch 2.
0 10 200
2
4
6
Arc−length (cm)
Curv
atu
re (
1/c
m)
(c) Stitch 3.
0 10 202
4
6
Arc−length (cm)
Curv
atu
re (
1/c
m)
(d) Stitch 4.
0 20 400
5
10
Arc−length (cm)
Curv
atu
re (
1/c
m)
(e) Stitch 5.
Figure 5.11: Curvature signal of the trajectory of the left instrument for the pull-through segment of the top-ranked participant.
Curvature Discussion
When analyzing simple gestures, curvature correlation is useful. Though neither
is high after aggregation, the curvature correlations of the simpler movements of
the left hand seemed to have a higher relationship to skill than the more complex
movements of the right hand. This curvature-based approach seems more suited to
dexemes rather than surgemes, but dexemes are not currently clearly defined mak-
ing analysis difficult at this level. If a reliable segmentation process and suitable
dexeme vocabulary is developed, curvature correlation could likely be used to con-
struct a useful measure of similarity.
Curvature correlation is not effective for the longer motions characteristic of
typical surgemes. The computation of the curvature is sensitive to noise, and un-
bounded. Complex gestures have increasingly complex curvature signatures that
become more difficult to analyze and compare. Differences in signal length are
largely unaccounted for, resulting in shorter signals that match well with a small
window within a larger gesture.
The cross-correlation operation used to compute similarity between signals is
likely too simple to provide a robust measure of skill. This comparison method is
77

not robust to variations in the length of gesture. If a surgeon performs a gesture
that is slightly longer or includes some idle movement, but is otherwise the same, it
can severely reduce the correlation measure. Idle movement of the instrument can
also produce delays in the signal which prevent useful correlation. More complex
approaches, such as dynamic time warping, or comparing hidden Markov models
generated from the curvature signals may provide a more robust estimator of skill
from curvature.
Though the curvature correlation is not effective, the use of self-repetition seems
to be a robust method of evaluating skill. By visual inspection, the trajectories
of experts appear quite consistent. This visual inspection focussed mainly on the
overall shape of the trajectories. Trajectories with clear changes in directions in the
roughly same location were considered to be similar. Small deviations in the path
were not considered to be significant. With more effective modelling techniques,
this similarity could be quantified and more thoroughly analyzed. One benefit of
using self-repetition is that the gestures need not be pre-defined, and no expert
template is needed. This method would likely be limited to laboratory conditions,
as there is too much natural variance in operating room conditions to allow for the
same gestures to be performed consistently.
78

−25
−20
−15 118
120
122−18
−16
−14
−12
y (cm)x (cm)
z (
cm
)
2
3
4
5
6
7
(a) Stitch 1.
−25
−20
−15
−10 115
120
125−18
−16
−14
−12
y (cm)x (cm)
z (
cm
)
2
2.5
3
3.5
4
4.5
5
(b) Stitch 2.
−22
−20
−18
−16 115
120
125−17
−16
−15
−14
y (cm)x (cm)
z (
cm
)
2
2.5
3
3.5
4
(c) Stitch 3.
−25
−20
−15 120
122
124−18
−16
−14
−12
y (cm)x (cm)
z (
cm
)
2.5
3
3.5
4
4.5
5
(d) Stitch 4.
−25
−20
−15
−10 115
120
125−16
−14
−12
y (cm)x (cm)
z (
cm
)
1
2
3
4
5
6
7
8
(e) Stitch 5.
Figure 5.12: Plots of the trajectory of the left instrument for the pull-through seg-ment of the top-ranked participant with colour indicating curvature.
79

0 20 400
5
10
Arc−length (cm)
Curv
atu
re (
1/c
m)
(a) Stitch 1.
0 10 200
5
10
Arc−length (cm)
Curv
atu
re (
1/c
m)
(b) Stitch 2.
0 20 400
5
10
Arc−length (cm)
Curv
atu
re (
1/c
m)
(c) Stitch 3.
0 10 200
5
10
Arc−length (cm)
Curv
atu
re (
1/c
m)
(d) Stitch 4.
0 500
2
4
6
Arc−length (cm)
Curv
atu
re (
1/c
m)
(e) Stitch 5.
Figure 5.13: Curvature signal of the trajectory of the left instrument for the pull-through segment of the lowest ranked participant.
0 500
5
10
Arc−length (cm)
Curv
atu
re (
1/c
m)
(a) Stitch 1.
0 20 40−5
0
5
10
Arc−length (cm)
Curv
atu
re (
1/c
m)
(b) Stitch 2.
0 50−5
0
5
10
Arc−length (cm)
Curv
atu
re (
1/c
m)
(c) Stitch 3.
0 20 40−5
0
5
10
Arc−length (cm)
Cu
rva
ture
(1/c
m)
(d) Stitch 4.
0 500
5
10
Arc−length (cm)
Cu
rva
ture
(1/c
m)
(e) Stitch 5.
Figure 5.14: Curvature signal of the trajectory of the left instrument for the insertionsegment of the highest ranked participant.
80

0 5 100.4
0.45
0.5
0.55
0.6
0.65
Skill level
Mean c
orr
ela
tion
(a) Left hand
0 5 100.35
0.4
0.45
0.5
Skill level
Mean c
orr
ela
tion
(b) Right hand
Figure 5.15: Mean curvature correlation for each participant.
81

5.3.2 Local Energy
Gesture similarity based on energy is computed in a similar way as the curvature
signals. The energy signals are first resampled and mapped to the arc-length do-
main. Energy signals representing the same segment are then cross-correlated us-
ing the same Windsorised process as with the curvature signals. The peak of the
resulting cross correlation of the energy is compared to the energy noise model to
determine significance.
The noise model for energy was computed in much the same way as the noise
model for curvature described in Section 5.3.1. Ten thousand randomly selected
pairs were cross-correlated, and the same Winsorizing process was applied. The
resulting model (Figure 5.16) has an approximate Gaussian distribution centered
around 0, with a standard deviation of σ = 0.27. Cross correlation peaks above
0.54 are considered significant.
−1 −0.5 0 0.5 10
100
200
300
400
500
600
Cross correlation peak
Num
ber
of cro
ss c
orr
ela
tions
Figure 5.16: Histogram of energy noise model.
Energy Correlation
The energy signals were mapped into the arc-length domain to eliminate the time-
dependence of the signal. The mapping was performed by assigning each arc-length
index the energy value computed from the corresponding time frame using equation
3.1. No interpolation was used in this process.
82

The correlation value was computed as the peak of the normalized cross corre-
lation between two energy signals, Ea and Eb.
ρE =0.9·Nmax
s=−0.9·N
(1
N − 1·N∑i=1
(Ea(i)− Ea) · (Eb(i+ s)− Eb)σEa · σEb
). (5.3)
Simple, similar gestures tend to correlate highly with this method, as was the case
with curvature. This can be seen in the energy signal from the left hand of the
‘double-loop’ segment performed by the second-rank participant. As shown in Fig-
ure 5.17a-e, the trajectory and energy signal appear quite similar, and of the ten pairs
of segments, eight correlate significantly (ρE > 0.54). The energy correlations also
reflect dissimilarities in gestures (Figure 5.18). These trajectories and energy pat-
terns are quite different and indicative of a novice. The energy correlation reflects
this, with only two of the ten correlations being significant (ρE > 0.54).
0 20 400
1
2
Arc−length (cm)
Energ
y (
J)
(a) Stitch 1.
0 20 400
0.5
1
1.5
Arc−length (cm)
Energ
y (
J)
(b) Stitch 2.
0 20 400
0.5
1
Arc−length (cm)
Energ
y (
J)
(c) Stitch 3.
0 20 400
0.5
1
1.5
Arc−length (cm)
Energ
y (
J)
(d) Stitch 4.
0 20 400
0.5
1
1.5
Arc−length (cm)
Energ
y (
J)
(e) Stitch 5.
Figure 5.17: Energy signal of the trajectory of the left instrument for the ‘double-loop’ segment of the second-highest ranked participant.
Energy correlation seems more robust than curvature correlation when aggregat-
ing scores. While the mean ρE values of neither the left nor the right hand display
a significant correlation with expert-assessed skill, there appears to be a trend with
the left hand. As shown in Figure 5.19a, there is a strong positive correlation present
if the outliers at rank 1 and 8 are ignored (p < 0.01). The equivalent correlation
83

0 50 1000
0.5
1
Arc−length (cm)E
nerg
y (
J)
(a) Stitch 1.
0 50 1000
0.5
1
Arc−length (cm)
Energ
y (
J)
(b) Stitch 2.
0 50 1000
0.5
1
Arc−length (cm)
Energ
y (
J)
(c) Stitch 3.
0 20 400
0.5
1
Arc−length (cm)
Energ
y (
J)
(d) Stitch 4.
0 50 1000
0.5
1
Arc−length (cm)
Energ
y (
J)
(e) Stitch 5.
Figure 5.18: Energy signal of the trajectory of the left instrument for the ‘insertion’segment of the third-worst ranked participant.
for the right hand does not show such a correlation (Figure 5.19b), likely due to the
increased complexity of the movements of the right hand.
0 5 100.4
0.5
0.6
0.7
0.8
Skill level
Mean c
orr
ela
tion
(a) Left hand
0 5 100.45
0.5
0.55
0.6
0.65
Skill level
Mean c
orr
ela
tion
(b) Right hand
Figure 5.19: Mean energy correlation for each participant.
Energy Discussion
Energy accounts for the forces that are applied, as well as the velocity of the in-
strument, which may result in the energy signal containing more useful information
than the curvature signal. As with the curvature signals, the movements of the right
hand are too complex to provide a meaningful measure. Again, the use of similar-
ity measures that are more sophisticated than cross correlation will likely produce
84

a stronger relationship between skill and energy signatures. By visual inspection,
the energy correlation seems to support the use of self-repetition as an indicator of
skill. The patterns of energy that are applied appear very similar, and more sophis-
ticated techniques will likely produce a clear differentiation between the signals of
an expert and those of a novice.
85

Chapter 6
Conclusions and Future Work
6.1 Conclusions
Automated evaluation of surgical skill removes the subjectivity and variability from
current expert-based evaluation methods. Current methods of automated evaluation
are not yet able to replace the expert evaluator due to the equipment needed and a
lack of adequate skill metrics. Once refined, these methods will be able to provide
feedback to trainees throughout their training program and evaluate the capabilities
of trainees before they enter the operating room.
A system was designed that is capable of recording a wide range of data from
participants performing laparoscopic tasks on a training box. The position and ori-
entation of the instrument, and the kinematic structure of the participant’s upper
body were recorded using an optical motion captured device. Force and torque
sensors placed on a pair of laparoscopic needle drivers record the dynamics of the
participant’s movements. Two video streams capture the view from the laparoscopic
camera, as well as a birds-eye view of the participant performing the tasks. All data
was synchronized and digitally stored for offline processing.
Empirical studies were conducted using the developed system. Participants per-
formed a number of laparoscopic tasks while their movements were recorded. The
study included a number of tasks that require different skill levels to be completed.
The participants represented a broad range of skill, from first year residents to ex-
pert surgeons. This study provided a basis to study how the movements of surgeons
differ with expertise.
86

Two global measures were developed. The global measure of total energy was
found to be a useful indicator of skill, and appears to be complimentary to other
measures of motion quantity. The mean and peak applied energy was not found
to be significantly related to surgical, and illustrated the difficulty in using global
measures to assess quality of movements.
The local analyses were performed using the curvature of the signal and the
energy signature. While neither of these methods were able to clearly distinguish
between novice and expert, they do show promise. Both methods showed a high
correlation with surgical skill with simple gestures. By segmenting the gestures at
the dexeme level, rather than the surgeme level it is likely that these methods will
prove very effective.
6.2 Future Work
Developing a segmentation process that operates at the dexeme level would be very
beneficial to surgical skill analysis. This would involve analyzing the various move-
ments that surgeons use across different tasks and with different tools. From this, a
complete vocabulary of dexemes could be developed. Once this vocabulary was in
place, an automated segmentation process could be developed that would remove
all subjective input to surgical skill evaluation.
More work can be done analyzing the orientation of the instrument as well.
Global measures, such as total angular rotation, and average rotational velocity can
be computed and analyzed for a relationship to surgical skill. A local analysis on the
orientation can be performed as well in a similar manner to the curvature analysis.
87

Bibliography
[1] 3D-Med. TRLCD07 3-Dmed standard MITS with joystickSimScope description. http://www.3-dmed.com/TRLCD07 3-Dmed Standard MITS with Joystick SimScope Description.html, 2010.
[2] Motion Analysis. Motion analysis corporation, the motion capture leader.http://www.motionanalysis.com/, 2010.
[3] ATI. ATI industrial automation: Robotic end effectors and automation tooling.http://www.ati-ia.com/, 2010.
[4] S. D. Bann, M. S. Khan, and A. W. Darzi. Measurement of surgical dexter-ity using motion analysis of simple bench tasks. World Journal of Surgery,27(4):390–394, 2003.
[5] T. Blum, N. Padoy, H. Feuner, and N. Navab. Modeling and online recognitionof surgical phases using hidden markov models. Medical Image Computingand Computer-Assisted Intervention, pages 627–635, 2008.
[6] Z. Boom-Saad, S. A. Langenecker, L. A. Bieliauskas, C. J. Graver, J. R.O’Neill, A. F. Caveney, L. J. Greenfield, and R. M. Minter. Surgeons out-perform normative controls on neuropsychologic tests, but age-related decayof skills persists. The American Journal of Surgery, 195(2):205–209, 2008.
[7] L. Bouarfa, P. P. Jonker, and J. Dankelman. Surgical context discovery bymonitoring low-level activities in the OR. In MICCAI Workshop on Modelingand Monitoring of Computer Assisted Interventions, 2009.
[8] L. Bouarfa, P.P. Jonker, and J. Dankelman. Discovery of high-level tasks inthe operating room. Journal of Biomedical Informatics, In Press, CorrectedProof:–, 2010.
[9] J. D. Brown, J. Rosen, L. Chang, M. N. Sinanan, and B. Hannaford. Quan-tifying surgeon grasping mechanics in laparoscopy using the blue DRAGONsystem. Studies in Health Technology and Informatics, pages 34–36, 2004.
[10] S. N. Buzink, A. D. Koch, J. Heemskerk, S. M. B. I. Botden, R. H. M.Goossens, H. de Ridder, E. J. Schoon, and J. J. Jakimowicz. Acquiring ba-sic endoscopy skills by training on the GI mentor II. Surgical Endoscopy,21(11):1996–2003, 2007.
[11] C. Cao, C. MacKenzie, and S. Payandeh. Task and motion analyses in endo-scopic surgery. In Proceedings ASME Dynamic Systems and Control Division,pages 583–590, 1996.
88

[12] M. K. Chmarra. How to objectively classify residents based on their psy-chomotor laparoscopic skills? Minimally Invasive Therapy & Allied Tech-nologies, 19(2), 2010.
[13] M. K. Chmarra, N. H. Bakker, C. A. Grimbergen, and J. Dankelman. TrEndo,a device for tracking minimally invasive surgical instruments in training se-tups. Sensors & Actuators: A. Physical, 126(2):328–334, 2006.
[14] M. K. Chmarra, C. A. Grimbergen, and J. Dankelman. Systems for trackingminimally invasive surgical instruments. Minimally Invasive Therapy & AlliedTechnologies, 16(6):328–340, 2007.
[15] M. K. Chmarra, S. Klein, J. C. F. de Winter, F. W. Jansen, and J. Dankelman.Objective classification of residents based on their psychomotor laparoscopicskills. Surgical Endoscopy, 24(5):1031–1039, 2010.
[16] M. K. Chmarra, W. Kolkman, F. W. Jansen, C. A. Grimbergen, and J. Dankel-man. The influence of experience and camera holding on laparoscopic in-strument movements measured with the TrEndo tracking system. SurgicalEndoscopy, 21(11):2069–2075, 2007.
[17] S. Cotin, N. Stylopoulos, M. Ottensmeyer, P. Neumann, D. Rattner, andS. Dawson. Metrics for laparoscopic skills trainers: the weakest link! MedicalImage Computing and Computer-Assisted Intervention, pages 35–43, 2002.
[18] S. M. Cristancho, A. J. Hodgson, O. N. M. Panton, A. Meneghetti,G. Warnock, and K. Qayumi. Intraoperative monitoring of laparoscopicskill development based on quantitative measures. Surgical endoscopy,23(10):2181–2190, 2009.
[19] V. Datta, A. Chang, S. Mackay, and A. Darzi. The relationship between mo-tion analysis and surgical technical assessments. American Journal of Surgery,184(1):70, 2002.
[20] V. Datta, S. Mackay, M. Mandalia, and A. Darzi. The use of electromag-netic motion tracking analysis to objectively measure open surgical skill inthe laboratory-based model. Journal of the American College of Surgeons,193(5):479, 2001.
[21] M. D. Derossis, M. Anna, M. D. Fried, M. Gerald, M. Abrahamowicz PhD,M. D. Sigman, H. Harvey, M. D. Barkun, S. Jeffrey, and M. D. Meakins.Development of a model for training and evaluation of laparoscopic skills.The American Journal of Surgery, 175(6):482–487, 1998.
[22] DivX. DivX - download DivX software & find devices that play DivX video |DivX.com. http://www.divx.com/en/mac, 2010.
[23] A. Dosis, R. Aggarwal, F. Bello, K. Moorthy, Y. Munz, D. Gillies, andA. Darzi. Synchronized video and motion analysis for the assessment of pro-cedures in the operating theater. Archives of Surgery, 140(3):293, 2005.
[24] P. Dubois, Q. Thommen, and A. C. Jambon. In vivo measurement of surgicalgestures. IEEE Transactions on Biomedical Engineering, 49(1):49–54, 2002.
[25] A. Dubrowski, R. Sidhu, J. Park, and H. Carnahan. Quantification of motioncharacteristics and forces applied to tissues during suturing. The AmericanJournal of Surgery, 190(1):131–136, 2005.
89

[26] T. A. Emam, G. B. Hanna, C. Kimber, and A. Cuschieri. Differences betweenexperts and trainees in the motion pattern of the dominant upper limb duringintracorporeal endoscopic knotting. Digestive surgery, 17(2):120, 2000.
[27] T. A. Emam, G. B. Hanna, C. Kimber, P. Dunkley, and A. Cuschieri. Effectof intracorporeal-extracorporeal instrument length ratio on endoscopic taskperformance and surgeon movements. Archives of Surgery, 135(1):62, 2000.
[28] C. Feng, H. Haniffa, J. Rozenblit, J. Peng, A. Hamilton, and M. Salkini. Sur-gical training and performance assessment using a motion tracking system.In 2nd European Modeling and Simulation Symposium. EMSS 2006, pages647–652, 2006.
[29] E. D. Grober, M. Roberts, E. J. Shin, M. Mahdi, and V. Bacal. Intraoperativeassessment of technical skills on live patients using economy of hand motion:establishing learning curves of surgical competence. The American Journalof Surgery, 199(1):81–85, 2010.
[30] S. Gunther, J. Rosen, B. Hannaford, and M. Sinanan. The red DRAGON:a multi-modality system for simulation and training in minimally invasivesurgery. Studies in health technology and informatics, 125:149, 2007.
[31] H. Hwang, J. Lim, C. Kinnaird, A. G. Nagy, O. N. M. Panton, A. J. Hodg-son, and K. A. Qayumi. Correlating motor performance with surgical error inlaparoscopic cholecystectomy. Surgical Endoscopy, 20(4):651–655, 2006.
[32] T. N. Judkins, D. Oleynikov, and N. Stergiou. Objective evaluation of ex-pert and novice performance during robotic surgical training tasks. SurgicalEndoscopy, 23(3):590–597, 2009.
[33] P. S. Kundhal and T. P. Grantcharov. Psychomotor performance measured ina virtual environment correlates with technical skills in the operating room.Surgical Endoscopy, 23(3):645–649, 2009.
[34] P. Lamata, E. J. Gomez, F. L. Hernandez, A. O. Pastor, F. M. Sanchez-Margallo, and F. del Pozo Guerrero. Understanding perceptual boundariesin laparoscopic surgery. IEEE Transactions on Biomedical Engineering,55(3):866–873, 2008.
[35] LapSim. PRODUCTS - surgical science. http://www.surgical-science.com/productsmain/, 2010.
[36] J. J. H. Leong, M. Nicolaou, L. Atallah, G. P. Mylonas, A. W. Darzi, and G. Z.Yang. HMM assessment of quality of movement trajectory in laparoscopicsurgery. Computer Aided Surgery, 12(6):335–346, 2007.
[37] H. C. Lin, I. Shafran, T. E. Murphy, A. M. Okamura, D. D. Yuh, and G. D.Hager. Automatic detection and segmentation of robot-assisted surgical mo-tions. Lecture Notes in Computer Science, 3749:802, 2005.
[38] LiveInCode. LiveInCode. http://liveincode.rm.pp.ru/, 2010.
[39] Logitech. QuickCam orbit MP. http://www.logitech.com/en-us/435/245,2010.
90

[40] J. A. Martin, G. Regehr, R. Reznick, H. MacRae, J. Murnaghan, C. Hutchison,and M. Brown. Objective structured assessment of technical skill (OSATS) forsurgical residents. British Journal of Surgery, 84(2), 1997.
[41] MATLAB. The MathWorks - MATLAB and simulink for technical comput-ing. http://www.mathworks.com/, 2010.
[42] R. Moreau, V. Ochoa, M. T. Pham, P. Boulanger, T. Redarce, and O. Dupuis.Evaluation of obstetric gestures: An approach based on the curvature of 3-Dpositions. In 29th Annual International Conference of the IEEE Engineeringin Medicine and Biology Society, 2007. EMBS 2007, pages 3634–3637, 2007.
[43] NationalInstruments. National instruments - test and measurement.http://www.ni.com/, 2010.
[44] J. A. Oostema, M. P. Abdel, and J. C. Gould. Time-efficient laparoscopicskills assessment using an augmented-reality simulator. Surgical Endoscopy,22(12):2621–2624, 2008.
[45] OpenCV. Welcome - OpenCV wiki. http://opencv.willowgarage.com/wiki/,2010.
[46] OptoTrak. Optotrak certus motion capture system - Research-Grade motion capture system for life sciences applications | NDI.http://www.ndigital.com/lifesciences/certus-motioncapturesystem.php,2010.
[47] N. Padoy, T. Blum, I. Essa, H. Feussner, M. O. Berger, and N. Navab.A boosted segmentation method for surgical workflow analysis. In Medi-cal Image Computing and Computer-Assisted Intervention, pages 102–109.Springer-Verlag, 2007.
[48] N. Padoy, T. Blum, H. Feussner, M. O. Berger, and N. Navab. On-line recogni-tion of surgical activity for monitoring in the operating room. In Procs of the20th Conference on Innovative Applications of Artificial Intelligence (IAAI-08), 2008.
[49] Purdue Pegboard. Purdue pegboard test | hu-man evaluation from lafayette instrument company.http://www.lafayetteevaluation.com/product detail.asp?ItemID=159, 2010.
[50] M. G. C. Pellen, L. F. Horgan, J. R. Barton, and S. E. Attwood. Construct va-lidity of the ProMIS laparoscopic simulator. Surgical Endoscopy, 23(1):130–139, 2009.
[51] PTIPhoenix. PTI high performance Real-Time 3D motion capture for profes-sionals. http://www.ptiphoenix.com/, 2010.
[52] RanDOT. Stereo fly and other StereoTests stereopsis, strabismus, and ambly-opia testing. http://www.stereooptical.com/html/stereo-test.html, 2010.
[53] C. Reiley and G. Hager. Task versus subtask surgical skill evaluation ofrobotic minimally invasive surgery. Medical Image Computing and Computer-Assisted Intervention, pages 435–442, 2009.
91

[54] C. E. Reiley, H. C. Lin, B. Varadarajan, B. Vagvolgyi, S. Khudanpur, D. D.Yuh, and G. D. Hager. Automatic recognition of surgical motions using sta-tistical modeling for capturing variability. Studies in health technology andinformatics, 132:396, 2008.
[55] C. E. Reiley, H. C. Lin, D. D. Yuh, and G. D. Hager. Review of methods forobjective surgical skill evaluation. Surgical Endoscopy, pages 1–11, 2009.
[56] C. Richards, J. Rosen, B. Hannaford, C. Pellegrini, and M. Sinanan. Skillsevaluation in minimally invasive surgery using force/torque signatures. Surgi-cal Endoscopy, 14(9):791–798, 2000.
[57] E. M. Ritter, T. W. Kindelan, C. Michael, E. A. Pimentel, and M. W. Bowyer.Concurrent validity of augmented reality metrics applied to the fundamentalsof laparoscopic surgery (FLS). Surgical Endoscopy, 21(8):1441–1445, 2007.
[58] J. Rosen, J. D. Brown, L. Chang, M. Barreca, M. Sinanan, and B. Hannaford.The BlueDRAGON - a system for measuring the kinematics and the dynamicsof minimally invasive surgical tools InVivo. In IEEE International Conferenceon Robotics and Automation, volume 2, pages 1876–1881, 2002.
[59] J. Rosen, J. D. Brown, L. Chang, M. N. Sinanan, and B. Hannaford. General-ized approach for modeling minimally invasive surgery as a stochastic processusing a discrete markov model. IEEE Transactions on Biomedical Engineer-ing, 53(3):399–413, 2006.
[60] J. Rosen, L. Chang, J. D. Brown, B. Hannaford, M. Sinanan, and R. Satava.Minimally invasive surgery task decomposition-etymology of endoscopic su-turing. Studies in Health Technology and Informatics, pages 295–301, 2003.
[61] J. Rosen, M. MacFarlane, C. Richards, B. Hannaford, and M. Sinanan.Surgeon-tool force/torque signatures evaluation of surgical skills in minimallyinvasive surgery. Medicine Meets Virtual Reality: The Convergence of Phys-ical & Informational Technologies: Options for a New Era in Healthcare,62:290–296, 1999.
[62] J. Rosen, M. Solazzo, B. Hannaford, and M. Sinanan. Objective laparoscopicskills assessments of surgical residents using hidden markov models based onhaptic information and tool/tissue interactions. Studies in Health Technologyand Informatics, pages 417–423, 2001.
[63] J. Rosen, M. Solazzo, B. Hannaford, and M. Sinanan. Task decompositionof laparoscopic surgery for objective evaluation of surgical residents’ learn-ing curve using hidden markov model. Computer Aided Surgery, 7(1):49–61,2002.
[64] G. M. Saleh, Y. Voyazis, J. Hance, J. Ratnasothy, and A. Darzi. Evaluat-ing surgical dexterity during corneal suturing. Archives of Ophthalmology,124(9):1263, 2006.
[65] S. Sinigaglia, G. Megali, O. Tonet, A. Pietrabissa, and P. Dario. Defining met-rics for objective evaluation of surgical performances in laparoscopic train-ing. In International Congress Series, volume 1281, pages 509–514. Elsevier,2005.
[66] Inuitive Surgical. Intuitive surgical, inc. - da vinci surgical system.http://www.intuitivesurgical.com/index.aspx, 2010.
92

[67] Symbionix. LAP mentor laparoscopic surgery simulator for general surgery,gynecology and urology. http://www.simbionix.com/LAP Mentor.html, 2010.
[68] K. Tanoue, S. Yamaguchi, K. Konishi, T. Yasunaga, D. Yoshida, N. Kinjo,K. Kobayashi, S. Ieiri, K. Okazaki, and H. Nakashima. Construct validity foreyehand coordination skill on a virtual reality laparoscopic surgical simulator.Surgical Endoscopy, 21(12):2253–2257, 2007.
[69] A. L. Trejos, R. V. Patel, M. D. Naish, and C. M. Schlachta. Design of asensorized instrument for skills assessment and training in minimally invasivesurgery. In 2nd IEEE RAS & EMBS International Conference on BiomedicalRobotics and Biomechatronics, 2008. BioRob 2008, pages 965–970, 2008.
[70] K. W. van Dongen, E. Tournoij, D. C. van der Zee, M. P. Schijven, and IAMJBroeders. Construct validity of the LapSim: can the LapSim virtual real-ity simulator distinguish between novices and experts? Surgical Endoscopy,21(8):1413–1417, 2007.
[71] M. C. Vassiliou, L. S. Feldman, C. G. Andrew, S. Bergman, K. Leffondr,D. Stanbridge, and G. M. Fried. A global assessment tool for evaluationof intraoperative laparoscopic skills. The American Journal of Surgery,190(1):107–113, 2005.
[72] E. G. G. Verdaasdonk, L. P. S. Stassen, M. P. Schijven, and J. Dankelman.Construct validity and assessment of the learning curve for the SIMENDOendoscopic simulator. Surgical Endoscopy, 21(8):1406–1412, 2007.
[73] Vicon. Motion capture systems from vicon. http://www.vicon.com/, 2010.
[74] J. F. Waljee, L. J. Greenfield, J. B. Dimick, and J. D. Birkmeyer. Surgeon ageand operative mortality in the united states. Annals of surgery, 244(3):353,2006.
[75] G. Xeroulis, A. Dubrowski, and K. Leslie. Simulation in laparoscopic surgery:a concurrent validity study for FLS. Surgical Endoscopy, 23(1):161–165,2009.
93

Appendix A
Pre-trial Questionnaire
Age:
Gender:
Male / Female
Dominant Hand:
Left / Right
Level:
None Med Student R1 R2 R3 R4 R5 Fellow “Expert”
Do you have normal, or corrected to normal vision?
Yes / No
If you are a med student, do you have an interest in surgery?
Yes / No
How would you rate your laparoscopic suturing skills?1 2 3 4 5No Experience I have prac-
ticed on endo-trainers;
I have learnedthe basic skillsI am confidentwith my skills;ready to suturein the OR onpatients
Experienceperformingfull operations
Expert sur-geon
94

How would you rate your skills in open surgical procedures?1 2 3 4 5No Experience I have prac-
ticed onsynthetic tis-sue; I havelearned thebasic skills
I am confidentwith my skills;ready to suturein the OR onpatients
Experienceperformingfull operations
Expert sur-geon
Have you performed a laparoscopic cholecystectomy?
Approximately how many operations:
Have you performed a laparoscopic fundoplication?
Approximately how many operations:
Do you regularly play video games, or perform tasks involving fine motor skills
or hand eye co-ordination (repair small machines, assemble models, etc.)? Please
describe.
How many hours of sleep have you missed in the last week (i.e. due to call com-
mitments, travel, illness)?
How many caffeinated drinks (coffee, tea, energy drinks) have you had in the last
24 hours?
When was the last time you performed, or practiced, hands-on laparoscopy (on
synthetic or live tissue) (how many days ago)?
95

Appendix B
Post-trial Questionnaire
How would you rate your performance today?1 2 3 4 5Poor perfor-mance
Below average Averageperformance
Above averageperformance
Very good per-formance
96


