Embed Size (px)
Citation preview
Limits on �e and ��e disappearance from Gallium and reactor experiments
Mario A. Acero,1,2,3 Carlo Giunti,2 and Marco Laveder4
1Dipartimento di Fisica Teorica, Universita di Torino, Via P. Giuria 1, I–10125 Torino, Italy2INFN, Sezione di Torino, Via P. Giuria 1, I–10125 Torino, Italy
3Laboratoire d’Annecy-le-Vieux de Physique Thorique LAPTH, Universite de Savoie, CNRS/IN2P3, 74941 Annecy-le-vieux, France4Dipartimento di Fisica ‘‘G. Galilei,’’ Universita di Padova, and INFN, Sezione di Padova, Via F. Marzolo 8, I–35131 Padova, Italy
(Received 16 July 2008; published 16 October 2008)
The deficit observed in the Gallium radioactive source experiments is interpreted as a possible
indication of the disappearance of electron neutrinos. In the effective framework of two-neutrino mixing
we obtain sin22# * 0:03 and �m2 * 0:1 eV2. The compatibility of this result with the data of the Bugey
and Chooz reactor short-baseline antineutrino disappearance experiments is studied. It is found that the
Bugey data present a hint of neutrino oscillations with 0:02 & sin22# & 0:08 and �m2 � 1:8 eV2, which
is compatible with the Gallium allowed region of the mixing parameters. This hint persists in the
combined analyses of Bugey and Chooz data, of Gallium and Bugey data, and of Gallium, Bugey, and
Chooz data.
DOI: 10.1103/PhysRevD.78.073009 PACS numbers: 14.60.Pq, 14.60.Lm, 14.60.St
I. INTRODUCTION
The observation of solar and very-long-baseline reactorneutrino oscillations due to the squared-mass difference�m2
SOL ¼ ð7:59� 0:21Þ � 10�5 eV2 [1] and the observa-
tion of atmospheric and long-baseline accelerator neutrinooscillations due to the squared-mass difference �m2
ATM ¼2:74þ0:44
�0:26 � 10�3 eV2 [2] give very robust evidence of
three-neutrino mixing (for reviews of the theory and phe-nomenology of neutrino mixing, see Refs. [3–11]). Thereare, however, some anomalies in the data of neutrinoexperiments which could be interpreted as indications ofexotic neutrino physics beyond three-neutrino mixing: theLSND anomaly [12], the Gallium radioactive source ex-periments anomaly [13], and the MiniBooNE low-energyanomaly [14]. In this paper we consider the anomalyobserved in the Gallium radioactive source experiments[13,15–18], in which the Gallium solar neutrino detectorsGALLEX [19] and SAGE [20] were tested by measuringthe electron neutrino flux produced by intense artificialradioactive sources placed inside the detectors. TheGallium radioactive source experiments measured a num-ber of events smaller than expected. This deficit can beinterpreted1 as an indication of the disappearance of elec-tron neutrinos due to neutrino oscillations [22–24]. Underthis hypothesis, we analyze the data of the Gallium radio-active source experiments in the effective framework oftwo-neutrino mixing, which describes neutrino oscillationsdue to a �m2 that is much larger than the solar andatmospheric ones (see Refs. [5,6,11]). We also study thecompatibility of this interpretation of the Gallium radioac-tive source experiments anomaly with the data of the
Bugey [25] and Chooz [26] reactor short-baseline antineu-trino disappearance experiments.
II. GALLIUM
The GALLEX [19] and SAGE [20] solar neutrino de-tectors (see Refs. [3–11]) have been tested in so-called‘‘Gallium radioactive source experiments’’ which consistin the detection of electron neutrinos produced by intenseartificial 51Cr and 37Ar radioactive sources placed insidethe detectors.The radioactive nuclei 51Cr and 37Ar decay through
electron capture (e� þ 51Cr ! 51Vþ �e and e� þ37Ar ! 37Clþ �e) emitting �e lines with the energiesand branching ratios listed in Table I. These neutrinoswere detected through the same reaction used for thedetection of solar neutrinos [28]:
�e þ 71Ga ! 71Geþ e�; (1)
which has the low neutrino energy threshold Eth� ð71GaÞ ¼
0:233 MeV. The cross sections of the �e lines emitted in51Cr and 37Ar decay interpolated from Table II of Ref. [27]are listed in Table I.The ratios R of measured and predicted 71Ge production
rates in the two GALLEX 51Cr radioactive source experi-ments,2 Cr1 [15] and Cr2 [16], and the SAGE 51Cr [17,18]and 37Ar [13] radioactive source experiments, as reported
1Another possible explanation is that the theoretical crosssection of the Gallium detection process has been overestimated[13,21].
2As explained in Ref. [13], the values of R in Table II for thetwo GALLEX 51Cr radioactive source experiments are differentfrom those published in Refs. [15,16], because of an improvedreanalysis of the data. Similar results have been publishedrecently in a PhD thesis [29] and discussed at the Neutrino2008 Conference [30]: RðCr1Þ ¼ 0:997� 0:11 and RðCr2Þ ¼0:807þ0:11
�0:10 in a standard rise-time analysis; RðCr1Þ ¼ 0:953�0:11 and RðCr2Þ ¼ 0:812þ0:10
�0:11 in a pulse-shape analysis. We haveverified that our results are stable against such small changes ofthe data.
PHYSICAL REVIEW D 78, 073009 (2008)
1550-7998=2008=78(7)=073009(10) 073009-1 � 2008 The American Physical Society

in Ref. [13], are listed in Table II. Since the weightedaverage, [13]
RGa ¼ 0:88� 0:05; (2)
is smaller than unity by more than 2�, it can be interpretedas an indication of the disappearance of electron neutrinosdue to neutrino oscillations [22–24]. The �2 in the absenceof oscillation is 8.19 for 4 degrees of freedom, correspond-ing to a 8.5% goodness-of-fit,3 as shown in Table III.Therefore, a fluctuation of the data in the case of nooscillations cannot be excluded. However, since from aphysical point of view it is interesting to explore possibleindications of nonstandard physics, in the following weconsider the case of neutrino oscillations.
In the effective framework of two-neutrino oscillations,which is appropriate in the case of short-baseline oscilla-tions generated by a squared-mass difference much largerthan �m2
SOL and �m2ATM (see Refs. [5,11]), the survival
probability of electron neutrinos and antineutrinos withenergy E� at a distance L from the source is given by4
P�ð�Þ
e! �ð�Þ
e
ðL; E�Þ ¼ 1� sin22#sin2��m2L
4E�
�; (3)
where # is the mixing angle and �m2 is the squared-massdifference. The fit of the data gives information on thevalues of the mixing parameters sin22# and �m2.
In our calculation, the theoretical value of the ratio R ofthe predicted 71Ge production rates in each of the Galliumradioactive source experiments in the cases of presence andabsence of neutrino oscillations is given by
R ¼RdVL�2
PiðB:R:Þi�iP�e!�e
ðL; E�;iÞPiðB:R:Þi�i
RdVL�2
; (4)
where i is the index of the �e lines emitted in 51Cr or 37Ar,which are listed in Table I. The measured ratios are listed inTable II, together with the dimensions of the detectors,which we approximate as cylindrical, and the height fromthe base of each detector at which the radioactive sourceswere placed along the axis of the respective detector. Weaveraged the neutrino path length L with a Monte Carlointegration over the volume V of each cylindrical detector.In the separate analysis of the result of each Gallium
radioactive source experiment in terms of neutrino oscil-lations, the two mixing parameters cannot be determinedthrough a least-squares analysis from one data point.Therefore, we adopt a Bayesian approach, as done inRef. [33], considering R as a random variable with auniform prior probability distribution between zero andone. Then, if Robs is the observed value of R, the normal-ized posterior probability distribution of R is given by
pðRjRobsÞ ¼ pðRobsjRÞR10 dRpðRobsjRÞ
: (5)
Here, pðRobsjRÞ is the sampling distribution of Robs givenR, which we assume to be Gaussian with standard devia-tion equal to the experimental uncertainty. The allowedinterval of R with a given Bayesian confidence level isgiven by the highest posterior density interval with inte-grated probability equal to the confidence level. Figure 1shows the resulting allowed regions in the sin22# � �m2
plane. One can see that the first GALLEX source experi-ment (Cr1) and the 51Cr SAGE source experiment, inwhich the measured rate is within 1� from unity, implyonly upper limits for the mixing parameters. On the otherhand, the analyses of the second GALLEX source experi-ment (Cr2) and the 37Ar SAGE source experiment give 2�allowed bands, which have a large overlap for �m2 *1 eV2.
TABLE II. Ratios R of measured and predicted 71Ge produc-tion rates in the two GALLEX 51Cr radioactive source experi-ments, Cr1 [15] and Cr2 [16], and the SAGE 51Cr [17,18] and37Ar [13] radioactive source experiments, as reported inRef. [13]. We give also the radii and heights of the GALLEXand SAGE cylindrical detectors and the heights from the base ofthe detectors at which the radioactive sources were placed alongthe axes of the detectors.
GALLEX SAGE
Cr1 Cr2 51Cr 37Ar
R 1:00� 0:10 0:81� 0:10 0:95� 0:12 0:79� 0:10
radius [m] 1.9 0.7
height [m] 5.0 1.47
source height [m] 2.7 2.38 0.72
TABLE I. Energies ðE�Þ, branching ratios (B.R.) and Galliumcross sections ð�Þ of the �e lines emitted in 51Cr and 37Ar decaythrough electron capture. The cross sections are interpolatedfrom Table II of Ref. [27].
51Cr 37Ar
E� [keV] 747 752 427 432 811 813
B.R. 0.8163 0.0849 0.0895 0.0093 0.902 0.098
�½10�46 cm2� 60.8 61.5 26.7 27.1 70.1 70.3
3The goodness-of-fit is the probability to obtain a worse fitunder the assumption that the model under consideration iscorrect (see Ref. [31]). It is the standard statistic used for theestimation of the quality of a fit obtained with the least-squaresmethod, assuming the validity of the approximation in which�2min has a �2 distribution with NDF ¼ ND � NP degrees of
freedom, where ND is the number of data points and NP is thenumber of fitted parameters. The fit is usually considered to beacceptable if the goodness-of-fit is larger than about 1%.
4The symmetry under CPT transformations, which is a char-acteristic of all relativistic local quantum field theories, impliesthat the survival probabilities of neutrinos and antineutrinos areequal (see Ref. [11]).
MARIO A. ACERO, CARLO GIUNTI, AND MARCO LAVEDER PHYSICAL REVIEW D 78, 073009 (2008)
073009-2

TABLE III. Values of �2min, number of degrees of freedom (NDF) and goodness-of-fit (GoF) for the fit of different combinations of
the results of the Gallium radioactive source experiments and the Bugey and Chooz reactor experiments. The first three linescorrespond to the case of no oscillations (No Osc.). The following five lines, including the best-fit values of sin22# and �m2,correspond to the case of oscillations (Osc.). The last three lines describe the parameter goodness-of-fit (PG) [32].
Ga Bu Gaþ Bu Buþ Ch Gaþ Ch Gaþ Buþ Ch
�2min 8.19 50.94 59.13 51.00 8.26 59.19
No Osc. NDF 4 55 59 56 5 60
GoF 0.085 0.63 0.47 0.66 0.14 0.51
�2min 2.94 47.97 53.87 48.63 6.60 54.80
NDF 2 53 57 54 3 58
Osc. GoF 0.23 0.67 0.59 0.68 0.086 0.60
sin22#bf 0.22 0.048 0.062 0.041 0.08 0.60
�m2bf ½eV2� 1.98 1.85 1.85 1.85 1.72 1.85
��2min 2.98 0.59 3.63 3.85
PG NDF 2 1 1 3
GoF 0.23 0.44 0.057 0.28
sin22ϑ
∆m2
[eV
2 ]
10−3 10−2 10−1 110−2
10−1
1
10
102
Gallex Cr1
68.27% C.L. (1σ)95.45% C.L. (2σ)99.73% C.L. (3σ)
Gallex Cr1
68.27% C.L. (1σ)95.45% C.L. (2σ)99.73% C.L. (3σ)
sin22ϑ
∆m2
[eV
2 ]
10−3 10−2 10−1 110−2
10−1
1
10
102
Gallex Cr2
68.27% C.L. (1σ)95.45% C.L. (2σ)99.73% C.L. (3σ)
Gallex Cr2
68.27% C.L. (1σ)95.45% C.L. (2σ)99.73% C.L. (3σ)
sin22ϑ
∆m2
[eV
2 ]
10−3 10−2 10−1 110−2
10−1
1
10
102
SAGE 51Cr
68.27% C.L. (1σ)95.45% C.L. (2σ)99.73% C.L. (3σ)
SAGE 51Cr
68.27% C.L. (1σ)95.45% C.L. (2σ)99.73% C.L. (3σ)
sin22ϑ
∆m2
[eV
2 ]
10−3 10−2 10−1 110−2
10−1
1
10
102
SAGE 37Ar
68.27% C.L. (1σ)95.45% C.L. (2σ)99.73% C.L. (3σ)
SAGE 37Ar
68.27% C.L. (1σ)95.45% C.L. (2σ)99.73% C.L. (3σ)
FIG. 1. Allowed regions in the sin22# ��m2 plane obtained from the fits of the results of the two GALLEX 51Cr radioactive sourceexperiments, Cr1 and Cr2, and the SAGE 51Cr and 37Ar radioactive source experiments. The curves in the GALLEX Cr1 and SAGE51Cr plots exclude the region on the right. In the GALLEX Cr2 and SAGE 37Ar plots, the pairs of 1� and 2� curves delimit allowedregions, whereas the 3� curves exclude the region on the right.
LIMITS ON �e AND ��e . . . PHYSICAL REVIEW D 78, 073009 (2008)
073009-3

Let us now discuss the combined fit of the four Galliumsource experiments. Since there are enough data points todetermine the two mixing parameters sin22# and �m2, weabandon the Bayesian approach in favor of a standardfrequentist least-squares fit. This method is based on aglobal minimization of the �2 in the sin22# � �m2 planeand the calculation of the Confidence Level contours cor-responding to a ��2 with 2 degrees of freedom: ��2 ¼2:30, 6.18, 11.83 for 68.27% (1�), 95.45% (2�) and99.73% (3�) C.L., respectively, (see Ref. [31]).
The result of the combined least-squares analysis of thefour Gallium source experiments is shown in Fig. 2. Onecan see that there is an allowed region in the sin22# ��m2 plane at 1� for �m2 * 0:6 eV2 and 0:08 &sin22# & 0:4. The values of �2
min, the number of degrees
of freedom (NDF), the goodness-of-fit (GoF) and the best-fit values of the mixing parameters are given in Table III.The value of the goodness-of-fit (23%) shows that the fit isacceptable.
Table IV shows the allowed ranges of sin22# and �m2
obtained from the corresponding marginal ��2 ��2 � �2
min in Fig. 2. The presence of 2� lower limits for
sin22# and �m2 in spite of the absence of a 2� lower limitin the sin22# � �m2 plane in Fig. 2 is an effect due to thestatistical analysis: for one parameter 2� corresponds to��2 ¼ 4, whereas for two parameters it corresponds to��2 ¼ 6:18. Hence, it is fair to conclude that there is an
indication of a possible neutrino disappearance due toneutrino oscillations with sin22# * 0:03 and �m2 *0:1 eV2 at a confidence level between one and two sigmas(� 70–90% C:L:).
III. BUGEY
The disappearance of electron antineutrinos have beeninvestigated by several reactor neutrino experiments atdifferent baselines (see Refs. [11,34]). Since, accordingto Eq. (3), the survival probabilities of neutrinos and anti-neutrinos are equal, the interpretation of the results ofGallium radioactive source experiments in terms of elec-tron neutrino disappearance can be compared directly withthe results of reactor neutrino experiments.In this section we consider the results of the reactor
short-baseline Bugey experiment [25], which put themost stringent constraints on the disappearance of electronantineutrinos due to �m2 * 0:1 eV2.Reactor neutrino experiments detect electron antineutri-
nos through the inverse neutron decay process
�� e þ p ! nþ eþ: (6)
The neutrino energy E� and the positron kinetic energy Te
are related by
E� ¼ Te þ Tn þme þmn �mp ’ Te þ 1:8 MeV; (7)
where Tn is the negligibly small recoil kinetic energy of theneutron. In the Bugey experiment the survival probabilityof electron antineutrinos was measured at three source-detector distances: Lj ¼ 15, 40, 95 m, for j ¼ 1, 2, 3,
respectively. We use the ratio of observed and expected(in the case of no oscillation) positron spectra given inFig. 17 of Ref. [25], in which there are Nj ¼ 25, 25, 10
energy bins. We analyze the data with the following �2,taken from Ref. [25]:
TABLE IV. Allowed ranges of sin22# and �m2 from thecombined fit of the results of Gallium radioactive source experi-ments, from the fit of the results of the Bugey reactor experi-ment, and from the combined fit. The dots indicate the absenceof limits.
Parameter C.L. Ga Bu Gaþ Bu
68:27%ð1�Þ 0.12–0.33 0.021–0.075 0.035–0.087
sin22# 95:45%ð2�Þ >0:028 � � � 0.007–0.19
99:73%ð3�Þ � � � � � � � � ��m2 ½eV2� 68:27%ð1�Þ >0:85 1.77–1.91 1.79–1.91
95:45%ð2�Þ >0:079 � � � >0:7799:73%ð3�Þ � � � � � � � � �
sin22ϑ
∆m2
[eV
2 ]
10−3 10−2 10−110−2
10−1
1
10
+
02
46
810
∆χ2
0 2 4 6 8 10
∆χ2
Ga
68.27% C.L. (1σ)95.45% C.L. (2σ)99.73% C.L. (3σ)
Ga
68.27% C.L. (1σ)95.45% C.L. (2σ)99.73% C.L. (3σ)
FIG. 2. Allowed regions in the sin22# ��m2 plane and mar-ginal ��2’s for sin22# and �m2 obtained from the combined fitof the results of the two GALLEX 51Cr radioactive sourceexperiments and the SAGE 51Cr and 37Ar radioactive sourceexperiments. The best-fit point corresponding to �2
min is indi-
cated by a cross.
MARIO A. ACERO, CARLO GIUNTI, AND MARCO LAVEDER PHYSICAL REVIEW D 78, 073009 (2008)
073009-4

�2 ¼ X3j¼1
�XNj
i¼1
½ðAaj þ bðEji � E0ÞÞRtheji � R
expji �2
�2ji
þ ðaj � 1Þ2�2
aj
�þ ðA� 1Þ2
�2A
þ b2
�2b
; (8)
where Eji is the central energy of the ith bin in the positron
kinetic energy spectrum measured at the Lj source-
detector distance, Rexpji and Rthe
ji are, respectively, the cor-
responding measured and calculated ratios. The uncertain-ties �ji include the statistical uncertainty of each bin and a
1% systematic uncertainty added in quadrature, whichtakes into account the uncertainty of the spectrum calcu-lation (with a total of about 5% uncorrelated systematicuncertainty over 25 bins). The coefficients (Aaj þ bðEji �E0Þ), with E0 ¼ 1 MeV, were introduced in Ref. [25] inorder to take into account the systematic uncertainty of thepositron energy calibration. The value of �2 as a functionof sin22# and �m2 is calculated by minimizing Eq. (8)with respect to the five parameters A, aj (j ¼ 1, 2, 3), b,
which have, respectively, uncertainties �A ¼ 0:048, �aj ¼0:014 �b ¼ 0:02 MeV�1 [25]. Following Ref. [35], weapproximate the neutrino flux, the detection cross sectionand the detection efficiency as constants in each energybin. Then, Rthe
ji is given by
Rtheji
¼RdLL�2
REjiþ�Ej=2
Eji��Ej=2dE
Rþ1�1dTeFðE;TeÞP ��e! ��e
ðL;E�Þ�Ej
RdLL�2
:
(9)
Here Te and E� are, respectively, the positron kineticenergy and the neutrino energy, related by Eq. (7), where-as E is the measured positron kinetic energy, whichis connected to Te by the energy resolution functionof the detector FðE; TeÞ. We considered a Gaussianenergy resolution function with standard deviation
0:252ffiffiffiffiffiffiffiffiffiffiffiffiffiffiffiffiffiffiffiffiffiffiffiffiffiE=4:2 MeV
pMeV [25]. The quantities �Ej are the
widths of the energy bins in each detector. The integrationover the neutrino path length L is performed by aMonte Carlo which takes into account the geometries ofthe reactor and of the detectors and their relative positions[36].
With this method we obtained the 90% C.L. raster-scan5
exclusion curve shown in Fig. 3, which is similar to theoriginal 90% C.L. raster-scan Bugey exclusion curve inRef. [25].
Let us emphasize that the raster-scan method is statisti-cally weak, because it does not have proper coverage [37].We presented in Fig. 3 the raster-scan exclusion curve onlyto show by comparison with the analogous figure inRef. [25] that our analysis of the Bugey data is acceptable.The dashed line in Fig. 3 shows the 90% C.L. Bugeyexclusion curve obtained with the standard least-squaresmethod, which we adopted also in the previous Fig. 2 andthe following Figs. 4–9. From Fig. 3 one can see that the90% C.L. raster-scan exclusion curve overcovers for allvalues of �m2, except for small intervals around �m2 ’0:9 eV2 and �m2 ’ 1:9 eV2.Figure 4 shows the allowed regions in the sin22# �
�m2 plane and the marginal ��2’s for sin22# and �m2
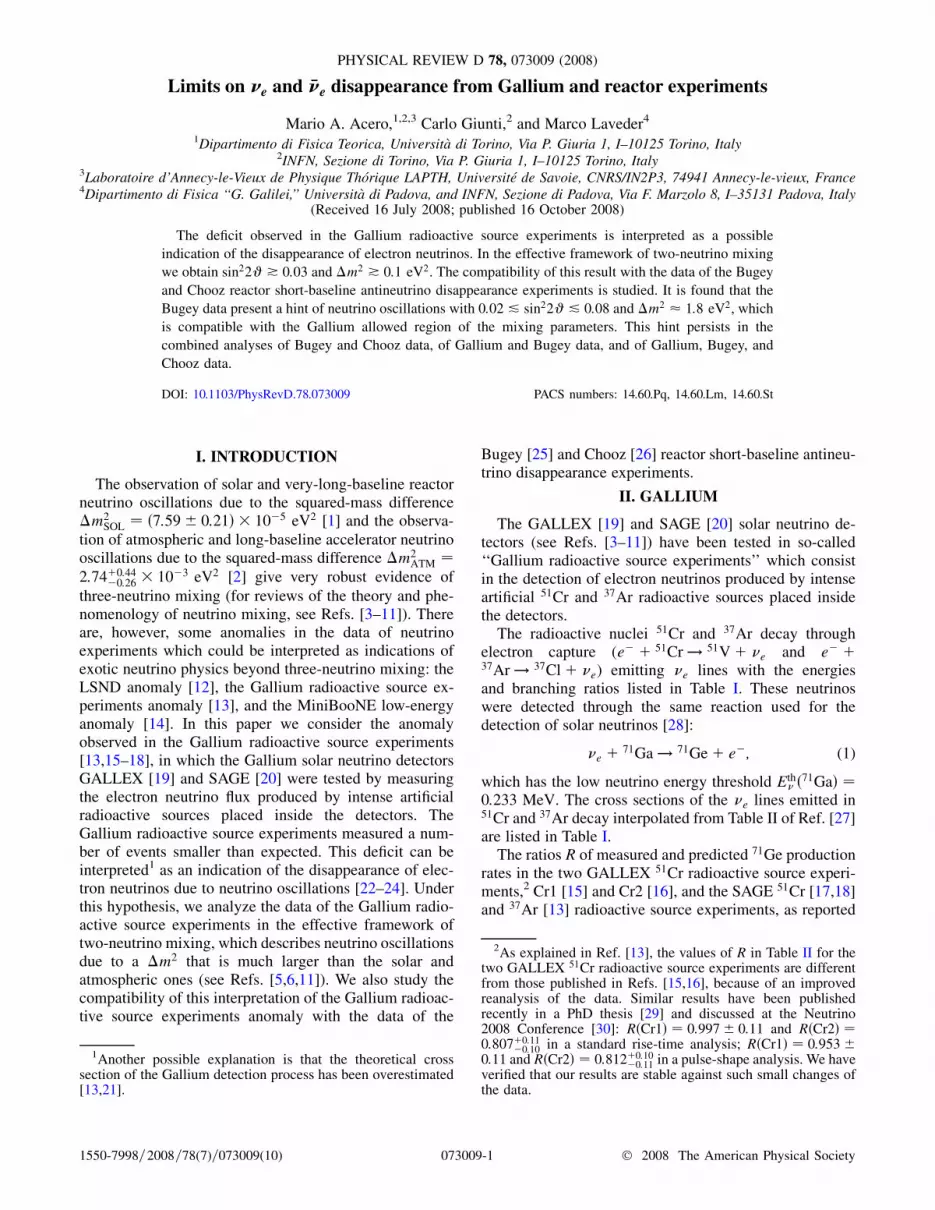
obtained from the least-squares analysis of Bugey data.The value and location in the sin22# � �m2 plane of theminimum of the �2, the number of degrees of freedom(NDF) and the goodness-of-fit (GoF) are given in Table III.The fit is satisfactory, since the goodness-of-fit is 67%. Thebest-fit value of the oscillation parameters and the small 1�allowed regions in Fig. 4 are in favor of neutrino oscilla-tions. However, the 2� and 3� contours in Fig. 4 provideonly upper limits to neutrino oscillations. Also, the value ofthe �2 in the case of absence of oscillations and thecorresponding goodness-of-fit (63%) do not allow us toexclude the absence of oscillations.The reason of the hint in favor of neutrino oscillations
given by the Bugey data is illustrated in Fig. 5, where thehistogram relative to the best fit is shown against the Bugey
sin22ϑ
∆m2
[eV
2 ]
10−3 10−2 10−1 110 −
2
10−1
1
10
102
+
Bugey
90.00% C.L. Raster Scan90.00% C.L. Global Fit
Bugey
90.00% C.L. Raster Scan90.00% C.L. Global Fit
FIG. 3. 90% C.L. exclusion curves in the sin22# ��m2 planeobtained from a raster-scan analysis of Bugey data (solid line)and from a standard global least-squares fit (dashed line).
5In the raster-scan method, �2min is found for each fixed value
of �m2. The corresponding upper limit for sin22# is calculatedas the value of sin22# for which the cumulative distributionfunction of ��2 � �2 � �2
min, which has 1 of freedom, is equal
to the confidence level (��2 ¼ 2:71 for 90% C.L.).
LIMITS ON �e AND ��e . . . PHYSICAL REVIEW D 78, 073009 (2008)
073009-5
Rexpji ’s. With the help of the histogram, one can see that
there is a weak hint of oscillations. The 1� allowed regionsin Fig. 4 have very narrow �m2 ranges around 0:9 eV2,1:85 eV2, and 3 eV2, because slight shifts of �m2 fromthese optimal values spoil the agreement with the data ofthe histogram in Fig. 5.Table IV shows the marginal allowed ranges of sin22#
and �m2 obtained from the corresponding ��2’s in Fig. 4.One can see that there is a hint of neutrino oscillations with0:02 & sin22# & 0:08 and �m2 � 1:8 eV2.From a comparison of Figs. 2 and 4 one can see that
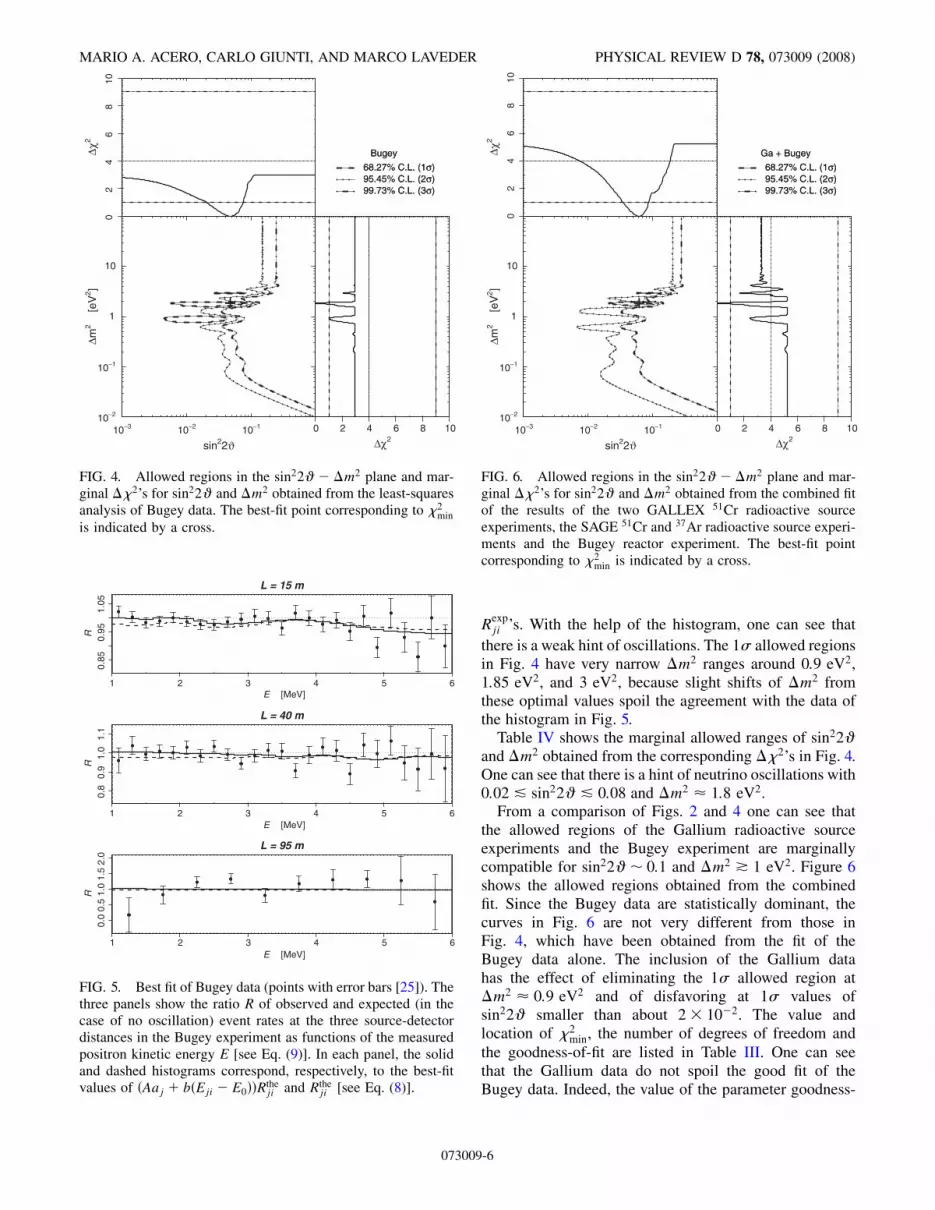
the allowed regions of the Gallium radioactive sourceexperiments and the Bugey experiment are marginallycompatible for sin22# � 0:1 and �m2 * 1 eV2. Figure 6shows the allowed regions obtained from the combinedfit. Since the Bugey data are statistically dominant, thecurves in Fig. 6 are not very different from those inFig. 4, which have been obtained from the fit of theBugey data alone. The inclusion of the Gallium datahas the effect of eliminating the 1� allowed region at�m2 � 0:9 eV2 and of disfavoring at 1� values ofsin22# smaller than about 2� 10�2. The value andlocation of �2
min, the number of degrees of freedom and
the goodness-of-fit are listed in Table III. One can seethat the Gallium data do not spoil the good fit of theBugey data. Indeed, the value of the parameter goodness-
sin22ϑ
∆m2
[eV
2 ]
10−3 10−2 10−110−2
10−1
1
10
+
02
46
810
∆χ2
0 2 4 6 8 10
∆χ2
Ga + Bugey
68.27% C.L. (1σ)95.45% C.L. (2σ)99.73% C.L. (3σ)
Ga + Bugey
68.27% C.L. (1σ)95.45% C.L. (2σ)99.73% C.L. (3σ)
FIG. 6. Allowed regions in the sin22# ��m2 plane and mar-ginal ��2’s for sin22# and �m2 obtained from the combined fitof the results of the two GALLEX 51Cr radioactive sourceexperiments, the SAGE 51Cr and 37Ar radioactive source experi-ments and the Bugey reactor experiment. The best-fit pointcorresponding to �2
min is indicated by a cross.
0.85
0.95
1.05
E [MeV]
R
L = 15 m
0.8
0.9
1.0
1.1
E [MeV]
R
L = 40 m
1 2 3 4 5 6
1 2 3 4 5 6
1 2 3 4 5 6
0.0
0.5
1.0
1.5
2.0
E [MeV]
R
L = 95 m
FIG. 5. Best fit of Bugey data (points with error bars [25]). Thethree panels show the ratio R of observed and expected (in thecase of no oscillation) event rates at the three source-detectordistances in the Bugey experiment as functions of the measuredpositron kinetic energy E [see Eq. (9)]. In each panel, the solidand dashed histograms correspond, respectively, to the best-fitvalues of ðAaj þ bðEji � E0ÞÞRthe
ji and Rtheji [see Eq. (8)].
sin22ϑ
∆m2
[eV
2 ]
10−3 10−2 10−110−2
10−1
1
10
+
02
46
810
∆χ2
0 2 4 6 8 10
∆χ2
Bugey
68.27% C.L. (1σ)95.45% C.L. (2σ)99.73% C.L. (3σ)
Bugey
68.27% C.L. (1σ)95.45% C.L. (2σ)99.73% C.L. (3σ)
FIG. 4. Allowed regions in the sin22# ��m2 plane and mar-ginal ��2’s for sin22# and �m2 obtained from the least-squaresanalysis of Bugey data. The best-fit point corresponding to �2
min
is indicated by a cross.
MARIO A. ACERO, CARLO GIUNTI, AND MARCO LAVEDER PHYSICAL REVIEW D 78, 073009 (2008)
073009-6
of-fit6 [32] reported in Table III shows that the Bugey andGallium data are compatible under the hypothesis of neu-trino oscillations. The marginal allowed ranges of sin22#and �m2 obtained from the corresponding ��2’s in Fig. 6are given in Table IV.
IV. CHOOZ
In this section we consider the result of the long-baselinereactor neutrino experiment Chooz [26], which gives limitson neutrino oscillations which are comparable with thoseof the Bugey experiment for �m2 * 2 eV2.
In the Chooz experiment the ratio of the number ofobserved events and that expected in the absence of neu-trino oscillations is
RChooz ¼ 1:01� 0:04: (10)
The value of this ratio puts a constraint on the disappear-ance of electron (anti)neutrinos with energies in the MeVrange at distances smaller than about 1 km. This corre-sponds to a constraint on sin22# for �m2 * 10�3 eV2. Inthe range of sensitivity of the Gallium radioactive sourceexperiments, �m2 * 10�1 eV2 (see Figs. 2), the oscilla-tion length of reactor antineutrinos is much shorter than theChooz source-detector distance. In this case, the Choozexperiment is only sensitive to the averaged survival proba-bility
hP�ð�Þ
e! �ð�Þ
e
i ¼ 1� 12sin
22#: (11)
Therefore, the Chooz result in Eq. (10) can be combined7
with the results of the Gallium radioactive source experi-ments simply by considering it as a measurement ofsin22#: in the Bayesian approach of Eq. (5)
sin 22# < 0:071; 0:15; 0:23; (12)
at 68.27% (1�), 95.45% (2�), 99.73% (3�) BayesianConfidence Level, respectively.
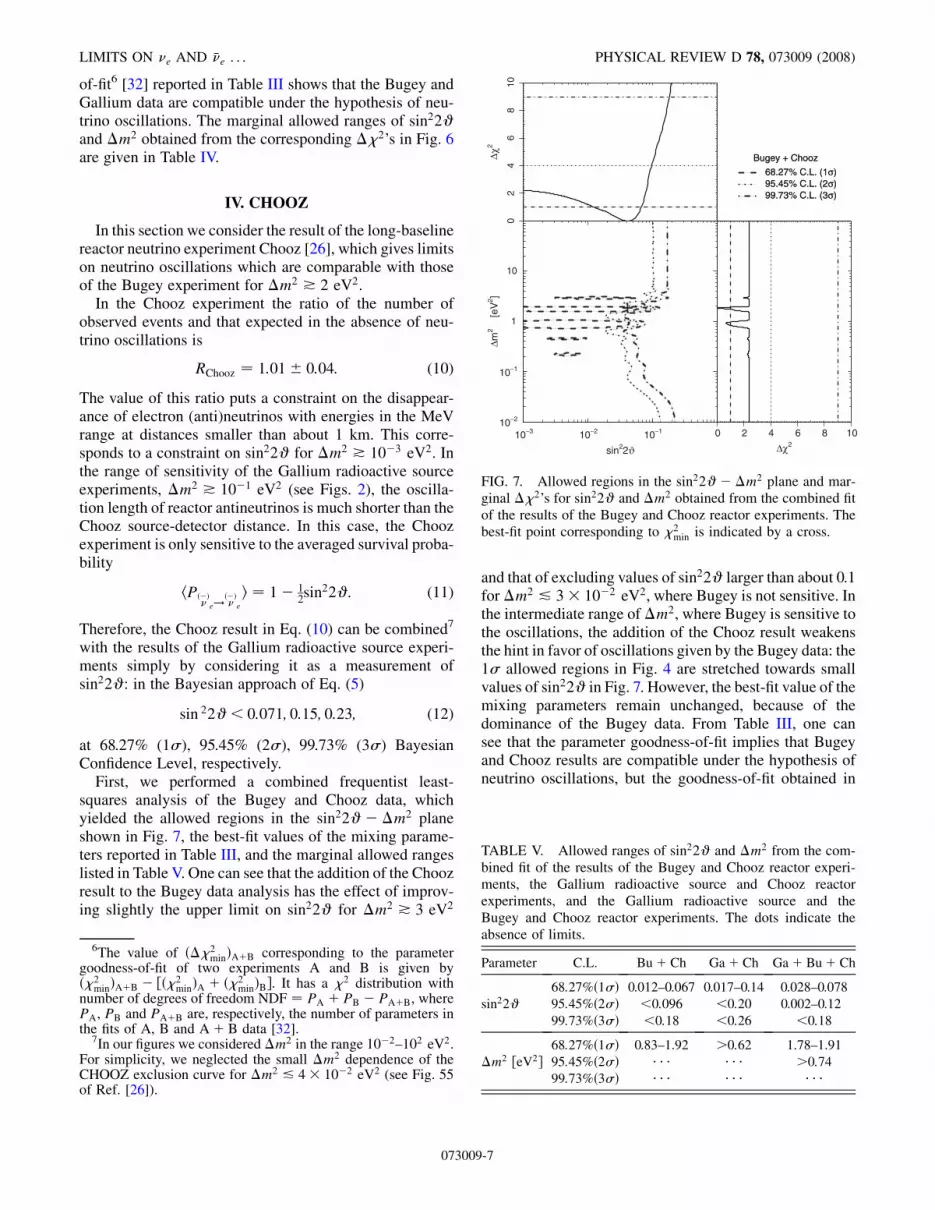
First, we performed a combined frequentist least-squares analysis of the Bugey and Chooz data, whichyielded the allowed regions in the sin22# ��m2 planeshown in Fig. 7, the best-fit values of the mixing parame-ters reported in Table III, and the marginal allowed rangeslisted in Table V. One can see that the addition of the Choozresult to the Bugey data analysis has the effect of improv-ing slightly the upper limit on sin22# for �m2 * 3 eV2
and that of excluding values of sin22# larger than about 0.1for�m2 & 3� 10�2 eV2, where Bugey is not sensitive. Inthe intermediate range of�m2, where Bugey is sensitive tothe oscillations, the addition of the Chooz result weakensthe hint in favor of oscillations given by the Bugey data: the1� allowed regions in Fig. 4 are stretched towards smallvalues of sin22# in Fig. 7. However, the best-fit value of themixing parameters remain unchanged, because of thedominance of the Bugey data. From Table III, one cansee that the parameter goodness-of-fit implies that Bugeyand Chooz results are compatible under the hypothesis ofneutrino oscillations, but the goodness-of-fit obtained in
sin22ϑ
∆m2
[eV
2 ]
10−3 10−2 10−110−2
10−1
1
10
+
02
46
810
∆χ2
0 2 4 6 8 10
∆χ2
Bugey + Chooz
68.27% C.L. (1σ)95.45% C.L. (2σ)99.73% C.L. (3σ)
Bugey + Chooz
68.27% C.L. (1σ)95.45% C.L. (2σ)99.73% C.L. (3σ)
FIG. 7. Allowed regions in the sin22# ��m2 plane and mar-ginal ��2’s for sin22# and �m2 obtained from the combined fitof the results of the Bugey and Chooz reactor experiments. Thebest-fit point corresponding to �2
min is indicated by a cross.
TABLE V. Allowed ranges of sin22# and �m2 from the com-bined fit of the results of the Bugey and Chooz reactor experi-ments, the Gallium radioactive source and Chooz reactorexperiments, and the Gallium radioactive source and theBugey and Chooz reactor experiments. The dots indicate theabsence of limits.
Parameter C.L. Buþ Ch Gaþ Ch Gaþ Buþ Ch
68:27%ð1�Þ 0.012–0.067 0.017–0.14 0.028–0.078
sin22# 95:45%ð2�Þ <0:096 <0:20 0.002–0.12
99:73%ð3�Þ <0:18 <0:26 <0:18
68:27%ð1�Þ 0.83–1.92 >0:62 1.78–1.91
�m2 ½eV2� 95:45%ð2�Þ � � � � � � >0:7499:73%ð3�Þ � � � � � � � � �
6The value of ð��2minÞAþB corresponding to the parameter
goodness-of-fit of two experiments A and B is given byð�2
minÞAþB � ½ð�2minÞA þ ð�2
minÞB�. It has a �2 distribution withnumber of degrees of freedom NDF ¼ PA þ PB � PAþB, wherePA, PB and PAþB are, respectively, the number of parameters inthe fits of A, B and Aþ B data [32].
7In our figures we considered �m2 in the range 10�2–102 eV2.For simplicity, we neglected the small �m2 dependence of theCHOOZ exclusion curve for �m2 & 4� 10�2 eV2 (see Fig. 55of Ref. [26]).
LIMITS ON �e AND ��e . . . PHYSICAL REVIEW D 78, 073009 (2008)
073009-7
the case of no oscillations do not allow us to exclude thispossibility.
From the comparison of Eq. (12) and Fig. 2, one can seethat the results of the Chooz and the Gallium radioactivesource experiments are compatible only at the 2� level. Infact the parameter goodness-of-fit reported in Table IIIshows a tension between Gallium and Chooz data underthe hypothesis of neutrino oscillations.
Figure 8 shows the allowed regions in the sin22# ��m2 plane obtained with the combined least-squares fitof Gallium and Chooz data. The values of �2
min and good-
ness of fit and the best-fit values of the mixing parametersare given in Table III. It is clear that the combined fit is notgood, since the results of Chooz and the Gallium radioac-tive source experiments are in contradiction regardingneutrino disappearance. The marginal allowed ranges ofsin22# and �m2 in Table V are of little interest, since theminima of the corresponding ��2’s in Fig. 8 are veryshallow, except for the upper bound on sin22# driven byChooz data. As one can see from the allowed regions in thesin22# � �m2 plane in Fig. 8, the Chooz bound on sin22#in Eq. (12) is weakened by the results of the Galliumradioactive source experiments in a significant way onlyfor �m2 * 10�1 eV2 at the 1� level.
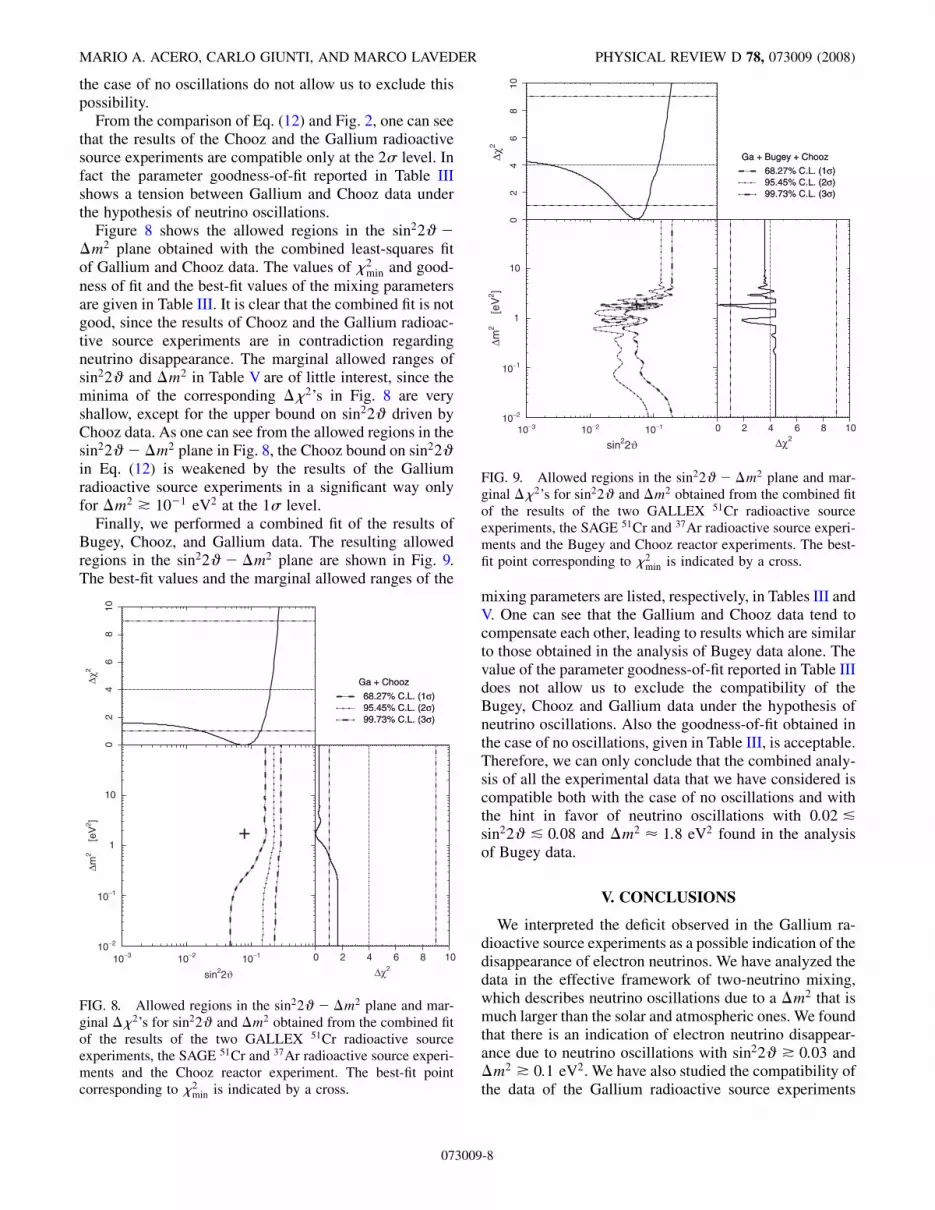
Finally, we performed a combined fit of the results ofBugey, Chooz, and Gallium data. The resulting allowedregions in the sin22# ��m2 plane are shown in Fig. 9.The best-fit values and the marginal allowed ranges of the
mixing parameters are listed, respectively, in Tables III andV. One can see that the Gallium and Chooz data tend tocompensate each other, leading to results which are similarto those obtained in the analysis of Bugey data alone. Thevalue of the parameter goodness-of-fit reported in Table IIIdoes not allow us to exclude the compatibility of theBugey, Chooz and Gallium data under the hypothesis ofneutrino oscillations. Also the goodness-of-fit obtained inthe case of no oscillations, given in Table III, is acceptable.Therefore, we can only conclude that the combined analy-sis of all the experimental data that we have considered iscompatible both with the case of no oscillations and withthe hint in favor of neutrino oscillations with 0:02 &sin22# & 0:08 and �m2 � 1:8 eV2 found in the analysisof Bugey data.
V. CONCLUSIONS
We interpreted the deficit observed in the Gallium ra-dioactive source experiments as a possible indication of thedisappearance of electron neutrinos. We have analyzed thedata in the effective framework of two-neutrino mixing,which describes neutrino oscillations due to a �m2 that ismuch larger than the solar and atmospheric ones. We foundthat there is an indication of electron neutrino disappear-ance due to neutrino oscillations with sin22# * 0:03 and�m2 * 0:1 eV2. We have also studied the compatibility ofthe data of the Gallium radioactive source experiments
sin22ϑ
∆m2
[eV
2 ]
10−3 10−2 10−110−2
10−1
1
10
+
02
46
810
∆χ2
0 2 4 6 8 10
∆χ2
Ga + Bugey + Chooz
68.27% C.L. (1σ)95.45% C.L. (2σ)99.73% C.L. (3σ)
Ga + Bugey + Chooz
68.27% C.L. (1σ)95.45% C.L. (2σ)99.73% C.L. (3σ)
FIG. 9. Allowed regions in the sin22# ��m2 plane and mar-ginal ��2’s for sin22# and �m2 obtained from the combined fitof the results of the two GALLEX 51Cr radioactive sourceexperiments, the SAGE 51Cr and 37Ar radioactive source experi-ments and the Bugey and Chooz reactor experiments. The best-fit point corresponding to �2
min is indicated by a cross.
sin22ϑ
∆m2
[eV
2 ]
10−3 10−2 10−110−2
10−1
1
10
+
02
46
810
∆χ2
0 2 4 6 8 10
∆χ2
Ga + Chooz
68.27% C.L. (1σ)95.45% C.L. (2σ)99.73% C.L. (3σ)
Ga + Chooz
68.27% C.L. (1σ)95.45% C.L. (2σ)99.73% C.L. (3σ)
FIG. 8. Allowed regions in the sin22# ��m2 plane and mar-ginal ��2’s for sin22# and �m2 obtained from the combined fitof the results of the two GALLEX 51Cr radioactive sourceexperiments, the SAGE 51Cr and 37Ar radioactive source experi-ments and the Chooz reactor experiment. The best-fit pointcorresponding to �2
min is indicated by a cross.
MARIO A. ACERO, CARLO GIUNTI, AND MARCO LAVEDER PHYSICAL REVIEW D 78, 073009 (2008)
073009-8

with the data of the Bugey and Chooz reactor short-baseline antineutrino disappearance experiments in thesame effective framework of two-neutrino mixing, inwhich the disappearance of neutrinos and antineutrinosare equal. We found that the Bugey data present a hint ofneutrino oscillations with 0:02 & sin22# & 0:08 and�m2 � 1:8 eV2, which is compatible with the region ofthe mixing parameters allowed by the analysis of the dataof the Gallium radioactive source experiments. We havealso performed combined analyses of the Bugey and Choozdata, of the Gallium and Bugey data, of the Gallium andChooz data, which show that the Bugey and Chooz data arecompatible, the Gallium and Bugey data are compatible,and the Gallium and Chooz data are marginally compat-ible. The weak indication in favor of neutrino oscillationsfound in the analysis of the Bugey data persists in thecombined analyses of the Bugey data with the Galliumand Chooz data. However, we cannot exclude the absenceof oscillations.
From a physical point of view, a hint in favor of short-baseline neutrino oscillations generated by �m2 *0:1 eV2 is extremely interesting. This squared-mass differ-ence is too large to be compatible with the three-neutrinomixing scheme inferred from the observation of neutrinooscillations in solar, very-long-baseline reactor, atmos-pheric and long-baseline accelerator experiments, in whichthere are only two independent squared-mass differences,�m2
SOL � 8� 10�5 eV2 and �m2ATM � 3� 10�3 eV2.
Therefore, the results of our analysis indicate the possibleexistence of at least one light sterile neutrino �s (seeRefs. [5,6,11]). We think that it is very important to explorethis intriguing hint of new physics beyond the standardmodel.
As already discussed in Ref. [24], short-baseline �ð�Þ
e !�ð�Þ
s transitions have an influence on the interpretation of all
experiments with an initial �ð�Þ
e beam. In the existing solarand atmospheric neutrino experiments the survival proba-
bility of �ð�Þ
e is the averaged one in Eq. (11). However, the
uncertainties of the experimental data and our knowledge
of the initial flux do not allow us to exclude �ð�Þ
e ! �ð�Þ
s
transitions at the level of about 20% in the case of solarneutrinos [38] and about 30% (see Ref. [11]) in the case ofatmospheric neutrinos.Future experiments which are well suited for finding
small �ð�Þ
e ! �ð�Þ
s transitions are those with a source pro-
ducing a �ð�Þ
e flux which is known with high accuracy.
Since sterile neutrinos are invisible, �ð�Þ
e ! �ð�Þ
s transitionscan be revealed either by measuring a disappearance of
�ð�Þ
e’s without �ð�Þ
or �ð�Þ
production in the detection process
or by measuring a disappearance of �ð�Þ
e’s due to oscilla-tions with a squared-mass difference much larger than�m2
SOL and �m2ATM. We are aware of the following possi-
bilities: beta-beam experiments [39] which have a pure �e
or ��e beam from nuclear decay (see the reviews inRefs. [40,41]); neutrino factory experiments in which thebeam is composed of �e and ���, from �þ decay, or ��e and
��, from �� decay (see the review in Ref. [40,42]);
Mossbauer neutrino experiments, with a ��e beam producedin recoilless nuclear decay and detected in recoilless nu-clear antineutrino capture [43]; the LENS detector [44,45]with an artificial Megacurie �e source [46]. Let us alsonotice the very interesting possibility to reveal the exis-tence of sterile neutrinos in the flux of high-energy astro-physical neutrinos after their passage through the Earth bymeasuring the peculiar matter effects [47,48].
ACKNOWLEDGMENTS
We would like to express our gratitude to Y. Declais forgiving us detailed information on the Bugey experiment.M.A. Acero would like to thank the InternationalDoctorate on AstroParticle Physics (IDAPP) for financialsupport. C. Giunti would like to thank the Department ofTheoretical Physics of the University of Torino for hospi-tality and support.
[1] S. Abe et al. (KamLAND), Phys. Rev. Lett. 100, 221803(2008).
[2] P. Adamson et al. (MINOS), Phys. Rev. D 77, 072002(2008).
[3] S.M. Bilenky and B. Pontecorvo, Phys. Rep. 41, 225(1978).
[4] S.M. Bilenky and S. T. Petcov, Rev. Mod. Phys. 59, 671(1987).
[5] S.M. Bilenky, C. Giunti, and W. Grimus, Prog. Part. Nucl.Phys. 43, 1 (1999).
[6] M. Gonzalez-Garcia and Y. Nir, Rev. Mod. Phys. 75, 345(2003).
[7] C. Giunti and M. Laveder, in Developments in QuantumPhysics–2004, edited by F. Columbus and V.Krasnoholovets (Nova Science Publishers, Inc.,Hauppauge, New York, 2003), pp. 197–254
[8] M. Maltoni et al., New J. Phys. 6, 122 (2004).[9] G. L. Fogli et al., Prog. Part. Nucl. Phys. 57, 742 (2006).[10] A. Strumia and F. Vissani, arXiv:hep-ph/0606054.[11] C. Giunti and C.W. Kim, Fundamentals of Neutrino
LIMITS ON �e AND ��e . . . PHYSICAL REVIEW D 78, 073009 (2008)
073009-9

Physics and Astrophysics (Oxford University Press, NewYork, 2007).
[12] A. Aguilar et al. (LSND), Phys. Rev. D 64, 112007 (2001).[13] J. N. Abdurashitov et al., Phys. Rev. C 73, 045805 (2006).[14] A. Aguilar-Arevalo et al. (MiniBooNE), Phys. Rev. Lett.
98, 231801 (2007).[15] P. Anselmann et al. (GALLEX), Phys. Lett. B 342, 440
(1995).[16] W. Hampel et al. (GALLEX), Phys. Lett. B 420, 114
(1998).[17] J. N. Abdurashitov et al. (SAGE), Phys. Rev. Lett. 77,
4708 (1996).[18] J. N. Abdurashitov et al. (SAGE), Phys. Rev. C 59, 2246
(1999).[19] W. Hampel et al. (GALLEX), Phys. Lett. B 447, 127
(1999).[20] J. N. Abdurashitov et al., Astropart. Phys. 25, 349 (2006).[21] G. Fogli et al., arXiv:hep-ph/0605186.[22] M. Laveder, Nucl. Phys. B, Proc. Suppl. 168, 344 (2007).[23] C. Giunti and M. Laveder, Mod. Phys. Lett. A 22, 2499
(2007).[24] C. Giunti and M. Laveder, Phys. Rev. D 77, 093002
(2008).[25] B. Achkar et al. (Bugey), Nucl. Phys. B434, 503 (1995).[26] M. Apollonio et al. (CHOOZ), Eur. Phys. J. C 27, 331
(2003).[27] J. N. Bahcall, Phys. Rev. C 56, 3391 (1997).[28] V. A. Kuzmin, Sov. Phys. JETP 22, 1051 (1966) [Zh. Eksp.
Teor. Fiz. 49, 1532 (1965)].[29] F. Kaether, Ph.D. Thesis (in German), 2007; URL: http://
www.ub.uni-heidelberg.de/archiv/7501/.
[30] R. L. Hahn, Neutrino 2008, 2008 (Christchurch, NewZealand, 2008); URL: http://www2.phys.canterbury.ac.nz/~jaa53/presentations/Hahn.pdf .
[31] W.M. Yao et al., J. Phys. G 33, 1 (2006); URL: http://pdg.lbl.gov.
[32] M. Maltoni and T. Schwetz, Phys. Rev. D 68, 033020(2003).
[33] J. N. Bahcall, P. I. Krastev, and E. Lisi, Phys. Lett. B 348,121 (1995).
[34] C. Bemporad, G. Gratta, and P. Vogel, Rev. Mod. Phys. 74,297 (2002).
[35] W. Grimus and T. Schwetz, Eur. Phys. J. C 20, 1 (2001).[36] Y. Declais (private communication).[37] G. J. Feldman and R.D. Cousins, Phys. Rev. D 57, 3873
(1998).[38] J. N. Bahcall, M. C. Gonzalez-Garcia, and C. Pena-Garay,
J. High Energy Phys. 08 (2004) 016.[39] P. Zucchelli, Phys. Lett. B 532, 166 (2002).[40] C. Albright et al. (Neutrino Factory/Muon Collider),
arXiv:physics/0411123.[41] C. Volpe, J. Phys. G 34, R1 (2007).[42] M. Apollonio et al., arXiv:hep-ph/0210192.[43] R. S. Raghavan, arXiv:hep-ph/0601079.[44] R. S. Raghavan, Phys. Rev. Lett. 78, 3618 (1997).[45] R. S. Raghavan et al. (2002), URL: http://lens.in2p3.fr/
lens-rep-02.pdf.[46] C. Grieb, J. Link, and R. S. Raghavan, Phys. Rev. D 75,
093006 (2007).[47] H. Nunokawa, O. L. G. Peres, and R. Z. Funchal, Phys.
Lett. B 562, 279 (2003).[48] S. Choubey, J. High Energy Phys. 12 (2007) 014.
MARIO A. ACERO, CARLO GIUNTI, AND MARCO LAVEDER PHYSICAL REVIEW D 78, 073009 (2008)
073009-10


