Embed Size (px)
Citation preview
Nitrogen isotope constraints on subantarctic biogeochemistry
Peter J. DiFiore,1 Daniel M. Sigman,1 Thomas W. Trull,2 Martin J. Lourey,3
Kristen Karsh,1,2 Greg Cane,1 and Ruby Ho1
Received 10 August 2005; revised 29 January 2006; accepted 28 April 2006; published 11 August 2006.
[1] We report nitrate (NO3�) nitrogen isotope ratios for seawater samples collected in the
Subantarctic Zone of the Southern Ocean during both winter and summer as part of theAustralian Antarctic CRC Subantarctic Zone (SAZ) Project. The concentration and15N/14N of the wintertime surface nitrate are very close to those of the subantarcticthermocline. The 15N/14N of nitrate in the surface increases sharply into the summereven though there is little seasonal change in nitrate concentration. There are two possibleend-member explanations for this observation. First, there may be significant equatorwardnitrate transport during the summer, including a supply from the Antarctic surface.Second, the isotope effect of algal nitrate assimilation may be higher than has beenestimated elsewhere, for example, for the seasonal sea ice zone of the Antarctic. We use asimple geochemical box model of the SAZ surface mixed layer as it evolves over thecourse of the summer to simulate salinity, nitrate concentration, and the 15N/14N of nitrateand sinking N. Our results suggest that a significant portion (�30%) of the summertimeSAZ nitrate is supplied from south of the Subantarctic Front and that N export is �3.5mmol N m�2 d�1. Our approach also identifies the necessity of an isotope effect for nitrateassimilation in the SAZ of �7% and probably 8–9%. Comparison to laboratory resultssuggests that this relatively high isotope effect may result from light limitation of algalgrowth in the SAZ.
Citation: DiFiore, P. J., D. M. Sigman, T. W. Trull, M. J. Lourey, K. Karsh, G. Cane, and R. Ho (2006), Nitrogen isotope constraints
on subantarctic biogeochemistry, J. Geophys. Res., 111, C08016, doi:10.1029/2005JC003216.
1. Introduction
[2] The Southern Ocean represents a region of intensecommunication between the ocean and atmosphere as wellas a critical junction in the exchange of waters between thecold, deep ocean and the warmer, low-latitude surface andthermocline. The combined effect of wind-driven surfacewater transport and geostrophy as well as the densificationassociated with surface cooling and sea ice formation resultin the surfacing of deep CO2-charged, nutrient-rich water inthe Antarctic. Despite intense export production in someparts of the Antarctic, the consumption of the majornutrients (N and P) is incomplete, so that excess CO2 inupwelled deep water escapes to the atmosphere. Westerlywinds advect surface water northward across the Polarfrontal zone and into the Subantarctic Zone (SAZ), wherebiological uptake draws nutrient concentrations to lowervalues northward and generates a sinking flux of organicmatter that reinjects part of the escaped CO2 back into theocean interior [Takahashi et al., 1997]. However, the major
nutrients are not completely consumed in much of theSubantarctic, which may be due to limitation of phytoplank-ton growth by iron, silica, and/or light [Boyd et al., 1999,2001; Debaar et al., 1995; Hutchins et al., 2001; Martin etal., 1990; Mitchell et al., 1991; Sedwick et al., 1999, 1997].[3] The degree of SAZ nutrient drawdown affects not
only atmospheric CO2 but also the nutrient content of thethermocline and thus the fertility and biogeochemistry ofthe low-latitude ocean. Nutrients are constantly being lostfrom the low-latitude surface ocean and thermocline by therain of organic detritus that survives into the abyss. Thesenutrients may be dominantly resupplied to the upper oceanfrom the new middepth waters that form in the Subantarctic[Sarmiento et al., 2004]. If so, the nutrient supply to thesubtropical, tropical, and equatorial surface ocean dependslargely on the incomplete consumption of nutrients by algaein the Southern Ocean surface; if nutrients in the SouthernOcean surface were more efficiently depleted, the supply ofnutrients to the low-latitude thermocline and surface oceanwould be reduced [Keir, 1988; Matsumoto et al., 2001;Robinson et al., 2005; Sigman et al., 2003]. Increasednutrient drawdown could occur in either the Antarctic orthe Subantarctic, but the nutrient concentration in theSubantarctic is the final determinant of the nutrient supplyto the low-latitude thermocline. Thus the development of aquantitative and mechanistic understanding of subantarcticbiogeochemistry is central to an understanding of globalocean biogeochemistry.
JOURNAL OF GEOPHYSICAL RESEARCH, VOL. 111, C08016, doi:10.1029/2005JC003216, 2006ClickHere
for
FullArticle
1Department of Geosciences, Princeton University, Princeton, NewJersey, USA.
2Antarctic Climate and Ecosystem Cooperative Research Centre,CSIRO Marine and Atmospheric Research, Hobart, Tasmania, Australia.
3CSIRO Marine and Atmospheric Research, Wembley, WesternAustralia, Australia.
Copyright 2006 by the American Geophysical Union.0148-0227/06/2005JC003216$09.00
C08016 1 of 19
[4] The integrated rates of net primary production andexport production estimated from direct measures areplagued by the spatial and temporal variability of thesurface ocean as well as artifacts associated with makingthese measurements (e.g., bottle effects and sediment trapartifacts). Dissolved geochemical tracers are useful becausethey integrate over heterogeneities and do not involvemanipulation of the organisms responsible for the biogeo-chemical fluxes. Over the last forty years, there has beengreat progress in characterizing the spatial distribution ofbioactive species in the ocean. The distributions of dis-solved inorganic carbon, alkalinity, dissolved oxygen, andthe nutrients nitrate, phosphate, and silicate are relativelywell-defined, and the databases are being continuouslyimproved [Conkright et al., 2002; Key et al., 2004]. Theuse of these distributions to quantify physical and biolog-ical fluxes is an area of active research. If the oceancirculation was known, then the nutrient fields could beoverlain on the circulation field to quantify the uptake ofnutrients and carbon throughout the surface ocean (‘‘nu-trient restoring’’ [Deutsch et al., 2001; Dunne et al., 2005;Jin and Gruber, 2003; Najjar et al., 1992; Schlitzer,2002]). However, uncertainties in the model-derived cir-culation compromise these estimates. In the surface ocean,where transport and mixing occur in complex patterns, itcan be difficult to derive rates and patterns of nutrientassimilation from nutrient concentration fields becauseboth assimilation and water exchange affect the nutrientconcentration. Thus additional dissolved tracers with dif-ferent sensitivities to physical and biological processeswould be of great complementary use.[5] Nitrate assimilation by phytoplankton leaves a clear
imprint on the isotopic composition of oceanic nitrateand on the products of phytoplankton growth. Field andlaboratory studies have demonstrated isotopic fractionationassociated with nitrate assimilation by phytoplankton, withthe preferential incorporation of 14N into phytoplanktonbiomass [Altabet et al., 1991; Altabet and Francois, 1994;Altabet and McCarthy, 1985; Farrell et al., 1995; Francoiset al., 1992; Montoya and McCarthy, 1995; Nakatsuka etal., 1992; Pennock et al., 1996; Wada, 1980; Wada andHattori, 1978; Waser et al., 1998; Wu et al., 1997]. In thecase of a finite nitrate pool, this pool becomes progres-sively enriched in 15N as nitrate is consumed, also leadingto an increase in the d15N of newly formed biomass N(d15N versus atmospheric N2 = [[(15N/14N)sample/(15N/14N)atm] � 1]).[6] Because this anticorrelation between the degree of
nitrate consumption and nitrate 15N/14N is propagated to thesinking flux out of the surface ocean and to deep seasediments, the N isotopes have been used as an indicatorof past changes in nutrient utilization (the ratio of nutrientuptake to gross nutrient supply) in Southern Ocean surfacewaters [Altabet and Francois, 1994; Francois et al., 1992,1997; Robinson et al., 2004, 2005; Sigman et al., 1999b].There are several processes and parameters that must beunderstood for the paleoceanographic application of the linkbetween nitrate utilization and the N isotopes in the South-ern Ocean. The d15N of the nitrate supply and the amplitudeof isotope discrimination associated with nitrate assimila-tion are two key parameters relating nitrate utilization to theisotopic composition of nitrate in oceanic surface waters and
of the sinking flux to the seafloor. Both parameters requirequantification in the modern ocean, assessments of theirvariability, and the development of a mechanistic under-standing of the parameters that control them.[7] As shown previously, the possible sources of nitrate
to the subantarctic surface have distinct nitrate d15N-to-[NO3
�] relationships (hereafter ‘‘d15N/[NO3�]’’) [Sigman et
al., 1999a, 2000]. From the perspective of paleoceano-graphic studies, this largely represents an unwanted com-plexity. However, for modern ocean studies, it may proveuseful in defining and quantifying the routes of nitratesupply to the subantarctic surface. Moreover, mixing ofwaters that have previously undergone nitrate assimilationhas an effect on the d15N of nitrate that is very differentfrom the effect of nitrate assimilation alone: while [NO3
�]mixes conservatively, the d15N of nitrate of a volumetricmixture of waters is weighted toward the end-member withthe higher [NO3
�]. Thus assimilation and mixing in theupper ocean should be distinguishable when the concentra-tion and isotope constraints are coupled.[8] Much as in paleoceanographic studies, the major
limitation on nitrate d15N as a tool for modern upper oceanstudies is uncertainty in the amplitude of N isotope dis-crimination associated with nitrate assimilation. This dis-crimination is quantified as the isotope effect, e, which isdefined as (14k/15k � 1), where 14k and 15k are the ratecoefficients of nitrate assimilation for the 14N- and 15N-labeled forms of nitrate, respectively. Currently, estimates ofe from the ocean range between roughly 4 and 10%[Altabet and Francois, 2001; Karsh et al., 2003; Loureyet al., 2003; Sigman et al., 1999a], while the range observedin batch culture experiments is much greater, 0 to 20%[Granger et al., 2004; Montoya and McCarthy, 1995;Needoba et al., 2003;Waser et al., 1997]. The first SouthernOcean data yielded isotope effect estimates in the range of 4to 6% [Sigman et al., 1999a]; however, subsequent esti-mates from the Southern Ocean near the polar frontal zonehave yielded higher values (7–10%) [Altabet and Francois,2001; Karsh et al., 2003; Lourey et al., 2003]. There may becoherent spatial (i.e., environmentally driven) variationwithin the Southern Ocean and among nutrient-rich regionsin general. For the degree of nitrate consumption to bederived from nitrate isotope data, a better understanding ofthe isotope effect and its controls must be developed. At thesame time, evidence has arisen that the magnitude of theisotope effect is affected by the factors that limit phyto-plankton growth [Needoba and Harrison, 2004; Needoba etal., 2004], so that reliable estimates of the isotope effect inthe subantarctic ocean may have implications for whatcontrols phytoplankton growth in this region.[9] Previous nitrate isotope measurements from subant-
arctic samples collected during the austral summer showclear signs of net northward transport of nitrate in thesubantarctic surface layer, such that the underlying thermo-cline cannot be the sole source of nitrate to the surface layer[Sigman et al., 1999a]. The entire data set was consistentwith nitrate being supplied from the Polar Frontal Zone andbeing assimilated with an isotope effect of �5%. However,this study included no samples collected during winterconditions, under which nitrate supply from the thermoclineis most likely to occur.
C08016 DIFIORE ET AL.: SUBANTARCTIC NITRATE N ISOTOPES
2 of 19
C08016
[10] Here, we report new data for 15N/14N of nitrate fromsamples collected during both summer and winter condi-tions across the Subantarctic and Polar Frontal Zones southof Australia. While seasonal changes in surface nitrateconcentration are unremarkable, we observe a dramaticsummertime increase in nitrate 15N/14N across the entireSubantarctic. This indicates that the meridional gradient innitrate concentration is purely a circulation feature duringthe winter, whereas it is strongly modified by assimilationduring the summer. As in previous work [Sigman et al.,1999a], there is evidence for equatorward transport of
nitrate, especially close to the Subantarctic Front, thepoleward border of the SAZ. However, the new seasonalinformation indicates that the high-nitrate 15N/14N in theSAZ surface is generated in the very short time intervalassociated with summertime stratification and nitrate draw-down. Over this short time interval, surface salinity hasbeen used as a constraint on water transport [Lourey andTrull, 2001; Wang et al., 2001], as ocean/atmosphereexchanges of freshwater have been found to be insignificantduring the spring/summer productive season [Rintoul andEngland, 2002]. The modest summertime decrease in sub-
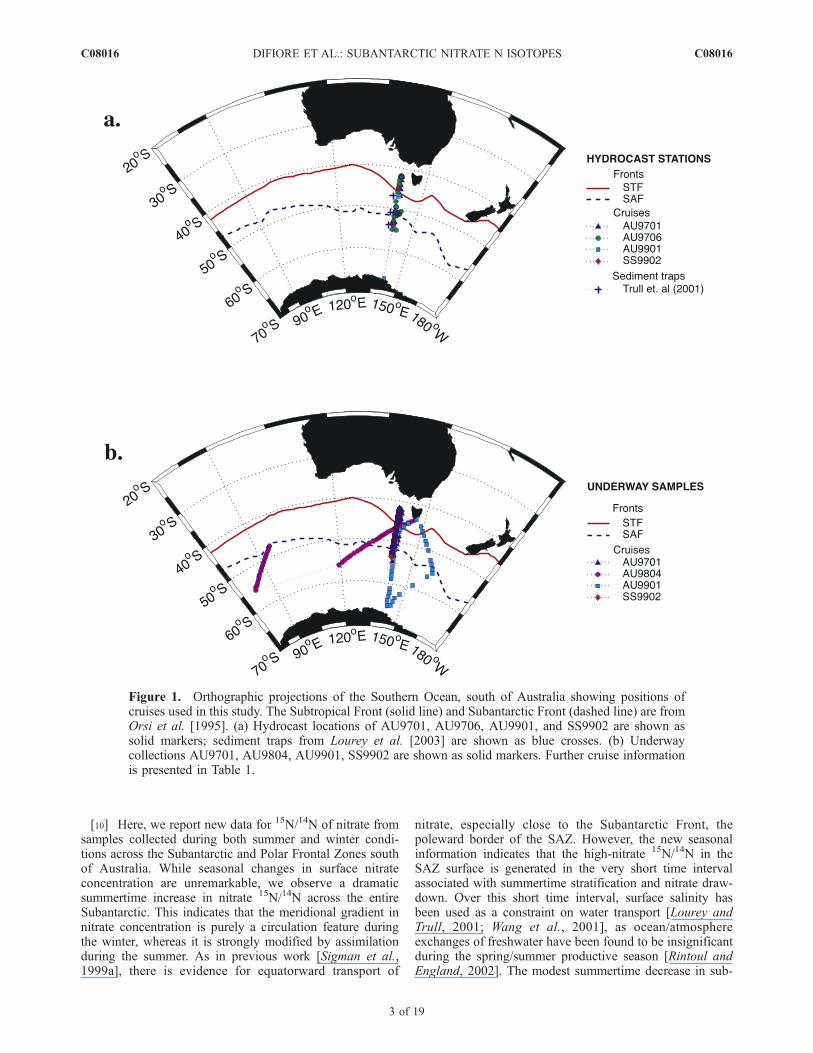
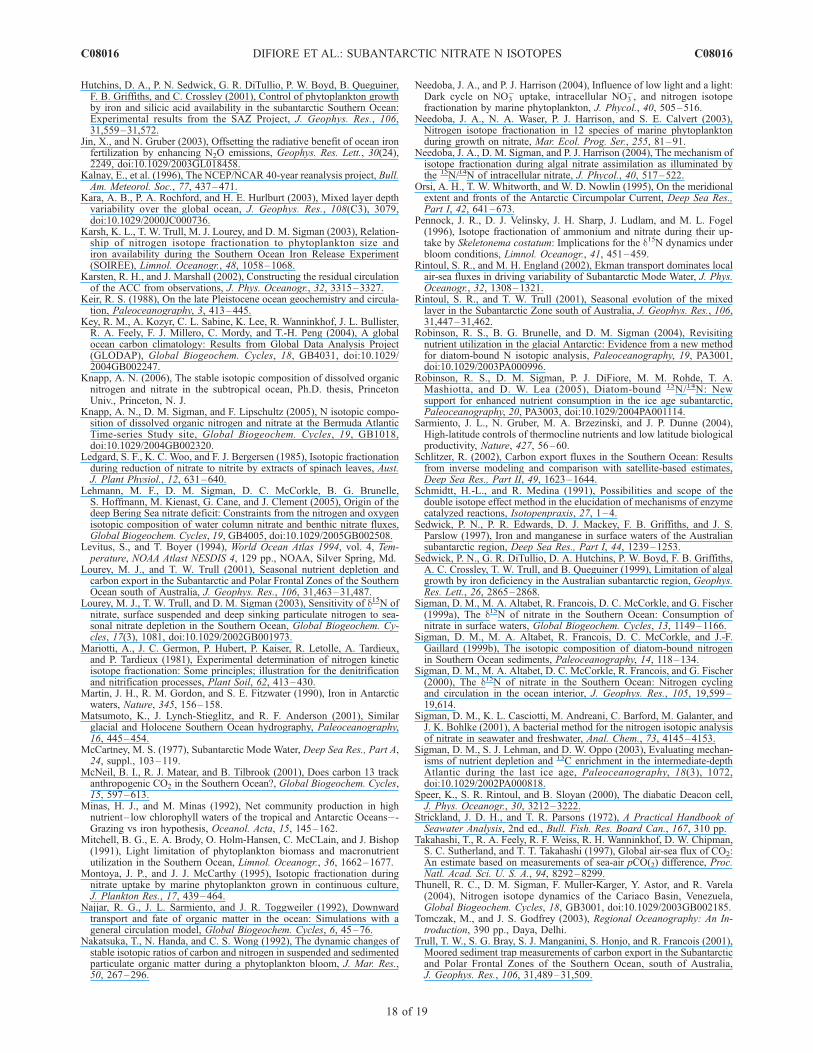
Figure 1. Orthographic projections of the Southern Ocean, south of Australia showing positions ofcruises used in this study. The Subtropical Front (solid line) and Subantarctic Front (dashed line) are fromOrsi et al. [1995]. (a) Hydrocast locations of AU9701, AU9706, AU9901, and SS9902 are shown assolid markers; sediment traps from Lourey et al. [2003] are shown as blue crosses. (b) Underwaycollections AU9701, AU9804, AU9901, SS9902 are shown as solid markers. Further cruise informationis presented in Table 1.
C08016 DIFIORE ET AL.: SUBANTARCTIC NITRATE N ISOTOPES
3 of 19
C08016
antarctic surface salinity essentially puts an upper bound onthe quantity of Antarctic water imported into the Subant-arctic during the summer. The data set reported here alsobenefits from sediment trap collections in this region andthe constraint that they provide on the 15N/14N of sinking N[Lourey et al., 2003]. While uncertainties exist in theinterpretation of these data, combining them with theseasonally resolved nitrate isotope data provides at least arough constraint on the amplitude of the isotope effect ofnitrate assimilation. We explore the constraints provided bythe available data with a simple geochemical model of theSAZ surface mixed layer subsequent to the onset of warmseason stratification, with emphasis placed on evaluating themagnitudes of Antarctic nitrate supply and N export duringthese periods and on developing a revised estimate of theisotope effect of nitrate assimilation in the SAZ.
2. Sample Sets
[11] Water column depth profiles (‘‘hydrocasts’’) werecollected from two companion sediment trap deployment/retrieval cruises as a starting basis for comparison of winterand summer seasons in the Subantarctic Zone south ofTasmania (Figure 1 and Table 1). Meridional transects ofhydrographic profiles were collected along 142�E duringSeptember of 1997 (AU9701) and between 141� and144.5�E during March of 1998 (AU9706), both aboardthe R/V Aurora Australis by the Antarctic CooperativeResearch Centre (CRC). During AU9701, 7 profiles werecollected for nitrate isotopes, augmented by 40 samplestaken from �7 m depth by the ship’s underway system;during AU9706, 10 depth profiles were collected. Bothcruises traverse the Subtropical front into the SubantarcticZone and extend across the Subantarctic Front into the PolarFrontal Zone at �52�S (Figure 1).[12] To improve our interseasonal comparison, our sam-
ple set was augmented by subsequent underway collections
from other SAZ transect cruises AU9804, AU9901, andSS9902 (Table 1 and Figure 1b). AU9804 and AU9901transects were completed on the R/V Aurora Australisduring 29 October to 23 December 1998 and 16 Julyto 6 September 1999, respectively. AU9804 included47underwaysurface samples,AU9901 included46underwaysamples and 3 hydrocasts. SS9902 completed on the R/VSouthern Surveyor of the Australian CommonwealthScientific and Industrial Research Organisation (CSIRO)during 9–16 February 1999, consisted of 14 underwaycollections and 2 hydrocasts at 44�S and 54�S.[13] Samples were collected in acid- and deionized wa-
ter–washed 500 mL HDPE bottles. The bottles were rinsedtwice with sample water before filling. The samples werepreserved for nitrate concentration and 15N/14N analysis byacidification with the addition of 0.5 mL 50% HCl to each500 mL seawater sample, bringing the sample pH tobetween 2 and 3.
3. Methods
[14] Nitrate concentration ([NO3�]) was analyzed by stan-
dard colorimetric methods at the University of Tasmania–Antarctic CRC [Eriksen, 1997; Strickland and Parsons,1972]. Some samples were reanalyzed at Princeton Univer-sity by reduction of NO3
� (and NO2�) to NO using a V(III)
reagent followed by measurement of NO by chemilumines-cence [Braman and Hendrix, 1989]. NO2
� was alwaysscarce and is subsequently disregarded. The 15N/14N ofnitrate was analyzed by the ‘‘denitrifier method’’ [Casciottiet al., 2002; Sigman et al., 2001]. Briefly, 10 or 20 nmolnitrate is quantitatively reduced to N2O by a strain ofbacteria that lacks an active N2O reductase, and the productN2O is analyzed by continuous flow isotope ratio massspectrometry. Referencing to the 15N/14N of N2 in air wasthrough parallel measurement of the potassium nitratereference material IAEA-N3, with a d15N of +4.7%
Table 1. Cruises and Sampling
Season Cruise Research Vessel Start Date End Date Underway Stations Casts
Winter AU9701 R/V Aurora Australisa 9 Sep 1997 22 Sep 1997 40 7Summer AU9706 R/V Aurora Australis 28 Feb 1998 1 Apr 1998 - 10Winter AU9804 R/V Aurora Australis 29 Oct 1998 23 Dec 1998 47 -Summer SS9902 R/V Southern Surveyorb 9 Feb 1999 16 Feb 1999 14 2Winter AU9901 R/V Aurora Australis 16 Jul 1999 6 Sep 1999 46 3
aR/V Aurora Australis is operated by the Australian Antarctic Division.bR/V Southern Surveyor is operated by the Australian Commonwealth Scientific and Industrial Research Organization
(CSIRO).
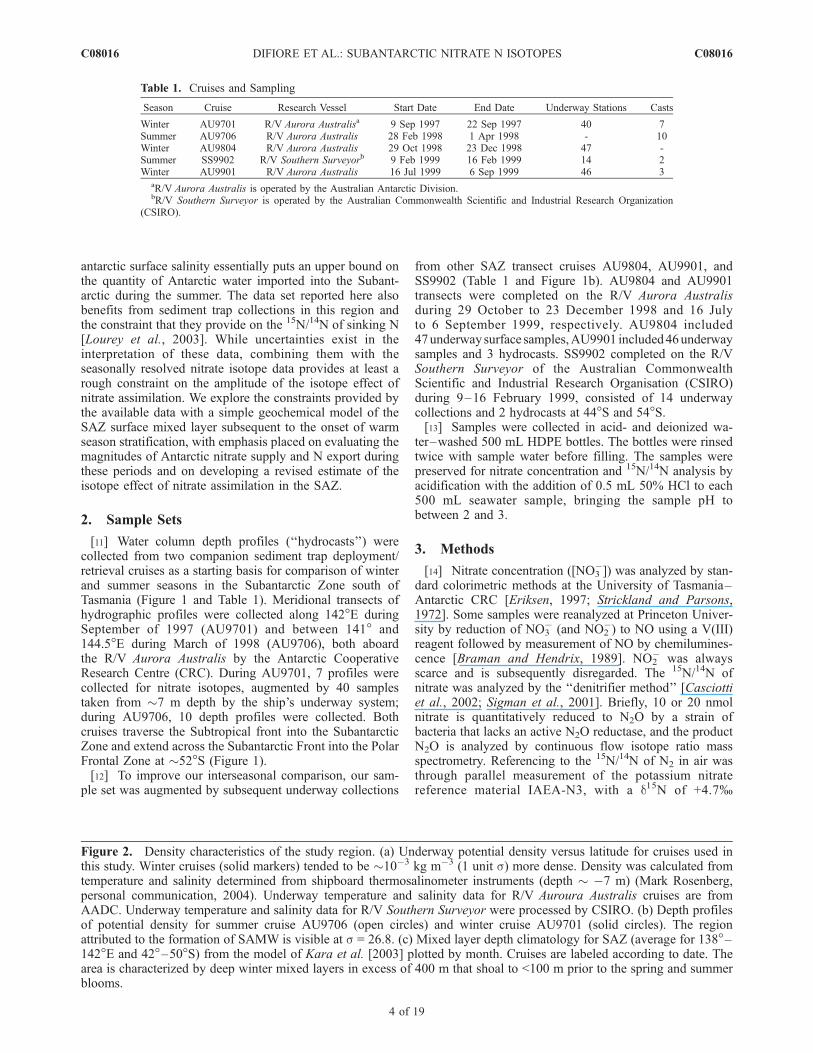
Figure 2. Density characteristics of the study region. (a) Underway potential density versus latitude for cruises used inthis study. Winter cruises (solid markers) tended to be �10�3 kg m�3 (1 unit s) more dense. Density was calculated fromtemperature and salinity determined from shipboard thermosalinometer instruments (depth � �7 m) (Mark Rosenberg,personal communication, 2004). Underway temperature and salinity data for R/V Auroura Australis cruises are fromAADC. Underway temperature and salinity data for R/V Southern Surveyor were processed by CSIRO. (b) Depth profilesof potential density for summer cruise AU9706 (open circles) and winter cruise AU9701 (solid circles). The regionattributed to the formation of SAMW is visible at s = 26.8. (c) Mixed layer depth climatology for SAZ (average for 138�–142�E and 42�–50�S) from the model of Kara et al. [2003] plotted by month. Cruises are labeled according to date. Thearea is characterized by deep winter mixed layers in excess of 400 m that shoal to <100 m prior to the spring and summerblooms.
C08016 DIFIORE ET AL.: SUBANTARCTIC NITRATE N ISOTOPES
4 of 19
C08016
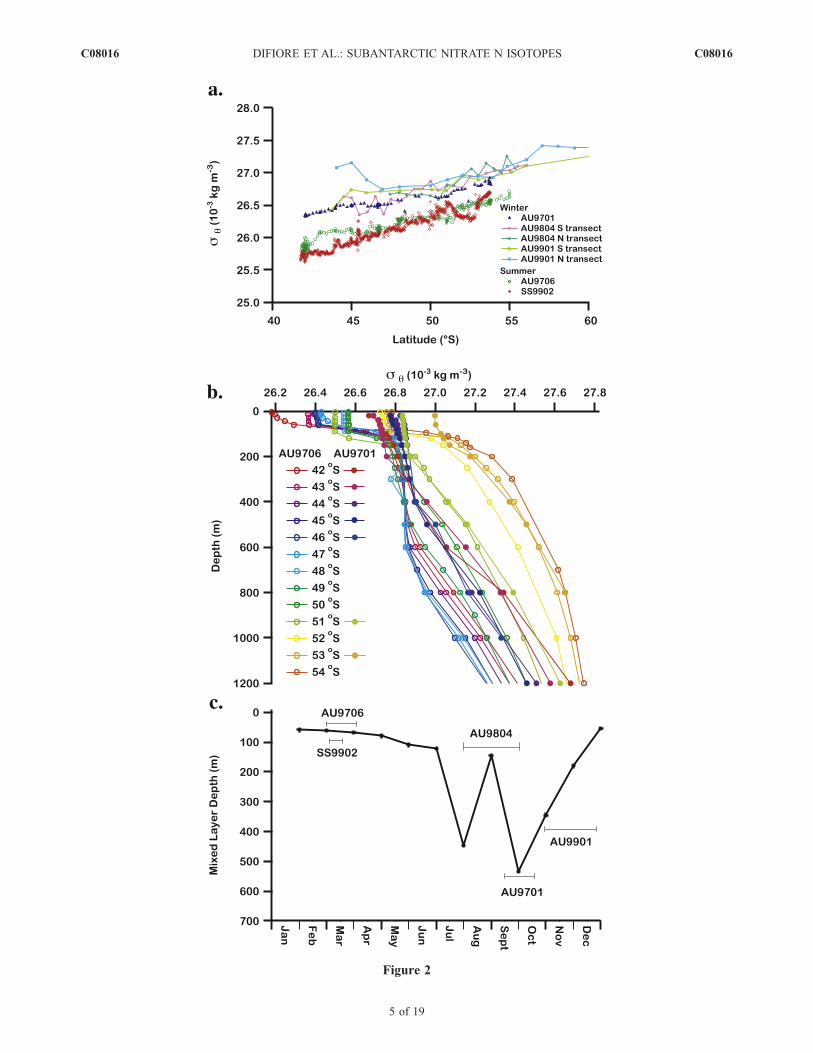
Figure 2
C08016 DIFIORE ET AL.: SUBANTARCTIC NITRATE N ISOTOPES
5 of 19
C08016

[Gonfiantini et al., 1995]. Replicate analyses were generallyconsistent with a reproducibility of 0.2% 1SD.
4. Results
4.1. Physical Conditions of the Upper Water Column
[15] There is a large winter to summer change in thedensity structure of the study region (Figure 2). While themixed layer is greater than 200 m in the Subantarctic andPolar Frontal Zones during the winter, summer mixed layerdepth in these regions is less than 100 m, with a shallowermixed layer toward the North [Rintoul and Trull, 2001]. Aclimatology of seasonal mixed layer evolution [Kara et al.,2003] illustrates that the AU9701 cruise occurred during thetime of year with the deepest mixed layer depth (althoughnear its end), whereas AU9706 occurs near the end of theperiod of shallowest mixed layer (Figure 2c).[16] The depth interval associated with Subantarctic
Mode Water (SAMW) is clearly defined in the AU9706(March 1998) profiles at a potential density of 26.8(Figure 2b). The AU9701 (September 1997) stations pole-ward of 43�S have surface densities close to that of thesummertime SAMW layer, consistent with development ofSAMW from wintertime deep mixing in the Subantarctic[McCartney, 1977]. In detail, the existence of a slightdensity decrease toward the surface in the AU9701 profiles(Figure 2b) and the slightly lower density of the surfaceduring AU9701 relative to other wintertime cruises(Figure 2a) suggest that AU9701 is just at the transitiontoward summertime conditions. There are also significant
differences in surface water density between our twosummertime samplings of subantarctic surface, on the orderof �0.5 � 10�3 kg m�3 (Figure 2a).
4.2. Nitrate Isotopes
4.2.1. Hydrocast Profiles[17] In the Subantarctic during both winter and summer,
there is an upward decrease in [NO3�] and an associated
increase in nitrate d15N into the surface mixed layer(Figure 3). In the Subantarctic during winter, the upwarddecrease in [NO3
�] and associated increase in d15N of nitratefrom the depth of Subantarctic Mode Water at 300–400 minto the surface mixed layer are modest and lack a cleardepth of transition from thermocline to surface conditions(Figures 3a and 3b). This is particularly true for the morepolar component of the SAZ (south of 45�S). The upwardincrease in d15N of nitrate into the surface is much moreclear and of greater amplitude in the summertime data thanin the wintertime data (Figure 3d compared to Figure 3b),suggestive of a winter-to-summer increase in the ratio ofnitrate assimilation relative to circulation-driven nitratesupply. As shown below, the summertime vertical gradientin the d15N of nitrate is larger than would be expected fromsummertime vertical [NO3
�] gradient (Figure 3c) if one wereto assume nitrate supply from below and assimilation withan isotope effect of 5 to 10% (Figure 3d). This is suggestedqualitatively by the winter-to-summer changes in the SAZprofiles: surface layer d15N of nitrate increases remarkablyfrom winter to summer (compare upper 100 m in Figures 3band 3d) while surface layer [NO3
�] decreases only slightly
Figure 3. Depth profiles of [NO3�] and d15N for (a) and (b) winter AU9701 cruise and (c) and
(d) summer AU9706 cruise; colors by latitude. The mixed layer is visible as near constant [NO3�] from
the surface to depth (200 m in Figure 3a and <100 m in Figure 3c).
C08016 DIFIORE ET AL.: SUBANTARCTIC NITRATE N ISOTOPES
6 of 19
C08016
from winter to summer and actually increases at somelatitudes (compare upper 100 m in Figures 3a and 3c).[18] In contrast to the upward d15N increase into the
summertime SAZ surface, the d15N of nitrate increases onlyslightly (<1%) upward through the thermocline, despite alarge (>12 mM) decrease in [NO3
�] from �1000 m to thebase of the mixed layer (compare Figures 3c and 3d). Thesethermocline observations are consistent with our previousunderstanding of the nitrate d15N/[NO3
�] relationship ofSubantarctic Mode Water, in which mixing along isopycnalswith the low-latitude thermocline leads to nitrate depletionwithout 15N enrichment of the nitrate [Sigman et al., 1999a,2000]. Vertical mixing during the winter imposes thed15N/[NO3
�] relationship of the thermocline on the over-lying surface layer, and nitrate assimilation modifies itonly modestly. In contrast, the d15N/[NO3
�] relationship isgreatly impacted by in situ nitrate assimilation in thesummertime subantarctic surface. This is shown moredirectly in section 5.4.2.2. Underway Collections of the Mixed Layer[19] The underway data provide a more complete sam-
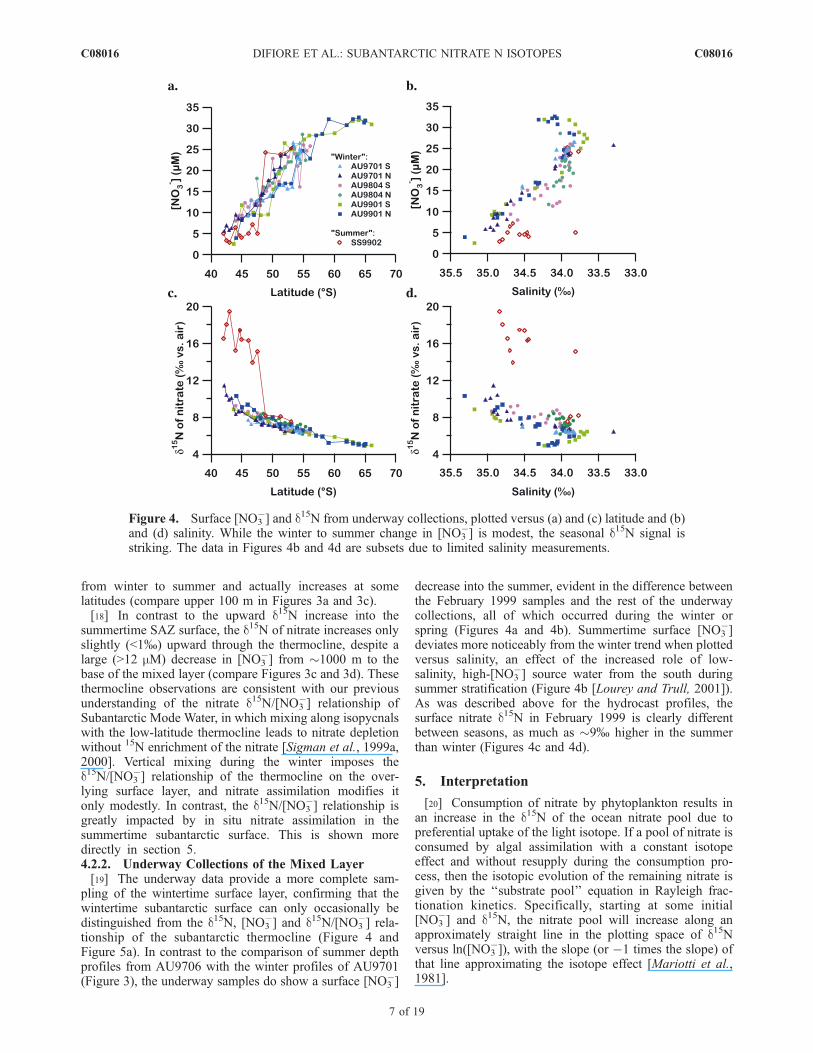
pling of the wintertime surface layer, confirming that thewintertime subantarctic surface can only occasionally bedistinguished from the d15N, [NO3
�] and d15N/[NO3�] rela-
tionship of the subantarctic thermocline (Figure 4 andFigure 5a). In contrast to the comparison of summer depthprofiles from AU9706 with the winter profiles of AU9701(Figure 3), the underway samples do show a surface [NO3
�]
decrease into the summer, evident in the difference betweenthe February 1999 samples and the rest of the underwaycollections, all of which occurred during the winter orspring (Figures 4a and 4b). Summertime surface [NO3
�]deviates more noticeably from the winter trend when plottedversus salinity, an effect of the increased role of low-salinity, high-[NO3
�] source water from the south duringsummer stratification (Figure 4b [Lourey and Trull, 2001]).As was described above for the hydrocast profiles, thesurface nitrate d15N in February 1999 is clearly differentbetween seasons, as much as �9% higher in the summerthan winter (Figures 4c and 4d).
5. Interpretation
[20] Consumption of nitrate by phytoplankton results inan increase in the d15N of the ocean nitrate pool due topreferential uptake of the light isotope. If a pool of nitrate isconsumed by algal assimilation with a constant isotopeeffect and without resupply during the consumption pro-cess, then the isotopic evolution of the remaining nitrate isgiven by the ‘‘substrate pool’’ equation in Rayleigh frac-tionation kinetics. Specifically, starting at some initial[NO3
�] and d15N, the nitrate pool will increase along anapproximately straight line in the plotting space of d15Nversus ln([NO3
�]), with the slope (or �1 times the slope) ofthat line approximating the isotope effect [Mariotti et al.,1981].
Figure 4. Surface [NO3�] and d15N from underway collections, plotted versus (a) and (c) latitude and (b)
and (d) salinity. While the winter to summer change in [NO3�] is modest, the seasonal d15N signal is
striking. The data in Figures 4b and 4d are subsets due to limited salinity measurements.
C08016 DIFIORE ET AL.: SUBANTARCTIC NITRATE N ISOTOPES
7 of 19
C08016
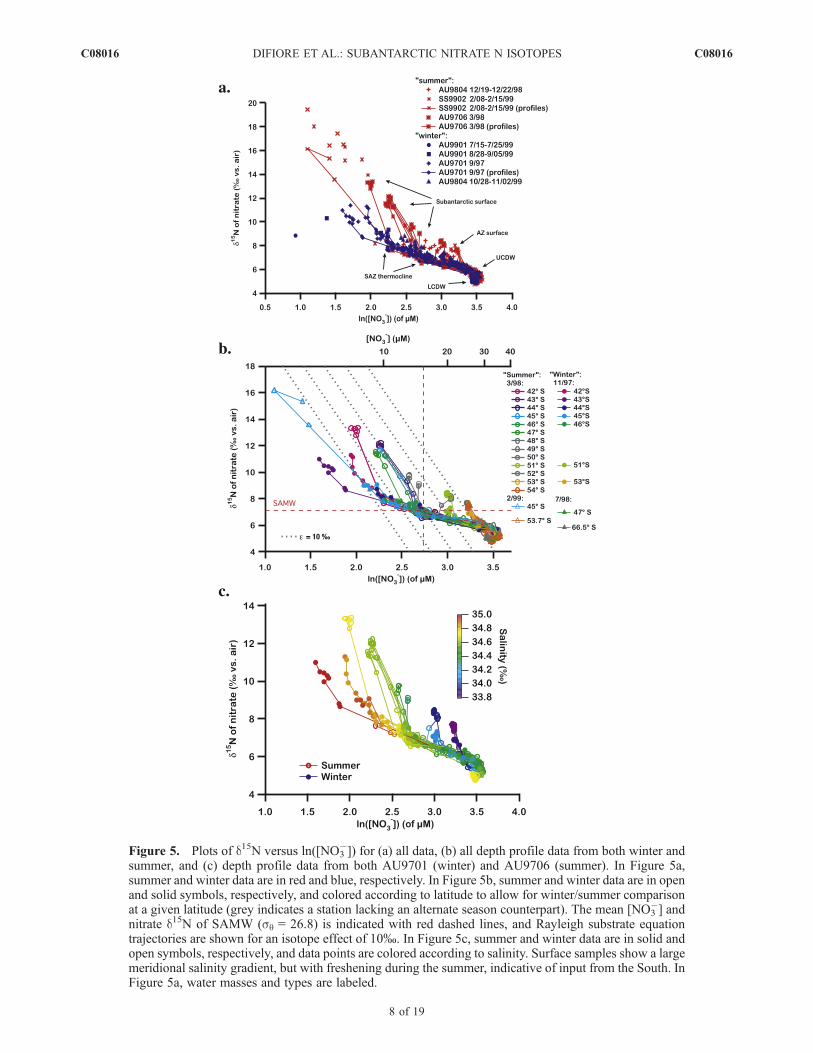
Figure 5. Plots of d15N versus ln([NO3�]) for (a) all data, (b) all depth profile data from both winter and
summer, and (c) depth profile data from both AU9701 (winter) and AU9706 (summer). In Figure 5a,summer and winter data are in red and blue, respectively. In Figure 5b, summer and winter data are in openand solid symbols, respectively, and colored according to latitude to allow for winter/summer comparisonat a given latitude (grey indicates a station lacking an alternate season counterpart). The mean [NO3
�] andnitrate d15N of SAMW (sq = 26.8) is indicated with red dashed lines, and Rayleigh substrate equationtrajectories are shown for an isotope effect of 10%. In Figure 5c, summer and winter data are in solid andopen symbols, respectively, and data points are colored according to salinity. Surface samples show a largemeridional salinity gradient, but with freshening during the summer, indicative of input from the South. InFigure 5a, water masses and types are labeled.
C08016 DIFIORE ET AL.: SUBANTARCTIC NITRATE N ISOTOPES
8 of 19
C08016
[21] Whether the Rayleigh model is appropriate for theinterpretation of a given oceanic nitrate isotope data setdepends on the specifics of the situation. For instance, theRayleigh system can be appropriate when there are non-overlapping events of nutrient supply (e.g., intense verticalmixing in the winter) and nutrient consumption (e.g., algalassimilation in a strongly stratified summer layer) or if anisolated parcel of surface water is being tracked during theconsumption process. As will be described in detail below,the Rayleigh model is not adequate for the Subantarctic as awhole. Nevertheless, the ‘‘Rayleigh space’’ of nitrate d15Nversus ln([NO3
�]) proves useful when interpreting data,including when this involves processes that clearly violatethe Rayleigh model.[22] Figure 5 recasts our water column profile and un-
derway data in Rayleigh space. In Figure 5a, we compare allwinter versus summer data. In Figure 5b, focusing on theprofile data, winter profiles are shown in solid symbols andsummertime profiles in open symbols, with colors chosen toallow comparison of winter and summer data from a givenlatitude (grey indicates no matching winter station).[23] Several key observations that have arisen in previous
work are worth mentioning here. Rising from the deepSouthern Ocean (Lower then Upper Circumpolar DeepWater, compressed at the lower right of Figures 5a–5c),nitrate d15N increases as [NO3
�] decreases upward throughthe thermocline (see water mass labels in Figure 5a).However, the magnitude of d15N increase for a given[NO3
�] decrease is small relative to what one observes fora given amount of nitrate consumption, assuming a reason-able value for the isotope effect of nitrate assimilation[Sigman et al., 1999a, 2000]. The cause of the thermoclinetrend (that is, the small magnitude of d15N increase for agiven amount of [NO3
�] decrease upward through thethermocline) has been addressed previously [Sigman et
al., 2000]. Regardless of its cause, it is an importantbackground observation for what follows. In particular,for a given isotope effect for nitrate assimilation, surfacewaters that undergo nitrate consumption starting fromSAMW composition will have a much lower d15N for agiven final [NO3
�] than if they start from the composition ofAntarctic or Polar Frontal Zone surface waters (see stationssouth of 51�S in Figure 5b).[24] Our wintertime data indicate that, during this exten-
sive portion of the year, the nitrate d15N/[NO3�] relationship
of the surface is similar to that of the thermocline (Figures 5aand 5b). While there is evidence for up to 2% 15Nenrichment above the thermocline trend in the late winter(September and October) data, the data from July 1999indicate that the surface and thermocline are completelyindistinguishable during this deepest part of winter (bluesolid circles of AU9901 in Figure 5a).[25] There is an equatorward decrease in subantarctic
surface [NO3�] during the winter without the level of
enrichment in 15N expected from nitrate assimilation (Fig-ure 4a). This lack of nitrate 15N enrichment indicates thatthe wintertime equatorward [NO3
�] decrease in the SAZsurface is set solely by physical processes. The moreequatorward subantarctic surface mixes vertically withunderlying thermocline water that has lower density thanthe SAZ thermocline to the south. This lower-densitythermocline water has more effective exchange with thesubtropical surface waters and thus has a lower [NO3
�]. Inaddition, the more equatorward SAZ is in closer contactwith the nitrate-free surface waters of the subtropics, ex-change with which will dilute SAZ nitrate without causingnitrate 15N enrichment.[26] The nitrate isotope data indicate a clearly different
situation during the summer, with nitrate assimilation greatlyaltering surface nitrate d15N. As described above, thesummertime increase in nitrate d15N is large relative to themodest winter-to-summer decrease in surface [NO3
�]. Plot-ting the data in Rayleigh space, two end-member optionsimmediately arise to explain this observation. First, a highisotope effect may apply to nitrate assimilation in the Sub-antarctic (see trajectories for e = 10% in Figure 5b). Second,nitrate in the summertime Subantarctic Zone may be fed fromsurface waters further south, such that a large amount ofnitrate consumption is required to generate summertime SAZ[NO3
�], in which case a lower isotope effect, similar to thatestimated from the Antarctic, is appropriate.[27] Comparing winter and summer data from the paired
cruises of AU9701 (September 1997) and AU9706 (March1998), it is not uncommon for the summer nitrate concen-tration to be similar to or even slightly higher than thewintertime nitrate concentration (Figure 5b). Yet, for alllatitudes, summer d15N of nitrate is higher than that forwinter. In addition, for many of the summertime profiles,d15N of nitrate increases markedly into the surface layereven though [NO3
�] decreases very little or even increases(Figure 5b). As described previously [Sigman et al., 1999a],the cases where d15N of nitrate increases into the surfaceeven as [NO3
�] is unchanged or increases represent strongevidence for equatorward transport of surface nitrate. Fur-thermore, temperature and salinity differences within theSAZ also indicate cross frontal supply of cold, fresh waterfrom the south [Rintoul and Trull, 2001].
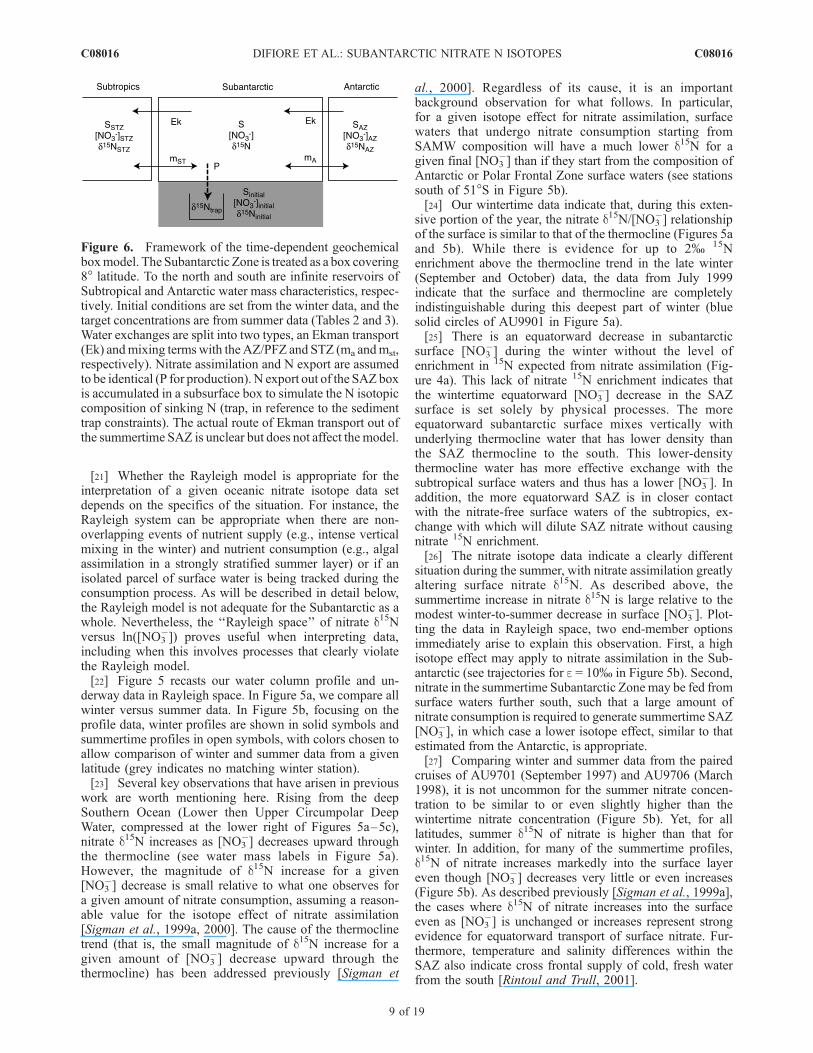
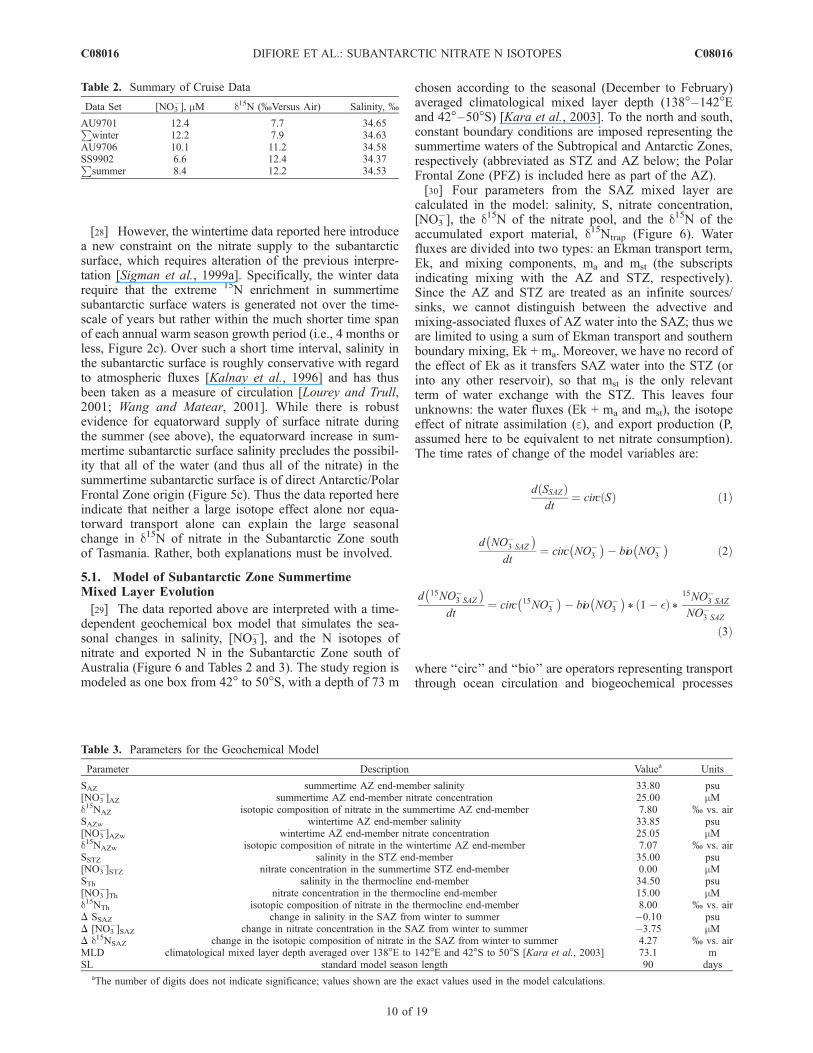
Figure 6. Framework of the time-dependent geochemicalboxmodel. The Subantarctic Zone is treated as a box covering8� latitude. To the north and south are infinite reservoirs ofSubtropical and Antarctic water mass characteristics, respec-tively. Initial conditions are set from the winter data, and thetarget concentrations are from summer data (Tables 2 and 3).Water exchanges are split into two types, an Ekman transport(Ek) andmixing termswith theAZ/PFZ and STZ (ma andmst,respectively). Nitrate assimilation and N export are assumedto be identical (P for production). N export out of the SAZ boxis accumulated in a subsurface box to simulate the N isotopiccomposition of sinking N (trap, in reference to the sedimenttrap constraints). The actual route of Ekman transport out ofthe summertime SAZ is unclear but does not affect the model.
C08016 DIFIORE ET AL.: SUBANTARCTIC NITRATE N ISOTOPES
9 of 19
C08016
[28] However, the wintertime data reported here introducea new constraint on the nitrate supply to the subantarcticsurface, which requires alteration of the previous interpre-tation [Sigman et al., 1999a]. Specifically, the winter datarequire that the extreme 15N enrichment in summertimesubantarctic surface waters is generated not over the time-scale of years but rather within the much shorter time spanof each annual warm season growth period (i.e., 4 months orless, Figure 2c). Over such a short time interval, salinity inthe subantarctic surface is roughly conservative with regardto atmospheric fluxes [Kalnay et al., 1996] and has thusbeen taken as a measure of circulation [Lourey and Trull,2001; Wang and Matear, 2001]. While there is robustevidence for equatorward supply of surface nitrate duringthe summer (see above), the equatorward increase in sum-mertime subantarctic surface salinity precludes the possibil-ity that all of the water (and thus all of the nitrate) in thesummertime subantarctic surface is of direct Antarctic/PolarFrontal Zone origin (Figure 5c). Thus the data reported hereindicate that neither a large isotope effect alone nor equa-torward transport alone can explain the large seasonalchange in d15N of nitrate in the Subantarctic Zone southof Tasmania. Rather, both explanations must be involved.
5.1. Model of Subantarctic Zone SummertimeMixed Layer Evolution
[29] The data reported above are interpreted with a time-dependent geochemical box model that simulates the sea-sonal changes in salinity, [NO3
�], and the N isotopes ofnitrate and exported N in the Subantarctic Zone south ofAustralia (Figure 6 and Tables 2 and 3). The study region ismodeled as one box from 42� to 50�S, with a depth of 73 m
chosen according to the seasonal (December to February)averaged climatological mixed layer depth (138�–142�Eand 42�–50�S) [Kara et al., 2003]. To the north and south,constant boundary conditions are imposed representing thesummertime waters of the Subtropical and Antarctic Zones,respectively (abbreviated as STZ and AZ below; the PolarFrontal Zone (PFZ) is included here as part of the AZ).[30] Four parameters from the SAZ mixed layer are
calculated in the model: salinity, S, nitrate concentration,[NO3
�], the d15N of the nitrate pool, and the d15N of theaccumulated export material, d15Ntrap (Figure 6). Waterfluxes are divided into two types: an Ekman transport term,Ek, and mixing components, ma and mst (the subscriptsindicating mixing with the AZ and STZ, respectively).Since the AZ and STZ are treated as an infinite sources/sinks, we cannot distinguish between the advective andmixing-associated fluxes of AZ water into the SAZ; thus weare limited to using a sum of Ekman transport and southernboundary mixing, Ek + ma. Moreover, we have no record ofthe effect of Ek as it transfers SAZ water into the STZ (orinto any other reservoir), so that mst is the only relevantterm of water exchange with the STZ. This leaves fourunknowns: the water fluxes (Ek + ma and mst), the isotopeeffect of nitrate assimilation (e), and export production (P,assumed here to be equivalent to net nitrate consumption).The time rates of change of the model variables are:
d SSAZð Þdt
¼ circ Sð Þ ð1Þ
d NO�3 SAZ
� �dt
¼ circ NO�3
� �� bio NO�
3
� �ð2Þ
d 15NO�3 SAZ
� �dt
¼ circ 15NO�3
� �� bio NO�
3
� �* 1� �ð Þ *
15NO�3 SAZ
NO�3 SAZ
ð3Þ
where ‘‘circ’’ and ‘‘bio’’ are operators representing transportthrough ocean circulation and biogeochemical processes
Table 2. Summary of Cruise Data
Data Set [NO3�], mM d15N (%Versus Air) Salinity, %
AU9701 12.4 7.7 34.65Pwinter 12.2 7.9 34.63
AU9706 10.1 11.2 34.58SS9902 6.6 12.4 34.37P
summer 8.4 12.2 34.53
Table 3. Parameters for the Geochemical Model
Parameter Description Valuea Units
SAZ summertime AZ end-member salinity 33.80 psu[NO3
�]AZ summertime AZ end-member nitrate concentration 25.00 mMd15NAZ isotopic composition of nitrate in the summertime AZ end-member 7.80 % vs. airSAZw wintertime AZ end-member salinity 33.85 psu[NO3
�]AZw wintertime AZ end-member nitrate concentration 25.05 mMd15NAZw isotopic composition of nitrate in the wintertime AZ end-member 7.07 % vs. airSSTZ salinity in the STZ end-member 35.00 psu[NO3
�]STZ nitrate concentration in the summertime STZ end-member 0.00 mMSTh salinity in the thermocline end-member 34.50 psu[NO3
�]Th nitrate concentration in the thermocline end-member 15.00 mMd15NTh isotopic composition of nitrate in the thermocline end-member 8.00 % vs. airD SSAZ change in salinity in the SAZ from winter to summer �0.10 psuD [NO3
�]SAZ change in nitrate concentration in the SAZ from winter to summer �3.75 mMD d15NSAZ change in the isotopic composition of nitrate in the SAZ from winter to summer 4.27 % vs. airMLD climatological mixed layer depth averaged over 138�E to 142�E and 42�S to 50�S [Kara et al., 2003] 73.1 mSL standard model season length 90 days
aThe number of digits does not indicate significance; values shown are the exact values used in the model calculations.
C08016 DIFIORE ET AL.: SUBANTARCTIC NITRATE N ISOTOPES
10 of 19
C08016
respectively. Epsilon, e, is the isotope effect of nitrateassimilation. Cross frontal mixing and advection of a giventracer, X, is parameterized as:
circ Xð Þ ¼ Ek þ mað Þ * XAZ � XSAZð Þ þ mstð Þ * Xst � XSAZð ÞVSAZ
ð4Þ
The export production parameter, P, is the biologicalremoval term, bio, integrated over the depth of the box,giving it units of mmol N m�2d�1:
P ¼Z 0
MLD
bio NO�3 SAZ
� �dz ð5Þ
The exported material collected to simulate the sinking fluxis:
Ntrap ¼Z t
0
P dt ð6Þ
15Ntrap ¼Z t
0
Z 0
MLD
bio NO�3 SAZ
� �* 1� �ð Þ *
15NO�3 SAZ
NO�3 SAZ
� �dz dt
ð7Þ
[31] Given the observational constraints (given below),the data cannot be fit by a steady state (i.e., time-indepen-dent) model. The summertime salinity of the SAZ isintermediate between the two inputs, requiring roughlyequivalent exchange with the two potential sources. TheSTZ input dilutes the nitrate concentration in the SAZ somuch that the export production required to fit the model isunrealistically low. To then fit the nitrate isotope datarequires an extremely high isotope effect, such that thesinking flux d15N is a large negative number, in this wayindicating that P is unreasonably low. Thus the wintertimeresupply from the thermocline is critically important to fuelthe high level of production in the SAZ during the sum-mertime transient state. In short, the observations dictate theuse of a time-dependent model. This time-dependent, for-ward model is fit to match the observed winter-to-summerchanges in salinity, [NO3
�], and d15N of NO3�.
[32] Data were sorted into 1� latitude bins, averaged (with[NO3
�] weighting in the case of nitrate d15N), then averagedto generate a single set of observational ‘‘mean’’ constraintsfor 42�–50�S latitude range (Table 2). While the definitionsof Orsi et al. [1995] indicate a Subantarctic Front latitude of�52�S in the SAZ study region, this front is somewhatfurther north (50�–51.5�) on the basis of slightly differentcriteria [Rintoul and Trull, 2001]. We chose to use 50�S as
the polar limit of our SAZ box partially on the basis of thesedefinitions and partially because [NO3
�] weighting of thenitrate isotope data would have strongly biased our modeltoward conditions near the Polar Frontal Zone. It can beargued that this choice causes us to underestimate the fluxof AZ/PFZ water into the SAZ, which often has its greatestsignature near the Subantarctic Front (Figure 5c) [Rintouland Trull, 2001; Sigman et al., 1999a]. Similarly, we chosea more northern extent for our simulated SAZ than sug-gested by Orsi et al. [1995] to prevent Subtropical watersfrom being defined as having significant [NO3
�]. Thestandard run length of the model is equivalent to 90 days,which is roughly appropriate for the evolution of the SAZsurface to midsummer conditions subsequent to shoaling ofthe mixed layer in October–November [Lourey and Trull,2001;Wang and Matear, 2001] (Figure 2). In addition to thehydrological data, a model constraint is provided by the d15Nof sediment trap material, which was collected at threelatitudes along140�Wfor the time interval between thecruisesAU9701 (trap deployment) and AU9706 (trap collection)[Lourey et al., 2003; Trull et al., 2001] (Figure 1a andTables 1 and 4). For our comparison, we use the materialcollected during the summer period in ‘‘SAZ traps’’ at 47�S(center column in Table 4) [Lourey et al., 2003].[33] As described above, we assume that salinity is
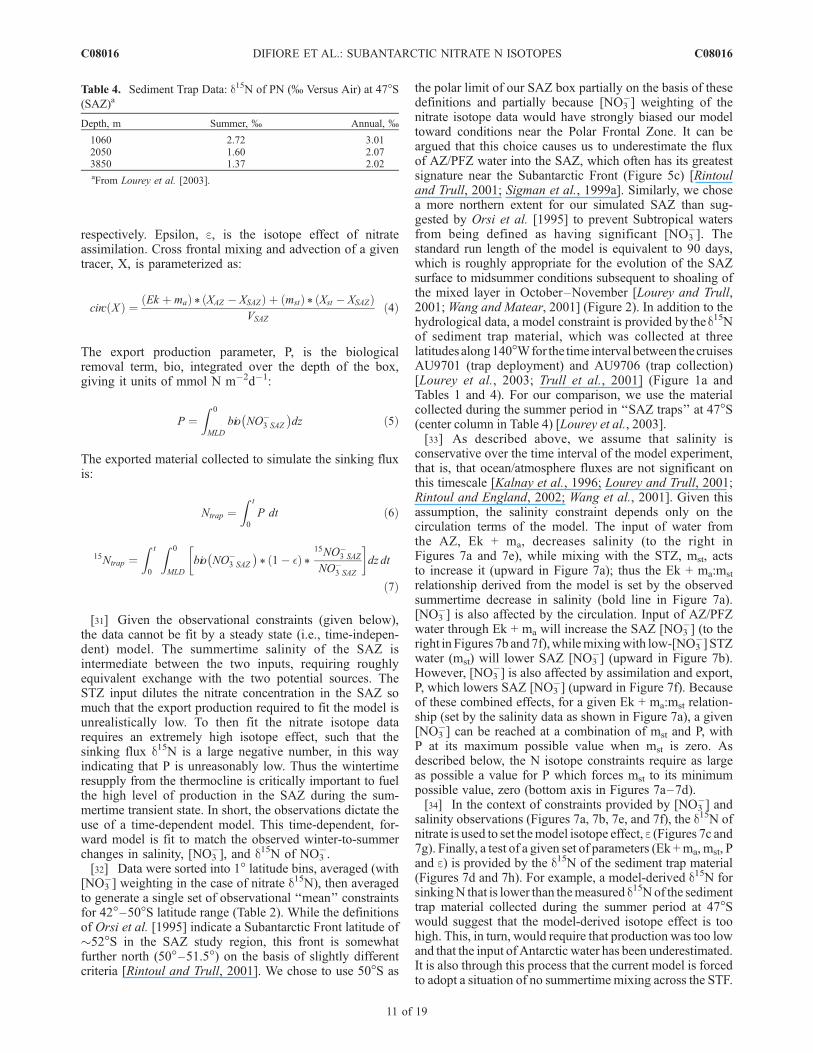
conservative over the time interval of the model experiment,that is, that ocean/atmosphere fluxes are not significant onthis timescale [Kalnay et al., 1996; Lourey and Trull, 2001;Rintoul and England, 2002; Wang et al., 2001]. Given thisassumption, the salinity constraint depends only on thecirculation terms of the model. The input of water fromthe AZ, Ek + ma, decreases salinity (to the right inFigures 7a and 7e), while mixing with the STZ, mst, actsto increase it (upward in Figure 7a); thus the Ek + ma:mst
relationship derived from the model is set by the observedsummertime decrease in salinity (bold line in Figure 7a).[NO3
�] is also affected by the circulation. Input of AZ/PFZwater through Ek + ma will increase the SAZ [NO3
�] (to theright in Figures 7b and7f),whilemixingwith low-[NO3
�] STZwater (mst) will lower SAZ [NO3
�] (upward in Figure 7b).However, [NO3
�] is also affected by assimilation and export,P, which lowers SAZ [NO3
�] (upward in Figure 7f). Becauseof these combined effects, for a given Ek + ma:mst relation-ship (set by the salinity data as shown in Figure 7a), a given[NO3
�] can be reached at a combination of mst and P, withP at its maximum possible value when mst is zero. Asdescribed below, the N isotope constraints require as largeas possible a value for P which forces mst to its minimumpossible value, zero (bottom axis in Figures 7a–7d).[34] In the context of constraints provided by [NO3
�] andsalinity observations (Figures 7a, 7b, 7e, and 7f), the d15N ofnitrate is used to set themodel isotope effect, e (Figures 7c and7g). Finally, a test of a given set of parameters (Ek +ma,mst, Pand e) is provided by the d15N of the sediment trap material(Figures 7d and 7h). For example, a model-derived d15N forsinkingN that is lower than themeasured d15Nof the sedimenttrap material collected during the summer period at 47�Swould suggest that the model-derived isotope effect is toohigh. This, in turn, would require that production was too lowand that the input of Antarctic water has been underestimated.It is also through this process that the current model is forcedto adopt a situation of no summertime mixing across the STF.
Table 4. Sediment Trap Data: d15N of PN (% Versus Air) at 47�S(SAZ)a
Depth, m Summer, % Annual, %
1060 2.72 3.012050 1.60 2.073850 1.37 2.02aFrom Lourey et al. [2003].
C08016 DIFIORE ET AL.: SUBANTARCTIC NITRATE N ISOTOPES
11 of 19
C08016
Such mixing would dilute the nitrate concentration in themodel without increasing the d15N of nitrate. This wouldrequire lower export production and thus a higher modelisotope effect to fit the summertime nitrate d15N data, whichwould yield a lower sinking flux d15N, diverging from thesediment trap measurements.[35] There are four independent equations that are solved in
the model (equations (1)–(3) and an equation combining (6)and (7) in terms of d15N) and four observables that provideconstraints (salinity, [NO3
�], the d15N of nitrate, and the d15Nof sinking N). Thus a unique solution should result. However,this solution falls in the parameter space of negative mst,which is physically impossible. Thus the solution we use(with mst = 0) must have some misfit with observations. Weforce the model misfit into the sinking flux d15N, for tworeasons. First, sinking flux d15N is the least precisely con-strained by measurements (see discussion of sediment trapdata below). Second, and more important, focusing on theamplitude of model misfit of d15Ntrap allows us to isolate theconstraint on SAZ biogeochemistry that the N isotopes canprovide. That is, we use theN isotopes to evaluate the solutionthat one gets without the N isotopes and to determine thelikely directions in which this solution errs. In future work(and hopefully with more data), an inverse model could beused to yield a ‘‘best fit’’ solution that takes into account
analytical and sampling uncertainties as well as model dy-namics when distributing the misfit between the modeled andobserved parameters (salinity, nitrate concentration, nitrated15N, and the d15N of N export).[36] There are a number of questions as to the reliability
of sediment trap d15N measurements as an indication of thed15N of the N sinking out of the surface ocean. For example,while biochemical reactions typically favor the light isotopesuch that remineralization would cause sinking N d15N to beconstant or increase with depth, the moored traps at 47�Sstudied by Lourey et al. [2003] indicate that sinking N d15Ndecreases from 2.7% at 1060 m to 1.4% at 3850 m(Table 4). Indeed, there is an observed decrease in sedimenttrap d15N with depth in many ocean regions, the cause ofwhich is unknown [Altabet and Francois, 1994; Lourey etal., 2003; Thunell et al., 2004]. In this study, we takesediment trap d15N to be only a rough (±1%) indicationof sinking N d15N and use it as a ‘‘check’’ on our model-derived scenarios, using the other parameters as ‘‘perfect’’constraints. Nevertheless, since we do interpret large (>2%)deviations from the sediment trap measurements to indicatethat a model solution is implausible, the coupling of isotopemeasurements of surface nitrate and sediment trap materialsis central to our modeling exercise and the new constraintthat arises from the N isotopes.
Figure 7. Results from the standard case model experiment. For the SAZ surface layer, contour plots ofthe winter to summer change in (a) and (e) salinity, (b) and (f) [NO3
�], (c) and (g) nitrate d15N, and(d) and (h) d15N of accumulated sinking N are shown as a function of (top) STZ water input (mst) versusAZ supply (Ek + ma) and (bottom) nitrate assimilation rate (P) versus AZ nitrate supply (Ek + ma). Boldlines indicate the winter-to-summer change required to fit the data (Tables 2 and 3). The solid circlerepresents the point of intersection between the four contour lines and represents the parameters at whichthe model fits the data. The dashed lines in Figures 7d and 7h represent the predicted d15N of accumulatedN export.
C08016 DIFIORE ET AL.: SUBANTARCTIC NITRATE N ISOTOPES
12 of 19
C08016
5.2. Model Results
[37] The data require a nitrate assimilation rate of�4.7 mmol N m�2 d�1, a rate for Ek + ma of 38 Sv, andan isotope effect for nitrate assimilation of 8.9% in thestandard case model (bold lines Figure 7). The predictedsediment trap d15N is +1% (bold dashed line in Figures 7dand 7h), which is close to but below the range of thesediment trap d15N measurements at 47�S (�1.4–2.7%)[Lourey et al., 2003] (Table 4). Given the uncertaintiesabout sediment trap d15N mentioned above, this fit seemsreasonably good. However, the generally low predictedsinking N d15N suggests to us that the model overestimatesthe isotope effect of nitrate assimilation by �1%.[38] It is illustrative to consider what would occur if we
were to force the model with a smaller isotope effect, so asto fit better fit the sediment trap d15N data. With no otherchanges, this would lead to a decrease in the d15N of thenitrate pool. To match the observed d15N of nitrate wouldthen require an increased ratio of N export to nitrate supply.If N export is then increased to match the observedsummertime increase in the d15N of nitrate (upward inFigure 7g), the summertime [NO3
�] decrease will be over-estimated (i.e., the summertime [NO3
�] will be underesti-mated; upward in Figure 7f). To fix this nitrateconcentration misfit would require an increase in the netinflux of nitrate by increasing Ek + ma or decreasing mst.Given that mst is already at zero, the only option would beto increase Ek + ma (to right in Figures 7b and 7f). If thiswere done, the model SAZ would become too fresh over thecourse of the 90 day summer period (to right in Figures 7aand 7e). Therefore the observations could be made consis-tent with a lower value for e (that is, more consistent withthe sediment trap d15N measurements) if one of the follow-ing were the case about our current estimates or assump-tions for the winter-to-summer evolution of SAZ conditions:(1) the summertime [NO3
�] drawdown was greater thanobserved; (2) the summertime salinity decrease was greater;or (3) there was enough evaporation during the summer to
cause salinity to underestimate inputs of low-salinity waterfrom the south.
5.3. Model Uncertainties
[39] A sensitivity test was performed in which the indi-vidual model constraints from our standard case (Table 3)were changed by ±25% (Table 5). While it is not possible tomake conclusive statements in this first effort at simulatingthe N isotopes in the Subantarctic, we see this as a generousdegree of error for most of the model parameters. Inaddition, two model simulations were performed to addressuncertainties regarding summertime inputs to the SAZmixed layer. In the first simulation, we assume wintertimeAZ constraints rather than our standard case summertimeAZ conditions; in the second, we allow for a continuoussupply of 10 Sv of thermocline water into the SAZ mixedlayer during the summer season (‘‘AZinput’’ and ‘‘Thermo’’in Table 5). The former simulation using wintertime AZconditions yields a slightly worse fit to the data, yielding agreater misfit in d15N of the sinking N (0.7 rather than 1%in the standard case). Its most significant effect on thesolution is an increase in the estimated supply of AZ waterto the SAZ mixed layer (40 rather than 38 Sv). The lattersimulation including summertime thermocline supplyrequires slightly less AZ input (37 rather than 38 Sv).One of the greater sensitivities of our model-derived esti-mates for water flux and production (but not for isotopedynamics) is to the mixed layer that we assign for thesummertime SAZ (Table 5). Our MLD of 73 m derives fromthe climatology of Kara et al. [2003]; the climatology ofLevitus and Boyer [1994] suggests a �25% deeper mixedlayer, which would have raised AZ input to 47 Sv and Nexport to 5.9 mmol N m�2 d�1 (Table 5). Finally, we alsoevaluated model uncertainty in a ‘‘Monte Carlo’’ analysis.Model constraint values were randomly generated withmean and standard deviations based on our available data,with a final summertime salinity of 34.53 ± 0.03%, a[NO3
�] of 8.43 ± 2 mM, a nitrate d15N of 12.17 ± 1%, amixed layer depth of 73.1 ± 25 m and a season length of
Table 5. Sensitivity of Model Output to Error in Constraints From Data
Model Ek + ma, Sv P, mmol N m�2 d�1 e, % d15Ntrap, %
Standard case 37.8 4.7 8.9 1.0DSSAZ + 25% 48.1 5.1 8.5 1.4D[NO3
�]SAZ + 25% 37.8 5.5 7.2 2.7Dd15NSAZ + 25% 37.8 4.7 11.1 �0.7MLD + 25% 47.0 5.9 8.9 1.0SL + 25% 30.0 3.7 8.9 1.0DSSAZ � 25% 28.0 4.3 9.4 0.5D[NO3
�]SAZ � 25% 37.8 3.9 11.3 �1.4Dd15NSAZ � 25% 37.8 4.7 6.7 2.7MLD � 25% 28.2 3.5 8.9 1.0SL � 25% 50.5 6.3 8.9 1.0AZinputa 40.0 4.8 9.2 0.7Thermob 36.7 4.8 8.9 1.0Monte Carloc 41.0 ± 21.9 5.3 ± 2.4 8.3 ± 1.0 1.6 ± 0.9
aIn this simulation, Antarctic end-member values were set to the wintertime values.bModel run included constant 10 Sv thermocline mixing over the entire summer simulation.cThe Monte Carlo analysis of the model was performed using the following mean values and standard
deviations for the modeled final (‘‘summertime’’) SAZ conditions: salinity = 34.53 ± 0.03%, [NO3�] = 8.43 ±
2 mM, nitrate d15N = 12.17 ± 1%, mixed layer depth = 73.1 ± 25 m, and season length = 90 ± 20 days. Solutionswith d15Ntrap outside the range of 0 to 3% were discarded.
C08016 DIFIORE ET AL.: SUBANTARCTIC NITRATE N ISOTOPES
13 of 19
C08016
90 ± 20 days. The model was solved with these constraints,and the solution set was parsed to include only those runs inwhich the d15N of the trap material produced is within therange of 0–3%. The estimates (Table 5) are consistent withthe ‘‘standard case’’ solution presented above but alsoindicate the combined effect of the uncertainties.[40] All together, the model results lead to several con-
clusions, which are ranked here in terms of certainty. Firstof all, the isotope effect of nitrate assimilation is greater than7% and likely closer to 8–9%. Next, if one takes thesediment trap data as at least a rough (±1%) recorder of thesinking flux d15N, then the isotope effect cannot be greaterthan 11%. If so, it becomes possible to draw inferencesabout the biogeochemical and physical rates in the SAZ.First, nitrate assimilation and export is 3.5 mmol N m�2 d�1
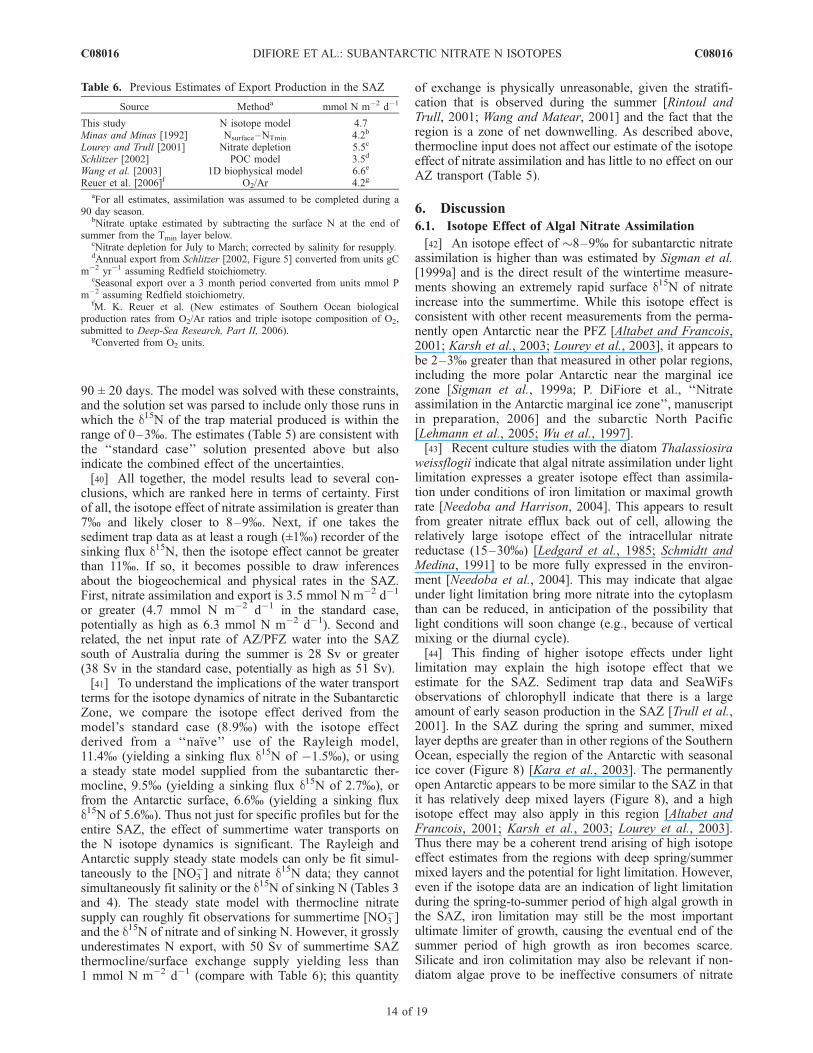
or greater (4.7 mmol N m�2 d�1 in the standard case,potentially as high as 6.3 mmol N m�2 d�1). Second andrelated, the net input rate of AZ/PFZ water into the SAZsouth of Australia during the summer is 28 Sv or greater(38 Sv in the standard case, potentially as high as 51 Sv).[41] To understand the implications of the water transport
terms for the isotope dynamics of nitrate in the SubantarcticZone, we compare the isotope effect derived from themodel’s standard case (8.9%) with the isotope effectderived from a ‘‘naı̈ve’’ use of the Rayleigh model,11.4% (yielding a sinking flux d15N of �1.5%), or usinga steady state model supplied from the subantarctic ther-mocline, 9.5% (yielding a sinking flux d15N of 2.7%), orfrom the Antarctic surface, 6.6% (yielding a sinking fluxd15N of 5.6%). Thus not just for specific profiles but for theentire SAZ, the effect of summertime water transports onthe N isotope dynamics is significant. The Rayleigh andAntarctic supply steady state models can only be fit simul-taneously to the [NO3
�] and nitrate d15N data; they cannotsimultaneously fit salinity or the d15N of sinking N (Tables 3and 4). The steady state model with thermocline nitratesupply can roughly fit observations for summertime [NO3
�]and the d15N of nitrate and of sinking N. However, it grosslyunderestimates N export, with 50 Sv of summertime SAZthermocline/surface exchange supply yielding less than1 mmol N m�2 d�1 (compare with Table 6); this quantity
of exchange is physically unreasonable, given the stratifi-cation that is observed during the summer [Rintoul andTrull, 2001; Wang and Matear, 2001] and the fact that theregion is a zone of net downwelling. As described above,thermocline input does not affect our estimate of the isotopeeffect of nitrate assimilation and has little to no effect on ourAZ transport (Table 5).
6. Discussion
6.1. Isotope Effect of Algal Nitrate Assimilation
[42] An isotope effect of �8–9% for subantarctic nitrateassimilation is higher than was estimated by Sigman et al.[1999a] and is the direct result of the wintertime measure-ments showing an extremely rapid surface d15N of nitrateincrease into the summertime. While this isotope effect isconsistent with other recent measurements from the perma-nently open Antarctic near the PFZ [Altabet and Francois,2001; Karsh et al., 2003; Lourey et al., 2003], it appears tobe 2–3% greater than that measured in other polar regions,including the more polar Antarctic near the marginal icezone [Sigman et al., 1999a; P. DiFiore et al., ‘‘Nitrateassimilation in the Antarctic marginal ice zone’’, manuscriptin preparation, 2006] and the subarctic North Pacific[Lehmann et al., 2005; Wu et al., 1997].[43] Recent culture studies with the diatom Thalassiosira
weissflogii indicate that algal nitrate assimilation under lightlimitation expresses a greater isotope effect than assimila-tion under conditions of iron limitation or maximal growthrate [Needoba and Harrison, 2004]. This appears to resultfrom greater nitrate efflux back out of cell, allowing therelatively large isotope effect of the intracellular nitratereductase (15–30%) [Ledgard et al., 1985; Schmidtt andMedina, 1991] to be more fully expressed in the environ-ment [Needoba et al., 2004]. This may indicate that algaeunder light limitation bring more nitrate into the cytoplasmthan can be reduced, in anticipation of the possibility thatlight conditions will soon change (e.g., because of verticalmixing or the diurnal cycle).[44] This finding of higher isotope effects under light
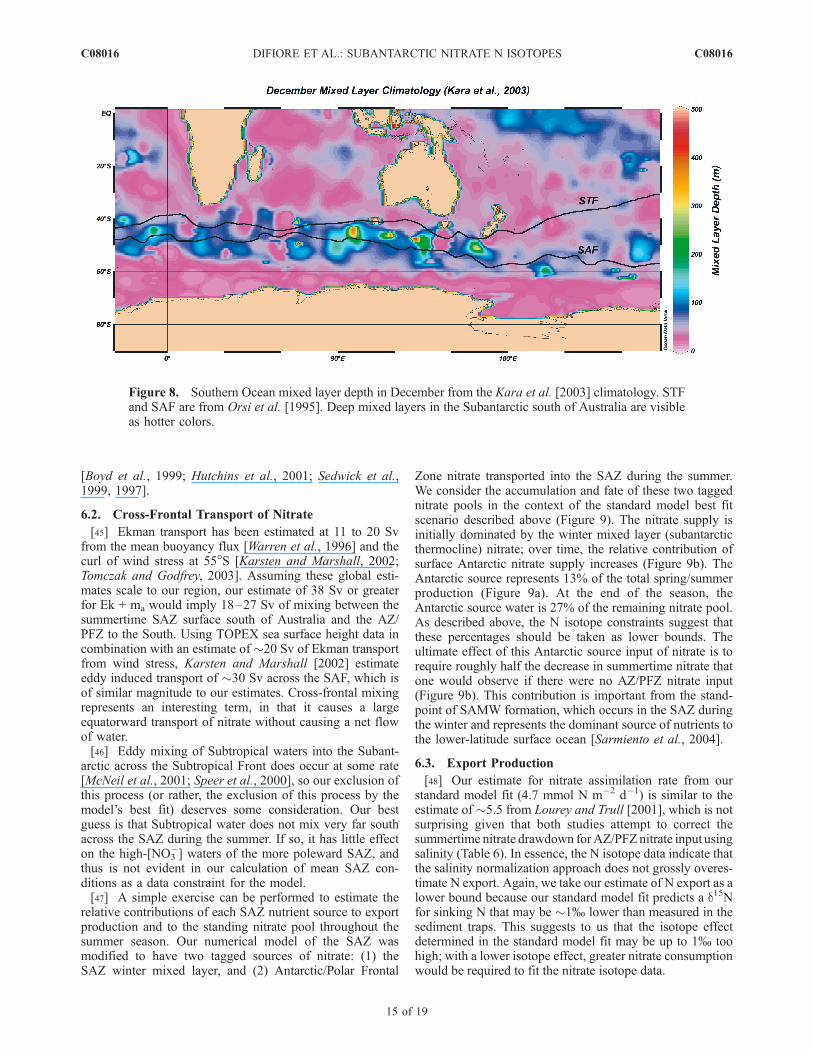
limitation may explain the high isotope effect that weestimate for the SAZ. Sediment trap data and SeaWiFsobservations of chlorophyll indicate that there is a largeamount of early season production in the SAZ [Trull et al.,2001]. In the SAZ during the spring and summer, mixedlayer depths are greater than in other regions of the SouthernOcean, especially the region of the Antarctic with seasonalice cover (Figure 8) [Kara et al., 2003]. The permanentlyopen Antarctic appears to be more similar to the SAZ in thatit has relatively deep mixed layers (Figure 8), and a highisotope effect may also apply in this region [Altabet andFrancois, 2001; Karsh et al., 2003; Lourey et al., 2003].Thus there may be a coherent trend arising of high isotopeeffect estimates from the regions with deep spring/summermixed layers and the potential for light limitation. However,even if the isotope data are an indication of light limitationduring the spring-to-summer period of high algal growth inthe SAZ, iron limitation may still be the most importantultimate limiter of growth, causing the eventual end of thesummer period of high growth as iron becomes scarce.Silicate and iron colimitation may also be relevant if non-diatom algae prove to be ineffective consumers of nitrate
Table 6. Previous Estimates of Export Production in the SAZ
Source Methoda mmol N m�2 d�1
This study N isotope model 4.7Minas and Minas [1992] Nsurface–NTmin 4.2b
Lourey and Trull [2001] Nitrate depletion 5.5c
Schlitzer [2002] POC model 3.5d
Wang et al. [2003] 1D biophysical model 6.6e
Reuer et al. [2006]f O2/Ar 4.2g
aFor all estimates, assimilation was assumed to be completed during a90 day season.
bNitrate uptake estimated by subtracting the surface N at the end ofsummer from the Tmin layer below.
cNitrate depletion for July to March; corrected by salinity for resupply.dAnnual export from Schlitzer [2002, Figure 5] converted from units gC
m�2 yr�1 assuming Redfield stoichiometry.eSeasonal export over a 3 month period converted from units mmol P
m�2 assuming Redfield stoichiometry.fM. K. Reuer et al. (New estimates of Southern Ocean biological
production rates from O2/Ar ratios and triple isotope composition of O2,submitted to Deep-Sea Research, Part II, 2006).
gConverted from O2 units.
C08016 DIFIORE ET AL.: SUBANTARCTIC NITRATE N ISOTOPES
14 of 19
C08016
[Boyd et al., 1999; Hutchins et al., 2001; Sedwick et al.,1999, 1997].
6.2. Cross-Frontal Transport of Nitrate
[45] Ekman transport has been estimated at 11 to 20 Svfrom the mean buoyancy flux [Warren et al., 1996] and thecurl of wind stress at 55�S [Karsten and Marshall, 2002;Tomczak and Godfrey, 2003]. Assuming these global esti-mates scale to our region, our estimate of 38 Sv or greaterfor Ek + ma would imply 18–27 Sv of mixing between thesummertime SAZ surface south of Australia and the AZ/PFZ to the South. Using TOPEX sea surface height data incombination with an estimate of �20 Sv of Ekman transportfrom wind stress, Karsten and Marshall [2002] estimateeddy induced transport of �30 Sv across the SAF, which isof similar magnitude to our estimates. Cross-frontal mixingrepresents an interesting term, in that it causes a largeequatorward transport of nitrate without causing a net flowof water.[46] Eddy mixing of Subtropical waters into the Subant-
arctic across the Subtropical Front does occur at some rate[McNeil et al., 2001; Speer et al., 2000], so our exclusion ofthis process (or rather, the exclusion of this process by themodel’s best fit) deserves some consideration. Our bestguess is that Subtropical water does not mix very far southacross the SAZ during the summer. If so, it has little effecton the high-[NO3
�] waters of the more poleward SAZ, andthus is not evident in our calculation of mean SAZ con-ditions as a data constraint for the model.[47] A simple exercise can be performed to estimate the
relative contributions of each SAZ nutrient source to exportproduction and to the standing nitrate pool throughout thesummer season. Our numerical model of the SAZ wasmodified to have two tagged sources of nitrate: (1) theSAZ winter mixed layer, and (2) Antarctic/Polar Frontal
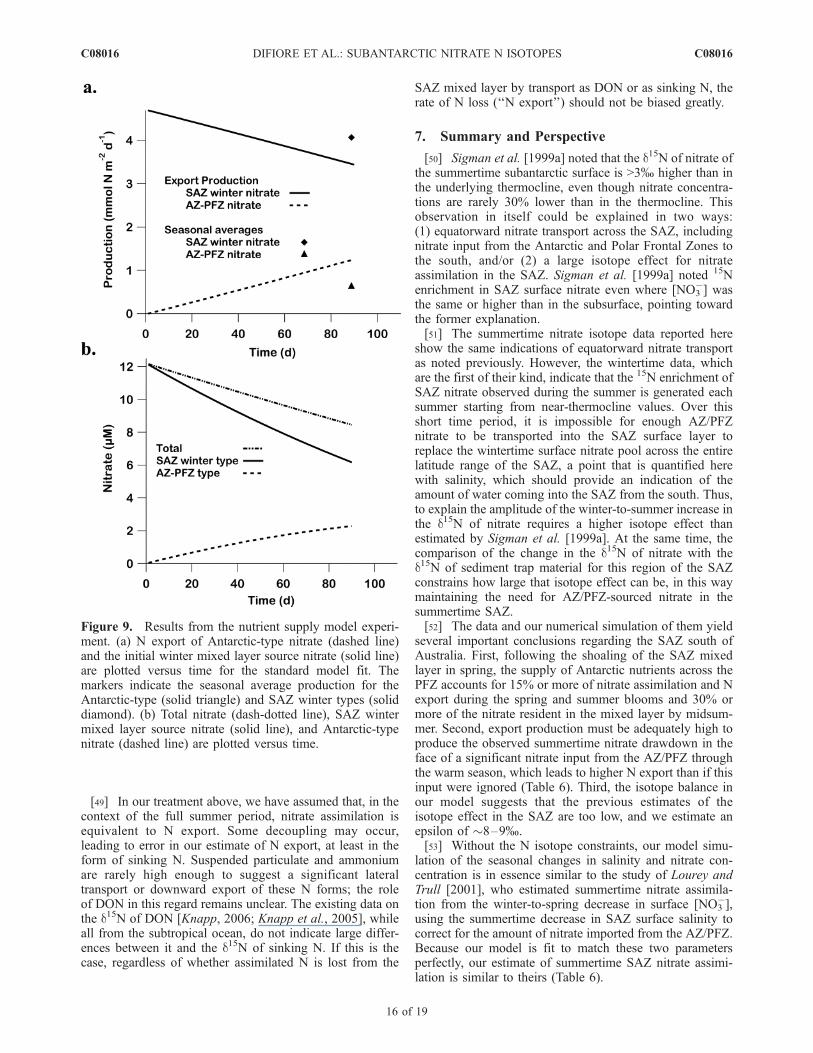
Zone nitrate transported into the SAZ during the summer.We consider the accumulation and fate of these two taggednitrate pools in the context of the standard model best fitscenario described above (Figure 9). The nitrate supply isinitially dominated by the winter mixed layer (subantarcticthermocline) nitrate; over time, the relative contribution ofsurface Antarctic nitrate supply increases (Figure 9b). TheAntarctic source represents 13% of the total spring/summerproduction (Figure 9a). At the end of the season, theAntarctic source water is 27% of the remaining nitrate pool.As described above, the N isotope constraints suggest thatthese percentages should be taken as lower bounds. Theultimate effect of this Antarctic source input of nitrate is torequire roughly half the decrease in summertime nitrate thatone would observe if there were no AZ/PFZ nitrate input(Figure 9b). This contribution is important from the stand-point of SAMW formation, which occurs in the SAZ duringthe winter and represents the dominant source of nutrients tothe lower-latitude surface ocean [Sarmiento et al., 2004].
6.3. Export Production
[48] Our estimate for nitrate assimilation rate from ourstandard model fit (4.7 mmol N m�2 d�1) is similar to theestimate of �5.5 from Lourey and Trull [2001], which is notsurprising given that both studies attempt to correct thesummertime nitrate drawdown forAZ/PFZnitrate input usingsalinity (Table 6). In essence, the N isotope data indicate thatthe salinity normalization approach does not grossly overes-timate N export. Again, we take our estimate of N export as alower bound because our standard model fit predicts a d15Nfor sinking N that may be �1% lower than measured in thesediment traps. This suggests to us that the isotope effectdetermined in the standard model fit may be up to 1% toohigh; with a lower isotope effect, greater nitrate consumptionwould be required to fit the nitrate isotope data.
Figure 8. Southern Ocean mixed layer depth in December from the Kara et al. [2003] climatology. STFand SAF are from Orsi et al. [1995]. Deep mixed layers in the Subantarctic south of Australia are visibleas hotter colors.
C08016 DIFIORE ET AL.: SUBANTARCTIC NITRATE N ISOTOPES
15 of 19
C08016
[49] In our treatment above, we have assumed that, in thecontext of the full summer period, nitrate assimilation isequivalent to N export. Some decoupling may occur,leading to error in our estimate of N export, at least in theform of sinking N. Suspended particulate and ammoniumare rarely high enough to suggest a significant lateraltransport or downward export of these N forms; the roleof DON in this regard remains unclear. The existing data onthe d15N of DON [Knapp, 2006; Knapp et al., 2005], whileall from the subtropical ocean, do not indicate large differ-ences between it and the d15N of sinking N. If this is thecase, regardless of whether assimilated N is lost from the
SAZ mixed layer by transport as DON or as sinking N, therate of N loss (‘‘N export’’) should not be biased greatly.
7. Summary and Perspective
[50] Sigman et al. [1999a] noted that the d15N of nitrate ofthe summertime subantarctic surface is >3% higher than inthe underlying thermocline, even though nitrate concentra-tions are rarely 30% lower than in the thermocline. Thisobservation in itself could be explained in two ways:(1) equatorward nitrate transport across the SAZ, includingnitrate input from the Antarctic and Polar Frontal Zones tothe south, and/or (2) a large isotope effect for nitrateassimilation in the SAZ. Sigman et al. [1999a] noted 15Nenrichment in SAZ surface nitrate even where [NO3
�] wasthe same or higher than in the subsurface, pointing towardthe former explanation.[51] The summertime nitrate isotope data reported here
show the same indications of equatorward nitrate transportas noted previously. However, the wintertime data, whichare the first of their kind, indicate that the 15N enrichment ofSAZ nitrate observed during the summer is generated eachsummer starting from near-thermocline values. Over thisshort time period, it is impossible for enough AZ/PFZnitrate to be transported into the SAZ surface layer toreplace the wintertime surface nitrate pool across the entirelatitude range of the SAZ, a point that is quantified herewith salinity, which should provide an indication of theamount of water coming into the SAZ from the south. Thus,to explain the amplitude of the winter-to-summer increase inthe d15N of nitrate requires a higher isotope effect thanestimated by Sigman et al. [1999a]. At the same time, thecomparison of the change in the d15N of nitrate with thed15N of sediment trap material for this region of the SAZconstrains how large that isotope effect can be, in this waymaintaining the need for AZ/PFZ-sourced nitrate in thesummertime SAZ.[52] The data and our numerical simulation of them yield
several important conclusions regarding the SAZ south ofAustralia. First, following the shoaling of the SAZ mixedlayer in spring, the supply of Antarctic nutrients across thePFZ accounts for 15% or more of nitrate assimilation and Nexport during the spring and summer blooms and 30% ormore of the nitrate resident in the mixed layer by midsum-mer. Second, export production must be adequately high toproduce the observed summertime nitrate drawdown in theface of a significant nitrate input from the AZ/PFZ throughthe warm season, which leads to higher N export than if thisinput were ignored (Table 6). Third, the isotope balance inour model suggests that the previous estimates of theisotope effect in the SAZ are too low, and we estimate anepsilon of �8–9%.[53] Without the N isotope constraints, our model simu-
lation of the seasonal changes in salinity and nitrate con-centration is in essence similar to the study of Lourey andTrull [2001], who estimated summertime nitrate assimila-tion from the winter-to-spring decrease in surface [NO3
�],using the summertime decrease in SAZ surface salinity tocorrect for the amount of nitrate imported from the AZ/PFZ.Because our model is fit to match these two parametersperfectly, our estimate of summertime SAZ nitrate assimi-lation is similar to theirs (Table 6).
Figure 9. Results from the nutrient supply model experi-ment. (a) N export of Antarctic-type nitrate (dashed line)and the initial winter mixed layer source nitrate (solid line)are plotted versus time for the standard model fit. Themarkers indicate the seasonal average production for theAntarctic-type (solid triangle) and SAZ winter types (soliddiamond). (b) Total nitrate (dash-dotted line), SAZ wintermixed layer source nitrate (solid line), and Antarctic-typenitrate (dashed line) are plotted versus time.
C08016 DIFIORE ET AL.: SUBANTARCTIC NITRATE N ISOTOPES
16 of 19
C08016
[54] The unique aspect of this study is our use of the Nisotope data to test this approach. While the d15N of nitratedata can be fit simply by adjusting the assumed isotopeeffect for nitrate assimilation, comparison of these data witha sediment trap–based estimate of sinking N d15N puts aconstraint on the isotope effect, precluding arbitrarily highvalues for it. We did not carry out a model simulation thataddressed this overconstrained system by trying to simul-taneously fit all parameters. Instead, it proved most trans-parent to simply allow the model to fit the salinity, [NO3
�],and d15N of nitrate data perfectly and then compare thepredicted sinking flux d15N with the sediment trap obser-vations, determining whether the fit to the sediment trapd15N data was good and in which direction any misfit to thedata tended to be.[55] While the model simulation predicted a sinking N
d15N that was arguably within �1% of the sediment trapconstraint, the sense of misfit was clearly for the model tounderestimate sinking N d15N. Far from being a detail oruncertainty, the observed sense of model misfit is a keywarning that AZ/PFZ nitrate transport into the SAZ andnitrate assimilation within the SAZ may be underestimatedby the approach of using seasonal nitrate concentration dataand assuming that salinity is a conservative tracer of AZwater inputs to the SAZ. Two end-member alternativeinterpretations of the misfit are that: (1) salinity is notacting in a completely conservative manner, and there issomewhat more AZ/PFZ nitrate entering the summertimeSAZ than we and Lourey and Trull [2001] allow, or (2) thesediment trap d15N is 1–2% higher than the true N exportout of the surface ocean, so that the true isotope effect fornitrate assimilation can be somewhat greater than we accepton the basis of our data/model comparison for sinking fluxd15N.[56] Coupled with recent progress in laboratory studies of
the nitrate assimilation isotope effect, this study raises thisisotope effect as a possible environmental tool to study thephysiological state of phytoplankton in modern aquaticenvironments. That our estimate for the isotope effect inthe SAZ is 2–3% higher than our estimates from themarginal ice zone of Antarctica [Sigman et al., 1999a;P. DiFiore et al., manuscript in preparation, 2006] suggestssome difference in the constraints on algal growth betweenthese two Southern Ocean environments. Given the avail-able culture data and the characteristics of the SAZ, a rolefor light limitation in the SAZ is a natural hypothesis for ourobservations. Along with continued use of algal cultures toexplore the mechanism of nitrate isotope discrimination,studies in the Southern Ocean that couple the isotope effectestimates extracted from regional tracer distributions (i.e.,the approach taken here) with shipboard-board growthexperiments should help to test this explanation and, moregenerally, illuminate the environmental controls on (and thephysiological significance of) the isotope effect of nitrateassimilation.[57] A fundamental goal of this study was to develop an
understanding of the constraints on subantarctic circulationand biogeochemistry that can be extracted from the cou-pling of N isotope measurements with standard oceano-graphic measurements. Beyond the proof of concept that webelieve was achieved, there are key lessons for the future. Inparticular, if the N isotope budgetary approach is to be
pursued further, the uncertainties on the d15N of exported Nshould be reduced. This includes not only improving ourability to measure the particulates sinking out of the surfaceocean but also accounting for the N exported laterally, suchas dissolved organic N.
[58] Acknowledgments. Sample collection was supported by theAustralian Commonwealth Cooperative Research Centre Program andAustralian Antarctic Science Award 1156 (T.W.T.). This work was fundedby U.S. NSF grant OCE–0081686 (to D.M.S.) and by BP and Ford MotorCompany through the Princeton Carbon Mitigation Initiative. We thankMichael Bender and Matt Reuer for discussions. This manuscript benefitedfrom reviews by Niki Gruber and an anonymous reviewer.
ReferencesAltabet, M. A., and R. Francois (1994), Sedimentary nitrogen isotopic ratioas a recorder for surface ocean nitrate utilization, Global Biogeochem.Cycles, 8, 103–116.
Altabet, M. A., and R. Francois (2001), Nitrogen isotope biogeochemistryof the Antarctic polar frontal zone at 170�W, Deep Sea Res., Part II, 48,4247–4273.
Altabet, M. A., and J. J. McCarthy (1985), Temporal and spatial variation inthe natural abundance of 15N in PON from a warm-core ring, Deep SeaRes., Part A, 32, 755–772.
Altabet, M. A., W. G. Deuser, S. Honjo, and C. Stienen (1991), Seasonaland depth-related changes in the source of sinking particles in the NorthAtlantic, Nature, 354, 136–139.
Boyd, P., J. LaRoche, M. Gall, R. Frew, and R. M. L. McKay (1999), Roleof iron, light, and silicate in controlling algal biomass in subantarcticwaters SE of New Zealand, J. Geophys. Res., 104, 13,395–13,408.
Boyd, P. W., A. C. Crossley, G. R. DiTullio, F. B. Griffiths, D. A. Hutchins,B. Queguiner, P. N. Sedwick, and T. W. Trull (2001), Control of phyto-plankton growth by iron supply and irradiance in the subantarctic South-ern Ocean: Experimental results from the SAZ Project, J. Geophys. Res.,106, 31,573–31,583.
Braman, R. S., and S. A. Hendrix (1989), Nanogram nitrite and nitratedetermination in environmental and biological materials by V(III) reduc-tion with chemiluminescence detection, Anal. Chem., 61, 2715–2718.
Casciotti, K. L., D. M. Sigman, M. G. Hastings, J. K. Bohlke, andA. Hilkert (2002), Measurement of the oxygen isotopic composi-tion of nitrate in seawater and freshwater using the denitrifiermethod, Anal. Chem., 74, 4905–4912.
Conkright, M. E., R. A. Locarnini, H. E. Garcia, T. D. O’Brien, T. P. Boyer,C. Stephens, and J. I. Antonov (2002), World Ocean Atlas 2001: Objec-tive Analyses, Data Statistics, and Figures, CD-ROM Documentation., 17pp., Natl. Oceanogr. Data Cent., Silver Spring, Md.
Debaar, H. J. W., J. T. M. Dejong, D. C. E. Bakker, B. M. Loscher, C. Veth,U. Bathmann, and V. Smetacek (1995), Importance of iron for planktonblooms and carbon-dioxide drawdown in the Southern-Ocean, Nature,373, 412–415.
Deutsch, C., N. Gruber, R. M. Key, J. L. Sarmiento, and A. Ganaschaud(2001), Denitrification and N2 fixation in the Pacific Ocean, GlobalBiogeochem. Cycles, 15, 483–506.
Dunne, J. P., R. A. Armstrong, A. Gnanadesikan, and J. L. Sarmiento(2005), Empirical and mechanistic models for the particle export ratio,Global Biogeochem. Cycles, 19, GB4026, doi:10.1029/2004GB002390.
Eriksen, R. (1997), A practical manual for the determination of salinity,dissolved oxygen, and nutrients in seawater, Antarct. CRC Rep. 11, 83pp., Antarct. Coop. Res. Cent., Hobart, Tasmania, Australia.
Farrell, J. W., T. F. Pedersen, S. E. Calvert, and B. Nielsen (1995), Glacial-interglacial changes in nutrient utilization in the equatorial Pacific Ocean,Nature, 377, 514–517.
Francois, R., M. A. Altabet, and L. H. Burkle (1992), Glacial to interglacialchanges in surface nitrate utilization in the Indian sector of the SouthernOcean as recorded by sediment d15N, Paleoceanography, 7, 589–606.
Francois, R. F., M. A. Altabet, E.-F. Yu, D. M. Sigman, M. P. Bacon,M. Frank, G. Bohrmann, G. Bareille, and L. D. Labeyrie (1997),Water column stratification in the Southern Ocean contributed to thelowering of glacial atmospheric CO2, Nature, 389, 929–935.
Gonfiantini, R., W. Stichler, and K. Rosanski (1995), Standards and inter-comparison materials distributed by the International Atomic EnergyAgency for Stable isotope measurements, in Reference and Intercompar-ison Materials for Stable Isotopes of Light Elements, IAEA-TECDOC-825, pp. 13–29, Int. At. Energy Agency, Vienna.
Granger, J., D. M. Sigman, J. A. Needoba, and P. J. Harrison (2004),Coupled nitrogen and oxygen isotope fractionation of nitrate during as-similation by cultures of marine phytoplankton, Limnol. Oceanogr., 49,1763–1773.
C08016 DIFIORE ET AL.: SUBANTARCTIC NITRATE N ISOTOPES
17 of 19
C08016
Hutchins, D. A., P. N. Sedwick, G. R. DiTullio, P. W. Boyd, B. Queguiner,F. B. Griffiths, and C. Crossley (2001), Control of phytoplankton growthby iron and silicic acid availability in the subantarctic Southern Ocean:Experimental results from the SAZ Project, J. Geophys. Res., 106,31,559–31,572.
Jin, X., and N. Gruber (2003), Offsetting the radiative benefit of ocean ironfertilization by enhancing N2O emissions, Geophys. Res. Lett., 30(24),2249, doi:10.1029/2003GL018458.
Kalnay, E., et al. (1996), The NCEP/NCAR 40-year reanalysis project, Bull.Am. Meteorol. Soc., 77, 437–471.
Kara, A. B., P. A. Rochford, and H. E. Hurlburt (2003), Mixed layer depthvariability over the global ocean, J. Geophys. Res., 108(C3), 3079,doi:10.1029/2000JC000736.
Karsh, K. L., T. W. Trull, M. J. Lourey, and D. M. Sigman (2003), Relation-ship of nitrogen isotope fractionation to phytoplankton size andiron availability during the Southern Ocean Iron Release Experiment(SOIREE), Limnol. Oceanogr., 48, 1058–1068.
Karsten, R. H., and J. Marshall (2002), Constructing the residual circulationof the ACC from observations, J. Phys. Oceanogr., 32, 3315–3327.
Keir, R. S. (1988), On the late Pleistocene ocean geochemistry and circula-tion, Paleoceanography, 3, 413–445.
Key, R. M., A. Kozyr, C. L. Sabine, K. Lee, R. Wanninkhof, J. L. Bullister,R. A. Feely, F. J. Millero, C. Mordy, and T.-H. Peng (2004), A globalocean carbon climatology: Results from Global Data Analysis Project(GLODAP), Global Biogeochem. Cycles, 18, GB4031, doi:10.1029/2004GB002247.
Knapp, A. N. (2006), The stable isotopic composition of dissolved organicnitrogen and nitrate in the subtropical ocean, Ph.D. thesis, PrincetonUniv., Princeton, N. J.
Knapp, A. N., D. M. Sigman, and F. Lipschultz (2005), N isotopic compo-sition of dissolved organic nitrogen and nitrate at the Bermuda AtlanticTime-series Study site, Global Biogeochem. Cycles, 19, GB1018,doi:10.1029/2004GB002320.
Ledgard, S. F., K. C. Woo, and F. J. Bergersen (1985), Isotopic fractionationduring reduction of nitrate to nitrite by extracts of spinach leaves, Aust.J. Plant Physiol., 12, 631–640.
Lehmann, M. F., D. M. Sigman, D. C. McCorkle, B. G. Brunelle,S. Hoffmann, M. Kienast, G. Cane, and J. Clement (2005), Origin of thedeep Bering Sea nitrate deficit: Constraints from the nitrogen and oxygenisotopic composition of water column nitrate and benthic nitrate fluxes,Global Biogeochem. Cycles, 19, GB4005, doi:10.1029/2005GB002508.
Levitus, S., and T. Boyer (1994), World Ocean Atlas 1994, vol. 4, Tem-perature, NOAA Atlast NESDIS 4, 129 pp., NOAA, Silver Spring, Md.
Lourey, M. J., and T. W. Trull (2001), Seasonal nutrient depletion andcarbon export in the Subantarctic and Polar Frontal Zones of the SouthernOcean south of Australia, J. Geophys. Res., 106, 31,463–31,487.
Lourey, M. J., T. W. Trull, and D. M. Sigman (2003), Sensitivity of d15N ofnitrate, surface suspended and deep sinking particulate nitrogen to sea-sonal nitrate depletion in the Southern Ocean, Global Biogeochem. Cy-cles, 17(3), 1081, doi:10.1029/2002GB001973.
Mariotti, A., J. C. Germon, P. Hubert, P. Kaiser, R. Letolle, A. Tardieux,and P. Tardieux (1981), Experimental determination of nitrogen kineticisotope fractionation: Some principles; illustration for the denitrificationand nitrification processes, Plant Soil, 62, 413–430.
Martin, J. H., R. M. Gordon, and S. E. Fitzwater (1990), Iron in Antarcticwaters, Nature, 345, 156–158.
Matsumoto, K., J. Lynch-Stieglitz, and R. F. Anderson (2001), Similarglacial and Holocene Southern Ocean hydrography, Paleoceanography,16, 445–454.
McCartney, M. S. (1977), Subantarctic Mode Water, Deep Sea Res., Part A,24, suppl., 103–119.
McNeil, B. I., R. J. Matear, and B. Tilbrook (2001), Does carbon 13 trackanthropogenic CO2 in the Southern Ocean?, Global Biogeochem. Cycles,15, 597–613.
Minas, H. J., and M. Minas (1992), Net community production in highnutrient– low chlorophyll waters of the tropical and Antarctic Oceans�-Grazing vs iron hypothesis, Oceanol. Acta, 15, 145–162.
Mitchell, B. G., E. A. Brody, O. Holm-Hansen, C. McCLain, and J. Bishop(1991), Light limitation of phytoplankton biomass and macronutrientutilization in the Southern Ocean, Limnol. Oceanogr., 36, 1662–1677.
Montoya, J. P., and J. J. McCarthy (1995), Isotopic fractionation duringnitrate uptake by marine phytoplankton grown in continuous culture,J. Plankton Res., 17, 439–464.
Najjar, R. G., J. L. Sarmiento, and J. R. Toggweiler (1992), Downwardtransport and fate of organic matter in the ocean: Simulations with ageneral circulation model, Global Biogeochem. Cycles, 6, 45–76.
Nakatsuka, T., N. Handa, and C. S. Wong (1992), The dynamic changes ofstable isotopic ratios of carbon and nitrogen in suspended and sedimentedparticulate organic matter during a phytoplankton bloom, J. Mar. Res.,50, 267–296.
Needoba, J. A., and P. J. Harrison (2004), Influence of low light and a light:Dark cycle on NO3
� uptake, intracellular NO3�, and nitrogen isotope
fractionation by marine phytoplankton, J. Phycol., 40, 505–516.Needoba, J. A., N. A. Waser, P. J. Harrison, and S. E. Calvert (2003),Nitrogen isotope fractionation in 12 species of marine phytoplanktonduring growth on nitrate, Mar. Ecol. Prog. Ser., 255, 81–91.
Needoba, J. A., D. M. Sigman, and P. J. Harrison (2004), The mechanism ofisotope fractionation during algal nitrate assimilation as illuminated bythe 15N/14N of intracellular nitrate, J. Phycol., 40, 517–522.
Orsi, A. H., T. W. Whitworth, and W. D. Nowlin (1995), On the meridionalextent and fronts of the Antarctic Circumpolar Current, Deep Sea Res.,Part I, 42, 641–673.
Pennock, J. R., D. J. Velinsky, J. H. Sharp, J. Ludlam, and M. L. Fogel(1996), Isotope fractionation of ammonium and nitrate during their up-take by Skeletonema costatum: Implications for the d15N dynamics underbloom conditions, Limnol. Oceanogr., 41, 451–459.
Rintoul, S. R., and M. H. England (2002), Ekman transport dominates localair-sea fluxes in driving variability of Subantarctic Mode Water, J. Phys.Oceanogr., 32, 1308–1321.
Rintoul, S. R., and T. W. Trull (2001), Seasonal evolution of the mixedlayer in the Subantarctic Zone south of Australia, J. Geophys. Res., 106,31,447–31,462.
Robinson, R. S., B. G. Brunelle, and D. M. Sigman (2004), Revisitingnutrient utilization in the glacial Antarctic: Evidence from a new methodfor diatom-bound N isotopic analysis, Paleoceanography, 19, PA3001,doi:10.1029/2003PA000996.
Robinson, R. S., D. M. Sigman, P. J. DiFiore, M. M. Rohde, T. A.Mashiotta, and D. W. Lea (2005), Diatom-bound 15N/14N: Newsupport for enhanced nutrient consumption in the ice age subantarctic,Paleoceanography, 20, PA3003, doi:10.1029/2004PA001114.
Sarmiento, J. L., N. Gruber, M. A. Brzezinski, and J. P. Dunne (2004),High-latitude controls of thermocline nutrients and low latitude biologicalproductivity, Nature, 427, 56–60.
Schlitzer, R. (2002), Carbon export fluxes in the Southern Ocean: Resultsfrom inverse modeling and comparison with satellite-based estimates,Deep Sea Res., Part II, 49, 1623–1644.
Schmidtt, H.-L., and R. Medina (1991), Possibilities and scope of thedouble isotope effect method in the elucidation of mechanisms of enzymecatalyzed reactions, Isotopenpraxis, 27, 1–4.
Sedwick, P. N., P. R. Edwards, D. J. Mackey, F. B. Griffiths, and J. S.Parslow (1997), Iron and manganese in surface waters of the Australiansubantarctic region, Deep Sea Res., Part I, 44, 1239–1253.
Sedwick, P. N., G. R. DiTullio, D. A. Hutchins, P. W. Boyd, F. B. Griffiths,A. C. Crossley, T. W. Trull, and B. Queguiner (1999), Limitation of algalgrowth by iron deficiency in the Australian subantarctic region, Geophys.Res. Lett., 26, 2865–2868.
Sigman, D. M., M. A. Altabet, R. Francois, D. C. McCorkle, and G. Fischer(1999a), The d15N of nitrate in the Southern Ocean: Consumption ofnitrate in surface waters, Global Biogeochem. Cycles, 13, 1149–1166.
Sigman, D. M., M. A. Altabet, R. Francois, D. C. McCorkle, and J.-F.Gaillard (1999b), The isotopic composition of diatom-bound nitrogenin Southern Ocean sediments, Paleoceanography, 14, 118–134.
Sigman, D. M., M. A. Altabet, D. C. McCorkle, R. Francois, and G. Fischer(2000), The d15N of nitrate in the Southern Ocean: Nitrogen cyclingand circulation in the ocean interior, J. Geophys. Res., 105, 19,599–19,614.
Sigman, D. M., K. L. Casciotti, M. Andreani, C. Barford, M. Galanter, andJ. K. Bohlke (2001), A bacterial method for the nitrogen isotopic analysisof nitrate in seawater and freshwater, Anal. Chem., 73, 4145–4153.
Sigman, D. M., S. J. Lehman, and D. W. Oppo (2003), Evaluating mechan-isms of nutrient depletion and 13C enrichment in the intermediate-depthAtlantic during the last ice age, Paleoceanography, 18(3), 1072,doi:10.1029/2002PA000818.
Speer, K., S. R. Rintoul, and B. Sloyan (2000), The diabatic Deacon cell,J. Phys. Oceanogr., 30, 3212–3222.
Strickland, J. D. H., and T. R. Parsons (1972), A Practical Handbook ofSeawater Analysis, 2nd ed., Bull. Fish. Res. Board Can., 167, 310 pp.
Takahashi, T., R. A. Feely, R. F. Weiss, R. H. Wanninkhof, D. W. Chipman,S. C. Sutherland, and T. T. Takahashi (1997), Global air-sea flux of CO2:An estimate based on measurements of sea-air pCO(2) difference, Proc.Natl. Acad. Sci. U. S. A., 94, 8292–8299.
Thunell, R. C., D. M. Sigman, F. Muller-Karger, Y. Astor, and R. Varela(2004), Nitrogen isotope dynamics of the Cariaco Basin, Venezuela,Global Biogeochem. Cycles, 18, GB3001, doi:10.1029/2003GB002185.
Tomczak, M., and J. S. Godfrey (2003), Regional Oceanography: An In-troduction, 390 pp., Daya, Delhi.
Trull, T. W., S. G. Bray, S. J. Manganini, S. Honjo, and R. Francois (2001),Moored sediment trap measurements of carbon export in the Subantarcticand Polar Frontal Zones of the Southern Ocean, south of Australia,J. Geophys. Res., 106, 31,489–31,509.
C08016 DIFIORE ET AL.: SUBANTARCTIC NITRATE N ISOTOPES
18 of 19
C08016
Wada, E. (1980), Nitrogen isotope fractionation and its significance inbiogeochemical processes occurring in marine environments, in IsotopeMarine Chemistry, edited by E. Goldberg, Y. Horibe, and K. Saruhashi,pp. 375–398, Uchida Rokakuho, Tokyo.
Wada, E., and A. Hattori (1978), Nitrogen isotope effects in the assimilationof inorganic nitrogenous compounds, Geomicrobiol. J., 1, 85–101.
Wang, X. J., and R. J. Matear (2001), Modeling the upper ocean dynamicsin the Subantarctic and Polar Frontal Zones in the Australian sector of theSouthern Ocean, J. Geophys. Res., 106, 31,511–31,524.
Wang, X. J., R. J. Matear, and T. W. Trull (2001), Modeling seasonalphosphate export and resupply in the Subantarctic and Polar FrontalZones in the Australian sector of the Southern Ocean, J. Geophys.Res., 106, 31,525–31,541.
Wang, X., R. J. Matear, and T. W. Trull (2003), Nutrient utilization ratios inthe Polar Frontal Zone in the Australian sector of the Southern Ocean: Amodel, Global Biogeochem. Cycles, 17(1), 1009, doi:10.1029/2002GB001938.
Warren, B. A., J. H. LaCasce, and P. E. Robbins (1996), On the obscurantistphysics of ‘‘form drag’’ in theorizing about the circumpolar current,J. Phys. Oceanogr., 26, 2297–2301.
Waser, N. A. D., J. Needoba, S. E. Calvert, and P. J. Harrison (1997),Nitrogen isotope fractionation by 4 groups of marine microalgae
during batch culture growth on nitrate, paper presented at ASLOAquatic Sciences Meeting, Am. Soc. of Limnol. and Oceanogr., SantaFe, N. M.
Waser, N. A. D., D. H. Turpin, P. J. Harrison, B. Nielsen, and S. E. Calvert(1998), Nitrogen isotope fractionation during the uptake and assimilationof nitrate, nitrite, ammonium and urea by a marine diatom, Limnol.Oceanogr., 43, 215–224.
Wu, J., S. E. Calvert, and C. S. Wong (1997), Nitrogen isotope variations inthe subarctic Pacific: Relationships to nitrate utilization and trophic struc-ture, Deep Sea Res., Part I, 44, 287–314.
�����������������������G. Cane, P. J. DiFiore, R. Ho, K. Karsh, and D. M. Sigman, Department
of Geosciences, Princeton University, Guyot Hall, Princeton, NJ 08544,USA. ([email protected])M. J. Lourey, CSIRO Marine and Atmospheric Research, Private Bag 5,
Wembley, WA 6913, Australia.T. W. Trull, Antarctic Climate and Ecosystem Cooperative Research
Centre, CSIRO Marine and Atmospheric Research, Hobart, TAS 7001,Australia.
C08016 DIFIORE ET AL.: SUBANTARCTIC NITRATE N ISOTOPES
19 of 19
C08016


