Embed Size (px)
Citation preview
NUREG/CP-0119Vol. 1
Proceedings of the U.S. Nuclear Regulatory Commission
Nineteenth Water Reactor SafetyInformation MeetingVolume 1
- Plenary Session- Presssure Vessel and Piping Integrity- Metallurgy and NDE- Aging and Components- Probabilistic Risk Assessment Topics
Held atBethesda Marriott HotelBethesda, MarylandOctober 28-30, 1991
U.S. Nuclear Regulatory Commission
Office of Nuclear Regulatory Research
Proceedings prepared byBrookhaven National Laboratory
NOTICE
These proceedings have been authored by a contractorof the United States Government. Neither the UnitedStates Government nor any agency thereof, or any oftheir employees, makes any warranty, expressed orimplied, or assumes any legal liability or responsibilityfor any third party's use, or the results of such use, ofany information, apparatus, product or process disclosed inthese proceedings, or represents that its use by such thirdparty would not infringe privately owned rights. Theviews expressed in these proceedings are not necessarilythose of the U.S. Nuclear Regulatory Commission.
Available from
Superintendent of DocumentsU.S. Government Printing Office
P.O. Box 37082Washington D.C. 20013-7082
and
National Technical Information ServiceSpringfield , VA 22161
NUREG/CP-0119Vol. 1R1 ,R2,R3,R4,R5,R9,RD,RF,RM,RV
Proceedings of the U.S. Nuclear Regulatory Commission
Nineteenth Water Reactor SafetyInformation Meeting
Volume 1- Plenary Session- Presssure Vessel and Piping Integrity- Metallurgy and NDE- Aging and Components- Probabilistic Risk Assessment Topics
Held atBethesda Marriott HotelBethesda, MarylandOctober 28-30, 1991
Manuscript Completed: April 1992
Compiled by: Allen J. Weiss
Office of Nuclear Regulatory ResearchU.S. Nuclear Regulatory CommissionWashington, DC 20555
Proceedings prepared byBrookhaven National Laboratory
ABSTRACT
This three-volume report contains 83 papers out of the 108 that were presented at theNineteenth Water Reactor Safety Information Meeting held at the Bethesda Marriott Hotel,Bethesda, Maryland, during the week of October 28-30, 1991. The papers are printedin the order of their presentation in each session and describe progress and results ofprograms in nuclear safety research conducted in this country and abroad. Foreignparticipation in the meeting included 14 different papers presented by researchers fromCanada, Germany, France, Japan, Sweden, Taiwan, and USSR. The titles of the papersand the names of the authors have been updated and may differ from those thatappeared in the final program of the meeting.
iii
PROCEEDINGS OF THE19th WATER REACTOR SAFETY INFORMATION MEETING
October 28-30, 1991
Published in Three Volumes
GENERAL INDEX
VOLUME 1
- Plenary Session- Pressure Vessel and Piping Integrity- Metallurgy & NDE- Aging and Components- Probabilistic Risk Assessment Topics
VOLUME 2
- Severe Accident Research- Severe Accident Policy Implementation- Accident Management
VOLUME 3
- Structural Engineering- Advanced Reactor Research- Advance Passive Reactors- Human Factors Research- Human Factors Issues Related to Advanced Passive LWRs- Thermal Hydraulics- Earth Sciences
V

REGIS, ED ATTENDEES(ON NRC)19It WATER REACTOR SAFETY INFORMATION MEETING
a ACKERCEA FRENCH ATOMIC E1NEGY COMISSIONCEB SAOLAY OMTISWTGIF SUR YVETEI. 91101FRANCE
S. ADDfIONTENERFARSAP7272 WISCONSIN AVE.. SUITE 300BETHESDA. MD 20814USA
T. AJIMANUPECNUcLEAR POWER 3NM TEST CENTER3-17,1-CHOME.TORANOMONMINATOKUTOKYO. 105JAPAN
F. ALLENWESTING-IOUSESAVAN4AH RVERCQ$ANYP.O. BOX 818AIKEN, SC 29802LISA
F. ALLENBAtTELLE-PACIFIC NORTHWEST LABS.P.O. BOX no1RICHLAND, WA 99352USA
C. AUSONE;&G IDAHQ NC..P.O. BOX 1626IDAHO FALLS. ID 83404UISA
MADRID POLYTEcHNK:AL UNIVERSITYJOSE GUTIERREZA ASCAL. 2MADRID, 28006SPAN
RAMARASCORIYASCIENTECH. NC11821 PARKLAWN DRIVEROCKVILLE. MD 20852LSA
T. ANDREYCHfEKWESTINGOUSE ELECTRICPO BOX 355PITTSBURGH, PA 15230LSA
F. ARAYAJAPANATOMIC ENERGYRES NSTTOKAIJMURA. NAKA-GUNIBARAKI-KEN, 313.11JAPAN
a ARCHULETAUNIVERSITY OF CALUFOANLk SANTA BARBARADEPT.OFGEGICALSCENCESSANTA BARBARA. CA 93106LSA
W. ARCIERIES511426 ROCKVILLE PIKE. SUITE 300ROCKVILLE. MD 20652USA
N ARNEKOREA ELECTRIC POWER CORP. NYOFFICE270 SYLVAN AVENUEENGLEWOOD CLIFFS. NJ 07632
*USA
V.ASMCLOVL V. KIURHATOV IIST. OF ATOMIC ENER3YxULt HTaw StuREMOSCOW, 123182USSR
M. AZARMBCOKVENNATIALLABRATORYBUILDING 130UPTON. NY 119t73LSA
S. BALLOAK ROGENATIONALLABORATORYP.O. BOX 2008OAK RIDGE, TN 378314010LSA
A BARTTAPENN STATE UNIVERSIfY21 SAKETT ILKG:UNIVERSITY PARK. PA 16802LISA - -'-
R. BARIBR00KHAVENNATINALLATORYTC .BUILDING 197CUPTON, NY 11973USA
. BAR(ISFRRAMATOE:TOUR FIAT CEDEX 16PARIS-LA-DEFENSE. 92084FRANCE
l BASSELIER
AVENUIEARIANE 4,BRUSSELS, 1200UELGILAM
J. BAStSTRATEGIC BUSINESS SYSTEMS
MD1NITAINVIEWTERRACEBALLSTON LAKE. NY 12019LESA
4. S0AJfTCCNSNS-MEXICOAV. NSURGENTESSUR. 1776MEXICO CltY, 01030ME=£
G. BALIGARTNERGAStERS HOFMAIN-FORCHSTRASSE 335WURICH 6029SWITZERLAND
FL BEATYSCIENCE & EN3NEERING ASSOCLATES. M1421 PRINCE STFEET. SUITE 300ALEXANDRIA. VA 82314USA
L BE%tAK ODGE4ATCNIALLABORATORYP.O, BOX 20&q. MS-0063OAK ADGE. TN 37831USA
R. BELL
1776 EYE STREET NW. SUITE 300WASHINGTON. DC $Ooo0UISA
G. BERNAEG0G IDAHONC.P.O. BOX 1625IDAHO FALLS, ID 83404USA
FL BEYERWESTING-IOSE206 NAVADO ROADW. PGH PA 16241 r.USA
D. eHARGAVAVIRSINUA POWER5000 DOMINION BLVD.GLEN ALLEN, VA 23060LSA
J. BICKELEG&G IDAHO. N.P.O. BOX 1626, MS 2405IDAHO FALLS. ID 83415-2406LSA
W. SINNERRES. CTR SIEBERSDORFKRAMER3ASSE IVIENNA. A-1010AUSTRUA
D. BLAHNIKBATTELLE-PACIFIC NORTHWEST LABS.P.O. BOX 999RICHLAND, WA 9M852LISA
L 1BO1HNSANDUANATICNALLABORATORIESP.O. BOX 5800. DIVISION 6419ALBUOUEROUE, NM 07185LESA
R BOSCHRCSTERW-EELEER ENERSYGROUP8 PEACH TREE Ht L ROADLIVINGSTON, NJ 07021USA
E BCU HERONSANDtA NATU.AL LABOFATORIESP.O. BOX 5800, DIVISION 6418ALBUOUEROUE. NM 87185-5800LUA
UL BOWMAN
BALTIVORE GAS A EECTRC CO.P.O. BOX 1535LUSBY. ID 20657LSA
B. BOYACKLOS AUMOS NAT10NAL LABORATORYP.O. BOX 1663. MS K551LOS ALAMOS. NM 87545USA
R BOYDWESTINGFOUE SAVANNAH SIVER COMPANYSAVANNAH RNVERSITEAIKEN, SC 29808 r
USA
U. BREDOLTABa ATOMBOX 53VASTERAS. 72183SWEDEN
vii

GENXAREN;Y178 CURTNER AVE. C 754SAN JOSE, CA 95125USA
Ft BUDNITZRnuTRE RESCURCESASsOCiATES INC2DD0 CENTER STREET. SUITE 418BERKELEY. CA 9470LSA
1 BUTLERNUMAR-1778 EYE STREET NW. SUITE 300WASHINGTON, DC 20C00USA
N. BUTTERYNJCLEAR ELECTRIC P/CPWR PRIXJECTGROUP. BOOTHSI HALL,KNITSFORD. CHESHIRE WA1680PUK
A CAMPSAND ANATIONAL LABORATORIESP.OQ BOX 5600, OISION 6412ALBUQUERQUE, NM 87185USA
1 CAREWB13ROAVEN NATIAL LA TORYBULDING 4759UPTON. NY 11973USA
D. CASADAOAK RIDGE IvTIONALLABORATORYP.O. 3OX 2009OAK RIDGE. TN 378314063ULA
FL CHAMBERSEGM& CDAHM NC.P.OQ BOX 1625IDAHO FALLS, ID 83415-1580USA
F. CIANGARGaNNENONTAL LABORATORY
7C0 5 CASS AVENUEARGONNE, IL 60439LSA
I CHAVEDGG IDAHI1 NC.P.O. BOX 1825 MS-2508IDAHO FALLS. ID 83404USA
COHFENGLBERET/COMMOMWEALTHP.O. BOX 1498READING, PA 19603LEA
S.CHENGNSTITUTEOFENERGYRESEARCltAECP.O. BOX 3-3LUNG-TAN. 32580TAIWAN
FtCHEVERMNOMK RIDGE NATIONALLABDRAORY7P.O. BOX 2009. BLDG 9204-tOAK RIDGE. TN 37831-8047LEA
OLC-GPRAARNNE NATINAL LAB ORATORY97C0 S CASS AVENUEARGONNE, IL 60439UlA
S CHVSTONE& WEBSTER ENS0. CORP.83 EXECUTIVE CAMPUS. ROUTE 70CHERRY HILL NJ 08003
L CHU,B=EHAVENNAT1ONALLABORATORYBULDING 130UPTON, NY 11973LSA
FL COLE, JR.5ANDUNATAlAL LABOPATORESP.O. BOX 580 DIVISION 6418ALBUCUERCUE, NM 87185-580DLSA
M. CONRANTDIRECTORATE SAFETY INSTAL ATION NUC1EARCEWFAR DRSN BP NO. 8FONTENAY-AUX-ROSES. 92265FPANCE
CCLODPERAEATEEHOOGY.WIRITHWIFR1THTECHNCL=eOYCCETREDORCHESTER, DORSET DT2 80WUK
4 COOPERMPRASSOCIATES. NC1050 CONNECTICUT AVE. NWWASHINGTON, DC 20038USA
W. COPELANDWESTNGOUSE SAVANNAH RIVER COMPANYSAVANNAH RIVER SITEAIKEN. SC 29S80USA
E CORSSANDIA NATMCALLABORATORIES41 EAGLE TRTIERAS, NM 87059USA
P. CORTICELLIEWEAV1O MARTIRI DI MONTESOLEBOLOGNA. 40100ITALY
W. CORWINOAK RIDGE NATIONALLABORATORYPO. BOX 2008, BLDG 4500SOAK RIDGE, TN 3783t-6151U5A
OAK RDGE NATlAlLLABRATORYP.O. BOX 2009OAK RIDGE, TN 378314038ISA
K OC2ENNLJMARC1776 EYE STREET NW, SUITE 300WASHINGTON. DC 20006LUA
D. CRAMERWESTIWHOUSESAVANNAH RIVER COMPANYSAVANNAH RIVER SITEAIKEN, SC 29808U5A
FR CURTISJUPITER CORPORATION15900 WHITE ROCK RD.GAITHERSBURG, MD 20878USA
D. DAHLGRENSANDIA NATX)NAL LABORATORIESP.O. BOX 5800. DIVISION 8410ALBUOUERQUENM 87185LIA
R. DALAPTECH BOENEERNG SERVICMINC9672 PENNSYLVANIA AVEUPPER MARLBORO, MD 20772*UA
R DALLMANUNC ANALYTICAL SERVICESP.O. BOX 5400ALBUQUERQUE, NM 87185USA
P. DAMERELLMPRASSOCIATES, NC1050 CONNECTICUT AVE. NWWASHINGTON. DC 20036USA
4 DANKDLW.OFTBI4ESSEECOLLEGE OF ENGINEERPNG PERKBS HALLKNOXVILLE TN 37996-20D0USA
N. DAVIESAFATE>NX0=;YRISLEYWARRINGTON. CHESHIRE WA3 GATUK
PA DAVISTERU.S. DEPARTMENT. OF ENERGY, DP-2119901 GERMANTOWN ROADGERMANTOWN. MD 20874USA
B. DE LEPINOISDIRECTORATE SAFETY NSTALLATlON NUCLEARCEN/FAR DRSN BP NO. 8FONTENAY-ALX-ROSES. 92265FWANCE
R. DE WITNAT'L NST. OF STANDARDS & TECHNOLOGYROOM B144. MATERIALS BLOG.GAITHERSBURG. MD 20899U5A
4 DEBORSCIENCE APPUCAT10NS INTL CORP.1710 OORIDGE DRIVEMCLEAN. VA 22102USA
EAUTEILE COLUMEUS505 KING AVE.COLUM3US. OHIO 43201LSA
J. DEVOSCEA FREN04ATOMIC ENERGYCOM8ISSIONCEB SACLAY DMT/SEWTGIFSURYVETTE, 91190FRAh'CE
K. DEWALLEWIG IDAHO. NCP.O. BOX 1625IDAHO FALLS. ID 83404USA
H. DIETERSHAGENKNOLLS ATOMC POWER LAS.- GENERAL ELEC.P.O. BOX 1072SCHENECTADY, NY 1230i-1072-USA
viii

M. DIMARZOUNIVEFISTYOFMARYLANDiME. DEPT.COLLEGE PARK, MD 20742LSA
C. DIPALOSCIENCEAPPLICATIONS INTL CORP.11OGOODRiDGEDRIVEMCLEAN, VA 22102LsA
&DOCTORBATTELLE-PACIFIC NORTHWEST LASS.P.O. Box o99RICHLAND. WA 99352LSA
M. DROLNSCE:CEAPPLICATIONS IML CORP.2109 AIR PARK RD, S. E.ALBULiUEROUE.NM 87106USk
R. DUFFEYBIIooKAveNNATOCNALLAORYBUILDING 197CUPTON, NY 11973LEA
R. DURANTEAECrLTI a1CI15400 CALHOUN DRIVE. SUITE 100ROCKVILLE, MD 20855LSA
K. DWIVEDYVIRGINIA POWER5000 DOMINION BLVD.GLEN ALLEN. VA 23060LEA
J. EASTWESTINGHOSE SAVANlNAH RAVER COMPANYSAVANNAH RIVER SITEAIKEN, SC 29608UISA
K. EBISAWAJAPAN ATOMIC ENERGYYREs INSTTOKAI-MURA, NAKA-GUNIBARAKI-KEN. 319-11JAPAN
J. EDsoNEG&G IDA, MNC.P.O. BOX 1625IDAHO FALLS. ID 83419-2406LSA
Z ELAWARAfIZONA PLBUC SERICEP.O. BOX 52034PHOENIX. AZ 852LUA
P. EMAINELECT1cfe DE FRANCE12-14, AVENUE DUTRIEVOZVILLEURBANNE. 69628FRANCE
G. EMBLEYGENERAL ELeCTRICP.O. BOX 1072SCHENCTADY,NY 12301usA
B ETTINGERMPRASSOCIATES INC1050 CONNECTICLT AVE. NWWASHINGTON. DC 2036LUA
B. EVANS
1776 EYE STREET NW. SULTE 300WASHINGTON. DC 20006ULA
RF FAiRYS3TB>061OES8930 STANFORD BLVD.COLUMBUA MD 21048LISA
M. FELTUSPENl STATE UNIVERSITY231 SAKETT SBLG.UNIVERSITY PARK. PA 16802us4
R PERCHATOMCENERSYONTLacARDP.O.BOX 1048, STATION BOTTAWA, ONTARIO KIP 5S9
M. FISCHERSIEMENS-KWULAMPEROAIHL 45ERLANGEN. W8520GEihAY
5. REGERSCIENCE APPU1CATONS INTL CORP.1710GOODRiDGE DRIVEMCLEAN. VA 22102LSA
FONiTANAOAK RUDGE NATIONALLAEORATORYP.O. BOX 2009OAK RIDGE, TN 37831-8063LEA
T. FORTUNATOBElTISATOCMC POWER LABORATORYP.O BOX 79WEST MIFLiN, PA 15122LEA
E. FOXOAK RIDGE NATIONALLABORATORY1P.O. BOX 2009OAK. RIDGE. TN 378314063LEA
W. FRIDSWEISiH NUCLEAR POWER INSPECIORATEP.O. BOX 27106STOCKHOLM. S-102 2SWEDEN
T. FINAHASHITOS-1BA CORORATION6. SHiNSUGITA -CHO. 1G040-KUYOKOIIAMA. 235JAPAN
H FLIRUKAWAHITACH WORKS, HITACHI LTD.1-1. 3-CHOME. SAIWAI-CHOHITACHI-SHI, IBARAKl-KEN 317 *JAPAN
RGAMBLESARTREt CORP.1700 ROCKVILLE PIKE. STE. 400ROCKVIULE. MD 20852USA
n GERTMANEG&G IDAHO. INC.P.O. BOX 1625 MS-2406IDAHO FALLS. ID 83404ULA
B. GILBERTEG&G 1)AMH INC.P.O. BOX 1625 MS-2405IDAHO FALLS. ID 83404LSA
.LGLEASONWYLE ABORATORIESP.O. BOX 07-7777HUNTSVILLE, AL 36U07-7777U5A
M.GOMOL14SKICEA FRENCH ATCIUC ENERGY OCCNMSSI1N321 RUE DE CHAVEVTONPARIS. 75012MANSE
W. GRANTMPFRASSOCIATES, WC1050 CONNECTICUT AVE. NWWASHINGTON. DC 20036USA
RGREENEOAK RDGENATK*NALLABORATORYP.O. BOX 2009OAK RIDGE. TN 378314-038LEA
EGROUOWWATERSCENCEAPiUCAT ION5 INTL CORP.1710GOODRiDGE DRIVEMCLEAN, VA 22102U5SA
EGRICVEBFOAVENNALLA BORATORYBUILDING 130UPTON, NY 11973LSA
T. HAKESANDI NATIONAL LABORATORIESP.Q BOX 5S00. DIVISION 6412ALBUOUEROUE, NM 87185UISA
R. HALLBROOHAVEN NATIONALLABORATORYBUILDING 130UPTON. NY 11973LSA
R HAMMERSLEYFAUSKE & ASSOCIATES18W070 W. 83RD STBURR RIDGE, L 60521ULA
BECHTEI9801 WASHINGTON BLVD.GAITHERSBURG, MD 20878-5356LEA
F. HARPERSANIA NATIONAL LABORATORIESP.O. BOX 8800, DIVISION 6413ALBUOUERQUE, NM 87185-5800LSA
C. HARRISONATOMIC ENERGY COINTR BOARD270 ALBERT ST.OTTAWA. ONTARIO KIP SS9
L HARROPiM NUCLEAR lNSTALLATIONS N'SSPECTORATEST. PETERS HOUE. BAlLIOL ROADBOOTLE, MERSEYSIDE L20 SZUK
ix

EG&G IDAHO. NCP.O. BOX 1625IDAHO FALLS. ID 83415240UUSA
RHARVEYYANKEE ATOMIC ELECTRIC CO.580 MAIN ST.BOLTON. MA 01740LEA
H HASHEUI1ANAMSCPRATION9111 CROSSPARK DRIVKNOXVILLE. TN 37923LEA
PA HASSANBROKALUVEN LA8TCALLAOTORYBULDING 130UPTON. NY 11973Lek
J. HAWTHORNEMATERWU" ENGIEEIG ASSOCATES9700-B MARTIN L KING. JR. HWYLANHAM. MD 20706LISA
N. HAYASHINUPEC-NUCLEAR POWER ENG. TEST CENTER3-17.1-CHOME.TORANOMON.MINATO-KUTOKYO. 1 08JAPAN
G. HEDRICKDUKE ENGiNEERNG a SERVICES, INCP.O. BOX 1004. W^S ST02ACHARLOTTE. NC 28201-1004LrA
&HENRYBALTi&(RE GAS & ELECTIUC CO.P.O. BOX 1535LUSBY. MD 20S57USA
H. HEPERUNIVERSITYOFMARYLAND9314 CHERRY HILL ROAD #217COLLEGE PARK. MD 20740USA
0. HIDINGERGENERAL ELCTRICP.O. BOX 1072SCHENCTADY, NY 12301ISA
J. HIGGINSBiOHAYENl NATICNAL BORATORYBULDING 130UPTON. NY 11973US%
P. HILLPENNSYLVANIA POWER a LIGHTTWODNORIi NINTH STFEETALLENTOWN, PA 18101USh
R. HOKBINSEOG IDAHQ INCP.O BOX 1625IDAHO FALLS. I0 83415-1580USA
N.HOSSONHhl NUCLEAR IN8TALLAT0NS INSPECTORATEST. PETERS HOS BAOL ROFtBOTLE, MERSEYSIDE W 3LZUK
L HOCHREITERWESIN/OUSEIECTRICPO BOX 355PITTSBURGH. PA 15230USA
SHODGEOAK RIDGENATINALLABORATORYP.O. BOX 2009OAK RIDGE. TN 37831-8057USk
P. HOFMANNKw;DSuNsETLA KAllSFUHEP.O. BOX 3640KARLSRUHE. W-7500G51MANY
C. H0FMAYERBR0OKHAVEN NATICNALLABOPATORYBUILDING 475CUPTON. NY 11973USA
P. HOLDENAEATECHNOU33RISLEYWARRINGTON. CHESHIRE WA3 62RtLK
H. HOLMSTROUOECDNWARENRYAGENCY34. BOULEVARD SUCHETPARIS, F-7501SFRANCE
R HOPPEBEITIS ATOUIC POWER LABORATORYP.O. BOX 79WEST MhFLIN, PA 15122LEA
Y. HDORKAWATHE KANSAi ELECTRIC POWER CO, INC.11 00 17TH STREET. NKW., SUITE 500WASHINGTON. DC 20036USA
D. HORSCHELSANDIA NATIOALLABORATORIESP.O. BOX 5800. DIVISION 8473ALBUOUEROUE. NM 8718-5800LSA
T. HSUVIRGINIA POWER5000 DOMINION BLVD.GLEN ALLEN. VA 23060USA
F. H9LJ81HAVEN NATltLLIIRATORYBUILDING 130UPTON. NY 11973USA
Y. HU4N3tNST1RJTE OF ENERGY FESEARCKtAECP.O. BOX 3-3LUNG-TAN. 32500TAIWAN
T. HNJTGULF STATES UTIUTIESP.O. BOX 220ST. FRANCISVILLE, LA 70778USA
T. HUNTEGbG IDAHO tNC.P.O. BOX 162SIDAHO FALLS. ID 83415-2408tJSA
S. HYTENWYLE LABORATORIESP.O. BOX 07TM7HUNTSVILLE. AL 35807-7777USA
S. INAMDARCNTAFIDHYDPO700 UNIVERSITY AVE.TORONTO. ONTARIO MS IX8CANDA
L INNESATOMtC ENERGYCCNTROLEOARD270 ALBERT ST.OTTAWA. ONTARIO KIP 5S9
J. IRELANDLUS ALALMS NATIONAL LABORATORYP.O. BOX 1663. MS K551LOS ALAMOS, NM 87545USA
H. ISBINNRC-NSRRC2815 MONTEREY PKWYST. LOUIS PARK. MN 55418Lsk
l. EHtGUROJAPAN NUS910 CLOPPER ROADGAITHERStURG, MD 20877LIA
R. JACOBSPENN STATE UNIVERSIIYDEPARTMENTOFPSYCHOLCGYUNIVERSITY PARK. PA i8802USA
M.JACB0USSANDIANATIOLALLABORATORIESP.O. BOX 5800. DIVISION 6419ALSUOUEROUE, NM 87188UISA
J. JANSKY8T8-JANSKYGERLINGERSTRASSE 151LEONBERG. 7250-GEFf~
0. JARRELLBATTELLE-PACIFIC NORTHWEST LABS,P.O. BOX 990RICHLAND. WA 9l352USA
J. JARVISBECHTEL9801 WASHINGTON BLVD.GAITHERSBURG. MD 20878-5358USA
A JIMENEZCSNJUSTO DORADO 11MADRID. 28040SPAIN
G. .DONEG&G IDAHO. MNC.P.O. BOX 1625IDAHO FALLS. ID 83404USA
a JOHINSONBATTELLE-PACIFIC NORTHWEST LABSP.O. BOX 990RICHLAND, WA 99352UISA
x

1JONES I. KIMOAK RIDGE NATIONAL LAORATORY B9RO0(AVEJ NATIONAL LAORATORYP.O. BOX 2009 BULDING 130OAK RIDGE. TN 378314063 UPTON. NY 11973L-A U6A
KJONES S. KINNERSLYEG&G IAH-INC. AEATELO*NOGY.WINFRrTHP.O. BOX 1625 MS-2508 WINFRITECNOYCENTREIDAHO FALLS. ID 63404 DORCHESTER DORSET 0126DH*U6SA UK
C. JUPFTER E. KtNERJUPITERCORPORATION NRCIRACSUITE 503 WHEATON PLAZA N. 2730 UNIVERSITY BLVD. WEST P.O. BOX 682WHEATON. MD 20902 NORWICH, VT 05055
uses USA
H. KARiVAT P.1KLOEGTECHN. UNIV. MUNICH KEMAFGSMHt1AREA UTRECHTSEWV0 310GARCHING. BAVARIA WS0o4 ARNHEM. 6812ARGERWhY THENETHIRLANDS
W. KASTENBERO G.KLOPPUXlA CIMMONWALIH EDISON48-121 ENGINEER IV 1400 OPUS PLACE. SUITE 400LOS ANGELES. CA 90024 DOWNERS GROVE. L 60515USA USA
S. KATANISHI L KMETYKJAPAN ATOMIC ENERGY RES. NST SANDIA NATIONALLABORATORIESTOKAI-MURA. NAKA-GUN P.O.S BOX 5800. DIVISION 6418IBARAKI-KEN. 319-11 ALBUQUERCUE. NM 87165400JAPAN MSA
W. KATO S KOBAYASHIBSRCOAVEN NATlCf*LLABORATORY ISHIKAWAJIMA-HARIMA HEAVY INDUSTRIESBUILDING 197C 1.SHIN-NAKAHARA-CHO. ISOGO-KUUPTON. NY 11973 YOKOHAMA. 235LSA JAPAN
S. KAWAKAMI T. KODAA1UPEC*4UCLEAR POWER EGtTESTCENTER MITSUBISHI HEAVY INDUSTRIES, LTD.
3.13.4-CHOME.TORANOMON.MINATO-KU 2-1-1. SHINHAMA. ARAI-CHOTOKYO. 105 TAKASAGO-SHI, HYOGO-KEN 678JAPAN JAPAN
K. KAWANISHI EKOCHNMITSUBISHI HEAVY INDUSTRIES. LTD. ONTAR1OHYDRO2-1-1, SHINHAMA. ARAI-CHO 700 UNIVERSITY AVE.TAKASAHO-SHIG HYO-KEN 67S 7ORC`IOONrARO AJAPAN
D. KELLY C, KTEbG0 IDA INC. ARGONNENATONALLABORATORYP.O. BOX 1625 MS-2405 970S. CASS AVENUEIDAHO FALLS. ID 63404 ARGONNE, IL 60439ISA USA
J. KELLY P. KPrSHNASWAMYSANDIA NATCANAL LABORATORIES BATTELLE COUMBIUSP.O. BOX 5800. DIVISION 6401 605 KING AVEALBUQUEROUE. NM 87185-800 COLUMBUS, OHIO 43201LSA USA
M. KHATIB-RAHBAR P. KUIANENERGY RESEARCH.tC M0Eb IDAHO, NC. MPO BOX 2034 P.O. BOX 1625 MS-15S0ROCKVILLE MD 20847 IDAHO FALLS. ID 83404LSA LISA
HHO KIM T.KUGIOYAKOREA INSTITUTE OF NJCLEAR SAFETY 0HIACORFORAtONP.O. BOX 16 DAEDLK-DANJI S. SHINSUGITAC41. I5OGO-KUDAEJON. 305353 YOKOHAMA. 235KIEA JAPAN
H. KIM Y. KUKITAKAERI JAPAN ATOMIC ENERGY RES. NSTP.O. BOX DAEDUK-DANAJ TOKAIIUURA. NAKA-OUNDAEJON, IBARAKI-KEN. 319-11KOREA JAPAN
M. KURIHARAMITSUBISHI HEAVY INDUSTRIES, LTD.4R1. 2-CHOME. SHIBAKOUEN , MINATO-KUTOKYO, 105JAPAN
Y.KKUSAMAJAERI. TAWASAKI PAD. CHEI RES. INST.1233 WATANUKI-MACHITAKASAKI. GUNMA. 370-12JAPAN
K. KUSSMALLWA STtIlTGARTP.O. BOX 2009STUTTGART S0, 0-7000GERM
J. LAKEEG&G IDAHO, NC.P.O. BOX 1625 MS-2507IDAHO FALLS. ID 83415-1560LESA
M. LAMBERTELECTICIT9 DE FRANCE12-14. AVENUE DUTRIEVOZVILLEUREANNE. 69628FWANCE
F. LANDYPENN STATE UNIVERSITYRESEARCH BLDG. DUNIVERSITY PARK, PA 16802LISA
a LEAVERTENERA1340 SARATOGA.SUNNYVALE ROADSANJOSECA 95129USA
C. LECWTECEA FRENCH ATCMC ENERGY CtMSSONCEBtFAR DRSN BP NO. 6FONTENAY-ALUX-ROSES, 92265FPANCE
J. LEEKOREA INSTITUTE OF NUCLEAR SAFETYP.O. BOX 16 DAEDIDK-DANJIDAEJON, 306353KOEA
S. LEEFAJSbE&ASSOCIATES1SWO70 W. 83RD STBURR RIDGE. L 60521LSA
. LEHNERBRPOOIAVEI NATKcIULLABORATORYBUILDING 130UPTON. NY 11973USA
R. LINLOS ALWMS NAT4AL LABORATORYP.O. BOX 1663. MS K567LOS ALAMOS, NM 67545U5A
M. LUNDOUISTWESTNGIOlSEHANFRDOOXBOX 1970RICHLAND, WA S352LeA
M. LIVOLANTCEA FRENCHATOMIC BENERGY 4CCLSSICNCENFAR DRSN BP NO. 6FONTENAY-AUX-ROSES. 92265FRANCE
xi

R LOFAROB IKAVEN NATAL LABORATORYBUILDING 130UPTON. NY 11973U5SA
J. LOPEZ-MONTERoMADRID POLYTECHNICALLUNIVERSrIYJOSE GUTIERREZABASCAL 2MADRID. 2800SSPAN
F. LOSSMATERPALS ENGNEERIN ASSOCIATES9700-8 MARTIN L KING. JR. HWYLANHAM. MD 20708USA
K LYNCHGROVE ENGNEE15215 SHADY GROVE RD. STE. 202ROCKVILLE MD 20850ISA
P. MacCONALDBOW IAHO. NMP.O. BOX 1625IDAHO FALLS. ID 83415-2408ISA
A. MacKMEYNUMARC177? EYE STREET NW. SUITE 300WASHINGTON. DC 20006USA
L MADNIBRO"AVEN NATI1OAL LABORATORYBUILDING 130UPTON. NY 11973ISA
D. MAGALLONCEC4JRC ISPRA-JRC EURATUM ISPRAISPRA. VARESE 21020ITALY
H. MAGLEBYEG&G IDAHO, N.P.O. BOX 1625IDAHO FALLS. 10 83415-2406LEA
M. MANAHANPENN STATE UNIVERSITY231 SACKETTUNIVERSITY PARK. PA 16802ISA
P. MANBECKIBALTPAORE GAS ELECTRIC CaP.O. BOX 632LUSBY, MD 20657UISA
R MANDLSIEMENS"KWUHMAMERBACHENSTR 12ERLANGEN.GERMANY
J. MARRINUCCIGILBERET/COMMOMWEALTHP.OL BOX 1498READING, PA 19603ISA
P. MARSIUIENEA-DISPVIA V. BRANCATI. 48ROME. 00144ITALY
L MASYIKAHITACHI RESEARCH LABORATORY3-1.SAIWAI-CHOHITACHI-SHI. IBARAKI-KEN 317JAPAN
H. UASSIEDNSAFETYBOARD ,825 INDIANA AVENUE. SUITE M00WASHINGTON, DC 20004ISA
A. MATSUMIOJAPAN ATCMIC ENERGY RES. NSTTOKAI-UURA. NAKA-GUNIBARAKI-KEN, 319-itJAPAN
a MAVKOJ. STEFAN INSTITIJTEJAMOVA 39LJUBLJANA, 61000SUNENIA
B. MAVKOJ. STEFAN NSTI4TTEJAMJOVA 39LJUBLJA. S61000
E. MCRAWDUKE ENGNEERRNG & SERVICES. WCP.O. BOX 1004. MIS ST02ACHARLOTTE. NC 28201-1004USA
W. McCURDYMPRAS5OCLATES. NC1050 CO NECTICUT AVE. WWASHINGTON. DC 20038
. McMULUANKNOLLSATCMIC POWER LAS. GENERAL LEC.P.O. BOX 1072SCHENECTADY. NY 12301-1072LISA
C. MEDICHSITVIA NINO BIXIO N. 27PIACENZA. 29100ITALY
J. MENCKEc aNU S POWERCOUPANY27780 BLUE STAR HIGHWAYCOVERT. MI 49043ISA
B. MENKEMATERULS ENGNEERN3 ASSOCIATES9700-B MARTIN L KING. JR. HWYLANHAM, MD 20706ISA
J. METCALFSTONE& WEBSTER ENG. CORP.245 SUMMER STREETBOSTON, MA 02107USA
Y. MEYZAUDFFUMA70OMETOUR FIAT CEDEX I$PARIS-LA-DEFENSE. 92084FRV4CE
L MILLERSCIENCE APPLICAT1ONS INTL CORP.1710GOODRIDGE DR.MC LEANK VA 22102LSA
S. MIRSKYSCIENCEAPPLICATIONS INTL CORP.1710GOODRIDGE DRIVEMCLEAN, VA 22102UI5A
QL M0DEENNUMARC1778 EYE STREET NW. SUITE 300WASHINGTON. DC 20008
S. MOOROEG~h IDAHO, M4417 S. HOLMES AVE.IDAHO FALLS. ID 83404LEA
K MOKHTARIANCBITECHNICAL SERVICESS00 JORIE BLVD.OAK BROOK. IL 60521Lek
F. MOODYGENUCLEAR ENERGY175 CURTNERAVENUESANJOSE.CA 95125USA
N MPAYUNIVERSITYCOF ULLOISDEPT. OF MECH. & IEURBANA. IL 61801LISA
D. MORRSONLMURE CORPORATION7525 COLSHIRE DRIVEMCLEAN, VA 22102USA
V. MUBAYIBRODKHAVEN NATIONALLABORATORYBUNLDING 130UPTON. NY 11973ISA
M. MUHLHEIMOAK RIDGE NATloNALLABORATORYP.O. BOX 2009. MS-8065OAK RIDGE. TN 37831-8C65LISA
A. MUJRASEHITACHI LTD.1166 MORIYAMA-CHOHITACHI-SHI IBARAKI 316JAPAN
K. MURATASANDIA NATIONAL LABORATORIESP.O. BOX 5800ALBUOUEROUE. NM 87168-5800ISA
S. NAFFEG&G IDAHO, NC,P.O. BOX 1625IDAHO FALLS. ID 83415U5SA
H. NAGSAKINJPEC4&DXLEAR POWER EN& TEST CENTER3-17.1-CHOME.TORANOMON.MINATO-KUTOKYO. 1 05JAPAN
T. NAKAYAMAHITACH WORKS. HITACHI LTD.1-t. 3-CHOME. SANWAI-CHOHITACHI-SHI. IBARAKI-KEN 317JAPAN
xii

K NAMATAME.MPANATOWC ENERGYRES, MSTTOKAISkMRA. NAKA-GUNIBARAKI-KEN. 319-11JAPAN
H. NARIAILIERSITYOFTSLIKUBA14",OETENNODAITSUKUBA-SHI. EARAKI-KEN 305JAPAN
DC NASSOAK RIDGE NATIONALLABORATORYP.O. BOX 2009OAK RIDGE. TN 378314063LSA
C NEGNGROE BEN515215 SHADY GROVE RD.. STE. 202ROCKVILLE, MD 20860
A. NELSONSUBLCLSURVEY
P.O. BOX 25046DENVER. CO 80225LSA
W. NELSONEG0G INAHO, C.PO BOX 1625IDAHO FALLS. IO 63415LSA
S. NESBITDLKE ENGINEERIN & SERVICES. INC600 MARYLAND AVE.. SW, SUITE 690WASHINGTON. DC 20024USA
J. NESTELLMPRASSOCIATES, INC16O0 CONNECTICUTAVE NWWASHINGTON, DC 20036LEa
MAW NIATC4ACENER5YCOtNCLB7LANE I44KEELUNG RD. SECT 4TAIPEI, TAIWAN
M. NICHOLSLINIVERSfTYOFhMIESOTA271 19TH AVE SOUTHMINNEAPOLIS. MN 55455USA
T. MSHWTOJAPAN ELEC. POWER NIWORMATION CENTER1726 M ST.. NW. STE. 403WASHINGTON. DC 20038LSA
H. NIUATOAC ENERYCWUNCL67 LANE 144 KEELUNG RD. SECT 4TAIPEI TAIWAN 10772R-C
A. IDI~AKNJPEC-NJCLEAR POWER EN. TEST CENTER3-13,4-CHOME.TORANOMONMINATO-KUTOKYO. 106JAPAN
H NORBAKHSHBEa ALENNATNALL0RATORYBULDING 130UPTON, NY 11873LEA
J.O'rRIENEG&4 IDA1O INC.301 RANCH DR.IDAHO FAILS. ID 83404LekA
D. OIAILEYTITAN CORP.4201 CATHEDRAL AVE. NW -APT 1410WWASHINGTON. DC 20016LSA
S OBSEMEIRERUS' LmASURVEY
22NATIONALCENTERRESTON, VA 22092USA
Y.OCHCOMPlUTER SOFTWARE 'EVELOPMET2-4-1.SHIBA KOENTOKYO. MINATO.KU 105JAPAN
RODETTEUMNVERSflYOFCALFORNIA, SANTA BARBARADEPT. OF CHEM, A NUCLEAR ENGNEERSANTA BARBARA, CA 93106LISA
B.OLAND'OAK RDGE NAT NALLARATOR YP.O. BOX 2009OAK RIDGE. TN 378314063LISA
R OLISTEADAECL R13EARCH'CH4LK RIVERLABORATORYCHALK RIVER, ONTARIO KOJI0CANDA
R'0LSCNSALTPVRE GAS & ELECTRC CO.P.O. BoX 1535LUSBY, MD 20657LISA
A.ONYEMAECHlS3TECHNOIJOES6930 STANFORD BLVD.COLUMBIA. MD 21045USA
M. ORTIZEG0G IDAHO, MIC.P.O. BOX 1625 MIS 2404IDAHO FALLS. ID 63416-2402U5A
LOTTOAK RIDGE NATIONALLADATORYP.O. BOX 2009OAK RIDGE. TN 378314067USA
N.PALPAL CONSULTANTS. NOC.16e5 THE ALAMEDE STREET 1001-HSAN JOSE. CA 95126LISA
D. PAUVIOSEE'BS ICAHOtNC.P.O. BOX 1625 MIS 2404IDAHO FALLS, ID 83415-2412LISA
F. PANISKOBATTELLE-PACIFIC NORTHWEST I ASS.P.O. BOX 999RICHLAND. WA 99352LISA
M. PARADESSYSTEM XPROVEMENTS. M238 PETERS ROAD.SUITE 301KNOXVLLE, TN 37923USA
S. PARISHCOUCL FORNUcLEAR SAFEIYP.O. BoX 7106HENNOPSMEER. 0046SOIHvAFRICA
', PAAIKSSANDIA NATIONALLASORATORIESP.O. BOX 5800, DIVISION 6473ALBUOUEROUE. NM 87165-5800LISA
W.PASEBA5.UL S. DEPARTETOFENERGYNE-42WASHINGTON, DC 20685LSA
M. PATTERSONSCIENTECH, INC11621 PARKLAWN DRIVEROCKVJLLE. MD 20652LISA
P. PAULDlUKEPOWERCO.P.O. BOX1006CHARLOTTE. NC 28201USA
A. PAYNE. JR.SANDIA NATIONAL LABORATORIESP.O. BOX 5800. DIVISION 6412ALBUOUEROUE. NM 87185.5800USA
W. PENBELOAK RIDGE NATIONAL LABORATORYP.O. BOX 2009OAK RIDGE. TN 37831-8056LSA
K. PEREIRAA7TOACEYEFRYCTR0L BaARDP.O.8OX 1048, STATION SOTTAWA. ONTARIO KIP 5S9
0.L PEREZCNSNS-MEXIC0OAV. INSURGENTES SUR. 1776MEXICO CITY. 01030MEXICO
Q PETRANGJENEA-DISPVIA V. SRANCATI, 48ROME. 00144ITALY
J.. PHILLIPSEG&G IDAHO. "NC.P.O. BOX 1625 MS-2406IDAHO FALLS. ID 6341515S60LSA
L PHLPOTGILBERET/COWOkMNEALTHP.O. BOX 1498READING, PA 19603L6A
B. PIKULMITRE CORPORATION7525 COLSHIRE DRIVEMCLEAN, VA 22102LSA
xiii

aPNOENEA-DISPVIA V. BRANCATL 41ROME. 00144ITALY
M. POCOWSKIRPLTROY NEW YRKDEPT.OF NUCLEAR ENGINEERINTROY. NY 12180-3592LISA
S. POPEHKUBURTON NUS18804 LINDENHOUSE RD.GArTHERSBURG. MO 20S79LSA
L PRICEE&G IDAHO. NC.P.O. BOX 1625IDAHO FALLS. ID 83415-2406USA
l PUBIAUNESAFLO.GEhVAS3MADRID. 28020SPAN
C. PUGH4CAK UDGE NATINAL LABORATORYP.o. aox 2009 MS 8063OAK RIDGE. TN 3792USA
D. RAKOVICHCNTARIFOHYDR700 UNIVERSITY AVE.TORIOTOONTARIO NMG1X8CANI
J. RANTAKIVIFINNISH CENTRE FOR RWD. & NUCL SAFETYP.O. BOX 265HELSINKI. SF-00101FINLAND
W. REECEEG&G IDAHO. INC.P.O. 8OX 1825 MS-2405IDAHO FALLS. 10 83404ISA
J. REMPEBG IDAHO. INC.P.O. BOX 1625 MS-2508IDAHO FALLS, ID 83404ISA
M. RO4CREUXCEA FRENCH ATCMIC ENERGY CCMSSI1NCEN CADARACHE DRS&VMRST PAUL LUEZ DURANCE, 13108FPANCE
W. RETTIGU S. DEPARTMENTOF ENERGY785 DOE PLACEIDAHO FALLS. ID 83402USA
L. RIBAECLT B>I15400 CALHOUN DRIVE. SUITE I00ROCKVILLE, MD 20855USA
M. RIGHTLEYSWMIA NATIINAL LABORATORIESP.O. BoX 5800, DIVISION 8463ALBUOUEROUE. NM 87185-5800LEA
a EWCNPENN STATE WNIVERSJTY231 SAKETT BLDG.UNIVERSITY PARK. PA 16802iUSA
U. RCFATGIEVAVEN NATL ALA& RAOhRY
BUILDING 4755UPTON, NY 11073USA
a FOLNUMARC -1778 EYE STREET NW. SUITE 300WASHINGTON. DC 200XUSA
SZWAL&OEAR SAFETY DEPARThENTKERSENGMARDE 215VOORBURIG. 2272NOTHE NETHERLANDS
E.ROIH
1310S8ELLA ROAD .PITTSBURGH, PA 15217USA
H. RYALSBETllSATCItC POWER LABORATORYP.O. BOX 79WEST MIFLIN. PA 15122USA
S. SAFFELLBATTELLECOLUMBUS505 KINE AVE.COLUMBUS, OH 43201USA
R SALUZON!WESTINGHCUSESAVANNAH RIVER COMPANYSAVAtWAH RIVER SITEAIKEN. SC 29M82ISA
P. SAAMANTAEIM)O L BVENNATIONALLAE1RATORYBUILDING 130UPTON. NY 11973tSA
R SAMIIATARFOGENERAL DYNMlICS75 EASTERN POINT ROADGROTON, CT 06340USA
J. SANCHEZ
JUSTOA DWW 1'1MADRID, 28040SPAN
a SANDERVAGSWEDISH NUCLEAR POWER INSPECTORATEP.O. BOX 27108STOCKHOLM, S-102 52SWEDEN
L SANTOWAC9NJ OORA 11MADRID. 28040SPAN
M. SARRAMUNITED ENGNEERS30 S. 17TH ST.PHILADELPHIA, PA 19101USA
K.SATOHITACHI.LTD3-1-1 SAIWAI-CHOHITACHI-SHI. IBARAKI-KEN 317JAPAN
Ft SCHMIDTBATTSLLE COLUJBUS505 KING AVE.COLUMBUS, OHIO 43201USA
RSCHNEtDERABSIC-E1000 PROSPECT HILL ROADWINDSOR, CT 06095USA
a SaHECKTANZUNIVERSALTESTING LABORATORIES5969 SHAULOWFORD RD. SUITE 531CHATANOOGA, TN 3742USA
E. SCHULTZINDUSTRIAL POWER CO. LTD -TWV27180 OLKLUOTOSUOMI, SF-27180FINLAND
GSC~HWARZATOMC ENER3Y CNTFOC E1OARD270 ALBERT ST.OTTAWA, ONTARIO KIP 5S9CAN"D
W. SEDDONHW NLCLEAR V.STALLATIDNS INSPECTORATEST. PETERS HOtSE. BALLIOL ROADBOOTLE. MERSEYSIDE L20 31ZUK
EtL SEHGALELECTRIC POWER RESEARCH INSTITUTE3412 HILLVIEW AVE. P.O. BOX 10412PALO ALTO, CA 94303LISA
S SER-IANGILBERET/COteMMOMWEALTHP.O. BOX 1498READING, PA 19603USA
S. SETHMTRECORPORATION7525 COLSHIRE DRIVEMCLEAN, VA 22102USA
W. SHAARNE NATIOALLABORATORY9700 S. CASS AVENUEARGONNE. IL 60439ISA
W. SHACKARXNNE NATIOAL LABORATORY9700 S. CASS AVENUE. BLDG 212ARGONNE IL 80439LISA
Ft SHAFFAAMERICAN ELECTRIC POWERONE RIVERSIDE PLAZACOLUMUS, OHIO 43215LEA
LANTINTSCHNLGIES2625 BUTTERFIELD RD.OAKBROOK IL 60521USA
xiv
K SHIBAJAPAN ATOMIC ENEfIGY RES. INSTTOKAI-MURA. NAKA-GUNIBARAKI-KEN, 319-11JAPAN
J. SHINEBASCO SERVICES, INC.WOWORLD TRADE CENTER
NEW YORK. NY 10048LEA
J. SIENICKIAR3NENATIONALLABORATORY3700 . CASS AVENUIE. BLDG 206ARGONNE. IL 6043LEA
F.JWCSATTELLE-PACIFIC NORTHWEST LABS.P.O. BOX 5O9RICHLAND, WA 99352LEA
A. SIMPKINSWESTI.GCWESAVANNAHVERtCOhPANYSAVANNAH RIVERSITEAIKEN, SC 29808LIA
C. SLATER1991 IDAHO. INC.P.O. BOX 1625IDAHO FALLS. 10 63404LISA
GMSULWHEROAK RIDGE NATIONALLABORATORYP.O. BOX 2008, BLDG 4500SOAK RIDGE. TN 378314152LVA
&SLOANEG&G K1AQ INC.PO BOX 1625IDAHO FALLS. ID 63415LISA
a SLOVIKBEROIAVEN NATOLLABORATORYBUILDING 4758UPTON. NY 11973LISA
L SMITHLOS ALAOS NALTI BORATORYP.O. BOX 1683 MS E5S1LOS ALAMOS, MA 6754LISA
KSODJAPAN ATOMIC ENERGY RES. ITTOKAI-MURA, NAKA-GUNIBARAKIKEN. 319-t1JAPAN
M. SOEJIMAMITSUBISHI HEAVY INDUSTRIES. LTD.t *1 ,.tCHOME.WADASAKI-CHO.HYOGO-KUKOBE-SHI. 652JAPAN
CSORRELLVIRGINIA POWER5000 DOMINION BLVD.GLEN ALLEN. VA 23080LSA
W. SPEZIALEMrWEVl[ao.JE SAVANNAH RVER COKFANY37 VARDEN DRIVEAIKEN. SC 29803U5A
K. STAHLKCOPFinECTRIC POWER RESEARCH INSTTLITE2412 HILLVIEW AVE. P.O. BOX 10412 'xPALO ALTO, CA t4303
R STARCK * ,MPRASSOCIATES, INC160 tCONNECTICUTAVE. 1WWASHINGTON, DC 26036LEA
M. STRANOJUPiTERCORPORATION , .2730 UNIVERSITY BLVD. WEST, S=3;WHEATON. MD O2M2LISA
11STRPASON .*MPRASSOCIATES. INC1050 CONNECTICUT AVE. NNWASHINGTON. DC 20038
EPAtEEL .AV. ARIANE 7BRUSSELS. B-12BELGIUM-
U. SUSUDHI,.BRClVENANATIONALLARATORYBUILDING 130 .UPTON. NY - 1973LISA
K. SUHlFAUSKE&ASSOCIATES16W070 W. 63RD STUURR RIDGE. L 60521
R. SUMMERSSNDIANATIONALLABORATORIESP.O. BOX W80. DIVOION 648ALUCIUERCUE. NM 8718r5-800LEA
J. S4UNAROONAL ALLORATORY
0 5 CASS AVENUEARGONNE, IL 6043
UTAWM. TAEB ,
MO STANFORD BLVD.COLUMBIA, MD 21045LISA
H. TAKEDANf PECJALEAR POWER MO. TEST qWNTER3.13.4-CHOMEJTORANOMONMINAO.KUTKYO. t - ..1JAPAN
IK TAKUMI,NtPEC-NUCLEAR POWER E3 TEST CEhTER3-13.4-CHOMETORANOMON.MINATO-KUTOKYO. 106JAPAN
l.TAYLORBSRCO RATO6 *TP*L 4BCC) -t3R
BUILDINg 130 -UPTON. NW 1973LEA
T.TFEOFACNUSUNIVERSATYCOFCALIRFON. SANTA WAARA6740 CORTONE DR.SANGOLETA.CA 93117USA
W.THOMASUtUJMTECHNOLOGY NC
2625 BUTTERFIELD RD.OAK BROOK. IL 60521LSA
STHIPSCNSANDIA NAT104AL LABORATORIESP.O. BOX 15800 DIVISION 6418ALBUOUERQUE. NM 67165-680LSA
H.TtOf4URGABS ATOM. INC.W0I S. WARFIELD DRIVEMT. AIRY. MD 21771USA
J. TILLSJACK TLLS & ASSOCIATES. IC.PO BOX 549SANDIA PARK. NM 67047.LEA
D.INGAEATEtNLOGYW SRDWIGSHAW LANECULCHRETH CHESHIRE WAS INEUK
T.TRANWESWtt.3HUSE SAVANNAH RIVER COMPANYSAVANNAH RVER SITEAIKEN. SC 29808ULA
P.TRPOYNEWMAN & HOLTZINGER1615 L STREET. N.W.WASHINGTON. DC 20036LEA
J.TUCCLAINEWESTGUSE SAVANNAH RIVER COMPANYSAVANNAH RIVER SITEAIKEN. SC 29808LSA
M. TUTTLELAMCNT-0OHERRYGEOLOGICALOCSBCOLUhBIA UNVERSITYPALISADES, NY 10964LSA
K. UMEKINUPEC-NUCLEAR POWER EN. TEST CENTER3-13.4-CHOME.TORANOMON.MINATO-KUTOKYO, 105JAPAN
L UNGERSYSTEM IMPFVB TS238 PETERS BLVD.. SUITE 301KNOXVILLE, TN 37923
R. VALENTINAR=*CE NATONALLABORATORY9700 . CASS AVENUE. BLDG 306ARGONNE. IL 60439USA
S. VAN HEMELSTAR MOUNTAIN. NC113 CLERht.T AVENUEALEXANDRIA, VA 22304LSA
J. VEEDERAEt LFARRCHCH4LK RIVERLABORATORYCHALK RIVER. ONTARIO KWIJOCAN-DA
.xv

R;CEL0ONJLTANT2081 ROBIN HOOD LANELOS ALTOS, CA 94024LSA
W. 1.N RIESIEMANNSANOIA NATO)AL LABORATORIESP.O. BOX 580 DIVISION 8473ALBUOUERCUE. NM 87185-5800LISA
WE0TrUIOUSE SAVANN4AH RIVE CMPANYSAVANNAH RIVER SITEAK(EN. SC 29808LEA
9, WALSHSCIENCE5 s 3iNEERING ASSOCiATES. I.8100 UPTOWN 8180.. NEALBUOUEROUE, N 87110LISA
D. WALTERS
1778 EYE STREET NW. SUITE 300WASHINGTON, DC 20006LEA
S, WANG,NSTUTEOF ENEPGY RESEARCHKAEC
P.O. 13OX 3-3LUNG-TAN. 32500TAIWAN
LWARDBGY]11428 ROCKVILLE PIKE SUITE 300ROCKVILLE, MD 20852USA
K WASHIINGTONSANDIA NTKIAL LABORITOMESP.O. BOX 5800, DIVSION 429ALBUOUERCUE. NM S7185a5800USA
R WATSQNSANDIA NATIONAL LABORATORIESP.O. BOX 5800. DIVSION 6473ALBUOUEROUE. NM 87185-5800LISA
.l WERNERUS. 0EPARTMENTOFENERGY788 DOE PLACEIDAHO FALLS. ID 83402USA
P. WHEATLEYEO&G AH06 ONC.P.O. BOX 1825 MIS 2412IDAHO FALLS, I0 83415-2412USA
0. WHITEHEADSANDIA NATCNAL LABORATORIESP.O. BOX 5800 DIVISION 6412ALBUCUERQUE, NM 87185USA
EL WHITESELNMFARC -'1778 EYE STREET NW. SUITE 300WASHINGTON, DC 20006USA
K. WHITSOJUOHEANUR40 INVERNESS CENTER PARKWAYBIRMINGHAM, AL 35201USA
a WILKOWSKIUTTELlE CO.LMBUS
505 KING AVE.COLUMBUS, OHIO 43201USA
K. WILLIAMSSCIENCEAPFUCATIONS INTL CORP.2109 AIR PARK RD.. S. E.'ALBUOUERCUE, NM 87106USA
J. WILSONAEATECHOUHARWELULABORATORYDI0LOT. OXFORDSHIRE OXII ORAUK
H.WNGO-WESTINGUSE SAVANNAH RIVER COMPANYSAVANNAH RIVERSITEAIKEN. SC 29680LISA
(IL WIRE
5893 KEYSTONE DR.BETHEL PARK. PA 15102UISA
F. WITT
P.O. BOX 2728PITTSBURGH. PA 15230-2728UISA
M. WITTELAWRENCE LNERMORE NATIONAL LASP.O. BoX 808. L-19SUVERMORE, CA 94550USA
L WOLFKlKtPMDR. BATTELLE-EUROPEPOSTFACH 900180.AM ROMESHOF 35FRANKFURT AM MAIN 90. 8000GE0MbWt
L WOLFNATICNALACAOBEYYOFSCIENCE2101 CONSTITUTION AVENUE NWWASHINGTON, DC 2041 8USA
N WCoODYWEST 1.0USE SAVANNAH RNVER COMPANYSAVANNAHRIVERSITEAIKEN. SC 29808USA
W. WULFFBROOKAVEN NATIOALLABORATORYBUILDING 4753UPTON. NY 11973USk
MN. ONOTATOKYO ELETRIC POWER1901 LST N.W. SUITE 720WASHINGTON, DC 20038USA
KVNB&WNUCLEARSERVICEPO BOX 10935LYNCHBURG, VA 24503USA
BR00KHAYEN NATIOAAL LABCATORYBULDING 130UPTON, NY 11973USA
SCIENCE & EGINEERING ASSOCIATES, NW8100 UPTOWN BLBD.. NEALBUqUERaUE, NM 87110ISA
F. ZIKRIAHARLUURTON NUS CORP910 KLOPPER ROADGAITHERS8URG. MD 20878USA
P. ZMOLAC a P ENGINEERtNG5409 NEWINGTON ROADBETHESDA. MO 20818USA
R.2 'RNMPRASSOCIATES. IN#1050CONNECTKWTAVENWWASHINGTON. DC 20036ISA
P. ZWICKYBASLER& HOFMANN
FORCFSTRASSE395ZURICH. 8029SWlTZERLAND
xvi
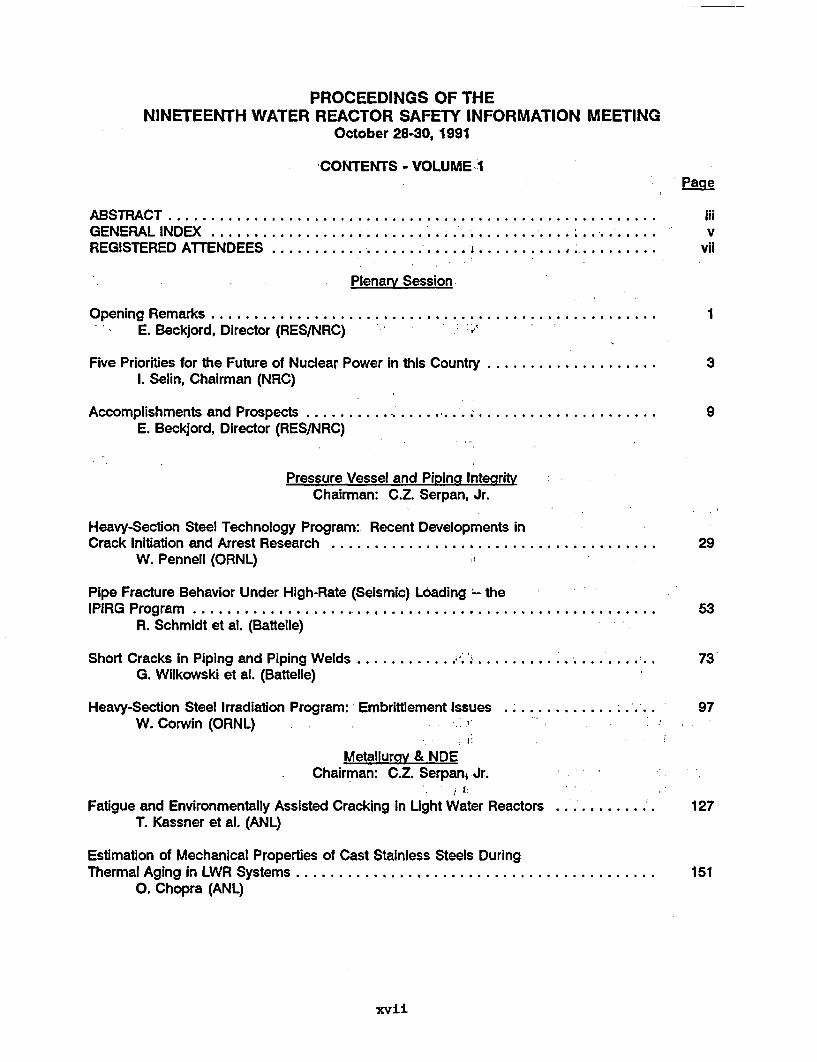
PROCEEDINGS OF THENINETEENTH WATER REACTOR SAFETY INFORMATION MEETING
October 28-30, 1991
CONTENTS - VOLUME 1
ABSTRACT.....................................GENERAL INDEX .................... .REGISTERED ATTENDEES ................... s .
-. Plenary Session
Page
* Iii. ' v
vii
...............
. . .. .. . . ...... .
Opening Remarks ................................- E. Beckjord, Director (RES/NRC) V-'
Five Priorities for the Future of Nuclear Power In this Country1. Selin, Chairman (NRC)
Accomplishments and Prospects .................E. Beckjord, Director (RESINRC)
1
3
9
Pressure Vessel and Piping IntegrityChairman: C.Z. Serpan, Jr.
Heavy-Section Steel Technology Program: Recent Developments inCrack Initiation and Arrest Research ................................
W. Pennell (ORNL)
Pipe Fracture Behavior Under High-Rate (Seismic) Loading - theIPIRG Program ...............................................
R. Schmidt et al. (Battelle)
Short Cracks in Piping and Piping Welds .............................G. Wilkowski et al. (Battelle)
Heavy-Section Steel Irradiation Program: Embrittlement Issues ............W. Corwin (ORNL)
Metallurgy & NDEChairman: C.Z. Serpan, Jr.
Fatigue and Environmentally Assisted Cracking In LUght Water ReactorsT. Kassner et al. (ANL)
Estimation of Mechanical Properties of Cast Stainless Steels DuringThermal Aging in LWR Systems ....................................
0. Chopra (ANL)
29
. . . . . . 53
73
.. .. 97
.. . . 127
151
xvii
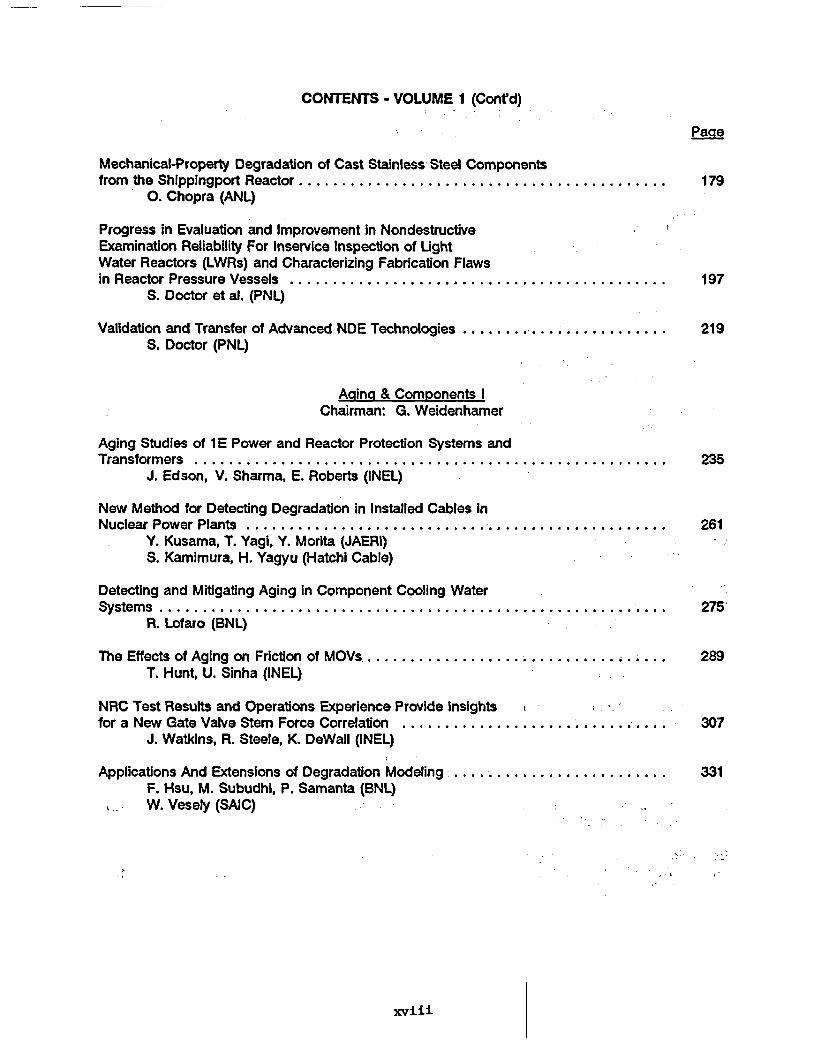
CONTENTS - VOLUME 1 (Cont'd)
Paae
Mechanical-Property Degradation of Cast Stainless Steel Componentsfrom the Shippingport Reactor ........................................... 179
0. Chopra (ANL)
Progress in Evaluation and Improvement in NondestructiveExamination Reliability For Inservice Inspection of LightWater Reactors (LWRs) and Characterizing Fabrication Flawsin Reactor Pressure Vessels ............................................ 197
S. Doctor et al. (PNL)
Validation and Transfer of Advanced NDE Technologies ......................... 219S. Doctor (PNL)
AMing & Components IChairman: G. Weidenhamer
Aging Studies of 1E Power and Reactor Protection Systems andTransformers . ...................................................... 235
J. Edson, V. Sharma, E. Roberts (INEL)
New Method for Detecting Degradation in Installed Cables InNuclear Power Plants .................................................. 261
Y. Kusama, T. Yagi, Y. Morita (JAERI)S. Kamimura, H. Yagyu (Hatchi Cable)
Detecting and Mitigating Aging in Component Cooling WaterSystems............................................................ 275
R. Lofaro (BNL)
The Effects of Aging on Friction of MOVs ................................... 289T. Hunt, U. Sinha (INEL)
NRC Test Results and Operations Experience Provide Insightsfor a New Gate Valve Stem Force Correlation ................................ 307
J. Watkins, R. Steele, K. DeWall (INEL)
Applications And Extensions of Degradation Modeling ......................... 331F. Hsu, M. Subudhi, P. Samanta (BNL)W. Vesely (SAIC)
Xviii
CONTENTS - VOLUME 1 (Cont'd)
PageAning & Components 11
Chairman: J. Burns
Aging Assessment of BWR Control Rod Drive Systems ......................... 343R. Greene (ORNL)
The Effect of Aging Upon CE and B&W Control Rod Drives ..................... 363E. Grove, W. Gunther (BNL)
Aging Related Degradation In Turbine Drives and Governors forSafety Related Pumps ................................................. 375
D. Cox (ORNL)
Aging, Condition Monitoring, and Loss-of-Coolant Accident (LOCA)Tests of Class 1 E Electrical Cables: Summary of Results ....................... 383
M. Jacobus (SNL)
Effects of Aging on Calibration and Response Time of NuclearPlant Pressure Transmitters ............................................. 399
H. Hashemian (AMS)
Snubber Aging Assessment: Results of NPAR Phase 11In-Plant Research .......................... 419
D. Blahnik, E. Werry (PNL)D. Brown (Lake Engineering)
Probabilistic Risk Assessment TopicsChairman: J. Johnson
Preliminary Results of the PWR Low Power and Shutdown AccidentFrequencies Program - Coarse Screening Analysis for Surry .................... 429
T-L Chu et al. (BNL)N. Siu (MIT)
Status of the Low Power and Shutdown Accident SequenceAnalysis Project for the Grand Gulf Nuclear Power Station ...................... 435
D. Whitehead, B. Staple, T. Brown (SNL)J. Darby, B. Walsh (SEA)
Integrated Level Ill Risk Assessment for the LaSalle Unit 2Nuclear Power Plant .................................................. 449
A. Payne Jr., T. Brown, L. Miller (SNL)
Risk-Based Performance Indicators ....................................... 473M. Azarm (BNL)W. Vesely (SAIC)
xix

CONTENTS - VOLUME 1 (Contd).
Page
Intersystem LOCA Risk Assessment:W. Gaylean et al. (INEL)
M d, .hoga R sl. .
Methodology and Results ...... 481
'. : i '
., I1'
xx
Opening Remarks19th Water Reactor Safety Meeting
Eric S. Beckjord, DirectorOffice of Nuclear Regulatory ResearchU.S. Nuclear Regulatory Commission
October 28, 1991
I am very pleased with the large attendance at this meeting, including foreignvisitors. I expect before the meeting ends there will be perhaps 500 peoplewho will have been in attendance. I want to welcome all those who are workingon and are interested in reactor safety research and I note that this is anexcellent opportunity to hear reports of the work underway and also forquestions and answers on the work that you hear reported. It's an opportunityfor exchange of ideas and to find out what is going on in this field ofnuclear reactor safety. You have three days ahead of you of technicalsessions that span all of the areas that the Nuclear Regulatory Commission isworking on in safety research. I look forward to an interesting and astimulating meeting, a useful meeting and I hope that it will fulfill yourexpectations and mine.
This is the opening plenary session and the occasion for the keynote addressof the 19th Water Reactor Safety Meeting. And I would like now to introducethe keynote speaker, Ivan Selin, Chairman of the Nuclear RegulatoryCommission. Dr. Selin received his PhD in electrical engineering withdistinction from Yale University in 1960. He was a.Fulbright scholar duringthe year 1960-1961 and received the Doctor of Science Degree with highesthonors in mathematics from the University of Paris. From 1960 to 1965, he wasa Research Engineer at the Rand Corporation working on statisticalcommunication theory and national security matters. During 1965 to 1970 heserved in the Office of the Assistant Secretary of Defense for SystemsAnalysis, acting as the Assistant Secretary at the end of that period. In1970, Dr. Selin founded American Management Systems, Inc. and was Chairman ofthe Board of his company which engaged in computer systems, services andconsulting. His principal responsibilities in the firm were corporatestrategy and management. His own area of expertise there was comprehensivefinancial management and procedures. In May of 1989 Dr. Selin became UnderSecretary at the Department of State for Management and held that post untilJuly 1st of this year when, after his nomination by the President andconfirmation by the Senate, he became the Chairman of the Nuclear RegulatoryCommission.
Dr. Selin is going to speak to us this morning and he has, as I understand it,five priorities for the future of nuclear power in this country and he's goingto speak to us about those. May I ask you all to give him a warm welcome.
1

Remarks of Ivan Selini9th Water Reactor Safeity Meeting
October 28, 1991
Good morning, ladies and gentlemen.. I am delighted to havethis opportunity to share my thoughts with you about some issuesI believe are important to the nuclear industry. As I do this, Ihope to weave in a few examples of how beneficial your projectshave been and how they have been used to great advantage inrecent Commission decisions.
Over the last few months, I have been refining a messagethat I want to send to all the diverse-elements of the'nuclearcommunity. I began to develop the messige during my confirmationhearings and you can see part of it in iy remarks prepared forthat occasion. I continued the development at'aa speech for aluncheon meeting of a local section of the American NuclearSociety earlier this month. I intended to repeat at this meetingmost of what I said there. Imagine my surprise when The EnerqvDaily picked it to publish in its October 22 issue. I didn'trealize that the message was so -- to use the title of The EnergyDaily's column -- "quotable." Nonetheless, I do want you to hearthe message, so here is a slightly modified version of the "sameold theme."
I want to hit hard at the outset about why I came to theagency believing that it is necessary to7 change the status quo.The change I have in mind entails much more openness to thepublic. I view this as an important change to facilitate publicunderstanding of the nuclear industry'. Without understandingthere will be no acceptance of, or support for, nuclear power.And without nuclear power as an option,'I believe our countryloses the potential benefits of having a range of energy optionsfrom which to choose.
The public has a right to know the facts about the NRC andabout NRC-licensed activities. Tfithihgs go wrong, the publicmust of course be told promptly and candidly.- (And by the sametoken, when things go well, the public has a right to know thattoo. The NRC should be willing to provide realistic assessmentsat all times. We need to tell the whole story- warts and all.
A recent example of this is the'YtiFee Rowe pressure vesselembrittlement issue. The petition to-shut down the Yankee Rowe'plant was dealt with in full view of the interested parties.,There were Commission briefings'where'all interested parties wereheard and public meetings near the plart. There was full'disclosure of all assumptions and calciilations to'all parties. 'Ifound two research products to be pertinent and helpful in myconsideration of the issue: (1) the fracture mechanics researchthat has been completed over the last several years,' and, '(2) the
3

thermal hydraulic analysis capability and.4its underlyingexperimental data base. Both weighed heavily in the Yankee Roweevaluations.
I take comfort from the fact that the NRC bases itsdecisions on the safety judgments of technical experts -- bothin-house and independent experts --,and.has seen those decisionsupheld by reviewing courts. But in the long run, this does notmatter if the American public does not have, confidence.Confidence in the competence, the integrity, apd the candor ofthose who are in charge of operating the nation's nuclear powerplants and confidence in the regulators who are making thedecisions. I believe that the NRC has been,a strong.regulator inthe past, but that the regulated industry has.not received thebenefit in the court of public opinion from that strong.regulation. In that respect, it has been tie worst of all.possible worlds -- the "pain" of a strong regulator without the"credit." Although it will-be painful at t'mes, we need to "tellit like it 'is", or the public will.imagine even worse.
. I look at the future.of nuclear power as depending on fiveitems, but I like to think of them as "one plus four." The "one"is the absolute priority of the 'safety of operating reactors.After that is assured, we can move on to the issues for thefuture -- the "four" I mentioned. I see those four issues as:waste disposal, license renewal, licensing.under Part 52, andstandard designs. I'll return to those in a minute.
First, however, let me focus on the number one priority' -
the safety of operating reactors. I see- the agency's principal.duty to be to ensure that existing nuclear power plants areoperated safely. Along with safety goes proper regard fornational security and for environmental values.. But safety isnot just the obligation of the NRC. First and foremost,' it isthe duty of the nuclear industry. Without safety, safety 'that isdemonstrable, consistent, and proven -- there will be no nuclearindustry. Enlightened self-interest is a powerful motivator tosustain efforts to keep the nuclear' house in order..,.
To 'a great extent, the NRC's role, as ,I see. it, consists ofmaking sure that the efforts of the nuclear industry are bothdeep enough and broad' enough to solve known problems. Our roleis also to ensure that attention is given to important areasbefore problems arise. Not only do we perform extensive. .evaluations.of individual plants, 'but also we look.broadly at.areas such as training, waste management, and maintenance. Andto hark-back to my point earlier about openness, we-will beseekingout opportunities to interact with the public asdwe.dothis.
While the agency's first obligation is to the.public, wehave an obligation to the regulated community as well. By
4

letting the industry know what is expected of it -- measuring offthe 'playing field" in advance, so to speak -- I believeeveryone's interest is served. Fairness goes without saying. Weneed to ensure that there is consistency in the way we apply ourregulations, from one time to another and from one plant toanother. The agency has to ensure that we do not impose expensesinadvertently. One example might be through delay in theperformance of regulatory responsibilities. Of course, wheresafety improvements are'needed, we will not hesitate to requirethem. However, unnecessary costs do not serve industry and donot serve the public. Ultimately they wind up on the electricbills of ratepayers. So there is another area where watchfulnessby the NRC benefits everyone.
I want to mention here that I have been impressed by thegood safety record in the nuclear industry. And this impressionhas been heightened by my recent visit to European and Eastern'European plants. From the time I began preparing for myconfirmation hearings and then took my'place as the Chairman ofthe agency, I have realized -- in a way that is not possible asan outsider -- that this good record is'not a matter of luck.This safety record represents a commitment to safety by theindustry as a whole. I have seen good plants and bad plants, andI want to tell you that I have been impressed by the high levelof safety of the plants in the United States. I also have cometo appreciate the competence and dedication of the staff of theNRC. This is exemplified by the fact that regulatory bodies'around the world regularly draw upon its' expertise. Part of thatexpertise, of course, derives from the research that NRCsponsors. A notable, recent example is'the thorough, systematiceffort to put together an up-to-date risk profile of five U.S.nuclear power plants. There is an additional facet of thateffort that is perhaps of more importance from the point of viewof the research community. That is the'effort to establish theuncertainty on those profiles by state-of-the-art methods. But,as we say to licensees who have excellent performance reviews,the greatest challenge is to maintain this level of performanceand not to rest on past achievements or to become complacent.
I hope you noticed that in referring to my awareness of the'good safety record, I deliberately used the phrase "in a way thatis not possible as an outsider." I think you will agree that thepublic does not share this perception. I believe the only way tochange public perception is for everyone to reaffirm thecommitment to safety and to reaffirm the commitment to thehighest levels of performance. In addition, the NRC mustcontinually demonstrate its vigilance,'fairness, and rigorousadherence to a safety-first approach to regulation. The moreopen our processes to public scrutiny, the more our mutualcommitment to safety will become evident.
5
I turn now to the four issues for the future. About nuclear,waste -- the ultimate nimby, or not in my backyard. I believethat we cannot in good conscience go forward with the nuclear,option without the expectation that a solution will be found forhigh level waste disposal., Toward this end, the agency has beenworking with the Environmental Protection Agency to develop acredible standard for a disposal site. We have also been workingwith DOE on what will be needed to license a high level waste-repository. In addition, I have asked the Advisory Committee onNuclear Waste to take a broad look at issues that may need to beresolved over the next 50 years. Are there technical issues,--technical flaws in ourthinking -- that should be addressed? TheCommission has in the past expressed its confidence that disposalof high level waste will be achievable within the first quarterof the 21st century. And I believe we can still do so.Nonetheless we will continue to review those plans to ensure thatthey remain sound.
For the second item on my list of four -- the agency's finallicense renewal rule, which should be published shortly as Part54 of our regulations. This rule, and its supporting guidance,documents, will define the "playing field" for operation beyondthe present 40-year licenses. The NRC will only renew a licenseif the public health and safety will be adequately protected.The agency has been preparing for the larger issue'of plant agingfor many years. There have been extensive programs for materials-- such as the embrittlement issue I discussed before --
programs for electrical and mechanical systems -- such as valves,,.motors and batteries -- and programs for civil structures -- suchas. the containment. Indeed, since about 20 percent ofourresearch budget has been spent on these programs-in recent years,I'm sure many of you are working on these programs...
Another recent example of the results qf applied research.being used to great advantage is also related to license renewal.The staff has issued for public comment a-gqneric environmentalimpact statement and supporting documents. These documents willmeet part. of the agency's responsibility un4er,the NationalEnvironmental Policy Act (or NEPA). This act calls for fulldisclosure of the environmental impacts of continued operationunder renewed licenses. If the agency's findings are'sustainedduring the comment period, the fact that the agency was able tomake generic findings will reduce the work load on both licensees,and the agency.
The final two issues for the future -- licensing under Part52 and plant standardization -- are closely related. Everyone-.agrees that the licensing process ought to be streamlined.. Thatstreamlining could come from using Part. 52 and ordering only -standard plants. But unfortunately, not everyone agrees on wherethe line should be drawn between safety decisions that would bemade early in the process and safety decisions that would come
6

later. I hasten to add that -- early or late -- the staff willdischarge its responsibility to ensure that all final safetydecisions will have been made before any plant is allowed tooperate. If the proper balance is not struck between decisionsthat are made early and those that are made late -- and today Idon't know where the balance point is -- we may end up only ableto repeat the custom plant approach of the past, which wouldprobably doom new plant construction.
To tie the last two of our "four" back to the "one", Ibelieve that safety is not something that goes into a plant afterit is designed and built. It needs to be built into the systemfrom square one and carried on from there throughout the lifetimeof the plant. But I do not think that the NRC will be doing itsjob if it does no more than rule up or down on proposed designsthat are submitted to it. The agency must act aggressively toseek out not only the problems and flaws in what is proposed --
the errors of commission -- but also to search for the gaps --
the errors of omission -- which are sometimes much harder tofind. For the NRC as regulators -- just as for the industry itregulates -- complacency is a luxury we cannot afford.
I believe that standardized design will significantlyenhance plant safety. Vendors can achieve major safety andtraining improvements over several installations. Among thebenefits are trained personnel for plants of common design --leading to a reduction in human errors, improved maintenance, andreadily available spare parts. In addition to enhancing safety,standardization should also accelerate licensing and reducecosts. These are two important attributes to evaluate asutilities, ratepayers, and utility commissions consider what typeof new generating capacity to develop.
In summary, I would like you to remember openness incommunication and "one plus four" as we move into the future. Weneed to ensure the safe operation of operating plants -- the"one" -- as we continue to work on the four factors for thefuture -- waste disposal, license renewal, Part 52 licensing andplant standardization. We need to accomplish every bit of thiswith openness, in spirit and in fact, to the public whom we allserve. And the last thing for you to remember is that thedecisions about safety and about future directions will needresearch input of the highest quality.
I wish you a productive conference and urge you to keep upthe good work. Again, I appreciate this opportunity to meet withyou and tell you about my views of NRC's priorities.
7

Second Plenary Session6l9th Water Reactor Safety Meeting
Eric S. Beckjord, DirectorOffice of Nuclear Regulatpry Research
October 29, 1991
My name is Eric Beckjord, I'm Director of the Office of Nuclear RegulatoryResearch. I'm glad to have this opportunity to speak to you this afternoon atthe 19th Water Reactor Safety Meeting. It is a forum for the exchange of,ideas in reactor safety, it's a great value-to the Nuclear RegulatoryCommission and I think also to the nuclear safety community in general., Iwant to thank the Research office staff .for'organizing the sessions at thismeeting. I want to thank the authors for their thoughts and presentations.here, I want to thank Al Burda and those on the Research office staff who havemade the arrangements and also Allen Weiss andhis people from Brookhaven whohave done-likewise. -
My purpose this afternoon is to review with you some of the majoraccomplishments in NRC research in the past year and I will-also speak aboutthe prospects for the coming year. I have more accomplishments and prospectsto mention'than I have time so I will not speak to every topic that is listedon the viewgraphs. I'm also regretful that I don't have two sets ofviewgraphs because the aspect angle is about from here to here. If you'resitting outside of that, it will be difficult to see. If I could have thefirst please, George.
This should be the structure of the NRC Research program. The first threecategories are essentially the lines of defense and the Water Reactor Safetycriteria. Advanced Reactors is a new category-this year and it signals thegrowing importance of that subject'. You will see this structure is also, andhas been for about five years, the organization of our budget. Take a goodlook at it because from the point of view of-the budget structure' I expect itwill change to move more along the programmatic lines of the NRC budget in thefuture. If I could have the second slide, please. -
International cooperation is very important tolthe research program. We haveactivities that are underway with each of thecountries listed here, Theseactivities are expanding and I have in mind'our cooperation with France on theCEA's Phebus project which is well underway. There are new agreements in 1991with Japan, through the Ministry of Trade and:qIndustry and NUPEC. They-haveto do with testing a large pre-stress containment-model and-also some BWR.steel shell containment models. In addition,,-there is-also a high temperaturehydrogen'combustion research program, combustion and detonation. There is anew agreement that we have all but concluded,;wiith the Russians through theKurchatov Institute on hydrogen research. There is the ,TMI vessel -- -
investigation program through the OECD organization in the Nuclear EnergyAgency that is approaching completion-now and.,in early 1993. I think it'sgoing to be a major contribution, in fact, even today it is a majorcontribution to the understanding-of that accident and the capability of areactor vessel to maintain its integrity under conditions of loading it wasnever designed for. Also, the completion of the Severe Fuel Damage Partners
9
-
Cooperation Program is coming into view. I'll say a bit more about thatlater. So, I'll turn back to these areas in the structure of the program,first accomplishments and then prospects.
The research people have contributed considerable in the evaluation of thecondition of the Yankee Rowe pressure vessel regarding the embrittlement, thethermal hydraulic analysis, and the pressurized thermal shock. The learningfrom this effort, which has been considerable in the past couple of months,suggests the need for some changes in our reactor vessel fracture mechanicsresearch effort in order to prepare for future cases Which are sure to comealong in the license renewal program, now getting under way. With regard toannealing, a U.S. team witnessed the annealing of the Novovorongzh 3 vesselearly this year through the Soviet/NRC cooperative agreement. This was veryInteresting to the U.S. team, and U.S. industry is now studying theapplicability of the Russian learning and their experience and looking toapplying it to U.S. plants. The aging evaluation research program hasprogressed in the reactor vessel and the'other major tomponents, and ten ofthe systems this year. Development of Regulatory Guides is underway forlicense renewal. The National Seismographic Center was dedicated at Golden,Colorado this spring and the Research office through the NRC provided fundsfor the network stations and for the instrumentation 'and the satellitecommunications for that facility, a world-class facility for earthquake'measurement 'and recording. I have mentioned already the cooperation withJapan on the containment tests, a final one which IVwould point out here isthe nondestructive testing methodology for primary components and piping, andthis method was demonstrated this year. If I could go on the next slide,please.
Now some prospects. Appendices G and H of Part 50 dealing with fracturetoughness and reactor vessel, surveillance requirements will be updated in thecoming year. Seismic siting criteria in Appendix A will be revised and therewill be a substitution of what is'called the inspection earthquake in place ofthe OBE or operating basis earthquake, and also the approval of seismic PRAswill be introduced. Regarding the seismic hazard question, many people arewell aware6of the differences between the Electric Power Research Institute',curves of seismic hazard and the Lawrence Livermore set''of'curves.' The work'on the resolution of the differences between those two should be essentiallycomplete in'1992; however, we are going through'a'process of consensus andpeer review which 'will extend that time, with completion around the end of1993. 'If-I could have the next slide,' please. '
Core damage prevention - regarding boiling water reactor stabilityithe-LaSalle event'study was completed this past' yearf and there are a number of'importantre'fults;'first, the available codes predict the phenomenon, secondlythe most Important 'stability parameters are inlet subcooling and axial powerprofile and I' must say I'm personally somewhat amused and delighted that'theimportance of inlet subcooling has been rediscovered since I published-a >number of papers on that subject about 30 years ago using rather crudermethods, the punch card computer'systems"that were then-available, and someanalogues and integral methods. The other point on the LaSalle stabilityevent is that we have concluded that the industry programs for detection andsuppression of instability will turn out todbe adequate. Accident managementstrategies - a lot of work under way there,' with good'progress on the' '
10
pressurized water reactor applications. Workshops were held in both the caseof the BWRs and the PWRs. With regard to BWR recriticality after a coredamage eVent, it is concluded that 700 parts per'million of boron ten issufficient for'all possible core configurationsto maintain subcriticality. Arisk-based performance'indicator of safety systems, the unavailability of.safety systems, was developed, the work was completed, and the validity ofthat performance indicator demonstrated in the past year. It's an indicatorwhich is based on the fraction of time in each'quarter of the year when a' .separate train of a particular'system would not have functioned when it wascalled upon to function." If there are two systems it's the product of'the'-unavailability of each system and so forth. ;If"I could have the next slide,please.
Core damage prevention - we are-completing the ICAP program and will be movinginto the international code application and maintenance program in this'comingyear'for the thermal hydraulics codes. Also we expect to complete theaccident management analysis for ice condenserstiiand Mark I containments.' ThisIs important, as you-know, because of the smallei safety margins in thesecontainment systems. 'If I could have the next slide, please.
Reactor containment performance - the methodology for resolution of the Mark Icontainment liner melt-through issue has been developed and peer reviewed, andin this past year the work on the remaining-four issues 'is almost complete.We expect to complete that with a final peer review in the coming year.Severe accident scaling methods, SASM, has been'developed'overthe last twoyer.We delayed the continuation of th "iet containment heating tests-atyears. Wdeaeth oinatino the dire'ctcnamethtigesst
SURTSEY until the completion of the SASM development so that it would beapplied to give us some assurance on the scale up of SURTSEY results to fullscale. As I say, that work has been done nowland it's completed.' A reportwill be coming out very soon. The SURTSEY one-tenth scale model tests,accordingly,'have begun again. The results in,'he early tests are excellent,and I have great hopes for the completion of th at program in thi'scoming year.If I could have the next slide, please.
With regard to the prospects for further work Wn'containment performance, weare now in a position to'compare the results of'DCH testing'betw'een the one-tenth scale model and the one-fortieth scale model, the two'at Sandia and 'atArgonne as you know. Sandia is also planning t6 do OCH tests on the one-sixthscale containment model'which was used for test?1pg'containment performancecapability a few years ago. That work is gettihg under way now and I hopethat we may have' a test'by the end 'of next yeai`-Accordingly, with thisprogram in prospect now, I feel that we can'seedthe closure of DCH essentiallyby the end of 1992. 'Debris coolability'tests' 2 "We will be doing some more-work, and that is' very important and has 'appliatiton' to the advanced reactorsnow beginning the review process.'If you attelnced Brian Sheron's talk'this'morning you'would have heard some more about that. We have made significant'progress on resolving severe accident issues, those that were set forth in theSevere Acc'ident Research Program of 1988.' The-severe accident research of thelast ten years, together'with a systemmatic engineeringlapproach toidentifying the issues that have high diisks, have brought closure of these'severe accident issues in sight. It's my own view that severe accidents are aproblem of enormous practical importance to 'the'"world and they have also beena great scientific difficulty. I don't believer''hat this point has received
11

due recognition in the scientific community, and'I hope that theseaccomplishments,4as they are published, will gain recognition and credit for'the menvand women'who have worked on them with brilliance and with success, onwhat a few years ago appeared to be an.intractable set of problems. If Icould'have the next slide, please.
There is a lot of work.to do for advanced reactors. That is the collection,the study, the distillation'of experience on the'more-than 1,500 reactor yearsof operation of light water reactorsin the United States, the additionalexperience available world-wide, the feedback and application of.that.knowledge to new designs to'assure as far as possible that they will not havethe faults of the first generation. I am saying that there is a need for someresearch on new and different features in these reactors.and the advanced LWRsparticularly. We are seeing some very creative ideas in the passive systems,but there are also unanswered questions; the passive system performance underthe range'of conditions that might be expected to occur in accidents and .'transients;, systems interactions in'the case of the AP-600, which Brian'Sherontouched on this morning; the general reliability of passive systems depending.on operation of check valves at low differential pressures. In operatingreactors the check valve is considered to be a passive system, and I thinkit's an interesting question as to what the view is going to be on the checkvalve in these new passive systems. There are also questions about theadvanced instrumentation and control, the'reliability of the low signal levellogic circuits and computer circuitry, and also the~very important matter ofsoftware verification and validation as these systems move into moresophisticated uses.of computer technology and'control and advisory functionsin new plants. The research in these areas has been planned andis getting'underway. I think that-Chairman Selin'said it very well yesterday, and Ithink I'm quoting him right.when he said that safety does not go into a plantafter it is built. Safety needs to be built into the system from square oneand.to be carried throughout the life of the plant. I completely agree with'that thought. If I could have the next slide, please.
There is a list here of accomplishments in the matter of resolving safetyissues and developing regulations. If you look down.that list,, I don't thinkI need to-spell out for you the significance of these rules'because I'thinkthey are self-evident ranging in application from the new Part 54 license.renewal rule to the update of Part.20, the first'in many,. many years, brinigingour radiation-protection standards up to international standards. An'd so ondown'the list. These are things that we do in the Office of Research, inaddition to the safety research projects which'you are hearing about here andthey'are extremely important because they become the regulations that'governthe activities at licensed power plants.. So I just don't want to'let this-pass without a nod to the people who have carried forward these efforts with 'great.diligence and timeliness. If I could have the next slide", please.
I-think the prospects in this area, of rules.and regulation's are as~oself-evident. I'll'just mention a couple of things. A source term revision ofParts 50 and 100 is~expected to-be completed. This represents a-major change'in regulatory philosophy that will essentially separate reactor sitingrequirements from the design and engineering requirements on the reactor.'.:safety systems themselves. There is'a line there about theIndi'vidual'PlantExamination. Probably some of you are aware of the recent submit tal on' the
12

part of the Surry plant for Virginia Electric Power and the turbine hallflooding Issue. Despite the bad press on this issue, I think that we see hereproof that the IPE process can do what the Commission intended, which was touncover severe accident vulnerabilities, so that actions could be taken toremedy whatever needs to be remedied. I'm not sure exactly what actions willbe the final ones at Surry, but I think it certainly makes this point veryclearly. We will also complete the U.S. reactor studies in 1992 of low-powerand shutdown risk. This is a very important issue and it was pointed out tous by our colleagues a few years ago in France.
There are a couple of slides which I included and if anybody is interested, Ididn't bring enough copies, but I can get them over here tomorrow. There arethree other issues that I want to say something about briefly. The first isthe budget prospect for FY 1993. As I've said in the past, I occasionally dohave comments on the budget process which a few of you have an interest in.The prospects for FY 1993, as I see it, are as follows. The 100 percent NRCfee tax on licensees is in effect now. The first tax bills were sent out tolicensees in September for the last fiscal year,'the one that ended inSeptember. This is going to affect the budgeting process for NRC infundamental ways. There is a very strong industry reaction to the 100 percentfee not only in reactor licensing, but throughout the whole range of licensesthat NRC has in the industrial and medical use area. Nobody is happy with itwho has to pay the tax. It is interesting that the sharpest attack on thisfee issue comes on the research budget of NRC. That is evident now and Ithought, to make the point, I would read to you a short paragraph i.n a part ofthe Senate report on the NRC budget which came out in August and I'm quoting,RFinally, the Committee notes increases in the Commission's requests yearafter year in staffing and funding in every mission area. At some point,increased spending on research in areas with direct connections to operationalreactor safety and increased numbers of regulations in ever expanding areas ofreactor operations will bring diminishing returns and lead to over regulationthat may, in fact, impact the level of safety achieved today. Therefore, theCommittee questions the need for across-the-board increases in all missionareas and directs the Commission to initiate an external review of theeffectiveness and cost efficiency of proposed additional programs." Now, thatis talking about research, I'm sure that point came across. I guess what I'msaying is there are some trials ahead for the research budget, I think that isevident and I really can't tell you more about that now except that I knowthat this independent outside review of the program will be undertakenshortly.
The second matter that I wanted to talk about briefly is what is known as theCFO, or the Chief Financial Officers Act. This is now effective in allgovernment agencies of the United States, and the net effect of it greatlyincreases the oversight of NRC expenditures as well as all other governmentexpenditures. Commercial procurements are hardly at all affected by thisbecause of the procedures and regulations in the Government Procurement Manualwhich are already in effect. But there will be an impact on research that isconducted at the national laboratories. I expect more exacting projectmanagement of our national laboratory programs. The NRC research managerswill be responsible for conducting a more businesslike relationship with theircounterparts at the national laboratories. I will shortly be sending out someguidance on how we are going to carry this out. But what it means, I think,
13
can be summarized as follows: more precise work statements for one thing,better cost estimates including a cost estimate which the research projectmanagers in the Office will prepare, careful expenditure control, and finally''a set of'project records which will pass audit, because I am reasonablycertain that there will be a program audit undertaken throughout our programsat the national laboratories in the coming year. So it is going to have animpact. I hope that it will not alter the fundamental mode of cooperation andcontribution on the part of the national laboratories to our safety research,but it's going to put some more focus on the manner in which our cooperationis managed on both sides.
The third thing I wanted to mention concerns the Inspector General'sinvestigation of the Research Office. I think it isino secret in the reactor isafety research community that the Inspector General performed aninvestigation of the Office of Research, beginning in July 1990, as the resultof an allegation of preferential treatment of contractors on the'part~ ofseveral research managers. The investigation was underway for nearly a year,and many RES employees and contractor personnel were interviewed'in itscourse.
The Inspector General's report was given to the Commission in June of thisyear. In essence, the'investigation did not substantiate the allegationsagainst the research managers. After careful review of the report, [met withall the Research staff in order to tell them of the findings. I mention thisnow,'because I'think it is important for all the safety research community to'be aware of thi s finding. It supports the integrity and rectitude'of theresearch management in carrying out its responsibility for the nuclear safety"research program.
14
NINETEENTH WATER REACTOR SAFETYINFORMATION MEETING
ACCOMPLISHMENTS AND PROSPECTS
ERIC S. BECKJORD, DIRECTOROFFICE OF NUCLEAR REGULATORY.RESEARCHU.S. NUCLEAR REGULATORY COMMISSION
OCTOBER 29, 1991
15
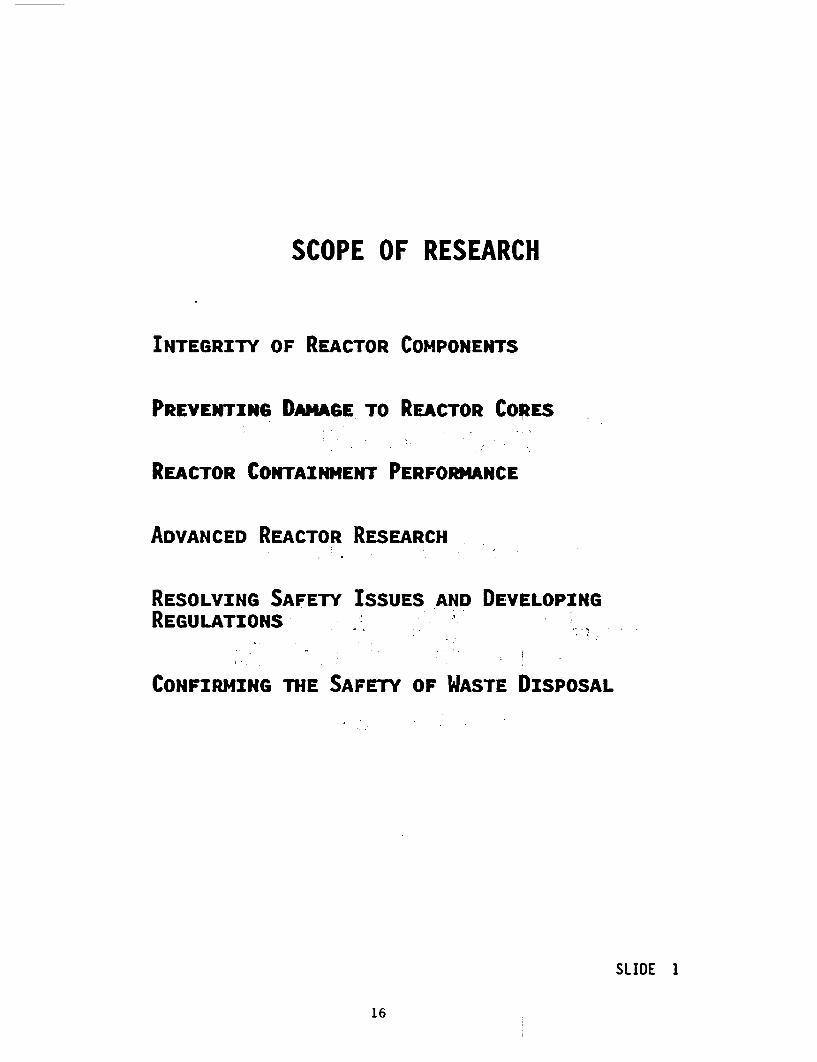
SCOPE OF RESEARCH
INTEGRITY OF REACTOR COMPONENTS
PREVENTING DAMAGE TO REACTOR CORES
REACTOR CONTAINMENT PERFORMANCE
ADVANCED REACTOR RESEARCH
RESOLVING SAFETY ISSUES AND DEVELOPINGREGULATIONS.
CONFIRMING THE SAFETY OF WASTE DISPOSAL
SLIDE I
16

INTERNATIONAL COOPERATIVEACTIVITIES
AUSTRALIA
BELGIUM
CANADA
FINLAND
FRANCE
GERMANY
ITALY
JAPAN
KOREA
MEXICO
NETHERLANDS
NORWAY
PHILIPPINES
SOVIET UNION
* SPAIN
SWEDEN
SWITZERLAND
AM. INST. INTAIWAN
UNITED KINGDOM
YUGOSLAVIA
CEC
NEA (OECD)
SLIDE 2
17
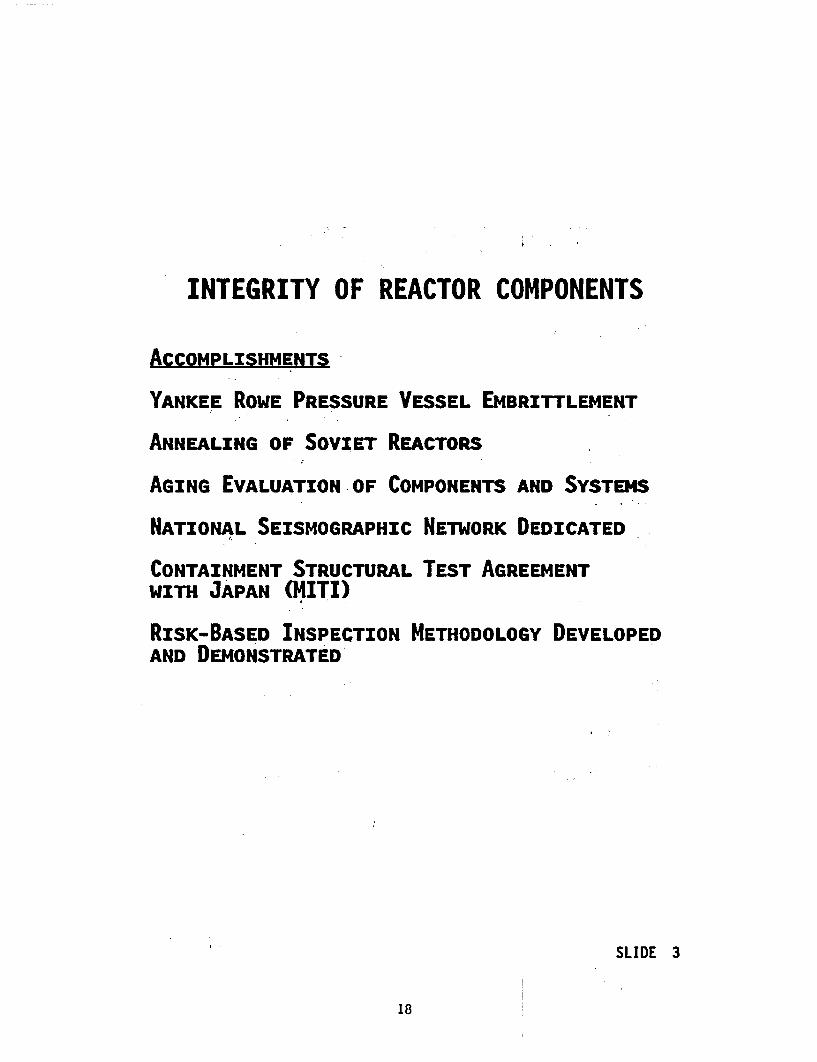
INTEGRITY OF REACTOR COMPONENTS
ACCOMPLISHMENTS
YANKEE ROWE PRESSURE VESSEL EMBRITTLEMENT
ANNEALING OF SOVIET REACTORS
AGING EVALUATION OF COMPONENTS AND SYSTEMS
NATIONAL SEISMOGRAPHIC NETWORK DEDICATED
CONTAINMENT STRUCTURAL TEST AGREEMENTWITH JAPAN (MITI)
RISK-BASED INSPECTION METHODOLOGY DEVELOPEDAND DEMONSTRATED
SLIDE 3
18
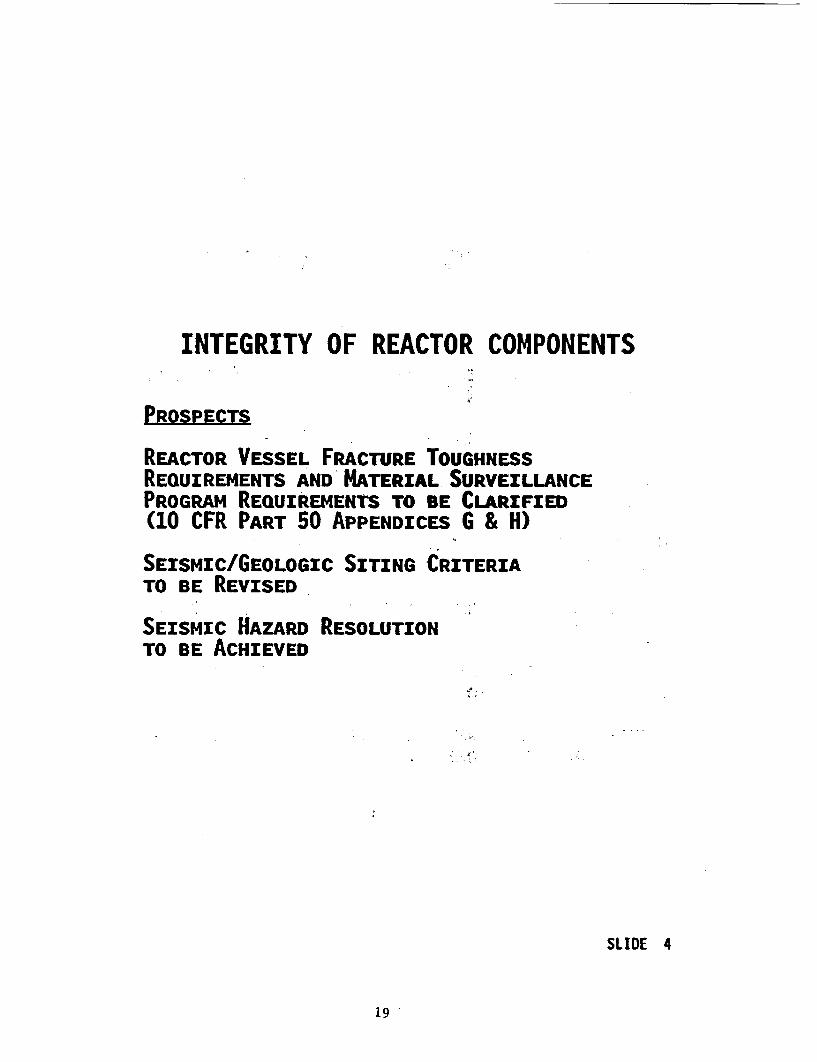
INTEGRITY OF REACTOR COMPONENTS
PROSPECTS
REACTOR VESSEL FRACTURE TOUGHNESSREQUIREMENTS AND MATERIAL SURVEILLANCEPROGRAM REQUIREMENTS TO BE CLARIFIED(10 CFR PART 50 APPENDICES G & H)
SEISMIC/GEOLOGIC SITING CRITERIATO BE REVISED
SEISMIC HAZARD RESOLUTIONTO BE ACHIEVED
SLIDE 4
19
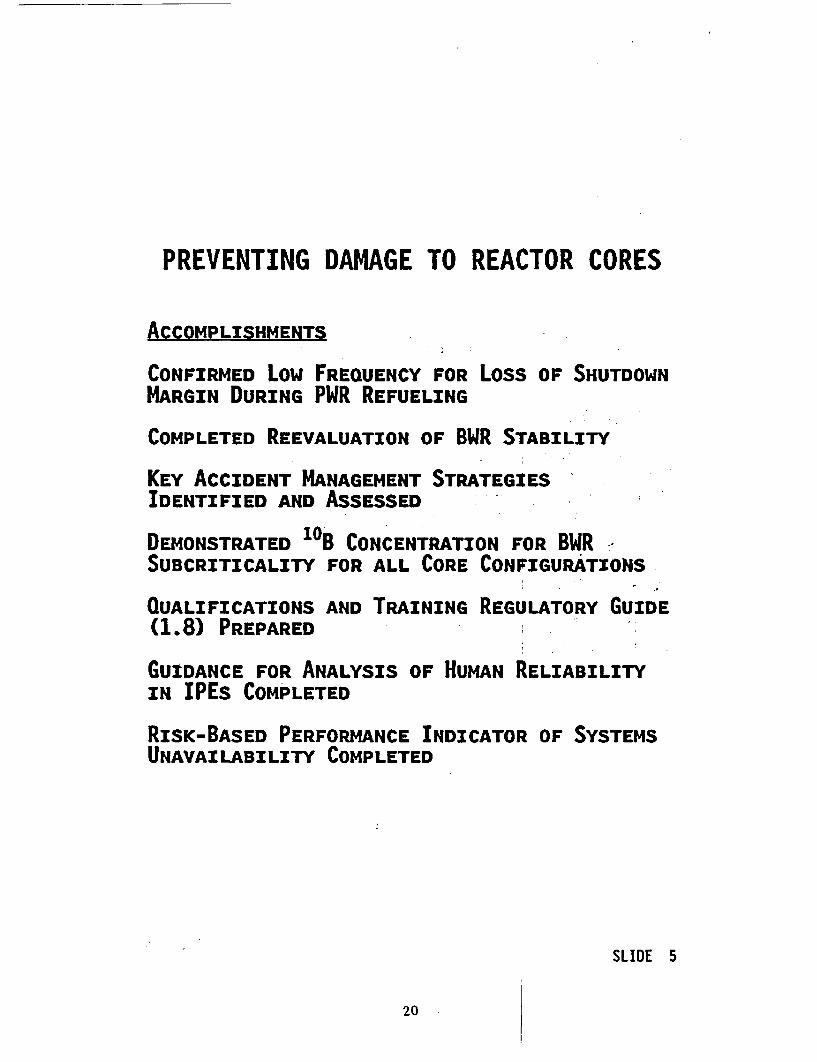
PREVENTING DAMAGE TO REACTOR CORES
ACCOMPLISHMENTS
CONFIRMED Low FREQUENCY FOR Loss OF SHUTDOWNMARGIN DURING PWR REFUELING
COMPLETED REEVALUATION OF BWR STABILITY
KEY ACCIDENT MANAGEMENT STRATEGIESIDENTIFIED AND ASSESSED
DEMONSTRATED 10B CONCENTRATION FOR BWRSUBCRITICALITY FOR ALL CORE CONFIGURATIONS
QUALIFICATIONS AND TRAINING REGULATORY GUIDE(1.8) PREPARED
GUIDANCE FOR ANALYSIS OF HUMAN RELIABILITYIN IPEs COMPLETED
RISK-BASED PERFORMANCE INDICATOR OF SYSTEMSUNAVAILABILITY COMPLETED
SLIDE 5
20
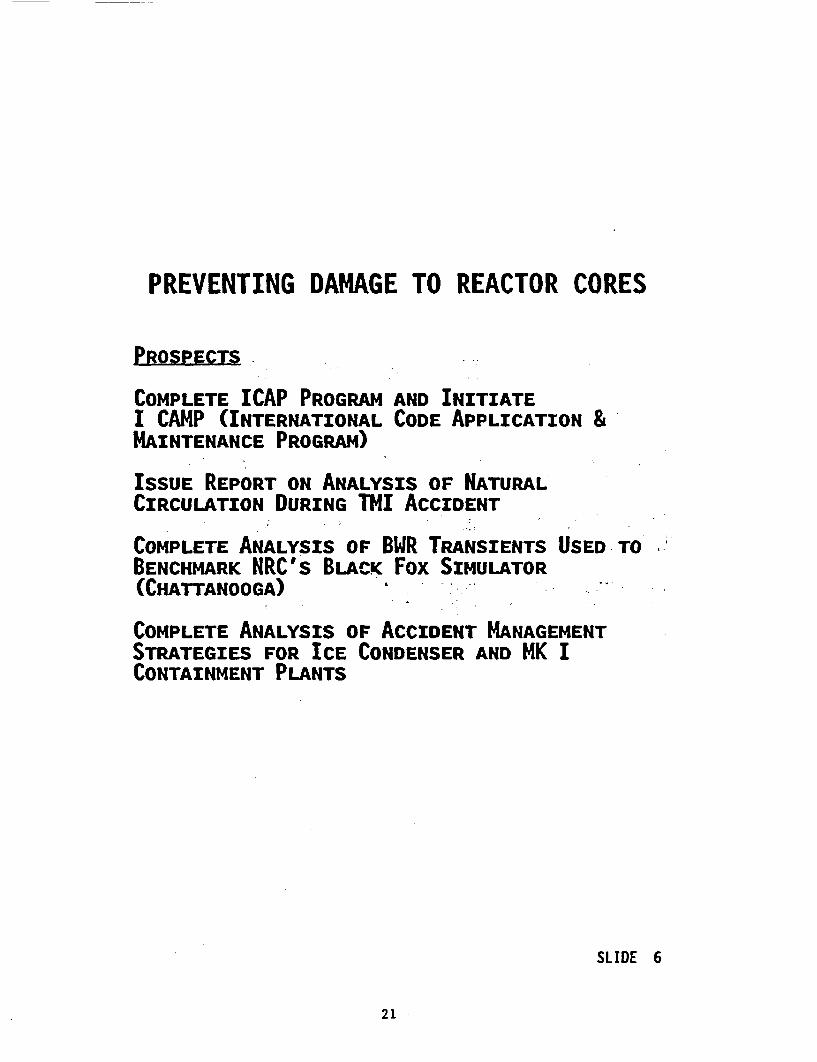
PREVENTING DAMAGE TO REACTOR CORES
PROSPECTM
COMPLETE ICAP PROGRAM AND INITIATEI CAMP (INTERNATIONAL CODE APPLICATION &MAINTENANCE PROGRAM)
ISSUE REPORT ON ANALYSIS OF NATURALCIRCULATION DURING ThI ACCIDENT
COMPLETE ANALYSIS OF BWR TRANSIENTS USED TOBENCHMARK NRC's BLACK Fox SIMULATOR(CHATTANOOGA)
COMPLETE ANALYSIS OF ACCIDENT MANAGEMENTSTRATEGIES FOR ICE CONDENSER AND MK ICONTAINMENT PLANTS
SLIDE 6
21
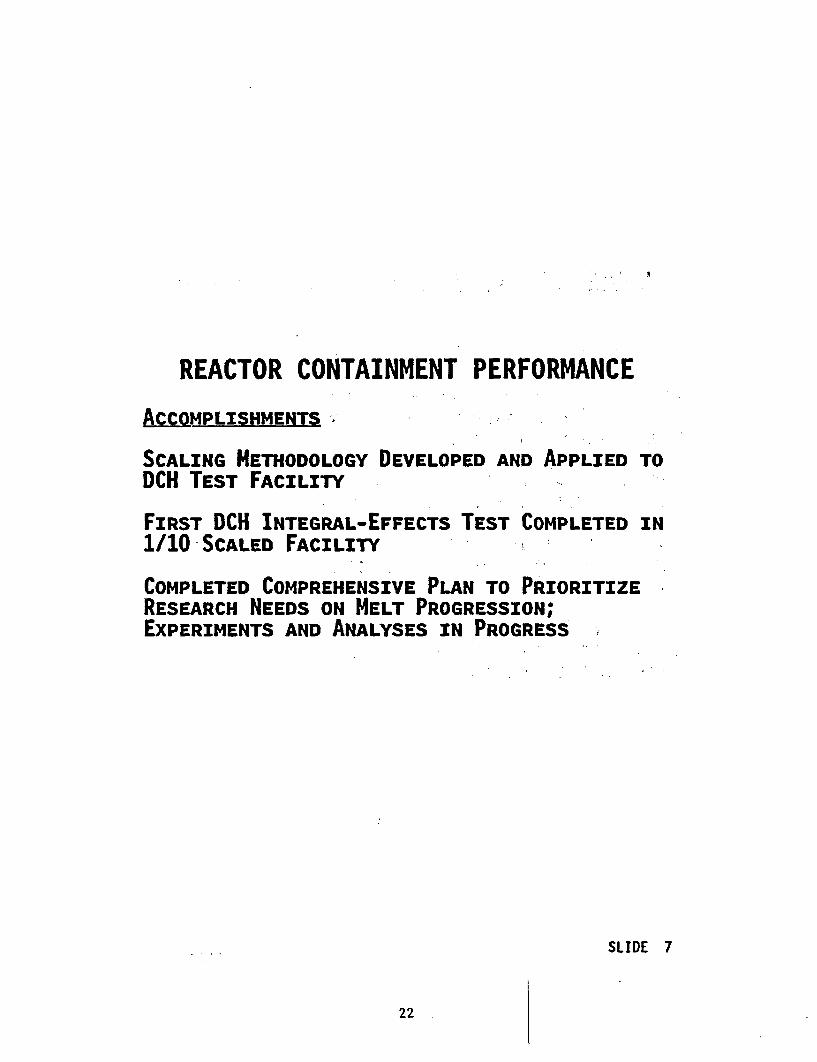
REACTOR CONTAINMENT PERFORMANCE
ACCOMPLISHMENT -
SCALING METHODOLOGY DEVELOPED AND APPLIED TODCH TEST FACILITY
FIRST DCH INTEGRAL-EFFECTS TEST COMPLETED IN1/10 SCALED FACILITY
COMPLETED COMPREHENSIVE PLAN TO PRIORITIZERESEARCH NEEDS ON MELT PROGRESSION;EXPERIMENTS AND ANALYSES IN PROGRESS
SLIDE 7
22
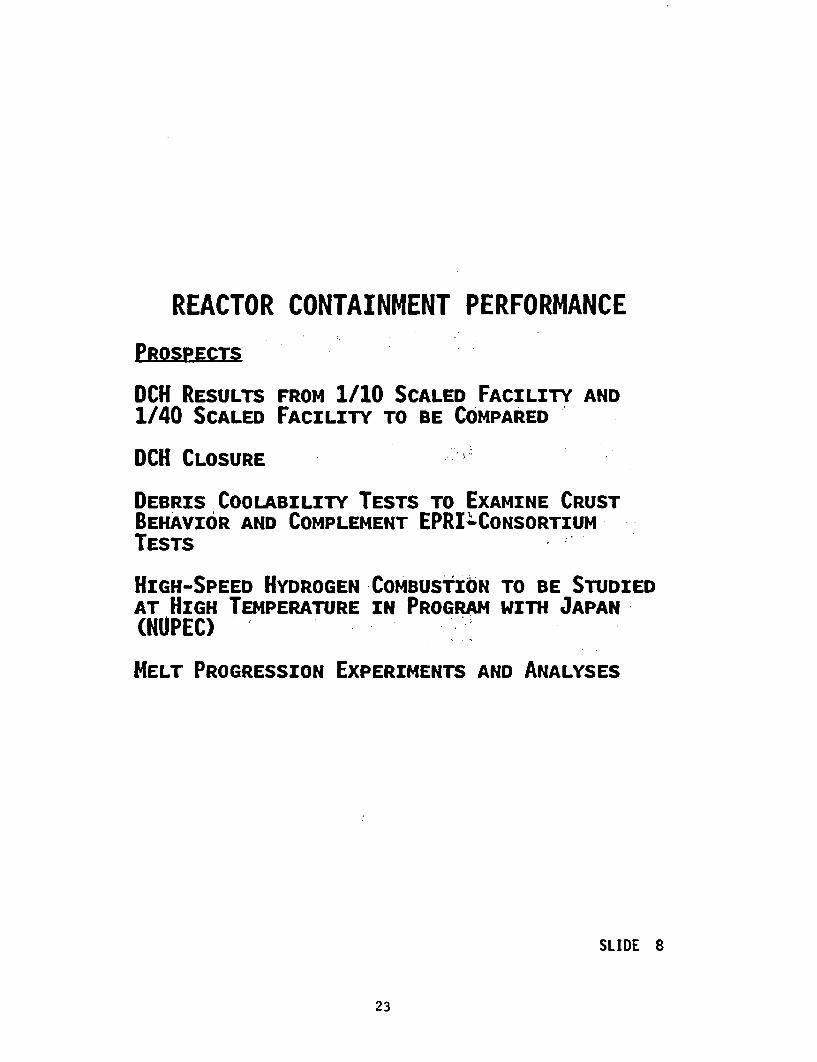
REACTOR CONTAINMENT PERFORMANCE
PROSPECT
DCH RESULTS FROM 1/10 SCALED FACILITY AND1/40 SCALED FACILITY TO BE COMPARED
DCH CLOSURE
DEBRIS COOLABILITY TESTS TO EXAMINE CRUSTBEHAVIOR AND COMPLEMENT EPRILCONSORTIUMTESTS
HIGH-SPEED HYDROGEN COMBUSTION TO BE STUDIEDAT HIGH TEMPERATURE IN PROGRAM WITH JAPAN(KUPEC)
MELT PROGRESSION EXPERIMENTS AND ANALYSES
SLIDE 8
23
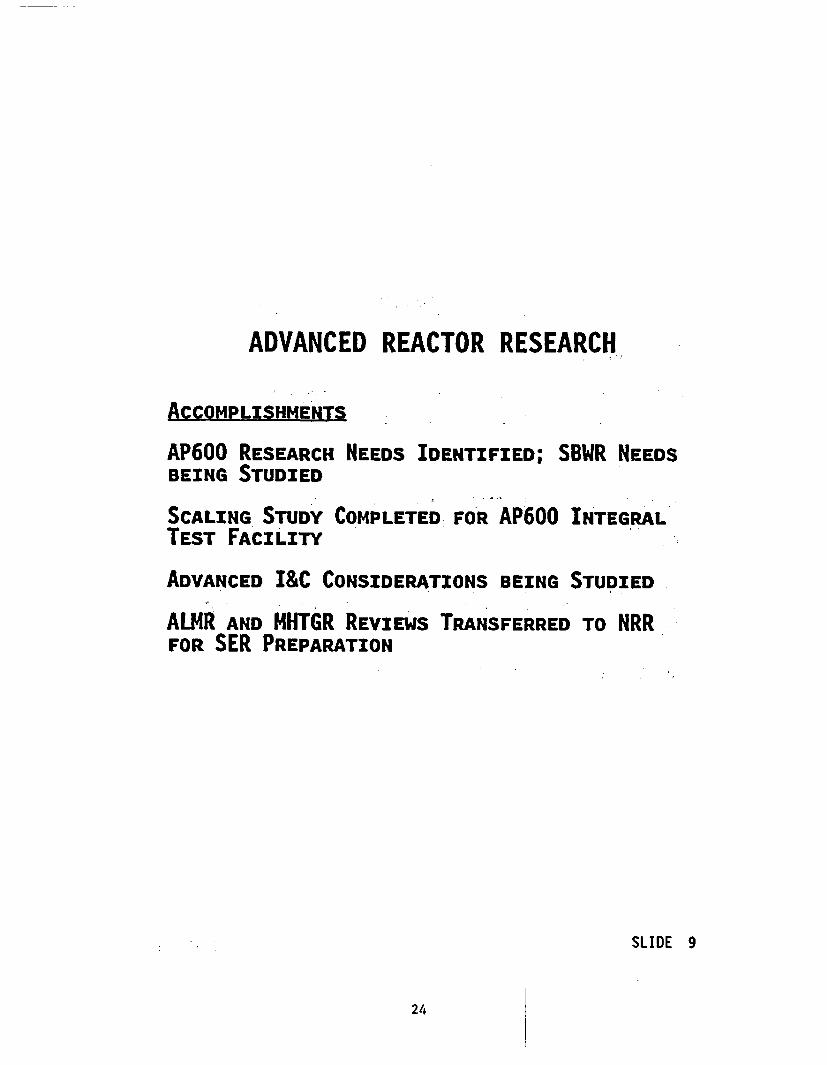
ADVANCED REACTOR RESEARCH
ACCOMPLISHMENTS
AP600 RESEARCH NEEDS IDENTIFIED; SBWR NEEDSBEING STUDIED
SCALING-STUDY COMPLETED FOR AP600 INTEGRALTEST FACILITY
ADVANCED I&C CONSIDERATIONS BEING STUDIED
ALMR AND HHTGR REVIEWS TRANSFERRED TO NRRFOR SER PREPARATION
SLIDE 9
24
it
ADVANCED REACTOR RESEARCH
PROSPECTEM -- 3 :
AP600 INTEGRAL (SYSTEMS TEST FACILITY
ALWR DESIGN CERTIFICATION CODES & ANALYSES., . s .
., 1 i ,,I
I
w . , I.
I . J F o .-
i.' 1
I .. I.
SLIDE 10
4-5
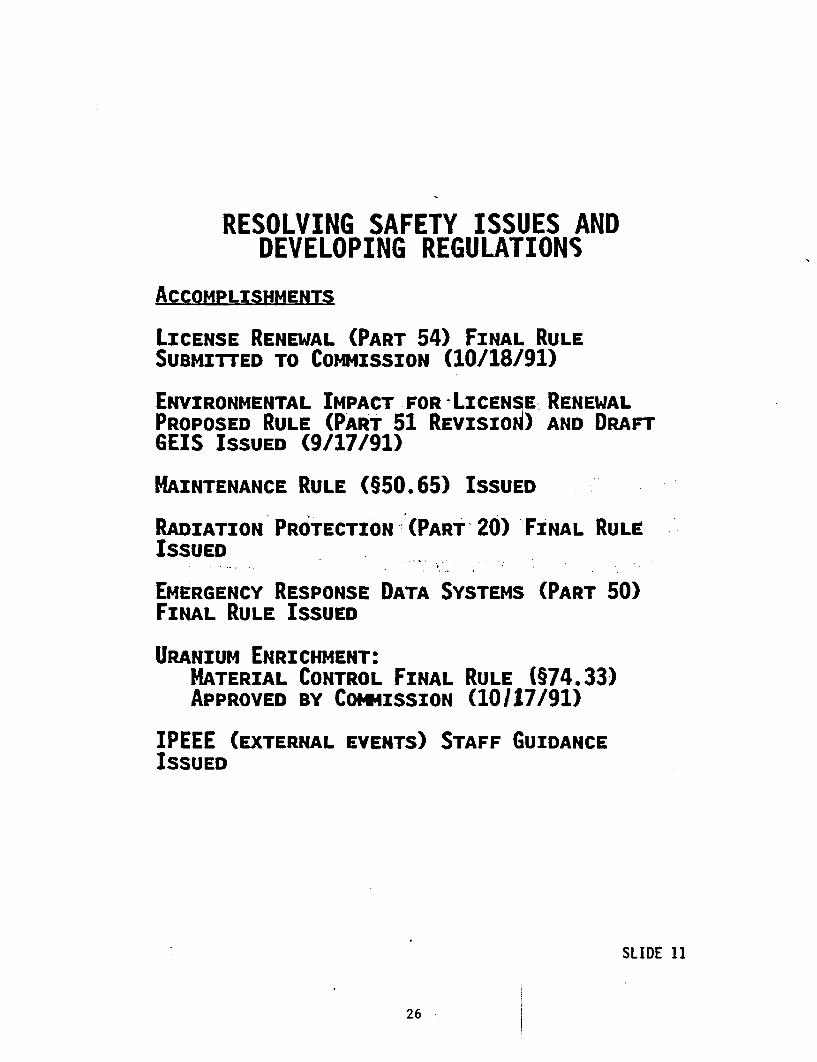
RESOLVING SAFETY ISSUES ANDDEVELOPING REGULATIONS
ACCOMPLISHMENTS
LICENSE RENEWAL (PART 54) FINAL RULESUBMITTED TO COMMISSION (10/18/91)
ENVIRONMENTAL IMPACT FOR LICENSE RENEWALPROPOSED RULE (PART 51 REVISION) AND DRAFTGEIS ISSUED (9/17/91)
MAINTENANCE RULE (§50.65) ISSUED
RADIATION PROTECTIONJ(PART 20) FINAL RULEISSUED
EMERGENCY RESPONSE DATA SYSTEMS (PART 50)FINAL RULE ISSUED
URANIUM ENRICHMENT:MATERIAL CONTROL FINAL RULE (§74.33)APPROVED BY COMMISSION (10117/91)
IPEEE (EXTERNAL EVENTS) STAFF GUIDANCEISSUED
SLIDE 11
26
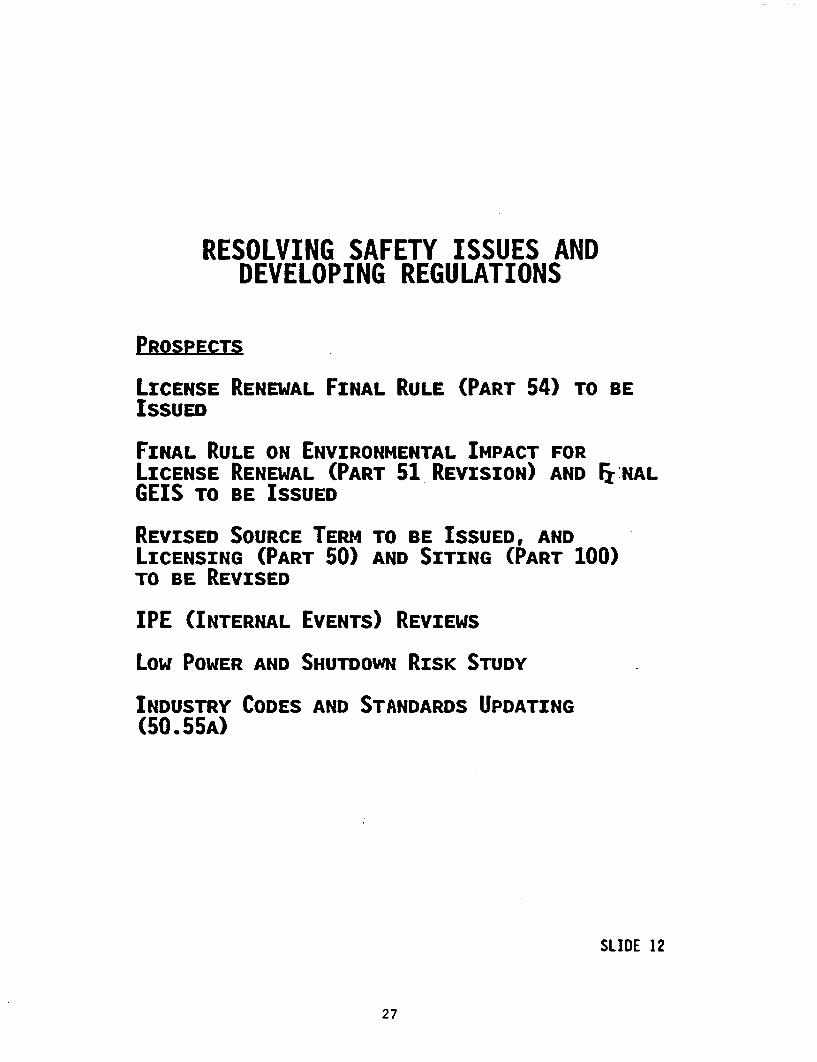
RESOLVING SAFETY ISSUES ANDDEVELOPING REGULATIONS
PROSPECT
LICENSE RENEWAL FINAL RULE (PART 54) TO BEISSUED
FINAL RULE ON ENVIRONMENTAL IMPACT FORLICENSE RENEWAL (PART 51 REVISION) AND FijNALGEIS TO BE ISSUED
REVISED SOURCE TERM TO BE ISSUEDr ANDLICENSING (PART 50) AND SITING (PART 100)TO BE REVISED
IPE (INTERNAL EVENTS) REVIEWS
Low POWER AND SHUTDOWN RISK STUDY
INDUSTRY CODES AND STANDARDS UPDATING(50.55A)
SLIDE 12
27
Heavy-Section Steel Technology Program: Recent Developments inCrack Initiation and Arrest Research*
W. E. Pennell ,
Engineering Technology Division:Oak Ridge National Laboratory
Oak Ridge, Tennessee
Abstract
Technology for the analysis of crack initiation and arrest is central tothe reactor pressure vessel fracture-marpin-assessment process.Regulatory procedures for nuclear plants utilize this technology to assurethe retention of adequate fracture-prevention margins throughout the plantoperating license period. As nuclear plants age and regulatory proceduresdictate that fracture- margin assessments be performed, interest in thefracture-mechanics technology incorporated into those procedures hasheightened. This has led to proposals from a, number of sources fordevelopment and refinement of the underlying crack-initiation and arrest-analysis technology. This paper presents an overview of ongoing Heavy-Section Steel Technology (HSST) Program research aimed at refining thefracture toughness data used in the analysis of fracture margins underpressurized-thermal-shock loading conditions.
Introduction
Pressurized-thermal-shock (PTS) has emerged as a loading condition of dominantconcern in the structural-integrity evaluation of pressurized-water-reactor (PWR) pressurevessels. This loading condition can result from activation of the plant safety injection system(SIS) in response to detection of a loss-of-coolant accident (LOCA) condition. The resultinginjection of cool SISi water into the reactor vessel downcdmer annulus generates the thermal-shock portion of the loading condition. Thermal stresses resulting from this thermal shock canbe high. They constitute the major element of a transieni stress field which has been showncapable of initiating cracks from pre-existing flaws, should hie vessel material fracture toughnessbe sufficiently low.
9'Research sponsored by the Office of Nuclear Regulatory Reearch U S. Nuclear Regulatory Commission underInteragency Agreement 1886-8011-9B with the U.S. Department of nergy under Contract DE-AC05-840R21400with Martin Marietta Energy Systems, Inc.
The submitted manuscript has been authored by a contractor of the U. S. Government under Contract DE-AC05-840R21400. Accordingly, the U. S. Government retains a nonexclusive, royalty-free license to publish orreproduce the published form of this contribution, or allow others to do so, for U. S. Government purposes.
29
Pressure loading, while contributing in a minor way to crack initiation, is the dominantinfluence on the behavior of the crack 'once it has penetrated deep within the reactor vessel wall.Activation of the SIS in response to a small break LOCA can produce pressure recovery in thereactor vessel sufficient to drive the crack through the vessel wall. The major contribution toreactor vessel failure rates predicted in a PTS analysis comes from a small number of dominanttransients, many of which are characterized by recovery of high vessel internal pressures.
It will be evident from the above discussion of the PTS scenario that an accuratedefinition of the vessel material crack initiation and arrest toughness is essential to the PTSanalysis process. A major segment of the Heavy-Section Steel Technology (HSST) Program isdevoted to refining the definition of vessel material crack initiation and arrest toughness for theunique combination of conditions existing during a PTS event. This paper provides a statusreport on this ongoing research. Specific areas of research reviewed are (a) the effect of crack-tip constraint on crack-initiation toughness as influenced by both crack depth and biaxial loadingand (b) the influence of vessel dynamic response following crack initiation on the subsequentcrack-arrest behavior.
Shallow Flaw. Fracture Toughness
Research conducted at the University of Kansas has demonstrated enhanced fracturetoughness for shallow flaws in both A36 and A517 structural steels.1'2 This result is attributedto the loss of crack-tip constraint associated with the proximity of the free surface of the materialto the crack tip. Enhanced fracture toughness for shallow flaws has a special significance in theanalysis of PTS events since prior studies3 have shown that the majority of crack initiationsoriginate from shallow flaws. Major elements of the HSST shallow-flaw task'are devoted to (a)the generation of a shallow-flaw data base for the A 533, Grade B Class 1 material used in theconstruction of many U.S. PWR vessels, and (b) the development of technology for applicationof this data base to the analysis of reactor vessel response to PTS transients..
The HSST shallow-flaw tests are generating fracture-toughness data for A 533 Grade BClass 1 material for a range of crack depths of interest to the PTS analysis. Specimens used inthe development phase of the testing are shown in Fig. 1. Thqy are nominally '102 mm (4 in.)deep with widths ranging from 51 mm (2 in.) to' 152 mm (6T"M.). Analysis, preparation andtesting of these specimens has been described by Theiss et aL in Refs. 4 and 5.
Use of such a large test specimen is expensive in terms of consumption of valuable, fullycharacterized test material. Selection of the test specimen size reflects a concern that the testresults must be capable of interpretation in terms of both the ibsolute crack depth "a" and therelative crack depth a/w. Finite-element analysis of shallow-flaw specimens recently reported byKirk et al.6 reinforces the need for this approach. They found that neither a nor a/w, whenconsidered alone, provided an adequate basis for transfer of data from test specimen to differingapplication geometries. Their results show that interaction of the plastic field generated by stressconcentrations at the crack tip with that generated by overall response of the structural section tothe applied loading controls the magnitude of stresses ahead of the crack tip and, thereby, thefracture toughness.
30
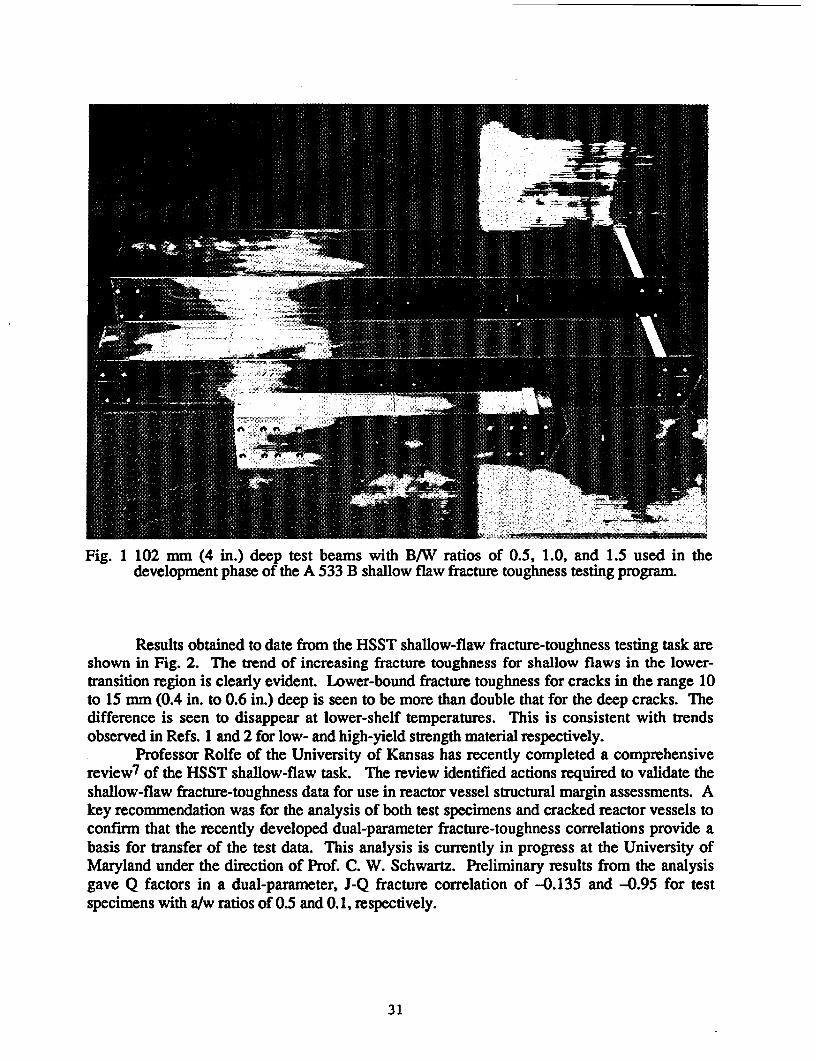
Fig. 1 102 mm (4 in.) deep test beams with B/W ratios of 0.5, 1.0, and 1.5 used in thedevelopment phase of the A 533 B shallow flaw fracture toughness testing program.
Results obtained to date from the HSST shallow-flaw fracture-toughness testing task areshown in Fig. 2. The trend of increasing fracture toughness for shallow flaws in the lower-transition region is clearly evident. Lower-bound fracture toughness for cracks in the range 10to 15 mm (0.4 in. to 0.6 in.) deep is seen to be more than double that for the deep cracks. Thedifference is seen to disappear at lower-shelf temperatures. This is consistent with trendsobserved in Refs. 1 and 2 for low- and high-yield strength material respectively.
Professor Rolfe of the University of Kansas has recently completed a comprehensivereview7 of the HSST shallow-flaw task. The review identified actions required to validate theshallow-flaw fracture-toughness data for use in reactor vessel structural margin assessments. Akey recommendation was for the analysis of both test specimens and cracked reactor vessels toconfirm that the recently developed dual-parameter fracture-toughness correlations provide abasis for transfer of the test data. This analysis is currently in progress at the University ofMaryland under the direction of Prof. C. W. Schwartz. Preliminary results from the analysisgave Q factors in a dual-parameter, J-Q fracture correlation of -0.135 and -0.95 for testspecimens with a/w ratios of 0.5 and 0.1, respectively.
31
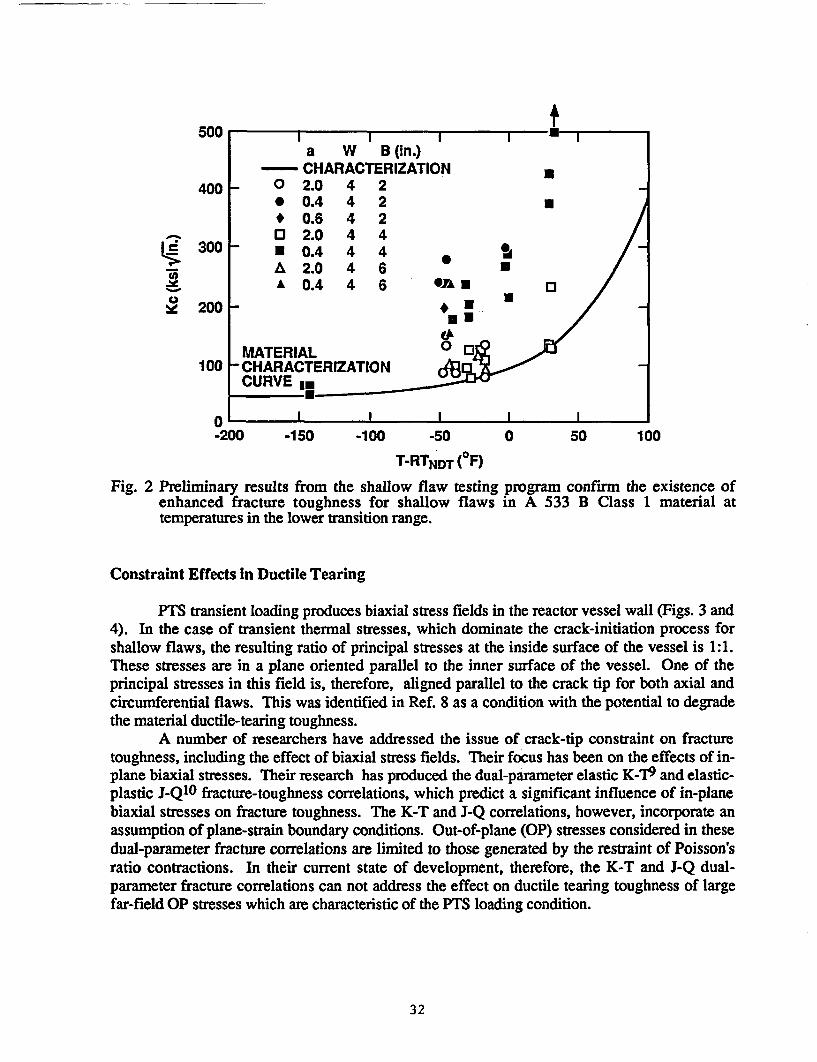
500
400 - Z.u 4 z* 0.4 4 2* 0.6 4 20 2.0 4 4
300 - * 0.4 4 4A 2.0 4 6 *A 0.4 4 6 *^*
y 200
MATERIAL100 CHARACTERIZATION
-200 -150 -100 -50 0 50 100
T-RTNDT (OF)
Fig. 2 Preliminary results from the shallow flaw testing program confirm the existence ofenhanced fracture toughness for shallow flaws in A 533 B Class 1 material attemperatures in the lower transition range.
Constraint Effects in Ductile Tearing
PTS transient loading produces biaxial stress fields in the reactor vessel wall (Figs. 3 and4). In the case of transient thermal stresses, which dominate the crack-initiation process forshallow flaws, the resulting ratio of principal stresses at the inside surface of the vessel is 1:1.These stresses are in a plane oriented parallel to the inner surface of the vessel. One of theprincipal stresses in this field is, therefore, aligned parallel to the crack tip for both axial andcircumferential flaws. This was identified in Ref. 8 as a condition with the potential to degradethe material ductile-tearing toughness.
A number of researchers have addressed the issue of crack-tip constraint on fracturetoughness, including the effect of biaxial stress fields. Their focus has been on the effects of in-plane biaxial stresses. Their research has produced the dual-parameter elastic K-T9 and elastic-plastic J-Q10 fracture-toughness correlations, which predict a significant influence of in-planebiaxial stresses on fracture toughness. The K-T and J-Q correlations, however, incorporate anassumption of plane-strain boundary conditions. Out-of-plane (OP) stresses considered in thesedual-parameter fracture correlations are limited to those generated by the restraint of Poisson'sratio contractions. In their current state of development, therefore, the K-T and J-Q dual-parameter fracture correlations can not address the effect on ductile tearing toughness of largefar-field OP stresses which are characteristic of the PTS loading condition.
32
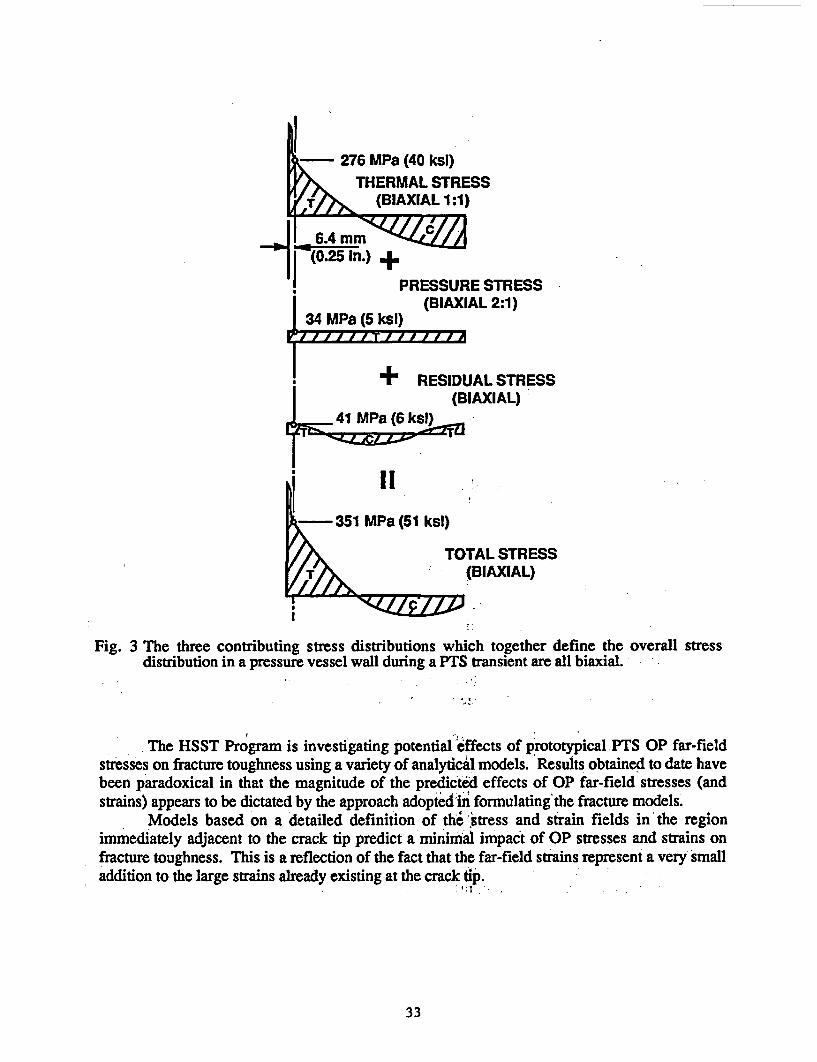
-276 MPa (40 ksl)THERMAL STRESS
T/ (BIAXIAL 1:1)
1 .4mm02 Ion.) +1
PRESSURE STRESS(BIAXIAL 2:1)
34 MPa (5 ksl)
+ RESIDUAL STRESS(BIAXIAL)
351 MPa (51 ksl)
TOTAL STRESST : (BIAXIAL)
Fig. 3 The three contributing stress distributions which together define the overall stressdistribution in a pressure vessel wall during a PTS transient are all biaxial.
The HSST Program is investigating potential effects of prototypical PTS OP far-fieldstresses on fracture toughness using a variety of analytical models. Results obtained to date havebeen paradoxical in that the magnitude of the predicted effects of OP far-field stresses (andstrains) appears to be dictated by the approach adopted in formulating the fracture models.
Models based on a detailed definition of the stress and strain fields in the regionimmediately adjacent to the crack tip predict a minimal impact of OP stresses and strains onfracture toughness. This is a reflection of the fact that the far-field strains represent a very smalladdition to the large strains already existing at the crack tip.
33
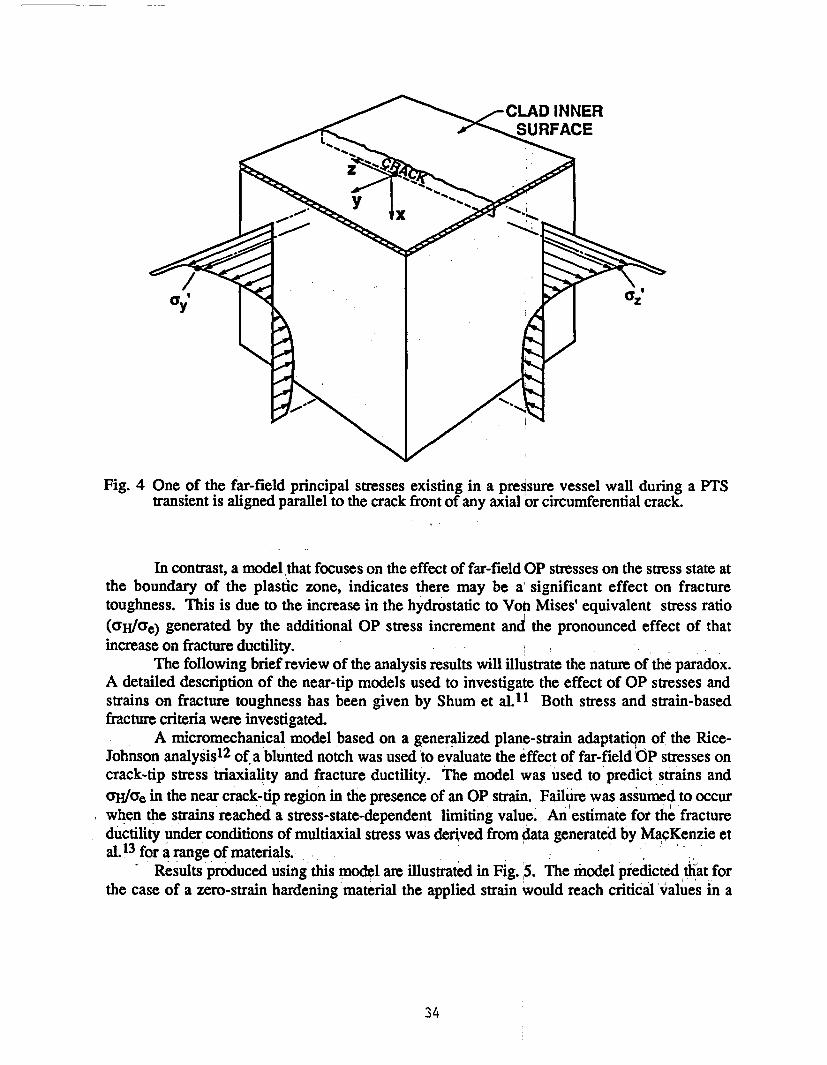
Fig. 4 One of the far-field principal stresses existing in a pressure vessel wall during a PTStransient is aligned parallel to the crack front of any axial or circumferential crack.
In contrast, a model that focuses on the effect of far-field OP stresses on the stress state atthe boundary of the plastic zone, indicates there may be a significant effect on fracturetoughness. This is due to the increase in the hydrostatic to Von Mises' equivalent stress ratio(CYH/ae) generated by the additional OP stress increment and the pronounced effect of thatincrease on fracture ductility.
The following brief review of the analysis results will illustrate the nature of the paradox.A detailed description of the near-tip models used to investigate the effect of OP stresses andstrains on fracture toughness has been given by Shum et al.11 Both stress and strain-basedfracture criteria were investigated.
A micromechanical model based on a generalized plane-strain adaptation of the Rice-Johnson analysis12 of a blunted notch was used to evaluate the effect of far-fieldbOP stresses oncrack-tip stress triaxiality and fracture ductility. The model was used to predict strains and(Y/Ore in the near crack-tip region in the presence of an OP strain. Failure was assumed to occurwhen the strains reached a stress-state-dependent limiting value. An estimate for the fractureductility under conditions of multiaxial stress was derived from data generated by MacKenzie etal t13 for a range of materials.
Results produced using this model are illustrated in Fig. ,5. The model predicted that forthe case of a zero-strain hardening-material the applied strain would reach critical'values in a
34
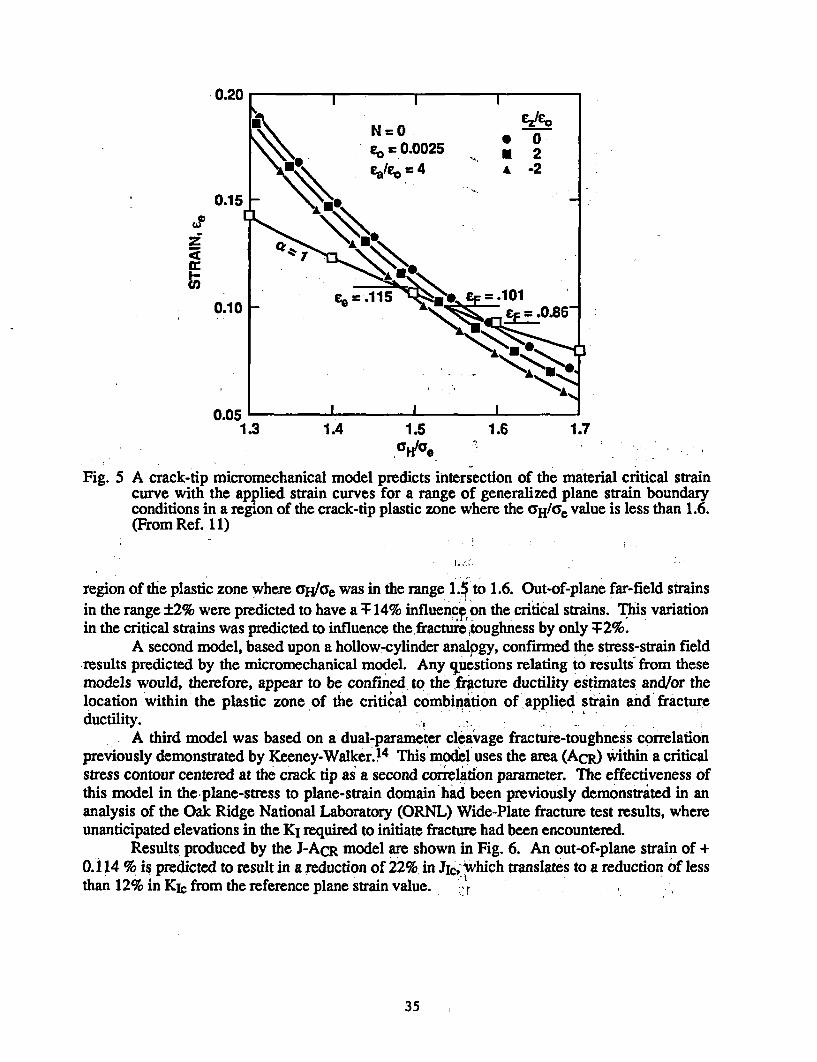
0.20
N=0 Q 001 =0.0025 4 2A -2
0.10 ~CF -086-
0.051.3 1.4 1.5 1.6 1.7
Fig. 5 A crack-tip micromechanical model predicts intersection of the material critical straincurve with the applied strain curves for a range of generalized plane strain boundaryconditions in a region of the crack-tip plastic zone where the CrH/Ge value is less than 1.6.(From Ref. 11)
region of the plastic zone where Gcrule was in the range 1.5 to 1.6. Out-of-plane far-field strainsin the range ±2% were predicted to have a T 14% influencfon the critical strains. This variationin the critical strains was predicted to influence the fracture toughness by only T2%.
A second model, based upon a hollow-cylinder analogy, confirmed the stress-strain fieldresults predicted by the micromechanical model. Any questions relating to results from thesemodels would, therefore, appear to be confined to the Lrcture ductility estimates and/or thelocation within'the plastic zone of the critical combination of applied strain and fractureductility.
A third model was based on a dual-parameter cleavage fracture-toughness correlationpreviously demonstrated by Keeney-Walker.14 This model uses the area (ACR)) ;ithin a criticalstress contour centered at the crack tip as a second correlation parameter. The effectiveness ofthis model in the-plane-stress to plane-strain domain had been previously demonstrated in ananalysis of the Oak Ridge National Laboratory (ORNL) Wide-Plate fracture test results, whereunanticipated elevations in the KI required to initiate fracture had been encountered.
Results produced by the J-ACR model are shown in Fig. 6. An out-of-plane strain of +0.114 % is predicted to result in a reduction of 22% in JIc, which translates to a reduction of lessthan 12% in KIC from the reference plane strain value.
35
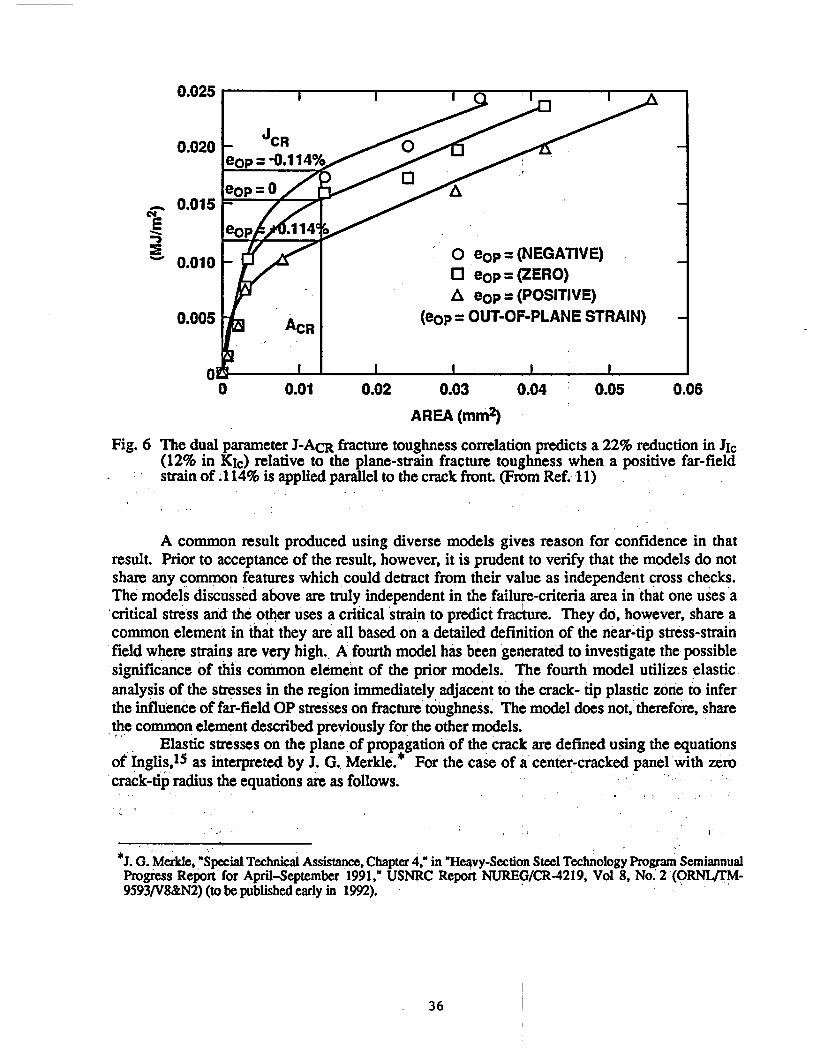
0.025
0.020 -C O 0eop = -0.1 14%
a_ 0.015_ / -_
00 eOP=(NE=ATIVE)03 eop = (ZERO)A eop = (POSITIVE)
0.005 z(ecp OUT-OF-PLANE STRAIN)
0 0.01 0.02 0.03 0.04 0.05 0.06
AREA (mm2)
Fig. 6 The dual parameter J-ACR fracture toughness correlation predicts a 22% reduction in Jic(12% in KIc) relative to the plane-strain fracture toughness when a positive far-fieldstrain of .114% is applied parallel to the crack front. (From Ref. 11)
A common result produced using diverse models gives reason for confidence in thatresult. Prior to acceptance of the result, however, it is prudent to verify that the models do notshare any common features which could detract from their value as independent cross checks.The models discussed above are truly independent in the failure-criteria area in that one uses acritical stress and the other uses a critical strain to predict fracture. They do, however, share acommon element in that they are all based on a detailed definition of the near-tip stress-strainfield where strains are very high. A fourth model has been generated to investigate the possiblesignificance of this common element of the prior models. The fourth model utilizes elasticanalysis of the stresses in the region immediately adjacent to the crack- tip plastic zone to inferthe influence of far-field OP stresses on fracture toughness. The model does not, therefore, sharethe common element described previously for the other models.
Elastic stresses on the plane of propagation of the crack are defined using the equationsof Inglis,15 as interpreted by J. G. Merkle.* For the case of a center-cracked panel with zerocrack-tip radius the equations are as follows.
J. G. Merkle, "Special Technical Assistance, Chapter 4," in "Heavy-Section Steel Technology Program SemiannualProgress Report for April-September 1991," USNRC Report NUREG/CR-4219, Vol 8, No.' 2 (ORNLI[M-9593/V8&N2) (to be published early in 1992).
36
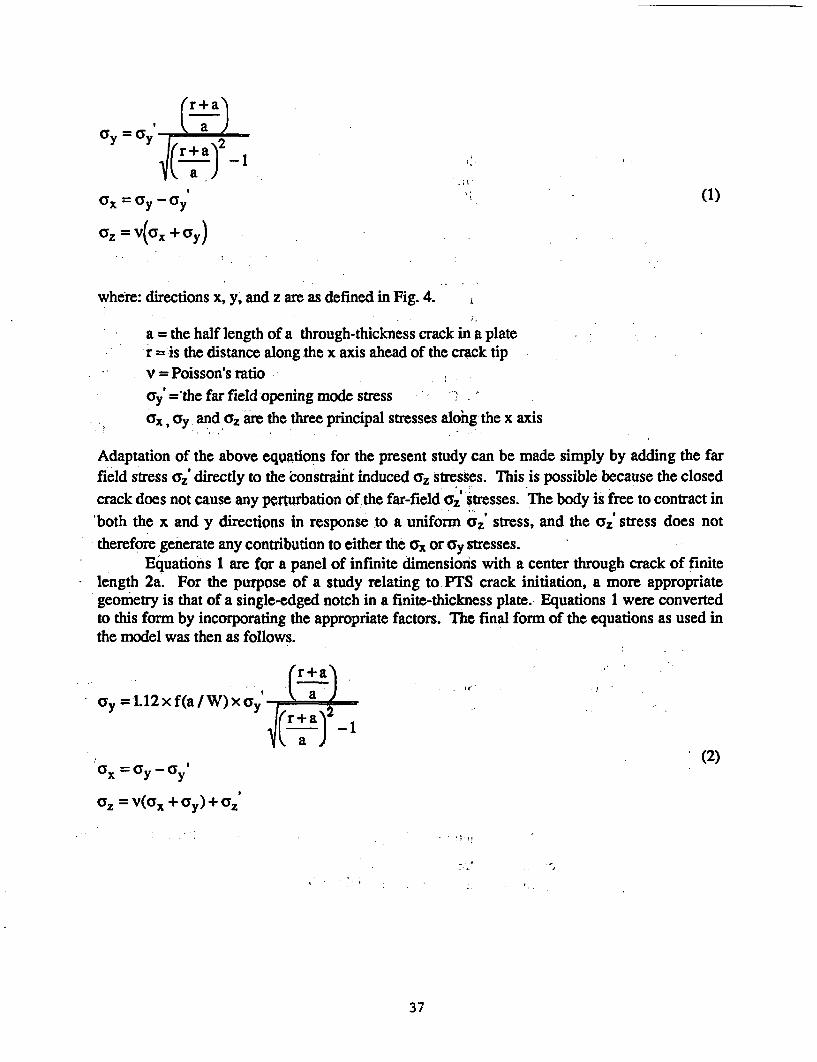
(r+a)2
0 x = 0 y 0 y (1)
aZ = v(Gx + ay)
where: directions x, y, and z are as defined in Fig. 4.
a the half length of a through-thickness crack in a plate* r = is the distance along the x axis ahead of the crack tipv = Poisson's ratio
ay ='the far field -opening mode stressCax, ay and az are the three principal stresses alohg the x axis
Adaptation of the above equations for the present study can be made simply by adding the farfield stress caz directly to the constraint induced CZ stresses. This is possible because the closedcrack does not cause any perturbation of the far-field a2z stresses. The body is free to contract inboth the x and y directions in response to a uniform CZ' stress, and the caz stress does nottherefore generate any contribution to either the ax or Iy stresses.
Equations 1 are for a panel of infinite dimensions with a center through crack of finite* length 2a. For the purpose of a study relating to PTS crack initiation, a more appropriate
geometry is that of a single-edged notch in a finite-thickness plate. Equations 1 were convertedto this form by incorporating the appropriate factors. The final form of the equations as used inthe model was then as follows.
(r+a
Cy =L12xf(a/W)xay a
(2)Ox =C syx + y
a2 = v(O2 + ay) + Z
37
where
aYZ is the far-field stress parallel to the crack front andf(a/w) is a coefficient accounting for the effect of the finite-plate geometry on the
stress-intensity factor.16
Equations (2) were used to calculate the Von Mises' equivalent stress (ae) and the hydrostaticstress (aoH for a potential part-through surface cracked biaxial test specimen for plane-stress,plane-strain and biaxial-loading constraint conditions. The far-field stress was set at 345 MPa(50 ksi) to match typical stress levels predicted at a depth of 6 mm (0.25 in.) beneath the innersurface of a vessel at the time of crack initiation during a PTS transient (Figs 3 and 4). A platethickness of 76.2 mm (3 in.) was selected based on the loading capacity of potential testmachines. The crack depth was selected as 23 mm (0.9 in.) to produce a crack tip K1 value of154 MPa4m (140 ksiVih). This value was selected to match the plane-strain fracturetoughness reported by Landes and McCabe 17 in a series of plane-stress and plane-strain fracturetoughness tests on A 533 Grade B Class 2 material. Plane stress and plane strain fracture-toughness data produced under otherwise identical conditions were required as input to thisscoping analysis model.
Fig. 7 shows the test specimens used in the study of Ref. 17. Ouf-of-plane stresses in theanalysis of the plane-stress case were set at 20% of the plane-strain value rather than zero inrecognition of the finite transverse dimension of the plane-stresi specimen shown in Fig. 7.
Results generated using the modified Inglis equations are shown in Fig. 8. Theelastically estimated crack-tip plastic-zone boundary is defined by the intersection of theequivalent-stress curve with the yield-stress line for each of th? three boundary-condition casesconsidered. Corresponding cyH/ae values at the elastic-plastic boundary are obtained as 0.68,1.82, and 3.38 for the plane-stress, plane-strain, and biaxial-loading cases, respectively. Theo'HIde value for the plane-strain case is similar to that obtained from the micromechanical model,as illustrated in Fig. 5. The biaxial-loading case, in contrast, gives a cIdae value approximatelydouble that given in Fig. 5.
The oHae ratio is of interest because of its influence on fracture ductility. Weiss18 hasinvestigated the effect of stress state on fracture strain and proposed the following relationships:
= bo1/n
£TF (3)
where
eF aP Ris the effective fracture strain (plastic strain) predicted in a triaxial stress field
characterized by stress ratios a and P3.6TF is the effective fracture strain in uniaxial tension
38
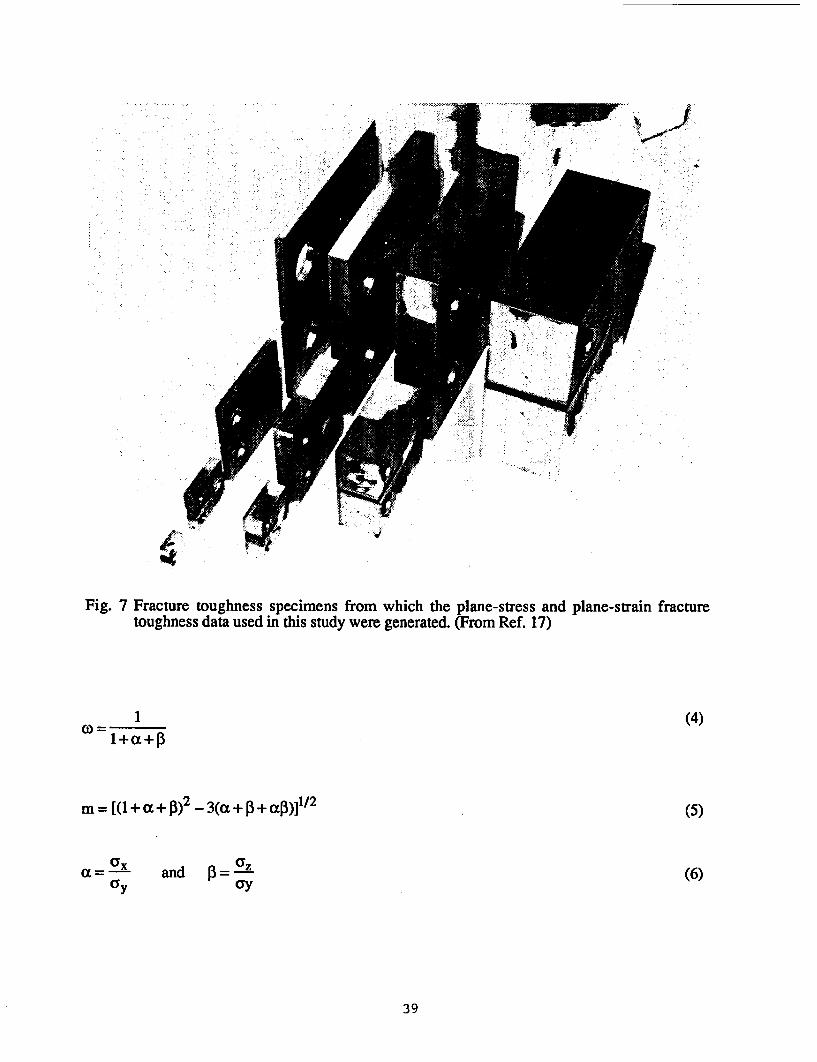
wv I 'J"'
I''.4F
Fig. 7 Fracture toughness specimens from which the plane-stress and plane-strain fracturetoughness data used in this study were generated. (From Ref. 17)
m I
m = [(1+ +o 2 _3(ot + f3 + p)12
(4)
(5)
axyC=O and ==-
a'Y (6)
39
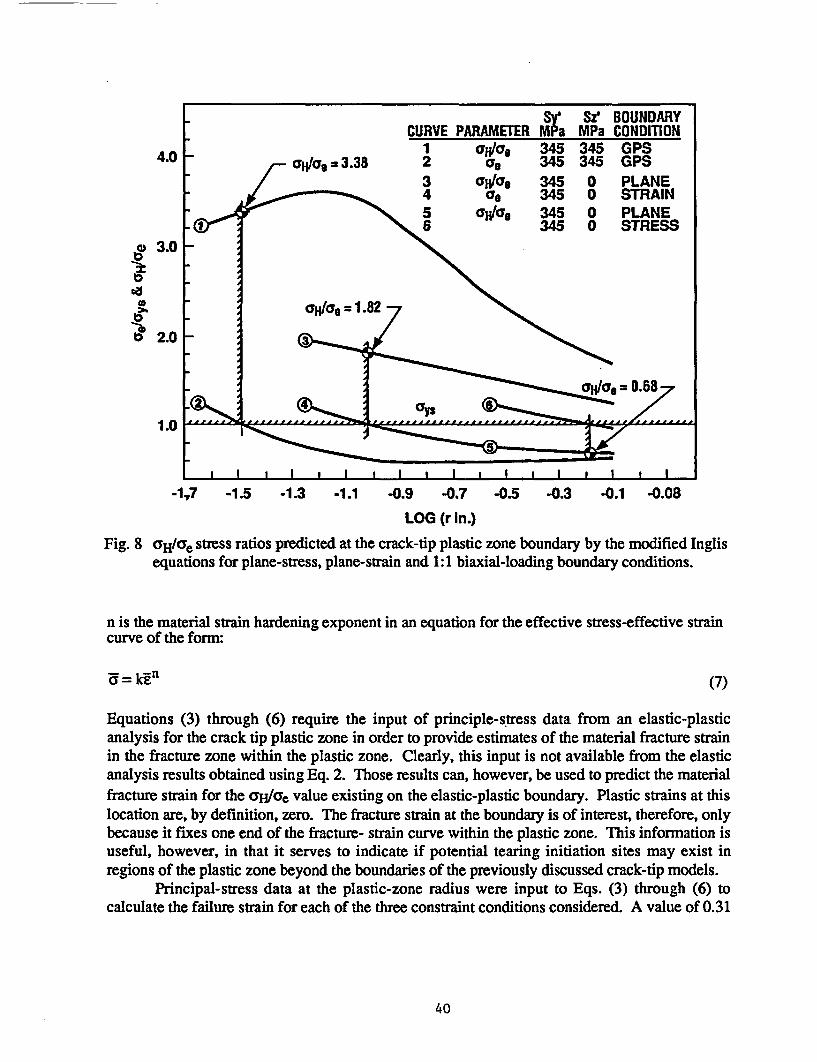
Sy' Sz' BOUNDARYCURVE PARAMETER MPa MPa CONDITION
1 aH/ag 345 345 GPS4.0 caH/ -3.38 2 CF 345 345 GPS
3 aSFIV 345 0 PLANE4 CF 345 0 STRAIN5 8 ITo 345 0 PLANE
3345 0 STRESS3.0-
2.0
Pablo,=0.687
-1,7 -1.5 -1.3 -1.1 -0.9 -0.7 -0.5 -0.3 -0.1 -0.08
LOG (r In.)
Fig. 8 aH/ce stress ratios predicted at the crack-tip plastic zone boundary by the modified Inglisequations for plane-stress, plane-strain and 1:1 biaxial-loading boundary conditions.
n is the material strain hardening exponent in an equation for the effective stress-effective straincurve of the form:
by = ken (7)
Equations (3) through (6) require the input of principle-stress data from an elastic-plasticanalysis for the crack tip plastic zone in order to provide estimates of the material fracture strainin the fracture zone within the plastic zone. Clearly, this input is not available from the elasticanalysis results obtained using Eq. 2. Those results can, however, be used to predict the materialfracture strain for the oWde value existing on the elastic-plastic boundary. Plastic strains at thislocation are, by definition, zero. The fracture strain at the boundary is of interest, therefore, onlybecause it fixes one end of the fracture- strain curve within the plastic zone. This information isuseful, however, in that it serves to indicate if potential tearing initiation sites may exist inregions of the plastic zone beyond the boundaries of the previously discussed crack-tip models.
Principal-stress data at the plastic-zone radius were input to Eqs. (3) through (6) tocalculate the failure strain for each of the three constraint conditions considered. A value of 0.31
40
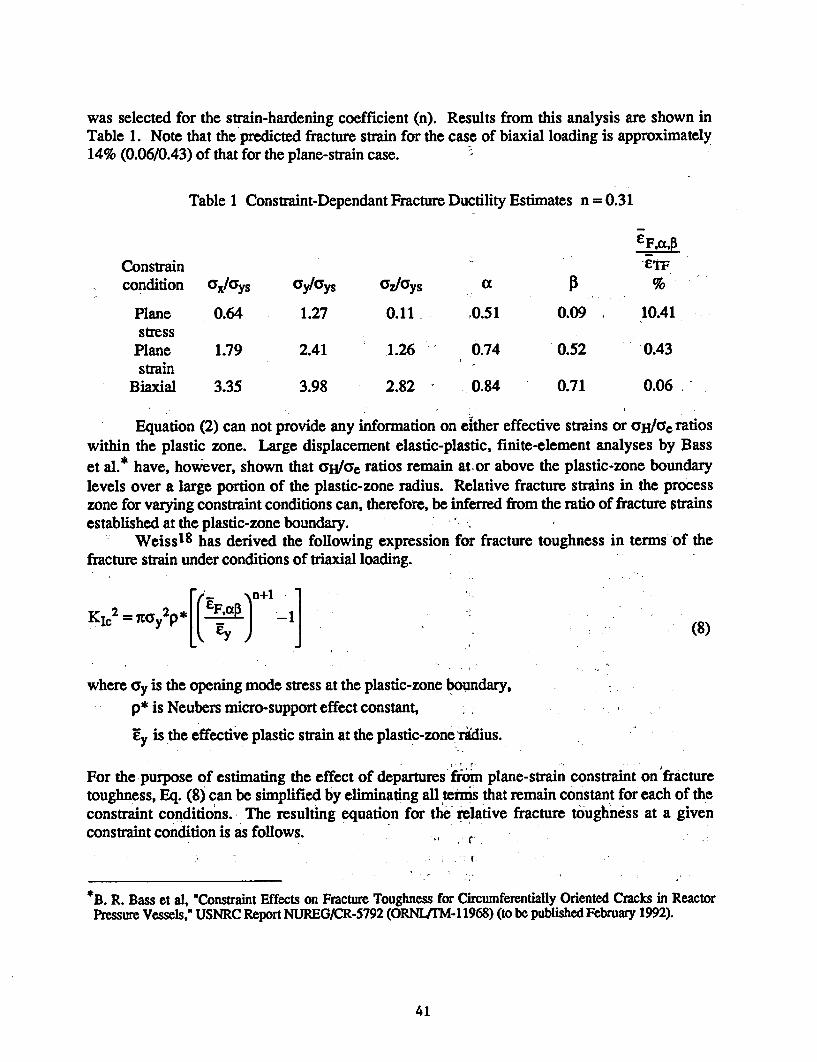
was selected for the strain-hardening coefficient (n). Results from this analysis are shown inTable 1. Note that the predicted fracture strain for the case of biaxial loading is approximately14% (0.06/0.43) of that for the plane-strain case.
Table 1 Constraint-Dependant Fracture Ductility Estimates n = 0.31
Constrain -TFcondition Cax/ays Fy/ys eY/oys a %3
Plane 0.64 1.27 0.11 0.51 0.09 10.41stress
Plane 1.79 2.41 1.26 0.74 0.52 0.43strain
Biaxial 3.35 3.98 2.82 0.84 0.71 0.06
Equation (2) can not provide any information on either effective strains or c;H/e ratioswithin the plastic zone. Large displacement elastic-plastic, finite-element analyses by Basset al.* have, however, shown that aH/ae ratios remain at or above the plastic-zone boundarylevels over a large portion of the plastic-zone radius. Relative fracture strains in the processzone for varying constraint conditions can, therefore, be inferred from the ratio of fracture strainsestablished at the plastic-zone boundary.
Weiss18 has derived the following expression for fracture toughness in terms of thefracture strain under conditions of triaxial loading.
K 7y) ] (8)
where cy is the opening mode stress at the plastic-zone boundary,p* is Neubers micro-support effect constant,
Yy is the effective plastic strain at the plastic-zone Tidius.
For the purpose of estimating the effect of departures' firnm plane-strain constraint on fracturetoughness, Eq. (8) can be simplified by eliminating all terms that remain constant for each of theconstraint conditions. The resulting equation for the' relative fracture toughness at a givenconstraint condition is as follows.
*B. R. Bass et al, "Constraint Effects on Fracture Toughness for Circumferentially Oriented Cracks in ReactorPressure Vessels," USNRC Report NUREG/CR-5792 (ORNLfTM-1 1968) (to be published February 1992).
41
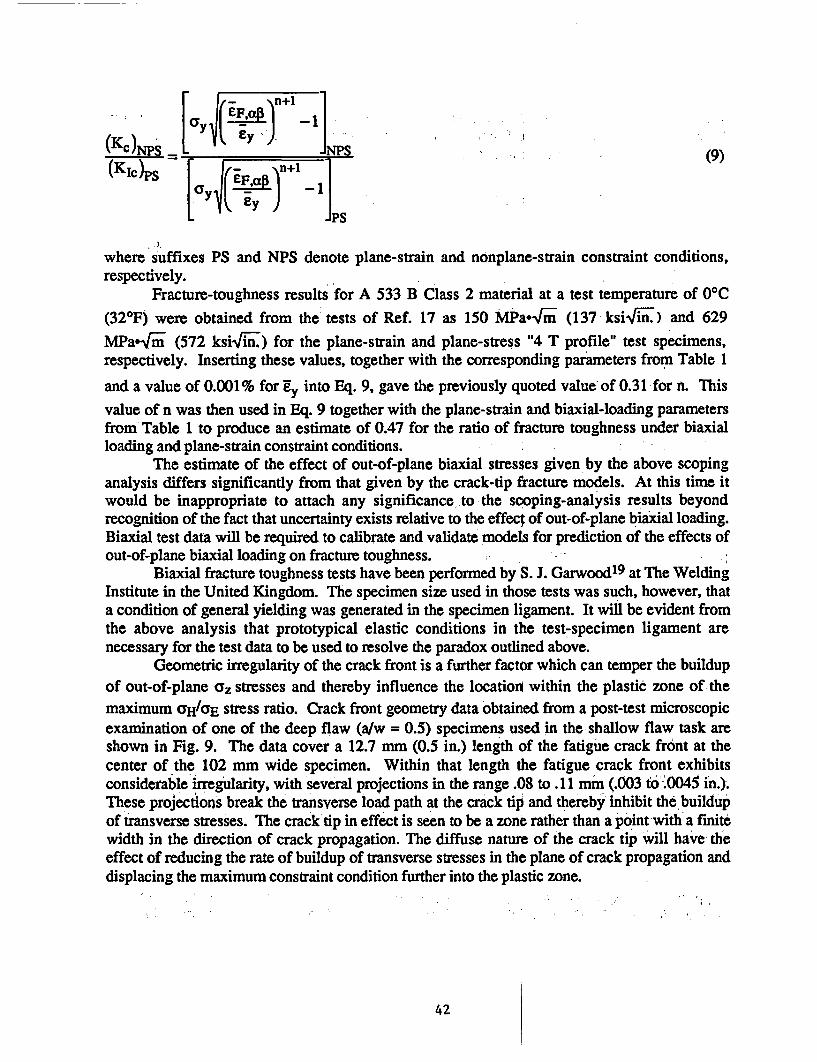
(Kc)N~ L" / NPS(9
(KC)pS [ n+1
where suffixes PS and NPS denote plane-strain and nonplane-strain constraint conditions,respectively.
Fracture-toughness results for A 533 B Class 2 material at a test temperature of 0C(320F) were obtained from the tests of Ref. 17 as 150 MPa.'lmi (137 ksi1i;) and 629MPa limi (572 ksiliii:) for the plane-strain and plane-stress "4 T profile" test specimens,respectively. Inserting these values, together with the corresponding parameters from Table 1
and a value of 0.001% for E into Eq. 9, gave the previously quoted value'of 0.31 for n. Thisvalue of n was then used in Eq. 9 together with the plane-strain and biaxial-loading parametersfrom Table 1 to produce an estimate of 0.47 for the ratio of fracture toughness under biaxialloading and plane-strain constraint conditions.
The estimate of the effect of out-of-plane biaxial stresses given by the above scopinganalysis differs significantly from that given by the crack-tip fracture models. At this time itwould be inappropriate to attach any significance to the scoping-analysis results beyondrecognition of the fact that uncertainty exists relative to the effect of out-of-plane biaxial loading.Biaxial test data will be required to calibrate and validate models for prediction of the effects ofout-of-plane biaxial loading on fracture toughness.
Biaxial fracture toughness tests have been performed by S. J. Garwood19 at The WeldingInstitute in the United Kingdom. The specimen size used in those tests was such, however, thata condition of general yielding was generated in the specimen ligament. It will be evident fromthe above analysis that prototypical elastic conditions in the test-specimen ligament arenecessary for the test data to be used to resolve the paradox outlined above.
Geometric irregularity of the crack front is a further factor which can temper the buildupof out-of-plane <Yz stresses and thereby influence the location within the plastic zone of themaximum aH/aE stress ratio. Crack front geometry data obtained from a post-test microscopicexamination of one of the deep flaw (atw = 0.5) specimens used in the shallow flaw task areshown in Fig. 9. The data cover a 12.7 mm (0.5 in.) length of the fatigue crack front at thecenter of the 102 mm wide specimen. Within that length the fatigue crack front exhibitsconsiderable irregularity, with several projections in the range .08 to .11 mm (.003 to .0045 in.>.These projections break the transverse load path at the crack tip and thereby inhibit the. buildupof transverse stresses. The crack tip in effect is seen to be a zone rather than a point with a finitewidth in the direction of crack propagation. The diffuse nature of the crack tip will have theeffect of reducing the rate of buildup of transverse stresses in the plane of crack propagation anddisplacing the maximum constraint condition further into the plastic zone.
42
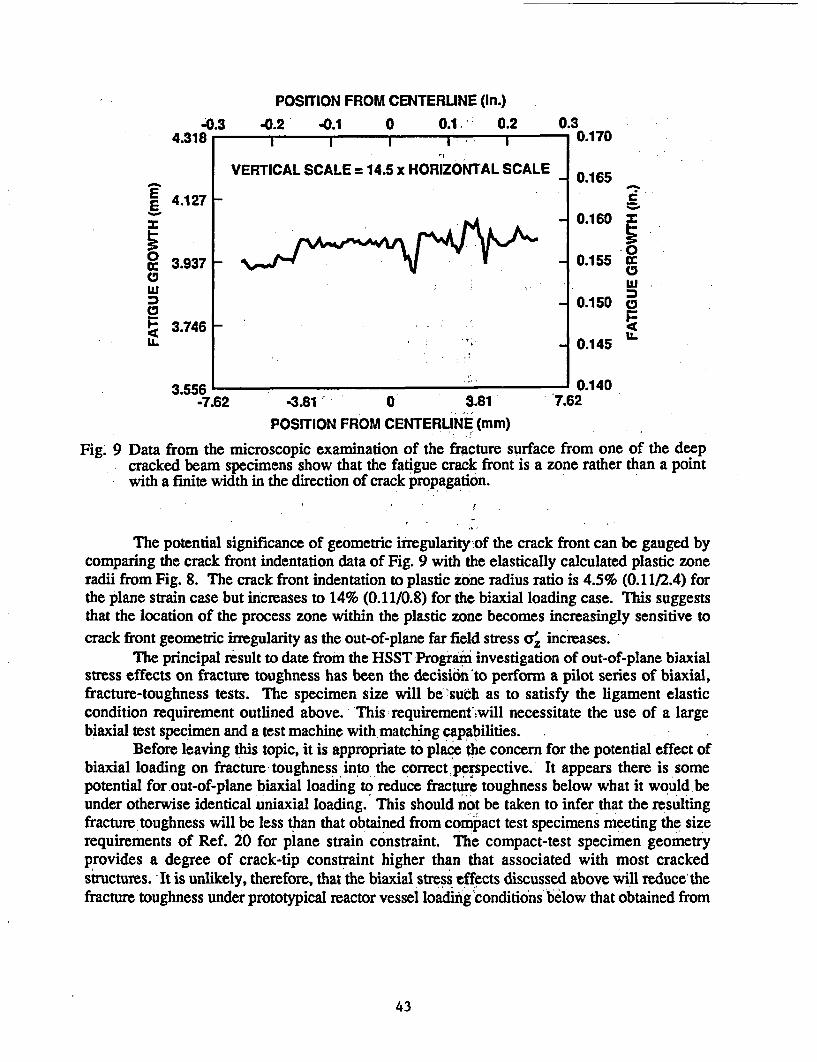
POSITION FROM CENTERUNE (in.)
-0.3 -0.2 -0.1 0 0.1 0.2 0.34.318 0.170
VERTICAL SCALE = 14.5 x HORIZONTAL SCALE 0.165
E 4.127
A 0.160
3.937 _ / 0.155 W
0.150 o
3.746 0.145
3.556 . 0.140-7.62 -3.81 0 3.81- 7.62
POSITION FROM CENTERUNE (mm)
Fig. 9 Data from the microscopic examination of the fracture surface from one of the deepcracked beam specimens show that the fatigue crack front is a zone rather than a pointwith a finite width in the direction of crack propagation.
The potential significance of geometric irregularity of the crack front can be gauged bycomparing the crack front indentation data of Fig. 9 with the elastically calculated plastic zoneradii from Fig. 8. The crack front indentation to plastic zone radius ratio is 4.5% (0.11/2.4) forthe plane strain case but increases to 14% (0.11/0.8) for the biaxial loading case. This suggeststhat the location of the process zone within the plastic zone becomes increasingly sensitive tocrack front geometric irregularity as the out-of-plane far field stress ac increases.
The principal result to date from the HSST Program investigation of out-of-plane biaxialstress effects on fracture toughness has been the decision'to perform a pilot series of biaxial,fracture-toughness tests. The specimen size will be'such as to satisfy the ligament elasticcondition requirement outlined above. This requirement Lwill necessitate the use of a largebiaxial test specimen and a test machine with matching capabilities.
Before leaving this topic, it is appropriate to place the concern for the potential effect ofbiaxial loading on fracture toughness into the correct perspective. It appears there is somepotential for out-of-plane biaxial loading to reduce fracture toughness below what it would beunder otherwise identical uniaxial loading. This should not be taken to infer that the resultingfracture toughness will be less than that obtained from compact test specimens meeting the sizerequirements of Ref. 20 for plane strain constraint. The compact-test specimen geometryprovides a degree of crack-tip constraint higher than that associated with most crackedstructures. -It is unlikely, therefore, that the biaxial stress effects discussed above will reduce'thefracture toughness under prototypical reactor vessel loading conditidons' below that obtained from
43
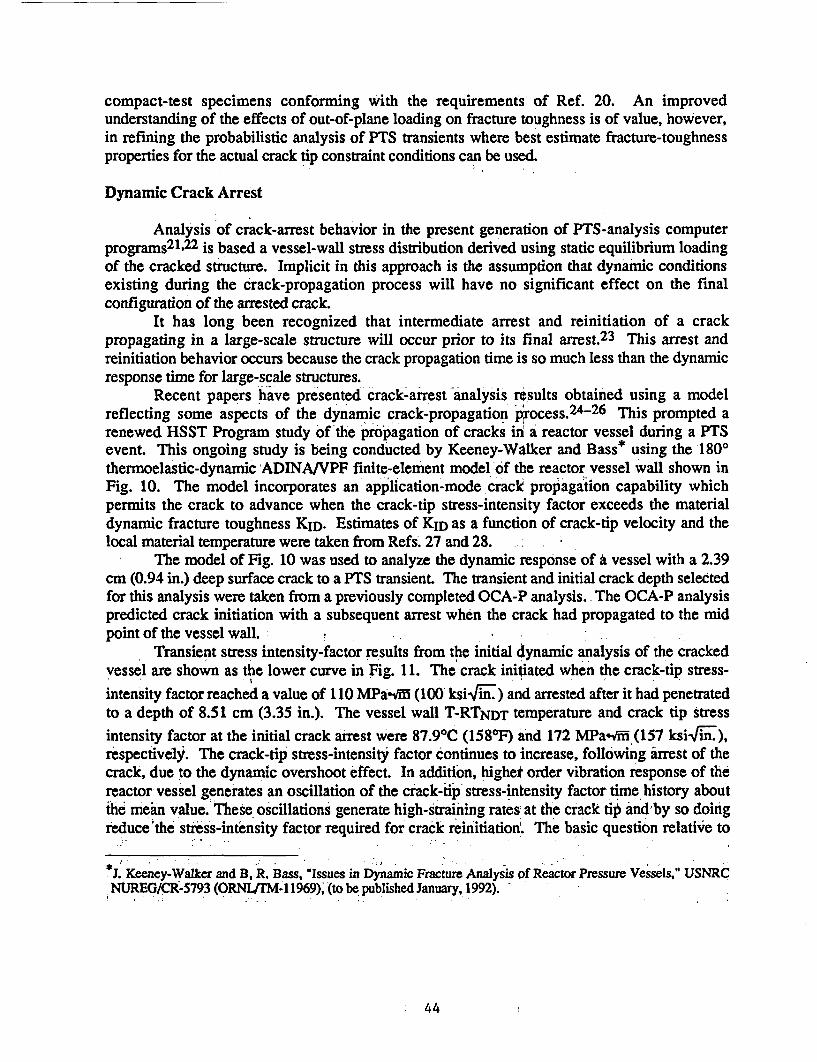
compact-test specimens conforming with the requirements' of Ref. 20. An improvedunderstanding of the effects of out-of-plane loading on fracture toughness is of value, however,in refining the probabilistic analysis of PTS transients where best estimate fracture-toughnessproperties for the actual crack tip constraint conditions can be used.
Dynamic Crack Arrest
Analysis of crack-arrest behavior in the present generation of PTS-analysis computerprograms21 22 is based a vessel-wall stress distribution derived using static equilibrium loadingof the cracked structure. Implicit in this approach is the assumption that dynamic conditionsexisting during the crack-propagation process will have no significant effect on the finalconfiguration of the arrested crack.
It has long been recognized that intermediate arrest and reinitiation of a crackpropagating in a large-scale structure will occur prior to its final arrest.23 This arrest andreinitiation behavior occurs because the crack propagation time is so much less than the dynamicresponse time for large-scale structures.
Recent papers have presented crack-arrest analysis results obtained using a modelreflecting some aspects of the dynamic crack-propagation process. 24-26 This prompted arenewed HSST Program study of -the propagation of cracks in a reactor vessel during a PTSevent. This ongoing study is being conducted by Keeney-Walker and Bass* using the 1800thermoelastic-dynamic ADINA/VPF finite-element model of the reactor vessel wall shown inFig. 10. The model incorporates an application-mode crack propagation capability whichpermits the crack to advance when the crack-tip stress-intensity factor exceeds the materialdynamic fracture toughness KID. Estimates of KID as a function of crack-tip velocity and thelocal material temperature were taken from Refs. 27 and 28.
The model of Fig. 10 was used to analyze the dynamic response of a vessel with a 2.39cm (0.94 in.) deep surface crack to a PTS transient. The transient and initial crack depth selectedfor this analysis were taken from a previously completed OCA-P analysis. The OCA-P analysispredicted crack initiation with a subsequent arrest when the crack had propagated to the midpoint of the vessel wall.
Transient stress intensity-factor results from the initial dynamic analysis of the crackedvessel are shown as the lower curve in Fig. 11. The crack initiated when the crack-tip stress-intensity factor reached a value of 110 MPa-i (100 ksi-/ii.) and arrested after it had penetratedto a depth of 8.51 cm (3.35 in.). The vessel wall T-RTNDT temperature and crack tip stressintensity factor at the initial crack arrest were 87.90C (1580F) and 172 MPa./ii (157 ksiFjiT.),respectively. The crack-tip stress-intensity factor continues to increase, following arrest of thecrack, due to the dynamic overshoot effect. In addition, higher order vibration response of thereactor vessel generates an oscillation of the crack-tip' stress-intensity factor time history aboutihe mean value. These oscillations generate high-straining rates at the crack tip and by so doingreduce'th6 stress-intensity factor required for crack reinitiationr. The basic question relative to
J. Keeney-Walker and B, R. Bass, "Issues in Dynamic Fracture Analysis of Reactor Pressure Vessels," USNRCNUlREG/CR-5793 (ORNLIfM-1 1969), (to be published January, 1992).
44
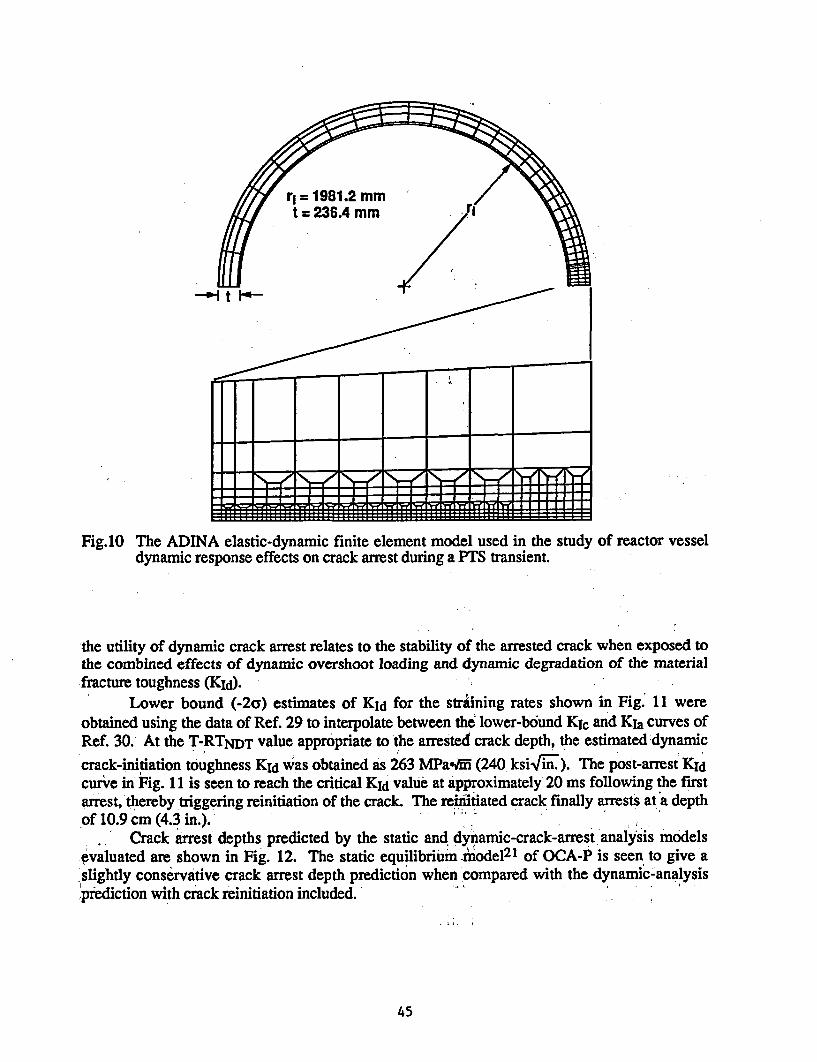
Fig.10 The ADINA elastic-dynamic finite element model used in the study of reactor vesseldynamic response effects on crack arrest during a PTS transient.
the utility of dynamic crack arrest relates to the stability of the arrested crack when exposed tothe combined effects of dynamic overshoot loading and dynamic degradation of the materialfracture toughness (KId).
Lower bound (-2a) estimates of KId for the straining rates shown in Fig.' 11 wereobtained using the data of Ref. 29 to interpolate between the lower-b6und KIc and Kja curves ofRef. 30. At the T-RTNDT value appropriate to the arrested crack depth, the estimated dynamic
crack-initiation toughness KId was obtained as 263 MPaMi (240 ksibK). The post-arrest KIdcurve in Fig. 11 is seen to reach the critical KId value at approximately 20 ms following the firstarrest, thereby triggering reinitiation of the crack. The reinitiated crack finally arrests at a depthof 10.9 cm (4.3 in.).
Crack arrest depths predicted by the static and dynamic-crack-arrest 'analysis modelsevaluated are shown in Fig. 12. The static equilibrium model21 of OCA-P is seen to give aslightly conservative crack arrest depth prediction when compared with the dynamic-analysisprediction with crack reinitiation included.'
45
500
450 400
400 - K1 RANGE AFTER WITH
350 RE-INmATION RE-INmATIONRE-INmATION 300
LT. 300 Kxaaw0320 K~d at a/W = 0.36 \ ; ;,
200 .
200 2
150 FIRST ARREST WITH NO
100 FIRST /-o4C1o0 RE-INmATION 100
INITIATION500
0 5 10 15 20 25 30 35 40 45TIME (Ms)
Fig.11 Time history of the crack-tip stress intensity factor following crack initiation showingthe effect of reinitiation of the the crack after an initial arrest.
It will be evident from the above discussion that the current analyses provide what isprobably a lower bound estimate of the influence of vessel dynamic response effects on crackarrest. The plane strain analysis model of Fig. 10 incorporates the assumption of an infinite flawlength. Prior analyses31l 32 have shown that the stress intensity factor at the deepest point of asemielliptical surface crack remains less than that for an infinite flaw even when the flaw surfacedimension becomes very long. The stress-intensity-factor time history given, in Fig. 11 for theperiod following the initial crack arrest will therefore be conservative for flaws of finite length.Incorporation of finite-length-flaw stress intensity factors into the analysis together with astatistical rather than a lower bound representation of KId would preclude crack reinitiation inmany cases. The initial crack arrest would then become the final arrest.
The analysis results of Fig. 12 shows that without reinitiation, the crack depth to vessel.wall-thickness ratio (alw) at arrest would be 0.36 rather than the value of 0.5 predicted by theOCA-P static equilibrium model. This difference could be very important in a probabilisticfracture mechanics analysis since, beyond a critical depth, the arrested cleavage crack becomesunstable due to the onset of ductile tearing.' This effect is illustrated in the criticl-craci-depthcurves and tearing-instability curves of Fig. 13, which are reproduced from Ref. 33. The OCA-Pstatic-equilibrium analysis (point 5) and the dynamic analysis with crack reinitiation (point 4)both predict crack arrest at depths where ductile tearing would cause an infinitely long arrestedcleavage crack to propagate to failure. In the event cleavage crack reinitiation does not occurhowever, the crack would arrest at a depth where it would remain stable, provided that the vesseldoes not contain low-upper-shelf material.
46
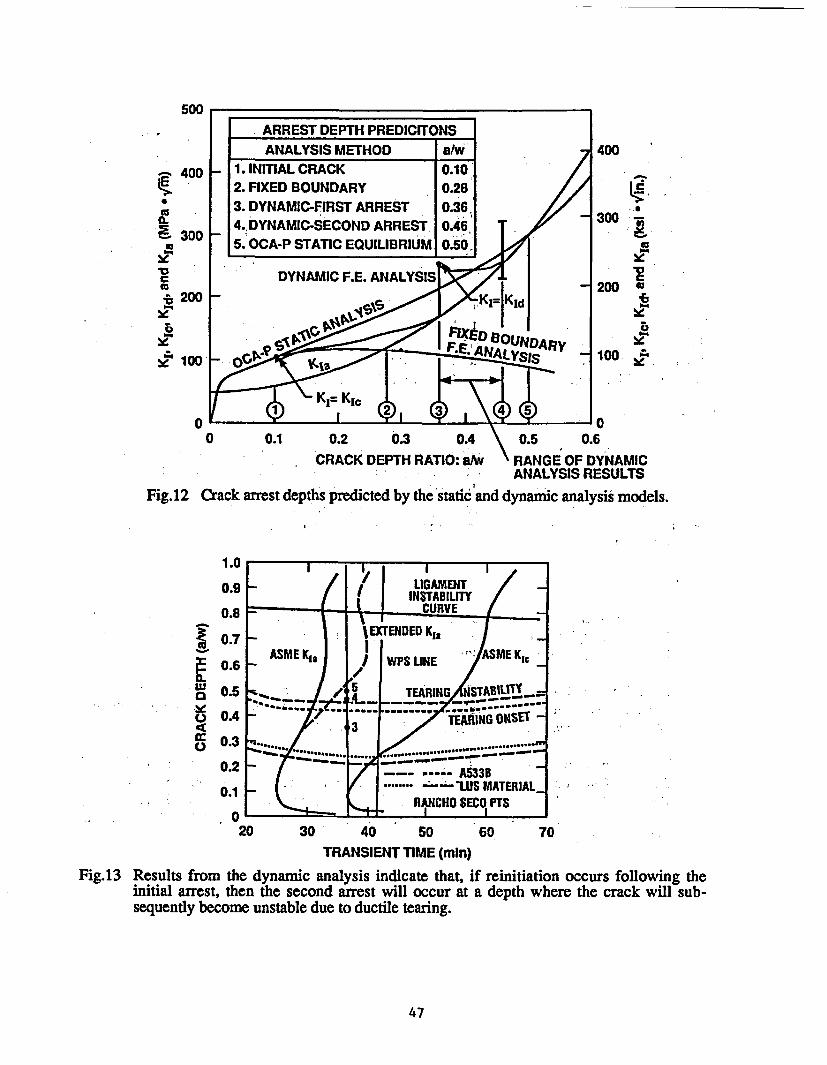
-{ 4C
0.
.2
241C
C)
Fig.12
400
300 ;7
U. I
200 X
1
100 ~'
01 I NI I x IV, 0I
0 0.1 0.2 0.3 0.4 0.5 0.6
CRACK DEPTH RATIO:W# \ RANGE OF DYNAMICANALYSIS RESULTS
Crack arrest depths predicted by the static. and dynamic analysis models.
1.0
0.9
0.8
0.7
0.6
. I...ED 0.5 *
o 0.4 -
00 0.3 _.
0.2
0.1
*020
I :30 40 50 60 70
TRANSIENT liME (min)
Fig.13 Results from the dynamic analysis indicate that, if reinitiation occurs following theinitial arrest, then the second arrest will occur at a depth where the crack will sub-sequently become unstable due to ductile tearing.
47
Conclusions
Preliminary results from the shallow-flaw fracture-toughness testing of A533 B Class 1material confirm the existence of an enhanced shallow flaw fracture toughness effect for thismaterial. This property may decrease the significance to pressure vessel integrity of the shallowflaws which are both most numerous and most difficult to detect.
Studies of the potential effect of out-of-plane biaxial stresses on fracture toughness havebeen inconclusive to this point. Biaxial fracture toughness tests, with specimens of sufficientsize to permit retention of elastic conditions in the unbroken ligament up to the point of fracture,are required to provide a basis for the further development and validation of out-of-plane biaxialfracture models.
Reactor vessel dynamic response effects during crack propagation may have a significantinfluence offthe number of stable crack arrests predicted in a probabilistic PTS analysis. Finiteflaw length effects are also important with regard to the arrest and subsequent stability ofpropagating cracks. Additional dynamic crack initiation toughness (K1d) data for A533 B Class 1material will be required to determine the magnitude of this effect.
Acknowledgements
The author wishes to acknowledge the support, assistance and consultation received fromthe staff of the Heavy Section Steel Technology program at Oak Ridge National Laboratory andthe program consultants at Brown University, The University of Maryland and the University ofKansas. The support and encouragement provided by M. E. Mayfield (HSST Program Monitor)and C. Z. Serpan (Chief, Materials Engineering Branch) of the NRC is also gratefullyacknowledged.
References
1. William A. Sorem, The Effect of Specimen Size and Crack Depth on the Elastic-PlasticFracture Toughness of a Low-Strength High-Strain-Hardening Steel, Ph.D. dissertation,University of Kansas, May 1989.
2. J. A. Smith and S. T. Rolfe, "The Effect of Crack Depth to Specimen Width Ratio on theElastic-Plastic Fracture Toughness of a High-Strength Low-Strain Hardening Steel,"Welding Research Council Bulletin 358, November 1990.
3. R. D. Cheverton and D. G. Ball, "Chapter 5, Probabilistic Fracture Mechanics Analysis ofPotential Overcooling Sequences for H. B. Robinson Unit 2," pp. 263-306 in Pressurized-Thermal-Shock-Evaluation of the H. B. Robinson Nuclear Power Plant, NUREG/CR-4183,Vol. 1 (ORNL/TM- 9567/VI), Martin Marietta Energy Systems Inc., Oak Ridge NationalLaboratory (September 1985).
48
4. T. J. Theiss, G. C. Robinson , and S. T. Rolfe, "Preliminary Test Results from the Heavy-Section Steel Technology Shallow-Crack Fracture Toughness Program," PVP-Vol.-13/MPC-Vol.32, Pressure Vessel Integrity, American Society of Mechanical Engineers,June 1991.
5. Timothy J. Theiss and John W. Bryson, "Influence of Crack Depth on the FractureToughness of Reactor Pressure Vessel Steel," presented at the ASTM Symposium inIndianapolis on Constraint Effects in Fracture, May 8-9, 1991, ASTM STP-xxx,American Society of Testing and Materials (to be published).
6. M. T. Kirk, K. C. Koppenhoefer, and C. F. Shih, "Effect of Constraint on SpecimenDimensions Needed to Obtain Structurally Relevant Toughness Measures," presented atthe ASTM Symposium in Indianapolis on Constraint Effects in Fracture, May 8-9,1991, ASTM STP-xxx, American Society of Testing and Materials (to be published).
7. S. T. Rolfe, University of Kansas, "Interpretive Report on the Application of Shallow-FlawCTOD Test Data to the Structural Margin Assessmeit of Reactor Pressure Vessels withFlaws," Prepared for Marietta Energy Systems Inc., USNRC Report NUREG/CR-5767,ORNL/Sub/90-SH640/1, November 1991.
8. W. E. Pennell, Martin Marietta Energy Systems, Inc., Oak Ridge Nati. Lab., "Heavy-Section Steel Technology Program : Fracture Issues," pp. 1-16 in Proceedings of the US.Nuclear Regulatory Commission Seventeenth Water Reactor Safety Meeting, October23-25, 1989, USNRC Report NUREG/CP-0105, March 1990.
9. C. Beteg6n and J. W. Hancock, "Two-Parameter Characterization of Elastic-Plastic CrackTip Fields," Journal of Applied Mechanics (58) (1991), pp. 311-325.
10. C. F. Shih, N. P. Dowd, and M. T. Kirk, "A Framework for Quantifying'Crack TipConstraint," presented at the ASTM Symposium in Ifhdianapolis on Constraint Effectsin Fracture, May 8-9, 1991, ASTM STP-xxx, American Society of Testing and Materials(to be published).
11. D. K. M. Shum et al., Martin Marietta Energy Systems, Inc., Oak Ridge Nail. Lab.,"Analytical' Studies of Transverse Strain Effects on Fracture -Toughness forCircumferentially Oriented Cracks," NUREG/CR-5592, (ORNLIrM-11581), MartinMarietta Energy Systems, Inc., Oak Ridge National Laboratory, April 1991.
12. J. R. Rice and M. A. Johnson, Brown University, Providence,- R.I., The Role of LargeCrack Tip Geometry Changes in Plane Strain Fracture, Report NYO-2394-38, September1969.
49
13. A. C. MacKenzie, J. W. Hancock, and D. K. Brown, "On the Influence of the State ofStress on Ductile Failure Initiation in High Strength Steels," Department of MechanicalEngineering, University of Glasgow, Scotland, Engineering Fracture Mechanics (9) 1977,Pergamon Press, pp. 167-188.
14. J. Keeney-Walker, "A Numerical Study of Local Crack-Tip Fields for Modeling CleavageFracture Initiation," Masters Thesis, The University of Tennessee, Knoxville, May 1990.
15. C. E. Inglis, "Stresses in a Plate Due to the Presence of Cracks and Sharp Corners,"Transactions of the Institution of Naval Architects, London, England (55) 1913, pp. 219-230.
16. John M. Barsom and Stanley T. Rolfe, Fracture & Fadgue- Control in Structures-Applications of Fracture Mechanics, second edition, 1987, Prentice-Hall Inc., pp. 41,Table 2.2.
17. J. D. Landes and D. E. McCabe, Westinghouse R&D Center, Pittsburgh, PA, !'Effect ofSection Size on Transition Temperature. Behavior of, Structural Steels," FractureMechanics: Fifteenth Symposiun, ASTM STP 833, 1984, pp. 378-39.
18. V. Weiss, Syracuse University, Material Ductility and Fracture Toughness of Metals,Proceedings of the International Conference on Mechanical Behavior of Materials, Kyoto,Japan, August 15-20, 1971, The Society of Materials Science, Japan 1972.
19. S. J. Garwood, The Welding Institute of the United Kingdom, "The Significance of BiaxialLoading on the Fracture Performance of a Pressure Vessel Steel," PVP-Vol. 213/MPC-Vol32, Pressure Vessel Intgegrity, American Society of Mechanical Engineers, June 1991.
20. ASTM E399-83, ."Standard Method for Plane-Strain Fracture Toughness of MetallicMaterials," Metals-Mechanical Testing; Elevated And Low-Temperature Tests;Metallography, Annual Book of ASTM Standards, Vol. 03.01, 1990.
21. R. D. Cheverton and D. G. Ball, Martin Marietta Energy Systems, Inc., Oak Ridge Natl.Lab., "A Deterministic and Probabilistic Fracture-Mechanics Code for Application toPressure Vessels," USNRC Report NUREG/CR-3618 (ORNL-5991), May 1984.
22. F. A. Sirnonen et al., Pacific Northwest Laboratory, "V, ISA-It - A Computer Code forPredicting the Probability of Reactor Pressure Vessel Failure," USNRC ReportNUREG/CR-4486 (PNL-5775), March 1986.
23. D. J. Naus et al., Martin Marietta Energy Systems, Inc., Oik Ridge Nad. Lab., "SEN Wide-Plate Crack-Arrest Tests Using A 533 Grade B Class 1 Material: WP-CE Test Series,"USNRC Report NUREG/CR-5408 (ORNLTM-11269), November 1989.
50
24. David J. Ayres, et al., "Comparison of Analysis and Experimental Data for a Unique CrackArrest Specimen," ASTM Special Technical Publication 969, American Society forTesting and Materials, 1988, pp. 724-751.
25. E. Smith and T. J. Griesbach, "Simulating the Effect of Pressure Plus Thermal Loadings onCrack Arrest During a Hypothetical Pressurized Thermal Shock Event," pp. 41-46 in PVP-Vol. 213IMPC-Vol 32, Pressure Vessel Intgegrity, American Society of MechanicalEngineers, June 1991.
26. D. S. Moelling et al., "Probabilistic Fracture Mechanics Application of Dynamic CrackArrest by Static Analogy," pp. 261-268 in PVP-Vol. 213/MPC-Vol 32, Pressure VesselIntgegrity, American Society of Mechanical Engineers, June 1991.
27. B. R. Bass et al., "Fracture Analyses of Heavy-Section Steel Technology Wide-PlateCrack-Arrest Experiments, "Fracture Mechanics: Nineteenth Symposium, ASTM STP969, T. A. Cruse, ed., American Society for Testing and Materials, pp. 691-723, 1988.
28. M. F. Kanninen, J. Ahmad, and V. Papaspyropoulos, pp. 119-121 in "Heavy-Section SteelTechnology Program Semiannual Progress Report for April-September 1984," USNRCReport NUREG/CR-3744, Vol. 2 (ORNL/TM-9154/V2), December 1984.
29. W. 0. Shabbits, W. H. Pryle, and E. T. Wessel, Westinghouse Electric Corporation, PWRSystems Division, Pittsburgh, Pa., Heavy-Section Fracture Toughness Properties of A 533Grade B Class I Steel Plate and Submerged Arc Weldment, WCAP-7414, December1969.
30. Section XI, Appendix A of the American Society of Mechanical Engineers Boiler andPressure Vessel Code, Rules for Inservice Inspection of Nuclear Power Plant Components,1989.
31. J. G. Merkle et al., Comparisons of 3-D and 2-D Computed K Values for Long, InsideSurface Flaws in a PWR for Combined Pressure-Thermal Loading, pp. 3-4 in "Heavy-Section Steel Technology Program Quarterly Progress Report for July-September 1982,"USNRC/CR-2571, Vol. 3 (ORNUITM-8369/V3), January 1983.
32. R. D. Cheverton and D. G. Ball, "A Reassessment of PWR Pressure Vessel IntegrityDuring Overcooling Accidents, Considering 3-D Flaws," in Journal of Pressure VesselTechnology (6) 1984, pp. 375-382.
33. T. L. Dickson and T. J. Theiss, "Potential Impact of Enhanced Fracture-Toughness Data onFracture Mechanics Assessment of PWR Vessel Integrity for Pressurized-Thermal-Shock,"pp. 101-108 in PVP-Vol. 208, Power Plant SystemstComponents Aging Management andLife Extension, American Society of Mechanical Engineers, June 1991.
51
Pipe Fracture Behavior Under High-Rate(Seismic) Loading - the IPIRG Program
by
RA. Schmidt, G.M. Wilkowski,P.M Scott, and RJ. Olson
BATTELLEColumbus, Ohio
- ABSTRACT
Results are summarized from numerous experiments and supporting analyses conducted toinvestigate the behavior of circumferentially flawed piping and piping systems subjected to high-rate loading typical of seismic events. The investigation included both "separate effects"experiments on simple pipe specimens with either pure inertial or displacement-controlledloading, and full-scale experiments on a representative piping system with combined loadingtested at pressurized water reactor (PWR) conditions.
INTRODUCTION
The International Piping Integrity Research Group (IPIRG) program was an international groupprogram managed by the U.S. Nuclear Regulatory Commission (USNRC) and funded by aconsortium of organizations from nine nations: Canada, France, Italy, Japan, Sweden,Switzerland, Taiwan, the United Kingdom, and the United States. The organizations andcognizant individuals in the IPIRG program are listed in Table 1. 'A Technical Advisory Group(TAG), consisting of experts from all member countries, metfformally twice a year to exchangeideas, data, and analysis and to provide technical guidance to the program. Figure 1 is a photo ofthe participants at one of these meetings. The active participation of the members provided aforum for discussing significant technological issues and for working towards achieving aninternational consensus on LBB and flaw evaluation criteria. The five-year program, conductedat Battelle in Columbus, Ohio, was completed in June 1991.'!
The objective of the program was to develop data needed to verify engineering methods forassessing the integrity of nuclear power plant piping that contains circumferential defects. Thesedata are considered essential to verify the validity-and degree of conservatism of current LBBanalyses and in-service flaw assessment methods. Many flaived-piping research programs havebeen conducted in the U.S. (e.g. Wilkowski et al. 1989; Vassilaros et al. 1984; Tang et al. 1985)and in other countries (e.g. Takumi 1989; Darlaston and Harrison 1977; Maricchiolo and
53
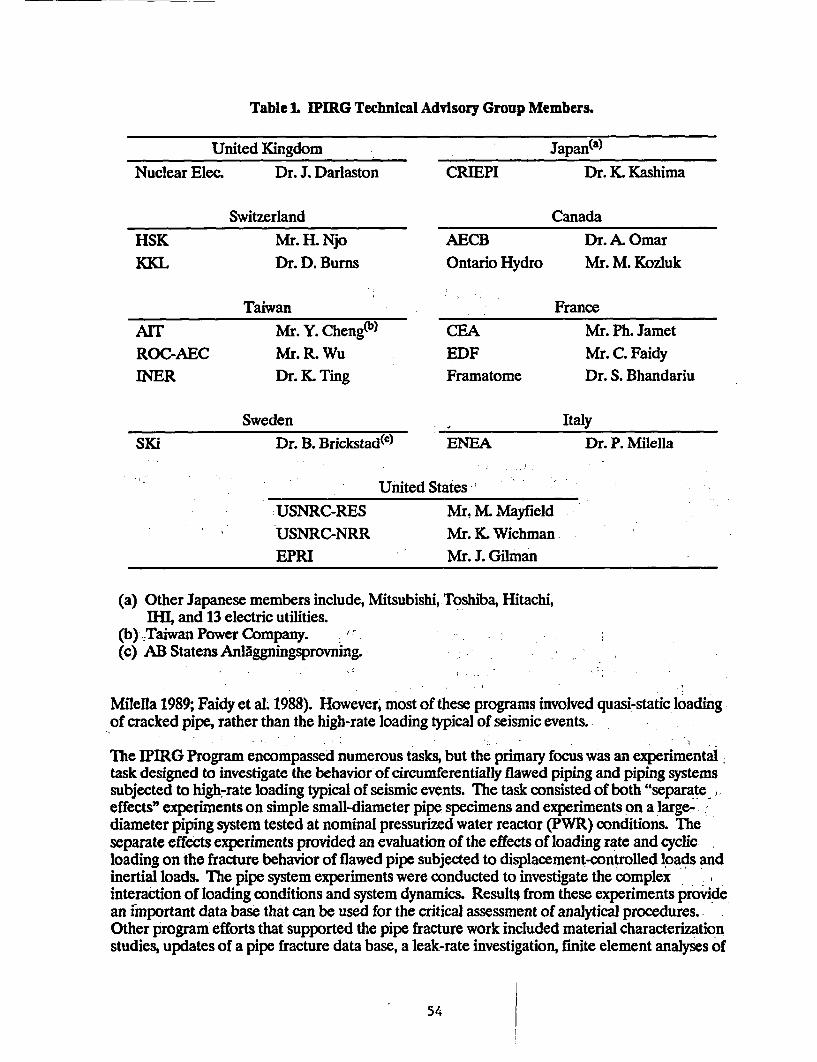
Table L IPIRG Technical Advisory Group Members.
United KingdomNuclear Elec. Dr. J. Darlaston
SwitzerlandHSK Mr. H. NjoKKL Dr. D. Burns
Taiwan
AIT Mr. Y. Cheng@)ROC-AEC Mr. R. WuINER Dr. K Ting
Sweden
Japan(a)
CRIEPI Dr. K Kashima
CanadaAECB Dr. A. OmarOntario Hydro Mr. M. Kozluk
FranceCEA Mr. Ph. JametEDF Mr. C. FaidyFramatome Dr. S. Bhandariu
_. IItalySKi Dr. B. Brickstad(c) ENEA Dr. P. Milella
United States
-USNRC-RESUSNRC-NRREPRI
Mr. M. MayfieldMr. K WichmanMr. J. Gilman
(a) Other Japanese members include, Mitsubishi, Toshiba, Hitachi,I1, and 13 electric utilities.
(b) Taiwan Power Company. ,
(c) AB Statens Anlaggningsprovning.
Milella 1989; Faidy et al. 1988). However, most of these programs involved quasi-static loadingof cracked pipe, rather than the high-rate loading typical of seismic events.
The IPIRG Program encompassed numerous tasks, but the primary focus was an experimentaltask designed to investigate the behavior-of circumferentially flawed piping and piping systemssubjected to high-rate loading typical of seismic events. The task consisted of both "separateeffects" experiments on simple small-diameter pipe specimens and experiments on a large-.diameter piping system tested at nominal pressurized water reactor (PWR) conditions. Theseparate effects experiments provided an evaluation of the effects of loading rate and cyclicloading on the fracture behavior of flawed pipe subjected to displacement-controlled loads andinertial loads. The pipe system experiments were conducted to investigate the complexinteraction of loading conditions and system dynamics. Results from these experiments providean important data base that can be used for the critical assessment of analytical procedures..Other program efforts that supported the pipe fracture work included material characterizationstudies, updates of a pipe fracture data base, a leak-rate investigation, finite element analyses of
54
circumferential through-wall-cracked pipe fracture experiments, two 30-inch diameter quasi-static pipe fracture experiments, seminars, and workshops.
PIPE FRACTURE EXPERIMENTS
The design of piping systems in nuclear power plants recognizes the existence of both inertialand displacement-controlled loads. Uncertainties in the ability to characterize inertial loads has,in part, led to a prevailing industry design practice that results in inherently stiff piping systems.However, stiff systems are less tolerant of displacement-controlled loads caused by thermalexpansion and differential anchor motion. Furthermore, the hardware used to restrict pipemotion in nuclear plants, such as pipe hangers, snubbers, and pipe whip restraints, makes pipesystem inspection difficult. As a result operators and designers are considering more flexiblepiping systems. A concern with flexible piping systems is the stability of cracks in piping whichmay be subjected to loads with a high inertial component. The IPIRG program was formulatedto investigate the separate effects of both inertial and displacement-controlled stresses on flawedpiping as well as the combined effects on representative piping systems.
Displacement-Controlled Experiments
Eleven experiments were conducted on 6-inch diameter Schedule 120 pipe samples containingcircumferential through-wall cracks and loaded in four-point bending under displacementcontrol. Pipe specimens were either wrought TP304 stainless steel or A106 Grade B carbonsteel. The through-wall crack lengths were 37 percent of the circumference. All experimentswere conducted at 288 C, but unlike the other pipe experiments conducted in this program, thesepipe specimens did not contain pressurized water.
One objective of these experiments was to isolate the effects of high loading rates typical ofseismic events, and the effects of cyclic loading during ductile tearing. Displacement-controlledloading was used for this investigation since it is generally the easiest to conduct and analyze, andsince existing data from the USNRC's Degraded Piping Program (Wilkowski et al. 1989) ondisplacement-controlled experiments could be efficiently utilized for a direct comparison ofresults. In addition, tensile and C(lI) fracture toughness tests were conducted at both quasi-static rates and at high rates of loading for direct comparison to the pipe experiments.
Figures 2 and 3 summarize the tensile test results. At high loading rates, the strength, as well asthe toughness, of the wrought TP304 stainless steel improved slightly.. For the A106 Grade B,both strength and toughness decreased significantly at the higher loading rates. These trends arereflected in the moment-rotation behavior from the pipe fracture experiments. A slight increaseis observed in the load-carrying capacity of the stainless steel at the high loading rate (Fig. 4),while a significant decrease in load-carrying capacity is obsqrved for the carbon steel (Fig. 5). J-R curves calculated for the pipe fracture experiments also show little effect of high-rate loadingon stainless steel toughness, while the toughness of the carbon steel decreased significantly at thehigh loading rate. The lowering of strength and toughness of the carbon steel at high loadingrates is believed to be due to dynamic strain aging of this particular A106 Grade B pipe.
The effects of cyclic loading on ductile tearing in pipe fracture experiments showed that there aretwo important parameters to consider. One is the ratio of minimum to maximum load or loadratio, R, and the other is the incremental plastic displacement or incremental crack growth. Theeffects of load ratio on the moment-rotation behavior of stainless and carbon steel pipe fracture
55
experiments are summarized in Figures 6 and 7. (The curves for the cyclic experiments representthe envelope of successive maximum points achieved during cycling.) Little cyclic effect isobserved for R = 0, but for R = -1 (fully reversed cycling) a significant drop in load-carryingcapacity is observed. J-R curves calculated for these experiments reflect similar trends.
The effect of incremental plastic displacement on fracture behavior was investigated for thestainless steel pipe. Generally, the amount of incremental plastic displacement allowed betweencycles was held constant throughout a given experiment In several of the stainless steel pipefracture experiments the amount of incremental plastic displacement for each cycle was heldconstant for a block of cycles and then changed to a new value for the next block (Fig. 8).Figure 9 shows the effect of the incremental plastic displacement on the normalized crack-tip-opening angle (CTOA) for the stainless steel at R = 0 and R = -1. These results suggest that asthe incremental plastic displacement gets smaller (smaller crack growth per cycle), the apparentfracture resistance can drop significantly.
Estimates of load ratios for typical seismic loading on nuclear plant piping indicate that R maybe as low as -0.6. However, typical seismic load histories would be expected to have relativelyfew cycles that produce crack growth. Results displayed in Figure 9 suggest that a cyclic loadinghistory with few, large amplitude cycles may be of little consequence to maximum loadpredictions in these applications.
Inertlally Loaded Experiments
Several pipe fracture experiments with inertial loading were conducted on the same 6-inchdiameter carbon and stainless steel pipe used for the displacement-controlled experiments. Theprimary objective of these experiments was to investigate the effect of inertial loading on thestability of pressurized cracked pipe. Five cracked-pipe specimens with either through-wallcracks or surface cracks were loaded to failure at 288 C. The length of the through-wall crackswas 37 percent of the circumference. The surface cracks had a length that was 50 percent of thecircumference and a depth that was approximately 70 percent of the pipe thickness. The pipeswere pressurized with water at 15.2 MPa.
A unique computer-controlled test system was designed and fabricated to conduct thesedynamic experiments (Fig. 10). The test system is a servo-hydraulic design with the test pipemounted horizontally and with a large mass attached to each end. The computer controls force arapid, vertical motion, at 3.5 Hz, which is 83 percent of the system's first natural frequency, 4.2 Hi.The pipe test frame and specimen configuration were analyzed using a finite element model andthe ANSYS code to aid in design of the test system.
The pipe specimens were loaded by applying a sinusoidal displacement function of increasingamplitude. This produced a bending moment that varied in time, such as seen in Figure 11. Theresulting moment-rotation behavior is seen in Figure 12. One of the more importantobservations that can be made from these experiments is that once maximinn load was achieved,there were very few additional cycles until the pipe essentially broke into two pieces. For four ofthe five cracked pipe experiments there were only 2 to 4 cycles that the pipe specimens survivedpast maximum load. The implication from a fracture viewpoint is that, in seismic applications,inertial stresses should be considered as load-coitrolled (primary) stresses, not displacement-controlled (secondary) stresses.
56
Pipe System Experiments -
The objective of the pipe system experiments was to provide the data necessary to assess theanalysis methodologies for characterizing the fracture behavior of circumferentially cracked pipein a representative piping configuration under combined inertial and displacement-controlledstresses. Results from the separate effects experiments conducted with purely displacement-controlled and inertially controlled loading were used to evaluate results of these complexexperiments. By developing data on Ia full-scale representative piping system, the complexinteraction of loading conditions and system dynamics'provided important test cases for the;assessment of current analytical procedures. The piping system was designed to have flexibilitythat is representative of typical nuclear piping systems." -
While this task was primarily experimental, extensive supporting analyses were conducted todesign the facility and the piping system as well as to design)the individual experiments andanalyze the results. The pipe system experiments involved one uncracked pipe experimentdesigned to investigate system dynamics and boundary conditions, and five cracked pipeexperiments, each on a different material. All experiments, except the uncracked pipeexperiment, were taken to failure, as evidenced by the occurrence of a double-ended break or, atleast, a very long through-wall crack.
A unique experimental facility was designed and constructed to conduct these experiments (Fig.13 and 14). The piping system was fabricated as an expansion loop with over 30 m of 16-inchdiameter Schedule 100 pipe and five long radius elbows. The pipe loop configuration, itssupporting framework, and the foundation were designed by means of dynamic finite elementcalculations using the ANSYS code. One of the key design criteria included the requirementthat the pipe loop be reusable for all six experiments in the original test matrix. The cracked testspecimens were welded into the pipe loop at a location of high bending stress as identified fromthe calculations. Each experiment was conducted by simply replacing the failed test section witha new one. In order to minimize plastic deformation in the pipe loop and to concentrate thedeformation in the cracked specimen, thle pipe loop was fabricated using high strength steel pipe(ASTM A710, Grade A, Class 3).
The pipe loop is supported and constrained at several locations using various specialized piecesof hardware. 'These supports and hardware were designed to produce specific well-definedboundary conditions that could be easily modeled in nuniefical calculations. There was nointent to simulate supports used in actual nuclear plants. The emphasis was to gather data that'can be used to test analytical capabilities without the complication of large unknowns in test'conditions. The pipe loop is rigidly constrained at two fixed ends, it is vertically supported onhydrostatic bearings at two locations, and it is constrained from motion perpendicular to thepipe by spherical bearings at three locations (Fig. 13).
System loads are applied by a computer-controlled hydraulic actuator'with a 1560-kN loadcapacity and a 460-mm stroke. 'The actuator is driven by an 8000 liter per minute three-stageservovalve.' The servovalve is supplied with oil at 21 MPa by piston accumulators of 380 litercapacity. Nitrogen gas used to drive the accumulators is stored in a separate pressure vessel.Heat for bringing the pipe loop and water to test temperature is supplied by heater tapeswrapped continuously around the exterior of the pipe loop. 'The pipe loop is covered withfiberglass insulation. Water in the pipe loop is circulated bya pump connected to the two fixedends to'provide an even'temperature distribution. The Entire pipe loop contains approximately3000 liters of water. The pipe system was extensively instrumented. A computerized data
57
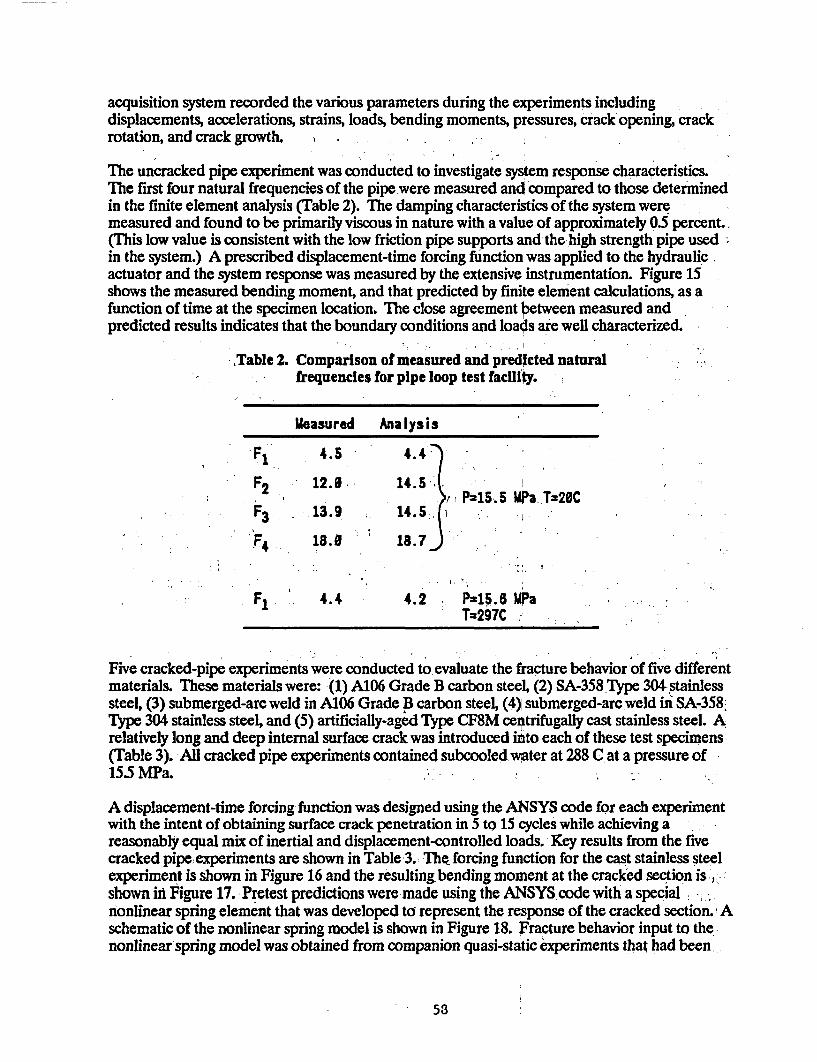
acquisition system recorded the various parameters during the experiments includingdisplacements, accelerations, strains, loads, bending moments, pressures, crack opening, crackrotation, and crack growth.
The uncracked pipe experiment was conducted to investigate system response characteristics.The first four natural frequencies of the pipe were measured and compared to those determinedin the finite element analysis (Table 2). The damping characteristics of the system weremeasured and found to be primarily viscous in nature with a value of approximately 0.5 percent..(This low value is consistent with the low friction pipe supports and the high strength pipe used;in the system.) A prescribed displacement-time forcing function was applied to the hydraulicactuator and the system response was measured by the extensive instrumentation. Figure 15shows the measured bending moment, and that predicted by finite element calculations, as afunction of time at the specimen location. The close agreement between measured andpredicted results indicates that the boundary conditions and loads are well characterized.
Table 2. Comparison of measured and predicted naturalfrequencies for pipe loop test facillty.
Measured Analysis
F ~ 4.5 4.4
F2 12.0. 14.5 - i,' P215.5 MPa T=20C
F3 13.9 14.5 ,
-F4 18.9 18.7
F1 4.4 4.2 PN15.B MaT:297C
Five cracked-pipe experiments were conducted to evaluate the fracture behavior of five differentmaterials. These materials were: (1) A106 Grade B carbon steel, (2) SA-358.TIype 304 stainlesssteel, (3) submerged-arc weld in A106 Grade B carbon steel, (4), submerged-arc weld in SA-358.Type 304 stainless steel, and (5) artificially-aged Type CF8M centrifugally cast stainless steel. Arelatively long and deep internal surface crack was introduced into each of these test specimens(Table 3). All cracked pipe experiments contained subcooled water at 288 C at a pressure of15.5 MPa.
A displacement-time forcing function was designed using the ANSYS code for each experimentwith the intent of obtaining surface crack penetration in 5 to 15 cycles while achieving areasonably equal mix of inertial and displacement-controlled loads. Key results from the fivecracked pipe. experiments are shown in Table 3. The forcing function for the cast stainless steelexperiment is shown in Figure 16 and the resulting bending moment at the cracked section is',shown iW Figure 17. Pretest predictions were made using the ANSYS code with a specialnonlinear spring element that was developed to represent the response of the cracked section. Aschematic of the nonlinear spring model is shown in Figure 18. Fracture behavior input to thenonlinear spring model was obtained from companion quasi-static experiments that had been
53

performed on these materials in previous programs and from J-estimation scheme analyses. Acomparison of analytical prediction with experimental results is shown in Figure 19 for thestainless steel base metal experiment.
In all five experiments the surface crack penetrated the pipe wall and grew unstably until itarrested at the ends of the surface crack. Subsequent cyclic loading caused additional through-wall crack growth. Two of the five experiments included a sufficient number of extra cycles afterpenetration to produce a double-ended break. The forcing function for the aged cast stainlesssteel experiment is shown in Figure 16 which indicates that thirteen additional cycles ofincreasing amplitude were required after surface crack penetration to produce the final double-ended break. Results showed that each additional cycle advanced the through-wall crack untilthe double-ended break occurred when the crack was 94 percent of the circumference and only75 mm of ligament remained. Figure 20 is a photograph of the fracture surface showing theremaining ligament.
The results of a Net-Section Collapse analysis with fixed and free boundary conditions are shownin Figure 21. The fixed-end assumption gives an instability prediction that coincides well withthe results for the aged cast stainless steel experiment. This suggests that either the piping systemitself restricts the bending of the cracked section, or some other factor such as the thrust loads ofthe steam jet help to restrict pipe rotations, and thus delay the final instability until membranestress alone can produce the failure.
Results from the five cracked pipe experiments were analyzed on the basis of elastic stressanalyses and elastic-plastic fracture analyses. In the elastic stress analyses, finite elementcalculations were used to predict the total stress (bending plus membrane) that would occur atthe crack location using the known actuator displacement at the time of maximum measuredstress. The calculated stress varied from 0.93 to 1.43 of thepmeasured stress in these fiveexperiments. These results support the finding that this pipe system primarily behaves elasticallyand that most of the nonlinear behavior is concentrated within the cracked section.
Various fracture analyses were conducted to evaluate the margins inherent in these methods.Analyses evaluated were: (1) Net-Section-Collapse (NSC), (2) Dimensionless plastic-zoneparameter (DPZP), (3) ASME Section XI flaw evaluation criteria, (4) R6 Revision 3 Option 1,and (5) J-estimation schemes. Margins are determined by dividing the measured stress by thepredicted stress at the time of maximum measured bending moment. Figure 22 shows the rangeof margins calculated for both the IPIRG pipe system experiments as well as the companion.quasi-static experiments conducted previously..
FINDINGS AND CONCLUSIONS
Loading Rate Effects
For the two carbon steels examined at 288 C there was a rndest degradation of fracture.;resistance at loading rates typical of seismic events. The reduced toughness in this carbon steel isattributed to dynamic strain aging (DSA). In contrast, for the stainless steels and welds testedthere appeared to be little effect of high-rate loading on fracture properties and strength.
59
Cyclic Loading Effects
For both carbon steel and stainless steel, cyclic loading was found to reduce the load-carryingcapacity of through-wall-cracked pipe by as much as 26 percent depending on load-ratio and thesize of the incremental plastic displacement. Effects of cyclic loading on surface-cracked pipeare less clear, but results from the pipe system experiments suggest that cyclic effects may bemore significant for the surface crack geometry.
Inertial Versus Displacement-Controlled Loading
The inertial load experiments showed markedly less fracture stability than those conductedunder displacement-controlled loads. While the maximum load results for the two types ofloading compare closely, inertial loading was shown to produce complete fracture instability inonly a few cycles past maximum load. The inertial stresses produced in these experiments weresimilar to load-controlled stresses for fracture stability analyses and should probably beconsidered as primary loads.
Use of Laboratory Data to Predict FractureBehavior of a Piping System
Data from C(T) tests, in some cases, were shown to overestimate the effective fracture resistanceobserved in a surface-cracked piping system under dynamic loads. Results of pipe systemexperiments were compared with companion quasi-static experiments. While results of thesepipe system experiments cannot, as yet, be completely rationalized and modeled on the basis ofstandard laboratory specimen data, the IPIRG Program has increased the understanding ofcontrolling parameters and is pointing the way to defining the specific laboratory data that areneeded. Once the effects of these controlling parameters are understood better, analyticalmodels coupled with laboratory specimen data should be able to predict the behavior of large-diameter piping systems to a variety of loading conditions.
Stress Analysis of Pipe System Experiments
Straightforward linear-elastic dynamic finite element analyses with 0.5 percent damping wereshown to give an excellent description of the response of the uncracked piping system. Thedynamic behavior of the piping system containing a section of surface-cracked pipe wasaccurately modeled with a nonlinear, time-dependent finite element analysis that included anonlinear spring model to simulate the cracked section. Results of linear elastic stress analysissupport the finding that this piping system primarily behaves elastically and that most of thenonlinear behavior is concentrated within the cracked section.
Fracture Analysis
All quasi-static and dynamic pipe fracture experiments, as well as pipe system experiments, wereanalyzed using state-of-the-art predictive fracture methods (Net Section Collapse, DimensionlessPlastic Zonie Parameter, and J-estimation) and failure avoidance methods (R6 and'ASMESection XI). The predictive methods gave relatively accurate predictions of maximum bending -moments. R6 and ASME analyses generally underestimated the maximum bending moments.
60
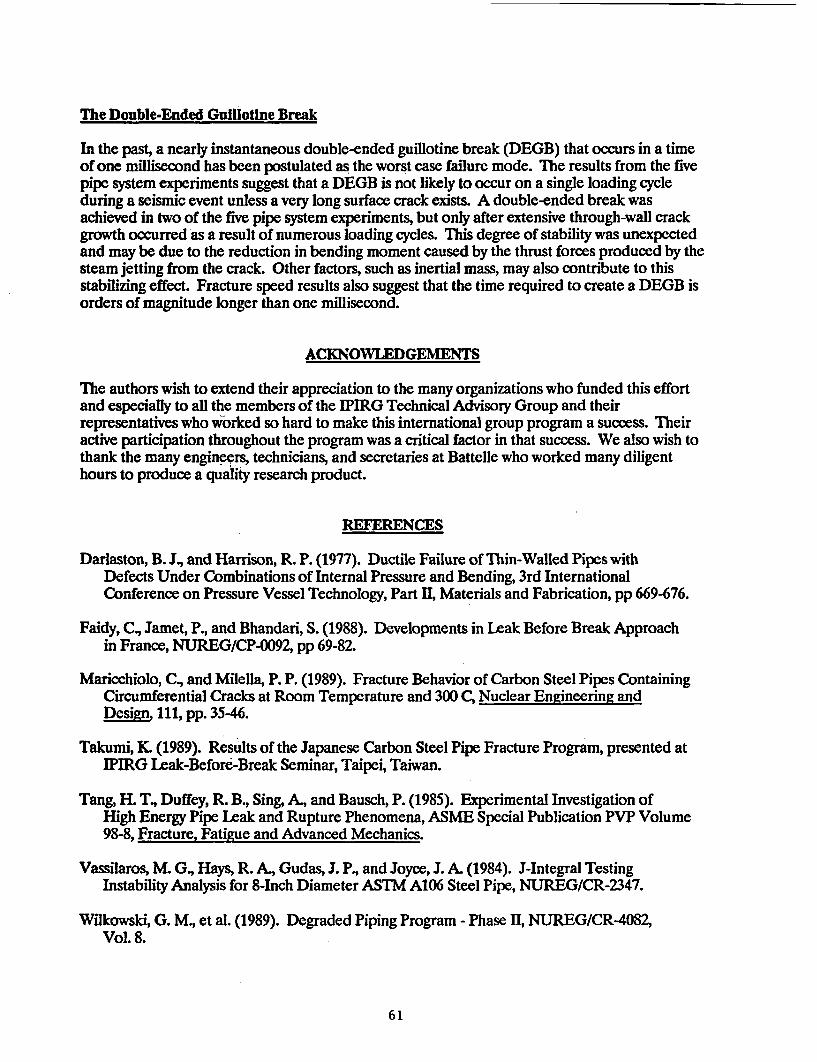
The Double-Ended Guillotine Break
In the past, a nearly instantaneous double-ended guillotine break (DEGB) that occurs in a timeof one millisecond has been postulated as the worst case failure mode. The results from the fivepipe system experiments suggest that a DEGB is not likely to occur on a single loading cycleduring a seismic event unless a very long surface crack exists. A double-ended break wasachieved in two of the five pipe system experiments, but only after extensive through-wall crackgrowth occurred as a result of numerous loading cycles. This degree of stability was unexpectedand may be due to the reduction in bending moment caused by the thrust forces produced by thesteam jetting from the crack. Other factors, such as inertial mass, may also contribute to thisstabilizing effect. Fracture speed results also suggest that the time required to create a DEGB isorders of magnitude longer than one millisecond.
ACKNOWLEDGEMENTS
The authors wish to extend their appreciation to the many organizations who funded this effortand especially to all the members of the IPIRG Technical Advisory Group and theirrepresentatives who worked so hard to make this international group program a success. Theiractive participation throughout the program was a critical factor in that success. We also wish tothank the many engineers, technicians, and secretaries at Battelle who worked many diligenthours to produce a quality research product.
REFERENCES
Darlaston, B. J., and Harrison, R. P. (1977). Ductile Failure of Thin-Walled Pipes withDefects Under Combinations of Internal Pressure and Bending, 3rd InternationalConference on Pressure Vessel Technology, Part 11, Materials and Fabrication, pp 669-676.
Faidy, C, Jamet, P., and Bhandari, S. (1988). Developments in Leak Before Break Approachin France, NUREG/CP-0092, pp 69-82.
Maricchiolo, C., and Milella, P. P. (1989). Fracture Behavior of Carbon Steel Pipes ContainingCircumferential Cracks at Room Temperature and 300 C, Nuclear Engineering andDesign, 111, pp. 35-46.
Takumi, K (1989). Results of the Japanese Carbon Steel Pipe Fracture Program, presented atIPIRG Leak-Before-Break Seminar, Taipei, Taiwan.
Tang, H. T., Duffey, R. B., Sing, A, and Bausch, P. (1985). Experimental Investigation ofHigh Energy Pipe Leak and Rupture Phenomena, ASME Special Publication PVP Volume98-8, Fracture, Fatigue and Advanced Mechanics.
Vassilaros, M. G., Hays, R. A., Gudas, J. P., and Joyce, J. A. (1984). J-Integral TestingInstability Analysis for 8-Inch Diameter ASTM A106 Steel Pipe, NUREG/CR-2347.
Wilkowski, G. M., et al. (1989). Degraded Piping Program - Phase II, NUREG/CR-4082,Vol. 8.
61
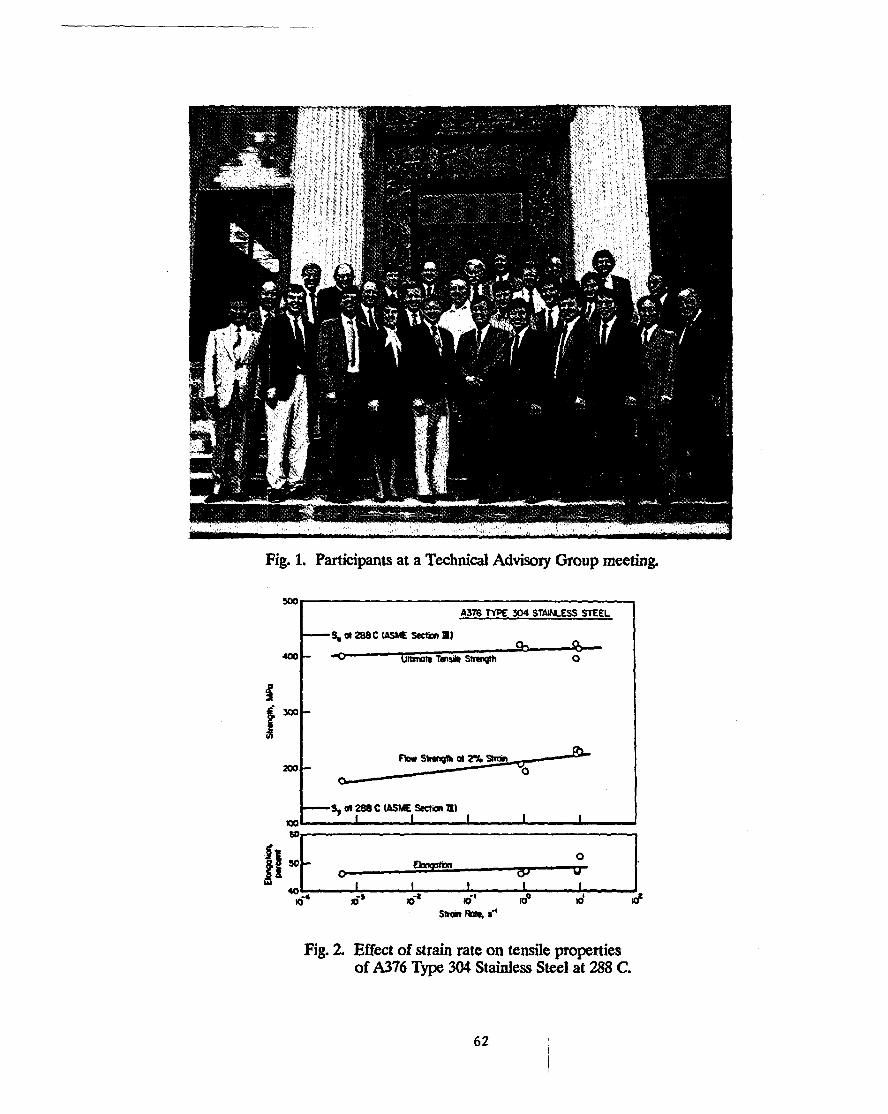
Fig. 1. Participants at a Technical Advisory Group meeting.
5oo -
A376 TYPE 304 STAOILESS STEEL
-%,o2 88CAMM Sectta N)
400- ' °oteh TVi Strgth 0
4300
Fbow SbVigl at 2o% S200
-5 288 C (ASME Section EI)II I I 1
Oj V
2 t O . 08 048
S&M note, al
Fig. 2. Effect of strain rate on tensile propertiesof A376 Type 304 Stainless Steel at 288 C.
62
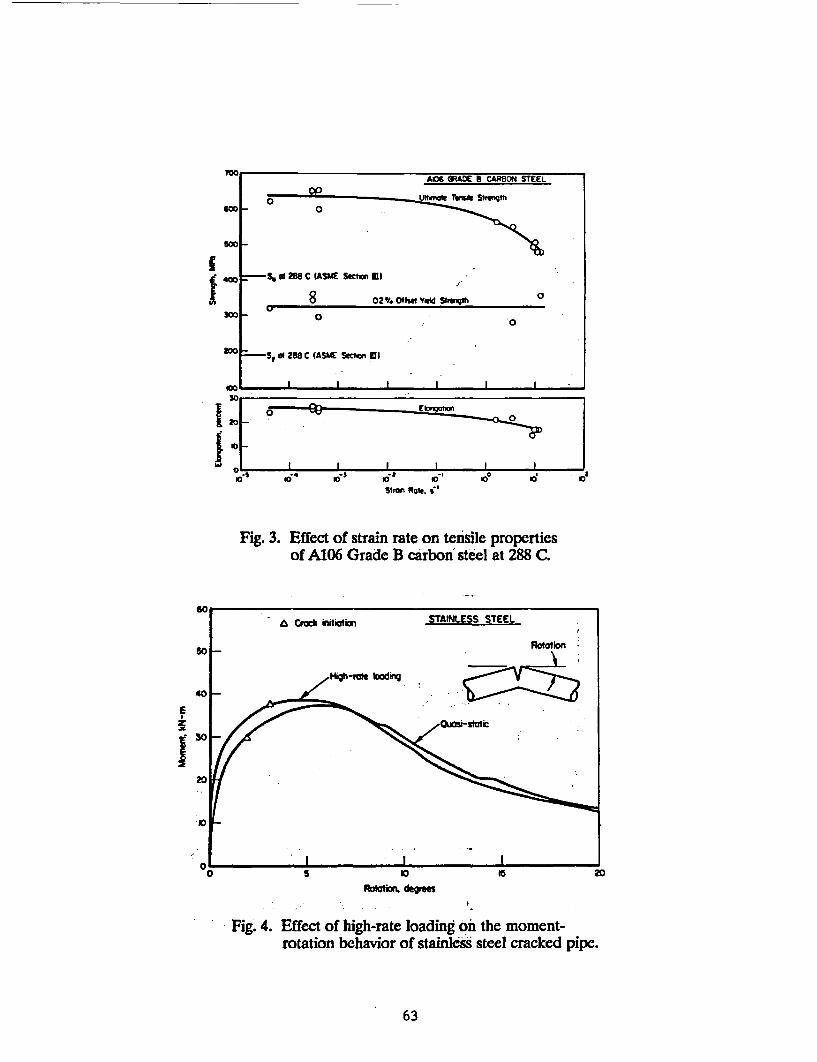
$00E
SW0
I4X0o
£06 GRADE 8 CARBON STEEL
0 0
=- Sf258 C ASME Swim IC)
8 02% Oft YWd SIreq% 0
- 0
=.S al 288 C (ASME Seeimn C)
I I -
2D0
IVWI|
Ii
3 0.I O- -bga
1''-,10
a t,
e- eI
St. Ram, ;'.o Id I'
Fig. 3. Effect of strain rate on tensile propertiesof A106 Grade B carboni steel at 288 C.
E
k
I
Ro~m d~egr
Fig. 4. Effect of high-rate loading on the moment-rotation behavior of stainless steel cracked pipe.
63
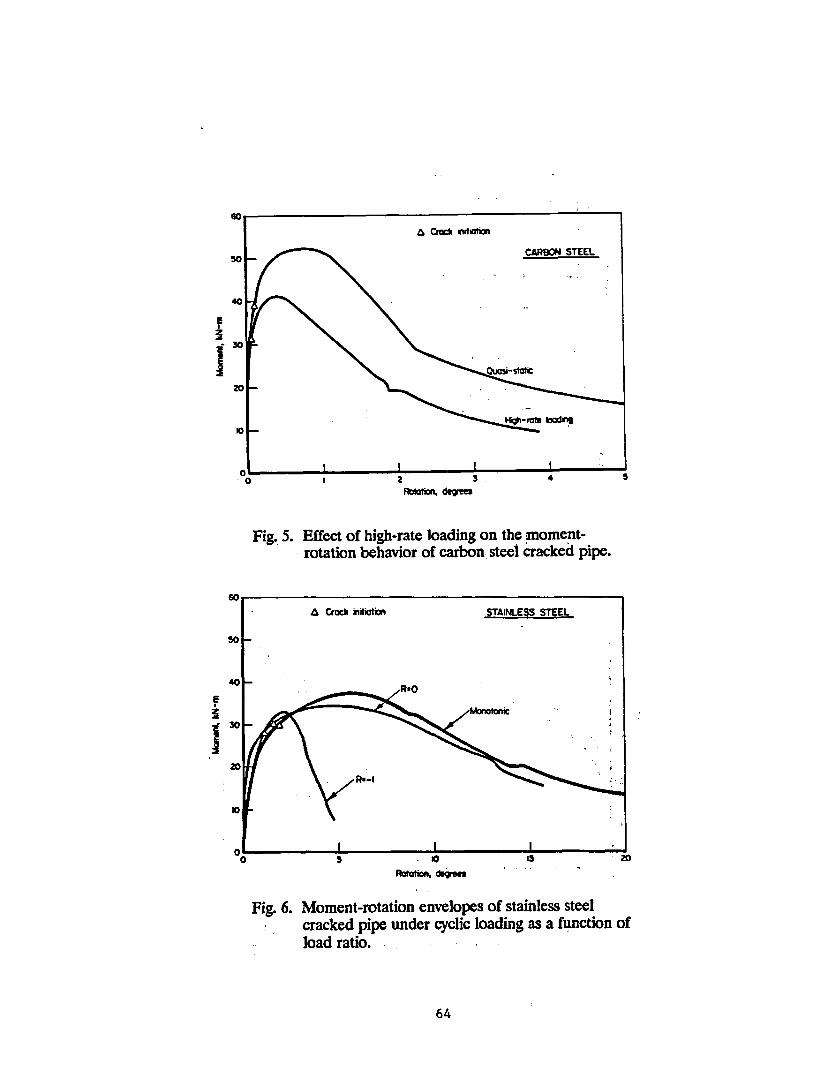
Ei
Fig. 5. Effect of high-rate loading on the moment-rotation behavior of carbon steel cracked pipe.
.
.1
pAti. *ge
Fig. 6. Moment-rotation envelopes of stainless steelcracked pipe under cyclic loading as a function of
- load ratio.
64
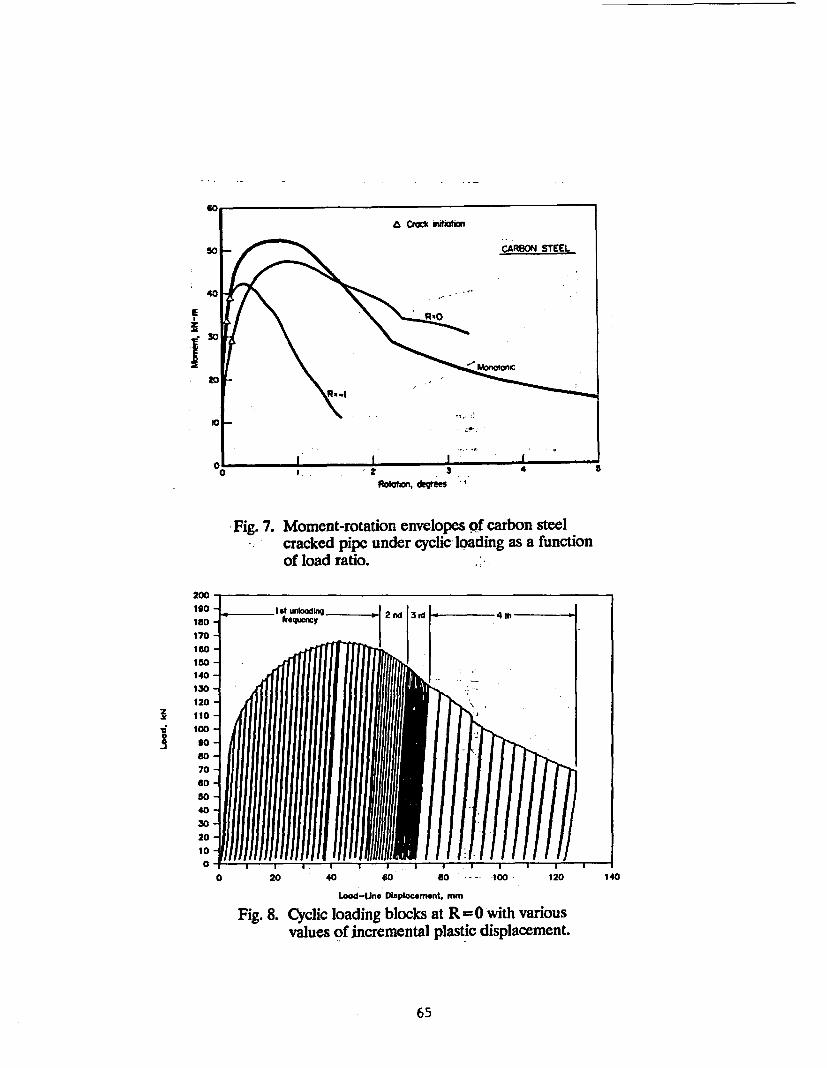
1 3 4Robtion, *gree
Fig. 7. Moment-rotation envelopes of carbon steel-cracked pipe under cyclic- loading as a function
of load ratio.
200
ISO frqec
170 - ~qacq|2n 34tto
200 40 6 -- 0 2 4
2 0 - _ _
200
170-160
140-130-120-
8070
60 20 4 0 s 0 12 14
Lod-Une DWxplcement. mm
Fig. 8. Cyclic loading blocks at R 0 0 with variousvalues of incremental plastic displacement.
65
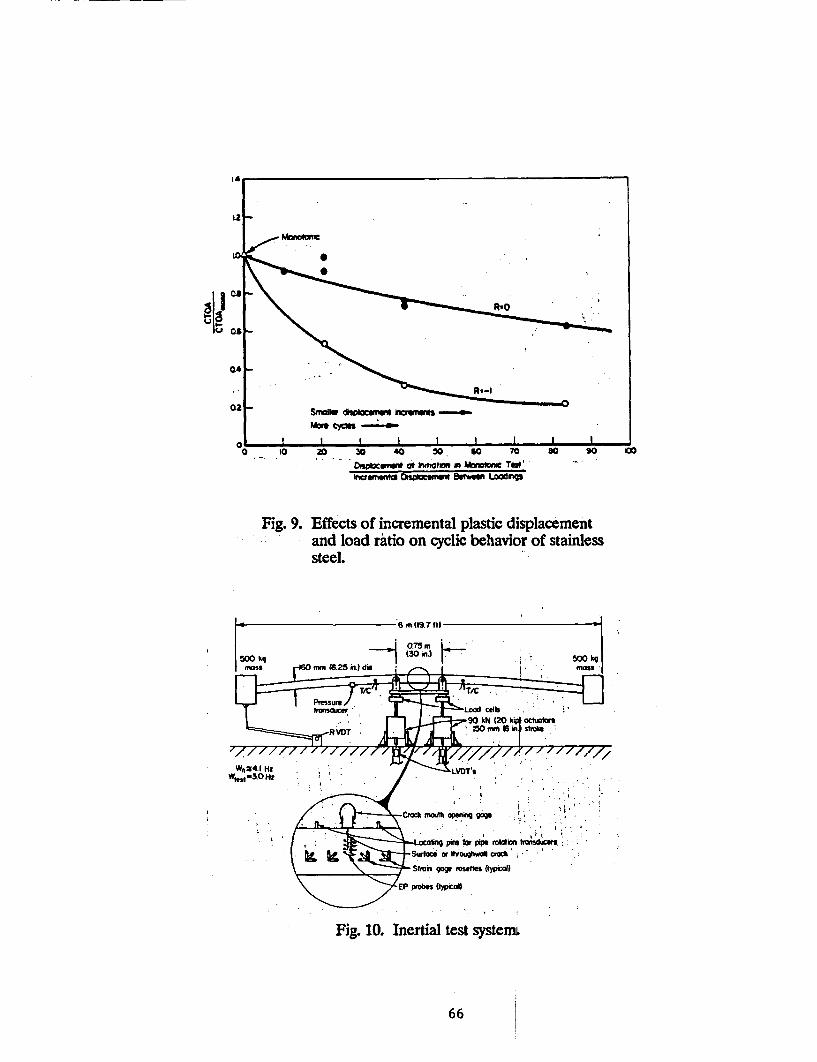
LZ
MOMOOM I�1�
Q2s. -
I I - I I I I0 0 20 30 40 50 0 70 80 so Ca
Dmxn* of -htm inee Morwsi To#'NaWMM DSOMW Umm LOwu'Q
Fig. 9. Effects of incremental plastic displacementand load ratio on cyclic behavior of stainlesssteel.
6 m (19.7 ftl
____ ___ ____ ___ ____ __ 75 rn
500 q 0T(30 iid
Stn0 Noodtdh (0 actu= R~~~~ VDTu9t5N 2
Waj Hz - e
Fig.10 Iner testnq m o sy.t; '
6Lo 6snq pin bo pipe mihl transducers
\Strainrgsn rosettes (tycl)
\Yprobs (typ
Fig. 1Q. Inertial test systemL
66
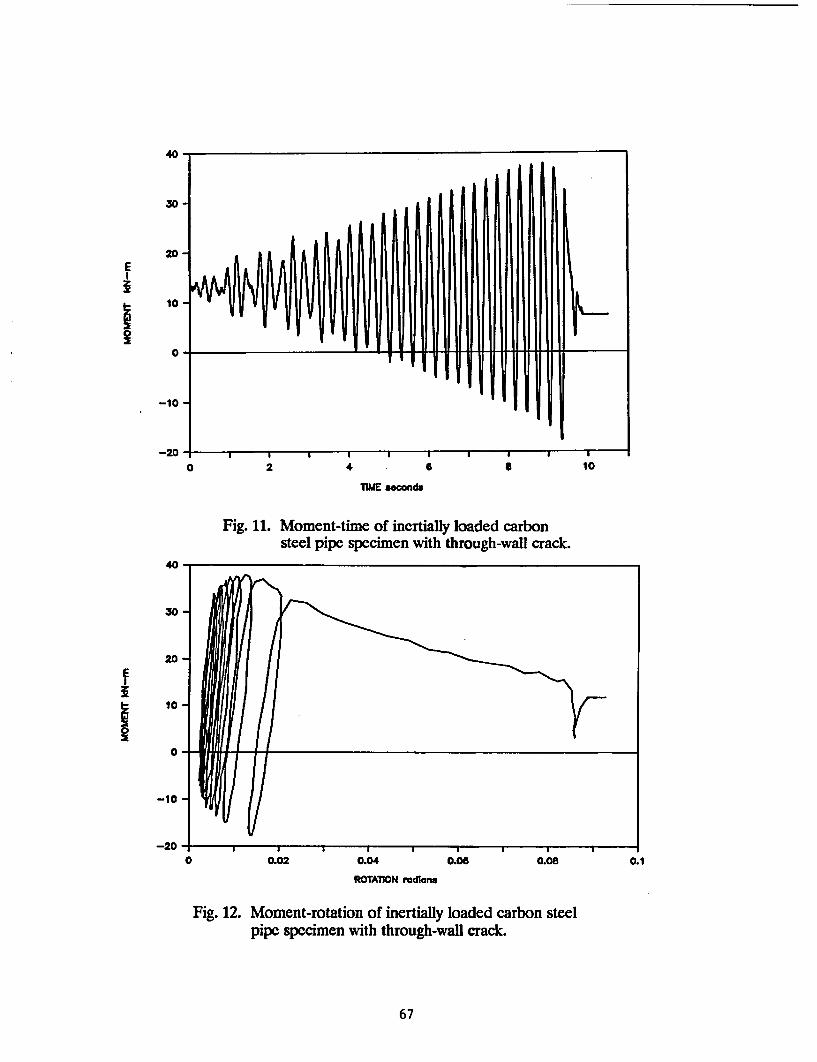
40
30
E20
10
0
-10
-200 2 4 6 I 10
lhIE Pocondt
Fig. 11. Moment-time of inertially loaded carbonsteel pipe specimen with through-wall crack.
40
30
20
10
-10
-200.1
ROTATION radians
Fig. 12. Moment-rotation of inertially loaded carbon steelpipe specimen with through-wall crack.
67
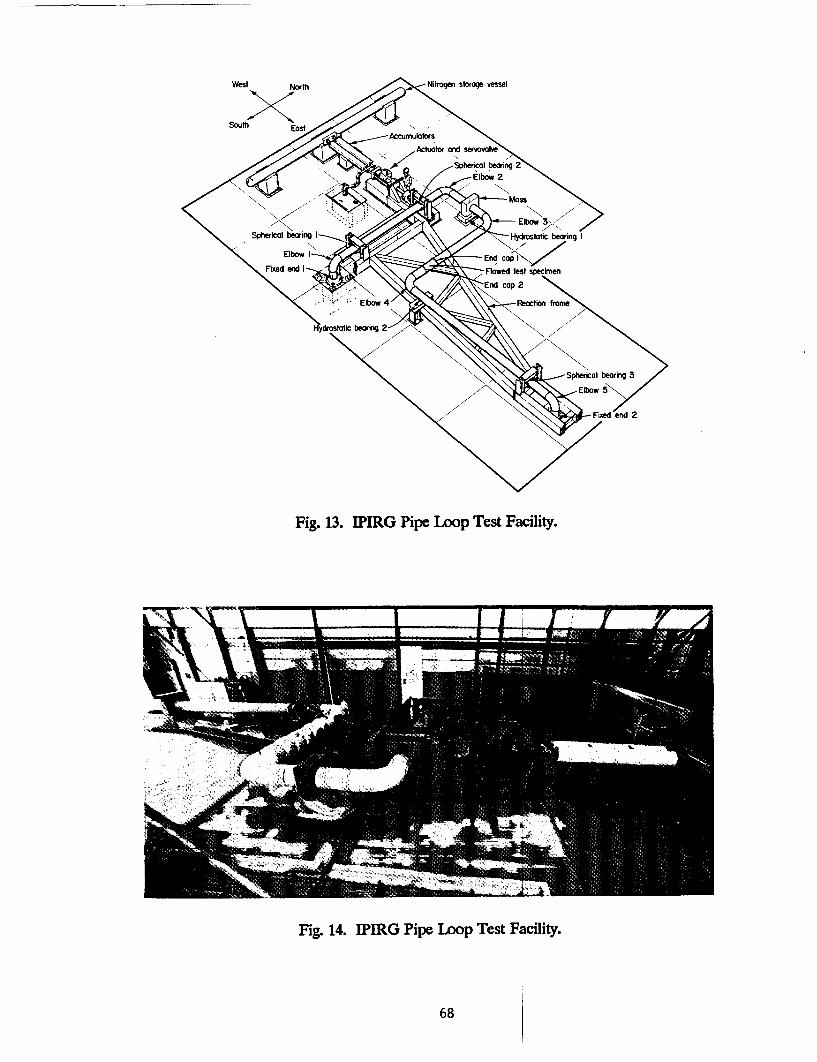
Fig. 13. IPIRG Pipe Loop Test Facility.
Fig. 14. IPIRG Pipe Loop Test Facility.
68
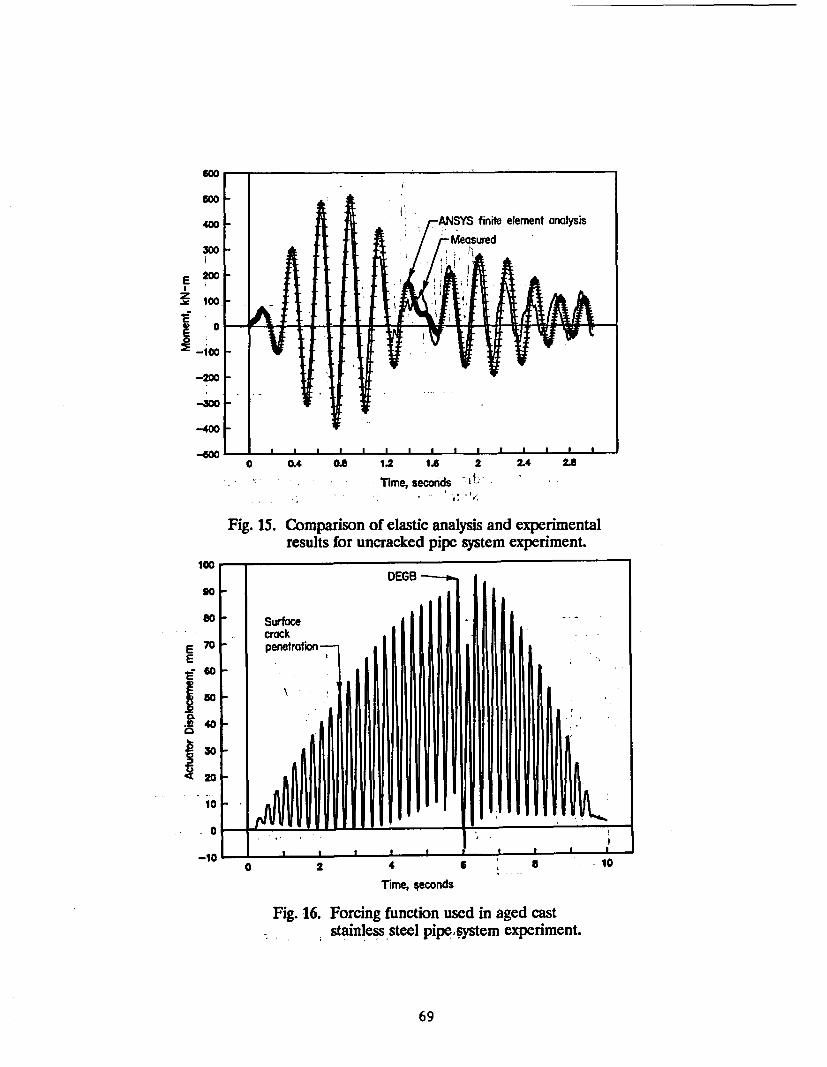
600--'Goo
400 ANSYS finite element analysisMeasured
200
E.
.M 100
-00
-400
-50 . A I A&:&0 0.4 0.o 1.2 IA 2 2.4 2.8
'rime, seconds -o
Fig. 15. Comparison of elastic analysis and experimentalresults for uncracked pipe system experiment.
100 -DEGB
go
so - Surfacecrack
E 70 penetrationE
~60
in0.12 40-
AdA
0 2 4 6 a I
Time, seconds
Fig. 16. Forcing function used in aged cast; stainless steel pipeWrstem experiment.
10
69
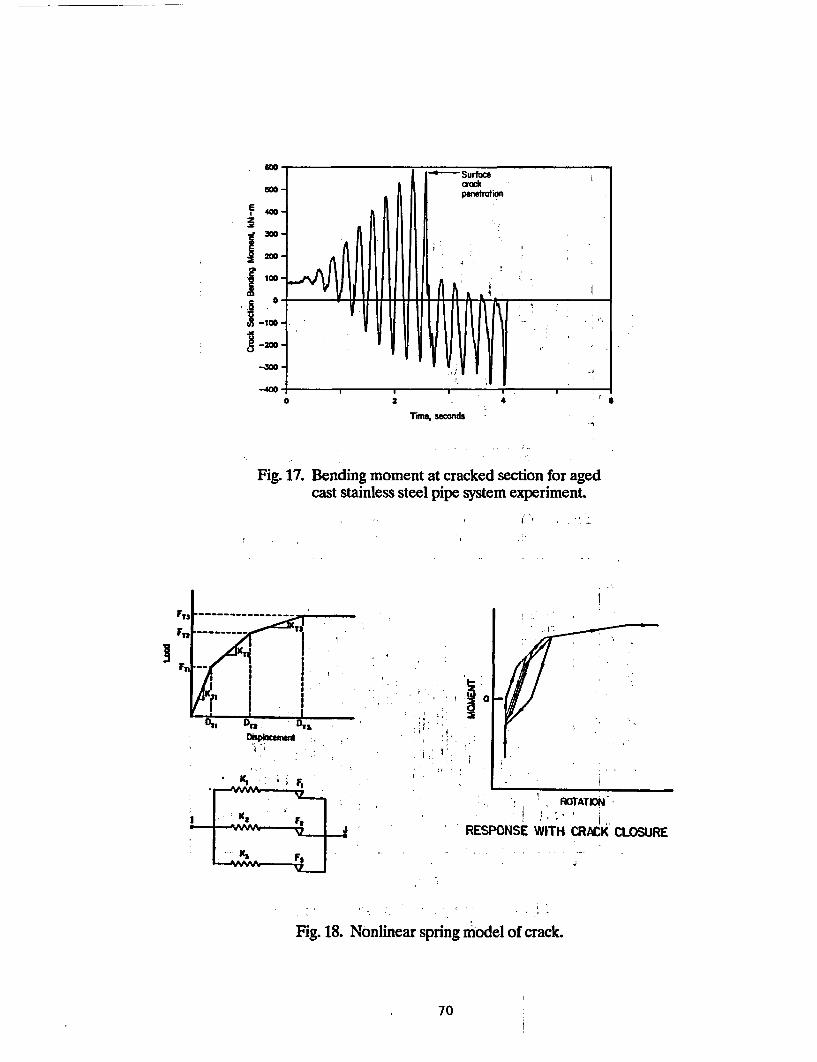
60 --
00-
I 400-z
120-Ia -
-100-
-200
-1300
-400 -
0
Fig. 17.
2 a
rime, seconds
Bending moment at cracked section for agedcast stainless steel pipe system experiment.
k' E
j.4.
CLOSURE
I . I
Fig. 18. Nonlinear spring model of crack.
70
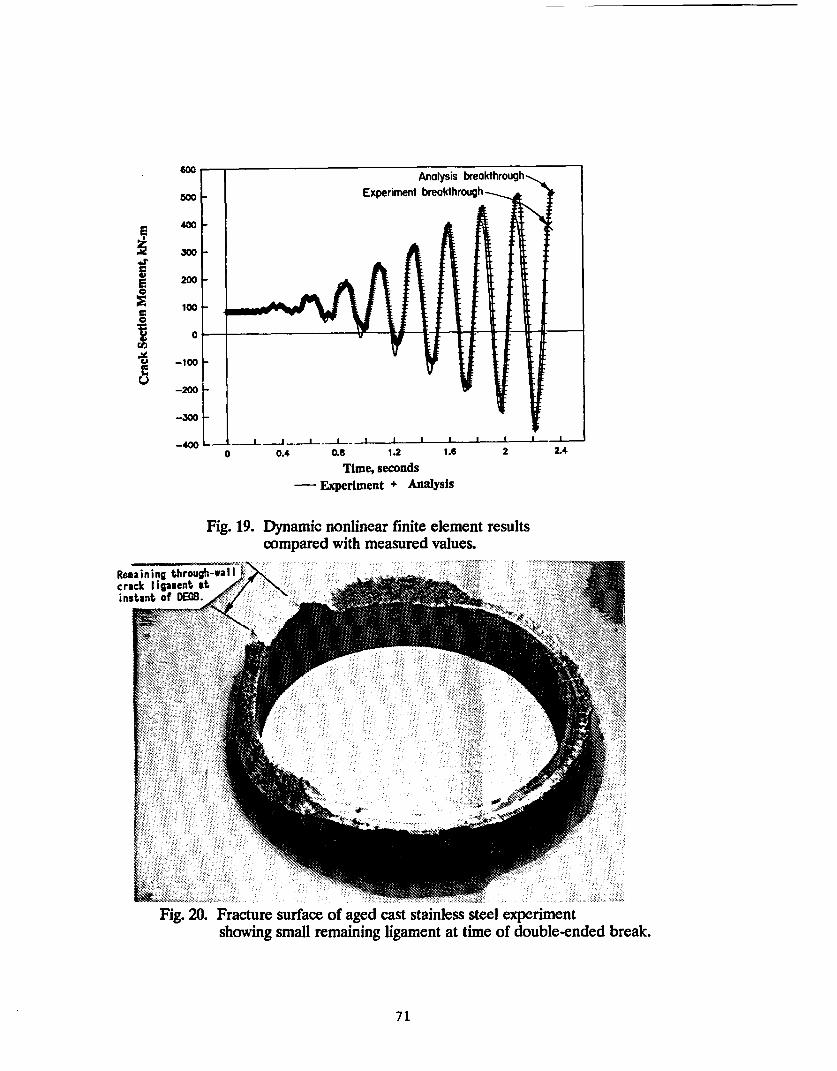
6GM
500 _ LperIleiIi nLeunulwlwl
S 400-
300
200 -C
100
0
U -100
-200
0 0.4 0.8 1.2 1.6 2
Time, seconds-Experiment + Analysis
Fig. 19. Dynamic nonlinear finite element resultscompared with measured values.
2.4
Remaincrackinstan
Fig. 20. Fracture surface of aged cast stainless steel experimentshowing small remaining ligament at time of double-ended break.
71
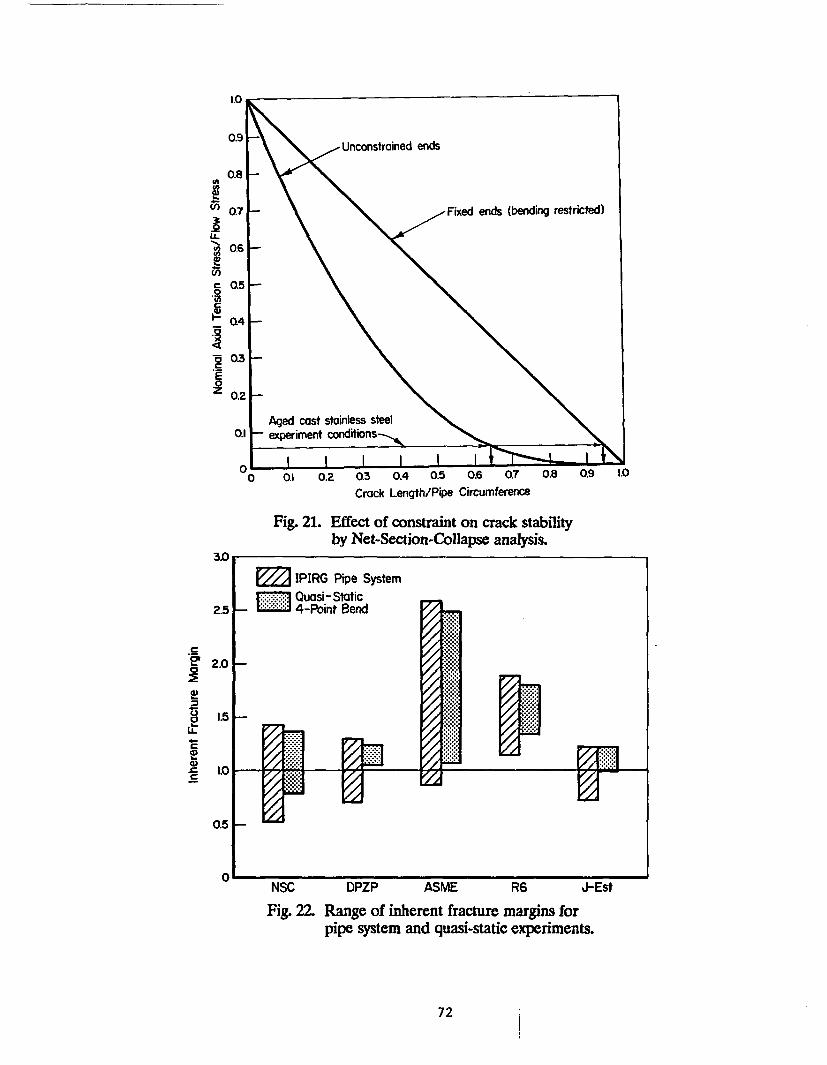
-
0
Lob
An
Ut
I0
a
9
I-
C
0I
0.3 0.4 05 O0. 07Crack Length/Pipe Circumference
Fig. 21. Effect of constraint on crack stabilityby Net-Section-Collapse analysis.
.1.
a)
0
a)
C
IFig. 22. Range of inherent fracture margins for
pipe system and quasi-static experiments.
72
SHORT CRACKS IN PIPING AND PlPING WELDS
by
G. Wilkowski, F. Brus, R Francini, T. KilinskiP. Krishnaswany, M. Landow, C. MarschaI,.
S. Rahman, and P. Scott
BA'TXLLE COLUMBUS DIVSION
1.0 INTRODUCTION
The overall objective of the 'Short Cracks in Piping and Piping Welds Program is to verify andimprove engineering analyses to predict the fracture behavior of circumferentially crackedpipe under quasi-static loading with particular attention to crack lengths typically used in.LBB or flaw evaluation criteria. Specific efforts focus on clarification of technical issues thatevolved during the Degraded Piping Program - Phase II.
The program consists of 7 technical tasks. The tasks and whether they were active to date ornot are listed below.
Task 1Task 2Task 3Task 4Task STask 6Task 7
Short through-wall-cracked (T`WC) pipe, Evaluations ,Short surface-cracked (SC) pipe evaluationsBi-metallic weld crack evaluationsDynamic strain aging and crack instabilitiesFracture evaluations of anisotropic pipe -Crack-opening-area evaluationsNRCPIPE Code improvements
(Active)(Active)
(Inactive)(Active)(Active)(Active)(Active)
2.0 SUMMARYOFRESEARCHfPROGRESS
Technical efforts in the NRC's Short Cracks in Piping and Piping Welds research programstarted in May of 1990. Because of the number of activities in the program, not all of themcan be summarized in'this paper. Further details of the program efforts are given in Refs. 1and 2. The full-scale pipe experimental efforts involve conducting large-diameter-pipe - ,fracture experiments at LWR conditions. -These data will then be used to validate and/Prdevelop improved analysis procedures for'leak-before-break or in-service flaw inspectioncriteria such as the ASME Section XI Article IWB-3640 and 3650 criteria. Table 1 gives a listof the pipe experiments to be conducted.
, . j , . -. 4, . v!
. __ , �J_
I . , , . . . . - I� I I I . I I . . 1 � , i . I
: - q I -
73
Task I - Short Throuh-Mall-Cracked (fac) P.pe Evaluations
There are five subtasks'in this'task. These are:
Subtask 1.1 Material characterization of pipes to be testedSubtask 1.2 Facility modifications for large diameter pipe experimentsSubtask 13 Conduct large diameter pipe experimentsSubtask 1.4 Analysis modification and verificationsSubtask 1.5 Topical report."
Of these subtasks, the major progress was in Subtask 13 and 1.4. In Subtask 13, three pipefracture experiments have been completed. These results are summarized below.
Progress from Subtask L3 - Conduct Ldre Diameter Pipe Experinents
Two 28-inch diameter TWC pipe experiments were conducted with the specific objective toevaluate the effects of a short TWC on the analytical predictions. A third experiment wasconducted on a French stainless steel pipe, with the specific objective to replicate anElectricitd de France (EDF) pipe test to evaluate reproducibility of the Battelle and EDFsystems.
2&-nch Dfameter Pip. ERwerlfnenti. The first pipe fracture experiment was on a 28-inchdiameter Schedule 60 A516 Grade 70 steam-line pipe. The second test (Experiment1.1.1.23), was on a 28-inch diameter Schedule 80 TP304 stainless steel pipe with a crack in thecenter of a submerged-arc weld (SAW). Similar experiments were conducted in theDegraded Piping Program with 37-percent circumferential cracks, Ref. 3.
The initial through-wall-crack length in these experiments were 6.25 percent of the'circumference, typical of an LBB size through-wall crack in large diameter pipe. Figures 1and 2 show the experimental record of the total load versus average load-line displacementfor the two experiments.
For Experiment 1.1.1.21, the A516 Grade 70 pipe, there were approximately 22 relativelysmall crack instabilities which are evident by the load drops in the load-displacement curve,see Figure 1. The lengths of the crack jumps in this experiment are similar to those evident inthe past Degraded Piping Program experiment on the same pipe.
For Experiment 1.1.1.23, the TP304 stainless steel pipe with a IWC in the center of an SAW,the crack initiated earlier on one side than on the other, and grew in the center of the weld,!on that side. On the other side, the crack initiated later and the crack quickly turned. into, thebase metal. The crack growth on the base metal side was approximatel half of that evidenton the weld metal side.
4-Inch Diameter French Pipe ERxeriment. This experiment was conducted out of concerns fromthe IPIRG Program, Ref. 4. In that program, finite element analyses were conducted on twoTWC stainless steel pipe experiments. One experiment was conducted at Battelle with acircumferential through-wall crack in a TP304 stainless steel pipe at 288 C without internalpressure. The other experiment was conducted at Electricitd de France (EDF), also with a
74
circumferential through-wall crack in a TP316 stainless steel pipe at 20 C without internalpressure.
The FEM analysis of the Battelle test by two round-robin participants underpredicted theexperimental maximum load by 27 percent, see Figure 3. Conversely, the FEM analysis ofthe EDF test by four round-robin participants agreed well with the experimental'data, 'see'Figure 4. Differences of up to 30 percent in past FEM analyses of through-wall-crackedstainless steel pipe experimental loads has been observed in the past, Refs. 5 and 6.Conversely Ref. 7 showed excellent agreement between FEM results and experimental loadsfor an entirely different stainless steel TWC test. Clearly either the experimental data or theanalyses needed to be checked further. The first step was to conduct this experiment tocheck the Battelle and EDF experimental systems.
EDF sent a piece of pipe that was part of the moment arm from their Experiment Number24. The pipe for Experiment 24 had a 90 degree through-wall crack. At Battelle, the EDFpipe was machined with the same initial flaw size and theflWvelded to other pipe of similarsize for the moment arms. The test pipe was then tested in' four-point bending. The results"showed that the maximum loads were only 3.6 percent different, which is within the ±5 -'
percent variation typically seen in replicate experiments at Battelle. Hence, the experimentaltest systems at EDF and Battelle give good agreement.
Since the two test systems agreed with each other, there appears to be no significantexperimental error that would account for the FEM dikcepancies. The discrepancy in theFEM results must be due to differences in the behavior of the different stainless steels. Oneobserved difference was that the EDF stainless steel had aisignificant amount of anisotropyin that the fracture surface of the round-bar tensile specimen had an elliptical shape with a 2to 1 ratio of the major to minor axis. Further work on constitutive modeling of stainlesssteels appears to be needed. - '
Promress from Subtask .4 -Analsis Modiflcaiion and Verificaons
Analyses efforts are underway in several activities. One is to assess current analyses methodsusing the newly developed short TWC data. Another is to pursue improvements in TWCanalyses.
Assessment of Current TWCAnaises Methods. The maximum load predictions using currentcalculational methods were made for the short crack experiments, as well as the companionlong crack experiments in the Degraded Piping Program. The calculations were made forvarious crack lengths for all the analyses. Figures 5 and 6 show the various predictedmaximum moments from the various TWC analyses to the data from the experiments in thisprogram and the companion experiments from the Degraded Piping Program.
Improvements to TWCAnalses. Two main efforts that have'been undertaken to improve TWCpipe J-estimation scheme analyses involve improvements in the GE/EPRI functions for shortcrack lengths, and modifications to the LBB.ENG analyses to include the effect of weldmetal strength along with the base metal strength in the J-estimation scheme analysis.
Improvements in the GEIEPPJ functions forshort TWCs. A matrix of FEM analyses wasconducted with the purpose of refining the GE/EPRI fuhdions for elastic and fully plasticloading. These calculations were made using ABAQUS 20 noded isoparametric brick
75
elements. In the GE/EPRI analysis for through-wall-cracked pipe in bending, thedisplacement functions for short crack lengths were negative, Ref. 8. This is impossible,which indicates some errors existed in the development of the functions from the finiteelement analyses.
The elastic functions F, V1, and V3 were calculated as well as: the fully plastic functions hl, h2,and h4. The largest disagreements were for the elastic and plastic rotation functions V3 andh4,respectively, The Battelle/ABAQUS elastic rotation function (V3)was a positive valuewhereas the GE/EPRI value was negative, see Tables 2 and 3; and the Battelle/ABAQUSplastic rotation function (h4) was typically 5 to 10 times larger than the GE/EPRI value.These rotation relations are used in the LBB.GE J-estimation scheme, Ref. 9.
Interestingly, the h1 function which relates load to the applied J was 8 to 20 percent lower inthe Battelle/ABAQUS calculations than the GE/EPRI solutions for both the tension andbending solutions. This is consistent with the comparisons with the experimental results inRef. 3 where the GE/EPRI handbook solutions typically overestimated the crack drivingforce and gave the most conservative load predictions which were approximately 15 percenton the average below the experimental loads.
Improvements to LBB.ENG analysis to account for weld metal strenoh Typically flaws inwelds are assessed by using the weld metal J-R curve and the base metal stress-strain curve.Several FEM analyses have shown this to be reasonable. However, data from the DegradedPiping Program on two sets of as-welded and solution-annealed pipe experiments withidentical cracks suggest that the weld metal strength can affect the predictions by more than15 percent, see Ref. 6. Consequently, an effort was undertaken to modify an estimationscheme to account for weld metal strength differences.
The LBB.ENG analysis lends itself to inclusion of the weld metal strength properties.However, a series of finite element analyses were needed to calibrate the model. This wasdone since there was a disposable parameter called - which required FEM calibration, seefurther details in Ref. 2. The FEM analyses were conducted for different pipe R/t ratios anddifferent ratios of the base and weld metal strain-hardening exponent. Figure 7 shows a,typical result for base and stainless steel submerged-arc weld metal properties. These resultsshow that the - value of 4 is a good selection. Further calculations are needed to assess theeffect of varying the reference stress (or yield strength) as well as the strain-hardeningexponent.
Task 2 - Short Surface- Cracked (SC) Pipe Evaluations
This task has been divided into five subtasks. These are:
Subtask 2.1 Material characterization of pipes to be testedSubtask 2.2 Conduct small diameter pipe experiments-Subtask 23 Conduct large diameter pipe experiments .Subtask 2A Analysis modification and verifications*aSubtask 23 Topical report.
Of these subtasks, the material characterization efforts have started. The stainless steel welddata has been determined. However, the weld procedure for a low toughness carbon-
76
manganese-molybdenum SAW used in a PWR is;still being pursued. The two small-diameter pipe experiments have been conducted, and the two large diameter pipeexperiments will be conducted by the end of FY91.
For the analysis subtask, there are five activities. These are:
Activity 2A.1 Uncracked pipe analysisActivity 2A.2 Improve SC.TNP and SC.TKP analysesActivity 2A3 Compare limit-load analyses to short-surface-cracked small-
diameter pipe dataActivity 2.4A Analyze large diameter SC pipe test dataActivity 2.4.5 Evaluate procedures in J-estimdtion schemes for surface cracks in
welds.
Efforts are underway in several of these activities. The first being to conduct uncracked pipeanalyses. These efforts are'needed for several different reasons. The first is to determine thesmallest size surface crack that'can be tested without buckling the pipe. Details of these.efforts are given in Ref. 2. The second is to assess simple alosed-form buckling solutions thatcould be of potential value to improve limit-load and J-estimation scheme solutions for shortsurface-cracked pipe.
Promess from Subtask 2.2 -Conduct SmalDiameter Piae Experiments
Two 6-inch diameter stainless steel experiments were conducted with short circumferentialsurface cracks in four-point bending at 288 C. The objective of these experiments was todevelop data where the toughness of the material is sufficiently high enough that limit-load,analyses should be appropriate. One of the 6-inch diameter TP304 pipes was a thin wall,Schedule 40, and the other was a heavy-wall pipe, Schedule XXS. The objective of includingthe different thickness pipes was to assess the'effect of Rltiratio on the NSC analysis. Thecrack size was 50 percent of the circumference in length and 66 percent of the wall thicknessin depth. The effect of different crack sizes needs to be evaluated by the data in this programand other data in the literature.
The first problem encountered in conducting these experiments was to determine what wasthe smallest flaw size that could be tested without having the pipe fail by buckling.Uncracked pipe buckling analyses were compared to experimental data, see Ref. 2. Theaccuracy of those analyses were not as good as desired and empirical corrections were -'
needed for more accurate predictions. The flaw size selected was the one that would be themost marginal for the worst case experiment. The worst case experiment was the 6-inchdiameter Schedule 40 pipe experiment. The flaw size selected to be used in all the shortsurface-crack experiments was 25 percent of the circumference and 50 percent of thethickness.
Figure 8 shows the load-displacement record of the thin-wall pipe experiment (1.2.1.22). Inthis experiment, buckling started prior to crack initiation and breakthrough of the surfacecrack. This behavior of buckling followed by fracture was! not thought to be possible,'since 'itwas believed that if a buckle started, the deformation energy would be going towards formingthe buckle and not driving the crack. However, during the' buckling while the load wasdropping, the crack was still locally being loaded. The buckle formed at a girth weld about
77
one pipe diameter from the crack. The girth weld was necessary for installing the internalinstrumentation.
The heavy-wall pipe experiment (1.2.1.21) load-displacement data are shown in Figure 9.Here the pipe did not buckle and crack initiation occurred at maximum load..
Pro-ress from Subtask 2.4 - Compare iUnit-Load Analses toShort Surface-Cracked Smal-Diameter Pipe Data
The initial analysis of these experiments involved comparison of the experimental results tothe Net-Section-Collapse predicted loads, with the objective of assessing the accuracy of thisanalysis for pipe with short circumferential surface cracks. In addition to the twoexperiments from this program, there were two experiments from an older EPRI/BattelleProgram, Ref. 10, considered.
The experimental moment was normalized by the predicted Net-Section-Collapse momentsin Figure 10. For the thin-walled pipe experiment (1.2.1.22), the maximum load used was thebuckling load, not the load at crack initiation or breakthrough. The upper bound line comesfrom the Degraded Piping Program data with larger cracks, i.e., d/t = 0.66 and 2c/nD = 0.5.All the short crack experiments had lower normalized failure stresses than the DegradedPiping Program empirical fit for larger surface cracks. This may be a reflection of the factthat the pipe samples for the short crack experiments flattened (i.e., ovalized) more due tothe higher applied loads. The trend of the data with R/t ratio does not appear to be as clear.An additional experiment on 16-inch diameter TP304 pipe with a larger R/t ratio is to beconducted. That experiment should shed some light on the trend with R/t ratio for shortcracks.
Task 3 - Bi-Metallic Weld Crack Evaluations
The objective of this task is to conduct experiments and develop the necessary analyticalengineering estimation schemes to assess the behavior of through-wall and surface cracks inbimetallic welded pipe under combined bending and tension.
In nuclear piping systems, there are several bimetallic welds. Some examples are: weldsfrom Westinghouse cast stainless steel hot and cold legs to the reactor pressure vessel andsteam generators, CE and B&W ferritic piping to cast stainless steel pump housings, as wellas at many nozzle locations. For BWR's, the stainless steel piping welds to the reactorpressure vessels are also bimetallic. Such welds are difficult to fabricate and inspect.Consequently, a more thorough evaluation of the fracture behavior of such welds iswarranted. These efforts will be initiated in FY92.
Task 4 - Dynamic Strain AGrn and Crack Instabilities
The objective of this task is to predict the effects of crack instabilities, believed to be due todynamic strain aging, on the fracture behavior of ferritic pipe., Specific objectives are to,establish a simple screening criterion to predict which ferritic steels may be susceptible tounstable crack jumps, and to evaluate the ability of current J-based analysis methodologies toassess the effect of unstable crack jumps on the fracture behavior of ferritic steel pipe. If
78
necessary, alternative procedures for predicting pipe behavior in the presence of crack jumpswill be derived.
The methodology developed here will be applicable to both LBB and in-service flawevaluations. It will also be valuable for selection of materials for future inherently safereactor designs.
There are four subtasks and two optional subtasks in this task. These are:
Subt
Subt
Subt
Subt
ask 4.1 Establish a screening criterion to predict unstable crack jumps inferritic steels
ask 4.2 Evaluate procedures for characterizing fracture resistance duringcrack jumps in laboratory specimens
ask 43 Assess current procedures for predicting crack jump magnitude inpipes
task 4.4 Prepare interim and topical report on dynamic strain aging inducedcrack instabilities in ferritic nuclear piping steels at LWRtemperatures
ask 45 Refine procedures for characterizing fracture resistance duringcrack jumps in laboratory specimens (Optional)
ask 4.6 Refine procedures for predicting crack jump magnitude in pipes(Optional)
Subt
Subt
The approach in Task 4 is based on experimental data obtained in the Degraded PipingProgram, Ref. 3. In several pipe steels tested at 288 C, crack instabilities were observed bothin laboratory and pipe specimens, interspersed between periods of stable, ductile tearing.These instabilities have been assumed to be related to a steel's susceptibility to DSA, Ref. 11.However, no firm proof of that tie-in presently exists.
The significance of crack instabilities in flawed-pipe safety analyses has already beendemonstrated in at least one 288 C pipe test conducted at David Taylor Research Center.During that experiment a crack jump of approximately one-fourth of the pipe circumferencewas observed for a through-wall circumferential crack. Therefore, it is important todetermine how to predict the occurrence and magnitude of crack instabilities.
Proress from Subtask 41- Establish a Screenlng Crteron toPredict Unstable Crack Jumps in Ferritic Steels
The first step was to assess if a simple screening criterion'can be developed to assess if a steelis susceptible to dynamic strain aging. Five different ferritic pipes from the Degraded PipingProgram were selected for this study. These pipes were known to have relatively differentamounts of dynamic strain aging susceptibility, i.e., they exhibited either large, small, or nounstable crack jumps in laboratory or pipe tests at 288 C.
Dynamic strain aging occurs when the strength at elevated temperatures is higher than thestrength at room temperature. It follows that since hardness can be related to the materialstrength, that the dynamic strain aging sensitivity can be related to the hardness at room andelevated temperatures.
79
Figure 11 shows the yield, ultimate, and hardness data as a function of temperature for thefive different steels. There is a peak in the ultimate strength curve in all but Pipe F11, whichwas thought to be a ferritic steel pipe with little to no dynamic strain aging sensitivity. Forthe steels with peaks in the ultimate strength curves, there is'also peak in the hardness curve,but at a temperature approximately 100 C higher than the quasi-static ultimate strength peak.This difference in the peak temperatures may be due to the fact that dynamic strain aging isalso strain rate sensitive, and the hardness tests are faster than the tensile tests. Typically, aBrinell hardness test loads the material for 6 seconds.
Some other interesting features'from the graphs in Figure 11 are:
* - The peak temperature is the highest for the 16-inch diameter submerged arcweld. In the IPIRG Program, this weld actually showed an increase in toughnessat seismic rates compared to quasi-static rates, Ref. 4, whereas all the ferriticbase metals showed a decrease in strength and toughness at seismic rates.
* Pipe F30 showed two distinctly different hardness versus temperature curvesfromn samples taken relatively close to each other. 'In the IPIRG Program, thispipe showed' considerable variability in dynamic monotonic pipe fractureexperiments at 288 C, Ref. 12.
In summary, the ratio of high temperature hardness data to room temperature hardness dataappears to be a reasonable relation to determine if a material is susceptible to dynamic strainaging. In the future, the magnitude of the hardness ratios will be related to the propensity forunstable crack jumps.
Task 5 - Fracture Evauations ofAnlsotropDl Pipe
The objective of this subiask is to assess if anisotropic fracture properties (where thetoughness is typically lower in the helical or axial direction than in th6 circumferentialdirection for ferritic seamless pipe) together with having high principal'stresses in a helicaldirection can cause a lower failure stress than calculated using the toughness in thecircumferential (L-C) orientation and using only the longitudinal stresses.
The rationale for this task is to assess if current LBB and ASME'flaw evaluation proceduresmay have lower margins for out-of-plane crack growth under certain service loading'.conditions. If current procedures are found to have significantly lower margins,modifications to existing fracture analysis method will be made. Five subtasks will beconducted in this task, two of which are optional.
Subtask 5.1 Assess effect of toughness anisotropy on pipe fracture undercombined loads
Subtask 5.2 Determine magnitude of toughness anisotropy and establish ascreening criterion to predict out-of-plane crack growth
Subtask 53 Prepare interim and topical reports on anisotropy and mixed-modestudies
Subtask 5.4 Establish ductile crack growth resistance under mixed-modeloading (Optional)
Subtask 5.5 Refine J-estimation scheme analyses for pipes (Optional)
80
Of these subtasks, work has started in Subtask 5.1 only. The general objective of this subtaskis to conduct a parametric analysis to determine if there is significant nonconservatism incurrent LBB fracture analyses for service loading conditions of circumferentially through-wall cracked pipe with anisotropic fracture toughness. Subtask 5.1 involves six activities.
Activity 5.1.1 Determine driving force for angled stationary crackActivity 5.1.2 Conduct tensile tests at differentorientations, and additional
skewed orientation C(T) specimens on a 4-inch diameter pipe toassess strength and toughness variations
Activity 5.13 Determine driving force for angled growing crackActivity 5.1.4 Determine angled crack principal stressesActivity 5.1.5 Formulate approximate correctionsActivity 5.1.6 Assess if optional efforts are necessary
Of these activities, significant progress has'been made in' Activity 5.1.2.
Progmssfnom Aeyvit 51.2 on Effect of Orientation onStrenjth and Toughness
In Activity 5.1.2, efforts to date involved testing tensile and C(T) specimens in variousorientations. Initial work on the effect of specimen orientation in carbon steel pipes camefrom efforts in Ref. 13 where C(T) specimens were taken at different angles to the pipe axis.This was done on a 4-inch diameter pipe (Battelle Pipe number F11). The toughness wasfound to be lower in a helical direction, which'corresponded to the alignment direction of theinclusions in the pipe.
In this effort we examined five different pipes used in the l&graded Piping Program pipeexperiments where the crack grew in a helical direction. Four of these were seamless and theother was seam welded. The seam welded pipe obviously should have the low toughnessdirection and inclusions aligned in the axial direction of thq pipe. However, in theexperiment the crack grew at a 30 degree angle with respect to the circumferential plane.Furthermore, the results of the metallurgical analysis showed that all but one of the pipes hadthe inclusions oriented in the axial direction of the'pipe. Only the 4 inch seamless pipe fromthe prior Degraded Piping Program investigation had helical orientations.
Charpy V-notch tests were also conducted at various orientations to the pipe axis. The uppershelf energy versus orientation is shown in Figure 12. The smallest ratio of the transverse tolongitudinal upper shelf Charpy energy was 0.29. Further tests and analyses will beconducted next year.
Task 6 - Crack-Open mR-Area I s
The objective of this subtask is to make improvements in the crack-opening area predictionsfor circumferentially cracked pipe, with particular attention to cracks in welds. The crack-opening-area analyses will be incorporated into the NRCPIPE code, and then into theSQUIRT code.
From past efforts in the Degraded Piping Program, and ASME Section XI round-robinefforts, it has been found that the leakage area predictions are reasonably good for
81
circumferential through-wall-cracked pipe in bending (with the cracks in the base metal).For the case of a crack in the center of the weld, the predictions showed more scatter in theintermediate to higher bending load levels. For the case of a crack in the base metal, butwith the pipe in combined bending and tension, the scatter in the results was significantlyworse. If the crack had been in a weld under combined loading, the scatter probably wouldhave increased further. The accuracy of the solutions for a crack in a weld needs verificationand improvement for LBB analyses.
There are five specific subtasks in this task. These are:
Subtask 6.1 Combined loading improvementsSubtask 6.2 Implement short TWC crack opening improvementsSubtask 63 Improve weld crack evaluationsSubtask 6A Modify SQUIRT CodeSubtask 6.5 Prepare topical report on, crack-opening-area improvements.Subtask 6.6 Quantifying leak-rates for updating Reg. Guide 1.45
Of these, progress was made in Subtasks 6.1 and 6.6.
Progress firm Subtask 61- Combined Load Imrovernents
As part of the IPIRG Program, Ref. 4, a leak-rate code called SQUIRT was created. Thiscode used the GE/EPRI estimation scheme to calculate the crack-opening area. Anothercrack-opening analysis approach is used in the LBB.NRC and the NUREG/CR-3464approaches, Refs. 14 and 15. The crack-opening analyses have generally been checked usingexperiments with pipe in pure bending. The effect of combined loading is first being checkedby making crack-opening analysis improvements in the NRCPIPE Code, prior toincorporating these improvements into the SQUIRT code.
The first effort involved incorporating a crack-opening analysis in the LBB.ENG2 J-estimation scheme analysis. The LBB.ENG2 J-estimation scheme was found to give slightlyconservative, but reasonably accurate maximum load predictions, whereas the GE/EPRIestimation scheme gave the most conservative predictions of alE the analyses, Ref. 3. Effortsin this program show that for up to crack initiation, both the GE/EPRI and LBB.ENG2analyses gave similar predictions for pipes in pure bending, see Figure 13.
For pure pressure loading of a through-wall circumferentially cracked pipe with end caps, theLBB.ENG2 and GE/EPRr analyses gave good predictions. These comparisons are shown fora 6-inch diameter TP304 stainless steel pipe experiment in Figure 14.
For combined pressure and bending loading, the predictions were not as good. Figure 15shows experimental and predicted load versus center-crack-opening displacements from a 6-inch diameter TP304 stainless steel pressure and bend pipe experiment from the DegradedPiping Program. Figure 16 is a similar comparison for a 10-inch diameter A333 Grade 6carbon steel pipe experiment under pressure alnd bending. Note that: (1) the variousmethods are not in agreement with each other nor with the experimental data, (2) the :LBB.NRC method consistently underpredicts the crack opening, whereas, the LBB.ENG2and LBB.GE analyses underpredict the crack opening in one experiment and overpredict thecrack opening. in the other experiment, and (3) the GE/EPRI solution is not given since thereis only very limited combined load GE/EPRI solutions. (Under pure linear elastic
8n
conditions, the GEIEPRI tension and bending displacements could be added to getcombined load center-crack-opening displacements.)
Further efforts are also underway to evaluate the effect of weld metal strength on the crack-opening displacement using the LBBENG2 analysis method.
ProRMssfom Subtsk 6.6- OuantIfng Leak-Rates forUndatin .Re Guide L45
The objective of this effort is to perform analyses to support changes to the NRC's currentRegulatory Guide 1.45, "Reactor Coolant Pressure Boundary Leakage Detection Systems".Regulatory Guide 1.45 was published in May, 1973, and is considered outdated. The NRCcurrently wants to update this procedure taking into account the current leak-detectioninstrumentation capabilities, experience from the accuracy of leak detection systems in thepast, and current analysis methods to assess the significance of the detectable leakage relativeto the structural integrity of the plant. Leak-detection capabilities at normal operatingconditions are used in current leak-before-break (LBB) analyses. The consistency of theLBB procedures needs to be considered in any changes to Regulatory Guide 1.45.Additionally, the impact of such changes on structural integrity of piping not approved forLBB needs to be considered.
The analyses to be performed shall build on other work being done in Task 6. The specificwork to be performed shall include the following activities.
Activity 6.6.1 Develop the technical background information for verification ofanalyses to be used
Activity 6.6.2 Evaluate the proposed changes in leak detection requirements interms of the potential impact on LBB analyses
Activity 6.6.3 Evaluation of the proposed changes on leak rate for "non-LBB"piping systems
Activity 6.6A Coordination with NRC-RES and NRC-NRR staffActivity 6.6.5 NUREG report
The progress in this subtask to date involves evaluation of the effect of induced bendingrestraint for axial tension loads for circumferentially cracked pipe, as part of Activity 6.6.1.Current analyses assume that for axial stresses (generally pressure induced), the pipe is freeto rotate. The restraint of the rotation increases the failure stresses (Ref. 17), but candecrease the crack opening at a given load. If the pipe system restrains the bending(i.e., from cracks being close to a nozzle or restraint from the rest of the piping system) thenthe leak rate will be less than calculated by using analyses that assume that the pipe is free torotate. This will cause the actual crack to be larger than calculated by the current analysesmethods for the same leak rate. Since normal operating stresses have a large component ofthe total stress being the pressure stress, this can have an effect on LBB analyses.
As a numerical example, consider a TWC pipe with mean radius Rm = 355.6 mm, thicknesst = 35.56 mm, Rm/t = 10, and two distinct cases of initial crack angle (26), i.e., O/ir = 1/8and O6/ = 1/4. For material properties, it is assumed that the modulus of elasticity E = 200GPa and the Poisson's ratio v = 0.3. The pipe is subjected to remote pressure with theresultant force applied at the centroid of uncracked pipe cross-section. Linear elastic
83
analyses by finite element method (FEM) are performed to examine the effects of restraintdue to induced bending in a piping system when the pressure load is applied.
Figure 17 presents the results of crack opening displacements (COD) as a function of"restraint length" normalized with respect to the mean pipe diameter Dm(Dm = 2Rm).Therestraint length defined here simply represents the location of restrained pipe cross-sectionfrom the cracked plane. The COD values are also normalized with reference to the crack-opening displacement when there are no external constraints present in the pipe (i.e., whenthe restraint length becomes infinity) allowing free rotation and ovalization.
The results suggest that when the crack angle is "small" (8/n = 1/8), the restraint effects maybe neglected. However, for larger crack angles (O/e = 1/4), the restrained COD can besignificantly different than the unrestrained COD, and hence, will affect the margins in thecrack opening area analysis for leak rate quantification. It is interesting to note that asignificant input parameter like the "restraint length" is not considered in either the currentversions of the thermohydraulic codes SQUIRT, PICEP (Ref. 18), or in any other leak-rateanalyses.
Task 7 - NRCPIPE Code Improvement,
The main objective of this task is to incorporate the analysis improvements from Tasks 1, 2,and 6 into the NRCPIPE code. A secondary objective is to make the NRCPIPE code moreefficient and also to restructure the code to allow for ease of implementation of the activitiesdescribed below.
In the Degraded Piping Program, the computer code NRCPIPE was developed forcircumferential through-wall-cracked pipe fracture analyses. Numerous J-estimationschemes were developed or modified. The improvements made in this program need to beincorporated into this code to take advantage of the technology developments, as well as tofacilitate the comparisons with the experimental results. To accomplish the objectives of thistask, there are four subtasks to be undertaken.
Subtask 7.1 Improve efficiency of current versionSubtask 7.2 Incorporate TWC improvements in NRCPIPESubtask 73 Make SC version of NRCPIPESubtask 7.4 Provide new user's manual
The crack-opening-area analysis improvements will also be incorporated into the SQUIRTcode in Subtask 6.4.
84
3.0 CONCLUSIONS.-
From the work conducted to date, several conclusions can be drawn.
(1) The replicate TWC pipe test showed good agreement between the Battelle and EDFfacilities. This eliminated experimental error as a reason for FEM analysis significantlyunderpredicting the experimental loads from several TWC stainless steel pipeexperiments. Further efforts are perhaps needed in examining constitutive modelingof the different stainless steels tested in the past pipe fracture experiments.
(2) The Battelle/ABAQUS reassessment of the GE/EPRI elastic and fully plastic F, V, andh functions showed: (a) good agreement with the F-function, (b) developed improvedrotation functions (V3 and h4) that were not negative values for short crack lengths,and (c) the h1 function most frequently used to relate J to moment or load was foundto be 8 to 20 percent lower than the GE/EPRI values. The lower hlvalues areconsistent with past experimental comparisons that showed that on the average theGE/EPRI predicted loads were 15 percent below the experimental loads.
(3) Short circumferential surface-cracked pipe in bending has lower failure stress thanpredicted by the Net-Section-Collapse analysis, but. the data to date does not show aclear trend with R/t ratio.
(4) A comparison of high temperature and room temperature hardness testing appears tobe a useful method for determining the dynamic strain aging sensitivity of ferriticsteels.
(5) Most ferritic seamless pipe had inclusions oriented in the axial direction, which is thelow toughness direction. Hence, helical crack growth is due to the ratio of the crackgrowth resistance to crack driving force being a minimum at a particular angle, even ifthe lowest toughness is not at that angle.
(6) Crack-opening area analyses were found to be accurate for pure bending or puretension. Comparison of combined tension and bending experimental results andanalyses showed significantly lower accuracy in the analyses.
..
(7) For the effect of tension (pressure) loading on circumferential through-wall-crackedpipe, currently all leak-rate analyses assume the pipe is free to rotate as if the pipe wasan endcapped piece of straight pipe. Linear elastic analyses conducted showed that ifthe crack is in a piping system, a fixed end (i.e, a nozzle) can restrain the crackopening. This effect was found to be more significant as the crack length increased,and as it was closer to the fixed end.
4.0.; - ~4.0 REFERENCES-i
(1) Wilkowski, G. M. and others, "Short Cracks in Piping and Piping Welds - FirstProgram Report, March-September 1990", NUREG/CR-4599, Vol. 1, No. 1, May 1991.
(2) Wilkowski, G. M. and others, "Short Cracks in Piping and Piping Welds - SecondProgram Report, October 1990 to March 1991", NUREG/CR-4599 Vol 1, No. 2,October 1991.
85
(3) Wilkowski, G. M. and others, "Degraded Piping Program -Phase II", Summary ofTechnical Results and Their Significance to Leak-Before-Break and In-Service FlawAcceptance Criteria, March 1984-January 1989, by Battelle Columbus Division,NUREG/CR-4082, Vol. 8, March 1989.
(4) Schmidt, R. A., Wilkowski, G. M., and Mayfield, M. E., "The International PipingIntegrity Research Group (IPIRG) Program - An Overview", SMiRT-11, Division G,Paper G23/1, August 1991.
(5) Ahmad, J., Nakagaki, M., Papaspyropoulos, V., and Wilkowski, G., "Elastic-PlasticFinite Element Analysis of Crack Growth in Large Compact Tension andCircumferentially Through-Wall-Cracked Pipe Specimen", NRC Topical Report byBattelle Columbus Division, NUREG/CR-4573, October 1986.
(6) Wilkowski, G. M. and others, "Analysis of Experiments on Stainless Steel Flux Welds",NUREG/CR-4878, April 1987.
(7) Nakagaki, M., Marschall, C., and Brust, F., "Analysis of Cracks in Stainless Steel TIGWelds", Battelle Topical Report from NRC Degraded Piping Program,NUREG/CR-4806, December 1986.
(8) Kumar, V. and others, "Advances in Elastic-Plastic Fracture Analysis", EPRI FinalReport NP-3607, August 1984.
(9) Brust, F. W., "Approximate Methods for Fracture Analyses of Through-Wall CrackedPipes", NRC Topical Report by Battelle Columbus Division, NUREG/CR-4853,February 1987.
(10) Kanninen, M. F. and others, "Instability Predictions for Circumferentially CrackedType 304 Stainless Steel Pipes Under Dynamic Loadings", Final Report on EPRIProject T118-2, by Battelle Columbus Laboratories, EPRI Report Number NP-2347,April 1982.
(11) Marschall, C. W., Landow, M. P., and Wilkowski, G. M., "Effect of Dynamic StrainAging on Fracture Resistance of Carbon Steels Operating at Light-Water-ReactorTemperatures", in ASTM STP 1074,1990, pp. 339-360.
(12) Wilkowski, G. M., Vieth, P., Kramer, G., Marschall, C., and Landow, M., "Results ofSeparate Effects Pipe Fracture Experiments", Post SMiRT-11 Conference SeminarNo. 2, Taiwan, Taipei, August 1991.
(13) Scott, P. and Brust, F., "An Experimental and Analytical Assessment ofCircumferential Through-Wall Cracked Pipes Under Pure Bending", Battelle TopicalReport from NRC Degraded Piping Program, NUREG/CR-4574 September 1986.
(14) Klecker, R. and others, "NRC Leak-Before-Break (LBB.NRC) Analysis Method forCircumferentially Through-Wall-Cracked Pipes Under Axial Plus Bending Loads",NUREG/CR4572, May 1986.
86
(15) Paris, P. C. and Tada, H., "The Application of Fracture Proof Design Methods UsingTearing Instability Theory to Nuclear Piping Postulating Circumferential Through-Wall Cracks", NUREG/CR-3464, September'1983.
(16) Hiser, A. L and Callahan, G. M., "A User's Guide to the NRC's Piping FractureMechanics Database (PIFRAC)", NUREG/CR-4894, May 1987.
(17) Wilkowski, G. M. and others, "Degraded Piping Program - Phase II", SemiannualReport, October 1984-March 1985, by Battelle Columbus Laboratories, NUREG/CR-4082, Vol. 2, July 1985, see Section 2.5. ,
(18) Norris, D., Okamoto, A., Chexal, B., and Griesbach, T., "PICEP: Pipe CrackEvaluation Program", EPRI report NP-3596-SR, August 1984.
: -
87
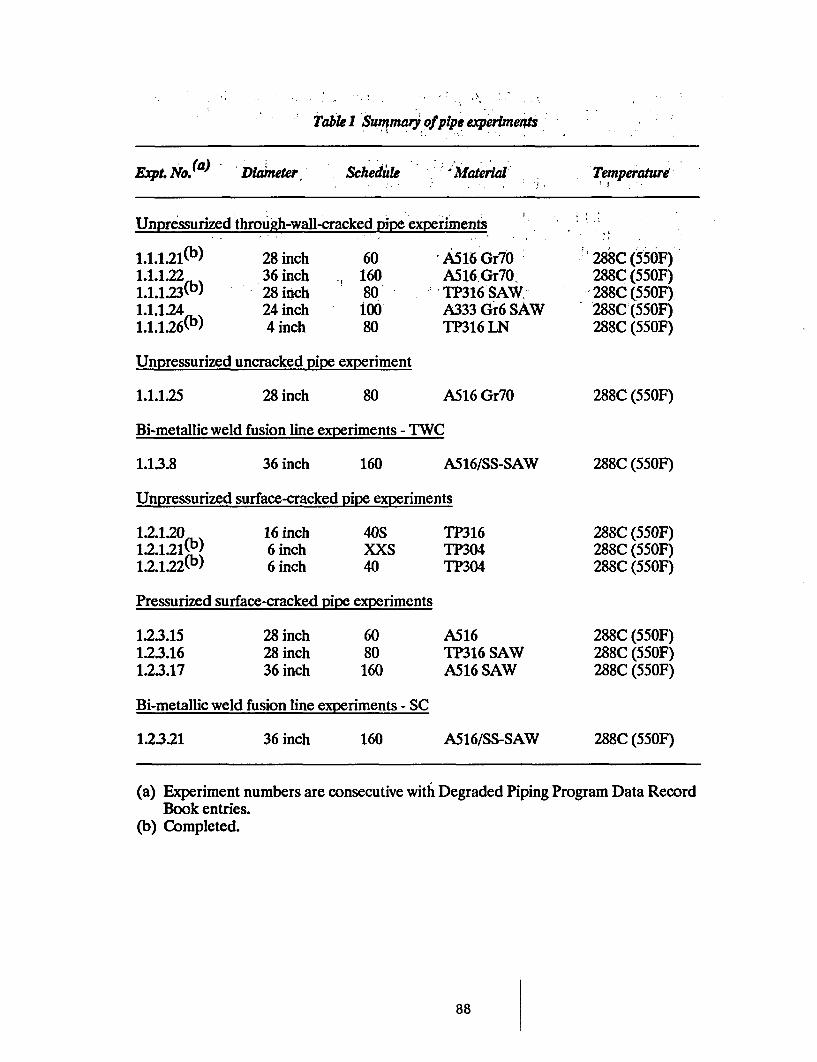
Tablk I Summary ofpipe eperimeots
E.qt. No.(a) Diaineter- Schide u lMaerial Temperatur
Unpressurized through-wall-cracked pipe experiments
1.1.1.21(b) 28 inch 60 A516 Gr7O1.1.1.22 36 inch 160 A516,Gr7O,1.1.1.23(b) 28 inch 80 - TP316 SAW1.1.1.24 24 inch 100 A333 Gr6 SAW1.1.1.26( 4 inch 80 TP316 LN
.
:~288C (550F)288C (550F)288C (550F)288C (55OF)288C (550F)
Unpressurized uncracked pipe experiment
1.1.1.25 28 inch 80 A516 Gr7O 288C (550F)
Bi-metallic weld fusion line experiments - TWC
1.1.3.8 36 inch 160 A516/SS-SAW 288C (550F)
Unpressurized surface-cracked pipe experiments
1.2.1.201.2 .1.2 1(b)1.2 .1.2 2 (b)
16 inch6 inch6 inch
40SXXS40
TP316TP304TP304
288C (550F)288C (550F)288C (550F)
Pressurized surface-cracked pipe experiments
1.2.3.151.2.3.161.2.3.17
28 inch28 inch36 inch
6080160
A516TP316 SAWA516 SAW
288C (550F)288C (550F)288C (550F)
Bi-metallic weld fusion line experiments - SC
1.2.3.21 36 inch 160 A516/SS-SAW 288C (550F)
(a) Experiment numbers are consecutive with Degraded Piping Program Data RecordBook entries.
(b) Completed.
88
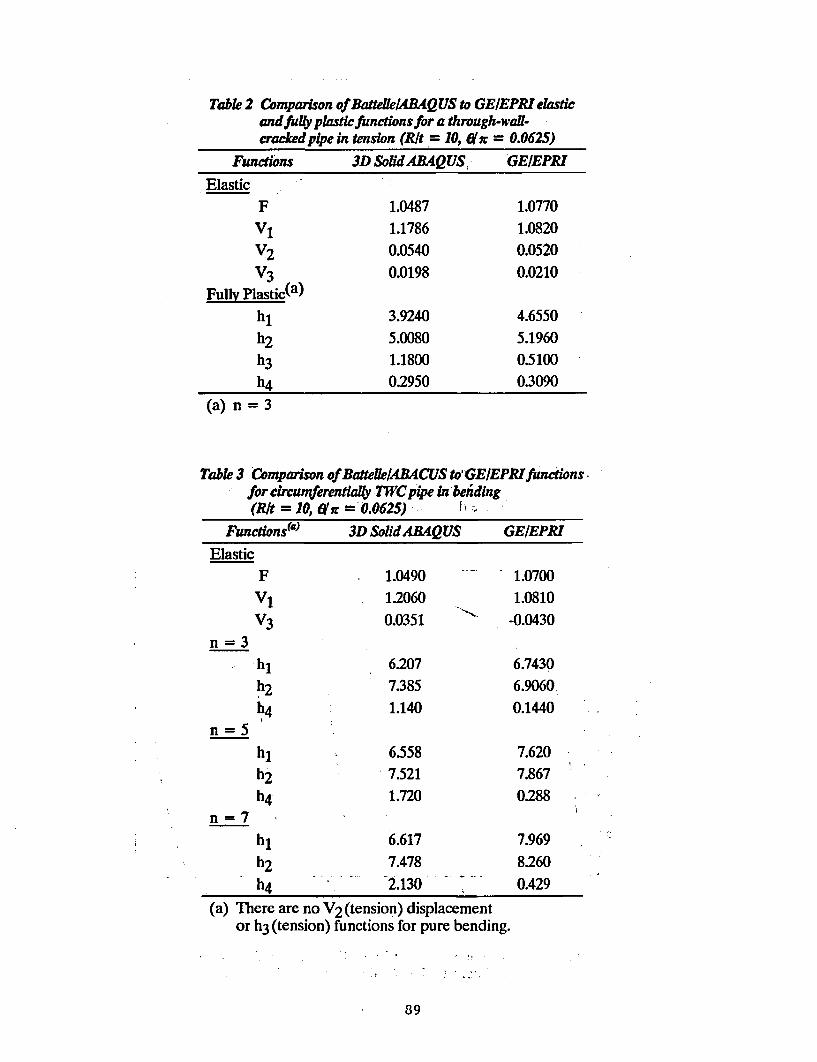
Table 2 Comparison of BatteffelABAQUS to GEIEPRI elasticandfuliy plastic functions for a through-waff-cracked pipe in tension (Rlt = 10, 0/c = 0.0625)
Functions 3D SoldABAQUS, GEIEPRI
ElasticF 1.0487 1.0770V1 1.1786 1.0820
V2 0.0540 0.0520V3 0.0198 0.0210
Fully Plastic(a)hl 3.9240 4.6550
h2 5.0080 5.1960h3 1.1800 0.5100h4 0.2950 0.3090
(a) n = 3
Table 3 Comparison of BattellelABACUS toGE/EPSifunctionsfor circumferentially 7WCpipe inbehding(Rlt = 10, Mr =. 0.0625) -
Functionska) 3D Solid ABAQUS GEIEPRI
ElasticF 1.0490 1.0700V1 1.2060 1.0810
V3 0.0351 * -0.0430
n 3hl 6.207 6.7430h2 7.385 6.9060
h4 1.140 0.1440
n =5h 6.558 7.620
h 7.521 7.867
h4 1.720 0.288n=7
hl 6.617 7.969
h2 7.478 8.260
h4 2.130 0.429
(a) There are no V2 (tension) displacementor h3 (tension) functions for pure bending.
89
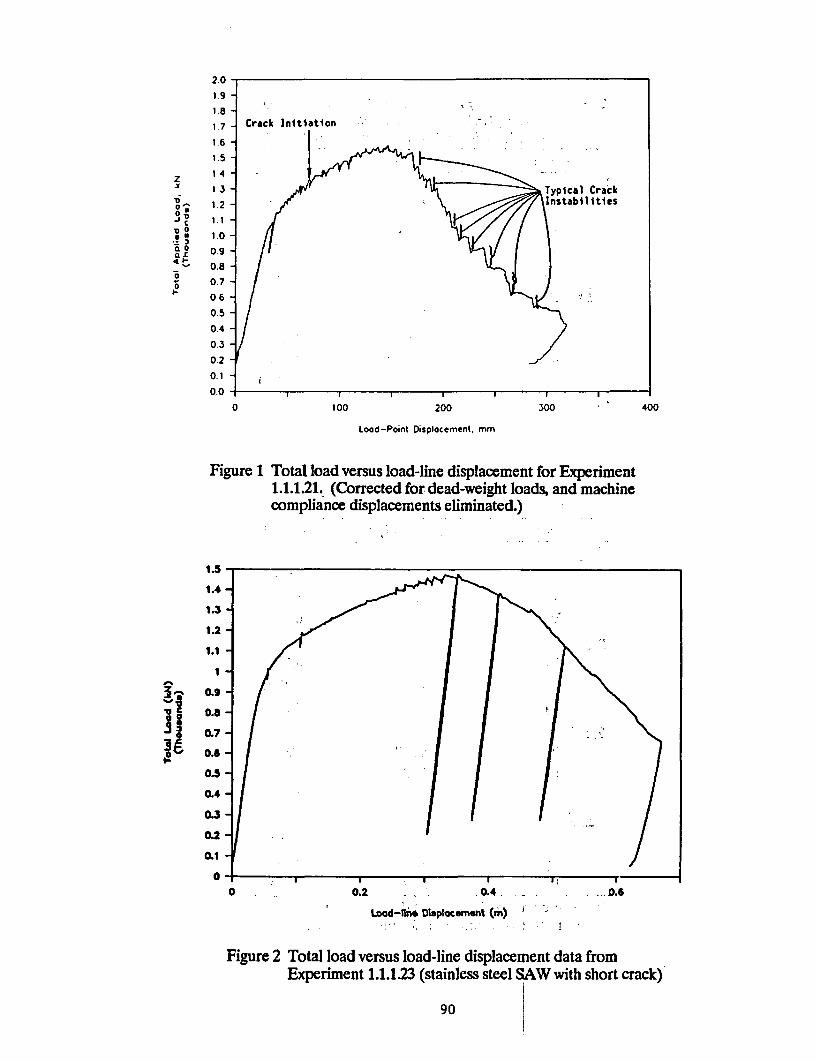
z
0o ,.c
D.0
a 0a,
F
2.0 -1.9 -
1.8 -s1.7 Crack Initiation
1.6
1.5
1 4
lT yical Crack
1.0
0.9
0.8 -
0.7 -
0.6-
0.5
0.4-
0.3
0.2
0.1
0 100 200 300
Load-Point Displacemenl. mm
Figure 1 Total load versus load-line displacement for Experiment1.1.1.21. (Corrected for dead-weight loads, and machinecompliance displacements eliminated.)
1.4-
1.3-
1.2-
1.1
0.9 ,
0.8
0.7-
0.6
0.5
0.4-
0.3-
0.2-
0.1 .I
0*
400
0 0.2 _ .0.4
Laad-niA Diaplacement (m)I... .. I I
_01.6
Figure 2 Total load versus load-line displacement data fromExperiment 1.1.1.23 (stainless steel SAW with short crack)
90
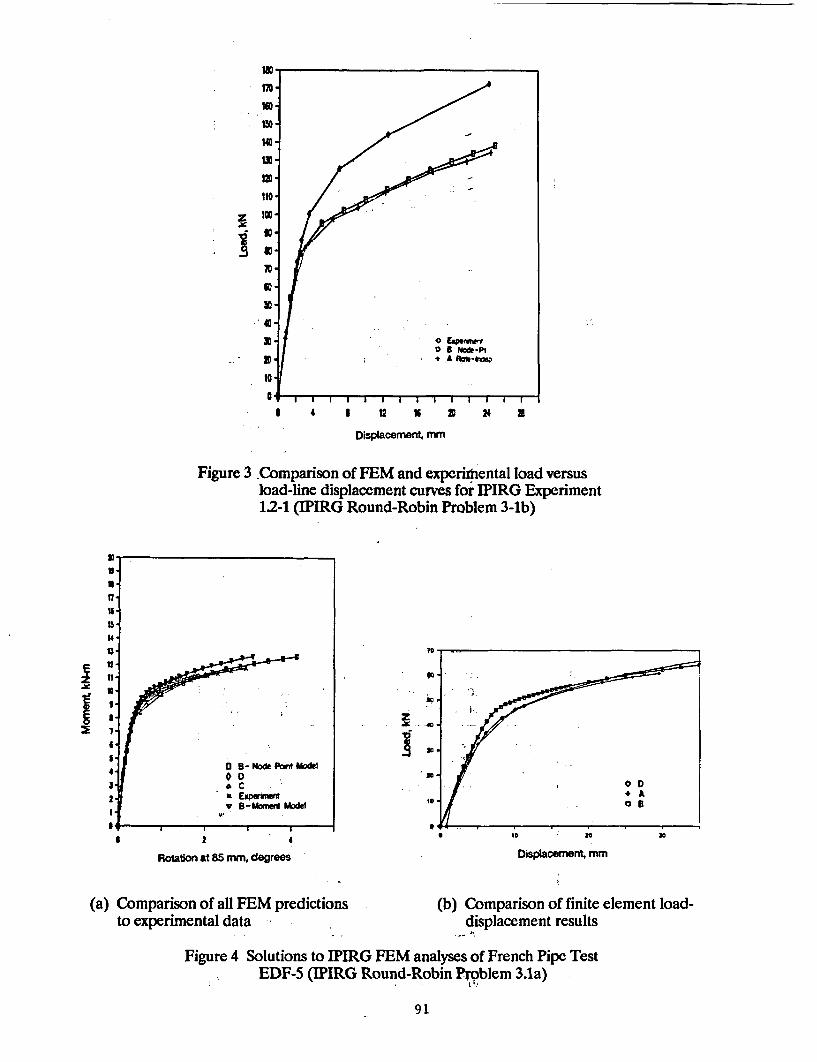
OSa NO&-PI10
I0
6 4 I U lt v 24 a
Displacement, mm
Figure 3 Comparison of FEM and experimental load versusload-line displacement curves for IPIRG Experiment1.2-1 (IPIRG Round-Robin Problem 3-tb)
.
,0II
X0
W0
10
* 2 4
Rolation at 85 mm, degrees
(a) Comparison of all FEM predictionsto experimental data
0 I0 20 30
Dlsplacement, mm
(b) Comparison of finite element load-displacement results
Figure 4 Solutions to IPIRG FEM analyses of French Pipe TestEDF-5 (IPIRG Round-Robin Problem 3.1a)
91
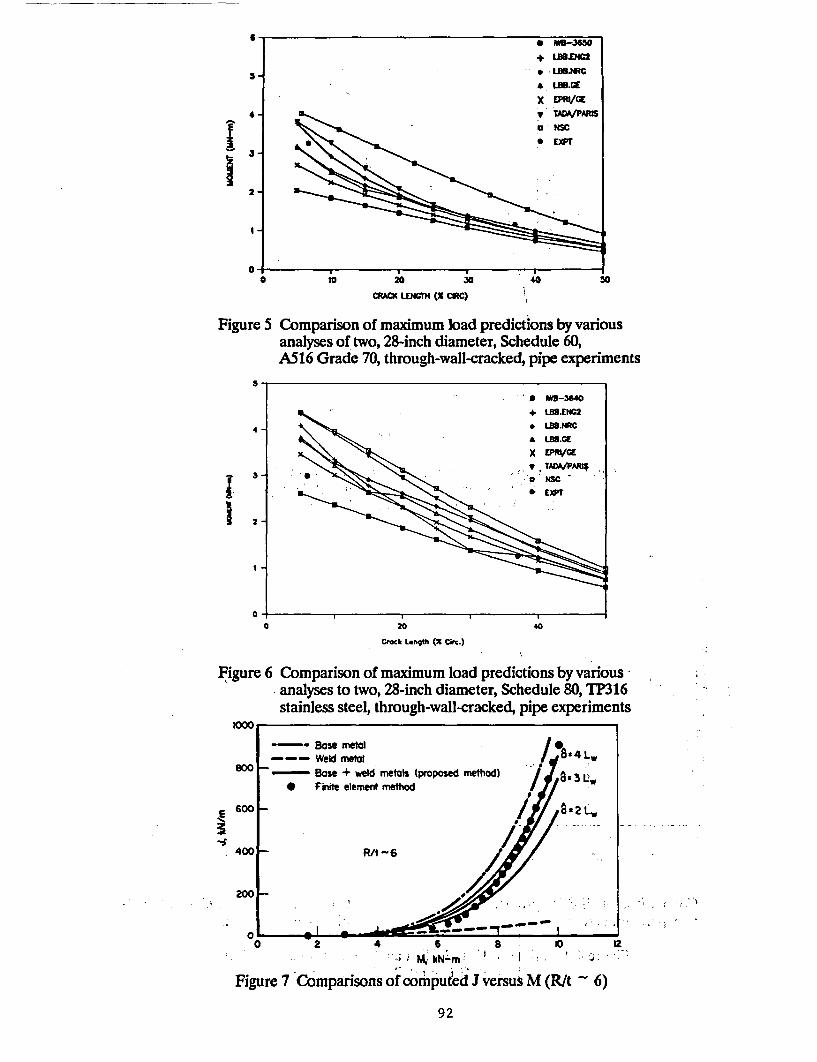
II
20 JO 40
CRY LENGH (Z CRC) i
50
Figure 5 Comparison of maximum load predictions by variousanalyses of two, 28-inch diameter, Schedule 60,A516 Grade 70, through-wall-cracked, pipe experiments
II
3
2
a
0 20 40
Crock Length (% Crc.)
Figure 6 Comparison of maximum load predictions by various -analyses to two, 28-inch diameter, Schedule 80, TP316stainless steel, through-wall-cracked, pipe experiments
,E 600
-.:400
-2--I-� , �. -f -�
- 5
0 2 4 6 8 10' ii M, tkN-m
Figure 7 Comparisons of computed J versus M (R/t - 6)
92
12
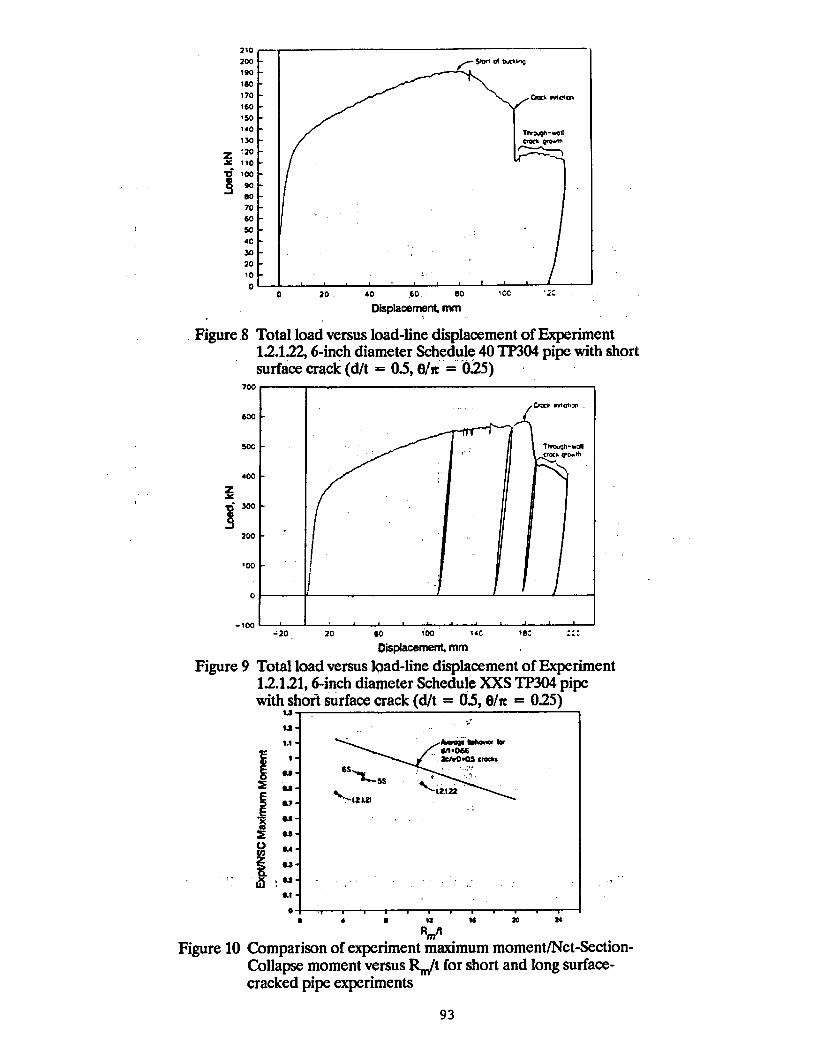
z :..
la 10o
I CC;C7C
60
SC40
3020
1o
C
Figure 8
70(
50(
40(
zi3c
20C
'0c
- lo(
Figure 9
0 20 40 SC0 So 10C
Displaoement mm
Total load versus load-line displacement of Experiment1.2.1.22, 6-inch diameter Schedule 40 TP304 pipe with shortsurface crack (d/t = 0.5, e/c -0.25)
I -20 20 t0 100 14C 1 ,
ODsplacemenM mm
Total load versus load-line displacement of Experiment12.1.21,6-inch diameter Schedule XXS TP304 pipewith short surface crack (d/t = 0.5, e/n = 0.25)
I
I
1.2-
1.1 -
I-
6. -
U-
04 -
Aamep b4.oor kwdA-06620~.0as crocks
es1- f . 2 -:,
%~_Mlz Q122 -
0'O.
Figure 10
, . . . . .I . . . .- -* a 12 is MS 2 24
R0 A
Comparison of experiment maximum moment/Net-Section-Collapse moment versus Rm/t for short and long surface-cracked pipe experiments
93
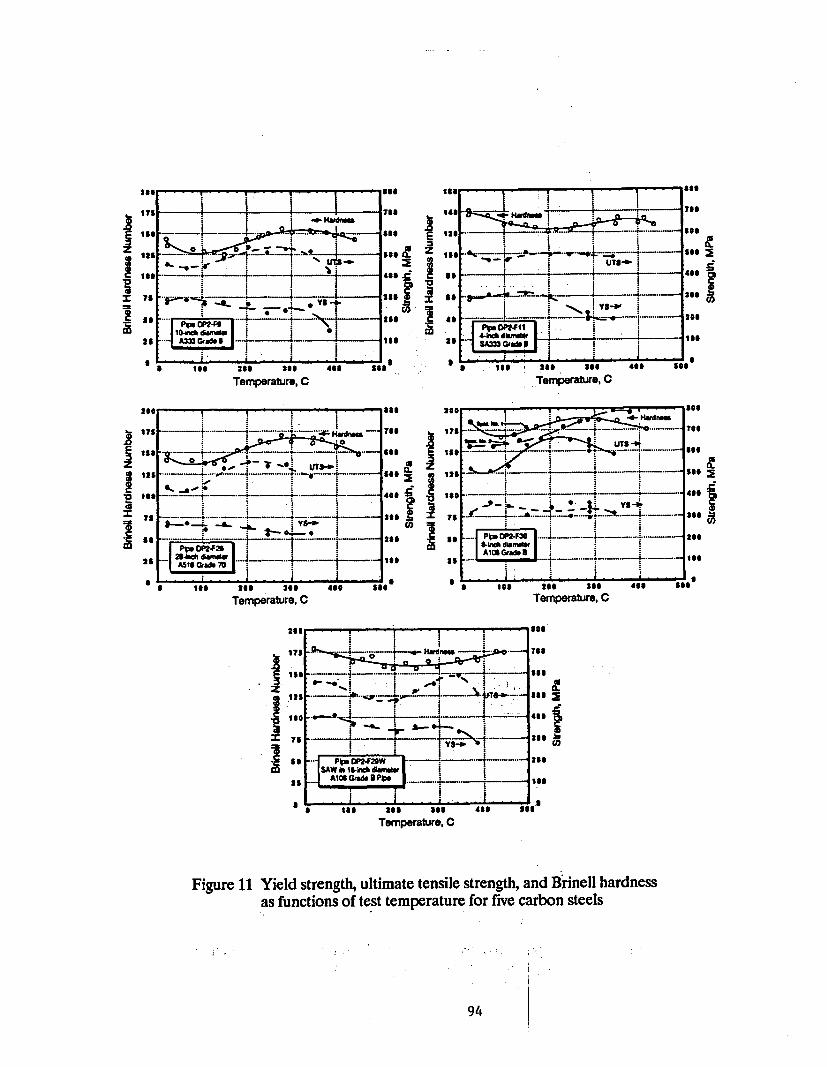
I
IIo
I
of - - - - gel
ITS Too
l~t ~$Is.
__ ,____
5 6 285 aS 41m SSS, I-- -lL - "'m
* s ~ ~ -| 1*3 Cr U : S t*
0% .. . . . 1 . .
Temperabure, C
~et ------ --- -- -o
ss & ,. =T_ i tITS-ass
... .-. YS t .... .
"' - K -----*--- i------; "
a . -- -- . .
430 55
I.
I.1
..-. -'3..m-
ml '' - ,-*--*--.-*'-I -'J-'-l
.. 4s - <-_-kddfuI____ -- --. ...
.~~~. - a - . .... i ..
As imn 0 25 0 sni T, , YS
Temperature, C
-I. - ---
UA!
CD
if
I.
if
I .
(o1.
171 ----- -.-~~-U= _; :
.. ' - . ..... ...
2. - - t - -I ,_ _ -. _ .. __- ._ - Age
75
to
as
a
t
e -0- 161 -.- -�- Ys-** .__.,_._.__._ al--- !-- - - - - q- �- Wv r .,.
_...I POO DP2-F30 ..Sindh dirnerA1C0 Grael
-I - .i ---- S * I 's1 J5._ _ _ _4__._._ _._____._._ a..... . ...... -L @
as _m _s _ . _stoo ass ao CTempe rature, C
489 see its 2Tr 3 9 C
Temperature, C499 see
-'II
2so 1 1- - oI-
S 1-- . - o... I----- i W % - ; ...!s ._ ,,; <_ r ._ &_A7._
ISO _e_ S _ __ _ 469
Ira,
I -v i ON75
as
_ __
S . * __.__ s * |_.___4,_ i ----- *^s:-t-----*sWI I
. PO* CP2.F20W .SAW i 1khF diWw
... , 10 .- d ; PO* .. _
, i . _dh i .___tsl is
05'SI . _ __ _ _ . _I
Temperature, C499 9 I
Figure 11 Yield strength, ultimate tensile strength, and Brinell hardnessas functions of test temperature for five carbon steels
94
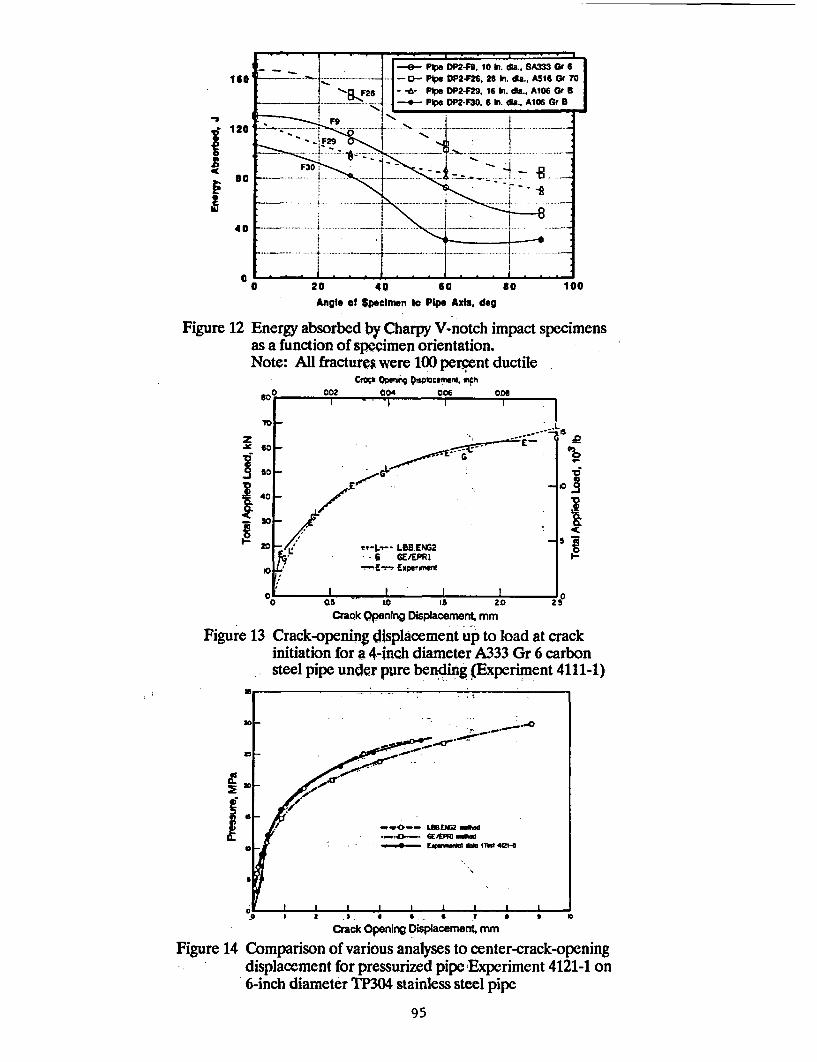
It
40
40
0 20 40 60 80 100Angle of Specimen to Pipe Asft, dog
Fil pure 12 Energy absorbed by Charpy V-notch impact specimensas a function of specimen orientation.Note: All fractures were 100 percent ductile
CQok Opeinr >DM0sO .ent, Mth
0 002 004 OK 00 l
70 -
so -EEvz . II
C5 0 152-
00
0 ~LhIMNG2 n25
Ckak penngDisplacement mm
Figure 13 Crack-opening displacement up to load at crackinitiation for a 4inch diameter A333 Gr 6 carbonsteel pipe under pure bending (Experiment 4111-1)
ri
K
R
ifK.. a
00-
10, . . L
-- *-- LWEW2 0904de-40-- GEPtPM moved
i . . P*- E" o dM (TOO 40-4
U
U
I
Figure 14
-° I a .3 , . * . .. 7 T 9 0 I
Crack Opening Displacement, mm
Comparison of various analyses to center-crack-openingdisplacement for pressurized pipe Experiment 4121-1 on6-inch diameter TP304 stainless steel pipe
95
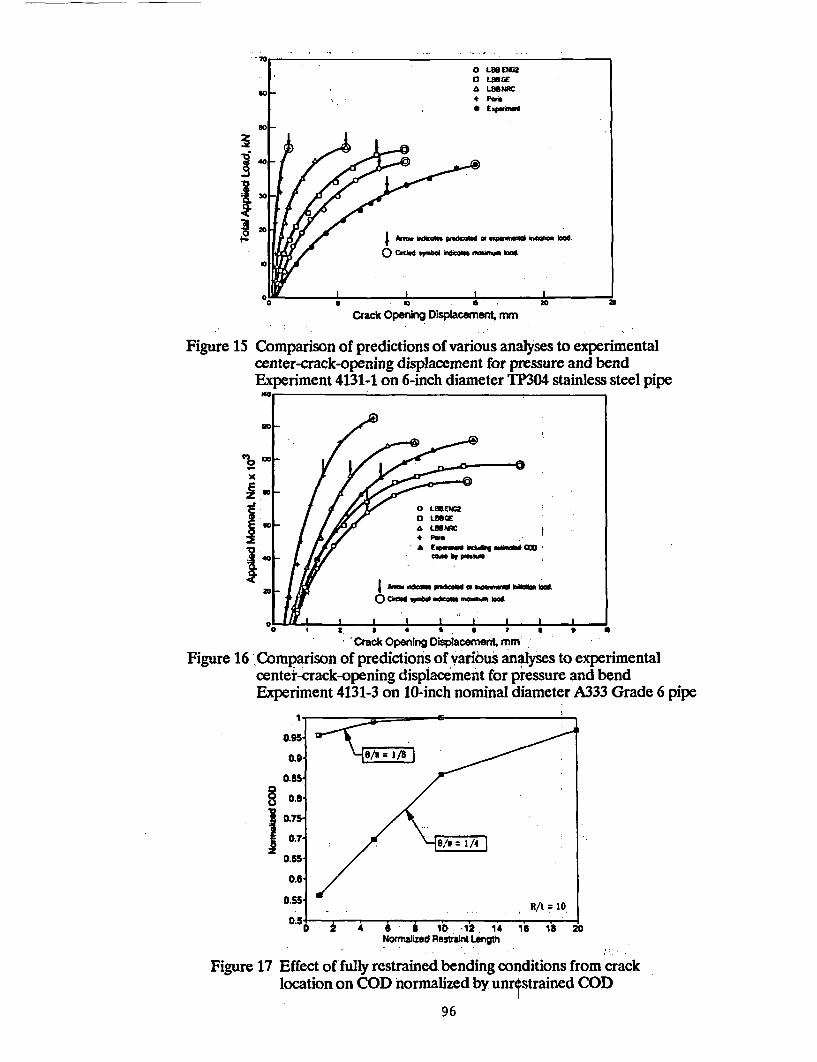
j~40
o 0°~ *aI~ - .~I *- e2
Crack Opening Displacement, mm
Figure 15 Comparison of predictions of various analyses to experimentalcenter-crack-opening displacement for pressure and bendExperiment 4131-1 on 6-inch diameter TP304 stainless steel pipe
co
20 ~ uiai At ~ ~ h g.Ace Whabid
'Crack Opening Displacement, mm;Figure 16 Comparison of predictions of various analyses to experimental
center-crack-opening displacement for pressure and bendExperiment 413 1-3 on 10inch nominal diameter A333 Grade 6 pipe
0.95 3'
0.BS
I 5 .0.
0.65
0.
0.5
D.5 2 4 6 3 10 -12; 14 1618 20SNopmalized Restpacnt Length
Figure 17 Effect of fulpy restrained bending conditions from cracklocation on COD normalized bym unrestrained COD
96
Heavy-Section Steel Irradiation Program: Embrittlement Issues*
W. R. Corwin
Oak Ridge National LaboratoryOak Ridge, Tennessee 37831
ABSTRACI
Maintaining the integrity of the reactor pressure vessel (RPV) in a light-water-cooled nuclear power plant is crucial in preventing and controlling severeaccidents and the potential for major contamination releases. The RPV is one ofonly two major safety-related components of the plant for which a duplicate orredundant backup system does not exist. It is imperative to understand andpredict the capabilities and limitations of its integrity. In particular, it is vital tofully understand the degree of irradiation-induced degradation of the RPV'sfracture resistance which occurs during service, since without that radiationdamage it is virtually impossible to postulate a realistic scenario which wouldresult in RPV failure. For this reason, the Heavy-Section Steel Irradiation(HSSI) Program has been established by the -U.S. Nuclear RegulatoryCommission (USNRC) to provide a thorough, quantitative assessment of theeffects of neutron irradiation on the material behavior, and in particular thefracture toughness properties, of typical pressure vessel steels as they relate tolight-water reactor pressure-vessel integrity. Effects of specimen size, materialchemistry, product form and microstructure, irradiation fluence, flux, temperatureand spectrum, and postirradiation annealing are being examined on a wide rangeof fracture properties including fracture toughness (KIC and JIc), crack arresttoughness (KIa), ductile' tearing resistance (dJ/da), Charpy V-notch (CVN)impact energy, dropweight nil-ductility temperature (NDT), and tensileproperties. Models based on observations of radiation-induced microstructuralchanges using the field ion microprobe and the high resolution transmissionelectron microscope provide improved bases for extrapolating the measuredchanges in fracture properties to wider ranges of irradiation conditions. Theprincipal materials examined within the HSSI program are high-copper weldssince their postirradiation properties are most frequently limiting in the continuedsafe operation of commercial RPVs. In addition,-a limited effort focuses onstainless steel weld-overlay cladding, typical of that used on the inner surface
*Research sponsored by the Office of Nuclear Regulatory Research, U.S. NuclearRegulatory Commission under Interagency Agreement DOE 1886-8109-8L with theU.S. Department of Energy under Contract DE-AC05-840R21400 with Martin MariettaEnergy Systems, Inc.
The submitted manuscript has been authored by a contractor of the U.S. Governmentunder Contract DE-AC05-840R21400. Accordingly,, the U.S. Government retains anonexclusive, royalty-free license to publish or reproduce the published form of thiscontribution, or allow others to do so, for U.S. Government purposes.
97
of RPVs, since its postirradiation fracture properties have the potential forstrongly affecting the extension of small surface flaws during overcoolingtransients.
Recent results are described concerning the shifts in fracture toughnessand crack arrest toughness in high-copper welds, the effects of irradiation onstainless-steel weld-overlay cladding, the unirradiated examination of a lowupper-shelf (LUS) weld from the Midland reactor, irradiation temperature effectson Charpy and tensile properties of several LUS welds, initial theoretical studiesrelated to irradiation-rate effects, and the continued investigation into the causes ofaccelerated low-temperature embrittlement recently observed in RPV supportsteels.
PROGRAM SCOPE AND GOALS
It is vital' to fully understand the degree of irradiation-induced degradation of the RPV'sfracture resistance which occurs during service, since without that radiation damage it is virtuallyimpossible to postulate a realistic scenario which would result in RPV fracture. For this reason,the HSSI program has been established with its primary goal to provide a thorough, quantitativeassessment of the effects of neutron irradiation on the material behavior, and in particularthe fracture toughness properties, of typical pressure vessel steels as they relate to light-waterreactor pressure-vessel integrity. Results from the HSSI studies will be integrated to aid inresolving major regulatory issues facing the USNRC which involve RPV irradiationembrittlement such as pressurized-thermal shock, operating pressure-temperature limits, low-temperature overpressurization, and the specialized problems associated with LUS welds. Takentogether the results of these studies also provide guidance and bases for evaluating both the agingbehavior and the potential for plant life extension of light-water reactor pressure vessels.
The HSSI program includes the direct continuation of irradiation studies previouslyconducted within the Heavy-Section Steel Technology (HSST) program augmented by enhancedexaminations of the accompanying microstructural changes. Effects of specimen size, materialchemistry, product form' and microstructure,,irradiation fluence, flux, temperature and spectrum,and postirradiation annealing are being examined on a wide range of fracture properties. TheHSSI Program is arranged into 9 tasks: (1) program management, (2) KIC curve shift in high-copper welds, (3) KIa curve shift in high-copper welds, (4) irradiation effects on cladding,(5) KIC and KIa curve shifts in LUS welds, (6) irradiation effects in a commercial LUS weld,(7) microstructural analysis of irradiation effects, (8) in-service aged material evaluations, and(9) correlation monitor materials. Recent results and plans for each technical task are described inthe following sections.
KIc CURVE SHIFTS IN HIGH-COPPER WELDS
'n the fracture mechanics integrity analysis of RPVs, the initiation and arrest fracturetoughness curves as described in Sect. XI of the ASME Boiler and Pressure Vessel Code areoften used. These curves are also used for the normal operation of RPVs. The effects of neutronirradiation on toughness are accounted for by shifting the curves upward in iemperature withoutchange din shape by an amount equal to the shift (plus a margin term) of the CVN impact energycurve at the 41-J level. Such a procedure implies that the shifts in the fracture toughness curves
98
are the same as those of the CVN 41-J energy level, and that irradiation does not change theshapes of the fracture toughness curves.
The objectives of the HSSI Fifth Irradiation Series are to determine the KIc curve shiftsand shapes for two irradiated high-copper, 0.23 and 0.31 wt %, submerged-arc welds(72W ,and 73W, respectively). All planned unirradiated and irradiated testing for the FifthIrradiation Series has been completed. The irradiations were performed by the Oak RidgeNational Laboratory (ORNL) at the Oak Ridge Research Reactor (ORR) at'a nominal temperatureof 2880C to average fluences of about 1.5 x 10¹⁹ neutrons/cm2 (>1 MeV). Tests wereperformed by both ORNL and Materials Engineering Associates, Inc., and included tensile, CVNimpact, drop-weight, and fracture toughness. Unirradiated compact specimens of 25-, 51-, 102-,152-, and 203-mm thickness (IT, 2T, 4T, 6T, and 8TC(T), respectively) were tested, whereasirradiated testing was limited to IT, 2T, and 4TC(T) specimens.
The results of testing have been presented previously. 1 For the CVN results, the 41-Jtransition temperature shifts using Weibull-based analyses were very similar to those obtainedfrom hyperbolic or exponential curve-fitting techniques for the 72W and 73W welds. The 41-Jshifts were 72 and 820C, while the 68-J shifts were 82 and 105'C for welds 72W and 73W,respectively. The analyses also indicated that variations in neutron fluence did not influence theshifts or the shapes of the irradiated curves and, therefore, will allow for conclusions concerningeffects of irradiation on curve shape.
The first step in the analysis was to evaluate the fracture toughness data to establish thedata base appropriate for statistical analyses. For those specimens which met the E 399 criteriafor a valid KIC, the KIC value is used. For those specimens which exhibited curvature in the load-displacement record, indicative of plastic deformation and, perhaps, stable ductile tearing, theKJc value was used. Because the data base includes results from both linear-elastic and elastic-plastic fracture mechanics calculations, the fracture toughness data have been designated KC1 forcleavage fracture toughness.
An unexpectedly large number of cleavage pop-ins in the irradiated specimens requiredexamination of those results. Out of 156 unirradiated compact specimens, only' twoexhibited pop-ins. For the 110 irradiated specimens, however, 28 specimens exhibited a total of36 pop-ins. For a number of previously stated reasons,2 only the initial pop-in was used hereinto determine cleavage fracture toughness for those specimens exhibiting pop-ins. Pop-ins of anysize representing a cleavage event in the specimen were considered significant. Figure 1 shows aplot of cleavage fracture toughness for weld 72W in the irradiated condition. Each datum plottedrepresents one test specimen (the abscissa is not scaled).'. As shown, the pop-in results fitgenerally within the scatter bands of the fracture results and the lowest values are mixed betweenpop-ins and fracture results. These results suggest that cleavage pop-ins are significant relative tondicating propensity for cleavage fracture in the test specimen.
The Kic curve in Sect. XI of the ASME Codeis a lower boundary to th~e data' used for itsdevelopment. 3 Three-parameter nonlinear regression analyses were peiformed for 72W and73W in both the unirradiated and irradiated conditions' using the simple exponential form of theASME KIc curve. Various intercept values were obtained-but statistical analyses revealed thatthey did not differ significantly from the ASME value of'36.48; thus, the intercept value wBasfixed at .36.48 MPa/m. Mean curve fits from the subsequriltwo-parameter nonlinear regressionanalyses gave fracture toughness temperature shifts, measured at the 100 MPaq4m-level, of about94 and lO&C for 72W and 73W, respectively, the same results obtained from the three-parameter
99
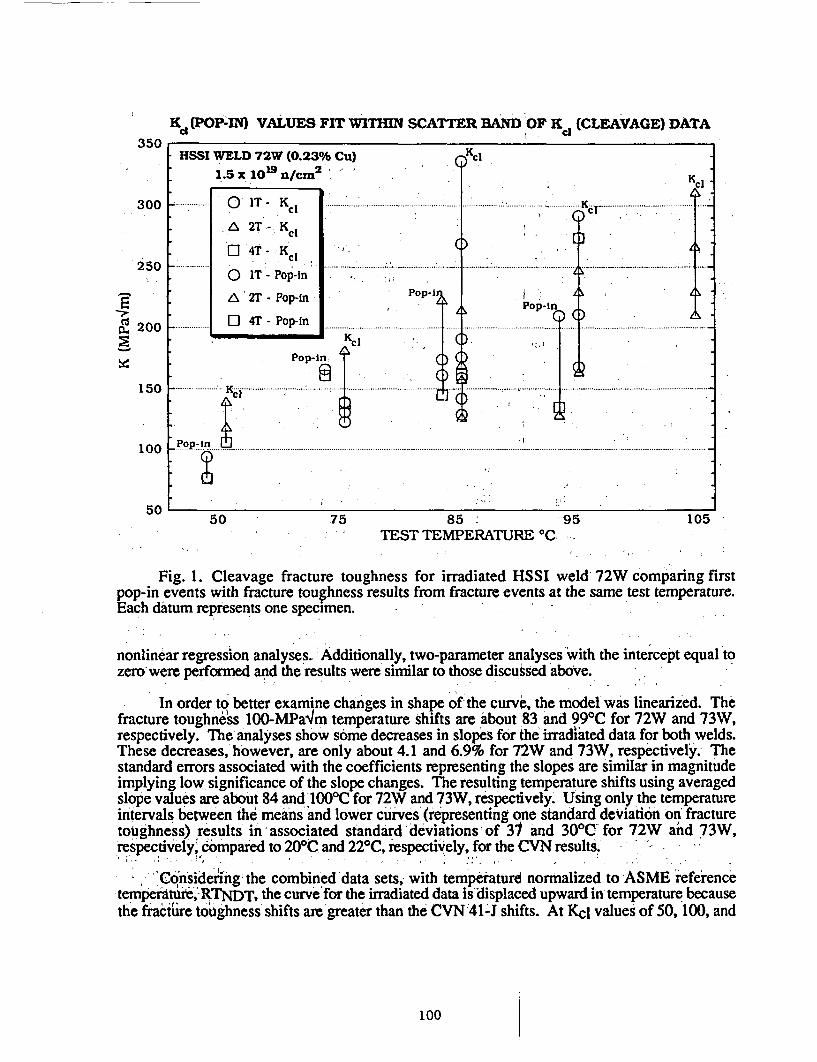
Kd (POP-IN VALUES FIT WITHIN SCATTER BAND OF KR (CLEAVAGE) DATA350
HSSI WELD 72W (0.23% Cu) Ki1.5 x 1019 n/cm 2 .K K I
300 0....... IT- K
A 2T-.Kcl
CJ 4T -250 _:..... .. . .... .
250 0 IT - Pop-in
.A ' Z Pop-in
o. 200 ] 0 4T - Pop-in
* A, , . . and-CI
pop-]opI
Pop-in
*5 0 ..... .. .......... ... ... ........ ...... .. ........................... ...... ...... .... ; .... ............ ..... .... ._..... ........ ..... ...... ... ...
1 0 o p .- n .. .. . .... ...... ........ ... . . . ... .... .. ...... ........ ....... . .............. .................................. ....... ............. ........
5050 75 85 95 105
TEST TEMPERATURE 0C
Fig. 1. Cleavage fracture toughness for irradiated HSSI weld 72W comparing firstpop-in events with fracture toughness results from fracture events at the same test temperature.Each datum represents one specimen. -
nonlinear regression analyses :Additionally, two-parameter analyses with the intercept equal tozero were performed and the results were similar to those discussed above.
In order to better examine changes in shape of the curve, the model' was linearized. Thefracture toughness 100-MPaqm temperature shifts are about 83 and 99 0C for 72W and 73W,respectively. The analyses show some decreases in slopes for the irradiated data for both welds.These decreases, however, are only about 4.1 and 6.9% for 72W and 73W, respectively. Thestandard errors associated with the coefficients representing the slopes are similar in magnitudeimplying low significance of the slope changes. The resulting temperature shifts using averagedslope values are about 84 and 10000 for 72W and 73W, respectively. Using only the temperatureintervals between the means rand lower curves' (representing one standard deviation on' fracturetoughness) results in associated standard deviations of 31 and 30'C for 72W and 73W,respectively compared to 20 0C and 22`C, respectively, for the CVN results.
,'Cdnsidefng the combined data sets, with temperature normalized to ASME referenceternpertartu,' RTNDT, the curve'for the irradiated data is'displaced upward in temperature becausethe fract~re toughness shifts are greater than the CVN '414J shifts. At Kcl values of 50, 100, and
100
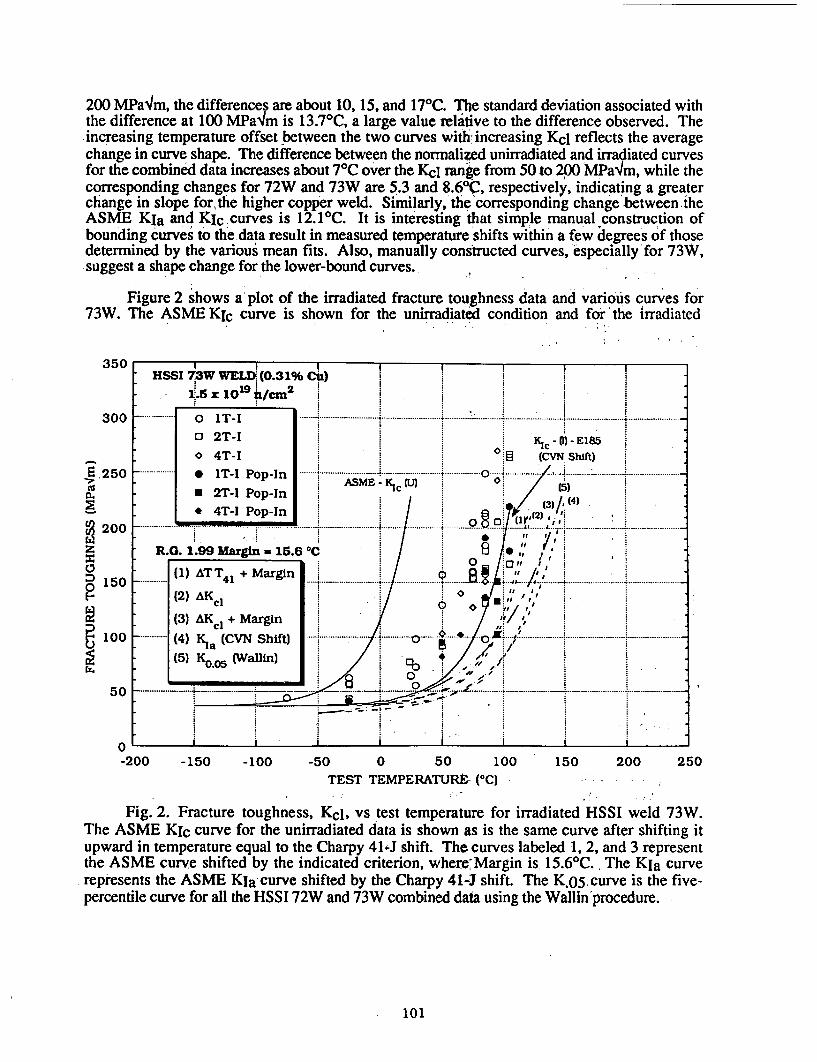
200 MPalm, the differences are about 10, 15, and 170C. The standard deviation associated withthe difference at 100 MPalm is 13.70C, a large value relative to the difference observed. Theincreasing temperature offset between the two curves with increasing Kcl reflects the averagechange in curve shape. The difference between the normalized unirradiated and irradiated curvesfor the combined data increases about 70C over the KCl range from 50 to 200 'MPalm, while thecorresponding changes for 72W and 73W are 5.3 and 8.69C, respectively, indicating a greaterchange in slope forthe higher copper weld. Similarly, the corresponding change between theASME KIa and KIc curves is 12.10C. It is interesting that simple manual construction ofbounding curves to the data result in measured temperature shifts within a few degrees of thosedetermined by the various mean fits. Also, manually constructed curves, especially for 73W,suggest a shape change for the lower-bound curves.
Figure 2 shows a'plot of the irradiated fracture toughness data and various curves for73W. The ASME KIc curve is shown for the unirradiated condition and for 'the irradiated
350
300
E 1250
a.,
5
12005
O: 150
100
50
HSSI 7.3W WELD (0.31% Cil)-1..5w 9 lO /cm2 | I
_ .......T-. ........ ..... ....... ..... . ......... ................. ... .... ....... ....
a 2T-I*c -n E185
o 4T-I (CVN Shift)_. . ...... * 1T -1 P o p -In ... . ...... .... .. . ............. ........ - ..... ... - -. ..... ........................ . .... ..........
* ASME 0* 2T-I Pop-In (4.
* 4T-1 Pop-In. . .
...... ........ ...... ......... ...... ... .. ..... . ...... ' ....'.....-'''''''--....--.. - 2 .. '' ''- ................. . .... ...... .#- ................ '''''-'''''''
R.G. L.99 Margin 15.60 C . /,
(1)ATT 4 1 + Margin ° 8
(2) AKi
(3) AK + Margin
--- - (4) Kia (CVN Shift) 0 - ° --- - * i .- .---(5) KO0 5 (Wallin)
_ _ _ . I... _ _. __ , _ _ _.- _ _ _. _ _
nV _
-200 -150 -100 -50 0 50 100T1;C!: -TRpv1DATT1DVt 1orI
150 200 250
Fig. 2. Fracture toughness, KC1, vs test temperature for irradiated HSSI weld 73W.The ASME KIc curve for the unirradiated data is shown as is the same curve after shifting itupward in temperature equal to the Charpy 41 4 shift. The curves labeled 1, 2, and 3 representthe ASME curve shifted by the indicated criterion, where Margin is 15.60C. . The KIa curverepresents the ASME Kia curve shifted by the Charpy 41-J shift. The K.05 curve is the five-percentile curve for all the HSSI 72W and 73W combined data using the Wallin'procedure.
101
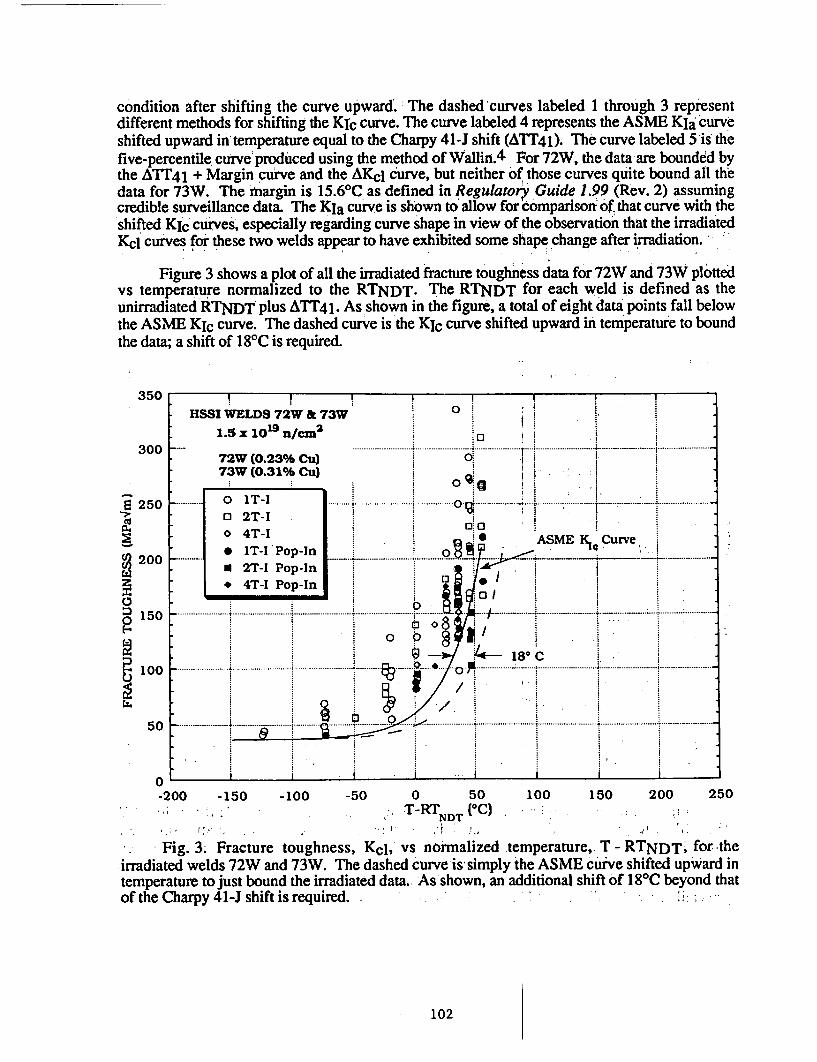
condition after shifting the curve upward. The dashed curves labeled 1 through 3 representdifferent methods for shifting the KIC curve. The curve labeled 4 represents the ASME KIa curveshifted upward in temperature equal to the Charpy 41-J shift (ATT41). The curve labeled 5 is thefive-percentile curve produced using the method of Wallin.4 Por 72W, the data are bounded bythe ATT41 + Margin curve and the AKcl curve, but neither of those curves quite bound all thedata for 73W. The margin is 15.60C as defined in Regulator7 Guide 1.99 (Rev. 2) assumingcredible surveillance data. The KIa curve is shown to' allow for comparison of that curve with theshifted KIc curves, especially regarding curve shape in view of the observation that the irradiatedKcl curves for these two welds appear to have exhibited some shape change after irradiation.
Figure 3 shows a plot of all the irradiated fracture toughness data for 72W and 73W plottedvs temperature normalized to the RTNDT. The RTNDT for each weld is defined as theunirradiated RTNDT plus ATT41. As shown in the figure, a total of eight data points fall belowthe ASME KIC curve. The dashed curve is the Kic curve shifted upward in temperature to boundthe data; a shift of 1 8'C is required.
350
300
a 250
200
Ca
O 150
E 100
50
r� , r r F r
HSSI WELDS 72W & 73W1.5 x 1019 n/Cm2
I0
.0....... ....................... .. i..................... .... .... . ............... . ................ ,. ...... . ...... . .... ... . ..... ....... _... ..
72W (0.23%/ Cu)73W (0.31% Cu)
0.
iFt
o 1T-IO 2T-IO 4T-I* 1T-I Pop-In* 2T-I Pop-In* 4T-I Pop-In
--- ---- -- -- - ---- ----- ;-- - -00 C
ASME KI, CUa_... ....... _ _ _ _ ......
0'--0 I
- I0. .................. . ............... ... ........ .. ......................... ... .......... .. .. -....... -.... ,.. -. .... ..... ........
000
. . .. ........ .................... ..... .. 0 ... .. ....... ..... .... . ......
_ _ _ _ _ _ _ _ _ .. . . . _ _ _ _ _ _ _ ._ _ _ _ _ _ _ .. _ _ _ _ _ ...... _ _ _ _ . ... . ....... _ I _ _ _ _ _ _ _.......__ _ _ _ . .. . .. ._ ......
A I
-200 -150.. ; . ... ..
-100 -50 0 50I T - R T ( C
RTNDT [ C)"I. I; ;
100 150 200 250
Fig. 3. Fracture toughness, Kcl, vs normalized temperature, T - RTNDT' for theirradiated welds 72W and 73W. The dashed curve is simply the ASME curve shifted upward intemperature to just bound the irradiated data. As shown, an additional shift of 1 8'C beyond thatof the Charpy 41-J shift is required. - ;
102
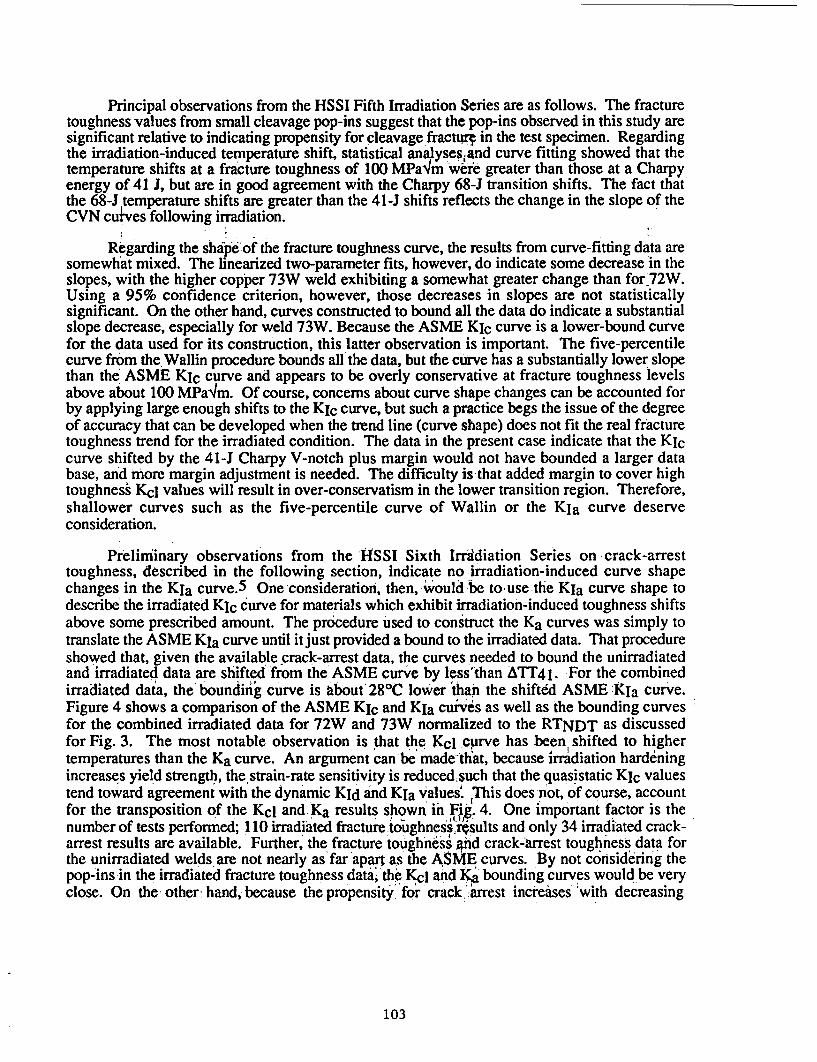
Principal observations from the HSSI Fifth Irradiation Series are as follows. The fracturetoughness values from small cleavage pop-ins suggest that the pop-ins observed in this study aresignificant relative to indicating propensity for cleavage fractqr in the test specimen. Regardingthe irradiation-induced temperature shift, statistical analysesiand curve fitting showed that thetemperature shifts at a fracture toughness of 100 MPa'm were greater than those at a Charpyenergy of 41 J, but are in good agreement with the Charpy 68-J transition shifts. The fact thatthe 68-J temperature shifts are greater than the 41-J shifts reflects the change in the slope of theCVN cuives following irradiation.
Regarding the sha'peof the fracture toughness curve, the results from curve-fitting data aresomewhat mixed. The linearized two-parameter fits, however, do indicate some decrease in theslopes, with the higher copper 73W weld exhibiting a somewhat greater change than for 72W.Using a 95% confidence criterion, however, those decreases in slopes are not statisticallysignificant. On the other hand, curves constructed to bound all the data do indicate a substantialslope decrease, especially for weld 73W. Because the ASME KIc curve is a lower-bound curvefor the data used for its construction, this latter observation is important. The five-percentilecurve from the Wallin procedure bounds all the data, but the curve has a substantially lower slopethan the ASME KIc curve and appears to be overly conservative at fracture toughness levelsabove about 100 MPa"m. Of course, concerns about curve shape changes can be accounted forby applying large enough shifts to the KIC curve, but such a practice begs the issue of the degreeof accuracy that can be developed when the trend line (curve shape) does not fit the real fracturetoughness trend for the irradiated condition. The data in the present case indicate that the KIccurve shifted by the 41-J Charpy V-notch plus margin would not have bounded a larger database, and more margin adjustment is needed. The difficulty is-that added margin to cover hightoughness Kcl values will result in over-conservatism in the lower transition region. Therefore,shallower curves such as the five-percentile curve of Wallin or the KIa curve deserveconsideration.
Preliminary observations from the 1SSI Sixth Irradiation Series on crack-arresttoughness, described in the following section, indicate no irradiation-induced curve shapechanges in the KIa curve.5 One consideration, then, would be to use the KIa curve shape todescribe the irradiated KIc curve for materials which exhibit irradiation-induced toughness shiftsabove some prescribed amount. The procedure used to construct the Ka curves was simply totranslate the ASME KIa curve until it just provided a bound to the irradiated data. That procedureshowed that, given the available crack-arrest data, the curves needed to bound the unirradiatedand irradiated data are shifted from the ASME curve by less'than ATT41. For the combinedirradiated data, the' boundin'g curve is about 280C lower than the shifted ASME KIa curve.Figure 4 shows a comparison of the ASME KIc and KIa curives as well as the bounding curvesfor the combined irradiated data for 72W and 73W normalized to the RTNDT as discussedfor Fig. 3. The most notable observation is that the KcI curve has been shifted to highertemperatures than the Ka curve. An argument can be made-that, because irradiation hardeningincreases yield strength, the strain-rate sensitivity is reduced~such that the quasistatic KIc valuestend toward agreement with the dynamic KId and KIa values' This does not, of course, accountfor the transposition of the KCI and Ka results shown in 1~. 4. One important factor is thenumber of tests performed; 110 irradiated fracture toIghnessresults and only 34 irradiated crack-arrest results are available. Further, the fracture toughness And crack-arrest toughness data forthe unirradiated welds are not nearly as far apart as the ASME curves. By not considering thepop-ins in the irradiated fracture toughness dataithe Kcl and Kal bounding curves would be veryclose. On the other hand, because the propensity, for crack arrest increases 'with decreasing
103
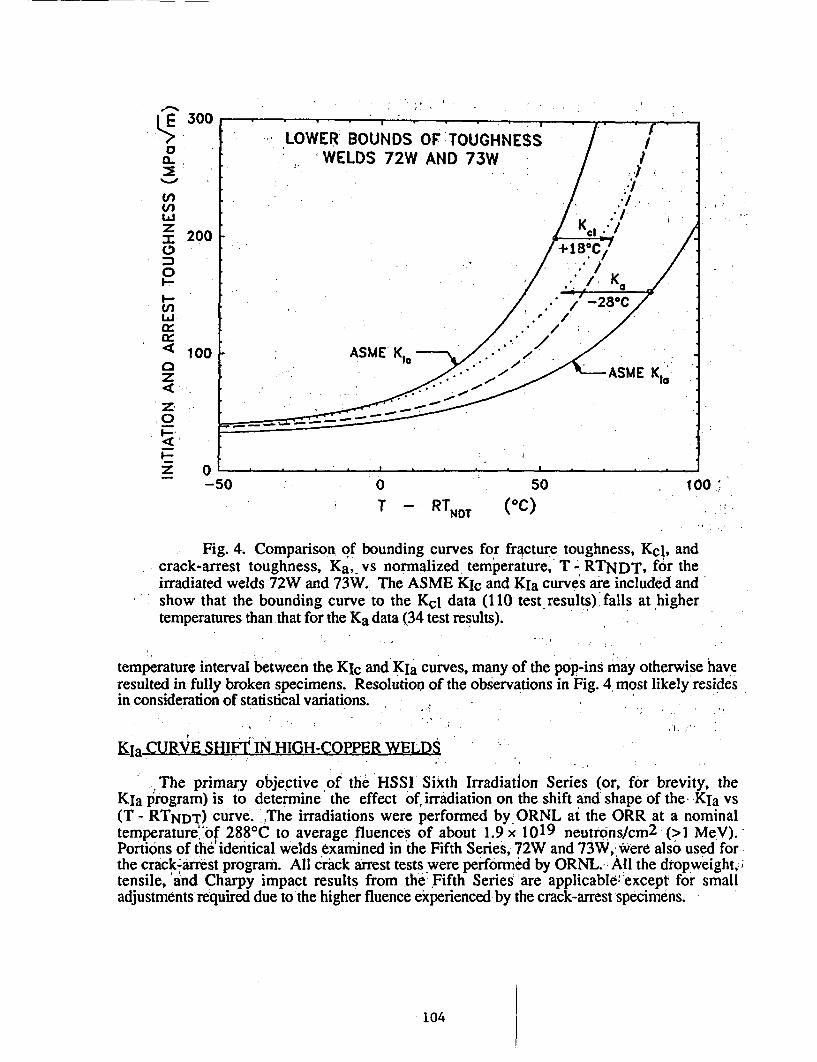
E 300LOWER' BOUNDS OF'TOUGHNESS /
X WELDS 72W AND 73W /
Z o
200 +15 C0
0
I-80LJ
iraitdwls7Wad7W h ASME KIan acuvsreilddad
4.
-50 0 50 too~
T - RTND (0c)
Fig. 4. Comparison, of bounding curves. for fractureL toughness, Kd~, andcrack-arrest toughness, Ka,-vs normalized, temperaiure, T -' RTNDT, for theirradiated welds 72W and 73W. The ASME KIc and KIa curve's are included and*show that the bounding curve to the KcI data (1 10 test resulIts)'falls at highertemperatures than that for the Ka data (34 test results).
temperature interval between the KIc and KIa curves, many of the pop-ins may otherwise haveresulted in fully broken specimens. Resolution of the observations in Fig. 4 most likely residesin consideration of statistical variations.
K CURVE SHIFT IN HIGH-COPPER WELDS
K The primary objective of the HSSI Sixth Irradiation Series (or, for brevity, theKla program) is to determine the effect of irradiation on the shift and shape of the KIa vs(T - RTNDT) curve. 1The irradiations were performed by ORNL at the ORR at a nominaltemperatureiof 2880C to average fluences of about 1.9 x 10¹⁹ neutrons/cm2 (>I MeV).Portions of the identical welds examined in the Fifth Series, 72W and 73W, were also used forthe crack-arrest program. All crack arrest tests were performed by ORNL. All the dropweight,tensile, and Charpy impact results from the Fifth Series" are applicable:except for smalladjustments required due to the higher fluence experienced by the crack-arrest specimens.
104
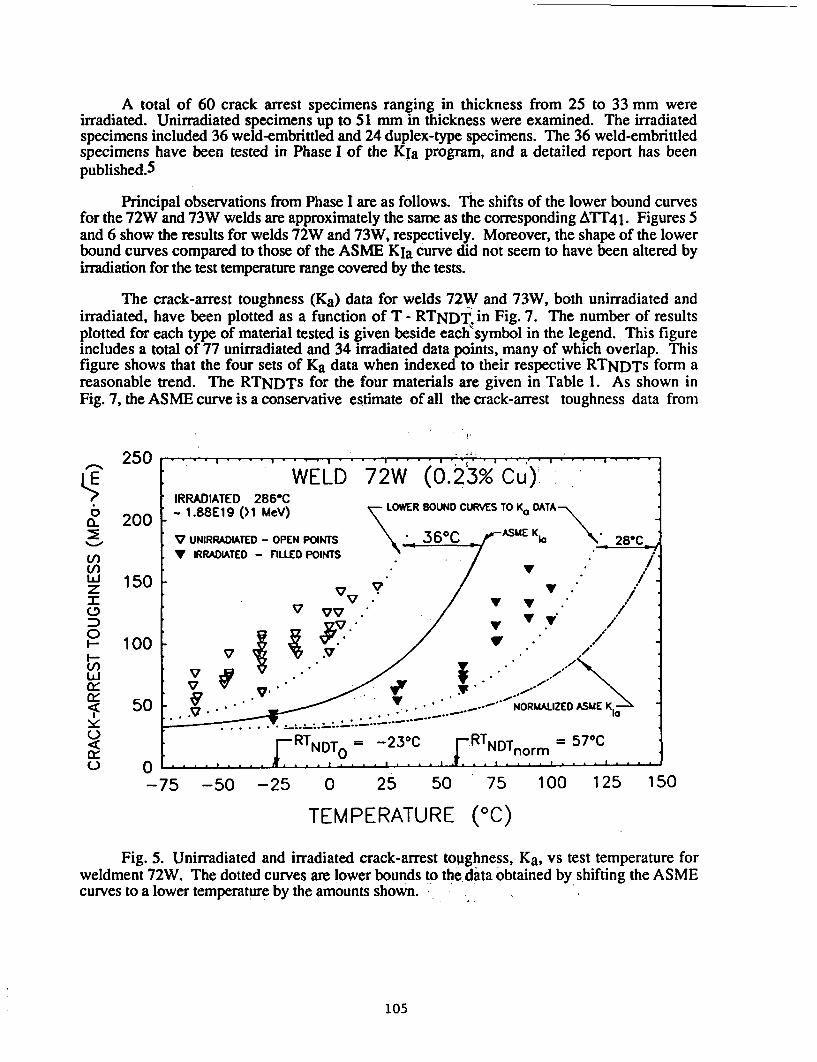
A total of 60 crack arrest specimens ranging in thickness from 25 to 33 mm wereirradiated. Unirradiated specimens up to 51 mm in thickness were examined. The irradiatedspecimens included 36 weld-embrittled and 24 duplex-type specimens. The 36 weld-embrittledspecimens have been tested in Phase I of the KIa program, and a detailed report has beenpublished.5
Principal observations from Phase I are as follows. The shifts of the lower bound curvesfor the 72W and 73W welds are approximately the same as the corresponding ATT4 1. Figures 5and 6 show the results for welds 72W and 73W, respectively. Moreover, the shape of the lowerbound curves compared to those of the ASME KIa curve did not seem to have been altered byirradiation for the test temperature range covered by the tests.
The crack-arrest toughness (Ka) data for welds 72W and 73W, both unirradiated andirradiated, have been plotted as a function of T - RTNDT. in Fig. 7. The number of resultsplotted for each type of material tested is given beside each'symbol in the legend. This figureincludes a total of 77 unirradiated and 34 irradiated data points, many of which overlap. Thisfigure shows that the four sets of Ka data when indexed to their respective RTNDTs form areasonable trend. The RTNDTs for the four materials are given in Table 1. As shown inFig. 7, the ASME curve is a conservative estimate of all the crack-arrest toughness data from
250 ., , , , , .-E WELD 72W (0.2'3% Cu')'
IRRADIATED 286°Co 2 1.88E19 (>1 MeV) LOWER8BUNDCURVSTOK DATAo.. 200
'V UNIRRADIATED - OPEN POINTS 3 ASME K 280Cv IRRADUITED - FnLLED POINTS / ,
7150 V - o
V. VV/
VV.IF V y
TEMPRNORMALIZED AS(E KC
RT ~ -3 0C NDnr0 ..... 9 . . ..... ,
-75 -50 -25 0 25 50 75 100 125 150
TEMPERATURE (0C)
Fig. 5. Unirradiated and irradiated crack-arrest toughness, Ka, vs test temperature forweldment 72W. The dotted curves are lower bounds to the data obtained by shifting the ASMEcurves to a lower temperature by the amounts shown.
105
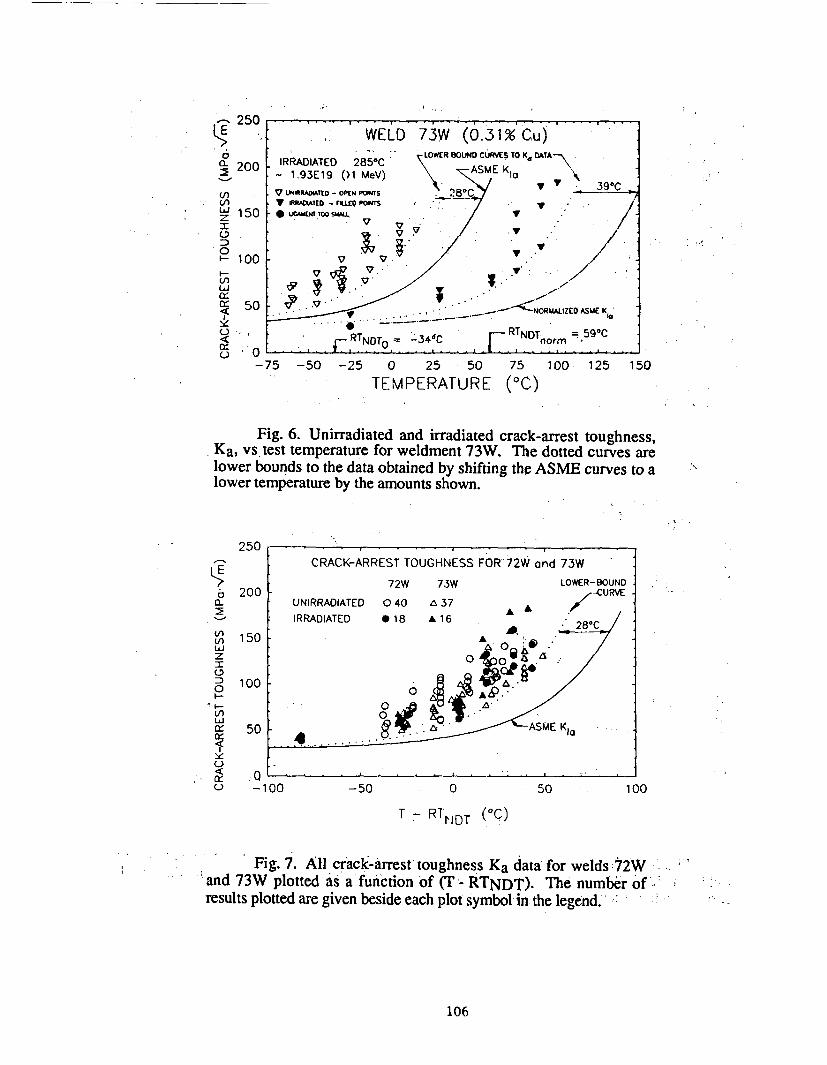
250
I E
3 200
Lz150I0
I .
a:
.0
I
: WELD 73W (0.31% Cu)LOWER BOUND CURVES TO K OATA
IRRADIATED 285C A d
- 1.93E19 t1 MeV) 3SME K90V UNWRADIATEO -OPEN MNTS 28 , 39CV RRATED . FIL= KC'tS
-*V 'AMZNT/ OS,.' ,/
4.._--NORMALZED ASME K
_RT NDTo_5 .34 - -:0
; nI
-75 -50 -25 0 25 50 75 100- 125 150
TEMPERATURE (0C)
Fig. 6. Unirradiated and irradiated crack-arrest toughness,Ka, vs test temperature for weldment 73W. The dotted curves arelower bounds to the data obtained by shifting the ASME curves to alower temperature by the amounts shown.
:
250
C
0~
zI0
0I-
a:ca:-0
a:
0
200
150
100
50
. Q I-100 -50 0 50 1 00
T - RITrDT (CC)
Fig. 7. All crack-arrest toughness Ka data for welds 72W -and 73W plotted as a function of (T - RTNDT). The number of'-.results plotted are given beside each plot symbol in the legend.
106
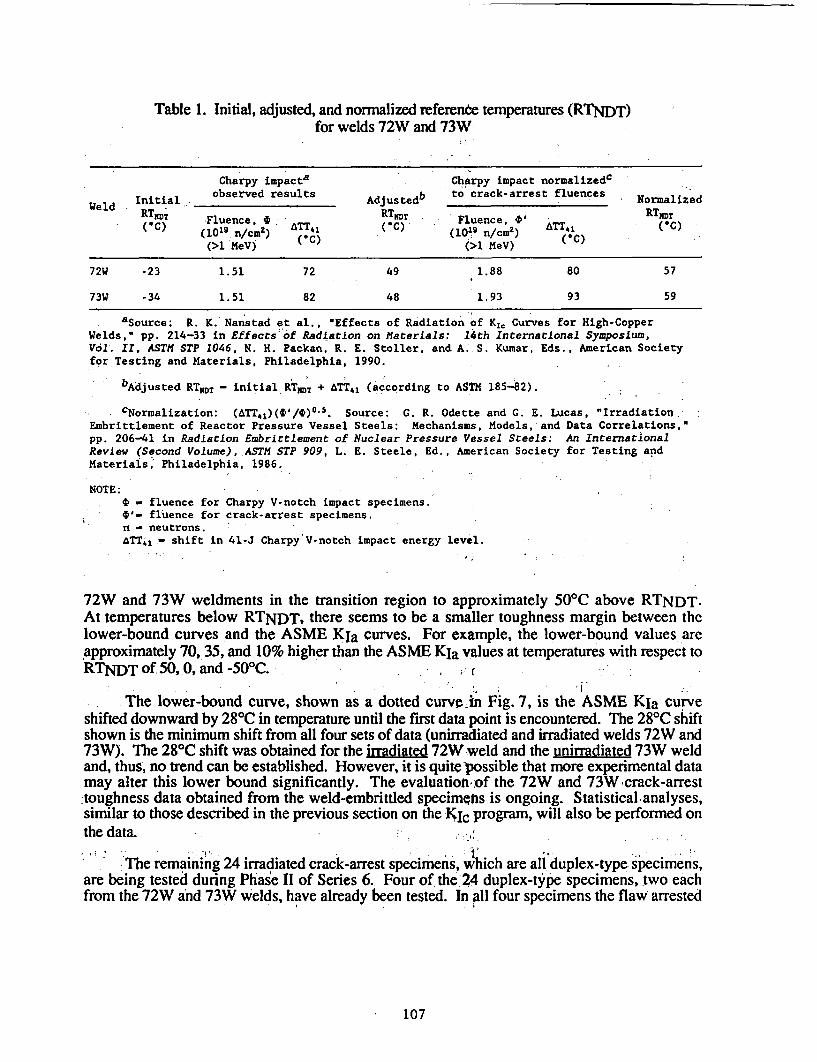
Table 1. Initial, adjusted, and normalized reference temperatures (RTNDT)for welds 72W and 73W
Charpy impacta Charpy impact normalizedC Iobserved results Adutdb to crack-arrest fluences
Wed Initial Adj__________ used flecs NormalizedWeld RTRTBDT Fluence. ¢ RTNDT Fluence, O' RTT
(C) (G 1 n/CM2
) aTT41 ( C) (10 n/cm2
) A (IC)
(>1 MeV) ("C) (>1 IeV) (C)
72W -23 1.51 72 49 1.88 80 57
73W -34 1.51 82 48 1.93 93 59
aSource: R. K. Nanstad et al., 'Effects of Radiation of KIc Curves for High-CopperWelds," pp. 214-33 in Effects of Radiation on Materials: 14th International Symposium,Vol . II, ASTM STP 1046, N. H. Packan, R. E. Stoller, and A.-S. Kumar, Eds., American Societyfor Testing and Materials, Philadelphia, 1990.
bAdjusted RTNDT - initial RTNOT + ATTA1 (according to ASTM 185-82).
cNormalization: (aTT*,)(c'/o)05. Source: G. R. Odette and G. E. Lucas, "IrradiationEmbrittlement of Reactor Pressure Vessel Steels: Mechanisms, Models, and Data Correlations,"pp. 206-41 in Radiation Embrictlement of Nuclear Pressure Vessel Steels: An InternationalReview (Second Volume), ASTM STP 909, L. E. Steele, Ed., American Society for Testing andMaterials, Philadelphia, 1986.
NOTE:* _ fluence for Charpy V-notch impact specimens.0'- fluence for crack-arrest specimens.n - neutrons.&TTil- shift in 41-J Charpy'V-notch impact energy level.
72W and 73W weldments in the transition region to approximately 50'C above RTNDT.At temperatures below RTNDT, there seems to be a smaller toughness margin between thelower-bound curves and the ASME KIa curves. For example, the lower-bound values areapproximately 70, 35, and 10% higher than the ASME KIa values at temperatures with respect toRTNDT of 50,0, and -50'C.
T-bound curve, shown as a dotted curnpin Fig. 7, is the ASME KIa curThe lowere The 2Ca shfve
shifted downward by 28s in temperature until the first data point is encountered. The 28W shiftshown is the minimum shift from all four sets of data (unirradiated and irradiated welds 72W and73W). The 28n C shift was obtained for the irradiated 72W weld and the unirradiated 73W weld
and, thuse n trend can be established. However, i t is quitepossible that more experimental datamay alte this lower bound significantly. The evaluatiodin-of the 72W and 73WS crack-arrestloughness data obtained from the weld-embrittled specimens is ongoing. Statistical analyses,similar to those described in the previous section on the KIC program, will also be performed onthe data.
The remaining 24 irradiated crack-arrest specimens, which are ali duplex-type specimens,are being tested during Phase II of Series 6. Four of the 24 duplex-type specimens, two eachfrom the 72W and 73W welds, have already been tested. In all four specimens the flaw- arrested
107
in the fusion zone between the hardened crack-starter material, and the weld metal test section.Porosity and lack of fusion were the major reasons for the crack arresting in that region. That islikely to preclude successful testing of the remaining duplex specimens in their present form. Inorder to utilize these specimens, various modifications to the duplex specimens are beingconsidered. The initial modification being pursued is to increase the crack-driving force byincreasing the diameter of the crack-starter hole. At present, the diameter of the hole in the24 irradiated duplex specimens is approximately 4 nmm. The idea behind this modification is thata sufficiently large increase in crack-driving force may cause thq propagating flaw to jump acrossthe unfused, porous zone, but still allow arrest within the test section of the specimen.
IRRADIATION EFFECTS ON STAINLESS STEEL CLADDING
The objective of the HSSI Seventh Irradiation Series is to obtain toughness properties fortwo types of stainless steel cladding in the unirradiated and irradiated conditions. JThe propertiesobtained include tensile, CVN impact, and J-integral toughness. The goal is to evaluate thefracture resistance of irradiated weld metal cladding representative of that used in earlypressurized-water reactors. Irradiation effects on the single-wire, submerged-arc cladding havebeen published previously, 6 as have the irradiation effects on the tensile and Charpy impactbehavior of three-wire cladding.7 This section will summarize recently completed testing ofirradiation effects on the fracture toughness of three-wire series-arc cladding.
The commercially produced three-wire series-arc stainless steel cladding was evaluatedunder similar irradiation and testing conditions as had been used previously for the single-wirecladding. To summarize results of CVN testing of the three-wire cladding specimens, irradiatedat 2880C to fluence levels of 2 and 5 x 10¹⁹ neutrons/cm 2 (>I MeV), it was observed that theCVN upper-shelf energy decreased by 15 and 20% and the 41-I transition temperature increasedby 13 and 280C, respectively. Irradiation also degraded the CVN lateral expansion significantly;expansion on the upper shelf was reduced by approximately 40% for both fluence levels. Theseresults generally agree with those for the single-wire cladding produced with good weldingpractice.
Figure 8'shows that irradiation at 2880C to an average fluence of 2.41 x 10¹⁹neutrons/cm2 (>1l MeV) resulted in decreases in initiation ductile fracture toughness, JIc.Decreases in the tearing modulus were observed as well' but the tearing modulus values did notchange significantly with test temperature from about room temperature to 2889C. The JIcdecreases generally agree with the reductions in both the CVN upper-shelf energy and lateralexpansion except that the CVN data do not show a significant change with increasing testtemperature.
Figure 9'provides a graphical comparison of the JIc values vs test temperature for thethree-wire cladding with a typical A533 grade B class 1 plate (HSST Plate 02, 0.14 wt % c6pper)and! a low upper-shelf weld (HSSI Weld 61W, 0.28 wt. % copper), all in the unirradiatedcondition.' Figure 10 shows a similar comparison of the same materials following irradiation at2880C to similar fluence levels. Weld 61W gave the lowest JI value (43.1 kJ/mZ) observed'forthe LUS welds tested in the HSSI Second and Third Irradiation Series.9 The JIc of the irradiatedcladding at 2880C is only about half that of 61W. It is also substantially lower. than the lowest JIcyaiue (833 kJ/m2) obtained for HSST Plate 02 in the HSSI Fourth Irradiation Series.lO Thelow fracture toughness of the three-wire stainless steel cladding has the potential for stronglyaffecting the extension of small surface flaws during overcooling transients.
108
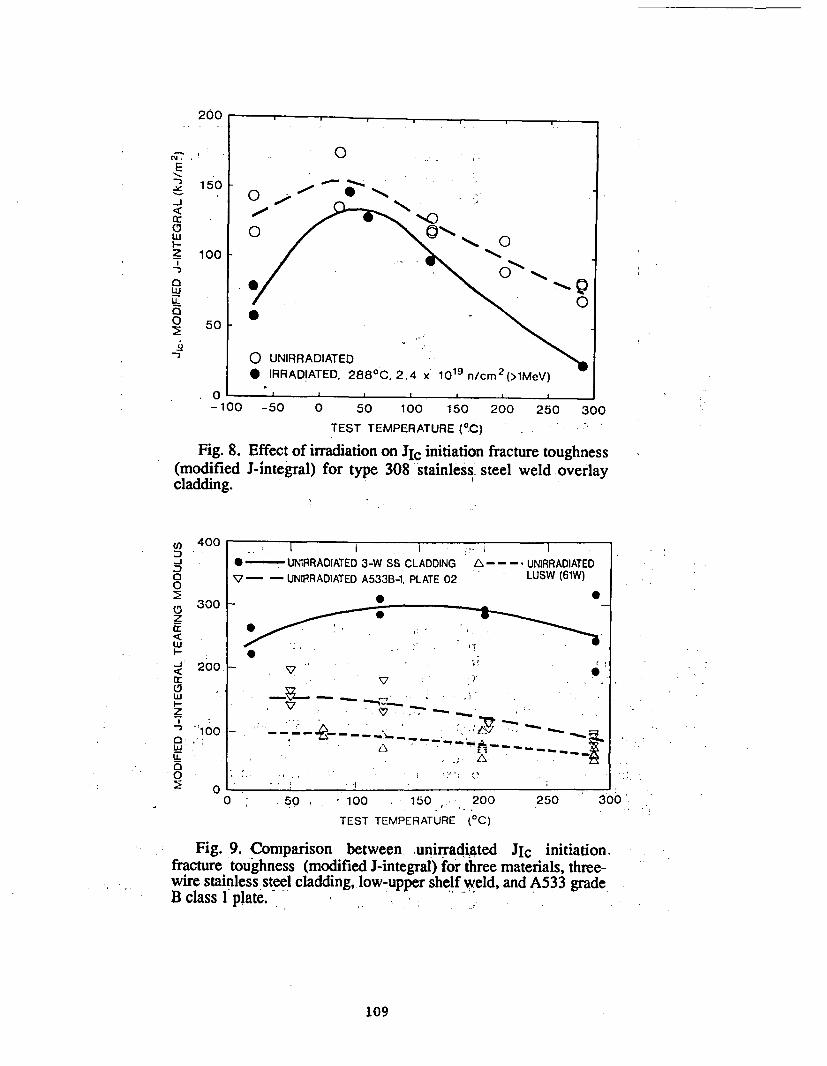
200
6- ,
E
"I
0:
LuU-0
Uz
0
1500j
100 I
,N
0
\' o
. . . 0
0
IS
50 F
o UNIRRADIATED* IRRADIATED. 288°C. 2.4 x 10'" n/cm' (>lMeV)
O L
-100 -50 0 50 100 150 200 250 300
TFEST TFMAPEPATIUIF: 0te -
Fig. 8.(modifiedcladding.
, - Lt - r1--- Vl- IEffect of irradiation on J1c initiation fracture toughnessJ-integral) for type 308 stainless: steel weld overlay
u, 400-J00
a 300z
LuE
-j 200a:
z
I' '100
LuU-
100
I II. I i
0- UNIRRADIATED 3-W SS CLADDING7 - - UNIRRADIATED A533B-1. PLATE 02
i -- -- UNIRRADIATED- LUSW (61W)
* 0-
-I--. v 0
v ,- -.
V .. �, 7*-*---�.�- I;�.- �
AA
0 .50 100 . 150. 200
TEST TEMPERATURE (0C)
250 300O
Fig. 9. Comparison between unirradiated JIc initiation.fracture toughness (modified J-integral) for three materials, three-wire stainless steel cladding, low-upper shelf weld, and A533 gradeB class [ plate.
109
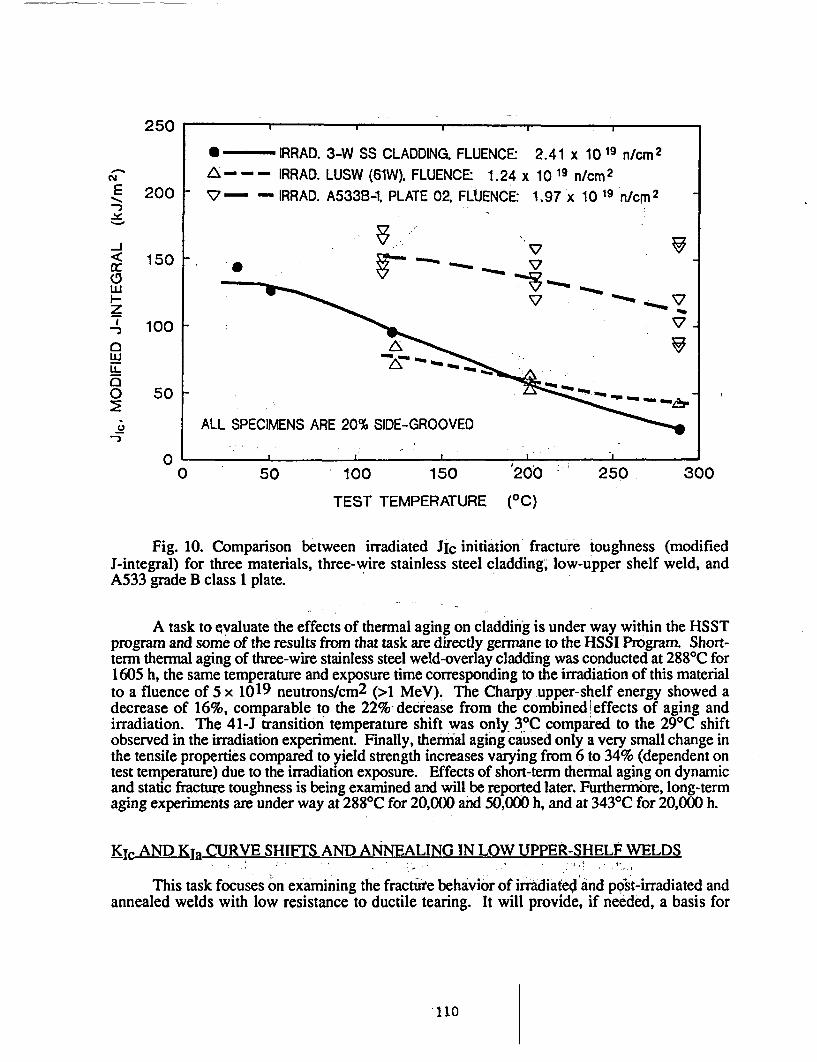
250 _ I I -
* - IRRAD. 3-W SS CLADDING. FLUENCE: 2.41 x 10 19 n/cm2
N14 - --- IRRAD. LUSW (61W). FLUENCE: 1.24 x 10 19 n/cm2
E 200 V - IRRAD. A533B-1, PLATE 02. FLIUENCE: 1.97 x 10 19 n/cm2
< 150 V_
z, 100
0 50
o ALL SPECIMENS ARE 20% SIDE-GROOVED
0 50 100 150 200 250 300
TEST TEMPERATURE (0C)
Fig. 10. Comparison between irradiated JIc initiation fracture toughness (modifiedJ-integral) for three materials, three-wire stainless steel cladding; low-upper shelf weld, andA533 grade B class 1 plate.
A task to evaluate the effects of thermal aging on cladding is under way within the HSSTprogram and some of the results from that task are directly germane to the HSSI Program. Short-term thermal aging of three-wire stainless steel weld-overlay cladding was conducted at 2880C for1605 h, the same temperature and exposure time corresponding to the irradiation of this materialto a fluence of 5 x 10¹⁹ neutrons/cm2 (>1 MeV). The Charpy upper-shelf energy showed adecrease of 16%, comparable to the 22%-decrease from the combined!effects of aging andirradiation. The 41-J transition temperature shift was only 30C compared to the 29CC shiftobserved in the irradiation experiment. Finally, thermal aging caused only a very small change inthe tensile properties compared to yield strength increases varying from 6 to 34% (dependent ontest temperature) due to the irradiation exposure. Effects of short-term thermal aging on dynamicand static fracture toughness is being examined and will be reported later. Furthermore, long-termaging experiments are under way at 2880C for 20,000 and 50,000 h, and at 3430C for 20,000 h.
-Ic AND KIa CURVE SHIFTS AND ANNEALING IN LOW UPPER-SHELP WELDS
This task focuses on examining the fracture behavior of irradiated and p6st-irradiated andannealed welds with low resistance to ductile tearing. It will provide, if needed, a basis for
I110
modification of the current method for shifting the various ASME fracture toughness curves(KIc, KIa, KIR) to account for irradiation embrittlementi specifically in LUS welds. Theinformation developed under this task will augment that obtained in experiments performed ontwo high upper-shelf weldments under the Fifth and SixthIrradiation Series and provide anexpanded basis for accounting for irradiation-induced embrittlement in reactor vessel materials.Additionally, it will examine the effects of thermal annealing and reirradiation on KIC, KIa, andductile tearing resistance (J-R) in large specimens representative of reactor vessels. The planningfor these irradiation experiments, designated Series 8 (KIC and KIa curve shifts) and Series 9(annealing effects) has begun but procurement of material and irradiations will not startbefore 1992.
IRRADIATION EFFECTS IN COMMERCIAL LOW UPPER-SHELF WELDS
The focus in this task is the investigation of commercially produced submerged-arc weldswith low Charpy upper-shelf energy. It will substantially augment the information obtained inthe HSSI Second and Third Irradiation Series which examined the effects of irradiation on theductile fracture toughness of commercially fabricated LUS welds. All of these welds have beenfabricated with Linde 80 flux and copper-coated weld wire. The task currently includes twosubtasks, the investigation of welds from the Midland Reactor Vessel, and the final analyses ofirradiation temperature and fluence variations on the tensile and Charpy impact data from theSecond and Third Series.
Irradiation Effects in the Midland Reactor Vessel Weld
The primary objective of the HSSI Tenth Irradiation Series is to investigate thepostirradiation fracture toughness of the WF-70 submerged-arc weld from the Midland Unit 1reactor vessel. The weld metal is known to be low upper-shelf energy material, and this sameweld material (WF-70) is known to be the controlling material in five commercial operatingreactors. The test program will provide vital information on the significance of test methods thatare applied in surveillance programs.
Consumers Power Company canceled and legally abandoned the facilities at Unit 1 of theMidland Power Station. The reactor vessel of Unit 1 was fabricated with a completecircumferential seam weld of WF-70 material at the core beltline. The WF-70 designation byBabcock and Wilcox, Co. (B&W) is the identification of a particular heat of weld wire (72105)and particular lot of Linde 80 welding flux (8669). The circumferential double-butt nozzle weldseam, interrupted by the nozzles, was fabricated using WF-70 on the outer half and WF-67 onthe inner half of the weldment. Procedure WF-67 used the same Linde 80 welding flux as forWF-70, but used a different heat of weld wire (72442). Consumers Power Company providedthe material free of charge as an act of goodwill for the benefit of the nuclear industry. A jointeffort was initiated, at the instigation of the USNRC and th6 Electric Power Research Institute(EPRI), to obtain the WF-70 welds from the Unit 1 reactor vessel. Participants in the effortincluded Commonwealth Edison, B&W Owners Group, Westinghouse Electric Owners Group,and ORNL (representing the USNRC). Blocks of material, about 1.2 m long and 0.7 m wide,were removed from the 216-mm-thick vessel beltline region and the 305-mm-thick nozzle regionby air-arc gouging the stainless steel cladding and flame cutting the base material using a vacuum-mounted fixture. Five beltline and two nozzle course sections.were obtained by ORNL.
A plan for evaluating the WF-70 welds has been completed and includes both unirradiatedand irradiated testing. In addition to a detailed characterization of the bulk chemical composition
ill
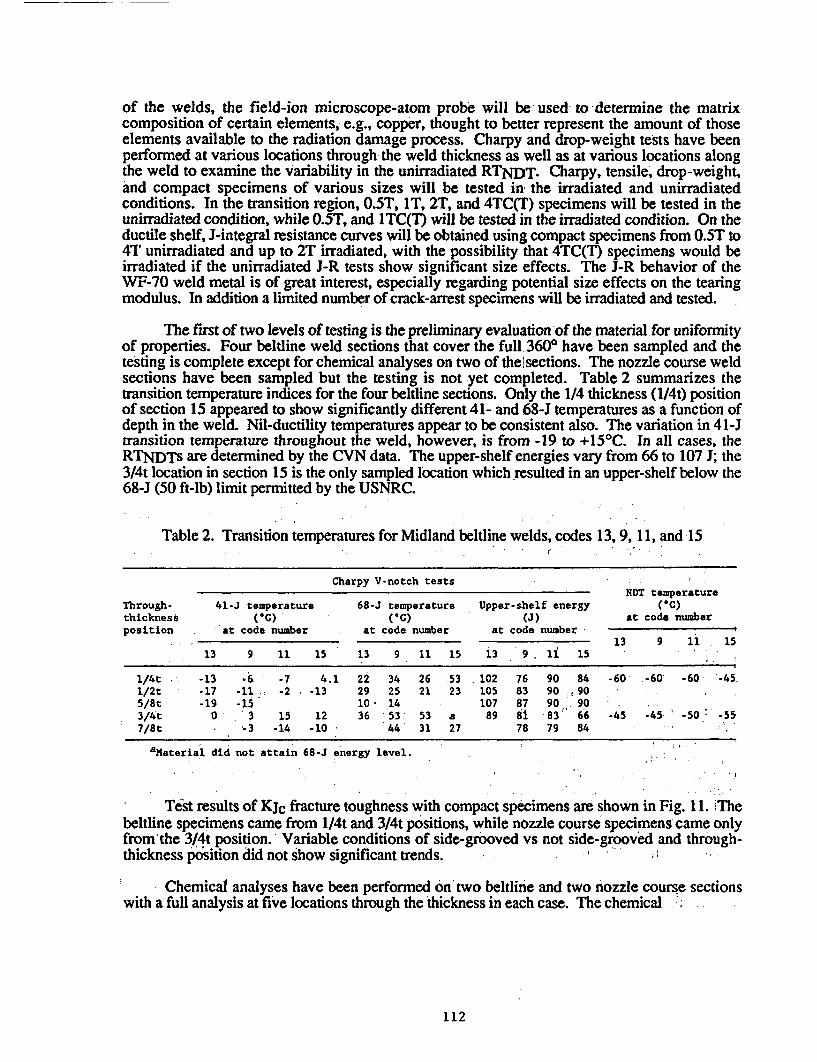
of the welds, the field-ion microscope-atom probe will be used to 'determine the- matrixcomposition of certain elements, e.g., copper, thought to better represent the amount of thoseelements available to the radiation damage process. Charpy and drop-weight tests have beenperformed at various locations through the weld thickness as well as at various locations alongthe weld to examine the variability in the unirradiated RTNDT. Charpy, tensile, drop-weight,and compact specimens of various sizes will be tested in the irradiated and unirradiatedconditions. In the transition region, 0.5T, IT, 2T, and 4TC(T) specimens will be tested in theunirradiated condition, while 0.5T, and ITC(T) will be tested in the irradiated condition. On theductile shelf, J-integral resistance curves will be obtained using compact specimens from 0.5T to4T unirradiated and up to 2T irradiated, with the possibility that 4TC(T) specimens would beirradiated if the unirradiated J-R tests show significant size effects. The J-R behavior of theWF-70 weld metal is of great interest, especially regarding potential size effects on the tearingmodulus. In addition a limited number of crack-arrest specimens will be irradiated and tested.
The first of two levels of testing is the preliminary evaluation of the material for uniformityof properties. Four beltline weld sections that cover the full 3600 have been sampled and thetesting is complete except for chemical analyses on two of theIsections. The nozzle course weldsections have been sampled but the testing is not yet completed. Table 2 summarizes thetransition temperature indices for the four beltline sections. Only the 1/4 thickness (1/4t) positionof section 15 appeared to show significantly different 41- and 68-J temperatures as a function ofdepth in the weld. Nil-ductility temperatures appear to be consistent also. The variation in 41-Jtransition temperature throughout the weld, however, is from -19 to +15'C. In all cases, theRTNDTS are determined by the CVN data. The upper-shelf energies vary from 66 to 107 J; the3/4t location in section 15 is the only sampled location which resulted in an upper-shelf below the68-J (50 ft-lb) limit permitted by the USNRC.
Table 2. Transition temperatures for Midland beldline welds, codes 13, 9, 11, and 15
Charpy V-notch testsNDT temperature
Through- 41-J temperature 68-J temperature Upper-shelf energy (IC)thickness (IC) ('C) (J) at code numberposition at code number at code number at code number
13 9 1i 1513 9 11 15 13 9 11 15 13 9, li 15
1/4t -1 -13 . 6 -7 4.1 22 34 26 53 .102 76 90 84 -60- -60 -60 ;-45.1/2t -17 -11 . -2 -13 29 25 21 23 105 83 90 905/8t -19 -15 10 14 107 87 90 903/4t 0 3 15 12 36 53 53 a 89 81 83 66 -45 -45 -50 -557/8t -3 -14 -10 44 31 27. 78 79 84
aMaterial did not attain 68-J energy level.
Test results of KJc fracture toughness with compact specimens are shown in Fig. 11. Thebeltline specimens came from l/4t and 3/4t positions, while nozzle course specimens came onlyfrom'the 3/4t position. Variable conditions of side-grooved vs not side-grooved and through-thickness p6sition did not show significant trends.
Chemical analyses have been performed on two beltline and two fiozzle course sectionswith a full analysis at five locations through the thickness in each case. The chemical
112
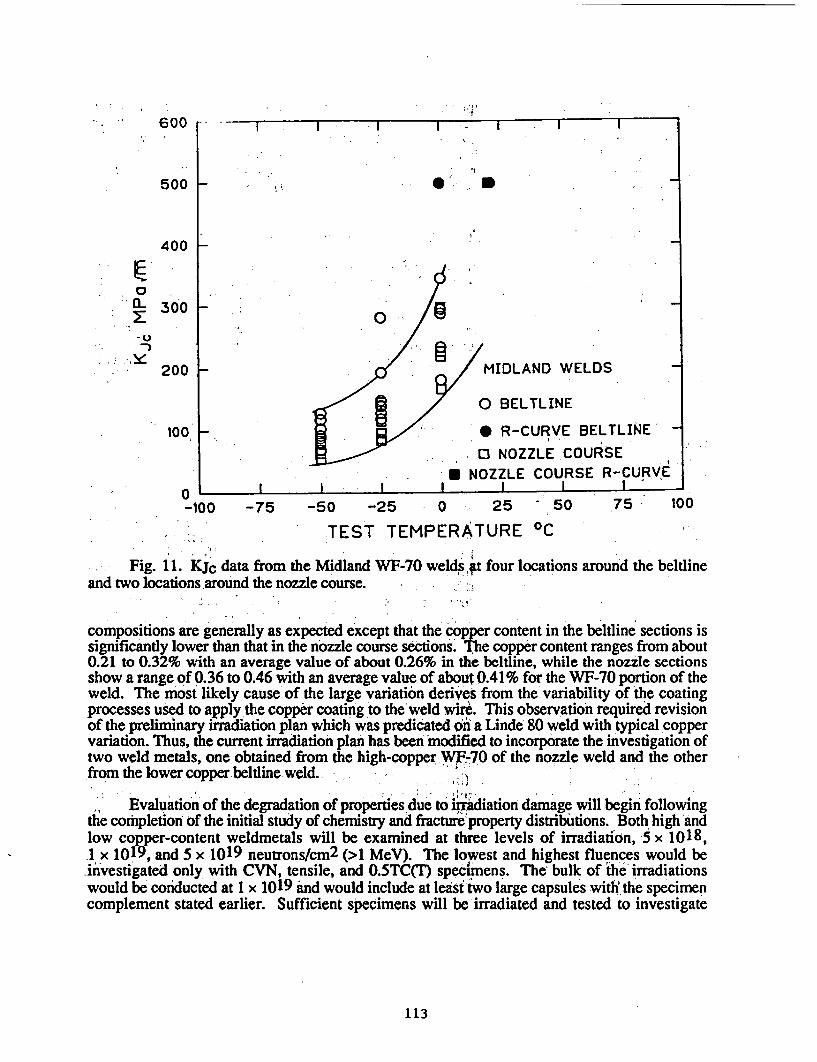
I
* I600
500
400
., . 5
.0a-.. .300
200
; ;
MIDLAND WELDS
3 0 BELTLINE
* R-CURVE BELTLINE -
O NOZZLE COURSE- NOZZLE COURSE R-CURVE
I~~ II
100 _
-100 -75 -50 -25 0 25 50 75- 100
TEST TEMPERATURE 0C
Fig. 11. KJc data from the Midland WF-70 welds At four locations around the beitlineand two locations around the nozzle course.
compositions are generally as expected except that the copper content in the beldine sections issignificantly lower than that in the nozzle course sections. The copper content ranges from about0.21 to 0.32% with an average value of about 0.26% in the beitline, while the nozzle sectionsshow a range of 0.36 to 0.46 with an average value of about 0.41% for the WF-70 portion of theweld. The most likely cause of the large variation derives from the variability of the coatingprocesses used to apply the copper coating to the'weld wire. This observation required revisionof the preliminary irradiation plan which was predicated on a Linde 80 weld with typical coppervariation. Thus, the current irradiation plan has been modified to incorporate the investigation oftwo weld metals, one obtained from the high-copper W0 of the nozzle weld and the otherfrom the lower copper beltline weld.
Evaluation of the degradation of properties due to i#adiation damage will begin followingthe completion of the initial study of chemistry and fracture property distributions. Both high andlow copper-content weldmetals will be examined at three levels of irradiation, 5 x 1018,1 x 1019, and 5 x 10¹⁹ neutrons/cm2 (>1 MeV). The lowest and highest fluences would beinvestigated only with CVN, tensile, and 0.5TC(T) specimens. The bulk'of the irradiationswould be conducted at 1 x 10¹⁹ and would include at least two large capsules with the specimencomplement stated earlier. Sufficient specimens will be'irradiated and tested to investigate
113
material variability. One area of emphasis will be a comparison of transition temperature shiftsfrom surveillance capsule size specimens vs those from the larger specimens. The latter are morelikely to agree with ASME Code curve behavior. R-curve trends for upper-shelf behavior willalso be evaluated in terms of surveillance specimens vs the larger specimens that will yield moreJ values (as per ASTM E 1152) for JR curve development. Design of the large capsules ispresently underway with irradiations scheduled to begin during 1991 at the Ford Nuclear Reactorat the University of Michigan.
Analyses of Charpy and Tensile Data From Irradiation Series 2 and 3
The HSSI Second and Third hradiation Series had the primary objective to investigate theeffects of irradiation on the ductile fracture of seven commercially fabricated LUS submerged-arcwelds. AR the welds were fabricated with copper-coated wire and Linde 80 flux which producedwelds with relatively low Charpy upper-shelf energy in the unirradiated condition and ofrelatively high sensitivity to neutron radiation. The development of experimental elastic-plasticfracture mechanics methods was pursued concurrently with the conduct of these irradiationseries. The irradiation of compact specimens up to 4TC(T) and testing of those specimens toobtain i-integral resistance curves represented a major undertaking which was shared by anumber of organizations.
Irradiation of the compact specimens at a nominal temperature of 2880C to an averagefluence of about 8 x 10¹⁸ neutrons/cm2 (>1 MeV) was relatively successful and their resultshave been published previously.9 However, the Charpy impact and tensile specimens werelocated at positions in the capsule where temperature control was less and the irradiationtemperatures spanned the range 235 to 3450C for those specimens. Additionally, the neutronfluences for the small specimens varied from about 4 to 13 x 1018 neutrons/cm2 (>1 MeV).Although not desirable within the intended context of the experiments, those variations didprovide the opportunity to investigate the effects of irradiation temperature and fluence (over theranges observed) on the tensile and Charpy impact properties of these LUS welds. The dataavailable for such analyses was limited from a statistical viewpoint, yeti'allowed for somereasonable observations which could be compared with results from other studies. For most ofthose comparisons, the Charpy and tensile results were normalized for fluence variations to theaverage fluence of 8 x 10¹⁸. The results of the irradiations and their analyses have beenrecently published.11 The important observations and conclusions which can be stated based onthe results of those analyses are summarized here.
Analyses of irradiated tensile data showed a dependence on irradiation temperature of -1.15 MPaPC for yield strength, -0.79 MPa/C for ultimate strength, and -0.014%/"C for totalelongation. Analyses of irradiated Charpy data showed a dependence oIn irradiation temperatureof about -0.5oC/PC for transition temperature shift and -0.05 JP:C for upper-shelf energy drop.
The results indicated that the radiation-induced changes in yield strengths (in megapascals) andCharpy transition temperature shifts (in degrees Celsius) for the seven welds can be expressed asATT41 = 0.70*Asy. The Charpy results indicated a dependence on copper concentration whichcan be expressed as ATT41 = 234*(Cu - O.1)0.57, where A1T41 is degrees;Celsius andcopper (qu) is weight percent. I
Comparison of the Charpy results with data for the same materials irradiated in powerreactor surveillance programs showed mixed results with the power reactor changes being greaterin some cases and the test reactor changes greater in others.
114
MICROSTucrLlRAL ANALYSIS AND MODELING ,
Over the past thirty years, a large amount of experimental data has been accumulated on theirradiation embrittlement of pressure vessel steels. Specimens irradiated in materials test reactorsand surveillance locations of operating power reactors have been used to flesh out the irradiationproperty change response of these materials. However, in the broader context of research onradiation effects phenomena in materials, embrittlement historically has been treated in aqualitatively different manner. Other phenomena such asirradiation-induced swelling, creep,solute segregation, precipitation and helium-affected ductility loss have been subject to moremechanistically oriented work covering two areas. The first is extensive microstructural andmicrocompositional analysis using analytical electron microscopy (AEM) and other techniques.Irradiation response on the atomic and microstructural scales has been characterized with respectto both materials parameters and irradiation variables. The second is the development offundamental understanding of the observed phenomena. The most detailed and quantitativeexpression of this understanding is in the formulation of physically-based theoretical modelsdescribing macroscopic property changes and their relation to the atomic and defect levelstructure.
The situation has changed recently concerning pressure vessel steels. Greatly increasedcapabilities are now available for atomic- and defect-scale characterization. It is now possible toreliably identify the irradiation-induced clusters responsible for hardening and to characterizethem with respect to size, density, and elemental composition, for example. Modern capabilitiescan now be used to develop an understanding of embrittlement on a physical basis commensuratewith the current knowledge in the other areas of radiation effects.
A physical theory based on defect reactions and microstructural evolution can now beformulated. It needs to be tethered soundly on the microstructural level by results from themicrostructural characterization techniques, and constrained at the macroscopic level to producepredictions consistent with the large array of macroscopic embrittlement measurements. Modelsof this type formulated to describe swelling, irradiation creep, solute segregation and hightemperature ductility loss have proven remarkably successful. A viable theoretical model willresult in predictions of embrittlement for conditions where experimental data are unavailable(temperature, dose rate, dose) but where behavior must be known. It is expected to also provideguidance for the design of embrittlement-resistant alloys tailored for specific irradiationconditions. Results of the initial work within the HSSI program in this task are described below,focussing on two principal areas of efforL One is an analytical evaluation of embrittlement effectsfocusing on rate effects in general and the initial hardening transient in particular. The other is anexperimental effort to obtain definitive information on spectrum and rate effects at lowtemperatures, similar to those at which vessel supports operate.
Transient and Rate Effect on Embrittlement
The reaction rate theory description of radiation damage has been widely used to modelphenomena such as void swelling and irradiation creep. Tharwork has generally been concernedwith irradiation conditions of relatively high doses (>1 dpa) and high temperatures (T > 300'C).In that regime, the vacancies and interstitials rapidly,-come into equilibrium with themicrostructure and it is safe to assume that the point defect Concentrations are at their steady statevalues. Point defect behavior in the steady state has been thoroughly explored.I 1-15 Analyticalsolutions to the rate equations have been obtained for certain limiting cases that describe thedependence of the point defect concentrations on the total dose or the displacement rate.l 1-16
115
In contrast, the time required for the point defect concentrations to reach steady state at thelower temperatures typical of reactor pressure vessels and reactor support structures can be quitelong, at the lowest temperatures even exceeding the in-service component lifetime. 16 Therefore,the use of the steady-state point defect concentrations in models for the behavior of materials inthis regime can give irrelevant and misleading resuIts. A simple model has been developed andused to conduct a detailed numerical analysis of the influence of the point defect transient. Thisinitial work has focused on the influence of the displacement rate because of the importance ofaccelerated testing to research on pressure vessel embrittlementI, The number or fraction of pointdefects that are lost to bulk recombination have been used as a measure of radiation sensitivity,since it is only defects that escape recombination that are available to contribute to radiation-induced 'embrittlement.
The number of point defects that have recombined up to some time, t, can be calculated as
NR RCiCvdt, (1)
where R'is the bulk recombination coefficient and Ci and Cv are the interstitial and vacancyconcentrations, respectively. Using the limiting values of Ci and Cv that are obtained during thelinear portion of the point defect transient and at steady state, for sink-dominated point defectabsorption,l 2 ,16 analytical expressions for the number and fraction of point defects lost torecombination were derived. These expressions are listed in Table 3, where the dose, A, is theproduct of the modified displacement rate (G'd a) and the time, and'the Di,v and Si,v are thediffusivities and total sink strengths for interstitiats and vacancies.
Table 3. Number (NR) and fraction (fR) of point defects lost toi recombination for limiting cases
NR fR
Linear transient R A3 R A2
Steady state, - _____ AdRGparecombination dominant DD.,S rS:7
,.~ l: . : S72.
The symbol G'dpa represents the generation rate of defects' that' avoid in-cascaderecombination, i.e., the actual displacement rate times the fraction that avoids in-cascaderecombination. The expressions listed in Table 3 provide an eitimate for how the recombinationfraction- changes with the displacement rate. Alternately, the change in' the irradiation timerequired to give'equivalent recombination fractions at different displacement rates can be
116
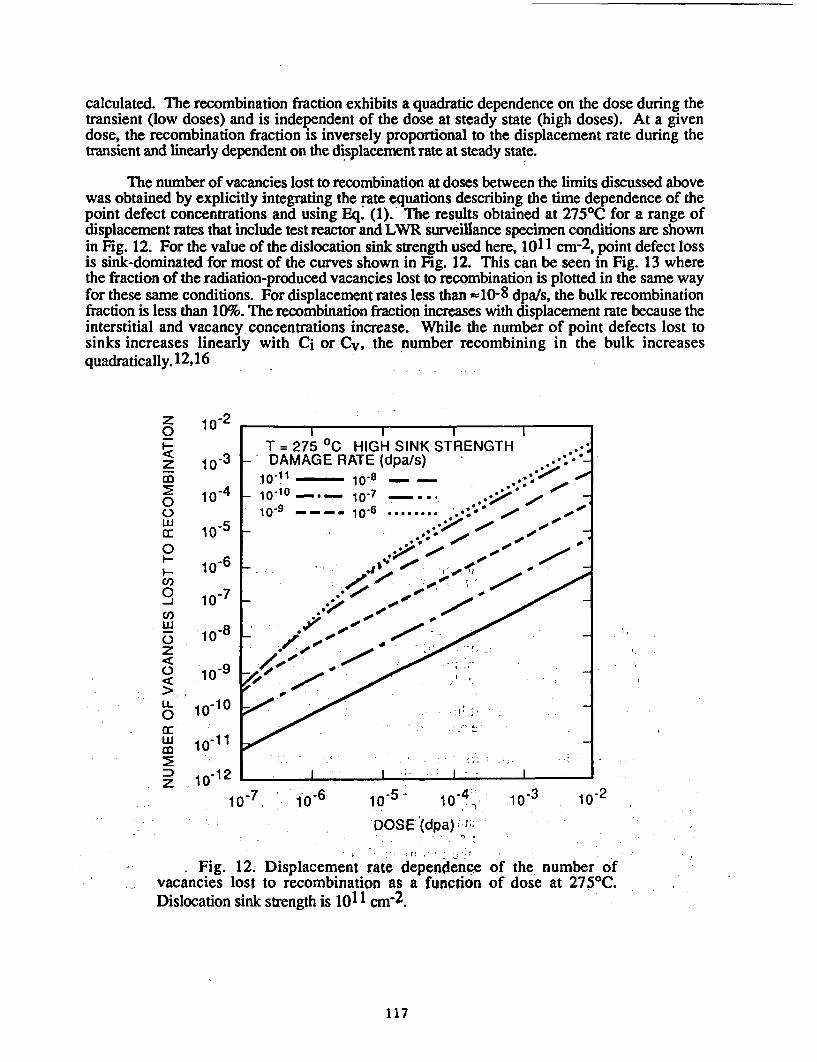
calculated. The recombination fraction exhibits a quadratic dependence on the dose during thetransient (low doses) and is independent of the dose at steady state (high doses). At a givendose, the recombination fraction is inversely proportional to the displacement rate during thetransient and linearly dependent on the displacement rate at steady state.
The number of vacancies lost to recombination at doses between the limits discussed abovewas obtained by explicitly integrating the rate equations describing the time dependence of thepoint defect concentrations and using Eq. (1). The results obtained at 2751C for a range ofdisplacement rates that include test reactor and LWR surveillance specimen conditions are shownin Fig. 12. For the value of the dislocation sink strength used here, 101 1 cm-2, point defect lossis sink-dominated for most of the curves shown in Fig. 12. This can be seen in Fig. 13 wherethe fraction of the radiation-produced vacancies lost to recombination is plotted in the same wayfor these same conditions. For displacement rates less than -l0-8 dpals, the bulk recombinationfraction is less than 10%. The recombination fraction increases with displacement rate because theinterstitial and vacancy concentrations increase. While the number of point defects lost tosinks increases linearly with Ci or Cv, the number recombining in the bulk increasesquadratically. 12,16
z 10-2
0
tZ 1-3
O 10-
a: 1 0-5
010-6
'n
o 10-7
U 8
0- 109
, 10-19mL0 o-1
- -I --- I IIT = 275 °C HIGH SINK STRENGTH
- DAMAGE RATE (dpa/s)10-11 10-8 -_ -:o,/
- 10 100 7 -7 . -10'9 -- - 10-6 ... B *;@0 0j .0 ,
...
J*1 . , _
I~~~0 I . .LO
10-5i - 104
DOSE (dpa) :I .. , I.
10-3
Fig. 12. Displacement rate dependenge of the number ofvacancies lost to recombination as a function of dose at 275 0C.Dislocation sink strength is 101 1 cmD2.
117
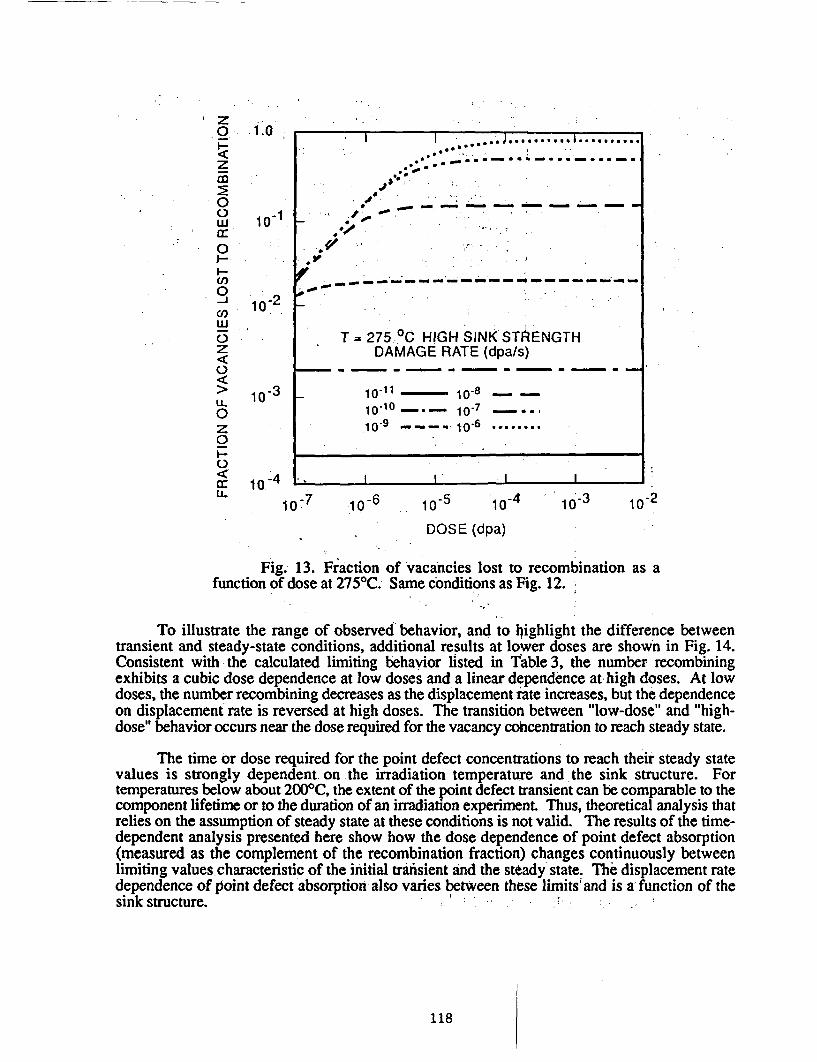
z :1; ;.0 1.0,~
I-z
co00
U)
UJ 10 1
.9 10-2,
C ,w5z
0 1o
0z
a: 1.-4
1
X I -.. * .d.J...JI.~ ~ ~~j .S .I . - . .. . . , _,
-- - _ - - - - - - - - - _
_~** - S,~..
-. . ,. -:
_- -- - _ _ _--
T = 275 :C HIGH SINK STRENGTHDAMAGE RATE (dpa/s)
_ - - - - - - -
lo-11 10-8 _ _
lo10 1°-. 0-7 _.
10- ---- 16 ........
. II I
.-
.-
0-7 10-6 10-4 10- 10-2
DOSE (dpa)
Fig. 13. Fraction of vacancies lost to recombination as afunction of dose at 2750C. Same conditions as Fig. 12.
To illustrate the range of observed behavior, and to lighlight the difference betweentransient and steady-state conditions, additional results at lower doses are shown in Fig. 14.Consistent with the calculated limiting behavior listed in table 3, the number recombiningexhibits a cubic dose dependence at low doses and a linear dependence at high doses. At lowdoses, the number recombining decreases as the displacement rate increases, but the dependenceon displacement rate is reversed at high doses. The transition between "low-dose" and "high-dose" behavior occurs near the dose required for the vacancy concentration to reach steady state.
The time or dose required for the point defect concentrations to reach their steady statevalues is strongly dependent on the irradiation temperature and the sink structure. Fortemperatures below about 2000C, the extent of the point defect transient can be comparable to thecomponent lifetime or to the duration of an irradiation experiment. Thus, theoretical analysis thatrelies on the assumption of steady state at these conditions is not valid. The results of the time-dependent analysis presented here show how the dose dependence of point defect absorption(measured as the complement of the recombination fraction) changes continuously betweenlimiting values characteristic of the initial transient and the steady state. The displacement ratedependence of point defect absorption also varies between these limits'and is a function of thesink structure.
118
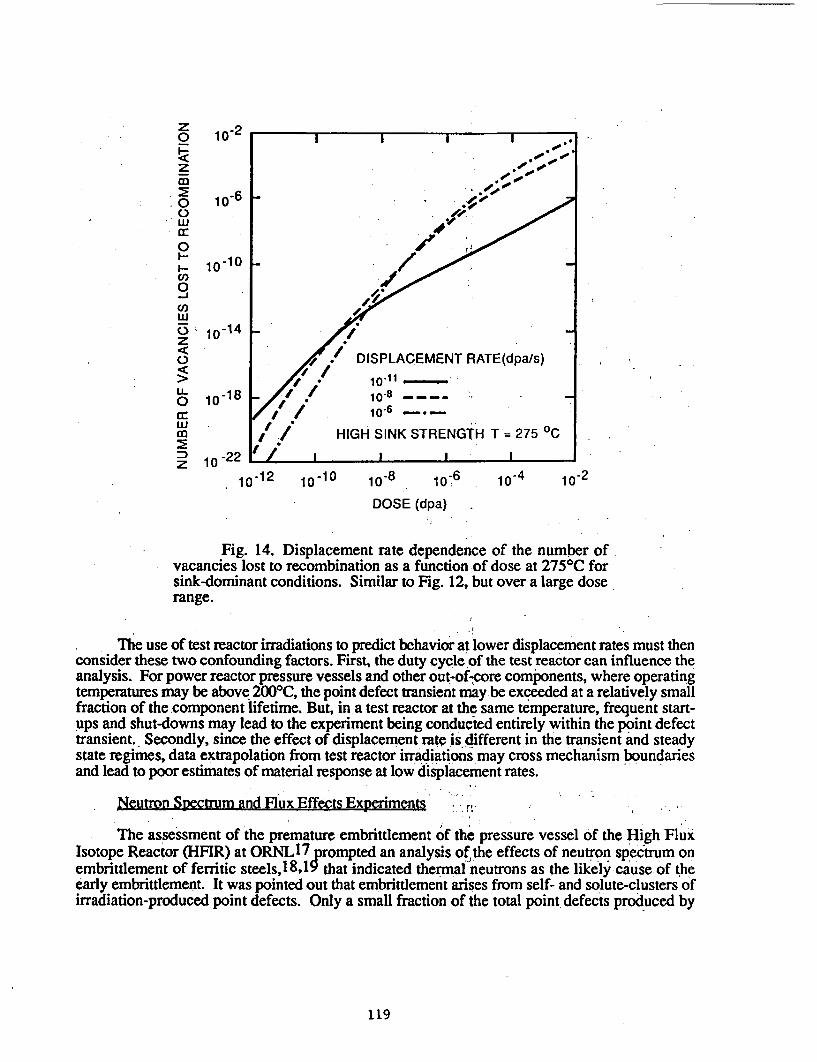
z0 11
o
I- 1
* W
z
Co0
10CO,0
-j
coW0 10
U-o 10
z 10
-2
106
)-10
I ~ ~ ,1 , 1
/ / DISPLACEMENT RATE(dpa/s)quiz/// lo-II
/t . ~10 8 __at / . 10'6-.
/1 I HIGH SINK STRENGTH T =275 C
fi I I
I
-14
)C
-22
i_12~ 1 10-l i0o 1 -2
DOSE (dpa)
Fig. 14. Displacement rate dependence of the number ofvacancies lost to recombination as a function of dose at 2750C forsink-dominant conditions. Similar to Fig. 12, but over a large doserange.
The use of test reactor irradiations to predict behavior at lower displacement rates must thenconsider these two confounding factors. First, the duty cycle of the test reactor can influence theanalysis. For power reactor pressure vessels and other out-of-core components, where operatingtemperatures nay be above 2000C, the point defect transient may be exceeded at a relatively smallfraction of the component lifetime. But, in a test reactor at the same temperature, frequent start-ups and shut-downs may lead to the experiment being conducted entirely within the point defecttransient. Secondly, since the effect of displacement rate is different in the transient and steadystate regimes, data extrapolation from test reactor irradiations may cross mechanism boundariesand lead to poor estimates of material response at low displacement rates.
Neutron Spectrum and Flux Effects Experiments
The assessment of the premature embrittlement of the pressure vessel of the High FluxIsotope Reactor (HFIR) at ORNL1 7 prompted an analysis ofthe effects of neutron spectrum onembrittlement of ferritic steels,18,lJ that indicated thermal neutrons as the likely cause of theearly embrittlement. It was pointed out that embrittlement arises from self- and solute-clusters ofirradiation-produced point defects. Only a small fraction of the total point defects produced by
119
atomic displacements are involved in the clusters. The bulk of the point defects are lost byrecombination within the displacement cascades where they are created, so only the survivingpoint defects are relevant to embrittlement. Thermal neutrons make small cascades via (n,g)recoils, and the point defects made in such cascades have a much greater probability of survivalthan those born in the large dense cascades associated with fast neutrons. Therefore, thermalneutrons should create more surviving point defects per unit displaced atom than fast neutrons,perhaps a factor of ten more. Determining the magnitude of the weighting factor for the thermalneutrons is crucial. It means that for irradiations in a neutron spectrum where more than 10% ofthe atomic displacements are caused by thermal neutrons, the resulting damage to microstructureand mechanical properties should be dominated by thermal neutrons, not by fast neutrons as istraditionally supposed. If damage is assessed solely in terms of fast neutrons, which is theconventional way, the contribution from thermal neutrons will be considered negligible or minor,and embrittlement in a highly ther-malized neutron spectrum will appear to be accelerated.
At the HFIR vessel, preliminary calculations indicate that the spectrum contains upwardsof 96% thermal neutrons, which implies that more than 30% of the atomic displacements arecreated by thermal neutrons. But the neutron fluxes there are too low to permit confirmatoryembrittlement experiments to be made in reasonable times; Therefore, to substantiate thehypothesis regarding spectrum effects experiments were initiated in the heavy-water High FluxBeam Reactor (IFBR) at Brookhaven National Laboratory. One scoping run was made beforethe reactor was shutdown in response to a safety question. When it became apparent that theHFBR would be down for a protracted period, it also became apparent another reactor with ahigh flux, highly-thermalized spectrum would be required.
The hydraulic facility of the NRU reactor at Chalk River, Canada was selected with ChalkRiver to provide neutron exposures and mechanical testing and ORNL to provide specimens,encapsulation and neutron dosimetry. Irradiation capsule designs have been approved and athorough dosimetry survey of two sites in the hydraulic facility has been completed. The neutronconditions in the facility are ideal for the experiments. The neutron fluxes (>1012 fastneutrons/cm 2-s and >1014 thermal neutrons/cm 2-s) are high enough to induce embrittlement inexposure times of a few weeks, and the spectrum is more than 95% thermal neutrons.
The experiments have two goals. One is to obtain embrittlement data in a soft spectrum tocompare with existing data for a harder spectrum. The other is to measure the contribution ofthermal neutrons to embrittlement by using cadmium wrappers around the specimens to absorbthe thermal neutrons. Specimens will be irradiated over a range of fluences, with and withoutcadmium wrappers, and the changes in tensile yield stress will be measured as an index ofembrittlement. The test materials consist of four different ferritic steels. Two of these, A212Band A350, are HFIR pressure vessel archive materials for which there is reference tensileembrittlement data obtained after irradiations in the HFIR and the ORR. A third steel is A36,which is'of interest for external reactor support structures. The fourth is A533B, pertinent tocommercial light water reactor vessels. Irradiation of the specimens is scheduled for late in 1991.
To fully explore the possibilities which may influence irradiation effects on pressure vesselsupport materials, which experience a temperature and neutron exposure rate in some wayssimilar to that of the HFIR vessel,17 experiments were begun to examine potential neutron fluxeffects under realistic exposure conditionslfor vessels supports. To compliment 'the experimentsin the Chalk River reactor designed to explore the potential for a spectrum-induced accelerationduring low temperature irradiation embrittlement, specimens are being exposed in the cavitysurrounding the RPV in the Trojan pressurized water reactor. It is anticipated that thesespecimens will be exposed to a neutron fluence of roughly 2 x 10¹⁷ neutrons/cm2 (E > lMeV)
120
over a period of about two years. This will produce a fast neutron exposure of a level comparableto that seen in the HFIR vessel, at a flux of only one order of magnitude higher. In addition thespectrum, which is being extensively characterized for the HSST program, will be typical of atleast one possible set of conditions which exist in a-reactor cavity and could be experienced byvessel support materials. By comparing the results from this effort with the those from the HFIRsurveillance program and those from the Chalk River reactor exposure, it should be possible togain a substantially enhanced knowledge of the causes of the accelerated embrittlement observedin the HFIR vessel and its application to reactor pressure supports.
Specimens being irradiated in the Trojan Reactor cavity were machined from A212grade B, A350 LF3, and A36 steels. The A212 grade B and A350 LF3 specimens were takenfrom HFIR archival materials to allow direct comparisons with existing data. The A36 specimenswere included since it is a material which has been frequently used in pressure vessel supports.Five and six Charpy V-notch impact specimens from A36 and A212 grade B, respectively, in theL-T orientation were included. A holder, whose external dimensions are equal to that of astandard Charpy V-notch specimen, was designed, manufactured and assembled with 44 mini-tensile specimens. It contained an approximately equal number of mini-tensile specimensmachined in the L orientation from each of the three materials mentioned above.
IN-SERVICE AGED MATERIAL EVALUATIONSi
The primary objective of this task is to evaluate nuclear reactor components as aconsequence of aging. The task focuses on directly examining structural components to allow forthe assessment of actual material condition caused by exposure to normal or off-normalconditions.
The initial efforts under this task have addressed the assessment of existing facilities atORNL and the establishment of supplementary facilities needed for conducting investigations ofcomponents removed from service. The examination of irradiated materials requires, of course,not only the usual mechanical property testing equipment, but facilities for determining physicalproperties and for detailed metallurgical studies, such as optical metallography, scanning electronfractography, and transmission electron microscopy. Also, machining of irradiated materialsrequires a remote machining operation in a hot cell or hot shop.
The efforts to date have focused on a detailed assessment of the extensive existingcapabilities at ORNL for such examinations as well as individual deficiencies and courses ofproposed action. The two items have been identified as most urgently needed. A.remotelyoperated electrodischarge machining facility is required for efficient sectioning of activatedmaterials and their fabrication into test specimens. An automated hardness tester is needed forscreening of embrittlement on received components. Plans have been made and fundingtentatively secured to obtain and install these items over the next two years.
CORRELA M ITOR MATERIALSJ
Correlation monitor materials have been widely used-to provide added confidence of theresults of commercial power reactor surveillance capsule results. The recently approved revisionthe ASTM Standard Practice E 185 for Conducting Surve~llance tests for Light-Water CooledNuclear Power Reactor Vessels now makes their use mandatory for the results to be consideredcredible. This increased need for and the recognition of decreasing supplies of suitable
121
correlation monitor materials were the bases for the establishment of a task with the specific goalof assuring an adequate supply of these materials for the foreseeable future.
Since two of the heavy-section plates procured in the early years of the HSST program,HSST plates 02 and 03, have been used for this purpose, 20 and moreover represent virtually allof the originally qualified correlation monitor material stili available, the initial activity within thistask is to prepare a detailed inventory of all remaining material from these plates and to establishan archival-quality storage facility in which to keep it. This effort was begun within the past yearand is expected to be completed in 1993. In conjunction with archiving and maintaining custodyof the material, the HSSI program has been authorized by the USNRC to release appropriatelypedigreed correlation monitor material at no cost to qualified users who require it. In the pastyear, material has been supplied to General Electric for use in the BWR Owners GroupSupplemental Surveillance Program and to Korean Heavy Industries for use in the surveillanceprogram for Units 3 and 4 of the Yong Gwang pressurized water reactors.
SUMMARY
The HSSI program is actively involved in providing information in several technical areasregarding the irradiation embrittlement behavior of RPVs which is vital to their continued safeoperation. In the HSSI Fifth and Sixth Irradiation Series, designed to examine the shifts andpossible changes in shape in the ASME KIc and KIa curves for two irradiated high-copperwelds, it was seen that both the lower bound and mean fracture toughness shifts were greaterthan those of the associated Charpy-impact energies, whereas the shifts in crack arrest toughnesswere comparable. The irradiation-shifted fracture toughness data fell slightly below. theappropriately indexed ASME KIC curve even when it was shifted according to Revision 2 ofRegulatory Guide 1.99 including its margins.
The beltline weld which was removed from the Midland reactor, fabricated by B&W usingLinde 80 flux, is being examined in the Tenth Irradiation Series to establish the effects ofirradiation on a commercial LUS weld. A wide variation in the unirradiated fracture properties ofthe Midland weld were measured with values of RTNDT ranging from -22 to 540 F through itsthickness. In addition, a wide range of copper content front 0.21 to 0.45 wt % was found,compared to the 0.42 wt % previously reported. The remainder of the unirradiated fracturetesting and preparations for the irradiations of this material are under way.
Results from the Seventh Irradiation Series on stainless steel cladding have shown that theductile fracture toughness initiation and tearing modulus of, the cladding were significantlyreduced by irradiation. The degree of reduction was such that post-irradiation ductile fractureresistance is as low or lower than comparably irradiated low upper-shelf weld metal.
Initial studies have shown that the time or dose required for the point defect concentrations,which ultimately contribute to irradiation embrittlement, to reach their steady state values can becomparable to the component lifetime or to the duration of an irradiation experiment. Thus,embrittlement models which rely on the assumption of steady state at these conditions are notvalid. Consequently, simple direct comparisons of embrittlement generated under different ratesof exposure (eg. test reactors vs power reactors) may be misleading because the relative statewithin the initial defect production transient will likely bd different. Since the effect ofdisplacement rate is different in the transient and steady state regimes, data extrapolation from testreactor irradiations may cross mechanism boundaries and lead to poor estimates of materialresponse at low displacement rates.
122
A theoretical examination of the detailed irradiation mechanics which exist in low-temperature irradiations such as those which produced the accelerated embrittlement of the HFIRpressure vessel has led to the tentative conclusion that the cause of the acceleration is the highfraction of very low-energy thermal neutrons which existed rather than the low rate at which thefluence was accumulated. This conclusion is being investigated in two experiments. Specimensare being irradiated at low temperatures and high-fluence gates in spectra with and without largecomponents of thermal neutrons. Other specimens are being exposed in the cavity of apressurized water reactor at low temperatures and low fluence rates. As a result of the twoexperiments it should be possible to establish the mechanism primarily responsible for theaccelerated low-temperature embrittlement.
Additional activities have been initiated which will provide for more detailed examinationof the irradiation, annealing, and reirradiation response' of LUS weldmetal, establish an improvedfacility for the examination of materials irradiated in service, and to assure a continuin'g sourge ofsupply for correlation monitor materials for use in light-water reactor surveillance programs.'-
C LEDGME.
The author would like to acknowledge the numerous members of the Heavy-Section SteelIrradiation Program who contributed to the technical content of this work includingC. A. Baldwin, K. Farrell, F. M. Haggag, S. K. Iskander, F. B. K. Kam, L. K. Mansur,D. E. McCabe, M. K. Miller, R. K. Nanstad, R. E. Stollgr, K. R. IThoms,' and J. A. Wang.In addition the author would like to thank A. Taboada, technical monitorof the program, and therest of the U.S. Nuclear Regulatory Commission for the financial and technical support of thisresearch effort.
REFERENCES
1. R. K. Nanstad et al, "Effects of Radiation on KIc Curves for High Copper Welds,"pp. 214-233 in Effects of Radiation on Materials: 14th International Symposium (Volume I1),ASTM STP 1046, N. H. Packan, R. E. Stoller, and A. S. Kumar, Eds., American Society ofTesting and Materials, Philadelphia, Pa., 1990.
2. W. R. Corwin, Martin Marietta Energy Systems, -Inc., Oak Ridge Nadl. Lab., Oak Ridge,Tenn., Heavy-Section Steel Irradiation Program Semiannual Progress Report for October 1989-March 1990, USNRC Report NUREG/CR-5591,,Vol.1,- No.1 (ORNLZ/TM-1l568/V1&N1),August 1990.
3. ASME Boiler and Pressure Vessel Code, An Anerican National Standard, Sect. XI,Appendix A, American Society of Mechanical Engineers, I)ew York, 1986.
4. K. Wallin, "The Scatter in KIc-Results," Engineering Fracture Mechanics, 19(6), 1085-93(1984).
5. S. K. Iskander, W. R. Corwin, and R. K. Nanstad, Martin Marietta Energy Systems, Inc.,Oak Ridge Nail. Lab., Oak Ridge, Tenn., Results of Crack-Arrest Tests on Two Irradiated High-Copper Welds, USNRC Report NUREG/CR-5584 (ORNL/TM-1 1575), December 1990.
123
6. W. R. Corwin, R. G. Berggren, and R. K. Nanstad, Mdrtin Marietta Energy Systems,Inc., Oak Ridge Natl. Lab., Oak Ridge, Tenn., Charpy Toughness and Tensile Properties of aNeutron Irradiated Stainless Steel Submerged-Arc Weld Cladding Overlay, USNRC ReportNUREG/CR-3927 (ORNLwrM-9709), September 1984.
7. F. M. Haggag, W. R. Corwin, D. J. Alexander, and R. K. Nanstad, "Tensile and CharpyImpact Behavior of an Irradiated Three-Wire Series-Arc Stainless Steel Cladding," pp. 361-372in Effects of Radiation on Materials. 14th International Symposium (Volume II), ASTM STP1046, N. H. Packan, R. E. Stoller, and A. S. Kumar, Eds., Afnerican- Society of Testing andMaterials, Philadelphia, Pa., 1990.
8. F. M. Haggag, W. R. Corwin, and R. K. Nanstad, Martin Marietta Energy Systems, Inc.,Oak Ridge Natd. Lab., Oak Ridge, Tenn., Irradiation Effects on Strength andToughness of Three-Wire Series-Arc Stainless-Steel Weld Oi.rlay Cladding, USNRC ReportNUREGICR-5511 (ORNLITM-11439), February 1990.
9. A. L. Hiser, F. J. Loss, and B. H. Menke, Material Engineering Assoc., Lantharn, Md.,J-R Curve Characterization of Irradiated Low Upper Shelf Welds, USNRC ReportNUREG/CR-3506, MEA-2028, April 1984.
10. J. J. McGowan, R. K. Nanstad, and K. R. Thoms, Martin Marietta Energy Systems, Inc.,Oak Ridge Nad. Lab., Oak Ridge, Tenn., Characterization of Irradiated Current-Practice Weldsand A533 Grade B Class I Plate for Nuclear Pressure Vessel Service, USNRC ReportNUREG/CR-4880 Vols. l and 2 (0RNLIrM-6484/V1 and V2); July 1988.
11. R. K. Nanstad and R. G. Berggren, Martin Marietta Energy Systems, Inc., Oak RidgeNatl. Lab., Oak Ridge, Tenn., Irradiation Effects on Charpy Impact and Tensile Properties ofLow Upper-Shelf Welds, Heavy-Section Steel Irradiation Program, Irradiation Series 2 and 3,USNRC Report NUREG/CR-5696(ORNL/TM-1 1804), June 1991.
12. -L. K. Mansur, American Nuclear Society Critical Reviews, Nucl. Technol. 40, 5.34(1978).
13. R. E. Stoller and G. R. Odette, "A Composite Model of Microstructural Evolution inAustenitic Stainless Steel Under Fast Neutron Irradiation,` pp. 371-392 in Radiation-InducedChanges in Microstructure: 13th International Symposium, ASTM STP 955, F. A. Garner,N. H. Packan and A. S. Kumar, Eds., American Society of Testing and Materials,Philadelphia, Pa., 1987.
14. L. K. Mansur, "Irradiation Creep by Climb-Enabled Glide of Dislocations Resulting FromPreferred Absorption of Point Defects" in Phil. Mag. A 39, 497-506 (1979).
15. A. D. Brailsford and R. Bullough, AERE Harwell, UK, The Theory of Sink Strengths,AERE Harwell Report TP 854, 1980.
16. R. E., Stoller and L. K. Mansur, "The Influence of Displacement Rate on DamageAccumulation during the Point Defect Transient in Irradiated Materials," pp. 52-67 inProceedings of PM-90: International Conference on Radiztion Materials Science; Vol. 1,May 22-25, 1990, Alushta, The Crimea, USSR.
124
17. R. K. Nanstad, K. Farrell, D. N. Braski and W. R. Corwin, "Accelerated NeutronEmbrittlement of Ferritic Steels at Very Low Damage Rate," J. Nucl. Mater. 158, 1-6 (1988).
18. L. K. Mansur and K. Farrell, "On Mechanisms by Which a Soft Neutron Spectrum MayInduce Accelerated Embrittlement," J. Nucl. Mater. 170, 236-245 (1990).
19. L. K. Mansur and K. Farrell, "New Insights on Reactor Vessel Embrittlement," Oak RidgeNational Laboratory Review, 22-4, 30-35 (1989).
20. F. W. Stallman, Martin Marietta Energy Systems, Inc., Oak Ridge Natl. Lab., Oak Ridge,Tenn., Analysis of A302B and A533B Standard Reference Materials in Surveillance Capsules ofCommercial Power Reactors, USNRC Report NUREG/CR-4947 (ORNL/TM-10459),January 1988.
125
FATIGUE AND ENVIRONMENTALLY ASSISTED CRACKINGIN LIGHT WATER REACTORS
T. F. Kassner. W. E. Ruther, H. M. Chung, P. D. Hicks, A. G. Hins, J. Y. Park, and W. J. Shack
Materials and Components Technology DivisionArgonne National Laboratory
Argonne, illinois 60439 USA
Abstract
Fatigue and environmentally assisted cracking of piping, pressure vessels, and corecomponents in light water reactors are important concerns as extended reactor lifetimesare envisaged. Topics that have been Investigated during this year include (1) fatigue andstress corrosion cracking (SCC) of low-alloy steel used in-piping and in steam generator andreactor pressure vessels, (2) role of chromate and sulfate In simulated boiling water reactor(BWR) water on SCC of sensitized Type 304 SS. and (3) radiation-induced segregation (RIS)and irradiation-assisted SCC of lype 304 SS after accumulation of relatively high fluence.Fatigue data obtained on medium-sulfur-content A533-Gr B and A106-Gr B pressure-vesseland piping steels in high-purity (HP) deoxygenated water, in simulated pressurized waterreactor (PWR) water, and in air all lie above the ASME design curve. Crack-growth-rate(CGR) measurements on composite specimens of A533-Gr B/Inconel-182/lnconel-600(plated with nickel) and on homogeneous specimens of A533-Gr B material (plated withgold or nickel) indicate that CGRs increased markedly during small-amplitude cyclicloading (R = 0.95) in HP water with '300 ppb dissolved oxygen. Under cyclic loading, crackgrowth was observed at Kmax values that produced no crack growth under constant (R = 1)loading. The CGR dependence on dissolved-oxygen concentration (0.3 to 30 ppm) was alsoInvestigated under different loading conditions. Possible synergistic reactions involvingchromate and sulfate in SCC of sensitized Type 304' SS have been investigated by fracture-mechanics CGR tests. Low chromate concentrations in BWR water (25-35 ppb) may actuallyhave a beneficial effect on SCC if the sulfate concentration is below a critical level. Failuresof reactor-core internal components in BWRs and PWRs after accumulation of relatively highfluence have been attributed to RIS of Si, P. S. Ni. and Cr; -however, the degree to which RISproduces susceptibility to irradiation-assisted SCC is unclear. Microchemical andmicrostructural changes in HP and commercial-purity (CP) Type 304 SS specimens fromcontrol-blade absorber tubes used in two operating BWRs were studied by Auger electronspectroscopy and scanning electron microscopy, and slqw-strain-rate-tensile tests wereconducted on tubular specimens in air and in simulated B*R water at 289-C. Intergranularstress corrosion cracking (IGSCC) susceptibility of the CP absorber tubes was similar to thatof other CP heats of Types 304 and 316 SS reported in'ithe literature. However, the HPabsorber tubes exhibited greater IGSCC susceptibility than did the CP materials. High SCCsusceptibility seems to be consistent with irradiation-induced Cr depletion at grainboundaries, which was more significant in the HP heat than in the CP heat.
*Work supported by the Office of Nuclear Regulatory Research. U.S. Nillear Regulatory Commission.FIN Nos. A22 122 and A22562; Program Managers: Drs. J. Muscara and E. Woolrldge.
The submitted manuscrit has beenautoedd by a contractor of the U.S.Government under contract No. W-31-109-ENG-38. Accordingly, the U.S.Government retains a nonexchusive.royalty-free license to publish orreproduce the published form of thiscontribution, oralow others lo do to,for U.S. Government purposes.
127
1 Introduction
Fatigue and environmentally assisted cracking of piping, pressure vessels, and corecomponents in light water reactors (LWRs) are important concerns as extended reactorlifetimes are envisaged. The degradation processes include intergranular stress corrosioncracking (IGSCC) of austenitic stainless steel (SS) piping in boiling water reactors (BWRs),and propagation of fatigue or SCC cracks (which initiate in sensitized SS cladding) into low-alloy ferritic steels In BWR pressure vessels. Similar cracking has also occurred in uppershell-to-transition cone girth welds in pressurized water reactor (PWR) steam generatorvessels. Another concern is failure of reactor-core internal components after accumulationof relatively high fluence. which has occurred in both BWRs and PWRs. Research during thepast year focused on (1) fatigue and SCC of ferritic steels used In piping and in steamgenerator and reactor pressure vessels, (2) role of chromate and sulfate in simulated BWRwater in SCC of sensitized Type 304 SS, and (3)'Irradiation-assisted SCC In high- andcommercial-purity Type 304 SS specimens from control-blade absorber tubes used in'twooperating BWRs. Failure after accumulation of relatively high fluence has been attributed toradiation-induced segregation (RIS) of elements such as Si, P. S. NI, and Cr.
2 Summary of Research Progress
2.1 Fatigue of Forritic Steels
Plain carbon and low-alloy steels are used extensively in PWR and BWR nuclear steamsupply systems as piping and pressure-vessel materials., The steels of interest for theseapplications include A106-Gr B and A333-Gr 6ofor seamless pipe and A302-Gr B. A508-2,and A533-Gr B plate for pressure vessels. The current Section III fatigue curves for carbonand low-alloy steels are based on tests in air at room; temperature.I Tests in air at reactoroperating temperatures show some deviation from the ASMB mean data curve, but all datalie above the ASME design curve.2 However, In tests at' high strait amplitudes in oxygenatedwater, the fatigue life of carbon steels is significantly decreased, and in some cases failureswere observed below the ASME Section Design Curve.3 .4 lida et al.5 studied the fatigue ofalloys equivalent to A508-C13 and A333-C16 in deionized water at temperatures up to 2900C.They showed that in oxygenated water at large strain amplitudes, fatigue lives were reducedin tests at lower strain rates. The magnitude of the decrease depended strongly onf'alloycomposition, temperature, and concentration of dissolved oxygen in the water. Atdissolved-oxygen concentrations of <100 ppb. the aqueous' environment had little effect on,the fatigue life of either alloy.
Nagata et al.6 performed fatigue tests on forged, ASTM A508 CI-3 and on the rolled;equivalent ASTM A533-Gr B CI-1 under strain control (at various strain rates) in pure waterat several dissolved-oxygen levels. Compared to tests in air, water containing 100 ppbdissolved oxygen had very little effect on the fatigue behavior of both alloys at a strain rate of1 x 10-3 s-1. Alloy A508 also showed little effect of strain rate, whereas a decrease in strainrate by up to two orders of magnitude decreased the fatigue life of A533-Gr B steel. Nagata
128
et al.6 attributed this to initiation effects due to the higher sulfide content of the A533-Gr Bsteel compared to the A508 material. They argue that A533-Gr B is more susceptible tosurface pitting near manganese sulfide (MnS) inclusions, and the surface pitting near theseinclusions decreases the initiation time for cracking. The lower strain rates simply providemore time for the pitting to occur. All tests were at a strain range of 0.7-0.8% and a strainrate of 0.1% with a triangular wave form. For dissolved-oxygen levels >1 ppm, the fatiguelives of both alloys decreased by up to 66%. However, it should be noted that lida et al.5 sawvery little environmental effect in the high-cycle regime where initiation would be expectedto dominate even In high-sulfur materials.
Terrell7 tested A106-Gr B in PWR environments. Forvcycllc frequency in the range of1.0-0.017 Hz, the fatigue life of. smooth test specimens was virtually unaffected by theenvironment, whereas a small-decrease in life occurred for notched specimens in tests atthe lowest frequency. However, all data lie above the ASME design curve.
2.1.1 Experimental Methods
Uniaxial fatigue properties of A533-Gr B pressure vessel and A106-Gr B piping steels inwater and in air were investigated. The A533-Gr B material for the test specimens wasobtained from the lower head of the Midland Reactor, which was scrapped before the plantwas completed. The medium-sulfur-content (0.016% S) steel had a tempered bainiticmicrostructure in the as-fabricated condition. Chemical antlyses of these two materials andof the ferritic and austenitic steels used in CGR tests are given in Table 1.
Fatigue tests were performed on smooth (1.0-im 'surface-polished gage 'length,19 mm) cylindrical hourglass-type specimens. During polishing of the specimen gagelength, pullout of MnS inclusions occasionally occurred, tending to scuff the surface of thespecimen., These inclusions were visible under a low-power microscope and appeared asslight surface roughness. The final polish of the specimen; gage length was in a lengthwisedirection to prevent circumferential scratches that might act as stress raisers during fatigue.The specimens were loaded uniaxially with a triangular' wave form at a strain rate of4 x 10-3 S-1
Tests were first performed in air at 2881C, under strain control at zero mean strainmeasured with an axial extensometer. Strain ranges of .0. 0.75. 0.50, and 0.35% wereselected. The stroke response was recorded so that subsijuent fatigue tests in water couldbe run in stroke control. This experimental procedure aroids difficulties associated withusing a strain extensometer in a pressurized-water environment. After obtaining the straincontrol data in air, a repeat test was performed under stroke control in air at 2880C. Themean stroke and stroke amplitude settings for these tests were the same as the strokevalues obtained at the half-lives of the strain control tests. During the stroke-control tests,the. strain was accurately monitored to give a better'Indication of the true strain experiencedby the specimens when they are tested in water under stroke control. The strain amplitudein amplitude-versus-fatigue-life plots corresponds to that at the specimen half-life, asdetermined in high-temperature tests in air under stroke control.
129
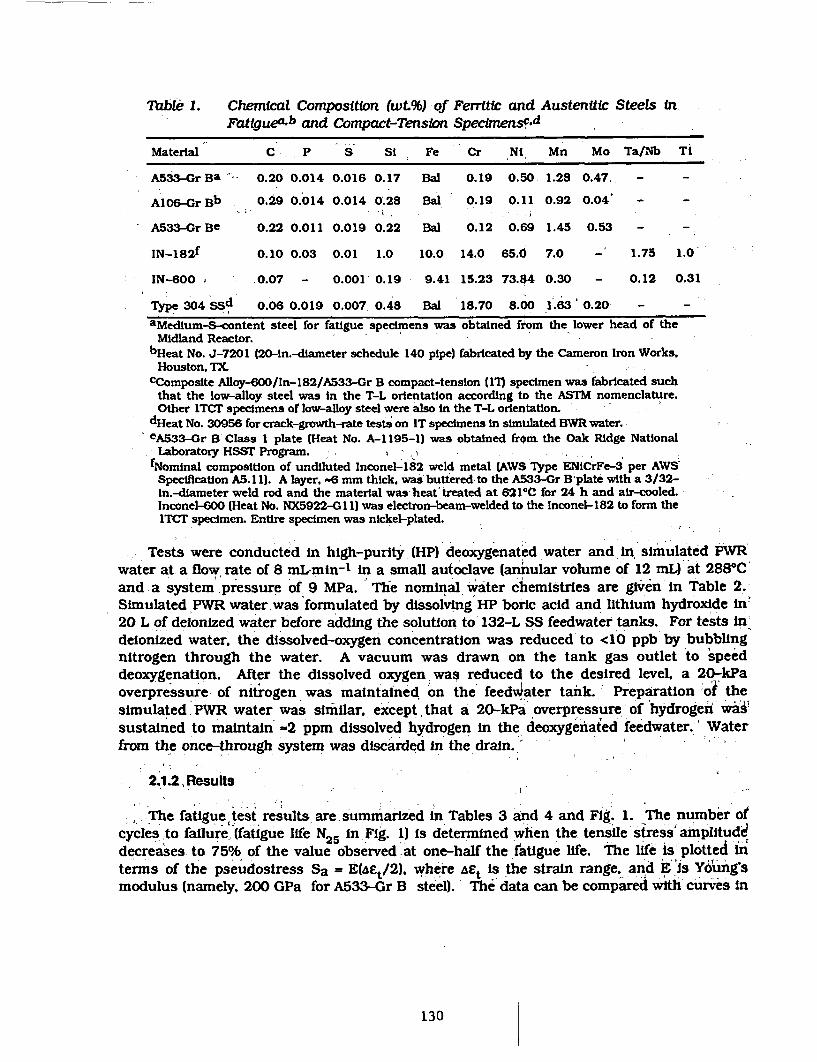
Table 1. Chemical Composition (wt%) of Ferritic and Austenitic Steels in- _t_. h_ ___.- ---- .- -_ _ _-- A
rcauzgue- ania Goaypact-lC1enswIn apecunenb-''
Material C P S St Fe Cr Nt Mn Mo Ta/Nb Ti
A533 Gr Ba - 0.20 0.014 0.016 0.17 Bal 0.19 0.50 1.28 0.47. - -
A106Gr Bb 0.29 0.014 0.014 0.28 Bal 0.19 0.11 0.92 0.04 - -
A533-Gr Be 0.22 0.011 0.019 0.22 Bal 0.12 0.69 1.45 0.53
IN-182f 0.10 0.03 0.01 1.0 10.0 14.0 65.d 7.0 - 1.75 1.0-
IN-600 0.07 - 0.001 0.19 9.41 15.23 73.84 0.30 - 0.12 0.31
Type 304 SSd 0.06 0.019 0.007 0.48 Bal 18.70 8.00 1.63 0.20 -
aMedium-S-content steel for fatigue specimens was obtained from the lower head of theMidland Reactor.
bHeat No. J-7201 (20-in.--diameter schedule 140 pipe) fabricated by the Cameron Iron Works.Houston. TX
CComposite Alloy-600/ln-182/A533-Gr B compact-tension (l17 specimen was fabricated suchthat the low-alloy steel was in the T-L orientation according to the ASTM nomenclature.Other ITCT specimens of low-alloy steel were also In the T-L orientation.
dHeat No. 30956 for crack-growth-rate tests on IT specimens in simulated BWR water.eA533-Gr B Class 1 plate (Heat No. A-1195-1) was obtained frorn the Oak Ridge National
Laboratory HSST Program.fNominal composition of undiluted Inconel-182 weld metal (AWS Type ENiCrFe-3 per AWS
Specification AS. 11). A layer, -6 nun thick. was buttered to the A533-Gr B'plate with a 3/32-in.-dtameter weld rod and the material was heat' treated at 621CC for 24 h and air-cooled.Inconel-600 (Heat No. NX5922-G I1) was electron-beam-welded to the Inconel-182 to form thelTCT specimen. Entire specimen was nickel-plated.
-
Tests were conducted in high-purity (HP) deoxygenated water and in simulated PWRwater at a flow rate of 8 mL-min- 1 in a small autoclave (annular volume of 12 mL) at 2880 Cand a system pressure of 9 MPa. The nominal water chemistries are given in Table 2.Simulated PWR water was formulated by dissolving HP boric acid and lithium hydroxide in'20 L of deionized water before adding the solution to 132-L SS feedwater tanks. For tests indeionized water, the dissolved-oxygen concentration was reduced to <10 ppb by bubblingnitrogen through the water. A vacuum was drawn on the tank gas outlet to speeddeoxygenation. After the dissolved oxygen was reduced to the desired level, a 20-kPaoverpressure of nitrogen was maintained on the feed-ater tank. Preparation of thesimulated PWR water was similar, except. that a 20-kPa overpressure of hydrogen wadsustained to maintain -2 ppm dissolved hydrogen in the' deoxygenated feedwater..' Waterfrom the once-through system was discarded in the drain.'
2.1.2, Results
The fatigue test results are summarized in Tables 3 and 4 and Fig. 1. The number ofcycles to failure, (fatigue life N25 in Fig. 1) is determined when the tensile stress amplitudedecreases to 75% of the value observed .at one-half the fatigue life. The life' is plotted interms of the pseudostress Sa = E(Aet/2). where ait Is the strain range. and E is Young'smodulus (namely, 200 GPa for A533-Gr B steel). The data can be compared with curves in
130
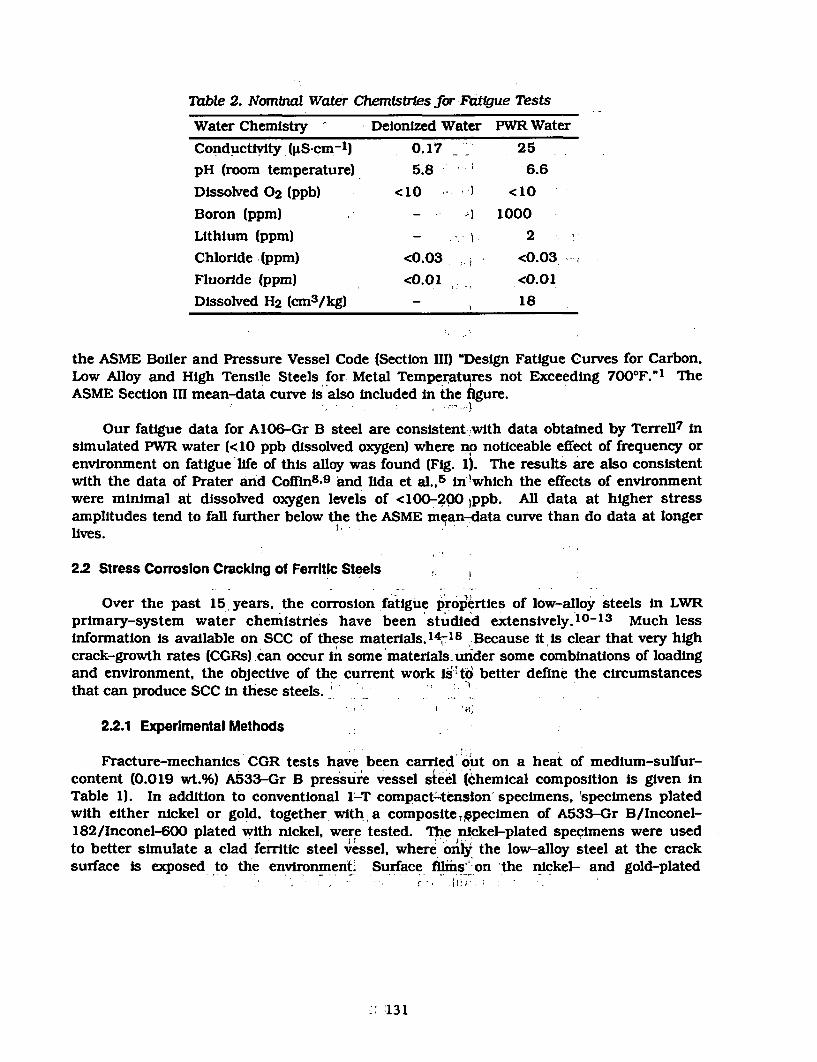
Table 2. Nominal Water Chemistries for Fatigue Tests
Water Chemistry ' Deionized Water PWR WaterConductivity (ttS-cm-1) 0.17_ 25pH (room temperature) 5.8 6.6Dissolved 02 (ppb) <10 l <10Boron (ppm) _ ) 1000Lithium (ppm) - - 2
Chloride (ppm) <0.03 <0.03-Fluoride (ppm) <0.01 <0.01Dissolved H2 (cm3 /kg) - 18
the ASME Boiler and Pressure Vessel Code (Section III) 'Design Fatigue Curves for Carbon,Low Alloy and High Tensile Steels for Metal Temperatures not Exceeding 7000F."I TheASME Section III mean-data curve is also included in the figure.
Our fatigue data for A106-Gr B steel are consistent with data obtained by Terrell 7 insimulated PWR water (<10 ppb dissolved oxygen) where no noticeable effect of frequency orenvironment on fatigue life of this alloy was found (Fig. 1). The results are also consistentwith the data of Prater and Coffin8.9 and lida et al..5 in'which the effects of environmentwere minimal at dissolved oxygen levels of <100-200 )ppb. All data at higher stressamplitudes tend to fall further below the the ASME mean-data curve than do data at longerlives.
2.2 Stress Corrosion Cracking of Ferritic Steels
Over the past 15 years, the corrosion fatigue properties of low-alloy steels in LWRprimary-system water chemistries have been studied extensively.10-13 Much lessinformation is available on SCC of these materials.14718 Because it is clear that very highcrack-growth rates (CGRs) can occur in some materials under some combinations of loadingand environment, the objective of the current work isi'to better define the circumstancesthat can produce SCC in these steels.
2.2.1 Experimental Methods
Fracture-mechanics CGR tests have been carried out on a heat of medium-sulfur-content (0.019 wt.%) A533-Gr B pressure vessel steel (chemical composition is given InTable 1). In addition to conventional I-T compact-tension' specimens, -specimens platedwith either nickel or gold, together with a compositeppecimen of A533-Gr B/Inconel-182/Inconel-600 plated with nickel, were tested. The nickel-plated specimens were usedto better simulate a clad ferritic steel vessel, where only the low-alloy steel at the cracksurface is exposed to the environment. Surface filmis' on the nickel- and gold-plated
- if , l'1 ;
i131
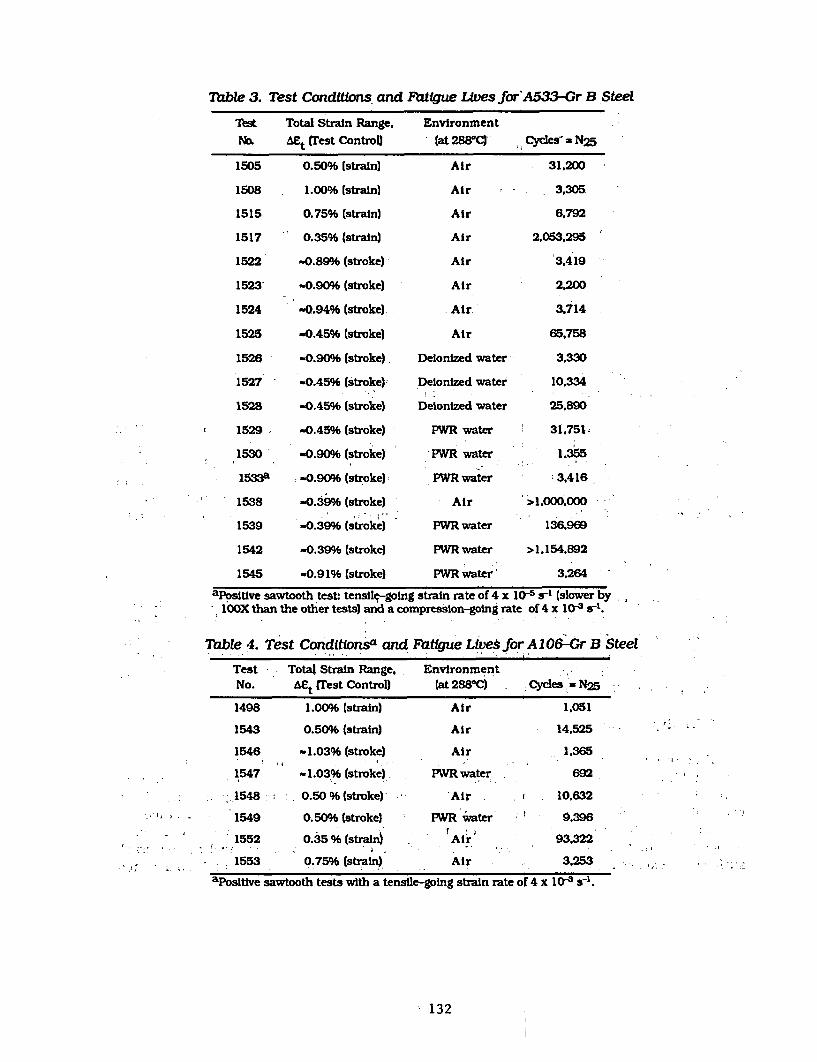
Table 3. Test Conditions and Fatigue Lives for A533-Gr B Steel
Test
1505
1508
1515
1517
1522
1523'
1524
1525
1526
1527
1528
r 1529.
1530 '
15 3 3a
1538
1539
1542
-
Total Strain Range,A~t (rest Control)
0.50% (strain)
1.00% (strain)
0.75% (strain)
0.35% (strain)
-0.89% (stroke)
-0.90% (stroke)
-0.94% (stroke)
-0.45% (stroke)
-0.90% (stroke)
-0.45% (stroke)
-0.45% (stroke)
-0.45% (stroke)
-0.90% (stroke)
-0.90% (stroke)
-0.39%§ (stroke)
-0.39% (stroke)
-0.39% (stroke)
Environment(at 288°C)
Air
Air
Air
Air
Air
Air
Air
Air
Delonized water
Delonized water
Deionized water
PWR water
PWR water
PWR water
Air
PWR water
PWR water
PWR water'
Cycyes- N25
31.200
3,305
6.792
2,053.295
3.419
2.200
3.714
65.758
3,330
10,334
25.890
31,751
1.355
3.416
>1.000,000
136.969
>1.154.892
3.2641545 -0.91% (stroke)
aPosiuve sawtooth test- tensile-going strain rate of 4 x 10- s-' (slower bylOOX than the other tests) and a compression-going rate of 4 x 10³ s-1.
Table 4. Test Condltionsa and Fatigue Lives for A1 06-Gr B Steel
Test Total Strain Range. EnvironmentNo. AC, (Test Control) (at 288°C) Cycles N25
1498 1.00% (strain) Air 1,051
1543 0.50% (strain) Air 14,525
1546 -1.03% (stroke) Air 1.365
1547 - 1.03% (stroke) PWR water 692
- 1548 0.50% (stroke) Air i 10,632
1549 0.50% (stroke) PWR water 9,396
1552 0.35%(straiin Atir 93.322
1553 0.75% (strain) Air 3.253
aPoslttve sawtooth tests with a tensile-going strain rate of 4 x 10³ s-1.
I . i
I .
132
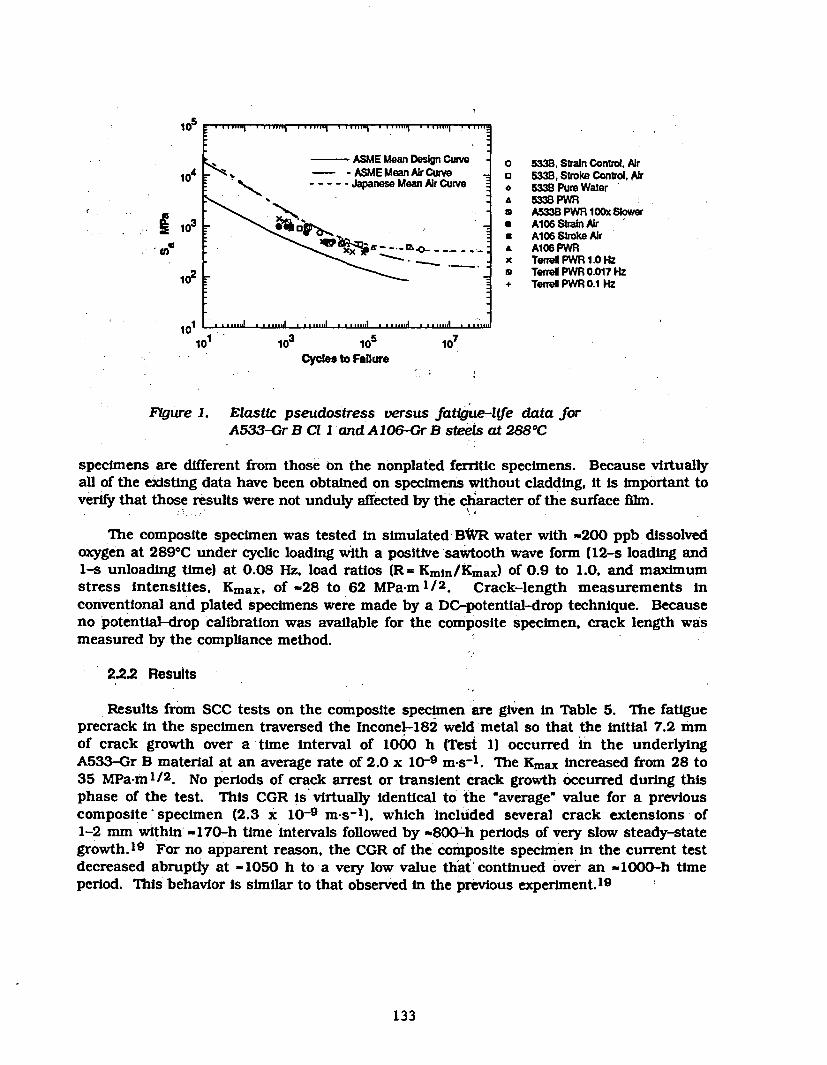
105
- ASMt mlean LWgn curve 0 5338. Strain Control, Air104 - -ASMEMeanAirCurve a 533B Stoke Control, Air
- Japanese Moan Air Curve 5338 Pure WaterA 533B PWR3 A533BPWRI00xSlower
103 \ o Al06 Strain AiraA106 Stroe Air
XX A- _ A106 PWRX Tend PWR 1.0 Hz
1o2 *. TO PWR 0.017 Hz+ Teare PWR 0.1 Hz
101 103 105 107
- Cycles to Failure
FYgure 1. Elastic pseudostress versus fatigue-liffe data forA533-Gr B Cl I and Al06-Gr B steels at 2880 C
specimens are different from those on the nonplated ferritic specimens. Because virtuallyall of the existing data have been obtained on specimens without cladding, it is important toverify that those results were not unduly affected by the character of the surface film.
The composite specimen was tested in simulated BWR water with -200 ppb dissolvedoxygen at 2890 C under cyclic loading with a positive sawtooth wave form (12-s loading and1-s unloading time) at 0.08 Hz, load ratios (R= Kmin/Kmax) of 0.9 to 1.0. and maximumstress intensities, Kmax, of -28 to 62 MPa m 1/2. Crack-length measurements inconventional and plated specimens were made by a DC-potential-drop technique. Becauseno potential-drop calibration was available for the composite specimen. crack length wasmeasured by the compliance method.
2.2.2 Results
Results from SCC tests on the composite specimen are given in Table 5. The fatigueprecrack in the specimen traversed the Inconel-182 weld metal so that the initial 7.2 mmof crack growth over a time interval of 1000 h (Test 1) occurred in the underlyingA533-Gr B material at an average rate of 2.0 x 10⁻⁹ m-s-1 . The Kmax increased from 28 to35 MPa-m1 /2. No periods of crack arrest or transient crack growth occurred during thisphase of the test. This CGR is virtually identical to the 'average' value for a previouscomposite specimen (2.3 x 10⁻⁹ m-s-l), which included several crack extensions of1-2 mm within -170-h time intervals followed by -800-h periods of very slow steady-stategrowth.1 9 For no apparent reason, the CGR of the composite specimen in the current testdecreased abruptly at -1050 h to a very low value that continued over an -1000-h timeperiod. This behavior is similar to that observed in the previous experiment.19
133
In Test 2. the Kmax of the composite specimen was increased to 40 MPa-m I/2 at anR of 0.95. Whereas an increase of Kmax In the previous experiment. 19 in general. resulted ina brief increase In the CGR, no such increase was noted during the next 300-h period inthis test. After that period, the dissolved-oxygen concentration in the feedwater wasincreased to -30 ppm (Test 3). This action initiated a return to the high-CGR regime,which we allowed to persist for two weeks. The feedwater was then returned to the normaldissolved-oxygen concentration of -0.4 ppm In Test 4. and shortly thereafter the CGRreturned to a low level (7.6 x 10.1 m-s-1) for 800 h. The dissolved-oxygen level was thenincreased to 6 ppm in Test 5, and two days later rapid crack growth resumed. Theseexperiments indicate that dissolved-oxygen concentration is an important variable at a loadratio of 0.95.
In the next series of tests, the effect of load ratio was investigated. In Test 6. the loadratio was increased from 0.95 to 1.0 (i.e.. constant load): shortly thereafter, the CGRreturned to the low level even though the dissolved-oxygen level remained at 6 ppm. Thelow CGR persisted for an additional 1200 h, after which the dissolved-oxygen level wasIncreased to -30 ppm in Test 7. This caused a modest Increase In the CGR over anadditional exposure period of 800 h. The load ratio was then decreased to 0.98 in Test 8and the CGR decreased slightly during an additional 310-h period. The load ratio wasdecreased further to 0.95 in Test 9 and the CGR remained at the same low value(3.8 x 10⁻¹¹ m-s-1) over a 200-h, interval. In Test 10, the load ratio was decreased to 0.9,and within 24 h. crack growth resumed a high rate (7.8 x 10-9.m-s-1 ). The test wasterminated after -20 h because the crack length exceeded the maximum allowable value.Even at a high K level (62 MPa-ml/ 2 ). a load ratio of <1 is required to Initiate a high CGR.No crack growth occurred in a conventional (nonplated) A533-Gr B specimen at a stressintensity factor of 28.7 MPa-m 1/2 over the entire -6600-h experiment under the differentenvironmental and loading conditions.
The CGR results In Table 5 at different dissolved-oxygen levels and load ratios fall intotwo ranges. I.e.. -2 to 8 x 10⁻¹ I and -2 to 8 x 10⁻⁹ mas-1. High CGRs occurred at an R of0.95 in water containing 0.3, 6, and 30 ppm dissolved oxygen (Tests 1. 5,. and 3,respectively). Low CGRs were also measured at this R value in water containing -0.3-0.4and 28 ppm dissolved oxygen trests 2. 4. and 9). As mentioned previously, under constantload (R = 1.0), an increase in dissolved-oxygen concentration from 6 to 30 ppm produced arelatively small increase in the CGRs (Tests 6 and 7). A significant decrease In load ratiofrom 1.0 to 0.9 (sequentially in Tests 7-10) caused an abrupt transition to the high-CGRregime at an R of 0.9 in water containing -30 ppm dissolved oxygen.
These results, along with those from a previous composite specimen in which unusuallylarge jumps in crack length (-1-2 mm) occurred whenever Kmax was increased (followed byperiods of relatively slow crack growth), 1 9 indicate that triggering events in theenvironment and/or in the loading conditions can produce abrupt changes in the CGRs bytwo orders of magnitude. For example, increases in dissolved-oxygen concentration andKmax and decreases in load ratio can lead to high CGRs. Conversely, a transition from thehigh- to low-CGR regime can occur by decreasing the dissolved-oxygen concentration or by
134
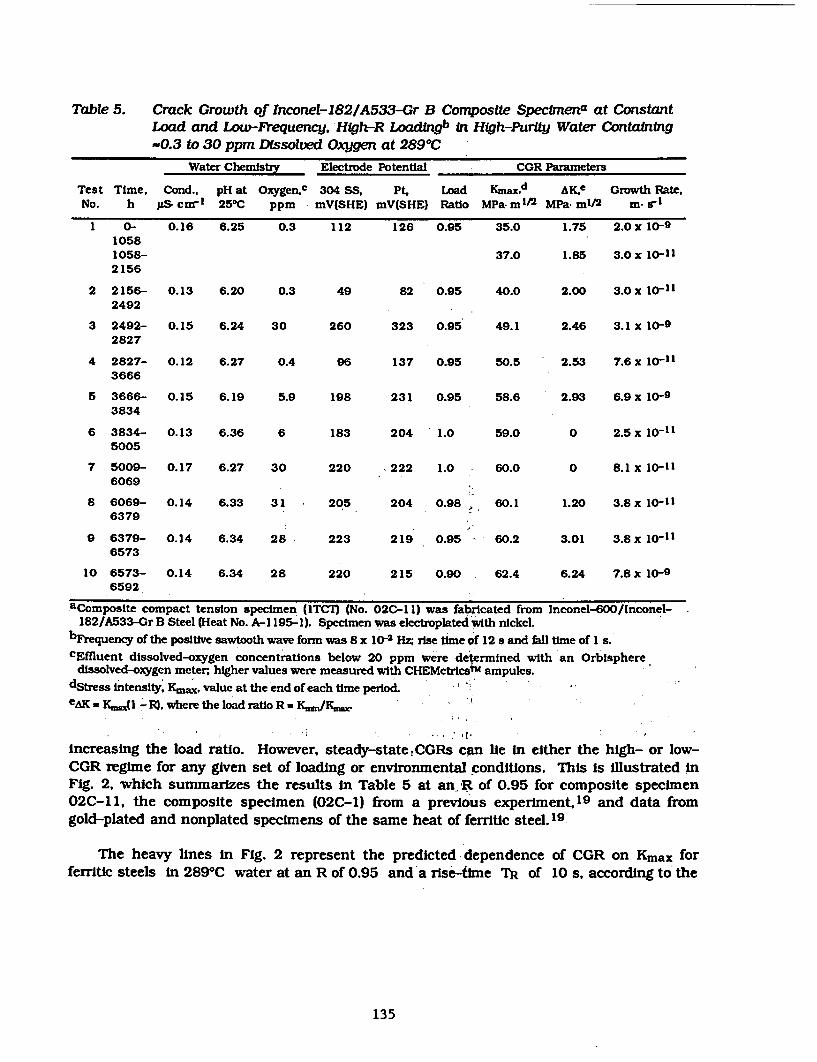
Table 5. Crack Growth of Inconel-182/A533-Gr B Composite Specimena at ConstantLoad and Low-Frequency, High-R Loadngb in High-Purity Water Containing-0.3 to 30 ppm Dissolved Oxygen at 289'C
Water Chemistry Electrode Potential CGR Parameters
Test Time, Cond., pH at Oxygen.c 304 SS, Pt. Load Kmaxcd a1 e Growth Rate,No. h p.S carl 250C ppm mV(SHE) mV(SHE) Ratio MPa m'12 MPa- mAl/ m- 71
1 0- 0.16 6.25 0.3 112 126 0.95 35.0 1.75 2.0x 10-910581058- 37.0 1.85 3.0x 10-112156
2 2156- 0.13 6.20 0.3 49 82 0.95 40.0 2.00 3.0x 10-2492
3 2492- 0.15 6.24 30 260 323 0.95 49.1 2.46 3.1 x 10-92827
4 2827- 0.12 6.27 0.4 96 137 0.95 50.5 2.53 7.6x 10-113666
5 3666- 0.15 6.19 5.9 198 231 0.95 58.6 2.93 6.9 x 10-93834
6 3834- 0.13 6.36 6 183 204 1.0 59.0 0 2.5x 10-115005
7 5009- 0.17 6.27 30 220 222 1.0 - 60.0 0 8.1 x 10-"6069
8 6069- 0.14 6.33 31 205 204 0.98 60.1 1.20 3.8 x 10-116379
9 6379- 0.14 6.34 28 223 219 0.95 60.2 3.01 3.8x 10-116573
10 6573- 0.14 6.34 28 220 215 0.90 62.4 6.24 7.8x 10 -96592
aComposite compact tension specimen (ITCT1 (No. 02C-1 1) was fabricated from182/A533-Gr B Steel (Heat No. A-1 195-1). Specimen was electroplated with nickeL
Inconel-600/Inconel-
bFrequency of the positive sawtooth wave form was 8 x 10⁻² Hz; rise time of 12 s and fall time of 1 s.
cEffluent dissolved-oxygen concentrations below 20 ppm were determined with an Orbispheredissolved-oxygen meter, higher values were measured with CHEMetrlicslrm ampules.
dStress intensity, K.,axt value at the end of each time period.
eA KF.,JI -R). where the load ratio R * K-,*,/
increasing the load ratio. However, steady-state! CRS can lie in either the high- or low-CGR regime for any given set of loading or environmental conditions. This is illustrated inFig. 2, which summarizes the results in Table 5 at an, R of 0.95 for composite specimen02C-11, the composite specimen (02C-1) from a previous experiment.19 and data fromgold-plated and nonplated specimens of the same heat of ferritic steel.19
The heavy lines in Fig. 2 represent the predicted dependence of CGR on Kmax forferritic steels in 2890C water at an R of 0.95 and a rise-time TR of 10 s, according to the
135
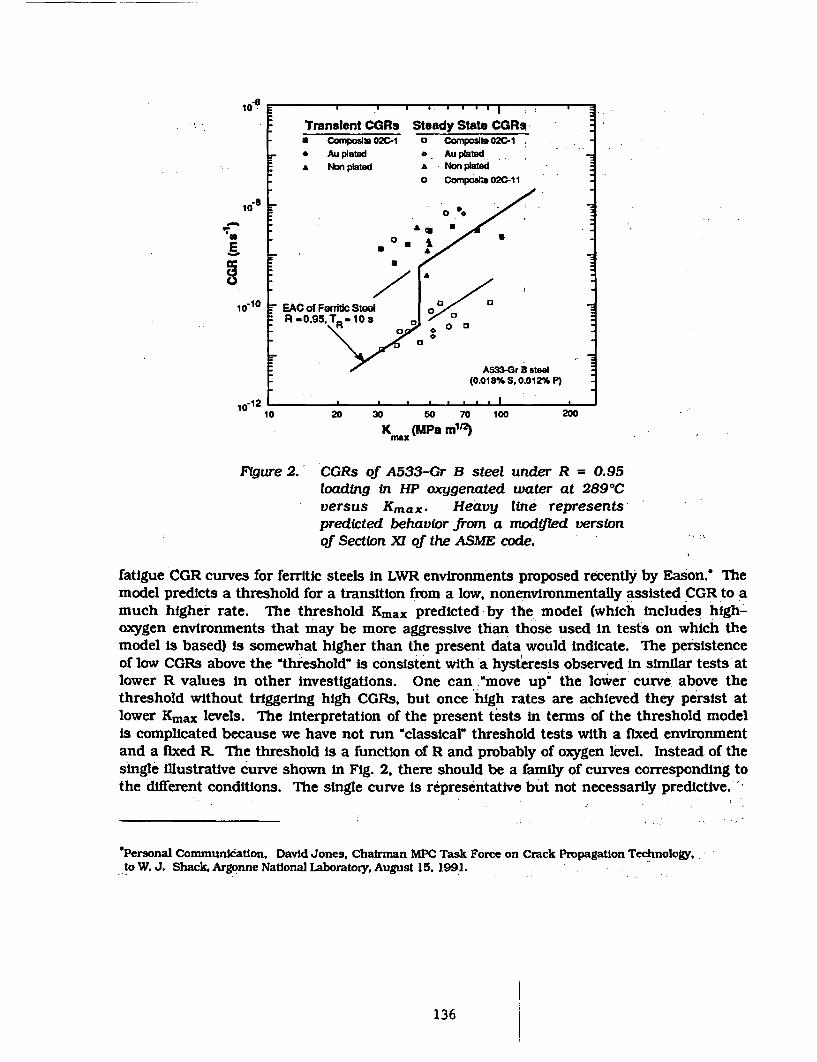
10-6 *
Translent CGRs Steady Stats CGR-* Composite 02C-1 ° Composlt. 02C-1* Au plated o AuplatndA Non platd A Non plaod
o Composit 02C-11
lo %
1010 EAC of Ferritic Stal a0 0R -0.95. TR 0 0
A533-Gr ts(0.018% S. 0.012% P)
i- 12
20 30 50 70 100 200
K (MPa m1"2 )
Figure 2. CGRs of A533-Gr B steel under R = 0.95loading in HP oxygenated water at 2890Cversus Kmax. Heavy line representspredicted behavior from a modifted versionof Section XM of the ASME code.
fatigue CGR curves for ferritic steels in LWR environments proposed recently by Eason.' Themodel predicts a threshold for a transition from a low, nonenvironmentally assisted CGR to amuch higher rate. The threshold Kmax predicted by the model (which includes high-oxygen environments that may be more aggressive than those used in tests on which themodel is based) is somewhat higher than the present data would indicate. The persistenceof low CGRs above the 'threshold" is consistent with a hysteresis observed in similar tests atlower R values in other investigations. One can "move up" the lower curve above thethreshold without triggering high CGRs, but once high rates are achieved they persist atlower Kmax levels. The interpretation of the present tests in terms of the threshold modelis complicated because we have not run "classicar threshold tests with a fixed environmentand a fixed R The threshold is a function of R and probably of oxygen level. Instead of thesingle illustrative curve shown in Fig. 2, there should be a family of curves corresponding tothe different conditions. The single curve is representative but not necessarily predictive.
"Personal Communkcatlon, David Jones. Chairman MPC Task Force on Crack PropagaUon Technology,to W. J. ShacIk. Argonne National Laboratory, August 15. 1991.
136
The upper-bound values for the experimental data in the high- and low-CGR regimesare -2 x 10⁻⁹ and 2 x 10⁻¹ I m-s-1 (-2.5 and 0.025 in.-yr-1), respectively, at a Kmax value of35 MPa-m 1/2. Crack-growth rates in the upper regime are clearly Unacceptable. Thenature of the transitions between the two regimes and the observation that the initial fatiguecrack in companion nonplated specimens did not propagate will be investigated further infuture experiments.
2.3 Role of Chromate and Sulfate In SCC of Type 304 SS
Soluble corrosion products from system materials are the major species present in BWRwater when ingress of -ionic impurities into the coolant system from leaks in condensertubes and from ion-exchange resins in the reactor water cleanup system (RWCS). includingresin fines, is maintained at very low levels. Examples include Cu+ and Cu2+ in plants witheither copper alloy condenser tubes and/or feedwater heaters and HCrOj from corrosion ofSS piping, weld cladding on the interior of the reactor vessel, and internal componentsfabricated from this material. Although chromate (K2CrO4) is used as a corrosion inhibitorin component cooling water systems (CCWS) in BWRs and PWRs, these systems operate atrelatively low temperatures (-1701C) and pressures (-150 psig); thus, direct Ingress ofchromate from the CCWS into the reactor coolant water is unlikely under normal operatingconditions. Nevertheless, because only a small fraction of the recirculation water in BWRspasses through the RWCS, the concentration of corrosion-product ions in the reactor watercan be considerably greater than in the feedwater (e.g.. -25-35 ppb versus<1 ppb, respectively). Consequently, HCrO- and the counterbalancing hydronium cation(H30+) are major contributors to water conductivity. To further mitigate IGSCC of sensitizedType 304 SS in these systems through water chemistry control, utilities have considered (1)neutralizing the residual chromic acid by NaOH additions to the feedwater (to takeadvantage of the lower specific conductivity of Na+ relative to that of H30+), and (2) devisingmethods to remove chromate from the water by ion exchange.2 0
2.3.1 Experimental Methods,
A fracture-mechanics CGR experiment was performed to determine the effect ofchromate additions to simulated BWR water (without and with low levels of sulfate) on SCCof our reference heat (No. 30956) of Type 304 SS (composition Is given ,in Table 1). Cracklength was measured by the DC potential-drop technique over time intervals of -800-1500h it each test condition. Three specimens were heat treated to produce a solution-annealed condition, and moderate and high levels of sensitization corresponding toelectrochemical potentlokinetic reactivation (EPR) values of 0, 8. and 30 C-cm-2 ,respectively. The specimens were fatigue-precracked in HP water containing 200-300 ppbdissolved oxygen at 2890C. CGR tests were conducted in oxygenated water with differentchromate and sulfate additions under several loading conditions.
137
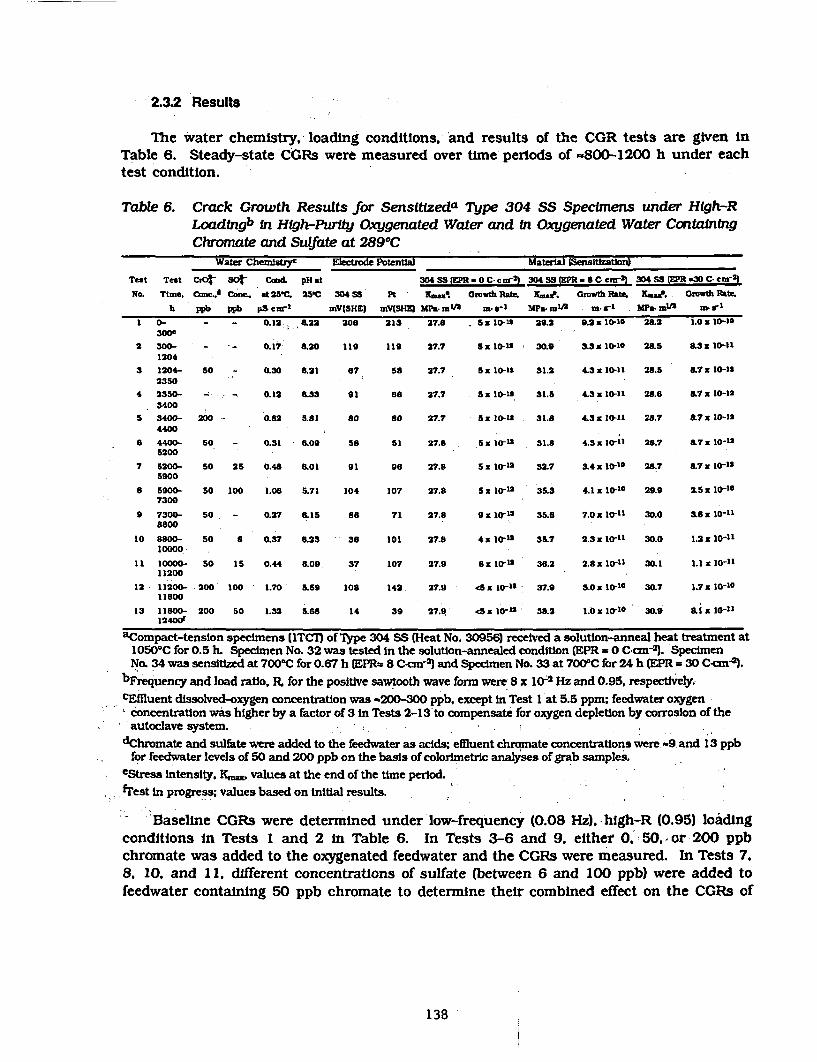
2.3.2 Results
The water chemistry, loading conditions, and results of the CGR tests are given inTable 6. Steady-state CGRs were measured over time periods of -800-1200 h under eachtest condition.
Table 6. Crack Growth Results for Sensitizeda Type 304 SS Specimens under High-RLoadtngb in High-Purity Oxygenated Water and In Oxygenated Water ContainingChromate and Sulfate at 289°C
Water Chemisy Electrode Potential Material fSensitizatlon)
Test Test CiOr S0t Cm& pH at 304 SS (EPR * 0 C CMn21 304 SS IEPR - 8 0 cm-2) 30459 SEPR *30 C COO)
No. Tlme. Conc.. Con_, at 25C. 25'C 304 58 Pt K4*. Gowth Rahte. Xa. Growth Rite. Kama. Gowth rate.
h ppb ppb LS c-I mMVSHSJ MV(SHE) MWi mnI m. VI MPa. mIA m Sr MP. pSIA m. rl
I 0- - _ 0.12 6.22 20 21S 27.S 0 5 -1* 29.2 9.2: 10-10 28.2 1.0K 10-l0300'
2 300- - 0.17 6.20 119 119 27.7 5 :10-11 30.9 3 a3 10-10 28.5 .3 : 10-11204
3 1204- 50 - 0.30 6.21 67 58 27.7 5x 10-11 31.2 4.Sx 10-11 28.5 a7x 10-112350
4 2350- - 0- .12 f.33 91 58 27.7 5x 10⁻¹ 31.5 4.3x 10⁻³¹ 28f6 a7x 10-123400
5 3400- 200 - 0.82 5.81 80 80 27.7 5x 10⁻¹u 31.8 4.3x 10⁻¹¹ 28.7 &7x 10-134400
6 4400- 50 - 0.31 6.09 58 51 27.8 5x 10¹² 31.8 4.3S 10ti 28.7 *7x 10-105200
7 5200- 50 25 0.46 6.01 91 96 27.8 Si 10-1 32.7 3.4x 10⁻¹⁰ 28.7 8.7x 10-125900
a 5900- S0 100 1.06 5.71 104 107 27.8 5 x 10⁻¹ 35.3 4.1 x 10⁻¹⁰ 29.9 2.5 x 1107300
9 7300- 50 - 0.27 6.15 88 71 27.8 9x 10 -' 35.6 7.0x 10⁻¹¹ 30.0 36 x 10-118800
1o 8800- 50 6 0.37 6.23 38 101 27.8 4x 10⁻¹ 35.7 2.3 10-11 30.0 1.2x 10-1110000
11 10000- 50 15 0.44 6.09 37 107 27.9 Sx l0-12 36.2 2.8 x 10⁻¹¹ 30.1 1.1 x 10-"11200
12 11200- 200 100 1.70 5.59 108 142. 27.9 cSx 10-12 37.9 SOx 10-10 30.7 1.7x 10-1011800
13 11800- 200 50 1.32 5.68 14 39 27.9 d5z 10-12 3S.2 1.0 X10-0O 30.9 8I.X1:-1112400(
aCompact-tension specimens (lTCT) of Type 304 SS (Heat No. 30956) received a solution-anneal heat treatment at10500C for 0.5 h. Specimen No. 32 was tested in the solution-annealed condition (EPR - 0 CCM-2 . SpecimenNo. 34 was sensitized at 700°C for 0.67 h (EPR= 8 Ccm) and Specimen No. 33 at 700°C for 24 h MEPR = 30 acnm -
bFrequency and load ratio, It for the positive sawtooth wave form were 8 x 10² Hi and 0.95, respectively.cEffluent dissolved-oxygen concentration was '200-300 ppb. except in Test 1 at 5.5 ppm: feedwater oxygen
concentration was higher by a factor of 3 in Tests 2-13 to compensate fbr oxygen depletion by corrosion of theautoclave system. 1
dChromate and sulfate were added to the feedwater as acids; effluent chromate concentrations were -9 and 13 ppbfor feedwater levels of 50 and 200 ppb on the basis of colorimetric analyses of grab samples.
eStress intensity. K,. values at the end of the time period.;fest in progress; values based on initial results.
Baseline CGRs were determined under low-frequency (0.08 Hz), high-R (0.95) loadingconditions in Tests 1 and 2 in Table 6. In Tests 3-6 and 9. either 0, 50, or 200 ppbchromate was added to the oxygenated feedwater and the CGRs were measured. In Tests 7,8. 10, and 11, different concentrations of sulfate (between 6 and 100 ppb) were added tofeedwater containing 50 ppb chromate to determine their combined effect on the CGRs of
138

the steel. In Tests 12 and 13, the chromate concentration in the feedwater was increasedto 200 ppb and the sulfate concentrations were 100 and 50 ppb. respectively.
The results in Table 6 reveal that the solution-annealed specimen (EPR = 0 C-cm- 2)exhibited very low CGRs (<5 x 10-12 m.s-I) under all water chemistry conditions. Of thetwo sensitized specimens (EPR = 8 and 30 C-cm-2 ), the specimen with the lower EPR valueexhibited the highest CGRS under each test condition. This level of sensitization producedmaximum SCC susceptibility in slow-strain-rate-tensile (SSRTI tests at 2890C in oxygenatedwater without and with 100 ppb sulfate.2 1 The results for the sensitized specimens can besummarized as follows. In oxygenated feedwater, 50-200 ppb chromate has a beneficialeffect, as indicated by the low CGRS (<7 x 10⁻¹ 1 m-s-i) in Tests 3, 5. 6. and 9. In watercontaining 50 ppb chromate. low levels of sulfate (6 or 15 ppb) did not lead to high CGRs inTests 10 and 11. In water containing 50 ppb chromate and 25 or 100 ppb sulfate (ests 7and 8). CGRs of the moderately sensitized specimen (EPR = 8 C-cm-2 ) increasedsignificantly (to >3 x 10⁻¹⁰ m-s-l), whereas the heavily sensitized specimen exhibited thisrate in water containing 100 ppb sulfate. At a higher chromate concentration (e.g.,200 ppb) In oxygenated feedwater containing 100 ppb sulfate (Test 12), the CGRs of thesensitized specimens were high (>1 x 10⁻¹⁰ in-s-1). However, chromate appears to have asmall beneficial effect at a somewhat lower sulfate concentration of 50 ppb in Test 13.
The present results indicate that the CGRs of the sensitized specimens may exhibit aunique dependence on sulfate and chromate concentrations in oxygenated feedwater.Figure 3 shows the CGRs of the moderately sensitizedspecimen (EPR = 8 C.cm-2) as afunction of the ratio of the concentrations of chromate and sulfate in the feedwater. Whenthese species were not added to the feedwater (Table 6), their concentrations wereassumed to be -1 ppb for the purpose of obtaining the patios in Fig. 3. The limited datasuggest that the CGRS are in the low regime if the (CrOi-)/(SO42) ratio In the feedwater Is23. Chromate concentrations in fedwater and effluent water were determined bycolorimetric analyses (Cr+6) on grab samples. The measured feedwater concentrations werein excellent agreement with the amounts added to the water; however, the effluent valueswere lower by a factor of >5 owing to the low flow velocity and reaction with the largesurface area of stainless steel in the autoclave system at g890C. The feedwater and effluentsulfate concentrations were virtually the same In all expermpents.
Although SSRT tests Indicated that chromate at concentrations >100 ppb In oxygenatedwater contributes to IGSCC in a manner similar to that of other oxyanions,2 0 .2 2 the presentCGR results suggest that this species has a mitigating effect on IGSCC at lowerconcentrations, provided that the sulfate concentration Is lower by a factor of -3. Becausechromate concentrations in BWR .recirculation water are -25-35 ppb, the sulfateconcentration should be maintained at l10 ppb to mitigate IGSCC. Achievable values forsulfate are <15 ppb and typically can be maintained at the, 5 ppb level. Consequently, thesewater chemistry conditions would place sensitized Type 304 SS in the low-CGR regime.Efforts to remove chromate from recirculation loop water without decreasing the criticalsulfate level could be counterproductive. Furthermore, maintaining sulfate concentrations atlevels of <5 ppb may be Impractical. -
139
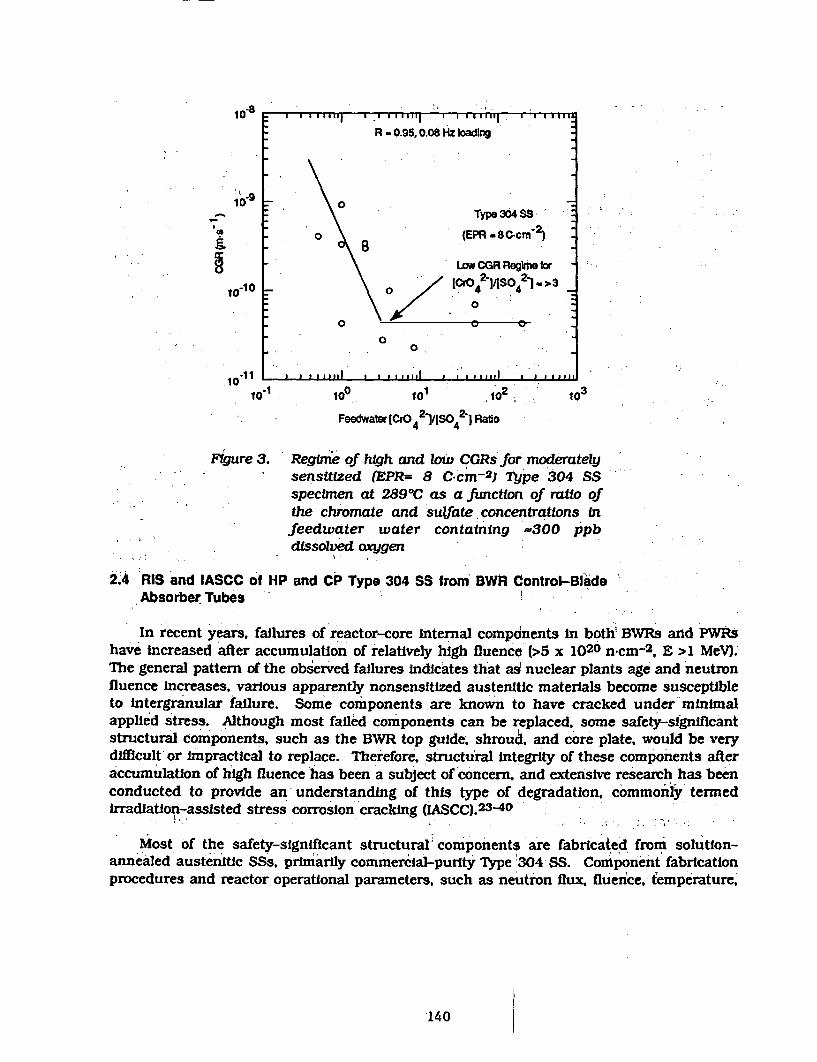
Iox * I I II I I I I I 4 I I I II ill I I I I I tl l , I I I a $via
R.0.95,0.08Hzloading -
* 0-- \A C. . -
0 (EPR 8C-cm ) ..
Low OGR Regkie br
l0-10 [Ci0 42 S48V 1-3
0
00
'11 ,a ,,, I l , ,, ,,, ',,, I ' ' X111 , ''10 1 100 101 10,2 10
Feedwator (CrO 42 /[SO4
2 -1 Ratio
Figure 3. Regime of high and low CGRs for moderately
sensitized (EPR= 8 Ccm-2) Type 304 SS
specimen at 2890C as a finctlon of ratio of
the chromate and sulfate concentrations In
feedwater water containing -300 ppb
dissolved oxygen
2.4 RIS and IASCC of HP and CP Type 304 SS from BWR Control-BladeAbsorber Tubes
In recent years, failures of reactor-core Internal compdnents in both BWRs and PWRshave increased after accumulation of relatively high fluence (>5 x 10²⁰ n-cm- 2 , E >1 MeV)).The general pattern of the observed failures indicates that as nuclear plants age and neutronfluence increases, various apparently nonsensitized austenitic materials become susceptibleto Intergranular failure. Some components are known to have cracked under minimalapplied stress. Although most failed components can be replaced, some safety-significantstructural components, such as the BWR top guide, shroud and core plate, would be verydifficult or impractical to replace. Therefore, structural integrity of these components afteraccumulation of high fluence has been a subject of concern, and extensive research has beenconducted to provide an. understanding of this type of degradation, commonly termedirradiation-assisted stress corrosion cracking (IASCC).2 3-4 0
Most of the safety-significant structural components are fabricated from solution-annealed austenitic SSs. primarily commercial-purity Type 304 SS. Component' fabricationprocedures and reactor operational parameters, such as neutron flux, fluernce, temperature,
140
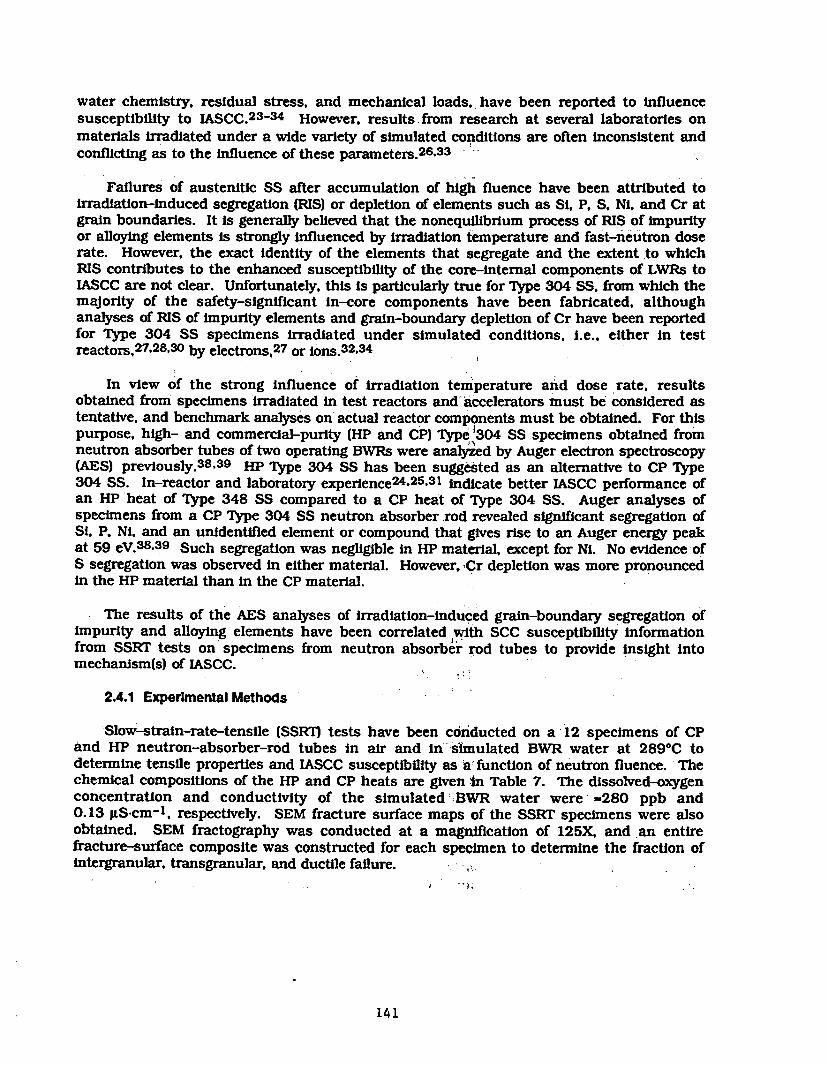
water chemistry, residual stress, and mechanical loads,, have been reported to influencesusceptibility to IASCC.2 3 -3 4 However, results from research at several laboratories onmaterials irradiated under a wide variety of simulated conditions are often inconsistent andconflicting as to the influence of these parameters. 2 6 .3 3
Failures of austenitic SS after accumulation of high fluence have been attributed toirradiation-Induced segregation (RIS) or depletion of elements such as Si, P. S. Ni, and Cr atgrain boundaries. It is generally believed that the nonequilibrium process of RIS of impurityor alloying elements is strongly influenced by irradiation temperature and fast-neutron doserate. However, the exact identity of the elements that segregate and the extent to whichRIS contributes to the enhanced susceptibility of the core-internal components of LWRs toIASCC are not clear. Unfortunately, this is particularly true for Type 304 SS, from which themajority of the safety-significant in-core components have been fabricated, althoughanalyses of RIS of impurity elements and grain-boundary depletion of Cr have been reportedfor Type 304 SS specimens Irradiated under simulated conditions, i.e., either in testreactors,2 7 .2 8 .3 0 by electrons, 27 or ions.32 .34
In view of the strong influence of irradiation temperature and dose rate, resultsobtained from specimens Irradiated in test reactors and' accelerators must be considered astentative, and benchmark analyses on actual reactor components must be obtained. For thispurpose, high- and commercial-purity (HP and CP) Type 1304 SS specimens obtained fromneutron absorber tubes of two operating BWRs were analyzed by Auger electron spectroscopy(AES) previously.3 8 -3 9 HP Type 304 SS has been suggested as an alternative to CP Type304 SS. In-reactor and laboratory experience 24 .25 .3 1 indicate better IASCC performance ofan HP heat of Type 348 SS compared to a CP heat of Type 304 SS. Auger analyses ofspecimens from a CP Type 304 SS neutron absorber .rod revealed significant segregation ofSi, P. Ni. and an unidentified element or compound that gives rise to an Auger energy peakat 59 eV.38-39 Such segregation was negligible in HP material, except for Ni. No evidence ofS segregation was observed in either material. However,-Cr depletion was more pronouncedIn the HP material than in the CP material.
The results of the AES analyses of Irradiation-induced grain-boundary segregation ofimpurity and alloying elements have been correlated with SCC susceptibility informationfrom SSRr tests on specimens from neutron absorber rod tubes to provide insight intomechanism(s) of IASCC.
2.4.1 Experimental Methods
Slow-strain-rate-tensile (SSRTI tests have been conducted on a 12 specimens of CPand HP neutron-absorber-rod tubes in air and in -simulated BWR water at 2890C todetermine tensile properties and IASCC susceptibility as a function of neutron fluence. Thechemical compositions of the HP and CP heats are given 'in Table 7. The dissolved-oxygenconcentration and conductivity of the simulated* BWR water were -280 ppb and0.13 ttS-cm-l, respectively. SEM fracture surface maps of the SSRT specimens were alsoobtained. SEM fractography was conducted at a magnification of 125X, and an entirefracture-surface composite was constructed for each specimen to determine the fraction ofintergranular, transgranular, and ductile failure. -
141
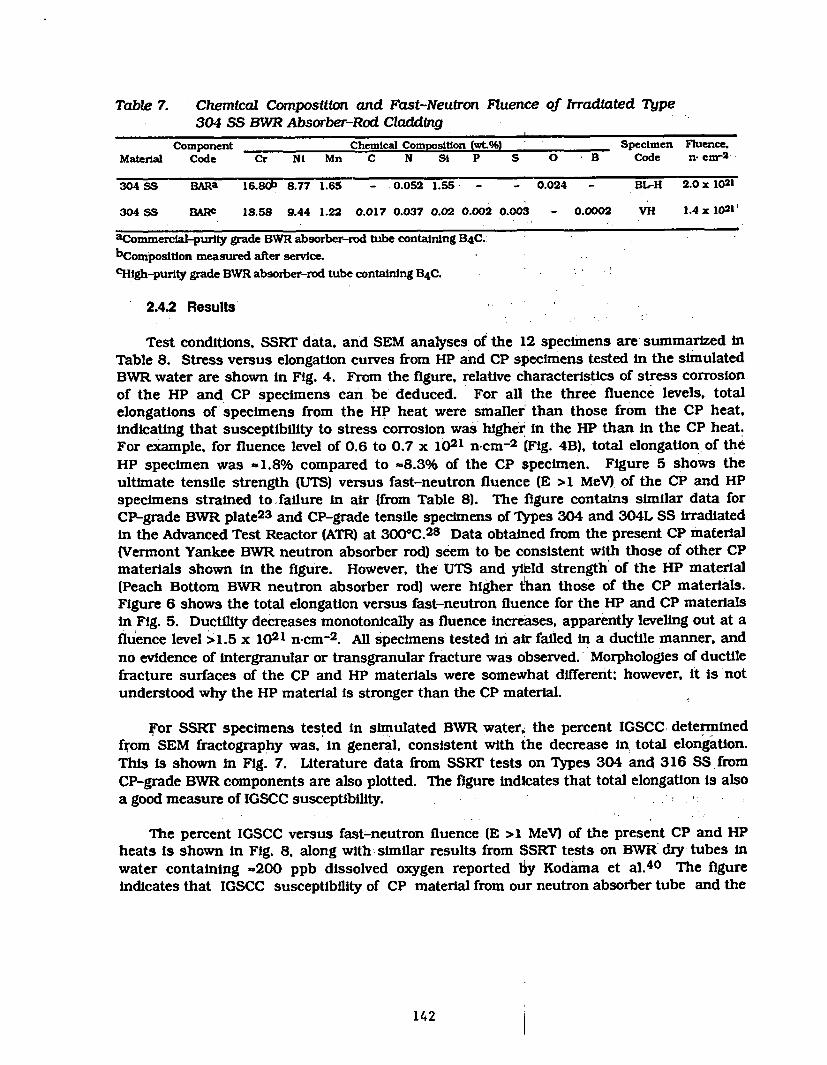
Table 7. C hemical Composition and Fast-Neutron Fluence of Irradiated Type304 SS BWR Absorber-Rod Cladding
Component Chemical Composition (wt.%) Specimen Fluence.Material Code Cr Ni Mn C N Si P S 0 B Code n- cm-2
304 SS BARa 16.8C& 8.77 1.65 - 0.052 1.55 - - 0.024 - BL-H 2.0 x 10²¹
304 SS BARC 18.58 9.44 1.22 0.017 0.037 0.02 0.002 0.003 - 0.0002 VH 1.4 x 10²¹'
aCommercial-purlty grade BWR absorber-rod tube containing B4C.
bComposition measured after service.
CHlgh-purity grade BWR absorber-rod tube containing B4 C.
2.42 Results
Test conditions, SSRT data, and SEM analyses of the 12 specimens are summarized inTable 8. Stress versus elongation curves from HP and CP specimens tested in the simulatedBWR water are shown in Fig. 4. From the figure. relative characteristics of stress corrosionof the HP and CP specimens can be deduced. For all the three fluence levels, totalelongations of specimens from the HP heat were smaller than those from the CP heat,indicating that susceptibility to stress corrosion was higher in the HP than in the CP heat.For example, for fluence level of 0.6 to 0.7 x 10²¹ n-cm-2 (Fig. 4B), total elongation of theHP specimen was -1.8% compared to -8.3% of the CP specimen. Figure 5 shows theultimate tensile strength (UTS) versus fast-neutron fluence (E >1 MeV) of the CP and HPspecimens strained to failure in air (from Table 8). The figure contains similar data forCP-grade BWR plate2 3 and CP-grade tensile specimens of Types 304 and 304L SS irradiatedin the Advanced Test Reactor (ATR) at 3000C.28 Data obtained from the present CP material(Vermont'Yankee BWR neutron absorber rod) seem to be consistent with those of other CPmaterials shown in the figure. However, the UTS and yield strength of the HP material(Peach Bottom BWR neutron absorber rod) were higher than those of the CP materials.Figure 6 shows the total elongation versus fast-neutron fluence for the HP and CP materialsin Fig. 5. Ductility decreases monotonically as fluence increases, apparently leveling out at afluence level >1.5 x 10²¹ n-cm- 2. All specimens tested in air failed in a ductile manner, andno evidence of intergranular or transgranular fracture was observed. Morphologies of ductilefracture surfaces of the CP and HP materials were somewhat different; however, it is notunderstood why the HP material is stronger than the CP material.
for SSRT specimens tested in simulated BWR water, the percent IGSCC determinedfrom SEM fractography was, In general, consistent with the decrease in total elongation.This is shown in Fig. 7. Literature data from SSRT tests on Types 304 and 316 SS fromCP-grade BWR components are also plotted. The figure indicates that total elongation is alsoa good measure of IGSCC susceptibility.
The percent IGSCC versus fast-neutron fluence (E >1 MeV) of the present CP and HPheats Is shown in Fig. 8, along with similar results from SSRT tests on BWR dry tubes inwater containing -200 ppb dissolved oxygen reported by Kodama et al.4 0 The figureindicates that IGSCC susceptibility of CP material from our neutron absorber tube and the
142
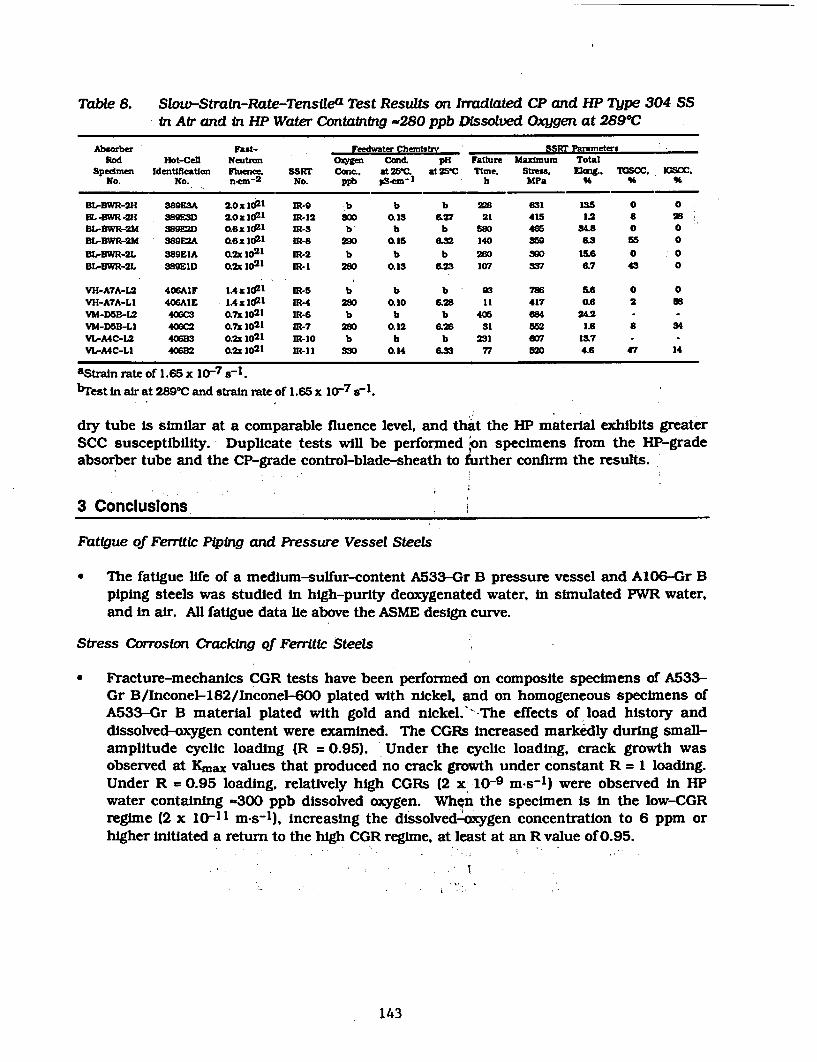
Table 8. Slow-Strain-Rate-Tensilea Test Results on Irradiated CP and HP Type 304 SSin Air and in HP Water Containing -280 ppb pMssolved Oxygen at 2890C
Absorber Fast- Feedwater Chemlstr _ SSRr ParametersRod Hot-Cell Neutron Oqrgen Cand. pH Failure Maximum Total
Spedmen Identification Fluence. SSRT Canc, at 25C. at 25 C Time. Stress. EMag.. TCS0C. IMWCSCNo. No. nem-
2 No. ppb PScn I b MP- h
BLBWR-2H 389ESA 2.0x 10²¹ IR-9 b b b 228 631 135 0 0L4-BWR -2H 389ESD 2.0: 1021 IR-12 SO0 0.13 627 21 415 1.2 a 28
BL-BWR-2M 3893D 06 x 1021 IR-S b b b 560 486 34.8 0 0BL-BWR-2M 389E2A Q6 x 1021 ER-8 290 0.15 8.32 140 359 a.s 55 0BL-BWR-2L 389ELA .2x 1021 11-2 b b b 200 390 156 0 0BL-BWR-2L 389EID Q2k l02 IR-I 20 0.13 623 107 SS7 6.7 43 0
VH-A7A-L2 4061F IA x 10I21 lR-5 b b b 93 786 56 0 0VH-A7A-L1 406A1E 1Axt102 1
IR4 280 0.10 6.28 11 417 0.6 2 58VM-D5B-L2 406CM 0.7 1021 IR-6 b b b 405 684 24.2 ,VM-D58-LI 408C2 07x 1021 IR-7 280 0.12 626 31 5i2 1.8 8 34VL-A4C-L2 406B3 Q2x 1021 IR-10 b b b 231 es7 13.7 -VL-A4C-LI 406B2 .2x 1021 IR-II S3D Q14 633 77 52D 4.6 47 14
astajin rate of 1.65 x 10⁷ s-1.
blTest in air at 289°C and strain rate of 1.65 x 10⁻⁷ sf.
dry tube is similar at a comparable fluence level, and that the HP materlal exhibits greaterSCC susceptibility. Duplicate tests will be performed on specimens from the HP-gradeabsorber tube and the CP-grade control-blade-sheath to further confirm the results.
3 Conclusions
Fatigue of Ferritic Piping and Pressure Vessel Steels
* The fatigue life of a medium-sulfur-content A533-Gr B pressure vessel and A106-O r Bpiping steels was studied in high-purity deoxygenated water, in simulated PWR water,and In air. All fatigue data lie above the ASME design curve.
Stress Corrosion Cracking of Ferritic Steels
* Fracture-mechanics CGR tests have been performed on composite specimens of A533-Gr B/Inconel-182/Inconel-600 plated with nickel. and on homogeneous specimens ofA533-Gr B material plated with gold and nickel.' -The effects of load history anddissolved-oxygen content were examined. The CGRs increased markedly during small-amplitude cyclic loading (R = 0.95). Under the cyclic loading, crack growth wasobserved at K6ma values that produced no crack growth under constant R = 1 loading.Under R = 0.95 loading, relatively high CGRs (2 x' 10-9 m-s-1) were observed in HPwater containing -300 ppb dissolved oxygen. When the specimen is in the low-CGRregime (2 x 10⁻¹ I m-s--), increasing the dissolved-~=ygen concentration to 6 ppm orhigher initiated a return to the high CGR regime, at least at an R value of 0.95.
143
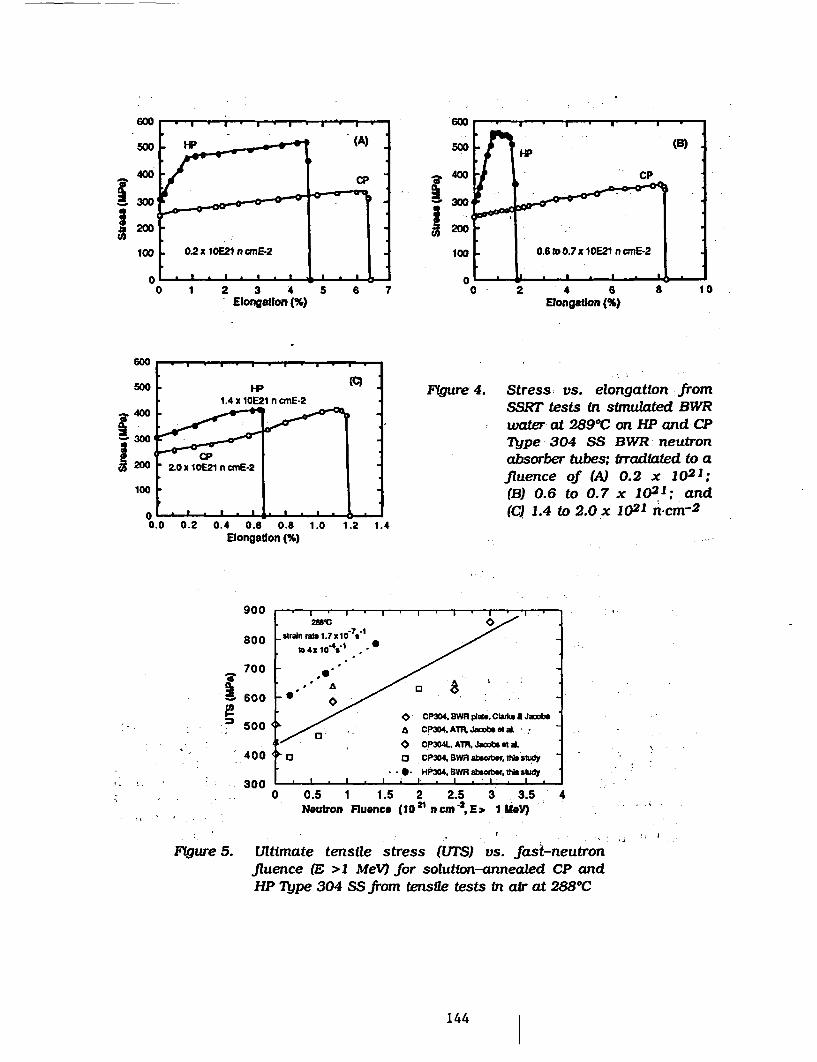
600
500
I
100 0.6 toO.7x10E21 ncmE-2
0 2 4 6 a8 10Elongation (%)
Figure 4. Stress vs. elongation fromSSRT tests in simulated BWRwater at 2890C on HP and CPType 304 SS BWR neutronabsorber tubes: Irradiated to afluence of (A) 0.2 x 10² 1:(B) 0.6 to 0.7 x 10²¹; and(C) 1.4 to 2.0 x 10²¹ n-cm 2
600
500v
.400
300
1200
100
00
1.4 x l0E21 n anE-2
zo0 x I10E21 n cmnE-2
. I . a . I . I .- I.0 0.2 0.4 0.6 0.8
Elongation (%)1.0 1.2 1.4
900
800
la700
600
500
400'
. . I ,. I. C .I
-strain rabft i.7 1607't /4to 4x10⁻⁴ ,,-
/ - CP304.TWR pa1OkSda.coJh. / 0 A CP304 ATM ataL di
O CP304L. AT, Jan St d.F3 0 CP304. BWR absorba1. tis S
* HP304. BWR absorber. eh stUdy. * I . I i I . I . ' , ,Ii
. I
-ann0 0.5 1 1.5
Neutron Fluenco2 2.5 3 3.5 4
(10 2 n cmr n E a 1 MeV)
e . ,
Figure 5. Ultimate tensile stress (UPS) vs. fast-neutronfluence (E >1 MeV7 for solution-annealed CP andHP Type 304 SS from tensile tests in air at 288°C
144
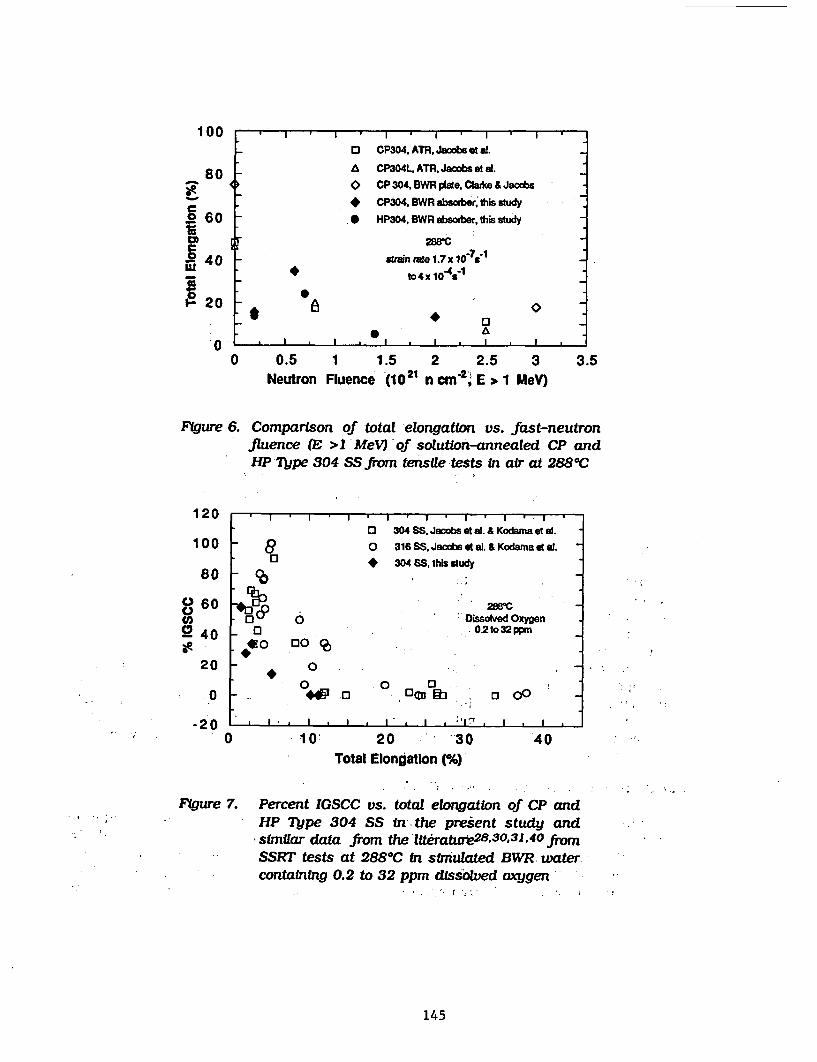
100
80
° 0C.2 60
8 40'a
1 20
.I .I I . AI.I, .Io . I .O CP304, ATR, Jacobs et a.
^ CP3W4L, ATh, Jacs et ad.O CP 304, BWR plate, Claike & Jacobs* CP304, BWR absorber; this study* HP304, SWR absorber, this study
ostn rate 1.7 x 10⁻⁷to 4x 10⁴
, I _ , I
0 0.5 1 1.5 2 2.5 3Neutron Fluence (1021 n cm-2, E > 1 MeV)
3.5
FYgure 6. Comparison of total elongatIon vs. fast-neutronfluence (B >1 MeV) of solution-annealed CP andHP 7Vpe 304 SSfrom tensile tests in air at 288°C
..
120
100
80
80U60
40
20
0 304 SS. J t al. & Kodana et al.- 0 316 SS, Jacbs al. & Kodama gt a.
3 * 304 SS, this study
* 0' 0 Dlssohved Oxygen_ 3 0.2 to 32 ppm
*0 00 (_ 0
0 0 0- (3o '3 - . 00
* I * . , I ,. I n. I . I-20-2 1I
. . . . . . . . . . . * * .
10 20 '30Total Elondatlon (%)_
40
Figure 7. Percent IGSCC vs. total elongation of CP andHP 7ype 304 SS in. the present study andsimilar data from the lIterature2 8 .30 31 .40 fromSSRT tests at 2880C in simulated BWR wa=ter.containing 0.2 to 32 ppm dissolved oxygen
145
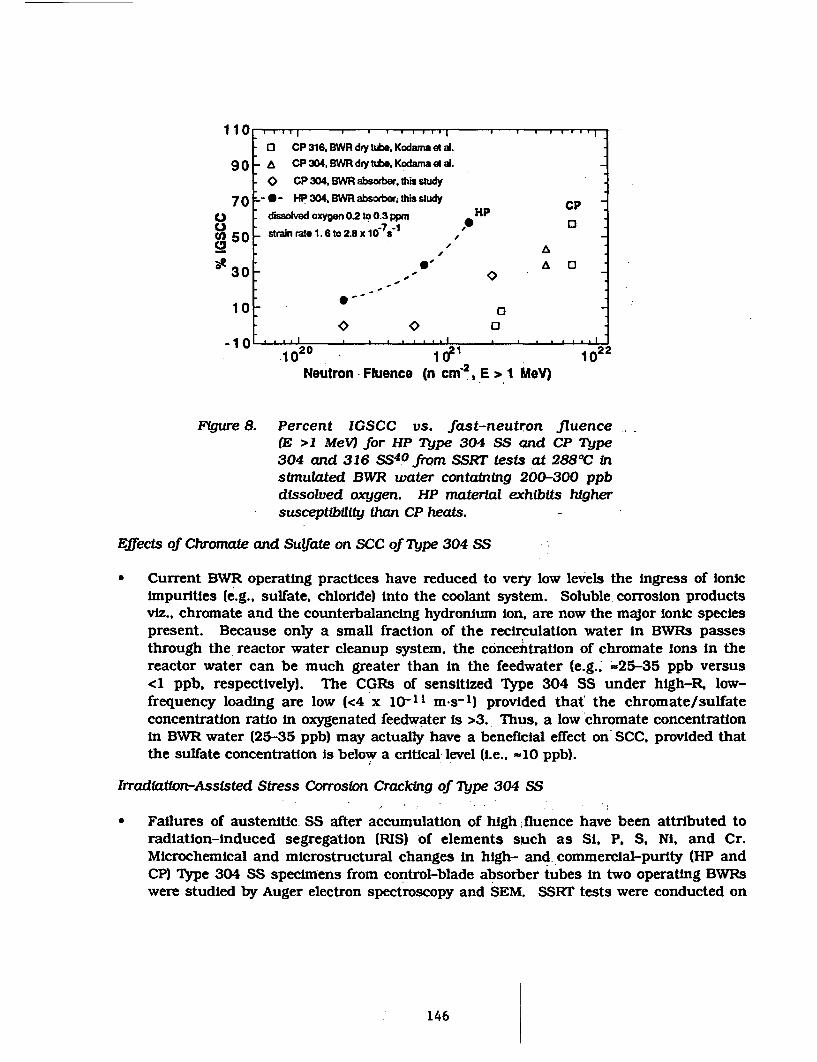
110 . . .. . . . . .. , .
0 CP 316, BWR dr tube. Kodana et al.
90 - a CP 304, BWR dry tube. Kodamna e al.- CP 304, BWR absorber, this study
70 -0- HP 304, BWR absorberi this studyo dissolved oxygen 02 to 0.3 ppm HP
5 50 strain rate1.6to2.8x10 7 s1 ,'
230 ,- - 0
10 000
1 .I20 . . I . . I2221 0 I OF' 10Neutron - Fluenco (n cm-, E > 1 MeV)
FIgure 8. Percent IGSCC vs. .fast-neutron fluence(E >1 MeV) for HP Type 304 SS and CP Type304 and 316 SS4 0 from SSRT test4 at 2880C insimulated BWR water containing 200-300 ppbdissolved oxygen. HP material exhibits highersusceptibility than CP heats.
Effects of Chromate and Sulfate on SCC of Type 304 SS
* Current BWR operating practices have reduced to very low levels the ingress of ionicimpurities (e.g., sulfate, chloride) into the coolant system. Soluble corrosion productsviz., chromate and the counterbalancing hydronlum ion, are now the major Ionic speciespresent. Because only a small fraction of the recirculation water in BWRs passesthrough the reactor water cleanup system. the concentration of chromate ions in thereactor water can be much greater than in the feedwater (e.g.. 525-35 ppb versus<1 ppb, respectively). The CGRs of sensitized Type 304 SS under high-R, low-frequency loading are low (<4 x 10-11 m-s-l) provided that' the chromate/sulfateconcentration ratio in oxygenated feedwater is >3. Thus, a low chromate concentrationin BWR water (25-35 ppb) may actually have a beneficial effect on SCC, provided thatthe sulfate concentration is below a critical level (i.e., m10 ppb).
Irradiation-Ass sted Stress Corros ion Cracking of Type 304 SS
* Failures of austenitic SS after accumulation of high fluence have been attributed toradiation-induced segregation (RIS) of elements such as Si, P. S. Ni, and Cr.Microchemical and microstructural changes in high- and, commercial-purity (HP andCP) Type 304 SS specimens from control-blade absorber tubes in two operating BWRswere studied by Auger electron spectroscopy and SEM. SSRT tests were conducted on
146
tubular specimens in air and in simulated BWR water at 2890 C. Results in air showed*that the yield and ultimate tensile strengths of the HP material were higher than thoseof the CP material for a comparable fluence.
Stress versus elongation characteristics of the SSRT specimens were consistent withresults of SEM analyses of the percent IGSCC on fracture surfaces. IGSCC susceptibilityof the present CP absorber tubes was similar to those of other CP heats of Types 304and 316 SS reported in literature. However, the HP-absorber tubes exhibited greaterIGSCC susceptibility than did the CP materials.
* It is difficult to explain the relatively high susceptibility of the HP material on the basisof Si or P segregation, because impurity segregation in the HP absorber tubes was
- negligible for all flutence levels. Rather, the high susceptibility seems to be consistentwith the observation that irradiation-induced Cr depletion was more significant in theHP heat than in the CP heat, indicating that irradiation-induced grain-boundarydepletion of Cr is the primary process In IASCC, at least in simulated BWR water.
References
1. Criteria of Section III of the ASME Boiler and Pressure Vessel Code for Nuclear Vessels.The American Society of Mechanical Engineers, United Engineering Center, New York.Library of Congress Catalog No. 56-3934, (1989).
2. J. B. Terrell, Fatigue Life Characterization of Smooth and Notched Piping SteelSpecmens in 2880C Air Environments, NUREG/CR-5013, MEA-2232 (May 1988).
3. D. Weinstein, BWR Environment Crack*W Margins for Carbon Steel Piping-Final Report.EPRI Report NP-2046, Electric Power Research Institute, Palo Alto, CA (1982).
4. D. Hale. S. A. Wilson, J. W. Kass, and E. Kiss, Low Cycle Fatigue of Commercial PipingSteels in a BWR Primary Water Environment. J. Eng. Mater. and Technol. 103,15-25 (1981).
5. K. Ilda, H. Kobayashi, and M. Higuchi, Predictive Method of Low Cycle Fatigue Life ofCarbon and Low Alloy Steels in High Temperature Water Environments. NUREG/CP-0067, MEA-2090, Vol. 2 (April 1986).
6. N. Nagata, S. Sato, and Y. Katada, Low Cycle Fatigue Behavior of Low Alloy Steels in HighTemperature Pressurized Water,' Structural Mechanics in Reactor Technol. 10,209-214 (1989-8).
7. J. B. Terrell, Effect of Cyclic Frequency on the Fatigue Life of ASME SA-106-B PipingSteel In PWR Environments, J. Mater. Eng. 10, 193-203 (1988).
8. T. A. Prater and L. F. Coffin, The Use of Notched Compact-Type Specimens for CrackInitiation Design Rules in High-Temnperature WaterEnvironments, Corrosion Fatigue:Mechanics Metallurgy, Electrochemistry, and' Engineering, ASTM STP 801,T. W. Crooker and B. N. Leis, eds., American Society for Testing and Materials,Philadelphia, pp. 423-444 (1983).
147
9. T. A. Prater and L. F. Coffin, Notch Fatigue Crack Initiation in High Temperature WaterEnvironments: Experiments and Life Prediction, J. of Pressure Vessel Technol., Trans.ASME. 109, 124-134 (1987).
10 P. D. Hicks and F. P. A. Robinson. Fatigue Crack Growth Rates in a Pressure Vessel Steelunder Various Conditions of Loading and the Environment. Met. Trans. 1 7A.1837-1849 (1986).
11. 'Proc. of the Int. Atomic Energy Agency Specialists' Meeting on Subcritical CrackGrowth, NUREG/CP-0044, MEA-2014, Vols. 1 & 2 (May 1983).
12. Proc. of the 2nd Int. Atomic Energy Agency Specialists' Meeting on Subcritical CrackGrowth, NUREG/CP-0067, MEA-2090, Vols. 1 I& 2 (April 1986).
13. Proc. of the 3rd Int. Atomic Energy Agency Specialists' Meeting on Subcritical CrackGrowth, NUREG/CP-01 12, Vols. 1 & 2 (August 1990)..
14. T. A. Prater, W. R. Catlin, and L. F. Coffin, Surface Cdack Growth Behavior of StructuralMetals in High Temperature Water Environments, J. Eng. Mater. Technol. 108,2-9 (1986).
15. M. 0. Speidel and R. M. Magdowskl, Stress Corrosion Cracking of Nuclear ReactorPressure Vessel Steel in Water: Crack Initiation versus Crack Growth, Corrosion 88,Paper No. 283, St. Louis. MO (March 1988).
16. D. A. Hale, The Effect of BWR Startup Environments on Crack Growth in StructuralAlloys, J. Eng. Mater. Technol. 108, 44-49 (1986).
17. F. P. Ford and P. L. Andresen, Stress Corrosion Cracking of Low-Alloy Pressure VesselSteels in 2880 C Water, in Proc. 3rd Int. Atomic Energy Agency Specialists' Meeting onSubcritical Crack Growth, NUREG/CP-0112, Vol. 1, pp. 37-56 (August 1990).
18. P. M. Scott and D. R.Tice, Stress Corrosion in Low-Alloy Steels, Nucl. Eng. Des. 119,399-413 (1990).
19. T. F. Kassner, W. J. Shack. W. E. Ruther, and J. Y. Park. in Environmentally AssistedCracking in Light Water Reactors: Semiannual Report April-September 1990,NUREG/CR-4667 Vol. 11, ANL-91/9, pp. 3-8 (May 1991).
20. Proceedings of EPRI Workshop on Significance and Control of Chromate in BWRs.Chicago (November 13-14, 1990).
21. W. E. Ruther, W. K Soppet, and T. F. Kassner, in Environmentally Assisted Cracking inLight Water Reactors: Semiannual Report April-September 1988, NUREG/CR-4667Vol. 7, ANL-89/40, pp. 18-29 (March 1990).
22. W. E. Ruther, W. K Soppet, and T. F. Kassner, in Environmentally Assisted Cracking inLight Water Reactors: Annual Report October 1983-September 1984. NUREG/CR-4287, ANL-85-33, pp. 93-101 (June 1985).
23. W. L. Clark and A. J. Jacobs, Effect of Radiation Environment on SCC of AusteniticMaterials, in Proc. 1st Int. Symp. Environmental Degradation of Materi1s' in NuclearPower Systems - Water Reactors, National Association of Corrosion Engineers, Houston,pp. 451-461 (1984).
148
24. F. Garzarolli, D. Alter, and P. Dewes, Deformablibty of Austenitic Stainless Steels and Ni-Base Alloys In the Core of a Boiling and Pressurized Water Reactor, in Proc. 2nd Int.Symp. Environmental Degradation of Materials in Nuclear Power Systems - WaterReactors, National Association of Corrosion Engineers, Houston, pp. 131-138 (1986).
25. F. Garzarollf, D. Alter, P. Dewes, and J. L. Nelson, Deformablity of Austenitic StainlessSteels and NI-Base Alloys in the Core of a Boiling and Pressurized Water Reactor, inProc. 3rd Int. Symp. Environmental Degradation of Materials in Nuclear Power Systems- Water Reactors, G. J. Theus and J. R. Weeks, eds., The Metallurgical Society,Warrendale, PA. pp. 657-664 (1988).
26. H. Hanninen and I. Aho-Mantila, Environment-Sensitive Cracking of Reactor Internals,Ibid., pp. 77-92.
27. K. Fukuya, S. Nakahigashi. S. Ozaki, M. Teresawa. and S. Shima, Grain BoundarySegregation of Impurity Atoms In Irradiated Austenitic Stainless Steels, Ibid.,pp. 665-67 .
28. A. J. Jacobs, G. P. Wozaldo, K. Nakata, T. Yoshida,. and I. Masaoka, Radiation Effects onthe Stress Corrosion and Other Selected Properties of Type-304 and Type-316Stainless Steels, ibid., pp. 673-681.
29. E. P. Simonen and R H.. Jones, Calculated Solute Segregation Kinetics Related toIrradiation Assisted Stress Corrosion Cracking. ibid., pp. 683-690.
30. A. J. Jacobs, RP E. Clausing. L. Heatherly, and R. M. Kruger, Irradiation-Assisted StressCorrosion Cracking and Grain Boundary Segregation in Heat-Treated Type 304 SS. inEffects of Radiation on Materials: 14th Int. Symp., VoL I, ASTM STP 1046, N. H. Packan,R. E. Stoller, and A. S. Kumar, eds., American Society for Testing and Materials,Philadelphia, pp. 424-436 (1989).
31. A. J. Jacobs, R E. Clausing, M. K. Miller, and C. Shepherd, Iryfluence of Grain BoundaryComposition on the LASCC Susceptitbity of Type 348 Stainless Steel, in Proc. 4th Int.Symp. Environmental Degradation of Materials in Nuclear Power Systems - WaterReactors, National Association of Corrosion Engineers, Houston, pp. 14-21 to 14-45(1990).
32. C. M. Shepherd and T. M. Williams, Simulation of Microstructural Aspects of IASCC inWater Reactor Core Components, Ibid., pp. 14-11 to 14-20.
33. P. L. Andresen, F. P. Ford, S. M. Murphy, and J. M. Perks, State of Knowledge ofRadiation Effects on Environmental Cracking in Light Water Reactor Core Materials,ibid., pp. 1-83 to 1-121.
34. S. Bruemmer, L. A. Charlot, and E. P. Simonen, Grain Boundary Chemistry Effects onIrradiatton-Assisted Stress Corrosion Cracking, Corrosion 90, Paper No. 506, Las Vegas,NV (April 1990).
35. W. J. S. Yang, Precipitation Evolution in Type 316 Stainless Steels Irradiated in EBR-H,In Radiation-Induced Changes in Microstructure: 13th Int. Symp., ASTM STP 955.F. A. Garner, N. H. Packan, and A. S. Kumar, eds., American Society for Testing andMaterials, Philadelphia, pp. 628-646 (1987).
149
36. A. Strasser, J. Santucci. K. Lindquist, W. Yarlo, G. Stem, L. Goldstein, and L. Joseph,Evaluation of Stainless Steel Cladding in LWRs, EPRI NP-2642, Electric PowerResearch Institute. Palo Alto, CA (December 1982).
37. H. M. Chung and W. E. Ruther, in Environmentally Assisted Cracking In Light WaterReactors: Semiannual Report, October 1989-March 1990, NUREG/CR-4667 Vol. 10,ANL-91/5, pp. 14-17 (March 1991).
38. H. M. Chung and W. E. Ruther, in Environmentally Assisted Cracking In Light WaterReactors: Semiannual Report. April-September 1990, NUREG/CR-4667 Vol. 11,ANL-91/9, pp. 16-22 (April 1991).
39. H. M. Chung and W. E. Ruther, in Environmentally Assisted Cracking in Light WaterReactors: Semiannual Report, October 1990-March 1991, NUREG/CR-4667 Vol. 12,ANL-91/24, pp. 37-54 (August 1991).
40. M. Kodama. S. Nishimura, J. Morisawa, S. Shima, S. Suzuki, and M. Yamamoto, Effects ofFluence and Dissolved Oxygen on IASCC in Austenttlc Stainless Steels, 5th Int. Symp.Environmental Degradation of Materials in Nuclear Power Systems - Water Reactors,National Association of Corrosion Engineers (August 1992).
Acknowledgments
W. F. Burke, D. R. Perkins, W. K. Soppet, J. E. Sanecki, G. J. Talaber. and J. C. Tezakcontributed to the experimental effort in this program. This work'was conducted inprograms titled 'Environmentally Assisted Cracking in' LWR Systems' and 'MaterialsStudies on Service Aged Components' and sponsored by the Office of Nuclear RegulatoryResearch. U.S. Nuclear Regulatory Commission, under FIN Numbers A22122 and A22562;Program Managers: Drs. J. Muscara and E. Woolridge.
150
Estimation of Mechanical Properties of Cast Stainless Steelsduring Thermal Aging In LWR Systems
0. K Chopra
Materials and Components Technology DivisionArgonne National Laboratory
9700 South Cass Avenue The sbnitted manuscrpt has beenArgonne, Illinois 6043? Government under contract No. W-31-
109-ENG-38. Accordingly, Whe U.S.Government retains a nonexdusive.
i iC royalty-free license to publish orreproduce the pubtihed lorm of tisconbtrixtion. er Om owthers b0 do so, foAbstract u.s. Governrment purposes.
A procedure and correlations are presented'for predicting Charpy-impactenergy, tensile flow stress, fracture toughness J-R curve, and JIc of aged caststainless steels from known material Information. The 'saturation' impactstrength and fracture toughness of a specific cast stainless steel, i.e., the mini-mum value that would be achieved for the material after long-term service, Isestimated from the chemical composition of the steel. Mechanical properties asa function of time and temperature of reactor service are estimated from impactenergy and flow stress of the unaged material and the kinetics of embrittlement,which are also determined from chemical composition. The JIC values are de-termined from the estimated J-R curve and flow stress. Examples of estimatingmechanical properties of cast stainless steel components during reactor serviceare presented. A common "predicted lower-bound" J-R curve for cast stainlesssteels'of unknown chemical composition is also defined for a given grade ofsteel, ferrite content, and temperature.
1 Introduction
Investigations at Argonne National Laboratory (ANLYI- 4 and elsewhere 5 -1 2 have shownthat thermal embrittlement of cast stainless steels used for components of light water reac-tors (LWRs), e.g., valve bodies, pump casings, and primary coolant piping, can occur duringthe reactor design lifetime of 40 y. Thermal aging of cast stainless steels at reactor operat-ing temperatures,' i.e., 280-320C (536-6081F) increases hardness 'and tensile' strength anddecreases ductility, impact strength, and fracture toughness of the 'material. The Charpytransition curve shifts to higher temperatures.-' Most btudies on thermal embrittlement ofcast stainless steels involve simulation of end-of-life reactor conditions by accelerated agingat higher temperatures, viz., 4000 C (7520F), because tfi6tlme period for operation 'of powerplants (-40 y) is far longer than can generally be consiaered for laboratory studies. Thus,estimates of the loss'of fracture toughness of cast stainless steel components are based'on anArrhenius extrapolation of high-temperature data to reactor operating conditions.
A procedure and correlations are presented for predicting mechanical properties ofcast stainless steel components during thermal aging ii' LWRs at 280-3301C (536-6260 F).These correlations are updates of those presented earliet.'l 3 .14 The present analysis focusedon developing correlations for fracture properties In terms of material Information In certi-fied material test records (CMTRs) and on'ensuring that the correlations are adequately
151
conservative for cast stainless steels defined by-ASTM Specification A 351. These correla-tions do not consider the effect of microstructural differences that may arise from differ-ences in production heat treatment or casting process and, therefore, may be conservativefor some steels.
Mechanical properties of a specific cast stainless steel are estimated from the extentand kinetics of thermal embrittlement. The extent of thermal embrittlement is character-ized by room-temperature (RT) 'normalized" Charpy-impact energy (Charpy-impact energyper unit fracture area). A correlation for the extent of embrittlement at 'saturation,. i.e.,the minimum impact energy that can be achieved for the material after lont-term aging, isgiven in terms of chemical composition. The results indicate that Charpy-impact energycan be <85 J/cm2 (<50 ft.lb) for cast stainless steels with ferrite contents as low as 10%6.
Extent of thermal embrittlement as a function of time and temperature of reactor ser-vice is estimated from the extent of embrittlement at saturation and from the correlationsdescribing the kinetics of embrittlement, which are also given in terms of the chemicalcomposition of the steel. The fracture toughness J-R curve for the material is. then obtainedfrom the correlation between fracture toughness parameters and the 'RT Charpy-impact en-ergy used to characterize the extent of thermal embrittlement. A common lower-bound J-Rcurve for cast stainless steels of unknown chemical composition is also defined for a givenmaterial grade and temperature. In addition, correlations are presented for estimating theincrease in tensile flow stress from data on the kinetics of thermal embrittlement; initialtensile flow stress of the unaged material is needed to determine the flow stress of the agedmaterial. Fracture toughness parameters, e.g., Jlc and tearing modulus, are determinedfrom the estimated J-R curve and tensile flow stress. Examples of estimating mechanicalproperties of cast stainless steel components during reactor service are included.
2 Mechanism of Thermal Embrittlement
Thermal embrittlement of cast duplex stainless steels results in brittle fracture associ-ated with either cleavage of the ferrite or separation of the ferrite/austenite phase boundary.The degree of thermal. embrittlement is controlled by the amount of brittle fracture. Caststainless steels with poor impact strength exhibit >80% brittle fracture. In some caststeels. a fraction of the material may fail in brittle fashion but the surrounding austeniteprovides ductility and toughness. Such steels have adequate impact strength even afterlong-term aging. A predominantly brittle failure occurs when either the ferrite phase iscontinuous, e.g... in cast material with a large ferrite content, or the ferrite/austenite phaseboundary provides an easy path for crack propagation, e.g.. in high-C grades of cast steelsthat contain phase-boundary carbides., Consequently. the amount, size, and distribution offerrite in the duplex structure and phase-boundary carbides are important parameters thatcontrol the extent of thermal embrittlement. The extent of thermal embrittlement in-creases with increased ferrite content. The low-C CF-3. steels are the most resistant. andthe Mo-bearing, high-C CF-8M steels are the least resistant to thermal embrittlement.
Thermal aging of cast stainless steels at <5000C (<9321F) leads to, precipitation of addi-tional phases in the ferrite, e.g.. formation of a Cr-rich a' phase by spinodal decomposition;nucleation Iand growth of at' precipitation of a Ni- and Si-rich G phase, M2 3C 6, and y2(austenite); and additional precipitation and/or growth of existing carbides at the fer-
152
rite/austenite phase boundaries.15 -2 1 Formation of ct' phase is the primary strengtheningmechanism for ferrite. which increases strain-hardening and local tensile stress.Consequently, the critical stress level for brittle fracture is achieved at higher temperatures.Other precipitate phases in ferrite have little or no effect on the extent of thermalembrittlement.
Phase-boundary separation generally occurs in the high-C steels because of the pres-ence of large M23C 6 carbides at the phase boundaries. For CF-8 steels, the phase-boundarycarbides form during production heat treatment of the casting. Consequently, unaged CF-8steels exhibit low lower-shelf energy and high mid-shelf Charpy transition temperature(CTr) relative to the CF-3 steels. The fracture mode for, CF-8 steels in the lower-shelf ortransition-temperature regime Is predominantly phase-boundary separation.2 -4 In contrast,CF-3 steels show dimpled ductile failure, Fracture by phase-boundary separation is observedin only a few heats of unaged CF-8M steels and is dependent on whether the material con-tains phase-boundary carbides. Materials aged at 4500 C (8420F) show significant precipita-tion of phase-boundary carbides (also nitrides in high-N steels) and a large decrease in fer-rite content of the material.3 .4 At reactor temperatures, such processes either do not occuror their kinetics are extremely slow. Consequently, data obtained at 4500C aging do not re-flect the mechanisms active under reactor operating conditions, and extrapolation of the4500C data to predict the extent of thermal embrittlement at reactor temperatures is notvalid.
The kinetics of thermal embrittlement of cast stainless steels are controlled primarilyby the kinetics of ferrite strengthening, i.e., the size and spacing of Cr fluctuations producedby spinodal decomposition of ferrite. Small changes in the constituent elements of the ma-terial can cause the kinetics of thermal embrittlement to vary significantly. Activation ener-gies of thermal embrittlement can range from 65 to 230 kJ/mole (15 to 55 kcal/mole).Also, the aging behavior at 4000C (7520F) shows significant heat-to-heat variation. The de-crease in Charpy-impact energy during thermal aging at 4000 C for various heats of caststainless steels used in studies at ANL.3.4 Georg Fischer Co. (GF),5 Framatome (FRA),10 andElectric Power Research Institute (EPRI)12 is shown in Fig. 1. The results indicate that allmaterials reach a saturation impact energy, i.e., minimum value that would be achieved bythe material after long-term aging. Saturation impact energy. in general. decreases with anincrease in ferrite content or the concentration of C and N in the steel. As discussed above,both of these factors promote brittle fracture.
Figure 1 also indicates that the time for aging at 4000 C (7520F) for a given decrease inimpact energy varies more than 2 orders of magnitude for the various heats. Productionheat treatment, and possibly the casting process, influence aging behavior at 4000C and,therefore, the kinetics of thermal embrittlement. The log of the aging time at 4000C for a50% reduction in Charpy-impact energy has been shown to be a useful parameter for char-acterizing the kinetics of thermal embrittlement.13 Activation energy for thermal embrit-tlement is high for steels that show fast embrittlement at 400 0C, and low for those thatshow' slow embrittlement at 4000C. Also, cast materials with high activation energy of em-brittlement do not contain G phase and those with low activation energy contain G phase. Itis likely that material parameters, e.g., production heat treatment, that influence the kinet-ics of thermal embrittlement also affect G-phase precipitation; the physical presence of Gphase has little or no effect on either the extent or kinetics of embrittlement.
153
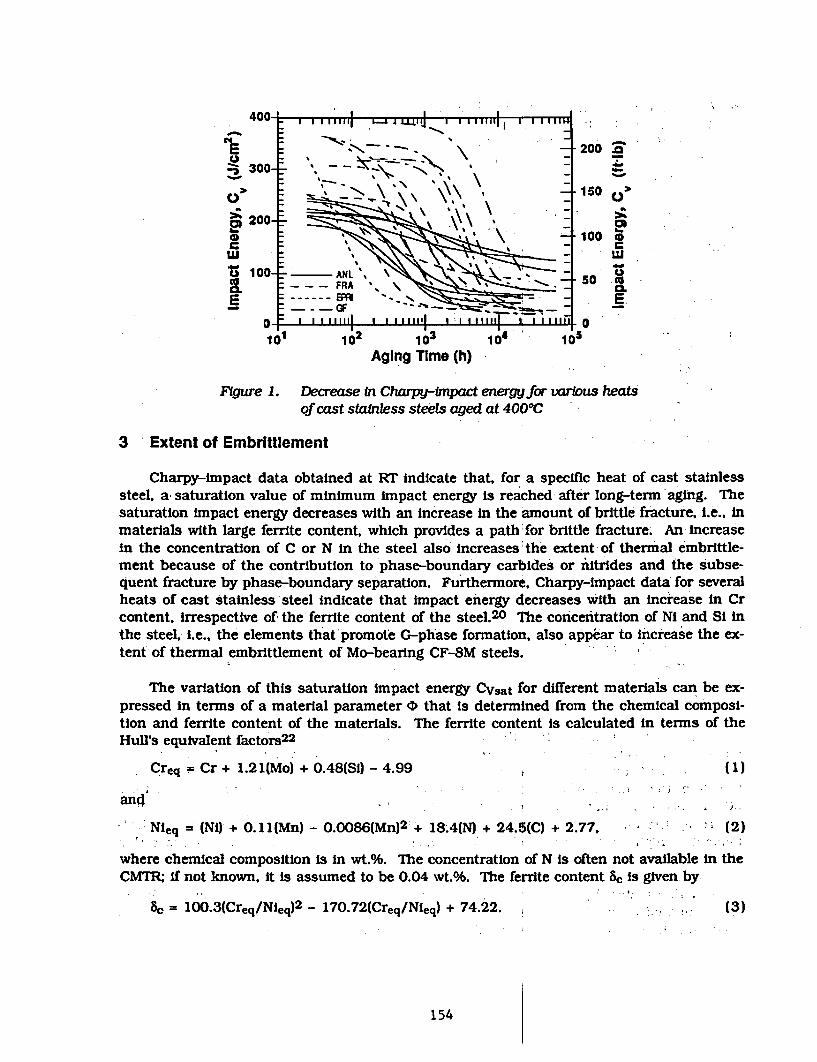
400-
200 aAt 300 '--
150
20~I 200
1 1 102 1 1 4 l 1Aging Time (h)
figure 1. Decrease in Charpy-impact energy for vaius heats
of cast stainless steels aged at 4000C
3 Extent of Embrittlement
Charpy-impact data obtained at RT indicate that, for a specific heat of cast stainlesssteel, a saturation value of minimum impact energy is reached after long-term'aging. Thesaturation impact energy decreases with an increase in the amount of brittle fracture. i.e., inmaterials with large ferrite content, which provides a path' for brittle fracture. An increasein the concentration of C or N in the steel also increases the extent of thermal embrittle-ment because of the contribution to phase-boundary carbides or nitrides and the subse-quent fracture by phase-boundary separation. Furthermore. Charpy-impact data for severalheats of cast stainless steel indicate that impact energy decreases with an increase in Crcontent, irrespective of the ferrite content of the steel.2 0 The concentration of Ni and Si inthe steel, i.e., the elements that'promote G-phase formation, also appear to increase the ex-tent of thermal embrittlement of Mo-bearing CF-8M steels.
The variation of this saturation Impact energy Cvsat for different materials can be ex-pressed in terms of a material parameter 4> that Is determined from the chemical composi-tion and ferrite content of the materials. The ferrite content is calculated in terms of theHull's equivalent factors2 2
Creq = Cr + 1.21(Mo) + 0.48(Si) - 4.99 (1)
and ,
Nleq = (Ni) + O.ll(Mn) - 0.0086(Mn) 2 + 18.4(N) + 24.5(C) + 2.77. (2)
where chemical composition is in wt.%. The concentration of N is often not available in theCMTR: if not known, It is assumed to be 0.04 wt.%. The ferrite content 8c is given by
SC = 100.3(Creq/Nieq) 2 - 17O. 7 2(Creq/Nieq) + 74.22. (3)
154
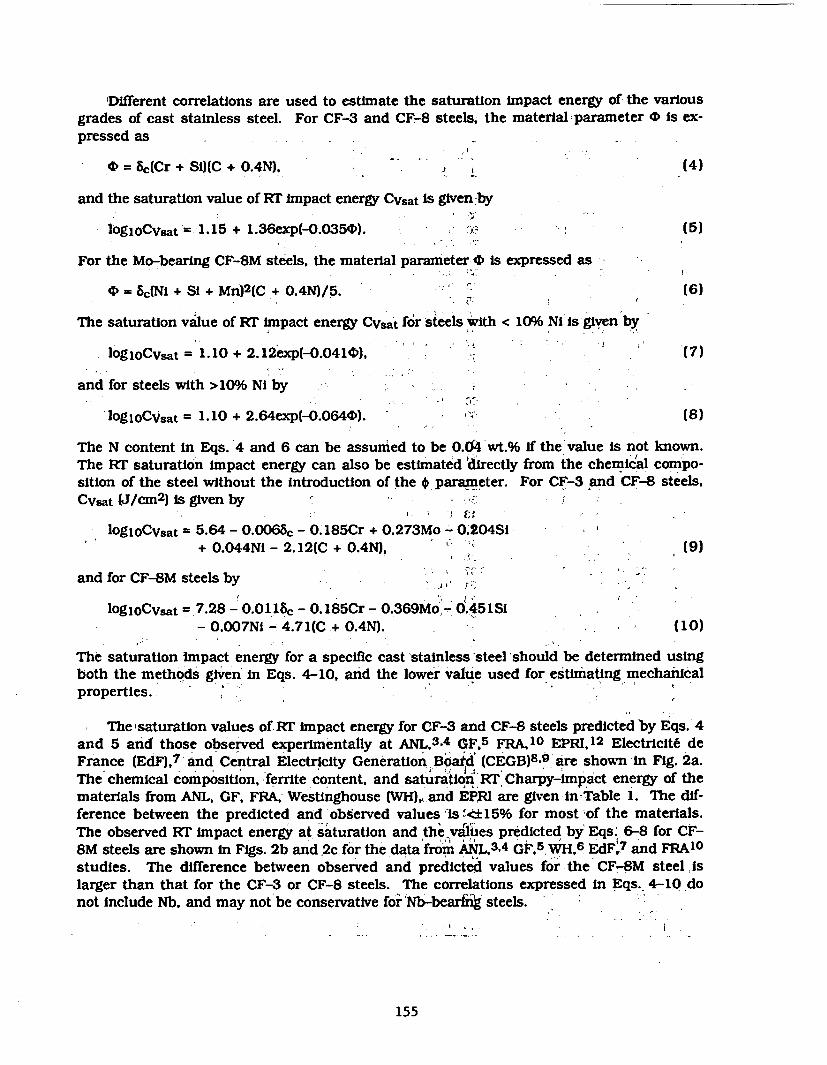
Different correlations are used to estimate the saturation impact energy of the variousgrades of cast stainless steel. For CF-3 and CF-8 steels. the material parameter 0 Is ex-pressed as
0 = Sc(Cr + SI)(C + O.4N). (4)
and the saturation value of RI impact energy CVsat is given by
logloCvsat-- 1.15 + 1.36exp(-0.0354'). (6)
For the Mo-bearing CF-8M steels, the material parameter 10 is expressed as
0 = Sc(Ni + Si + Mn)2 (C + O.4N)/5. (6)
The saturation value of Rr impact energy CvSat for steels with < 10% Ni is given by
log1oCVsat 1.10 + 2.12exp(-0.0410), (7)
and for steels with >10% Ni by
logjOCVsat = 1.10 + 2.64exp(-0.0640). (8)
The N content in Eqs. 4 and 6 can be assumed to be 0.04'wt.% if the'value Is not known.The Rr saturation Impact energy can also be estimated directly from the chemical compo-sition of the steel without the Introduction of the O parameter. For CF-3 and CF-8 steels,Cvsat (J/cm2) is given by
logioCvsat = 5.64 - 0.0068c - 0.185Cr + 0.273Mo - 0.204SI+ 0.044NI - 2.12(C + 0.4N), ' t (9)
and for CF-BM steels by
logloCvsat = 7.28 - 0.0,15c - 0. 185Cr - 0.369Mo - 0.451SI- 0.007Ni - 4.71(C + 0.4N). (10)
The saturation impact energy for a specific cast -stainless 'steel should be determined usingboth the methods given' In Eqs. 4-10, and the lower value used for estimating mechanicalproperties.
The saturation values of RI impact energy for CF-3 and CF-8 steels predicted by Eqs. 4and 5 and those observed experimentally at ANL, 3 .4 GF,5 FRA,10 EPRI.1 2 Electricite deFrance (EdF),? and Central Electricity Generation Boafd (CEGB)8 .9 are shown in Fig. 2a.The chemical composition, ferrite content, and saturation R, Charpy-impact energy of thematerials from ANL, GF, FRA,- Westinghouse (WH),1 and EPJR are given in-Table 1. The dif-ference between the predicted and'observed values 'isf'±15% for most of the materials.The observed RI impact energy at saturation and the vcaiies predicted by Eqs. 6-8 for CF-8M steels are shown in Figs. 2b and 2c for the data from ANL,3.4 GF,5 WH.6 EdF.7 and FRA1 0
studies. The difference between observed and predicted values for the CF-8M steel islarger than that for the CF-3 or CF-8 steels. The correlations expressed in Eqs. 4-10 donot include Nb. and may not be conservative for Nb-bearriik steels.
155
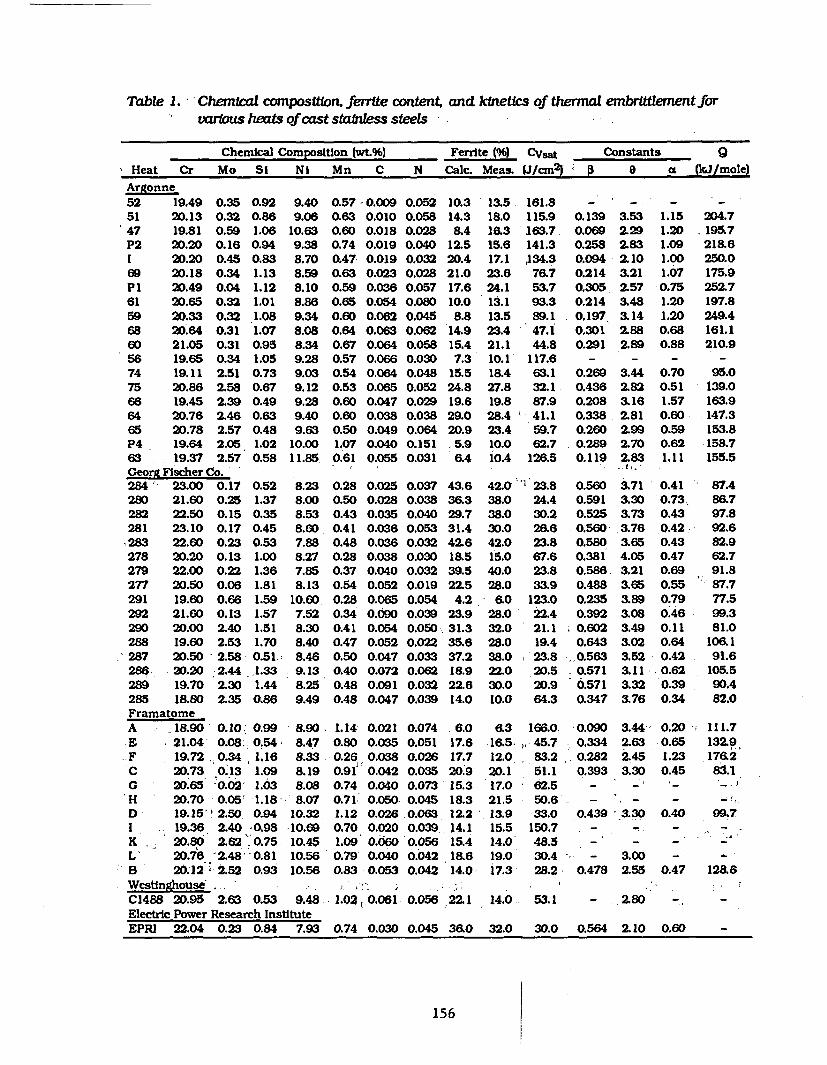
Table 1. Chemical compositWon. ferrite content, and kinetics of thermal Mbritenentforvarious heats of cast stainess steels
Chemical Composition (wL%) Ferrite (%) CVsat Constants sHeat Cr Mo Si Ni Mn C N Calc. Meas. PJ/cm 2 l 0 8 L (kJ/mole)
Argonne52 19.49 0.35 0.92 9.40 0.57 0.009 0.052 10.351 20.13 0.32 0.86 9.06 0.63 0.010 0.058 14.347 19.81 0.59 1.06 10.63 0.60 0.018 0.028 8.4P2 20.20 0.16 0.94 9.38 0.74 0.019 0.040 12.51 20.20 0.45 0.83 8.70 0.47 0.019 0.032 20.469 20.18 0.34 1.13 8.59 0.63 0.023 0.028 21.0P1 20.49 0.04 1.12 8.10 0.59 0.036 0.057 17.661 20.65 0.32 1.01 8.86 0.65 0.054 0.080 10.059 20.33 0.32 1.08 9.34 0.60 0.062 0.045 8.868 20.64 0.31 1.07 8.08 0.64 0.063 0.062 14.960 21.05 0.31 0.95 8.34 0.67 0.064 0.058 15.456 19.65 0.34 1.05 9.28 0.57 0.066 0.030 7.374 19.11 2.51 0.73 9.03 0.54 0.064 0.048 15.575 20.86 2.58 0.67 9.12 0.53 0.065 0.052 24.866 19.45 2.39 0.49 9.28 0.60 0.047 0.029 19.664 20.76 2.46 0.63 9.40 0.60 0.038 0.038 29.065 20.78 2.57 0.48 9.63 0.50 0.049 0.064 20.9P4 19.64 2.05 1.02 10.00 1.07 0.040 0.151 5.963 19.37 2.57 0.58 11.85 0.61 0.055 0.031 6.4Georg Fischer Co.284 23.00 0.17 0.52 8.23 0.28 0.025 0.037 43.6280 21.60 0.25 1.37 8.00 0.50 0.028 0.038 36.3282 22.50 0.15 0.35 8.53 0.43 0.035 0.040 29.7281 23.10 0.17 0.45 8.60 0.41 0.036 0.053 31.4283 22.60 0.23 0.53 7.88 0.48 0.036 0.032 42.6278 20.20 0.13 1.00 8.27 0.28 0.038 0.030 18.5279 22.00 0.22 1.36 7.85 0.37 0.040 0.032 39.5277 20.50 0.06 1.81 8.13 0.54 0.052 0.019 22.5291 19.60 0.66 1.59 10.60 0.28 0.065 0.054 4.2.292 21.60 0.13 1.57 7.52 0.34 0.090 0.039 23.9290 20.00 2.40 1.51 8.30 0.41 0.054 0.050. 31.3288 19.60 2.53 1.70 8.40 0.47 0.052 0.022 35.6287 20.50 2.58 0.51 8.46 0.50 0.047 0.033 37.2286 20.20 2.44 1.33 9.13 0.40 0.072 0.062 18.9289 19.70 2.30 1.44 8.25 0.48 0.091 0.032 22.6285 18.80 2.35 0.86 9.49 0.48 0.047 0.039 14.0
13.5 161.818.0 115.916.3 163.715.6 141.317.1 [134.323.6 76.724.1 53.713.1 93.313.5 89.123.4 47.121.1 44.810.1 117.618.4 63.127.8 32.119.8 87.928.4 41.123.4 59.710.0 62.710.4 126.5
42.0 1'23.838.0 24.438.0 30.230.0 26.642.0 23.815.0 67.640.0 23.828.0 33.9
6.0 123.028.0 22.432.0 21.128.0 19.438.0 23.822.0 20.530.0 20.910.0 64.3
0.139 3.530.069 2.290.258 2.830.094 2.100.214 3.210.305 2.570.214 3.480.197 3.140.301 2.880.291 2.89
0.269 3.440.436 2.820.208 3.160,338, 2.810.260 2.990.289 2.700.119 2.83
' " '
0.560 3.710.591 3.300.525 3.730.560 .3760.580 3.650.381 4.050.586 3.210.488 3.650.235 3.890.392 3.080.602 3.490.643 3.02
1.151.201.091.001.070.751.201.200.680.88
0.700.511.570.600.590.621.11
204.7* 195.7218.6250.0175.9252.7197.8249.4161.1210.9
95.0139.0163.9147.3153.8158.7155.5
0.41 ' 87.40.73k 86.70.43 97.80.42 92.60.43 82.90.47 62.70.69 91.80.55 ; 87.70.79 77.50.46 99.30.11 81.00.64 106.1
. 0.563 3.52 0.42 ,0.571 3.11 0.62
'6.571 3.32 '0.39,0.347 3.76 0.34
91.6105.590.482.0
FramatomeA 18.90 0.10: 0.99 8.90 1.14 0.021 0.074 6.0 &3 166.0 0.090 3.44 0.20E 21.04' 0.08. 0.54 8.47 0.80 0.035 0.051 17.6 16.5. 45.7 0.334 2.63 0.65F 19.72 0.34, 1.16 8.33 0.26 0.038 0.026 17.7 12.0 83.2 0.282 2.45 1.23C 20.73 0.13 1.09 8.19 0.91 0.042 0.035 20.9 20.1 51.1 0.393 3.30 0.45G 20.65 0.02 1.03 8.08 0.74 0.040 0.073 15.3 17.0 62.5 - - -H 20.70 0.05' 1.18 8.07 0.71 0.050- 0.045 18.3 21.5 50.6 - - -D 19.15' 2.50 0.94 10.32 1.12 0.026 0.063 12.2 13.9 33.0 0.439 3.30 0.40I . 19.36 2.40 098 10.69 0.70 0.020 0.039, 14.1 15.5 150.7 - - -K 20.80 2.62 0.75 10.45 1.09 0.060 0.056 15.4 14.0 48.5 - - -L 20.76 2.48 - .81 10.56 0.79 0.040 0.042 18.6 19.0 30.4 - 3.00 -B 20.12 2.52 0.93 10.56 0.83 0.053 0.042 14.0 i7.3 28.2 0.478 2.55 0.47Westinghouse , ' ,C1488 20.95 2.63 0.53 9.48 1.02,,0.061 0.056 22.1 14.0 53.1 - 2.80 -Electric Power Research InstituteEPRI 22.04 0.23 0.84 7.93 0.74 0.030 0.045 36.0 32.0 30.0 0.564 2.10 0.60
* 111.7132.9176.283.1
12 6
- :7
128.6
156
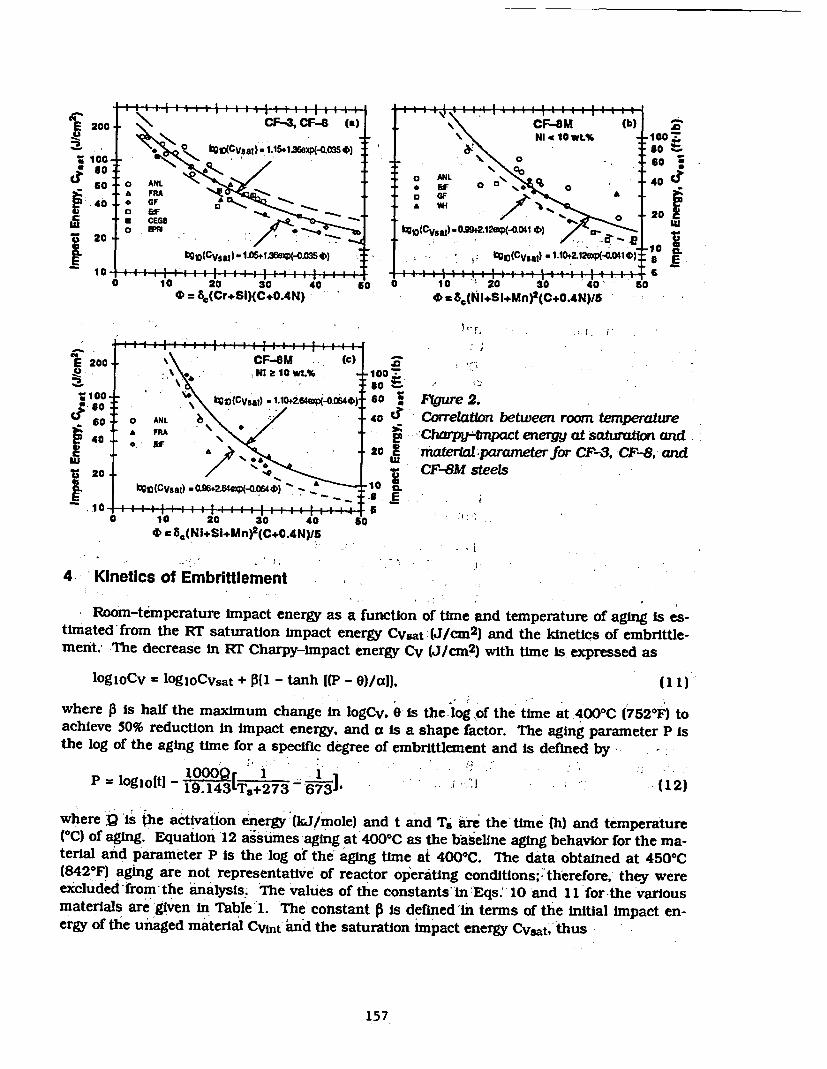
E 200 .- CF- 3,CF- .\ 0 FU (b)H0 I \C 1t _ 10r
cJ 0 NI
6 . . A 0 L 40.;so . **FA 0 * o GF s
40 -F F W
r 0 ETB_ 20
20o ( - 5 e _e _lC2sat) 9Oq*OO4 I O) /O0 - 10 j
& bg1(C VsaI) 1- 1.s66V(-0.03S0) . IQ 1091(CVat) -1.1+2.12i2 0.041) :0 c
l i - I I Ii i 1 J I f I I 60 10 20 30 40 0 0 10 20 30 40' 50
= 8,(Cr+Si)(C+0.4N) 0* a86(hi.SM+Mn)(C.0.4N)/5
E 200 CF-GM (c)H . "I a10 Wt% Ica0
* 00 (C *Vsat}) * 1.OZ64W(-O.M44) 0 gure 2.
- 60 0 ANL 40 Correlation between room temperatureE 40 " E -Charp-rn t energy at salurtion and
20* mater -parameter r CF-3, CF-B, and
% 20 CF-8M steels| t(~CVsa:) +2h4eip(-_.0640)- . 10
-,10. II 11 4I 1-C 111 1 9 ̂ .,
0 10 20 30 40 504* 8,(NI+Si+Mn)2 (C gC0.4N)/5
4 'Kinetics of Embrittlement
Room-temperature Impact energy as a function of time and temperature of aging is es-timated from the Rr saturation impact energy CVsat (J/cm2 ) and the kinetics of embrittle-ment.' The decrease in Rr Charpy-impact energy Cv (J/cra2 ) with time is expressed as
log1oCv = 10g10Cvsat + Ofl - tanh I(P - W)/aXI, (ll)
where A is half the maximum change in logCv. e is the log of the time at 4000C (7520 F) toachieve 50% reduction in Impact energy, and a is a shape factor. The aging parameter P isthe log of the aging time for a specific degree of embrittlement and is defined by
P = logiofti - [ +273 -`673]' A 'J (12)
where Q is the activation energy (kJ/mole) and t and Ta are the' time (Ih) and temperature(°C) of aging. Equation 12 assumes aging at 400°C as the baseline aging behavior for the ma-terial and parameter P is the log of the aging time at 4000C. The data obtained at 450°C(842°F) aging are not representative of reactor operating conditions; therefore, they wereexcluded-from the analysis. The values of the constants''In 'Eqs: 10 and l1 for the variousmaterials are given in Table 1. The' constant P is defined in terms of the initial impact en-ergy of the unaged material Cvjnt and the saturation impact energy Cvsatt thus
157
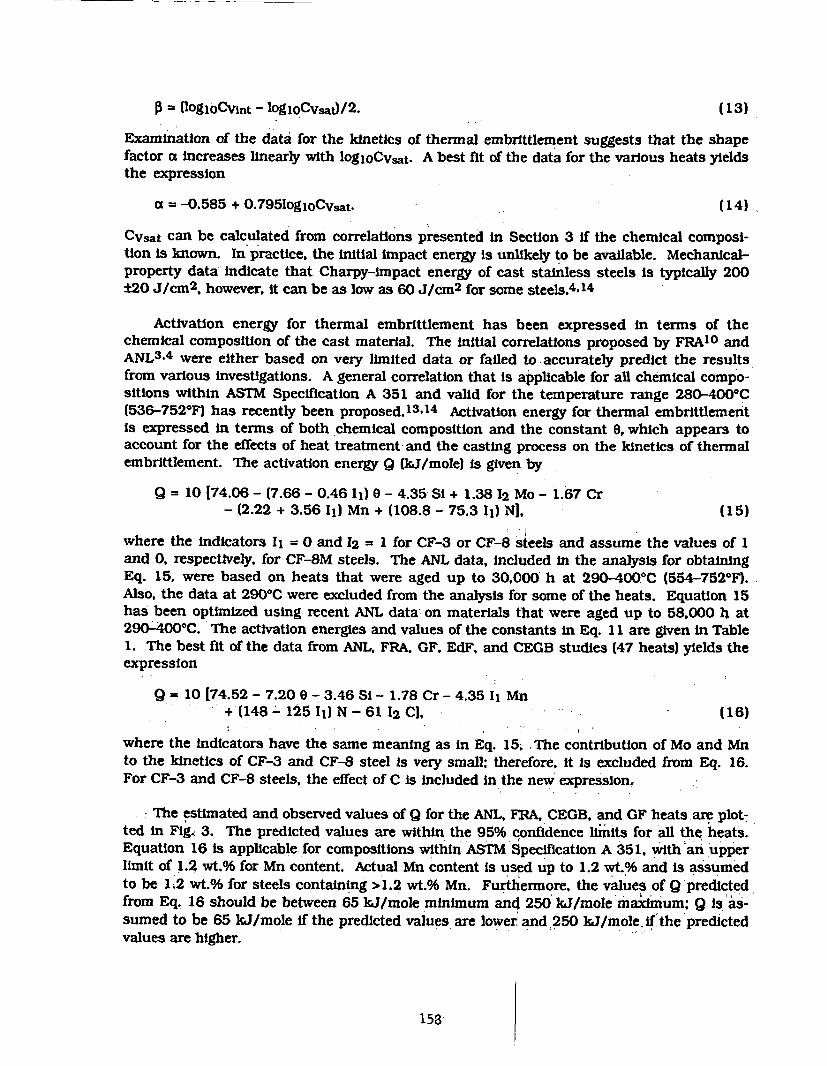
D= (Iog10CVint - logioCvsaj/2. (3(13)
Examination of the data for the kinetics of thermal embrittlement suggests that the shapefactor a increases linearly with logloCvsat. A best fit of the data for the various heats yieldsthe expression
a = -0.585 + 0.795loglCvsat. (14)
CVsat can be calculated from correlations presented in Section 3 if the chemical composi-tion is known. In practice, the initial impact energy is unlikely to be available. Mechanical-property data' indicate that Charpy-impact energy of cast stainless steels is typically 200±20 J/cm2 , however, it can be as low as 60 J/cm2 for some steels.4 .14
Activation energy for thermal embrittlement has been expressed in terms of thechemical composition of the cast material. The initial correlations proposed by FRAIO andANL3 ,4 were either based on very limited data or failed to accurately predict the resultsfrom various investigations. A general correlation that is applicable for all chemical compo-sitions within ASTM Specification A 351 and valid for the temperature range 280-4000 C(536-7521F) has recently been proposed. 13 .14 Activation energy for thermal embrittlementis expressed in terms of both chemical composition and the constant 8, which appears toaccount for the effects of heat treatment and the casting process on the kinetics of thermalembrittlement. The activation energy 9 (kJ/mole) is given by
9 = 10 [74.06 - (7.66 - 0.46 II) e - 4.35 Si + 1.38 12 Mo - 1.67 Cr- (2.22 + 3.56 Ii) Mn + (108.8 - 75.3 Ii) NJ. (15)
where the Indicators Ii = 0 and 12 = 1 for CF-3 or CF-8 steels and assume the values of 1and 0, respectively, for CF-8M steels. The ANL data, Included in the analysis for obtainingEq. 15. were based on heats that were aged up to 30,000 h at 290-4000 C (554-7520 F).Also, the data at 2900C were excluded from the analysis for some of the heats. Equation 15has been optimized using recent ANL data on materials that were aged up to 58,000 h at290-4000 C. The activation energies and values of the constants in Eq. 11 are given in Table1. The best fit of the data from ANL. FRA, GF, EdF. and CEGB studies (47 heats) yields theexpression
Q = 10 [74.52 - 7.20 0 - 3.46 Si - 1.78 Cr - 4.35 11 Mn+ (148 - 125 II) N-61 I2 CI, (16)
where the Indicators have the same meaning as in Eq. 15, The contribution of Mo and Mnto the kinetics of CF-3 and CF-8 steel is very small; therefore, it is excluded from Eq. 16.For CF-3 and CF-8 steels, the effect of C is included in the new expression.
The estimated and observed values of Q for the ANL, FRA, CEGB, and GF heats are plot-ted in Fig. 3. The predicted values are within the 95% -onfidence limits for all the heats.Equation 16 is applicable for compositions within ASTM Specification A 351, with an upperlimit of 1.2 wt.% for Mn content. Actual Mn content is used up to 1.2 wt.% and is assumedto be 1.2 wt.% for steels containing >1.2 wt.% Mn. Furthermore, the values of Q predictedfrom Eq. 16 should be between 65 kJ/mole minimum and 250 kJ/mole maximum; Q Is as-sumed to be 65 kJ/mole if the predicted values are lower, and 250 kJ/mole if the predictedvalues are higher.
158
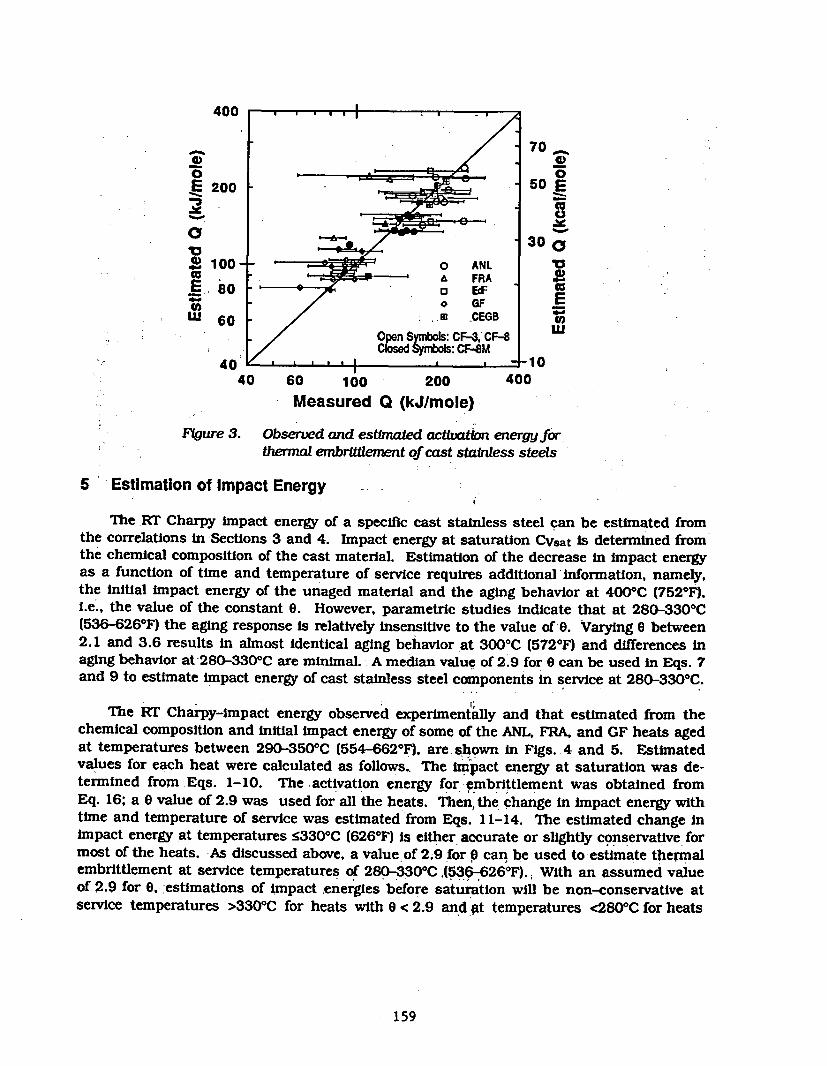
400
-~~ 70_
.200 50 i
o30Q
a 100 0 ANL laX .FRA
W 60 / . CEGB
Oen Synftos: CF-3, CF-8/closed Sytls: CF-8M
- 40 ... , -1040 60 100 200 400
Measured Q (kJ/mole)
Figure 3. Observed and estimated activation energy forthermal embrittlement of cast stainless steels
5 Estimation of Impact Energy -
The RT Charpy impact energy of a specific cast stainless steel can be estimated fromthe correlations in Sections 3 and 4. Impact energy at saturation CVsat is determined fromthe chemical composition of the cast material. Estimation of the decrease In impact energyas a function of time and temperature of service requires additional Information, namely.the initial impact energy of the unaged material and the aging behavior at 400'C (7520 F).i.e., the value of the constant 0. However, parametric studies indicate that at 280-3300C(536-6260F) the aging response is relatively insensitive to the value of 0. Varying 6 between2.1 and 3.6 results in almost identical aging behavior at 3000C (5720F) and differences inaging behavior at 280-330 0C are minimal. A median value of 2.9 for 0 can be used in Eqs. 7and 9 to estimate impact energy of cast stainless steel components in service at 28G-330 0C.
The RT Charpy-impact energy observed experimentally and that estimated from thechemical composition and initial impact energy of some of the ANL, FRA, and GF heats agedat temperatures between 290-350 0C (554-662 0F), are shown in Figs. 4 and 5. Estimatedvalues for each heat were calculated as follows., The impact energy at saturation was de-termined from Eqs. 1-10. The activation energy for embrittlement was obtained fromEq. 16; a 0 value of 2.9 was used for all the heats. Then, the change in impact energy withtime and temperature of service was estimated from Eqs. 11-14. The estimated change Inimpact energy at temperatures S3300C (6260F) is either accurate or slightly conservative formost of the heats. As discussed above, a value of 2.9 for 9 can be used to-estimate thermalembrittlement at service temperatures of 280-3301CA(53"626 0F). With an assumed valueof 2.9 for 0. estimations of impact energies before saturation will be non-conservative atservice temperatures >3300C for heats with 0 < 2.9 and ;t temperatures <2800C for heats
159
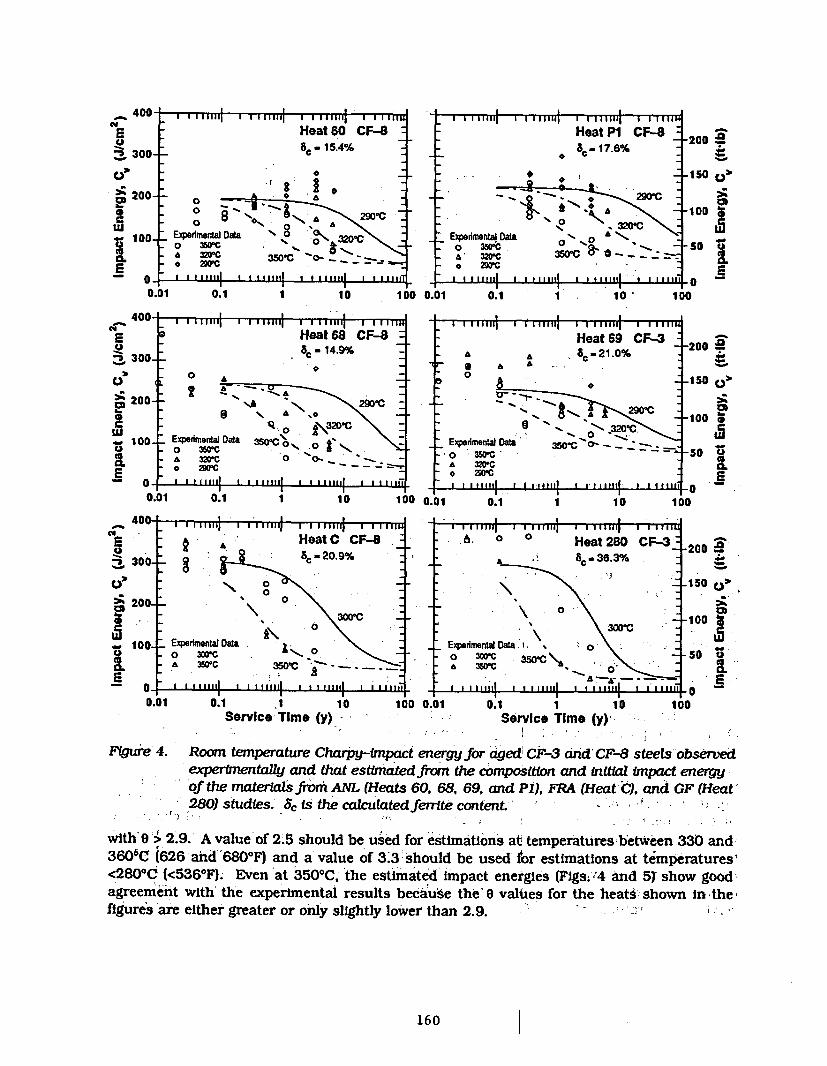
l
ann-uv-_ ... .I ....1.....1-i2 3C
es2 2C
8El
aL 1
£ I
_ I I I I I ll~llj I I I I aii, I I llle
Heat 60 CF-8
0-C -15.4%
o- 8- --
D0- Expertmantia Data 3 s30c
o 20C 3502 __
O- - I I 1111114 1 1 I!ll 1iii 1 lll 111114 11
Heat P1 CF-- A_ -17.6%
I-, 1e320
Expedmead Data o A
o 0 0
_ I , I .i _D.01 0.1 1 10tO 1000.01 0.1 1 10 1
I
CO a
Ann. I--- r
W
Z 300-
>; 200-
00. 100-
E- n
""" I 1111111 i i lIIj i 111111 I I ml ii
Heat 68 CF-S8C- 14.9%
0 £
2 4 ..q ' \ X290'C
a \ ^ ,*
a*o 2\320C \Expendmetal Data 350-C Oo 350'C 0* 3201C 0 0'* 29c --
I i m i I g iituf I I Im id I I 1111111
' I I 11 "" I I 1 1 I 111I11 I I 1 1 4l
Heat 69 CF-3± . 8 c -21.0%
0
0 91
Expedmental Dt --0 3srCa 3WC
- O aO2c- 111111 I I I I I I I 11111 I " 1111
u- _
0.01 0.1 1 10 II D0 (_T- 1 - 1- -|** - *
0.01 0.1 1 10 10
'4 1 . I I
-21
-1.
-11
-5
-0
.21
.1!
.Si
DO SitoD
50 c?,
100A
150 c?
a
DO A
Eo 0
a.
iOA
ta
Ul
cm
0
E
400-Heat C CF-.
30 9 8C-20.9%
0
00
200- 0 % 0
1 0 Expenimenta Data0 300CeA 35C 350-C
0 - ll li I lI It I I1 11 1 I I I I I I I I I III
,.. .,, ,, .1 .g1 , iiw r l }j l I i 1II 1 1 1 I I
* 6, 0 0 Heat280 CF-3:^ - 8C_ 38.3%
-3
_EwodmenW Data. .1.0 360M mwoch* .\0
4~~~ - -Ar_,
L 11 1
_ ' F0.01 0.1 .1 10
Service Time (y) -100 C
.. i ' ' ' ."'I . ' u . . - u
1.01 0.1 1 10 100Service Time (y)
;. !.i . ~
F~gre 4. Room temerature Charpy-irnpact energy for aged CF-3 and CF-8 steels observedexpertmenrtally and that esttmated frorn the compostuon and Initial impact energyof the materials firom ANL (Heats 60, 68, 69, and P1), FRA (Heat C). and GF (Heat280) studies. .c is the calculatedferrite content.
with' 9: 2.9.' A value of 2.5 should be used for estimations at temperaturesibetween 330 and36060 (626 and 680°F) and a' value of 3;3 should be used for estimations at temperatures'<280'4C (k5360F). Even at 350°C, the estimated impact energies (Figs. '4 and 51 show goodagreement with' the experimental results because the-0 values for the heats shown in thefigures are either greater or only slightly lower than 2.9.
160
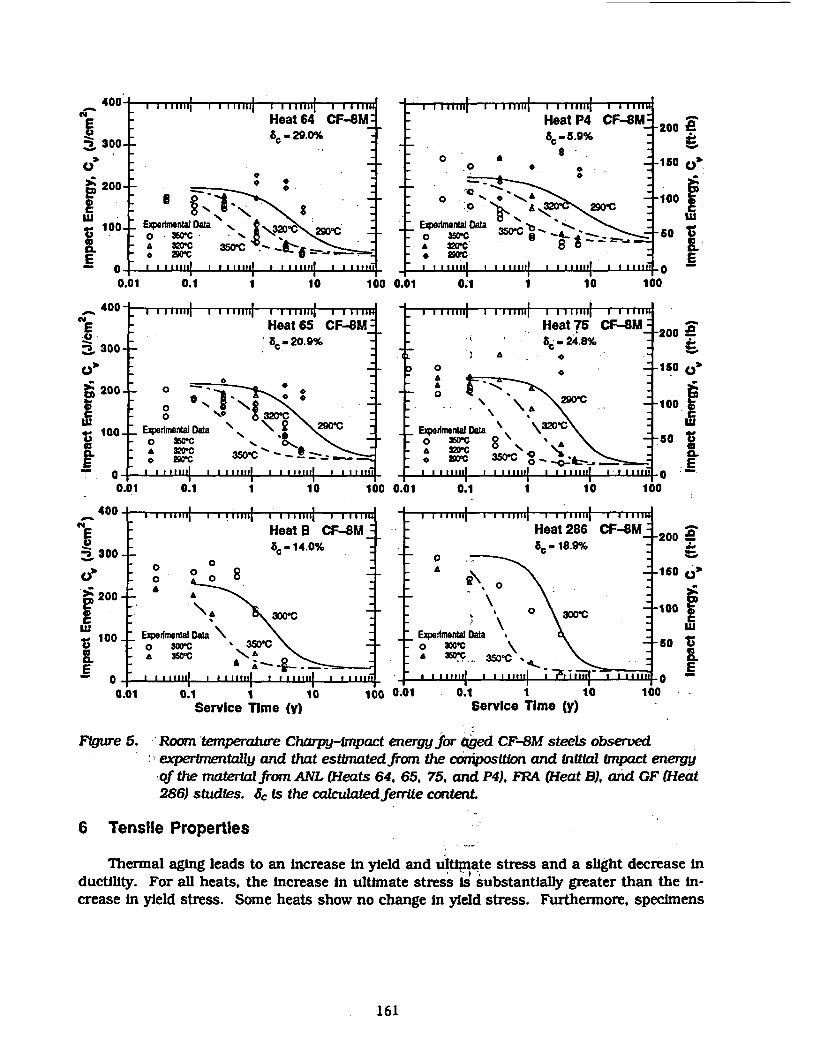
nn I. I*llU---
Ei 300
Ul.w
i 100
I I
0-t0.I
i al I I I Isfll l I I I 111111 I I I 61.a
Heat 64 CF-SM:,290%
e e
0 35VC6 8
Eiwedmenla1Data ,s ~ o 232 0C
A 320C 350'C
. I I 1111.1 I 2I umm a a i uuiall a . I i*I
.F I' 1 ........ ..... 1
Heat P4 CFr M:c 5.9%
e 290C
I Iednd Data 315a
0 3WO C
I I ,I atld a aaaa I 1,111111 I I a a Iaa
-200 a
-150 C?
6-100 S
£
-5 0 Z
E
I I 10.1 I 10 14'0 0. 01 0.1 1I I
10 1
I
10
_- | I I 111111 1 11 11 I I 111111 I I Ills"
Heat 75 CF8M-* 8 -24.% _
e
A
A
ExpedmeraI Data \320C- O 50C O 0
A-- * -- -- T,201C , Qs1*@ t, 1
-200 atII
-150 C)3
-100
-50 i
: E
iO-I - -t
0. 01 0.1 1 10I 10
zE'
CILl
a1a +0.01
I I0.1 1
Service Time (y)10 100
- _I -
I 1Service Time (y)
Figure 5. -Room temperature Charpy-InWact energyfor aed CF-M steels observedexperinentaly and that estlmratedffrom the cosition and iniWtal Ipact energyof the materal from ANL (Heats 64. 65. 75, and P4). FRA (Heat B). and GF (Heat286) studIes. Sc is the calculatedferrite content
6 Tensile Properties
Thermal aging leads to an increase in yield and ultimate stress and a slight decrease inductility. For all heats, the increase In ultimate stress is substantially greater than the in-crease in yield stress. Some heats show no change in yield stress. Furthermore, specimens
161
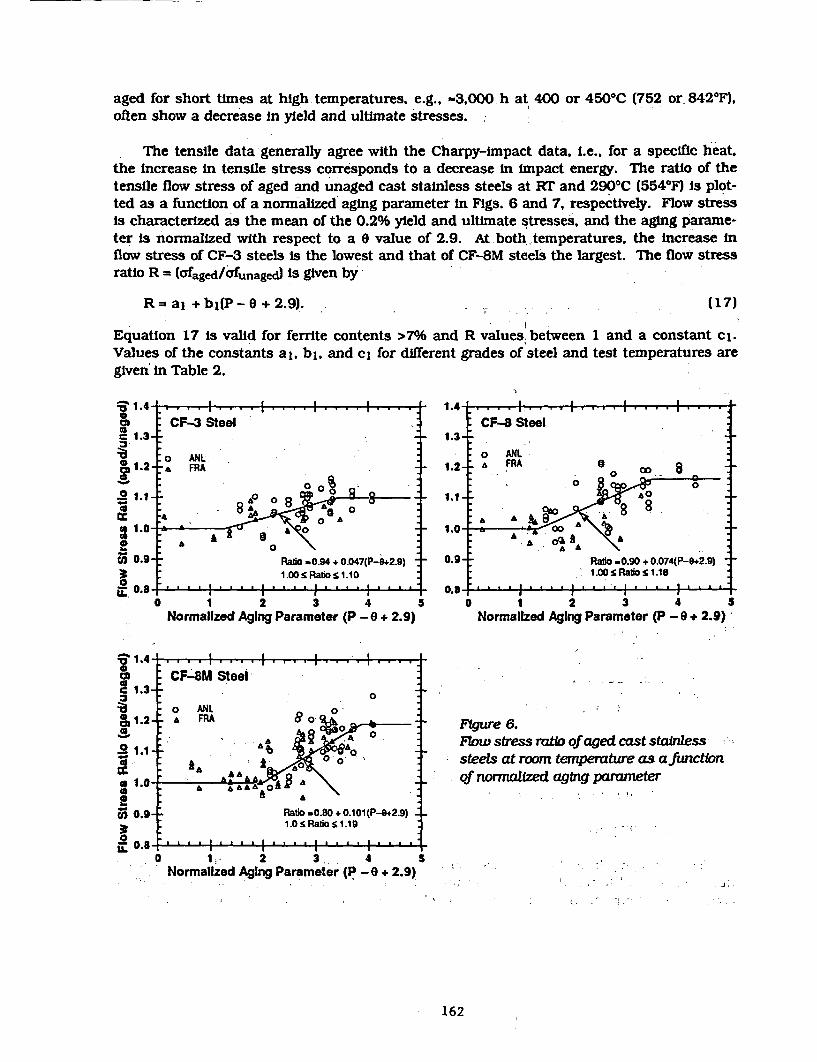
aged for short times at high temperatures. e.g., -3.000 h at 400 or 450'C (752 or- 8421F),often show a decrease in yield and ultimate stresses.
The tensile data generally agree with the Charpy-impact data, i.e.. for a specific heat.the increase in tensile stress corresponds to a decrease in impact energy. The ratio of thetensile flow stress of aged and unaged cast stainless steels at RT and 2900C (5540F) Is plot-ted as a function of a normalized aging parameter in Figs. 6 and 7, respectively. Flow stressIs characterized as the mean of the 0.2% yield and ultimate stresses, and the aging parame-ter is normalized with respect to a e value of 2.9. At both, temperatures, the increase inflow stress of CF-3 steels is the lowest and that of CF-8M steels the largest. The flow stressratio R = (Ofagedf/Ufunaged) Is given by
R= ai +bj(P-e +2.9)... (17)
Equation 17 is valid for ferrite contents >7% and R values, between 1 and a constant cl.Values of the constants al. bl. and cl for dierent grades of steel and test temperatures aregiven' in Table 2.
X 1.4-
Cs 1.3-i
t3 1.2--S
2 1.1i-
: 1.0-0
ui 0.9-
. 0.8-
a I I Ii ... .. .. .. . .i. .... - .SI .e
CF-3 Steel
-o-A
ANLFRA K
100 % s aos11- -A
0 00 00
* .AA
£0A
- A 0
Ratio .0.94 + 0.047(P-S+2.9)1.00!cRatio i 1.10
- . . .I . . . . . . a . . .I . . ..
I 1 2 3 4Normalized Aging Parameter (P - e + 2.9)
5 0 1 2 3 4 5Normalized Aging Parameter (P - a + 2.9)'
1 1.4-c 1.4 -IC 1.3-3
1 1.2..
Cs 1.0-
@; 0.9-
.- nA
I I I I. . . . I . ... . . .... . . . .. .. .
CF-
o.0
, * i i i . i
-aM Steel0
ANL 0FRA I 0
0
0
A
Ratio o0.80 + 0.101 (P-82.9)1.0 Ratio!1.19
_-
.
F~gure 6.Flow stress ratio of aged cast stainlesssteels at room temperature as afunctionof normalozed aging parameter
U. I II -- AI -- U -a 1, 2 3 4 S
Normalized Aging Parameter (P -3 + 2.9)
162
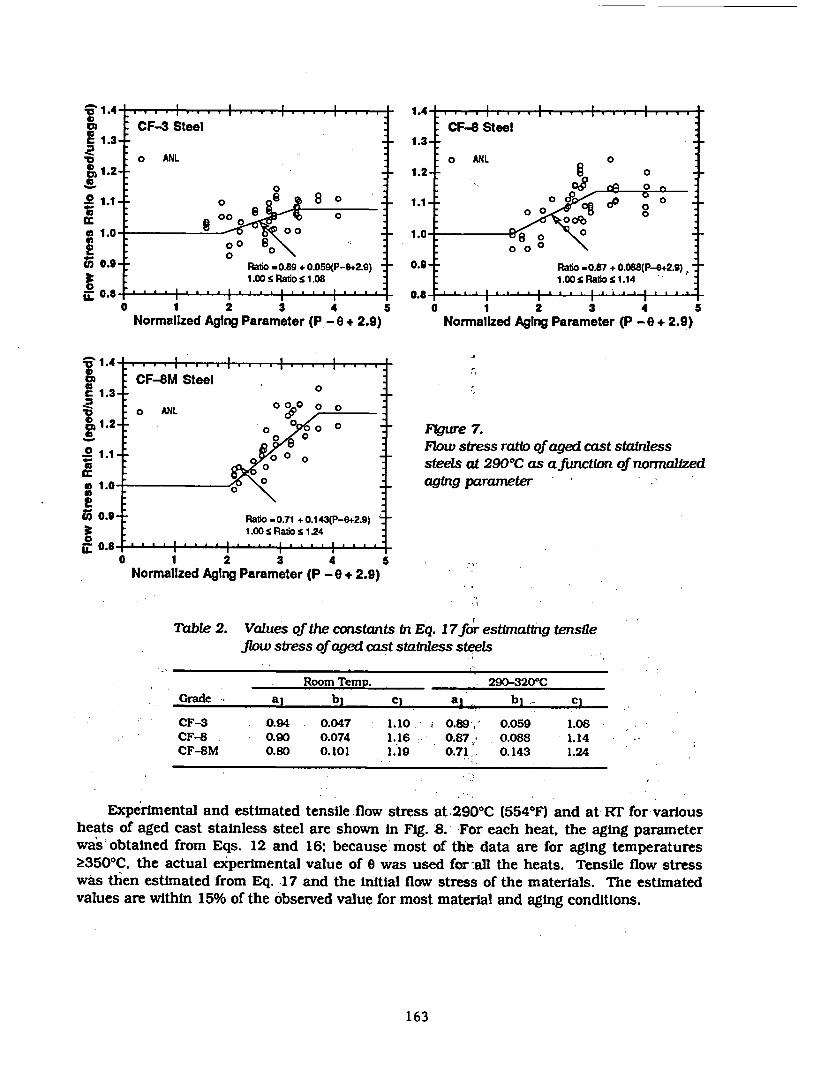
11.4.VaC 1.3
Z7 12
cm 1.1-ia
0 1.0-
ra 0.9-
0a: 0.6.
. .
....... * . . . . . .* . .- .r . 1A
CF-3 Stee
0 ANL
00 8 8 000 a
0 0 0
~0 S0
Ratio -0.89 + 0.059(P-O+2.9)1.00 S Rabo S 1.08
1.3-
1.2-
1.1.
1.0-
* CF Steel
o ANL
| . . . . . . . . . . . . .
n
'- 0
0
ocP Cp 0 0
00o 0
Ratio -0.87 + 0.088(P- +2.g)91.00O sRatboS 1.14
.,,,, ,,,,,,,,,.1.... .
_ _
0.,4
... I . a.I I I T
D 1 2 3 4 1Normalized Aging Parameter (P -6. 2.9)
5 0 1 2 3 4Normalized Aging Parameter (P - 0 + 2.9)
5
0 0 0 0 Fligure 7.°, Flow stress ratio of aged cast stainless
%o 0 0 steels at 2900C as afunctbon of normal ized0 aging parameter
Ratio -0.71 + 0.143(P-e+2.9)1.00 S Ratio s 1.24
I.... I**,* I****I,,,,1 2 3 4 5!lzed Aging Parameter (P - 0 + 2.9)
Table 2. Values of the constants In Eq. 17for estimating tensileflow stress of aged cast stainless steels
Norma
Room Temp. 290-3200C
Grade a] b 1 c1 al b 1 c1
CF-3 0.94 0.047 1.10 0.89, 0.059 1.08CF-8 0.90 0.074 1.16 0.87.y 0.088 1.14CF-8M 0.80 0.101 1.19 0.71. 0.143 1.24
Experimental and estimated tensile flow stress at 2900C (5540F) and at RTI for variousheats of aged cast stainless steel are shown in Fig. 8. For each heat, the aging parameterwa's obtained from Eqs. 12 and 16: because most of the data are -for aging temperatures2350°C, the actual experimental value of 6 was used for all the heats. Tensile flow stresswas then estimated from Eq. -17 and the initial flow stress of the materials. The estimatedvalues are within 15% of the observed value for most material and aging conditions.
163
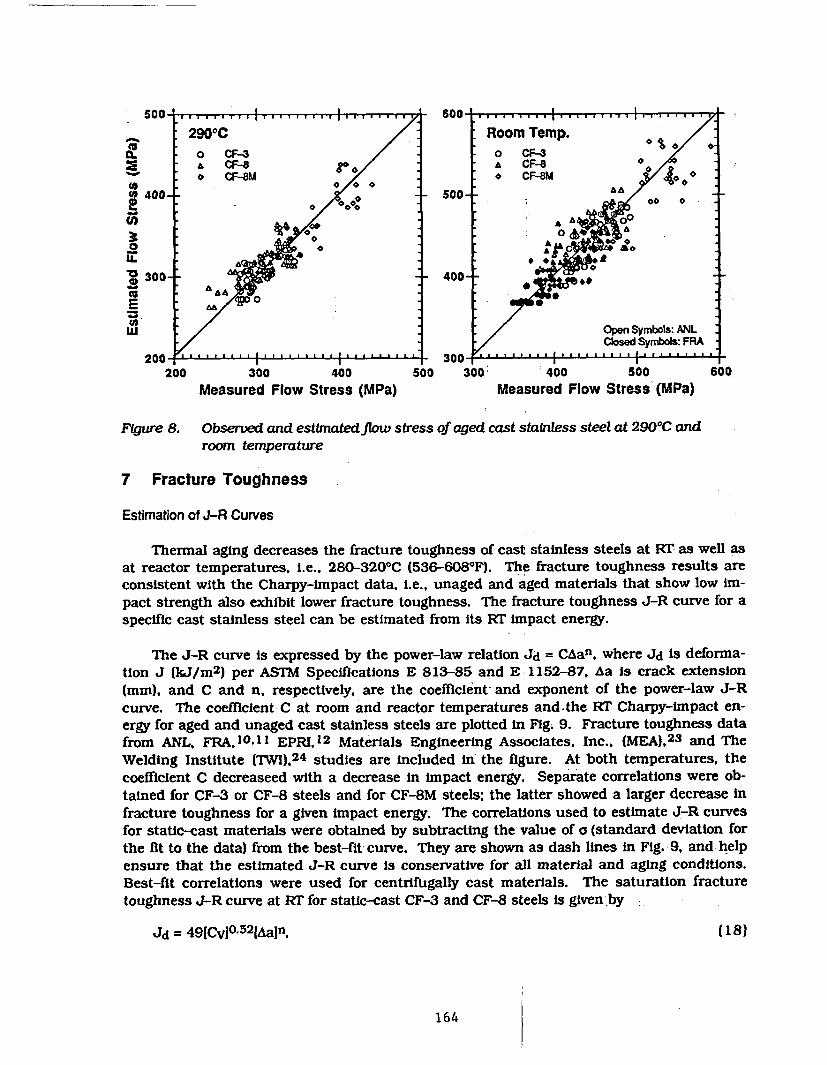
- -- - , ' 00S T0. 0 CF-3 0 CR-3 0a CF-8 A CF-8o CF-8M o0 CF-8 0
0400- - S .500o0
o 0A2.
_ 300 400-
1/ Open Symbols: ANLClosed Symbols: FRA
200- '' '300.- ' ' 4'200 300 400 500 300 400 500 600
Measured Flow Stress (MPa) Measured Flow Stress (MPa)
Figure 8. Observed and estimatedjlow stress of aged cast stainless steel at 290"C androom temperature
7 Fracture Toughness
Estimation of J-R Curves
Thermal aging decreases the fracture toughness of cast stainless steels at RE- as well asat reactor temperatures, i.e.. 28G-320 0C (536-6081F). The fracture toughness results areconsistent with the Charpy-impact data. i.e., unaged and aged materials that show low lim-pact strength also exhibit lower fracture toughness. The fracture toughness J-R curve for aspecific cast stainless steel can be estimated from its RT impact energy.
The J-R curve is expressed by the power-law relation Jd = CAan. where Jd is deforma-tion J (kJ/m2 ) per ASTM Specifications E 813-85 and E 1152-87. Aa is crack extension(mm). and C and n, respectively, are the coefficient and exponent of the power-law J-Rcurve. The coefficient-C at room and reactor temperatures and-the RT Charpy-impact en-ergy for aged and unaged cast stainless steels are plotted in Fig. 9. Fracture toughness datafrom ANL, FRA, 10 .1 1 EPRI.1 2 Materials Engineering Associates. Inc.. (MEA),23 and TheWelding Institute (MWI), 24 studies are included in the figure. At both temperatures, thecoefficient C decreaseed with a decrease in impact energy. Separate correlations were ob-tained for CF-3 or CF-8 steels and for CF-8M steels; the latter showed a larger decrease infracture toughness for a given impact energy. The correlations used to estimate J-R curvesfor static-cast materials were obtained by subtracting the value of a (standard deviation forthe fit to the data) from the best-fit curve. They are shown as dash lines in Fig. 9, and helpensure that the estimated J-R curve is conservative for all material and aging conditions.Best-fit correlations were used for centrifugally cast materials. The saturation fracturetoughness J-R curve at RT for static-cast CF-3 and CF-8 steels is given by
Jd = 491CvI0 52 Aaln, (18)
164
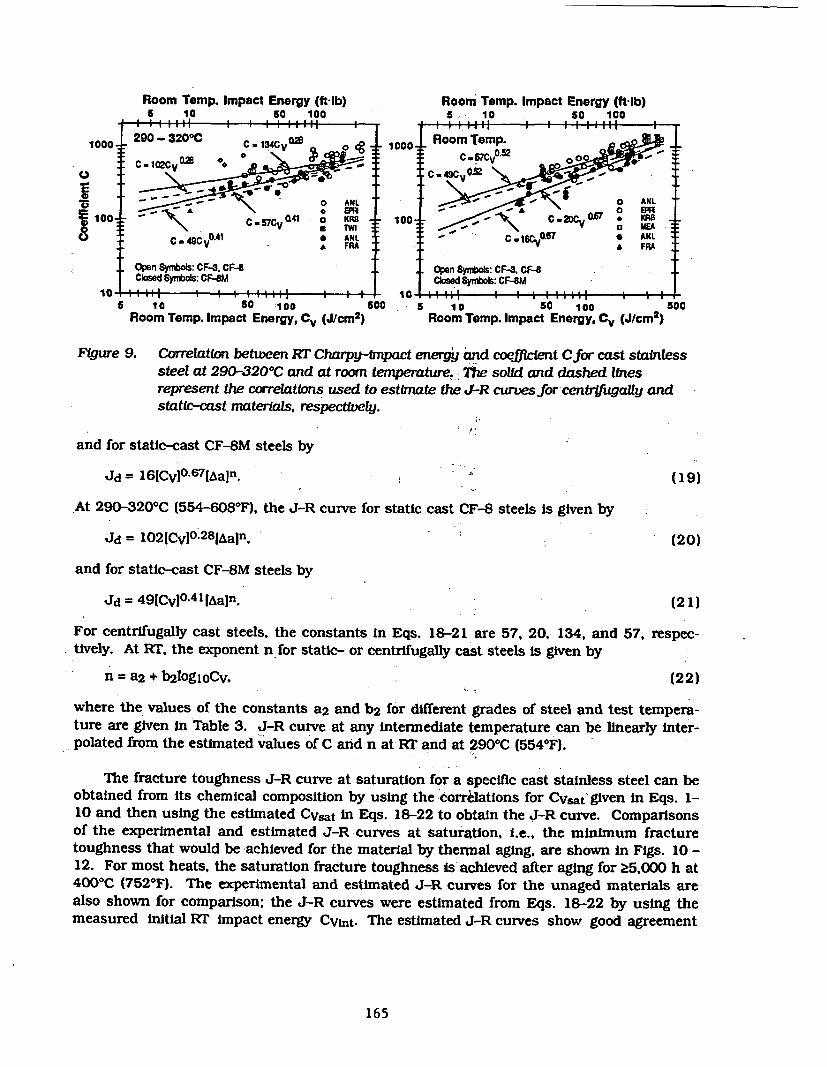
Room Temp. Impact Energy (ft-lb) Room Temp. Impact Energy (ft-lb)5 10 50 100 5 10 50 100
.I 111111 l I l l11111 l 11I1 11
1000oo 290-3200C omTemp.~00
§ 0,*\C * ~ 4 R- .100C , B C 6 tCv-- 0 ANL AL
C*49CVOA1 FRA a FRA
Open Symbols: CF-3, CF-I Open Symbols: CF-3. CF-8Closed Symbols: CF-SM Closed Symbols: CF-8M
10- I IIII1 -I I I -10II -- I I I EIlI I5 10 50 100 500 - 5 10 SO 100 500
Room Temp. Impact Energy, CV (J/cm2) Room Temp. Impact Energy, Cv (J/cm2)
Figure 9. Correlation between RT Charpy-impact energy and coefficient Cfor cast stainless
steel at 290-320"C and at room temperature. The solid and dashed lines
represent the correlations used to estimate the J-R curves for centrifugally andstatic-cast materials, respectively.
and for static-cast CF-8M steels by
Jd= 16[Cv10.6 7[Aaln. (19)
At 290-320 0C (554-608 0F). the J-R curve for static cast CF-8 steels is given by
Jd = 1O2ICvIO. 28Ialna. (20)
and for static-cast CF-8M steels by
Jd = 49ICv10 .4 1 Aaln. (2 1)
For centrifugally cast steels. the constants in Eqs. 18-21 are 57, 20. 134. and 57, respec-tively. At RT, the exponent n for static- or centrifugally cast steels is given by
n = a2 + b2logloCv. (22)
where the values of the constants a2 and b2 for different grades of steel and test tempera-ture are given in Table 3. J-R curve at any intermediate temperature can be linearly inter-polated from the estimated values of C and n at RT and at 2900C (5540F).
The fracture toughness J-R curve at saturation for a specific cast stainless steel can beobtained from its chemical composition by using the correlations for Cvyt given in Eqs. 1-10 and then using the estimated Cvsat in Eqs. 18-22 to obtain the J-R curve. Comparisonsof the experimental and estimated J-R curves at saturation, i.e., the minimum fracturetoughness that would be achieved for the material by thermal aging, are shown in Figs. 10 -12. For most heats, the saturation fracture toughness is achieved after aging for 25.000 h at400'C (7520F). The experimental and estimated J-R curves for the unaged materials arealso shown for comparison; the J-R curves were estimated from Eqs. 18-22 by using themeasured initial RT impact energy Cvint. The estimated J-R curves show good agreement
165
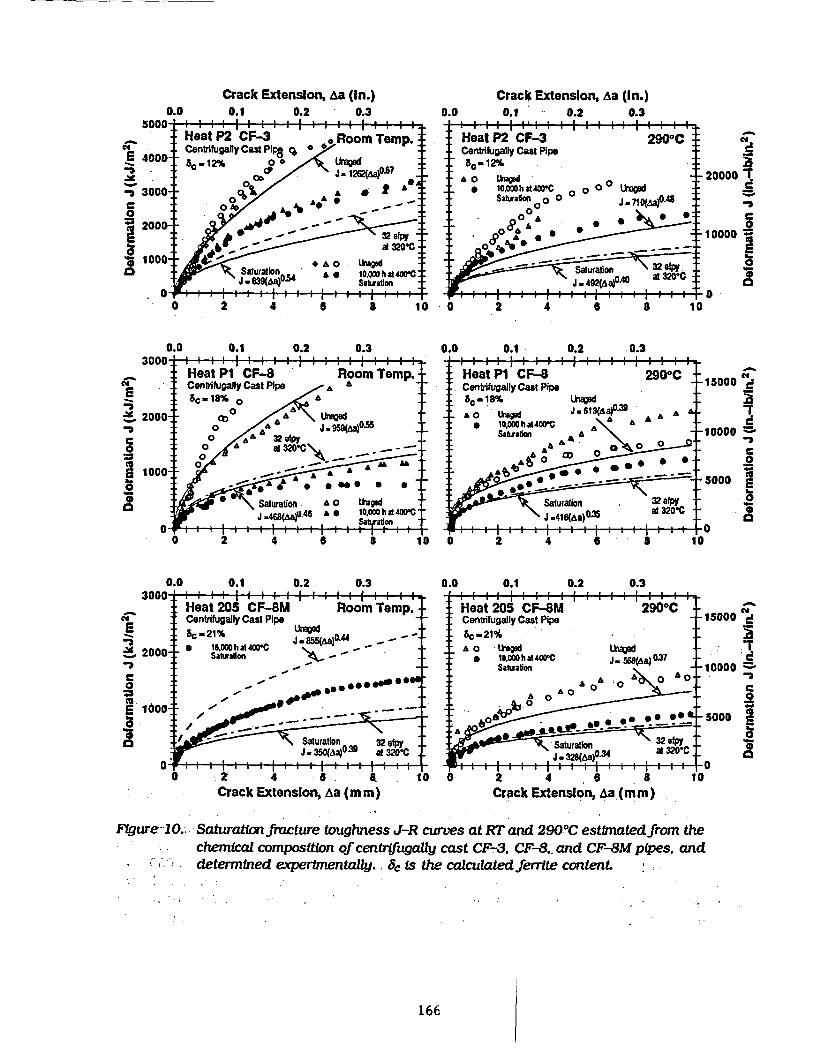
Crack Extension, Aa (In.)0.0 0.1 0.2 0.3
Crack Extension, Aa (In.)0.1 0.2 0.3
.. . .. . ... . . . . . . .I . .0.0
cdE
-5
*1
co
E
Cl
-2
~20
0
a
Heat P2 CF-3 290CCentrifugally Cast Pipe
£0 Lkipd-* .INOOhat C 0 o ° °
Sabraioln 00 0 J 71O(&0.48
0 . a05
- CIA
- 20000 T
- C
-10000 S
- 0
I I f B ' f f I . . . . . I . . . I ,2 4 6 8 I 0
0.0 0.1 0.2 0.3* . . . . . . . .
2MUU I I I .----
iC
.2-10000
O
* 000 a
. is
CM
-3
C0_ '
A
0.0 0.1 0.2 0.3. I I I I I I I I I I 1 I I I I I 1
Heat 205 CF-8M 2900CCentrifugally Cast Pipe -t
c- 210A. o Waged UW
* 1bonht 400C J * 568(a) 0 7
Safteation
A
000 5
J t a3 n2 O-0
5000
-SD000 ='
-3C
000 '53
IJ°°A
a. . . t. . . . . . .A . .
Crack Extension, Aa (m m)0. 2 4 i 6 8
Crack Extension, Aa (mm)1a
Flgure- 10.; Saturation fracture toughness J-R curves at RT and 290 0C estinated from thechemical composition of centrifugally cast CF-3. CF-8. and CF-8M pApes. anddetermntned experimentally.. bc Ls the calculated ferrite content.
166
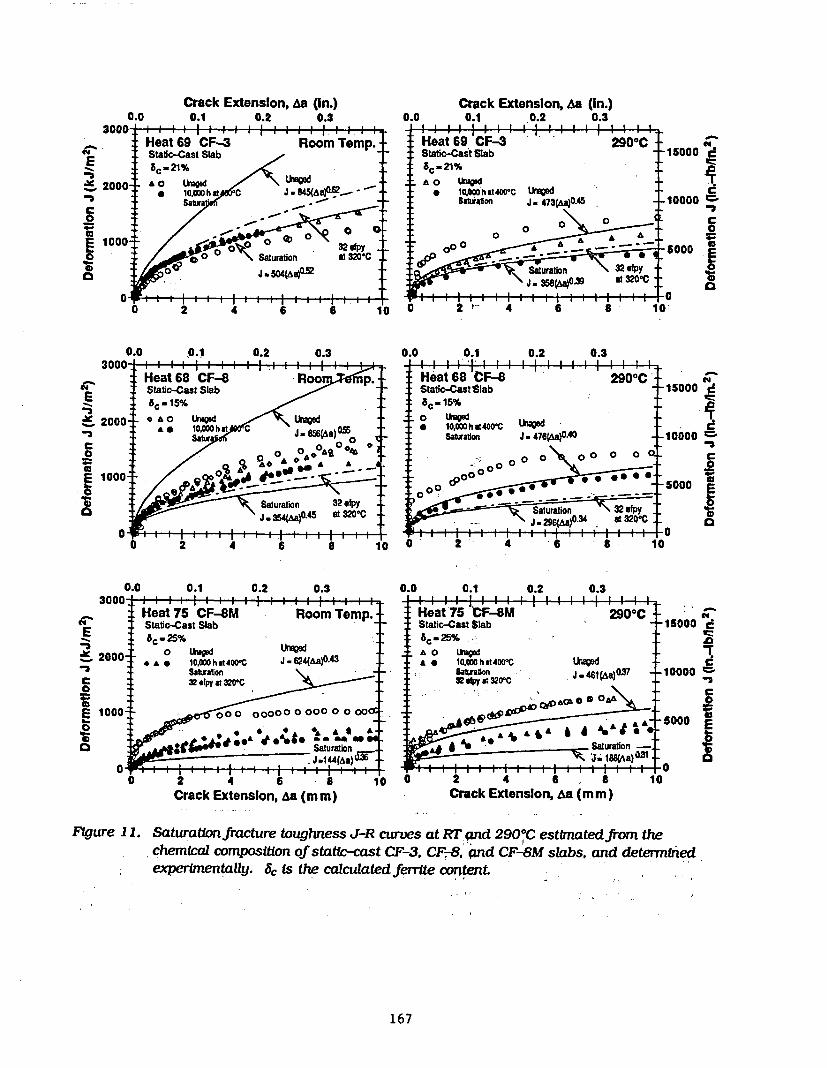
Crack Extension, Aa (In.)0.0 0.1 0.2 0.3
J I I I I I I I I I I I I I I I I I I I .
EcdC
E
.2Ita
-5~
-E
C
a
Heat 69 CF-3 .-. . 290°CStatic-Cast Slab
&c ,,
-1
* 10,OOWh&t400 C Un^FdSaanon J. 473Ita
T45 I
1-. . . . . . j 1 1 s l 1 i - o
10000 C
0E
a
i 't-' ' � I . . . . . . .6 a 110 '
CIA
C!C-s.2
4..S
a
0..0 0.1 0.2i.,.. ...
0.3 0.0 0.1 0.2 0.3. . . . I . I , ., I I
3nnn- I I I I I I I I I I _^ I I * . . > . . F I I I I I I I I I I I I ICWUSW _ _
a,
E
3
C
.2
a
Heat 75 CF-8MStatic-Cast Slab
Room Temp.
2000-
1000
C - 25d
*A 100,OOha t4dOOC J.624(&a)0.43
Satrabon32 elpy at 3201C
00 0 0 ooo ooO0 O 00cc
* * C AS ;-
Heat 75 1CFeMStatic-Cast Slab
AO IWKag
A * 10000 h at 400CLatradon32 py at 320°C
290°a C
J - 461tAa)037-
1
-1i
5000 CD
D ooo G-
2
.0
0000E
2
26 A4 6 8 51'
rl~~~~~J Iwo IIIIII I I o. r . . . * . . . . J . . r I . I - L n
.H . . . . . . . . . ._-0 2 4 6 8
Crack Extension, Aa (mm)
, 10 I1 o
Crack Extension, Aa (mm)1I o
Figure 11. Saturationfracture toughness J-R curves at RT and 2900C esttmatedfrom the
chemical composition of static-cast CF-3, CF-8. qnd CF-8M slabs, and determined
experimentaUy. Ac is the calculated ferrite content.
167
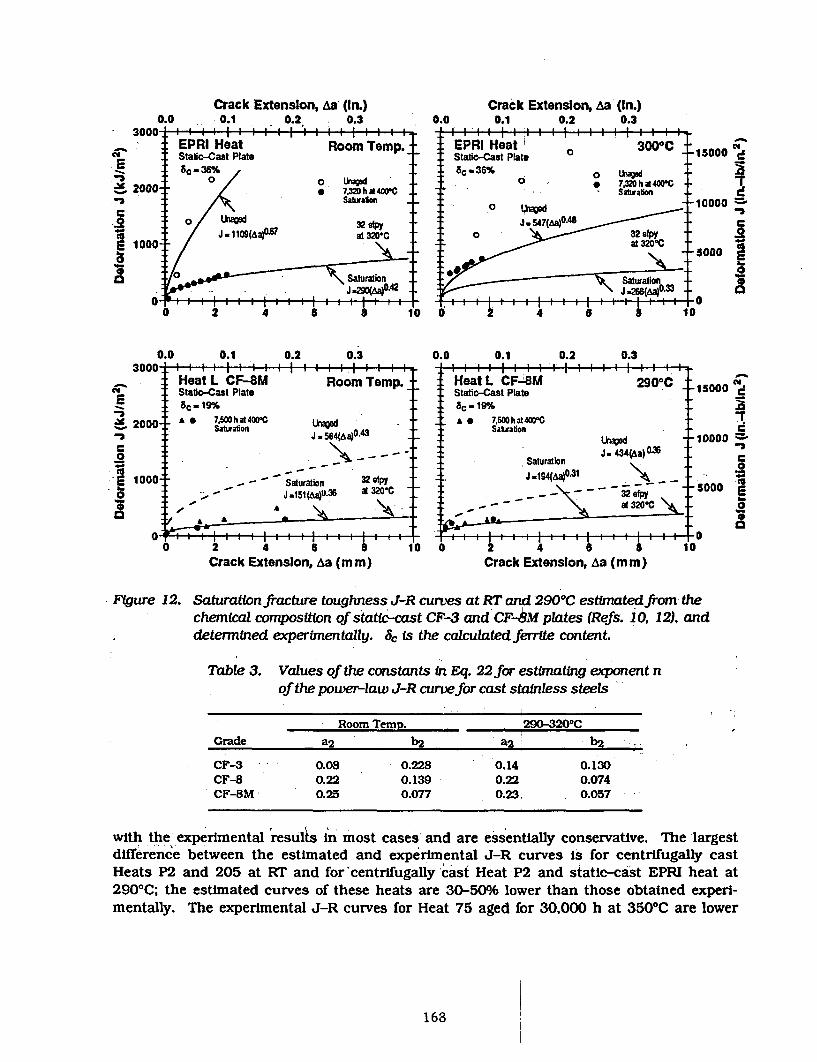
Crack Extension, Aa (in.)0.1 - 0.2 0.30.0
Crack Extension, Aan (In.)0.0 0.1 0.2 0.3
. - . . . . . . I . . . . I .300
ECe.200
E 100
'0* I I I I I I l I I I I I I lEPRI Heat Room Temp.Static-Cast Plate8c. 36%
0 O tk~age10 o 7.320 h A 4OC
Sahmallon
0 Ud32e pyJ-1109(taPR at320-C
10
0 _ - n Saturaton
0 2 8 10 2 4 B 8 10
I. ~ . .oCEPRI Heat iStalic-Cast Plate5 c - 3 6 #
o
I . . . . I I .
0 3000C -0 na
o Lkae* 1'.Uz n1 am4 -
-Satration
- o t4fta-
J .547(,AO-48
o yat 320C
< > Saturatlon
J .266t(sa°33 -
'10000 7O
-5000 E
A.a
1, , , , I . . I . . I , , , , , , " U0 2 4 a 8 10
0.0 0.1 0.2 0.3. I I I I I I I I I I I I
0.0- - -
0.1 0.2. . . . , . . . I .
0.3I
4@
E
-I
.2
'C-
C'0
a
200
100
. I T . I .
Heat L CF-8MStatic-Cast Plate8c -19%
I . .. o , o , , Temp.
Room Temp.I T T I . . ,
Heat L CF-4MStatic-cast PlateBC19%
* 0 7500 h at 4OCSatsation
t C . rI 2 r, r
2900C 15000
. . A 7.5O0hat 40C- _- SattSaturationUn d
J = 564(AB0-4
0 ~ ~ ~ Saturation ~ epJ .151(AaU.
36at 320C
:: J. :%4(^aa)036Saturation 1
-' .=1 "Aaa>°31 b
- _ al 320'C \.* _ AS@.
:: 1 1 j I I I I I I -
~D00
000
C!
B=T
C.2C'Q
0
, 2 4 6 8
Crack Extension, Aa (mm)10 I. . . I . . . . . . . I . . . I0 2 4 6 8
Crack Extension, Aa (mm)1o
F~gure 12. Saturation fracture toughness J-R curves at RT and 2900C estimatedfrom thechemical composton of static-cast CF-3 and CF-4M plates (Refs. 10, 12). anddetermined experinentally. 3c Is the calculated ferrite content.
Table 3. Values of the constants in Eq. 22for estimating exponent nof the power-law J-R curvefor cast stainless steels
Room Temp. 290-S20°C
Grade a b 2 b2
CF-3 0.08 0.228 0.14 0.130CF-8 0.22 0.139 0.22 0.074CF-8M 0.25 0.077 0.23, 0.057
with the experimental results in most cases and are essentially conservative. The largestdifference between the estimated and experimental J-R curves is for centrifugally castHeats P2 and 205 at RT and for 'centrifugally cast Heat P2 and static-cast EPRI heat at2900C: the estimated curves of these heats are 30-50%/0 lower than those obtained experi-mentally. The experimental J-R curves for Heat 75 aged for 30,000 h at 3500C are lower
168
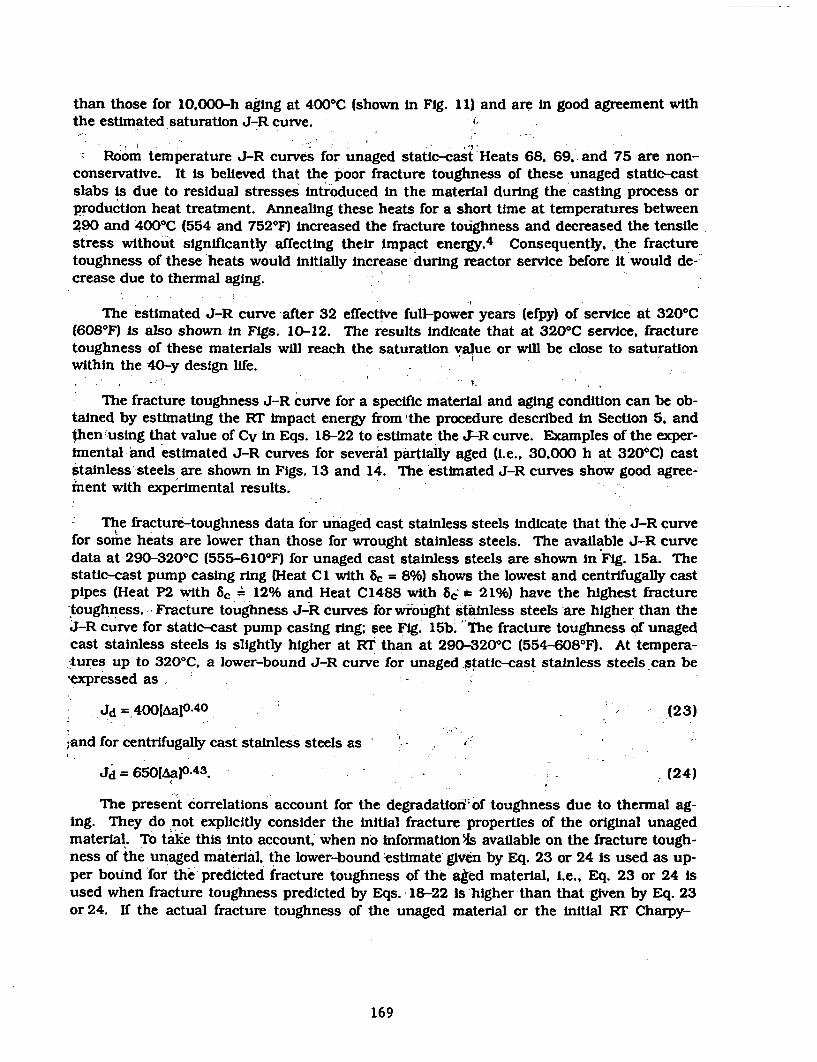
than those for 10,000-h aging at 4000 C (shown in Fig. 1 I) and are in good agreement withthe estimated saturation J-R curve.
Room temperature J-R curves for unaged static-cast Heats 68, 69,. and 75 are non-conservative. It is believed that the poor fracture toughness of these unaged static-castslabs is due to residual stresses introduced in the material during the casting process orproduction heat treatment. Annealing these heats for a short time at temperatures between290 and 4000C (554 and 752*F) increased the fracture toughness and decreased the tensilestress without significantly affecting their impact energy. 4 Consequently, the fracturetoughness of these -heats would initially Increase during reactor service before it would de-"crease due to thermal aging.
The estimated J-R curve after 32 effective full-power years (efpy) of service at 3200C(6087F) is also shown in Figs. 10-12. The results indicate that at 3200C service, fracturetoughness of these materials will reach the saturation value or will be close to saturationwithin the 40-y design life. - --
The fracture toughness J-R curve for a specific material and aging condition can be ob-tained by estimating the RT impact energy from the procedure described in Section 5, andthen using that value of Cv in Eqs. 18-22 to estimate the J-R curve. Examples of the exper-imental and estimated J-R curves for several partially aged (i.e., 30,000 h at 3200C) caststainless steels are shown in Figs. 13 and 14. The estimated J-R curves show good agree-ment with experimental results.
The fracture-toughness data for unaged cast stainless steels indicate that the J-R curvefor somie heats are lower than those for wrought stainless steels. The available J-R curvedata at 290-3200C (555-6100F) for unaged cast stainless steels are shown in Fig. 15a. Thestatic-cast pump casing ring (Heat Cl with tc = 8%) shows the lowest and centrifugally castpipes (Heat P2 with 8c 12% and Heat C1488 with 8b = 21%) have the highest fracturetoughness. Fracture toughness J-R curves for wrought stainless steels -are higher than theJ-R'curve for static-cast pump casing ring; see Fig. 15b. 'The fracture toughness of unagedcast stainless steels is slightly higher at Rr than at 290-3200C (554-6080F). At tempera-tures up to 3200C, a lower-bound J-R curve for unaged static-cast stainless steels can be'expressed as
Jd=,400[Aa] 0-4 0 (23)
;and for centrifugally cast stainless steels as -
Jd = 650[Aap0 .43 (24)
The present correlations account for the degradatiot of toughness due to thermal ag-ing. They do not explicitly consider the initial fracture properties of the original unagedmaterial. To taie this into account.' when no information SIs available on the fracture tough-ness of the unaged material, the lower-boundtestimate given by Eq. 23 or 24 is used as up-per bound for the predicted fracture toughness of the aged material, i.e., Eq. 23 or 24 isused when fracture toughness predicted by Eqs. 18-22 is higher than that given by Eq. 23or 24. If the actual fracture toughness of the unaged material or the initial RT Charpy-
169
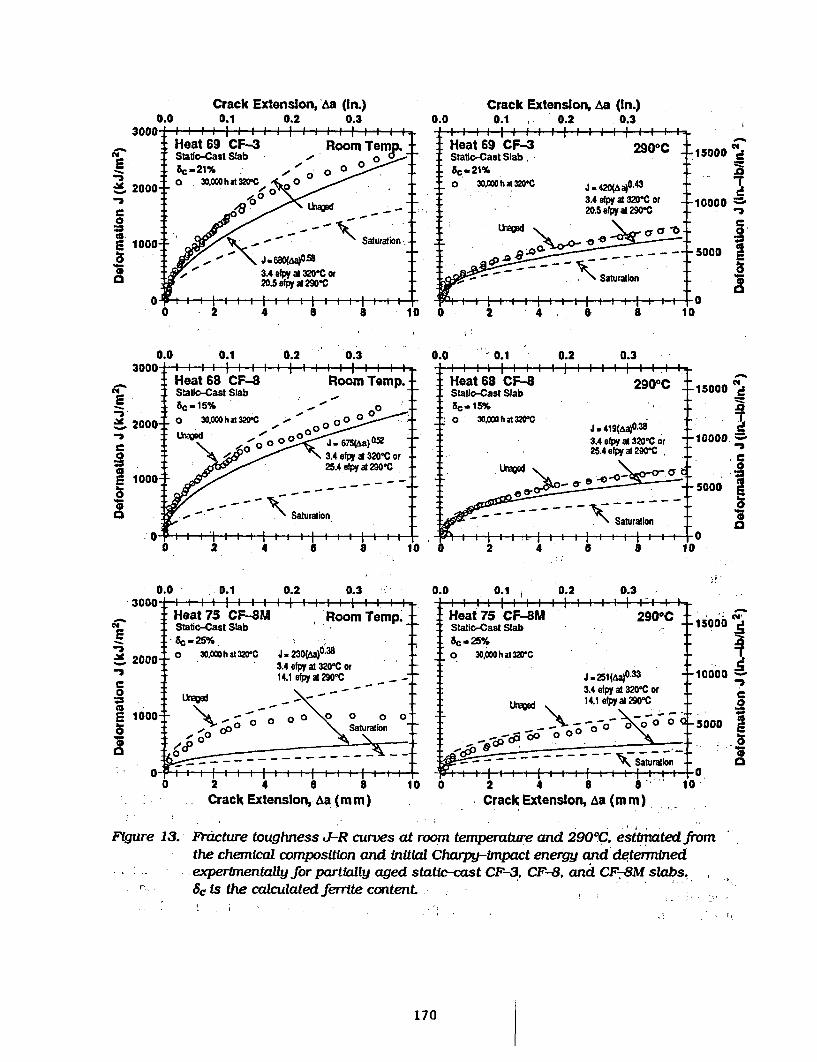
Crack Extension, 'Aa (in.)0.1 0.2 0.3
Crack Extension, Aa (In.)0.0 0.1 , 0.2 0.3
-115000
10000 C-
* C
a
-5000 N
0
:: 1
-10000. n
O
- 0. -
- S 0
- 0
0.0 0.1 0.2 0.31 . I , , I
* I I I r TIIIJ... j I,I , 1 THeat 68 CF-8 2900CStatio-Cast SlabSC 15%0 3oo h at 32C
J . 419(O.-383.4 efpy at 3201C or25.4 efpy at 290'C
- .- Saturation_n
_r 1 1r 1 1 1 I I I I I I I I I U0 2 4 a 8 10
0.0 0.1 0.2 0.3I .I 2 I. . . I . I I .
. .
c
Y. 2000-13C0toE 1000
0
0
. . I . , I . . . . I .
Heat 75 CF-MStatic-Cast Slabc . 25%
0 30,o h at 3zrC
. . . C . . . .
290°C
J - 25aO0.33
3.4 alpy at 3201C or14.1 elpy at 290-C
-- .
-15000 N
C-10000 c
* C
,to-5000 F
' ;S
.......~ ~~ _n-- -...... 1. I..-uF
Crack Extension, Aa (mm)2. 4 - l '0
I Crack Extenslon, a ((mm)
Fgure 13. Fracture toughness J-R curves at room temperature and 2900C. estimatedfromthe chemical composition and fnitial Charpy-impact energy and determinedexperimentally for partially aged static-cast CF-3, CF-8. and CF-8M slabs.Sc Is the calculated ferrlite content.
170
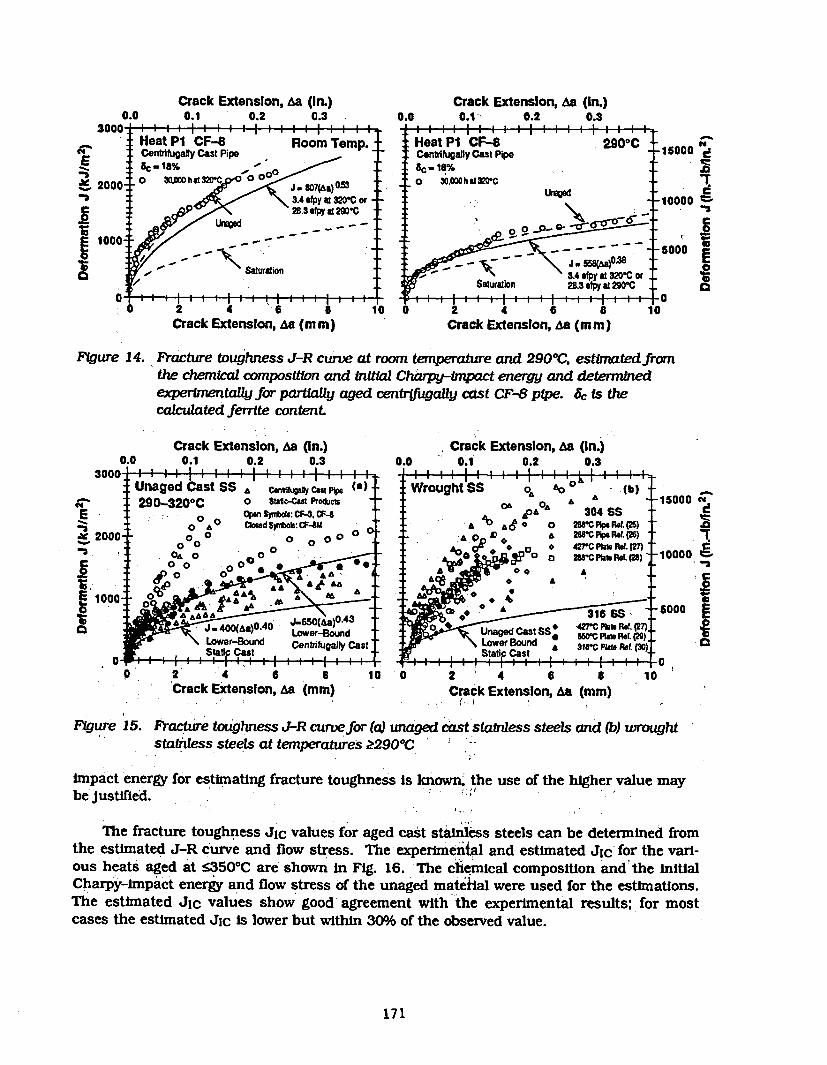
Crack Extenslon, &a (in.)0.1 0.2 0.3
Crack Extension, Aa (in.)0.1 0.2 0.30.0 0.0
30C
JS 200
£
I loo
I I I I I I I , , , _
Heat P1 CF-S Room Temp.Centrifugally Cast Pipe
10 0 3J,eoo0h St 000, 3.4 4y a 3 201C or --
dkgsj928.3p tWof290-c
: , ~Saturation
Heat P1 CF-8 290°CCentrifugally Cast Pipe-C - 18%0 300OOhat32rC
.. . 1
3.~ 4 dpr of 320rc ofSaturation 28. dpr at290-C
I I i 1 I I i I6 fIi I a
r41
5000 d
. 0
000 '
; 2 4 6 ECrack Extension, As (mm)
la Ca2 i 6 8Crack Extension, ba (mm)
10
FIgure 14. Fracture toughness J-R curve at room temperature and 2900C, estimatedfromthe chernmal compositfon and Initi Charpy-impact energy and determinedexperimentalyfor partilly aged centrifugally cast CF-8 pipe. Itc s thecalculated ferrite content.
Crack Extenslon, ma (In.)0.1 0.2 0.30.0
Crack Extension, As (in.)0.1 0.2 0.3
. . . .* II I . . , I .. .m. .i I a a. .0.0
WU
-s.W 20C-5
a
UnagedCast SS CfgaflyCPp (a)290-3200C 0 Sutlo-Cst Proclucta
. O pen Spbds: CF-3, CF40 A ° amd Srfto: CFX c
0 .100
o~o00000000
W rought SS I .,. b0. A0~
A . .
O& A -
,PA AA 304 SS
0 2sBC rU.Ref. (2s)
Ss 0 4WC MetRFW. (27),
Stati Cat A 21rC PkMt ROL. (30
-15000 N.
- r
C-10000 =.-S2
I0 2 4 6 8Crack Extension, As (mm)
. . .
10 0 2 4 6 a lCrack Extension, As (mm)
* . j
Figure 15. Fracture toughness J-R curvefor (a) unaged cast stainless steels and (b) wroughtstainless steels at temperatures 22900C
impact energy for estimating fracture toughness is known, the use of the higher value maybe Justified.
The fracture toughness JIC values for aged cast stainless steels can be determined fromthe estimated J-R curve and flow stress. The experimental and estimated JIc for the varl-ous heats aged at s35 0 "C are shown in Fig. 16. The ciemical composition and the initialCharpy-impact energy and flow stress of the unaged mateihal were used for the estimations.The estimated Jic values show good agreement with the experimental results; for mostcases the estimated Jic is lower but within 30% of the observed value.
171
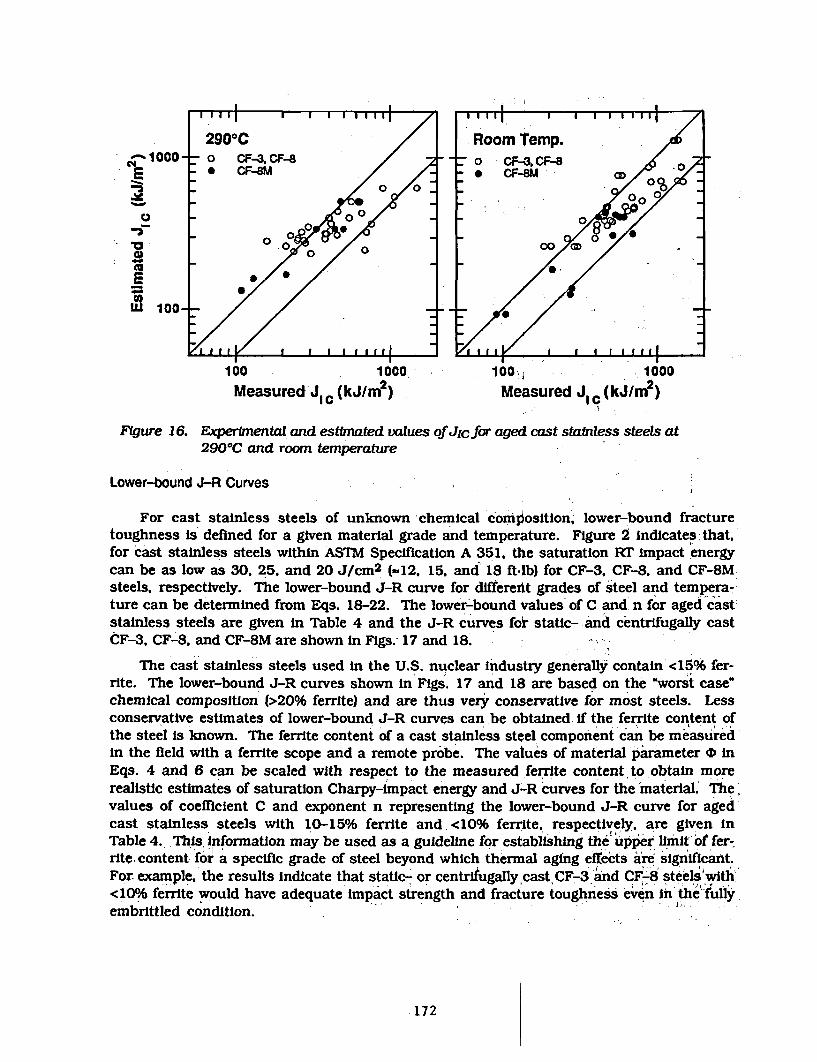
-1UUU-- 0 CF-3. CF-8 0 CF-%CF% 8X* CF-- * CF-SM i:
iM100Mt000
1 0 1000 1000
Measured- J c(kJ/m2) Measured J (~kj/M2)
FYgure 16. Experimental and estimated values of Jlcfor aged cast statnless steels at290°C and room temperature
Lower-bound A-R Curves...
For cast stainless steels of unknown -chemical'composition,. lower-bound fracturetoughness is defined for a given material grade and temperature. Figure 2 indicates that,for cast stainless steels within ASTM Specification A 351, the saturation RT impact energycan be as low as 30, 25, and 20 J/CM2 (-12, 15, and' 18 ft-lb) for CF-3, CF-8, and CF-8Msteels, respectively. The lower-bound J-R curve for differerit grades of steel and tempera-,ture can be deter-mined from Eqs. 18-22. The lower-Lbound values of C. and n for aged cast:stainless steels are given in Table 4 and the J-R curves fo& static- and centrifugally castCF-3, CF-8. and CF-8M are shown in Figs.- 17 and 18.
The cast stainless steels used in the U.S. nuclear industry generally contain <15°06 fer-rite. The lower-bound J-R curves shown in Figs. 17 and 18 are based- on the 'worst case'chemical composition (>20% ferrite) and are thus very' conservative for most steels. Lessconservative estimates of lower-bound J-R curves can.be obtained. if the ferrite content ofthe steel is known. The ferrite content of a cast stainless steel. component can' be measuredin the field with a ferrite scope and a remote probe. The vatues of material parameter zP inEqs. 4 and 6 can be scaled with respect to the measured ferrite content to obtain morerealistic estimates of saturation Charpy-impact energy and J-R curves for theimaterial.' The,values of coefficient C and exponent n representing the lower-bound J-R curve for agedcast stainless steels with 10-150/6ferrite.and,<10% ferrite, respectively, are given inTable 4. ThMis. information may be used as a guideline for establishing the upper lftimt' of fer-rite.content for a specific grade of steel beyond which thermal aging effects a're Significant.For. exam~ple, the results indicate that static- or centrifugally castCF-3'and CF,-8 stee swith'<100/6 ferrite would have adequate impact strength and fracture toughness even' in thet-fullyembttled condition.'
172
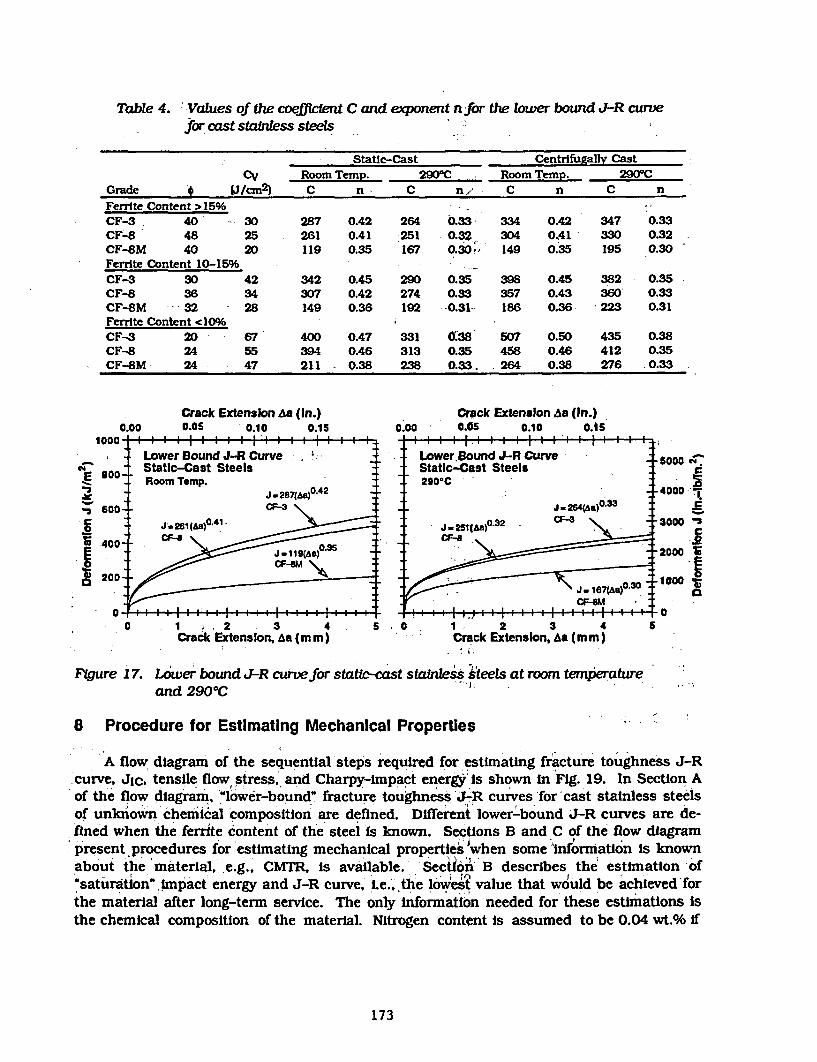
Table 4. Values of the coefficient C and exponent nfor the lower bound J-R curvefor cast staitless steels
Static-Cast Centrifugally CasteV Room Temp. 290°C Room Temp. 290°C
Grade /Jncm2) C n C n, C n C nFerrite Content >15%CF-3 40 30 287 0.42 264 0.33 334 0.42 347 0.33CF-8 48 25 261 0.41 251 0.32 304 OA1 330 0.32CF-8S 40 20 119 0.35 167 0.30,' 149 0.35 195 0.30Ferrite Content 10-15% - -CF-3 30 42 342 0.45 290 0.35 398 0.45 382 0.35CF-8 36 34 307 0.42 274 0.33 357 0.43 360- 0.33CF-8M --- 32 - 28 149 0.36 192 -0.31 186 0.36 223 0.31Ferrite Content <10.%CF-3 20 67 400 0.47 331 (.S8 507 0.50 435 0.38CF-8 24 55 394 0.46 313 0.35 458 0.46 412 0.35CF-8M- 24 47 211 0.38 238 0.33. 264 0.38 276 .0.33
0.00Crack Extension Aa (In.)0.05 I0.10 0.15
. . . . . . 1. . . . . .0.00
Crack Extension .a (in.)0.05 0.10 0.15
.......... .......... .
14
IIs
Lower. Bound J-R CurveStatic-Cast Steels290sC
J .264)o
- nlap3 C-
ffi ~ \J. 1e70zaap 30Cl:eM
-5000 '-C
-4000 7
a2000
tooE
. . . . . . . . . . . . . . . I I , ,
0 . 1 , 2 3 4Crack Extenslon, aa (m m)
5 I .5 . o .
.1 .. . . . I i
1 - 2 3 4Crack Extension, ba (mm)
.I V
5
FRgure 17. Lower bound J-R curvefor stac-cast stainless steels at room temperatureand 2900C
8 Procedure for Estimating Mechanical Properties
A flow diagram of the sequential steps required for estimating fracture toughness J-Rcurve, JiC. tensile flow stress, and Charpy-impact energy Is shown in Fig. 19. In Section Aof the flow diagram., 'lower-bound" fracture toughness'J-R curves for'cast stainless steelsof unknown chemical composition are defined. Different lower-bound J-R curves are de-fined when the ferrite content of the steeI Is known. Sections B and C of the flow diagrampresent procedures for estimating mechanical properties 'when some 'information is knownabout the material, e.g., CMT is available.' Section B describes the estimation ofUsaturationo tmpact energy and J-R curve,' I.e.',,the lowest value that would be achieved'forthe material after long-term service. The only Information needed for these estimations Isthe chemical composition of the material. Nitrogen content Is assumed to be 0.04 wt.% if
173
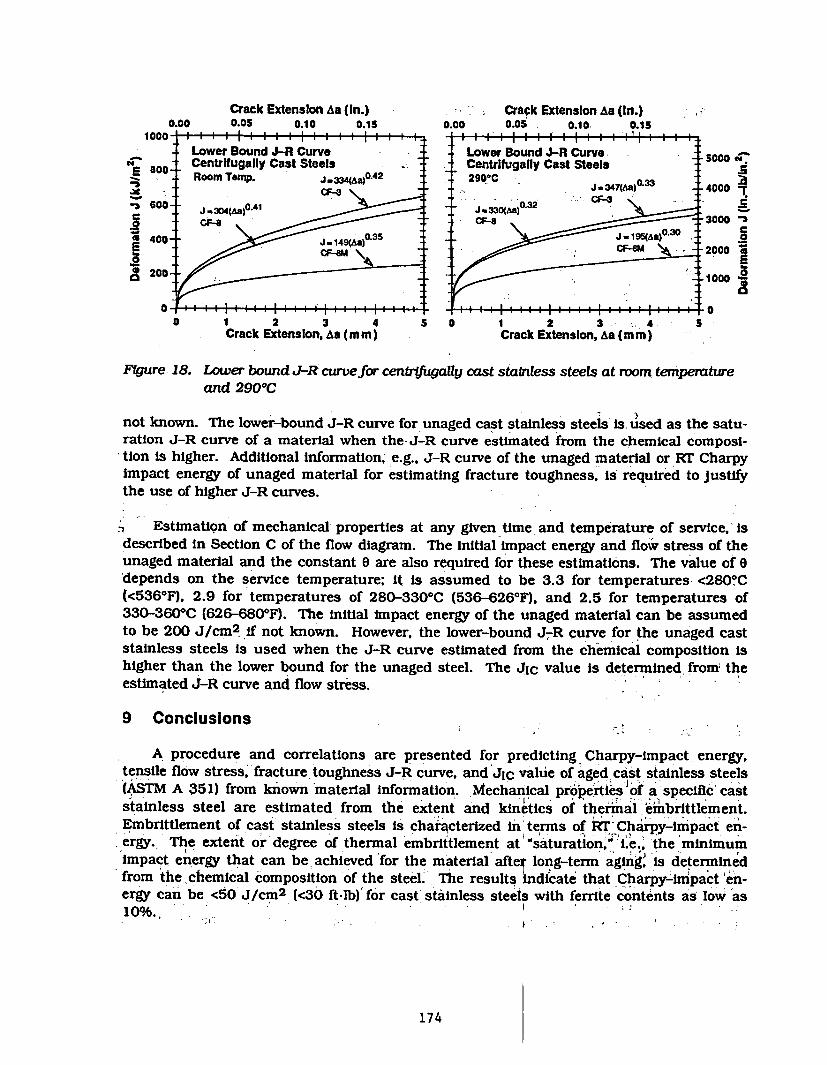
Crack Extension Aa (in.) Crack Extension Aa (In.)0.00 0.05 0.10 0.15 0.00 0.05 0.10. 0.15
1000 - a 1 i 1 1 a 1 a 1 1 1 a 1 1 1 1 1 1 1 . - | I l.1 a I 'I I I I 1
Lower Bound J-R Curve Lower Bound J-R Curve - . _-00800 Centrifugally Cast Steels Centrifugally Cast Steels
E 600- 0.42_Room Tc-. J 334D 2s00C 033X C - ." J 347(Aa°- 4Q0001
. CF-3 M20-3 600- . 30a4(AaP.41 J- 3~30(Aa)3 --.32 So
C -8_ CF-8 -1000 -0
A400- J 149(Aa)>5J12a>3
200- f000 28
0 0
o 1 2 3 4 5 0 1 2 3 .4 5Crack Extension, Aa (m m) Crack Extenslon, ha (mm)
FYgure 18. Lower bound J-R' curvefor cenbftgaUy cast stainless steels at room temperatureand 2900C
not known. The lower-bound J-R curve for unaged cast stainless steels is. used as the satu-ration J-R curve of a material when the-J-R curve estimated from the chemical composi-tion is higher. Additional information, e.g.. J-R curve of the unaged material or RT Charpyimpact energy of unaged material for estimating fracture toughness, is required to justifythe use of higher J-R curves.
n Estimation of mechanical properties at any given time and temperature of service, isdescribed in Section C of the flow diagram. The initial impact energy and flow stress of theunaged material and the constant 9 are also required for these estimations. The value of 9'depends on the service temperature; it is assumed to be 3.3 for temperatures <280?C(<5360 F), 2.9 for temperatures of 280-330 0C (536-6260 F). and 2.5 for temperatures of330-3600 C (626-680 0F). The initial impact energy of the unaged material can be assumedto be 200 J/cm2 if not known. However, the lower-bound J-R curve for the unaged caststainless steels is used when the J-R curve estimated from the chemical composition ishigher than the lower bound for the unaged steel. The JIc value is determined from theestimated J-R curve and flow stress.
9 Conclusions
A procedure and correlations are presented for predicting Charpy-impact energy.tensile flow stress, fracture toughness J-R curve. and JIc value of aged cast stainless steels(ASTM A 351) from known material information. Mechanical properties of a specific caststainless steel are estimated from the extent and kinetics of thermal 'e6mbrittlement.Embrittlement of cast stainless steels is characterized in'terms of RTiCharpy-impact en-ergy.. The extent or degree of thermal embrittlement at 'saturatlon, L.e., the minimumimpact energy that can be achieved for the material afte¶ long-term aglnig is determinedfrom the chemical composition of the steel. The results indicate that Charpy-inipact 'en-ergy can be <50 J/cM2 (<30 ft-lb) for cast' stainless steels with ferrite contents as low as1 096 i ,''I'i'' ' ' i10-%..
174
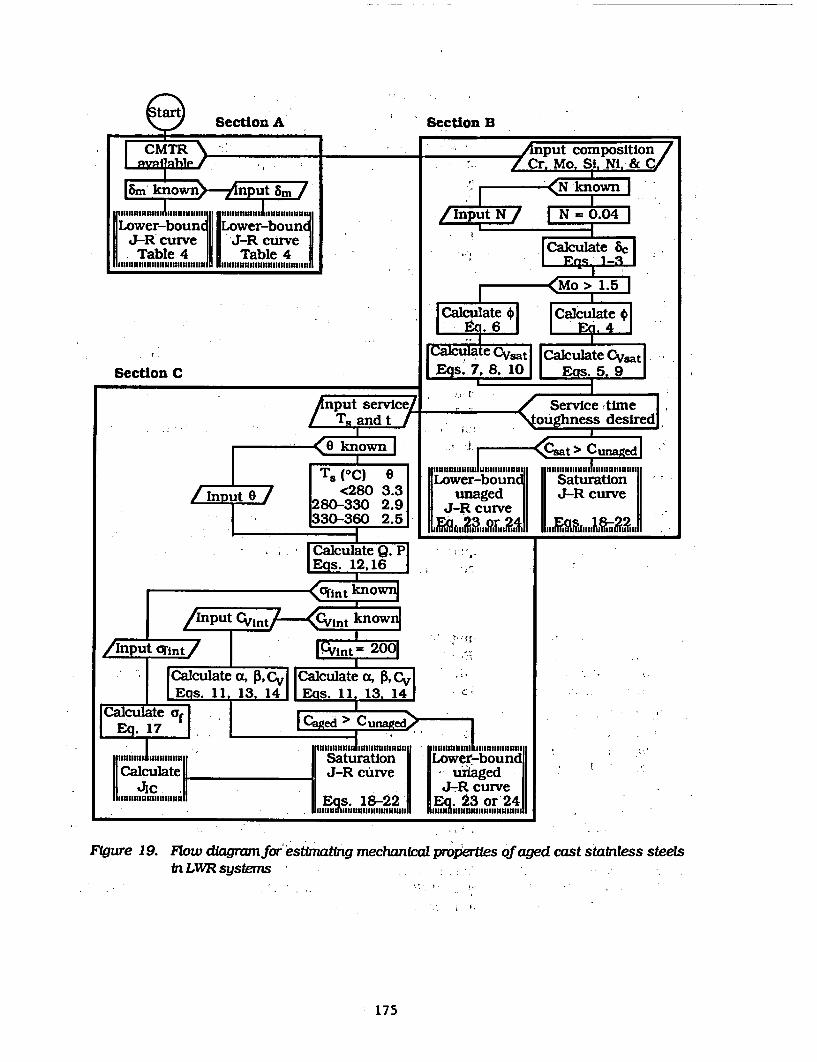
J-R curve f uiagedJ-JR curve
18 22 23 or 2.ul U M111111fllllllllulull 11UlnuufutIIIIIIlIllIIlI
FIgure 19. Flow dagram for estimating mechanical propertes of aged cast stainless steelsin LWR systems
175
Charpy-impact energy as a function of time and temperature of reactor service is esti-mated from the kinetics of thermal embrittlement, which is also determined from thechemical composition. The initial impact energy of the unaged steel is required for theseestimations. Initial tensile flow stress is needed for estimating the flow stress of aged ma-terial., The fracture toughness J-R curve for the material is then obtained from correlationsbetween RT Charpy-Impact energy and fracture toughness parameters. The JIc value is de-termined from the estimated J-R curve and flow stress. A common 'lower-bound" J-Rcurve for cast stainless steels with unknown chemical composition is also defined for agiven grade of steel, ferrite content, and temperature. This information can serve as aguideline for establishing the upper limit of ferrite content for a specific grade of steel be-yond which thermal aging effects are significant.
Fracture toughness J-R curve data have been mostly obtained on 1-T compact tensionspecimens. According to ASTM Specification E 1152-87 they are valid only for crackgrowth up to 10% of the initial uncracked ligament. However, it is widely accepted that theJ-R curve crack growth validity limits fall between 25 and 40% of the initial uncrackedligament. or -8 mm of crack extension. In future work under this program, these extendedvalidity limits for J-controlled crack growth will be qualified and better defined for caststainless steels in terms of specimen size, toughness, and crack extension. Representationof J-R curves by expressions other than power law (e.g., by power-exponential relation) willalso be evaluated for more accurate extrapolation of J-R curve data.
Acknowledgments
This work was supported by the Office of Nuclear Regulatory Research of the U.S.Nuclear Regulatory Commission. The author thanks A. Sather, T. M. Galvin, L. Y. Bush, W. F.Michaud, and W. F. Burke for experimental contributions and J. Muscara, W. J. Shack, andT. F. Kassner for their helpful discussions.
References
1. 0. K. Chopra and H. M. Chung. "Aging Degradation of Cast Stainless Steels: Effects onMechanical Properties," in Environmental Degradation of Materials In Nuclear! PowerSystems-Water Reactors, G. J. Theus and J. R Weeks, eds. The Metallurgical Society,Warrendale, PA., pp. 737-748 (1988).
2. 0. K. Chopra and H. M. Chung, "Effect of Low-Temperature Aging on the MechanicalProperties of Cast Stainless Steels," In Properties of Stainless Steels fi ElevatedTemperature Service, M. Prager, ed., MPC Vol. 26, PVP Vol. 132, American Society ofMechanical Engineers. NewYork, pp. 79-105 (1988).
3. 0. K Chopra, 'Thei-mal Aging of Cast Stainless Steels: Mechanisms and Predictions," inFatigue, Degradation, and Fracture - 1990, W. H. Bamford, C. Becht, S. Bhandari, J. D.Gilman, L. A. James, and M. Prager. eds., MPC Vol. 30, PVP Vol. 195. American Societyof Mechanical Engineers, New York, pp. 193-214 (1990).
4. 0. K. Chopra and A. Sather, Initial Assessment of the Mechanisms and Sign~ficance of Low-Temperature Embrittlement of Cast Stainless Steels In LWR Systems, NUREG/CR-5385,ANL-89/17, Argonne National Laboratory, Argonne, IL (August 1990).
176
5. A. Trautwein and W. Gysel, 'Influence of Long Time Aging of CF-8 and CF-8M CastSteel at Temperatures Between 300 and 5000C on the Impact Toughness and theStructure Properties." in Stainless Steel Castings, V. G. Behal and A. S. Melilli. eds.,ASTM STP 756, pp. 165-189 (1982).
6. E. I. Landerman and W. H. Bamford, 'Fracture Toughness and Fatigue Characteristics ofCentrifugally Cast Type 316 Stainless Steel Pipe after Simulated Thermal ServiceConditions," in Ductility and Toughness Considerations In Elevated Temperature Service.MPC-8. American Society of Mechanical Engineers, New York. pp. 99-127 (1978).
7. S. Bonnet, J. Bourgoin, J. Champredonde, D. Guttmann, and M. Guttmann,"Relationship between Evolution of Mechanical Properties of Various Cast DuplexStainless Steels and Metallurgical and Aging Parameters: An Outline of Current EDFProgrammes," Mater. Sci and Technol., 6. 221-229 (1990).
8. K. N. Akhurst and P. H. Pumphrey, The Aging Kinetics of CF3 Cast Stainless Steel in theTemperature Range 3000 C to 4000C, RD/L/3354/R88. Central Electricity GeneratingBoard, Leatherhead, UK (November 1988).
9. P. H. Pumphrey and K. N. Akhurst, *Aging Kinetics of CF3 Cast Stainless Steel inTemperature Range 300 - 4000C," Mater. ScL and Technol., 6, 211-219 (1990).
10. G. Slarna. P. Petrequin. and T. Mager, "Effect of Aging on Mechanical Properties ofAustenitic Stainless Steel Castings and Welds," presented at SMIRT Post-ConferenceSeminar 6. Assuring Structural Integrity of Steel Reactor Pressure Boundary Components,August 29-30. 1983, Monterey, CA.
11. Y. Meyzaud, P. Ould, P. Balladon, M. Bethmont, and P. Soulat, Tearing Resistance ofAged Cast Austenitic Stainless Steel," presented at IntL Conf on Thermal Reactor Safety(NUCSAFE 88). October 1988, Avignon, France.
12. P. McConnell and J. W. Sheckherd. Fracture Toughness Characterization of ThermallyEmbrittled Cast Duplex Stainless Steel, Report NP-5439, Electric Power ResearchInstitute, Palo Alto, CA (September 1987).
13. 0. K. Chopra. "Estimation of Fracture Toughness -of Cast Stainless Steels in LWRSystems," in Proc. 18th Water Reactor Safety Iriormation Meeting, U.S. NuclearRegulatory Commission, NUREG/CP-01 14 Vol. 3, p. 195 (April 1991).
14. 0. K. Chopra. Estimation of Fracture Toughness of Cast Stainless. Steels during ThermalAging in LWR Systems. NUREG/CR-4513, ANL-90/42, Argonne National Laboratory,Argonne, IL (June 1991).
15. M. Vrinat, P, Cozar, and Y. Meyzaud, 'Precipitated Phases in the Ferrite of Aged CastDuplex Stainless Steels." Scrlpta Metal., 20, 1101-1106 (1986).
16. H. M. Chung and 0. K. Chopra, "Long-Term-Aging Embrittlement of Cast AusteniticStainless Steels - Mechanism and Kinetics," in Propert.es of Stainless Steels in ElevatedTemperature Service, M. Prager, ed., MPC Vol. 26, PVP Vol. 132, American Society ofMechanical Engineers, New York. pp. 17-34 (1988).
17. H. M. Chung and T. R Leax. 'Embrittlement of Laboratory and Reactor Aged CF3, CF8,and CF8M Duplex Stainless Steels." Mater. Sci. and Tech. 6. 249-262 (1990).
177
18. J. Sassen. M. G. Hetherlngton, T. J. Godfrey, G. D. W. Smith, P. H. Pumphrey, and K. N.Akhurst, 'Kinetics of Spinodal Reaction in the Ferrite Phase of a Duplex StainlessSteel," in Properties of Stainless Steels in Elevated Temperature Service, M. Prager, ed.,MPC Vol. 26, PVP Vol. 132, ASME, New York. pp. 65-78 (1988).
19. M. K. Miller and J. Bentley, 'Characterization of Fine-Scale Microstructures In AgedPrimary Coolant Pipe Steels." in Environmental Degradation of Materials in NuclearPower Systems-Water Reactors. Proc. 3rd Intl. Symp.. G. J. Theus and J. R. Weeks, eds.,The Metallurgical Society, Warrendale, PA., pp. 341-349 (1988).
20. P. Auger. F. Danoix. A. Menand, S. Bonnet, J. IBourgoin, and M. Guttmann, 'Atom Probeand Transmission Electron Microscopy Study of Aging of Cast Duplex Stainless Steels,"Mater. Sci. and Technol., 6, 301-313 (1990).
21. J. E. Brown, A. Cerezo, T. J. Godfrey, M. G. Hetherington, and G. D. W. Smith,'Quantitative Atom Probe Analysis of Spinodal Reaction in Ferrite Phase of DuplexStainless Steel," Mater. Sct and TechnoL, 6, 293-300 (1990).
22. L. S. Aubrey, P. F. Wieser, W. J. Pollard. and E. A. Schoefer. 'Ferrite Measurement andControl in Cast Duplex Stainless Steel," In Stainless Steel Castings. V. G. Behal and A. S.Melilli, eds., ASTM STP 756, pp. 126-164 (1982).
23. A. L. Hiser, Tensile and J-R Curve Characterization of Thermally Aged Cast- StainlessSteels, NUREG/CR-5024, MEA-2229, Materials Engineering Associates, Inc.. Lanham,MD. (September 1988).
24. G. E. Hale and S. J. Garwood, The Effect of Aging or the Fracture Behaviour of CastStainless Steel and Weldments," Mater. Sct and Technol.. 8, pp. 230-235 (1990).
25. A. L. Hiser, Fracture Toughness Characterization of Nuclear Piping Steels, NUREG/CR-5118, MEA-2325. Materials Engineering Associates, Inc., Lanham, MD, (November1989) .
26. G. M. Wilkowski. et. al., Degraded Piping Program - Phase 11, Semiannual Report,NUREG/CR-4082, Vol. 2 (June 1985).
27. W. J. Mills, "Heat-to-Heat Variations in the Fracture Toughness of Austenitic StainlessSteels," Eng. Fracture Mech., 30, 469-492 (1988).
28. M. G. Vassilaros, R A. Hays, and J. P. Gudas, 'Investigation of the Ductile FractureProperties of Type 304 Stainless Steel Plate' Welds, and 4-Inch Pipe," in Proc. 12thWater Reactor Safety Information Meeting, U.S. Nuclear Regulatory Commission.NUREG/CP-058 Vol. 4, p. 176 (January 1985).
29. P. Balladon, J. Heritier, and P. Rabbe, 'Influence of Microstructure on the DuctileRupture Mechanisms of a 316L Steel at Room and Elevated Temperatures," FractureMechanics: Fourteenth Sympostum, ASTM STP 791. pp. II496-II513 (1983),
30. W. H. Bamford and A. J. Bush, "Fracture Behavior of Stainless Steel." Elastic-PlasticFracture, ASTM STP 668, pp. 553-577 (1979).
178
Mechanical-Property Degradation of Cast Stainless Steel Components from theShippingport Reactor
0. K Chopra
Materials and Components Technology DivisionArgonne National Laboratoiy
9700 South Cass AvenueArgonne. Illinois 60439
Abstract
The mechanical properties of cast stainless steels from the Shlppingport reac-tor have been characterized. Baseline properties for unaged materials were ob-tained from tests on either recovery-annealed material or material from a coolerregion of the component. The materials exhibited modest decrease In Impact en-ergy and fracture toughness and a small increase in tensile strength. The fracturetoughness J-R curve, JIc value, tensile flow stress, and Charpy-impact energy ofthe materials showed very good agreement with estimations based on acceleratedlaboratory aging studies. The kinetics of thermal embrittlement and degree of em-brittlement at'saturation, i.e., the minimum impact energy that would be achievedafter long-term aging, were established from materials that were aged further inthe laboratory at temperatures between 320 and 4000C. The results showed verygood agreement with estimates; the activation energies ranged from 125 to250 k/mole and the minimum room-temperature impact energy was >75 J/cm2 .
-The estimated impact energy and fracture toughness J-R curve for materials fromthe Rlnghals reactor hot and crossover-leg elbows are also presented.
I -Introduction
Cast duplex stainless steels used in LWR systems for primary pressure-boundary com-ponents such as valve bodies, pump casings, and primary coolant piping are susceptible tothermal embrittlement after extended service at reactor operating temperatures, i.e., 280-3200C (536-6080 F). Aging of cast stainless steels at these temperatures leads to increasedhardness and tensile strength and decreased ductility, impact strength, and fracture tough-ness. Most studies of thermal embrittlement of cast stainless steels involve simulation ofend-of-life reactor conditions by accelerated aging at higher temperatures, viz., 400'C(7521F), because the time period for operation of power plahts (.40 y) is far longer than cangenerally be considered in laboratory studies. Thus, estimates of mechanical-propertydegradation suffered by cast stainless steel components during service are based on anArrhenlus extrapolation of high-temperature data to reactor operating conditions.
Several laboratory studies have Investigated thermal embrittlement of cast stainlesssteels under LWR operating conditions.1-1 2 A procedure and correlations have been devel-oped for estimating-fracture toughness, tensile, and Charpy-impact properties of cast stain-less steel components during thermal aging.1 3.14 Because the embrittlement mechanismsand kinetics are complex, microstructural studies and mechanical testing of actual compo-nent materials that have completed long in-reactor service are necessary, to ensure that the
.me submitted _anusclpt has beenauthored by a contracor of the U.S.Government under contact No. W-31-109-ENG-38. Acoordinly, he U.S.Government retains a nonexxdusive,royalty-free license to publish or
179 reproduce the published form of thisconlrbutlon. or allow others to do so, forU.S. Government purposes.
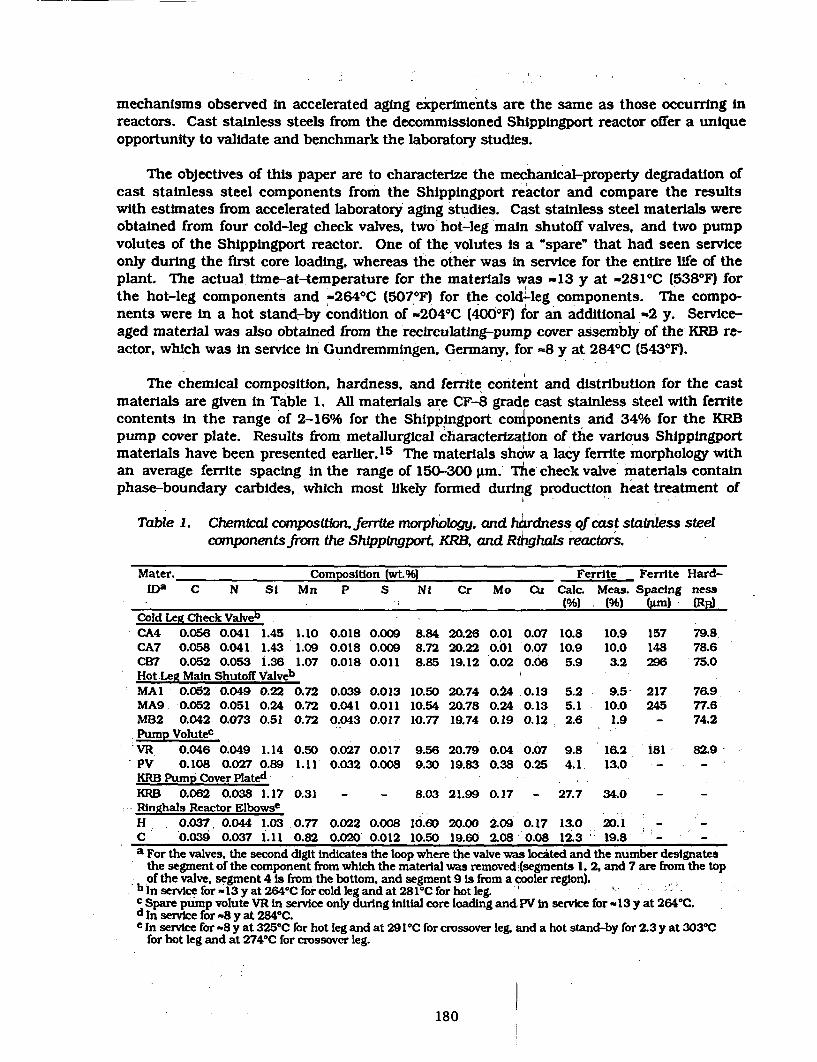
mechanisms observed in accelerated aging experiments are the same as those occurring inreactors. Cast stainless steels from the decommissioned Shippingport reactor offer a uniqueopportunity to validate and benchmark the laboratory studies.
The objectives of this paper are to characterize the mechanical-property degradation ofcast stainless steel components from the Shippingport reactor and compare the resultswith estimates from accelerated laboratory aging studies. Cast stainless steel materials wereobtained from four cold-leg check valves, two hot-leg main shutoff valves, and two pumpvolutes of the Shippingport reactor. One of the volutes is a 'spare" that had seen serviceonly during the first core loading, whereas the other was in service for the entire life of theplant. The actual time-at-temperature for the materials was -13 y at -2811C (5380F) forthe hot-leg components and -2640C (5070F) for the cold-leg components. The compo-nents were in a hot stand-by condition of -204OC (400IF) for an additional "2 y. Service-aged material was also obtained from the recirculating-pump cover assembly of the KRB re-actor. which was in service in Gundremmingen, Germany, for -8 y at 2840 C (5430F).
The chemical composition, hardness, and ferrite content and distribution for the castmaterials are given in Table 1. All materials are CF-8 grade cast stainless steel with ferritecontents in the range of 2-16% for the Shippingport components and 34% for the KRBpump cover plate. Results from metallurgical characterization of the various Shippingportmaterials have been presented earlier.15 The materials show a lacy ferrite morphology withan average ferrite spacing in the range of 150-300 Jtm.' Tie check valve materials containphase-boundary carbides, which most likely formed during production heat treatment of
Table 1. Chemical compositionferte morphology, and hardness of cast stainless steelcomponents from the Shippingport. KRB, and Rthghals reactors.
Mater. Composition (wt.%) Ferrite Ferrite Hard-IDa C N St Mn P S Ni Cr Mo CQ Caic. Meas. Spacing ness
X (%) (%) (;m) (RB)CnwA 1 ask~i ui-Ub
-yu 0. .4 10 0.018 0 .
C4 0060.041 1.45 1.10 0.018 0.009 8.84 20.26 0.01 0.07 10.8 10.9 157 79.8CA7 0.058 0.041. 1.43 1.09 0.018 0.009 8.72 20.22 0.01 0.07 10.9 10.0 148 78.6CB7 0.052 0.053 1.36 1.07 0.018 0.011 8.85 19.12 0.02 0.06 5.9 3.2 296 75.0Hot Leg Main Shutoff ValvebMAI 0.052 0.049 0.22 0.72 0.039 0.013 10.50 20.74 0.24 .0.13 5.2 9.5- 217 76.9MA9 0.052 0.051 0.24 0.72 0.041 0.011 10.54 20.78 0.24 0.13 5.1 10.0 245 77.6MB2 0.042 0.073 0.51 0.72 0.043 0.017 10.77 19.74 0.19 0.12 2.6 1.9 - 74.2Pump VolutecVR 0.046 0.049 1.14 0.50 0.027 0.017 9.56 20.79 0.04 0.07 9.8 16.2 181 82.9PV 0.108 0.027 0.89 1.11 0.032 0.008 9.30 19.83 0.38 0.25 4.1 13.0 - -KRB Pump Cover PlatedKRB 0.062 0.038 1.17 0.31 - - 8.03 21.99 0.17 - 27.7 34.0 - -
Ringhals Reactor ElbowseH 0.037. 0.044 1.03 0.77 0.022 0.008 10.60 20.00 2.09 0.17 13.0 20.1 - -
C 0.039 0.037 1.11 0.82 0.020 0.012 10.50 19.60 2.08 0.08 12.3 19.8 - -
a For the valves, the second digit indicates the loop where the valve was located and the number designatesthe segment of the component from which the material was removed (segments 1. 2, and 7 are from the topof the valve, segment 4 is from the bottom, and segment 9 is from a cooler region).
b In service for -13 y at 264'C for cold leg and at 281C for hot leg. '-c Spare pump volute VR In service only during initial core loading and PV In service for -13 y at 264'C.d In service for "8 y at 2840C.e In service for -8 y at 3251C for hot leg and at 291IC for crossover leg, and a hot stand-by for 2.3 y at 303"C
for hot leg and at 274'C for crossover leg.
180
the casting. Also, the check-valve material showed phase boundary migration, and theoriginal phase boundaries were decorated with carbides.
Microstructural examination indicates that the mechanism of low-temperature embrit-tlement of the cast materials is the same as that of the laboratory-aged materials.16 .17 Allmaterials showed spinodal decomposition of the ferrite to form a chromium-rich a' phase.In addition, the check-valve materials contained a nickel- and silicon-rich G phase in theferrite and M23C6 carbides at the austenite/ferrite phase boundary. An unexpected ml-crostructural feature, i.e., a phase precipitates on slip bands and stacking faults, was alsoobserved in the austenite of the check-valve material. Precipitation of a phase generally oc-curs at temperatures >550C (>10221F). The presence offs phase and phase-boundary mi-gration Indicate significant differences between the production heat treatment of the checkvalves and that of the other materials.
The mechanical-property degradation of cast stainless steel (CF-8M) elbows from theRinghals reactor hot leg and crossover leg was also assessed and compared with experimen-tal data.18I The chemical composition, ferrite content, and service conditions for the mate-rials are given in Table 1.
2 Mechanical Properties
Specimens for Charpy-Impact. tensile, and fracture toughness J-R curve tests were ob-tained from different locations across the thickness .of the various components. All speci-mens were in the LC orientation. Impact tests were s onducted on standard Charpy V-notch specimens machined accQrding to ASTM Specification E 23. A Dynatup Model8000A drop-weight impact machine with an instrumented tup and data readout system wasused for the tests. Tensile tests were performed on cylindrical specimens 5 mm in diame-ter, with a gauge length of 20 mm. The tests were conducted at an initial strain rate of 4 x10⁻⁴ s-1. The J-R curve tests were conducted according to ASTM Specifications E 813-85and E 1152-87. Compact-tension specimens, 25.4-mm thick, were used for the tests.
The baseline mechanical properties for the as-cast materials must be known to estab-lish the thermal-aging effects during reactor service. Microstructural and annealing stud-ies2 ,15 -17 . 9 on laboratory- and reactor-aged materials Indicate that mechanical propertiesof unaged material can be determined from recovery-annealed material, i.e.. embrittled ma-terial that has been annealed for 1 h at 5500C and then water-quenched. To obtain baselineproperties, Charpy-impact tests were also conducted on material from a cooler region ofthe main shutoff valve. Charpy transition curves for MA9 material and recovery-annealedMA9 and MAl material are shown in Fig. 1. These materials are from the Loop A mainshutoff valve, although MA9 is from a cooler region of the valve. The results indicate thatMA9 material suffered little or no thermal-aging embrittlement, i.e., annealing had no effecton the transition curves. The results for annealed MAI material also show good agreementon the transition curves. The results for annealed MA1 also show good agreement with thetransition curve for MA9. The upper-shelf energy (USE) for both materials is not constantbut'decreases as temperature increases. The average impact energies at room temperature
The first digit represents the direction normal to the plane of a crack and the second digit Indicates the directionof crack propagation: L = longitudinal and C = circumferential.
181
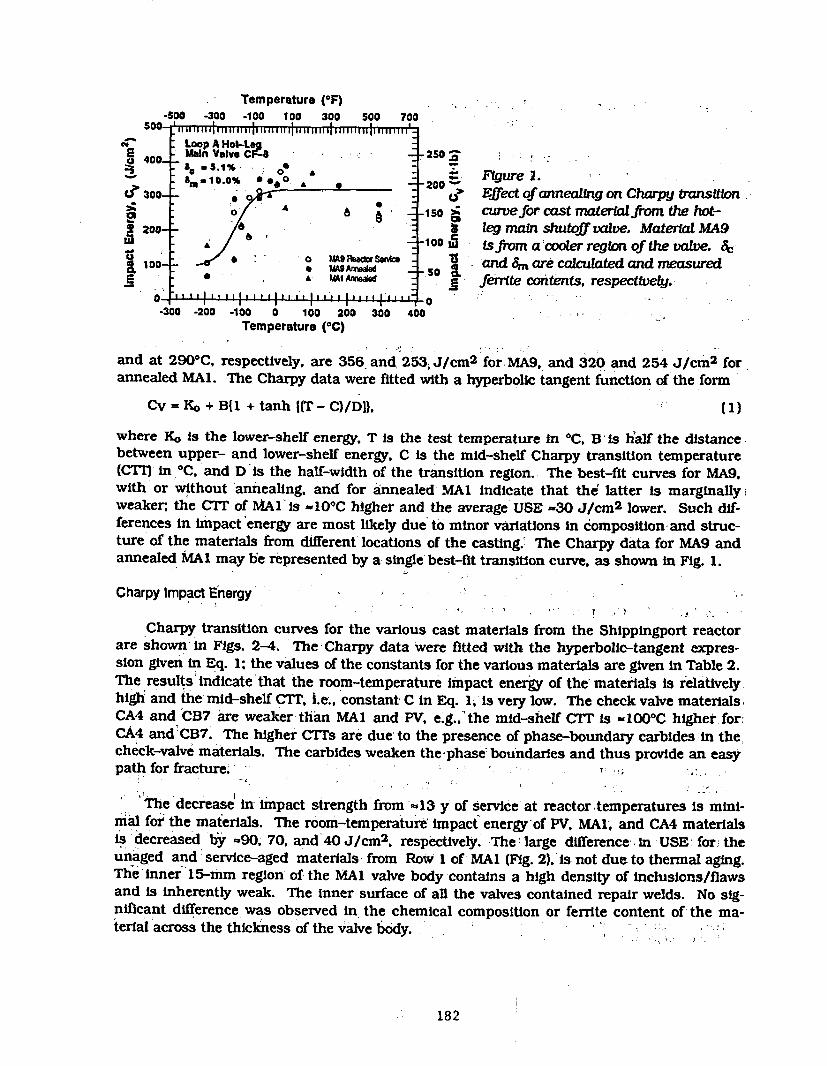
Temperature (OF)-500 -300 -100 100 300 500 700
11111111 '1111111 miii1111111 mmI ii iii111111miii mll l iiiT~
4 |Loop A Hot-LogS Main Volvo CF- 250~o400 's
S. 4 - 200- Figre 1.am. 1.0%
300- Effect of annealing on Charpy transition0 - -IO curefor cast maltelalfrom the hot-
200- 1 00 g main shutoff valve. Materal MA9s '-Is-1 ifrom a'cooler region of the valve. SC
lo o__ 0 U SWAN -and Am are calculated and measuredioWA )AAWveid 50&M * Azv-edg ferrite contents, respectively.
0- " ' mI I I I I ' ' ' ' i' --300 -200 .100 0 100 200 300 400
Temperature (,C)
and at 2900C, respectively, are 356 and 253, J/cm2 for MA9, and 320 and 254 J/cm2 forannealed MAl. The Charpy data were fitted with a hyperbolic tangent function of the form
Cv = Ko + B{1 + tanh UtT- C)/DI), (1)
where Ko Is the lower-shelf energy, T Is the test temperature in CC. B Is half the distancebetween upper- and lower-shelf energy. C is the mid-shelf Charpy transition temperature(CTIM in 0C, and D 'is the half-width of the transition regloA. The best-fit curves for MA9,with or without annealing. and for annealed MAl indicate that the[ latter Is marginallyweaker; the CTT of MAI'is -100 C higher and the average IUSE -30 J/cm2 lower. Such dif-ferences in impact'energy are most likely due' to minor variations in composition and struc-ture of the materials from different locations of the casting.' The Charpy data for MA9 andannealed MAL may be represented by a single' best-fit transition curve, as shown in Fig. 1.
Charpy Impact EnergyI .) -' . '
Charpy transition curves for the various cast materials from the Shippingport reactorare shown in Figs. 2-4. The Charpy data were fitted with the hyperbolic-tangent expres-sion given in Eq. 1: the values of the constants for the various materials are given in Table 2.The results indicate'that the room-temperature impact energy of the materials is relativelyhigh and the mid-shelf CiT, i.e., constant C in Eq. 1, is very low. The check valve materials.CA4 and CB7 are weaker than MAI and PV, e.g.,'the mid-shelf CIT is -1000 C higher for'CA4 and'CB7. The higher CTTs are due to the presence of phase-boundary carbides in thecheck-valve materials. The carbides weaken the phase boundaries and thus provide an easypath for fracture. ' ' . .
The decrease in impact strength from "43 y of service at reactor temperatures is mini-mal for the materials. The room-temperature' impact energy'of PV, MAI- and CA4 materialsis decreased ba -90. 70, and'40 J/cm2 , respectively. The large difference in USE: for theunaged and service-aged materials from Row 1 of MAI (Fig. 2). is not due to thermal aging.The'inner"15-mm region of the MAI valve body contains a high density of inclusions/flawsand is inherently weak. The Inner surface of all the valves contained repair welds. No sig-nificant difference was observed in the chemical composition or ferrite content of -the ma-terial across the thickness of the valve body.
182
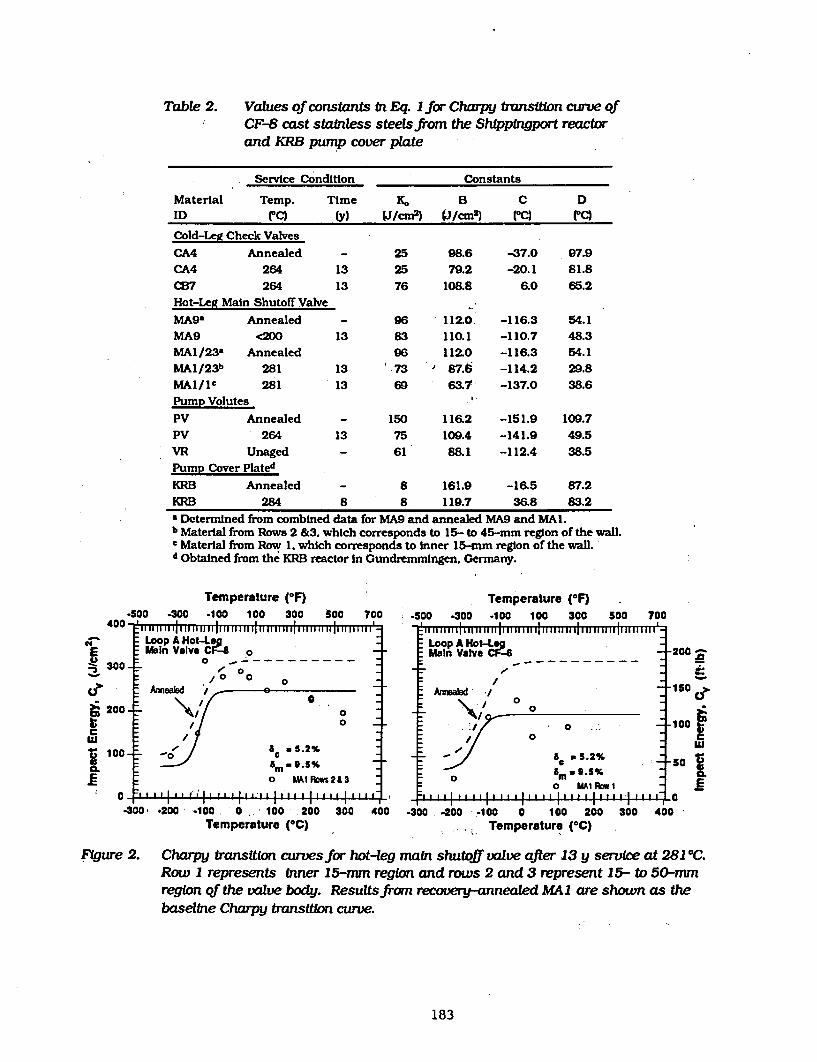
Table 2. Values of constants fn Eq. 1 for Charpy transition curve ofCF-B cast stainless steels from the Shlpptngport reactorand KRB pump cover plate
Service Condition Constants
Material Temp. Time K. B C DID KC) Ly) (J/cm2) Wj/cm 2 ) (1C) "C)
Cold-Leg Check Valves
CA4 Annealed - 25 98.6 -37.0 97.9CA4 264 13 25 79.2 -20.1 81.8CB7 264 13 76 108.8 6.0 65.2Hot-Leg Main Shutoff Valve
MA9' Annealed - 96 112.0. -116.3 54.1MA9 <200 13 83 110.1 -110.7 48.3MA1/23' Annealed 96 112.0 -116.3 54.1MAI/23b 281 13 73 87.6 -114.2 29.8MAl/Ic 281 13 69 63.7 -137.0 38.6Pump Volutes
PV Annealed - 150 116.2 -151.9 109.7PV 264 13 75 109.4 -141.9 49.5VR Unaged - 61 88.1 -112.4 38.5Pump Cover Plated
KRB Annealed - 8 161.9 -16.5 87.2KRB 284 8 8 119.7 36.8 83.2' Determlned from combined data for MA9 and annealed MA9 and MAI.b Material from Rows 2 &3. which corresponds to 15- to 45-mm region of the wall.c Material from Row 1, which corresponds to Inner 15-mm region of the wall.d Obtained from the KRB reactor In Gundremmingen, Germany.
Temperature (OF).300 -100 100 300 500 700
I I I I-500
Ann --zvv
WN
-e 300-
; 200-
Irl
I 100-CL
O.
,,,,,,, ,1, ,,11,,11,,111111,1,1Il1111111111111 11 111l1111 11111 1 1 _
Loop A Hot-LeUaln Volve C- o
o _…
Xo o MO~ ws
. O
ms.5%o MAI Rows 2 & 3
Temperature ('F)-500 .300 -100 100 300 500 700
Loop A Hot-LegMain Valve CF-8 -2
+ _------_____ -
F / °o iiAnnealed '
00
E / 0
_ 5Z .5.2%
o S2.5%o MAI Row 1
E1II III III 11II 1II I "i i Il In
100
.:
50 Cr>
)0a
O I
_ . . . . . . . . .. . . . . . . . . . .. . . . . . . ...1 1 1 1 ' I .. i 1 1-0oo .200 -100, 0 100 200 3s0
Temperature (°C)400 -300 .200 -100 0 100 200 300 400
Temperature ('C)
Ftgure 2. Charpy transition curvesfor hot-eg main shutoffvalve after 13 y service at 281 °C.Row I represents Inner 15-mun region and rows 2 and 3 represent 15- to 50-mnregion of the valve body. Resultsfrom recovery-annealed MAI are shown as thebaseline Charpy transition curve.
183
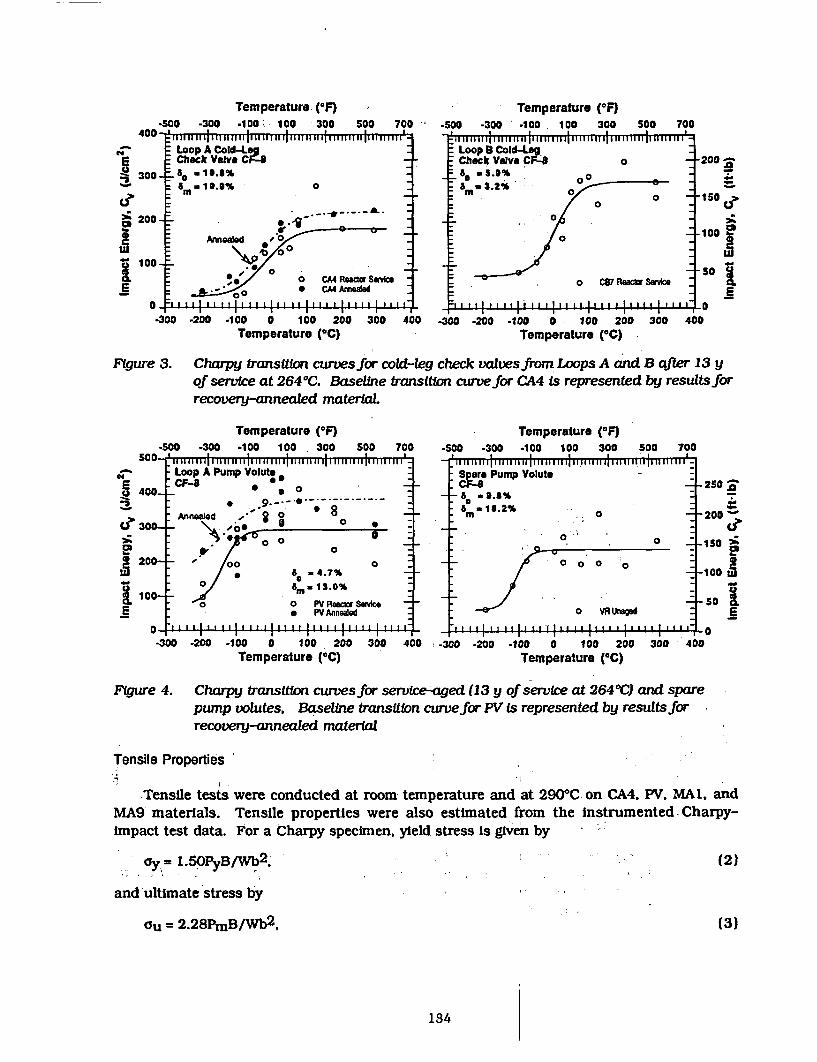
Temperature (OF)
.soo -300 -100 o - 100 300 so5 700Temperature (°F)
-500 -300 -100 100 300 500 700p pI I I4UU. 6300-
C2E
:8 300-
200-
1l
I 100-
E
I
Loop A Cold-LegCheck Valve Ca-80 a10.5%8m a 10.9% 0
Annealed -0
*0 Reactr CMReSnfo0 C~M Ann~e
*. S nll
Loop B Cold-LegCheck Valve CF o -2S
art,, 3 .2
o C87RecoSwc
: II II I I I II Ii I I I I I
20J-
30I
0 .. . . ... I I11 U.. ml.... ... . . . . .
-300 -200 .100 0 100 200 300 400Temperature (°C)
_ I I ,
-300 -200 -100 0 100 200 300 400Temperature (*C)
Figure 3. Charpy transition curvesfor cold-leg check valvesfrom. Loops A and B after 13 yof service at 264 0C. Baseline transition curvefor CA4 is represented by resultsforrecovery-annealed material
Temperature (°F)-soo -300 -100 100 300 500 700
soo,1 .I ...... . , 1 ., , ,1 ,, , .. 1 , ' .
Temperature (*F)-500 -300 .100 100 300 500 700-I ...lIE, 1 1, 1 .. 1., i ... II,,,Im ia alig1 11 ' 1.1 111.
E 400-
(' 300-
2! 200-
I 100-
I
LopA Pump VoluteCF-a 8~
0 - 8
* 0-
0
* 0 .13.0%-
* a0 PY ReactorServkce -
e PV Annealed-
Pump Volute- -
.00
0 0 0
*0 VR Unaged-
-250 -
-200
-150
-100 3
-50 iE
-,,,..., .. ,,-..,,,,,,..,,,,,. _3 I
-300 -200 -100 0 100 200 300 400Temperature (OC)
I U -T - - I - -~ - I I F_,-300 -200 100 0 100 200 300 400
Temperature (°C)
Figure 4. Charpy transition curvesfor service-aged (13 y of service at 264 0C) and sparepump volutes, Baseline transition curvefor PVis represented by resultsforrecovery-annealed material
Tensile Properties
Tensile tests were conducted at room temperature and at 2900C on CA4. PV. MAL, andMA9 materials. Tensile properties were also estimated from the instrumented Charpy-impact test data. For a Charpy specimen, yield stress is given by
Gy l5OPyB/Wb2 . , (2)
and ultimate stress by
au = 2.28PmB/Wb2 , (3)
134
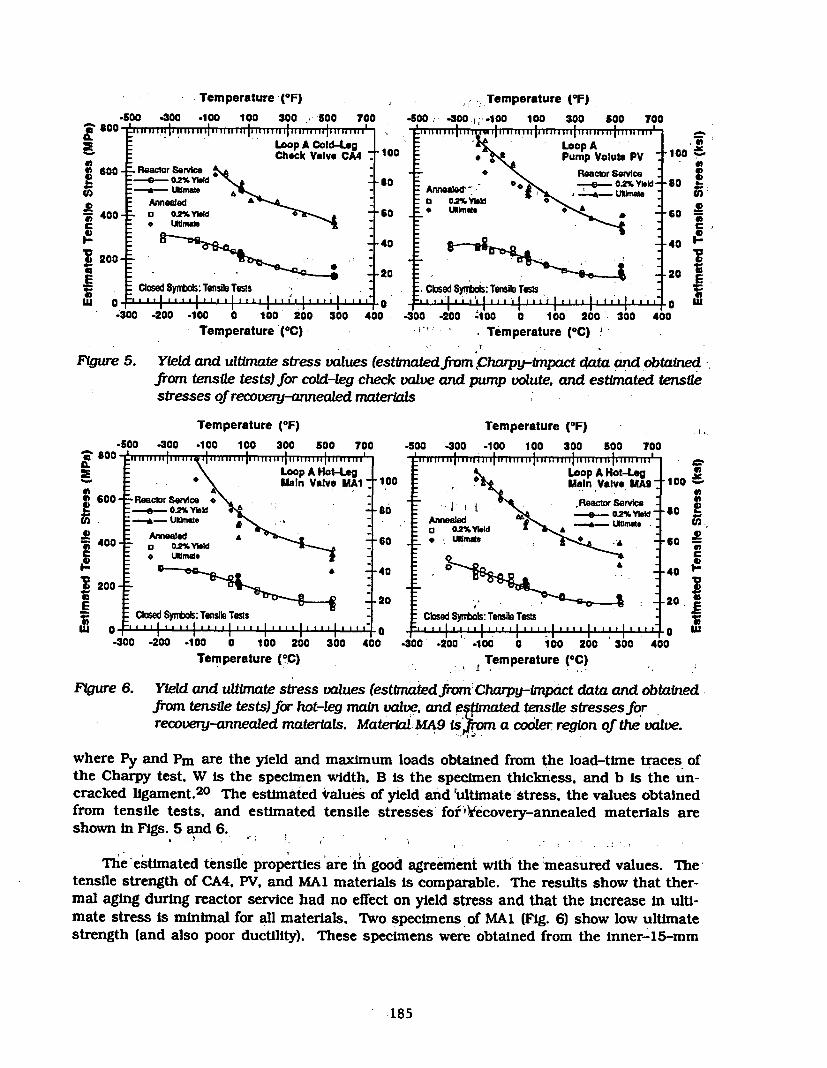
Temperature ,(F)
.1500 .300 o100 100
-. Temperature (OF)
4500 .0 0;--100 100 300 500 700'. i a,,,1111 I....l o .. ....I h ,1 j, Iaaat I Iaala aa. 1,Iaa~aar
300 . 500 7000ao
0,
m 600
j 400
3 200
E..4-1
W a
Loop A Cold-LegCheck Valve CA4
Reactor Serviceo 02% Yielda Utimae _Annealeda 02%Ylud 4 -
0 ltimate
* U~ms0
-100
-ao
-60
-40
-20
-e Pump Volute PV* Reactor Service
-e- - 002%Ynel-Annea* Ultiroeta 02% Ylel
:. LatIl.± *
.0,-100 Y
. 00,
-80U,
-60 P
-40 F
-20 EE uV
Closed Syibos: Tensilo Tests..la- l , I .aaIaa .I .l I .
IIII
clsd yltbTen~sile TestsE. I" II I I IIII III IIIIIII
. .... . . . . . . . . . . . . . . . . . . . .
-. o3 .200 .100 0 100 200Temperature (6C)
300 400 30o0 .200 -1o0 o 100 200 300. Temperature (°C) I
400
Figure 5. Yield and ultlmate stress values (estimatedfromr harpy-mpact data and obtainedfrom tensile tests) for cold-Leg check valve and pump volute, and estimated tensilestresses of recovery-annealed materials
Temperature (OF)
.500 -300 100 100 300 500 700n. ' L- I I I I
Temperature (OF)
.500 -300 -100 100 300 500 700I , I .....
a
0,
CnI-
Oa
01
w
eu '. . . ......... ...........
I I I I I
___ l_1 1 1 1 1 1 1 1 ' I " " ' I 40 ... .. .. .... . .. 1 lI. .. .. .. I.
600-
400 -
200-
a \ Loop A Hot-LMaIn Valve I
=-Reactor Service *-a 02%Ylld- Ultmate
Annealed a0 0.2%Yield
- D, male
Closed Synbols: Tensile Tes5 5 1, 1, _
A91H1 t -100
B90. .
-60 -
'40
20
II !
Annealed:a 0.2%
*s -SUAM
:CoedSn
Cbsod . I. r
Loop A Hot-Lg° UMain Valvo e A9 -
i , -.Reactor Servie.4. 02% Yield -
Yield £ A t
',
ols: Tensile Tests.1 ,, , .... I....a
�I III if III I I II III 11 11 III t1i III III' I VVIT11 II II ITTTi fill II
030)
(0 E
g..-60 a
C40-40A
20, 1
Oi w0 ..................- I*---1-.-1*---.300 -200 .100 0 100 200 300
Temperature (°C)
w
400I , § I Il . I
.300 .200 4100 0 100 200 300Temperature ( 0C)
400
Figure 6. Yield and ultimate stress values (esttmatedfrom Charpy-tmpact data and obtainedfrom tensile tests)for hot-leg main valve, and eMnated tensile stressesforrecovery-annealed materials. Material.MA9 isrm a cooler region of the valve.
where Py and Pm are the yield and maximum loads obtained from the load-time traces ofthe Charpy test, W is the specimen width, B is the specimen thickness, and b is the un-cracked ligament.2 0 The estimated iralues of yield and ultimate stress, the values obtainedfrom tensile tests, and estimated tensile stresses fori)ecovery-annealed materials areshown In Figs. 5 and 6.
The'estimated tensile properties are In good agreement with the measured values. Thetensile strength of CA4. PV, and MA1 materials is comparable. The results show that ther-mal aging during reactor service had no effect on yield stress and that the increase In ulti-mate stress is minimal for all materials. Two specimens of MA1 (Fig. 6) show low ultimatestrength (and also poor ductility). These specimens were obtained from the Inner-15-imm
185
region of the valve body. The poor tensile properties are caused by, Inclusions In the mate-rial. As discussed above, the room-temperature impact energy of Row 1 specimens Is alsolow, e.g.. -177 ±33 J/cm2 , compared to -299 ±33 J/cm2 for specimens from other regions.of the valve body.
3 Estimation of Mechanical Properties
Charpy-4mpact Energy
A procedure and correlations have been presented for predicting Charpy-impact en-ergy, tensile flow'stress, and fracture toughness J-R curves of aged cast stainless steelsfrom the chemical composition of the steel. Embrittlement of cast stainless steels Is char-acterized In terms of room-temperature Charpy-impact energy. The extent or degree ofembrittlement at 'saturation," i.e., the minimum impact energy that would be achieved forthe material after long-term aging, Is described in terms of a material parameter 4, which,for CF-3 and CF-8 steels, is expressed as
UP = Sc(Cr+Si)(C+0.4N) (4a)
and for CF-8M steels as
tD = 8c(NI+Si+Mn) 2 (C+0.4N)/5, (4b)
where the ferrite content 8c Is in % and chemical composition of the steel is in wt.%. Theferrite content is calculated from Hull's equivalent factors;2 1 the values for the various castmaterials are given in Table 1. The saturation room-temperature impact energy CVsat(J/cm2 ) for CF-3 and CF-8 steels is given by
logloCvsat = 1.15 + 1.36exp(-0.0354)), (5a)
and for CF-8M steels with >10% Ni by
logloCvsat = 1.10 + 2.64exp(-0.0644b). (5b)
The room-temperature saturation impact energy is also estimated from the chemical com-position of the steel. For CF-3, and CF-8 steels, Cvsat (J/cm2 ) is given by
lOgoCvsat = 5.64 - 0.0068c - 0.185Cr + 0.273Mo - 0.204Si+ 0.044Ni - 2.12(C + 0.4N), (6a)
and for CF-8M steels by
logoCvsat = 7.28 - 0.01 1c -0.185Cr - 0.369Mo - 0.451SI,0.007Ni - 4.71(C + 0.4N). - , (6b)
The saturation impact energy for a specific cast stainless steel is determined by both themethods given in Eqs. 4-6; and the lower value is then used for estimating mechanicalproperties.
'Estimation of Mechanical Properties of Cast Stainless Steels during Thermal Aging in LWR Systems." thisconference, - -
186
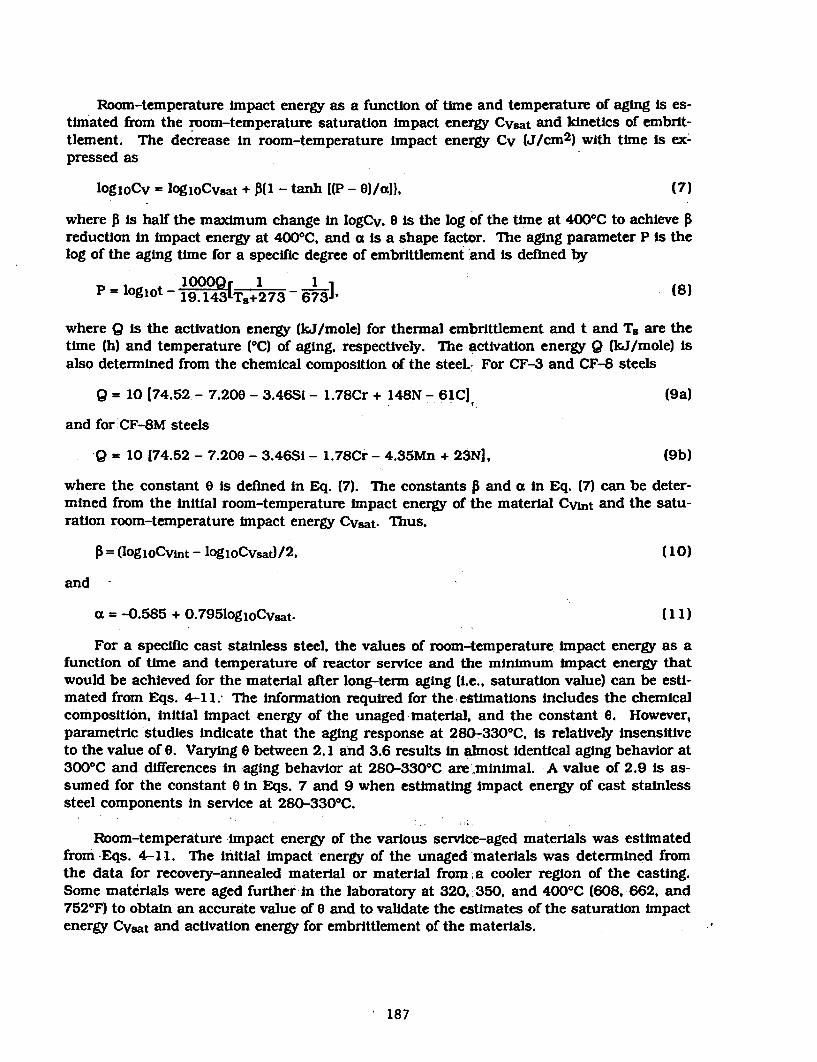
Room-temperature impact energy as a function of time and temperature of aging is es-timated from the room-temperature saturation impact energy Cvsat and kinetics of embrit-tlement. The decrease in room-temperature impact energy Cv (J/cm2 ) with time is ex-pressed as
1og0oCv = logioCvsat + - tanh (P - W)/al), (7)
where f is half the maximum change In logCv, 0 is the log of the time at 4000C to achieve Preduction in impact energy at 4000 C, and a is a shape factor. The aging parameter P is thelog of the aging time for a specific degree of embrittlement and is defined by
P = loglot - 9.1[T+273 - 6731' (8)
where Q is the activation energy (kJ/mole) for thermal embrittlement and t and Ts are thetime (h) and temperature (IC) of aging, respectively. The activation energy Q (kJ/mole) Isalso determined from the chemical composition of the steel.- For CF-3 and CF-8 steels
Q = 10 [74.52 - 7.200 - 3.46Si - 1.78Cr + 148N - 61CJ (9a)
and for CF-8M steels
Q = 10 174.52 - 7.200 - 3.46Si - 1.78Cr - 4.35Mn + 23N|, (9b)
where the constant 0 is defined in Eq. (7). The constants P and a in Eq. (7) can be deter-mined from the initial room-temperature impact energy of the material Cvint and the satu-ration room-temperature impact energy Cvsa Thus,
= (log1oC-i nt-logoCvsad/2, (10)
and
a = -0.585 + 0.795logloCvsat. (1 )
For a specific cast stainless steel, the values of room-temperature impact energy as afunction of time and temperature of reactor service and the minimum impact energy thatwould be achieved for the material after long-term aging (i.e., saturation value) can be esti-mated from Eqs. 4-11. The information required for the estimations includes the chemicalcomposition, initial impact energy of the unaged material, and the constant 8. However,parametric studies indicate that the aging response at 280-330 0C. is relatively insensitiveto the value of 0. Varying 8 between 2.1 and 3.6 results in almost Identical aging behavior at3000C and differences in aging behavior at 280-330 0C are'minimal. A value of 2.9 Is as-sumed for the constant 0 in Eqs. 7 and 9 when estimating Impact energy of cast stainlesssteel components in service at 280-330°C.
Room-temperature impact energy of the various service-aged materials was estimatedfrom Eqs. 4-11. The initial impact energy of the unaged materials was determined fromthe data for recovery-annealed material or material from ,a cooler region of the casting.Some materials were aged further In the laboratory at 320, -350, and 400°C (608, 662, and7520F) to obtain an accurate value of 0 and to validate the estimates of the saturation impactenergy CV~at and activation energy for embrittlement of the materials.
187
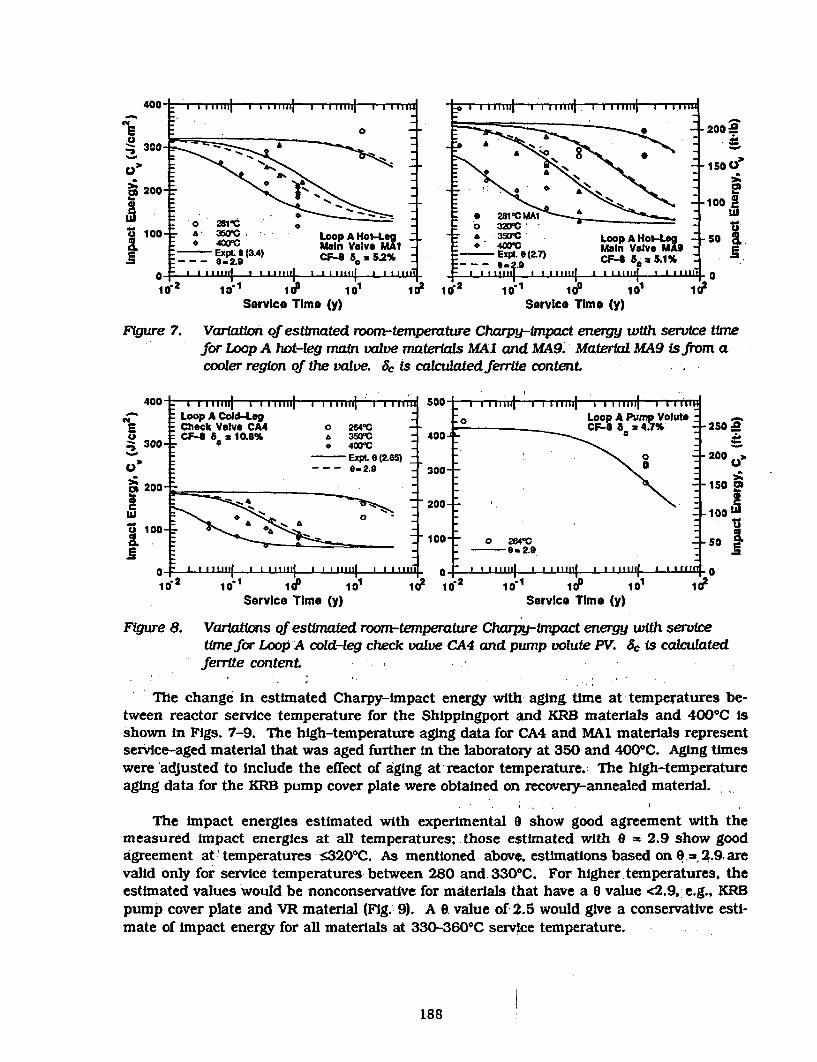
-
E a 0oA2300 _ -
|. 1500-_°4i Viot-_ B YIOfi*-51000
0 281'C Lu~S100 a 35Loop A Hot-LeA 350CM Loop A Hot-Log 50 o
E -3_4 CF- 5g C 52% - -Ex-. E(2.7) CF-S a 51 %t 2 1 1I 1 I iVl e I II 4 ' I I I 0I I
Service Time (y) Service Time (y)
Figure 7. Variation of estimated room-temperature Charpy-lnipact energy with service timefor Loop A hot-Leg main valve materials MAI and MA9. Material MA9 is from acooler region of the valve. Ac is calculated Jerrite content.
400- Sa-
Loop A Cold-Leg Lon A Pump Volute1 Check Valve CA4 O 264'C 4.7% 250 8
CF-30-8 10.8% O 5= _ 400-, C
_ E]xPL 9 (2.65) -\ $-200 >
-200 _- 0.2.9 _ 300 _\ -5-200 O
20100-I0 -e
-0=2.9
io.2 id" in ,101 4 i i' P 10Service Time (y) Service Time (y)
Figure 8. Variations of estimated room-temperature Charpy-impact energy with servicetimefor Loop A cold-leg check valve CA4 and pump volute PV. 6 c is calculatedferrite content.
bThe change in estimated Charpy-impact energy with aging time at temperatures be-tween reactor service temperature for the Shippingport and KRB materials and 4000C isshown in Figs. 7-9. The high-temperature aging data for CA4 and MAI materials representservice-aged material that was aged further in the laboratory at 350 and 4000 C. Aging timeswere adjusted to include the effect of aging at reactor temperature. The high-temperatureaging data for the KRB pump cover plate were obtained on recovery-annealed material.
The impact energies estimated with experimental 9 show good agreement with themeasured impact energies at all temperatures; those estimated with e = 2.9 show goodagreement at -temperatures s3200C. As mentioned above. estimations based on 0 . 2.9. arevalid only for service temperatures between 280 and. 330°C. For higher temperatures, theestimated values would be nonconservative for materials that have a e value <2.9, e.g., KRBpump cover plate and VR material (Fig. 9). A 9. value of 2.5 would give a conservative esti-mate of impact energy for'all materials at 330-360°C service temperature.
188
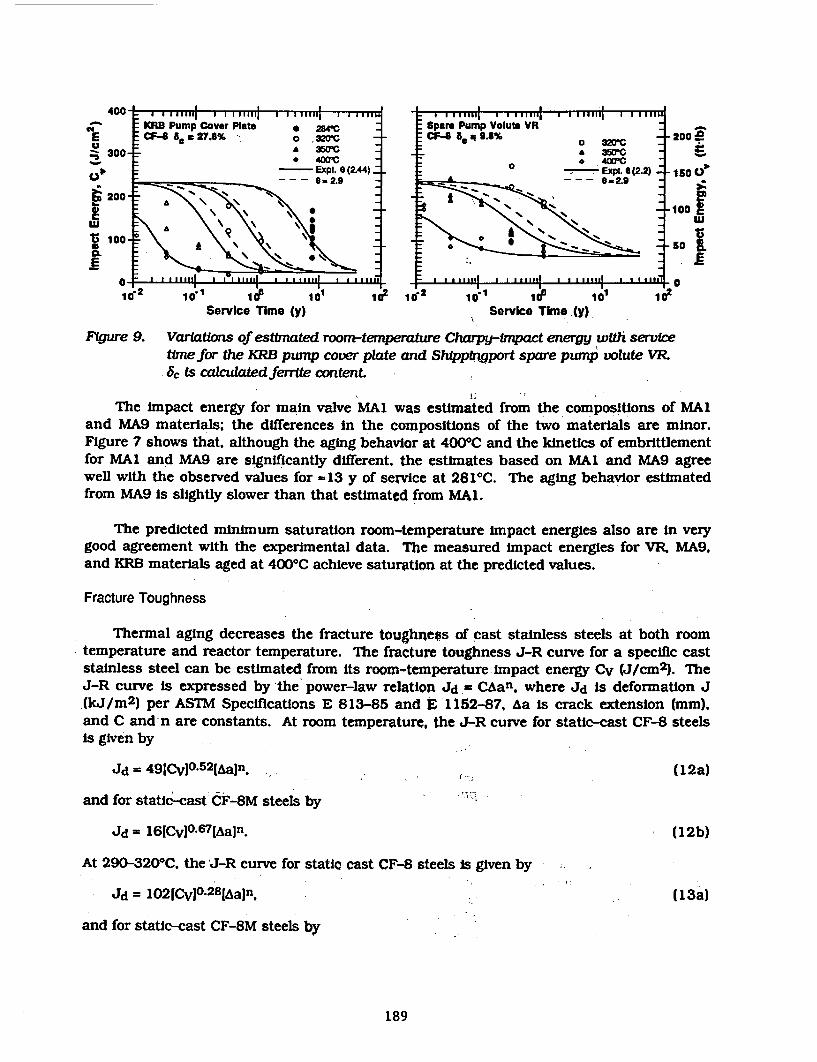
KRB Pump Cover Plate * 254 - Spare Pump Volute VRE CF-S 8, 27.8% - ,3c _ CF-S B ;s 200 Dn 300- - o 400eC -~3Cr-- 300
Expt. S (2.44) - Exp-. - e (2.2) 1So0
200 -100
1102 1 i I 2
Service Time (y) Service Time Cy)
Figure 9. Variations of estimated room-temperature Charpy-irnpact energy with servicetime for the KRB pump cover plate and ShippfrOgport spare purmp volute VR3c Is calculated ferrite content.
The impact energy for main valve MAI was estimated from the compositions of MAIand MA9 materials; the differences in the compositions of the two materials are minor.Figure 7 shows that, although the aging behavior at 4000C and the kinetics of embrittlementfor MAI and MA9 are significantly different, the estimates based on MAI and MA9 agreewell with the observed values for -13 y of service at 2810C. The aging behavior estimatedfrom MA9 is slightly slower than that estimated from MAI.
The predicted minimum saturation room-temperature impact energies also are in verygood agreement with the experimental data. The measured impact energies for VR MA9.and KRB materials aged at 4000C achieve saturation at the predicted values.
Fracture Toughness
Thermal aging decreases the fracture toughness of cast stainless steels at both roomtemperature and reactor temperature. The fracture toughness J-R curve for a specific caststainless steel can be estimated from its room-temperature impact energy Cv (J/cm2 ). TheJ-R curve is expressed by the power-law relation Jd = CAan. where Jd Is deformation J(kJ/m2 ) per ASTM Specifications E 813-85 and Z 1152-87, Aa is crack extension (mm),and C and-n are constants. At room temperature, the J-R curve for static-cast CF-8 steelsis given by
Jd = 49[Cv]0 .5 2 1,aIn (12a)
and for static-cast CF-8M steels by
Jd = 16CvI0.6 7IAaln. (1 2b)
At 290-320 0C, the J-R curve for static cast CF-8 steels is given by
Jd = 102[CvIO28[Aaln. (13a)
and for static-cast CF-8M steels by
189
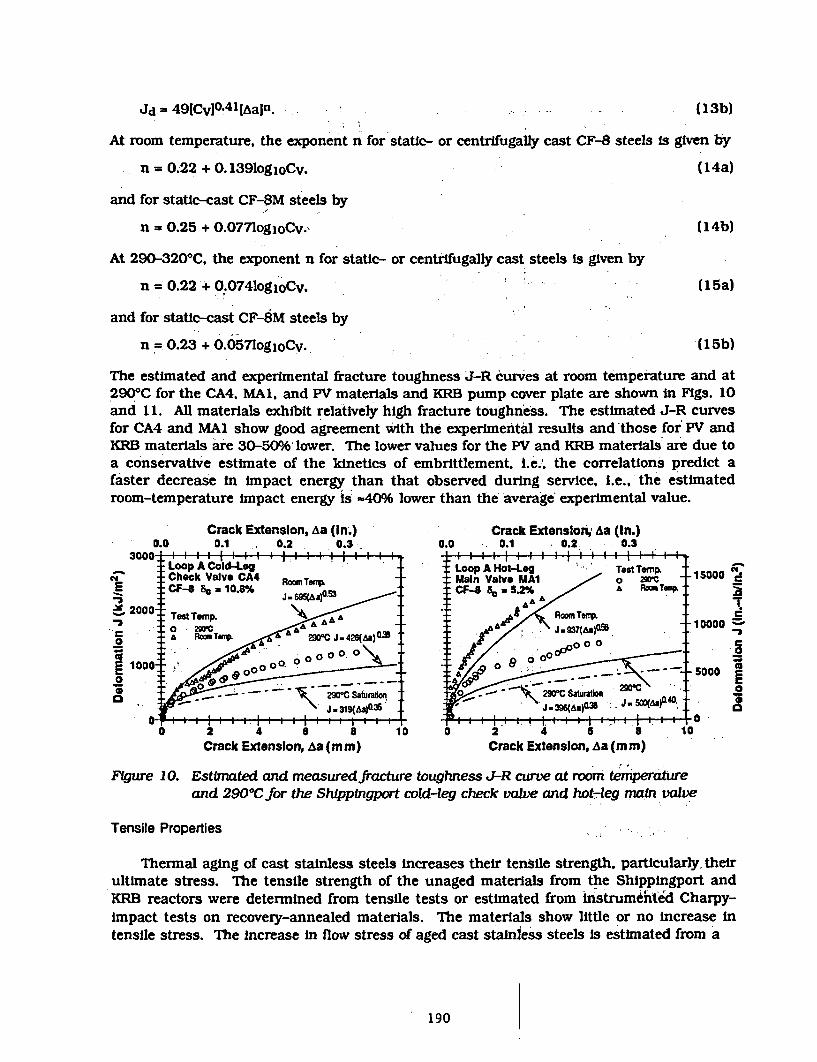
Jd - 49ICv 0 -41IAaIn. (13b)
At room temperature, the exponent n for static- or centrifugally cast CF-8 steels is given by
n = 0.22 + 0.139logioCv, (1 4a)
and for static-cast CF-8M steels by
n = 0.25 + 0.077logjoCv. (14b)
At 290-3200 C, the exponent n for static- or centrifugally cast steels is given by
n - 0.22 + .0.74logloCv, (1 5a)
and for static-cast CR-8M steels by
n - 0.23 + 0.057logioCv. (15b)
The estimated and experimental fracture toughness J-R curves at room temperature and at2900C for the CA4, MA1, and PV materials and KRB pump cover plate are shown in Figs. 10and 11. All materials exhibit relatively high fracture toughness. The estimated J-R curvesfor CA4 and MAl show good agreement with the experimental results and those for PV andKRB materials are 30-50%' lower. The lower values for the PV and KRB materials are due toa conservative estimate of the kinetics of embrittlement, L.e.. the correlations predict afaster decrease in impact energy than that observed during service, i.e., the estimatedroom-temperature impact energy is -40% lower than the average experimental value.
Crack Extension, Aa (in.) Crack Extenslon, aa (In.)0.0 0.1 0.2 0.3 0.0 0.1 0.2. 0.3
3000- | 1 l 17 l l l l l l l l l l l l l l l | l lLoop A coldLog. Loop A Hot-Log Test Temp, 150CI hc av oTi~Main Valve M I 0 mmC*i Check Valve CA4 RoomTsen F-S :~ *al Y aw U1 o2rc - 1000E CF So Bea10.8% J.3sa3:~CF-8 a, - 52 % A &= PTamE
12 I
2000 TWAp . A . RoomTeMr. .52TestTemp. _hA, - 10000 Z
a RoonT A, 290-C J-426(AS) 3 / 0 °0°10000 0va 0 9 - - - - - - -d - 5000000
- 9C a rto ~ 0 .~2901C Saturatbnf-31 J.3*6Aa)Oax
0 2 4 6 8 10 0 2 4 6 8 10Crack Extension, Aa (mm) Crack Extension, Aa (mm)
Figure 10. Estimated and measuredfracture toughness J-R curve at room temperatureand 2900 Cfor the Shtpplngport cold-leg check valve and hot-leg main valve
Tensile Properties
Thermal aging of cast stainless steels increases their tensile strength. particularly, theirultimate stress. The tensile strength of the unaged materials from the Shippingport andKRB reactors were determined from tensile tests or estimated from instrumented Charpy-impact tests on recovery-annealed materials. The materials show little or no increase intensile stress. The increase in flow stress of aged cast stainless steels is estimated from a
* 190
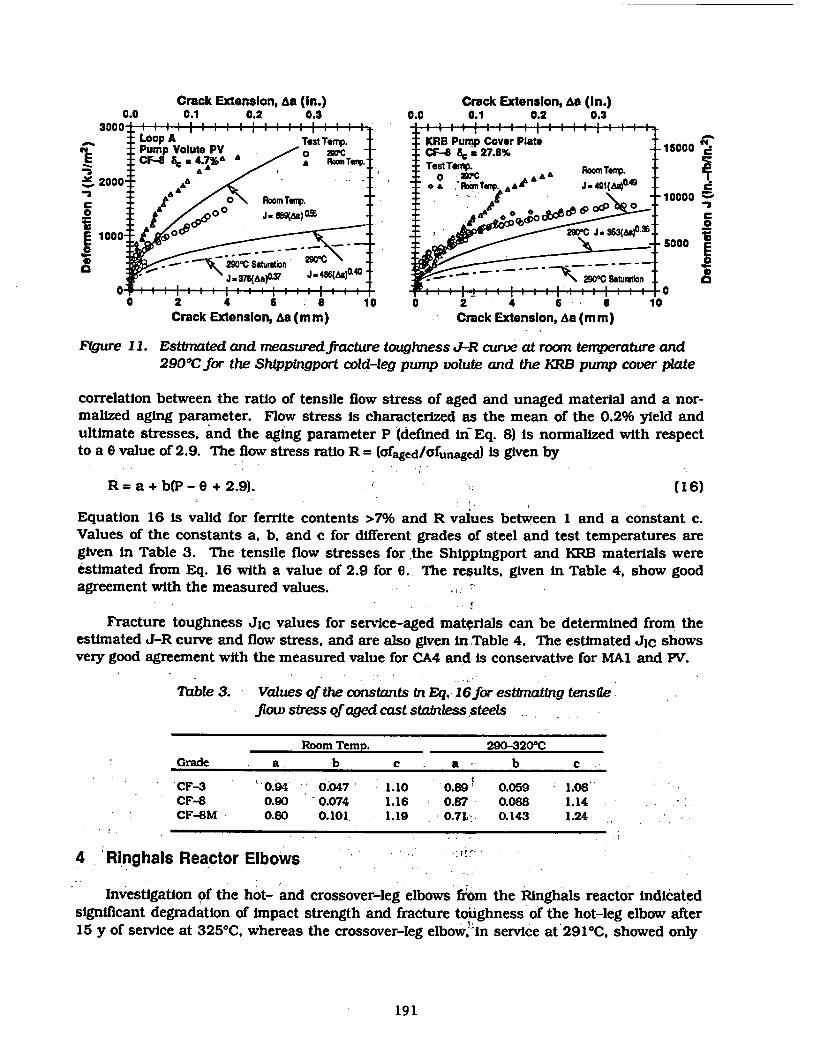
Crack Extension, As (In.) Crack Extension, As (In.)0.0 0.1 0.2 0.3 0.0 0.1 0.2 0.3
Pump VoAutg P Test TarpKRB Pump Cover Plate 15000 cPupVlt oV 2M' CE-438 a~ 27.8% CCF-8 ac * 47 &A a RoorTS Te stTemp Roofnr.
20-_.., e*& stnp. kA J4o1(n C20010000A A-*a 0lRommtamp..aa
I c00000E~o- Je-*IABoAOc
X '-29C Sat----0'SE n la
0 2 4 6 a 10 0 2 4 6 I a 10Crack Extension, ha (mm) Crack Extenslon,ha (mm)
FI;gure I11. Estftwted and mneasuredfracture toughness J-R curve at room temperature and290*C for the Shlppingport cold-leg pump volute and the KRB pump cover plate
correlation between the ratio of tensile flow stress of aged and unaged material and a nor-malized aging parameter. Flow stress is characterized as the mean of the 0.2% yield andultimate stresses, and the aging parameter P (defined in Eq. 8) is normalized with respectto a 0 value of 2.9. The flow stress ratio R = (Ofaged/ofunaged) is given by
R=a+b(P-0 +2.9). (16)
Equation 16 is valid for ferrite contents >7% and R values between 1 and a constant c.Values of the constants a, b. and c for different grades of steel and test temperatures aregiven in Table 3. The tensile flow stresses for the Shippingport and KRB materials wereestimated from Eq. 16 with a value of 2.9 for 6. The results, given in Table 4, show goodagreement with the measured values.
Fracture toughness JIc values for service-aged materials can be determined from theestimated J-R curve and flow stress, and are also given in Table 4. The estimated JIc showsvery good agreement with the measured value for CA4 and- is conservative for MA1 and PV.
Table 3. Values ofthe constants in Eq, 16for estimating tensileflow stress of aged cast stainless steels
Room Temp. 290-3200CGrade a b c a b c
CF-3 0.94 i0;047 1.10 0.89' 0.059 1.08CF-8 0.90 0.074 1.16 0.87 0.088 1.14CF-8M 0.80 0.101 1.19 0.71,R 0.143 1.24
4 Ringhals Reactor Elbows
Investigation of the hot- and crossover-leg elbows from the Ringhals reactor indicatedsignificant degradation of impact strength and fracture toughness of the hot-leg elbow after15 y of service at 3250 C, whereas the crossover-leg elbow. in service at 2910 C, showed only
191
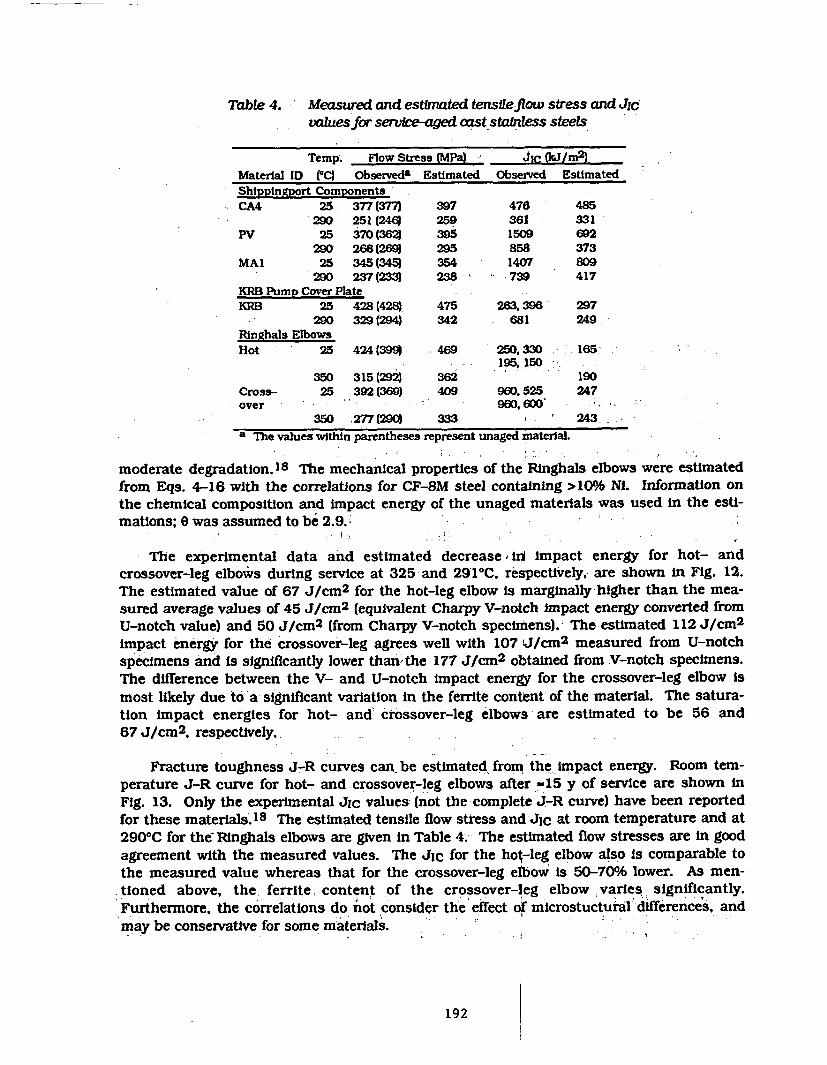
Table 4. Measured and estirnated tensile-flow stress and Jicvalues for servie-ageed cast stainless steels
Temp. Flow Stress (MPa) JIc W/J/m 2 )Material ID (0C) Observeda Estimated Observed EstimatedShippingport ComponentsCA4 25 377(377) 397 478 485
290 251(246) 259 361 331PV 25 370 (362) 395 1509 692
290 266(269) 295 858 373MAI 25 345 (345) 354 1407 809
290 237 (233) 238 -739 417KRB Pump Cover PlateKRB 25 428 (428) 475 263,398 297
290 329 (294) 342 681 249Rlnghals ElbowsHot 25 424 (399) 469 250,330 165
195,150350 315 (292) 362 190
Cross- 25 392 (369) 409 960,525 247over 960,600-
350 .277(290) 333 243a The values within parentheses represent unaged material.
moderate degradation.' 8 The mechanical properties of the Rlnghals elbows were estimatedfrom Eqs. 4-16 with the correlations for CF-8M steel containing >10% Ni. Information onthe chemical composition and impact energy of the unaged materials was used in the esti-mations; 9 was assumed to be 2.9.
The experimental data and estimated decrease win impact energy for hot- andcrossover-leg elbows during service at 325 and 2910 C, respectively, are shown in Fig. 12.The estimated value of 67 J/cm2 for the hot-leg elbow is marginally higher than the mea-sured average values of 45 J/cm2 (equivalent Charpy V-notch impact energy converted fromU-notch value) and 50 J/cm2 (from Charpy V-notch specinens). The estimated 112 J/cm2
impact energy for the crossover-leg agrees well with 107 J/cm2 measured from U-notchspecimens and is significantly lower than the 177 J/cm2 obtained from V-notch specimens.The difference between the V- and U-notch impact energy for the crossover-leg elbow ismost likely due to a significant variation in the ferrite content of the material. The satura-tion impact energies for hot- and crossover-leg elbows are estimated to be 56 and67 J/cm2 , respectively.
Fracture toughness J-R curves can, be estimated from the impact energy. Room tem-perature J-R curve for hot- and crossover-leg elbows after -15 y of service are shown inFig. 13. Only the experimental JIc values (not the complete J-R curve) have been reportedfor these materials.1 8 The estimated tensile flow stress and JIc at room temperature and at2900C for the Ringhals elbows are given in Table 4. The estimated flow stresses are in goodagreement with the measured values. The JIC for the ho~-leg elbow also is comparable tothe measured value whereas that for the crossover-leg elbow is 50-70% lower. As men-tioned above, the ferrite, content of the crossover-leg elbow varies significantly.Furthermore, the correlations do not consider the effect of microstuctujal' differences, andmay be conservative for some materials.
192
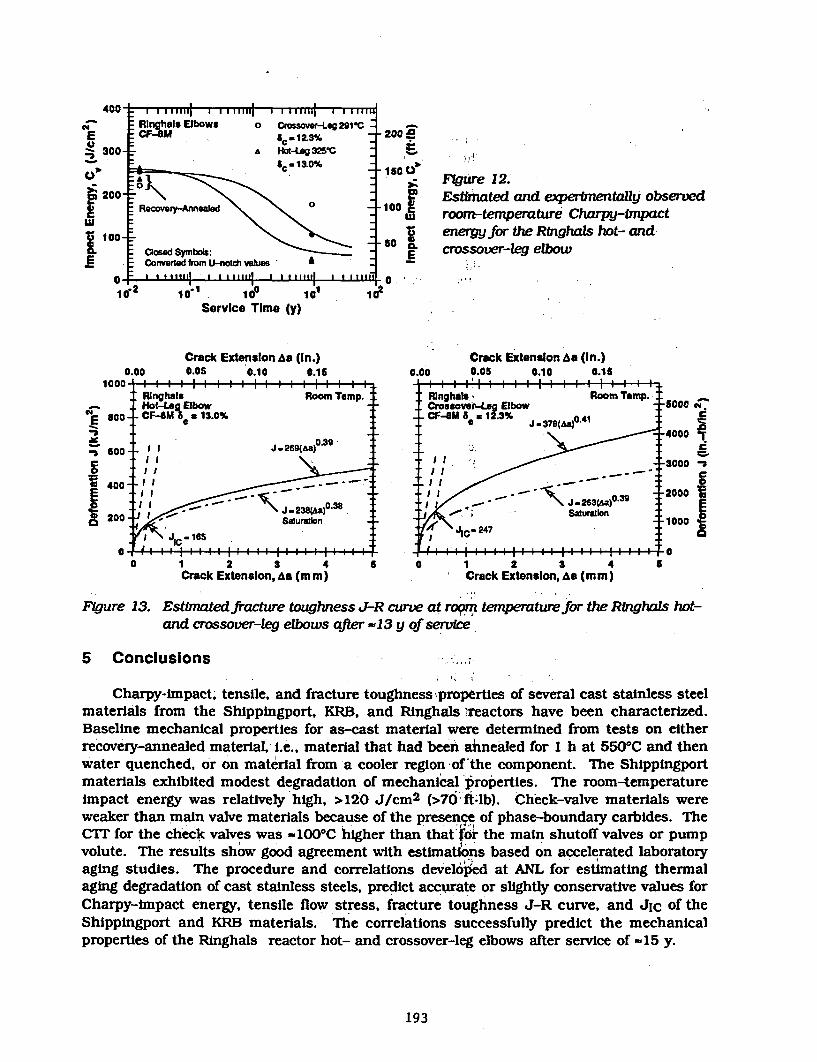
LAn-I . ......
Cd;
E0 300-
9 200-
& 100-
&
, . . . , . ...
= Rlngshals Elbows-: CF-8Mz
0 Crossover-Log 291IC -
&,.12.3%a Hot-Leg 325'C
I .4GIWL
-O}
: Recovery-Anneae
- Closed Symbols::-Converted from U-notch values '
: I I ,,1 1 1 , ,11 I I 1 111111 - , I -1 1 - , I - - - -
-100 E
X° soIL
- I !-i
Fgure 12.Estimated and experimentally observedroorm-temperature Charpy-irpactenergy for the Rlnghals hot- andcrossover-leg elbow
.10' -a . ' ' ' I1 10 10Se'ri. 1e Tm 0y
Service Time (y)I i?
Crack Extension hA (In.)0.05 0.10 0.160.00
Ca
Cd
.0
-r_-2C
1 2 3 4Crack Extension, As (m m)
, , .. , . I,, . , . , . . . , [,
1 2 3 4Crack Extension, ha (mm)
FIgure 13. Estimated fracture toughness J-R curve at roam tmperaturefor the Ringhals hot-and crossover-leg elbows after -13 y of service
5 Conclusions
Charpy-impact, tensile, and fracture toughness properties of several cast stainless steelmaterials from the Shippingport, KRB. and Ringhals'reactors have been characterized.Baseline mechanical properties for as-cast material were determined from tests on eitherrecovery-annealed material, i.e., material that had been annealed for 1 h at 5500C and thenwater quenched, or on material from a cooler region of the component. The Shippingportmaterials exhibited modest degradation of mechanical properties. The room-temperatureimpact energy was relatively high, >120 J/cm 2 (>760ft.lb). Check-valve materials wereweaker than main valve materials because of the presence of phase-boundary carbides. TheCTI for the check valves was -1000C higher than thatfjo the main shutoff valves or pumpvolute. The results show good agreement with estimations based on accelerated laboratoryaging studies. The procedure and correlations developed at ANL for estimating thermalaging degradation of cast stainless steels, predict accurate or slightly conservative values forCharpy-impact energy, tensile flow stress, fracture toughness J-R curve, and Jic of theShippingport and KRB materials. The correlations successfully predict the mechanicalproperties of the Ringhals reactor hot- and crossover-leg elbows after service of -15 y.
193
Acknowledgments
This work was supported by the Office of Nuclear Regulatory Research of the U.S.Nuclear Regulatory Commission. The author is grateful to A. Sather, T. M. Galvin, L. Y. Bush,G. M. Dragel, and W. F. Burke for experimental contributions and thanks W. J. Shack and T.F. Kassner for their helpful discussions.
References
1. 0. K. Chopra and H. M. Chung, 'Aging Degradation of Cast Stainless Steels: Effects onMechanical Properties," in Environmental Degradation of Materials In Nuclear PowerSystems-Water Reactors, G. J. Theus and J. RI Weeks, eds. The Metallurgical Society,Warrendale, PA., pp. 737-748 (1988).
2. 0. K. Chopra and H. M. Chung, 'Effect of Low-Temperature Aging on the MechanicalProperties of Cast Stainless Steels," in Properties of Stainless Steels In ElevatedTemperature Service, M. Prager, ed., MPC Vol. 26, PVP Vol. 132, American Society ofMechanical Engineers, New York, pp. 79-105 (1988).
3. 0. K. Chopra, 'Therral Aging of Cast Stainless Steels: Mechanisms and Predictions." inFatigue, Degradation, and Fracture - 1990, W. H. Bamford, C. Becht, S. Bhandari. J. D.Gilman, L. A. James, and M. Prager, eds.. MPC Vol. 30, PVP Vol. 195, American Societyof Mechanical Engineers, New York, pp. 193-214 (1990).
4. 0. K. Chopra and A. Sather, Inital Assessment of the Mechanisms and Signfkance of Low-Temperature Embrittlement of Cast Stainless Steels in LWR Systems, NUREG/CR-5385,ANL-89/17, Argonne National Laboratory, Argonne, IL (August 1990.)
5. A. Trautwein and W. Gysel, Influence of Long Time Aging of CF-8 and CF-8M CastSteel at Temperatures Between 300 and 5000C on the Impact Toughness and theStructure Properties," in Stainless Steel Castings, V. 0. Behal and A. S. Melilli, eds.,ASTM STP 756, pp. 165-189 (1982).
6. E. I. Landerman and W. H. Bamford, 'Fracture Toughness and Fatigue Characteristics ofCentrifugally Cast Type 316 Stainless Steel Pipe after Simulated Thermal ServiceConditions," in Ductility and Toughness Considerations in Elevated Temperature Service,MPC-8, American Society of Mechanical Engineers, New York, pp. 99-127 (1978).
,
7. S. Bonnet, J. Bourgoin, J. Champredonde. D. Guttmann. and M.. Guttmann,'Relationship between Evolution of Mechanical Properties of Various Cast DuplexStainless Steels and Metallurgical and Aging Parameters: An Outline of Current EDFProgrammes," Mater. Sc. and Technol. 6, 221-229 (1990).
8. K. N. Akhurst and P. H. Pumphrey, The Aging Kinetics of CF3 Cast Stainiess Steel In theTemperature Range 3000C to 4000C, RD/L/3354/R88, Central Electricity GeneratingBoard, Leatherhead, UK (November 1988).
9. P. H. Pumphrey and K. N. Akhurst, "Aging Kinetics Uf CF3 Cast Stainless Steel InTemperature Range 300 - 4000C," Mater. SdL and Techhot., 6, 211-219 (1990).
194
10. G. Slama, P. Petrequin. and T. Mager, 'Effect of Aging on Mechanical Properties ofAustenitic Stainless Steel Castings and Welds," presented at SMIRT Post-ConferenceSeminar 6, Assuring Structural Integrity of Steel Reactor Pressure Boundary Components.August 29-30. 1983. Monterey, CA.
11. Y. Meyzaud, P. Ould, P. Balladon, M. Bethmont, and P. Soulat, 'Tearing Resistance ofAged Cast Austenitic Stainless Steel," presented at Intl. Conf on Thermal Reactor Safety(NUCSAFE 88). October 1988. Avignon, France.
12. P. McConnell and J. W. Sheckherd, Fracture Toughness Characterization of ThermallyEmbrittled Cast Duplex Stainless Steel. Report NP-5439, Electric Power ResearchInstitute, Palo Alto, CA (September 1987).
13. 0. K. Chopra. "Estimation of Fracture Toughness of Cast Stainless Steels in LWRSystems," In Proc. 18th Water Reactor Safety Information Meeting, U.S. NuclearRegulatory Commission, NUREG/CP-01 14 Vol. 3. p. 195 (April 1991).
14. 0. K. Chopra, Estimation of Fracture Toughness of Cast Stainless Steels during ThermalAging in LWR Systems. NUREG/CR-4513, ANL-90/42, Argonne National Laboratory.Argonne. IL (June 1991).
15. 0. K. Chopra, 'Studies of Aged Cast Stainless Steel from the Shippingport Reactor." InProc. 18th Water Reactor Safety Information Meeting. U.S. Nuclear RegulatoryCommission. NUREG/CP-01 14 Vol. 3. 369 (April 1991).
16. H. M. Chung, "Thermal Aging of Decommissioned Reactor Cast Stainless SteelComponents and Methodology for Life Prediction," in Life Assessment and Life Extensionof Power Plant Components, T. V. Narayanan. C. B. Bond, J. Sinnappan, A. E. Meligi. M.Prager, T. R. Mager. J. D. Parker, and K. Means, eds., PVP Vol. 171, American Society ofMechanical Engineers, New York pp. 111-125 (1989).
17. H. M. Chung and T. R. Leax, "Embrittlement of Laboratory and Reactor Aged CF3, CF8,and CF8M Duplex Stainless Steels," Mater. Scd. and Tech. 6. 249-262 (1990).
18. C. Jansson, 'Degradation of Cast Stainless Steel Elbows after 15 Years in Service,"presented at Fontevraud II IntL Symp., Sept. 10-14, 1990, Royal Abbey of Fontevraud,France.
19. H. M. Chung and 0. K. Chopra, "Long-Term-Aging Embrittlement of Cast AusteniticStainless Steels - Mechanism and Kinetics," in Properties of Stainless Steels in ElevatedTemperature Service, M. Prager, ed., MPC Vol. 26, PVP Vol. 132. American Society ofMechanical Engineers, New York, pp. 17-34 (1988).
20. W. L. Server, "Impact Three-Point Bend Testing for Notched and PrecrackedSpecimens," J. Testing and Eval. 6, 29 (1978).
21. L. S. Aubrey, P. F. Wieser. W. J. Pollard, and E. A. Schoefer, "Ferrite Measurement andControl in Cast Duplex Stainless Steel," in Stainless Steel Castings, V. G. Behal and A. S.MeliMi, eds., ASTM STP 756, pp. 126-164 (1982).
195
PROGRESS IN EVALUATION AND IMPROVEMENT IN NONDESTRUCTIVE EXAMINATIONRELIABILITY FOR INSERVICE INSPECTION OF LIGHT WATER REACTORS (LWRi) AND
CHARACTERIZING FABRICATION FLAWS IN REACTOR PRESSURE VESSELS
S. R. Doctor, E. S. Andersen, R. E. Bowey, A. A. Diaz, J. R. Friley,M. S. Good, M. S. Greenwood, P. G. Heasler, R. L. Hockey, R. J. Kurtz,G. J. Schuster, F. A. Simonen, J. C. Spanner, T. T. Taylor, T. V. Vo
Pacific Northwest LaboratoryOperated by Battelle Memorial, Institute
Richland, Washington 99352
ABSTRACT
This paper is a review of the work conducted under twoprograms. One (NDE Reliability Program) is a multi-year programaddressing the reliability of nondestructive evaluation (NDE) forthe inservice inspection (ISI) of light water reactor components.This program examines the reliability of current NDE, theeffectiveness of evolving technologies, and provides assessmentsand recommendations to ensure that the NDE is applied at the righttime, in the right place with sufficient effectiveness thatdefects of importance to structural integrity will be reliablydetected and accurately characterized. The second program(Characterizing Fabrication Flaws in Reactor Pressure Vessels) isassembling a data base to quantify the distribution of fabricationflaws that exist in U.S. nuclear reactor pressure vessels withrespect to density, size, type, and location, These programs willbe discussed as two separate sections in this report.
NOE RELIABILITY PROGRAM
INTRODUCTION
This section reports on progress achieved under the NRC program entitled"Evaluation and Improvement in Nondestructive Examination Reliability forInservice Inspection of Light Water Reactors (LWR)' (NDE Reliability Program).This program consists of eight major tasks as follows: 1) Code Activities, 2)BWR Pressure Vessel Research, 3) Plant Life Extension, 4) UT EquipmentInteraction Matrix, 5) New Inspection Criteria, 6) PISC-III, 7)Cast StainlessSteel, and 8) Surface Roughness Conditions. Activities conducted under thesetasks are summarized below.
The NDE Reliability Program objectives are to quantify the effectivenessof inservice inspection (ISI) techniques for LWR primary system componentsthrough independent research and to establish means for improving the overall
1Work supported by the U.S. Nuclear Regulatory Commission under ContractDE-AC06-76RLO 1830; FIN B2289 and L1099; Dr. J. Muscara, NRC Program Manager.
197
reliability of ISI systems and processes. Significant progress was achievedduring the past year in several of these areas..
1.0 CODE ACTIVITIES
Proactive participation in ASME Section XI activities continued. towardachieving ASME Code acceptance of NRC-funded PNL research results to improvethe reliability of nondestructive examination/inservice inspection (NDE/ISI).The objective of this task is to develop upgraded criteria and requirementsfor qualifying ultrasonic testing/inservice inspection (UT/ISI) systems.
During the past year, PNL representatives attended four different seriesof meetings held in conjunction with the ASME Section XI Subcommittee onInservice Inspection of Nuclear Power Plant Components (SC-XI). PNL staffhold voting memberships on the SC-XI Working Group on Volumetric Examinationand Procedure Qualification, SC-XI Working Group on Surface Examination andPersonnel Qualification, chair a SC-XI Task Group on Acoustic Emission, andserve as Secretary and voting member of the SC-XI Subgroup on NondestructiveExamination (SGNDE). Following each SGNDE meeting, minutes are prepared anddistributed to a mailing list of about 65 addressees, and agenda materials andother information are also assembled and distributed to provide each SGNDEmember with a complete package prior to each meeting.-,
Assistance was also provided in support of related efforts to achieveCode acceptance of new personnel qualification (PQ) and performance -demonstration (PD) requirements for eddy current equipment operators and dataanalysts, and a new SC-V activity to develop requirements and criteria forcomputerized UT imaging techniques. During a joint meeting of the SC-VASubgroup on Acoustic Emission (SGAE) and the SC-XI Task Group on AE, aproposed scope of a new Section V article on AE monitoring of inservicepressure boundary components was developed and approved.
The development of performance demonstration requirements for the eddycurrent method continues to encounter obstacles within the Special WorkingGroup on Eddy Current Testing (SWGET). To date, the SWGET has reached a non-unanimous consensus on the scope of this Mandatory Appendix and on a samplingplan approach. During the SGNDE meeting in August 1991, active discussionfocused on--the sampling plan, specimen set criteria, and other open issues.Concern was expressed regarding the possible'consequences of differentpass/fail criteria for-the eddy current and ultrasonic methods (i.e., AppendixVIII).--
Revised visual acuity requirements for NDE personnel were developed andapproved for publication in the 1991 Addenda to Section XI. A new requirementfor generic practical examinations for Level III NDE personnel was also!;approved by the BNCS for publication'in the 1991 Addenda. A SpecialTask ;_Group was appointed to study a proposal for Code adoption of the 1988 Editionof SNT-TC-1A, as well as to evaluate the new ASNT Standard on Personnel-,Qualification. This task group recommended that the ASME Code retain its
198
current reference to the 1984 Edition of SNT-TC-1A, in lieu of adopting eitherof the newer documents.
2.0 BWR PRESSURE VESSEL RESEARCH
The objective of this task is to assess the-development of newtechnology for the inspection of Boiling Water Reactors (BWRs) reactorpressure vessels (RPVs) and provide guidance toethe NRC-on the status andpotential effectiveness of this development for reliably detecting andcharacterizing flaws. The work accomplished for the year involvedparticipating in meetings held by industry to demonstrate their equipment andwitnessing operation of a system at one operating reactor..
Industry has devoted significant efforts to'the development of thetechnology that will provide access to the'RPV. Most of the efforts havefocused on performing the examinations from the 'inside of-the RPV. GeneralElectric and the EPRI NDE Center have performed evaluations of the access fromthe inside to the regions where'the jet pumps are located.- It appears thatmost of these areas should be accessible with the hardest region being thewelds located in the lower head. The designs of the scanner assemblies arebased on the successful designs that have been developed for otherexaminations. Therefore, the new scanners are o'nly new in that a portion ofthe scanner has been modified to accommodate the limited inspection accessencountered in the vicinity of the jet pumps. This work looks quite good-andshould provide the necessary scanning equipment.
The more significant problem areas remaining include whether there aremany things attached to the RPV walls-that are not on drawings but which will'limit access for inspecting the vessel. The surface roughness of the claddingis an unknown for most of the RPV, and this condition will have a significantinfluence on the effectiveness of the 1SI that cah be performed.
Future work will involve continuing to follow the evolution of theequipment and assessing industry activities that are directed toward resolvingthe problem areas of access and cladding surface conditions.
3.0 PLANT LIFE EXTENSION
The License Renewal Task was initiated in April of this year. Theobjective of this task is to determine inservice ihspection (ISI) requirementsfor license renewal. Initial efforts have focussed on reviewing the technicalbases for existing reactor pressure vessel i(RPV) flaw acceptance criteria'. -
The RPV was selected for initial study since it was judged to be the mostimportant component unlikely to be replaced and isLthe one component mostsusceptible to radiation damage.
Work during this fiscal year examined the rules and procedures for flawevaluation presented in ASME Section XI, Division I for the welds in RPVs.The most relevant portions of the Code are presented below.
199
Subsection IWA describes methods for determining if flaws of varioussizes and shapes are linear, laminar, or planar. Furthermore, equivalentsizes (length for linear flaws, and ellipse dimensions for planar and laminarflaws) are determined in accordance with this subsection. The pass/failevaluation of these flaws is then conducted, starting with Subsection IWB3500. If a flaw fails to pass under IWB 3500 a more detailed fracturemechanics evaluation (Appendix A of Section XI) can be utilized to see if theflaw is acceptable. Thus, IWB 3500 might be considered to be an initialscreening process to accept those flaws with relatively large safety margins,thus avoiding the effort of a more detailed evaluation.
Planar flaws are evaluated with the use of the flaw acceptance'standardsof Table IWB 3510-1. This table gives allowable equivalent flaw sizes as afunction of ellipse-aspect ratio and vessel wall thickness. The surface'reference flaw' size was selected to-be one tentK as large as the so called.maximum postulated defect (a/l-1/6, a-t/4 when a -,through-wall extent, I -length, and t - wall thickness) of Appendix G, Section 1Il. This gives asuitable safety factor on stress. Sizes of other elliptical surface flaws (ofdifferent aspect ratios) were then computed so that they would have the samesafety factor as the-surface reference flaw.
The tables in IWB. 3500 for flaw evaluation do not directly involve theuse of the stress level at the flaw location. It is assumed that the stressstate meets the design requirements of Section III. In addition, it is statedthat the tables may be used only if minimum fracture toughness can be assured.This is mandated in several places in IWB 3500. The first is Subarticle IWB3410-1 which states that the material must conform to the requirements. ofSection III, Division l Appendices in regard to selection of a maximumpostulated defect. In addition, the flaw size tables of IWB 3500 state thatthe material must meet the fracture toughness requirements of NB 2331 and G2110(b), Section III. Subarticle NB 2331 contains procedures for determiningthe reference nil ductility temperature (RTNDT). This involves performingCharpy V-notch testing and obtaining results If at least 50 ft-lbs and atleast 35 mils of lateral expansion.
If a detected flaw does not pass the acceptance standards tables of IWB3500, then acceptability can still be achieved by performing detailed fracturemechanics analyses as described in Appendix A of Section XI'. Appendix Autilizes stress field data at the flaw location, measured flaw size, andestimated material properties (including irradiation effects) and 'computes thestress intensity factor of the flaw in question, the critical flaw' size, and:the material fracture toughness. The RT of Section III, NB-2231" is usedfor the fracture toughness evaluation.' wAosideration is given to both normaland faulted loading conditions.. For-;normal loading conditions, the safetyfactor is 3 for-stress and-10 for flaw size -a approximately the same values-used for the IWB 3500 tables if the stress level is at the maximum allowablefor Section III.
The objective of the work for next fiscal year will be to determine!ifthe flaw acceptance criteria, summarized above, adequately consider the impactof degraded material properties. The goal is to determine if adequate NDE
200
reliability exists for flaw detection and sizing after considering 'the effectof material property degradation on the locations, types, and sizes of flawsthat may be of concern from a license renewal perspective.
4.0 UT EQUIPMENT INTERACTION MATRIX
The objective of this task is to evaluate the effects of frequencydomain, UT/ISI equipment interactions, and determine equipment tolerancevalues for improving inspection reliability. The equipment interaction matrixstudy, was confined to six months due to budgetary restraints. Recent studieshave shown that computer code modifications required to model the effects ofcomponent curvature are extensive. This code was'transported to a Sunworkstation for improved speed and efficiency. -
5.0 "INEW INSPECTION CRITERIA
The objective of this task is to assess the adequacy of existing ASMECode requirements for inservice inspection of nuclear power plant components,and to develop technical'bases for improving these requirements.. Workcontinued to focus on risk-based approaches to inspection planning, which arebeing applied to establish criteria for improved ISI (type, extent,effectiveness, and frequency).
5.1 Development of Risk-Based Approaches
During 'the past year PNL has continued to develop approaches forrisk-based inspections'through participation on the ASME Research Task Forceon Risk-Based Inspection Guidelines. This group was organized by ASME as asociety supported research activity with a membership representing severalindustries in addition to nuclear power generation. The ASME group has beenidentified by .PNL as an effective route to achieve long-range goals forimproved'inspections at' nuclear power plants.
The ASME Research Task Force has met quarterly during the past year, 'andhas issued an initial "white paper" (ASME 1991) that reviews the currentstatus of risk-based methods and gives general recommendations for risk-basedinspection requirements. This general document is applicable to anyindustrial facility'or structural systemiwhere structural integrity failureshave thelpotential to lead to severe safety and/or economic consequences.
The recent focus of thelASME Research Task Force has been on nuclearpower applications, and on the development of practical risk-based .methodsthat can be recommended for consideration'by ASME.Section XI.' Completion of asecond draft document-on the special topic of nuclear power applications wasaccomplished-during the past year (Volume 2:- Part 1).- This documentrecommends and describes specific methods that apply to nuclear power.-facilities. A draft was distributed for comment and peer review during Marchof 1991. Publication by ASME is scheduled no later than December of 1991.
201
Current and future efforts of the ASME Research Task Force are nowapplying the recommended risk-based methodologies, And will develop improvedinspection programs for nuclear power plant components., This work will resultin a future document (Volume 2 - Part 2), which is scheduled for publication'in the later part of 1993. The document will make recommendations forconsideration by ASME Code, Section XI. PNL is performing probabilisticcalculations as part of the NDE Reliability Program, which are'providingimportant support to the ASME Research Task Force.
5.2 Risk-Based Calculations of ISI Priorities
A major part on this task has been a pilot application of PRA methods tothe Surry-1 nuclear plant. The Surry-1 work has applied results of PRA's incombination with the techniques of failure modes and effects analysis (FMEA)to identify and prioritize the most risk-important systems and components atnuclear power plants. The specific Surry-1 systems initially selected foranalysis were the reactor pressure vessel, the reactor coolant, the low -
pressure injection (including the accumulators) and the auxiliary feedwater.Studies of these four systems'are now complete and example results arereported below. Ongoing efforts are addressing other systems including thehigh pressure injection, main feedwater, service water, component cooling.water, main steam, condensate, and residual heat removal systems.
Core damage frequency (Level-I PRA) has been used as the bottom linerisk measure. FMEA results are applied to calculate the relative importanceof each component within the systems being addressed. The calculatedimportance measures reflect the expected consequences of failure of thecomponent (from-the Surry-I PRA) and the expected probability of failure-,(rupture) of the component. Estimates of rupture probabilities for theSurry-1 components have been obtained from-expert judgement elicitation.-
Staff from the Virginia Electric Power Company (VEPCO) have been,,actively participating in the Surry-1 pilot study. This, participationisimportant to assure that the plant models are as realistic as possible andreflect plant operational practices. Several v.isits to the Surry-1 plant sitehave been made for system walkdowns, and for discussions with plantoperational technical' staff. : -
Figure 1 shows numerical rankings of the relative risk-importance ofcomponents within the initial four selected-Surry-1 systems (stated in termsof core damage frequency). On the basis of core damage frequency, the mostrisk-important components are those located within the beltline region of thereactor pressure vessel. -Relatively high rankings were estimated for certain ;pipe segments of the'low pressure injection (LPI) system, and also certain.pipe'segments within theauxiliary feedwater system, Potential-ruptures of,most other components had much smaller contributions to core damage-frequency.,The calculated risk importances covered a range of over eight orders ofmagnitude in numerical values. - i - -
. '' ! ; ' .' . Al1Xt. .' .'.
202
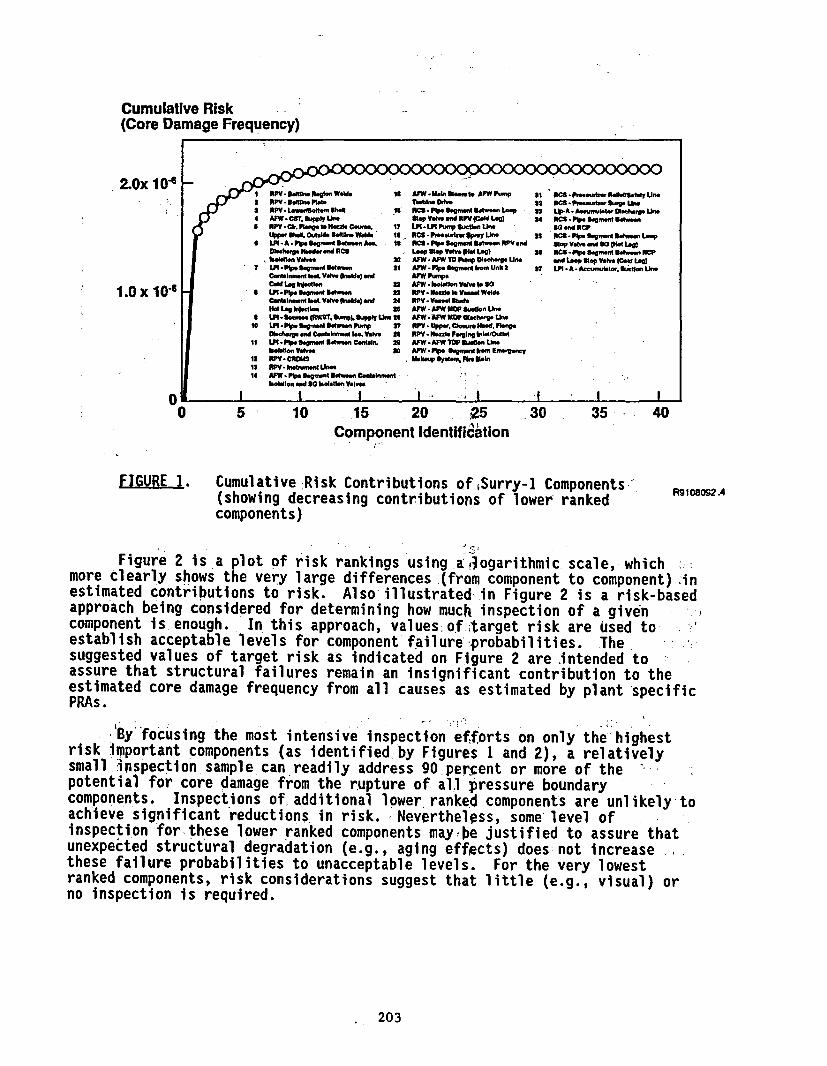
Cumulative Risk(Core Damage Frequency)
2.Ox 104 _ I R VlBtPI flolon Wos s 11 MA lomI aFwW Im MlCS: _reovtro llf UneX1c~ R"P1101111"rk T&nDS Vd1 .2 Bungro-r, .. k3 OP4 .P.Iw- n Shell It MWM S-iP setgns UtN la 32 L -A-A.eu t..b0- enL.
OFW -nneup LeL atrw Onn d)- e Pid pMW Sn -7RPY - IBM PolanbCa 17 Nozle 0K0 l I Eos-n ~tunek Ma Ohi RCP
Upper106 OAW& mORZ1 VW S ProYue Ad 3CS tslieqLA UA a Pip Onf-, ll vA if NM tC X" Eonsw lOt n RPV end andl Voln _, so glot bugCUDbetnp HN I nd L4 RP I mp 04V01 L 30 MM -Y e Studs l_ W;P1.4 Lng t S 2t M .AFW e utD 0-TUm " ltep Vat"u(own LAO
7 LPI -Pkm Sg..M 8 _ An.... P a- AUn I *7 LIU - a-A * aeed, i detn UneI tlnn,.d lC0. V .. Vi_ .aW AW -d F t. P
6I |P C ldqdbn . nt MW.AfWn vato tinee d0 xI V010. d .LNPentl Nozzle I en V essel .Wesl
14 leA WoP t Se Ven lt 3 . nd Conte-. StlHetLalog Injentin Xi Ant . AW IDSu.n Lk"
0 5 10 15 P0" 9""M B30 35PV 40ppwCoNed, ng1 Componen IPd e ng IlMM4tbo
| C t iveR.isnkContri n Xr FWbAuifSW-C onne1w(h beoaing dasing co n -trbtonso leowe rnE
11 8"PVCRDUtS ,iho lxupd t ,h Min
la NO kipwgnwn An Mnniss
:0 5 E 10 15 20 .25 30 35 40- Component Identification
FIGURE 1. Cumulative :Risk Contributions of ,Surry-I Components,' R189.(showing decreasing contributions of lower ranked R189.components)
Figure 2 is a plot of risk rankings using alogarithmic scale, whichmore clearly shows the very large differences (from component to component) inestimated contributions to risk. Also illustrated in Figure 2 is a risk-basedapproach being considered for determining how much inspection of a givencomponent is enough. In this approach, values of target risk are used to,establish acceptable levels for component failure probabilities. Thesuggested values of target risk as indicated on Figure 2 are intended toassure that structural failures remain an insignificant contribution to theestimated core damage frequency from all causes as estimated by plant specificPRAs .
'By focusing the most intensive inspection efforts on only the--highestrisk important components (as identified by Figures 1 and 2), a relativelysmall 'ipspection sample can readily address 90 per-ent or more of thepotential for core damage from the rupture of all pressure boundarycomponents. Inspections of additional lower ranked components are unlikely-toachieve significant reductions in risk. Nevertheless, some level ofinspection for these lower ranked components maybe justified to assure thatunexpected structural degradation (e.g., aging effects) does not increasethese failure probabilities to unacceptable levels. For the very lowestranked components, risk considerations suggest that little (e.g., visual) orno inspection is required.
203
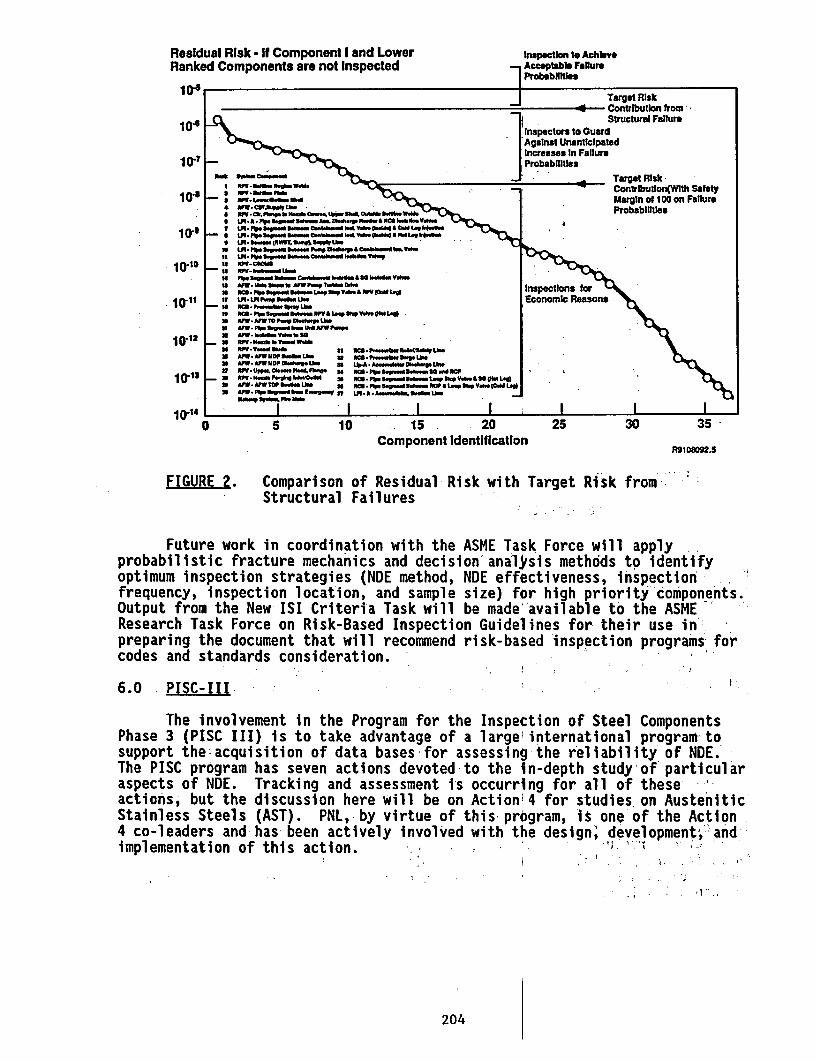
Residual Risk - It Component I and LowerRanked Components are not Inspected
inspection to Achiem_ Acceptable Failure
Probabli hssII-4 f - INu I1 Target Risk
- Contribution from *Structural Failure
10-6
I �
Inspectors to GuardAgainst UnanticipatedIncreases In FailureProbabilities
10.6
lo,'
10-11
a"
7
- a
a
- uU
NMWDll.C.T a0IW.
RWV. S. Pbp tM.~.b ."..%UffU.4 ddS&dbWdtH.-A.-Pk" §bwsdS dW_ AMs HD.. b= &Nd .. YwUl. P"5 Ssg.Ms N...6Cs-W h Vds.4hdg" a Cdi L" Ww"sU4 I. r.a.usd B10.. bH..d hd. 5. ow"d a Ha., hI.0 sLH.Sww (NWT.bS.-O ka, La.
tFI. "sSpm sd E.scssw.Sd hUbH. a so 5 W
SOS. Ps,. S.F..5 ad.. I... II'adW & UVOWSLpj
MFW. AW 10F P-p Lb. a=ft,.t1.Lh
MW. AMTOP a..15 Lb. * M * 8"- Df-M1 & . W d.(. .MW. -VMW 55 0..Hs Ls ' ST .d~
MY'a5f.ItbdaPa HSS s.Ng.dNH. d5
Target RiskContuibulon(WIth SafetyMargin of 100 on FailureProbabilities
INh,
10-12 1
10-131
10-14 IC
I L 1
D. . .
5 10 15 20Component Identification
25 30 35
R9108092.5
FIGURE 2. Comparison of Residual Risk with TargetStructural Failures
Risk from i
Future work in coordination with the ASME Task Force will applyprobabilistic fracture mechanics and decision analysis methods to identifyoptimum inspection strategies (NDE method, NDE effectiveness, inspectionfrequency, inspection location, and sample size) for high priority components.Output from the New ISI Criteria Task will be made available to the ASMEResearch Task Force on Risk-Based Inspection Guidelines for their use in'preparing the document that will recommend risk-based inspection programs forcodes and standards consideration.
6.0 PISC-III ,
The involvement in the Program for the Inspection of Steel ComponentsPhase 3 (PISC III) is to take advantage of a largelinternational program-tosupport the acquisition of data bases for assessing the reliability of NDE.The PISC program has seven actions devoted to the in-depth study of' particularaspects of NDE. Tracking and assessment is occurring for all of these-actions, but the discussion here will be on Action 4 for studies on AusteniticStainless Steels (AST). PNL, by virtue of this program, it one of the Action4 co-leaders and has been actively involved with the design, development,-andimplementation of this action. ; -;
204
The AST has been initiated with inspections.pccurring for;the capabilitystudies for wrought stainless steel. There have been inspections performed byteams from across Europe and Japan. These specimens will be in the USA at theend of February 1992. Two teams have committed to"examine these specimens andefforts are being expended to try to locate additional participants. Thecast-to-cast and wrought-to-cast capability specimens are being fabricatedwith studies on these being planned to start during the second quarter of1992. PNL has prepared for conducting relative operating characteristic curve(ROC) analysis on the AST data. Data should be received in late fall forconducting this analysis.
The reliability studies on wrought'and cast specimens has been slow instarting. There is a shortage of funding that hag primarily been responsiblefor this delay. The reliability study on wrough.t. stainless steel is beingrescoped to focus primarily on IGSCC. At this time there is limited interestfrom most of the European participants in this study. Only two teams havemade a commitment-to participate'in these studies.
The future work will continue to support the studies in progress throughboth the coordination of teams from'the USA and in'conducting analysis of datagenerated in the studies'. .
6.0 CAST STAINLESS STEEL INSPECTION
The objective of the cast-stainless-steel-inspection task is todetermine the effectiveness and reliability of ultrasonic inspection on'LWRcomponents containing cast stainless steel material. Examples of componentscontaining cast material are cladded pipe and.pressure vessels, pump and.valvebodies, centrifugally cast stainless steel (CCSS)-'piping, stainless steel anddissimilar metal welds, and weld-overlay-repaired pipe joints.
Work performed this past year entailed 'a CC6S workshop as part of atraining course for NRC staff on computer-based UT.systems, a letter report tothe NRC on employing critical angle technique's for classifying CCSSmicrostructure, and publication of two papers for the annual "Review ofProgress in Quantitative Nondestructive Evaluation" (QNDE) conferenceproceedings.
A training course for NRC staff was held at PNL in April 1991. Duringthe course NRC Headquarters and Region personnel'were given lecture on studiesassessing ultrasonic inservice inspection of cast.-material and participated'inthree laboratory'exercises for demonstration and hands-onexperience. Duringthe lecture, algorithms to classify CCSS 'micro'str1Uctures were review d whichincluded Rayleigh critical angle imaging by llildebrand, Good',1 et al. and
2Hildebrand, B. P., M. S. Good, A. A. Diaz, and E. R. Green. 199L. '
"Application of Critical Angle Imaging to the'Ch~aracterization of Cast -
Stainless Steels," submitted for publication in Review of Pro'ress inQuantitative Nondestructive Evaluation, Vol. '11,'Plenum Publishing, New York,'to be published 1992.
205
techniques developed by Kupperman, Reimann, et al.' (1987), which were bothdeveloped under NRC sponsorship. These techniques detected microstructuralchanges as a function of depth and lateral position over piping.
Rayleigh-critical angle is the technique of insonifying a material at anincident angle where the acoustic energy that 2enters a material is a surfacewave instead of a shear or longitudinal wave. The basic principle is thatthe amplitude of the reflected wave'undergoes a substantial decrease andrecovery over a one to two degree change in the incident angle. Prior to thesecond critical angle, the incident wave is partitioned into a reflected waveand transmitted waves. At the Rayleigh critical angle which is just slightlylarger than' the second critical, a dramatic drop in reflected amplitude occursdue to a highly efficient'mode conversion to surface waves. A dramaticrecovery is observed one degree past the Rayleigh critical angle due tothewave being totally reflected. This phenomenon, therefore, is. a sharp acousticfeature that is extremely sensitive to material properties such as wavevelocity and acoustic attenuation. Since wave velocity of different CCSSmicrostructures vary, the technique should be capable of classifying the CCSSmicrostructure. Furthermore, since the surface-wave penetration is roughlyone wavelength, multi-frequency techniques might be' able to detect underlyinglayers of different microstructures and classify them. 'The work performedshowed that it is feasible to classify microstructures;.however, thelimitations of the technique have not been determined.
Future work will represent'a change in-strategy to investigate very lowfrequency techniques that are expected to be'less sensitive to the problemsimposed upon ultrasonic ISI by coarse microstructur~es; e g., Lamb waves, phasemeasurements, and large aperture L-wave transducers employing a pitch-catchconfiguration. The~goal is to'determine'the smallest crack that can bereliably detected and then to assess, using fracture mechanics, the 'significance of this crack size to structural integrity.
8.0 SURFACE ROUGHNESS CONDITIONS
The objective of the surface roughness task is to make Coderecommendations which assure that a surface condition does not'degrade the;effectiveness and reliability of ultrasonic inspection of LWR components.-
PNi r !ePNL took an empirical approach to evaluate the effect: of'surfacecondition; however, this changed to estimating distortion by means of computermodelling. 'The'empirical work was directed towards weld'crowns and piping.The result was a letter report "Significance of Surface Condition UpbnUltrasonic Inspection" submitted to the NRC in 1988. This. report stated thatthe as-built,'surface-condition was governed by the subjective judgement of -
the radiographer during construction and that abrupt surface changes on theorder of 1.5 mm are expected. It was also noted that the newer versions ofthe Code did not circumvent the problem of subjectivity. In other words? theASME Code does not provide an objective',specificatilon to quantify surface.condition,'for inservice inspection.'.
206
After the initial study, PNL and the Center for NDE at Iowa StateUniversity (CNDE-ISU) discussed possible collaboration using a computer modelas a much more efficient means of determining recommendations concerningacceptable/unacceptable surface conditions for ultrasonic ISI. In 1988 acoordination plan between the US NRC and EPRI was approved. Tasks includedmodel refinement by CNDE-ISU under EPRI sponsorship, experimental dataacquisition and model validation by PNL under US NRC sponsorship, andsubmission of ASME Code recommendations by both institutes.
Work performed this past year entailed comparison of longitudinal wave(L-wave) data, transfer of the current model to PNL, and use of a simplisticray tracing model at PNL.
One objective was to refine the CNDE-ISU model so that it could bevalidated for the simulation of weld crowns (step discontinuities). Modelrefinement included an evaluation of normal (00) and oblique (450) L-wavesthrough step discontinuities. Of interest if thelfield amplitude at the backsurface of the plate. The model predicted the response along the back surfacewhile experimental measurements used a through-transmission technique with amicroprobe receiver positioned adjacent to the back surface. No comparisonswere made for shear waves. This was due to interference from spurious signalswhen collecting experimental data.
The 00, L-wave data showed good agreement between model prediction andexperimental data (Figure 3). These included the reference case of a flatplate with parallel, planar surfaces as well as cases with stepdiscontinuities of 0.25, 0.75, and 1.50 mm.
The 450, L-wave data showed discrepancies that were more apparent thanwith the 00 data (Figure 4). Data matched well for a flat plate with nodiscontinuity (Figure ,4a) and a step height of 0.25 mm (Figure 4b); however,large discrepancies existed for step discontinuities of 0.75 and 1.50 mm.Comparison of model predictions with experimental measurements were documentedin a paper by A. Minachi, R. B. Thompson, et al.
Two problems exist with model refinement. One is the discrepancy in L-wave data which may be due to either experiment or~model. An obviouspossibility is checking the alignment between transmitter and the stepdiscontinuity. The other problem-is a spurious signal causing interferencewith shear wave reception during experimental data acquisition.
3Minachi, A., R. B. Thompson, M. S. Good, and A. A. Diaz. 1991."Ultrasonic Wave Propagation Through an Interface with a Step Discontinuity"submitted for publication in Review of Progress in Nondestructive Evaluation,Vol. 12. Plenum Press, New York, to be published 1992.
207
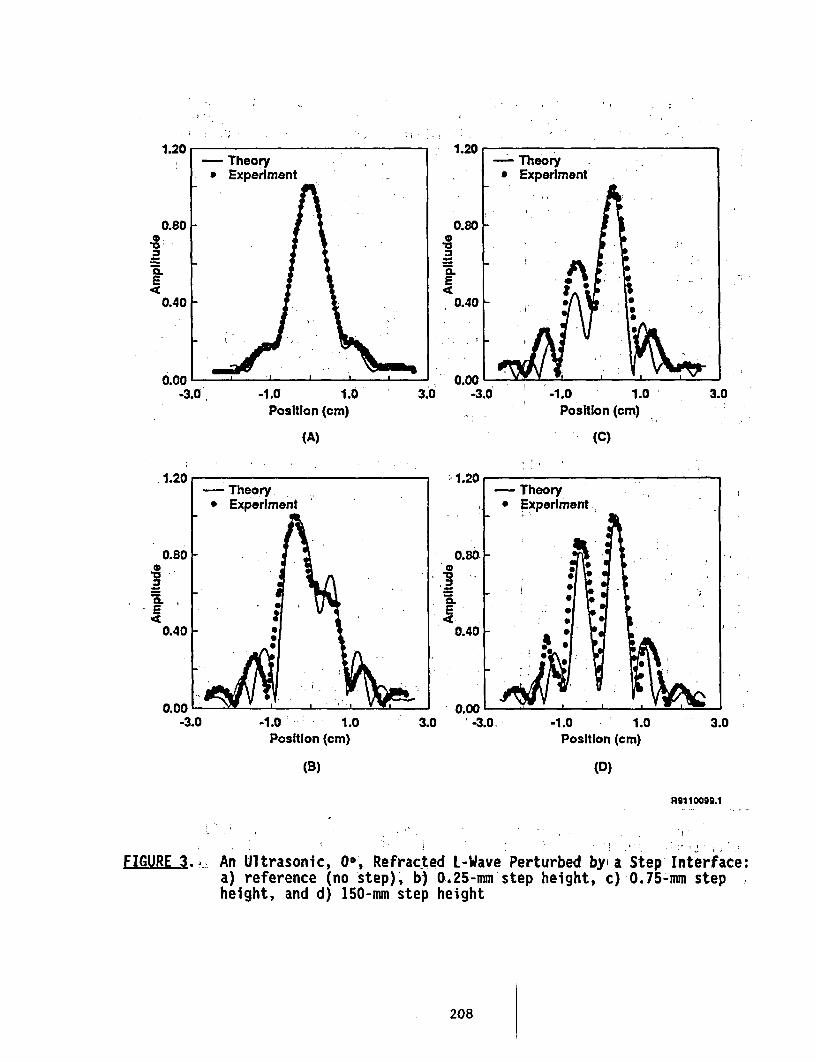
1.20
0.800X.
S
-i , .
--- I . 1.
I .-3.0 -1.0 1.0 3.0 -3.0 -1.0 1.0
Position (cm) Position (cm)
(A) (C)
3.0
1.20
-1.0 1.0 3.0Position (cm)Position (cm)
(B) (D)
R91 10099.1
FIGURE 3.... An Ultrasonic, O*, Refracted L-Wave Perturbed byia Step-Interface:a) reference (no step), b) 0,25-mm step height, c) 0.75-mm stepheight, and d) 150-mm step height
208
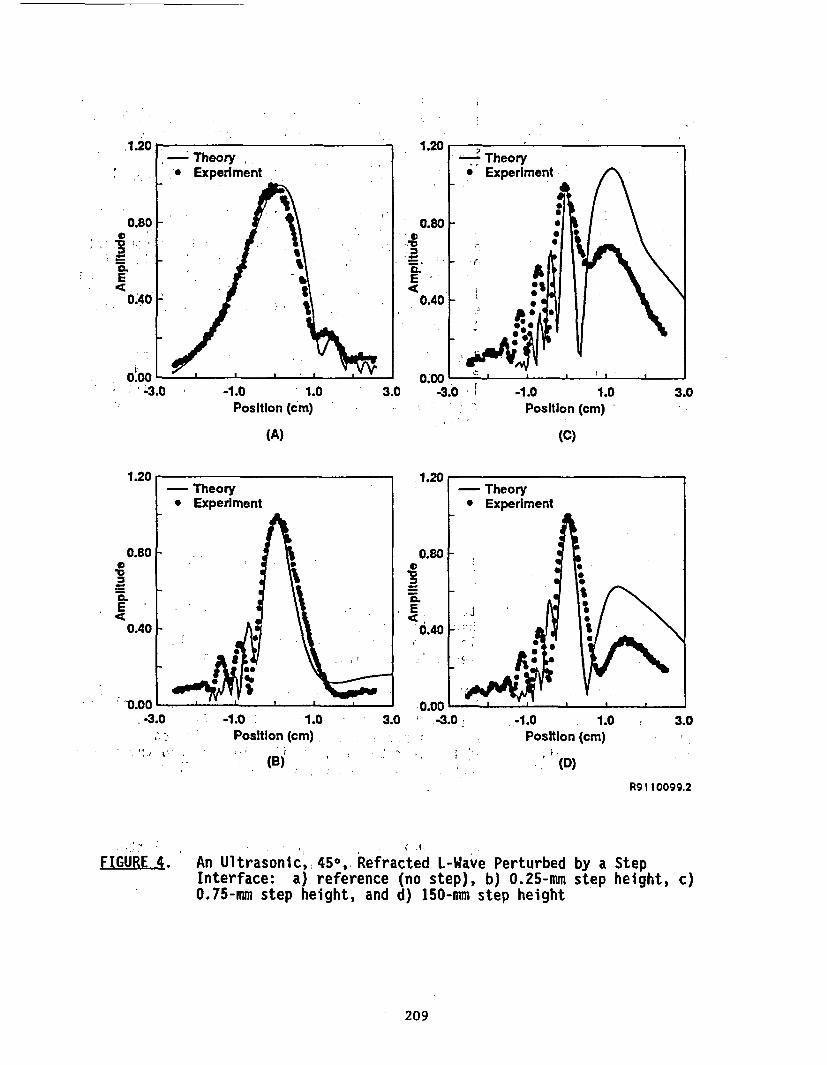
-
.1.20- Theory
* Experiment
C
a .
E
C
0.80
0.40
*-.00 . . .
-1.0 1.0Position (cm)
(A)
3.0 -1.0 1.0Position (cm)
(C)
3.0
0
a.E
.1.20 -
0.80
E
0.40
- 0.00. E
3.0 , -3.0-0.00'-
.-3.04, -.
* -4 A.
- -1.0 ' 1.0Position (cm)
(B)
-1.0 1.0Position (cm)
II (D)
3.0
R9 1 10099.2
FIGURE4A.I .1
An Ultrasonic, 450, Refracted L-Wave Perturbed by a StepInterface: a) reference (no step), b) 0.25-mm step height, c)0.75-mm step height, and d) 150-mm step height
209
A simplistic central ray model was developed at PNL to gain insight intothe use of models and to make better use of the CNDE-ISU model. The technicalgoal of this activity was to consider how the central beam from a probetravels through a stainless steel pipe as the probe passes over a-weld-crown(step discontinuity). .The data were in good agreement with the'modelpredictions and results were documented in a letter report to the US NRC.
The primary conclusion in the report was that the experimental'data fromsimulated weld crowns matched well with model predictions. Model analysisindicated that the refraction at the~probe-wedge-tq-couplant and the couplant-to-steel interfaces play important role's in determining spatial location ofthe beam and arrival time of received responses. As the probe slides over theedge of a weld crown, variables such as probe tilt may result in a volumetricregion not being fully scanned, a crack base mispositioned farther away, andcrack under-sizing by crack tip analysis.
Future work will entail continued model-refinement and validation,including amplitude and phase response from notch reflectors, broadband timeresponse, and-expansion to all four geometries; i.e., step discontinuity (weldcrown), concave surface (over grind), convex surface (diametrical shrinkage),and elevated point (weld splatter).
FABRICATION FLAWS
INTRODUCTION
1.0 SAMPLING PLAN - DETERMINATION OF FABRICATION FLAW DISTRIBUTIONS INREACTOR PRESSURE VESSELS
The objective of this task is to accurately Estimate the distribution offabrication flaws (i.e., numbers, location, and siZes) that occur in lightwater reactor pressure vessels. The flaw distribution is generally animportant input to fracture mechanics calculations and risk assessments.
Data concerning the flaw distribution is to be acquired by performingNDE examinations of a set of pressure vessel weldments that were-never placedin service. The examination is to be conducted' using state-of-the-artultrasonic inspection (SAFT). This section discusses the statisticalmethodology that will be used to estimate the flaw distribution and the amountof inspection that will be required to accurately estimate the flawdistribution.
4Greenwood, M. 5. 1991. "Modeling of a Step Discontinuity," letterreport submitted to US NRC in September Monthly Report, Pacific Northwest-Laboratory, Richland, WA.
210
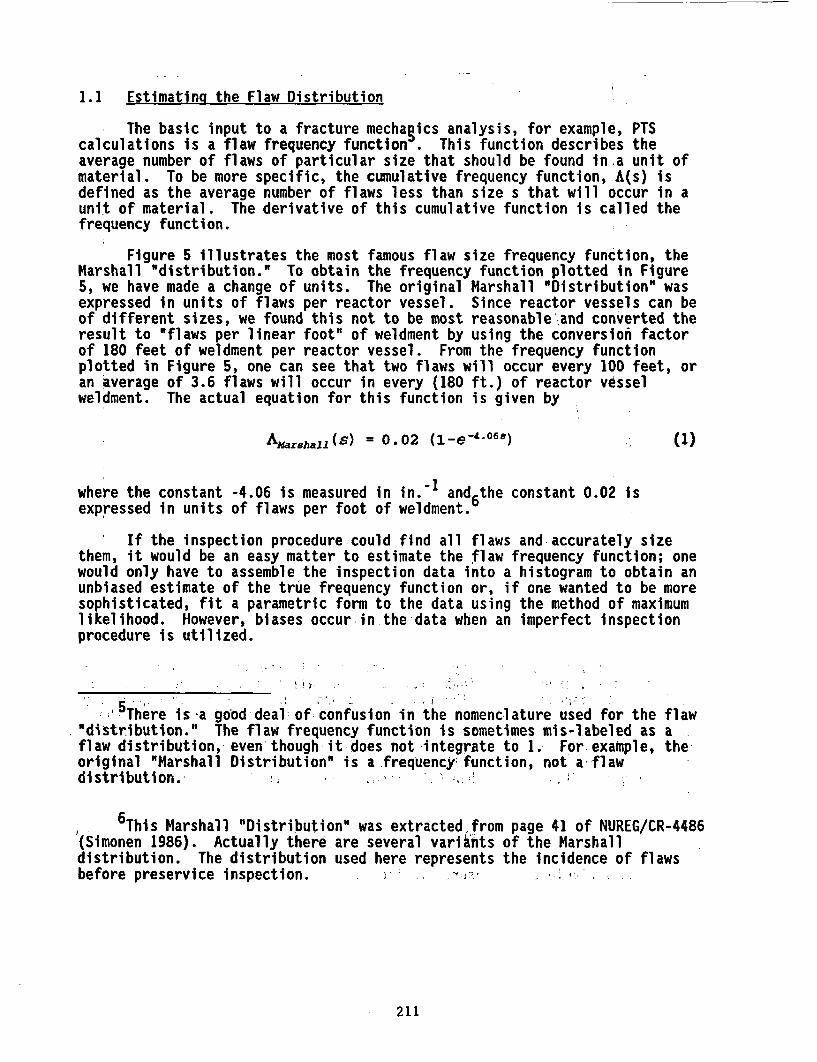
1.1 Estimating the Flaw Distribution
The basic input to a fracture mechagics analysis, for example, PTScalculations is a flaw frequency function . This function describes theaverage number of flaws of particular size that should be found in a unit ofmaterial. To be more specific, the cumulative frequency function, A(s) isdefined as the average number of flaws less than size s that will occur in aunit of material. The derivative of this cumulative function is called thefrequency function.
Figure 5 illustrates the most famous flaw size frequency function, theMarshall "distribution." To obtain the frequency function plotted in Figure5, we have made a change of units. The original Marshall 'Distribution" wasexpressed in units of flaws per reactor vessel. Since reactor vessels can beof different sizes, we found this not to be most reasonable and converted theresult to "flaws per linear foot" of weldment by using the conversion factorof 180 feet of weldment per reactor vessel. From the frequency functionplotted in Figure 5, one can see that two flaws will occur every 100 feet, oran average of 3.6 flaws will occur in every (180 ft.) of reactor vesselweldment. The actual equation for this function is given by
Am= 0 .02 (1-e' 065 ) (1)
where the constant -4.06 is measured in in 1 and6the constant 0.02 isexpressed in units of flaws per foot of weldment.
If the inspection procedure could find all flaws and-accurately sizethem, it would be an easy matter to estimate the flaw frequency function; onewould only have to assemble the inspection data into a histogram to obtain anunbiased estimate of the true frequency function or, if one wanted to be moresophisticated, fit a parametric form to the data using the method of maximumlikelihood. However, biases occur in the data when an imperfect inspectionprocedure is utilized.
5There is a gobd deal of confusion in the nomenclature used for the flaw"distribution." The flaw frequency function is sometimes mis-labeled as aflaw distribution, even though it does not integrate to 1. For example, theoriginal Marshall Distribution" is a frequency function, not aiflawdistribution.;
6This Marshall "Distribution" was extracted from page 41 of NUREG/CR-4486(Simonen 1986). Actually there are several variants of the Marshalldistribution. The distribution used here represents the incidence of flawsbefore preservice inspection.
211
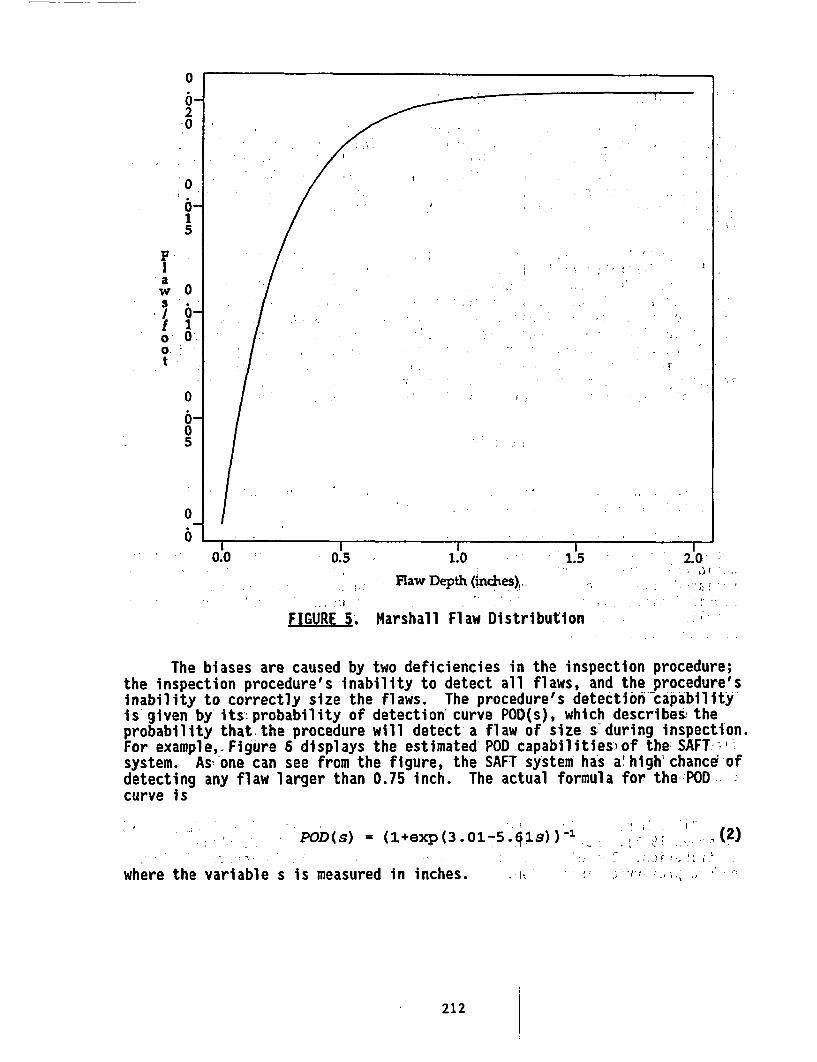
06-
2~O
0 :
15
F iI
W, O
3; '. '
two
0
/0
oO
0,
0
0.0I I
0.5 1.0
Flaw DepthI .. -3 B . M h F
FIGURE S. Marshall Fla
(inch
tw- Di
I 0I1.5 2.0
.. . : I:; "j .. ' .:. 7
es '- . . . I 1 .1 ,
Istribution .11.
. .
i .
The biases are caused by two deficiencies in the inspection procedure;the inspection procedure's inability to detect all flaws, and the procedure'sinability to correctly size the flaws. The procedure's detection-capabilityis-given by its--probability of detection curve POD(s), which describes theprobability that-the procedure will detect a flaw of size si during inspection.For example,-Figure 6 displays the estimated POD capabilitiesiof the SAFT'-Isystem. As'one can see from the figure, the SAFT system has a'high'chance ofdetecting any flaw larger than 0.75 inch. The actual formula for the POD -
curve is
POD(s) = (1+exp(3.01-5.q1s) ) - - ,2)
where the variable s is measured in inches. - ,
212
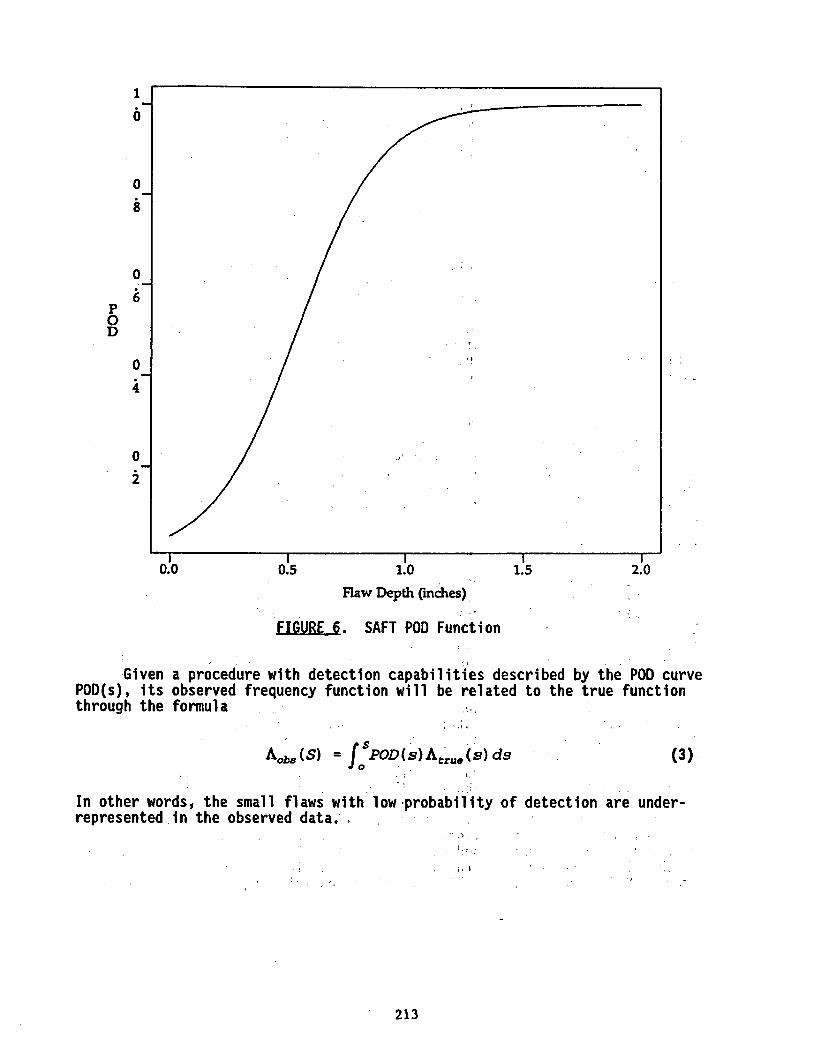
1
0
0&
0
P0D
0
0
I . ..I0.0 0.5 1.0 1.5 2.0
Flaw Depth (inches)
FIGURE 6. SAFT POD Function
Given a procedure with detection capabilities described by the POD curvePOD(s), its observed frequency function will be related to the true functionthrough the formula
Ads C(S) = f POD (s') Atkru (s) ds
In other words, the small flaws with low probability of detectionrepresented in the observed data,.
(3)
are under-
213
A similar formula describesfrequency function. For example,minus true size) is described by 1observed frequency function will Iformula
the effects of sizing error on the observedif the measurement error (i.e., measuredthe probability density ¢(e), then thebe related to the true function through the
Aobs (S) = f| -(sAZ) Atru.(Z) dz (4)
In other words, measurement error produces a "smeared" version of thetrue frequency function; the true frequency function is convolved with theerror distribution to obtain the observed function.
Equations (3) and (4) describe the basic relationship between the trueand observed frequency functions. These formulas can also be used to produceunbiased estimates of the true frequency function. To obtain the simplestestimate, one simply needs to "invert" equations (3) and (4) so that Atrue(s)can be expressed in terms of Aobs(s).
This is the method we will use to estimate the flaw size frequencyfunction. It will produce a "non-parametric" estimate for this function; thatis the estimate will require no assumptions concerning the shape of theunderlying distribution. The method will require that the characteristics ofthe inspection procedure be accurately known (i.e., POD(s) and ¢(e)). Toobtain this information, the SAFT procedure has been subjected toqualification testing.
1.2 Amount of Material to be Inspected
The accuracy (more specifically, standard deviation) with which thefrequency function A(s) can be estimated is proportional to 1/iR, where N isthe number of flaws found during the inspection; in order for the exercise tobe successful, it must examine enough material to be assured of detecting acertain minimal number of flaws. As an initial design criteria, it isreasonable to require the inspection to find at least 10 flaws of size largerthan' 1/4 inch in order to estimate the flaw distribution with some precision.
Tables for various assumptions for the distribution based on NDEeffectiveness and assumed distribution form have been generated. With alimited amount of material being available, the actual sampling plan is basedon performing sufficient inspections on the PVRUF RPV that the true flawdistribution can be estimated correctly. The limitation of materialnecessitates that the distribution will only be as a function of flaw depth.Although, other information will be gathered for each flaw, the limited size-of the data base will not allow accurate estimates of the distributional formfor these other parameters (location, length size, etc.). At the same time wewill perform an analysis based on type of flaw but will most likely lump allof the flaws together. The rationale for performing this last step is thatfrom an NDE standpoint, it will be nearly impossible to prove that non-planar
214
flaws do not have stress risers that will make them respond in a fracturemechanics sense like a planar flaw.
2.0 EQUIPMENT PREPARATION
2.1 Upgrades to SAFT-UT Inspection System
This year's improvements to the SAFT-UT system were chosen to facilitatethe inspection of the PVRUF RPV that is at ORNL.-- This includes a series oftasks that need to be performed since the SAFT system will be at ORNL and theplan is to have the data collected there and returned to PNL for analysis.Secondly, because of the complex geometry of the-nozzles, a roboticmanipulator will be used to scan the inner and outer radius of these nozzles;.Thirdly, a Sun SparcStation2 graphics workstation has been set up to analyzethe'SAFT data.
2.2 SAFT-UT Inspection System
A description of the SAFT system can be found in Doctor et al. (1991).The upgraded SAFT-UT system is shown in Figure 7. The existing dataacquisition system controls the SAFT pipe scanner and transfers ultrasonicdata to the host computer. The host computer receives data from the dataacquisition systems, files the data, and prepares the data for processing anddisplay. The real-time processor is a peripheral device to the host computerthat performs the computationally intense SAFT algorithm. The existing Ramtekgraphics processor provides the image display to the operator forinterpretation as does the new Sun graphics workstation. Finally, a new dataacquisition system controls a robotic scanner and transfers data to the hostcomputer.
2.3 Robotic Data Acquisition System
A robotic data acquisition system has been'assembled for scanning thenozzle areas of-the'reactor pressure vessel. A PUMA 562 industrial robot willbe used. This is a six-axis robot with a radial reach of'36 inches and arepeatability of better than 0.004 inches. A preamplifier is located on therobotic arm. This>-amplifies the received echo's'ignal and provides the inputto the main amplifier for'data acquisition.- ;The remote preamplifier has again of 20 dB and a 3-db'bandwidth offs MHz. It significantly increases thesignal-to-noise ratio-by amplifying the echo signal prior to transmission onthe long interconnecting cable; thus, any noise introduced during thetransmission will be significantly less with respect to the echo signal.
The data acquisition subsystem uses a 486 computer with SAFT dataacquisition software. This-subsystem Contains the electronics to control therobot, amplify the returned echo, and digitize the full'RF signal. Includedin the data acquisition subsystem is a Time Variable Gain (TVG) amplifier to'compensate' for material attenuation and to maximize the system dynamic range.The gain of the-TVG amplifier'is programmable Lip'to a maximum of 40 dB. TheTVG supplies the input signal to the STR8100 digitizer to be sampled,converted, and stored.
215
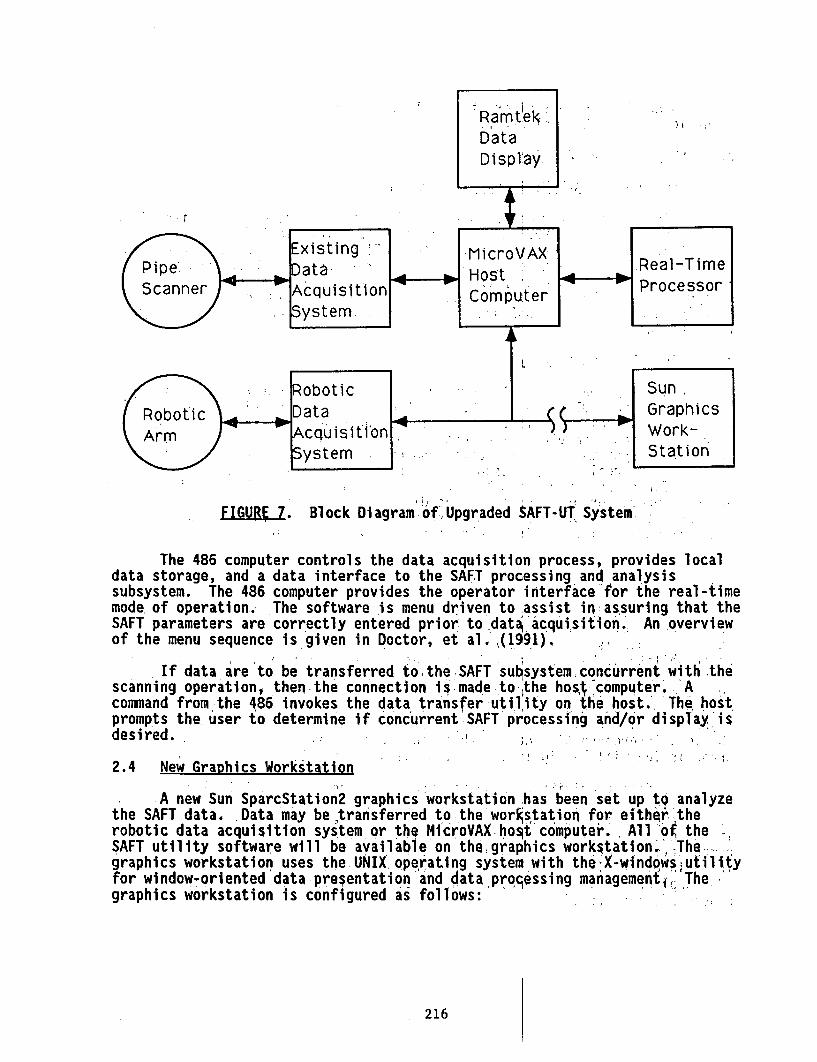
t~
Sun.Robotic Data . GraphiArm AcQuisition Work-
System Station
FIGURE 7. Block Diagram of 1Upgraded SAFT-UT System'
The 486 computer controls the data acquisition process, provides localdata storage, and a data interface to the SAFT processing and analysissubsystem. The 486 computer provides the operator interface for the real-timemode of operation. The software 'is menu driven to.assist in assuring that theSAFT parameters are correctly entered prior to.data acquisition. An.overviewof the menu sequence is given in Doctor, et al. (1991). .
.If data are to be transferred toethe SAFT sutsystem concurrent with.thescanning operation, then the connection is made-to ,the host computer. 'A.command from the 486 invokes the data transfer utility on the host.' The hostprompts theuser to determine if concurrent'SAFT processing and/or displayersdesired. . i X
2.4 New Graphics Workstation .
A new Sun SparcStation2 graphics'workstation has been set up to analyzethe SAFT data. Data may betransferred to the worIstation for either'therobotic data acquisition system or the Mi'croVAX host computer.. All 'of the ISAFT utility software will be available on the graphics workstatlon,'-The-...,,'graphics workstation uses the UNIXopeyrating system with the X-windOws utilityfor window-oriented data presentation and data pro'essing managements Thegraphics workstation is configured as follows:
216
* SparcStation2 computer with color monitor* 48 MB memory* 400 MB system disk* 1.5 GB SCSI disk drive for data storage* 800 MB write once laser disk* IEEE 488 interface* color printer -
3.0 MIDLAND DATA ANALYSIS
The SAFT system-was used to perform inspections on four blocks that hadbeen cut from the beltline weldment of the Midland reactor vessel. A total of164" of circumferential weld length was inspected. This is a-weldment that isa double "V" design and the cladding was deposited using a multi-wire processand smoothed with a belt grinder. The SAFT system was operated at maximumsensitivity to try to detect very small flaws and then to characterize-themaccurately. Table 1 contains a summary of the'results from this analysis. Itshould be noted that these 11 are denoted as indications and follow-up work isplanned through some destructive testing to validate the data in this table.,It must be remembered that this is a limited data base and the extension tothe population of RPVs in a generic-sense is difficult to do. The extensionof this data to predict the true flaw population of the Midland RPV is not aneasy thing to do because the data represents only-the conditions of a limitedportion of the beltline weldment. Even with these caveats, it should be noted.that some useful trends can be seen in the data.: The data was analyzed andcompared to the "Marshall" distribution and was found to possess the sameshape. However,-the 'Midland data is found to be a factor of-over 40-times-larger than that predicted by the "Marshall' distribution. More work isplanned on this data base, and then it will be integrated with the new data tobe generated next year on the PVRUF RPV. ,
REFERENCES
ASME. 1991. Risk-Based Inspection - Development of Guidelines. Volume 1General Document, CRTD-Vol. 20-1, prepared by the Research-Task Force on Risk-Based Inspection Guidelines, issued by the America`i Society of MechanicalEngineers Center for Research and Technology'Development.
Doctor, S. R., R. E. Bowey, P. H. Hutton, R. J. Kurtz, and G. J. Schuster.1991. "Advanced NDE Technologies and Characterization of RPV FlawDistribution," in Proceedings of the U.S. Nuclear Regulatorv CommissionEighteenth Water Reactor Safety Information Meeting, NUREG/CP-0114, Vol. 3,pp. 137-155.
Kupperman, D. S., K. J. Reimann, and J. Abrego-Lopez. 1987. "Ultrasonic NDEof Cast Stainless Steel" in NDT International, Vol. 20, No. 3, pp 145-152.
Simonen, F. A. 1986. VISA-I - A Computer Code for Predicting theProbability of Reactor Pressure Vessel Failure, NUREG/CR-4486. Prepared byPacific Northwest Laboratory for the U.S. Nuclear Regulatory Commission,Washington, D.C.
217
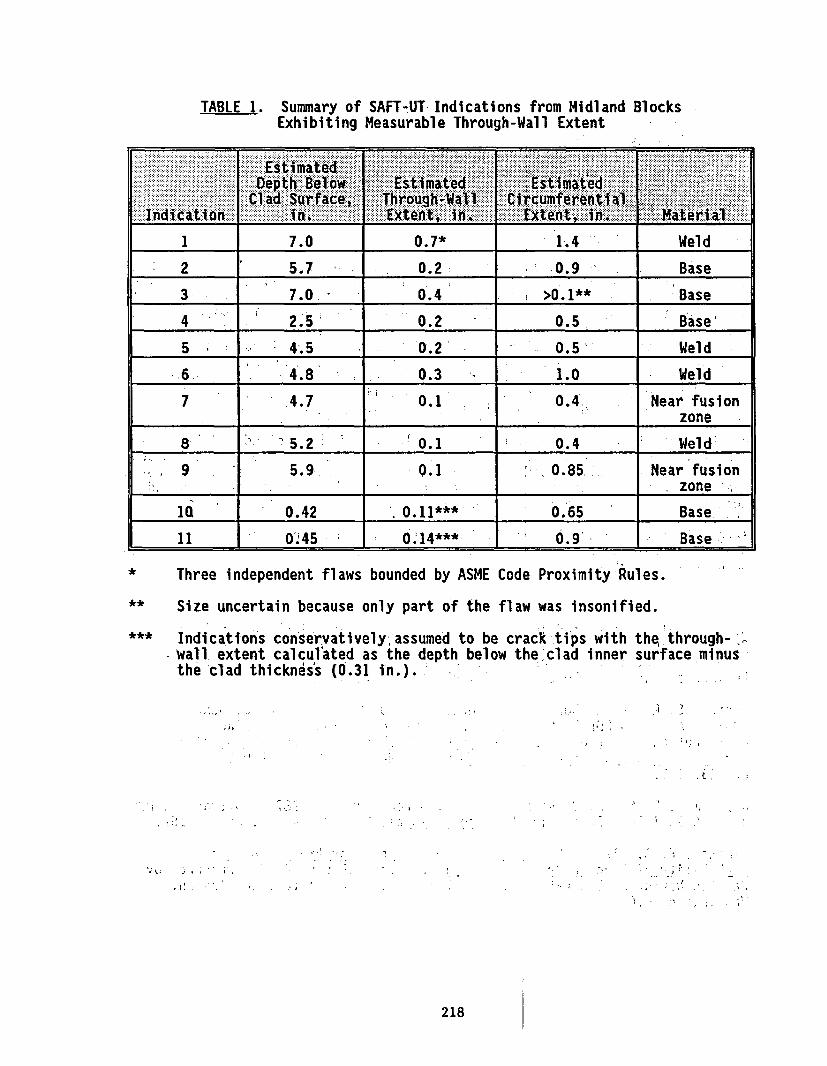
TABLE 1. Summary of SAFT-UT Indications from Midland BlocksExhibiting Measurable Through-Wall Extent
1 7.0 0.7* 1.4 Weld
2 5.7 0.2 .0.9 Base
3 7.0 0.4 >0.1** Base
4 2.5 0.2 0.5 Base'
5 4.5 0.2 0.5 Weld
.6 4.8 0.3 1.0 Weld
7 4.7 0.1 0.4. 'Near fusion
' ' ' 5.2 0.1 0.4 Weld
9 5.9, 0.1 0.85. Near fusion___ __ .__ __ , zone
10 0.42 . 0.11** 0.65 Base.
11 0;45 0.114*** . 0.9' Base
*
**
Three independent flaws bounded by ASME Code Proximity Rules.
Size uncertain because only part of the flaw was insonified.
Indications conservativelyassumed to be crackktips with thq-through-i -- wall extent calculated as the depth below the-clad inner surface minus
the clad thickness (0.31 in.).:
,.; , . . .,. Jo , ,
: I I, , ,, ,.-
.- , .. . I
@ t, , . ,, I , '
.: ,, * .
: ! I I ,,I
I ., ... ,Z .h I I - I I
: . ; , I I ;.S
218
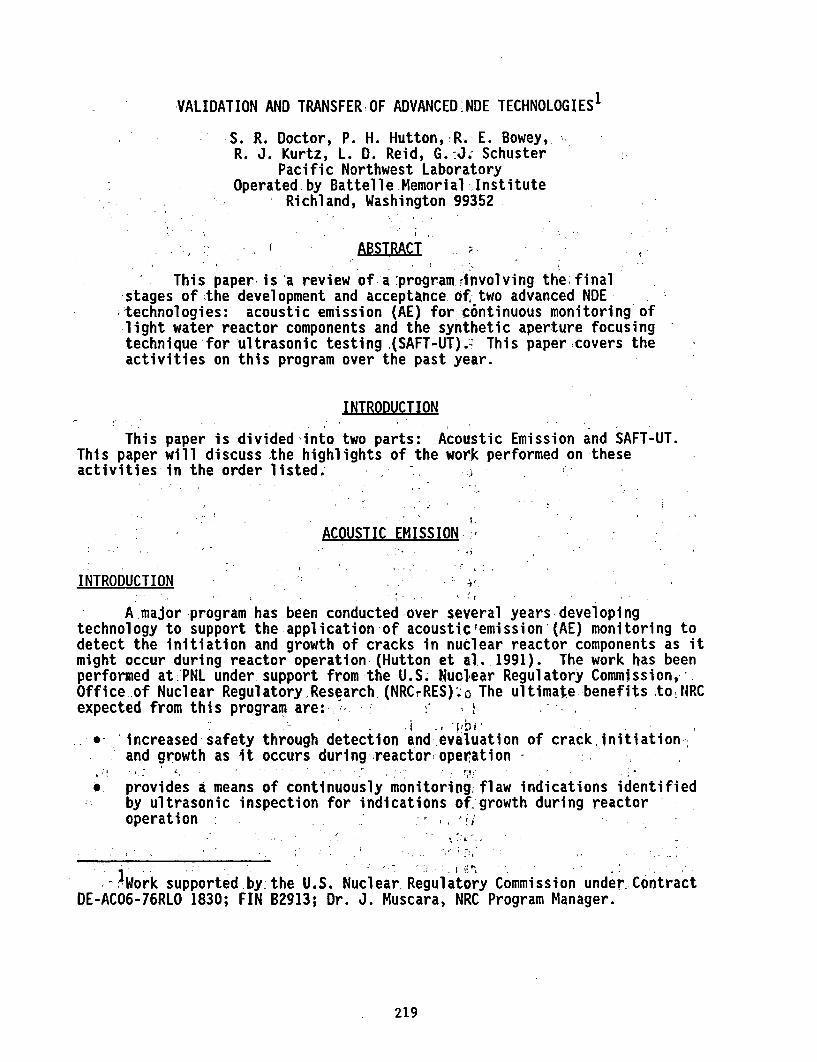
VALIDATION AND TRANSFER-OF ADVANCED.NDE TECHNOLOGIES1
S. R. Doctor, P. H. Hutton, R. E. Bowey,R. J. Kurtz, L. D. Reid, G.-J. Schuster
Pacific Northwest LaboratoryOperated by Battelle:Memorial:Institute
Richland, Washington 99352
ABSTRACT .
'This paper is 'a review of a programrinvolving the finalstages of the development and acceptance of two advanced NDE .technologies: acoustic emission (AE) for c6ntinuous monitoring oflight water reactor components and the synthetic aperture focusingtechnique for ultrasonic testing.(SAFT-UT).: This papericovers theactivities on this program over the past year.
INTRODUCTION
This paper is divided into two parts: Acoustic Emission and SAFT-UT.This paper will discuss the highlights of the work performed on theseactivities in the order listed..
ACOUSTIC EMISSION
INTRODUCTION - .i
A.major program has been conducted over several years developingtechnology to support the application of acoustic emission (AE) monitoring todetect the initiation and growth of cracks in nuclear reactor components as itmight occur during reactor operation (Hutton et al,. 1991). The work has beenperformed at.PNL under support from the U.S. Nuclear Regulatory Commission,Office.of Nuclear Regulatory.Research,(NRCrRES).o The ultimate benefits *to:NRCexpected from this program are:. -"
.* increased safety through detection and evaluation of crackinitiationand growth as it occurs during reactor operation -
* provides a means of continuously monitoring flaw indications identifiedby ultrasonic inspection for indications of. growth during reactoroperation
I tWork supported by.the U.S. Nuclear. Regulatory Commission under.ContractDE-AC06-76RLO 1830; FIN B2913; Dr. J. Muscara, NRC Program Manager.
219
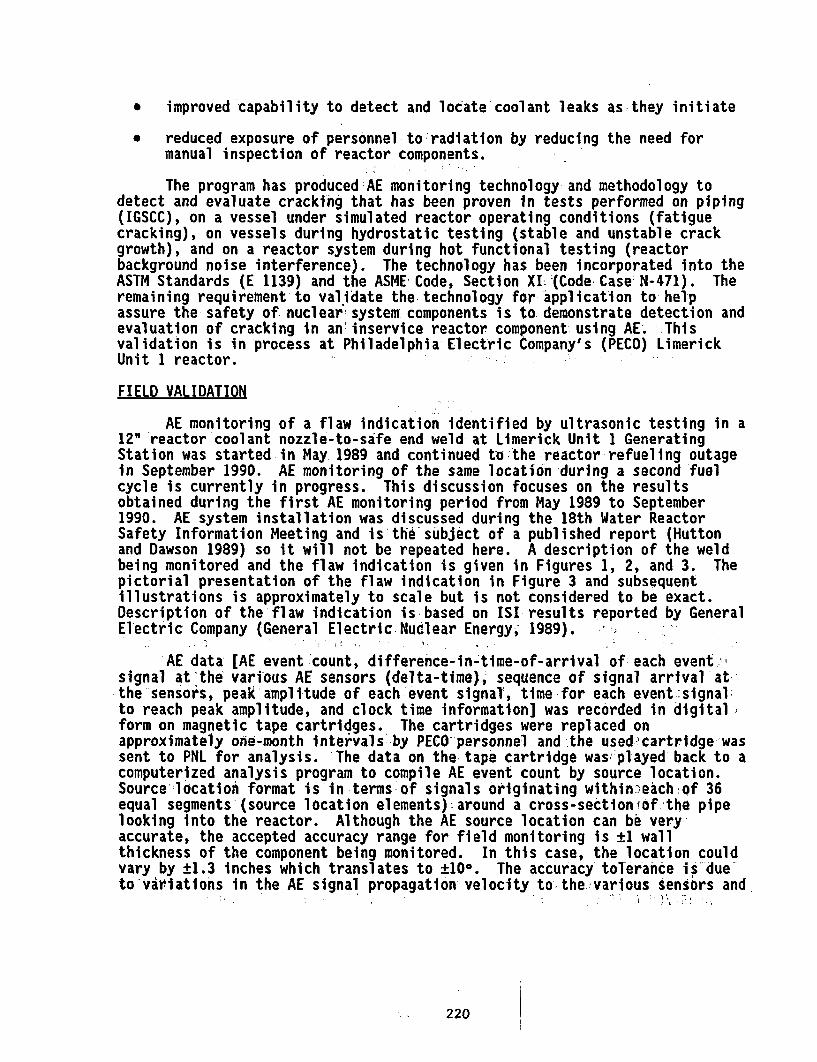
* improved capability to detect and locate coolant leaks as they initiate
* reduced exposure of personnel to radiation by reducing the need formanual inspection of reactor components.
The program has produced AE monitoring technology and methodology todetect and evaluate cracking that has been proven In tests performed on piping(IGSCC), on a vessel under simulated reactor operating conditions (fatiguecracking), on vessels during hydrostatic testing (stable and unstable crackgrowth), and on a reactor system during hot functional testing (reactorbackground noise interference). The technology has been incorporated into theASTM Standards (E 1139) and the ASME Code, Section XI (Code Case'N-471). Theremaining requirement to validate the technology for application to helpassure the safety of nuclear' system components is to demonstrate detection andevaluation of cracking in an inservice reactor component using AE. Thisvalidation is in process at Philadelphia Electric Company's (PECO) LimerickUnit 1 reactor.
FIELD VALIDATION
AE monitoring of a flaw indication identified by ultrasonic testing in a12" reactor coolant nozzle-to-sife end weld at Limerick Unit 1 GeneratingStation was started in May 1989 and continued to the reactor refueling outagein September 1990. AE monitoring of the same location 'during a second fuelcycle is currently in progress. This discussion focuses on the resultsobtained during the first AE monitoring period from May 1989 to September1990. AE system installation was discussed during the 18th Water ReactorSafety Information Meeting and is th6 subject of a published report (Huttonand Dawson 1989) so it will not be repeated here. A description of the weldbeing monitored and the flaw indication is given in Figures 1, 2, and 3. Thepictorial presentation of the flaw indication in Figure 3 and subsequentillustrations is approximately to scale but is not considered to be exact.Description of the flaw indication is based on ISI results reported by GeneralEl'ectric Company (General Electric Nuclear Energy, 1989).
AE data [AE event 'count, difference-in-time-of-arrival of each event",signal at'the various AE sensors (delta-time), sequence of signal arrival atthe sensors, peak amplitude of each'event signal', time for each event-signal.to reach peak amplitude, and clock time information] was recorded in digitalform on magnetic tape cartridges. The cartridges were replaced onapproximately one-month intervals'by PECO'personnel and the used- cartridge wassent to PNL for analysis. -The data on the tape cartridge was'played'back to acomputerized analysis program to compile AE event count by source location.Source' location format is in terms of signals originating within eachiof 36equal segments.(source location elements)laround a cross-sectionfof'the pipelooking into the reactor. Although the AE source location can be veryaccurate, the accepted accuracy range for field monitoring is ±1 wallthickness of the component being monitored. In this case, the location couldvary by ±1.3 inches which translates to ±100. The accuracy-toTerance is-dueto viaiatlons in the AE signal propagation velocity totthe various lensors and
220
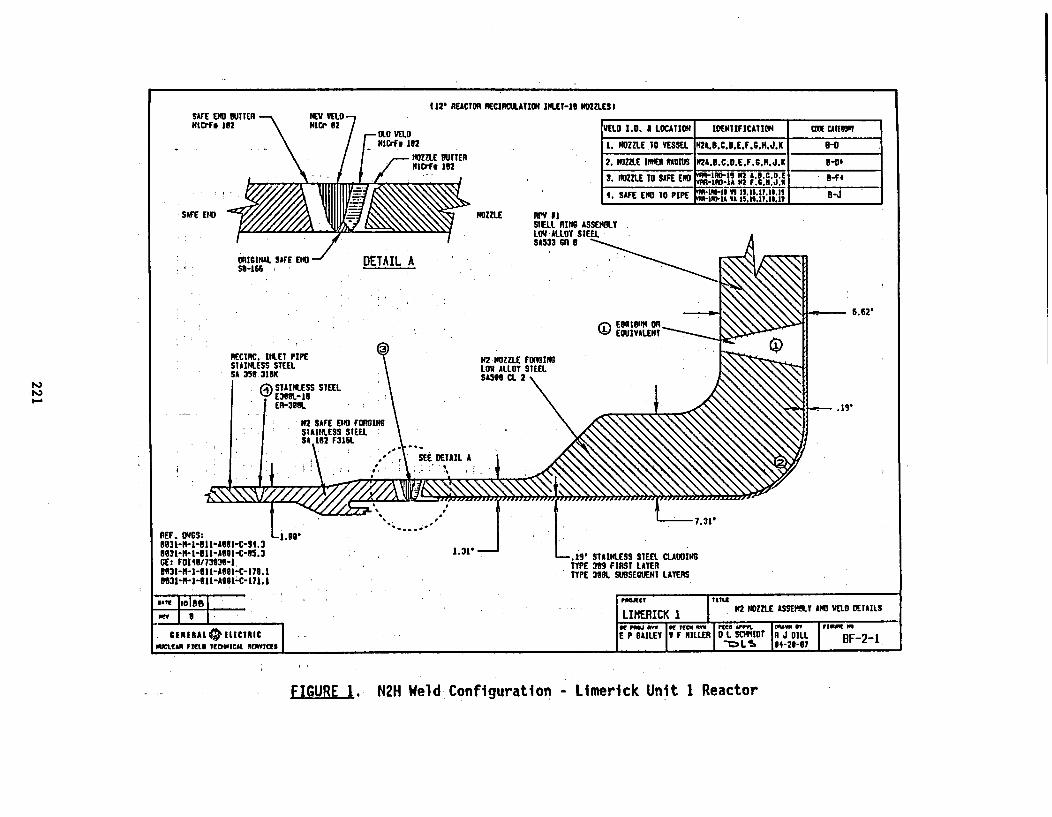
t 12 REACTOR RECIRCUAtIlN INLET-1l NOZZLES I
VELO I.D. A LOCATION | IDENtIFICATION CIE ltEWt
1. NOZZLE 10 VESSEL RN24A.in.C.O..F.S6.NMd 8-O
2. NOZME IN" RAIUSM RZA.B.C.D.E.F.B.H.J.K 8-0*
3. NOZZLE TO SAFE ENO Y N2 t 8 9 J .- F____________ _ SIFE ErOIOPIPE -1A _ _ ________-
14. SAFE ENO 1O PIPE ii,5: 1: I ", IT.ISlt
SAFE NOZZLE arv 11511ELL INIGS ASSEMOLYL0ll ALLOY STEEL
^A323 6n 0
; .
REF. DUGS: Li.6031-M-1-BI1I-AOII-C-SU.8031-H-1-BI1-AIVI-C-85.3GE: F0118/73030-I8e3l-n-1-0l1-AIlI-C-171 1
N31-M-1-1U-AfI-^C-17. I
GENEnAL I 4e ELCtRICPMEAR FKLt T(UICAL S.. .ICES _
L..19 STAINLESS SEEL CLADDINGTYPE m FIRST LAYERTYPE 38L SU0SEOUENT LAYERS
rpct -
LIMERICK 1_tlLS
N2 NOZZLE ASSEMOLT AND VELD DETAILS
I rr M N I ((CS i. 1 5'9I I SF -2 -1_E P 0UILEV IV F NILLER ID L SC#IIt J DILL 8F-2-1
II I -7 11L4-23-81 I "":
FIGURE 1.- N2H Weld Configuration - Limerick Unit 1 Reactor
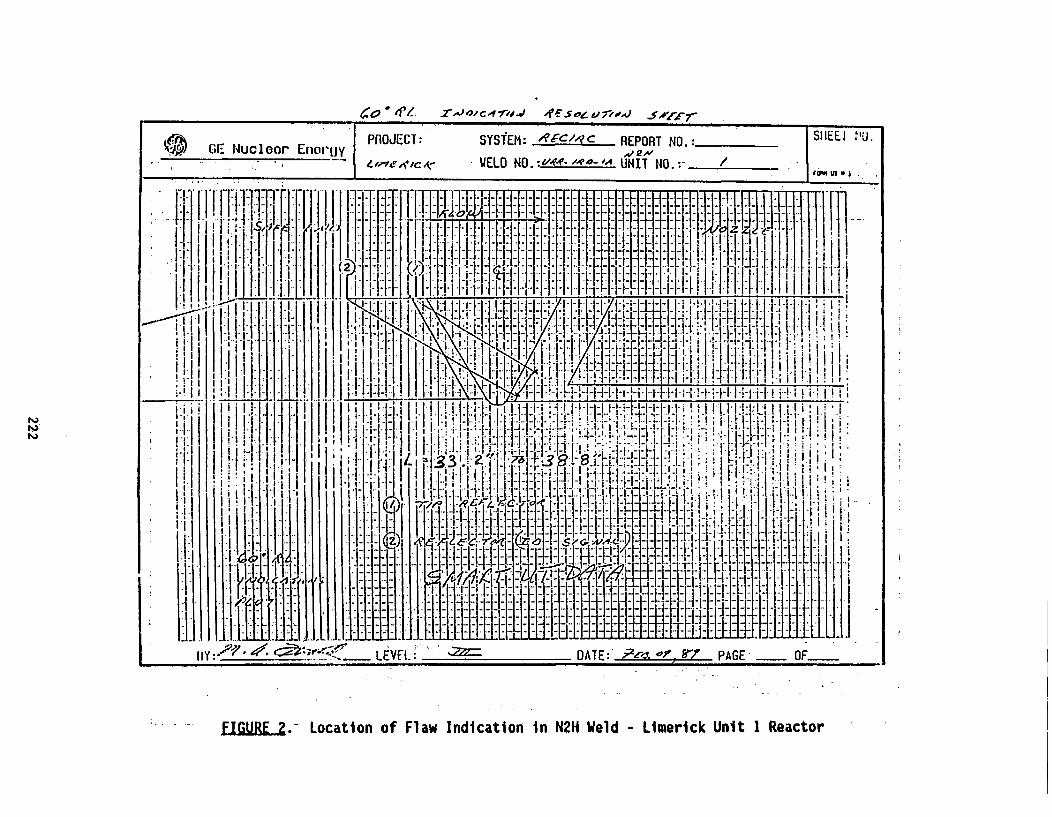
___ GE Nuclor' EnorJy{PROJECT: SYSTEM: 4-c4/c REPORT NO.: S__EEi____
j GE§ Nucflear'iY~ j 1'u~TY~~ EnI -y, iif2HWF R. r- .e .- ,f -- ds- WELD N.a-8f' UNIT NO.:- ........ ,wl
I-- - ---- - - - --i
III
-Xl~~~~ll3i1t:'l
LEM I I'. ~l*1 R~C Ile Ir' PAEIOU11 I i,. -A . .t
h~I4 1
1- .- FIGURE2.- Location of Flaw Indication in N2H Weld - Limerick Unit 1 Reactor
I:
2700 - - 900
-I R91 100732
1w EM Crack Size per ISI - 2/89
I .
1800 '
- .I ,
.I ,
r . A
Pipe Cross Section Showing Profile of flawFebruary 1989 - N2H Weld at Limerick Unit
Indicated by UT in1 Reactor
223
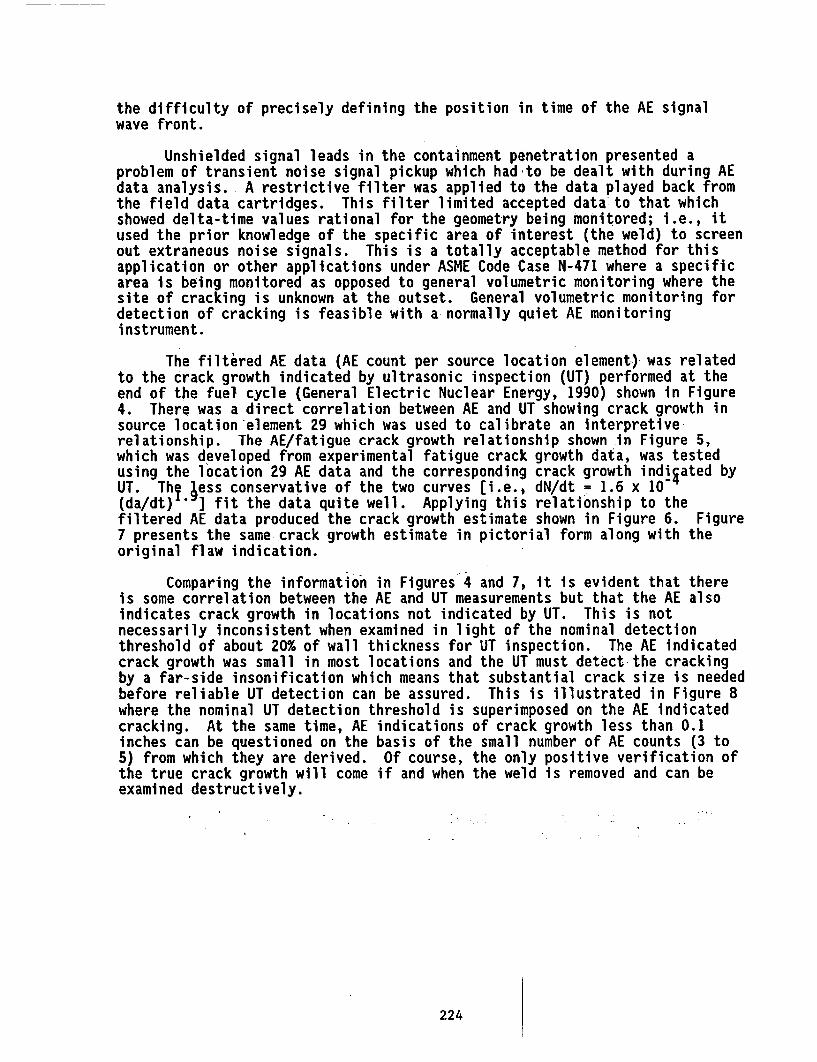
the difficulty of precisely defining the position in time of the AE signalwave front.
Unshielded signal leads in the containment penetration presented aproblem of transient noise signal pickup which had to be dealt with during AEdata analysis. A restrictive filter was applied to the data played back fromthe field data cartridges. This filter limited accepted data to that whichshowed delta-time values rational for the geometry being monitored; i.e., itused the prior knowledge of the specific area of interest (the weld) to screenout extraneous noise signals. This is a totally acceptable method for thisapplication or other applications under ASME Code Case N-471 where a specificarea is being monitored as opposed to general volumetric monitoring where thesite of cracking is unknown at the outset. General volumetric monitoring fordetection of cracking is feasible with a normally quiet AE monitoringinstrument.
The filtered AE data (AE count per source location element-) was relatedto the crack growth indicated by ultrasonic inspection (UT) performed at theend of the fuel cycle (General Electric Nuclear Energy, 1990) shown in Figure4. There was a direct correlation between AE and UT showing crack growth insource location element 29 which was used to calibrate an interpretiverelationship. The AE/fatigue crack growth relationship shown in Figure 5,which was developed from experimental fatigue crack growth data, was testedusing the location 29 AE data and the corresponding crack growth indiated byUT. Thy less conservative of the two curves [i.e., dN/dt = 1.6 x 10-(da/dt) ] fit the data quite well. Applying this relationship to thefiltered AE data produced the crack growth estimate shown in Figure 6. Figure7 presents the same crack growth estimate in pictorial form along with theoriginal flaw indication.
Comparing the information in Figures 4 and 7, it is evident that thereis some correlation between the AE and UT measurements but that the AE alsoindicates crack growth in locations not indicated by UT. This is notnecessarily inconsistent when examined in light of the nominal detectionthreshold of about 20% of wall thickness for UT inspection. The AE indicatedcrack growth was small in most locations and the UT must detect the crackingby a far-side insonification which means that substantial crack size is neededbefore reliable UT detection can be assured. This is illustrated in Figure 8where the nominal UT detection threshold is superimposed on the AE indicatedcracking. At the same time, AE indications of crack growth less than 0.1inches can be questioned on the basis of the small number of AE counts (3 to5) from which they are derived. Of course, the only positive verification ofthe true crack growth will come if and when the weld is removed and can beexamined destructively.
224
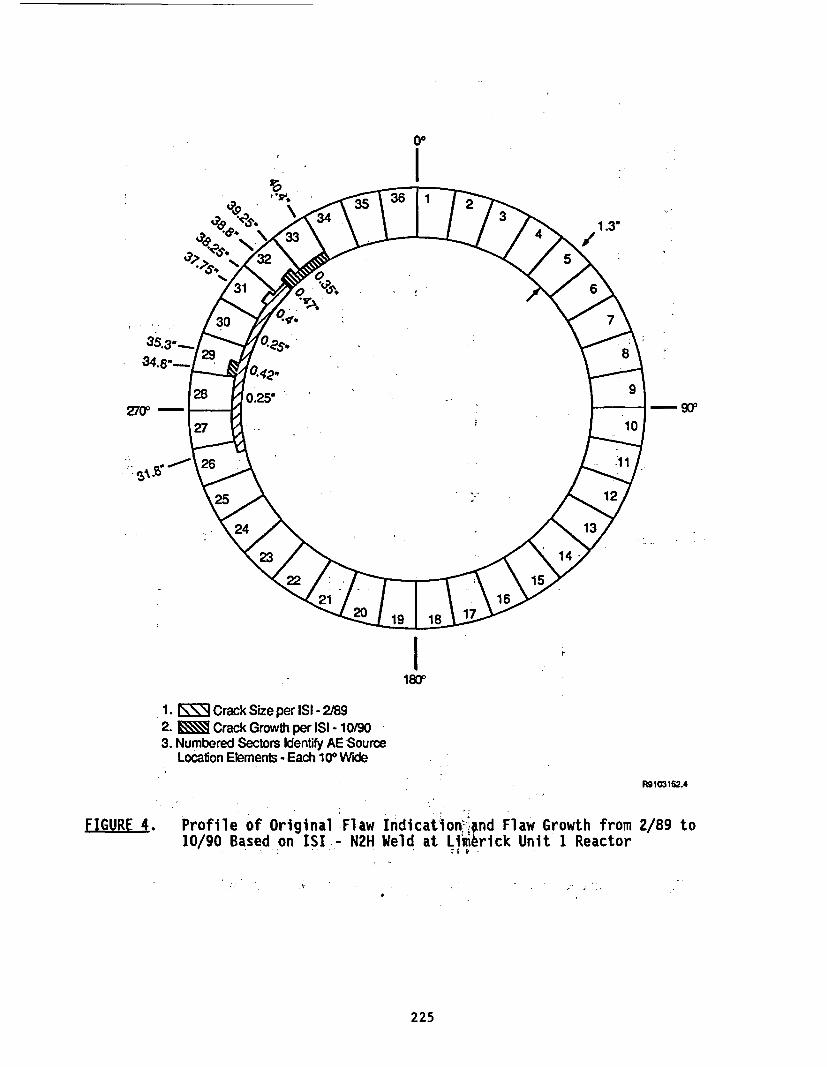
l
I18O7
1. I E Crack Size per ISI - 2/892. Crack Growth per ISI -10/903. Numbered Sectors Identify AE Source
Locaton Elements -Each 100 Wide
FIGURE 4. Profile of Original Flaw10/90 Based on ISI - N2H
R9 103162.4
Indication ,,nd Flaw Growth from 2/89 toWeld at Lrimerick Unit 1 Reactor
i , to
225
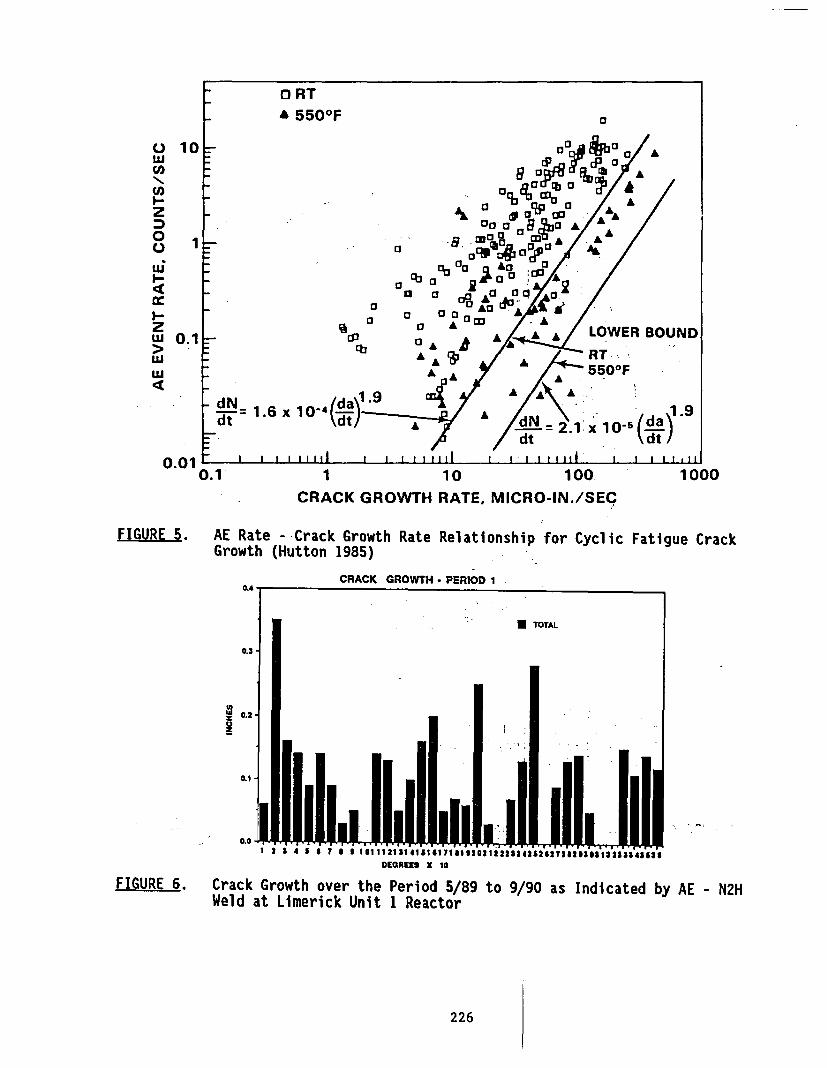
O RTA 5500 F a
0C.,
Ca
z
0C.)UJ
zLU
UlL
10
1
0.1
a,
a
aaa
a a
I aC I .
LOWER BOUNDa
a AA . /,- RT
5500 FAA
- dN= 1.6 xA A* /\ */dN= 2.1 x
/ dt
1.910-5 d
(dt/)- , ,,,-) ,
0.01 I I I ,, , 1, I I I, I II It I t I II III I I I I I .11
D. 1 1 10 100 1000
CRACK GROWTH RATE, MICRO-IN./SEC
FIGURE 5. AE Rate - Crack Growth Rate Relationship for CyclicGrowth (Hutton 1985)
Fatigue Crack
CRACK GROWTH- PERIOD 1
IAUJ
FIGURE 6.DEGREEn X 1O
Crack Growth over the Period 5/89 to 9/90 as Indicated by AE - N2HWeld at Limerick Unit 1 Reactor
226
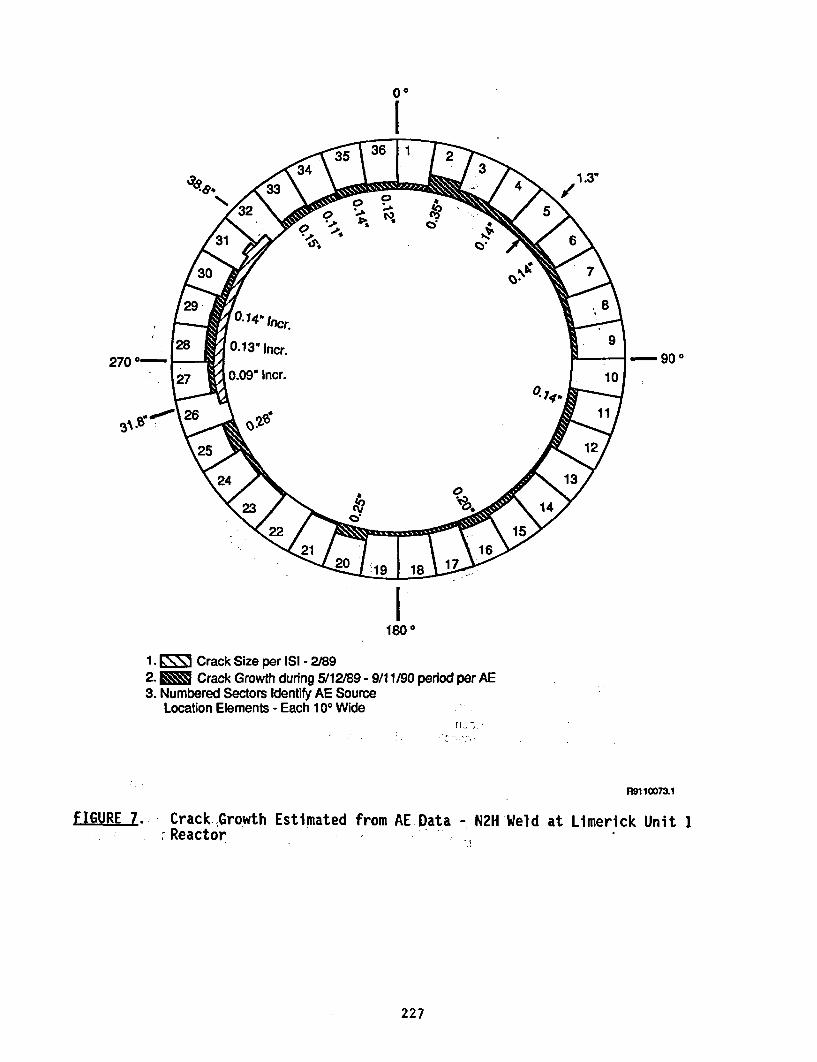
lo
270 °- g90o
3s.'r'
I1180 0
1. 1 Crack Size per ISI - 2/892. Crack Growth during 5/12/89 - 9/11/90 period per AE3. Numbered Sectors Identify AE Source
Location Elements - Each 100 WideX i.!
R91 10073.1
FIGURE 7.:; Crack.Growth Estimated from AE Data - N2H Weld at. Reactor
Limerick Unit 1
227
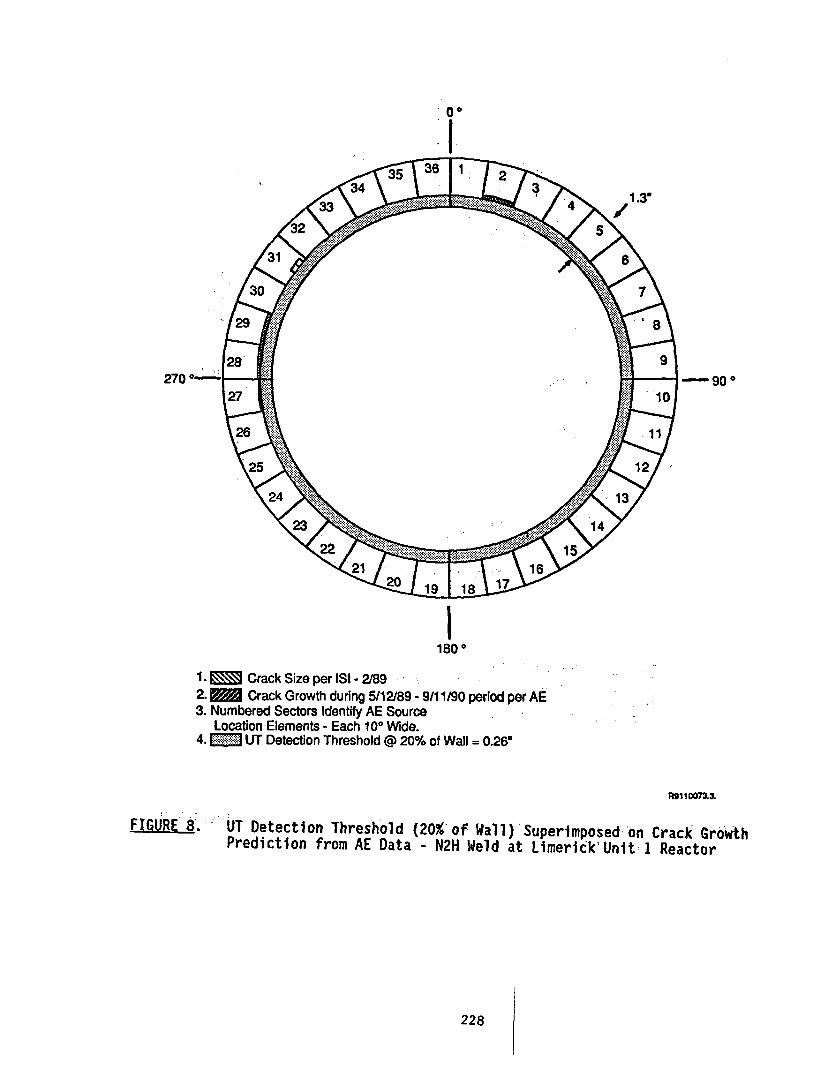
270 0 90 0
27 10
1800
1. Crack Size per ISI - 21892. Crack Growth during 5/12189 - 9/11/90 period per AE3. Numbered Sectors Identify AE Source
Location Elements - Each 10° Wide.4. UT Detection Threshold @ 20% of Wall = 0.26
IW11OO73 1
FIGURE . 'UT Detection Threshold (20% of Wall) Superimposed on Crack GrowthPrediction from AE Data - N2H Weld at Limerick Unit l Reactor
228
-
A crack-arrest-verification-specimen (CAVS)-assembly previously used atPeach Bottom 2 reactor was installed at Limerick Unit 1 to provide theofficial basis for estimating growth of the flaw indication in Weld N2H duringreactor operation. Basically, the CAVS system exposes a fracture mechanicsspecimen of appropriate material to the reactor coolant water. The specimenis loaded externally with the intent of simulating the stress present aroundthe flaw indication and a potential drop method is used to measure resultingcrack growth. Results from the CAYS system surveillance indicated a crackgrowth rate of 0.026 inches/year (Ranganath and Hale 1990).
Comparing the three surveillance methods on a common basis of maximumcrack rate Per year indicated: UT shows 0.38", AE shows 0.28", and CAVS shows0.026". It is evident that the UT and AE indications are in reasonably goodagreement, while the CAYS prediction is about an order-of-magnitude lower.
The first AE monitoring period at Limerick Unit 1 has been very valuableto the AE development effort - it has permitted demonstration that an AEsystem can be installed on an operating reactor, that noise problems can beovercome and coolant flow noise is not a problem, and that meaningful data canbe obtained. PECO deserves high marks for their progressive attitude inmaking this opportunity available, and it goes without saying that thecontinued support of NRC-RES is invaluable.
REPORTS
The final report for the AE/Flaw Characterization Program was publishedin October 1991. The report is titled:
NUREG/CR-5645Final ReportACOUSTIC EMISSION/FLAW RELATIONSHIPSFOR INSERVICE MONITORING OF LWRs-
SAFT-UT
INTRODUCTION
A major multi-year program has been conducted to provide the engineeringnecessary to make the synthetic aperture focusing technique (SAFT) a real-timesystem, engineer a field prototypic system, provide field validation of thetechnology, and move the technology into the field for the purpose ofinspecting light water reactor components. This phase of the work has beenperformed at PNL under support from the U.S. Nuclear Regulatory Commission,office of Nuclear Regulatory Research. The benefits to the NRC from thisprogram are:
* improved reliability of flaw detection and
229
* more accurate characterization (sizing)-of flaws in structuralcomponents
The program goals are nearing completion. A field-portable system hasbeen developed and undergone extensive validation testing. The final fieldvalidation testing was conducted this year through participation in the PISCIII Full Scale Vessel Test. The SAFT technology was successfully transferredto another commercial inspection vendor. The SAFT technology is beingincorporated into the ASME Section V Code through a new appendix for computer-based UT systems. The details of these activities are described in theremainder of this paper.
PISC-II FSV
The decision was made to evaluate the SAFT-UT technology in a series ofblind tests. One of the tests selected was the PISC-III Full-Scale Vessel(FSV) Test located in Stuttgart, Germany at the Materialpruefungsanstalt (MPA)Laboratory that involved the characterization of 12 indications in a full-scale reactor pressure vessel.
During December 1990, three PNL staff traveled to Stuttgart and spent 11days performing inspections on the FSV. Eight of the inspection zones wereexamined from both the inside and the outside surfaces of the reactor vessel.In these examinations, there were over 650 Mbytes of data collected. Theinspections included 00, +450, +600, +700, and tandem SAFT. The data was notanalyzed in Germany, but was shipped back to PNL for this evaluation.
Field trip notes were developed during the course of the testing at theMPA site. These notes were recorded on a PC to document the activities thatoccurred during the testing. This turned out to be'very useful because therewere a number of confusing points that these detailed notes clarified.
There were a number of things that were learned in this exercise. TheSAFT system, in general, performed very well; but there were several areasthat were found where improvements were needed. The most important of whichwas that the header for the files needed to be changed to accommodate thesizes of numbers to cover the dimensions of a full-sized reactor pressurevessel.
During January the SAFT equipment was returned to the United States.Upon arrival the equipment was set up and checked out to determine itscondition.' Several minor problems were encountered and some maintenance wasperformed on the scanner.
All 650 Mbytes of data were methodically analyzed, The analysis wasperformed by first evaluating the data from the clad surface, followed by thedata from the unclad surface, and then evaluating the data combined. Thisapproach allowed us to learn more from the data evaluation and gave us theopportunity to determine optimum inspection combinations.
230
During the analysis, it became apparent that the amount of data to beanalyzed was substantially more than had been analyzed previously for anyother inspection. In other examinations, most'of'the scanned material wereblank, but in this case every area scanned had substantial numbers ofindications. One conclusion from this exercise is that improvements to thesystem are needed to facilitate handling of large data sets.
Another result from the data analysis was that the UT responses obtainedfrom the various directions and inspection conditions lead to differentconclusions about how to interpret the indication'.' Consequently,' a decisionwas needed as to which signals and interpretation to believe. Every attemptwas made to follow the rules that had been estiblished from previous work, butthere were many instances of ambiguity associat-ed with the interpretation. Inthese cases', a decision was reached by looking atlthe strength of the signals(top tip signal amplitude versus bottom tip amplitude), or recognizing thatvolumetric indications should be detected during a normal beam scan,' etc. Thetandem scans'were very useful in determining if an indication was surfaceconnected or if two signal tips were from a single indication or two differentindications.
At the'completion of the analysis, the results were reviewed by severalknowledgeable PNL staff to ensure that nothing was overlooked in theevaluation and to confirm the flaw size estimatesg. The SAFT inspectionresults were provided to the JRC at Ispra, Italy." Overall the results werefelt to be good, but there were difficulties in interpreting the data. Thiswas due, in part, to the-number of indications in-each of the zones examined,and the fact that defects have'a large''range of scattering'properties. Someindications were easy to interpret, but others were quite complex and did notfit simple models.
Validation of the first analysis must await 'the destructive examinationof each inspection zone. The destructive examination results are not expected'tolbe available for correlation with the SAFT data until the later part of1992. ' "
TECHNOLOGY TRANSFER ''
This has been a driving force of the program at PNL from the start. Anumber of'decisions were made to'ensure that'the-program would-be successful'in moving the technology from PNL to the commercfal nuclear industry.- Todate, PNL has transferred the SAFT technology-to'-tombustion Engineering and'Sandia National Laboratory. During this year, the SAFT technology wassuccessfully transferred to the'General Electric'"Co. (GE). GE is evaluatingthe SAFT technology for inclusion in the'nextIgeneration of reactor'pressurevessel inspection systems that they'intend 'to build.
PNL has also had discussions with Dynacon to transfer the SAFT-technology to them to become another processing option of the UDRPS system.This will be one of the activities to be pursuedduring the next fiscal year.
231
SECTION V
Proactive participation in ASME Section v Subcommittee activitiescontinued toward achieving ASME Code adoption of NRC-funded research resultsto improve the reliability of nondestructive examination. (NDE) and'inservice.inspection (ISI). The objective of this task is to develop and promulgateupgraded criteria and requirements within the Section V Code book.
Proposed new Code requirements are'being drafted to encourage broaderutilization, ofthe SAFT technology developed under NRC-sponsored researchprograms at PNL and the University of Michigan. These requirements weresubmitted to the ASME Section V Subgroup on Ultrasonic Testing (SGUT) tofulfill the need for Code rules to cover the computerized UT imaging systemsthat are being utilized by the NDE/ISI'industry to examine critical nuclearpower plant components. These proposed new requirements are organized tospecify general requirements for computerized imaging systems, plus specificrequirements covering calibration, SAFT-UT, LSAFT, broadband holography, andUT-phased arrays.
The major attribute of computerized imaging techniques (CITs) is theireffectiveness when used to characterize and evaluate indications; however,CITs may also be used to perform the basic scanning functions required forflaw detection.. Computer-processed data analysis and display techniques areused in conjunction with automated scanning mechanisms to produce two- andthree-dimensional images of flaws which provides an enhanced capability forexamining important components and structures. Computer-graphics processes'-can then be used, to quantitatively evaluatethe type, size, shape, location,and orientation'of flaws detected by ultrasonic testing or other NDE methods.Computerized imaging techniques should be qualified in accordance with therequirements for flaw detection and/or sizing (as applicable) that arespecified in Appendix VIII of Section XI.
The written procedures for CIT applications should identify the specifictest frequency and bandwidth to be utilized. In addition, such proceduresshould identify the signal processing algorithms, should include explicitguidelines for image interpretation, and should identify the softwarecode/program version that is used. This information should be documented foravailability when these functions must be accurately repeated at alater timeif, and when, necessary. Calibration of CITs should'be conducted inrsuch amanner that the gain levels are optimized for imagjng purposes. The'traditional DAC-based calibration processes may also be required to establishspecific scanning and/or flaw detection sensitivity levels.
In conjunction with the development of this text, two special ultrasonictest blqcks were designed, fabricated, and evaluated. The purpose ofithese,.,mild steel blocks is to evaluate the lateral and-depth resolution-ofSAFT-typesystems. The key design features of these blocks were then incorporated intothe proposed -T-435 writeup to describe calibration requirements for SAFT-type,computerized UT imaging systems. These proposed new requirements for Article4 of ASME Section V were formally approved by the SGUT in mid-Jp91, and werethen 'submitted for Subcommittee V consideration. formal Subcommittee'approval
232

was deferred to provide adequate time for review of additional SGUT revisionsand detailed descriptions of newly developed lateral and depth resolutionblocks. This proposed T-435 package received favorable consideration duringthe November 1991 Code meetings and is expected to receive formal Subcommitteeapproval during the Section V meetings scheduled for November 1991 andFebruary 1992.
Extensive discussions have occurred regarding performance demonstrationand the division of responsibilities between ASME Code Sections V and XI.This has not been resolved, and a number of proposals are being discussed.
REFERENCES
General Electric Nuclear Energy. 1989. Limerick Generating Station Unit 1Inservice Inspection Report No. 89-003.
General Electric Nuclear Energy. 1990. Limerick Generating Station Unit 1Inservice Inspection Report No. D-3001-4.
Hutton, P. H., R. J. Kurtz, M. A. Friesel, J. R. Skorpik, and J. F. Dawson.1991. Final Report - Acoustic Emission/Flaw Relationships for InserviceMonitoring of LWRs, NUREG/CR-5645. Prepared for the U.S. Nuclear RegulatoryCommission. Pacific Northwest Laboratory, Richland, Washington.
Hutton, P. H. and J. F. Dawson. 1989. Limerick Unit I Generating StationMod. No. 043-002. Inservice Pipe Weld Monitoring Using the Acoustic EmissionMethod - Acoustic Emission System Installation. Battelle Northwest, Richland,Washington.
Hutton, P. H., R. J. Kurtz, R. A. Pappas, J. F. Dawson, L. S. Dake, and J. R.Skorpik. 1985. Acoustic Emission Results Obtained from Testing the ZB-1Intermediate Scale Pressure Vessel. NUREG/CR-3915. Prepared for the U.S.Nuclear Regulatory Commission. Pacific Northwest Laboratory, Richland,Washington.
Ranganath, S. and D. A. Hale. 1990. Structural Evaluation of the Indicationin the Limerick 1 Recirc. Inlet Nozzle N2H Safe End Weld. General ElectricNuclear Energy.
233
AGING STUDIES OF IE POWER AND REACTOR PROTECTION SYSTEMS,AND TRANSFORMERSa
J. L. Edson, V. Sharma, and E. W. Roberts
Idaho National Engineering LaboratoryEG&G Idaho, Inc.
Idaho Falls, ID 83415-2406
I
I
ABSTRACT -
Previous 1E power and Reactor Protection System Phase Iaging studies have shown that a significant percentage of failuresare not being detected by planned inspection, surveillance andmonitoringmethods (IS&MM). This paper presents a Phase II studythat was performed to determine the effectiveness of currentIS&MM, identify the risk significant 1E power system components,and identify additional IS&MM that may effectively supplementcurrent practices. In addition, a Phase I aging study of 1E powersystem transformers was performed to identify stressors andfailure mechanisms, investigate whether transformers are showingsigns of increased failure rates as they grow older, and todetermine if current surveillance methods are effective in-mitigating aging effects.
r:
! '4
a. Work performed by the U.S. Nuclear Regulatory Commission, Office ofResearch, under DOE Contract No. DE-AC07-76ID01570. !
235
INTRODUCTION'
The Phase II aging study of the IE Power and Reactor Protection System(RPS) has focused on determining the effectiveness of current IS&MM;identifying the risk significant lE power system components; and theidentification of additional IS&MM that may effectively supplement currentpractices. In addition, a Phase I aging study of power transformers wasperformed to identify stressors and failure mechanisms, investigate whethertransformers are showing signs of increased failure rates as they grow older,and to determine if current surveillance methods are effective in mitigatingaging effects.
Phase I aging studies have previously been performed for the lE powersystem and the RPS as documented in NUREG/CR-5181 and NUREG/CR-4740,respectively. These studies showed that a significant percentage of failuresin both systems are not being detected by planned (routine) IS&MM but ratherby incidental (nonroutine) activities. This finding led to the conclusionthat additional studies should be performed to further investigate theeffectiveness of current IS&MM and identified methods that may improve theearly detection of these failures.
The following sections of this paper discuss the studies that wereperformed for the 1E power system, the RPS, and transformers. Each sectionincludes a brief description of the system or component, the methodologyfollowed, and the results specific to the component or system. A discussionof an in-plant study of.IS&MM that may supplement current IS&MM'is thenpresented..
1E POWER SYSTEM AND TRANSFORMERS
1E POWER SYSTEM
A typical nuclear power station electrical diagram is shown in Figure 1.Each individual plant will have its own detailed lE'system configurationdesigned to meet particular needs, though the general setup shown here istypical.
The 1E power system covered by this aging study is shown within thedashed line area and includes the power distribution to all the safetysystems. The following subsystems are included in this study:
* Plant alternating current (ac) power systems (PAC)
* Vital instrument ac power systems (IAC)
* Direct current (dc) power systems (DCP)
* Emergency power systems (EMP).
lThis ~tudy does not include the unit generators and their bUses,generator breaker, startup transformers, connections to the station'
236
switchyard, switchyard, transmission lines, or the offsite transmissionnetwork because they are outside the 1E power system boundary.
In general, actuated components are considered to be part of anothersystem and are not within the boundaries of this study. For example, thehigh-pressure injection (HPI) pump motor, powered by the vital bus "1A,".wouldbe a part of the HPI system, not the 1E system.
As shown in Figure 1, the breaker feeding vital bus "lA" is consideredthe dividing point between the nonsafety power supply and the safety-relatedpower supply (Class IE). Each vital bus can range in voltage from 4,160 to13,800 Vac, depending upon the nuclear steam supply system (NSSS) vendor andthe specific plant design. The number of buses ranges from at least two tofour, with one bus or a set of buses grouped in a separate train or channel.Each of these buses will have an emergency diesel generator (EDG) attached incase of bus failure. The EDG and its support components are classified as theemergency power (EMP) subsystem in this report.
This main vital bus (vital bus "1A"), feeds at least two secondary vitalbuses, vital bus "lAl," and "1A2." Each of these secondary vital buses feedsa vital load center such as the motor control center (MCC). Both thesecondary vital buses and the MCC buses are rated from 208 to 600 Vac. Themain and secondary vital buses, along with the vital load center buses (thelatter which runs the battery chargers) are classified as part of the PAC,subsystem.
Battery chargers and battery banks (with ratings of 125 to 250 Vdc)combine with dc control buses to comprise the dc power subsystem. The numberof banks varies widely according to plant specific design; there are at leasttwo banks per train/channel, though many designs call for three or four banks.
Inverters and vital instrument buses comprise the IAC subsystem, whichis usually rated at 125 Vac. The buses normally receive power from the vitalload center buses and use batteries as an emergency backup. One function ofthe IAC subsystem is to provide power for the Reactor Protection Systemchannels.
An important aspect of the Class lE system design is its redundancy inregard to operation. Multiple trains/channels can allow component failureswhile retaining system functionality. The many possible cross-ties andinterconnections also protect against total loss of system function.
A flowchart detailing the methodology followed to perform this study isshown in Figure 2. Identified risk significant components were added to anexisting component list (compiled from an evaluation of database records) toprovide a final list of components and failure causes. This list containscomponents that have a significant portion of failures not detected withcurrent, routine IS&MM and is composed of components failing most frequentlyas well as those considered risk significant. The failure causes not detectedby current IS&MM are then identified for both the components that are failing
237
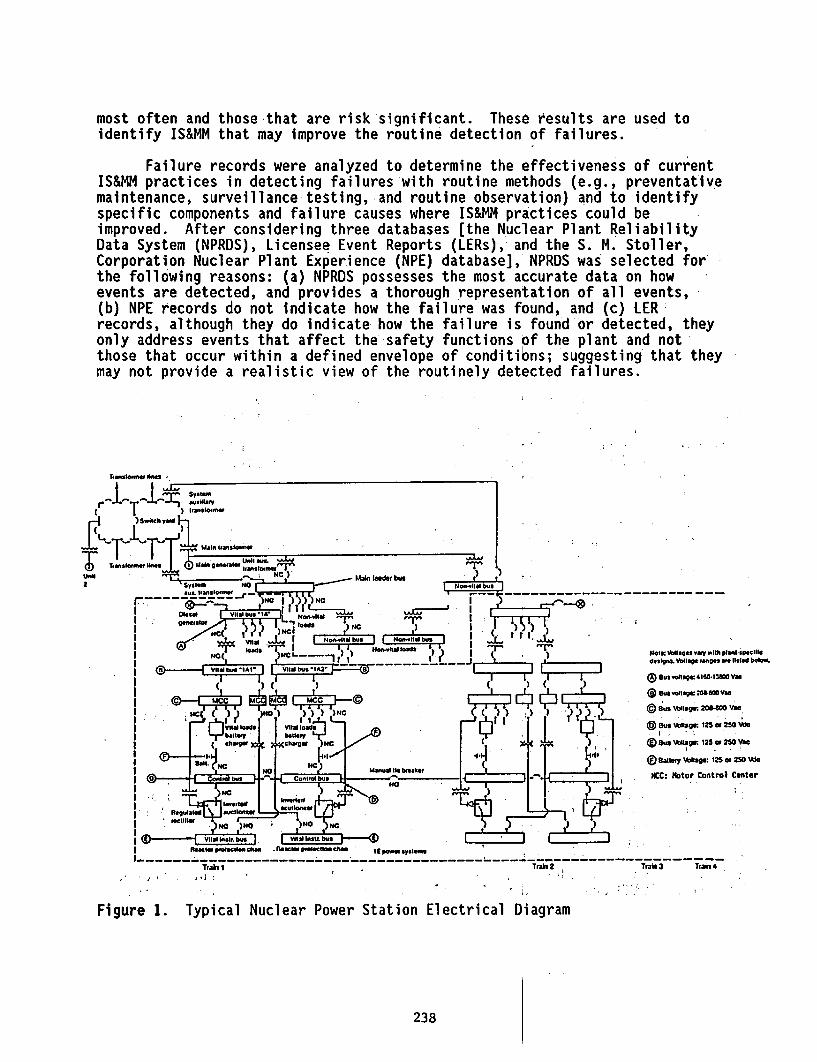
most often-and those that are risk significant. These results *are used toidentify IS&MM that may improve the routine detection of failures.
Failure records were analyzed to determine the effectiveness of currentIS&MM practices in detecting failures with iroutine methods (e.g., preventativemaintenance, surveillance testing,:and routine observation) and to identifyspecific components and failure causes where IS&MM practices could beimproved. After considering three databases [the Nuclear Plant ReliabilityData System (NPRDS), Licensee Event Reports (LERs), and the S. M. Stoller,Corporation Nuclear Plant Experience (NPE) database], NPRDS was selected forthe following reasons: (a) NPRDS possesses the most-accurate data on howevents are detected, and provides a thorough representation of all events,~(b) NPE records do not indicate how the failure was found, and (c) LER:records, although they do indicate how the failure is found or detected, theyonly address events that affect the 'safety functions of the plant and not,those that occur within a defined envelope of conditions; suggesting that theymay not provide a realistic view of the routinely detected failures.
T.,atao~mes sisem
.Marn ,nl.,
SyNC Min feeerlbu
generator I ~ I
.. ~L. J.~ I Hofl.rlM Hu
NC(designs. Veoungemprang , Ott" faictbioe.
@8uVilgdbO&8O~i
I NMCCw MCCbqaka
Cotia bu C,.ol bm .Du*C Nooliffr C2onra25 Cane
I Q BsVIlagi; 25of2lVA
"&. . -… SOW
Figure1. Tyical NclearPowerotatio Electical iagra
238
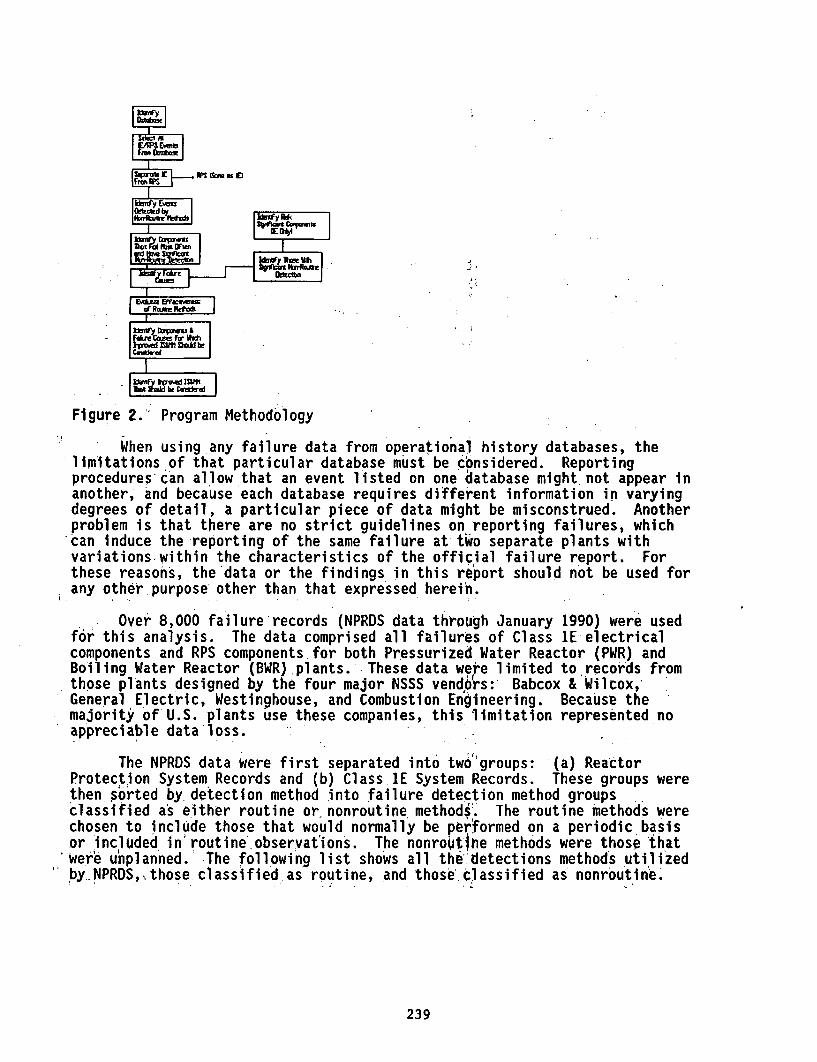
I nIOM k i AdJ I
Figure 2.' Program Methodology
When using any failure data from operational history databases, thelimitations of that particular database must be considered. Reportingprocedures can allow that an event listed on one database might not appear inanother, and because each database requires different information in varyingdegrees of detail, a particular piece of data might be misconstrued. Anotherproblem is that there are no strict guidelines on reporting failures, whichcan induce the reporting of the same failure at two separate plants withvariations within the characteristics of the official failure report. Forthese reasons, the'data or the findings in this report should not be used forany other purpose other than that expressed herein.
Over 8,000 failure records (NPRDS data through January 1990) were usedfor this analysis. The data comprised all failures of Class IE electricalcomponents and RPS components for both Pressurized Water Reactor (PWR) andBoiling Water Reactor (BWR) plants. These data wete limited to records fromthose plants designed by the four major NSSS vendojrs: Babcox & Wilcox,General Electric, Westinghouse, and Combustion Engineering. Because themajority of U.S. plants use these companies, this limitation represented noappreciable data'loss.
The NPRDS data were first separated into two6groups: (a) ReactorProtection System Records and (b) Class IE System Records. These groups werethen sorted by detection method into failure detection method groupsclassified as either routine ornonroutine methodi'. The routine methods werechosen to include those that would normally be performed on a periodic basisor included in'routine'observations. The nonroutine methods were those 'thatwere unplanned. The following list shows all the detections methods utilizedby.NPRDS,\those classified as routine, and those classified as nonroutine.
239
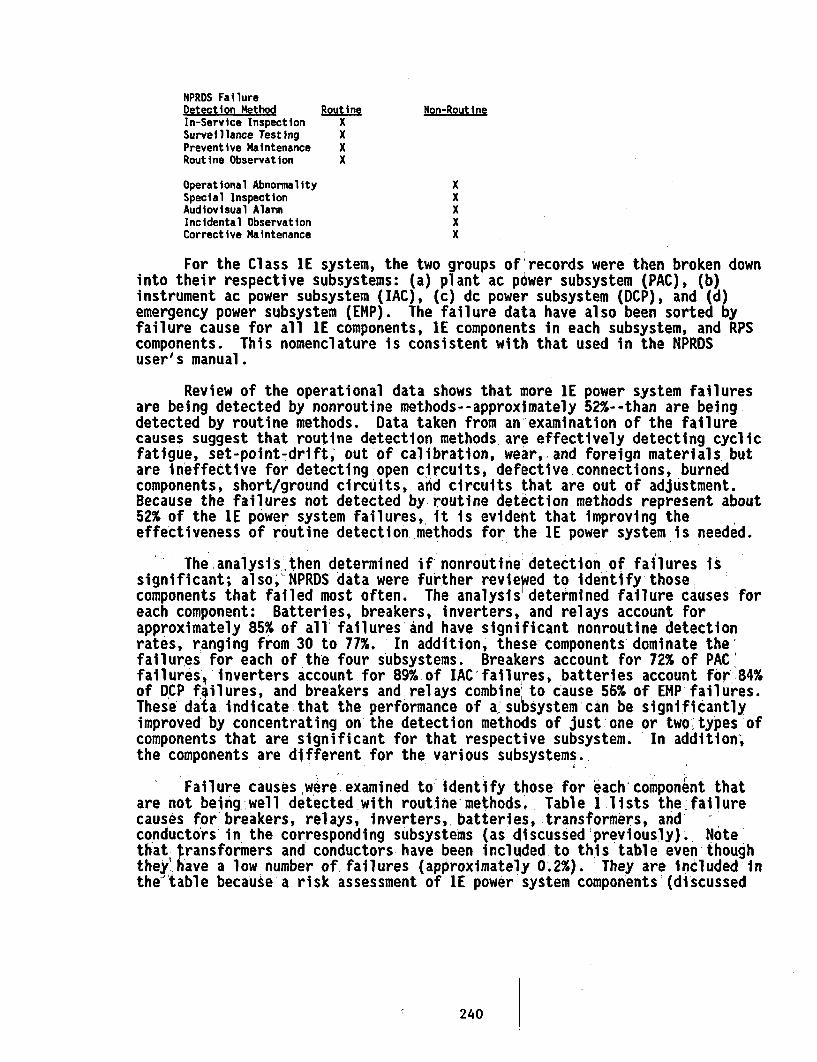
NPRDS FailureDetection Method Routine Non-RoutineIn-Service Inspection XSurveillance Testing XPreventive Maintenance XRoutine Observation X
Operational Abnormality XSpecial Inspection XAudiovisual Alarm XIncidental Observation XCorrective Maintenance X
For the Class lE system, the two groups of'records were then broken downinto their respective subsystems: (a) plant ac power subsystem (PAC), (b)instrument ac power subsystem (IAC), (c) dc power subsystem (DCP), and (d)emergency power subsystem (EMP). The failure data have also been sorted byfailure cause for all lE components, lE components in each subsystem, and RPScomponents. This nomenclature is consistent with that used in the NPRDSuseris manual.
Review of the operational data shows that more 1E power system failuresare being detected by nonroutine methods--approximately 52%--than are beingdetected by routine methods. Data taken from an examination of the failurecauses suggest that routine detection methods are effectively detecting cyclicfatigue, set-point-drift', out of calibration, wear,.and foreign materials, butare ineffective for detecting open circuits, defective connections, burnedcomponents, short/ground circuits, and circuits that are out of adjustment.Because the failures not detected by routine detection methods represent about52% of the WE power system failures, it is evident that improving theeffectiveness of routine detection methods for the lE power system is needed.
The analysis'then determined if' nonroutine 'detection of failures is'significant; also;"NPRDS data were further revieied to identify thosecomponents that failed most often.' The analysis'determined failure causes foreach component: Batteries, breakers, inverters, and relays account forapproximately 85% of all' failures and have significant nonroutine detectionrates, ranging from 30 to 77%. In addition, these components'dominate thefailures for each of the four subsystems. Breakers account for 72% of PAC'failures, inverters account for 89% of IAC failures, batteries account for '84%of DCP failures, and breakers and relays combine to cause 56% of EMP failures.These data indicate that the performance of a-subsystem can be significantlyimproved by concentrating on the detection methods of just one or two' types ofcomponents that are significant for that respective subsystem. In addition,the components are different for the various subsystems.
Failure causes were examined to identify those for each'component thatare not being well detected with routine methods. Table I lists the-failurecauses for'breakers, relays, inverters, batteries, transformers, and'conductors' in the corresponding subsystems (as discussed'previously). Notethat transformers and conductors have been included'to this table even!thoughthey have a low number of failures (approximately 0.2%). :They are includediinthe"'table because a risk assessment of 1E power system components (discussed
240

subsequently) has identified them as making significant contributions to theoverall-plant risk. Table 1 shows that the set of failure causes for eachcomponent differ from one another. This is anticipated because the componentsare dissimilar and perform significantly different functions. However, opencircuit appears for each component and shorted/grounded and burned/burned outappear for more than one component. The most common circuit breaker,nonroutinely detected, failure causes were open circuit, weld related, andout-of-adjustment. Nonroutinely detected failures of inverters were primarilyopen circuits and shorted/grounded, while the largest battery nonroutinefailures were shorted/grounded, open circuit, burned/burned out,normal/abnormal wear, and aging/cyclic fatigue. The most common nonroutinelydetected failures of relays were caused by open circuit, normal/abnormal wear,burned/burned out, and out-of-adjustment. Defective connections, out-of-adjustment, and abnormal stress were the major nonroutine failure causes fortransformers. The dominant failure causes for conductors were insulationbreakdown and short/ground.
The components and nonroutinely detected failure causes identified inTable I either account for a significant number of 1E power-system failures orthe components are significant contributors to overall plant risk. The tablealso provides the basis for identifying inspection, surveillance, andmonitoring methods that have potential to significantly reduce the number of.nonroutinely detected 1E power system failures.
A partial aging risk analysis of the IE Power System was performed todetermine if the aging of a single component or group of components.has asignificant impact on overall risk. The partial aging risk analysis wasperformed by using time-dependent failure rates for selected components ofinterest and constant failure rates for the balance. The nuclear plant PRAwas chosen for prescreening because it is well documented in NRC supported.literature and is familiar to many in the PRA community. Additionally, it hadbeen previously loaded and verified on the Integrated Reliability and RiskAssessment System (IRRAS) software. Expected changes in failure rates as afunction of time as developed by expert opinion were also used for screening;'The Parametric HAZard function Estimation (PHAZE) computer code was used toestimate the time-dependent failure rate of a lE component. Finally, theaging risk, expressed in terms of core damage frequency, was quantified usingthe PHAZE estimate.
The fault trees for the nuclear plant PRA included breakers,transformers, -buses, inverters, rectifiers, and batteries. -The lE ctmponentsdiscussed previously can be related to the nuclear plant PRA-components asshown in Table 2.
Relays and isolation devices were the only major 1E Power Systemcomponents not included explicitly in the PRA. -
Quantification of-a PRA generally involves'-truncation of thosecut setsthatido not contribute significantly to the final core damage frequency--thiswas the-case for the nuclear plant PRA. All cutsets with a probability of
241
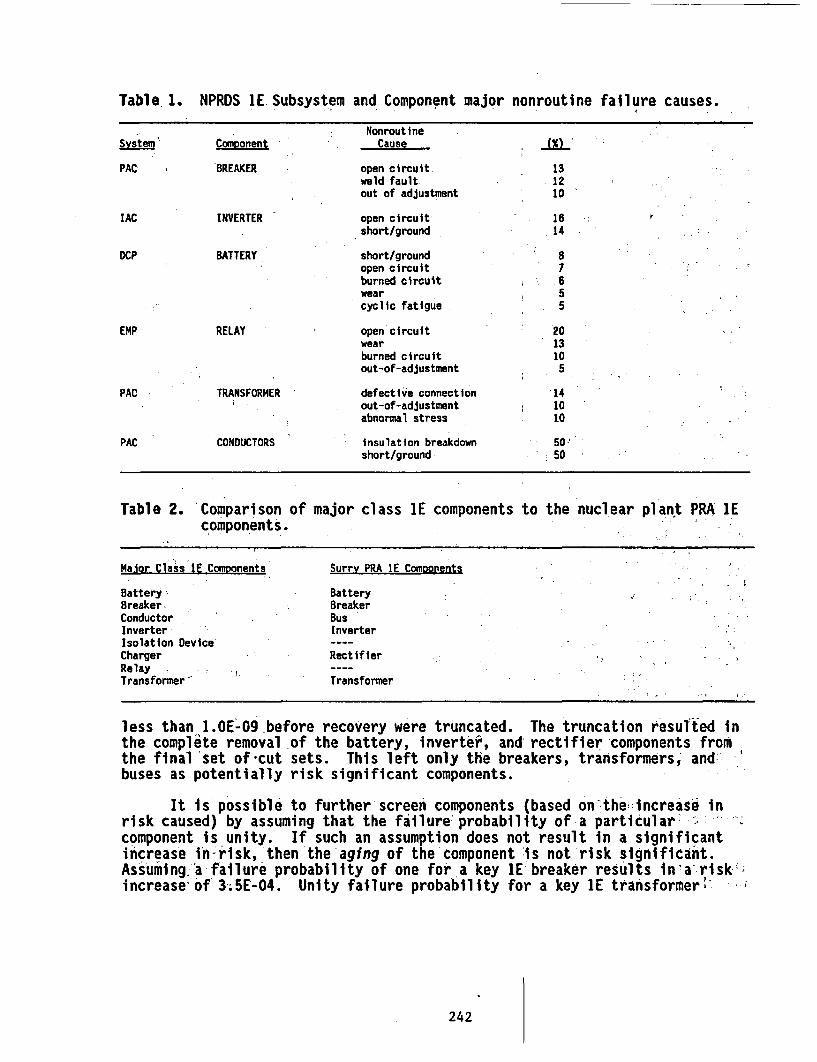
Table l. NPRDS lE.Subsystem and Component major nonroutine failure causes.
NonroutineSvst Comoonent Cause
PAC BREAKER open circuit. 13weld fault 12out of adjustment 10
IAC INVERTER open circuit 16short/ground 14
DCP BATTERY short/ground 8open circuit 7burned circuit 6wear 5cyclic fat.igue 5
EMP RELAY open circuit 20wear 13burned circuit 10out-of-adjustment 5
PAC TRANSFORMER defective connection 14out-of-adjustment 10abnormal stress 10
PAC CONDUCTORS insulation breakdown 50short/ground 50
Table 2. 'Comparison of major class lE components to the nuclear plant PRA 1Ecomponents.
Malor Class 1E Components Surrv PRA IE Components
Battery? BatteryBreaker- BreakerConductor BusInverter- InverterIsolation Device ----Charger RectifierRelayTransformer Transformer
less than 1.OE-O9 before recovery were truncated. The truncation resulted inthe complete removal of the battery, inverter, and rectifier components fromthe final 'set of cut sets. This left only the breakers, transformers, and'buses as potentially risk significant components.
It Is possible to further screen components (based onthe increase inrisk caused) by assuming that the failure probability of a particular' :-component is unity. If such an assumption does not result in a significantincrease in-risk, then the'aging of the component Dis not risk significant.Assuming 'a failure probability of one for a key IE breaker results in a risk-;increase' of 3;5E-04. Unity failure probability for a key IE transformer
242
yields a risk increase of 1.OE-04, and for a key bus yields a risk increase of1.3E-04. Comparing these increases to the total core damage frequency of3.30E-05 indicates that significant increase in failure probability ofbreakers, transformers, and buses could contribute significantly to plantrisk.
The major conclusion drawn from the analysis of the nuclear plant PRA isthat aging of breakers, transformers, and buses has the potential tosignificantly increase core damage frequency. The effect of aging ofinverters, rectifiers, and batteries on core damage frequency is assumed to beinsignificant because these components-are not initially risk significant.This assumption cannot be completely checked without a requantification of thePRA in which these components are not truncated. The requantification wouldbe time intensive and was not performed.
The three components found to be risk significant prior to aging arebreakers, transformers, and buses. It was also found that unity failure ratesfor these components resulted in significant changes in core damage frequency.However, unity failure rates are not expected, therefore, further screening ofthese three components was performed to determine the likely affect ofreasonable aging. The screening was performed by simply applyingthe aging rates determined by expert opinion, as-reported in the TIRGALEXDatabase to the initial failure rates used in the PRA to determine ifsignificant changes occurred as a function of time. The aging rates inTIRGALEX are linear and are reported as failures per hour per year.
The initial failure rates, aging rates, and failure rates at time equalto 40 years are shown in Table 3. The failure rate at 40 years compared to"the initial failure rate has increased by 20% for breakers, 6% for .transformers, and by less'.than 1% for buses. Requantification of the nuclearplant PRA using the failure rates calculated at 40,years resulted in anincrease in core damage frequency of less than 1X, therefore, none of theseincreases causes a significant change in overall'plant risk. To confirm this'conclusion on at least one component, an aging analysis (using operational'data taken from NPRDS), was performed on the component expected to show thegreatest increase, (i.e., the breakers).
Data were collected from the NPRDS databasie'to allow estimation of thefailure rate of breakers as a function of time' Tbe estimate is made using acomputer coded statistical approach as described by Atwood (1990). The neededinputs for the estimation are the in-service date for each breaker,' the periodof time over which failures were looked for, and shJe specific failure times.The data recorded in the NPRDS database are generally more reliable-after1984; therefore the period over which the failures were looked for was thebeginning of 1984 to the end of 1989. If the in-service date was after thebeginning of 1984, then the start of the observation period is adjustedaccordingly.
The NPRDS records for the 63, 4 kV breakers' epresenting 22 units werereviewed to determine which records reflected aging failures. 'The 22 units
243
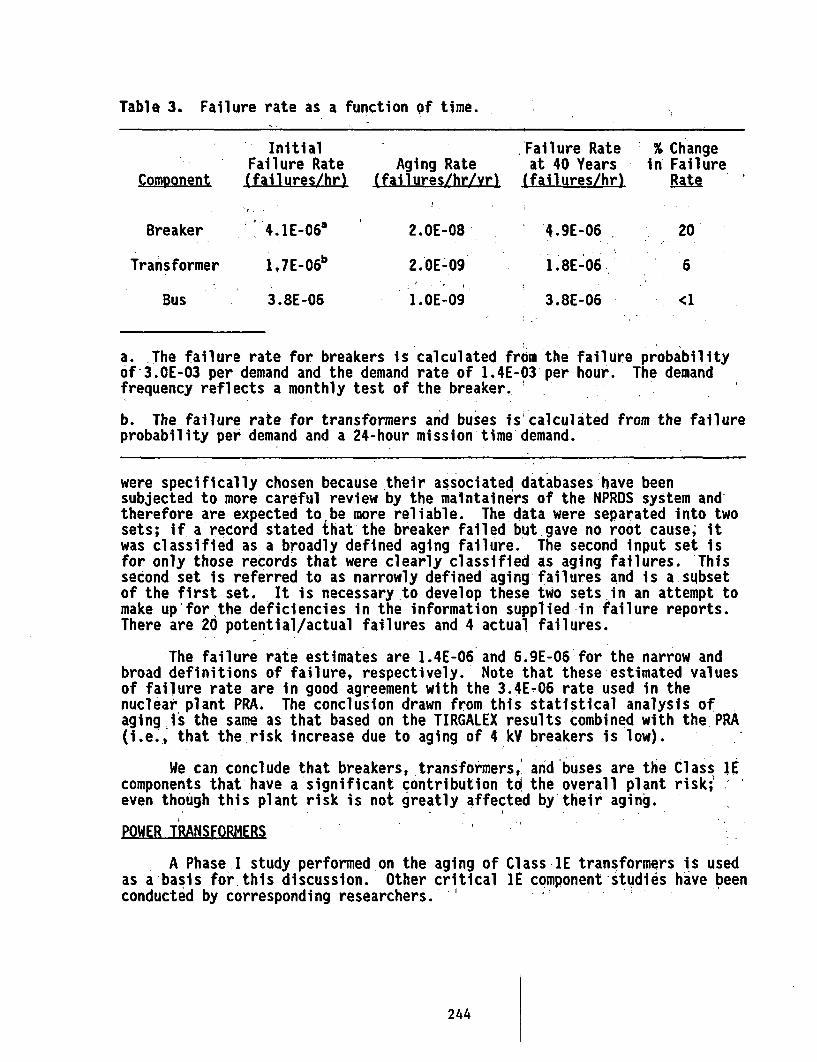
Table 3. Failure rate as a function of time. ,
InitialFailure Rate(failures/hr)
Aging Rate(failures/hr/vr)
Failure Rateat 40 Years(failures/hr)
* % Changein Failure
Rate ' 'Component
Breaker
Transformer
Bus
4.IE-068
1 ,7E-06b
3.8E-06
2.OE-08
2.OE-09
1.OE-09
f '4.9E-06
1.8E-06,
3.8E-06
20'
6
<1
a. The failure rate for breakers is calculated from the failure probabilityof-3.OE-03 per demand and the demand rate of 1.4E-03 per hour. The demandfrequency reflects a monthly test of the breaker.
b. The failure rate for transformers and buses is calculated from the failureprobability per demand and a 24-hour mission time demand.
were specifically chosen because their associated databases'have beensubjected to more careful review by the maintainers of the NPRDS system and,therefore are expected to be more reliable. The data were separated into twosets; if a record stated that the breaker failed but gave no root cause; itwas classified as a broadly defined aging failure. The second input set isfor only those records that were clearly classified as aging failures. Thissecond set is referred to as narrowly defined aging failures and is a subsetof the first set. It is necessaryto develop these two sets in an attempt tomake up'for the deficiencies in the information supplied in failure reports.There are 20 potential/actual failures and 4 actual failures.
The failure rate estimates are 1.4E-06 and 6.9E-06 for the narrow andbroad definitions of failure, respectively. Note that these estimated valuesof failure rate are in good agreement with the 3.4E-06 rate used in thenuclear plant PRA. The conclusion drawn from this statistical analysis ofaging is the same as that based on the TIRGALEX results combined with the PRA(i.e., that the risk increase due to aging of 4 kV breakers is low).
We can conclude that breakers, transformers, and buses are thecomponents that have a'significant contribution to the overall planteven though this plant risk is not greatly affected by'their aging.
POWER TRANSFORMERS
Class 1Erisk;'
A Phase-I study performed on the aging ofas a basis for this discussion. Other criticalconducted by corresponding researchers. '
Class lE transformers is usedIE component studies have been
244
A nuclear plant usually has less than 10 Class lE power transformerssupplying the many safety-related systems and'equipment.' Figure 1 shows atypical nuclear plant electrical distribution system with the associated powertransformers. Individual nuclear plants classify different power transformersas Class 1E, depending on their safety analysis. formally,- all nuclear plantsacknowledge the power transformers included in the section surrounded by thedashed line (see Figure 1). lSome plants take credit for high voltage ,equipment (located outside the dashed line) ln!their safety analysis and as aresult have high voltage (15 kV or greater) ClasshdE power transformers. Thevoltages on the high voltage winding (primary) of;transformers--locatedoutside the dashed line--varies between 15 and 500 kV; depending on theindividual plants and the connected commercial power system.
Transformers currently installed in Class 1E applications consist ofthree general types: (a) dry-type, (b) gas-filled, and (c) liquid-filled.'.The dry-type transformers have air surrounding the winding insulation and theenclosure is usually vented to the'.surrounding atmosphere. Dry-typetransformers account for about 77%, while 17% are-;liquid-filled, and 7% aregas filled. All of the transformers with a rating over 15 kV (7% oftransformers) are oil-filled, using mineral oil as the insulator and coolingmedium. Dry-type transformers, which are of lower voltage, are used in cleandry areas; gas and nonflammable fluid filled transformers are generally usedin areas where a contaminated or moisture atmosphere is present.- - ,
Figure 3 shows the basic components of all power transformers. Thefigure shows that basic transformer components include a ferro-magnetic core,copper or aluminum windings (two or more with connections to the bushings),solid insulation, the insulator/coolant medium, electrical bushings (two perwinding), external connections, and a tank (enclosure).
A transformer is a device with no moving parts. Power transformers are
made by completing two separate copper windings on a silicon-steel core. Uponapplying an ac voltage and current'to one (primary) winding, a correspondingmagnetic flux is created in the core. The magnetic flux in the core induces avoltage and current on the secondary winding. Some transformers have multiplesecondary windings allowing power to be transferred at different voltages.The input to output voltages are in direct ratio to the number of turns oneach winding. The use of power transformers allows power to be transmitted athigh voltages (reducing line losses) and then lowered to usable voltages.
Each turn in a transformer has a certain potential (voltage) across itand must be insulated'from the other turns to prevent electrical shorts. Inaddition, the separate windings (primary and secondaries) must be insulatedfrom each other and from grounds for the same reason. Higher voltages resultin higher potentials between turns, between separate windings, betweenenergized and nonenergized conducting parts. I
The degrading or failure of a transformer is caused by the opening oflawinding or the electrical shorting between wifiding turns, windings; or; -
windings to ground. Bushing failures or the opefi/high impedance externalconnections to the transformer windings also result in power system
245
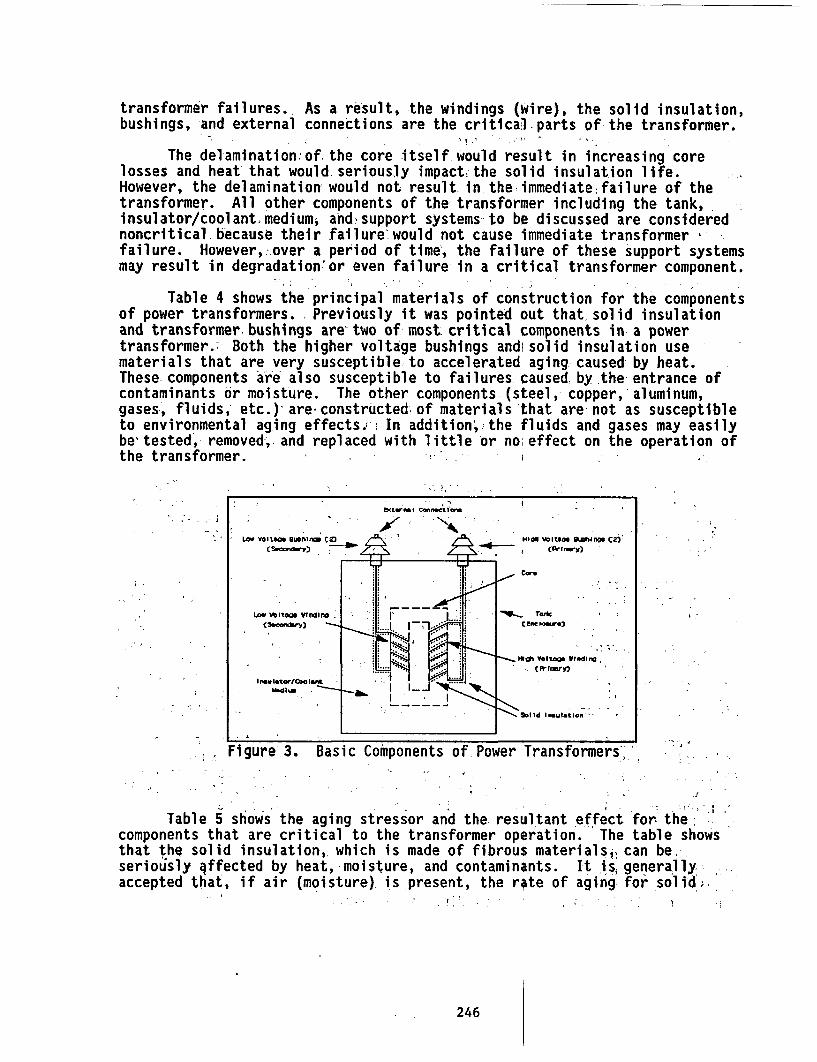
transformer failures.. As a result, the windings (Wire), the solid insulation,bushings, and external connections are the critical parts of the transformer.
The delamination;of the core itself would result in increasing corelosses and heat that would seriously impact the solid insulation life.However, the delamination would not result in thevimmediatefailure of thetransformer. All other components of the transformer including the tank,insulator/coolantimedium, ahd support systems to be discussed are considerednoncritical because their failure would not cause immediate transformer vfailure. However,:over a period of time', the failure of these support systemsmay result in degradation or even failure in a critical transformer component.
Table 4 shows the principal materials of construction for the componentsof power transformers. Previously it was pointed out that, solid insulationand transformer. bushings are' two of most critical components in a powertransformer.; Both the higher voltage bushings and solid insulation usematerials that are very susceptible to accelerated aging caused by heat.These components are also susceptible to failures caused by the entrance ofcontaminants or moisture. The other components (steel, copper, aluminum,gases, fluids,- etc.)-are-constructed of materials that are not as susceptibleto environmental aging effects. In addition; the fluids and gases may easilybe'tested, removed, and replaced with little or noieffect on the operation ofthe transformer.
' . ' ' e,¢lotas cc-Wtetlcst ' ;'
L- o VoltaOO Bush non sON volt" kU I fhlOl C6)
LOW Vo11r6 Vnnire.d A r:
. : s . t i: acloewe
MO VlIItage Wading,
Solid:::xuation-
Figure 3. Basic Components of Power Transformers,
Table 5 shows' the aging stressor and the resultant effect for- thei:'components that are critical to the transformer operation. The table showsthat the solid insulation, which is made of fibrous materials can be,seriously qffected by heat, moisture, and contaminants. It is, generallyaccepted that, if air (moisture) is present, the rate of aging for solid:..
246
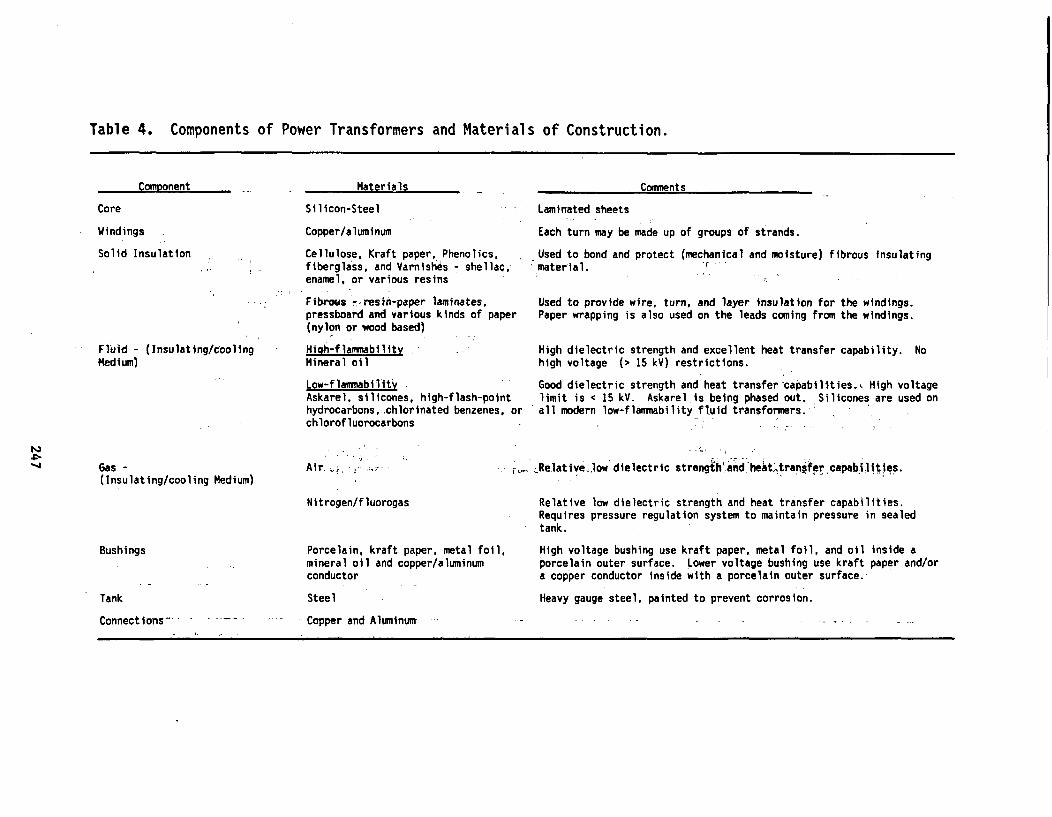
Table 4. Components of Power Transformers and Materials of Construction.
Core
Materials
Silicon-Steel - Laminated sheets
Windings
Solid Insulation
Copper/aluminum
Cellulose, Kraft paper, Phenolics,fiberglass, and Varnishes - shellac,enamel, or various resins
Fibrous --resin-paper laminates,pressboard and various kinds of paper(nylon or wood based)
ig/cooling High-flammabilityMineral oil
Low-f lammabilityAskarel, silicones, high-flash-pointhydrocarbons,.chlorinated benzenes, ochlorofluorocarbons
Each turn may be made up of groups of strands.
Used to bond and protect (mechanical and moisture) fibrous insulatingmaterial.
Used to provide wire, turn, and layer insulation for the windings.Paper wrapping is also used on the leads coming from the windings.
High dielectric strength and excellent heat transfer capability. Nohigh voltage (> 15 kV) restrictions.
Good dielectric strength and heat transfer-capabilitiesw, High voltagelimit is c 15 kV. Askarelis being phased out. Silicones are used on
ir all modern low-flammability fluid transformers. -
Fluid - (InsulatiMedium)
Air, , -! i;'Gas -(Insulating/cooling Medium)
Nitrogen/fluorogas
Relative low dielectric strenghand heit'transfer capabilities.
Relative low dielectric strength and heat transfer capabilities.Requires pressure regulation system to maintain pressure in sealedtank.
High voltage bushing use kraft paper, metal foil, and oil inside aporcelain outer surface. Lower voltage bushing use kraft paper and/ora copper conductor inside with a porcelain outer surface.
Heavy gauge steel, painted to prevent corrosion.
Bushings
Tank
Connections - -- ---
Porcelain, kraft paper, metal folmineral oil and copper/aluminumconductor
Steel
Copper and Aluminunt -
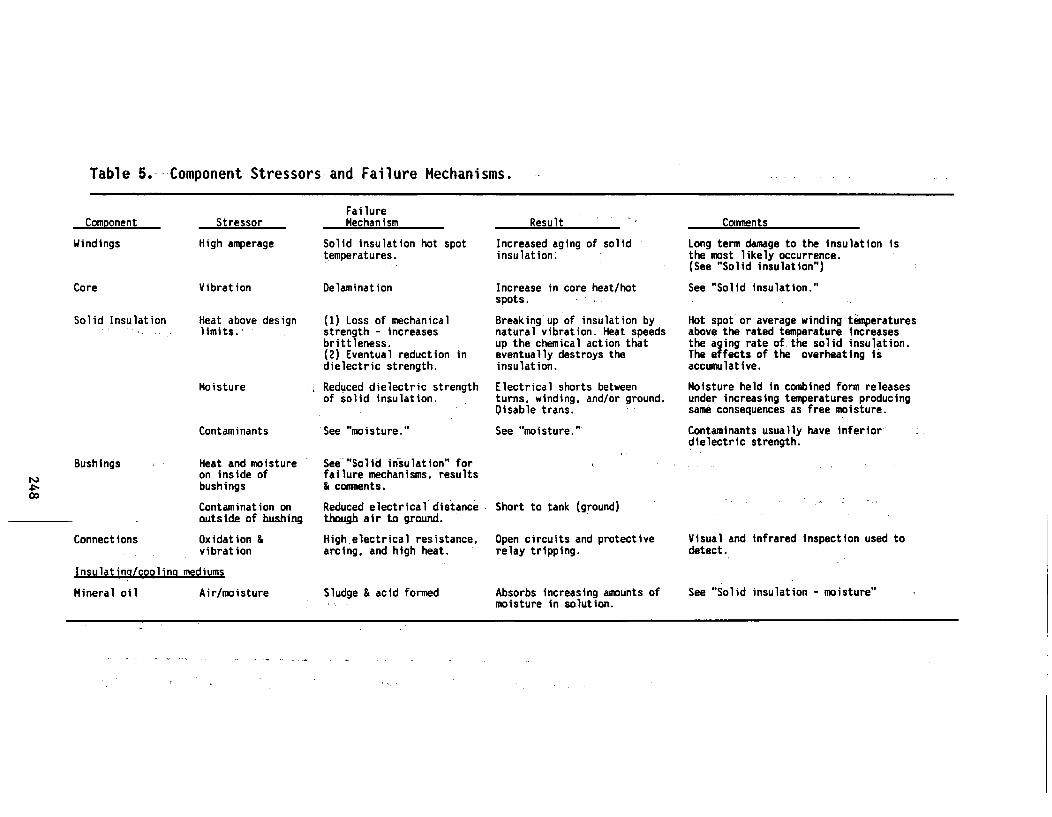
Table 5.- Component Stressors and Failure Mechanisms.
Component
Windings
Core
Solid Insulation
Stressor
High amperage
Vibration
Heat above designl imits.X
Moisture
Contaminants
FailureMechanism
Solid insulation hot spottemperatures.
Delamination
(1) Loss of mechanicalstrength - increasesbrittleness.(2) Eventual reduction indielectric strength.
Reduced dielectric strengthof solid insulation.
See "moisture."
Result
Increased aging of solid -
insulation.
Increase in core heat/hotspots.
Breaking up of insulation bynatural vibration. Heat speedsup the chemical action thateventually destroys theinsulation.
Electrical shorts betweenturns, winding, and/or ground.Disable trans.
See "moisture."
Comments
Long term damage to the insulation isthe most likely occurrence.(See "Solid insulation")
See "Solid insulation."
Hot spot or average winding temperaturesabove the rated temperature increasesthe aging rate of.the solid insulation.The effects of the overheating isaccumulative.
Moisture held in combined form releasesunder increasing temperatures producingsame consequences as free moisture.
Contaminants usually have inferiordielectric strength.
Bushings Heat and moistureba on inside of.Ds bushingsco
Contamination onoutside of bushing
Connections Oxidation &vibration
Insulatina/coolina mediums
Mineral oil Air/moisture
See"Solid insulation" forfailure mechanisms, results& comments.
Reduced electrical distance...though air to ground.
High electrical resistance.arcing, and high heat.
Short to tank (ground)
Open circuits and protectiverelay tripping.
Visual and infrared inspection used todetect.
Sludge & acid formed Absorbs increasing amounts of- .- moisture in solution.
See "Solid insulation - moisture"
insulation doubles for each 8'C above a 65*C average winding temperature. Even ifthe solid insulation is surrounded by protective fluids or gases, the presence ofair/moisture in the fluid or gas accelerates the aging.
The materials used for the solid insulation are essentially the same for alltransformer types and voltages. Fibrous materials under design conditions providethe necessary dielectric strength (insulate) to withstand the voltages within thetransformer. However as the voltages on the transformers increase it becomes morecritical that the dielectric strength of fibrous materials isnot degraded. As shown in Table 5, moisture and heat are two stressors that willcause the dielectric strength of the solid insulation to deteriorate. It should benoted that solid insulations have over double.the dielectric strength of any liquidor gas insulation material. To prevent the entry of contaminatin materials(including water) that would impair or destroy the transformer soyid insulation, thewindings, core, and other internal electric parts are surrounded by either a gas orliquid insulating medium. The materials also provide the method to remove the heatgenerated by core and winding losses.
Dry-type (air) transformers are designed to operate at lower voltages. Themost important materials are resins/varnishes that are used to seal:.moisture/contaminants out of the solid insulation. However, the insulation ages inthe same manner as the other types of transformers.
The transformer tank provides a personal protection barrier and barrier to theentry of contaminating materials. Sealed tanks are used for transformers usingliquids and gases (excluding air) as an insulator/coolant medium. To allow fornormal expansion and contraction of fluids in sealed tanks, various methods are usedincluding: leaving an air space above the fluid in the seal tank blanketing thefluid with a pressurized nitrogen atmosphere (requires gas cylinders and pressurecontrols); using a sealed flexible diaphragm on top of the oil (with an air spaceabove the diaphragm); and maintaining a low-pressure gas atmosphere in the sealedtank. The gas-filled transformer pressure is maintained using gas-filled cylinders,pressure gauges, and pressure regul ators.
Mineral oil also ages at a rate depending on time, temperature, and theexposure to air and moisture. Oil aging results in the formation of sludge andacids, and while that is not considered critical, mineral oil with the presence ofacids takes into solution an increasing amount of water. This in turn causes thesolid insulation to age and deteriorate. Other fluids used in transformers have nonormal stressors that change the composition of the fluids, however, they do carryany contamination that enters the tank to the solid insulation.
The aging stressors shown for the core are not normally expected duringtransformer operation. If they do occur, the effects will be detected ifmanufacturer's and industry recommended maintenance tests are completed by thelicensees during their maintenance programs.
Although not part of the transformer proper there are certain support systemsthat are used on some of the transformers. The failure of the support systems caneffect the life of the transformer and in some cases disable the transformer. Thesupport systems include the following:
Load tap changer (LTC) - Some' of the'Class IE high voltage (> ;15 kV) transformersused in the nuclear plants have Load Tap Changing (LTC) equipment, This equipmentmaintains a constant plant system voltage' by increasing or decreasing the activeturns in the high voltage winding. The tap changer contacts, which arc during
249
changes, are located in a sealed oil-filled compartment that-is isolated from thetransformer core and windings. Voltage measuring and tap changer motor controlsallow both a variable time delay and voltage operational band to preventunnecessary wear of the system parts.transformer failures. As a result, thewindings (wire), the solid insulation, bushings, and external connections are thecritical parts of a transformer. The delamination of the core itself would resultin increasing core losses'and heat that would seriously impact the solid insulationlife. However, the delamination'Would not result in the-immediate failure of thetransformer. All other components of the transformer including the tank,insulator/coolant medium, and support systems to be discussed are considerednoncritical because their failure would not cause immediate transformer failure.However, over a period of time, the failure of these support systems may result indegradation or even failure of a critical transformer component.
Gas regulation system - Each gas insulated/cooled transformer requ-ires a gas source(cylinders) and a tank pressure regulator to maintain the internal tank gas pressurewithin preset limits.
Gas Blanket - Liquid-filled transformers using a low-pressure nitrogen blanketrequire a gas source (cylinders) and a tank pressure regulator to maintain theinternal tank gas pressure within preset limits.
Forced cooling - An important part in the operation of the transformer is theprevention of high core/winding temperatures that would shorten the'life of theelectrical insulation. All power transformers;are designed to maintain thetransformer temperatures below acceptable limits when the transformer load isoperated below'the kVA'rating for each type of cooling. The following coolingmethods are used to remove the winding/core heat:
Natural'convection (self-cooled)--May or may not have radiators.
'Forced-air--Requires radiators, temperature transducer, controls, andfans/motors.
Forced-oil--Uses forced-air radiators. Requires temperature transducer,controls and oil pump(s).
OPERATING EXPERIENCE
Information from the NRC Licensee Event Reports (LERs), the Nuclear Plant,Reliability Data System (NPRDS), the Nuclear Power Experience (NPE). databases, aswell as from cooperating utilities, was used in the study of the nuclear planttransformer operating experience between 1983 and 1991. During this study, it wasdetermined that the NPRDS was the only information source with nameplate data on theClass lE power transformers used at the nuclear plants. Because this study was onthe effects of power transformer aging, a decision was made to not use thetransformer data on plants licensed since January 1, 1989. The subsequent review ofNPRDS data showed that only 88 other plants had Class WE transformer!nameplate dataincluded in the database.
During the study of 88 plants it was determined that there were 723 Class lEtransformers in the plants consisting of 77% dry-type (air), 17% liquid-filled, and7% gas-filled. The high voltage transformers (> 15 kV), which are filled with ,mineral oil, made up Woof the IE total. It was also determined that 95% of the lEtransformers arel-Under 20 years old and 75% are under 15 years old. '
250

Table 6 shows the recorded Class lE and aging related problems from January 1, 1983through January 1, 1991. During this period, 33 problems were reported in Class 1Etransformers. Five of these problems resulted in reportable events (LERs). Eventhough oil (liquid-filled) transformers only comprise 17% of the 88 plants studied,they incurred 64% of the reported problems. However, four of these problemsoccurred on the cooling system and seven were oil and nitrogen leaks. These typesof problems would not normally result in the immediate failure of the transformerand would only be significant if not detected and/or no action taken. ;The bushingand tap changer problems all occurred on high voltage (> 15 kV) transformers. Thisis to be expected because the higher the voltages, the more critical the insulationbecomes. The high voltage bushings are located outside and if not inspected,cleaned, and tested periodically can be shorted by airborne contaminants. Inaddition, because of the importance of the insulation and support systems, thetransformers are provided with increased monitoring equipment, and the surveillance,inspection, testing, and maintenance programs are more rigorous than fortransformers below 15 kV.
Although few problems were reported on the dry-type transformers, this doesnot mean that significant aging is not taking place. Because of the low voltagesimpressed on the transformers, the solid insulation can deteriorate for a long timeuntil the dielectric strength of the insulation is low enough to allow voltagebreakthrough. In addition, they have less monitoring devices and thesurveillance/inspection of the solid insulation requires the removal of the case.Thus making online inspections difficult. Because dry -type transformers are exposedto the surrounding atmosphere, and even though the solid insulation is varnishcoated to prevent the entry of moisture the solid insulation will deteriorate morerapidly than that of liquid and gas-filled transformers. To prevent a more rapiddeterioration of the insulation the transformer should be operated within thenameplate rating and located in area that is clean, dry, free from any contaminantsthat would remove the varnishes. To detect aging problems and prevent operationalfailures requires a rigorous periodic inspection, cleaning, testing and replacementprogram. We were unable to determine if this has being performed during thisperiod.
To determine if there is an increasing trend of transformer problems, theyearly transformer problems were determined from January 1, 1983 through January 1,1991. Table 7 shows the problems occurring each year during this period. There isno increasing trend in reported problems. However this is not totally unexpected,because the study found that over 95% of the transformers are less than 20 years oldand 75% are less than 15 years old. Transformers are normally considered a lon9-life item; with proper operation and maintenance, transformers (with the exceptionof the dry-type) should provide reliable operation for more than 40 years.
To determine what was required to prevent, retard, and detect the aging oftransformers (solid insulation) a review was made of the recommended procedures ofall major transformer manufacturers, the IEEE/NEMA standards, and availabletechnical literature. Discussions were also held with personnel responsible for themaintenance of transformers at the INEL and area utilities.-
An idealized inspection, surveillance, testing, and maintenance program wasdeveloped to see how a nuclear plant would compare. The program from cooperatingutilities was compared with the developed program. The utility program was found tocompare favorably with only minor differences.
251
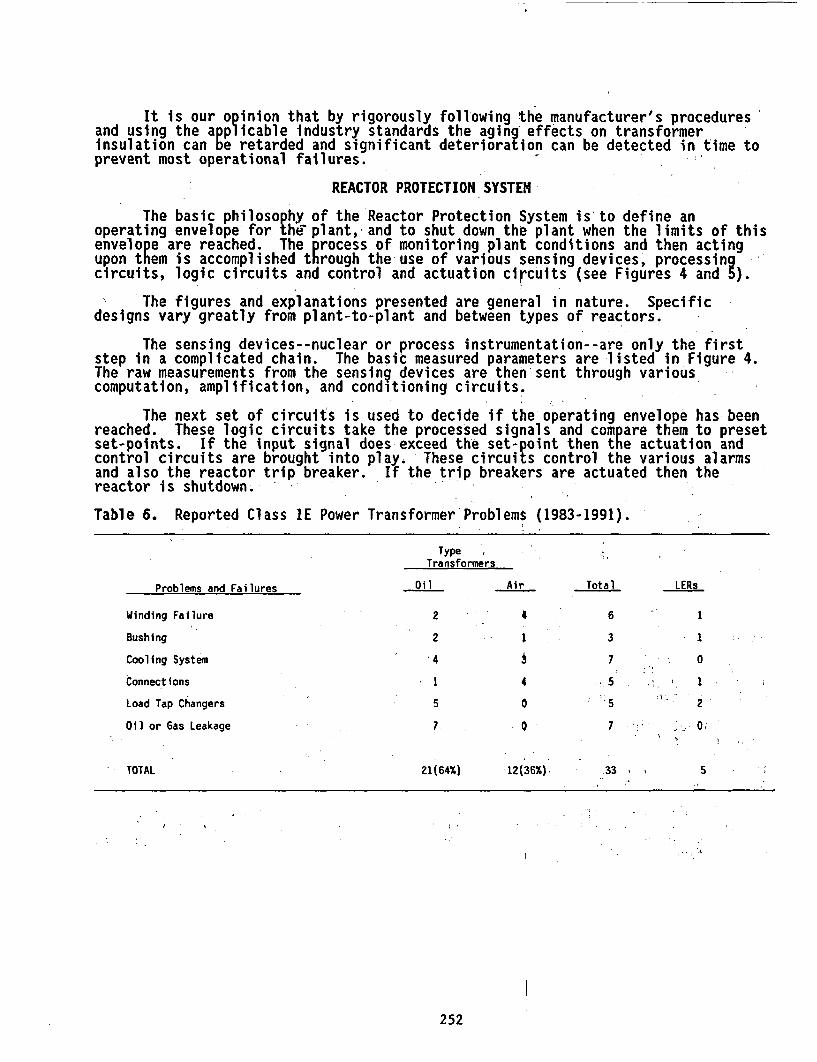
It is our opinion that by rigorously following the manufacturer's proceduresand using the applicable industry standards the aging effects on transformerinsulation can be retarded and significant deterioration can be detected in time toprevent most operational failures.
REACTOR PROTECTION SYSTEM
The basic philosophy of the Reactor Protection System is to define anoperating envelope for the plant, and to shut down the plant when the limits of thisenvelo e are reached. The Drocess of monitoring plant conditions and then actingupon tem is accomplished through the use of various sensing devices, processingcircuits, logic circuits and control and actuation circuits (see Figures 4 and 5).
The figures and explanations presented are general in nature. Specificdesigns vary greatly from plant-to-plant and between types of reactors.
The sensing devices--nuclear or process instrumentation--are only the firststep in a complicated chain. The basic measured parameters are listed in Figure 4.The raw measurements from the sensing devices are then sent through variouscomputation, amplification, and conditioning circuits.
The next set of circuits is used to decide if the operating envelope has beenreached. These logic circuits take the processed signals and com pare them to presetset-points. If the input signal does exceed the set-point then the actuation andcontrol circuits are brought into play. These circuits control the various alarmsand also the reactor trip breaker. If the trip breakers are actuated then thereactor is shutdown.
Table 6. Reported Class IE Power Transformer Problems (1983-1991).
TypeTransformers
Problems and Failures Oil Air Total LERs
Winding Failure 2 4 6 1
Bushing 2 3 1
Cooling System 4 . 7 : 0
Connections 1 4 5 i. 1
Load Tap Changers 5 0 5 2
Oil or Gas Leakage 7. 7 .;
TOTAL 21(64%) 12(36%) 33 5
252
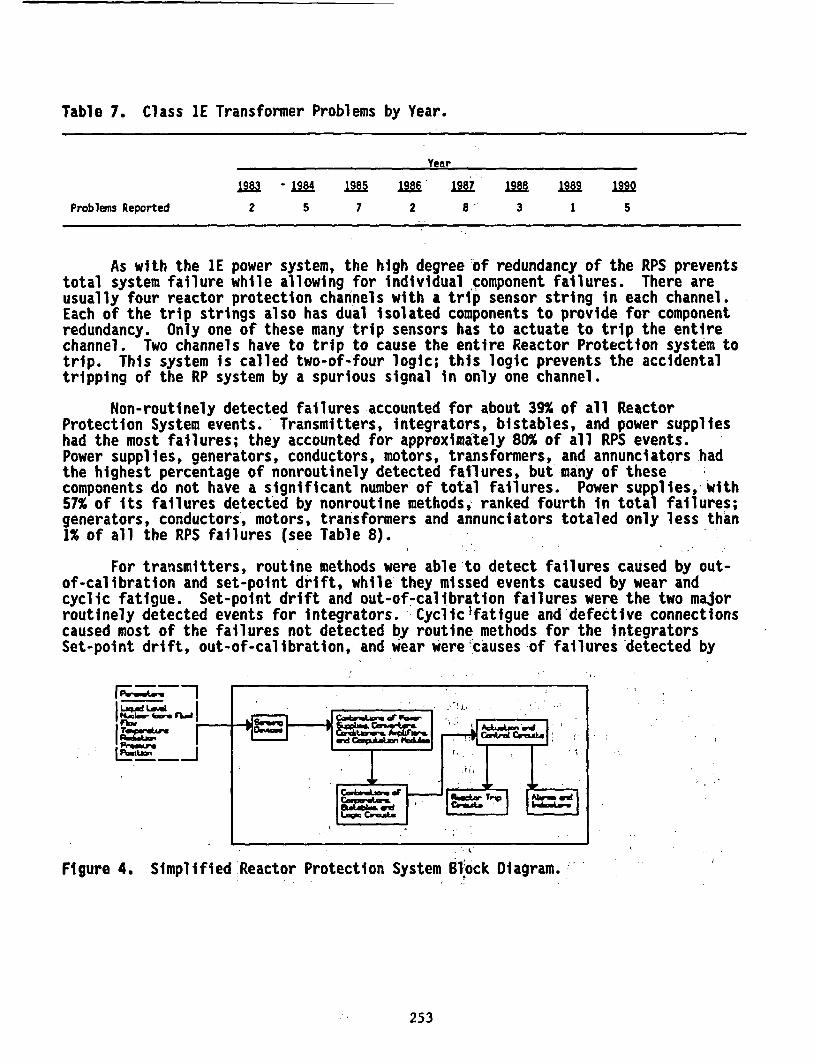
Table 7. Class IE Transformer Problems by Year.
Year
8 - 1984 1X n 7 1988 MX9 9Problems Reported 2 5 7 2 8 3 1 5
As with the IE power system, the high degree'of redundancy of the RPS preventstotal system failure while allowing for individual component failures. There areusually four reactor protection channels with a trip sensor string in each channel.Each of the trip strings also has dual isolated components to provide for componentredundancy. Only one of these many trip sensors has to actuate to trip the entirechannel. Two channels have to trip to cause the entire Reactor Protection system totrip. This system is called two-of-four logic; this logic prevents the accidentaltripping of the RP system by a spurious signal in only one channel.
Non-routinely detected failures accounted for about 39% of all ReactorProtection System events. Transmitters, integrators, bistables, and power supplieshad the most failures; they accounted for approximately 80% of all RPS events.Power supplies, generators, conductors, motors, transformers, and annunciators hadthe highest percentage of nonroutinely detected failures, but many of thesecomponents do not have a significant number of total failures. Power supplies, with57% of its failures detected by nonroutine methods, ranked fourth in total failures;generators, conductors, motors, transformers and annunciators totaled only less than1% of all the RPS failures (see Table 8).
For transmitters, routine methods were able to detect failures caused by out-of-calibration and set-point drift, while they missed events caused by wear andcyclic fatigue. Set-point drift and out-of-calibration failures were the two majorroutinely detected events for integrators. Cyclicyfatigue and defective connectionscaused most of the failures not detected by routine methods for the integratorsSet-point drift, out-of-calibration, and wear were causes of failures-detected by
Figure 4. Simplified Reactor Protection System Block Diagram.
253
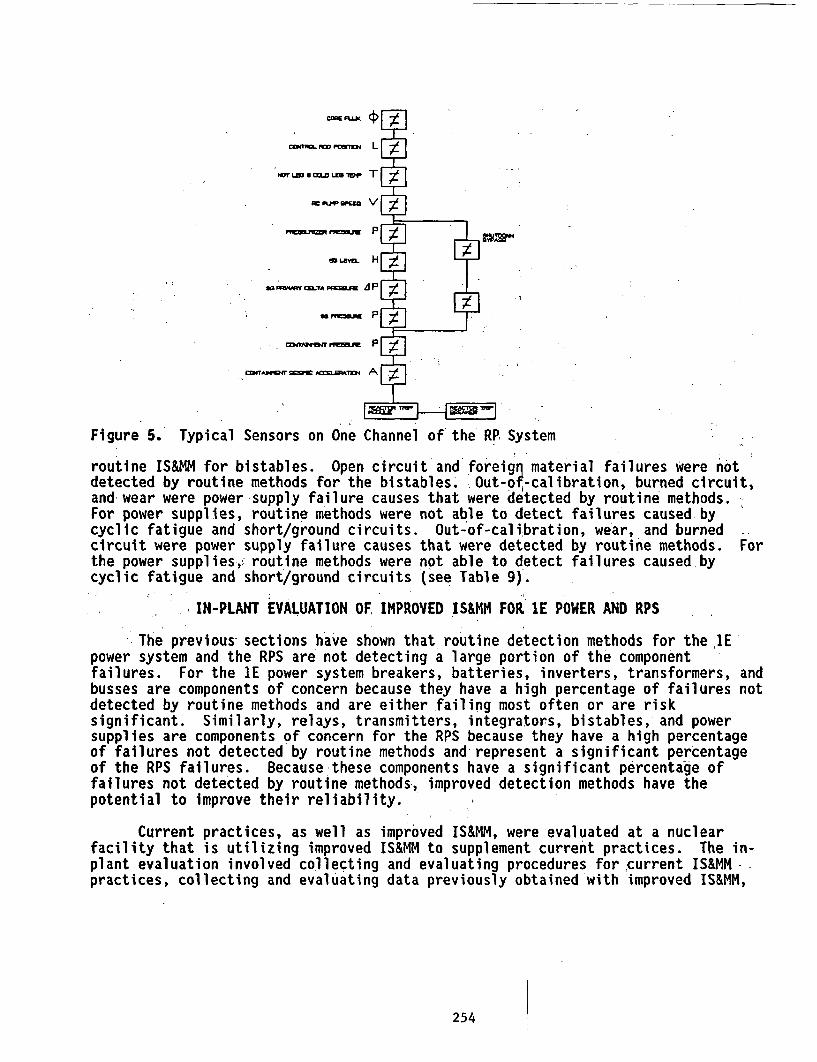
coity. p o
mar Lan a C.D LED l I
P PU P=NO V
Pb
MYk sOLTA PFl J P
VAJT CJ Pa
IKTS A dmuim A
Figure 5. Typical Sensors on One Channel of the RP System
routine IS&MM for bistables. Open circuit and foreign material failures were notdetected by routine methods for the bistables. Out-oN-calibration, burned circuit,and wear were power supply failure causes that were detected by routine methods.For power supplies, routine methods were not able to detect failures caused bycyclic fatigue and short/ground circuits. Out-of-calibration, wear, and burnedcircuit were power supply failure causes that were detected by routine methods. Forthe power supplies,, routine methods were not able to detect failures caused bycyclic fatigue and short/ground circuits (see Table 9).
lN-PLANT EVALUATION OF, IMPROVED IS&MN FOR 1E POWER AND RPS
The previous-sections have shown that routine detection methods for the lEpower system and the RPS are not detecting a large portion of the componentfailures. For the 1E power system breakers, batteries, inverters, transformers, andbusses are components of concern because they have a high percentage of failures notdetected by routine methods and are either failing most often or are risksignificant. Similarly, relays, transmitters, integrators, bistables, and powersupplies are components of concern for the RPS because they have a high percentageof failures not detected by routine methods and-represent a significant percentageof the RPS failures. Because-these components have a significant percentage offailures not detected by routine methods-, improved detection methods have thepotential to improve their reliability.
Current practices, as well as improved IS&MM, were evaluated at a nuclearfacility that is utilizing improved IS&MM to supplement current practices. The in-plant evaluation involved collecting and evaluating procedures for current IS&MM -practices, collecting and evaluating data previously obtained with improved IS&MM,
254
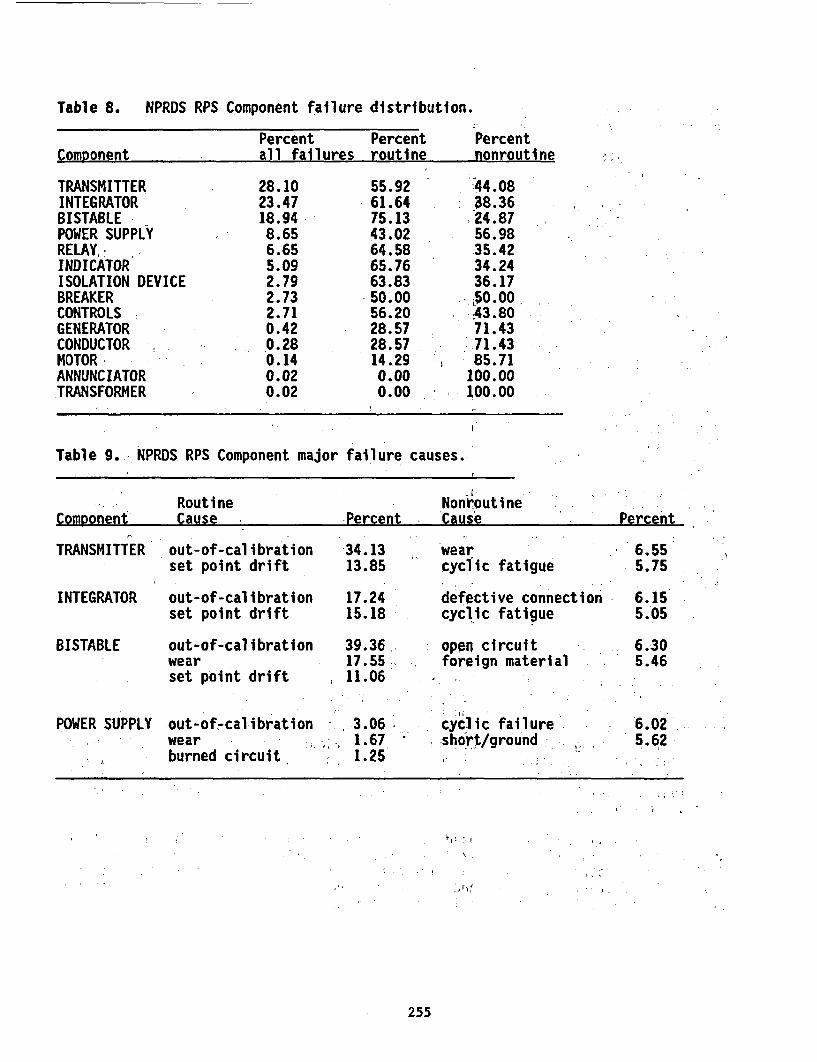
Table 8. NPRDS RPS Component failure distribution.
PercentComnonent all failures
Percentroutine
Percentnonroutine~~~~~~--a o- -as---- -g - - -. _.__ .._. ___.
TRANSMITTERINTEGRATORBISTABLEPOWER SUPPLYRELAY, .INDICATORISOLATION DEVICEBREAKERCONTROLSGENERATORCONDUCTORMOTOR,ANNUNCIATORTRANSFORMER
28.1023.4718.948.656.655.092.792.732.710.420.280.140.020.02
55.9261.6475.1343.0264.5865.7663.8350.0056.2028.5728.5714.290.000.00
-44.0838.36.24.8756.9835.4234.2436.17[p0.00
. .43.8071.43
-,71.43--?85.71
100.00100.00
Table 9.- NPRDS RPS Component major failure causes.
Routinern dc a D."o-ran1>
Nonroutinera .ea
. . . n.
%VU111U .. I %, W. 9u .. I . . %, rC * '.a **
1.
TRANSMITTER
INTEGRATOR
out-of-calibrationset point drift
out-of-calibrationset point drift
34.1313.85
17.2415.18
wear . 6.55cyclic fatigue .5.75
defective connection 6.15cyclic fatigue 5.05
BISTABLE out-of-calibrationwearset point drift
39.36.17.55 :
. 11.06
open circuitforeign material
6.305.46
POWER SUPPLY!
I
out-of-calibration -wear - -burned circuit
.3.06 cyclic failure .1.67 short/ground -.1.25 , .
6.025.62
t . . : I
,
255
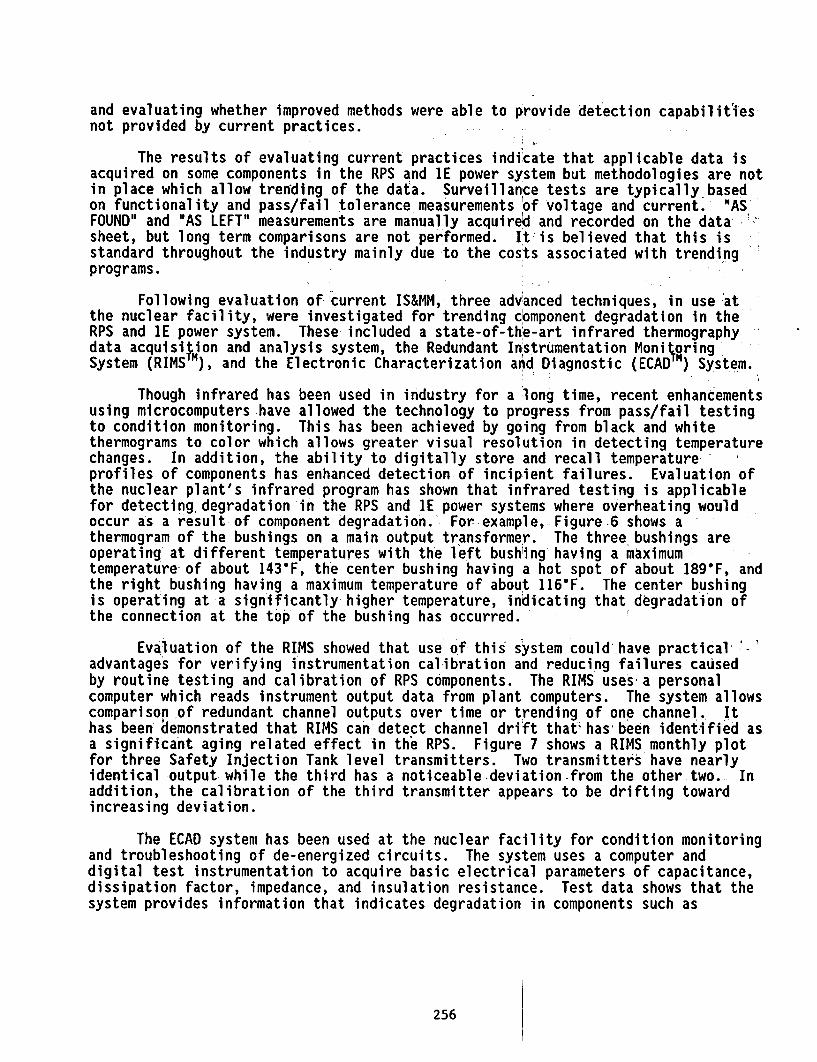
and evaluating whether improved methods were able to provide detection capabilitiesnot provided by current practices.
The results of evaluating current practices indicate that applicable data isacquired on some components in the RPS and IE power system but methodologies are notin place which allow trending of the data. Surveillance tests are typically basedon functionality and pass/fail tolerance measurements of voltage and current. "ASFOUND" and "AS LEFT" measurements are manually acquired and recorded on the datasheet, but long term comparisons are not performed. It'is believed that this isstandard throughout the industry mainly due to the costs associated with trendingprograms.
Following evaluation of current IS&MM, three advanced techniques, in use atthe nuclear facility, were investigated for trending component degradation in theRPS and lE power system. These included a state-of-the-art infrared thermographydata acquisition and analysis system, the Redundant Instrumentation Moni oringSystem (RIMS "), and the Electronic Characterization and Diagnostic (ECAD ) System.
Though infrared has been used in industry for a long time, recent enhancementsusing microcomputers-have allowed the technology to progress from pass/fail testingto condition monitoring. This has been achieved by going from black and whitethermograms to color which allows greater visual resolution in detecting temperaturechanges. In addition, the ability to digitally store and recall temperature'profiles of components has enhanced detection of incipient failures. Evaluation ofthe nuclear plant's infrared program has shown that infrared testing is applicablefor detecting, degradation in the RPS and 1E power systems where overheating wouldoccur as a result of component degradation. For example, Figure-6 shows athermogram of the bushings on a main output transformer. The three bushings areoperating at different temperatures with the left bush'ing having a maximumtemperature of about 143'F, the center bushing having a hot spot of about 189F, andthe right bushing having a maximum temperature of about 116F. The center bushingis operating at a significantly- higher temperature, indicating that degradation ofthe connection at the top of the bushing has occurred.
Evaluation of the RIMS showed that use of this system could have practical"advantages for verifying instrumentation calibration and reducing failures causedby routine testing and calibration of RPS components. The RIMS uses a personalcomputer which reads instrument output data from plant computers. The system allowscomparison of redundant channel outputs over time or trending of one channel. Ithas been demonstrated that RIMS can detect channel drift that'has been identified asa significant aging related effect in the RPS. Figure 7 shows a RIMS monthly plotfor three Safety Injection Tank level transmitters. Two transmitters have nearlyidentical output-while the third has a noticeable-deviation-from the other two. Inaddition, the calibration of the third transmitter appears to be drifting towardincreasing deviation.
The ECAD system has been used at the nuclear facility for condition monitoringand troubleshooting of de-energized circuits. The system uses a computer anddigital test instrumentation to acquire basic electrical parameters of capacitance,dissipation factor, impedance, and insulation resistance. Test data shows that thesystem provides information that indicates degradation in components such as
256
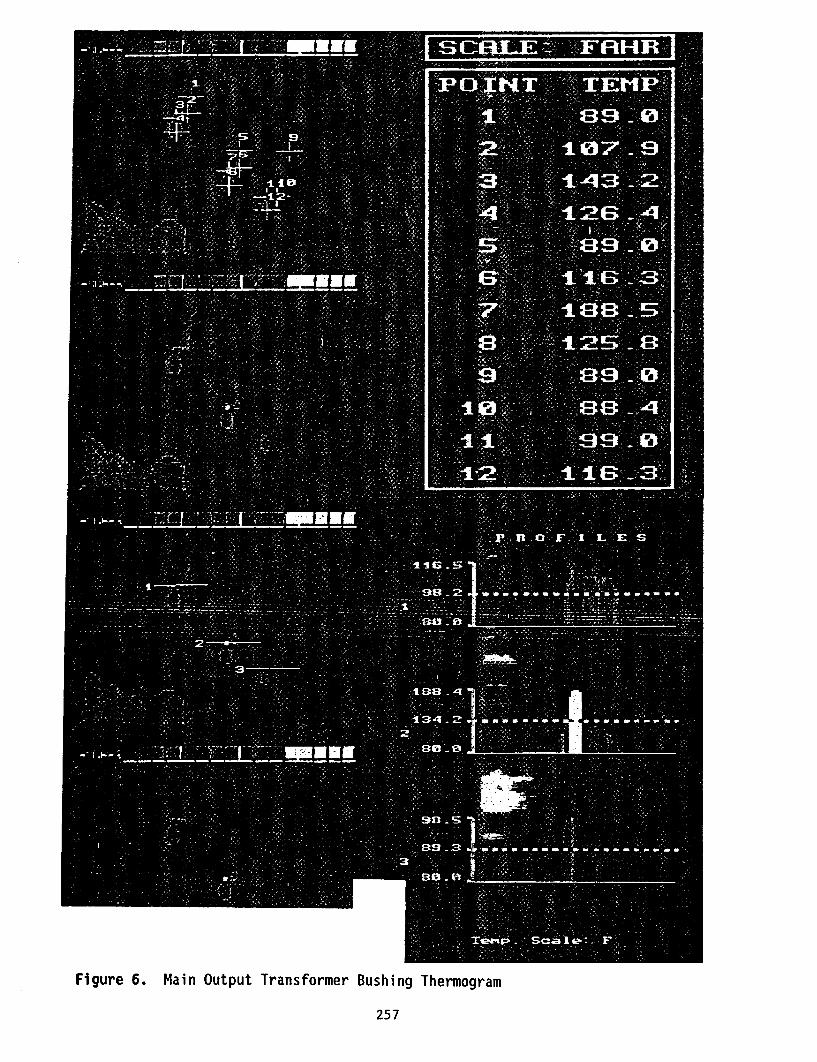
a mm
d CI
*I
l
Figure 6. Main Output Transformer Bushing Thermogram
257
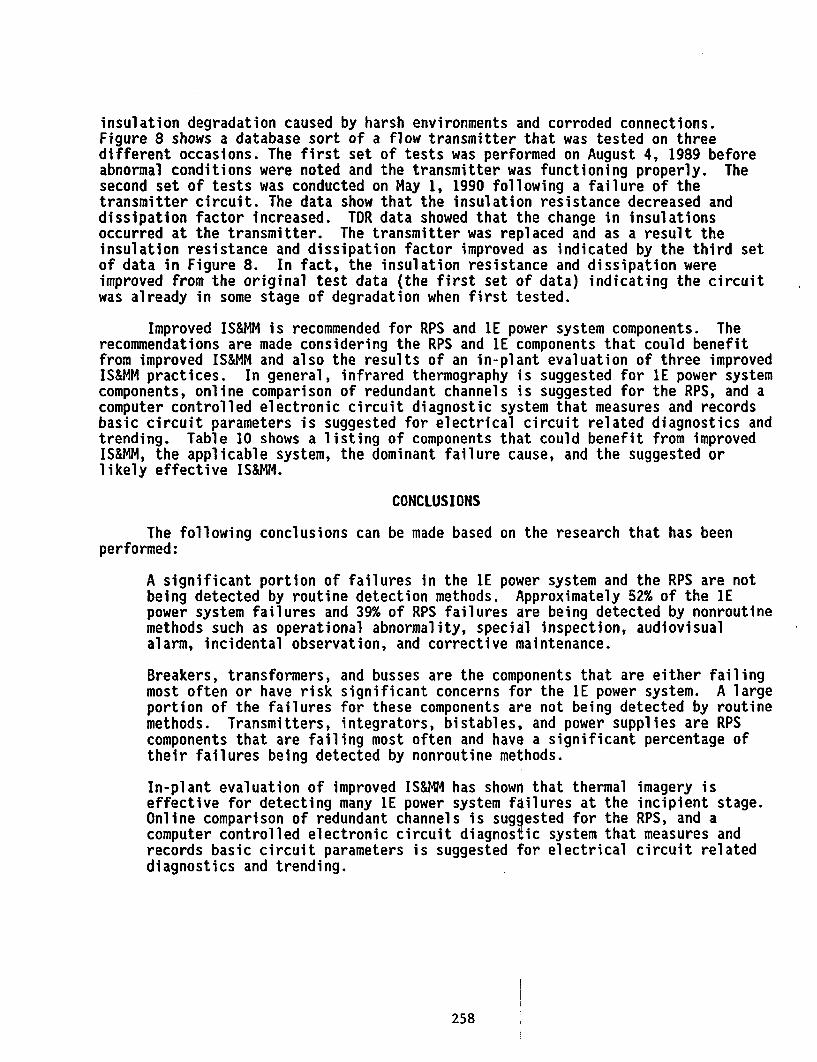
insulation degradation caused by harsh environments and corroded connections.Figure 8 shows a database sort of a flow transmitter that was tested on threedifferent occasions. The first set of tests was performed on August 4, 1989 beforeabnormal conditions were noted and the transmitter was functioning properly. Thesecond set of tests was conducted on May 1, 1990 following a failure of thetransmitter circuit. The data show that the insulation resistance decreased anddissipation factor increased. TDR data showed that the change in insulationsoccurred at the transmitter. The transmitter was replaced and as a result theinsulation resistance and dissipation factor improved as indicated by the third setof data in Figure 8. In fact, the insulation resistance and dissipation wereimproved from the original test data (the first set of data) indicating the circuitwas already in some stage of degradation when first tested.
Improved IS&MM is recommended for RPS and lE power system components. Therecommendations are made considering the RPS and lE components that could benefitfrom improved IS&MM and also the results of an in-plant evaluation of three improvedIS&MM practices. In general, infrared thermography is suggested for 1E power systemcomponents, online comparison of redundant channels is suggested for the RPS, and acomputer controlled electronic circuit diagnostic system that measures and recordsbasic circuit parameters is suggested for electrical circuit related diagnostics andtrending. Table 10 shows a listing of components that could benefit from improvedIS&MM, the applicable system, the dominant failure cause, and the suggested orlikely effective IS&MM.
CONCLUSIONS
The following conclusions can be made based on the research that has beenperformed:
A significant portion of failures in the lE power system and the RPS are notbeing detected by routine detection methods. Approximately 52% of the IEpower system failures and 39% of RPS failures are being detected by nonroutinemethods such as operational abnormality, special inspection, audiovisualalarm, incidental observation, and corrective Maintenance.
Breakers, transformers, and busses are the components that are either failingmost often or have risk significant concerns for the lE power system. A largeportion of the failures for these components are not being detected by routinemethods. Transmitters, integrators, bistables, and power supplies are RPScomponents that are failing most often and have a significant percentage oftheir failures being detected by nonroutine methods.
In-plant evaluation of improved IS&MM has shown that thermal imagery iseffective for detecting many 1E power system failures at the incipient stage.Online comparison of redundant channels is suggested for the RPS, and acomputer controlled electronic circuit diagnostic system that measures andrecords basic circuit parameters is suggested for electrical circuit relateddiagnostics and trending.
258
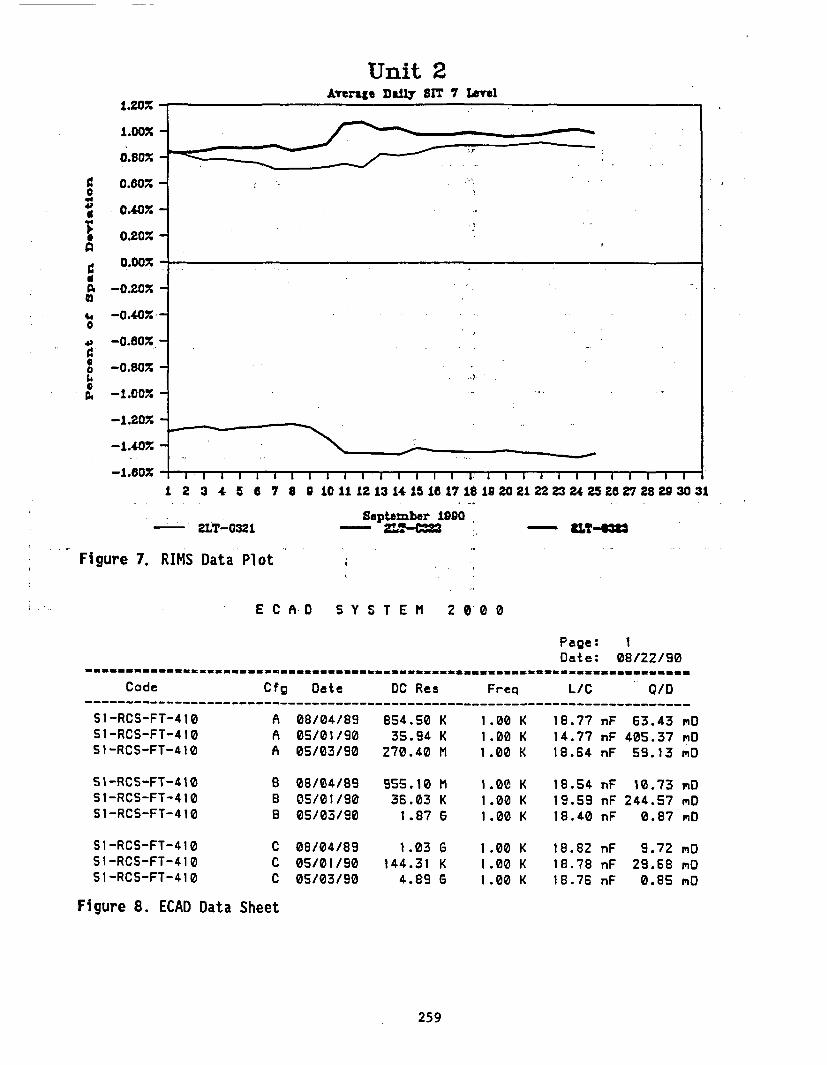
Unit 2ATerage Daily SIT 7 Level
a
woO
a
0.
aIIAf M
1.20%
1.00%
0.80%
0.60%
0.40%
0.20%
0.00%
-0.20%
-0.80%
-1.00%
-1.20%
-1.40
_4 An*n-. ,w uuI I I I I I I I I I I I I I I I I I1. I I I I I I I I I U I I I
1 2 3 4 5 6 7 8 9 101112131415117 10 192021 22232425 2 27 28283031
September 19902LT-0321 - -- C= L T-33
Figure 7. RIMS Data Plot ;
E C A-D S Y S T E M 2 0 0 0
Page: 1Date: 08/22/90
555555 -=--.s..seasaas a sea as===ssess aa=555 _ss- ssaas =
Code Cfg Date DC Res Freq L/C O/D___________________________________________________________________________
SI-RCS-FT-410SI -RCS-FT-4 10S1-RCS-FT-410
A 08/04/89A 05/01/90A 05/03/90
854.50 K35.94 K
270.40 M
1.00 K1.00 K1.00 K
18.7714.7718.64
nF 63.43 mDnF 405.37 mDnF 59.13 mD
SI-RCS-FT-410Si -RCS-FT-4 10S1-RCS-FT-410
8 08/04/898 OS/01/90E 05/03/90
955.10 M36.03 K1.87 6
1.00 K 18.541.00 K 19.591.00 K 18.40
nF 10.73 mDnF 244.57 mDnF 0.87 mD
Si-RCS-FT-410S1-RCS-FT-410Si-RCS-FT-410
C 08/04/89C 05/01/90C 05/03/90
1.03 6144.31 K4.89 G
1.00 K1.00 K1.00 K
18.82 nF18.78 nF18.76 nF
9.72 mD29.68 mD0.85 mD
Figure 8. ECAD Data Sheet
259
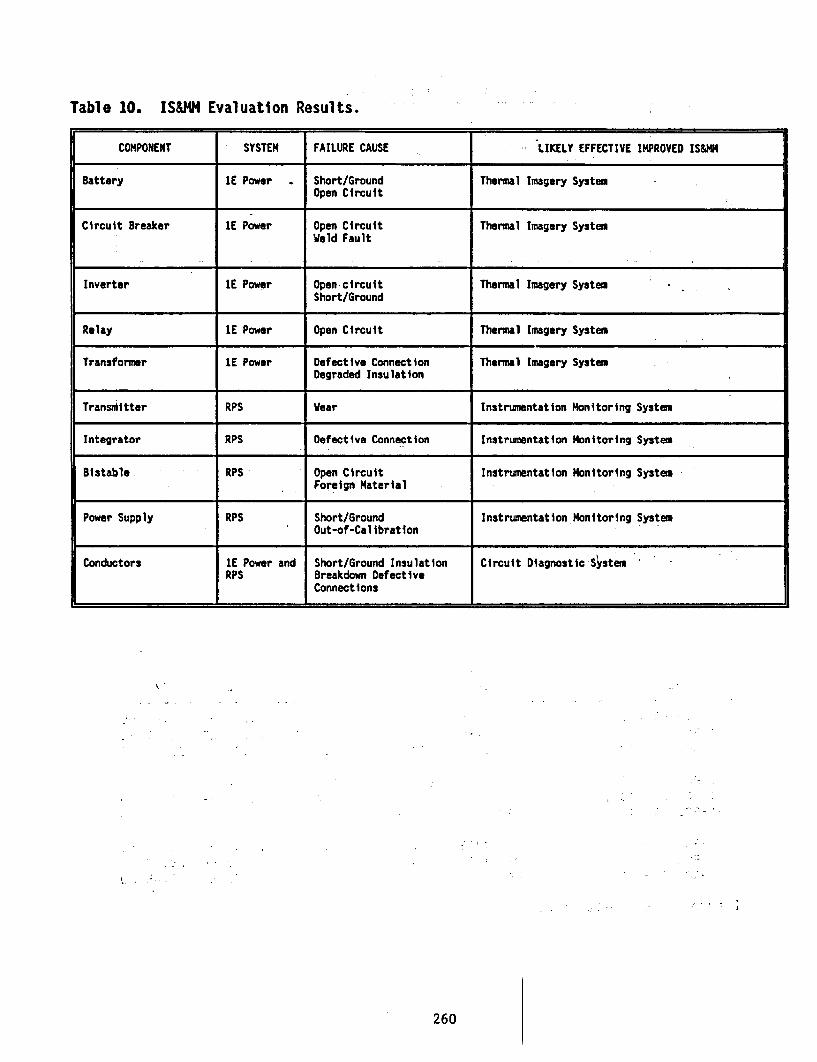
Table 10. ISMW Evaluation Results.
COMPONENT SYSTEM FAILURE CAUSE LIKELY EFFECTIVE IMPROVED IS&HN
Battery 1E Power Short/Ground Thermal Imagery SystemOpen Circuit
Circuit Breaker lE Power Open Circuit Thermal Imagery SystemWeld Fault
Inverter 1E Power Open circuit Thermal Imagery SystemShort/Ground
Relay 1E Power Open Circuit Thermal Imagery System
Transformer 1E Power Defective Connection Thermal Imagery SystemDegraded Insulation
Transmitter RPS Wear Instrumentation Monitoring System
Integrator RPS Defective Connection Instrumentation Monitoring System
Bistable - RPS Open Circuit Instrumentation Monitoring SystemForeign Material
Power Supply RPS Short/Ground Instrumentation Monitoring SystemOut-of-Calibration
Conductors 1E Power and Short/Ground Insulation Circuit Diagnostic SystemRPS Breakdown Defective
Connections
I .,
.I
I
260
METHOD FOR DETECTING DEGRADATION IN INSTALLED CABLES, NUCLEAR POWER PLANTS
Yasuo KUSAMA, Toshiaki YAGI, Yosuke MORITASeiji KAMIMURA* and Hideki YAGYU*
Japan Atomic Energy Research Institute (Takasaki)*Hitachi Cable
AbstractThe object of the investigation is to develop non-
destructive detecting method for degradation 'of cablesinstalled in nuclear power plants from the viewpoint ofthe safety operation and the life extension of *theplants. Two -kinds of detecting method a)torque-strain response and b)Thermogravimetry were studied inorder to -apply to the low voltage 'cables, for whicheffective detecting methods have not been completed.Applicability of the methods to the low voltage CVcables (cross-linked polyethy-lene insulation,polyvinylchloride jacket) were discussed by usingelongation at break as a primary standard.
1.IntroductionHuge amounts of cables are used in nuclear power plants in
wide varieties as power supply, instrumentation and control.These cables, especially used in safety systems, are consideredto be one of the -essential components as a pressure vessel andconcrete structures, on which plant life inevitably depends.
Generally, cable life is dominated by the degradation of itsorganic insulation materials, because their thermal and /orradiation resistances are inferior to those of metal conductor.The degradation of cable insulators and jacket by thermal and/orradiation aging has been examined by visual observation and bytensile'tests, and the degree of degradation has been evaluatedfrom the ultimate'strength and elongation.
Simple and precise methods for detecting degradation of theinstalled cables in the facility, therefore, are expected todevelop from the view point of the safety operation and themaintenance of the plants which bring the plant life extension.
Cables used in the power plants can'be divided roughly intotwo categories as high voltage use and low voltage use. For thehigh voltage power cables, monitoring method of their conditionshas' been studied about the leakage current for' !D.C. and comesinto practical use. But for most of the- low voltage cables;various detecting methods, for example indenter test[l], residualvoltage[2], electronic characterization and diagnosticsystem:EtAD[3], and time domain spectrbmetry:TDS[4] have beeninvestigated and the practical application of these methods arein progress.
In this report, we study two non-destructive methods forestimating the degradation of the installed cables. Thesemethods are a torque-strain response and a thermogravimetry,which 'detect the degradation of PVC 'lacket material on thecables. We compare the data obtained by the two methods with
261
those obtained by tensile elongation which-is standard indicatorof the degradation of polymeric materials.. These results have alinear relations each other from which we'can estimate life timeof PVC jacket materials.
2.ExperimentalSample:
Low voltage (60OV) CV cables (normal type, flame and/or heatresistant types) were used to study torque-strain response.Sheet samples(1.0 mm thick) of their jacket materials and sheetsamples(O.5 mm thick) of PVC were prepared to studythermogravimetry.
Irradiation and, Thermal Aging:The cable samples and the sheet samples of their jacket
materials were irradiated by 60Co gamma rays at room temperatureunder pressurized oxygen at a dose rate of 5 kGy/h and in air at0.03-1.09 kGy/h at room temperature. The sheet samples wereirradiated at room temperature in air at 0.5 and 10 kGy/h andunder pressurized oxygen at,5 kGy/h.
Thermal aging was carried out in an air circulated type ovenin a temperature range of 100-1580C.
Torque-Strain Response:Fig.l shows the scheme of a prototype apparatus for torque-
strain response measurement. A fixed length of the cable washeld with two chucks and small angle, torsions(usually from +5 to+10 degrees)of variable frequency were added with one of thechuck. Stress(Torque) yielded by torsion was detected at theother side of the chuck.
Thermogravimetry:Small amounts of the sample (usually 4-5 mg) were scratched
out from the surface of cable jacket and sheet samples. - Theirthermal decomposition temperatures were 'measured; bythermogravimetric analyzer(TGA) in an inert gas atmosphere at atemperature rise of 10-20*C/min.
Tensile Test:After the measurement of torque-train response, the
dumbbell shaped specimens for tensile test were cut from thecable'jacket in. order to use elongation at break(Eb) as anindicator of degradation. Tensile properties of the cable andthe sheet samples were, measured by tensile tester at a,,chucXspeed. of 200 mm/min.
Molecular Weight Measurement: 'Molecular weight and molecular weight distribution were
measured by gel permeation chromatograph in order ,to,assuredegradation mechanism.
3. Result and Discussion .'Fig.2 shows basic idea for examining the 'degradation of the
low voltage CV cables. In. the low voltage CV cables,degradation of mechanical property ip larger than that of
262
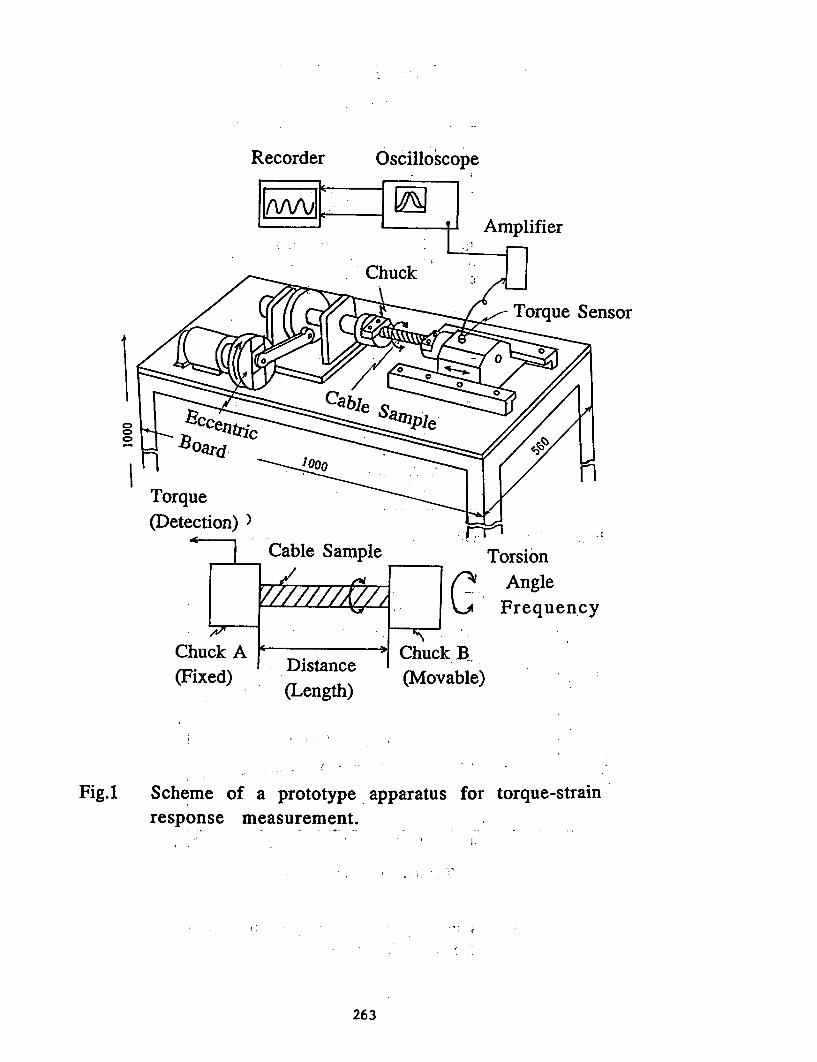
Recorder Oscilloscope
Sensor
01
(Detection) ) . ..Cable Sample Torsion
//////w I AngleC _Frequency
Chuck A < , Chuck B.(Fixed) - D (Movable)
kLsUEl UJ)
Fig.1 Scheme of a prototype apparatus for torque-strainresponse measurement.
263
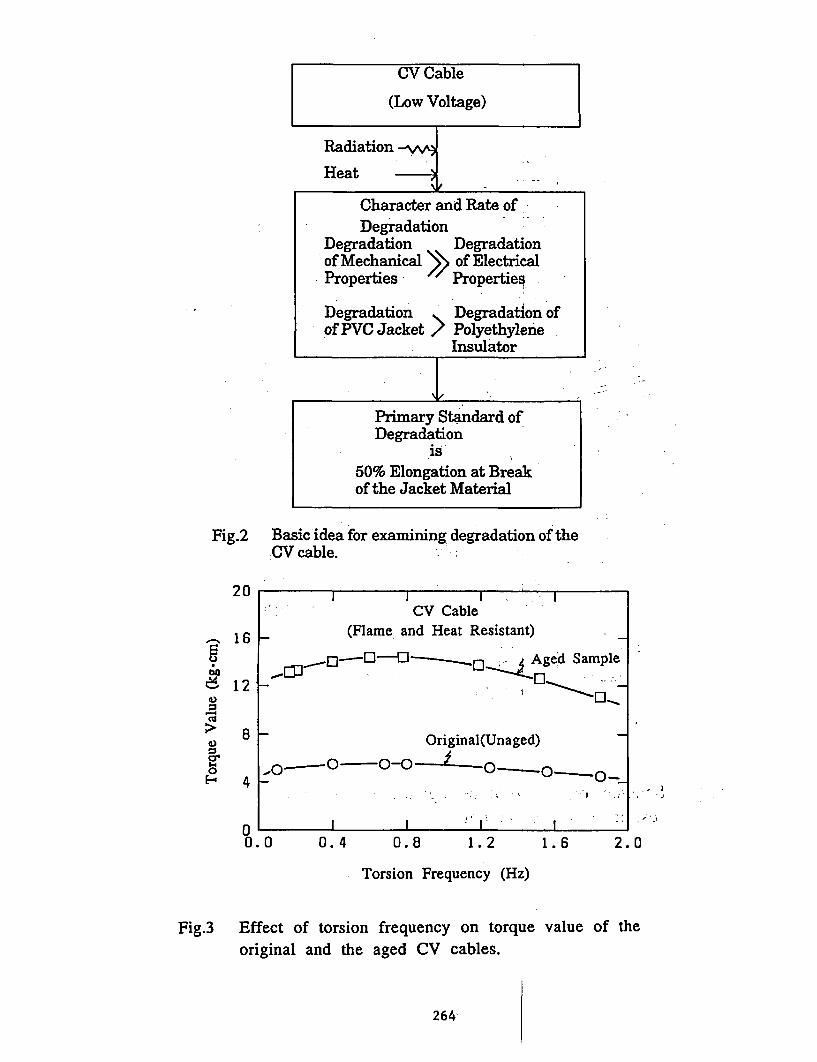
CV Cable
(Low Voltage)
Radiation -
HeatNe .
Character and Rate ofDegradation
Degradation Degradationof Mechanical >> of ElectricalProperties Properties
Degradation Degradation ofof PVC Jacket > Polyethylene
Insulator
Primary Standard ofDegradation
is50% Elongation at Breakof the Jacket Material
Fig.2 Basic idea for examining degradation of theCV cable.
20
?
:0C)
4)
E-I
16
12
8
4
CV Cable(Flame and Heat Resistant)
Aged Sample
Original(Unaged)
0-,o 0-0 2 O -ud
I I I Xn f0. 0 0. 4 0. 8 1. 2 1. 6 2
I *-
. 0
Torsion Frequency (Hz)
Fig.3 Effect of torsion frequency on torque value of theoriginal and the aged CV cables.
264
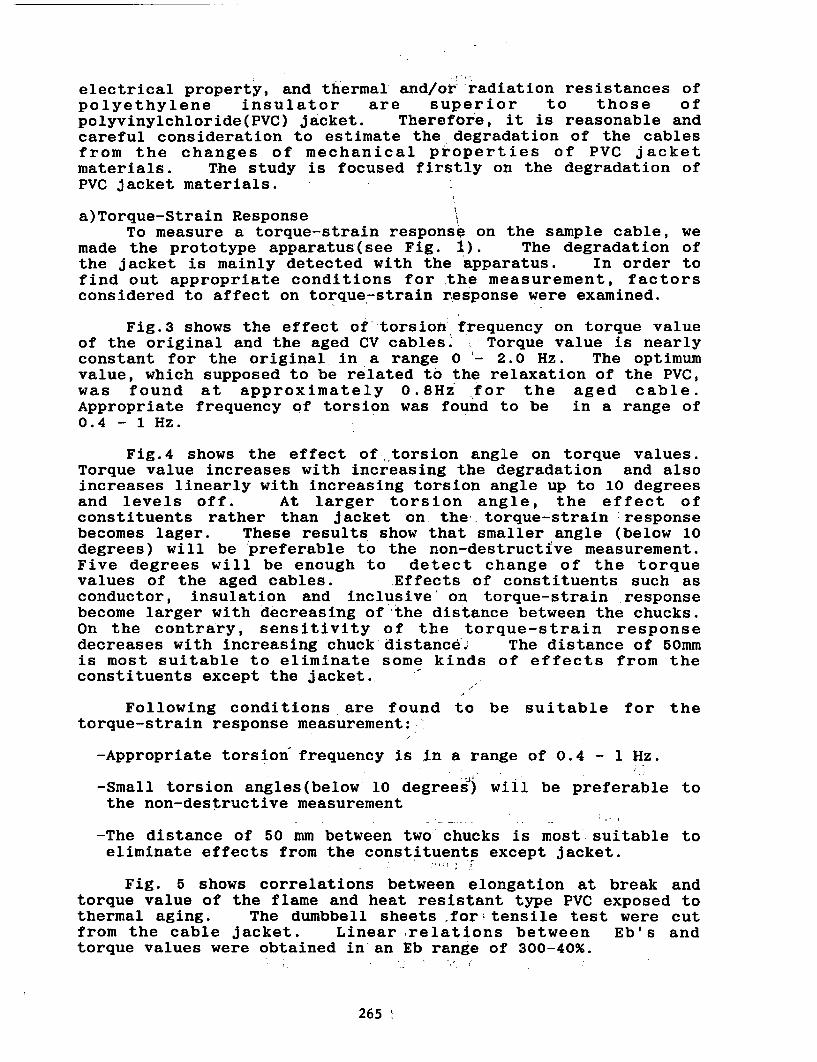
electrical property, and thermal and/or radiation resistances ofpolyethylene insulator are superior to those ofpolyvinylchloride(PVC) jacket. Therefore, it is reasonable andcareful consideration to estimate the degradation of the cablesfrom the changes of mechanical properties of PVC jacketmaterials. The study is focused firstly on the degradation ofPVC jacket materials.
a)Torque-Strain ResponseTo measure a torque-strain response on the sample cable, we
made the prototype apparatus(see Fig. 1). The degradation ofthe jacket is mainly detected with the apparatus. In order tofind out appropriate conditions for the measurement, factorsconsidered to affect on torque-strain response were examined.
Fig.3 shows the effect of-torsion' frequency on torque valueof the original and the aged CV cables. Torque value is nearlyconstant for the original in a range 0'- 2.0 Hz. The optimumvalue, which supposed to be related to the relaxation of the PVC,was found at approximately 0.8Hz for the aged cable.Appropriate frequency of torsion was found to be in a range of0.4 - 1 Hz.
Fig.4 shows the effect of torsion angle on torque values.Torque value increases with increasing the degradation and alsoincreases linearly with increasing torsion angle up to 10 degreesand levels off. At larger torsion angle, the effect ofconstituents rather than jacket on the. torque-strain *responsebecomes lager. These results show that smaller angle (below 10degrees) will be preferable to the non-destructive measurement.Five degrees will be enough to detect change of the torquevalues of the aged cables. Effects of constituents such asconductor, insulation and inclusive' on torque-strain responsebecome larger with decreasing of the distance between the chucks.On the contrary, sensitivity of the torque-strain responsedecreases with increasing chuck distance. The distance of 50mmis most suitable to eliminate some kinds of effects from theconstituents except the jacket.,
Following conditions are found to be suitable for thetorque-strain response measurement:-
-Appropriate torsion frequency is in a range of 0.4 - 1 Hz.
-Small torsion angles(below 10 degrees) will be preferable tothe non-destructive measurement
-The distance of 50 mm between two chucks is most suitable toeliminate effects from the constituents except jacket.
Fig. 5 shows correlations between elongation at break andtorque value of the flame and heat resistant type PVC exposed tothermal aging. The dumbbell sheets for' tensile test were cutfrom the cable jacket. Linear relations between Eb's andtorque values were obtained in an Eb range of 300-40%.
265
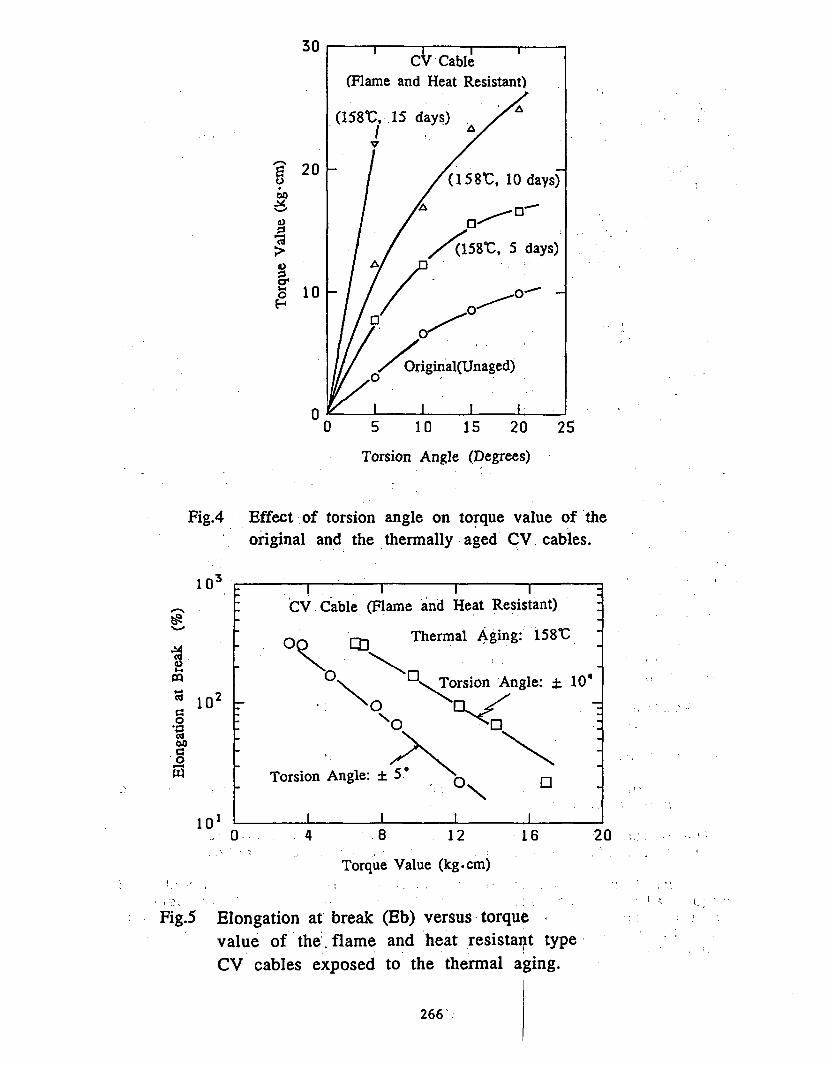
30
. 20q
4)
8 10
a
II 1 ICV Cable
(Flame and Heat Resistant)
(158tC 1S days)
I/
(1581C, 10 days)
/ (158CC, 5 days)
o/ rigingal(Unaged)
I II
[0 5 1 0 1 5 20 25
Torsion Angle (Degrees)
Fig.4 Effect of torsion angle on torque value of theoriginal and the thermally aged CV. cables.
I-.
4.
tP
0XMf
00
0bo
.0
I I I I7 CV Cable (Flame and Heat Resistant)
' Th, .1 et Ain 1 ;qr2
102
0T
Torsion An,
El] 1L IVL11-L L---5 ... -z s l~lIIIX lll. *J
° Torsion Angle: i 10'\~IO \ X _
0 0 ., ON
Lgle: ± 5 o. . \~"
10a I I I I4 8 12
Torque Value (kg. cm)
16 20 - I I
Fig.5 Elongation at break (Eb) versus torquevalue of the" flame and heat resistant type,CV cables exposed to the thermal aging.
r,;:
266
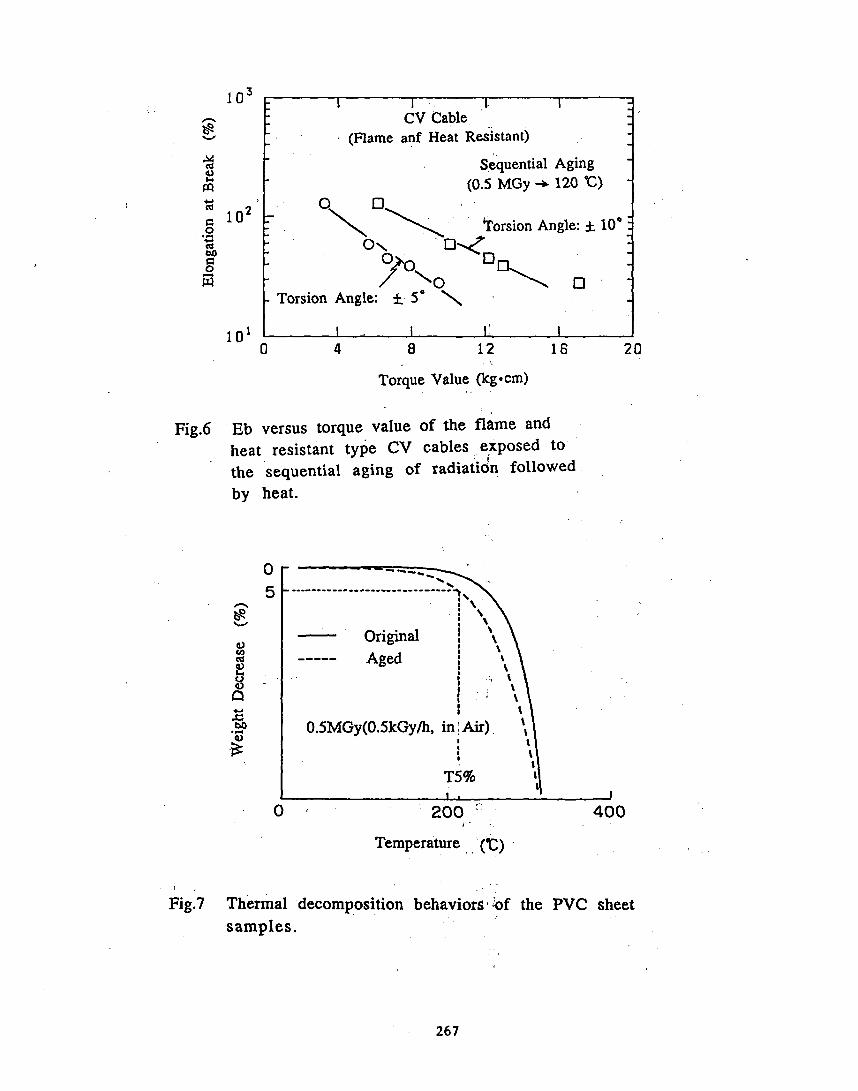
I103
I--
'U4)
4-.
*04-.
0
I I ICV Cable
(Flame anf Heat Resistant)
l
102
Sequential Aging(0.5 MGy -+ 120 'C)
0 0
- I \ 'torsion Angle: ± 10'
- ?ON.z7 Tri Anl 0 5
- Torsion Angle: ± j5*
10l 1 1 1
0 4 8 12 16 20
Torque Value (kg-cm)
Fig.6 Eb versus torque value of the flame and
heat resistant type CV cables exposed to
the sequential aging of radiation followedby heat.
0
5 ----
Cd Aged
0.5MGy(0.5kGy/h, in, Air).
1. I
0 ' 200"
Temperature ("C)
400
Fig.7 Thermal decomposition behaviors of the PVC sheet
samples.
267
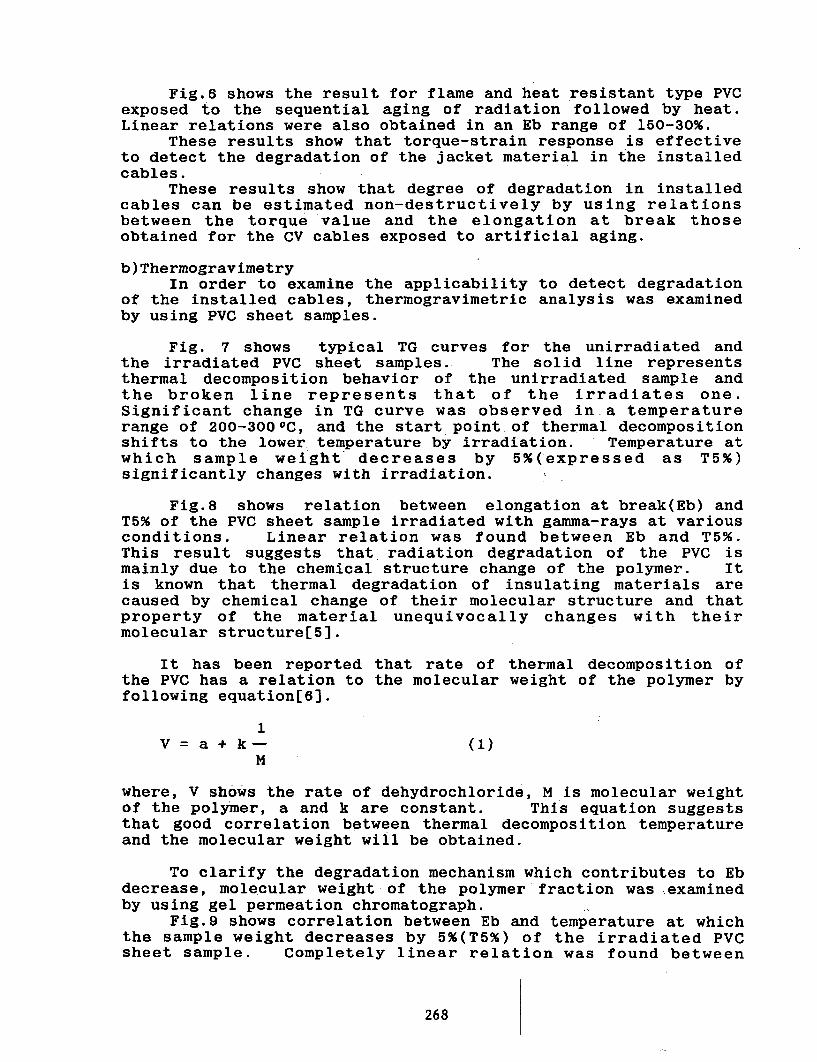
Fig.6 shows the result for flame and heat resistant type PVCexposed to the sequential aging of radiation followed by heat.Linear relations were also obtained in an Eb range of 150-30%.
These results show that torque-strain response is effectiveto detect the degradation of the jacket material in the installedcables.
These results show that degree of degradation in installedcables can be estimated non-destructively by using relationsbetween the torque value and the elongation at break thoseobtained for the CV cables exposed to artificial aging.
b)ThermogravimetryIn order to examine the applicability to detect degradation
of the installed cables, thermogravimetric analysis was examinedby using PVC sheet samples.
Fig. 7 shows typical TG curves for the unirradiated andthe irradiated PVC sheet samples. The solid line representsthermal decomposition behavior of the unirradiated sample andthe broken line represents that of the irradiates one.Significant change in TG curve was observed in a temperaturerange of 200-300 0C, and the start point of thermal decompositionshifts to the lower temperature by irradiation. Temperature atwhich sample weight decreases by 5%(expressed as T5%)significantly changes with irradiation.
Fig.8 shows relation between elongation at break(Eb) andT5% of the PVC sheet sample irradiated with gamma-rays at variousconditions. Linear relation was found between Eb and T5%.This result suggests that radiation degradation of the PVC ismainly due to the chemical structure change of the polymer. Itis known that thermal degradation of insulating materials arecaused by chemical change of their molecular structure and thatproperty of the material unequivocally changes with theirmolecular structure[5].
It has been reported that rate of thermal decomposition ofthe PVC has a relation to the molecular weight of the polymer byfollowing equation[6].
1V = a + k - (1)
M
where, V shows the rate of dehydrochloride, M is molecular weightof the polymer, a and k are constant. This equation suggeststhat good correlation between thermal decomposition temperatureand the molecular weight will be obtained.
To clarify the degradation mechanism which contributes to Ebdecrease, molecular weight -of the polymer fraction was examinedby using gel permeation chromatograph.
Fig.9 shows correlation between Eb and temperature at whichthe sample weight decreases by 5%(T5%) of the irradiated PVCsheet sample. Completely linear relation was found between
268
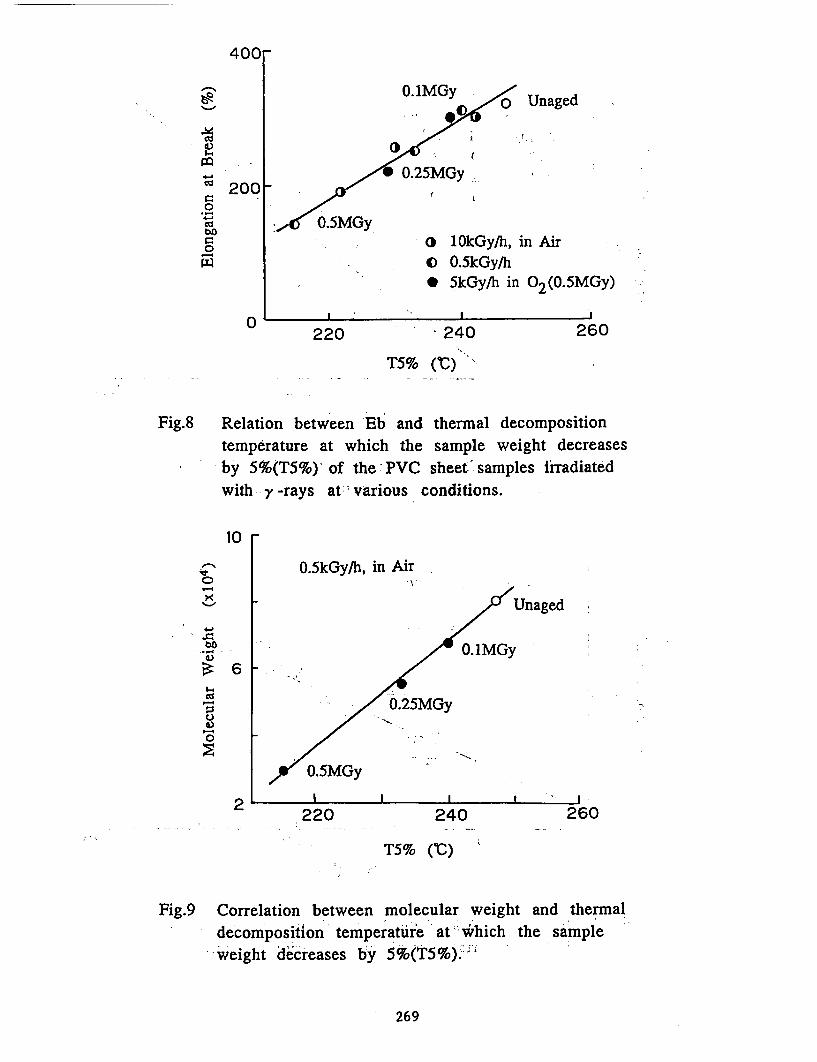
400r
O.IMGy0o Unaged
S4
I-
0
-.
0boc
in
200
O I0.25MGy_
r
i
0.5MGyo 1OkGy/h, in Air0 0.5kGy/h* 5kGy/h in 02 (0.5MGy)
I I0
-
220 240 260
T5% (IC)
Fig.8 Relation between Eb and thermal decompositiontemperature at which the sample weight decreasesby 5%(T5%) of the 'PVC sheet samples irradiatedwith y -rays at various conditions.
10
-4xo
I--
0.5kGy/h, in Air
04)
c1Uo
..
0
6O.1MGI
Unaged
2
260
0.5MGy
l I I0 220 240
T5% (°C)
Fig.9 Correlation between molecular weight and thermaldecomposition temperature at which the sample
-weight decreases by 5%(T5%)..I
269
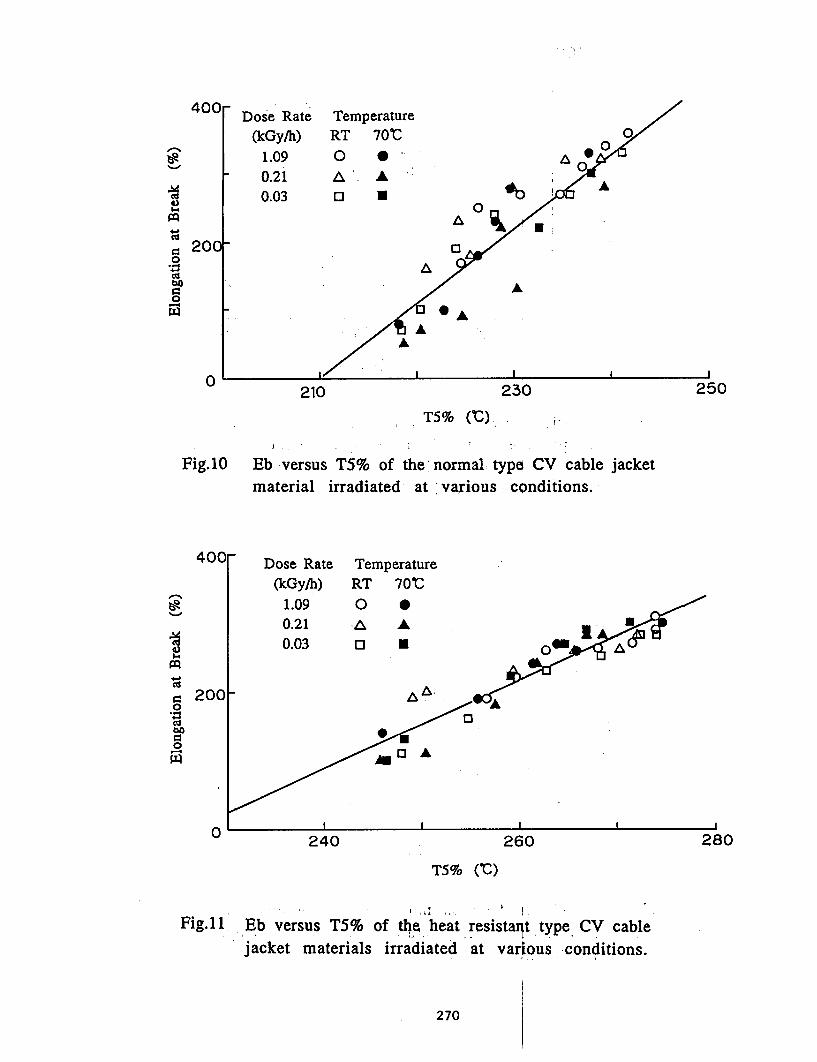
Dose Rate(kGy/h)
TemperatureRT 70°C
1.09 0 0
0.21 A'A A0.03 0 * O 3
V 200 D30A
bO A A
bo
*A
AA
0210 230
T5% (C).
Fig.10 Eb versus T5% of the' normal type CV cable jacketmaterial irradiated at various conditions.
400 Dose Rate Temperature
(kGy/h) RT 70tC1.09 0 S0.21 A A
0.0 05-4
200 _ ^0
CU
00.w
250
0 240 260 280
T5% (C)
I~~ ~ ~ I; ,, ' .' I
Fig.11. Eb versus T5% of the heat resista- t type CV cablejacket materials irradiated at various conditions.
270
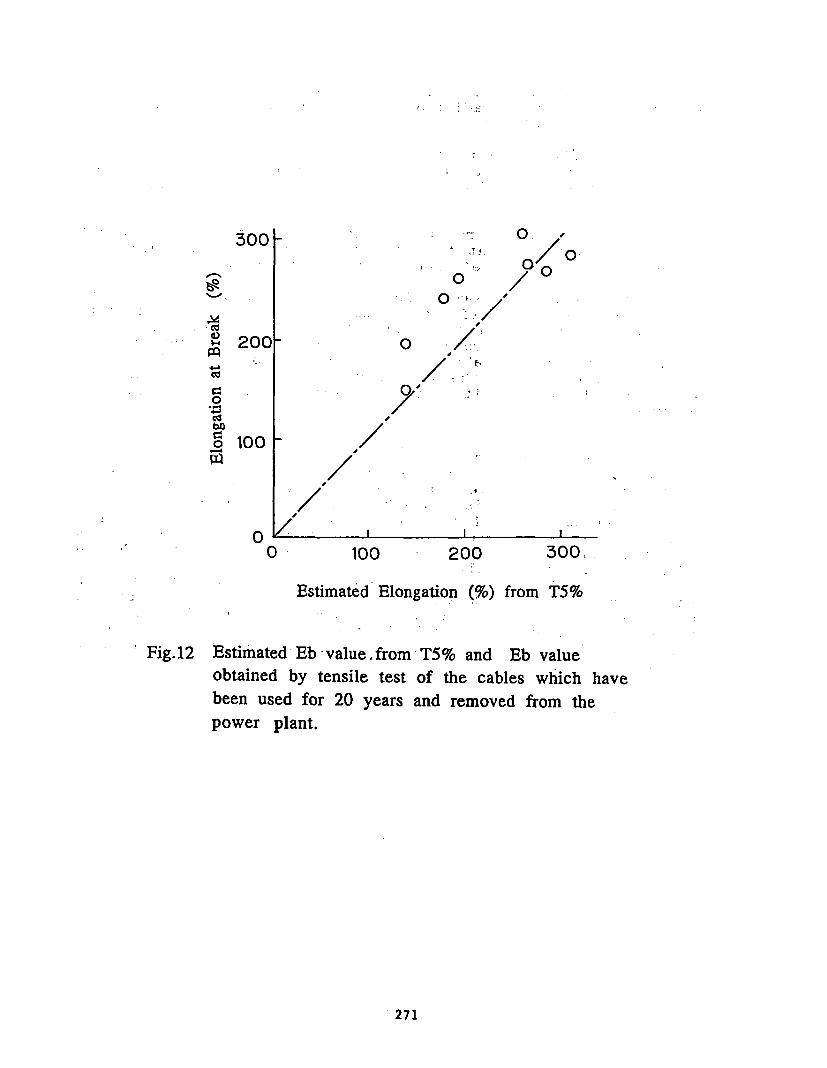
300 -
I--,
4-a
4a
"S0ram
blo
r.
200
0I
0 '
//
0'
. /
/ . i
100
,/s LI
n) I I I6
0 100 200
Estimated Elongation (%)
300
from T5%
' Fig.12 Estimated Eb value,.from TS% and Eb valueobtained by tensile test of the cables which havebeen used for 20 years and removed from thepower plant.
271
molecular weight and Eb. This result shows that degradation ofPVC with gamma ray irradiation is attributed to the main chainscission of the polymer.
Fig.10 shows the results obtained for the normal type CVcable jacket material irradiated at various temperature and doserate conditions. Good correlation between Eb and T5% was foundin a wide Eb range.
Fig.11 shows the result for heat resistant type CV cablejacket material irradiated at various temperature and dose rateconditions. Good correlation was also found between Eb and T5%.
Fig.12 shows an example in application of thermogravimetryto estimate the degradation of CV cables which have been used inthe nuclear power plant for about 20 years and removed from it.In this figure, the ordinates represents Eb value obtained bytensile test and the abscissa represents Eb value which wasestimated from T5% of the TGA measurement. Eb value obtainedfrom T5% well agrees with real Eb value obtained by destructivemeasurement.
4. ConclusionIn the torque-strain response measurement, factors which
affect on torque-strain response are found to be torsionfrequency, torsion angle and distance between the chucks.
Good correlation is found between the torque value and theelongation at break of the cables exposed to the artificialaging. Experimental results show that the torque-strainresponse can be-used as a non-destructive method to detect degreeof degradation in installed cables.
In thermogravimetry, good correlation is also found betweenthe elongation at break and the T5% of the CV cable exposed toartificial and natural aging. It can be concluded that theseresults will provide a possibility to practical application ofthese methods to detect degradation of installed cables in powerplant.
272
5. References
[1]S.P.Carfagno et al,"Development of a cable indenter to monitorcable aging in situ," International Conference on Operabilityof Nuclear Systems in Normal and Adverse Environments,Proceedings, Vol. 1, ppl95-202,1989
[2]S.Yamanaka et al," A method for obtaining the dielectriccharacteristics by analyzing the residual voltage,"Trans. IEE of Japan, Vol. 110-A, No. 3, ppl8l-189,1990
[3]R.D.Meininger,"Electronic characterization and Diagnosis,"Proceedings of Work Shop on Power Cable Condition Monitoring19-1 EPRI EL/NP/CS-5914-SR, 1988
[4]F.I.Mospik and F.D.Martzroff,"Time domain spectroscopy tomonitor the condition of cable insulation," Proceedings of 16thWater Reactor Safety Information Meeting NUREG/CP-0097 Vol.3,pp21-40,1989
[5]S.Okada et al,"Deterioration test of insulatiing materials ofcables for nuclear power generating stations,"
J. of At. Energy Soc. JPN. Vol.21, No.10, pp808-814,1979(Japanese)
[6]M.B.Neiman,"Aging and Stabilization of Polymers", 1964
273
DETECTING AND MITIGATING AGING IN COMPONENT COOLING WATER SYSTEMS*
Robert J. LofaroBrookhaven National Laboratory
Upton, New York 11973
ABSTRACT
The time-dependent effects of aging on component cooling water (CCW)systems in nuclear power plants has been studied and documented aspart of a research program sponsored by the U.S. Nuclear RegulatoryCommission. It was found that age related degradation leads tofailures in the CCW system which can result in an increase in systemunavailability, if not properly detected and mitigated. To identifyeffective methods of managing this degradation, information oninspection, monitoring, and maintenance practices currentlyavailable was obtained from various operating plants and reviewed.The findings were correlated with the most common aging mechanismsand failure modes, and a compilation of aging detection andmitigation practices was formulated. This paper discusses theresults of this work.
INTRODUCTION
The component cooling water (CCW) system is one of many systems that isimportant for safe operation of nuclear power plants. In a research programsponsored by the U.S. Nuclear Regulatory Commission (NRC), the CCW system hasbeen studied to determine how aging affects its performance and reliability. Thestudy was performed in two phases and included extensive analyses of dataobtained from national data bases, as well as data obtained from actual plantvisits. This paper discusses how the results of those analyses can be used tohelp detect and mitigate the affects of aging in CCW systems.
The function of the CCW system is to remove heat from various loadsthroughout the plant and discard it to an open loop cooling system, such as theservice water system. The loads serviced by the CCV system can be safety-relatedor non-safety-related, and include the reactor coolant pump seals, the shutdownheat exchangers, the residual heat removal heat exchangers, and the safetyinjection pumps. Due to the diversity of the loads dependent on it, the CCWsystem is continuously operating, and is required during normal, as well as off-normal plant operation. Therefore, the affects of aging must be properly managedto ensure safe plant operation in later years.
PHASE I RESULTS
In phase I of the CCW system aging study1 an analysis of past operatingexperience showed that the CCW components are susceptible to aging degradation,
* Work performed under the auspices of the;U.S. Nuclear Regulatory Commission
275
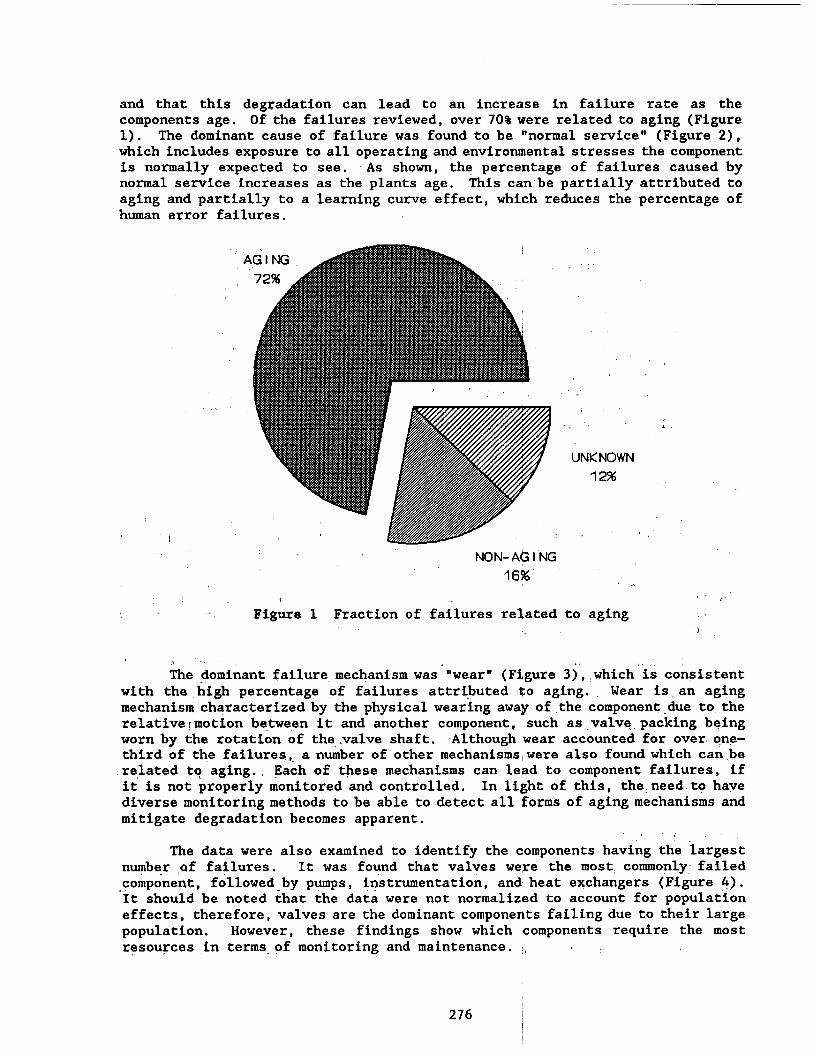
and that this degradation can lead to an increase in failure rate as thecomponents age. Of the failures reviewed, over 70% were related to aging (Figure1). The dominant cause of failure was found to be "normal service" (Figure 2),which includes exposure to all operating and environmental stresses the componentis normally expected to see. As shown, the percentage of failures caused bynormal service increases as the plants age. This can be partially attributed toaging and partially to a learning curve effect, which reduces the percentage ofhuman error failures.
AG ING _||||.s...:
72% s||| | l| l|l|i
UNKNOWN12%
NON-Ad I NG16%
Figure 1 Fraction of failures related to aging
The dominant failure mechanism was "wear" (Figure 3), which is consistentwith the high percentage of failures attributed to aging. Wear is an agingmechanism characterized by the physical wearing away of the component due to therelativermotion between it and another component, such as valvq packing beingworn by the rotation of the valve shaft. Although wear accounted for over, one-third of the failures, a number of other mechanisms were also found which can berelated to aging., Each of these mechanisms can lead to component failures, ifit is not properly monitored and controlled. In light of this, the need to havediverse monitoring methods to be able to detect all forms of aging mechanisms andmitigate degradation becomes apparent.
The data were also examined to identify the components having the largestnumber of failures. It was found that valves were the most commonly failedcomponent, followed by pumps, instrumentation, and heat exchangers (Figure 4).It should be noted that the data were not normalized to account for populationeffects, therefore, valves are the dominant components failing due to their largepopulation. However, these findings show which components require the mostresources in terms of monitoring and maintenance..
276
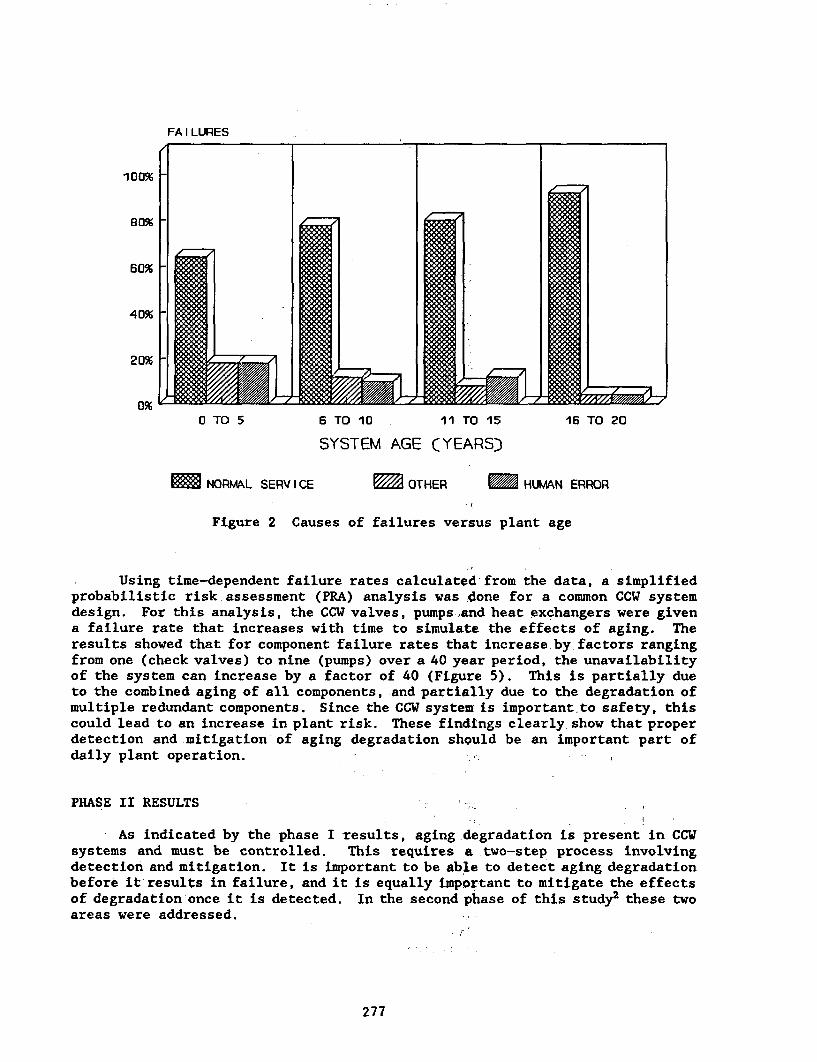
FA I LURES
100%
20%
60%
40%
20%
0 TO 5 6 TO 10 11 TO 15 16 TO 20
SYSTEM AGE (YEARS)
NORMAL SERVICE OTHER HUMAN ERROR
Figure 2 Causes of failures versus plant age
Using time-dependent failure rates calculated from the data, a simplifiedprobabilistic risk assessment (PRA) analysis was done for a common CCW systemdesign. For this analysis, the CCW valves, pumps and heat exchangers were givena failure rate that increases with time to simulate the effects of aging. Theresults showed that for component failure rates that increase by factors rangingfrom one (check valves) to nine (pumps) over a 40 year period, the unavailabilityof the system can increase by a factor of 40 (Figure 5). This is partially dueto the combined aging of all components, and partially due to the degradation ofmultiple redundant components. Since the CCW system is important.to safety, thiscould lead to an increase in plant risk. These findings clearly show that properdetection and mitigation of aging degradation should be an important part ofdaily plant operation.
PHASE II RESULTS
As indicated by the phase I -results, aging degradation is present in CCWsystems and must be controlled. This requires a two-step process involvingdetection and mitigation. It is important to be able to detect aging degradationbefore it results in failure, and it is equally important to mitigate the effectsof degradation once it is detected. In the second phase of this study2 these twoareas were addressed.
277
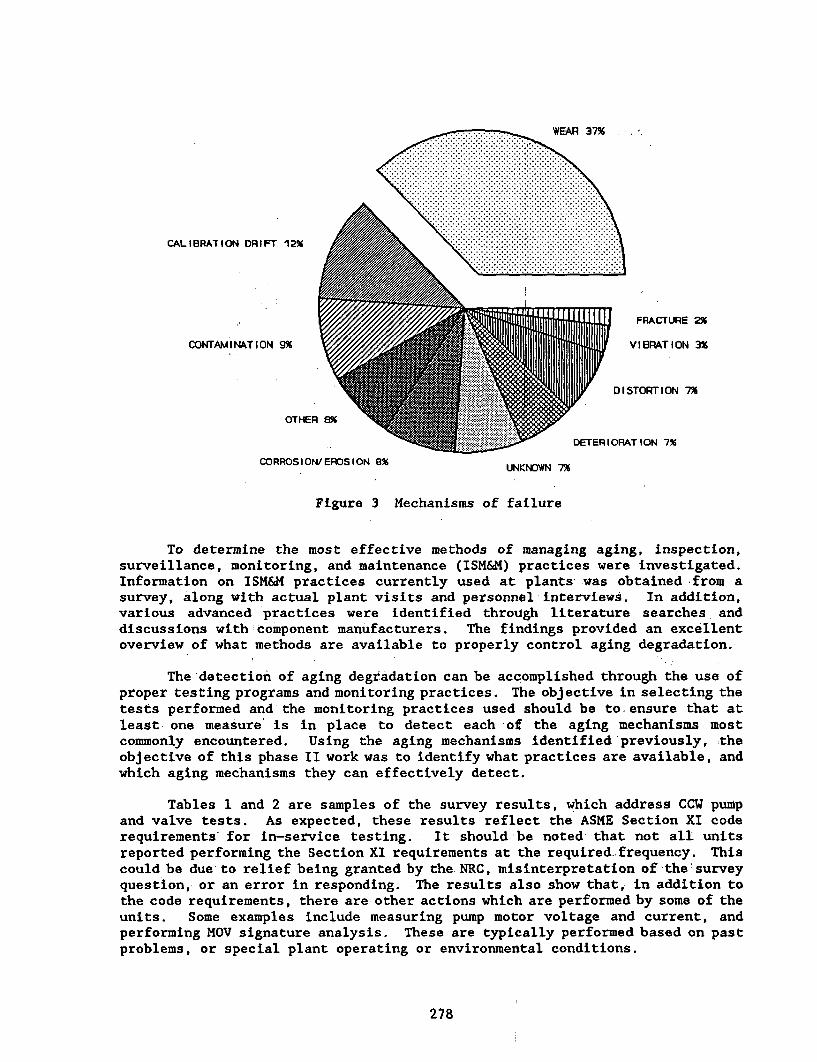
RWEAR 37%
CDETERIORATION 7R
OORROS I OW EFS ION SX UNKNOWN 7X
. ................. ............
Figure 3 Mechanisms of failure
To determine the most effective methods of managing aging, inspection,surveillance, monitoring, and maintenance (ISM&14) practices were investigated.Information on ISM&14 practices currently used at plants was obtained from asurvey, along with actual plant visits and personnel interviews. In addition,various advanced practices were identified through literature searches anddiscussions with component manufacturers. The findings provided an excellentoverview of what methods are available to properly control aging degradation.
. . . . . . . . . . . . . . .
The detection of aging degriadation can be accomplished through the use ofproper testing programs and monitoring practices. The objective in selecting thetests performed and the monitoring practices used should be to ensure that atleast one measure is in place to detect each of the aging mechanisms mostcommonly encountered. Using the aging mechanisms identified previous ly, theobjective of this phase II work was to identify what practices are available, andwhich aging mechanisms they can effectively detect.
Tables 1 and 2 are samples of the survey results, which address CCW pumpand valve tests. As expected, these results reflect the ASME Section XI coderequirements~ for in-service testing. It should be noted that not all unitsreported performing the Section XI requirements at the required. frequency. Thiscould be due to relief being granted by the NRC, misinterpretation of the surveyquestion, or an error in responding. The results also show that, in addition tothe code requirements, there are other actions which are performed by some of theunits. Some examples include measuring pump motor voltage and current, andperforming NOV signature analysis. These are typically performed based on pastproblems, or special plant operating or environmental conditions.
278
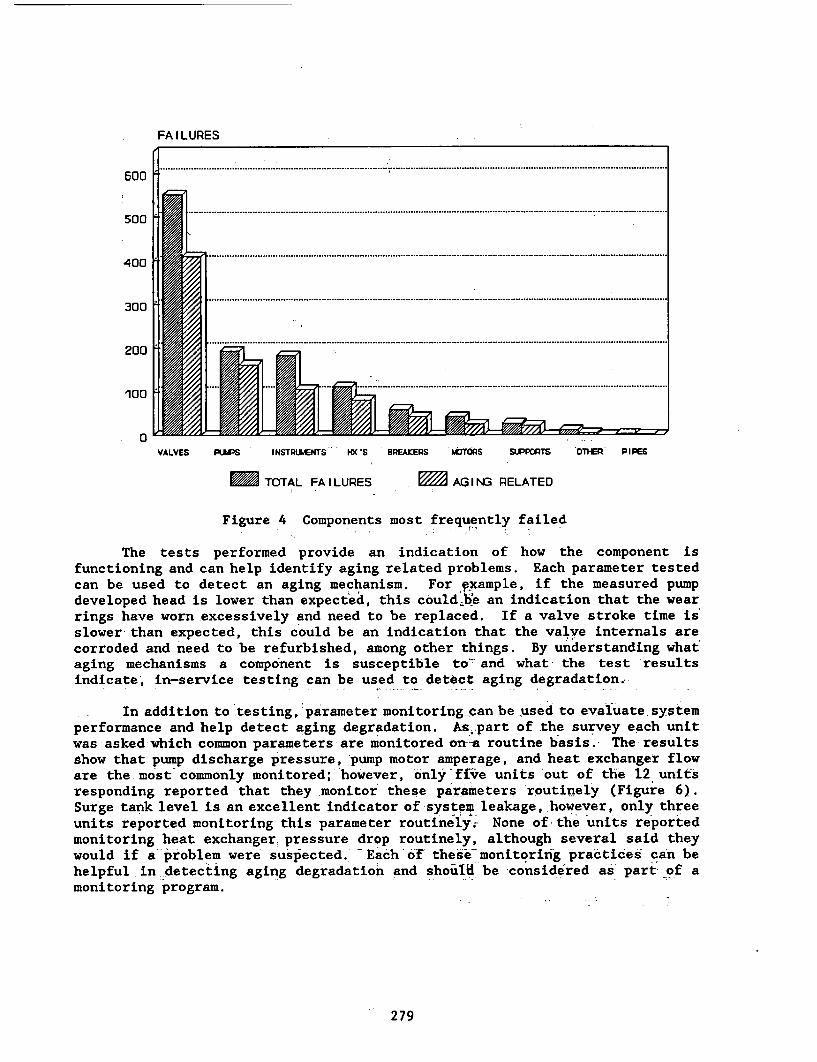
FAILURES
600
500 .....................................................................................................................................................................................500
400
300
200
. . .. ..... .. . .. _. . . . . . .. . . . . . . . .. . . . . . . . . . . . . . . . . . .. . . . . . . . . . . . . . . . . . .
100
0VALVES PULPS INSTRUMENTS HX-S BREAKERS LETOMS dPPOTS OTH PIPS
TOTAL FAILURES AJGI1NG RELATED
Figure 4 Components most frequently failed
The tests performed provide an indication of how the component isfunctioning and can help identify aging related problems. Each parameter testedcan be used to detect an aging mechanism. For example, if the measured pumpdeveloped head is lower than expected, this couldbe an indication that the wearrings have worn excessively and need to be replaced. If a valve stroke time isslower than expected, this could be an indication that the valve internals arecorroded and need to be refurbished, among other things. By understanding whataging mechanisms a component is susceptible to-'and what the test resultsindicate, in-service testing can be used to detect aging degradation.
In addition to testing, parameter monitoring-can be used to evaluate systemperformance and help detect aging degradation. Aspart of the survey each unitwas -asked which common parameters are monitored on-a routine basis. The resultsshow that pump discharge pressure,'pump motor amperage, and heat exchanger floware the most commonly monitored; however, only fi;ve units 'out of the 12 unitsresponding reported that they monitor these parameters routinely (Figure 6).Surge tank level is an excellent indicator of -system leakage, however, only threeunits reported monitoring this parameter routinely. None of the units reportedmonitoring heat exchanger, pressure drop routinely, although several said theywould if a'p'roblem were suspected.- -Each of theisiezmonitoring practices can behelpful in detecting aging degradation and shoulad be considered as' part of amonitoring program.
279
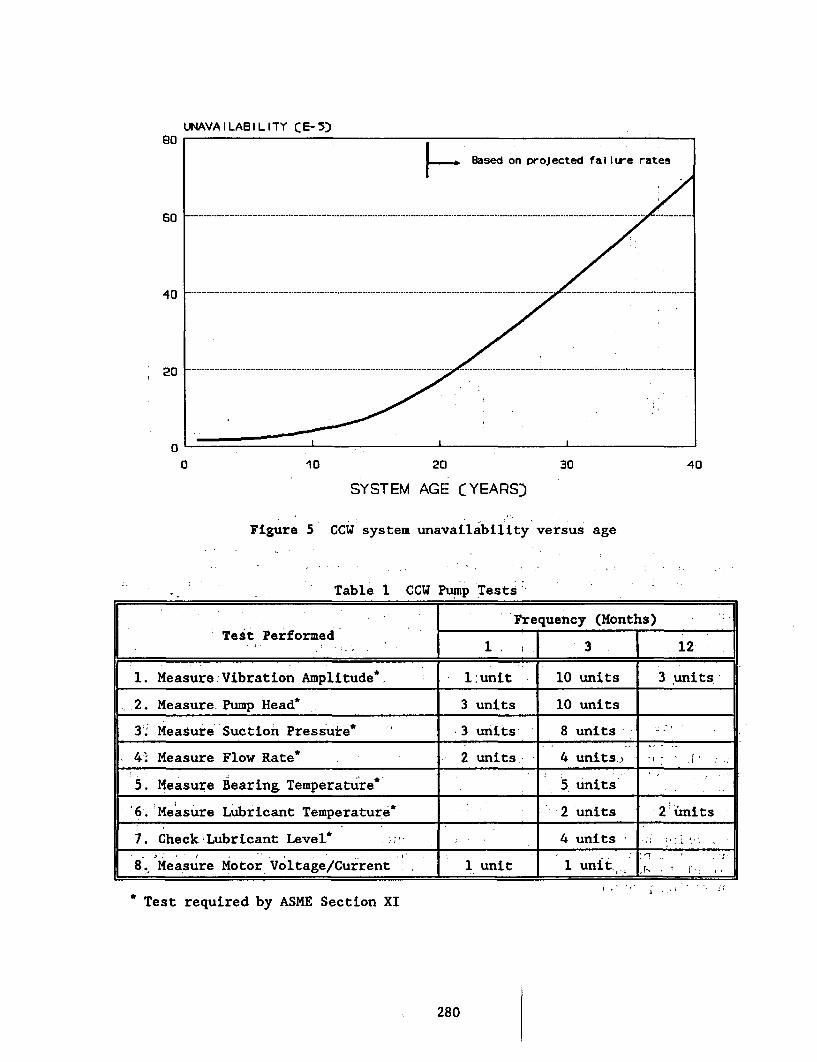
UNAVAILABILITY CE-5)e0
60
40
;20
0
a 10 20 30
SYSTEM AGE CYEARS)
Figure 5 CCW system unavailability versus age
40
Table 1 CCW Pump Tests
Frequency (Months)Test Performed | l 3 12
1. Measure.Vibration Amplitude* l:unit 10 units 3 units.
2. Measure. Pump Head* 3 units 10 units
3: Measure Suction Pressures 3 units 8 units
4. Measure Flow Rate* 2 units 4 units.
5. Measure Bearing Temperature 5 units
6. Measure Lubricant Temperature 2 units 2iunits
7. Check Lubricant Level* -. 4 units
8., Measure Motor Voltage/Current 1 unit 1 unit., r_ -. I'
I . ' i … I , -.
* Test required by ASME Section XI
280
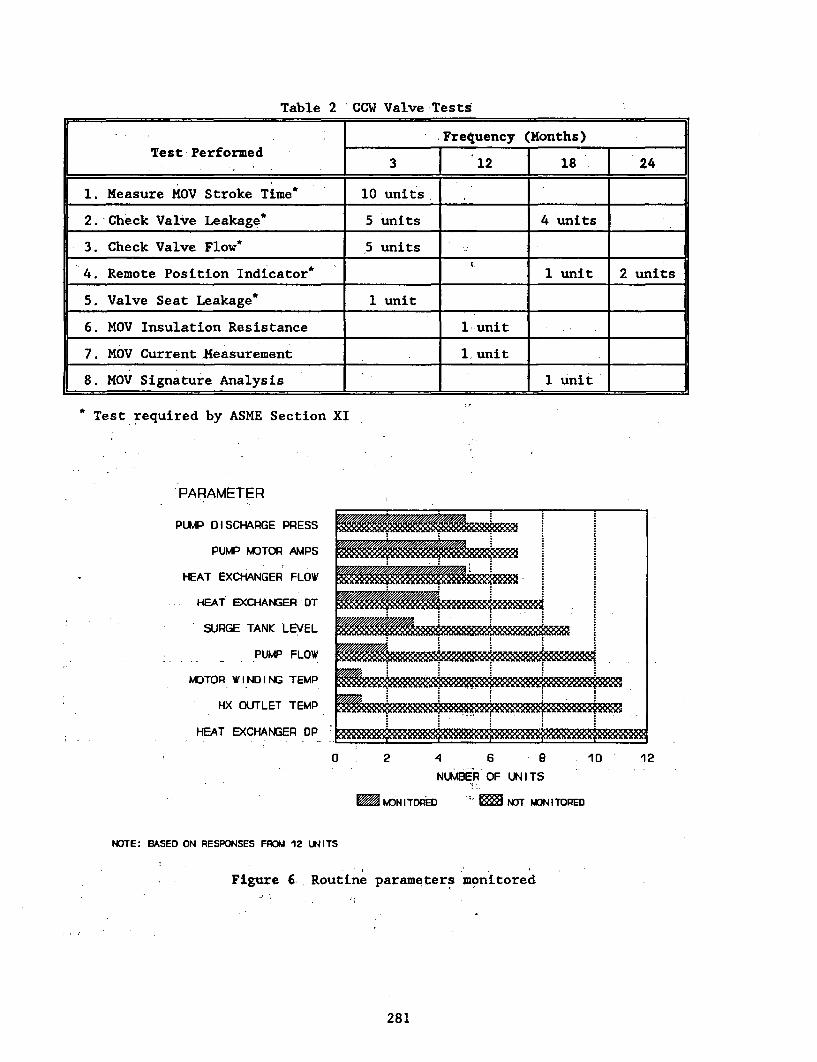
Table 2 CCW Valve Tests
._._ Frequency (Months)Test Performed . .
: 3 1 12 18 24
1. Measure MOV Stroke Time* 10 units|
2. Check Valve Leakage* 5 units 4 units
3. Check Valve Flow' 5 units
4. Remote Position Indicator' 1 unit 2 units.
5. Valve Seat Leakage' 1 unit .
6. MOV Insulation Resistance 1 unit
7. MOV Current Measurement 1 unit
8. MOV Signature Analysis . 1 unit
Test required by ASME Section XI
PARAMETER
PUMP DISCHARGE PRESS
PUMP MOTOR AMPS
HEAT EXCHANGER FLOW
H-EAT EXCHANGER DT
SURGE TANK LEVEL
PUMP FLOW
MOTOR WINDING TEMP
MX OUTLET TEMP
HEAT EXCHANGER DP
, . . .
NNEVEMW.4m iI
71A F/,
NFRIFURVEN
V111,111,11'A"AlOWWWW10
2 4 6 6 10
NUMBER OF UNITS
KIN I TORED I- M NOT MONITORED
12
INTE: BASED ON RESPONSES FMOM 12 UNITS
Figure 6 Routine parameters monitored... I.
I
281
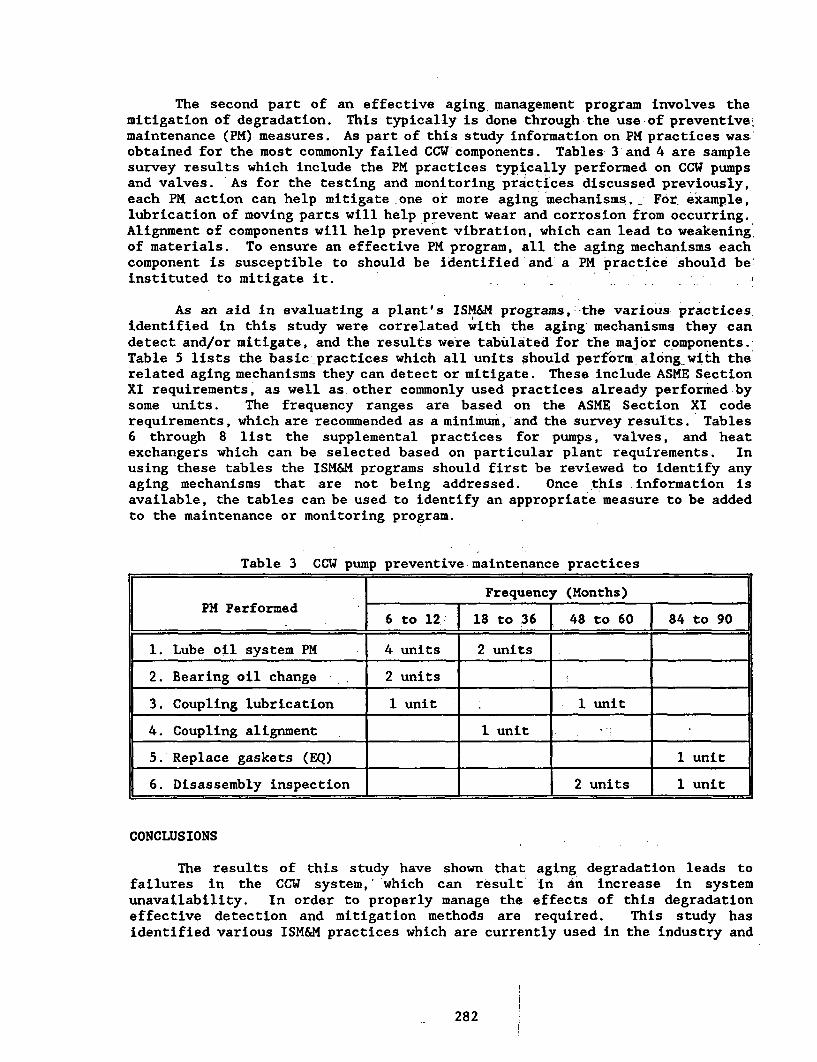
The second part of an effective aging management program involves themitigation of degradation. This- typically is done through the use of preventive,maintenance (PM) measures. As part of this study information on PM practices wasobtained for the most commonly failed CCW components. Tables- 3 and 4 are samplesurvey results which include the PM practices typically performed on CCW pumpsand valves. -As for the testing and monitoring practices discussed previously,each PM action can help mitigate one or more aging mechanisms. For example,lubrication of moving parts will help prevent wear and corrosion from occurring.Alignment of components will help prevent vibration, which can lead to weakening.of materials. To ensure an effective PM program, all the aging mechanisms eachcomponent is susceptible to should be identified and a PM practice should be'instituted to mitigate it.
As an aid in evaluating a plant's ISM&M programs,-the various practicesidentified in this study were correlated with the aging mechanisms they candetect and/or mitigate, and the results were tabulated for the major components.Table 5 lists the basic-practices which all units should perform along with therelated aging mechanisms they can detect or mitigate. These include ASME SectionXI requirements, as well as other commonly used practices already performed bysome units. The frequency ranges are based on the ASME Section XI coderequirements, which are recommended as a minimum, and the survey results. Tables6 through 8 list the supplemental practices for pumps, valves, and heatexchangers which can be selected based on particular plant requirements. Inusing these tables the ISM&M programs should first be reviewed to identify anyaging mechanisms that are not being addressed. Once this information isavailable, the tables can be used to identify an appropriate measure to be addedto the maintenance or monitoring program.
Table 3 CCW pump preventive maintenance practices
Frequency (Months)PM Performed
6 to 12 18 to 36 48 to 60 84 to 90
1. Lube oil system PM 4 units 2 units
2. Bearing oil change 2 units
3. Coupling lubrication 1 unit 1 unit
4. Coupling alignment _ 1 unit _
5.'Replace gaskets (EQ) 1 unit
6. Disassembly inspection _ 2 units 1 unit
CONCLUSIONS
The results of this study have shown that aging degradation leads tofailures in the CCW system,' which can result' in an increase in systemunavailability. In order to properly manage the effects of this degradationeffective detection and mitigation methods are required. This study hasidentified various ISM&M practices which are currently used in the industry and
282
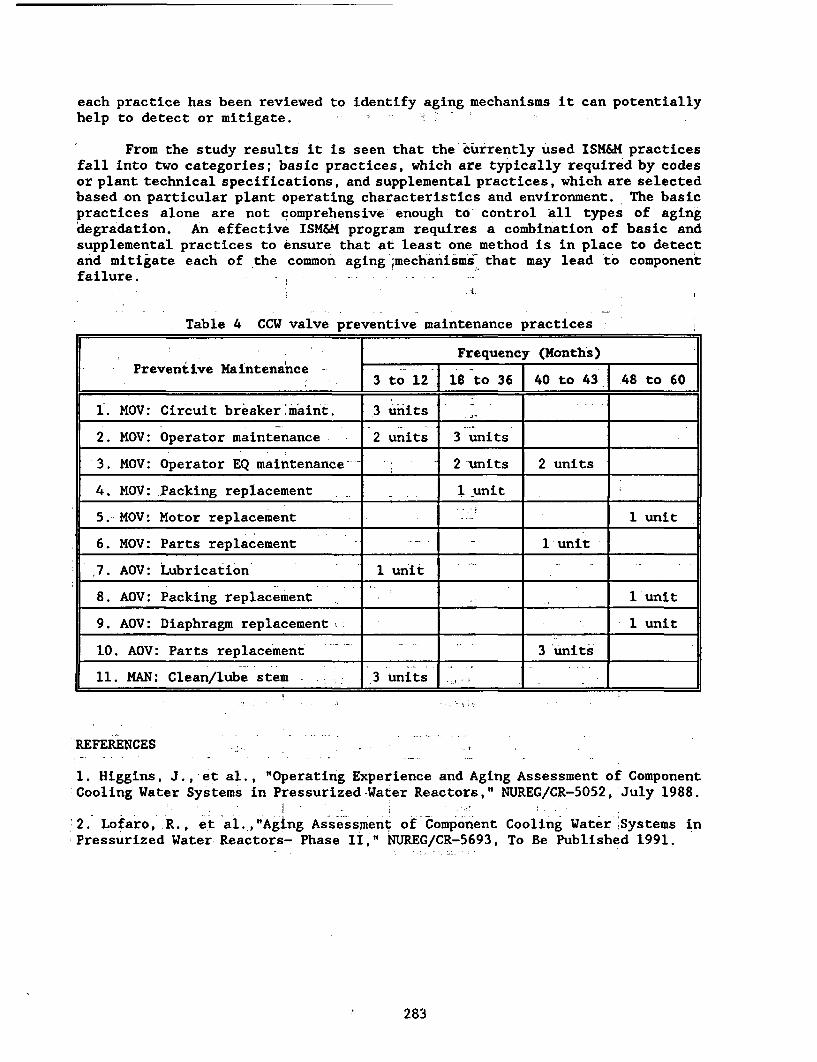
each practice has been reviewed to identify aging mechanisms it can potentiallyhelp to detect or mitigate. -
From the study results it is seen that the currently used ISM&M practicesfall into two categories; basic practices, which are typically required by codesor plant technical specifications, and supplemental practices, which are selectedbased on particular plant operating characteristics and environment. The basicpractices alone are not comprehensive enough to- control all types of agingdegradation. An effective ISM&M program requires a combination of basic andsupplemental practices to ensure that at least one method is in place to detectand mitigate each of the common 'aging 'mechanismis that may lead 'to componentfailure.
Table 4 CCW valve preventive maintenance practices
Frequency (Months)- Preventive Maintenance -t
3 to 12 18 to 36 140 to 431 48 to 60
1. MOV: Circuit breaker maint. 3 units | , | _ -l l
2. MOV: Operator maintenance 2 units 3 units
3. MOV: Operator EQ maintenance- - 2-units 2 units
4. MOV: Packing replacement 1 unit
5.-- MOVi Motor replacement ' 1 unit
6. MOV: Parts replacement 1 unit
.7. AOV: Lubrication 1 unit
8. AOV: Packing replacement 1 unit
9. AOV: Diaphragm replacement, 1 unit
10. AOV: Parts replacement 3'units__
11. MAN: Clean/lube stem -3 units
REFERENCES-7
1. Higgins, J., et al., "Operating Experience and Aging Assessment of ComponentCooling Water Systems in Pressurized -Water Reactors," NUREG/CR-5052, July 1988.
2. Lofaro, R., et al.,"Aging Assessment of Component Cooling Water Systems inPressurized Water Reactors- Phase II," NUREG/CR-5693, To Be Published 1991.
283
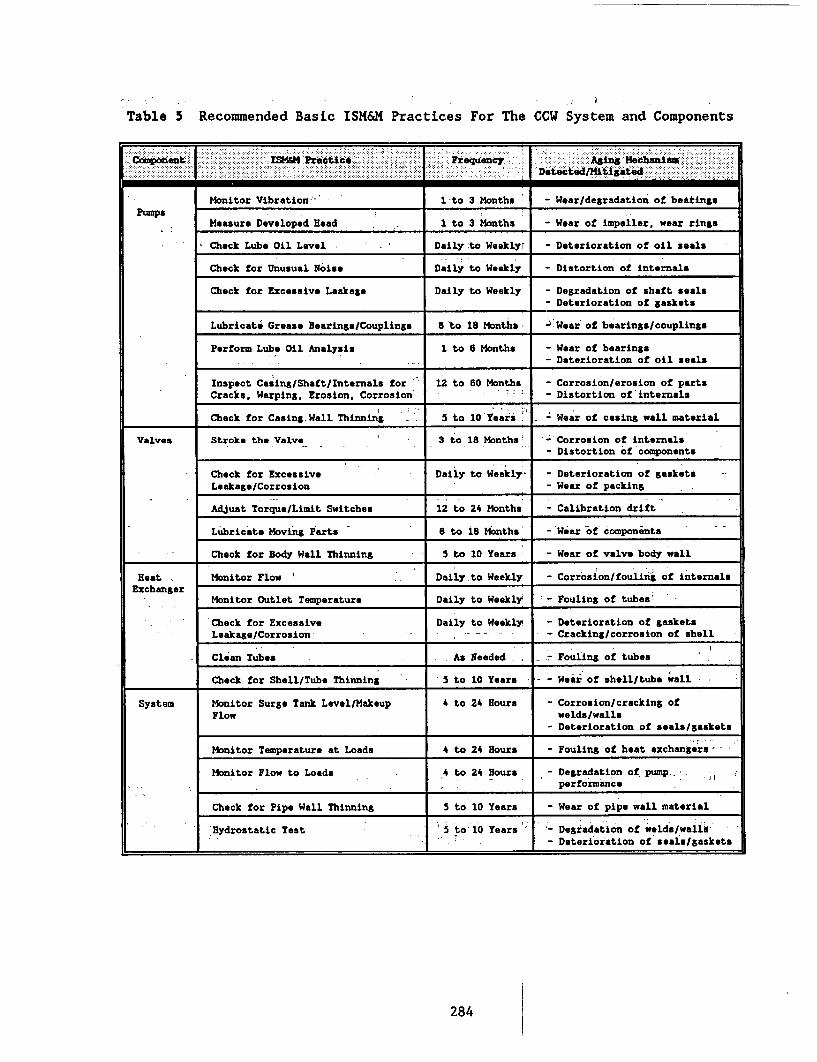
Table 5 Recommended Basic ISM&M Practices For The CCW System and Components
~comonen-a ISM&M P*racticjrqec gn ehns
Monitor Vibration I to 3 Months - Wear/degradation of beatings
PumpsMeasure Developed Head 1 to 3 Months - Wear of impeller, wear rings
Check Lubs Oil Level Daily to Weeklyt - Deterioration of oil seals
Check for Unusual Noise Daily to Weekly - Distortion of internals
Check for Excessive Leakage Daily to Weekly -Degradation of shaft seals- Deterioration of gaskets
Lubricate Grosse Bearings/Couplings 5 to 18 Months J'Wear of bearings/couplings
Perform Lube Oil Analysis 1 to 6 Months - Wear of bearings- Deterioration of oil seals
Inspect Casing/Shaft/Internals for 12 to 60 Months - Corrosion/erosion of parts
Cracks, Warping, Erosion, Corrosion 71- - Distortion of internals
Check for Casing Wall Thinning . 5 to 10 Years - Wear of casing wall material
Valves Stroke the Valve 3 to 18 Months! Corrosion of internals- Distortion of components
Check for Excessive - Daily to Weekly- - Deterioration of gaskets
Leakage/Corrosion - Wear of packing
Adjust Torque/Limit Switches 12 to 24 Months - Calibration drift
Lubricate Moving Parts 6 to iS Months - Wear of components
Check for Body Wall Thinning 5 to 10 Years - Wear of valve body wall
Beat Monitor Flow Daily-to.Weekly - Corrosion/fouling of internalsExchanger
Monitor Outlet Temperature Daily to Weekly - Fouling of tubes'
Check for Excessive Daily to Weekly - Deterioration of gasketsLeakage/Corrosion - _ _ - Cracking/corrosion of shell
Clean Tubes As Needed - Fouling of tubes
Check for Shell/Tube Thinning 5 to 10 Years - - Wear of shell/tube wall
System Monitor Surge Tank Level/Makeup 4 to 24 Hours - Corrosion/cracking ofFlow welds/walls
- Deterioration of seals/gaskets
Monitor Temperature at Loads 4 to 24 Hours - Fouling of heat exchangers-
Monitor Flow to Loads 4 to 24 Hours - Degradation of pump.:performance
Check for Pipe Wall Thinning 5 to 10 Years - Wear of pipe wall material
Hydrostatic Test 5 to-10 Years Degradation of welds/walls- Deterioration of seai/gaskets
284
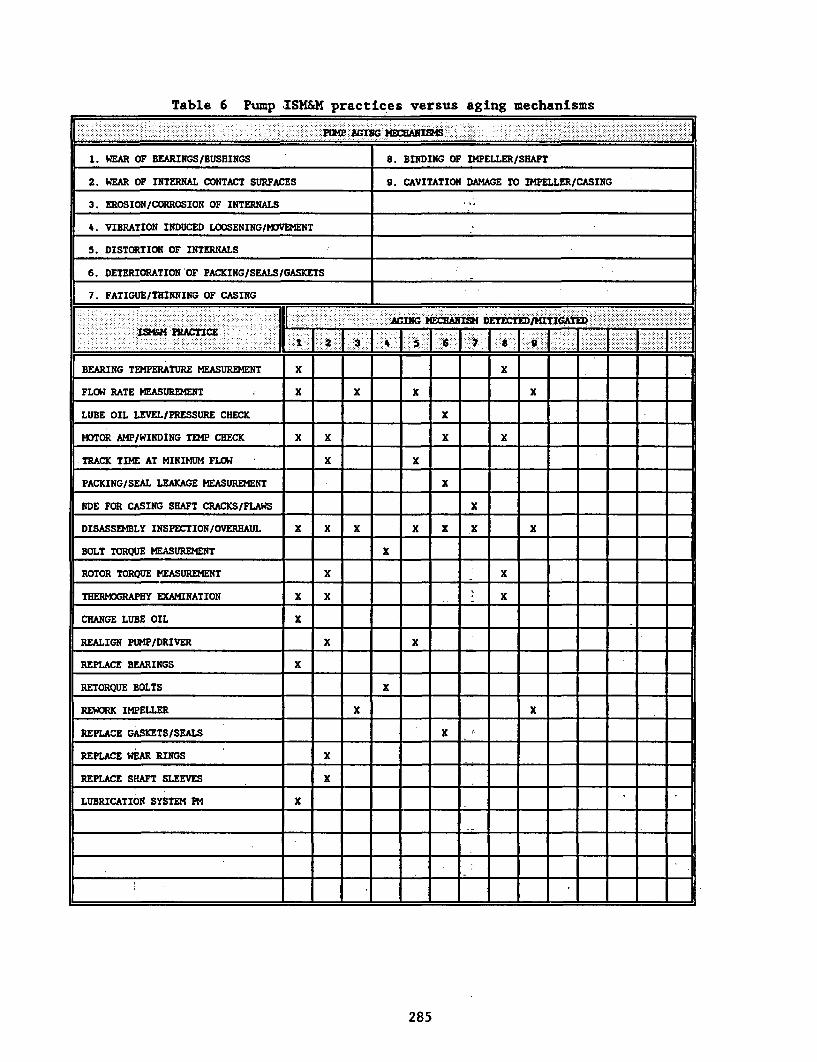
Table 6 Pump .ISK&M practices versus aging mechanisms
........... AMCN EH~ANISMS:"
1. WEAR OF BEARINGS/BUSHINGS S. BINDING OF IMPELLER/SHAFT
2. WEAR OF INTERNAL CONTACT SURFACES 9. CAVITATION DAMAGE TO IMPELLER/CASING
3. EROSION/CORROSION OF INTERNALS
4. VIBRATION INDUCED LOOSENING/MVEMENT
5. DISTORTION OF INTERNALS
6. DETERIORATION OF PACKING/SEALS/GASKETS :
7. FATIGUE/THINNING OF CASING
l . . ,, -.............................. .. ,.CANI-M-
* .:S ; 000 000- :. ;.- 00005-E0 ........... ;0.--i-:-00;i-t000i::;iS-!EV~ 1:li;0Eiliilig:3ii;. : . . .- .. . . . .:1
BEARING TEMPERATURE MEASUREMENT X X
FLOW RATE MEASUREMENT X X X X
LUBE OIL LEVEL/PRESSURE CHECK X
MOTOR AMP/WINDING TEMP CHECK X X X X
TRACK TIME AT MINIMUM FLOW X X
PACKING/SEAL LEAKAGE MEASUREMENT X
NDE FOR CASING SHAFT CRACKS/FLAWS X
DISASSEMBLY INSPECTION/OVERHAUL Y X X X X A X
BOLT TORQUE MEASUREMENT X
ROTOR TORQUE MEASUREMENT X X
THERMDGRAPHY EXAMINATION X X x
CHANGE LUBE OIL X
REALIGN PUMP/DRIVER X X
REPLACE BEARINGS X
RETORQUE BOLTS X
REWORK IMPELLER X X
REPLACE GASKETS/SEALS X
REPLACE WEAR RINGS X
REPLACE SHAFT SLEEVES X
LUBRICATION SYSTEM PM X
285
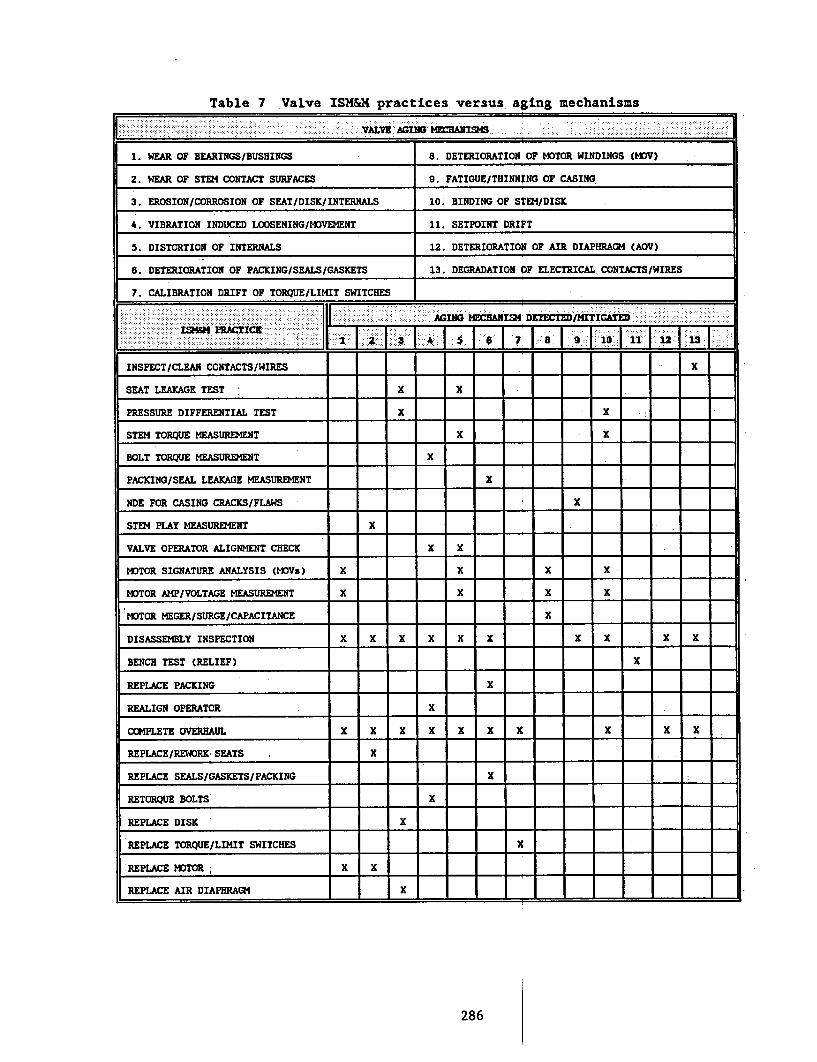
Table 7 Valve ISMH& practices versus aging mechanisms
I VALVE AGING MECHANISMS:
1. WEAR OF BEARINGS/BUSHINGS 8. DETERIORATION OF MOTOR WINDINGS (MOV)
2. WEAR OF STEM CONTACT SURFACES 9. FATIGUE/THINNING OF CASING
3. EROSION/CORROSION OF SEAT/DISK/INTERNALS 10, BINDING OF STEM/DISK
4. VIBRATION INDUCED LOOSENING/MOVEMENT 11. SETPOINT DRIFT
5. DISTORTION OF INTERNALS 12, DETERIORATION OF AIR DIAPHRAGM (AOV)
6. DETERIORATION OF PACKING/SEALS/GASKETS 13. DEGRADATION OF ELECTRICAL CONTACTS/WIRES
7. CALIBRATION DRIFT OF TORQUE/LIMIT SWITCHES
- .......... . . I. .. II AGING -- |.i:M NIS D T C;: -4 0 G0IMM PRAcTICE SI T T F T I T T
INSPECT/CLEAN CONTACTS/WIRES X
SEAT LEAKAGE TEST | X x
PRESSURE DIFFERENTIAL TEST X X
STEM TORQUE MEASUREMENT X X
BOLT TORQUE MEASUREMENT X
PACKING/SEAL LEAKAGE MEASUREMENT X
NDE FOR CASING CRACKS/FLAWS X
STEM PLAY MEASUREMENT X
VALVE OPERATOR ALIGNMENT CHECK X X
MOTOR SIGNATURE ANALYSIS (MOVs) X X X X
MOTOR AMP/VOLTAGE MEASUREMENT X X X X
MOTOR MEGER/SURGE/CAPACITANCE X
DISASSEMBLY INSPECTION X X X X X X X X X X
BENCH TEST (RELIEF) X
REPLACE PACKING X
REALIGN OPERATOR X
CCMPLETE OVERHAUL X X X X X X X X X X
REPLACE/REORK SEATS X
REPLACE SEALS/GASKETS/PACKING X
RETORQUE BOLTS X
REPLACE DISK X
REPLACE TORQUE/LIMIT SWITCHES X
REPLACE MOTOR X X
REPLACE AIR DIAPHRAGM X
286
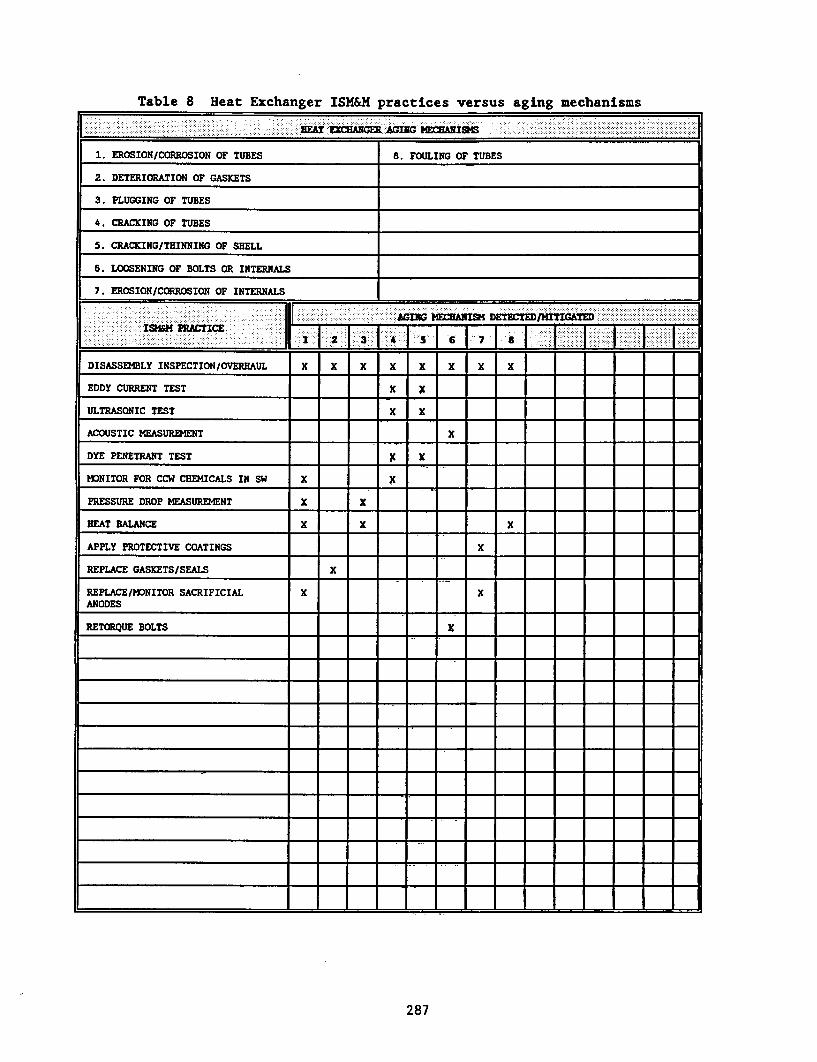
Table 8 Heat Exchanger ISM&M practices versus aging mechanisms
1. EROSION/CORROSION OF TUBES 8. FOULING OF TUBES
2. DETERIORATION OF GASKETS
3. PLUGGING OF TUBES
4. CRACKING OF TUBES
5. CRACKING/THINNING OF SHELL
6. LOOSENING OF BOLTS OR INTERNALS
7. EROSION/CORROSION OF INTERNALS
IAGING HECRBBIa4 DETECTED~/...... ................
DISASSEMBLY INSPECTION/OVERHAUL X X X X X X X X
EDDY CURRENT TEST X X
ULTRASONIC TEST X X
ACOUSTIC MEASUREMENT X
DYE PENETRANT TEST
MONITOR FOR CCW CEEMICALS IN SW X
PRESSURE DROP MEASUREMENT X X
HEAT BALANCE X X X
APPLY PROTECTIVE COATINGS X
REPLACE GASXETS/SEALS X
REPLACE/MONITOR SACRIFICIAL X XANODES
RETORQUE BOLTS =
287
The Effects of Aging on Friction of MOVsa
Thomas H. Hunt :Upendra P. Sinha
Idaho National Engineering LaboratoryEG&G Idaho, Inc.
Idaho Falls, Idaho 83415
ABSTRACT
As part of the Nuclear Regulatory Commission's Nuclear Plant AgingResearch Program, the Idaho National Engineering Laboratory studiedaging mechanisms affecting the friction coefficients of motor-operatedvalves (MOVs). The study reviewed current corrosion theory and MOVoperating history data, observed in-service MOV conditions, and discussedvalve operability failures with engineering and maintenance personnel todetermine the effects of corrosion, erosion, and oxide deposition on valvesliding surface friction coefficients. This paper reports an overview of thestudy's methodology and results.
INTRODUCTION
The ability of safety-related motor-operated valves (MOVs) to operate under designbasis conditions has been questioned because MOV failures have occurred at severaloperating facilities in recent years. As a result, the U.S. Nuclear Regulatory Commission(NRC) issued several information notices and a generic letter to address these concerns.
While working on Generic Issue 87 (GI 87) concerns for the NRC, engineers at theIdaho National Engineering Laboratory (INEL) develop'ed a fault tree of factors that couldcause high energy line MOVs at boiling water reactors (BWRs) to fail to isolate in the eventof a line break. A portion of that fault tree is reproduced in Figure 1. In the shaded block,the aging mechanisms, corrosion, erosion, and depositioniiare identified as factors that could
a. Research sponsored by the Office of Nuclear Regulatory Research, U.S. NuclearRegulatory Commission under contract DE-AC07-761D01570 with EG&G Idaho, Inc.
289

affect the surface condition of the valve's sliding surfaces. These changes may cause thevalve's friction coefficients to increase above the value used to predict the valve's closingload. If this occurs, the predicted load will be less than the actual force required to closethe valve. If the operator is undersized, the valve will not close. If the operator isadequately sized, the torque switch that limits the motor's output torque will be set too low,and the motor will trip before it enough force is generated to operate the valve to thedesired position.
The force required to operate the valve under design conditions is found using anequation similar to Equation (1). This equation is typical of the equations that have beenused in the past. The equation has three terms: stem-packing drag, stem rejection, and diskload. The largest term is normally the disk load. This term contains the friction coefficientof concern to this study and identified in the fault tree as a potential problem.
Ft Fp + A5P + AAAP (1)
where
Ft =total stem force required
Fp-packing drag load
As = cross-sectional area of the stem
P = system pressure
Ad = disk friction factor
Ad = cross-sectional area of the disk
AP = differential pressure across the disk. '
A'typical value used for the disk friction coefficient is about 0.3, which may not beconservative enough to bound the operating force requirements at design conditions.' Full-scale testing on MOVs typical of GI 87 valves done by the INEL indicates thait'his valueis too low and may result in underpredicting the operating force requirements for theMOVs. Any increase in the actual friction coefficients will further jeopardize' MOVoperability in an accident scenario.
I ,
290
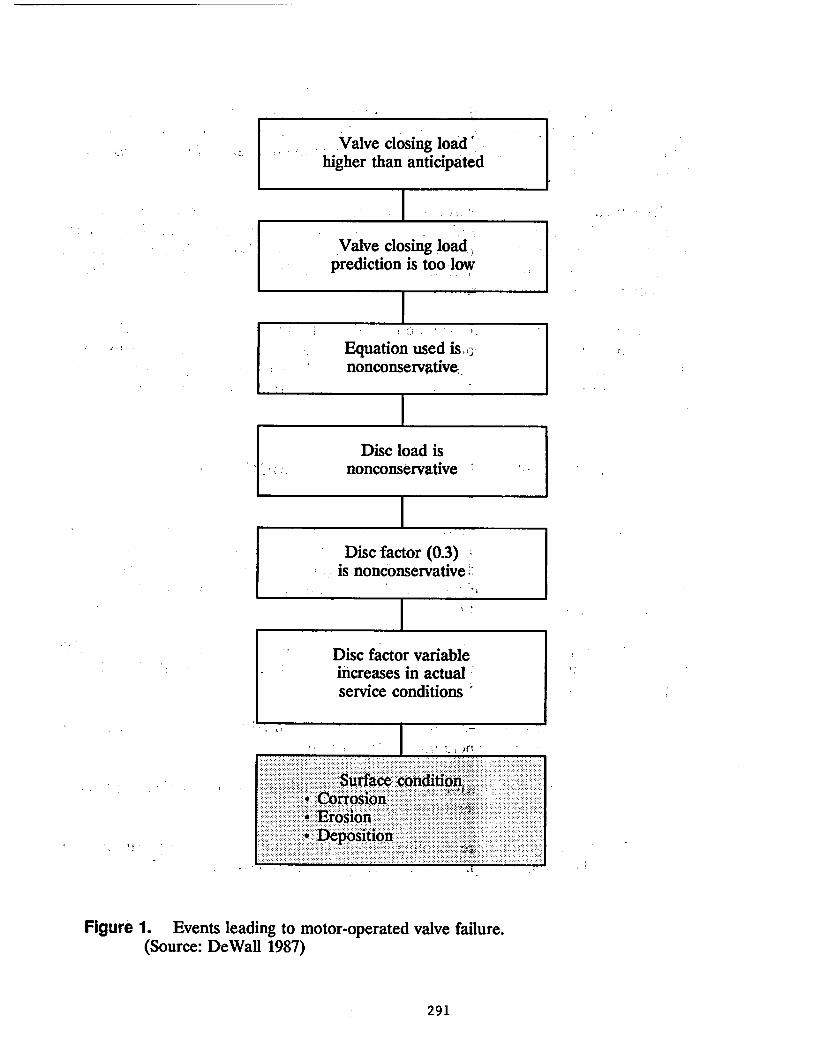
', I .:IValve closing load'higher than anticipated
l ~ - . Il.TL Valve closing load;
prediction is too low
Equation used is,nonconservative
Disc load isnonconservative
Disc factor (0.3)is nonconservative:-
Disc factor variableincreases in actualservice conditions'
... .... ... .. ....
.... .. ..*E:Corosion . .
Depoito
Figure 1. Events leading to motor-operated valve failure.(Source: DeWall 1987)
291
To evaluate aging and friction, we. used a two-phased approach. First, we studied theaging mechanisms theoretically, to determine if they were likely to affect friction. Second,we reviewed MOV operating history data to determine the frequency of the failures causedby these aging mechanisms.
The theoretical review focused on the mechanisms that cause corrosion, erosion-corrosion, and deposition. We identified the rates at which these aging mechanisms areexpected to occur and the factors affecting these rates. We also examined the effects ofthese mechanisms on friction, and' the possibility of their products binding the valve byobstructing its mechanical tolerances.
For the operating history review,' we used three databases as sources of MOV failureinformation. Interviews were conducted with MOV manufacturers and end users to obtaintheir experience with failures caused by the mechanisms of this study. Two operatingfacilities were also visited to directly observe and photograph the in-service condition ofMOVs.
CORROSION, DEPOSITION, AND EROSION-CORROSION
Corrosion, deposition, and erosion-corrosion can alter the surface finish of a valve'ssliding surfaces. These changes may adversely affect the coefficients of friction of thesesurfaces and result in increased operating force requirements for the MOVs. This wouldbe most pronounced during accident conditions when the disk is exposed to its highest flowand differential pressure conditions.
In this study, we sorted the MOV materials and the environmental conditions to whichthey are exposed into the following three groups, accounting for nearly all of the MOVsrequired to operate during accident conditions:
* BWR reactor coolant-carbon steel materials exposed to pure water or saturatedsteam at elevated temperatures of 450550F
* Pressurized water reactor (PWR) primary-stainless steel materials exposed toborated water at temperatures less than 150"' F
* BWR Emergency Core Cooling System (ECCS)-PWR secondary-carbon steelmaterials exposed to pure water at temperatures of less than 150 "F.
292
Corrosion
Corrosion can affect the operation of the MOVs in one of two ways. First, it attacksthe metal surfaces and can roughen these surfaces. Second, the corrosion process producesan oxide film, and the oxide film's properties may affect the friction coefficient. Also, if theoxide film grows at a rapid rate, it may block the mechanical tolerances of the valve andbind the valve.
Corrosion Rates
A variety of factors affects the rate of corrosion, including temperature, dissolved oxygencontent, and coolant pH. In the three groups of conditions we evaluated (BWR reactorcoolant, PWR primary, BWR ECCS-PWR secondary), the corrosion rates ranged from a lowvalue of 0.01 mil/year to a high value of 16 mil/year. Table 1 lists these values.
The corrosion rates presented in Table 1 represent rates calculated from the mass ofthe oxide formed and do not represent the thickness of the oxide film produced. Todetermine the oxide thickness or its growth rate, another factor, the Pilling/Bedworth (P/B)ratio, is required. The P/B ratio is defined as the volume of the oxidized form of a metaldivided by the volume of its unoxidized form. For the oxides produced by corrosion incommercial reactors, the P/B ratios range from about 1.5 to 2.4. These values were usedto bound the oxide film growth rates, and are presented in the oxide growth rate column ofTable 1. The growth rates are useful for determining whether the oxide film is likely toblock the mechanical tolerances of the valve.
For most of the valves used in commercial reactor systems, the mechanical tolerancesrange from about 20 to 250 mils. The only condition where the annual growth rate exceedsthe minimum tolerances is during BWR startup and shutdown. However, BWRs spend onlya small fraction (less than 5%) of their operating time in these conditions, so it should nothave a great impact on their MOVs. Also, these MOVs are cycled once per quarter in mostcases, and at least once per operating cycle, to meet' American Society of MechanicalEngineers (ASME) requirements. This cycling should limit the buildup on the slidingsurfaces because valve operation tends to "wipe" the oxide film from these surfaces. Thecombination of periodic operation and the annual oxide growth rates being less than typicaltolerances should ensure that oxide binding of the valves is not a significant concern.
293
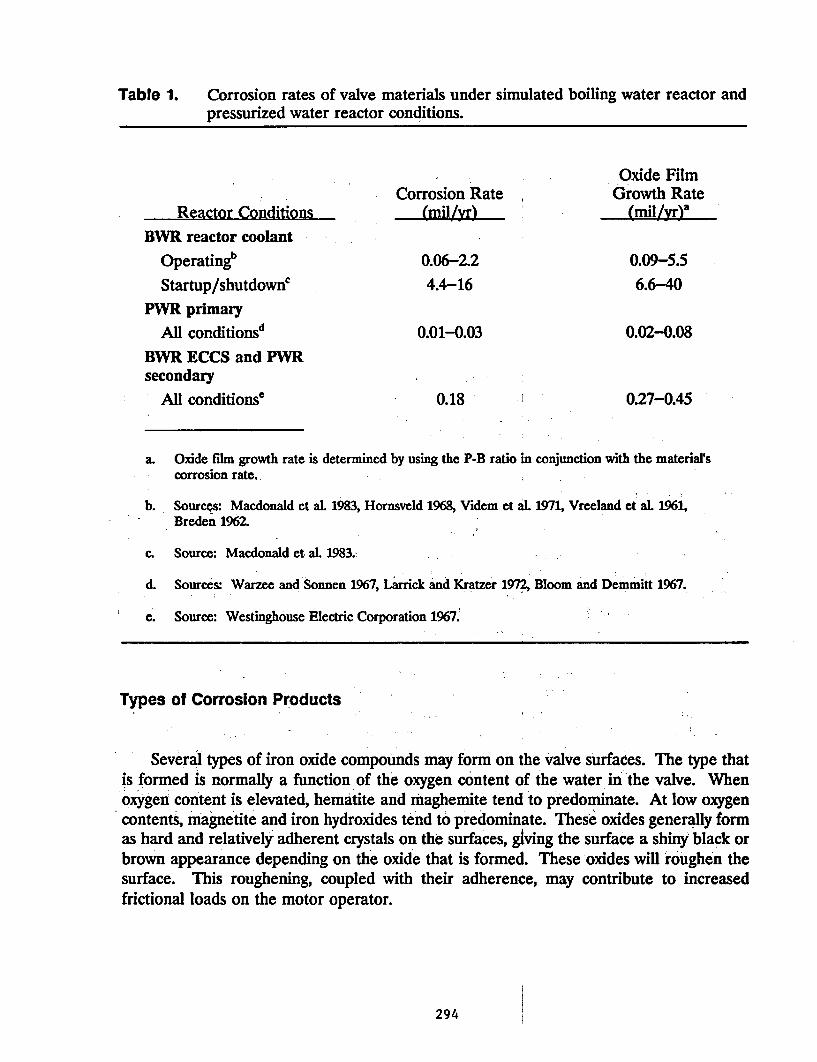
Table 1. Corrosion rates of valve materials under simulated boiling water reactor andpressurized water reactor conditions.
Corrosion Rate(rnl&/y)
Oxide FilmGrowth Rate
(mil/r)aReactor ConditionsBWR reactor coolant
Operatingb
Startup/shutdowncPWR primary
All conditionsd
BWR ECCS and PWRsecondary
All conditionse
0.06-2.24.4-16
0.01-0.03
0.18
0.09-5.5
6.6-40
0.02-0.08
0.27-0.45
a. Oxide film growth rate is determined by using the P-B ratio in conjunction with the material'scorrosion rate.
b. Sources: Macdonald et al. 1983, Hornsveld 1968, Videm et al. 1971, Vreeland et al. 1961,Breden 1962.
c. Source: Macdonald et al. 1983.
d. Sources: Warzee and Sonnen 1967, Larrick and Kratzer 1972, Bloom and Demmitt 1967.
e. Source: Westinghouse Electric Corporation 1967.
Types of Corrosion Products
Several types of iron oxide compounds may form on the valve surfaces. The type thatis formed is normally a function of the oxygen content of the water in the valve. Whenoxygen content is elevated, hematite and maghemite tend to predominate. At low oxygencontents, magnetite and iron hydroxides tend to predominate. These oxides generally formas hard and relatively adherent crystals on the surfaces, giving the surface a shiny black orbrown appearance depending on the oxide that is formed. These oxides will roughen thesurface. This roughening, coupled with their adherence, may contribute to increasedfrictional loads on the motor operator.
294
Corrosion Mechanisms
The corrosion mechanism that is expected to occur in all reactorlchemistry conditionsproduces a two-layer oxide film. The significance of the two-layer film is that as it forms,it creates a protective barrier against further corrosion, causing corrosion rates to decreasewith respect to time.
Another time-dependent mechanism occurs that tends to moderate the growth of theoxide layer. The oxide layer can dissolve in the aqueous solution surrounding it. One studyshowed that after 1,000 hours of exposure to 5500 F pure water, 12% of the oxide's onstainless steel and 1% of those on carbon steel dissolved. (Honda et al. 1987) Thecombination of corrosion rates decreasing with time and oxides dissolving should tend tomitigate the effects of corrosion induced oxide film growth.
The effects of corrosion are expected to have a detrimental effect on the frictioncoefficients of MOVs. It will roughen the surface by creating hard and adherent oxides, andattack the base metal, degrading its surface finish. Corrosion is not expected to createenough oxides to pose a significant threat to MOV operability by binding the valve. Itsoxide growth rate is less than the typical mechanical tolerances of the valves used in theindustry. Also, the oxide layer growth should be mitigated by the protective two-layer oxidefilm and the dissolution of the oxides.
Corrosion Product Deposition
Deposition on valve surfaces typically occurs where changes in fluid hydrodynamics, fluidtemperature, or the redox potential occur. These deposits can adversely affect valveperformance by fouling the sliding surfaces causing increased friction and possiblyobstructing operation of sliding surfaces. Deposition could be a greater problem thancorrosion induced oxide film growth for three -reasons: 2(a) large amounts of oxides can bedeposited in short time periods, (b) the oxides can bet-very adherent land crystalline innature, and (c) localized thick oxide deposits can be produced.
Deposition Rates
Existing' information is incomplete about the nature and rate of deposition on valvematerials for the environmental conditions of PWVRs and BWRs. Most of this informationaddresses deposition on fuel elements or activation product transfer, and neglects iron oxidedeposition on materials used in valves. For these types of conditions, the highest reported
295
rate of deposition was about 0.1 mil/year. This value is an order of magnitude less than theexpected rates for corrosion in BWR conditions reported in the previous section of thispaper. However, since deposition occurs in more localized areas than corrosion, lower ratesmay produce thicker localized deposits than corrosion. Because of this, the effect of thesedeposits on the binding of valves is not clear.
Deposition Mechanisms and Deposit Characteristics
There are two ways deposition occurs on valve surfaces. The first involves thecrystallization of materials in solution on the surfaces. Depending on the oxide that iscrystallized, these deposits can be hard and highly adherent to the surface, which wouldroughen the surfaces where the deposits form.
The second way involves the adhesion of suspended particles on the valve's surfaces.These deposits tend to be porous and weakly adherent. Although this mechanism resultsin a weakly bound deposit, if it is left undisturbed, it can be converted to a harder, moreadherent deposit by recrystallization and Ostwald ripening.
In BWR conditions, magnetite and maghemite would be expected to deposit. These arehard, crystalline, and highly adherent deposits. In the PWR primary and BWR ECCS-PWRsecondary conditions, a softer deposit of iron hydroxide and iron hydroxyl-oxide shouldpredominate. The harder deposits are expected to increase the friction coefficients of thevalve. The effect of the softer deposits on friction is uncertain.
Erosion-Corrosion
Erosion-corrosion is an accelerated corrosion process induced by fluid flow breakingdown the- protective oxide layer on the metal's surface. As the oxide layer erodes, newmetal is exposed and subsequently corrodes. The highest orosion-corrosion rates occur inwet steam environments (40 to 80% quality) and at temperatures around 300' F. The onlysafety-related valves exposed to these conditions are the steam line valves for BWR high-pressure injection systems and steam line valves for PWR auxiliary feedwater systems. Noneof the valves in these systems are normally exposed to these conditions for extended periodsof time, however. Also, the only sliding surfaces exposed to these conditions are the valveseats. These are usually hard-faced with Stellite, which is not very susceptible to erosion-corrosion. Because of these factors, erosion-corrosion is not expected to significantly affectthe friction coefficients of MOVs.
. I-.
296
Corrosion Review Summary -
Corrosion of and deposition on valve sliding surfaces should degrade their surface finishand produce an oxide layer on them. Since the friction coefficient is dependent on surfacefinish, the extent of the surface finish change will determine the change in friction. Theinfluence of the oxide layer on the friction coefficient may also increase friction dependingon the type of oxide formed. These two effects are expected to cause increases in friction,and consequently increased operating force requirements for the valve.
OPERATING EXPERIENCE REVIEW
We reviewed the operating history of MOVs to identify the extent of problems beingexperienced as a result of the three aging mechanisms of this study. This information wasobtained from three sources:
* Operating history databases
* Interviews with industry personnel with MOV operations and maintenanceexperience
* Direct observation of the in-service condition of MOVs.
Operating History Databases
To identify MOV failures that have occurred in recent years, we surveyed threedatabases: NRC's Licensee Event Reports (LERs), the Institute of Nuclear PowerOperations' Nuclear Plant Reliability Data System (NPRDS), and Stoller Engineering'sNuclear Plant Experience (NPE). The failure records were reviewed and filtered toeliminate those not caused by problems associated with valve internals. Of the failurerecords eliminated in this process, the largest group (more than 50%) were external leakageevents that were caused mostly by stem packing seal failures. Other failures that wereeliminated included events such as electrical or mechanical failures of the motor operatorsand human-related failures. The resulting data sets represented failures of MOVs that werethe result of some malfunction of a component internal to 'the valve. This set contains thosefailures that result from aging of the sliding surfaces of this study.
The data review showed that only corrosion was specifically identified in each of thedatabases. Deposition failures were contained in related causes such as particulate
297
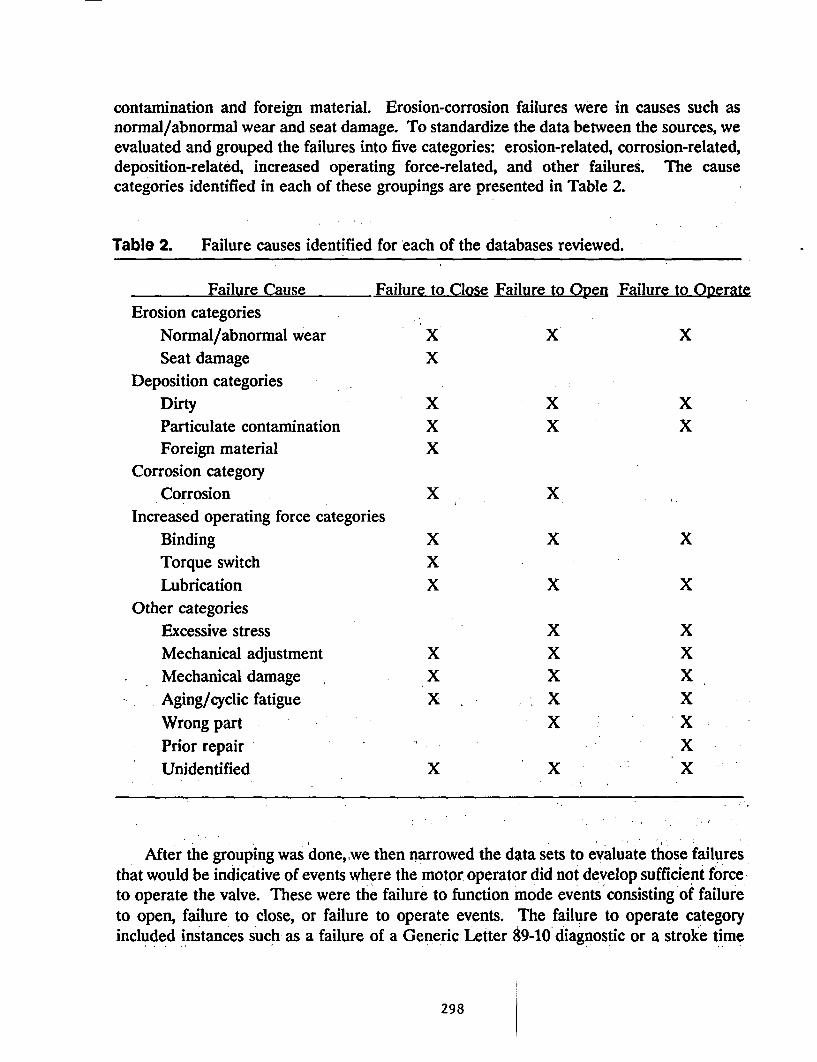
contamination and foreign material. Erosion-corrosion failures were in causes such asnormal/abnormal wear and seat damage. To standardize the data between the sources, weevaluated and grouped the failures into five categories: erosion-related, corrosion-related,deposition-related, increased operating force-related, and other failures. The causecategories identified in each of these groupings are presented in Table 2.
Table 2. Failure causes identified for each of the databases reviewed.
Failure Cause Failure to Close Failure to Open Failure to OperateErosion categories
Normal/abnormal wear X X XSeat damage X
Deposition categoriesDirty X X XParticulate contamination X X XForeign material X
Corrosion categoryCorrosion X X
Increased operating force categoriesBinding X X XTorque switch XLubrication X X X
Other categoriesExcessive stress X XMechanical adjustment X X XMechanical damage X X XAging/cyclic fatigue X X XWrong part X XPrior repair XUnidentified X X X
After the grouping was done, we then narrowed the data sets to evaluate those failuresthat would be indicative of events where the motor operator did not develop sufficient forceto operate the valve. These were the failure to function mode events consisting of failureto open, failure to close, or failure to operate events. The failure to operate categoryincluded instances such as a failure of a Generic Letter 89-10 diagnostic or a stroke time
298
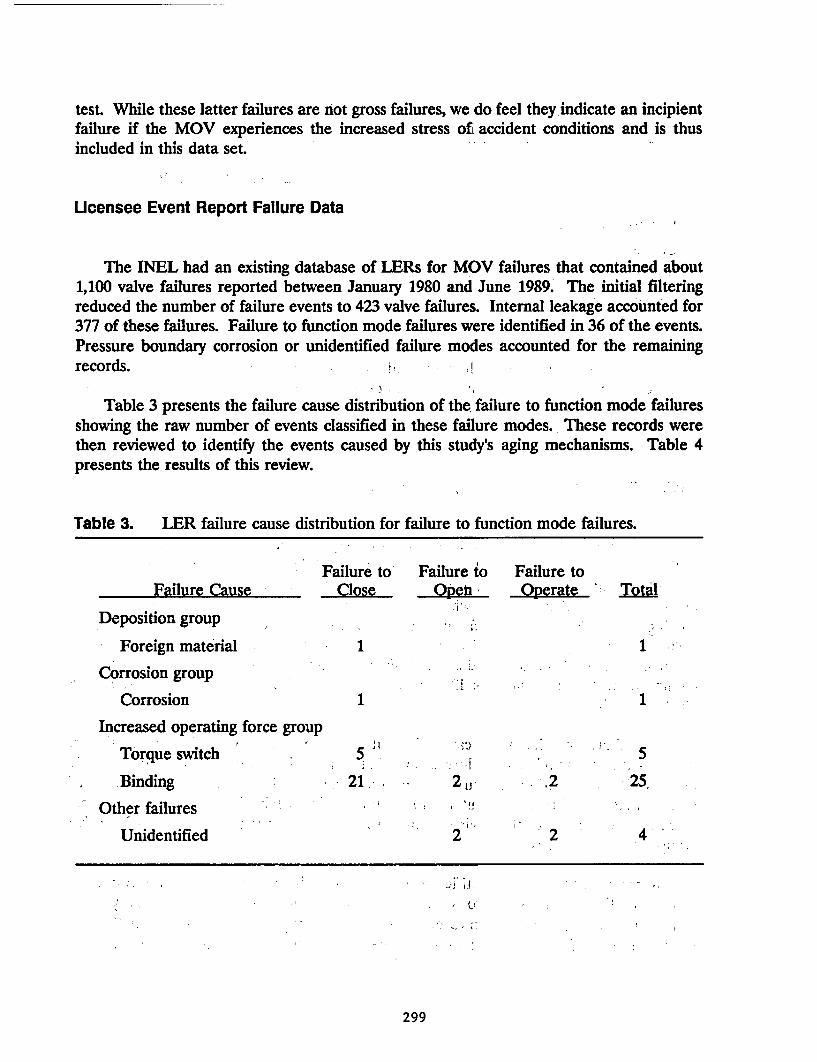
test. While these latter failures are not gross failures, we do feel they indicate an incipientfailure if the MOV experiences the increased stress of accident conditions and is thusincluded'in this data set.'
Ucensee Event Report Failure Data
The INEL had an existing database of LERs for MOV failures that contained about1,100 valve failures reported between January 1980 and June 1989.: The initial filteringreduced the number of failure events to 423 valve failures. Internal leakage accounted for377 of these failures. Failure to function mode failures were identified in 36 of the events.Pressure boundary corrosion or unidentified failure modes accounted for the remainingrecords. -
Table 3 presents the failure cause distribution of the failure to function mode failuresshowing the raw number of events classified in these failure modes. These records werethen reviewed to identify the events caused by this study's aging mechanisms. Table 4presents the results of this review.
Table 3. LER failure cause distribution for failure to function mode failures.
Failure Cause
Deposition group
Foreign material
Corrosion group
Corrosion
Failure to' Close
Failure toOpet!
I I
Failure to1perate :' Ial
1I1
.1 1 -- .
1,I1
Increased operating force group
Torque switch
Binding
Other failures
Unidentified
5i . I-. 21 -
I i
2 A
2
.2
'2
5
25,
4
I 1 ; i d ?.
299
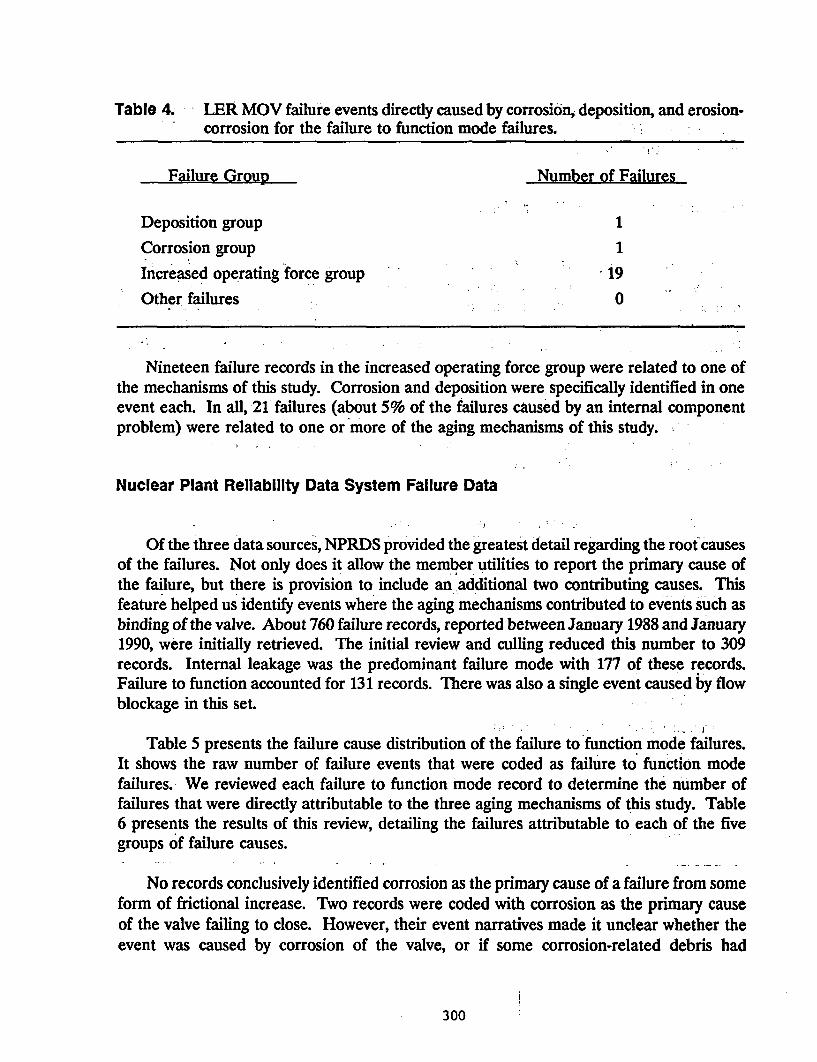
Table 4. LER MOV failure events directly caused by corrosion, deposition, and erosion.corrosion for the failure to function mode failures.
Failure Group Number of Failures
Deposition group 1Corrosion group 1Increased operating force group 19
Other failures 0
Nineteen failure records in the increased operating force group were related to one ofthe mechanisms of this study. Corrosion and deposition were specifically identified in oneevent each. In all, 21 failures (about 5% of the failures caused by an internal componentproblem) were related to one or more of the aging mechanisms of this study.
Nuclear Plant Reliability Data System Failure Data
Of the three data sources, NPRDS provided the greatest detail regarding the root causesof the failures. Not only does it allow the member utilities to report the primary cause ofthe failure, but there is provision to include an additional two contributing causes. Thisfeature helped us identify events where the aging mechanisms contributed to events such asbinding of the valve. About 760 failure records, reported between January 1988 and January1990, were initially retrieved. The initial review and culling reduced this number to 309records. Internal leakage was the predominant failure mode with 177 of these records.Failure to function accounted for 131 records. There was also a single event caused by flowblockage in this set.
Table 5 presents the failure cause distribution of the failure to function mode failures.It shows the raw number of failure events that were coded as failure to function modefailures. We reviewed each failure to function mode record to determine the number offailures that were directly attributable to the three aging mechanisms of this study. Table6 presents the results of this review, detailing the failures attributable to each of the fivegroups of failure causes.
No records conclusively identified corrosion as the primary cause of a failure from someform of frictional increase. Two records were coded with corrosion as the primary causeof the valve failing to close. However, their event narratives made it unclear whether theevent was caused by corrosion of the valve, or if some corrosion-related debris had
300
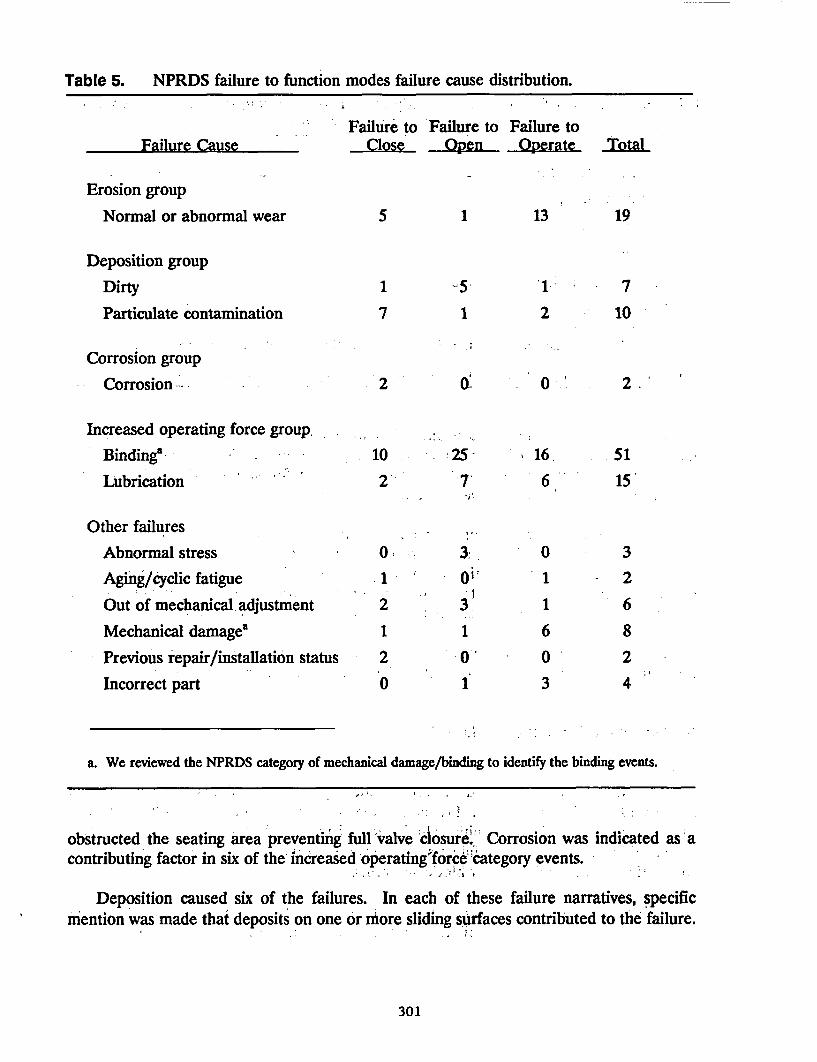
Table 5. NPRDS failure to function modes failure cause distribution.
Failure to Failure to Failure toailure Cause Close Qpen QperateF
Erosion group
Normal or abnormal wear
Deposition group
Dirty
Particulate contamination
Corrosion group
- Corrosion :- -
5
1
7
'2
1
1
13
'1.
2
o A
Total
19
7
10
2>0-
Increased operating force group,Binding' 10
Lubrication 2'
Other failuresAbnormal stress 0
Aging/cyclic fatigue 1Out of mechanical adjustment 2
Mechanical damage' 1Previous repair/installation status 2Incorrect part 0
I 25--7
.1 I
3oi-3
10'1
. 16.
6
01
1
6
0 '
3
. 51
15
3
-2
6
82
4
a. We reviewed the NPRDS category of mechanical damage/binding to identify the binding events.
obstructed the seating area preventing full valve closure. Corrosion was indicated as acontributing factor in six of the' increased operating force'category events.
Deposition caused six of the failures. In each of these failure narratives, specificmention was made that deposits on one or more sliding surfaces contributed to the failure.
301
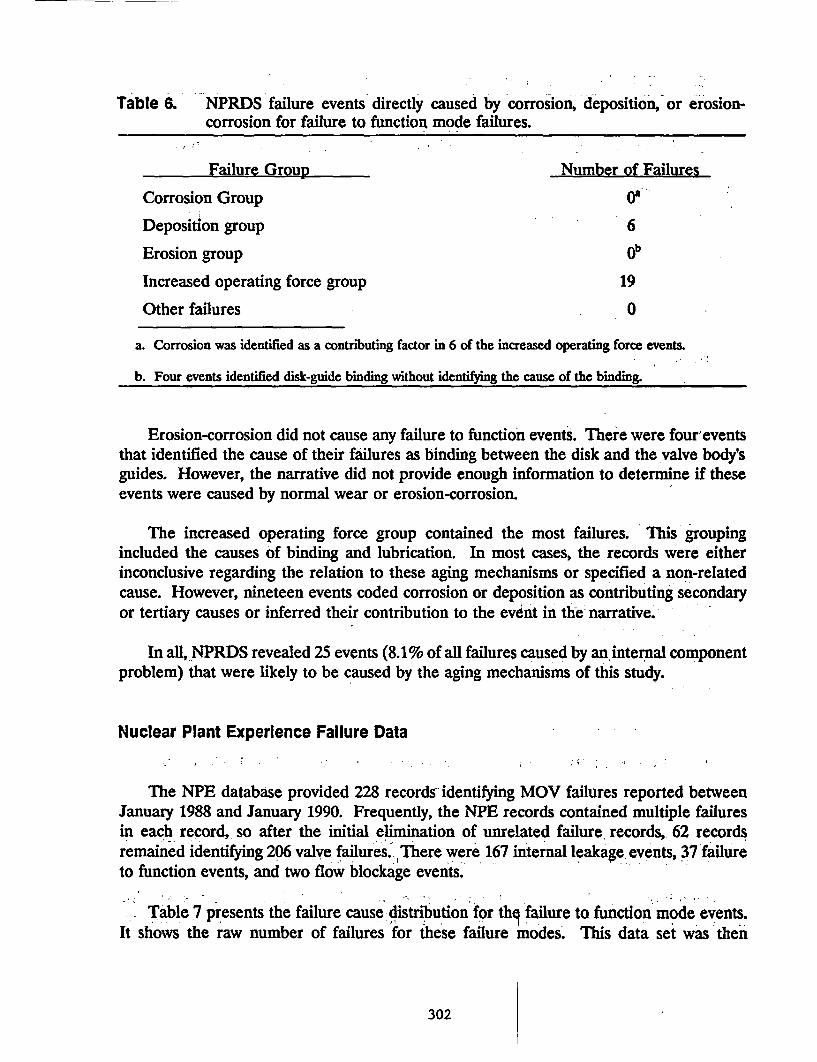
Table 6. NPRDS failure events directly caused by corrosion, deposition, or erosion-corrosion for failure to function mode failures.
Failure Group Number of Failures
Corrosion Group 02
Deposition group 6
Erosion group 0"
Increased operating force group 19
Other failures 0
a. Corrosion was identified as a contributing factor in 6 of the increased operating force events.
b. Four events identified disk-guide binding without identifying the cause of the binding.
Erosion-corrosion did not cause any failure to function events. There were four eventsthat identified the cause of their failures as binding between the disk and the valve body'sguides. However, the narrative did not provide enough information to determine if theseevents were caused by normal wear or erosion-corrosion.
The increased operating force group contained the most failures. This groupingincluded the causes of binding and lubrication. In most cases, the records were eitherinconclusive regarding the relation to these aging mechanisms or specified a non-relatedcause. However, nineteen events coded corrosion or deposition as contributing secondaryor tertiary causes or inferred their contribution to the event in the narrative.
In all, NPRDS revealed 25 events (8.1% of all failures caused by an internal componentproblem) that were likely to be caused by the aging mechanisms of this study.
Nuclear Plant Experience Failure Data
The NPE database provided 228 records identifying MOV failures reported betweenJanuary 1988 and January 1990. Frequently, the NPE records contained multiple failuresin each record, so after the initial elimination of unrelated failure records, 62 recordsremained identifying 206 valve failures. There were 167 internal leakage. events, 37 failureto function events, and two flow blockage events.
Table 7 presents the failure cause distribution for thq failure to function mode events.It shows the raw number of failures for these failure modes. This data set was then
302
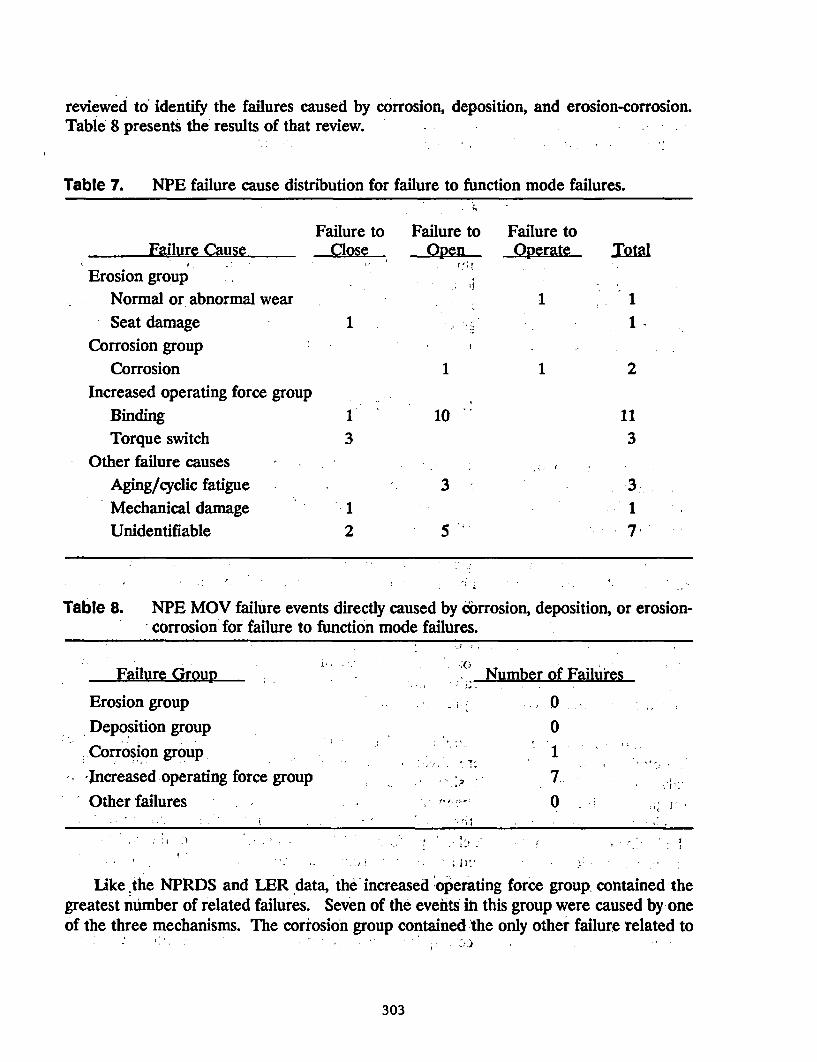
reviewed to' identify the failures caused by corrosion, deposition, and erosion-corrosion.Table 8 presents the results of that review.
Table 7. NPE failure cause distribution for failure to function mode failures.
Failure Cause
Erosion groupNormal or abnormal wearSeat damage
Corrosion groupCorrosion
Failure toClose
Failure toOpen
F , .~: ,5
Failure to1perate
,11.
1 1 2Increased operating force group
BindingTorque switch
-- Other failure causesAging/cyclic fatigue -Mechanical damageUnidentifiable
13
10 ' 113
3 3- 1
- I 7 '1
2 5,
Table 8. NPE MOV failure events directly caused by corrosion, deposition, or erosion-corrosion for failure to function mode failures.
Failure Group Number of Failures
Erosion group 0Deposition group 0Corrosion group ; 1Increased operating force group 7lOther failures - ' 0
Like the NPRDS and LER data, the increased operating force group contained thegreatest number of related failures. Seven of the events it this group were caused by oneof the three mechanisms. The corrosion group contained-the only other failure related to
303
this study. Neither the erosion-corrosion or deposition groups contained any related failuresin this instance. In all, the NPE data had eight related failures accounting for about 4%, ofthe 206 failures associated with an internal component problem.
Operating Experience Summary
From 4% to 8% of valve failures caused by problems with internal components of thevalve were caused by corrosion, deposition, or erosion-corrosion. 'Although thesepercentages are low, they may be significantly higher if the valves were tested or operatedmore frequently at or near design conditions because increases in friction at low loads arenot expected to challenge the motor-operator's capability.
In-Plant Observations
We visited two operating facilities, one PWR and one BWR, to obtain first-handinformation about the in-service condition of MOVs. We either directly observed andphotographed, or obtained copies of existing photographs from 16 MOVs (12 of carbon steeland four of stainless steel construction).
The observations and photographs agreed with the appearance of the oxide layer for thecarbon steel valves as predicted by the corrosion study. The carbon steel valves exposed torelatively high oxygen concentrations and low temperatures tended to have brown to rustycolored deposits typical of the hematite oxides and iron hydroxides the study predictedshould be present. Those exposed to higher temperatures and lower oxygen concentrationshad a darker brown to black oxide layer typical of the magnetite and maghemite alsopredicted. The stainless steel valves showed little evidence of oxide buildup, which agreedwith the low rates of corrosion predicted for these valves.
Although the observations could not characterize the surface conditions of the valvesin detail, certain conditions were obvious from the observations. The three stainless steelvalves observed at the PWR showed no obvious indications of surface oxidation orroughening although they had been in service for more than ten years and had not beenserviced for more than 18 months. In fact, one of the valve disks still showed the traces ofthe bluing dye used in the leak check performed 18 months earlier. All of the carbon steelvalves had obvious oxidation and an apparent rough surface from the oxide layer. Anotherfeature that appeared in several of the carbon steel valves was an apparent 'wiping" of theoxide layer from the surfaces that contact each other during valve operation. This includedthe valve guides in the valve body and the seating surfaqe on one of the valve disks. Thissupports the ASME surveillance requirement to periodically stroke test those valves with
304
safety functions, as it appears to reduce the likelihood of obstructing mechanical tolerancesby oxide layer growth. Although this wiping" removed some of the oxide layer, its effecton the surface finish was indeterminate from the photographs.
CONCLUSIONS
The review of existing corrosion theory and operating experience led us to the followingconclusions:
* Obstruction of the mechanical tolerances of the valve is not expected to be asignificant problem as a result of corrosion and deposition fouling of valve surfaces.The expected annual rates of oxide formation on the surfaces are much smallerthan the typical mechanical tolerances of the valves. Also, the normal surveillancepractice of periodically operating valves with safety significance should limit thegross accumulation of oxide material on their sliding surfaces.
* It is likely that the corrosion and deposition mechanisms will result in increases inthe coefficients of friction of the valve's sliding surfaces. Both of these mechanismscan produce degraded, roughened surface finishes, which would increase friction.Also, -the hard, crystalline deposits and corrosfon products on the surfaces mayincrease the friction coefficients.
* Further study to quantify the effects of deposits and corrosion products on thefriction coefficients of MOV materials is needed. Studies currently are in progressat the INEL to provide the initial answers to this question.
* Increases in the failure rates of MOVs at design conditions as a result of corrosion,deposition, and erosion-corrosion induced frictional increases cannot be ruled out.The occurrence of these types of failures during operation Tunder low-stressconditions supports the premise that increasts may occur since the total loadincrease on the motor operator will be much higher under high-stress accidentconditions. -
305
REFERENCES
Bloom, G. R., and T. F. Demmitt, 1967, Corrosion and Boron Deposition in Boric AcidSolutions, USAEC Report BNWL520, December.
Breden, C. R., 1962, Boiling Water Reactor Technology Status of the Art Report, Volume IIWater Chemistry and Corrosion, USAEC Report BNWL-520, December.
DeWall, KG., 1987, Generic Issue 87 Research Plan, EGG-REQ-7676, July.
Honda, T., et al., 1987, 'Corrosion of Ferrous Materials and Deposition of Trace Metal Ionsat High Temperature and in Ultra-pure Water," Corrosion Engineering, 36, 5, p. 257.
Hornsveld, E. M., 1968, Corrosion of Carbon Steel, Institute for Atomenergi Kjeller ResearchEstablishment, KR-127, May.
Larrick, A. P., and W. K Kratzer, 1972, Corrosion Monitoring in N-Reactor, USAEC ReportDUN-5A-194.
MacDonald, D. D., et al., 1983, The General and Localized Corrosion of Carbon and Low-Alloy Steels in Oxygenated High-Temperature Water, EPRI NP-2853, February.
Videm, K L, Lunde S. Ans, and K. Fjellestad, 1971, Mild Steel in the Primary Circuit ofWater Cooled Reactors, Institute for Atomenergi, HPR-143, September.
Vreeland, D. C., G. G. Gaul, and W. L Pearl, 1961, 'Corrosion of Carbon and Low-AlloySteels in Out-of-Pile Boiling Water Reactor Environment," Corrosion, 17, 6, June,pp. 269t-276t.
Warzee, M., and C. Sonnen, 1967, Corrosion of Carbon Steels and Stainless Steels inPressurized Water at High-Temperature, EURAEC Report-1896, July.
Westinghouse Electric Corporation, 1967, Absorption of Corrosion Hydrogen by A302B Steelat 70 to 500F, USAEC Report WCAP-7099, December 1.
306
NRC TEST RESULTS AND OPERATIONS EXPERIENCEPROVIDE INSIGHTS FOR A
NEW GATE VALVE STEM FORCE CORRELATIONS
J. C. Watkins, R. Steele, K. G. DeWall
Idaho National Engineering LaboratoryEG&G Idaho, Inc."
Idaho Falls, Idaho 83415
ABSTRACT
The Idaho National Engineering Laboratory (INEL) is performingmotor-operated valve (MOV) research in support of the U.S. NuclearRegulatory Commission's (NRC's) efforts regarding Generic Issue 87,"Failure of HPCI [High-Pressure Coolant Injection] Steam Line WithoutIsolation," and-'Generic Letter 89-10 (GL-89-10), "Safety-RelatedMotor-Operated Valve Testing and Surveillance." This paper presentsthe results' of testing to assess valve and motor operator performanceunder varying pressure and fluid conditions. This effort included anexamination of the methods used by the industry to predict therequired stem force of a valve, and research to provide guidelines forthe extrapolation of in situ test results to design basis conditions.
This research has identified several inconsistencies with theexisting industry gate valve stem force equation and has challengedthe overly simplistic assumptions inherent in its use. This paperdiscusses the development of the INEL correlation to bound the stemforce necessary to close flexwedge gate valves whose operationalcharacteristics have been shown to be predictable. The authors alsopresent a method whereby the results of testing such valves at lowdifferential pressure can be used to bound valve response atconditions up to their design basis.
a. Work supported by the U.S.,Nuclear Reguiatory.'Commissfon, Office of NuclearRegulatory Research, Divisi on of Engineer~ng' and Di vision of Safety' IssuesResolution, Under DOE Contract No. -DE-AC07-761001570; G. H., Weidenhamer and0. 0. Rothberg', Technical Monitors.
307
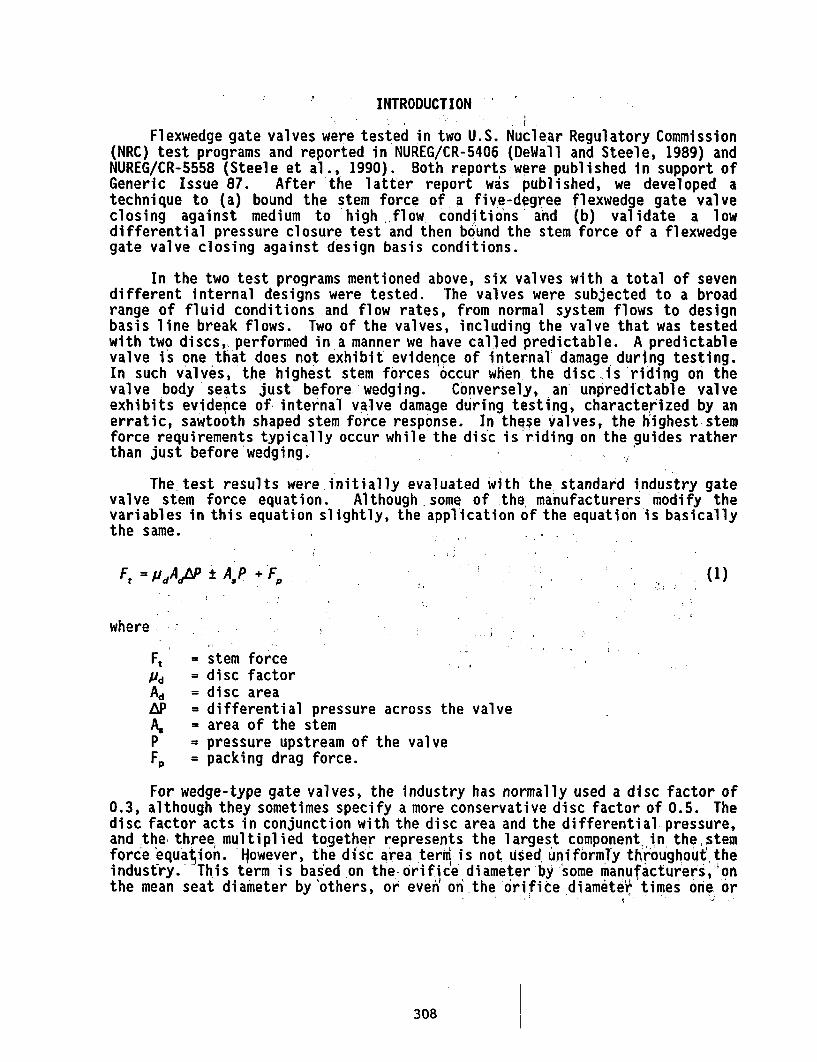
INTRODUCTION
Flexwedge gate valves were tested in two U.S. Nuclear Regulatory Commission(NRC) test programs and reported in NUREG/CR-5406 (DeWall and Steele, 1989) andNUREG/CR-5558 (Steele et al., 1990). Both reports were published in support ofGeneric Issue 87. After 'the latter report was published, we developed atechnique to (a) bound the stem force of a five-degree flexwedge gate valveclosing against medium to high flow conditions' and (b) validate a lowdifferential pressure closure test and then bound the stem force of a flexwedgegate valve closing against design basis conditions.
In the two test programs mentioned above, six valves with a total of sevendifferent internal designs were tested. The valves were subjected to a broadrange of fluid conditions and flow rates, from normal system flows to designbasis line break flows. Two of the valves, including the valve that was testedwith two discs,. performed in a manner we have called predictable. A predictablevalve is one that does not exhibit' evidence of internal damage, during testing.In such valves, the highest stem forces occur when the disc is 'riding on thevalve body seats just before wedg'ing. Conversely, an- unpredictable valveexhibits evidepce of internal valve damage during testing,'characterized by anerratic, sawtooth shaped stem force response. In these valves, the highest stemforce requirements typically occur while the disc is'riding on the guides ratherthan just before wedging.'
The test results were initially evaluated with'the standard industry gatevalve stem force equation. Although some of the, manufacturers modify thevariables in this equation slightly, the application of the equation is basicallythe same.
Ft,= dAP t AP + F, (1)
where -
Ft = stem forcePd = disc factorAd = disc areaAP - differential pressure across the valveA. = area of the stemP = pressure upstream of the valveFp = packing drag force.
For wedge-type gate valves, the industry has normally used a disc factor of0.3, although they sometimes specify a more conservative disc factor of 0.5. Thedisc factor acts in conjunction with the disc area and the differential pressure,and the three multiplied together represents the largest component in the stemforce 'equation. However, the disc area term' is not used, uniformly throughouf' theindustry. This term is based on the-orific'e diameter by Isome manufacturers,'onthe mean seat diameter by'others, or even' on the orifice diameter times one or
308
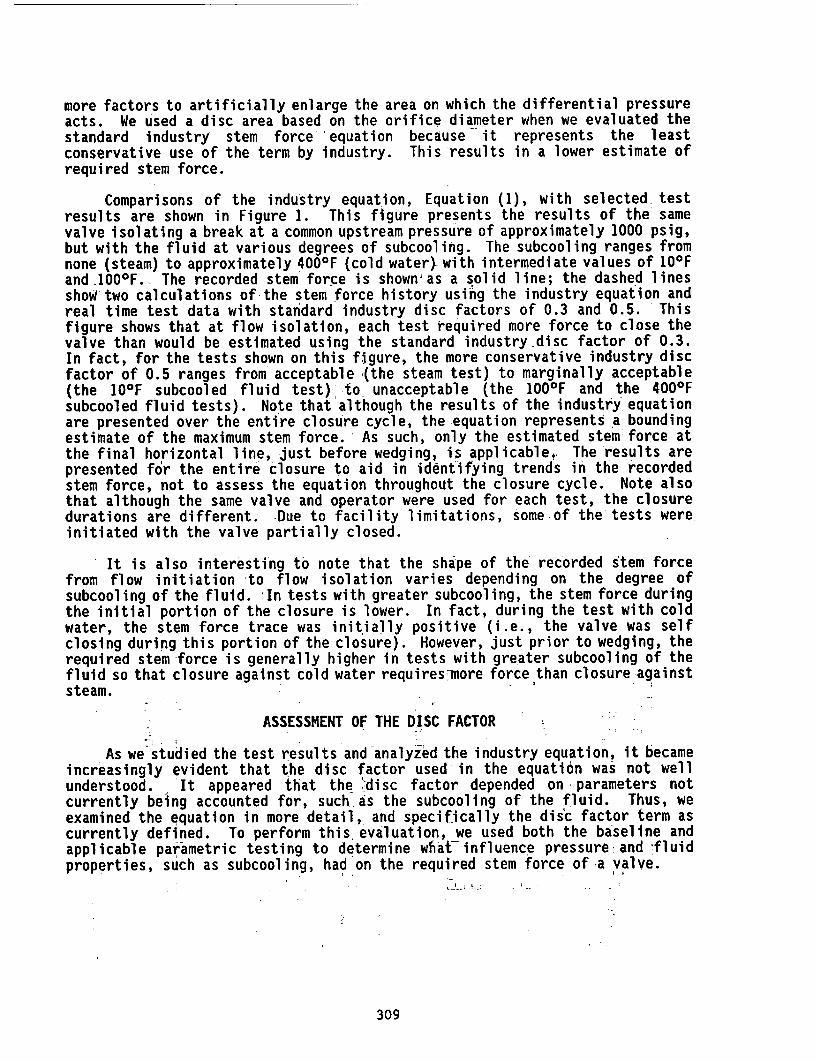
more factors to artificially enlarge the area on which the differential pressureacts. We used a disc area based on the orifice diameter when we evaluated thestandard industry stem force 'equation because it represents the leastconservative use of the term by industry. This results in a lower estimate ofrequired stem force.
Comparisons of the industry equation, Equation (1), with selected testresults are shown in Figure 1. This figure presents the results of the samevalve isolating a break at a common upstream pressure of approximately 1000 psig,but with the fluid at various degrees of subcooling. The subcooling ranges fromnone (steam) to approximately 4000F (cold water) with intermediate values of 10Fand 1000F.. The recorded stem force is shown as a solid line; the dashed linesshow two calculations of the stem force history using the industry equation andreal time test data with standard industry disc factors of 0.3 and 0.5. Thisfigure shows that at flow isolation, each test -equired more force to close thevalve than would be estimated using the standard industry disc factor of 0.3.In fact, for the tests shown on this figure, the more conservative industry discfactor of 0.5 ranges from acceptable (the steam test) to marginally acceptable(the 10F subcooled fluid test) to unacceptable (the 100I F and the 4000Fsubcooled fluid tests). Note that although the results of the industry equationare presented over the entire closure cycle, the equation represents ,a boundingestimate of the maximum stem force. As such, only the estimated stem force atthe final horizontal line, just before wedging, is applicable,. The results arepresented for the entire closure to aid in identifying trends in the recordedstem force, not to assess the equation throughout the closure cycle. Note alsothat although the same valve and operator were used for each test, the closuredurations are different. Due to facility limitations, some of the tests wereinitiated with the valve partially closed.
It is also interesting to note that the shape of the recorded stem forcefrom flow initiation to flow isolation varies depending on the degree ofsubcooling of the fluid. In tests with greater subcooling, the stem force duringthe initial portion of the closure is lower. In fact, during the test with coldwater, the stem force trace was initially positive (i.e., the valve was selfclosing during this portion of the closure). However, just prior to wedging, therequired stem force is generally higher in tests with greater subcooling of thefluid so that closure against cold water requires more force than closure -againststeam.
ASSESSMENT OF THE DISC FACTOR
As we studied the test results and-analyzed the industry equation, it becameincreasingly evident that the disc factor used in the equation was not wellunderstood. It appeared that the -disc factor depended on parameters notcurrently being accounted for, such as the subcooling of the fluid. Thus, weexamined the equation in more detail, and specifically the disc factor term ascurrently defined. To perform this, evaluation, we used both the baseline andapplicable parametric testing to determine what influence pressure and fluidproperties, such as subcooling, had on the required stem force of a valve.
309
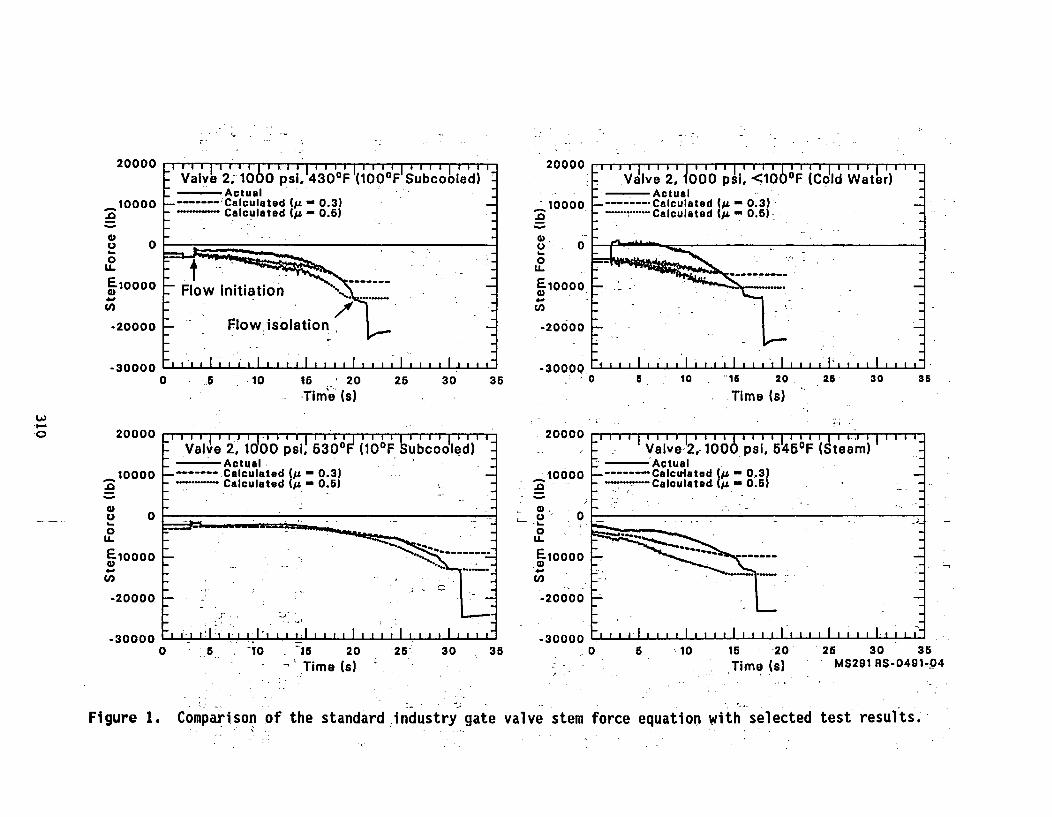
20000
_10000.0
u 0
0LL.
E.10000
-20000
-30000
-100 psi,'430°F (100°F Subcooled)-cActual
…--Calculated (A - 0.31- Calculated (is - 0.6)
Flow Initiation .-
~ ~ Flow isolation -
,~~~~ ~~~~ ,., I, I. I,, A ,, ,, ,, I,,.
0 .5 - 10 16 20 25 30 3-Time (s)
-Va'lve 2,10'00 psi, 0 (100F ubcooled)_ Actual---
--- Calculated C- 0.3)Calculated (A - 0.5)_ -- A ct- ,.
6
20000
~10000
.0_i -oo
0
Eloooou ..
-20000
-30000
20000
10000-- 0
_ O0,
L- Q0
Eloooo
-20000
U,3
-30000
4 5 10- 5 0 25 30 3
-Valve 2,1000 psi, <'100°F iodid 'Water;)
A -ctual
…-Calculated (;s - 0.3--_*---Calculated Q& - 0.6)
_ -. .- - ,
Ia t I _ I
0 6 l0 -is 20 25 30 36
. - . .Time (s)
a - ale2',- 100psi b546°0F Sta m_ Actual
----- Calcuisted (1 - 0.31- ---- Calculated 4& - 0.6)
WI -.0 20000
_10000n
0)o 00U-
U,
-20000
-30000 .
- - - - -0 - 5 T0 35 20 25 30
- '' Time (s)35 0 5 10 15 20
Time (s)1. I
26 30 35MS291 RS-0491-04
Figure 1. Comparison of the standard industry gate valve stem force equation with selected test results.
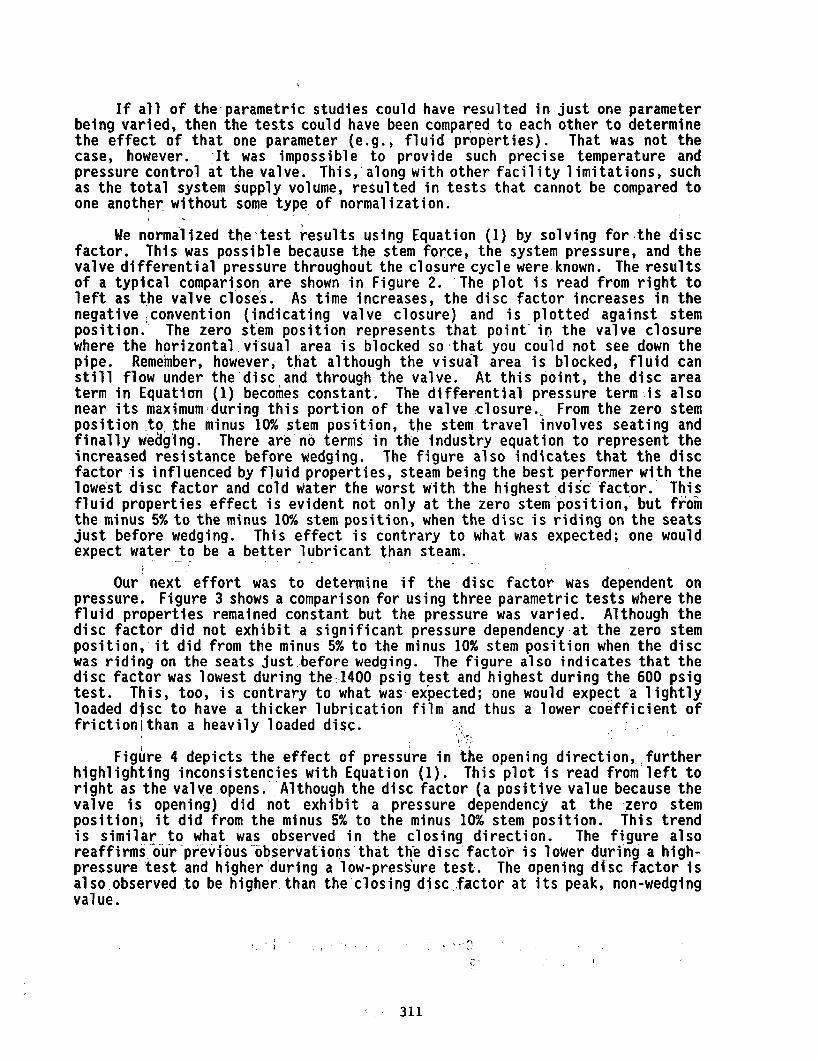
If all of the-parametric studies could have resulted in just one parameterbeing varied, then the tests could have been compared to each other to determinethe effect of that one parameter (e.g., fluid properties). That was not thecase, however. It was impossible to provide such precise temperature andpressure control at the valve. This,'along with other facility limitations, suchas the total system supply volume, resulted in tests that cannot be compared toone another without some type of normalization.
We normalized the-test results using Equation (1) by solving for the discfactor. This was possible because the stem force, the system pressure, and thevalve differential pressure throughout the closure cycle were known. The resultsof a typical comparison are shown in Figure 2. The plot is read from right toleft as the valve closes. As time increases, the disc factor increases in thenegative convention (indicating valve closure) and is plotted against stemposition. The zero stem position represents that point in the valve closurewhere the horizontal visual area is blocked so that you could not see down thepipe. Remember, however, that although the visual area is blocked, fluid canstill flow under the disc and through the valve. At this point, the disc areaterm in Equation (1) becomes constant. The differential pressure term is alsonear its maximumrduring this portion of the valvetclosure.- From the zero stemposition to the minus 10% stem position, the stem; travel involves seating andfinally wedging. There are no terms in the Industry equation to represent theincreased resistance before wedging. The figure also indicates that the discfactor is influenced by fluid properties, steam being the best performer with thelowest disc factor and cold Water the worst with the highest disc factor. Thisfluid properties effect is evident not only at the zero stem position,' but fromthe minus 5% to the minus 10% stem position, when the disc is riding on the seatsjust before wedging. This effect is contrary to what was expected; one wouldexpect water to be a better lubricant than steam.
Our next effort was to determine if the disc factor was dependent onpressure. Figure 3 shows a comparison for using three parametric tests where thefluid properties remained constant but the pressure was varied. Although thedisc factor did not exhibit a significant pressure dependency at the zero stemposition, it did from the minus 5% to the minus 10% stem position when the discwas riding on the seats just-before wedging. The figure also indicates that thedisc factor was lowest during the--1400 psig test and highest during the 600 psigtest. This, too, is contrary to what was expected; one would expect a lightlyloaded disc to have a thicker lubrication film and thus a lower coefficient offrictionithan a heavily loaded disc.
Figure 4 depicts the effect of pressure in the opening direction, furtherhighlighting inconsistencies with Equation (1). This plot is read from left toright as the valve opens.''Although the disc factor (a positive value because thevalve is opening) did not exhibit a pressure dependency at the -zero stemposition; it did from the minus 5% to the minus 10% stem position. This trendis similar to what was observed in the closing direction. The figure alsoreaffirms our previous Observations that th-e disc factor is lower during a high-pressure test and higher during a low-presiure test. The opening disc factor isalso observed to be higher than the'closing disc .factor at its peak, non-wedgingvalue.
I . 311
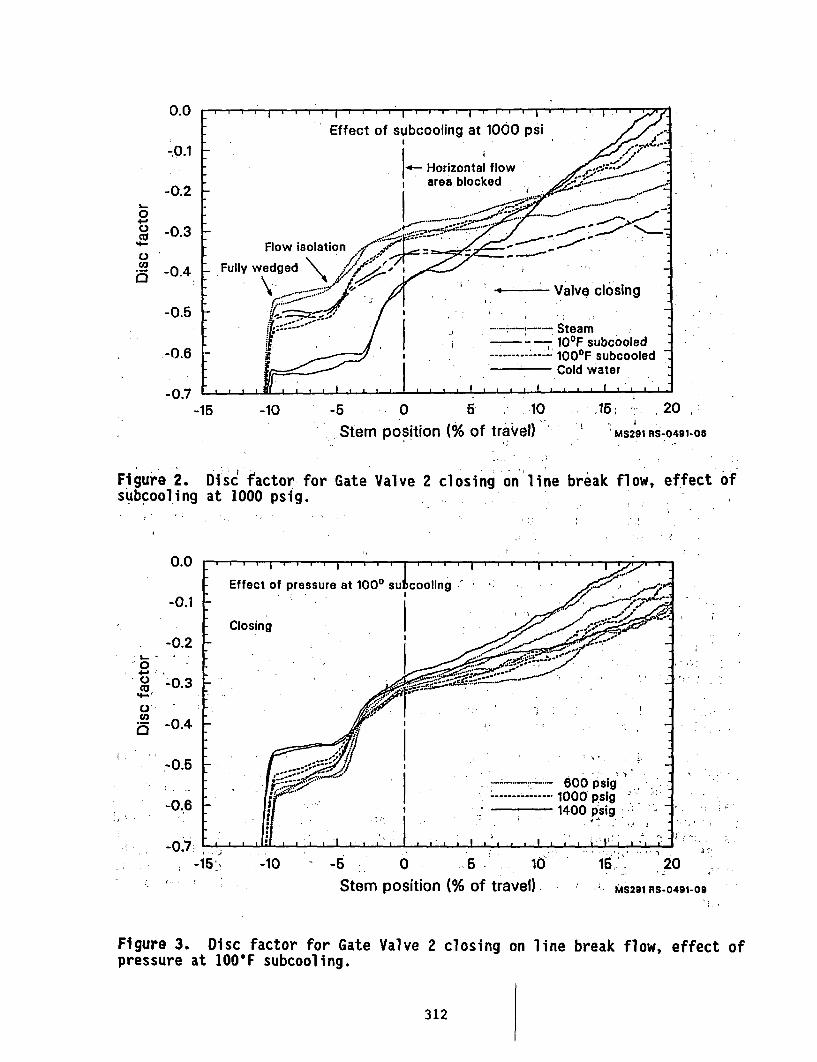
0.0
-0.1
-0.20
CO -0.3
0 o4
-0.5
-0.6
-0.7
Effect of subcooling at 1000 psi -:
J4 Horizontal flow .S-*- .area blocked -
Flow isolation -;-F/£ *---
Fully wedged /1/>..i
\* ,,.:7- ' . ; - Valve closing
------ Steam|. -- 10°F subcooled
--------------- 100OF subcooled*_________Cold water
-15 -10 -5 0- 6 - 10 - .15; 20 ,
Stem position (% of trairel)I
IMS291 RS-0491-05
Figure 2.subcool ing
Disc factor for Gateat 1000 psig.
Valve 2 closing on lineI I . .
break flow, effect of
0.0
-0.2
.0
4-CY -0co
d -0.4
,
-5 0 .6 10Stem position (% of travel).
15. 20MS291 RS-0491-09
Figure 3. Disc factor for Gate Valve 2 closing on line break flow, effect ofpressure at IOOF subcooling.
312
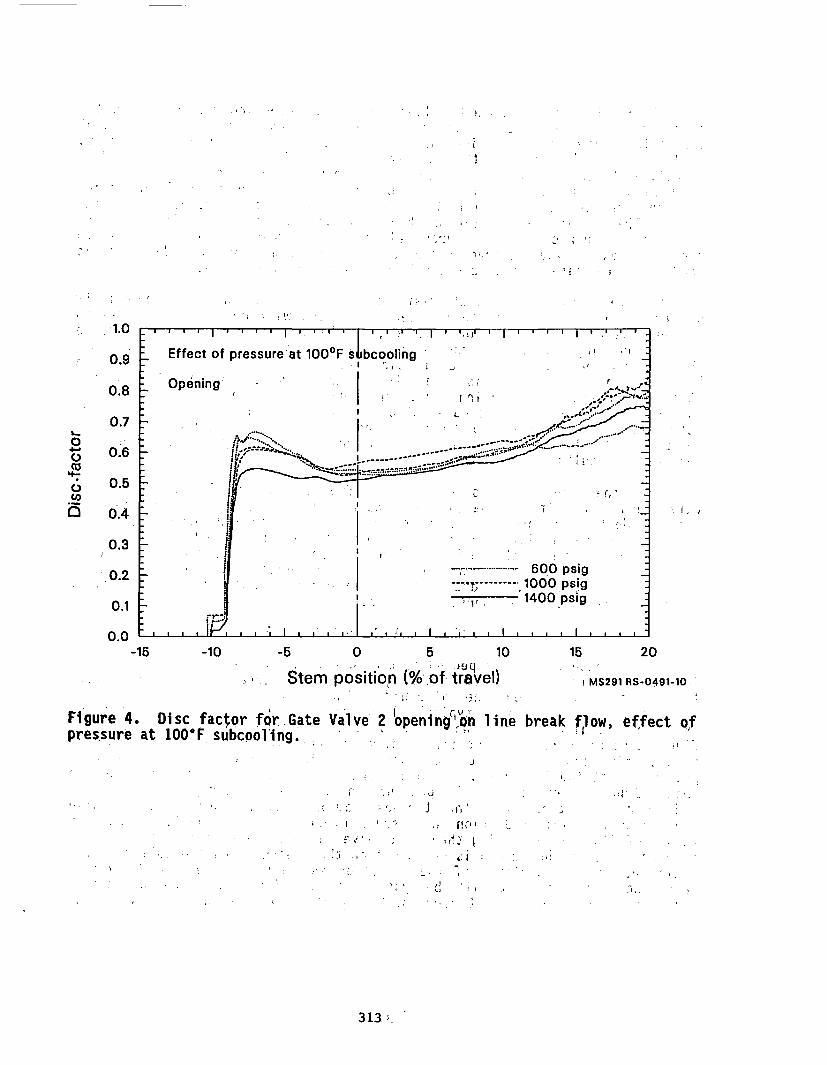
.4
I ;
: . I
- 10 rF
4 . I
- 0.9
0.8
04.'
0'ILO
a
0.7
0.6
0.5
0.4I . I
0.3
0.2
0.1
0.0-15 -10 -5 0 5 10 15 20
StmpoSition (%o travel)Ste m n M.f, MS291 RS-0491-10
Figure 4. Disc factor for Gate Valve 2 'opening"b'n line break flow, effect ofpressure at 100* subcooling. ; . -
-I
I. , ,- -
313 y
The previously unaccounted influence of fluid subcooling and pressure on thedisc factor is very evident. This influence is also contrary to what one mightexpect in terms of the effectiveness of a lubricant. However, what was expectedis based on a lubrication that separates the load bearing surfaces with arelatively thick film of lubricant to minimize metal-to-metal contact. This typeof lubrication is known as thick film lubrication. In the event the load bearingsurfaces are not separated by a film of lubrication, metal-to-metal contact canoccur. This condition is known as thin film lubrication. The deficiencies ofthis type of lubrication are aggravated by surface areas that are too small tocarry the maximum load, a load that exceeds the maximum expected or design basisload, or a decrease in the velocity between the moving surfaces.
When metal-to-metal contact exists, any condition that increases the abilityof the lubricant to penetrate the bearing region will decrease the frictionbetween the two surfaces. For instance, the higher the differential pressureacross a bearing region, the more likely a given lubricant will be forced intothis region and thus lower the friction between the surfaces. Likewise, alubricant in a vapor state is more likely than the same lubricant in a liquidstate to penetrate the bearing region and thus lower the friction between thesurfaces. Other researchers have noticed these same phenomenon; however, theyattribute this sensitivity to changes in the temperature of the fluid and metal.We are still investigating this phenomenon, and we hope to provide moreconclusive results in the future.
From the results discussed above and from similar results for the othervalves evaluated, it is apparent that Equation (1) is incomplete and does not,totally identify and predict the increasing stem force once the disc is past thehorizontal visual isolation or zero position. In addition, the fluid subcoolingand pressure dependencies of the disc factor are inconsistent with 'pastassumptions inherent in the application of the industry equation. Thus, weconcluded that the'equation does not consider parameters that have an importanteffect on the observed responses of the valves.
FLOW PHENOMENA THROUGH A VALVE
In response to the unexpected test results, we directed our efforts towardinvestigating the flow phenomena' through a'flexwedge gate valve and the effectthat pressures throughout the valve had on the resultant stem force. Figure 5shows a cross section of a typical flexwedge gate valve and identifies thoseareas on 'the disc and stem where the various pressure forces can act. Thisfigure also indicates where we drilled three pressure measurement ports into eachof the valve bodies prior to the Phase II testing to assist in this internalpressure distribution study. Figure 6 shows a typical pressure distributionobserved during our testing. The pressure in both the bonnet region of the valveand under the disc are lower than the upstream pressure during most of the valveclosure cycle. This reduction in pressure is due to the Bernoulli effect, theresult of fluid accelerating through a valve in response to a reduction in theflow area. This phenomenon is dependent on the pressure and subcooling of thefluid and on the magnitude of the reduction in flow area through the valve.Thus, the Bernoulli effect will be system and fluid dependent. The bonnet areaalso shows a lower pressure because of the split in the disc and because of the
314
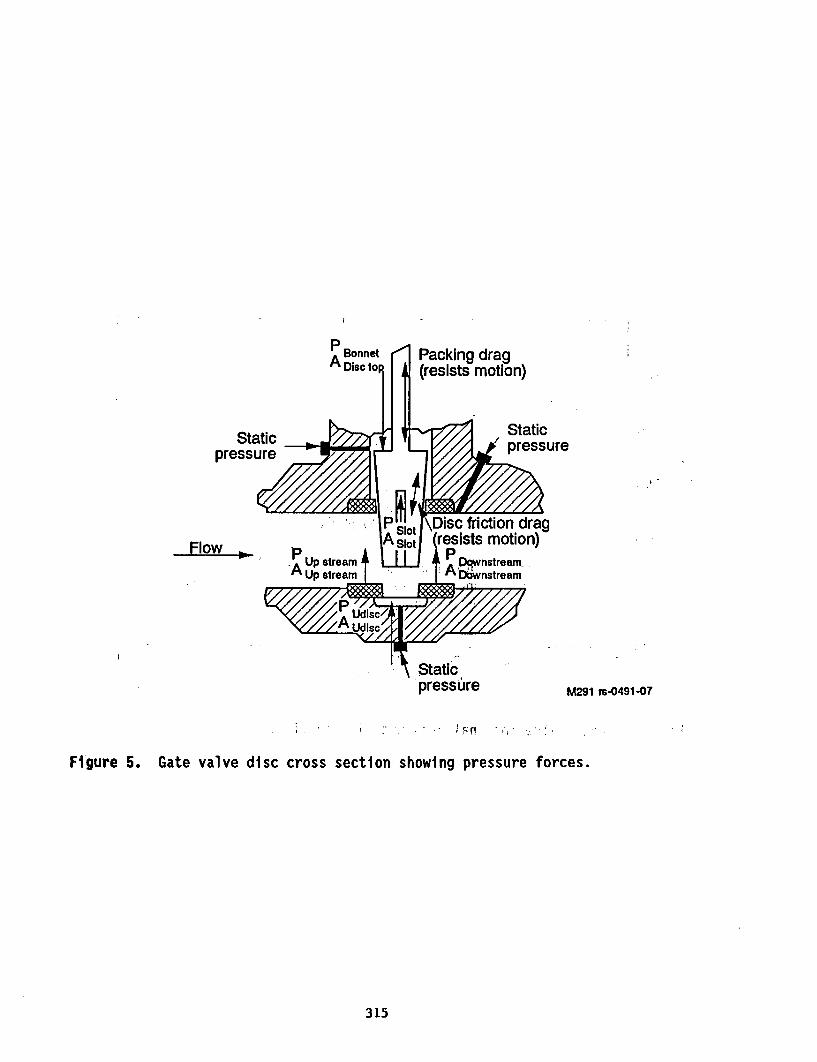
Staticpressure
Flow -
Staticpressure M291 rs-0491-07
Figure 5. Gate valve disc cross section showing pressure forces.
315
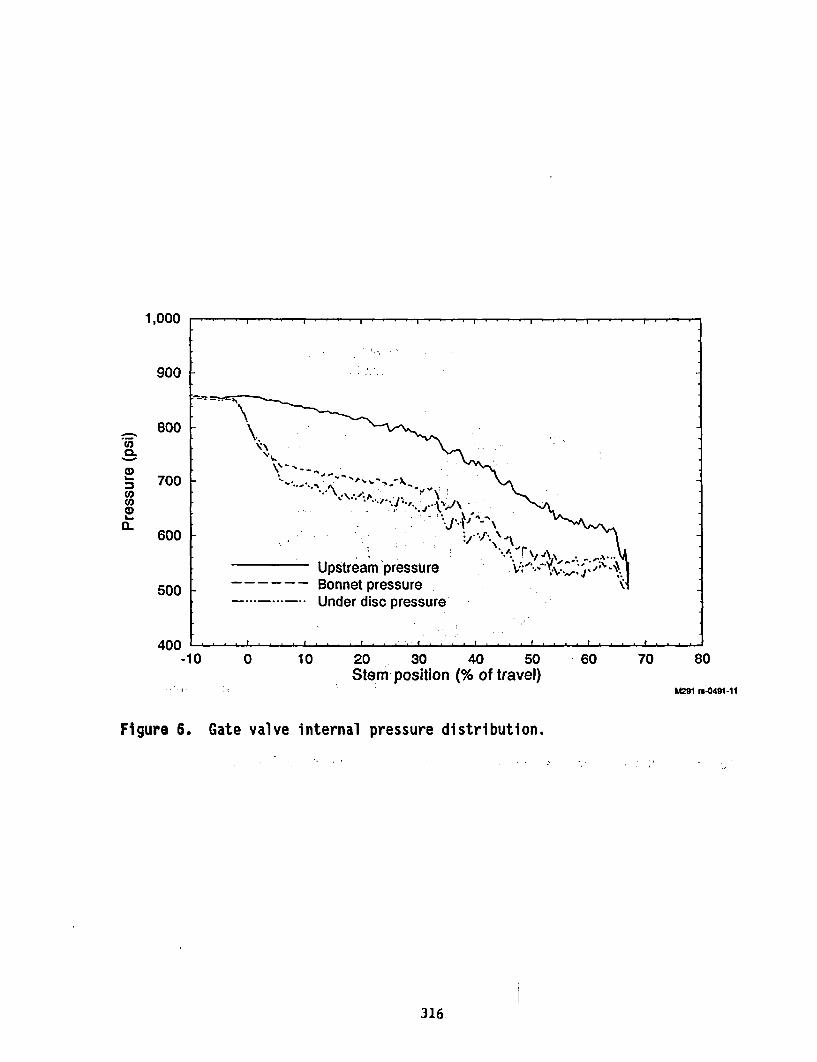
1,000 . . .
900
-o
Upstream pressure A '_voe
500 - -- - -- Bonnet pressure.-- -Under disc pressure
400-10 0 10 20 30 40 50 60 70 80
Stern position (% of travel)i b'lMM rs4491-11
Figure 6. Gate valve internal pressure distribution.
316
gap between the disc and the valve body seats; these structural features providea path such that the pressure in the bonnet region can more closely follow thepressure in the region under the disc.
However, from the minus 3% to the minus 10% stem position during this test,the pressures converge. During this portion of the valve stroke, flow has beenisolated and the disc is riding on the valve body seats; however, wedging of thedisc has not yet begun. It is also during this portion of the valve stroke thatpredictable valves exhibit the largest stem force. Thus, we concentrated ourefforts on this segment of the valve closure cycle. Wedging forces were notconsidered because these forces are not the result of fluid dynamic andfrictional effects, but instead depend on the force capabilities of a givenoperator and on the structural stiffness characteristics of a specific disc andvalve body.
DEVELOPMENT OF THE INEL CORRELATION
Our first effort was to develop a relatively detailed free body diagram ofthe disc while it is moving in the closing direction, after the flow has beenisolated but before wedging. This was done with the hope of better understandingthe pressure and area terms that effect the stem force. Figure 7 presents theresults of this effort and identifies all the nonsymmetrical forces acting on thedisc. Note that according to the free body diagram, the forces acting on thedisc ultimately react through the valve body seats,.-which are at a slight angle(for a flexwedge gate valve) relative to the horizontal and vertical valvecoordinate system. To account for this slight seat'angle so that the forces areexpressed in values consistent with the definition of a traditional frictionfactor, we found it necessary to transform the horizontal and vertical forcesinto a coordinate system that is normal and tangent to the valve body seatingsurfaces.
Following this logic, we theorized the existence of two horizontal forcesacting on the disc. The first horizontal force, (Fp) is due to the upstreampressure (Pup) acting on that area of the disc defined by the mean diameter ofthe downstream seating surface. The downstream seating surface presents acircular profile in the horizontal plane. The mean seat diameter was selectedbecause it best approximates that area of the disc in contact with the crown ofthe downstream seating surface over which the various pressure forces act. Fpis defined as,
F.,= PU ____ (2)
Resisting this force (Fup) is a horizontal force (FdOwn) due to the downstreampressure (PdOwn) also acting on that area of the disc defined by the meandiameter of the downstream seating surface. FdOWfn is defined as
317
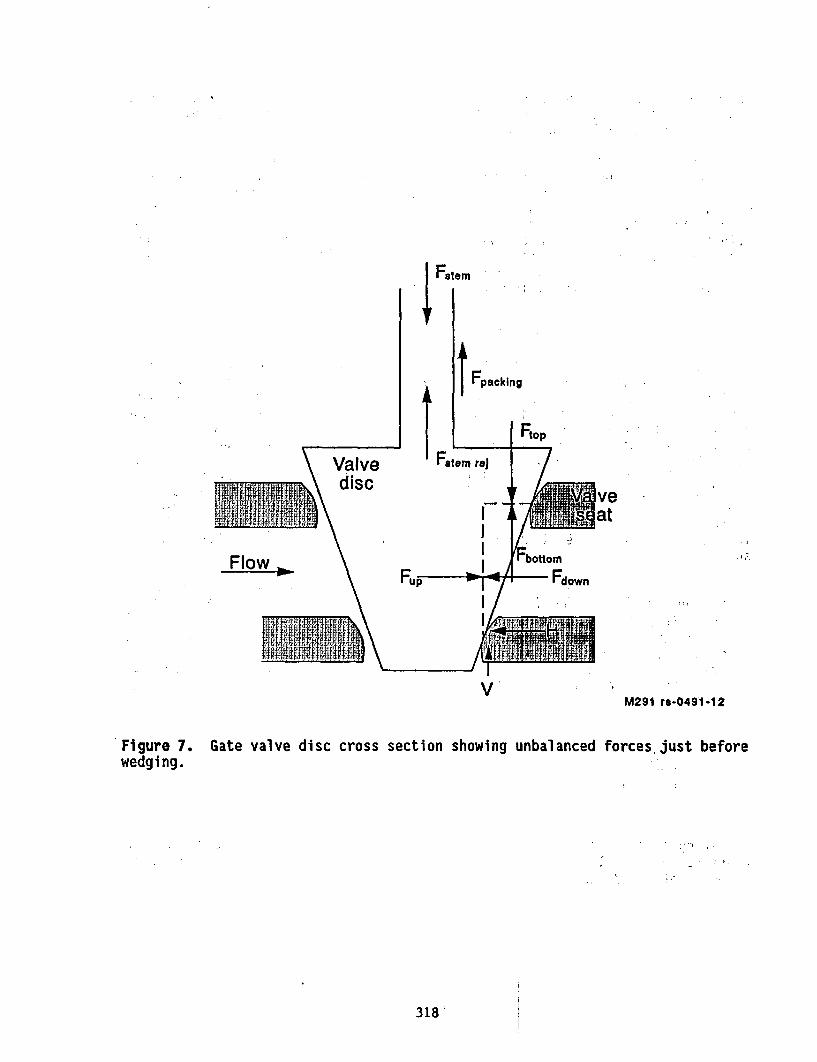
Fstem
1Fpacking
Valve Ftetm re) Fdisc
Flow ottom*F\up > D Fdown
VM291 rs-0491-12
Figure 7. Gate valve disc cross section showing unbalanced forces just beforewedging.
318
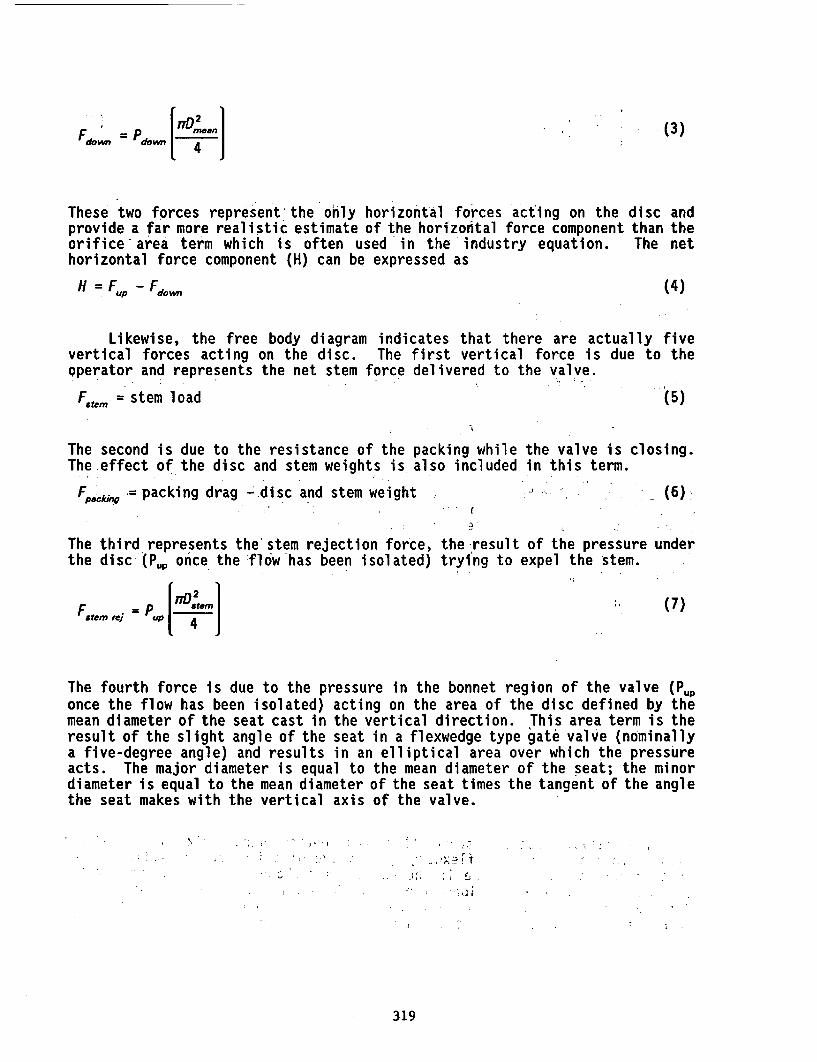
IS2|(nd. Di.n]
- ~do4(3)
These two forces represent the only horizontal forces acting on the disc andprovide a far more realistic estimate of the horizontal force component than theorifice area term which is often used in the industry equation. The nethorizontal force component (H) can be expressed as
H = Fp - Fdo. (4)
Likewise, the free body diagram indicates that there are actually fivevertical forces acting on the disc. The first vertical force is due to theoperator and represents the net stem force delivered to the valve.
F.tem = stem load (5)
The second is due to the resistance of the packing while the valve is closing.The effect of the disc and stem weights is also included in this term.
Fpc packing drag -'disc and stem weight I (6)
The third represents the'stem rejection force, the result of the pressure underthe disc (Pup once the flo'w'has been isolated) trying to expel the stem.
F.te rej = uP., t.D,.~F - [ Stem4(7)
The fourth force is due to the pressure in the bonnet region of the valve (Puponce the flow has been isolated) acting on the area of the disc defined by themean diameter of the seat cast in the vertical direction. This area term is theresult of the slight angle of the seat in a flexwedge type gate valve (nominallya five-degree angle) and results in an elliptical area over which the pressureacts. The major diameter is equal to the mean diameter of the seat; the minordiameter is equal to the mean diameter of the seat times the tangent of the anglethe seat makes with the vertical axis of the valve.
I I . I . !.~ .
319
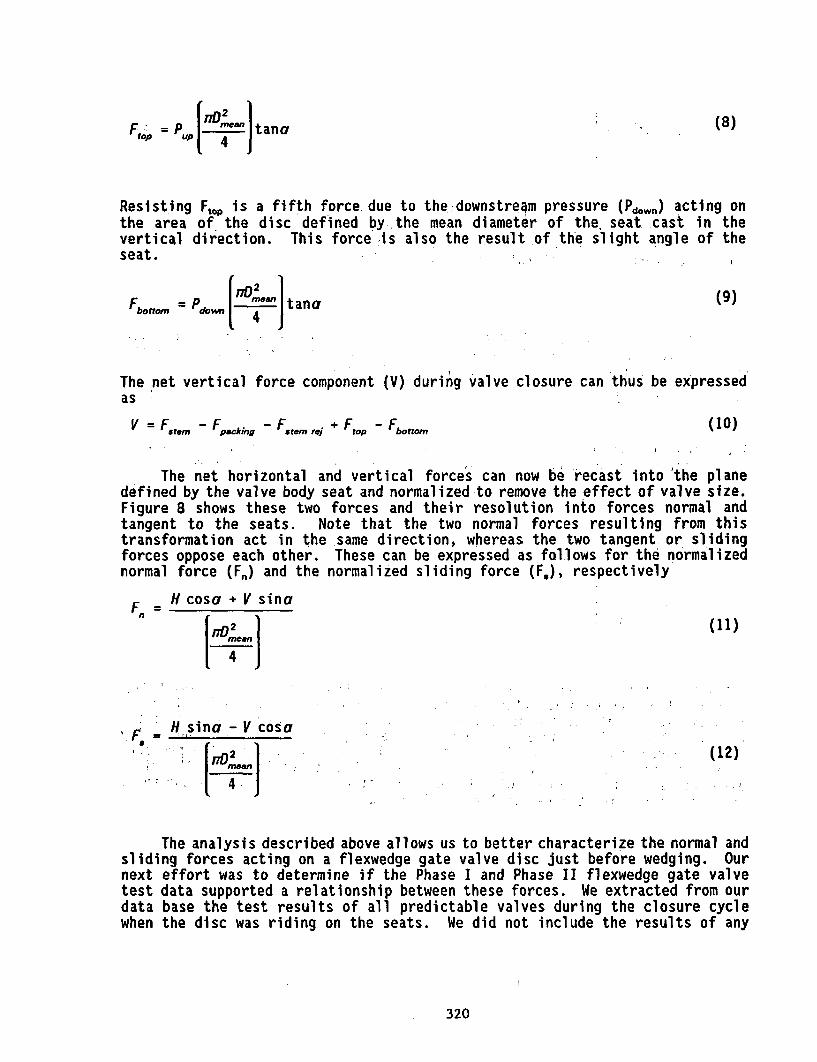
Fto; = Pup e |tana (8)
Resisting Ft0p is a fifth force due to thedownstream pressure (P wn) acting onthe area of the disc defined by the mean diameter of the seat cast in thevertical direction. This force his also the result of the slight angle of theseat.
Fottom Pd.. me '.|tana (9
The net vertical force component (V) during valve closure can thus be expressedas
V= Fst.m -Fpci . Fa Ftem + Ftop - Fbolom (10)
The net horizontal and vertical forces can now be recast into the planedefined by the valve body seat and normalized to remove the effect of valve size.Figure 8 shows these two forces and their resolution into forces normal andtangent to the seats. Note that the two normal forces resulting from thistransformation act in the same direction, whereas the two tangent or slidingforces oppose each other. These can be expressed as follows for the normalizednormal force (F,) and the normalized sliding force (F.), respectively
H cosa + V sinof =
[I7D.ne J4
I . , H,,sinct - V cosa
I- 4
(11)
( 2
I .. .. (12)
The analysis described above allows us to better characterize the normal andsliding forces acting on a flexwedge gate valve disc just before wedging. Ournext effort was to determine if the Phase I and Phase II flexwedge gate valvetest data supported a relationship between these forces. We extracted from ourdata base the test results of all predictable valves during the closure cyclewhen the disc was riding on the seats. We did not include the results of any
320
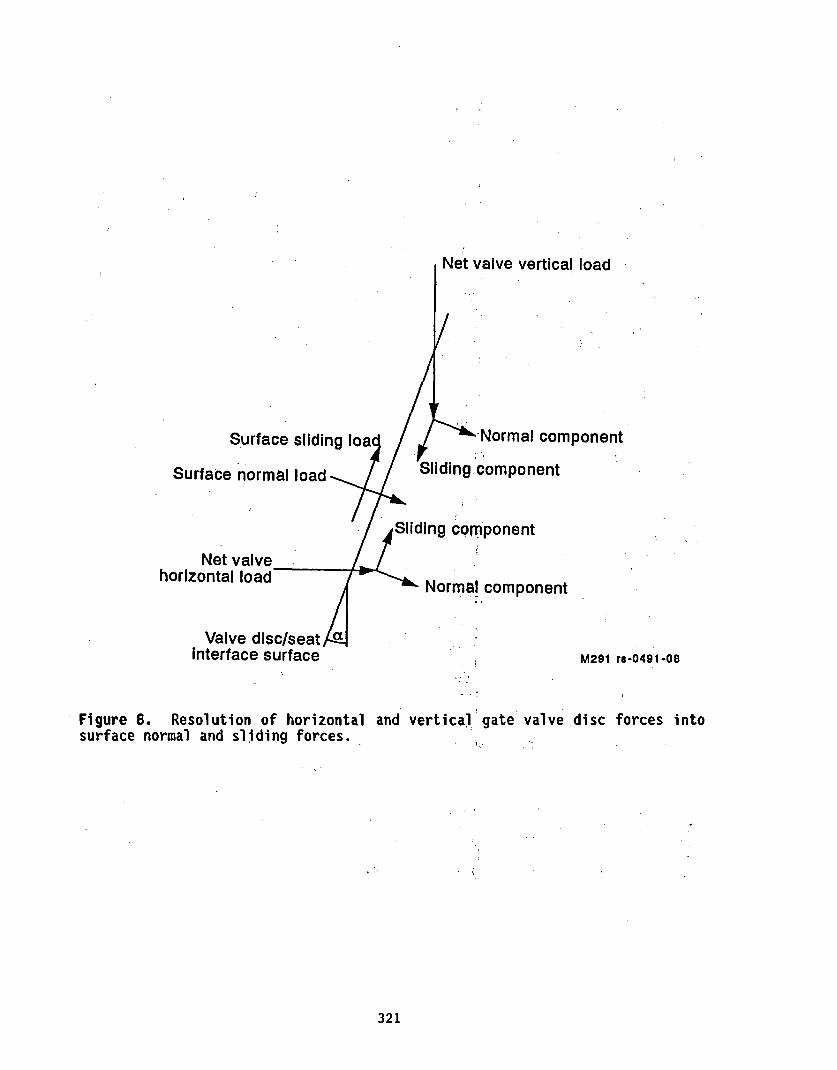
Net valve
Surface sliding lo,
Surface normal load
Net valve /
vertical load
al component
onent
int
Donent
M291 re-0491-08
Normal coml
Valve disc/seat,interface surface
Figure 8. Resolution of horizontal andsurface normal and sliding forces.
vertical gate valve disc forces into
321
testing if severe internal damage was evident. However, if the valve exhibitedevidence of internal damage while the disc was riding on the guides but showedno evidence of such behavior while the disc was riding on the valve body seats,we included the results.
The Phase II data extraction included testing with three valves representingtwo valve sizes (6-in. and 10-in.). Design basis flow isolation tests and normaloperating flow isolation tests were used; upstream pressures ranged from 600 psigto 1400 psig, and fluid conditions ranged from steam to 4000F subcooled water.However, the results of tests when the differential pressure was less than 20Y.of the upstream pressure or when both the differential pressure and the stemforce were increasing very rapidly while the disc was riding on the valve seatwere not included. This is because the magnitude and trends of the resultingforces are obscured by relatively low loadings on the valve disc (which affectthe transition from thick film lubrication to thin film lubrication), and byrapid changes in both the stem force and the differential pressure. Thisextraction yielded data from 30 tests.
The Phase I data extraction included testing with two valves representinga single valve size (6-in.). By way of comparison, these valves were nearly thesame as Valves 1 and 2 in the Phase II testing. Only design basis flow isolationtests were used from the Phase I testing. Upstream pressures ranged from400 psig to 1400 psig, and fluid conditions ranged 'from 10OF subcooled to 140OFsubcooled water. This extraction yielded data from 12 tests.
The results of both data extractions were used in the force balancedeveloped as described above and presented in Figures 9 and 10. The resultsreveal two linear relationships between the normal force on a seat (Fn) and thetangent or sliding force (F.) necessary to induce motion. One is representativeof a fluid subcooling of less than 700F, while the other is representative of afluid subcooling of 700F or greater. The two dashed lines on either side of thesolid line represent the limits of the observed data scatter. The tight groupingof the data scatter lends confidence that not only can we bound the forcerequirements of a flexwedge gate valve, but we can also devise a method where theresults of low differential pressure flexwedge gate valve testing can be verifiedand then the design basis conditions used to bound the maximum stem force. Notealso that the dashed lines do not extend below a normalized normal force of400 lbf/in2. Due to the limited low pressure and low differential pressure dataavailable and the postulated friction mechanism, the applicability of the INELcorrelation is currently limited to normalized normal forces of 400 lbf/in2 andabove. We are continuing to extend the applicability of the INEL correlation.
THE INEL CORRELATION
We can now rearrange the previously developed force balance and solve forthe stem force based on a linear relationship between the normalized normal andsliding forces. Using Figures 9 and 10, the slope of the solid line (thefriction factor between the disc and the seat) can be used to relate thenormalized normal force (Fn) to the normalized sliding force (F.) as
, 322
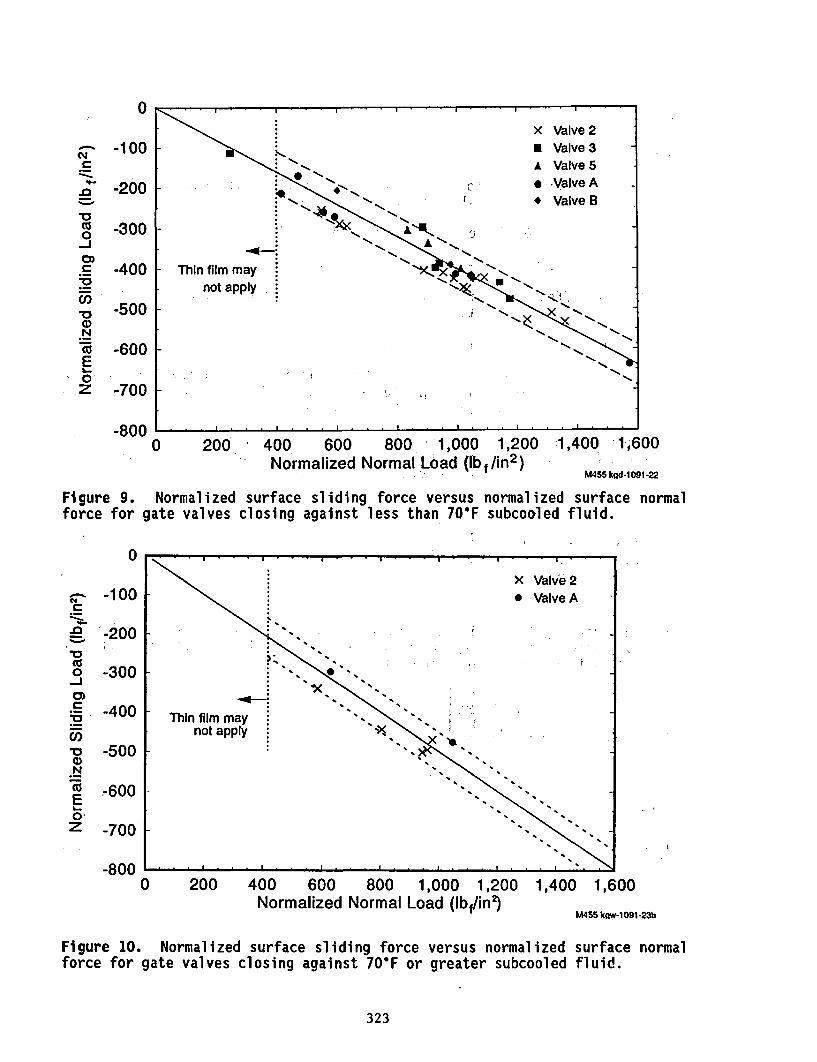
0
c
a)
Z-S
'aO
-0Cu0)
0),
CU
I 0
-oZ
-100
-200
-300
-400
-500
-600
-700
-8000 200 400 600 800 1,000 1,200
Normalized Normal Load (Ibf/in2)1,400 1,600
M455 kgd-1091-22
Figure 9. Normalized surface sliding force versus normalized surface normalforce for gate valves closing against less than 70F subcooled fluid.
0
C
-o
`0cc0
._
._C
laen
a1)N
Z
-100
-200
-300
-400
-500
-600
-700
-8000 200 400 600
Normalized800 1,000 1,200
Normal Load (Ibf/in2)1,400 1,600
M455 kow-1 091-23b
Figure 10. Normalized surface sliding force versus normalized surface normalforce for gate valves closing against 70*F or greater subcooled fluid.
323
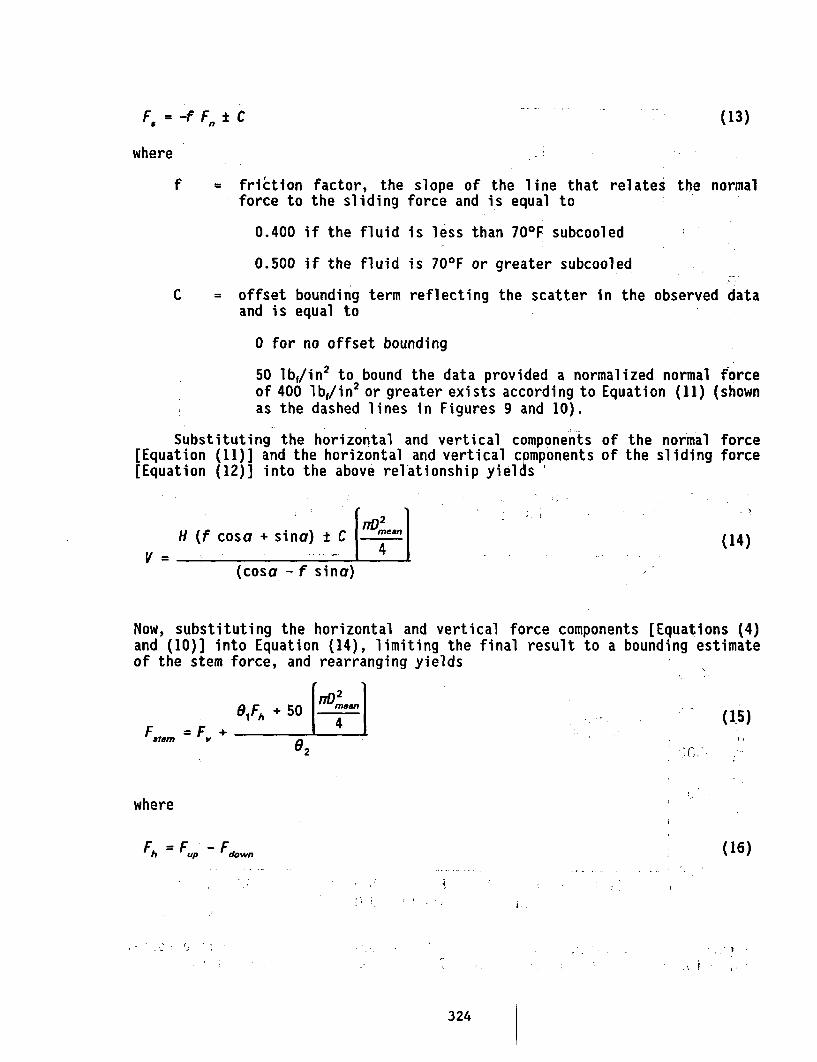
F. = -f Fn tC (13)
where
f friction factor, the slope of the line that relates the normalforce to the sliding force and is equal to
0.400 if the fluid is less than 700F subcooled
0.500 if the fluid is 700F or greater subcooled
C = offset bounding term reflecting the scatter in the observed dataand is equal to
0 for no offset bounding
50 lbf/in2 to bound the data provided a normalized normal forceof 400 lb,/in2 or greater exists according to Equation (11) (shownas the dashed lines in Figures 9 and 10).
Substituting the horizontal and vertical components[Equation (11)] and the horizontal and vertical components[Equation (12)] into the above relationship yields '
of the normal forceof the sliding force
H (f cosa + sina) t C fmeanj
,4(14)
(cosa - f sina)
Now, substituting the horizontal and vertical force components [Equations (4)and (10)] into Equation (14), limiting the final result to a bounding estimateof the stem force, and rearranging yields
91 Fh + 50 [WM_ lF =F +
(15)I,,
02
where
Fs = F~p Fdow (16)
324
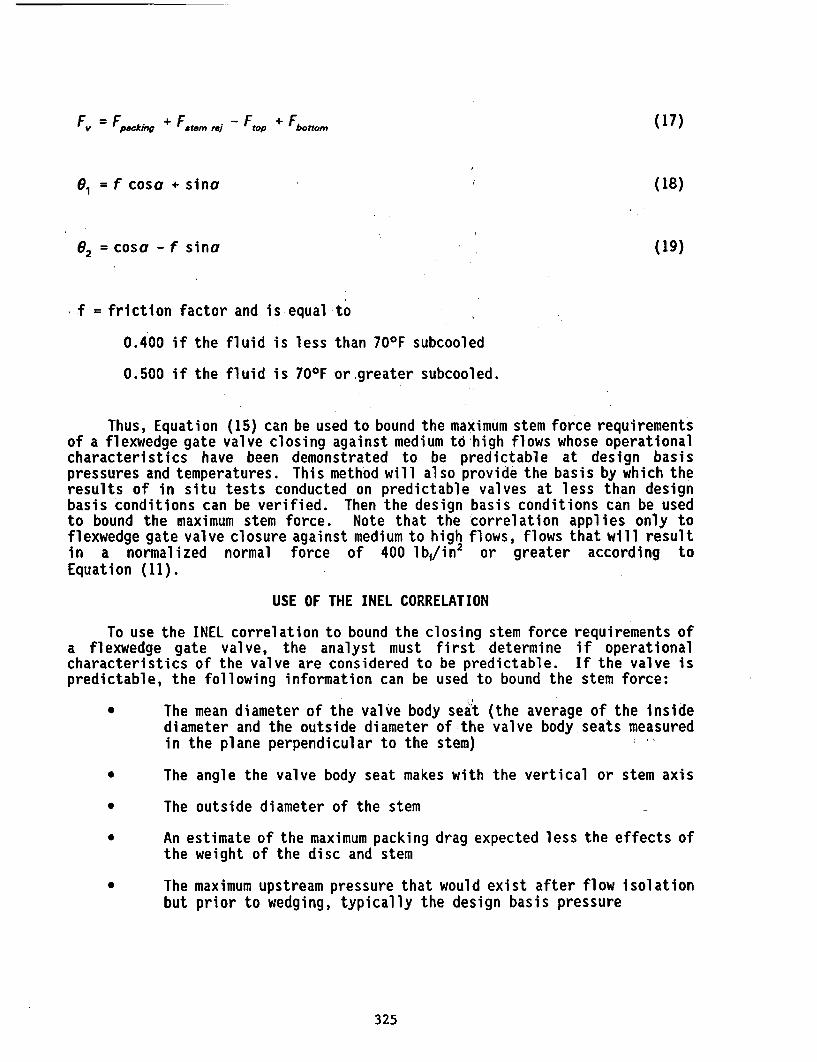
Fv = Fp.ckmg +Fatem ,ej- Fp + Faho (17)
01 = f cosa + sina (18)
02 =cosa -f sina (19)
f = friction factor and is equal to
0.400 if the fluid is less than 700F subcooled
0.500 if the fluid is 700F or greater subcooled.
Thus, Equation (15) can be used to bound the maximum stem force requirementsof a flexwedge gate valve closing against medium to high flows whose operationalcharacteristics have been demonstrated to be predictable at design basispressures and temperatures. This method will also provide the basis by which theresults of in situ tests conducted on predictable valves at less than designbasis conditions can be verified. Then the design basis conditions can be usedto bound the maximum stem force. Note that the correlation applies only toflexwedge gate valve closure against medium to high flows, flows that will resultin a normalized normal force of 400 lbf/in 2 or greater according toEquation (11).
USE OF THE INEL CORRELATION
To use the INEL correlation to bound the closing stem force requirements ofa flexwedge gate valve, the analyst must first determine if operationalcharacteristics of the valve are considered to be predictable. If the valve ispredictable, the following information can be used to bound the stem force:
* The mean diameter of the valve body seat (the average of the insidediameter and the outside diameter of;the valve body seats measuredin the plane perpendicular to the stem)
* The angle the valve body seat makes with the vertical or stem axis
* The outside diameter of the stem
* An estimate of the maximum packing drag expected less the effects ofthe weight of the disc and stem
* The maximum upstream pressure that would exist after flow isolationbut prior to wedging, typically the design basis pressure
325
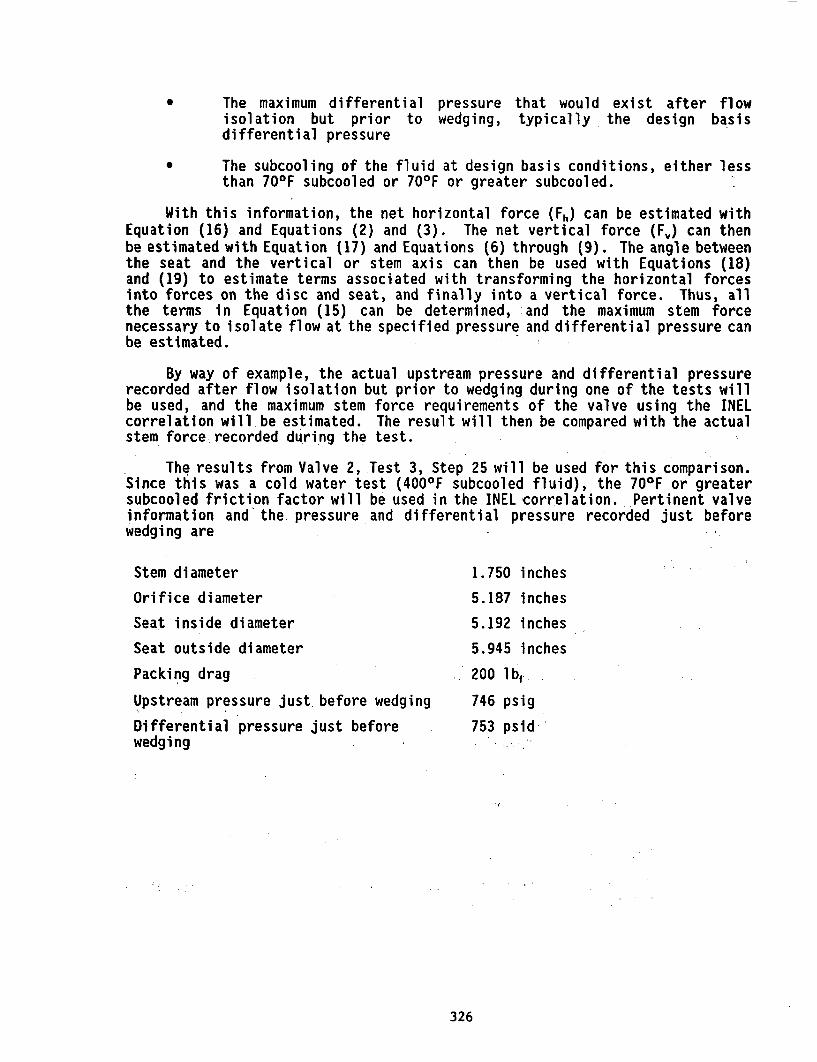
* The maximum differential pressure that would exist after flowisolation but prior to wedging, typically the design basisdifferential pressure
* The subcooling of the fluid at design basis conditions, either lessthan 700F subcooled or 700F or greater subcooled.
With this information, the net horizontal force (Fh) can be estimated withEquation (16) and Equations (2) and (3). The net vertical force (FJ) can thenbe estimated with Equation (17) and Equations (6) through (9). The angle betweenthe seat and the vertical or stem axis can then be used with Equations (18)and (19) to estimate terms associated with transforming the horizontal forcesinto forces on the disc and seat, and finally into a vertical force. Thus, allthe terms in Equation (15) can be determined, and the maximum stem forcenecessary to isolate flow at the specified pressure and differential pressure canbe estimated.
By way of example, the actual upstream pressure and differential pressurerecorded after flow isolation but prior to wedging during one of the tests willbe used, and the maximum stem force requirements of the valve using the INELcorrelation will be estimated. The result will then be compared with the actualstem force recorded during the test.
The results from Valve 2, Test 3, Step 25 will be used for this comparison.Since this was a cold water test (4000F subcooled fluid), the 700F or greatersubcooled friction factor will be used in the INEL correlation. Pertinent valveinformation and the pressure and differential pressure recorded just beforewedging are
Stem diameter 1.750 inches
Orifice diameter 5.187 inches
Seat inside diameter 5.192 inches
Seat outside diameter 5.945 inches
Packing drag 200 lbf
Upstream pressure just before wedging 746 psig
Differential pressure just before 753 psidwedging
326
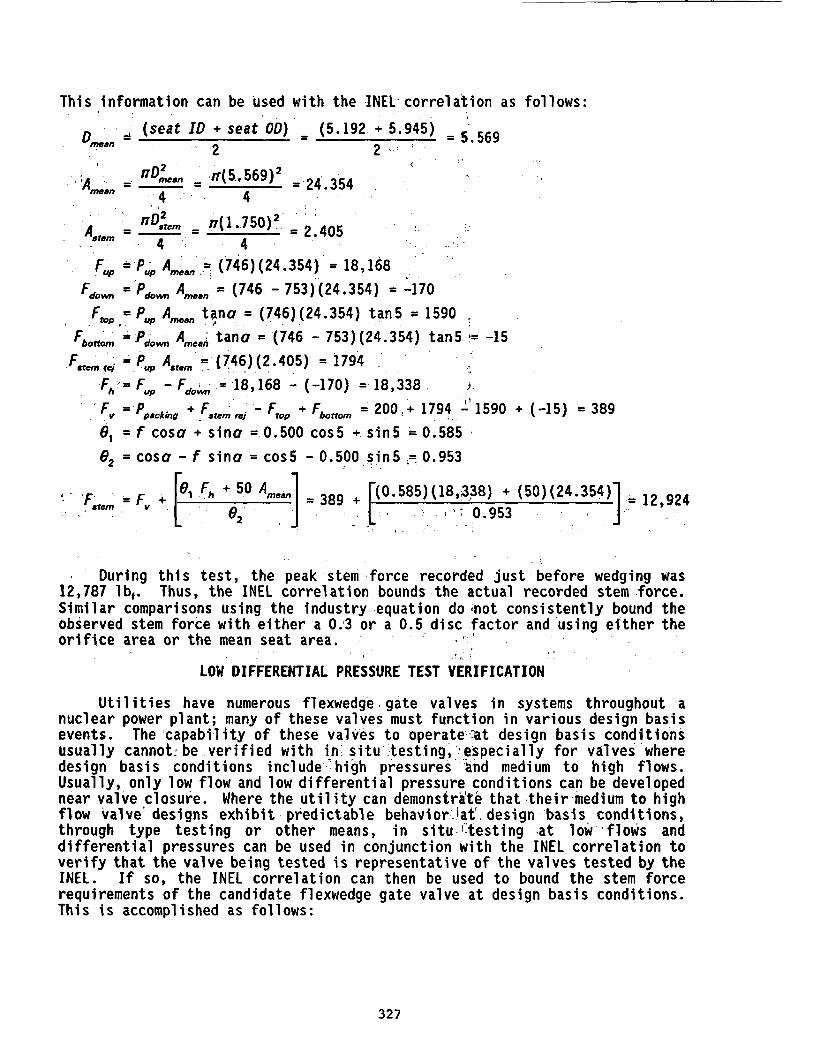
This information can be used with the INEL-correlation as follows:
I (seat ID + seat OD) = (5.192 + . = 5.569D.On 5.52
I'A., _ ~n~me me4= W(5,569)2 = 24'.354
4
IAteme = ,r(1.750), 2.405
. 4 . 4 -X u Pw Amean = (746)(24.354) = 18,168
Fdon Pd..do wi Aan (746 - 753)(24.354) = -170
Ft.., Py,, A,.,) tana = (746)(24.354) tanS = 1590
Fbtoam =.Pd, Am.an tana = (746 - 753)(24.354) tanS= -15
F =P,,. Aatem - (746)(2.405) = 1794
Fh= FUp - Fdo, =-18,168 - (-170) = 18,338
Fv=Ppckmg +FFtemrj -Fa0 +Fi. = 200+ 1794 -1590
81 = f cosa + sina = 0.500 cos5 + sinS = 0.585
02 = cosa - f sina = cos5 - 0.500 sinS -0.953
+ (-15) = 389
fstem =v+ Fh + 50 Am.0nl 389 +(0.585)(18,338) + (50)(24.354)1 2,924
0 J ; 0.953
During this test, the peak stem force recorded just before wedging was12,787 lbf. Thus, the INEL correlation bounds the actual recorded stem-.force.Similar comparisons using the industry equation do not consistently bound theobserved stem force with either a 0.3 or a 0.5 disc factor and using either theorifice area or the mean seat area.
LOW DIFFERENTIAL PRESSURE TEST VERIFICATION
Utilities have numerous flexwedge.gate valves in systems throughout anuclear power plant; many of these valves must function in various design basisevents. The capability of these valves to operate-at design basis conditionsusually cannot, be verified with in situ testing, especially for valves'wheredesign basis conditions include 'high pressures 'and medium to high flows.Usually, only low flow and low differential pressure conditions can be developednear valve closure. Where the utility can demonstrate that their medium to highflow valve' designs exhibit predictable behaviorfat'. design basis conditions,through type testing or other means, in situ-,,testing at low 'flows anddifferential pressures can be used in conjunction with the INEL correlation toverify that the valve being tested is representative of the valves tested by theINEL. If so, the INEL correlation can then be used to bound the stem forcerequirements of the candidate flexwedge gate valve at design basis conditions.This is accomplished as follows:
327
Step 1: A differentialpressure test is performed. The results of thetesting are then used to estimate the normalized normal andsliding forces-'for the valve according to Equations (11)and (12).'' If the upstream pressure and differential pressurewhile the disc is riding on the seats results in a normalizednormal force of not less than 400 lbf/in2'and if the resultingforces fall within the upper and lower bounds expected forvalves of this design (see Figures 9 and 10), the valve isconsidered to be representative of the valves tested by theINEL. If the resulting forces'do not fall within the expectedband, the results of our testing are not representative of thevalve being tested and the INEL correlation may not beapplicable.
Step 2: If the results of Step I fall Within the expected band, actualdesign basis conditions can be used in the INEL correlation tobound the stem force requirement, of th~e valve being tested.This maximum stem force estimate is then tsed, along with theother necessary motortoperator sizing-calculations, to verifythe size of the operator and the setting of the torque switchto ensure that sufficient stem force is available to operatethe valve at design.basis.conditions.
CON&LUSIONS
The industry's traditional gate 'valve sizing, equation is incompleteregardless of the disc area term or the disc factor used. This is because moreterms are included in the disc factor than the sliding friction term.
A new correlation was developed based on the results of two full-scaleflexwedge gate valve qualification and flow interruption test programs. Thiscorrelation has been shown to consistently bound the stem force requirements ofa flexwedge gate valve whose operational characteristics have been shown to bepredictable. This correlation also allows a flexwedge gate valve.to be verifiedbased on the results of a low differential pressure test. If so verified, theresults of the INEL correlation are shown to be applicable at design basisconditions.
REFERENCES; . . ; J
DeWall, K, G., and R. Steele,. Jr., 1989,- BWR Reactor Water Cleanup SystemFlexible Wedge Gate Isolation Valve Qualification and High Energv FlowInterruption Test, NUREG/CR-5406, EGG-2569.
Steele, R.., Jr,,- K. G. DeWall, and J. C. Watkins, 1990, Generic Issue 87Flexible Wedge Gate Valve Test Program. Phase II Results-and Analysis,-NUREG/CR-5558, EGG-2600.-
I IF
I �I
328
NOTICE
This report was prepared as an account of work sponsored by an agency of theUnited States Government. Neither the United States Government nor any agencythereof, or any of their employees, makes any warranty, expressed or implied, orassumes any legal liability or responsibility for any third party's use, or theresults of such use, of any information, apparatus, product, or process disclosedin this report, or represents that its use by such third party would not infringeprivately owned rights. The views expressed in this report are not necessarilythose of the U.S. Nuclear Regulatory Commission.
329
APPLICATIONS AND EXTENSIONS OF DEGRADATION MODELING
F. Hsu, W.E. Veselyt, M. Subudhi, and P.K. Samanta
Department of Nuclear EnergyBrookhaven National LaboratoryUpton, New York 11973, USA
tScience Applications International Corporation, Ohio, USA
ABSTRACT
Component degradation modeling being developed to understand the aging process can havemany applications with potential advantages. Previous work has focussed on developing the basicconcepts and mathematical development of a simple degradation model. Using this simple model, timesof degradations and failures occurrences were analyzed for standby components to detect indications ofaging and to infer the effectiveness of maintenance in preventing age-related degradations fromtransforming to failures. Degradation modeling approaches can have broader applications in agingstudies and in this paper, we discuss some of the extensions and applications of degradation modeling.
The application and extension of degradation modeling approaches, presented in this paper, covertwo aspects: (a) application to a continuously operating component, and (b) extension of the approachto analyze degradation-failure rate relationship.
The application of the modeling approach to a continuously operating component (namely, aircompressors) shows the usefulness of this approach in studying aging effects and the role of maintenancein this type component. In this case, aging effects in air compressors are demonstrated by the increasein both the degradation and failure rate and the faster increase In the failure rate compared to thedegradation rate shows the ineffectiveness of the existing maintenance practices. Degradation-failure raterelationship was analyzed using data from residual heat removal system pumps. A simple linear modelwith a time-lag between these two parameters was studied. The application in this case showed a time-lag of 2 years for degradations to affect failure occurrences.
1. INTRODUCTION
Component degradation modeling includes modeling of occurrences of component degradationsand analyses of these occurrences to understand the aging-degradaion process and its implications. Inthis modeling approach, dividing the operational performance of a component into three states - normaloperating state, degraded state, and failure state, we established relations among these states using ratesof degradation and failure occurrences. The relations are used to define estimates of the effectivenessof maintenance in preventing degradation from becoming failures. In an earlier paper' we have focussedon basic concepts and mathematical development of simple degradation modeling as applicable to agingand maintenance effectiveness applications.
This work was performed under the auspices of the U.S. Nuclear Regulatory Commission.
331
- -
In this paper, we study further application and extensions bf degradation modeling approachesfocusing on two aspects:
a) applications of degradation modeling approaches to a continuously operating component,and
b) extension of degradation modeling approaches to analyze degradation-failure raterelationship.
Previously, we studied standby "active" components. Here, we analyze degradation and failuredata for air compressors to study the applicability of this modeling approach to a continuously operativecomponent. Thus, the degradation modeling analysis of air compressors shows the applicability of theapproach for an active component under different operating conditions. Also, because they arecontinuously operating component, air compressors are expected to suffer degradations which aredetected and corrected; thus, making them ideal candidates for degradation modeling analysis.
Understanding the relationship between degradations and failures is important in aging studiesand can result in significant benefits in defining maintenance strategies for controlling aging and inconducting aging reliability and risk studies particularly when aging failure data are sparse. In terms ofmaintenance strategies, if degradation-failure relationship is known, then effective maintenance/repair/refurbishment can be performed through monitoring of degradations, thus avoiding componentfailures. For aging reliability studies, relationship between degradations and failure is important sinceit can be used to estimate failure rates from degradation rates when failure data are sparse. In thispaper, this important correlation between degradations and failures is statistically studied and the conceptof a delayed effect of degradation on failures is explored.
2. DEGRADATION ANALYSIS USING AIR COMPRESSOR AGING DATA
Here, our objective is to explore the applicability of degradation modeling approaches for acontinuously operating component, different from standby components studied previously. We selectedan air compressor for this analysis. The analysis approach is similar to that followed for the componentsstudied in our earlier work.'
Definitions of Deiradations
To analyze degradations, the degraded state of the component must first be defined so it can beidentified and analyzed. Definitions of the degraded state can be at a gross level or at a detailed level.At a gross level, a component is described as degraded whenever any deterioration occurs which doesnot cause loss of function. The operational performance of the component is divided into three states:the normal operating state, the degraded state, and the failure state. An example of a gross definitionof degradation is that a component degradation occurs whenever corrective maintenance is required, butthe component has not failed.
More detailed modeling of degradations involves dividing the degradation space into multipledegraded states. A given degraded state is then associated with a given range of characteristics of thecomponent or performances of the component. For example, detailed degraded states for circuitbreakers can be defined based on defined ranges for the pick-up/drop-out voltage, inrush/holding current,and other measurable degradation characteristics.
The advantage of defining more detailed degradation states is that we can accurately predictimpacts on the failure rate of the component. When aging occurs, the component generally progresses
332
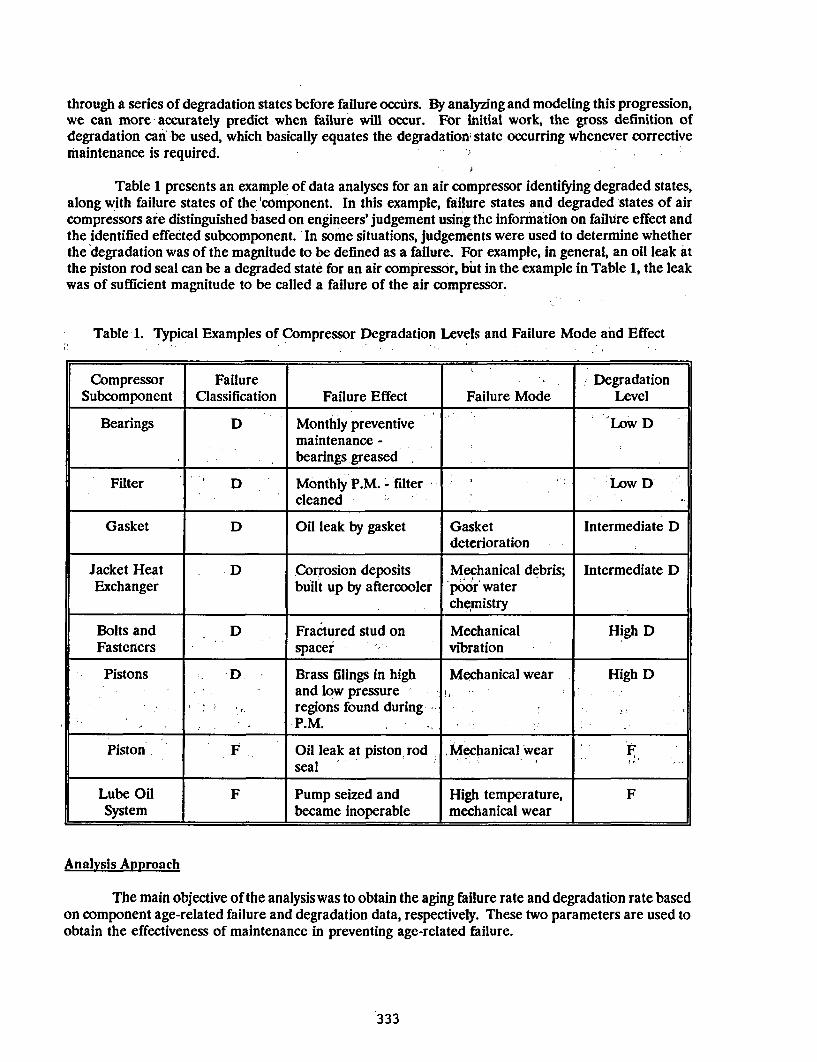
through a series of degradation states before failure occurs. By analyzing and modeling this progression,we can more - accurately predict when failure will occur. For Initial work, the gross definition ofdegradation can be used, which basically equates the degradation' state occurring whenever correctivemaintenance is required. -
Table 1 presents an example of data analyses for an air compressor identifying degraded states,along with failure states of the component. In this example, failure states and degraded states of aircompressors are distinguished based on engineers' judgement using the information on failure effect andthe identified effected subcomponent. In some situations, judgements were used to determine whetherthe degradation was of the magnitude to be defined as a failure. For example, in general, an oil leak atthe piston rod seal can be a degraded state for an air compressor, but in the example in Table 1, the leakwas of sufficient magnitude to be called a failure of the air compressor.
Table 1. Typical Examples of Compressor Degradation Levels and Failure Mode and Effect
Compressor Failure DegradationSubcomponent Classification Failure Effect Failure Mode Level
Bearings D Monthly preventive Low Dmaintenance -
__ bearings greased
Filter D Monthly P.M. - filter . Low Dcleaned
Gasket D Oil leak by gasket Gasket Intermediate Ddeterioration
Jacket Heat D Corrosion deposits Mechanical debris; Intermediate DExchanger built up by aftercooler poor water
chemistry
Bolts and D Fractured stud on Mechanical High DFasteners spacer vibration
Pistons D Brass filings in high Mechanical wear High Dand low pressureregions found duringP.M.
Piston F Oil leak at piston rod Mechanical wearFseal
Lube Oil F Pump seized and High temperature, FSystem became inoperable mechanical wear
Analysis Approach
The main objective of the analysis was to obtain the aging failure rate and degradation rate basedon component age-related failure and degradation data, respectively. These two parameters are used toobtain the effectiveness of maintenance in preventing age-related failure.
333
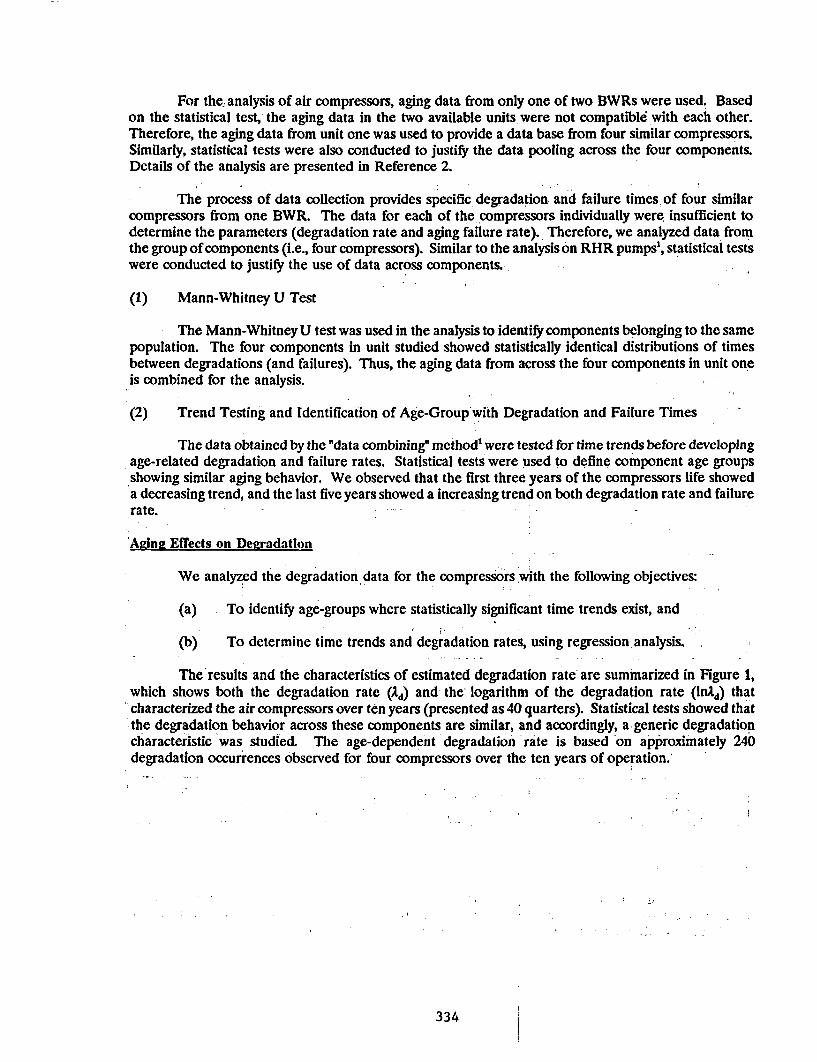
For the, analysis of air compressors, aging data from only one of two BWRs were used. Basedon the statistical test,- the aging data in the two available units were not compatible with each other.Therefore, the aging data from unit one was used to provide a data base from four similar compressors.Similarly, statistical tests were also conducted to justify the data pooling across the four components.Details of the analysis are presented in Reference 2.
The process of data collection provides specific degradation and failure times of four similarcompressors from one BWR. The data for each of the compressors individually were insufficient todetermine the parameters (degradation rate and aging failure rate). Therefore, we analyzed data fromthe group of components (i.e., four compressors). Similar to the analysis on RHR pumps', statistical testswere conducted to justify the use of data across components,-
(1) Mann-Whitney U Test
The Mann-Whitney U test was used in the analysis to identify components belonging to the samepopulation. The four components in unit studied showed statistically identical distributions of timesbetween degradations (and failures). Thus, the aging data from across the four components in unit oneis combined for the analysis.
(2) Trend Testing and Identification of Age-Group with Degradation and Failure Times
The data obtained by the "data combining" method1 were tested for time trends before developingage-related degradation and failure rates. Statistical tests were used to define component age groupsshowing similar aging behavior. We observed that the first three years of the compressors life showeda decreasing trend, and the last five years showed a increasing trend on both degradation rate and failurerate.
Adina Effects on Degradation
We analyzed the degradation data for the compressors with the following objectives:
(a) To identify age-groups where statistically significant time trends exist, and
(b) To determine time trends and degradation rates, using regression analysis.
The results and the characteristics of estimated degradation rate are summarized in Figure 1,which shows both the degradation rate (Ad) and the logarithm of the degradation rate (lnAd) thatcharacterized the air compressors over ten years (presented as 40 quarters). Statistical tests showed thatthe degradation behavior across these components are similar, and accordingly, a generic degradationcharacteristic was studied. The age-dependent degradation rate is based on approximately 240degradation occurrences observed for four compressors over the ten years of operation.'
334
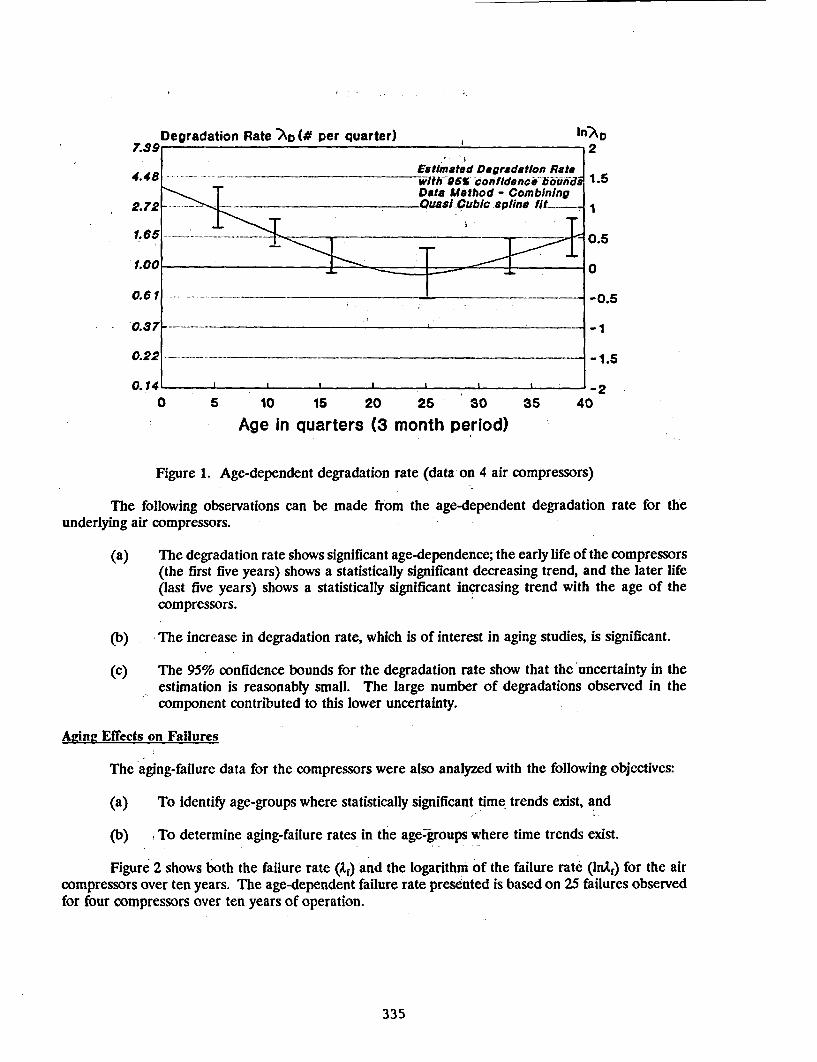
Degradation Rate ?A (# per quarter) Iln-D7.99. 2
Estimated Degradation Ratel4thu-06% confidence bbund 1.5
Data Method - Combining2.72 < .Quasi-Cubic spline Ilt.__ 1
I!5 0i0.5
0.61 - _ ______-0.5
0.37
0.22 _ .___ 1.5
0.14 -20 5 10 15 20 25 30 35 40
Age in quarters (3 month period)
Figure 1. Age-dependent degradation rate (data on 4 air compressors)
The following observations can be made from the age-dependent degradation rate for theunderlying air compressors.
(a) The degradation rate shows significant age-dependence; the early life of the compressors(the first five years) shows a statistically significant decreasing trend, and the later life(last five years) shows a statistically significant increasing trend with the age of thecompressors.
(b) The increase in degradation rate, which is of interest in aging studies, is significant.
(c) The 95% confidence bounds for the degradation rate show that the uncertainty in theestimation is reasonably small. The large number of degradations observed in thecomponent contributed to this lower uncertainty.
Aging Effects on Failures
The aging-failure data for the compressors were also analyzed with the following objectives:
(a) To identify age-groups where statistically significant time trends exist, and
(b) To determine aging-failure rates in the age-groups where time trends exist.
Figure 2 shows both the failure rate (Af) and the logarithm of the failure rate (Inlf) for the aircompressors over ten years. The age-dependent failure rate presented is based on 25 failures observedfor four compressors over ten years of operation.
335
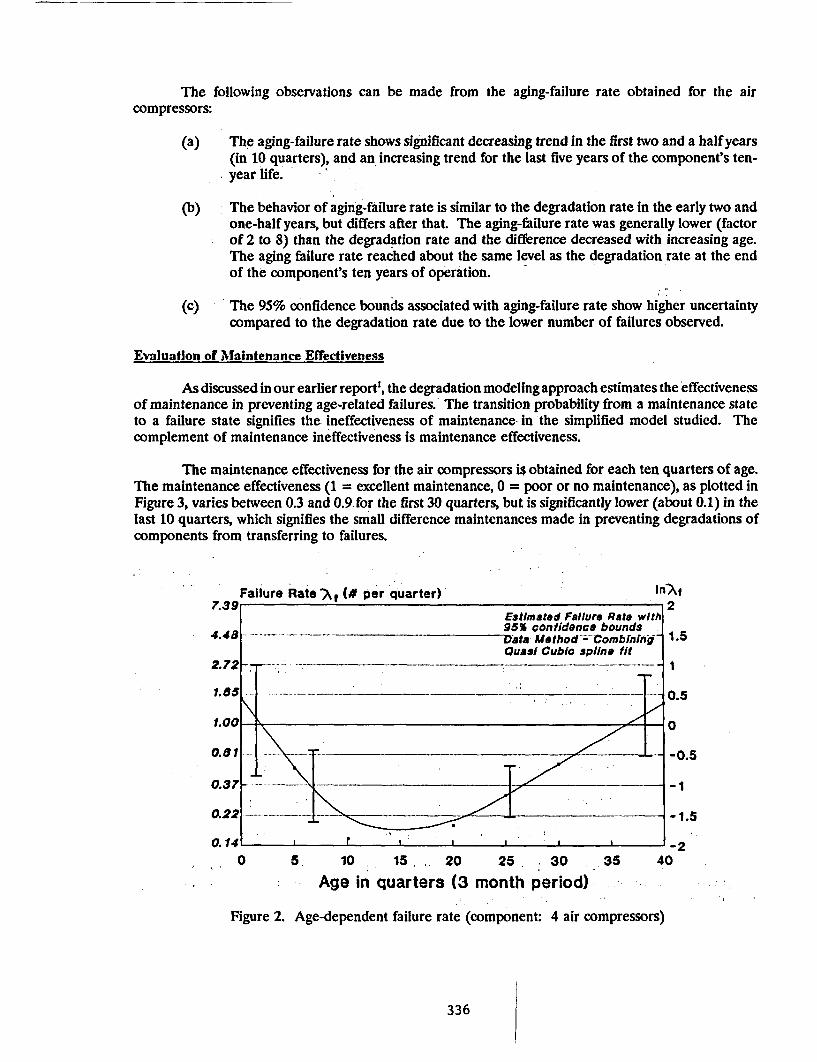
The following observations can be made from the aging-failure rate obtained for the aircompressors:
(a) The aging-failure rate shows significant decreasing trend in the first two and a half years(in 10 quarters), and an increasing trend for the last five years of the component's ten-year life.
(b) The behavior of aging-failure rate is similar to the degradation rate in the early two andone-half years, but differs after that. The aging-failure rate was generally lower (factorof 2 to 8) than the degradation rate and the difference decreased with increasing age.The aging failure rate reached about the same level as the degradation rate at the endof the component's ten years of operation.
(c) The 95% confidence bounds associated with aging-failure rate show higher uncertaintycompared to the degradation rate due to the lower number of failures observed.
Evaluation of Maintenance Effectiveness
As discussed in our earlier report', the degradation modeling approach estimates the effectivenessof maintenance in preventing age-related failures. The transition probability from a maintenance stateto a failure state signifies the ineffectiveness of maintenance in the simplified model studied. Thecomplement of maintenance ineffectiveness is maintenance effectiveness.
The maintenance effectiveness for the air compressors is obtained for each ten quarters of age.The maintenance effectiveness (1 = excellent maintenance, 0 = poor or no maintenance), as plotted inFigure 3, varies between 0.3 and 0.9 for the first 30 quarters, but is significantly lower (about 0.1) in thelast 10 quarters, which signifies the small difference maintenances made in preventing degradations ofcomponents from transferring to failures.
Failure Rate -A (A per quarter) In2it7.39 .2
Estimated Failure Rate with_ _ __ 95% confidence bounds
4.48 Data Method-Comb~ning 1.5Quasi Cubic spline fit
2.72 ___- _ _ _ __ _ ____ _
1.85 \ _ _ ___ ___ _ 0.5
0.61-- -*-- -- ----1.00 . \0
*.8 ; s
0.22- --- _ _---- -1.5
0.14 , r a ' '-20 5. 10 155 20 25. 30 35 40
Age in quarters (3 month period)
Figure 2. Age-dependent failure rate (component: 4 air compressors)
336
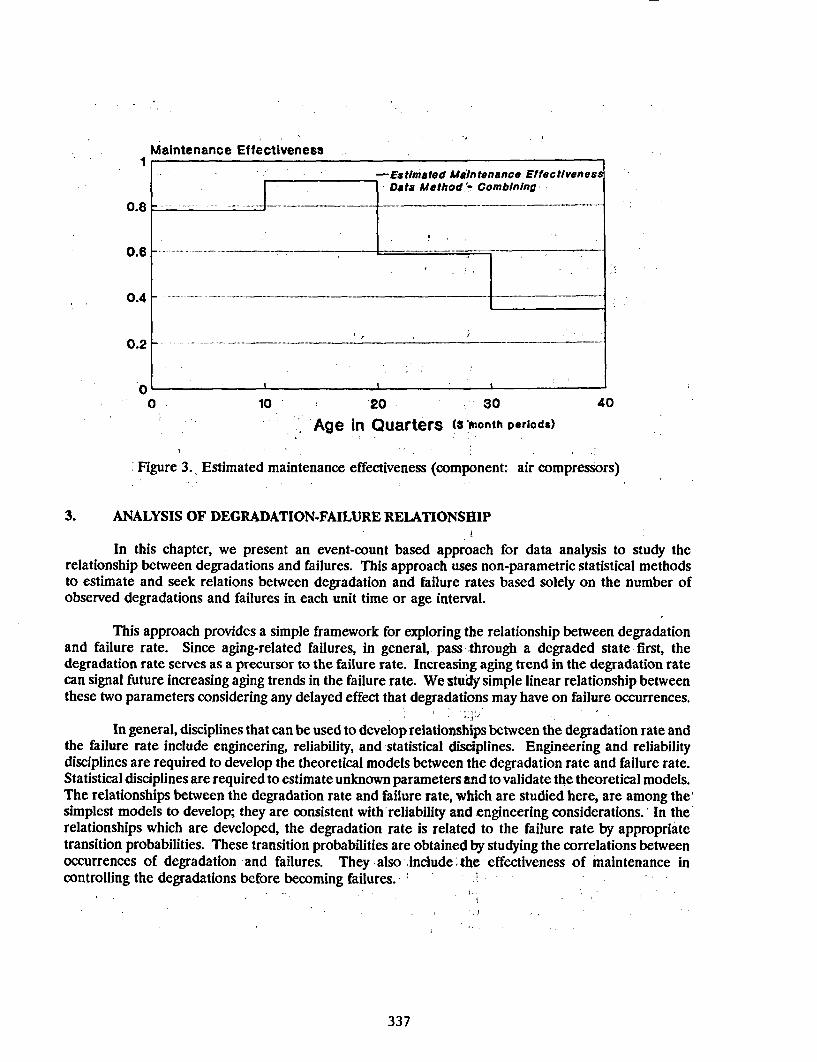
Maintenance Effectiveness
-Estimated Maintenance EffectivenessData Method .- Combining
0.8 Id - ___ :
0.6 .. ._ _0.6 -- ----- - -----
0.4 ..... _____________ _
0.2 -
0 ,0 10 20 - 30 40
Age In Quarters (3 sonth periods)
-Figure 3. Estimated maintenance effectiveness (component: air compressors)
3. ANALYSIS OF DEGRADATION-FAILURE RELATIONSHIP
In this chapter, we present an event-count based approach for data analysis to study therelationship between degradations and failures. This approach uses non-parametric statistical methodsto estimate and seek relations between degradation and failure rates based solely on the number ofobserved degradations and failures in each unit time or age interval.
This approach provides a simple framework for exploring the relationship between degradationand failure rate. Since aging-related failures, in general, pass through a degraded state first, thedegradation rate serves as a precursor to the failure rate. Increasing aging trend in the degradation ratecan signal future increasing aging trends in the failure rate. We study simple linear relationship betweenthese two parameters considering any delayed effect that degradations may have on failure occurrences.
In general, disciplines that can be used to develop relationships between the degradation rate andthe failure rate include engineering, reliability, and statistical disciplines. Engineering and reliabilitydisciplines are required to develop the theoretical models between the degradation rate and failure rate.Statistical disciplines are required to estimate unknown parameters and to validate the theoretical models.The relationships between the degradation rate and failure rate, which are studied here, are among thesimplest models to develop; they are consistent with reliability and engineering considerations. In therelationships which are developed, the degradation rate is related to the failure rate by appropriatetransition probabilities. These transition probabilities are obtained by studying the correlations betweenoccurrences of degradation and failures. They also include';the effectiveness of maintenance incontrolling the degradations before becoming failures. i
337
Analysis of Correlation Between Degradation and Failure Frequencies - Time-Lag Considerations
As we stated, the objective of degradation modeling is to develop relationships between thecomponent degradation rate and the component failure rate. These'relationships involve predicting howthe component failure rate will change based on observations of the component degradation rate. Ofmost interest is predicting aging trends in the failure rates based on observed aging trends and patternsin the degradation rate.
If Af denotes the failure rate, and Ad denotes the degradation rate, then the objective ofdegradation modeling can be interpreted as developing relationships between Ad and AO. If the symbol"R" denotes these relationships then we may write:
Af = R(Ad) (1)
Thus, the objective of degradation modeling is to find the relationship R.
This equation expresses the relationship between degradation and failure rate increasing agingtrends in the degradation rate can signal future increasing aging trends in the failure rate. Also, byrecording the characteristics of the degradations, the severity of the degradation rate can be determined.Increasing severities of the degradation rate can, also signal future increases in the failure rate. We,however, focused on relating occurrence rates and did not study the impact of increased severity of thedegradation to failure rate at this time. Effect of increased degradation severity can be studied byexpanding the Markov modeling approach to multiple degraded states supported by engineering criteriaand data to obtain the necessary information from tests on component, maintenance, and operabilityrecords.
For our study, the relationship (1) is expressed as:
A, (t+1) = CdflA(t) (2)
where,
Ad(t) is the degradation rate at time (t)
A(t+l) is the failure rate at time (t+l)
I is the time-lag at which degradations impact failure occurrences
Cdf is the correlation coefficient between degradation occurrences and failure occurrences
The above expression assumes a linear relationship where Cdb to be estimated from data analyses;is similar to the parameter of maintenance ineffectiveness. The parameter I represents the delayed effectbecause the component generally passes through a degraded state before experiencing failures, and is alsoestimated from data.
We used the event-count based data analysis to determine the correlation coefficient as well asthe lagged time between degradation and failure frequencies. Using the data, the Kendall's Rank,Correlation analysis method was employed to estimate the correlation coefficient for each individual plantdata, as well as the combined data of the 3 plants. A statistical software package (STATGRAPH) wasused to calculate the correlation coefficient for a large number of possible time-lag values. Among all
338
the calculated time-lag correlation coefficients, the correlation coefficient using a time-lag of 2 yearsreached the maximum value at a significance level of a=0.029. The statistical results of Kendall's RankCorrelation coefficients are summarized in Table 2 and Table 3.)
Table 2. Kendall's Rank Correlation Analysis Resultsfor RHR Pumps at 3 Units
Correlation Analyses Between Nr and Nd.
Plant 1: Correlation Coefficient: 0.3570Significance Level: 0.0139
Plant 2: Correlation Coefficient: 0.5429Significance Level: 0.0005
Plant 3: Correlation Coefficient: -0.2067Significance Level: 0.5134
3 Plant Combined:
Nf vs. Nd: Correlation Coefficient: 0.3721Significance Level: 0.0692
Nf = number of failuresNd = number of degradations
Table 3. Kendall's Rank Correlation Analysis Using Time-Lag Considerations(Data on RHR Pumps from 3 Units)
No Time-Lag
Correlation Coefficient: 0.3721Significance Level: 0.0692
One-Year Time-Lag
Correlation Coefficient: 0.1826Significance Level: 03966
Two-year Time-Lag
Correlation Coefficient: 0.505Significance Level: 0.0294 -
339
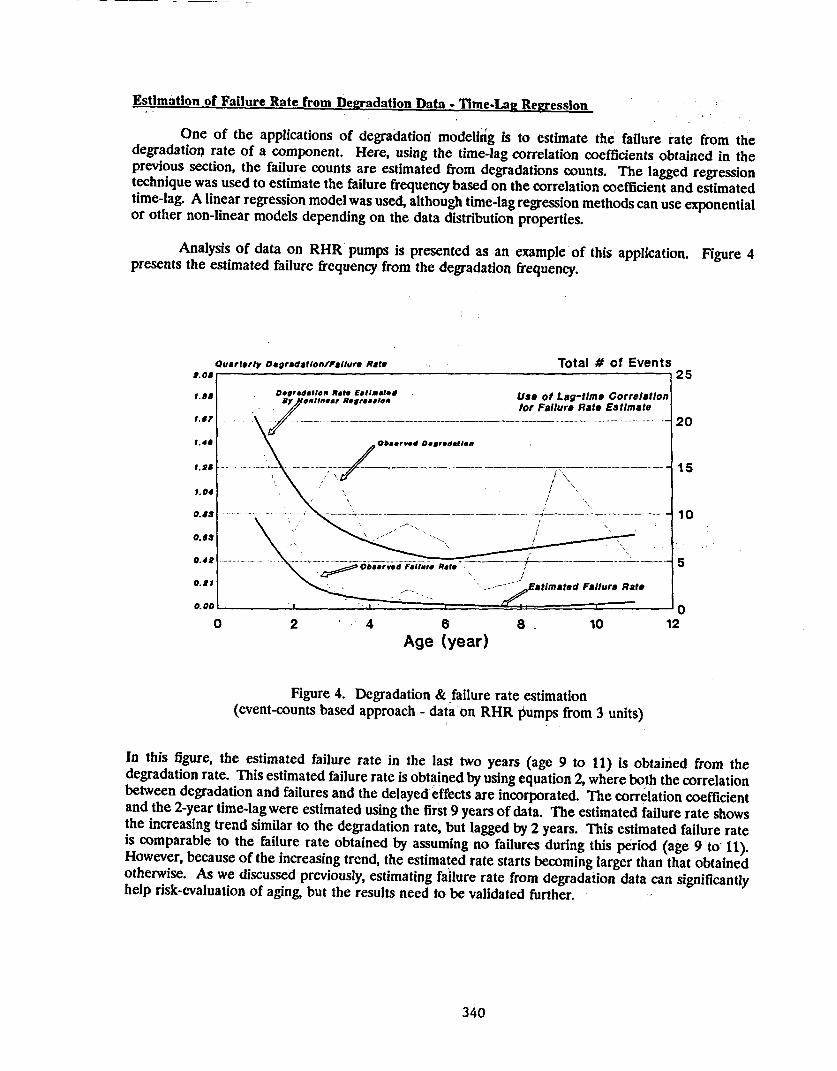
Estimation of Failure Rate from Degradation Data - Tlme-Lag Regression
One of the applications of degradation modeling is to estimate the failure rate from thedegradation rate of a component. Here, using the time-lag correlation coefficients obtained in theprevious section, the failure counts are estimated from degradations counts. The lagged regressiontechnique was used to estimate the failure frequency based on the correlation coefficient and estimatedtime-lag. A linear regression model was used, although time-lag regression methods can use exponentialor other non-linear models depending on the data distribution properties.
Analysis of data on RHR pumps is presented as an example of this application. Figure 4presents the estimated failure frequency from the degradation frequency.
Quartetly Dogradation/falluro Rate Total # of Events25
20
15
10
5
10 l - .. I I 0 L
0 2 4. 6 8a 10 12Age (year)
Figure 4. Degradation & failure rate estimation(event-counts based approach - data on RHR pumps from 3 units)
In this figure, the estimated failure rate in the last two years (age 9 to 11) is obtained from thedegradation rate. This estimated failure rate is obtained by using equation 2, where both the correlationbetween degradation and failures and the delayed effects are incorporated. The correlation coefficientand the 2-year time-lag were estimated using the first 9 years of data. The estimated failure rate showsthe increasing trend similar to the degradation rate, but lagged by 2 years. This estimated failure rateis comparable to the failure rate obtained by assuming no failures during this period (age 9 tow 11).However, because of the increasing trend, the estimated rate starts becoming larger than that obtainedotherwise. As we discussed previously, estimating failure rate from degradation data can significantlyhelp risk-evaluation of aging, but the results need to be validated further.
340
Anplications of the Degradation Rate-Failure Rate Relationship
Once the relationship between the'degradation rate ahd the failure rate is determined, it can beapplied in several 'important ways.' We studied one application (estimation of component failure ratefrom degradation rate), but other important applications can be studied with potential advantages. Someare summarized below.
1. The component failure rate can be estimated from degradation data. This estimationgreatly increases 'the accuracy of the' failure rate estimation for reliability and riskevaluations,' and allows the failure rate to be estimated even if there is no failure data.If failure-data exists, the estimate of the failure rate from the failure data can beoptimally combined with 'the estimate from the degradation data.
2. Aging trends in the component failure rate can be estimated from aging trends in thedegradation rate. This estimation is one of the most powerful applications of thedegradation rate-failure rate relationship. Aging trends, which are identified indegradation data, can be input into the relationship to predict the aging trend in thefailure rate. The determined aging-dependent failure rate in turn, can, be input toreliability and risk models to predict the resulting, impact on the reliability and risk.
3. Degradations can be monitored for their reliability and risk impacts. Alert levels andwarning levels can' be designed to monitor degradation to indicate when the failure rateis too high or is significantly increasing.
4.' Maintenance can be monitored for its 'reliability and risk effectiveness. This againimmediately follows from the degradation rate-failure rate relationship. The degradationrate-failure rate relationship which is determined through degradation modeling, is afunction of the maintenance program. If the degradation rate as determined from thedata on corrective maintenance and preventative maintenance implies that the failurerate is too high or is significantly increasing, then the maintenance is ineffective. If thefailure rate is maintained at an acceptable level, then the maintenance is effective froma reliability and risk standpoint.
The accuracy and extent to which degradation rate-failure rate relationship can be determinedare critical in demonstrating these applications. These applications can provide important inputs inmaintenance decisions and aging evaluations, because in the past, degradations and maintenances havenot been explicitly related to the failure rate, except in special cases.
4. SUMMARY
In this paper, we presented application of degradation modeling approaches to a continuouslyoperating component, different from a standby component. In addition, the relationship betweendegradation and failure frequency was studied to predict failure rates based on degradations. The majorfindings are summarized below.
Application of Degradation Modeling to a Continuously Operating Component
The application of degradation modeling approaches to a continuously operating component (aircompressors) shows the usefulness of this modeling approach in studying aging effects and the role ofmaintenance in this type of component. Analyses of degradation and failure data of air compressorsusing degradation modeling approaches show that aging effects are evident in both degradation and
341

failure occurrences. In this case, both rates show aging effects; however, the faster increase in the failurerate compared to the degradation rate indicates the ineffectiveness of maintenance, which is reflectedin the evaluation of maintenance effectiveness. The decline in maintenance effectiveness with agesignifies that maintenance is ineffective in preventing age-related degradations from. failures.
Relation between Degradation and Failure Frequencv
Understanding the relationship between degradations and failures is an important aspect in thedegradation modeling approaches. Knowledge of relationships between degradations and failures willhelp define the maintenance activities necessary for preventing 4egradation-caused failures and can beused in risk-evaluations of aging. In this report, an event-count based approach to data analysis ispresented to study correlations between degradation and failure frequencies. We used this approach todiscover if there were delayed effects of degradations on failures. For the specific component studies(RHR pumps), a lag-time of 2 years was observed between degradation, and failure occurrences.Existence of such lag-times, which are expected to be component specific, can be beneficial for decidingthe maintenance activities that are necessary to mitigate the effects of aging. Additional applications willbe needed to demonstrate the validity of the existence of time-lag between degradations and failures.
REFERENCES.
1. P.K. Samanta, W.E. Vesely, F. Hsu, and M. Subudhi, 'Degradation Modeling with Applicationto Aging and Maintenance Effectiveness Evaluations," NUREG/CR-5612, BNL-NUREG-52252,March 1991.
2. F. Hsu, W.E. Vesely, E. Grove, M. Subudhi, and P.K. Samanta, "Degradation ModelingExtensions and Applications," BNL Technical Report A-3270 6-21-91, June 1991.
342
AGING ASSESSMENT OF BWR CONTROL ROD DRIVE SYSTEMS'
Rebecca H. Greene aid aC O U-.iGoWi eda eyelet NO- CCE-AC064421400. AaIv UW US.
Oak Ridge National Laboratory ,0,,,. bw ,,or,, pro,.Operated by Martin Marietta Energy Systems, Inc. pbid fom of *i CW Or
P. O. Box 2009 WId.O.Us
Oak Ridge, TN 37831-8038
ABSTRACT
This Phase I NPAR study examines the aging phenomena associated with boilingwater reactor (BWR) control rod drive mechanisms (CRDMs) and assesses themerits of various methods of managing this aging. Information for this study wasacquired from (1) the results of a special CRDM aging questionnaire distributedto each U.S. BWR utility, (2) a first-of-its-kind workshop held to discuss CRDMaging and maintenance concerns, (3) an analysis of Nuclear Plant ReliabilityData System (NPRDS) failure cases attributed to the CRD system, and (4)personal Information exchange with industry experts.
An eight-page questionnaire was prepared by the Oak Ridge National Laboratory(ORNL) and distributed to all domestic BWR plants. The survey solicited site-specific data on CRDM degradation and failure experience, maintenance and agingInteractions, and current testing procedures. To obtain firsthand Information onCRDM aging histories, a workshop was sponsored by ORNL to discuss CRDMperformance and the overall questionnaire results With utility participants. Thethree-day meeting on CRDM aging and maintenance was attended by 26 utilitypersonnel from 21 BWR plants and 14 vendor and commercial representatives.These attendees provided Invaluable Information needed for understanding degra-dation mechanisms and maintenance constraints associated with BWR CRDMs.
As part of this study, nearly 3500 NPRDS failure reports have been analyzed toexamine the prevailing failure trends for CRD system components. An investi-gation was conducted to summarize the occurrence frequency of these componentfailures, discovery methods, reported failure causes, their respective symp-toms, and actions taken by utilities to restore component and system service.
The results of this research have identified the predominant CRDM failure modesand causes. In addition, recommendations are presented that identify specificactions utilities can Implement to mitigate CRDM aging. An evaluation has alsobeen made of certain maintenance practices and tooling which have enabled someutilities to reduce ALARA exposures received from routine CRDM replacementand rebuilding activities.
Research sponsored by the Office of Nuclear Regulatory Research.1U. S. Nuclear RegulatoryCommission under interagency Agreement DOE 1886-8082-SB with the U. S. Department of Energyunder contract No. DE-AC05-840R21400 with the Martin Marietta Energy Systems, Inc.
343
INTRODUCTION
Control rod drive mechanisms (CRDMs) are located at the bottom of boiling water reactor(BWR) pressure vessels, and they position the neutron absorbing control rod assemblies(CRAs) within the reactor core to provide reactivity control during startup and shutdown of thereactor, flux shaping at power, and emergency shutdown (scram). The CRD system consists ofthe CRDMs, the hydraulic control units (HCUs), and various valves, pumps, and headers thatsupply, move, and retain the system's operating fluid.
The CRDM is a double-acting, mechanically latched, hydraulic cylinder that uses reactor qualitywater as its operating medium. Each CRDM has a companion HCU that contains numerous valveswhich regulate the operating flows and pressures delivered to the device. A CRA Is attached toeach CRDM at the spud, and movement is accomplished by admitting pressurized water into theappropriate part of the CRDM (Fig. 1). The drive mechanism is capable of inserting orwithdrawing a CRA at a slow, controlled rate In order to vary reactor power, or can providescram insertion to accomplish rapid shutdown of the reactor within a few seconds.
General Electric has manufactured six different models of CRDMs and four basic models of HCUswhich are in service at BWRs throughout the United States. Improved scram times and enhancedoperational performance have been the basis for many of the design differences occurring amongthe various models of both the CRDM and the HCU. Some aging-related degradation reported inthe BWR-2, -3, -4, and -5 design CRDMs has been substantially reduced by materialimprovements and design features inherent to the BWR-6 models. Other types of reportedcomponent degradation are subject to plant operational parameters, such as water chemistry,and vary in frequency of occurrence with each different BWR unit.
Normal CRDM maintenance involves the overall cleaning and replacement of a relatively stan-dard set of components with new or spare parts. If necessary, any part of the the CRDM can bereplaced during rebuilding activities. Several utilities have established maintenance goals thatrequire the refurbishment of all the CRDMs In a BWR unit every 10 years. However, historicaldata suggest that the maintenance interval varies for CRDMs with respect to their location in thecore: centrally located drives are rebuilt more often than drives located along the periphery.The cause for dissimilar maintenance intervals is uncertain but could be attributed to the factthat peripheral drives (which have a limited power shaping contribution) do not experience thehigher core fluxes or undergo as many "feet of travel" as centrally located CRDMs.
Selection criteria for CRDM changeout does vary between plants. To monitor service wear anddegradation, most utilities routinely trend individual CRDM withdrawal stall flows andoperating temperatures. In addition, plant technical specifications require scheduled scramtime testing and weekly-to-monthly CRDM "exercise" tests to ensure operability. In general,CRDM components degrade slowly as they age, and most operational problems do not occursuddenly but over a time interval of at least several months.
When a CRDM's performance does not meet plant requirements, it is scheduled for maintenance,usually during the next plant refueling outage. In recent years, advancements in maintenancetooling, changeout and rebuilding training, CRDM handling devices, and improvements in wor-ker comfort have significantly decreased the human error contribution to CRDM aging as well asreducing ALARA exposures. The following sections highlight the predominant modes-of CRDsystem degradation and specific steps taken by utilities to mitigate component aging and curtailmaintenance related doses. Final research results are to be published in NUREG/CR-5699, Vol,1, entitled 'Aging and Service Wear of Control Rod Drive Mechanisms for BWR Nuclear Plants."
344
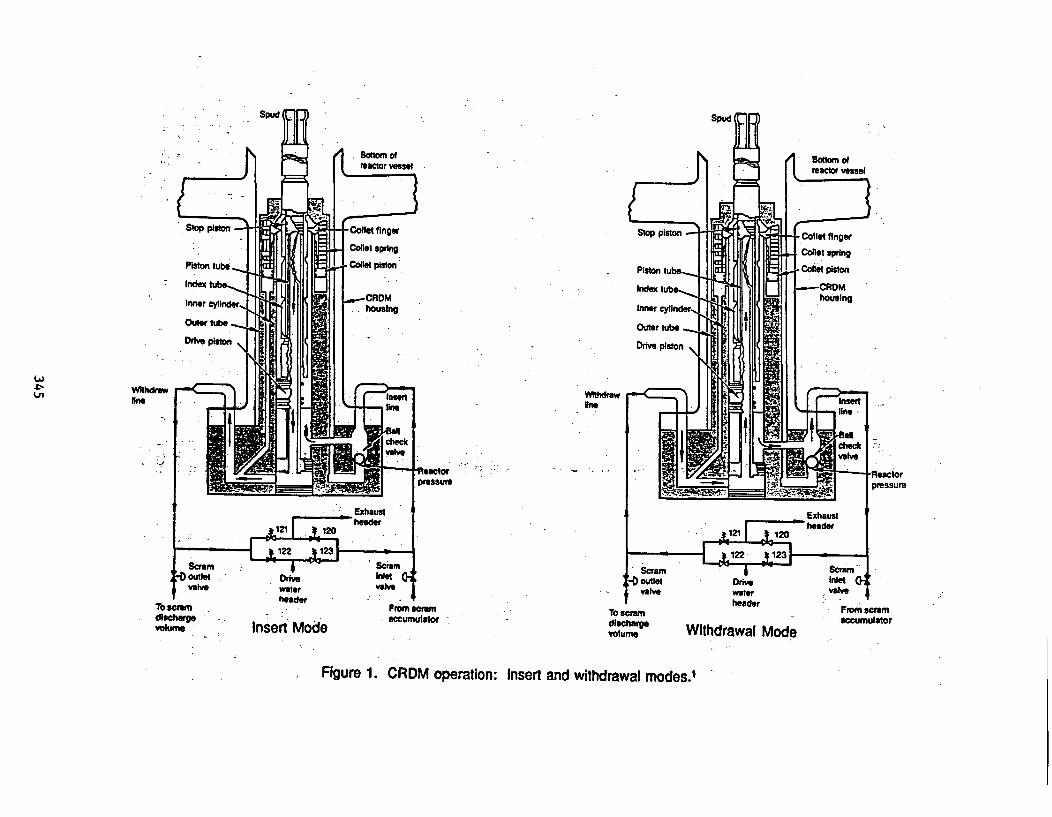
e' Wihdrawone .hdr"gmn
t vareTo cramdischargeVolume
I sveltr I-header - W 4
Fromscw
Insert Mode accumulator -
tTo scramdischargevolume
tna o'From scramaccumulator
Withdrawal Mode
Figure 1. CRDM operation: Insert and withdrawal modes.'
CRDM Degradation: Causes and Corrective Actions
As a whole, the 21 nuclear plants that responded to the CRDM aging workshop questionnairereported a good performance history for the BWR control rod drive mechanisms. NPRDS dataanalysis confirms this observation, with 72% of the failure reports being discovered byscheduled testing or routine observation, 24% by control room personnel, and only 2% as aresult of a failed service demand (the remaining 2% of the NPRDS reports did not identify adiscovery method in the failure narrative). The term *failure" applied in these NPRDS casehistories refers to a component that-did not perform its design function and does not necessarilyimply the occurrence of an operational event.
Workshop participants were also asked to share their observations regarding the primarycauses of CRDM aging. In addition to normal service wear, the reported causes of CRDMdegradation are Graphitar seal embrittlement, fatigue fracture, and thermal degradation, collethousing cracking, nitrided surface corrosion, human errors made during drive changeout andrebuilding activities, and, to a lesser extent, plastic deformation due to improper storagemethods.
Water Chemistry, Corrosion, and IGSCC
Poor plant water chemistry has been a primary contributor to corrosion and "crud' formation(dirt particles, debris, and foreign materials that are found in varying amounts in the coolant).Corrosion usually occurs first on CRDM components having nitrided surfaces: the index tube,piston tube, guide cap, and collet assembly. Debris becomes entrapped in the CRDM duringnormal operations, and its presence scars metal surfaces and defaces the Graphitar seals. Ascrud accumulates in the CRDM, the device's coolant flow rate may decrease and cause drivetemperatures to increase, thus contributing to the thermal degradation of the seals. After ascram, coolant flow rates may increase and CRDM temperatures decrease because some of thecrud has been shaken out" of the drive. In addition, entrapped crud in the Graphitar sealseating surfaces (on the drive and stop pistons) creates uneven force distributions that cancause seal breakage during scrams.
To reduce the amount of crud that can become entrapped in the CRDM, some utilities arevacuuming the b6ttom of the reactor vessel in and around the guide tubes during refuelingoperations. In addition, the pre-BWR-6 design CRDMs had problems with the cooling waterorifices becoming plugged with crud, which caused increased operating temperatures. Manyutilities have retrofitted the older CRDMs with upgrade kits that modified the design of thecooling water orifice to mitigate this potential problem. Water chemistry has also beenmodified by the addition of hydrogen in at least nine BWR facilities to reduce the potential forcorrosion in the primary coolant system. However, one workshop attendee reported that theirplant management was considering discontinuing this practice because an increase In systemradioactivity levels had been observed since its incorporation.
Nitrided surface corrosion has also been aggravated by poor storage methods. Occasionally,CRDMs are stored wet in air for more than 30 days before they can be rebuilt, usually due tostrained outage schedules. The nitrided surfaces of the CRDMs begin to corrode, and the drivebecomes excessively hard to disassemble for rebuilding. CRDM components can be inadvertentlydamaged during a difficult disassembly process from mishandling. One utility is currentlyemploying a long-term storage technique which places its "dirty" CRDMs in an aqueous solutionof triethanolamine, a corrosion inhibitor, so that they can be rebuilt during the next outage,
346
just prior to installation. Since there will be radioactive decay during the twelve to eighteenmonths of storage, It is hoped that the doses obtained from rebuilding these CRDMs will be lowerthan if they had been rebuilt soon after they were pulled from the vessel. According to attendeesat the workshop, this method of storage has been used several times before without anynoticeable component deterioration.
Significant numbers of CRDMs have been retired from service due to collet housing cracking.This intergranular stress corrosion cracking (IGSCC) phenomenon has been found in the modelA, B, and C drives that were originally installed in BWR-2, -3, -4, and -5 plants. One utilityreported in the questionnaire that 46% of the cylinder, tube, and flange assemblies in itsCRDMs had to be replaced because of this type of degradation. Later CRDM designs (models D, E,and F) that were supplied in BWR-6 plants changed this component's material from a 304 to a304L stainless steel. These Improved models have not experienced this problem. Utilitiesobserving collet housing cracking in their drives have either replaced affected CRDMs with thelater model drives or improved the earlier models with upgrade kits from the vendor.
Radiation-induced Effects
Radiation-induced degradation is suspected to be the cause of certain effects observed in thespud, the CRDM component that engages the control rod assembly blade via the uncoupling rod.There have been reports of the Nfingers" of this Inconel X-750 component being easily bentafter a prolonged service history (> 15 years) in the reactor vessel. CRDM rebuildingtechnicians have described the effect as *the fingers losing their memory." The strength andresilience, which normally typifies parts made of this alloy, no longer remains. Although noprofessional metallurgical examinations have been performed on these components, the cause ofthis phenomena Is speculated to be neutron annealing, because the observed effects are similarto those recorded by researchers who irradiated different reactor materials to low dose (<1020neutron cm-2), thermalized neutrons 2, With this type of material degradation, spud fingerscan become deformed in-service and lose their concentricity, as shown in Figure 2. This type ofspud damage can present a myriad of coupling and uncoupling difficulties with the CRA. Thespud, like all CRDM components, can be exchanged with a new spare part during rebuildingactivities.
Nitrided Surface Degradation
In some CRDMs having a continuous service history greater than 15 years, degradation of thenitriding has been observed to the extent that, in one particular example, the unusually roughsurface of an index tube could be easily scored with a piece of wood.3 Although no formalmetallurgical investigations have been conducted to determine the nature of this effect, it couldbe the result of a combination of causes: prolonged radiation exposure, poor water chemistry,and variations in the case hardening from the nitriding process. No operational problems werereported for the CRDM whose striped" index tube Is shown in Figure 3, but the component wasnot reused In the rebuilt device because Its continued serviceability was consideredquestionable.
Graphitar Seal Wear and Breakage
Replacement of the Graphitar seals is a standard requirement during CRDM rebuildingactivities. An intact and correctly seated seal allows differential hydraulic pressures (uponwithdrawal, insert, and scram signals) to position the drive. As these seals degrade and becomeless effective, i.e., become broken, scarred, or chipped due to numerous scram impacts, undergo
347
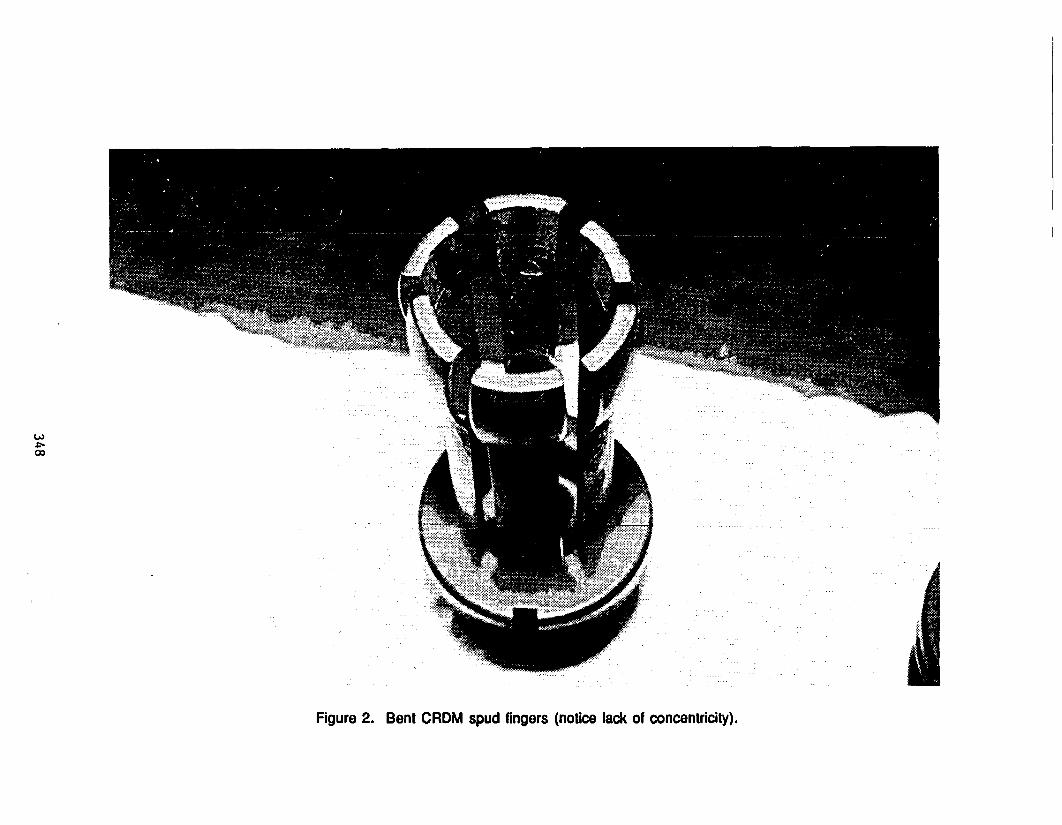
I L
: iE >< d
U3A:.
000 :'
r,
I.
rw77
Figure 2. Bent CRDM spud fingers (notice lack of concentricity).
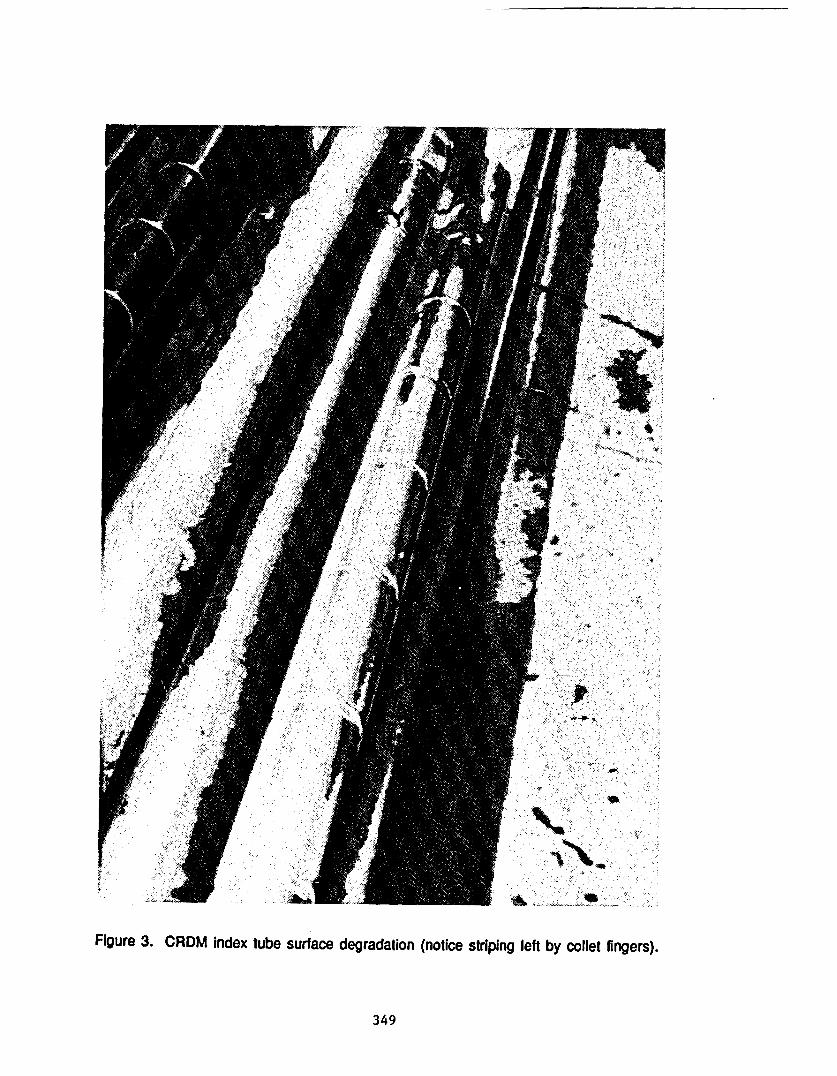
F � 10� 1 1
:� , I -,-
Figure 3. CRDM index tube surface degradation (notice striping left by collet fingers).
349
normal surface wear, or experience thermal degradation (caused by drive temperatures greaterthan 3500 F), the CRDM's stall flows increase and greater hydraulic pressures are required tomaneuver the drive. There were 275 NPRDS failure reports that cited Graphitar seal wear asthe cause of deteriorating CRDM performance. The predominant location of the seal failures wason the stop piston. CRDM withdrawal stall flows over 5.0 gpm (not attributable to the valvingconfiguration on the HCU) are considered Indicative of deteriorated seals that need to bereplaced. Both General Electric and the Toshiba Corporation have developed improved Graphitarseals designed to be more durable and have a longer service life than those currently used Indomestic BWR CRDMs. General Electric's new CRDMs are equipped with these improved seals,but an improved replacement seal kit for earlier models is currently not available to utilities.
Inner Filter Disengagement
Each CRDM has an inner and outer filter which serves to collect debris from the cooling waterand reactor water that might otherwise damage the CRDM. The inner filter has been attributedwith 90 failure reports in the NPRDS. Installation and maintenance errors were cited in 35cases. Inner filters that are incorrectly installed during CROM rebuilding can become looseduring drive operation and cause the CRA to uncouple itself from the CRDM's spud. Uncouplingis a symptom observed in 27 of these reports.
The inner filter is mechanically attached to the stop piston by means of a spring clip (Fig. 4).When assembled, the inner filter engages the piston connector knob and is retained by lockingflats that capture its spring clip after the filter is pushed onto the piston knob and rotated about900 (Fig. 5). To test the proper installation of the inner filter, General Electric recommendsusing a filter assembly tool to pull the inner filter away from the stop piston with a force ofabout 20 to 30 pounds. After engagement has been verified, the tool is removed from the CRDM,sometimes with an unintentional jiggling or twisting motion. When this is done, the filterbecomes improperly oriented and can easily be disengaged. Even if the filter is not fully rotated900, the filter may be inadvertently rotated more during CRDM rebuilding and handlingactivities.
After this CRDM has been placed into service, a long, continuous withdrawal signal can cause thedisengaged inner filter to become buoyed. Hydraulic pressures push the filter against theuncoupling rod, lifting it upwards and pushing the locking plug above the spud fingers. At thispoint uncoupling may occur. Even if operations personnel succeed In recoupling the drive withthe CRA, repeated uncoupling and recoupling caused by a disengaged inner filter can result in abent uncoupling rod.
The Toshiba Corporation has Instituted a modification in its inner filter's base configuration inorder to provide an improved design that would prevent uncoupling trouble due to misassembly.To date, there have been no design enhancements made in the attachment configuration of innerfilters used in CRDMs operating in US BWRs that would circumvent this type of disengagement.
Improper CROM Storage Methods
The 15-foot-long, 450-pound CRDM can be a challenge to store. Inadequate storage support hasbeen blamed for a few observed cases of CRDM *sagging", which were confirmed by performingrunout measurements along the length of the drive. Utilities store CRDMs in shielded vaults, onspecially built racks, and sometimes in their original shipping crates. CRDM components canbe damaged by laying drives on the floor with only the collet housing and the flange endsupporting the weight as shown in Figure 6. CRDMs should not be stacked on top of each other,
350
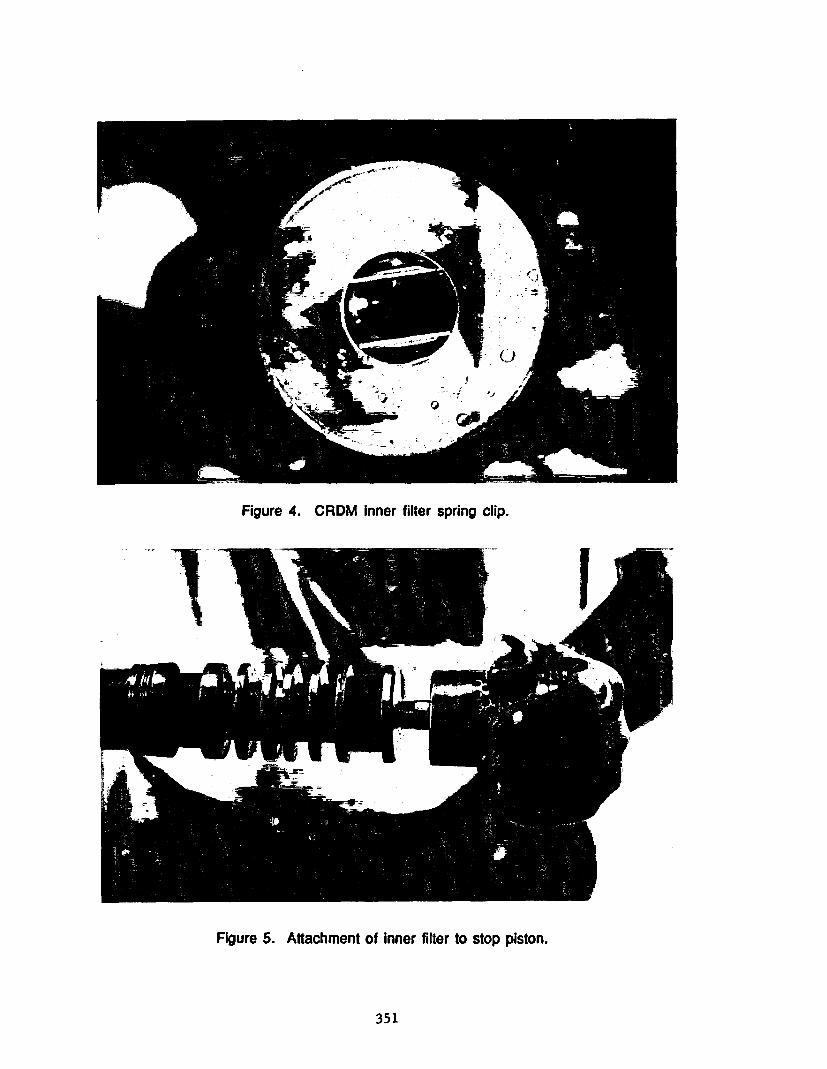
Figure 4. CRDM inner filter spring clip.
Figure 5. Attachment of Inner filter to stop piston.
351

separated by wooden blocks, which, in essence, transmits the weight of the stack to the lowestdrive. Heavy, lead shielding "pigs are sometimes left hanging on the spud end of 'hot drivesfor long periods of time, which places a moment on the collet housing. As shown in Figure 7,CRDMs should be stored in racks or vaults with a minimum of 2 points of support located 24inches from the flange end and 54 inches from the spud end.
HCU Degradation: Causes and Corrective Actions
The NPRDS analysis yielded specific Information on HCU degradation. Over 59% of the CRDsystem failures are attributable to the HCU. The HCU components requiring the most mainte-nance and replacement (as reported in the NPRDS) are identified in Figure 8. The followinginformation discusses the HCU components requiring the most maintenance and the causes oftheir aging.
Accumulator Nitrogen Charging Cartridge Valve (HCU part no. 111)
There were 526 NPRDS failure reports on this particular valve. The leading reported cause offailure was attributed to worn valve packing (189 cases -- 36%). Normal valve wear or agingwas "runner-up" in the cause category (164 cases -- 31%), and a worn valve stem rankedthird among failure causes (71 cases -- 14%). Additional reported failure causes weremultiple-cause valve aging (cites the failures of several valve parts), valve seat aging, andworn valve seals.
The cartridge valve is located at the bottom of the HCU on the instrumentation block. Thiscomponent is frequently referred to as the "star valve" because of the shape of the hand crank onthe stem. Many of the failures of the "U-cup" packing may ice attributed to incorrectinstallation. General Electric manufactures a four-part packing installation tool that wasspecifically designed to replace the U-cup packing in this valve. If the packing tool is not usedwhen repacking the valve, it is easy to damage the packing on the valve stem threads duringinstallation and create a new leak. It has also been reported that utility maintenance personneloccasionally adjust the star valve with their foot, rather than bending over and using their hand.This practice could easily bend the narrow valve stem in addition to damaging the packing.
Scram Water Accumulator (HCU part no. 125)
The NPRDS has recorded 189 failure reports of this component with 119 of them requiringreplacement units. In the pre-BWR-6 models, the chromium plating liner of this carbon steeltank Is porous enough to allow water to seep in and cause corrosion of the carbon steel. GeneralElectric Issued a service information letter regarding the interior surfaces of theseaccumulators and determined that high-chloride, low pH water conditions would produceblistering and pitting of the plating throughout the cylinder. It was further reported that looseflakes of this plating may leave the accumulator and collect on the Teflon seat of the inlet scramvalve and cause some leakage. If this occurs, it can result in control rod insertion. In addition,the tank's corrosion flakes can etch Teflon from the scram valve seat and subsequently becomeentrapped in the cooling water orifice of the companion CRDM. General Electric and the ToshibaCorporation have developed stainless steel replacement units for this component. The predom-inant symptom of accumulator degradation reported in the NPRDS is a high water level alarmfor the accumulator.
352
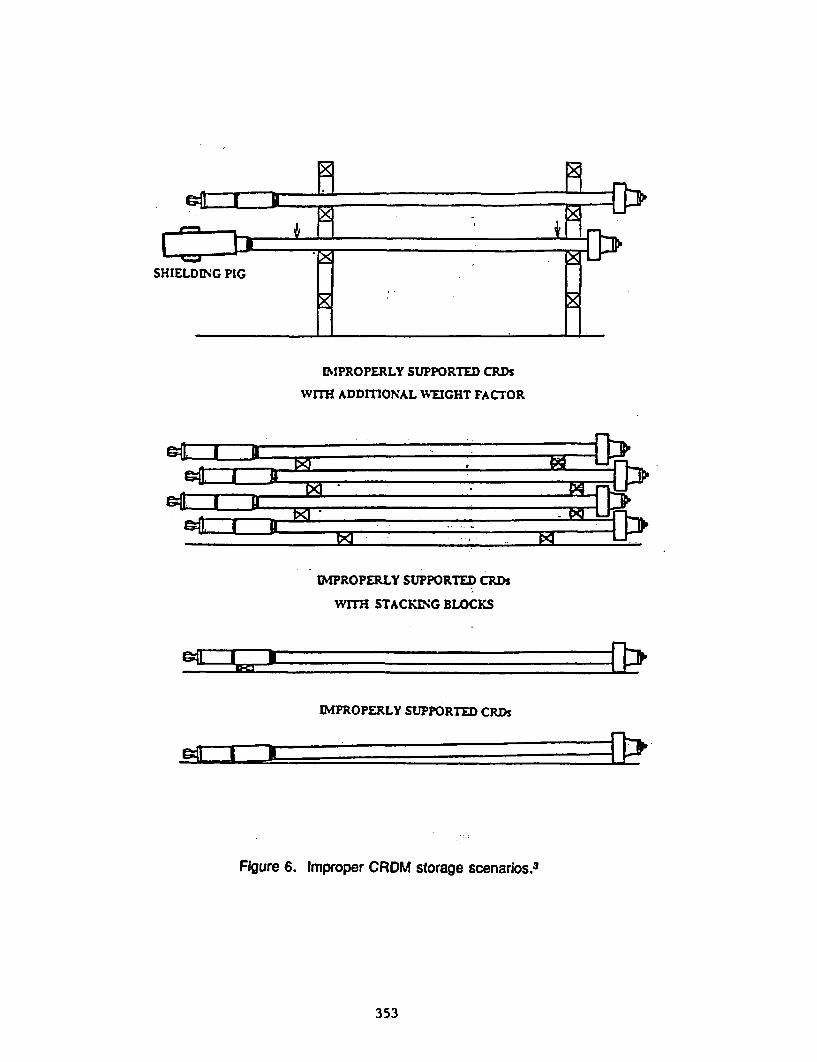
IP
SHIELDSM' PIG
-0 1 q,
* *. . . ..
IMPROPERLY SUPPORTED CRDs
WITH ADDmOONAL WEIGHT FACTOR
Mill I I I-1 t n-.
9Ia l U-
A tEI1 I Z�if
U- . . - _i.I
ME I UM , . .
IMPROPERLY SUPPORTED CRDI
WITH STACKrNG BLOCKS
l-r- .1_
IMPROPERLY SUPPORTED CRDs
n * _IEl I U2~--ik
Figure 6. Improper CRDM storage scenarios.3
353
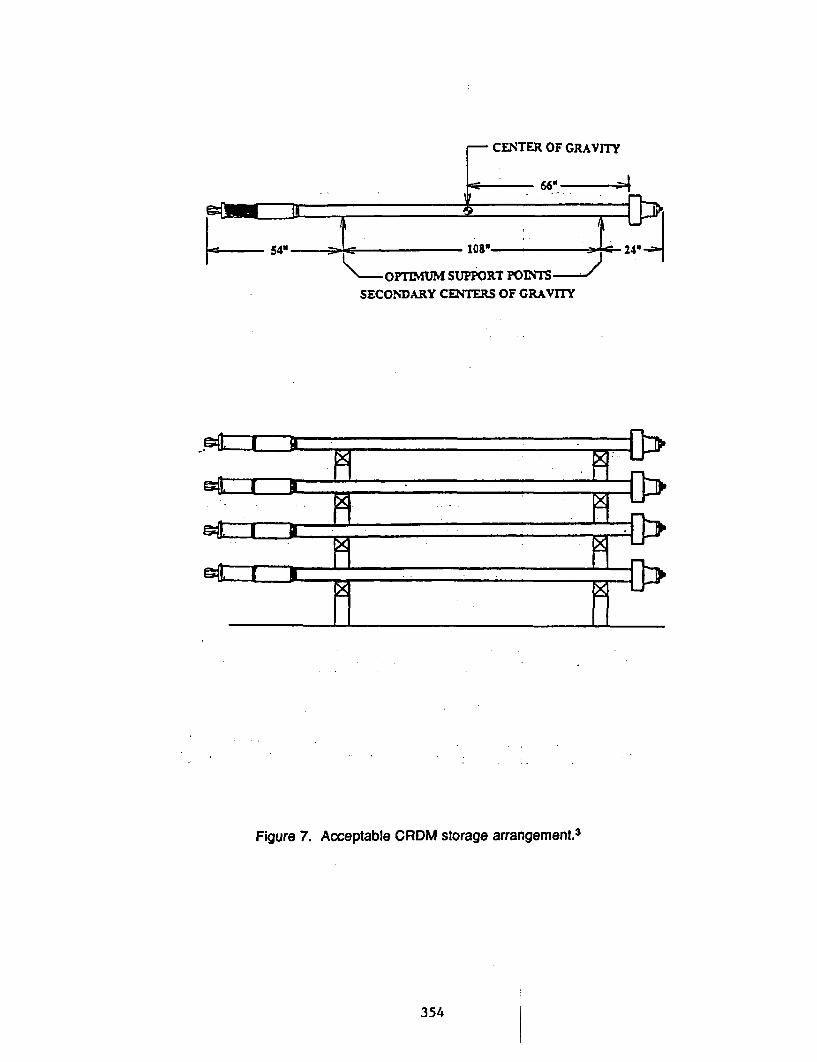
CENTER OF GRAVITY
66. 4- r
SECONDARY CEaTERS OF GRAVITY
rL- --I 9
Figure 7. Acceptable CRDM storage arrangements
354
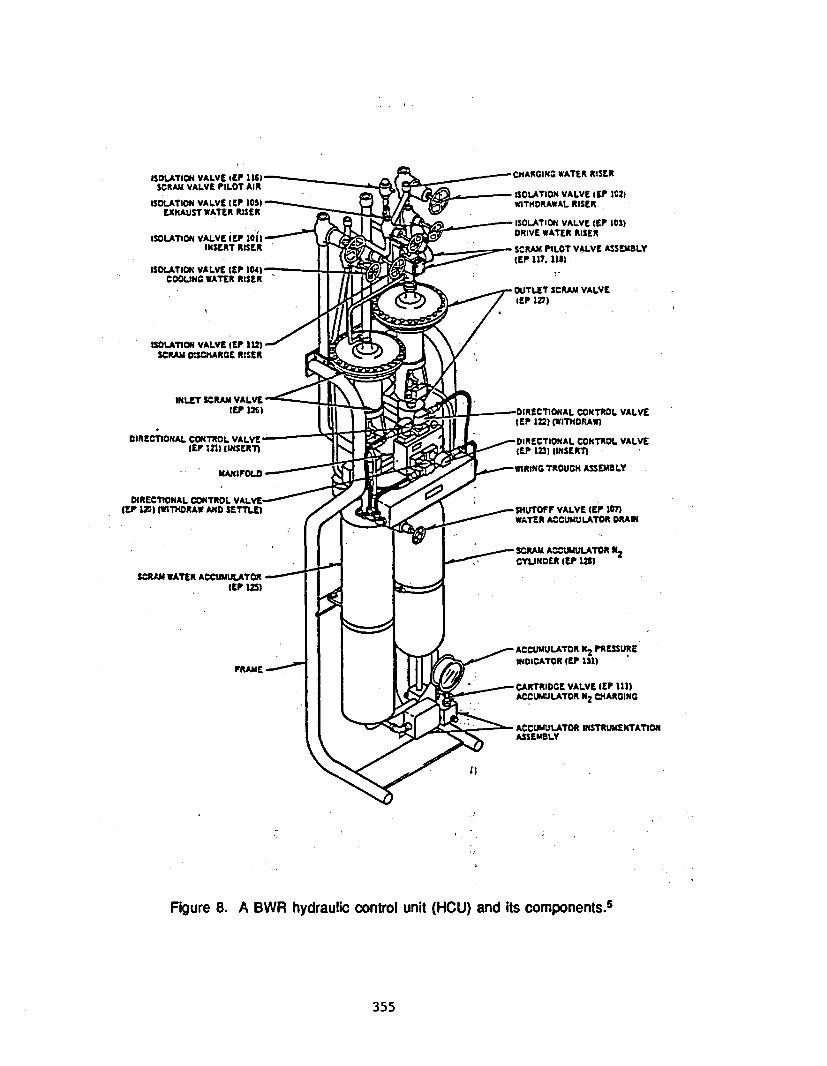
CHARGING WATER RISER
ISOLATION VALVE CE? 102)WITHDRAWAL RISER
ISOLATION VALVE IEV 103)DRIVE WATER RISER
SCRAM PILOT VALVE ASSEMLYfE? 117. 118)
OUTLET SCRAM VALVEEP 127)
-DIRECTIONAL CONTROL VALVEIE? 12) (WITHDRAW)
-DIRECTIONAL CONTROL VALVECEP 123 IINSERT)
WIRtNG TROUGH ASSEMLY
-SHUTOFF VALVE EV ionWATER ACCUMULATOR DRAIN
- SCRAM ACCUMULATOR N2CYUNDER IV 1t)
- ACCUMULATOR h PRESSUREINDICATOR CE? 131)
- CARTRIDGE VALVE (EP 111)ACCUMULATOR N2 CHARGING
- ACCUMULATOR INSTRUMENTATIONASSEMBLY
Figure 8. A BWR hydraulic control unit (HCU) and its components.5
355
Inlet and Outlet Scram Valves (HCU part nos. 126 and 127)
There were 129 failure reports on the inlet scram valve (No. 126). The primary causes ofdegradation identified in the NPRDS were aging of the valve seat, multiple valve parts aging,worn valve packing, and worn valve diaphragms. Almost 65% of these reported failures haverequired valve rebuilding or replacement. As previously discussed, flakes of plating from acorroded accumulator can collect and erode the Teflon seat of this valve. In addition, thediaphragms of this valve are made from Buna-N reinforced with nylon. In a service infor-mation letter issued on this valve, General Electric recommends the lifetime (elapsed timebetween diaphragm cure and installation plus time in service) of this component to be 15 yearsfor BWR/2s through BWR/5s and 12 years for BWRI6s. A supplemental service informationletter from General Electric also stated that the nylon fibers around the diaphragm center holeon the Hammel-Dahl scram valve diaphragms could be damaged by the valve stem thread duringdiaphragm installation if the stem nut Is tightened with the spring force applied under thediaphragm button. The outlet scram valve (No. 127) had 77 failure reports that cited incorrectoperation, worn seats, worn diaphragms, and worn stems and packing. More than 85% of theoutlet scram valve failures reported in the NRPDS have required rebuilding or replacement torestore service.
Scram Pilot Valve Assemblies and Solenoids (HCU part nos. 11 7 and 118)
There were 71 and 69 failure reports on the Nos. 117 and 118 valves, respectively. Thecauses of failure observed most frequently for this valve were a worn diaphragm, aged solenoidcomponents (such as a coil "short" or a "blown fuse), and normal valve wear or aging. Thescram pilot valve solenoids had 241 reports of failure (185 by one plant) that cited theprimary causes of failure as a worn seat (or disc). General Electric issued a serviceinformation letter indicating that cracking of the Buna-N rubber discs had been observed at aBWR plant causing delays in CRDM scram times. The cracking and deterioration of the Buna-Ndisc material was accelerated by long-term exposure to the heat of the normally energizedsolenoid coil. Since there is a continuous heat source from these normally energized solenoids,utilities could periodically monitor and trend surface temperatures to detect coil degradation,which was cited as the secondary cause of failure for these valves (increasing temperatures canindicate imminent coil failure)4. Industrial pyrometers could be used to obtain these data.General Electric also recommended in a service information letter that all BWR utilitiesestablish a preventive maintenance program to replace all core assemblies, diaphragms, andassociated parts in all CRD scram pilot valves, backup scram valves, and scram dischargevolume test valves at periodic intervals since the Buna-N parts in these valves have a combined7-year shelf and in-service life that elapses from the packaging date on the rebuilt kit. Thesymptoms of scram pilot valve and solenoid degradation include slow scram times, leaking air,and abnormal solenoid noise (chattering rattling, or ac hum).
Balance-of-CRD-System Component Failures
If failure report cited in the NPRDS was not attributed to a component associated with either theHCU or the CRDM, this analysis effort classified it as a balance-of-CRD system (BOCRDS)component failure. Only 18% of the failures reported in the NPRDS were attributed tocomponents comprising this category. The following paragraphs discuss those componentcategories which had the higher numbers of failure reports.
356
CRD System Pumps and Pump Components -
The CRD system pumps and pump components had 117 failure reports In the NPRDS. Wornbearings, seals, piping and parts erosion, looseness, and normal wear or aging are the mostprevalent problems Identified In this data base. Over 98% of the pump failures were discoveredby testing or routine maintenance. Several U.S. utilities (both BWR and PWR) have Institutedmonthly-to-quarterly vibration signature analysis programs on various types of rotatingmachinery in their stations as part of their overall maintenance and ALARA reduction efforts.Bearing anomalies, misalignment, unbalance, looseness, and soft foundations are readilyanalyzed and diagnosed using fast Fourier transform (FFT) analysis. Other programs augmenttheir diagnostics by utilizing oil analysis to examine metallic parts degradation. Although therehave been a few CRD pumps completely changed out, pump components have normally beenreplaced on an was-needed basis" to restore service, and occasionally, entirely rebuilt.
Miscellaneous Scram Discharge Volume Valves
There were 44 failure reports on valves associated with the scram discharge volume. In 25%of these cases, the valve actuator or operator was simply out of adjustment. Over 27% of thereports cited entrapped debris causing component failure. One station reported corrosion andentrapped debris on the scram discharge volume vent valve due to a failure in procedures toregularly cycle the valve. To mitigate buildup of debris, procedures were enhanced to requirequarterly timing and results trending of valve actuation. Another station reported a failure ofthe scram discharge volume drain valve caused by an accumulation of dirt and corrosion on theseat surface. The failure narrative reported that the maintenance staff felt this may have beencaused by a prolonged shutdown. The majority of these valve failures (80%) required valverebuilding or replacement.
HCU and BOCRDS Electical Components
This section groups the results of the electrical component failures for the HCU and CRDsystem, including any electrical components associated with the CRD pumps. The group Includesthe reported failures of electrical relays, switches, controllers, transmitters, power supplies,circuit breakers, and fuses. There were 207 failures altogether comprising 65 reportsattributed to the HCU and 142 associated with the BOCRDS. There were no electrical componentreports on the CRDM. The predominant causes of failure in these areas were cited as electricalcomponent aging and the device being out of calibration (includes setpoint drift). As might beexpected, the component was restored to service either via adjustment or complete replacement.
CRD System Instrumentation
There were 79 reports of failed gauges and instrumentation in the entire CRD system. As In thecase of electrical components, the predominant causes of failure identified In the NPRDS wereelectronic component aging and out-of-calibration. Over 91% of these failures were correctedby an adjustment and the remainder required a like-for-like ,replacement.
Selection Criteria for CRDM Changeout and Rebuilding
There Is much debate regarding the criteria applied by utilities to select CRDMs for changeoutand rebuilding. Although there are many contributing factors that may vary the rate and effects
357
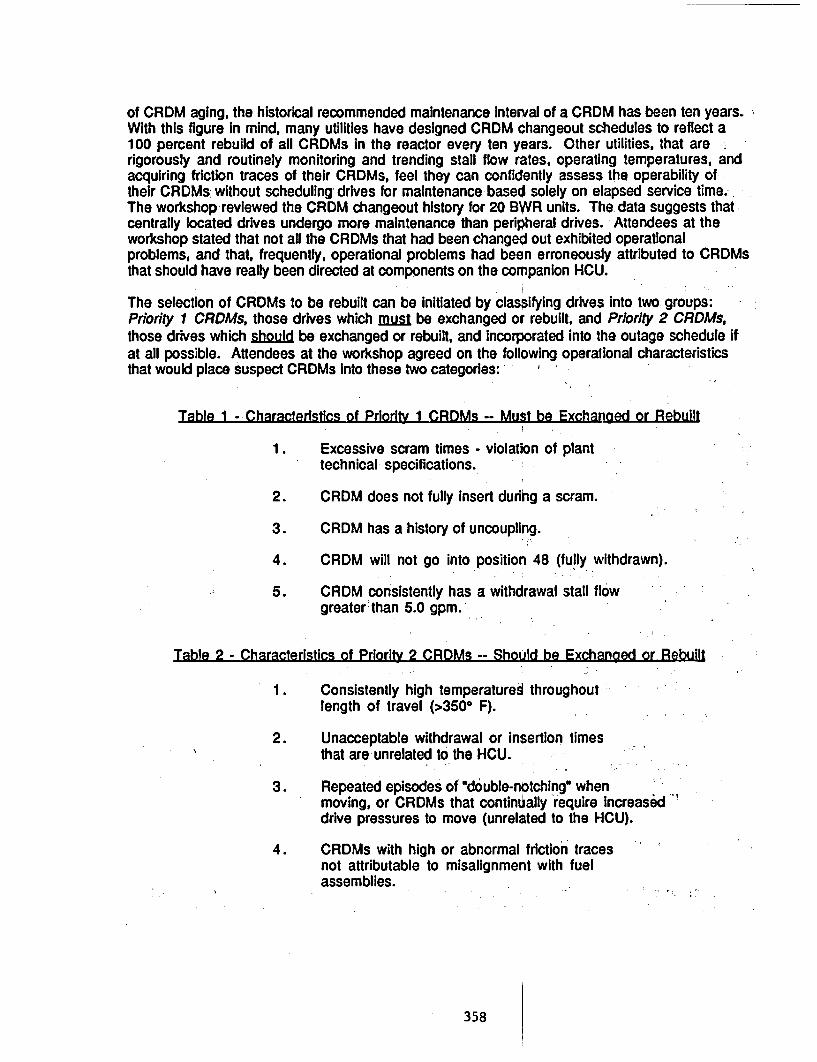
of CRDM aging, the historical recommended maintenance interval of a CROM has been ten years.With this figure In mind, many utilities have designed CRDM changeout schedules to reflect a100 percent rebuild of all CRDMs in the reactor every ten years. Other utilities, that are .rigorously and routinely monitoring and trending stall flow rates, operating temperatures, andacquiring friction traces of their CRDMs, feel they can confidently assess the operability oftheir CRDMs without scheduling drives for maintenance based solely on elapsed service time.-The workshop reviewed the CRDM changeout history for 20 BWR units. The data suggests thatcentrally located drives undergo more maintenance than peripheral drives. Attendees at theworkshop stated that not aN the CRDMs that had been changed out exhibited operationalproblems, and that, frequently, operational problems had been erroneously attributed to CRDMsthat should have really been directed at components on the companion HCU.
The selection of CRDMs to be rebuilt can be initiated by classifying drives into two groups:Priority I CRDMs, those drives which mus be exchanged or rebuilt, and Priority 2 CRDMs,those drives which should be exchanged or rebuilt, and incorporated into the outage schedule itat all possible. Attendees at the workshop agreed on the following operational characteristicsthat would place suspect CRDMs into these two categories:
Table I Characteristics of Priority 1 CRDMs--Must be Exchanged or Rebuilt
1. Excessive scram times - violation of planttechnical specifications.
2. CRDM does not fully insert during a scram.
3. CRDM has a history of uncoupling.
4. CRDM will not go into position 48 (fully withdrawn).
5. CRDM consistently has a withdrawal stall flowgreater than 5.0 gpm.
Table 2 - Characteristics of Priority 2 CRDMs -- Should be Exchanged or Rebuilt
1. Consistently high temperatures throughoutlength of travel (>3500 F).
2. Unacceptable withdrawal or insertion timesthat are unrelated to the HCU.
3. Repeated episodes of "double-notching" whenmoving, or CRDMs that continually require increaseddrive pressures to move (unrelated to the HCU).
4. CRDMs with high or abnormal friction tracesnot attributable to misalignment with fuelassemblies.
358
Attendees at the workshop also stated that when CRDMs began to display operational problems,several of the anomalies listed in Tables 1 and 2 would usually be manifested concurrently. Forthat reason, many utilities choose to rebuild CRDMs If they display any of the operationalcharacteristics mentioned In these categories, and might also Include those'drives that have acontinuous service time of ten years. Most CRDM operational problems, however, do have a longlead time and do not suddenly occur without exhibiting characteristic warning signals.
ALARA Reduction During CRDM Changeout and Rebuilding
Workshop attendees commented that CRDM changeout and rebuilding is one of the highest dose,-most physically demanding, and complicated maintenance activities routinely accomplished byBWR utilities. In the 30 years since the BWR design concept for commercial nuclear powerproduction was first successfully demonstrated, there have been many enhancements in themaintenance techniques used to pull and refurbish CRDMs. However, some utilities have nottaken advantage of new tooling and continue to use outdated maintenance equipment, which stilladequately performs the task, yet inevitably results In higher doses delivered to the nuclearworker. According to questionnaire responses and nuclear commercial services input,substantial ALARA reduction can be realized by focusing imprvements In'three key areasassociated with CRDM'maintenance work: CRDM handling and'exchange tools, worker comfortand environment, and worker training.
CRDM Handling and Exchange Tools
There are currently five different companies offering pneumatically or hydraulically operateddevices which can be placed in existing BWR undervessel work platforms to assist CRDMpersonnel with changeout activities. They replace conventional, electrically driven winchsystems supplied with the plants and require only two technicians for equipment operation.More than half of the sites responding to the'questionnaire stated that they had either purchasedor contracted the use of this type of device In their CRDM chan'geout work, and also verified thatIt had significantly Improved the performance of CRDM maintenance. Most further stated thatthis type of device had reduced Job-related exposures, with'two plants reporting overallexposure reductions of 38 and 56 percent.
CRDM Worker Comfort and Environment
The CRDM Aging Questionnaire asked utilities to Indicate which conditions during CRDMchangeout had the most influence toward Improper CRDM maintenance. High temperatures wererecognized by 65 percent of those participants as having the biggest negative impact on workerperformance. In addition, high radiation levels (creating, in some cases, a false sense ofurgency In workers not accustomed to this type of work), extremely cramped workingconditions (a person works *hunched over" for long periods of-time during changeoutoperations), poor vision (obstructed from instrumentation cabling and hampered byinsufficient lighting), and inadequate communication were pirealent conditions that furthercomplicate an already complex task. Other job location factors contributing to mishandlingerrors were disorientation, remoteness, cumbersome protection clothing, and visualimpairment during CRDM *rainshowerso (the normal 2 to 3 gpm leak of reactor water whendrives are removed from the vessel).
359
There are several utilities which have invested much time and money into developing improvedmaintenance conditions for CRDM changeout work. Some plants have revised and streamlinedprocedures, while others are testing new designs of radiation protection clothing, portable airconditioning apparatus, installing temporary lighting, and developing specialized tools for thesetasks. The overall consensus of the workshop attendees was that any utility which sought waysto improve worker comfort during these activities would realize benefits not only in ALARAreduction but also In fewer maintenance errors.
CRDM Worker Training
CRDM worker training, particularly with undervessel mockups, improves crew performanceand helps expedite tight outage schedules. "Full-rad dress" rehearsals are particularlyvaluable in acquainting technicians with working under restrained conditions. Both the CRDMchangeout and rebuild crews should receive specialized trainipg to correctly perform thesetasks. More than half of the participants responding to the qcJestionnaire either trained; theirown crews on mockup assemblies or employed contractors thot had completed similar training.Many of the utilities provide three to five days of training to crews involved in changeout andrebuilding activities. In some cases, shortened !refresher" courses are provided to thosepersonnel with previous experience. Several utilities stated that the training also involvedindividual testing. All of those utilities providing training or using specialized crews verifiedthat these activities yielded improvements in Job performances Other benefits mentioned werereductions in radiation doses, increased worker safety, improved worker attitude, and fewerrebuild errors.
Other modifications made by utilities to reduce radiation exposures acquired during CRDMchangeout and rebuilding activities include:
* Inner and outer filters were discarded as waste ratherthan cleaned.
* Shielded inner and outer filter removal tools were used.
* Flush tanks were used during CRDM rebuilding activities.
* Installed ALARA shielding achieved reductions at severalsites that historically have 'hot" drives.
* -Shielded storage racks and/or customized concrete vaultshave been built into CRDM rebuilding rooms.
' Remote cameras installed under the vessel and in therebuild room have helped to better coordinate activities,save time, and reduce exposures.,
360
Conclusions
As a whole, BWR control rod drive mechanisms have a good service record at U. S. nuclearplants. The BWR-6 design CRDMs have incorporated modifications that have eliminatedproblems experienced by the earlier models. The primary causes of CRDM aging are embrittle-ment, fatigue fracture and thermal degradation of the Graphitar seals, nitrided surface corro-sion, mishandling and rebuilding errors occurring during CRDM maintenance and, to a lesserextent, improper storage support. According to NRPDS failure reports, the majority ofmaintenance for the CRD system occurs on the HCU. The HCU components reporting the mostfailures are the scram water accumulator, the accumulator nitrogen charging cartridge valve,the Inlet and outlet scram valves, and their scram pilot valve assemblies and solenoids.
CRDM changeout and rebuilding activities occur at all BWR nuclear plants, but with varyingamounts of worker exposures and time expended on the removal and refurbishment of drives.Many utilities are seeking ways to improve their overall CRDM maintenance processes. Someplants are aggressively pursuing ways to reduce radiation exposures acquired during CRDMmaintenance by Installing state-of-the-art tooling, Improving worker comfort, and increasingmaintenance training.
References
1 . Residual Life Assessment of Major Light Water Reactor Components -- Overview, V. N.Shah and P. E. MacDonald, Editors, NUREG/CR-4731, November 1 1989. Available forpurchase from the National Technical Information Service, Springfield, Virginia 22161.
2. Effect of Prior History on the Response of Some Commercial Aluminum Alloys to LowDose Neutron Irradiation, Z. H. Ismail and H. G. Mohammed, Nuclear Research Center,Atomic Energy Commission, Cairo, Egypt. Scripta Metallurgica, 1989, Vol 23, pp2067-2072. Available for purchase from Pergamon Press, New York.
3. Control Rod Maintenance Strategies, presented by Lee Penney at the ORNL Workshop onControl Rod Drive Aging, January 30, 1991. Available from Nuclear Energy Services,Inc., Danbury, CT.
4 . Aging and Service Wear of Solenoid-Operated Valves Used in Safety Systems of NuclearPower Plants, Vol. 2: Monitoring Methods Evaluation," R. C. Kryter, NUREG/CR-4819,Vol.2, September 1991. Available for purchase from the National Technical InformationService, Springfield, Virginia 22161.
5. Operation and Maintenance Instructions for Hydraulic Control Unit Part Nos.729E950G1 through G6, GEK-9582A, General Electric Company, San Jose, CA.
361
THE EFFECT OF AGING UPON CE AND B&W CONTROL ROD DRIVES
Edward Grove and William GuntherBrookhaven National Laboratory
Upton, New York 11973
ABSTRACT
The effect of aging upon the Babcock & Wilcox (B&W) and CombustionEngineering (CE) Control Rod Drive (CRD) systems has been evaluated as part ofthe USNRC Nuclear Plant Aging Research (NPAR) program. Operatingexperience data for the 1980-1990 time period was reviewed to identify predominantfailure modes, causes, and effects. These results, in conjunction with an assessmentof component materials and operating environment, conclude that both systems aresusceptible to age degradation. System failures have resulted in significant planteffects, including power reductions, plant shutdowns, scrams, and Engineered SafetyFeature (ESF) actuation. Current industry inspection and maintenance practiceswere assessed. Some of these practices effectively address aging, while others donot.
Introduction
The Babcock & Wilcox (B&W) and Combustion Engineering (CE) control rod drive (CRD)systems consist of the mechanical and electrical components necessary to position the control rodassemblies in the core in response to automatic or manual reactivity control signals. Both systemsare designed to provide a rapid insertion of the control rods upon loss of AC power. As part ofthe USNRC Nuclear Plant Aging Research (NPAR) program, the design, materials, maintenance,and operation of both designs were evaluated to determine the potential for age degradation.
The system boundaries used for this aging study included the control rod drive mechanisms(CRDMs), CRDM power and control systems, rod position indication systems, CRDM coolingsystems, and the control rod assemblies. The fuel assembly and upper internal guide tubes werealso included, since failure of these components could preclude control rod insertion.
System Design
Reactivity control in B&W reactors is supplied by a combination of control rod assemblies(CRAs) and axial power shaping rod assemblies (APSRAs). Each B&W control rod assemblyconsists of sixteen individual poison rods connected to a spider assembly which geometricallyarranges the rods for insertion into the fuel assembly guide tubes. The spider assembly alsoprovides for attachment between the CRA and the CRDM leadscrew. APSRAs mechanicallyresemble the CRAs, and are used to control the axial power shape across the core during the fuelcycle. The APSRA drive mechanisms are modified to prevent them from inserting rapidly duringa reactor scram.
All eight of the B&W plants use the roller nut type CRDM. These consist of an electricallydriven, rotating nut assembly within the primary coolant pressure boundary; a four pole six phase,
363
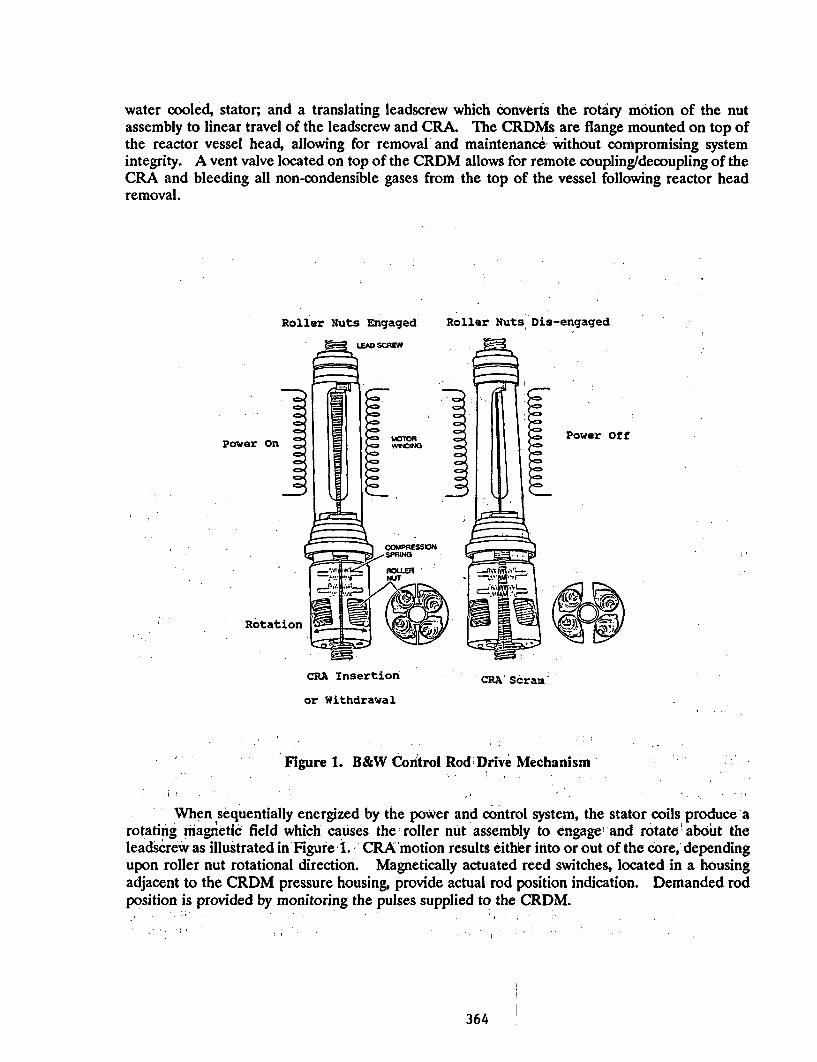
water cooled, stator; and a translating leadscrew which converts the rotary motion of the nutassembly to linear travel of the leadscrew and CRA. The CRDMs are flange mounted on top ofthe reactor vessel head, allowing for removal and maintenance without compromising systemintegrity. A vent valve located on top of the CRDM allows for remote coupling/decoupling of theCRA and bleeding all non-condensible gases from the top of the vessel following reactor headremoval.
Roller Nuts Engaged Roller Nuts Dis-engaged
P On , o Dower Off
COMPRESSONU mSPRiNG
Rotation X
CRA Insertion TV Scram
or Withdrawal
Figure 1. B&W Control Rod Drive Mechanism
When sequentially energized by the power and control system, the stator coils produce arotating magnetic field which causes the roller nut assembly to engage and rotate' about theleadscrew as illustrated in Figure 1. CRA motion results either into or out of the core, dependingupon roller nut rotational direction. Magnetically actuated reed switches, located in a housingadjacent to the CRDM pressure housing, provide actual rod position indication. Demanded rodposition is provided by monitoring the pulses supplied to the CRDM.
364
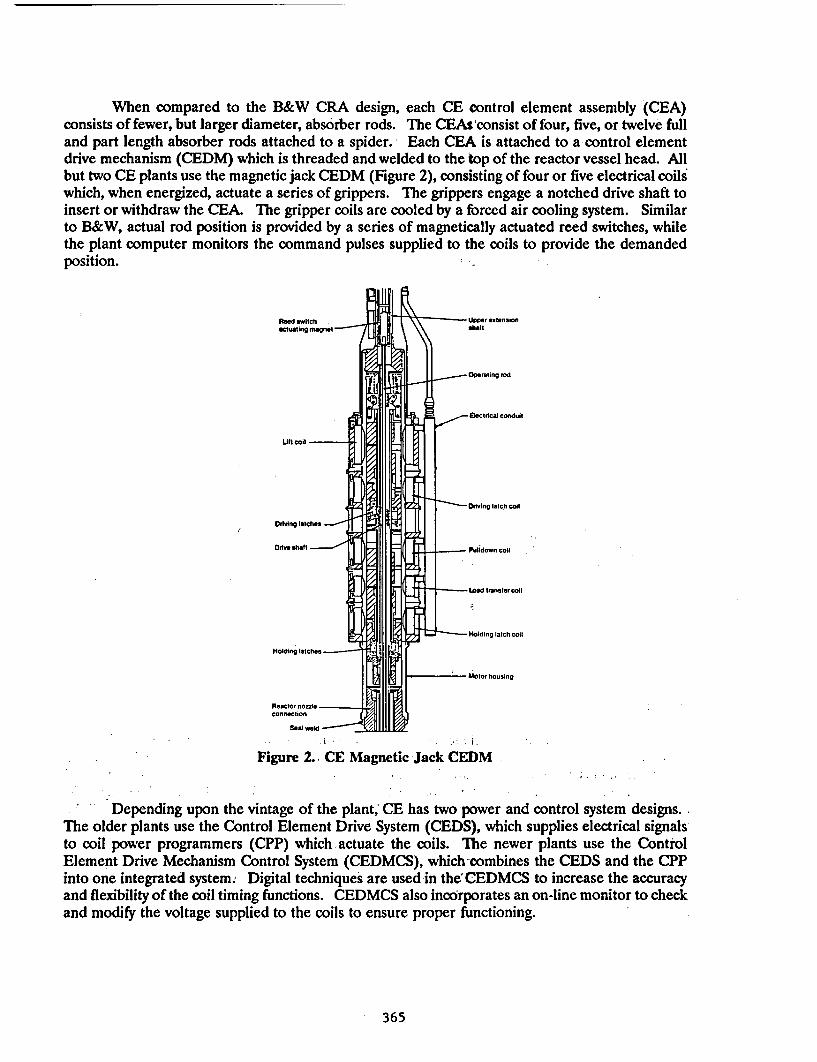
When compared to the B&W CRA design, each CE control element assembly (CEA)consists of fewer, but larger diameter, absorber rods. The CEAsiconsist of four, five, or twelve fulland part length absorber rods attached to a spider. Each CEA is attached to a control elementdrive mechanism (CEDM) which is threaded and welded to the top of the reactor vessel head. Allbut two CE plants use the magnetic jack CEDM (Figure 2), consisting of four or five electrical coils'which, when energized, actuate a series of grippers. The grippers engage a notched drive shaft toinsert or withdraw the CEA. The gripper coils are cooled by a forced air cooling system. Similarto B&W, actual rod position is provided by a series of magnetically actuated reed switches, whilethe plant computer monitors the command pulses supplied to the coils to provide the demandedposition.
Reed switch Upper extensionactuating maget -shaft
_Opeling md
tEectical conduit
Ult coil
Dr.v- ing latch Coil
Drhving latches
Drive shaft Putdown coil
Lo~ad transfer colt
Holding latch coil
Hol.ing l ah eS
Motor housing
Reactornozzle lconnectin
Figure 2.. CE Magnetic Jack CEDM
Depending upon the vintage of the plant,' CE has two power and control system designs.The older plants use the Control Element Drive System (CEDS), which supplies electrical signalsto coil power programmers (CPP) which actuate the coils. The newer plants use the ControlElement Drive Mechanism Control System (CEDMCS), which-combines the CEDS and the CPPinto one integrated system. Digital techniques are used in the CEDMCS to increase the accuracyand flexibility of the coil timing functions. CEDMCS also incorporates an on-line monitor to checkand modify the voltage supplied to the coils to ensure proper functioning.
365
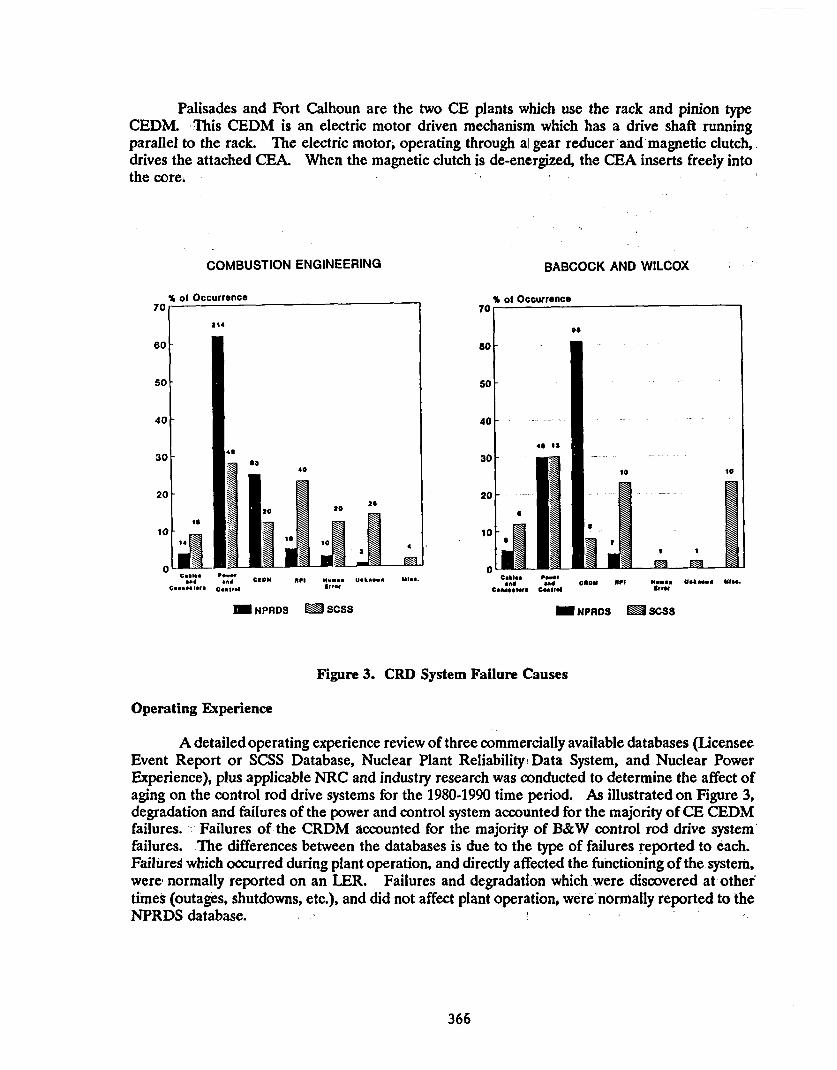
Palisades and Fort Calhoun are the two CE plants which use the rack and pinion typeCEDM. This CEDM is an electric motor driven mechanism which has a drive shaft runningparallel to the rack. The electric motor, operating through al gear reducer and magnetic clutch,.drives the attached CEA. When the magnetic clutch is de-energized, the CEA inserts freely intothe core.
COMBUSTION ENGINEERING BABCOCK AND WILCOX
% of Occurrence % of Occurrence
*.d *_d CEON AN _ U.k.... mi*.
C...rd c d .. ar,a Wo. r-o CDSrt
C.....tIe. C..mrd Gst
m NPROS E SCSS1 NPRDs ESCSS
Figure 3. CRD System Failure Causes
Operating Experience
A detailed operating experience review of three commercially available databases (LicenseeEvent Report or SCSS Database, Nuclear Plant Reliability Data System, and Nuclear PowerExperience), plus applicable NRC and industry research was conducted to determine the affect ofaging on the control rod drive systems for the 1980-1990 time period. As illustrated on Figure 3,degradation and failures of the power and control system accounted for the majority of CE CEDMfailures. Failures of the CRDM accounted for the majority of B&W control rod drive systemfailures. The differences between the databases is due to the type of failures reported to each.Failures which occurred during plant operation, and directly affected the functioning of the system,were, normally reported on an LER. Failures and degradation which were discovered at othertimes (outages, shutdowns, etc.), and did not affect plant operation, were normally reported to theNPRDS database.
366
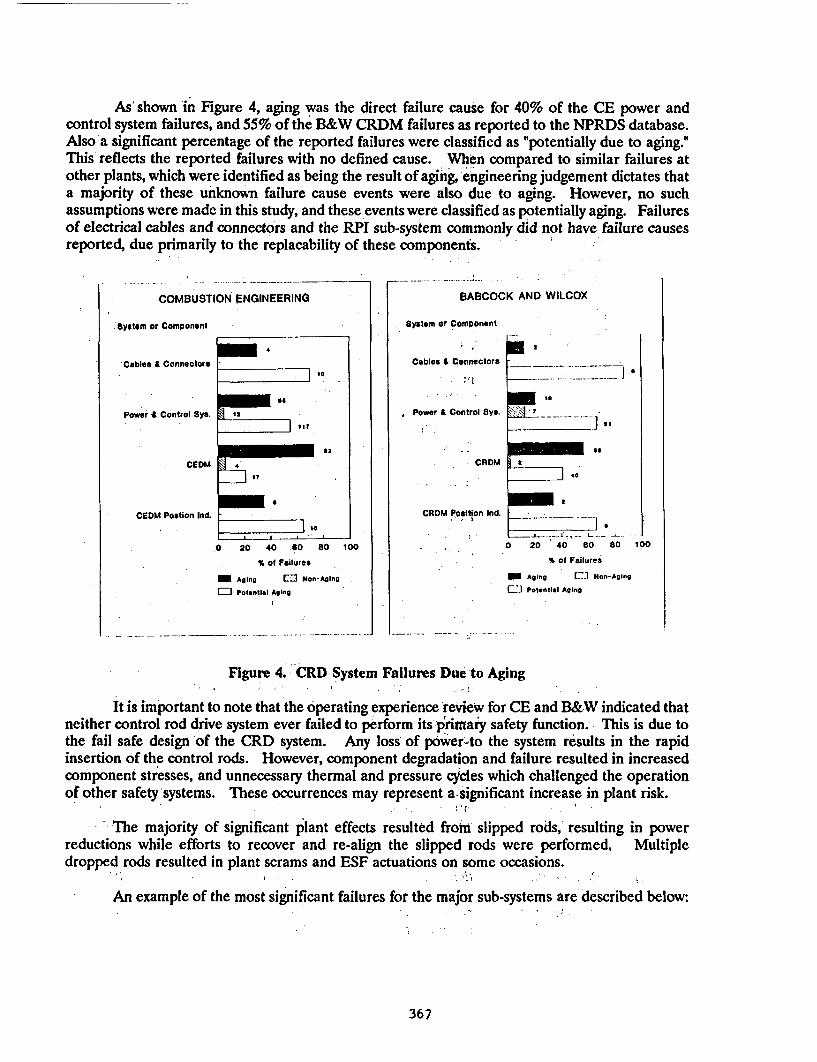
As' shown in Figure 4, aging was the direct failure cause for 40% of the CE power andcontrol system failures, and 55% of the B&W CRDM failures as reported to the NPRDS database.Also a significant percentage of the reported failures were classified as "potentially due to aging."This reflects the reported failures with no defined cause. When compared to similar failures atother plants, which were identified as being the result of aging, engineering judgement dictates thata majority of these unknown failure cause events were also due to aging. However, no suchassumptions were made in this study, and these events were classified as potentially aging. Failuresof electrical cables and connectors and the RPI sub-system commonly did not have failure causesreported, due primarily to the replacability of these components.
COMBUSTION ENGINEERING
System or Component
'Cables & Connectors
BABCOCK I N WC.
r BABCOCK AND WILCOX
system or Component
Cables & Connectors
-Coo y
. Powes, Control Sys.Power 4 Control Sys.
- CEDM
CEDM Postion Ind.
~~~I so~$a 1
Isr
ZZIIIZII t
A" II.
E a
-'5H ' -~1'i
a
-1 S
[ se
CRDKM
CRDM Position Ind.
&I
40
.anL___ S -
0 20 40 s0 80 100
% of Failures
_ Aging L J Non-Agieg
C71 Potential Aging
.0 20 40 60 80 100
t. of Failures
_ Aging rAL Non-Aging .EL1 Potential Aging
Figure 4. CRD System Failures Due to Aging
It is important to note that the operating experience review for CE and B&W indicated thatneither control rod drive system ever failed to perform its primary safety function. This is due tothe fail safe design of the CRD system. Any loss of power-to the system results in the rapidinsertion of the control rods. However, component degradation and failure resulted in increasedcomponent stresses, and unnecessary thermal and pressure cycles which challenged the operationof other safety systems. These occurrences may represent a significant increase in plant risk.
: The majority of significant plant effects resulted fromn slipped rods, resulting in powerreductions while efforts to recover and re-align the slipped rods were performed. Multipledropped rods resulted in plant scrams and ESF actuations on some occasions.
An example of the most significant failures for the major sub-systems are described below
367
a) Cables and Connectors - Cables and connectors are used extensively throughout thesystem. The power and control cables located on the top of the, reactor head arelocated in a much more severe environment (radiation, temperature, humidity) thanthose used in the power and control cabinets located outside of the containment.Brittle and cracked CEDM electrical cabling has been found and replaced at severalplants. Loose and broken electrical connections were also frequently noted.
b) Power and Control System Failures - This system consists primarily of modularizedelectrical components centrally located in control cabinets outside of the primarycontainment. Numerous instances of failed system power supplies were reportedresulting in dropped rods. No actual cause of failure was provided. As a correctiveaction, many utilities are modifying their system design to incorporate redundantpower supplies. Another common reported failure early in the 1980's was slippedor dropped rods due to the improper or sluggish actuation of the grippers. Aspreviously described, CE has modified the power and control system design toincorporate the Automatic CEDM Timer Module (ACTM). The ACTM monitorsand adjusts the current waveshape supplied to the grippers to ensure proper gripperactuation. This has improved the reliability of the gripper actuation. Controlsystem breaker failures were not common, however one plant experienced a manualtrip due to this type of failure. Subsequent testing indicated that the breakeropened at 30 amps, 25% less than the designed 40 amps. All of the sub-systemmolded case circuit breakers were subsequently added to the plants PM program toinsure continued reliability for the 40 year design life.
c) Control Rod Ddve Mechanisms - Numerous instances of primary coolant leakageresulting from failed gaskets and cracked pressure housings were reported. Gasketembrittlement due to aging was the primary failure cause for the B&W flexitallicgaskets. B&W has replaced the original asbestos impregnated spiral wound designwith a graphite impregnated stainless steel spiral wound design. Primary coolantleakage in a high temperature area, will cause the boric acid to boil and concentrate,increasing its corrosiveness and acidity. Uncorrected, the boric acid crystals mayaccumulate and block cooling passages.
Though only two plants use the rack and pinion CEDM, failures of the rotating sealsused in the mechanism accounted for 60% of the CE primary coolant leakageoccurrences. Cracked pressure housings resulting from stress corrosion cracking hasalso been identified on the rack and pinion CEDMs. The design of this CEDM isconducive to this type of failure if the drives are not adequately vented.
Immovable control rod assemblies caused by fractured internal CRDM components.were also reported. These fragments became lodged between the roller nuts and,the leadscrew, preventing movement. Plant operational procedures were modifiedto include visual verification of proper CRDM component alignment each time aCRA was coupled to a CRDM. ;
d) Rod Position Indication - Due to the redundancy provided by the two position-- , indication systems, RPI failure primarily resulted in a redundancy loss, and
operational procedure changes designed to verify the proper positioning of the rodswhile the RPI system is inoperable. The location of the reed switches in the same
368
severe environment as the CRDM has been the primary failure cause. Moistureintrusion has caused reed switch corrosion. Failures of the CE Control ElementAssembly Calculator (CEAC) has resulted in reactor power reductions andsubsequent scrams. The CEAC monitors CEA position in the core and providesthis information to the Core Protection Calculator (CPC). The CPC, -based uponthis information, provides overly conservative penalty factors to the automaticprotection and control systems resulting in the power reductions and scrams.
e) Control Rod Assembly - Failures of the control' rod assemblies and the fuel assemblyand upper internal guide tubes may be significant since they 'can interfere with or'prevent the insertion of the CRAs. A CE plant recently reported the failure of acontrol rod due to the radiation induced swelling of the B4C poison. This resultedin an increase in the clad stress which eventually led to the propagation of a crackaround the rod. The lower portion of the rod and the poison pellets fell out of therod into the guide tube, preventing the insertion of the CRA. Subsequentinspections revealed other similarly cracked rods. Other instances of immovableCRAs due to loose parts in the reactor core being wedged between the rod and'theguide tubes, were noted.
CE fuel assembly guide tubes have also experienced through wall wear caused by thecontrol element rods. When fully withdrawn, the tips of the rods remain engagedwith the upper portion of the fuel assembly guide tube. Flow induced vibrationcaused by the coolant was the root cause of the failure. To prevent this wear, astainless steel sleeve is inserted in the upper portion of the guide tubes. ThoughCE has subsequently modified the fuel flow characteristics of the fuel assembly to.preclude this type of wear, the sleeves are still being used.
Since 1980, B&W plants have reported 64 instances of cracked fuel assembly hold downsprings. Though none of these cases has interfered with control rod insertion, they remain a causeof concern. Due to the close proximity of the hold down spring with the control rods, failuresresulting in the displacement of spring material may interfere with the movement of the controlrods.
In addition to the sub-system failures, 'the operational experience review also demonstratedthat the CRD system was susceptible to failures and degradation due to human error andinadequate maintenance. Examples of these were error's during the performance of normal systemmaintenance and refueling operations. System maintenance errors typically resulted in dropped orslipped rods, while errors during refueling resulted in damaged CEDM extension shafts. Numerousinstances of Technical Specification violations, primarily due to'missed surveillance intervals, werealso noted.
A significant number of failures were also reported which either gave 'no failure report orlisted the cause as unknown. These occurrences resulted in significant plant effects, and on severaloccasions, similar failures were reported before the root failure cause was determined. As noted,this may be indicative of an inadequate root failure cause program. Though the modularizeddesign of many electrical components allows easy replacement, efforts to identify and correct thefailure causes are still needed.
369
Current Utility Inspection, Maintenance, and Surveillance Practices
An operating survey was conducted to obtain information on current utility systemmaintenance and inspection practices. Responses were received from two B&W plants, and fourCE plants (representing eight units). Meetings were also held with cognizant vendor system designpersonnel..
Combustion Engineering and Babcock & Wilcox recommended annual system inspectionsare listed in Table 1. The majority of the recommended inspections are electrical. The actualinspections performed on the control rod drive system, as determined by the survey, are providedin Table 2. A comparison between these tables indicate that not all of the vendor recommendedsystem maintenance is actually performed.
Most utilities commonly use meggering to check electrical integrity of the systemcomponents. Meggering is a go/no-go test which is not capable of providing data which can betrended to detect age degradation. Also, failure of nieggering is not conclusive of componentfailure, since moisture intrusion will result in low megohm readings. CE plants obtain gripper coiltraces each cycle. These traces document the current and actuation time of each of the grippercoils. The results are visually compared to those obtained from the previous cycle. CErecommends that traces which represent a 10% difference be dispositioned by them. Again, agingdegradation may not be clearly discernable from this type of test.
Visual inspections for primary coolant leakage are conducted following each cycle. If theleakage is judged unacceptable (>1 gpr.) the mechanism is removed, and the gasket replaced orweld repaired. The lack of space between mechanisms on the top of the reactor head makes thisinspection very difficult to perform, and therefore should not be relied upon to solely detectleakage. Other methods, such as viewing ports around the circumference of the CRDM coolingshroud have been useful in enhancing the visual inspections.
Visual inspections are also performed on the vent valve, for any leakage indication. If theleak cannot be readily corrected, some utilities have seal welded the valve shut. CE recommendsthat the internal ball and o-ring be replaced each time the valve is used.
All respondents reported as being in compliance with the ten year ISI inspections applicableto CRDMs. The current requirement is that only 10% of the peripheral housings be inspected,every 10 years. Given the continued instances of housing defects and failures, modification of thisrequirement should be considered to include interior mechanisms as well.
The majority of the respondents reported that they do not have a reliability program. Sucha program should be established, and include accessing one (or more) of the operating data bases.This would result in a more efficient predictive maintenance program capable of alerting utilitypersonnel to failures at other plants, and allowing for corrective maintenance before componentfailure. Relying solely on vendor supplied information may not be timely enough.
370
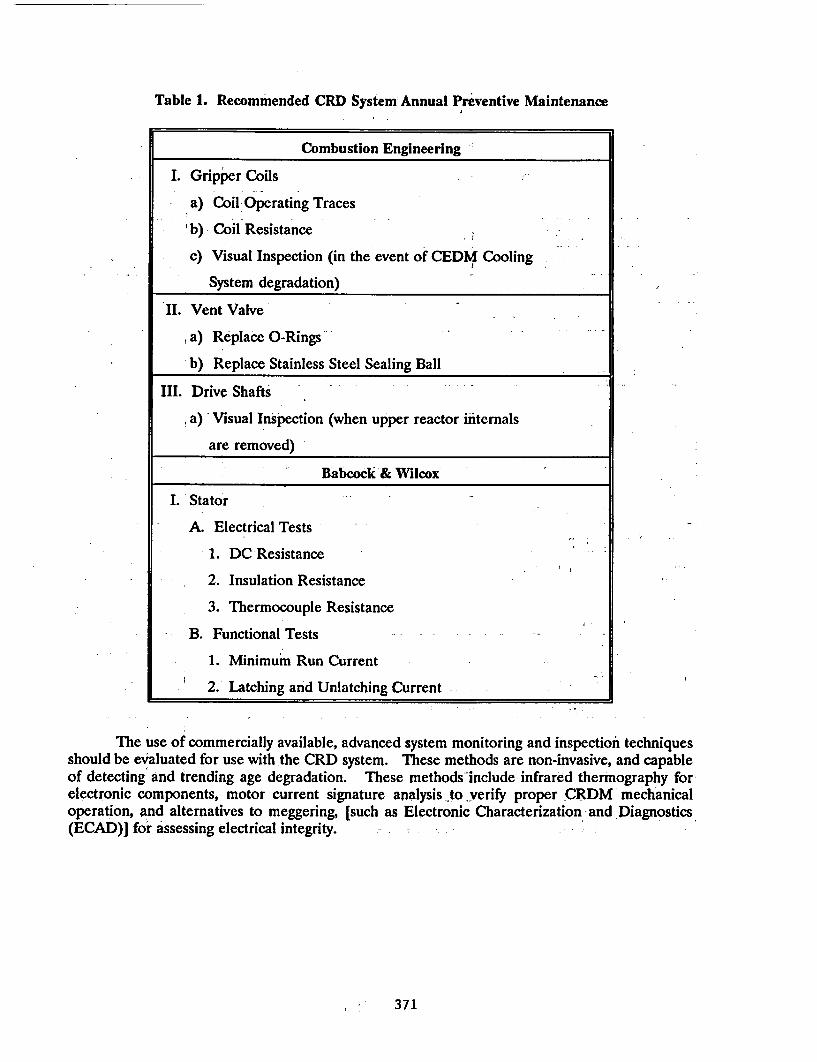
Table 1. Recommended CRD System Annual Preventive Maintenance
Combustion Engineering
I. Gripper Coils
a) Coil Operating Traces
'b) Coil Resistance
c) Visual Inspection (in the event of CEDM Cooling
System degradation)
II. Vent Valve
a) Replace O-Rings
b) Replace Stainless Steel Sealing Ball
III. Drive Shafts
a) Visual Inspection (when upper reactor internals
are removed)
Babcock & Wilcox
I. Stator
A. Electrical Tests
1. DC Resistance
2. Insulation Resistance
3. Thermocouple Resistance
B. Functional Tests
1. Minimum Run Current
2. Latching and Unlatching Current
The use of commercially available, advanced system monitoring and inspection techniquesshould be evaluated for use with.the CRD system. These methods are non-invasive, and capableof detecting and trending age degradation. These methods-include infrared thermography forelectronic components, motor current signature analysis to verify proper CRDM mechanicaloperation, and alternatives to meggering, [such as Electronic Characterization and Diagnostics(ECAD)] for assessing electrical integrity. . -.
! , 371
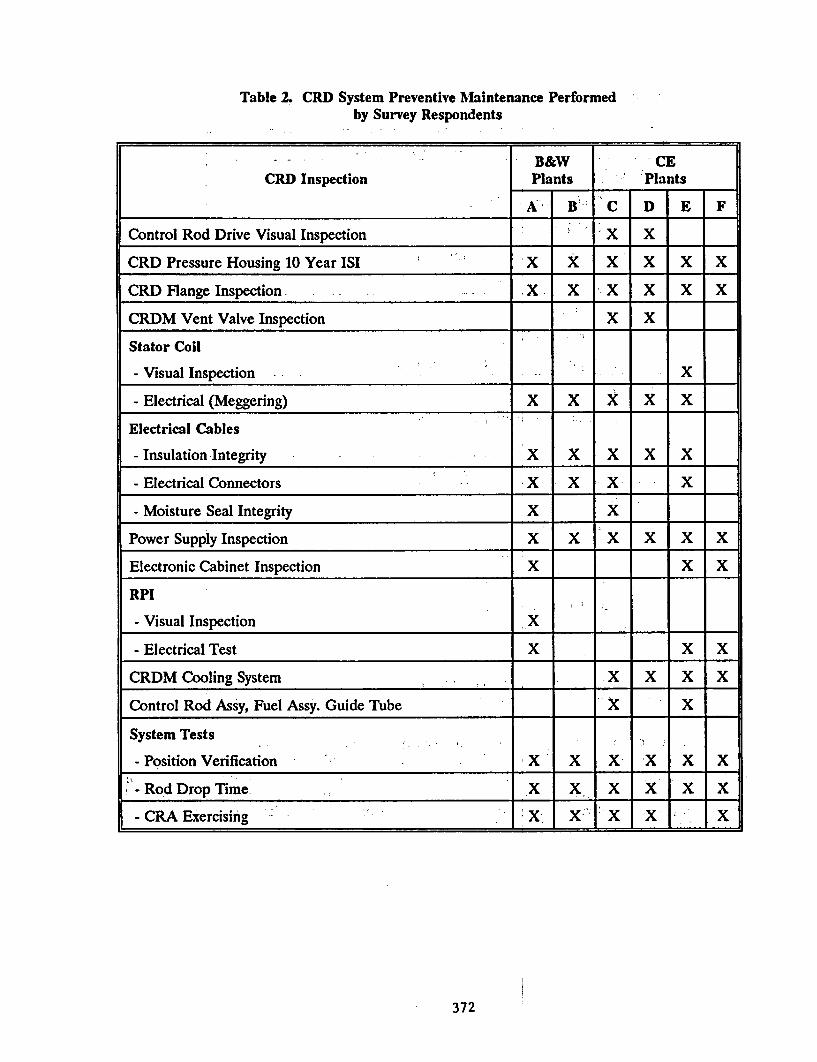
Table 2. CRD System Preventive Maintenance Performedby Survey Respondents
B&W CECRD Inspection Plants Plants
A B C D E F
Control Rod Drive Visual Inspection X X
CRD Pressure Housing 10 Year ISI X X X X X X
CRD Flange Inspection . X X X X X X
CRDM Vent Valve Inspection X X
Stator Coil
- Visual Inspection X
- Electrical (Meggering) X X X X X
Electrical Cables
- Insulation Integrity X X X X X
- Electrical Connectors X - X X- X
- Moisture Seal Integrity X X
Power Supply Inspection X X X X X X
Electronic Cabinet Inspection X X X
RPI
- Visual Inspection X
- Electrical Test X X X
CRDM Cooling System A X X X
Control Rod Assy, Fuel Assy. Guide Tube X X
System Tests
- Position Verification X X X X X X
- Rod Drop me XX X X X X
- CRA Exercising X X" X X X
372
Conclusions
The results of this NPAR study show that aging degradation and failures have occurred inboth the B&W and CE Control Rod Drive Systems. Though these occurrences have not preventedthe system from performing its primary safety function, they do present unnecessary challenges tothe operation of other plant safety systems when they result in unplanned reactor scrams. As theresults of the utility survey indicate, CRD aging has been recognized and is being addressed, tovarying degrees, by the utilities' inspection and maintenance programs. However, agingdegradation and failures are still occurring. The results of this study highlight these areas, andrecommendations are provided regarding preventive and predictive maintenance which may furtherreduce aging failures.
References
1. NUREG-1144, Rev. 2, 'Nuclear Plant Aging Research (NPAR) Program Plan," June 1991.
2. Grove, E. and Gunther, W.,"An Operational Assessment of the Babcock & Wilcox andCombustion Engineering Control Rod Drives," BNL Technical Report TR-3270-9-90,September 1990.
3. Grove, E. and Gunther, W., "An Aging Assessment of the Combustion Engineering andBabcock & Wilcox Control Rod Drives," Draft NUREG/CR-5783, September 1991.
4. Gunther, W. and Sullivan, K., "Aging Assessment of the Westinghouse PWR Control RodDrive System," NUREGICR-5555, March 1991.
373
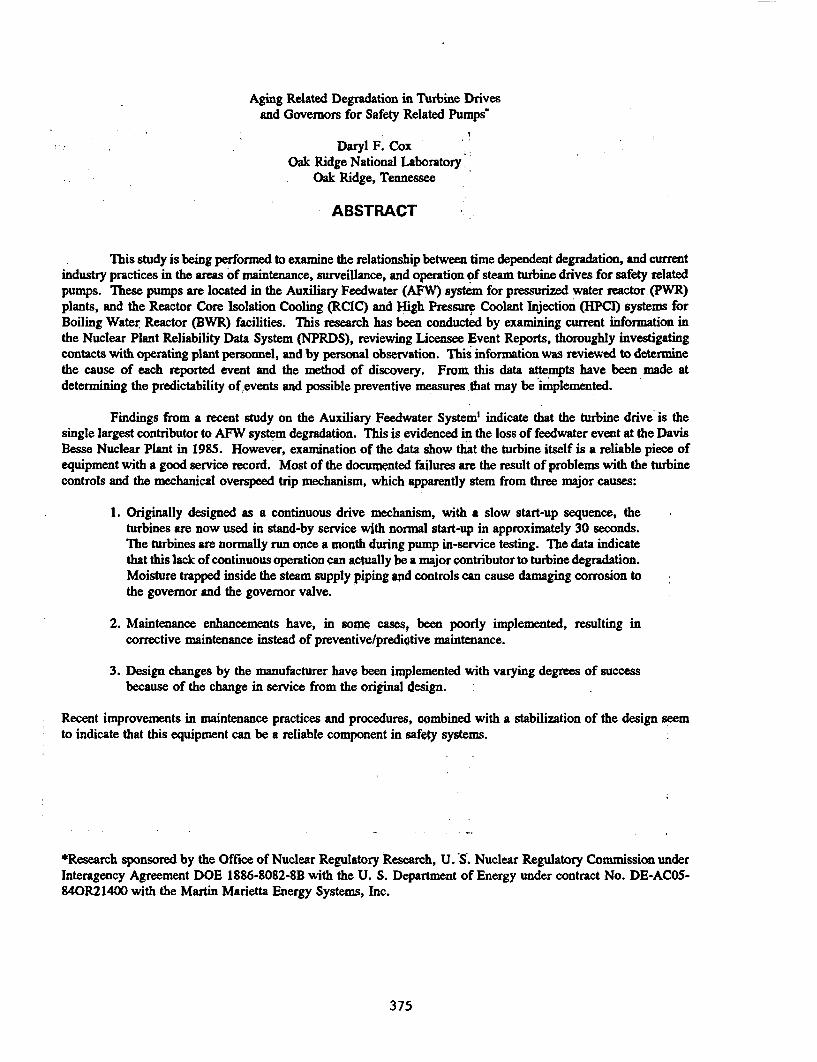
Aging Related Degradation in Turbine Drivesand Governors for Safety Related Pumps
Daryl F. CoxOak Ridge National Laboratory
Oak Ridge, Tennessee
ABSTRACT
This study is being performed to examine the relationship between time dependent degradation, and currentindustry practices in the areas of maintenance, surveillance, and operation of steam turbine drives for safety relatedpumps. These pumps are located in the Auxiliary Feedwater (AFW) system for pressurized water reactor (PWR)plants, and the Reactor Core Isolation Cooling (RCIC) and High Pressure Coolant Injection (HPCI) systems forBoiling Water Reactor (BWR) facilities. This research has been conducted by examining current information inthe Nuclear Plant Reliability Data System (NPRDS), reviewing Licensee Event Reports, thoroughly investigatingcontacts with operating plant personnel, and by personal observation. This information was reviewed to determinethe cause of each reported event and the method of discovery. From this data attempts have been made atdetermining the predictability ofevents and possible preventive measures that may be implemented.
Findings from a recent study on the Auxiliary Feedwater System' indicate that the turbine drive is thesingle largest contributor to AFW system degradation. This is evidenced in the loss of feedwater event at the DavisBesse Nuclear Plant in 1985. However, examination of the data show that the turbine itself is a reliable piece ofequipment with a good service record. Most of the documented failures are the result of problems with the turbinecontrols and the mechanical overspeed trip mechanism, which apparently stem from three major causes:
1. Originally designed as a continuous drive mechanism, with a slow start-up sequence, theturbines are now used in stand-by service with normal start-up in approximately 30 seconds.The turbines are normally run once a month during pump in-service testing. The data indicatethat this lack of continuous operation can actually be a major contributor to turbine degradation.Moisture trapped inside the steam supply piping and controls can cause damaging corrosion tothe governor and the governor valve.
2. Maintenance enhancements have, in some casest been poorly implemented, resulting incorrective maintenance instead of preventive/prediotive maintenance.
3. Design changes by the manufacturer have been implemented with varying degrees of successbecause of the change in service from the original design.
Recent improvements in maintenance practices and procedures, combined with a stabilization of the design seemto indicate that this equipment can be a reliable component in safety systems.
*Research sponsored by the Office of Nuclear Regulatory Research, U. S. Nuclear Regulatory Commission underInteragency Agreement DOE 1886-8082-8B with the U. S. Department of Energy under contract No. DE-AC05-840R21400 with the Martin Marietta Energy Systems, Inc.
375
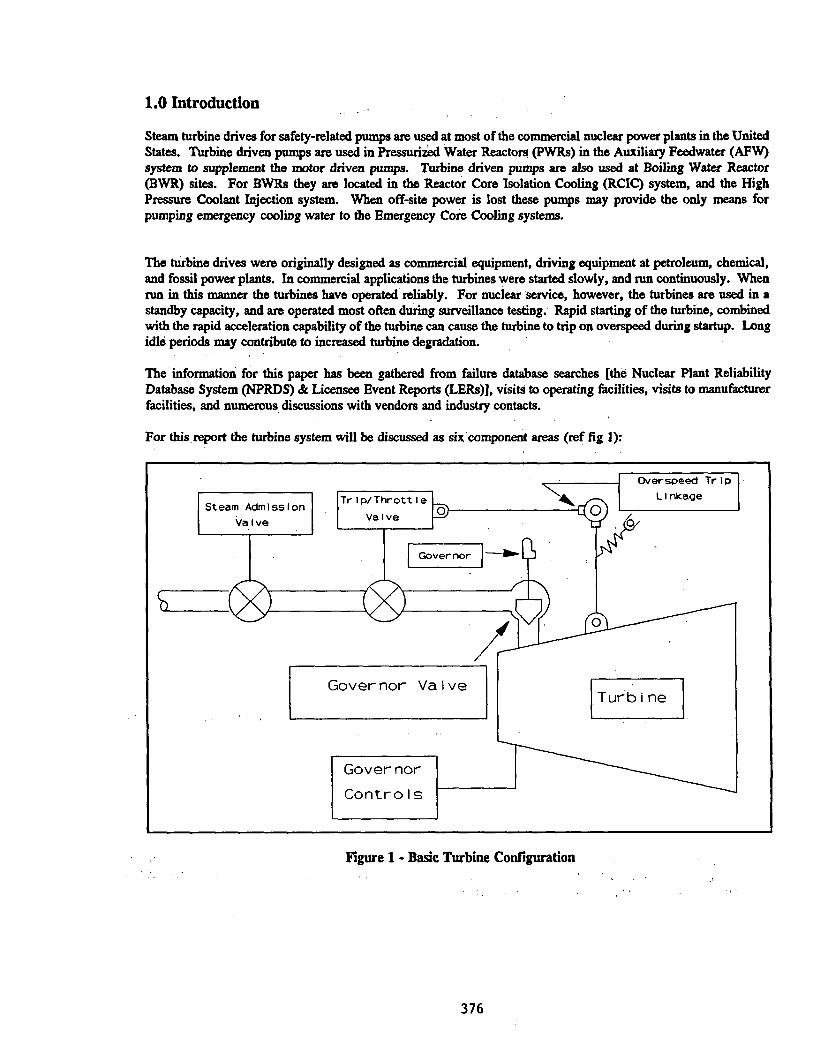
1.0 Introduction
Steam turbine drives for safety-related pumps are used at most of the commercial nuclear power plants in the UnitedStates. Turbine driven pumps are used in Pressurized Water Reactors (PWRs) in the Auxiliary Feedwater (AFW)system to supplement the motor driven pumps. Turbine driven pumps are also used at Boiling Water Reactor(BWR) sites. For BWRs they are located in the Reactor Core Isolation Cooling (RCIC) system, and the HighPressure Coolant Injection system. When off-site power is lost these pumps may provide the only means forpumping emergency cooling water to the Emergency Core Cooling systems.
The turbine drives were originally designed as commercial equipment, driving equipment at petroleum, chemical,and fossil power plants. In commercial applications the turbines were started slowly, and run continuously. Whenrun in this manner the turbines have operated reliably. For nuclear service, however, the turbines are used in astandby capacity, and are operated most often during surveillance testing. Rapid starting of the turbine, combinedwith the rapid acceleration capability of the turbine can cause the turbine to trip on overspeed during startup. Longidle periods may contribute to increased turbine degradation.
The information for this paper has been gathered from failure database searches [the Nuclear Plant ReliabilityDatabase System (NPRDS) & Licensee Event Reports (LERs)], visits to operating facilities, visits to manufacturerfacilities, and numerous discussions with vendors and industry contacts.
For this report the turbine system will be discussed as six component areas (ref fig 1):
I Overspeed Trip
LInkage
Figure 1- Basic Turbine Configuration
376
* Steam Admission Valve *Trip/Throttle Valve
* Governor/Governor Controls * Governor Valve
* Turbine * Overspeed Trip Mechanism
2.0 Configuration of the turbine
Steam Admission Valve: The Steam Admission Valve isolates the turbine system from the steam supply. This valveopens on a turbine start signal, if the trip/throttle valve is normally closed, to start the turbine.
Trip Throttle Valve: 'The primary function of the trip and throttle valve is to rapidly shut off the flow of inlet steamto the turbine upon actuation of the overspeed trip. 2 The trip and throttle valve also may be used to start theturbine if the steam admission valve is normally open.
Governor: The governor maintains the turbine speed such that the pump flow remains constant. It provides apositioning signal to the servo mechanism that manipulates the governor valve linkage. The governor may be eithera mechanical/hydraulic unit with it's own control oil, or an analog electric/hydraulic unit that draws control oil fromthe turbine lubricating oil sump.
Governor Valve: The governor valve regulates the amount of steam entering the turbine, which controls turbinespeed.
Turbine: The turbine is the actual driver for the safety-related pump. It is a solid wheel design, capable of rapidstarts and operation with a wide range of steam quality.
Overspeed Trip Mechanism: The mechanical overspeed trip mechanism actuates when the turbine exceeds apredetermined speed to close the trip and throttle valve, and thus stop steam flow to the turbine.
3.0 Review of Failure Data
The failure databases noted above were reviewed and the following parameters were extracted.
Method of discovera: This field determines how the failure was discovered from a list of six possible options.
* Demand Failures: These are failures that occur when the system it called upon to function in a non-testsituation.
* Testing: Testing failures occurred during surveillance, post maintenance testing; or periodic operability testing.Also included are instances where the turbine may not have failed to operate, but has been declared inoperabledue to unacceptable oil samples.
* Inspection: This category includes both n-Service Inspection and any special inspection performed on theturbine.
* Maintenance: Any item discovered during preventive or corrective maintenance.
* Routine/Incidental Observation: Those items that are observed as ,part of an individuals normil job. Thisincludes operators, system engineers, or any other person who periodically examines the turbine for visible
377
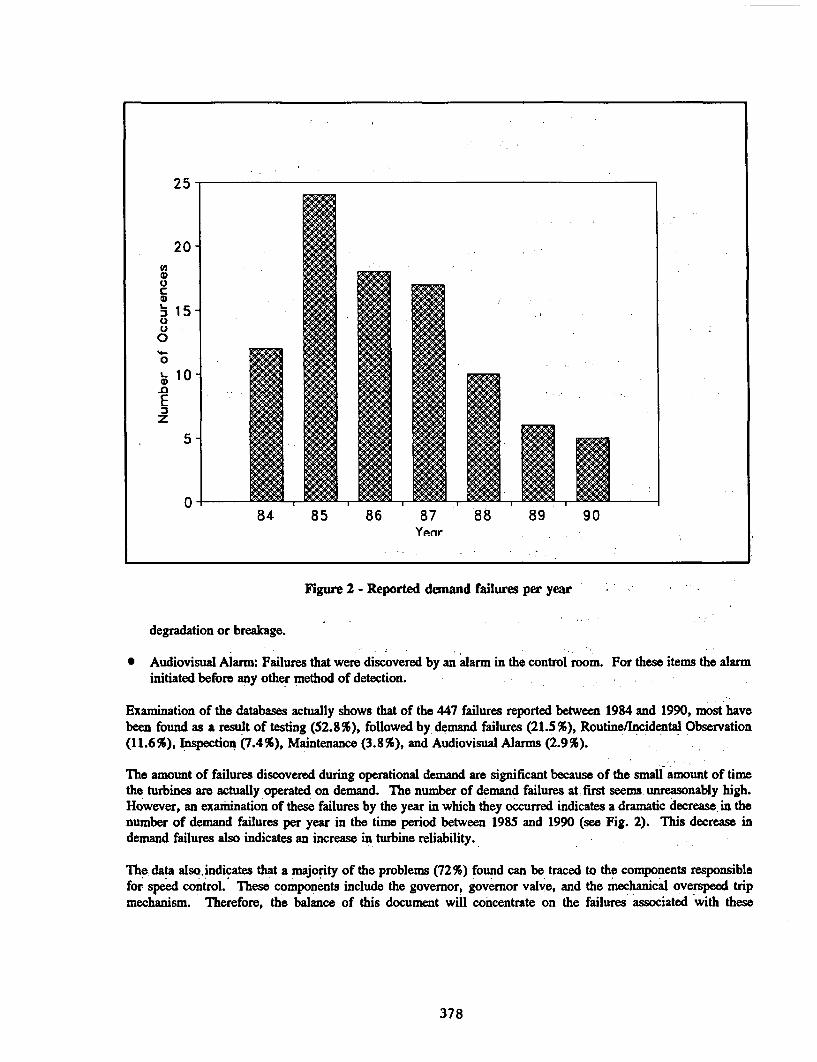
Figure 2 - Reported demand failures per year
degradation or breakage.
* Audiovisual Alarm: Failures that were discovered by an alarm in the control room. For these items the alarminitiated before any other method of detection.
Examination of the databases actually shows that of the 447 failures reported between 1984 and 1990, most havebeen found as a result of testing (52.8%), followed by. demand failures (21.5%), Routine/Incidental Observation(11.6%), Inspection (7.4%), Maintenance (3.8%), and Audiovisual Alarms (2.9%).
The amount of failures discovered during operational demand are significant because of the small amount of timethe turbines are actually operated on demand. The number of demand failures at first seems unreasonably high.However, an examination of these failures by the year in which they occurred indicates a dramatic decrease in thenumber of demand failures per year in the time period between 1985 and 1990 (see Fig. 2). This decrease indemand failures also indicates an increase in turbine reliability.
The data also, indicates that a majority of the problems (72%) found can be traced to the components responsiblefor speed control. These components include the governor, governor valve, and the mechanical overspeed tripmechanism. Therefore, the balance of this document will concentrate on the failures associated with these
378
component groups.
Mechanical Overspeed Trip Mechanism: The mechanical overspeed trip mechanism is comprised of the actual tripassembly and a linkage which connects it to the trip and throttle valve. The linkage is spring loaded, actuating whenthe trip assembly is triggered. The three main modes of failure for this assembly are:
(a) maladjustment of the trip pin X(b) breakage/binding of the trip tappet(c) improper tension adjustment of the linkage spring
The trip pin is normally mounted on the turbine shaft. It moves radially outward, striking the trip tappet when theturbine shaft speed exceeds a preset value. Maladjustment of the trip pin will either prevent it from striking thetappet head, prevent it from striking the tappet head hard enough to trip the mechanism, or cause the trip pin tostrike the tappet head too hard and bend the tappet stem.
The head of the trip tappet (which is the part actually struck by the trip pin) is normally made of urethane. Severaldesign changes have taken place over the years to create a head that will absorb the impact of being struck at highspeed without shattering. Once damage occurs to the head of the trip tappet, sufficient force cannot be transmittedto the rest of the mechanism to close the trip and throttle valve. Binding will happen if the urethane head swellsfrom a chemical reaction with turbine oil (older tappets). Binding may also occur if the tappet stem is bent fromexcess impact, caused by a maladjusted trip pin. Swelling of the trip tappet head, or a bent stem may preventresetting the mechanical overspeed trip mechanism.
The vendor recommends adjusting the overspeed trip linkage spring to 28 -32 lbs tension when measured in thedirection of linkage travel. If the spring tension is weak, a trip may not occur. Too much spring tension mayaccelerate wear of the trip mechanism, and cause premature turbine trip&.
Governor Valve: The fundamental problem associated with the governor valve is degraded response times, whichallow overspeed trips. This is primarily caused by a degraded valve -stem or a degraded linkage between thegovernor and the governor valve. Either situation can cause the turbine to overspeed. The linkage, for this report,shall be considered part of the governor valve.
Binding of the governor valve causes a loss of the ability to maintain speed control of the turbine. Corroded or bentvalve stems can drag against the governor valve packing. The research indicates that stem corrosion has twoprimary sources: leakage of the steam supply isolation valve, and scale build-up from periodic testing. Since theturbines are infrequently operated, the presence of steam during the time between monthly pump tests can corrodethe valve stem. This condition can result from leaking isolation valves, which place the valve stem in a consistentlyhot, wet environment. The scale build-up then tends to drag on the valve packing, increasing wear on the packingand degrading governor valve response. In extreme cases binding can result in buckling of the valve stem. Inaddition, valve stem scale can also cause erratic behavior of the governor valve. Design basis conditions for thesteam supply can cause pressures as low as 105 psig. The capability of operating at such low pressures leads to thetendency for very rapid accelerations at normal steam supply pressures. .Normal inlet steam pressure (1000 psig)is capable of accelerating the turbine at approximately 2000 rpm/sec. Therefore, any binding of the governor valvemay result in an overspeed trip.
Governor: Degraded governor response may be caused primarily by worn or improperly adjusted control oil valvesinside the governor, drift in the settings of electronic controller boards, or contaminated control oil. Improperlyadjusted valves can result in sluggish, erratic, or unstable governor responses. Too much restriction in the valveports prevents the governor from responding to load changes in an acceptable manner.
The electronic governors currently in use are analog devices. As such these devices are subject to set point drift
379
(approx. 15 % of the reported governor problems). In general, it can be seen that calibration of the governor is nota requirement of the plant technical specifications. Therefore, calibrations are not always done with regularity oron a timely schedule.
Additionally, problems can result from the accumulation of contaminants in the governor oil. These contaminantscan be water, particulate, degraded oil additives, and/or dirt. Oil contamination can come from several sources;worn bearings, contaminants introduced at the time the oil was put in the turbine, poor house keeping duringmaintenance, left over machine filings from manufacturing, turbine wear (electronic governor systems), buildupfrom infrequent changes, clogged filters, etc. Recent problems at several utilities also indicate that contaminatedcontrol oil may cause the governor response to be too slow to control turbine starts. The electric governors (EGseries) are particularly susceptible to this phenomena. This is because the governor control oil is supplied from theturbine lubricating oil sump. Therefore contamination of one system lead; to contamination of both systems. Thesecontaminants may accumulate on any surface that is normally in contact with the oil.
The quality of the oil used in the governor is critical to proper governor function. Supplement 2 to NRCInformation Notice 86-14 clearly demonstrates performance degradation due to dirty oil. For purposes of this reportdirty oil will be called contaminated oil.
Water contamination has two primary sources: Leaking oil coolers, and leaking steam seals. Once steam has leakedpast the shaft seals it can condense and contaminate the control oil. For EG systems the shaft seals most affectedare the turbine shaft seals. For mechanical (PG) type governors leakage past the governor drive shaft is the mostprobable path of steam leakage.
Water' in the control oil of the governor can create rust inside the governor. Rust clogs orifices, causing thegovernor to respond poorly. Water in the control oil also tends to change the viscosity of the control oil, and thuschanging the operating characteristics of the governor.
Many times the root cause of a problem is not determined. Since this is a safety system, its failure may put theplant in a Limiting Condition of Operation (LCO). The system must be returned to operation within a certain period(typically 72 hours), or the plant must be shut down. Therefore, the entire governor assembly may be replaced,and the root cause never determined.
4.0 Conclusions
The aging study of turbine pump drives is ongoing. The data evaluated to date indicate an increase in turbinereliability in recent years. Demand failures are decreasing and more problems are being found duringinspection/testing. Experience and education appear to have a major part in these positive trends. With propermaintenance the turbine can be a reliable part of nuclear plant safety systems.
5.0 Recommendations
Three areas are particularly important to enhancing turbine system reliability:
* Periodically perform complete chemical analysis of turbine and governor oil. This will reveal the presence ofcontaminants and/or oil degradation. The experience of each utility should be used to determine a time periodthat will increase reliability (for example, annual or semi-annual analysis).
* Calibrate governors on a regular basis. Currently, this is not a requirement in the plant technical operatingspecifications.
380
* Periodically verify overspeed tip operation by manually taking the turbine to overspeed to verify the functionof the mechanical overspeed trip mechanism. This is a vendor recommendation, and will give a positiveindication that the entire mechanical overspeed trip mechanism is properly functioning.
References
1. D.A. Casada, Oak Ridge National Laboratory, Auxiliary Feedwater System Aging Study - NUREG/CR-5404
2. Terry Turbine Controls Guide, EPRI NP-6909s
381
SAND91-1397C
Aging, Condition Monitoring, and Loss-of-Coolant Accident (LWOCA) Testsof Class lE Electrical Cables: Summary of Results
Mark J. Jacobus
Sandia National LaboratoriesAlbuquerque, NM 87185
C.
Abstract '
This paper summarizes the results of aging, condition monitoring, and accident testing ofClass 1E cables used in nuclear power generating stations. Three sets of cables wereaged. for up to 9 months under simultaneous thermal (alOO0 C) and radiation(40.10 kGyfhr) conditions. After the aging, the cables were exposed to a simulatedaccident consisting of high dose rate irradiation (-6 kGy/hr) followed by a hightemperature steam exposure. A fourth set of cables, which were unaged, were alsoexposed to the accident conditions. The cables that were aged for 3 months and thenaccident tested were subsequently exposed to a high temperature steam fragility test (upto 400"C), while the cables that were aged for 6 months and then accident tested weresubsequently exposed to a 1000-hour submergence test in a chemical solution.' Theresults of the tests indicate that the feasibility of life extension of many popular nuclearpower plant cable products is promising and that mechanical measurements (primarilyelongation, modulus, and density) were more effective than electrical measurements formonitoring age-related degradation. In the high temperature steam test, ethylenepropylene rubber (EPR) cable materials generally survived to higher temperatures thancrosslinked polyolefin (XLPO) cable materials. jn dielectric testing after thesubmergence testing, the XLPO materials performed better than the EPR materials.This paper presents some' recent experimental data that are not yet available elsewhereand a summary of findings from the entire experimental program.
1.0 INTRODUCTION
Cables are used throughout nuclear power plants in a wide variety of applications. Cablequalification typically includes thermal and radiation aging intended to put the cable inits end-of-life condition.' The radiation dose is' normally applied at high dose rates (1-10kGy/hr) with Arrhenius methods used to establish accelerated aging times andtemperatures. Generally, the radiation and thermal aging are applied to the specimenssequentially.. Because-of'the high dose rates and temperatures that are typicallyemployed, cable materials can experience oxygen diffusion effects that result in non-uniform'aging. Consequently, it is of interest to 'determine the extent to which thesefactors might have affected previous testing. Typical qualification programs also providevery little information that is useful for establishing effective condition monitoringprograms to assess remaining cable life. The current experimental program goes beyondprevious efforts by employing considerably less accelerated, simultaneous thermal andradiation aging conditions; by employing many more condition monitoringmeasurements during aging; and by performing similar accident-tests on cables aged tothree different nominal lifetimes.
The broad objectives of this' e'perimental program weie to determine the life extension-potential of popular cable products used in nuclear, power plants and to determine thepotential of condition monitoring'(CM) for residual life'assessment.
* The Aging Degradation of Cables Program is supported by the United States Nuclear RegulatoryCommission and performed at Sandia Nationa Laboratories, which is operated for the U.S.Department of Energy under contract number DE-AC04-76DP00789.
383
A number of previous publications describe different aspects of this experimentalprogram. Reference [11 describes the overall test program, some details of the electricalcondition monitoring measurements, and a small amount of the electrical conditionmonitoring data. Reference [2] gives an overview of some of the mechanical propertymeasurements for many different cable types, while References [3] and [4] provide moredetailed mechanical property data for XLPO and EPR cable products, respectively.None of the density or modulus profile data is available in References [2-4]; thereforesome of that data will be included in this paper. Referefice [5) gives an overview of theLOCA test data from the cables that were aged to a nominal lifetime of 60 years.Reference [6] gives more LOCA test data with some comparisons of the accidentbehavior of cables aged to the three different nominal lifetimes. Reference [7] givesdetailed results of the high temperature steam test and the submergence test. Finally, aseries of three reports -10J that describe the complete testing program (except theinformation already included i Reference [71) is in preparation.
2.0 EXPERIMENTAL ARRANGEMENT
The experimental program consisted of two phases. Phase I was' a simultaneous thermal(=100° C) and radiation aging (=0.10 kGy/hr) exposure, and Phase II was an accidentexposure consisting of high dose rate irradiation (.6 kGy/hr) followed .by a simulatedloss-of-coolant accident (LOCA) steam exposure. Our test program generally followedthe guidance of IEEE 323-1974 [11] and IEEE 383-1974 [12].
In Phase I, we included up to 12 different cable products (see Table 1) in three differenttest chambers, with the cables in each chamber aged ito a different extent prior toaccident testing. Cables were aged for 3 months in the first chamber, 6 months in thesecond chamber, and 9 months in the third chamber. (A fourth chamber, containingunaged cables, was only used for the accident exposure of Phase II.) The acceleratedaging temperature was determined by equating the 6-month exposure to a 40-year lifeand assuming an activation energy of 1.15 eV and a plant ambient temperature of 552C.The accelerated radiation aging dose rate was detexmined by assuming a 40-yearradiation dose of 400 kGy. The 3-month chamber was therefore nominally equivalent to20 years of aging and the 9-month chamber was nominally equivalent to 60 years ofaging. The aging was performed in Sandia's Low Intensity Cobalt Array (LICA) facility.During the aging exposure, cable lead wires and penetrations were shielded to reducetheir radiation and thermal exposures and reduce artificial failures that might occur atthese locations.
For each' cable type, 23-m (76-ft) lengths of cable were wrapped around a mandrel. Theeffective cable length inside the test chamber was typically 4.6-6.1 m '(15-20 ft), with theremainder of the cable used for external connections.- Where both single' andmulticonductors samples of the same cable were tested, the single conductors wereobtained by stripping the jacket from' the multiconductor and renioving all, fillermaterials.
Dose rates in the chambers were determined using thermoluminescent dosimeters(TLDs). The 'estimated uncertainty in the radiation aging exposure data is 20%. Thetest chamber temperature was maintained using electric wall heaters: and electric'inletair heaters. Temperature uniformity was controlled to the extent possible by insulatingthe chamber and providing air circulation. About 4.7 1/s (10 ft3/min), of outside air'(about 40 air'changes per hour) was introduced into the chamber to maintain circulation'and amIbient oxygen concentration. The pressure in e6ich chamber was maintainedslightly above ambient to prevent water leakage into the chamber. The pressure was notcontinuously recorded nor controlled. With Albuquerque's altitude reducing ambient
.
384
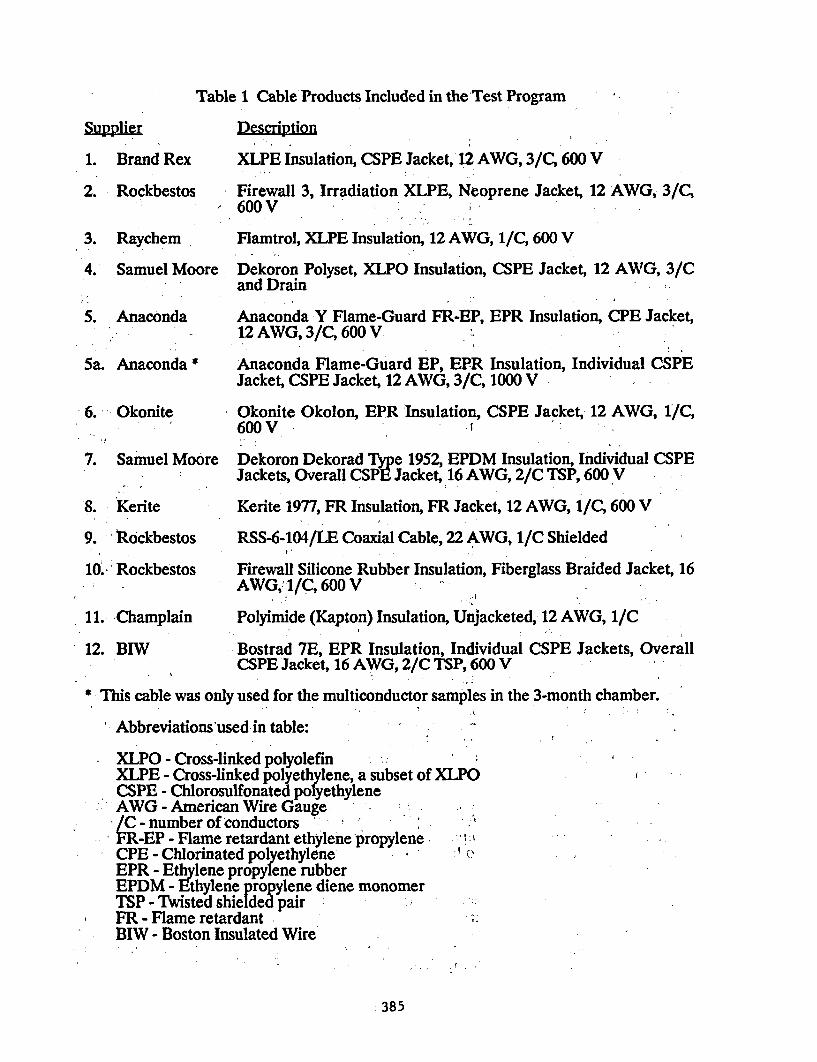
Table 1 Cable' Products Included in the Test Program
1. Brand Rex
2. Rockbestos
3. Raychem
Description
XLPE Insulation, CSPE Jacket, 12 AWG, 3/C, 600 V
Firewall 3, Irradiation XLPE, Neoprene Jacket, 12 AWG, 3/C,600 V
Flamtrol, XLPE Insulation, 12 AWG, 1/C, 600 V
4. Samuel Moore Dekoron Polyset, XLPO Insulation, CSPE Jacket, 12 AWG, 3/Cand Drain
5. Anaconda Anaconda Y Flame-Guard FR-EP, EPR Insulation, CPE Jacket,12 AWG, 3/C, 600 V
5a. Anaconda Anaconda Flame-Guard EP, EPR Insulation, Individual CSPEJacket, CSPE Jacket, 12 AWG, 3/C, 1000 V
-6. Okonite Okonite Okolon, EPR Insulation, CSPE Jacket, 12 AWG, 1/C,600V
7. Samuel Moore Dekoron Dekorad Type 1952, EPDM Insulation, Individual CSPEJackets, Overall CSPE Jacket, 16 AWG, 2/C TSP, 600 V
8. Kerite Kerite 1977, FR Insulation, FR Jacket, 12 AWG, 1/C, 600 V
9. -ockbestos RSS-6-104/LE Coaxial Cable, 22 AWG, 1/C Shielded
10. Rockbestos Firewall Silicone Rubber Insulation, Fiberglass Braided Jacket, 16AWG, 1/C, 600 V
11. Champlain Polyimide (Kapton) Insulation, Unjacketed, 12 AWG, 1/C
12. BIW Bostrad 7E, EPR Insulation, Individual CSPE Jackets, OverallCSPE Jacket, 16 AWG, 2/C TSP, 600 V
This cable was only used for the multiconductor samples in the 3-month chamber.
Abbreviations used in table:
XLPO - Cross-linked polyolefinXLPE - Cross-linked polyethylene, a subset of XLPOCSPE - Chlorosulfonated polyethyleneAWG - American Wire Gauge/C - number of conductorsPR-EP - Flame retardant ethylene propylene-CPE - Chlorinated polyethylene-EPR - Ethylene propylene rubberEPDM - Ethylene propylene diene monomerTSP - Twisted shielded pairFR -Flame retardant-BIW - Boston Insulated Wire
385
pressure of about 20% from sea level conditions, the positive gauge pressure in the testchamber resulted in an absolute pressure close to ambient pressure at sea level.
In addition to the 23-m lengths of cable, 15-cm (6-in)'insulation and jacket specimensand 36-cm (14-in) single and multiconductor cable samples were also included in the testchambers during aging. The 15-cm insulation and jacket samples were used for tensilestrength and elongation testing. The copper conductors were removed from these cablesamples prior to the beginning of aging. The 36-cm completed cable samples, whichwere simply cut from a reel of cable, were used for hardness and modulus testing.
During the aging exposure, various electrical and mechanical condition monitoringmeasurements were performed on the cables. Some of the measurements wereperformed on completed cable samples and others were performed on the small samplesremoved from the test chambers during aging. The parameters measured includedinsulation resistance and polarization index at three different voltages, capacitance anddissipation factor over a wide range of frequencies, elongation and tensile strength atfailure, modulus profiles, cable indenter modulus tests (using a cable indenter developedat Franklln Research Center under Electric Power Research Institute funding [13,141),hardness, and bulk density.
Phase II consisted of exposing each set of aged cables, as well as the set of unaged cables,to a simulated LOCA environment in Sandia's Area I facility. The cables were firstexposed to a nominal accident radiation dose of 1100 kGy at a dose rate of 6 kGy/hr.The estimated uncertainty in the actual accident radiation exposure data is ±10%. Thesamples were then exposed to a high temperature and. pressure steam environment. Thetest profile generally followed that given in IEEE 323-1974 [11] for a combinedBWR/PWR generic test except that the final portion of our tests was at a highertemperature and for a shorter duration than IEEE 323 suggests. Four separate LOCAtests were performed, one for each test chamber.; The cables were energized at 110 Vdcduring the accident simulations. Insulation resistance measurements (IRs) weremeasured on-line throughout the test. IRs were also measured periodically with anindependent measurement technique that is more accurate than the on-linemeasurement system at IRs above 108 o. No chemical spray was used during the steamexposure,.but a 1000-hr post-LOCA submergence test was performed on the cables thathad been aged for 6 months and accident tested. The submergence test used a chemicalspray solution similar to the spray, solution recommended by IEEE 323-1974 [11]. Thenominal conditions during the submergence, test were 95±50C with a slightly positivepressure. The cables that had been aged for 3 months and then accident test weresubsequently exposed to a high temperature steam fragility test that included a peaktemperature of 4000C (750F). The test profile for the high temperature steam test isshown in Figure 1. The purpose of the high temperature steam test was to study theultimate fragility level of typical cable; the test conditions are well beyond the designbasis for nuclear power plants. Details of the submergence and high temperature steamtests may be found in Reference [7].
Details of the mechanical measurement techniques, except for density and modulusprofiling, are available in Reference [4] and will not be repeated here; Details of theelectrical measurement techniques are given in Reference 11] and will not be repeatedhere. Descriptions of the modulus profiling and density measurement techniques aregiven below:
a. Modulus profiles were determined using an appar1tus developed at Sandia [15,16].The modulus is a measure of the slope of the stress versus strain curve in the initiallinear portion of the curve. The modulus profile gives information on the modulusof the sample across its cross section. It also gives an indication of the uniformityof the aging process [15,16]. The primary purpose for using modulus profiling in
386
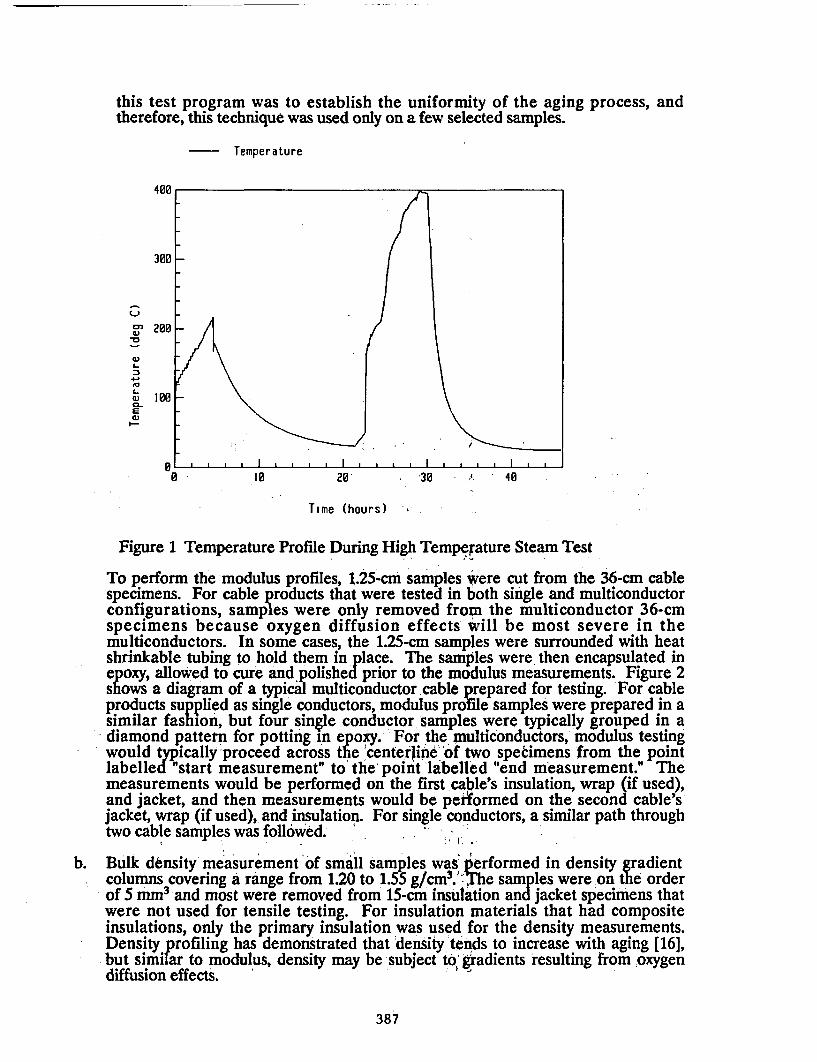
this test program was to establish the uniformity of the aging process, andtherefore, this technique was used only on a few selected samples.
Temperature
400
300 -
,, 200 ,
w if \I(U 100 _
0 \ I \
0 10 20 '30 40
Time (hours)
Figure 1 Temperature Profile During High Tempefature Steam Test
To perform the modulus profiles, 1.25-cm samples were cut from the 36-cm cablespecimens. For cable products that were tested in both single and multiconductorconfigurations, samples were only removed from the multiconductor 36-cmspecimens because oxygen diffusion effects will be most severe in themulticonductors. In some cases, the 1.25-cm samples were surrounded with heatshrinkable tubing to hold them in place. The samples were. then encapsulated inepoxy, allowed to cure and polished prior to the modulus measurements. Figure 2shows a diagram of a typical multiconductor cable prepared for testing. For cableproducts supplied as single conductors, modulus profile samples were prepared in asimilar fashion, but four single conductor samples were typically grouped in adiamond pattern for potting in epoxy. For the xnulticonductors, modulus testingwould typically proceed across tfie centerini 6of two specimens from the pointlabelled "start measurement" to' the point 'labelled "end measurement." Themeasurements would be performed on the first cable's insulation, wrap (if used),and jacket, and then measurements would be petformed on the second cable's-jacket, wrap (if used), and insulation. For single conductors, a similar path throughtwo cable samples was followed.
b. Bulk density measurement of small samples was performed in density gradientcolumns covering a range from 1.20 to 1.5-5 g 'cm3 -'The samples were on the orderof 5 mm3 and most were removed from 15-cm insulation and jacket specimens thatwere not used for tensile testing. For insulation materials that had compositeinsulations, only the primary insulation was used for the density measurements.Density profiling has demonstrated that 'density tends to increase with aging [16],but similar to modulus, density may be subject to, gradients resulting from oxygendiffusion effects.
387
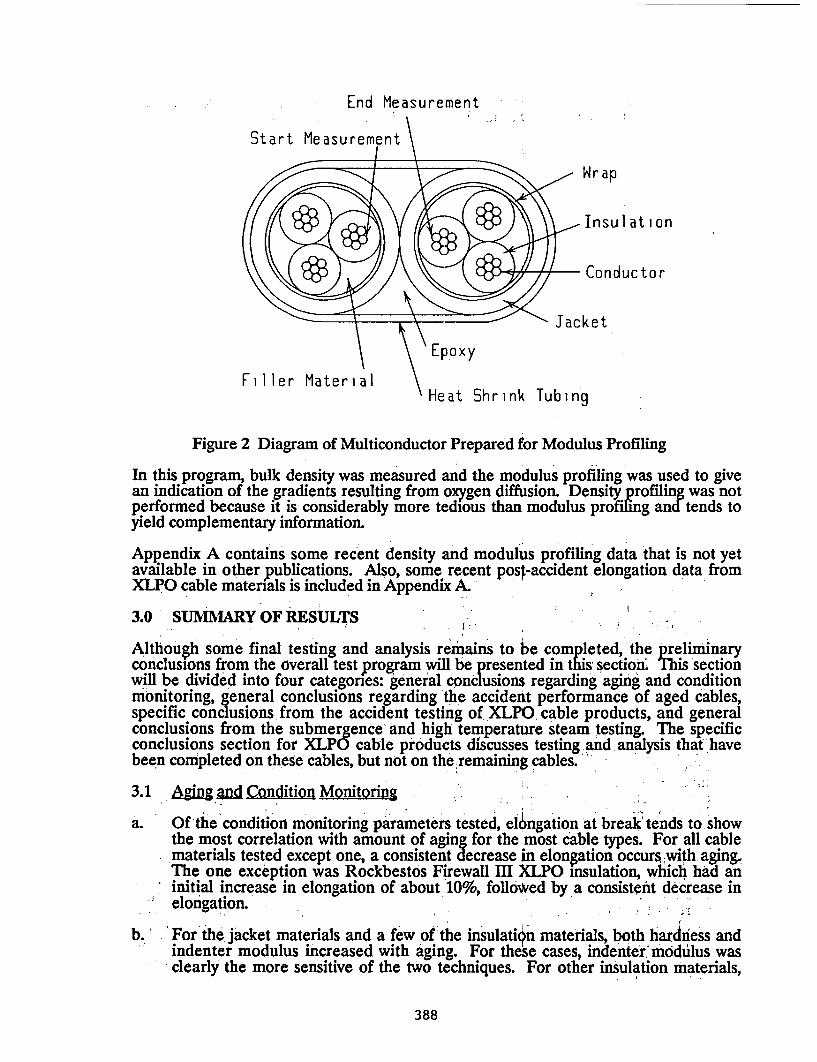
End Measurement
Start Measurement\
Wr ap
Insulation
Conductor
~- \ \ ~ JacketEpoxy
Filler MaterialHeat Shrink Tubing
Figure 2 Diagram of Multiconductor Prepared for Modulus Profiling
In this program, bulk density was measured and the modulus profiling was used to givean indication of the gradients resulting from oxygen diffusion. Density profiling was notperformed because it is considerably more tedious than modulus profiling and tends toyield complementary information.
Appendix A contains some recent density and modulus profiling data that is not yetavailable in other publications. Also, some recent post-accident elongation data fromXLPO cable materials is included in Appendix A.,
3.0 SUMMARY OF RESULTS
Although some final testing and analysis remains to be completed, the preliminaryconclusions from the overall test program will be presented in this section. This sectionwill be divided into four categories: general conclusions regarding aging and conditionmonitoring, general conclusions regarding the accident performance of aged cables,specific conclusions from the accident testing of XLPO cable products, and generalconclusions from the submergence and high temperature steam testing. The specificconclusions section for XLPO cable products discusses testing and analysis that havebeen completed on these cables, but not on the remaining cables.
3.1 Aging and Condition Monitoring
a. Of the condition monitoring parameters tested, elongation at break tends to showthe most correlation with amount of aging for the most cable types. For all cablematerials tested except one, a consistent decrease in elongation occurs with aging&The one exception was Rockbestos Firewall Iml XLPO insulation, which had aninitial increase in elongation of about 10%, followed by a consistent decrease inelongation.
b. 'For the jacket materials and a: few of the insulation materials, both hardness andindenter modulus increased with aging. For these cases, indenter., modulus wasclearly the more sensitive of the two techniques. For other insulation materials,
388
particularly EPR materials that did not have a bonded jacket and XLPO materials,hardness and indenter modulus did not change consistently.
c. Over the 9-month aging period, density increased by 1-6% for many of theinsulation and jacket materials. However, a few materials had no change orinconsistent changes in density.
d. Although there were some exceptions, neither tensile strength nor any of theelectrical measurements had any significant, consistent trend with aging.
e. The modulus profiles indicated that oxygen diffusion effects were minimal in mostcases. Some materials did experience diffusion effects, but evidence indicated thatthese effects were not overly severe.
3.2 Accident Performanc Qf Aged Cables
a. In most cases, the maximum differences between the accident insulation resistanceof unaged cables and cables aged to the three different lifetimes was about twoorders of magnitude. The range of the accident insulation resistances of the cablesaged to the three different lifetimes was normally less than one order ofmagnitude. In most cases, insulation resistance during the accident was lower forcables that had greater amounts of aging.
b. The accident insulation resistance of individual conductors removed frommulticonductor cables was typically higher than the insulation resistance of themulticonductor cable, indicating that testing of. only single conductor cables (aspermitted by IEEE 383-1974 [12]) may not adequately represent the insulationresistance behavior of multiconductor cables.
c. Over the range from 50-250 V, insulation resistance was largely independent of testvoltage during both aging and accident testing for all materials.
d. As expected, during accident testing, the insulationyXesistance of most cables testedbehaved in a reasonably consistent inverse temperature fashion, i.e., as thetemperature was reduced, the insulation resistance increased.
e. During the initial steam transients, some cables had insulation resistances that fellwell below the steady state value and then recovered. Except for this overshootphenomenon, periodic measurements of IR would have been sufficient to indicatecable performance throughout the accident tests.
3.3 Accident performance of A- XLPO Ca1bles
a. The three XLPO multiconductor cable products tested had accident IRs that werewithin an order of -magnitude of each other. The iingle conductor cable producttested had IRs that were 2-3 orders of magnitude higher than the multiconductors.
b. Only one XLPO conductor failed during the accident tests. This was one of threeconductors of one of two Rockbestos multiconductor cables that had been aged for9 months (nominal equivalent of 60 years). Thus, the generic life extensionpotential of the XLPO cable products is very promising.
c. A statistically significant conclusion regarding the number of failures versus theamount of aging for XLPO cable products is difficult. However, the only XLPO
389
conductor that failed during an accident test was'one that had been aged for themaximum amount of time.
d. The accident IR performance of our XLPO cablesaged to three different lifetimeswas comparable to the accident performance of aged XLPO cables in industry testsat somewhat different aging conditions. This observation reinforces the notion thatgross electrical failures during accident conditions are necessarily preceded bymechanical degradation, which may be'either global or local (e.g., material flaw).
e. With the exception of the one conductor that failed during the LOCA test, allXLPO conductors successfully passed high voltage tests at an applied voltage of80 V/mil following the accident tests. Three conductors (all Dekoron PolysetXLPO) failed a similar high voltage test after an IEEE 383-1974 [12] post-accidentmandrel bend test. However, the location of the failures may have received morethermal aging than the rest of the cable. All three conductors failed within 5 cm(2 in) of each other, near where the cables began wrapping on the aging/accidenttest mandrel.
f. Following the accident exposure, dielectric withstand voltages of XLPO cableswere very high. Mechanical damage (cracking) was generally necessary to causebreakdown voltages to occur at voltages below 80 V/mil of insulation.
g. When cracking was observed after mandrel bends, it was usually through to theconductor and very obvious. '
h. For three of the four XLPO materials that had been aged for 9 months, theelongation was greater after the accident test than before the accident test. Thismay be a resuft of moisture being absorbed into the cable and acting as aplasticizer or a result of the crystalline structure of the XLPO materials beingmelted and reformed.
i. Although the IEEE 383-1974 [12] mandrel bend requirement is quite severe, mostof the XLPO materials tested to our conditions survived mandrel bendssignificantly more severe than the IEEE 383 requirement. This result is consistentwith the elongations of the cables following exposure to the accident conditions.Based on the elongation prior to the steam exposure, the cables would not havedone as well in bend tests if they had been tested prior to the steam exposure.
3.4 Submergence Testing and High Temperature Steam Tesfing
a. EPR cables generally survived to higher temperatures than XLPO cables in thehigh temperature steam fragility test. The XLPO-insulated conductors had noinsulation remaining at the end of the test (after a 400C peak exposure)
b. i; A number of cables that performed well during the submergence test failed post-submergence dielectric withstand testing (either before or after the mandrel bend).This demonstrates that the IEEE 383 dileectric withstand tests and mandrel bendscan induce failure of otherwise functional cables. Note that this conclusion doesnot imply a criticism of the IEEE 383 requirements, which are intended to providea level of conservatism in the testing. ' '
c. The IEEE 383 dielectric withstand tests are very severe even if a mandrel bend isnot performed. This is evidenced by the failure of nine conductors and the nearfailure of three more conductors in the post-submergence dielectric withstand test
390
X(with no prior mandrel bend). Near failure in this case was leakage currents stillslightly below the acceptance criterion, but an order of magnitude higher thanthose prior to the submergence test. Only two of the conductors that failed thisdielectric test indicated strong degradation during the submergence test.
d. XLPO cables generally performed better than EPR cables in the submergence testand in. the post-submergence dielectric testing. By the end of the final dielectrictest (after a 4OxD mandrel bend), only 1 of 11 XLPO-insulated conductors hadfailed, while 17 of 20 EPR-insulated conductors had failed.
4.0 REFERENCES
1. M. J. Jacobus, "Condition Monitoring Methods Applied to Class E' Cables,"International Journal of Nuclear Engineering and Design, 118 (1990) pp. 497-503.
2. M. J. Jacobus and G. F. Fuehrer, "Mechanical Properties of Cables Exposed toSimultaneous Thermal and Radiation Aging," SAND90-1690C, Appears inProceedings of the U.S. Nuclear Regulatory Commission Eighteenth Water ReactorSafety Information Meeting, NUREG/CP-0114, Vol.3, April, 1991.
3. M. J. Jacobus, "Mechanical Property Condition Monitoring of Cables Exposed toLong-Term Thermal and Radiation Aging--XLPO Results," SAND91-0187C,ANS Topical Meeting on Nuclear Power Plant & Facility Maintenance, Salt LakeCity, UT, April, 1991. t 1
4. M. J. Jacobus, "Mechanical Property Condition Monitoring of Cables Exposed toLong-Term Thermal and Radiation Aging--EPR Results," SAND91-0186C, 15thBiennial Reactor Operations Topical Meeting, Bellevue, WA, August, 1991.
5. M. J. Jacobus, "Loss-of-Coolant Accident (LOCA) Testing of Aged Cables forNuclear Plant Life Extension", Appears in Proceedings of the U.S. NuclearRegulatory Commission Seventeenth Water Reactor Safety Information Meeting,NUREG/CP-0105, Vol3, March, 1990.
6. M. J. Jacobus, "Loss-of-Coolant Accident (LOCA) Testing of Aged Cables withApplication to Nuclear Plant Life Extension," SAND90-0811J, submitted to theInternational Joumal of NuclearEngineering and Design
7. M. J. Jacobus and G. F. Fuehrer, Submergence and High Temperature Steam Testingof Class 1E Electrical Cables, "NUREG/CR-5655, SAND90-2629, April, 1991.
8. M. J. Jacobus, Aging Condition Monitoring, and Loss-of-Coolant Accident (LOCA)Tests of Class 1£ Electrical Cables, Volume 1: S Crosslinked Polyolefin Cables,NUREG/CR-5772, SAND91-1766/1, In preparation.
9. M. J. Jacobus, Aging, Condition Monitoring, and Loss-of-Coolant Accident (LOCA)Tests of Class JE Electrical Cables, Volume 2: Ethylene Propylene Rubber Cables,NUREG/CR-5772, SAND91-1766/2, In preparation.
, :' .- o -Coln Acidn l 'O. '10. M. J. Jacobus, Aging Condition Monitoring, and Los of-Coolant Accident (LOCA)
Tests of Class 1E Electrical Cables, Volume 3: Miscellaneous Cable Types, EG/CR.5772, SAND91-1766/3, In preparation.
11. IEEE Standard for Qualifying Class 1E Equipment for Nuclear Power GeneratingStations, IEEE Standard 323-1974, New York, NY.
391
12. IEEE Standard for Type Test of Class 1E Electric Cables; Field Splices, andConnections for Nuclear Power. Generating Stations, ANSI/IEEE Standard383-1974 (ANSI N41.1C-1975), New York, NY.
13. Toman, G. J. and G. Sliter, "Development of a Nondestructive MechanicalCondition Evaluation Test for Cable Insulation," Proceedings: Operability ofNuclear Power Systems in Normal and Adverse Environments, Albuquerque, NewMexico, September 29-October 3, 1986.
14. Gardner, J. B. and T. A. Shook, "Status and Prospective Application ofMethodologies from an EPRI Sponsored Indenter Test Project,' Appears inProceedings: Workshop on Power Plant Cable Condition Monitoring, EPRIEL/NP/CS5914-SR, July 1988.
15. Gillen, K T., R. L Clough, and C. A. Quintana, "Modulus Profiling of Polymers,"Polymer Degradation and Stability, Vol. 17, p. 31, 1987.
16. Clough, R. L., K. T. Gillen, and C. A. Quintana, Heterogeneous OxidativeDegradation in Irradiated Polymers, NUREG/CR-3643, SAND83-2493, SandiaNational Laboratories, Albuquerque, New Mexico, April 1984.
APPENDIX A Recent Experimental Data
This appendix presents some recent experimental data that has not yet been publishedelsewhere. Some results from density and modulus profile measurements are givenalong with some data from elongation testing of XLPO materials after accident testing.
A.1 Bulk Density
Plots of density relative to the initial value (D/Do) are presented in this section as afunction of total radiation dose. For reference, thebaseline density, Do, is shown on theplots. Note that small changes in density are readily detectable, so that a change of only1-2% can be very significant.
The density data is plotted against total radiation dose. Because of radiation gradients inthe test chambers, equal total dose on the plots does not necessarily imply an equalamount of thermal aging. Data from the aging portion of the exposure is coupled withdata for theaging plus accident radiation exposures. Th6 data below 600 kGy is from theaging exposures. The data above 600 kGy (as many as four data points) is from the aging(d, 3, 6, or 9 months) plus accident radiation exposures. Unaged samples that wereexposed to accident radiation only were includeed iih the 6-month chamber for theaccident dose and give a data point at about 800-1000 kGy. This total dose range isbelow the nominal accident dose because of the locations of the samples in the testchamber. '
The density of Brand Rex XLPE insulation (Figure A-3) had a consistent increase to1.5% above the initial value during the aging exposure. The accident radiation generallyinhreased the density slightly, but after the 9-month aging exposure, the- densitydecreased slightly- as a result'of the accident radiation exposure. The density of BrandRex CSPE jacket (Figure A4) first increased until the total dose reached 100 kGy, thendecreased during the remainder of the aging exposure. The accident radiation exposuredid not produce any notable effects on the density.
t . .
392
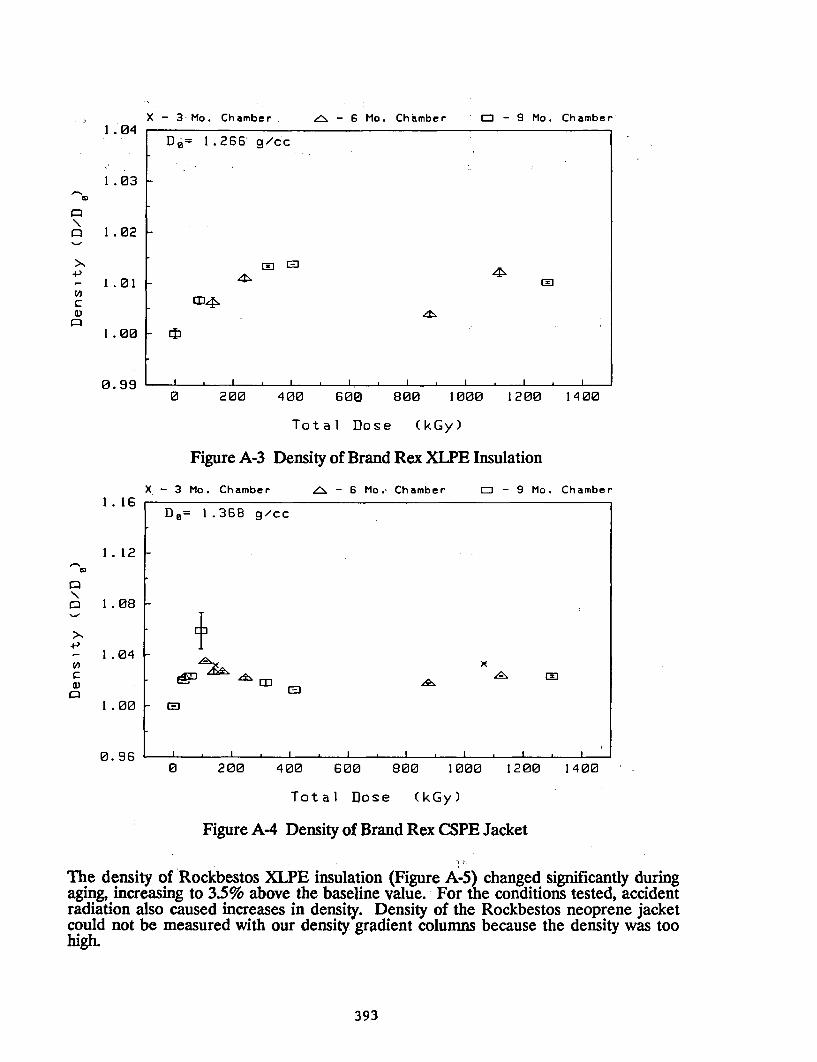
X - 3 Mo. Chamber as- 6 Mo. Chamber M6 - 9 Mo. Chamber1.04
a
>1
-P
1.03
1.02
D - 1.266 g/cc
r. 1
II E
tfllyI 01 -
1 .00
0.990 200 400 600 800 1000 1200 1400
Total Dose (kGy)
Figure A-3 Density of Brand Rex XLPE Insulation
X - 3 Mo. Chamber Zs - 6 Mo.. Chamber C] - 9 Mo. Chamber1. 16
1. 12co
4->
c0
a
1 .08
1.04
I.00
0.960 200 400 600 800 1000 1200 1400
Total Dose (kGy)
Figure A-4 Density of Brand Rex CSPE Jacket
The density of Rockbestos XLPE insulation (Figure A-5) changed significantly duringaging, increasing to 3.5% above the baseline value. For the conditions tested, accidentradiation also caused increases in density. Density of the Rockbestos neoprene jacketcould not be measured with our density gradient columns because the density was toohigh.
393
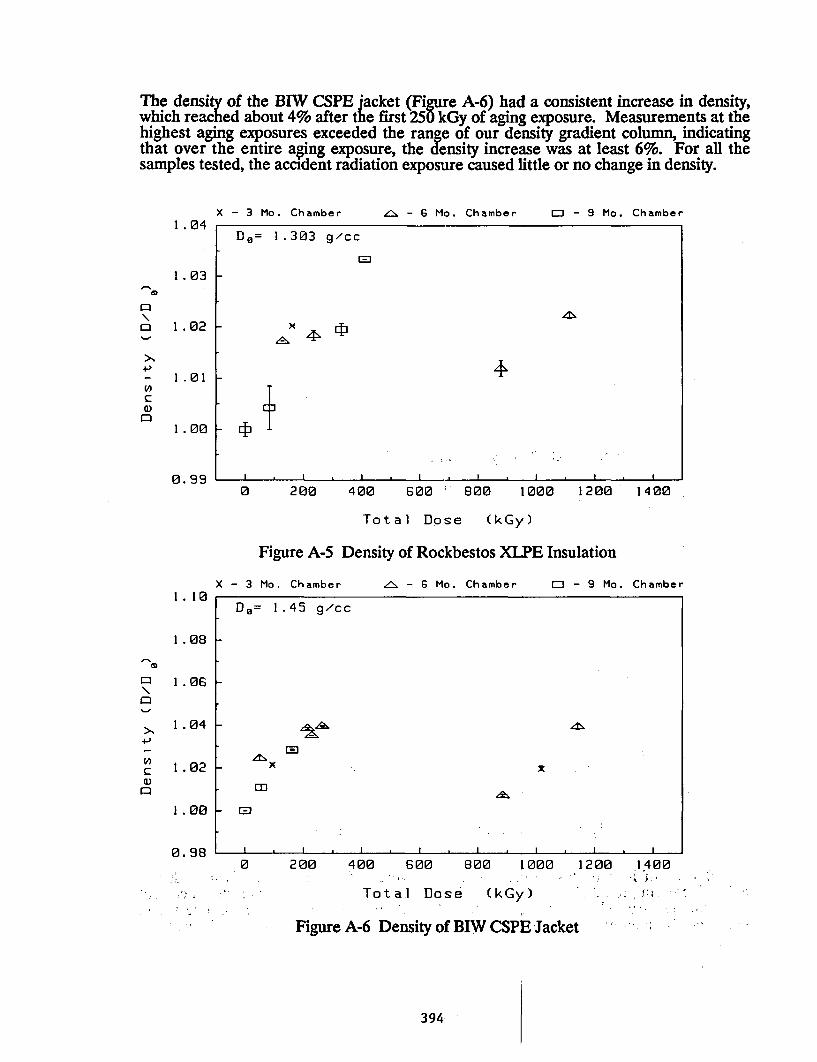
The density of the BIW CSPE jacket (Figure A-6) had a consistent increase in density,which reached about 4% after the first 250 kGy of aging exposure. Measurements at thehighest aging exposures exceeded the range of our density gradient column, indicatingthat over the entire aging exposure, the density increase was at least 6%. For all thesamples tested, the accident radiation exposure caused little or no change in density.
X - 3 Mo. Chamber is - 6 Mo. Chamber - 9 Mo. Chamber1 .04
Do= 1.303 g/cc
M3
1 . 03
a 1 . 02 X
I . 01
I . .
0 . 99 -0 200 400 600 800 1000 1200 1400
Total Dose (kGy)
Figure A-S Density of Rockbestos XLPE Insulation
X - 3 Mo. Chamber __ - 6 Mo. Chamber E- 9 Mo. Chamber1. 10
Do= 1.45 g/cc
I .08
=1 1.06
.044.)
C 1 . 02 xUCO
1.00 _ JI: . :0
0.98 , . , . , . . . ,0 200 400 600 800 1000 1200 1400
Total Dose (kGy) .
Figure A-6 Density of BIW CSPE Jacket
394
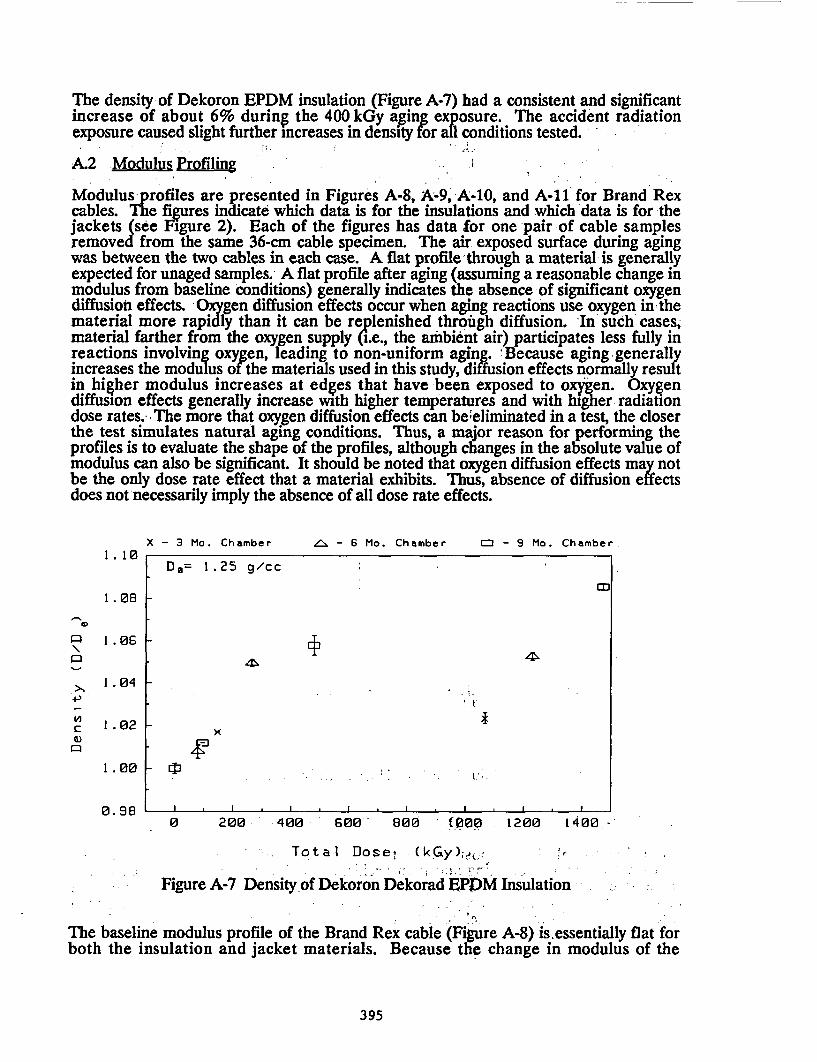
The density of Dekoron EPDM insulation (Figure A-7) had a consistent and significantincrease of about 6% during the 400 kGy aging exposure. The accident radiationexposure caused slight further increases in density ?or at conditions tested.
A.2 Modulus Profiling
Modulus profiles are presented in Figures A-8, A-9, A-10, and A-11 for Brand Rexcables. The figures indicate which data is for the insulations and which data is for thejackets (see Figure 2). Each of the figures has data for one pair of cable samplesremoved from the same 36-cm cable specimen. The air exposed surface during agingwas between the two cables in each case. A flat profile through a material is generallyexpected for unaged samples. A flat profile after aging (assuming a reasonable change inmodulus from baseline conditions) generally indicates the absence of significant oxygendiffusion effects. Oxygen diffusion effects occur when aging reactions use oxygen in thematerial more rapidly than it can be replenished through diffusion. 'In such cases,material farther from the oxygen supply (i.e., the ambient air) participates less fully inreactions involving oxygen, leading to non-uniform aging. Because aging generallyincreases the modulus of the materials used in this study, diffusion effects normally resultin higher modulus increases at edges that have been exposed to oxygen. O)xygendiffusion effects generally increase with higher temperatures and with higher radiationdose rates. The more that oxygen diffusion effects can be eliminated in a test, the closerthe test simulates natural aging conditions. Thus, a major reason for performing theprofiles is to evaluate the shape of the profiles, although changes in the absolute value ofmodulus can also be significant. It should be noted that oxygen diffusion effects ma notbe the only dose rate effect that a material exhibits. Thus, absence of diffusion effectsdoes not necessarily imply the absence of all dose rate effects.
X - 3 Mo. Chamber A- 6 Mo. Chamber O - 9 Mo. Chamber1.10
D 0 = 1.25 g/cc
1 . 08
1.06
1 . 04
1 .02 ~x:U,,
I .02
1.00 _l
0.98 , . . . . . . .0 200 400 600 800 (000 1200 t400
Total Doset (kGy).
Figure A-7 Density of Dekoron Dekorad EPDM Insulation
The baseline modulus profile of the Brand Rex cable (Figure A-8) is essentially flat forboth the insulation and jacket materials. Because the change in modulus of the
395
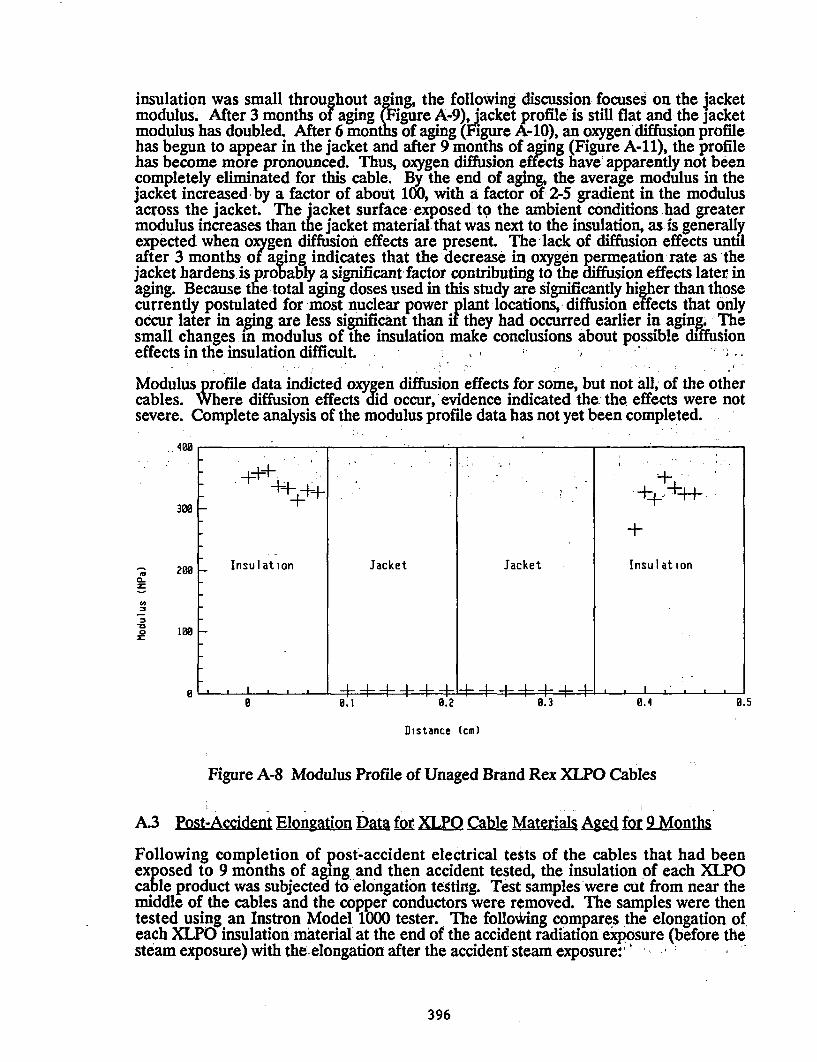
insulation was small throughout aging, the following discussion focuses on the jacketmodulus. After 3 months of aging (Figure A-9), jacket profile is still flat and the jacketmodulus has doubled. After 6 mont of aging (Figure A-10), an oxygen diffusion profilehas begun to appear in the jacket and after 9 months of aging (Figure A-11), the profilehas become more pronounced. Thus, oxygen diffusion effects have apparently not beencompletely eliminated for this cable. By the end of aging, the average modulus in thejacket increased by a factor of about 100, with a factor of 2-5 gradient in the modulusacross the jacket. The jacket surface exposed to the ambient conditions had greatermodulus increases than the jacket material that was next to the insulation, as is generallyexpected when oxygen diffusion effects are present. The lack of diffusion effects untilafter 3 months of aging indicates that the decrease in oxygen permeation rate as thejacket hardens is probably a significant factor contributing to the diffusion effects later inaging. Because the total aging doses used in this study aWe significantly higer than thosecurrently postulated for most nuclear power plant locations, diffusion effects that onlyoccur later in' aging are less significant' than if they had occurred earlier in aging. Thesmall changes in modulus of the insulation make conclusions about possible diffusioneffects in the insulation difficult.
Modulus profile data indicted oxygen diffusion effects for some, but not all, of the othercables. Where diffusion effects did occur,'evidence indicated the the effects were notsevere. Complete analysis of the modulus profile data has not yet been completed.
.400
+++300 -
g 208 Insulation Jacket Jacket Insulation
o 108
0 *1= ++++++ 1 I +±+±+, IO 0.1 0.2 0.3 0.4 0.5
Distance (cm)
Figure A-8 Modulus Profile of Unaged Brand Rex XLPO Cables
A.3 Post-Accident Elongation DM for XLPO Cable Materials Aged fu 9 Months
Following completion of post-accident electrical tests of the cables that had beenexposed to 9 months of aging and then accident tested, the insulation of each XLPOcable product was subjected to elongation testing. 'Test samples'were cut from near themiddle of the cables and the copper conductors were removed. The samples were thentested using an Instron Model 1000 tester. The following compares the elongation ofeach XLPO insulation material' at the end of the accident radiation exposure (before thesteam exposure) with the. elongation after the accident steam exposure:
396
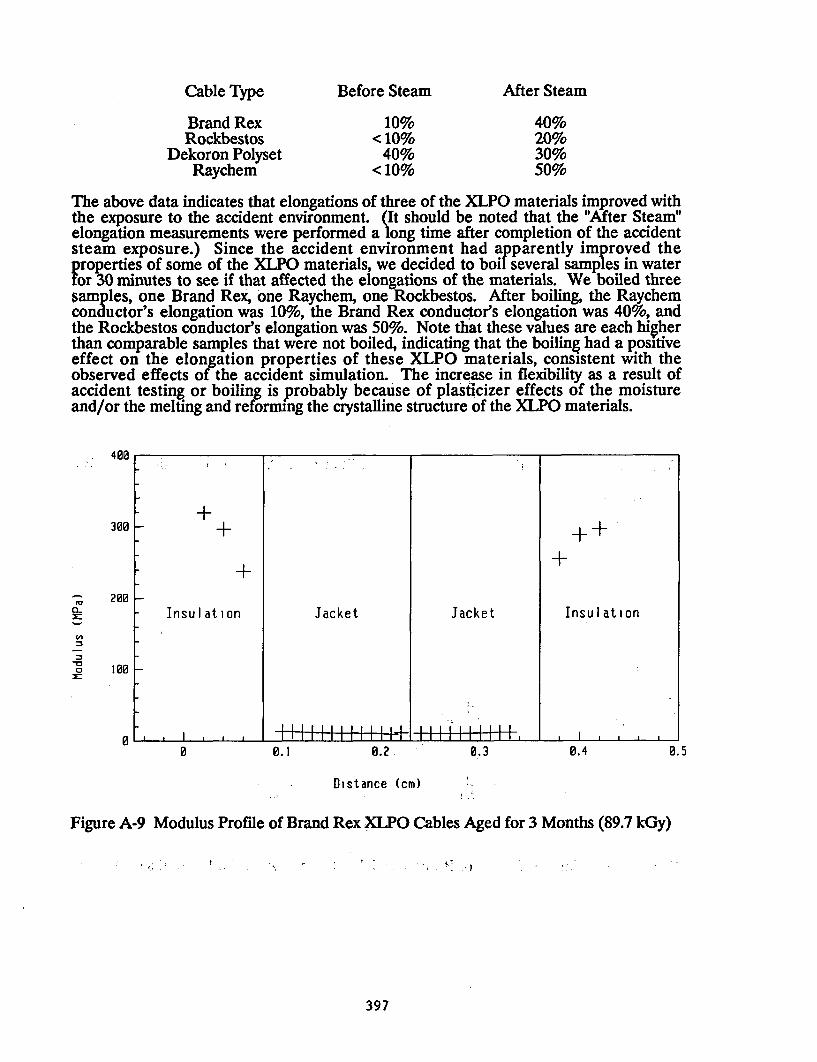
Cable Type Before Steam After Steam
Brand RexRockbestos
Dekoron PolysetRaychem
10%< 10%
40%< 10%
40%20%30%50%
The above data indicates that elongations of three of the XLPO materials improved withthe exposure to the accident environment. (It should be noted that the "After Steam"elongation measurements were performed a long time after completion of the accidentsteam exposure.) Since the accident environment had apparently improved theproperties of some of the XLPO materials, we decided to boil several samples in waterfor 30 minutes to see if that affected the elongations of the materials. We boiled threesamples, one Brand Rex, one Raychem, one Rockbestos. After boiling, the Raychemconductor's elongation was 10%, the Brand Rex conductor's elongation was 40%, andthe Rockbestos conductor's elongation was 50%. Note that these values are each higherthan comparable samples that were not boiled, indicating that the boiling had a positiveeffect on the elongation properties of these XLPO materials, consistent with theobserved effects of the accident simulation. The increase in flexibility as a result ofaccident testing or boiling is probably because of plasticizer effects of the moistureand/or the melting and reforming the crystalline structure of the XLPO materials.
- 400
±+
a-
_02:
Insulationr
l I l l l
100
Jacket
l-H+III444H±H-
Jacket
I i H I H | 1 i -,
+++
Insulation
I I l l l l00 0.1 0.2 0.3 0.4 0.5
Distance (cm)
Figure A-9 Modulus Profile of Brand Rex XLPO Cables Aged for 3 Months (89.7 kGy)
-~~~~ *,;E,
397
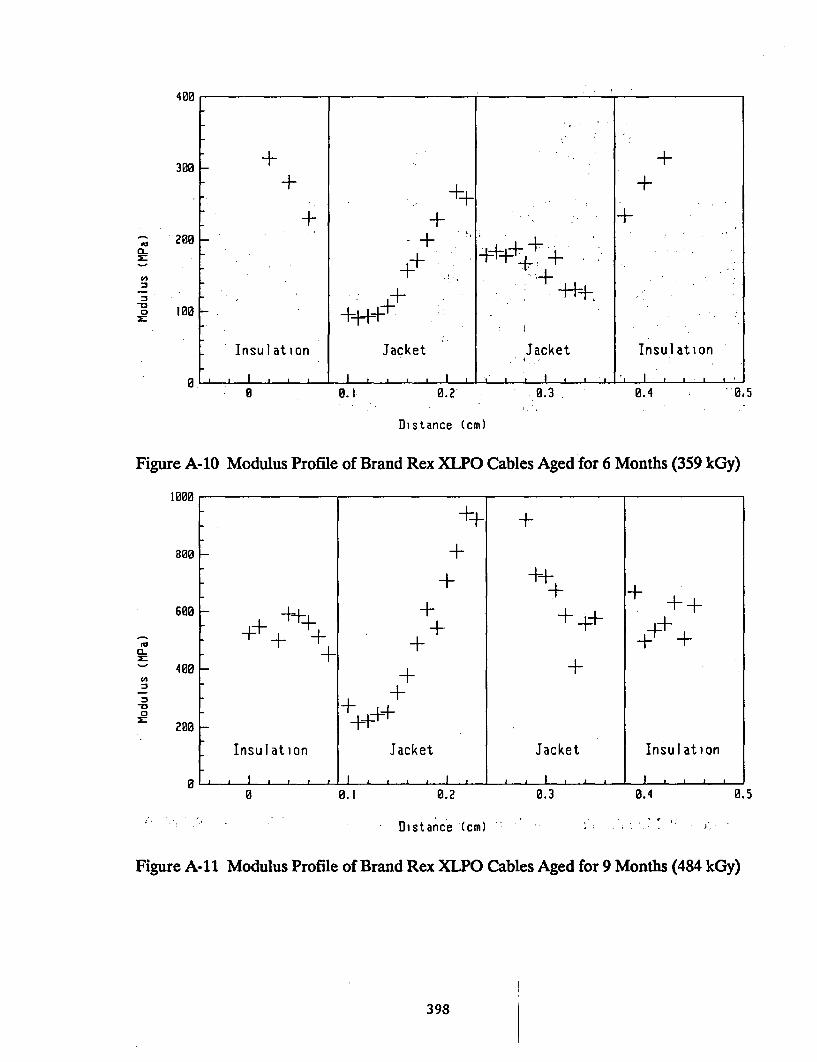
400
_0
0
0 0.1 0.2 . 0.3 0.4 0.5
Distance (cm)
Figure A-10 Modulus Profile of Brand Rex XLPO Cables Aged for 6 Months (359 kGy)
1000
800
rlaEL
'4
_0a
++ 4 ++
Insulation
1 I .,,,
++
+++++
Jacket
I . . . . I .
++
+++
Jacket
. , I . . .
Insulation
I . I I00.1 0.2 0.3 0.4 0.5
- Distance (cm) '; .. . '
Figure A-11 Modulus Profile of Brand Rex XLPO Cables Aged for 9 Months (484 kGy)
398 1
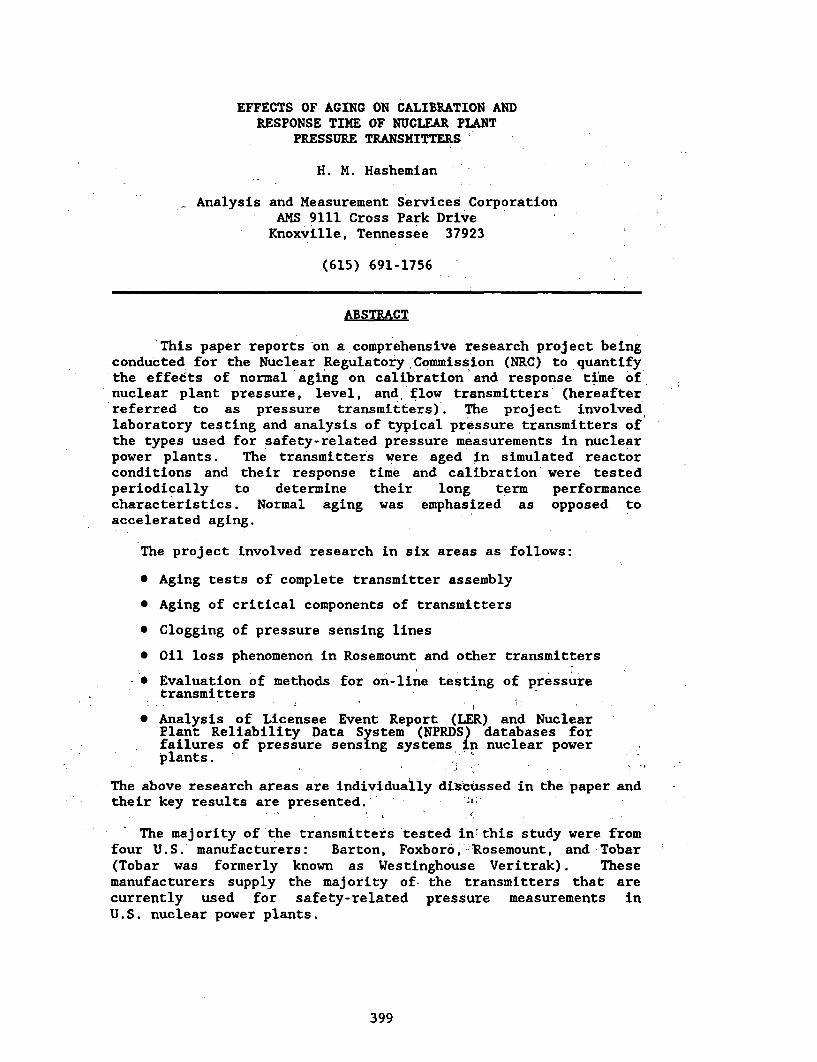
EFFECTS OF AGING ON CALIBRATION ANDRESPONSE TIME OF NUCLEAR PLANT
PRESSURE TRANSMITTERS
H. M. Hashemian
Analysis and Measurement Services CorporationAMS 9111 Cross Park DriveKnoxville, Tennessee 37923
(615) 691-1756
ABSTRACT
This paper reports on a comprehensive research project beingconducted for the Nuclear Regulatory Commission (NRC) to quantifythe effects of normal aging on calibration and response time ofnuclear plant pressure, level, and flow transmitters- (hereafterreferred to as pressure transmitters). The project involvedlaboratory testing and analysis of typical pressure transmitters ofthe types used for safety-related pressure measurements in nuclearpower plants. The transmitters were aged in simulated reactorconditions and their response time and calibration were testedperiodically to determine their long term performancecharacteristics. Normal aging was emphasized as opposed toaccelerated aging.
The project involved research in six areas as follows:
* Aging tests of complete transmitter assembly
* Aging of critical components of transmitters
* Clogging of pressure sensing lines
* Oil loss phenomenon in Rosemount and other transmitters
- * Evaluation of methods for on-line testing of pressuretransmitters
* Analysis of Licensee Event Report (LER) and NuclearPlant Reliability Data System (NPRDS) databases forfailures of pressure sensing systems in nuclear powerplants.
The above research areas are individually discussed in the paper andtheir key results are presented. '."
The majority of the transmitters'tested in~this study were fromfour U.S.' manufacturers: Barton, Foxboro,-Rosemount, and Tobar(Tobar was formerly known as Westinghouse Veritrak). Thesemanufacturers supply the majority of. the transmitters that arecurrently used for safety-related pressure measurements inU.S. nuclear power plants.
399
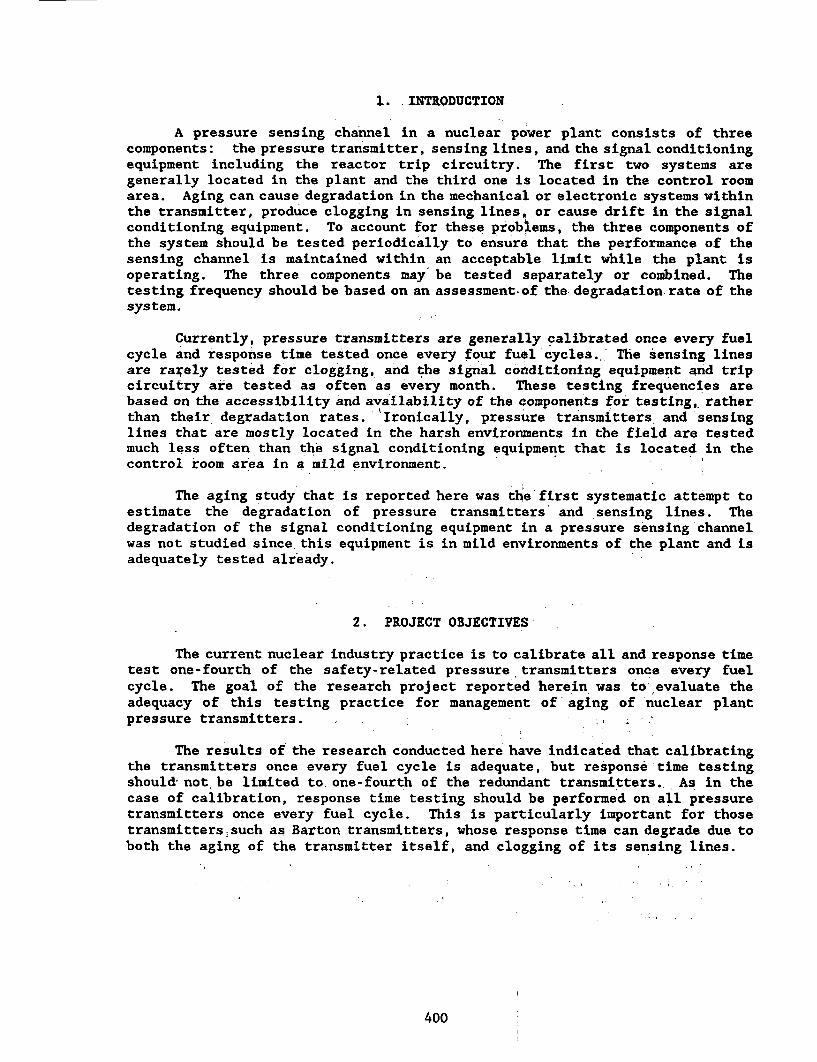
1. INTRODUCTION
A pressure sensing channel in a nuclear power plant consists of threecomponents: the pressure transmitter, sensing lines, and the signal conditioningequipment including the reactor trip circuitry. The first two systems aregenerally located in the plant and the third one is located in the control roomarea. Aging can cause degradation in the mechanical or electronic systems withinthe transmitter, produce clogging in sensing lines, or cause drift in the signalconditioning equipment. To account for these problems, the three components ofthe system should be tested periodically to ensure that the performance of thesensing channel is maintained within an acceptable limit while the plant isoperating. The three components may be tested separately or combined. Thetesting frequency should be based on an assessment-of the degradation rate of thesystem.
Currently, pressure transmitters are generally calibrated once every fuelcycle and response time tested once every four fuel cycles., The sensing linesare rarely tested for clogging, and the signal conditioning equipment and tripcircuitry are tested as often as every month. These testing frequencies arebased on the accessibility and availability of the components for testing,, ratherthan their degradation rates. Ironically, pressure transmitters and sensinglines that are mostly located in the harsh environments in the field are testedmuch less often than the signal conditioning equipment that is located in thecontrol room area in a mild environment.
The aging study that is reported here was the first systematic attempt toestimate the degradation of pressure transmitters and sensing lines. Thedegradation of the signal conditioning equipment in a pressure sensing channelwas not studied since this equipment is in mild environments of the plant and isadequately tested already.
2. PROJECT OBJECTIVES-
The current nuclear industry practice is to calibrate all and response timetest one-fourth of the safety-related pressure transmitters once every fuelcycle. The goal of the research project reported herein was to evaluate theadequacy of this testing practice for management of aging of nuclear plantpressure transmitters.
The results of the research conducted here have indicated that calibratingthe transmitters once every fuel cycle is adequate, but response time testingshoul& not be limited to one-fourth of the redundant transmitters. As in thecase of calibration, response time testing should be performed on all pressuretransmitters once every fuel cycle. This is particularly important for thosetransmitters.such as Barton transmitters, whose response time can degrade due toboth the aging of the transmitter itself, and clogging of its sensing lines.
400
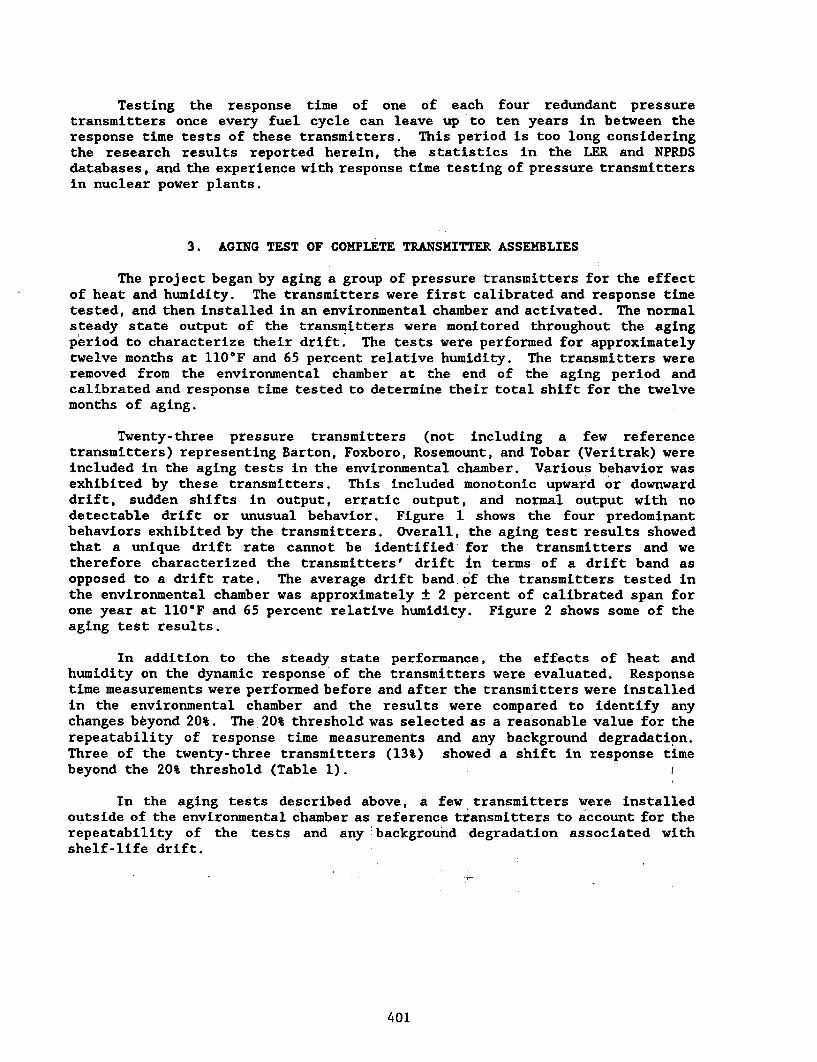
Testing the response time of one of each four redundant pressuretransmitters once every fuel cycle can leave up to ten years in between theresponse time tests of these transmitters. This period is too long consideringthe research results reported herein, the statistics in the LER and NPRDSdatabases, and the experience with response time testing of pressure transmittersin nuclear power plants.
3. AGING TEST OF COMPLETE TRANSMITTER ASSEMBLIES
The project began by aging a group of pressure transmitters for the effectof heat and humidity. The transmitters were first calibrated and response timetested, and then installed in an environmental chamber and activated. The normalsteady state output of the transmitters were monitored throughout the agingperiod to characterize their drift. The tests were performed for approximatelytwelve months at 110'F and 65 percent relative humidity. The transmitters wereremoved from the environmental chamber at the end of the aging period andcalibrated and response time tested to determine their total shift for the twelvemonths of aging.
Twenty-three pressure transmitters (not including a few referencetransmitters) representing Barton, Foxboro, Rosemount, and Tobar (Veritrak) wereincluded in the aging tests in the environmental chamber. Various behavior wasexhibited by these transmitters. This included monotonic upward or downwarddrift, sudden shifts in output, erratic output, and normal output with nodetectable drift or unusual behavior. Figure 1 shows the four predominantbehaviors exhibited by the transmitters. Overall, the aging test results showedthat a unique drift rate cannot be identified for the transmitters and wetherefore characterized the transmitters' drift in terms of a drift band asopposed to a drift rate. The average drift band of the transmitters tested inthe environmental chamber was approximately ± 2 percent of calibrated span forone year at 110'F and 65 percent relative humidity. Figure 2 shows some of theaging test results.
In addition to the steady state performance, the effects of heat andhumidity on the dynamic response of the transmitters were evaluated. Responsetime measurements were performed before and after the transmitters were installedin the environmental chamber and the results were compared to identify anychanges beyond 20%. The 20% threshold was selected as a reasonable value for therepeatability of response time measurements and any background degradation.Three of the twenty-three transmitters (13%) showed a shift in response timebeyond the 20% threshold (Table 1).
In the aging tests described above, a few transmitters were installedoutside of the environmental chamber as reference transmitters to account for therepeatability of the tests and any background degradation associated withshelf-life drift.
401
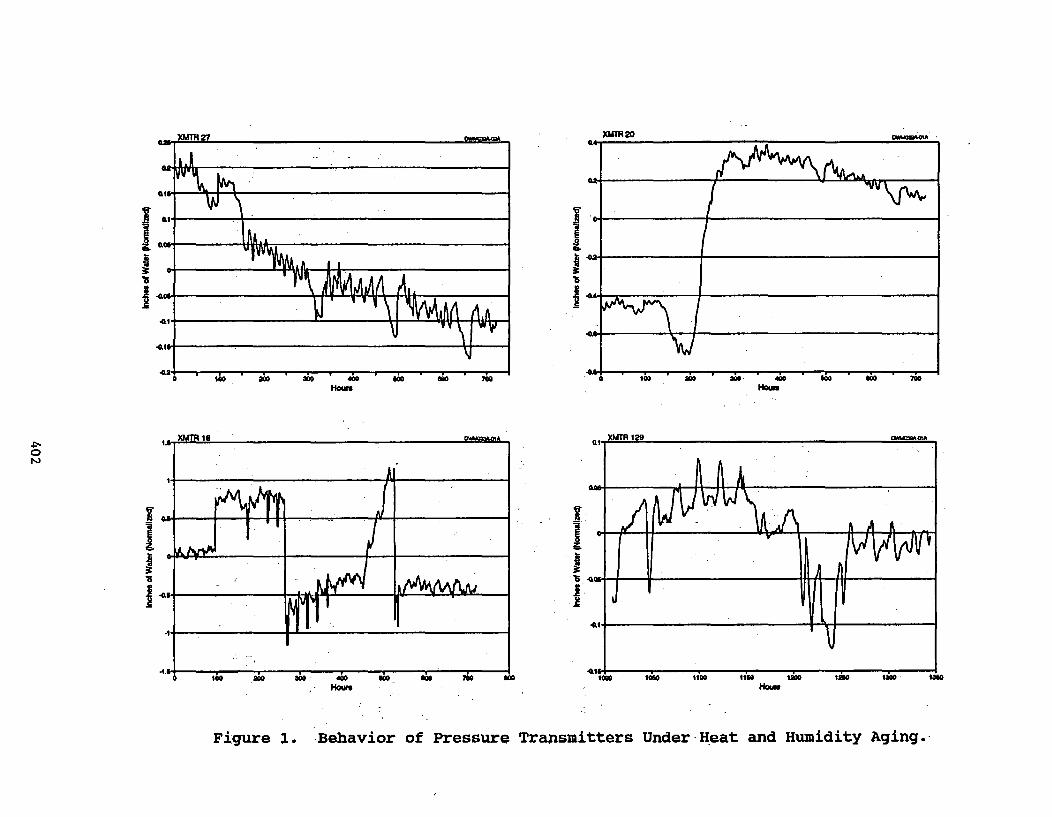
flaa
061
0.
41- A
.410
. MM la
42 Na0 100 3co 3oo 400 Lo 000 700
beMThIt ~0t
It ''i1X10' 1-m
14'- I 1 .y . 7': 1 IME1 | .
Hous
Figure 1. .Behavior of Pressure Transmitters Under-Heat and Humidity Aging.-
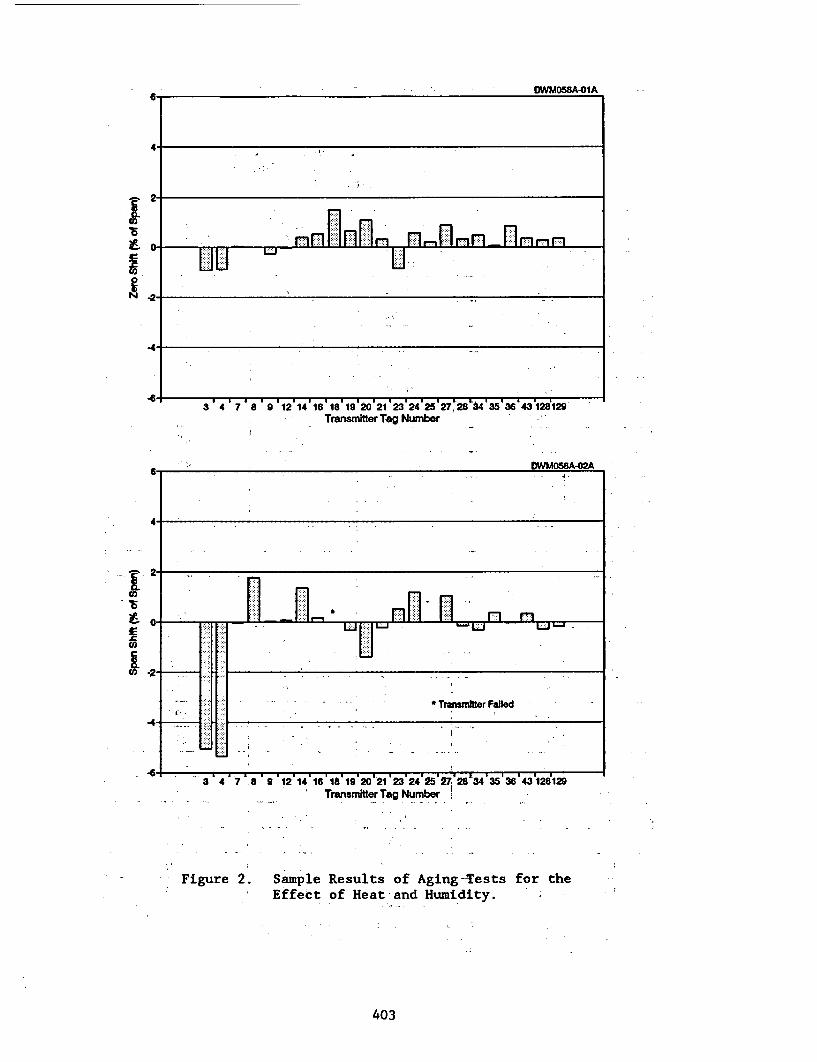
DWMOSAO41A
4
2
n121- J- ' - .mnr....
-2
.4
3 3 4 7' 8 9 '12'14' 16'18'19'20'21'23 24'25'27284 35'36'43128129Transmitter Tag Number
f
- L5co
I.
- Figure 2. SampleEffect
Results of Aging-Testsof Heat and Humidity.
for the
403
TABLE 1
Changes in Static and Dynamic Characteristics ofTransmitters for 12 Months of Aging at
110°F and 65% Relative Humidity
Calibration Shifts CI) Response TimeTag A Make Zero (%) Span (%) (2) Changes (%)
1 (3) Foxboro 0.53 -3.35 <20
3 Foxboro -0.93 -5.07 23%
4 Foxboro -0.88 -5.37 <20
6 (3) Foxboro 0.00 0.55 <20
7 RSMT 0.03 -0.03 <20
8 Foxboro .0.00 1.75 <20
9 Foxboro -0.28 0.03 <20
11 (3) Foxboro 0.08 1.92 <20
12 RSMT -0.03 O.Q8 <20
14 RSMT 0.40 1.35 >100%
16 Tobar 0.53 0.18 <20
18 Barton 1.50 20.00 >100%
19 Barton 0.65 -0.30 <20
20 Barton 1.11 -1.39 <20
21 RSMT 0.32 -0.22 <20
23 Barton -0.85 0.53 i <20,
24 Tobar 0.58 1.17 <20'
25 Tobar 0.20 0.00 <20
27 Honeywell 0.88 1.05 <20
28 Honeywell 0.33 -0.13 <20
34 Barton 0.48 -0.30 <20
35 Barton , 0.05, 0.37 <20
36 Barton 0.85 -0.03 <20
43 RSMT 0.35 0.32 <20
128 Bailey 0.28 -0.28 <20
B129 ailey 0.35 ,0.18- <20
(1) All calibration shifts are presented as percentage of total calibration span.(2) Response times were measured using the ramp test method.(3) Reference transmitter.
404
4. COMPONENT AGING
Component aging was performed by two methods. The first method employeda commercial software package called "PSpice" which is used for the study ofsteady state and transient response of electrical and electronic circuits. Theelectronics of typical pressure transmitters were simulated in PSpice and theirresponse to changes in the values of electronic components were determined.Typical results are shown in Table 2 for a Barton model 764 pressure transmitter.
The second method involved thermal aging of the individual components fora few hours at approximately 150'F. The transmitters were tested before, duringand after the aging. Sample results are shown in Figure 3 for a few circuitcomponents of a Rosemount Transmitter. Similar results are shown in Table 3.It is apparent that the application of the heat did not cause any permanentchange in the value of the components as evident in the results of tests afterthe aging.
5. DEGRADATION OF PRESSURESENSING LINES
Sensing lines are used to bring the pressure signal from the process topressure transmitters located about 20 to' 200 feet away from the process,depending on the-plant and the pressures being measured. There are pneumatic,oil-filled, and water-filled sensing lines in nuclear power plants. Water-filledsensing lines 'are the most prevalent type and were therefore the type selectedto be-studied in this project.
Water-filled sensing lines can become partially or totally blocked over aperiol of time-as sludge is built up in the system, boron solidification, andother effects. The blockage will not have a significant effect on the steadystate performance of transmitters, but can cause a large increase in the responsetime of-transmitters.
The study-of sensing lines in this project involved simulating blockagesusing snubbers placed in the sensing lines in a laboratory test loop. Figure 4shows laboratory response time results as a function of induced blockages in thesensing lines. It is apparent that the effect of blockages is different indifferent transmitters. More specifically, the effects of sensing line blockageson the response time of a pressure sensing system depends predominantly on thevolumetric displacement of the sensing element' iii the transmitter. If thetransmitter operates based on a measurable volumetric displacement of sensingelement when a pressure is applied, then its response time will depend very muchon any blockage in the sensing line that can restrict the flow to thetransmitter. On the other hand, if the sensing element does not have to movemuch to indicate the pressure, sensing line blockages will not be as importantunless they are advanced to over 90 percent of the original diameter of thesensing line.
:405
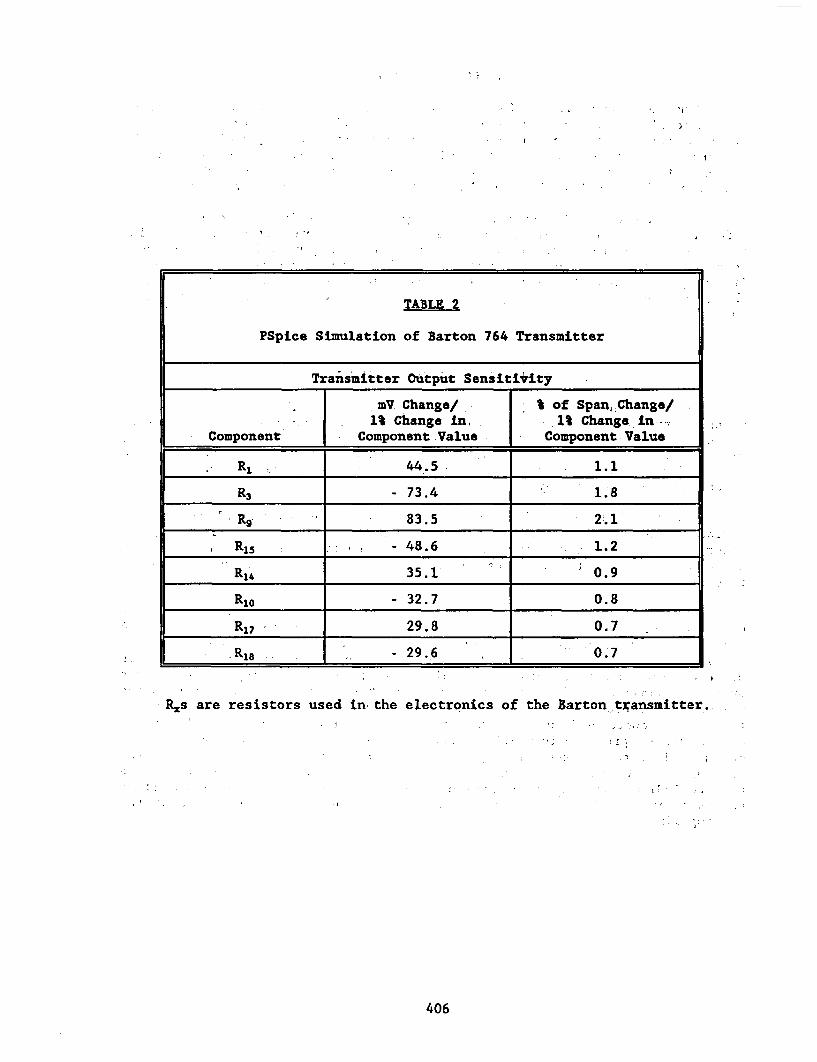
I1
TABLE 2
PSpice Simulation of Barton 764 Transmitter
Transmitter Output Sensitivity
_ mV Change/ % of Span,,Change/ope 1% Change in, 1% Change in
Component Component Value Component Value
R1 44.5 1.1
1R3 L 73.4 1.8
|R0 83.5 2.1
R15- 48.6 1.2
RI 35.1 0.9
|- 32.7 0.8
l 29.8 0.7
I 1 29.6 0.7
I aRxs are. r~esistors used in the
I
electronics
. ,-
of the Barton transmitter.
: ., I. .- , 2i
I . I
406
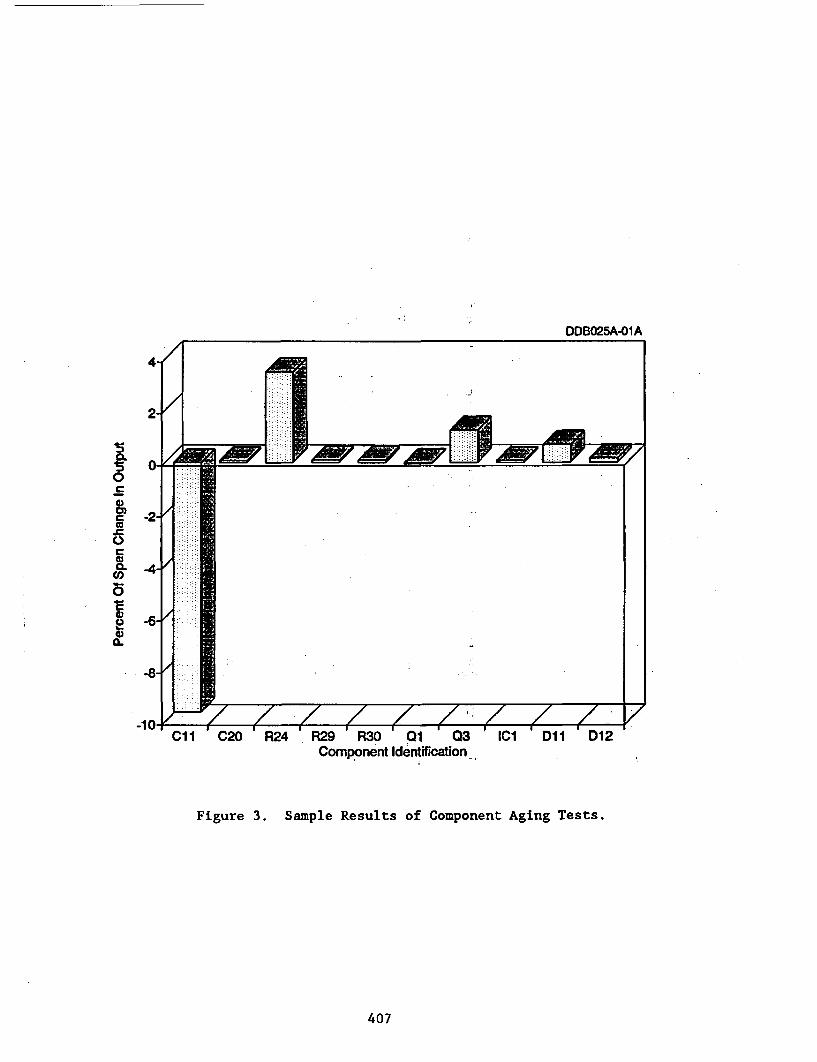
DDBO25A-01A
4
2-/
- A0
.n0co
n
co
0
0.co,
0C)IL.
- = 4 E;: I l: ta
ii p
-2-
-4-'
-64-k
-84'"
I-
z/ 7-10-Cl1 ' C20 R24 R29 ' R30 ' 01 3
Component IdentificationIC1 ' Di i D12
Figure 3. Sample Results of Component Aging Tests.
407
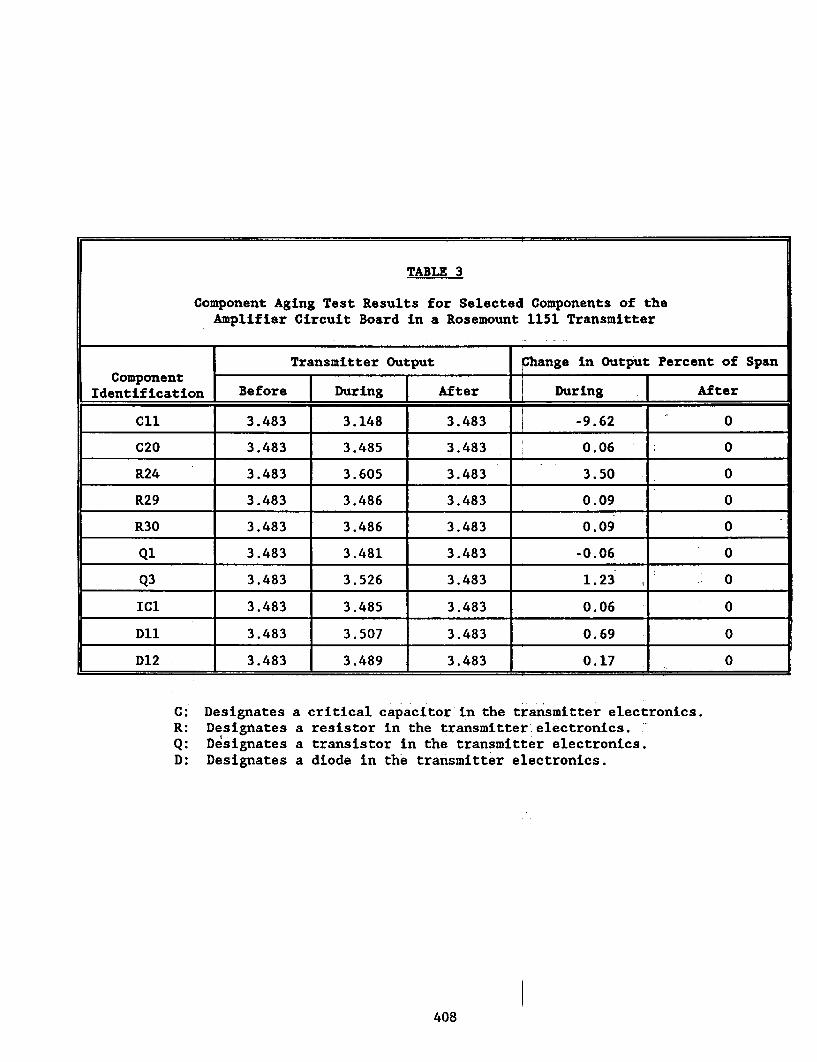
TABLE 3
Component Aging Test Results for Selected Components of theAmplifier Circuit Board in a Rosemount 1151 Transmitter
Transmitter Output Change in Output Percent of SpanComponent I
Identification Before T During After During After
Cl 3.483 3.148 3.483 -9.62 0
C20 3.483 3.485 3.483 0.06 0
R24 3.483 3.605 3.483 3.50 0
R29 3.483 3.486 3.483 0.09 0
R30 3.483 3.486 3.483 0.09 0
Q1 3.483 3.481 3.483 -0.06 0
Q3 3.483 3.526 3.483 1.23 . 0
IC 3.483 3.485 3.483 0.06 0
Dl 3.483 3.507 3.483 0.69 0
D12 3.483 3.489 3.483 0.17 0
C: Designates aR: Designates aQ: Designates aD: Designates a
critical capacitor in the transmitter electronics.resistor in the transmitter-electronics. -:transistor in the transmitter electronics.diode in the transmitter electronics.
408
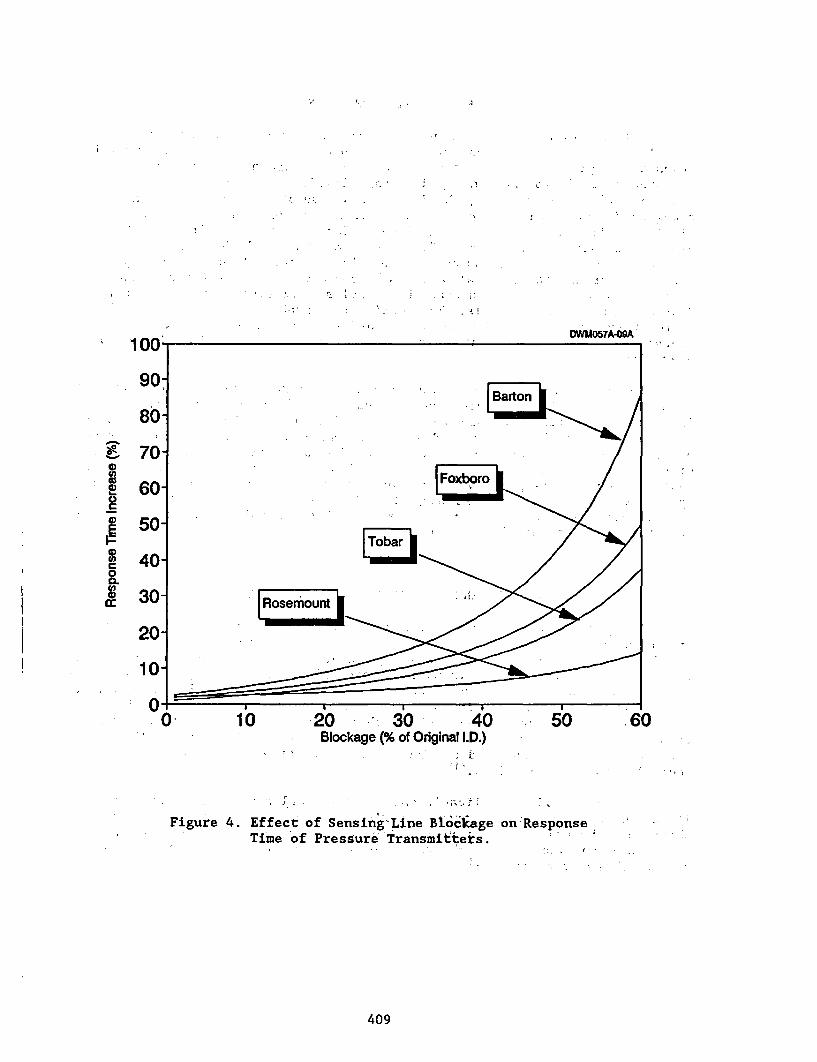
T; , I.
:, ' .
k . .
:
: :, .. ..
:
,
. .
. . : .
. . .
I 1. .. I
I . . i''
:
DWM057A-M
00
0C)
0EF-0
-20 -. 30 40Blockage (% of Original I.D.)
. I-I- I .. ..
*,
Figure 4. Effect of Sensing-Line Blockage on ResponseTime of Pressure Transmittets.
409
6. OIL LOSS PHENOMENON
Oil loss is a well-known problem in certain models of pressure transmittersmade by Rosemount. In these Rosemount transmitters, silicon oil is used totransfer the pressure signal from the isolation diaphragm that is in contact withthe process fluid to the sensing diaphragm inside the transmitter. If the oilleaks out of the transmitter, the dynamic response of the transmitter can becomesluggish in addition to a change in calibration (Zero and Span) that occursslowly as oil leaks from the transmitter. Table 4 shows oil loss results fromexperiments with a normal and a failed Rosemount model 1153 transmitter. Notethat the transmitter that has suffered oil loss is not only sluggish compared tothe normal transmitter, but also it has become nonlinear as evident in the largedifferences between the response time results from tests with increasing anddecreasing ramp input signals. The nonlinearity problem makes it more difficultto identify the oil loss with on-line or off-line test methods especially if thetransmitter does not operate close to its pressure setpoint during plantoperation.
The performance of transmitters other than Rosemount are not' adverselyaffected by the oil loss' phenomenon because the oil is used as a damping fluidin these transmitters, as opposed to a transfer fluid. Table 5 shows responsetime test results for a Tobar and a Barton transmitter with and without inducedoil loss. Figure 5 shows the response time of a Barton transmitter as a functionof oil removed. It is apparent that the Tobar and Barton transmitters becomefaster in dynamic response with oil loss due to less damping of the mechanicalsystem of the transmitters. Although the oil loss is not immediately detrimentalto the performance of these transmitters, it has a significant effect on theirlongevity and mechanical integrity.
7. ON-LINE TEST OF PRESSURE'TRANSHITTERS
The performance of pressure transmitters is verified by period calibrationand response time testing. Presently, calibration testing cannot be doneon-line-, but new methods are currently under development and validation andshould be available-for use in nuclear power-plants in 2 to 4 years. Responsetime testing, however, can be performed- on-line using--the--noise analysis andPower Interrupt (PI) techniques. The noise- analysis- technique is based onmonitoring the natural fluctuations that exist at the outputof pressuretransmitters while the process is operating. It has been shown that thesefluctuations can be analyzed to give the response time of pressure transmittersincluding the sensing lines.(1 )
The PI method is applicable only to force balance pressure transmitters.It is based on turning the transmitter's power; off, and then on. It has beenshown that the transmitter's output after the power is turned on is a transientthat can be analyzed to give the response time of the complete electromechanicalsystem of the transmitter.(2)
410
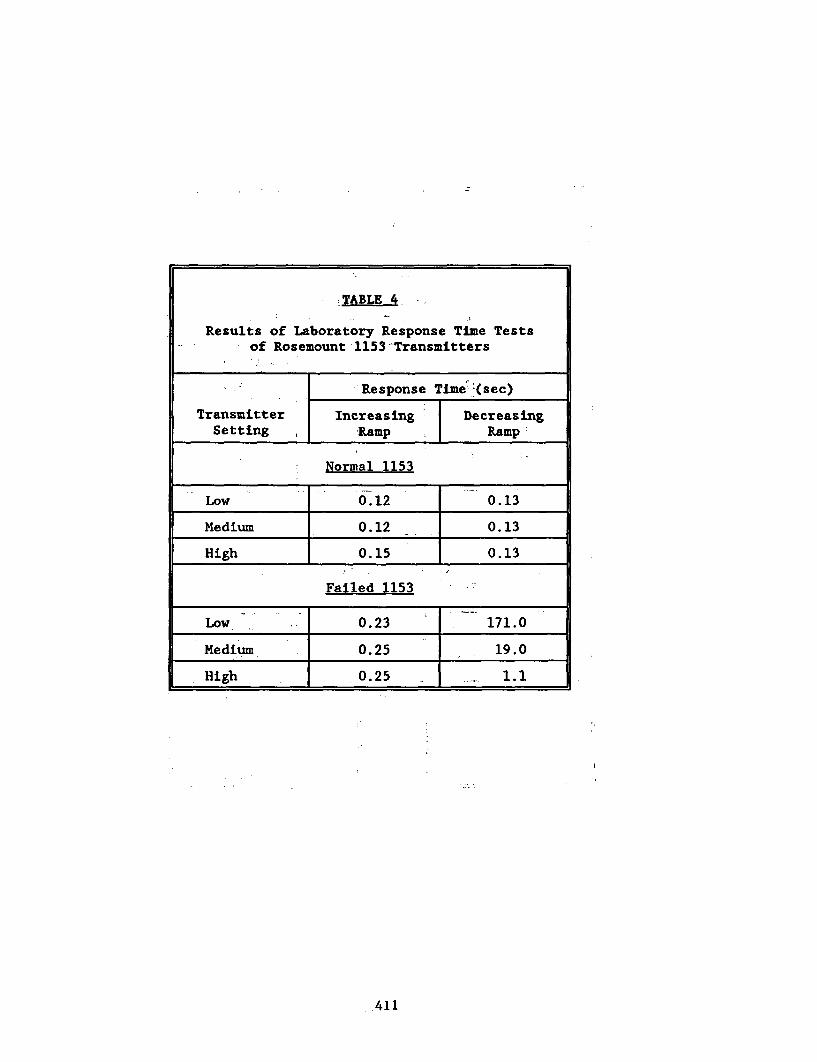
:TABLE 4I
Results of Laboratory Response Time Testsof Rosemount 1153 -Transmitters
Response Time""(sec)
Transmitter Increasing DecreasingSetting , Ramp . Ramp
Normal 1153
Low 0.12 0.13
Medium 0.12 0.13
High 0.15 0.13
Failed 1153
Low 0.23 171.0
Medium 0.25 . 19.0
High 0.25_._. 1.1
411
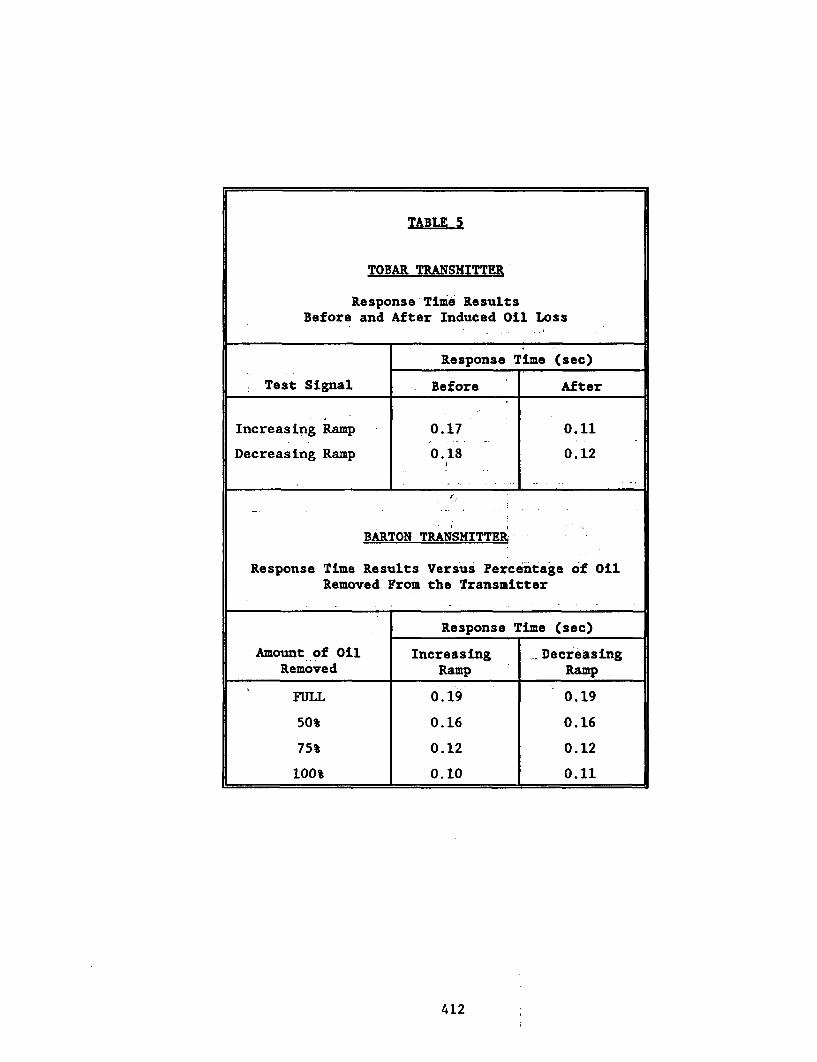
TABLE 5
TOBAR TRANSMITTER
Response Time ResultsBefore and After Induced Oil Loss
Response Time (sec)
Test Signal Before After
Increasing Ramp 0.17 0.11
Decreasing Ramp 0.18 0.12
BARTON TRANSMITTER
Response Time Results Versus Percentage of OilRemoved From the Transmitter
Response Time (sec)
Amount of Oil Increasing DecreasingRemoved Ramp Ramp
FULL 0.19 0.19
50% 0.16 0.16
75% 0.12 0.12
100% 0.10 0.11
412
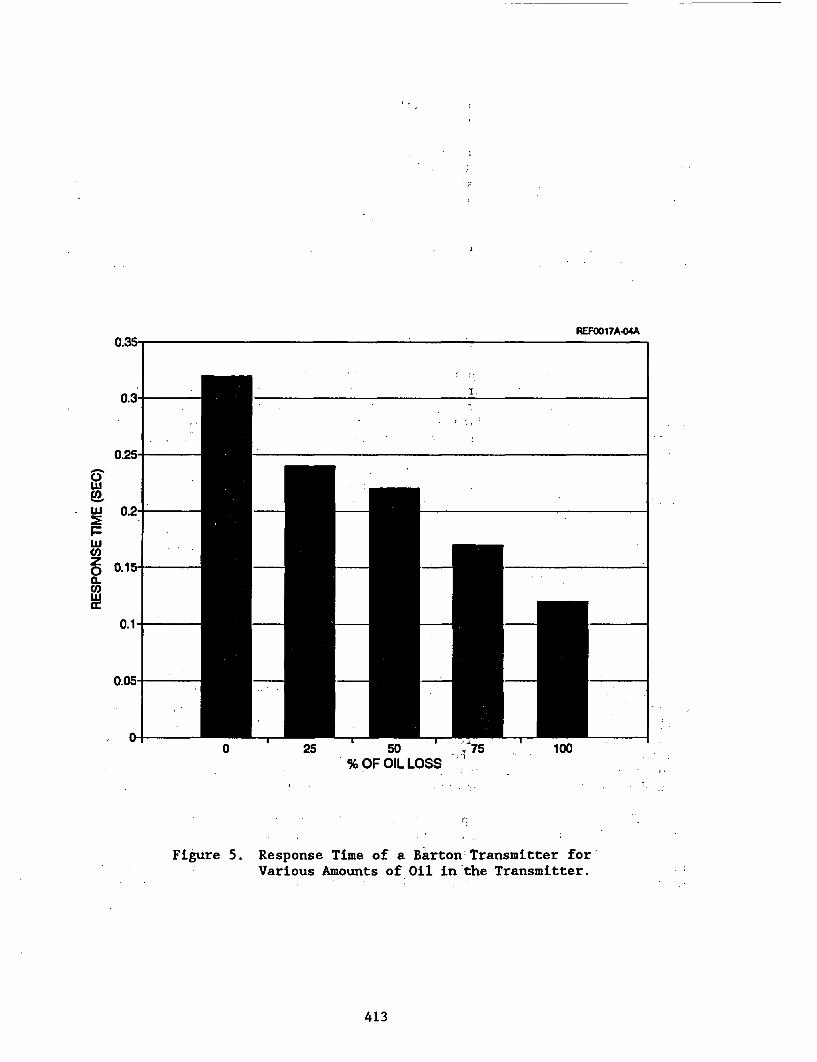
REFOO17A4"net
0.3-I
0.25-
E 0.2-
Fw
co0 0.15-0.coCKuJ
0.1 -
0.05-
0-0 25 50 --75
% OF OIL LOSS100
Figure 5. Response Time of a Barton Transmitter forVarious Amounts of Oil in-the Transmitter.
413
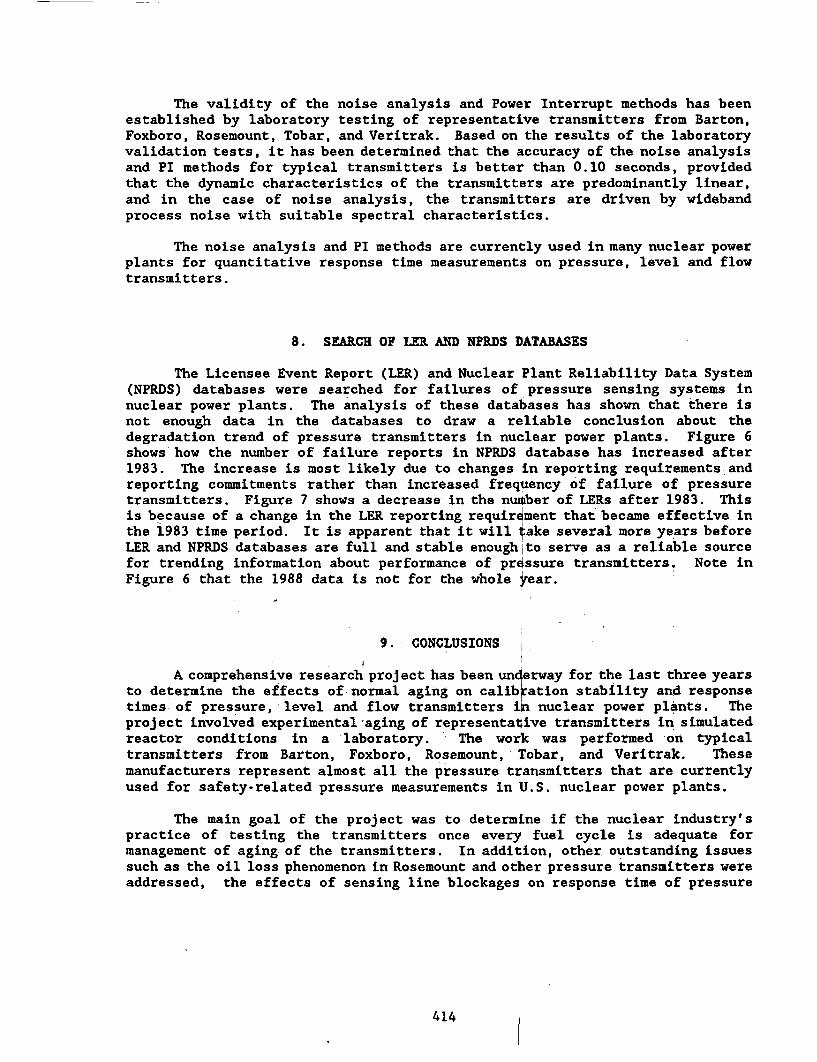
The validity of the noise analysis and Power Interrupt methods has beenestablished by laboratory testing of representative transmitters from Barton,Foxboro, Rosemount, Tobar, and Veritrak. Based on the results of the laboratoryvalidation tests, it has been determined that the accuracy of the noise analysisand PI methods for typical transmitters is better than 0.10 seconds, providedthat the dynamic characteristics of the transmitters are predominantly linear,and in the case of noise analysis, the transmitters are driven by widebandprocess noise with suitable spectral characteristics.
The noise analysis and PI methods are currently used in many nuclear powerplants for quantitative response time measurements on pressure, level and flowtransmitters.
8. SEARCH OF LER AND NPRDS DATABASES
The Licensee Event Report (LER) and Nuclear Plant Reliability Data System(NPRDS) databases were searched for failures of pressure sensing systems innuclear power plants. The analysis of these databases has shown that there isnot enough data in the databases to draw a reliable conclusion about thedegradation trend of pressure transmitters in nuclear power plants. Figure 6shows how the number of failure reports in NPRDS database has increased after1983. The increase is most likely due to changes in reporting requirements andreporting commitments rather than increased frequency of failure of pressuretransmitters. Figure 7 shows a decrease in the number of LERs after 1983. Thisis because of a change in the LER reporting requirement that became effective inthe 1983 time period. It is apparent that it will take several more years beforeLER and NPRDS databases are full and stable enough'to serve as a reliable sourcefor trending information about performance of pressure transmitters. Note inFigure 6 that the 1988 data is not for the whole year.
9. CONCLUSIONS
A comprehensive research project has been underway for the last three yearsto determine the effects of-normal aging on calibration stability and responsetimes of pressure, level and flow transmitters in nuclear power plants. Theproject involved experimental'aging of representative transmitters in simulatedreactor conditions in a laboratory. The work was performed -on typicaltransmitters from Barton, Foxboro, Rosemount, Tobar, and Veritrak. Thesemanufacturers represent almost all the pressure transmitters that are currentlyused for safety-related pressure measurements in U.S. nuclear power plants.
The main goal of the project was to determine if the nuclear industry'spractice of testing the transmitters once every fuel cycle is adequate formanagement of aging of the transmitters. In addition, other outstanding issuessuch as the oil loss phenomenon in Rosemount and other pressure transmitters wereaddressed, the effects of sensing line blockages on response time of pressure
414
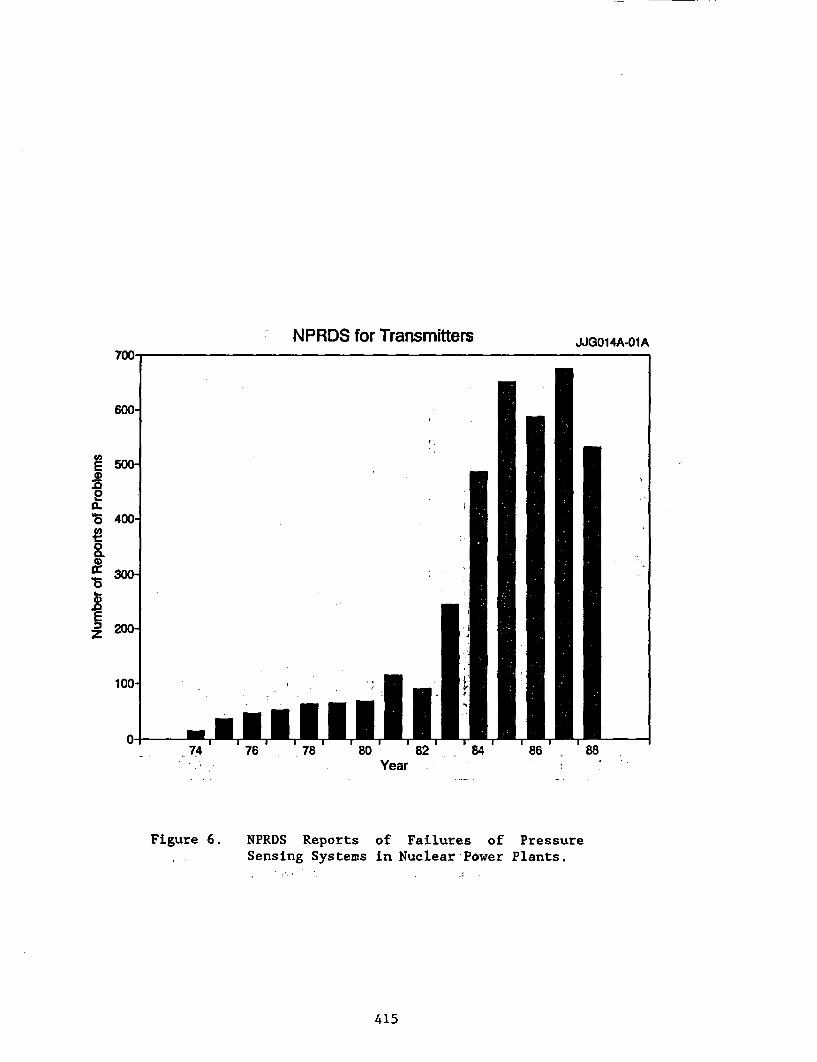
NPRDS for Transmitters JJG014A-O1A
@2E0
10
a.Is
Year
Figure 6. NPRDS ReportsSensing Systems
of Failures of Pressurein Nuclear Power Plants.
415
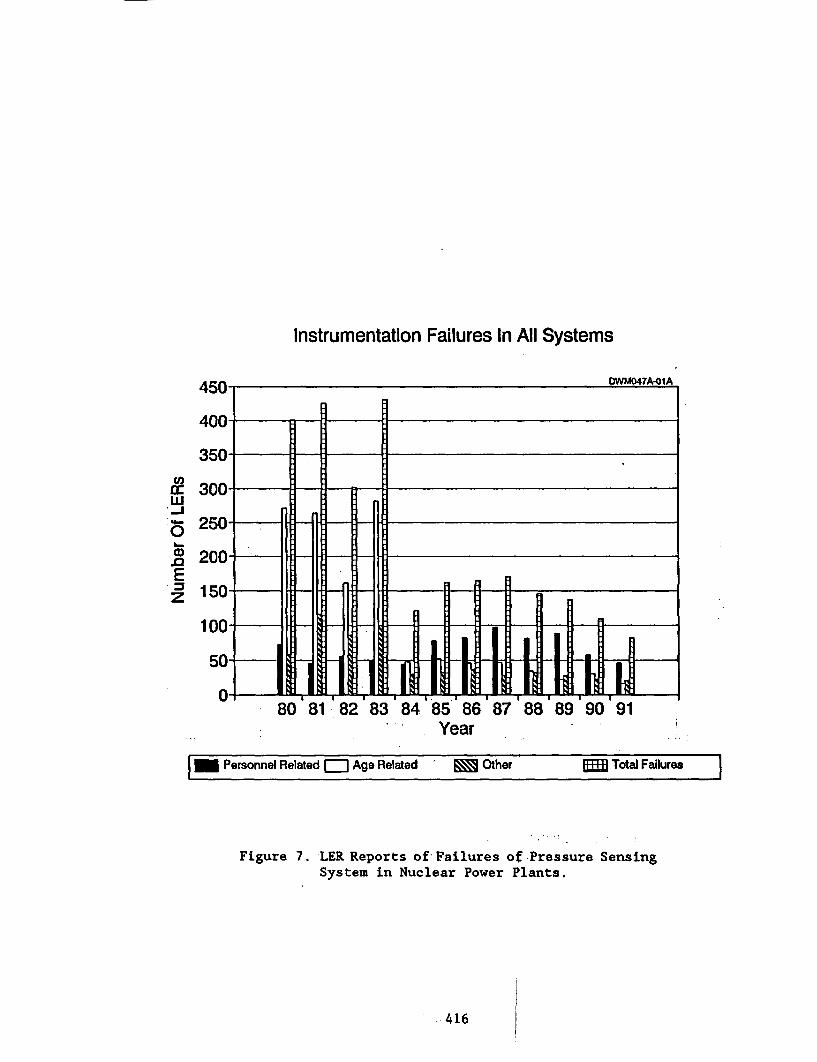
Instrumentation Failures In All Systems
OWMO47A-1A
W-
0.0
Ez
40 0_ - _ __ _ _ __ _ _ __ _ _ __ ____
400-
350- . .
300-
250'- . _ . ._
200 - - - _ R _ _
I r
I
100--
50-
0- l 1 171 IiIII.-IiI.-IiIiI'
t I I I- I i I I I80 81 82 884 85 86 87 88 89 90 91- Year
I _ Personnel Related a Age Related Other Q Total Failures I
Figure 7. LER Reports of -Failures of %Pressure SensingSystem in Nuclear Power Plants.
416
transmitters were quantified, and the on-line methods for response time testingand calibration of pressure transmitters were evaluated. The LER and NPRDSdatabases were searched as a part of the project and analyzed for failures ofpressure sensing systems in nuclear power plants.
The project has concluded that in light of a moderate number ofdegradations that were observed in the project and found in databases, testingthe response time and calibration of pressure transmitters once every fuel cycleor every 18 to 24 months should be adequate for management of normal aging ofpressure transmitters, provided that all safety-related pressure transmitters aretested as opposed to testing only one out of four redundant transmitters.
The oil loss phenomenon was found to be an important safety issue only inRosemount pressure transmitters in which silicon oil is used to transfer thepressure signal from the process to the sensing element in the center of thetransmitter. In other pressure transmitters (i.e., Barton, Foxboro, Tobar, andVeritrak) the oil is used as a damping fluid and it does not play a major rolein the normal performance of the transmitters. The significance of oil loss inRosemount transmitters is that it can lead to calibration shift and response timedegradation, both of which can go undetected unless an on-line monitoring systemis implemented or periodic tests are performed to account for the problem.
The search and analysis of the LER and NPRDS databases did not reveal anyunusual or systematic problem in the pressure sensing systems of nuclear powerplants except to confirm our laboratory findings that pressure transmitterssuffer calibration shifts and response time degradation in a moderate rate, andthe current testing practices in the nuclear industry is therefore justified foraging management of the transmitters from the manufacturers we tested in thisstudy.
10. REFERENCES
1. Hashemian, H.M., et.al, "Effect of Aging on Response Time of Nuclear PlantPressure Sensors", U.S. Nuclear Regulatory Commission, NUREG/CR-5383,(June 1989).
2. Hashemian, H.M., Petersen, K.M., "Response Time Testing of PressureTransmitters in Nuclear Power Plants', Instrument Society of America,First Annual Joint ISA/EPRI Power Instrumentation Symposium, St.Petersburg, FL, (June 1991).
417
SNUBBER AGING ASSESSMENT: RESULTS.)OF NPAR PHASE II IN-PLANT RESEARCH'a,
D. E. Blahnik and E V WerryD. P. Browntb)
Pacific Northwest Laboratory(c)Richland, Washington 993$2
ABSTRACT
Snubbers are safety-related devices used to restrain undesirabledynamic loads at various piping and large equipment locations innuclear power plants (NPPs). Snubbers are designed to accommodatenormal thermal movements of a plant's operating systems or equipmentand to be capable of restraining the maximum, off-normal dynamicloads postulated for its specific location. Snubbers are subject tothe effects of aging, and the factors that degrade their safety per-formance need to be better understood. This paper describes theU.S. Nuclear Regulatory Commission (NRC), Phase II Nuclear PlantAging Research (NPAR) in-plant aging study conducted to enhance theunderstanding of snubber aging, providing a basis to mitigate itsconsequences. The research methodology, results, recommendations,and conclusions are described in this paper. Recommendations formonitoring the service life of snubbers is a principal result of theresearch, and-will provide input to the American Society of Mechani-cal Engineers (ASME) Operations and Maintenance (OM) Code, Sub-section ISTD.
DISCUSSION
SNUBBER USAGE
Snubbers are dynamic restraining devices used in commercial nuclear powerplants (NPPs). Snubbers are available in two basit types: hydraulic andmechanical. Hydraulic snubbers, which have been in service for many years,are used to restrain safety-related equipment and piping systems. The ma-jority of mechanical snubbers, which have been used predominantly within thelast decade, are used solely to restrain piping systems.
(a) Work supported by the U.S. Nuclear Regulatory Commission, Office~ofNuclear Regulatory Research.
(b) Lake Engineering Company, Greenville, Rhode Island 02828.
(C) Operated for the U.S. Department of Energy by Battelle Memorial Instituteunder Contract DE-AC06-76RL0 1830.
419
Snubber procurement and usage falls within the purview of Title 10, Part 50 ofthe Code of Federal Regulations (CFR), Appendix A'(General Design Criteria forNuclear Power Plants) and Appendix B (Quality Assurance Criteria for NuclearPower Plants). These regulations stipulate that systems, structures, andcomponents, (e.g., snubbers) shall be designed to'withstand the effects ofnormal and off-normal dynamic reactions. The principal normal dynamic re-actions are those associated with thermal expansions and contractions duringplant start-ups and shutdowns; off-normal dynamic reactions are primarilythose associated with postulated seismic loads. To comply with the CFR, eachsnubber must therefore allow for expansion or contraction under normal plantoperations, while maintaining the capability to restrain the maximum off-normal dynamic load by locking up and restraining dynamic motion.
SNUBBER RESEARCH AND OBJECTIVES
The NPP industry and the'codes and standard groups, i.'e., ASME and the NRC,have recognized the need to enhance the performance of snubbers. Snubbers aresubject to age-related degradation, and their effective operation is importantto a plant's continued safe operation. The NRC's NPAR Program Plan,(l)originally introduced in 1985, provided a logical' avenue' for sponsorship ofsnubber aging research and the identification of 'improved service-lifemonitoring techniques for snubbers. The NPAR strategy involves a two-phaseapproach for conducting research. Phase I(2) provided a preliminary as-sessment of snubber aging. A Phase II interim study(3 ) provided an agingassessment and recommendations for snubber research. Specific information onsnubber performance, obtained through in-plant research, involved sendingresearch staff to various NPPs.(4) The following research objectives forevaluating the effects of aging on mechanical and hydraulic snubbers weredeveloped during Phase II: I
* enhance the understanding of how snubbers age and degrade
* enhance the understanding of snubber failure characteristics
* determine the technical information needed to improve the level ofsnubber performance.
This paper describes the in-plant research to meet'these objectives and theresults of the research. Cooperation from various utilities significantly en-hanced this effort.
SUMMARY OF IN-PLANT RESEARCH
The in-plant research involved 1) selecting potential sites for research,2) conducting interviews and determining which sites were to be visited, and3) site visits to obtain and analyze snubber service data. The first twotasks were vitally important in determining the quality and quantity ofsnubber data available. The study was'structured to select plants'withcomprehensive inspection and testing programs and plants that maintainedrecords on snubber failures.
420
The third task, the information gathering and analysis process, was conductedin two parts. Part one involved interviews with the site engineering andmaintenance staff and review of snubber tracking databases, snubber failurereports, functional test data, and maintenance practices. Part two involvedanalysis of the special data collected at each site, e.g., the maintenancerecords and the inservice inspection (ISI) and test records.
Eight sites (13 plants) were visited. The principal goal of the plant visitswas to gain an updated perspective of recent performance history for both -mechanical and hydraulic snubbers. Because there was little information onmechanical snubbers, special emphasis was placed on gathering information on,the performance, testing, and maintenance of these-devices. Five of the siteswere key sites for evaluating mechanical snubbers,ztwo sites were key sitesfor evaluating hydraulic snubbers, and one site was selected for snubberservice-life monitoring techniques,
Approximately 95% of all mechanical snubbers in NPP service are the acceler-ation-limiting type; most of the remaining 5% incorporate a velocity-limitingfeature. Approximately 99% of all hydraulic snubbers in NPP service utilize adual-mode, lock-up/bleed type control valve; the remaining 1% utilize asingle-mode, velocity-limiting design. The aging research primarily focusedon the aging characteristics of acceleration-limiting mechanical snubbers andlock-up/bleed type hydraulic snubbers. It should be noted, however, that muchof the information obtained in the research would also be expected to becharacteristic of the remaining snubber types because of similarities ofdesign features, e.g.,, ball nut and screw for mechanicals, seals for hy-draulics, etc., and common environmental stressors.
In addition to the site visits, the research results are based upon over 70telephone interviews conducted with knowledgeable plant staff. (This includesa review of records of prior telephone conversations between Lake Engineeringand utility personnel.) Selected snubbers were also disassembled and examinedat the Lake Engineering Rhode Island facility. Some of the research insightwas acquired from snubber experience and in-house information at LakeEngineering and Wyle Laboratories.
REVIEW OF INDUSTRY INFORMATION
The information obtained during the in-plant research included the number andtype of'snubber failures. ESpecial attention was given to failure categoryanalysis, with particular emphasis on distinction between age-related andnonage-related failures. This distinction has not been emphasized in previousstudies. The majority of failures, for both mechanical and hydraulic snub-bers, were detected during functional testing; the number of failures found byvisual examination, on the other hand, was minimal.
The following five failure categories were selected:
1. Mishandling (i.e., installation, handling, and maintenance-relateddeficiencies)
421
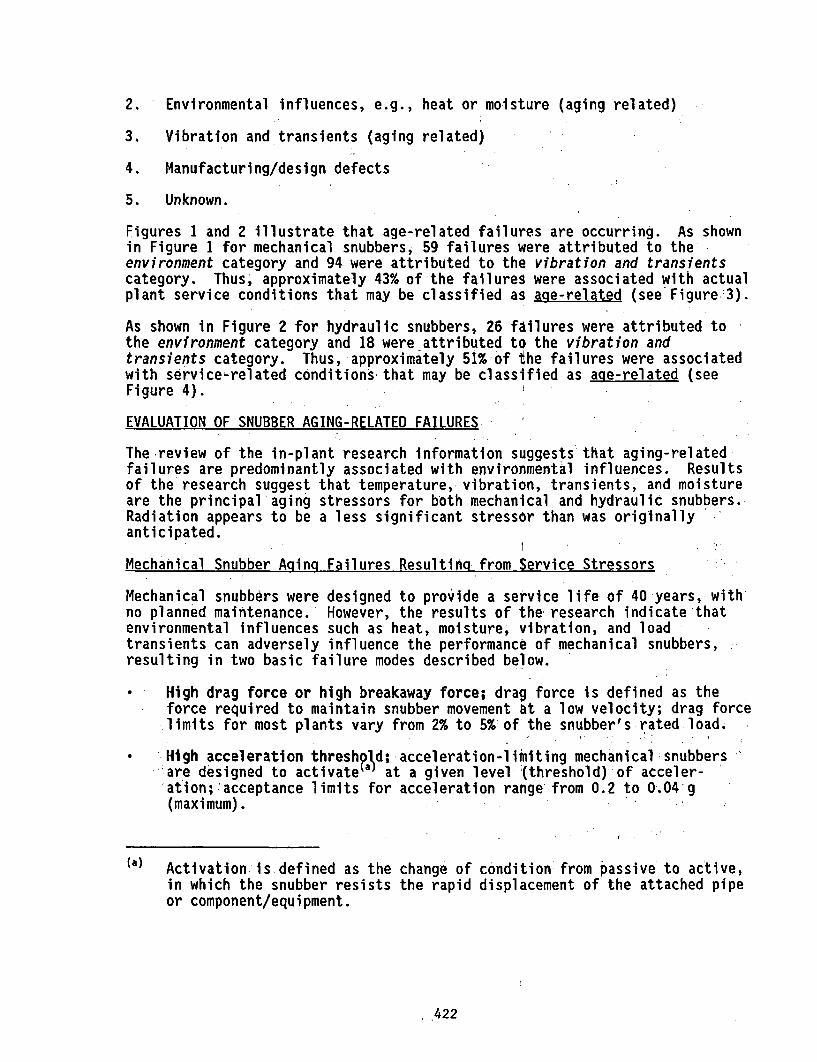
2. Environmental influences, e.g., heat or moisture (aging related)
3. Vibration and transients (aging related)
4. Manufacturing/design defects
5. Unknown.
Figures 1 and 2 illustrate that age-related failures are occurring. As shownin Figure 1 for mechanical snubbers, 59 failures were attributed to theenvironment category and 94 were attributed to the vibration and transientscategory. Thus, approximately 43% of the failures were associated with actualplant service conditions that may be classified as age-related (see Figure-3).
As shown in Figure 2 for hydraulic snubbers, 26 failures were attributed tothe environment category and 18 were attributed to the vibration andtransients category. Thus, approximately 51% of the failures were associatedwith service-related conditions that may be classified as age-related (seeFigure 4).
EVALUATION OF SNUBBER AGING-RELATED FAILURES-
The review of the in-plant research information suggests that aging-relatedfailures are predominantly associated with environmental influences. Resultsof the research suggest that temperature, vibration, transients, and moistureare the principal aging stressors for both mechanical and hydraulic snubbers.Radiation appears to be a less significant stressor than was originallyanticipated.
Mechanical Snubber Aging Failures Resultino from Service Stressors
Mechanical snubbers were designed to provide a service life of 40 years, withno planned maintenance. However, the results of the research indicate thatenvironmental influences such as heat, moisture, vibration, and loadtransients can adversely influence the performance of mechanical snubbers,resulting in two basic failure modes described below.
* High drag force or high breakaway force; drag force is defined as theforce required to maintain snubber movement at a low velocity; drag forcelimits for most plants vary from 2% to 5% of the snubber's rated load.
* High acceleration threshod; acceleration-limiting mechanical snubbersare designed to activate a at a given level '(threshold) of acceler-ation; acceptance limits for acceleration range from 0.2 to 0.04-g(maximum).
(a) Activation-is defined as the change of condition from passive to active,in which the snubber resists the rapid displacement of the attached pipeor component/equipment.
.422
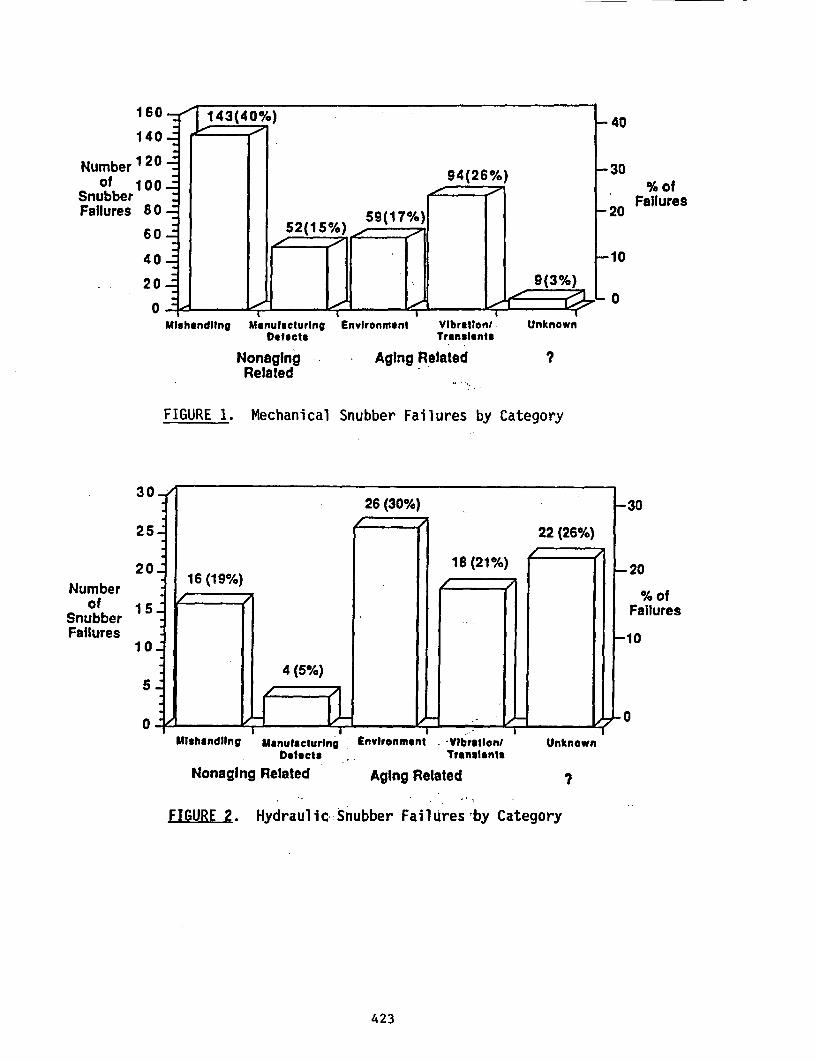
160-
140 -1 20 _
Number 120oif 100
SnubberFailures 8 0
60
)143(40
94(26%)
-40
-30
-20
-in
%ofFailures
40_
2:11
Mishandling
52(15%) 59(17%)
9(3%)_
I
IManufacturingDefects
Environment Vlbratlon/Transients
Unknown
NonagingRelated
Aging Related ?
FIGURE 1. Mechanical Snubber Failures by Category
Numberof
SnubberFailures
30
25
20
1 5
1 0
5
0.
26 (301%)
El
18 (21%)
oc=}
22 (26%)
4:- /
16(19%)
.- 30
-20
% ofFailures
-10
4 (5%)
.f 1 0a - I *....,.....I
I IMishandling ManufacturingDefects
Nonaging Related
Environment - -Vibration/Transients
Aging Related
I IUnknown
?
FIGURE 2. Hydraulic Snubber Failures by Category
423
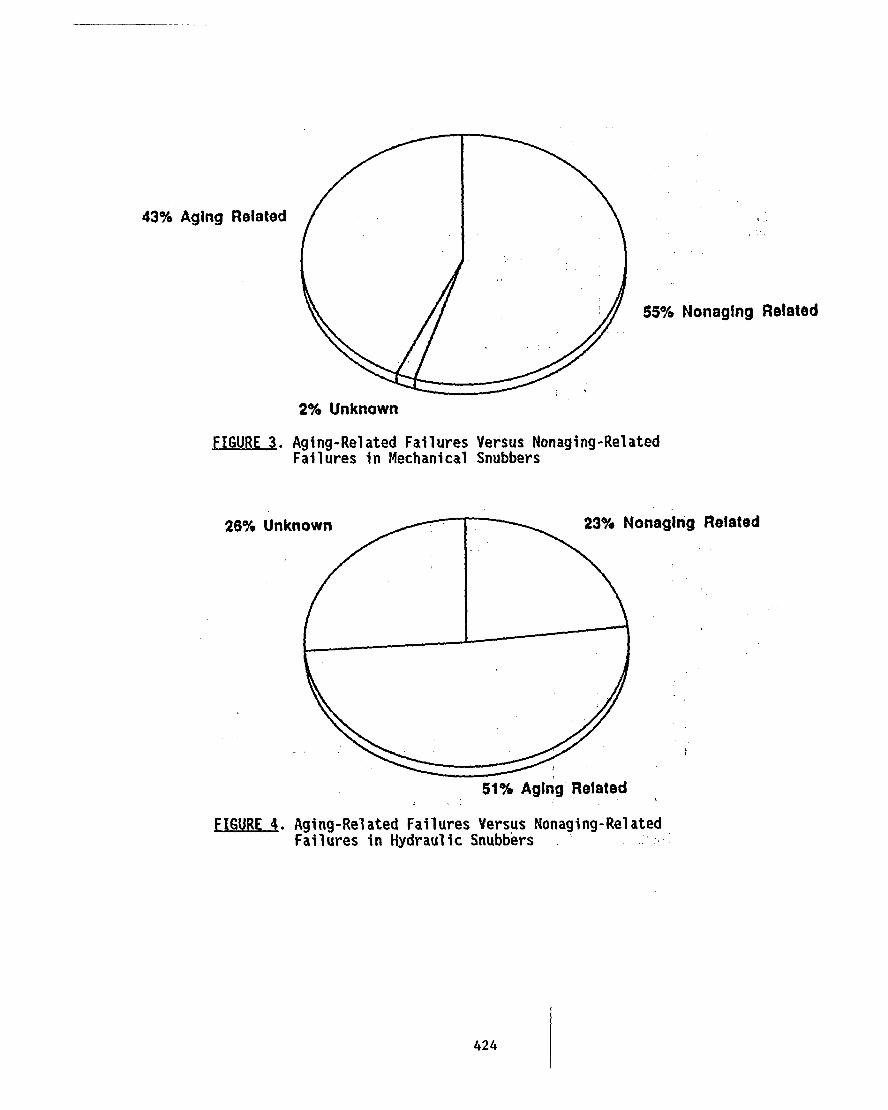
43% Aging Related
55% Nonaging Related
2% Unknown
FIGURE 3.Aging-Related Failures
Versus Nonaging-Related
Failures in Mechanical
Snubbers
26% Unknown
23% Nonaging Related
51% Aging Related
FIGURE 4. Aging-Related
Failures Versus Nonaging-Related
Failures in Hydraulic
Snubbers. .
424
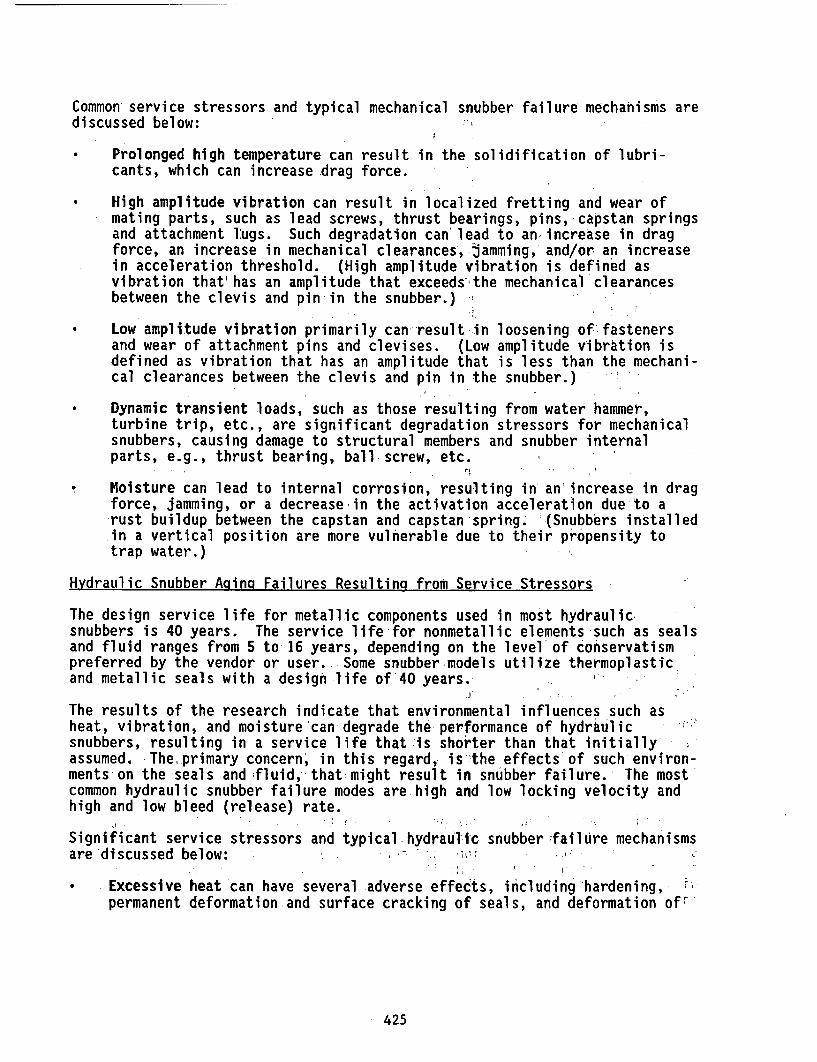
Common service stressors and typical mechanical snubber failure mechanisms arediscussed below:
* Prolonged high temperature can result in the solidification of lubri-cants, which can increase drag force.
* High amplitude vibration can result in localized fretting and wear ofmating parts, such as lead screws, thrust bearings, pins, capstan springsand attachment lugs. Such degradation can'lead to an increase in dragforce, an increase in mechanical clearances, jamming, and/or an increasein acceleration threshold. (High amplitude vibration is defined asvibration that'has an amplitude that exceeds-the mechanical clearancesbetween the clevis and pin in the snubber.)
* Low amplitude vibration primarily can result in loosening offastenersand wear of attachment pins and clevises. (Low amplitude vibration isdefined as vibration that has an amplitude that is less than the mechani-cal clearances between the clevis and pin in the snubber.)
* Dynamic transient loads, such as those resulting from water hammer,turbine trip, etc., are significant degradation stressors for mechanicalsnubbers, causing damage to structural members and snubber internalparts, e.g., thrust bearing, ball screw, etc.
* Moisture can lead to internal corrosion, resulting in an increase in dragforce, jamming, or a decrease-in the activation acceleration due to arust buildup between the capstan and capstan spring. (Snubbers installedin a vertical position are more vulnerable due to their propensity totrap water.)
Hydraulic Snubber Aging Failures Resulting from Service Stressors
The design service life for metallic components used in most hydraulicsnubbers is 40 years. The service life for nonmetallic elements such as sealsand fluid ranges from 5 to 16 years, depending on the level'of conservatismpreferred by the vendor or user. Some snubber models utilize thermoplastic.and metallic seals with a design life of'40 years.
The results of the research indicate that environmental influences such asheat, vibration, and moisture can degrade the performance of hydraulicsnubbers, resulting in a service life that is shorter than that initiallyassumed. The primary concern' in this regard, is'the effects of such environ-ments'on the seals and fluid, that might result in snubber failure. The most-common hydraulic snubber failure modes are high and low locking velocity andhigh and low bleed (release) rate.
Significant service stressors and typical hydraulic snubber failure mechanismsare discussed below: -
* Excessive heatcan have several adverse effects, including hardening, F-permanent deformation and surface cracking of seals, and deformation of'
425
plastic reservoirs. These effects can lead to loss of hydraulic fluidthat may result in snubber failure. Seal degradation resulting fromsevere high temperature applications, a limited number of which are com-mon to most plants, can result in leakage in one or two operatingintervals. This supports the assumption that seal degradation can beaccelerated by elevated temperature.
* Vibration can cause extensive wear of hydraulic snubber metallic parts,e.g., piston, cylinder, clevis pins, attachment hardware, etc. andloosening of threaded fasteners. Gelated hydraulic fluid has beenidentified in several hydraulic snubbers that were exposed to significanthigh amplitude vibration; such gelation has occasionally affected thesnubber control valve performance. Although the exact cause of thisgelation has not been determined, it is generally thought to be theresult of localized internal vibration effects caused by the highamplitude vibration.
* Dynamic transient loads resulting-from water hammer,'turbine trip, etc.,can cause significant structural damage to a hydraulic snubber, e.g.,deformed piston rod, deformed structural attachments, sheared pistonthreads, etc.
* Moisture contributes to the corrosion of metallic parts. Parts used inhydraulic snubbers are not always corrosion resistant. The siliconehydraulic fluid used in most hydraulic snubbers readily absorbs moisture,particularly for snubbers with vented reservoirs; in some cases, this hasresulted in internal corrosion. Corrosion products can cause particulatecontamination of the hydraulic fluid, potentially degrading the controlvalve performance.
RESULTS AND CONCLUSIONS OF THE IN-PLANT RESEARCH
The results of the in-plant research confirm that aging can degrade the per-formance of mechanical and hydraulic snubbers.' Analysis of service data showsthat heat, high and low amplitude vibration, transients, and moisture con-tribute to approximately half of all failures. The remaining failures areprimarily caused by design/manufacturing deficiencies, andinstallation/mishandling errors.
Snubbers subject to rapid degradation as a result of abnormally severeoperating environments should be managed on a case-by-case basis and mayrequire augmented surveillance or maintenance. Representative snubbers fromthe remaining plant population should be monitored for progressive degradationusing trendable degradation parameters.
The nuclear power industry has progressed in the areas of snubber inspection,testing, maintenance, and snubber reduction, demonstrating an improved under-standing of safety implications and performance. Some plants have identifiedsevere environments and have modified the environment or replaced snubberswith more durable models. The NPAR snubber aging researcher.3) has contributedin this regard by providing useful information pertaining to snubber aging
426
mechanisms and aging management. Additionally, more effective and realisticfunctional test acceptance limits have been developed to significantly reducefailure rates. Most plants have yet to implement a formal service-life moni-toring program. The recommended service-life monitoring guidelines resultingfrom the NPAR research should be useful to establish such programs.
RECOMMENDED SERVICE-LIFE MONITORING GUIDELINES FOR SNUBBERS
NRC standard technical specifications(5) (STS) require that plants maintain aservice-life monitoring program. The ASME Subsection ISTD Working Group onmechanical equipment restraints is developing mandatory service-life moni-toring requirements that will likely be included in Subsection ISTD of the OMCode. A non-mandatory appendix that will provide some guidelines for service-life monitoring is also being developed by the working Group. Although anumber of plants have conducted specific seal-life evaluations, most have yetto implement a formal service-life monitoring program. Based on the resultsof the research, the following guidelines are recommended for implementationin the snubber service-life monitoring program.
* It is important to distinguish between service-related and nonservice-related failures. For this reason the root causes of snubber failuresand degradation should be determined. Diagnostic testing is useful forthis purpose as well as visual evaluation, particularly during snubberdisassembly. Personnel training in failure evaluation techniques is alsoimportant.
* Because plant operating environments may differ from design specifi-cations, general area snubber environmental conditions, e.g., temper-ature, should be monitored. Depending on the range of environmentalstressors in the plant, it may be practical to establish more than oneservice-life population.
* Specific snubber applications (locations) involving severe environmentalinfluences that could cause short-term degradation, e.g., high temper-atures, high amplitude vibration, etc., should be identified and dealtwith on a case-by-case basis. Such applications may require specificin situ monitoring equipment, frequent surveillance, maintenance, orsnubber replacement.
* Service-life for the general snubber population (snubbers in a moderateenvironment that are not subject to short-term degradation) should beestablished by trending relevant degradation parameters in representativesnubbers. For example, because the primary failure mode of concern forseals is gradual loss of fluid, snubber seal life should be based onpredicted low pressure seal performance. Baseline data are essential fortrending.
* "Hands-on" evaluation methods, such as hand stroking, can be used toidentify potential snubber degradation, particularly that caused bydynamic load transients.
427
* Evaluation of test parameter time traces obtained during routinefunctional tests is useful to identify performance anomalies that may beindicators of snubber degradation.
* Test machines used for trending and for diagnostic tests should becapable of providing a time trace of load and velocity. Accuracy andrepeatability are important features of-test machines used for trending.A feature that is important for diagnostic testing is the ability to varythe level of test parameters, such as velocity and load.
Service-life projections based on data from snubbers exposed to actualplant operating environments are generally preferable to laboratorydeveloped service-life projections.
REFERENCES
1. U.S. Nuclear Regulatory Commission. 1991. Nuclear Plant Aging Research(NPAR) Program Plan. NUREG-1144, Rev. 2, U.S. Nuclear RegulatoryCommission, Washington, D.C.
2. Bush, S. H., P. G. Heasler, and R. E. Dodge. 1986. Aging and ServiceWear of Hydraulic and Mechanical Snubbers Used on Safety-Related Pipingand Components of Nuclear Power Plants. NUREG/CR-4279, PNL-5479, Vol. 1,U.S. Nuclear Regulatory Commission, Washington, D.C.
3. Brown, D. P., G. R. Palmer, E. V. Werry, and D. E. Blahnik. 1990. Basisfor Snubber Aging Research: Nuclear Plant Aging Research Program.NUREG/CR-5386, PNL-6911, U.S. Nuclear Regulatory Commission, Washington,D.C.
4. Wyle Laboratories and Lake Engineering Company. 1990. NPAR SnubberAging Research. Wyle Report No. 17131-01, Letter Report Prepared by WyleLaboratories and Lake Engineering Company for Pacific NorthwestLaboratory, Richland, Washington.'
5. U.S. Nuclear Regulatory Commission. 1984, Technical Specifications forSnubbers. Generic Letter 84-13, U.S. Nuclear Regulatory Commission,Washington, D.C.
428
PRELIMINARY RESULTS OF THE PWR LOW POWER AND SHUTDOWN
ACCIDENT FREQUENCIES PROGRAM - COARSE SCREENING
ANALYSIS FOR SURRY*
T-L. Chu, Z. Musicki, W.; Luckas, S.M. Wong, L. Neymotin,
D.J. Diamond, C-J. Hsu,-G. Bozokij P. Kohut, R. Fitzpatrick, N. Siu**
Department of Nuclear EnergyBrookhaven National LaboratoryUpton, New York 11973 U.S.A.
ABSTRACT
This document presents the preliminary internal events Level 1results (including fire and flood) obtained as a result of a coarsescreening analysis on the low .power and shutdown accidentfrequencies of the Surry Nuclear Power -Plant. The work wasperformed by Brookhaven National Laboratory (BNL) for the NuclearRegulatory Commission Office of Nuclear Regulatory Research (RES).This coarse screening analysis was performed in support of the NRCstaff's follow-up actions subsequent to the March 20, 1990 Vogtleincident with the objective of providing high-level qualitativeinsights within a relatively short time frame. It is the firstphase of a major study that will utimately produce estimates on thecore damage frequency of a pressurized water reactor (PWR) duringlow power and shutdown conditions. Phase 2 of the study will beguided by the Phase 1 results in order to,,concentrate the effort onthe various plant operational statesilluthe dominant accidentsequences, and pertinent data items according to their importance tocore damage frequency and risk.
*This work was performed under the auspices of the U.S.-NucLear Regulatory Comnission.**Massachusetts institute of TechnoLogy
429
1. BACKGROUND
This paper presents the preliminary internal events Level 1 resultj(including fire and flood) obtained as a result of a coarse screening analysison the low power and shutdown accident frequencies of the Surry Nuclear PowerPlant. The work was performed by Brookhaven National Laboratory (BNL) for theNuclear Regulatory Commission Office of Nuclear Regulatory Research (RES). Thiscoarse screening analysis was performed in order to meet the RES commitment tothe Office of Nuclear Reactor Regulation (NRR), in support of the NRC staff'sfollow-up actions subsequent to the March 20, 1990 Vdgtle incident. It is thefirst phase of a study that will produce final estimates on the core damagefrequency of a pressurized water reactor (PWR) during low power and shutdownconditions. Phase 2 of the study is to produce a final Level 1 PRA analysis.It will be guided by the Phase 1 results. In Phase 2, effort will concentrateon he various plant operational states, the dominant accident sequences, andpertinent data items according to their importance to core damage frequency andrisk.
Surry Unit 1 was chosen as the PWR to be analyzed, in part because theSurry plant was previously analyzed in the Reactor Safety Study and NUREG-1150and in part because Virginia Power offered their cooperation. This willfacilitate comparison of the core damage frequency or risk during shutdownoperations with that of power operations. The Surry Plant contains two unitseach rated at 788 megawatts (electrical) capacity and is located near Surry inVirginia. Grand Gulf, a boiling water reactor, was selected as the plant to beanalyzed in a parallel study2 performed by Sandia National Laboratories (SNL).
This study is concerned with 'traditional' internal events as well asinternal fires and floods. External events are beyond the scope of the BNLeffort. A separate NRC-sponsored project entitled "Scoping'Analysis of LWRShutdown Accidents Initiated by Earthquakes," performed by Future ResourcesAssociates Inc. and PRD Consulting, addresses seismic induced accidents. In thatstudy, seismic induced loss-of-offsite-power transients were analyzed with theplant-specific fragilities generated in the NUREG-1150 seismic PRA for Surry, andthe loss-of-offsite-power event tree developed in this study.
2. RESULTS AND INSIGHTS
-Due to the necessarily conservative nature of the coarse screeninganalysis, it was decided that qualitative results will be stressed in thisdocument. Qualitative discussions highlighting- the results. follow. It isbelieved that these highlights are generally applicable to all PWRs.
2.1 Potentially Vulnerable Configurations
In the coarse screening analysis, some plant configurations in an outagewere found to be more vulnerable than others. These configurations are based onthe operational practices at the Surry plant and are routinely entered duringshutdown operations. Their descriptions follow:
Mid-loop Operations Approximately twice a year, the plant has gone into mid-loop operation with the vessel level maintained at 9 inches above the reactorcoolant loop hot leg mid-plane. This mode can occur within one 'day aftershutdown with decay heat still as high as 12.4 Mw. Under these conditions, core
430
uncovery can occur as early as 1.5 hours after a loss of cooling event. In pastrefueling outages, one or more reactor coolant loops have been isolated forextended periods of time, including a large fraction (if not total) of the mid-loop operation period. This leaves the associated steam generator(s) ineffectiveas a heat sink.
Use of Temporarv Seals at the Seal Table In-core flux thimbles (and core-exitthermocouples) are normally inserted up into the core region through the guidetubes that penetrate the bottom head of the reactor vessel. The space betweenthe moveable thimble tubes and fixed guide tubes' forms part of the reactorcoolant pressure boundary. This space is sealed against full system pressure atthe seal table during normal operation. In a refueling outage, the in-core fluxthimbles are retracted out of the core, and temporary seals are used at the sealtable. These temporary seals can only withstand )approximately 15-25 psig. Aslight increase in system pressure could cause failure of the temporary sealsinducing a loss'of coolant accident. Further pressurization can quickly lead tocore uncovery. It was estimated that approximately 10 days during a refuelingoutage such seals are in place with the reactor coolant system (RCS) closed andvessel head in place. It is during this period that such a scenario canpotentially occur.
Isolation of the Steam Generators During an outage, the secondary sides of thesteam generators are often filled to approximately 98-100 percent wide rangelevel (called "wet layup"), and represent a good heat sink if connected to theRCS. As discussed above, in a refueling outage, reactor coolant loops can beisolated for extended periods of time. This removes the one or more steamgenerators as a potential heat sink.
During a RCS cooldown prior to initiating the RHR system, the motoroperated valves (MOVs) in the individual steam generator feed lines from theauxiliary feedwater (AFW) system are closed. After the RCS temperature decreasesto 228-250° F, the main steam trip valves (and non-return valves) are closed.Therefore, the secondary side of the steam generators are isolated from the mainsteam system. This configuration makes it difficult for the plant to cope withstation blackout (SBO) events during shutdown. Basically, the AFW lines to eachindividual steam generators are isolated with the MOVs located inside thecontainment. The steam generator relief valves (atmospheric'dumps) fail closedon loss of air and cannot be opened manually (quite-unique at the Surry plant).
The loss-of-all-AC-power emergency procedure; instructs the operators tomanually open the bypass valves (locally at the valves) around the main steamtrip valves, close the condenser vacuum breaker, :"evacuate [the] turbine deck",and dump 'steam to the main condenser (and ultimately to the turbine buildingabove the turbine deck). The timely success in manually dumping steam into theturbine building is essential to the mitigation of an SBO at Surry.' This isespecially true because the operating RHR removal system is a weakness in the RCSpressure boundary, and the RCS side relief valves are not capable of relievingthe large volume of steam that could be generated in the vessel.
It was estimated that an overpressurization of the RHR system can occur asearly as 0.7 hours after a SBO occurs. The RHR system has a design pressure of600 psig. It is connected to the RCS prior'to the SBO. The relief valves thatmay be available are the pressurizer PORVs, the RHR relief valve and possibly the
431
relief valve in the CVCS letdown line. During a S$O, these valves are expectedto relieve either liquid or two phase flow. It was estimated that the combinedcapacity of the valves is 2550 gpm at 600 psig, equivalent to the volumetricvapor generation rate of 5,8 Mw of decay heat. This corresponds to the decayheat approximately 17 days after shutdown. After 17 days, the relief valvesshould be able to relieve. However, they may still be inoperable or fail to openupon demand.
2.2 Maintenance Unavailability and Simultaneous Maintenanceof Redundant Eauipment
Preliminary analysis of the data collected indicates that maintenanceunavailabilities at shutdown are much higher than that during power operation.With the plant at cold shutdown, few Surry Technical Specification requirementsare applicable. In terms of inventory makeup to the RCS, one high head injectiontrain and one low head injection train are required to be operable while the RCSlevel is below 15.3' (i.e., reduced inventory), which is less than 3 feet abovethe 12.5' mid-loop level. This requirement is not in the- Surry TechnicalSpecifications, but is written in the operating procedure as a result of Surry'sresponse to Generic Letter 88-17.
One concern regarding maintenance unavailability is simultaneousmaintenance of redundant equipment. Preliminary review of the Surry dataindicates that simultaneous maintenance of the two motor driven AFW pumps hastaken place. In principle, simultaneous maintenance may take place if nototherwise prohibited. In this coarse screening analysis, the assumption thatsimultaneous maintenance can occur was applied and simultaneous maintenanceturned out to be the dominant cause for core damage in many sequences. A morerealistic maintenance model based upon actual plant practice will be developedin Phase 2 of this study. For example, discussions with. plant personnelindicated that, in practice, no two emergency diesel generators (EDGs) could bemaintained at the same time. (Note: there are a total of three EDGs at the Surrysite, that are available for both units).
2.3 Reactivity Accident;Scenarios Identified in the French PRA
Two reactivity accident scenarios identified in the French PRA wereanalyzed taking into consideration the Surry-specific design and operation.. Thefirst scenario involves startup of a reactor coolant pump after improper dilutionduring a loss of offsite power transient. The second scenario involves adilution event while the plant is in the mid-loop, condition. Conservativeassumptions were made in the coarse screening analysis, and the results indicatethat the scenarios have high frequency. It is believed that some of theassumptions are very conservative. For example, in the first scenario, it wasassumed that the decay heat is so low that natural circulation does not causemixing of the unborated water with the reactor coolant. It is expected that moredeterministic analysis is needed to resolve the issue in support of, the Phase 2effort.
2.4 Findings of Fire and Flood Analysis
b- The results of the analysis show that fire and flood risk at shutdown couldbe potentially significant. More detailed analysis is planned in Phase 2 for thefollowing areas.
432
Fire Flood
Cable vault and tunnels Yes NoEmergency switchgear andrelay room Yes ''-Yes
Control room ' Yes NoContai'nment'' -Yes YesAux. Building Yes YesSafeguard area Yes YesTurbine building Yes Yes
In the process of performing this portion of the Phase 1 study, some issuesthat only apply to shutdown conditions were identified:
1. Surry's compliance with Appendix R requirements emphasizes power operationsnot shutdown conditions. For example, Appendix R states that
"Both trains of equipment necessary-to achieve cold shutdown may be'damaged by a single fire"... but damage must be limited'so that at'least ;one train can be repaired or made-operable within 72 'hoursusing onsite capability.'
Based on this statement, the Surry implementation of Appendix R relies on repairor replacement of the residual heat removal (RHR) pump cables rather than cableseparation. According to the associated analysis, cable replacement will take35 hours. Therefore, if the fire starts while the plant is operating, there isenough time to achieve cold shutdown within the allowed'72 hours. However, inthis study, It' is assumed that the plant is already in-coldi-shutdown when thefire occurs. In this case, the 35 hour replacement time appears to be too longfor the scenarios analyzed. The basic difference here is that, from power, thesteam generators Can be utilized to delay the need for RHR, At shutdown, thisdelay capability it not available.-
Arguing in a similar manner, the credit taken by the Appendix R submittalfor repair or replacement of the component cooling water (CCW) pump motors andcables, while acceptable for fires starting when the plant is at power, appearsto be inappropriate for fires starting when the plant is shut down.
Two other situations which appear to have been overlooked due to theemphasis on fires during operation involve the steam generator pilot-operatedrelief valves (SG PORVs) and Main Control Room fires. In the case of a fire thatcauses the loss of the SG PORVs, the alternative shutdown method prescribed bythe Appendix R submittal employs the SG code safety valves. Although this is aviable approach at power, the setpoints of the valves are too high to be usefulfor decay heat removal while at cold shutdown. In the case of Main Control Roomfires, the operators may have to use the Auxiliary Shutdown Panel (in theEmergency Switchgear Room) to control the plant. However, as seen from Tables5-2a and 5-2b of the Appendix R submittal, this panel does not have controlcircuits for the RHR pumps. (At Surry, the RHR system is located withincontainment and is separate from the low pressure injection system.)
It should be pointed out that the above finding regarding Appendix R'scoverage of shutdown fires is generic; plants that rely on alternative shutdown
433
methods rather than separation may need to develop means to maintain a plant atcold shutdown, given that a fire occurs when the plant is shut down (or in theprocess of shutting down).
2. Fire or flood barriers that are available'during power operations may beremoved during shutdown. They include cable and pipe penetrations, fire doors,flood dikes, floor plugs, and backflow preventers in the floor drain system.Surry did have some reported incidents in which one flood dike and two backflowpreventers were removed.
3. Future Work
The Findings presented in this paper are based on the preliminary results'of the Phase 1 Study of the PWR Low Power-and Shutdown Accident FrequenciesProgram. The program is the Level I part of an over-all program that addressesthe risks of a PWR during low power and shutdown conditions. The Level 2 and 3part of the program is -being. initiated. In phase 2 of the level 1 study,detailed analysis will be performed,` particularly in the areas of systemanalysis, human reliability- analysis, and accident scenario development.Interfaces with levels 2 and 3 will be established, and: the resulting riskmeasures for low power and shutdown conditions will be compared with those ofpower operations.
REFERENCES:
1. Chu, T-L., et al., "PWR tow Power and Shutdown Accident Frequencies-Program,Phase 1A - Coarse Screening Analysis," Rough Draft Letter Report, sNovember 13,.1991.
2. Whitehead, D.W., et al., "BWR Low Power and Shutdown Accident Sequence-Frequencies Project," Phase 1 - Coarse Screening Analysis, Vol. 1-!,Rough Draft Letter Report, Sandia National Laboratories, September 21, 1991.
434
SAND91-1610CSTATUS OF THE LOW POWER AND SHUTDOWN ACCIDENT SEQUENCE
ANALYSIS PROJECT FOR THE GRAND GULF NUCLEAR POWER STATION'
Donnie W. Whitehead'John Darby2
Bevan D. Staple' t
Bob Walsh2
Thomas D. Brown3
'Reactor Systems Safety Analysis DivisionSandia National Laboratories
Albuquerque, New Mexico 87185
2Science & Engineering Associates, Inc.Albuquerque, New Mexico 87110
"Reactor Modeling & Regulatory Applications DivisionSandia National Laboratories
Albuquerque, New Mexico 87185
ABSTRACT
This paper describes the current status of Phases 1 and LA of theBWR Low Power and Shutdown Accident Frequencies Program beingconducted at Sandia National -Laboratories -for the U.S. NuclearRegulatory Commission. The major focus of the project to date hasbeen the identification and coarse screening quantification ofaccident sequences initiated in modes of operation other -than fullpower. The coarse screening provides a filtering mechanism wherebythe potentially important accident sequences are identified. Theinformation obtained during these two phases will be used toprioritize the more detailed analyses which will occur during Phase2 of the project. A summarization of the project including resultsand insights from Phases 1 and 1A is presented.
INTRODUCTION
The purpose of this paper is to provide a -brief "overview of the work beingconducted at Sandia National Laboratories (SNL) with regard to the identificationand quantification of accident sequences initiated in modes of operation otherthan full power for the Grand Gulf Nuclear Power Plant.
As discussed in a previous paper on this subject [1], probabilistic riskassessments (PRAs) for nuclear power plants traditionally have characterized the
'This work is supported by o the United States Ndelear Regulatory Commissionand is performed at Sandia National Laboratories, which is operated for theU.S. Department of Energy under Contract Number DE-AC04-76DP00789.
435
risk associated with accidents initiated while the plant is in full-poweroperation. This concentration of effort on full-power events was-based on thejudgment that the level of risk associated with accidents that could occur duringfull-power operation is greater than that associated with accidents that couldoccur during the other modes of operation, such as low power and shutdown. Aswas stated in Reference 1, the primary justification for such a claim appearedto be that lower decay heat levels are generally associated with these othermodes of operation, so more time is available to recover from adverse situationsarising in these modes. However, as a result of the Chernobyl accident and otherprecursor events, the U.S. Nuclear Regulatory Commission's Office of NuclearRegulatory Research has undertaken a two-phase project to analyze thefrequencies, consequences, and risk of accidents occurring during modes ofoperation other than full power.
This paper summarizes the activities that have occurred during the first phaseof the project (i.e., Phase 1 and Phase 1A) for a boiling water reactor (BWR) andpresents preliminary results based on the objectives for the first phase. Acompanion project for a pressurized water reactor (PWR) was conducted byBrookhaven National Laboratory and results of that analysis will be described ina separate paper.
OBJECTIVES AND SCOPE
The overall project objectives are to:
(1). assess the frequencies of severe accidents initiated during plantoperational modes other than full power for a U.S. BWR;
(2) compare the estimated core damage frequencies, important accidentsequences, and other qualitative and quantitative results of thisstudy with those of accidents initiated during full-power operation;and,
(3) demonstrate methodologies for accident sequence analysis for plantsin non full-power modes of operation.
However, the Phase 1 and 1A objectives are more narrow in scope and include thefollowing:
(1) Perform a coarse screening analysis to provide some estimation ofthe potential for accidents during low power and shutdown conditions
,. -by:
* determining which, if any, plant configuration (i.e.,plant operational state) is more susceptible to coredamage accident sequences, -
identifying the set of accident initiating eventsapplicable to each plant operational state, and
436
* -grouping the core damage sequences into either a high,medium, or low category based on the potential coredamage frequency of each sequence.
(2) Characterize the potential risk associated with each of the coredamage sequences surviving truncation based upon the following:
* Is the containment open or closed,
* Is the reactor vessel open, closed, or vented, and
* Does core damage occur in a fast or intermediate timeframe?
(3) Use the results of the accident sequence analysis to prioritize thework to be performed during Phase 2 -(i.e., the detailed analysisphase) of the project.
The scope of this project includes the analysis of the potential accidents thatcould occur at the Grand Gulf'Nuclear Power Plant as- the plant operates in modesother than full power. :This includes operation of the plant at:
1.' Low power (i.e., a subset of the Power mode of operation as definedby .the plant's Technical Specifications), where the'power level isless than or equal-to 15 percent of rated power.
2. Startup as defined by the Technical Specifications.
3. Hot Shutdown as defined by the Technical Specifications.
4. Cold Shutdown as defined by the Technical Specifications.
5. Refueling as defined by the Technical Specifications.
The analysis for the Refueling mode of operation was limited to those events thatcould affect the fuel inside the reactor vesseli-'thereby excluding events suchas fuel transfer accidents once the fuel bundle pissed through an imaginary rightcircular cylinder defined by the reactor vessel.--
Included in the program scope was a coarse screening analysis of potentialaccidents initiated by -internal floods and Internal fires for one plantoperational state. (NOTE: The effects of seismically induced accidents arebeing examined in another study.) -
The program scope for this study excluded examination of the long term issuesfollowing a reactor accident from full power, except for the special case definedby the uppermost success path in the full power event trees. The exclusion ofthe "other" paths in the full power event trees from this study is not meant toimply that they are unimportant. The exclusion simply reflects the resourcesavailable at this time. Also excluded from this study is an analysis of thepotential accidents that could occur during the first time startup of the plant,
437
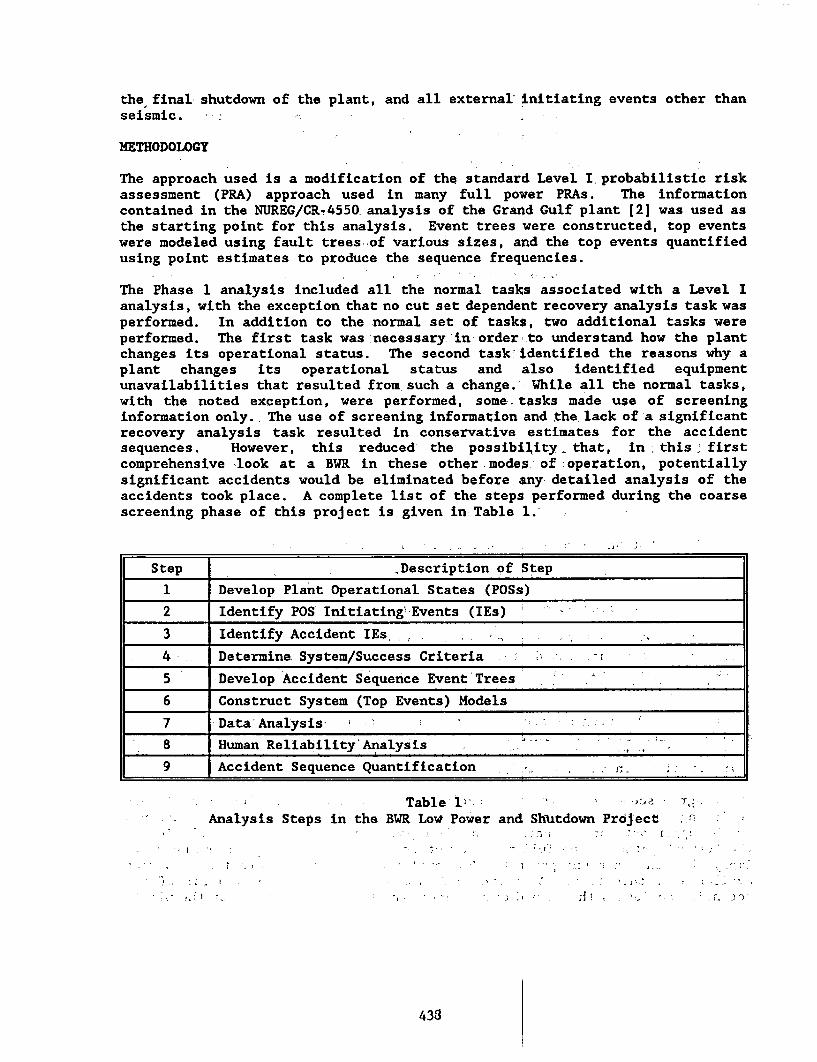
the final shutdown of the plant, and all external initiating events other thanseismic.
METHODOLOGY
The approach used is a modification of the standard Level I probabilistic riskassessment (PRA) approach used in many full power PRAs. The informationcontained in the NUREG/CR-4550, analysis of the Grand Gulf plant [2] was used asthe starting point for this analysis. Event trees were constructed, top eventswere modeled using fault trees of various sizes, and the top events quantifiedusing point estimates to produce the sequence frequencies.
The Phase 1 analysis included all the normal tasks associated with a Level Ianalysis, with the exception that no cut set dependent recovery analysis task wasperformed. In addition to the normal set of tasks, two additional tasks wereperformed. The first task was necessary 'in order to understand how the plantchanges its operational status. The second task identified the reasons why aplant changes its operational status and also identified equipmentunavailabilities that resulted from such a change.' While all the normal tasks,with the noted exception, were performed, some. tasks made use of screeninginformation only. The use of screening information and the lack of a significantrecovery analysis task resulted in conservative estimates for the accidentsequences. However, this reduced the possibility.. that, in this firstcomprehensive look at a BWR in these other modes of operation, potentiallysignificant accidents would be eliminated before any detailed analysis of theaccidents took place. A complete list of the steps performed during the coarsescreening phase of this project is given in Table 1.
Step 'Description of Step
1 Develop Plant Operational States (POSs)
2 Identify POS Initiating! Events (IEs)
3 Identify Accident IEs. , -
4 Determine System/Success Criteria
5 Develop Accident Sequence Event Trees
6 Construct System (Top Events) Models
7 Data' Analysis'
8 Human Reliability Analysis v '
9 Accident Sequence Quantification
Table l; ae'- Analysis Steps in the BWR Low Power and Shutdown Project
* - * 1 *** * ,'
433
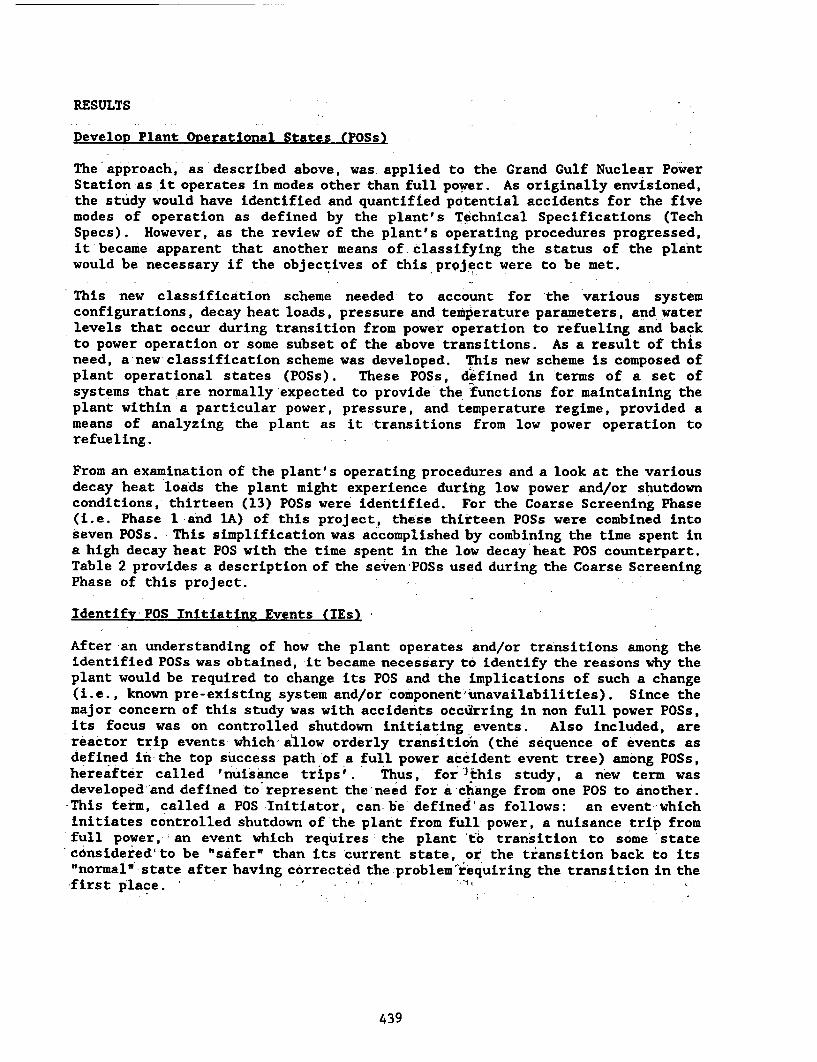
RESULTS
Develop Plant Operational States (POSs)
The approach, as described above, was applied to the Grand Gulf Nuclear PowerStation as it operates in modes other than full power. As originally envisioned,the study would have identified and quantified potential accidents for the fivemodes of operation as defined by the plant's Technical Specifications (TechSpecs). However, as the review of the plant's operating procedures progressed,it became apparent that another means of classifying the status of the plantwould be necessary if the objectives of this project were to be met.
This new classification scheme needed to account for 'the various systemconfigurations, decay heat loads, pressure and temperature parameters, and waterlevels that occur during transition from power operation to refueling and backto power operation or some subset of the above transitions. As a result of thisneed, a new classification scheme was developed.- This new scheme is composed ofplant operational states (POSs). These POSs, defined in terms of a set ofsystems that are normally expected to provide the functions for maintaining theplant within a particular power, pressure, and temperature regime, provided ameans of analyzing the plant as it transitions from low power operation torefueling.
From an examination of the plant's operating procedures and a look at the variousdecay heat loads the plant might experience during low power and/or shutdownconditions, thirteen (13) POSs were identified. For the Coarse Screening Phase(i.e. Phase 1 and 1A) of this project, these thirteen POSs were combined intoseven POSs. This simplification was accomplished by combining the time spent ina high decay heat POS with the time spent in the low decay heat POS counterpart.Table 2 provides a description of the seven POSs used during the Coarse ScreeningPhase of this project.
Identify POS Initiating Events (MEs)
After an understanding of how the plant operates and/or transitions among theidentified POSs was obtained, it became necessary to identify the reasons why theplant would be required to change its POS and the implications of such a change(i.e., known pre-existing system and/or component unavailabilities). Since themajor concern of this study was with accidents occXrring in non full power POSs,its focus was on controlled shutdown initiating events. Also included, arereactor trip events which allow orderly transition (the sequence of events asdefined in the top success path of a full power accident event tree) among POSs,hereafter called 'nuisance trips'. Thus,' for 1this study, a new term'wasdeveloped and defined to represent the need for a change from one POS to another.-This term, called a POS Initiator, can be'defined'as follows: an event whichinitiates controlled shutdown of the plant from full power, a nuisance trip fromfull power, an event which requires the plant 'to transition to some 'statec6nsidered'to be "safer" than its current state, or the transition back to its"normal" state after having corrected the:problemeiequiring the transition in the-first place. -v
439
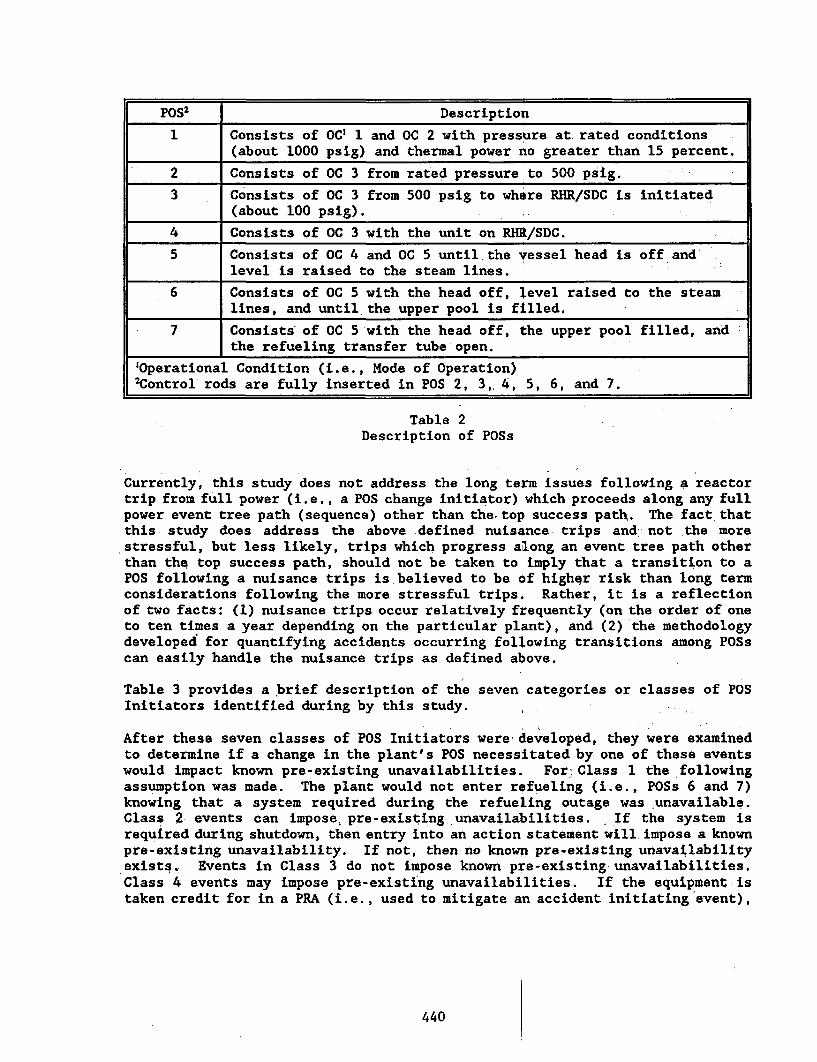
pOS2 Description
1 Consists of OCI 1 and OC 2 with pressure at rated conditions(about 1000 psig) and thermal power no greater than 15 percent.
2 Consists of OC 3 from rated pressure to 500 psig. -
3 Consists of OC 3 from 500 psig to where RHR/SDC is initiated(about 100 psig).
4 Consists of OC 3 with the unit on RHR/SDC.
5 Consists of OC 4 and OC 5 until the vessel head is off andlevel is raised to the steam lines.
6 Consists of OC 5 with the head off, level raised to the steamlines, and until the upper pool is filled.
7 Consists- of OC 5 with the head off, the upper pool filled, andthe refueling transfer tube open.
'Operational Condition (i.e., Mode of Operation)2Control rods are fully inserted in POS 2, 3, 4, 5, 6, and 7.
Table 2Description of POSs
Currently, this study does not address the long term issues following a reactortrip from full power (i.e., a POS change initiator) which proceeds along any fullpower event tree path (sequence) other than the top success path. The fact thatthis- study does address the above defined nuisance trips and. not the morestressful, but less likely, trips which progress along an event tree path otherthan the top success path, should not be taken to imply that a transition to aPOS following a nuisance trips is believed to be of highqr risk than long termconsiderations following the more stressful trips. Rather, it is a reflectionof two facts: (1) nuisance trips occur relatively frequently (on the order of oneto ten times a year depending on the particular plant), and (2) the methodologydeveloped for quantifying accidents occurring following transitions among POSscan easily handle the nuisance trips as defined above.
Table 3 provides a brief description of the seven categories or classes of POSInitiators identified during by this study.
After these seven classes of POS Initiators were developed, they were examinedto determine if a change in the plant's POS necessitated by one of these eventswould impact known pre-existing unavailabilities. For; Class 1 the followingassumption was made. The plant would not enter refueling (i.e., POSs 6 and 7)knowing that a system required during the refueling outage was unavailable.Class 2 events can impose, pre-existing unavailabilities. If the system isrequired during shutdown, then entry into an action statement will impose a knownpre-existing unavailability. If not, then no known pre-existing unavailabilityexists. Events in Class 3 do not impose known preexisting unavailabilities.Class 4 events may impose preexisting unavailabilities. If the equipment istaken credit for in a PRA (i.e., used to mitigate an accident initiating event),
440
then it does impose a pre-existing unavailability. If not, then no pre-existingunavailability- exists. Class 5 events do not impose pre-existingunavailabilities. If the equipment were non-functional, then it would be inClass 2 or 4. Class 6 events could very well impose pre-existingunavailabilities. However, this study is limited to only those events thatprogress along the top success path of the full power accident event trees, andfurther, the assumption was made that whatever caused the nuisance trip iscorrected before the plant transitions out of the P0S it entered while respondingto the trip. No exact determination of Class 7 events was made, as these eventsare outside the scope of this project.
Class Description
1 Refueling. The plant is scheduled for its next refuelingoutage.
2 Controlled shutdown required by Tech Specs due to violation ofa Safety Limit (SL) or Limiting Condition of Operation (LCO).
3 Controlled shutdown required by Tech Specs due to missedSurveillance Requirement (SR).
4 Controlled shutdown due to failures in non-Tech Specequipment.
5 Preventive maintenance. -
6 Change necessitated by a reactor trip from full power(nuisance trip only).
7 First time startup or final shutdown.
Table 3Description of Seven POS Initiator Classes
Identify Accident Initiating Events
The accident initiating event analysis task for this project was performed inmuch the same manner as for any full power PRA. First, a definition of what ismeant by an initiating event was developed, and then a search for events whichfit the definition was made. Finally, information was analyzed to produceestimates of the frequency for each initiating event.
In this study there are two definitions used for an initiating event dependingupon the initial POS of the plant. For power operation, an initiating event isdefined as an event which requires a rapid.shutdow'nor trip of the plant,"so asto challenge the safety systems to remove the decay heat still being generatedin the reactor core. For non-power operations, an initiating event is definedas an event which would require an automatic or manual response to prevent coredamage in the vessel. Table 4 provides a list of the initiating events
441
identified during this study. The table also includes the applicability of eachinitiating event to each POS and the screening value used for the frequency ofthe event.
Determine System/Success Criteria
After the initiating events were identified, the next step was to determine theapplicable systems and success criteria for each initiating event or group ofinitiating events with respect to each POS. The success criteria used for theinitiating events applicable in POSs 1, 2, and 3are those used in the full powerstudy [2]. For POSs 4, 5, 6, and 7 new success criteria were developed. The newsuccess criteria are based on two basic methods of cooling the core:
(1) Injecting a small quantity of subcooled or saturated water so thatthe fluid exiting the vessel after being heated by decay heat issubcooled or is a two phase mixture of low quality.
(2) Injecting subcooled or saturated water in small quantities andsteaming out the vessel.
These two cooling methods, in conjunction'with thp systems available at GrandGulf and the decay heat loads experienced during POSs 4, 5,. 6, and 7, result ina number of possible specific combinations of systems which can prevent coredamage.
Develop Accident Sequence Event Trees
The construction of event trees for the seven POSs was a major task.Approximately 160 initiating event specific event trees were developed. Most ofthese event specific event trees transfer to several additional trees, bringingthe total number of "event trees". developed to more than 500. In an attempt tomake the event trees as realistic as possible, several cooling options wereincluded. Some of these options are not specifically included in Grand Gulf'sEmergency' Procedures, but were nevertheless included in the trees forcompleteness. Due to the large number of trees developed no specific trees areincluded in this paper.
Construct System (ToR Events) Models
Most of the system'models used during this study were based upon those createdin Reference 2 with appropriate modifications as necessary for the low power andshutdown conditions being examined in this study. In addition to using andmodifying the Reference 2 models, two new systems were modeled. These newsystems included the Alternate Decay Heat Removal System and the Fuel PoolCooling 1and Cleanup System. Both 'systems can be used during low power andshutdown to provide cooling to the reactor vessel. These systeIs were modeledto approximately the same level of detail as was the systems obtained fromReference 2.
442
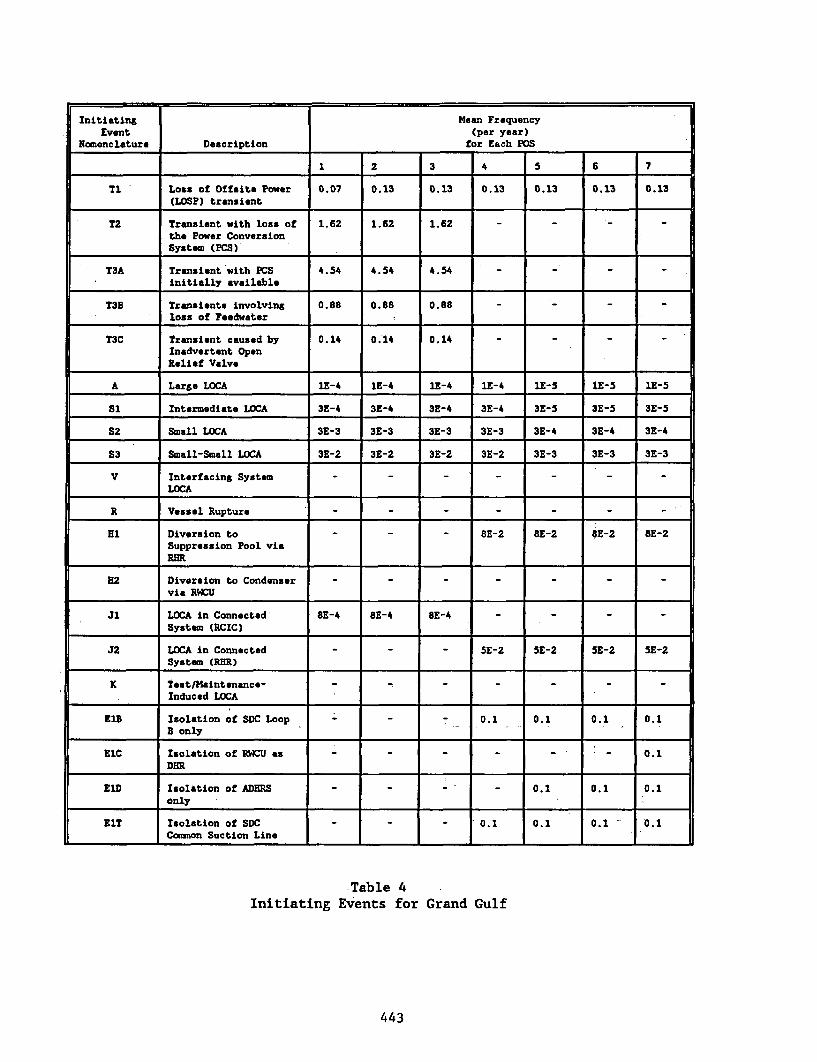
Initiating Mean FrequencyEvent (per year)
Nomenclature Description for Each POS
1 2 3 4 5 6 7
T1 Loss of Offsite Power 0.07 0.13 0.13 0.13 0.13 0.13 0.13(LOSP) transient
T2 Transient with loss of 1.62 1.62 1.62 - - - -
the Power ConversionSystem (PCS) _
T3A Transient with PCS 4.54 4.54 4.54 _ _ -
initially available
T3B Transients involving 0.88 0.88 0.88 _ - _loss of Feedwater
T3C Transient caused by 0.14 0.24 0.14 _ _ _Inadvertent OpenRelief Valve
A Large LOCA lE-4 lE-4 1E-4 1E-4 1E-5 1E-5 IE-5
Si Intermediate LOCA 3E-4 31-4 3E-4 3E-4 3E-5 3E-5 3E-5
S2 Small LOCA 3E-3 3E-3 3E-3 3E-3 3E-4 3E-4 3E-4
S3 Small-Small LOCA 3E-2 3E-2 3E-2 3E-2 3E-3 3E-3 3E-3
V Interfacing System _ _ _ _ _ _LOCA
R Vessel Rupture _ _ _ _ _
H1 Diversion to _ _ 8E-2 8E-2 8E-2 8E-2Suppression Pool viaRER
E2 Diversion to Condenser _ _ _ _ _ _ _via RWCU
Ji LOCA in Connected 8E-4 8E-4 8E-4 _ _ _ _System (RCIC)
J2 LOCA in Connected _ _ 5E-2 5E-2 5E-2 5E-2System (RRR)
K Teat/Maintenance- _ _ _ _ _ _ _Induced LOCA
E1B Isolation of SDC Loop _ _ 0.1 0.1 0.1 0.1B only
EIC Isolation of RWCU as _ _ _ _ _ _ 0.1DER
EID Isolation of ADERS _ - - 0.2 0.2 0.2only
ElIT Isolation of SDC _ 0.1 0.1 0.1 0.lCommon Suction Line
Table 4Initiating Events for Grand Gulf
443
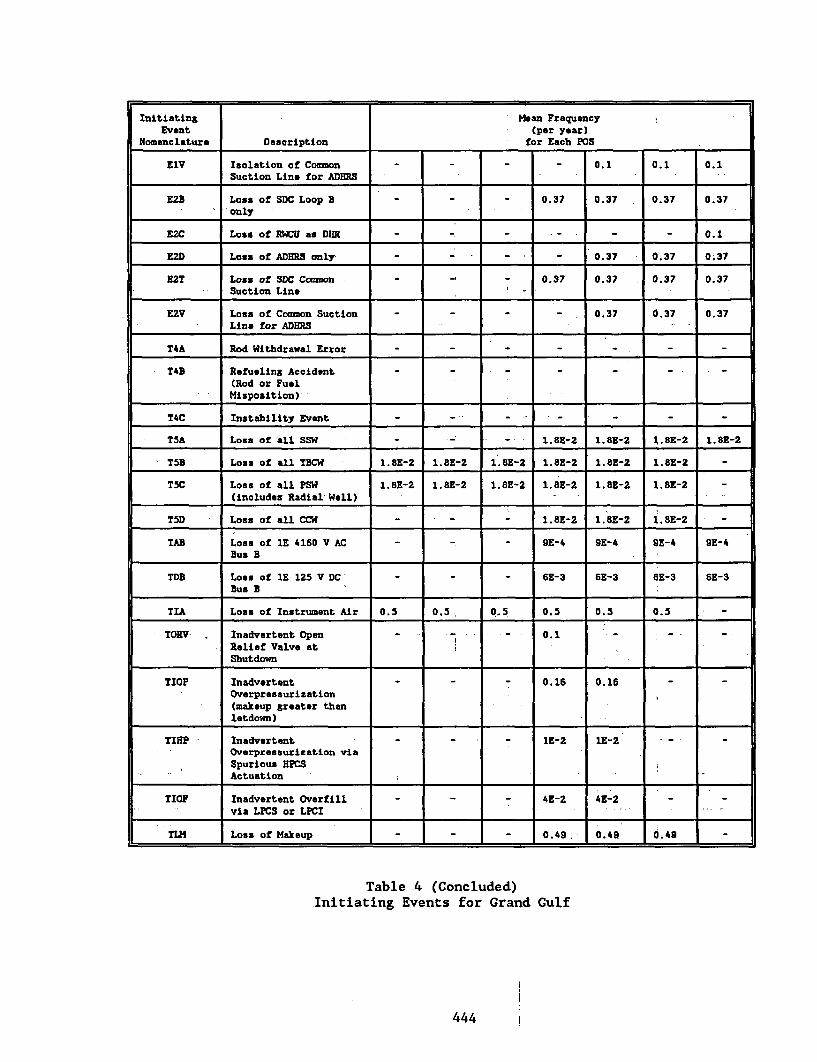
Initiating Mean FrequencyEvent (per year)
Nomenclature Description for Each POS
E1V Isolation of Common _ _ _ 0.1 0.1 0.1Suction Line for ADHRS
E2B Loss of SDC Loop B - _ _ 0.37 0.37 0.37 0.37only
E2C Loss of RWCU as DER - _ _ _ _ 0.1
12D Loss of ADHRS only- - -- - 0.37 0.37 0.37
E2T Loss of SDC Common -, _ 0.37 0.37 0.37 0.37Suction Line
E2V Loss of Common Suction _- - 0.37 0.37 0.37Line for ADBRS
T4A Rod Withdrawal Error _- - -
T4B Refueling Accident - _ _ _ _ _(Rod or FuelMisposition) -
T4C Instability Event _______ _
T5A Loss of all SSW - _ 1.8E-2 1.8E-2 1.8E-2 1.8E-2
- T5B Loss of all TBCW 1.8E-2 1.8E-2 1.8u-a 1.8E-2 1.8E-2 1.8E-2 -
T5C Loss of all PSW 1.8E-2 1.8E-2 1.8E-2 1.8E-2 1.8E-2 1.8U-2 -
(includes Radial Wall)
T5D Loss of all CCW _ _ 1.8E-2 1.8E-2 1.8E-2
TAB Loss of 1E 4160 V AC _ - 9E-4 9E-4 9E-4 SE-4Bus B
TDB Loss of 1E 125 V DC - _ _ 6E-3 6E-3 8E-3 6E-3Bus B
TIA Loss of Instrument Air 0.5 0.5 0.5 0.5 0.5 0.5
TORV- Inadvertent Open _ _ _ 0.1 IRelief Valve atShutdown
TIOP Inadvertent _ _ 0.16 0.16 _Overpressurization(makeup greater thanletdown)
TIHP Inadvertent - _ - 1E-2 1E-2 _Overpressurization viaSpurious HPCSActuation
TIOF Inadvertent Overfill _ _ 4E-2 4E-2 _via LPCS or LPCI
TLM Loss of Makeup 0 _ _ 0.49 .049 0.49 _
Table.4 (Concluded)Initiating Events for Grand Gulf
444 1
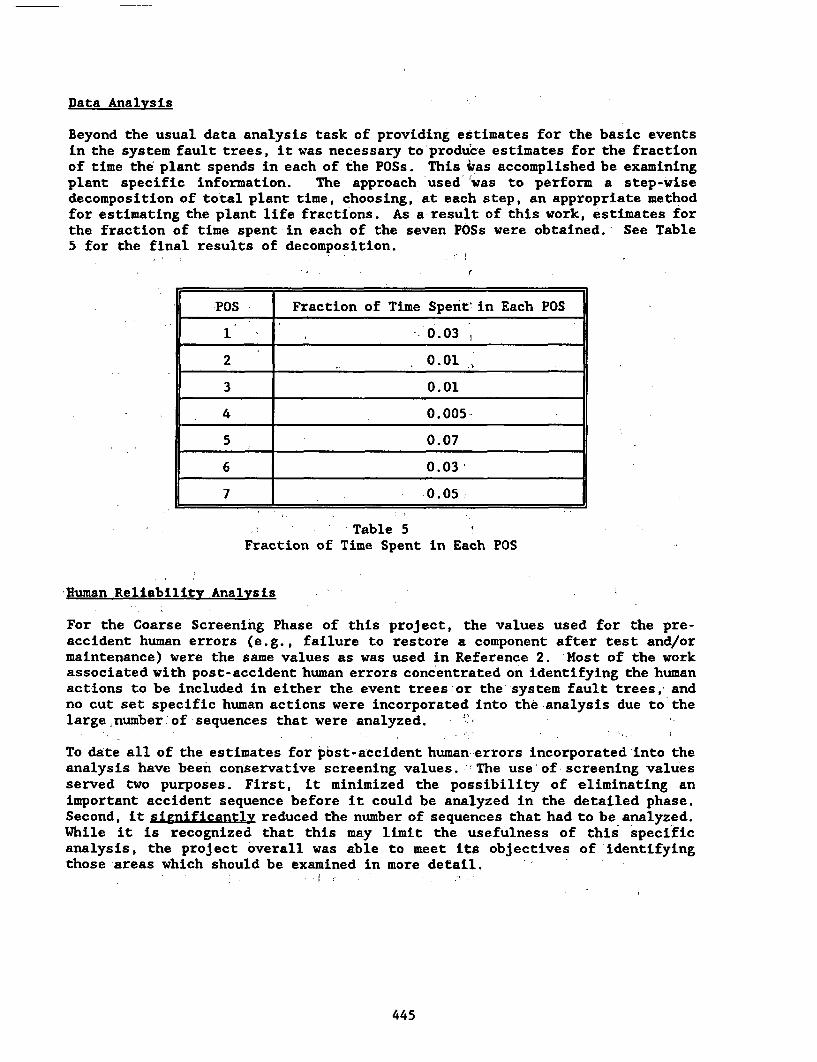
Data Analysis
Beyond the usual data analysis task of providing estimates for the basic eventsin the system fault trees, it was necessary to produce estimates for the fractionof time the plant spends in each of the POSs. This iWas accomplished be examiningplant specific information. The approach 'used 'was to perform a step-wisedecomposition of total plant time, choosing, at each step, an appropriate methodfor estimating the plant life fractions. As a result of this work, estimates forthe fraction of time spent in each of the seven POSs were obtained. See Table5 for the final results of decomposition.
POS Fraction of Time Spent'in Each POS
1 0.03,
2 0.01
3 0.01
4 0.005-
5 0.07
6 0.03'
7 0.05
Table 5Fraction of Time Spent in Each POS
Human Reliability Analysis
For the Coarse Screening Phase of this project, the values used for the pre-accident human errors (e.g., failure to restore a component after test and/ormaintenance) were the same values as was used in Reference 2. Most of the workassociated with post-accident human errors concentrated on identifying the humanactions to be included in either the event trees or the system fault trees, andno cut set specific human actions were incorporated into the-analysis due to thelarge number of sequences that were analyzed.
To date all of the estimates for pbst-accident human errors incorporated into theanalysis have been conservative screening values.- The use' of screening valuesserved two purposes. First, it minimized the possibility of eliminating animportant accident sequence before it could be analyzed in the detailed phase.Second, it significantly reduced the number of sequences that had to be analyzed.While it is recognized that this may limit the usefulness of this specificanalysis, the project overall was able to meet its objectives of identifyingthose areas which should be examined in more detail. '
445
Accident Sequence Ouantification
First, the sequence logic was generated using the event treesdeveloped for thisproject. Second, the sequence logic generated was checked for any error. Thisstep was used as a sanity check by the project members to make sure that thesequences resulting from the combination of the event trees were in actualityvalid sequences.' This was deemed necessary due to the large number of eventtrees constructed during this project. Third, any accident specific data changeswere made. Finally, the sequences were quantified.
As a means of accomplishing the major objective of this study, to identify thosePOSs and/or initiating events requiring more detailed analysis, 4188 accidentnon-fire/flood sequences were analyzed for the seven POSs. The results of thiscoarse screening analysis indicated that 1163 survived the- screening truncationlevel of 1E-8. Of the 1163- sequences that did' survive', 303 sequences werecategorized as having potentially high core damage frequencies. Of the 303sequences, approximately 22 percent would have about 14 hours for any recoveryactions to be completed. Many of the remaining sequences have-as a minimum, 2to 2.5 hours for recovery.
There were 351 sequences that were classified as having potentially medium coredamage frequencies. Of these, approximately 16 percent have about 14 hours forany recovery actions to be completed. Many of the remaining sequences have asa minimum, 2 to 2.5 hours for recovery.
The remaining sequences, 509, were classified as having low core damagefrequencies. Of these, approximately 3 percentihave about 14 hours for anyrecovery actions to be completed. Many of the remaining sequences have as aminimum, 2 to 2.5 hours for recovery.
Screening analyses were performed on fire and flood initiated accidents for asingle POS (i.e., POS 4). For accident sequences initiated by a fire, 692sequences were quantified. Of these 692 sequences 319 sequences were truncated,leaving 373 sequences surviving truncation. Of the 373 sequences surviving-truncation, 106 sequences were classified as having potentially medium' coredamage frequencies while 267- were classified as having low core damagefrequencies. None of the surviving fire sequences were classified, as havingpotentially high core damage frequencies. For accident sequences initiated bya flood, 792 sequences were quantified. Of the, flood sequences quantified, 243survived truncation while 549 sequences were truncated. Of those flood' sequencessurviving truncation, 59 were classified as having potentially medium core damagefrequencies while 184 sequences were classified as having low core damagefrequencies. Again, no flood sequences were classified as having potentiallyhigh core damage frequencies.
The sequences are classified as "potentially" high.' (o; medium) sincerecovery actions have not been applied.' After including recovery actions,it is possible that sequences would no longer be classified in the high(or medium) category.
446
INSIGHTS -`
Since this was a screening analysis to identify-events requiring more detailedstudy, only results that correspond to the objectives of this phase of the studywill be presented. '
Not surprisingly, one significant insight of the study is the importance of humanactions. While the analysis used screening estimates for many of the:humanrecovery actions included in the accident sequences, it is expected that humanactions will continue to be important even when a more detailed human reliabilityanalysis takes place during-the detailed analysis phase. This' outcome isexpected due to the number of human actions incorporated into the models and usedin the solution of the accident sequences. The importance associated with thehuman actions should not be'construed to be all negative. 'It is very likely thathuman recovery actions will positively affect'.(i.e., significantly reduce) thequantitative results of the detailed analysis.-
Another insight from the study is the importance of ensuring that adequate meansof removing decay heat from the reactor vessel as the plant transitions from lowpower operation to refueling and back are preserved. One means of removing decayheat deals with the availability of the safety relief valves (SRVs) as the planttransitions to refueling. During POS 5 (which corresponds to Cold Shutdown),Grand Gulf requires that one SRV be operable at all times. This Grand Gulfrequirement exceeds the Technical Specifications requirements for SRVs in thisPOS. While the availability of one SRV is important since it provides the optionof removing decay heat via steaming, Grand Gulf's procedure for dealing with lossof decay heat removal capability indicates that two SRVs should be opened whenestablishing a water solid loop to the suppression pool. For this analysis, thewater solid means of removing decay heat was assumed to be unavailable, therebyincreasing the importance of the SRVs.
A third insight from the analysis is the identification of two potentiallyimportant accident initiating events or classes of events. The initiatingevents identified as potentially important include loss of instrument air as aunique initiating event (the result of which is the loss of several potentialmitigation systems) and the loss of the operating decay heat removal system(train) as a class of events. For the loss of instrument air, this is notparticularly surprising, given an understanding of the relationship of thissupport system to the front-line systems that could be used to provide thefunctions necessary for maintaining the plant in the POS. The importance of theloss of the operating decay heat removal system is even less surprising.Removing decay heat is the main function necessary for preventing core damage.
A final insight from the study is the identification of two POSs as potentiallyimportant operational states. These two POSs include POS 5 (Cold Shutdown toRefueling when the water level is raised to the steam lines) and POS 6 (Refuelingwith the water level raised to the steam lines). Many of the sequencesclassified in the potentially high or medium categories occurred in these twoPOSs.
Having made the above statements, the reader is cautioned that these insights are
447
based on coarse screening results. As has been stated before, the majorobjective of the coarse screening phase was to provide information that could beused to. prioritize the detailed work of Phase 2. The authors believe that thishas been accomplished. Nevertheless, we wish to emphasize that the specificinsights identified above are subject to change once the detailed phase of thisproject has been completed.
REFERENCES
[1] D. W. Whitehead and T. M. Hake,. "Accident Pequence Analysis for a BWRDuring Low Power and Shutdown Operations," Eighteenth Water Reactor SafetyInformation Meeting, NUREG/CP-0114, Vol. 2, page 449, 1990.
(2] M.,T. Drouin, et. al., Analysis of Core Damage Frequency: Grand Gulf.Unit I Internal Events, NUREG/CR-4550, Vol. 6, Rev. 1, SAND86-2084, SandiaNational Laboratories, September 1989.
J: . 1 . :
I .,
I. ..
! I
I . I . I, - I I , 1 r ' . ' ,
448
SAND91-1668C
Integrated Level III Risk Assessment for theLaSalle Unit 2 Nuclear Power Plant*
I
Arthur C. Payne Jr.Thomas D. BrownLeAnn A. Miller
Sandia National LaboratoriesAlbuquerque, New Mexico 87185
Abstract
In this paper we discuss the methodology and results of theintegrated Level III Probabilistic Risk Assessment (PRA) of theLaSalle County Station Unit 2 Nuclear Power Plant. Methods weredeveloped for integrating internal and external events into oneanalysis based on a common model of the plant and a common methodfor representing the output. Additional methods were developed forrepresenting and propagating uncertainties in the basic inputs tothe models to determine their effects on the final (orintermediate) results. The integrated core damage frequency forthe LaSalle plant is 1.O1E-4/R-yr,. with a 5th percentile of 5.34E-6/R-yr., a median value of 2.92E-5/R-yr., and a 95th percentile of2.93E-4/R-yr. The* dominant sequence is short-term stationblackout. The risk from the LaSalle plant is low, especially withrespect to the NRC safety goals. The mean individual earlyfatality risk within one mile and the mean individual latent cancerrisk are 1.1E-10/R-yr. and 8.5E-9/R-yr., respectively; both ofwhich are several orders of magnitude less than the safety goals.
1. Introduction
An integrated Level III Probabilistic Risk Assessment (PRA) was performed on theLaSalle county station unit 2 Nuclear Power Plant by Sandia NationalLaboratories (SNL) for the Nuclear Regulatory Commission (NRC) [1,2). This studyhad three primary objectives:
-1. To perform a Level III PRA analysis on a BWR-5 nuclear power plantwith a Mark II containment,
2. To develop,- implement, and demonstrate methods for integratinginternal and external events into one consistent analysis, and
* This work was supported by the U. S. Nuclear Regulatory Commission andperformed at Sandia National Laboratories which is operated for the U. S.Department of Energy under Contract No. DE-AC04-76DP00789.
449
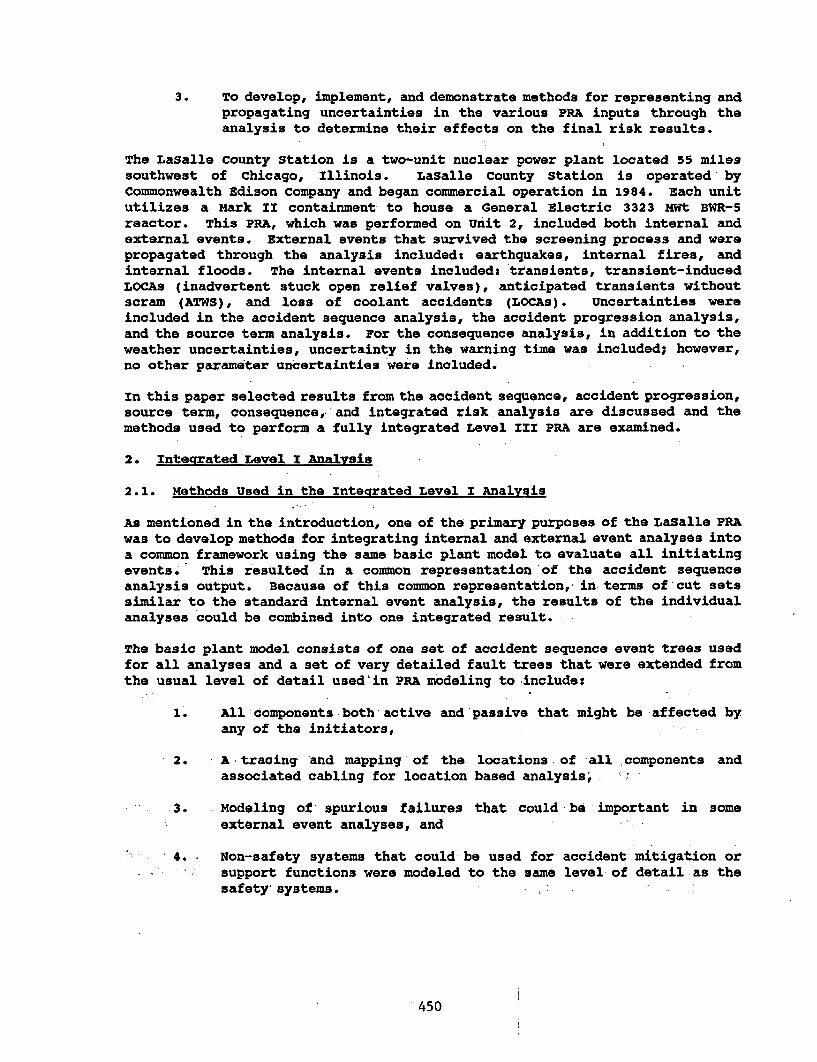
3. To develop, implement, and demonstrate methods for representing andpropagating uncertainties in the various PRA inputs through theanalysis to determine their effects on the final risk results.
The LaSalle county station is a two-unit nuclear power plant located 55 milessouthwest of Chicago, Illinois. LaSalle County Station is operated byCommonwealth Edison Company and began commercial operation in 1984. Each unitutilizes a Mark II containment to house a General Electric 3323 MWt BWR-5reactor. This PRA, which was performed on unit 2, included both internal andexternal events. External events that survived the screening process and werepropagated through the analysis included: earthquakes, internal fires, andinternal floods. The internal events included: transients, transient-inducedLOCks (inadvertent stuck open relief valves), anticipated transients withoutscram (ATWS), and loss of coolant accidents (LOCks). uncertainties wereincluded in the accident sequence analysis, the accident progression analysis,and the source term analysis. For the consequence analysis, in addition to theweather uncertainties, uncertainty in the warning time was included; however,no other parameter uncertainties were included.
In this paper selected results from the accident sequence, accident progression,source term, consequence, and integrated risk analysis are discussed and themethods used to perform a fully integrated Level III PRA are examined.
2. Integrated Level I Analysis
2.1. Methods Used in the Integrated Level I Analysis
As mentioned in the introduction, one of the primary purposes of the LaSalle PRAwas to develop methods for integrating internal and external event analyses intoa common framework using the same basic plant model to evaluate all initiatingevents. This resulted in a common representation of the accident sequenceanalysis output. Because of this common representation, in terms of-cut setssimilar to the standard internal event analysis, the results of the individualanalyses could be combined into one integrated result.
The basic plant model consists of one set of accident sequence event trees usedfor all analyses and a set of very detailed fault trees that were extended fromthe usual level of detail used'in PRA modeling to include:
1. All components both active and passive that might be affected byany of the initiators,
2. A tracing and mapping of the locations, of all components andassociated cabling for location based analysis,''
3. Modeling of spurious failures that could be important in someexternal event analyses, and
4. Non-safety systems that could be used for accident mitigation orsupport functions were modeled to the same level of detail as thesafety' systems.
450
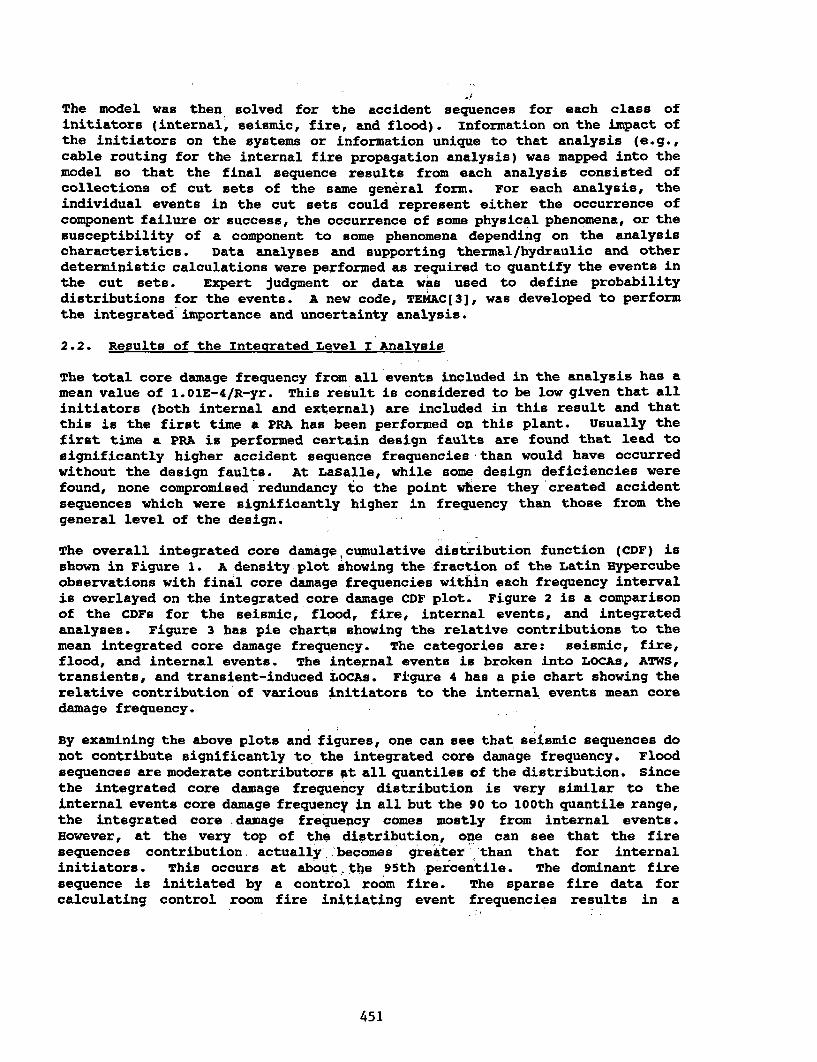
The model was then solved for the accident sequences for each class ofinitiators (internal, seismic, fire, and flood). Information on the impact ofthe initiators on the systems or information unique to that analysis (e.g.,cable routing for the internal fire propagation analysis) was mapped into themodel so that the final sequence results from each analysis consisted ofcollections of cut sets of the same general form. For each analysis, theindividual events in the cut sets could represent either the occurrence ofcomponent failure or success, the occurrence of some physical phenomena, or thesusceptibility of a component to some phenomena depending on the analysischaracteristics. Data analyses and supporting thermal/hydraulic and otherdeterministic calculations were performed as required to quantify the events inthe cut sets. Expert judgment or data was used to define probabilitydistributions for the events. A new code, TEMAC(3], was developed to performthe integrated importance and uncertainty analysis.
2.2. Results of the Integrated Level I Analysis
The total core damage frequency from all events included in the analysis has amean value of 1.OlE-4/R-yr. This result is considered to be low given that allinitiators (both internal and external) are included in this result and thatthis is the first time a PRA has been performed on this plant. Usually thefirst time a PRA is performed certain design faults are found that lead tosignificantly higher accident sequence frequencies than would have occurredwithout the design faults. At LaSalle, while some design deficiencies werefound, none compromised redundancy to the point where they created accidentsequences which were significantly higher in frequency than those from thegeneral level of the design.
The overall integrated core damage cumulative distribution function (CDF) isshown in Figure 1. A density plot showing the fraction of the Latin Eypercubeobservations with final core damage frequencies within each frequency intervalis overlayed on the integrated core damage CDF plot. Figure 2 is a comparisonof the CDFs for the seismic, flood, fire, internal events, and integratedanalyses. Figure 3 has pie charts showing the relative contributions to themean integrated core damage frequency. The categories are: seismic, fire,flood, and internal events. The internal events is broken into LOCAs, ATWS,transients, and transient-induced LOCAs. Figure 4 has a pie chart showing therelative contribution of various initiators to the internal events mean coredamage frequency.
By examining the above plots and figures, one can see that seismic sequences donot contribute significantly to the integrated core damage frequency. Floodsequences are moderate contributors pt all quantiles of the distribution. Sincethe integrated core damage frequency distribution is very similar to theinternal events core damage frequency in all but the 90 to 100th quantile range,the integrated core damage frequency comes mostly from internal events.However, at the very top of the distribution, one can see that the firesequences contribution actually becomes greater than that for internalinitiators. This occurs at about. the 95th percentile. The dominant firesequence is initiated by a control room fire. The sparse fire data forcalculating control room fire initiating event frequencies results in a
451
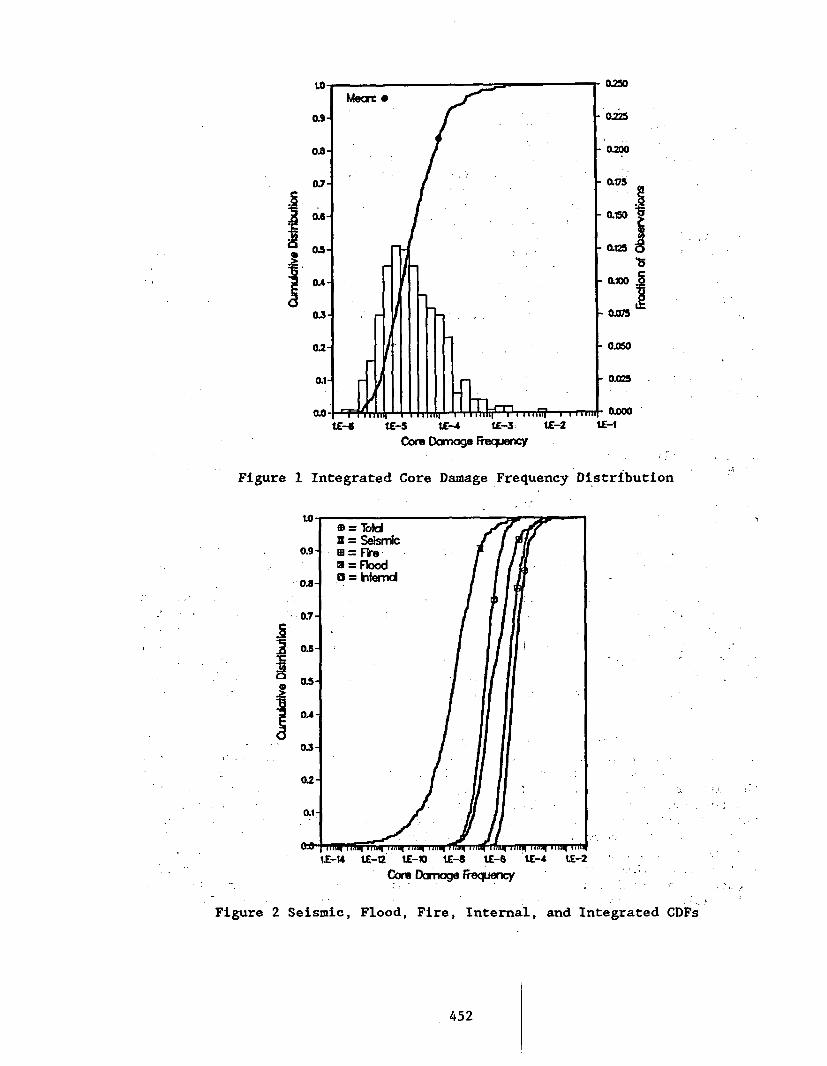
I - - I.
II
Mer.
0.7-
A-s
0.5-
OA-
0.3-
0.2
m.l
0250
0225
0.200
0.150
0.125
*0.10 0 j
0.075
0050
0.000 '"-I
tribution
tW- .E-5 tE-4 tE-S tE-2Co Daige fRe
Figure 1 Integrated Core Damage Frequency
i P
Dist
I.
I
i ,. .. I
IE-14 tE-12 UE-10 IE-iE U-6 tE-4 1.E-2
COr DNiage PKWICY
Figure 2 Seismic, Flood, Fire, Internal, and Integrated CDFs
452
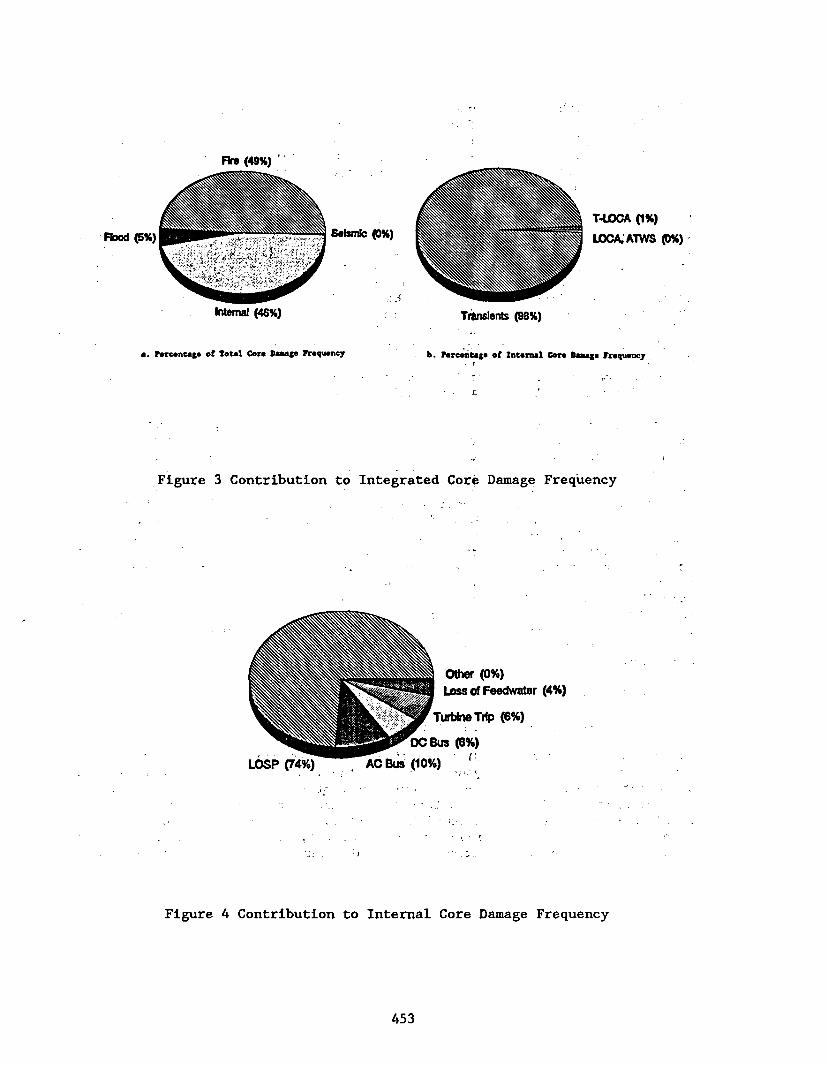
Fl._ (4%) r
Selarnlc (0%)flood (5%)
TihnAlens (98%)
TWLOA (1%)LOA ATWS (0%)
Intrma (46%)
a. Percentage of Total Core Damge Frequency b. Percentage .f Internal Care Daage Frequency. I
Figure 3 Contribution to Integrated Core Damage Frequency
LOSP 74.%)
. .1
W Ocher (0%)
9 | ! WLoud Feedwater (4%)
ilii~Tuft tTube~p (B%)
Cjl - DBU (8%)AC Bus (0%) (
''. ',
Figure 4 Contribution to Internal Core Damage Frequency
453
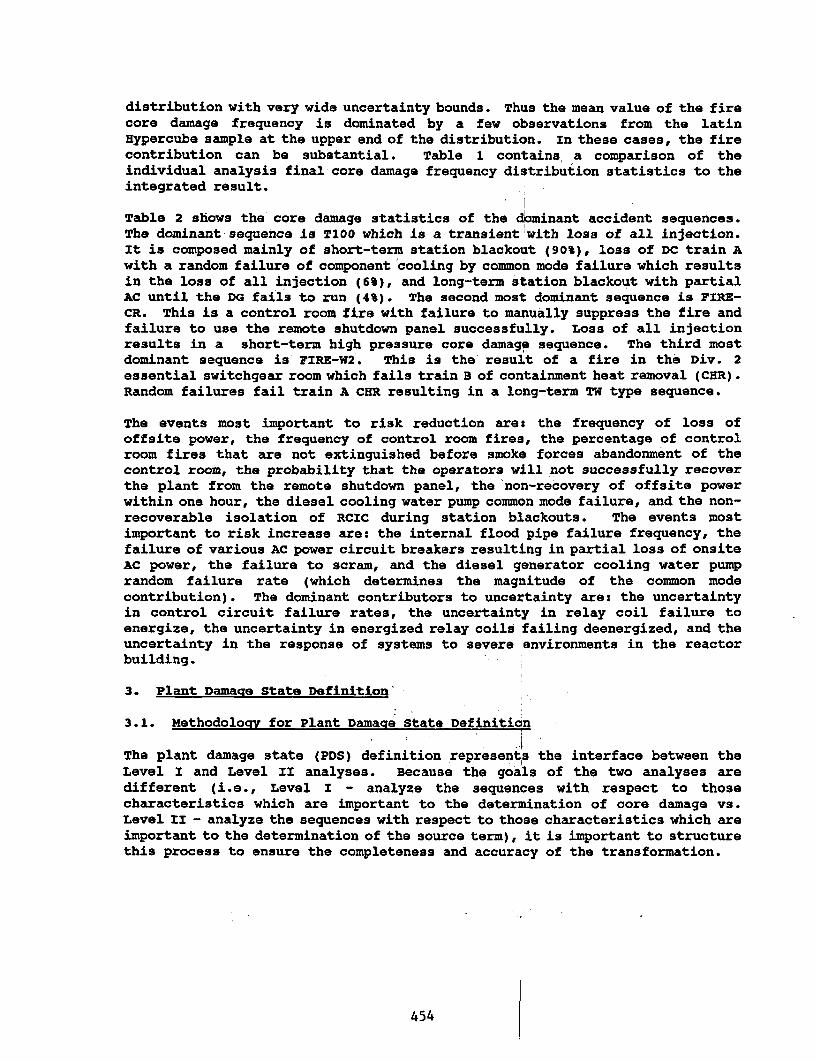
distribution with very wide uncertainty bounds. Thus the mean value of the firecore damage frequency is dominated by a few observations from the latinHypercube sample at the upper end of the distribution. In these cases, the firecontribution can be substantial. Table 1 contains a comparison of theindividual analysis final core damage frequency distribution statistics to theintegrated result.
Table 2 shows the core damage statistics of the dominant accident sequences.The dominant sequence is T100 which is a transient with loss of all injection.It is composed mainly of short-term station blackout (90%), loss of DC train Awith a random failure of component cooling by common mode failure which resultsin the loss of all injection (6%), and long-term sation blackout with partialAC until the DG fails to run (4%). The second most dominant sequence is FIR$-CR. This is a control room fire with failure to manually suppress the fire andfailure to use the remote shutdown panel successfully. Loss of all injectionresults in a short-term high pressure core damage sequence. The third mostdominant sequence is FIRE-W2. This is the result of a fire in the Div. 2essential switchgear room which fails train B of containment heat removal (CHR).Random failures fail train A CHR resulting in a long-term TW type sequence.
The events most important to risk reduction ares the frequency of loss ofoffsite power, the frequency of control room fires, the percentage of controlroom fires that are not extinguished before smoke forces abandonment of thecontrol room, the probability that the operators will not successfully recoverthe plant from the remote shutdown panel, the non-recovery of offsite powerwithin one hour, the diesel cooling water pump common mode failure, and the non-recoverable isolation of RCIC during station blackouts. The events mostimportant to risk increase are: the internal flood pipe failure frequency, thefailure of various AC power circuit breakers resulting in partial loss of onsiteAC power, the failure to scram, and the diesel generator cooling water pumprandom failure rate (which determines the magnitude of the common modecontribution). The dominant contributors to uncertainty are: the uncertaintyin control circuit failure rates, the uncertainty in relay coil failure toenergize, the uncertainty in energized relay coils failing deenergized, and theuncertainty in the response of systems to severe environments in the reactorbuilding.
3. Plant Damage State Definition
3.1. Methodology for Plant Damage state Definition
The plant damage state (PDS) definition represents the interface between theLevel I and Level II analyses. Because the goals of the two analyses aredifferent (i.e., Level I - analyze the sequences with respect to thosecharacteristics which are important to the determination of core damage vs.Level II - analyze the sequences with respect to those characteristics which areimportant to the determination of the source term), it is important to structurethis process to ensure the completeness and accuracy of the transformation.
454
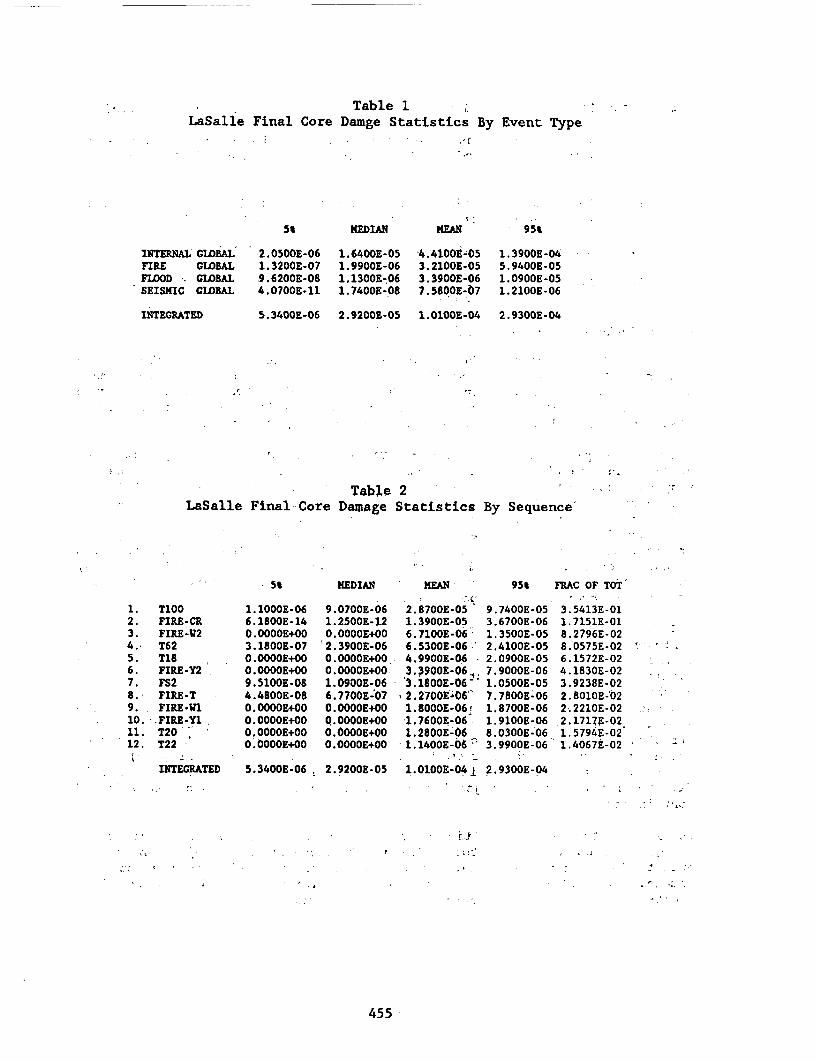
Table 1LaSalle Final Core Damge Statistics By Event Type
5%
INTERNAL GLOBALFIRE GLOBALFLOOD -. GLOBALSEISMIC GLOBAL
2.0500E-061.3200E-079. 6200E-084.0700E-11
MEDIAN
1.6400E-051.9900E-061.1300E-061.7400E-08
MEAN
4 .4100E-053.2100E-053.3900E-067.5800E-07
95%
1.3900E-045.9400E-051.0900E-051.2100E-06
INTEGRATED 5.3400E-06 2.9200E-05 1.0100E-04 2.9300E-04
.r
TableLaSalle Final Core Damage
2Statistics By Sequence
5 St
1 .2.3.4..5.6.7.8.9.10.11.12.
1
T100FIRE-CRFIRE-W2T62T18FIRE-Y2FS2FIRE-TFIRE-W1FIRE-Y1T20T22
1.1000E-066.1800E-14O.OOOOE+OO3.1800E-07O.OOOOE+0OO.OOOOE+OO9. 5100E-084.48OOE-08O.OOOOE+O0O.OOOOE+OOO.OOOOE+OOO.OOOOE+OO
MEDIAN
9.0700E-061.2500E-12O.OOOOE+0O'2.3900E-06O.OOOOE+00O.OOOOE+0O1.0900E-066.7700E-070.OO0OE+OOo.ooooe+ooO.OOOOE+00O.OOOOE+OO
MEAN 95t
2.8700E-05 9.7400E-051.3900E-05 3.6700E-066.7100E-06 1.3500E-056.5300E-06 2.4100E-054.9900E-06 2.0900E-053.390OE-06*, 7.9000E-063.1800E-06- 1.0500E-05
12.270OE.06; 7.7800E-061.8OOOE-061 1.8700E-061.7600E-06 1.9100E-061.2800E-06 8.0300E-06
-1.1400E-066~ 3.9900E-06
1.0100E-041 2.9300E-04
FRAC OF TOT
3.5413E-011.7151E-018.2796E-028.0575E-026.1572E-024.1830E-023.9238E-022.8010E-'022.2210E-022.1717g-021.5794E-021.4067E-02
I �� , I ." ,
� I � I
INTEGRATED 5.3400E-06 ! 2.9200E-05
r _t
455
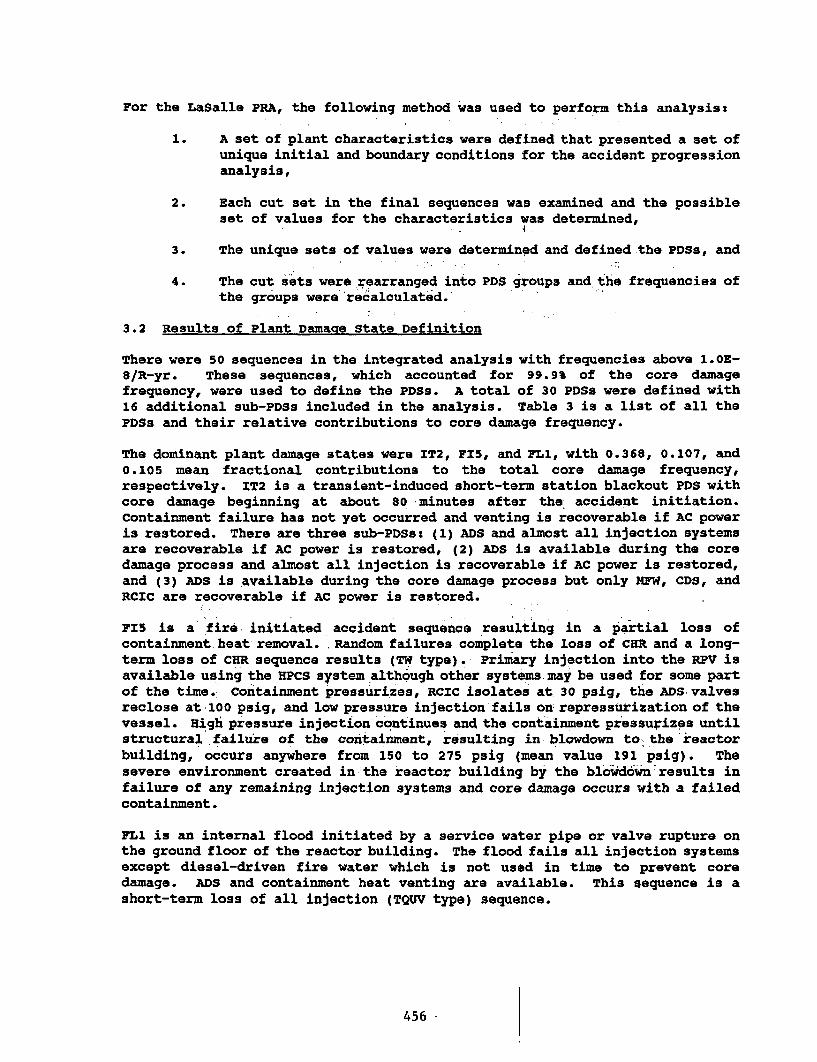
For the LaSalle PRA, the following method was used to perform this analysis:
1. A set of plant characteristics were defined that presented a set ofunique initial and boundary conditions for the accident progressionanalysis,
2. Each cut set in the final sequences was examined and the possibleset of values for the characteristics was determined,
3. The unique sets of values were determined and defined the PDSs, and
4. The cut sets were rearranged into PDS groups and the frequencies ofthe groups were recalculated.'
3.2 Results of Plant Damage state Definition
There were 50 sequences in the integrated analysis with frequencies above 1.0Z-8/R-yr. These sequences, which accounted for 99.9% of the core damagefrequency, were used to define the PDSs. A total of 30 PDSs were defined with16 additional sub-PDsS included in the analysis. Table 3 is a list of all thePDSs and their relative contributions to core damage frequency.
The dominant plant damage states were IT2, Fx5, and FL1, with 0.368, 0.107, and0.105 mean fractional contributions to the total core damage frequency,respectively. IT2 is a transient-induced short-term station blackout PDS withcore damage beginning at about 80 minutes after the accident initiation.containment failure has not yet occurred and venting is recoverable if AC poweris restored. There are three sub-PDSs: (1) ADS and almost all injection systemsare recoverable if AC power is restored, (2) ADS is available during the coredamage process and almost all injection is recoverable if AC power is restored,and (3) ADS is available during the core damage process but only MFW, CDS, andRCIC are recoverable if AC power is restored.
715 is a fire initiated accident sequence resulting in a partial loss ofcontainment heat removal. . Random failures complete the loss of CHR and a long-term loss of CHR sequence results (TW type). Primary injection into the RPV isavailable using the HPCS system although other systems. may be used for some partof the time. Containment pressurizes, RCIC isolates at 30 psig, the ADS. valvesreclose at 100 psig, and low pressure injection fails on repressurization of thevessel. High pressure injection continues and the containment pressurizes untilstructural failure of the containment, resulting in blowdown to- the'reactorbuilding, occurs anywhere from 150 to 275 psig (mean value 191 psig). Thesevere environment created in the reactor building by the blo4down results infailure of any remaining injection systems and core damage occurs with a failedcontainment.
FL1 is an internal flood initiated by a service water pipe or valve rupture onthe ground floor of the reactor building. The flood fails all injection systemsexcept diesel-driven fire water which is not used in time to prevent coredamage. ADS and containment heat venting are available. This sequence is ashort-term loss of all injection (TQUV type) sequence.
456 -
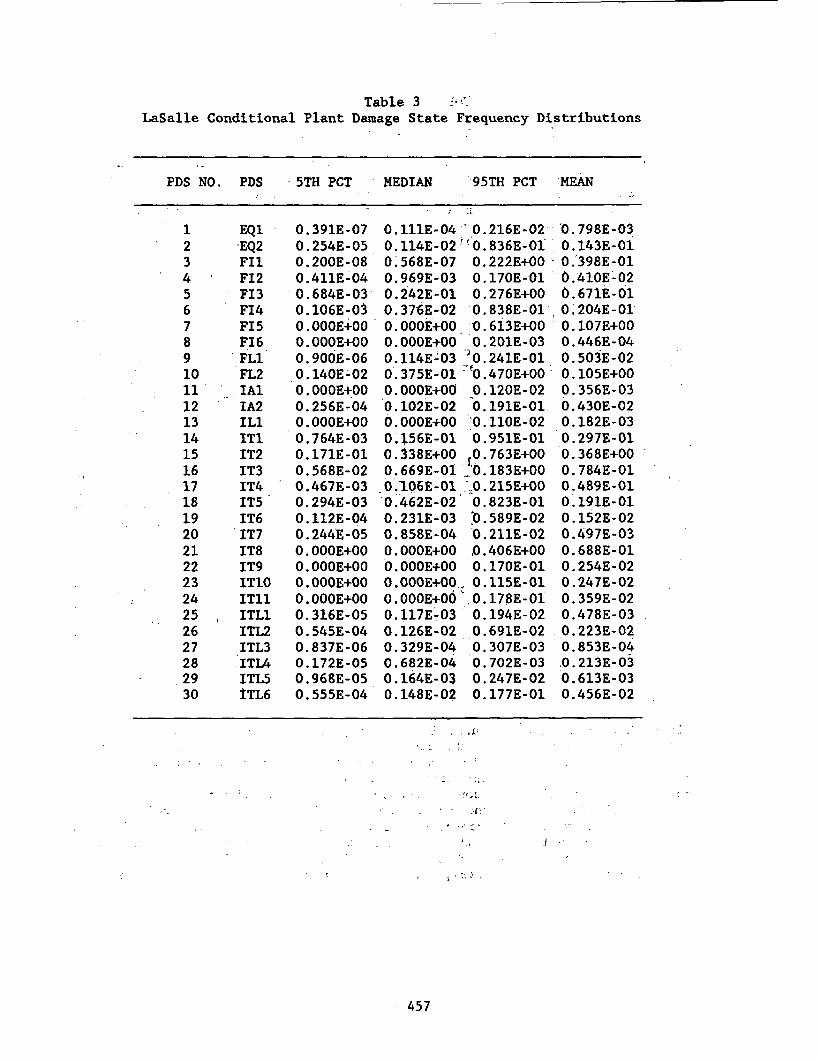
Table 3 t'LaSalle Conditional Plant Damage State Frequency Distributions
PDS NO. PDS -5TH PCT MEDIAN 95TH PCT 'MEAN
1 EQ12 -EQ23 FI14 FI25 FI36 FI47 FI58 FI69 FL110 FL211 IAl12 IA213 ILl14 ITl15 IT216 IT317 IT418 IT519 IT620 IT721 IT822 IT923 IT1024 ITll25 ITL126 ITL227 ITL328 ITL429 ITL530 ITL6
0.391E-07 0.1l1E-04 '0.216E-02 0.798E-030.254E-05 0.114E-02 '0.836E-01' 0.143E-O10.200E-08 0.568E-07 0.222E+00'- 0.398E-O10.411E-04 0.969E-03 0.170E-01 0.410EL020.684E-03 0.242E-01 0.276E+00 0.671E-O10.106E-03 0.376E-02 0.838E-01 0.204E-01O.'OOOE+00 O.OOOE+00 0.613E+00 0.107E+00O.OOOE+00 O.OOOE+O0 0.201E-03 0.446E-040.900E-06 0.114E-03 '0.241E-01 0.503E-020.140E-02 0.375E-01 f0.470E+00- 0.105E+00O.OOOE+00 O.OOOE+0O 0.120E-02 0.356E-030.256E-04 0.102E-02 O.l91E-01 0.430E-02O.OOOE+00 O.OOOE+00 '0.llOE-02 0.182E-030.764E-03 0.156E-01 0.951E-01 0.297E-010.171E-01 0.338E+00 0 .763E+00 0.368E+000.568E-02 0.669E-01 -b.183E+00 0.784E-010.467E-03 0.106E-01 '0.215E+00 0.489E-010.294E-03 0.462E-02 0.823E-01 0.191E-Ol0.112E-04 0.231E-03 ,.589E-02 0.152E-020.244E-05 0.858E-04 0.211E-02 0.497E-030.OOOE+00 O.OOOE+00 0.406E+00 0.688E-01O.OOOE+00 O.OOOE+00 0.170E-01 0.254E-02O.OOOE+00 0.OOOE+00_ 0.115E-01 0.247E-02O.OOOE+00 O.OOOE+06,0.178E-01 0.359E-020.316E-05 0.117E-03 0.194E-02 0.478E-030.545E-04 0.126E-02 0.691E-02 0.223E-020.837E-06 0.329E-04 0.307E-03 0.853E-040.172E-05 0.682E-04 0.702E-03 0.213E-030.968E-05 0.164E-03 0.247E-02 0.613E-030.555E-04 0.148E-02 0.177E-01 0.456E-02
11 11
I.I
: 457
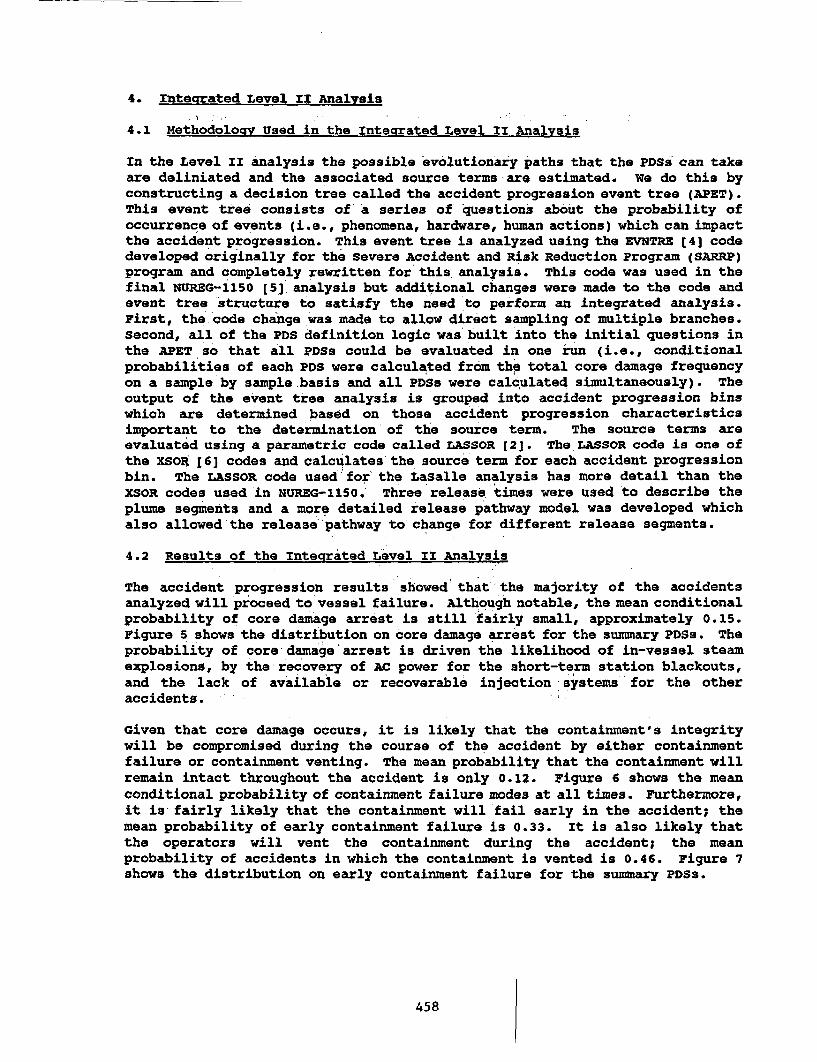
4. Integrated Level II Analysis
4.1 Methodology Used in the Integrated Level II Analysis
In the Level II analysis the possible evolutionary paths that the PDSs can takeare deliniated and the associated source terms are estimated. We do this byconstructing a decision tree called the accident progression event tree (APET).This event tree consists of a series of questions about the probability ofoccurrence of events (i.e., phenomena, hardware, human actions) which can impactthe accident progression. This event tree is analyzed using the EVNTRE (4] codedeveloped originally for the Severe Accident and Risk Reduction Program (SARRP)program and completely rewritten for this analysis. This code was used in thefinal NUREG-1150 5]. analysis but additional changes were made to the code andevent tree structure to satisfy the need to perform an integrated analysis.First, the.code change was made to allow direct sampling of multiple branches.Second, all of the PDS definition logic was built into the initial questions inthe APET so that all PDSs could be evaluated in one run (i.e., conditionalprobabilities of each PDS were calculated from the total core damage frequencyon a sample by sample basis and all PDSs were calculated simultaneously). Theoutput of the event tree analysis is grouped into accident progression binswhich are determined based on those accident progression characteristicsimportant to the determination of the source term. The source terms areevaluated using a parametric code called LASSOR (2]. The LASSOR code is one ofthe XSo0 16] codes and calculates the source term for each accident progressionbin. The LASSOR code used for the Lasalle analysis has more detail than theXSOR codes used in NUREG-l1SO. Three release times were used to describe theplume segments and a more detailed release pathway model was developed whichalso allowed the release pathway to change for different release segments.
4.2 Results of the Integrated Level II Analysis
The accident progression results showed that" the majority of the accidentsanalyzed will proceed to vessel failure. Although notable, the mean conditionalprobability of core damage arrest is still fairly small, approximately 0.15.Figure 5 shows the distribution on core damage arrest for the summary PDSB. Theprobability of core damage arrest is driven the likelihood of in-vessel steamexplosions, by the recovery of AC power for the short-term station blackouts,and the lack of available or recoverable injection systems for the otheraccidents.
Given that core damage occurs, it is likely that the containment's integritywill be compromised during the course of the accident by either containmentfailure or containment venting. The mean probability that the containment willremain intact throughout the accident is only 0.12. Figure 6 shows the meanconditional probability of containment failure modes at all times. Furthermore,it is fairly likely that the containment will fail early in the accident; themean probability of early containment failure is 0.33. It is also likely thatthe operators will vent the containment during the accident; the meanprobability of accidents in which the containment is vented is 0.46. Figure 7shows the distribution on early containment failure for the summary PDSS.
458
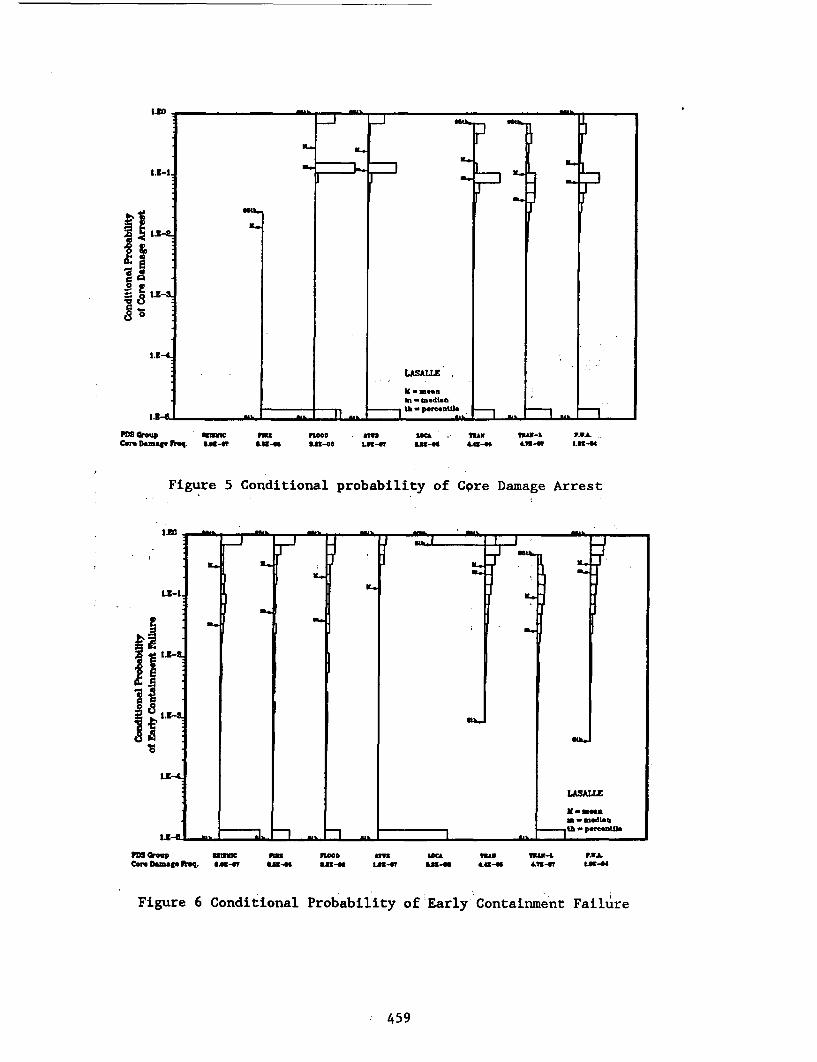
k
1.3-
1..
LASALLE
-mesa
Jn - median
th U perneoœut.
VWS Group IRumc MmHOD gm3 teca ,' RA31 9313- 1.1.3Can Damae feq. Lee- r AM-ed am-od .U-4W A3-d5 gAo-dS *-a 1.3m-u
Figure 5 Conditional probability of Core Damage Arrest
L~ --
139-1
I.'AU
~~JYL
Figure 6 Conditional Probability of Earl Containment Failuire
459
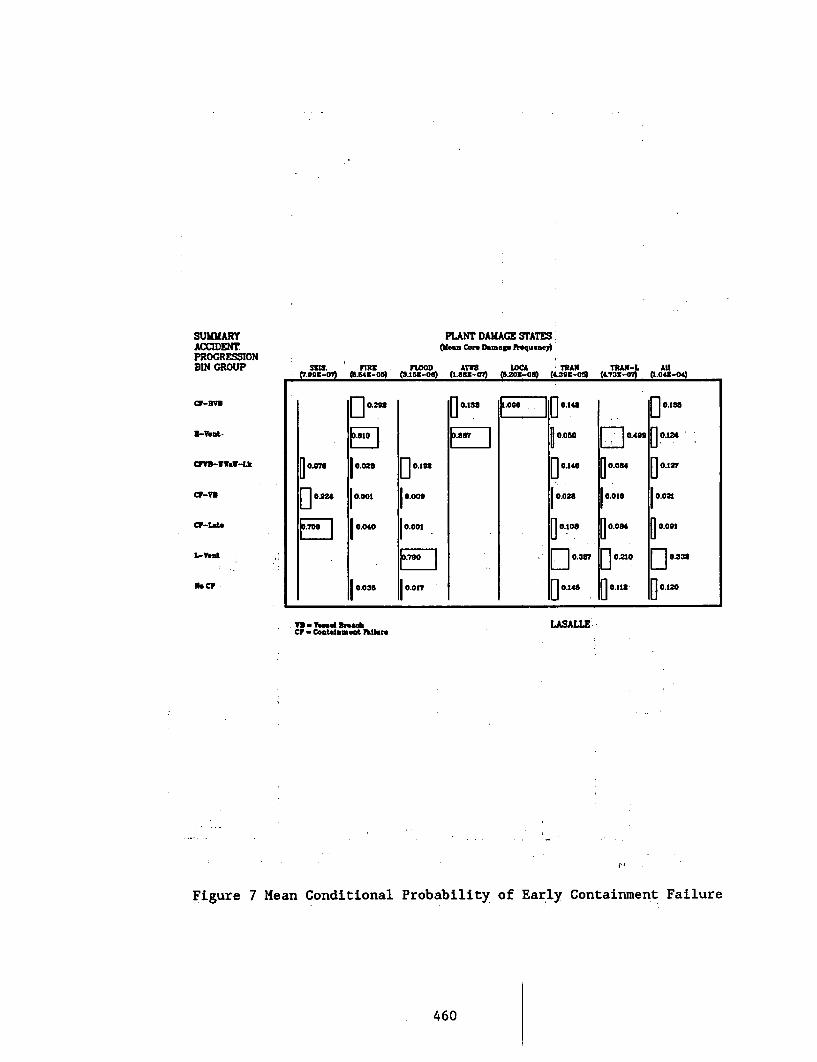
SUMMARYACCIDENTPROGRESSIONBIN GROUP
C-3V3
11-7sat.
Orv9-1fwa-Lk
m-L-at
L-V.nt
No CF
PLANT DAMAGE STATESWean Core Damage "uench
ATI3 LJOCh TRANIt AeE-ffA 19203-881 (A-592-ft
sU.e FlUE FLOOD(v.03rn 5~43-05) (3.153-06)
TRAN-L Allt.72-WA ft oAA-O4s
o0.29
0.07 10.023
el"224 0.001
~13 10.040
10.035
I 0.133
EZ]o.ooa
10.006
0.0011
I0.017
110 048
0.050
0 .40
0.026
10.108. l 0.31 7
C014s
0.0'
00.084
0 210
9 0.112
1110.188
l 0A12
Elo0.021
j]0.091D 0.332
0 1.120
.3- Vaind smackCF - Containment Mhan
LASA11E
Fi r 7
Figure 7 Mean Conditional Probability, of Early Containment Failure
460
Given that core damage occurs, it is likely that the core debris released fromthe vessel will participate in core-concrete interactions (CCI). The meanprobability of CCI, conditional on core damage, is 0.77. Thus, the potentialexists for a large release late in the accident. Figure 8 shows the meanconditional probability of various categories of CCI.
The events that result in containment failure before core damage are slowpressurization events that result from the accumulation of steam andnoncondensibles during accidents in which CER isE'lost or inadequate (i.e.,long-term loss of CER accidents, long-term stationbilackout accidents, and ATWSaccidents).' Events that result in containment failure around the time of vesselbreach include fast pressurization of the containment from loads accompanyingvessel breach (i.e., DCH, ex-vessel steam explosions, RPV blowdown), alpha modeevents, drywell failure induced by reactor pedestal failure, and cavity drainline isolation failure). Late in the accident, events that result incontainment failure include the slow pressurization of the containment from thesteam and noncondensibles generated during CCI and failure of the reactorpedestal caused by concrete erosion during CCI. = Figure '9 shows the meanconditional probability of summary accident progression bins for various summaryPDSs.
The source term results showed that the pressure of the RPV does notsignificantly affect the total source term for a particular accident progressionif vessel breach occurs. This is due to the differences in the fraction of aspecies released from the fuel'before vessel breach being negated when thevessel breaches and the radionuclides in the vessel revolatilize (i.e., lowrelease before vessel breach results in high release after vessel breach andvice versa).
The release path through which the radionuclides pass was determined to beimportant. The path that resulted in the highest release to the environment isthrough the wetwell above the water line. If the cavity floor failed,radionuclides may leave the containment without being scrubbed by sprays or thesuppression pool. The venting pathway is also through the wetwell above thewater line. In most cases, containment failures in the drywell or drywell headwere accompanied by successful' operation of containment sprays whichsignificantly reduced the amount of radionuclides being released. Also, formany of the cases for which'containment failure in the drywell head occurred,core damage did not occur because severe environments were not created in thereactor building and injection systems did not subsequently fail.
The analysis showed that late iodine revolatilization results in significantreleases due to much of the iodine being scrubbed by the suppression poolinitially and being revolatilized later when the removal mechanisms are not aseffective. For this reason, the modeling of late'iOdine revolatilization mayneed to be investigated further.
The regression analysis shows that much of the uncertainty in the final resultsis due to uncertainty in the source term parameters. Much of the uncertaintymay be due to the fact the distributions being used were elicited for cases withlarge uncertainties in the initial and boundary conditions. Some of this
461
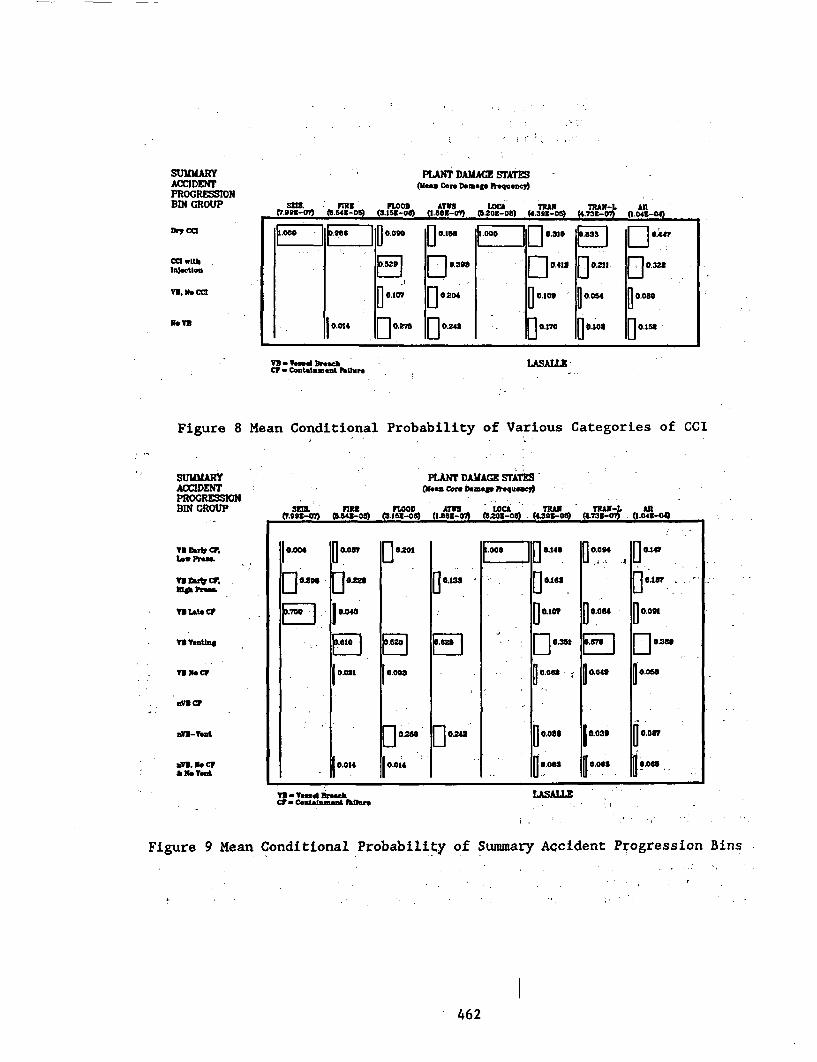
PLANT DAMAGE STATESQl en Core Damage "qoney)
AT"1 LUC TUNl(1.8e3-O0 (1.20Z-o08 (4.32o-oo (4y
SUMMARYACCIDENTPROGREiSIONBDIN GROUP
DVS ca
CeIwtbInjetio
vs. me CCI
le TN
SEll. FIRR FLOODCy.SBz-0I) (5.549-01 (3.153-090
MAX-L Ann3E-WA ft nfz-"
[j o [G 410.s[ 0W410 0211, [0.322
0. oio7 0204 0.103 0 8I.04 10.080
10.014 []o 11 0] [ .J70 0.10o 0.158
VD B .. * eBCr - Conatlament Mhue
LASALLE
I.I
Figure 8 Mean Conditional Probability of Various C.
SUIAIRY PLAWT DMAGC STAItESACCIDENT -Me- cove Dem fwqut"*PROGREIONBIN GROUP ML r7 FLOOD A73 LO0) ThA
((gl-,) W.u-n) (88 (IS (18-* (50-8e(o9-8
ategories of CCI
SRAN-L AUl"73s-0) . (.043-04
Lea Pr"s&.gtC. _
13 Late C?
an-'rent
a". me CF&aoenut
|. 0o | 7 0[01o . E I || e.u4 0 0.04 0 4o
0I] 6.[J22j 0.133 1]616 137009 0 a 03t. 1 , .. [ 1
E ] 10.040 0t187 ||oo 0.oons
|0.02 | eow .|ooa OM | e | .
0200 102u D08° 0.03" 0.0870._ 0o014 |eoaS _ ° 11 0- -0 .
cr- s Tea d a ch LLAUZ=
Figure 9 Mean Conditional Probability of Summary Accident Progression Bins
462
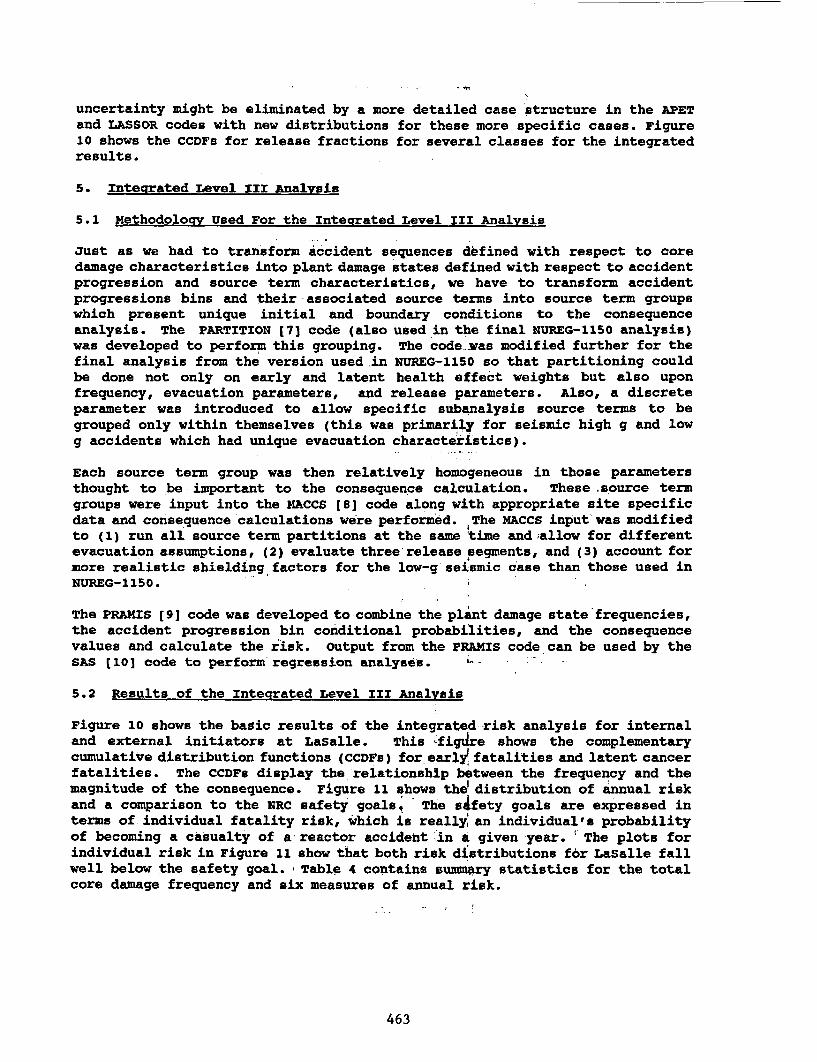
uncertainty might be eliminated by a more detailed case structure in the APETand LASSOR codes with new distributions for these more specific cases. Figure10 shows the CCDFs for release fractions for several classes for the integratedresults.
5. Intecrated Level III Analysis
5.1 Methodology Used For the Integrated Level III Analysis
Just as we had to transform accident sequences defined with respect to coredamage characteristics into plant damage states defined with respect to accidentprogression and source term characteristics, we have to transform accidentprogressions bins and their-associated source terms into source term groupswhich present unique initial and boundary conditions to the consequenceanalysis. The PARTITION [7] code (also used in the final NUREG-1150 analysis)was developed to perform this grouping. The code was modified further for thefinal analysis from the version used .in NUREG-1150 so that partitioning couldbe done not only on early and latent health effect weights but also uponfrequency, evacuation parameters, and release parameters. Also, a discreteparameter was introduced to allow specific subanalysis source terms to begrouped only within themselves (this was primarily for seismic high g and lowg accidents which had unique evacuation characteristics).
Each source term group was then relatively homogeneous in those parametersthought to be important to the consequence calculation. These source termgroups were input into the MACCS [8] code along with appropriate site specificdata and consequence calculations were performed. ,The MACCS input was modifiedto (1) run all source term partitions at the same time and;allow for differentevacuation assumptions, (2) evaluate three release segments, and (3) account formore realistic shielding factors for the low-g'seismic case than those used inNUIREG-1150.
The PRAMIS [9] code was developed to combine the plant damage state'frequencies,the accident progression bin conditional probabilities, and the consequencevalues and calculate the risk. output from the PRAMIS code can be used by theSAS [10] code to perform' regression analyses. -
5.2 Results of the Integrated Level III Analysis
Figure 10 shows the basic results of the integrated-risk analysis for internaland external initiators at LaSalle. This 'figi re shows the complementarycumulative distribution functions (CCDFU) for early fatalities and latent cancerfatalities. The CCDFs display the relationship between the frequency and themagnitude of the consequence. Figure 11 shows the' distribution of annual riskand a comparison to the NRC safety goals, The safety goals are expressed interms of individual fatality risk, which is really an individual's probabilityof becoming a casualty of a reactor accident in a given'year. The plots forindividual risk in Figure 11 show that both risk distributions for LaSalle fallwell below the safety goal. Table 4 contains sumnmary statistics for the totalcore damage frequency and six measures of annual risk.
463
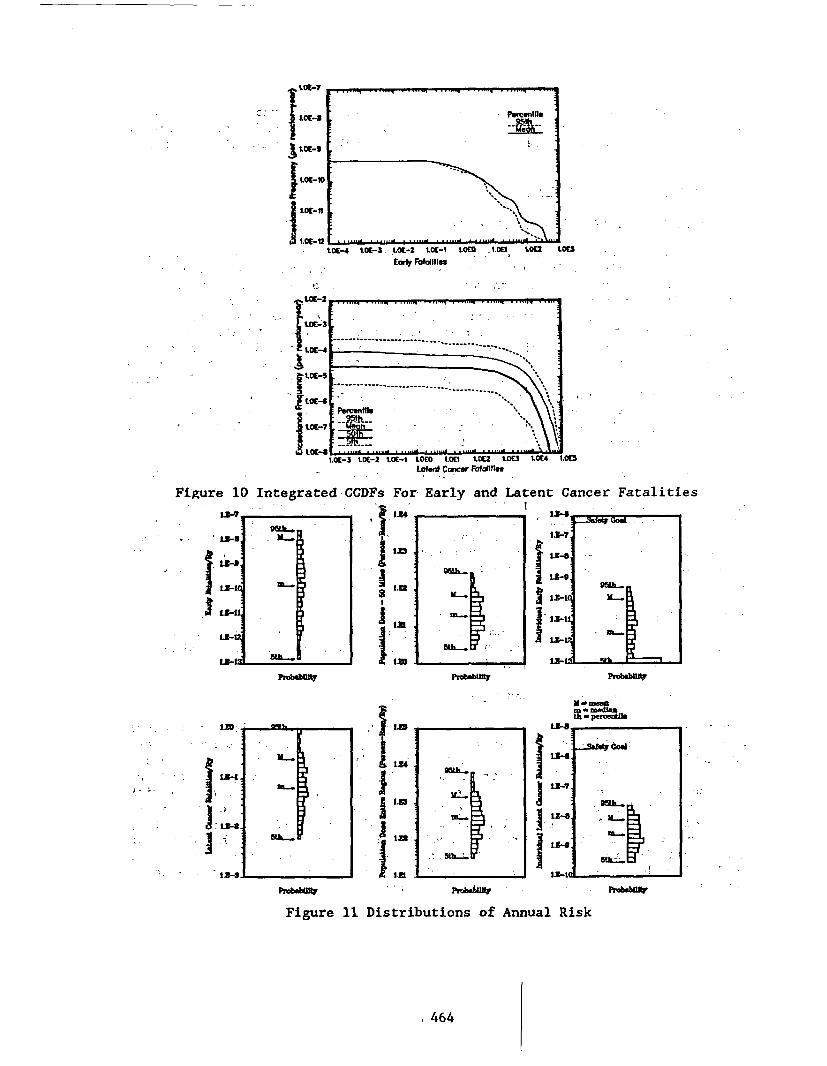
tot-7
A tat-$
LOE-ID
I 101-U
3.Ot-Utc
:' .
I
4I
I.OE-3 tOE-2 tOE-1 .OEO 1.01 LOE2 1.03 .OE1 1.ESLatnt Coner FaWfles
Figure 10 Integrated CCDFs For Early and Latent Cancer
X -? 124 13-i
is-a 3-
1O ta.i11D-
1:11LI--
L3-t 8t...__ _ _ _ _ __ 31
Fatalities
1- Perosuule
I:
:. - . I sI 4
3i~
.. -a,
. .
ta-
13-7
. S1L-I S I. ..IM
:1'.9',I. 5U-
. !Ils-U _
F i g u r e 1' t Pto n s o fInn a l i s
Figure 11 Distributions of Annual Risk
k 464
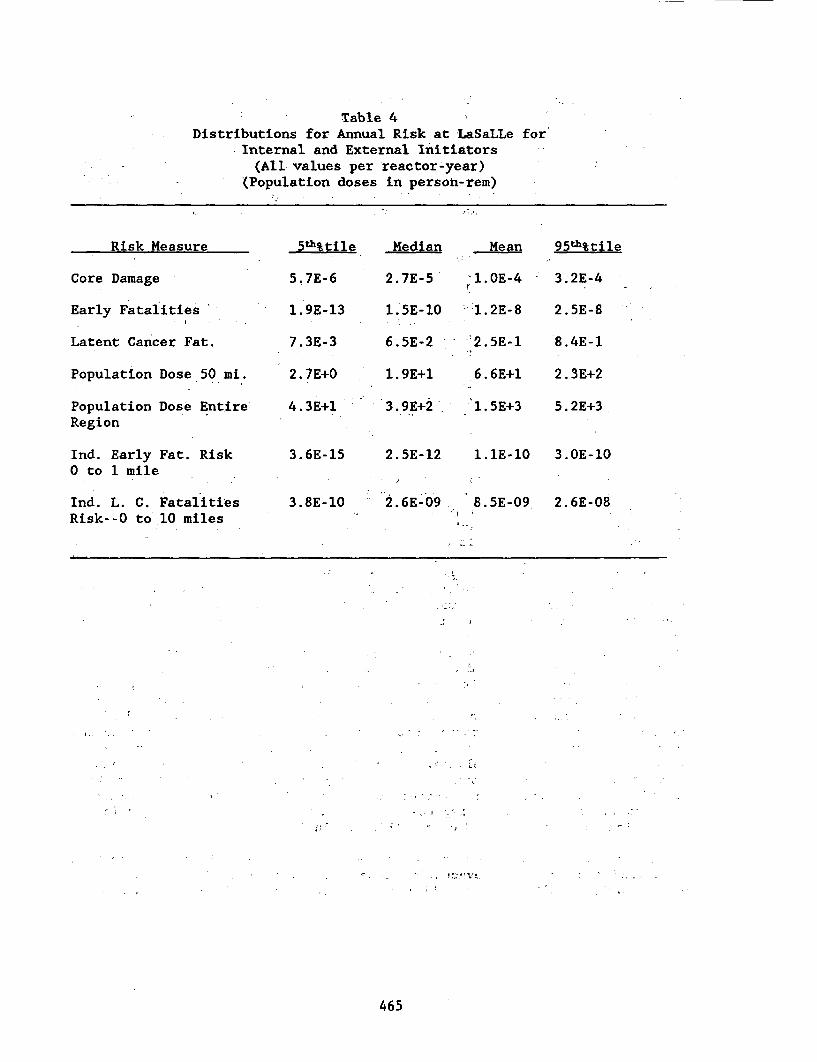
Table 4 IDistributions for Annual Risk at LaSaLLe for
-Internal and External Initiators(All values per reactor-year)
(Population doses in persoh-rem)
Risk Measure
Core Damage
Early Fatalities
Latent Cancer Fat.
Population Dose 50 mi.
Population Dose EntireRegion
Ind. Early Fat. Risk0 to 1 mile
Ind. L. C. FatalitieesRisk--O to 10 miles
5t11%tile Median Mean 95th%tile
5.7E-6
1.9E-13
7.3E-3
2.7E+O
4.3E+l
3.6E-15
2.7E-5 -1.OE-4
1.5E-10 -'1.2E-8
6.5E-2 - -'2.5E-1
l.9E+1 6.6E+l
3.2E-4
2.5E-8
8.4E-1
2.3E+2
. 3.9E-.2 1.5E+3 5.2E+3
2.5E-12 1AlE-10 3.OE-10
3.8E-10 2.6E-09 8.5E-09, 2.6E-08
. .
I .I . V.
I p,
465
Table 5 shows the contribution of seven summary PDS groups to the various riskmeasures. For all of the consequence measures, the risk is dominated by thefire PDS group and the transient PDS group. These groups are also the dominantcontributors to the core damage frequency. The LOCA and -the transient-inducedLOCA PDS groups, on the other hand, are very minor contributors to the risk.The seismic, ATWS, and flood groups are intermediate contributors. The seismicand ATWS PDS groups involve potentially high consequence accidents, however,their frequency of occurrence is sufficiently low that the resulting risk doesnot dominate the risk profile.
Table 6 shows the contribution of eight summary accident progression bins to thevarious risk measures. The risk is dominated by accidents that progress tovessel breach and involve loss of containment integrity. Vessel breach isimportant because it affects the magnitude of the source term. If the coredamage process is arrested, there are only in-vessel releases which are likelyto be scrubbed by the suppression pool. If, on the other hand, vessel breachoccurs, there are both in-vessel releases and ex-vessel releases. Releases fromcore-concrete interactions, which is an ex-vessel release, can be a significantcontributor to the total release. Loss of containment integrity is important,because if the containment remains intact the release to the environment throughnormal leakage is extremely small and is a negligible contributor to risk. Forthis analysis the timing of the release did not significantly influence therisk.
There are several factors that lead to these low values for risk. First, whilethe mean core damage frequency for Lasalle, 1.OX-04/R-yr., appears high whencompared to the NUREG-1150 plants, it must be remembered that this is anintegrated value and represents not only accidents from internal initiators butalso accidents from fire, flood, and seismic initiators. In fact, if one addsup the mean core damage frequencies for the internal, fire, and seismic analysesat the Peach Bottom plant analyzed in NUREG-1150, the mean core damage frequencyis 1.4B-04/R-yr. with LLNL seismic hazard curve and 6.6E-O5/R-yr. with the EPRIcurve. This is in the same range as the Lasalle core damage frequency and thePeach Bottom analysis did not include internal flooding which was included inthe LaSalle analysis. second, two features of the Lasalle plant that reduce themagnitude of the source term are the suppression pool and the reactor building.In the majority of the accidents analyzed, the in-vessel releases (i.e., earlyreleases) are scrubbed by the suppression pool. In addition to the suppressionpool, the reactor building surrounding the LaSalle containment also traps aportion of the radionuclides that escape the containment. Third, for all of thenon-seismic source term groups that were generated during the partitioningprocess, the population in the emergency planning zone, EPZ, began evacuationbefore the start of the release. Thus, the dose received by the evacuatingpopulation was generally small and no early fatalities resulted from thisfraction of the population. Because of the rapid evacuation, the timing ofcontainment failure was not important in the LaSalle analysis. changes in theevacuation assumptions could change this conclusion.
The latent cancer fatalities are generally associated with the population thatis beyond the emergency evacuation zone. Thus, this risk measure is notparticularly sensitive to the timing of containment failure, but rather to
466
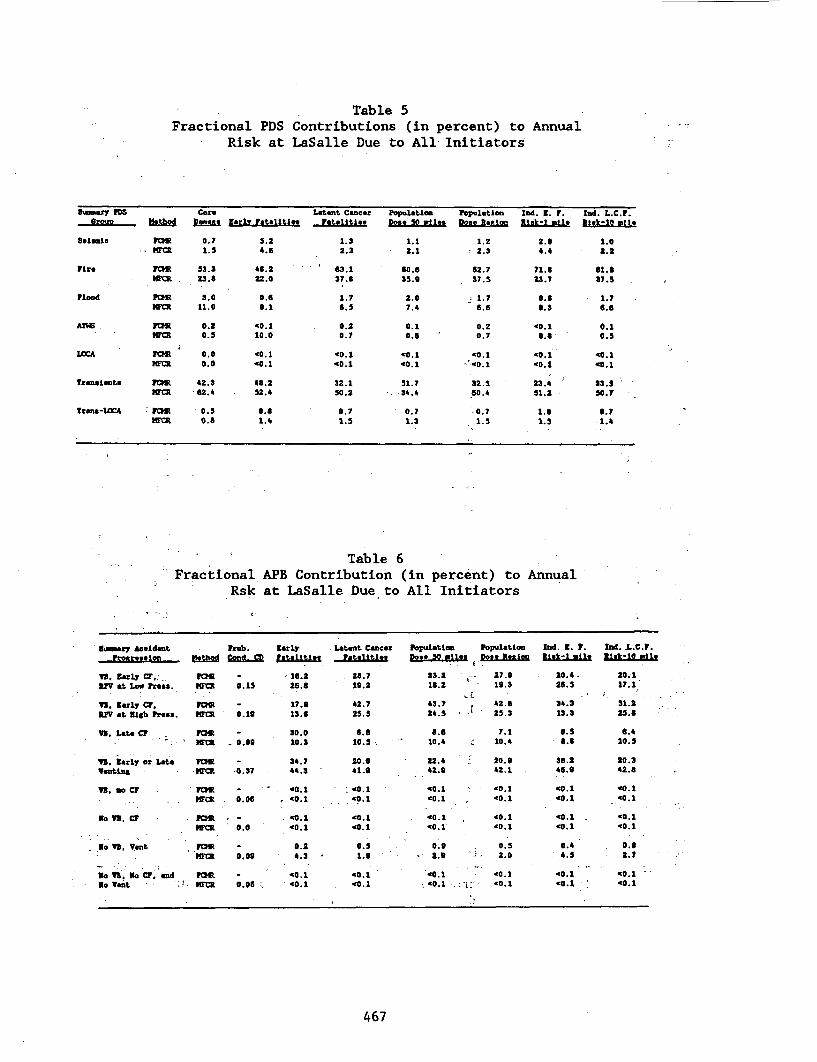
Table 5Fractional PDS Contributions (in percent) to Annual
Risk at LaSalle Due to All- Initiators
UMnAry PDSgroup Msthod
Beimle PFOI .MM
Fire FMRMM .
Flood Frr
"i
Tras Ients YC"IWCR
Trans-LOCA 7 rORmmc
CoreD1323
0.7
1.5
53.323.6
3.011.0
0.20.5
0.00.0
42.3e62.4
0.50.6
Za2rlr Fatalltres
52
46 222.0
0.69.1
'0.110.0
'0.1<0.1
g6 252.4
e.81.4
Latent CancerFatalities
1.32.3
e63.137.6
1.76.5
0.20.7
'0.1'0.1
32.150.2
0.71.5
PopuletionDos* 50 miles
1.12.1
60.635.9
2.07.4
0.10.6
'0.1'0.1
51.734.4
- 0.7
1.3
PopulationDose Retion
1.2- 2.3
62.737.5
1.76.6
0.2- 0.7
'0.1' '0.1
32.550.4
.0.7
1.5
Ind. I~_. FRiek-1 oil*
2.94.4
71.623.7
0.60.3
'0.19.8
'0.1'0.1
23.451.2
1.01.5
Ind. L.C.F.RIAl-10 fl
1.02.2
61.a37.5
1.7
6.6
0.10.5
'0.1'0.1
13.550.7 -
0.7-1.4
Table 6Fractional APB Contribution (in percent) to Annual
Rsk at LaSalle Due to All Initiators
S rzy AccidentFrorleain Usthod
Y. 2arly Cr,., FMRV at Low Press. PM
I. Early CF. FORUV at U1 Prbss. WEC
vs Late CF FOR
3. Zarly or Late FMRventing MFEC
Vs, so CF PR
IICR
"ci
so 13. CF - FM
2O Bo 3 Vent FOHR- DCR
to U3. o CF. and TFRgo *ent - ;J M
Prob. larly Latent Cancer Population PopulationCond, CD atellitIe Fattities Dome 50 *la Dole Region
. . . I . .
0. 15
0.19
- 0.0;
-0.37
0. 06
0.0
0.09
- 26.2
26.6
17.913.6
30.0' 10.3
34.744.3
40.1. V0.1
'0. 1'0.1
0.24.3
28.719.2
42.725.5
6.610.4
20.641.9
': '0.1
'0.140.1
0.5I 1.9
*0.1
V0.1
23.218.2
43.7 ra 3 I ..24.5
8.610.4
22.442.9
'0.1'0.1
'0.1'0.1
0.9
'0.1D'0.1 .
27.919.3
42.025.3
7.110.4
20.942.1
'0.1
'0.1
'0.1
'0.1
0.52.0
'<0.1
'0.1
Wa. Z. P.lielk-l ile
20.4 -
26.5
34.313.3
8.5- .6
36.246.9
'0.1
'0.1
40.1
0.4.5
c. I
'0.1, '0.1, '
2nd. L.C.F.ILLsk-l 11ml
20.117.1
. ,l a
51.225.6
6.410. 5
20.342.6
'0.1'0.1
'0 .1'0.1
0.9
2.?
40.1'0.1
-co0.10.06 I '0. 1
467
whether the containment fails or not. Therefore, the latent cancer fatalityrisk is primarily dependent on the frequency of containment failure and themagnitude of the radionuclide release. Because of the plant features thatreduce the magnitude of the source term, the latent cancer fatality risk remainslow even though there is a high likelihood that the containment will fail inmost of the core damage accidents that were analyzed.
5.3 Regression Analysis
Sensitivity analysis results for the six consequence measures used to expressrisk are presented in Table 7. This table contains the results of performinga stepwise linear regression on the risk. The statistical package SAS [10] wasused to perform the regression.
For each consequence measure, Table 7 lists the variables in the order that theyentered the regression analysis, gives the sign of the regression coefficientsfor that variable, and shows the R2 values that result with the entry ofsuccessive variables into the model. The order that the variables enter themodel is based on the fraction of the uncertainty that is explained by eachvariable. First, the fraction of the uncertainty that is explained by eachvariable individually is determined. The variable with the largest fraction isthe first variable that is entered into the model. Second, the variability thatis explained by this variable is removed and the process is repeated with theremaining variables. The tendency of a dependent variable to increase anddecrease with an independent variable is indicated by a positive or negativeregression coefficient, respectively.
The regression analyses for early fatalities and the individual risk of an earlyfatality within 1 mile only account for about 49% of the observed variability.The top four variables (the release from CCI, the retention in the containment,reactor building decontamination factor, and the late'. release of iodine)determine the magnitude of the source term. The'regression analyses for theother four consequence measures are somewhat more successful as they are ableto account for about 60% of the variability. Twelve of the eighteen-variablesare from the Level I analysis and are used to determine the frequency of coredamage. Five variables are from the source term analysis' and one from -theaccident progression analysis. For latent cancer fatalities the- dominantvariables are: control circuit failure, severe environment failure of injectionsystems in the reactor building, and ex-vessel release to the reactor building.
The early fatality measures are critically dependent on the magnitude 'of therelease and whether or not people are caught in the plume. Since most peopleevacuate ahead of the plume, the fraction remaining is fairly'constant in mostscenarios and the magnitude of the source term is of primary importance., Latentcancer fatalities and the other measures depend on the total exposure over longperiods of time and are therefore driven mostly by uncertainties - in thefrequency of occurrence of the accidents. Because this is a highly non-linearproblem, the results of this regression should be taken as preliminary. Muchof the uncertainty is unexplained and other variables could show up with moredetailed analysis. The methods used in this analysis and in'NUREd-1150 needfurther development before definitive statements can be made as to the relative
468
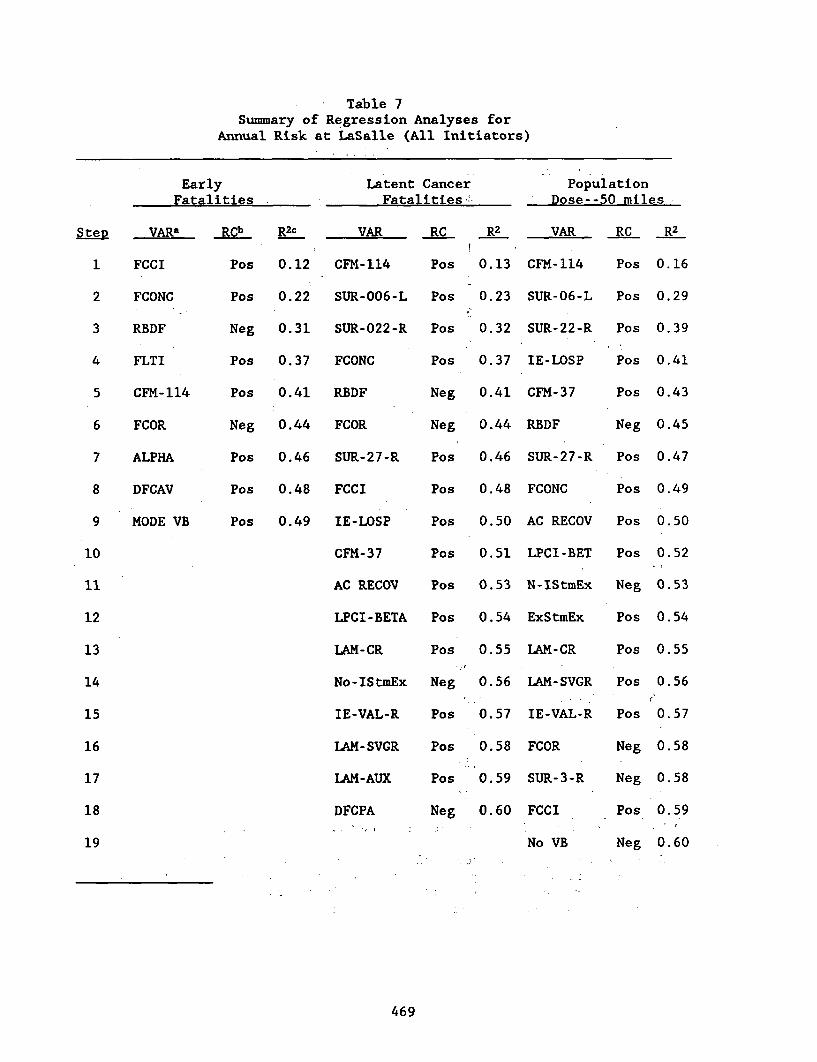
Table 7Summary of Regression Analyses for
Annual Risk at LaSalle (All Initiators)
EarlyFatalities
Latent CancerFatalities'
PopulationDose--50 miles
SteD
1
2
3
4
5
6
7
8
9
10
11
12
13
14
15
16
17
18
19
VARa
FCCI
FCONC
RBDF
FLTI
CFM- 114
FCOR
ALPHA
DFCAV
MODE VB
RCb
Pos
Pos
Neg
Pos
Pos
Neg
Pos
Pos
Pos
R2 c
0.12
0.22
0.31
0.37
0.41
0.44
0.46
0.48
0.49
VAR
CFM-114
SUR-006-L
SUR-022-R
FCONC
RBDF
FCOR
SUR-27-R
FCCI
IE-LOSP
CFM-37
AC RECOV
LPCI-BETA
LAM-CR
No-IStmEx
IE-VAL-R
LAM-SVGR
LAM-AUX
DFCPAA . . I
RC _R2
Pos 0.13
Pos 0.23
Pos 0.32
Pos 0.37
Neg 0.41
Neg 0.44
Pos 0.46
Pos 0.48
Pos 0.50
Pos 0.51
Pos 0.53
Pos 0.54
Pos 0.55
Neg 0.56
Pos 0.57
Pos 0.58
Pos 0.59
Neg 0.60
VAR RC
CFM-114 Pos
SUR-06-L Pos
SUR-22-R Pos
IE-LOSP Pos
CFM-37 Pos
RBDF Neg
SUR-27-R Pos
FCONC Pos
AC RECOV Pos
LPCI-BET Pos
N-IStmEx Neg
ExStmEx Pos
LAM-CR Pos
LAM-SVGR Pos
IE-VAL-R Pos
FCOR Neg
SUR-3-R Neg
FCCI Pos
No VB Neg
R2
0.16
0.29
0.39
0.41
0.43
0.45
0.47
0.49
0.50
0.52
0.53
0.54
0.55
0.56
0.57
0.58
0.58
0.59
0.60
469
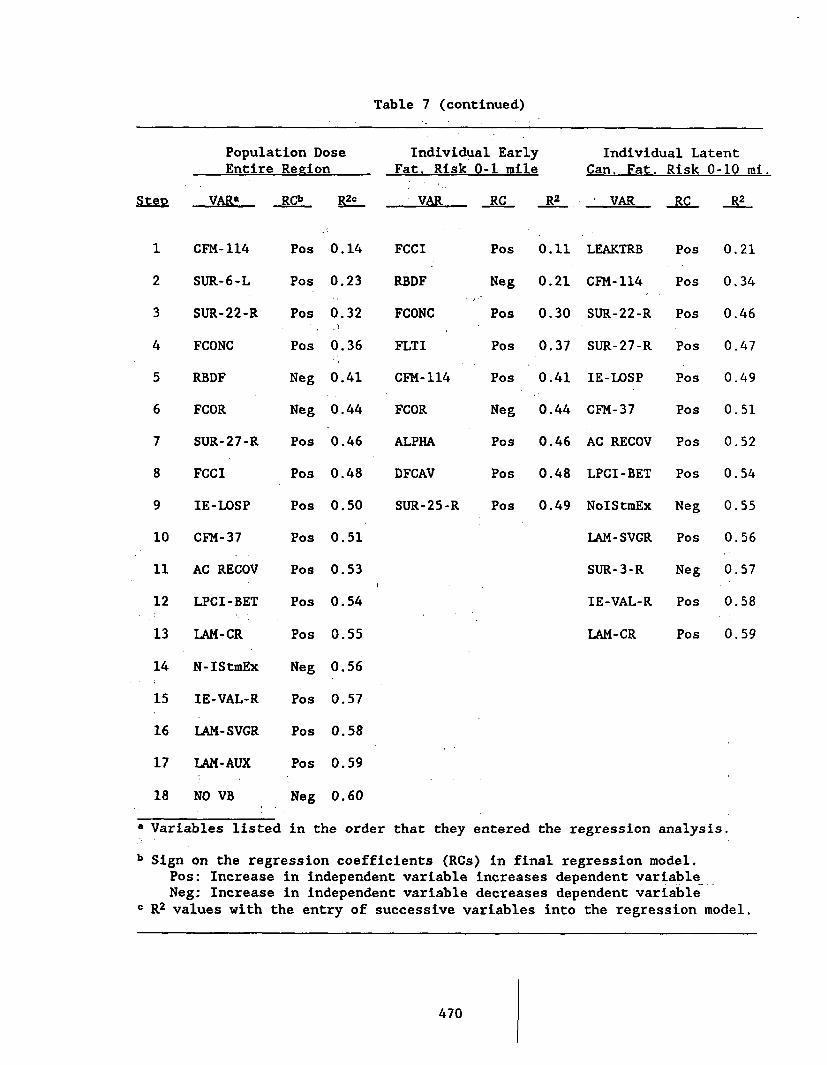
Table 7 (continued)
Population DoseEntire Region
Individual EarlyFat. Risk 0-1 mile
-VAR RC R2
Individual LatentCan. Fat. Risk 0-10 mi.
VAR RC R2Step VARa RCb R2c
1 CFM-114
2 SUR-6-L
3 SUR-22-R
4 FCONC
5 RBDF
6 FCOR
7 SUR-27-R
8 FCCI
9 IE-LOSP
10 CFM-37
11 AC RECOV
12 LPCI-BET
13 LAM-CR
14 N-IStmEx
15 IE-VAL-R
16 LAM-SVGR
17 LAM-AUX
18 NO VB
Pos
Pos
Pos
Pos
Neg
Neg
Pos
Pos
Pos
Pos
Pos
Pos
Pos
Neg
Pos
Pos
Pos
Neg
0.14
0.23
0.32
0.36
0.41
0.44
0.46
0.48
0.50
0.51
0.53
0.54
0.55
0.56
0.57
0.58
0.59
0.60
FCCI
RBDF
FCONC
FLTI
CFM-114
FCOR
ALPHA
DFCAV
SUR-25-R
Pos
Neg
Pos
Pos
Pos
Neg
Pos
Pos
Pos
0.11
0.21
0.30
0.37
0.41
0.44
0.46
0.48
0.49
LEAKTRB
CFM-114
SUR-22-R
SUR-27-R
IE-LOSP
CFM-37
AC RECOV
LPCI-BET
NoIStmEx
LAM-SVGR
SUR-3-R
IE-VAL-R
LAM-CR
Pos 0.21
Pos 0.34
Pos 0.46
Pos 0.47
Pos 0.49
Pos 0.51
Pos 0.52
Pos 0.54
Neg 0.55
Pos 0.56
Neg 0.57
Pos 0.58
Pos 0.59
a Variables listed in the order that they entered the regression analysis.
b Sign on the regression coefficients (RCs) in final regression model.Pos: Increase in independent variable increases dependent variableNeg: Increase in independent variable decreases dependent variable
c R2 values with the entry of successive variables into the regression model.
470
importance of various variables. Also, consequence parameter uncertainty andevacuation parameter uncertainty need to be explicitly included before any finalstatement can be made about the relative importance of various parameters torisk.
6. References
[1] A. C. Payne Jr., et. al., "Analysis of the LaSalle Unit 2 NuclearPower Plants Risk Methods Integration and Evaluation Program(RMIEP)," Vol. 1-10, NUREG/CR-4832, SANDB7-7157, Sandia NationalLaboratories, Albuquerque, NM, (in preparation).
[2] T. D. Brown., A. C. Payne Jr., et. al., "integrated Risk Assessmentfor the LaSalle Unit 2 Nuclear Power Plant: Phenomenology and RiskUncertainty Evaluation Program (PRUEP)," Vol. 1-3, NUREG/CR-5305,SAND90-2765, Sandia National Laboratories, Albuquerque, NM, (inpreparation).
[3] R. L. Iman, M. J. Shortencarier, "A User's Guide for the Top EventMatrix Analysis code (TEMAC)," NUREG/CR-4598, SAND86-0960, SandiaNational Laboratories, Albuquerque, NM, August 1986.
[4] J. M. Griesmeyer, and L. N. Smith, "A Reference Manual for theEvent Progression Analysis Code (EVNTRE)," NUREG/CR-5174, SAND88-1607, Sandia National Laboratories, Albuquerque, NM, September1989.
[5] "Severe Accident Risks: An Assessment for Five U.S. Nuclear PowerPlants," NUREG-1150 Vols. 1 and 2, Final Summary Report, U.S.Nuclear Regulatory Commission, December 1990.
[6] H-N Jow, W. B. Murffin, and J. D. Johnson, "XSOR Codes User'sManual," NUREG/CR-5360, SAND89-0943, Sandia National Laboratories,Albuquerque, NM, (in preparation).
[7] R. L. Iman, J. C. Helton, and J. D. Johnson, "PARTITION: A Programfor Defining the Source Term/Consequence Analysis Interface in theNUREG-1150 Probabilistic Risk Assessments User's Guide," NUREG/CR-5253, SAND88-2940, Sandia National Laboratories, Albuquerque, NM,May 1990.
[8] D.I. Chanin, et.al.,"MELCOR Accident Consequence Code System(MACCS)," Vol. 1-3, NUREG/CR-4691, SAND86-1562, Sandia NationalLaboratories, Albuquerque, NM, February 1990.
[9] R. L. Iman, J. D. Johnson, and J. C. Belton, wPRAMISs ProbabilisticRisk Assessment Model Integration System User's Guide," NUREG/CR-5262, SAND88-3093, Sandia National Laboratories, Albuquerque, NM,May 1990.
[10] SAS Institute Inc., "SAS User's Guide: Basics, Version 5 Edition,"SAS Institute Inc., Cary, NC, 1985.
471
RISK-BASED PERFORMANCE INDICATORS*
H.A. Azarm and W.E. Vesely**Engineering Technology DivisionDepartment of Nuclear Energy
-Brookhaven National LaboratoryUpton, New York 11973
**Science Applications International Corporation
This research was sponsored by the U.S. Nuclear Regulatory Commission (NRC)to develop methods for monitoring an aspect of safety performance of licensednuclear power plants; i.e., unavailability of safety systems.
Various options were evaluated for constructing system unavailabilityindicators using basic reliability principles and consistent with the content ofdata collected. The capabilities of each indicator option, in terms of detectionprobabilities and false alarm rates within a fixed response period for varioustypes of anomalies, were evaluated through detailed simulation studies2 -4. Asan example, the option of using system vs train downtimes to construct safetysystem unavailability indicators was evaluated. Comparison of response timesindicated that the latter option has significantly shorter response periods (byfactors of 10 - 30), i.e., more timely results.
Brookhaven National Laboratory performed two studies5'6 to evaluate thecapability of NPRDS (Nuclear Plant Reliability Data System) as a data source forconstruction of system unavailability -indicators,. -- Specific indicators weredeveloped consistent with the limited scope of NPRDS data. In order to generatesystem unavailability indicators in an efficient manner, the processes for NPRDSdata acquisition, indicator construction, and analyses were automated using PCsoftware7. Limited pilot applications and verification were also performed.
An important aspect of risk-based indicators deals with the concept ofdependent failures. The conventional dependent failure definition which consistsof simultaneous failures of similar redundant components will generate a longresponse time for proper detection of anomalies,- and it is not suitable forconstruction of an indicator. A recent study8 attempted to relax the definitionof dependent failures by defining a time window within which the failure ofsimilar redundant components can be accounted for. In this study, we have de-veloped a model using basic reliability principles to treat the time between thefailures of similar redundant components as a continuum rather than a truncatedwindow. Using detailed reliability models we have developed a formulation forevaluating the risk implication of various failure patterns realized when theobservation time is treated as a continuum9. This methodology not only provides
*Work performed under the auspices of the U.S. Nuclear Regulatory Commission
473
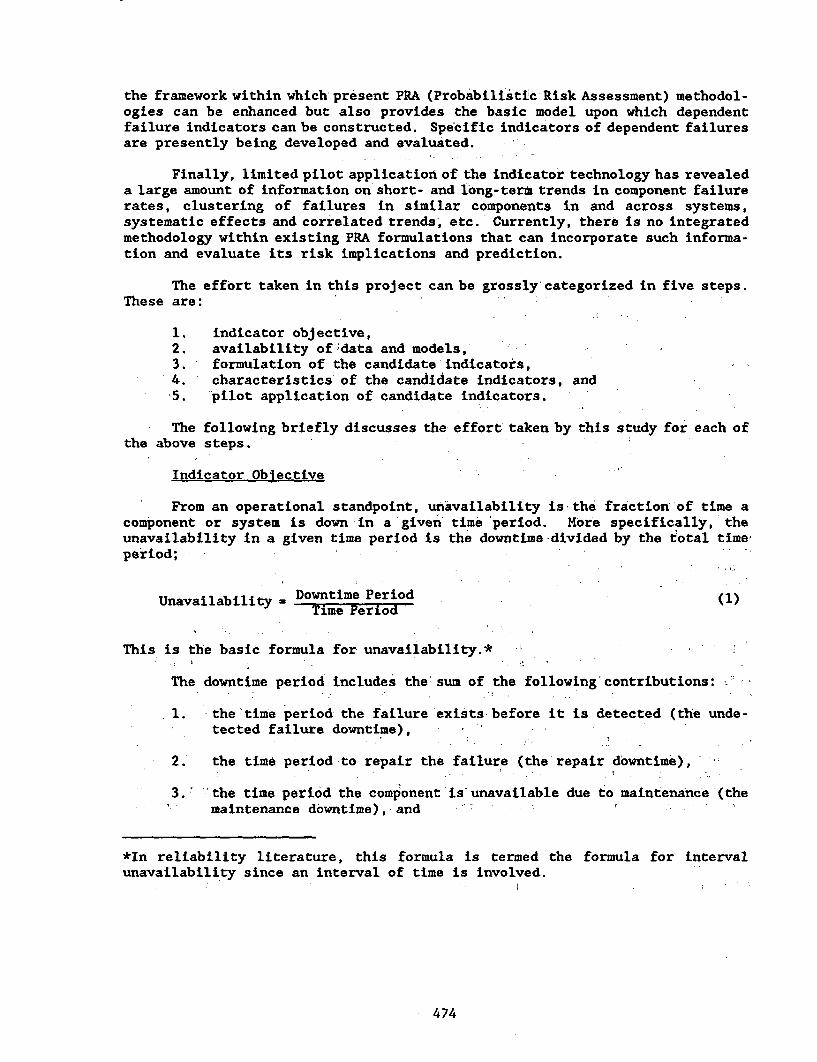
the framework within which present PRA (Probabilistic Risk Assessment) methodol-ogies can be enhanced but also provides the basic model upon which dependentfailure indicators can be constructed. Specific indicators of dependent failuresare presently being developed and evaluated.
Finally, limited pilot application of the indicator technology has revealeda large amount of information on short- and long-term trends in component failurerates, clustering of failures in similar components in and across systems,systematic effects and correlated trends, etc. Currently, there is no integratedmethodology within existing PRA formulations that can incorporate such informa-tion and evaluate its risk implications and prediction.
The effort taken in this project can be grossly categorized in five steps.These are:
1. indicator objective,2. availability of-;data and models,3. formulation of the candidate'indicators,4. characteristics of the candidate indicators, and'5. pilot application of candidate indicators.
The following briefly discusses the effort taken by this study for each ofthe above steps.
Indicator Objective
From an operational standpoint, unavailability is the fraction of time acomponent or system is down in a'given' time 'period. More specifically, theunavailability in a given time period is the downtime divided by the total time,period;
Unavailability , Downtime Period (1)Time Period
This is the basic formula for unavailability.* I
The downtime period includes the'sum of the following'contributions:
1. the time period the failure exists before it is detected (the unde-tected failure downtime),
2.' the time period to repair the failure (the repair downtime),
3.' 'the time period the component is'unavailable due to maintenance (themaintenance downtime), and
*In reliability literature, this formula is termed the formula for intervalunavailability since an interval of time is involved.
474
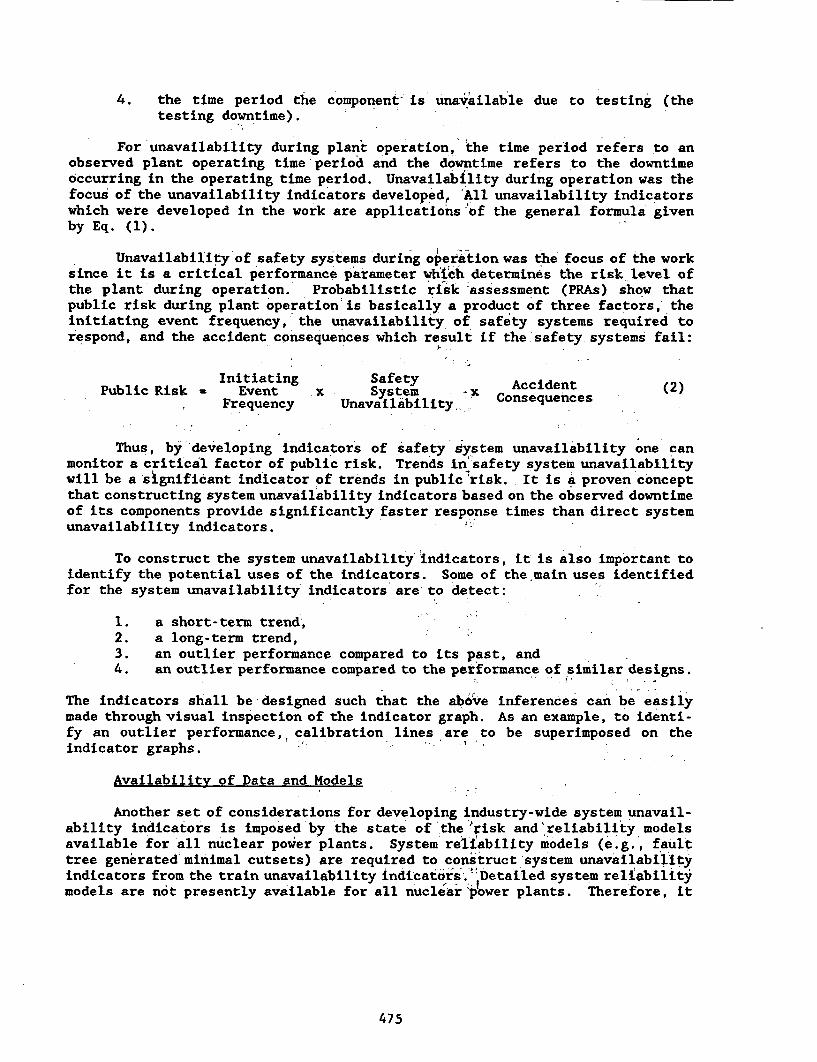
4. the time period the component- is unavailable due to testing (thetesting downtime).
For unavailability during plant operation, the time period refers to anobserved plant operating time period and the downtime refers to the downtimeoccurring in the operating time period. Unavailability during operation was thefocus of the unavailability indicators developed, 'All unavailability indicatorswhich were developed in the work are applications-of the general formula givenby Eq. (1).
Unavailability of safety systems during operation was the focus of the worksince it is a critical performance parameter which determines the risk level ofthe plant during operation. Probabilistic risk assessment (PRAs) show thatpublic risk during plant operation is basically a product of three factors,' theinitiating event frequency, the unavailability of safety systems required torespond, and the accident consequences which result if the safety systems fail:
Initiating SafetyPublic Risk - Event x System _x Accidentes
Frequency Unavailability,- Consequences
Thus, by developing indicators of safety system unavailability one canmonitor a critical factor of public risk. Trends in safety system unavailabilitywill be a significant indicator of trends in public risk. It is a proven conceptthat constructing system unavailability indicators based on the observed downtimeof its components provide significantly faster response times than direct systemunavailability indicators.
To construct the system unavailability'-indicators, it is also important toidentify the potential uses of the indicators. Some of the main uses identifiedfor the system unavailability indicators are to detect:
1. a short-term trend,2. a long-term trend,3. an outlier performance compared to its past, and4. an outlier performance compared to the performance of similar designs.
The indicators shall be designed such that the above inferences can be easilymade through visual inspection of the indicator graph. As an example, to identi-fy an outlier performance, calibration lines are to be superimposed on theindicator graphs.
Availability of Data and Models
Another set of considerations for developing industry-wide system unavail-ability indicators is imposed by the state of'the risk and'reliability modelsavailable for all nuclear power plants. System reliability models (e.g., faulttree generated minimal cutsets) are required to construct system unavailabilityindicators from the train unavailability indicators .Detailed system reliabilitymodels are not presently available for all nucle'arip ower plants. Therefore, it
475
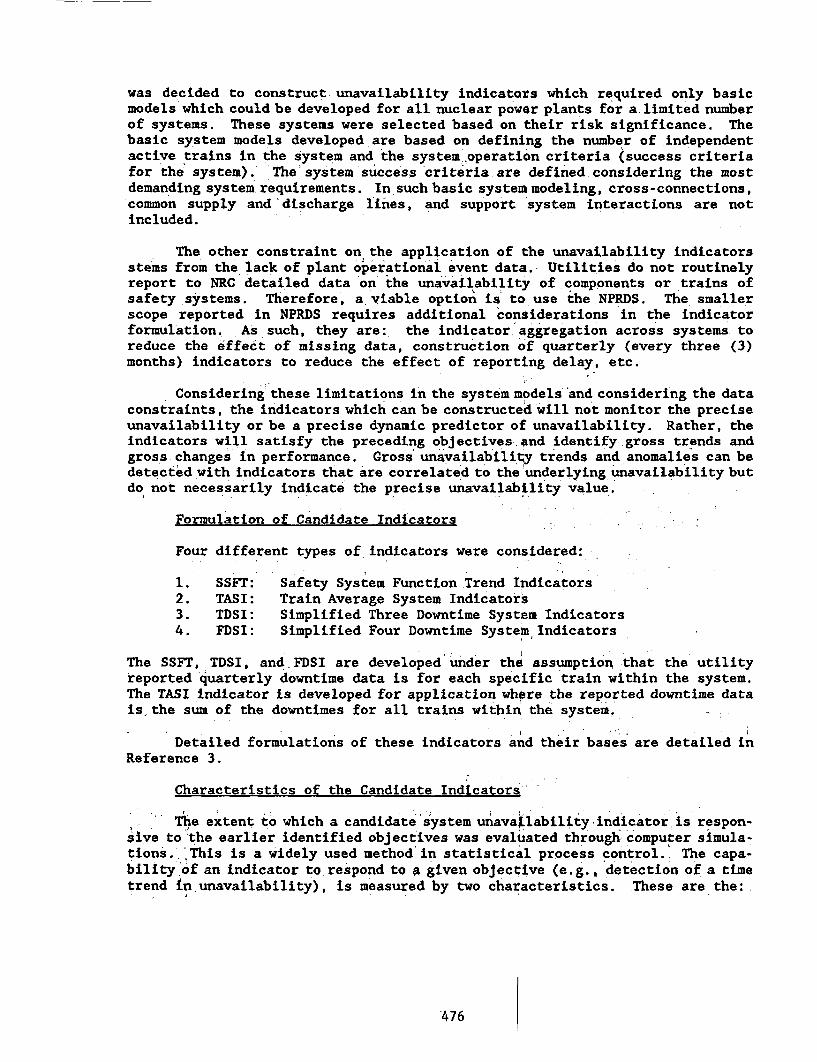
was decided to construct unavailability indicators which required only basicmodels which could be developed for all nuclear power plants for a limited numberof systems. These systems were selected based on their risk significance. Thebasic system models developed are based on defining the number of independentactive trains in the system and 'the system .operation criteria (success criteriafor the system). The'system success criteria are defined considering the mostdemanding system requirements. In such basic system modeling, cross-connections,common supply. and'discharge lines, and support system interactions are notincluded.
The other constraint on the application of the unavailability indicatorsstems from the lack of plant operational event data.- Utilities do not routinelyreport to NRC detailed data on' the unavailability of .components or trains ofsafety systems. Therefore, a viable option is to use the NPRDS. The smallerscope reported in NPRDS requires additional considerations in the indicatorformulation. As such, they are:. the indicator aggregation across systems toreduce the effect of missing data, construction of quarterly (every three (3)months) indicators to reduce the effect of reporting delay, etc.
Considering these limitations in the system models'and considering the dataconstraints, the indicators which can be constructed will not monitor the preciseunavailability or be a precise dynamic predictor of unavailability. Rather, theindicators will satisfy the preceding objectives-4nd identify-gross trends andgross changes in performance. Gross unavailability trends and anomalies can bedetected with indicators that are correlated to the underlying unavailability butdo not necessarily indicate the precise unavailability value.
Formulation of Candidate Indicators
Four different types of indicators were considered:
1. SSFT: Safety System Function Trend Indicators2. TASI: Train Average System Indicators3. TDSI: Simplified Three Downtime System Indicators4. FDSI: Simplified Four Downtime System Indicators
The SSFT, TDSI, and-FDSI are developed under the assumption that the utilityreported quarterly downtime data is for each specific train within the system.The TASI indicator is developed for application where the reported downtime datais the sum of the downtimes for all trains within the system.
Detailed formulations of these indicators and their bases are detailed inReference 3.
Characteristics of the Candidate Indicators -
The extent to which a candidate s'ystem unavailability indicator is respon-sive to the earlier identified objectives was evaluated through computer simula-tions. 'This is a widely used method in statistical process control., The capa-bility of an indicator to respond to a given objective (e.g., detection of a timetrend inn unavailability), is measured by two characteristics. These are the:.
'476
1) detection probability: The probability of detecting an anomaly whenthe anomaly exist, and
2) false alarm probability: The probability of erroneously indicatingan anomaly when it does not exist.
In addition to the false alarm and detection probabilities, the thirdimportant characteristics of an indicator is the indicator response time whichis an indication of how fast after the initiation of an anomaly the indicatordetects it. The indicator response time is usually measured as the average timeit takes to detect an anomaly and is called the Average Run Length (ARL). Adetection is credited if the anomaly is indicated in a fixed period of time(about 1.5 years after the anomaly occurs). Anomalies indicated beyond thisperiod are not credited in calculating the detection probabilities.
To determine the detection probability, a large number of similar anomaliesare modeled to generate computer simulated data for the component failures anddowntimes. This detection probability was then determined by taking the fractionof anomalies detected over the total number of anomalies simulated. The meansfor detection of an anomaly can be either based on statistical tests or by visualidentification. The first phase validation concentrated on the latter i.e., theanomalies were detected consistent with visual examination of the indicatorgraph. A computer code CSCI was developed to perform these simulations. Thefalse alarm probabilities were determined in the similar manner as the detectionprobabilities.
Figures 1 and 2 present some of the results of the simulation studies inregard to the detection and false alarm probability of the indicators. Anindicator is considered superior if it posses higher detection probability andlower false alarm rate.
Pilot Application and Field Validation
Two types of pilot applications were performed. In one case, a total of10 plants and over 38 years of plant historical data were collected for thepurpose of constructing system unavailability indicators. These case studies,referred to as the retrospective case studies, were performed to verify if theindicators can confirm instances that were suspected of high, low, or changingunavailability of safety systems. Figure 3 depicts a typical unavailabilitygraph generated from this analyses which shows the instances of high unavailabil-ity of the auxiliary feedwater system in Plant 2.
In the other case study, the indicators generated for all PWR plants usingautomated retrieval of NPRDS data and computerized calculations and analyses ofthe indicators. The program generates indicator graphs with applicable calibra-tion lines. The pilot application covered five years of data for all PWRs forthree systems; auxiliary feedwater system, high-pressure injection system, andlow-pressure injection system. The anomalies detected by the indicators werethen correlated with precursor events. The correlation results supported theusefulness of the indicators.
477
Probability of Trend Detection
FI I
, A,
1
0.8
0.8
0.4
0.2
00.1 to 0.2 0.1 to 0.4 0.1 to 0.6
Failure Rate Changes (Imonth)
M SSFT E TASI TDSI (3-Cycle) [ZJ FDSI (4-Cycle)-- I-!
Figure 1. Sensitivity analysis of trend detection probability .vs different change ratios of 1
Probability of False Alarm
0.5
. 0.4
0.3
0.2
0.1
0-0.1 to 0.2 0.1 to 0.4 . 0.1 to 0.6
Failure Rate Changes (/month)
|IMOSSFT EJTASI MTOSI (3-Cycle) EJFDSI (4-Cycle)
Figure 2. Sensitivity analysis of trend detection - false alarm probability--vs different change ratios of Af
478
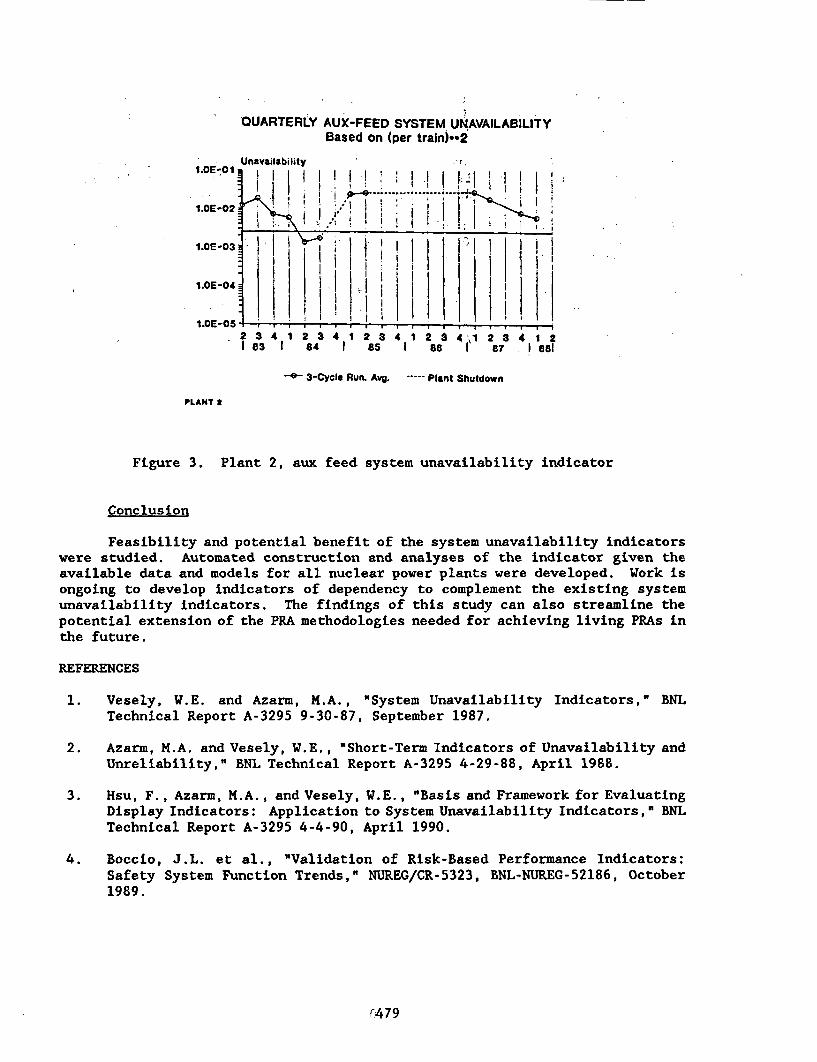
QUARTERLY AUX-FEED SYSTEM UNAVAILABILITYBased on (per train)'*2
- Unavailability1.0E1-01 I I I I i
I . ~ i .
,- I i i I I I t i-1 I I i I
† . . 1 I I T--I -I rI ,2 3 4 1 2 3 4 1 2 3 4 1 2 4\1 2 3 4 1 21 63 1 64 1 as I se 67 1 ! 881
-- ° 3-Cycle Run. Avg- ----- Plant Shutdown
PLANT a
Figure 3. Plant 2, aux feed system unavailability indicator
Conclusion
Feasibility and potential benefit of the system unavailability indicatorswere studied. Automated construction and analyses of the indicator given theavailable data and models for all nuclear power plants were developed. Work isongoing to develop indicators of dependency to complement the existing systemunavailability indicators. The findings of this study can also streamline thepotential extension of the PRA methodologies needed for achieving living PRAs inthe future.
REFERENCES
1. Vesely, W.E. and Azarm, M.A., "System Unavailability Indicators," BNLTechnical Report A-3295 9-30-87, September 1987.
2. Azarm, M.A. and Vesely, W.E., 'Short-Term Indicators of Unavailability andUnreliability," BNL Technical Report A-3295 4-29-88, April 1988.
3. Hsu, F., Azarm, M.A., and Vesely, W.E., "Basis and Framework for EvaluatingDisplay Indicators: Application to System Unavailability Indicators, I BNLTechnical Report A-3295 4-4-90, April 1990.
4. Boccio, J.L. et al., "Validation of Risk-Based Performance Indicators:Safety System Function Trends,' NUREG/CR-5323, BNL-NUREG-52186, October1989.
'479
5. Azarm, M.A. et al., "Automated Use of NPRDS for Construction of Indicatorsof System Unavailabilities and Aggregate Component Failures," Draft, BNLTechnical Report, November 1990.
6. Economos, C., Carbonaro, J.F., and Azarm,-M.A., 'Applicability of theNuclear Plant Reliability Data System for Risk-Based Performance IndicatorDevelopment," BNL Technical Report A-3295 10-2-89, October 1989.
7. Carbonaro, J.F. and Azarm, M.A., "Quantification of SSFT Indicators: AComparison of Plant Operating Log Data and NPRDS Data," BNL TechnicalReport A-3295 8-1-90, August 1990.
8. Zikria, A.F. and Mosleh, A., " A Parametric Model for Time Delay Common-Cause Failures," ANS Transactions, Vol. 61, pp. 210-211, June 1990.
9. Azarm, M.A. and Vesely, W.E., "Dependent Failure Indicators," Draft LetterReport, July 1991.
I I i , I -
. .
480
INTERSYSTEM LOCA RISK ASSESSMENT: METHODOLOGY AND RESULTS
W. J. GALYEAN, D. L. KELLY, J. A. SCHROEDERJ. L. AUFLICK, H. S. BLACKMAN, D. I. GERTMAN, L. N. HANEY
INEL/EG&G Idaho, Inc., P.O. Box 1626, Idaho Falls, Idaho 83415
ABSTRACT
,.The United States Nuclear Regulatory Commission (NRC). is.sponsoring a research program to develop an improved understandingof the human factors, hardware, and accident consequence issuesthat dominate the risk from an Intersystem Loss-of-CoolantAccident (ISLOCA) at a nuclear power plant. To accomplish thegoals of this program, a methodology has been developed for-estimating ISLOCA core damage frequency and risk. The steps in-this methodology are briefly described, along with the resultsobtained from an application of the methodology at threepressurized water reactors (PWRs).
INTRODUCTION
ISLOCAs have been included in probabilistic risk assessments (PRAs)since WASH-1400 (1). While they have not been significant contributors tocore damage frequency, ISLOCAs have been identified as major contributors tooffsite risk, because they have the potential to cause core damage andcontainment bypass, leading to an early release of large quantities of fissionproducts offsite. Recent events at several operating reactors in the U. S.and abroad have been labeled as ISLOCA precursors. These events have raisedconcerns that the frequency of ISLOCA sequences might be underestimated inPRAs performed to date.
ANALYSIS OBJECTIVES AND SCOPE
In order to support the resolution of Generic Issue 105, the NRC issponsoring an ISLOCA research program, conducted.by EG&G Idaho, Inc. at the.Idaho National Engineering Laboratory. The objective of.this program is toobtain information, both qualitative and quantitative, on the hardware, humanfactors, and accident consequence issues that dominate ISLOCA risks. To meetthis objective, the approach being taken includes analysis of all interfacesbetween the reactor coolant system and other, lower pressure systems. Thehistorical record (primarily Licensee Event Reports) has provided the basisfor setting the scope of the analysis with respect to potential pressureisolation boundary failure mechanisms. It is important to note that, in thevast majority of these historical events, the.primary.failure of concern was ahuman error. Because of their significance .in this regard, human errors aregiven particular attention in the present analysis.,
431
ANALYSIS METHODOLOGY
A methodology has been developed for estimating the core damagefrequency and risk associated with an ISLOCA, and this methodology has beenapplied to three-individual U. S. nuclear power plants (2-4].
Initiating Event and Scenario Identification
This methodology consists of a series of detailed, integrated steps. Inthe first step, piping and instrumentation diagrams (P&IDs), systemdescriptions, and operating procedures are reviewed to screen the'plant'sreactor coolant system (RCS) interfaces. These interfaces are the pressureisolation boundaries between the RCS and an interfacing system that isdesigned for pressures and temperatures lower than the normal operatingpressure and temperature of the RCS. This screening identifies those'interfaces which, if breached, would-allow significant reactor coolant flowrates into the interfacing systems. A lower limit on line diameter of 1 inchwas used to screen out the many small instrumentation and drain lines. Thissize cutoff is based on the approximate leak rate:(about 200,gpm)' produced byfailure of a 1-inch line connected to the RCS, as well as the normal makeupcapacity to the RCS (about 150 gpm) and the volume of water available formakeup (e.g. RWST - about 400,000 gal.).
In the second step, plant operations are examined in more detail toidentify scenarios that could possibly breach an RCS pressure isolationboundary. This operations review relied upon historical experience (i.e.,'applicable Licensee Event Reports on ISLOCA wprecursors"),. plant procedures-and practices, and discussions with plant personnel. The relatively highlikelihood of human errors initiating or contributing to the occurrence of'potential ISLOCA sequences is particularly well-supported in the historicaldata (see Appendix A of Reference 2). Therefore, in this portion of theanalysis, extra attention was focused on identifying possible human errors ofcommission that could lead to an ISLOCA.
An extended visit to each plant allowed thelanalysts to gather the' 'information needed to complete these reviews and to develop and analyze thecandidate ISLOCA scenarios. Members of-the team that developed the candidatescenarios obtained information by interviewing plant personnel and walking 'l;-down the systems of interest. This task was performed in conjunction with a'special ISLOCA team inspection conducted by the Office of Nuclear ReactorRegulation of' the U. S. NRC. Information obtained during this' visit included:
a. Detailed information on the hardware that would be inVolved in anISLOCA, for example, data on control valves, relief valves''piping,'flanges, pumps, and heat exchangers, -
b. Detailed information on the' procedures, guidelines, and practicesfollowed by plant personnelduring startup, normal 'power ''operation, and shutdowniof the plant,4-as well as detailedinformation on maintenance and in-service testing, and
482
c. Detailed information on factors that could influence performance -of plant personnel as related to initiation, detection, diagnosis,prevention, or mitigation of an ISLOCA.
After the plant-specific information was collected, a final list of lowpressure'interfaces and candidate scenarios was compiled and the detailedaccident sequence analysis begun. This analysis Was a jointeffort of PRA andhuman factors specialists. The scenarios were modeled using (primarily)component level event trees combining the hardware faults and human errorsthat constitute each sequence in the scenario. In general, each event treecomprised three phases:i
I
-1. The'initiating events, which are those combinations of failures,both hardware and human-related, that-breach the RCS pressureisolation boundary and expose the low pressure interfacing systemto the RCS,
2. The rupture events, which model a break in the'interfacing system,its size, and location, and
3. The post-rupture events, which model the performance of the.control room and auxiliary operators in recovering from ormitigating-the consequences of the ISLOCA. The list of possibleISLOCA sequences contains both hardware-based sequences (as foundin typical PRAs) and 'sequences initiated by human error.' Thepotentialhuman errors in both types of sequence comprised errorsof omission,'commission, and preexisting or latent errors.
fl . . -Rupture Probability Estimation
After the possible ISLOCA sequences were developed in the event trees,simple RELAP5 [5] computer models of the interfacing system were constructedto estimate the pressure that would likely be generated in the interfacingsystem by a breach'of the RCS pressure isolation boundary. Convolving theselocal system pressures with estimates of the pressure capacities of systemcomponents gave the rupture probabilities of individual components. The -.combination of these probabilities then gave the rupture probability of theinterfacing system as a whole.
The failure pressure distributions used Lin the rupture probabilitycalculations were developed from an independent component and pipingstructural'analysis'performed by Impell Corporation [6]. Not-only werefailure pressures calculated for components and piping in the'interfacingsystems, bUt'likely leak rates and leak areas, also. In thi's respect, boltedflanges were found to be somewhat unique in that there are actually twofailure pressures of interest. First, there is the estimated gross leakpressure`(GLP), at which a measurable leak area develops. At pressures belowthe GLP, 'seepage around the flange 'gasket is possible, but the leak rate's arevery small (of the order of mg/sec). Once pressure exceeds :the GLP, they''flange bolts begin to stretch' (elastically deform). and the flange surfacesbegin to separate. At some yet higher pressure (P.), the bolts begin to
483
deform plastically. At this point, large leak areas begin to.develop withcorrespondingly large leak rates. These three regiMes (below-GLP, between GLPand PO, and greater than PO) are associated with three leak sizes: sprayleaks, small leaks, and large leaks, respectively.
Other components, specifically pipes and vessels (including heatexchangers) were estimated to fail catastrophically at their failure pressure.This is the case because the likely failure mode includes the formation ofcracks.1that grow very rapidly, resulting in very large.ruptures.
The net result of this analysis is that low-pressure-rated systems (forexample, the decay heat removal (DHR) system at the Babcock and Wilcox (B&W)plant, which contains 150 and 300 psi-rated components) are able to withstandseveral times their design pressure. However, they cannot withstand normalRCS operating pressure. The B&W DHR system aggregate (i.e.,, total system)median failure pressure was calculated to be approximately 1150 psig. This isthe failure pressure associated with a large rupture, that is, a rupture largeenoughto depressurize and protect the rest of thelDHR system. The likelyfailure locations were the DHR heat exchanger and the DHR pump suction piping.
Recovery and Mitigation,
Given the very rapid.pressure rise predicted by the RELAP calculations(approximately 30,seconds to.equilibrium pressure for systems with flow, i.e.,open-ended, systems or systems with little relief valve capacity),- there is notmuch potential for operator, recovery before a.rupture occurs in theinterfacing system. However, using conservatively bounded thermal-hydraulicassumptions, core uncovery was estimated to occur at between two and fourhours after the break (for large and small ruptures, respectively).. This.timeinterval is used in estimating the probability of 'the operators isolating thi'rupture (and terminating the sequence) and initiating any mitigative actionsthat could:reduce the severity of the offsite release. Isolating the rupturewould entailire-establishing the pressure isolation boundary (if: the hardware.is still available and accessible),, While an example of a mitigative actionmight be manual actuation-of-fire protection sprays in the area of therelease.. . .
Human Reliability Analysis . .
The predominant human errors for each scenario in the ISLOCA PRA:weremodeled using the techniques of human reliability analysis (HRA). ,HRAjis amethodological tool used for prediction, evaluation, and quantitative analysisof work-oriented human performance. As a diagnostic tool, HRA can estimatethe:error.rate anticipated for individual tasks and can identify where errorsare likely to be most frequent.. . .l -.-
-. The general. methodological framework for the ISLOCA HRA was, basd onguidelines (under development).from the NRC-sponsoredTask Anal vsis-LinkedEvaluation Technique (TALENT) Program,[7],. which recommends the use of-task;.analyses,-time line analyses, and interface analyses-in a detailed HRA. .-NUREG/CR-1278, the Handbook of Human Reliability Analysis with-Emphasis on
484
Nuclear Power Plant ADDlications (THERP) (8], recommends similar techniquesand, in addition, provides a data base that can be used for estimating humanerror probabilities (HEPs). Finally, the ISLOCA BRA integrated the steps fromthe Systematic Human Action Reliability Procedure (SHARP),[9] and A Guide forGeneral Principles of Human Action Reliability Analysis for Nuclear PowerGeneration Stations (the draft IEEE standard P1082/D7 (10]).
From this combination of approaches, the anRlysts identified 11 basicsteps to be followed in performing the HRA: .
1. Select the analysis team and train them on relevant plantfunctions and systems (IEEE P1082);
2. Familiarize the team with the plant.through the use of.system -walkdowns, simulator observations, etc. (IEEE P1082);
3. Ensure that-the full..range of potential human actions andinteractions is considered.in the analysis (SHARP) (IEEE P1082);
4. Construct the initial model of the relevant systems andinteractions (IEEE P1082);
5. Identify and screen specific human actions that are significantcontributors to safe operation of the plant. This was accomplishedthroughidetailed task analyses, time line analyses, observationsof operator performance in the plant and in the simulator, and.evaluations of the human-machine interface (SHARP and IEEE P1082);
6. Develop a detailed description of the -important human interactionsand associated key factors necessary to complete the plant model.This description should include thekey failure modes, anidentification oferrors of omission/commission, and a review ofrelevant performance shaping factors.(SHARP) (IEEE P1082);
7. Select and apply the appropriate HRA:techniques for modeling theimportant human actions (SHARP);
8. Evaluate the impact on ISLOCA of significant human actionsidentified in Step 6 (SHARP); -.
9. Estimate error probabilities for the.-arious human actions andinteractions,.determine sensitivitiesr,,and establish uncertaintyranges (SHARP and IEEE P1082);
10. Review results for completeness and relevance (IEEE P1082);
11. Document all information necessary to provide an audit trail and'1 ,to makeithe information understandable,(SHARP).
Because most of the human actions in this HRA involved the use ofwritten normal, abnormal,. and emergency operatingprocedures, THERP-type HRA
485
event trees (8] were used to model most 'of the hunian actions in'the detailedanalysis. However; not all ISLOCA scenarios were best represented by THERPevent trees alone. In those cases, HRA fault trees were used in conjunction ,with the THERP event trees. The fault trees and THERP event trees were usedin a detailed analysis to estimate the probability of human error for each ofthe dominant human actions.
The basic, or unmodified, HEPs for branches in the HRA event trees wereestimated using techniques from THERP and HCR (Hunan Cognitive Reliability,see [11]). These basic HEP estimates were then revised by using performanceshaping factors (PSFs) to more realistically model' the work process at theplant. Each PSF was either positive or negative and, accordingly, eitherdecreased or increased the likelihood of a given human error. For example, ananalog meter, like a pressure gauge, if it does not have easily seen limitmarks, would be Judged to be a negative PSF. Thui, there would be a higher-than-normal probability for error in reading the gauge. Individual PSFs werederived from task analyses, time line analyses, evaluation of the human-machine interface, and direct observations of operator performance.
Specific PSFs which were investigated include:
1 - the quality of the human-machine interface;2 - written procedures (emergency, Abnormal, maintenance, etc.);3 - P&IDs;4 - response times for systems and Oerson'nel;5 - communication requirements; -
6 - whether operator actions were skill, rule, or knowledge-based;
7 - crew experience;,8 - levels of operator stress (situation-specific);9 - feedback from systems'in the plant;10 - task dependence and operator defendence;11 - location of the task (control r6om', auxiliary building,
etc.);12 - training for individual operatot actions, especially those
required in ISLOCA situations. '
Finally, the combination of all identified failure paths'(i.e.,sequences that included either single or multiple human'errors-leading to afailure of the action modeled by the HRA tree) gave the failure probabilityfor the top-level action modeled in the HRA tree. The guidelines of THERPwere followed in identifying the individual error paths.> Probabilities foreach unique error path were calculated by multiplying each HEP'on a givenerror path by other HEPs on the same path.
Core Damage Frequency and Risk
coan,th
After quantifying the recovery and mitigative actfonsi, the frequency ofre damage was calculated with the event tree models. Offsite consequencesd risk were also calculated, using'surrogate soirce terms and site data withe'MACCS code (13,14]. The existing literature tn containment bypass source
486
terms was reviewed to find an appropriate surrogate source term. Thecontainment bypass (V sequence) source term from the Oconee PRA [15] wasselected for the B&W plant, while the NUREG-1150 V sequence source term forSequoyah was used for the Westinghouse and CE plants. Similarly, the sitedata were those used in the consequence calculations for the Surry analysis inNUREG-1150 (16]. Surry was chosen as the representative site based on acomparison (performed for the present work) 'among the 5 NUREG-1150 sites andthe average of the 91 sites examined in the Sandia Siting Study [17]. Thiscomparison of the wind rose-weighted site population factors indicated thatSurry was a reasonably good representative of an 'average" U. S. site.
Auxiliary Building Environmental Analysis
One of the issues that has arisen during the course of the ISLOCAresearch program concerns the effects a break outside containment would haveon equipment in the break compartment and in adjacent compartments. Thepossibility exists that multiple redundant trains of emergency core coolingsystems (ECCS) could be disabled by high temperature, high humidity, andflooding. Thus, the assumption that only equipment in the break compartmentis impaired by the break may not be accurate.
To help resolve this issue, mechanistic calculations have, to date, beenperformed for the B&W plant to estimate the environmental conditions in theauxiliary building during an ISLOCA accident sequence (prior to core damage).The parameters of interest are the pressure, temperature, relative humidity,and water level in affected ECCS equipment rooms. The results of thesecalculations will be used, in a subsequent analysis, to estimate the extent towhich equipment in compartments adjacent to the break compartment failsbecause of high temperature or submergence, and to estimate the extent towhich operator recovery actions would be limited by steam and waterpropagation through the auxiliary building.
Five break sequences were evaluated using a combination of RELAP5 andCONTAIN [18] thermal-hydraulic models. The five sequences involved breaks inthe following locations within the B&W decay heat removal/low pressureinjection (DHR/LPI) and high pressure injection (HPI) systems:
1) A 12-inch break with discharge into room 236 of the auxiliarybuilding. This occurred as a result of premature entry into DHRcooldown,,with the RCS at an elevated pressure.
2) A simultaneous rupture in both DHR heat exchangers, with dischargeinto room 113 of the auxiliary''building. The limiting flow area(choke plane) for this break was in the 2.5-inch bypass linesaround valves DH-1517 and DH-1518. This occurred as a result ofpremature entry into DHR cooldown, with the RCS at an elevatedpressure.
3) A simultaneous rupture in the low-pressure DHR pump suctionpi'ping, discharging into both rooms 105 and 113 of the auxiliarybuilding. As above, the limiting flow area was in the 2.5-inch
487
bypass lines around valves DJ-1517 andDH-1518. This occurred asa result of premature entry into DHR c6oldown, with the RCS at anelevated pressure. -
4) Rupture of the 1-2 decay heat cooler with discharge into room 113of the auxiliary building. The break occurred because pressureisolation check valves in the injection piping of the LPI systemfailed internally.
5) A rupture in the suction piping to HPI pump 1-2 with dischargeinto room 115 of the auxiliary building. The break occurred as aresult of internal failure of the HPI discharge isolation checkvalves.
Figures 1-4 are simplified P&IDs of the systems in which the modeled breakswere located.
The auxiliary building pressures, temperatures, and water levels dependon the steam flow rate into the building, the steam energy, the volume of theauxiliary building, flow paths through the building, and the rate of heatremoval by condensation of steam on structural materials, equipment, andremoval by fire sprays. The steam energy and flow rate into the building werecalculated with simple RELAP5 models of the RCS. The resulting steam sourcedata were then used as boundary conditions for a CONTAIN calculation of theauxiliary building response to the ISLOCA.
The RELAP5 models of the RCS comprised fivevolum'es: the cold leg'lower plenum, core, upper plenum, and hot leg. Decay'heat was modeled with abest-estimate Oconee core model normalized to the B&W reference plantoperating power level. ECCS injection was included in the model via pressure-dependent flow tables, while pressure losses between the RCS and the breaklocation were estimated by including detailed models of the piping run. Thepurpose of this approach was to obtain a first order-approximation of RCSbehavior on the premise that the auxiliary buildihg response to the ISLOCA isnot strongly dependent on fine details of RCS behavior.
The CONTAIN computer code was used to calculate the time response of theauxiliary building parameters. CONTAIN is a containment modeling code thathas adequate steam-condensing heat transfer models for the scenarios ofinterest, and engineered system models that allow modeling of fire sprays,compartment sumps, and drainage paths between compartments. The approach usedin this calculation was to construct detailed cell models of compartments withECCS equipment that might be affected by the ISLOCA. These were auxiliarybuilding rooms 105, 113, 115, and 236. The remaining spaces in the plant werelumped'into a single balance-of-plant volume. The nodalization diagram forthe CONTAIN model is shown in Figure 5.
The CONTAIN model used in this analysis included a best-estimaterepresentation of the gas volume of each compartment, the flow losscharacteristics and area of flow paths between each compartment, and adescription of heat transfer surfaces within each compartment, and a
488
description of drainage paths between-compartments. The code tracked pooldepths in each compartment that resulted from both condensation of steam, anddrainage of fire sprays or condensate from adjacent compartments. This is animportant aspect of the large-break sequences because the high break dischargeflow rates quickly fill the compartment sumps, causing flooding of adjacentcompartments and compartments at a lower elevation. Only one compartment inthis analysis (room 236) has fire sprays. Since these can be expected toactuate early in the break sequence, resulting in an aggravated floodingproblem, they are included in the model.
Compartment sump pumps, fan coolers, and pump heat were excluded fromthe model. The sump pumps were excluded because they do not have adequatecapacity to remove the break discharge, condensate, and firewater. In thesmall-breaksequences, where the combined accumulation of water from thesesources was close to the sump pump capacity, the impact of sump pump operationwas evaluated qualitatively. Pump heat was neglected because it would beremoved by the fan coolers, and the fan coolers were not modeled because alarge fraction of their capacity would be used to remove pump heat.
489
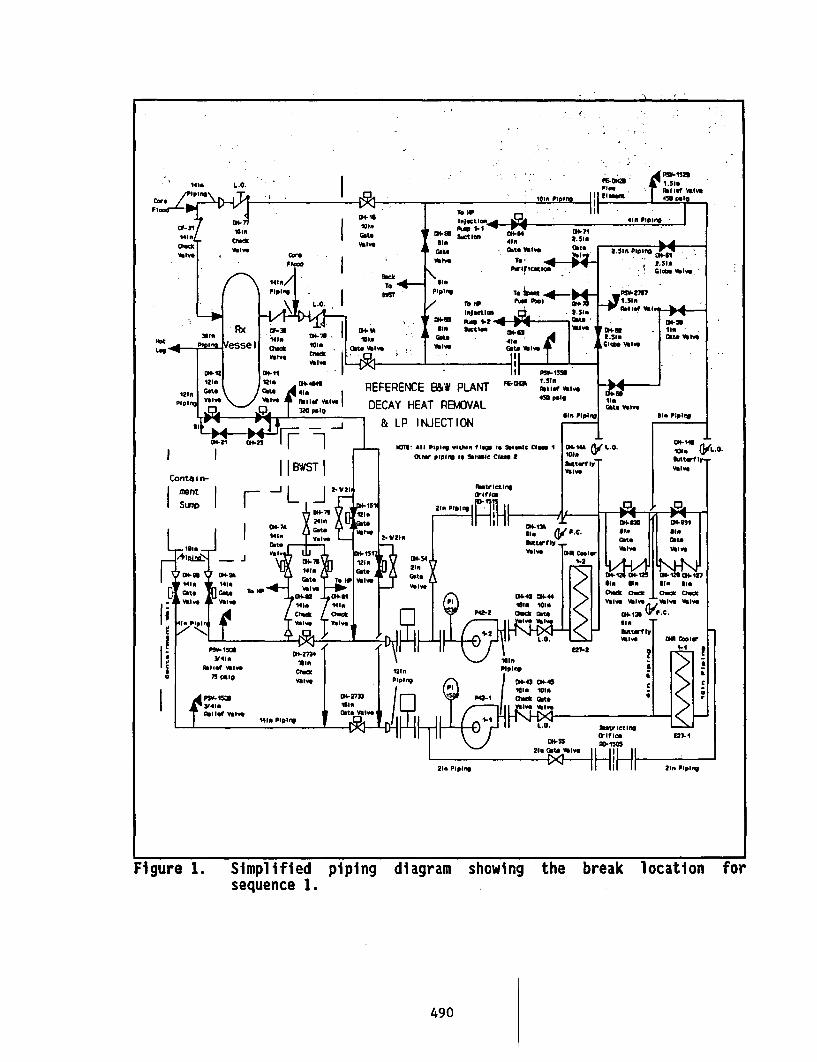
I II
ION L.D.
I1.540
-In'. I - , - I I sim n _ _ __1
IwoP4-a-4
.X . - - . . -Ii
ovo
Wloi
iii
TOi I
I � IdPA Plt;, I41I
I
A
DickTo -4-
RV ?
sinl
uct4 140 014-4 .I410 alGate Volvo 01te
Pwl!rICauop4
PiIn~g To ~ion," t
$11% satea4 I 0 Valve~ mu 440
Volvo 0041001 , 1%I,* M * 'ml'
1.510P,4!P17 " I
2.540: Icto Valve,
-0I10 ole Val
F04-U I
Ca. 10 400 VavIGIWO Pal" in
N Ii p-- InVo I II i l -1330
REFERENCE 3&W PLANT 4- 'P I IveIN,rvr- v- -- 4 1 *pl19
DECAY HEAT REMOVAL
I 1WSTI
LP IrNJECTIONson Pip1ng
Conta In-
NM:I All Pipi.g .Plin~ 1.04 Is SDOMbC Cl1n01h4w Pplotn Is 01.0040 elma I
0L-4AIvINNa
swre"TL.o. 110. W'L-..
&dwIIyT
[ ent t 24V40
111
I P5W 1 1 ios
144 0 14 1410
Ca.Gate GM Volvo
I T C,, nOct0PpIVolvo Val"o
0411150401-2731414440 lp l i I
01A44.0 Val"o Check44 5 Vale Volvo
144 Piln
lP14- 15111240
fiffte
Volvo
Olotricting
2401 Plping -112-1/210 son~'.C
0454 Vow
m1110" 1006
017-2
1240 PiIPng
Piplain4- loin
P42- utat
04535210 (~ta Vlvs II
I l A. >4
Mi- II 9 04. I7si Clls IlI . lla
Volve Volvo Volvo Vol.*
nowt lot Irvorifice E2.11111-1i04
-273
t;vY
- Vave
11 14
2 4 0 P ipin g ~X -. - I I~ Ii I l P p n g2i. PlPlSg � I I I III I I 2in Plpiq
Figure 1. Simplified piping diagram showing the break location forsequence 1.
490
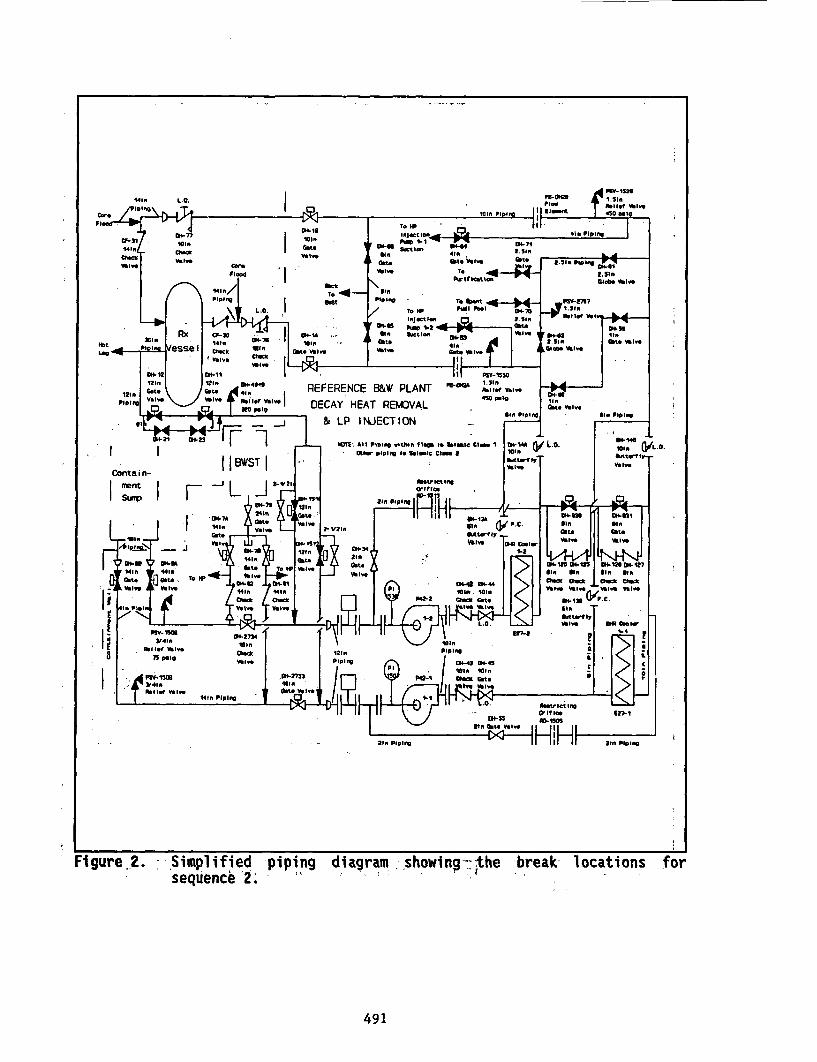
r 04-7i 101.
101. Gte
Ch.* I __ -vsl�
V. I "We
i IPip
-401.
Rx Cp� GWIAno. 141 W.,ipma Vesse I
Ow '12 I12i. lei.G." Got* 41 PEV.1" Val" I!ftl1of %laf """" .. I DEall?, NO 0019
Figure 2. -.Simplified piping diagram -showing-*the break- locations. forsequencel. 2.- -
491
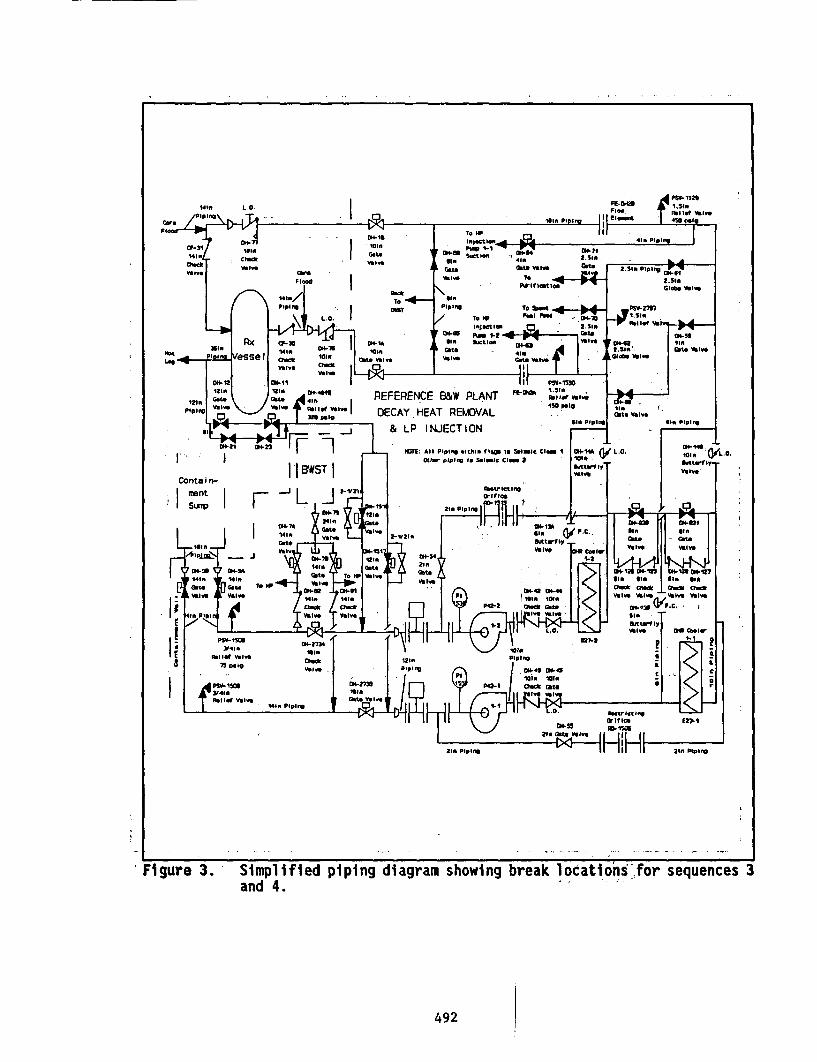
A ---
Oll.lot.
cramVal"
GireFl-d 1
141-/Plot,%
f L.O.
381. CF- 30NX se loinChltValve ChUft
D11- cwli Val"
III IM OW41"GfA 4in
Piping Valve lbalIOf Val"
-C?. f NO 0619
la I !I' IE~ 43 Paloloin P'o6,u
owlis To PUI.
G.t0 IF - S.gt.. OH-S4 IN&?16av 1n 41. 2hi1
r~eGkin Valv Gate 2.1SIO Pipilito '
To tSt.
injectift 2.1in Ihilof eilv
101Glae 0 OW=
PEEENEBW PLANT FL-e1.1
DECAY HEAT PEMOVAL - i pp We ot 04..*lPii
&LP INJECTION
NOTE: All PipIng .1thl. f I is .44; ClnIm 1 ll 04-1 L.O. in ( .
Otiw, MiOiS of b"latic Clenu~atwi~vT kIW
CO , in- i IBWST II mnta i r- ->2
IsuLXP I- r L1 a L
-L - .... I--- - - -1Figure 3. Simplified piping diagram showing break locationsfor sequences 3
and 4.
492
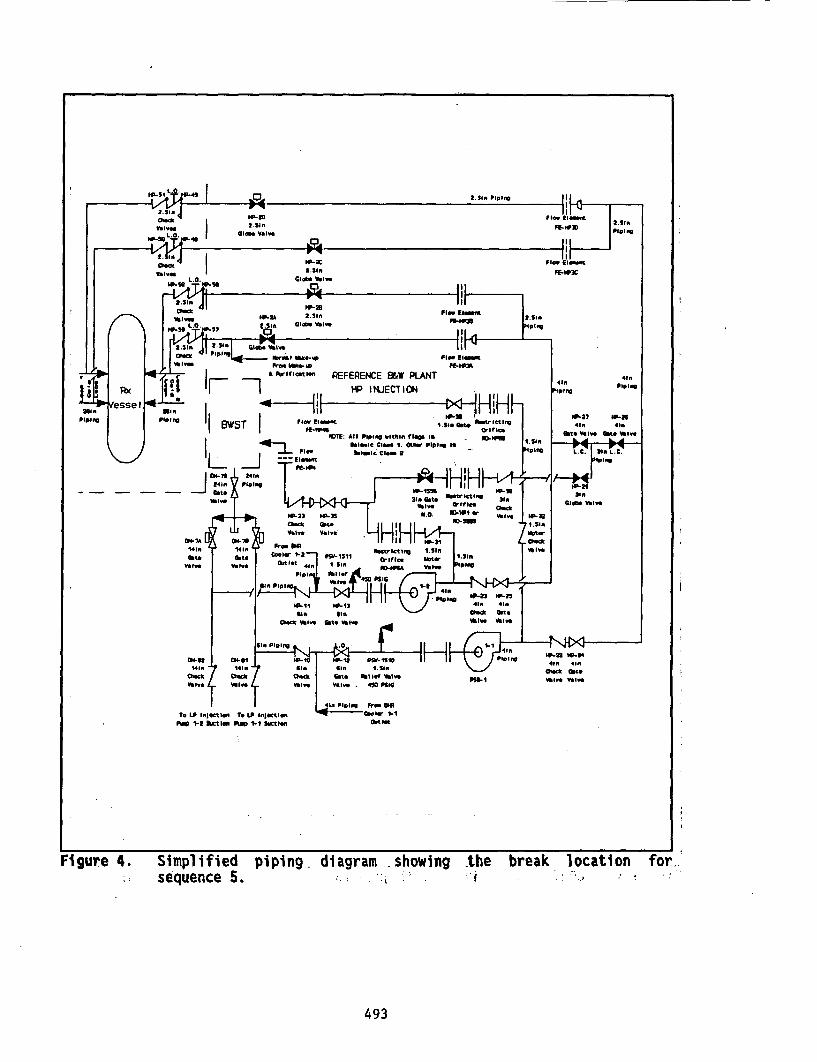
To Lo Ir14" Io To JP Mja1Ia _ ol -NO 1-2 %"Io PUM -I W"Ie A
Figure 4. Simplified; sequence 5.
piping. diagram showing. , ! .
the break location-. I
for..
493
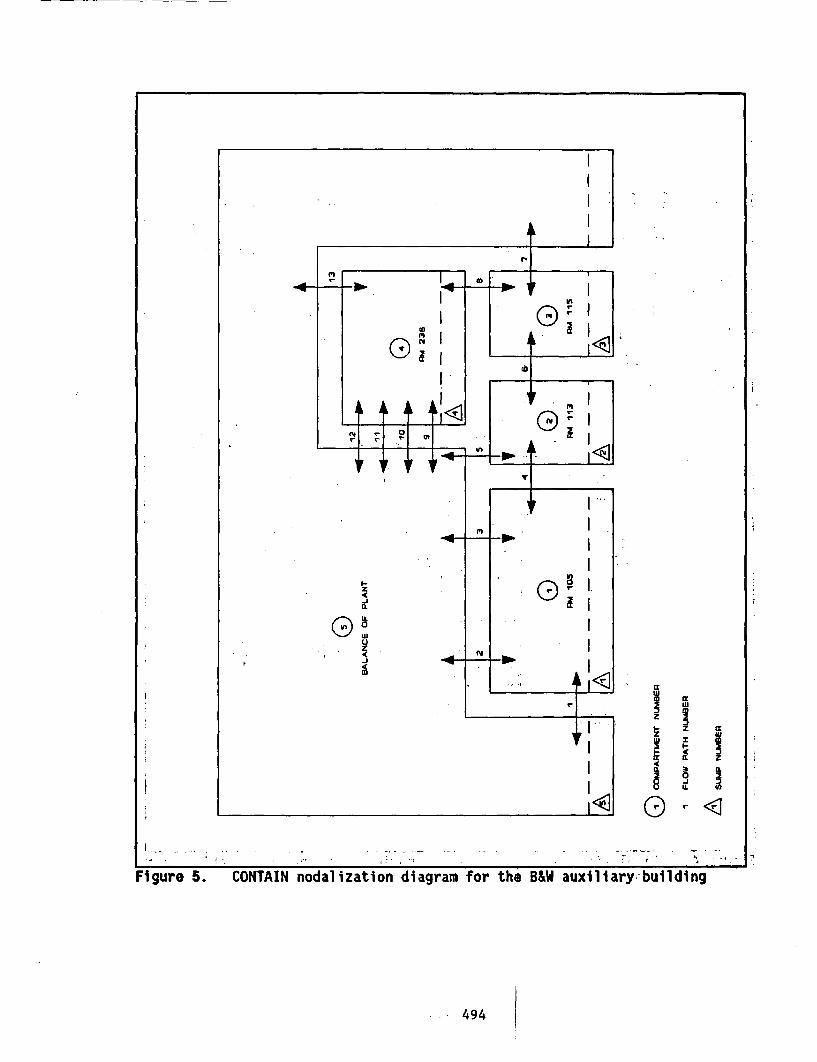
U'
4
0L
I
I-
<3
7
Figure 5. CONTAIN nodalization diagram for the B&W auxiliary building
494
RESULTS FOR THE THREE PLANTS ANALYZED
The trial application of this state-of-the-art ISLOCA methodology tothree U. S. nuclear power plants provided the following results. The readeris cautioned that extrapolating these results to other plants at this timewithout further analysis would be highly speculative.
B&W Plant Findings
1. The total ISLOCA core damage frequency was estimated to be-2 x 10.6 per reactor-year.
2. Potential human errors during mode changes were found to be the'dominant contributors to ISLOCA core damage frequency and risk.ISLOCA initiating events driven by human error were composed oferrors of commission that could occur during execution of normalprocedural tasks, such as entering shutdown cooling.
3. Scenarios initiated primarily by hardware failures of pressureisolation valves were relatively small contributors to ISLOCA coredamage frequency and risk.
4. Break isolation would be required to prevent core damage, becausethe makeup capacity to the borated water storage tank (BWST) isinsufficient to maintain an adequate reactor coolant inventory forbreaks larger than two inches in diameter. Although the analysisindicates that hardware would probably be available to isolatethese breaks, specific procedures and training were not in placeat the time of the plant visit to ensure that this hardware isused.
5. Operational experience related to ISLOCA made credible thespecific human errors of commission that were the dominantcontributors to ISLOCA risk.
The large contribution to ISLOCA risk from human errors that could occurduring shutdown highlights the importance of including a comprehensiveassessment of the role of plant personnel in an ISLOCA risk evaluation. To becomplete, this assessment should consider the potential for errors ofcommission and the effect that possible latent errors could have on the normalexecution of procedures.
The CONTAIN calculations performed for thisiplant show thatpressurization of the auxiliary building is limited to less than 1 psig,because the modeled auxiliary building compartments are very well connected toone another. The modeling parameters that affectithe calculated pressure risebetween compartments are flow area, discharge coefficient, and L/D. Theseparameters were all accurately modeled for the ECCS rooms, so anyuncertainties in the flow model (and hence the pressure calculation) wouldstem from the number of flow junctions neglected in the balance-of-plantportion of the model. The largest pressure drop in the auxiliary building
495
model should occur as the fluid passes from the break compartment to theimmediately adjacent compartments (assuming roughly equal flow areasconnecting each compartment). At each successive flow junction, the mass flowwill be reduced by the mass condensed in passing through each compartment, andthe effective area associated with the flow will increase as more and moreparallel'flow paths become available to the fluid. Therefore, pressure dropsat each succeeding junction will decrease as distance from the breakincreases. This effect leads to the conclusion that refinements to theCONTAIN model would not have a appreciable affect on the calculated pressures.
CONTAIN predicts that, for the range of break sizes analyzed,temperatures in the auxiliary building will not exceed 212° F. However, thereis one modeling uncertainty that could-change this result significantly: thequality of the water-steam mixture discharged from the break into theauxiliary building. For all of the break sequences analyzed, the breakdischarge is a two-phase mixture with steam quality no higher thanapproximately 0.90. Because CONTAIN models the RCS blow down as anisenthalpic expansion from RCS pressure to compartment pressure, the resultingcompartment temperatures will always be at, or very near, the saturationtemperature associated with the calculated compartment pressure, as long asthe break quality does not exceed'approximately 0.93. At break qualitieshigher than 0.93, the enthalpy of the discharged'fluid will be high enough(greater than 1150 Btu/lbm) to produce superheated steam in the compartment.The maximum steam temperature obtainable by this process is approximately 3200F., and occurs~when dry saturated steam at approximately 500 psia isdischarged from the RCS through the break. It must be emphasized that none ofthe simplified model predictions Indicate that dry steam will be present inthe break discharge. However, recent best-estimate Oconee SBLOCA calculationsdo show prolonged geriods during which the discharge is very nearly dry.Given the uncertainty inherent in any calculation of this type, one cannotrule out the possibility that high quality steam will be discharged for a longenough period of time to superheat the steam in the break compartment.
The relative humidity predictions were similar-in each sequence. All ofthe auxiliary building rooms that were evaluated experienced periods of 100%relative humidity.
The rate of flooding varied considerably among the five sequences, asillustrated by Figures 6 and 7. Figure 6 shows compartment pool depths-plotted against time after rupture for a large break in the DHR letdown line.In this sequence (sequence 1), the source of flooding Is located in room 236.The flood propagated through a pipe chase in the floor of room 236 into room115. From there water spilled over two flood walls to.flood rooms 113 and105, submerging all ECCS pump motors in-a little over 30 minutes. This wasprimarily the result of propagation of the unflashed portion of the breakdischarge. In this sequence, sump pump operation would have been ineffectivein mitigating the flooding, because of the low capacity of the sump pumps.
496
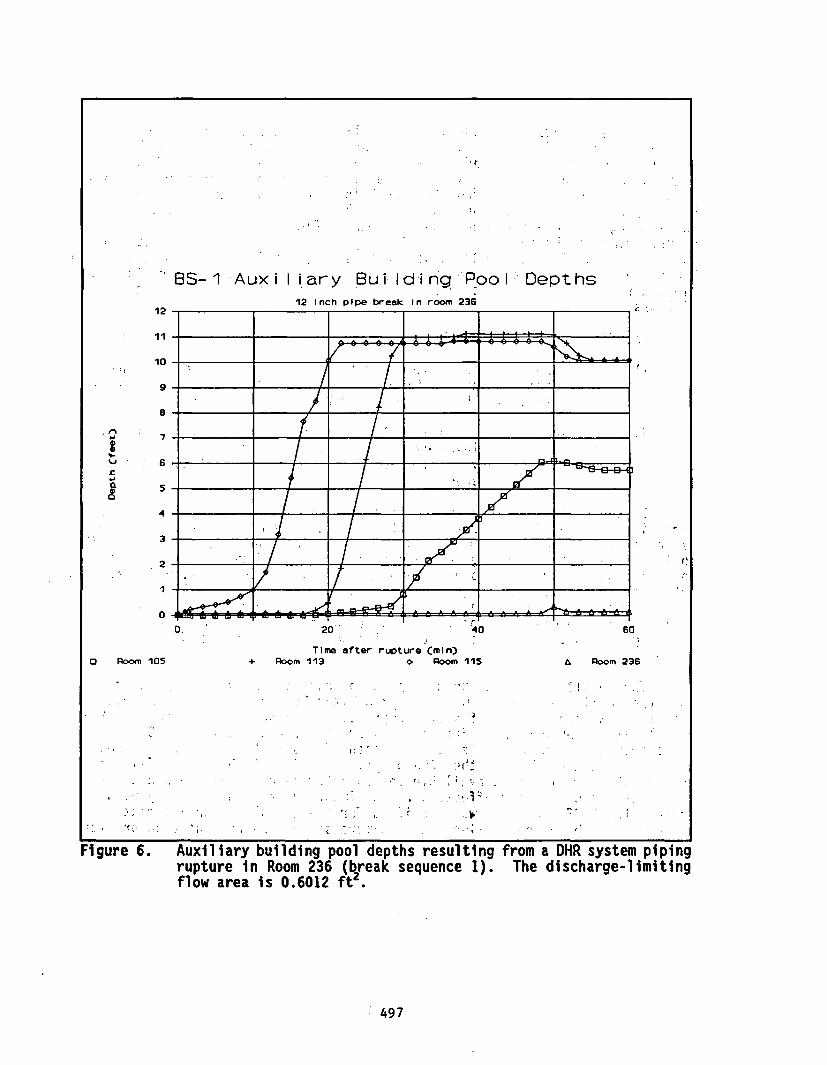
Ij
'BS- 1 Aux iIi ar y Bui d i ng12 Inch pipe break In room
Poo I236
Depths
12
11
10
9
a
I, .1 7a10''-I, 6
a 5
4
3
2
I
0
_a
O Room 105
20 40 60
Time after rupture CmIn)+ Room 113 o RooM 115 P Rm236
. ,
: , '. ,I, . . I I I I . ..
'1
z . , ; t _
. I . , .
. ; , I. . I 6
Figure 6. Auxiliary building pool depths resulting from a DHR system pipingrupture in Room 236 (break sequence 1). The discharge-limitingflow area is 0.6012 ft2.
497
Figure 7 shows pool depths for a small-break sequence (sequence 5).The resulting flood was minimal because the mass discharged from the break wasrelatively small, and much of it flashed to steam. The steam was then carriedthrough the building and released to the outside atmosphere through blowouts,or was condensed well away from the break location. Furthermore, sump pumps,had they been included in the model, could have slowed pool growth and delayedthe submergence threat to the ECCS equipment. Flooding in this sequenceoccurs primarily because firewater discharged from the sprinkler system inroom 236 drains into the ECCS compartment below (room 115). At the end of twohours the flood had not yet reached the top of the spill wall separating room115 and room 113. Equipment in room 105 would not be threatened for a numberof hours.
The flooding results can be summarized with two general statements:
1) For large-break sequences 1 and 4, flooding will occur in thebreak-compartment and in adjacent compartments at a rate that willcover essential ECCS components within one hour.
2) For small-break sequences 2, 3, and 5, flooding will occur slowlyand could be delayed by operation of the compartment sump pumps.A period of many hours would pass before essential ECCS componentswould be threatened.
Of the various factors controlling pool formation, two dominate. Thefirst is the rate of discharge of unflashed fluid from the break. The secondis the extent to which firewater and condensate from the balance-of-plant findtheir way into rooms housing ECCS-equipment. For the large-break sequences,,the principal contributor to pool formation is the discharged liquid that doesnot flash to steam. For large-break sequences I and 4, as the RCS cools down,this becomes essentially the runout flow of the surviving ECCS. In sequences2, 3, and 5, the discharge of fire protection sprays provides a greaterflooding hazard than the accumulation of condensate or unflashed breakdischarge.
The results from the steam propagation analysis show that operator entryinto the auxiliary building would be prohibited by the live steam environmentthat forms within minutes of system rupture. The results also show that themost limiting environmental factor is water pool formation in the ECCScompartments. When the pools reach a depth of two feet, the ECCS pump motorswill be submerged, failing the ECCS pumps. The time at which this failurebecomes the limiting time available for operator recovery of the plant. Thetemperature and humidity effects were not important at the B&W study plantbecause the ECCS equipment was qualified for the postulated environmentproduced by a high energy line break, a more severe environment than predictedhere. -
498
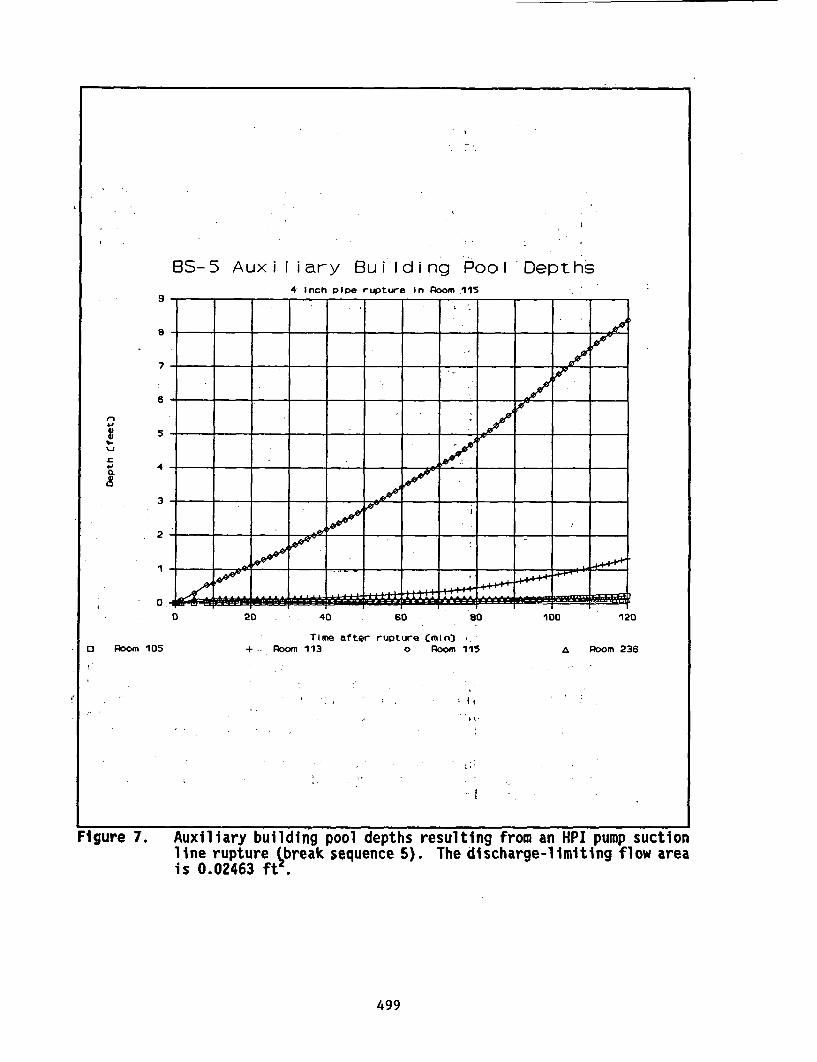
BS-5 Auxiliary Building PoolDepths4 Inch pipe rupture in Room 115
B
a
7
6
4.
z4..$I
8
5
4
3
2
1
Time after rupture Cmin) ,,+.. Room 113 o Room 1150 Room 105 a Room 236
- I i
Figure 7. Auxiliary building pool depths resulting from an HPI pump suctionline rupture (break sequence 5). The discharge-limiting flow areais 0.02463 ft .
499
Westinghouse Dlant results
1. The total ISLOCA core damage frequency was estimated to be-2 x 10- per reactor-year.
2. Human errors that could occur during startup and shutdown of theplant were negligible contributors to ISLOCA core damage frequencyand risk. This is in contrast to the finding for the B&W plantand is a direct result of the high quality of the administrativecontrols and safety culture found at the Westinghouse plant.
3. Sequences initiated by hardware failures of pressure isolationcheck valves were the only significant contributors to ISLOCA coredamage frequency and risk.
4. As in the B&W plant, break isolation would be an importantrecovery action, because the makeup capacity from the refuelingwater storage tank (RWST) is insufficient to maintain an adequatereactor coolant inventory for breaks that are larger thanapproximately two Inches in diameter. The analysis indicates thathardware would be available to isolate-these ISLOCA breaks, and,in contrast with the finding for the B&W plant, adequateprocedures and training are generally available to ensure thatthis hardware is used.
5. At the time of the plant visit, a general survey was made of theinterfacing system flow paths to Qualitatively estimate the impacton equipment of ruptures in various locations. This survey couldnot verify that the ECCS components are adequately separated suchthat any postulated rupture would not affect redundant ECCStrains. In particular, in the case of the residual heat removala(RHR) system, the pumps for units 1 and 2 (the analyzed plant islocated at a two-unit site) are located in the basement of theauxiliary building and a common-corridor runs outside of theindividual pump rooms. If there were a pipe break and blowdown ofsteam and liquid from the RCS into one of the RHR pump rooms, thisconfiguration may not ensure that at least one train of ECCS wouldstill be available following the rupture. In other words, becauseof the common corridor, a rupture in the RHR pump room of one unitcould conceivably disable the RHR pumps for the other unit, also.,
6. A significant reduction in ISLOCA risk through relatively simple,changes to procedures, training, and instrumentation does notappear achievable.
. . . . .. . . .. .
500
Combustionl Inctineering Plant Results i -�,_... i, _,,
1. The total ISLOCA core damage frequency was estimated to be-2 x 10⁶ per reactor-year.
1. As at the Westinghouse plant, human errors that could occur duringstartup and shutdown of the plant were negligible contributors toISLOCA core damage frequency and risk. Again, this is a directresult of the high quality of the administrative controls andsafety culture found at the plant.-
2. Sequences initiated by hardware failures of pressure isolationcheck valves were the dominant contributors to ISLOCA core damagefrequency and risk. However, at the CE plant, exposure of thelow-pressure interfacing system is preripitated by stroke-testing*of a normally closed injection flow control valve.
3. As in the other two plants, break isolation would be an importantrecovery action, because makeup capacity to the refueling waterstorage pool (RWSP) is insufficient to maintain an adequatereactor coolant inventory for breaks that are larger thanapproximately two inches in diameter. The analysis indicates thathardware would be available to isolate these ISLOCA breaks;,however, as for the B&W plant, procedures were not available atthe time of the plant visit to ensure that this hardware is usedin all sequences.
4. 'At the time ,of the plant visit, a general 'survey was made of theinterfacing system flow paths to qualitatively estimate the impacton equipment of ruptures in various locations. As for theWestinghouse plant, this survey could ;lot verify that theemergency core cooling systems (ECCS) are adequately separatedsuch that any postulated rupture would not affect redundant ECCStrains.
5. It appears that relatively simple changes to procedures andtraining could reduce ISLOCA risk by reducing the initiatorfrequency and by increasing the likelihood of successfullyisolating an intersystem break. '.E
FUTURE RESEARCH AREAS
Further research is planned in the following areas to achieve finalresolution of GI-105: '
1) Screening criteria will be developed tq evaluate thethreat toECCS equipment from the post-break auxiliary building environment.
2) An evaluation will be made of the ISLOGA risk at BWRs. ,
501
3) Guidelines will be developed for use In evaluating ISLOCA risk atother plants.
4) An evaluation will be made of the ISLOCA risk for advanced lightwater reactor designs.
ACKNOWLEDGEMENT ,
This program is under the sponsorship of thei U. S. Nuclear RegulatoryCommission, Office of Nuclear Regulatory Research,' Division of Safety IssueResolution - Dr. Gary R. Burdick, NRC Project Manager.
REFERENCES'
1. U. S. Nuclear Regulatory Commission, Reactor' SafetY Study-An Assessmentof Accident Risks in U.S. Commercial Nuclear Power Plants, WASH-1400(NUREG/75-014), October 1975.
2. W. J. Galyean etfal., Assessment of ISLOCA Risk - Methodologv andApplication: Babcock and Wilcox Nuclear Power.Station (Draft), EG&GIdaho, Inc., NUREG/CR-5604 (EGG-5604), Februiary 1991.
3. D.'L. Kelly et al., Assessment'of ISLOCA Risks - Methodologv andADDlication:' Westinghouse Four-LooD'Ice Condenser Plant, NUREG/CR-5744,to-be published.
4. D. L. Kelly et al., Assessment of ISLOCA Risks - Methodology andApDlication: Combustion Enguineering Plant, NUREG/CR-5745, to bepublished.
5. V. H. Ransom et al., RELAP5/MOD2 Code Manual, EG&G Idaho, Inc.,EGG-2396,'August 1985. '
6. D. A. Wesley et al.,ComDonent Pressure Fraillities for PipingComDonents, ABB Impell Corporation, NUREG/CR-5603 (EGG-2607),October 1990.
7. T. G. Ryan", 'A Task Analysis Linked Approach for Integrating the HumanFactor in Reliability Assessment of NPP," Reliabilitv En ineering andSystem SafgU, vol. 22, 1988.
8. A. Swain and H. Gutman, Handbook of Human Reliability Analysis withEmphasis on Nuclear Power Plant Apolications, NUREG/CR-1278, August1983.
9. G. Hannaman and A. Spurgin', Systematic Humal Action ReliabilityProcedure (SHARP), EPRI NP-3583, 1984.
10. R. Hall (ed.),' A Guide'for General Princioljs of Human Actiob,Reliability Analysis for Nuclear Power Generation Stations, IEEEDraft Standard P1082/D7, August 1989.
502
11. G. W. Hannaman, A. Spurgin, and Y. Lukic, Human Cognitive ReliabilityModel for PRA Analysis, NUS-4531, Electric Power Research Institute,1984.
12. U.S. Nuclear Regulatory Commission, Office of Nuclear RegulatoryResearch, Severe Accident Risks: An Assessment for Five U.S. NuclearPower Plants, NUREG-1150, Volume 1, Second Draft for Peer Review, June1989.
13. K. R. Jones, C. A. Dobbe, and D. L. Knudson, INEL Personal ComguterVersion of MACCS 1.5, NUREG/CR-5667, March 1991.
14. MELCOR Accident Consequence Code System. MACCS Version 1.5 User'sManual, NUREG/CR-4691, Vol. 1, February 1990.
15. Oconee PRA: A Probabilistic Risk Assessment of Oconee Unit 3, NuclearSafety Analysis Center (Electric Power Research Institute) and DukePower Company, NSAC-60, June 1984.
16. Evaluation of Severe Accident Risks and the Potential for RiskReduction: Surrv Power Station. Unit 1, NUREG/CR-4551 (SAND86-1309),Draft Report for Comment, February 1987.
17. D. C. Aldrich et al., Technical Guidance for Siting CriteriaDevelopment, Sandia National Laboratory, NUREG/CR-2239 (SAND81-1549),1982.
18. K. K. Murata et al., User's Manual for CONTAIN 1.1: A Computer Code forSevere Nuclear Reactor Accident Analysis, NUREG/CR-5026, November 1989.
503
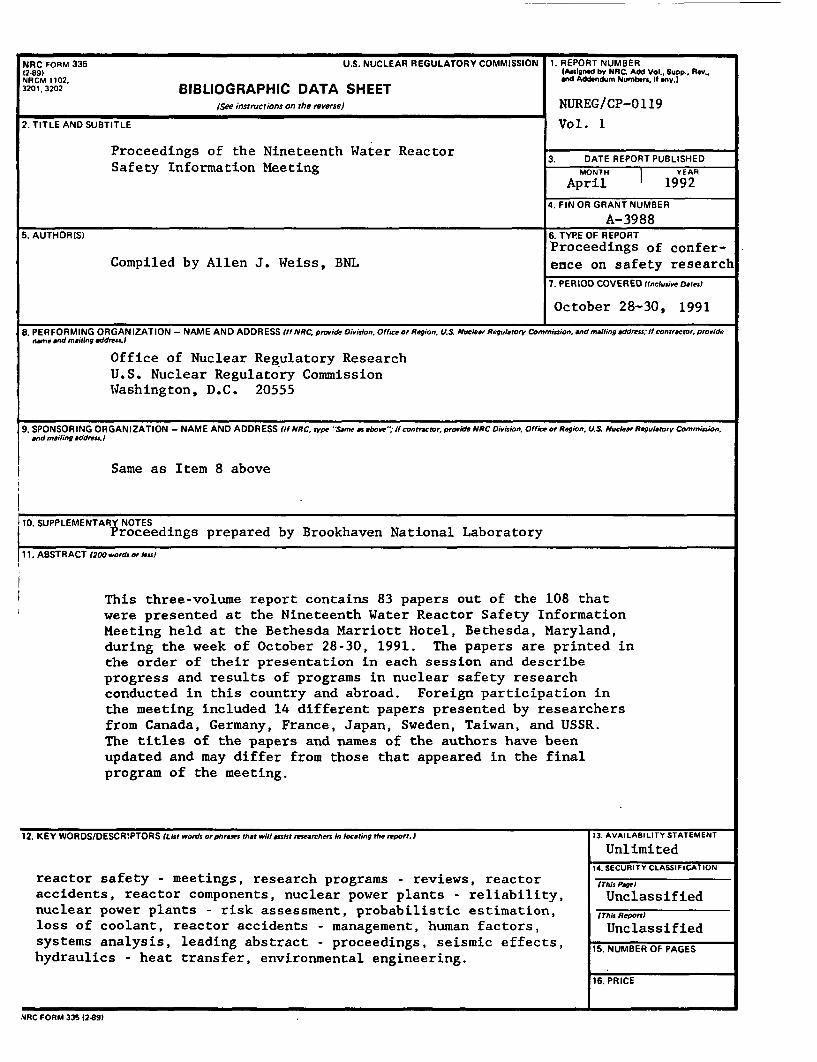
NRIC FORM 335 U.S. NUCLEAR REGULATORY COMMISSION 1. REPORT NUMBER12NR9) FAsSigned bU NRC. Add Vol., Supp., Rev.,NRCM 1102. And Addendum Numbers, It any.)3201,3202 BIBLIOGRAPHIC DATA SHEET
(See mnstrucrtons on the reverse) NUREG/CP-01192. TITLE AND SUBTITLE Vol. 1
Proceedings of the Nineteenth Water Reactor 3. DATE REPORT PUBLISHED
Safety Information Meeting MONTH YEAR
April 1992
4. FIN OR GRANT NUMBER
A-39885. AUTHORIS) 6. TYPE OF REPORT
Proceedings of confer-Compiled by Allen J. Weiss, BNL ence on safety research
7. PERIOD COVERED (inclusive Dates)
October 28-30, 1991
8. P ER F 0 R M I N G O RGAN I ZAT I N - NAM E A N D AD DR E SS (It NRC, provide DivisinOr. Offieo Region, U.S. Nuclear Regulatory Comm7ission. and mailing address: if con tractor, pro videname and mailing address.)
Office of Nuclear Regulatory ResearchU.S. Nuclear Regulatory CommissionWashington, D.C. 20555
9. SPONSOR ING OR GAN I ZATION - NAME AND ADD R ESS fit NRC, type 'Same as abovre if contractor, provide NRC Division. Office or Region, U.S. Nucleir Regula tory Commission,and mailing address.)
Same as Item 8 above
10, SUPPLEMENTARY NOTESProceedings prepared by Brookhaven National Laboratory
1, ABSTRACT (200 words or less)
This three-volume report contains 83 papers out of the 108 thatwere presented at the Nineteenth Water Reactor Safety InformationMeeting held at the Bethesda Marriott Hotel, Bethesda, Maryland,during the week of October 28-30, 1991. The papers are printed inthe order of their presentation in each session and describeprogress and results of programs in nuclear safety researchconducted in this country and abroad. Foreign participation inthe meeting included 14 different papers presented by researchersfrom Canada, Germany, France, Japan, Sweden, Taiwan, and USSR.The titles of the papers and names of the authors have beenupdated and may differ from those that appeared in the finalprogram of the meeting.
12. KEY WORDS/DESCR!PTORS (List words or phrases that will assist researchers in locating the report.) 13. AVAILABILITY STATEMENT
Unlimited14. SECURITY CLASSIFICATION
reactor safety - meetings, research programs - reviews, reactor This Page)
accidents, reactor components, nuclear power plants - reliability, Unclassifiednuclear power plants - risk assessment, probabilistic estimation, fr^isReport
loss of coolant, reactor accidents - management, human factors, Unclassifiedsystems analysis, leading abstract - proceedings, seismic effects, 15.NUMBEROFPAGES
hydraulics - heat transfer, environmental engineering.
16. PRICE
NRC FORM 33512-891

THIS DOCUMENT WAS PRINTED USING RECYCLED PAPER

I PERMIT No. O-87
OFFICIAL BUSINESSPENALTY FOR PRIVATE USE, $300


![[Smallpox in Ferrara in the nineteenth century]](https://img.dokumen.tips/doc/110x75/6335d9e164d291d2a302a581/smallpox-in-ferrara-in-the-nineteenth-century.jpg)


