Embed Size (px)
Citation preview
Research article
TheJournalofClinicalInvestigation http://www.jci.org Volume 118 Number 11 November 2008 3775
NFATc1 in mice represses osteoprotegerin during osteoclastogenesis
and dissociates systemic osteopenia from inflammation in cherubism
Antonios O. Aliprantis,1,2 Yasuyoshi Ueki,3 Rosalyn Sulyanto,1,4 Arnold Park,1 Kirsten S. Sigrist,1 Sudarshana M. Sharma,5 Michael C. Ostrowski,5 Bjorn R. Olsen,3 and Laurie H. Glimcher1,2
1Department of Infectious Diseases and Immunology, Harvard School of Public Health, Boston, Massachusetts, USA. 2Division of Rheumatology, Allergy and Immunology, Department of Medicine, Brigham and Women’s Hospital, Harvard Medical School,
Boston, Massachusetts, USA. 3Department of Developmental Biology and 4Harvard School of Dental Medicine, Boston, Massachusetts, USA. 5Department of Molecular and Cellular Biochemistry and Comprehensive Cancer Center, The Ohio State University, Columbus, Ohio, USA.
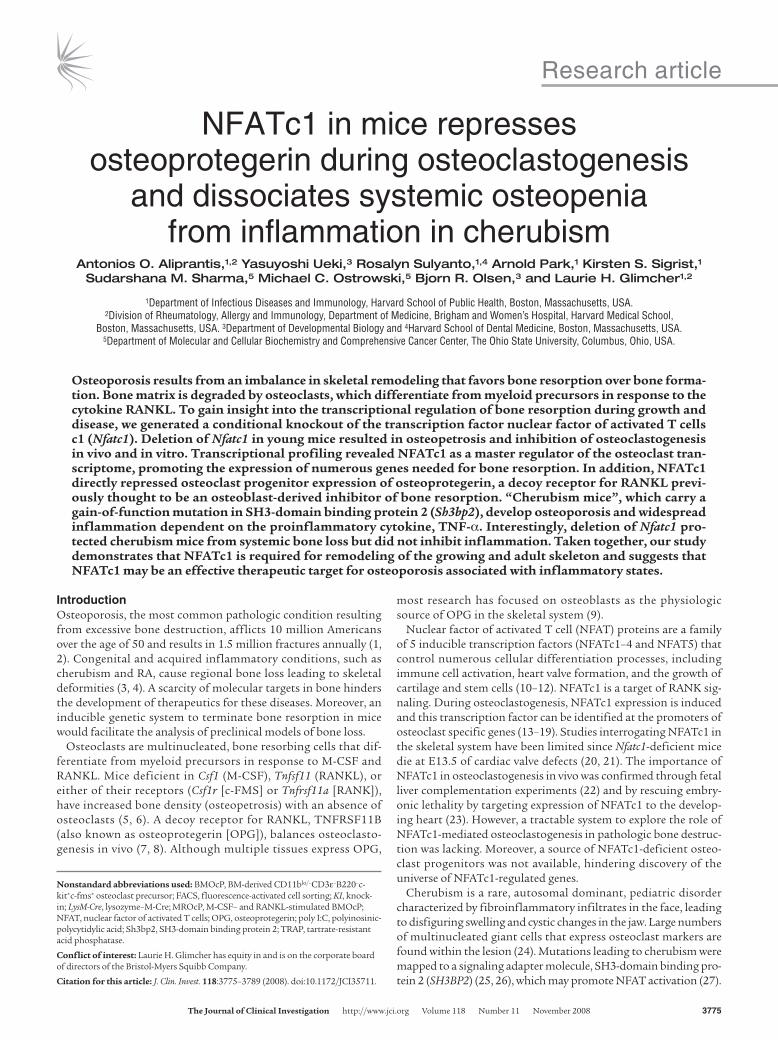
Osteoporosisresultsfromanimbalanceinskeletalremodelingthatfavorsboneresorptionoverboneforma-tion.Bonematrixisdegradedbyosteoclasts,whichdifferentiatefrommyeloidprecursorsinresponsetothecytokineRANKL.Togaininsightintothetranscriptionalregulationofboneresorptionduringgrowthanddisease,wegeneratedaconditionalknockoutofthetranscriptionfactornuclearfactorofactivatedTcellsc1(Nfatc1).DeletionofNfatc1inyoungmiceresultedinosteopetrosisandinhibitionofosteoclastogenesisinvivoandinvitro.TranscriptionalprofilingrevealedNFATc1asamasterregulatoroftheosteoclasttran-scriptome,promotingtheexpressionofnumerousgenesneededforboneresorption.Inaddition,NFATc1directlyrepressedosteoclastprogenitorexpressionofosteoprotegerin,adecoyreceptorforRANKLprevi-ouslythoughttobeanosteoblast-derivedinhibitorofboneresorption.“Cherubismmice”,whichcarryagain-of-functionmutationinSH3-domainbindingprotein2(Sh3bp2),developosteoporosisandwidespreadinflammationdependentontheproinflammatorycytokine,TNF-α.Interestingly,deletionofNfatc1pro-tectedcherubismmicefromsystemicbonelossbutdidnotinhibitinflammation.Takentogether,ourstudydemonstratesthatNFATc1isrequiredforremodelingofthegrowingandadultskeletonandsuggeststhatNFATc1maybeaneffectivetherapeutictargetforosteoporosisassociatedwithinflammatorystates.
IntroductionOsteoporosis, the most common pathologic condition resulting from excessive bone destruction, afflicts 10 million Americans over the age of 50 and results in 1.5 million fractures annually (1, 2). Congenital and acquired inflammatory conditions, such as cherubism and RA, cause regional bone loss leading to skeletal deformities (3, 4). A scarcity of molecular targets in bone hinders the development of therapeutics for these diseases. Moreover, an inducible genetic system to terminate bone resorption in mice would facilitate the analysis of preclinical models of bone loss.
Osteoclasts are multinucleated, bone resorbing cells that dif-ferentiate from myeloid precursors in response to M-CSF and RANKL. Mice deficient in Csf1 (M-CSF), Tnfsf11 (RANKL), or either of their receptors (Csf1r [c-FMS] or Tnfrsf11a [RANK]), have increased bone density (osteopetrosis) with an absence of osteoclasts (5, 6). A decoy receptor for RANKL, TNFRSF11B (also known as osteoprotegerin [OPG]), balances osteoclasto-genesis in vivo (7, 8). Although multiple tissues express OPG,
most research has focused on osteoblasts as the physiologic source of OPG in the skeletal system (9).
Nuclear factor of activated T cell (NFAT) proteins are a family of 5 inducible transcription factors (NFATc1–4 and NFAT5) that control numerous cellular differentiation processes, including immune cell activation, heart valve formation, and the growth of cartilage and stem cells (10–12). NFATc1 is a target of RANK sig-naling. During osteoclastogenesis, NFATc1 expression is induced and this transcription factor can be identified at the promoters of osteoclast specific genes (13–19). Studies interrogating NFATc1 in the skeletal system have been limited since Nfatc1-deficient mice die at E13.5 of cardiac valve defects (20, 21). The importance of NFATc1 in osteoclastogenesis in vivo was confirmed through fetal liver complementation experiments (22) and by rescuing embry-onic lethality by targeting expression of NFATc1 to the develop-ing heart (23). However, a tractable system to explore the role of NFATc1-mediated osteoclastogenesis in pathologic bone destruc-tion was lacking. Moreover, a source of NFATc1-deficient osteo-clast progenitors was not available, hindering discovery of the universe of NFATc1-regulated genes.
Cherubism is a rare, autosomal dominant, pediatric disorder characterized by fibroinflammatory infiltrates in the face, leading to disfiguring swelling and cystic changes in the jaw. Large numbers of multinucleated giant cells that express osteoclast markers are found within the lesion (24). Mutations leading to cherubism were mapped to a signaling adapter molecule, SH3-domain binding pro-tein 2 (SH3BP2) (25, 26), which may promote NFAT activation (27).
Nonstandardabbreviationsused: BMOcP, BM-derived CD11blo/–CD3e–B220–c-kit+c-fms+ osteoclast precursor; FACS, fluorescence-activated cell sorting; KI, knock-in; LysM-Cre, lysozyme–M-Cre; MROcP, M-CSF– and RANKL-stimulated BMOcP; NFAT, nuclear factor of activated T cells; OPG, osteoprotegerin; poly I:C, polyinosinic-polycytidylic acid; Sh3bp2, SH3-domain binding protein 2; TRAP, tartrate-resistant acid phosphatase.
Conflictofinterest: Laurie H. Glimcher has equity in and is on the corporate board of directors of the Bristol-Myers Squibb Company.
Citationforthisarticle: J. Clin. Invest. 118:3775–3789 (2008). doi:10.1172/JCI35711.
research article
3776 TheJournalofClinicalInvestigation http://www.jci.org Volume 118 Number 11 November 2008
Recently, a mouse model of cherubism was developed (3). These knock-in (KI) mice contain a missense mutation in Sh3bp2, result-ing in a proline to arginine substitution (P416R), the most com-monly identified mutation in cherubism (P418R in humans). Homozygous KI/KI mice exhibit multiorgan inflammation and severe systemic bone loss that is dependent on TNF-α derived from myeloid cells. In mouse models and humans, TNF-α has been implicated in the systemic bone loss associated with inflammatory conditions like RA and postmenopausal estrogen withdrawal states (28). Mutant SH3BP2 enhances TNF-α produc-tion in macrophages and promotes osteoclastogenesis via ERK and spleen tyrosine kinase pathways, respectively (3). Since NFATs can promote both osteoclastogenesis (22) and TNF-α production (29, 30), here we have asked which aspects of the cherubism phe-notype depend on NFATc1?
Using a conditional knockout strategy, we show that genetic abla-tion of Nfatc1 results in osteoclast-poor osteopetrosis. This result complements previous studies (22, 23) and extends the require-ment of NFATc1 to bone remodeling in the growing and adult skeleton. Molecular profiling of highly purified osteoclast precur-sors reveals 2 families of NFATc1-regulated genes in osteoclasts: those that are augmented by NFATc1 and those that absolutely depend on this transcription factor. Remarkably, in the absence of NFATc1, RANKL stimulates the expression of OPG, identify-ing a previously unrecognized function for NFATc1 in this path-way. Last, we show that NFATc1 functions downstream of mutant SH3BP2 and prevents the enhanced osteoclastogenesis and sys-temic bone loss characteristic of “cherubism mice”, which carry a gain-of-function mutation in Sh3bp2 (3). Notably, cherubism mice deficient in NFATc1 still display multiorgan inflammation. Thus, NFATc1 uncouples systemic inflammation from osteopenia in this unique model and may represent a therapeutic target for TNF-α–dependent bone loss.
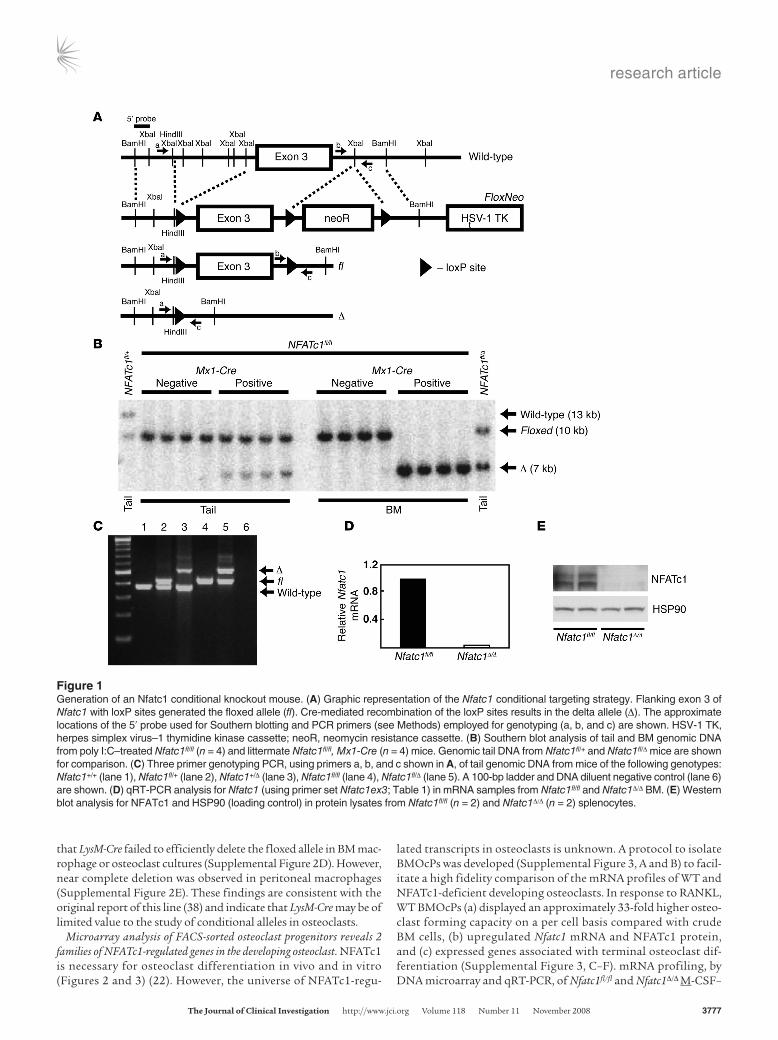
ResultsCreation of an Nfatc1 conditional knockout mouse. To circumvent embryonic lethality (20), the exon encoding the regulatory domain of Nfatc1 (exon 3) was flanked with loxP sites (Nfatc1fl/fl) (Figure 1A) (31). Nfatc1-deficient mice (Nfatc1Δ/Δ) were generated by crossing Nfatc1fl/fl mice with a transgenic line expressing the Cre recombi-nase from a type I interferon inducible promoter (Mx1-Cre) (32). Activation of Mx1-Cre by i.p. injection of polyinosinic-polycytidylic acid (poly I:C) resulted in complete deletion of exon 3 in BM DNA (Figure 1B), a greater than 95% reduction in Nfatc1 mRNA levels in BM (Figure 1D), and markedly diminished NFATc1 protein levels in splenic lysates (Figure 1E).
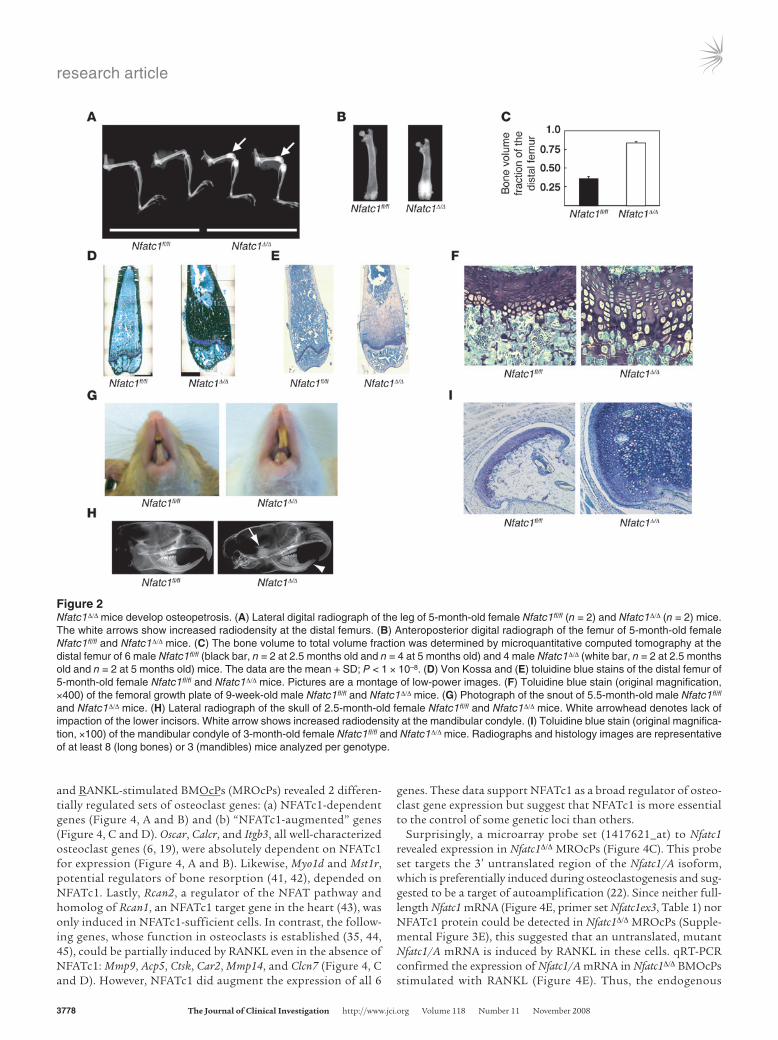
Nfatc1Δ/Δ mice develop osteoclast-poor osteopetrosis. Nfatc1 was ablat-ed in 10-day-old pups to examine its role in the skeleton of grow-ing and adult mice. Compared with littermate controls, Nfatc1Δ/Δ mice displayed (a) short, club-shaped long bones, with higher radiodensity at the distal femur and proximal tibia (Figure 2, A–C, and Supplemental Figure 1A; supplemental material available online with this article; doi:10.1172/JCI35711DS1); (b) a massive increase in Von Kossa and toluidine blue–positive matrix (calcified cartilage) adjacent to the growth plates (Figure 2, D and E); and (c) growth plate dysplasia, characterized by an increase in thickness, acellular areas, and the retention of hypertrophic chondrocytes beyond the chondro-osseous junction (Figure 2, E and F). Other skeletal sites, such as diaphyseal cortical bone and the epiphysis did not display increased bone density (Supplemental Figure 1B
and A.O. Aliprantis, data not shown). Some Nfatc1Δ/Δ mice devel-oped upper incisor overgrowth with short or absent lower incisors (Figure 2G). Lateral radiographs of the skull did not show impac-tion of the lower incisors in the jaw but did reveal widened, hyper-dense mandibular condyles (Figure 2H). Histologically, the man-dibular condyles of Nfatc1fl/fl mice showed a thin cap of articular cartilage overlying a mature neck of compact bone, while those from Nfatc1Δ/Δ mice displayed marked retention of hypertrophic cartilage (Figure 2I). These data suggest that the tooth pheno-type observed in Nfatc1Δ/Δ mice is a consequence of malocclusion from abnormal biomechanical properties at the mandibular con-dyle, though a selective defect in lower incisor growth cannot be excluded. The increased bone density in Nfatc1Δ/Δ mice is not due to augmented osteoblast function because (a) these mice showed a trend toward reduced osteoblast numbers (Supplemental Figure 1, C and D) and (b) Nfatc1fl/fl mice expressing the Cre recombi-nase from the osteoblast-specific osterix promoter (33) did not display a similar high bone mass phenotype (Supplemental Fig-ure 1E). Taken together, Nfatc1Δ/Δ mice display features of severe osteopetrosis, with improperly shaped long bones and a failure to resorb primary spongiosa (calcified cartilage), resulting in aber-rant endochondral growth and ossification (34, 35).
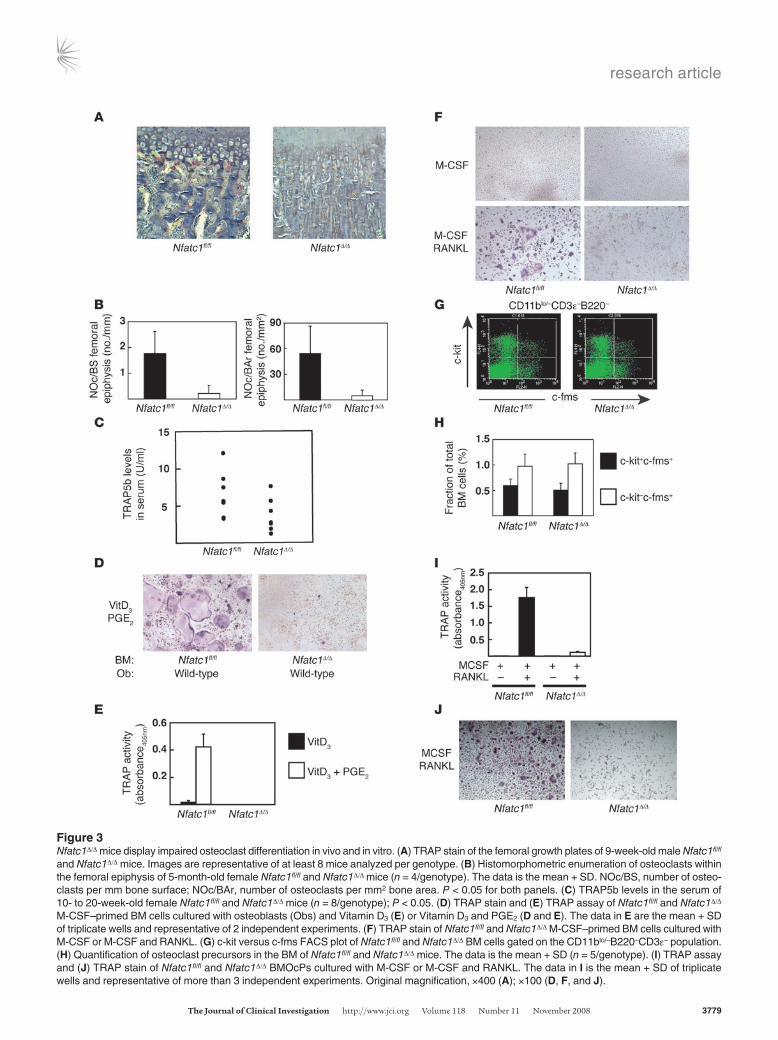
Osteopetrosis results from either a decrease in osteoclast num-bers or a reduction in osteoclast function (6). Therefore osteoclast differentiation was investigated in Nfatc1Δ/Δ mice in vivo and in vitro. Compared with Nfatc1fl/fl littermates, Nfatc1Δ/Δ mice displayed (a) a deficiency in tartrate-resistant acid phosphatase–positive (TRAP-positive) multinucleated cells at the growth plates of the long bones and mandibles (Figure 3A and A.O. Aliprantis, data not shown); (b) reduced osteoclast numbers by histomorphometric analysis (Figure 3B); and (c) decreased TRAP5b levels, a serologic marker of osteoclast function (Figure 3C). Rare TRAP-positive, morphologically normal osteoclasts could be identified in some Nfatc1Δ/Δ mice (Supplemental Figure 1, F and G), consistent with our observation that serum TRAP5b levels were reduced, but not absent, in these mice. Consistent with markedly reduced osteoclast numbers in vivo, BM cells from Nfatc1Δ/Δ mice failed to generate osteoclasts in vitro in response to either osteoblasts (Figure 3, D and E) or M-CSF and RANKL (Figure 3F). To establish that the differentiation defect was due to a failure of osteoclast progeni-tors to differentiate, and not to a lack of progenitors, osteoclast precursors were purified. Within the CD11blo/–CD3e–B220–c-fms+ population in BM are c-kit+ and c-kit– cells, with the former being the most highly osteoclastogenic (36). Similar numbers of each population were found in Nfatc1fl/fl and Nfatc1Δ/Δ BM (Figure 3, G and H). Fluorescence-activated cell sorting–purified (FACS-puri-fied) BM-derived CD11blo/–CD3e–B220–c-kit+c-fms+ osteoclast precursors (BMOcPs) from Nfatc1Δ/Δ mice failed to generate osteo-clasts (Figure 3, I and J). Importantly, M-CSF induced normal macrophage differentiation in Nfatc1Δ/Δ BM cells, as determined by CD11b and F4/80 staining (A.O. Aliprantis, data not shown) (37). In summary, Nfatc1-deficient mice display a progenitor intrinsic defect in osteoclastogenesis.
Nfatc1 deletion using lysozyme–M-Cre does not result in osteopetrosis. Lysozyme–M-Cre (LysM-Cre) (38) has been used to interrogate osteoclast function in mice carrying conditional alleles (39, 40). LysM-Cre mice express the Cre recombinase from a myeloid spe-cific promoter (38). Surprisingly, no alterations in bone density or osteoclast differentiation were observed in Nfatc1fl/Δ, LysM-Cre mice (Supplemental Figure 2, A–C). This result was explained by the fact
research article
TheJournalofClinicalInvestigation http://www.jci.org Volume 118 Number 11 November 2008 3777
that LysM-Cre failed to efficiently delete the floxed allele in BM mac-rophage or osteoclast cultures (Supplemental Figure 2D). However, near complete deletion was observed in peritoneal macrophages (Supplemental Figure 2E). These findings are consistent with the original report of this line (38) and indicate that LysM-Cre may be of limited value to the study of conditional alleles in osteoclasts.
Microarray analysis of FACS-sorted osteoclast progenitors reveals 2 families of NFATc1-regulated genes in the developing osteoclast. NFATc1 is necessary for osteoclast differentiation in vivo and in vitro (Figures 2 and 3) (22). However, the universe of NFATc1-regu-
lated transcripts in osteoclasts is unknown. A protocol to isolate BMOcPs was developed (Supplemental Figure 3, A and B) to facil-itate a high fidelity comparison of the mRNA profiles of WT and NFATc1-deficient developing osteoclasts. In response to RANKL, WT BMOcPs (a) displayed an approximately 33-fold higher osteo-clast forming capacity on a per cell basis compared with crude BM cells, (b) upregulated Nfatc1 mRNA and NFATc1 protein, and (c) expressed genes associated with terminal osteoclast dif-ferentiation (Supplemental Figure 3, C–F). mRNA profiling, by DNA microarray and qRT-PCR, of Nfatc1fl/fl and Nfatc1Δ/Δ M-CSF–
Figure 1Generation of an Nfatc1 conditional knockout mouse. (A) Graphic representation of the Nfatc1 conditional targeting strategy. Flanking exon 3 of Nfatc1 with loxP sites generated the floxed allele (fl). Cre-mediated recombination of the loxP sites results in the delta allele (Δ). The approximate locations of the 5′ probe used for Southern blotting and PCR primers (see Methods) employed for genotyping (a, b, and c) are shown. HSV-1 TK, herpes simplex virus–1 thymidine kinase cassette; neoR, neomycin resistance cassette. (B) Southern blot analysis of tail and BM genomic DNA from poly I:C–treated Nfatc1fl/fl (n = 4) and littermate Nfatc1fl/fl, Mx1-Cre (n = 4) mice. Genomic tail DNA from Nfatc1fl/+ and Nfatc1fl/Δ mice are shown for comparison. (C) Three primer genotyping PCR, using primers a, b, and c shown in A, of tail genomic DNA from mice of the following genotypes: Nfatc1+/+ (lane 1), Nfatc1fl/+ (lane 2), Nfatc1+/Δ (lane 3), Nfatc1fl/fl (lane 4), Nfatc1fl/Δ (lane 5). A 100-bp ladder and DNA diluent negative control (lane 6) are shown. (D) qRT-PCR analysis for Nfatc1 (using primer set Nfatc1ex3; Table 1) in mRNA samples from Nfatc1fl/fl and Nfatc1Δ/Δ BM. (E) Western blot analysis for NFATc1 and HSP90 (loading control) in protein lysates from Nfatc1fl/fl (n = 2) and Nfatc1Δ/Δ (n = 2) splenocytes.
research article
3778 TheJournalofClinicalInvestigation http://www.jci.org Volume 118 Number 11 November 2008
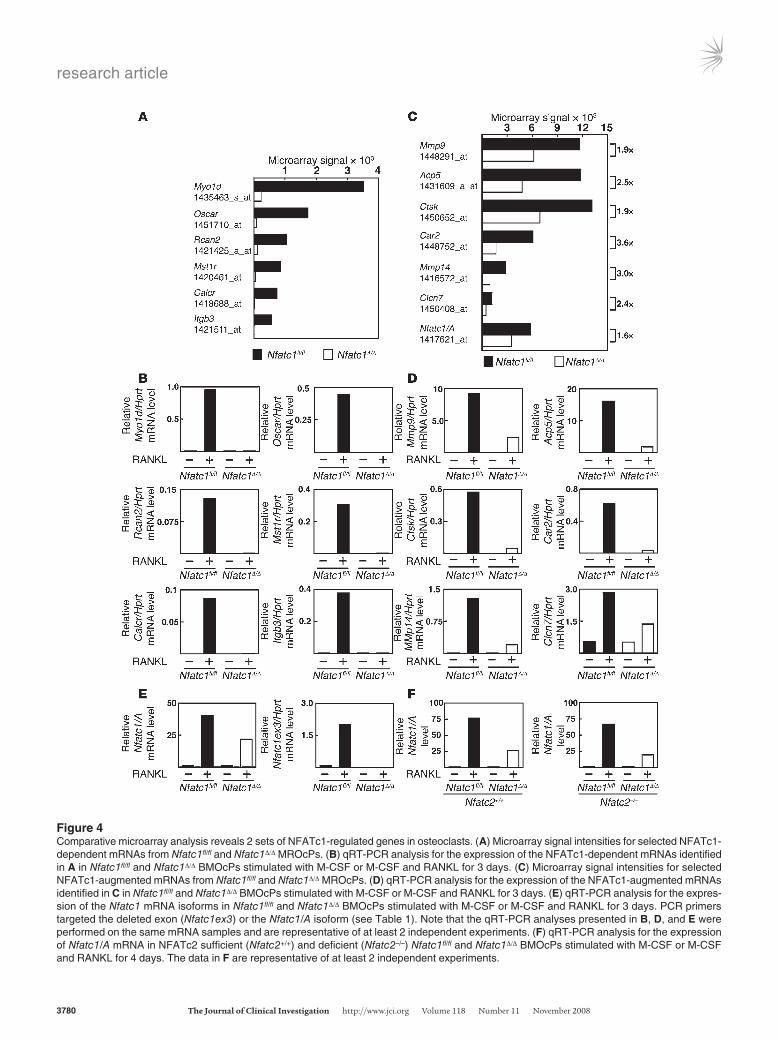
and RANKL-stimulated BMOcPs (MROcPs) revealed 2 differen-tially regulated sets of osteoclast genes: (a) NFATc1-dependent genes (Figure 4, A and B) and (b) “NFATc1-augmented” genes (Figure 4, C and D). Oscar, Calcr, and Itgb3, all well-characterized osteoclast genes (6, 19), were absolutely dependent on NFATc1 for expression (Figure 4, A and B). Likewise, Myo1d and Mst1r, potential regulators of bone resorption (41, 42), depended on NFATc1. Lastly, Rcan2, a regulator of the NFAT pathway and homolog of Rcan1, an NFATc1 target gene in the heart (43), was only induced in NFATc1-sufficient cells. In contrast, the follow-ing genes, whose function in osteoclasts is established (35, 44, 45), could be partially induced by RANKL even in the absence of NFATc1: Mmp9, Acp5, Ctsk, Car2, Mmp14, and Clcn7 (Figure 4, C and D). However, NFATc1 did augment the expression of all 6
genes. These data support NFATc1 as a broad regulator of osteo-clast gene expression but suggest that NFATc1 is more essential to the control of some genetic loci than others.
Surprisingly, a microarray probe set (1417621_at) to Nfatc1 revealed expression in Nfatc1Δ/Δ MROcPs (Figure 4C). This probe set targets the 3′ untranslated region of the Nfatc1/A isoform, which is preferentially induced during osteoclastogenesis and sug-gested to be a target of autoamplification (22). Since neither full-length Nfatc1 mRNA (Figure 4E, primer set Nfatc1ex3, Table 1) nor NFATc1 protein could be detected in Nfatc1Δ/Δ MROcPs (Supple-mental Figure 3E), this suggested that an untranslated, mutant Nfatc1/A mRNA is induced by RANKL in these cells. qRT-PCR confirmed the expression of Nfatc1/A mRNA in Nfatc1Δ/Δ BMOcPs stimulated with RANKL (Figure 4E). Thus, the endogenous
Figure 2Nfatc1Δ/Δ mice develop osteopetrosis. (A) Lateral digital radiograph of the leg of 5-month-old female Nfatc1fl/fl (n = 2) and Nfatc1Δ/Δ (n = 2) mice. The white arrows show increased radiodensity at the distal femurs. (B) Anteroposterior digital radiograph of the femur of 5-month-old female Nfatc1fl/fl and Nfatc1Δ/Δ mice. (C) The bone volume to total volume fraction was determined by microquantitative computed tomography at the distal femur of 6 male Nfatc1fl/fl (black bar, n = 2 at 2.5 months old and n = 4 at 5 months old) and 4 male Nfatc1Δ/Δ (white bar, n = 2 at 2.5 months old and n = 2 at 5 months old) mice. The data are the mean + SD; P < 1 × 10⁻⁸. (D) Von Kossa and (E) toluidine blue stains of the distal femur of 5-month-old female Nfatc1fl/fl and Nfatc1Δ/Δ mice. Pictures are a montage of low-power images. (F) Toluidine blue stain (original magnification, ×400) of the femoral growth plate of 9-week-old male Nfatc1fl/fl and Nfatc1Δ/Δ mice. (G) Photograph of the snout of 5.5-month-old male Nfatc1fl/fl and Nfatc1Δ/Δ mice. (H) Lateral radiograph of the skull of 2.5-month-old female Nfatc1fl/fl and Nfatc1Δ/Δ mice. White arrowhead denotes lack of impaction of the lower incisors. White arrow shows increased radiodensity at the mandibular condyle. (I) Toluidine blue stain (original magnifica-tion, ×100) of the mandibular condyle of 3-month-old female Nfatc1fl/fl and Nfatc1Δ/Δ mice. Radiographs and histology images are representative of at least 8 (long bones) or 3 (mandibles) mice analyzed per genotype.
research article
TheJournalofClinicalInvestigation http://www.jci.org Volume 118 Number 11 November 2008 3779
Figure 3Nfatc1Δ/Δ mice display impaired osteoclast differentiation in vivo and in vitro. (A) TRAP stain of the femoral growth plates of 9-week-old male Nfatc1fl/fl and Nfatc1Δ/Δ mice. Images are representative of at least 8 mice analyzed per genotype. (B) Histomorphometric enumeration of osteoclasts within the femoral epiphysis of 5-month-old female Nfatc1fl/fl and Nfatc1Δ/Δ mice (n = 4/genotype). The data is the mean + SD. NOc/BS, number of osteo-clasts per mm bone surface; NOc/BAr, number of osteoclasts per mm2 bone area. P < 0.05 for both panels. (C) TRAP5b levels in the serum of 10- to 20-week-old female Nfatc1fl/fl and Nfatc1Δ/Δ mice (n = 8/genotype); P < 0.05. (D) TRAP stain and (E) TRAP assay of Nfatc1fl/fl and Nfatc1Δ/Δ M-CSF–primed BM cells cultured with osteoblasts (Obs) and Vitamin D3 (E) or Vitamin D3 and PGE2 (D and E). The data in E are the mean + SD of triplicate wells and representative of 2 independent experiments. (F) TRAP stain of Nfatc1fl/fl and Nfatc1Δ/Δ M-CSF–primed BM cells cultured with M-CSF or M-CSF and RANKL. (G) c-kit versus c-fms FACS plot of Nfatc1fl/fl and Nfatc1Δ/Δ BM cells gated on the CD11blo/–B220–CD3e– population. (H) Quantification of osteoclast precursors in the BM of Nfatc1fl/fl and Nfatc1Δ/Δ mice. The data is the mean + SD (n = 5/genotype). (I) TRAP assay and (J) TRAP stain of Nfatc1fl/fl and Nfatc1Δ/Δ BMOcPs cultured with M-CSF or M-CSF and RANKL. The data in I is the mean + SD of triplicate wells and representative of more than 3 independent experiments. Original magnification, ×400 (A); ×100 (D, F, and J).
research article
3780 TheJournalofClinicalInvestigation http://www.jci.org Volume 118 Number 11 November 2008
Figure 4Comparative microarray analysis reveals 2 sets of NFATc1-regulated genes in osteoclasts. (A) Microarray signal intensities for selected NFATc1-dependent mRNAs from Nfatc1fl/fl and Nfatc1Δ/Δ MROcPs. (B) qRT-PCR analysis for the expression of the NFATc1-dependent mRNAs identified in A in Nfatc1fl/fl and Nfatc1Δ/Δ BMOcPs stimulated with M-CSF or M-CSF and RANKL for 3 days. (C) Microarray signal intensities for selected NFATc1-augmented mRNAs from Nfatc1fl/fl and Nfatc1Δ/Δ MROcPs. (D) qRT-PCR analysis for the expression of the NFATc1-augmented mRNAs identified in C in Nfatc1fl/fl and Nfatc1Δ/Δ BMOcPs stimulated with M-CSF or M-CSF and RANKL for 3 days. (E) qRT-PCR analysis for the expres-sion of the Nfatc1 mRNA isoforms in Nfatc1fl/fl and Nfatc1Δ/Δ BMOcPs stimulated with M-CSF or M-CSF and RANKL for 3 days. PCR primers targeted the deleted exon (Nfatc1ex3) or the Nfatc1/A isoform (see Table 1). Note that the qRT-PCR analyses presented in B, D, and E were performed on the same mRNA samples and are representative of at least 2 independent experiments. (F) qRT-PCR analysis for the expression of Nfatc1/A mRNA in NFATc2 sufficient (Nfatc2+/+) and deficient (Nfatc2–/–) Nfatc1fl/fl and Nfatc1Δ/Δ BMOcPs stimulated with M-CSF or M-CSF and RANKL for 4 days. The data in F are representative of at least 2 independent experiments.
research article
TheJournalofClinicalInvestigation http://www.jci.org Volume 118 Number 11 November 2008 3781
Nfatc1 locus can still be stimulated by RANKL in the absence of NFATc1. However, NFATc1 was necessary for optimal expres-sion, since higher levels of Nfatc1/A mRNA were detected in Nfatc1fl/fl BMOcPs stimulated with RANKL compared with Nfatc1Δ/Δ cells (Figure 4E), consistent with autoamplification (22). Thus, Nfatc1/A is an NFATc1 augmented transcript. Since NFAT family members often display redundant functions (46) and NFATc2 is recruited to the Nfatc1 promoter (22), the induc-tion of Nfatc1/A mRNA by RANKL was investigated in NFATc2-deficient and NFATc1/NFATc2 doubly deficient BMOcPs. WT (Nfatc1fl/flNfatc2+/+) and NFATc2-deficient (Nfatc1fl/flNfatc2–/–) BMOcPs strongly upregulated Nfatc1/A in response to RANKL treatment for 4 days (Figure 4F). Interestingly, the induction of Nfatc1/A mRNA was not further attenuated in doubly deficient (Nfatc1Δ/ΔNfatc2–/–) BMOcPs compared with those lacking NFATc1 alone (Nfatc1Δ/ΔNfatc2+/+) (Figure 4F). These data suggest that NFATc2 does not play a dominant or compensatory role in the induction of Nfatc1/A mRNA during osteoclastogenesis.
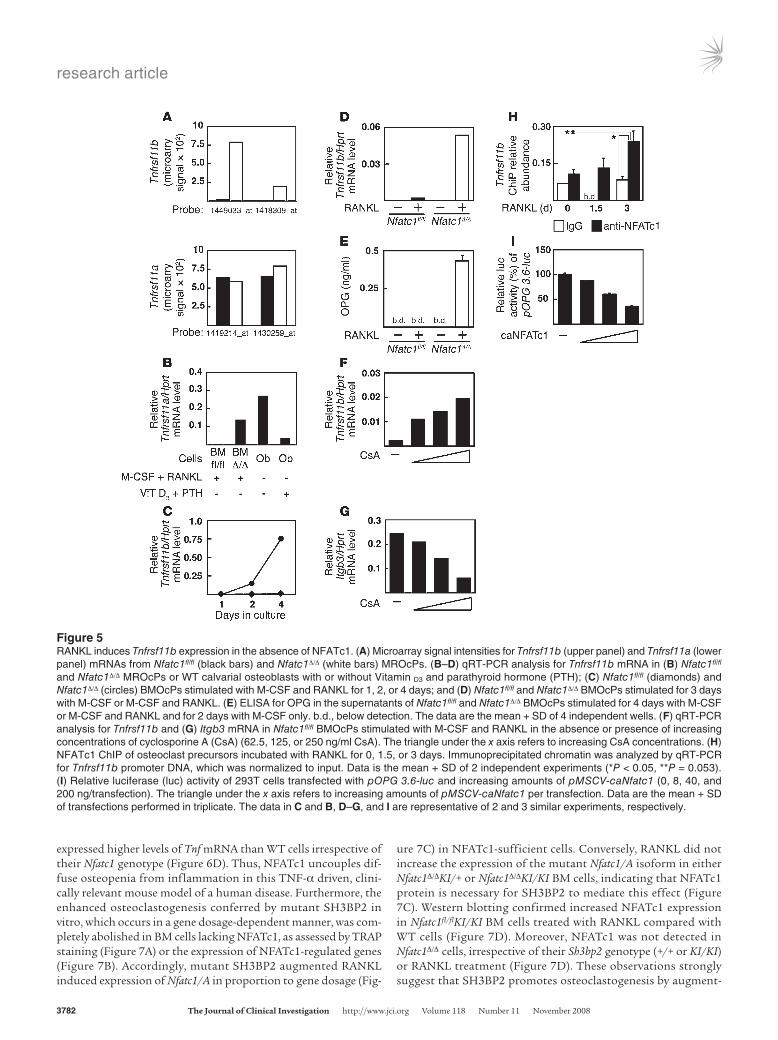
Tnfrsf11b is upregulated in osteoclast precursors in the absence of NFATc1. Although the expression and function of OPG by osteo-blasts has been well studied (47), OPG expression by osteoclast-like cells has only been reported, to our knowledge, in giant cell tumors (24, 48). Remarkably, 2 probe sets showed expression of Tnfrsf11b in Nfatc1Δ/Δ MROcPs but not in Nfatc1fl/fl cells (Figure 5A). In comparison, Tnfrsf11a expression levels were similar (Figure 5A). The expression of Tnfrsf11b mRNA by Nfatc1Δ/Δ MROcPs was similar to levels found in WT osteoblasts (Figure 5B), increased over time in culture (Figure 5C), and was dependent on RANKL, as cells cultured in M-CSF alone did not express Tnfrsf11b (Fig-ure 5D). In addition, OPG was detected in the culture superna-tants of Nfatc1Δ/Δ MROcPs (Figure 5E). Treatment of Nfatc1fl/fl MROcPs with cyclosporine A, an inhibitor of the NFAT activating phosphatase calcineurin (10), reciprocally upregulated Tnfrsf11b and downregulated the NFATc1-dependent gene, Itgb3 (Figure 5, F and G). Despite the dramatic upregulation of Tnfrsf11b mRNA
by Nfatc1Δ/Δ MROcPs, no differ-ences in serum OPG levels were observed between Nfatc1fl/fl and Nfatc1Δ/Δ mice (Supplemental Fig-ure 4). To exclude the possibility that cells of mesenchymal origin (i.e., osteoblasts) were contami-nating our BMOcP preparations from Nfatc1Δ/Δ mice and produc-ing the OPG signal observed in these experiments, osteoclast precursors were derived from spleen cells. Similar to FACS-sorted BMOcPs, Nfatc1Δ/Δ spleen cells both failed to differentiate into osteoclasts and upregulated Tnfrsf11b upon stimulation with RANKL (Supplemental Figure 5, A–D). Interestingly, a putative NFAT binding site was identi-fied in a conserved region of the human TNFRSF11B and mouse Tnfrsf11b promoters, located approximately 2 kb and 3 kb from the transcription start
site (TSS), respectively (Supplemental Figure 6A). After 3 days of RANKL treatment, NFATc1 was recruited to the Tnfrsf11b pro-moter, as determined by a ChIP assay using primers flanking this conserved sequence (Figure 5H and Supplemental Figure 6A). In contrast, NFATc1 binding to the Itgb3 promoter peaked at 1.5 days of RANKL treatment and was almost undetectable by 3 days (Supplemental Figure 6B), consistent with previous observations (18). Lastly, a constitutively active version of NFATc1 (caNFATc1) repressed the basal activity of a Tnfrsf11b reporter plasmid (pOPG 3.6-luc) (Figure 5I). Appropriately, caNFATc1 had little effect on an NF-κb reporter plasmid (pBII-luc) and strongly activated an NFAT luciferase reporter construct (pNFAT-luc) (Supplemental Figure 6, C and D). Taken together, these results uncover a previously unrecognized regulatory loop downstream of RANKL: calcineu-rin/NFATc1-mediated repression of OPG expression.
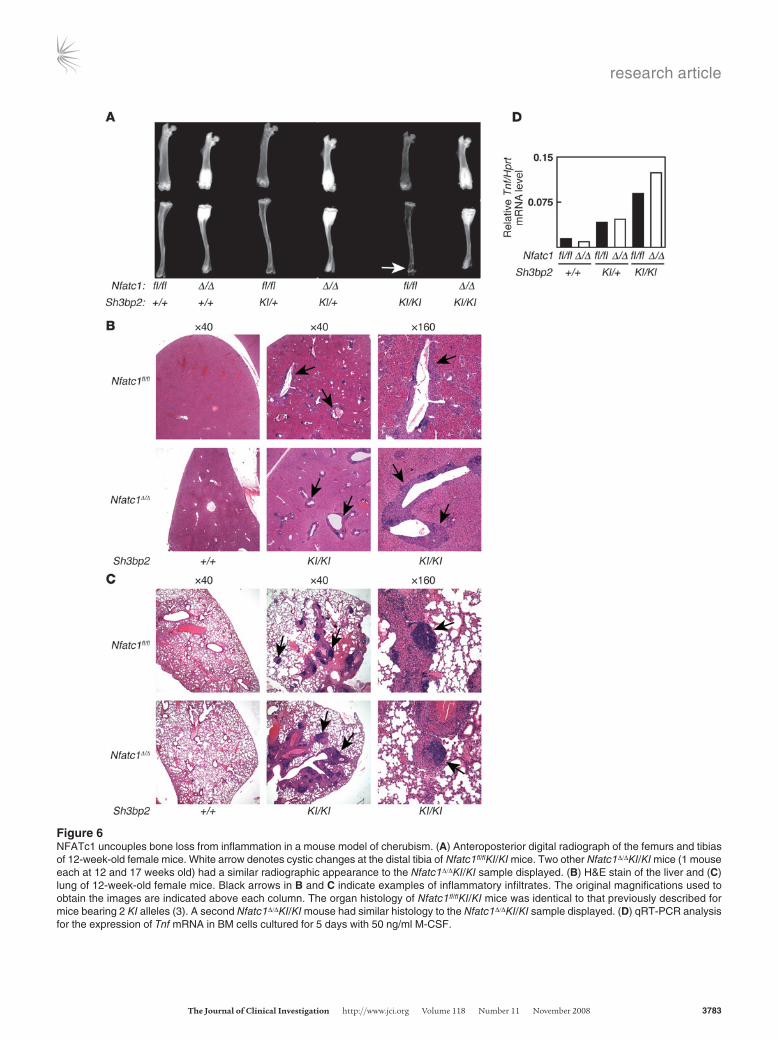
NFATc1 dissociates systemic bone loss and osteoclastogenesis from inflam-mation in cherubism. Our conditional knockout strain represents a unique tool to evaluate the role of NFATc1 in disease. Cherubism is a pediatric, craniofacial, inflammatory disorder, characterized by bone loss in the jaw that is caused by mutations in an adapter mol-ecule SH3BP2 (3, 25). To clarify the role of NFATc1 in cherubism, Mx1-Cre was used to ablate Nfatc1 in mice carrying 1 (KI/+) or 2 (KI/KI) cherubism alleles (3). This approach was taken since the cherubism phenotype is intrinsic to myeloid cells (3) and deletion of Nfatc1fl/fl by Mx1-Cre is complete in the BM (Figure 1, B and D). Deletion of Nfatc1 reversed the diffuse bone loss and focal cystic changes characteristic of cherubism mice (Figure 6A). In contrast, Nfatc1Δ/ΔKI/KI mice still developed widespread inflammation in the liver and lungs (Figure 6, B and C) as well as lymph nodes, spleen, and stomach (A.O. Aliprantis and Y. Ueki, data not shown). The systemic bone loss and inflammatory phenotypes of cherubism mice are dependent on TNF-α derived from myeloid cells, which express abnormally high levels of Tnf mRNA (3). Consistent with our observation that deletion of Nfatc1 had no effect on inflamma-tion in vivo, BM macrophage cultures from KI/+ and KI/KI mice
Table 1qRT-PCR primers used in this study
Primer set Forward primers (5′–3′) Reverse primers (5′–3′)Nfatc1ex3A TGCCTTTTGCGAGCAGTATCT CAGGCAAGGATGGGCTCATATNfatc1/AB GGTAACTCTGTCTTTCTAACCTTAAGCTC GTGATGACCCCAGCATGCACCAGTCACAGItgb3C TCCAGACCCTGGGTACCAAG GCCAATCCGAAGGTTGCTAGCalcrC GCCTCCCCATTTACATCTGC CTCCTCGCCTTCGTTGTTGMyo1dA TCATTCGAACACCCCGTACAC CACGCCACACCTTTTGTAGGAOscarA TCTGCCCCCTATGTGCTATCA AGGAGCCAGAACCTTCGAAACRcan2A CCACTCTGGTCGCCTGTGT CGGAACAGTCCCTCGAATTTTTCCTTAMst1rA TCACCACCAAGTCCGATGTGT AGGTCGAAGGGATCGATATGGTnfrsf11bD (OPG) TGTCCAGATGGGTTCTTCTCA CGTTGTCATGTGTTGCATTTCCMmp9C ACGGACCCGAAGCGGAC GGGATACCCGTCTCCGTGCAcp5C CAGCAGCCCAAAATGCCT TTTTGAGCCAGGACAGCTGACtskC GGGCTCAAGGTTCTGCTGC TGGGTGTCCAGCATTTCCTCCar2D TCCCACCACTGGGGATACAG CTCTTGGACGCAGCTTTATCATAMmp14D AGTGACAGGCAAGGCTGATTT AGGGGTGTAATTCTGAATGCAGClcn7D CGCCAGTCTCATTCTGCACT GCTTCTCGTTGTGTGGAATCTTnfA CATCTTCTCAAAATTCGAGTGACAA TGGGAGTAGACAAGGTACAACCC
ADesigned with the use of Primer Express Software (Applied Biosystems). BPreviously described in ref. 22. CSequences were a kind gift from K. McHugh, Harvard Medical School. DThe Center for Comparative and Integrative Biology Primer Bank, Harvard Medical School (78). Primerbank IDs 31543882a3 (Tnfrsf11b), 31981657a1 (Car2), 31982191a2 (Mmp14), and 6753436a1 (Clcn7).
research article
3782 TheJournalofClinicalInvestigation http://www.jci.org Volume 118 Number 11 November 2008
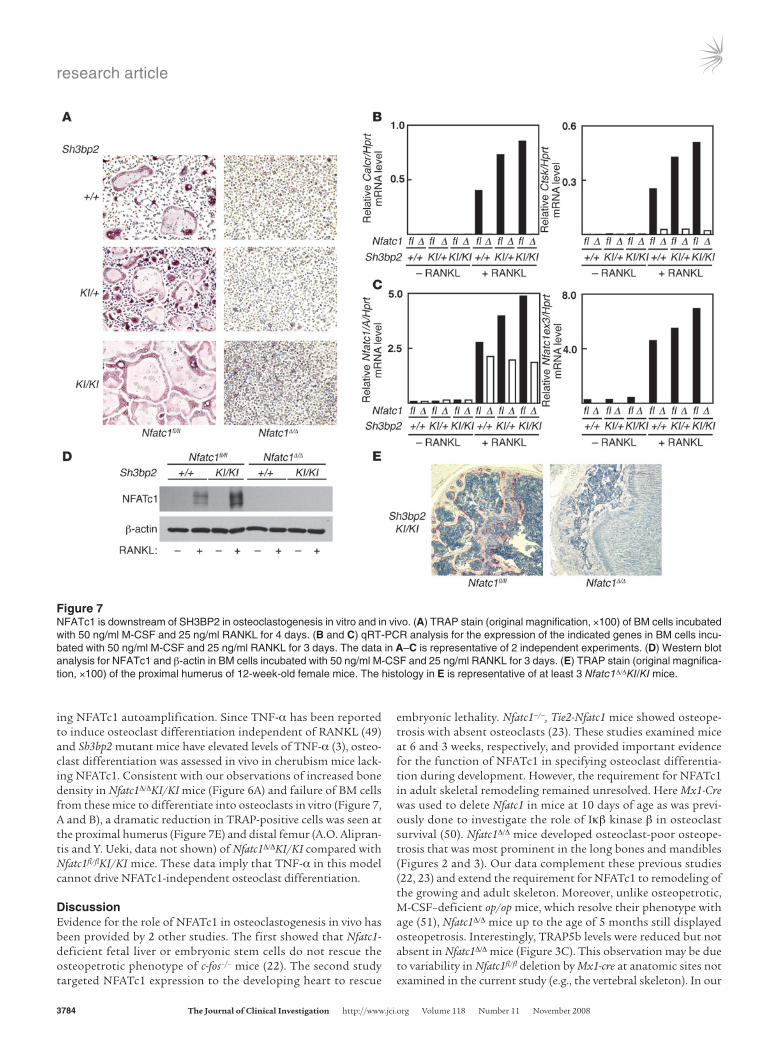
expressed higher levels of Tnf mRNA than WT cells irrespective of their Nfatc1 genotype (Figure 6D). Thus, NFATc1 uncouples dif-fuse osteopenia from inflammation in this TNF-α driven, clini-cally relevant mouse model of a human disease. Furthermore, the enhanced osteoclastogenesis conferred by mutant SH3BP2 in vitro, which occurs in a gene dosage-dependent manner, was com-pletely abolished in BM cells lacking NFATc1, as assessed by TRAP staining (Figure 7A) or the expression of NFATc1-regulated genes (Figure 7B). Accordingly, mutant SH3BP2 augmented RANKL induced expression of Nfatc1/A in proportion to gene dosage (Fig-
ure 7C) in NFATc1-sufficient cells. Conversely, RANKL did not increase the expression of the mutant Nfatc1/A isoform in either Nfatc1Δ/ΔKI/+ or Nfatc1Δ/ΔKI/KI BM cells, indicating that NFATc1 protein is necessary for SH3BP2 to mediate this effect (Figure 7C). Western blotting confirmed increased NFATc1 expression in Nfatc1fl/flKI/KI BM cells treated with RANKL compared with WT cells (Figure 7D). Moreover, NFATc1 was not detected in Nfatc1Δ/Δ cells, irrespective of their Sh3bp2 genotype (+/+ or KI/KI) or RANKL treatment (Figure 7D). These observations strongly suggest that SH3BP2 promotes osteoclastogenesis by augment-
Figure 5RANKL induces Tnfrsf11b expression in the absence of NFATc1. (A) Microarray signal intensities for Tnfrsf11b (upper panel) and Tnfrsf11a (lower panel) mRNAs from Nfatc1fl/fl (black bars) and Nfatc1Δ/Δ (white bars) MROcPs. (B–D) qRT-PCR analysis for Tnfrsf11b mRNA in (B) Nfatc1fl/fl and Nfatc1Δ/Δ MROcPs or WT calvarial osteoblasts with or without Vitamin D3 and parathyroid hormone (PTH); (C) Nfatc1fl/fl (diamonds) and Nfatc1Δ/Δ (circles) BMOcPs stimulated with M-CSF and RANKL for 1, 2, or 4 days; and (D) Nfatc1fl/fl and Nfatc1Δ/Δ BMOcPs stimulated for 3 days with M-CSF or M-CSF and RANKL. (E) ELISA for OPG in the supernatants of Nfatc1fl/fl and Nfatc1Δ/Δ BMOcPs stimulated for 4 days with M-CSF or M-CSF and RANKL and for 2 days with M-CSF only. b.d., below detection. The data are the mean + SD of 4 independent wells. (F) qRT-PCR analysis for Tnfrsf11b and (G) Itgb3 mRNA in Nfatc1fl/fl BMOcPs stimulated with M-CSF and RANKL in the absence or presence of increasing concentrations of cyclosporine A (CsA) (62.5, 125, or 250 ng/ml CsA). The triangle under the x axis refers to increasing CsA concentrations. (H) NFATc1 ChIP of osteoclast precursors incubated with RANKL for 0, 1.5, or 3 days. Immunoprecipitated chromatin was analyzed by qRT-PCR for Tnfrsf11b promoter DNA, which was normalized to input. Data is the mean + SD of 2 independent experiments (*P < 0.05, **P = 0.053). (I) Relative luciferase (luc) activity of 293T cells transfected with pOPG 3.6-luc and increasing amounts of pMSCV-caNfatc1 (0, 8, 40, and 200 ng/transfection). The triangle under the x axis refers to increasing amounts of pMSCV-caNfatc1 per transfection. Data are the mean + SD of transfections performed in triplicate. The data in C and B, D–G, and I are representative of 2 and 3 similar experiments, respectively.
research article
TheJournalofClinicalInvestigation http://www.jci.org Volume 118 Number 11 November 2008 3783
Figure 6NFATc1 uncouples bone loss from inflammation in a mouse model of cherubism. (A) Anteroposterior digital radiograph of the femurs and tibias of 12-week-old female mice. White arrow denotes cystic changes at the distal tibia of Nfatc1fl/flKI/KI mice. Two other Nfatc1Δ/ΔKI/KI mice (1 mouse each at 12 and 17 weeks old) had a similar radiographic appearance to the Nfatc1Δ/ΔKI/KI sample displayed. (B) H&E stain of the liver and (C) lung of 12-week-old female mice. Black arrows in B and C indicate examples of inflammatory infiltrates. The original magnifications used to obtain the images are indicated above each column. The organ histology of Nfatc1fl/flKI/KI mice was identical to that previously described for mice bearing 2 KI alleles (3). A second Nfatc1Δ/ΔKI/KI mouse had similar histology to the Nfatc1Δ/ΔKI/KI sample displayed. (D) qRT-PCR analysis for the expression of Tnf mRNA in BM cells cultured for 5 days with 50 ng/ml M-CSF.
research article
3784 TheJournalofClinicalInvestigation http://www.jci.org Volume 118 Number 11 November 2008
ing NFATc1 autoamplification. Since TNF-α has been reported to induce osteoclast differentiation independent of RANKL (49) and Sh3bp2 mutant mice have elevated levels of TNF-α (3), osteo-clast differentiation was assessed in vivo in cherubism mice lack-ing NFATc1. Consistent with our observations of increased bone density in Nfatc1Δ/ΔKI/KI mice (Figure 6A) and failure of BM cells from these mice to differentiate into osteoclasts in vitro (Figure 7, A and B), a dramatic reduction in TRAP-positive cells was seen at the proximal humerus (Figure 7E) and distal femur (A.O. Alipran-tis and Y. Ueki, data not shown) of Nfatc1Δ/ΔKI/KI compared with Nfatc1fl/flKI/KI mice. These data imply that TNF-α in this model cannot drive NFATc1-independent osteoclast differentiation.
DiscussionEvidence for the role of NFATc1 in osteoclastogenesis in vivo has been provided by 2 other studies. The first showed that Nfatc1-deficient fetal liver or embryonic stem cells do not rescue the osteopetrotic phenotype of c-fos–/– mice (22). The second study targeted NFATc1 expression to the developing heart to rescue
embryonic lethality. Nfatc1–/–, Tie2-Nfatc1 mice showed osteope-trosis with absent osteoclasts (23). These studies examined mice at 6 and 3 weeks, respectively, and provided important evidence for the function of NFATc1 in specifying osteoclast differentia-tion during development. However, the requirement for NFATc1 in adult skeletal remodeling remained unresolved. Here Mx1-Cre was used to delete Nfatc1 in mice at 10 days of age as was previ-ously done to investigate the role of Iκβ kinase β in osteoclast survival (50). Nfatc1Δ/Δ mice developed osteoclast-poor osteope-trosis that was most prominent in the long bones and mandibles (Figures 2 and 3). Our data complement these previous studies (22, 23) and extend the requirement for NFATc1 to remodeling of the growing and adult skeleton. Moreover, unlike osteopetrotic, M-CSF–deficient op/op mice, which resolve their phenotype with age (51), Nfatc1Δ/Δ mice up to the age of 5 months still displayed osteopetrosis. Interestingly, TRAP5b levels were reduced but not absent in Nfatc1Δ/Δ mice (Figure 3C). This observation may be due to variability in Nfatc1fl/fl deletion by Mx1-cre at anatomic sites not examined in the current study (e.g., the vertebral skeleton). In our
Figure 7NFATc1 is downstream of SH3BP2 in osteoclastogenesis in vitro and in vivo. (A) TRAP stain (original magnification, ×100) of BM cells incubated with 50 ng/ml M-CSF and 25 ng/ml RANKL for 4 days. (B and C) qRT-PCR analysis for the expression of the indicated genes in BM cells incu-bated with 50 ng/ml M-CSF and 25 ng/ml RANKL for 3 days. The data in A–C is representative of 2 independent experiments. (D) Western blot analysis for NFATc1 and β-actin in BM cells incubated with 50 ng/ml M-CSF and 25 ng/ml RANKL for 3 days. (E) TRAP stain (original magnifica-tion, ×100) of the proximal humerus of 12-week-old female mice. The histology in E is representative of at least 3 Nfatc1Δ/ΔKI/KI mice.
research article
TheJournalofClinicalInvestigation http://www.jci.org Volume 118 Number 11 November 2008 3785
experience, within the bone marrow of long bones, Mx1-cre–medi-ated deletion of Nfatc1fl/fl was nearly complete at the level of DNA recombination or mRNA expression (Figure 1, B and D).
NFATc1 binds the promoters of many osteoclast-specific genes, including Nfatc1 itself (13–19, 22). However, a source of NFATc1-deficient osteoclast progenitors from mouse BM was not avail-able prior to this study. Therefore, the relative contribution of NFATc1 to the expression of the osteoclast transcriptome could not be determined using loss of function experiments. To facilitate this analysis, a strategy to isolate a pure population of BMOcPs was devised (Supplemental Figure 3). Transcriptional profiling revealed NFATc1 as a broad regulator of osteoclast gene expres-sion (Figure 4). Two sets of NFATc1-regulated genes were identi-fied: those that are augmented by NFATc1 (Figure 4, C and D) but still induced to some extent by RANKL in NFATc1-deficient cells and those that absolutely depend on NFATc1 for expression (Fig-ure 4, A and B). The temporal recruitment of NFATc1 to different genetic loci may underlie this observation. Recently, ChIP analyses have demonstrated that NFATc1 binds the Itgb3, Oscar, Acp5, and Ctsk promoters during osteoclastogenesis (16–18, 52). Interest-ingly, whereas NFATc1 was recruited to the Itgb3 and Oscar pro-moters (NFATc1-dependent genes) within 12–48 hours of RANKL stimulation (17, 18, 52), NFATc1 was only detected at the Acp5 and Ctsk promoters (NFATc1-augmented genes) at day 5 after RANKL stimulation (16). The fact that we see differences in expression of Acp5 and Ctsk at day 3 (Figure 4D) between NFATc1-sufficient and -deficient cells is likely due to our use of highly osteoclasto-genic BMOcPs. We hypothesize that NFATc1-dependent genes need early NFATc1 recruitment to initiate transcription, whereas NFATc1-augmented genes employ NFATc1 at later time points to effect optimal expression. Other possible reasons these 2 sets of genes differentially require NFATc1 include compensatory use of other osteoclast transcription factors, like AP-1, c-Fos, Pu.1, and Mitf (19, 53), and indirect effects of NFATc1 deficiency.
The most intriguing finding from our profiling experiments was the dramatic upregulation of Tnfrsf11b mRNA and protein by RANKL in NFATc1-deficient BMOcPs (Figure 5). OPG, a decoy receptor for RANKL, is a potent negative regulator of osteoclas-togenesis. Hence, OPG-deficient mice are osteoporotic (54) while OPG transgenic mice, like RANK knockout mice, display increased bone mass (7, 55). Osteoblasts are thought to be the physiolog-ic source of OPG in the skeleton (47). However, contaminat-ing osteoblasts are very unlikely to be the source of OPG in our experiments, since a pure population of BMOcPs, isolated by flow cytometry, was used. Moreover, osteoclast precursors derived from Nfatc1Δ/Δ spleen cells also upregulated Tnfrsf11b mRNA in response to RANKL. Although, the physiologic significance of our obser-vation is presently unknown, we suggest that NFATc1 dampens the induction of OPG that occurs as a consequence of signaling pathways shared by RANK and other TNF receptor family mem-bers. The RANKL/RANK/OPG axis has a well-described role out-side of the skeleton in regulating adaptive immune responses (9). In human B cells and dendritic cells, CD40 ligation induces OPG expression (56, 57). CD40, like RANK, is a member of the TNF receptor superfamily. Both receptors utilize TNF receptor-associ-ated factor 6 as a proximal signaling component (58, 59). However, RANK is unique in its ability to promote calcium oscillations and upregulate NFATc1 (59). Consistent with these observations, WT BMOcPs stimulated with RANKL in the presence of cyclosporine A, which blocks calcium-mediated activation of the calcineurin/
NFAT pathway, express more Tnfrsf11b mRNA (Figure 5F). Fur-thermore, it is likely that NFATc1 directly, negatively regulates the Tnfrsf11b promoter (Figure 5, H and I), which is similar to the observation in previous reports that NFAT family members repress Cdk4 expression (12, 60). Taken together, these observations sug-gest that suppression of OPG expression downstream of RANKL is a previously unrecognized function of NFATc1 in osteoclastogen-esis. Interestingly, giant cell tumors of bone, which contain multi-nucleated giant cells with features of osteoclasts, have been shown to express OPG (24, 48). This intriguing clinical correlate suggests that dysregulation of OPG expression by cells of the osteoclast lin-eage may occur in pathologic conditions.
Our Nfatc1 conditional knockout mouse provides a genetic sys-tem to study the role of this transcription factor in disease. Here, a mouse model of the human disorder, cherubism, was investigated. Cherubism mice carry a gain-of-function mutation in Sh3bp2 and develop systemic inflammation and bone loss due to overproduc-tion of TNF-α by myeloid cells (3). NFATc1-deficient mice homo-zygous for the cherubism mutation still developed inflammation in multiple organs (Figure 6, B and C). In addition, macrophages grown from the BM of Nfatc1Δ/ΔKI/KI mice had similarly elevated levels of Tnf transcripts compared with their NFATc1-sufficient counterparts (Figure 6D). These results indicate that NFATc1 is not downstream of SH3BP2 for TNF-α production and are con-sistent with a recent report that NFATc1 does not promote TNF-α expression in T cells (30). However, the inflammatory pheno-type of cherubism may depend on other NFAT family members, like NFATc2 (30, 61, 62). Genetic ablation of Nfatc1 did protect cherubism mice from systemic bone loss (Figure 6A) and com-pletely abrogated the enhanced osteoclastogenesis observed in vitro in BM cells carrying mutant alleles of Sh3bp2 (Figure 7, A and B). Mutant Sh3bp2 cells also displayed increased induction of the Nfatc1/A isoform by RANKL in a manner proportional to gene dosage. This effect was not observed in NFATc1-deficient cells (Figure 7C). Taken together, these observations situate SH3BP2 upstream of NFATc1 in osteoclastogenesis, likely within the NFATc1 autoamplification loop. Cherubism mice also develop TNF-α–dependent arthritis with cortical erosions (3). Whether NFATc1 deficiency will protect from local bone loss around inflamed joints, as has been described for osteoclast-deficient mice in other arthritis models (63, 64), is under investigation.
In conclusion, this study reveals that NFATc1 is an important regulator of osteoclastogenesis in growing and adult mice con-sistent with previous reports exploring its function in embryonic and early postnatal development (22, 23). NFATc1 deficiency also protects from systemic bone loss in a mouse model of the human disease, cherubism, without inhibiting the inflammatory aspects of the disease. A gene profiling approach revealed that most genes classically associated with terminal osteoclast differentiation require NFATc1 for expression. Intriguingly, we found that RANKL promoted a dramatic induction of OPG in NFATc1-deficient cells. We propose that pharmacologic perturbation of the NFAT path-way in osteoclast precursors may transform these cells into potent OPG producers, which could inhibit resorption in the bone micro-environment and lead to novel treatments for osteolysis.
MethodsCreation of an Nfatc1 conditional knockout allele. A targeting vector contain-ing exon 3 of Nfatc1 and a neomycin resistance cassette, both flanked by loxP sites, was generated (Figure 1A) using lambda phage murine Nfatc1
research article
3786 TheJournalofClinicalInvestigation http://www.jci.org Volume 118 Number 11 November 2008
DNA kindly provided by Edgar Serfling and Eriks Jankevics of the Univer-sity of Wuerzburg, Wuerzburg, Germany. As indicated in Figure 1, 3 kb of DNA were deleted upstream of exon 3 in crafting the targeting construct. C57BL/6 ES cells were transfected with the linearized targeting construct (clone 3D5) and antibiotic selected to obtain stable clones, whose integra-tion site was confirmed by Southern blotting. Targeted ES cells were inject-ed into blastocysts to achieve initial germ-line transmission (Nfatc1floxNeo). Nfatc1floxNeo/+ mice were crossed onto transgenic EIIA-Cre mice (65) (The Jackson Laboratory), and progeny were selected by Southern blotting for selective loss of the neomycin resistance cassette to finally generate Nfatc1fl/+ mice, which were intercrossed with other lines used in this study.
Mice. The following genetically engineered mice have been previously described: Nfatc2–/– (gift of Anjana Rao, Harvard University) (66), Mx1-Cre (The Jackson Laboratory) (32), LysM-Cre (gift of Ira Tabas, Columbia Uni-versity, New York, New York, USA) (38), and Osterix-Cre (gift of Andrew McMahon, Harvard University) (33). Cherubism mice bearing a mutation in Sh3bp2 were described (3). In all experiments where histology or imag-ing is reported, Nfatc1fl/fl, Mx1-Cre mice were injected i.p. with 0.25 ml of 1 mg/ml poly I:C (Amersham Biosciences) in PBS every other day start-ing at postnatal day 10 for a total of 3 doses to generate Nfatc1Δ/Δ mice. Littermates without the Mx1-Cre transgene were identically treated with poly I:C and served as NFATc1-sufficient (Nfatc1fl/fl) controls. In some experiments, in which BMOcPs were isolated for cell culture, mice were treated with poly I:C between 6 and 8 weeks of age. In all experiments, lit-termates were used as controls except in the cherubism studies where mice had been backcrossed 6 generations onto the C57BL/6 background. This allowed us to generate mice with the 6 relevant genotypes from parallel breeding pairs. A pathogen-free facility at the Harvard School of Public Health housed all the mice in this report. Experimental protocols were reviewed and approved by the Standing Committee on Animals at the Harvard Medical School and were designed in accordance with institu-tional and NIH guidelines for the humane use of animals.
Southern blotting of genomic DNA and PCR genotyping of Nfatc1 conditional knockout mice. Five micrograms of genomic DNA was digested with BamHI (NE Biolabs), resolved by agarose gel electrophoresis, transferred to a Gene Screen membrane (Perkin-Elmer), and crosslinked and hybrid-ized with a radiolabeled BamHI/XbaI (NE Biolabs) 5′ probe. Mice were genotyped using the following 3 PCR primers, which discriminate the wild-type, floxed, and Δ Nfatc1 alleles (Figure 1, A and C): INT2-S5, 5′-AAGGAATTACTGGGAAGCCTGGCA-3′ (primer a, Figure 1A); INT3-S2, 5′-AGGGACTATCATTTGGCAGGGACA-3′ (primer b, Figure 1A); and INT3-AS2, 5′-ACAGGAAACAGCTCTGTTCCACAC-3′ (primer c, Figure 1A). An annealing temperature of 66°C was used.
SDS-PAGE and Western blotting. A single-cell suspension was prepared from spleens incubated for 1 hour with collagenase as described previously (67). Splenocytes were washed with PBS and lysed with RIPA buffer (20 mM Tris, pH 8.0, 150 mM NaCl, 0.1% SDS, 0.5% NaDeoxycholate, 1% Triton X-100) plus protease (Roche) and phosphatase inhibitors. Protein concentrations were determined by the DC protein assay (Bio-Rad). Fifty micrograms of protein per sample were resolved by SDS-PAGE and analyzed by Western blotting using anti-NFATc1 (mAb 7A6; BD Biosciences — Pharmingen) and rabbit anti-mouse HSP90 (Santa Cruz Biotechnology Inc.) antibodies along with the appropriate HRP-conjugated secondary reagents.
RNA extraction and real-time PCR. Total RNA was extracted using either RNeasy kits (Qiagen) or TRIzol (Invitrogen) and solubilized in RNAase-free water. cDNA was synthesized using either kits from Stratagene or Bio-Rad. qRT-PCR reactions were performed using the SYBR Green PCR Master Mix (Applied Biosystems) or the Brilliant II SYBR Green QPCR Master Mix (Stratagene) in a PRISM 7700 system (Applied Biosystems) or Mx3005P QPCR System (Stratagene). Ct values for duplicate samples
were averaged and the amounts of mRNA relative to Hprt were calcu-lated using the ΔCt method. qRT-PCR primers used in this study are reported in Table 1. All qRT-PCR reactions yielded products with single peak dissociation curves.
Histology and histomorphometry. The Musculoskeletal Biology group at the Indiana University School of Medicine performed all histology except for the mandible and cherubism studies. Briefly, formalin-fixed tissues were embedded in methyl methacrylate without decalcification, sectioned with a tungsten-carbide knife, and stained with either (a) Von Kossa/MacNeal tetrachrome, (b) a TRAP protocol counterstained with Gill’s Hematoxylin no. 3 (68), or (c) toluidine-blue. Cellular histomorphometry measurements were made in the femoral epiphysis using a ×40 objective, within 0.25 mm of the cortical surface and growth plate throughout, using a semiautomat-ic analysis system (Bioquant OSTEO 7.20.10; Bioquant Image Analysis Co.) attached to a Nikon Optiphot 2 microscope (Nikon). The epiphysis was chosen as the site to report cellular histomorphometry, since the param-eters to which cell numbers are normalized to were similar in the epiphysis of Nfatc1fl/fl and Nfatc1Δ/Δ mice. A trend toward reduced osteoclast numbers was also observed in the metaphysis of Nfatc1Δ/Δ mice. For the analysis of mandibles, formaldehyde-fixed skulls were decalcified for 4.5 days in 10% EDTA, embedded in paraffin, and sectioned starting behind the ear at an angle parallel to the mandibular ramus. Sections were stained with tolu-idine-blue or for TRAP (69). Histologic analyses for the cherubism studies were performed as described (3).
Radiography and microquantitative computed tomography. Plain radiographs were taken on a HP Faxitron 43855A (skulls) or a Faxitron Mx-20 (long bones). Distal femoral bone volume fraction was assessed with microquanti-tative computed tomography. Femora were immersed in saline and scanned (μCT-40; Scanco Medical) with the following settings 70 kV, 114 μA, and 0.012 mm isotropic voxels. After reconstruction, the bone volume frac-tion was determined by calculating the ratio of bone voxels to total voxels in the volume of interest, which included both cortical and trabecular bone compartments, since the distal femur of NFATc1Δ/Δ mice was too dense to separate these compartments (70).
Purification of highly enriched BMOcPs. A scheme of the protocol is shown in Supplemental Figure 3A. Briefly, a single-cell suspension of mouse BM cells was incubated for 20 minutes at 5 × 10⁷ per ml with anti-CD117 (c-kit)-APC (1 μl per 107 cells) at 4°C in αMEM-10 (αMEM [Cellgro] supplemented with 10% FCS, 1× penicillin/streptomycin). Cells were washed twice with ice-cold PBS plus 0.5% BSA and 2 mM EDTA (MACS buffer) and incubated with anti-APC microbeads (Miltenyi Biotec) (2 μl per 107 cells) for 20 min-utes at 4°C. After 2 washes with ice-cold MACS buffer, CD117+ cells were positively selected on a MACS LS column (Miltenyi Biotec). The CD117 enriched fraction was stained with labeled antibodies (anti-B220–FITC, anti–CD3e-Alexa Fluor 488, anti-CD115(c-fms)-biotin/streptavidin–PE, anti-CD11b-PerCP–Cy5.5, and anti-CD117–APC). Cells were sorted at the Harvard Medical School Center for Neurologic Diseases Cell Sorting Facil-ity on a FACS Aria II sorter. All conjugated antibodies were from Becton Dickinson except anti–CD115-biotin, which was from eBioscience. For the quantification of CD11blo/–CD3e–B220–c-fms+c-kit+ and CD11blo/–CD3e–
B220–c-fms+c-kit– osteoclast progenitors, BM cells were stained with an identical cocktail of antibodies and analyzed by flow cytometry.
Macrophage, osteoclast, and osteoblast cultures. Cell culture experiments were performed in αMEM-10 (Cellgro) at 37°C with 5% CO2. Four populations of osteoclast progenitors were used: (a) BM cells cultured overnight with M-CSF and purified over a Histopaque 1083 (Sigma-Aldrich) gradient (71), used at an initial density of 1 × 10⁵ cells per well in 96-well plates; (b) highly enriched BMOcPs used at an initial density of 2,500 cells per well in 96-well plates for TRAP assays or at 20,000 cells per well in 24-well plates for RNA isolation; (c) crude BM cells for the cherubism studies as described (3); or (d)
research article
TheJournalofClinicalInvestigation http://www.jci.org Volume 118 Number 11 November 2008 3787
spleen cells incubated with M-CSF for 3 days. M-CSF (R&D Systems) and RANKL (RANKL/TRANCE was a kind gift from Y. Choi, University of Penn-sylvania, Philadelphia, Pennsylvania, USA) were used at final concentrations of 20 ng/ml and 200–300 ng/ml, respectively. For the cherubism studies, M-CSF and RANKL were purchased from Peprotech and were used at the concentrations indicated in the figure legends. For coculture experiments, neonatal calvarial osteoblasts were purified from BALB/c mice as described (72) and plated at a density of 6,000 cells per well in 96-well plates. After an overnight incubation, 1 × 10⁵ M-CSF–primed BM cells, 10 nM Vitamin D3 (Sigma-Aldrich), and 10 μM PGE2 (Calbiochem) were added. Biochemical assays for TRAP secreted into the culture supernatant (73) or staining of cellular TRAP (using either a commercially available kit [Sigma-Aldrich] or as previously described in ref. 69) were performed after 4 or 5 days (recom-binant cytokines) or after 8 days (coculture). Where indicated, osteoblasts were treated for 2 hours with 10 nM Vitamin D3 (Sigma-Aldrich) and 10 nM parathyroid hormone (Sigma-Aldrich). To generate samples for Southern blot, peritoneal macrophages were collected 3–4 days after i.p. injection of 40 μg of Concanavalin A (Sigma-Aldrich) as described previously (74).
DNA microarray analysis of MROcPs. Independently prepared duplicate samples containing pooled cells from multiple mice for each genotype were analyzed. Briefly, CD11blo/–CD3e–B220–c-kit+c-fms+ BMOcPs from 8- to 13-week-old Nfatc1Δ/Δ and Nfatc1fl/fl littermate controls (n = 4/genotype, rep-licate 1 and n = 3/genotype, replicate 2; respectively) were incubated at an initial density of 20,000 per well in 24-well plates, with 1.2 ml αMEM-10 supplemented with M-CSF and RANKL. After 3 days of culture, mRNA was purified (RNeasy; Qiagen) and RNA profiling was performed by the microarray facility at the Harvard Medical School and Partners Center for Genetics and Genomics using the Affymetrix mouse 430A 2.0 array, which contains probes for approximately 14,000 well-characterized mouse genes. Data for all 4 samples were scaled to 500 and replicate samples were aver-aged for reporting in Figure 4. A gene was classified as “NFATc1 augment-ed” if (a) the expression level of that gene was higher in Nfatc1fl/fl samples compared with Nfatc1Δ/Δ samples and (b) a “present” detection call was des-ignated in both samples for the probe set recognizing that gene. “NFATc1 dependent” genes had an “absent” detection call for either one or both of the Nfatc1Δ/Δ samples and were “present” at higher expression levels in Nfatc1fl/fl samples. A similar experimental design was used to generate independent RNA samples for validation of the microarray results by qRT-PCR.
In silico analysis of the Tnfrsf11b promoter and NFATc1 ChIP assay. The mouse and human genomic sequences 3.6 kb upstream of the Tnfrsf11b gene were extracted from Ensembl database (www.ensembl.org). Z picture and rVista options in ECR browser (75) were used to identify and align regions of high conservation and putative NFATc1 binding sites in this region, respectively. ChIP assays were performed as described previously (16). Briefly, WT M-CSF–primed spleen cells were incubated with RANKL and immunoprecipitation was carried out on precleared, sheared soluble chro-matin with anti-NFATc1 (Santa Cruz Biotechnology Inc.) or nonspecific IgG overnight at 4°C. Immune complexes were isolated using Protein G agarose, washed, decrosslinked, and purified as described previously (16). ChIP samples were analyzed by qRT-PCR for the Tnfrsf11b promoter using the FastStart TaqMan Master kit (Roche) and the universal probe library (Roche Diagnostics) with the following primers: 5′-TTAGGGAATACCT-CAGGAAAATACA-3′ (forward) and 5′-TTGTAGGAGCACGAGGTGAA-3′ (reverse). Analysis for the Itgb3 promoter was performed as described (18). The signal for the promoter being studied was adjusted using input threshold values as a reference and is reported as relative enrichment.
Promoter luciferase assays. A firefly luciferase reporter plasmid containing 3.6 kb of the Tnfrsf11b proximal promoter (pOPG 3.6-luc) was a gift of G. Karsenty, Columbia University (76). An expression plasmid for constitutive-ly active NFATc1 (pMSCV-caNfatc1) was a gift of N. Clipstone, Northwestern
University, Chicago, Illinois, USA (77). 293T cells were transiently trans-fected using the Effectene Reagent (Qiagen) with the indicated luciferase reporter plasmids and a Renilla luciferase vector (pRL-TK) as an internal con-trol at a ratio of 10:1, along with the indicated amounts of pMSCV-caNfatc1. The total amount of DNA per transfection was held constant by supple-menting with empty vector DNA. Forty hours after transfection Firefly and Renilla luciferase activities were determined in cell lysates using the Dual-Luciferase Reporter Assay System (Promega). Firefly luciferase activity was normalized to Renilla luciferase to control for transfection efficiency.
Immunofluorescence of NFATc1. BMOcPs were cultured on chamber slides for 3 days with M-CSF and RANKL. Cells were fixed with 4% PFA, permea-bilized, and stained with anti-NFATc1 and goat anti-mouse Alexa Fluor 488 (Invitrogen). Hoechst (Sigma-Aldrich) was used as a nuclear counterstain.
Quantification of TRAP5b and OPG. Commercially available kits were used to determine the concentrations of TRAP5b (Immunodiagnostic Systems) in mouse serum or OPG (R&D Systems) in mouse serum or tissue culture supernatants according to the manufacturer’s directions. Since RANKL in the tissue culture supernatants of osteoclast cultures can interfere with the OPG ELISA, supernatants were collected from BMOcPs first incu-bated for 4 days with M-CSF or M-CSF and RANKL and then cultured for 2 days with M-CSF only.
Statistics. Unpaired, 2-tailed Student’s t tests were used for all statistical comparisons. A P value of less than 0.05 was considered significant.
AcknowledgmentsThe authors especially thank Stanford Peng, Geancarlo Lugo-Villa-rino, and Arlene Sharpe for their early participation in the NFATc1 conditional knockout project. We also acknowledge Dorothy Zhang, Kazuki Ueno, David Burr, and Keith Condon for their preparation and analysis of histologic sections; Deneen Kozoriz for cell sorting; Landy Kangaloo, Steven Swartz, Pamela Okerholm, and Jennifer Donovan for technical assistance; Zie Skobe, Roberto Fajardo, and Pat Dunning for help with radiology; Kyleigh Nevis for manuscript preparation; and Dallas Jones, Ann-Hwee Lee, Marc Wein, Jing Wu, Ellen Gravallese, Kevin McHugh, Tania Crotti, and Nicole Walsh for guidance and experimental advice. We are indebted to the staff at the Harvard Medical School Center for Animal Resources and Com-parative Medicine for their excellent care of our mice. This work was supported by grants from the Charles H. Hood Foundation (to Y. Ueki), NIH AR36819 (to B.R. Olsen), NIH AI31541 (to L.H. Glimch-er), and NIH AR0447129 (to M.C. Ostrowski). A.O. Aliprantis is the recipient of the Abbott Scholar Award in Rheumatology Research and the 2007 American Society for Clinical Investigation Young Investigator Award. R. Sulyanto is a recipient of the Harvard Medi-cal School Carl W. Walter Fellowship.
Received for publication March 21, 2008, and accepted in revised form September 3, 2008.
Address correspondence to: Laurie H. Glimcher, Harvard School of Public Health, 651 Huntington Avenue, FXB 205, Boston, Massa-chusetts 02115, USA. Phone: (617) 432-0622; Fax: (617) 432-0084; E-mail: [email protected].
Yasuyoshi Ueki’s present address is: Department of Oral Biology, School of Dentistry, University of Missouri-Kansas City, Kansas City, Missouri, USA.
Yasuyoshi Ueki and Rosalyn Sulyanto contributed equally to this work.
research article
3788 TheJournalofClinicalInvestigation http://www.jci.org Volume 118 Number 11 November 2008
1. United States Department of Health and Human Services. 2004. Bone health and osteoporosis: a report of the Surgeon General. http://www.surgeon-general.gov/library/bonehealth/content.html.
2. Woolf, A.D., and Pfleger, B. 2003. Burden of major musculoskeletal conditions. Bull. World Health Organ. 81:646–656.
3. Ueki, Y., et al. 2007. Increased myeloid cell respons-es to M-CSF and RANKL cause bone loss and inflammation in SH3BP2 “cherubism” mice. Cell. 128:71–83.
4. Goldring, S.R., and Gravallese, E.M. 2000. Patho-genesis of bone erosions in rheumatoid arthritis. Curr. Opin. Rheumatol. 12:195–199.
5. Wada, T., Nakashima, T., Hiroshi, N., and Pen-ninger, J.M. 2006. RANKL-RANK signaling in osteoclastogenesis and bone disease. Trends Mol. Med. 12:17–25.
6. Teitelbaum, S.L., and Ross, F.P. 2003. Genetic regu-lation of osteoclast development and function. Nat. Rev. Genet. 4:638–649.
7. Simonet, W.S., et al. 1997. Osteoprotegerin: a novel secreted protein involved in the regulation of bone density. Cell. 89:309–319.
8. Bucay, N., et al. 1998. Osteoprotegerin-deficient mice develop early onset osteoporosis and arterial calcification. Genes Dev. 12:1260–1268.
9. Boyce, B.F., and Xing, L. 2007. Biology of RANK, RANKL, and osteoprotegerin. Arthritis Res. Ther. 9(Suppl. 1):S1.
10. Hogan, P.G., Chen, L., Nardone, J., and Rao, A. 2003. Transcriptional regulation by calcium, calci-neurin, and NFAT. Genes Dev. 17:2205–2232.
11. Graef, I.A., Chen, F., and Crabtree, G.R. 2001. NFAT signaling in vertebrate development. Curr. Opin. Genet. Dev. 11:505–512.
12. Horsley, V., Aliprantis, A.O., Polak, L., Glimcher, L.H., and Fuchs, E. 2008. NFATc1 balances qui-escence and proliferation of skin stem cells. Cell. 132:299–310.
13. Ishida, N., et al. 2002. Large scale gene expression analysis of osteoclastogenesis in vitro and eluci-dation of NFAT2 as a key regulator. J. Biol. Chem. 277:41147–41156.
14. Takayanagi, H., et al. 2002. Induction and activa-tion of the transcription factor NFATc1 (NFAT2) integrate RANKL signaling in terminal differentia-tion of osteoclasts. Dev. Cell. 3:889–901.
15. Kim, K., Lee, S.H., Ha Kim, J., Choi, Y., and Kim, N. 2008. NFATc1 induces osteoclast fusion via up-regulation of Atp6v0d2 and the dendritic cell-specific transmembrane protein (DC-STAMP). Mol. Endocrinol. 22:176–185.
16. Sharma, S.M., et al. 2007. MITF and PU.1 recruit p38 MAPK and NFATc1 to target genes during osteoclast differentiation. J. Biol. Chem. 282:15921–15929.
17. Kim, Y., et al. 2005. Contribution of nuclear factor of activated T cells c1 to the transcriptional control of immunoreceptor osteoclast-associated receptor but not triggering receptor expressed by myeloid cells-2 during osteoclastogenesis. J. Biol. Chem. 280:32905–32913.
18. Crotti, T.N., et al. 2008. PU.1 and NFATc1 mediate osteoclastic induction of the mouse beta3 integrin promoter. J. Cell. Physiol. 215:636–644.
19. Sharma, S.M., et al. 2006. Genetics and genomics of osteoclast differentiation: integrating cell signaling pathways and gene networks. Crit. Rev. Eukaryot. Gene Expr. 16:253–277.
20. Ranger, A.M., et al. 1998. The transcription factor NF-ATc is essential for cardiac valve formation. Nature. 392:186–190.
21. Luis de la Pompa, J., et al. 1998. Role of the NF-ATc transcription factor in morphogenesis of cardiac valves and septum. Nature. 392:182–186.
22. Asagiri, M., et al. 2005. Autoamplification of NFATc1 expression determines its essential role in bone homeostasis. J. Exp. Med. 202:1261–1269.
23. Winslow, M.M., et al. 2006. Calcineurin/NFAT sig-naling in osteoblasts regulates bone mass. Dev. Cell. 10:771–782.
24. Liu, B., Yu, S.F., and Li, T.J. 2003. Multinucleated giant cells in various forms of giant cell containing lesions of the jaws express features of osteoclasts. J. Oral Pathol. Med. 32:367–375.
25. Ueki, Y., et al. 2001. Mutations in the gene encoding c-Abl-binding protein SH3BP2 cause cherubism. Nat. Genet. 28:125–126.
26. Tiziani, V., et al. 1999. The gene for cherubism maps to chromosome 4p16. Am. J. Hum. Genet. 65:158–166.
27. Lietman, S.A., Kalinchinko, N., Deng, X., Kohanski, R., and Levine, M.A. 2006. Identification of a novel mutation of SH3BP2 in cherubism and demon-stration that SH3BP2 mutations lead to increased NFAT activation. Hum. Mutat. 27:717–718.
28. Weitzmann, M.N., and Pacifici, R. 2005. The role of T lymphocytes in bone metabolism. Immunol. Rev. 208:154–168.
29. Peng, S.L., Gerth, A.J., Ranger, A.M., and Glimcher, L.H. 2001. NFATc1 and NFATc2 together control both T and B cell activation and differentiation. Immunity. 14:13–20.
30. Kaminuma, O., et al. 2008. Differential contribu-tion of NFATc2 and NFATc1 to TNF-alpha gene expression in T cells. J. Immunol. 180:319–326.
31. Kuhn, R., and Torres, R.M. 2002. Cre/loxP recombi-nation system and gene targeting. Methods Mol. Biol. 180:175–204.
32. Kuhn, R., Schwenk, F., Aguet, M., and Rajewsky, K. 1995. Inducible gene targeting in mice. Science. 269:1427–1429.
33. Rodda, S.J., and McMahon, A.P. 2006. Distinct roles for Hedgehog and canonical Wnt signaling in speci-fication, differentiation and maintenance of osteo-blast progenitors. Development. 133:3231–3244.
34. Kawata, T., et al. 1999. Recruitment of osteoclasts in the mandibular condyle of growing osteope-trotic (op/op) mice after a single injection of mac-rophage colony-stimulating factor. Arch. Oral Biol. 44:81–88.
35. Tolar, J., Teitelbaum, S.L., and Orchard, P.J. 2004. Osteopetrosis. N. Engl. J. Med. 351:2839–2849.
36. Jacquin, C., Gran, D.E., Lee, S.K., Lorenzo, J.A., and Aguila, H.L. 2006. Identification of multiple osteo-clast precursor populations in murine bone marrow. J. Bone Miner. Res. 21:67–77.
37. Leenen, P.J., de Bruijn, M.F., Voerman, J.S., Camp-bell, P.A., and van Ewijk, W. 1994. Markers of mouse macrophage development detected by monoclonal antibodies. J. Immunol. Methods. 174:5–19.
38. Clausen, B.E., Burkhardt, C., Reith, W., Renkawitz, R., and Forster, I. 1999. Conditional gene targeting in macrophages and granulocytes using LysMcre mice. Transgenic Res. 8:265–277.
39. Kenner, L., et al. 2004. Mice lacking JunB are osteopenic due to cell-autonomous osteoblast and osteoclast defects. J. Cell Biol. 164:613–623.
40. Kim, H.J., et al. 2006. Glucocorticoids suppress bone formation via the osteoclast. J. Clin. Invest. 116:2152–2160.
41. Kurihara, N., Tatsumi, J., Arai, F., Iwama, A., and Suda, T. 1998. Macrophage-stimulating protein (MSP) and its receptor, RON, stimulate human osteoclast activity but not proliferation: effect of MSP distinct from that of hepatocyte growth factor. Exp. Hematol. 26:1080–1085.
42. Sato, M., and Grasser, W. 1990. Myosin II antibod-ies inhibit the resorption activity of isolated rat osteoclasts. Cell. Motil. Cytoskeleton. 17:250–263.
43. Wu, H., et al. 2007. Down syndrome critical region-1 is a transcriptional target of nuclear factor of activated T cells-c1 within the endo-cardium during heart development. J. Biol. Chem. 282:30673–30679.
44. Sundaram, K., et al. 2007. RANK ligand signaling
modulates the matrix metalloproteinase-9 gene expression during osteoclast differentiation. Exp. Cell Res. 313:168–178.
45. Sato, T., et al. 1997. Identification of the mem-brane-type matrix metalloproteinase MT1-MMP in osteoclasts. J. Cell Sci. 110:589–596.
46. Wu, H., Peisley, A., Graef, I.A., and Crabtree, G.R. 2007. NFAT signaling and the invention of vertebrates. Trends Cell Biol. 17:251–260.
47. Kieslinger, M., et al. 2005. EBF2 regulates osteo-blast-dependent differentiation of osteoclasts. Dev. Cell. 9:757–767.
48. Atkins, G.J., et al. 2001. Osteoprotegerin inhibits osteoclast formation and bone resorbing activity in giant cell tumors of bone. Bone. 28:370–377.
49. Kim, N., et al. 2005. Osteoclast differentiation inde-pendent of the TRANCE-RANK-TRAF6 axis. J. Exp. Med. 202:589–595.
50. Ruocco, M.G., et al. 2005. I{kappa}B kinase (IKK){beta}, but not IKK{alpha}, is a critical mediator of osteoclast survival and is required for inflammation-induced bone loss. J. Exp. Med. 201:1677–1687.
51. Begg, S.K., et al. 1993. Delayed hematopoietic development in osteopetrotic (op/op) mice. J. Exp. Med. 177:237–242.
52. Kim, K., et al. 2005. Nuclear factor of activated T cells c1 induces osteoclast-associated receptor gene expression during tumor necrosis factor-related activation-induced cytokine-mediated osteoclas-togenesis. J. Biol. Chem. 280:35209–35216.
53. Asagiri, M., and Takayanagi, H. 2007. The molecu-lar understanding of osteoclast differentiation. Bone. 40:251–264.
54. Mizuno, A., et al. 1998. Severe osteoporosis in mice lacking osteoclastogenesis inhibitory fac-tor/osteoprotegerin. Biochem. Biophys. Res Commun. 247:610–615.
55. Li, J., et al. 2000. RANK is the intrinsic hemato-poietic cell surface receptor that controls osteo-clastogenesis and regulation of bone mass and calcium metabolism. Proc. Natl. Acad. Sci. U. S. A. 97:1566–1571.
56. Yun, T.J., et al. 1998. OPG/FDCR-1, a TNF recep-tor family member, is expressed in lymphoid cells and is up-regulated by ligating CD40. J. Immunol. 161:6113–6121.
57. Schoppet, M., et al. 2007. Osteoprotegerin expres-sion in dendritic cells increases with maturation and is NF-kappaB-dependent. J. Cell. Biochem. 100:1430–1439.
58. Naito, A., et al. 1999. Severe osteopetrosis, defec-tive interleukin-1 signalling and lymph node organogenesis in TRAF6-deficient mice. Genes Cells. 4:353–362.
59. Gohda, J., et al. 2005. RANK-mediated amplifica-tion of TRAF6 signaling leads to NFATc1 induction during osteoclastogenesis. EMBO J. 24:790–799.
60. Baksh, S., et al. 2002. NFATc2-mediated repression of cyclin-dependent kinase 4 expression. Mol. Cell. 10:1071–1081.
61. Hodge, M.R., et al. 1996. Hyperproliferation and dysregulation of IL-4 expression in NF-ATp-defi-cient mice. Immunity. 4:397–405.
62. Tsytsykova, A.V., and Goldfeld, A.E. 2000. Nuclear factor of activated T cells transcription factor NFATp controls superantigen-induced lethal shock. J. Exp. Med. 192:581–586.
63. Pettit, A.R., et al. 2001. TRANCE/RANKL knock-out mice are protected from bone erosion in a serum transfer model of arthritis. Am. J. Pathol. 159:1689–1699.
64. Redlich, K., et al. 2002. Osteoclasts are essential for TNF-alpha-mediated joint destruction. J. Clin. Invest. 110:1419–1427.
65. Xu, X., et al. 2001. Direct removal in the mouse of a floxed neo gene from a three-loxP conditional knockout allele by two novel approaches. Genesis.
research article
TheJournalofClinicalInvestigation http://www.jci.org Volume 118 Number 11 November 2008 3789
30:1–6. 66. Xanthoudakis, S., et al. 1996. An enhanced immune
response in mice lacking the transcription factor NFAT1. Science. 272:892–895.
67. Lugo-Villarino, G., Maldonado-Lopez, R., Pos-semato, R., Penaranda, C., and Glimcher, L.H. 2003. T-bet is required for optimal production of IFN-gamma and antigen-specific T cell activa-tion by dendritic cells. Proc. Natl. Acad. Sci. U. S. A. 100:7749–7754.
68. Erlebacher, A., and Derynck, R. 1996. Increased expression of TGF-beta 2 in osteoblasts results in an osteoporosis-like phenotype. J. Cell Biol. 132:195–210.
69. Takahashi, N., Udagawa, N., Tanaka, S., and Suda, T. 2003. Generating murine osteoclasts from bone marrow. Methods Mol. Med. 80:129–144.
70. Fajardo, R.J., Muller, R., Ketcham, R.A., and Col-bert, M. 2007. Nonhuman anthropoid primate femoral neck trabecular architecture and its rela-tionship to locomotor mode. Anat. Rec. (Hoboken). 290:422–436.
71. McHugh, K.P., et al. 2000. Mice lacking beta3 inte-grins are osteosclerotic because of dysfunctional osteoclasts. J. Clin. Invest. 105:433–440.
72. Jones, D.C., et al. 2006. Regulation of adult bone mass by the zinc finger adapter protein Schnurri-3. Science. 312:1223–1227.
73. Janckila, A.J., Takahashi, K., Sun, S.Z., and Yam, L.T. 2001. Naphthol-ASBI phosphate as a preferred substrate for tartrate-resistant acid phosphatase isoform 5b. J. Bone Miner. Res. 16:788–793.
74. Smith, C.W., and Goldman, A.S. 1972. Effects of concanavalin A and pokeweed mitogen in vivo
on mouse peritoneal macrophages. Exp. Cell Res. 73:394–398.
75. Loots, G., and Ovcharenko, I. 2007. ECRbase: data-base of evolutionary conserved regions, promoters, and transcription factor binding sites in vertebrate genomes. Bioinformatics. 23:122–124.
76. Glass, D.A., 2nd, et al. 2005. Canonical Wnt signal-ing in differentiated osteoblasts controls osteoclast differentiation. Dev. Cell. 8:751–764.
77. Hirotani, H., Tuohy, N.A., Woo, J.T., Stern, P.H., and Clipstone, N.A. 2004. The calcineurin/nuclear factor of activated T cells signaling pathway regu-lates osteoclastogenesis in RAW264.7 cells. J. Biol. Chem. 279:13984–13992.
78. Wang, X., and Seed, B. 2003. A PCR primer bank for quantitative gene expression analysis. Nucleic Acids Res. 31:e154.


