Embed Size (px)
Citation preview
FOR AN UN REDACTED COPY OF THIS PROPOSAL CONTACT NEW FLYER DIRECTLY AT:
Cindy Campbell
Contract Administrator
PSTA – Pinellas Suncoast Transit
Authority
RFP 21-980369 Xcelsior CHARGE™
- XE35 - XE40 - XE60
- D45 CRT LE CHARGE™ - D45 CRT CHARGE
Package 1 Technical
PSTA– Pinellas Suncoast Transit Authority RFP 21-980369
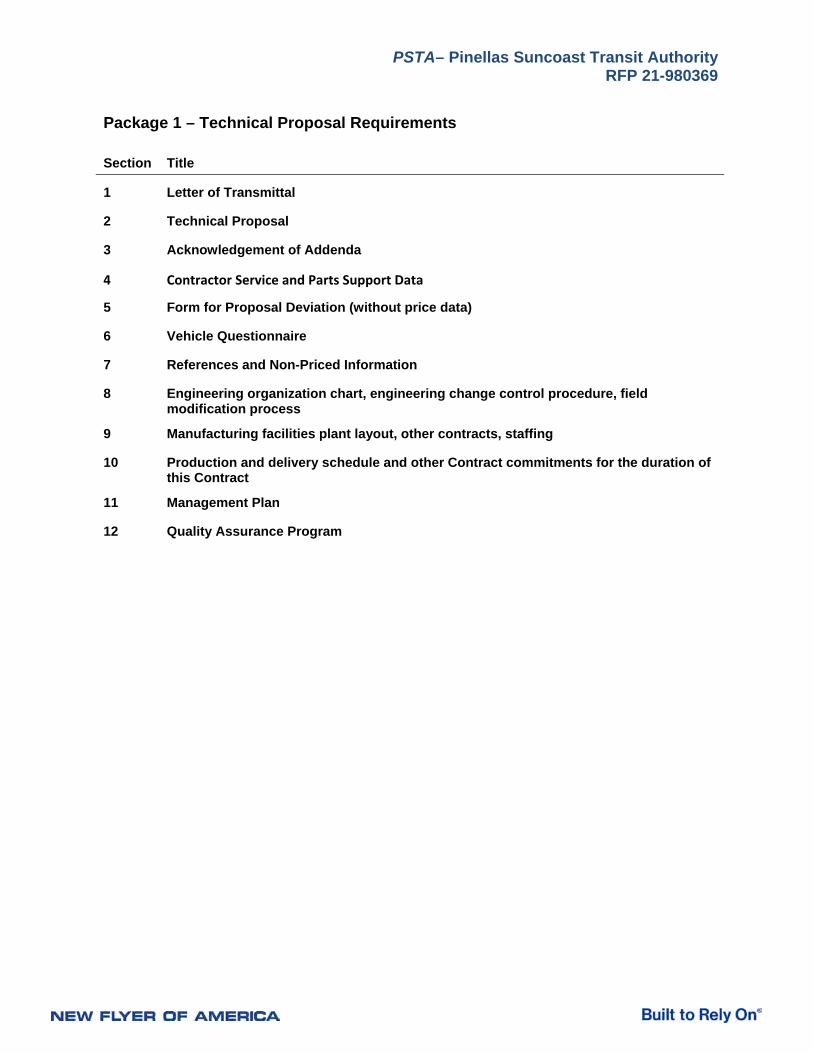
Package 1 – Technical Proposal Requirements
Section Title
1 Letter of Transmittal
2 Technical Proposal
3 Acknowledgement of Addenda
4 Contractor Service and Parts Support Data
5 Form for Proposal Deviation (without price data)
6 Vehicle Questionnaire
7 References and Non-Priced Information
8 Engineering organization chart, engineering change control procedure, field modification process
9 Manufacturing facilities plant layout, other contracts, staffing
10 Production and delivery schedule and other Contract commitments for the duration of this Contract
11 Management Plan
12 Quality Assurance Program

September 17, 2021
Alvin R. Burns Jr. Director of Procurement Pinellas Suncoast Transit Authority 3201 Scherer Drive, St. Petersburg, FL 33716
Subject: Request for Proposal for the Florida Electric Transit Buses with charging and associated equipment, RFP No. 21-980369
Dear Mr. Burns,
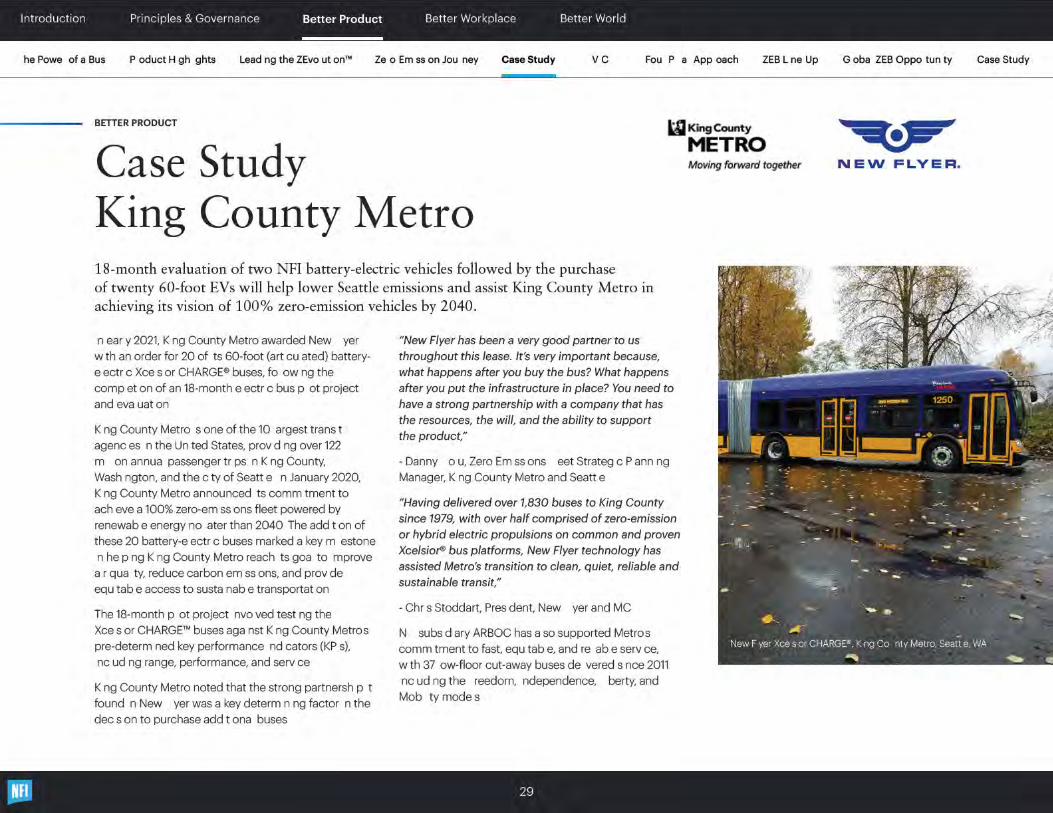
New Flyer of America Inc. (“New Flyer”) is honored to have the opportunity to submit our response to the Pinellas Suncoast Transit Authority (“PSTA”) for proposal No. 21-980369. This proposal is for the manufacture and delivery of 35-foot, 40-foot, 45-foot, 60-foot electric buses, and charging equipment.
We understand the importance of connecting people safely and on time to places for PSTA, based on that, we believe our most advanced product line under the Xcelsior® brand which includes our battery-electric 35, 40, 45 and 60 foot heavy-duty transit buses, charging options and our aftermarket service are the perfect combination of technology and lifetime support that will best help PSTA reach its goal.
New Flyer will partner with PSTA to achieve the following goals:
- Looking for innovative ways to make sure our riders get to their destinations on time, this will assist PSTA’s goal to increase ridership.
- PSTA’s mission is to be people’s first choice for transportation and a driving force for social, environmental, and economic vitality in the community through innovation and partnership. This is what drives us, and our buses, to safely connect people to places.
- Provide transportation options to meet the needs of disadvantaged communities.

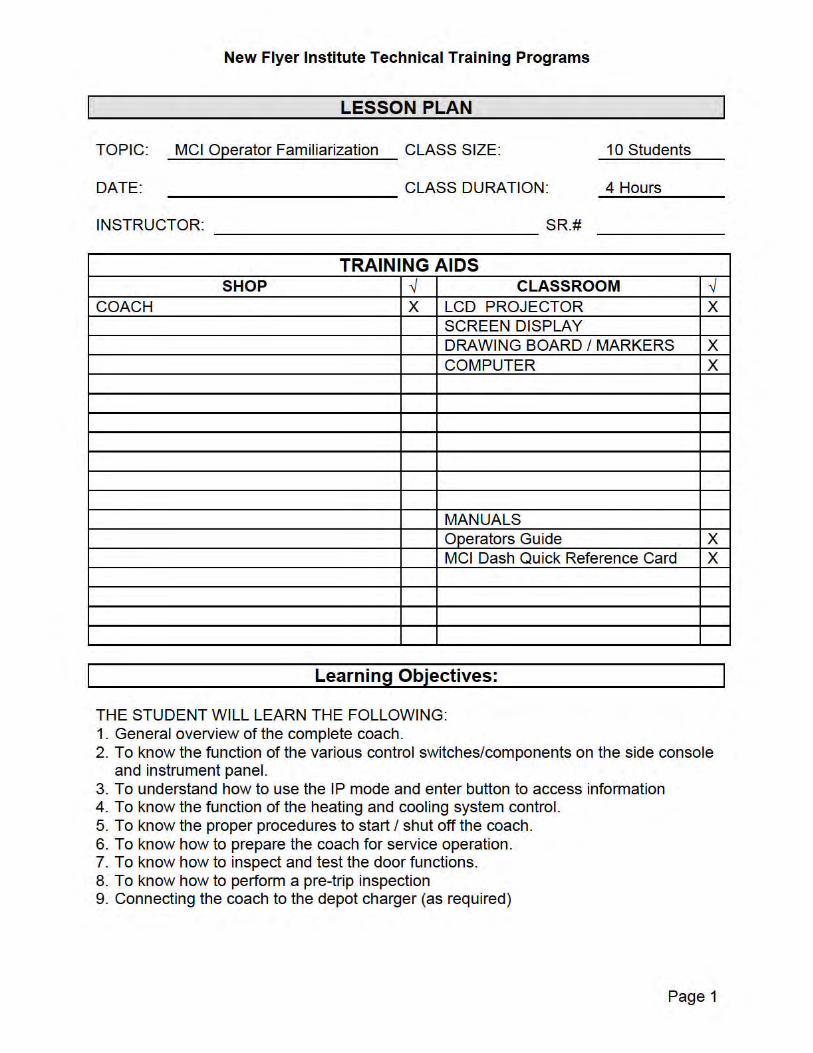

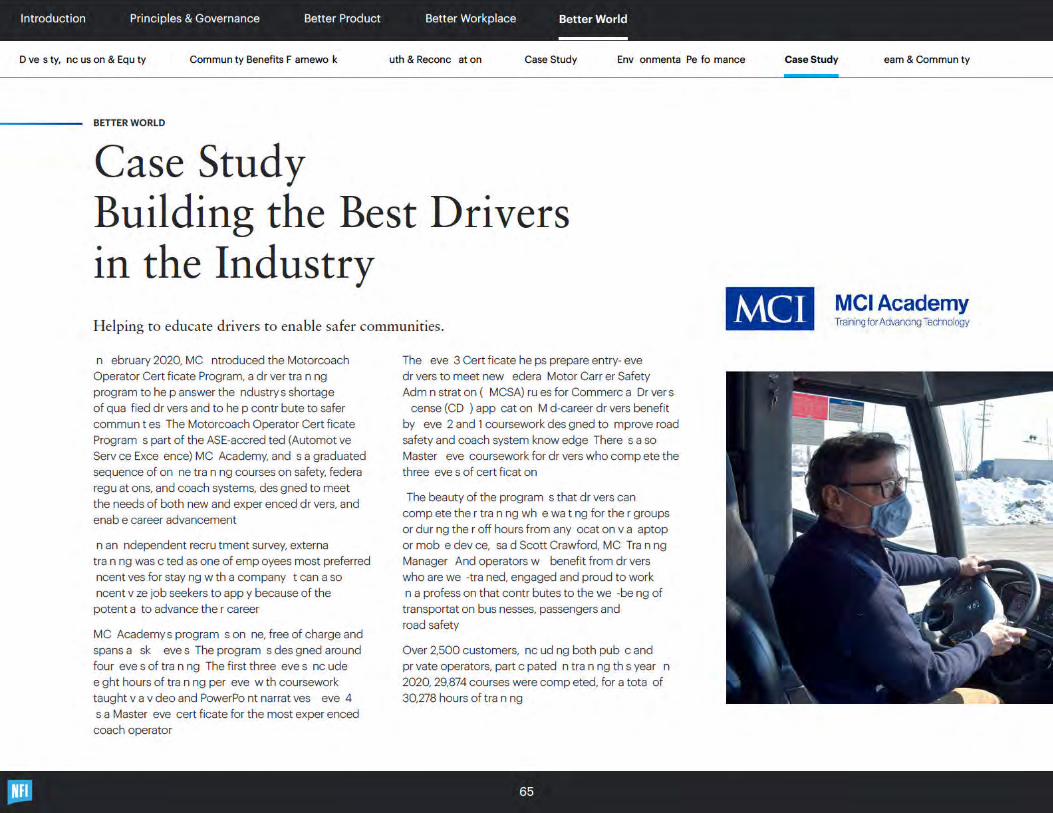
MCI Coach Training Programs
Page 2
PREREQUISITE:
THE STUDENT SHOULD HAVE THE FOLLOWING SKILLS / KNOWLEDGE: 1. Basic understanding of coach operation.2. Basic understanding of door systems.3. Basic understanding of air systems.4. Basic understanding of electrical systems.5. Basic understanding of a Pre-Trip inspection.
THE STUDENT SHOULD HAVE COMPLETED THE FOLLOWING TRAINING ON MCI COACHES:
1. Not applicable for orientation class.
INTRODUCTION1. INTRODUCTION OF SELF / INCLUDE BACKGROUND
2. REPRESENTING: COMPANY / SCHOOL / ETC.
3. DISCUSS BREAKS / LUNCH / EXITS / WASHROOM LOCATION / ETC.
4. COMPLETE ATTENDANCE FORM / COPY TO PROPERTY
5. SUBJECT AND MATERIAL TO BE COVERED
6. OUTLINE HOW CLASS WILL BE CONDUCTED / DURATION
COURSE CONTENT
METHOD / AIDS Discussion 1.BRIEF OVERVIEW EXPLANATION OF SYSTEM
Discussion 2.DESCRIPTION OF COMPONENTS a. ASK FOR AND RESPOND TO QUESTIONS
Discussion 3.STEP BY STEP DESCRIPTION OF SYSTEMS AND OPERATION a. ASK FOR AND RESPOND TO QUESTIONS
Discussion 4.DESCRIPTION OF SERVICE LITERATURE a. ASK FOR AND RESPOND TO QUESTIONS
Discussion 5.STEP BY STEP DESCRIPTION OF SERVICE PROCEDURES AND DIAGNOSIS
a. ASK FOR AND RESPOND TO QUESTIONS
New Flyer Institute Technical Training Programs
Page 3
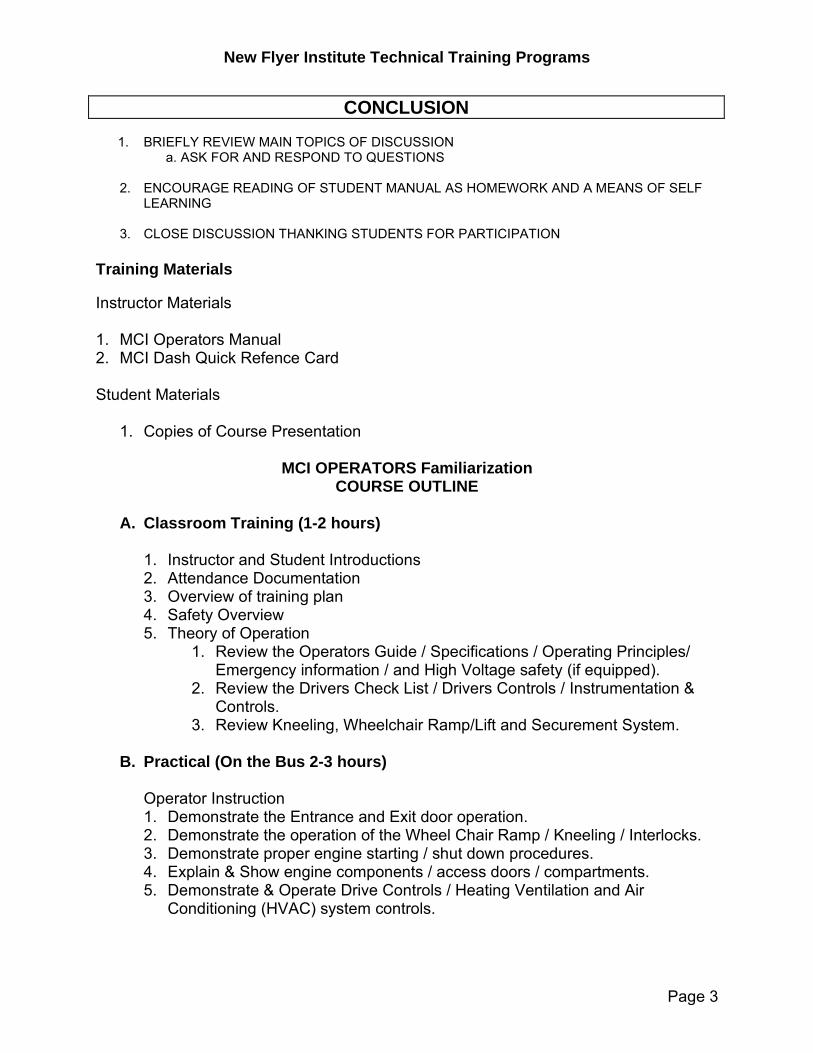
CONCLUSION1. BRIEFLY REVIEW MAIN TOPICS OF DISCUSSION
a. ASK FOR AND RESPOND TO QUESTIONS
2. ENCOURAGE READING OF STUDENT MANUAL AS HOMEWORK AND A MEANS OF SELFLEARNING
3. CLOSE DISCUSSION THANKING STUDENTS FOR PARTICIPATION
Training Materials
Instructor Materials
1. MCI Operators Manual2. MCI Dash Quick Refence Card
Student Materials
1. Copies of Course Presentation
MCI OPERATORS Familiarization COURSE OUTLINE
A. Classroom Training (1-2 hours)
1. Instructor and Student Introductions2. Attendance Documentation3. Overview of training plan4. Safety Overview5. Theory of Operation
1. Review the Operators Guide / Specifications / Operating Principles/Emergency information / and High Voltage safety (if equipped).
2. Review the Drivers Check List / Drivers Controls / Instrumentation &Controls.
3. Review Kneeling, Wheelchair Ramp/Lift and Securement System.
B. Practical (On the Bus 2-3 hours)
Operator Instruction 1. Demonstrate the Entrance and Exit door operation.2. Demonstrate the operation of the Wheel Chair Ramp / Kneeling / Interlocks.3. Demonstrate proper engine starting / shut down procedures.4. Explain & Show engine components / access doors / compartments.5. Demonstrate & Operate Drive Controls / Heating Ventilation and Air
Conditioning (HVAC) system controls.
PSTA– Pinellas Suncoast Transit Authority RFP 21-980369
Section 2B
Solicitation Requirements:
TS 5.13 Fire Suppression.
Description to match the specifications.
New Flyer Response:
Fire Suppression on the D45CRTeLE and C45CRTe is not standard as there are no gasses on an electric coach, therefore not required.
PSTA– Pinellas Suncoast Transit Authority RFP 21-980369
Section 2C
Solicitation Requirements:
TS 5.11 Interior Noise and Exterior Noise.
New Flyer response:
In the attachments Motor Coach Industries is providing the exterior noise and vibrations tests, interior noise and vibrations tests. These tests have been completed through the Altoona Testing; the objective of these tests is to record exterior and interior noise levels under various conditions to ensure the SAE standards are met. The results are on the following pages.
1405 Page 123 of 128
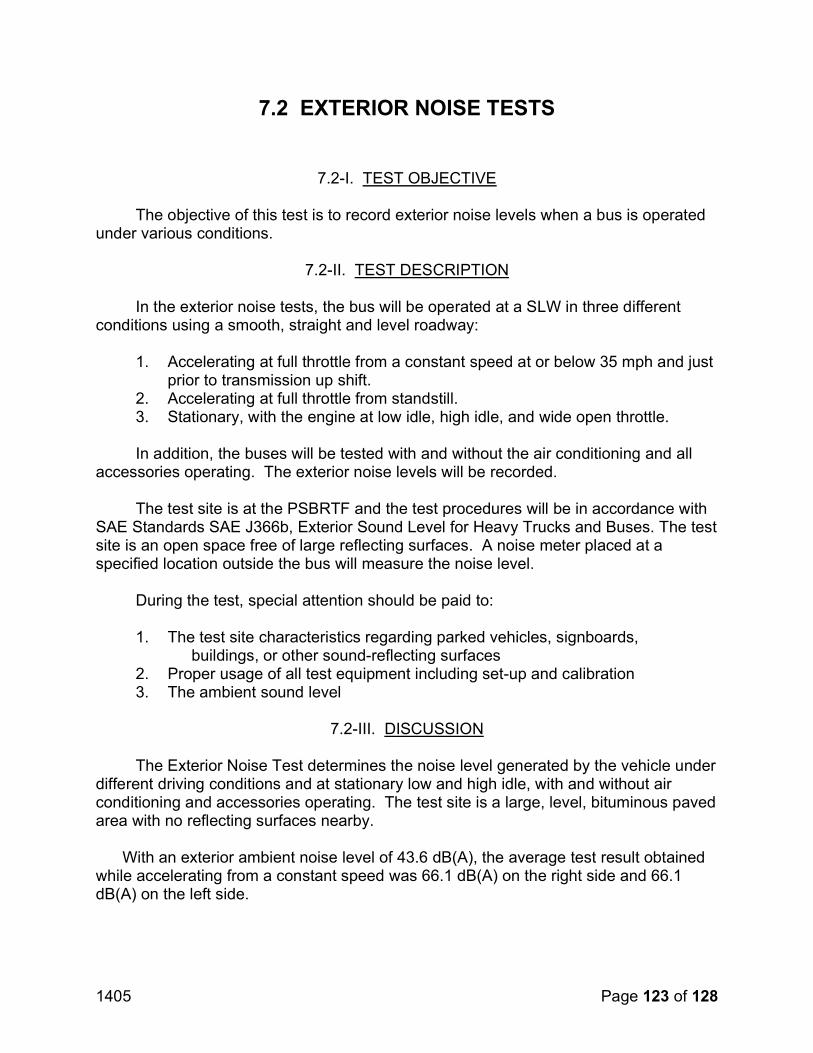
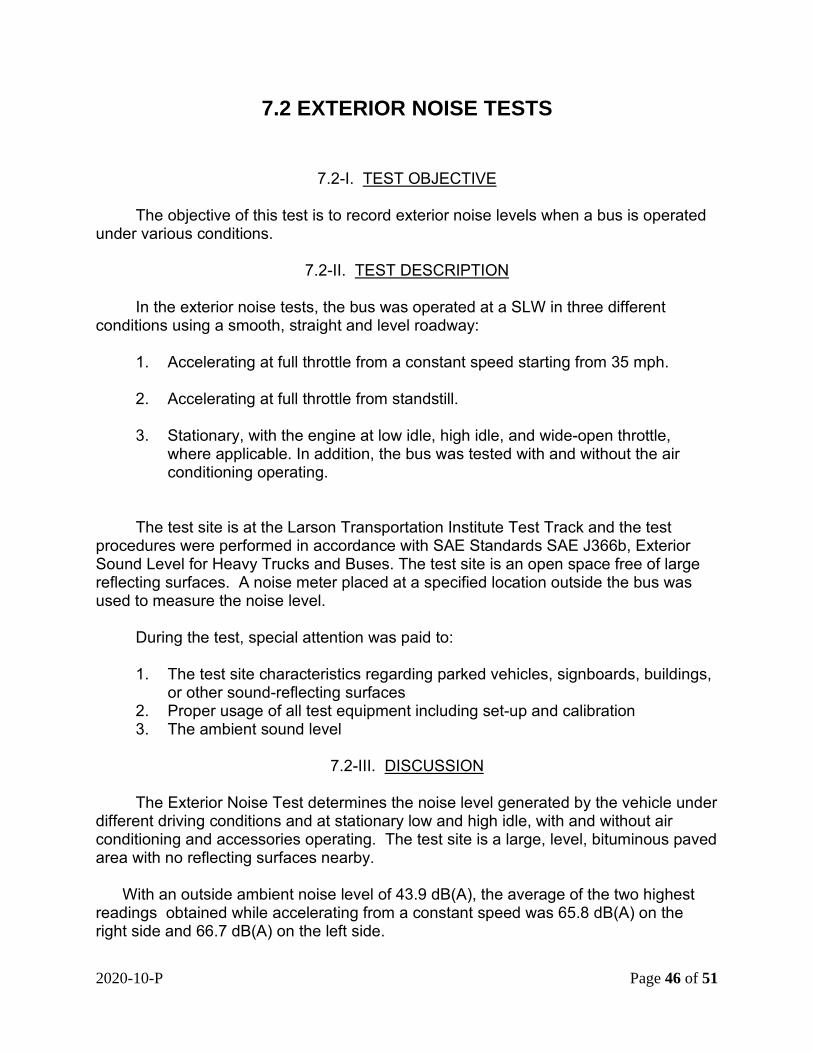
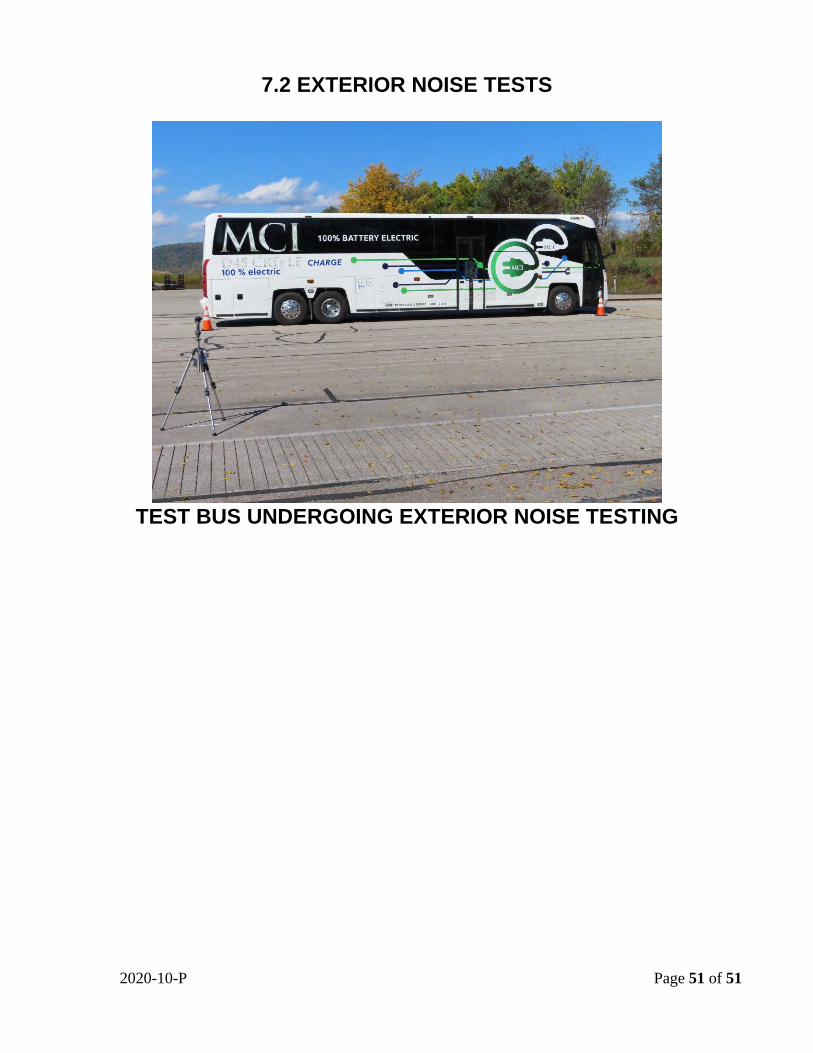
7.2 EXTERIOR NOISE TESTS
7.2-I. TEST OBJECTIVE
The objective of this test is to record exterior noise levels when a bus is operated under various conditions.
7.2-II. TEST DESCRIPTION
In the exterior noise tests, the bus will be operated at a SLW in three different conditions using a smooth, straight and level roadway:
1. Accelerating at full throttle from a constant speed at or below 35 mph and justprior to transmission up shift.
2. Accelerating at full throttle from standstill.3. Stationary, with the engine at low idle, high idle, and wide open throttle.
In addition, the buses will be tested with and without the air conditioning and all accessories operating. The exterior noise levels will be recorded.
The test site is at the PSBRTF and the test procedures will be in accordance with SAE Standards SAE J366b, Exterior Sound Level for Heavy Trucks and Buses. The test site is an open space free of large reflecting surfaces. A noise meter placed at a specified location outside the bus will measure the noise level.
During the test, special attention should be paid to:
1. The test site characteristics regarding parked vehicles, signboards,buildings, or other sound-reflecting surfaces
2. Proper usage of all test equipment including set-up and calibration3. The ambient sound level
7.2-III. DISCUSSION
The Exterior Noise Test determines the noise level generated by the vehicle under different driving conditions and at stationary low and high idle, with and without air conditioning and accessories operating. The test site is a large, level, bituminous paved area with no reflecting surfaces nearby.
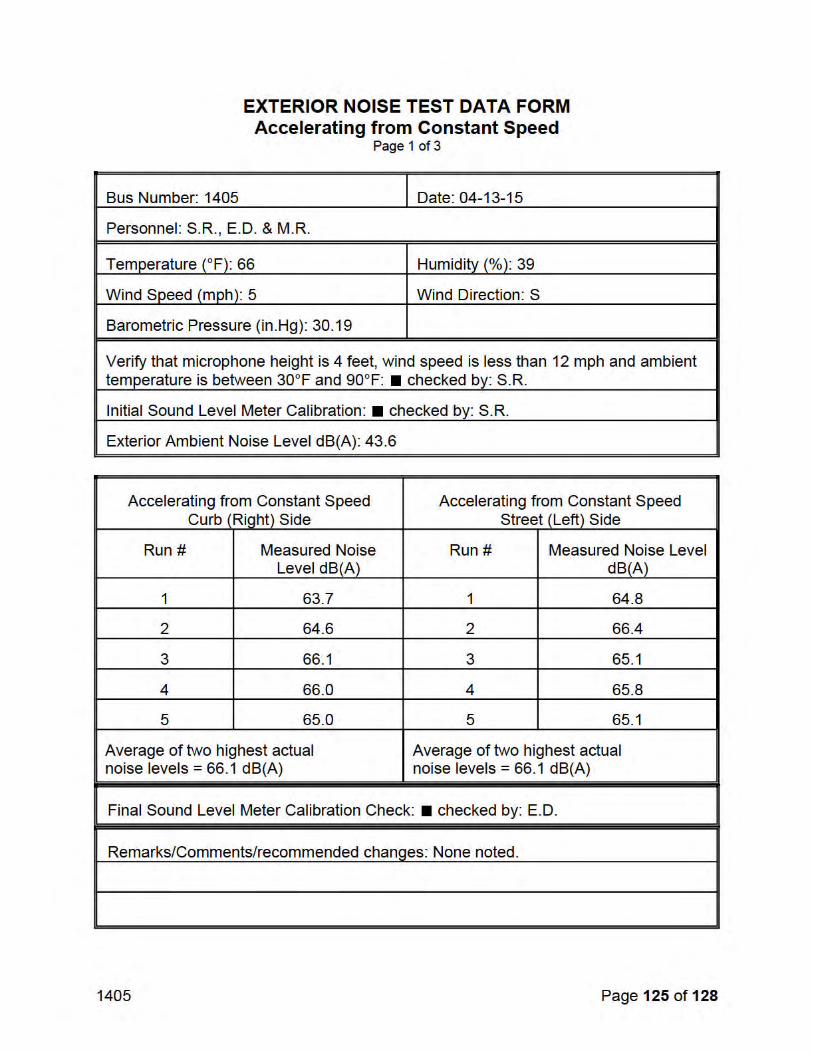
With an exterior ambient noise level of 43.6 dB(A), the average test result obtained while accelerating from a constant speed was 66.1 dB(A) on the right side and 66.1 dB(A) on the left side.

1405 Page 124 of 128
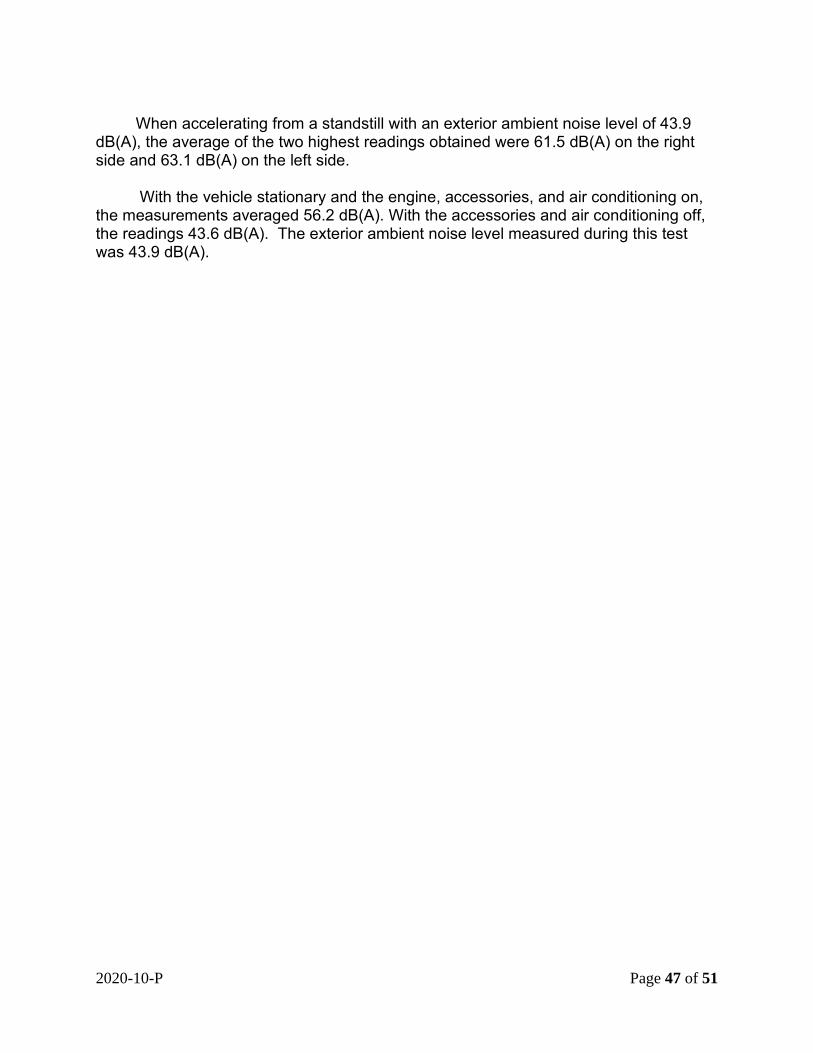
When accelerating from a standstill with an exterior ambient noise level of 44.1 dB(A), the average of the results obtained were 64.5 dB(A) on the right side and 64.9 dB(A) on the left side.
With the vehicle stationary and the engine, accessories, and air conditioning on, the measurements averaged 48.8 dB(A) at idle. With the accessories and air conditioning off, the readings averaged 9.6 dB(A) lower at idle. Note; this electric bus is not equipped with high idle and wide open throttle positions. The exterior ambient noise level measured during this test was 43.9 dB(A).


1405 Page 128 of 128
7.2 EXTERIOR NOISE TESTS
TEST BUS UNDERGOING EXTERIOR NOISE TESTING

1405 Page 118 of 128
7. NOISE
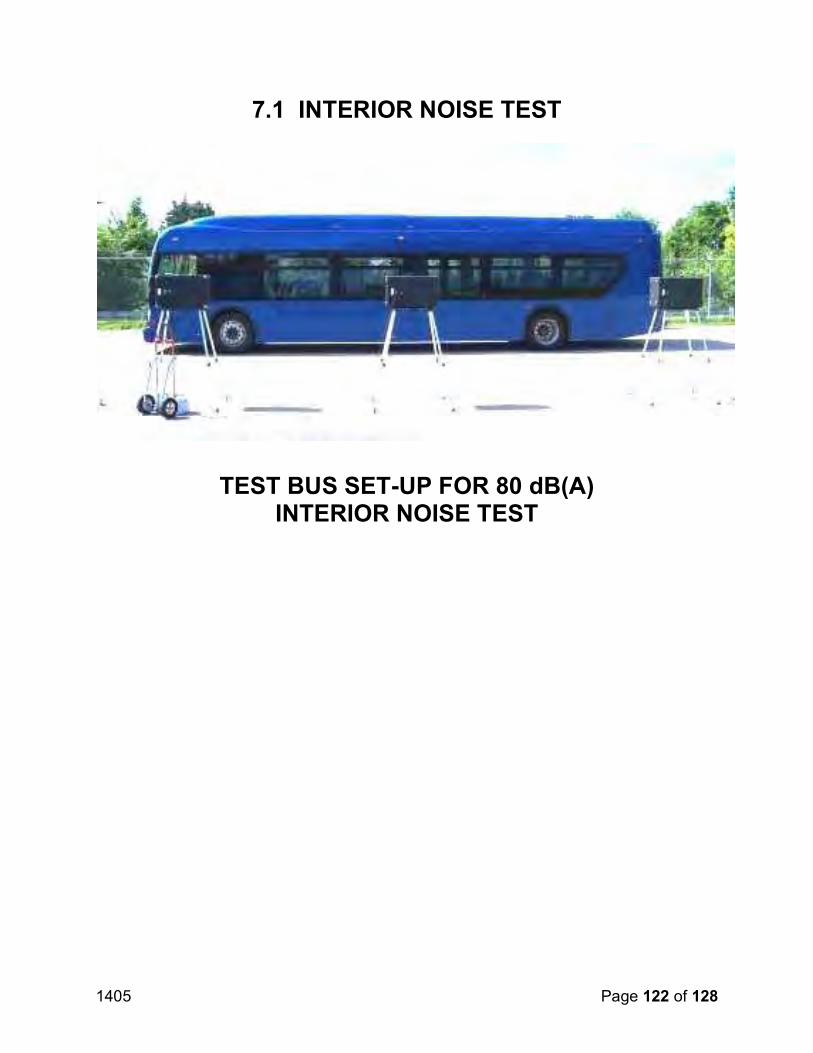
7.1 INTERIOR NOISE AND VIBRATION TESTS
7.1-I. TEST OBJECTIVE
The objective of these tests is to measure and record interior noise levels and check for audible vibration under various operating conditions.
7.1-II. TEST DESCRIPTION
During this series of tests, the interior noise level will be measured at several locations with the bus operating under the following three conditions:
1. With the bus stationary, a white noise generating system shall provide a uniformsound pressure level equal to 80 dB(A) on the left, exterior side of the bus. Theengine and all accessories will be switched off and all openings including doorsand windows will be closed. This test will be performed at the ABTC.
2. The bus accelerating at full throttle from a standing start to 35 mph on a levelpavement. All openings will be closed and all accessories will be operating duringthe test. This test will be performed on the track at the Test Track Facility.
3. The bus will be operated at various speeds from 0 to 55 mph with and withoutthe air conditioning and accessories on. Any audible vibration or rattles will benoted. This test will be performed on the test segment between the Test Trackand the Bus Testing Center.
All tests will be performed in an area free from extraneous sound-making sourcesor reflecting surfaces. The ambient sound level as well as the surrounding weather conditions will be recorded in the test data.
7.1-III. DISCUSSION
This test is performed in three parts. The first part exposes the exterior of the vehicle to 80.0 dB(A) on the left side of the bus and the noise transmitted to the interior is measured. The overall average of the six measurements was 47.0 dB(A); ranging from 45.5 dB(A) at the rear passenger seats to 47.9 dB(A) in line with the rear speaker.The interior ambient noise level for this test was < 30.0 dB(A).
The second test measures interior noise during acceleration from 0 to 35 mph.This noise level ranged from 66.4 dB(A) at the front passenger seats to 70.2 dB(A) at the rear passenger seats. The overall average was 68.6 dB(A). The interior ambient noise level for this test was < 30.0 dB(A).
The third part of the test is to listen for resonant vibrations, rattles, and other noise sources while operating over the road. No vibrations or rattles were noted.


1405 Page 122 of 128
7.1 INTERIOR NOISE TEST
TEST BUS SET-UP FOR 80 dB(A)INTERIOR NOISE TEST
PSTA– Pinellas Suncoast Transit Authority RFP 21-980369
Section 2D
Solicitation Requirements:
TS 5.14 Respect for the Environment.
The Contractor shall provide a plan for reuse or recycling of replaced battery cells and/or battery packs.
New Flyer response:
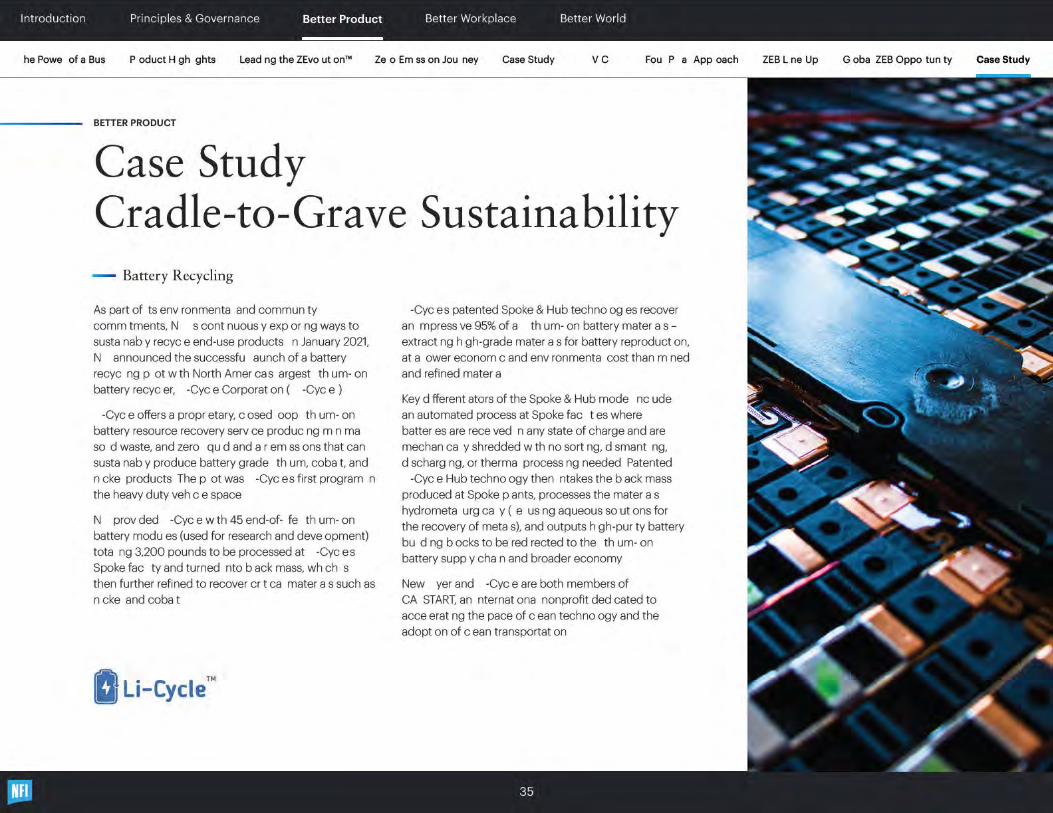
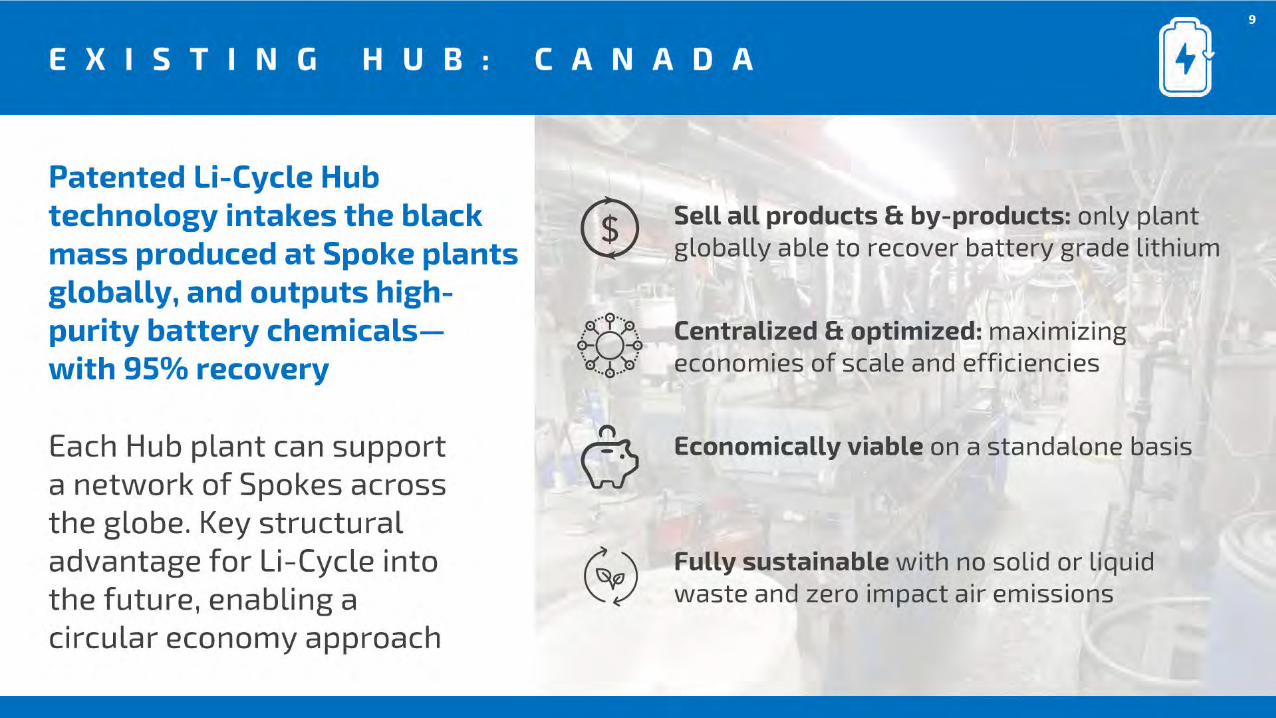
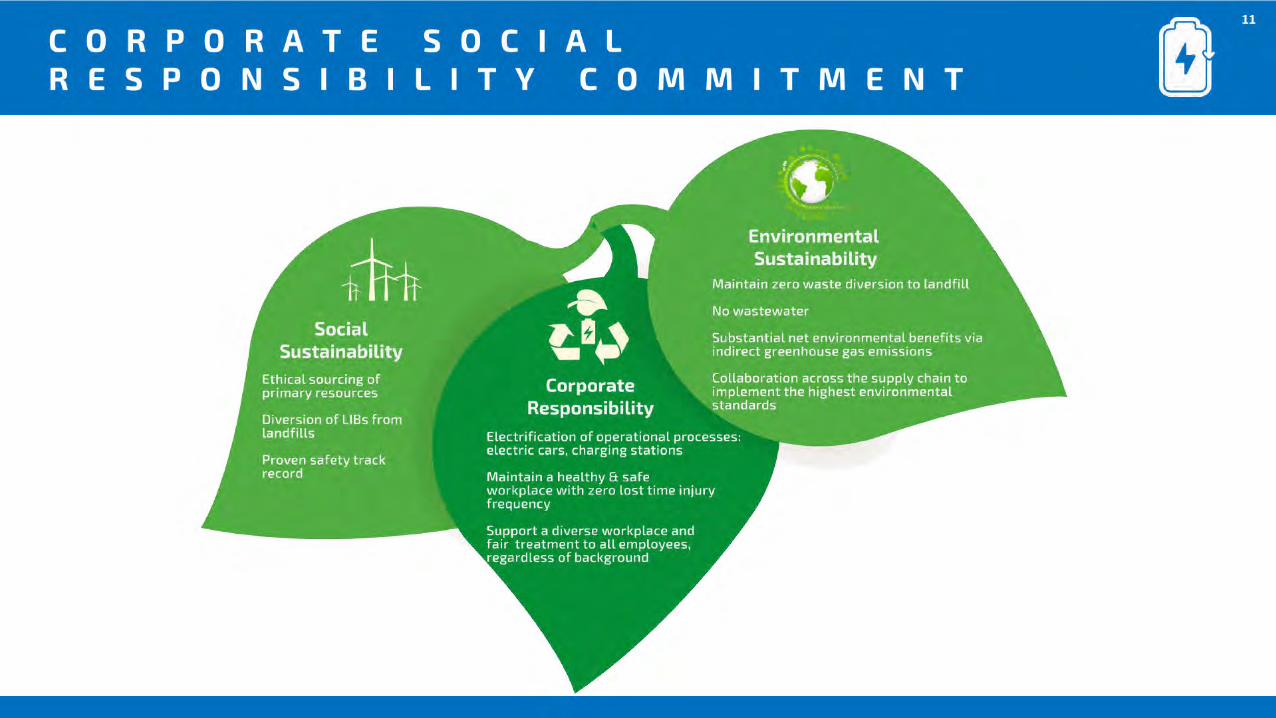
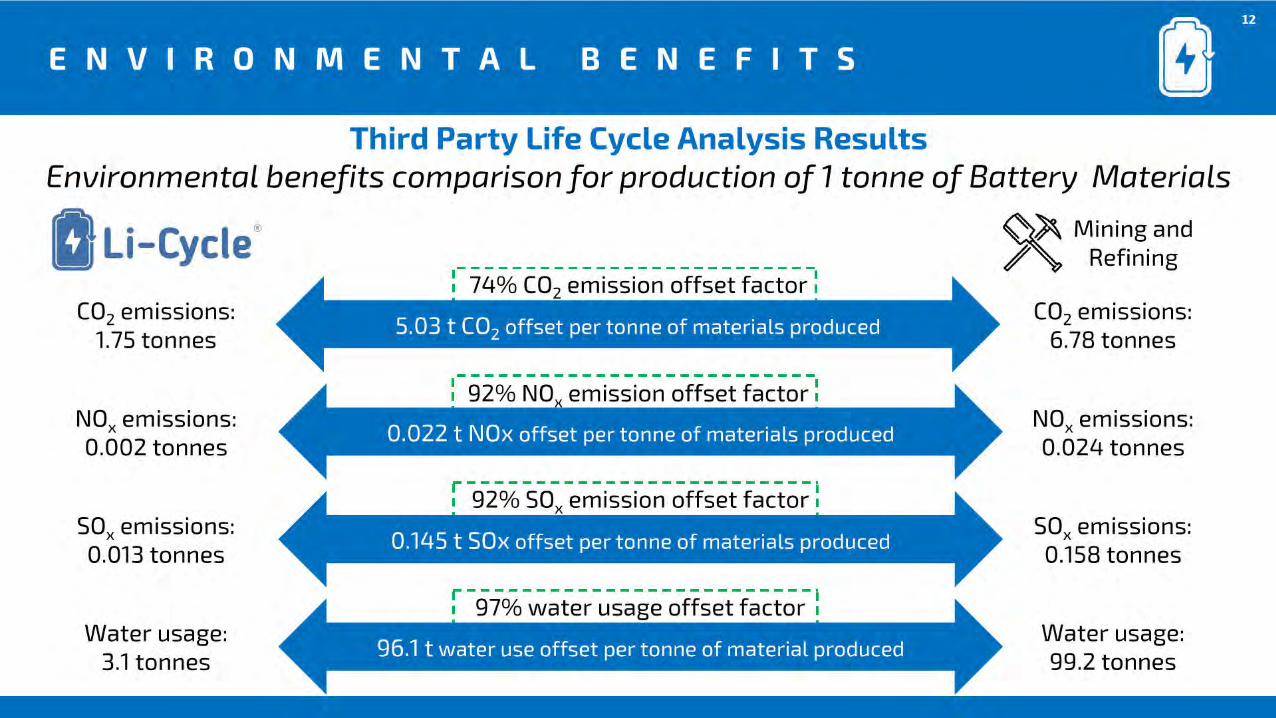
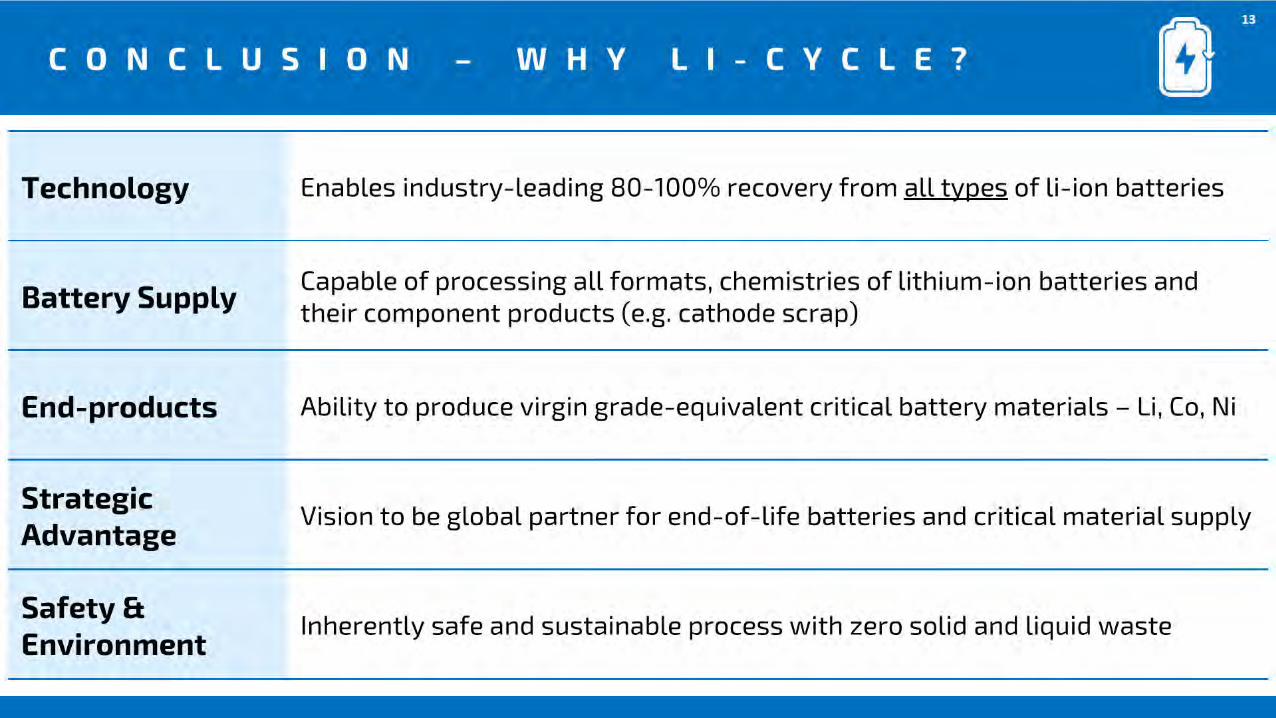
In the attached documents, Environmental, Social & Governance Report, and Li-Cycle. The report/study from Environmental, Social & Governance Report outlining the importance of electric batteries regarding the recycling is noted on Page 35. The full report is included as a matter of importance and interest in our changing world.


2020-10-P Page 29 of 51
PERFORMANCE DATA FORM Page 1 of 1
Bus Number: 2020-10-P Date: 10/14/2020
Personnel: M.H. S.I.
Temperature ( F): 71.8 Humidity (%): 37
Barometric Pressure (inHg): 28.8
INITIALS:
Air Conditioning - OFF Checked M.H.
Heater pump motor - OFF Checked M.H.
Defroster - OFF Checked M.H.
Exterior and interior lights - ON Checked M.H.
Windows and doors - CLOSED Checked M.H.
ACCELERATION, GRADEABILITY, TOP SPEED
Recorded Interval Times
Speed Run 1 Run 2 Run 3
10 mph 3.3 3.1 3.0
20 mph 5.6 5.3 5.3
30 mph 8.2 7.9 7.9
40 mph 14.4 14.2 14.3
50 mph 24.6 24.4 24.4
60 mph 40.7 40.5 40.6
70 mph 78.4 77.6 77.6
Maximum Speed (mph): 71.9 (maximum governed speed reached)


PSTA– Pinellas Suncoast Transit Authority RFP 21-980369
Section 2I
Solicitation Requirements:
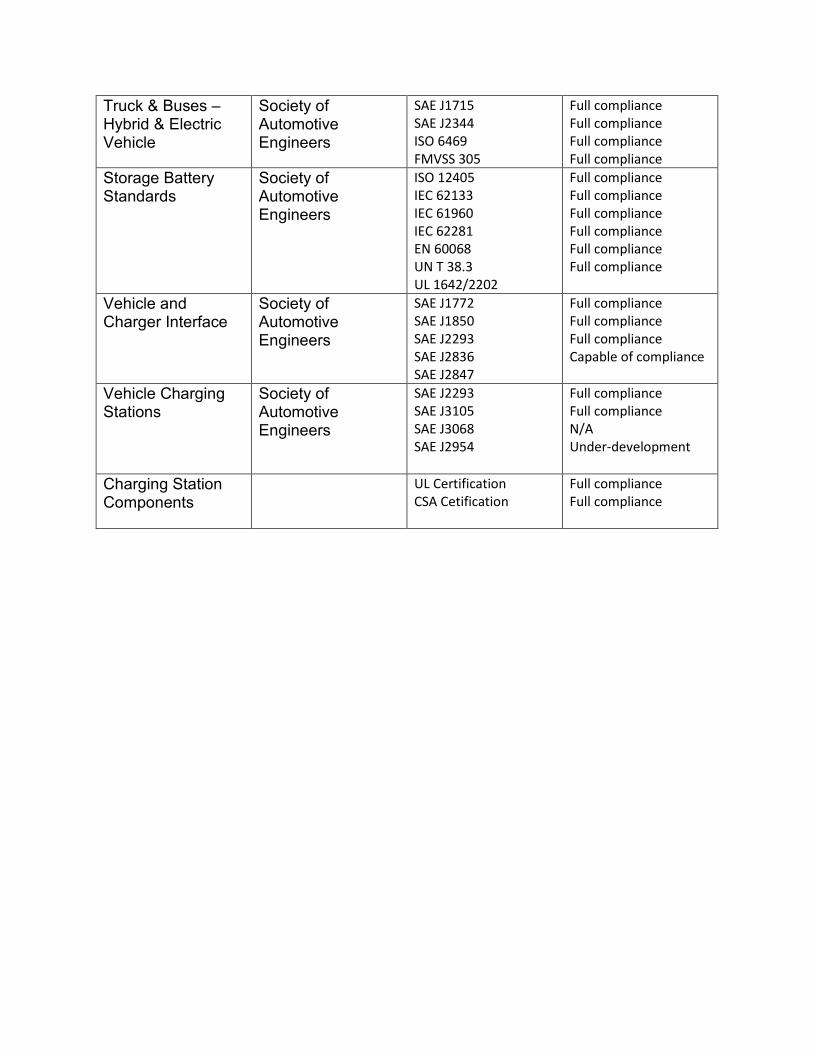
TS 9.1.1 Electric Propulsion System.
Provide a list of applicable industry standards that the proposed propulsion system meets.
New Flyer response:
Attached documentation for the Electric Vehicle Codes Standards for the electric
propulsion system that meet the industry standards.
Truck & Buses – Hybrid & Electric Vehicle
Society of Automotive Engineers
SAE J1715 SAE J2344 ISO 6469 FMVSS 305
Full compliance Full compliance Full compliance Full compliance
Storage Battery Standards
Society of Automotive Engineers
ISO 12405 IEC 62133 IEC 61960 IEC 62281 EN 60068 UN T 38.3 UL 1642/2202
Full compliance Full compliance Full compliance Full compliance Full compliance Full compliance
Vehicle and Charger Interface
Society of Automotive Engineers
SAE J1772 SAE J1850 SAE J2293 SAE J2836 SAE J2847
Full compliance Full compliance Full compliance Capable of compliance
Vehicle Charging Stations
Society of Automotive Engineers
SAE J2293 SAE J3105 SAE J3068 SAE J2954
Full compliance Full compliance N/A Under-development
Charging Station Components
UL Certification CSA Cetification
Full compliance Full compliance


PSTA– Pinellas Suncoast Transit Authority RFP 21-980369
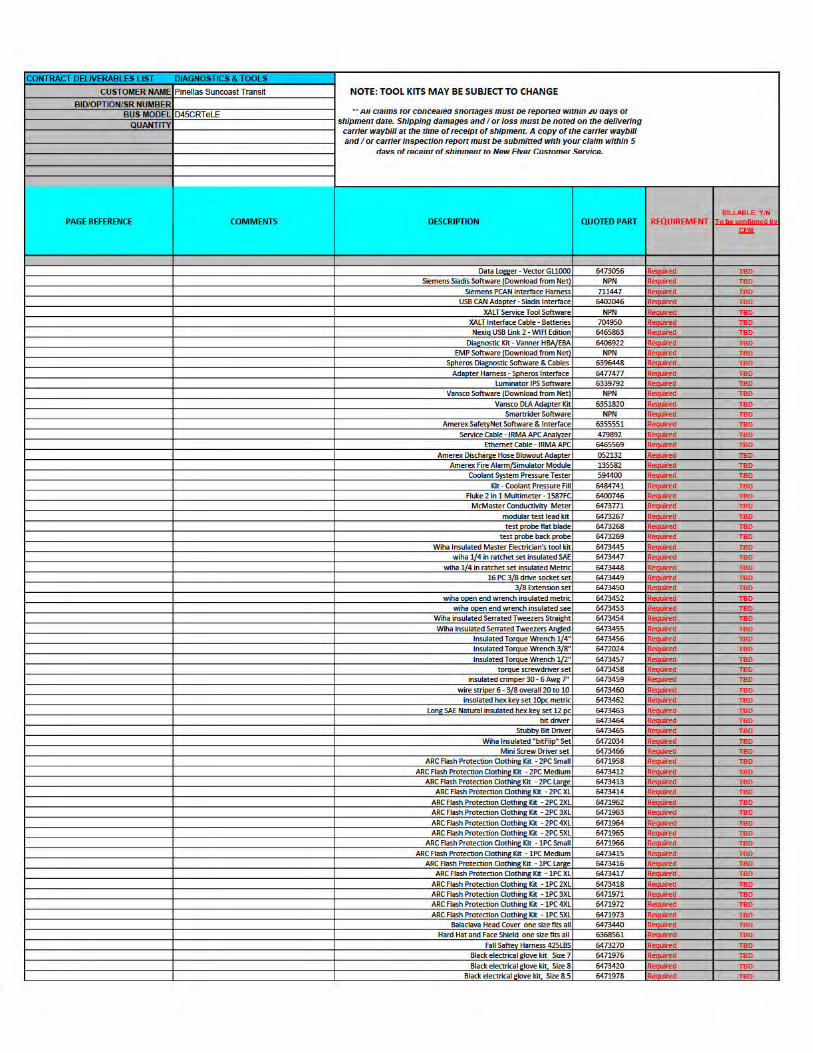
Section 2K6
Solicitation Requirements:
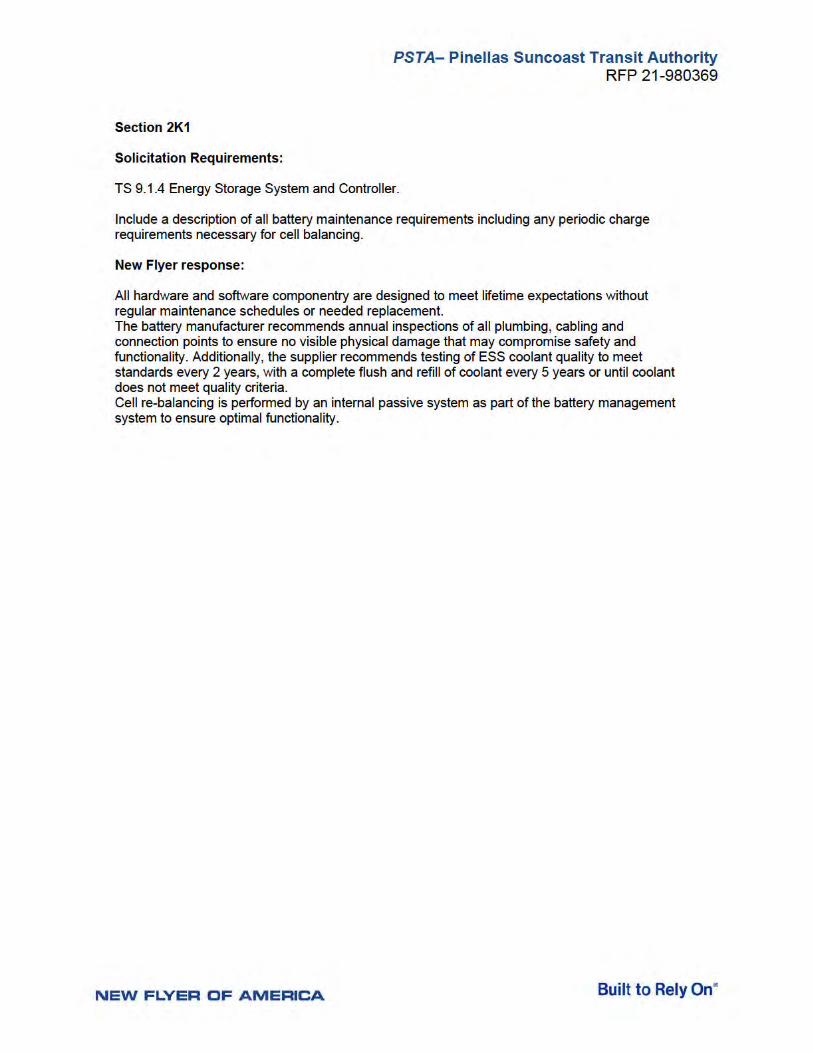
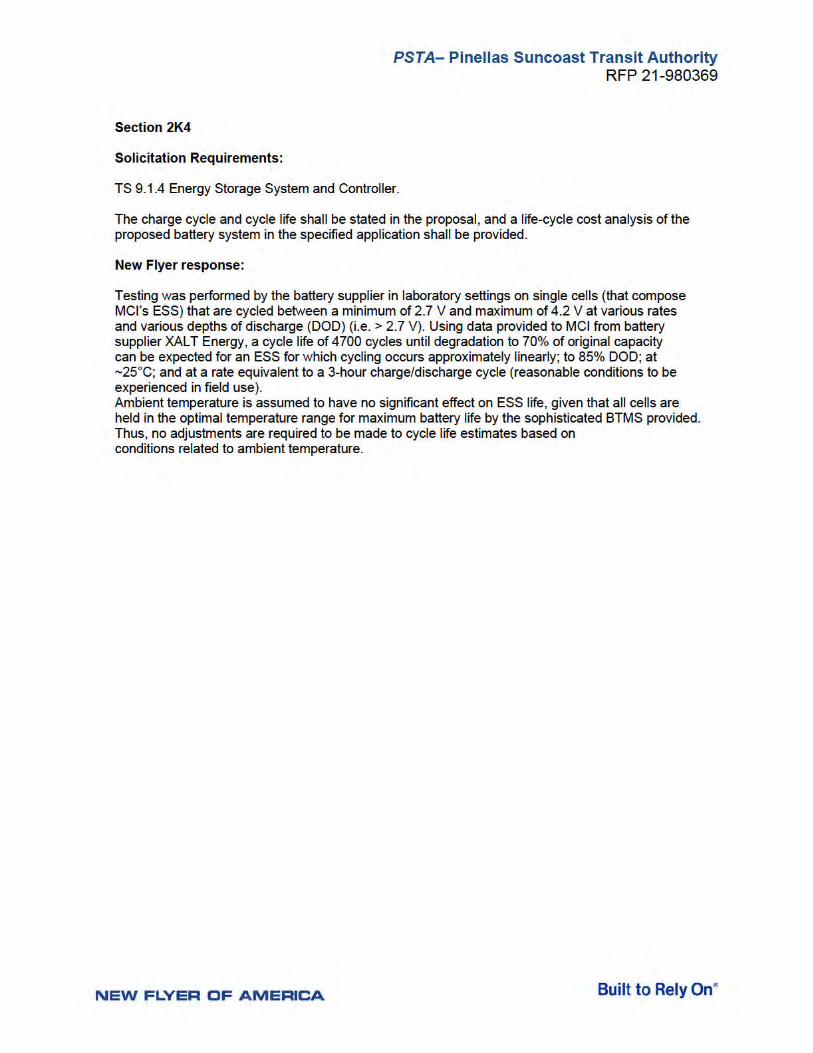
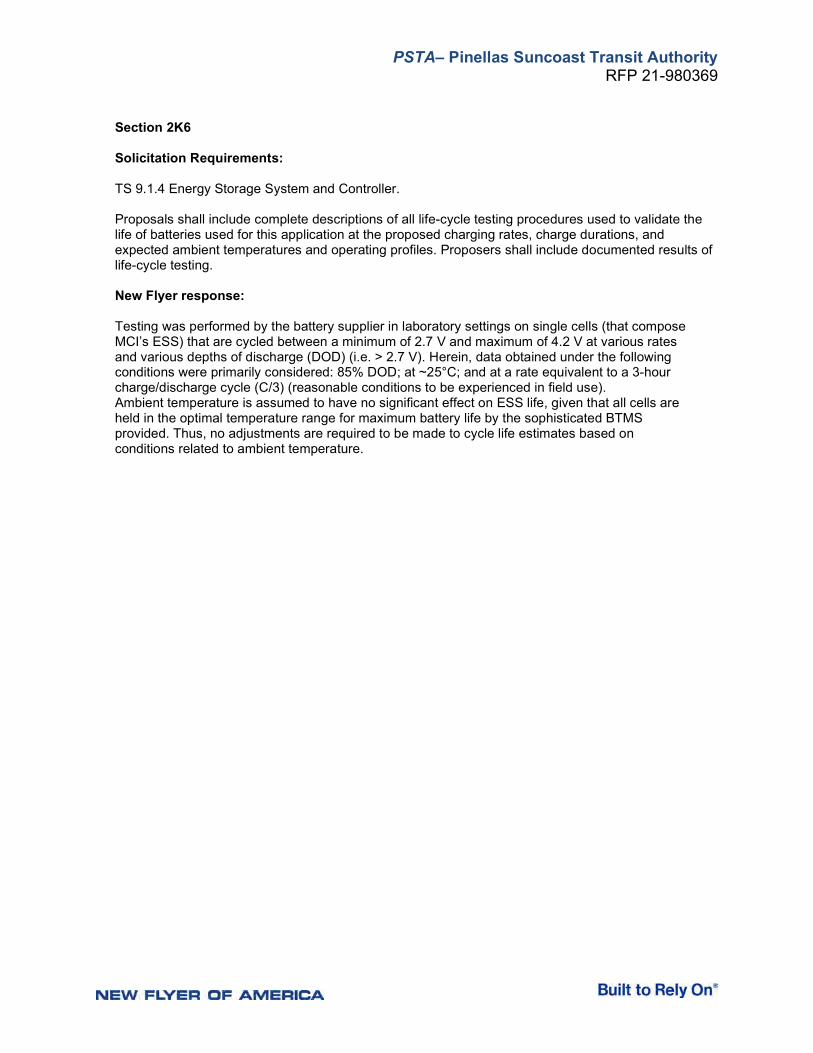
TS 9.1.4 Energy Storage System and Controller.
Proposals shall include complete descriptions of all life-cycle testing procedures used to validate the life of batteries used for this application at the proposed charging rates, charge durations, and expected ambient temperatures and operating profiles. Proposers shall include documented results of life-cycle testing.
New Flyer response:
Testing was performed by the battery supplier in laboratory settings on single cells (that compose MCI’s ESS) that are cycled between a minimum of 2.7 V and maximum of 4.2 V at various rates and various depths of discharge (DOD) (i.e. > 2.7 V). Herein, data obtained under the following conditions were primarily considered: 85% DOD; at ~25°C; and at a rate equivalent to a 3-hour charge/discharge cycle (C/3) (reasonable conditions to be experienced in field use). Ambient temperature is assumed to have no significant effect on ESS life, given that all cells are held in the optimal temperature range for maximum battery life by the sophisticated BTMS provided. Thus, no adjustments are required to be made to cycle life estimates based on conditions related to ambient temperature.


FEDERAL TRANSIT BUS TEST
Performed for the Federal Transit Administration U.S. DOT In accordance with 49 CFR, Part 665
Manufacturer: Motor Coach Industries Model: D45 CRTe LE
Partial Test
December 2020 Report Number: LTI-BT-R2020-10-P
The Thomas D. Larson Pennsylvania Transportation Institute 201 Transportation Research Building The Pennsylvania State University University Park, PA 16802 (814) 865-1891 Bus Testing and Research Center 2237 Plank Road Duncansville, PA 16635 (814) 695-3404
2020-10-P Page 2 of 51
FEDERAL TRANSIT BUS TEST
Performed for the Federal Transit Administration, U.S. DOT 1200 New Jersey Avenue, SE
Washington, DC 20590
In accordance with 49 CFR Part, 665
Manufacturer: Motor Coach Industries
Manufacturer’s address: 1475 Clarence Avenue
Winnipeg, Manitoba, Canada R3T1T5
Model: D45 CRTe LE
Partial Test Report Number: LTI-BT-R2020-10-P
2020-10-P Page 3 of 51
TABLE OF CONTENTS
Page
EXECUTIVE SUMMARY ........................................................................................................................... 4 ABBREVIATIONS AND ACRONYMS ..................................................................................................... 5 BUS CHECK-IN ........................................................................................................................................ 6 1. MAINTAINABILITY
1.1 ACCESSIBILITY OF COMPONENTS AND SUBSYSTEMS ........................................ 21 1.3 REPLACEMENT AND/OR REPAIR OF SELECTED SUBSYSTEMS .......................... 25
4. PERFORMANCE ............................................................................................................................... 28 6. ENERGY ECONOMY ........................................................................................................................ 32 7. NOISE
7.1 INTERIOR NOISE AND VIBRATION TESTS ............................................................... 41 7.2 EXTERIOR NOISE TESTS ........................................................................................... 46
2020-10-P Page 4 of 51
EXECUTIVE SUMMARY
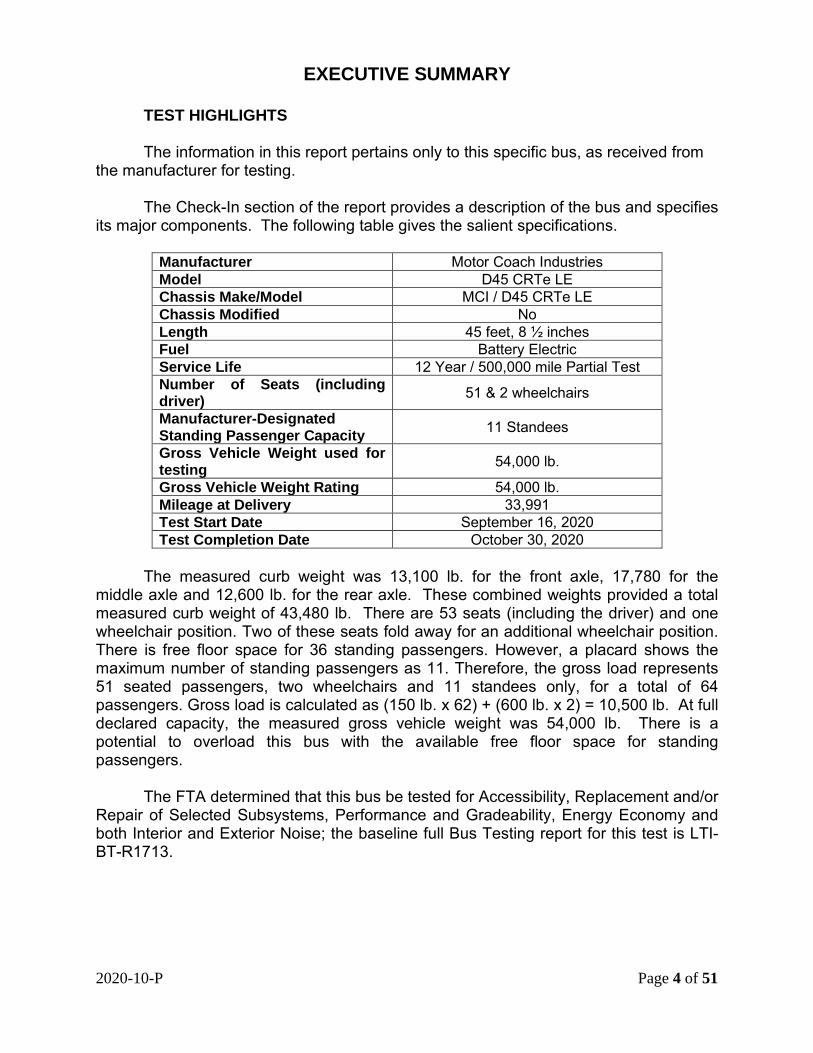
TEST HIGHLIGHTS The information in this report pertains only to this specific bus, as received from
the manufacturer for testing. The Check-In section of the report provides a description of the bus and specifies
its major components. The following table gives the salient specifications.
Manufacturer Motor Coach Industries Model D45 CRTe LE Chassis Make/Model MCI / D45 CRTe LE Chassis Modified No Length 45 feet, 8 ½ inches Fuel Battery Electric Service Life 12 Year / 500,000 mile Partial Test Number of Seats (including driver) 51 & 2 wheelchairs
Manufacturer-Designated Standing Passenger Capacity 11 Standees
Gross Vehicle Weight used for testing 54,000 lb.
Gross Vehicle Weight Rating 54,000 lb. Mileage at Delivery 33,991 Test Start Date September 16, 2020 Test Completion Date October 30, 2020
The measured curb weight was 13,100 lb. for the front axle, 17,780 for the
middle axle and 12,600 lb. for the rear axle. These combined weights provided a total measured curb weight of 43,480 lb. There are 53 seats (including the driver) and one wheelchair position. Two of these seats fold away for an additional wheelchair position. There is free floor space for 36 standing passengers. However, a placard shows the maximum number of standing passengers as 11. Therefore, the gross load represents 51 seated passengers, two wheelchairs and 11 standees only, for a total of 64 passengers. Gross load is calculated as (150 lb. x 62) + (600 lb. x 2) = 10,500 lb. At full declared capacity, the measured gross vehicle weight was 54,000 lb. There is a potential to overload this bus with the available free floor space for standing passengers.
The FTA determined that this bus be tested for Accessibility, Replacement and/or
Repair of Selected Subsystems, Performance and Gradeability, Energy Economy and both Interior and Exterior Noise; the baseline full Bus Testing report for this test is LTI-BT-R1713.
2020-10-P Page 5 of 51
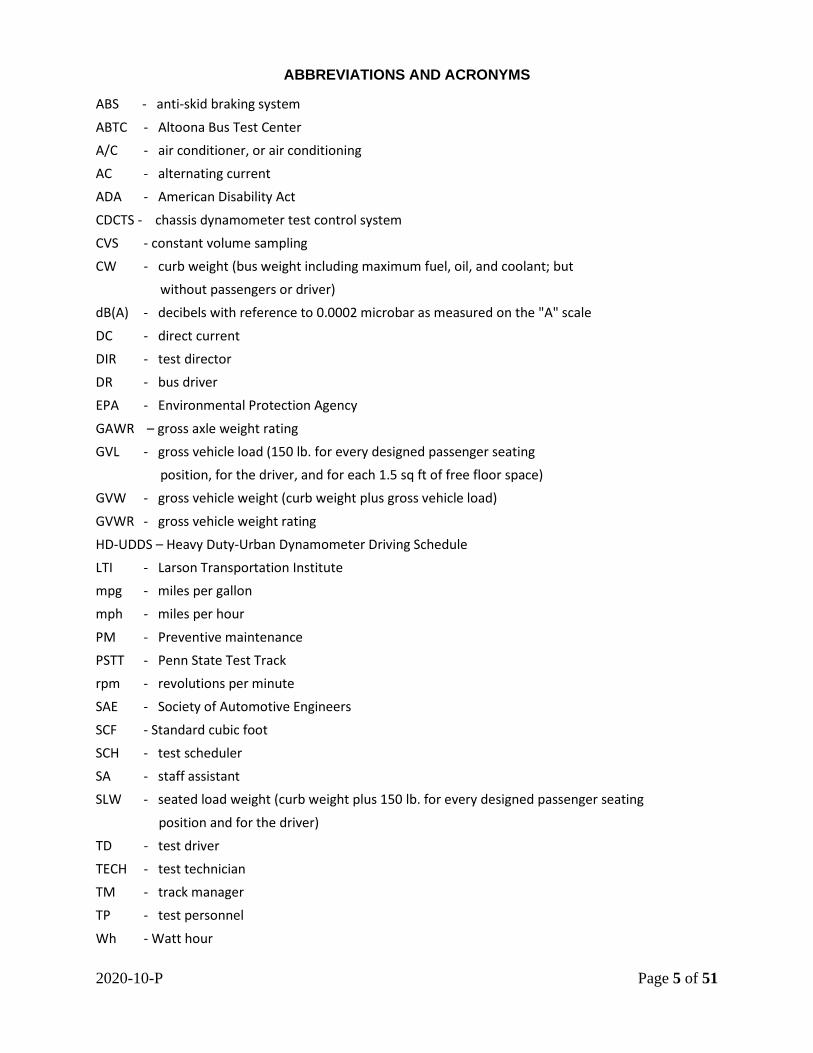
ABBREVIATIONS AND ACRONYMS
ABS - anti-skid braking system
ABTC - Altoona Bus Test Center A/C - air conditioner, or air conditioning AC - alternating current ADA - American Disability Act
CDCTS - chassis dynamometer test control system CVS - constant volume sampling CW - curb weight (bus weight including maximum fuel, oil, and coolant; but without passengers or driver) dB(A) - decibels with reference to 0.0002 microbar as measured on the "A" scale
DC - direct current DIR - test director DR - bus driver EPA - Environmental Protection Agency
GAWR – gross axle weight rating GVL - gross vehicle load (150 lb. for every designed passenger seating position, for the driver, and for each 1.5 sq ft of free floor space) GVW - gross vehicle weight (curb weight plus gross vehicle load)
GVWR - gross vehicle weight rating HD-UDDS – Heavy Duty-Urban Dynamometer Driving Schedule LTI - Larson Transportation Institute mpg - miles per gallon mph - miles per hour
PM - Preventive maintenance PSTT - Penn State Test Track rpm - revolutions per minute SAE - Society of Automotive Engineers
SCF - Standard cubic foot SCH - test scheduler SA - staff assistant SLW - seated load weight (curb weight plus 150 lb. for every designed passenger seating
position and for the driver) TD - test driver TECH - test technician TM - track manager TP - test personnel
Wh - Watt hour
2020-10-P Page 6 of 51
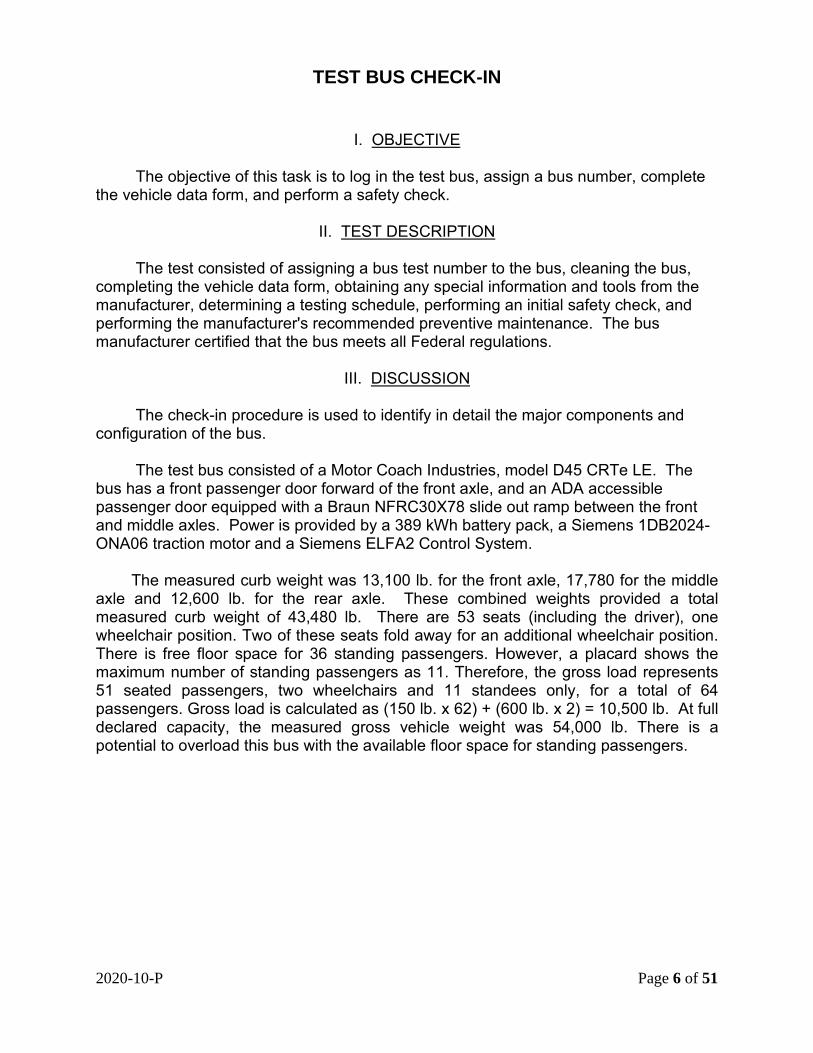
TEST BUS CHECK-IN I. OBJECTIVE
The objective of this task is to log in the test bus, assign a bus number, complete the vehicle data form, and perform a safety check. II. TEST DESCRIPTION
The test consisted of assigning a bus test number to the bus, cleaning the bus, completing the vehicle data form, obtaining any special information and tools from the manufacturer, determining a testing schedule, performing an initial safety check, and performing the manufacturer's recommended preventive maintenance. The bus manufacturer certified that the bus meets all Federal regulations. III. DISCUSSION
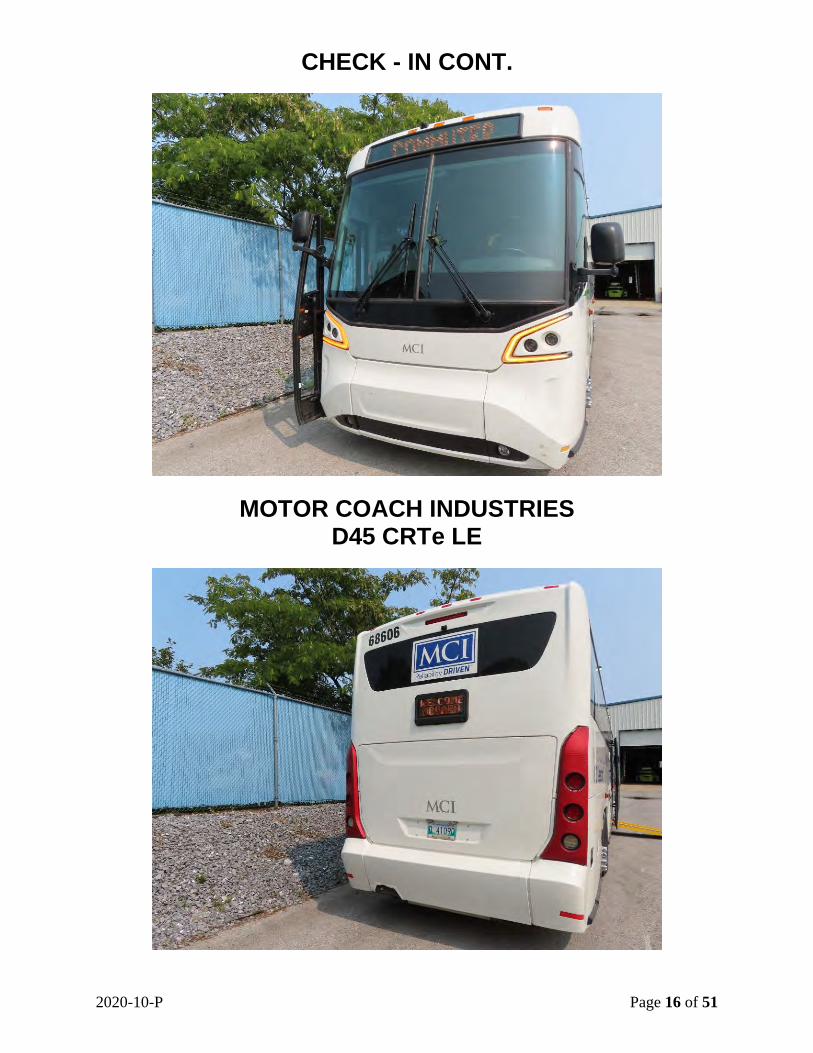
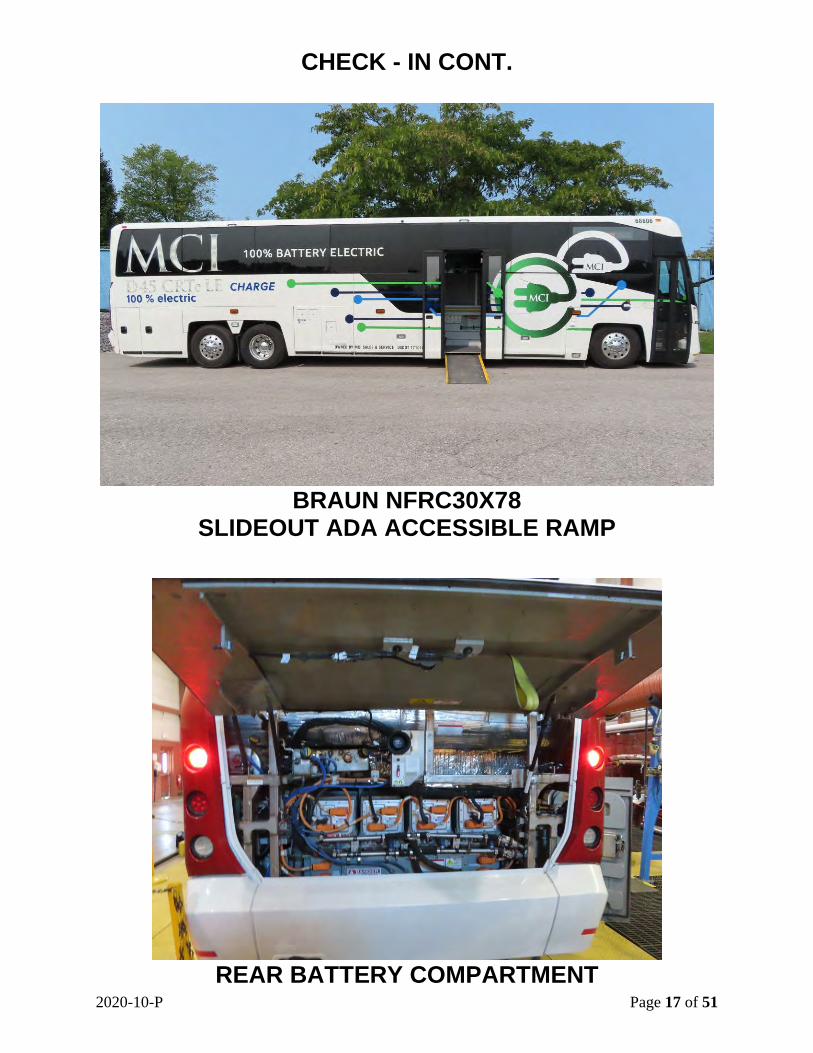
The check-in procedure is used to identify in detail the major components and configuration of the bus.
The test bus consisted of a Motor Coach Industries, model D45 CRTe LE. The bus has a front passenger door forward of the front axle, and an ADA accessible passenger door equipped with a Braun NFRC30X78 slide out ramp between the front and middle axles. Power is provided by a 389 kWh battery pack, a Siemens 1DB2024-ONA06 traction motor and a Siemens ELFA2 Control System. The measured curb weight was 13,100 lb. for the front axle, 17,780 for the middle axle and 12,600 lb. for the rear axle. These combined weights provided a total measured curb weight of 43,480 lb. There are 53 seats (including the driver), one wheelchair position. Two of these seats fold away for an additional wheelchair position. There is free floor space for 36 standing passengers. However, a placard shows the maximum number of standing passengers as 11. Therefore, the gross load represents 51 seated passengers, two wheelchairs and 11 standees only, for a total of 64 passengers. Gross load is calculated as (150 lb. x 62) + (600 lb. x 2) = 10,500 lb. At full declared capacity, the measured gross vehicle weight was 54,000 lb. There is a potential to overload this bus with the available floor space for standing passengers.
2020-10-P Page 7 of 51
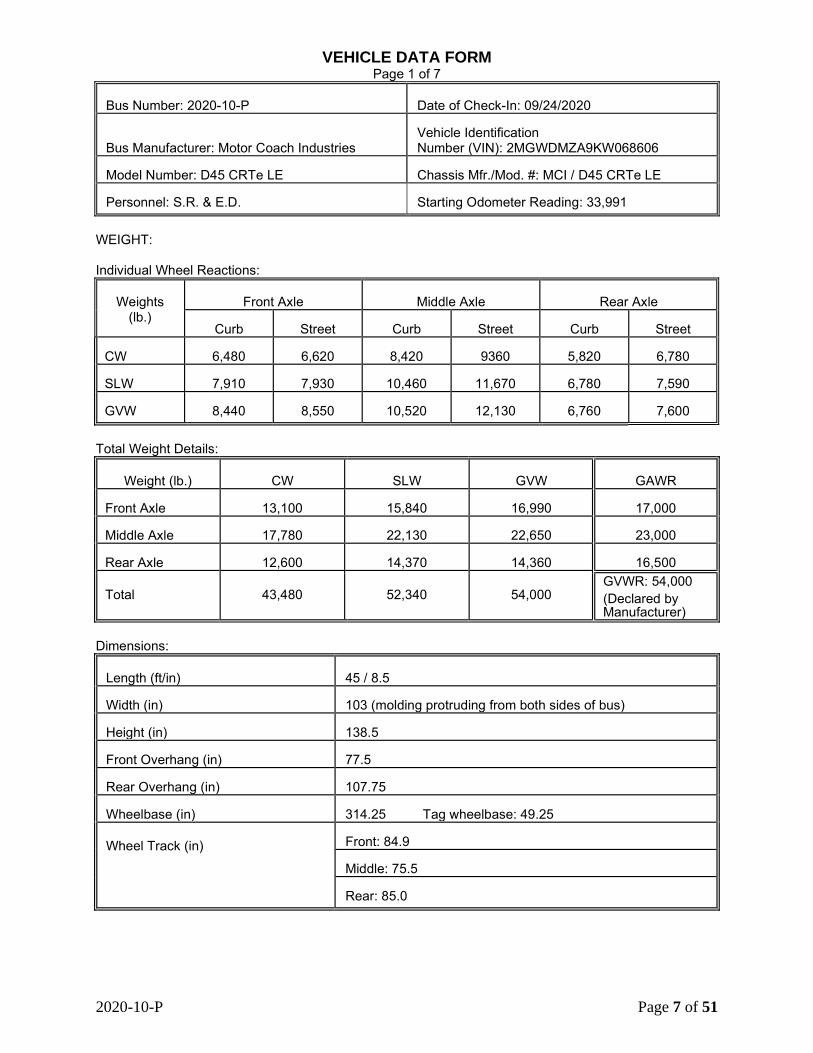
VEHICLE DATA FORM Page 1 of 7
Bus Number: 2020-10-P Date of Check-In: 09/24/2020
Bus Manufacturer: Motor Coach Industries
Vehicle Identification Number (VIN): 2MGWDMZA9KW068606
Model Number: D45 CRTe LE
Chassis Mfr./Mod. #: MCI / D45 CRTe LE
Personnel: S.R. & E.D. Starting Odometer Reading: 33,991
WEIGHT: Individual Wheel Reactions:
Weights
(lb.)
Front Axle
Middle Axle
Rear Axle
Curb
Street
Curb
Street
Curb
Street
CW 6,480 6,620 8,420 9360 5,820 6,780 SLW 7,910 7,930 10,460 11,670 6,780 7,590 GVW 8,440 8,550 10,520 12,130 6,760 7,600
Total Weight Details:
Weight (lb.)
CW
SLW
GVW
GAWR
Front Axle 13,100 15,840 16,990
17,000
Middle Axle 17,780 22,130 22,650
23,000
Rear Axle 12,600 14,370 14,360
16,500
Total 43,480 52,340 54,000
GVWR: 54,000 (Declared by Manufacturer)
Dimensions:
Length (ft/in) 45 / 8.5 Width (in) 103 (molding protruding from both sides of bus) Height (in) 138.5 Front Overhang (in) 77.5 Rear Overhang (in) 107.75 Wheelbase (in) 314.25 Tag wheelbase: 49.25 Wheel Track (in)
Front: 84.9 Middle: 75.5 Rear: 85.0
2020-10-P Page 8 of 51
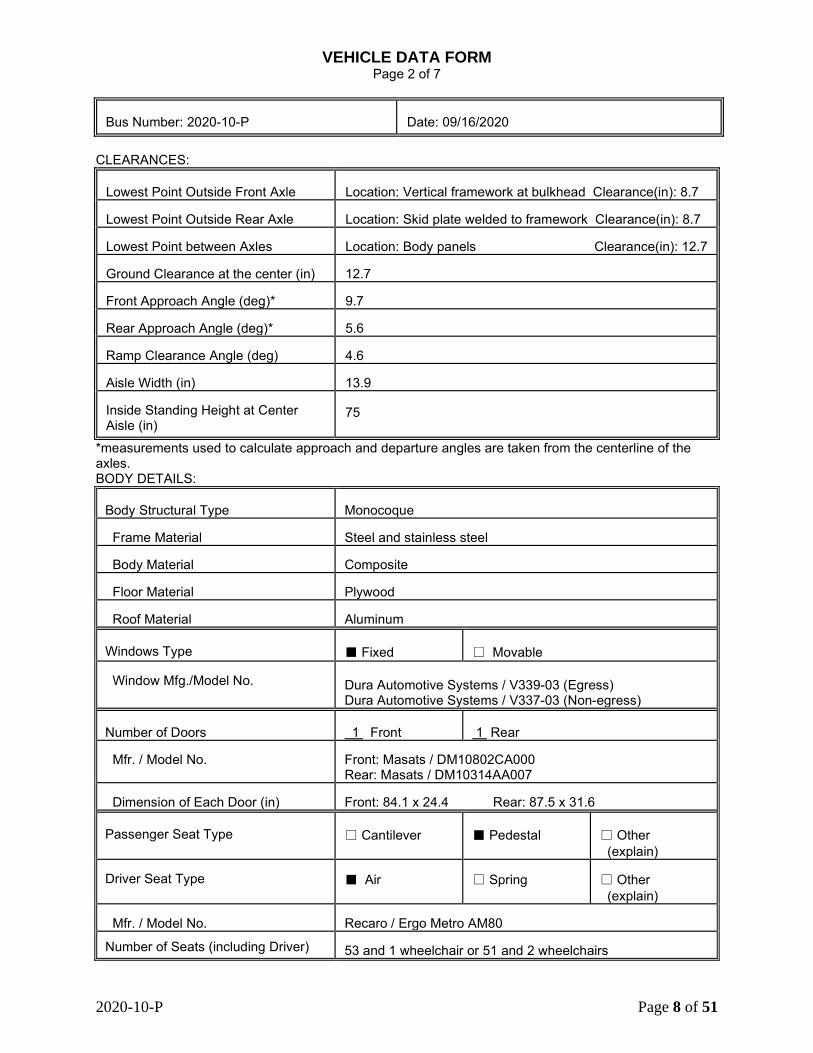
VEHICLE DATA FORM Page 2 of 7
CLEARANCES:
Lowest Point Outside Front Axle
Location: Vertical framework at bulkhead Clearance(in): 8.7
Lowest Point Outside Rear Axle
Location: Skid plate welded to framework Clearance(in): 8.7
Lowest Point between Axles
Location: Body panels Clearance(in): 12.7
Ground Clearance at the center (in) 12.7 Front Approach Angle (deg)* 9.7 Rear Approach Angle (deg)* 5.6 Ramp Clearance Angle (deg) 4.6 Aisle Width (in) 13.9 Inside Standing Height at Center Aisle (in)
75
*measurements used to calculate approach and departure angles are taken from the centerline of the axles. BODY DETAILS:
Body Structural Type Monocoque Frame Material Steel and stainless steel Body Material Composite Floor Material Plywood Roof Material Aluminum Windows Type
■ Fixed
□ Movable
Window Mfg./Model No.
Dura Automotive Systems / V339-03 (Egress) Dura Automotive Systems / V337-03 (Non-egress)
Number of Doors
1 Front
1 Rear
Mfr. / Model No.
Front: Masats / DM10802CA000 Rear: Masats / DM10314AA007
Dimension of Each Door (in) Front: 84.1 x 24.4 Rear: 87.5 x 31.6 Passenger Seat Type
□ Cantilever
■ Pedestal
□ Other (explain)
Driver Seat Type
■ Air
□ Spring
□ Other (explain)
Mfr. / Model No.
Recaro / Ergo Metro AM80
Number of Seats (including Driver) 53 and 1 wheelchair or 51 and 2 wheelchairs
Bus Number: 2020-10-P
Date: 09/16/2020
2020-10-P Page 9 of 51
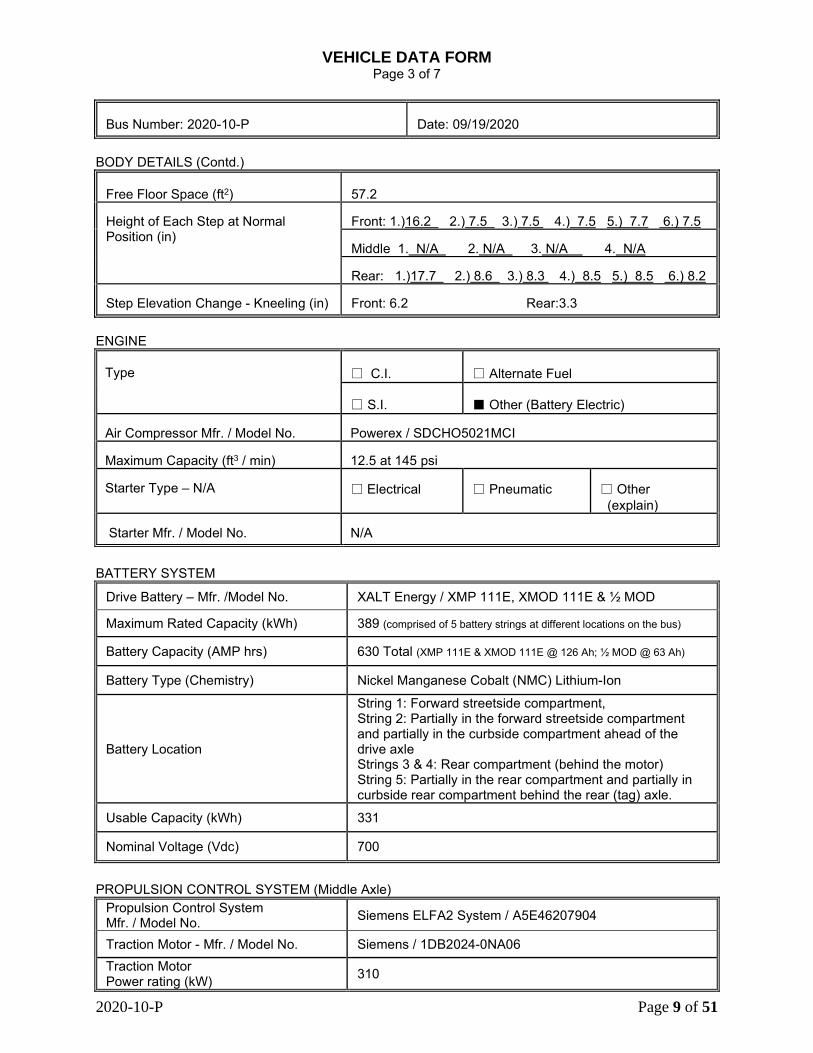
VEHICLE DATA FORM Page 3 of 7
Bus Number: 2020-10-P
Date: 09/19/2020
BODY DETAILS (Contd.)
Free Floor Space (ft2)
57.2
Height of Each Step at Normal Position (in)
Front: 1.)16.2 2.) 7.5 3.) 7.5 4.) 7.5 5.) 7.7 6.) 7.5 Middle 1. N/A 2. N/A 3. N/A 4. N/A Rear: 1.)17.7 2.) 8.6 3.) 8.3 4.) 8.5 5.) 8.5 6.) 8.2
Step Elevation Change - Kneeling (in)
Front: 6.2 Rear:3.3
ENGINE
Type
□ C.I.
□ Alternate Fuel
□ S.I.
■ Other (Battery Electric)
Air Compressor Mfr. / Model No.
Powerex / SDCHO5021MCI
Maximum Capacity (ft3 / min)
12.5 at 145 psi
Starter Type – N/A
□ Electrical
□ Pneumatic
□ Other (explain)
Starter Mfr. / Model No.
N/A
BATTERY SYSTEM
Drive Battery – Mfr. /Model No. XALT Energy / XMP 111E, XMOD 111E & ½ MOD
Maximum Rated Capacity (kWh) 389 (comprised of 5 battery strings at different locations on the bus)
Battery Capacity (AMP hrs) 630 Total (XMP 111E & XMOD 111E @ 126 Ah; ½ MOD @ 63 Ah)
Battery Type (Chemistry) Nickel Manganese Cobalt (NMC) Lithium-Ion
Battery Location
String 1: Forward streetside compartment, String 2: Partially in the forward streetside compartment and partially in the curbside compartment ahead of the drive axle Strings 3 & 4: Rear compartment (behind the motor) String 5: Partially in the rear compartment and partially in curbside rear compartment behind the rear (tag) axle.
Usable Capacity (kWh) 331
Nominal Voltage (Vdc) 700
PROPULSION CONTROL SYSTEM (Middle Axle)
Propulsion Control System Mfr. / Model No. Siemens ELFA2 System / A5E46207904
Traction Motor - Mfr. / Model No. Siemens / 1DB2024-0NA06 Traction Motor Power rating (kW) 310
2020-10-P Page 10 of 51
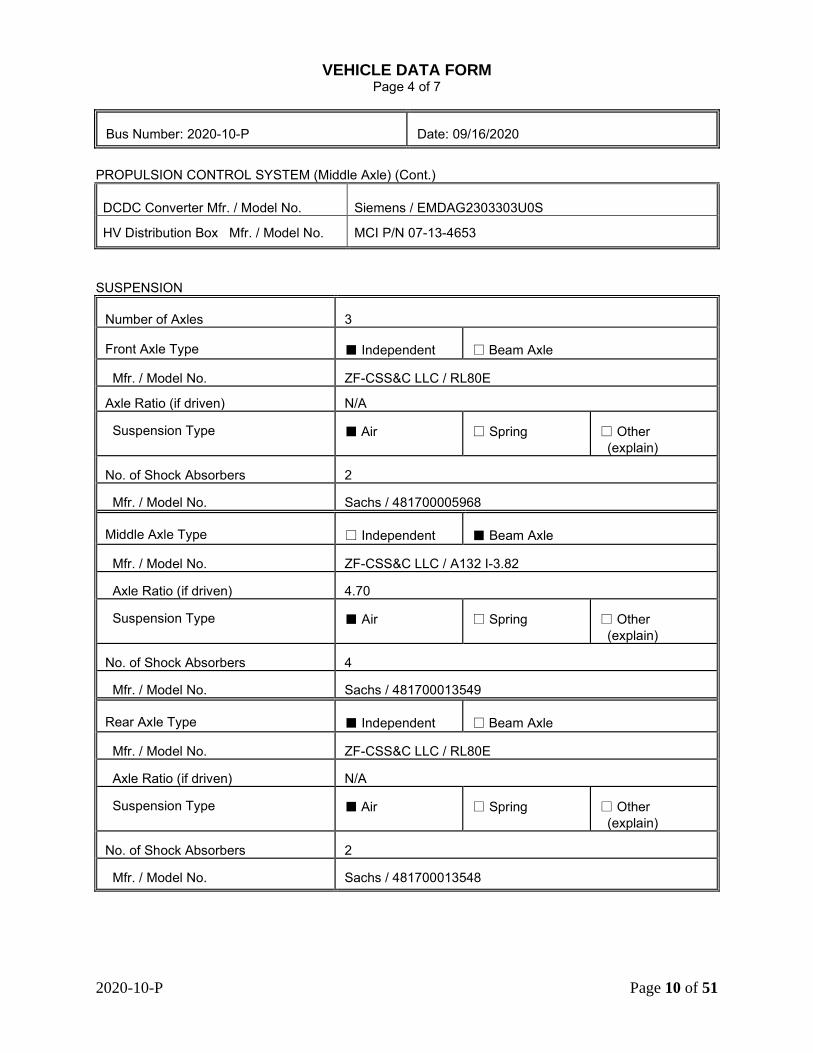
VEHICLE DATA FORM Page 4 of 7
Bus Number: 2020-10-P
Date: 09/16/2020
PROPULSION CONTROL SYSTEM (Middle Axle) (Cont.)
DCDC Converter Mfr. / Model No. Siemens / EMDAG2303303U0S
HV Distribution Box Mfr. / Model No. MCI P/N 07-13-4653
SUSPENSION
Number of Axles
3
Front Axle Type
■ Independent
□ Beam Axle
Mfr. / Model No.
ZF-CSS&C LLC / RL80E
Axle Ratio (if driven) N/A Suspension Type
■ Air
□ Spring
□ Other (explain)
No. of Shock Absorbers
2
Mfr. / Model No.
Sachs / 481700005968
Middle Axle Type
□ Independent
■ Beam Axle
Mfr. / Model No.
ZF-CSS&C LLC / A132 I-3.82
Axle Ratio (if driven)
4.70
Suspension Type
■ Air
□ Spring
□ Other (explain)
No. of Shock Absorbers
4
Mfr. / Model No.
Sachs / 481700013549
Rear Axle Type
■ Independent
□ Beam Axle
Mfr. / Model No.
ZF-CSS&C LLC / RL80E
Axle Ratio (if driven) N/A Suspension Type
■ Air
□ Spring
□ Other (explain)
No. of Shock Absorbers
2
Mfr. / Model No.
Sachs / 481700013548
2020-10-P Page 11 of 51
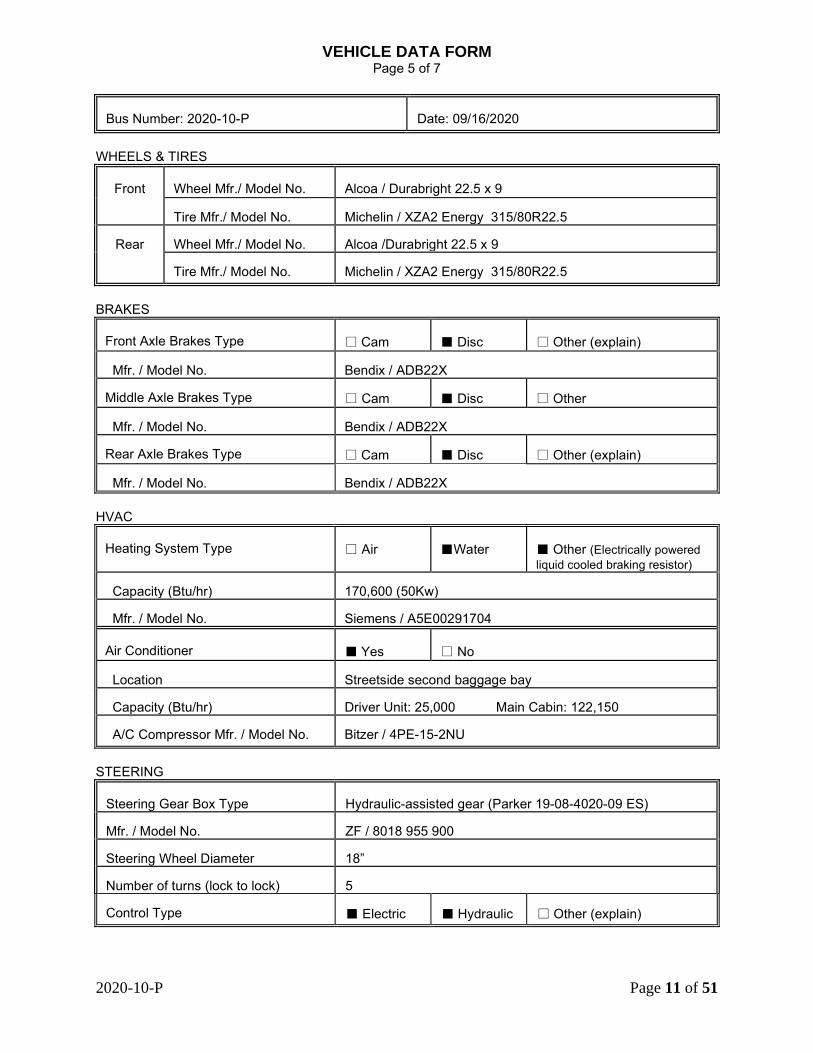
VEHICLE DATA FORM
Page 5 of 7
Bus Number: 2020-10-P
Date: 09/16/2020
WHEELS & TIRES
Front
Wheel Mfr./ Model No. Alcoa / Durabright 22.5 x 9 Tire Mfr./ Model No. Michelin / XZA2 Energy 315/80R22.5
Rear
Wheel Mfr./ Model No. Alcoa /Durabright 22.5 x 9 Tire Mfr./ Model No. Michelin / XZA2 Energy 315/80R22.5
BRAKES
Front Axle Brakes Type
□ Cam
■ Disc
□ Other (explain)
Mfr. / Model No.
Bendix / ADB22X
Middle Axle Brakes Type
□ Cam
■ Disc
□ Other
Mfr. / Model No.
Bendix / ADB22X
Rear Axle Brakes Type
□ Cam
■ Disc
□ Other (explain)
Mfr. / Model No.
Bendix / ADB22X
HVAC
Heating System Type
□ Air
■Water
■ Other (Electrically powered liquid cooled braking resistor)
Capacity (Btu/hr) 170,600 (50Kw) Mfr. / Model No. Siemens / A5E00291704 Air Conditioner
■ Yes
□ No
Location
Streetside second baggage bay
Capacity (Btu/hr)
Driver Unit: 25,000 Main Cabin: 122,150
A/C Compressor Mfr. / Model No.
Bitzer / 4PE-15-2NU
STEERING
Steering Gear Box Type Hydraulic-assisted gear (Parker 19-08-4020-09 ES) Mfr. / Model No. ZF / 8018 955 900 Steering Wheel Diameter 18” Number of turns (lock to lock) 5 Control Type
■ Electric
■ Hydraulic
□ Other (explain)
2020-10-P Page 12 of 51
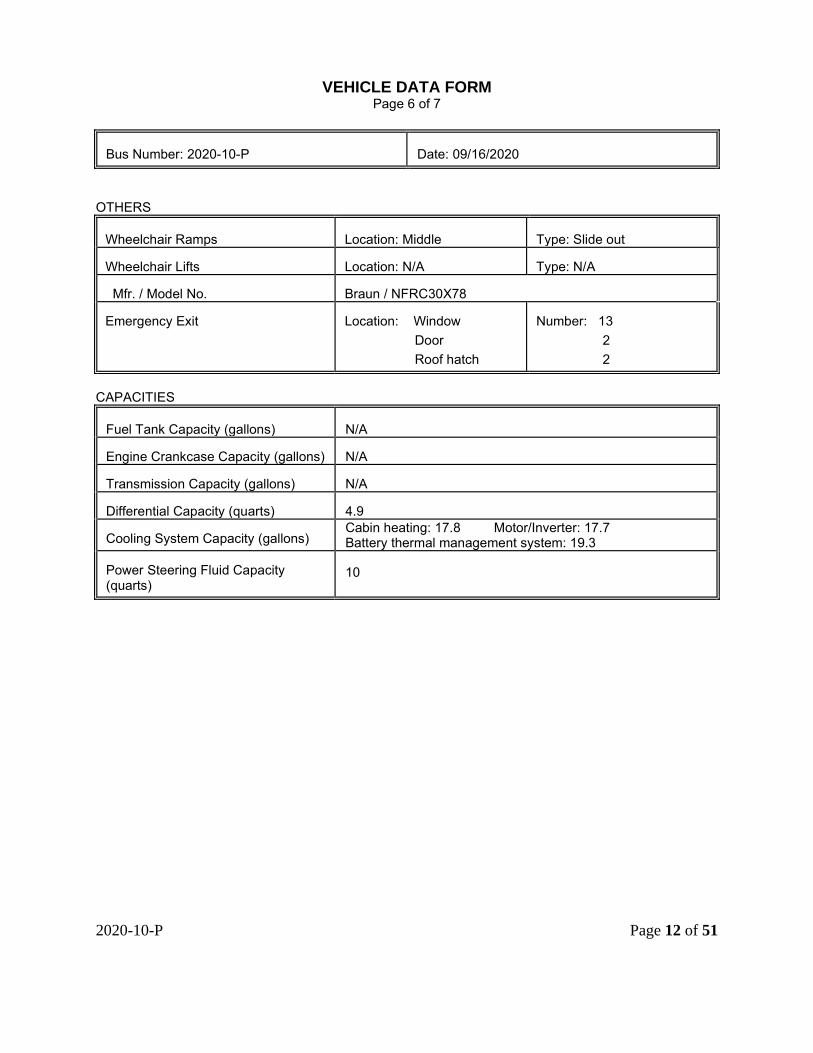
VEHICLE DATA FORM Page 6 of 7
Bus Number: 2020-10-P
Date: 09/16/2020
OTHERS
Wheelchair Ramps
Location: Middle
Type: Slide out
Wheelchair Lifts
Location: N/A
Type: N/A
Mfr. / Model No.
Braun / NFRC30X78
Emergency Exit
Location: Window Door Roof hatch
Number: 13 2 2
CAPACITIES
Fuel Tank Capacity (gallons) N/A Engine Crankcase Capacity (gallons) N/A Transmission Capacity (gallons) N/A Differential Capacity (quarts) 4.9 Cooling System Capacity (gallons)
Cabin heating: 17.8 Motor/Inverter: 17.7 Battery thermal management system: 19.3
Power Steering Fluid Capacity (quarts)
10
2020-10-P Page 13 of 51
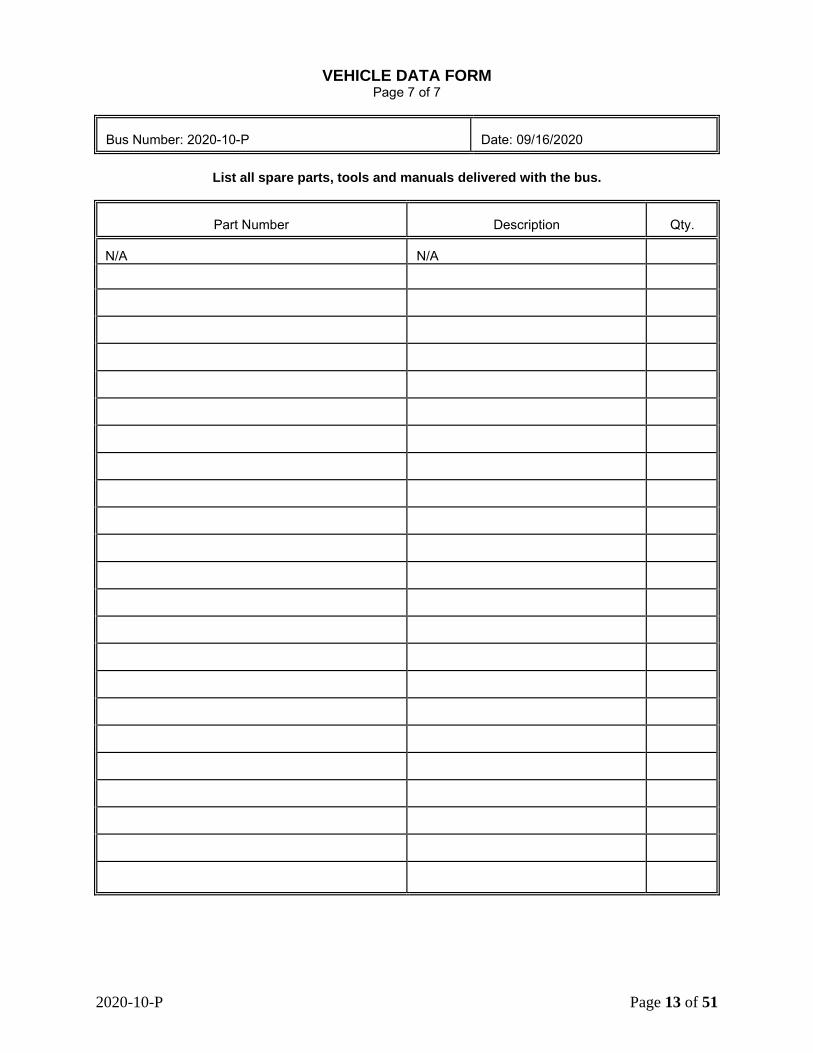
VEHICLE DATA FORM
Page 7 of 7
Bus Number: 2020-10-P
Date: 09/16/2020
List all spare parts, tools and manuals delivered with the bus.
Part Number
Description
Qty.
N/A N/A
2020-10-P Page 14 of 51
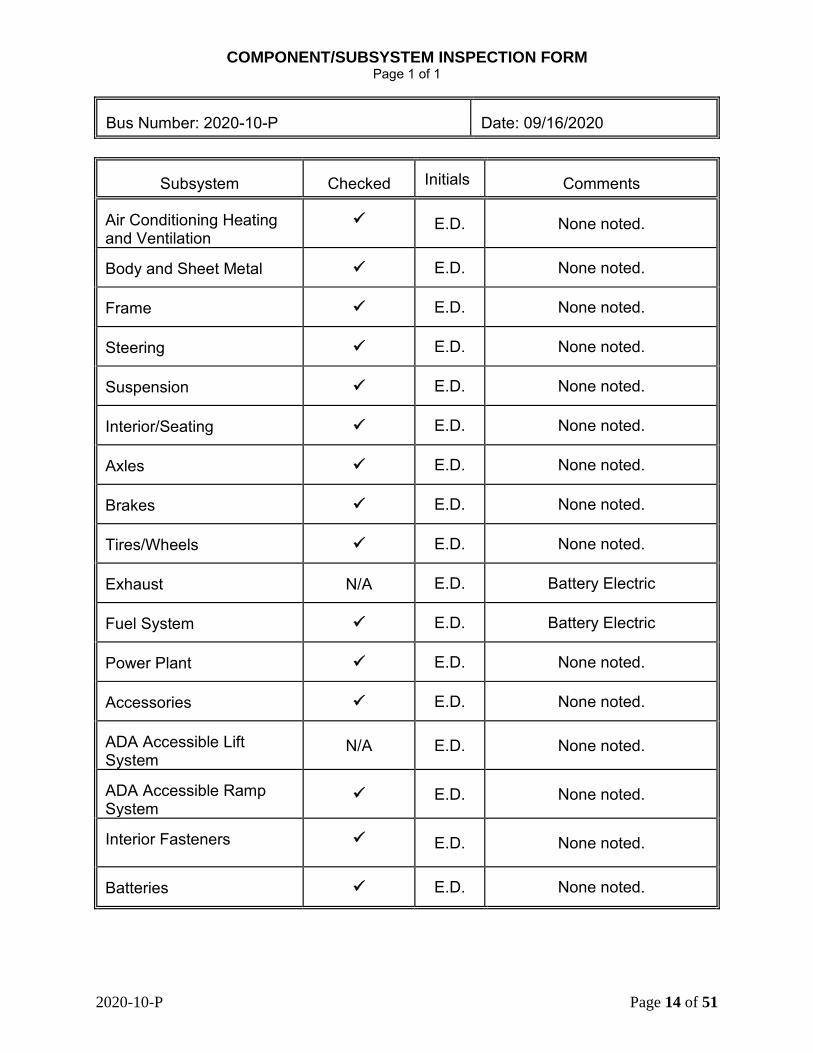
COMPONENT/SUBSYSTEM INSPECTION FORM Page 1 of 1
Bus Number: 2020-10-P
Date: 09/16/2020
Subsystem
Checked
Initials
Comments
Air Conditioning Heating and Ventilation
E.D. None noted.
Body and Sheet Metal
E.D. None noted.
Frame
E.D. None noted.
Steering
E.D. None noted.
Suspension
E.D. None noted.
Interior/Seating
E.D. None noted.
Axles
E.D. None noted.
Brakes
E.D. None noted.
Tires/Wheels
E.D. None noted.
Exhaust
N/A E.D. Battery Electric
Fuel System
E.D. Battery Electric
Power Plant
E.D. None noted.
Accessories
E.D. None noted.
ADA Accessible Lift System
N/A E.D. None noted.
ADA Accessible Ramp System
E.D. None noted.
Interior Fasteners
E.D. None noted.
Batteries
E.D. None noted.
2020-10-P Page 15 of 51
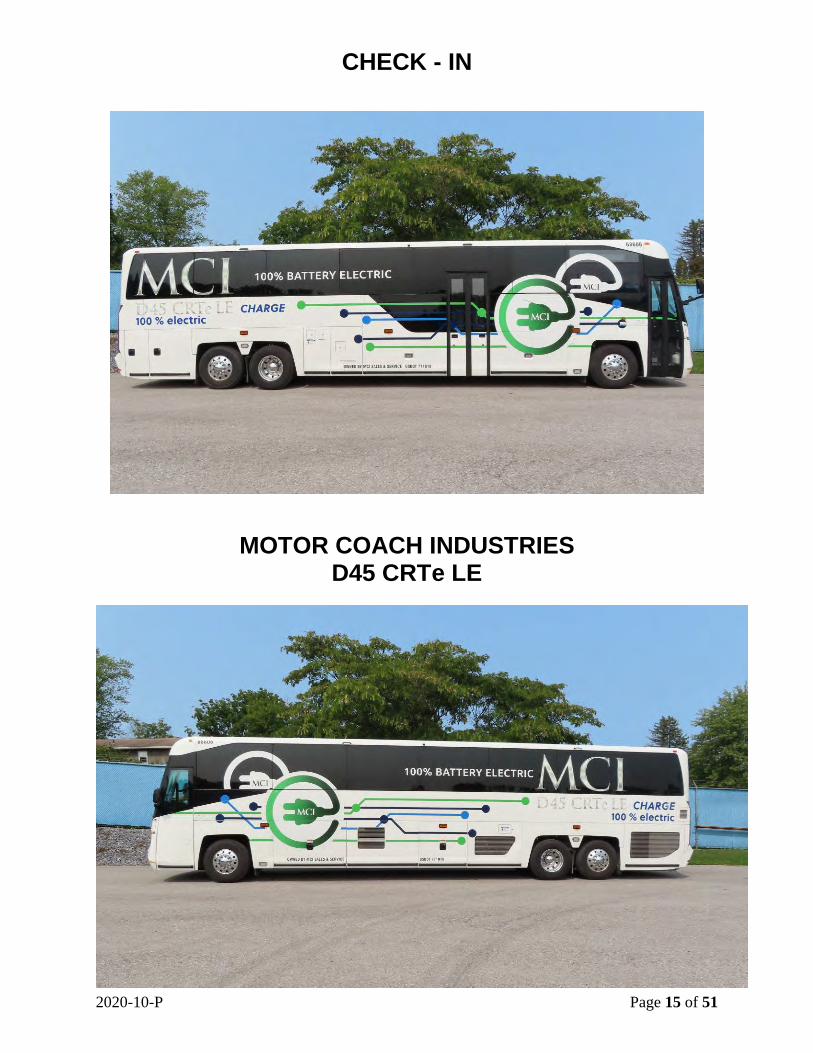
CHECK - IN
MOTOR COACH INDUSTRIES D45 CRTe LE
2020-10-P Page 16 of 51
CHECK - IN CONT.
MOTOR COACH INDUSTRIES D45 CRTe LE
2020-10-P Page 17 of 51
CHECK - IN CONT.
BRAUN NFRC30X78
SLIDEOUT ADA ACCESSIBLE RAMP
REAR BATTERY COMPARTMENT
2020-10-P Page 18 of 51
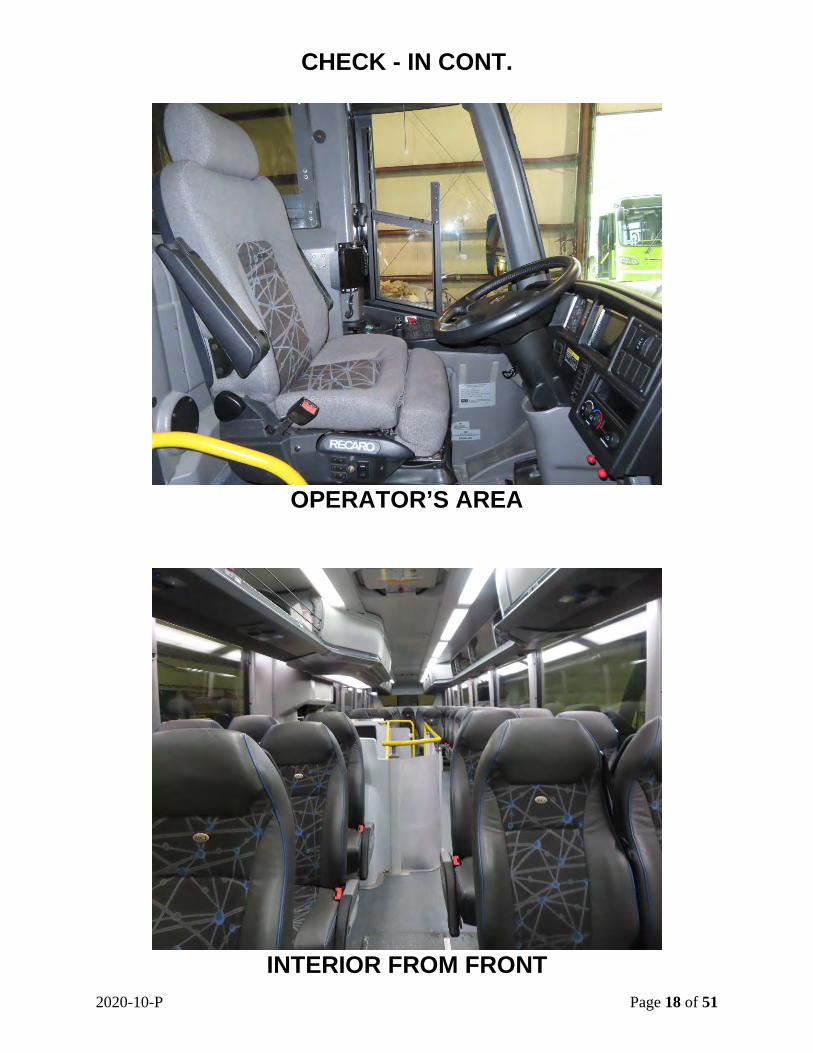
CHECK - IN CONT.
OPERATOR’S AREA
INTERIOR FROM FRONT
2020-10-P Page 19 of 51
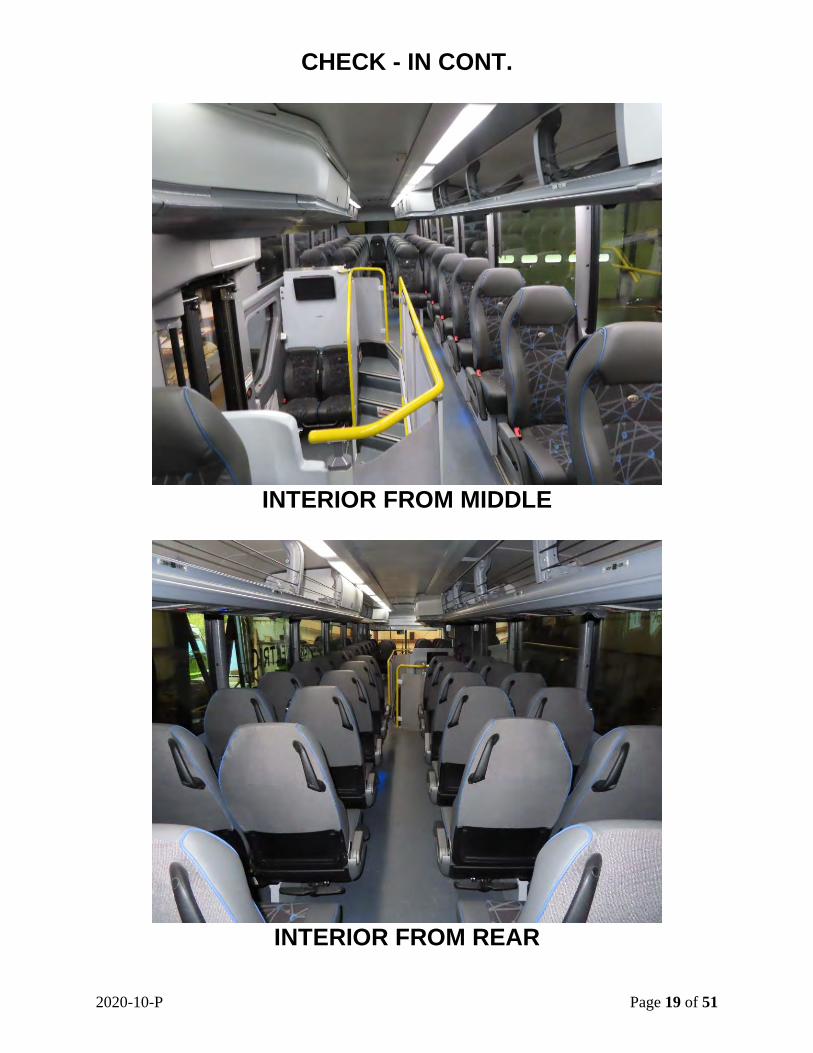
CHECK - IN CONT.
INTERIOR FROM MIDDLE
INTERIOR FROM REAR
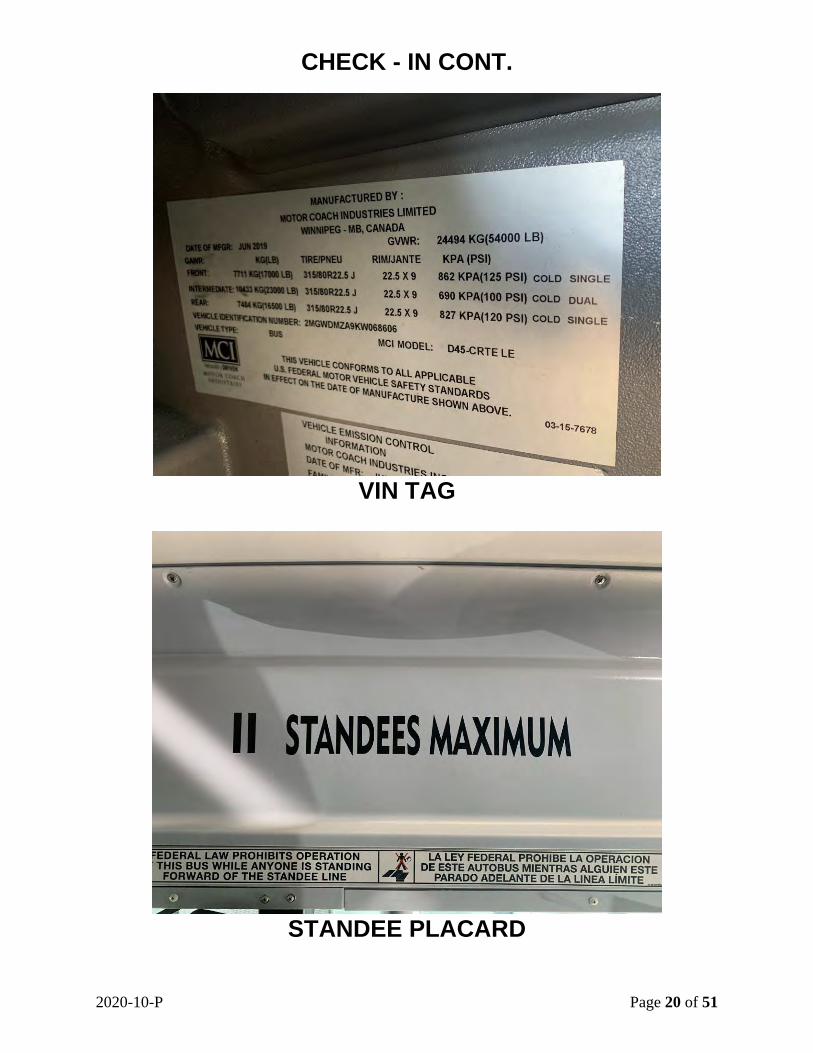
2020-10-P Page 20 of 51
CHECK - IN CONT.
VIN TAG
STANDEE PLACARD

2020-10-P Page 21 of 51
CHECK - IN CONT.
CHARGE POINT CHARGER
2020-10-P Page 22 of 51
1. MAINTAINABILITY
1.1 ACCESSIBILITY OF COMPONENTS AND SUBSYSTEMS 1.1-I. TEST OBJECTIVE
The objective of this test is to check the accessibility of components and subsystems. 1.1-II. TEST DESCRIPTION
Accessibility of components and subsystems was checked, and where accessibility was restricted the subsystem was noted along with the reason for the restriction. 1.1-III. DISCUSSION
Accessibility, in general, was adequate. Components covered in Section 1.3 (repair and/or replacement of selected subsystems), along with all other components encountered during testing, were found to be readily accessible and no restrictions were noted.
2020-10-P Page 23 of 51
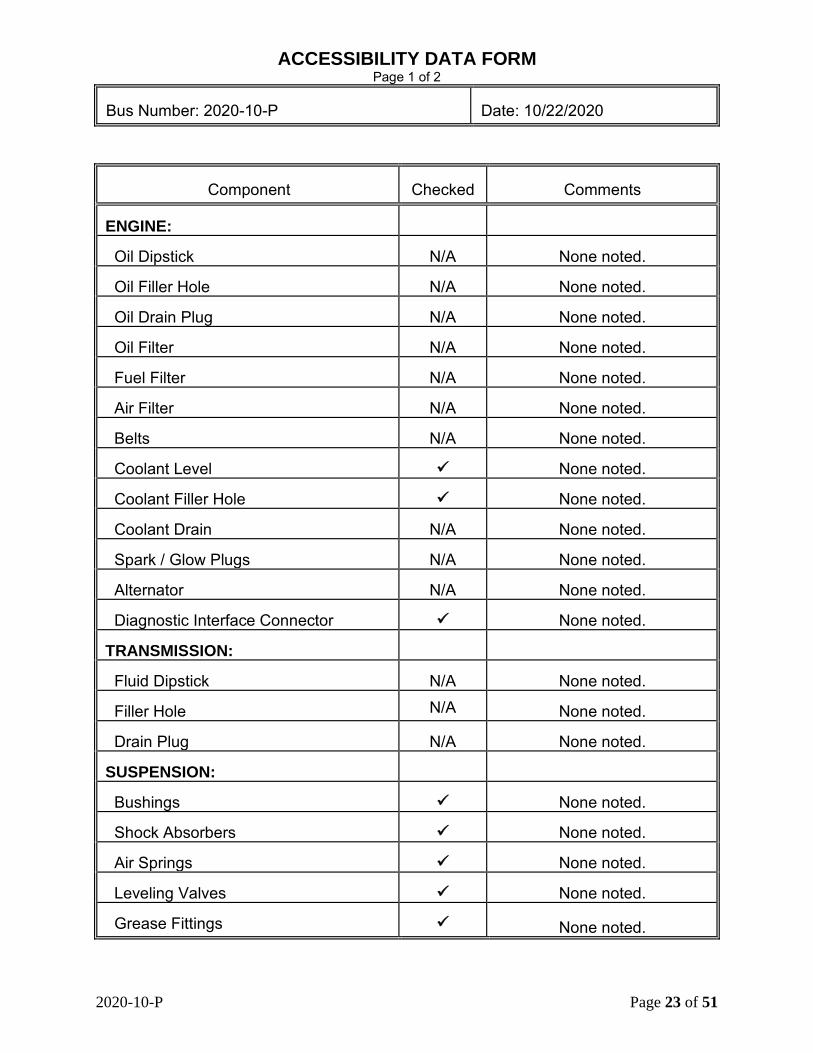
ACCESSIBILITY DATA FORM Page 1 of 2
Bus Number: 2020-10-P
Date: 10/22/2020
Component
Checked
Comments
ENGINE:
Oil Dipstick
N/A None noted.
Oil Filler Hole N/A None noted. Oil Drain Plug N/A None noted. Oil Filter N/A None noted. Fuel Filter N/A None noted. Air Filter N/A None noted. Belts N/A None noted. Coolant Level
None noted.
Coolant Filler Hole
None noted.
Coolant Drain N/A None noted. Spark / Glow Plugs N/A None noted. Alternator N/A None noted. Diagnostic Interface Connector
None noted.
TRANSMISSION:
Fluid Dipstick N/A None noted. Filler Hole N/A None noted. Drain Plug N/A None noted. SUSPENSION:
Bushings
None noted.
Shock Absorbers
None noted.
Air Springs
None noted.
Leveling Valves
None noted.
Grease Fittings
None noted.
2020-10-P Page 24 of 51
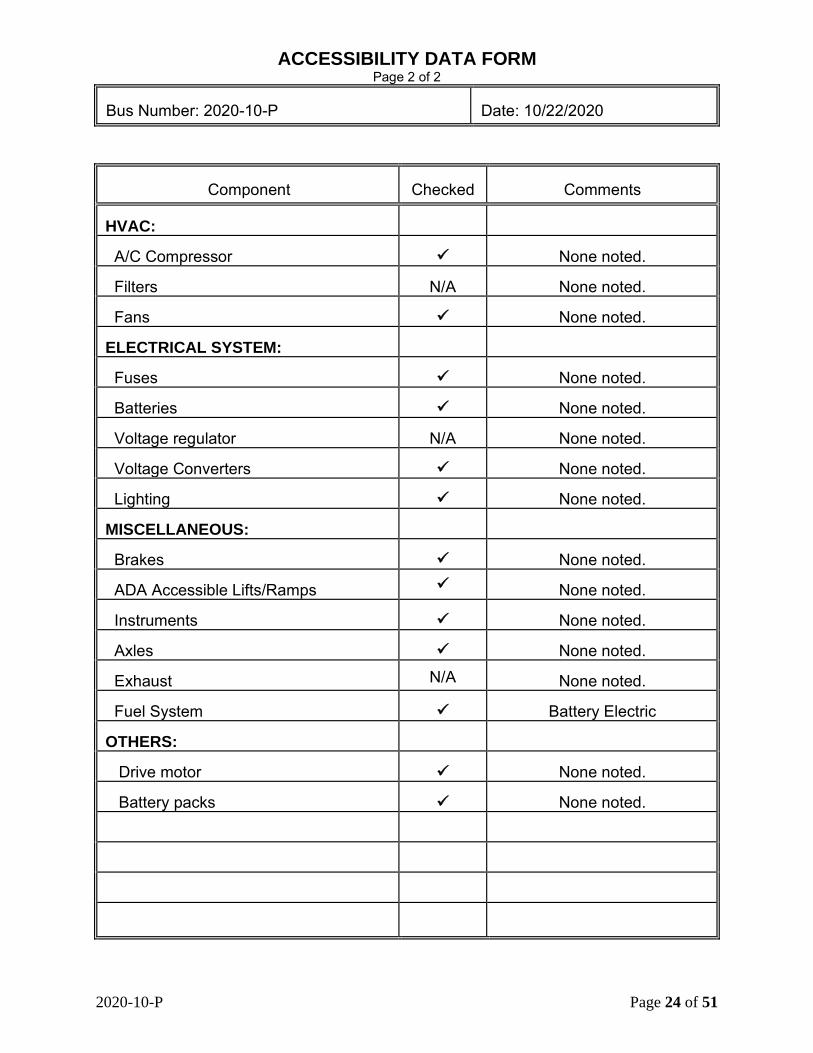
ACCESSIBILITY DATA FORM Page 2 of 2
Bus Number: 2020-10-P
Date: 10/22/2020
Component
Checked
Comments
HVAC:
A/C Compressor
None noted.
Filters N/A None noted. Fans
None noted.
ELECTRICAL SYSTEM:
Fuses
None noted.
Batteries
None noted.
Voltage regulator N/A None noted. Voltage Converters
None noted.
Lighting
None noted.
MISCELLANEOUS:
Brakes
None noted.
ADA Accessible Lifts/Ramps None noted. Instruments
None noted.
Axles
None noted.
Exhaust N/A None noted. Fuel System
Battery Electric
OTHERS:
Drive motor None noted. Battery packs None noted.
2020-10-P Page 25 of 51
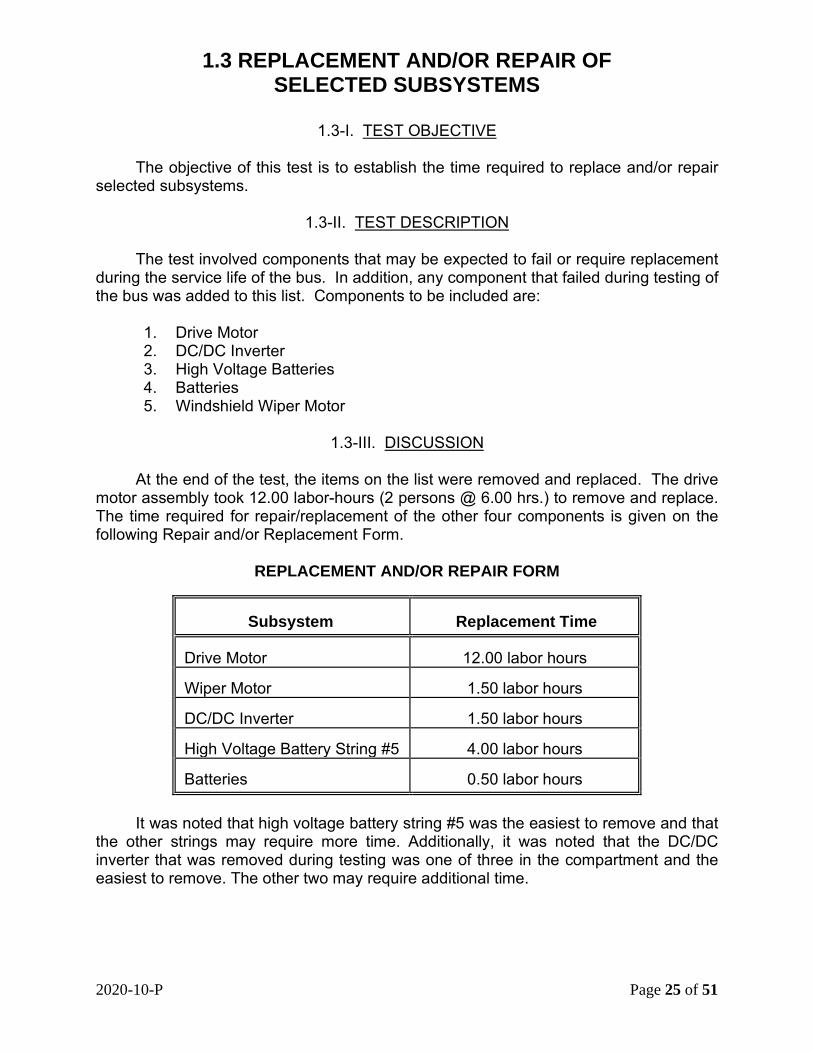
1.3 REPLACEMENT AND/OR REPAIR OF SELECTED SUBSYSTEMS 1.3-I. TEST OBJECTIVE
The objective of this test is to establish the time required to replace and/or repair selected subsystems. 1.3-II. TEST DESCRIPTION
The test involved components that may be expected to fail or require replacement during the service life of the bus. In addition, any component that failed during testing of the bus was added to this list. Components to be included are:
1. Drive Motor 2. DC/DC Inverter 3. High Voltage Batteries 4. Batteries 5. Windshield Wiper Motor
1.3-III. DISCUSSION
At the end of the test, the items on the list were removed and replaced. The drive motor assembly took 12.00 labor-hours (2 persons @ 6.00 hrs.) to remove and replace. The time required for repair/replacement of the other four components is given on the following Repair and/or Replacement Form.
REPLACEMENT AND/OR REPAIR FORM
Subsystem
Replacement Time
Drive Motor
12.00 labor hours
Wiper Motor
1.50 labor hours
DC/DC Inverter
1.50 labor hours
High Voltage Battery String #5
4.00 labor hours
Batteries
0.50 labor hours
It was noted that high voltage battery string #5 was the easiest to remove and that
the other strings may require more time. Additionally, it was noted that the DC/DC inverter that was removed during testing was one of three in the compartment and the easiest to remove. The other two may require additional time.
2020-10-P Page 26 of 51
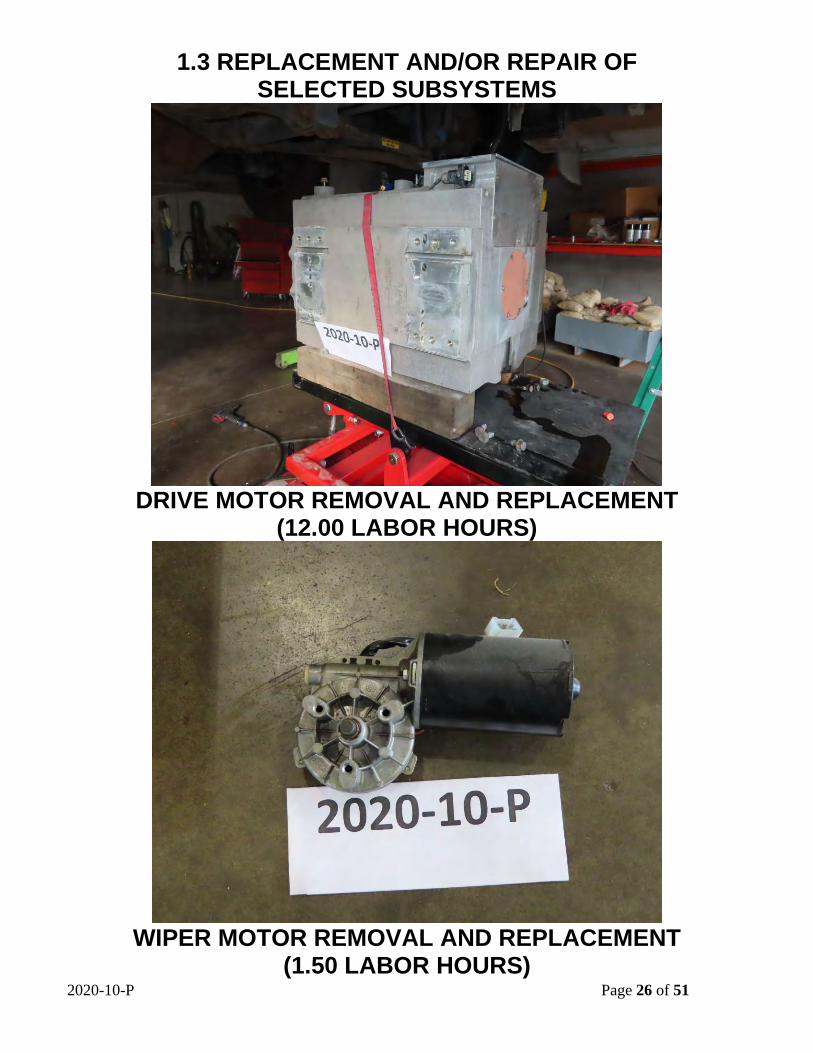
1.3 REPLACEMENT AND/OR REPAIR OF SELECTED SUBSYSTEMS
DRIVE MOTOR REMOVAL AND REPLACEMENT
(12.00 LABOR HOURS)
WIPER MOTOR REMOVAL AND REPLACEMENT
(1.50 LABOR HOURS)
2020-10-P Page 27 of 51
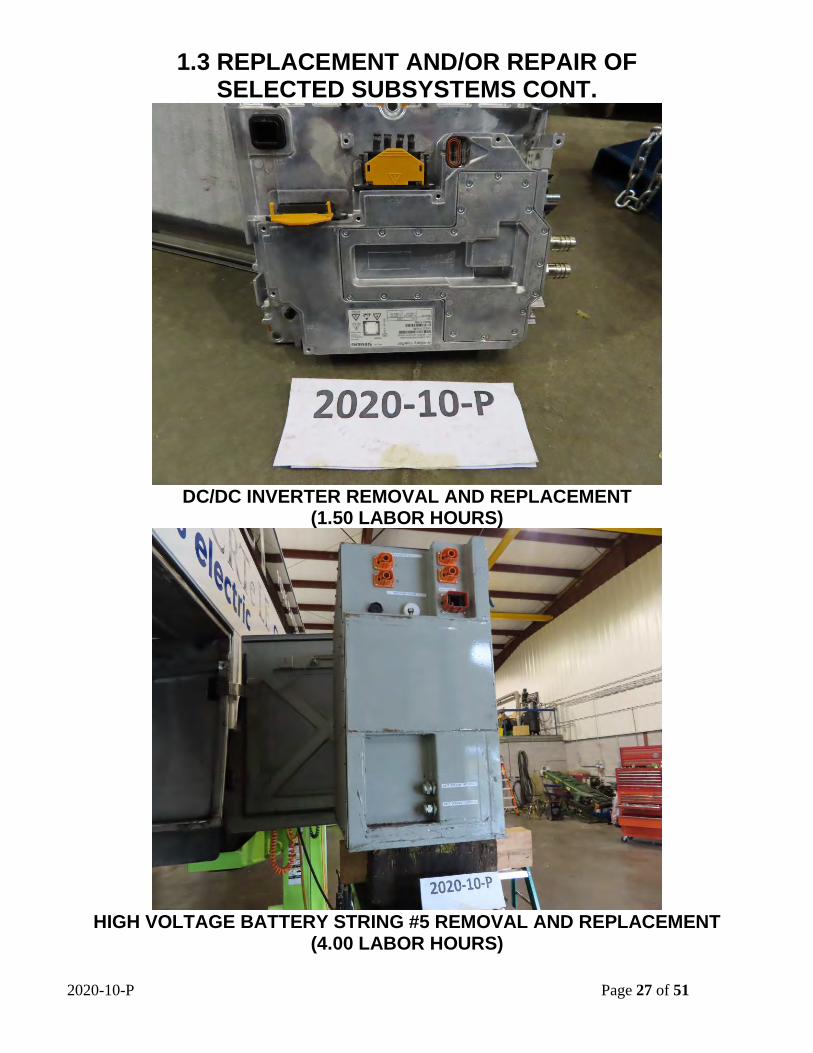
1.3 REPLACEMENT AND/OR REPAIR OF SELECTED SUBSYSTEMS CONT.
DC/DC INVERTER REMOVAL AND REPLACEMENT (1.50 LABOR HOURS)
HIGH VOLTAGE BATTERY STRING #5 REMOVAL AND REPLACEMENT
(4.00 LABOR HOURS)
2020-10-P Page 28 of 51
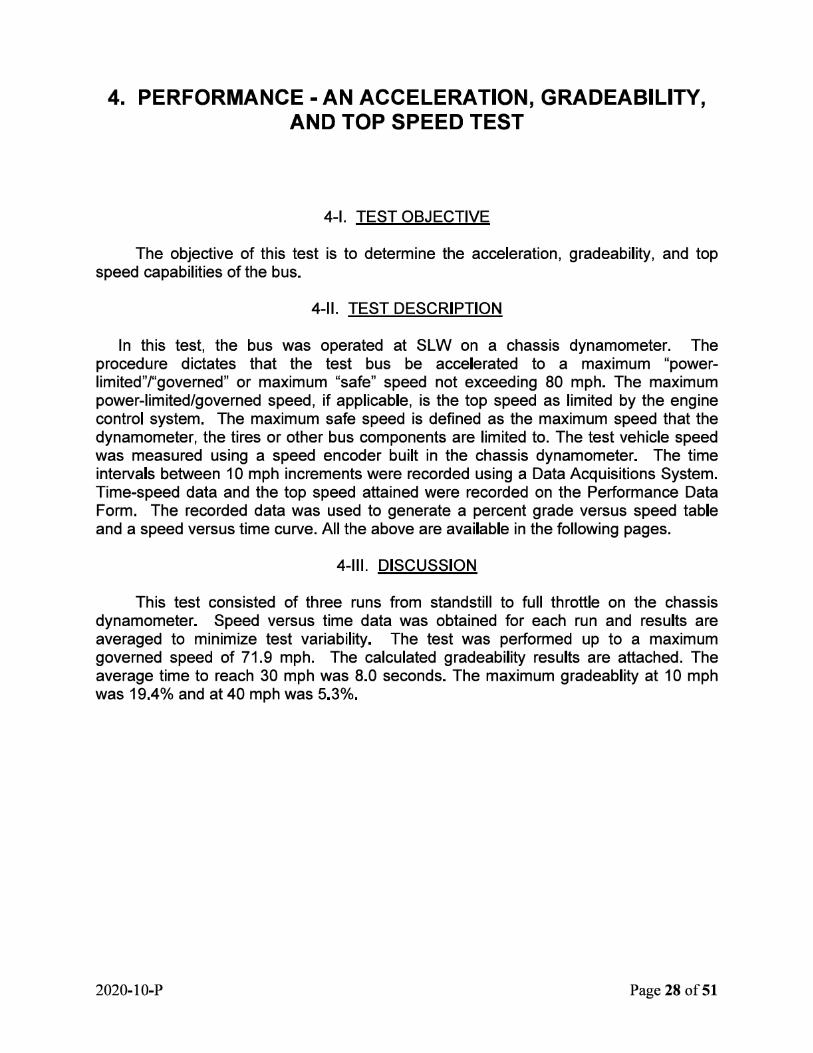
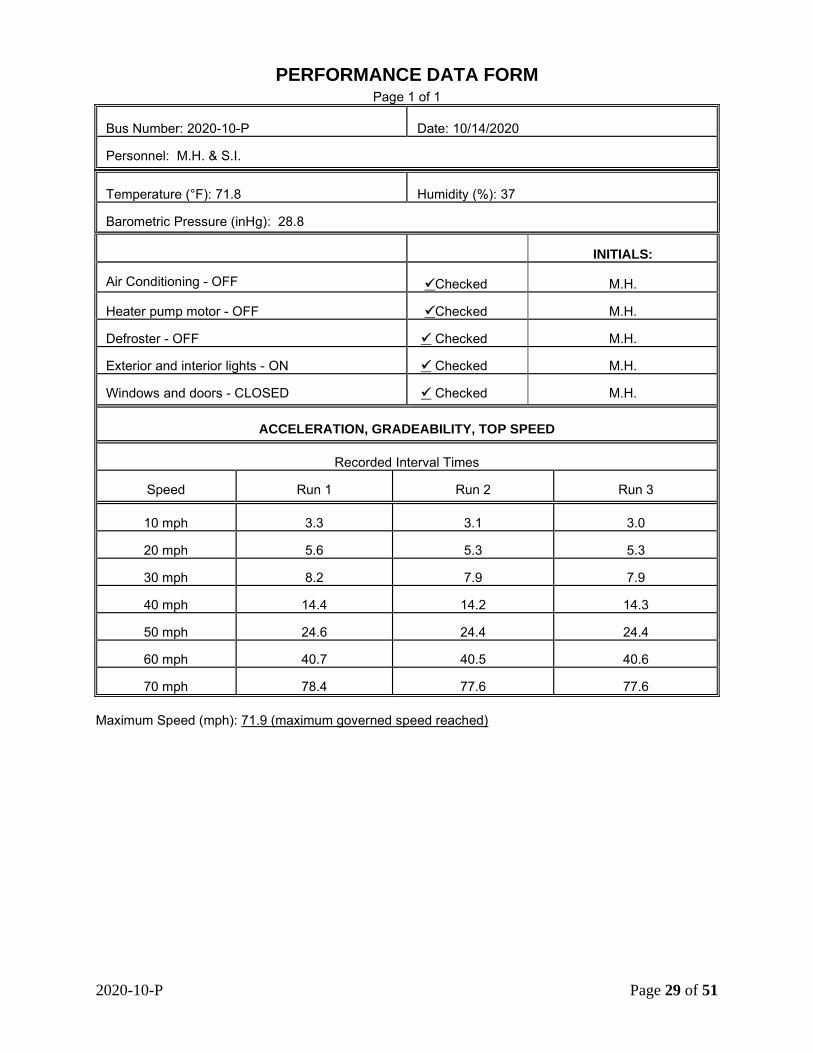
4. PERFORMANCE - AN ACCELERATION, GRADEABILITY, AND TOP SPEED TEST 4-I. TEST OBJECTIVE
The objective of this test is to determine the acceleration, gradeability, and top speed capabilities of the bus. 4-II. TEST DESCRIPTION In this test, the bus was operated at SLW on a chassis dynamometer. The procedure dictates that the test bus be accelerated to a maximum “power-limited”/“governed” or maximum “safe” speed not exceeding 80 mph. The maximum power-limited/governed speed, if applicable, is the top speed as limited by the engine control system. The maximum safe speed is defined as the maximum speed that the dynamometer, the tires or other bus components are limited to. The test vehicle speed was measured using a speed encoder built in the chassis dynamometer. The time intervals between 10 mph increments were recorded using a Data Acquisitions System. Time-speed data and the top speed attained were recorded on the Performance Data Form. The recorded data was used to generate a percent grade versus speed table and a speed versus time curve. All the above are available in the following pages. 4-III. DISCUSSION
This test consisted of three runs from standstill to full throttle on the chassis dynamometer. Speed versus time data was obtained for each run and results are averaged to minimize test variability. The test was performed up to a maximum governed speed of 71.9 mph. The calculated gradeability results are attached. The average time to reach 30 mph was 8.0 seconds. The maximum gradeablity at 10 mph was 19.4% and at 40 mph was 5.3%.
2020-10-P Page 29 of 51
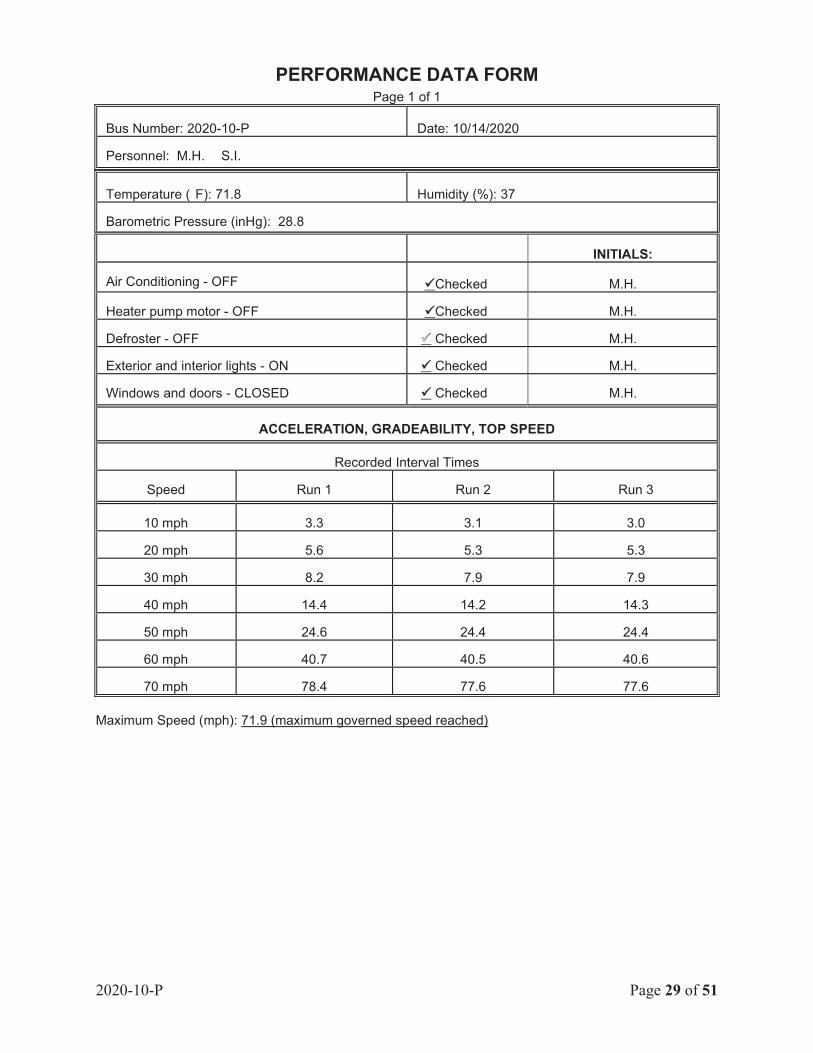
PERFORMANCE DATA FORM Page 1 of 1
Bus Number: 2020-10-P
Date: 10/14/2020
Personnel: M.H. & S.I.
Temperature (°F): 71.8
Humidity (%): 37
Barometric Pressure (inHg): 28.8
INITIALS: Air Conditioning - OFF
Checked M.H.
Heater pump motor - OFF
Checked M.H.
Defroster - OFF
Checked M.H.
Exterior and interior lights - ON
Checked M.H.
Windows and doors - CLOSED Checked M.H.
ACCELERATION, GRADEABILITY, TOP SPEED
Recorded Interval Times
Speed
Run 1
Run 2
Run 3
10 mph 3.3 3.1 3.0
20 mph 5.6 5.3 5.3
30 mph 8.2 7.9 7.9
40 mph 14.4 14.2 14.3
50 mph 24.6 24.4 24.4
60 mph 40.7 40.5 40.6
70 mph 78.4 77.6 77.6 Maximum Speed (mph): 71.9 (maximum governed speed reached)
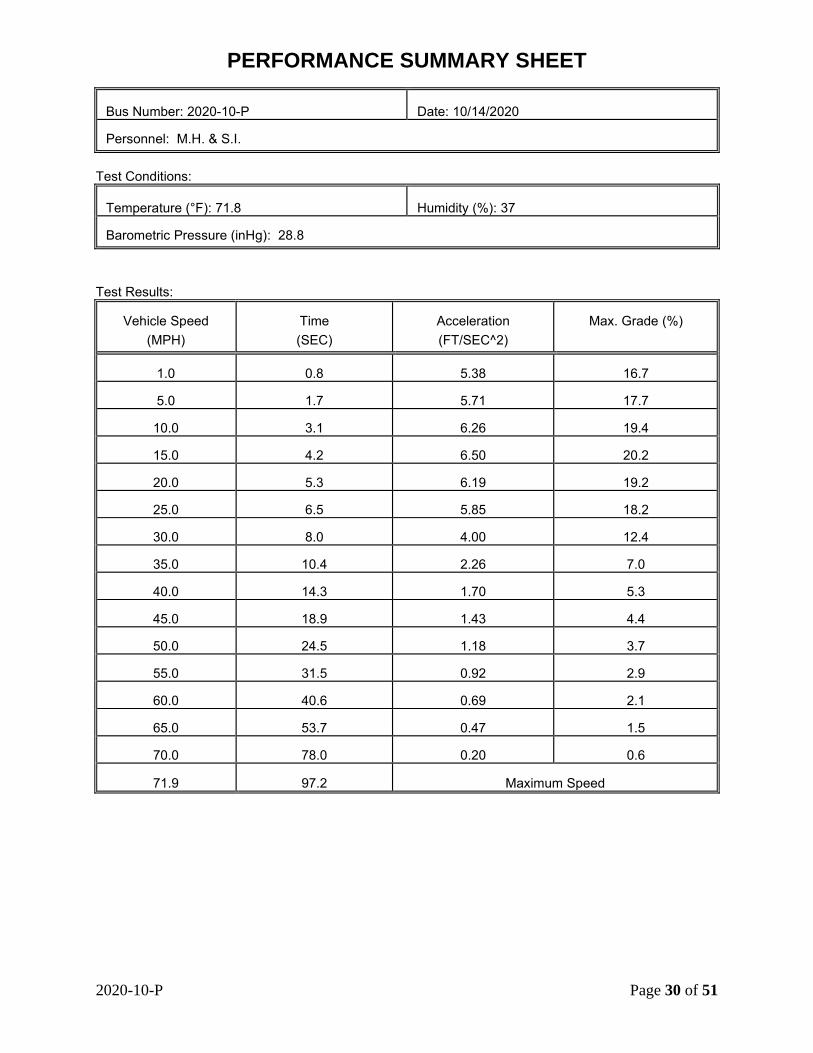
2020-10-P Page 30 of 51
PERFORMANCE SUMMARY SHEET
Bus Number: 2020-10-P
Date: 10/14/2020
Personnel: M.H. & S.I.
Test Conditions:
Temperature (°F): 71.8
Humidity (%): 37
Barometric Pressure (inHg): 28.8
Test Results:
Vehicle Speed
(MPH)
Time (SEC)
Acceleration (FT/SEC^2)
Max. Grade (%)
1.0 0.8 5.38 16.7
5.0 1.7 5.71 17.7
10.0 3.1 6.26 19.4
15.0 4.2 6.50 20.2
20.0 5.3 6.19 19.2
25.0 6.5 5.85 18.2
30.0 8.0 4.00 12.4
35.0 10.4 2.26 7.0
40.0 14.3 1.70 5.3
45.0 18.9 1.43 4.4
50.0 24.5 1.18 3.7
55.0 31.5 0.92 2.9
60.0 40.6 0.69 2.1
65.0 53.7 0.47 1.5
70.0 78.0 0.20 0.6
71.9 97.2 Maximum Speed

2020-10-P Page 31 of 51
2020-10-P Page 32 of 51
6. ENERGY ECONOMY AND RANGE TEST – AN ENERGY CONSUMPTION AND RANGE TEST FOR BATTERY
ELECTRIC BUSES USING APPROPRIATE OPERATING CYCLES
6-I. TEST OBJECTIVE
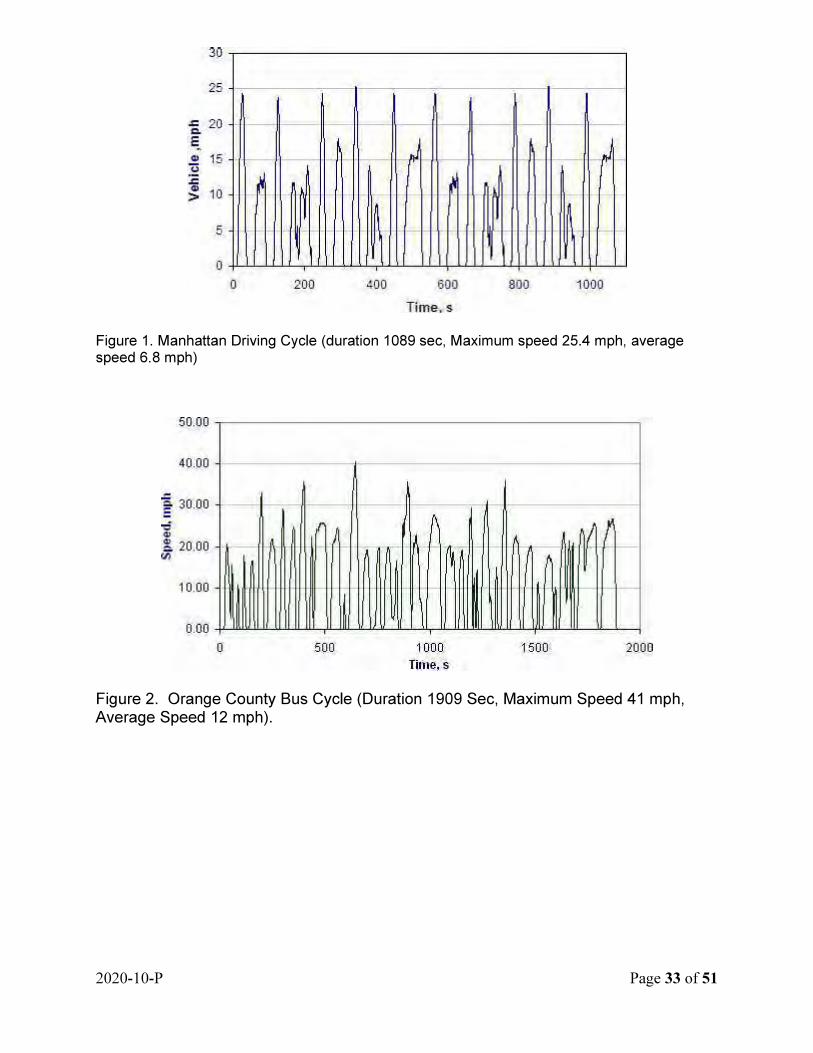
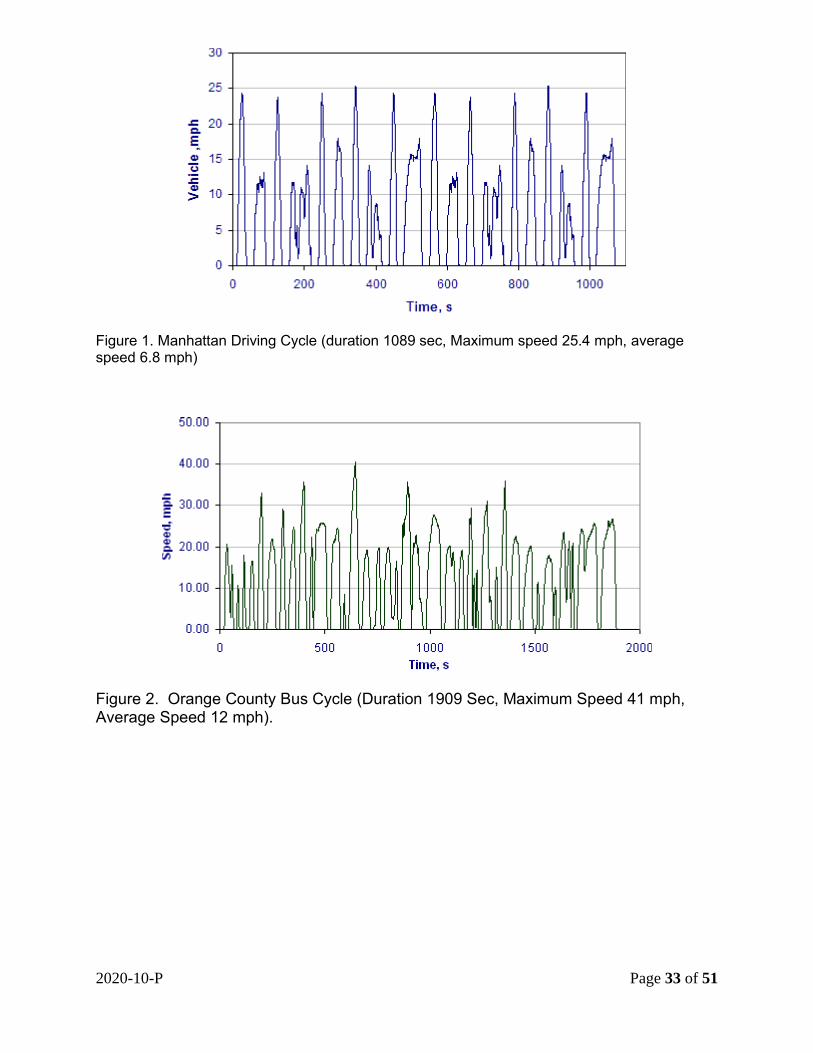
The objective of this test is to provide accurate comparable energy consumption data on battery electric transit buses produced by different manufacturers. This energy economy test bears no relation to the calculations done by the Environmental Protection Agency (EPA) to determine levels for the Corporate Average Fuel Economy Program. EPA’s calculations are based on tests conducted under laboratory conditions intended to simulate city and highway driving. This energy economy test, as designated here, is a measurement of the energy consumed by a vehicle traveling a specified test operating profile, under specified operating conditions that are typical of transit bus operation. The results of this test will not represent actual energy usage but will provide data that can be used by FTA Grantees to compare buses tested using this procedure. 6-II. TEST DESCRIPTION This test is performed in the emissions bay of the LTI Vehicle Testing Laboratory. The Laboratory is equipped with a Schenk Pegasus 300 HP, large-roll (72 inch diameter) chassis dynamometer suitable for heavy-vehicle emissions testing. The driving cycles are the Manhattan cycle, a low average speed, highly transient urban cycle (Figure 1), the Orange County Bus Cycle which consists of urban and highway driving segments (Figure 2), and the EPA HD-UDDS Cycle (Figure 3). This test is conducted at seated load weight. This test is conducted generally as per the methods described in the SAE standard J 1634-2017. The light-duty test cycles specified in this standard are replaced by transit bus test cycles mentioned above. The Multi-Cycle test (MCT) procedure is adopted for this bus. The end of test is determined when the bus cannot keep up with the speed trace of the test cycle, as recommended by the bus manufacturer. The battery system is recharged to full SOC at the end of the test, following procedures specified in SAE J 1634-2017. During the recharge, the DC energy (into the battery system) and the AC energy (into the charger) are recorded. From these data, the average AC energy consumption, the charger efficiency (DC Energy, kWh/AC Energy, kWh) and range (miles) for each test cycle is calculated.
2020-10-P Page 33 of 51
Figure 1. Manhattan Driving Cycle (duration 1089 sec, Maximum speed 25.4 mph, average speed 6.8 mph)
Figure 2. Orange County Bus Cycle (Duration 1909 Sec, Maximum Speed 41 mph, Average Speed 12 mph).
2020-10-P Page 34 of 51
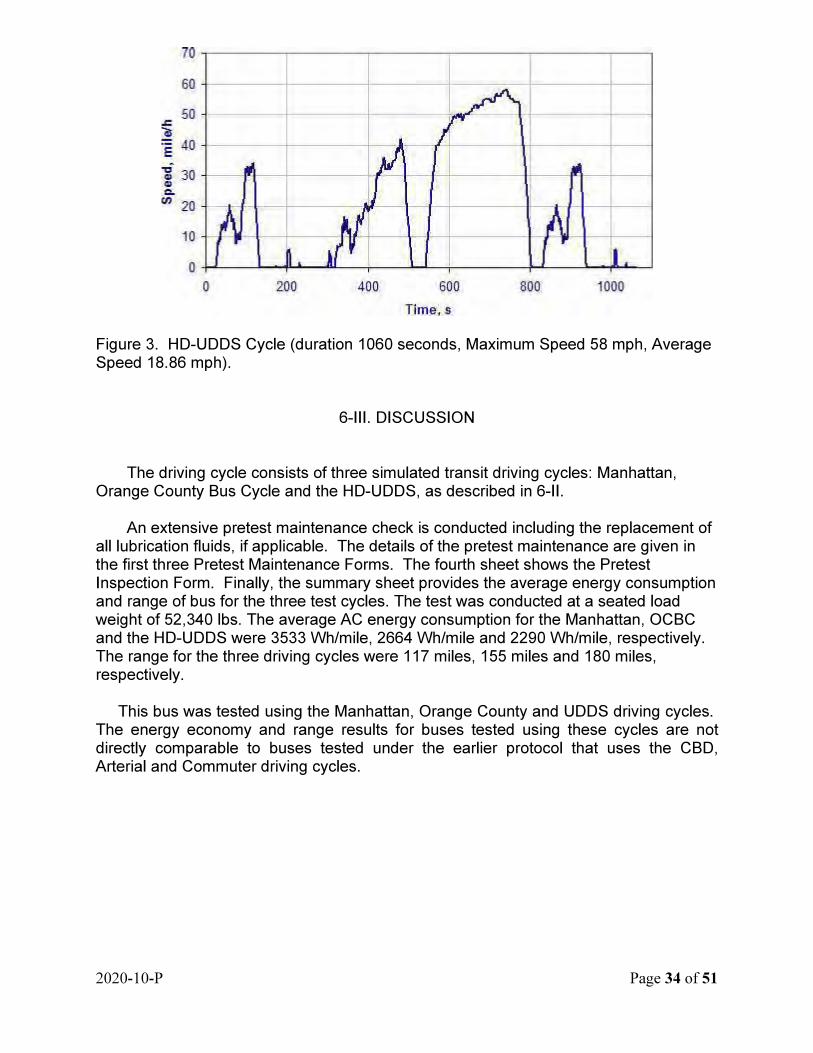
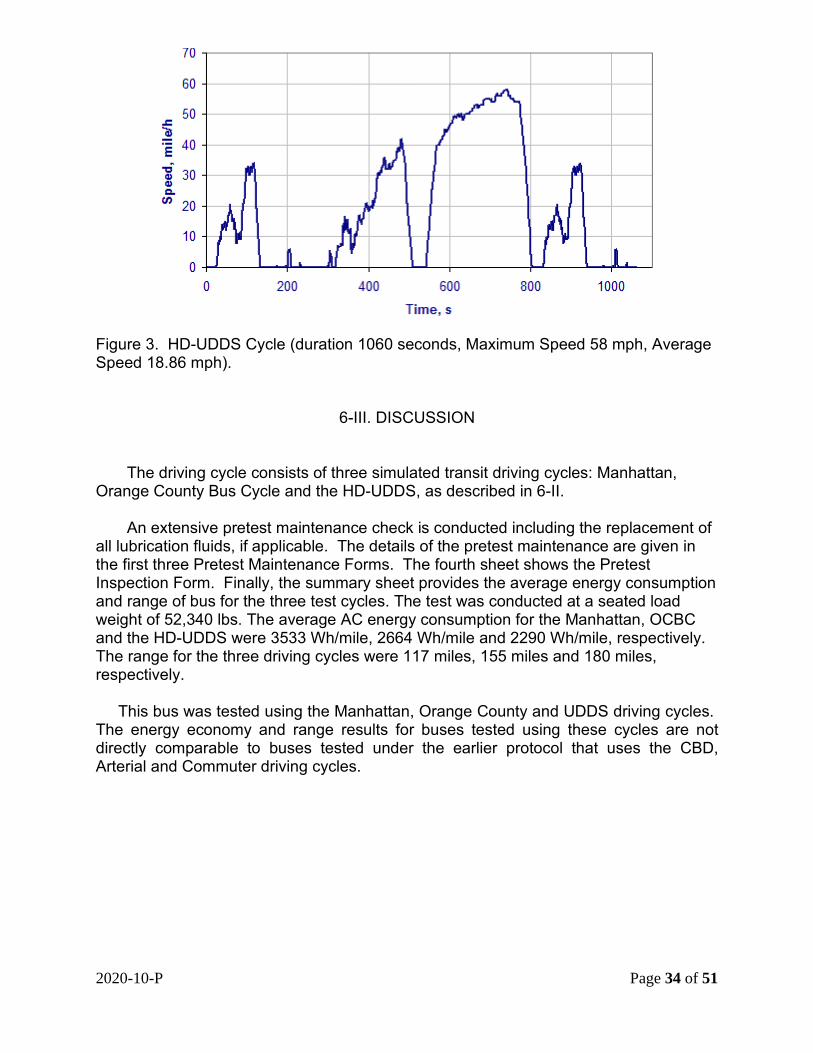
Figure 3. HD-UDDS Cycle (duration 1060 seconds, Maximum Speed 58 mph, Average Speed 18.86 mph).
6-III. DISCUSSION
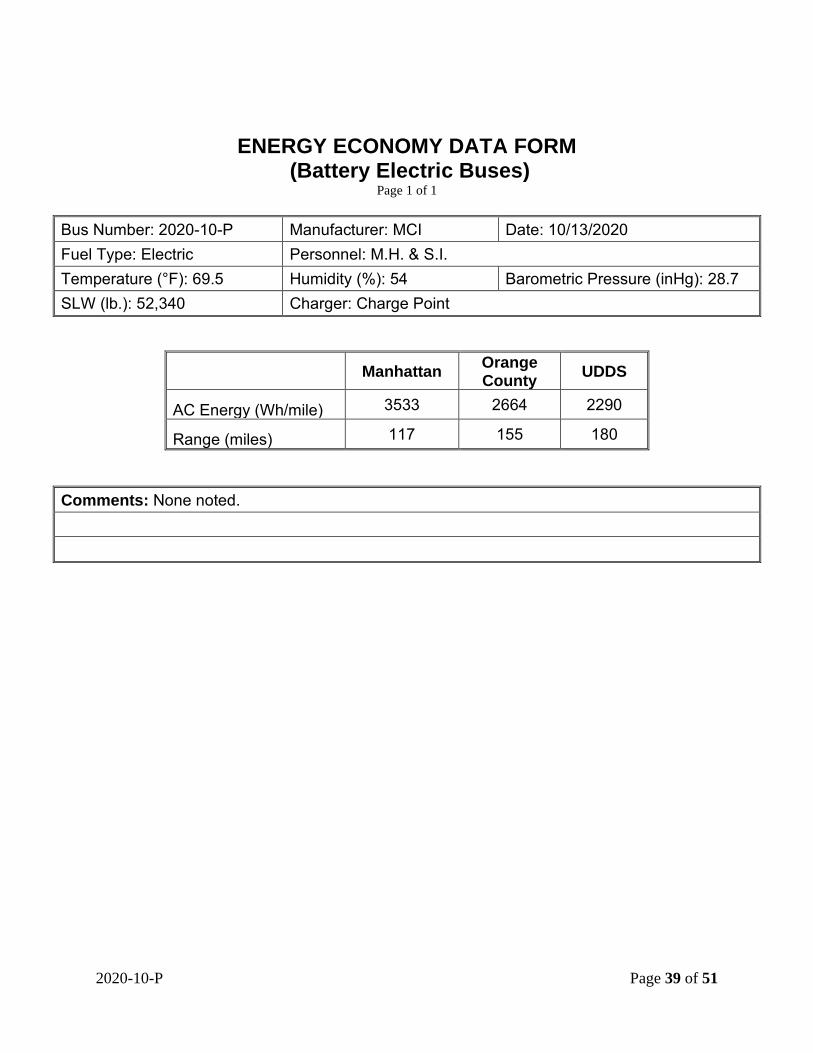
The driving cycle consists of three simulated transit driving cycles: Manhattan, Orange County Bus Cycle and the HD-UDDS, as described in 6-II. An extensive pretest maintenance check is conducted including the replacement of all lubrication fluids, if applicable. The details of the pretest maintenance are given in the first three Pretest Maintenance Forms. The fourth sheet shows the Pretest Inspection Form. Finally, the summary sheet provides the average energy consumption and range of bus for the three test cycles. The test was conducted at a seated load weight of 52,340 lbs. The average AC energy consumption for the Manhattan, OCBC and the HD-UDDS were 3533 Wh/mile, 2664 Wh/mile and 2290 Wh/mile, respectively. The range for the three driving cycles were 117 miles, 155 miles and 180 miles, respectively. This bus was tested using the Manhattan, Orange County and UDDS driving cycles. The energy economy and range results for buses tested using these cycles are not directly comparable to buses tested under the earlier protocol that uses the CBD, Arterial and Commuter driving cycles.
2020-10-P Page 35 of 51
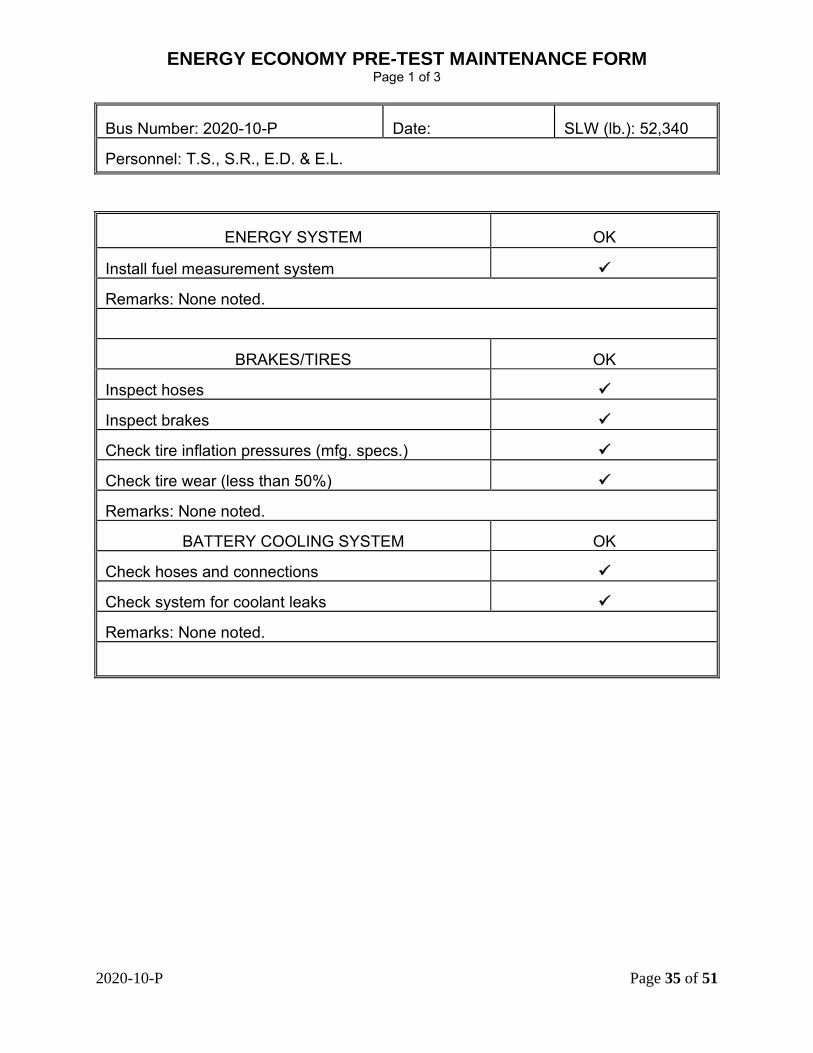
ENERGY ECONOMY PRE-TEST MAINTENANCE FORM Page 1 of 3
Bus Number: 2020-10-P
Date:
SLW (lb.): 52,340
Personnel: T.S., S.R., E.D. & E.L.
ENERGY SYSTEM
OK
Install fuel measurement system Remarks: None noted.
BRAKES/TIRES
OK Inspect hoses Inspect brakes Check tire inflation pressures (mfg. specs.) Check tire wear (less than 50%) Remarks: None noted.
BATTERY COOLING SYSTEM
OK Check hoses and connections Check system for coolant leaks Remarks: None noted.
2020-10-P Page 36 of 51
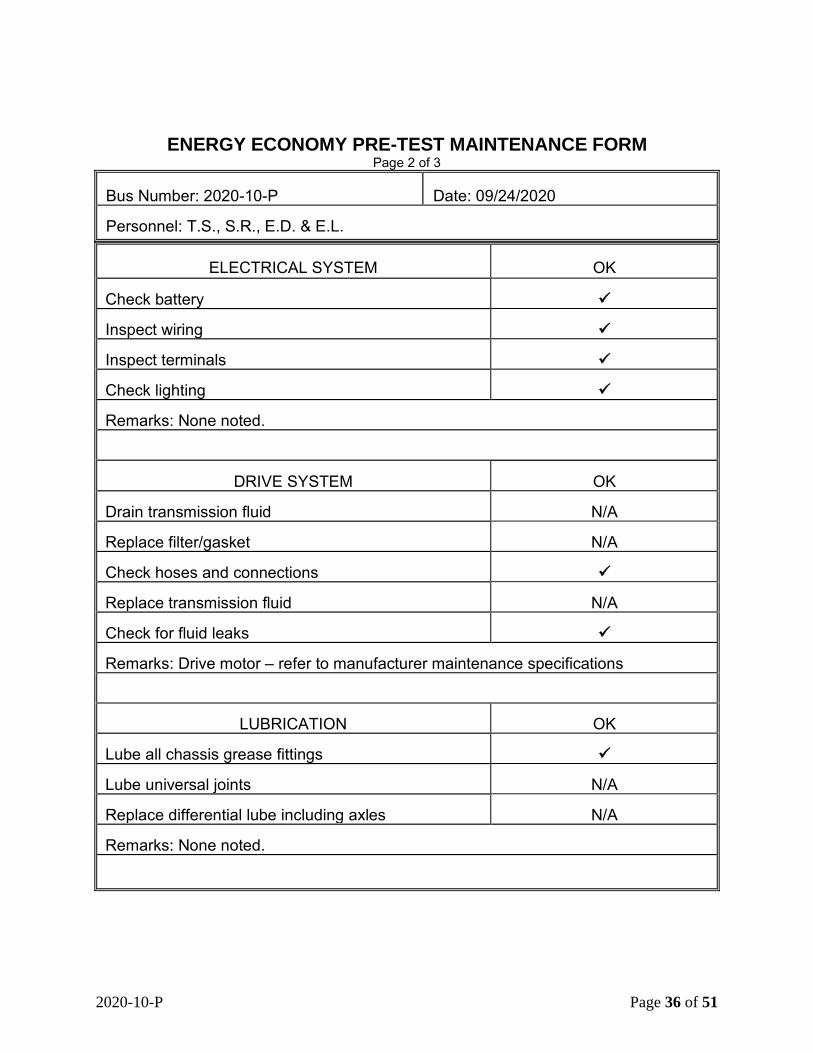
ENERGY ECONOMY PRE-TEST MAINTENANCE FORM
Page 2 of 3 Bus Number: 2020-10-P
Date: 09/24/2020
Personnel: T.S., S.R., E.D. & E.L.
ELECTRICAL SYSTEM
OK Check battery Inspect wiring Inspect terminals Check lighting Remarks: None noted.
DRIVE SYSTEM
OK Drain transmission fluid N/A Replace filter/gasket N/A Check hoses and connections Replace transmission fluid N/A Check for fluid leaks Remarks: Drive motor – refer to manufacturer maintenance specifications
LUBRICATION
OK Lube all chassis grease fittings Lube universal joints N/A Replace differential lube including axles N/A Remarks: None noted.
2020-10-P Page 37 of 51
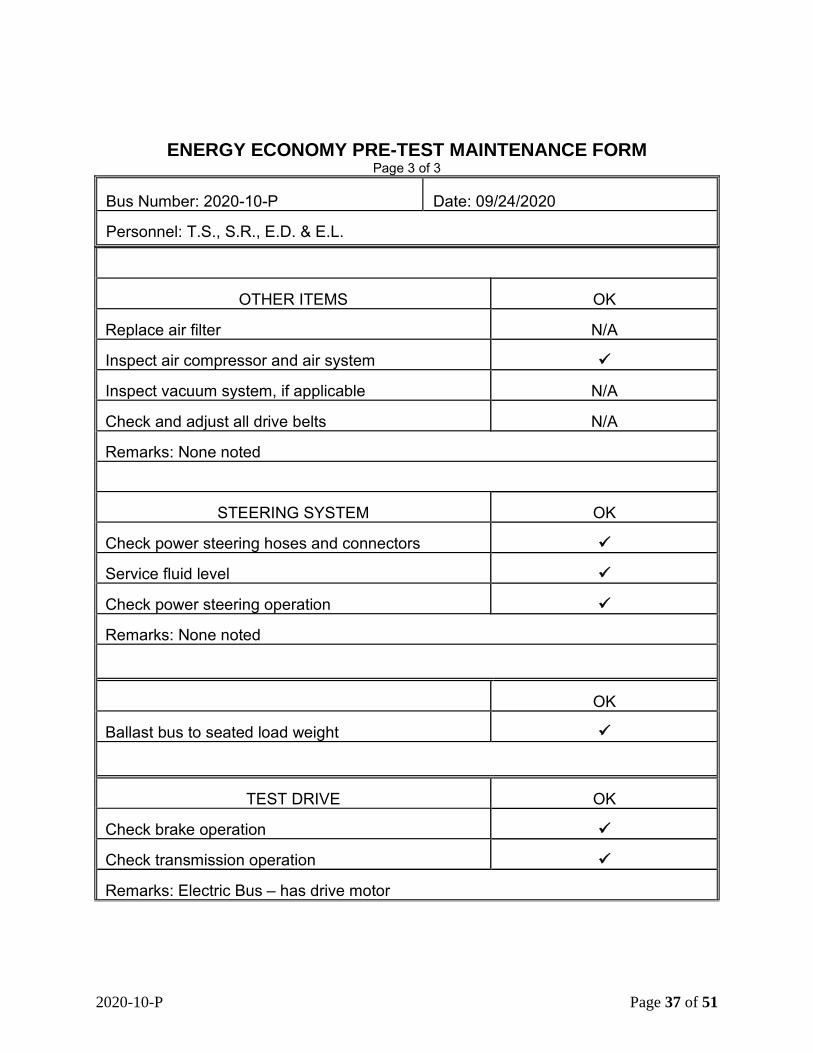
ENERGY ECONOMY PRE-TEST MAINTENANCE FORM Page 3 of 3
Bus Number: 2020-10-P
Date: 09/24/2020
Personnel: T.S., S.R., E.D. & E.L.
OTHER ITEMS
OK Replace air filter N/A Inspect air compressor and air system Inspect vacuum system, if applicable N/A Check and adjust all drive belts N/A Remarks: None noted
STEERING SYSTEM
OK Check power steering hoses and connectors Service fluid level Check power steering operation Remarks: None noted
OK Ballast bus to seated load weight
TEST DRIVE
OK Check brake operation Check transmission operation Remarks: Electric Bus – has drive motor
2020-10-P Page 38 of 51
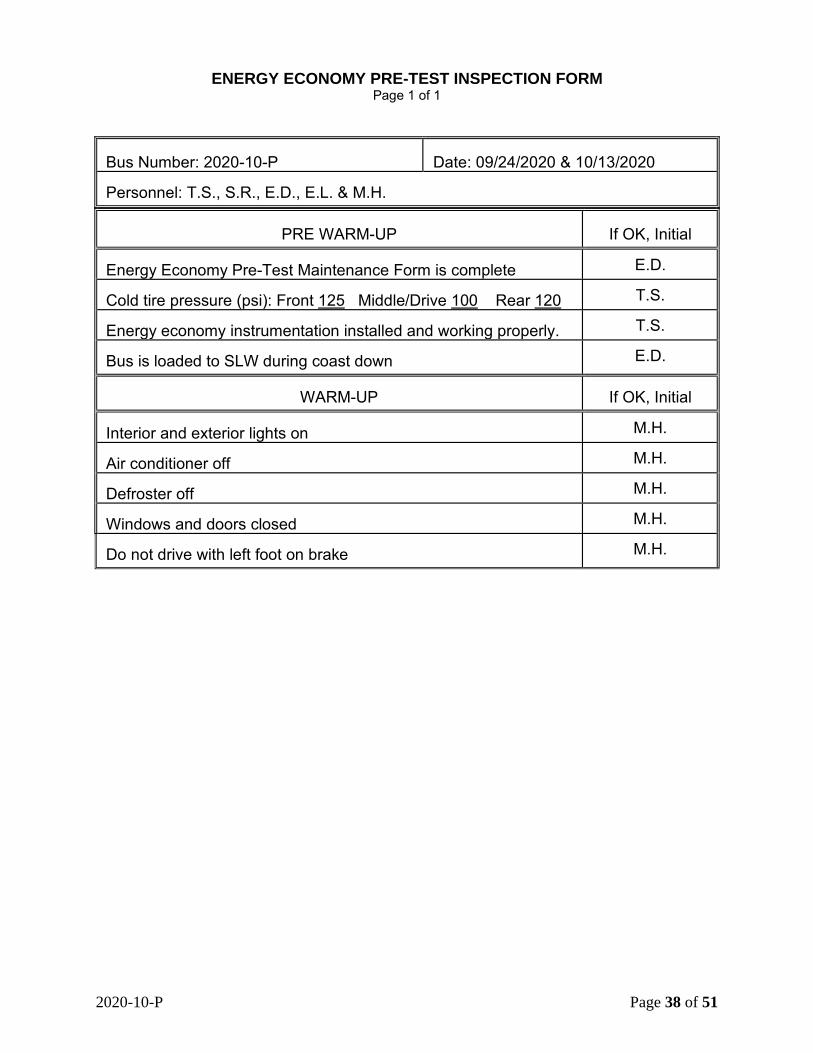
ENERGY ECONOMY PRE-TEST INSPECTION FORM
Page 1 of 1
Bus Number: 2020-10-P
Date: 09/24/2020 & 10/13/2020
Personnel: T.S., S.R., E.D., E.L. & M.H.
PRE WARM-UP
If OK, Initial Energy Economy Pre-Test Maintenance Form is complete E.D. Cold tire pressure (psi): Front 125 Middle/Drive 100 Rear 120 T.S. Energy economy instrumentation installed and working properly. T.S. Bus is loaded to SLW during coast down E.D.
WARM-UP
If OK, Initial Interior and exterior lights on M.H. Air conditioner off M.H. Defroster off M.H. Windows and doors closed M.H. Do not drive with left foot on brake M.H.
2020-10-P Page 39 of 51
ENERGY ECONOMY DATA FORM (Battery Electric Buses)
Page 1 of 1
Bus Number: 2020-10-P Manufacturer: MCI Date: 10/13/2020 Fuel Type: Electric Personnel: M.H. & S.I. Temperature (°F): 69.5 Humidity (%): 54 Barometric Pressure (inHg): 28.7 SLW (lb.): 52,340 Charger: Charge Point
Manhattan Orange County UDDS
AC Energy (Wh/mile) 3533 2664 2290
Range (miles) 117 155 180
Comments: None noted.
2020-10-P Page 40 of 51
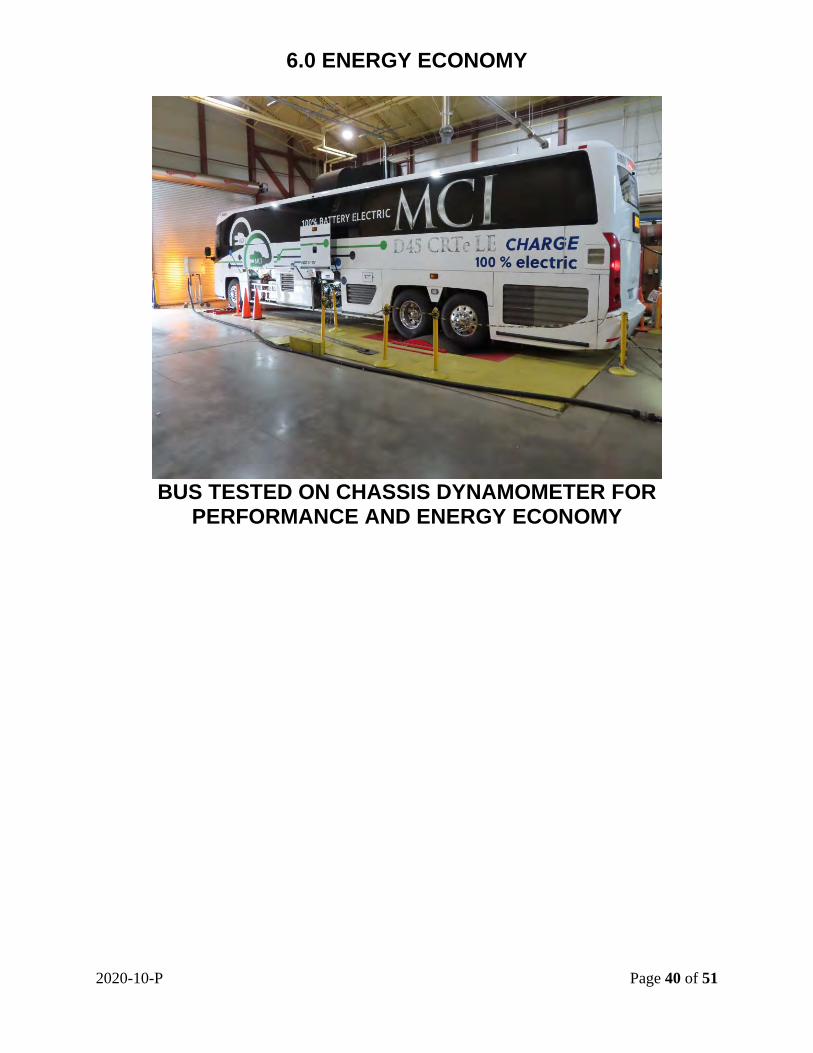
6.0 ENERGY ECONOMY
BUS TESTED ON CHASSIS DYNAMOMETER FOR
PERFORMANCE AND ENERGY ECONOMY
2020-10-P Page 41 of 51
7. NOISE
7.1 INTERIOR NOISE AND VIBRATION TESTS 7.1-I. TEST OBJECTIVE
The objective of these tests is to measure and record interior noise levels and check for audible vibration under various operating conditions. 7.1-II. TEST DESCRIPTION
During this series of tests, the interior noise level was measured at several locations with the bus operating under the following three conditions:
1. With the bus stationary, a white noise generating system provided a uniform sound pressure level equal to 80 dB(A) on the left, exterior side of the bus. The engine and all accessories were switched off and all openings including doors and windows were closed. This test was performed at the LTI Test Track Facility.
2. The bus was accelerated at full throttle from a standing start to 35 mph on a level
pavement. All openings were closed and all accessories were operating during the test. This test was performed on the track at the LTI Test Track Facility.
3. The bus was operated at various speeds from 0 to 55 mph with and without the
air conditioning and accessories on. Any audible vibration or rattles were noted. This test was performed on the test segment between the LTI Test Track and the Bus Testing Center.
All tests were performed in an area free from extraneous sound-making sources or
reflecting surfaces. The ambient sound level as well as the surrounding weather conditions were recorded in the test data. 7.1-III. DISCUSSION
For the first part, the overall average of the six measurements was 42.2 dB(A); ranging from 40.6 dB(A) at the driver’s seat to 44.2 dB(A) in line with the middle speaker. The interior ambient noise level for this test was less than 30 dB(A).
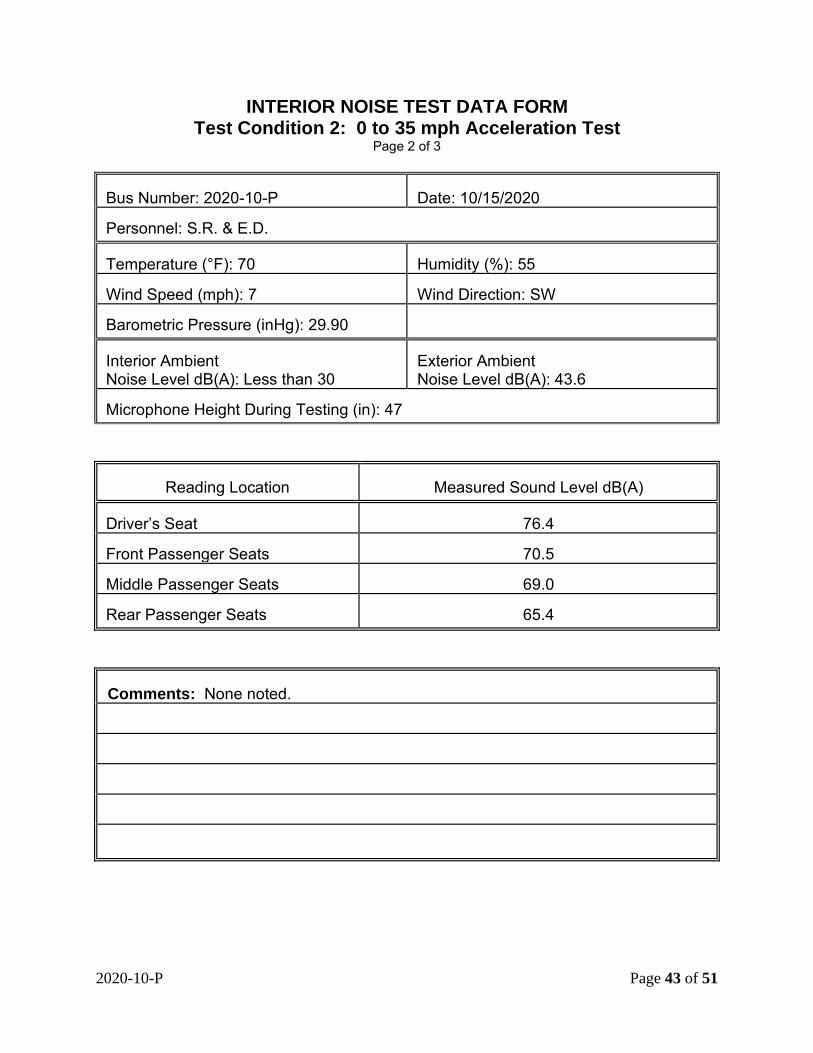
For the second part, the interior noise level ranged from 65.4 dB(A) at the rear passenger seats to 76.4 dB(A) at the driver’s seat. The overall average was 70.3 dB(A). The interior ambient noise level for this test was less than 30 dB(A).
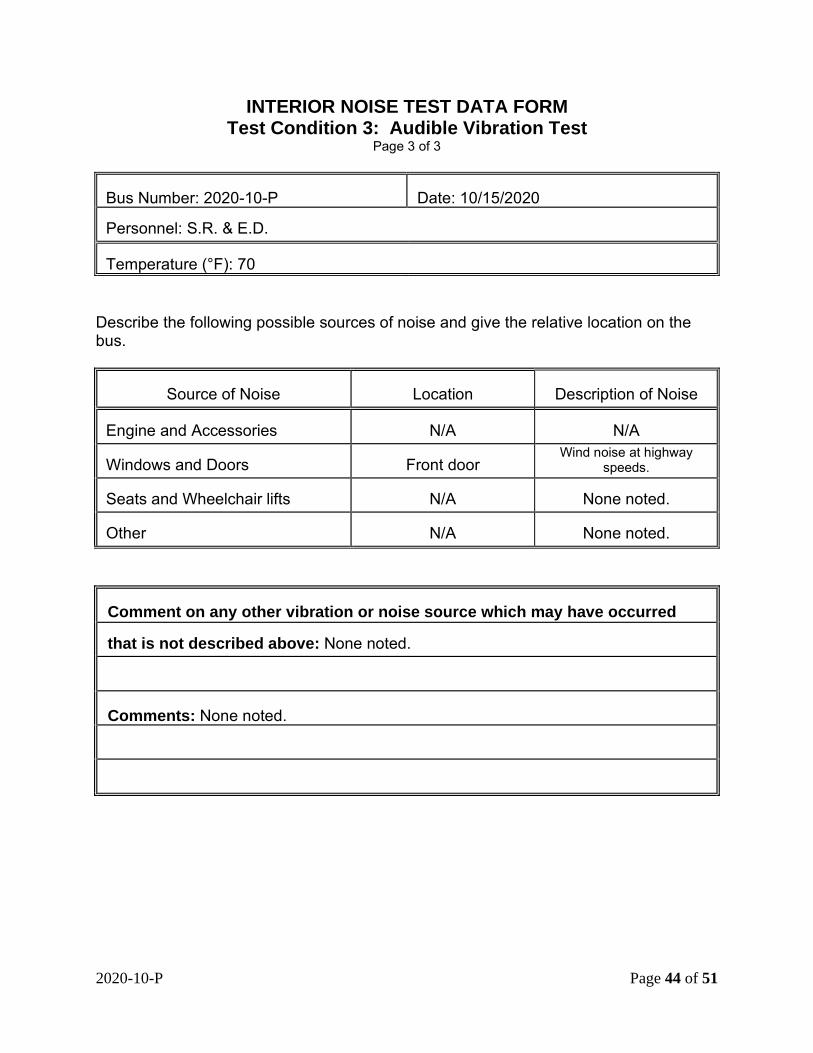
No vibrations or rattles were noted during the third part of this test, however, a wind
noise was heard at the front door when the bus was operated at highway speeds.
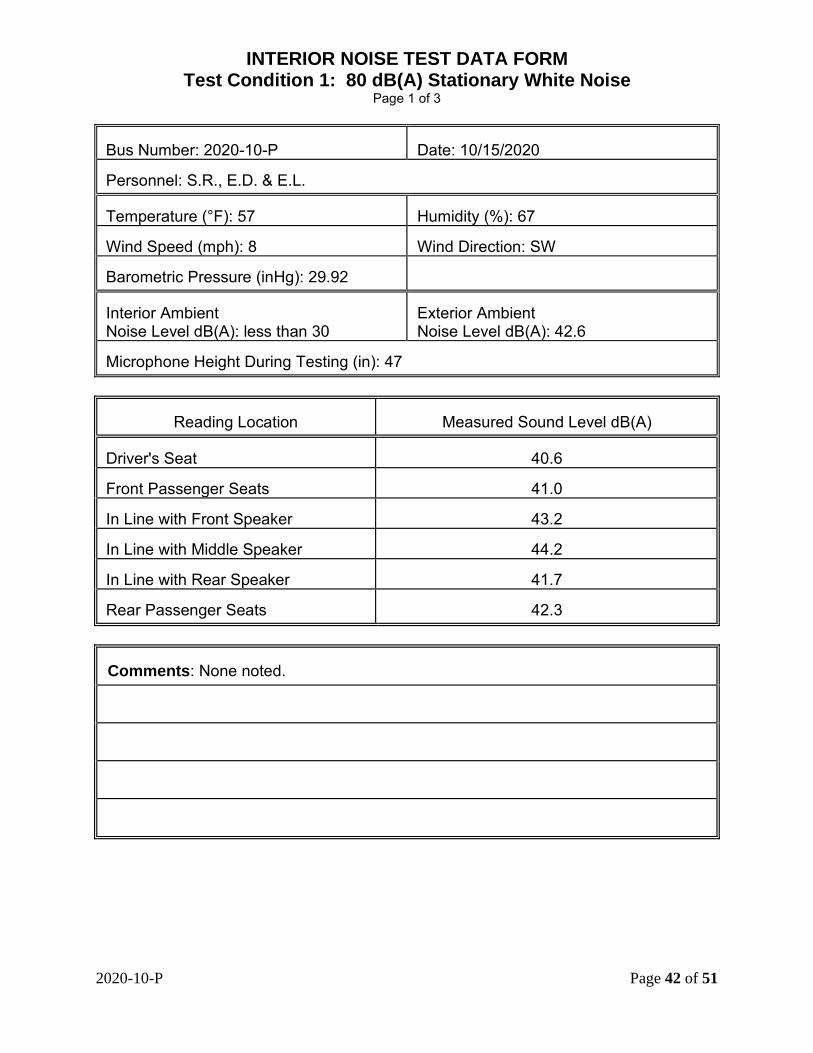
2020-10-P Page 42 of 51
INTERIOR NOISE TEST DATA FORM Test Condition 1: 80 dB(A) Stationary White Noise
Page 1 of 3
Bus Number: 2020-10-P
Date: 10/15/2020
Personnel: S.R., E.D. & E.L. Temperature (°F): 57
Humidity (%): 67
Wind Speed (mph): 8
Wind Direction: SW
Barometric Pressure (inHg): 29.92
Interior Ambient Noise Level dB(A): less than 30
Exterior Ambient Noise Level dB(A): 42.6
Microphone Height During Testing (in): 47
Reading Location
Measured Sound Level dB(A) Driver's Seat
40.6
Front Passenger Seats
41.0
In Line with Front Speaker
43.2
In Line with Middle Speaker
44.2
In Line with Rear Speaker
41.7
Rear Passenger Seats
42.3
Comments: None noted.
2020-10-P Page 43 of 51
INTERIOR NOISE TEST DATA FORM Test Condition 2: 0 to 35 mph Acceleration Test
Page 2 of 3
Bus Number: 2020-10-P
Date: 10/15/2020
Personnel: S.R. & E.D. Temperature (°F): 70
Humidity (%): 55
Wind Speed (mph): 7
Wind Direction: SW
Barometric Pressure (inHg): 29.90
Interior Ambient Noise Level dB(A): Less than 30
Exterior Ambient Noise Level dB(A): 43.6
Microphone Height During Testing (in): 47
Reading Location
Measured Sound Level dB(A)
Driver’s Seat
76.4
Front Passenger Seats
70.5
Middle Passenger Seats
69.0
Rear Passenger Seats
65.4
Comments: None noted.
2020-10-P Page 44 of 51
INTERIOR NOISE TEST DATA FORM Test Condition 3: Audible Vibration Test
Page 3 of 3
Bus Number: 2020-10-P
Date: 10/15/2020
Personnel: S.R. & E.D. Temperature (°F): 70
Describe the following possible sources of noise and give the relative location on the bus.
Source of Noise
Location Description of Noise
Engine and Accessories
N/A
N/A
Windows and Doors
Front door
Wind noise at highway speeds.
Seats and Wheelchair lifts
N/A
None noted.
Other
N/A
None noted.
Comment on any other vibration or noise source which may have occurred that is not described above: None noted.
Comments: None noted.
2020-10-P Page 45 of 51
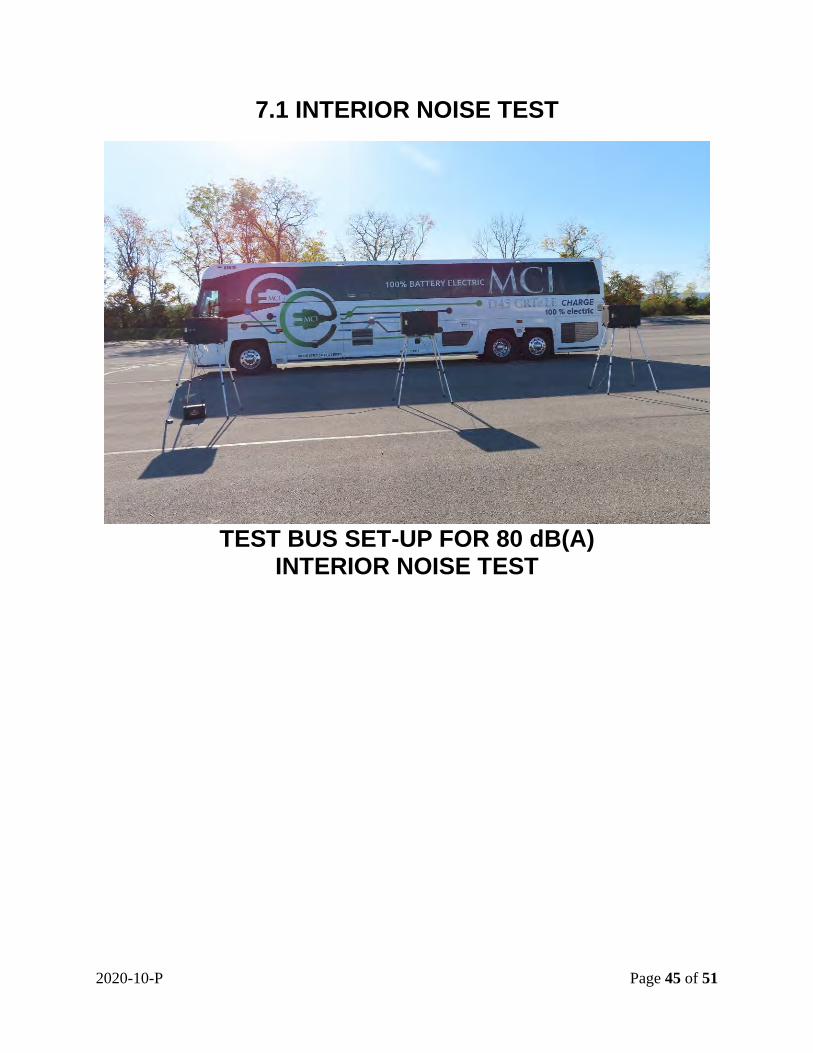
7.1 INTERIOR NOISE TEST
TEST BUS SET-UP FOR 80 dB(A) INTERIOR NOISE TEST
2020-10-P Page 46 of 51
7.2 EXTERIOR NOISE TESTS 7.2-I. TEST OBJECTIVE
The objective of this test is to record exterior noise levels when a bus is operated under various conditions. 7.2-II. TEST DESCRIPTION
In the exterior noise tests, the bus was operated at a SLW in three different conditions using a smooth, straight and level roadway:
1. Accelerating at full throttle from a constant speed starting from 35 mph.
2. Accelerating at full throttle from standstill.
3. Stationary, with the engine at low idle, high idle, and wide-open throttle, where applicable. In addition, the bus was tested with and without the air conditioning operating.
The test site is at the Larson Transportation Institute Test Track and the test procedures were performed in accordance with SAE Standards SAE J366b, Exterior Sound Level for Heavy Trucks and Buses. The test site is an open space free of large reflecting surfaces. A noise meter placed at a specified location outside the bus was used to measure the noise level.
During the test, special attention was paid to:
1. The test site characteristics regarding parked vehicles, signboards, buildings, or other sound-reflecting surfaces
2. Proper usage of all test equipment including set-up and calibration 3. The ambient sound level
7.2-III. DISCUSSION
The Exterior Noise Test determines the noise level generated by the vehicle under different driving conditions and at stationary low and high idle, with and without air conditioning and accessories operating. The test site is a large, level, bituminous paved area with no reflecting surfaces nearby. With an outside ambient noise level of 43.9 dB(A), the average of the two highest readings obtained while accelerating from a constant speed was 65.8 dB(A) on the right side and 66.7 dB(A) on the left side.
2020-10-P Page 47 of 51
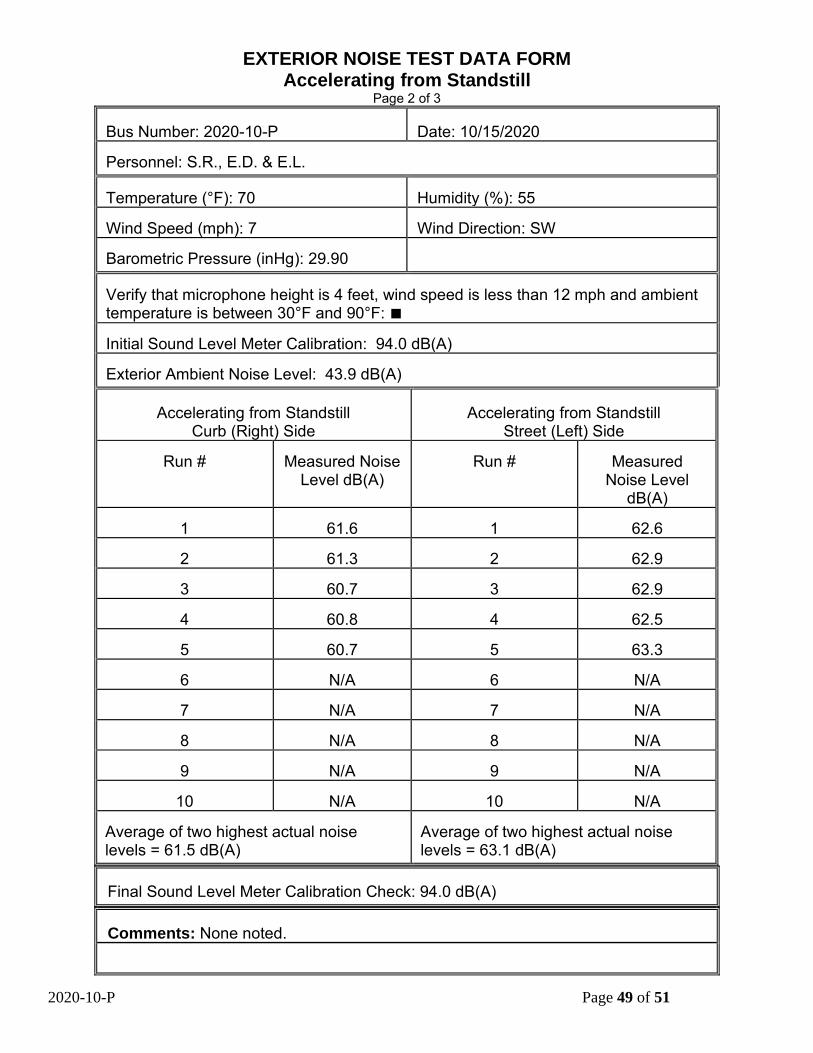
When accelerating from a standstill with an exterior ambient noise level of 43.9
dB(A), the average of the two highest readings obtained were 61.5 dB(A) on the right side and 63.1 dB(A) on the left side.
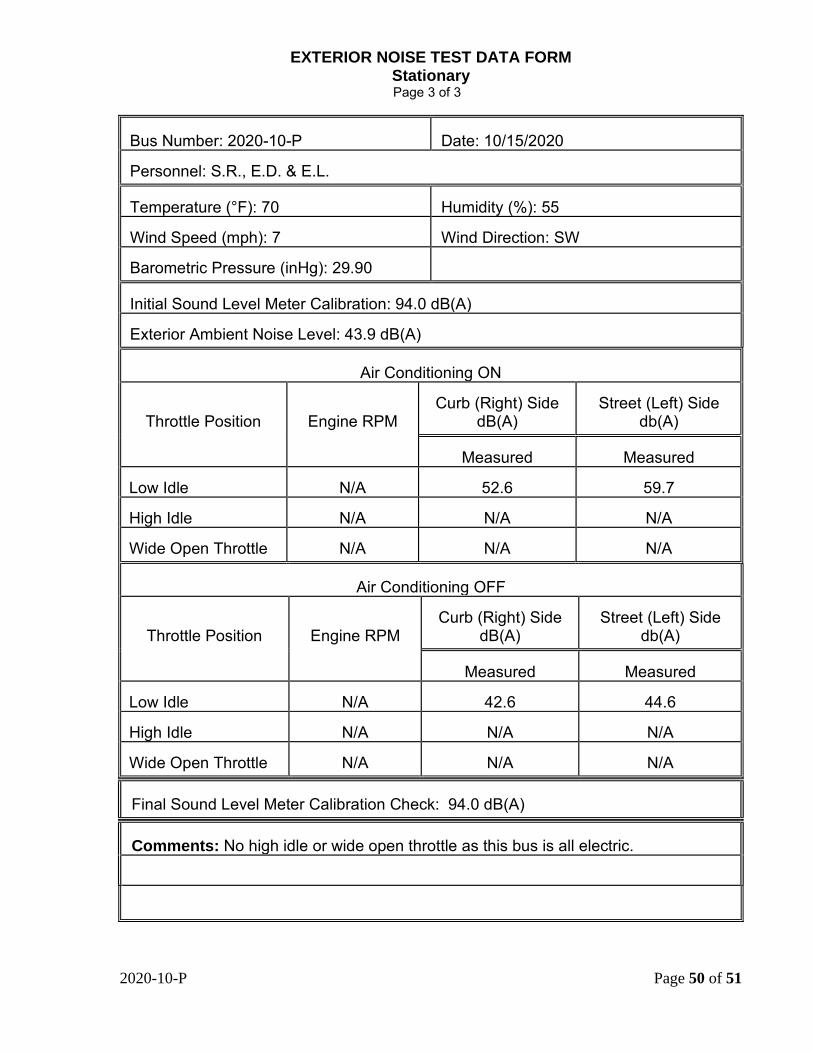
With the vehicle stationary and the engine, accessories, and air conditioning on, the measurements averaged 56.2 dB(A). With the accessories and air conditioning off, the readings 43.6 dB(A). The exterior ambient noise level measured during this test was 43.9 dB(A).

2020-10-P Page 48 of 51
EXTERIOR NOISE TEST DATA FORM Accelerating from Constant Speed
Page 1 of 3 Bus Number: 2020-10-P
Date: 10/15/2020
Personnel: S.R., E.D. & E.L. Temperature (°F): 70
Humidity (%): 55
Wind Speed (mph): 7
Wind Direction: SW
Barometric Pressure (inHg): 29.90
Verify that microphone height is 4 feet, wind speed is less than 12 mph and ambient temperature is between 30°F and 90°F: ■ Initial Sound Level Meter Calibration: 94.0 dB(A) Exterior Ambient Noise Level: 43.9 dB(A)
Accelerating from Constant Speed Curb (Right) Side
Accelerating from Constant Speed
Street (Left) Side
Run #
Measured Noise Level dB(A)
Run #
Measured Noise Level
dB(A)
1 65.1
1
66.3
2 64.6
2
66.2
3 65.9
3
66.7
4 65.2
4
66.4
5 65.6
5
66.6
6
N/A
6
N/A
7
N/A
7
N/A
8
N/A
8
N/A
9
N/A
9
N/A
10
N/A
10
N/A Average of two highest actual noise levels = 65.8 dB(A)
Average of two highest actual noise levels = 66.7 dB(A)
Final Sound Level Meter Calibration Check: 94.0 dB(A) Comments: None noted.
2020-10-P Page 49 of 51
EXTERIOR NOISE TEST DATA FORM Accelerating from Standstill
Page 2 of 3 Bus Number: 2020-10-P
Date: 10/15/2020
Personnel: S.R., E.D. & E.L. Temperature (°F): 70
Humidity (%): 55
Wind Speed (mph): 7
Wind Direction: SW
Barometric Pressure (inHg): 29.90
Verify that microphone height is 4 feet, wind speed is less than 12 mph and ambient temperature is between 30°F and 90°F: ■ Initial Sound Level Meter Calibration: 94.0 dB(A) Exterior Ambient Noise Level: 43.9 dB(A)
Accelerating from Standstill Curb (Right) Side
Accelerating from Standstill
Street (Left) Side
Run # Measured Noise
Level dB(A)
Run #
Measured
Noise Level dB(A)
1 61.6
1 62.6
2 61.3
2 62.9
3 60.7
3 62.9
4 60.8
4 62.5
5 60.7
5 63.3
6
N/A
6
N/A
7
N/A
7
N/A
8
N/A
8
N/A
9
N/A
9
N/A
10
N/A
10
N/A
Average of two highest actual noise levels = 61.5 dB(A)
Average of two highest actual noise levels = 63.1 dB(A)
Final Sound Level Meter Calibration Check: 94.0 dB(A) Comments: None noted.
2020-10-P Page 50 of 51
EXTERIOR NOISE TEST DATA FORM Stationary
Page 3 of 3
Bus Number: 2020-10-P
Date: 10/15/2020
Personnel: S.R., E.D. & E.L. Temperature (°F): 70
Humidity (%): 55
Wind Speed (mph): 7
Wind Direction: SW
Barometric Pressure (inHg): 29.90
Initial Sound Level Meter Calibration: 94.0 dB(A) Exterior Ambient Noise Level: 43.9 dB(A)
Air Conditioning ON
Throttle Position
Engine RPM
Curb (Right) Side
dB(A)
Street (Left) Side
db(A)
Measured
Measured Low Idle
N/A
52.6
59.7
High Idle
N/A
N/A
N/A
Wide Open Throttle
N/A
N/A
N/A
Air Conditioning OFF
Throttle Position
Engine RPM
Curb (Right) Side
dB(A)
Street (Left) Side
db(A)
Measured
Measured Low Idle
N/A
42.6
44.6
High Idle
N/A
N/A
N/A
Wide Open Throttle
N/A
N/A
N/A
Final Sound Level Meter Calibration Check: 94.0 dB(A) Comments: No high idle or wide open throttle as this bus is all electric.
2020-10-P Page 51 of 51
7.2 EXTERIOR NOISE TESTS
TEST BUS UNDERGOING EXTERIOR NOISE TESTING
PSTA– Pinellas Suncoast Transit Authority RFP 21-980369
Section 2N Solicitation Requirements: TS 21.2 Crashworthiness Report.
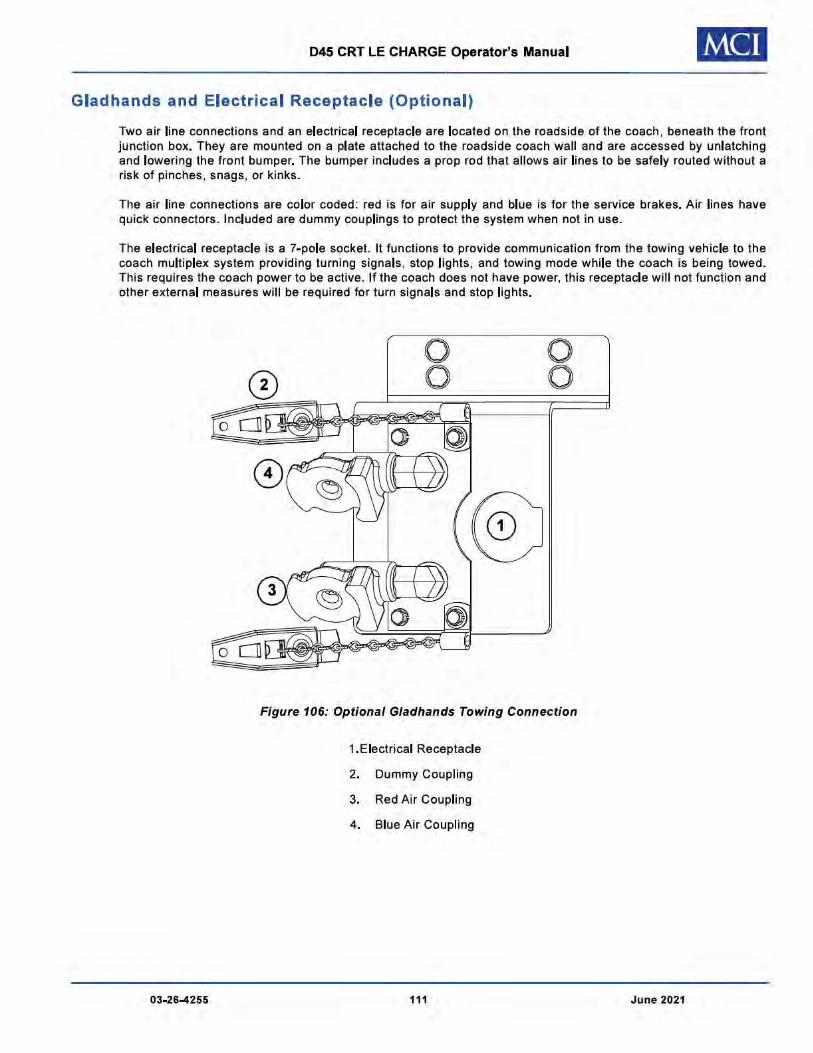
New Flyer Response: Please refer to the attachment impact 2019-001-D45 CRT LE Side Impact Test Report for complete description of procedures regarding towing the D45eLE electric coaches This bulletin serves as material to assist in the towing of any of the MCI Charge buses, if there are any situations that require assistance New Flyers RPSM will be available to assist with any questions the agency may have. Please note:
There is no regulatory requirement for rollover or roof impact that applies to D45CRTeLE coaches.
PSTA– Pinellas Suncoast Transit Authority RFP 21-980369
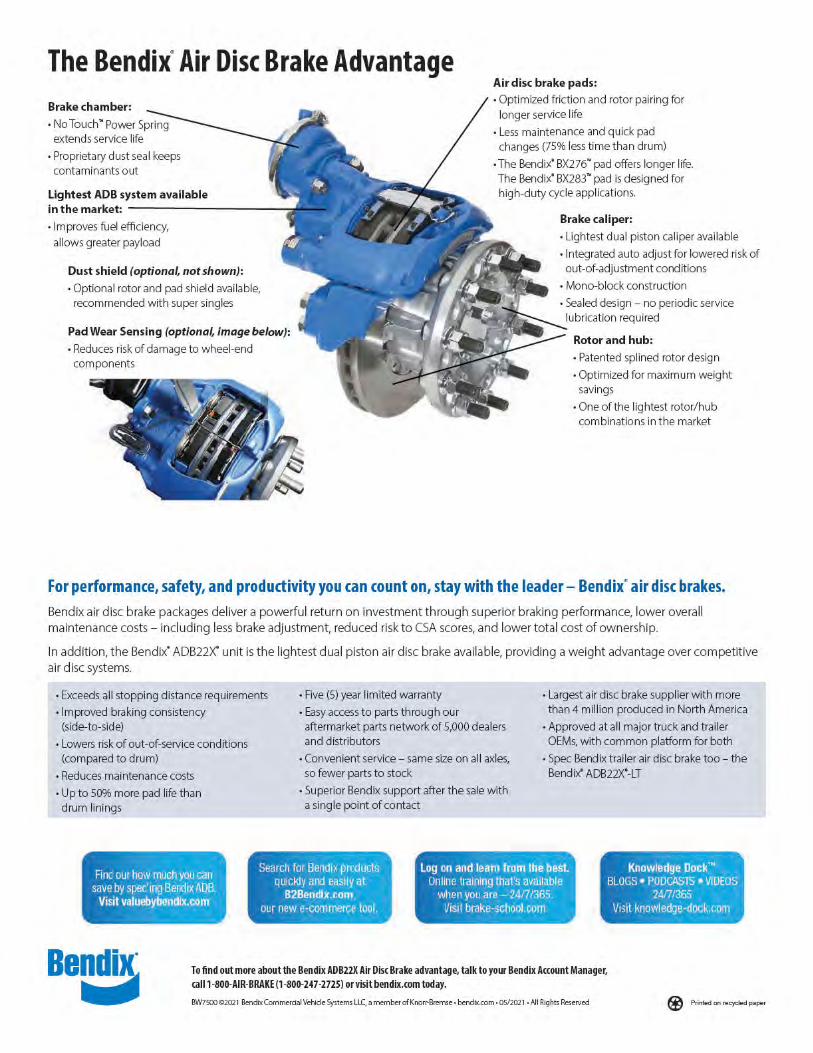
Attached is also a brochure from New Flyer’s vendor Bendix. The brochure outlines the Bendix Air Disc Brake Advantage with the following information:
- Brake chamber - ADB system available - Dust Shields - Pad wear sensing - Air disc brake pads - Brake caliper - Rotor and hub

— PRO DUC T LE A FLE T
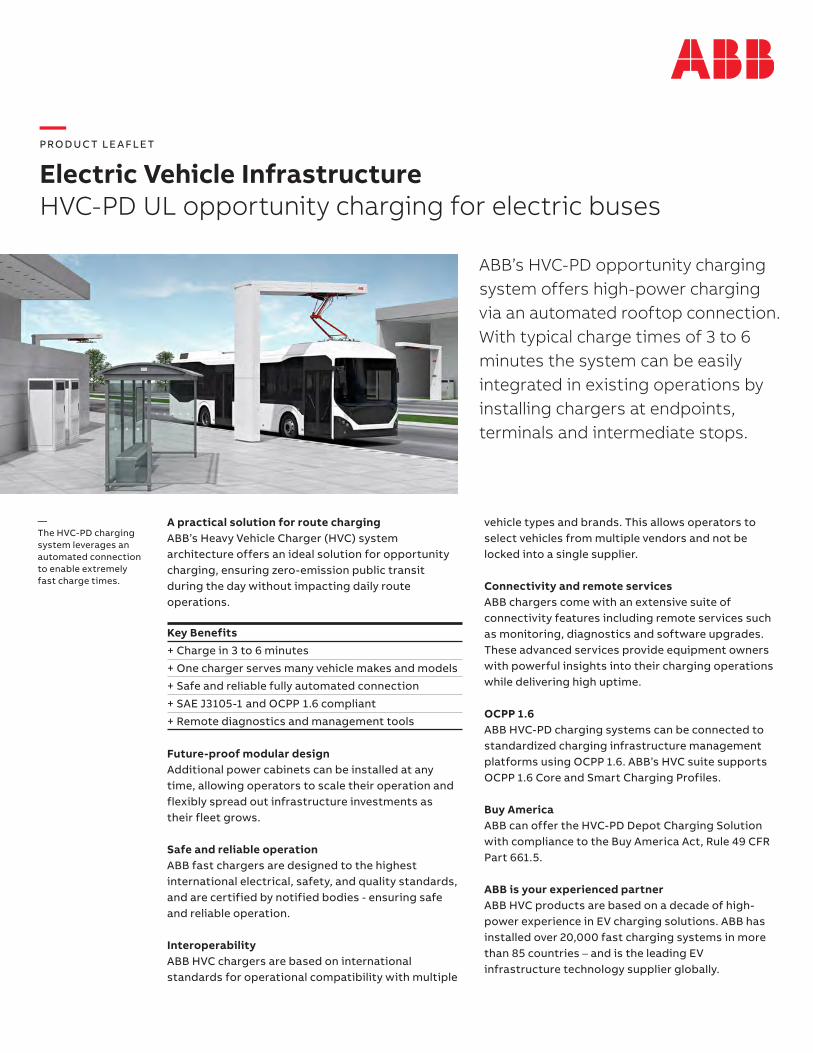
Electric Vehicle InfrastructureHVC-PD UL opportunity charging for electric buses
ABB’s HVC-PD opportunity charging system offers high-power charging via an automated rooftop connection. With typical charge times of 3 to 6 minutes the system can be easily integrated in existing operations by installing chargers at endpoints, terminals and intermediate stops.
A practical solution for route chargingABB’s Heavy Vehicle Charger (HVC) system architecture offers an ideal solution for opportunity charging, ensuring zero-emission public transit during the day without impacting daily route operations.
Future-proof modular designAdditional power cabinets can be installed at any time, allowing operators to scale their operation and flexibly spread out infrastructure investments as their fleet grows.
Safe and reliable operationABB fast chargers are designed to the highest international electrical, safety, and quality standards, and are certified by notified bodies - ensuring safe and reliable operation.
InteroperabilityABB HVC chargers are based on international standards for operational compatibility with multiple
Key Benefits+ Charge in 3 to 6 minutes
+ One charger serves many vehicle makes and models
+ Safe and reliable fully automated connection
+ SAE J3105-1 and OCPP 1.6 compliant
+ Remote diagnostics and management tools
—The HVC-PD charging system leverages an automated connection to enable extremely fast charge times.
vehicle types and brands. This allows operators to select vehicles from multiple vendors and not be locked into a single supplier.
Connectivity and remote servicesABB chargers come with an extensive suite of connectivity features including remote services such as monitoring, diagnostics and software upgrades. These advanced services provide equipment owners with powerful insights into their charging operations while delivering high uptime.
OCPP 1.6ABB HVC-PD charging systems can be connected to standardized charging infrastructure management platforms using OCPP 1.6. ABB’s HVC suite supports OCPP 1.6 Core and Smart Charging Profiles.
Buy AmericaABB can offer the HVC-PD Depot Charging Solution with compliance to the Buy America Act, Rule 49 CFR Part 661.5.
ABB is your experienced partnerABB HVC products are based on a decade of high-power experience in EV charging solutions. ABB has installed over 20,000 fast charging systems in more than 85 countries – and is the leading EV infrastructure technology supplier globally.


Flex 180kW B DC HPC D UL
Page 2 of 13 Doc-id: HE9821001-01-824-EN-002
ApplicabilityThis document applies to a Flex 180KW B DC HPC D UL delivered by Heliox Technology Inc. or any of its Affiliates (Heliox Technology Inc. or the respective Affiliate hereinafter together and
affiliated with, or that directly or indirectly controls, is controlled by or is under common control
share capital or the right to exercise 50% (fifty percent) or more of the voting rights in the appointment of the directors of such company, firm, partnership or other legal entity, but any such legal entity shall be deemed to be an Affiliate only as long as such liaison exists.
Disclaimer By accessing and using information, data and materials or related graphics contained in this document, the user hereby agree to accept the following terms and conditions:
Heliox makes no warranty or guarantee regarding the accuracy or reliability in this document. In addition, the user hereby recognizes that the information, data, materials, graphics, and all other content incorporated in this document are subject to change. However, Heliox makes no commitment to update the information, data, materials, graphics and all other content contained in this document. The information, data, materials, graphics and all other content contained in this document, are made available by Heliox for informational purposes only and no action should be taken without first viewing the official records of, and regulations adopted by Heliox.
All information, data, materials, graphics and all other content contained in this document is
implied warranties of merchantability and fitness for a particular purpose, and non-infringement of proprietary rights. Heliox does not warrant, guarantee, or make any representations regarding the use, or the results of the use, of the information provided to you by Heliox in terms of correctness, accuracy, reliability, completeness, usefulness, timeliness or otherwise. The entire risk as to the results and performance of any information obtained from Heliox is entirely assumed by the user. Any person who uses any information made available by Heliox waives any and all claims for damages, costs and expenses, and agrees that there are no remedies for negligence, or under strict liability, or breach of warranty or contract, including but not limited to indirect, consequential, punitive or incidental damages, even if you give notice of the possibility of such damages.
This document is originally written in the English language. If this is written in any other language than English, Heliox shall not be liable for errors in the translation.
Copyright © Copyright 2021 Heliox. All rights reserved. Heliox has the right to revise this document from time to time without prior notification. The information in this document is property of Heliox. No part of this document may be reproduced, stored in a retrieval system, or transmitted in any form or by any means electronic or mechanical, including photocopying and recording, for any purpose, without the express written permission of Heliox.
Trademarks The copyright of the (registered) trademarks are the property of Heliox or the respective owners.


— PRO DUC T LE A FLE T
Electric Vehicle InfrastructureHVC-C UL depot charging for electric fleets
ABB HVC-C UL Depot Charging systems offer a highly reliable, intelligent and cost-effective solution to charge large EV fleets such as buses, trucks and other commercial vehicles.
A practical solution for busy depotsABB Heavy Vehicle Charger (HVC) products enable electric buses and trucks to charge at the depot ensuring flexibility and scale for every fleet operation that is transitioning to zero-emission transportation.
Sequential ChargingImproving total cost of ownership is easy using the sequential charging feature offered by ABB’s depot chargers. This feature allows connection of up to three depot charge boxes with a single power cabinet and vehicles are charged sequentially over time. The system can follow an embedded, predefined charging process or remote triggers sent by a fleet management system via OCPP 1.6.
• Vehicles are charged with high power, maximizing vehicle availability
• The required grid connection is smaller, reducing upfront investments and operational costs
• The compact depot box is easy to install at sites with space constraints
• Optimal utilization of installed infrastructure meaning lower investments in charging equipment.
Key Benefits+ Smart charging
+ Small infrastructure footprint at vehicle interface
+ Flexible design for roof and floor mounting
+ SAE J1772 CCS and OCPP 1.6 compliant
+ Remote diagnostics and management tools
—HVC Depot Boxes and power cabinets, lined up at a depot site.
Buy AmericaABB can offer the HVC-C Depot Charging Solution with compliance to the Buy America Act Rule 49 CFR Part 661.5.
Future-proof modular designPower cabinets can be upgraded from 100 or 150 kW in the field, as well as add additional depot charge boxes, allowing operators to scale their operation and to spread investments over time.
Safe and reliable operationABB fast chargers are designed to the highest international electrical, safety, and quality standards, and are certified by notified bodies - guaranteeing safe and reliable operation.
Connectivity and remote servicesABB chargers come with an extensive suite of connectivity features including remote services such as monitoring, management, diagnostics and software upgrades. These advanced services provide equipment owners with powerful insights into their charging operations while enabling high uptime.
ABB is your experienced partnerABB HVC products are based on a decade of high power experience in EV charging solutions. ABB has installed over 17,000 fast charging systems in more than 80 countries – and is the leading EV infrastructure technology supplier globally.

Technical specifications
Configurations HVC 100C HVC 150CMaximum output power 100 kW 150 kWAC Input voltage UL: 3-phase, 480Y/277 VAC +/- 10 % (60 Hz)
CSA: 3-phase, 600Y/347 VAC +/-10% (60 Hz)AC Input connection L1, L2, L3, GND (no neutral)Rated input power 117 kVA 170 kVARated input current UL: 132 A / CSA: 108 A UL: 198 A / CSA: 168 ARecommended upstream circuit breaker(s) UL: 1 x 200 A / CSA: 1 x 150 A UL: 1 x 250 A / CSA: 1 x 250 AOutput voltage range 150 – 850 VDCMaximum DC output current 166 A 200 AVehicle connection interface CCS/Combo Type 1 ConnectorCable length 3.5 m (11.5 ft) standard; 7 m (23 ft) optionalDC connection standard SAE J1772 - IEC 61851-23 / DIN 70121 - ISO 15118Environment Indoor/OutdoorOperating temperature Standard: -10 °C to +50 °C (de-rating characteristic applies)
Optional: -35 °C to +50 °CProtection Power Cabinet: IP54 – IK10 (equivalent to NEMA 3R)
Depot Charge Box: IP65 - IK10Network connection GSM/3G modem | 10/100 base-T EthernetCompliance and Safety CSA No. 107.1-16 and UL 2202 certified by TUV
BA Rule 49 CFR Part 661.5 (Optional)DimensionsPower Cabinet Dimensions (H x W x D) 2030 x 1170 x 770 mm / 79.9 x 46.1 x 30.3 in
Weight 1340 kg / 2954 lbsDepot Charge Box (without pedestal)
Dimensions (H x W x D) 800 x 600 x 210 mm / 31.5 x 23.6 x 8.3 inWeight 61 kg / 134.5 lbs (with 7 m / 23 ft cable)
Depot Charge Box (with pedestal)
Dimensions (H x W x D) 1914 x 600 x 400 mm / 75.4 x 23.6 x 16.3 inWeight 181 kg / 398 lbs (with 7 m / 23 ft cable)
—Overnight charging 100 kW - 150 kWA field upgradeable system with future proof reliability
—We reserve the right to make technical changes or modify the contents of this document without prior notice We reserve all rights in this document and in the subject matter and illustrations contained therein Any reproduction, disclosure to third parties or utilization of its contents – in whole or in parts – is forbidden without prior written consent of ABB Copyright© 2020 ABB All rights reserved
—ABB Inc.950 W Elliott Road, Suite 101Tempe, AZ, 85284United States Phone: 800-435-7365E-mail: [email protected]
abb.com/evcharging
—ABB Inc.800 Hymus BoulevardSaint-Laurent, QC H4S 0B5CanadaPhone: 800-435-7365E-mail: [email protected]
9A
KK
1076
80
A4
436
R2
— A power upgrade can be done in the field by adding an extra power module. No groundworks, digging and disturbance to the site are required.
HVC 100C HVC 150C HVC 150C*
—* 150 kW overnight charging system with three depot charge boxes; shown mounted on pedestal option.
upgradable

Terra fast chargers: The most deployed DC fast chargers in the world.
• Power sharing for high utilization• Future proof, high-voltage technology• Reliable, compact and flexible design• Always connected, always smart
— Terra 94/124/184 UL Product guide


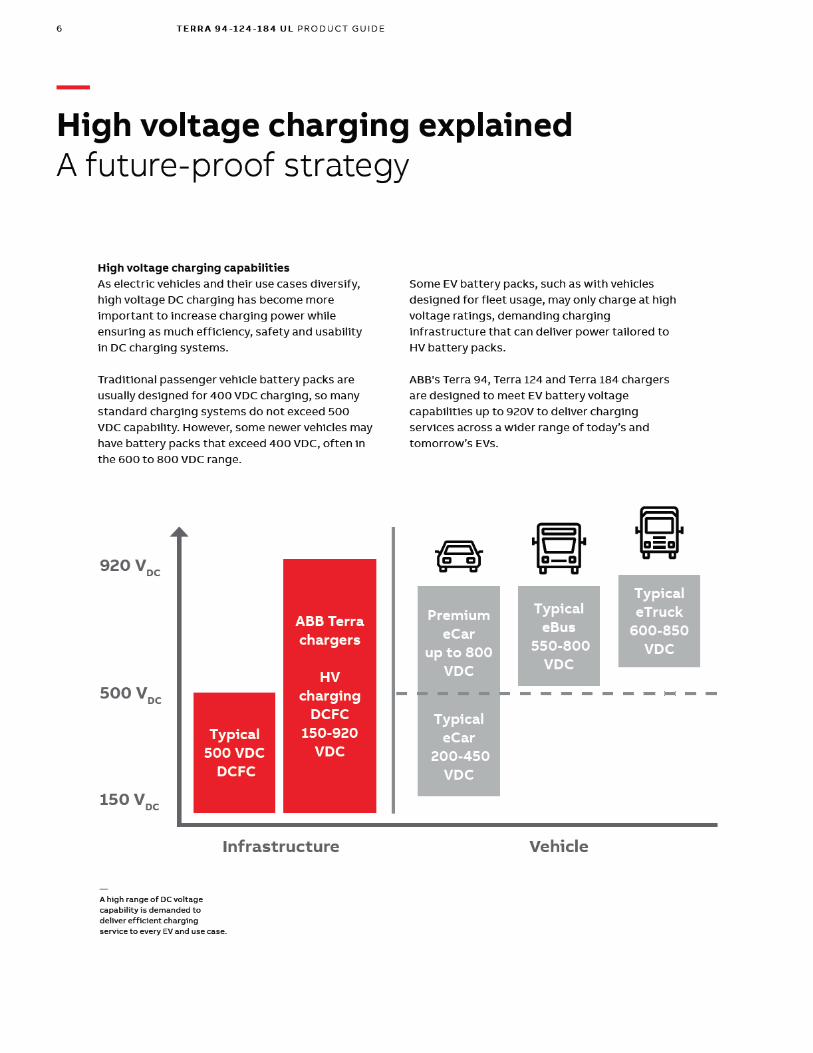

TE R R A 9 4 -1 2 4 -1 8 4 U L PR O D U C T G U I D E 7
60 kWh BEV400 VDC
90 kWh BEV400 VDC
100 kWh BEV800 VDC
150 kWh BEV Delivery Van800 VDC
Car
Bus
/Tru
ck
200 kWh BEV Work Truck800 VDC
300 kWh BEV 60' Transit Bus800 VDC
120 kWh BEV School Bus400 VDC
50 kWTerra 54
Terra 54HV
50
70
80
95
120
160
240
90 kWTerra 94
25
40
45
53
65
88
130
—Charge times shown based on average vehicle battery management system (BMS) requesting charging power from 20% to 80% under mild environmental conditions. Data assumes vehicles capable of charging at cited power levels.
—Terra charging times All-in-one charging for every EV
Charging time (minutes)
120 kWTerra 124
40
60
65
80
100
133
200
25
40
45
55
65
88
130
20
30
33
40
50
66
100
2 EVs 1 EV
180 kWTerra 184
2 EVs 1 EV
13
20
22
26
33
44
66

TE R R A 9 4 -1 2 4 -1 8 4 U L PR O D U C T G U I D E 9
—Terra DC Fast ChargersTechnical specification UL
Specifications Terra 94 Terra 124 Terra 184
Electrical
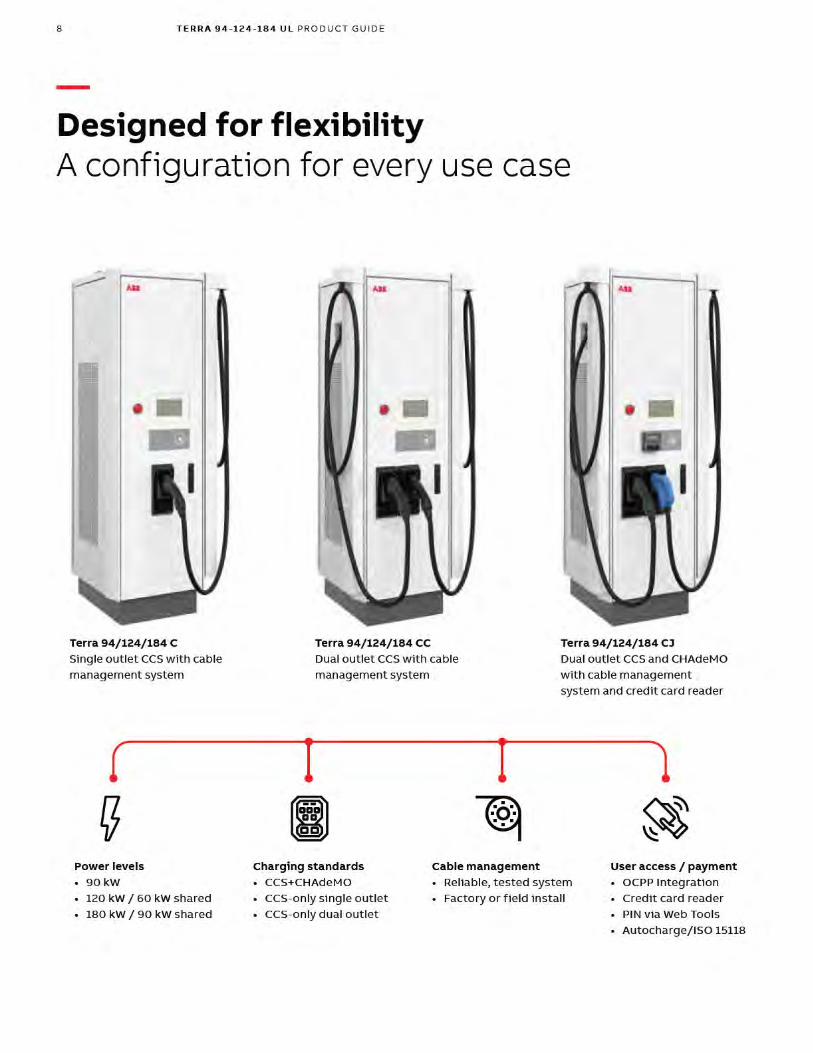
Maximum output power 90 kW 120 kW or 60 kW x 2
180 kW or 90 kW x 2
AC Input voltage 480Y / 277 VAC +/- 10 % (60 Hz)
AC input connection 3-phase: L1, L2, L3, GND (no neutral)
Nominal input current and input power rating 115 A, 96 kVA 153 A, 128 kVA 230 A, 192 kVA
Recommended upstream circuit breaker(s) 150 A 200 A 300 A
Power Factor* > 0.96
Current THD* < 5%
Short circuit current rating 65 kA
DC output voltage CCS-1: 150 - 920 VDC; CHAdeMO: 150 - 500 VDC
DC output current CCS-1: 200 A; CHAdeMO: 200 A
Efficiency* 95%
Interface and Control
Charging protocols CCS1 and CHAdeMO 1.2
User interface 7” high brightness full color touchscreen display
RFID system ISO/IEC 14443A/B, ISO/IEC 15393, FeliCa™ 1, NFC reader mode, Mifare, Calypso, (option: Legic)
Network connection GSM/3G/4G modem; 10/100 Base-T Ethernet
Communication OCPP 1.6 Core and Smart Charging Profiles; Autocharge via OCPP
Supported languages English (others available on request)
Environment
Operating temperature -35 °C to +55 °C / -31 °F to +131 °F(de-rating characteristics apply at extreme temperatures)
Recommended storage conditions -10 °C to +70 °C / 14 °F to +158 °C (dry environment)
Protection IP54, NEMA 3R; indoor and outdoor rated
Humidity 5% to 95%, non-condensing
Altitude up to 2000 m (6560 ft)
General
Charge cable 6 m (19.6 ft)
Dimensions (H x W x D) 1900 x 565 x 880 mm / 74.8 x 22.2 x 34.6 in
Weight 350 kg / 775 lbs 365 kg / 800 lbs 395 kg / 870 lbs
Compliance and safety UL 2202, CSA No. 107.1-16; UL 2231-1, UL 2231-2, CSA STD C22.2 No. 107.1; NEC Article 625, EN 61851, EN 62196; CHAdeMO 1.2; DIN 70121, ISO 15118; IEC 61000-6-3; EMC Class B, FCC Part 15
*Data shown at nominal output power


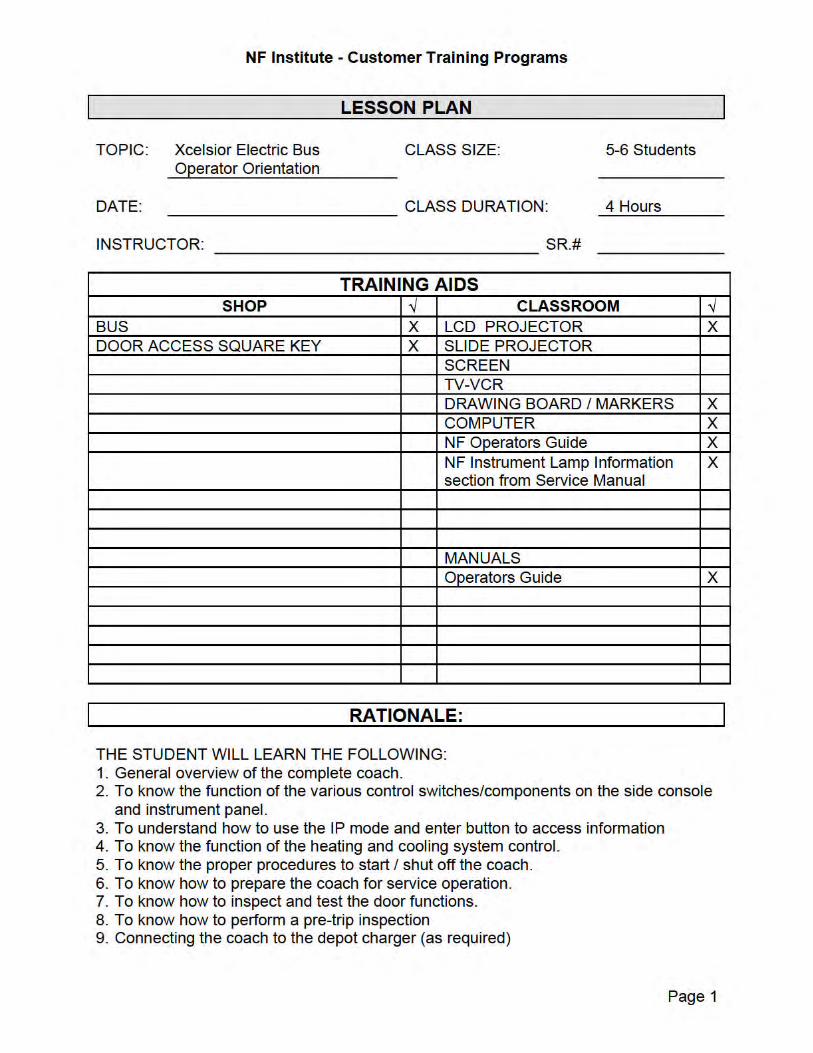
NF Institute � Customer Training Programs
Page 2
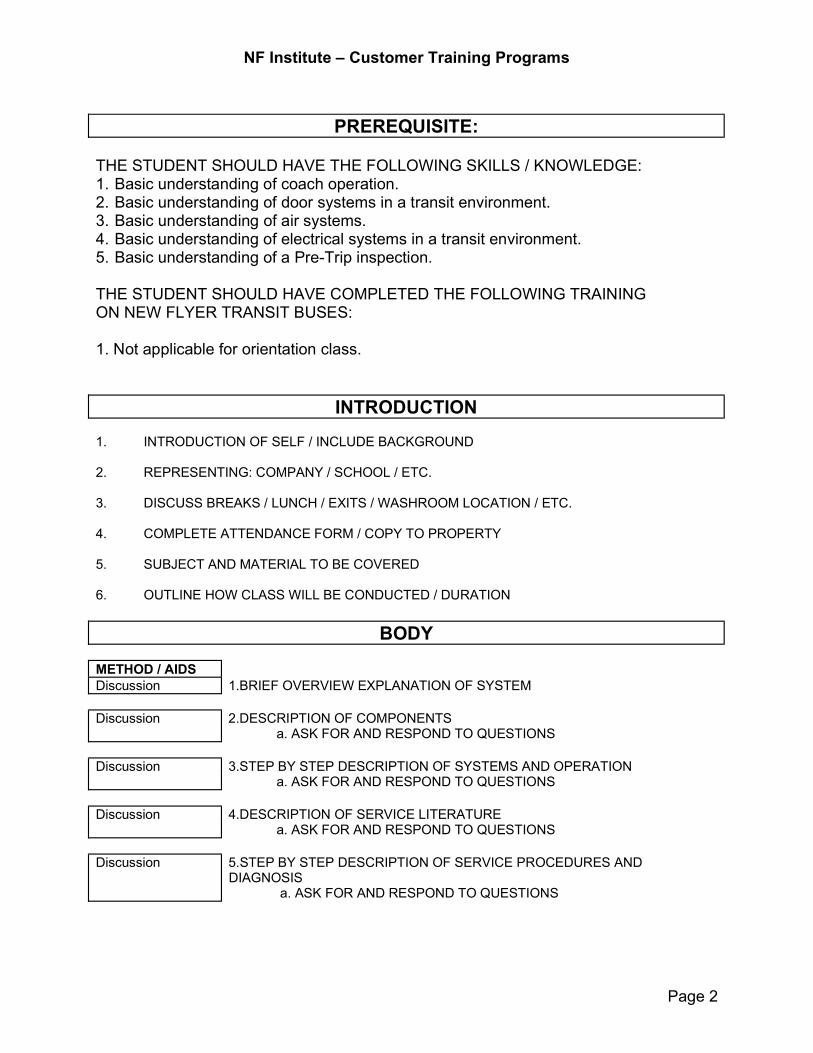
PREREQUISITE:
THE STUDENT SHOULD HAVE THE FOLLOWING SKILLS / KNOWLEDGE: 1. Basic understanding of coach operation.2. Basic understanding of door systems in a transit environment.3. Basic understanding of air systems.4. Basic understanding of electrical systems in a transit environment.5. Basic understanding of a Pre-Trip inspection.
THE STUDENT SHOULD HAVE COMPLETED THE FOLLOWING TRAINING ON NEW FLYER TRANSIT BUSES:
1. Not applicable for orientation class.
INTRODUCTION
1. INTRODUCTION OF SELF / INCLUDE BACKGROUND
2. REPRESENTING: COMPANY / SCHOOL / ETC.
3. DISCUSS BREAKS / LUNCH / EXITS / WASHROOM LOCATION / ETC.
4. COMPLETE ATTENDANCE FORM / COPY TO PROPERTY
5. SUBJECT AND MATERIAL TO BE COVERED
6. OUTLINE HOW CLASS WILL BE CONDUCTED / DURATION
BODY
METHOD / AIDS Discussion 1.BRIEF OVERVIEW EXPLANATION OF SYSTEM
Discussion 2.DESCRIPTION OF COMPONENTS a. ASK FOR AND RESPOND TO QUESTIONS
Discussion 3.STEP BY STEP DESCRIPTION OF SYSTEMS AND OPERATION a. ASK FOR AND RESPOND TO QUESTIONS
Discussion 4.DESCRIPTION OF SERVICE LITERATURE a. ASK FOR AND RESPOND TO QUESTIONS
Discussion 5.STEP BY STEP DESCRIPTION OF SERVICE PROCEDURES ANDDIAGNOSIS
a. ASK FOR AND RESPOND TO QUESTIONS
NF Institute - Customer Training Programs
Page 3
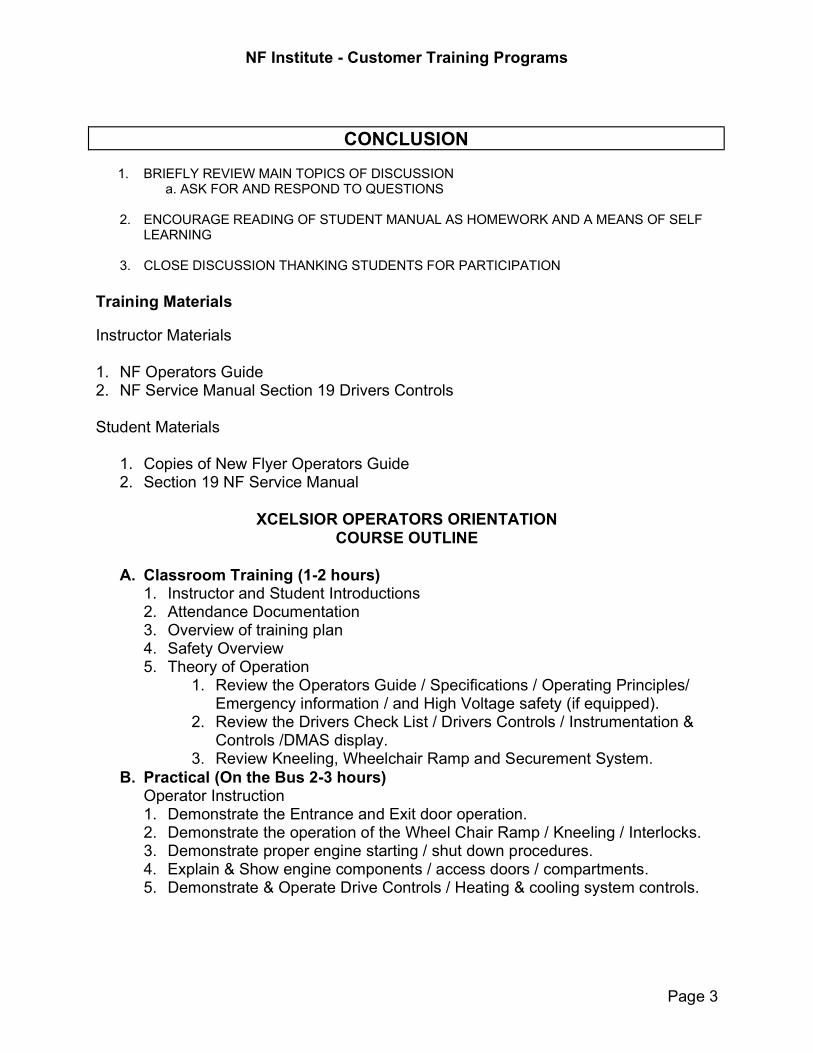
CONCLUSION
1. BRIEFLY REVIEW MAIN TOPICS OF DISCUSSIONa. ASK FOR AND RESPOND TO QUESTIONS
2. ENCOURAGE READING OF STUDENT MANUAL AS HOMEWORK AND A MEANS OF SELFLEARNING
3. CLOSE DISCUSSION THANKING STUDENTS FOR PARTICIPATION
Training Materials
Instructor Materials
1. NF Operators Guide2. NF Service Manual Section 19 Drivers Controls
Student Materials
1. Copies of New Flyer Operators Guide2. Section 19 NF Service Manual
XCELSIOR OPERATORS ORIENTATION COURSE OUTLINE
A. Classroom Training (1-2 hours) 1. Instructor and Student Introductions2. Attendance Documentation3. Overview of training plan4. Safety Overview5. Theory of Operation
1. Review the Operators Guide / Specifications / Operating Principles/Emergency information / and High Voltage safety (if equipped).
2. Review the Drivers Check List / Drivers Controls / Instrumentation &Controls /DMAS display.
3. Review Kneeling, Wheelchair Ramp and Securement System.B. Practical (On the Bus 2-3 hours)
Operator Instruction 1. Demonstrate the Entrance and Exit door operation.2. Demonstrate the operation of the Wheel Chair Ramp / Kneeling / Interlocks.3. Demonstrate proper engine starting / shut down procedures.4. Explain & Show engine components / access doors / compartments.5. Demonstrate & Operate Drive Controls / Heating & cooling system controls.


1405 Page 123 of 128
7.2 EXTERIOR NOISE TESTS
7.2-I. TEST OBJECTIVE
The objective of this test is to record exterior noise levels when a bus is operated under various conditions.
7.2-II. TEST DESCRIPTION
In the exterior noise tests, the bus will be operated at a SLW in three different conditions using a smooth, straight and level roadway:
1. Accelerating at full throttle from a constant speed at or below 35 mph and justprior to transmission up shift.
2. Accelerating at full throttle from standstill.3. Stationary, with the engine at low idle, high idle, and wide open throttle.
In addition, the buses will be tested with and without the air conditioning and all accessories operating. The exterior noise levels will be recorded.
The test site is at the PSBRTF and the test procedures will be in accordance with SAE Standards SAE J366b, Exterior Sound Level for Heavy Trucks and Buses. The test site is an open space free of large reflecting surfaces. A noise meter placed at a specified location outside the bus will measure the noise level.
During the test, special attention should be paid to:
1. The test site characteristics regarding parked vehicles, signboards,buildings, or other sound-reflecting surfaces
2. Proper usage of all test equipment including set-up and calibration3. The ambient sound level
7.2-III. DISCUSSION
The Exterior Noise Test determines the noise level generated by the vehicle under different driving conditions and at stationary low and high idle, with and without air conditioning and accessories operating. The test site is a large, level, bituminous paved area with no reflecting surfaces nearby.
With an exterior ambient noise level of 43.6 dB(A), the average test result obtained while accelerating from a constant speed was 66.1 dB(A) on the right side and 66.1 dB(A) on the left side.

1405 Page 124 of 128
When accelerating from a standstill with an exterior ambient noise level of 44.1 dB(A), the average of the results obtained were 64.5 dB(A) on the right side and 64.9 dB(A) on the left side.
With the vehicle stationary and the engine, accessories, and air conditioning on, the measurements averaged 48.8 dB(A) at idle. With the accessories and air conditioning off, the readings averaged 9.6 dB(A) lower at idle. Note; this electric bus is not equipped with high idle and wide open throttle positions. The exterior ambient noise level measured during this test was 43.9 dB(A).

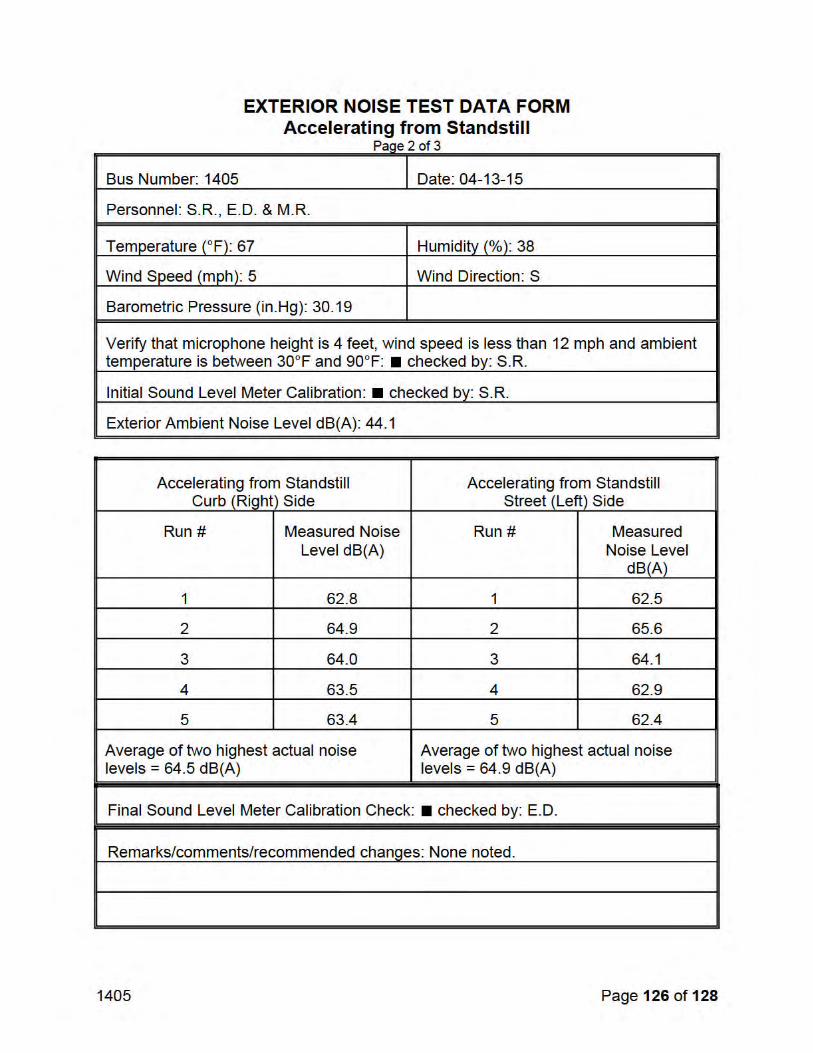
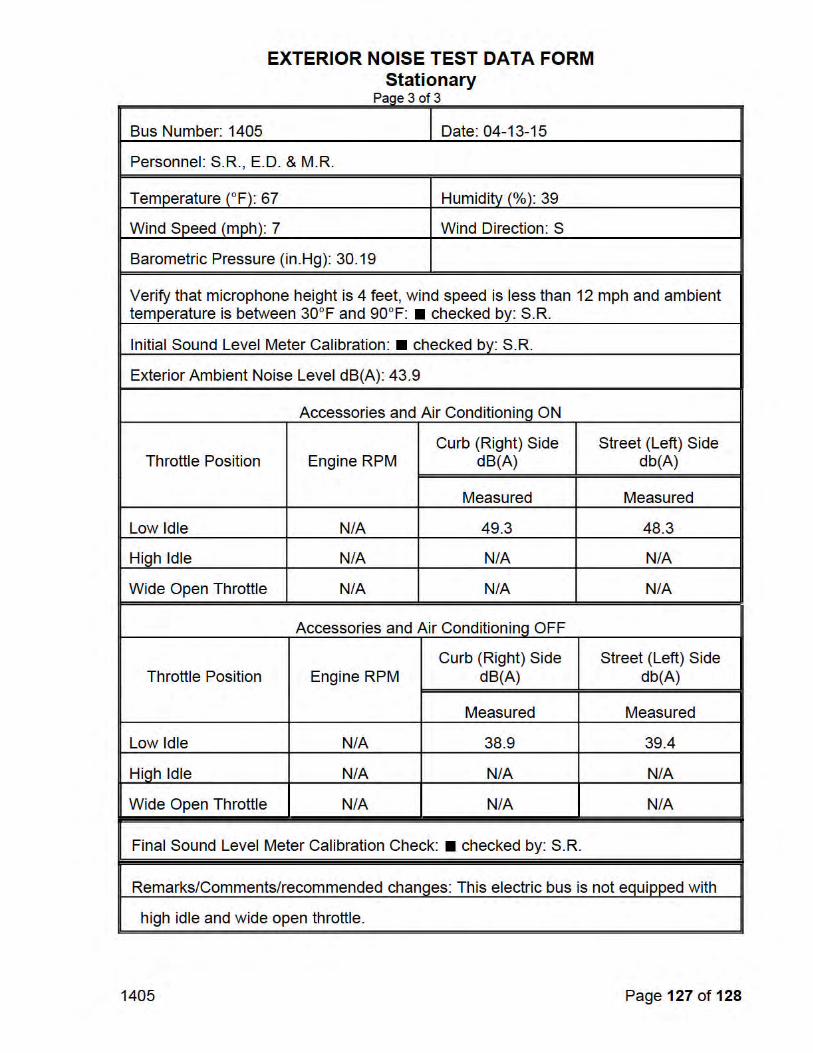
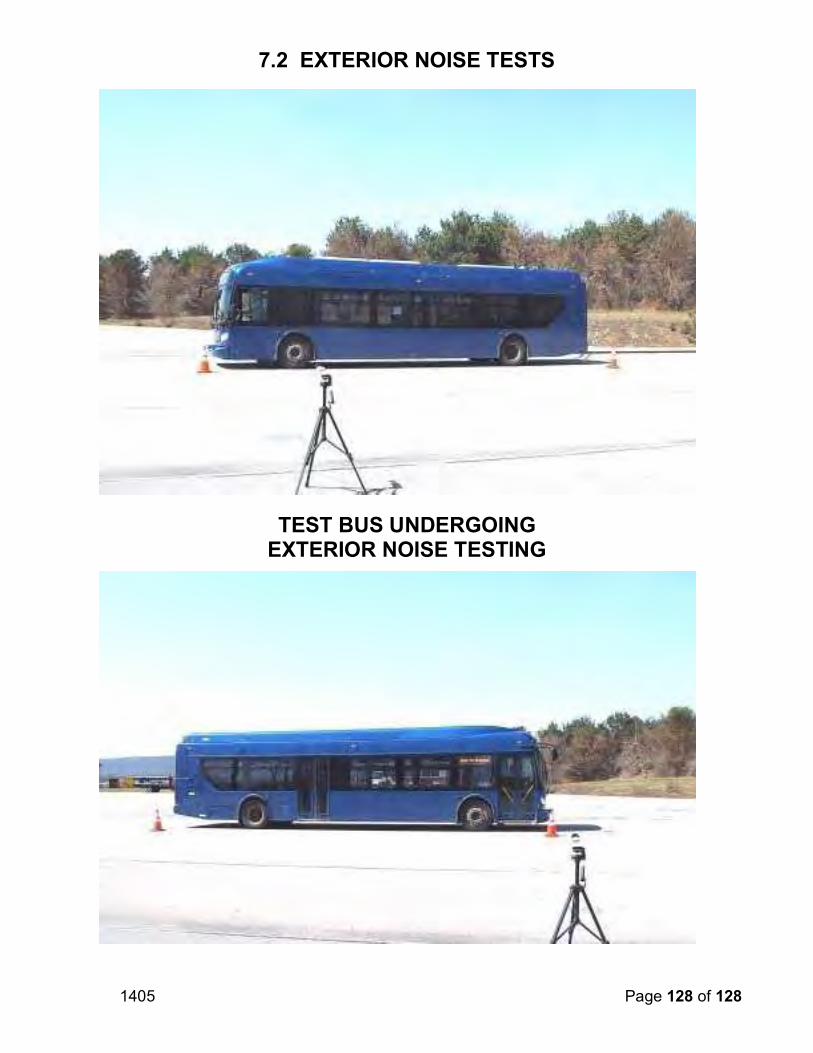
1405 Page 128 of 128
7.2 EXTERIOR NOISE TESTS
TEST BUS UNDERGOING EXTERIOR NOISE TESTING

1405 Page 118 of 128
7. NOISE
7.1 INTERIOR NOISE AND VIBRATION TESTS
7.1-I. TEST OBJECTIVE
The objective of these tests is to measure and record interior noise levels and check for audible vibration under various operating conditions.
7.1-II. TEST DESCRIPTION
During this series of tests, the interior noise level will be measured at several locations with the bus operating under the following three conditions:
1. With the bus stationary, a white noise generating system shall provide a uniformsound pressure level equal to 80 dB(A) on the left, exterior side of the bus. Theengine and all accessories will be switched off and all openings including doorsand windows will be closed. This test will be performed at the ABTC.
2. The bus accelerating at full throttle from a standing start to 35 mph on a levelpavement. All openings will be closed and all accessories will be operating duringthe test. This test will be performed on the track at the Test Track Facility.
3. The bus will be operated at various speeds from 0 to 55 mph with and withoutthe air conditioning and accessories on. Any audible vibration or rattles will benoted. This test will be performed on the test segment between the Test Trackand the Bus Testing Center.
All tests will be performed in an area free from extraneous sound-making sourcesor reflecting surfaces. The ambient sound level as well as the surrounding weather conditions will be recorded in the test data.
7.1-III. DISCUSSION
This test is performed in three parts. The first part exposes the exterior of the vehicle to 80.0 dB(A) on the left side of the bus and the noise transmitted to the interior is measured. The overall average of the six measurements was 47.0 dB(A); ranging from 45.5 dB(A) at the rear passenger seats to 47.9 dB(A) in line with the rear speaker.The interior ambient noise level for this test was < 30.0 dB(A).
The second test measures interior noise during acceleration from 0 to 35 mph.This noise level ranged from 66.4 dB(A) at the front passenger seats to 70.2 dB(A) at the rear passenger seats. The overall average was 68.6 dB(A). The interior ambient noise level for this test was < 30.0 dB(A).
The third part of the test is to listen for resonant vibrations, rattles, and other noise sources while operating over the road. No vibrations or rattles were noted.
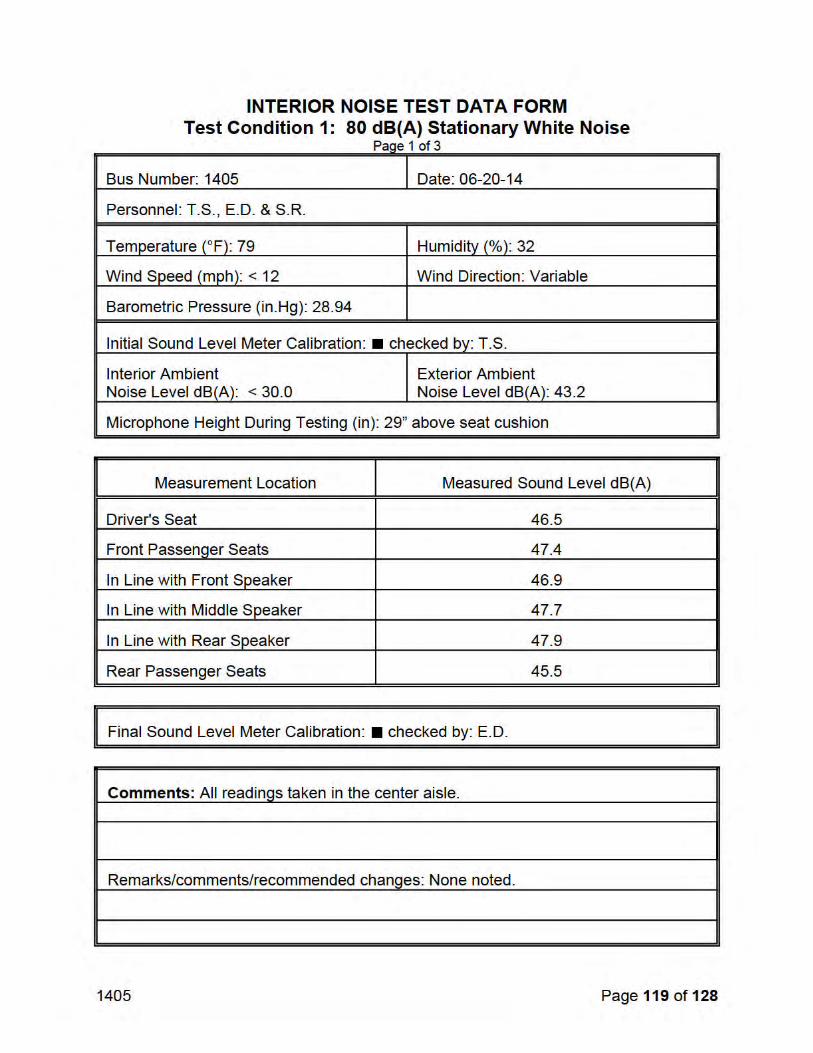


1405 Page 122 of 128
7.1 INTERIOR NOISE TEST
TEST BUS SET-UP FOR 80 dB(A)INTERIOR NOISE TEST


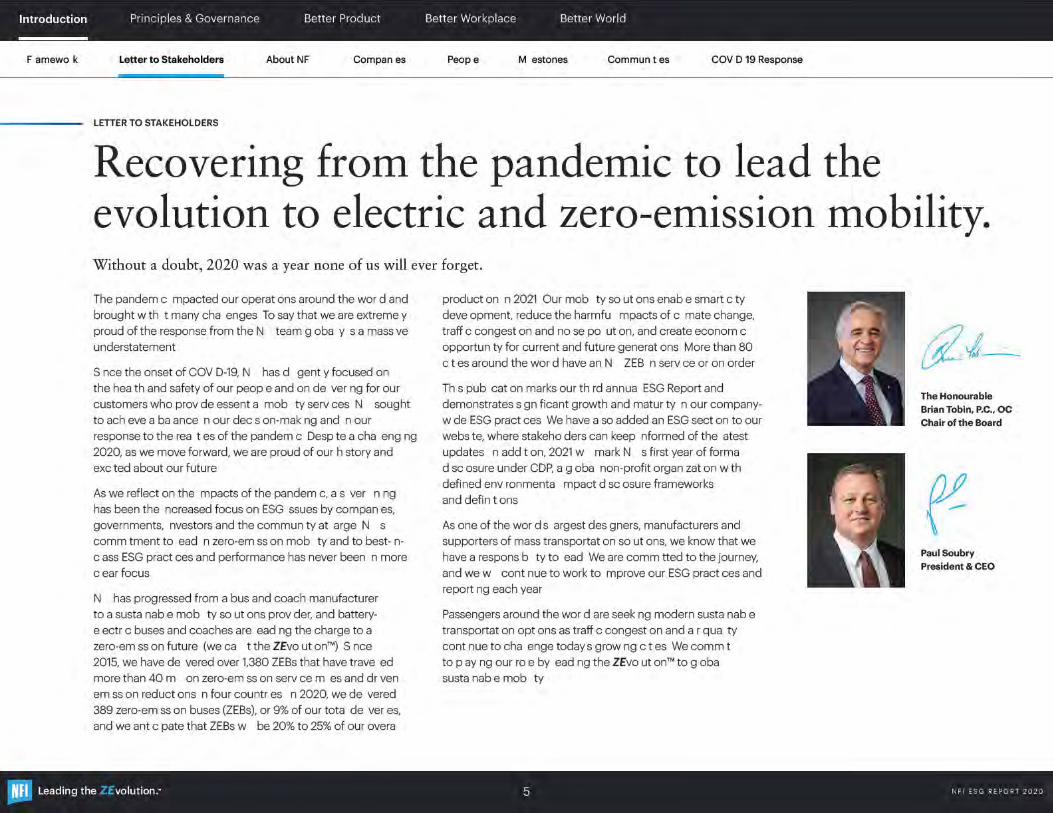
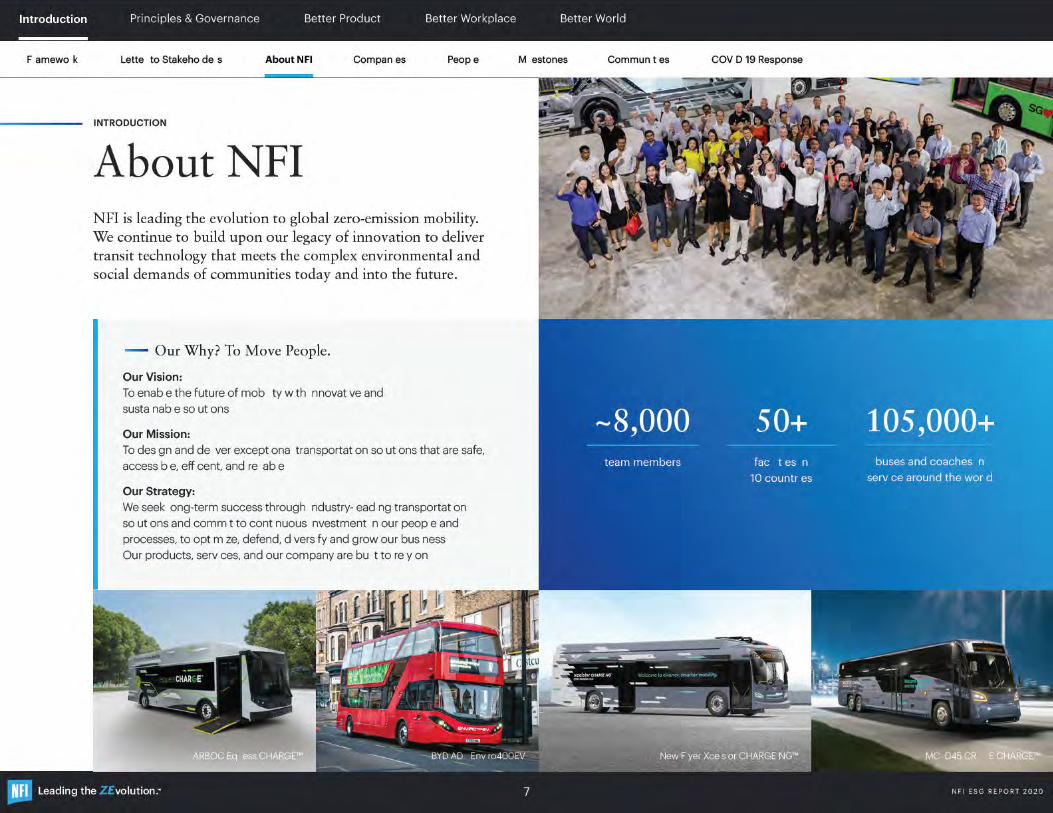
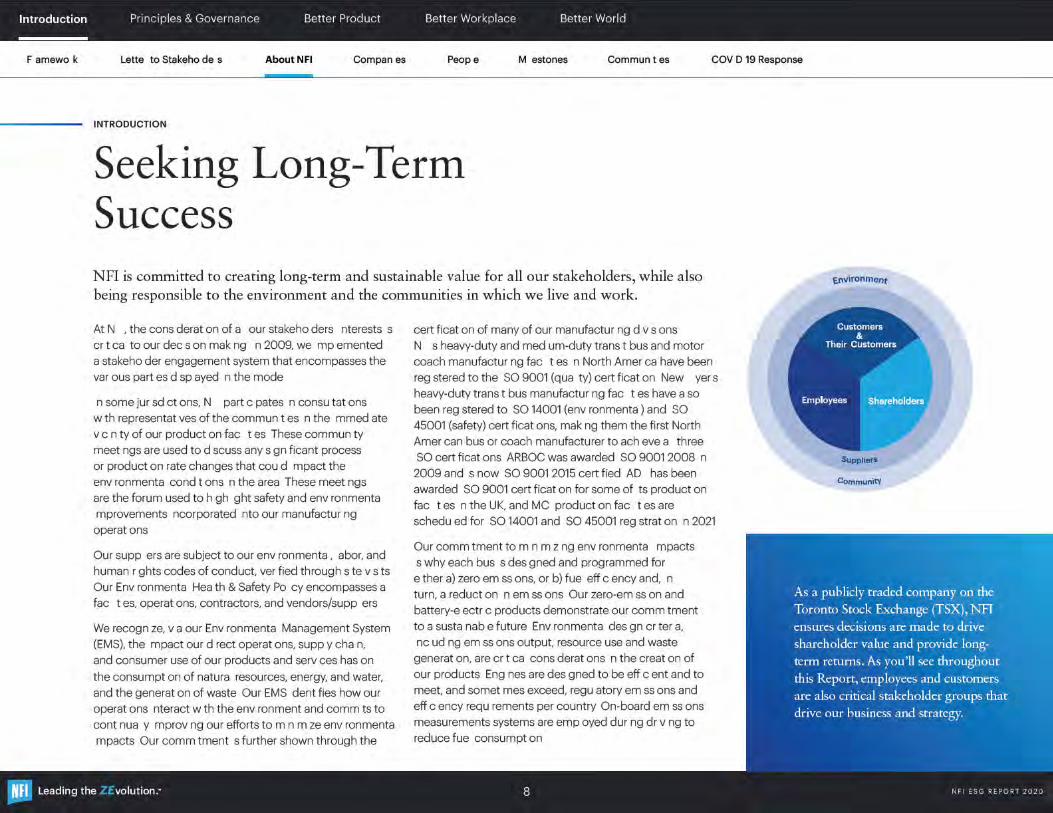

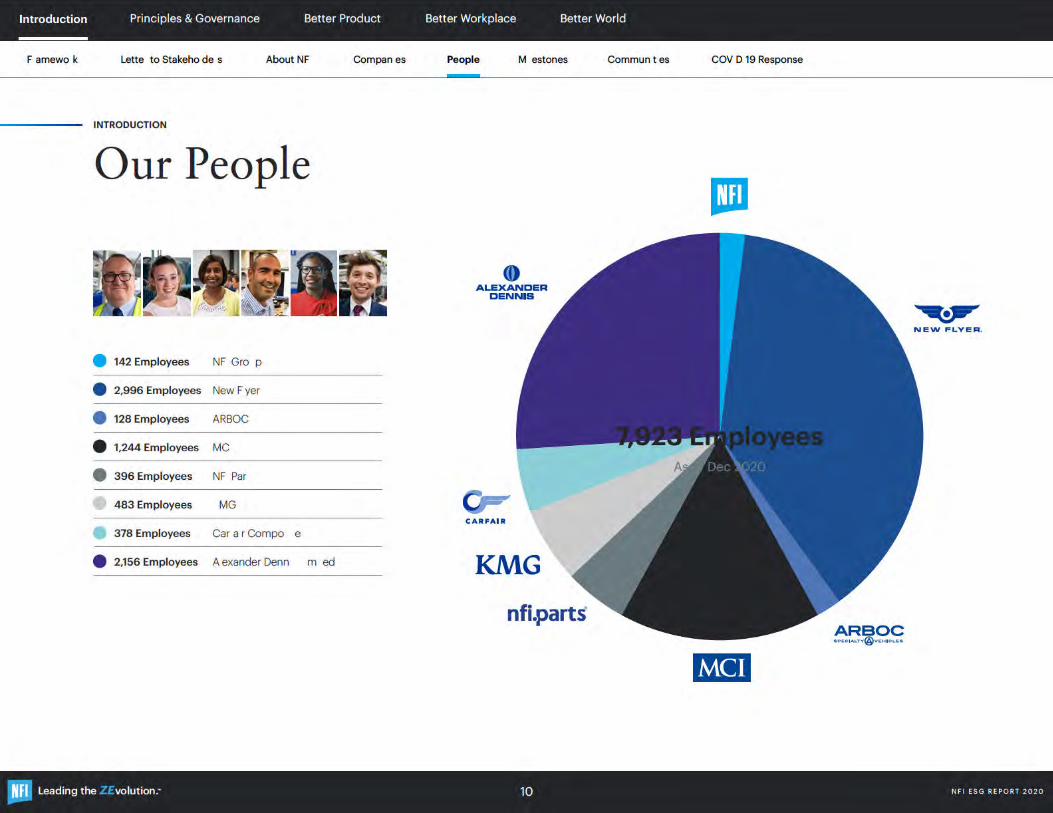


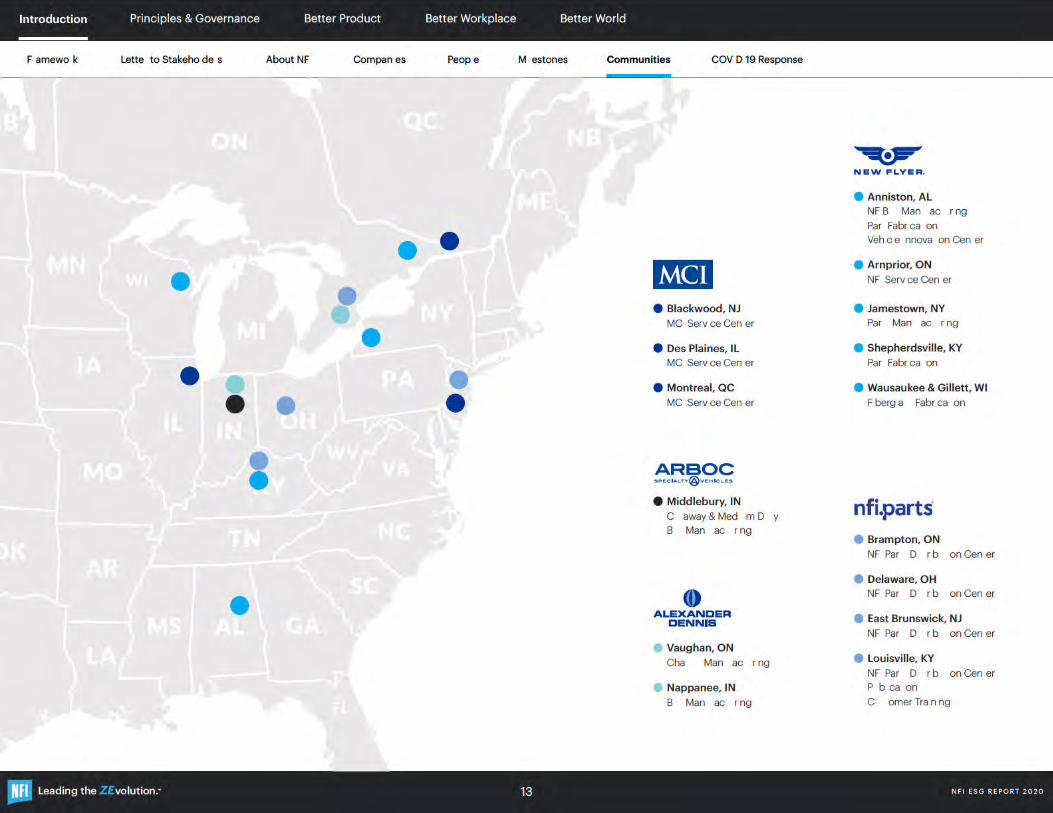
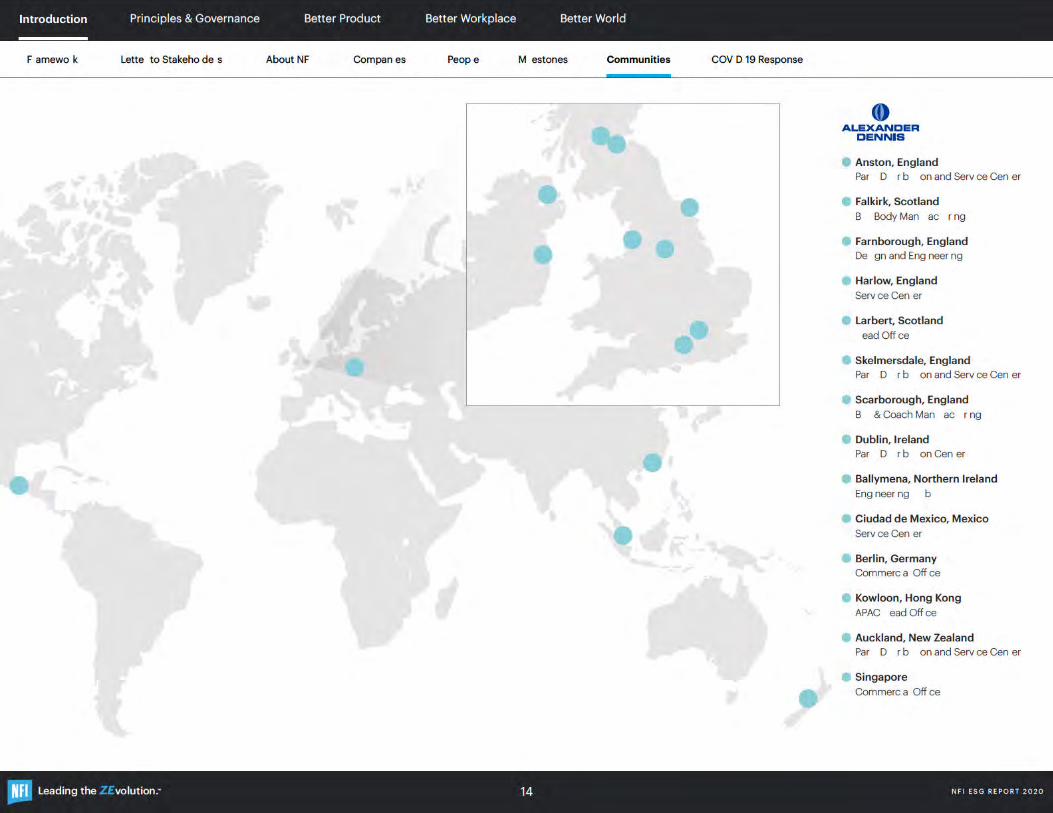


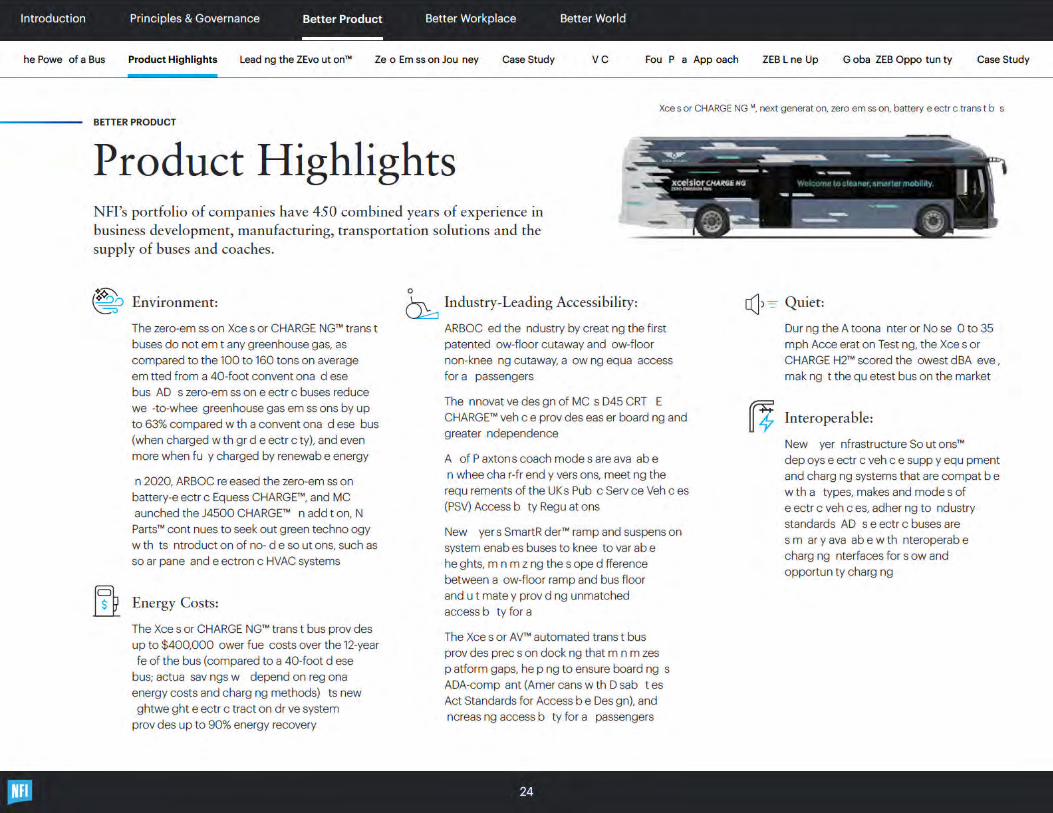


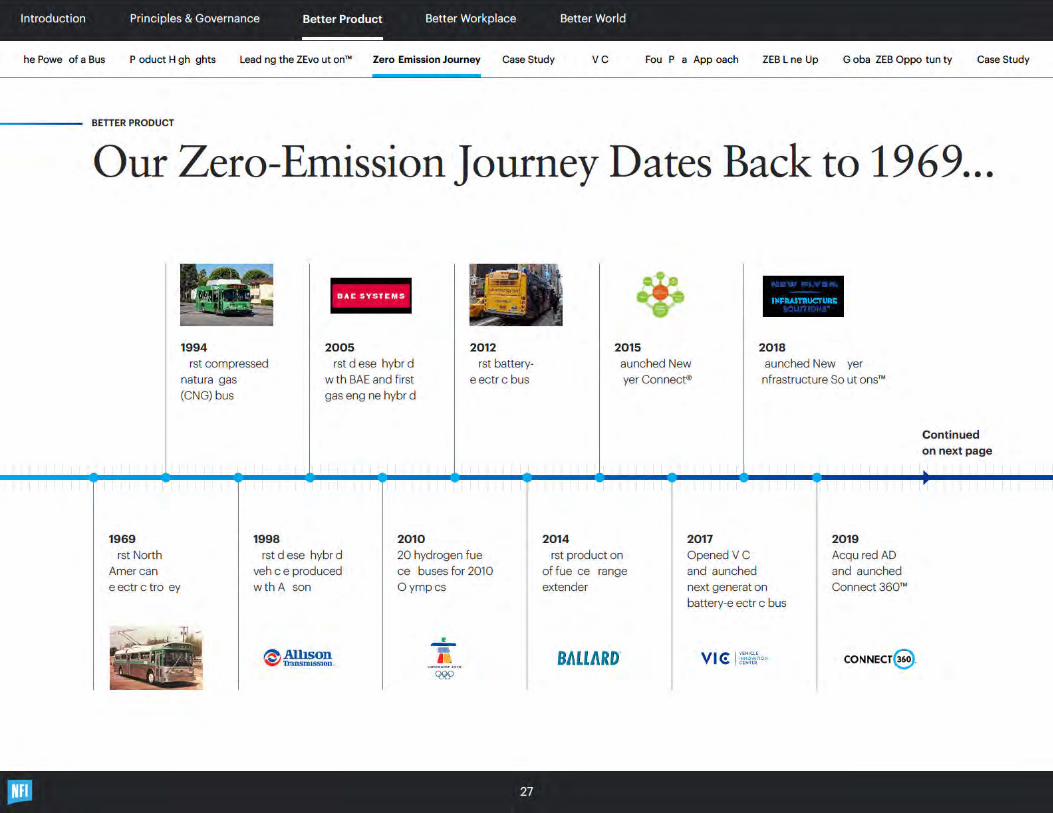
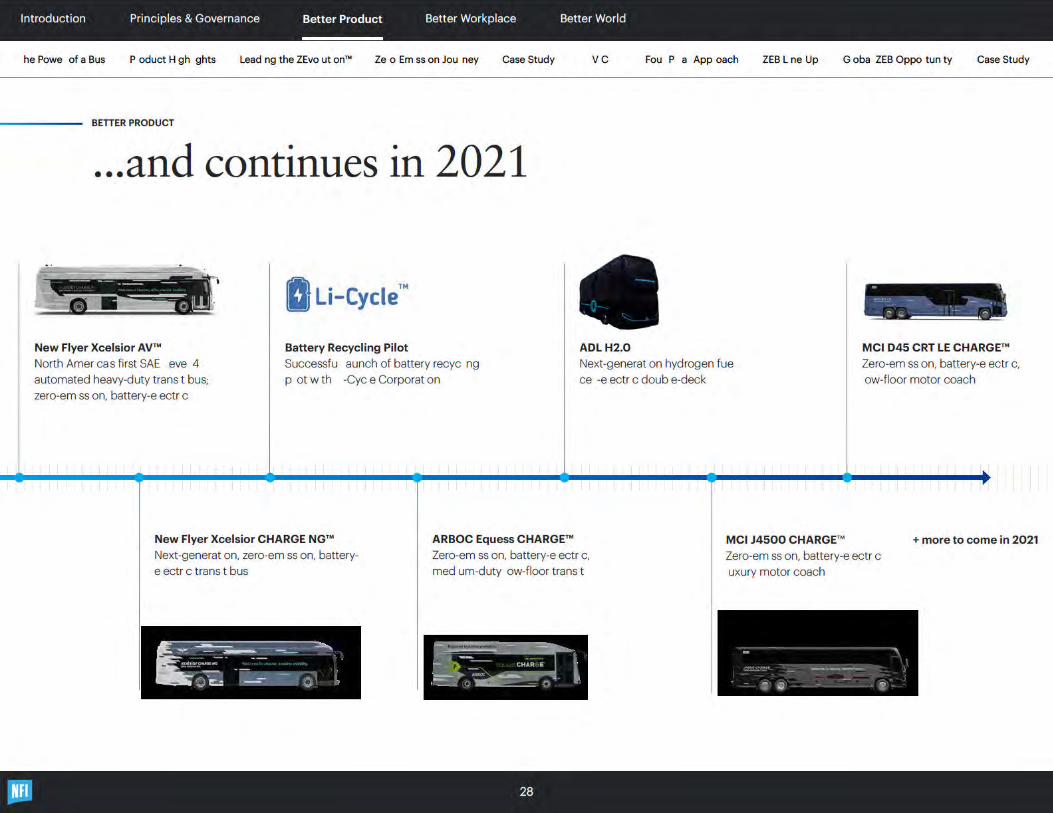

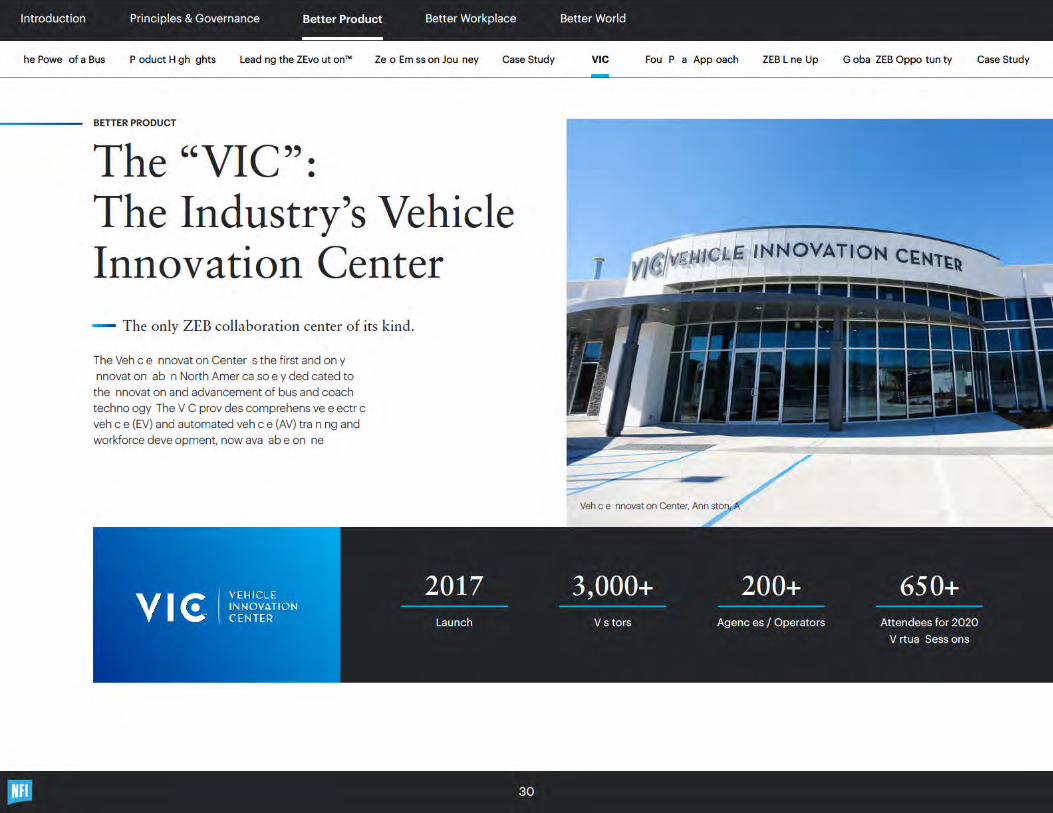
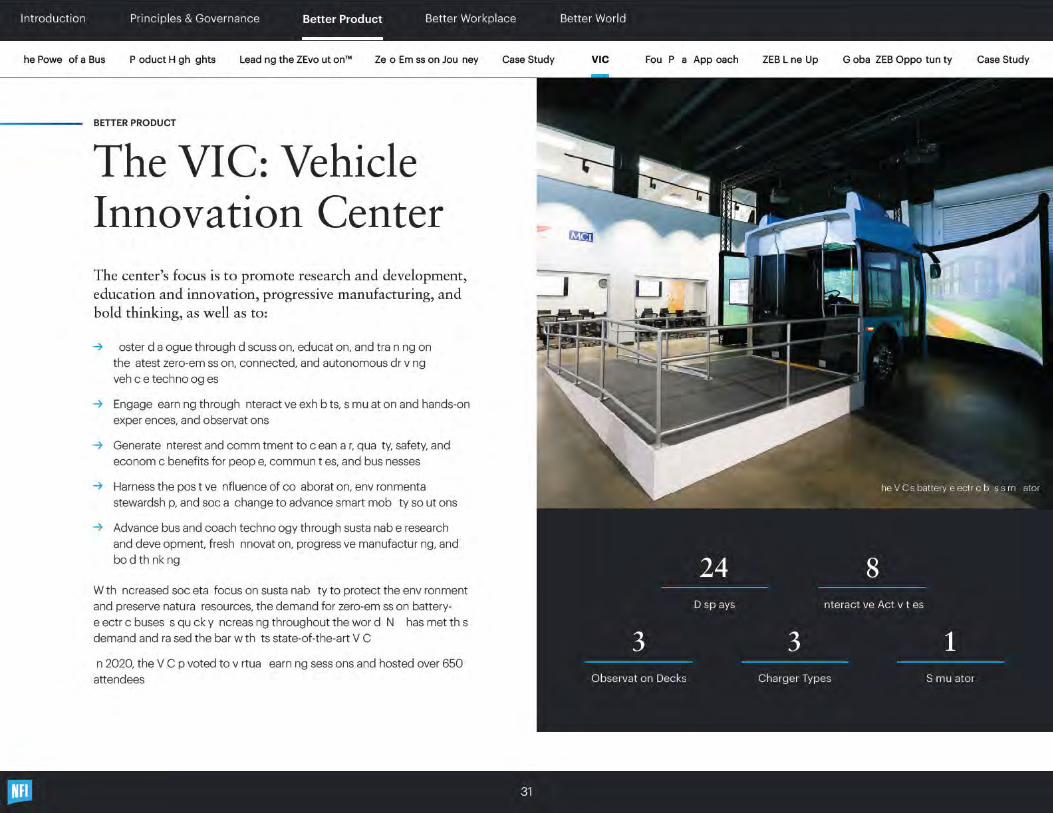
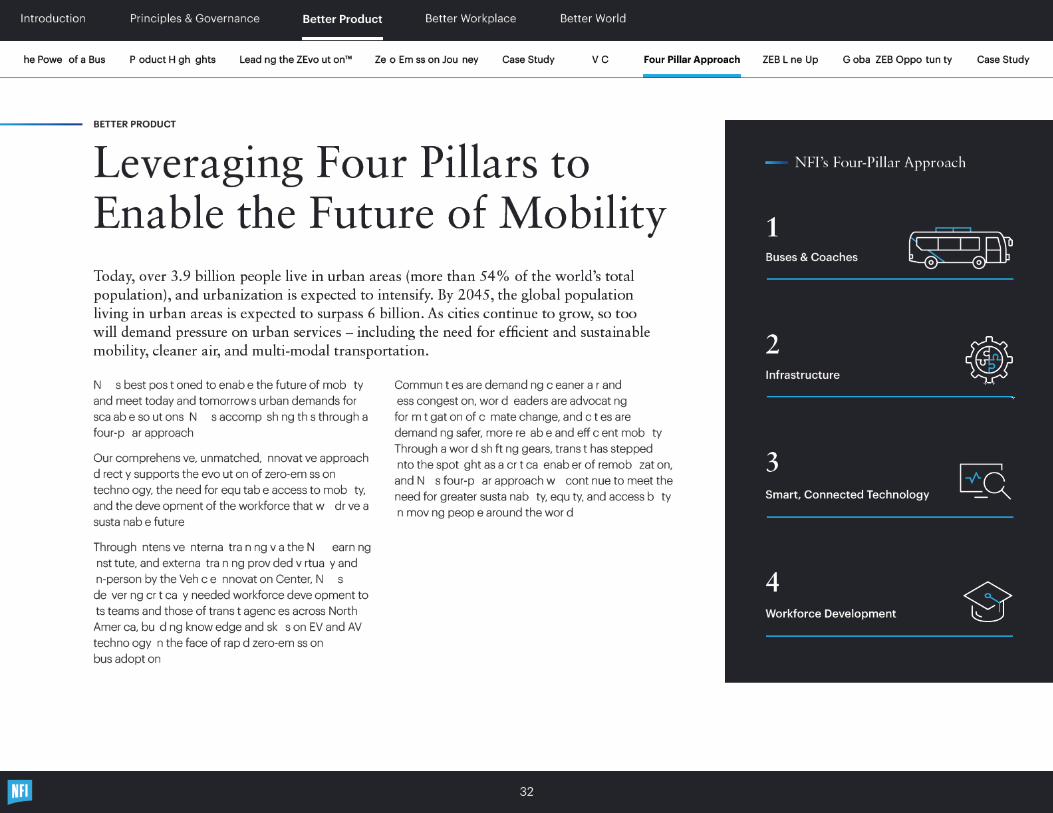
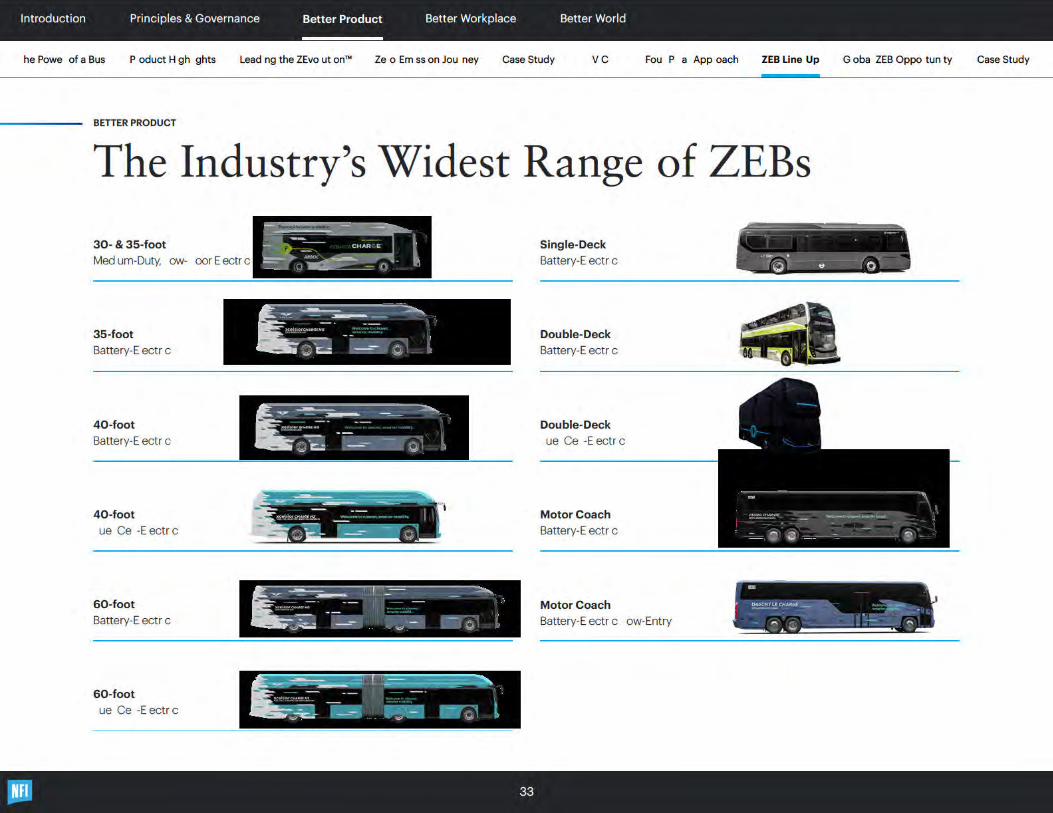


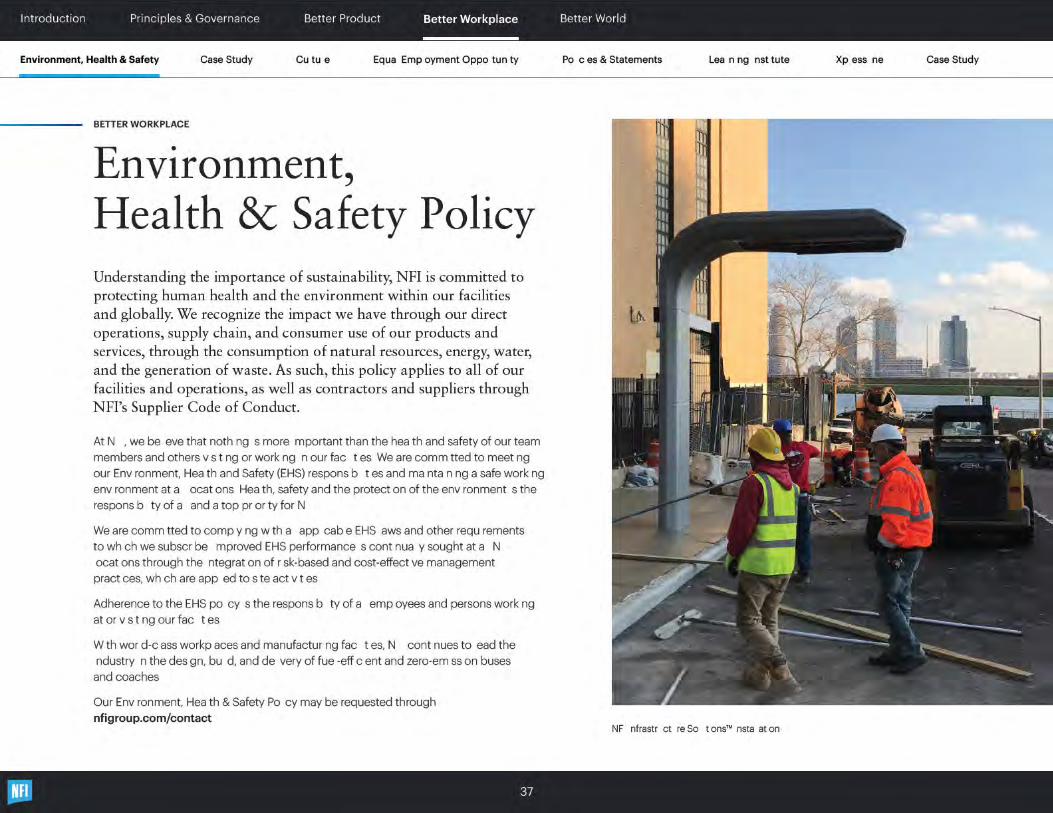

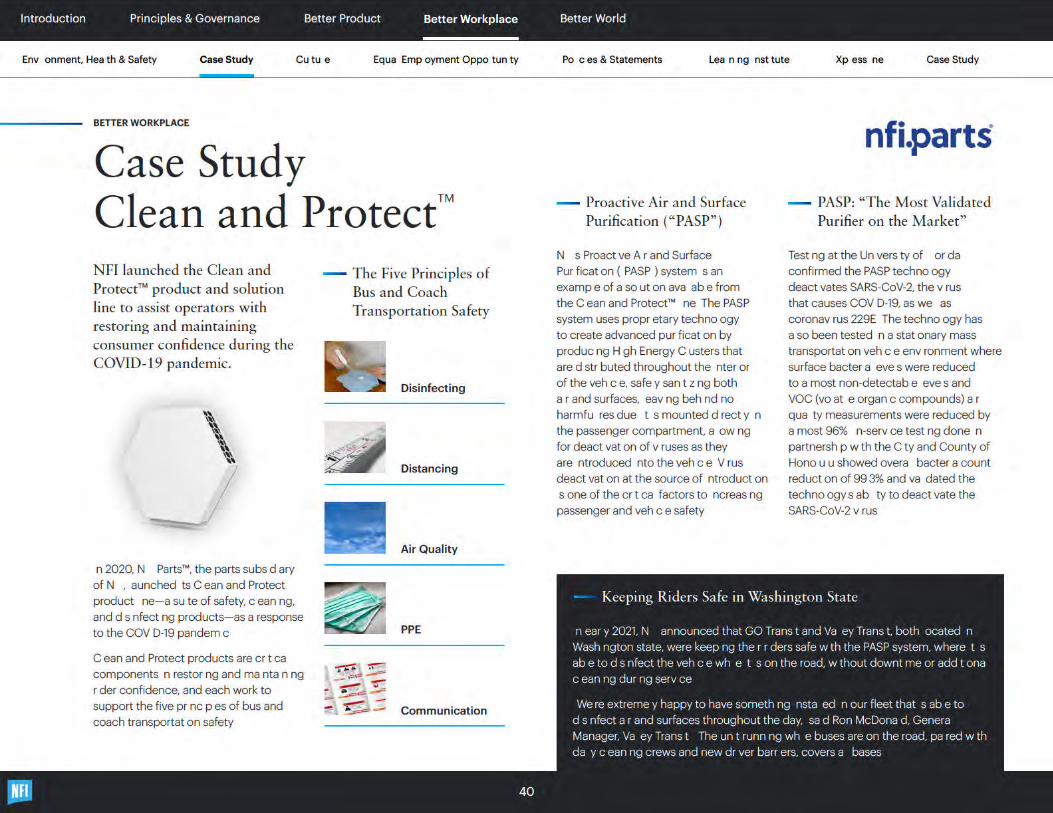


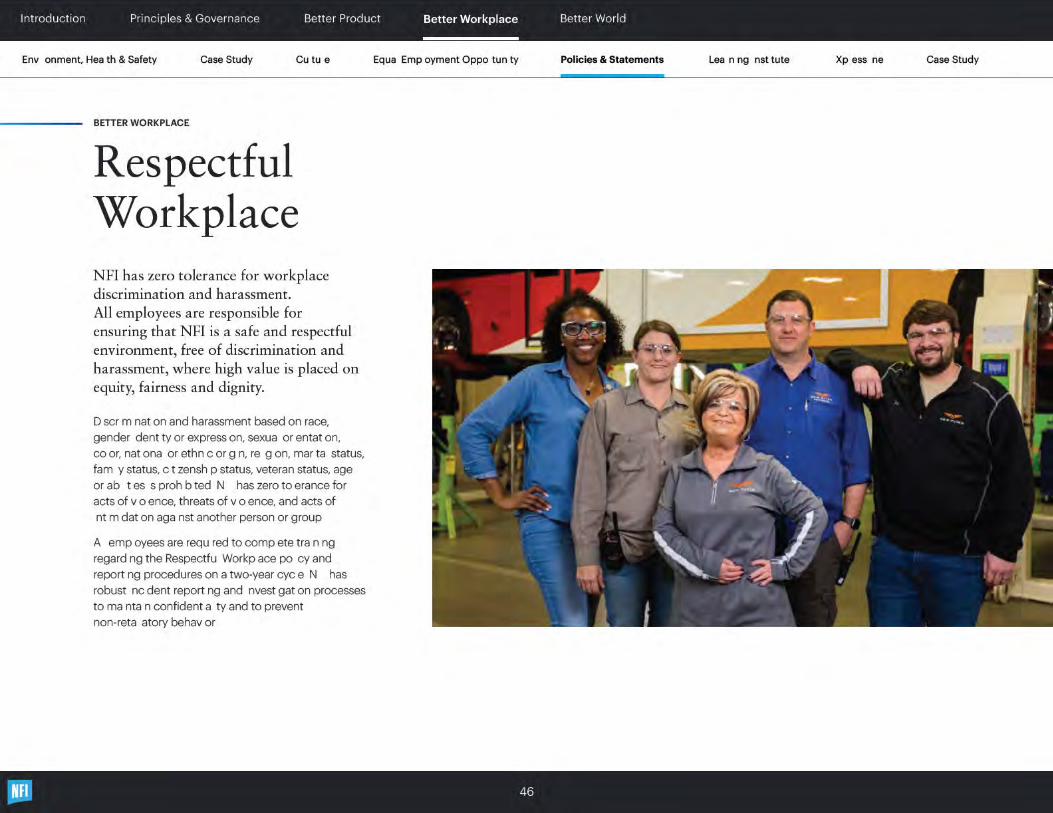
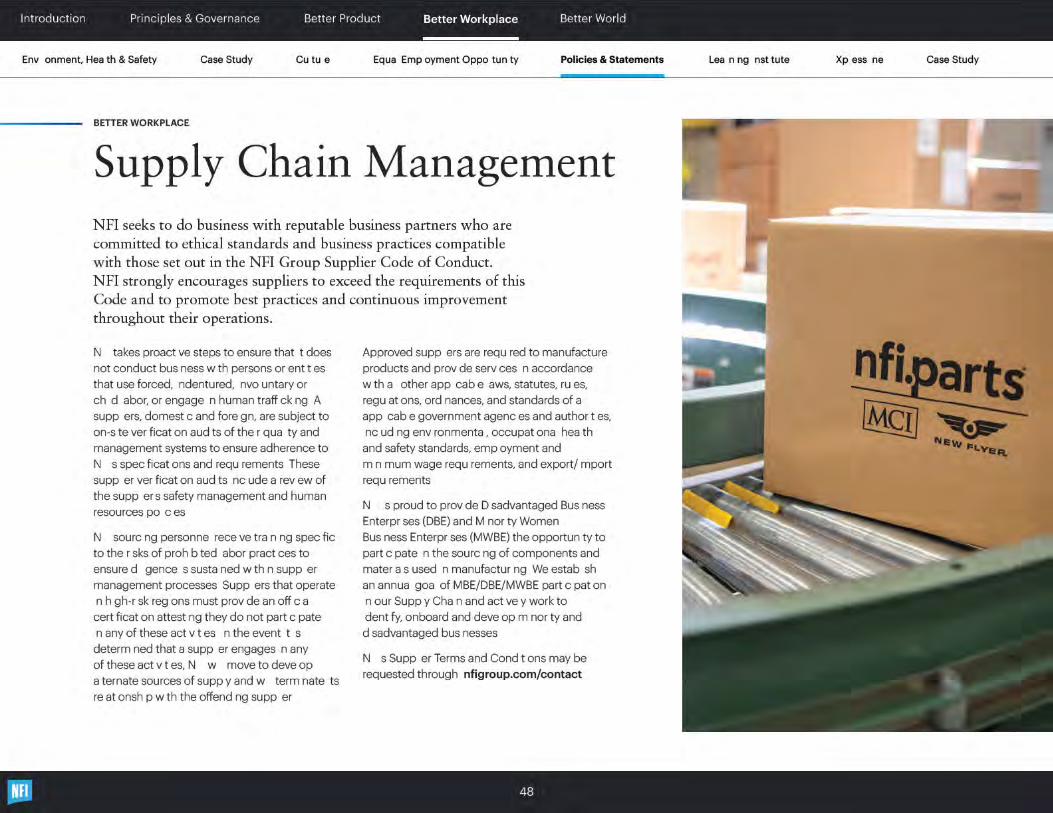
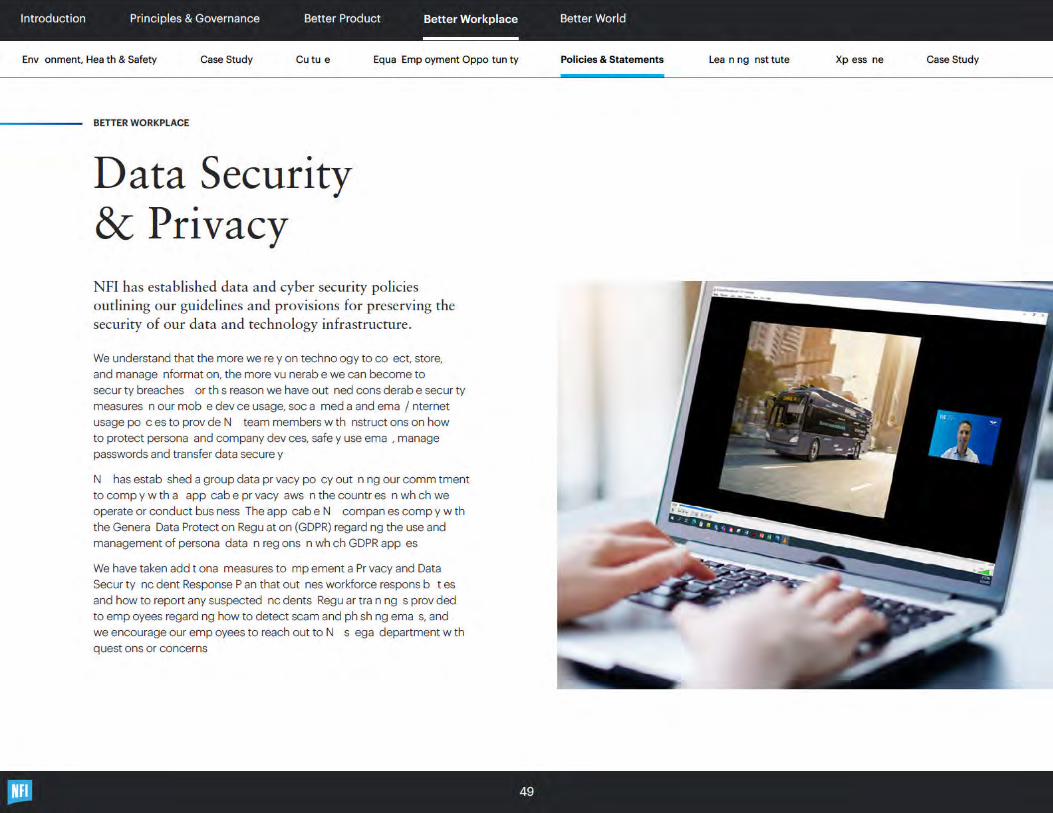


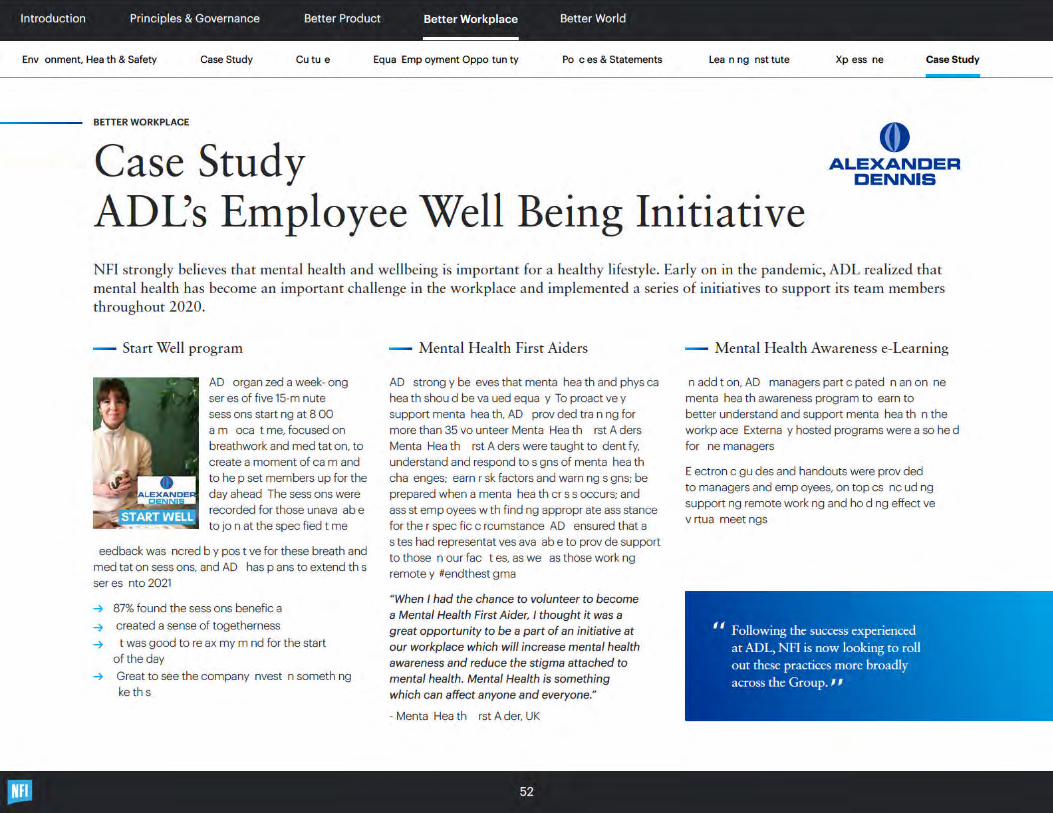


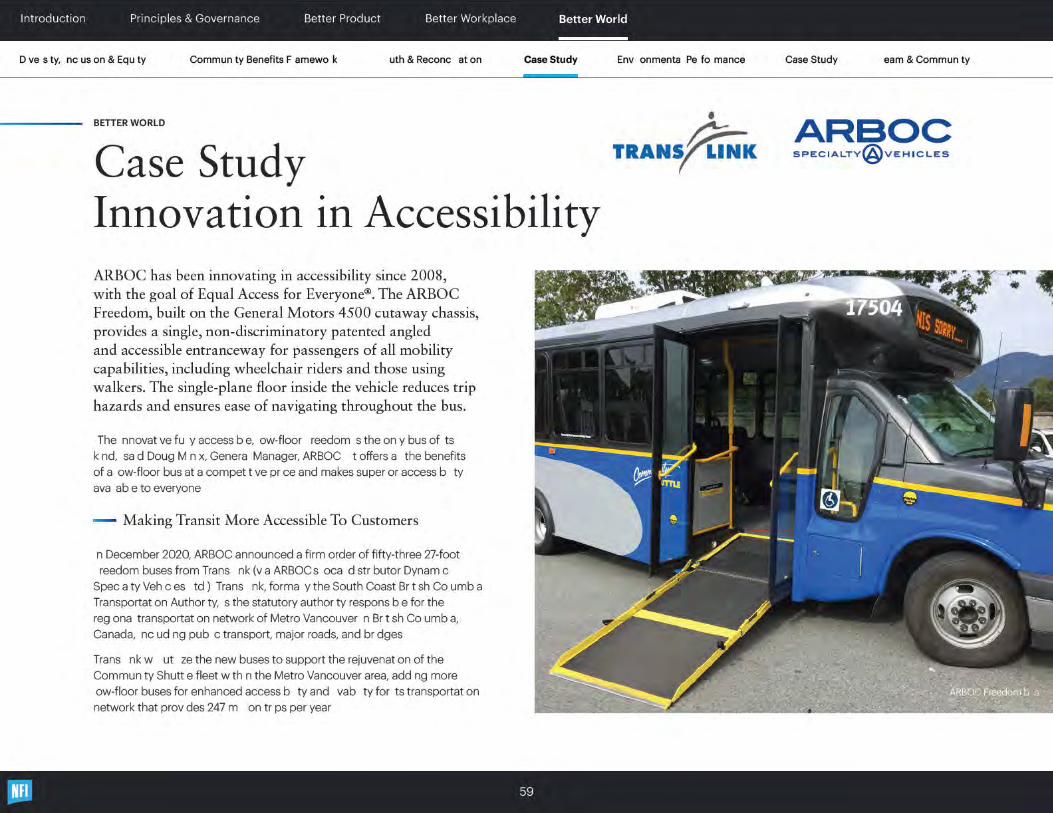


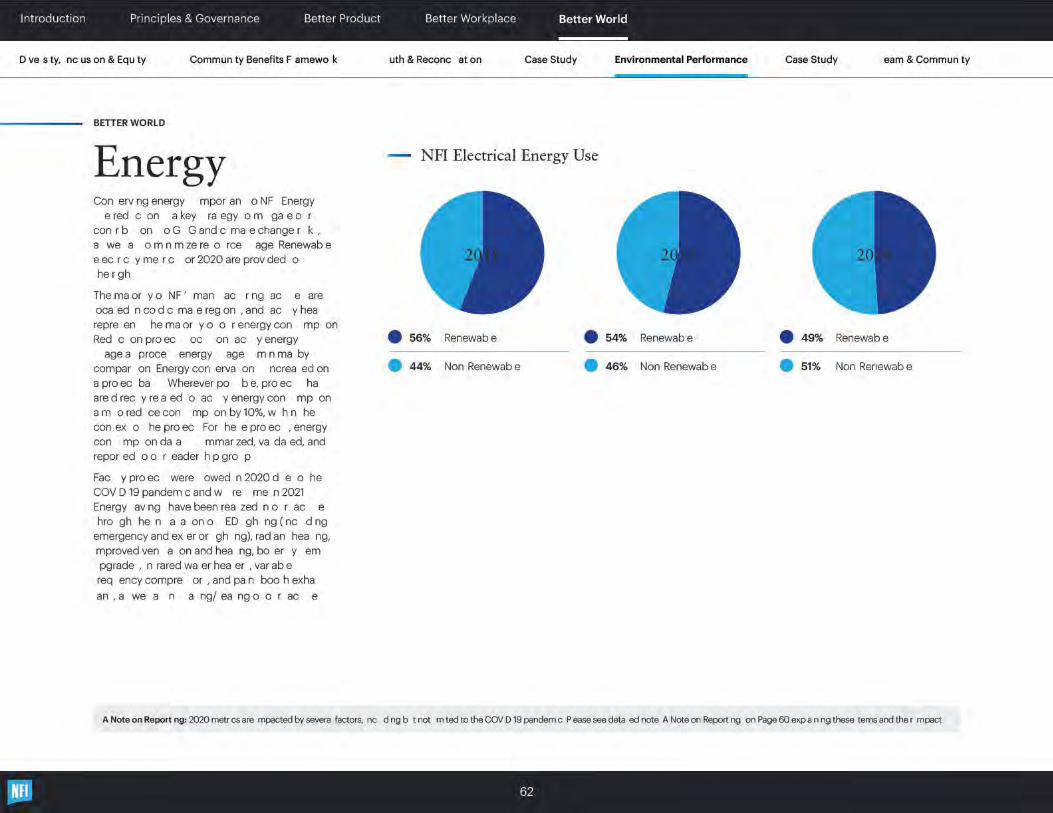


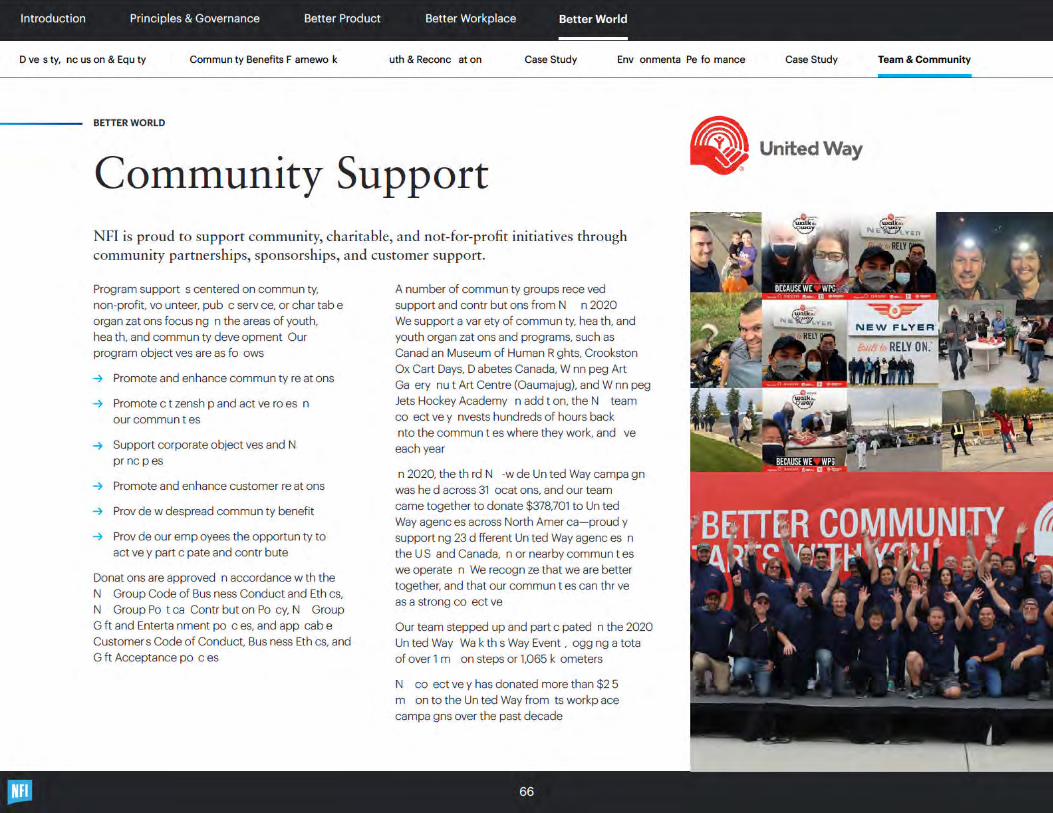


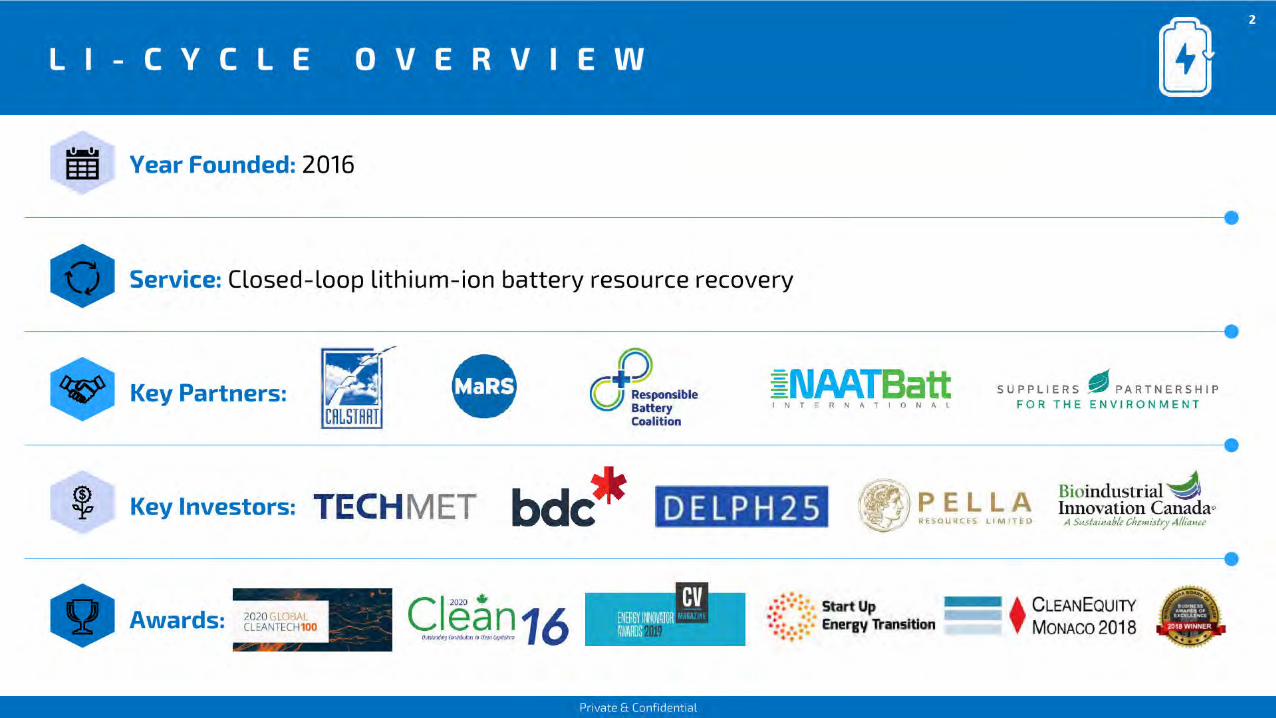


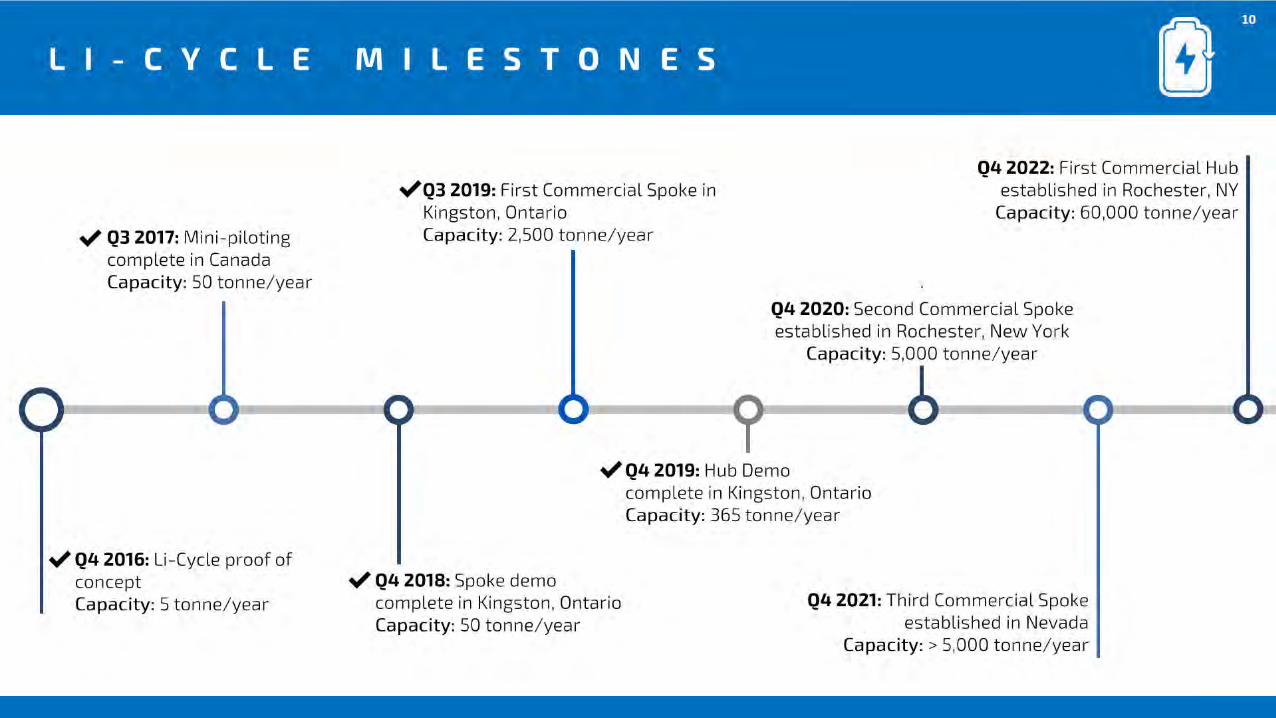


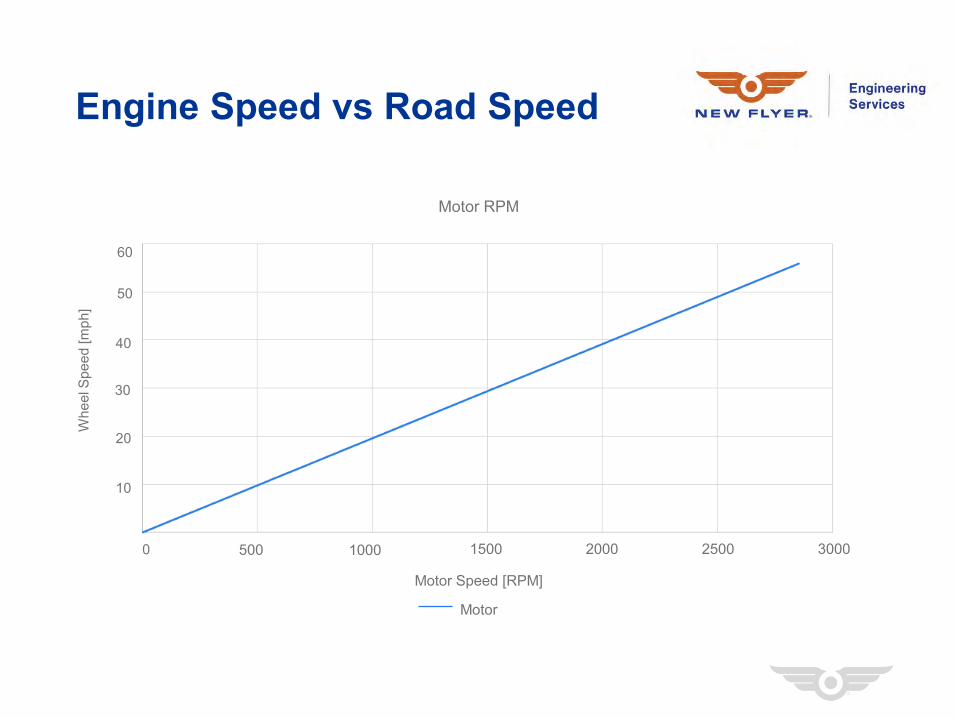
Engine Speed vs Road Speed
Motor RPM
Motor Speed [RPM]
Motor
0 500 1000 1500 2000 2500 3000
10
20
50
40
60
30
Whe
el S
peed
[mph
]

Motor Torque vs Motor Speed
Motor RPM
Motor Speed [RPM]
0500 1000 1500 2000 2500 3000
500
1000
2500
2000
3000
1500
Mot
or T
orqu
e [N
m]
3500
40003500

Vehicle Speed vs Time Unloaded
Motor RPM
Time [s]
Spee
d[m
ph]
10
20
50
40
60
30
70
80
010 20 30 40 50 60 70

Vehicle Speed vs Time Fully Load
Motor RPM
Time [s]
Spee
d[m
ph]
10
20
50
40
60
30
70
80
010 20 30 40 50 60 70
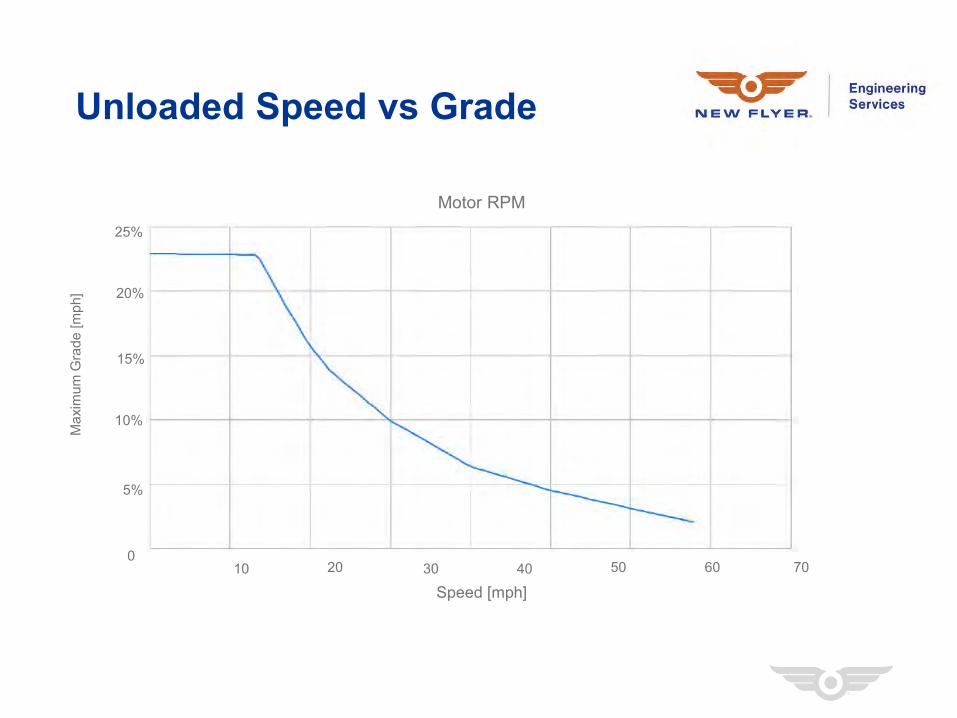
Unloaded Speed vs Grade
Motor RPM
Speed [mph]
Max
imum
Gra
de [m
ph]
5%
10%
15%
20%
25%
010 20 30 40 50 60 70

Fully Loaded Speed vs Grade
Motor RPM
Speed [mph]
Max
imum
Gra
de [m
ph]
5%
10%
15%
20%
25%
010 20 30 40 50 60 70

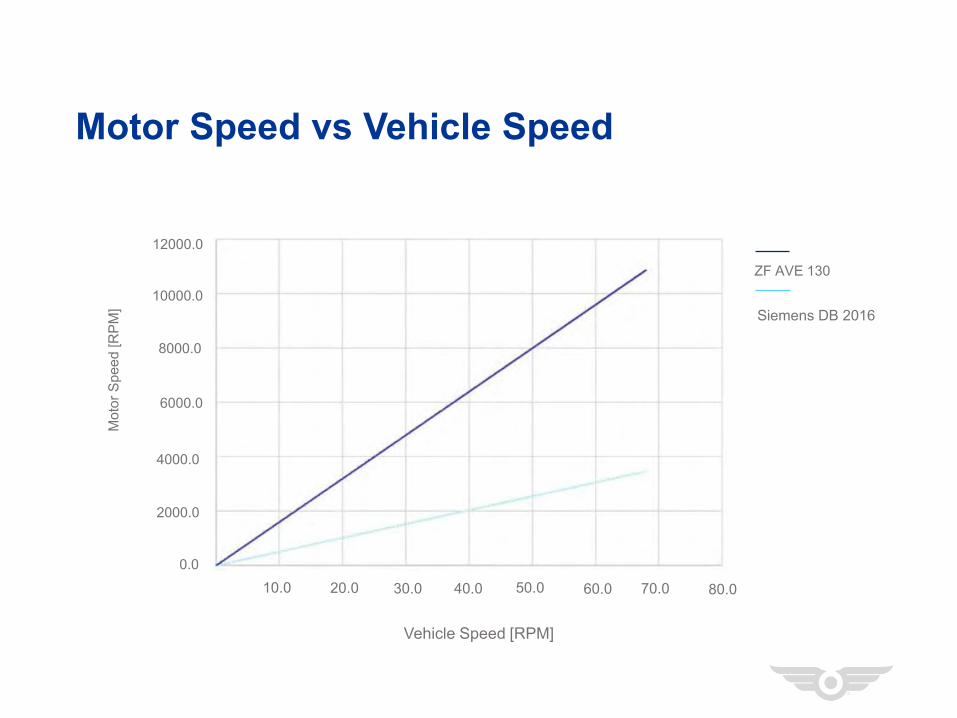
Motor Speed vs Vehicle Speed
Vehicle Speed [RPM]
0.010.0 20.0 30.0 40.0 50.0 60.0
2000.0
4000.0
10000.0
8000.0
12000.0
6000.0
Mot
orSp
eed
[RPM
]
ZF AVE 130
Siemens DB 2016
70.0 80.0
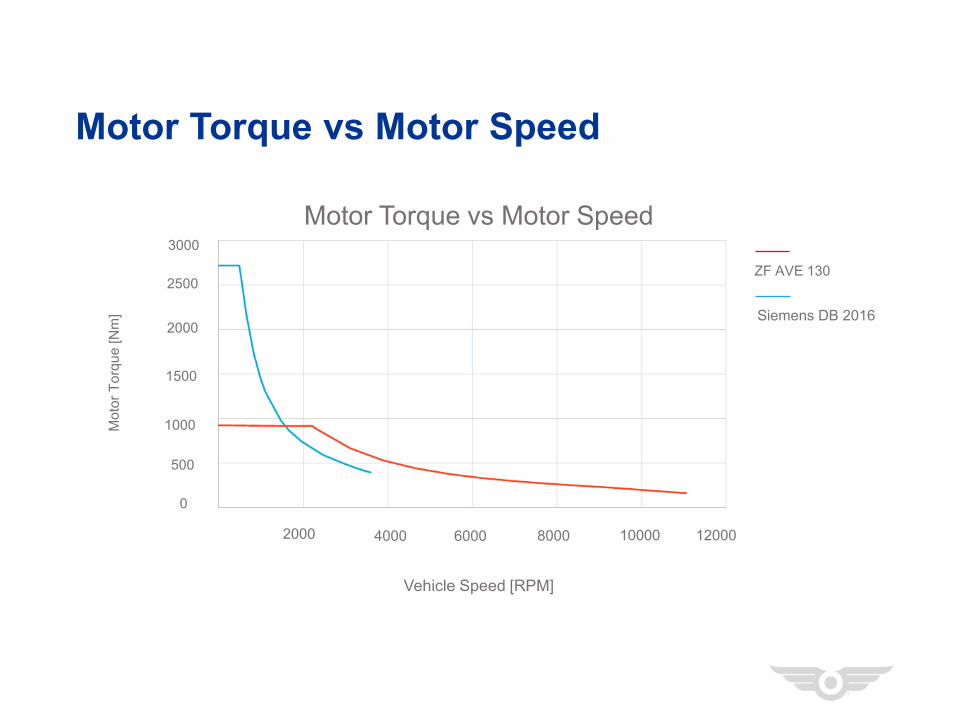
Motor Torque vs Motor Speed
Motor Torque vs Motor Speed
Vehicle Speed [RPM]
0
2000 4000 6000 8000 10000 12000
500
1000
2500
2000
1500
Mot
or T
orqu
e [N
m]
ZF AVE 130
Siemens DB 2016
3000

Horsepower vs Engine Speed
Motor Speed [RPM]
0
2000 4000 6000 8000 10000 12000
50
100
250
200
150
Mot
or P
ower
[hp]
ZF AVE 130
Siemens DB 2016
300
0
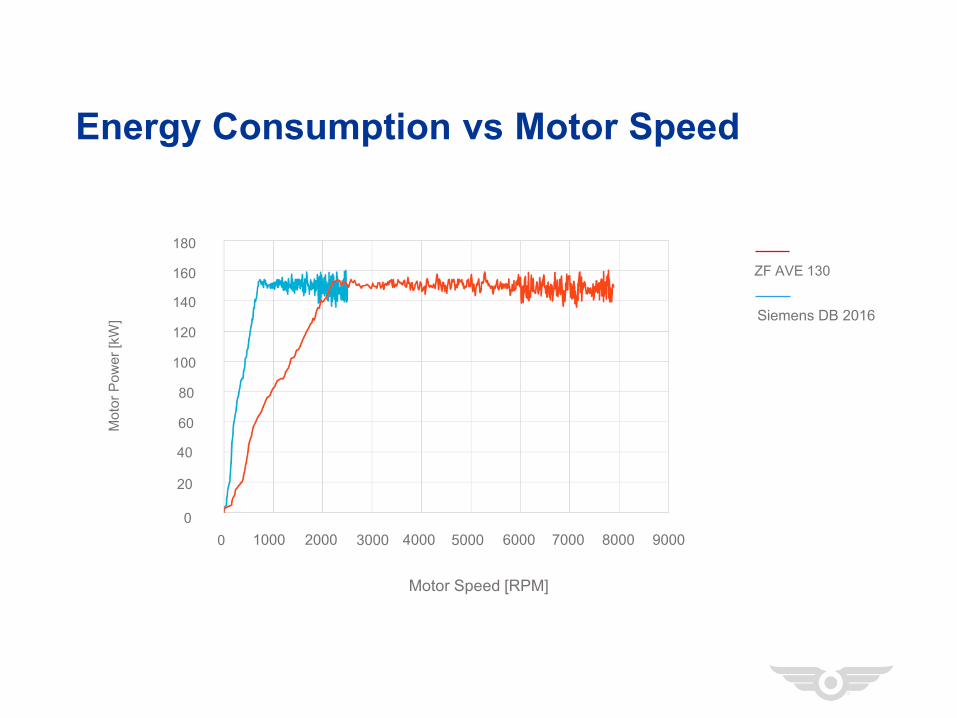
Energy Consumption vs Motor Speed
Motor Speed [RPM]
02000 3000 4000 6000 8000 9000
20
40
100
80
60Mot
or P
ower
[kW
]
ZF AVE 130
Siemens DB 2016
180
120
140
160
1000 5000 70000

Vehicle Speed vs Time (Unloaded)
Time [seconds]
05 10 15 20 25 30
10
20
50
40
30
Spee
d[m
ph]
60
350
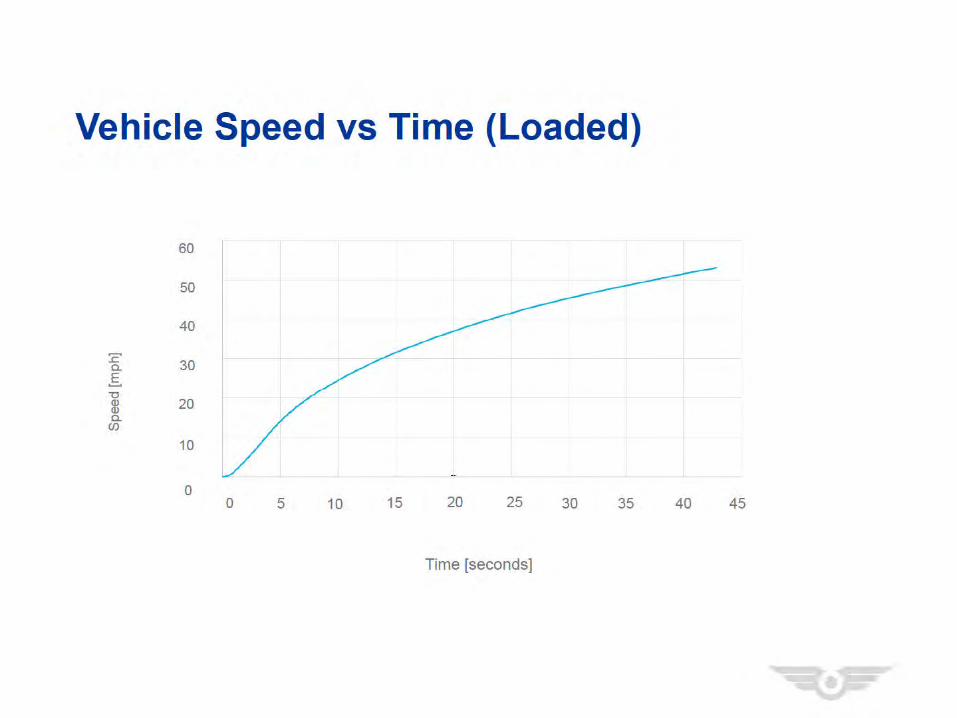

Vehicle Speed vs Grade (Unloaded)
Speed [mph]
0%
5%
10%
25%
20%
15%
Gra
de[%
]
30%
10 20 30 40 50 60 70 80
35%
0
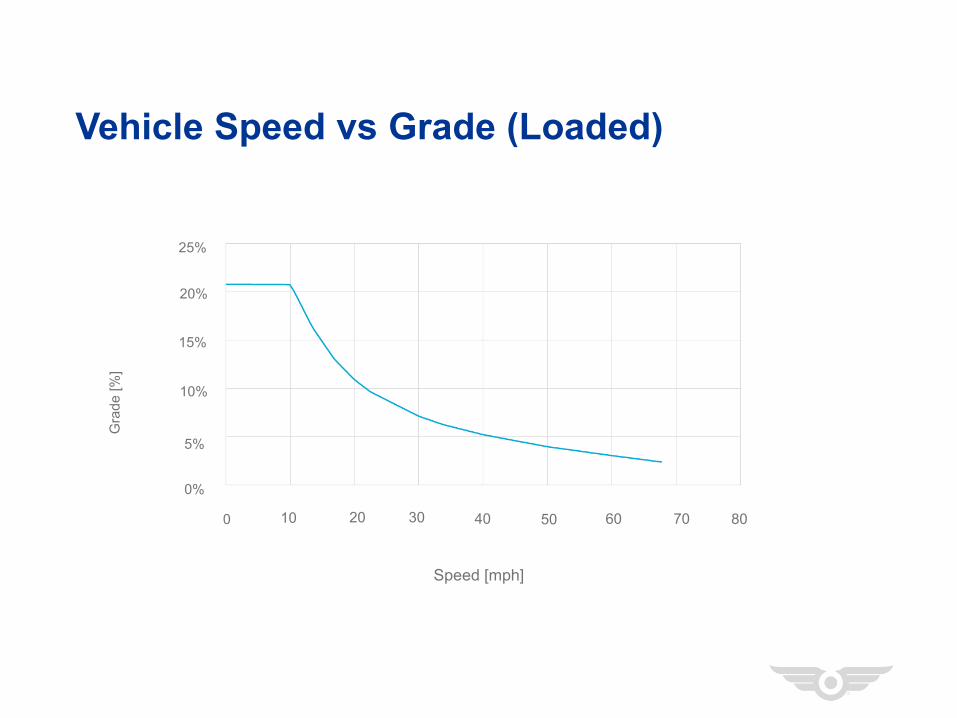
Vehicle Speed vs Grade (Loaded)
Speed [mph]
0%
5%
10%
25%
20%
15%
Gra
de[%
]
10 20 30 40 50 60 70 800
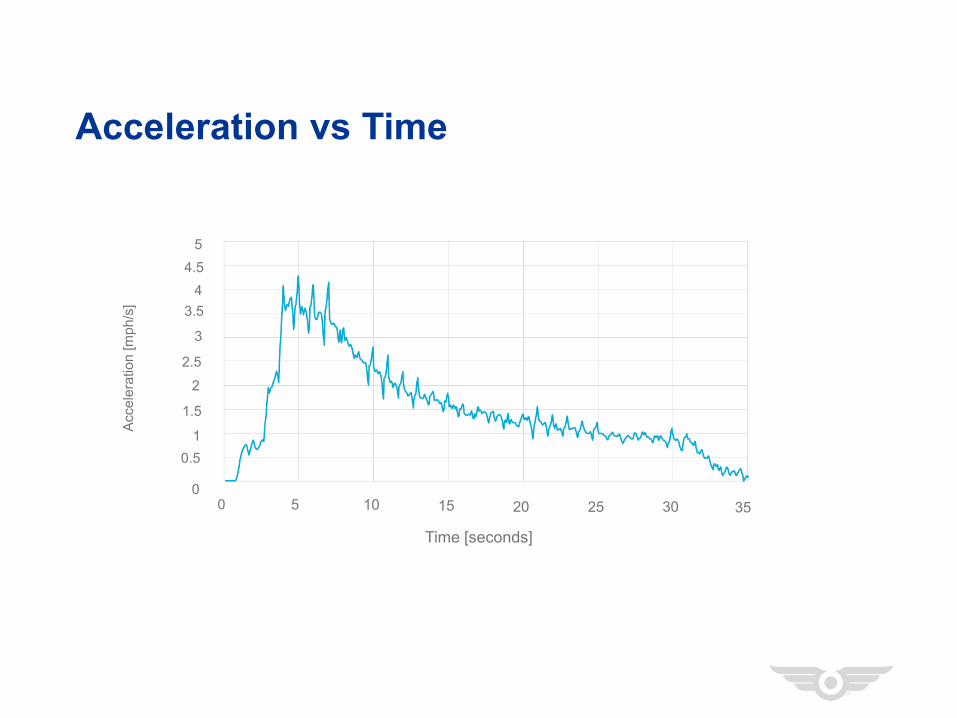
Acceleration vs Time
Time [seconds]
05 10 15 20 25 30
0.51
4
2
1.5
Acce
lera
tion
[mph
/s]
5
35
2.5
3.5
3
4.5
0

Jerk vs Time
Time [seconds]
-205 10 15 20 25 30
Jerk
[mph
/s²]
350
-15
-10
15
10
5
-5
0
20
Jerk
0.5 Second Average


Truck & Buses – Hybrid & Electric Vehicle
Society of Automotive Engineers
SAE J1715 SAE J2344 ISO 6469 FMVSS 305
Full compliance Full compliance Full compliance Full compliance
Storage Battery Standards
Society of Automotive Engineers
ISO 12405 IEC 62133 IEC 61960 IEC 62281 EN 60068 UN T 38.3 UL 1642/2202
Full compliance Full compliance Full compliance Full compliance Full compliance Full compliance
Vehicle and Charger Interface
Society of Automotive Engineers
SAE J1772 SAE J1850 SAE J2293 SAE J2836 SAE J2847
Full compliance Full compliance Full compliance Capable of compliance
Vehicle Charging Stations
Society of Automotive Engineers
SAE J2293 SAE J3105 SAE J3068 SAE J2954
Full compliance Full compliance N/A Under-development
Charging Station Components
UL Certification CSA Cetification
Full compliance Full compliance


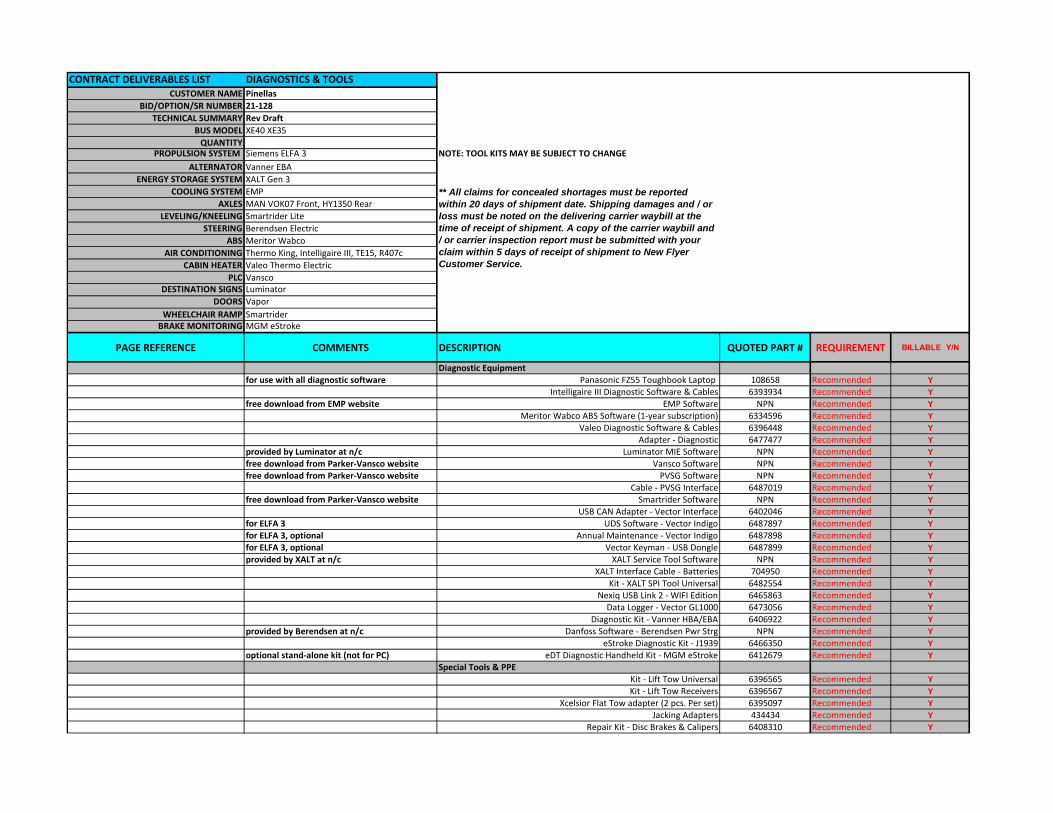
CONTRACT DELIVERABLES LIST DIAGNOSTICS & TOOLSCUSTOMER NAME Pinellas
BID/OPTION/SR NUMBER 21‐128
TECHNICAL SUMMARY Rev Draft
BUS MODEL XE40 XE35QUANTITY
PROPULSION SYSTEM Siemens ELFA 3 NOTE: TOOL KITS MAY BE SUBJECT TO CHANGE
ALTERNATOR Vanner EBAENERGY STORAGE SYSTEM XALT Gen 3
COOLING SYSTEM EMPAXLES MAN VOK07 Front, HY1350 Rear
LEVELING/KNEELING Smartrider LiteSTEERING Berendsen Electric
ABS Meritor WabcoAIR CONDITIONING Thermo King, Intelligaire III, TE15, R407c
CABIN HEATER Valeo Thermo ElectricPLC Vansco
DESTINATION SIGNS LuminatorDOORS Vapor
WHEELCHAIR RAMP SmartriderBRAKE MONITORING MGM eStroke
PAGE REFERENCE COMMENTS DESCRIPTION QUOTED PART # REQUIREMENT BILLABLE Y/N
Diagnostic Equipmentfor use with all diagnostic software Panasonic FZ55 Toughbook Laptop 108658 Recommended Y
Intelligaire III Diagnostic Software & Cables 6393934 Recommended Yfree download from EMP website EMP Software NPN Recommended Y
Meritor Wabco ABS Software (1‐year subscription) 6334596 Recommended YValeo Diagnostic Software & Cables 6396448 Recommended Y
Adapter ‐ Diagnostic 6477477 Recommended Yprovided by Luminator at n/c Luminator MIE Software NPN Recommended Yfree download from Parker‐Vansco website Vansco Software NPN Recommended Yfree download from Parker‐Vansco website PVSG Software NPN Recommended Y
Cable ‐ PVSG Interface 6487019 Recommended Yfree download from Parker‐Vansco website Smartrider Software NPN Recommended Y
USB CAN Adapter ‐ Vector Interface 6402046 Recommended Yfor ELFA 3 UDS Software ‐ Vector Indigo 6487897 Recommended Yfor ELFA 3, optional Annual Maintenance ‐ Vector Indigo 6487898 Recommended Yfor ELFA 3, optional Vector Keyman ‐ USB Dongle 6487899 Recommended Yprovided by XALT at n/c XALT Service Tool Software NPN Recommended Y
XALT Interface Cable ‐ Batteries 704950 Recommended YKit ‐ XALT SPI Tool Universal 6482554 Recommended Y
Nexiq USB Link 2 ‐ WIFI Edition 6465863 Recommended YData Logger ‐ Vector GL1000 6473056 Recommended Y
Diagnostic Kit ‐ Vanner HBA/EBA 6406922 Recommended Yprovided by Berendsen at n/c Danfoss Software ‐ Berendsen Pwr Strg NPN Recommended Y
eStroke Diagnostic Kit ‐ J1939 6466350 Recommended Yoptional stand‐alone kit (not for PC) eDT Diagnostic Handheld Kit ‐ MGM eStroke 6412679 Recommended Y
Special Tools & PPEKit ‐ Lift Tow Universal 6396565 Recommended YKit ‐ Lift Tow Receivers 6396567 Recommended Y
Xcelsior Flat Tow adapter (2 pcs. Per set) 6395097 Recommended YJacking Adapters 434434 Recommended Y
Repair Kit ‐ Disc Brakes & Calipers 6408310 Recommended Y
** All claims for concealed shortages must be reported within 20 days of shipment date. Shipping damages and / or loss must be noted on the delivering carrier waybill at the time of receipt of shipment. A copy of the carrier waybill and / or carrier inspection report must be submitted with your claim within 5 days of receipt of shipment to New Flyer Customer Service.
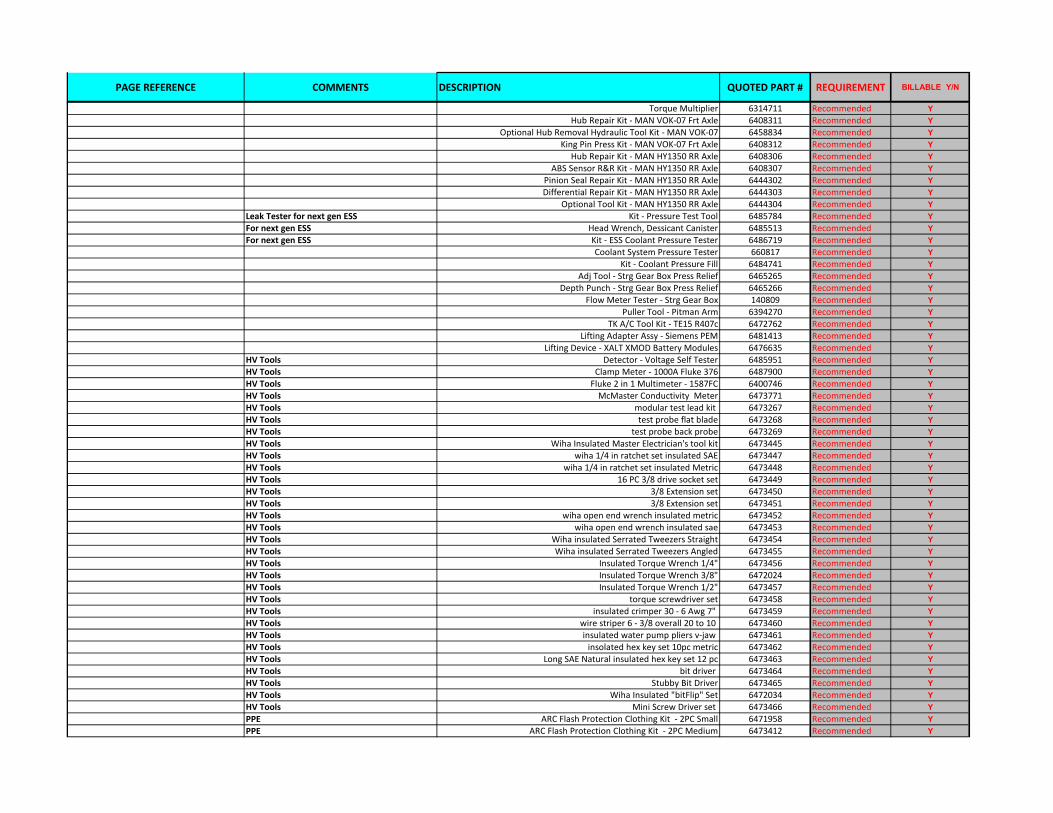
PAGE REFERENCE COMMENTS DESCRIPTION QUOTED PART # REQUIREMENT BILLABLE Y/N
Torque Multiplier 6314711 Recommended YHub Repair Kit ‐ MAN VOK‐07 Frt Axle 6408311 Recommended Y
Optional Hub Removal Hydraulic Tool Kit ‐ MAN VOK‐07 6458834 Recommended YKing Pin Press Kit ‐ MAN VOK‐07 Frt Axle 6408312 Recommended Y
Hub Repair Kit ‐ MAN HY1350 RR Axle 6408306 Recommended YABS Sensor R&R Kit ‐ MAN HY1350 RR Axle 6408307 Recommended Y
Pinion Seal Repair Kit ‐ MAN HY1350 RR Axle 6444302 Recommended YDifferential Repair Kit ‐ MAN HY1350 RR Axle 6444303 Recommended Y
Optional Tool Kit ‐ MAN HY1350 RR Axle 6444304 Recommended YLeak Tester for next gen ESS Kit ‐ Pressure Test Tool 6485784 Recommended YFor next gen ESS Head Wrench, Dessicant Canister 6485513 Recommended YFor next gen ESS Kit ‐ ESS Coolant Pressure Tester 6486719 Recommended Y
Coolant System Pressure Tester 660817 Recommended YKit ‐ Coolant Pressure Fill 6484741 Recommended Y
Adj Tool ‐ Strg Gear Box Press Relief 6465265 Recommended YDepth Punch ‐ Strg Gear Box Press Relief 6465266 Recommended Y
Flow Meter Tester ‐ Strg Gear Box 140809 Recommended YPuller Tool ‐ Pitman Arm 6394270 Recommended Y
TK A/C Tool Kit ‐ TE15 R407c 6472762 Recommended YLifting Adapter Assy ‐ Siemens PEM 6481413 Recommended Y
Lifting Device ‐ XALT XMOD Battery Modules 6476635 Recommended YHV Tools Detector ‐ Voltage Self Tester 6485951 Recommended YHV Tools Clamp Meter ‐ 1000A Fluke 376 6487900 Recommended YHV Tools Fluke 2 in 1 Multimeter ‐ 1587FC 6400746 Recommended YHV Tools McMaster Conductivity Meter 6473771 Recommended YHV Tools modular test lead kit 6473267 Recommended YHV Tools test probe flat blade 6473268 Recommended YHV Tools test probe back probe 6473269 Recommended YHV Tools Wiha Insulated Master Electrician's tool kit 6473445 Recommended YHV Tools wiha 1/4 in ratchet set insulated SAE 6473447 Recommended YHV Tools wiha 1/4 in ratchet set insulated Metric 6473448 Recommended YHV Tools 16 PC 3/8 drive socket set 6473449 Recommended YHV Tools 3/8 Extension set 6473450 Recommended YHV Tools 3/8 Extension set 6473451 Recommended YHV Tools wiha open end wrench insulated metric 6473452 Recommended YHV Tools wiha open end wrench insulated sae 6473453 Recommended YHV Tools Wiha insulated Serrated Tweezers Straight 6473454 Recommended YHV Tools Wiha insulated Serrated Tweezers Angled 6473455 Recommended YHV Tools Insulated Torque Wrench 1/4" 6473456 Recommended YHV Tools Insulated Torque Wrench 3/8" 6472024 Recommended YHV Tools Insulated Torque Wrench 1/2" 6473457 Recommended YHV Tools torque screwdriver set 6473458 Recommended YHV Tools insulated crimper 30 ‐ 6 Awg 7" 6473459 Recommended YHV Tools wire striper 6 ‐ 3/8 overall 20 to 10 6473460 Recommended YHV Tools insulated water pump pliers v‐jaw 6473461 Recommended YHV Tools insolated hex key set 10pc metric 6473462 Recommended YHV Tools Long SAE Natural insulated hex key set 12 pc 6473463 Recommended YHV Tools bit driver 6473464 Recommended YHV Tools Stubby Bit Driver 6473465 Recommended YHV Tools Wiha Insulated "bitFlip" Set 6472034 Recommended YHV Tools Mini Screw Driver set 6473466 Recommended YPPE ARC Flash Protection Clothing Kit ‐ 2PC Small 6471958 Recommended YPPE ARC Flash Protection Clothing Kit ‐ 2PC Medium 6473412 Recommended Y
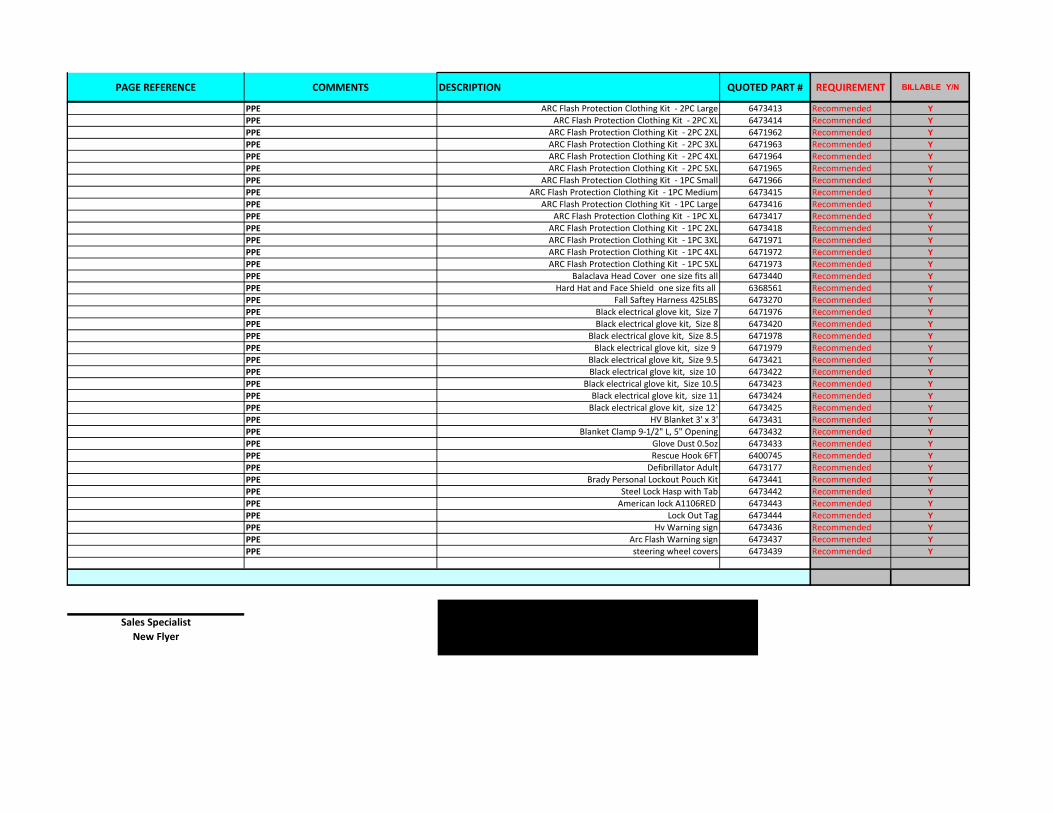
PAGE REFERENCE COMMENTS DESCRIPTION QUOTED PART # REQUIREMENT BILLABLE Y/N
PPE ARC Flash Protection Clothing Kit ‐ 2PC Large 6473413 Recommended YPPE ARC Flash Protection Clothing Kit ‐ 2PC XL 6473414 Recommended YPPE ARC Flash Protection Clothing Kit ‐ 2PC 2XL 6471962 Recommended YPPE ARC Flash Protection Clothing Kit ‐ 2PC 3XL 6471963 Recommended YPPE ARC Flash Protection Clothing Kit ‐ 2PC 4XL 6471964 Recommended YPPE ARC Flash Protection Clothing Kit ‐ 2PC 5XL 6471965 Recommended YPPE ARC Flash Protection Clothing Kit ‐ 1PC Small 6471966 Recommended YPPE ARC Flash Protection Clothing Kit ‐ 1PC Medium 6473415 Recommended YPPE ARC Flash Protection Clothing Kit ‐ 1PC Large 6473416 Recommended YPPE ARC Flash Protection Clothing Kit ‐ 1PC XL 6473417 Recommended YPPE ARC Flash Protection Clothing Kit ‐ 1PC 2XL 6473418 Recommended YPPE ARC Flash Protection Clothing Kit ‐ 1PC 3XL 6471971 Recommended YPPE ARC Flash Protection Clothing Kit ‐ 1PC 4XL 6471972 Recommended YPPE ARC Flash Protection Clothing Kit ‐ 1PC 5XL 6471973 Recommended YPPE Balaclava Head Cover one size fits all 6473440 Recommended YPPE Hard Hat and Face Shield one size fits all 6368561 Recommended YPPE Fall Saftey Harness 425LBS 6473270 Recommended YPPE Black electrical glove kit, Size 7 6471976 Recommended YPPE Black electrical glove kit, Size 8 6473420 Recommended YPPE Black electrical glove kit, Size 8.5 6471978 Recommended YPPE Black electrical glove kit, size 9 6471979 Recommended YPPE Black electrical glove kit, Size 9.5 6473421 Recommended YPPE Black electrical glove kit, size 10 6473422 Recommended YPPE Black electrical glove kit, Size 10.5 6473423 Recommended YPPE Black electrical glove kit, size 11 6473424 Recommended YPPE Black electrical glove kit, size 12` 6473425 Recommended YPPE HV Blanket 3' x 3' 6473431 Recommended YPPE Blanket Clamp 9‐1/2" L, 5" Opening 6473432 Recommended YPPE Glove Dust 0.5oz 6473433 Recommended YPPE Rescue Hook 6FT 6400745 Recommended YPPE Defibrillator Adult 6473177 Recommended YPPE Brady Personal Lockout Pouch Kit 6473441 Recommended YPPE Steel Lock Hasp with Tab 6473442 Recommended YPPE American lock A1106RED 6473443 Recommended YPPE Lock Out Tag 6473444 Recommended YPPE Hv Warning sign 6473436 Recommended YPPE Arc Flash Warning sign 6473437 Recommended YPPE steering wheel covers 6473439 Recommended Y
Sales Specialist
New Flyer
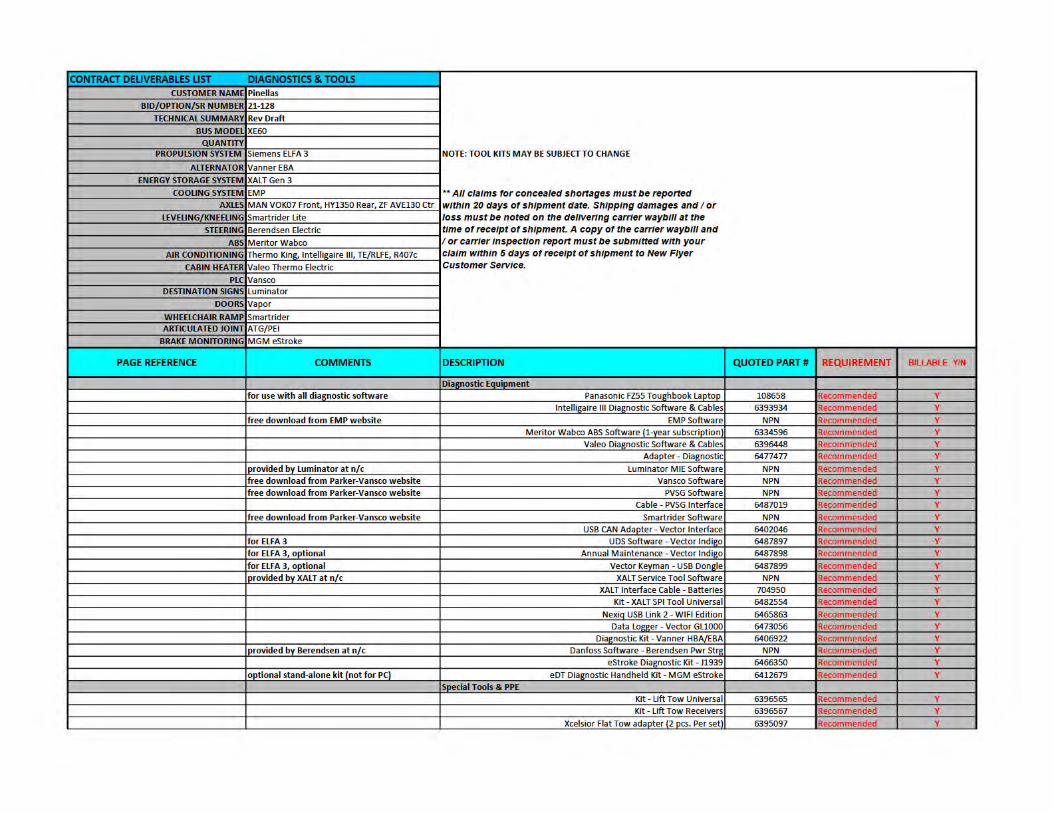
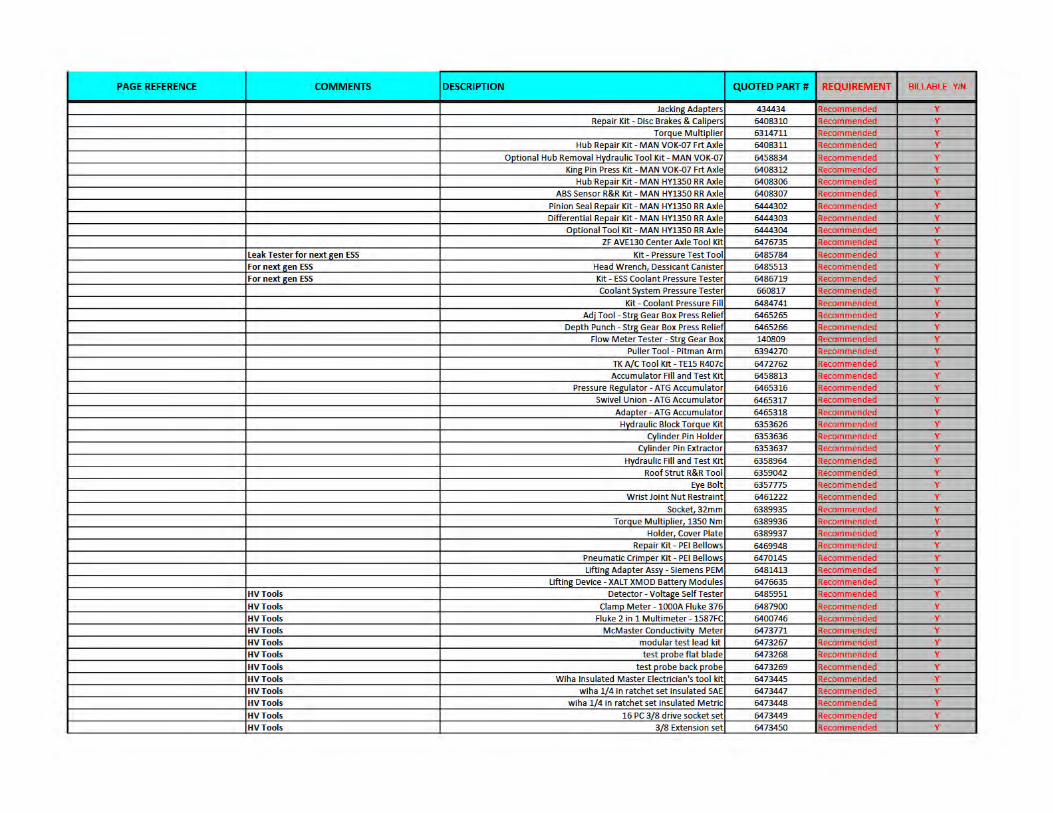
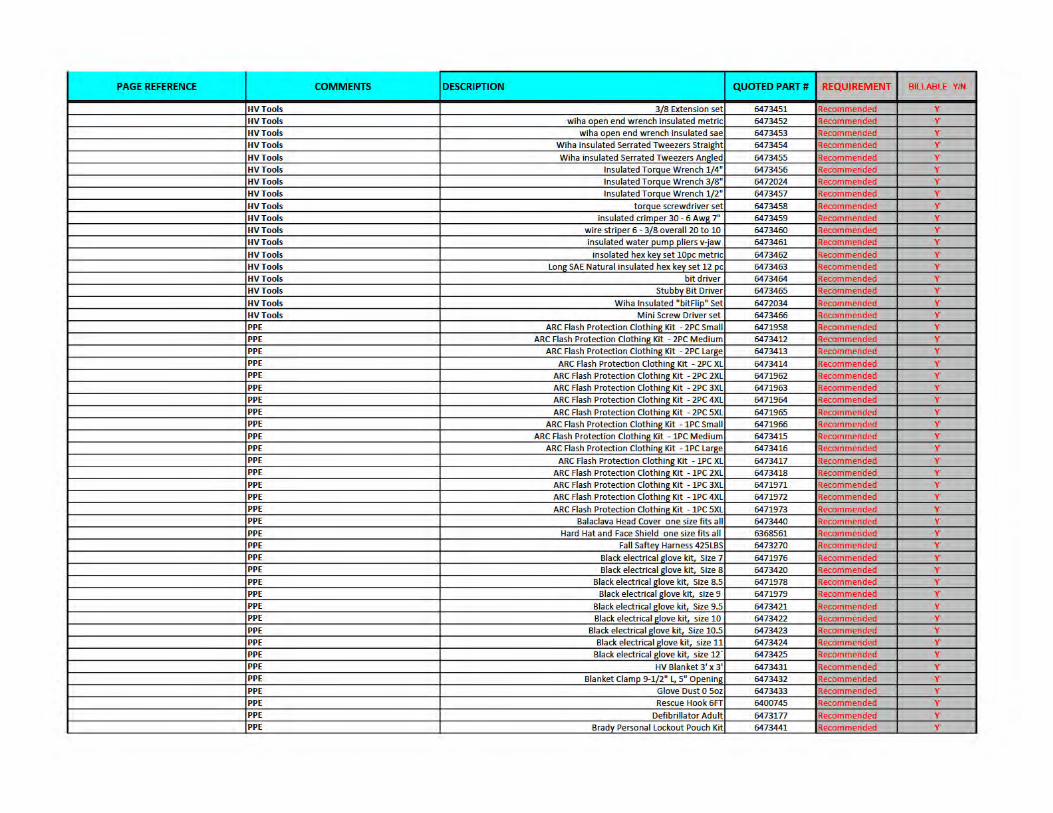
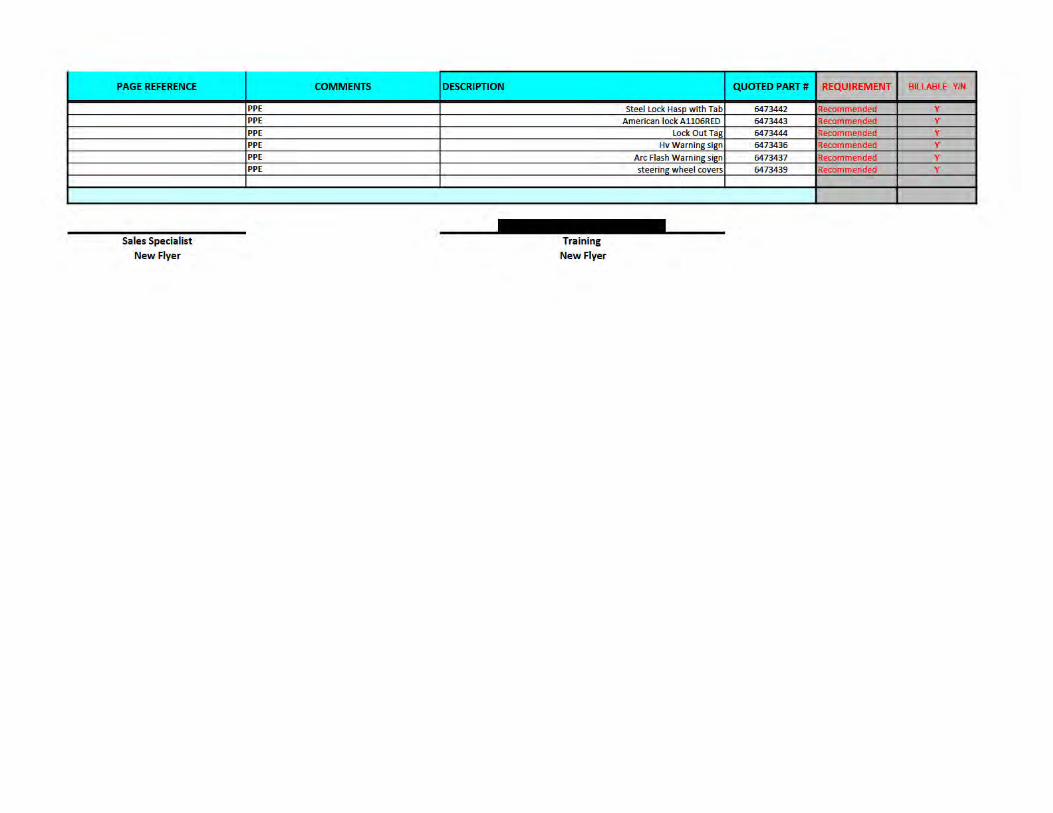
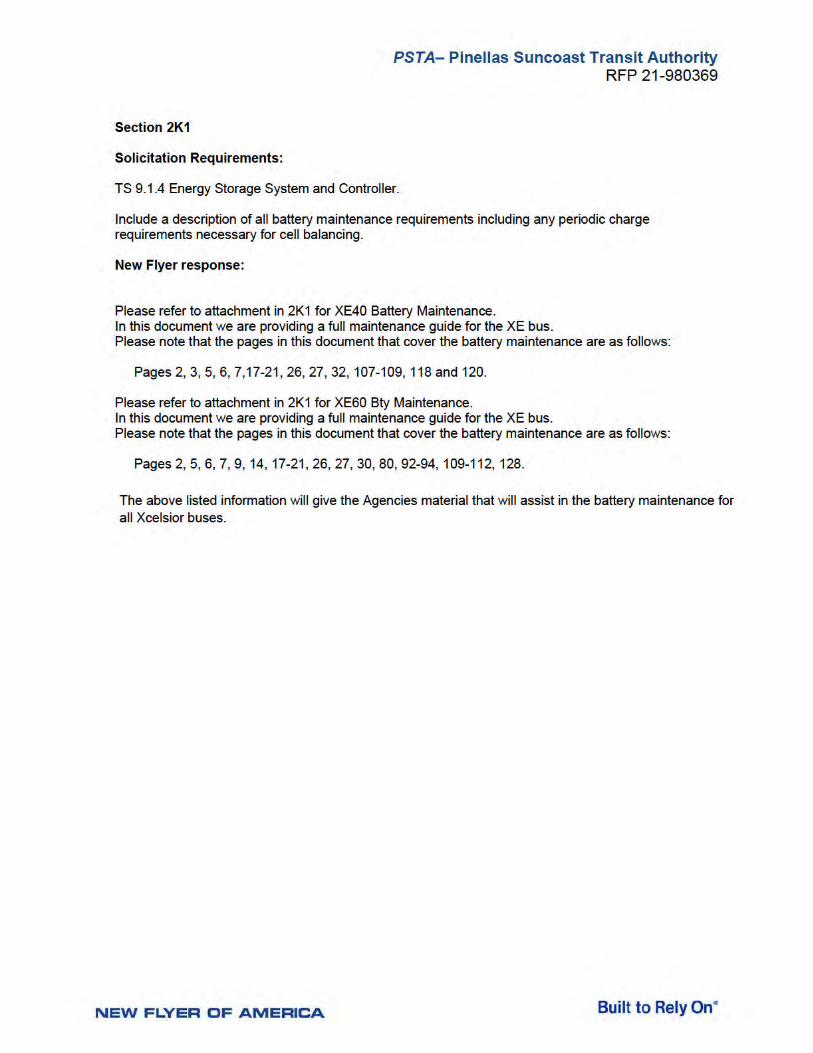
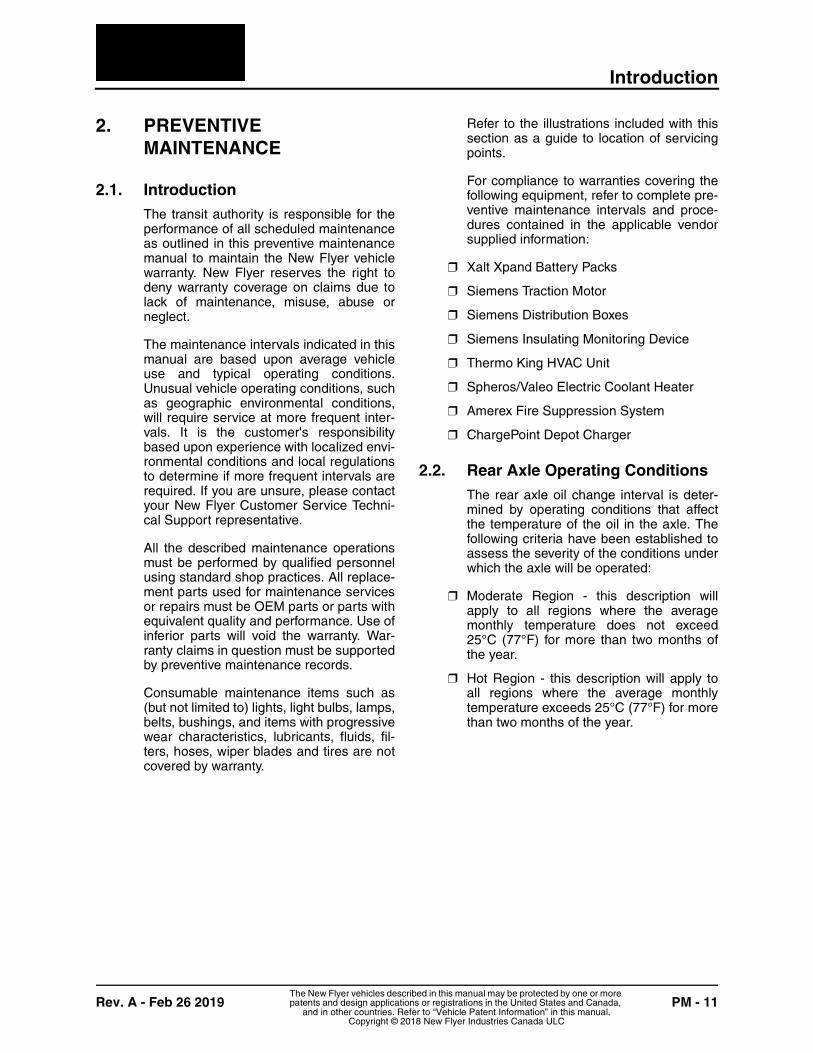
Introduction
Rev. A - Feb 26 2019 PM - 11The New Flyer vehicles described in this manual may be protected by one or more patents and design applications or registrations in the United States and Canada,
and in other countries. Refer to “Vehicle Patent Information” in this manual.Copyright © 2018 New Flyer Industries Canada ULC
2. PREVENTIVEMAINTENANCE
2.1. IntroductionThe transit authority is responsible for theperformance of all scheduled maintenanceas outlined in this preventive maintenancemanual to maintain the New Flyer vehiclewarranty. New Flyer reserves the right todeny warranty coverage on claims due tolack of maintenance, misuse, abuse orneglect.
The maintenance intervals indicated in thismanual are based upon average vehicleuse and typical operating conditions.Unusual vehicle operating conditions, suchas geographic environmental conditions,will require service at more frequent inter-vals. It is the customer's responsibilitybased upon experience with localized envi-ronmental conditions and local regulationsto determine if more frequent intervals arerequired. If you are unsure, please contactyour New Flyer Customer Service Techni-cal Support representative.
All the described maintenance operationsmust be performed by qualified personnelusing standard shop practices. All replace-ment parts used for maintenance servicesor repairs must be OEM parts or parts withequivalent quality and performance. Use ofinferior parts will void the warranty. War-ranty claims in question must be supportedby preventive maintenance records.
Consumable maintenance items such as(but not limited to) lights, light bulbs, lamps,belts, bushings, and items with progressivewear characteristics, lubricants, fluids, fil-ters, hoses, wiper blades and tires are notcovered by warranty.
Refer to the illustrations included with thissection as a guide to location of servicingpoints.
For compliance to warranties covering thefollowing equipment, refer to complete pre-ventive maintenance intervals and proce-dures contained in the applicable vendorsupplied information:
❒ Xalt Xpand Battery Packs
❒ Siemens Traction Motor
❒ Siemens Distribution Boxes
❒ Siemens Insulating Monitoring Device
❒ Thermo King HVAC Unit
❒ Spheros/Valeo Electric Coolant Heater
❒ Amerex Fire Suppression System
❒ ChargePoint Depot Charger
2.2. Rear Axle Operating ConditionsThe rear axle oil change interval is deter-mined by operating conditions that affectthe temperature of the oil in the axle. Thefollowing criteria have been established toassess the severity of the conditions underwhich the axle will be operated:
❒ Moderate Region - this description willapply to all regions where the averagemonthly temperature does not exceed25°C (77°F) for more than two months ofthe year.
❒ Hot Region - this description will apply toall regions where the average monthlytemperature exceeds 25°C (77°F) for morethan two months of the year.
Run-In Maintenance
PM - 12 Rev. A - Feb 26 2019The New Flyer vehicles described in this manual may be protected by one or more patents and design applications or registrations in the United States and Canada,
and in other countries. Refer to “Vehicle Patent Information” in this manual.Copyright © 2018 New Flyer Industries Canada ULC
2.3. Run-In MaintenanceCertain procedures described in this sec-tion are designed to ensure a smooth vehi-cle run-in process. Perform the followingprocedures as part of vehicle run-in.Thereafter, Refer to 2.5. “Preventive Main-tenance Guide” on page 13 in this sectionfor regularly scheduled maintenance inter-vals on this equipment.
❒ Wheels - Check wheel torque upon receiptof vehicle. Refer to Section 1 and 2 of thismanual for torque specifications andsequence.
❒ Rear Axle - Change oil upon receipt ofvehicle, Check oil level after first 3,000miles (4,800 km). Refer to Section 2 of thismanual for oil drain and fill procedure.Refer to 2.31. “Fluid & Lubrication Guide”on page 126 in this section for fluid specifi-cation.
2.4. Conditional MaintenanceThe following items are subject to mainte-nance on a conditional basis and do nothave a specific interval assigned againstthe maintenance requirement:
❒ Rear Axle Oil Filter - Replace the rear axleoil filter whenever the differential isremoved from the axle housing. Refer toSection 2 of this manual for replacementprocedure.
❒ Rear Axle Wheel Bearings - Repack wheelbearings and hub cavity with grease when-ever the wheel bearings or grease sealsare being serviced. Refer to 2.31. “Fluid &Lubrication Guide” on page 126 in thissection for grease specification. Refer toSection 2 of this manual for grease repack-ing procedure.
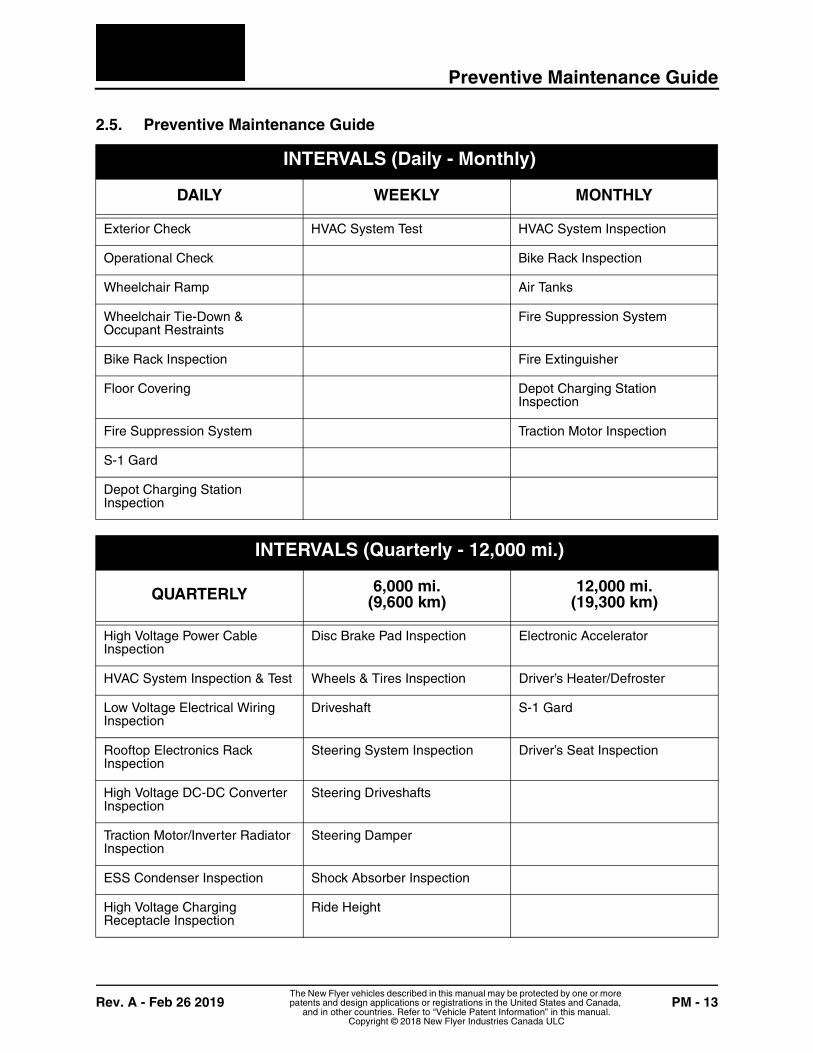
Preventive Maintenance Guide
Rev. A - Feb 26 2019 PM - 13The New Flyer vehicles described in this manual may be protected by one or more patents and design applications or registrations in the United States and Canada,
and in other countries. Refer to “Vehicle Patent Information” in this manual.Copyright © 2018 New Flyer Industries Canada ULC
2.5. Preventive Maintenance Guide
INTERVALS (Daily - Monthly)
DAILY WEEKLY MONTHLY
Exterior Check HVAC System Test HVAC System Inspection
Operational Check Bike Rack Inspection
Wheelchair Ramp Air Tanks
Wheelchair Tie-Down & Occupant Restraints
Fire Suppression System
Bike Rack Inspection Fire Extinguisher
Floor Covering Depot Charging Station Inspection
Fire Suppression System Traction Motor Inspection
S-1 Gard
Depot Charging Station Inspection
INTERVALS (Quarterly - 12,000 mi.)
QUARTERLY 6,000 mi. (9,600 km)
12,000 mi.(19,300 km)
High Voltage Power Cable Inspection
Disc Brake Pad Inspection Electronic Accelerator
HVAC System Inspection & Test Wheels & Tires Inspection Driver’s Heater/Defroster
Low Voltage Electrical Wiring Inspection
Driveshaft S-1 Gard
Rooftop Electronics Rack Inspection
Steering System Inspection Driver’s Seat Inspection
High Voltage DC-DC Converter Inspection
Steering Driveshafts
Traction Motor/Inverter Radiator Inspection
Steering Damper
ESS Condenser Inspection Shock Absorber Inspection
High Voltage Charging Receptacle Inspection
Ride Height
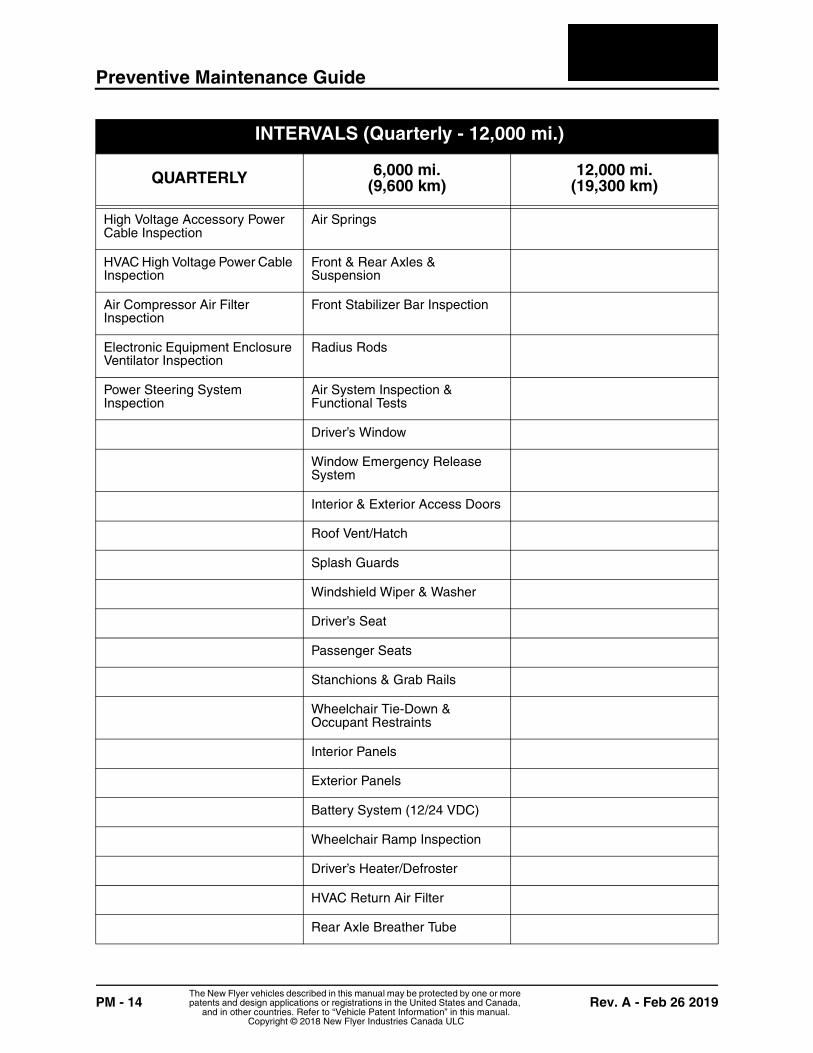
Preventive Maintenance Guide
PM - 14 Rev. A - Feb 26 2019The New Flyer vehicles described in this manual may be protected by one or more patents and design applications or registrations in the United States and Canada,
and in other countries. Refer to “Vehicle Patent Information” in this manual.Copyright © 2018 New Flyer Industries Canada ULC
High Voltage Accessory Power Cable Inspection
Air Springs
HVAC High Voltage Power Cable Inspection
Front & Rear Axles & Suspension
Air Compressor Air Filter Inspection
Front Stabilizer Bar Inspection
Electronic Equipment Enclosure Ventilator Inspection
Radius Rods
Power Steering System Inspection
Air System Inspection & Functional Tests
Driver’s Window
Window Emergency Release System
Interior & Exterior Access Doors
Roof Vent/Hatch
Splash Guards
Windshield Wiper & Washer
Driver’s Seat
Passenger Seats
Stanchions & Grab Rails
Wheelchair Tie-Down & Occupant Restraints
Interior Panels
Exterior Panels
Battery System (12/24 VDC)
Wheelchair Ramp Inspection
Driver’s Heater/Defroster
HVAC Return Air Filter
Rear Axle Breather Tube
INTERVALS (Quarterly - 12,000 mi.)
QUARTERLY 6,000 mi. (9,600 km)
12,000 mi.(19,300 km)
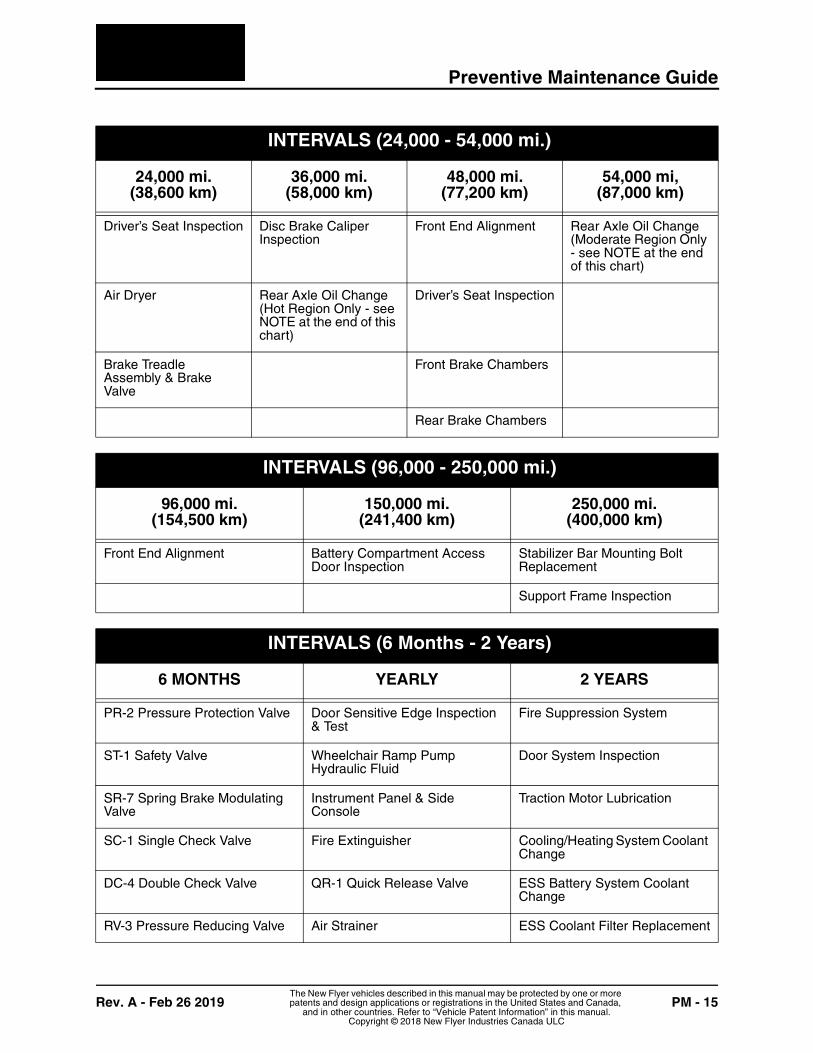
Preventive Maintenance Guide
Rev. A - Feb 26 2019 PM - 15The New Flyer vehicles described in this manual may be protected by one or more patents and design applications or registrations in the United States and Canada,
and in other countries. Refer to “Vehicle Patent Information” in this manual.Copyright © 2018 New Flyer Industries Canada ULC
INTERVALS (24,000 - 54,000 mi.)
24,000 mi. (38,600 km)
36,000 mi.(58,000 km)
48,000 mi. (77,200 km)
54,000 mi, (87,000 km)
Driver’s Seat Inspection Disc Brake Caliper Inspection
Front End Alignment Rear Axle Oil Change (Moderate Region Only - see NOTE at the end of this chart)
Air Dryer Rear Axle Oil Change (Hot Region Only - see NOTE at the end of this chart)
Driver’s Seat Inspection
Brake Treadle Assembly & Brake Valve
Front Brake Chambers
Rear Brake Chambers
INTERVALS (96,000 - 250,000 mi.)
96,000 mi. (154,500 km)
150,000 mi. (241,400 km)
250,000 mi. (400,000 km)
Front End Alignment Battery Compartment Access Door Inspection
Stabilizer Bar Mounting Bolt Replacement
Support Frame Inspection
INTERVALS (6 Months - 2 Years)
6 MONTHS YEARLY 2 YEARS
PR-2 Pressure Protection Valve Door Sensitive Edge Inspection & Test
Fire Suppression System
ST-1 Safety Valve Wheelchair Ramp Pump Hydraulic Fluid
Door System Inspection
SR-7 Spring Brake Modulating Valve
Instrument Panel & Side Console
Traction Motor Lubrication
SC-1 Single Check Valve Fire Extinguisher Cooling/Heating System Coolant Change
DC-4 Double Check Valve QR-1 Quick Release Valve ESS Battery System Coolant Change
RV-3 Pressure Reducing Valve Air Strainer ESS Coolant Filter Replacement
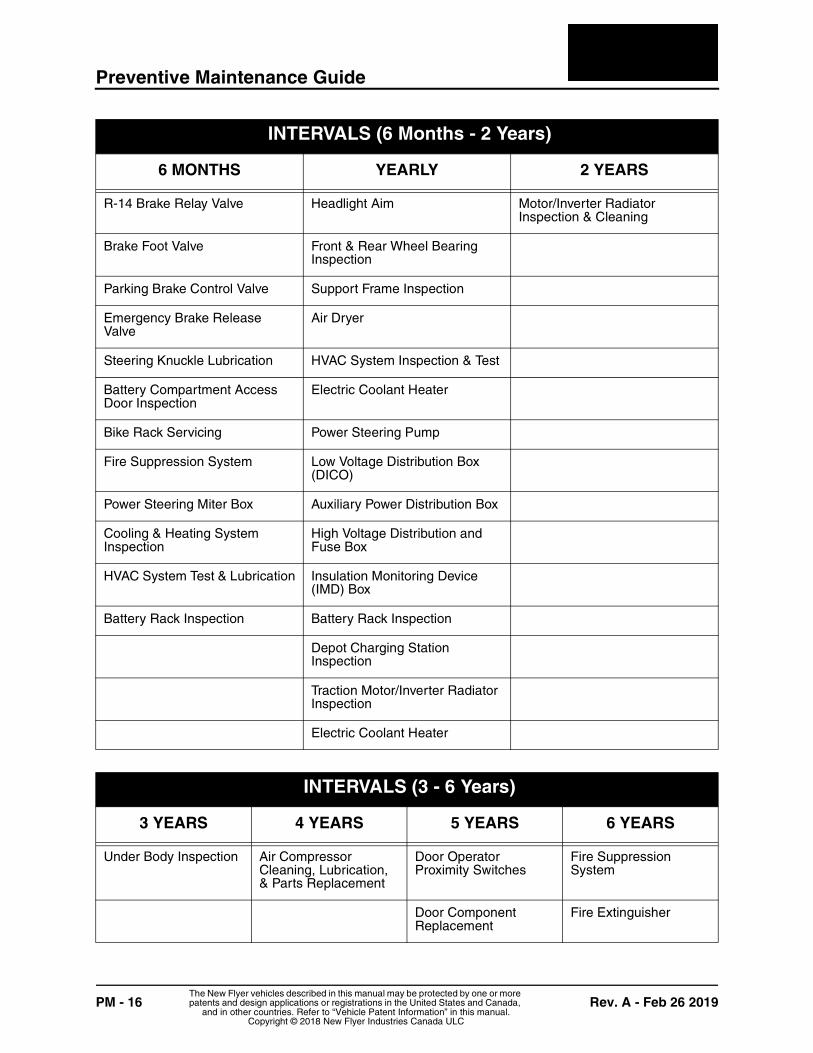
Preventive Maintenance Guide
PM - 16 Rev. A - Feb 26 2019The New Flyer vehicles described in this manual may be protected by one or more patents and design applications or registrations in the United States and Canada,
and in other countries. Refer to “Vehicle Patent Information” in this manual.Copyright © 2018 New Flyer Industries Canada ULC
R-14 Brake Relay Valve Headlight Aim Motor/Inverter Radiator Inspection & Cleaning
Brake Foot Valve Front & Rear Wheel Bearing Inspection
Parking Brake Control Valve Support Frame Inspection
Emergency Brake Release Valve
Air Dryer
Steering Knuckle Lubrication HVAC System Inspection & Test
Battery Compartment Access Door Inspection
Electric Coolant Heater
Bike Rack Servicing Power Steering Pump
Fire Suppression System Low Voltage Distribution Box (DICO)
Power Steering Miter Box Auxiliary Power Distribution Box
Cooling & Heating System Inspection
High Voltage Distribution and Fuse Box
HVAC System Test & Lubrication Insulation Monitoring Device (IMD) Box
Battery Rack Inspection Battery Rack Inspection
Depot Charging Station Inspection
Traction Motor/Inverter Radiator Inspection
Electric Coolant Heater
INTERVALS (3 - 6 Years)
3 YEARS 4 YEARS 5 YEARS 6 YEARS
Under Body Inspection Air Compressor Cleaning, Lubrication, & Parts Replacement
Door Operator Proximity Switches
Fire Suppression System
Door Component Replacement
Fire Extinguisher
INTERVALS (6 Months - 2 Years)
6 MONTHS YEARLY 2 YEARS
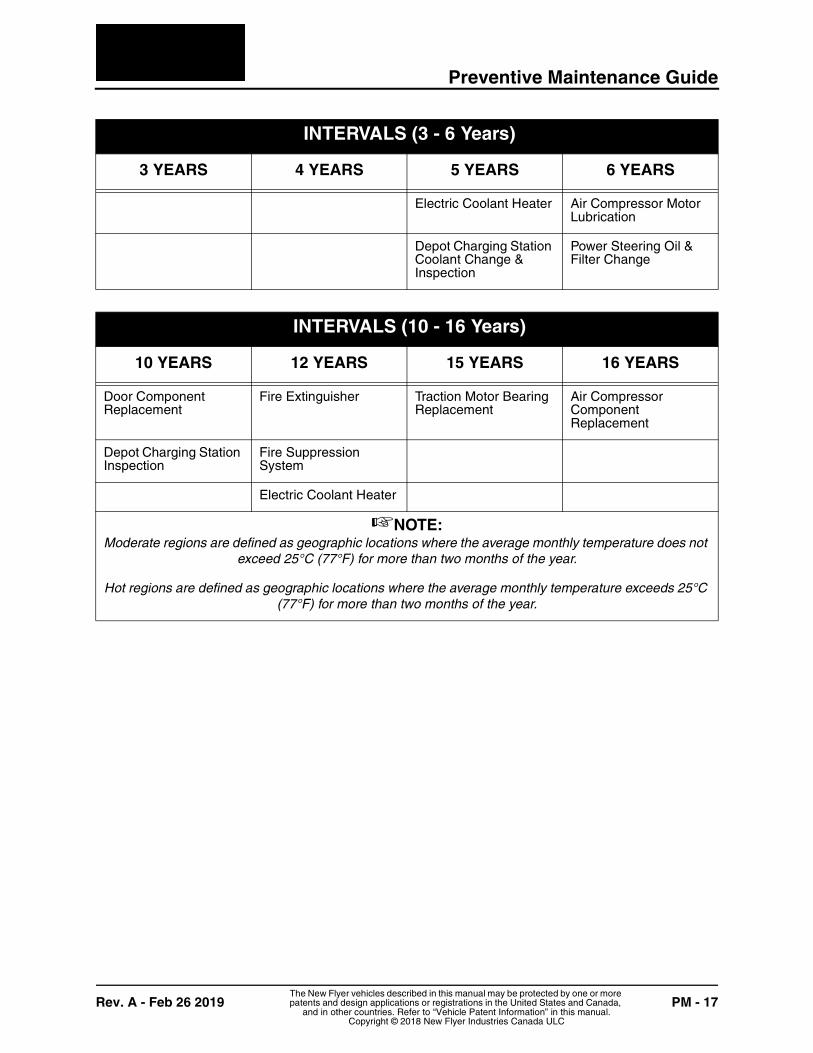
Preventive Maintenance Guide
Rev. A - Feb 26 2019 PM - 17The New Flyer vehicles described in this manual may be protected by one or more patents and design applications or registrations in the United States and Canada,
and in other countries. Refer to “Vehicle Patent Information” in this manual.Copyright © 2018 New Flyer Industries Canada ULC
Electric Coolant Heater Air Compressor Motor Lubrication
Depot Charging Station Coolant Change & Inspection
Power Steering Oil & Filter Change
INTERVALS (10 - 16 Years)
10 YEARS 12 YEARS 15 YEARS 16 YEARS
Door Component Replacement
Fire Extinguisher Traction Motor Bearing Replacement
Air Compressor Component Replacement
Depot Charging Station Inspection
Fire Suppression System
Electric Coolant Heater
☞NOTE:Moderate regions are defined as geographic locations where the average monthly temperature does not
exceed 25°C (77°F) for more than two months of the year.
Hot regions are defined as geographic locations where the average monthly temperature exceeds 25°C (77°F) for more than two months of the year.
INTERVALS (3 - 6 Years)
3 YEARS 4 YEARS 5 YEARS 6 YEARS
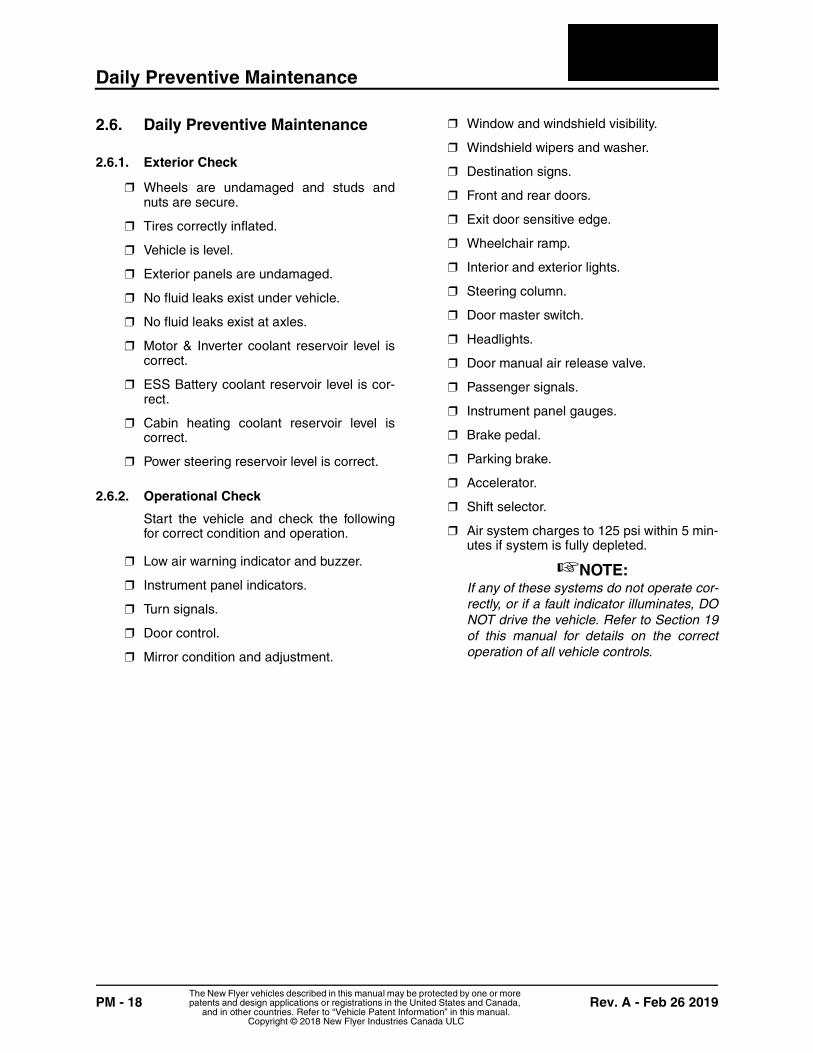
Daily Preventive Maintenance
PM - 18 Rev. A - Feb 26 2019The New Flyer vehicles described in this manual may be protected by one or more patents and design applications or registrations in the United States and Canada,
and in other countries. Refer to “Vehicle Patent Information” in this manual.Copyright © 2018 New Flyer Industries Canada ULC
2.6. Daily Preventive Maintenance
2.6.1. Exterior Check
❒ Wheels are undamaged and studs andnuts are secure.
❒ Tires correctly inflated.
❒ Vehicle is level.
❒ Exterior panels are undamaged.
❒ No fluid leaks exist under vehicle.
❒ No fluid leaks exist at axles.
❒ Motor & Inverter coolant reservoir level iscorrect.
❒ ESS Battery coolant reservoir level is cor-rect.
❒ Cabin heating coolant reservoir level iscorrect.
❒ Power steering reservoir level is correct.
2.6.2. Operational Check
Start the vehicle and check the followingfor correct condition and operation.
❒ Low air warning indicator and buzzer.
❒ Instrument panel indicators.
❒ Turn signals.
❒ Door control.
❒ Mirror condition and adjustment.
❒ Window and windshield visibility.
❒ Windshield wipers and washer.
❒ Destination signs.
❒ Front and rear doors.
❒ Exit door sensitive edge.
❒ Wheelchair ramp.
❒ Interior and exterior lights.
❒ Steering column.
❒ Door master switch.
❒ Headlights.
❒ Door manual air release valve.
❒ Passenger signals.
❒ Instrument panel gauges.
❒ Brake pedal.
❒ Parking brake.
❒ Accelerator.
❒ Shift selector.
❒ Air system charges to 125 psi within 5 min-utes if system is fully depleted.
☞NOTE:If any of these systems do not operate cor-rectly, or if a fault indicator illuminates, DONOT drive the vehicle. Refer to Section 19of this manual for details on the correctoperation of all vehicle controls.
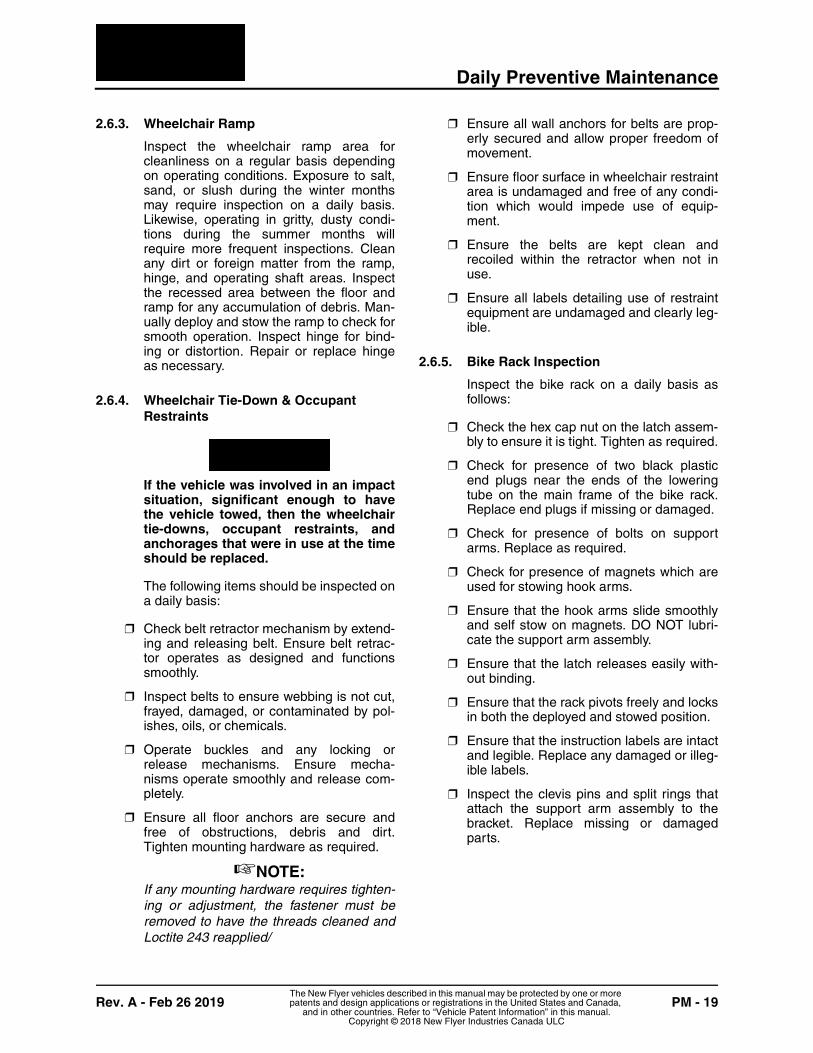
Daily Preventive Maintenance
Rev. A - Feb 26 2019 PM - 19The New Flyer vehicles described in this manual may be protected by one or more patents and design applications or registrations in the United States and Canada,
and in other countries. Refer to “Vehicle Patent Information” in this manual.Copyright © 2018 New Flyer Industries Canada ULC
2.6.3. Wheelchair Ramp
Inspect the wheelchair ramp area forcleanliness on a regular basis dependingon operating conditions. Exposure to salt,sand, or slush during the winter monthsmay require inspection on a daily basis.Likewise, operating in gritty, dusty condi-tions during the summer months willrequire more frequent inspections. Cleanany dirt or foreign matter from the ramp,hinge, and operating shaft areas. Inspectthe recessed area between the floor andramp for any accumulation of debris. Man-ually deploy and stow the ramp to check forsmooth operation. Inspect hinge for bind-ing or distortion. Repair or replace hingeas necessary.
2.6.4. Wheelchair Tie-Down & Occupant Restraints
If the vehicle was involved in an impactsituation, significant enough to havethe vehicle towed, then the wheelchairtie-downs, occupant restraints, andanchorages that were in use at the timeshould be replaced.
The following items should be inspected ona daily basis:
❒ Check belt retractor mechanism by extend-ing and releasing belt. Ensure belt retrac-tor operates as designed and functionssmoothly.
❒ Inspect belts to ensure webbing is not cut,frayed, damaged, or contaminated by pol-ishes, oils, or chemicals.
❒ Operate buckles and any locking orrelease mechanisms. Ensure mecha-nisms operate smoothly and release com-pletely.
❒ Ensure all floor anchors are secure andfree of obstructions, debris and dirt.Tighten mounting hardware as required.
☞NOTE:If any mounting hardware requires tighten-ing or adjustment, the fastener must beremoved to have the threads cleaned andLoctite 243 reapplied/
❒ Ensure all wall anchors for belts are prop-erly secured and allow proper freedom ofmovement.
❒ Ensure floor surface in wheelchair restraintarea is undamaged and free of any condi-tion which would impede use of equip-ment.
❒ Ensure the belts are kept clean andrecoiled within the retractor when not inuse.
❒ Ensure all labels detailing use of restraintequipment are undamaged and clearly leg-ible.
2.6.5. Bike Rack Inspection
Inspect the bike rack on a daily basis asfollows:
❒ Check the hex cap nut on the latch assem-bly to ensure it is tight. Tighten as required.
❒ Check for presence of two black plasticend plugs near the ends of the loweringtube on the main frame of the bike rack.Replace end plugs if missing or damaged.
❒ Check for presence of bolts on supportarms. Replace as required.
❒ Check for presence of magnets which areused for stowing hook arms.
❒ Ensure that the hook arms slide smoothlyand self stow on magnets. DO NOT lubri-cate the support arm assembly.
❒ Ensure that the latch releases easily with-out binding.
❒ Ensure that the rack pivots freely and locksin both the deployed and stowed position.
❒ Ensure that the instruction labels are intactand legible. Replace any damaged or illeg-ible labels.
❒ Inspect the clevis pins and split rings thatattach the support arm assembly to thebracket. Replace missing or damagedparts.
Daily Preventive Maintenance
PM - 20 Rev. A - Feb 26 2019The New Flyer vehicles described in this manual may be protected by one or more patents and design applications or registrations in the United States and Canada,
and in other countries. Refer to “Vehicle Patent Information” in this manual.Copyright © 2018 New Flyer Industries Canada ULC
2.6.6. Floor Covering
DO NOT clean the vehicle interior withpressure washing equipment. This typeof cleaning causes excessive soakingof the floor covering and can result inseparation of the rubber floor coveringfrom the floor substrate, warping ordeterioration of the floor substrate, andpossible damage to floor mountedequipment such as floor heaters.
Inspect the interior flooring for cleanlinesson a regular basis depending on operatingconditions. Exposure to salt, sand, or slushduring the winter months may requireinspection on a daily basis.
❒ Vacuum or sweep the floor area daily toremove surface soil before it becomesembedded in the rubber floor covering.
❒ Wash the floor using a mild detergent anda minimum amount of water to avoid soak-ing seams and edge areas.
❒ Visually inspect rubber flooring for gouges,cracks, seam separation, lifting, or anyother damage. Refer to Section 12 of thismanual for floor covering repair proce-dures.
Damaged rubber flooring covering mustbe repaired immediately to preventwater intrusion and subsequent dam-age to the wood flooring.
2.6.7. Fire Suppression System
Check the operational status of the firesuppression system on a daily basis. Setthe Master Run switch to DAY-RUN andobserve the display panel for the following:
❒ The display should read “System OK”immediately following self-configuration.
❒ Confirm that the system POWER greenLED is illuminated.
❒ Confirm that both the FIRE red LED andTROUBLE yellow LED are extinguished.
❒ Confirm that both GAS CONCENTRATIONLED’s (if equipped) are extinguished.
❒ Confirm that the RELAY RESET red LEDis extinguished
☞NOTE:DO NOT operate the vehicle if any of thered or yellow LED’s are illuminated. Con-tact service personnel to investigate thecause.
2.6.8. S-1 Gard
As part of the exterior vehicle inspection,ensure the S-1 Gard is securely in place, isinstalled level to the ground and is undam-aged. Make note of any damage, such astwists or tears in the guard material.
2.6.9. Depot Charging Station Inspection
Perform a visual inspection of the station toensure there is no debris or any substanceblocking the front and rear vents.
☞NOTE:During the winter months, do not allowsnow to build up any more that 10 in. (25mm) to ensure proper ventilation.
Weekly Preventive Maintenance
Rev. A - Feb 26 2019 PM - 21The New Flyer vehicles described in this manual may be protected by one or more patents and design applications or registrations in the United States and Canada,
and in other countries. Refer to “Vehicle Patent Information” in this manual.Copyright © 2018 New Flyer Industries Canada ULC
2.7. Weekly Preventive Maintenance
2.7.1. HVAC System Test
Operate all systems periodically, especiallyduring the off season. By operating thesystem weekly for short intervals (5 to 10minutes) year round, the internal parts ofthe compressor will remain lubricated. Off-season operation also helps reduce com-pressor shaft seal leakage and allowsearly detection of refrigerant loss.
Prior to operating the compressor dur-ing winter months, you must warm upthe vehicle interior to normal operatingtemperature (60 to 76 F [15 to 21 C]).Unless this precaution is taken, liquidrefrigerant might be forced into thecompressor, causing severe damage.
2.8. Monthly Preventive Maintenance
2.8.1. HVAC System Inspection
☞NOTE:The following inspection requirements alsoapply to the ESS Battery Chiller.
Perform the following maintenance tasksevery month or 6,000 miles (9,600 km),whichever occurs first. Refer to yourThermo King Maintenance Manual for pro-cedures.
❒ Check refrigerant charge.
❒ Visually inspect condition of refrigeranthoses and tubing.
❒ Visually inspect for refrigerant and oilleaks.
❒ Check “dry eye” in the liquid line sightglass for moisture content.
❒ Inspect condenser and evaporator coils forcleanliness.
❒ Visually inspect unit for loose damaged, orbroken parts.
Monthly Preventive Maintenance
PM - 22 Rev. A - Feb 26 2019The New Flyer vehicles described in this manual may be protected by one or more patents and design applications or registrations in the United States and Canada,
and in other countries. Refer to “Vehicle Patent Information” in this manual.Copyright © 2018 New Flyer Industries Canada ULC
2.8.2. Bike Rack Inspection
Inspect the bike rack on a monthly basis aspart of general maintenance. In addition tothe general maintenance inspection, per-form specific servicing and repairs result-ing from the monthly general maintenanceinspection. Refer to Section 13 of this man-ual for specific servicing and repair proce-dures.
❒ Ensure that the rack swings freely betweenstowed and deployed positions.
❒ Ensure that the release latch functionseasily without binding in the release posi-tion.
❒ Ensure that the release latch lockssecurely in both the stowed and deployedpositions.
❒ Ensure that the support arm hinge permitsthe support arm to raise and lower withoutbinding.
❒ Ensure that the support arm magnet con-tacts and retains the support arm. Adjustmagnet position as required.
❒ Ensure that the support arm hooks pull outsmoothly, stop at the stop screw, slide eas-ily into the stowed position, and self stowon the magnet when released.
❒ Check the pivot bolt assemblies to ensurethey are tight.
❒ Check pivot bolt bronze oilite bushings forwear or cracks. Replace as necessary.
❒ Check that all mounting bracket fastenersare tight, including the hardware for thesupport strap, quadrant, pivot plate tobracket pieces, and bracket pieces to vehi-cle bumper/structure.
❒ Check for presence of two black plasticend plugs near the ends of the loweringtube on the main frame of the bike rack.Replace end plugs if missing or damaged.
❒ Check torsion spring wear pad for exces-sive wear or loose attachment to frame.
❒ Check torsion spring pivot bolts for tight-ness.
❒ Ensure torsion springs do not interfere withrack deployment.
❒ Ensure that the instruction labels are intactand legible. Replace any damaged or illeg-ible labels. Clean the bike rack surface withisopropyl alcohol before applying newlabel.
❒ Inspect stainless steel surfaces for evi-dence of surface rust. Use naval jelly toremove rust.
Monthly Preventive Maintenance
Rev. A - Feb 26 2019 PM - 23The New Flyer vehicles described in this manual may be protected by one or more patents and design applications or registrations in the United States and Canada,
and in other countries. Refer to “Vehicle Patent Information” in this manual.Copyright © 2018 New Flyer Industries Canada ULC
2.8.3. Air Tanks
It is recommended that all air tanks bedrained monthly and a record of the con-tents collected be recorded. Performingthese inspections on a regular basis willestablish trend monitoring to assess theperformance of the compressor (excessiveoil passing) and air dyer (saturated desic-cant cartridge).
The following factors can influence thatamount of water collected and should betaken into consideration before making anassessment:
❒ An outside air source was used to chargethe system and did not pass through theair dryer.
❒ Exceptionally high air usage, exceeding25% compressor duty cycle due to eitherheavy accessory demand or system leak-age
❒ Daily temperature range exceeds 30°F(17°C) resulting in condensation. Underthese conditions the presence of smallamounts of moisture is normal and shouldnot be considered as an indication that theair dryer is not functioning properly.
☞NOTE:A small amount of oil in the system is notunusual and should not be considered areason to replace the desiccant cartridge.Oil stained desiccant can function ade-quately.
Perform the air tank drain and collectionprocess as follows:
1. Obtain Bendix BASIC test kit or equivalent.
2. Park the vehicle on level ground and chockthe wheels.
3. Place the collection cup at each drainvalve and slowly drain the air tank. Repeatthis process for all air tanks and collecttotal contents in a single collection cup.
4. Allow contents in collection cup to settleand assess whether fluid is primarily water,oil, or an emulsion.
5. Evaluate volume collected as follows:
a. More than one unit of oil in a 30 dayperiod will require the desiccant car-
tridges to be changed and is consid-ered cause for further inspection of theair compressor. Worn pistons or ringswill allow oil bypass and may requirerepair if amount of oil bypassed isexcessive. Also inspect compressordischarge line for excessive carbonbuildup.
b. More than one unit of water or emulsionwill be cause to conduct an air systemleakage test. Refer to Section 8 of thismanual for procedure.
c. More than five units of water in a 30 dayperiod indicates unsatisfactory air dryerperformance. Replace air dryer desic-cant cartridges.
2.8.4. Fire Suppression System
❒ Open access door behind streetside lightpanel, opposite the exit door, to accessgauge. See “Fig. PM-1: Fire SuppressionCylinder Inspection” on page 24.
❒ Check pressure gauge on agent cylinder toensure it is in the operating (green) range.
❒ Check all nameplates and instructionallabels for legibility.
❒ Check physical condition of all compo-nents for mechanical damage and securityof mounting.
❒ Check nozzles of agent cylinder. Nozzleoutlets must be free of obstructions. Blow-off caps must be intact and secure.
❒ Ensure pull pin on manual actuator is inplace.
❒ Test the alarm and LED functions bypressing the diamond-shaped “PRESS TOTEST” button on the face of the controlpanel. The alarm should sound and allLED's should illuminate.
❒ Test relay operation by pressing and hold-ing the SYSTEM TEST button. This willengage all relay operations as well assounding the alarm and illuminating theLED’s. Reset the relays by pressing theRELAY RESET button.
☞NOTE:The “Push to Test” function will not cause asystem discharge.
Monthly Preventive Maintenance
PM - 24 Rev. A - Feb 26 2019The New Flyer vehicles described in this manual may be protected by one or more patents and design applications or registrations in the United States and Canada,
and in other countries. Refer to “Vehicle Patent Information” in this manual.Copyright © 2018 New Flyer Industries Canada ULC
Fig. PM-1: Fire Suppression Cylinder Inspection
2.8.5. Fire Extinguisher
Inspect the fire extinguisher every monthas follows:
❒ Ensure the fire extinguisher is securelymounted in its proper location.
❒ Check that the safety pin lock is installed.
❒ Ensure that the hose is in good conditionand the nozzle is not obstructed.
❒ Confirm that the cylinder pressure indi-cated on the gauge is within the greenoperating range.
2.8.6. Depot Charging Station Inspection
Inspect the Depot Charger on a monthlybasis as follows:
❒ Inspect the station for any evidence of van-dalism or damage. Contact ChargePoint ifsign replacement is required or if the sta-tion is damaged.
❒ Check the charging cable for any signs ofwear or damage. Contact ChargePoint if acable appears to be damaged.
Monthly Preventive Maintenance
Rev. A - Feb 26 2019 PM - 25The New Flyer vehicles described in this manual may be protected by one or more patents and design applications or registrations in the United States and Canada,
and in other countries. Refer to “Vehicle Patent Information” in this manual.Copyright © 2018 New Flyer Industries Canada ULC
2.8.7. Traction Motor Inspection
Maintenance of high voltage equipmentmust be performed by qualified person-nel only. Refer to 1.1. “High VoltageSafety” on page 1 at the beginning ofthis section for safety requirements.Ensure that the High Voltage Interlockand Battery Disconnect switches areset to the OFF position.
Visually inspect the traction motor everymonth or 3,000 miles (5,000 km), which-ever occurs first.
❒ Inspect for any evidence of externalmechanical damage. Repair or replace anydamaged parts. See “Fig. PM-2: TractionMotor Inspection” on page 25.
❒ Visually inspect traction motor mounts forany obvious damage or loose fasteners.
❒ Remove any coarse debris such as leaves,paper etc.
❒ Check all electrical connections to ensurethey are in good condition and properlysecured. Replace any damaged cables.
❒ Visually inspect coolant hoses for damageor leaks.
❒ Visually inspect connection of tractionmotor to driveshaft for loose or missing fas-teners
Quarterly Preventive Maintenance
PM - 26 Rev. A - Feb 26 2019The New Flyer vehicles described in this manual may be protected by one or more patents and design applications or registrations in the United States and Canada,
and in other countries. Refer to “Vehicle Patent Information” in this manual.Copyright © 2018 New Flyer Industries Canada ULC
2.9. Quarterly Preventive Maintenance
2.9.1. High Voltage Power Cable Inspection
Maintenance of high voltage equipmentmust be performed by qualified person-nel only. Refer to 1.1. “High VoltageSafety” on page 1 at the beginning ofthis section for safety requirements.Ensure that the High Voltage Interlockand Battery Disconnect switches areset to the OFF position.
☞NOTE:High voltage power cables can be easilyidentified by their orange colored protec-tive covering.
Inspect the electric drive high voltagecables every three months or whenever ahigh voltage component has beeninspected, serviced, or replaced. Refer tohigh voltage component inspections withinthis section of the manual for more infor-mation on the specific component.
Inspect high voltage cables for the follow-ing conditions:
❒ Inspect for evidence of chaffing, rubbing,cuts, or other damage. Investigate causeof damage and provide additional clamp-ing or reroute cable as necessary.
❒ Inspect for proper routing and clamping.The cable should not be in direct contactwith adjacent cables, sharp surfaces, orhot surfaces. Cables should be clamped toprovide minimal slack without being taut.
❒ Visually inspect any accessible connec-tions for loose or corroded connections.Clean and tighten connections as required.Apply Truck-Lite NYK-77 corrosion preven-tive compound, or equivalent, to the termi-nals.
❒ Ensure cable jacket is sealed at connectorgland nut. See “Fig. PM-3: High VoltageCable Inspection” on page 27.
2.9.2. HVAC System Inspection & Test
☞NOTE:The following inspection requirements alsoapply to the ESS Battery Chiller.
Perform the following maintenance tasksevery three months or 18,000 miles(29,000 km), whichever occurs first. Referto your Thermo King Maintenance Manualfor procedures.
❒ Install service gauge manifold set andcheck system operating pressures, tem-peratures, and suction line conditions.

Quarterly Preventive Maintenance
PM - 28 Rev. A - Feb 26 2019The New Flyer vehicles described in this manual may be protected by one or more patents and design applications or registrations in the United States and Canada,
and in other countries. Refer to “Vehicle Patent Information” in this manual.Copyright © 2018 New Flyer Industries Canada ULC
2.9.4. Rooftop Electronics Rack Inspection
Maintenance of high voltage equipmentmust be performed by qualified person-nel only. Refer to 1.1. “High VoltageSafety” on page 1 at the beginning ofthis section for safety requirements.Ensure that the High Voltage Interlockand Battery Disconnect switches areset to the OFF position.
Use work platforms or scaffoldingwhenever working on roof-mountedcomponents. Ensure maintenance per-sonnel use an approved safety harness.
Inspect the inverter rack assembly andcomponents every three months.
1. Set the Battery Disconnect switch to theOFF position.
2. Set the High Voltage Interlock switch to theOFF position.
3. Open the hinged access doors on the roof-top inverter rack to gain access to theinternal components. See “Fig. PM-4:Rooftop Electronics Rack” on page 29.
4. Check the function of the two proximityswitches located inside the box. Refer to2.9.4.1. “Proximity Switch Test” on page 30for procedure.
5. Inspect all low and high voltage powercables. Refer to 2.9.1. “High Voltage PowerCable Inspection” on page 26 and Refer to2.9.3. “Low Voltage Electrical WiringInspection” on page 27 for inspection pro-cedures.
6. Inspect the inverter coolant lines for evi-dence of leakage. Torque hose clamps to30 to 70 in-lbs. as required.
7. Check all the electrical boxes to ensure nodamage or corrosion is evident.
8. Check all the electrical boxes to ensurethey are securely mounted to the rackassembly.
9. Inspect the fasteners that attach the rackassembly to the vehicle roof structure andensure the torque witness marks arealigned.
10.Close the access doors and ensure theyare properly latched and sealed.

Quarterly Preventive Maintenance
PM - 30 Rev. A - Feb 26 2019The New Flyer vehicles described in this manual may be protected by one or more patents and design applications or registrations in the United States and Canada,
and in other countries. Refer to “Vehicle Patent Information” in this manual.Copyright © 2018 New Flyer Industries Canada ULC
2.9.4.1. Proximity Switch Test
☞NOTE:Use the assistance of another personwhen performing this test. One person willneed to monitor the instrument panel whilethe other person is on the rooftop.
1. Power up the vehicle.
2. Gain access to the rooftop inverter rack.
3. Carefully unlatch one door and slowly raisethe door until the “HV Interlock” messagedisplays on the instrument panel LCDscreen.
4. If the “HV Interlock” message does not dis-play, then the proximity switch will need tobe adjusted or replaced. Refer to 2.9.4.2.“Proximity Switch Adjustment” on page 30for adjustment procedure.
5. Repeat the previous steps for the otheraccess door.
2.9.4.2. Proximity Switch Adjustment
1. Set the Battery Disconnect switch to theOFF position.
2. Set the High Voltage Interlock switch to theOFF position.
3. Unlatch and open both access doors onthe rooftop electronics rack.
4. Place a straightedge across the top sur-face of the latch retaining bracket.
☞NOTE:Placing a straightedge across the bracketwill represent the cover in the closed posi-tion.
5. Loosen the adjustment nuts on the proxim-ity switch and adjust the proximity switchuntil the desired gap of 0.063 to 0.197 inch(1.6 to 5.0 mm) is obtained. See “Fig. PM-5: Proximity Switch Adjustment” onpage 31.
6. Repeat the adjustment procedure for thesecond proximity switch as required.
7. Close and latch the access doors.
8. Set the Battery Disconnect switch to theON position.
9. Set the High Voltage Interlock switch to theON position.
10.Retest the proximity switch.

Quarterly Preventive Maintenance
PM - 32 Rev. A - Feb 26 2019The New Flyer vehicles described in this manual may be protected by one or more patents and design applications or registrations in the United States and Canada,
and in other countries. Refer to “Vehicle Patent Information” in this manual.Copyright © 2018 New Flyer Industries Canada ULC
2.9.5. High Voltage DC-DC Converter Inspection
Maintenance of high voltage equipmentmust be performed by qualified person-nel only. Refer to 1.1. “High VoltageSafety” on page 1 at the beginning ofthis section for safety requirements.Ensure that the High Voltage Interlockand Battery Disconnect switches areset to the OFF position.
Use work platforms or scaffoldingwhenever working on roof-mountedcomponents. Ensure maintenance per-sonnel use an approved safety harness.
Inspect the high voltage DC-DC converterevery three months.
1. Set the Battery Disconnect switch to theOFF position.
2. Set the High Voltage Interlock switch to theOFF position.
3. Gain access to the rooftop inverter rackand locate the DC-DC converter. See “Fig.PM-4: Rooftop Electronics Rack” onpage 29.
4. Remove the external fan filter/finger guardand clean any dirt or debris if required.
5. Reinstall fan filter/finger guard.
2.9.6. Traction Motor/Inverter Radiator Inspection
Maintenance of high voltage equipmentmust be performed by qualified person-nel only. Refer to 1.1. “High VoltageSafety” on page 1 at the beginning ofthis section for safety requirements.Ensure that the High Voltage Interlockand Battery Disconnect switches areset to the OFF position.
Use work platforms or scaffoldingwhenever working on roof-mountedcomponents. Ensure maintenance per-sonnel use an approved safety harness.
Inspect the roof-mounted motor/inverterradiator assembly every three months or6,000 miles (9,600 km), whichever occursfirst, as follows:
1. Set the Battery Disconnect switch to theOFF position.
2. Clean any debris from the fan shrouds andensure airflow is unrestricted. See “Fig.PM-6: Traction Motor/Inverter RadiatorAssembly” on page 33.
3. Inspect the fan shrouds for secure mount-ing.
4. Inspect the fan blades to ensure they arenot broken, chipped, cracked, or otherwisedamaged.
5. Rotate the fan blade to ensure it movesfreely and does not rub against the shroud.
6. Ensure the wiring harness is properlyclamped and there is no evidence of fret-ting or chafing
7. Check electrical connections from each fanas well as main harness to the systemcontroller to ensure they are secure and nocorrosion is evident.
8. Inspect coolant and vent hose connectionsfor any evidence of leakage. Torque hoseclamps to 30 to 70 in-lbs. as required.
9. Inspect the rubber mounting isolators forwear, cracks, or deterioration.
10.Check the mounting fasteners that securethe brackets to the roof structure andensure the torque witness marks arealigned.

Quarterly Preventive Maintenance
PM - 34 Rev. A - Feb 26 2019The New Flyer vehicles described in this manual may be protected by one or more patents and design applications or registrations in the United States and Canada,
and in other countries. Refer to “Vehicle Patent Information” in this manual.Copyright © 2018 New Flyer Industries Canada ULC
2.9.7. ESS Condenser Inspection
Use work platforms or scaffoldingwhenever working on roof-mountedcomponents. Ensure maintenance per-sonnel use an approved safety harness.
Inspect the roof-mounted ESS condenserassembly every three months as follows:
1. Set the Battery Disconnect switch to theOFF position.
2. Gain access to the rooftop condenser andclean any debris from the fan shroud andensure airflow is unrestricted. See “Fig.PM-7: ESS Condenser” on page 34.
3. Inspect refrigerant lines for any evidence ofdamage.
4. Inspect mounting fasteners and ensure thetorque witness marks are aligned.
Quarterly Preventive Maintenance
Rev. A - Feb 26 2019 PM - 35The New Flyer vehicles described in this manual may be protected by one or more patents and design applications or registrations in the United States and Canada,
and in other countries. Refer to “Vehicle Patent Information” in this manual.Copyright © 2018 New Flyer Industries Canada ULC
2.9.8. High Voltage Charging Receptacle Inspection
Maintenance of high voltage equipmentmust be performed by qualified person-nel only. Refer to 1.1. “High VoltageSafety” on page 1 at the beginning ofthis section for safety requirements.Ensure that the High Voltage Interlockand Battery Disconnect switches areset to the OFF position.
Inspect the high voltage charging recepta-cle every three months as follows:
1. Set the Battery Disconnect switch to theOFF position.
2. Set the High Voltage Interlock switch to theOFF position.
3. Open the access door to the high voltagecharging receptacle. See “Fig. PM-8: HighVoltage Charging Receptacle” on page 35.
4. Inspect external high voltage powercables. Refer to 2.9.1. “High Voltage PowerCable Inspection” on page 26 for inspec-tion procedure.
5. Inspect the dust cover to ensure it is inplace and in good condition.
6. Inspect the low voltage terminals for dam-age or corrosion.
7. Remove the dust cover and inspect thehigh voltage terminals for damage, corro-sion, or evidence of arcing.
8. Inspect the receptacle lock tab to ensure itis in place and not damaged.
9. Plug in the charging cable and ensure thecable fully engages the receptacle and anaudible click is heard when the lock tab isengaged.
10.Remove the charging cable and reinstallthe high voltage dust cap.
11.Inspect the drain vent on the bottom of thehousing to ensure it is open.
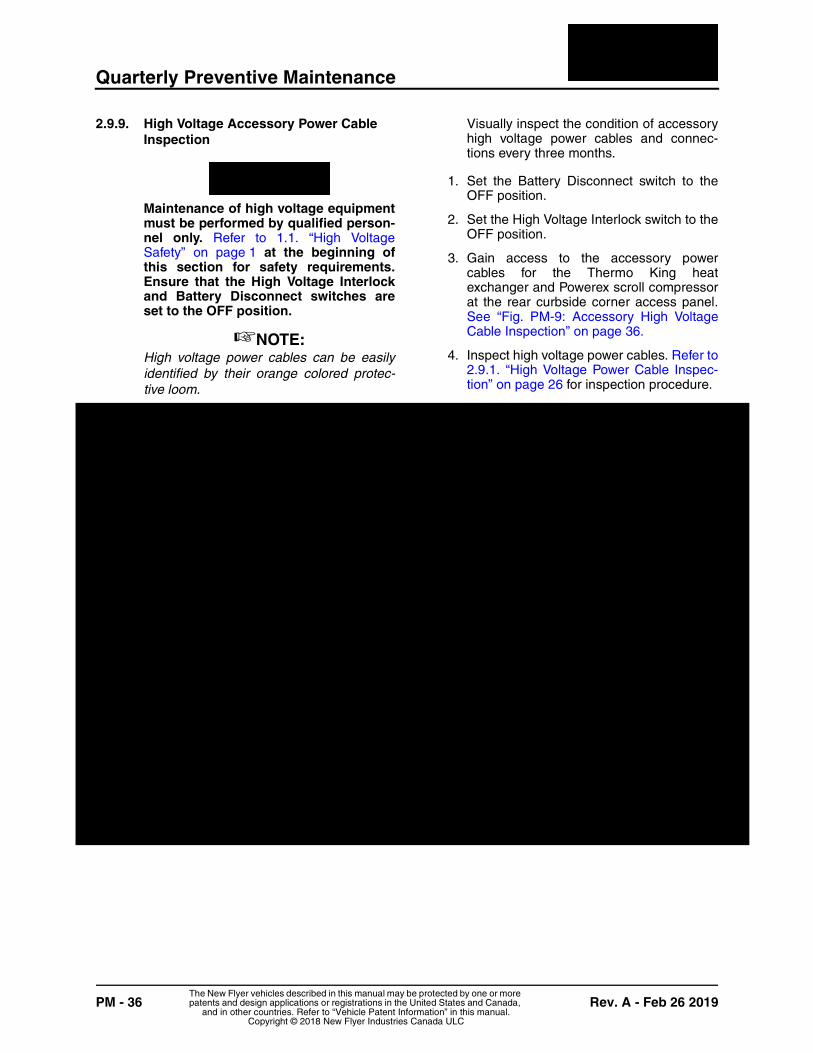
Quarterly Preventive Maintenance
PM - 36 Rev. A - Feb 26 2019The New Flyer vehicles described in this manual may be protected by one or more patents and design applications or registrations in the United States and Canada,
and in other countries. Refer to “Vehicle Patent Information” in this manual.Copyright © 2018 New Flyer Industries Canada ULC
2.9.9. High Voltage Accessory Power Cable Inspection
Maintenance of high voltage equipmentmust be performed by qualified person-nel only. Refer to 1.1. “High VoltageSafety” on page 1 at the beginning ofthis section for safety requirements.Ensure that the High Voltage Interlockand Battery Disconnect switches areset to the OFF position.
☞NOTE:High voltage power cables can be easilyidentified by their orange colored protec-tive loom.
Visually inspect the condition of accessoryhigh voltage power cables and connec-tions every three months.
1. Set the Battery Disconnect switch to theOFF position.
2. Set the High Voltage Interlock switch to theOFF position.
3. Gain access to the accessory powercables for the Thermo King heatexchanger and Powerex scroll compressorat the rear curbside corner access panel.See “Fig. PM-9: Accessory High VoltageCable Inspection” on page 36.
4. Inspect high voltage power cables. Refer to2.9.1. “High Voltage Power Cable Inspec-tion” on page 26 for inspection procedure.

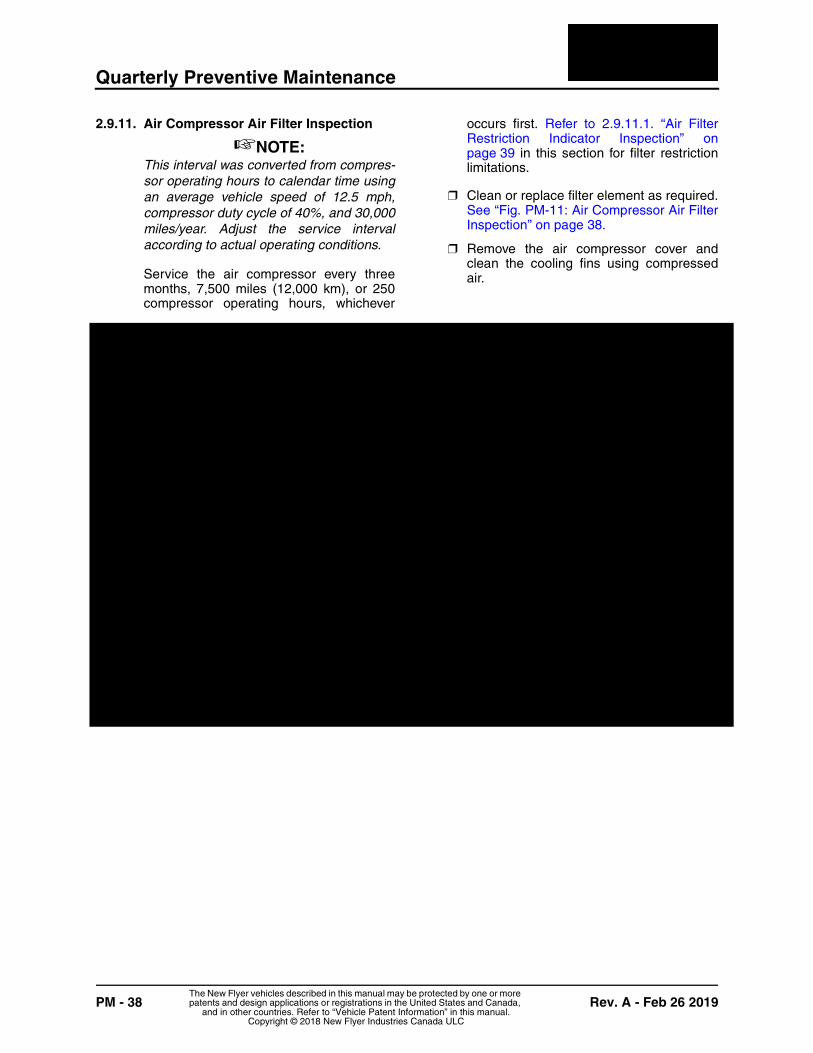
Quarterly Preventive Maintenance
PM - 38 Rev. A - Feb 26 2019The New Flyer vehicles described in this manual may be protected by one or more patents and design applications or registrations in the United States and Canada,
and in other countries. Refer to “Vehicle Patent Information” in this manual.Copyright © 2018 New Flyer Industries Canada ULC
2.9.11. Air Compressor Air Filter Inspection
☞NOTE:This interval was converted from compres-sor operating hours to calendar time usingan average vehicle speed of 12.5 mph,compressor duty cycle of 40%, and 30,000miles/year. Adjust the service intervalaccording to actual operating conditions.
Service the air compressor every threemonths, 7,500 miles (12,000 km), or 250compressor operating hours, whichever
occurs first. Refer to 2.9.11.1. “Air FilterRestriction Indicator Inspection” onpage 39 in this section for filter restrictionlimitations.
❒ Clean or replace filter element as required.See “Fig. PM-11: Air Compressor Air FilterInspection” on page 38.
❒ Remove the air compressor cover andclean the cooling fins using compressedair.
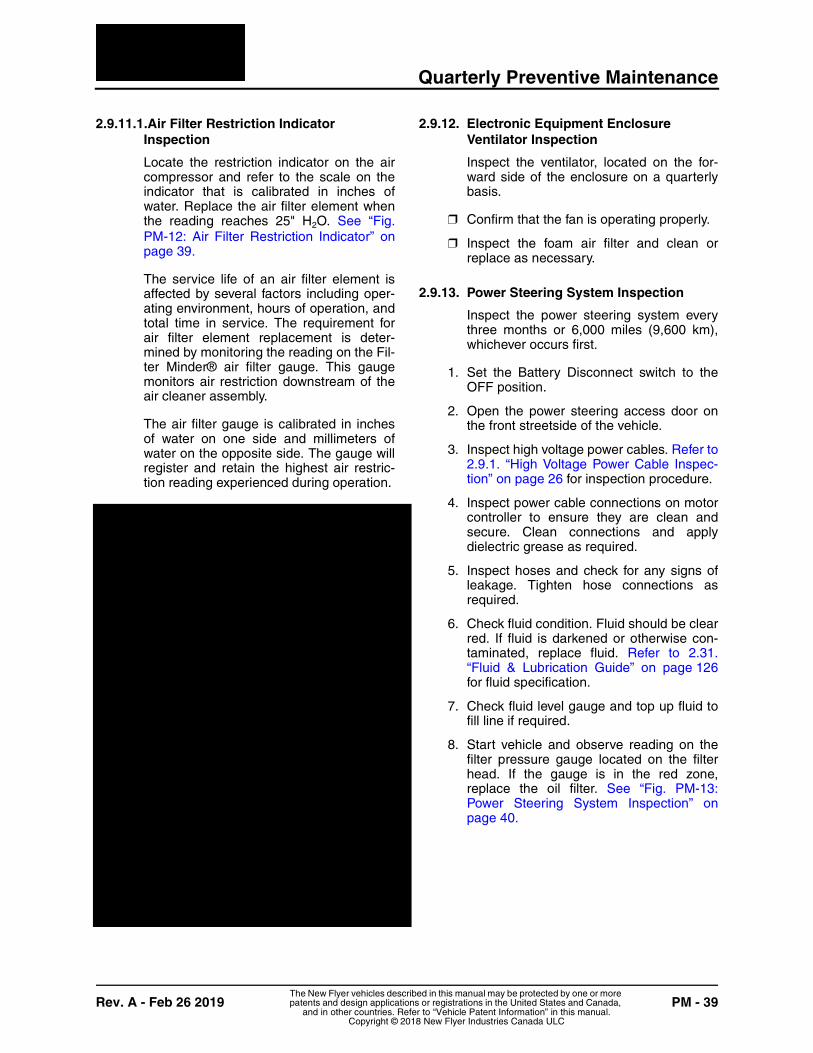
Quarterly Preventive Maintenance
Rev. A - Feb 26 2019 PM - 39The New Flyer vehicles described in this manual may be protected by one or more patents and design applications or registrations in the United States and Canada,
and in other countries. Refer to “Vehicle Patent Information” in this manual.Copyright © 2018 New Flyer Industries Canada ULC
2.9.11.1.Air Filter Restriction Indicator Inspection
Locate the restriction indicator on the aircompressor and refer to the scale on theindicator that is calibrated in inches ofwater. Replace the air filter element whenthe reading reaches 25" H2O. See “Fig.PM-12: Air Filter Restriction Indicator” onpage 39.
The service life of an air filter element isaffected by several factors including oper-ating environment, hours of operation, andtotal time in service. The requirement forair filter element replacement is deter-mined by monitoring the reading on the Fil-ter Minder® air filter gauge. This gaugemonitors air restriction downstream of theair cleaner assembly.
The air filter gauge is calibrated in inchesof water on one side and millimeters ofwater on the opposite side. The gauge willregister and retain the highest air restric-tion reading experienced during operation.
2.9.12. Electronic Equipment Enclosure Ventilator Inspection
Inspect the ventilator, located on the for-ward side of the enclosure on a quarterlybasis.
❒ Confirm that the fan is operating properly.
❒ Inspect the foam air filter and clean orreplace as necessary.
2.9.13. Power Steering System Inspection
Inspect the power steering system everythree months or 6,000 miles (9,600 km),whichever occurs first.
1. Set the Battery Disconnect switch to theOFF position.
2. Open the power steering access door onthe front streetside of the vehicle.
3. Inspect high voltage power cables. Refer to2.9.1. “High Voltage Power Cable Inspec-tion” on page 26 for inspection procedure.
4. Inspect power cable connections on motorcontroller to ensure they are clean andsecure. Clean connections and applydielectric grease as required.
5. Inspect hoses and check for any signs ofleakage. Tighten hose connections asrequired.
6. Check fluid condition. Fluid should be clearred. If fluid is darkened or otherwise con-taminated, replace fluid. Refer to 2.31.“Fluid & Lubrication Guide” on page 126for fluid specification.
7. Check fluid level gauge and top up fluid tofill line if required.
8. Start vehicle and observe reading on thefilter pressure gauge located on the filterhead. If the gauge is in the red zone,replace the oil filter. See “Fig. PM-13:Power Steering System Inspection” onpage 40.

6,000 Miles (9,600 km) Preventive Maintenance
Rev. A - Feb 26 2019 PM - 41The New Flyer vehicles described in this manual may be protected by one or more patents and design applications or registrations in the United States and Canada,
and in other countries. Refer to “Vehicle Patent Information” in this manual.Copyright © 2018 New Flyer Industries Canada ULC
2.10. 6,000 Miles (9,600 km) Preventive Maintenance
2.10.1. Disc Brake Pad Inspection
Visually check brake pad wear every 6,000miles (9.600km) or every 3 months, which-ever occurs first. Refer to “Brake Pad WearInspection” in Section 1 and 2 of this man-ual for inspection procedure.
2.10.2. Wheels & Tires Inspection
❒ Visually inspect tires for unusual treadwear indicating wheels are out of align-ment, suspension damage has occurred ortires are not properly inflated.
❒ Visually check that wheel rims are notbent, cracked or damaged.
❒ Check tires are same make, model andsize.
❒ Check wheels are balanced.
❒ Visually inspect the wheel check indicatorsto ensure they are properly installed andthe arrow of the indicator is pointing to thecenter of the adjacent nut.
❒ Check wheel nuts are tightened to thespecified torques. Refer to Section 1 andSection 2 of this manual for specifications.
☞NOTE:Refer to “Wheels” in Section 1 and Section2 of this manual for additional wheelinspection requirements.


6,000 Miles (9,600 km) Preventive Maintenance
PM - 44 Rev. A - Feb 26 2019The New Flyer vehicles described in this manual may be protected by one or more patents and design applications or registrations in the United States and Canada,
and in other countries. Refer to “Vehicle Patent Information” in this manual.Copyright © 2018 New Flyer Industries Canada ULC
☞NOTE:Excessive movement of the tie rod endtypically indicates a worn ball socket andthe tie-rod end will require replacement.However if movement is due to a loose fitof the tie-rod end tapered pin in the steer-ing arm, do not attempt to re-tighten thecastle nut. Remove the tie-rod end andinspect the bore of the steering arm forwear.
❒ Perform a visual torque inspection of allsteering component fasteners, includingthe lock nut on the steering stop adjustingbolt. Ensure that the torque witness marksare in alignment. Any fastener that hasillegible or missing witness marks shouldbe re-torqued to specification. Refer toSection 3 of this manual for torque specifi-cations.
☞NOTE:If the witness marks are no longer aligned,it is an indication that the fastener hasloosened and it will be necessary toreplace the fastener, torque to specifica-tion, and reapply torque witness mark.
❒ Inspect steering gear, hydraulic pump, andhoses for evidence of leakage.
ALWAYS wipe clean the area around thefiller cap before removing to preventcontaminants from entering the system.
❒ Inspect hydraulic reservoir fluid level andcondition. Replace fluid if dirt, sludge, orwater is evident in the system.
☞NOTE:If hydraulic fluid appears frothy it is likelythat air is trapped in the system and needsto be bled. Refer to Section 3 of this man-ual for power steering bleeding procedure.
❒ Check for smooth operation while turningthe steering system through a full left andfull right turn, Ensure that the power steer-ing gear relief valve activates before con-tacting steering stops. Refer to Section 3 ofthis manual if steering stop adjustment isrequired.
6,000 Miles (9,600 km) Preventive Maintenance
Rev. A - Feb 26 2019 PM - 45The New Flyer vehicles described in this manual may be protected by one or more patents and design applications or registrations in the United States and Canada,
and in other countries. Refer to “Vehicle Patent Information” in this manual.Copyright © 2018 New Flyer Industries Canada ULC
2.10.5. Steering Driveshafts
Inspect and lubricate the upper (vertical)and lower (horizontal) steering driveshafts
every 6,000 miles (9,600 km). See “Fig.PM-17: Steering Driveshaft Inspection” onpage 45.
6,000 Miles (9,600 km) Preventive Maintenance
PM - 46 Rev. A - Feb 26 2019The New Flyer vehicles described in this manual may be protected by one or more patents and design applications or registrations in the United States and Canada,
and in other countries. Refer to “Vehicle Patent Information” in this manual.Copyright © 2018 New Flyer Industries Canada ULC
2.10.5.1.Inspection
The steering driveshaft will exhibit a cer-tain amount of movement when rotated orforced side to side and can be attributedmostly to U-joint movement. The followinginspection provides procedures and allow-able limits specific to each area of thesteering driveshaft. Do not reject the steer-ing driveshaft for overall play unless one ormore of the following inspection pointsexceeds maximum allowable limits.
1. Visually inspect the steering driveshafts forany evidence of damage.
2. Visually check torque witness marks onclamp fasteners.
3. Inspect the U-joints to ensure that all snaprings are installed and fully seated withinthe groove on the bearing cup. The bear-ing cup must not protrude any more than0.105" beyond the surface of the yokebore. See “Fig. PM-18: Snap Ring Inspec-tion” on page 47.
4. Inspect the U-joint cross for end playmovement within the bearing cups:
a. Restrain the end yoke from moving andapply lateral side to side force on eachU-joint. Note the total back and forthmovement of the U-joint cross withinthe bearing cups. Maximum allowableend play is 0.012" (0.30 mm). See “Fig.PM-19: U-Joint Inspection” on page 47.
b. Repeat the previous step on the sameU-joint except apply pressure 90° fromprevious location.
☞NOTE:If any of the above readings are suspect,remove the steering driveshaft from thevehicle and clamp the yoke in a vise andmeasure movement with a dial indicator toconfirm.
5. Inspect the U-joint for worn needle bear-ings and/or cross trunnions:
a. Apply back and forth rotational force tothe yokes on the U-joint and note anyrelative movement between the U-jointcross and the bearing cups.
b. No perceptible movement is allowed.Replace steering driveshaft as anassembly.
☞NOTE:U-joints are not field replaceable, but maybe serviced by the manufacturer. ContactProp Shaft Supply in Elkhorn, Wisconsinfor further information on driveshaft over-haul.
6. Inspect the steering driveshaft end yokesfor excessive play:
a. Apply lateral side to side force on eachend yoke and note the deflection in thearea where the end yoke splines areclamped to the attaching component.See “Fig. PM-20: End Yoke Inspection”on page 47.
b. Spline movement should be minimal. Ifthe amount of spline movement isquestionable, remove the steeringdriveshaft for closer inspection of thesplines as well as the male splines onthe attaching component.
7. Check for excessive movement or back-lash in the telescoping slip-joint:
a. Grasp the male and female members ofthe telescoping slip-joint and apply aback and forth twisting motion whileobserving or feeling for movement. See“Fig. PM-21: Spline Backlash Inspec-tion” on page 47.
b. Spline movement should be minimal. Ifthe amount of spline movement isquestionable, remove the steeringdriveshaft for closer inspection of thetelescoping splines.
8. If telescoping slip-joint is disassembled,check the nylon coating on the splines forwear, cuts, gouges, or any other damage.
9. If damage is evident, the nylon coatingmust be stripped from the splines andreapplied. Contact Prop Shaft Supply inElkhorn, Wisconsin for further informationon driveshaft overhaul.

6,000 Miles (9,600 km) Preventive Maintenance
PM - 48 Rev. A - Feb 26 2019The New Flyer vehicles described in this manual may be protected by one or more patents and design applications or registrations in the United States and Canada,
and in other countries. Refer to “Vehicle Patent Information” in this manual.Copyright © 2018 New Flyer Industries Canada ULC
2.10.5.2.Universal Joint Lubrication
1. Locate the grease fittings on the universaljoints at both ends of the driveshaft.
2. Purge lubricate through the grease fittingsuntil fresh grease flows out of all four bear-ing cup seals. Refer to 2.31. “Fluid & Lubri-cation Guide” on page 126 in this sectionfor grease specifications. See “Fig. PM-22:Steering Driveshaft Lubrication Points” onpage 48.
3. If all four bearing cups do not purge lubri-cate successfully, then it will be necessaryto remove the steering driveshaft from thevehicle and tap the opposite cap or rotatethe adjacent yoke through its full range ofmotion while applying grease.
4. Wipe off excess grease from universaljoint.


6,000 Miles (9,600 km) Preventive Maintenance
PM - 52 Rev. A - Feb 26 2019The New Flyer vehicles described in this manual may be protected by one or more patents and design applications or registrations in the United States and Canada,
and in other countries. Refer to “Vehicle Patent Information” in this manual.Copyright © 2018 New Flyer Industries Canada ULC
2.10.7. Shock Absorber Inspection
Every 6,000 miles (9,600 km) check forand replace all shock absorbers damagedor leaking oil. Check the rubber mountingbushings and replace them if worn. Ensurethe shock absorber mounting brackets aretight and the shock absorber is not strikingor rubbing the frame or some other part ofthe chassis.
☞NOTE:A leaking shock will show clear signs offluid leaking in streams from the upperseal. These streams can most easily beseen when the shock is fully extended andone inspects as far up the main body of theshock (underneath the dust cover or tube)as possible. Misting shocks are often mis-diagnosed as failures. A misting shock willform a film on the entire outside of theshock body. Misting is perfectly normal anda necessary function of the shock.
2.10.8. Ride Height
Every 6,000 miles (9,600 km) or after ser-vice of air suspension components checkthe vehicle’s ride height. Measure the rideheight for the front and rear suspension.Refer to Section 3 of this manual for proce-dures.
2.10.9. Air Springs
☞NOTE:The air suspension system requires nolubrication.
❒ Examine air springs assembly for evidenceof cracks, punctures, deterioration, or chaf-ing. Replace with new air springs if anydamage is evident. Any surface on upperand lower retainers or on piston thattouches air springs should be smooth andfree of sharp edges that might causebreaks or damage air springs. Checkthreads on studs.
❒ Check for air leakage at all air springsupper and lower mountings. Coat mount-ings with soap and water solution andwatch for appearance of soap bubbles. Noleakage is permissible. If leakage is evi-dent, rubber air springs must be replaced.
❒ Check to see that there is sufficient clear-ance around the complete circumferenceof the air spring while at its maximumdiameter. Make sure contact doesn’t existbetween any air system component andthe outside diameter of the air spring.
❒ Check for tightness on all mounting hard-ware. Retorque to the proper specifica-tions. Refer to “Suspension TorqueSpecifications” in Section 1 and 2 of thismanual for correct values. Do not over-tighten.
2.10.10.Front & Rear Axles & Suspension
❒ Visually inspect all axle and suspensioncomponents for any evidence of damage.
❒ Visually inspect all suspension bushingsand rubber components for cracks, tears,separation or other damage.
❒ Inspect center link, drag link, and tie-rodends for excessive play. Use a pry bar tolever the component and inspect for exces-sive movement. Refer to Section 1 and 2 ofthis manual for specific inspection proce-dures.
❒ Perform a visual torque inspection of allaxle and suspension fasteners. Ensurethat the torque witness marks are in align-ment. Any fastener that has illegible ormissing witness marks should be re-torqued to specification. Refer to Section 1and 2 of this manual for torque specifica-tions.
☞NOTE:If the witness marks are no longer aligned,it is an indication that the fastener hasloosened and it will be necessary toreplace the fastener, torque to specifica-tion, and reapply torque witness mark.
6,000 Miles (9,600 km) Preventive Maintenance
Rev. A - Feb 26 2019 PM - 53The New Flyer vehicles described in this manual may be protected by one or more patents and design applications or registrations in the United States and Canada,
and in other countries. Refer to “Vehicle Patent Information” in this manual.Copyright © 2018 New Flyer Industries Canada ULC
2.10.11.Front Stabilizer Bar Inspection
Inspect the front stabilizer bar every 6,000miles (9,600 km) as follows:
❒ Check for excessive play in the bushings atthe stabilizer ends and link locations. See“Fig. PM-26: Stabilizer Bar Inspection” onpage 53. Replace worn bushings asrequired. Refer to Section 1 of this ServiceManual for replacement procedure.
❒ Check for excessive play in the bushings atthe two saddle clamps on the stabilizer bar.Replace worn bushings as required. Referto Section 1 of this Service Manual forreplacement procedure.
❒ Inspect the four 5/8" bolts that attach thestabilizer bar to the vehicle frame for evi-dence of cracks or damage. Replace allfour mounting bolts if any bolt is cracked.Refer to Section 1 of your New Flyer PartsManual for correct fastener part numbers.Refer to Section 1 of this Service Manualfor installation procedure and torque.
❒ Visually inspect the torque witness markson all fasteners to ensure the marks arealigned. If the marks are not aligned,retorque the fasteners to specification.Refer to Section 1 of this Service Manualfor torque specifications. Reapply torquewitness marks.
6,000 Miles (9,600 km) Preventive Maintenance
PM - 54 Rev. A - Feb 26 2019The New Flyer vehicles described in this manual may be protected by one or more patents and design applications or registrations in the United States and Canada,
and in other countries. Refer to “Vehicle Patent Information” in this manual.Copyright © 2018 New Flyer Industries Canada ULC
2.10.12.Radius Rods
☞NOTE:The radius rods are of similar configurationexcept for the upper radius rod on the frontaxle which does not have tubular construc-tion, replaceable bushings, nor snap-rings.All other inspection criteria apply.
Inspect all radius rods every 6,000 miles(9,600 km) as follows:
❒ Visually inspect torque witness marks onfasteners. If witness marks are not legible,then apply specified torque and paint a wit-ness mark across fastener. Refer to Sec-tion 1 & 2 of this manual for torquespecifications.
❒ Visually inspect radius rod tubes for defor-mation. Replace radius rod as an assem-bly if tube is deformed.
❒ Inspect bushings for wear by using a prybar. Apply force both axially and laterallywhile observing movement. Any excessiverelative movement between the rubbercomponent of the bushing and the cross-pin and/or the eye of the radius rod iscause for bushing replacement.
☞NOTE:If axial or lateral movement is suspect,remove radius rod from vehicle and con-firm excessive bushing movement byclamping cross-pin in a vise and movingradius rod through its operating range.
❒ Visually inspect rubber component ofbushing for cracks or separation. Smallcracks are acceptable. Separation of therubber from the metal cover plate or cross-pin is acceptable providing the separationdoes not exceed 1/3 of the circumferenceof the bushing.
❒ Inspect the metal cover plate of the bush-ing for cracks. Replace bushing if coverplate is cracked.
❒ Inspect snap-ring to ensure it is installedand fully seated. Check for shiny wearmarks as evidence of snap-ring move-ment. Replace bushing and inspect condi-tion of snap-ring groove if snap-ring ismissing, broken, or has rotated signifi-cantly.
❒ If excessive wear, corrosion or other dam-age is noted in the snap-ring groove orbore of the radius rod during the course ofbushing replacement, then the radius rodshould be replaced as an assembly.
2.10.13.Air System Inspection & Functional Tests
Inspect the air system hoses and performa functional test on the air system every6,000 miles (9,600 km).
2.10.13.1.Air System Hose Inspection
Inspect all flexible underbody hoses usedin the braking, suspension, and main airsupply systems as follows:
❒ Clean any buildup of debris, grime, orgrease that would hinder proper visualinspection.
❒ Inspect hose condition for cuts, cracks,kinks, deformation, twisted line, charring,blistering, or any other signs of damage.Replace hose if damaged.
❒ Inspect hose connections to ensure fittingsare properly tightened.
❒ Inspect hoses for proper clamping androuting.
2.10.13.2.Air System Functional Tests
Perform and air system functional test.Refer to "Air System Functional Tests" inSection 8 of this manual for procedure.
2.10.14.Driver's Window
Inspect the driver's window every 6,000miles (9,600 km) as follows:
❒ Slide the forward sash fully aft and ensurethe sash slides smoothly and makes con-tact with the window stop.
❒ Inspect the condition of the weather-strip-ping in the lower window channel/track.Clean window channel/track by vacuum-ing.
❒ Inspect the interior and exterior handles toensure they are securely mounted.

6,000 Miles (9,600 km) Preventive Maintenance
PM - 56 Rev. A - Feb 26 2019The New Flyer vehicles described in this manual may be protected by one or more patents and design applications or registrations in the United States and Canada,
and in other countries. Refer to “Vehicle Patent Information” in this manual.Copyright © 2018 New Flyer Industries Canada ULC
2.10.17.Roof Vent/Hatch
Inspect and clean the roof vent/hatch every6,000 miles (9,600 km).
❒ At each vehicle cleaning interval use a mildsoap and water solution to clean the vent/hatch surfaces and components. Do notuse solvents or petroleum based cleanersor coatings. Do not lubricate its movingparts. Refer to 2.10.17.1. “Coatings &Cleaners” on page 56 in this section foradditional information on coatings andcleaners.
❒ Inspect the vent/hatch moving parts every6,000 miles (9,600 km). Make sure thelatches close and fasten securely. Thelatches must fasten securely, with no slackor looseness. If the attaching hardwarecannot be tightened, replace the applicablelatch parts using new hardware and fas-teners. See “Fig. PM-28: Roof HatchInspection” on page 57.
❒ In cold climates, check daily and removeany accumulated ice and snow that mayrestrict movement of the vent/hatch.
2.10.17.1.Coatings & Cleaners
DO NOT use lubricants, paints, solventsor other coatings such as graffiti deter-ring sprays or cleaners. These chemi-cals often contain acetone, ether,lacquer thinner or other solvents thatcan destroy the high strength proper-ties of many engineering plastics. Anydamage, weakening, malfunction or fail-ure of the vent/hatch structure becauseof using improper coatings or cleanersis the responsibility of the transit prop-erty.
Graffiti resistant coatings often leave asticky residue that interferes with the freemovement of the ventilator mechanisms.Some of these coatings also contain sol-vent bases that will reduce the strength ofcertain components. Using these types ofcoatings on vents/hatches is not recom-mended.
If in doubt about a type of cleaner or coat-ing, apply a very small amount to anobscure, small area of the vent/hatch.Observe how the substance reacts to thesurface after a short interval. If the surfacestarts to craze, soften, discolor or dissolve,DO NOT use it.
6,000 Miles (9,600 km) Preventive Maintenance
Rev. A - Feb 26 2019 PM - 57The New Flyer vehicles described in this manual may be protected by one or more patents and design applications or registrations in the United States and Canada,
and in other countries. Refer to “Vehicle Patent Information” in this manual.Copyright © 2018 New Flyer Industries Canada ULC
2.10.18.Splash Guards
❒ Check splash guards every 6,000 miles(9,600 km) for loose bolts and damage.
❒ Tighten loose bolts and replace any unser-viceable guards.
❒ Check that ground clearance is withinspecifications.
2.10.19.Windshield Wiper & Washer
❒ Check wiper operation and condition.
❒ Remove any accumulated dirt and gritfrom the wiper blade.
❒ Check that the washer system emits anadequate flow of washer fluid.
2.10.20.Driver’s Seat Inspection
Perform the following inspections every6,000 miles (9,600 km) or 1,200 hours,whichever occurs first:
❒ Check “anti-cinch” on seatbelt retractor.
❒ Check seatbelt for wear.
❒ Check seatbelt latch for proper locking.
❒ Manually check fore and aft movement ofseat on tracks.
❒ Check tracks for proper lock engagement.
❒ Check auto-actuator switch (optional) forproper stroke.
❒ Check suspension up and down travel.
❒ Check rake adjustment for full range ofadjustment.
❒ Check all bushings for wear and lubricate.
6,000 Miles (9,600 km) Preventive Maintenance
PM - 58 Rev. A - Feb 26 2019The New Flyer vehicles described in this manual may be protected by one or more patents and design applications or registrations in the United States and Canada,
and in other countries. Refer to “Vehicle Patent Information” in this manual.Copyright © 2018 New Flyer Industries Canada ULC
2.10.21.Passenger Seats
Inspect the passenger seats every 6,000miles (9,600 km) as follows:
❒ Check the mounting hardware for tightnessand security. Tighten or replace asrequired.
❒ Inspect seats for rips or tears. Repair,patch or replace as required.
2.10.21.1.General Cleaning
For dirt and general spot removal, fiber-glass, composite resin and stainless steelmay be cleaned with a non-abrasive, mildhousehold detergent. Test a small, incon-spicuous area prior to cleaning. Wipe witha clean, damp cloth and allow to dry.
☞NOTE:Leaving any chemical on fiberglass orcomposite resin for extended periods canresult in damage to the surface. ALWAYSrinse with water after cleaning.
2.10.21.2.Tough Stain & Graffiti Removal
Markings and stains from permanentmarker and other compounds like shoepolish or nail polish can be removed fromfiberglass, composite resin and stainlesssteel materials with the following agents(or equivalents):
❒ Crown Anti-Vandal Spray 5062 (containsVOC’s)
❒ TSW9 Plasti-Master (does not containVOC’s)
☞NOTE:For Vision Seats, Scotch-Brite pads can beused to remove graffiti markings and returnthe surface to its original appearance.
2.10.21.3.Vacuum Formed Plastic Components
Use TSW9 Plasti-Master when removinggraffiti markings from vacuum-formed plas-tic components.
2.10.21.4.Upholstery Care
Extreme care should be taken whenselecting a cleaning agent. Solvent-based cleaners should be avoided.Some solutions may leave a residue ordiscolor the material. Test an incon-spicuous area prior to cleaning and fol-low the manufacturer's directions.
Regularly remove all dust and loose dirtfrom fabric with a whisk broom or vacuumcleaner. Always begin with lukewarm waterand a white cloth for stain removal beforeapplying any cleaning agent. Use foamupholstery cleaner or a mild householddetergent and first testing in a small area.Flush the area with water after cleaning.
2.10.22.Stanchions & Grab Rails
Inspect stanchions and grab rails for secu-rity of attachment and any evidence ofdamage. Tighten any loose hardware.Replace any damaged components.
2.10.23.Wheelchair Tie-Down & Occupant Restraints
Perform the following activities every 6,000miles (9,600 km):
❒ Clean belts as required using mild soapand water. Do not use solvents, chemicalsolutions or strong detergents. If required,soak belts for several hours in water toloosen dirt. Clean, rinse and dry thor-oughly before returning to service.
❒ Lubricate the tiedown belt buckles at thehinges being careful not to contaminatethe webbing.
2.10.24.Interior Panels
Inspect panels for scuffs, cracks and otherforms of damage. Clean panels and repairany defects. Refer to Section 12 of thismanual for further information on the inte-rior panels.
6,000 Miles (9,600 km) Preventive Maintenance
Rev. A - Feb 26 2019 PM - 59The New Flyer vehicles described in this manual may be protected by one or more patents and design applications or registrations in the United States and Canada,
and in other countries. Refer to “Vehicle Patent Information” in this manual.Copyright © 2018 New Flyer Industries Canada ULC
2.10.25.Exterior Panels
❒ Every 6,000 miles (9,600 km) inspect thesealant and caulking of the exterior panelseams, and wheel-housings. Replacewhere substance has failed.
Use only the recommended type ofsealant, caulk or adhesive. Refer toSection 13 of this manual for recom-mended type. DO NOT use substitutes.
❒ Clean the entire vehicle thoroughly toinspect for paint condition and for metalcorrosion damage. Pay particular attentionto the lower panels. Repair any areas withpaint failure, or corrosion.
☞NOTE:Increase inspection frequency in freezingweather, due to the effect of road deicingmaterials (salt, calcium chloride and soforth) on metal.
❒ Protect painted surfaces with a coating ofwax immediately after the vehicle hasbeen cleaned.
When cleaning the painted surfaces ofthe vehicle, use a cleaning agent thatwill not harm the acrylic finish or fiber-glass panels. (for example soap andwater).
2.10.26.Battery System (12/24 VDC)
ALWAYS replace batteries with thesame type and size identified in yourNew Flyer Parts Manual and charge thebatteries using the recommended volt-age. Over-charging a lead acid batterycan produce explosive and hazardous
gas. Any change in battery configura-tion may require modification to thecharging system voltage levels and bat-tery service procedures to preventover-charging and equipment damage.Consult the batter manufacturer’s rec-ommendations before installingreplacement components.
❒ Check external condition of battery andbattery cables periodically. If required,wash exterior with a dilute solution ofammonia or soda to neutralize acid, thenflush off with clean water. Keep vent plugstight to keep neutralizing solution out ofcells. Tighten hold-down nuts to preventbatteries from shaking but not so tight as tostrain battery case. See “Fig. PM-29: Bat-tery Tray” on page 60.
❒ Check the battery cable ends on the bat-tery posts. To ensure good contact, thesemust be tightened firmly.
❒ Check for post or cable end corrosion. Ifcorrosion exists disconnect cables fromthe posts and clean both with soda solu-tion and a wire brush. Install ends andtighten firmly, then coat with dielectricgrease.
❒ Check battery for obvious damage suchas, cracked case (shows loss of electro-lyte), or damaged, cracked, or loose termi-nal posts.
❒ If obvious damage is noted, replace bat-tery.
❒ If no obvious damage is noted, check elec-trolyte level.
❒ If electrolyte level is above top of plates inall cells, conduct specific gravity test. Referto Section 9 of this manual for procedure.
❒ If electrolyte level is below specified level inone or more cells, add water to proper lev-els, then charge for 15 minutes at 15 to 25amperes, with vent caps removed. Con-nect a 300 ampere load to battery for 15seconds to remove electrolyte surfacecharge. Conduct specific gravity test. Referto Section 9 of this manual for procedure.
6,000 Miles (9,600 km) Preventive Maintenance
PM - 60 Rev. A - Feb 26 2019The New Flyer vehicles described in this manual may be protected by one or more patents and design applications or registrations in the United States and Canada,
and in other countries. Refer to “Vehicle Patent Information” in this manual.Copyright © 2018 New Flyer Industries Canada ULC
Fig. PM-29: Battery Tray
2.10.27.Wheelchair Ramp Inspection
Inspect & lubricate the wheelchair rampmechanism every 6,000 miles (9,600 km).
2.10.27.1.Mechanism
❒ Inspect and adjust chain tension asrequired. Refer to Section 20 of this man-ual for inspection and adjustment proce-dure.
❒ Inspect ramp pump electrical connectorsfor condition and security. See “Fig. PM-30: Wheelchair Ramp Inspection” onpage 61.
❒ Inspect electrical harnesses and hydraulichoses for condition and secure attach-ment.
❒ Inspect fluid level in reservoir. Top up asrequired.
❒ Inspect and tighten mounting hardware asrequired.
❒ Ensure stowed proximity switch is function-ing and is positioned to activate at 15° fromthe STOWED position.
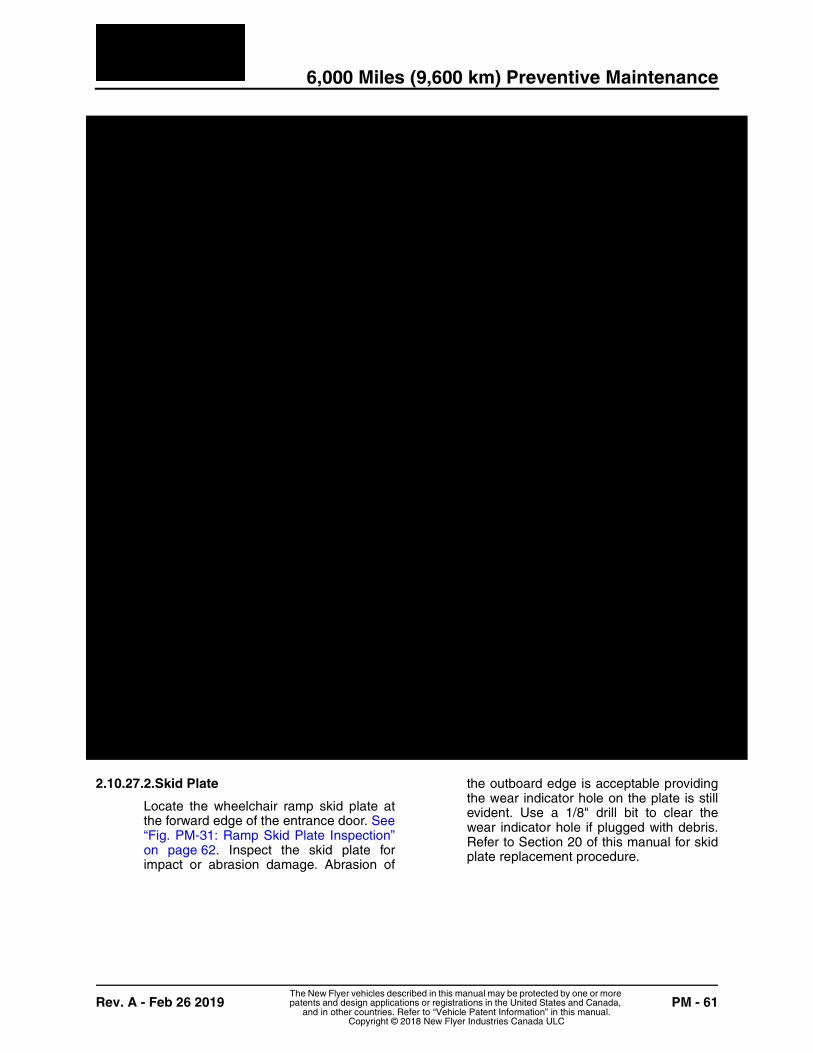
6,000 Miles (9,600 km) Preventive Maintenance
Rev. A - Feb 26 2019 PM - 61The New Flyer vehicles described in this manual may be protected by one or more patents and design applications or registrations in the United States and Canada,
and in other countries. Refer to “Vehicle Patent Information” in this manual.Copyright © 2018 New Flyer Industries Canada ULC
2.10.27.2.Skid Plate
Locate the wheelchair ramp skid plate atthe forward edge of the entrance door. See“Fig. PM-31: Ramp Skid Plate Inspection”on page 62. Inspect the skid plate forimpact or abrasion damage. Abrasion of
the outboard edge is acceptable providingthe wear indicator hole on the plate is stillevident. Use a 1/8" drill bit to clear thewear indicator hole if plugged with debris.Refer to Section 20 of this manual for skidplate replacement procedure.
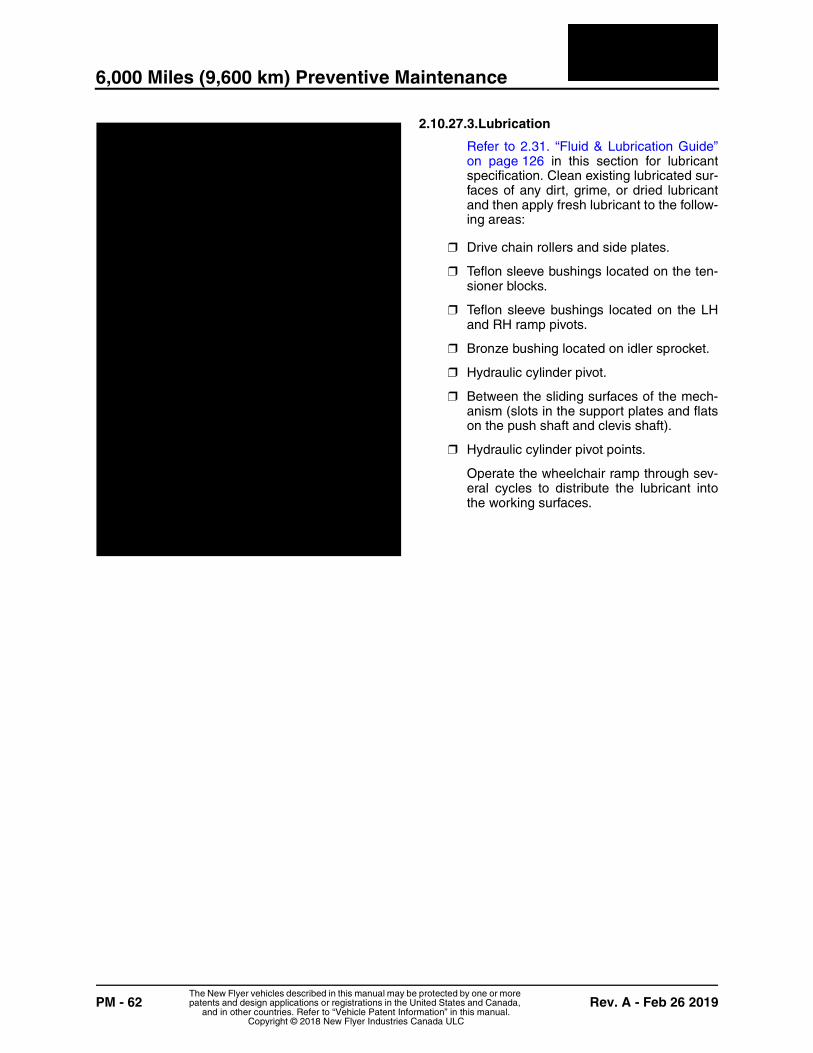
6,000 Miles (9,600 km) Preventive Maintenance
PM - 62 Rev. A - Feb 26 2019The New Flyer vehicles described in this manual may be protected by one or more patents and design applications or registrations in the United States and Canada,
and in other countries. Refer to “Vehicle Patent Information” in this manual.Copyright © 2018 New Flyer Industries Canada ULC
2.10.27.3.Lubrication
Refer to 2.31. “Fluid & Lubrication Guide”on page 126 in this section for lubricantspecification. Clean existing lubricated sur-faces of any dirt, grime, or dried lubricantand then apply fresh lubricant to the follow-ing areas:
❒ Drive chain rollers and side plates.
❒ Teflon sleeve bushings located on the ten-sioner blocks.
❒ Teflon sleeve bushings located on the LHand RH ramp pivots.
❒ Bronze bushing located on idler sprocket.
❒ Hydraulic cylinder pivot.
❒ Between the sliding surfaces of the mech-anism (slots in the support plates and flatson the push shaft and clevis shaft).
❒ Hydraulic cylinder pivot points.
Operate the wheelchair ramp through sev-eral cycles to distribute the lubricant intothe working surfaces.
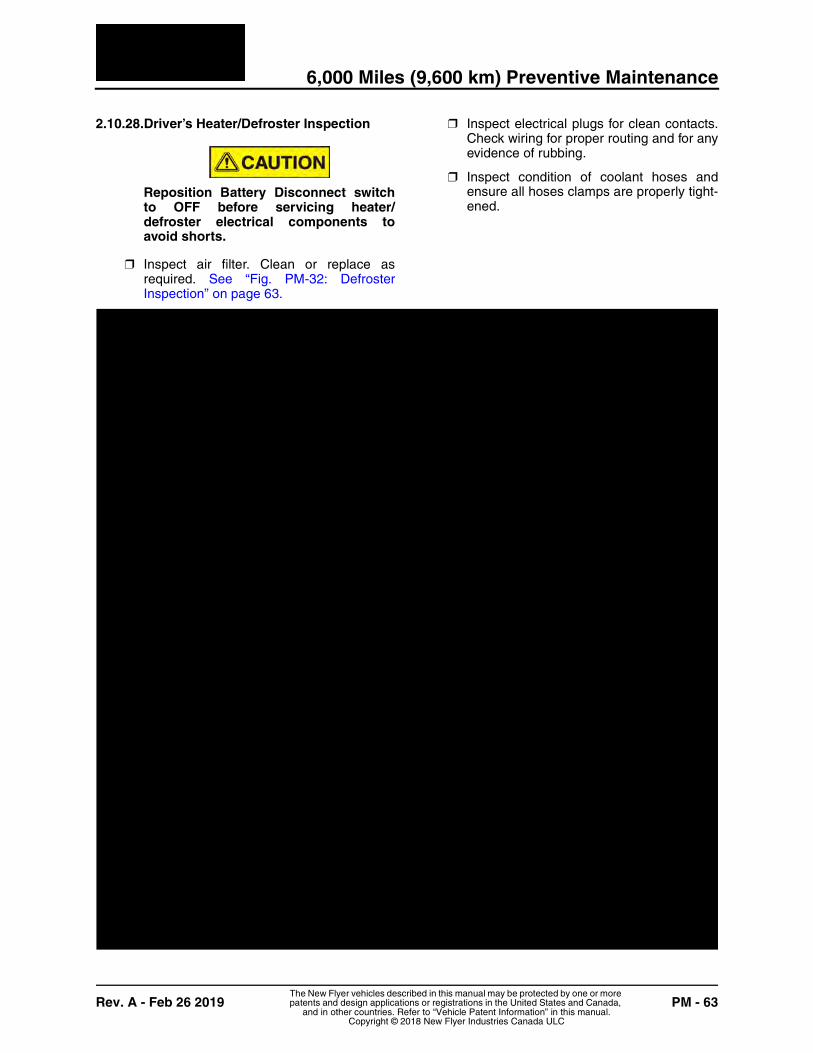
6,000 Miles (9,600 km) Preventive Maintenance
Rev. A - Feb 26 2019 PM - 63The New Flyer vehicles described in this manual may be protected by one or more patents and design applications or registrations in the United States and Canada,
and in other countries. Refer to “Vehicle Patent Information” in this manual.Copyright © 2018 New Flyer Industries Canada ULC
2.10.28.Driver’s Heater/Defroster Inspection
Reposition Battery Disconnect switchto OFF before servicing heater/defroster electrical components toavoid shorts.
❒ Inspect air filter. Clean or replace asrequired. See “Fig. PM-32: DefrosterInspection” on page 63.
❒ Inspect electrical plugs for clean contacts.Check wiring for proper routing and for anyevidence of rubbing.
❒ Inspect condition of coolant hoses andensure all hoses clamps are properly tight-ened.
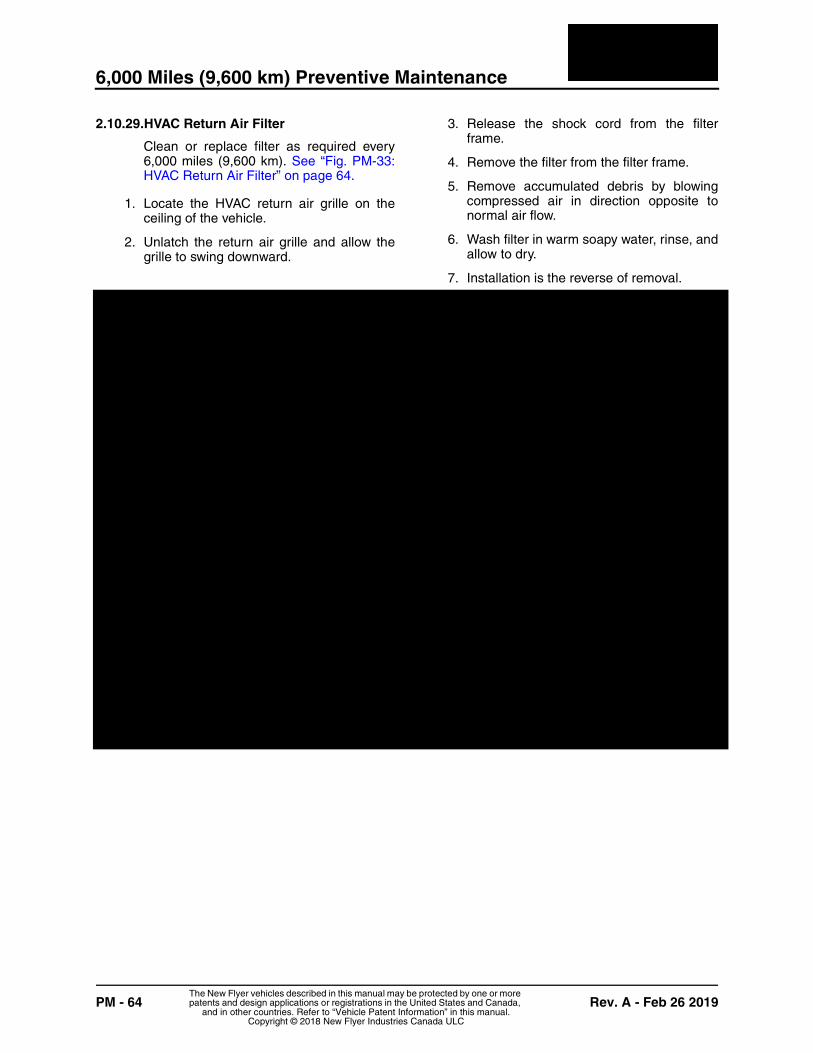
6,000 Miles (9,600 km) Preventive Maintenance
PM - 64 Rev. A - Feb 26 2019The New Flyer vehicles described in this manual may be protected by one or more patents and design applications or registrations in the United States and Canada,
and in other countries. Refer to “Vehicle Patent Information” in this manual.Copyright © 2018 New Flyer Industries Canada ULC
2.10.29.HVAC Return Air Filter
Clean or replace filter as required every6,000 miles (9,600 km). See “Fig. PM-33:HVAC Return Air Filter” on page 64.
1. Locate the HVAC return air grille on theceiling of the vehicle.
2. Unlatch the return air grille and allow thegrille to swing downward.
3. Release the shock cord from the filterframe.
4. Remove the filter from the filter frame.
5. Remove accumulated debris by blowingcompressed air in direction opposite tonormal air flow.
6. Wash filter in warm soapy water, rinse, andallow to dry.
7. Installation is the reverse of removal.
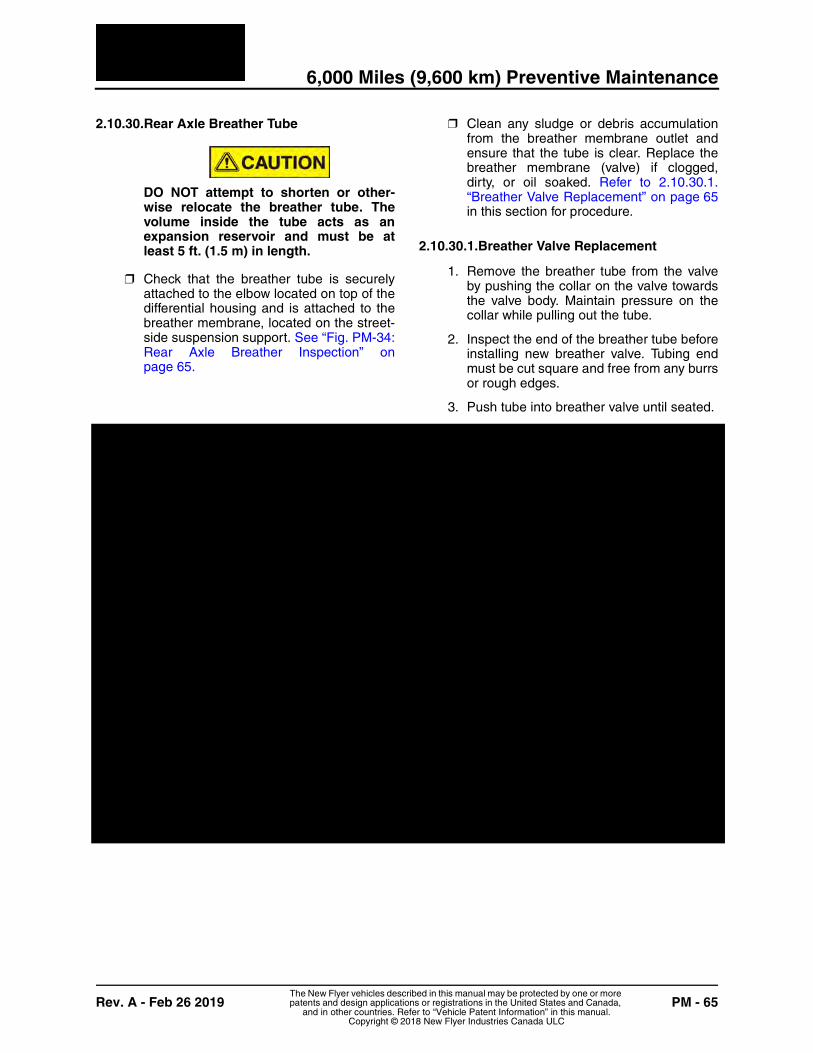
6,000 Miles (9,600 km) Preventive Maintenance
Rev. A - Feb 26 2019 PM - 65The New Flyer vehicles described in this manual may be protected by one or more patents and design applications or registrations in the United States and Canada,
and in other countries. Refer to “Vehicle Patent Information” in this manual.Copyright © 2018 New Flyer Industries Canada ULC
2.10.30.Rear Axle Breather Tube
DO NOT attempt to shorten or other-wise relocate the breather tube. Thevolume inside the tube acts as anexpansion reservoir and must be atleast 5 ft. (1.5 m) in length.
❒ Check that the breather tube is securelyattached to the elbow located on top of thedifferential housing and is attached to thebreather membrane, located on the street-side suspension support. See “Fig. PM-34:Rear Axle Breather Inspection” onpage 65.
❒ Clean any sludge or debris accumulationfrom the breather membrane outlet andensure that the tube is clear. Replace thebreather membrane (valve) if clogged,dirty, or oil soaked. Refer to 2.10.30.1.“Breather Valve Replacement” on page 65in this section for procedure.
2.10.30.1.Breather Valve Replacement
1. Remove the breather tube from the valveby pushing the collar on the valve towardsthe valve body. Maintain pressure on thecollar while pulling out the tube.
2. Inspect the end of the breather tube beforeinstalling new breather valve. Tubing endmust be cut square and free from any burrsor rough edges.
3. Push tube into breather valve until seated.
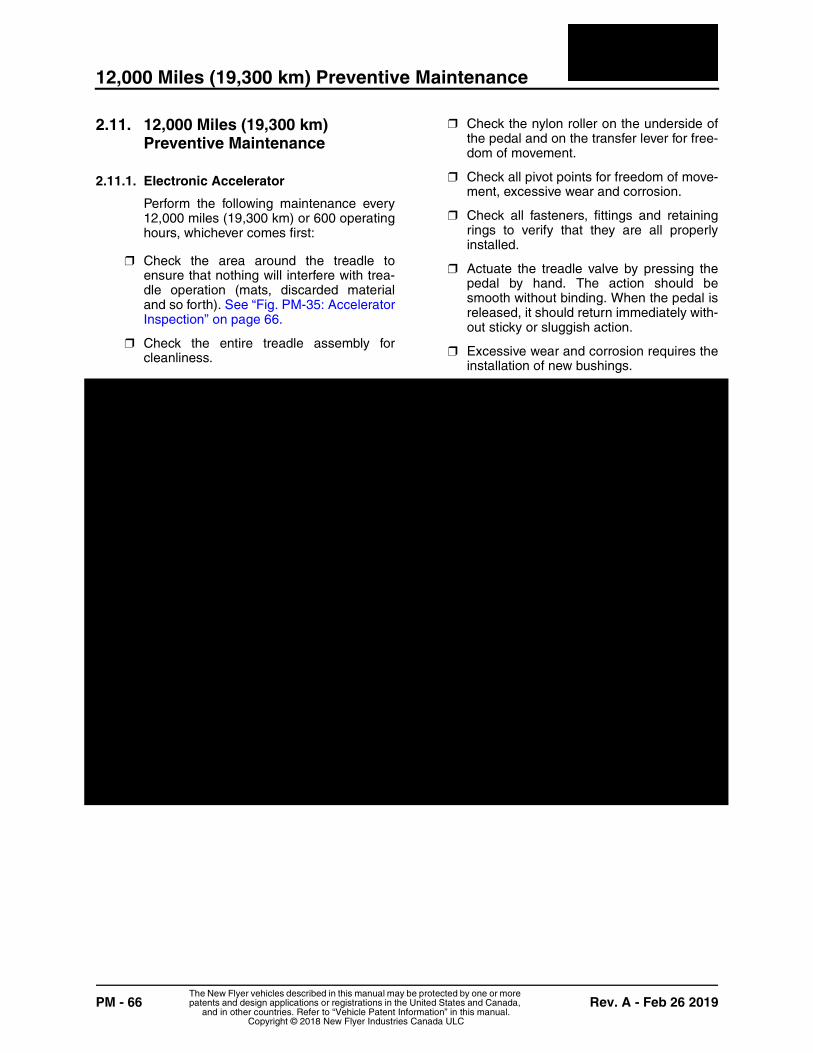
12,000 Miles (19,300 km) Preventive Maintenance
PM - 66 Rev. A - Feb 26 2019The New Flyer vehicles described in this manual may be protected by one or more patents and design applications or registrations in the United States and Canada,
and in other countries. Refer to “Vehicle Patent Information” in this manual.Copyright © 2018 New Flyer Industries Canada ULC
2.11. 12,000 Miles (19,300 km) Preventive Maintenance
2.11.1. Electronic Accelerator
Perform the following maintenance every12,000 miles (19,300 km) or 600 operatinghours, whichever comes first:
❒ Check the area around the treadle toensure that nothing will interfere with trea-dle operation (mats, discarded materialand so forth). See “Fig. PM-35: AcceleratorInspection” on page 66.
❒ Check the entire treadle assembly forcleanliness.
❒ Check the nylon roller on the underside ofthe pedal and on the transfer lever for free-dom of movement.
❒ Check all pivot points for freedom of move-ment, excessive wear and corrosion.
❒ Check all fasteners, fittings and retainingrings to verify that they are all properlyinstalled.
❒ Actuate the treadle valve by pressing thepedal by hand. The action should besmooth without binding. When the pedal isreleased, it should return immediately with-out sticky or sluggish action.
❒ Excessive wear and corrosion requires theinstallation of new bushings.
12,000 Miles (19,300 km) Preventive Maintenance
Rev. A - Feb 26 2019 PM - 67The New Flyer vehicles described in this manual may be protected by one or more patents and design applications or registrations in the United States and Canada,
and in other countries. Refer to “Vehicle Patent Information” in this manual.Copyright © 2018 New Flyer Industries Canada ULC
2.11.2. Driver's Heater/Defroster
Inspect and test the defroster blower motorevery 12,000 miles (19,300 km) or asdetermined by operating conditions. Theinspection interval will need to be more fre-quent during the winter months when theheaters are exposed to slush, salt and gritthat have been tracked into the vehicle.
❒ Remove defroster access cover to allowdetailed inspection of the blower motor andelectrical connections.
DO NOT attempt to clean defrosterassembly using pressure washingequipment or using shop air in excessof 60 psi
❒ Inspect for buildup of salt or dirt deposits inand around the blower motor. Clean sur-faces as necessary to remove contamina-tion.
❒ Inspect electrical connectors for loose orcorroded connections.
❒ Test operation of blower motor at all oper-ating speeds to ensure smooth and quietoperation.
❒ If blower motor operation is suspect, use aclamp-on Fluke ammeter, or equivalent, totest current draw at each speed setting.
Refer to Section 10 of this manual fordefroster motor specifications. Replaceblower motors that do not meet the speci-fied operating limits.
☞NOTE:Disassembly, cleaning, and repair of theblower motor is considered uneconomicaland it is recommended that the blowermotor be replaced if found defective.
2.11.3. S-1 Gard
Every 12,000 miles, inspect the guard andreceiver as follows:
1. Raise the vehicle. Refer to the GeneralInformation Section of this manual for pro-cedure.
2. Inspect guard material for excessive rips ortears. Excessive damage means that theminimal ground clearance of 4.5 ± 0.5"cannot be maintained. Replace guardswhich do not meet this specification.Scrapes or scarring of the material do notimpair its functionality. The guard’s entirelower edge must be level with the ground inorder for it to function correctly. Wornguards may display an uneven profile.
3. Excessive wear of guard material may bean indication of suspension problems,such as incorrect ride height adjustment,shock absorber wear, or air spring leaks.Correct suspension problems as required.
24,000 Miles (38,600 km) Preventive Maintenance
PM - 68 Rev. A - Feb 26 2019The New Flyer vehicles described in this manual may be protected by one or more patents and design applications or registrations in the United States and Canada,
and in other countries. Refer to “Vehicle Patent Information” in this manual.Copyright © 2018 New Flyer Industries Canada ULC
2.11.4. Driver’s Seat Inspection
1. Perform the following inspections every12,000 miles (19,300 km), or 2,400 hours,whichever occurs first:
a. Inspect and clean the seat tracks. Applyfresh lubricant using premium moly-lith-ium grease.
b. Check for proper function of seatrecline.
2. Perform the following inspections after thefirst 12,000 miles (19,300 km) of operationand then every 48,000 miles (77,200 km)thereafter.
a. Check the tracks to ensure the fasten-ers are properly tightened. Torque fas-teners to 16 ft-lbs (22 Nm) as required.
b. Check tracks for misalignment, binding,or wear.
c. Clean control panel switches.
d. Check control panel to ensure it issecurely mounted.
e. Inspect air lines at control panel forwear or cracks.
f. Check suspension bellows for cracks,holes, or tears.
g. Check air spring for wear or leakage.
h. Inspect shocks for leakage.
i. Check lumbar bags for leakage.
j. Check seat covers for abnormal wearor tears.
k. Check seat foam for deterioration, rips,or tears.
l. Check fore and aft tilt of adjustableheadrest.
m. Check up and down travel of headrest.
n. Check headrest for abnormal wear andtear.
2.12. 24,000 Miles (38,600 km) Preventive Maintenance
2.12.1. Driver’s Seat Inspection
Perform the following inspections every12,000 miles (19,300 km) or 4,800 hours,whichever occurs first:
❒ Check the seatbelt mounts to ensure theyare properly tightened. Torque lock nuts to37 ft-lbs (50 Nm) as required.
2.12.2. Air Dryer
DO NOT inject alcohol, anti-freeze, orother de-icing substances into orupstream of the air dryer. Use of thesesubstances may damage the air dryerand void warranty.
Perform the following maintenance every24,000 miles (38,000 km), 900 operatinghours, or every three months, whicheveroccurs first:
1. Visually inspect the air dryer for physicaldamage such as chaffed or broken air andelectrical lines and broken or missingparts.
2. Check mounting bolts for tightness. Torquethe two bolts that secure the air dryer endcover to the mounting bracket to 300 to360 in-lbs. (34 to 41 Nm). Torque the nuton the upper mounting bracket to 60 to 100in-lbs. (7 to 11 Nm).
3. Perform operation & Leakage Tests. Referto 2.12.2.1. “Operation & Leakage Tests”on page 69 in this section for procedure.
24,000 Miles (38,600 km) Preventive Maintenance
Rev. A - Feb 26 2019 PM - 69The New Flyer vehicles described in this manual may be protected by one or more patents and design applications or registrations in the United States and Canada,
and in other countries. Refer to “Vehicle Patent Information” in this manual.Copyright © 2018 New Flyer Industries Canada ULC
2.12.2.1.Operation & Leakage Tests
1. Test the delivery port check valve assem-bly as follows:
a. Install a test gauge in the supply line tothe wet tank.
b. Ensure all lines and fittings leading toand from the air dryer are in good con-dition and not leaking.
c. Build up system air pressure to gover-nor cutout (125 psi).
d. Observe the test gauge to ensure sys-tem pressure is maintained. If a rapidloss of pressure is indicated, proceed tothe following steps to confirm source ofleak.
e. Confirm cause of rapid pressure loss byshutting down the engine and drainingsystem pressure to a point below gov-ernor cut-in (less than 105 psi). Drainresidual air pressure in the compressordischarge line and remove the dis-charge line at the supply port of the airdryer. Ensure there is no air pressure atthe control port by disconnecting theline from the governor unload (UNL)port.
f. Apply a soap solution to the air supplyport on the air dryer. If a 1" bubbleforms within one second, then the deliv-ery check valve should be repaired.
g. Remove the test gauge before return-ing the vehicle to service.
2. Check for excessive leakage around thepurge valve. With the compressor inloaded mode (compressing air), apply asoap solution to the purge valve exhaust
port and observe that leakage does notexceed a 1" bubble in 1 second. If the leak-age exceeds the maximum specified,repair the purge valve assembly.
3. Close all reservoir drain cocks. Build upsystem pressure to governor cutout andnote that each AD-IP purges with an audi-ble escape of air. Apply the service brakesto reduce system air pressure to governorcut-in. Note that the system once againbuilds to full pressure and is followed byAD-IP purges.
4. Check the operation of the safety valve bypulling the exposed stem while the com-pressor is loaded (compressing air). Theremust be an exhaust of air while the stem isheld and the valve should reseat when thestem is released.
5. Check the operation of the end coverheater and thermostat assemblies duringcold weather operation. Refer to 2.12.2.2.“Electric Power Test” on page 69 and Referto 2.12.2.3. “Thermostat & Heater Opera-tion” on page 70 in this section for proce-dure.
2.12.2.2.Electric Power Test
With the Master Run switch set to the DAYRUN or NIGHT RUN operating position,check for voltage to the heater and thermo-stat assembly using a voltmeter or testlight. Unplug the electrical connector at theair dryer and place the test leads on eachof the pins of the male connector. If there isno voltage, look for a blown fuse, brokenwires, or corrosion in the vehicle wiringharness. Check to see if a good groundpath exists.
24,000 Miles (38,600 km) Preventive Maintenance
PM - 70 Rev. A - Feb 26 2019The New Flyer vehicles described in this manual may be protected by one or more patents and design applications or registrations in the United States and Canada,
and in other countries. Refer to “Vehicle Patent Information” in this manual.Copyright © 2018 New Flyer Industries Canada ULC
2.12.2.3.Thermostat & Heater Operation
☞NOTE:These tests are not required except in coldweather operation.
Switch off the master run switch and coolthe thermostat and heater assembly tobelow 35°F (2°C). Using an ohmmeter,check the resistance between the electricalpins in the air dryer connector half. Theresistance should be 6.0 to 9.0 ohms forthe 24 volt heater assembly. Warm thethermostat and heater assembly to over90°F (32°C) and again check the resis-tance. The resistance should exceed 1000ohms. If the resistance values obtained arewithin the stated limits, the assembly isoperating properly. If the resistance valuesobtained are outside the stated limits,replace the assembly.
☞NOTE:If, after completing the routine operationand leakage tests, it has been determinedthat one or more components of the airdryer requires replacement or mainte-nance, refer to your New Flyer Parts Man-ual. The air dryer has been designed sothat any of the maintenance kits can beinstalled without removing the air dryerfrom the vehicle.
2.12.3. Brake Treadle Assembly & Brake Valve
Perform maintenance on the brake treadleassembly and brake valve every 24,000miles (38,600 km), 900 operating hours orthree months, whichever occurs first,
❒ Remove any accumulated contamination,such as dirt and gravel, from the heel ofthe treadle, the plunger, the plunger bootand the mounting plate. See “Fig. PM-36:Brake Valve Inspection” on page 71.
❒ Clean and inspect the treadle roller, theroller pin, and the hinge pin. Replace anyworn, corroded, or damaged parts. Lubri-cate with Barium grease. Refer to 2.31.“Fluid & Lubrication Guide” on page 126 inthis section for lubrication specifications.
❒ Inspect the plunger boot for cracks, holesor deterioration and replace boot if dam-aged.
❒ Inspect the plunger for wear or corrosion.Replace plunger if required.
❒ Check that the brake treadle mountingplate is securely fastened. Inspect pivot pinholes and plunger bore in mounting platefor wear or corrosion. Replace mountingplate if required.
❒ Apply a thin layer of Barium greasebetween the plunger and the mountingplate bore. Do not use excessive amountsof lubricant.
❒ Perform operation and leakage tests onthe brake valve. Refer to Section 8 of thismanual for test procedures.

36,000 Miles (58,000 km) Preventive Maintenance
PM - 72 Rev. A - Feb 26 2019The New Flyer vehicles described in this manual may be protected by one or more patents and design applications or registrations in the United States and Canada,
and in other countries. Refer to “Vehicle Patent Information” in this manual.Copyright © 2018 New Flyer Industries Canada ULC
2.13. 36,000 Miles (58,000 km) Preventive Maintenance
2.13.1. Disc Brake Caliper Inspection
Perform a disc brake caliper inspectionevery 36,000 miles (58,000 km) or everyyear, whichever occurs first. A more fre-quent inspection may be necessarydepending on the operating conditions.Perform the following inspections:
❒ Inspect the six brake caliper mountingbolts that attach the brake caliper to theaxle to ensure the bolts are tight. Refer toSection 1 and 2 of this manual for mount-ing bolt torque specifications.
❒ Caliper Running Clearance - refer to“Adjuster Check” in Section 1 and 2 of thismanual for inspection procedure.
❒ Guide Pin Covers - check that the protec-tive covers are properly installed on thecaliper guide pins and are in good condi-tion. Replace covers if damaged or miss-ing.
❒ Adjuster Cap - check that the protectivecap is properly installed on the adjusterand is in good condition. Replace adjustercap if damaged or missing
❒ Brake Disc - refer to “Brake Disc Inspec-tion” in Section 1 and 2 of this manual forinspection procedure.
❒ Brake Adjuster - refer to “Adjuster Check”in Section 1 and 2 of this manual forinspection procedure
☞NOTE:The brake adjuster should always beinspected and tested whenever brake padshave been replaced
❒ Caliper Guide Pin - refer to “Caliper GuidePin Inspection” in Section 1 and 2 of thismanual for inspection procedure.
❒ Tappet & Boot Assembly - refer to “TappetRubber Boot Inspection” in Section 1 and 2of this manual for inspection procedure.
❒ Guide Pin Inner Boot - refer to “UpperGuide Rubber Boot Inspection” in Section1 and 2 of this manual for inspection pro-cedure.
36,000 Miles (58,000 km) Preventive Maintenance
Rev. A - Feb 26 2019 PM - 73The New Flyer vehicles described in this manual may be protected by one or more patents and design applications or registrations in the United States and Canada,
and in other countries. Refer to “Vehicle Patent Information” in this manual.Copyright © 2018 New Flyer Industries Canada ULC
2.13.2. Rear Axle Oil Change
Change the rear axle oil every 36,000miles (58,000 km), or every year, which-ever occurs first. Use this oil change inter-val only if operating with mineral oil in a hottemperature region. Refer to 2.2. “RearAxle Operating Conditions” on page 11 inthis section for a definition of a hot temper-ature region. Refer to 2.31. “Fluid & Lubri-cation Guide” on page 126 in this sectionfor fluid specification.
2.13.2.1.Drain
Differential fluid can reach operatingtemperatures in excess of 212°F(100°C). Allow adequate time fordifferential to cool before draining fluid.
1. Ensure vehicle is parked on a level surfaceor raised to a working height that maintainsa level attitude.
2. Place a suitably sized container beneaththe differential gear housing.
☞NOTE:Differential gear housing oil fill quantity isapproximately 4.0 U.S. gallons (15 liters)
3. Remove the fill plug from the front of thedifferential housing. See “Fig. PM-37: RearAxle Drain & Fill Locations” on page 73.
4. Remove the drain plug from the bottom ofthe differential housing and allow the differ-ential to drain completely.
Fig. PM-37: Rear Axle Drain & Fill Locations
2.13.2.2.Fill
1. Inspect the magnetic drain plug for any sig-nificant accumulation of metal particlesand wipe clean.
☞NOTE:Fine “fuzz-like” metal particles are consid-ered normal but any solid slivers of signifi-cant size or chips of metal will requirefurther investigation to determine cause.
2. Clean and inspect the threads of the drainplug before applying Loctite-567 threadsealant. Install and torque the drain plug to52 ft-lb. (70 Nm).
3. Add slightly less than 4.0 U.S. gallons (15liters) and allow fluid level to stabilize.
4. Continue to add fluid slowly until the fluid islevel with the bottom of the fill plug.
5. Install the fill plug and torque to 52 ft-lb. (70Nm).
48,000 Miles (77,200 km) Preventive Maintenance
PM - 74 Rev. A - Feb 26 2019The New Flyer vehicles described in this manual may be protected by one or more patents and design applications or registrations in the United States and Canada,
and in other countries. Refer to “Vehicle Patent Information” in this manual.Copyright © 2018 New Flyer Industries Canada ULC
2.14. 48,000 Miles (77,200 km) Preventive Maintenance
2.14.1. Front End Alignment
Perform minor alignment. Refer to Section3 of this manual for procedure.
2.14.2. Driver’s Seat Inspection
Perform the following inspections every48,000 miles (77,200 km) or 9,600 hours,whichever occurs first:
❒ Check the suspension air lines for wear orleaks.
❒ Check the suspension controls for brokenor cracked knobs.
❒ Check the suspension shock mounts forcracks or breaks.
❒ Check the seat back mounting bolts oneach side to ensure they are properly tight-ened. Torque mounting bolts to 30 ft-lbs(41 Nm) as required.
❒ Check the tracks to ensure the fastenersare properly tightened. Torque fasteners to16 ft-lbs (22 Nm) as required.
❒ Check tracks for misalignment, binding, orwear.
❒ Clean control panel switches.
❒ Check control panel to ensure it is securelymounted.
❒ Inspect air lines at control panel for wear orcracks.
❒ Check suspension bellows for cracks,holes, or tears.
❒ Check air spring for wear or leakage.
❒ Inspect shocks for leakage.
❒ Check lumbar bags for leakage.
❒ Check seat covers for abnormal wear ortears.
❒ Check seat foam for deterioration, rips, ortears.
❒ Check fore and aft tilt of adjustable head-rest.
❒ Check up and down travel of headrest.
❒ Check headrest for abnormal wear andtear.
2.14.3. Front Brake Chambers
2.14.3.1.Inspection
Perform the following inspection every48,000 miles (77,200 km):
1. Visually inspect the exterior surfaces of thebrake chamber for signs of damage.Replace the brake chamber if damaged.Refer to Section 1 of this manual forreplacement procedure.
2. Apply system pressure (minimum 100 psi)to the brake chamber and check for leaksaround the circumference of the clampband and air inlet fittings, using soapywater or leak detection solution.
a. If bubbles appear around clamp band,release air pressure and torque clampband nuts to 30 to 35 ft-lbs (41 to 47Nm). Recheck for leaks. If leaks con-tinue, perform a leakdown pressuretest. Refer to 2.14.3.2. “Front BrakeChamber Leakdown Test” on page 75in this section for test procedure.
b. If bubbles appear at air hose connec-tion, tighten hose until leaks cease, butdo not exceed 40 ft-lb. (54 Nm) If leakscontinue, release air pressure andremove air line from inlet port. Inspectthreads on hose and fitting. Replacehose or fitting as required Reinstall airline to the brake chamber and recheckfor leaks.
c. If bubbles appear at air inlet fitting,tighten fitting until leaks cease, but donot exceed 30 ft-lb. (41 Nm) If leakscontinue, release air pressure andremove fitting from brake chamberInstall new fitting with Loctite 567 andtighten two full turns past finger tight.Reinstall air lines to the brake chamberand recheck for leaks. If leaks continue,perform a leakdown pressure test.Refer to 2.14.3.2. “Front Brake Cham-ber Leakdown Test” on page 75 in thissection for test procedure. Replace fit-ting or brake chamber as required.
3. Check to ensure the mounting stud nutsare torqued to 133 to 155 ft-lb. (180 to 210Nm).
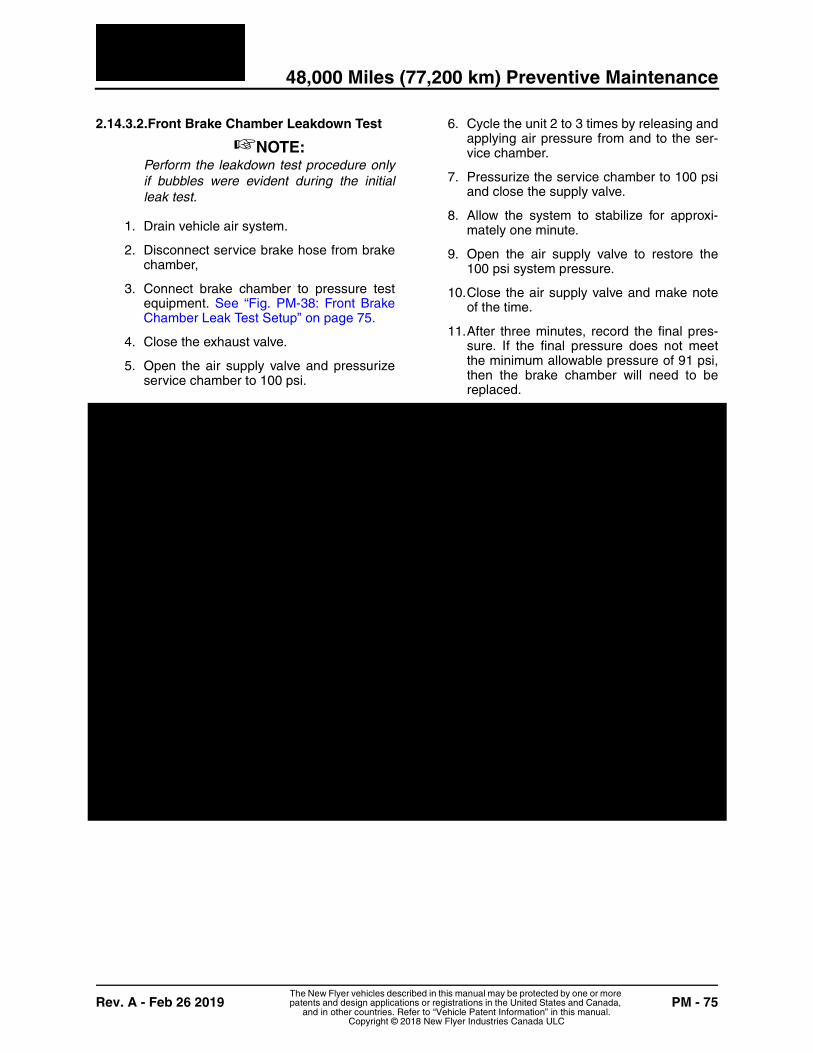
48,000 Miles (77,200 km) Preventive Maintenance
Rev. A - Feb 26 2019 PM - 75The New Flyer vehicles described in this manual may be protected by one or more patents and design applications or registrations in the United States and Canada,
and in other countries. Refer to “Vehicle Patent Information” in this manual.Copyright © 2018 New Flyer Industries Canada ULC
2.14.3.2.Front Brake Chamber Leakdown Test
☞NOTE:Perform the leakdown test procedure onlyif bubbles were evident during the initialleak test.
1. Drain vehicle air system.
2. Disconnect service brake hose from brakechamber,
3. Connect brake chamber to pressure testequipment. See “Fig. PM-38: Front BrakeChamber Leak Test Setup” on page 75.
4. Close the exhaust valve.
5. Open the air supply valve and pressurizeservice chamber to 100 psi.
6. Cycle the unit 2 to 3 times by releasing andapplying air pressure from and to the ser-vice chamber.
7. Pressurize the service chamber to 100 psiand close the supply valve.
8. Allow the system to stabilize for approxi-mately one minute.
9. Open the air supply valve to restore the100 psi system pressure.
10.Close the air supply valve and make noteof the time.
11.After three minutes, record the final pres-sure. If the final pressure does not meetthe minimum allowable pressure of 91 psi,then the brake chamber will need to bereplaced.
48,000 Miles (77,200 km) Preventive Maintenance
PM - 76 Rev. A - Feb 26 2019The New Flyer vehicles described in this manual may be protected by one or more patents and design applications or registrations in the United States and Canada,
and in other countries. Refer to “Vehicle Patent Information” in this manual.Copyright © 2018 New Flyer Industries Canada ULC
2.14.4. Rear Brake Chambers
2.14.4.1.Inspection
Perform the following inspection every48,000 miles (77,200 km):
1. Visually inspect the exterior surfaces of thespring brake chamber for signs of damage.Replace the brake chamber if damaged.Refer to Section 2 of this manual forreplacement procedure.
2. Apply system pressure (minimum 100 psi)to the spring brake chamber and check forleaks at the head/flange case interface, airinlet fittings, at vent elbows in non-pres-sure housing, and center seal using soapywater or leak detection solution.
a. If bubbles appear at the head/flangecase interface, a leak is present and Ifa leak is detected, perform a leakdownpressure test. Refer to 2.14.4.2. “SpringBrake Leakdown Test” on page 78 andRefer to 2.14.4.3. “Service Brake Leak-down Test” on page 79 in this sectionfor test procedure.
b. Check for leaks from the vent elbowlocated in the non-pressure housing. Ifmore than one vent elbow is present,plug all but one elbow and check forleaks at the unplugged elbow. If leaksare detected, there is an internal leak.Perform a leakdown pressure test.Refer to 2.14.4.2. “Spring Brake Leak-down Test” on page 78 and Refer to2.14.4.3. “Service Brake LeakdownTest” on page 79 in this section for testprocedure.
c. For center seal leaks, check for continu-ous discharge from the service sidequick release valve. If a leak isdetected, perform a leakdown pressuretest. Refer to 2.14.4.2. “Spring BrakeLeakdown Test” on page 78 and Referto 2.14.4.3. “Service Brake LeakdownTest” on page 79 in this section for testprocedure.
d. If bubbles appear at air hose connec-tion, tighten hose until leaks cease, butdo not exceed 20 ft-lb. (27 Nm) for thespring brake hose. If leaks continue,release air pressure and remove air linefrom inlet port. Inspect threads on hoseand fitting. Replace hose or fitting asrequired Reinstall air line to the brakechamber and recheck for leaks.
e. If bubbles appear at spring brake airinlet fitting, tighten fitting until leakscease, but do not exceed 30 ft-lb. (41Nm). If leaks continue, release air pres-sure and remove fitting from brakechamber Install new fitting with Loctite567 and tighten two full turns past fin-ger tight. Reinstall air line to the springbrake chamber and recheck for leaks. Ifleaks continue, perform a leakdownpressure test. Refer to 2.14.4.2. “SpringBrake Leakdown Test” on page 78 inthis section for test procedure. Replacebrake chamber as required.
48,000 Miles (77,200 km) Preventive Maintenance
Rev. A - Feb 26 2019 PM - 77The New Flyer vehicles described in this manual may be protected by one or more patents and design applications or registrations in the United States and Canada,
and in other countries. Refer to “Vehicle Patent Information” in this manual.Copyright © 2018 New Flyer Industries Canada ULC
3. With spring brake still fully pressurized,apply system pressure (minimum 100 psi)to the service brake chamber and checkfor leaks around the circumference of theclamp band and air inlet fittings, usingsoapy water or leak detection solution.
a. If bubbles appear around clamp band,release air pressure and torque clampband nuts to 30 to 35 ft-lb. (41 to 47Nm). Recheck for leaks. If leaks con-tinue, perform a leakdown pressuretest. Refer to 2.14.4.3. “Service BrakeLeakdown Test” on page 79 in this sec-tion for test procedure.
b. If bubbles appear at service brake airinlet fitting, tighten fitting until leakscease, but do not exceed 30 ft-lb. (41Nm). If leaks continue, perform a leak-down pressure test. Refer to 2.14.4.3.“Service Brake Leakdown Test” onpage 79 in this section for test proce-dure. Repair or replace hose and fit-tings as required.
c. Check to ensure the mounting studnuts are torqued to 133 to 155 ft-lb.(180 to 210 Nm).
DO NOT use an impact wrench totighten the release bolt in the followingstep.
4. Check to ensure that the release bolt isseated against the head insert and torquedto 50 to 60 ft-lb. (68 to 81 Nm). Fully seat-ing the release bolt ensures that the park-ing brake will have full stroke capability andseals the release bolt threads, preventingcontaminants from entering the brakechamber.
5. Check the external breather tube to ensurethere is no damage or cracks in the rubberelbows and ensure the tube is securelyengaged a minimum of ½ inch (13 mm)into the rubber elbows and glued togetherwith a high quality rubber cement. Replacewith breather tube repair kit if required.
48,000 Miles (77,200 km) Preventive Maintenance
PM - 78 Rev. A - Feb 26 2019The New Flyer vehicles described in this manual may be protected by one or more patents and design applications or registrations in the United States and Canada,
and in other countries. Refer to “Vehicle Patent Information” in this manual.Copyright © 2018 New Flyer Industries Canada ULC
2.14.4.2.Spring Brake Leakdown Test
☞NOTE:Perform the leakdown test procedure onlyif bubbles were evident during the initialleak test.
1. Drain vehicle air system.
2. Disconnect both brake hoses from brakechamber,
3. Connect pressure test equipment to springbrake chamber port #12. See “Fig. PM-39:Spring Brake Leak Test Setup” onpage 78.
4. Close the exhaust valve.
5. Open the air supply valve and pressurizespring brake chamber to 100 psi.
☞NOTE:Some minor movement (0.010 inch maxi-mum) to initially position the head may benoticed at the roll in area of the brakechamber. This is a normal condition.
6. Uncage the spring brake.
Exercise caution in the following stepwhen cycling the air pressure. Be awareof push rod movement.
7. Cycle the unit 2 to 3 times by releasing andapplying air pressure from and to thespring brake chamber.
8. Pressurize the spring brake chamber to100 psi and close the air supply valve.
9. Allow the system to stabilize for approxi-mately one minute.
10.Open the air supply valve to restore the100 psi system pressure.
11.Close the air supply valve and make noteof the time.
12.After three minutes, record the final pres-sure. If the final pressure does not meetthe minimum allowable pressure of 95 psi,then the brake chamber will need to bereplaced.
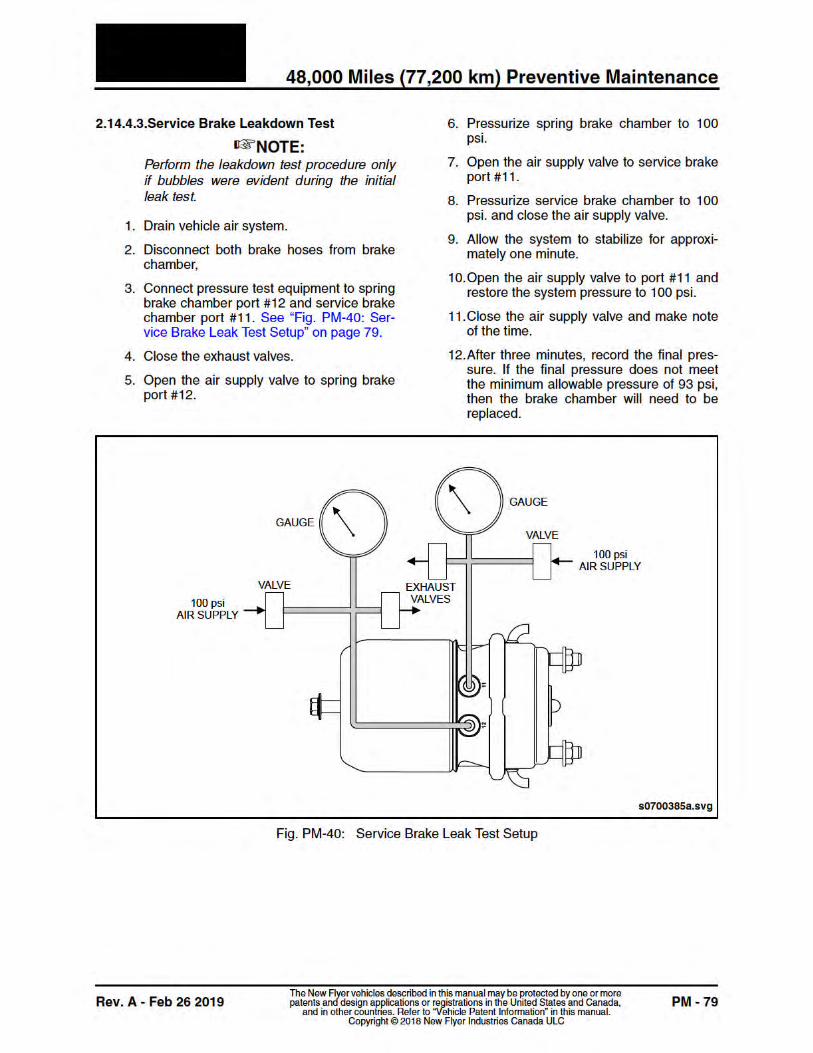
54,000 Miles (87,000 km) Preventive Maintenance
PM - 80 Rev. A - Feb 26 2019The New Flyer vehicles described in this manual may be protected by one or more patents and design applications or registrations in the United States and Canada,
and in other countries. Refer to “Vehicle Patent Information” in this manual.Copyright © 2018 New Flyer Industries Canada ULC
2.15. 54,000 Miles (87,000 km) Preventive Maintenance
2.15.1. Rear Axle Oil Change
Change the rear axle oil every 54,000miles (87,000 km), or every year, which-ever occurs first. Use this oil change inter-val only if operating with mineral oil in amoderate temperature region. Refer to 2.2.“Rear Axle Operating Conditions” onpage 11 in this section for a definition of amoderate temperature region. Refer to2.13.2. “Rear Axle Oil Change” on page 73in this section for oil change drain and fillprocedure. Refer to 2.31. “Fluid & Lubrica-tion Guide” on page 126 in this section forfluid specification.
2.16. 96,000 Miles (154,500 km) Preventive Maintenance
2.16.1. Front End Alignment
Perform major alignment. Refer to Section3 of this manual for procedure.
2.17. 150,000 Miles (241,400 km) Preventive Maintenance
2.17.1. Battery Compartment Access Door Inspection
Inspect the two scissor hinges on the bat-tery compartment door every 150,000miles (241,400 km) as follows:
1. Raise and lower the door slowly whileobserving the action of the scissor hinges.The hinges should operate smoothly with-out any binding or deflection. Replacehinge if damaged.
2. Inspect all pivot point fasteners to ensurethey are in good condition and properlytightened. Pay particular attention to theuppermost fasteners for possible damageor looseness. See “Fig. PM-41: ScissorHinge Inspection” on page 81. Replaceany damaged fasteners.
☞NOTE:If installing new fasteners, ensure that alight coating of Never-Seez is applied tothe inside of the pivot holes, between themoving linkages, and on the underside ofthe large washers. Wipe off excess grease.
3. Inspect torque witness marks on all fasten-ers as follows:
a. If witness marks are legible andaligned, no further action is required.
b. If witness marks are not aligned, notlegible, or missing entirely, then the fas-tener will need to be loosened andretorqued to 12 ft-lbs. (16 Nm). Reapplytorque witness mark.
4. If the hinge is sticking or damaged, replacethe hinge assembly.
250,000 Miles (400,000 km) Preventive Maintenance
Rev. A - Feb 26 2019 PM - 81The New Flyer vehicles described in this manual may be protected by one or more patents and design applications or registrations in the United States and Canada,
and in other countries. Refer to “Vehicle Patent Information” in this manual.Copyright © 2018 New Flyer Industries Canada ULC
2.18. 250,000 Miles (400,000 km) Preventive Maintenance
2.18.1. Stabilizer Bar Mounting Bolt Replacement
Replace the stabilizer bar mounting boltsevery 250,000 miles (400,00 km) as fol-lows:
1. Locate the four 5/8" bolts that attach thestabilizer bar to the vehicle frame. See“Fig. PM-42: Stabilizer Bolt Replacement”on page 82.
2. Remove and discard the bolts and wash-ers from the saddle clamps, being carefulnot to lose the spacers located betweenthe saddle clamps and vehicle frame.
3. Install new bolts and washers and torqueto specification. Refer to Section 1 of yourNew Flyer Parts Manual for correct fas-tener part numbers. Refer to Section 1 ofthis manual for installation torque.
250,000 Miles (400,000 km) Preventive Maintenance
PM - 82 Rev. A - Feb 26 2019The New Flyer vehicles described in this manual may be protected by one or more patents and design applications or registrations in the United States and Canada,
and in other countries. Refer to “Vehicle Patent Information” in this manual.Copyright © 2018 New Flyer Industries Canada ULC
2.18.2. Support Frame Inspection
Inspect the K-member on the supportframe after the first 250,000 miles (400,00km) of operation, and then every yearthereafter, as follows:
1. Raise the vehicle. Refer to the GeneralInformation Section of this manual for lift-ing procedures.
2. Locate the support frame. See “Fig. PM-43: Support Frame” on page 83.
3. Clean the support frame in the area of thebolted K-member to allow for proper visualinspection.
4. Inspect all fasteners to ensure torque wit-ness marks are aligned. Retorque anyloose fasteners to 370 to 390 ft-lbs. (500-525 Nm) and reapply torque witnessmarks.
5. Inspect all welded joints of the K-memberfor any cracks. Pay particular attention tothe location identified on the accompany-ing illustration as “critical area”. Replace K-member if cracks are evident at any loca-tion. Contact New Flyer Parts Departmentfor ordering information.

Six Month Preventive Maintenance
PM - 84 Rev. A - Feb 26 2019The New Flyer vehicles described in this manual may be protected by one or more patents and design applications or registrations in the United States and Canada,
and in other countries. Refer to “Vehicle Patent Information” in this manual.Copyright © 2018 New Flyer Industries Canada ULC
2.19. Six Month Preventive Maintenance
2.19.1. PR-2 Pressure Protection Valve
Perform an operating test and leakagecheck of the valve at this interval. Refer toSection 8 of this manual for procedure.
2.19.2. ST-1 Safety Valve
Every six months or 1,500 operating hoursperform operating and leakage test. Referto Section 8 of this manual for test proce-dure.
2.19.3. SR-7 Spring Brake Modulating Valve
Perform an operating and leakage testevery six months or 1,500 hours, which-ever occurs first.
DO NOT attempt to disassemble andservice the valve. The valve containshigh spring forces that could result inpersonal injury if disassembled.
2.19.3.1.Operating Test
1. Block vehicle and hold by means otherthan vehicle brakes.
2. Charge air system to governor cut-outpressure.
3. Place parking brake control valve in theAPPLIED position. Observe that the springbrake actuators apply promptly.
4. Remove the plug from the unused deliveryport and install a test pressure gaugeknown to be accurate.
5. Place the parking brake control valve in theRELEASE position. Observe that thespring brake actuators release fully.
6. With the parking control valve in theRELEASE position, note the gauge pres-sure reading. Spring brake actuator hold-off pressure should be 107 psi. If the pres-sure reading is incorrect, the valve must bereplaced.
7. Place the parking brake control valve in theAPPLIED position: The gauge readingshould drop to zero promptly. A slowrelease of pressure, more than three sec-onds, would indicate faulty operation.Replace the valve.
8. Maintain the parking brake control valve inthe APPLIED position and gradually applythe brake treadle. The reading on the testpressure gauge, installed in the deliveryport should increase.
9. Place the parking brake control valve in theRELEASE position.
10.Drain the rear brake reservoir to zero psi.
11.Apply the brake treadle several times andnote that the pressure reading on thegauge decreases each time the brake trea-dle is applied. After several applications,pressure on the gauge will drop to thepoint where release of the spring brakeactuators will no longer occur.
2.19.3.2.Leakage Test
With the air system fully charged and theparking brake control valve in theRELEASE position, coat all the ports,including the exhaust port, with a soapsolution. A 1" bubble in three seconds (175SCCM) is permitted.
If the Spring Brake Modulating Valve doesnot function as described in the operatingtest, or leakage is excessive, it is recom-mended that the valve be replaced.
Six Month Preventive Maintenance
Rev. A - Feb 26 2019 PM - 85The New Flyer vehicles described in this manual may be protected by one or more patents and design applications or registrations in the United States and Canada,
and in other countries. Refer to “Vehicle Patent Information” in this manual.Copyright © 2018 New Flyer Industries Canada ULC
2.19.4. SC-1 Single Check Valve
Every six months or 1,500 operating hoursperform operating and leakage test. Referto Section 8 of this manual for test proce-dure.
2.19.5. DC-4 Double Check Valve
Every six months or 1,500 operating hoursperform operating and leakage test. Referto Section 8 of this manual for test proce-dure.
2.19.6. RV-3 Pressure Reducing Valve
Inspect and test the pressure reducingvalve every six months or 1500 operatinghours, whichever occurs first. Refer to Sec-tion 8 of this manual for procedure.
2.19.7. R-14 Brake Relay Valve
Perform an operating and leakage testevery six months or 1,500 operating hours.Refer to Section 8 of this manual for proce-dure.
2.19.8. Brake Foot Valve
Every six months or 1,500 operating hoursperform operating and leakage test. Referto Section 8 of this manual for test proce-dure. Check for physical damage such asbroken air lines and missing parts.
2.19.9. Parking Brake Control Valve
Perform an operating and leakage testevery six months or 1,500 hours, which-ever occurs first. Refer to Section 8 of thismanual for procedure.
2.19.10.Emergency Brake Release Valve
Perform an operating and leakage testevery six months or 1,500 hours, which-ever occurs first. Refer to Section 8 of thismanual for procedure.
2.19.11.Steering Knuckle Lubrication
Lubricate the upper and lower steeringknuckle (kingpin) bearings every sixmonths if operating under harsh winterconditions where the vehicle is exposed tosalt spray or extremes of temperature. It isrecommended that the bearings begreased before the start of the winter sea-
son, and then again immediately followingthe winter season. Do not grease more fre-quently than recommended.
☞NOTE:The lubrication interval may be extendedto once every year or 36,000 miles (58,000km), whichever occurs first, if operatingunder less harsh conditions.
Lubricate the bearings as follows:
1. Ensure the wheels are supporting theweight of the vehicle. Do not lift on the axleor chassis with the wheels hanging unsup-ported, as this will prevent proper lubrica-tion of the upper bearing.
2. Remove the protective plastic cap from thegrease fitting and clean the fitting and sur-rounding area.
3. Ensure that the adapter on the grease gunproperly fits the grease fitting.
DO NOT over-pressurize the bearingcavity when greasing the bearing, asthis could cause the sealing washer,located below the circlip, to bulge out-ward. Replace sealing washer if dis-torted.
4. Lubricate the upper bearing first. Use onlyRenoLit LX-OTP-2 lubricant and continueto apply grease until the old grease beginsto escape from between the steeringknuckle and axle I-beam. It is not neces-sary to completely purge all of the oldgrease.
☞NOTE:If the lower bearing is lubricated first, it willtend to minimize the cavity above theupper kingpin bearing and restrict greaseflow to the upper bearing.
5. Lubricate the lower bearing, same as theupper bearing.
6. If difficulty is experienced lubricating eitherthe upper or lower bearing, Refer to2.19.11.1. “Lubrication Troubleshooting”on page 86 for troubleshooting procee-dures.
Six Month Preventive Maintenance
PM - 86 Rev. A - Feb 26 2019The New Flyer vehicles described in this manual may be protected by one or more patents and design applications or registrations in the United States and Canada,
and in other countries. Refer to “Vehicle Patent Information” in this manual.Copyright © 2018 New Flyer Industries Canada ULC
7. Clean any excess grease from the steeringknuckle joint as well as the area above thesealing washer.
8. Install protective plastic cap on grease fit-ting.
2.19.11.1.Lubrication Troubleshooting
Use the following checks and procedures ifdifficulty is experienced lubricating thebearings:
1. If neither bearing is taking grease, proceedas follows:
a. Confirm that the weight of the vehicle ison the wheels when applying grease.
b. Confirm that the proper grease gunadapter is being used.
c. If excessive greasing pressures arebeing used, a hydraulic lock may formand prevent the flow of grease. Relievethe excessive pressure by turning thewheels fully left and right several times.If grease pressure will not relieve, pro-ceed to the following step.
d. Use a thin punch or similar tool todepress the check ball in the grease fit-ting and allow grease to escape. Ifgrease pressure still won’t relieve, pro-ceed to the following step.
e. Remove the circlip and sealing washer,wipe off the grease, and turn thewheels fully left and right several times.
f. Install new grease fitting and ensure itdoes not protrude into the kingpin cav-ity. Reinstall sealing washer and circlip.
☞NOTE:Replace the sealing washer if any evi-dence of distortion or bulging is noted.
2. If only the upper bearing is not takinggrease, proceed as follows:
a. Confirm that the weight of the vehicle ison the wheels when applying grease.
b. Remove the snap ring and sealingwasher and examine the grease fittingto ensure that it is flush with the sealingwasher and does not protrude into thekingpin cavity.
☞NOTE:The use of a non-specified grease fittingwith longer threads could result in thegrease fitting contacting the upper kingpinsurface and effectively blocking the flow ofgrease. Refer to your New Flyer PartsManual for correct grease fitting applica-tion.
2.19.12.Battery Compartment Access Door Inspection
Inspect, clean, and lubricate the scissorhinges on the battery compartment doorevery six months as follows:
1. Operate the door through its openingrange while observing the hinge forsmooth operation. Ensure the hinge is notbuckled or distorted. Replace the hinge ifdamaged.
2. Use compressed air to blow out any gritfrom the pivot points of the hinge.
3. Wipe any displaced lubricant or grit with aclean cloth.
4. If the door is sticking, use a brush to workNever-Seez into all the pivot points of thehinge.
5. Wipe excess lubricant with a clean cloth,being careful not to remove any torque wit-ness marks.
2.19.13.Bike Rack Servicing
Service the bike rack latch mechanism andsupport arm assembly every six months.Refer to Section 13 of this manual for pro-cedure.
Six Month Preventive Maintenance
Rev. A - Feb 26 2019 PM - 87The New Flyer vehicles described in this manual may be protected by one or more patents and design applications or registrations in the United States and Canada,
and in other countries. Refer to “Vehicle Patent Information” in this manual.Copyright © 2018 New Flyer Industries Canada ULC
2.19.14.Fire Suppression System
The fire suppression system must beserviced by an authorized Amerex tech-nician that is trained and certified onthe Amerex SafetyNet System and inaccordance with NFPA and any federal,state, and/or local code requirements.
❒ Perform a six month inspection in accor-dance latest version of Amerex Installation,Operation, and Instruction Manual No.
16601 and Amerex Installation, and Main-tenance Manual 13980.
2.19.15.Power Steering Miter Box
Locate the grease fitting on the bottom ofthe power steering miter box. Use a man-ual grease gun and apply only two pumpsof grease to lubricate the miter box. Do notapply excessive pressure or quantity ofgrease that could result in damage toseals. Refer to 2.31. “Fluid & LubricationGuide” on page 126 in this section for lubri-cant specification. See “Fig. PM-44: PowerSteering Miter Box Lubrication” onpage 87.
Six Month Preventive Maintenance
PM - 88 Rev. A - Feb 26 2019The New Flyer vehicles described in this manual may be protected by one or more patents and design applications or registrations in the United States and Canada,
and in other countries. Refer to “Vehicle Patent Information” in this manual.Copyright © 2018 New Flyer Industries Canada ULC
2.19.16.Cooling & Heating System Inspection
Pressure test the cooling/heating systemand check anti-freeze concentration everysix months.
☞NOTE:The following inspection procedure appliesto both reservoirs located on the rearstreetside of the vehicle. The reservoir forthe traction motor and inverters is labeled”MOTOR & INVERTER COOLANT”. Thereservoir for the vehicle heating system islabeled “CABIN HEATING COOLANT”.
2.19.16.1.Inspection & Pressure Test
DO NOT attempt to open the pressurecap on the coolant reservoir until thesystem has cooled down and the pres-sure relief valve has been operated.Opening the pressure cap with pressur-ized hot coolant can result in scaldinginjury and loss of coolant.
1. If the system is cold, observe the coolantlevel through the sight tube. The coolantshould be visible within the clear plastictube.
2. Operate the vehicle until the coolant is hotand then observe the coolant level throughthe sight tube. The coolant should be levelwith the FULL line marked on the reservoir.See “Fig. PM-45: Coolant ReservoirInspection” on page 89.
3. Allow the system to cool and then top offcoolant to the correct level as requiredusing premix antifreeze. Refer to 2.31.“Fluid & Lubrication Guide” on page 126 inthis section for antifreeze specification.
4. Check hose connections for leaks andtighten clamps as necessary. Cracked,swollen or deteriorated hoses must bereplaced.
5. Check coolant sensor connector and elec-trical wiring.
DO NOT exceed 20 psi while pressuretesting, otherwise damage to the cool-ing system may result.
6. Pressure test the cooling system at 15 to20 psi (103 to 138 kPA) using special pres-sure regulated testing equipment. Refer to“Cooling System Pressure Test” and “Cool-ing System Special Tools” in Section 6 ofthis manual for pressure test procedureand special tooling. Maintain pressure forone minute while observing gauge read-ing. If pressure reading drops check forsource of leak and repair as necessary.
7. Pressure test reservoir cap at 12 to 15 psi(83 to 103 kPa) and ensure that it main-tains pressure. Increase pressure until thepressure relief actuates. Pressure reliefshould occur at approximately 16 psi. Alsoinspect the vacuum relief valve on theunderside of the cap to ensure that it func-tions.
2.19.16.2.Antifreeze Inspection
DO NOT use antifreeze concentrationsin excess of 60% or less than 40%.
Use only fully formulated coolants meetingASTM D6210 specification. Refer to 2.31.“Fluid & Lubrication Guide” on page 126 inthis section for coolant specification.
Antifreeze broadens the operating temper-ature range by lowering the coolant freez-ing point and raising the boiling point. Thecorrosion inhibitors protect cooling systemcomponents from corrosion and prolongcomponent life.
Use a Refractometer to provide a reliableand accurate measurement of freeze pointprotection and glycol (antifreeze) concen-tration. Use pre-mixed anti-freeze of 50%distilled water and 50% ethylene glycol toprovide year-round protection of -26°F(-32°F).

Six Month Preventive Maintenance
PM - 90 Rev. A - Feb 26 2019The New Flyer vehicles described in this manual may be protected by one or more patents and design applications or registrations in the United States and Canada,
and in other countries. Refer to “Vehicle Patent Information” in this manual.Copyright © 2018 New Flyer Industries Canada ULC
2.19.17.ESS HVAC Cooling & Heating System Inspection
Pressure test and check anti-freeze pro-tection for the ESS HVAC system every sixmonths.
☞NOTE:The ESS HVAC (Battery Thermal Manage-ment) system is a separate system, inde-pendent of other heating/cooling systemson the vehicle. The reservoir for the ESSHVAC system is labeled ”BATTERYCOOLANT”.
2.19.17.1.Inspection & Pressure Test
Use work platforms or scaffoldingwhenever working on roof-mountedcomponents. Ensure maintenance per-sonnel use an approved safety harness.
DO NOT attempt to open the pressurecap on the coolant reservoir until thesystem has cooled down and the pres-sure relief valve has been operated.Opening the pressure cap with pressur-ized hot coolant can result in scaldinginjury and loss of coolant.
1. Locate the “BATTERY COOLANT” reser-voir on the rear curbside of the vehicle.See “Fig. PM-46: ESS HVAC ReservoirInspection” on page 91.
1. If the system is cold, observe the coolantlevel through the sight tube. The coolantshould be visible within the clear plastictube. If the coolant is hot, it should be levelwith the FULL line marked on the reservoir.
2. Allow the system to cool and then top offcoolant to the correct level as requiredusing premix antifreeze. Refer to 2.31.“Fluid & Lubrication Guide” on page 126 inthis section for antifreeze specification.
3. Check hose connections for leaks andtighten clamps as necessary. Cracked,swollen or deteriorated hoses must bereplaced.
4. Check coolant sensor connector and elec-trical wiring.
DO NOT exceed 20 psi while pressuretesting, otherwise damage to the cool-ing system may result.
5. Pressure test the cooling system at 15 to20 psi (103 to 138 kPA) using special pres-sure regulated testing equipment. Refer to“Cooling System Pressure Test” and “Cool-ing System Special Tools” in Section 6 ofthis manual for pressure test procedureand special tooling. Maintain pressure forone minute while observing gauge read-ing. If pressure reading drops check forsource of leak and repair as necessary.
6. Pressure test reservoir cap at 12 to 15 psi(83 to 103 kPa) and ensure that it main-tains pressure. Increase pressure until thepressure relief actuates. Pressure reliefshould occur at approximately 16 psi. Alsoinspect the vacuum relief valve on theunderside of the cap to ensure that it func-tions.
2.19.17.2.Antifreeze Inspection
DO NOT use antifreeze concentrationsin excess of 60% or less than 40%.
Use only fully formulated coolants meetingASTM D6210 specification. Refer to 2.31.“Fluid & Lubrication Guide” on page 126 inthis section for coolant specification.
Antifreeze broadens the operating temper-ature range by lowering the coolant freez-ing point and raising the boiling point. Thecorrosion inhibitors protect cooling systemcomponents from corrosion and prolongcomponent life.
Use a Refractometer to provide a reliableand accurate measurement of freeze pointprotection and glycol (antifreeze) concen-tration. Use pre-mixed anti-freeze of 50%distilled water and 50% ethylene glycol toprovide year-round protection of -26°F(-32°F).

Six Month Preventive Maintenance
PM - 92 Rev. A - Feb 26 2019The New Flyer vehicles described in this manual may be protected by one or more patents and design applications or registrations in the United States and Canada,
and in other countries. Refer to “Vehicle Patent Information” in this manual.Copyright © 2018 New Flyer Industries Canada ULC
2.19.18.HVAC System Test & Lubrication
Perform the following maintenance tasksevery six months. Refer to your ThermoKing Maintenance Manual for procedures.
❒ Check evaporator blower motors speed,voltage, and amperes (all motors).
❒ Check condenser blower motors speed,voltage, and amperes (all motors).
❒ Lubricate fan shaft bearings with ShellAlvania EP grease.
2.19.19.Battery Rack Inspection
Maintenance of high voltage equipmentmust be performed by qualified person-nel only. Refer to 1.1. “High VoltageSafety” on page 1 at the beginning ofthis section for safety requirements.Ensure that the High Voltage Interlockand Battery Disconnect switches areset to the OFF position.
Inspect the rear compartment and rooftopbattery racks every six months.
2.19.19.1.Rear Battery Compartment
1. Set the Battery Disconnect switch to theOFF position.
2. Set the High Voltage Interlock switch to theOFF position.
3. Open the rear battery compartmentaccess door.
4. Inspect the battery enclosure covers toensure they are properly fastened and notcracked or otherwise damaged. See “Fig.PM-47: Rear Battery Compartment” onpage 93.
5. Inspect the high voltage power cables thatare external to the battery enclosure. Referto 2.9.1. “High Voltage Power CableInspection” on page 26 for inspection pro-cedure.
6. Ensure all ground connections are clean,properly tightened, and torque marked.
7. Locate the four duck-bill drains at the bot-tom of the battery enclosure and inspect toensure they are functional and not dam-aged. Refer to Fig. PM-48: “Rear BatteryCompartment Drains” on page 93
8. Close the battery compartment accessdoor and ensure the latches secure thedoor and are properly adjusted.
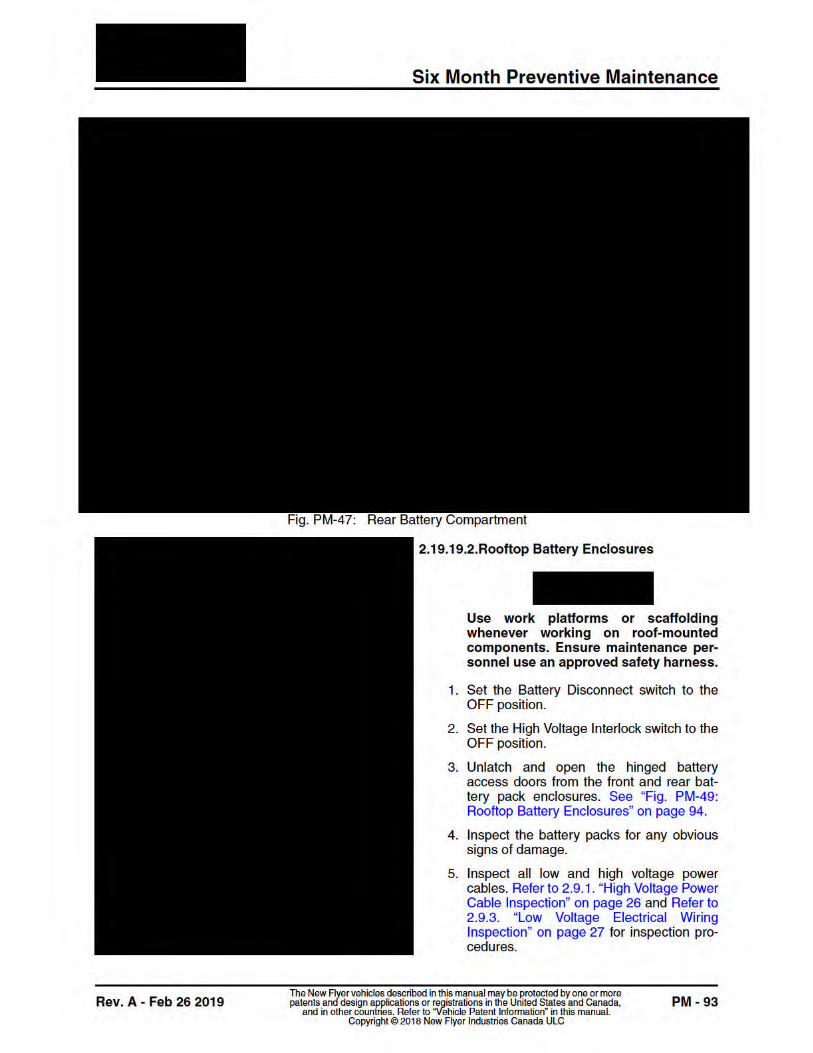
Yearly Preventive Maintenance
Rev. A - Feb 26 2019 PM - 95The New Flyer vehicles described in this manual may be protected by one or more patents and design applications or registrations in the United States and Canada,
and in other countries. Refer to “Vehicle Patent Information” in this manual.Copyright © 2018 New Flyer Industries Canada ULC
2.20. Yearly Preventive Maintenance
2.20.1. Door Sensitive Edge Inspection & Test
Inspect and test the door sensitive edgefunction every year or 100,000 door oper-ating cycles, whichever occurs first.
❒ Visually inspect door sensitive edge forcuts, tears, or other damage. Replace sen-sitive edge if damaged.
❒ Inspect for properly connect tubing fromsensitive edge to pressure wave switch.
❒ Inspect electrical connections on pressurewave switch.
❒ Perform a functional test on the sensitiveedge system. Refer to Section 16 of thismanual for test procedure.
2.20.2. Wheelchair Ramp Pump
2.20.2.1. Hydraulic Fluid
☞NOTE:The yearly fluid change interval is basedon typical transit operating conditions butmay need to be adjusted to suit actualoperating frequency. Periodic oil samplingsmay also be taken to determine fluid clean-liness.
Change fluid as follows:
1. Set Battery Disconnect switch to OFF posi-tion.
2. Suction fluid from reservoir and dispose offluid in accordance with local regulations.
3. Disconnect hydraulic lines from ports “1”and “2” on manifold.
4. Manually operate ramp through severaloperating cycles to expel as much fluid aspossible from the actuating cylinder andlines.
5. Inspect filters and screens. Refer to2.20.2.2. “Screen & Filter Inspection” onpage 96 in this section for replacementprocedure. See “Fig. PM-50: HydraulicPower Pack Assembly” on page 96.
6. Connect and tighten hydraulic lines toports “1” and “2” on the manifold.
7. Fill the reservoir. Refer to 2.31. “Fluid &Lubrication Guide” on page 126 in thissection for fluid specifications.
8. Manually place the ramp in the stowedposition.
9. Crack open or remove the STOW line atthe aft end of the cylinder.
10.Set the Battery Disconnect switch to theON position.
DO NOT allow the reservoir to run drywhile priming the pump
11.Use the ramp DEPLOY switch to “jog” theunit through short deploy strokes, Gradu-ally increase the length of the deploystrokes until a steady stream of fluid flowsfrom the line without air bubbles.
12.Tighten the STOW pressure line at the aftend of the cylinder and crack open orremove the DEPLOY line at the forwardend of the cylinder.
13.Use the ramp STOW switch to “jog” theunit through short stow strokes, Graduallyincrease the length of the stow strokesuntil a steady stream of fluid flows from theline without air bubbles.
14.Tighten the DEPLOY line at the forwardend of the cylinder.
15.Operate the ramp through several deploy/stow cycles.
16.Top up reservoir to within 1” of filler cap.
Yearly Preventive Maintenance
Rev. A - Feb 26 2019 PM - 97The New Flyer vehicles described in this manual may be protected by one or more patents and design applications or registrations in the United States and Canada,
and in other countries. Refer to “Vehicle Patent Information” in this manual.Copyright © 2018 New Flyer Industries Canada ULC
2.20.4. Fire Extinguisher
Examine every 12 months to ensure extin-guisher is operable. Recharge if below thespecified weight or pressure is below oper-able range. Replace any damaged parts.Check hose for obstructions.
Record maintenance use and rechargedates on the fire extinguisher maintenancetag.
2.20.5. QR-1 Quick Release Valve
Perform the following operation and leak-age test at every year or 1,500 hours,whichever occurs first:
1. Block the vehicle's wheels and fully chargethe air system.
2. Apply the parking brake.
3. Locate the QR-1 Quick Release Valve onthe front axle.
4. Apply and release the service brakes sev-eral times and observe that the brakespromptly respond at both wheels.
5. Make and hold a full brake application andapply a soap solution to the exhaust port.Leakage of a 1" bubble in 3 seconds is per-missible.
6. Maintain full brake application and apply asoap solution to the body and cover. Noleakage is permitted between the bodyand cover.
7. Repair or replace valves that do not func-tion properly or have excessive leakage.
2.20.6. Air Strainer
Replace the air strainer every year or36,000 miles, whichever occurs first.
1. Park the vehicle on level ground and chockthe wheels.
2. Drain the air tanks.
3. Locate the air strainer on the front brake &kneeling valve panel.
4. Disconnect air line from air strainer.
5. Unthread air strainer assembly from nippleconnector.
6. Remove fittings from air strainer and installin same position on new air strainer. UseLoctite 567 thread sealant on pipe threads.
7. Install new air strainer assembly on nippleconnector, using Loctite 567 thread seal-ant on pipe threads.
8. Connect and tighten air line.
9. Charge the air system to operating pres-sure and check for leaks at the air strainerconnections.
2.20.7. Headlight Aim
Check headlight aim on a yearly basis.Refer to Section 9 of this manual for head-light aiming procedures.
2.20.8. Front & Rear Wheel Bearing Inspection
Inspect the wheel bearing end play everyyear or 36,000 miles (58,000 km), which-ever occurs first. Refer to Sections 1 & 2 ofthis manual for inspection procedure.
Yearly Preventive Maintenance
Rev. A - Feb 26 2019 PM - 99The New Flyer vehicles described in this manual may be protected by one or more patents and design applications or registrations in the United States and Canada,
and in other countries. Refer to “Vehicle Patent Information” in this manual.Copyright © 2018 New Flyer Industries Canada ULC
2.20.12.Electric Coolant Heater
Maintenance of high voltage equipmentmust be performed by qualified person-nel only. Refer to 1.1. “High VoltageSafety” on page 1 at the beginning ofthis section for safety requirements.Ensure that the High Voltage Interlockand Battery Disconnect switches areset to the OFF position.
☞NOTE:Refer to your Valeo/Spheros WorkshopManual for specific requirements.
Perform the following inspections and testson a yearly basis:
❒ Inspect electrical connections.
❒ Inspect temperature sensors.
❒ Inspect burner head.
❒ Perform a functional check.
2.20.13.Power Steering Pump
Inspect and lubricate the power steeringpump every year or 10,000 operatinghours, whichever occurs first.
1. Remove the power steering pump from thevehicle. Refer to Section 3 of this manualfor procedure.
2. Clean splines on the power steering pumpand drive motor using solvent. Wipe dry.
3. Inspect splines for damage or excessivewear. Replace pump and/or drive motor ifsplines are damaged or excessively worn.
4. Lubricate the splines with fresh grease.Use Shell Gadus S3 V460D.
5. Install the power steering pump on theelectric drive motor. Refer to Section 3 ofthis manual for procedure.
2.20.14.Low Voltage Junction Box (DICO)
Locate the low voltage junction box on therooftop inverter rack and perform the fol-lowing inspections on a yearly basis:
❒ Check for internal and external damage.
❒ Check for ingress of excessive water ordirt. Check and repair cable gland sealsand/or cover seal.
❒ Check for signs of corrosion. Clean asrequired.
❒ Check for signs of heat damage. Investi-gate cause and make repairs as neces-sary.
❒ Check for any other abnormal conditions.
Yearly Preventive Maintenance
PM - 100 Rev. A - Feb 26 2019The New Flyer vehicles described in this manual may be protected by one or more patents and design applications or registrations in the United States and Canada,
and in other countries. Refer to “Vehicle Patent Information” in this manual.Copyright © 2018 New Flyer Industries Canada ULC
2.20.15.Auxiliary Power Distribution Box
Maintenance of high voltage equipmentmust be performed by qualified person-nel only. Refer to 1.1. “High VoltageSafety” on page 1 at the beginning ofthis section for safety requirements.Ensure that the High Voltage Interlockand Battery Disconnect switches areset to the OFF position.
Locate the auxiliary power distribution boxon the rooftop inverter rack and performthe following inspections on a yearly basis:
❒ Check for internal and external damage.
❒ Check for ingress of excessive water ordirt. Check and repair cable gland sealsand/or cover seal.
❒ Check for signs of corrosion. Clean asrequired.
❒ Check for signs of heat damage. Investi-gate cause and make repairs as neces-sary.
❒ Check for any other abnormal conditions.
2.20.16.High Voltage Distribution & Fuse Box
Maintenance of high voltage equipmentmust be performed by qualified person-nel only. Refer to 1.1. “High VoltageSafety” on page 1 at the beginning ofthis section for safety requirements.Ensure that the High Voltage Interlockand Battery Disconnect switches areset to the OFF position.
Locate the high voltage distribution andfuse box on the rooftop inverter rack andperform the following inspections on ayearly basis:
❒ Check for internal and external damage.
❒ Check for ingress of excessive water ordirt. Check and repair cable gland sealsand/or cover seal.
❒ Check for signs of corrosion. Clean asrequired.
❒ Check for signs of heat damage. Investi-gate cause and make repairs as neces-sary.
❒ Check for any other abnormal conditions.
2.20.17.Insulation Monitoring Device (IMD) Box
Maintenance of high voltage equipmentmust be performed by qualified person-nel only. Refer to 1.1. “High VoltageSafety” on page 1 at the beginning ofthis section for safety requirements.Ensure that the High Voltage Interlockand Battery Disconnect switches areset to the OFF position.
Locate the IMD box on the rooftop inverterrack and perform the following inspectionson a yearly basis:
❒ Check for internal and external damage.
❒ Check for ingress of excessive water ordirt. Check and repair cable gland sealsand/or cover seal.
❒ Check for signs of corrosion. Clean asrequired.
❒ Check for signs of heat damage. Investi-gate cause and make repairs as neces-sary.
❒ Check for any other abnormal conditions.
Yearly Preventive Maintenance
PM - 102 Rev. A - Feb 26 2019The New Flyer vehicles described in this manual may be protected by one or more patents and design applications or registrations in the United States and Canada,
and in other countries. Refer to “Vehicle Patent Information” in this manual.Copyright © 2018 New Flyer Industries Canada ULC
2.20.18.2.Rooftop Battery Enclosures
Maintenance of high voltage equipmentmust be performed by qualified person-nel only. Refer to 1.1. “High VoltageSafety” on page 1 at the beginning ofthis section for safety requirements.Ensure that the High Voltage Interlockand Battery Disconnect switches areset to the OFF position.
Use work platforms or scaffoldingwhenever working on roof-mountedcomponents. Ensure maintenance per-sonnel use an approved safety harness.
1. Set the Battery Disconnect switch to theOFF position.
2. Set the High Voltage Interlock switch to theOFF position.
3. Unlatch and remove the hinged batteryaccess doors.
4. Remove the fasteners and remove theremaining access panels from the batteryenclosures.
5. Visually inspect the battery packs for anyevidence of cracks, deformation, or otherdamage that could impair the sealingintegrity of the battery pack. See “Fig. PM-53: Rooftop Battery Pack Inspection” onpage 103.
6. Inspect all low and high voltage powercables. Refer to 2.9.1. “High Voltage PowerCable Inspection” on page 26 and Refer to2.9.3. “Low Voltage Electrical WiringInspection” on page 27 for inspection pro-cedures.
7. Visually inspect battery pack mounting fas-teners and confirm that torque witnessmarks are aligned.
8. Inspect coolant lines for any evidence ofleakage. Tighten connections as required.
9. Visually inspect the Battery DisconnectUnit (BDU) to ensure there is no obviousdamage and that the component issecurely mounted to the rack structure.
10.Check the battery pack power cable con-nections as follows:
a. Remove the side screen fairings andside covers to gain access to the powercable locations.
b. Visually check for any signs of corro-sion or evidence of arcing.
11.Reinstall fairings and side covers.
2.20.19.Depot Charging Station Inspection
Inspect the depot charge station on ayearly basis as follows:
❒ Check signs for marking or fading andreplace as necessary.
DO NOT pressure wash the chargingstation. Pressurized water could dam-age the system.
❒ Use a damp, lint-free cloth to wipe downthe outside surfaces of the staion, includ-ing the cables, outer surfaces of the con-nector, and touchscreen.
❒ Perform a test charge and check for properoperation.
❒ Check coolant level and top up if necess-sary.
❒ Check the body of the charging station forany signs of rust or damage. ContactChargePoint if any damage is found.
❒ Check the cables and connectors of thecharging station for any signs of damage.Do not use the station is damage is found.Contact Chargepoint.
❒ Check the area light board and LED dis-play for burned-out bulbs. Repalce lightsas required.
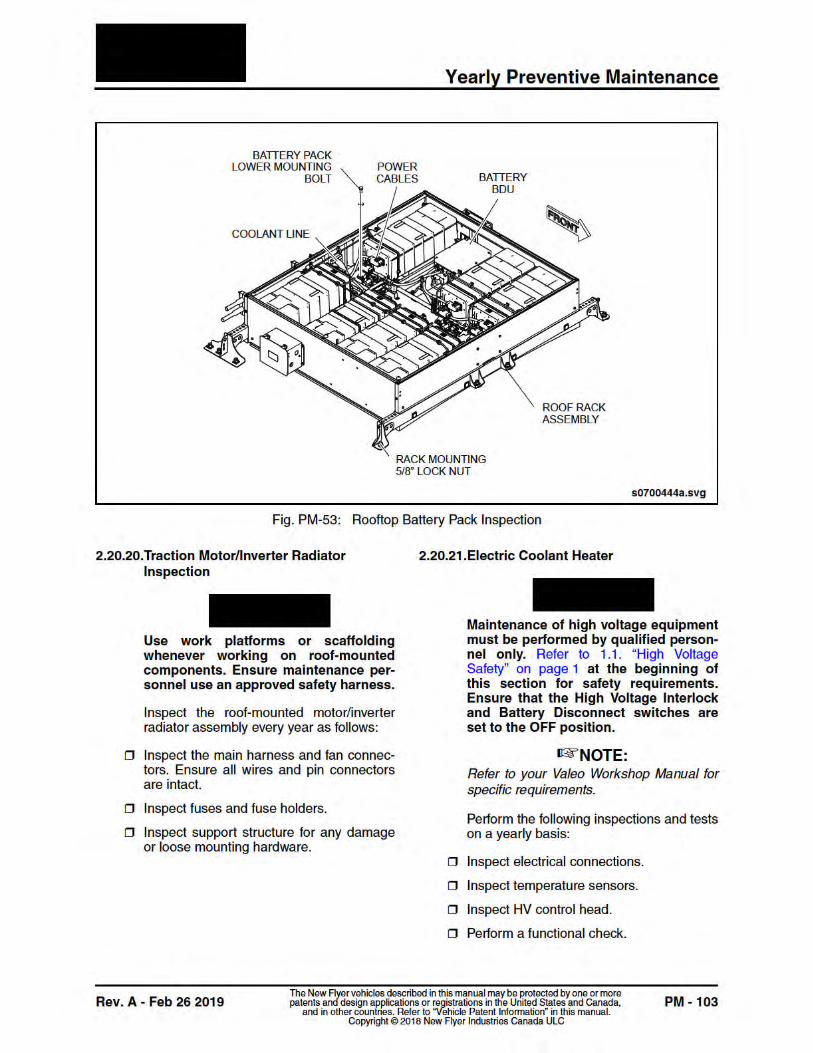
Two Year Preventive Maintenance
PM - 104 Rev. A - Feb 26 2019The New Flyer vehicles described in this manual may be protected by one or more patents and design applications or registrations in the United States and Canada,
and in other countries. Refer to “Vehicle Patent Information” in this manual.Copyright © 2018 New Flyer Industries Canada ULC
2.21. Two Year Preventive Maintenance
2.21.1. Fire Suppression System
The internal Nickel Metal Hydride (NiMH)backup battery, installed in the ControlPanel, will require periodic replacement.Refer to your Amerex Installation, Opera-tion, and Instruction Manual 19680 forreplacement instructions.
2.21.2. Door System Inspection
Perform the following inspection/mainte-nance on the major door system compo-nents every two years or 250,000 dooroperating cycles, whichever occurs first:
2.21.2.1.Connecting Rods & Rod End Bearings
❒ Visually inspect the fore and aft connectingrods on the baseplate for evidence ofbending or distortion. Replace damagedconnecting rods.
❒ Check jam nuts on the rod ends for tight-ness.
❒ Check for excessive play in the rod ends.Replace worn rod ends.
❒ Lubricate rod ends with a few drops ofSAE #20 oil. See “Fig. PM-54: EntranceDoor Baseplate Lubrication” on page 104.See “Fig. PM-55: Exit Door BaseplateLubrication” on page 105.
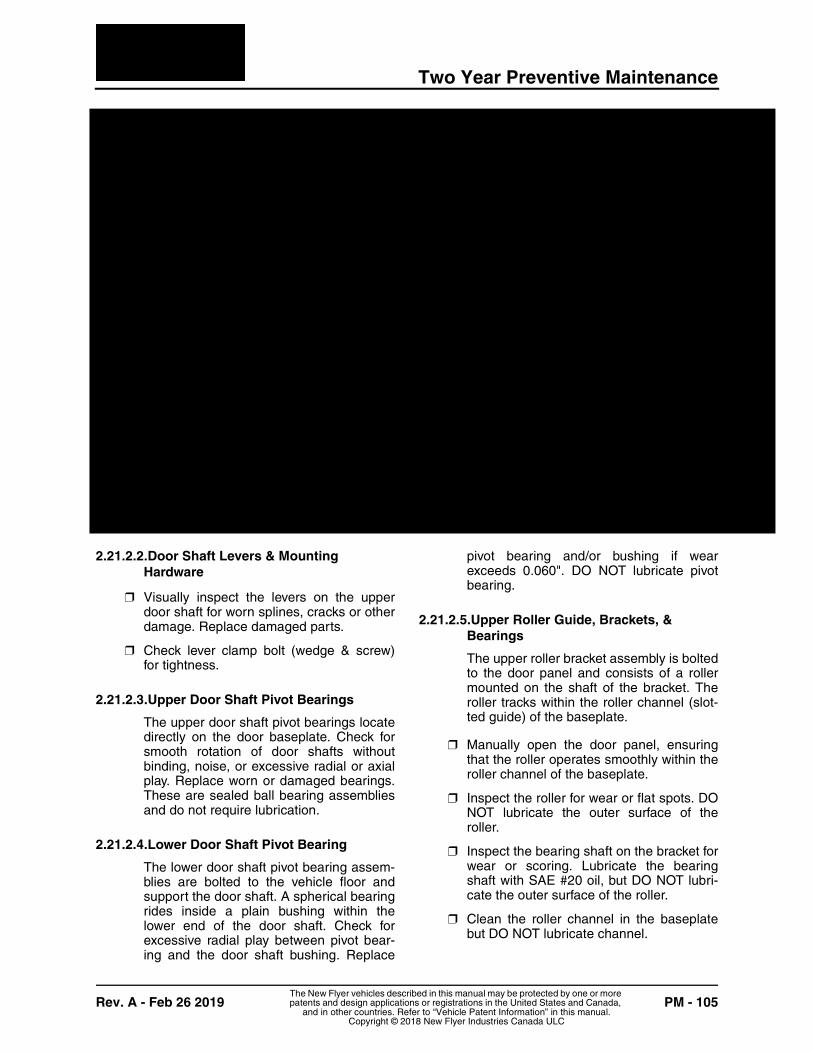
Two Year Preventive Maintenance
Rev. A - Feb 26 2019 PM - 105The New Flyer vehicles described in this manual may be protected by one or more patents and design applications or registrations in the United States and Canada,
and in other countries. Refer to “Vehicle Patent Information” in this manual.Copyright © 2018 New Flyer Industries Canada ULC
2.21.2.2.Door Shaft Levers & Mounting Hardware
❒ Visually inspect the levers on the upperdoor shaft for worn splines, cracks or otherdamage. Replace damaged parts.
❒ Check lever clamp bolt (wedge & screw)for tightness.
2.21.2.3.Upper Door Shaft Pivot Bearings
The upper door shaft pivot bearings locatedirectly on the door baseplate. Check forsmooth rotation of door shafts withoutbinding, noise, or excessive radial or axialplay. Replace worn or damaged bearings.These are sealed ball bearing assembliesand do not require lubrication.
2.21.2.4.Lower Door Shaft Pivot Bearing
The lower door shaft pivot bearing assem-blies are bolted to the vehicle floor andsupport the door shaft. A spherical bearingrides inside a plain bushing within thelower end of the door shaft. Check forexcessive radial play between pivot bear-ing and the door shaft bushing. Replace
pivot bearing and/or bushing if wearexceeds 0.060". DO NOT lubricate pivotbearing.
2.21.2.5.Upper Roller Guide, Brackets, & Bearings
The upper roller bracket assembly is boltedto the door panel and consists of a rollermounted on the shaft of the bracket. Theroller tracks within the roller channel (slot-ted guide) of the baseplate.
❒ Manually open the door panel, ensuringthat the roller operates smoothly within theroller channel of the baseplate.
❒ Inspect the roller for wear or flat spots. DONOT lubricate the outer surface of theroller.
❒ Inspect the bearing shaft on the bracket forwear or scoring. Lubricate the bearingshaft with SAE #20 oil, but DO NOT lubri-cate the outer surface of the roller.
❒ Clean the roller channel in the baseplatebut DO NOT lubricate channel.
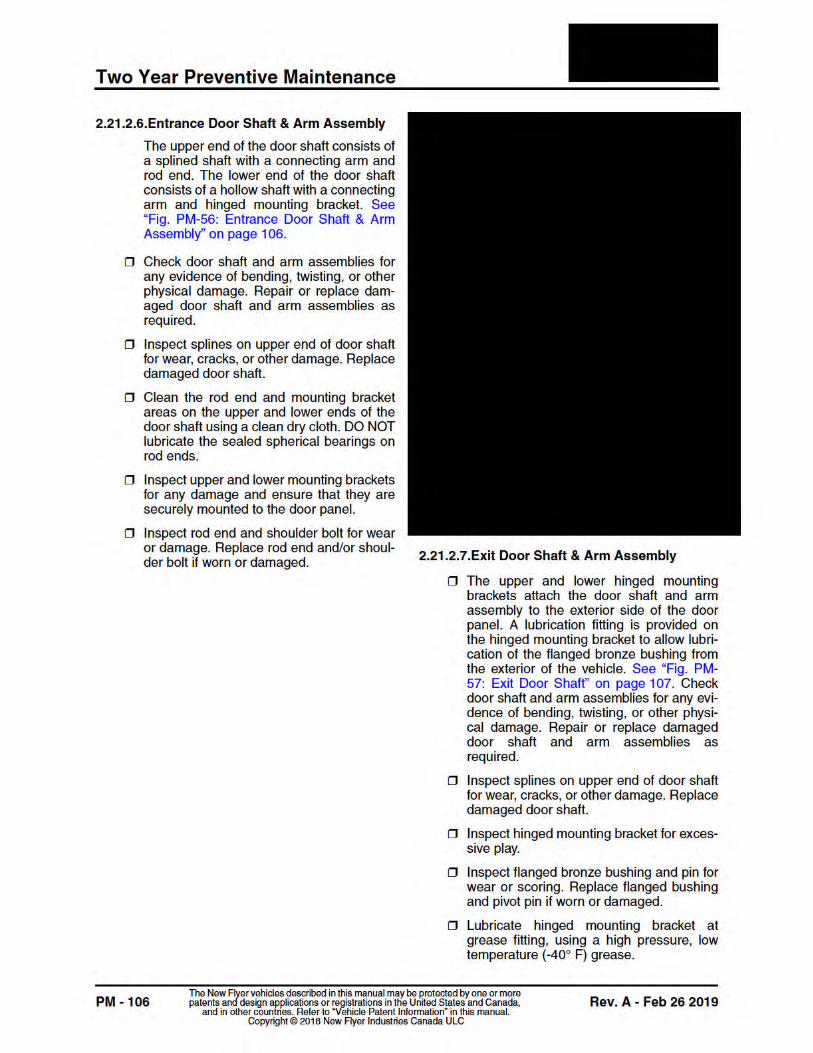

Two Year Preventive Maintenance
Rev. A - Feb 26 2019 PM - 107The New Flyer vehicles described in this manual may be protected by one or more patents and design applications or registrations in the United States and Canada,
and in other countries. Refer to “Vehicle Patent Information” in this manual.Copyright © 2018 New Flyer Industries Canada ULC
Two Year Preventive Maintenance
PM - 108 Rev. A - Feb 26 2019The New Flyer vehicles described in this manual may be protected by one or more patents and design applications or registrations in the United States and Canada,
and in other countries. Refer to “Vehicle Patent Information” in this manual.Copyright © 2018 New Flyer Industries Canada ULC
2.21.2.8.Door Panels
❒ Inspect door panels for structural damage.Repair or replace panel if required.
❒ Inspect exterior door panel pocket seals forcuts, tears, excessive wear, or other dam-age. Replace pocket seals if required.
❒ Inspect leading edge and door jamb sealsfor cuts, tears, excessive wear, or otherdamage. Replace if required.
❒ Apply a light film of silicone lubricant onthe mating surfaces of the leading edgeand door jamb seals and wipe clean with adry cloth.
2.21.2.9.Door Panel Top & Bottom Seal Assemblies
❒ Inspect for damage to brush bristles orrubber seal strip. Replace brush if bristlesare damaged.
❒ Adjust height of top brush to provide lightcontact only with the top edge of door pan-els so as to prevent binding.
❒ Adjust height of bottom brush to providelight contact only with the top surface ofthe flooring so as to prevent binding.
2.21.2.10.Door Operator Proximity Switches
❒ Check that the proximity switches functionproperly.
❒ Inspect electrical connections. Repairloose connections.
❒ Adjust proximity switch air gap if neces-sary. Refer to Section 16 of this manual foradjustment procedures.
2.21.2.11.Entrance Door Solenoid Valves
❒ Check for proper operation of the emer-gency release and dump valve solenoids.
❒ Inspect electrical connections.
❒ Inspect air lines to rotary dump valve andemergency release actuator cylinder.Ensure connections are tight.
❒ Inspect emergency release cable forproper operation.
2.21.2.12.Driver's Door Controller
❒ Operate the door controller through allpositions and check for proper function.
❒ Verify that the door controller moves freelywithout binding. Use a spring scale tomeasure torque required to rotate control-ler. Replace door controller if torqueexceeds 15 in-lbs.
Two Year Preventive Maintenance
Rev. A - Feb 26 2019 PM - 109The New Flyer vehicles described in this manual may be protected by one or more patents and design applications or registrations in the United States and Canada,
and in other countries. Refer to “Vehicle Patent Information” in this manual.Copyright © 2018 New Flyer Industries Canada ULC
2.21.3. Traction Motor Lubrication
Maintenance of high voltage equipmentmust be performed by qualified person-nel only. Refer to 1.1. “High VoltageSafety” on page 1 at the beginning ofthis section for safety requirements.Ensure that the High Voltage Interlockand Battery Disconnect switches areset to the OFF position.
☞NOTE:For initial run-in period, lubricate tractionmotor bearings after first 1,000 miles(1,500 km) of operation. Thereafter, lubri-cate every two years.
Lubricate the traction motor bearings everytwo years or 87,000 miles (140,000 km),whichever occurs first. Refer to SiemensOperating Instructions Manual for lubrica-tion procedure.
2.21.4. Cooling/Heating System Coolant Change
☞NOTE:The following drain and fill procedureapplies to both system reservoirs locatedon the rear streetside of the vehicle. Thereservoir for the traction motor and invert-ers is labeled “MOTOR & INVERTERCOOLANT”. The reservoir for the vehicleheating system is labeled “CABIN HEAT-ING COOLANT”.
Change the coolant in the traction motor/inverter cooling system and the cabin heat-ing system every two years. Refer to Sec-tion 6 in this manual for drain and fillprocedures. Examine the drained coolantfor contamination, particulate matter, ordiscoloration. Flush the system if neces-sary.
DO NOT use antifreeze concentrationsin excess of 60% or less than 40%.
Use only fully formulated coolants meetingASTM D6210 specification. Refer to 2.31.
“Fluid & Lubrication Guide” on page 126 inthis section for coolant specification.
2.21.5. ESS Battery System Coolant Change
☞NOTE:The battery coolant reservoir is located onthe curbside rear corner of the vehicle. Thereservoir is labeled “BATTERY COOL-ANT”.
Change the coolant in the ESS batteryheating/cooling system every two years.Refer to Section 6 in this manual for drainand fill procedures. Examine the drainedcoolant for contamination, particulate mat-ter, or discoloration. Flush the system ifnecessary.
DO NOT use antifreeze concentrationsin excess of 60% or less than 40%.
Use only fully formulated coolants meetingASTM D6210 specification. Refer to 2.31.“Fluid & Lubrication Guide” on page 126 inthis section for coolant specification.
2.21.6. ESS Battery Coolant Filter Replacement
DO NOT attempt to change the coolantfilter until the system has cooled downand the pressure relief valve has beenoperated. Servicing the coolant filterwith pressurized hot coolant can resultin scalding injury.
Replace the ESS battery coolant filterevery two years or whenever the ESS cool-ing system is serviced or flushed. Replacethe coolant filter as follows:
1. Set the Battery Disconnect switch to theOFF position.
2. Open the curbside corner pillar accessdoor and locate the coolant filter. See “Fig.PM-58: ESS Battery Coolant Filter” onpage 110.
3. Use clamps with soft face jaws to pinch theoutlet hose at the filter head.
Three Year Preventive Maintenance
Rev. A - Feb 26 2019 PM - 111The New Flyer vehicles described in this manual may be protected by one or more patents and design applications or registrations in the United States and Canada,
and in other countries. Refer to “Vehicle Patent Information” in this manual.Copyright © 2018 New Flyer Industries Canada ULC
2.22. Three Year Preventive Maintenance
2.22.1. Under Body Inspection
Refer to Section 11 of this manual for pro-cedure.
2.23. Four Year Preventive Maintenance
2.23.1. Air Compressor Cleaning, Lubrication & Parts Replacement
Maintenance of high voltage equipmentmust be performed by qualified person-nel only. Refer to 1.1. “High VoltageSafety” on page 1 at the beginning ofthis section for safety requirements.Ensure that the High Voltage Interlockand Battery Disconnect switches areset to the OFF position and locked-outand tagged-out.
☞NOTE:This interval was converted from compres-sor operating hours to calendar time usingan average vehicle speed of 12.5 mph,compressor duty cycle of 40%, and 30,000miles/year. Adjust the service intervalaccording to actual operating conditions.
2.23.1.1.Compressor Fins, Fan & Duct Cleaning
Clean compressor fins, fan and duct everyfour years, 125,000 miles (200,000 km) or4,000 compressor operating hours, which-ever occurs first. Remove the blower fancover and clean the compressor fins and
fan using compressed air. Wipe the fanduct interior with a clean cloth.
2.23.1.2.Oscillating Scroll Bearing Lubrication
Lubricate the OS bearing every four years,125,000 miles (200,000 km), or 4,000compressor operating hours, whicheveroccurs first.
☞NOTE:A grease gun kit with special adapters andgrease cartridge is available from Powerex,150 Production Drive, Harrison OH 45030YSA. (1-888-769-7979)
1. Remove scroll compressor assembly fromvehicle. Refer to Section 8 of this manualfor removal procedure.
2. Remove plastic dust cap for orbiting scrollbearing grease fitting. See “Fig. PM-59:Oscillating Scroll Bearing Lubrication” onpage 112.
3. Rotate compressor coupling until greasefitting is visible through lubrication port.
☞NOTE:Pump grease gun to eliminate air fromextension adapter before use.
4. Use a grease gun extension adapter toengage the fitting and supply the correctamount of grease to the main bearings.Refer to 2.23.1.3. “Compressor BearingGrease Delivery” on page 112 in this sec-tion for procedure.
5. Remove grease gun and reinstall plasticdust cap
6. Reinstall scroll compressor. Refer to Sec-tion 8 of this manual for installation proce-dure.
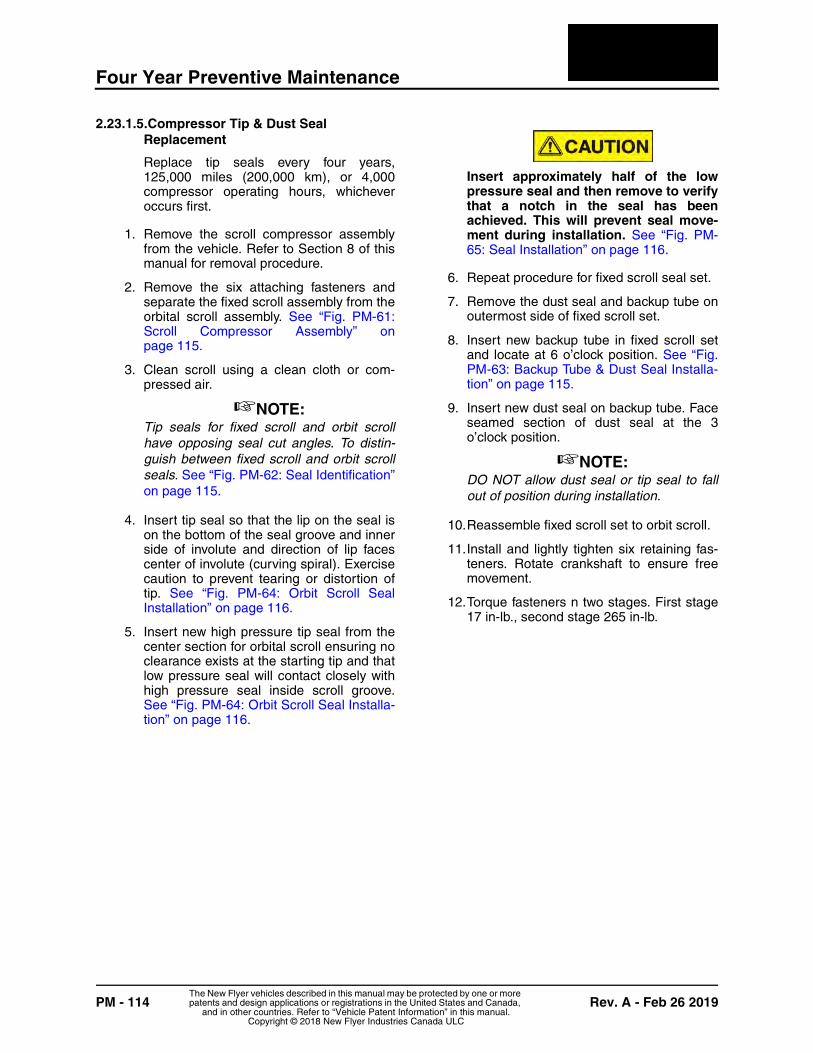
Four Year Preventive Maintenance
PM - 114 Rev. A - Feb 26 2019The New Flyer vehicles described in this manual may be protected by one or more patents and design applications or registrations in the United States and Canada,
and in other countries. Refer to “Vehicle Patent Information” in this manual.Copyright © 2018 New Flyer Industries Canada ULC
2.23.1.5.Compressor Tip & Dust Seal Replacement
Replace tip seals every four years,125,000 miles (200,000 km), or 4,000compressor operating hours, whicheveroccurs first.
1. Remove the scroll compressor assemblyfrom the vehicle. Refer to Section 8 of thismanual for removal procedure.
2. Remove the six attaching fasteners andseparate the fixed scroll assembly from theorbital scroll assembly. See “Fig. PM-61:Scroll Compressor Assembly” onpage 115.
3. Clean scroll using a clean cloth or com-pressed air.
☞NOTE:Tip seals for fixed scroll and orbit scrollhave opposing seal cut angles. To distin-guish between fixed scroll and orbit scrollseals. See “Fig. PM-62: Seal Identification”on page 115.
4. Insert tip seal so that the lip on the seal ison the bottom of the seal groove and innerside of involute and direction of lip facescenter of involute (curving spiral). Exercisecaution to prevent tearing or distortion oftip. See “Fig. PM-64: Orbit Scroll SealInstallation” on page 116.
5. Insert new high pressure tip seal from thecenter section for orbital scroll ensuring noclearance exists at the starting tip and thatlow pressure seal will contact closely withhigh pressure seal inside scroll groove.See “Fig. PM-64: Orbit Scroll Seal Installa-tion” on page 116.
Insert approximately half of the lowpressure seal and then remove to verifythat a notch in the seal has beenachieved. This will prevent seal move-ment during installation. See “Fig. PM-65: Seal Installation” on page 116.
6. Repeat procedure for fixed scroll seal set.
7. Remove the dust seal and backup tube onoutermost side of fixed scroll set.
8. Insert new backup tube in fixed scroll setand locate at 6 o’clock position. See “Fig.PM-63: Backup Tube & Dust Seal Installa-tion” on page 115.
9. Insert new dust seal on backup tube. Faceseamed section of dust seal at the 3o’clock position.
☞NOTE:DO NOT allow dust seal or tip seal to fallout of position during installation.
10.Reassemble fixed scroll set to orbit scroll.
11.Install and lightly tighten six retaining fas-teners. Rotate crankshaft to ensure freemovement.
12.Torque fasteners n two stages. First stage17 in-lb., second stage 265 in-lb.
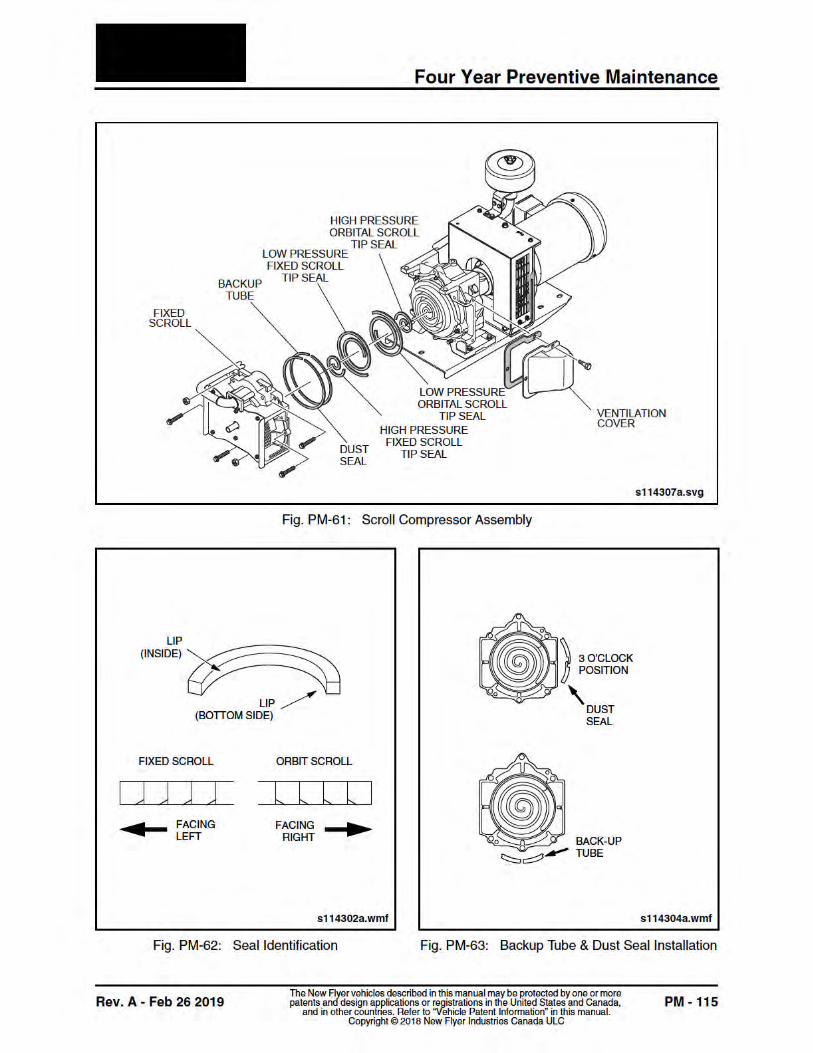
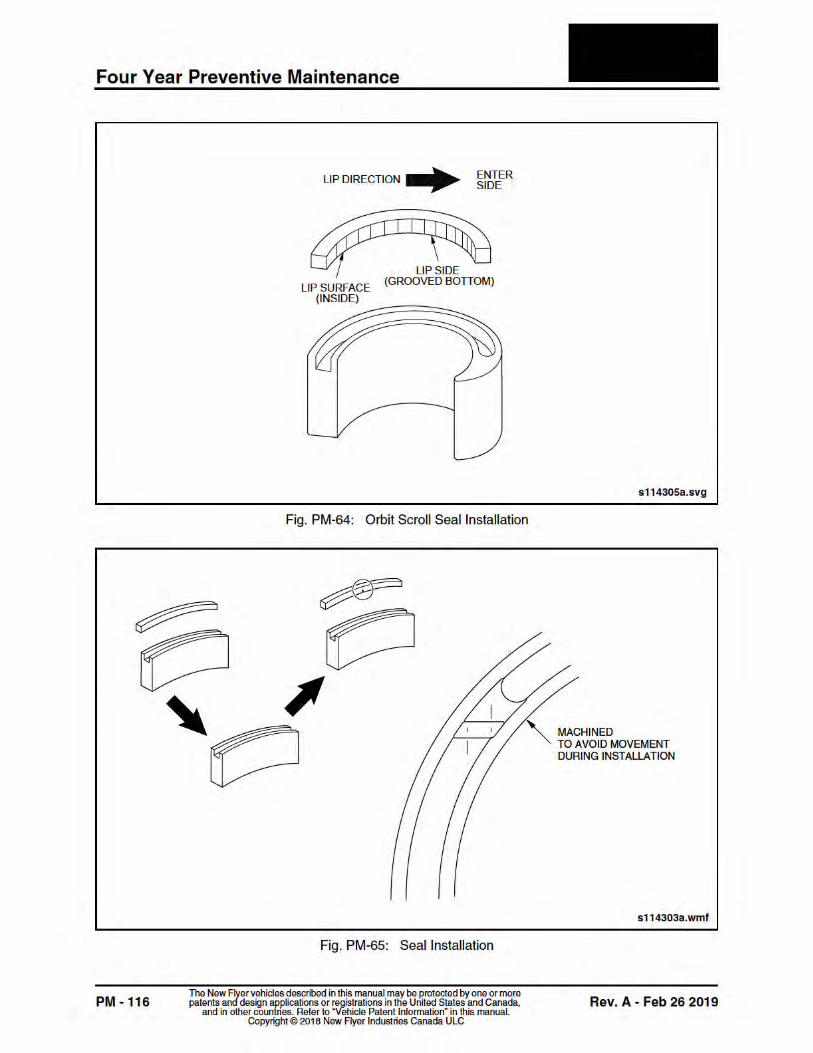
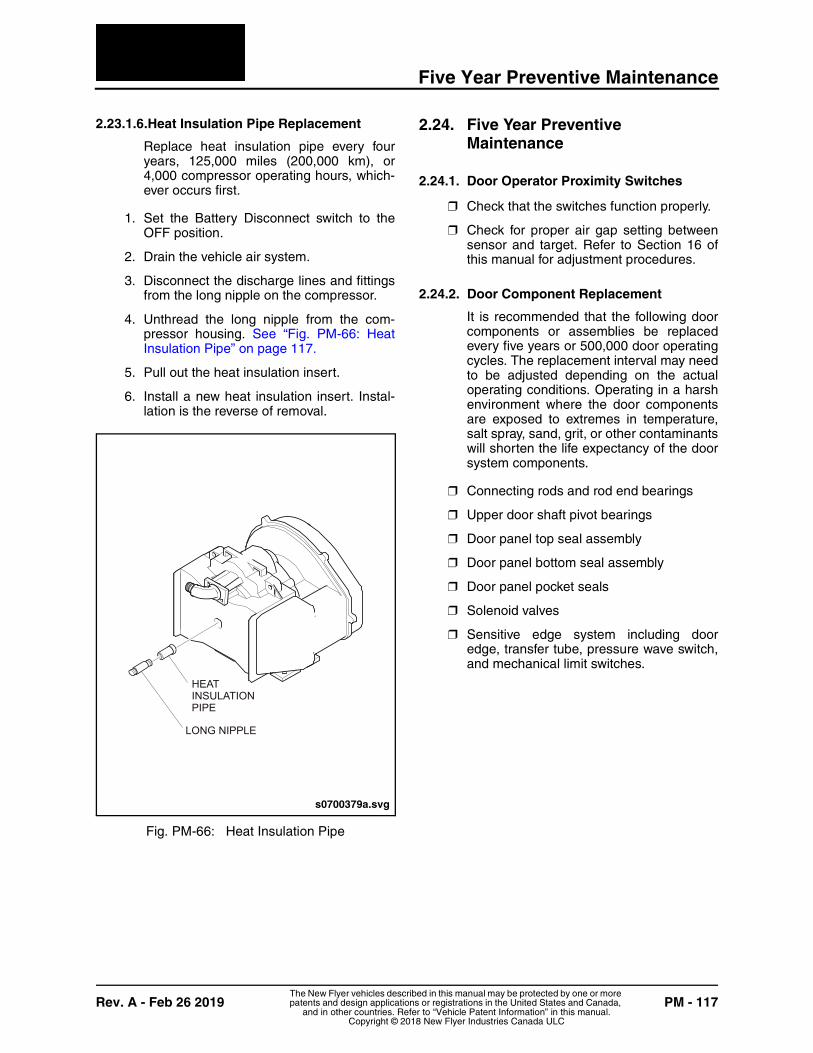
Five Year Preventive Maintenance
Rev. A - Feb 26 2019 PM - 117The New Flyer vehicles described in this manual may be protected by one or more patents and design applications or registrations in the United States and Canada,
and in other countries. Refer to “Vehicle Patent Information” in this manual.Copyright © 2018 New Flyer Industries Canada ULC
2.23.1.6.Heat Insulation Pipe Replacement
Replace heat insulation pipe every fouryears, 125,000 miles (200,000 km), or4,000 compressor operating hours, which-ever occurs first.
1. Set the Battery Disconnect switch to theOFF position.
2. Drain the vehicle air system.
3. Disconnect the discharge lines and fittingsfrom the long nipple on the compressor.
4. Unthread the long nipple from the com-pressor housing. See “Fig. PM-66: HeatInsulation Pipe” on page 117.
5. Pull out the heat insulation insert.
6. Install a new heat insulation insert. Instal-lation is the reverse of removal.
Fig. PM-66: Heat Insulation Pipe
2.24. Five Year Preventive Maintenance
2.24.1. Door Operator Proximity Switches
❒ Check that the switches function properly.
❒ Check for proper air gap setting betweensensor and target. Refer to Section 16 ofthis manual for adjustment procedures.
2.24.2. Door Component Replacement
It is recommended that the following doorcomponents or assemblies be replacedevery five years or 500,000 door operatingcycles. The replacement interval may needto be adjusted depending on the actualoperating conditions. Operating in a harshenvironment where the door componentsare exposed to extremes in temperature,salt spray, sand, grit, or other contaminantswill shorten the life expectancy of the doorsystem components.
❒ Connecting rods and rod end bearings
❒ Upper door shaft pivot bearings
❒ Door panel top seal assembly
❒ Door panel bottom seal assembly
❒ Door panel pocket seals
❒ Solenoid valves
❒ Sensitive edge system including dooredge, transfer tube, pressure wave switch,and mechanical limit switches.
HEAT INSULATIONPIPE
LONG NIPPLE
s0700379a.svg
Six Year Preventive Maintenance
PM - 118 Rev. A - Feb 26 2019The New Flyer vehicles described in this manual may be protected by one or more patents and design applications or registrations in the United States and Canada,
and in other countries. Refer to “Vehicle Patent Information” in this manual.Copyright © 2018 New Flyer Industries Canada ULC
2.24.3. Electric Coolant Heater
Maintenance of high voltage equipmentmust be performed by qualified person-nel only. Refer to 1.1. “High VoltageSafety” on page 1 at the beginning ofthis section for safety requirements.Ensure that the High Voltage Interlockand Battery Disconnect switches areset to the OFF position.
☞NOTE:Refer to your Valeo Workshop Manual forspecific requirements.
Replace the temperature switch every fiveyears.
2.24.4. Depot Charging Station Coolant Change & Inspection
Inspect the depot charging station everyfive years as follows:
❒ Replace the coolant.
❒ Check for correct torque on mountinganchors and cable tabs in the contactorassembly.
2.25. Six Year Preventive Maintenance
2.25.1. Fire Suppression System
Perform the following maintenance everysix years:
❒ As per NFPA 17 guidelines, stored pres-sure dry chemical Agent Cylinders must bedepressurized for inspecting the inside ofthe agent cylinder and the agent. Refer tolatest version of Amerex Installation, Oper-ation, and Maintenance Manual No. 13980for additional information.
❒ Replace the electric linear actuator,located on the discharge valve, if it hasbeen in service for six years.
2.25.2. Fire Extinguisher
Inspect the fire extinguisher every sixyears. Clean all parts to ensure they areoperable and refill with new powder andrepressurize. Refer to National Fire Protec-tion Association (NFPA) Standard No.10for additional information.
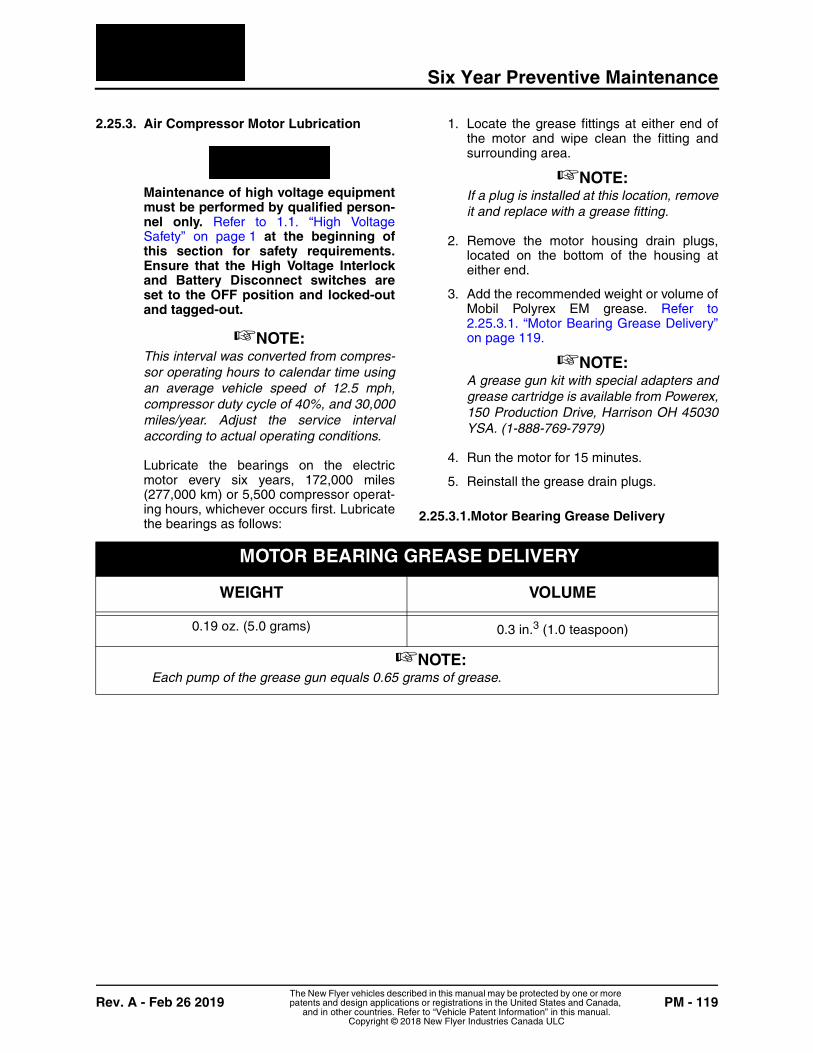
Six Year Preventive Maintenance
Rev. A - Feb 26 2019 PM - 119The New Flyer vehicles described in this manual may be protected by one or more patents and design applications or registrations in the United States and Canada,
and in other countries. Refer to “Vehicle Patent Information” in this manual.Copyright © 2018 New Flyer Industries Canada ULC
2.25.3. Air Compressor Motor Lubrication
Maintenance of high voltage equipmentmust be performed by qualified person-nel only. Refer to 1.1. “High VoltageSafety” on page 1 at the beginning ofthis section for safety requirements.Ensure that the High Voltage Interlockand Battery Disconnect switches areset to the OFF position and locked-outand tagged-out.
☞NOTE:This interval was converted from compres-sor operating hours to calendar time usingan average vehicle speed of 12.5 mph,compressor duty cycle of 40%, and 30,000miles/year. Adjust the service intervalaccording to actual operating conditions.
Lubricate the bearings on the electricmotor every six years, 172,000 miles(277,000 km) or 5,500 compressor operat-ing hours, whichever occurs first. Lubricatethe bearings as follows:
1. Locate the grease fittings at either end ofthe motor and wipe clean the fitting andsurrounding area.
☞NOTE:If a plug is installed at this location, removeit and replace with a grease fitting.
2. Remove the motor housing drain plugs,located on the bottom of the housing ateither end.
3. Add the recommended weight or volume ofMobil Polyrex EM grease. Refer to2.25.3.1. “Motor Bearing Grease Delivery”on page 119.
☞NOTE:A grease gun kit with special adapters andgrease cartridge is available from Powerex,150 Production Drive, Harrison OH 45030YSA. (1-888-769-7979)
4. Run the motor for 15 minutes.
5. Reinstall the grease drain plugs.
2.25.3.1.Motor Bearing Grease Delivery
MOTOR BEARING GREASE DELIVERY
WEIGHT VOLUME
0.19 oz. (5.0 grams) 0.3 in.3 (1.0 teaspoon)
☞NOTE:Each pump of the grease gun equals 0.65 grams of grease.
Ten Year Preventive Maintenance
Rev. A - Feb 26 2019 PM - 121The New Flyer vehicles described in this manual may be protected by one or more patents and design applications or registrations in the United States and Canada,
and in other countries. Refer to “Vehicle Patent Information” in this manual.Copyright © 2018 New Flyer Industries Canada ULC
2.26. Ten Year Preventive Maintenance
2.26.1. Door Component Replacement
It is recommended that the following doorcomponents or assemblies be replacedevery ten years or 1,000,000 door operat-ing cycles. The replacement interval mayneed to be adjusted depending on theactual operating conditions. Operating in aharsh environment where the door compo-nents are exposed to extremes in tempera-ture, salt spray, sand, grit, or othercontaminants will shorten the life expect-ancy of the door system components.
❒ Electric door operator
❒ Door shaft levers and mounting hardware
❒ Lower door shaft pivot bearings
❒ Upper roller guides, brackets, & bearings
❒ Door panel leading edge seals
❒ Door panel jamb seals
❒ Driver’s door controller
❒ Door panels
❒ Shaft and arm assemblies
❒ Shaft and arm assembly hinged mountingbrackets.
2.26.2. Depot Charging Station Inspection
Inspect the charging cables for any degra-dation every ten years. Replace cables ifnecessary.
2.27. Twelve Year Preventive Maintenance
2.27.1. Fire Extinguisher
Hydrostatically test the fire extinguisherevery twelve years. Refer to label on fireextinguisher for test pressure. Clean all
parts to ensure they are operable and refillwith new powder and repressurize. Recordmaintenance and recharge date on fireextinguisher inspection tag. Refer toNational Fire Protection Association(NFPA) Standard No.10 for additional infor-mation.
2.27.2. Fire Suppression System
Hydrostatic testing may only be doneby individuals certified to performhydrostatic testing by those havingjurisdiction in the particular area.
Perform a hydrostatic pressure test on theagent cylinder and all hose assembliesevery twelve years. Perform test in accor-dance with CGA Pamphlet C-6, NFPA 17,and DOT requirements. Refer to latest ver-sion of Amerex Installation, Operation, andMaintenance Manual No. 13980 for testpressure and test adapters.
2.27.3. Electric Coolant Heater
Maintenance of high voltage equipmentmust be performed by qualified person-nel only. Refer to 1.1. “High VoltageSafety” on page 1 at the beginning ofthis section for safety requirements.Ensure that the High Voltage Interlockand Battery Disconnect switches areset to the OFF position.
☞NOTE:Refer to your Valeo Workshop Manual forspecific requirements.
Replace the high voltage contactor everytwelve years.
Fifteen Year Preventive Maintenance
PM - 122 Rev. A - Feb 26 2019The New Flyer vehicles described in this manual may be protected by one or more patents and design applications or registrations in the United States and Canada,
and in other countries. Refer to “Vehicle Patent Information” in this manual.Copyright © 2018 New Flyer Industries Canada ULC
2.28. Fifteen Year Preventive Maintenance
2.28.1. Traction Motor Bearing Replacement
Maintenance of high voltage equipmentmust be performed by qualified person-nel only. Refer to 1.1. “High VoltageSafety” on page 1 at the beginning ofthis section for safety requirements.Ensure that the High Voltage Interlockand Battery Disconnect switches areset to the OFF position and locked-outand tagged-out.
Replace the traction motor bearings everyfifteen years or 60,000 operating hours,whichever occurs first. Contact your localSiemens Service Center for instructions.
2.29. Sixteen Year Preventive Maintenance
2.29.1. Air Compressor Component Replacement
Maintenance of high voltage equipmentmust be performed by qualified person-nel only. Refer to 1.1. “High VoltageSafety” on page 1 at the beginning ofthis section for safety requirements.Ensure that the High Voltage Interlockand Battery Disconnect switches areset to the OFF position and locked-outand tagged-out.
☞NOTE:This interval was converted from compres-sor operating hours to calendar time usingan average vehicle speed of 12.5 mph,compressor duty cycle of 40%, and 30,000miles/year. Adjust the service intervalaccording to actual operating conditions.
Replace the air compressor check valveand the compressor to motor rubber cou-pling every sixteen years, 500,000 miles(800,000 km), or 16,000 compressor oper-ating hours, whichever occurs first.
2.29.1.1.Discharge Valve Replacement
1. Set the Battery Disconnect switch to theOFF position.
2. Drain the vehicle air system
3. Locate the discharge valve on the outletside of the compressor. See “Fig. PM-68:Air Compressor Discharge Valve” onpage 123.
4. Disconnect the signal line and exhaust linefrom the discharge valve.
5. Unthread the discharge valve from the dis-charge fitting.
6. Place discharge valve in a vise andremove the signal line connector and theexhaust line nipple.
7. Install a new discharge valve. Installation isthe reverse of removal.
Sixteen Year Preventive Maintenance
Rev. A - Feb 26 2019 PM - 123The New Flyer vehicles described in this manual may be protected by one or more patents and design applications or registrations in the United States and Canada,
and in other countries. Refer to “Vehicle Patent Information” in this manual.Copyright © 2018 New Flyer Industries Canada ULC
2.29.1.2.Coupling Removal
1. Set the Battery Disconnect switch to theOFF position.
2. Drain the vehicle air system.
3. Remove the air compressor couplingguard to gain access to the coupling. See“Fig. PM-69: Air Compressor Coupling” onpage 124.
DO NOT loosen the setscrew thatsecures the drive hub to the motorshaft.
4. Remove the three socket head screws thatsecure the coupling rubber element radi-ally to the motor drive hub.
☞NOTE:The motor drive hub is keyed to the motorshaft and secured with a setscrew. The rel-ative position of the drive hub and motorshaft must be maintained.
☞NOTE:DO NOT loosen the hexagon screws thatsecure the motor adapter ring to the face-plate.
5. Support the weight of the motor andloosen the inner set of flat socket headscrews that hold the motor to the adapterring.
☞NOTE:DO NOT loosen the four hex head boltsthat secure the motor adapter ring to thefaceplate.
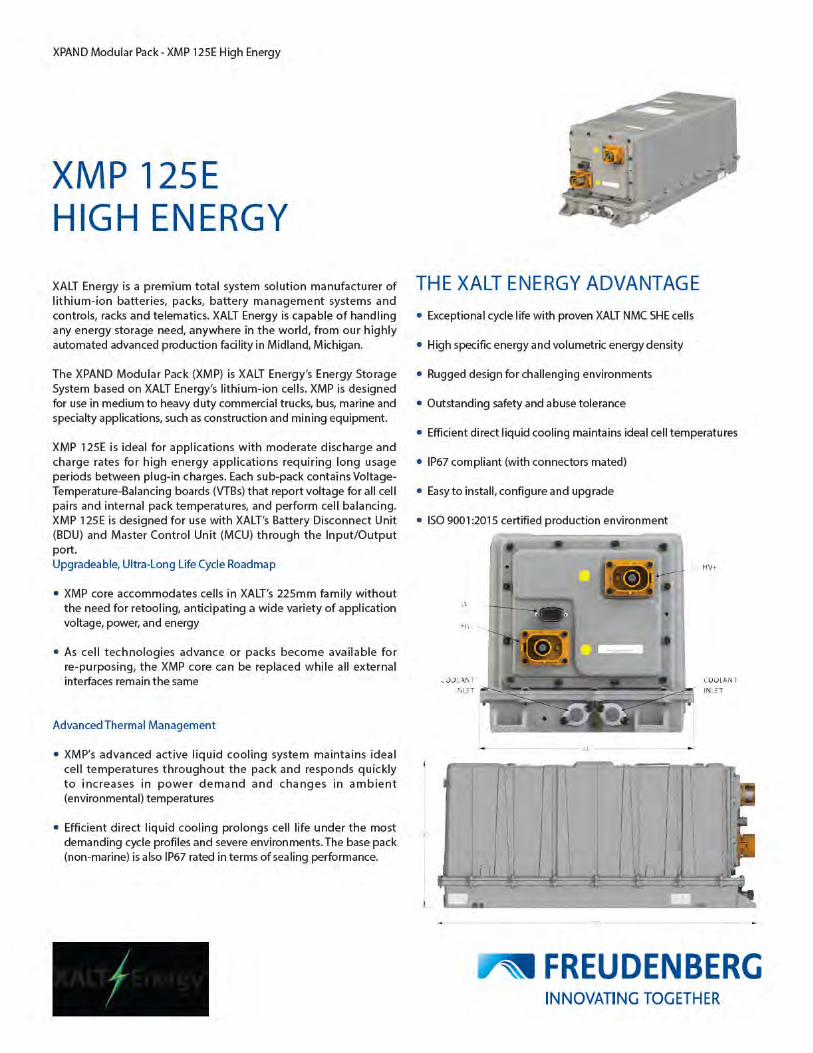
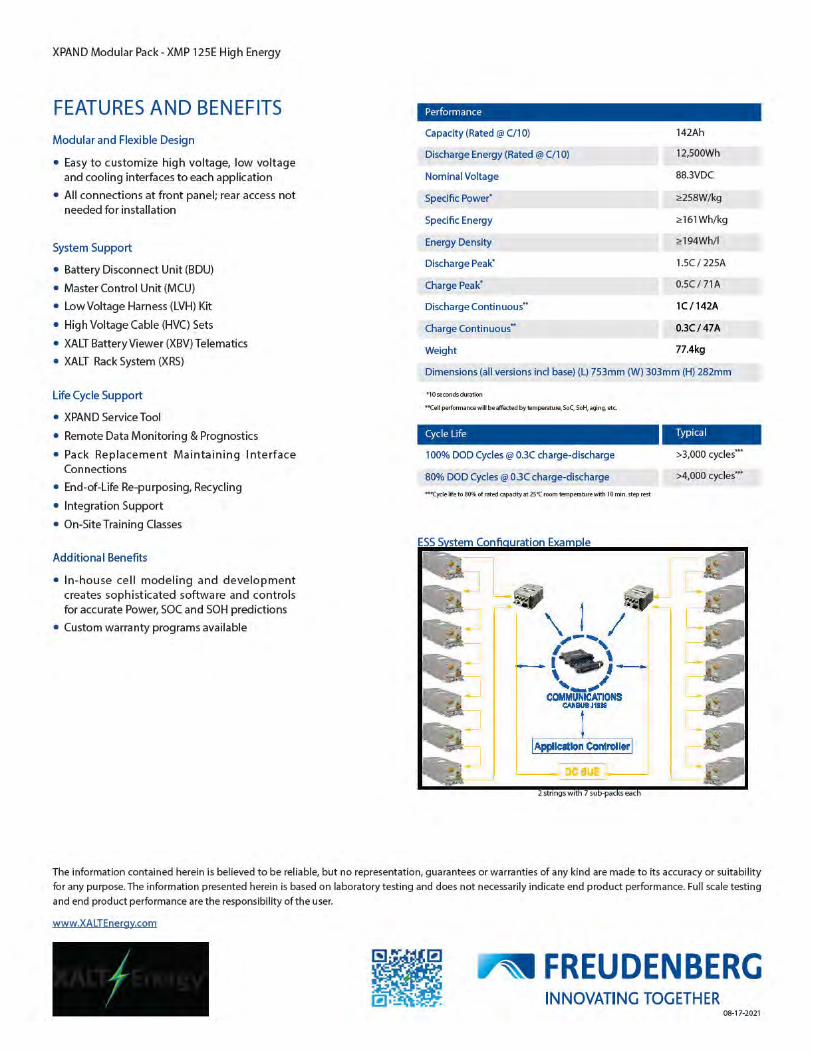
New Flyer Energy Cell/Pack Warranty
A. New Flyer warrants the Energy Storage System for 6 years or 300,000 miles (whichever occurs first) after the date of acceptance of each bus (“Warranty Period”), to be free of defects in design, material and workmanship; (the “Warranty”). The warranty applies to the battery cells and internal components, it also includes the Battery Management System (BMS) controllers and Power Distribution Unit (PDU). These components are warranted for proper operation for 6 years/300,000 miles when the ESS is maintained in the manner described in the New Flyer Service Manual.
B. In a warrantable event, New Flyer shall, at its sole discretion:
• During the six years of the foregoing warranty period, the sole remedy under theWarranty shall be the repair or replacement of the Product at New Flyer’s option and atits expense (including costs of shipping and packaging).
• This Warranty shall be null and void and there shall be no right to recovery whatsoeverif the Cell’s or Pack’s date code or serial number is defaced, missing or altered. Or ifunauthorized or improper maintenance and repairs are performed or if the battery isinstalled to ambient temperatures above 113°F (45°C) or below -22°F (-30°C) for morethan 2 weeks over the life of the warranty.
Capacity Fade Disclaimer
Capacity fade is the relative reduction of the total amount of energy the battery system can store in a single charge for the purpose of powering the bus as compared to capacity at beginning of life (BOL). Capacity fade is warranted to 80% of BOL total energy capacity at year 6 or 300,000 miles when;
1) Capacity measurements are taken from a balanced ESS (all strings connected and fullycharged), and
2) ESS is maintained in the manner described in the New Flyer Service Manual.”
THE WARRANTY HEREIN RESPECTING CELLS AND PACKS INCLUDING, WITHOUT LIMITATION, QUALITY AND PERFORMANCE AND ARE MADE EXPRESSLY IN LIEU OF AND EXCLUDE ANY IMPLIED WARRANTIES OF MERCHANTABILITY AND FITNESS FOR A PARTICULAR PURPOSE AND ALL OTHER EXPRESS OR IMPLIED REPRESENTATIONS AND WARRANTIES PROVIDED BY STATUTE OR COMMON LAW.
Xcelsior Charge NG – New Battery Enclosures Service expectations for the newly designed battery packaging


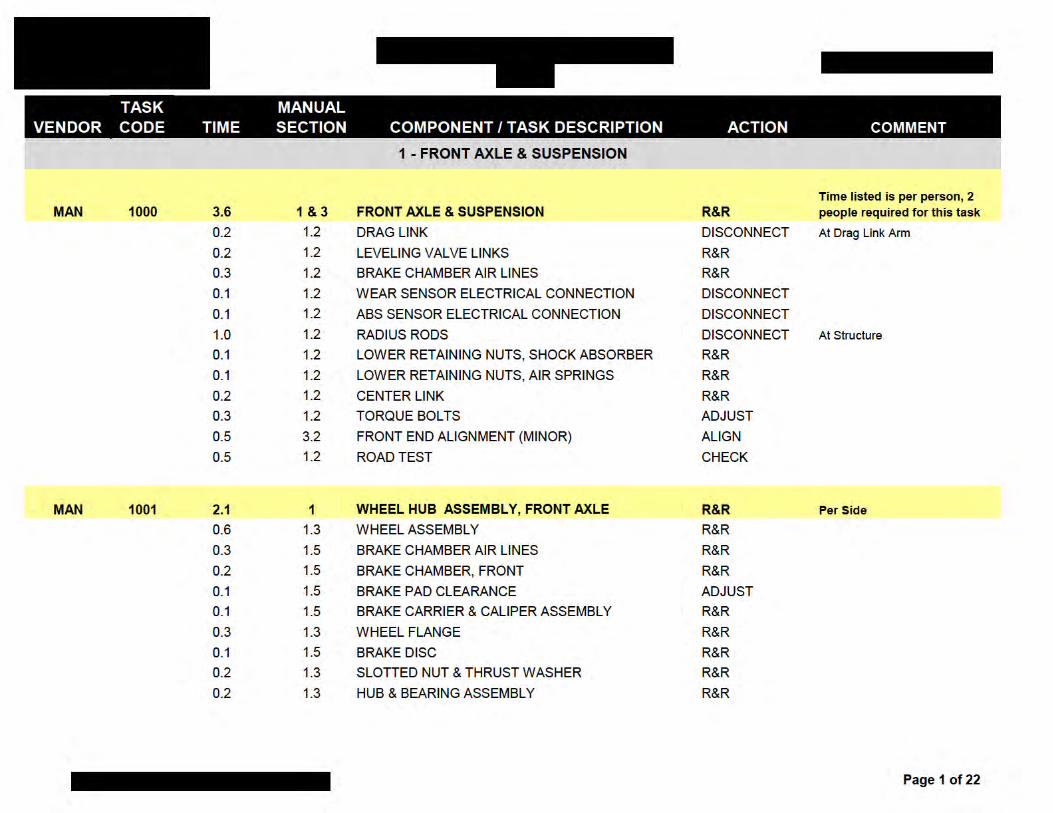
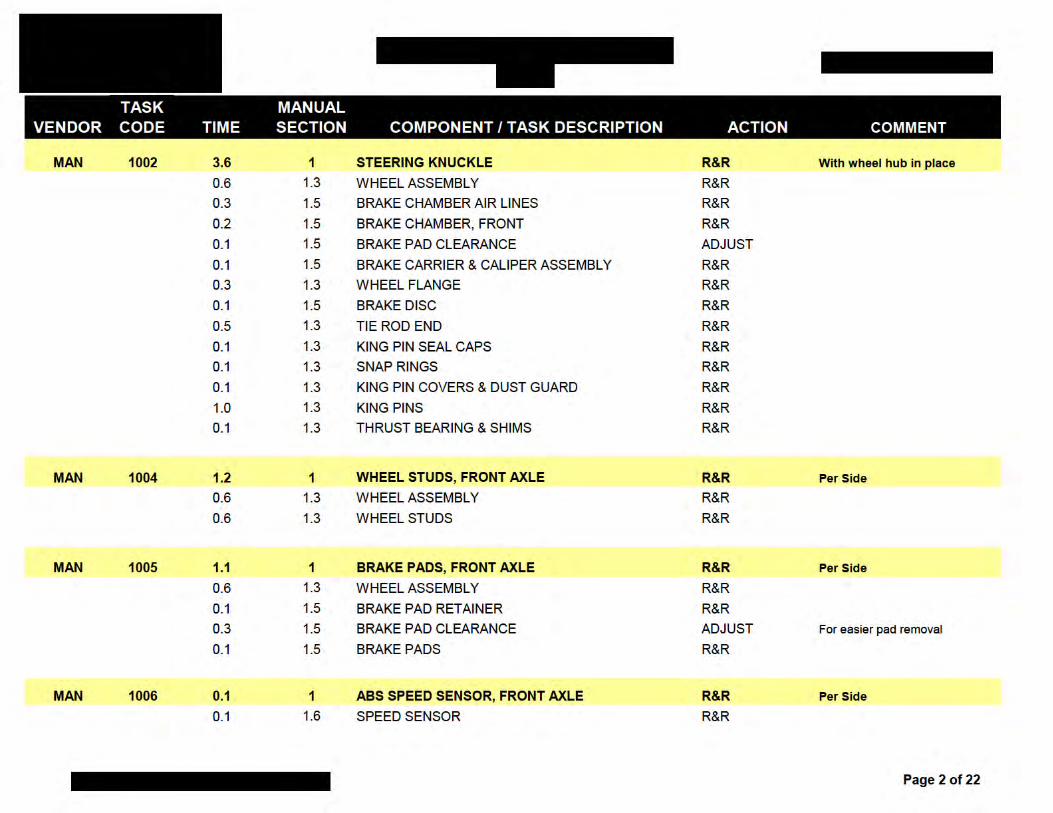
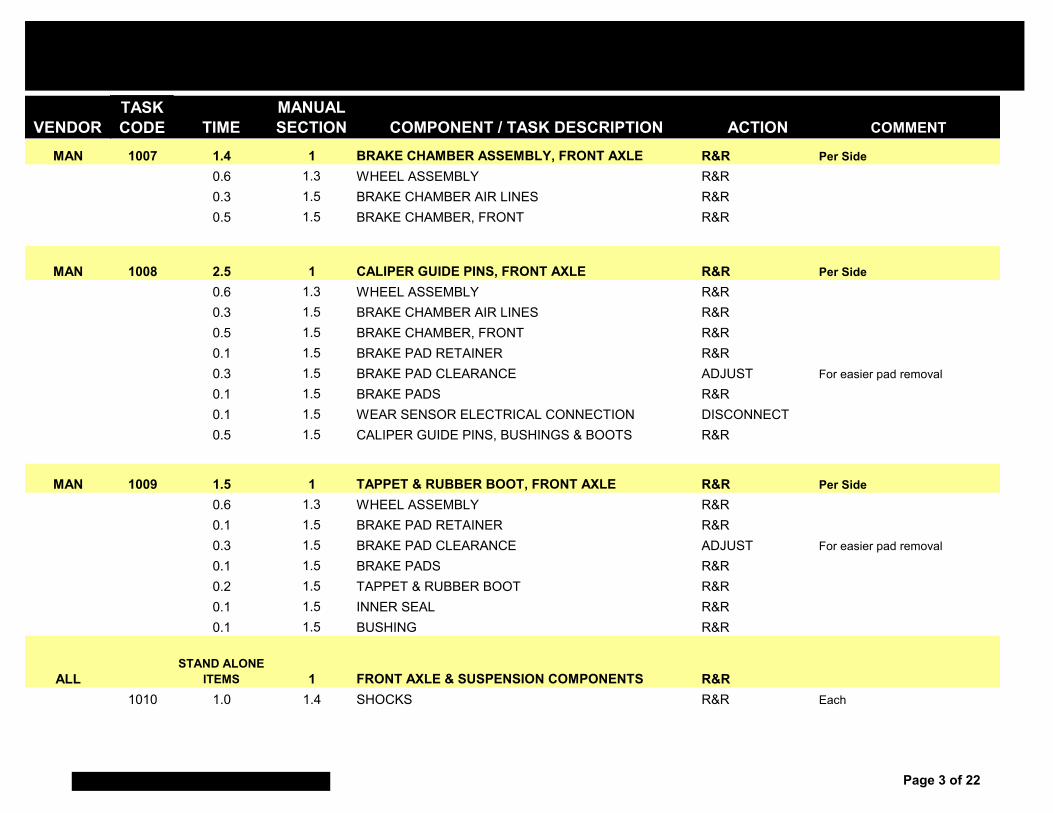
VENDORTASK CODE TIME
MANUAL SECTION COMPONENT / TASK DESCRIPTION ACTION COMMENT
MAN 1007 1.4 1 BRAKE CHAMBER ASSEMBLY, FRONT AXLE R&R Per Side0.6 1.3 WHEEL ASSEMBLY R&R0.3 1.5 BRAKE CHAMBER AIR LINES R&R0.5 1.5 BRAKE CHAMBER, FRONT R&R
MAN 1008 2.5 1 CALIPER GUIDE PINS, FRONT AXLE R&R Per Side0.6 1.3 WHEEL ASSEMBLY R&R0.3 1.5 BRAKE CHAMBER AIR LINES R&R0.5 1.5 BRAKE CHAMBER, FRONT R&R0.1 1.5 BRAKE PAD RETAINER R&R0.3 1.5 BRAKE PAD CLEARANCE ADJUST For easier pad removal
0.1 1.5 BRAKE PADS R&R0.1 1.5 WEAR SENSOR ELECTRICAL CONNECTION DISCONNECT0.5 1.5 CALIPER GUIDE PINS, BUSHINGS & BOOTS R&R
MAN 1009 1.5 1 TAPPET & RUBBER BOOT, FRONT AXLE R&R Per Side0.6 1.3 WHEEL ASSEMBLY R&R0.1 1.5 BRAKE PAD RETAINER R&R0.3 1.5 BRAKE PAD CLEARANCE ADJUST For easier pad removal
0.1 1.5 BRAKE PADS R&R0.2 1.5 TAPPET & RUBBER BOOT R&R0.1 1.5 INNER SEAL R&R0.1 1.5 BUSHING R&R
ALLSTAND ALONE
ITEMS 1 FRONT AXLE & SUSPENSION COMPONENTS R&R1010 1.0 1.4 SHOCKS R&R Each
Page 3 of 22
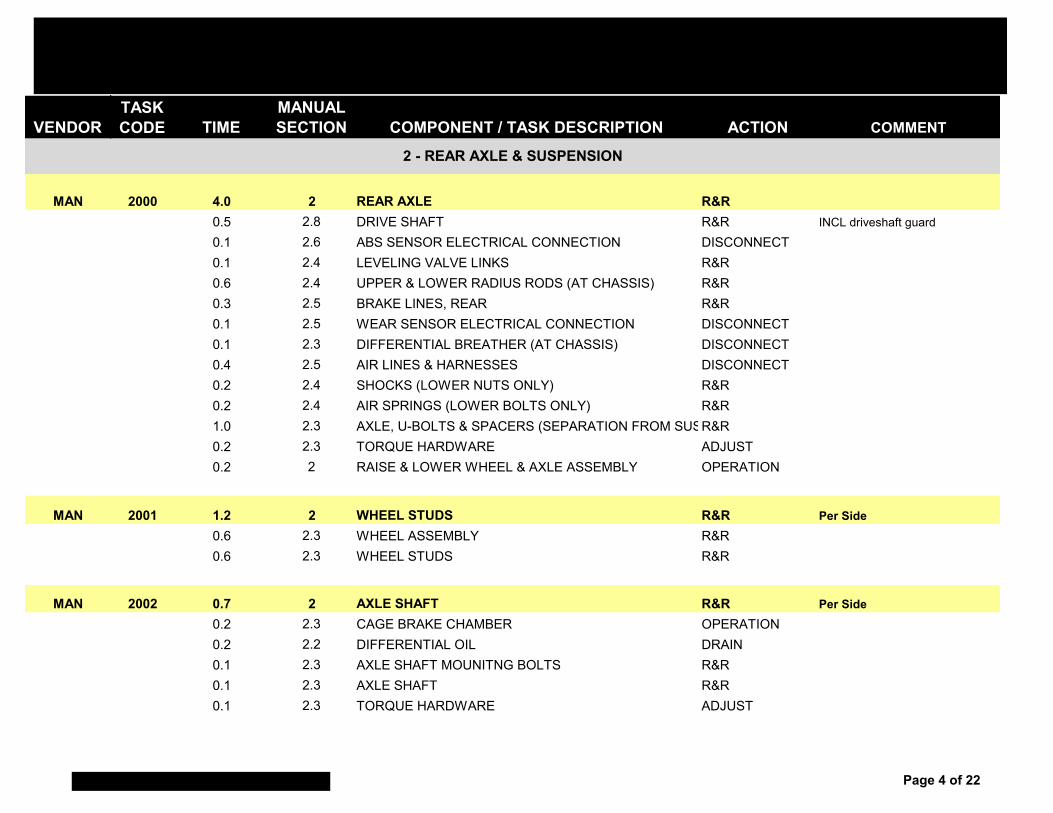
VENDORTASK CODE TIME
MANUAL SECTION COMPONENT / TASK DESCRIPTION ACTION COMMENT
MAN 2000 4.0 2 REAR AXLE R&R0.5 2.8 DRIVE SHAFT R&R INCL driveshaft guard
0.1 2.6 ABS SENSOR ELECTRICAL CONNECTION DISCONNECT0.1 2.4 LEVELING VALVE LINKS R&R0.6 2.4 UPPER & LOWER RADIUS RODS (AT CHASSIS) R&R0.3 2.5 BRAKE LINES, REAR R&R0.1 2.5 WEAR SENSOR ELECTRICAL CONNECTION DISCONNECT0.1 2.3 DIFFERENTIAL BREATHER (AT CHASSIS) DISCONNECT0.4 2.5 AIR LINES & HARNESSES DISCONNECT0.2 2.4 SHOCKS (LOWER NUTS ONLY) R&R0.2 2.4 AIR SPRINGS (LOWER BOLTS ONLY) R&R1.0 2.3 AXLE, U-BOLTS & SPACERS (SEPARATION FROM SUS R&R0.2 2.3 TORQUE HARDWARE ADJUST0.2 2 RAISE & LOWER WHEEL & AXLE ASSEMBLY OPERATION
MAN 2001 1.2 2 WHEEL STUDS R&R Per Side0.6 2.3 WHEEL ASSEMBLY R&R0.6 2.3 WHEEL STUDS R&R
MAN 2002 0.7 2 AXLE SHAFT R&R Per Side0.2 2.3 CAGE BRAKE CHAMBER OPERATION0.2 2.2 DIFFERENTIAL OIL DRAIN0.1 2.3 AXLE SHAFT MOUNITNG BOLTS R&R0.1 2.3 AXLE SHAFT R&R0.1 2.3 TORQUE HARDWARE ADJUST
2 - REAR AXLE & SUSPENSION
Page 4 of 22
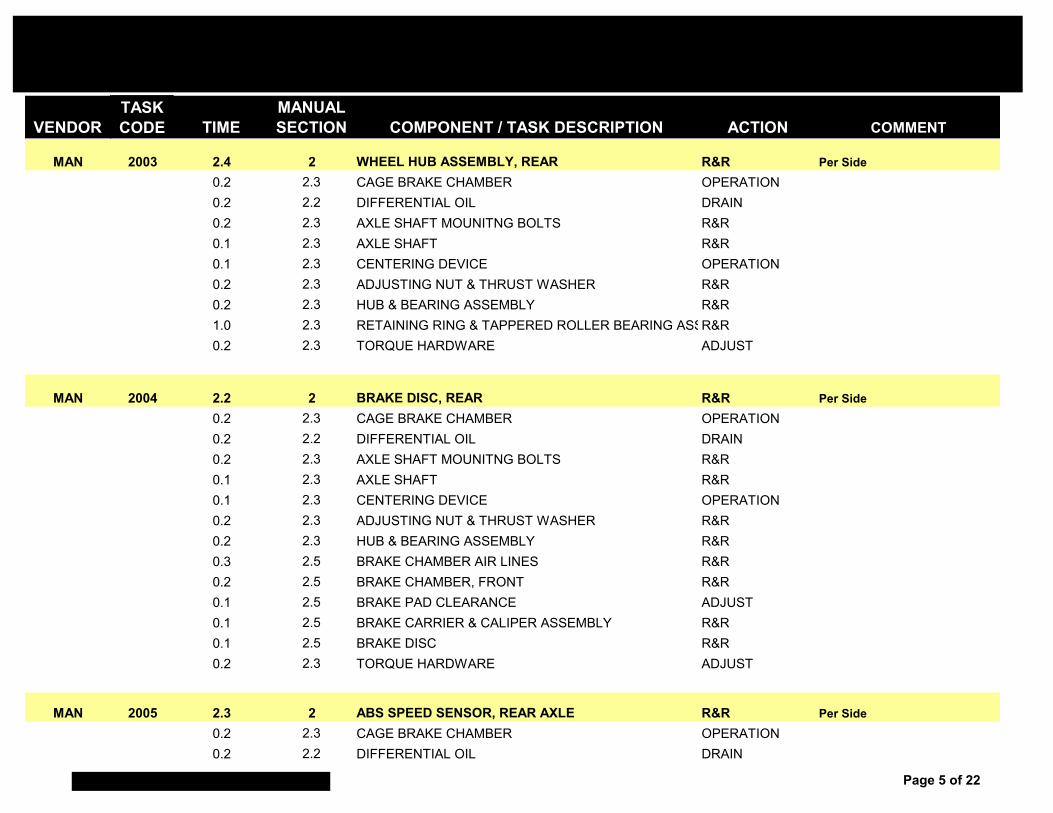
VENDORTASK CODE TIME
MANUAL SECTION COMPONENT / TASK DESCRIPTION ACTION COMMENT
MAN 2003 2.4 2 WHEEL HUB ASSEMBLY, REAR R&R Per Side0.2 2.3 CAGE BRAKE CHAMBER OPERATION0.2 2.2 DIFFERENTIAL OIL DRAIN0.2 2.3 AXLE SHAFT MOUNITNG BOLTS R&R0.1 2.3 AXLE SHAFT R&R0.1 2.3 CENTERING DEVICE OPERATION0.2 2.3 ADJUSTING NUT & THRUST WASHER R&R0.2 2.3 HUB & BEARING ASSEMBLY R&R1.0 2.3 RETAINING RING & TAPPERED ROLLER BEARING ASSR&R0.2 2.3 TORQUE HARDWARE ADJUST
MAN 2004 2.2 2 BRAKE DISC, REAR R&R Per Side0.2 2.3 CAGE BRAKE CHAMBER OPERATION0.2 2.2 DIFFERENTIAL OIL DRAIN0.2 2.3 AXLE SHAFT MOUNITNG BOLTS R&R0.1 2.3 AXLE SHAFT R&R0.1 2.3 CENTERING DEVICE OPERATION0.2 2.3 ADJUSTING NUT & THRUST WASHER R&R0.2 2.3 HUB & BEARING ASSEMBLY R&R0.3 2.5 BRAKE CHAMBER AIR LINES R&R0.2 2.5 BRAKE CHAMBER, FRONT R&R0.1 2.5 BRAKE PAD CLEARANCE ADJUST0.1 2.5 BRAKE CARRIER & CALIPER ASSEMBLY R&R0.1 2.5 BRAKE DISC R&R0.2 2.3 TORQUE HARDWARE ADJUST
MAN 2005 2.3 2 ABS SPEED SENSOR, REAR AXLE R&R Per Side0.2 2.3 CAGE BRAKE CHAMBER OPERATION0.2 2.2 DIFFERENTIAL OIL DRAIN
Page 5 of 22
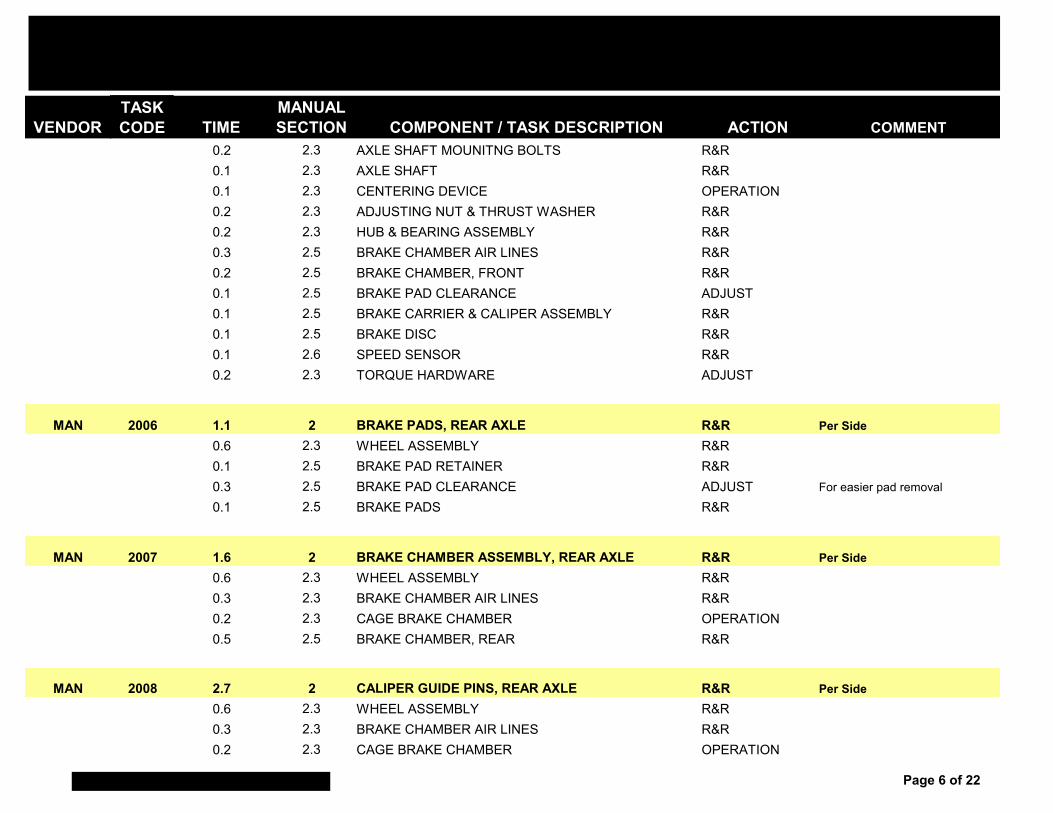
VENDORTASK CODE TIME
MANUAL SECTION COMPONENT / TASK DESCRIPTION ACTION COMMENT
0.2 2.3 AXLE SHAFT MOUNITNG BOLTS R&R0.1 2.3 AXLE SHAFT R&R0.1 2.3 CENTERING DEVICE OPERATION0.2 2.3 ADJUSTING NUT & THRUST WASHER R&R0.2 2.3 HUB & BEARING ASSEMBLY R&R0.3 2.5 BRAKE CHAMBER AIR LINES R&R0.2 2.5 BRAKE CHAMBER, FRONT R&R0.1 2.5 BRAKE PAD CLEARANCE ADJUST0.1 2.5 BRAKE CARRIER & CALIPER ASSEMBLY R&R0.1 2.5 BRAKE DISC R&R0.1 2.6 SPEED SENSOR R&R0.2 2.3 TORQUE HARDWARE ADJUST
MAN 2006 1.1 2 BRAKE PADS, REAR AXLE R&R Per Side0.6 2.3 WHEEL ASSEMBLY R&R0.1 2.5 BRAKE PAD RETAINER R&R0.3 2.5 BRAKE PAD CLEARANCE ADJUST For easier pad removal
0.1 2.5 BRAKE PADS R&R
MAN 2007 1.6 2 BRAKE CHAMBER ASSEMBLY, REAR AXLE R&R Per Side0.6 2.3 WHEEL ASSEMBLY R&R0.3 2.3 BRAKE CHAMBER AIR LINES R&R0.2 2.3 CAGE BRAKE CHAMBER OPERATION0.5 2.5 BRAKE CHAMBER, REAR R&R
MAN 2008 2.7 2 CALIPER GUIDE PINS, REAR AXLE R&R Per Side0.6 2.3 WHEEL ASSEMBLY R&R0.3 2.3 BRAKE CHAMBER AIR LINES R&R0.2 2.3 CAGE BRAKE CHAMBER OPERATION
Page 6 of 22
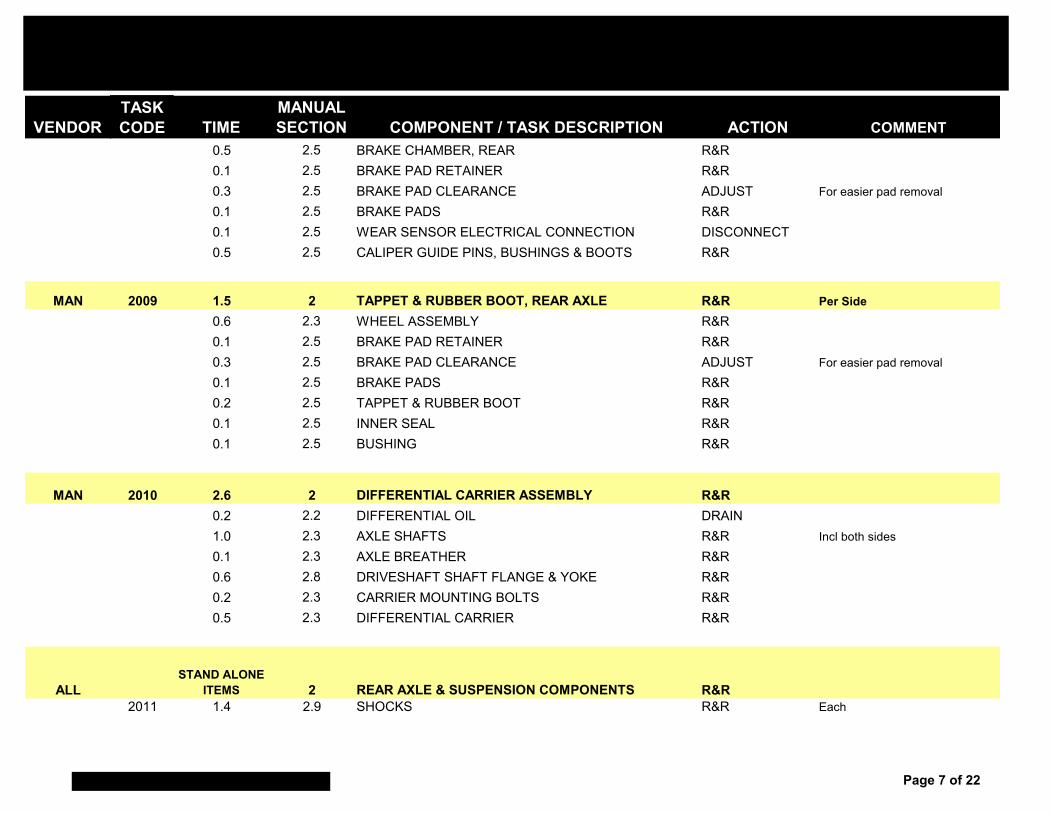
VENDORTASK CODE TIME
MANUAL SECTION COMPONENT / TASK DESCRIPTION ACTION COMMENT
0.5 2.5 BRAKE CHAMBER, REAR R&R0.1 2.5 BRAKE PAD RETAINER R&R0.3 2.5 BRAKE PAD CLEARANCE ADJUST For easier pad removal
0.1 2.5 BRAKE PADS R&R0.1 2.5 WEAR SENSOR ELECTRICAL CONNECTION DISCONNECT0.5 2.5 CALIPER GUIDE PINS, BUSHINGS & BOOTS R&R
MAN 2009 1.5 2 TAPPET & RUBBER BOOT, REAR AXLE R&R Per Side0.6 2.3 WHEEL ASSEMBLY R&R0.1 2.5 BRAKE PAD RETAINER R&R0.3 2.5 BRAKE PAD CLEARANCE ADJUST For easier pad removal
0.1 2.5 BRAKE PADS R&R0.2 2.5 TAPPET & RUBBER BOOT R&R0.1 2.5 INNER SEAL R&R0.1 2.5 BUSHING R&R
MAN 2010 2.6 2 DIFFERENTIAL CARRIER ASSEMBLY R&R0.2 2.2 DIFFERENTIAL OIL DRAIN1.0 2.3 AXLE SHAFTS R&R Incl both sides
0.1 2.3 AXLE BREATHER R&R0.6 2.8 DRIVESHAFT SHAFT FLANGE & YOKE R&R0.2 2.3 CARRIER MOUNTING BOLTS R&R0.5 2.3 DIFFERENTIAL CARRIER R&R
ALLSTAND ALONE
ITEMS 2 REAR AXLE & SUSPENSION COMPONENTS R&R2011 1.4 2.9 SHOCKS R&R Each
Page 7 of 22
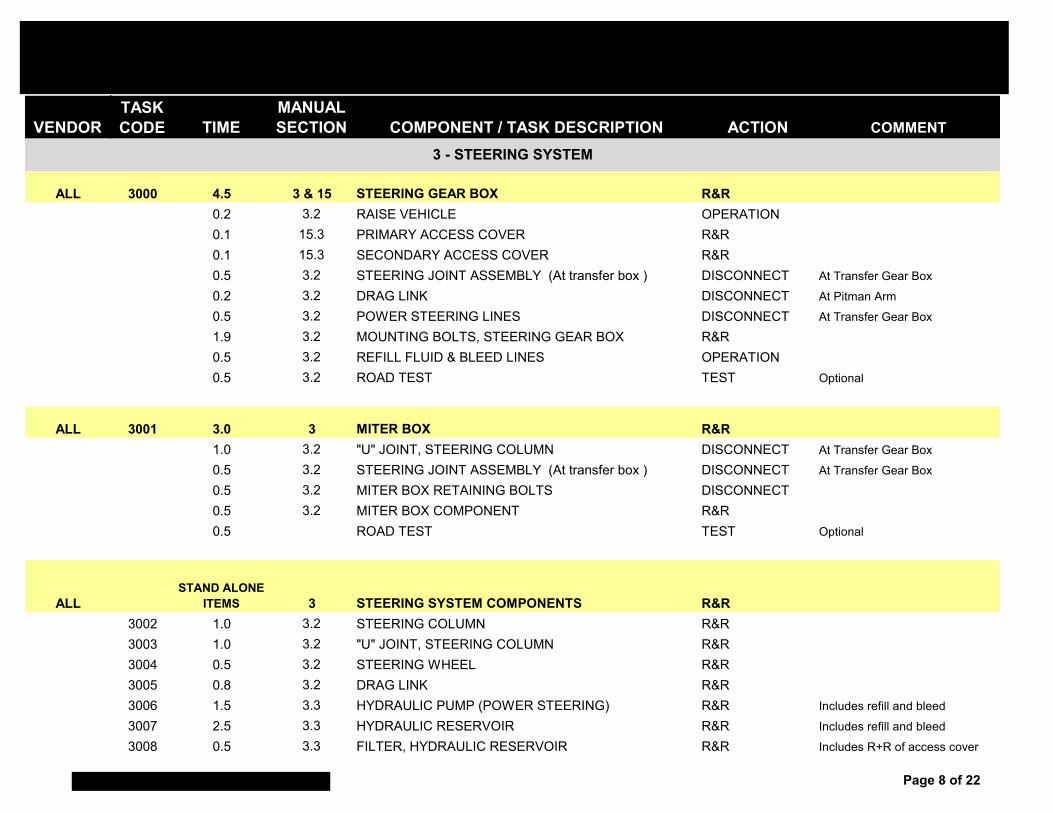
VENDORTASK CODE TIME
MANUAL SECTION COMPONENT / TASK DESCRIPTION ACTION COMMENT
ALL 3000 4.5 3 & 15 STEERING GEAR BOX R&R0.2 3.2 RAISE VEHICLE OPERATION0.1 15.3 PRIMARY ACCESS COVER R&R0.1 15.3 SECONDARY ACCESS COVER R&R0.5 3.2 STEERING JOINT ASSEMBLY (At transfer box ) DISCONNECT At Transfer Gear Box
0.2 3.2 DRAG LINK DISCONNECT At Pitman Arm
0.5 3.2 POWER STEERING LINES DISCONNECT At Transfer Gear Box
1.9 3.2 MOUNTING BOLTS, STEERING GEAR BOX R&R0.5 3.2 REFILL FLUID & BLEED LINES OPERATION0.5 3.2 ROAD TEST TEST Optional
ALL 3001 3.0 3 MITER BOX R&R1.0 3.2 "U" JOINT, STEERING COLUMN DISCONNECT At Transfer Gear Box
0.5 3.2 STEERING JOINT ASSEMBLY (At transfer box ) DISCONNECT At Transfer Gear Box
0.5 3.2 MITER BOX RETAINING BOLTS DISCONNECT0.5 3.2 MITER BOX COMPONENT R&R0.5 ROAD TEST TEST Optional
ALLSTAND ALONE
ITEMS 3 STEERING SYSTEM COMPONENTS R&R3002 1.0 3.2 STEERING COLUMN R&R3003 1.0 3.2 "U" JOINT, STEERING COLUMN R&R3004 0.5 3.2 STEERING WHEEL R&R3005 0.8 3.2 DRAG LINK R&R3006 1.5 3.3 HYDRAULIC PUMP (POWER STEERING) R&R Includes refill and bleed
3007 2.5 3.3 HYDRAULIC RESERVOIR R&R Includes refill and bleed
3008 0.5 3.3 FILTER, HYDRAULIC RESERVOIR R&R Includes R+R of access cover
3 - STEERING SYSTEM
Page 8 of 22
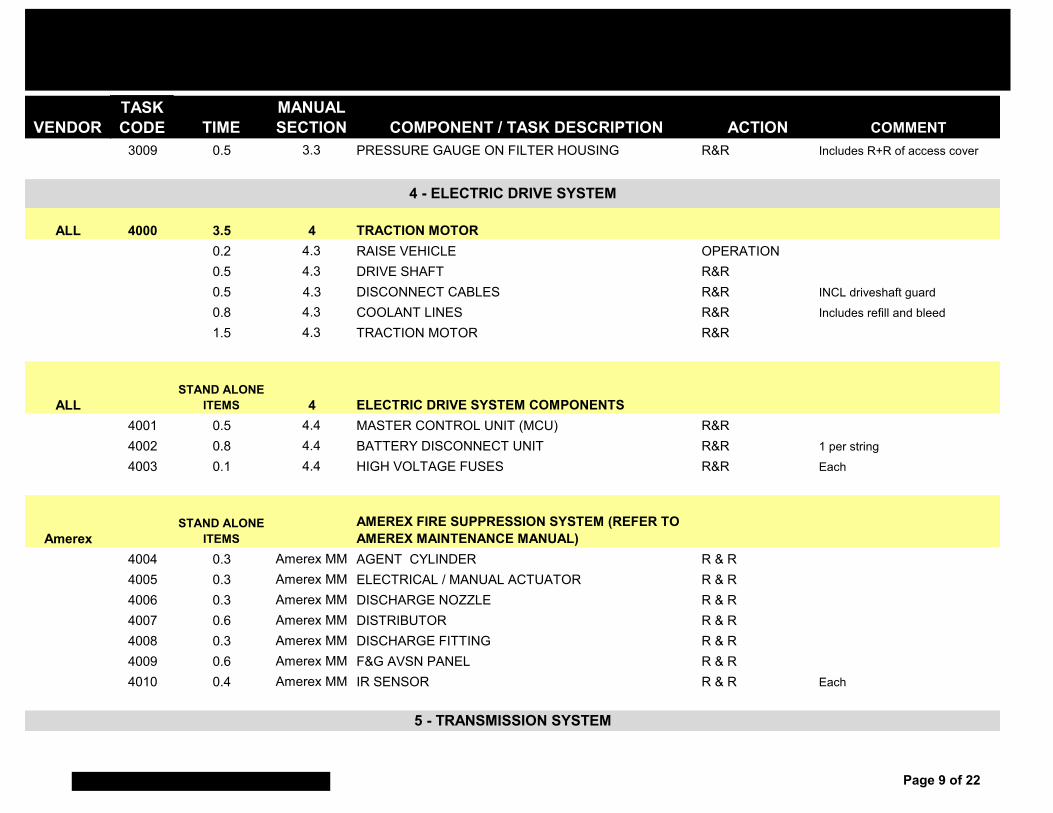
VENDORTASK CODE TIME
MANUAL SECTION COMPONENT / TASK DESCRIPTION ACTION COMMENT
3009 0.5 3.3 PRESSURE GAUGE ON FILTER HOUSING R&R Includes R+R of access cover
ALL 4000 3.5 4 TRACTION MOTOR0.2 4.3 RAISE VEHICLE OPERATION0.5 4.3 DRIVE SHAFT R&R0.5 4.3 DISCONNECT CABLES R&R INCL driveshaft guard
0.8 4.3 COOLANT LINES R&R Includes refill and bleed
1.5 4.3 TRACTION MOTOR R&R
ALLSTAND ALONE
ITEMS 4 ELECTRIC DRIVE SYSTEM COMPONENTS4001 0.5 4.4 MASTER CONTROL UNIT (MCU) R&R4002 0.8 4.4 BATTERY DISCONNECT UNIT R&R 1 per string
4003 0.1 4.4 HIGH VOLTAGE FUSES R&R Each
AmerexSTAND ALONE
ITEMSAMEREX FIRE SUPPRESSION SYSTEM (REFER TO AMEREX MAINTENANCE MANUAL)
4004 0.3 Amerex MM AGENT CYLINDER R & R4005 0.3 Amerex MM ELECTRICAL / MANUAL ACTUATOR R & R4006 0.3 Amerex MM DISCHARGE NOZZLE R & R4007 0.6 Amerex MM DISTRIBUTOR R & R4008 0.3 Amerex MM DISCHARGE FITTING R & R4009 0.6 Amerex MM F&G AVSN PANEL R & R4010 0.4 Amerex MM IR SENSOR R & R Each
4 - ELECTRIC DRIVE SYSTEM
5 - TRANSMISSION SYSTEM
Page 9 of 22
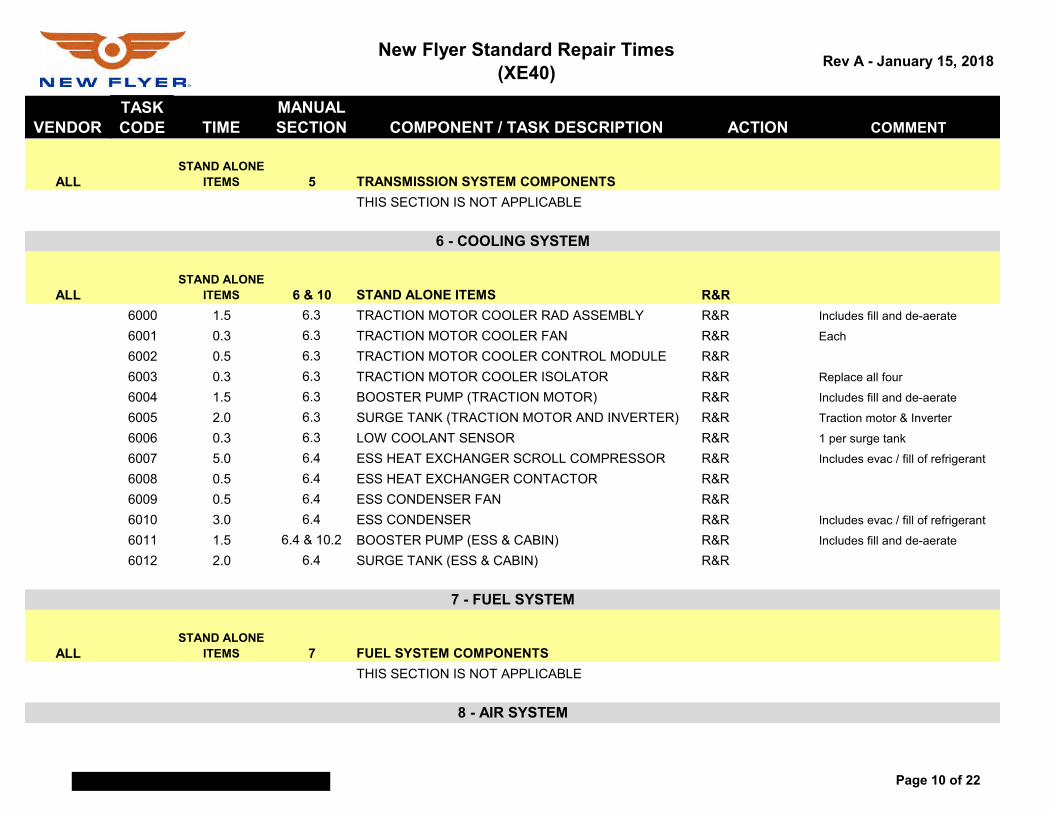
New Flyer Standard Repair Times(XE40) Rev A - January 15, 2018
VENDORTASK CODE TIME
MANUAL SECTION COMPONENT / TASK DESCRIPTION ACTION COMMENT
ALLSTAND ALONE
ITEMS 5 TRANSMISSION SYSTEM COMPONENTSTHIS SECTION IS NOT APPLICABLE
ALLSTAND ALONE
ITEMS 6 & 10 STAND ALONE ITEMS R&R6000 1.5 6.3 TRACTION MOTOR COOLER RAD ASSEMBLY R&R Includes fill and de-aerate
6001 0.3 6.3 TRACTION MOTOR COOLER FAN R&R Each
6002 0.5 6.3 TRACTION MOTOR COOLER CONTROL MODULE R&R6003 0.3 6.3 TRACTION MOTOR COOLER ISOLATOR R&R Replace all four
6004 1.5 6.3 BOOSTER PUMP (TRACTION MOTOR) R&R Includes fill and de-aerate
6005 2.0 6.3 SURGE TANK (TRACTION MOTOR AND INVERTER) R&R Traction motor & Inverter
6006 0.3 6.3 LOW COOLANT SENSOR R&R 1 per surge tank
6007 5.0 6.4 ESS HEAT EXCHANGER SCROLL COMPRESSOR R&R Includes evac / fill of refrigerant
6008 0.5 6.4 ESS HEAT EXCHANGER CONTACTOR R&R6009 0.5 6.4 ESS CONDENSER FAN R&R6010 3.0 6.4 ESS CONDENSER R&R Includes evac / fill of refrigerant
6011 1.5 6.4 & 10.2 BOOSTER PUMP (ESS & CABIN) R&R Includes fill and de-aerate
6012 2.0 6.4 SURGE TANK (ESS & CABIN) R&R
ALLSTAND ALONE
ITEMS 7 FUEL SYSTEM COMPONENTSTHIS SECTION IS NOT APPLICABLE
7 - FUEL SYSTEM
8 - AIR SYSTEM
6 - COOLING SYSTEM
Page 10 of 22
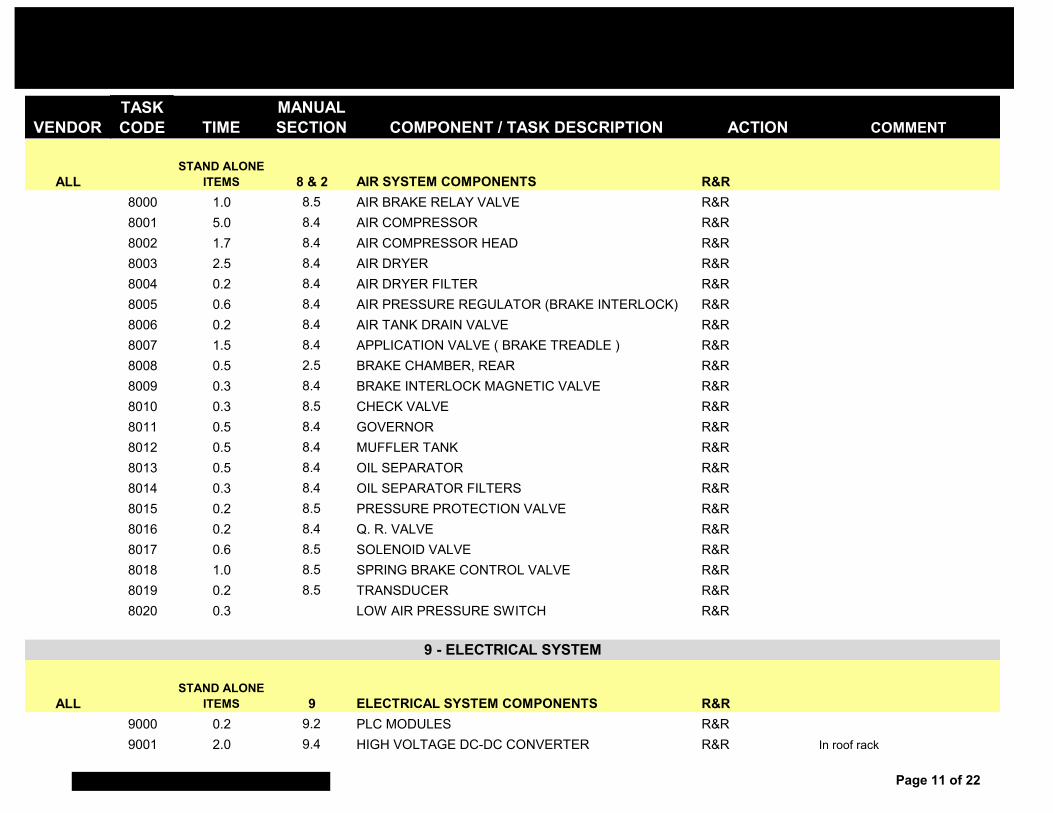
VENDORTASK CODE TIME
MANUAL SECTION COMPONENT / TASK DESCRIPTION ACTION COMMENT
ALLSTAND ALONE
ITEMS 8 & 2 AIR SYSTEM COMPONENTS R&R8000 1.0 8.5 AIR BRAKE RELAY VALVE R&R8001 5.0 8.4 AIR COMPRESSOR R&R8002 1.7 8.4 AIR COMPRESSOR HEAD R&R8003 2.5 8.4 AIR DRYER R&R8004 0.2 8.4 AIR DRYER FILTER R&R8005 0.6 8.4 AIR PRESSURE REGULATOR (BRAKE INTERLOCK) R&R8006 0.2 8.4 AIR TANK DRAIN VALVE R&R8007 1.5 8.4 APPLICATION VALVE ( BRAKE TREADLE ) R&R8008 0.5 2.5 BRAKE CHAMBER, REAR R&R8009 0.3 8.4 BRAKE INTERLOCK MAGNETIC VALVE R&R8010 0.3 8.5 CHECK VALVE R&R8011 0.5 8.4 GOVERNOR R&R8012 0.5 8.4 MUFFLER TANK R&R8013 0.5 8.4 OIL SEPARATOR R&R8014 0.3 8.4 OIL SEPARATOR FILTERS R&R8015 0.2 8.5 PRESSURE PROTECTION VALVE R&R8016 0.2 8.4 Q. R. VALVE R&R8017 0.6 8.5 SOLENOID VALVE R&R8018 1.0 8.5 SPRING BRAKE CONTROL VALVE R&R8019 0.2 8.5 TRANSDUCER R&R8020 0.3 LOW AIR PRESSURE SWITCH R&R
ALLSTAND ALONE
ITEMS 9 ELECTRICAL SYSTEM COMPONENTS R&R9000 0.2 9.2 PLC MODULES R&R9001 2.0 9.4 HIGH VOLTAGE DC-DC CONVERTER R&R In roof rack
9 - ELECTRICAL SYSTEM
Page 11 of 22

VENDORTASK CODE TIME
MANUAL SECTION COMPONENT / TASK DESCRIPTION ACTION COMMENT
9002 0.5 9.5 BATTERIES & LEADS R&R In battery tray
9003 0.5 9.5 BATTERY DISONNECT SWITCH R&R9004 0.7 9.5 VOLTAGE EQUALIZER R&R9005 1.0 9.5 BATTERY TRAY R&R9006 0.5 9.6 BATTERY DISCONNECT SOLENOID R&R Two - 12 and 24 V
9007 0.3 9.7 LED HEADLIGHT ASSEMBLY R&R9008 0.2 9.7 BACK UP LAMP R&R9009 0.2 9.7 BRAKE LAMP R&R9010 0.2 9.7 REAR SIGNAL LAMP R&R9011 0.2 9.7 CLEARANCE LAMP R&R9012 0.2 9.7 SIDE SIGNAL LAMP R&R9013 0.3 9.7 CORNERING LAMP R&R9014 0.1 9.8 INTERIOR LED LIGHT STRIPS R&R9015 0.2 9.10 HORNS R&R9016 0.5 9.12 P.A. SPEAKER R&R9017 0.2 9.17 DUAL USB CHARGE PORT R&R
ALLSTAND ALONE
ITEMS 10, 6, & PM HVAC SYSTEM COMPONENTS R&R10000 1.5 10.2 DRIVERS HEATER / DEFROSTER UNIT R&R10001 0.5 10.2 DRIVERS BOOSTER FAN MOTOR R&R10002 0.2 PM AIR FILTER, DEFROSTER R&R10003 1.0 10.2 DEFROSTER ELEMENT R&R10004 1.0 10.2 DEFROSTER FAN / MOTOR ASSEMBLY R&R10005 0.5 10.2 DEFROSTER ELECTRICAL CONTACTORS R&R 3 per unit
10006 2.0 10.2 DEFROSTER THERMAL CUTOUT R&R Per each. 2 per unit
10007 0.2 PM AIR FILTER, FLOOR HEATER R&R10008 1.0 10.2 FLOOR HEATER ELEMENT R&R10009 1.0 10.2 FLOOR HEATER FAN / MOTOR ASSEMBLY R&R
10 - HVAC SYSTEM
Page 12 of 22
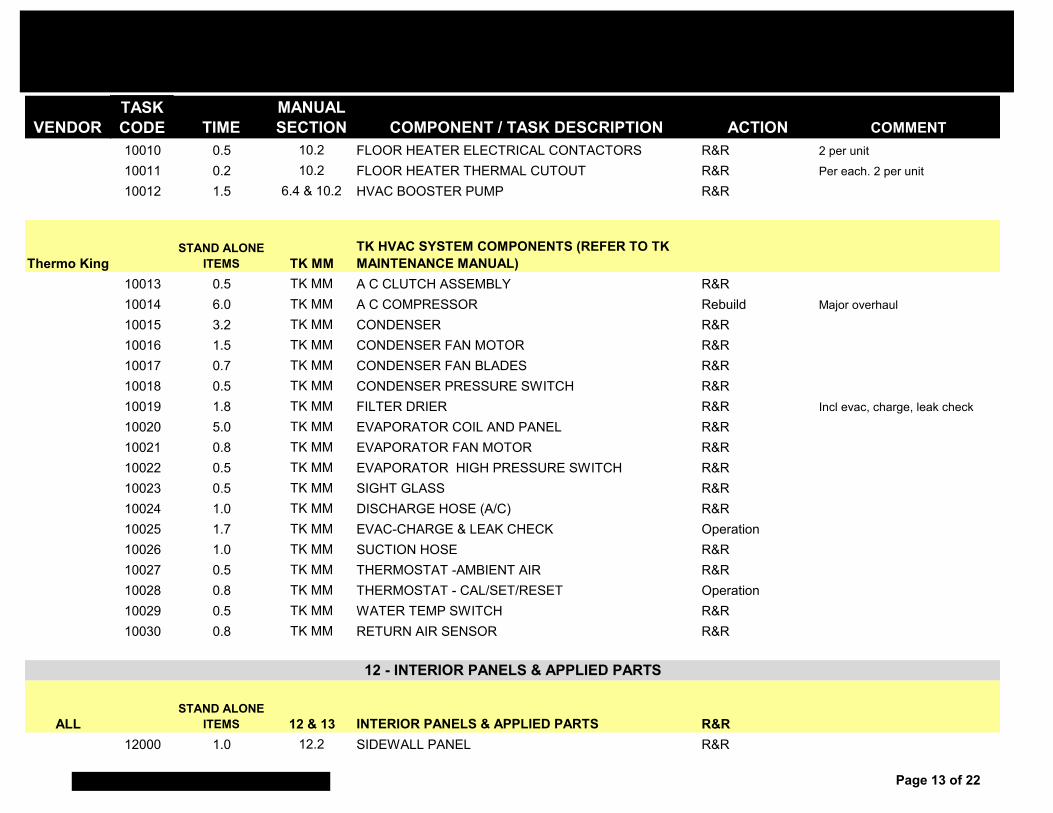
VENDORTASK CODE TIME
MANUAL SECTION COMPONENT / TASK DESCRIPTION ACTION COMMENT
10010 0.5 10.2 FLOOR HEATER ELECTRICAL CONTACTORS R&R 2 per unit
10011 0.2 10.2 FLOOR HEATER THERMAL CUTOUT R&R Per each. 2 per unit
10012 1.5 6.4 & 10.2 HVAC BOOSTER PUMP R&R
Thermo KingSTAND ALONE
ITEMS TK MMTK HVAC SYSTEM COMPONENTS (REFER TO TK MAINTENANCE MANUAL)
10013 0.5 TK MM A C CLUTCH ASSEMBLY R&R10014 6.0 TK MM A C COMPRESSOR Rebuild Major overhaul
10015 3.2 TK MM CONDENSER R&R10016 1.5 TK MM CONDENSER FAN MOTOR R&R10017 0.7 TK MM CONDENSER FAN BLADES R&R10018 0.5 TK MM CONDENSER PRESSURE SWITCH R&R10019 1.8 TK MM FILTER DRIER R&R Incl evac, charge, leak check
10020 5.0 TK MM EVAPORATOR COIL AND PANEL R&R10021 0.8 TK MM EVAPORATOR FAN MOTOR R&R10022 0.5 TK MM EVAPORATOR HIGH PRESSURE SWITCH R&R10023 0.5 TK MM SIGHT GLASS R&R10024 1.0 TK MM DISCHARGE HOSE (A/C) R&R10025 1.7 TK MM EVAC-CHARGE & LEAK CHECK Operation10026 1.0 TK MM SUCTION HOSE R&R10027 0.5 TK MM THERMOSTAT -AMBIENT AIR R&R10028 0.8 TK MM THERMOSTAT - CAL/SET/RESET Operation10029 0.5 TK MM WATER TEMP SWITCH R&R10030 0.8 TK MM RETURN AIR SENSOR R&R
ALLSTAND ALONE
ITEMS 12 & 13 INTERIOR PANELS & APPLIED PARTS R&R12000 1.0 12.2 SIDEWALL PANEL R&R
12 - INTERIOR PANELS & APPLIED PARTS
Page 13 of 22
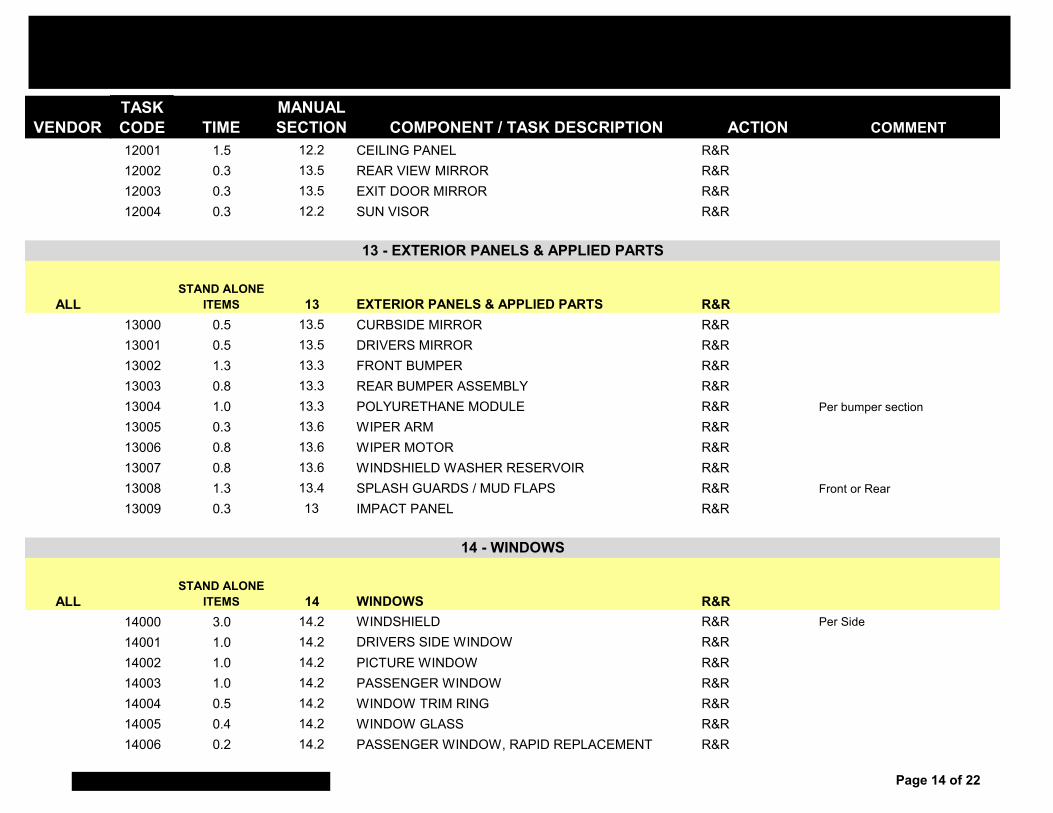
VENDORTASK CODE TIME
MANUAL SECTION COMPONENT / TASK DESCRIPTION ACTION COMMENT
12001 1.5 12.2 CEILING PANEL R&R12002 0.3 13.5 REAR VIEW MIRROR R&R12003 0.3 13.5 EXIT DOOR MIRROR R&R12004 0.3 12.2 SUN VISOR R&R
ALLSTAND ALONE
ITEMS 13 EXTERIOR PANELS & APPLIED PARTS R&R13000 0.5 13.5 CURBSIDE MIRROR R&R13001 0.5 13.5 DRIVERS MIRROR R&R13002 1.3 13.3 FRONT BUMPER R&R13003 0.8 13.3 REAR BUMPER ASSEMBLY R&R13004 1.0 13.3 POLYURETHANE MODULE R&R Per bumper section
13005 0.3 13.6 WIPER ARM R&R13006 0.8 13.6 WIPER MOTOR R&R13007 0.8 13.6 WINDSHIELD WASHER RESERVOIR R&R13008 1.3 13.4 SPLASH GUARDS / MUD FLAPS R&R Front or Rear
13009 0.3 13 IMPACT PANEL R&R
ALLSTAND ALONE
ITEMS 14 WINDOWS R&R14000 3.0 14.2 WINDSHIELD R&R Per Side
14001 1.0 14.2 DRIVERS SIDE WINDOW R&R14002 1.0 14.2 PICTURE WINDOW R&R14003 1.0 14.2 PASSENGER WINDOW R&R14004 0.5 14.2 WINDOW TRIM RING R&R14005 0.4 14.2 WINDOW GLASS R&R14006 0.2 14.2 PASSENGER WINDOW, RAPID REPLACEMENT R&R
13 - EXTERIOR PANELS & APPLIED PARTS
14 - WINDOWS
Page 14 of 22
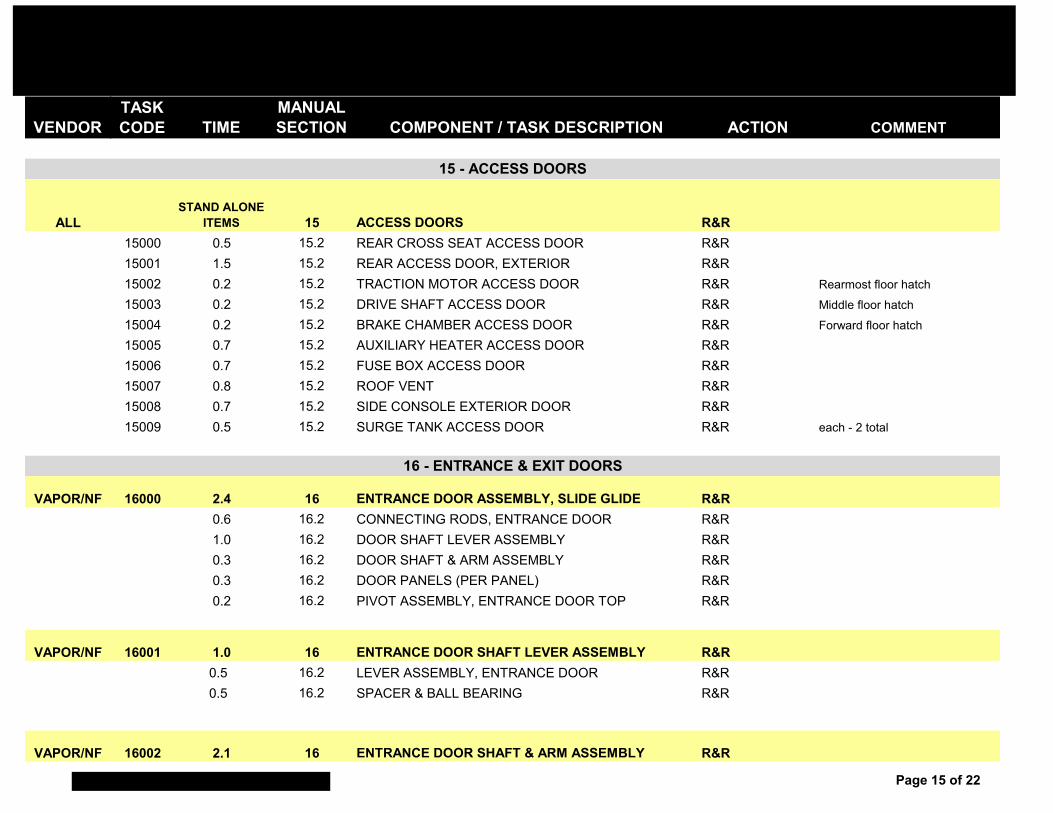
VENDORTASK CODE TIME
MANUAL SECTION COMPONENT / TASK DESCRIPTION ACTION COMMENT
ALLSTAND ALONE
ITEMS 15 ACCESS DOORS R&R15000 0.5 15.2 REAR CROSS SEAT ACCESS DOOR R&R15001 1.5 15.2 REAR ACCESS DOOR, EXTERIOR R&R15002 0.2 15.2 TRACTION MOTOR ACCESS DOOR R&R Rearmost floor hatch
15003 0.2 15.2 DRIVE SHAFT ACCESS DOOR R&R Middle floor hatch
15004 0.2 15.2 BRAKE CHAMBER ACCESS DOOR R&R Forward floor hatch
15005 0.7 15.2 AUXILIARY HEATER ACCESS DOOR R&R15006 0.7 15.2 FUSE BOX ACCESS DOOR R&R15007 0.8 15.2 ROOF VENT R&R15008 0.7 15.2 SIDE CONSOLE EXTERIOR DOOR R&R15009 0.5 15.2 SURGE TANK ACCESS DOOR R&R each - 2 total
VAPOR/NF 16000 2.4 16 ENTRANCE DOOR ASSEMBLY, SLIDE GLIDE R&R0.6 16.2 CONNECTING RODS, ENTRANCE DOOR R&R1.0 16.2 DOOR SHAFT LEVER ASSEMBLY R&R0.3 16.2 DOOR SHAFT & ARM ASSEMBLY R&R0.3 16.2 DOOR PANELS (PER PANEL) R&R0.2 16.2 PIVOT ASSEMBLY, ENTRANCE DOOR TOP R&R
VAPOR/NF 16001 1.0 16 ENTRANCE DOOR SHAFT LEVER ASSEMBLY R&R0.5 16.2 LEVER ASSEMBLY, ENTRANCE DOOR R&R0.5 16.2 SPACER & BALL BEARING R&R
VAPOR/NF 16002 2.1 16 ENTRANCE DOOR SHAFT & ARM ASSEMBLY R&R
15 - ACCESS DOORS
16 - ENTRANCE & EXIT DOORS
Page 15 of 22

VENDORTASK CODE TIME
MANUAL SECTION COMPONENT / TASK DESCRIPTION ACTION COMMENT
0.3 16.2 DOOR PANELS R&R Per Panel
1.0 16.2 DOOR GLASS R&R0.2 16.2 PIVOT ASSEMBLY, ENTRANCE DOOR TOP R&R0.3 16.2 SEALS & TRIM, ENTRANCE DOOR R&R0.3 16.2 BRUSHES, ENTRANCE DOOR R&R
VAPOR/NF 16003 2.6 16 ENTRANCE DOOR MECHANISM OVERHAUL R&R1.5 16.2 DOOR MOTOR ASSEMBLY R&R0.2 16.2 DOOR MAG VALVE R&R0.3 16.2 LIMIT SWITCHES R&R0.6 16.2 CONNECTING RODS, ENTRANCE DOOR R&R
VAPOR/NF 16004 6.4 16 EXIT DOOR SYSTEM, SWING R&R2.9 16.3 EXIT DOORS, SWING R&R0.8 16.3 EXIT DOOR PANELS R&R2.1 16.3 EXIT DOOR ASSEMBLY R&R0.6 16.3 EXIT DOOR ENGINE R&R
VAPOR/NF 16005 0.6 16 EXIT DOOR PANELS R&R BOTH0.5 16.3 DOOR GLASS R&R0.1 16.3 DOOR SHAFT LEVERS R&R
VAPOR/NF 16006 0.9 16 EXIT DOOR ASSEMBLY R&R SINGLE
0.3 16.3 SEALS & TRIM R&R0.3 16.3 DOOR BRUSHES R&R0.3 16.3 HANDLE R&R
Page 16 of 22
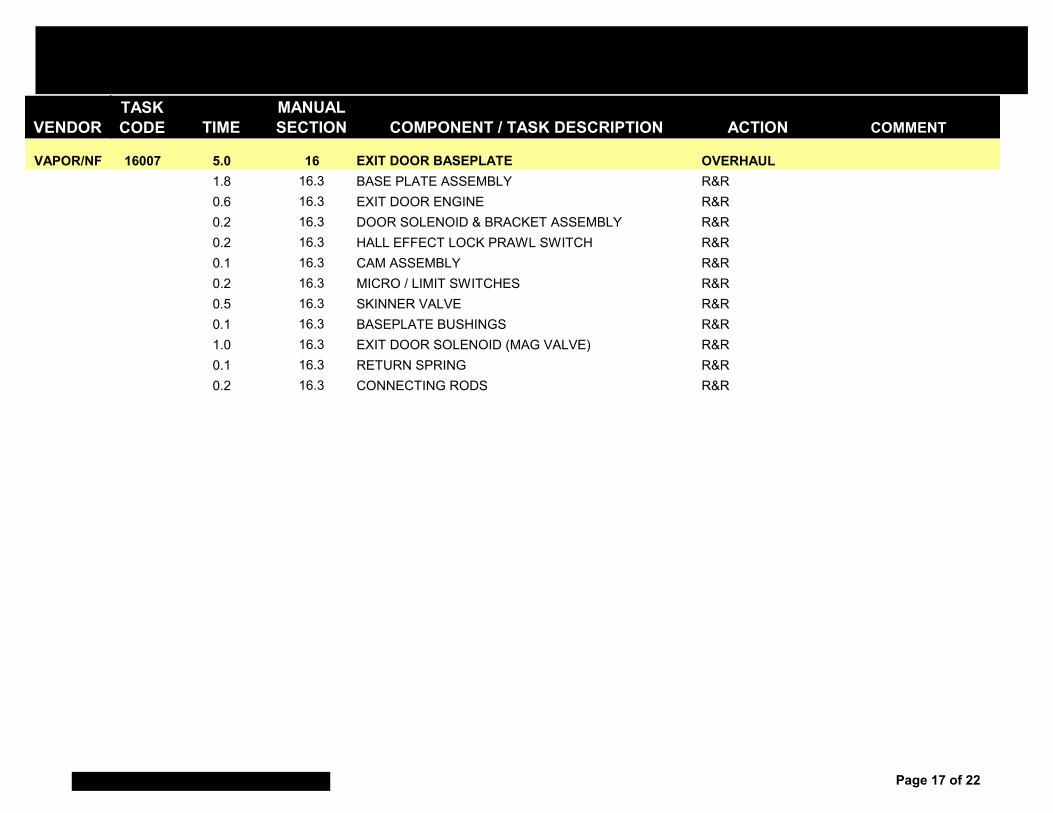
VENDORTASK CODE TIME
MANUAL SECTION COMPONENT / TASK DESCRIPTION ACTION COMMENT
VAPOR/NF 16007 5.0 16 EXIT DOOR BASEPLATE OVERHAUL1.8 16.3 BASE PLATE ASSEMBLY R&R0.6 16.3 EXIT DOOR ENGINE R&R0.2 16.3 DOOR SOLENOID & BRACKET ASSEMBLY R&R0.2 16.3 HALL EFFECT LOCK PRAWL SWITCH R&R0.1 16.3 CAM ASSEMBLY R&R0.2 16.3 MICRO / LIMIT SWITCHES R&R0.5 16.3 SKINNER VALVE R&R0.1 16.3 BASEPLATE BUSHINGS R&R1.0 16.3 EXIT DOOR SOLENOID (MAG VALVE) R&R0.1 16.3 RETURN SPRING R&R0.2 16.3 CONNECTING RODS R&R
Page 17 of 22
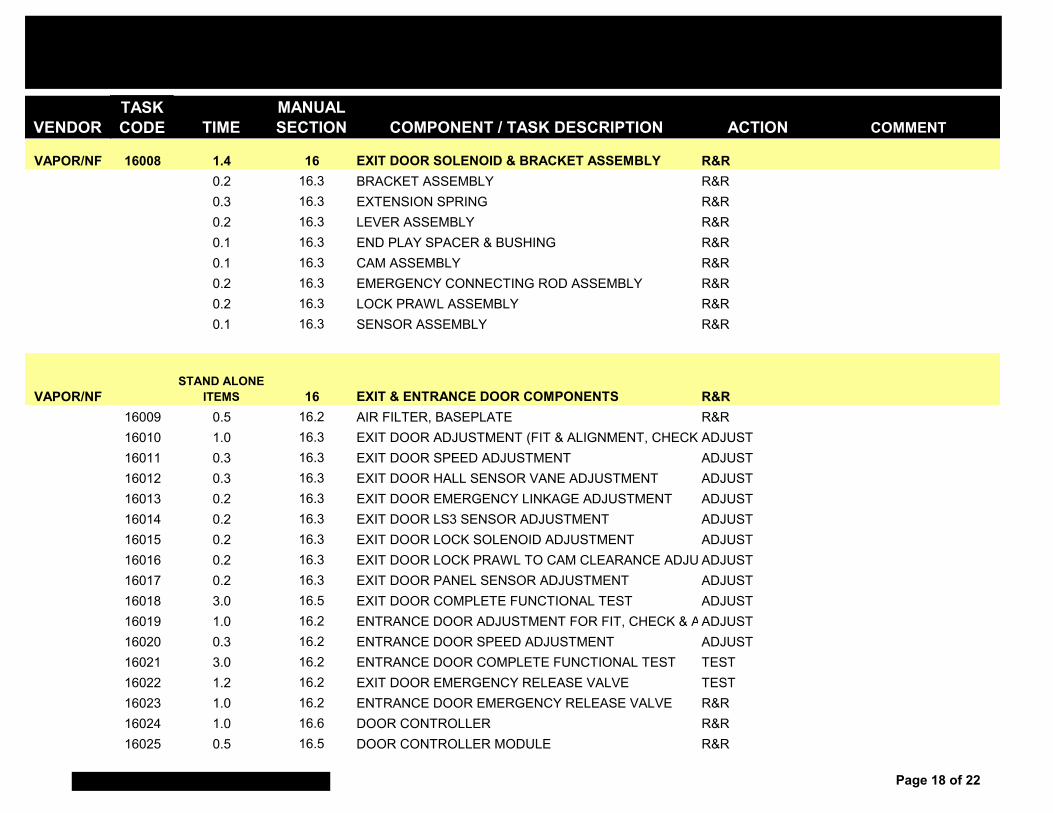
VENDORTASK CODE TIME
MANUAL SECTION COMPONENT / TASK DESCRIPTION ACTION COMMENT
VAPOR/NF 16008 1.4 16 EXIT DOOR SOLENOID & BRACKET ASSEMBLY R&R0.2 16.3 BRACKET ASSEMBLY R&R0.3 16.3 EXTENSION SPRING R&R0.2 16.3 LEVER ASSEMBLY R&R0.1 16.3 END PLAY SPACER & BUSHING R&R0.1 16.3 CAM ASSEMBLY R&R0.2 16.3 EMERGENCY CONNECTING ROD ASSEMBLY R&R0.2 16.3 LOCK PRAWL ASSEMBLY R&R0.1 16.3 SENSOR ASSEMBLY R&R
VAPOR/NFSTAND ALONE
ITEMS 16 EXIT & ENTRANCE DOOR COMPONENTS R&R16009 0.5 16.2 AIR FILTER, BASEPLATE R&R16010 1.0 16.3 EXIT DOOR ADJUSTMENT (FIT & ALIGNMENT, CHECK ADJUST16011 0.3 16.3 EXIT DOOR SPEED ADJUSTMENT ADJUST16012 0.3 16.3 EXIT DOOR HALL SENSOR VANE ADJUSTMENT ADJUST16013 0.2 16.3 EXIT DOOR EMERGENCY LINKAGE ADJUSTMENT ADJUST16014 0.2 16.3 EXIT DOOR LS3 SENSOR ADJUSTMENT ADJUST16015 0.2 16.3 EXIT DOOR LOCK SOLENOID ADJUSTMENT ADJUST16016 0.2 16.3 EXIT DOOR LOCK PRAWL TO CAM CLEARANCE ADJU ADJUST16017 0.2 16.3 EXIT DOOR PANEL SENSOR ADJUSTMENT ADJUST16018 3.0 16.5 EXIT DOOR COMPLETE FUNCTIONAL TEST ADJUST16019 1.0 16.2 ENTRANCE DOOR ADJUSTMENT FOR FIT, CHECK & AADJUST16020 0.3 16.2 ENTRANCE DOOR SPEED ADJUSTMENT ADJUST16021 3.0 16.2 ENTRANCE DOOR COMPLETE FUNCTIONAL TEST TEST16022 1.2 16.2 EXIT DOOR EMERGENCY RELEASE VALVE TEST16023 1.0 16.2 ENTRANCE DOOR EMERGENCY RELEASE VALVE R&R16024 1.0 16.6 DOOR CONTROLLER R&R16025 0.5 16.5 DOOR CONTROLLER MODULE R&R
Page 18 of 22
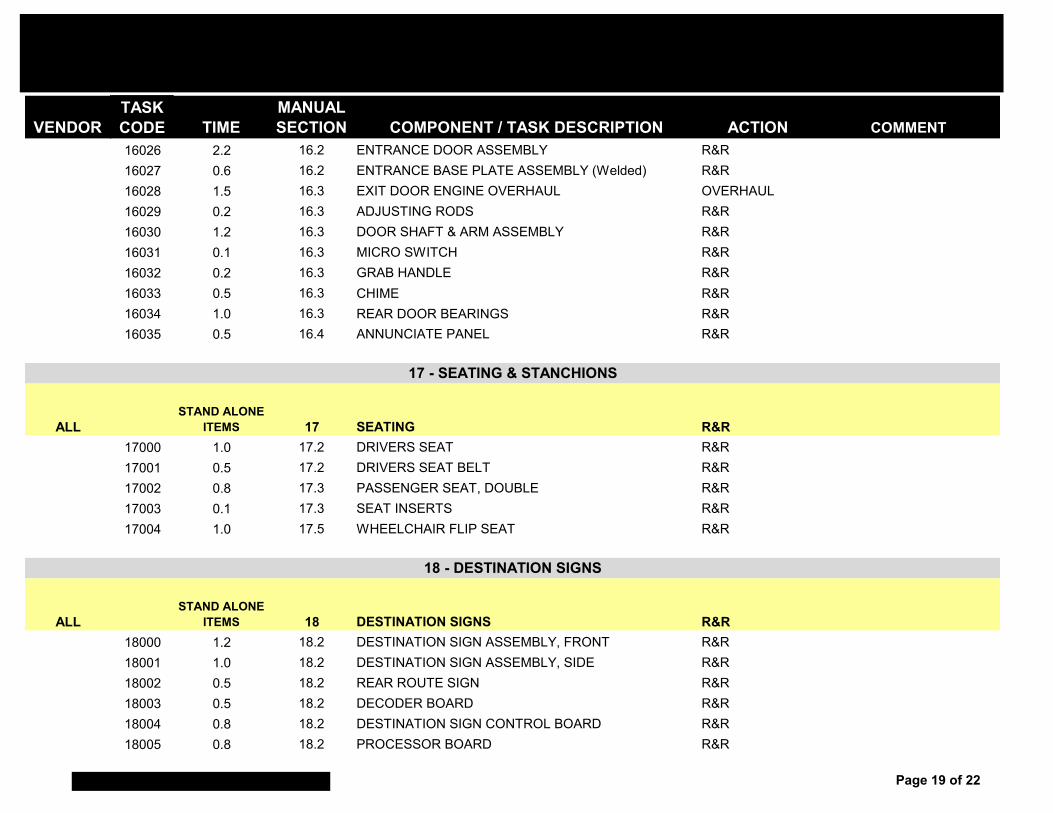
VENDORTASK CODE TIME
MANUAL SECTION COMPONENT / TASK DESCRIPTION ACTION COMMENT
16026 2.2 16.2 ENTRANCE DOOR ASSEMBLY R&R16027 0.6 16.2 ENTRANCE BASE PLATE ASSEMBLY (Welded) R&R16028 1.5 16.3 EXIT DOOR ENGINE OVERHAUL OVERHAUL16029 0.2 16.3 ADJUSTING RODS R&R16030 1.2 16.3 DOOR SHAFT & ARM ASSEMBLY R&R16031 0.1 16.3 MICRO SWITCH R&R16032 0.2 16.3 GRAB HANDLE R&R16033 0.5 16.3 CHIME R&R16034 1.0 16.3 REAR DOOR BEARINGS R&R16035 0.5 16.4 ANNUNCIATE PANEL R&R
ALLSTAND ALONE
ITEMS 17 SEATING R&R17000 1.0 17.2 DRIVERS SEAT R&R17001 0.5 17.2 DRIVERS SEAT BELT R&R17002 0.8 17.3 PASSENGER SEAT, DOUBLE R&R17003 0.1 17.3 SEAT INSERTS R&R17004 1.0 17.5 WHEELCHAIR FLIP SEAT R&R
ALLSTAND ALONE
ITEMS 18 DESTINATION SIGNS R&R18000 1.2 18.2 DESTINATION SIGN ASSEMBLY, FRONT R&R18001 1.0 18.2 DESTINATION SIGN ASSEMBLY, SIDE R&R18002 0.5 18.2 REAR ROUTE SIGN R&R18003 0.5 18.2 DECODER BOARD R&R18004 0.8 18.2 DESTINATION SIGN CONTROL BOARD R&R18005 0.8 18.2 PROCESSOR BOARD R&R
18 - DESTINATION SIGNS
17 - SEATING & STANCHIONS
Page 19 of 22

VENDORTASK CODE TIME
MANUAL SECTION COMPONENT / TASK DESCRIPTION ACTION COMMENT
18006 1.0 18.2 DESTINATION SIGN GLASS R&R
Page 20 of 22
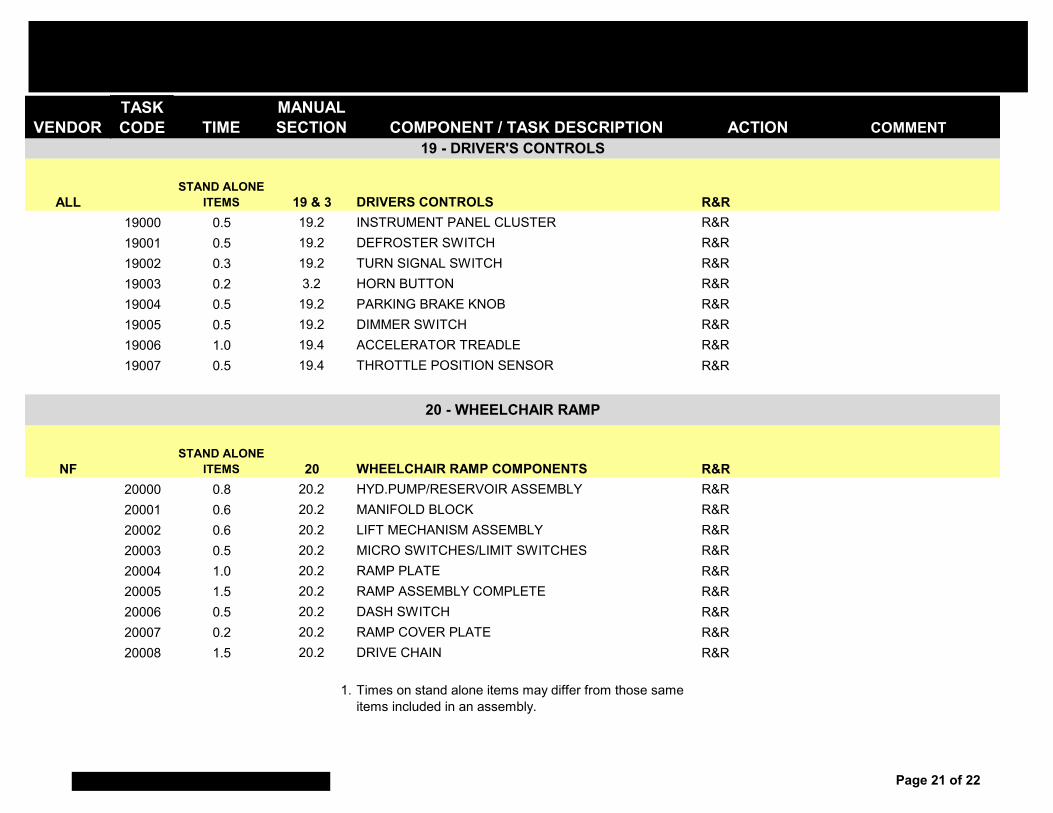
VENDORTASK CODE TIME
MANUAL SECTION COMPONENT / TASK DESCRIPTION ACTION COMMENT
ALLSTAND ALONE
ITEMS 19 & 3 DRIVERS CONTROLS R&R19000 0.5 19.2 INSTRUMENT PANEL CLUSTER R&R19001 0.5 19.2 DEFROSTER SWITCH R&R19002 0.3 19.2 TURN SIGNAL SWITCH R&R19003 0.2 3.2 HORN BUTTON R&R19004 0.5 19.2 PARKING BRAKE KNOB R&R19005 0.5 19.2 DIMMER SWITCH R&R19006 1.0 19.4 ACCELERATOR TREADLE R&R19007 0.5 19.4 THROTTLE POSITION SENSOR R&R
NFSTAND ALONE
ITEMS 20 WHEELCHAIR RAMP COMPONENTS R&R20000 0.8 20.2 HYD.PUMP/RESERVOIR ASSEMBLY R&R20001 0.6 20.2 MANIFOLD BLOCK R&R20002 0.6 20.2 LIFT MECHANISM ASSEMBLY R&R20003 0.5 20.2 MICRO SWITCHES/LIMIT SWITCHES R&R20004 1.0 20.2 RAMP PLATE R&R20005 1.5 20.2 RAMP ASSEMBLY COMPLETE R&R20006 0.5 20.2 DASH SWITCH R&R20007 0.2 20.2 RAMP COVER PLATE R&R20008 1.5 20.2 DRIVE CHAIN R&R
1. Times on stand alone items may differ from those sameitems included in an assembly.
19 - DRIVER'S CONTROLS
20 - WHEELCHAIR RAMP
Page 21 of 22
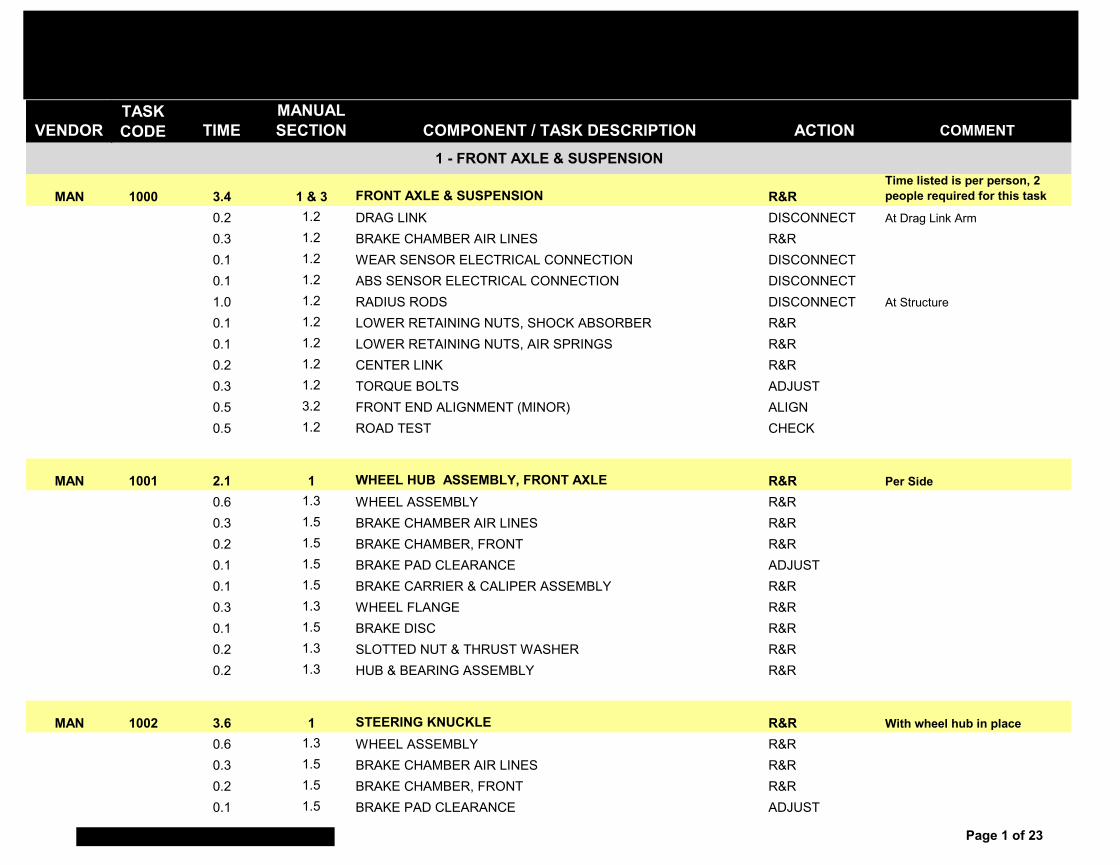
VENDORTASK CODE TIME
MANUAL SECTION COMPONENT / TASK DESCRIPTION ACTION COMMENT
MAN 1000 3.4 1 & 3 FRONT AXLE & SUSPENSION R&RTime listed is per person, 2 people required for this task
0.2 1.2 DRAG LINK DISCONNECT At Drag Link Arm
0.3 1.2 BRAKE CHAMBER AIR LINES R&R0.1 1.2 WEAR SENSOR ELECTRICAL CONNECTION DISCONNECT0.1 1.2 ABS SENSOR ELECTRICAL CONNECTION DISCONNECT1.0 1.2 RADIUS RODS DISCONNECT At Structure
0.1 1.2 LOWER RETAINING NUTS, SHOCK ABSORBER R&R0.1 1.2 LOWER RETAINING NUTS, AIR SPRINGS R&R0.2 1.2 CENTER LINK R&R0.3 1.2 TORQUE BOLTS ADJUST0.5 3.2 FRONT END ALIGNMENT (MINOR) ALIGN0.5 1.2 ROAD TEST CHECK
MAN 1001 2.1 1 WHEEL HUB ASSEMBLY, FRONT AXLE R&R Per Side0.6 1.3 WHEEL ASSEMBLY R&R0.3 1.5 BRAKE CHAMBER AIR LINES R&R0.2 1.5 BRAKE CHAMBER, FRONT R&R0.1 1.5 BRAKE PAD CLEARANCE ADJUST0.1 1.5 BRAKE CARRIER & CALIPER ASSEMBLY R&R0.3 1.3 WHEEL FLANGE R&R0.1 1.5 BRAKE DISC R&R0.2 1.3 SLOTTED NUT & THRUST WASHER R&R0.2 1.3 HUB & BEARING ASSEMBLY R&R
MAN 1002 3.6 1 STEERING KNUCKLE R&R With wheel hub in place0.6 1.3 WHEEL ASSEMBLY R&R0.3 1.5 BRAKE CHAMBER AIR LINES R&R0.2 1.5 BRAKE CHAMBER, FRONT R&R0.1 1.5 BRAKE PAD CLEARANCE ADJUST
1 - FRONT AXLE & SUSPENSION
Page 1 of 23
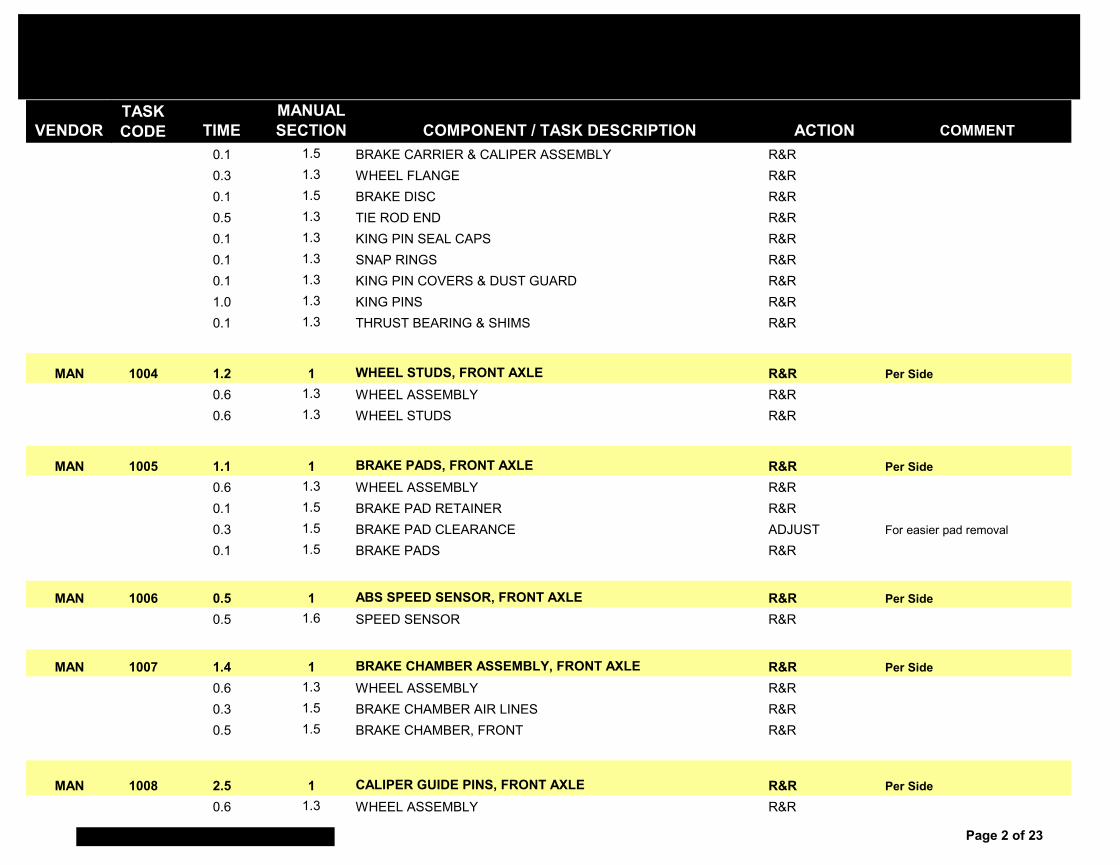
VENDORTASK CODE TIME
MANUAL SECTION COMPONENT / TASK DESCRIPTION ACTION COMMENT
0.1 1.5 BRAKE CARRIER & CALIPER ASSEMBLY R&R0.3 1.3 WHEEL FLANGE R&R0.1 1.5 BRAKE DISC R&R0.5 1.3 TIE ROD END R&R0.1 1.3 KING PIN SEAL CAPS R&R0.1 1.3 SNAP RINGS R&R0.1 1.3 KING PIN COVERS & DUST GUARD R&R1.0 1.3 KING PINS R&R0.1 1.3 THRUST BEARING & SHIMS R&R
MAN 1004 1.2 1 WHEEL STUDS, FRONT AXLE R&R Per Side0.6 1.3 WHEEL ASSEMBLY R&R0.6 1.3 WHEEL STUDS R&R
MAN 1005 1.1 1 BRAKE PADS, FRONT AXLE R&R Per Side0.6 1.3 WHEEL ASSEMBLY R&R0.1 1.5 BRAKE PAD RETAINER R&R0.3 1.5 BRAKE PAD CLEARANCE ADJUST For easier pad removal
0.1 1.5 BRAKE PADS R&R
MAN 1006 0.5 1 ABS SPEED SENSOR, FRONT AXLE R&R Per Side0.5 1.6 SPEED SENSOR R&R
MAN 1007 1.4 1 BRAKE CHAMBER ASSEMBLY, FRONT AXLE R&R Per Side0.6 1.3 WHEEL ASSEMBLY R&R0.3 1.5 BRAKE CHAMBER AIR LINES R&R0.5 1.5 BRAKE CHAMBER, FRONT R&R
MAN 1008 2.5 1 CALIPER GUIDE PINS, FRONT AXLE R&R Per Side0.6 1.3 WHEEL ASSEMBLY R&R
Page 2 of 23
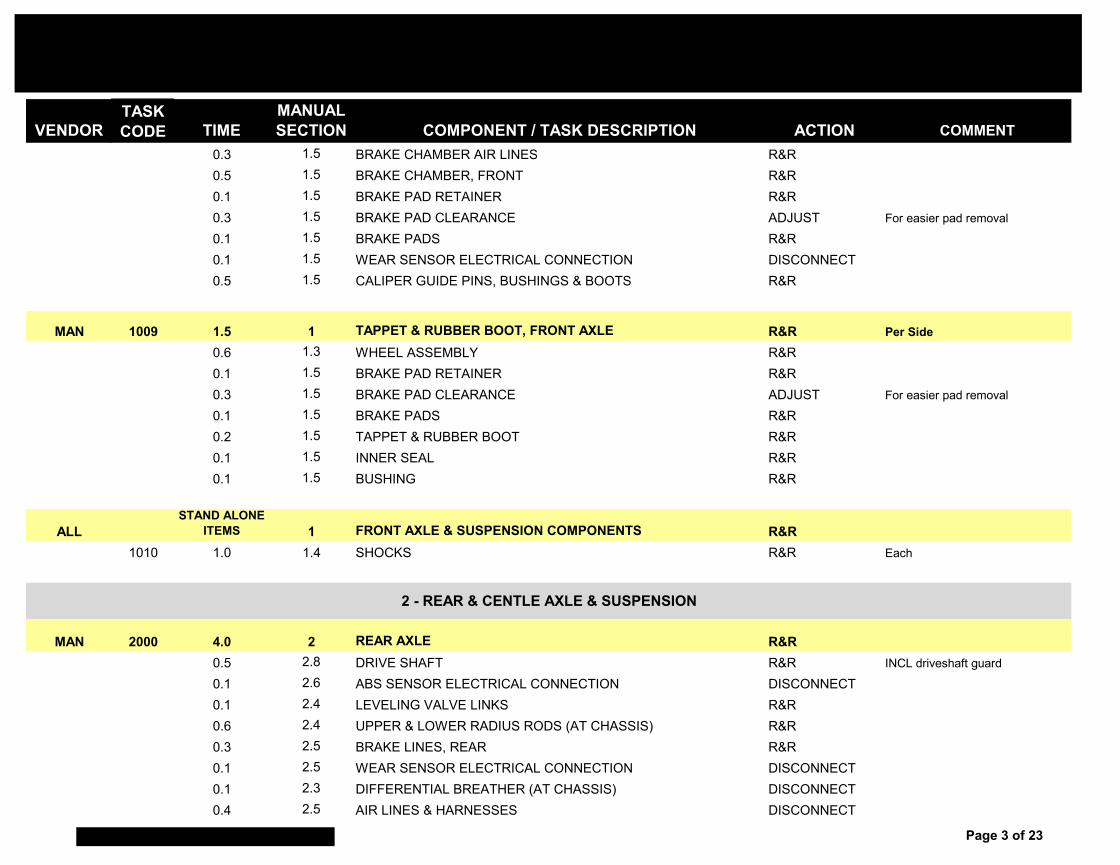
VENDORTASK CODE TIME
MANUAL SECTION COMPONENT / TASK DESCRIPTION ACTION COMMENT
0.3 1.5 BRAKE CHAMBER AIR LINES R&R0.5 1.5 BRAKE CHAMBER, FRONT R&R0.1 1.5 BRAKE PAD RETAINER R&R0.3 1.5 BRAKE PAD CLEARANCE ADJUST For easier pad removal
0.1 1.5 BRAKE PADS R&R0.1 1.5 WEAR SENSOR ELECTRICAL CONNECTION DISCONNECT0.5 1.5 CALIPER GUIDE PINS, BUSHINGS & BOOTS R&R
MAN 1009 1.5 1 TAPPET & RUBBER BOOT, FRONT AXLE R&R Per Side0.6 1.3 WHEEL ASSEMBLY R&R0.1 1.5 BRAKE PAD RETAINER R&R0.3 1.5 BRAKE PAD CLEARANCE ADJUST For easier pad removal
0.1 1.5 BRAKE PADS R&R0.2 1.5 TAPPET & RUBBER BOOT R&R0.1 1.5 INNER SEAL R&R0.1 1.5 BUSHING R&R
ALLSTAND ALONE
ITEMS 1 FRONT AXLE & SUSPENSION COMPONENTS R&R1010 1.0 1.4 SHOCKS R&R Each
MAN 2000 4.0 2 REAR AXLE R&R0.5 2.8 DRIVE SHAFT R&R INCL driveshaft guard
0.1 2.6 ABS SENSOR ELECTRICAL CONNECTION DISCONNECT0.1 2.4 LEVELING VALVE LINKS R&R0.6 2.4 UPPER & LOWER RADIUS RODS (AT CHASSIS) R&R0.3 2.5 BRAKE LINES, REAR R&R0.1 2.5 WEAR SENSOR ELECTRICAL CONNECTION DISCONNECT0.1 2.3 DIFFERENTIAL BREATHER (AT CHASSIS) DISCONNECT0.4 2.5 AIR LINES & HARNESSES DISCONNECT
2 - REAR & CENTLE AXLE & SUSPENSION
Page 3 of 23

VENDORTASK CODE TIME
MANUAL SECTION COMPONENT / TASK DESCRIPTION ACTION COMMENT
0.2 2.4 SHOCKS (LOWER NUTS ONLY) R&R0.2 2.4 AIR SPRINGS (LOWER BOLTS ONLY) R&R
1.0 2.3AXLE, U-BOLTS & SPACERS (SEPARATION FROM SUSPENSION BEAM) R&R
0.2 2.3 TORQUE HARDWARE ADJUST0.2 2 RAISE & LOWER WHEEL & AXLE ASSEMBLY OPERATION
MAN 2001 1.2 2 WHEEL STUDS R&R Per Side0.6 2.3 WHEEL ASSEMBLY R&R0.6 2.3 WHEEL STUDS R&R
MAN 2002 0.7 2 AXLE SHAFT R&R Per Side0.2 2.3 CAGE BRAKE CHAMBER OPERATION0.2 2.2 DIFFERENTIAL OIL DRAIN0.1 2.3 AXLE SHAFT MOUNITNG BOLTS R&R0.1 2.3 AXLE SHAFT R&R0.1 2.3 TORQUE HARDWARE ADJUST
MAN 2003 2.4 2 WHEEL HUB ASSEMBLY, REAR R&R Per Side0.2 2.3 CAGE BRAKE CHAMBER OPERATION0.2 2.2 DIFFERENTIAL OIL DRAIN0.2 2.3 AXLE SHAFT MOUNITNG BOLTS R&R0.1 2.3 AXLE SHAFT R&R0.1 2.3 CENTERING DEVICE OPERATION0.2 2.3 ADJUSTING NUT & THRUST WASHER R&R0.2 2.3 HUB & BEARING ASSEMBLY R&R1.0 2.3 RETAINING RING & TAPPERED ROLLER BEARING ASSEMBLIES R&R0.2 2.3 TORQUE HARDWARE ADJUST
MAN 2004 2.2 2 BRAKE DISC, REAR R&R Per Side
Page 4 of 23
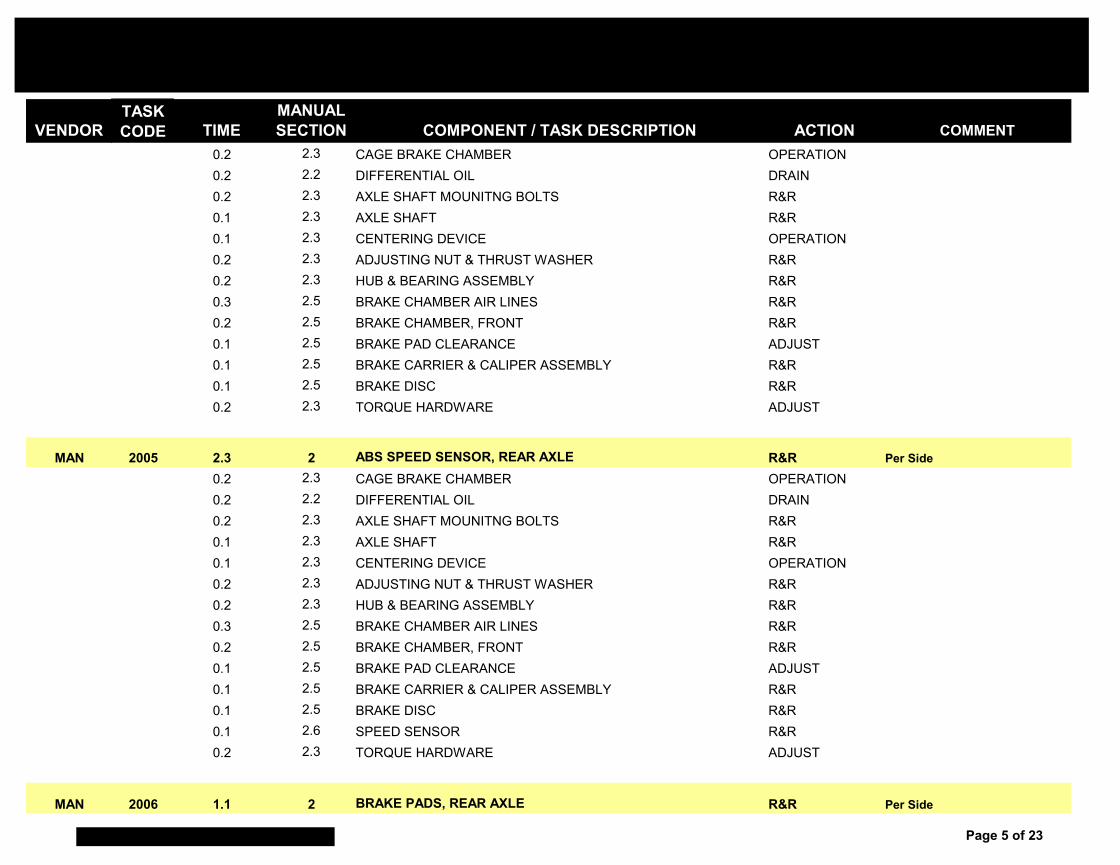
VENDORTASK CODE TIME
MANUAL SECTION COMPONENT / TASK DESCRIPTION ACTION COMMENT
0.2 2.3 CAGE BRAKE CHAMBER OPERATION0.2 2.2 DIFFERENTIAL OIL DRAIN0.2 2.3 AXLE SHAFT MOUNITNG BOLTS R&R0.1 2.3 AXLE SHAFT R&R0.1 2.3 CENTERING DEVICE OPERATION0.2 2.3 ADJUSTING NUT & THRUST WASHER R&R0.2 2.3 HUB & BEARING ASSEMBLY R&R0.3 2.5 BRAKE CHAMBER AIR LINES R&R0.2 2.5 BRAKE CHAMBER, FRONT R&R0.1 2.5 BRAKE PAD CLEARANCE ADJUST0.1 2.5 BRAKE CARRIER & CALIPER ASSEMBLY R&R0.1 2.5 BRAKE DISC R&R0.2 2.3 TORQUE HARDWARE ADJUST
MAN 2005 2.3 2 ABS SPEED SENSOR, REAR AXLE R&R Per Side0.2 2.3 CAGE BRAKE CHAMBER OPERATION0.2 2.2 DIFFERENTIAL OIL DRAIN0.2 2.3 AXLE SHAFT MOUNITNG BOLTS R&R0.1 2.3 AXLE SHAFT R&R0.1 2.3 CENTERING DEVICE OPERATION0.2 2.3 ADJUSTING NUT & THRUST WASHER R&R0.2 2.3 HUB & BEARING ASSEMBLY R&R0.3 2.5 BRAKE CHAMBER AIR LINES R&R0.2 2.5 BRAKE CHAMBER, FRONT R&R0.1 2.5 BRAKE PAD CLEARANCE ADJUST0.1 2.5 BRAKE CARRIER & CALIPER ASSEMBLY R&R0.1 2.5 BRAKE DISC R&R0.1 2.6 SPEED SENSOR R&R0.2 2.3 TORQUE HARDWARE ADJUST
MAN 2006 1.1 2 BRAKE PADS, REAR AXLE R&R Per Side
Page 5 of 23
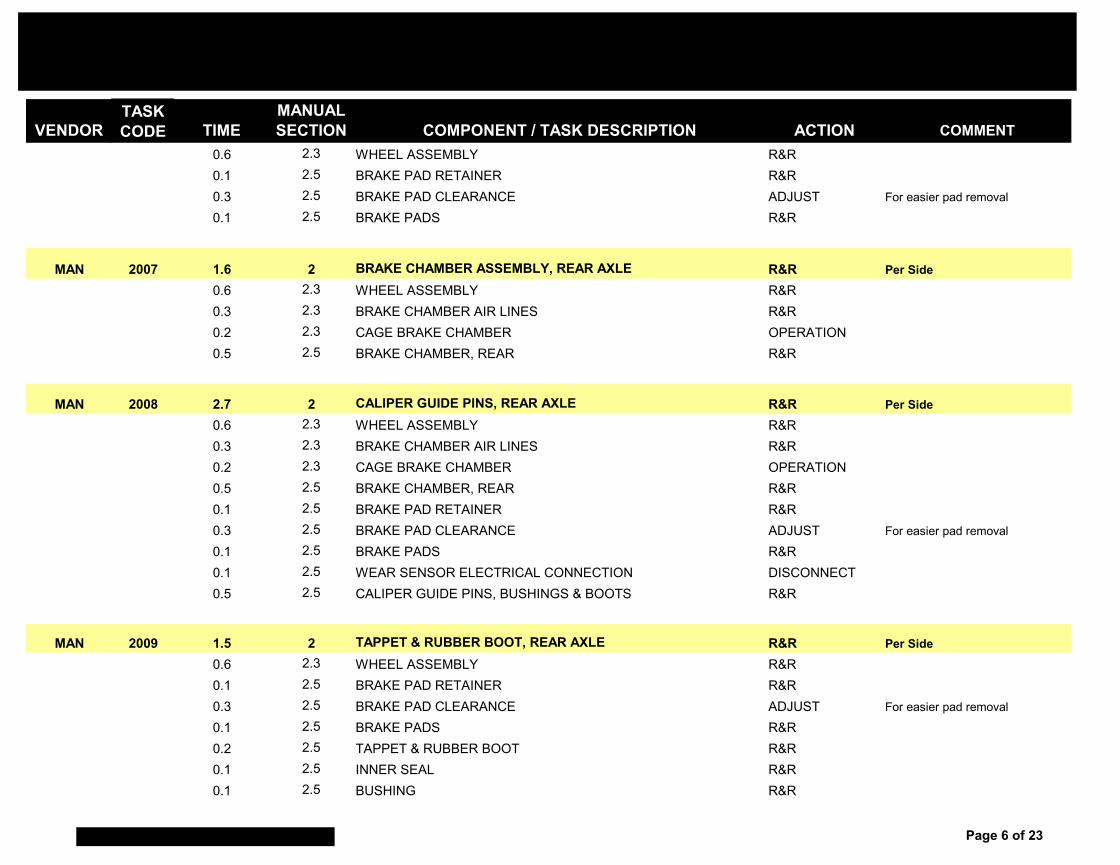
VENDORTASK CODE TIME
MANUAL SECTION COMPONENT / TASK DESCRIPTION ACTION COMMENT
0.6 2.3 WHEEL ASSEMBLY R&R0.1 2.5 BRAKE PAD RETAINER R&R0.3 2.5 BRAKE PAD CLEARANCE ADJUST For easier pad removal
0.1 2.5 BRAKE PADS R&R
MAN 2007 1.6 2 BRAKE CHAMBER ASSEMBLY, REAR AXLE R&R Per Side0.6 2.3 WHEEL ASSEMBLY R&R0.3 2.3 BRAKE CHAMBER AIR LINES R&R0.2 2.3 CAGE BRAKE CHAMBER OPERATION0.5 2.5 BRAKE CHAMBER, REAR R&R
MAN 2008 2.7 2 CALIPER GUIDE PINS, REAR AXLE R&R Per Side0.6 2.3 WHEEL ASSEMBLY R&R0.3 2.3 BRAKE CHAMBER AIR LINES R&R0.2 2.3 CAGE BRAKE CHAMBER OPERATION0.5 2.5 BRAKE CHAMBER, REAR R&R0.1 2.5 BRAKE PAD RETAINER R&R0.3 2.5 BRAKE PAD CLEARANCE ADJUST For easier pad removal
0.1 2.5 BRAKE PADS R&R0.1 2.5 WEAR SENSOR ELECTRICAL CONNECTION DISCONNECT0.5 2.5 CALIPER GUIDE PINS, BUSHINGS & BOOTS R&R
MAN 2009 1.5 2 TAPPET & RUBBER BOOT, REAR AXLE R&R Per Side0.6 2.3 WHEEL ASSEMBLY R&R0.1 2.5 BRAKE PAD RETAINER R&R0.3 2.5 BRAKE PAD CLEARANCE ADJUST For easier pad removal
0.1 2.5 BRAKE PADS R&R0.2 2.5 TAPPET & RUBBER BOOT R&R0.1 2.5 INNER SEAL R&R0.1 2.5 BUSHING R&R
Page 6 of 23
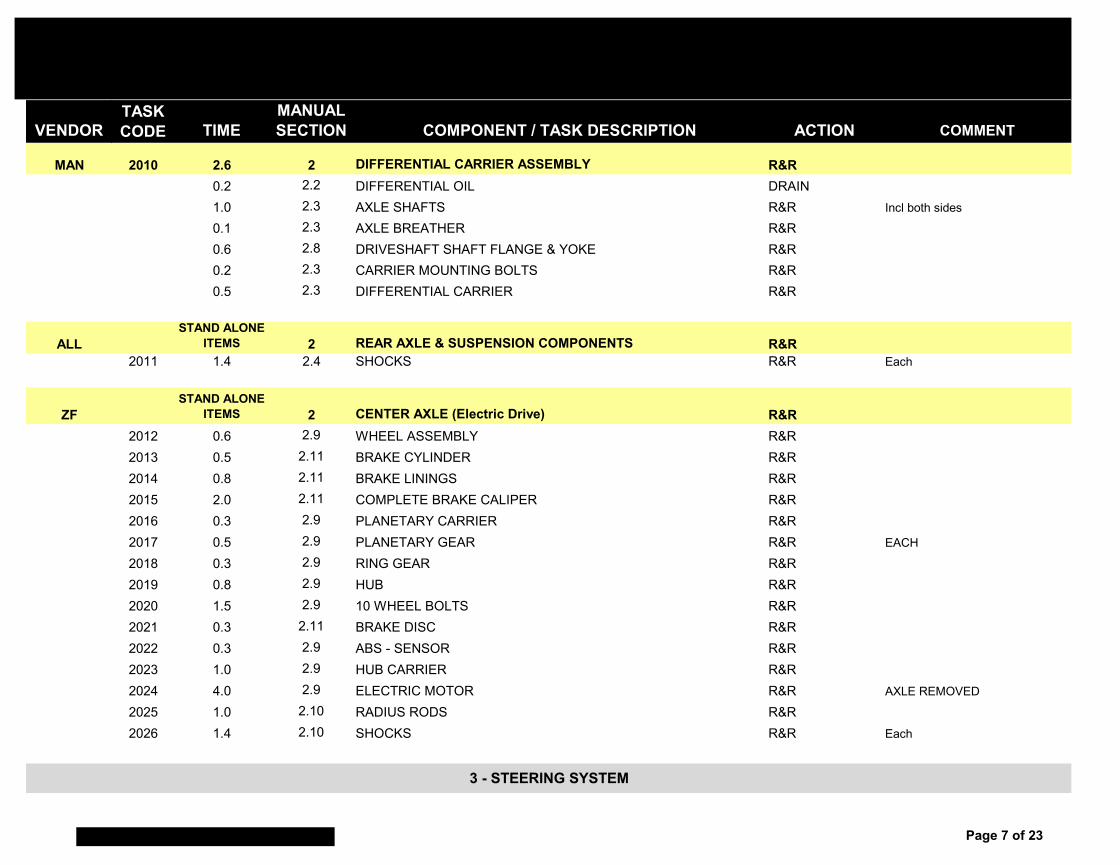
VENDORTASK CODE TIME
MANUAL SECTION COMPONENT / TASK DESCRIPTION ACTION COMMENT
MAN 2010 2.6 2 DIFFERENTIAL CARRIER ASSEMBLY R&R0.2 2.2 DIFFERENTIAL OIL DRAIN1.0 2.3 AXLE SHAFTS R&R Incl both sides
0.1 2.3 AXLE BREATHER R&R0.6 2.8 DRIVESHAFT SHAFT FLANGE & YOKE R&R0.2 2.3 CARRIER MOUNTING BOLTS R&R0.5 2.3 DIFFERENTIAL CARRIER R&R
ALLSTAND ALONE
ITEMS 2 REAR AXLE & SUSPENSION COMPONENTS R&R2011 1.4 2.4 SHOCKS R&R Each
ZFSTAND ALONE
ITEMS 2 CENTER AXLE (Electric Drive) R&R2012 0.6 2.9 WHEEL ASSEMBLY R&R2013 0.5 2.11 BRAKE CYLINDER R&R2014 0.8 2.11 BRAKE LININGS R&R2015 2.0 2.11 COMPLETE BRAKE CALIPER R&R2016 0.3 2.9 PLANETARY CARRIER R&R2017 0.5 2.9 PLANETARY GEAR R&R EACH
2018 0.3 2.9 RING GEAR R&R2019 0.8 2.9 HUB R&R2020 1.5 2.9 10 WHEEL BOLTS R&R2021 0.3 2.11 BRAKE DISC R&R2022 0.3 2.9 ABS - SENSOR R&R2023 1.0 2.9 HUB CARRIER R&R2024 4.0 2.9 ELECTRIC MOTOR R&R AXLE REMOVED
2025 1.0 2.10 RADIUS RODS R&R2026 1.4 2.10 SHOCKS R&R Each
3 - STEERING SYSTEM
Page 7 of 23
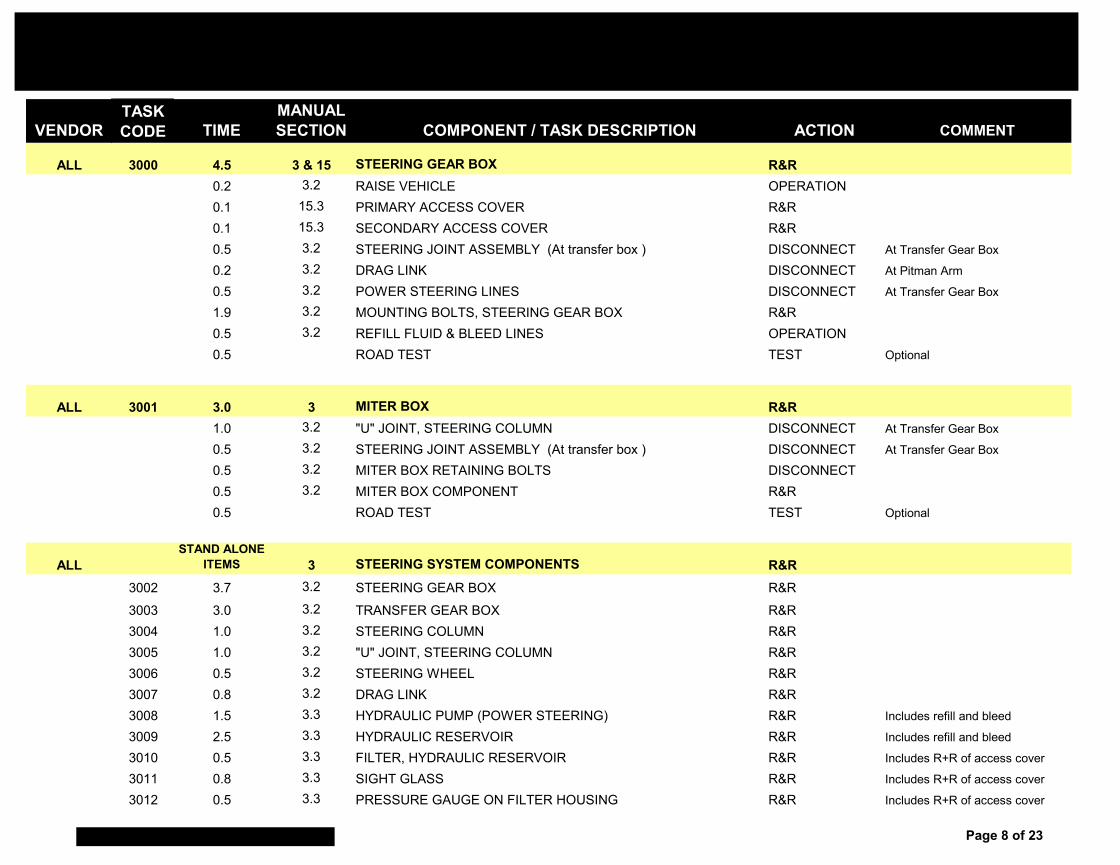
VENDORTASK CODE TIME
MANUAL SECTION COMPONENT / TASK DESCRIPTION ACTION COMMENT
ALL 3000 4.5 3 & 15 STEERING GEAR BOX R&R0.2 3.2 RAISE VEHICLE OPERATION0.1 15.3 PRIMARY ACCESS COVER R&R0.1 15.3 SECONDARY ACCESS COVER R&R0.5 3.2 STEERING JOINT ASSEMBLY (At transfer box ) DISCONNECT At Transfer Gear Box
0.2 3.2 DRAG LINK DISCONNECT At Pitman Arm
0.5 3.2 POWER STEERING LINES DISCONNECT At Transfer Gear Box
1.9 3.2 MOUNTING BOLTS, STEERING GEAR BOX R&R0.5 3.2 REFILL FLUID & BLEED LINES OPERATION0.5 ROAD TEST TEST Optional
ALL 3001 3.0 3 MITER BOX R&R1.0 3.2 "U" JOINT, STEERING COLUMN DISCONNECT At Transfer Gear Box
0.5 3.2 STEERING JOINT ASSEMBLY (At transfer box ) DISCONNECT At Transfer Gear Box
0.5 3.2 MITER BOX RETAINING BOLTS DISCONNECT0.5 3.2 MITER BOX COMPONENT R&R0.5 ROAD TEST TEST Optional
ALLSTAND ALONE
ITEMS 3 STEERING SYSTEM COMPONENTS R&R3002 3.7 3.2 STEERING GEAR BOX R&R3003 3.0 3.2 TRANSFER GEAR BOX R&R3004 1.0 3.2 STEERING COLUMN R&R3005 1.0 3.2 "U" JOINT, STEERING COLUMN R&R3006 0.5 3.2 STEERING WHEEL R&R3007 0.8 3.2 DRAG LINK R&R3008 1.5 3.3 HYDRAULIC PUMP (POWER STEERING) R&R Includes refill and bleed
3009 2.5 3.3 HYDRAULIC RESERVOIR R&R Includes refill and bleed
3010 0.5 3.3 FILTER, HYDRAULIC RESERVOIR R&R Includes R+R of access cover
3011 0.8 3.3 SIGHT GLASS R&R Includes R+R of access cover
3012 0.5 3.3 PRESSURE GAUGE ON FILTER HOUSING R&R Includes R+R of access cover
Page 8 of 23

VENDORTASK CODE TIME
MANUAL SECTION COMPONENT / TASK DESCRIPTION ACTION COMMENT
ALL 4000 3.5 4 TRACTION MOTOR0.2 4.3 RAISE VEHICLE OPERATION0.5 4.3 DRIVE SHAFT R&R0.5 4.3 DISCONNECT CABLES R&R INCL driveshaft guard
0.8 4.3 COOLANT LINES R&R Includes refill and bleed
1.5 4.3 TRACTION MOTOR R&R
ALLSTAND ALONE
ITEMS 4 ELECTRIC DRIVE SYSTEM COMPONENTS4001 0.5 4.4 MASTER CONTROL UNIT (MCU) R&R4002 0.8 4.4 BATTERY DISCONNECT UNIT R&R 1 per string
4003 0.1 4.4 HIGH VOLTAGE FUSES R&R Each
KiddeSTAND ALONE
ITEMS 4FIRE SUPPRESSION SYSTEM (REFER TO DUAL SPECTRUM MAINTENANCE MANUAL) R&R
4004 0.3 DS MM AGENT CYLINDER R&R4005 0.3 DS MM ELECTRICAL / MANUAL ACTUATOR R&R4006 0.3 DS MM PNEUMATIC CONTROL HEAD R&R4007 0.3 DS MM DISCHARGE NOZZLE R&R4008 0.6 DS MM DISTRIBUTOR R&R4009 0.3 DS MM DISCHARGE FITTING R&R4010 0.4 DS MM HEAT DETECTION THERMOSTATS R&R
ALLSTAND ALONE
ITEMS 5 TRANSMISSION SYSTEM COMPONENTSTHIS SECTION IS NOT APPLICABLE
4 - ELECTRIC DRIVE SYSTEM
6 - COOLING SYSTEM
5 - TRANSMISSION SYSTEM
Page 9 of 23
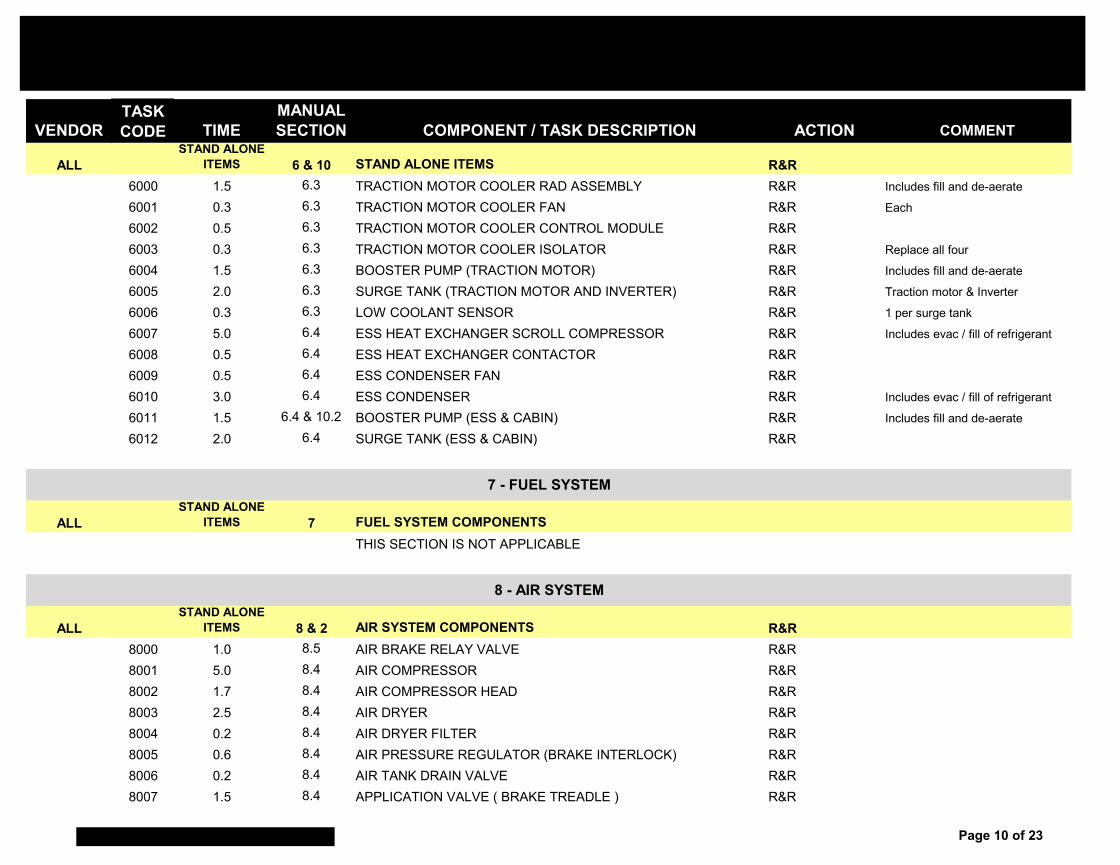
VENDORTASK CODE TIME
MANUAL SECTION COMPONENT / TASK DESCRIPTION ACTION COMMENT
ALLSTAND ALONE
ITEMS 6 & 10 STAND ALONE ITEMS R&R6000 1.5 6.3 TRACTION MOTOR COOLER RAD ASSEMBLY R&R Includes fill and de-aerate
6001 0.3 6.3 TRACTION MOTOR COOLER FAN R&R Each
6002 0.5 6.3 TRACTION MOTOR COOLER CONTROL MODULE R&R6003 0.3 6.3 TRACTION MOTOR COOLER ISOLATOR R&R Replace all four
6004 1.5 6.3 BOOSTER PUMP (TRACTION MOTOR) R&R Includes fill and de-aerate
6005 2.0 6.3 SURGE TANK (TRACTION MOTOR AND INVERTER) R&R Traction motor & Inverter
6006 0.3 6.3 LOW COOLANT SENSOR R&R 1 per surge tank
6007 5.0 6.4 ESS HEAT EXCHANGER SCROLL COMPRESSOR R&R Includes evac / fill of refrigerant
6008 0.5 6.4 ESS HEAT EXCHANGER CONTACTOR R&R6009 0.5 6.4 ESS CONDENSER FAN R&R6010 3.0 6.4 ESS CONDENSER R&R Includes evac / fill of refrigerant
6011 1.5 6.4 & 10.2 BOOSTER PUMP (ESS & CABIN) R&R Includes fill and de-aerate
6012 2.0 6.4 SURGE TANK (ESS & CABIN) R&R
ALLSTAND ALONE
ITEMS 7 FUEL SYSTEM COMPONENTSTHIS SECTION IS NOT APPLICABLE
ALLSTAND ALONE
ITEMS 8 & 2 AIR SYSTEM COMPONENTS R&R8000 1.0 8.5 AIR BRAKE RELAY VALVE R&R8001 5.0 8.4 AIR COMPRESSOR R&R8002 1.7 8.4 AIR COMPRESSOR HEAD R&R8003 2.5 8.4 AIR DRYER R&R8004 0.2 8.4 AIR DRYER FILTER R&R8005 0.6 8.4 AIR PRESSURE REGULATOR (BRAKE INTERLOCK) R&R8006 0.2 8.4 AIR TANK DRAIN VALVE R&R8007 1.5 8.4 APPLICATION VALVE ( BRAKE TREADLE ) R&R
8 - AIR SYSTEM
7 - FUEL SYSTEM
Page 10 of 23
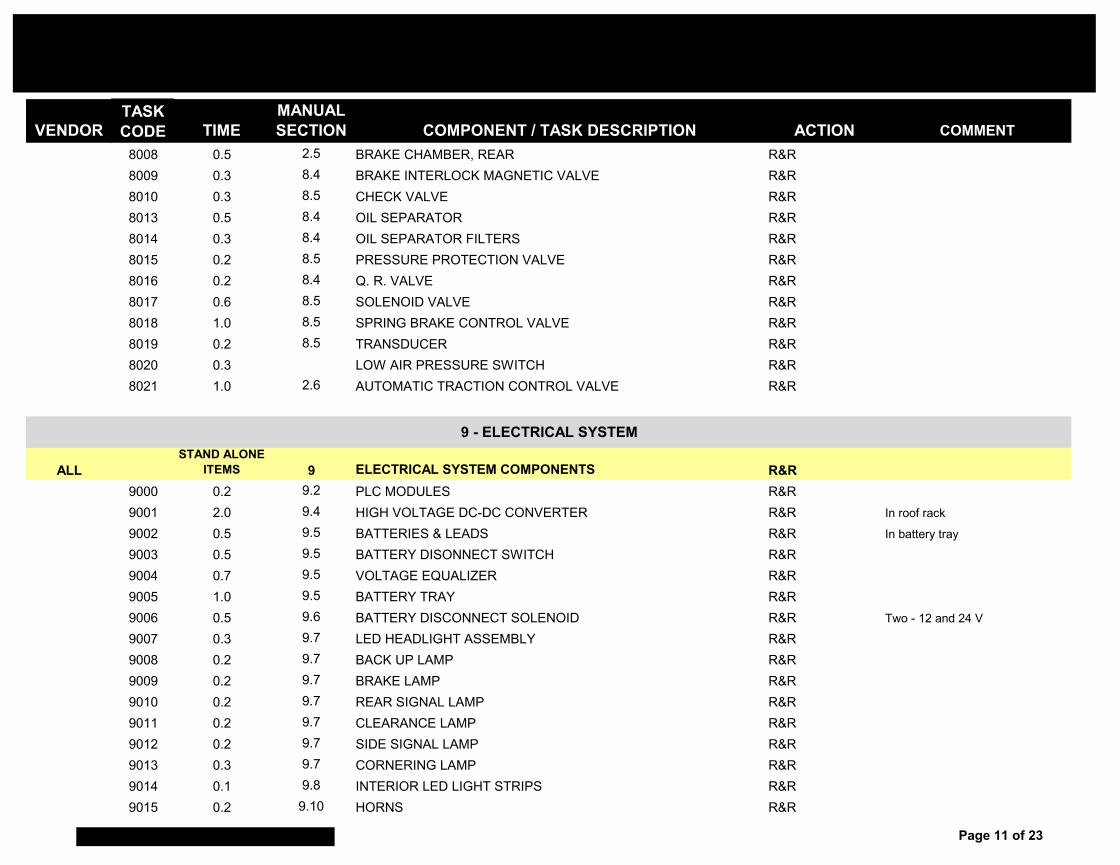
VENDORTASK CODE TIME
MANUAL SECTION COMPONENT / TASK DESCRIPTION ACTION COMMENT
8008 0.5 2.5 BRAKE CHAMBER, REAR R&R8009 0.3 8.4 BRAKE INTERLOCK MAGNETIC VALVE R&R8010 0.3 8.5 CHECK VALVE R&R8013 0.5 8.4 OIL SEPARATOR R&R8014 0.3 8.4 OIL SEPARATOR FILTERS R&R8015 0.2 8.5 PRESSURE PROTECTION VALVE R&R8016 0.2 8.4 Q. R. VALVE R&R8017 0.6 8.5 SOLENOID VALVE R&R8018 1.0 8.5 SPRING BRAKE CONTROL VALVE R&R8019 0.2 8.5 TRANSDUCER R&R8020 0.3 LOW AIR PRESSURE SWITCH R&R8021 1.0 2.6 AUTOMATIC TRACTION CONTROL VALVE R&R
ALLSTAND ALONE
ITEMS 9 ELECTRICAL SYSTEM COMPONENTS R&R9000 0.2 9.2 PLC MODULES R&R9001 2.0 9.4 HIGH VOLTAGE DC-DC CONVERTER R&R In roof rack
9002 0.5 9.5 BATTERIES & LEADS R&R In battery tray
9003 0.5 9.5 BATTERY DISONNECT SWITCH R&R9004 0.7 9.5 VOLTAGE EQUALIZER R&R9005 1.0 9.5 BATTERY TRAY R&R9006 0.5 9.6 BATTERY DISCONNECT SOLENOID R&R Two - 12 and 24 V
9007 0.3 9.7 LED HEADLIGHT ASSEMBLY R&R9008 0.2 9.7 BACK UP LAMP R&R9009 0.2 9.7 BRAKE LAMP R&R9010 0.2 9.7 REAR SIGNAL LAMP R&R9011 0.2 9.7 CLEARANCE LAMP R&R9012 0.2 9.7 SIDE SIGNAL LAMP R&R9013 0.3 9.7 CORNERING LAMP R&R9014 0.1 9.8 INTERIOR LED LIGHT STRIPS R&R9015 0.2 9.10 HORNS R&R
9 - ELECTRICAL SYSTEM
Page 11 of 23
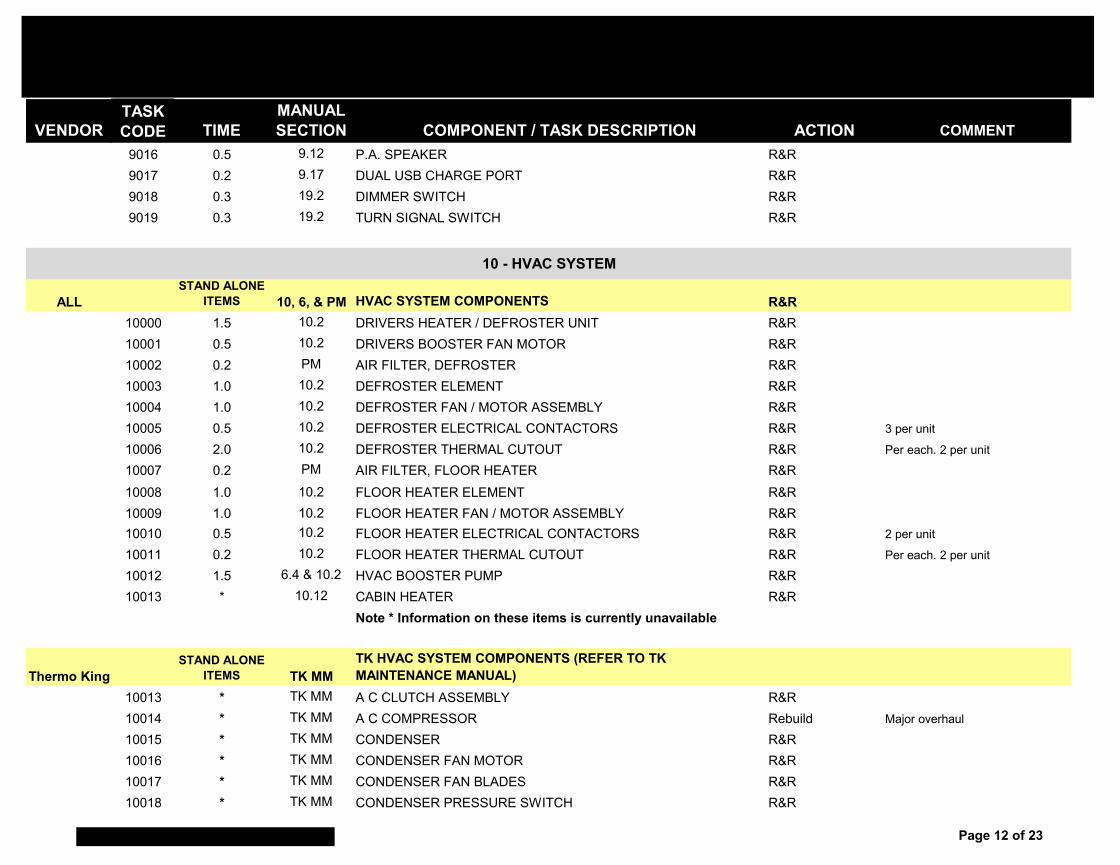
VENDORTASK CODE TIME
MANUAL SECTION COMPONENT / TASK DESCRIPTION ACTION COMMENT
9016 0.5 9.12 P.A. SPEAKER R&R9017 0.2 9.17 DUAL USB CHARGE PORT R&R9018 0.3 19.2 DIMMER SWITCH R&R9019 0.3 19.2 TURN SIGNAL SWITCH R&R
ALLSTAND ALONE
ITEMS 10, 6, & PM HVAC SYSTEM COMPONENTS R&R10000 1.5 10.2 DRIVERS HEATER / DEFROSTER UNIT R&R10001 0.5 10.2 DRIVERS BOOSTER FAN MOTOR R&R10002 0.2 PM AIR FILTER, DEFROSTER R&R10003 1.0 10.2 DEFROSTER ELEMENT R&R10004 1.0 10.2 DEFROSTER FAN / MOTOR ASSEMBLY R&R10005 0.5 10.2 DEFROSTER ELECTRICAL CONTACTORS R&R 3 per unit
10006 2.0 10.2 DEFROSTER THERMAL CUTOUT R&R Per each. 2 per unit
10007 0.2 PM AIR FILTER, FLOOR HEATER R&R10008 1.0 10.2 FLOOR HEATER ELEMENT R&R10009 1.0 10.2 FLOOR HEATER FAN / MOTOR ASSEMBLY R&R10010 0.5 10.2 FLOOR HEATER ELECTRICAL CONTACTORS R&R 2 per unit
10011 0.2 10.2 FLOOR HEATER THERMAL CUTOUT R&R Per each. 2 per unit
10012 1.5 6.4 & 10.2 HVAC BOOSTER PUMP R&R10013 * 10.12 CABIN HEATER R&R
Note * Information on these items is currently unavailable
Thermo KingSTAND ALONE
ITEMS TK MMTK HVAC SYSTEM COMPONENTS (REFER TO TK MAINTENANCE MANUAL)
10013 * TK MM A C CLUTCH ASSEMBLY R&R10014 * TK MM A C COMPRESSOR Rebuild Major overhaul
10015 * TK MM CONDENSER R&R10016 * TK MM CONDENSER FAN MOTOR R&R10017 * TK MM CONDENSER FAN BLADES R&R10018 * TK MM CONDENSER PRESSURE SWITCH R&R
10 - HVAC SYSTEM
Page 12 of 23
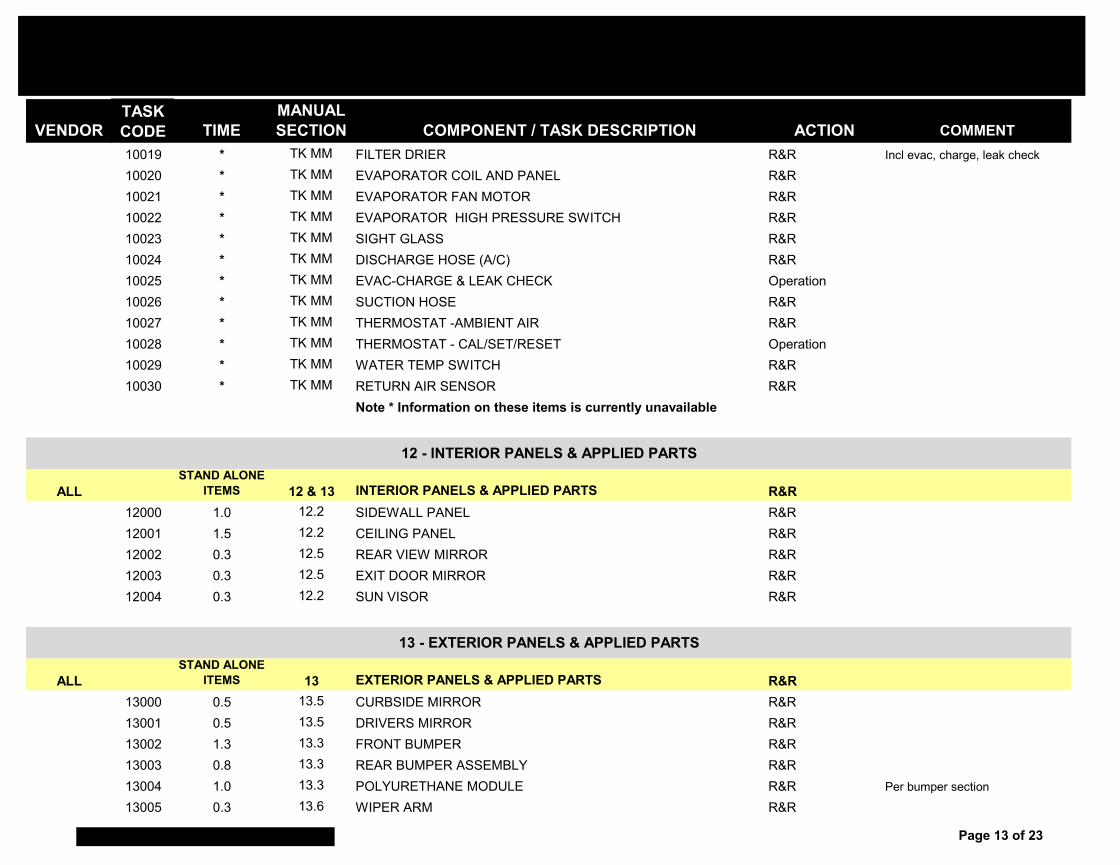
VENDORTASK CODE TIME
MANUAL SECTION COMPONENT / TASK DESCRIPTION ACTION COMMENT
10019 * TK MM FILTER DRIER R&R Incl evac, charge, leak check
10020 * TK MM EVAPORATOR COIL AND PANEL R&R10021 * TK MM EVAPORATOR FAN MOTOR R&R10022 * TK MM EVAPORATOR HIGH PRESSURE SWITCH R&R10023 * TK MM SIGHT GLASS R&R10024 * TK MM DISCHARGE HOSE (A/C) R&R10025 * TK MM EVAC-CHARGE & LEAK CHECK Operation10026 * TK MM SUCTION HOSE R&R10027 * TK MM THERMOSTAT -AMBIENT AIR R&R10028 * TK MM THERMOSTAT - CAL/SET/RESET Operation10029 * TK MM WATER TEMP SWITCH R&R10030 * TK MM RETURN AIR SENSOR R&R
Note * Information on these items is currently unavailable
ALLSTAND ALONE
ITEMS 12 & 13 INTERIOR PANELS & APPLIED PARTS R&R12000 1.0 12.2 SIDEWALL PANEL R&R12001 1.5 12.2 CEILING PANEL R&R12002 0.3 12.5 REAR VIEW MIRROR R&R12003 0.3 12.5 EXIT DOOR MIRROR R&R12004 0.3 12.2 SUN VISOR R&R
ALLSTAND ALONE
ITEMS 13 EXTERIOR PANELS & APPLIED PARTS R&R13000 0.5 13.5 CURBSIDE MIRROR R&R13001 0.5 13.5 DRIVERS MIRROR R&R13002 1.3 13.3 FRONT BUMPER R&R13003 0.8 13.3 REAR BUMPER ASSEMBLY R&R13004 1.0 13.3 POLYURETHANE MODULE R&R Per bumper section
13005 0.3 13.6 WIPER ARM R&R
12 - INTERIOR PANELS & APPLIED PARTS
13 - EXTERIOR PANELS & APPLIED PARTS
Page 13 of 23
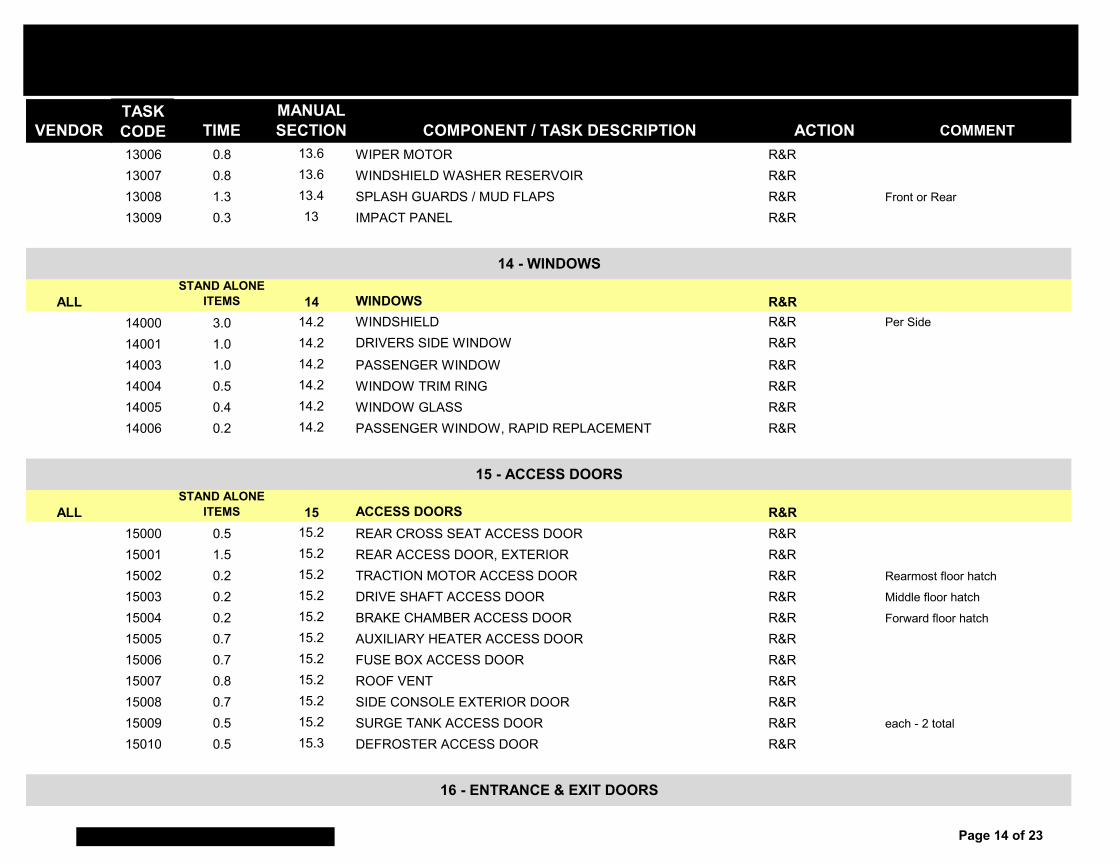
VENDORTASK CODE TIME
MANUAL SECTION COMPONENT / TASK DESCRIPTION ACTION COMMENT
13006 0.8 13.6 WIPER MOTOR R&R13007 0.8 13.6 WINDSHIELD WASHER RESERVOIR R&R13008 1.3 13.4 SPLASH GUARDS / MUD FLAPS R&R Front or Rear
13009 0.3 13 IMPACT PANEL R&R
ALLSTAND ALONE
ITEMS 14 WINDOWS R&R14000 3.0 14.2 WINDSHIELD R&R Per Side
14001 1.0 14.2 DRIVERS SIDE WINDOW R&R14003 1.0 14.2 PASSENGER WINDOW R&R14004 0.5 14.2 WINDOW TRIM RING R&R14005 0.4 14.2 WINDOW GLASS R&R14006 0.2 14.2 PASSENGER WINDOW, RAPID REPLACEMENT R&R
ALLSTAND ALONE
ITEMS 15 ACCESS DOORS R&R15000 0.5 15.2 REAR CROSS SEAT ACCESS DOOR R&R15001 1.5 15.2 REAR ACCESS DOOR, EXTERIOR R&R15002 0.2 15.2 TRACTION MOTOR ACCESS DOOR R&R Rearmost floor hatch
15003 0.2 15.2 DRIVE SHAFT ACCESS DOOR R&R Middle floor hatch
15004 0.2 15.2 BRAKE CHAMBER ACCESS DOOR R&R Forward floor hatch
15005 0.7 15.2 AUXILIARY HEATER ACCESS DOOR R&R15006 0.7 15.2 FUSE BOX ACCESS DOOR R&R15007 0.8 15.2 ROOF VENT R&R15008 0.7 15.2 SIDE CONSOLE EXTERIOR DOOR R&R15009 0.5 15.2 SURGE TANK ACCESS DOOR R&R each - 2 total
15010 0.5 15.3 DEFROSTER ACCESS DOOR R&R
15 - ACCESS DOORS
16 - ENTRANCE & EXIT DOORS
14 - WINDOWS
Page 14 of 23
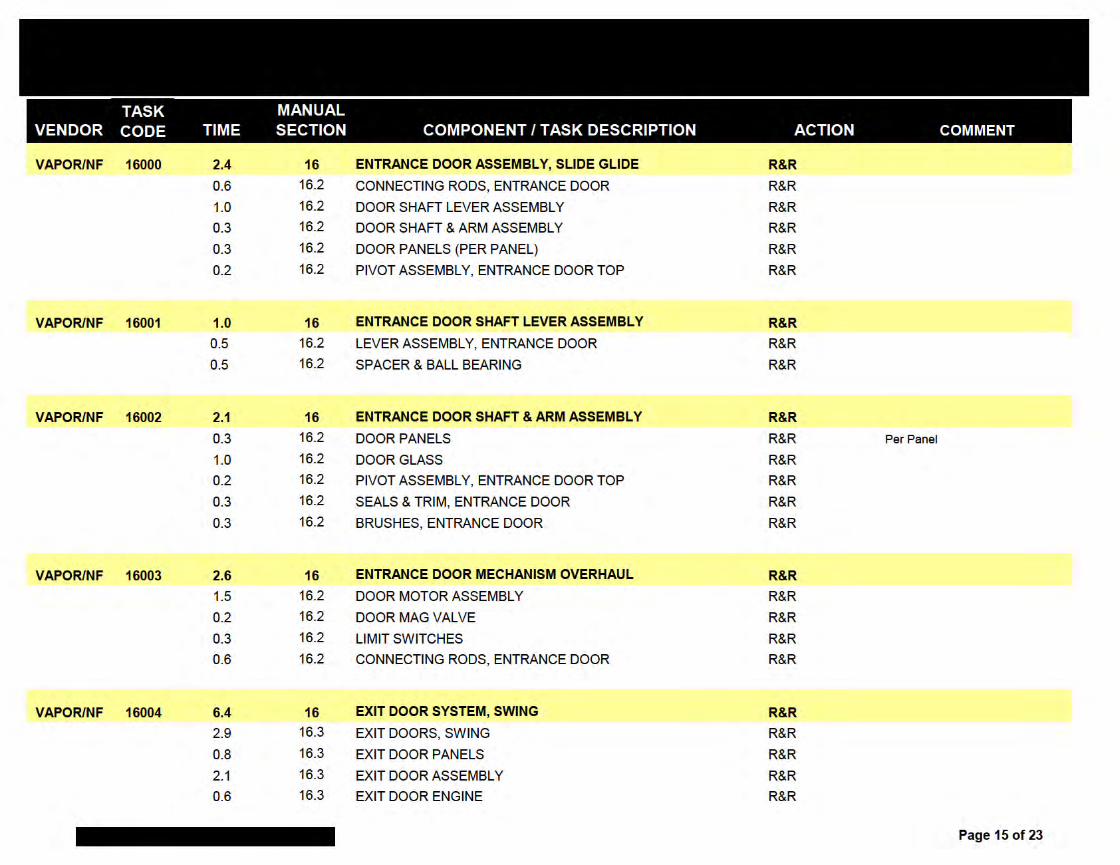
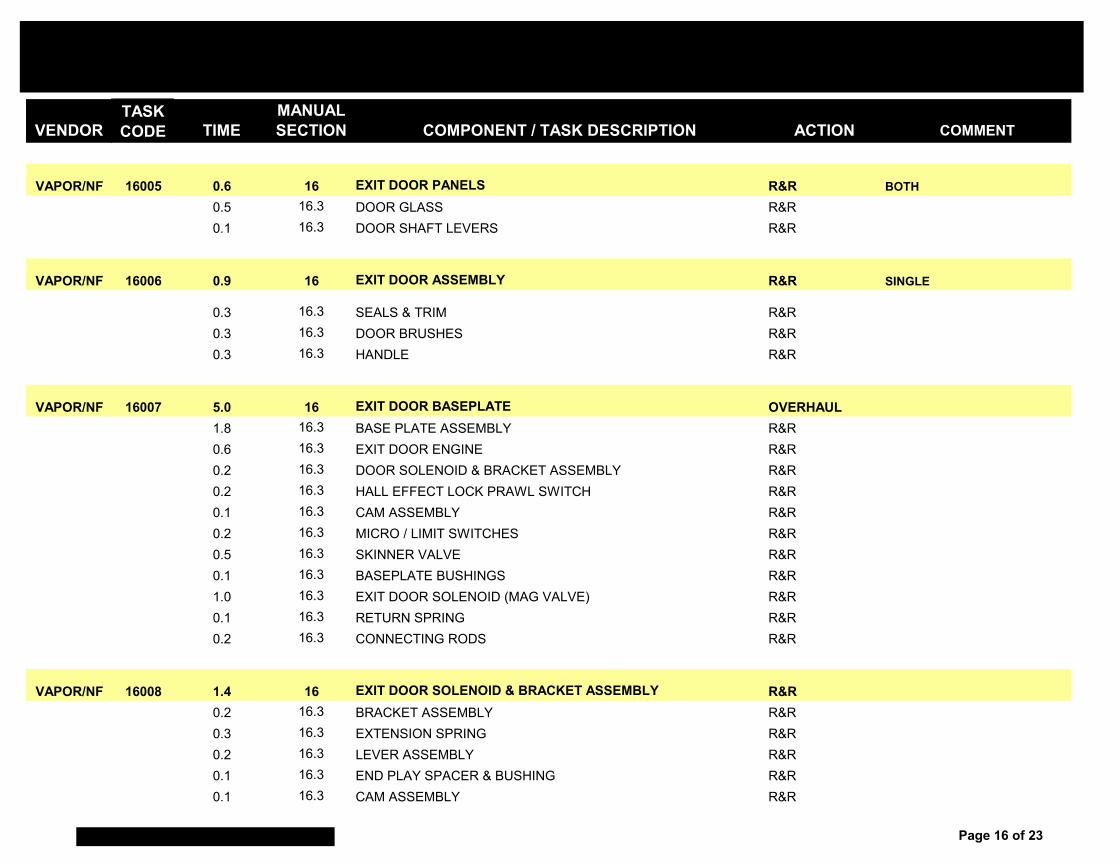
VENDORTASK CODE TIME
MANUAL SECTION COMPONENT / TASK DESCRIPTION ACTION COMMENT
VAPOR/NF 16005 0.6 16 EXIT DOOR PANELS R&R BOTH0.5 16.3 DOOR GLASS R&R0.1 16.3 DOOR SHAFT LEVERS R&R
VAPOR/NF 16006 0.9 16 EXIT DOOR ASSEMBLY R&R SINGLE
0.3 16.3 SEALS & TRIM R&R0.3 16.3 DOOR BRUSHES R&R0.3 16.3 HANDLE R&R
VAPOR/NF 16007 5.0 16 EXIT DOOR BASEPLATE OVERHAUL1.8 16.3 BASE PLATE ASSEMBLY R&R0.6 16.3 EXIT DOOR ENGINE R&R0.2 16.3 DOOR SOLENOID & BRACKET ASSEMBLY R&R0.2 16.3 HALL EFFECT LOCK PRAWL SWITCH R&R0.1 16.3 CAM ASSEMBLY R&R0.2 16.3 MICRO / LIMIT SWITCHES R&R0.5 16.3 SKINNER VALVE R&R0.1 16.3 BASEPLATE BUSHINGS R&R1.0 16.3 EXIT DOOR SOLENOID (MAG VALVE) R&R0.1 16.3 RETURN SPRING R&R0.2 16.3 CONNECTING RODS R&R
VAPOR/NF 16008 1.4 16 EXIT DOOR SOLENOID & BRACKET ASSEMBLY R&R0.2 16.3 BRACKET ASSEMBLY R&R0.3 16.3 EXTENSION SPRING R&R0.2 16.3 LEVER ASSEMBLY R&R0.1 16.3 END PLAY SPACER & BUSHING R&R0.1 16.3 CAM ASSEMBLY R&R
Page 16 of 23
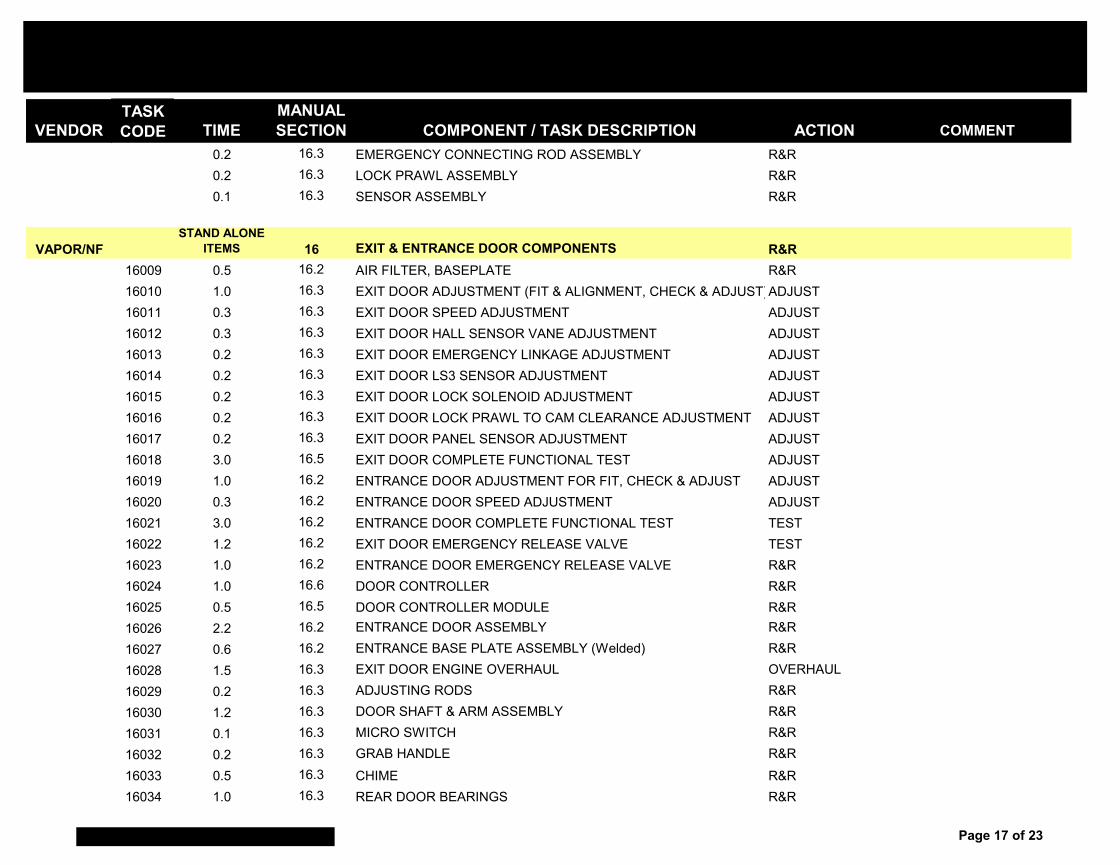
VENDORTASK CODE TIME
MANUAL SECTION COMPONENT / TASK DESCRIPTION ACTION COMMENT
0.2 16.3 EMERGENCY CONNECTING ROD ASSEMBLY R&R0.2 16.3 LOCK PRAWL ASSEMBLY R&R0.1 16.3 SENSOR ASSEMBLY R&R
VAPOR/NFSTAND ALONE
ITEMS 16 EXIT & ENTRANCE DOOR COMPONENTS R&R16009 0.5 16.2 AIR FILTER, BASEPLATE R&R16010 1.0 16.3 EXIT DOOR ADJUSTMENT (FIT & ALIGNMENT, CHECK & ADJUST)ADJUST16011 0.3 16.3 EXIT DOOR SPEED ADJUSTMENT ADJUST16012 0.3 16.3 EXIT DOOR HALL SENSOR VANE ADJUSTMENT ADJUST16013 0.2 16.3 EXIT DOOR EMERGENCY LINKAGE ADJUSTMENT ADJUST16014 0.2 16.3 EXIT DOOR LS3 SENSOR ADJUSTMENT ADJUST16015 0.2 16.3 EXIT DOOR LOCK SOLENOID ADJUSTMENT ADJUST16016 0.2 16.3 EXIT DOOR LOCK PRAWL TO CAM CLEARANCE ADJUSTMENT ADJUST16017 0.2 16.3 EXIT DOOR PANEL SENSOR ADJUSTMENT ADJUST16018 3.0 16.5 EXIT DOOR COMPLETE FUNCTIONAL TEST ADJUST16019 1.0 16.2 ENTRANCE DOOR ADJUSTMENT FOR FIT, CHECK & ADJUST ADJUST16020 0.3 16.2 ENTRANCE DOOR SPEED ADJUSTMENT ADJUST16021 3.0 16.2 ENTRANCE DOOR COMPLETE FUNCTIONAL TEST TEST16022 1.2 16.2 EXIT DOOR EMERGENCY RELEASE VALVE TEST16023 1.0 16.2 ENTRANCE DOOR EMERGENCY RELEASE VALVE R&R16024 1.0 16.6 DOOR CONTROLLER R&R16025 0.5 16.5 DOOR CONTROLLER MODULE R&R16026 2.2 16.2 ENTRANCE DOOR ASSEMBLY R&R16027 0.6 16.2 ENTRANCE BASE PLATE ASSEMBLY (Welded) R&R16028 1.5 16.3 EXIT DOOR ENGINE OVERHAUL OVERHAUL16029 0.2 16.3 ADJUSTING RODS R&R16030 1.2 16.3 DOOR SHAFT & ARM ASSEMBLY R&R16031 0.1 16.3 MICRO SWITCH R&R16032 0.2 16.3 GRAB HANDLE R&R16033 0.5 16.3 CHIME R&R16034 1.0 16.3 REAR DOOR BEARINGS R&R
Page 17 of 23
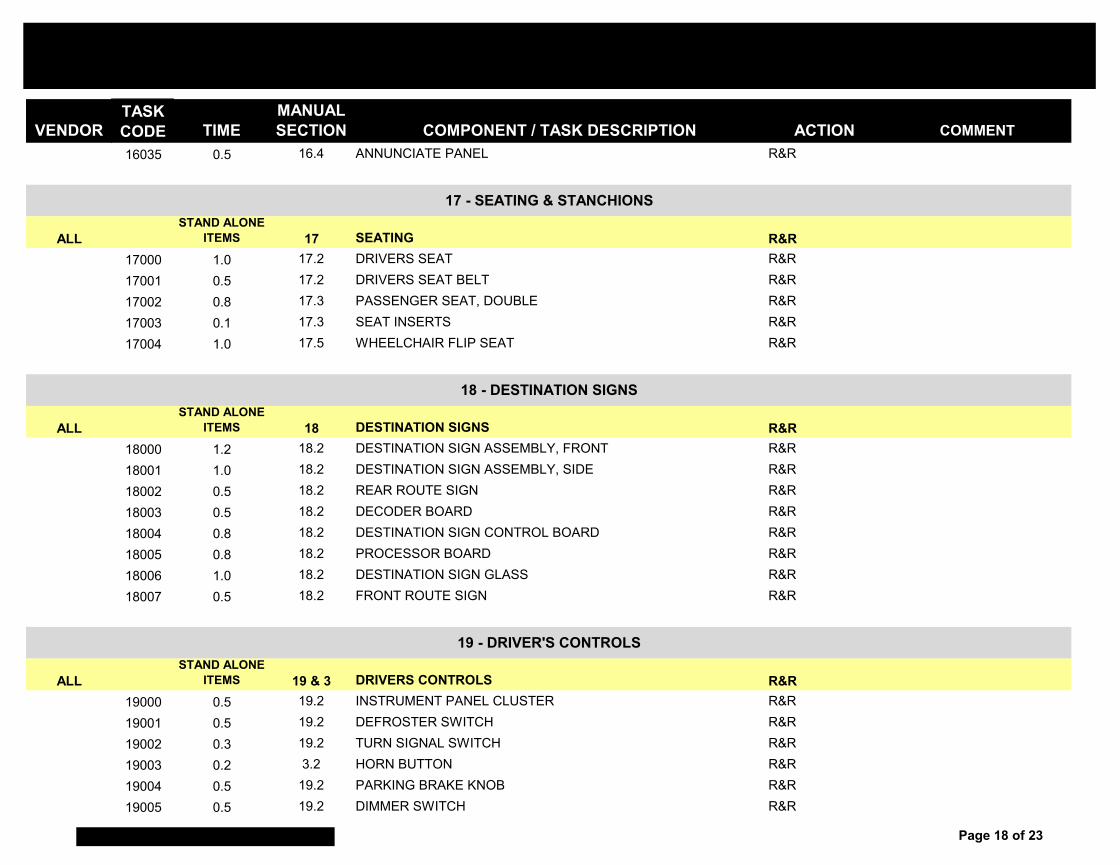
VENDORTASK CODE TIME
MANUAL SECTION COMPONENT / TASK DESCRIPTION ACTION COMMENT
16035 0.5 16.4 ANNUNCIATE PANEL R&R
ALLSTAND ALONE
ITEMS 17 SEATING R&R17000 1.0 17.2 DRIVERS SEAT R&R17001 0.5 17.2 DRIVERS SEAT BELT R&R17002 0.8 17.3 PASSENGER SEAT, DOUBLE R&R17003 0.1 17.3 SEAT INSERTS R&R17004 1.0 17.5 WHEELCHAIR FLIP SEAT R&R
ALLSTAND ALONE
ITEMS 18 DESTINATION SIGNS R&R18000 1.2 18.2 DESTINATION SIGN ASSEMBLY, FRONT R&R18001 1.0 18.2 DESTINATION SIGN ASSEMBLY, SIDE R&R18002 0.5 18.2 REAR ROUTE SIGN R&R18003 0.5 18.2 DECODER BOARD R&R18004 0.8 18.2 DESTINATION SIGN CONTROL BOARD R&R18005 0.8 18.2 PROCESSOR BOARD R&R18006 1.0 18.2 DESTINATION SIGN GLASS R&R18007 0.5 18.2 FRONT ROUTE SIGN R&R
ALLSTAND ALONE
ITEMS 19 & 3 DRIVERS CONTROLS R&R19000 0.5 19.2 INSTRUMENT PANEL CLUSTER R&R19001 0.5 19.2 DEFROSTER SWITCH R&R19002 0.3 19.2 TURN SIGNAL SWITCH R&R19003 0.2 3.2 HORN BUTTON R&R19004 0.5 19.2 PARKING BRAKE KNOB R&R19005 0.5 19.2 DIMMER SWITCH R&R
18 - DESTINATION SIGNS
19 - DRIVER'S CONTROLS
17 - SEATING & STANCHIONS
Page 18 of 23
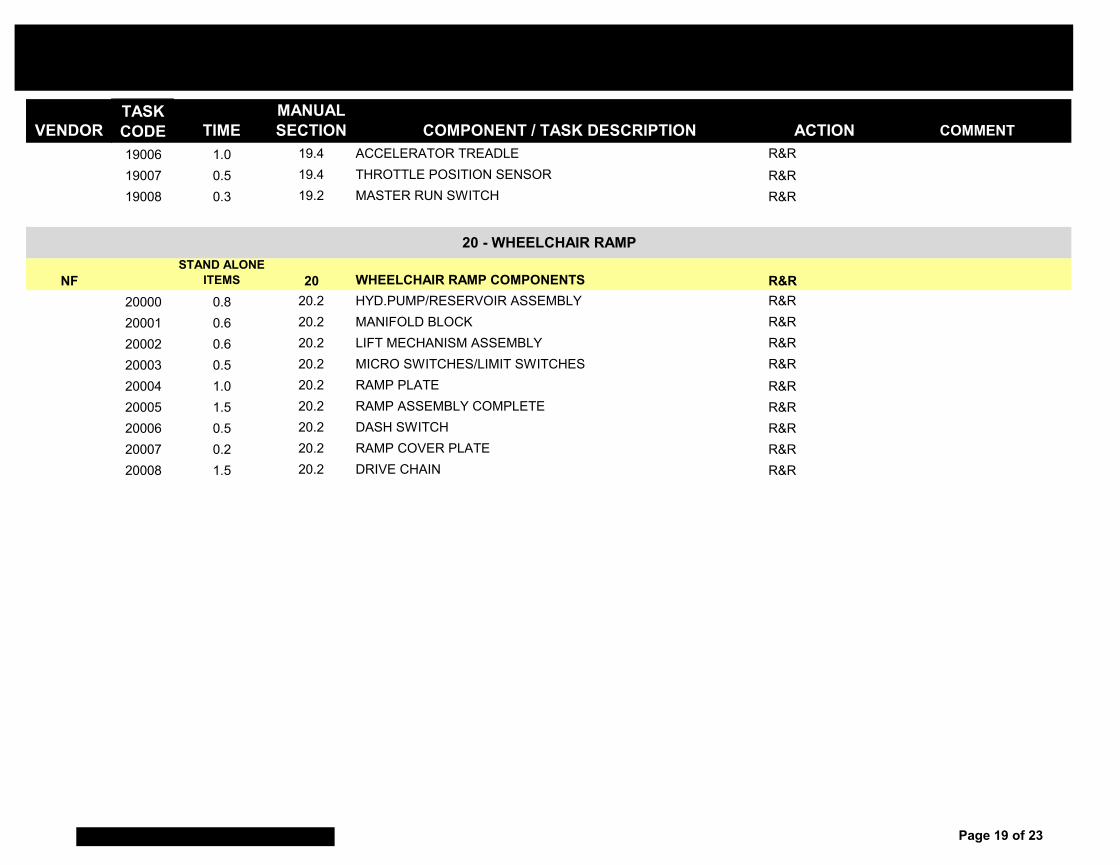
VENDORTASK CODE TIME
MANUAL SECTION COMPONENT / TASK DESCRIPTION ACTION COMMENT
19006 1.0 19.4 ACCELERATOR TREADLE R&R19007 0.5 19.4 THROTTLE POSITION SENSOR R&R19008 0.3 19.2 MASTER RUN SWITCH R&R
NFSTAND ALONE
ITEMS 20 WHEELCHAIR RAMP COMPONENTS R&R20000 0.8 20.2 HYD.PUMP/RESERVOIR ASSEMBLY R&R20001 0.6 20.2 MANIFOLD BLOCK R&R20002 0.6 20.2 LIFT MECHANISM ASSEMBLY R&R20003 0.5 20.2 MICRO SWITCHES/LIMIT SWITCHES R&R20004 1.0 20.2 RAMP PLATE R&R20005 1.5 20.2 RAMP ASSEMBLY COMPLETE R&R20006 0.5 20.2 DASH SWITCH R&R20007 0.2 20.2 RAMP COVER PLATE R&R20008 1.5 20.2 DRIVE CHAIN R&R
20 - WHEELCHAIR RAMP
Page 19 of 23
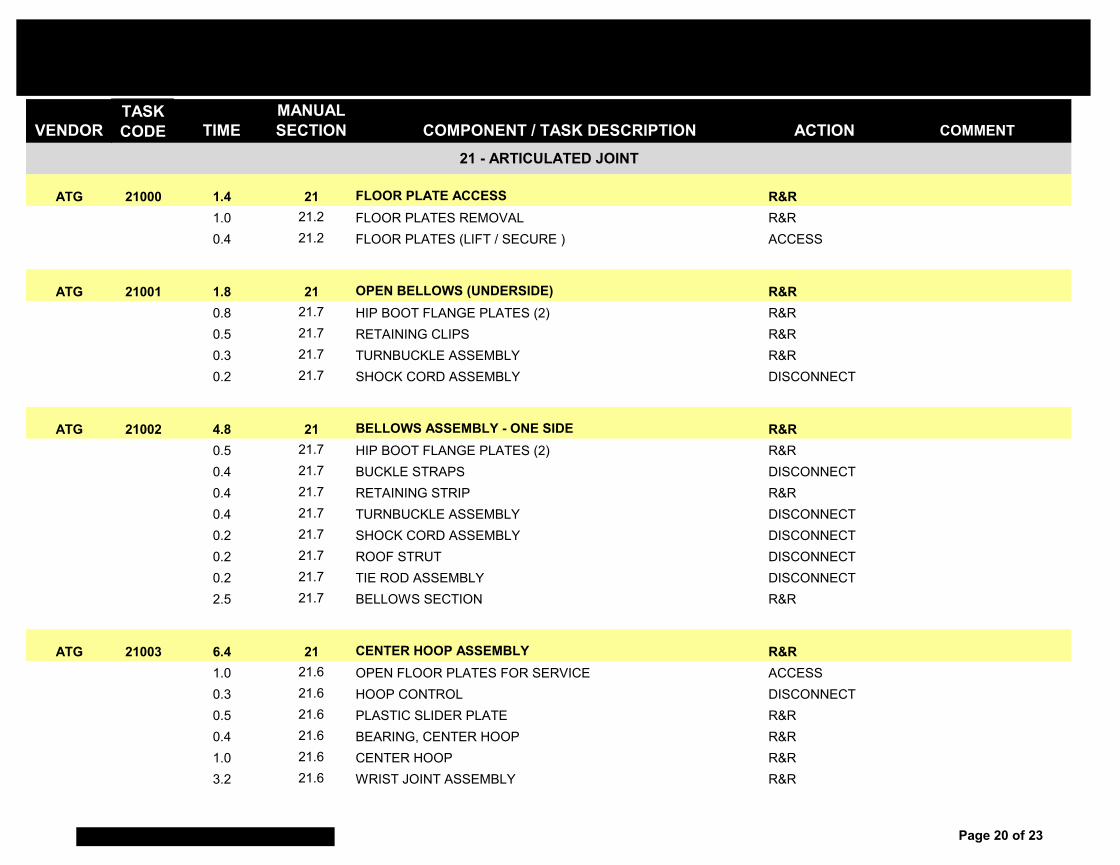
VENDORTASK CODE TIME
MANUAL SECTION COMPONENT / TASK DESCRIPTION ACTION COMMENT
ATG 21000 1.4 21 FLOOR PLATE ACCESS R&R1.0 21.2 FLOOR PLATES REMOVAL R&R0.4 21.2 FLOOR PLATES (LIFT / SECURE ) ACCESS
ATG 21001 1.8 21 OPEN BELLOWS (UNDERSIDE) R&R0.8 21.7 HIP BOOT FLANGE PLATES (2) R&R0.5 21.7 RETAINING CLIPS R&R0.3 21.7 TURNBUCKLE ASSEMBLY R&R0.2 21.7 SHOCK CORD ASSEMBLY DISCONNECT
ATG 21002 4.8 21 BELLOWS ASSEMBLY - ONE SIDE R&R0.5 21.7 HIP BOOT FLANGE PLATES (2) R&R0.4 21.7 BUCKLE STRAPS DISCONNECT0.4 21.7 RETAINING STRIP R&R0.4 21.7 TURNBUCKLE ASSEMBLY DISCONNECT0.2 21.7 SHOCK CORD ASSEMBLY DISCONNECT0.2 21.7 ROOF STRUT DISCONNECT0.2 21.7 TIE ROD ASSEMBLY DISCONNECT2.5 21.7 BELLOWS SECTION R&R
ATG 21003 6.4 21 CENTER HOOP ASSEMBLY R&R1.0 21.6 OPEN FLOOR PLATES FOR SERVICE ACCESS0.3 21.6 HOOP CONTROL DISCONNECT0.5 21.6 PLASTIC SLIDER PLATE R&R0.4 21.6 BEARING, CENTER HOOP R&R1.0 21.6 CENTER HOOP R&R3.2 21.6 WRIST JOINT ASSEMBLY R&R
21 - ARTICULATED JOINT
Page 20 of 23
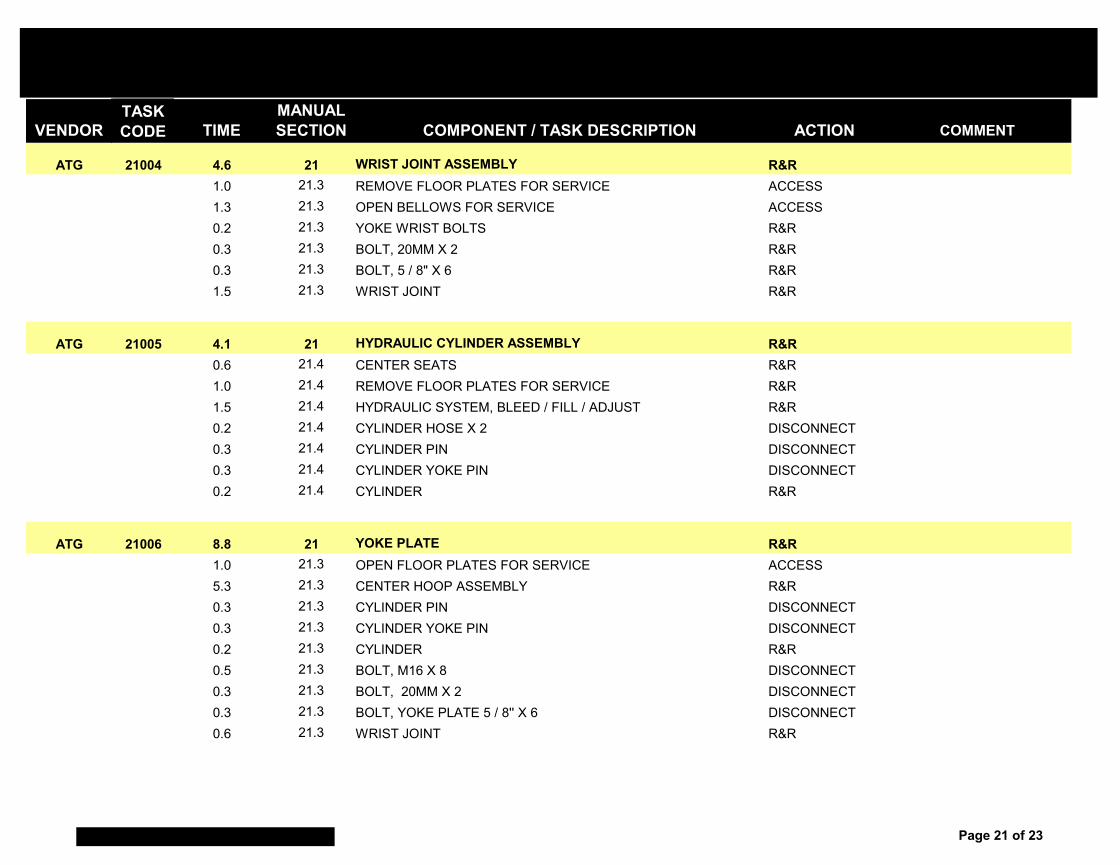
VENDORTASK CODE TIME
MANUAL SECTION COMPONENT / TASK DESCRIPTION ACTION COMMENT
ATG 21004 4.6 21 WRIST JOINT ASSEMBLY R&R1.0 21.3 REMOVE FLOOR PLATES FOR SERVICE ACCESS1.3 21.3 OPEN BELLOWS FOR SERVICE ACCESS0.2 21.3 YOKE WRIST BOLTS R&R0.3 21.3 BOLT, 20MM X 2 R&R0.3 21.3 BOLT, 5 / 8" X 6 R&R1.5 21.3 WRIST JOINT R&R
ATG 21005 4.1 21 HYDRAULIC CYLINDER ASSEMBLY R&R0.6 21.4 CENTER SEATS R&R1.0 21.4 REMOVE FLOOR PLATES FOR SERVICE R&R1.5 21.4 HYDRAULIC SYSTEM, BLEED / FILL / ADJUST R&R0.2 21.4 CYLINDER HOSE X 2 DISCONNECT0.3 21.4 CYLINDER PIN DISCONNECT0.3 21.4 CYLINDER YOKE PIN DISCONNECT0.2 21.4 CYLINDER R&R
ATG 21006 8.8 21 YOKE PLATE R&R1.0 21.3 OPEN FLOOR PLATES FOR SERVICE ACCESS5.3 21.3 CENTER HOOP ASSEMBLY R&R0.3 21.3 CYLINDER PIN DISCONNECT0.3 21.3 CYLINDER YOKE PIN DISCONNECT0.2 21.3 CYLINDER R&R0.5 21.3 BOLT, M16 X 8 DISCONNECT0.3 21.3 BOLT, 20MM X 2 DISCONNECT0.3 21.3 BOLT, YOKE PLATE 5 / 8'' X 6 DISCONNECT0.6 21.3 WRIST JOINT R&R
Page 21 of 23
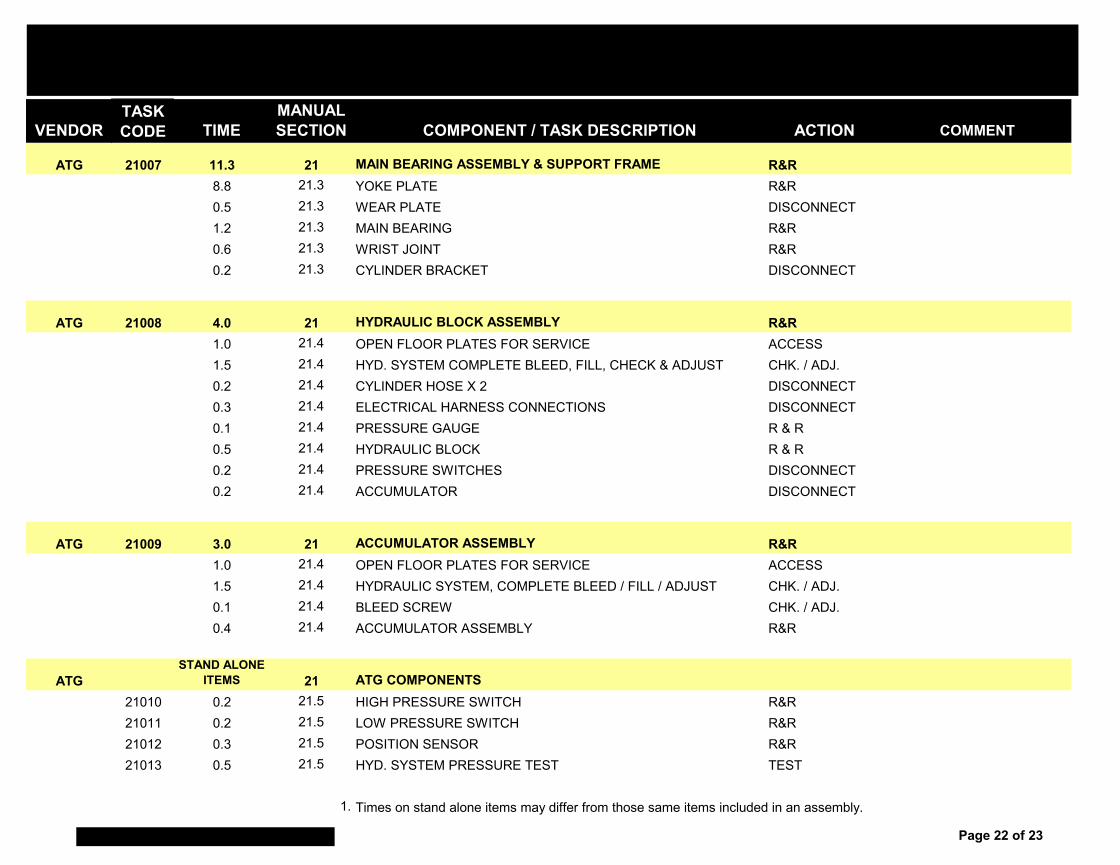
VENDORTASK CODE TIME
MANUAL SECTION COMPONENT / TASK DESCRIPTION ACTION COMMENT
ATG 21007 11.3 21 MAIN BEARING ASSEMBLY & SUPPORT FRAME R&R8.8 21.3 YOKE PLATE R&R0.5 21.3 WEAR PLATE DISCONNECT1.2 21.3 MAIN BEARING R&R0.6 21.3 WRIST JOINT R&R0.2 21.3 CYLINDER BRACKET DISCONNECT
ATG 21008 4.0 21 HYDRAULIC BLOCK ASSEMBLY R&R1.0 21.4 OPEN FLOOR PLATES FOR SERVICE ACCESS1.5 21.4 HYD. SYSTEM COMPLETE BLEED, FILL, CHECK & ADJUST CHK. / ADJ.0.2 21.4 CYLINDER HOSE X 2 DISCONNECT0.3 21.4 ELECTRICAL HARNESS CONNECTIONS DISCONNECT0.1 21.4 PRESSURE GAUGE R & R0.5 21.4 HYDRAULIC BLOCK R & R0.2 21.4 PRESSURE SWITCHES DISCONNECT0.2 21.4 ACCUMULATOR DISCONNECT
ATG 21009 3.0 21 ACCUMULATOR ASSEMBLY R&R1.0 21.4 OPEN FLOOR PLATES FOR SERVICE ACCESS1.5 21.4 HYDRAULIC SYSTEM, COMPLETE BLEED / FILL / ADJUST CHK. / ADJ.0.1 21.4 BLEED SCREW CHK. / ADJ.0.4 21.4 ACCUMULATOR ASSEMBLY R&R
ATGSTAND ALONE
ITEMS 21 ATG COMPONENTS21010 0.2 21.5 HIGH PRESSURE SWITCH R&R21011 0.2 21.5 LOW PRESSURE SWITCH R&R21012 0.3 21.5 POSITION SENSOR R&R21013 0.5 21.5 HYD. SYSTEM PRESSURE TEST TEST
1. Times on stand alone items may differ from those same items included in an assembly.
Page 22 of 23
VENDORTASK CODE TIME
MANUAL SECTION COMPONENT / TASK DESCRIPTION ACTION COMMENT
2. Refer to each section of the New Flyer Service Manual for identification of Special Tools.
Page 23 of 23
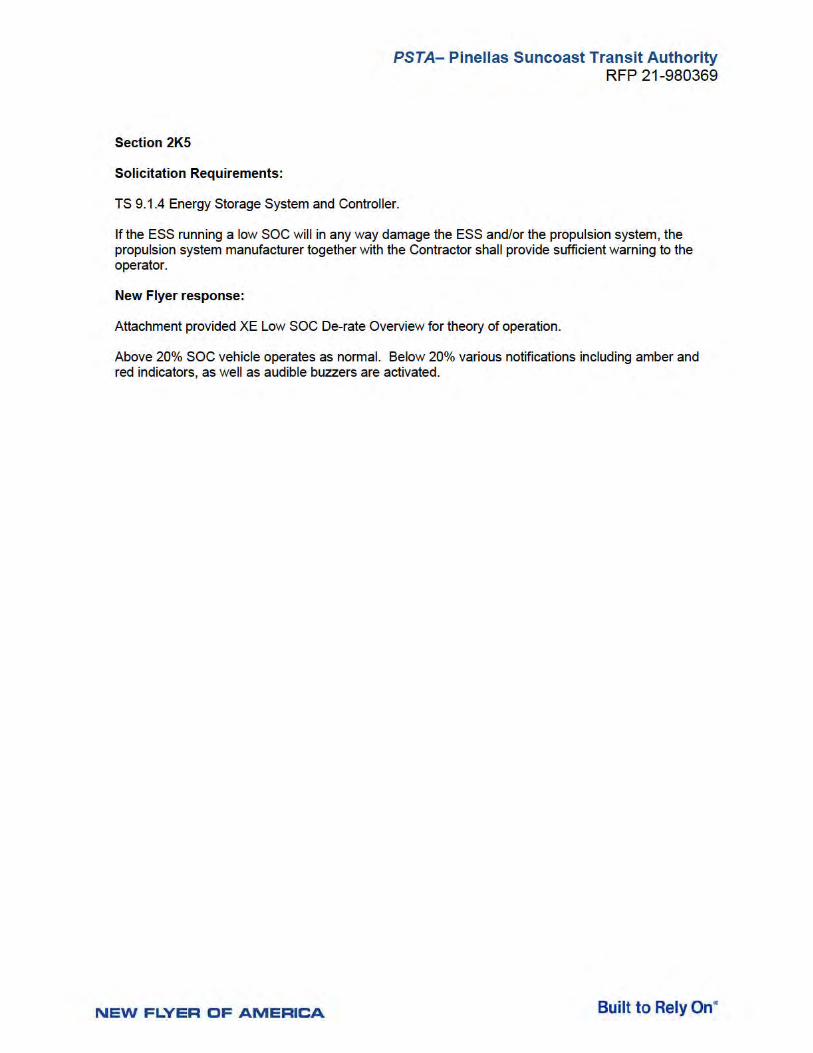


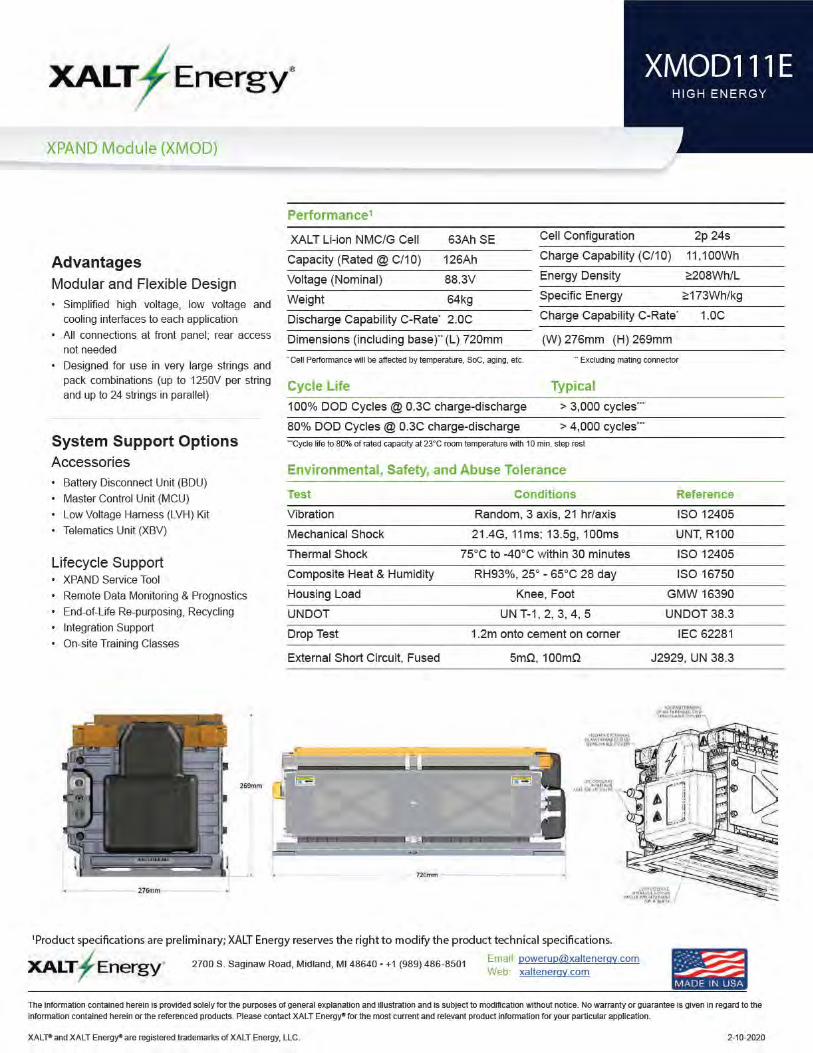
PSTA– Pinellas Suncoast Transit Authority RFP 21-980369
Section 2K8
Solicitation Requirements:
TS 9.1.4 Energy Storage System and Controller.
Written confirmation from the battery manufacturer attesting to the safety of the proposed battery system in the specified application and charging profile shall be submitted as part of the proposal, and shall include full disclosure and discussion of any and all relevant issues or prior incidents relating to safety.
New Flyer Response:
The XPAND battery system has been designed to protect itself. Nine (9) relevant functions have been defined as critical for functional safety as listed below:
1. Emergency Stop Function
2. Alarms and Shutdowns
3. High Voltage Interlock Loop (HVIL)
4. Temperature protection BMS 4.1. Cell Over-Temperature Protection: A condition when thesensed temperature is more than the peak allowable temperature for more than a specified time. − DTC for high temperature is escalated as “warning”, then “alarm” and finally as “error”.
− The SCU shall prevent continued use of the battery string if a module temperature exceeds the safety threshold (DTC escalation “error”) by entering the “Safe” state.
5. Over-Voltage Protection BMS 5.1. Cell Over-Voltage Protection: A condition when the voltagesensed across a cell is more than the upper operating voltage limit of that cell’s chemistry. − DTC for cell over voltage is escalated as “warning”, then “alarm” and finally as “error”. − The SCU SW shall prevent sustained cell over-voltage conditions (DTC escalation “error”) by entering the “Safe” state.
6. Under-Voltage Protection BMS 6.1. Cell Under-Voltage Protection: A condition when the voltagesensed across a cell is less than the lower voltage limit of that cell − DTC for cell under voltage is escalated as “warning”, then “alarm” and finally as “error”. − The SCU SW shall prevent sustained cell under-voltage conditions (DTC escalation “error”) by entering the “Safe” state.
− The SCU SW shall prevent recharging of a cell which is in a critical under-voltage (DTC escalation “lock-out”) condition by entering the “Safe” state. Contactors will not close again if the BMS detects this state.
7. Communication Failure
8. Welded Contactor Protection 8.1. Welded Contactor: A condition when a contactor in the BDUbecomes welded in the closed position − The SCU SW shall prevent sustained current by entering the “Safe” state, which will open the other contactor in the BDU.
9. Over-Current Protection BMSUser Manual - XPAND Battery System Overview Document Number: 001006-03

PSTA– Pinellas Suncoast Transit Authority RFP 21-980369
Section 2L
Solicitation Requirements:
13.1 Service.
List all special tools, fixtures or facility requirements recommended for servicing.
New Flyer Response:
No special tools or fixture requirements for this RFP.
FEDERAL TRANSIT BUS TEST
Performed for the Federal Transit Administration U.S. DOT In accordance with CFR 49, Volume 7, Part 665
Manufacturer: New FlyerModel: XE40
Submitted for Testing in Service-Life Category 12Year /500,000 Miles
JULY 2015
Report Number: LTI-BT-R1405
The Thomas D. Larson Pennsylvania Transportation Institute
201 Transportation Research Building The Pennsylvania State University
University Park, PA 16802 (814) 865-1891
Bus Testing and Research Center 2237 Old Route 220 North
Duncansville, PA 16635 (814) 695-3404
1405 Page 2 of 128
1405 Page 3 of 128
TABLE OF CONTENTS
Page
EXECUTIVE SUMMARY .......................................................................................................................... 4
ABBREVIATIONS .................................................................................................................................... 6
BUS CHECK-IN ....................................................................................................................................... 7
1. MAINTAINABILITY
1.1 ACCESSIBILITY OF COMPONENTS AND SUBSYSTEMS ....................................... 20 1.2 SERVICING, PREVENTATIVE MAINTENANCE, AND REPAIR AND
MAINTENANCE DURING TESTING ........................................................................... 23 1.3 REPLACEMENT AND/OR REPAIR OF SELECTED SUBSYSTEMS ......................... 27
2. RELIABILITY - DOCUMENTATION OF BREAKDOWN AND REPAIR TIMES DURING TESTING ................................................................................................................ 32
3. SAFETY - A DOUBLE-LANE CHANGE (OBSTACLE AVOIDANCE TEST) .................................... 35
4. PERFORMANCE TESTS
4.1 PERFORMANCE - AN ACCELERATION, GRADEABILITY, AND TOP SPEED TEST ............................................................................................................... 38
4.2 PERFORMANCE – BUS BRAKING PERFORMANCE TEST ...................................... 42
5. STRUCTURAL INTEGRITY
5.1 STRUCTURAL STRENGTH AND DISTORTION TESTS - STRUCTURAL SHAKEDOWN TEST ................................................................................................... 48
5.2 STRUCTURAL STRENGTH AND DISTORTION TESTS - STRUCTURAL DISTORTION ............................................................................................................... 52
5.3 STRUCTURAL STRENGTH AND DISTORTION TESTS - STATIC TOWING TEST ............................................................................................................ 64
5.4 STRUCTURAL STRENGTH AND DISTORTION TESTS - DYNAMIC TOWING TEST ............................................................................................................ 68
5.5 STRUCTURAL STRENGTH AND DISTORTION TESTS - JACKING TEST ......................................................................................................... 71
5.6 STRUCTURAL STRENGTH AND DISTORTION TESTS - HOISTING TEST ........................................................................................................ 73
5.7 STRUCTURAL DURABILITY TEST ............................................................................ 75
6. FUEL ECONOMY TEST - A FUEL CONSUMPTION TEST USING AN APPROPRIATE OPERATING CYCLE ........................................................................................... 93
7. NOISE
7.1 INTERIOR NOISE AND VIBRATION TESTS ......................................................... 118 7.2 EXTERIOR NOISE TESTS ...................................................................................... 123
1405 Page 4 of 128
EXECUTIVE SUMMARY
New Flyer submitted a model XE40, electric-powered 39 seat (including the driver) 40-foot bus, for a 12 yr. /500,000 mile STURAA test. The odometer reading at the time of delivery was 1,018 miles. Testing started on June 24, 2014 and was completed on July 9, 2015. The Check-In section of the report provides a description of the bus and specifies its major components.
The primary part of the test program is the Structural Durability Test, which also provides the information for the Maintainability and Reliability results. The Structural Durability Test was started on August 26, 2014 and was completed on March 19, 2015.
The interior of the bus is configured with seating for 39 passengers including the driver. Free floor space will accommodate 37 standing passengers resulting in a potential load of 76 persons. At 150 lbs per person, this load results in a measured gross vehicle weight of 43,550 lbs. The first segment of the Structural Durability Test was performed with the bus loaded to a GVW of 43,550 lbs. The middle segment was performed at a seated load weight of 38,700 lbs. and the final segment was performed at a curb weight of 32,770 lbs. Durability driving resulted in unscheduled maintenance and failures that involved a variety of subsystems. A description of failures and a complete and detailed listing of scheduled and unscheduled maintenance are provided in the Maintainability section of this report.
Effective January 1, 2010 the Federal Transit Administration determined that the total number of simulated passengers used for loading all test vehicles will be based on the full complement of seats and free-floor space available for standing passengers (150 lbs per passenger). The passenger loading used for dynamic testing will not be reduced in order to comply with Gross Axle Weight Ratings (GAWR’s) or the Gross Vehicle Weight Ratings (GVWR’s) declared by the manufacturer. Cases where the loading exceeds the GAWR and/or the GVWR will be noted accordingly. During the testing program, all test vehicles transported or operated over public roadways will be loaded to comply with the GAWR and GVWR specified by the manufacturer.
Accessibility, in general, was adequate, components covered in Section 1.3 (Repair and/or Replacement of Selected Subsystems) along with all other components encountered during testing, were found to be readily accessible and no restrictions were noted.
The Reliability section compiles failures that occurred during Structural Durability Testing. Breakdowns are classified according to subsystems. The data in this section are arranged so that those subsystems with more frequent problems are apparent. The problems are also listed by class as defined in Section 2. The test bus encountered no Class 1 or Class 2 failures. Of the twenty-one reported failures, twelve were Class 3 and 9 were Class 4.
The Safety Test, (a double-lane change, obstacle avoidance test) was safely performed in both right-hand and left-hand directions up to a maximum test speed of 45 mph. The performance of the bus is illustrated by a speed vs. time plot. Acceleration and gradeability test data are provided in Section 4, Performance. The average time to
1405 Page 5 of 128
obtain 50 mph was 43.96 seconds. The Stopping Distance phase of the Brake Test was completed with the following results; for the Uniform High Friction Test average stopping distances were 35.58’ at 20 mph, 67.96’ at 30 mph, 118.05’ at 40 mph and 145.59’ at 45 mph. The average stopping distance for the Uniform Low Friction Test was 34.99’. There was no deviation from the test lane during the performance of the Stopping Distance phase. During the Stability phase of Brake Testing the test bus experienced no deviation from the test lane. The Parking Brake phase was completed with the test bus maintaining the parked position for the full five minute period with no slip or roll observed in both the uphill and downhill positions.
The Shakedown Test produced a maximum final loaded deflection of 0.202 inches with a permanent set ranging between -0.001 to 0.005 inches under a distributed static load of 25,575 lbs. The Distortion Test was completed with all subsystems, doors and escape mechanisms operating properly. No water leakage was observed throughout the test. All subsystems operated properly.
The Static Towing Test was performed using a target load (towing force) of 39,312 lbs. All four front pulls were completed to the full test load with no damage or deformation observed. The Dynamic Towing Test was performed by means of a front-lift tow. The towing interface was accomplished using a hydraulic under-lift wrecker. The bus was towed without incident and no damage resulted from the test. The manufacturer does not recommend towing the bus from the rear; therefore, a rear test was not performed. The Jacking and Hoisting Tests were also performed without incident. The bus was found to be stable on the jack stands, and the minimum jacking clearance observed with a tire deflated was 3.1 inches.
A Fuel Economy Test was run on simulated central business district, arterial, and commuter courses. The results are available from pages 94-121 with in this report.
A series of Interior and Exterior Noise Tests were performed. These data are listed in Section 7.1 and 7.2 respectively.
1405 Page 6 of 128
ABBREVIATIONS
ABTC - Altoona Bus Test Center
A/C - air conditioner
ADB - advance design bus
ATA-MC - The Maintenance Council of the American Trucking Association
CBD - central business district
CW - curb weight (bus weight including maximum fuel, oil, and coolant; but
without passengers or driver)
dB(A) - decibels with reference to 0.0002 microbar as measured on the "A" scale
DIR - test director
DR - bus driver
EPA - Environmental Protection Agency
FFS - free floor space (floor area available to standees, excluding ingress/egress areas,
area under seats, area occupied by feet of seated passengers, and the vestibule area)
GVL - gross vehicle load (150 lb for every designed passenger seating
position, for the driver, and for each 1.5 sq ft of free floor space)
GVW - gross vehicle weight (curb weight plus gross vehicle load)
GVWR - gross vehicle weight rating
MECH - bus mechanic
mpg - miles per gallon
mph - miles per hour
PM - Preventive maintenance
PSTT - Penn State Test Track
PTI - Pennsylvania Transportation Institute
rpm - revolutions per minute
SAE - Society of Automotive Engineers
SCH - test scheduler
SA - staff assistant
SLW - seated load weight (curb weight plus 150 lb for every designed passenger seating
position and for the driver)
STURAA - Surface Transportation and Uniform Relocation Assistance Act
TD - test driver
TECH - test technician
TM - track manager
TP - test personnel
1405 Page 7 of 128
TEST BUS CHECK-IN
I. OBJECTIVE
The objective of this task is to log in the test bus, assign a bus number, complete the vehicle data form, and perform a safety check.
II. TEST DESCRIPTION
The test consists of assigning a bus test number to the bus, cleaning the bus, completing the vehicle data form, obtaining any special information and tools from the manufacturer, determining a testing schedule, performing an initial safety check, and performing the manufacturer's recommended preventive maintenance. The bus manufacturer must certify that the bus meets all Federal regulations.
III. DISCUSSION
The check-in procedure is used to identify in detail the major components and configuration of the bus.
The test bus consists of a New Flyer, model XE40. The bus has a front door equipped with a New Flyer model 32” wide flip out handicap ramp (1:7 slope), forward of the front axle and a rear door forward of the rear axle. Charging is provided by a New Flyer 100 kW portable depot charger. This charger charges 4 strings of 7 batteries.These Xalt Energy model Xsyst 7 (7 kWh) Lithium Ion batteries supply power to the Siemens Model 1DB2016 drive motor and bus auxiliaries thru Siemens ELFA2 Electric Drive system.
The measured curb weight is 10,550 lbs. for the front axle and 22,220 lbs. for the rear axle. These combined weights provide a total measured curb weight of 32,770 lbs.There are 39 seats including the driver and room for 37 standing passengers bringing the total passenger capacity to 76. Gross load is 150 lb. x 72 = 11,400 lbs. At full capacity, the measured gross vehicle weight is 43,550 lbs.
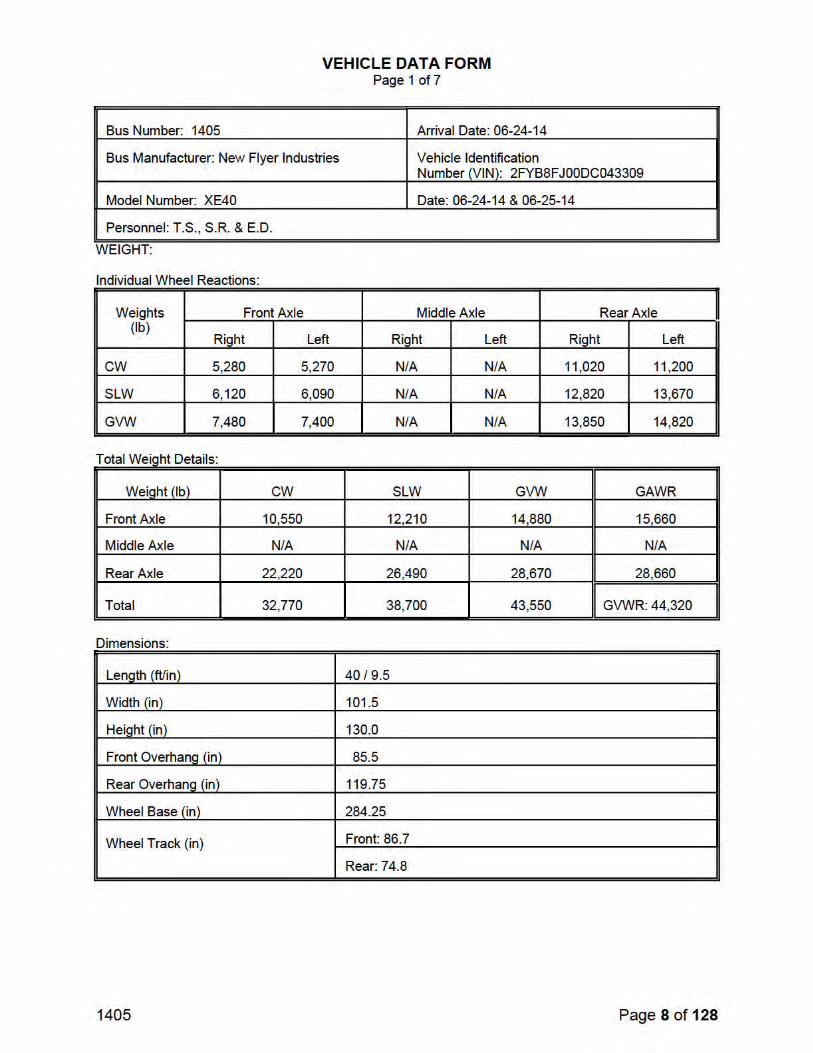
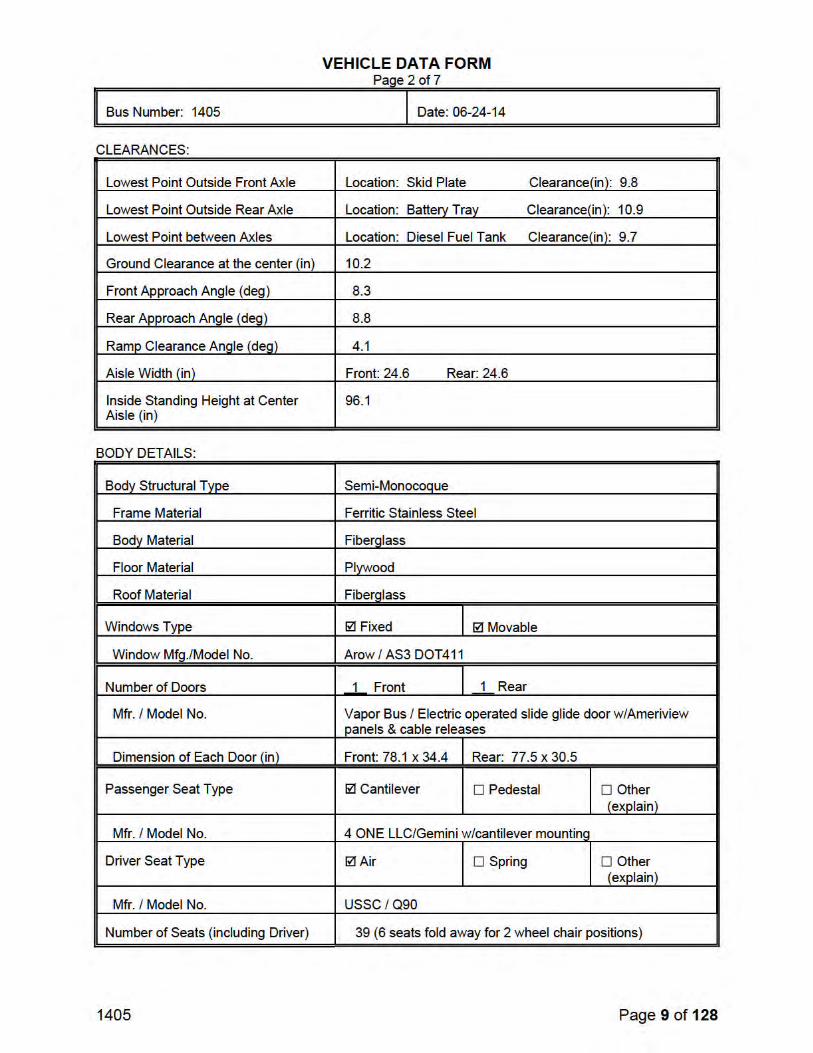
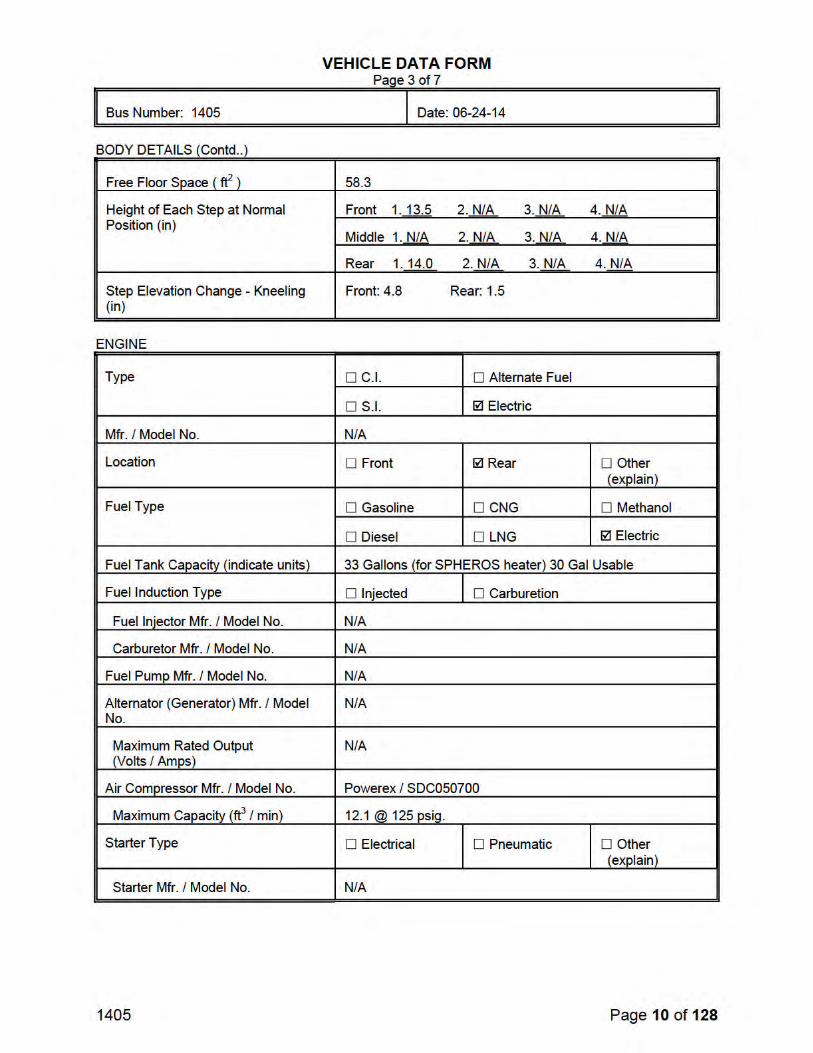
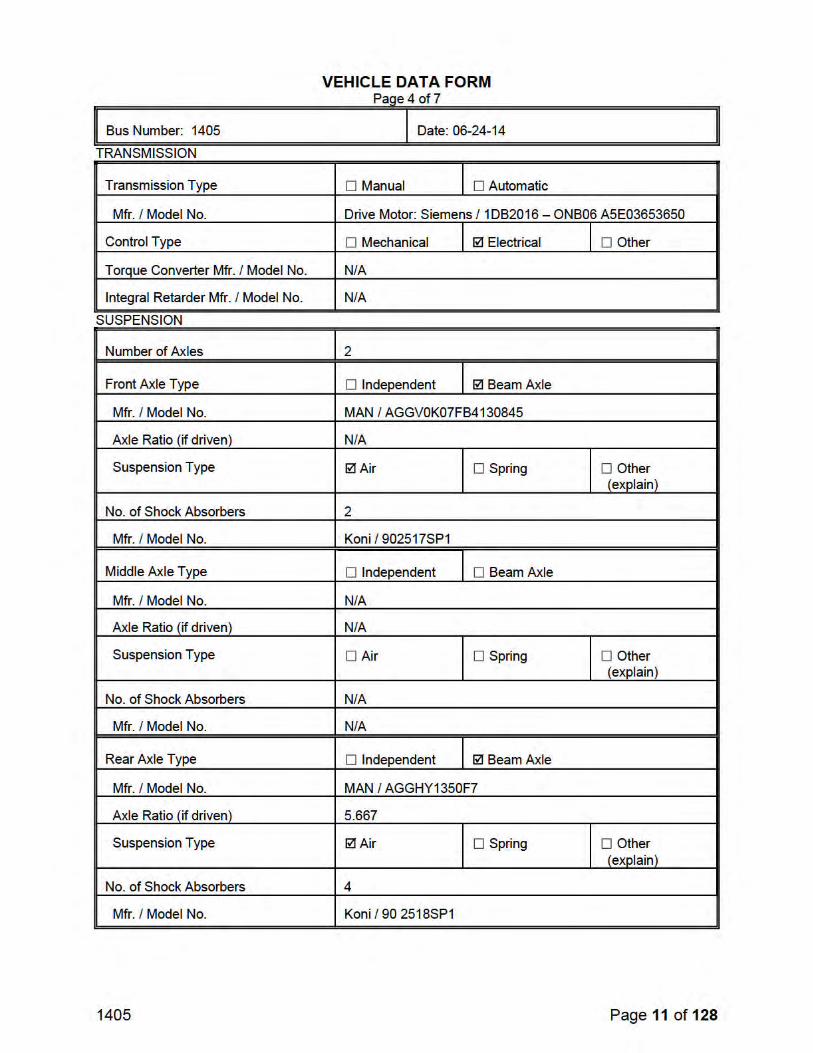

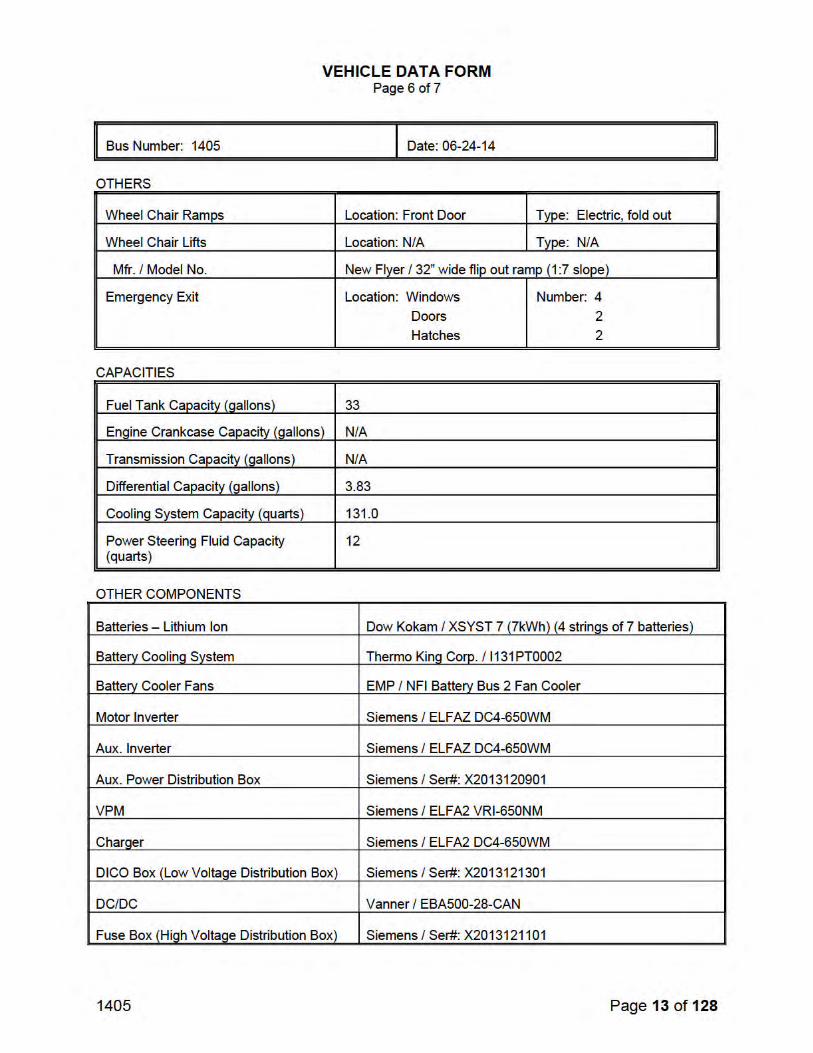
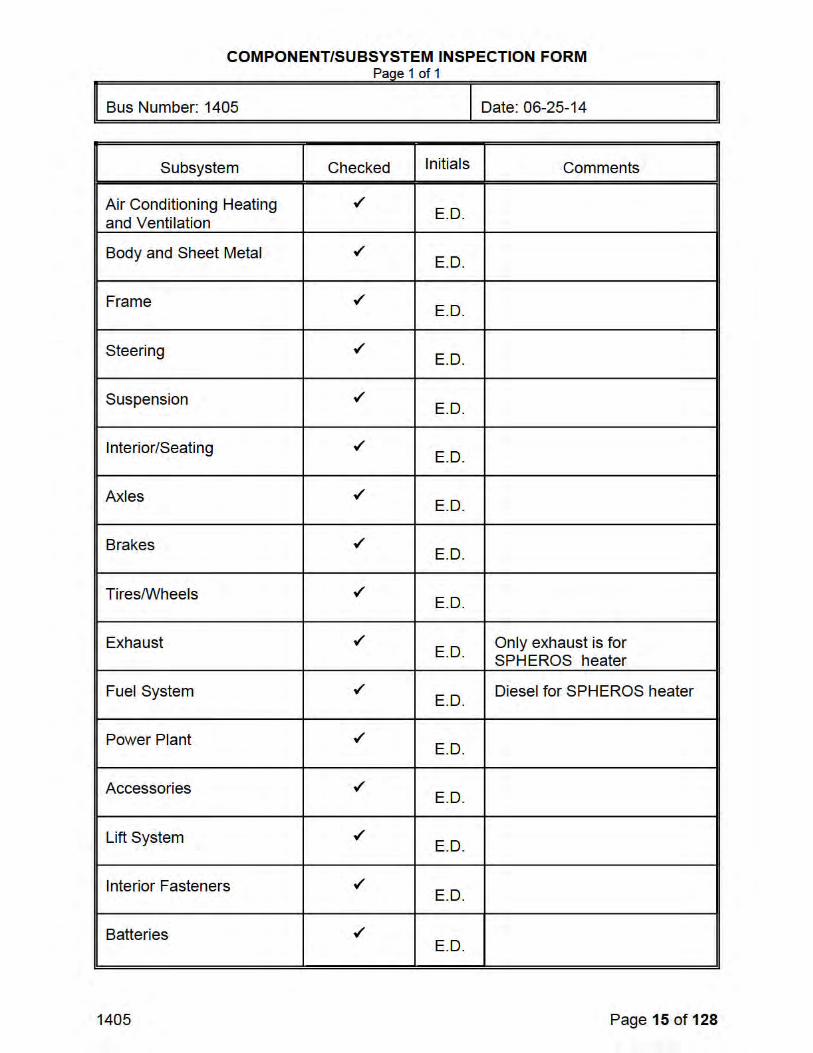
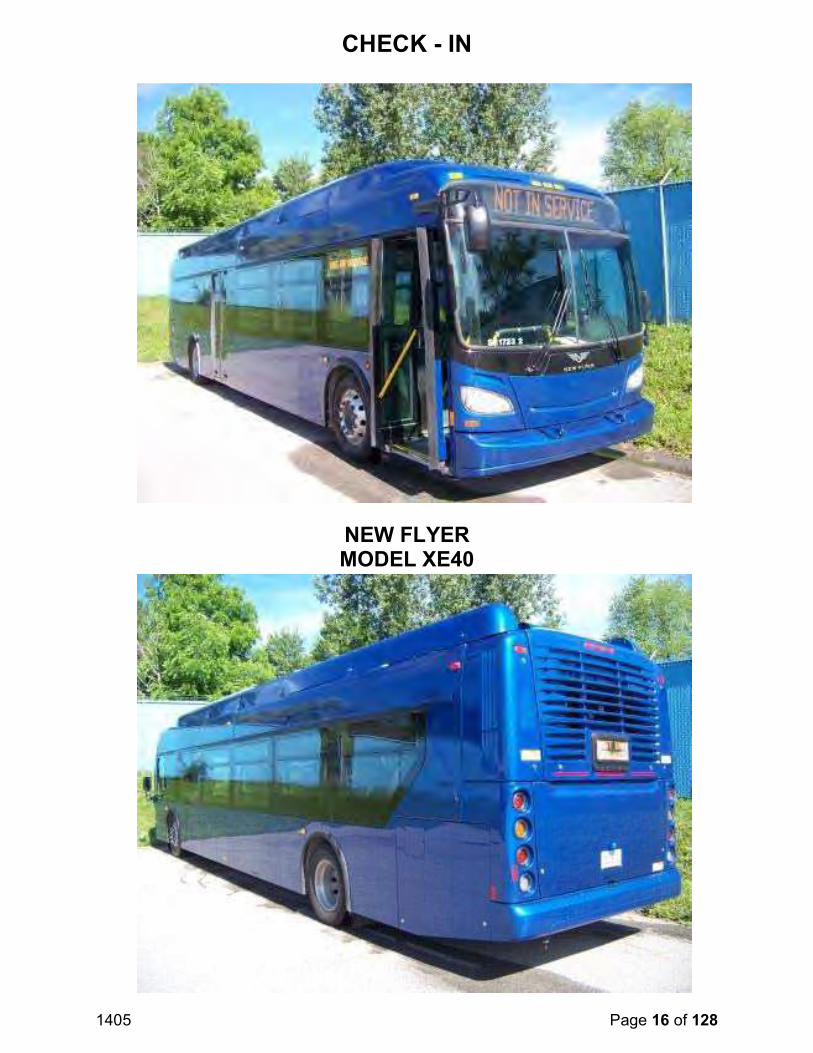
1405 Page 16 of 128
CHECK - IN
NEW FLYER MODEL XE40
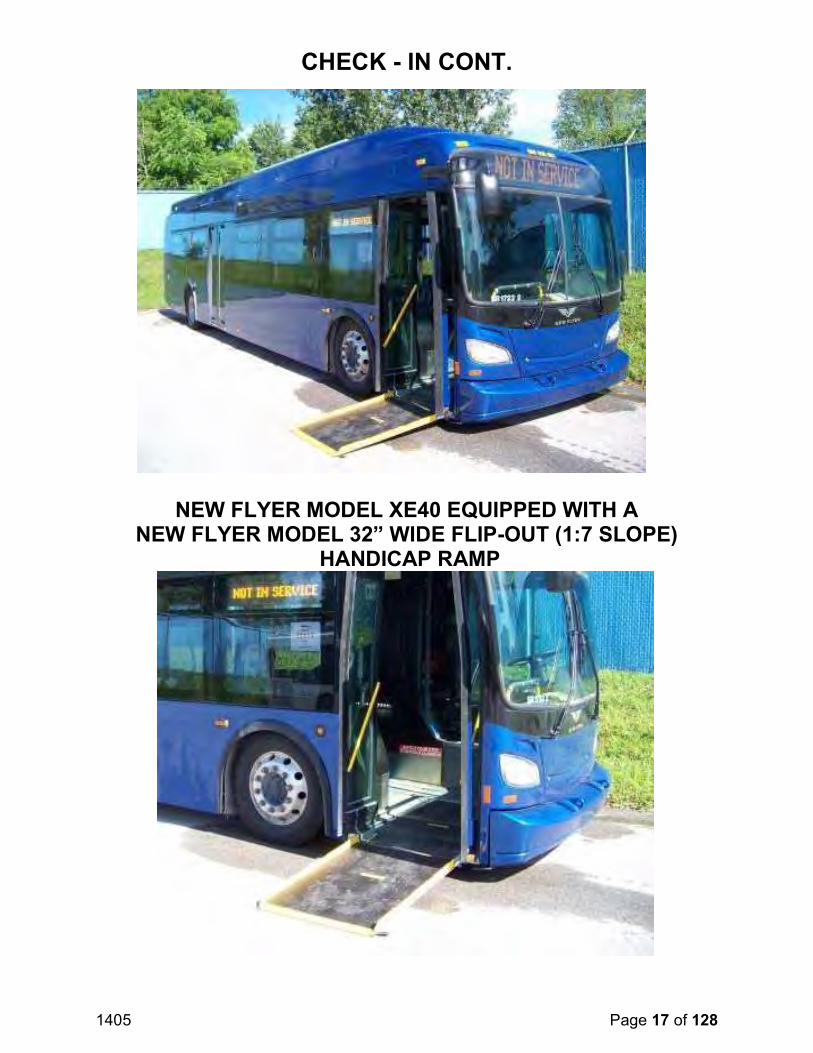
1405 Page 17 of 128
CHECK - IN CONT.
NEW FLYER MODEL XE40 EQUIPPED WITH ANEW FLYER MODEL 32” WIDE FLIP-OUT (1:7 SLOPE)
HANDICAP RAMP
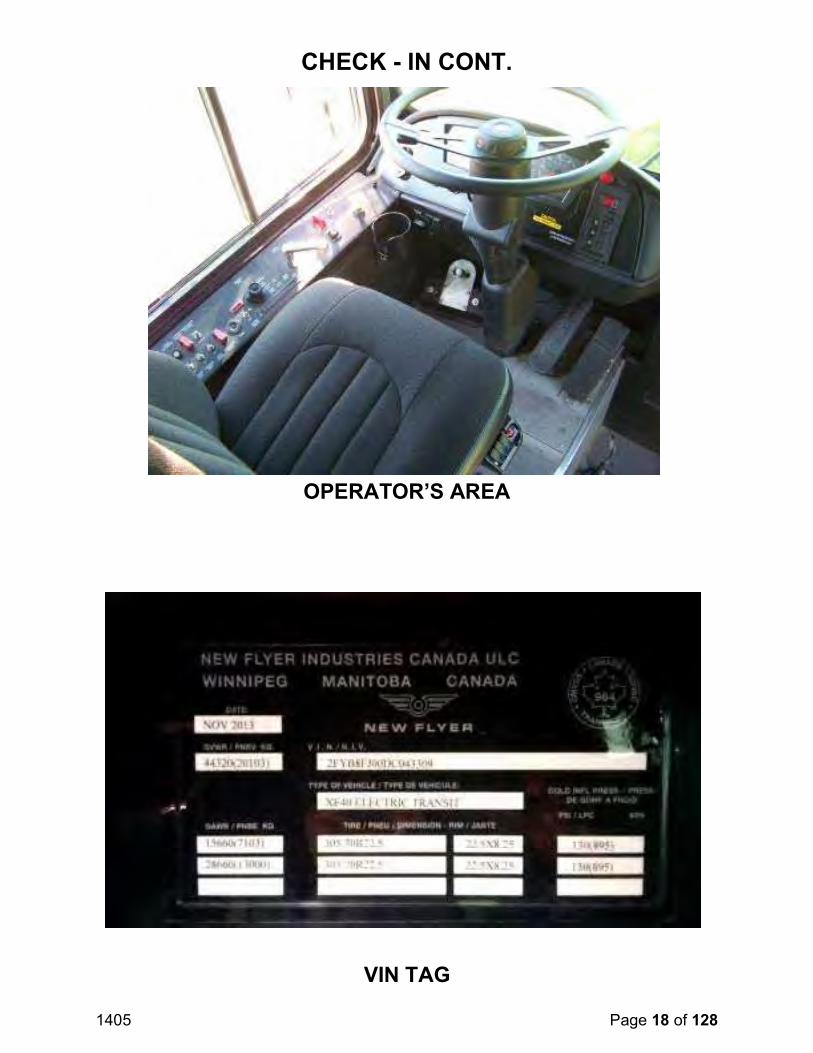
1405 Page 18 of 128
CHECK - IN CONT.
OPERATOR’S AREA
VIN TAG
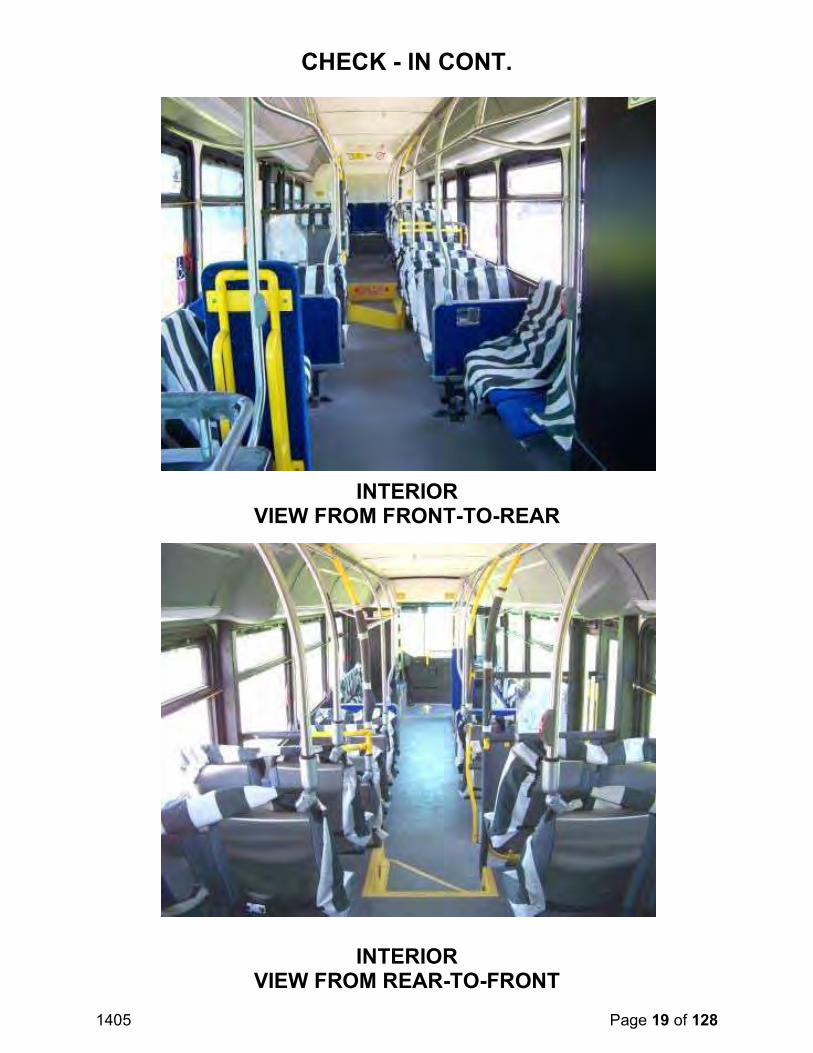
1405 Page 19 of 128
CHECK - IN CONT.
INTERIORVIEW FROM FRONT-TO-REAR
INTERIORVIEW FROM REAR-TO-FRONT
1405 Page 20 of 128
1. MAINTAINABILITY
1.1 ACCESSIBILITY OF COMPONENTS AND SUBSYSTEMS
1.1-I. TEST OBJECTIVE
The objective of this test is to check the accessibility of components and subsystems.
1.1-II. TEST DESCRIPTION
Accessibility of components and subsystems is checked, and where accessibility is restricted the subsystem is noted along with the reason for the restriction.
1.1-III. DISCUSSION
Accessibility, in general, was adequate. Components covered in Section 1.3 (repair and/or replacement of selected subsystems), along with all other components encountered during testing, were found to be readily accessible and no restrictions were noted.
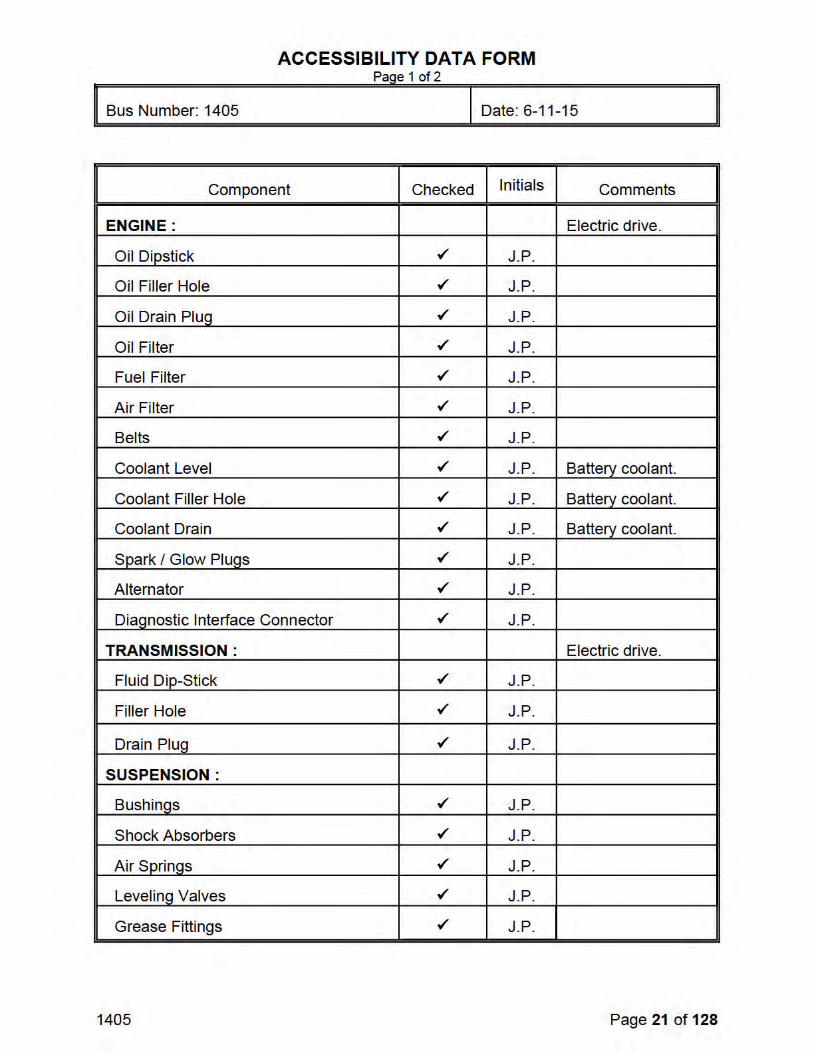
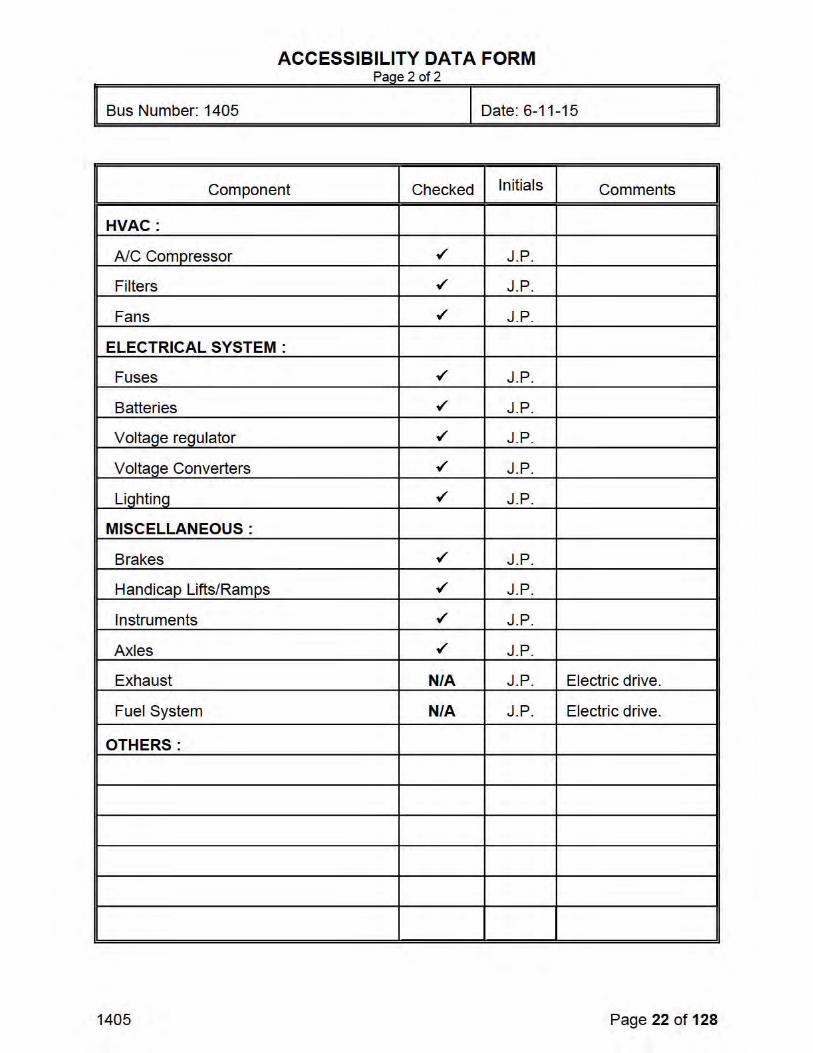
1405 Page 23 of 128
1.2 SERVICING, PREVENTIVE MAINTENANCE, AND REPAIR AND MAINTENANCE DURING TESTING
1.2-I. TEST OBJECTIVE
The objective of this test is to collect maintenance data about the servicing, preventive maintenance, and repair.
1.2.-II. TEST DESCRIPTION
The test will be conducted by operating the NBM and collecting the following data on work order forms and a driver log.
1. Unscheduled Maintenancea. Bus numberb. Datec. Mileaged. Description of malfunctione. Location of malfunction (e.g., in service or undergoing inspection)f. Repair action and parts usedg. Man-hours required
2. Scheduled Maintenancea. Bus numberb. Datec. Mileaged. Engine running time (if available)e. Results of scheduled inspectionsf. Description of malfunction (if any)g. Repair action and parts used (if any)h. Man-hours required
The buses will be operated in accelerated durability service. While typical items are given below, the specific service schedule will be that specified by the manufacturer.
A. Service1. Fueling2. Consumable checks3. Interior cleaning
B. Preventive Maintenance4. Brake adjustments5. Lubrication6. 3,000 mi (or equivalent) inspection
1405 Page 24 of 128
7. Oil and filter change inspection 8. Major inspection 9. Tune-up
C. Periodic Repairs1. Brake reline 2. Transmission change 3. Engine change 4. Windshield wiper motor change 5. Stoplight bulb change 6. Towing operations 7. Hoisting operations
1.2-III. DISCUSSION
Servicing and preventive maintenance were performed at manufacturer-specified intervals. The following Scheduled Maintenance Form lists the mileage, items serviced, the service interval, and amount of time required to perform the maintenance. Finally, the Unscheduled Maintenance List along with Unscheduled Maintenance-related photographs is included in Section 5.7, Structural Durability. This list supplies information related to failures that occurred during the durability portion of testing. The Unscheduled Maintenance List includes the date and mileage at which the malfunction occurred, a description of the malfunction and repair, and the time required to perform the repair.
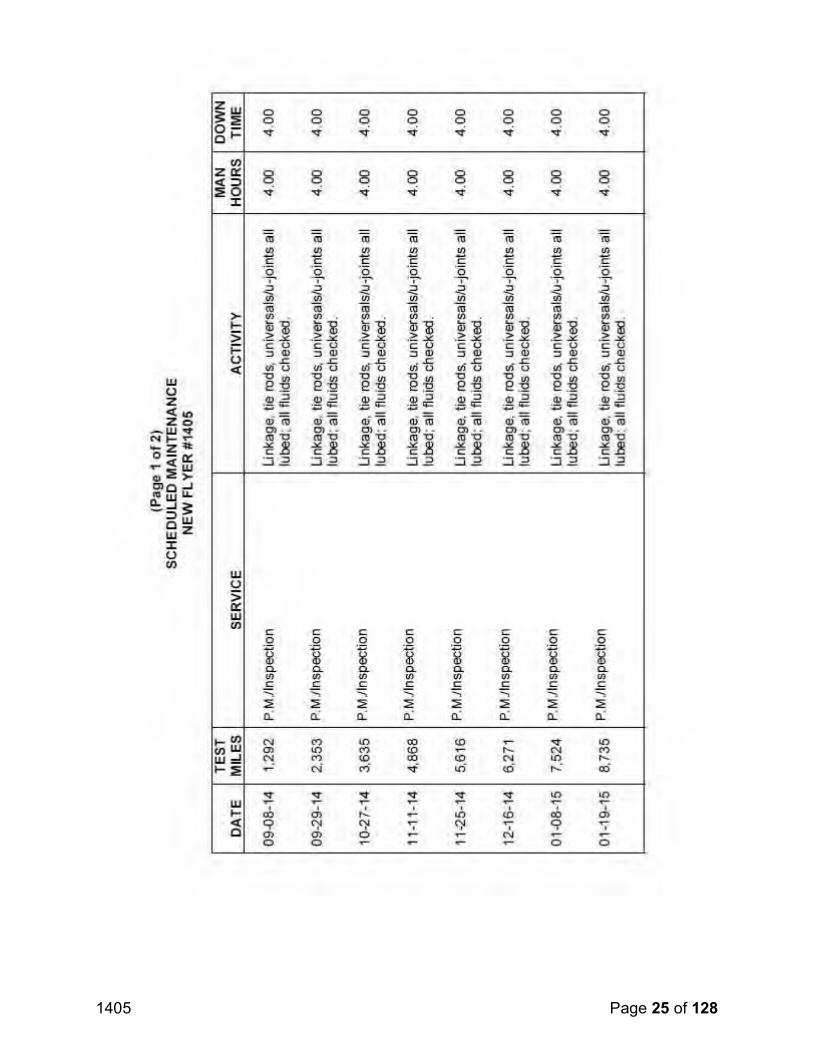
1405 Page 25 of 128
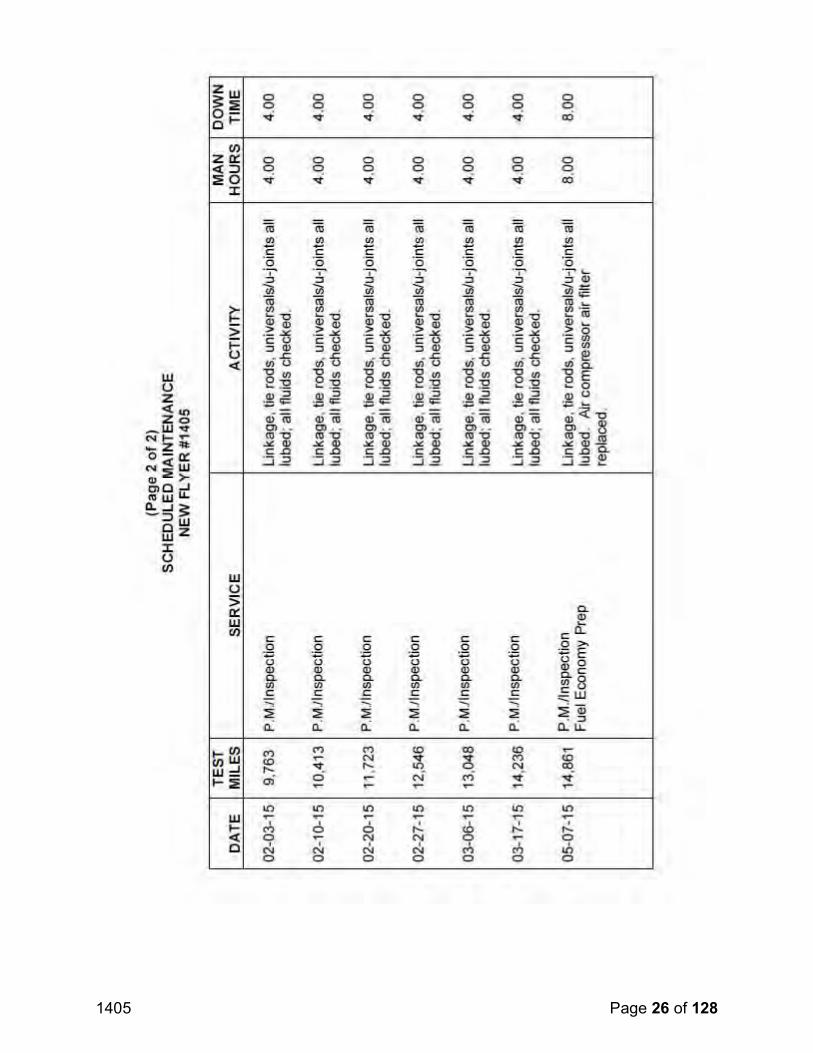
1405 Page 26 of 128
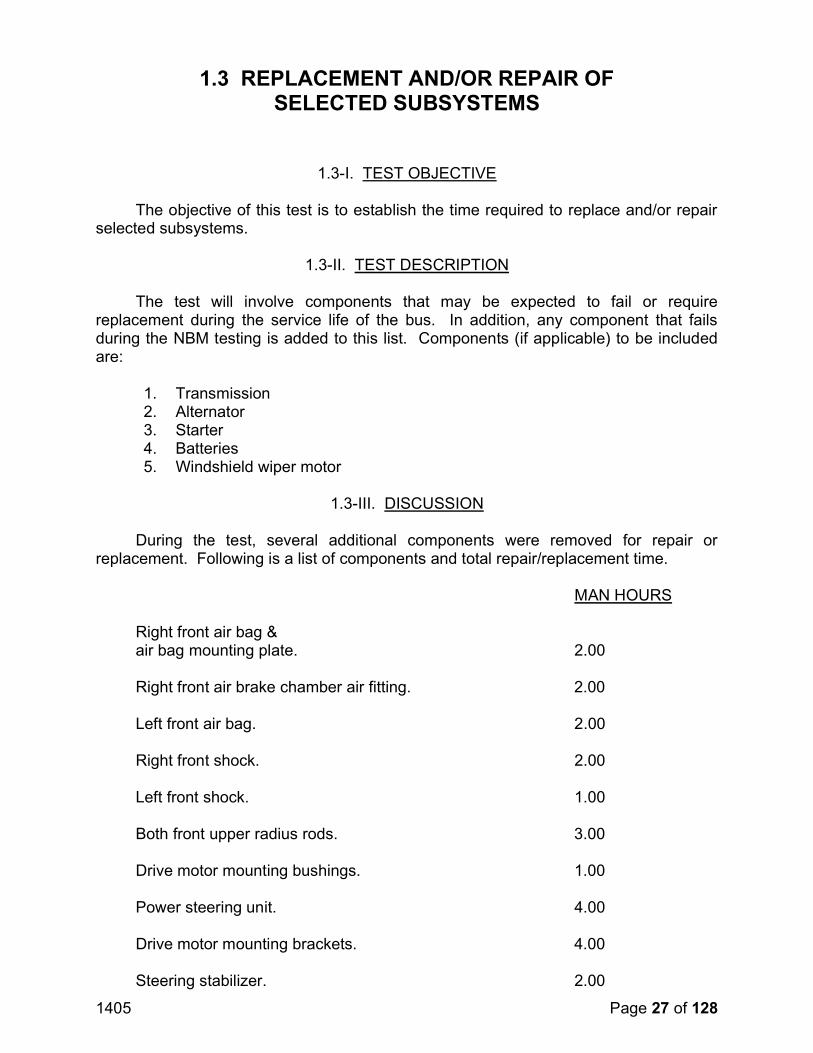
1405 Page 27 of 128
1.3 REPLACEMENT AND/OR REPAIR OF SELECTED SUBSYSTEMS
1.3-I. TEST OBJECTIVE
The objective of this test is to establish the time required to replace and/or repair selected subsystems.
1.3-II. TEST DESCRIPTION
The test will involve components that may be expected to fail or require replacement during the service life of the bus. In addition, any component that fails during the NBM testing is added to this list. Components (if applicable) to be included are:
1. Transmission2. Alternator3. Starter4. Batteries5. Windshield wiper motor
1.3-III. DISCUSSION
During the test, several additional components were removed for repair or replacement. Following is a list of components and total repair/replacement time.
MAN HOURS
Right front air bag &air bag mounting plate. 2.00
Right front air brake chamber air fitting. 2.00
Left front air bag. 2.00
Right front shock. 2.00
Left front shock. 1.00
Both front upper radius rods. 3.00
Drive motor mounting bushings. 1.00
Power steering unit. 4.00
Drive motor mounting brackets. 4.00
Steering stabilizer. 2.00
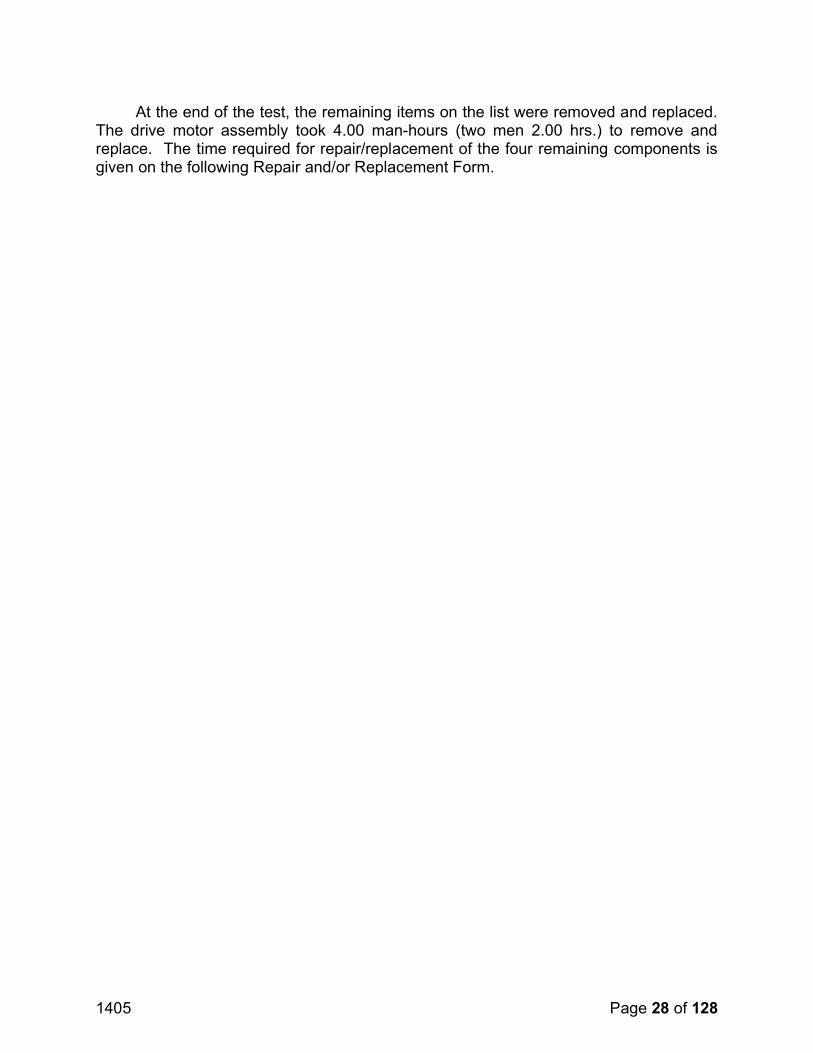
1405 Page 28 of 128
At the end of the test, the remaining items on the list were removed and replaced. The drive motor assembly took 4.00 man-hours (two men 2.00 hrs.) to remove and replace. The time required for repair/replacement of the four remaining components is given on the following Repair and/or Replacement Form.
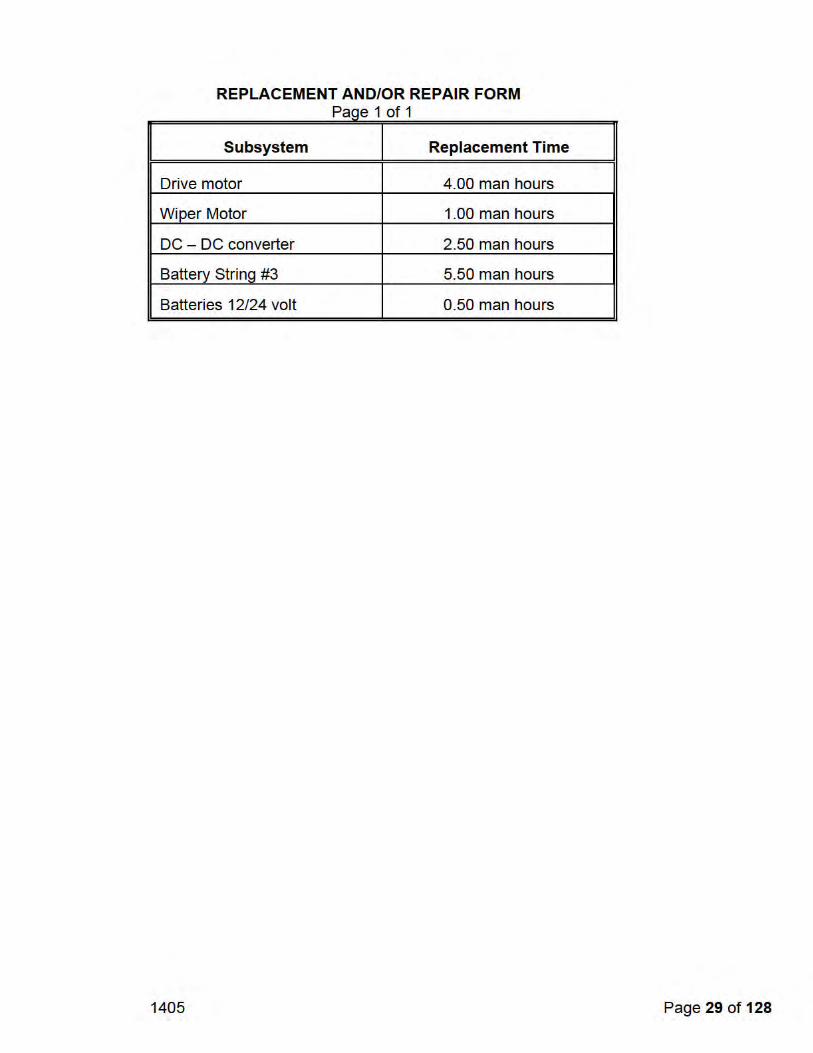
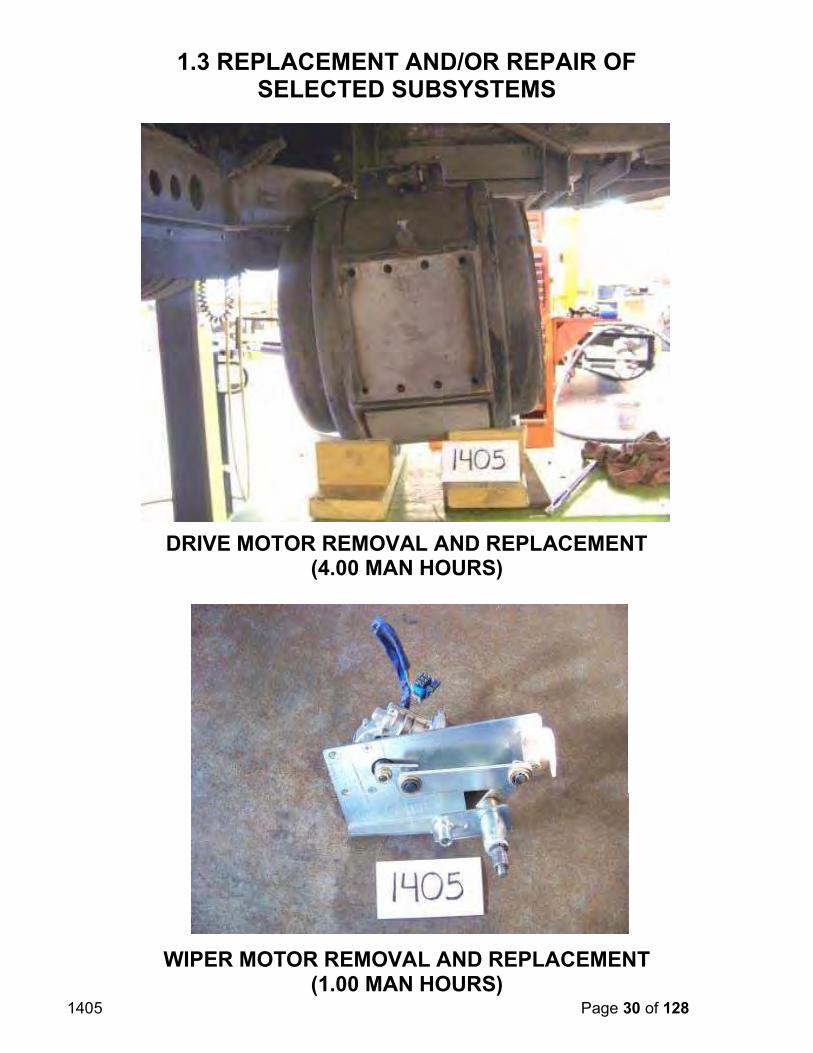
1405 Page 30 of 128
1.3 REPLACEMENT AND/OR REPAIR OFSELECTED SUBSYSTEMS
DRIVE MOTOR REMOVAL AND REPLACEMENT (4.00 MAN HOURS)
WIPER MOTOR REMOVAL AND REPLACEMENT (1.00 MAN HOURS)
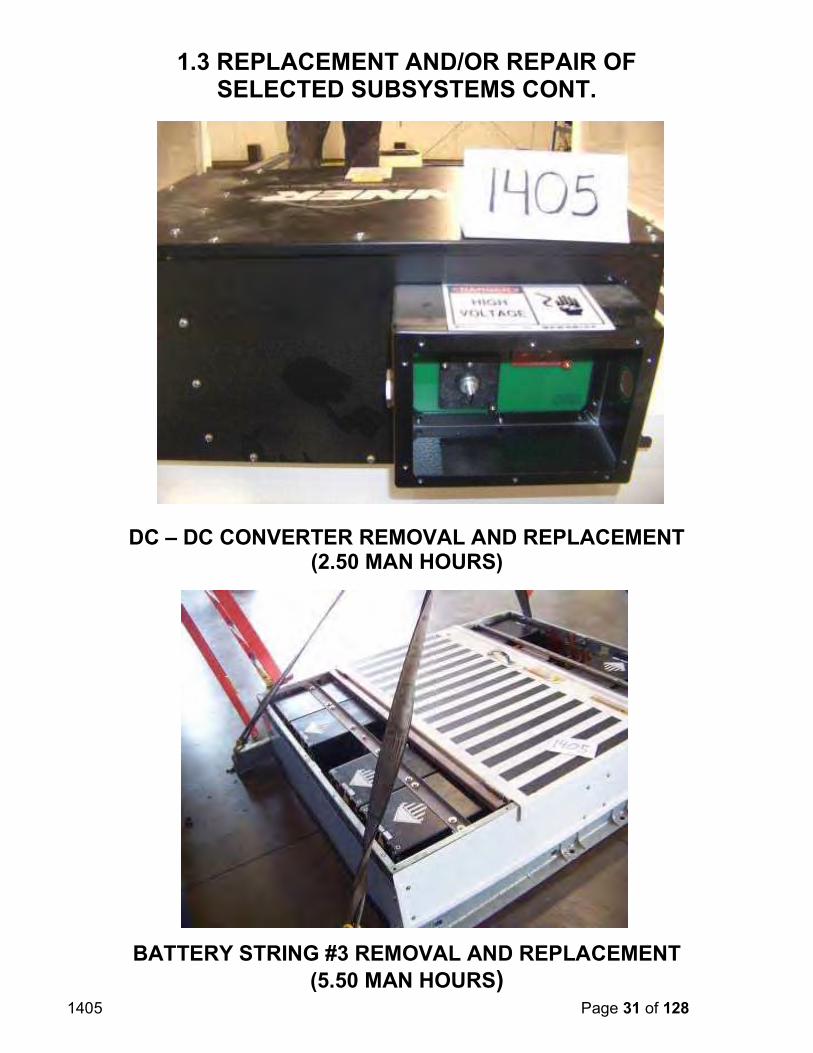
1405 Page 31 of 128
1.3 REPLACEMENT AND/OR REPAIR OFSELECTED SUBSYSTEMS CONT.
DC – DC CONVERTER REMOVAL AND REPLACEMENT (2.50 MAN HOURS)
BATTERY STRING #3 REMOVAL AND REPLACEMENT (5.50 MAN HOURS)
1405 Page 32 of 128
2. RELIABILITY - DOCUMENTATION OF BREAKDOWN AND REPAIR TIMES DURING TESTING
2-I. TEST OBJECTIVE
The objective of this test is to document unscheduled breakdowns, repairs, down time, and repair time that occur during testing.
2-II. TEST DESCRIPTION
Using the driver log and unscheduled work order forms, all significant breakdowns, repairs, man-hours to repair, and hours out of service are recorded on the Reliability Data Form.
CLASS OF FAILURES
Classes of failures are described below:
(a) Class 1: Physical Safety. A failure that could lead directly to passenger or driver injury and represents a severe crash situation.
(b) Class 2: Road Call. A failure resulting in an en route interruption of revenue service. Service is discontinued until the bus is replaced or repaired at the point of failure.
(c) Class 3: Bus Change. A failure that requires removal of the bus from service during its assignments. The bus is operable to a rendezvous point with a replacement bus.
(d) Class 4: Bad Order. A failure that does not require removal of the bus from service during its assignments but does degrade coach operation. The failure shall be reported by driver, inspector, or hostler.
2-III. DISCUSSION
A listing of breakdowns and unscheduled repairs is accumulated during the Structural Durability Test. The following Reliability Data Form lists all unscheduled repairs under classes as defined above. These classifications are somewhat subjective as the test is performed on a test track with careful inspections every two hours. However, even on the road, there is considerable latitude on deciding how to handle many failures.
The Unscheduled Repair List is also attached to provide a reference for the repairs that are included in the Reliability Data Forms.
1405 Page 33 of 128
The classification of repairs according to subsystem is intended to emphasize those systems which had persistent minor or more serious problems. There were no Class 1 or 2 failures. Of the twelve Class 3 failures, 6 involved the suspension system, three in the steering, and one each occurred with HVAC, electrical system, and compartments/framework. These, and the remaining nine Class 4 failures are available for review in the Unscheduled Maintenance List, located in Section 5.7 Structural Durability.
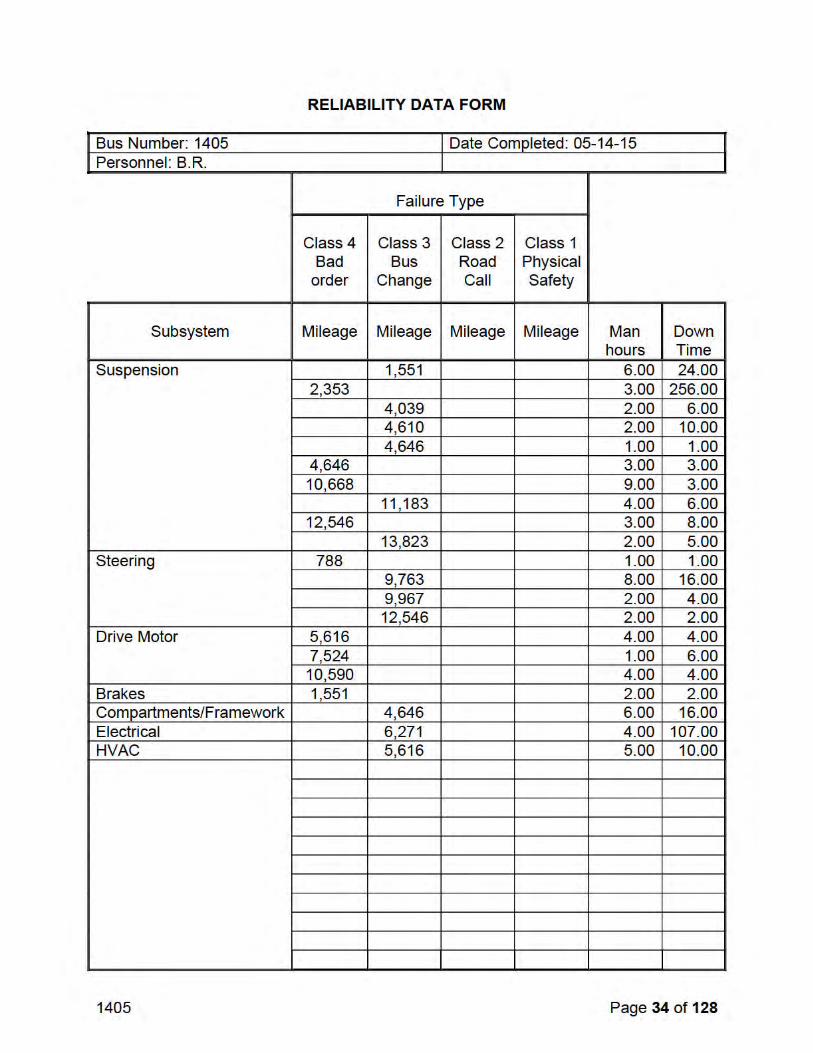
1405 Page 35 of 128
3. SAFETY - A DOUBLE-LANE CHANGE(OBSTACLE AVOIDANCE)
3-I. TEST OBJECTIVE
The objective of this test is to determine handling and stability of the bus by measuring speed through a double lane change test.
3-II. TEST DESCRIPTION
The Safety Test is a vehicle handling and stability test. The bus will be operated at SLW on a smooth and level test track. The bus will be driven through a double lane change course at increasing speed until the test is considered unsafe or a speed of 45 mph is reached. The lane change course will be set up using pylons to mark off two 12 foot center to center lanes with two 100 foot lane change areas 100 feet apart. The bus will begin in one lane, change to the other lane in a 100 foot span, travel 100 feet, and return to the original lane in another 100 foot span. This procedure will be repeated, starting first in the right-hand and then in the left-hand lane.
3-III. DISCUSSION
The double-lane change was performed in both right-hand and left-hand directions. The bus was able to safely negotiate the test course in both the right-hand and left-hand directions up to the maximum test speed of 45 mph.
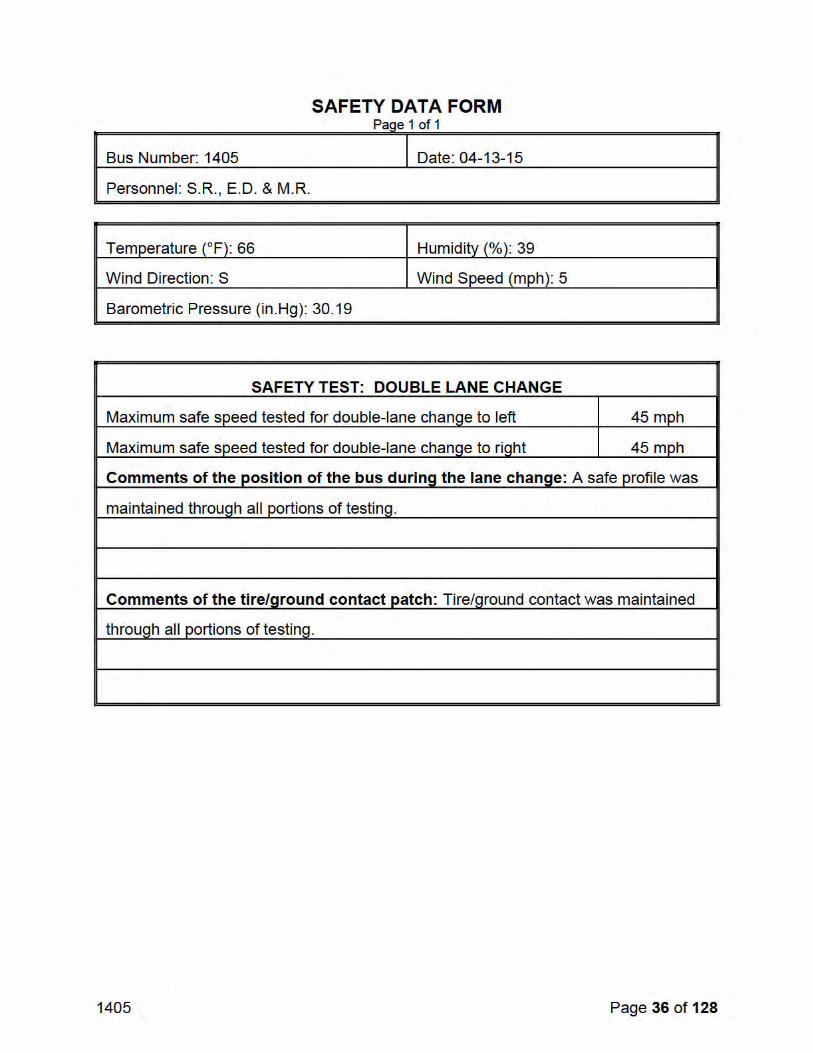
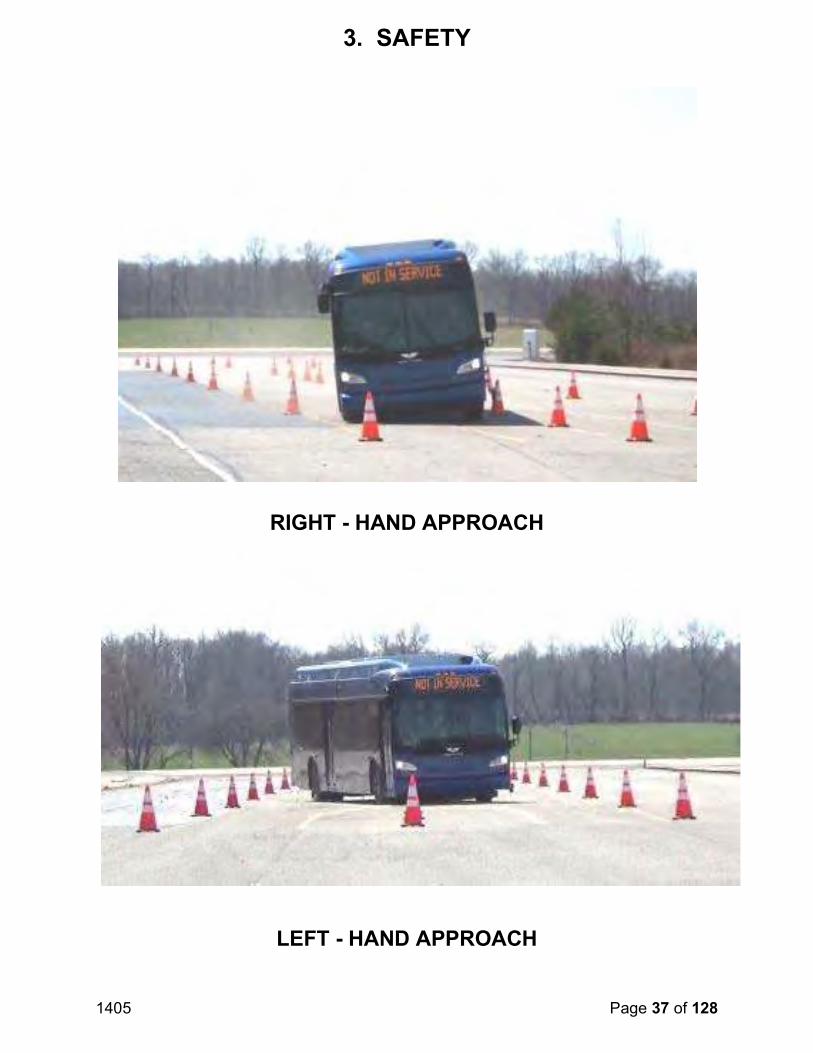
1405 Page 37 of 128
3. SAFETY
RIGHT - HAND APPROACH
LEFT - HAND APPROACH
1405 Page 38 of 128
4.0 PERFORMANCE
4.1 PERFORMANCE - AN ACCELERATION, GRADEABILITY, AND TOP SPEED TEST
4.1-I. TEST OBJECTIVE
The objective of this test is to determine the acceleration, gradeability, and top speed capabilities of the bus.
4.1-II. TEST DESCRIPTION
In this test, the bus will be operated at SLW on the skid pad at the PSBRTF. The bus will be accelerated at full throttle from a standstill to a maximum "geared" or "safe" speed as determined by the test driver. The vehicle speed is measured using a Correvit non-contacting speed sensor. The times to reach speed between ten mile per hour increments are measured and recorded using a stopwatch with a lap timer. The time to speed data will be recorded on the Performance Data Form and later used to generate a speed vs. time plot and gradeability calculations.
4.1-III. DISCUSSION
This test consists of three runs in both the clockwise and counterclockwise directions on the Test Track. Velocity versus time data is obtained for each run and results are averaged together to minimize any test variability which might be introduced by wind or other external factors. The test was performed up to a maximum speed of 50 mph. The fitted curve of velocity vs. time is attached, followed by the calculated gradeability results. The average time to obtain 50 mph was 43.96 seconds.
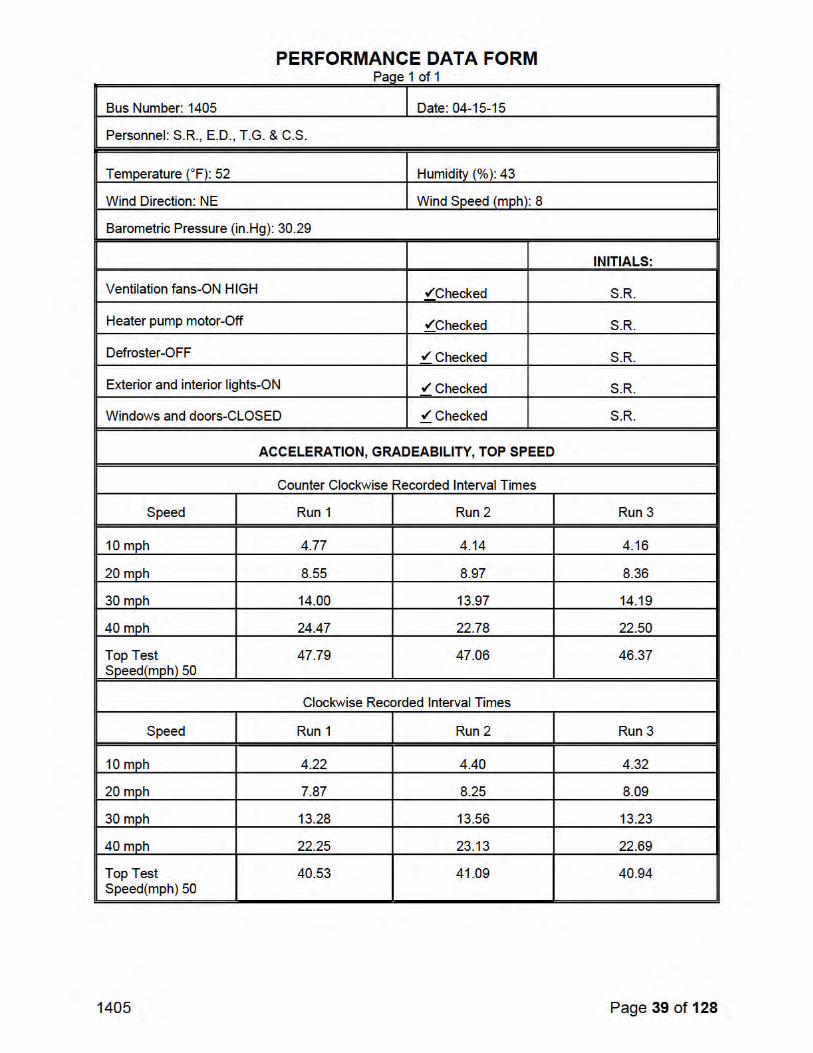
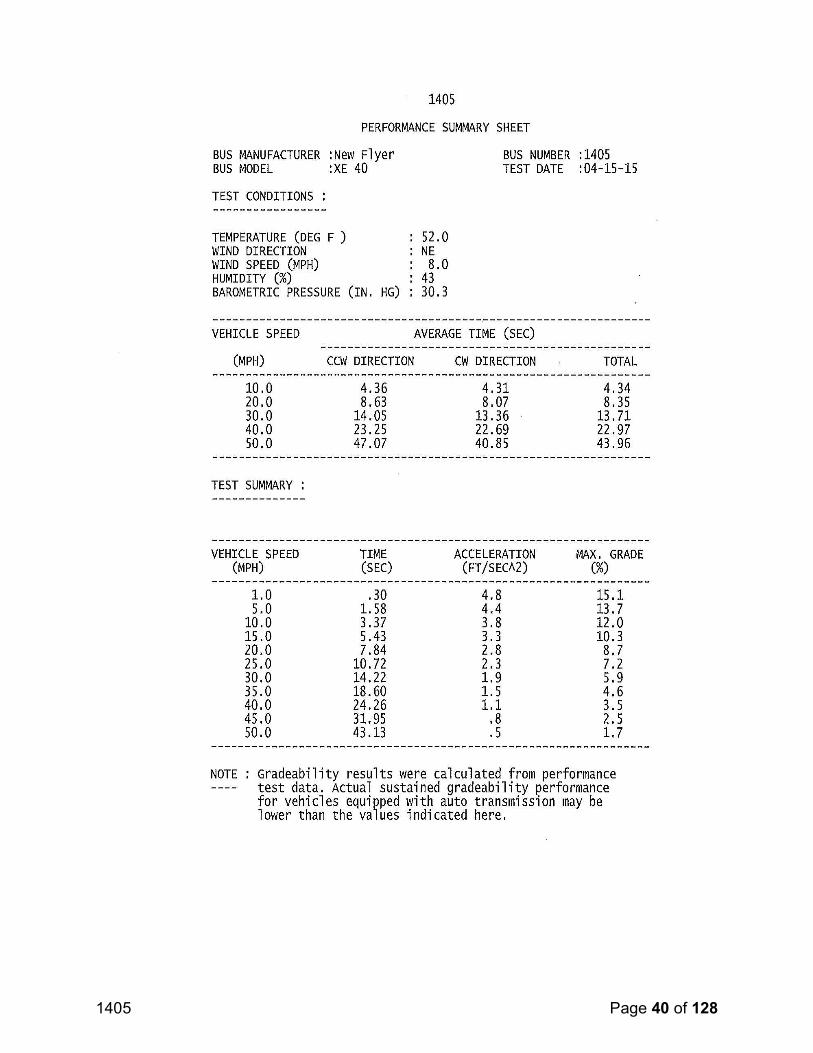
1405 Page 40 of 128
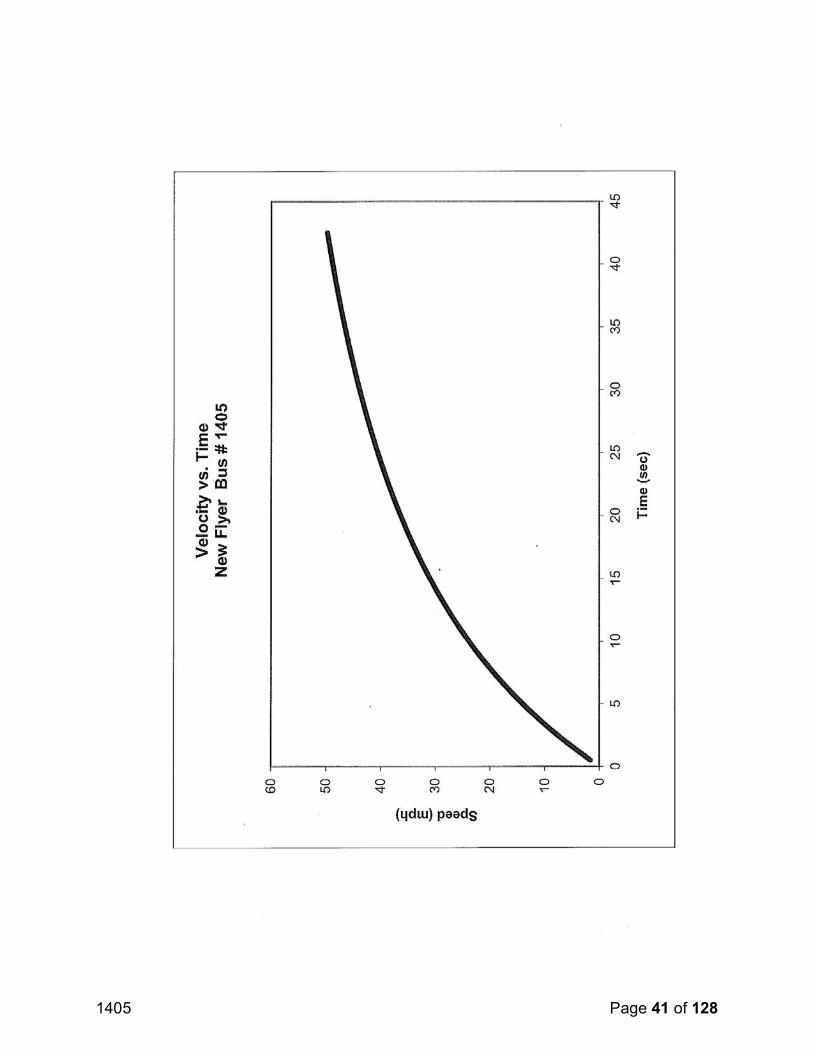
1405 Page 41 of 128
1405 Page 42 of 128
4.0 PERFORMANCE
4.2 Performance - Bus Braking
4.2 I. TEST OBJECTIVE
The objective of this test is to provide, for comparison purposes, braking performance data on transit buses produced by different manufacturers.
4.2 II. TEST DESCRIPTION
The testing will be conducted at the PTI Test Track skid pad area. Brake tests will be conducted after completion of the GVW portion of the vehicle durability test. At this point in testing the brakes have been subjected to a large number of braking snubs and will be considered well burnished. Testing will be performed when the bus is fully loaded at its GVW. All tires on each bus must be representative of the tires on the production model vehicle
The brake testing procedure comprises three phases:
1. Stopping distance tests
i. Dry surface (high-friction, Skid Number within the range of 70-76) ii. Wet surface (low-friction, Skid Number within the range of 30-36)
2. Stability tests 3. Parking brake test
Stopping Distance Tests
The stopping distance phase will evaluate service brake stops. All stopping distance tests on dry surface will be performed in a straight line and at the speeds of 20, 30, 40 and 45 mph. All stopping distance tests on wet surface will be performed in straight line at speed of 20 mph.
The tests will be conducted as follows:
1. Uniform High Friction Tests: Four maximum deceleration straight-line brake applications each at 20, 30, 40 and 45 mph, to a full stop on a uniform high-friction surface in a 3.66-m (12-ft) wide lane.
2. Uniform Low Friction Tests: Four maximum deceleration straight-line brake applications from 20 mph on a uniform low friction surface in a 3.66-m (12-ft) wide lane.
When performing service brake stops for both cases, the test vehicle is accelerated on the bus test lane to the speed specified in the test procedure and this speed is maintained into the skid pad area. Upon entry of the appropriate lane of the skid pad area, the vehicle's service brake is applied to stop the vehicle as quickly as possible. The stopping distance is measured and recorded for both cases on the test
1405 Page 43 of 128
data form. Stopping distance results on dry and wet surfaces will be recorded and the average of the four measured stopping distances will be considered as the measured stopping distance. Any deviation from the test lane will be recorded.
Stability Tests
This test will be conducted in both directions on the test track. The test consists of four maximum deceleration, straight-line brake applications on a surface with split coefficients of friction (i.e., the wheels on one side run on high-friction SN 70-76 or more and the other side on low-friction [where the lower coefficient of friction should be less than half of the high one] at initial speed of 30 mph).
(I) The performance of the vehicle will be evaluated to determine if it is possible to keep the vehicle within a 3.66m (12 ft) wide lane, with the dividing line between the two surfaces in the lane’s center. The steering wheel input angle required to keep the vehicle in the lane during the maneuver will be reported.
Parking Brake Test
The parking brake phase utilizes the brake slope, which has a 20% grade. The test vehicle, at its GVW, is driven onto the brake slope and stopped. With the transmission in neutral, the parking brake is applied and the service brake is released. The test vehicle is required to remain stationary for five minutes. The parking brake test is performed with the vehicle facing uphill and downhill.
4.2-III. DISCUSSION
The Stopping Distance phase of the Brake Test was completed with the following results; for the Uniform High Friction Test average stopping distances were 35.58’ at 20 mph, 67.96’ at 30 mph, 118.05’ at 40 mph and 145.59’ at 45 mph. The average stopping distance for the Uniform Low Friction Test was 34.99’ There was no deviation from the test lane during the performance of the Stopping Distance phase.
During the Stability phase of Brake Testing the test bus experienced no deviation from the test lane.
The Parking Brake phase was completed with the test bus maintaining the parked position for the full five minute period with no slip or roll observed in both the uphill and downhill positions.
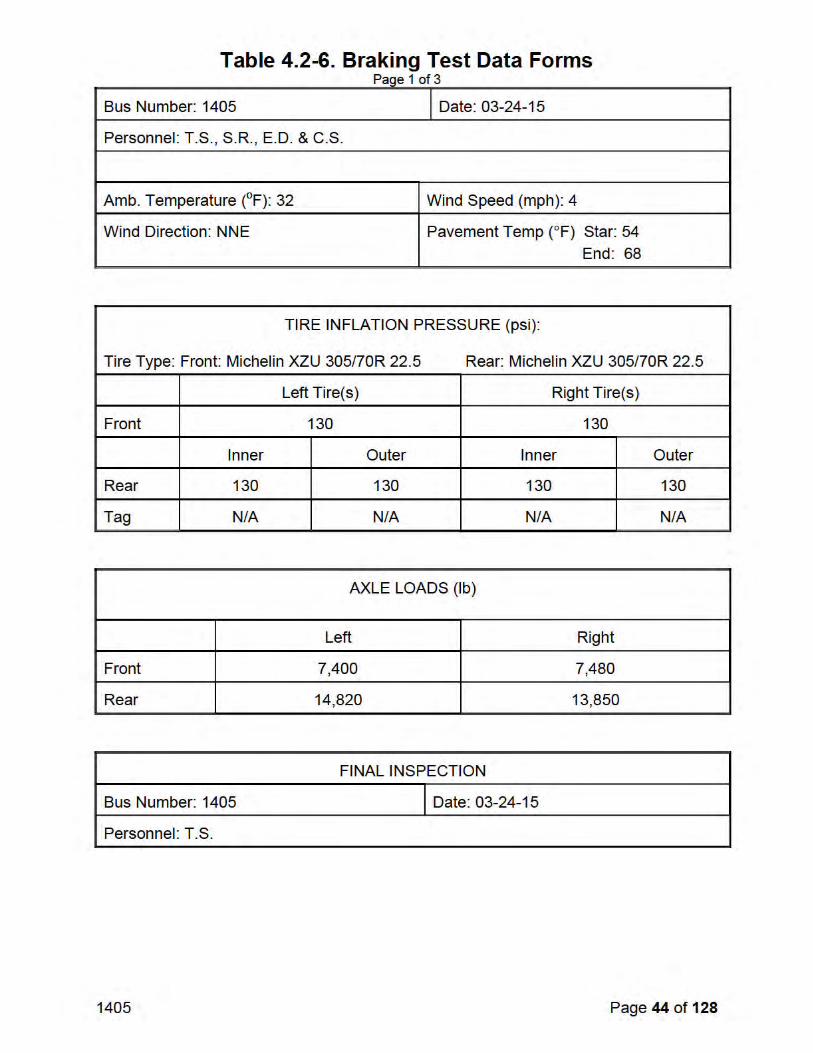
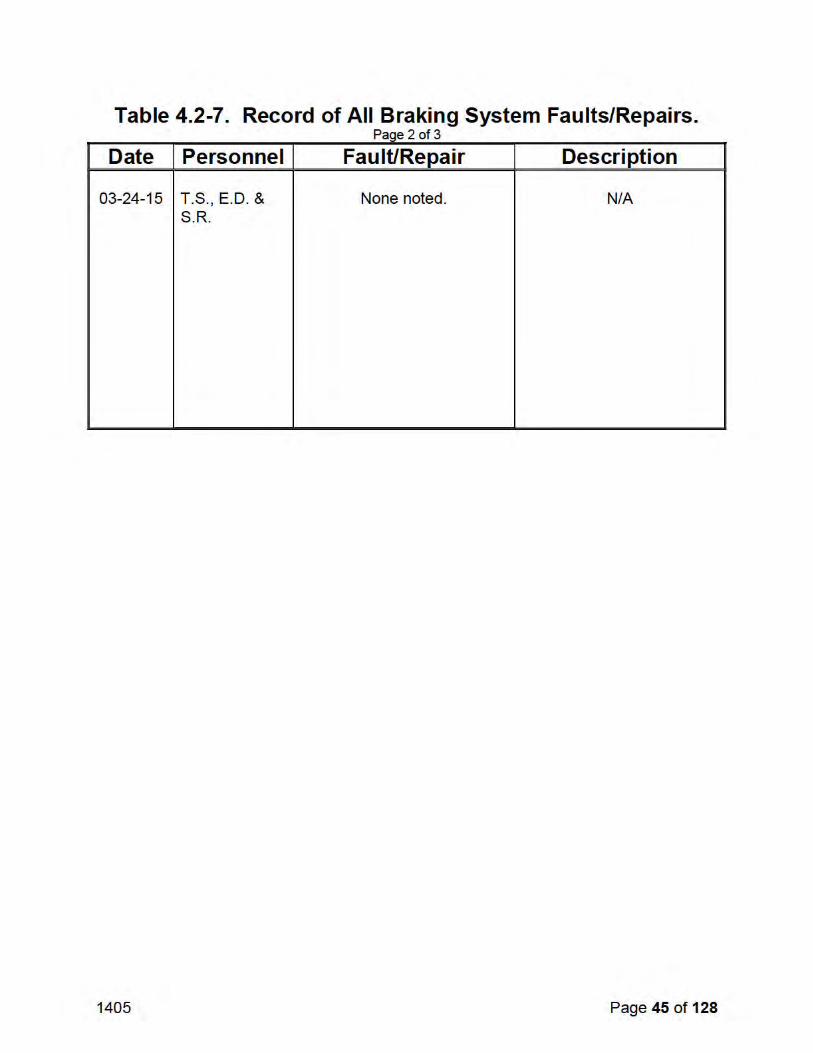
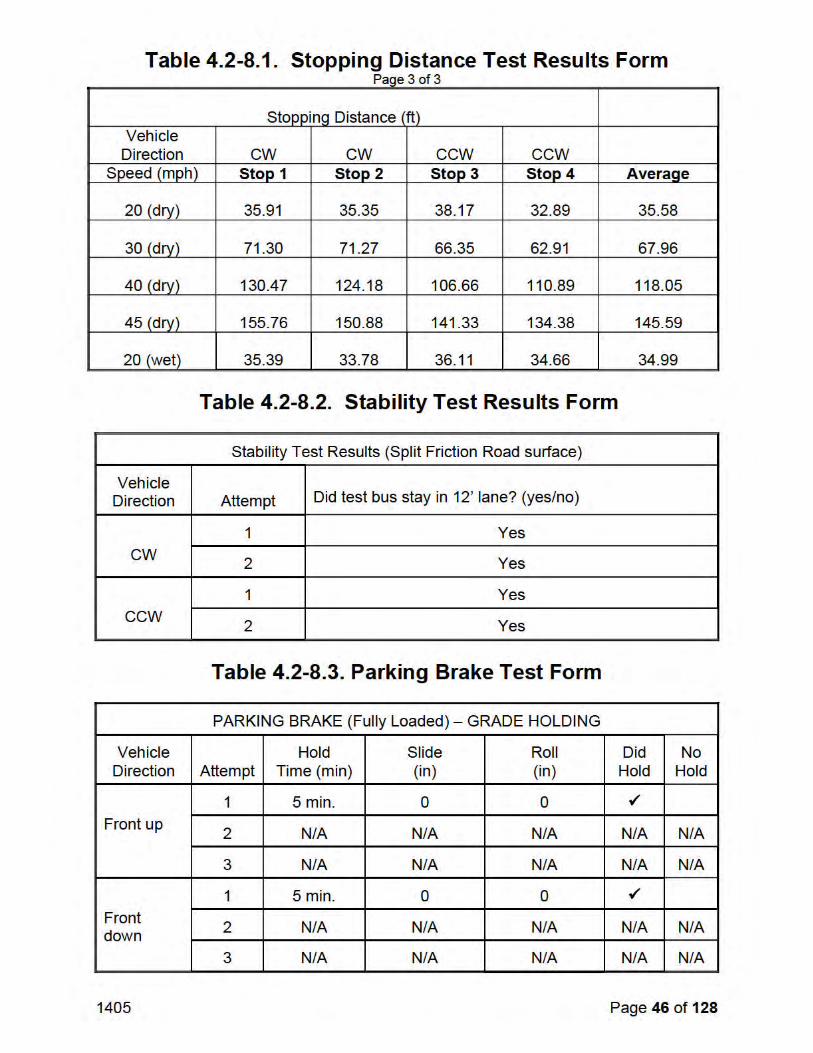
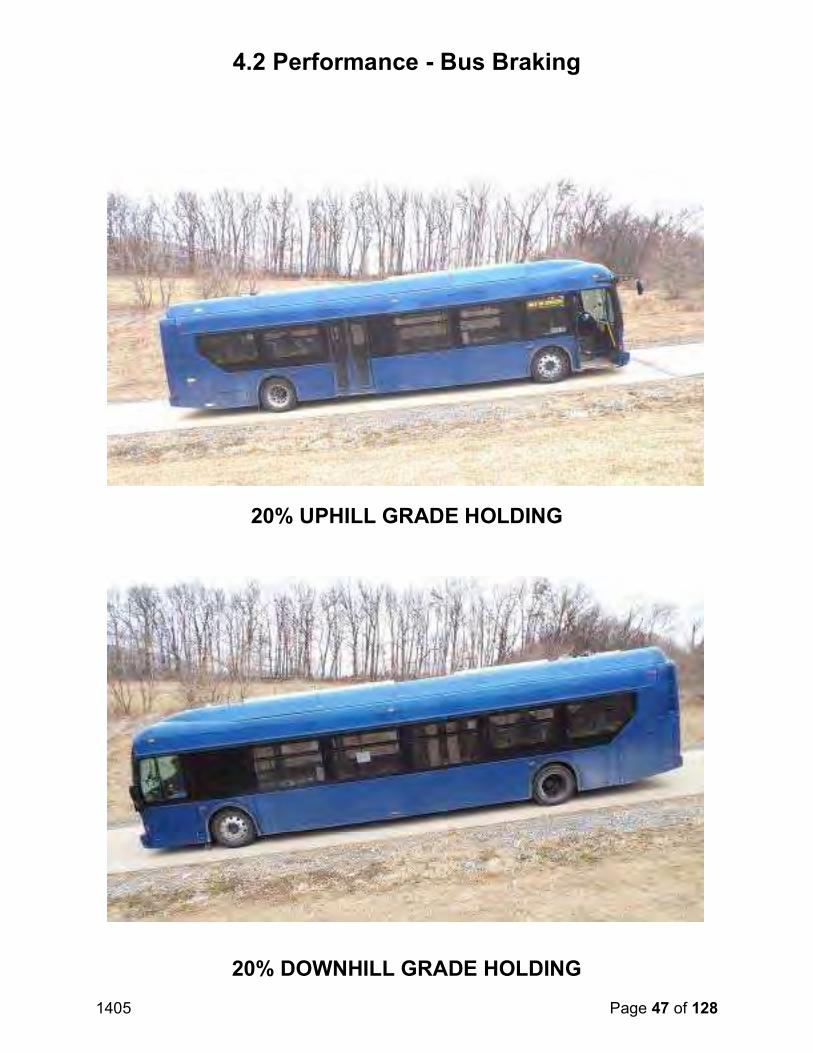
1405 Page 47 of 128
4.2 Performance - Bus Braking
20% UPHILL GRADE HOLDING
20% DOWNHILL GRADE HOLDING
1405 Page 48 of 128
5.1 STRUCTURAL INTEGRITY
5.1 STRUCTURAL STRENGTH AND DISTORTION TESTS – STRUCTURAL SHAKEDOWN TEST
5.1-I. DISCUSSION
The objective of this test is to determine certain static characteristics (e.g., bus floor deflection, permanent structural deformation, etc.) under static loading conditions.
5.1-II. TEST DESCRIPTION
In this test, the bus will be isolated from the suspension by blocking the vehicle under the suspension points. The bus will then be loaded and unloaded up to a maximum of three times with a distributed load equal to 2.5 times gross load. Gross load is 150 lb for every designed passenger seating position, for the driver, and for each 1.5 sq ft of free floor space. For a distributed load equal to 2.5 times gross load, place a 375-lb load on each seat and on every 1.5 sq ft of free floor space. The first loading and unloading sequence will “settle” the structure. Bus deflection will be measured at several locations during the loading sequences.
5.1-III. DISCUSSION
This test was performed based on a maximum passenger capacity of 65 people including the driver plus 2 wheelchair positions. The resulting test load is (65 X 375 lb.) = 24,375 lb. + 1,200 lbs. (2 wheelchair positions) = 25,575 lbs. The load is distributed evenly over the passenger space. Deflection data before and after each loading and unloading sequence is provided on the Structural Shakedown Data Form.
The unloaded height after each test becomes the original height for the next test. Some initial settling is expected due to undercoat compression, etc. After each loading cycle, the deflection of each reference point is determined. The bus is then unloaded and the residual (permanent) deflection is recorded. On the final test, the maximum loaded deflection was 0.202 Inches at reference point 10. The maximum permanent deflection after the final loading sequence ranged from -0.001 Inches at reference point 12 to 0.005 inches at reference points 10 and 11.
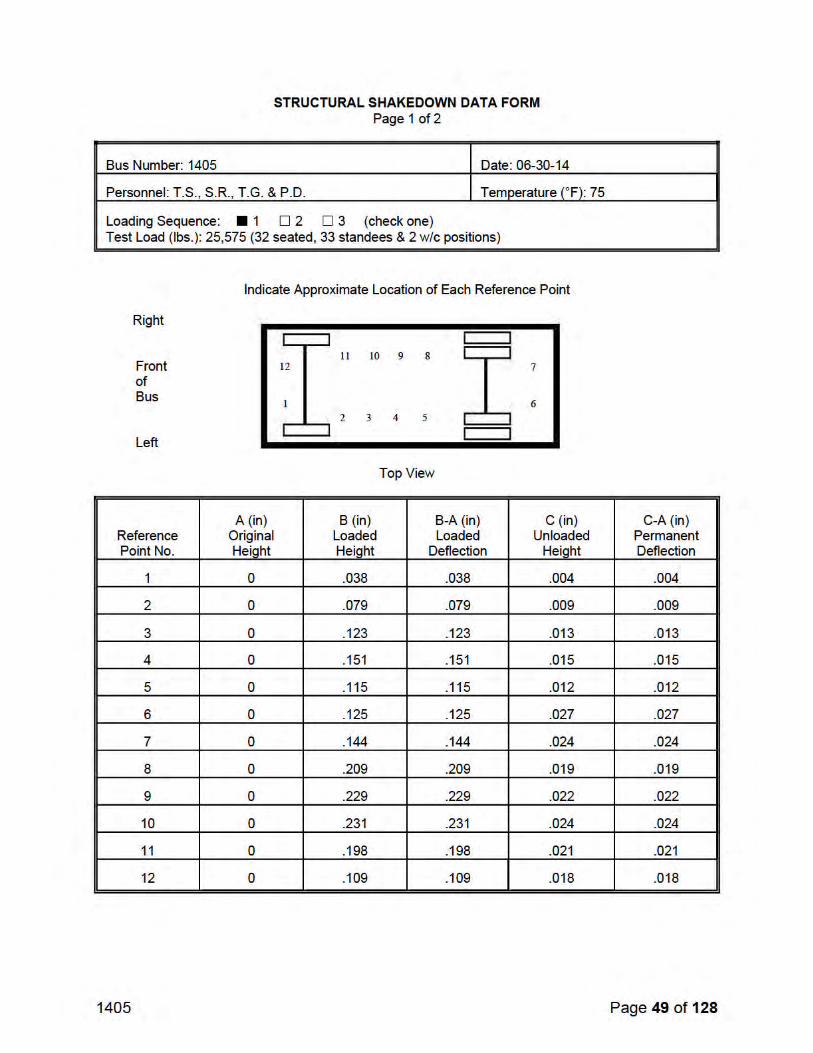
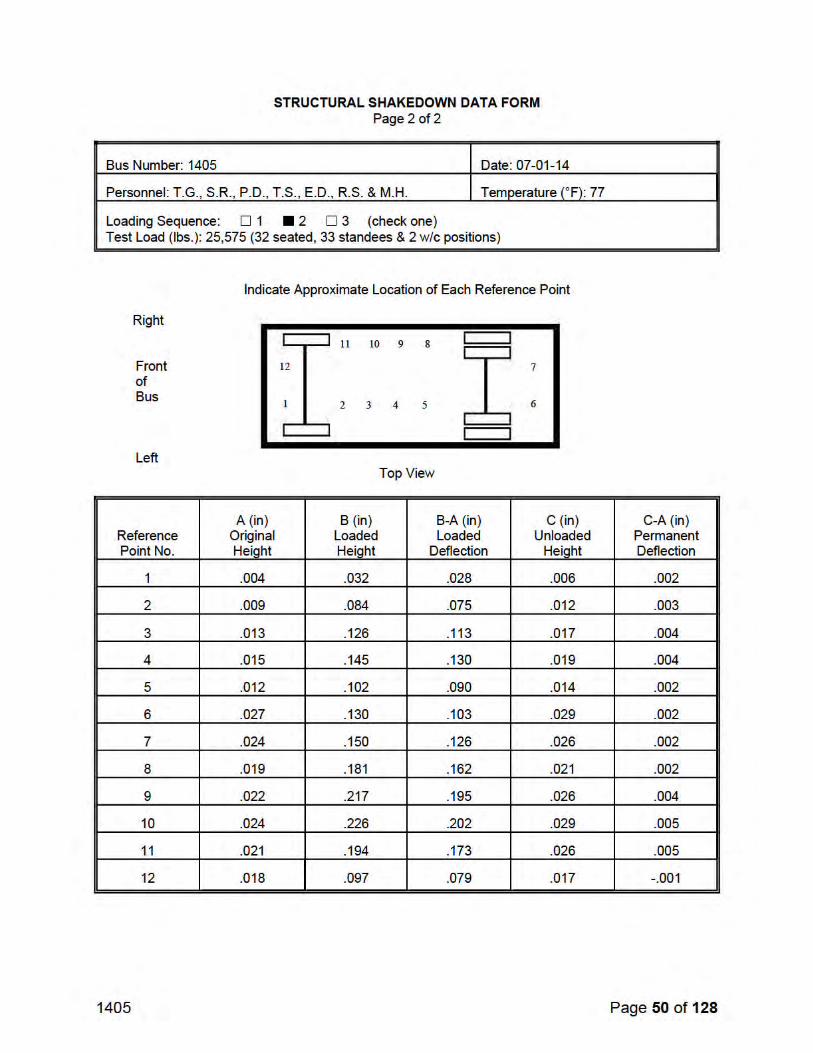
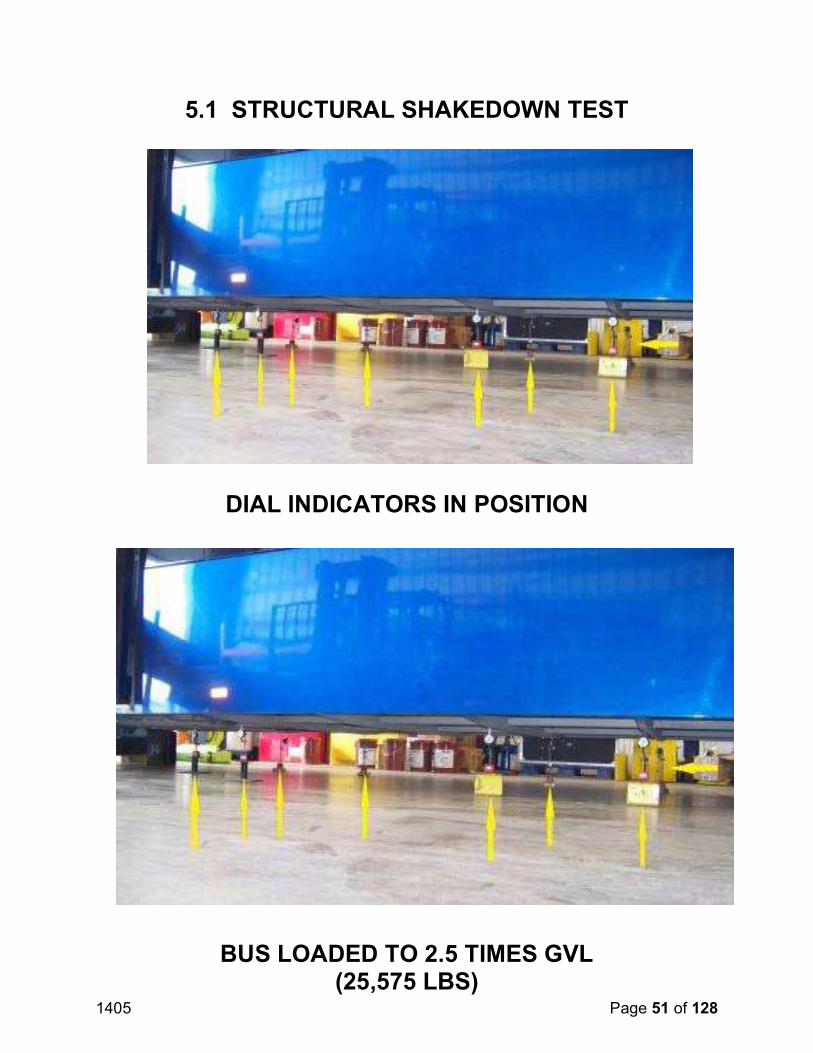
1405 Page 51 of 128
5.1 STRUCTURAL SHAKEDOWN TEST
DIAL INDICATORS IN POSITION
BUS LOADED TO 2.5 TIMES GVL(25,575 LBS)
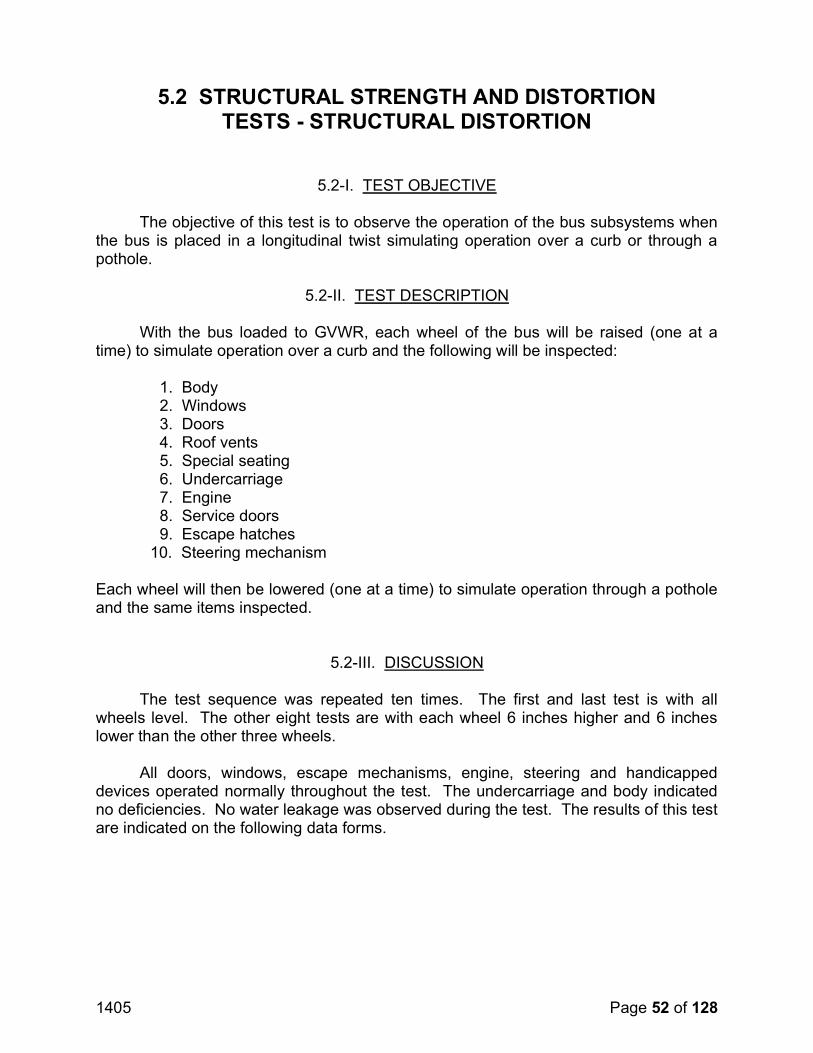
1405 Page 52 of 128
5.2 STRUCTURAL STRENGTH AND DISTORTION TESTS - STRUCTURAL DISTORTION
5.2-I. TEST OBJECTIVE
The objective of this test is to observe the operation of the bus subsystems when the bus is placed in a longitudinal twist simulating operation over a curb or through a pothole.
5.2-II. TEST DESCRIPTION
With the bus loaded to GVWR, each wheel of the bus will be raised (one at a time) to simulate operation over a curb and the following will be inspected:
1. Body2. Windows3. Doors4. Roof vents5. Special seating6. Undercarriage7. Engine8. Service doors9. Escape hatches
10. Steering mechanism
Each wheel will then be lowered (one at a time) to simulate operation through a pothole and the same items inspected.
5.2-III. DISCUSSION
The test sequence was repeated ten times. The first and last test is with all wheels level. The other eight tests are with each wheel 6 inches higher and 6 inches lower than the other three wheels.
All doors, windows, escape mechanisms, engine, steering and handicapped devices operated normally throughout the test. The undercarriage and body indicated no deficiencies. No water leakage was observed during the test. The results of this test are indicated on the following data forms.
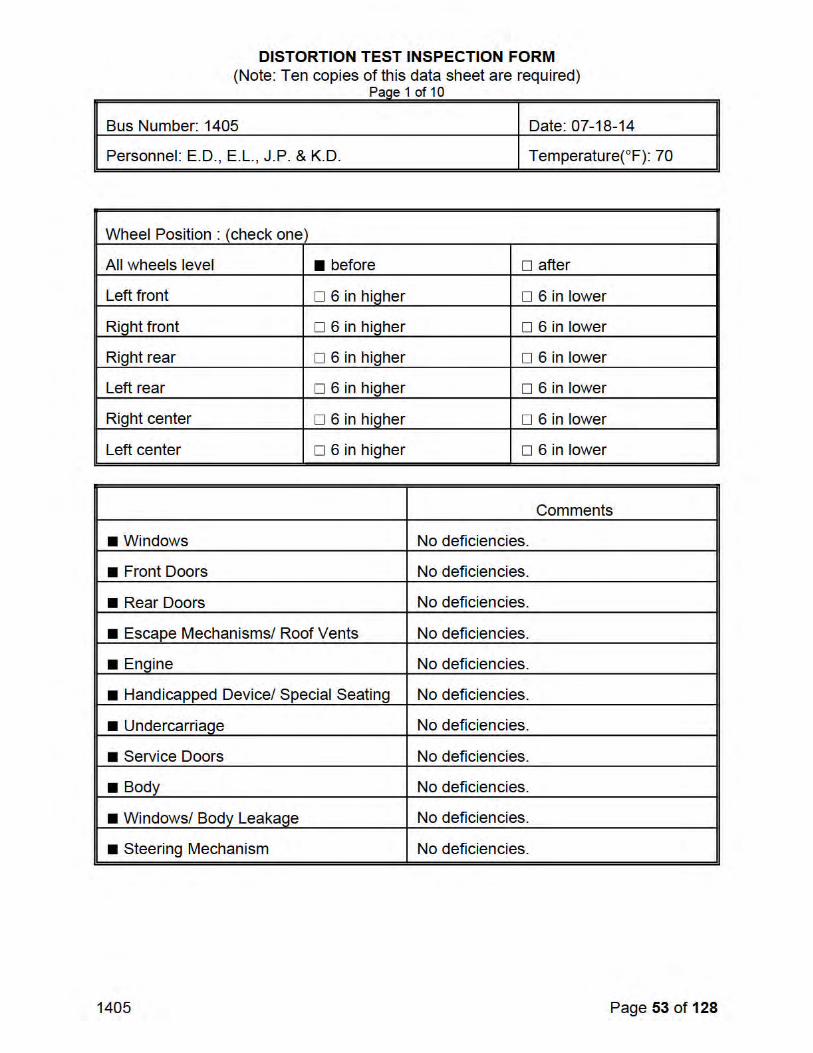
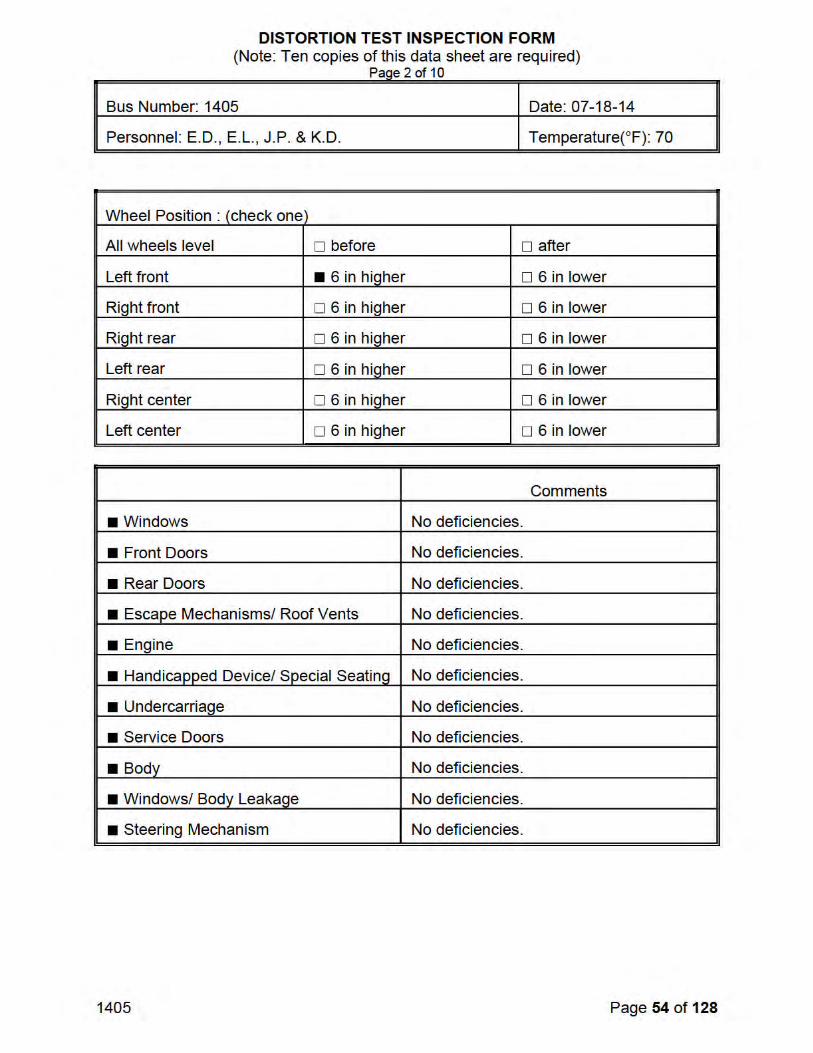
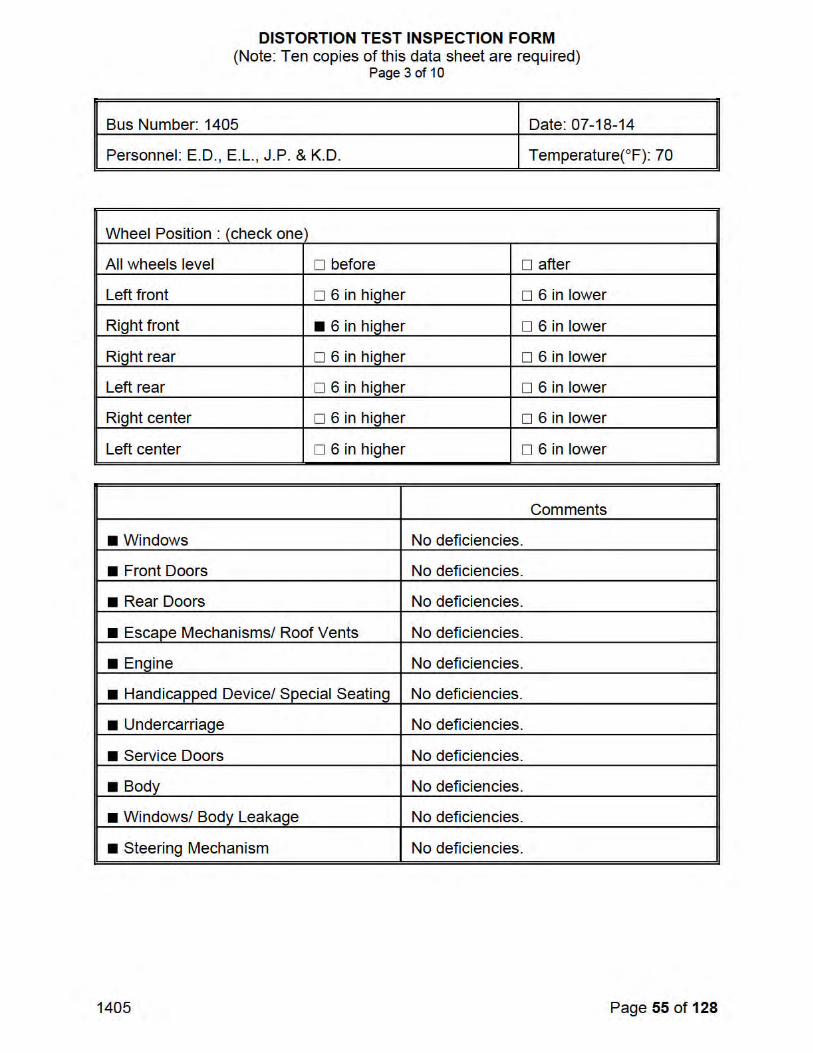

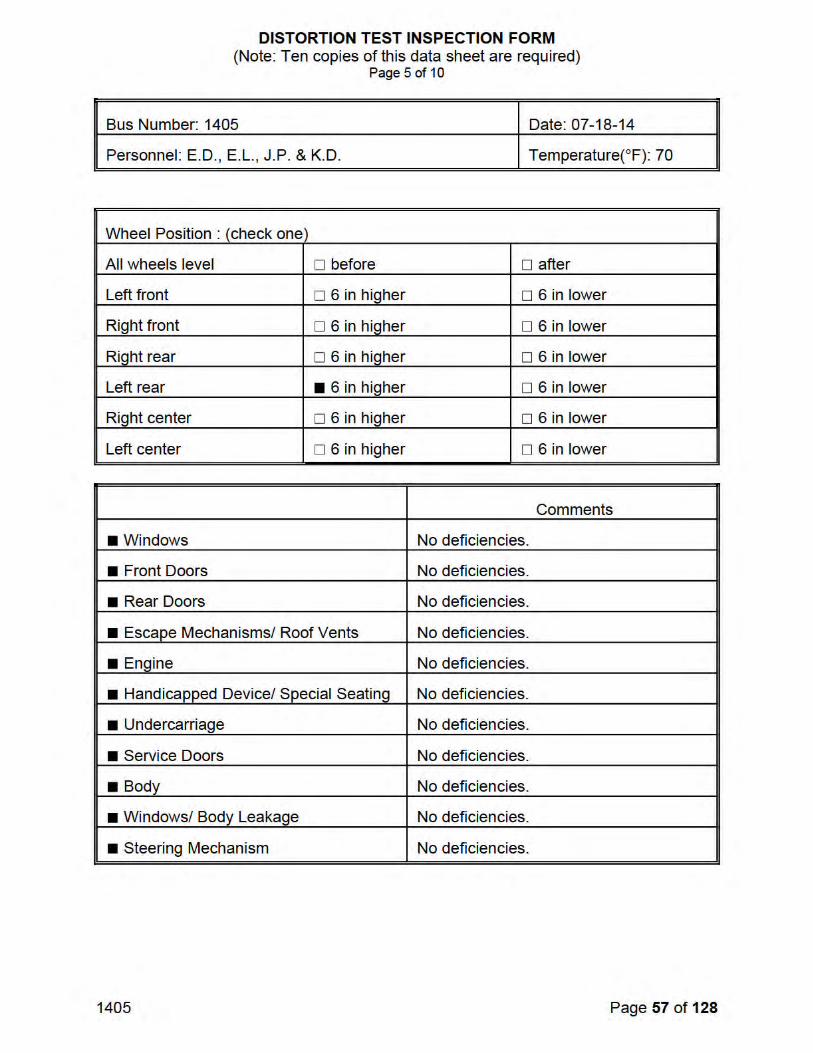
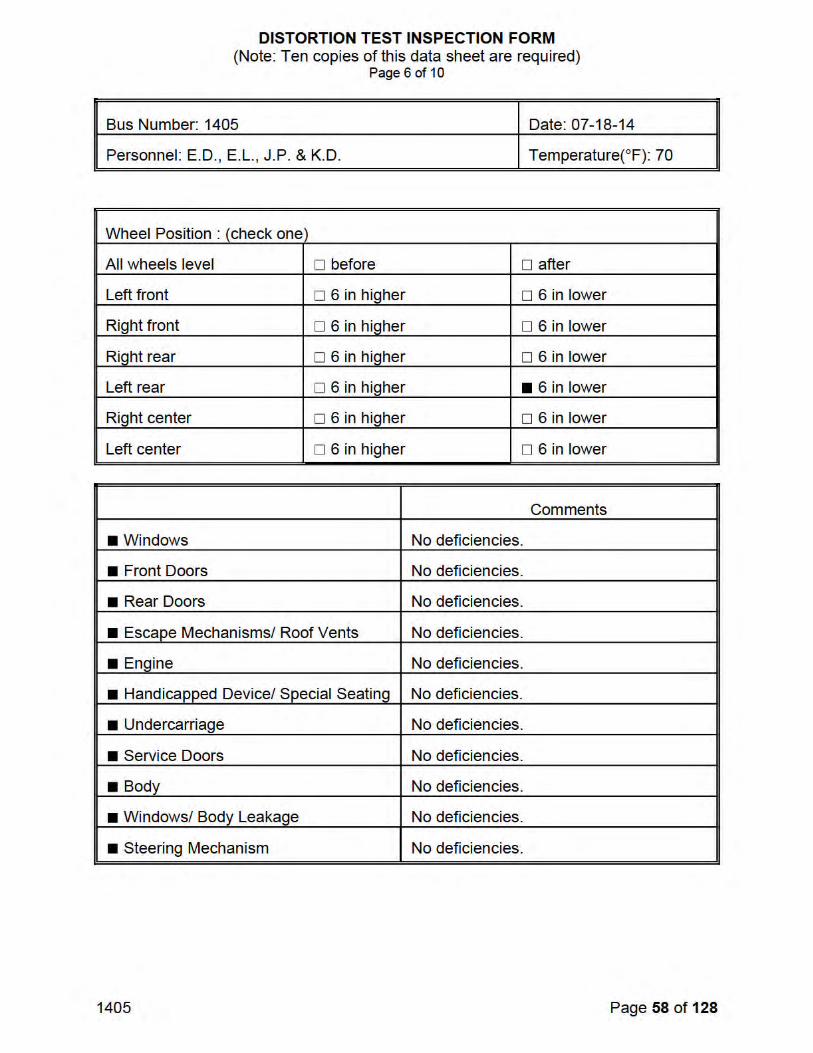
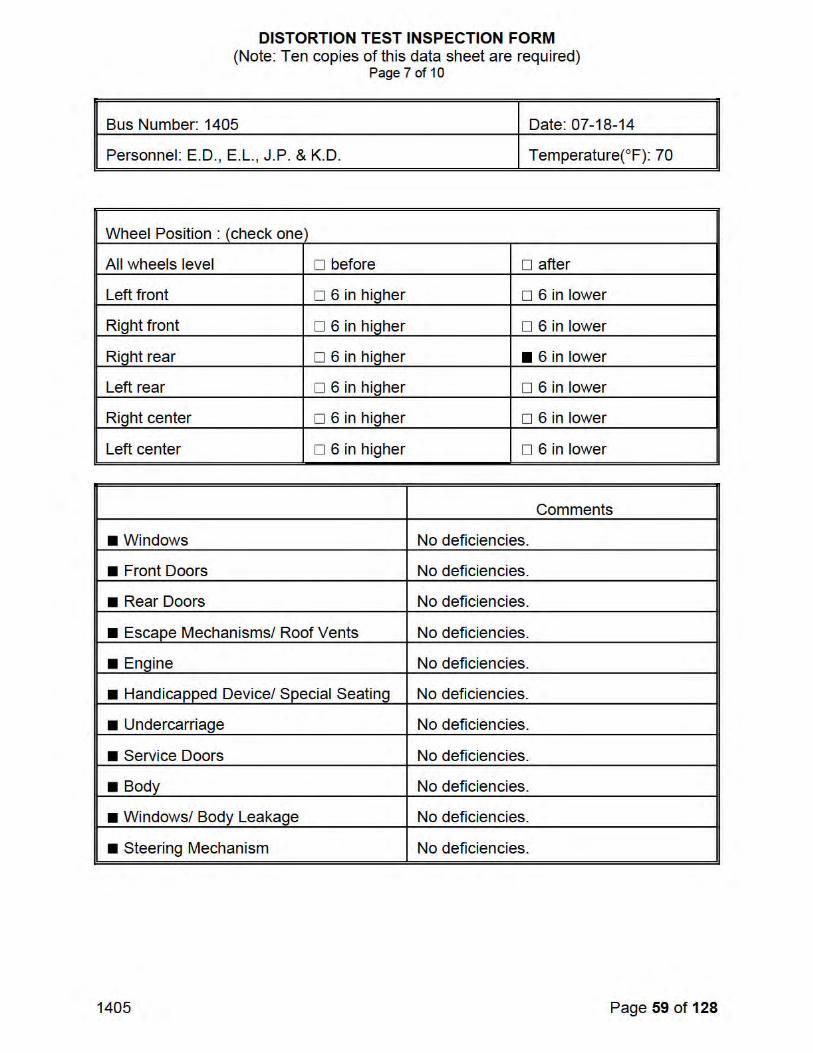

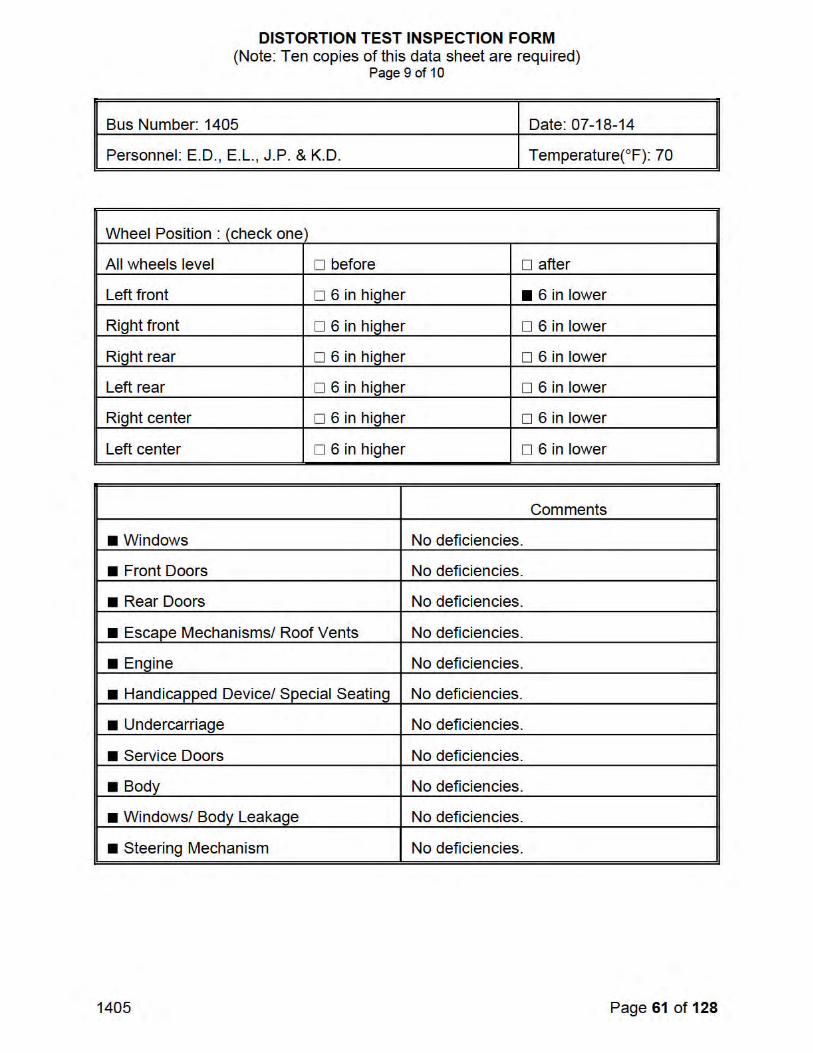
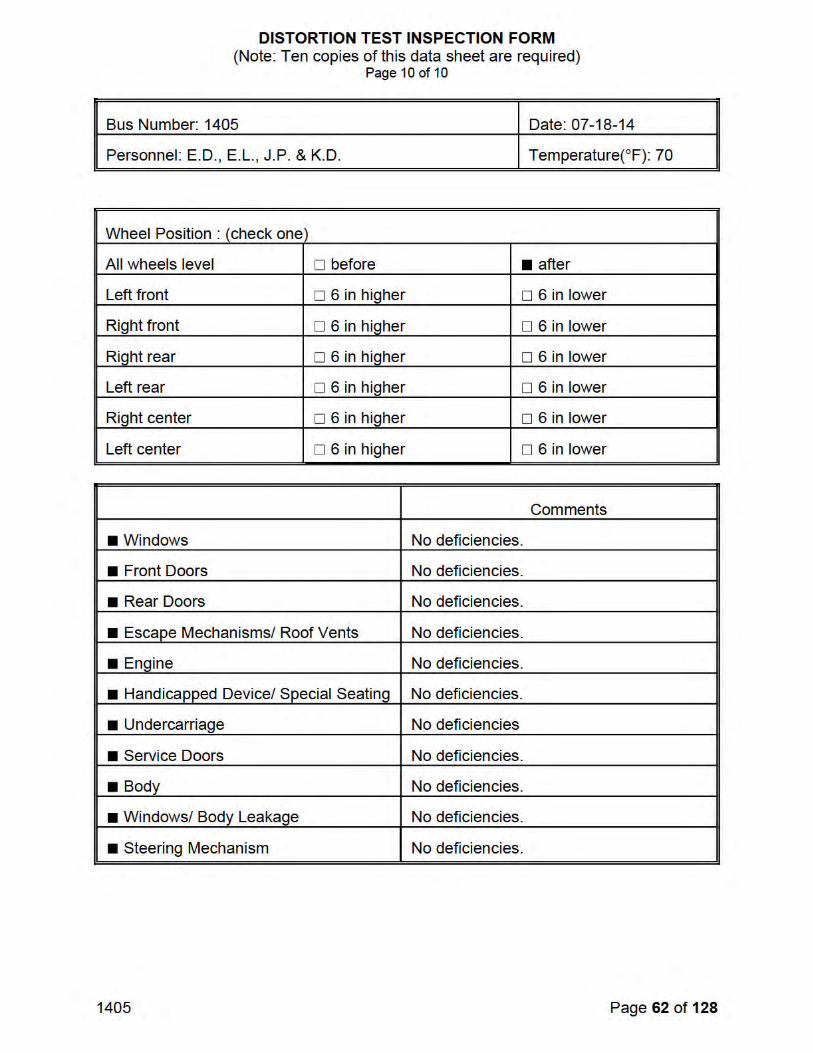
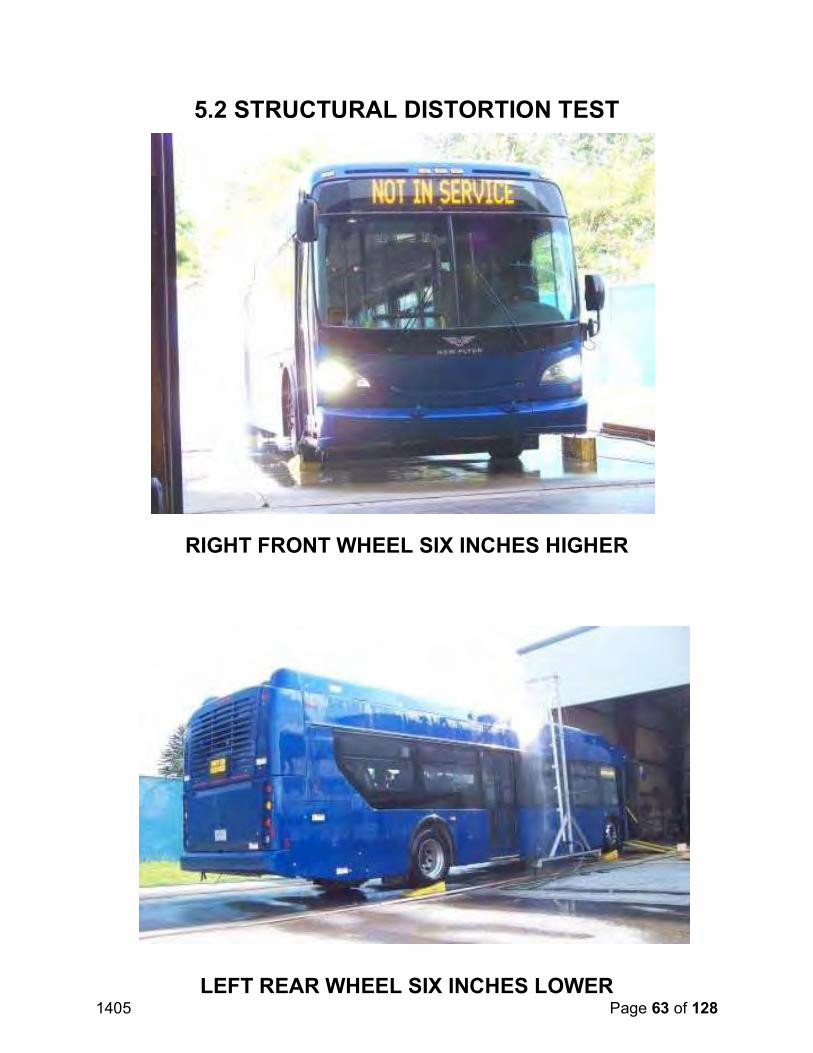
1405 Page 63 of 128
5.2 STRUCTURAL DISTORTION TEST
RIGHT FRONT WHEEL SIX INCHES HIGHER
LEFT REAR WHEEL SIX INCHES LOWER
1405 Page 64 of 128
5.3 STRUCTURAL STRENGTH AND DISTORTION TESTS - STATIC TOWING TEST
5.3-I. TEST OBJECTIVE
The objective of this test is to determine the characteristics of the bus towing mechanisms under static loading conditions.
5.3-II. TEST DESCRIPTION
Utilizing a load-distributing yoke, a hydraulic cylinder is used to apply a static tension load equal to 1.2 times the bus curb weight. The load will be applied to both the front and rear, if applicable, towing fixtures at an angle of 20 degrees with the longitudinal axis of the bus, first to one side then the other in the horizontal plane, and then upward and downward in the vertical plane. Any permanent deformation or damage to the tow eyes or adjoining structure will be recorded.
5.3-III. DISCUSSION
The load-distributing yoke was incorporated as the interface between the Static Tow apparatus and the test bus tow hook/eyes. The test was performed to the full target test weight of 39,312 lbs. (1.2 x 32,760 lbs. CW). No damage or deformation was observed during all four pulls of the test. The manufacturer does not recommend towing from rear therefore a rear test was not performed.
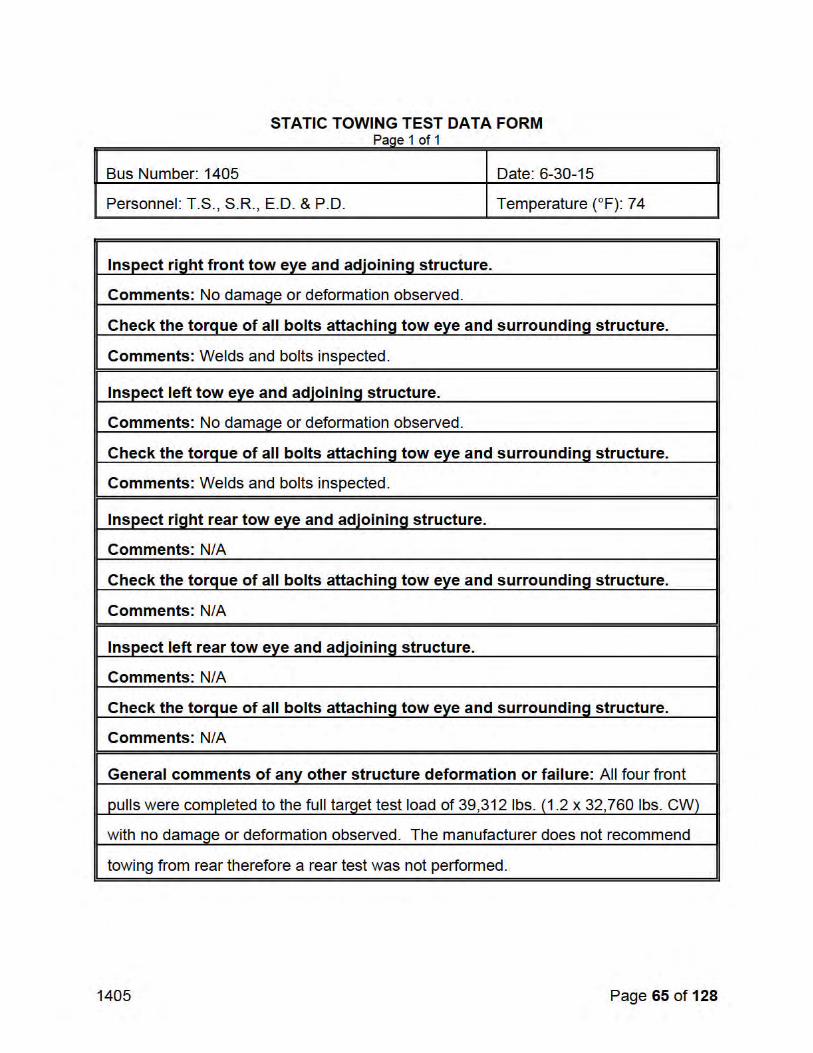
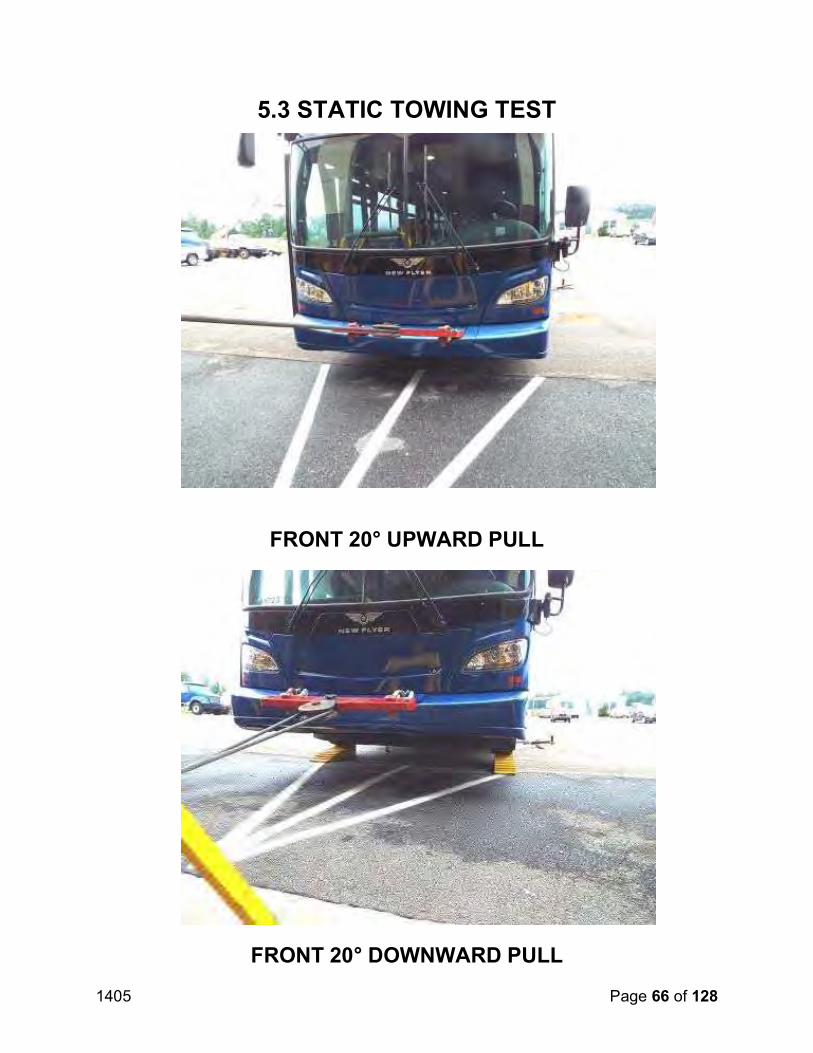
1405 Page 66 of 128
5.3 STATIC TOWING TEST
FRONT 20° UPWARD PULL
FRONT 20° DOWNWARD PULL
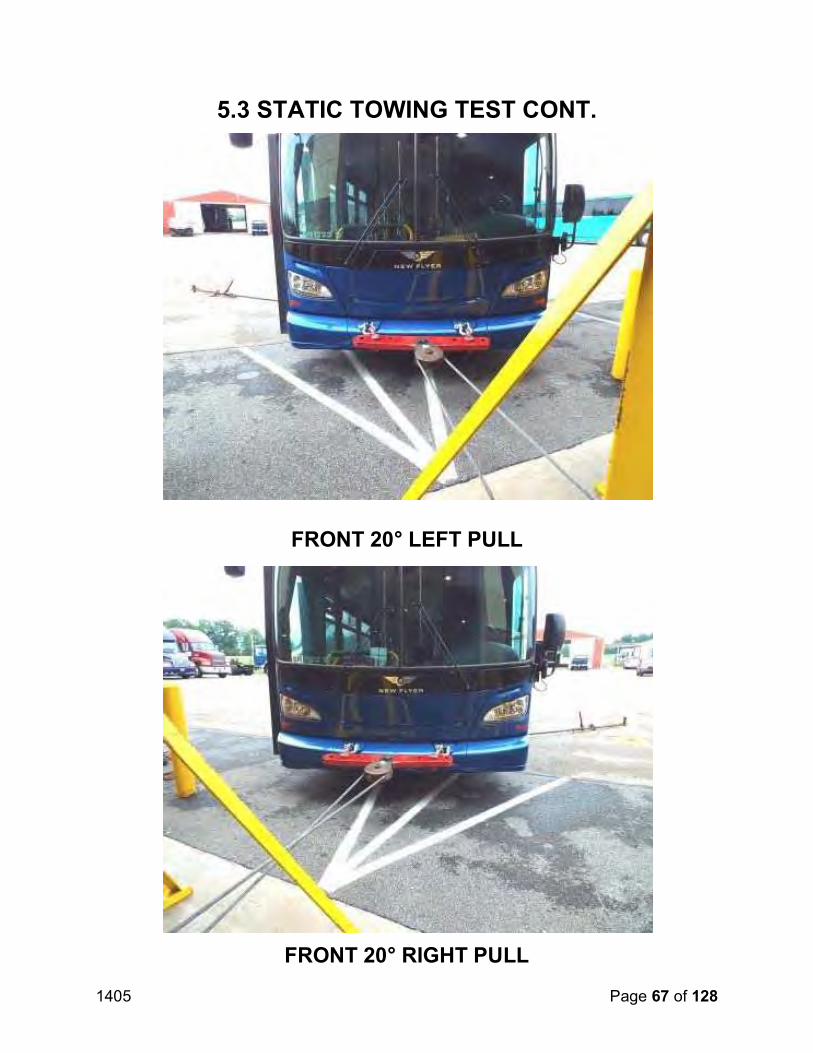
1405 Page 67 of 128
5.3 STATIC TOWING TEST CONT.
FRONT 20° LEFT PULL
FRONT 20° RIGHT PULL
1405 Page 68 of 128
5.4 STRUCTURAL STRENGTH AND DISTORTION TESTS - DYNAMIC TOWING TEST
5.4-I. TEST OBJECTIVE
The objective of this test is to verify the integrity of the towing fixtures and determine the feasibility of towing the bus under manufacturer specified procedures.
5.4-II. TEST DESCRIPTION
This test requires the bus be towed at curb weight using the specified equipment and instructions provided by the manufacturer and a heavy-duty wrecker. The bus will be towed for 5 miles at a speed of 20 mph for each recommended towing configuration.After releasing the bus from the wrecker, the bus will be visually inspected for any structural damage or permanent deformation. All doors, windows and passenger escape mechanisms will be inspected for proper operation.
5.4-III. DISCUSSION
The bus was towed using a heavy-duty wrecker. The towing interface was accomplished by incorporating a hydraulic under lift. A front lift tow was performed. Rear towing is not recommended. No problems, deformation, or damage was noted during testing.
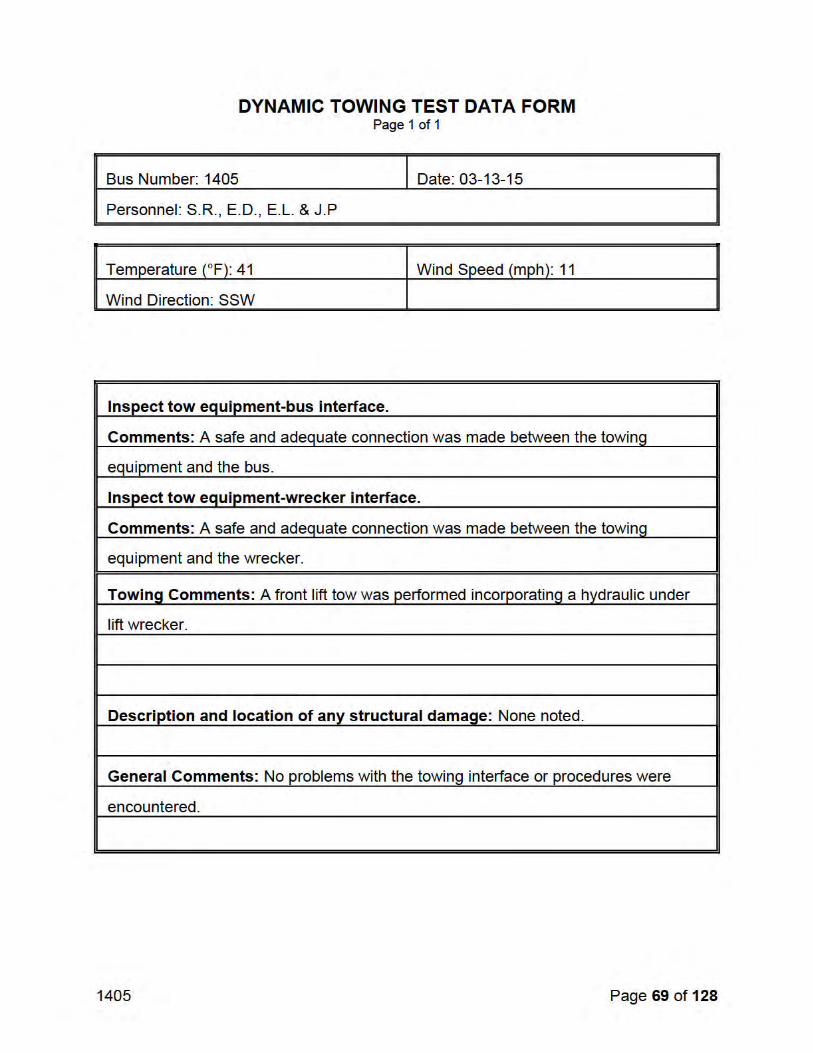
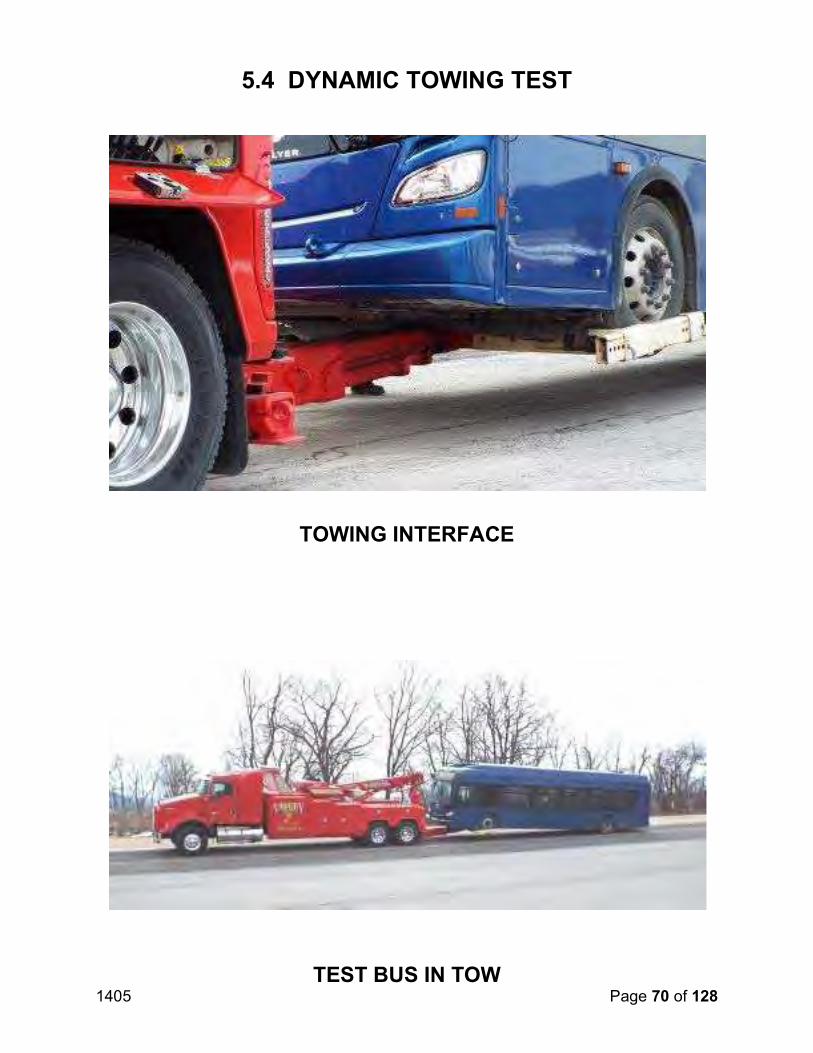
1405 Page 70 of 128
5.4 DYNAMIC TOWING TEST
TOWING INTERFACE
TEST BUS IN TOW
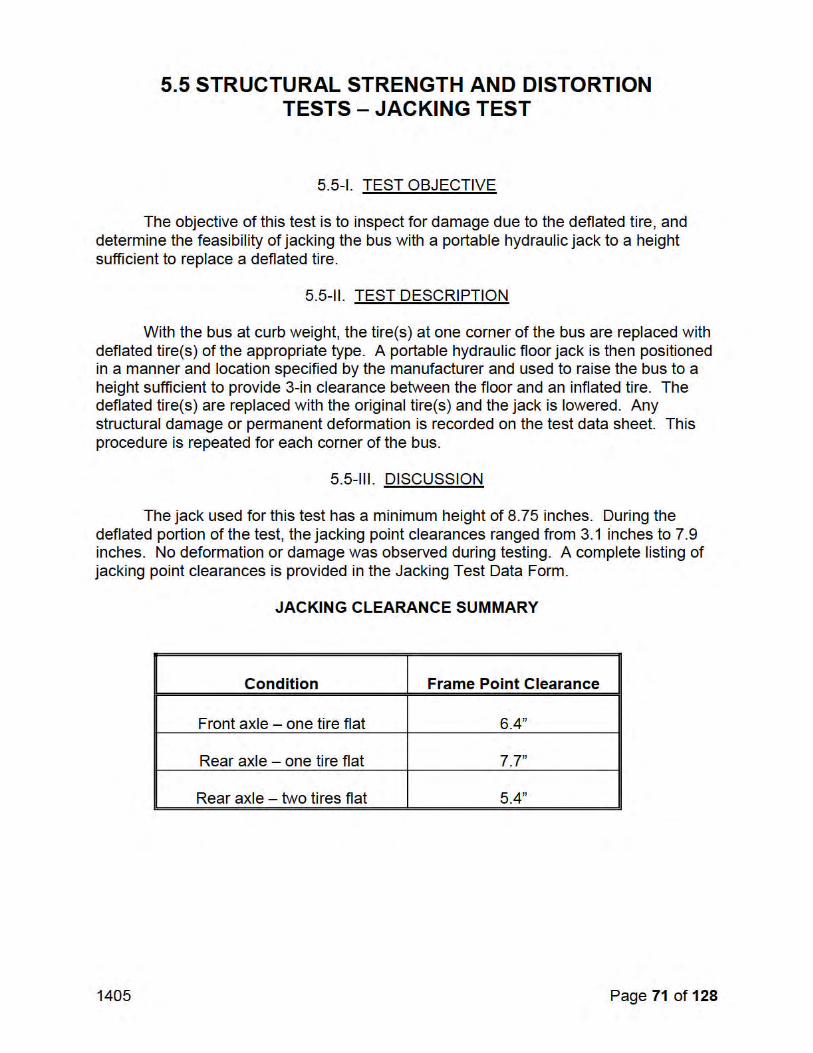
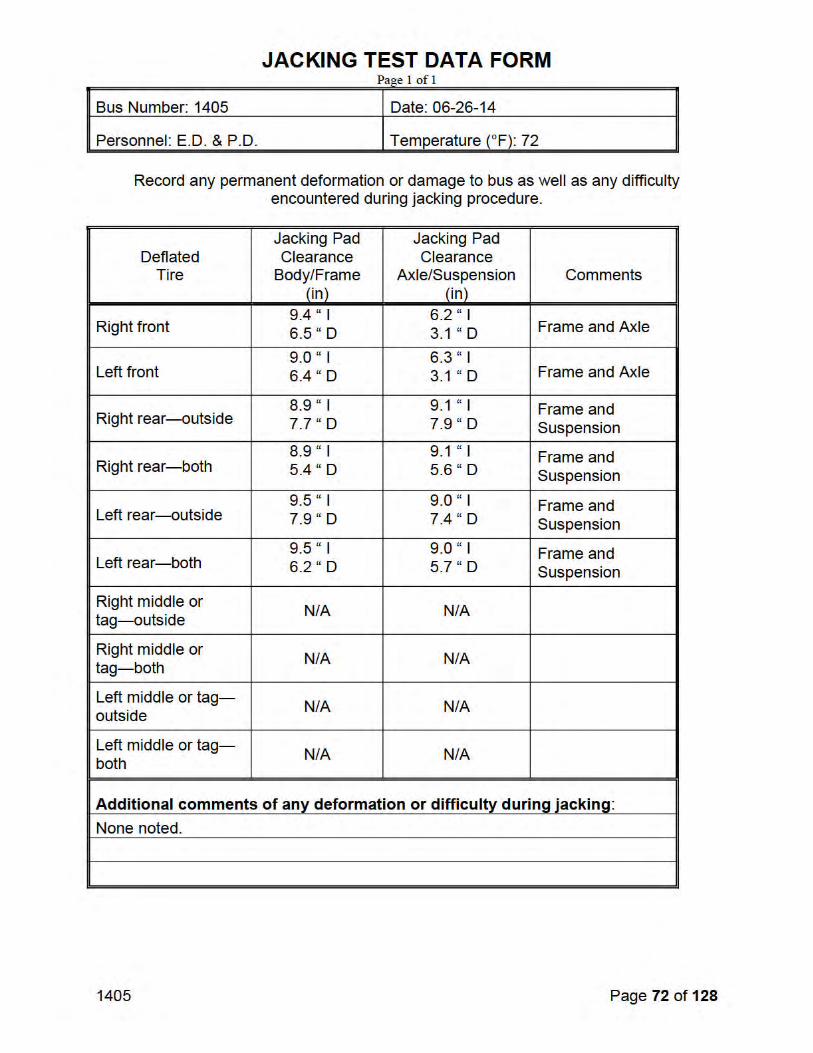
1405 Page 73 of 128
5.6 STRUCTURAL STRENGTH AND DISTORTION TESTS - HOISTING TEST
5.6-I. TEST OBJECTIVE
The objective of this test is to determine possible damage or deformation caused by the jack/stands.
5.6-II. TEST DESCRIPTION
With the bus at curb weight, the front end of the bus is raised to a height sufficient to allow manufacturer-specified placement of jack stands under the axles or jacking pads independent of the hoist system. The bus will be checked for stability on the jack stands and for any damage to the jacking pads or bulkheads. The procedure is repeated for the rear end of the bus. The procedure is then repeated for the front and rear simultaneously.
5.6-III. DISCUSSION
The test was conducted using four posts of a six-post electric lift and standard 19 inch jack stands. The bus was hoisted from the front wheel, rear wheel, and then the front and rear wheels simultaneously and placed on jack stands.
The bus easily accommodated the placement of the vehicle lifts and jack stands and the procedure was performed without any instability noted.
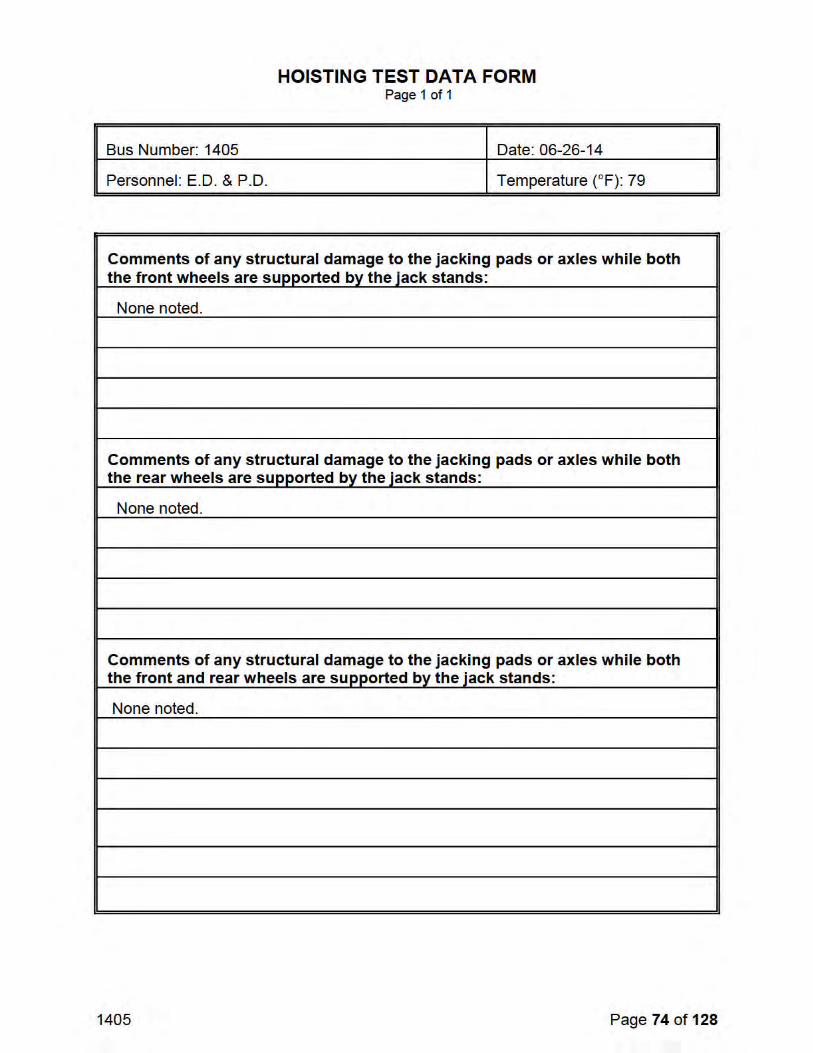
1405 Page 75 of 128
5.7 STRUCTURAL DURABILITY TEST
5.7-I. TEST OBJECTIVE
The objective of this test is to perform an accelerated durability test that approximates up to 25 percent of the service life of the vehicle.
5.7-II. TEST DESCRIPTION
The test vehicle is driven a total of 15,000 miles; approximately 12,500 miles on the PSBRTF Durability Test Track and approximately 2,500 miscellaneous other miles. The test will be conducted with the bus operated under three different loading conditions. The first segment will consist of approximately 6,250 miles with the bus operated at GVW. The second segment will consist of approximately 2,500 miles with the bus operated at SLW.The remainder of the test, approximately 6,250 miles, will be conducted with the bus loaded to CW. If GVW exceeds the axle design weights, then the load will be adjusted to the axle design weights and the change will be recorded. All subsystems are run during these tests in their normal operating modes. All recommended manufacturers servicing is to be followed and noted on the vehicle maintainability log. Servicing items accelerated by the durability tests will be compressed by 10:1; all others will be done on a 1:1 mi/mi basis. Unscheduled breakdowns and repairs are recorded on the same log as are any unusual occurrences as noted by the driver. Once a week the test vehicle shall be washed down and thoroughly inspected for any signs of failure.
5.7-III. DISCUSSION
The Structural Durability Test was started on August 26, 2014 and was conducted until March 19, 2015. The first 6,250 miles were performed at a GVW of 43,550 lbs. and completed on December 10, 2014. The next 2,500 mile SLW segment was performed at 38,700 lbs. and completed on January 15, 2015, and the final 6,250 mile segment was performed at a CW of 32,770 lbs and completed on March 19, 2015.
Effective January 1, 2010 the Federal Transit Administration determined that the total number of simulated passengers used for loading all test vehicles will be based on the full complement of seats and free-floor space available for standing passengers (150 lbs. per passenger). The passenger loading used for dynamic testing will not be reduced in order to comply with Gross Axle Weight Ratings (GAWR’s) or the Gross Vehicle Weight Ratings (GVWR’s) declared by the manufacturer. Cases where the loading exceeds the GAWR and/or the GVWR will be noted accordingly. During the testing program, all test vehicles transported or operated over public roadways will be loaded to comply with the GAWR and GVWR specified by the manufacturer.
1405 Page 76 of 128
The following mileage summary presents the accumulation of miles during the Structural Durability Test. The driving schedule is included, showing the operating duty cycle. A detailed plan view of the Test Track Facility and Durability Test Track are attached for reference. Also, a durability element profile detail shows all the measurements of the different conditions. Finally, photographs illustrating some of the failures that were encountered during the Structural Durability Test are included.
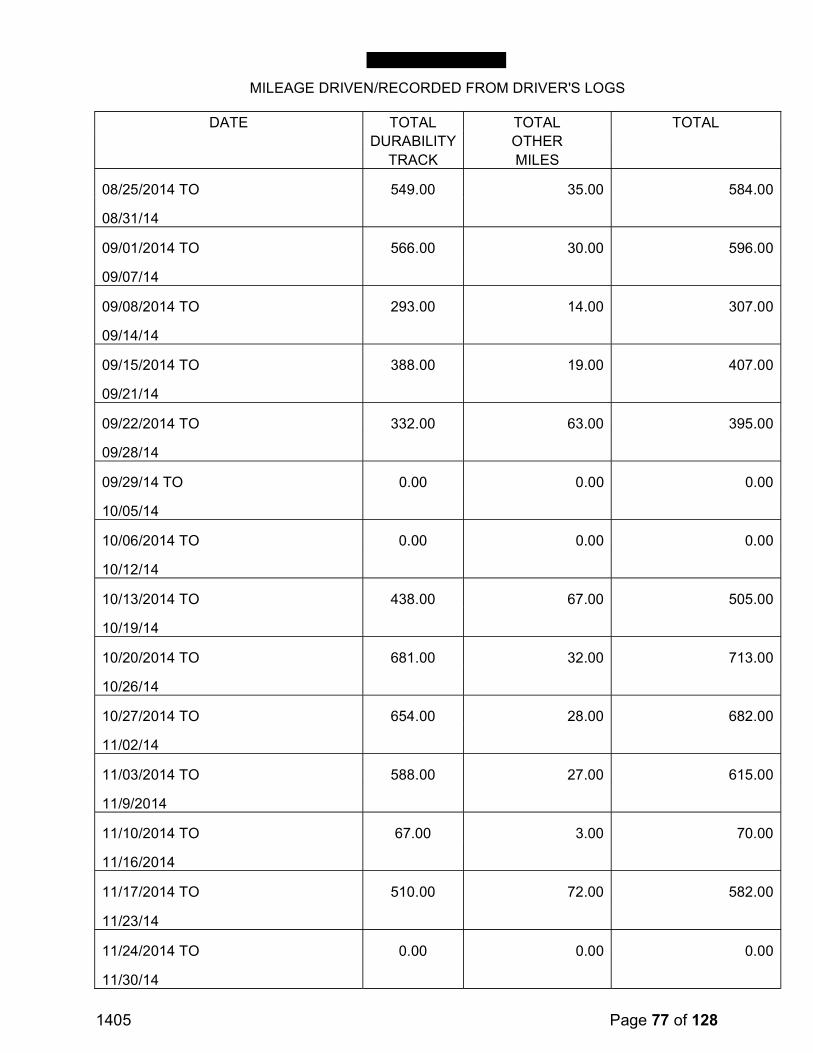
1405 Page 77 of 128
MILEAGE DRIVEN/RECORDED FROM DRIVER'S LOGS
DATE TOTAL TOTAL TOTAL DURABILITY OTHER
TRACK MILES
08/25/2014 TO 549.00 35.00 584.00
08/31/14
09/01/2014 TO 566.00 30.00 596.00
09/07/14
09/08/2014 TO 293.00 14.00 307.00
09/14/14
09/15/2014 TO 388.00 19.00 407.00
09/21/14
09/22/2014 TO 332.00 63.00 395.00
09/28/14
09/29/14 TO 0.00 0.00 0.00
10/05/14
10/06/2014 TO 0.00 0.00 0.00
10/12/14
10/13/2014 TO 438.00 67.00 505.00
10/19/14
10/20/2014 TO 681.00 32.00 713.00
10/26/14
10/27/2014 TO 654.00 28.00 682.00
11/02/14
11/03/2014 TO 588.00 27.00 615.00
11/9/2014
11/10/2014 TO 67.00 3.00 70.00
11/16/2014
11/17/2014 TO 510.00 72.00 582.00
11/23/14
11/24/2014 TO 0.00 0.00 0.00
11/30/14
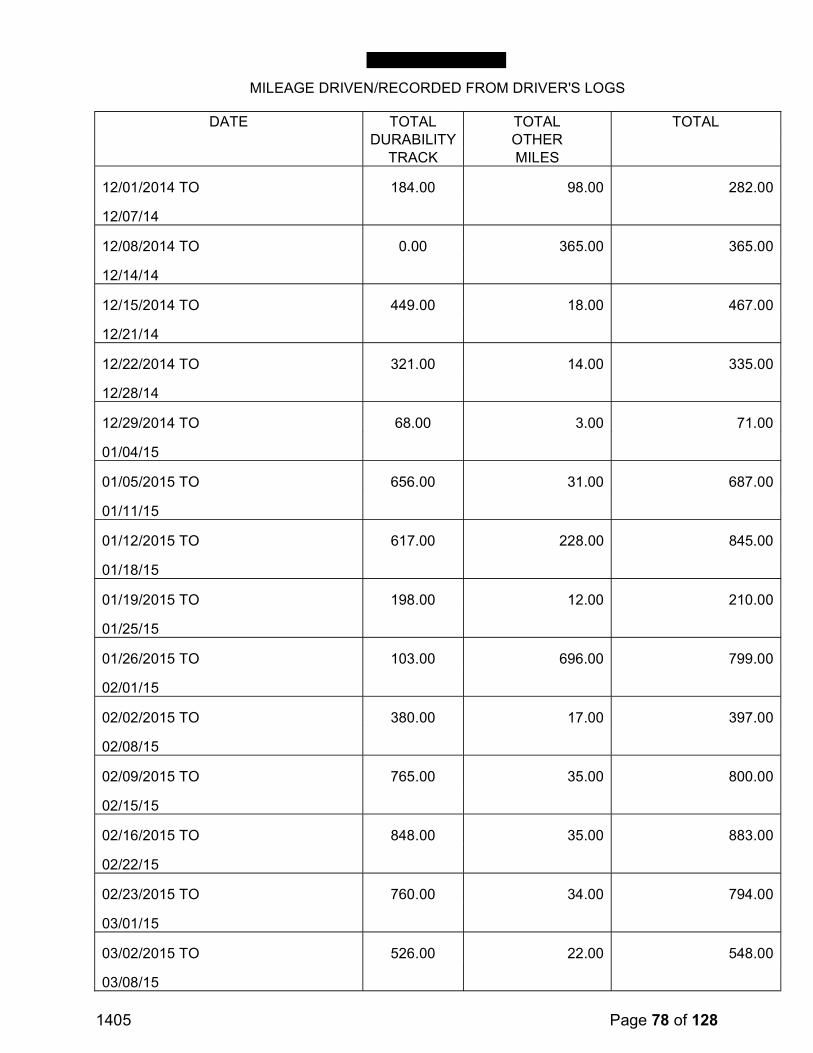
1405 Page 78 of 128
MILEAGE DRIVEN/RECORDED FROM DRIVER'S LOGS
DATE TOTAL TOTAL TOTAL DURABILITY OTHER
TRACK MILES
12/01/2014 TO 184.00 98.00 282.00
12/07/14
12/08/2014 TO 0.00 365.00 365.00
12/14/14
12/15/2014 TO 449.00 18.00 467.00
12/21/14
12/22/2014 TO 321.00 14.00 335.00
12/28/14
12/29/2014 TO 68.00 3.00 71.00
01/04/15
01/05/2015 TO 656.00 31.00 687.00
01/11/15
01/12/2015 TO 617.00 228.00 845.00
01/18/15
01/19/2015 TO 198.00 12.00 210.00
01/25/15
01/26/2015 TO 103.00 696.00 799.00
02/01/15
02/02/2015 TO 380.00 17.00 397.00
02/08/15
02/09/2015 TO 765.00 35.00 800.00
02/15/15
02/16/2015 TO 848.00 35.00 883.00
02/22/15
02/23/2015 TO 760.00 34.00 794.00
03/01/15
03/02/2015 TO 526.00 22.00 548.00
03/08/15
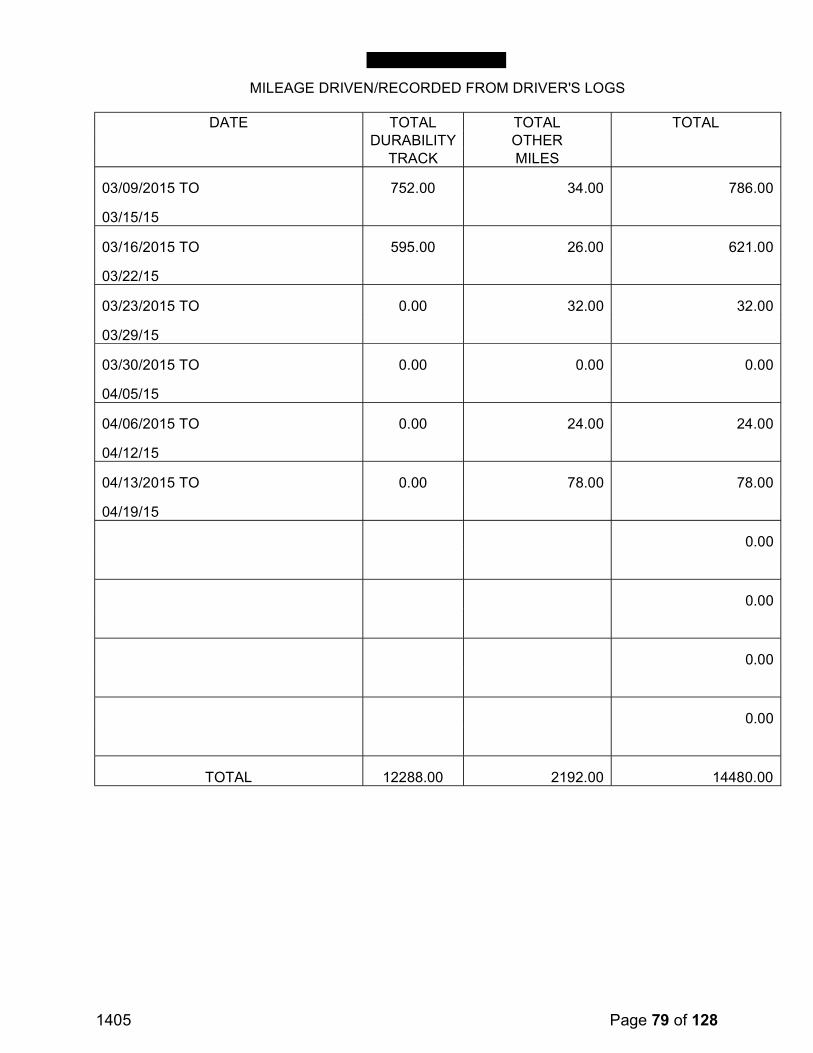
1405 Page 79 of 128
MILEAGE DRIVEN/RECORDED FROM DRIVER'S LOGS
DATE TOTAL TOTAL TOTAL DURABILITY OTHER TRACK MILES
03/09/2015 TO 752.00 34.00 786.00
03/15/15
03/16/2015 TO 595.00 26.00 621.00
03/22/15
03/23/2015 TO 0.00 32.00 32.00
03/29/15
03/30/2015 TO 0.00 0.00 0.00
04/05/15
04/06/2015 TO 0.00 24.00 24.00
04/12/15
04/13/2015 TO 0.00 78.00 78.00
04/19/15
0.00
0.00
0.00
0.00
TOTAL 12288.00 2192.00 14480.00
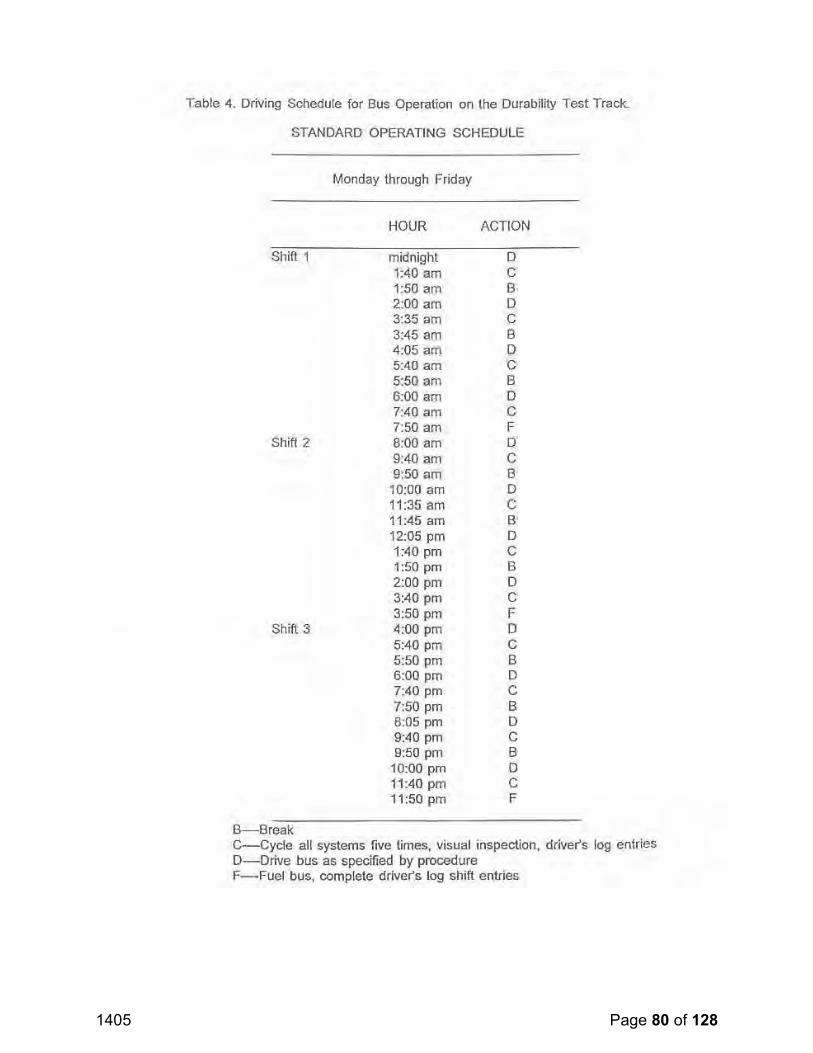
1405 Page 80 of 128
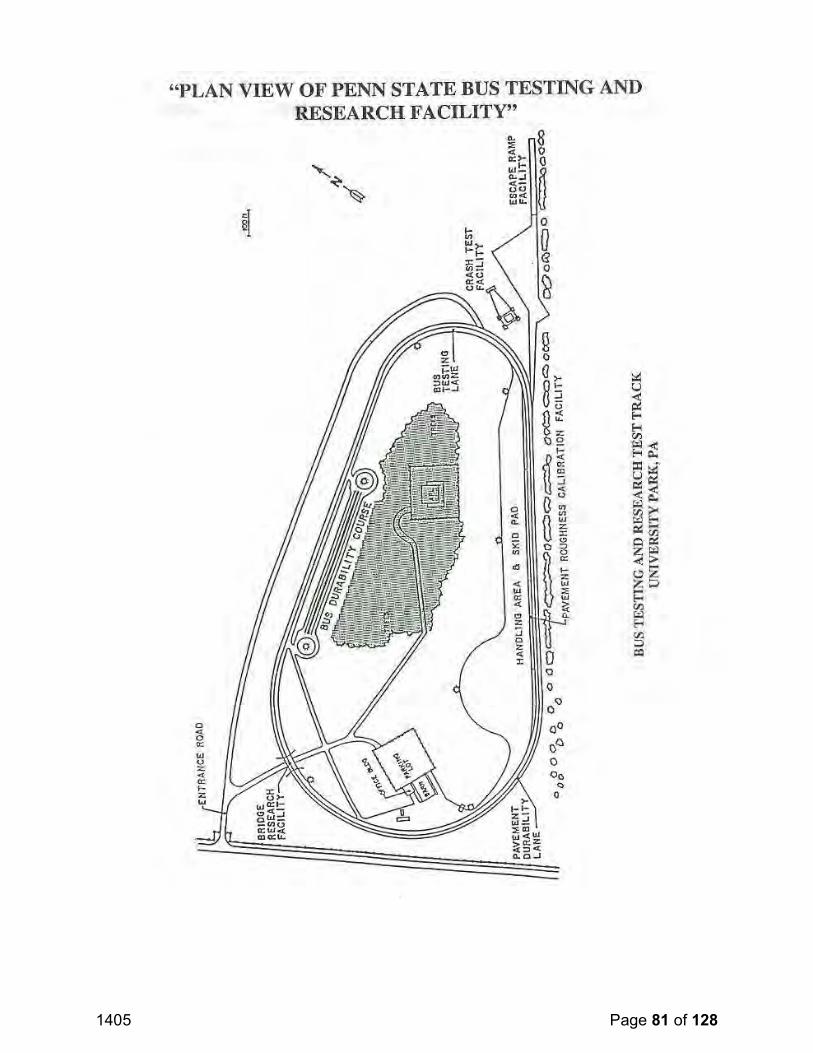
1405 Page 81 of 128
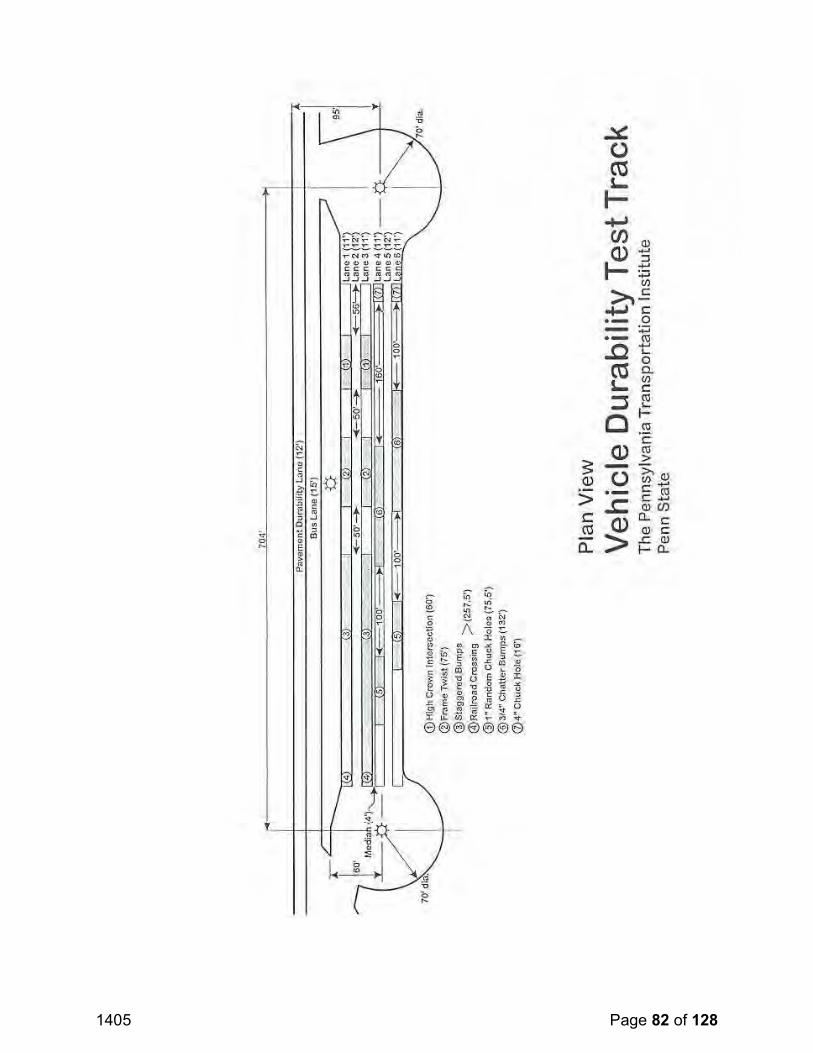
1405 Page 82 of 128
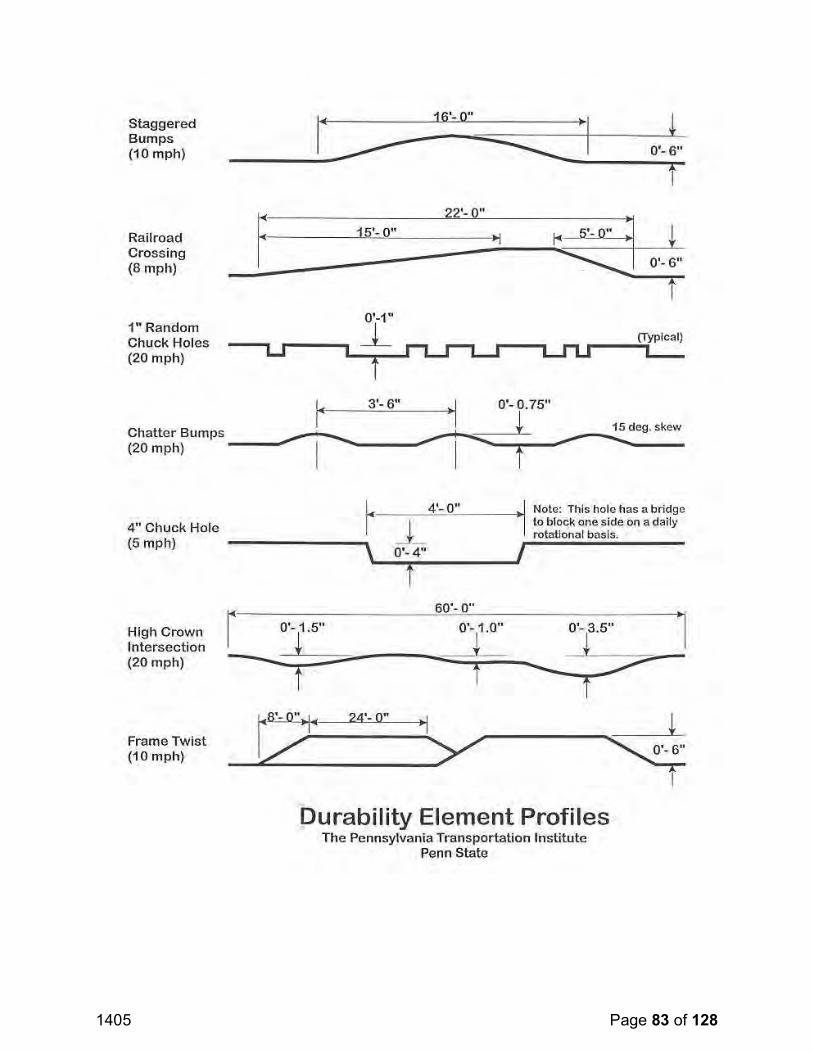
1405 Page 83 of 128
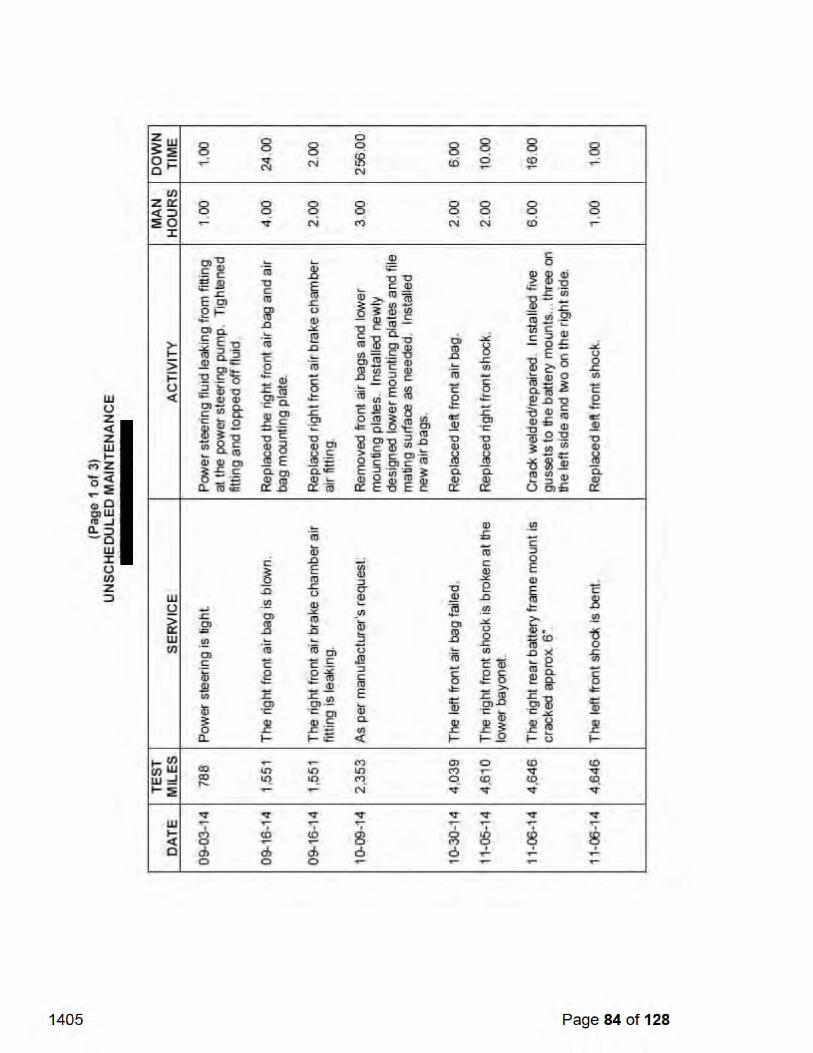
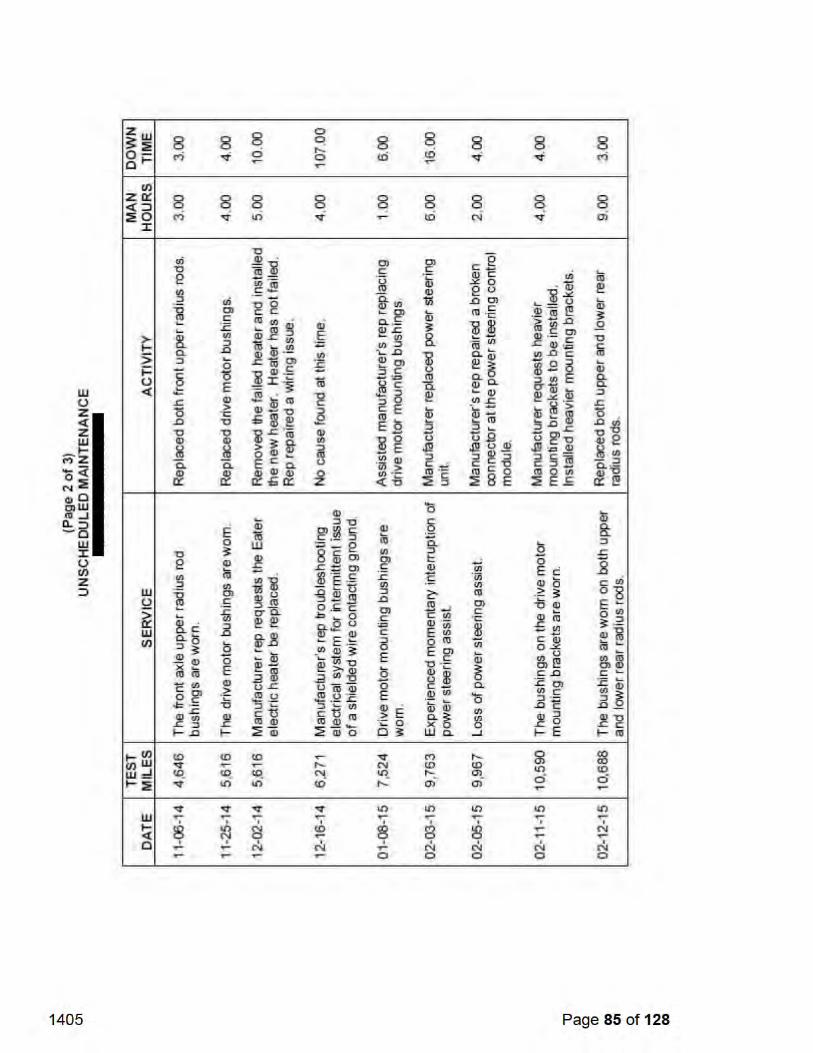
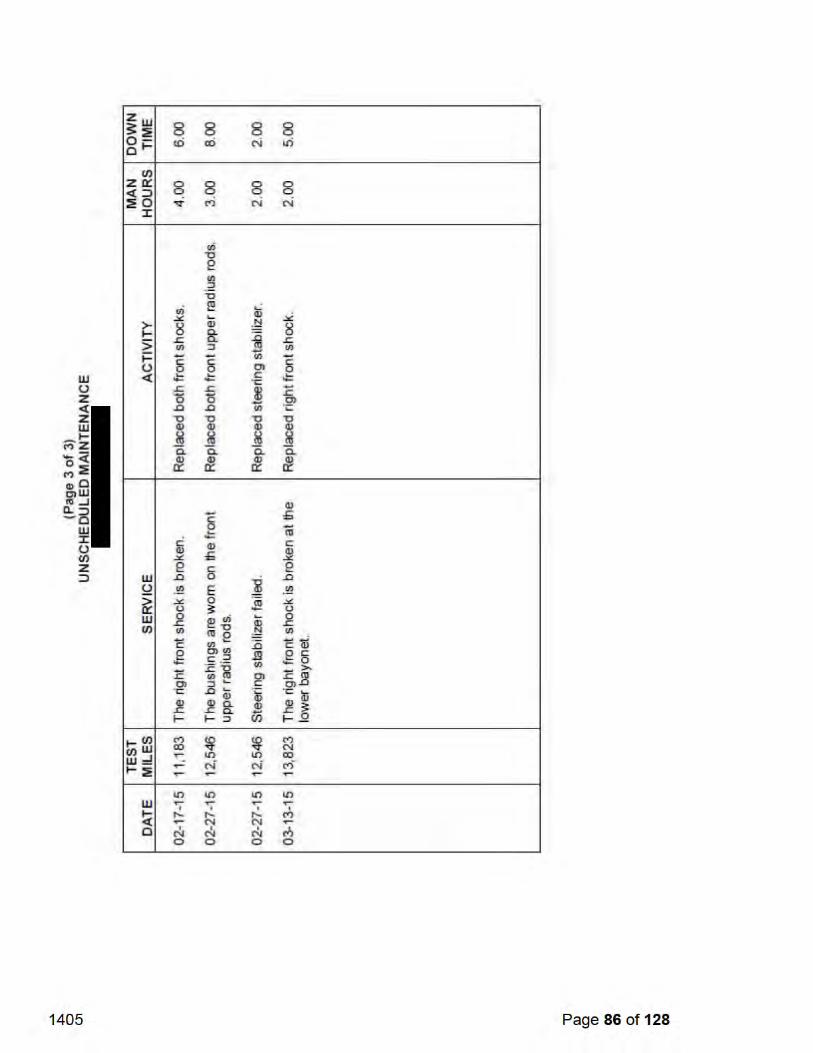
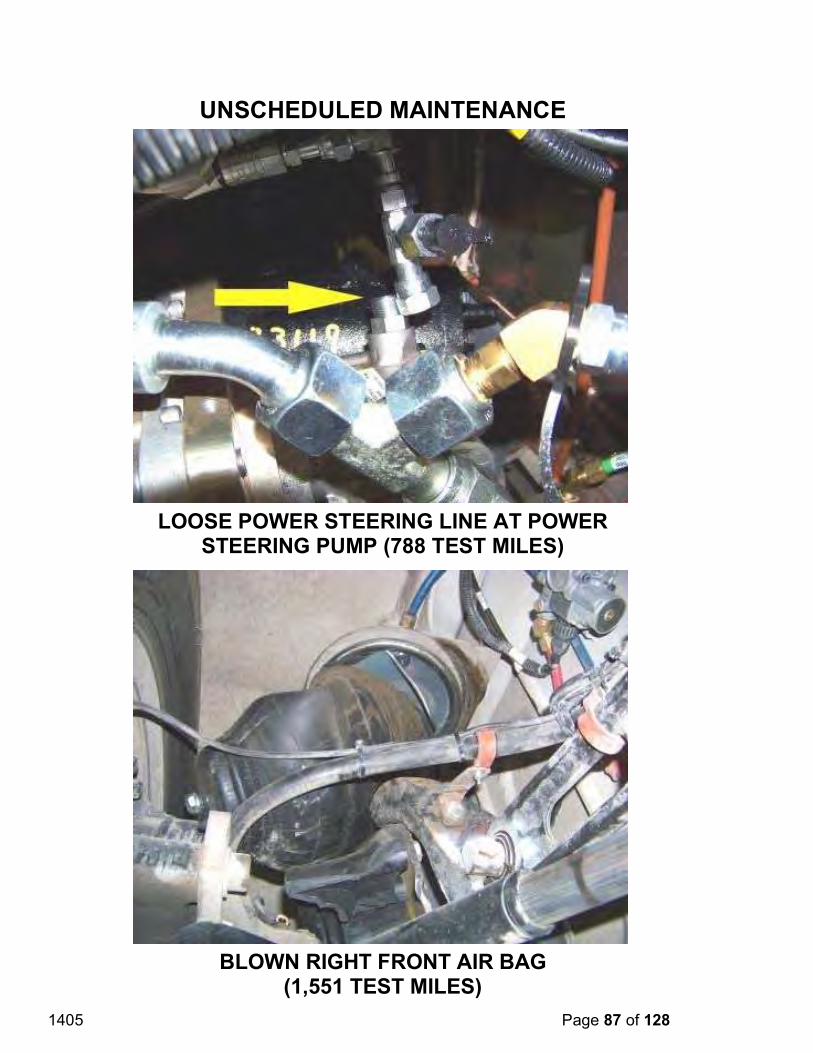
1405 Page 87 of 128
UNSCHEDULED MAINTENANCE
LOOSE POWER STEERING LINE AT POWER STEERING PUMP (788 TEST MILES)
BLOWN RIGHT FRONT AIR BAG (1,551 TEST MILES)
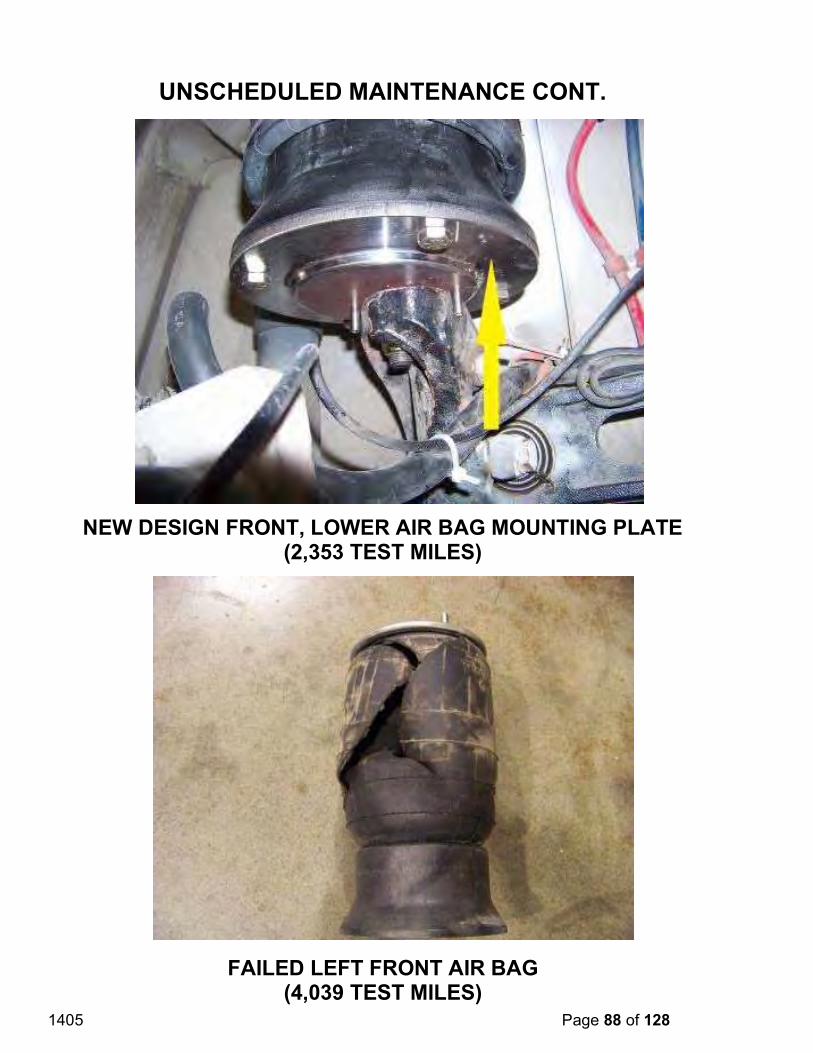
1405 Page 88 of 128
UNSCHEDULED MAINTENANCE CONT.
NEW DESIGN FRONT, LOWER AIR BAG MOUNTING PLATE (2,353 TEST MILES)
FAILED LEFT FRONT AIR BAG (4,039 TEST MILES)
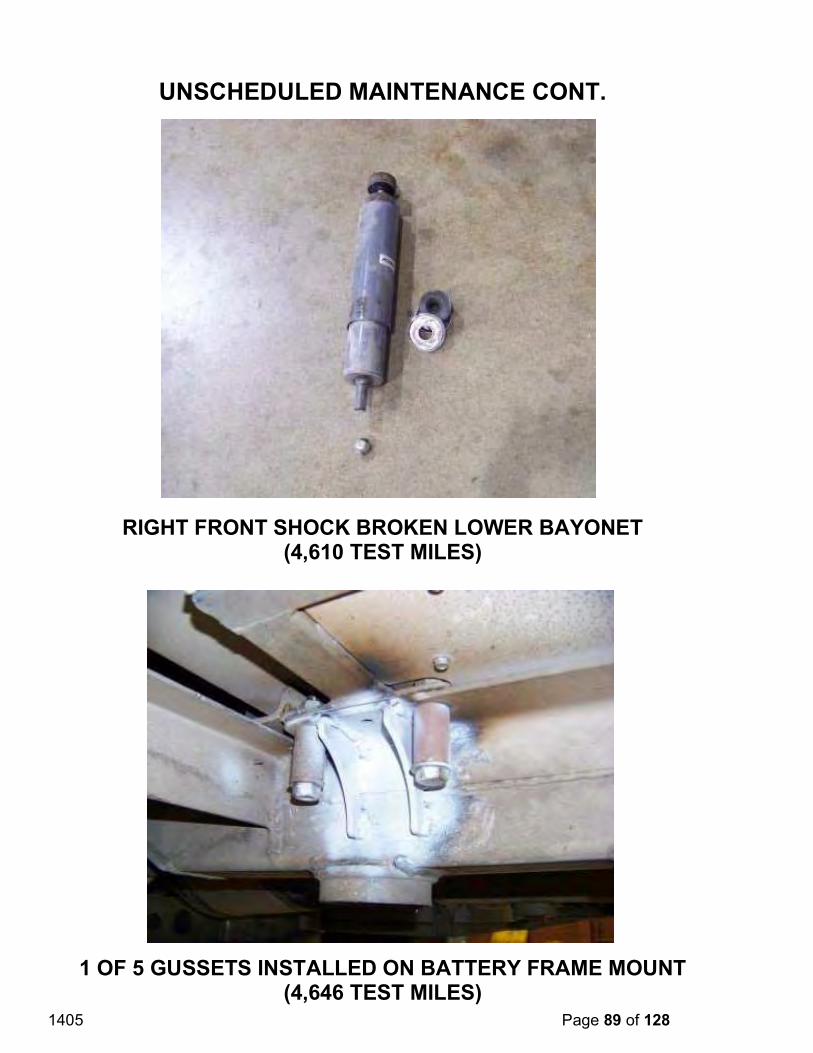
1405 Page 89 of 128
UNSCHEDULED MAINTENANCE CONT.
RIGHT FRONT SHOCK BROKEN LOWER BAYONET (4,610 TEST MILES)
1 OF 5 GUSSETS INSTALLED ON BATTERY FRAME MOUNT (4,646 TEST MILES)
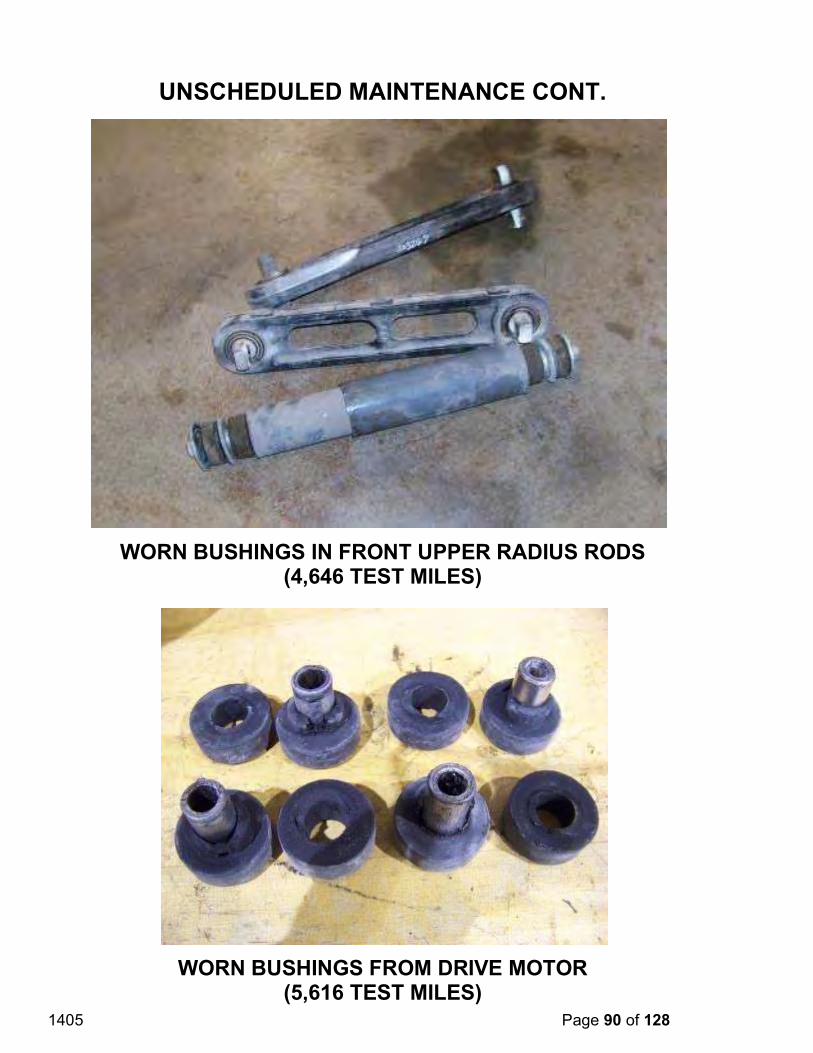
1405 Page 90 of 128
UNSCHEDULED MAINTENANCE CONT.
WORN BUSHINGS IN FRONT UPPER RADIUS RODS (4,646 TEST MILES)
WORN BUSHINGS FROM DRIVE MOTOR (5,616 TEST MILES)
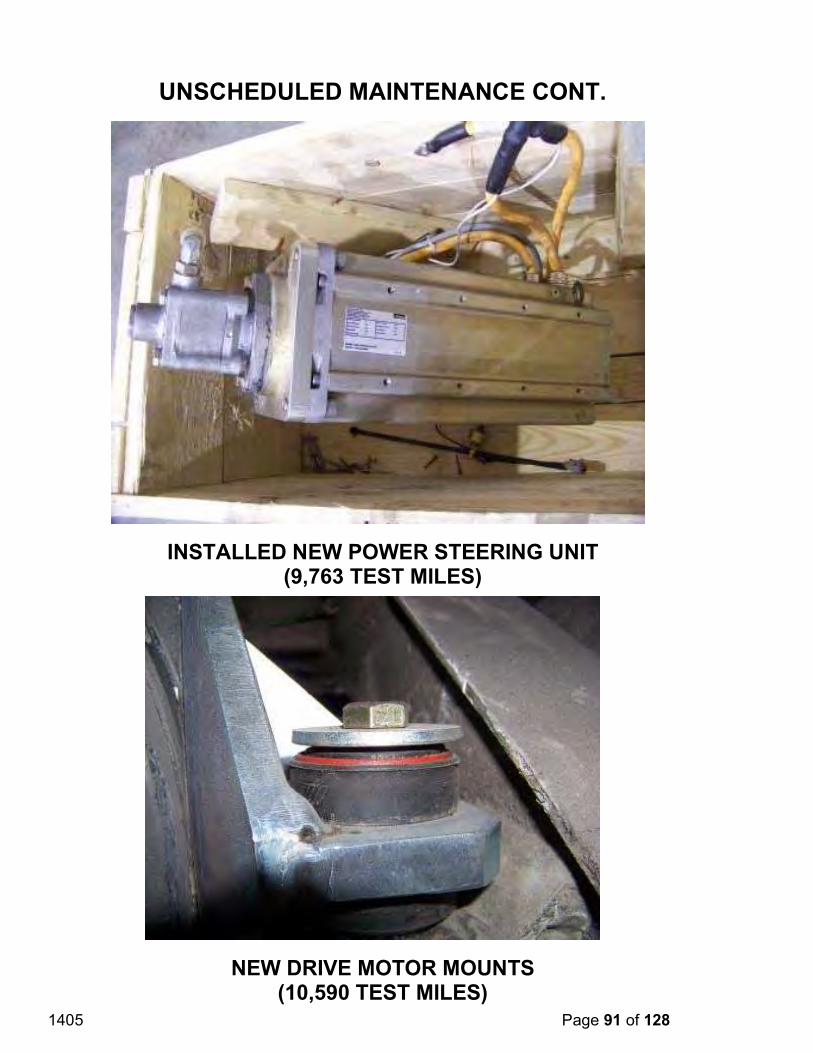
1405 Page 91 of 128
UNSCHEDULED MAINTENANCE CONT.
INSTALLED NEW POWER STEERING UNIT (9,763 TEST MILES)
NEW DRIVE MOTOR MOUNTS (10,590 TEST MILES)
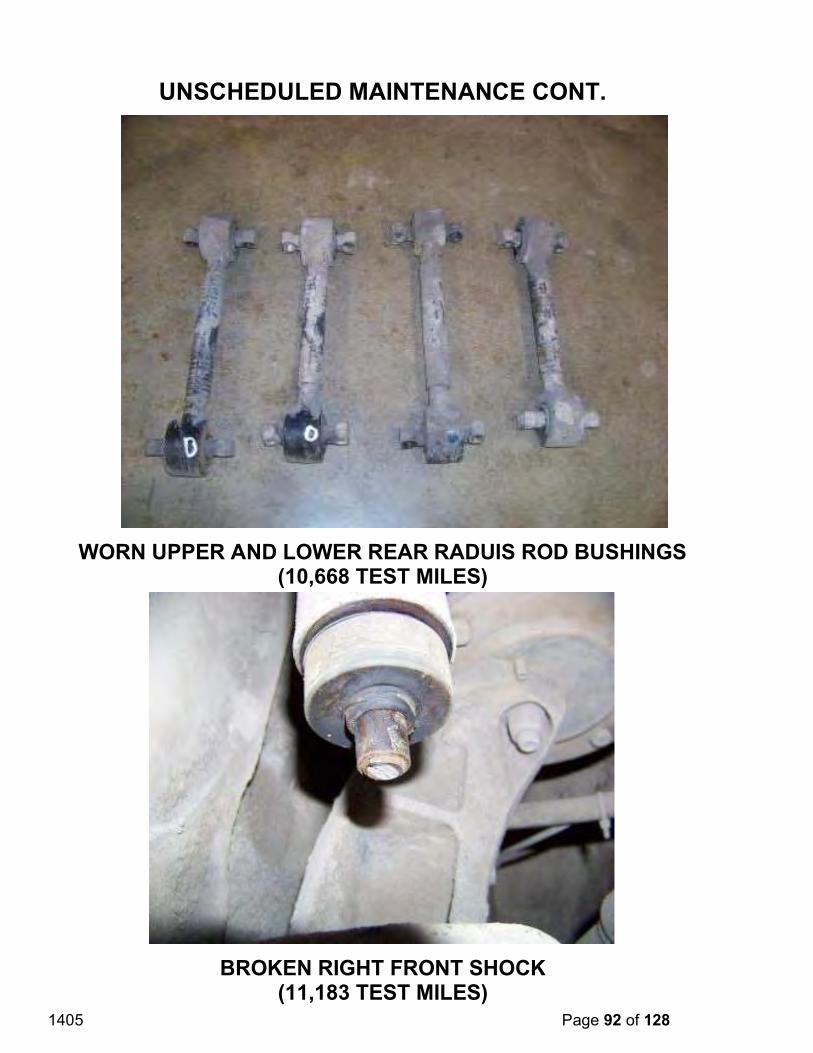
1405 Page 92 of 128
UNSCHEDULED MAINTENANCE CONT.
WORN UPPER AND LOWER REAR RADUIS ROD BUSHINGS (10,668 TEST MILES)
BROKEN RIGHT FRONT SHOCK (11,183 TEST MILES)
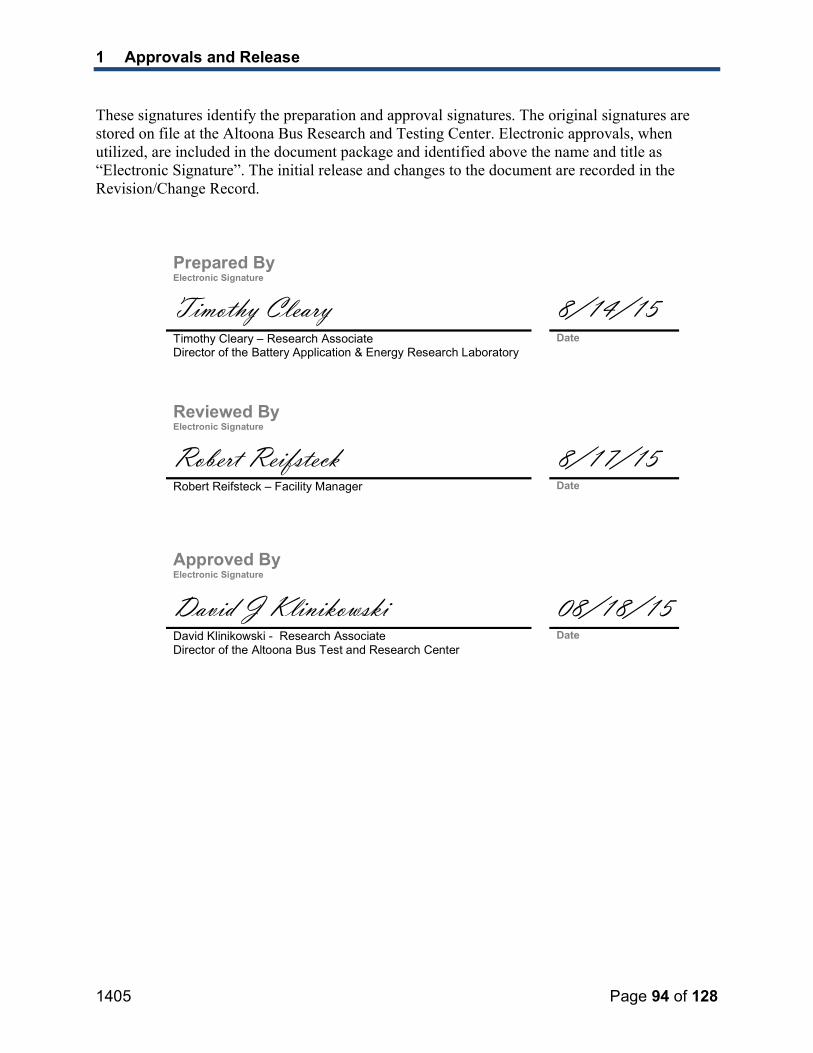
1405 Page 94 of 128
1 Approvals and Release
These signatures identify the preparation and approval signatures. The original signatures are stored on file at the Altoona Bus Research and Testing Center. Electronic approvals, when utilized, are included in the document package and identified above the name and title as “Electronic Signature”. The initial release and changes to the document are recorded in the Revision/Change Record.
Prepared By Electronic Signature
Timothy Cleary 8/14/15Timothy Cleary – Research Associate Director of the Battery Application & Energy Research Laboratory
Date
Reviewed By Electronic Signature
Robert Reifsteck 8/17/15Robert Reifsteck – Facility Manager Date
Approved ByElectronic Signature
David J Klinikowski 08/18/15David Klinikowski - Research Associate Director of the Altoona Bus Test and Research Center
Date
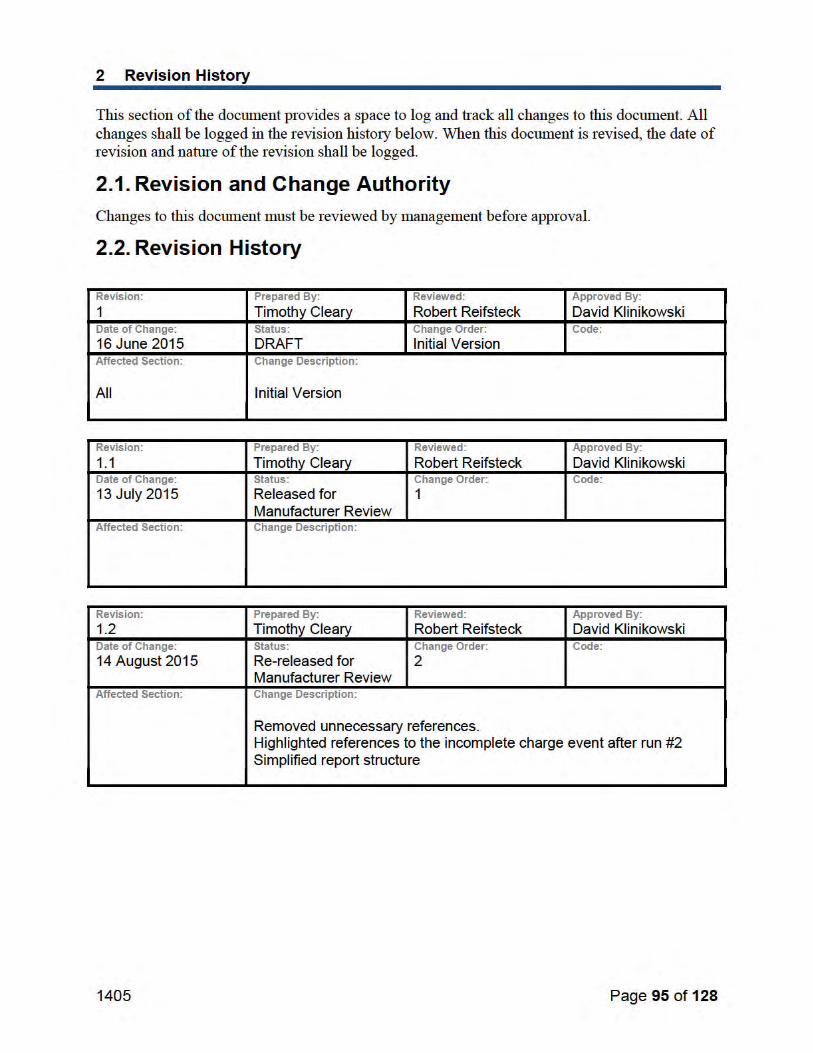
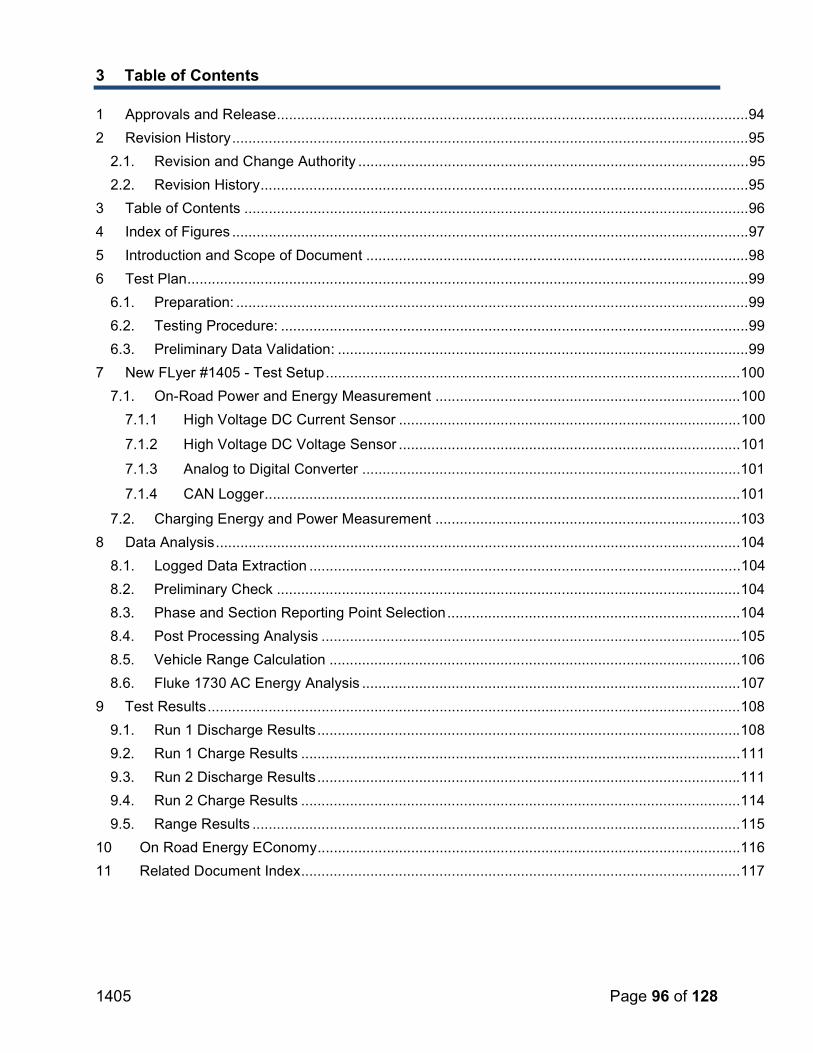
1405 Page 96 of 128
3 Table of Contents
1 Approvals and Release ....................................................................................................................94
2 Revision History ...............................................................................................................................95
2.1. Revision and Change Authority ................................................................................................ 95
2.2. Revision History ........................................................................................................................95
3 Table of Contents ............................................................................................................................96
4 Index of Figures ...............................................................................................................................97
5 Introduction and Scope of Document ..............................................................................................98
6 Test Plan ..........................................................................................................................................99
6.1. Preparation: ..............................................................................................................................99
6.2. Testing Procedure: ...................................................................................................................99
6.3. Preliminary Data Validation: .....................................................................................................99
7 New FLyer #1405 - Test Setup ......................................................................................................100
7.1. On-Road Power and Energy Measurement ........................................................................... 100
7.1.1 High Voltage DC Current Sensor .................................................................................... 100
7.1.2 High Voltage DC Voltage Sensor .................................................................................... 101
7.1.3 Analog to Digital Converter .............................................................................................101
7.1.4 CAN Logger .....................................................................................................................101
7.2. Charging Energy and Power Measurement ........................................................................... 103
8 Data Analysis .................................................................................................................................104
8.1. Logged Data Extraction ..........................................................................................................104
8.2. Preliminary Check ..................................................................................................................104
8.3. Phase and Section Reporting Point Selection ........................................................................ 104
8.4. Post Processing Analysis .......................................................................................................105
8.5. Vehicle Range Calculation .....................................................................................................106
8.6. Fluke 1730 AC Energy Analysis ............................................................................................. 107
9 Test Results ...................................................................................................................................108
9.1. Run 1 Discharge Results ........................................................................................................108
9.2. Run 1 Charge Results ............................................................................................................111
9.3. Run 2 Discharge Results ........................................................................................................111
9.4. Run 2 Charge Results ............................................................................................................114
9.5. Range Results ........................................................................................................................115
10 On Road Energy EConomy ........................................................................................................116
11 Related Document Index ............................................................................................................117
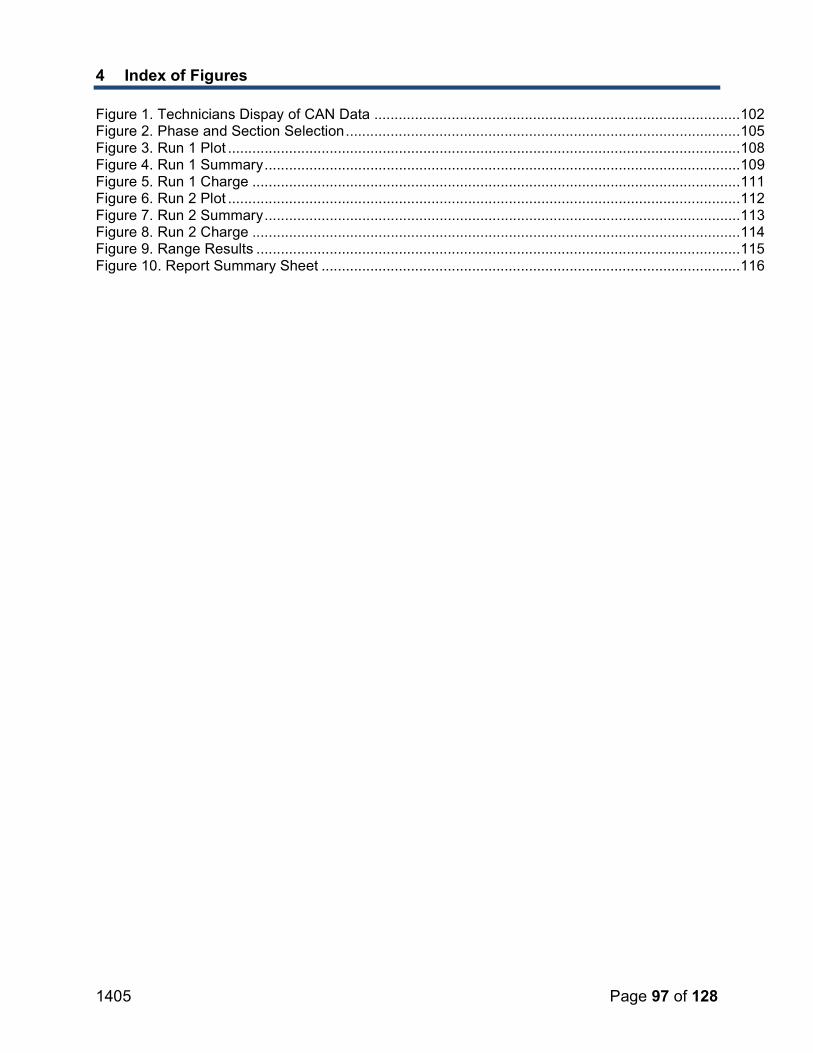
1405 Page 97 of 128
4 Index of Figures
Figure 1. Technicians Dispay of CAN Data ..........................................................................................102Figure 2. Phase and Section Selection .................................................................................................105Figure 3. Run 1 Plot ..............................................................................................................................108Figure 4. Run 1 Summary .....................................................................................................................109Figure 5. Run 1 Charge ........................................................................................................................111Figure 6. Run 2 Plot ..............................................................................................................................112Figure 7. Run 2 Summary .....................................................................................................................113Figure 8. Run 2 Charge ........................................................................................................................114Figure 9. Range Results .......................................................................................................................115Figure 10. Report Summary Sheet .......................................................................................................116
1405 Page 98 of 128
5 Introduction and Scope of Document
The purpose of this document is to report testing setup, data analysis and results of a fuel economy or more accurately, an energy consumption test performed at the Altoona Bus Test Center. This includes both on-road and charging energy consumption as well as phase specific average fuel economy and measured vehicle range.
1405 Page 99 of 128
6 Test Plan
The energy consumption test includes both on-road and stationary charge testing. Sensors are installed and tested prior to the official start. Manufacture data for maximum battery temperature, State of Charge (SOC) and vehicle speed are requested via the vehicles CAN bus. Ideally, all manufacturers will provide Deutsch series DT connectors with live, when enabled, high voltage connection directly to the high voltage energy storage bus as well as approximately 1 square foot of space around a high voltage cable carrying the full bus current for DC bus current measurement. Please ensure all high voltage safety precautions are exercised.
6.1. Preparation:
Current and voltage sensors are added to the bus between the battery system and all loads. Internal battery loads such as balancing functions are neglected. These sensors are integrated into an isolated CAN bus and logged during on-road testing. A Fluke 1730 power meter is attached to the power supply of the manufacturer’s charger. This meters data are logged during all charges after any on-road energy consumption testing. All sensors and logging systems are tested by driving a minimum of two full laps and charging for a minimum of 10 minutes prior to official testing.
Once preparation is complete testing may start.
6.2. Testing Procedure: 1) Fully charge the bus using manufacturer specific chargers and procedure
a. A one hour “warm up” is optional prior to on-road testing but the bus must returnto the charger and be fully charged prior to any official testing
2) Following a full charge and prior to initial vehicle movement data logging is enabled
3) Starting from the charger location the bus is driven to the start point on the oval testtrack
4) The bus is then driven in a counter clockwise direction around the track repeating theCBD, Arterial, CBD, Arterial, CBD, Commuter profile until the vehicles propulsion systemisn’t capable of keeping up with the required profile speeds
5) The bus is then driven directly to the manufactures charger
6) The power meter and its logging function is enabled
7) The bus is fully charged following the manufacturers procedures
8) Steps 2 through 7 are then repeated for clockwise direction
6.3. Preliminary Data Validation:
Following each day of testing data is preliminary reviewed to ensure all systems remained functional throughout the days testing. If any problems are found during this review the issues are presented to management for discussion and consideration. If necessary the bus may be retested.
1405 Page 100 of 128
7
A measurement of electrical power and energy was performed on the New Flyer EV bus #1405while on-road in a charge depleting mode and while stationary in a charging mode. In both modes of operation electrical energy was measured by utilizing current and voltage sensors. The details of these sensors and their data acquisition systems are presented here. All calibration certifications for sensors used in this testing are on file at the Altoona Bus Research and Testing Center.
7.1. On-Road Power and Energy Measurement
While in an on-road energy consumption mode current and voltage of the electrical energy storage system / high voltage battery was measured and logged. A single current sensor was placed in between the high voltage battery and all exterior loads while a single voltage sensor was connected to the high voltage DC bus. Any power consumed internal to the energy storage system for devices such as a battery management systems or functions such as cell balancing were not measured and are assumed to be negligible.
The current and voltage sensors used in this test generate analog signals which are in turn are converted by an analog to digital converter with CAN bus communication. The analog to digital converter scales measurements based on initial device configuration, tailored to the specific sensors and sends these raw measurements out on its associated CAN bus at a rate of 20ms or 50Hz. A CAN data logger is set to log all messages on this isolated CAN bus. A second CAN channel was integrated into the manufacturer’s vehicle CAN bus to log vehicle speed, maximum battery/cell temperature and estimated battery SOC. Two separate and dedicated 12V lead acid batteries were used to power the analog to digital converter and CAN data loggers. The other battery supported an inverter to power a technicians PC which was also logging the same CAN data. In this particular setup vehicle power was used for one of the two CAN loggers. The load of a Vector CANtech CANcaseXL log, the loggers used in this testing, is approximately 500ma at 12V or 6 Watts.
This intent of this power supply configuration is to limit power drawn from the vehicle during testing. It’s also worth noting that the high voltage DC voltage sensor may load the high voltage bus but this load is considered to be negligible.
7.1.1 High Voltage DC Current Sensor An AEMC brand model MR561 current probe was used along with an IPETRONIK high voltage current clamp isolator to generate the DC battery current analog signal.
Current probe manual: http://www.aemc.com/products/pdf/1200.73.pdf
High voltage isolator: https://www.ipetronik.com/sites/default/files/field_product_file/ipe_datasheet_iso_clamp_connector prelim.pdf
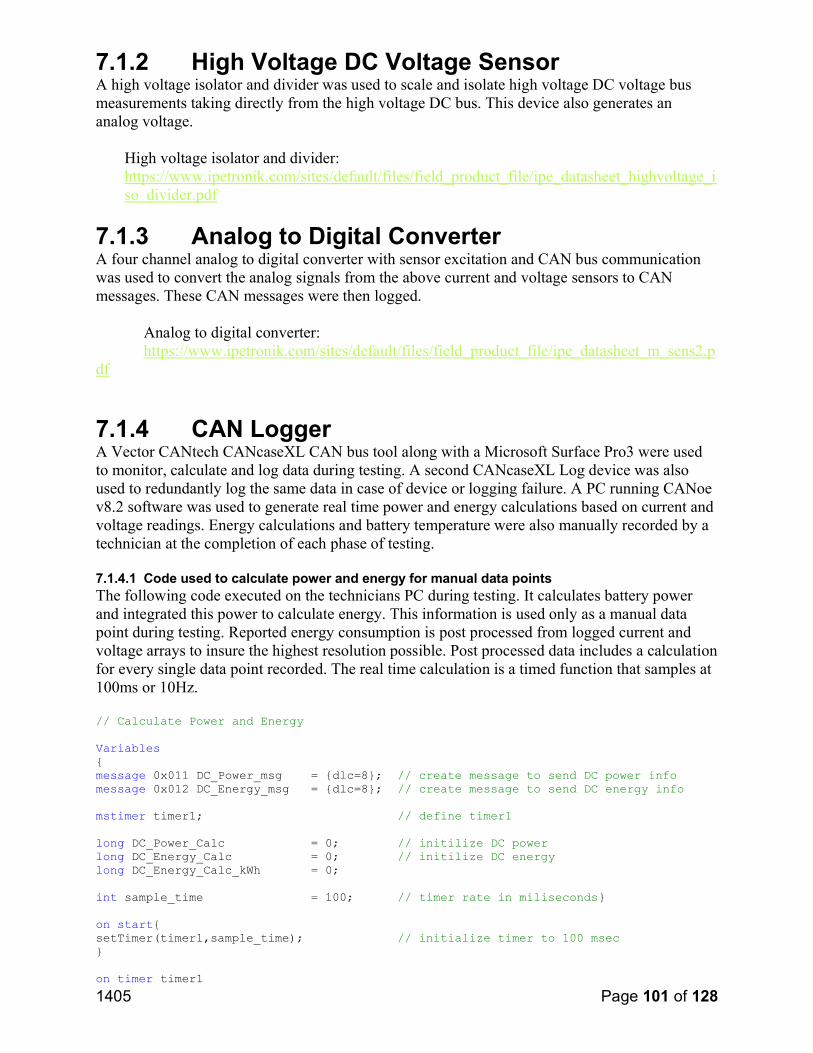
1405 Page 101 of 128
7.1.2 High Voltage DC Voltage Sensor A high voltage isolator and divider was used to scale and isolate high voltage DC voltage bus measurements taking directly from the high voltage DC bus. This device also generates an analog voltage.
High voltage isolator and divider: https://www.ipetronik.com/sites/default/files/field_product_file/ipe_datasheet_highvoltage_iso divider.pdf
7.1.3 Analog to Digital Converter A four channel analog to digital converter with sensor excitation and CAN bus communication was used to convert the analog signals from the above current and voltage sensors to CAN messages. These CAN messages were then logged.
Analog to digital converter: https://www.ipetronik.com/sites/default/files/field_product_file/ipe_datasheet_m_sens2.p
df
7.1.4 CAN Logger A Vector CANtech CANcaseXL CAN bus tool along with a Microsoft Surface Pro3 were used to monitor, calculate and log data during testing. A second CANcaseXL Log device was also used to redundantly log the same data in case of device or logging failure. A PC running CANoe v8.2 software was used to generate real time power and energy calculations based on current and voltage readings. Energy calculations and battery temperature were also manually recorded by a technician at the completion of each phase of testing.
7.1.4.1 Code used to calculate power and energy for manual data points The following code executed on the technicians PC during testing. It calculates battery power and integrated this power to calculate energy. This information is used only as a manual data point during testing. Reported energy consumption is post processed from logged current and voltage arrays to insure the highest resolution possible. Post processed data includes a calculation for every single data point recorded. The real time calculation is a timed function that samples at 100ms or 10Hz.
// Calculate Power and Energy
Variables{message 0x011 DC_Power_msg = {dlc=8}; // create message to send DC power infomessage 0x012 DC_Energy_msg = {dlc=8}; // create message to send DC energy info
mstimer timer1; // define timer1
long DC_Power_Calc = 0; // initilize DC powerlong DC_Energy_Calc = 0; // initilize DC energy long DC_Energy_Calc_kWh = 0;
int sample_time = 100; // timer rate in miliseconds}
on start{setTimer(timer1,sample_time); // initialize timer to 100 msec }
on timer timer1
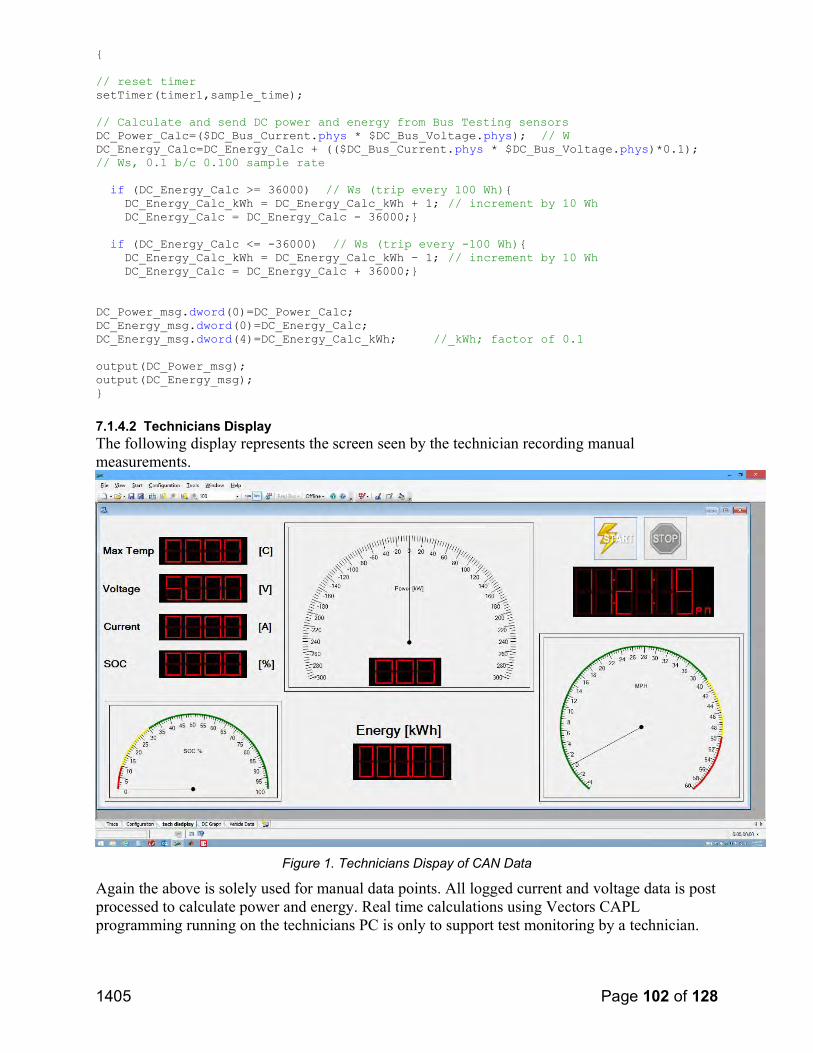
1405 Page 102 of 128
{
// reset timersetTimer(timer1,sample_time);
// Calculate and send DC power and energy from Bus Testing sensorsDC_Power_Calc=($DC_Bus_Current.phys * $DC_Bus_Voltage.phys); // WDC_Energy_Calc=DC_Energy_Calc + (($DC_Bus_Current.phys * $DC_Bus_Voltage.phys)*0.1);// Ws, 0.1 b/c 0.100 sample rate
if (DC_Energy_Calc >= 36000) // Ws (trip every 100 Wh){ DC_Energy_Calc_kWh = DC_Energy_Calc_kWh + 1; // increment by 10 Wh DC_Energy_Calc = DC_Energy_Calc - 36000;}
if (DC_Energy_Calc <= -36000) // Ws (trip every -100 Wh){ DC_Energy_Calc_kWh = DC_Energy_Calc_kWh - 1; // increment by 10 Wh DC_Energy_Calc = DC_Energy_Calc + 36000;}
DC_Power_msg.dword(0)=DC_Power_Calc;DC_Energy_msg.dword(0)=DC_Energy_Calc;DC_Energy_msg.dword(4)=DC_Energy_Calc_kWh; //_kWh; factor of 0.1
output(DC_Power_msg);output(DC_Energy_msg);}
7.1.4.2 Technicians Display The following display represents the screen seen by the technician recording manual measurements.
Figure 1. Technicians Dispay of CAN Data
Again the above is solely used for manual data points. All logged current and voltage data is post processed to calculate power and energy. Real time calculations using Vectors CAPL programming running on the technicians PC is only to support test monitoring by a technician.
1405 Page 103 of 128
7.2. Charging Energy and Power Measurement
All AC electrical power measurements are logged using a Fluke 1730 power meter. This devices sensors were installed in between the building power service and the New Flyer charging station. All calibration certifications are on file at the Altoona Bus Research and Testing Center.
Fluke 1730 3 Phase Energy Logger: http://www.fluke.com/fluke/m2en/power-quality-tools/logging-power-meters/fluke-1730.htm?PID=77038
Fluke Energy Analyze V1.2 software package is used to extract recorded data from the Fluke 1730 power meter. This data is ultimately exported to a Matlab data file.
1405 Page 104 of 128
8 Data Analysis
This section details the process of data analysis. Once all logged data is extracted from the logging devices a preliminary check is performed to determine if there were any discrepancies in the test procedure or data logging. Then data from multiple files are combined, if necessary, to create one file for the discharge and charge portion of each run. Finally, a point in between each completed phase or section of data is selected and calculated values for this point are reported.
Vehicle range calculation is also covered in this section as well as the Fluke 1730 energy meter data analysis.
8.1. Logged Data Extraction
All data are logged using a Vector CANcaseXL Log or similar. This information is either extracted from the log device itself or a connected PC acting as the logging device. It is then processed through Vector CANoe software and exported into a Matlab data file format. During the export process all messages are exported to ensure the highest possible resolution. No interpolation is performed.
8.2. Preliminary Check
All files extracted from the logging device are then preliminary processed. This includes plotting data such as vehicle speed to ensure that the test was conducted properly. Current and Voltage data is also plotted to ensure the signals are within reasonable ranges and behave as expected. Finally a check for disruptions in the signals is performed.
8.3. Phase and Section Reporting Point Selection
Phases and sections are selected manually based on both the technicians recorded phase time values and obvious stop points in between phases and or sections of the test. Test phases are the CBD, ART and Commuter drive profiles while test sections consist of the drive form the charger to the start point and return from the track to the charge after the last completed phase.
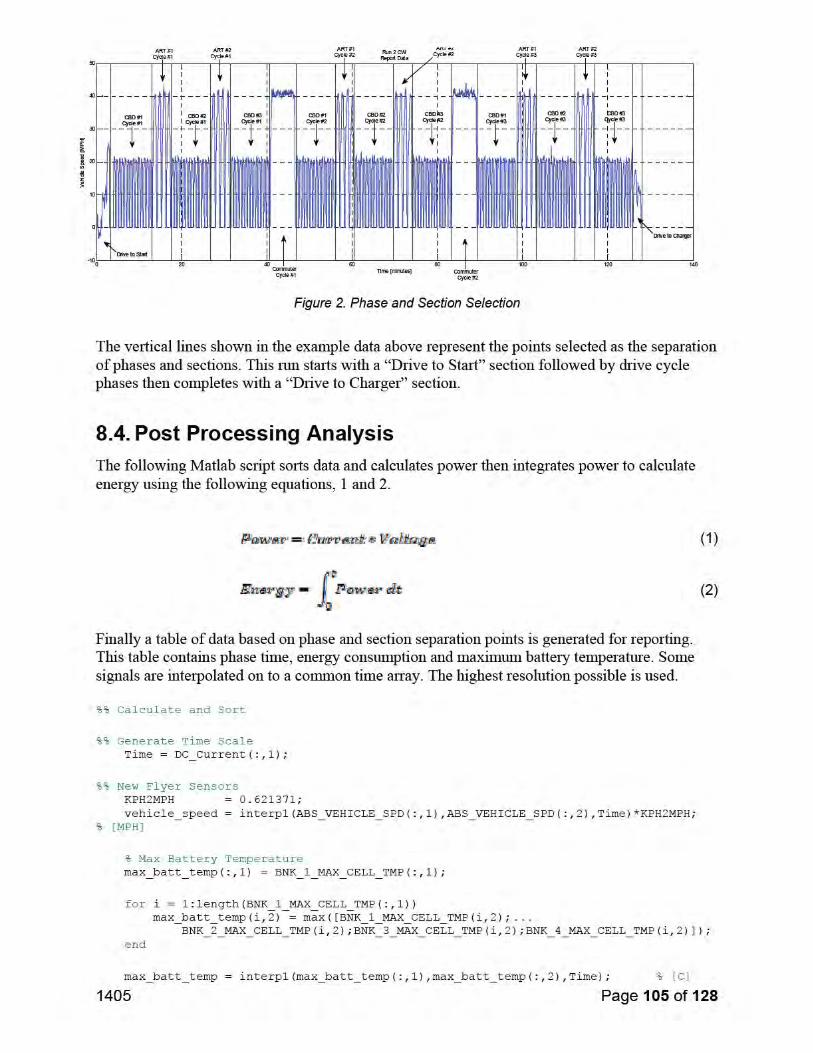
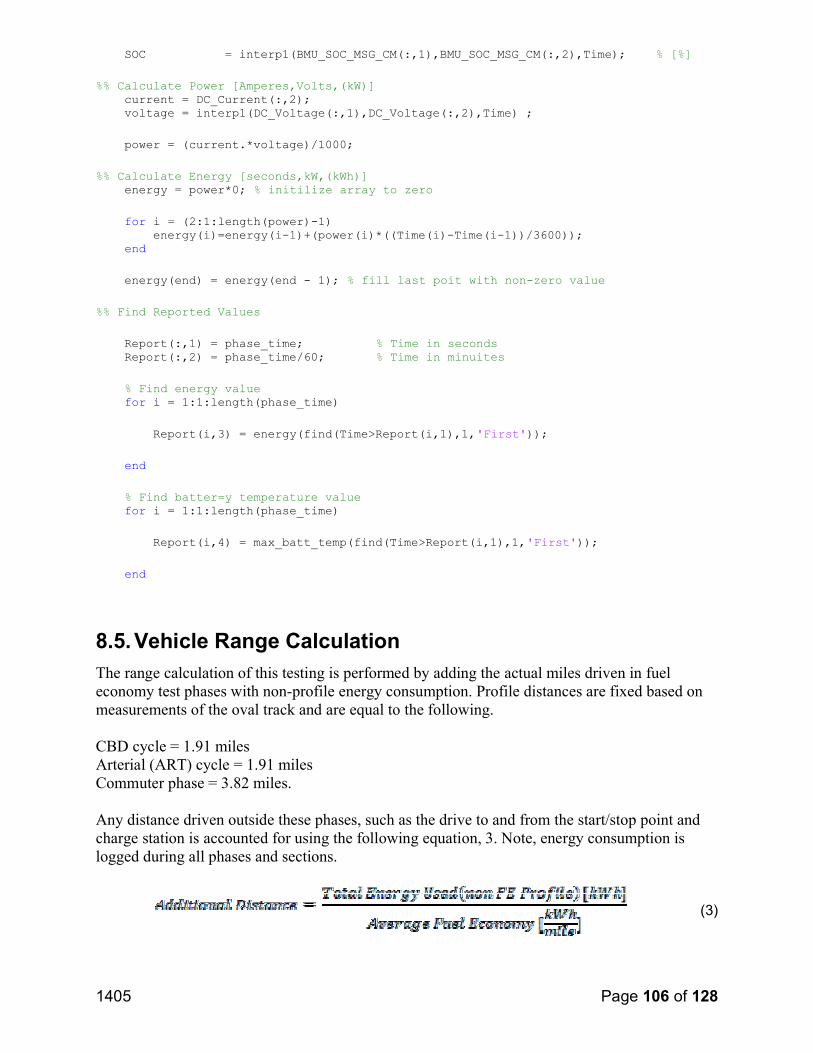
1405 Page 106 of 128
SOC = interp1(BMU_SOC_MSG_CM(:,1),BMU_SOC_MSG_CM(:,2),Time); % [%]
%% Calculate Power [Amperes,Volts,(kW)] current = DC_Current(:,2); voltage = interp1(DC_Voltage(:,1),DC_Voltage(:,2),Time) ;
power = (current.*voltage)/1000;
%% Calculate Energy [seconds,kW,(kWh)] energy = power*0; % initilize array to zero
for i = (2:1:length(power)-1)energy(i)=energy(i-1)+(power(i)*((Time(i)-Time(i-1))/3600));
end
energy(end) = energy(end - 1); % fill last poit with non-zero value
%% Find Reported Values
Report(:,1) = phase_time; % Time in seconds Report(:,2) = phase_time/60; % Time in minuites
% Find energy valuefor i = 1:1:length(phase_time)
Report(i,3) = energy(find(Time>Report(i,1),1,'First'));
end
% Find batter=y temperature valuefor i = 1:1:length(phase_time)
Report(i,4) = max_batt_temp(find(Time>Report(i,1),1,'First'));
end
8.5. Vehicle Range Calculation
The range calculation of this testing is performed by adding the actual miles driven in fuel economy test phases with non-profile energy consumption. Profile distances are fixed based on measurements of the oval track and are equal to the following.
CBD cycle = 1.91 miles Arterial (ART) cycle = 1.91 miles Commuter phase = 3.82 miles.
Any distance driven outside these phases, such as the drive to and from the start/stop point and charge station is accounted for using the following equation, 3. Note, energy consumption is logged during all phases and sections.
(3)
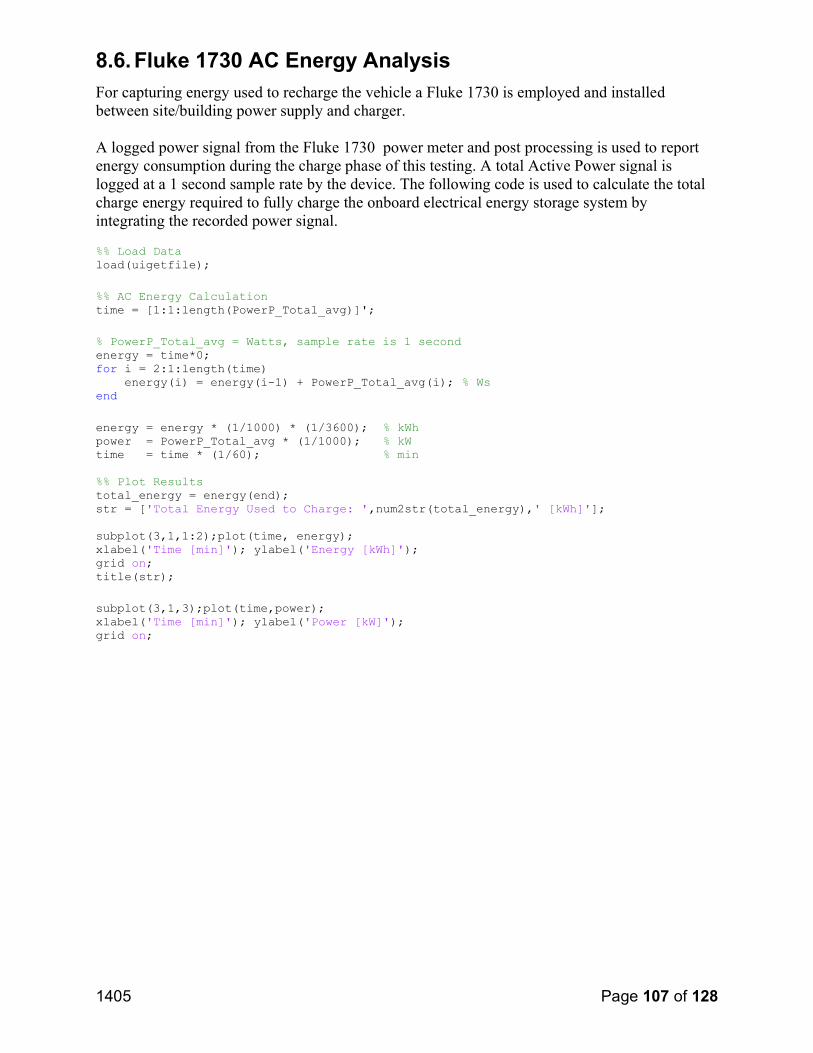
1405 Page 107 of 128
8.6. Fluke 1730 AC Energy Analysis
For capturing energy used to recharge the vehicle a Fluke 1730 is employed and installed between site/building power supply and charger.
A logged power signal from the Fluke 1730 power meter and post processing is used to report energy consumption during the charge phase of this testing. A total Active Power signal is logged at a 1 second sample rate by the device. The following code is used to calculate the total charge energy required to fully charge the onboard electrical energy storage system by integrating the recorded power signal.
%% Load Data load(uigetfile);
%% AC Energy Calculationtime = [1:1:length(PowerP_Total_avg)]';
% PowerP_Total_avg = Watts, sample rate is 1 secondenergy = time*0; for i = 2:1:length(time) energy(i) = energy(i-1) + PowerP_Total_avg(i); % Wsend
energy = energy * (1/1000) * (1/3600); % kWhpower = PowerP_Total_avg * (1/1000); % kWtime = time * (1/60); % min
%% Plot Resultstotal_energy = energy(end); str = ['Total Energy Used to Charge: ',num2str(total_energy),' [kWh]'];
subplot(3,1,1:2);plot(time, energy);xlabel('Time [min]'); ylabel('Energy [kWh]');grid on;title(str);
subplot(3,1,3);plot(time,power);xlabel('Time [min]'); ylabel('Power [kW]');grid on;
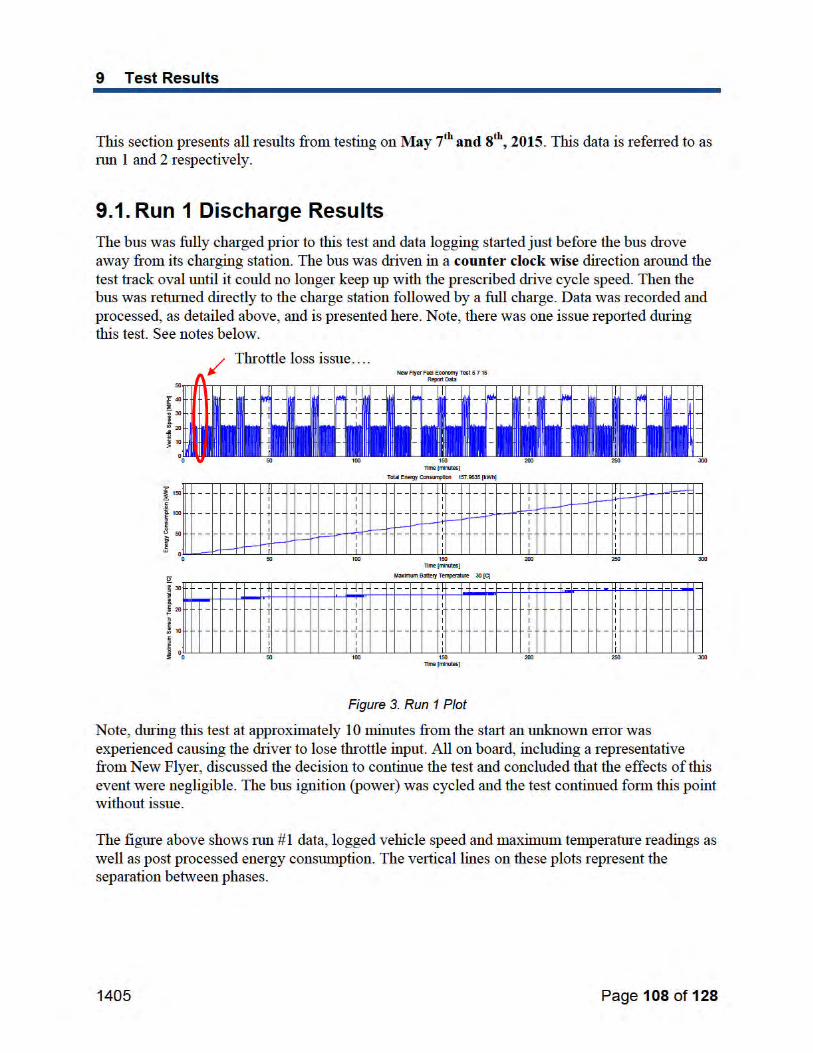
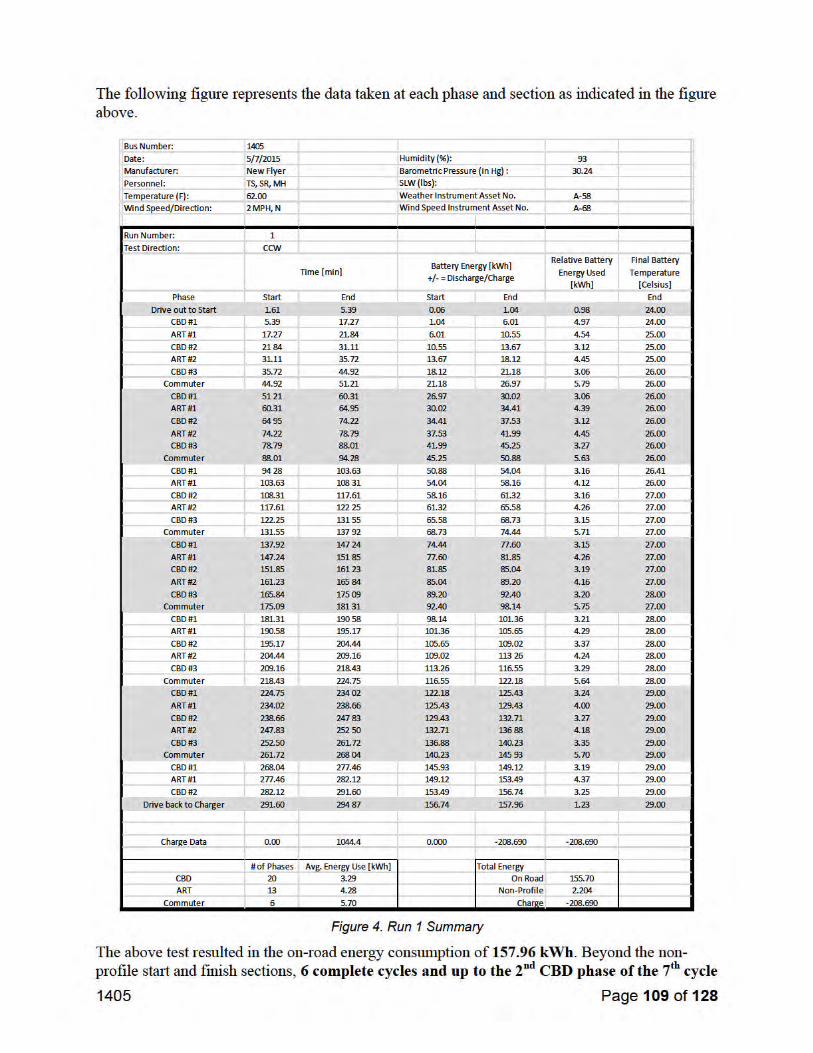
1405 Page 110 of 128
was completed. Note, the distance driven to and from the charger and start/stop location is also accounted for but in terms of energy then applied to the vehicle range value. See section 8.5 for more detail.
Total on road fuel economy profile distance for this run: 85.95 miles
Total on road non-fuel economy profile distance for this run: 1.20 miles
Total range for this run: 87.15 miles
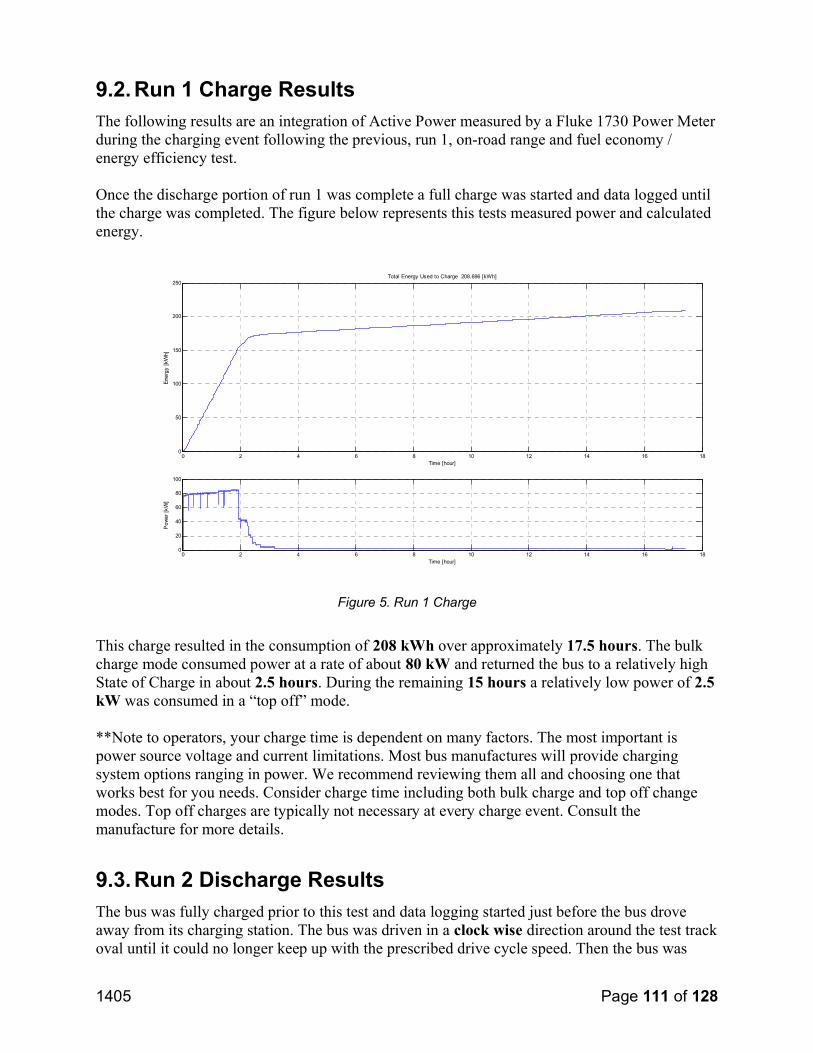
1405 Page 111 of 128
9.2. Run 1 Charge Results The following results are an integration of Active Power measured by a Fluke 1730 Power Meter during the charging event following the previous, run 1, on-road range and fuel economy / energy efficiency test.
Once the discharge portion of run 1 was complete a full charge was started and data logged until the charge was completed. The figure below represents this tests measured power and calculated energy.
0 2 4 6 8 10 12 14 16 180
50
100
150
200
250
Time [hour]
Total Energy Used to Charge 208.696 [kWh]
0 2 4 6 8 10 12 14 16 180
20
40
60
80
100
Time [hour]
Figure 5. Run 1 Charge
This charge resulted in the consumption of 208 kWh over approximately 17.5 hours. The bulk charge mode consumed power at a rate of about 80 kW and returned the bus to a relatively high State of Charge in about 2.5 hours. During the remaining 15 hours a relatively low power of 2.5kW was consumed in a “top off” mode.
**Note to operators, your charge time is dependent on many factors. The most important is power source voltage and current limitations. Most bus manufactures will provide charging system options ranging in power. We recommend reviewing them all and choosing one that works best for you needs. Consider charge time including both bulk charge and top off change modes. Top off charges are typically not necessary at every charge event. Consult the manufacture for more details.
9.3. Run 2 Discharge Results
The bus was fully charged prior to this test and data logging started just before the bus drove away from its charging station. The bus was driven in a clock wise direction around the test track oval until it could no longer keep up with the prescribed drive cycle speed. Then the bus was
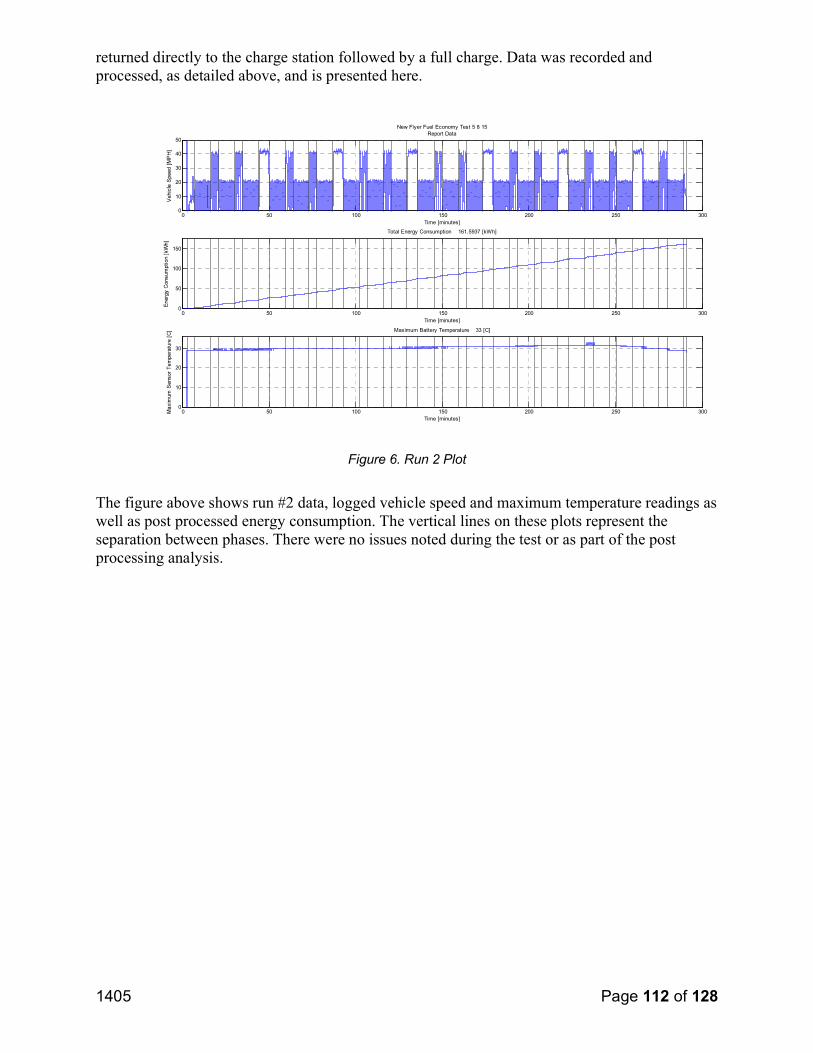
1405 Page 112 of 128
returned directly to the charge station followed by a full charge. Data was recorded and processed, as detailed above, and is presented here.
0 50 100 150 200 250 3000
10
20
30
40
50
Time [minutes]
New Flyer Fuel Economy Test 5 8 15Report Data
0 50 100 150 200 250 3000
50
100
150
Time [minutes]
Total Energy Consumption 161.5937 [kWh]
0 50 100 150 200 250 3000
10
20
30
Time [minutes]
Maximum Battery Temperature 33 [C]
Figure 6. Run 2 Plot
The figure above shows run #2 data, logged vehicle speed and maximum temperature readings as well as post processed energy consumption. The vertical lines on these plots represent the separation between phases. There were no issues noted during the test or as part of the post processing analysis.
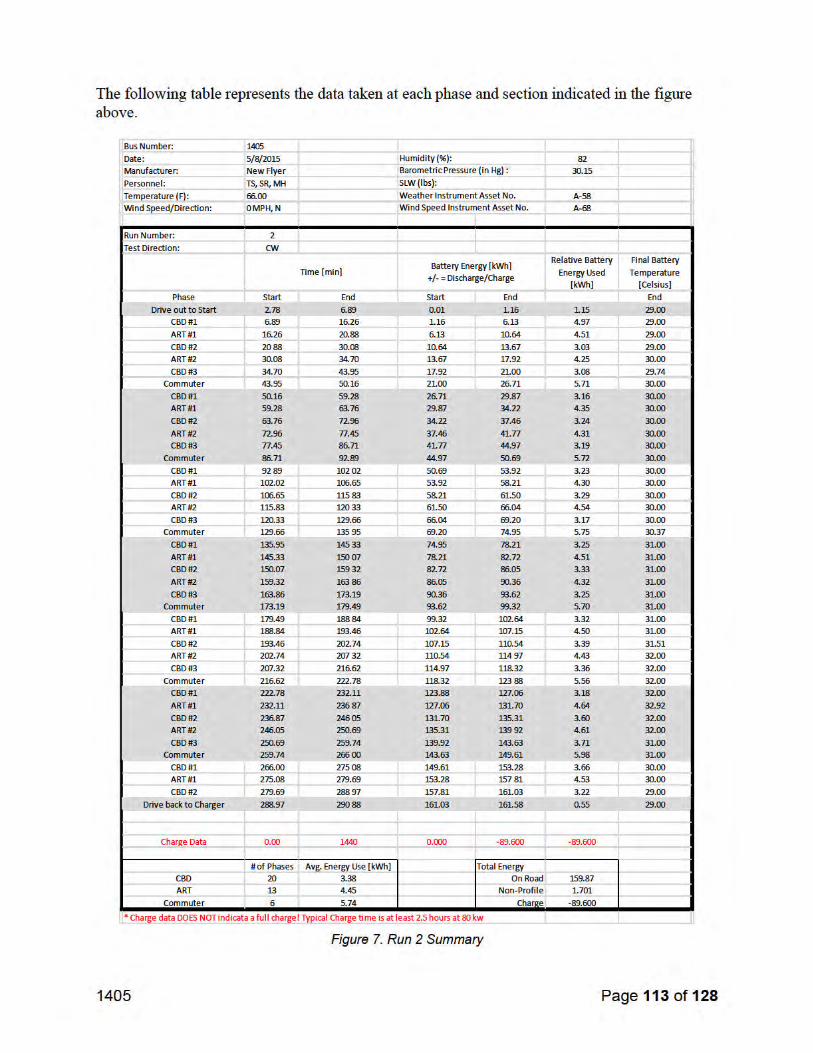
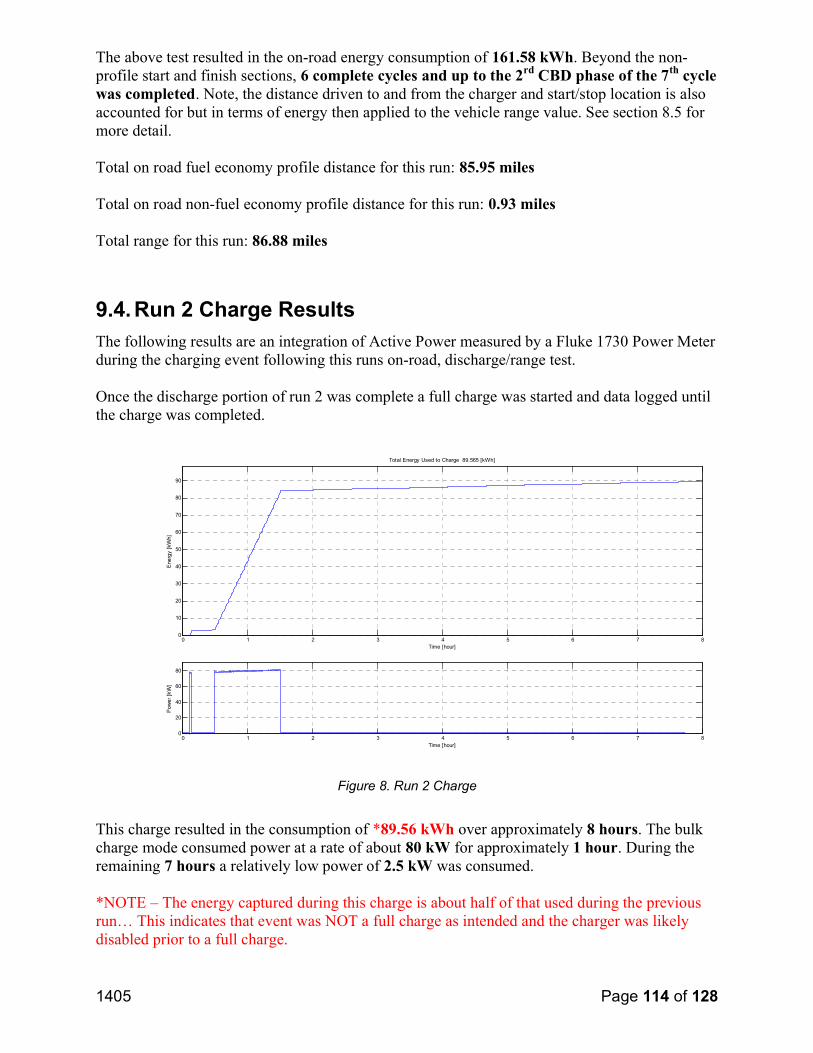
1405 Page 114 of 128
The above test resulted in the on-road energy consumption of 161.58 kWh. Beyond the non-profile start and finish sections, 6 complete cycles and up to the 2rd CBD phase of the 7th cycle was completed. Note, the distance driven to and from the charger and start/stop location is also accounted for but in terms of energy then applied to the vehicle range value. See section 8.5 for more detail.
Total on road fuel economy profile distance for this run: 85.95 miles
Total on road non-fuel economy profile distance for this run: 0.93 miles
Total range for this run: 86.88 miles
9.4. Run 2 Charge Results
The following results are an integration of Active Power measured by a Fluke 1730 Power Meter during the charging event following this runs on-road, discharge/range test.
Once the discharge portion of run 2 was complete a full charge was started and data logged until the charge was completed.
0 1 2 3 4 5 6 7 80
10
20
30
40
50
60
70
80
90
Time [hour]
Total Energy Used to Charge 89.565 [kWh]
0 1 2 3 4 5 6 7 80
20
40
60
80
Time [hour]
Figure 8. Run 2 Charge
This charge resulted in the consumption of *89.56 kWh over approximately 8 hours. The bulk charge mode consumed power at a rate of about 80 kW for approximately 1 hour. During the remaining 7 hours a relatively low power of 2.5 kW was consumed.
*NOTE – The energy captured during this charge is about half of that used during the previousrun… This indicates that event was NOT a full charge as intended and the charger was likely disabled prior to a full charge.
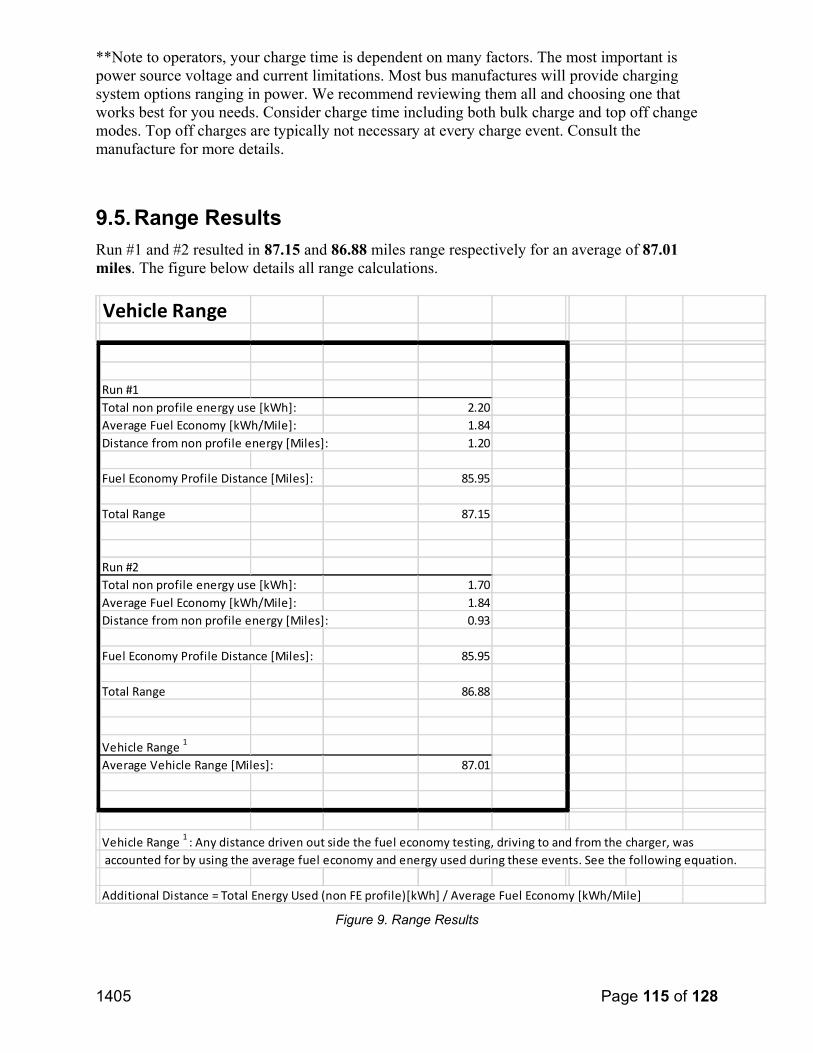
1405 Page 115 of 128
**Note to operators, your charge time is dependent on many factors. The most important is power source voltage and current limitations. Most bus manufactures will provide charging system options ranging in power. We recommend reviewing them all and choosing one that works best for you needs. Consider charge time including both bulk charge and top off change modes. Top off charges are typically not necessary at every charge event. Consult the manufacture for more details.
9.5. Range Results
Run #1 and #2 resulted in 87.15 and 86.88 miles range respectively for an average of 87.01miles. The figure below details all range calculations.
Vehicle Range
Run #1Total non profile energy use [kWh]: 2.20Average Fuel Economy [kWh/Mile]: 1.84Distance from non profile energy [Miles]: 1.20
Fuel Economy Profile Distance [Miles]: 85.95
Total Range 87.15
Run #2Total non profile energy use [kWh]: 1.70Average Fuel Economy [kWh/Mile]: 1.84Distance from non profile energy [Miles]: 0.93
Fuel Economy Profile Distance [Miles]: 85.95
Total Range 86.88
Vehicle Range 1
Average Vehicle Range [Miles]: 87.01
Vehicle Range 1 : Any distance driven out side the fuel economy testing, driving to and from the charger, wasaccounted for by using the average fuel economy and energy used during these events. See the following equation.
Additional Distance = Total Energy Used (non FE profile)[kWh] / Average Fuel Economy [kWh/Mile]
Figure 9. Range Results
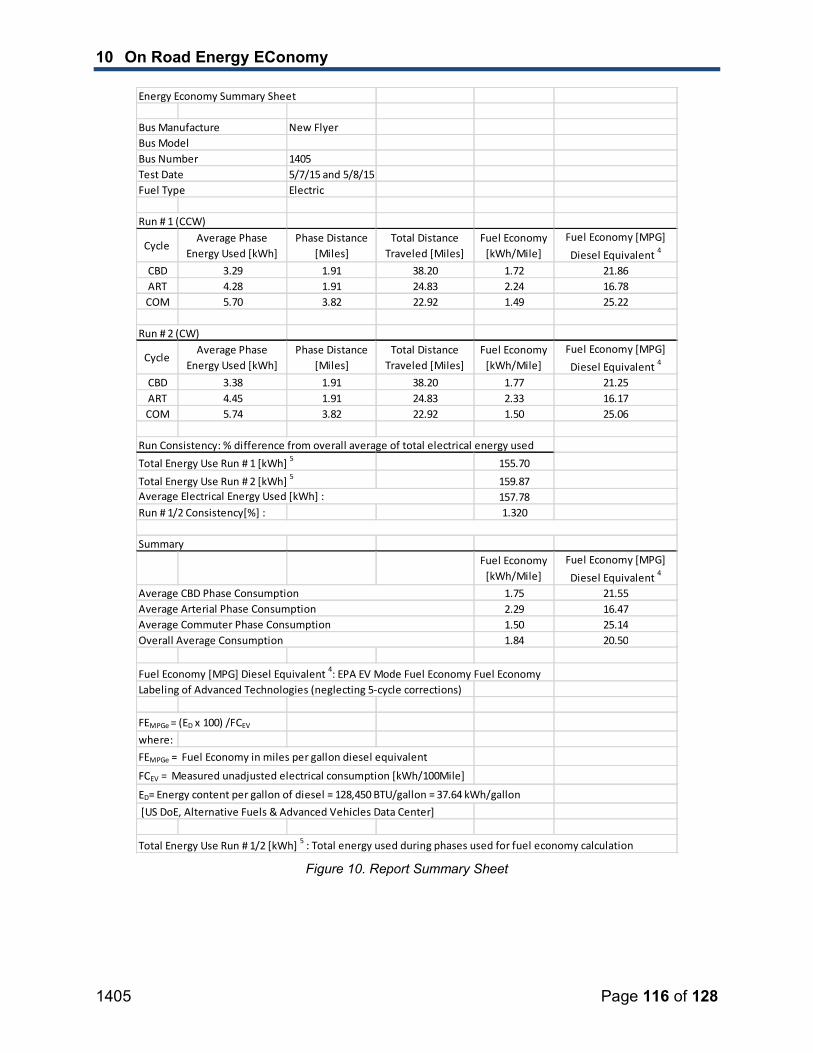
1405 Page 116 of 128
10 On Road Energy EConomy
Energy Economy Summary Sheet
New FlyerBus ModelBus Number 1405Test Date 5/7/15 and 5/8/15Fuel Type Electric
Run # 1 (CCW)
CycleAverage Phase
Energy Used [kWh]Phase Distance
[Miles]Total DistanceTraveled [Miles]
Fuel Economy[kWh/Mile]
Fuel Economy [MPG]
Diesel Equivalent 4
CBD 3.29 1.91 38.20 1.72 21.86ART 4.28 1.91 24.83 2.24 16.78COM 5.70 3.82 22.92 1.49 25.22
Run # 2 (CW)
CycleAverage Phase
Energy Used [kWh]Phase Distance
[Miles]Total DistanceTraveled [Miles]
Fuel Economy[kWh/Mile]
Fuel Economy [MPG]Diesel Equivalent 4
CBD 3.38 1.91 38.20 1.77 21.25ART 4.45 1.91 24.83 2.33 16.17COM 5.74 3.82 22.92 1.50 25.06
Run Consistency: % difference from overall average of total electrical energy used
Total Energy Use Run # 1 [kWh] 5 155.70
Total Energy Use Run # 2 [kWh] 5 159.87157.781.320
Fuel Economy[kWh/Mile]
Fuel Economy [MPG]
Diesel Equivalent 4
1.75 21.552.29 16.471.50 25.141.84 20.50
Fuel Economy [MPG] Diesel Equivalent 4: EPA EV Mode Fuel Economy Fuel EconomyLabeling of Advanced Technologies (neglecting 5 cycle corrections)
FEMPGe= (ED x 100) /FCEV
where:FEMPGe = Fuel Economy in miles per gallon diesel equivalent
FCEV = Measured unadjusted electrical consumption [kWh/100Mile]
ED= Energy content per gallon of diesel = 128,450BTU/gallon = 37.64 kWh/gallon[US DoE, Alternative Fuels & Advanced Vehicles Data Center]
Total Energy Use Run # 1/2 [kWh] 5 : Total energy used during phases used for fuel economy calculation
Average CBD Phase ConsumptionAverage Arterial Phase ConsumptionAverage Commuter Phase ConsumptionOverall Average Consumption
Bus Manufacture
Average Electrical Energy Used [kWh] :Run # 1/2 Consistency[%] :
Summary
Figure 10. Report Summary Sheet
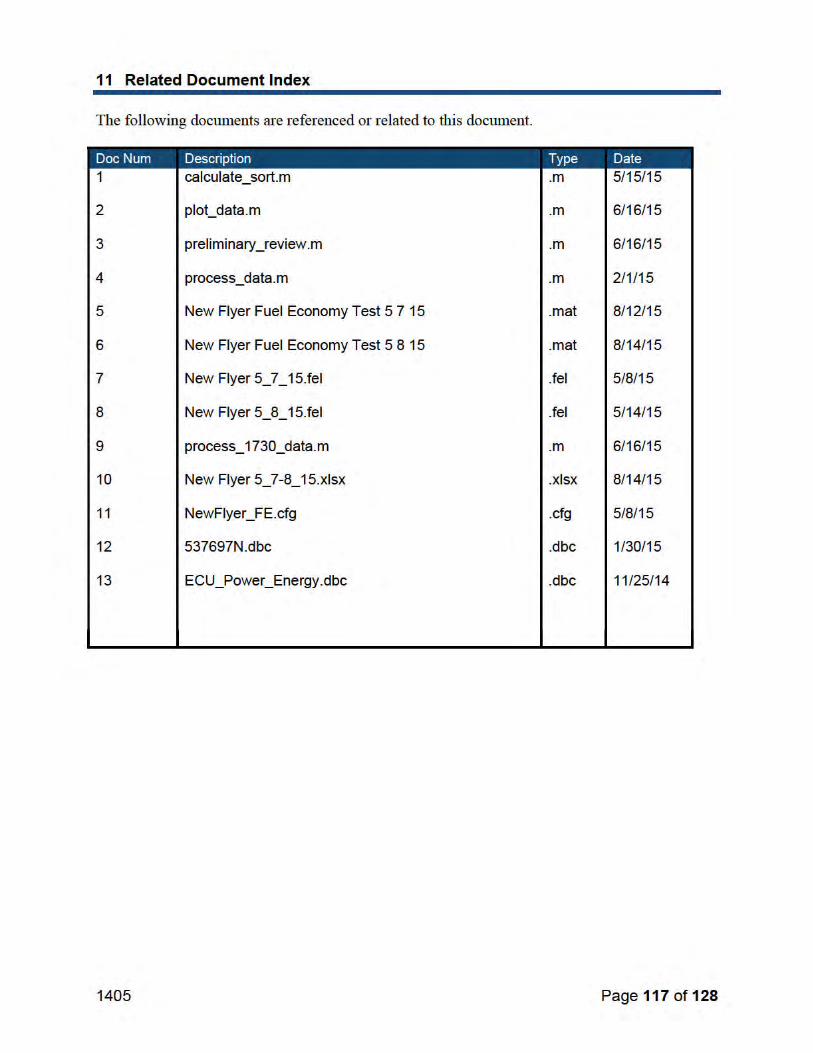
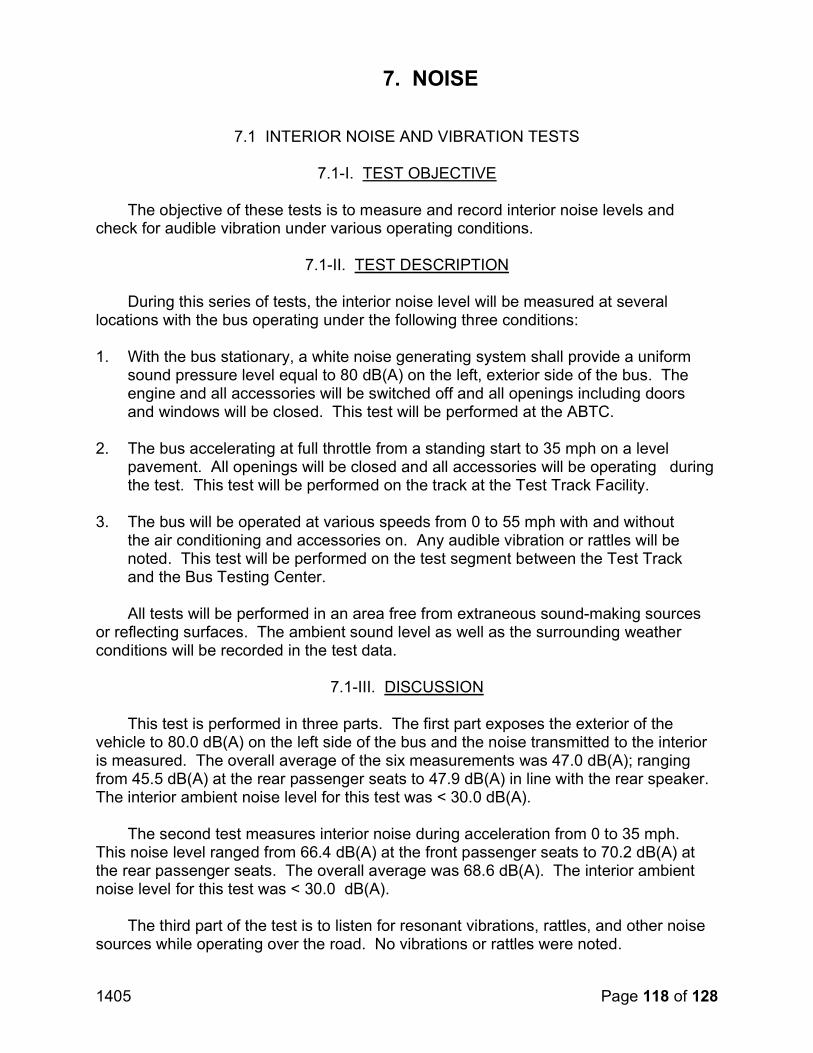
1405 Page 118 of 128
7. NOISE
7.1 INTERIOR NOISE AND VIBRATION TESTS
7.1-I. TEST OBJECTIVE
The objective of these tests is to measure and record interior noise levels and check for audible vibration under various operating conditions.
7.1-II. TEST DESCRIPTION
During this series of tests, the interior noise level will be measured at several locations with the bus operating under the following three conditions:
1. With the bus stationary, a white noise generating system shall provide a uniformsound pressure level equal to 80 dB(A) on the left, exterior side of the bus. Theengine and all accessories will be switched off and all openings including doorsand windows will be closed. This test will be performed at the ABTC.
2. The bus accelerating at full throttle from a standing start to 35 mph on a levelpavement. All openings will be closed and all accessories will be operating duringthe test. This test will be performed on the track at the Test Track Facility.
3. The bus will be operated at various speeds from 0 to 55 mph with and withoutthe air conditioning and accessories on. Any audible vibration or rattles will benoted. This test will be performed on the test segment between the Test Trackand the Bus Testing Center.
All tests will be performed in an area free from extraneous sound-making sourcesor reflecting surfaces. The ambient sound level as well as the surrounding weather conditions will be recorded in the test data.
7.1-III. DISCUSSION
This test is performed in three parts. The first part exposes the exterior of the vehicle to 80.0 dB(A) on the left side of the bus and the noise transmitted to the interior is measured. The overall average of the six measurements was 47.0 dB(A); ranging from 45.5 dB(A) at the rear passenger seats to 47.9 dB(A) in line with the rear speaker.The interior ambient noise level for this test was < 30.0 dB(A).
The second test measures interior noise during acceleration from 0 to 35 mph.This noise level ranged from 66.4 dB(A) at the front passenger seats to 70.2 dB(A) at the rear passenger seats. The overall average was 68.6 dB(A). The interior ambient noise level for this test was < 30.0 dB(A).
The third part of the test is to listen for resonant vibrations, rattles, and other noise sources while operating over the road. No vibrations or rattles were noted.

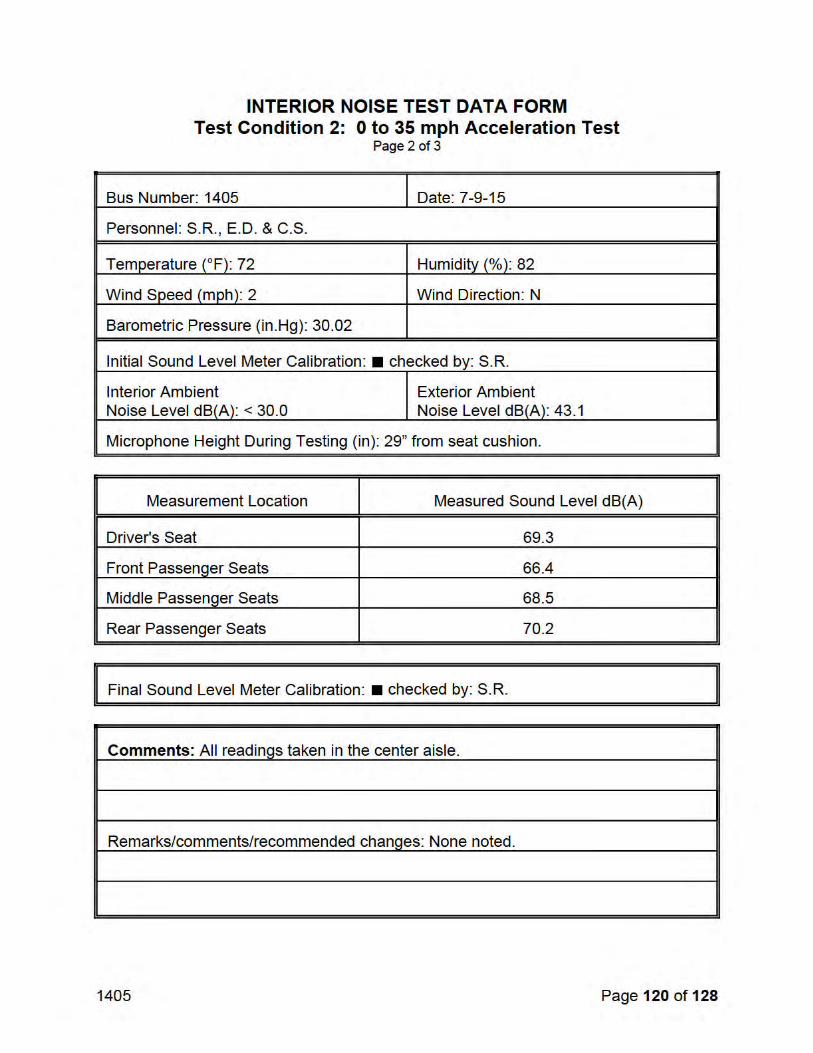
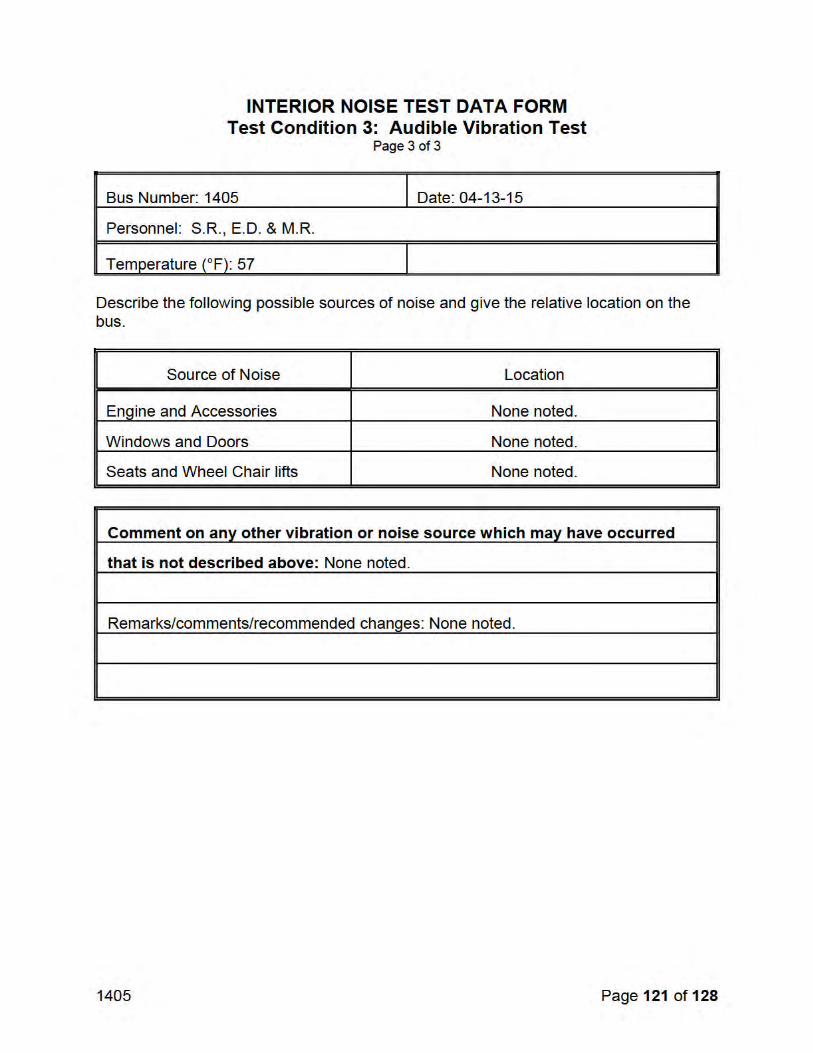

1405 Page 122 of 128
7.1 INTERIOR NOISE TEST
TEST BUS SET-UP FOR 80 dB(A)INTERIOR NOISE TEST

1405 Page 123 of 128
7.2 EXTERIOR NOISE TESTS
7.2-I. TEST OBJECTIVE
The objective of this test is to record exterior noise levels when a bus is operated under various conditions.
7.2-II. TEST DESCRIPTION
In the exterior noise tests, the bus will be operated at a SLW in three different conditions using a smooth, straight and level roadway:
1. Accelerating at full throttle from a constant speed at or below 35 mph and justprior to transmission up shift.
2. Accelerating at full throttle from standstill.3. Stationary, with the engine at low idle, high idle, and wide open throttle.
In addition, the buses will be tested with and without the air conditioning and all accessories operating. The exterior noise levels will be recorded.
The test site is at the PSBRTF and the test procedures will be in accordance with SAE Standards SAE J366b, Exterior Sound Level for Heavy Trucks and Buses. The test site is an open space free of large reflecting surfaces. A noise meter placed at a specified location outside the bus will measure the noise level.
During the test, special attention should be paid to:
1. The test site characteristics regarding parked vehicles, signboards,buildings, or other sound-reflecting surfaces
2. Proper usage of all test equipment including set-up and calibration3. The ambient sound level
7.2-III. DISCUSSION
The Exterior Noise Test determines the noise level generated by the vehicle under different driving conditions and at stationary low and high idle, with and without air conditioning and accessories operating. The test site is a large, level, bituminous paved area with no reflecting surfaces nearby.
With an exterior ambient noise level of 43.6 dB(A), the average test result obtained while accelerating from a constant speed was 66.1 dB(A) on the right side and 66.1 dB(A) on the left side.
1405 Page 124 of 128
When accelerating from a standstill with an exterior ambient noise level of 44.1 dB(A), the average of the results obtained were 64.5 dB(A) on the right side and 64.9 dB(A) on the left side.
With the vehicle stationary and the engine, accessories, and air conditioning on, the measurements averaged 48.8 dB(A) at idle. With the accessories and air conditioning off, the readings averaged 9.6 dB(A) lower at idle. Note; this electric bus is not equipped with high idle and wide open throttle positions. The exterior ambient noise level measured during this test was 43.9 dB(A).


1405 Page 128 of 128
7.2 EXTERIOR NOISE TESTS
TEST BUS UNDERGOING EXTERIOR NOISE TESTING
FEDERAL TRANSIT BUS TEST Performed for the Federal Transit Administration U.S. DOT
In accordance with 49 CFR, Part 665
Manufacturer: NEW FLYER OF AMERICA Model: XE60
PARTIAL TEST
APRIL 2019
Report Number: LTI-BT-R1903-P
The Thomas D. Larson Pennsylvania Transportation Institute 201 Transportation Research Building The Pennsylvania State University University Park, PA 16802 (814) 865-1891
Bus Testing and Research Center 2237 Plank Road Duncansville, PA 16635 (814) 695-3404
Bus 1903-P Page 2 of 42
FEDERAL TRANSIT BUS TEST Performed for the Federal Transit Administration, U.S. DOT
1200 New Jersey Avenue, SE Washington, DC 20590
In accordance with 49 CFR Part, 665
Manufacturer: NEW FLYER OF AMERICA Manufacturer’s address: 214 5TH AVENUE SW
CROOKSTON, MN 56716
Model: XE60
PARTIAL TEST
Report Number: LTI-BT-R1903-P
Bus 1903-P Page 3 of 42
TABLE OF CONTENTS
Page
EXECUTIVE SUMMARY .......................................................................................................................... 4
ABBREVIATIONS AND ACRONYMS ................................................................................................... 5
BUS CHECK-IN ....................................................................................................................................... 6
3. SAFETY
3.1 DOUBLE-LANE CHANGE (OBSTACLE AVOIDANCE TEST) .................................... 22 3.2 BUS BRAKING PERFORMANCE TEST ...................................................................... 26
6. FUEL ECONOMY ............................................................................................................................. 31
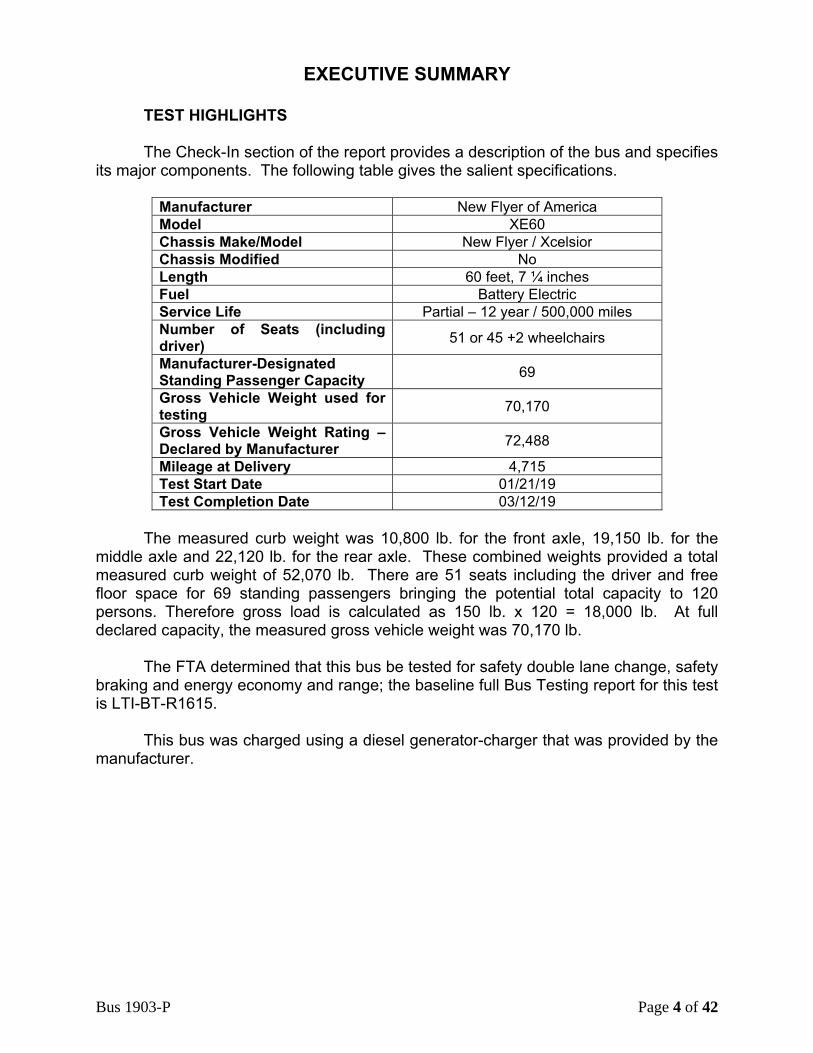
Bus 1903-P Page 4 of 42
EXECUTIVE SUMMARY
TEST HIGHLIGHTS
The Check-In section of the report provides a description of the bus and specifies its major components. The following table gives the salient specifications.
Manufacturer New Flyer of America Model XE60Chassis Make/Model New Flyer / Xcelsior Chassis Modified NoLength 60 feet, 7 ¼ inches Fuel Battery Electric Service Life Partial – 12 year / 500,000 miles Number of Seats (including driver) 51 or 45 +2 wheelchairs
Manufacturer-Designated Standing Passenger Capacity 69
Gross Vehicle Weight used for testing 70,170
Gross Vehicle Weight Rating – Declared by Manufacturer 72,488
Mileage at Delivery 4,715Test Start Date 01/21/19Test Completion Date 03/12/19
The measured curb weight was 10,800 lb. for the front axle, 19,150 lb. for the middle axle and 22,120 lb. for the rear axle. These combined weights provided a total measured curb weight of 52,070 lb. There are 51 seats including the driver and free floor space for 69 standing passengers bringing the potential total capacity to 120 persons. Therefore gross load is calculated as 150 lb. x 120 = 18,000 lb. At full declared capacity, the measured gross vehicle weight was 70,170 lb.
The FTA determined that this bus be tested for safety double lane change, safety braking and energy economy and range; the baseline full Bus Testing report for this test is LTI-BT-R1615.
This bus was charged using a diesel generator-charger that was provided by the manufacturer.
Bus 1903-P Page 5 of 42
ABBREVIATIONS AND ACRONYMS
ABS ‐ anti‐skid braking system
ABTC ‐ Altoona Bus Test Center
A/C ‐ air conditioner, or air conditioning
AC ‐ alternating current
ADA ‐ American Disability Act
CDCTS ‐ chassis dynamometer test control system
CVS ‐ constant volume sampling
CW ‐ curb weight (bus weight including maximum fuel, oil, and coolant; but
without passengers or driver)
dB(A) ‐ decibels with reference to 0.0002 microbar as measured on the "A" scale
DC ‐ direct current
DIR ‐ test director
DR ‐ bus driver
EPA ‐ Environmental Protection Agency
GAWR – gross axle weight rating
GVL ‐ gross vehicle load (150 lb. for every designed passenger seating
position, for the driver, and for each 1.5 sq ft of free floor space)
GVW ‐ gross vehicle weight (curb weight plus gross vehicle load)
GVWR ‐ gross vehicle weight rating
HD‐UDDS – Heavy Duty‐Urban Dynamometer Driving Schedule
LTI ‐ Larson Transportation Institute
mpg ‐ miles per gallon
mph ‐ miles per hour
PM ‐ Preventive maintenance
PSTT ‐ Penn State Test Track
rpm ‐ revolutions per minute
SAE ‐ Society of Automotive Engineers
SCF ‐ Standard cubic foot
SCH ‐ test scheduler
SA ‐ staff assistant
SLW ‐ seated load weight (curb weight plus 150 lb. for every designed passenger seating
position and for the driver)
TD ‐ test driver
TECH ‐ test technician
TM ‐ track manager
TP ‐ test personnel
Wh ‐ Watt hour
Bus 1903-P Page 6 of 42
TEST BUS CHECK-IN
I. OBJECTIVE
The objective of this task is to log in the test bus, assign a bus number, complete the vehicle data form, and perform a safety check.
II. TEST DESCRIPTION
The test consisted of assigning a bus test number to the bus, cleaning the bus, completing the vehicle data form, obtaining any special information and tools from the manufacturer, determining a testing schedule, performing an initial safety check, and performing the manufacturer's recommended preventive maintenance. The bus manufacturer certified that the bus meets all Federal regulations.
III. DISCUSSION
The check-in procedure is used to identify in detail the major components and configuration of the bus.
The test bus consisted of New Flyer of America, model XE60. The bus has a front passenger door located forward of the front axle, a passenger door located between the front and middle axles and a rear passenger door between the middle and rear axles. Power is provided by a battery pack coupled to a Siemens 1DB2016-1NB06 drive motor in the rear axle and a driven center axle, ZF AVE130, with individual wheel motors.
The measured curb weight was 10,800 lb. for the front axle, 19,150 lb. for the middle axle and 22,120 lb. for the rear axle. These combined weights provided a total measured curb weight of 52,070 lb. There are 51 seats including the driver and free floor space for 69 standing passengers bringing the potential total capacity to 120 persons. Therefore gross load is calculated as 150 lb. x 120 = 18,000 lb. At full declared capacity, the measured gross vehicle weight was 70,170 lb.
The FTA determined that this bus be tested for safety double lane change, safety braking and energy economy and range; the baseline full Bus Testing report for this test is LTI-BT-R1615.
This bus was charged using a diesel generator-charger that was provided by the manufacturer.
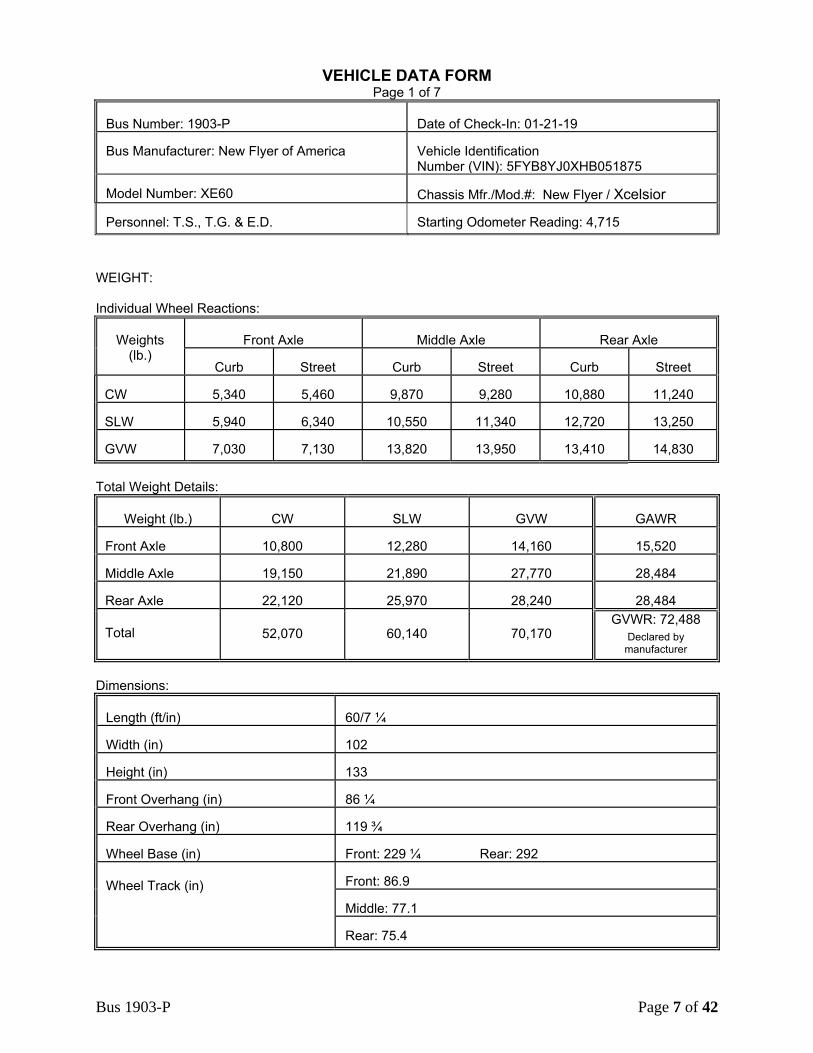
Bus 1903-P Page 7 of 42
VEHICLE DATA FORM Page 1 of 7
Bus Number: 1903-P Date of Check-In: 01-21-19
Bus Manufacturer: New Flyer of America Vehicle Identification Number (VIN): 5FYB8YJ0XHB051875
Model Number: XE60 Chassis Mfr./Mod.#: New Flyer / Xcelsior
Personnel: T.S., T.G. & E.D. Starting Odometer Reading: 4,715
WEIGHT:
Individual Wheel Reactions:
Weights (lb.)
Front Axle Middle Axle Rear Axle
Curb Street Curb Street Curb Street
CW 5,340 5,460 9,870 9,280 10,880 11,240
SLW 5,940 6,340 10,550 11,340 12,720 13,250
GVW 7,030 7,130 13,820 13,950 13,410 14,830
Total Weight Details:
Weight (lb.) CW SLW GVW GAWR
Front Axle 10,800 12,280 14,160 15,520
Middle Axle 19,150 21,890 27,770 28,484
Rear Axle 22,120 25,970 28,240 28,484
Total 52,070 60,140 70,170 GVWR: 72,488
Declared by manufacturer
Dimensions:
Length (ft/in) 60/7 ¼
Width (in) 102
Height (in) 133
Front Overhang (in) 86 ¼
Rear Overhang (in) 119 ¾
Wheel Base (in) Front: 229 ¼ Rear: 292
Wheel Track (in) Front: 86.9
Middle: 77.1
Rear: 75.4
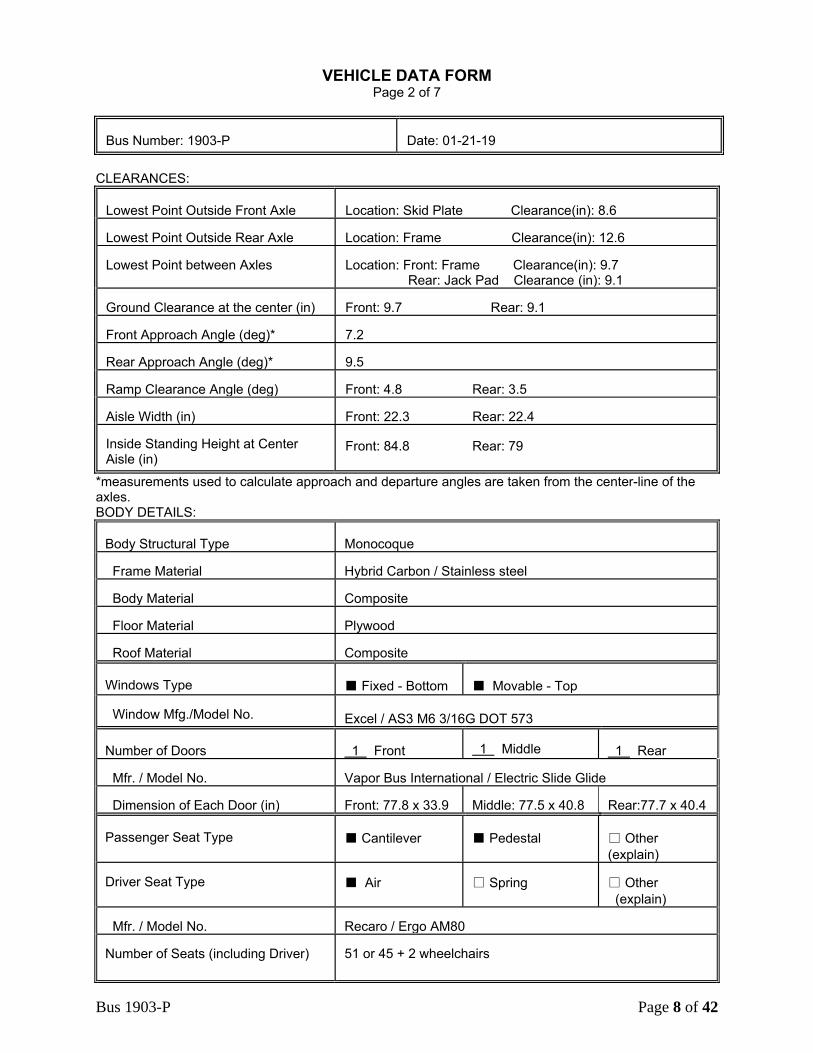
Bus 1903-P Page 8 of 42
VEHICLE DATA FORM Page 2 of 7
CLEARANCES:
Lowest Point Outside Front Axle Location: Skid Plate Clearance(in): 8.6
Lowest Point Outside Rear Axle Location: Frame Clearance(in): 12.6
Lowest Point between Axles Location: Front: Frame Clearance(in): 9.7 Rear: Jack Pad Clearance (in): 9.1
Ground Clearance at the center (in) Front: 9.7 Rear: 9.1
Front Approach Angle (deg)* 7.2
Rear Approach Angle (deg)* 9.5
Ramp Clearance Angle (deg) Front: 4.8 Rear: 3.5
Aisle Width (in) Front: 22.3 Rear: 22.4
Inside Standing Height at Center Aisle (in)
Front: 84.8 Rear: 79
*measurements used to calculate approach and departure angles are taken from the center-line of theaxles. BODY DETAILS:
Body Structural Type Monocoque
Frame Material Hybrid Carbon / Stainless steel
Body Material Composite
Floor Material Plywood
Roof Material Composite
Windows Type ■ Fixed - Bottom ■ Movable - Top
Window Mfg./Model No. Excel / AS3 M6 3/16G DOT 573
Number of Doors 1 Front 1 Middle 1 Rear
Mfr. / Model No. Vapor Bus International / Electric Slide Glide
Dimension of Each Door (in) Front: 77.8 x 33.9 Middle: 77.5 x 40.8 Rear:77.7 x 40.4
Passenger Seat Type ■ Cantilever ■ Pedestal □ Other(explain)
Driver Seat Type ■ Air □ Spring □ Other (explain)
Mfr. / Model No. Recaro / Ergo AM80
Number of Seats (including Driver) 51 or 45 + 2 wheelchairs
Bus Number: 1903-P Date: 01-21-19
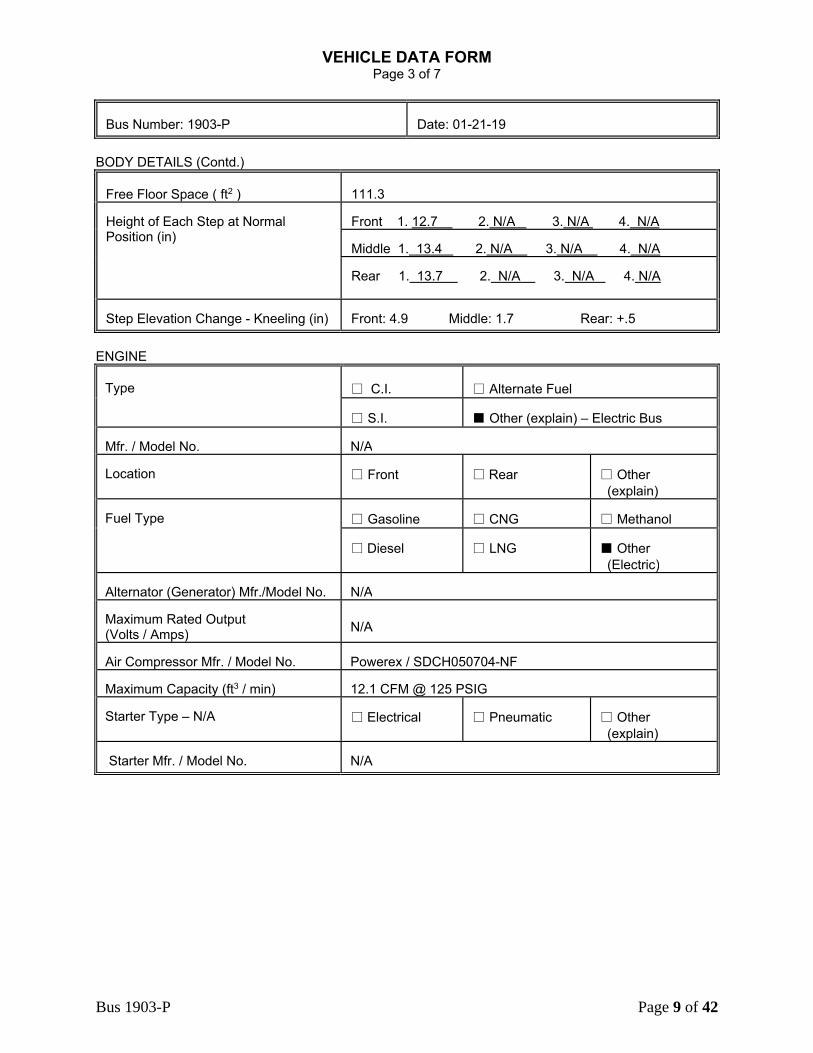
Bus 1903-P Page 9 of 42
VEHICLE DATA FORM Page 3 of 7
Bus Number: 1903-P Date: 01-21-19
BODY DETAILS (Contd.)
Free Floor Space ( ft2 ) 111.3
Height of Each Step at Normal Position (in)
Front 1. 12.7 2. N/A 3. N/A 4. N/A
Middle 1. 13.4 2. N/A 3. N/A 4. N/A
Rear 1. 13.7 2. N/A 3. N/A 4. N/A
Step Elevation Change - Kneeling (in) Front: 4.9 Middle: 1.7 Rear: +.5
ENGINE
Type □ C.I. □ Alternate Fuel
□ S.I. ■ Other (explain) – Electric Bus
Mfr. / Model No. N/A
Location □ Front □ Rear □ Other (explain)
Fuel Type □ Gasoline □ CNG □ Methanol
□ Diesel □ LNG ■ Other (Electric)
Alternator (Generator) Mfr./Model No. N/A
Maximum Rated Output (Volts / Amps) N/A
Air Compressor Mfr. / Model No. Powerex / SDCH050704-NF
Maximum Capacity (ft3 / min) 12.1 CFM @ 125 PSIG
Starter Type – N/A □ Electrical □ Pneumatic □ Other (explain)
Starter Mfr. / Model No. N/A
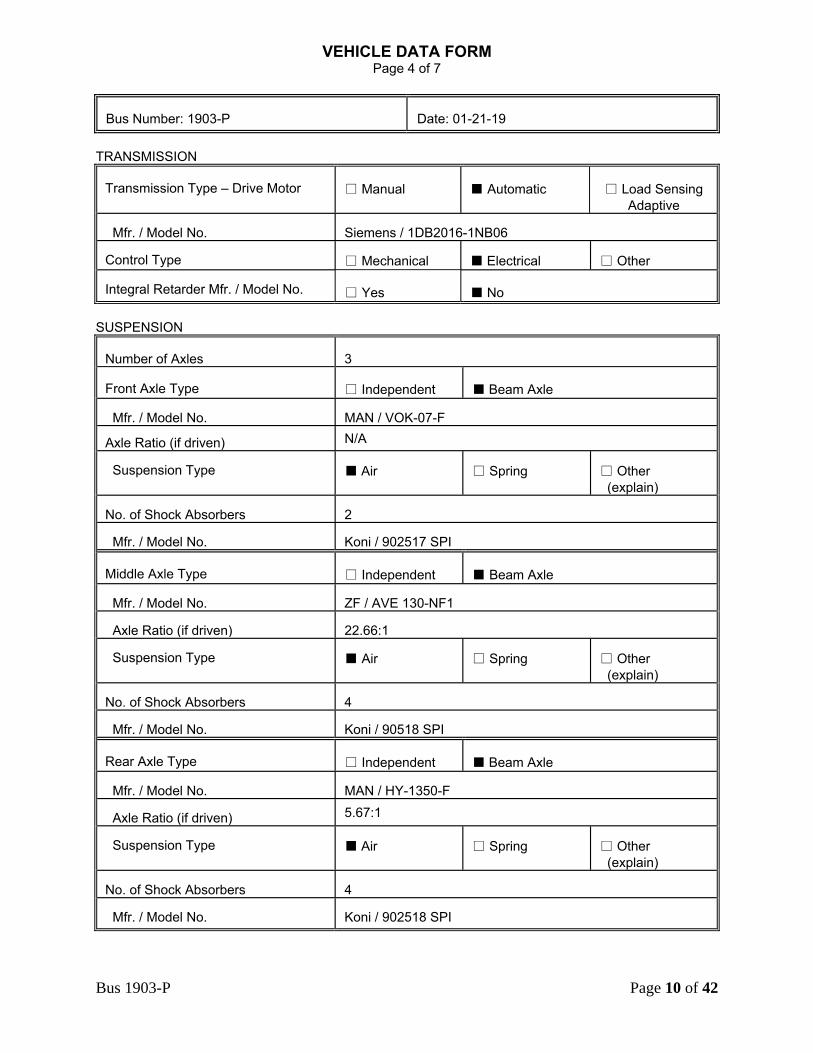
Bus 1903-P Page 10 of 42
VEHICLE DATA FORM
Page 4 of 7
Bus Number: 1903-P Date: 01-21-19
TRANSMISSION
Transmission Type – Drive Motor □ Manual ■ Automatic □ Load Sensing
Adaptive Mfr. / Model No. Siemens / 1DB2016-1NB06 Control Type □ Mechanical ■ Electrical
□ Other
Integral Retarder Mfr. / Model No. □ Yes ■ No
SUSPENSION
Number of Axles 3 Front Axle Type □ Independent ■ Beam Axle Mfr. / Model No. MAN / VOK-07-F
Axle Ratio (if driven) N/A Suspension Type ■ Air □ Spring
□ Other (explain)
No. of Shock Absorbers 2 Mfr. / Model No. Koni / 902517 SPI Middle Axle Type □ Independent ■ Beam Axle Mfr. / Model No. ZF / AVE 130-NF1 Axle Ratio (if driven) 22.66:1 Suspension Type ■ Air □ Spring
□ Other (explain)
No. of Shock Absorbers 4 Mfr. / Model No. Koni / 90518 SPI Rear Axle Type □ Independent ■ Beam Axle Mfr. / Model No. MAN / HY-1350-F Axle Ratio (if driven) 5.67:1 Suspension Type ■ Air □ Spring
□ Other (explain)
No. of Shock Absorbers 4 Mfr. / Model No. Koni / 902518 SPI
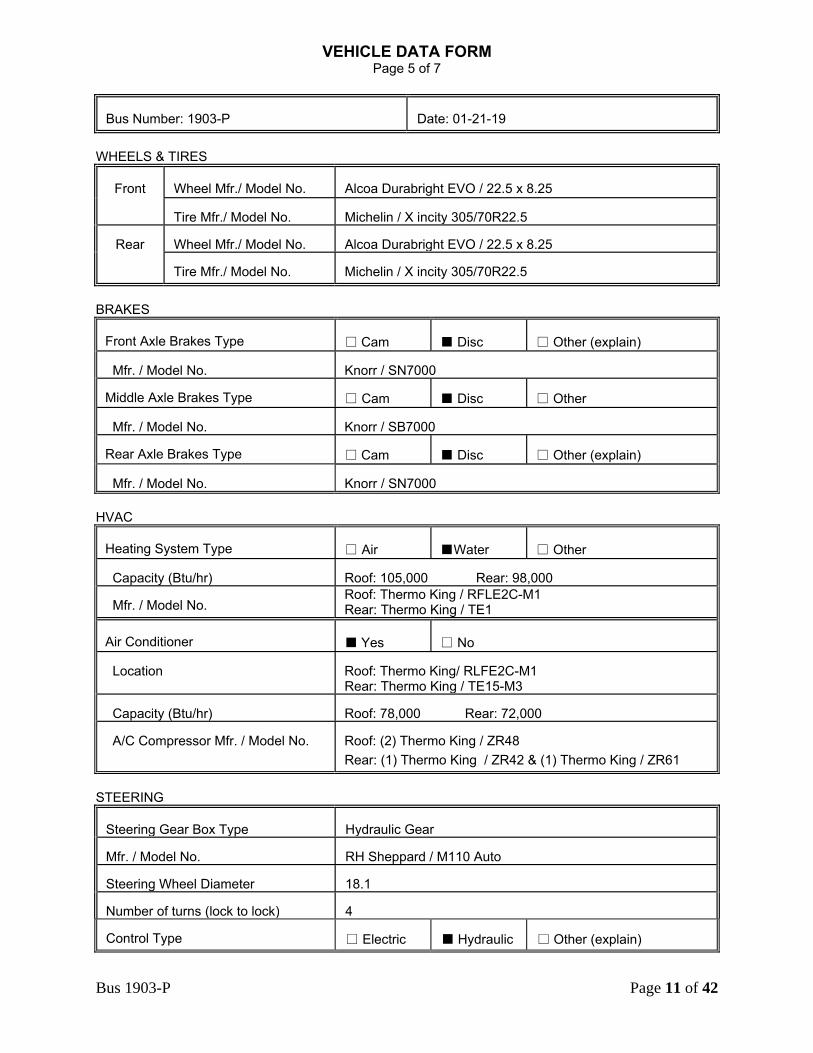
Bus 1903-P Page 11 of 42
VEHICLE DATA FORM Page 5 of 7
Bus Number: 1903-P Date: 01-21-19
WHEELS & TIRES
Front Wheel Mfr./ Model No. Alcoa Durabright EVO / 22.5 x 8.25
Tire Mfr./ Model No. Michelin / X incity 305/70R22.5
Rear Wheel Mfr./ Model No. Alcoa Durabright EVO / 22.5 x 8.25
Tire Mfr./ Model No. Michelin / X incity 305/70R22.5
BRAKES
Front Axle Brakes Type □ Cam ■ Disc □ Other (explain)
Mfr. / Model No. Knorr / SN7000
Middle Axle Brakes Type □ Cam ■ Disc □ Other
Mfr. / Model No. Knorr / SB7000
Rear Axle Brakes Type □ Cam ■ Disc □ Other (explain)
Mfr. / Model No. Knorr / SN7000
HVAC
Heating System Type □ Air ■Water □ Other
Capacity (Btu/hr) Roof: 105,000 Rear: 98,000
Mfr. / Model No. Roof: Thermo King / RFLE2C-M1 Rear: Thermo King / TE1
Air Conditioner ■ Yes □ No
Location Roof: Thermo King/ RLFE2C-M1 Rear: Thermo King / TE15-M3
Capacity (Btu/hr) Roof: 78,000 Rear: 72,000
A/C Compressor Mfr. / Model No. Roof: (2) Thermo King / ZR48 Rear: (1) Thermo King / ZR42 & (1) Thermo King / ZR61
STEERING
Steering Gear Box Type Hydraulic Gear
Mfr. / Model No. RH Sheppard / M110 Auto
Steering Wheel Diameter 18.1
Number of turns (lock to lock) 4
Control Type □ Electric ■ Hydraulic □ Other (explain)
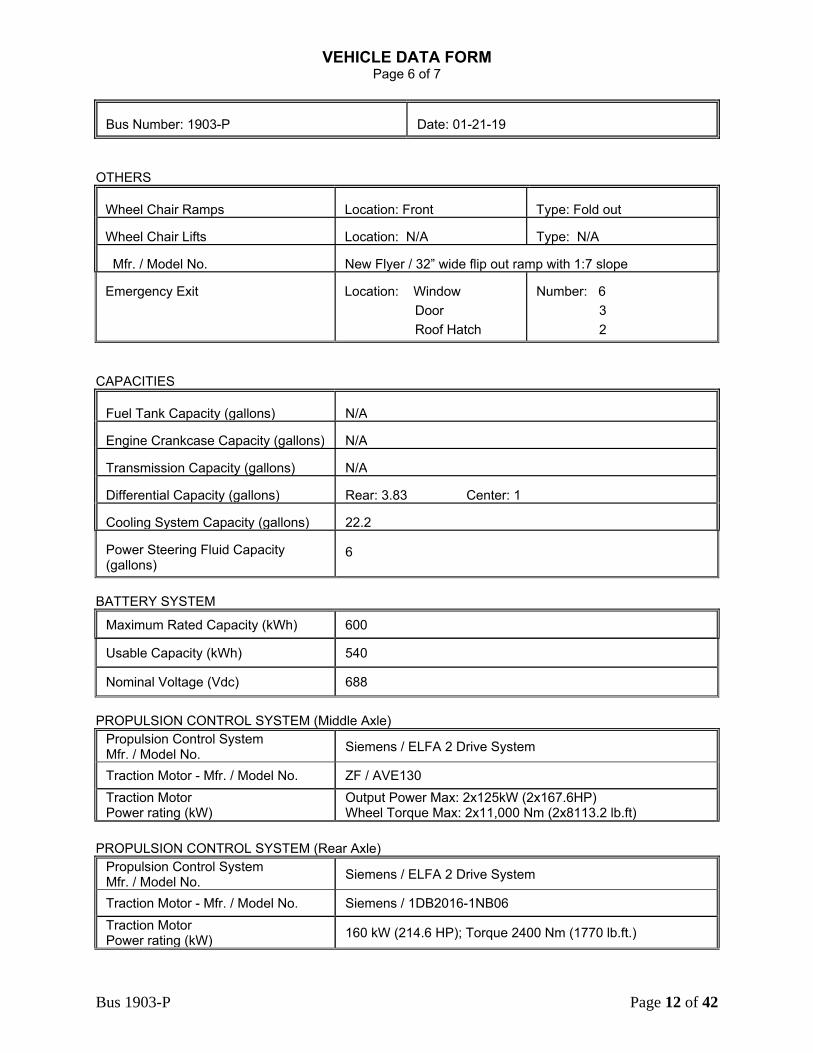
Bus 1903-P Page 12 of 42
VEHICLE DATA FORM Page 6 of 7
Bus Number: 1903-P Date: 01-21-19
OTHERS
Wheel Chair Ramps Location: Front Type: Fold out
Wheel Chair Lifts Location: N/A Type: N/A
Mfr. / Model No. New Flyer / 32” wide flip out ramp with 1:7 slope
Emergency Exit Location: Window Door Roof Hatch
Number: 6 3 2
CAPACITIES
Fuel Tank Capacity (gallons) N/A
Engine Crankcase Capacity (gallons) N/A
Transmission Capacity (gallons) N/A
Differential Capacity (gallons) Rear: 3.83 Center: 1
Cooling System Capacity (gallons) 22.2
Power Steering Fluid Capacity (gallons)
6
BATTERY SYSTEM
Maximum Rated Capacity (kWh) 600
Usable Capacity (kWh) 540
Nominal Voltage (Vdc) 688
PROPULSION CONTROL SYSTEM (Middle Axle) Propulsion Control System Mfr. / Model No. Siemens / ELFA 2 Drive System
Traction Motor - Mfr. / Model No. ZF / AVE130 Traction Motor Power rating (kW)
Output Power Max: 2x125kW (2x167.6HP) Wheel Torque Max: 2x11,000 Nm (2x8113.2 lb.ft)
PROPULSION CONTROL SYSTEM (Rear Axle) Propulsion Control System Mfr. / Model No. Siemens / ELFA 2 Drive System
Traction Motor - Mfr. / Model No. Siemens / 1DB2016-1NB06 Traction Motor Power rating (kW) 160 kW (214.6 HP); Torque 2400 Nm (1770 lb.ft.)
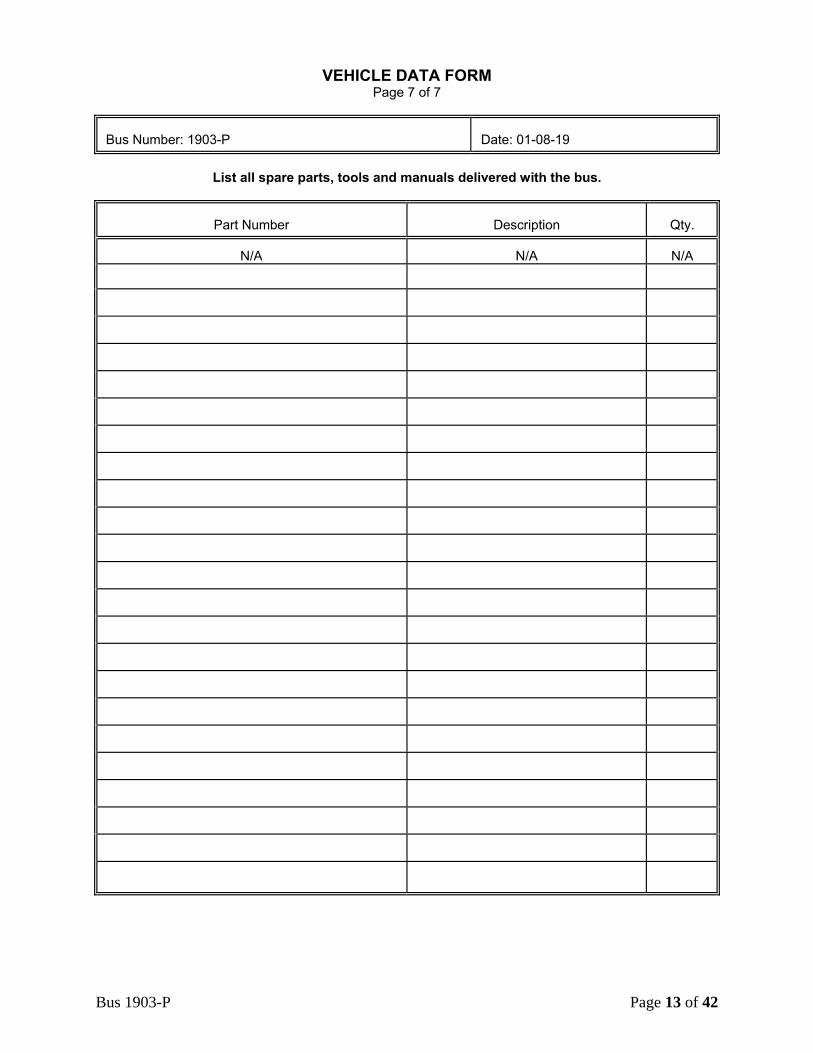
Bus 1903-P Page 13 of 42
VEHICLE DATA FORM Page 7 of 7
Bus Number: 1903-P Date: 01-08-19
List all spare parts, tools and manuals delivered with the bus.
Part Number Description Qty.
N/A N/A N/A
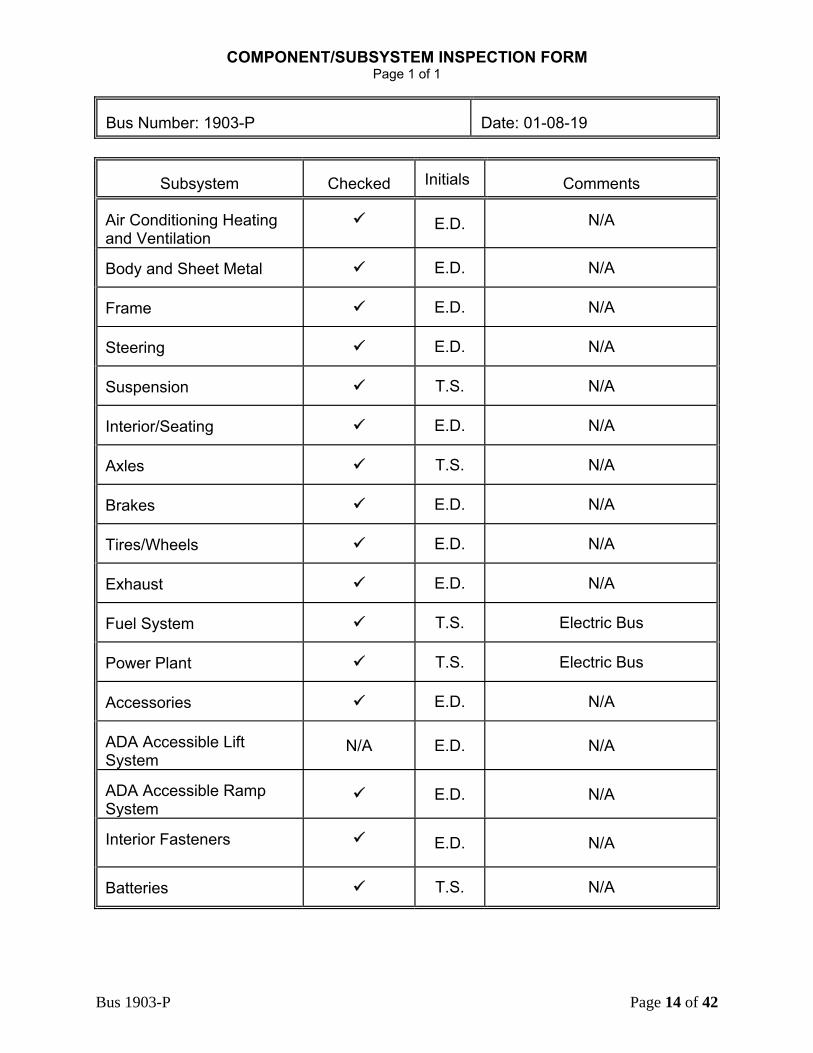
Bus 1903-P Page 14 of 42
COMPONENT/SUBSYSTEM INSPECTION FORM Page 1 of 1
Bus Number: 1903-P Date: 01-08-19
Subsystem Checked Initials Comments
Air Conditioning Heating and Ventilation
E.D. N/A
Body and Sheet Metal E.D. N/A
Frame E.D. N/A
Steering E.D. N/A
Suspension T.S. N/A
Interior/Seating E.D. N/A
Axles T.S. N/A
Brakes E.D. N/A
Tires/Wheels E.D. N/A
Exhaust E.D. N/A
Fuel System T.S. Electric Bus
Power Plant T.S. Electric Bus
Accessories E.D. N/A
ADA Accessible Lift System
N/A E.D. N/A
ADA Accessible Ramp System
E.D. N/A
Interior Fasteners E.D. N/A
Batteries T.S. N/A
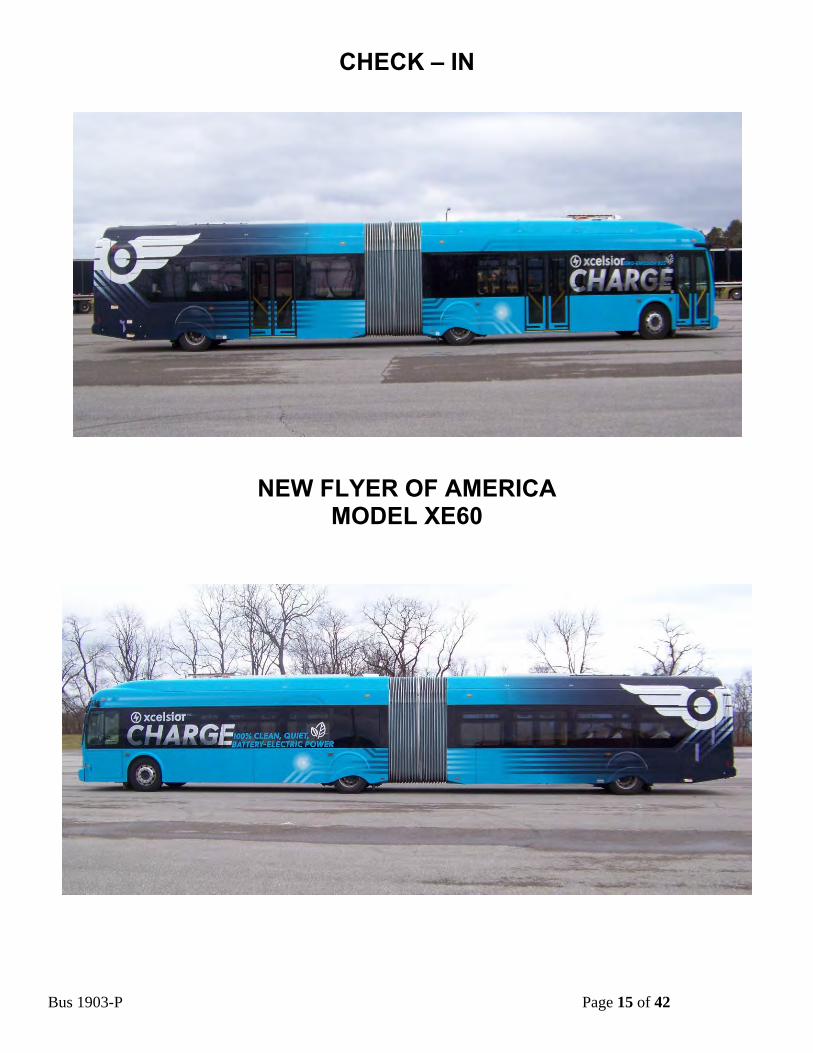
Bus 1903-P Page 15 of 42
CHECK – IN
NEW FLYER OF AMERICA MODEL XE60
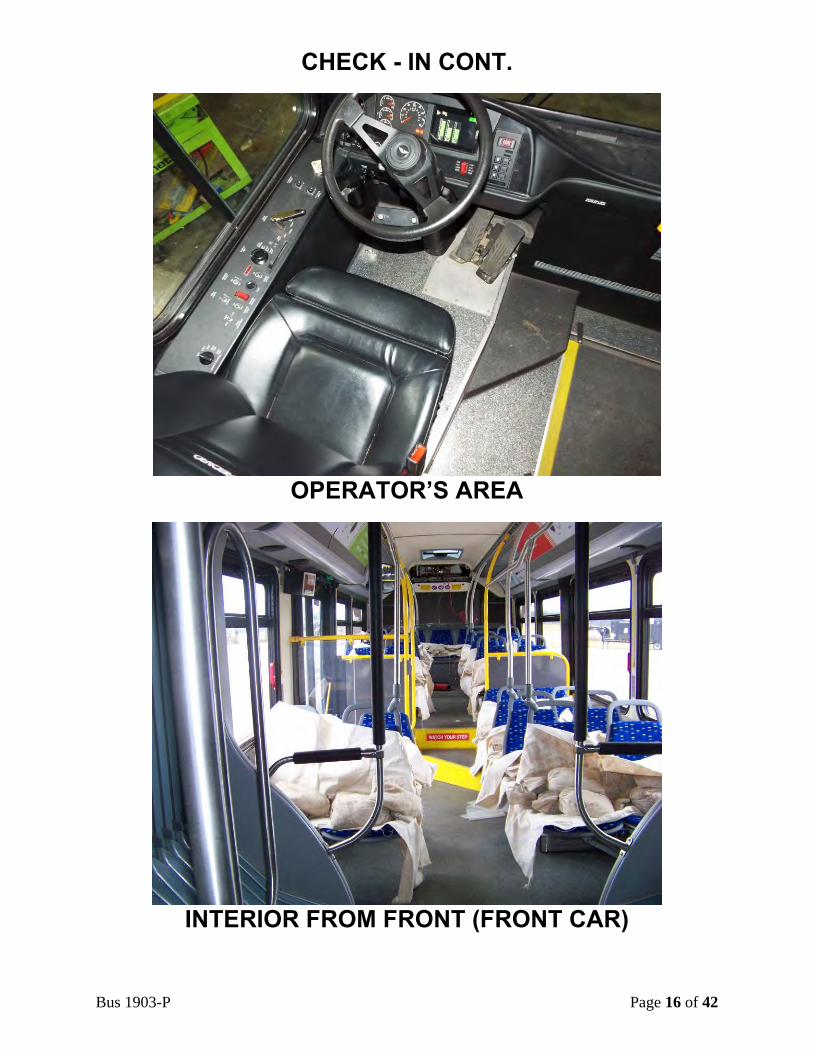
Bus 1903-P Page 16 of 42
CHECK - IN CONT.
OPERATOR’S AREA
INTERIOR FROM FRONT (FRONT CAR)
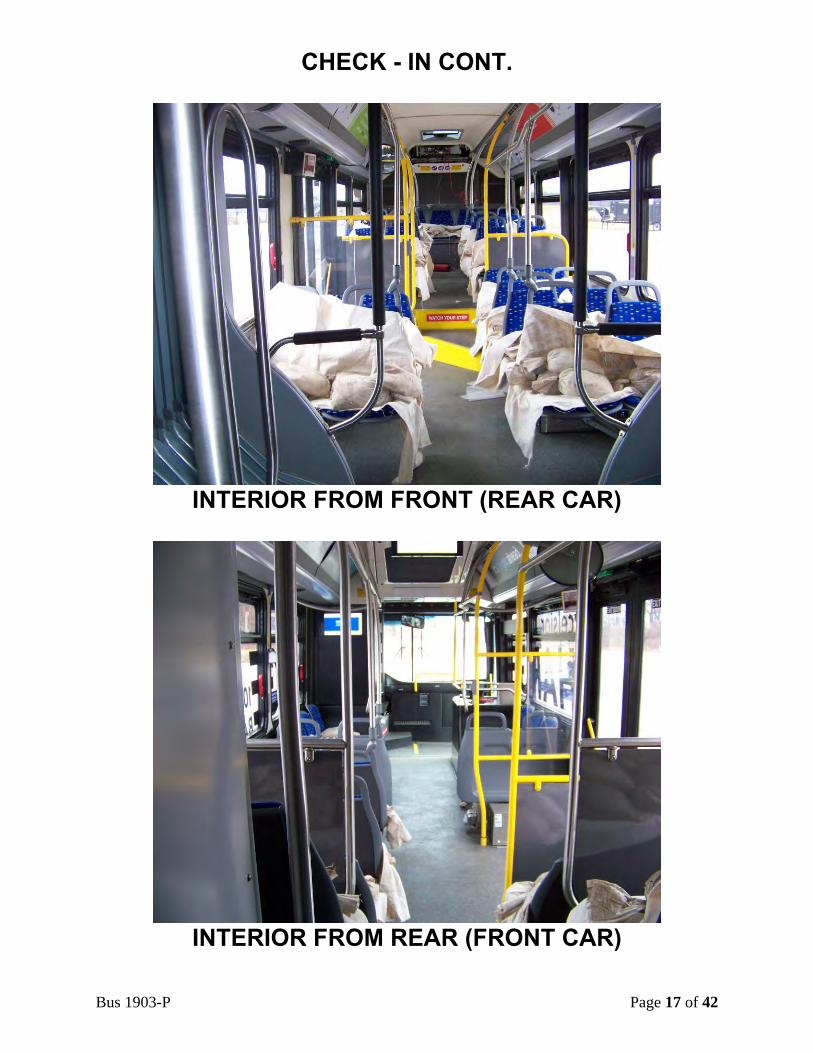
Bus 1903-P Page 17 of 42
CHECK - IN CONT.
INTERIOR FROM FRONT (REAR CAR)
INTERIOR FROM REAR (FRONT CAR)
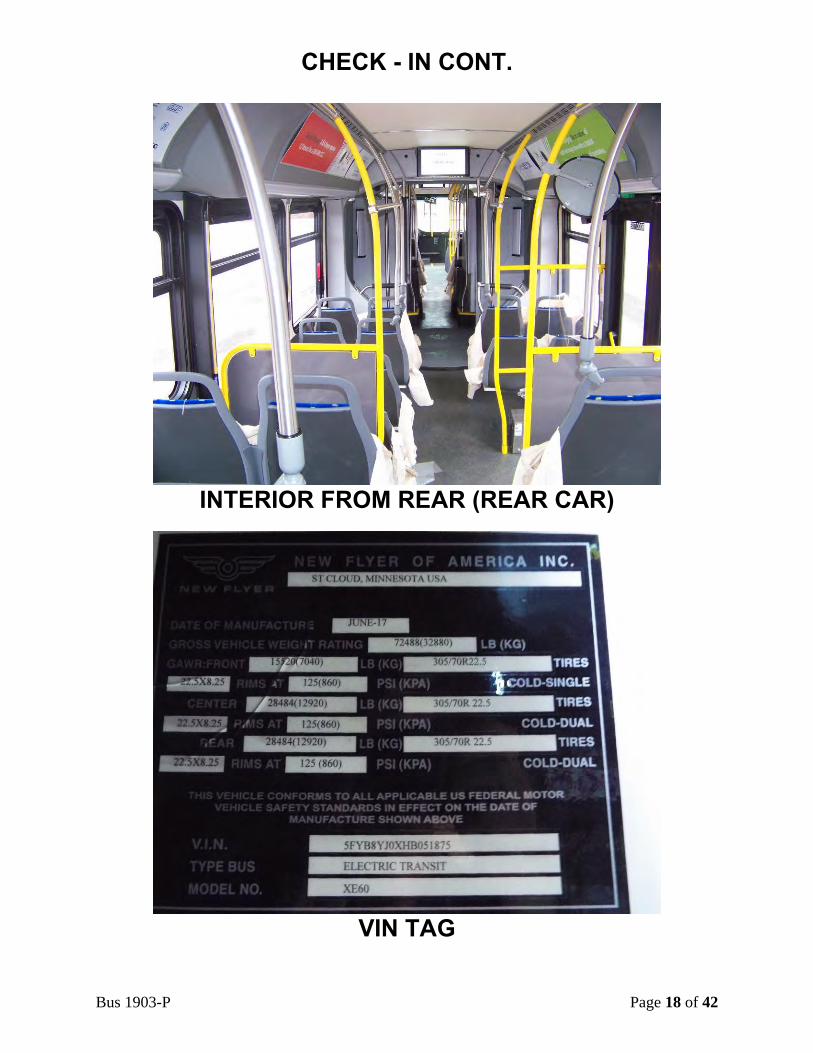
Bus 1903-P Page 18 of 42
CHECK - IN CONT.
INTERIOR FROM REAR (REAR CAR)
VIN TAG
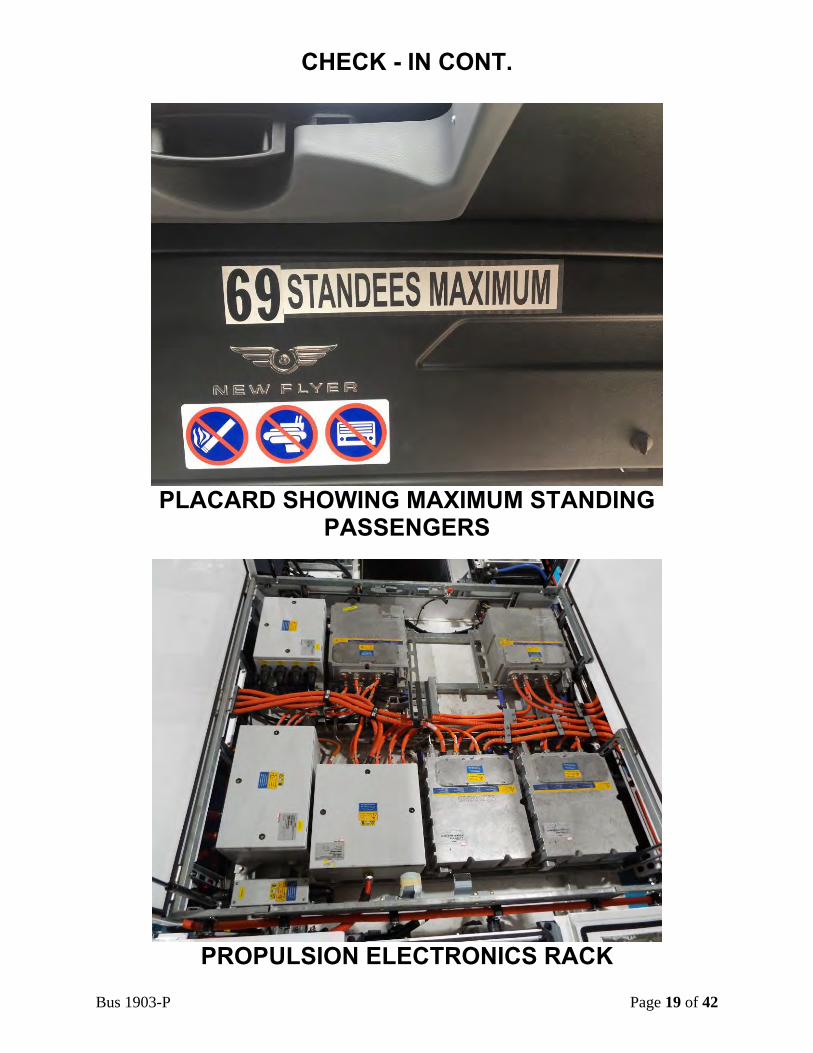
Bus 1903-P Page 19 of 42
CHECK - IN CONT.
PLACARD SHOWING MAXIMUM STANDING
PASSENGERS
PROPULSION ELECTRONICS RACK
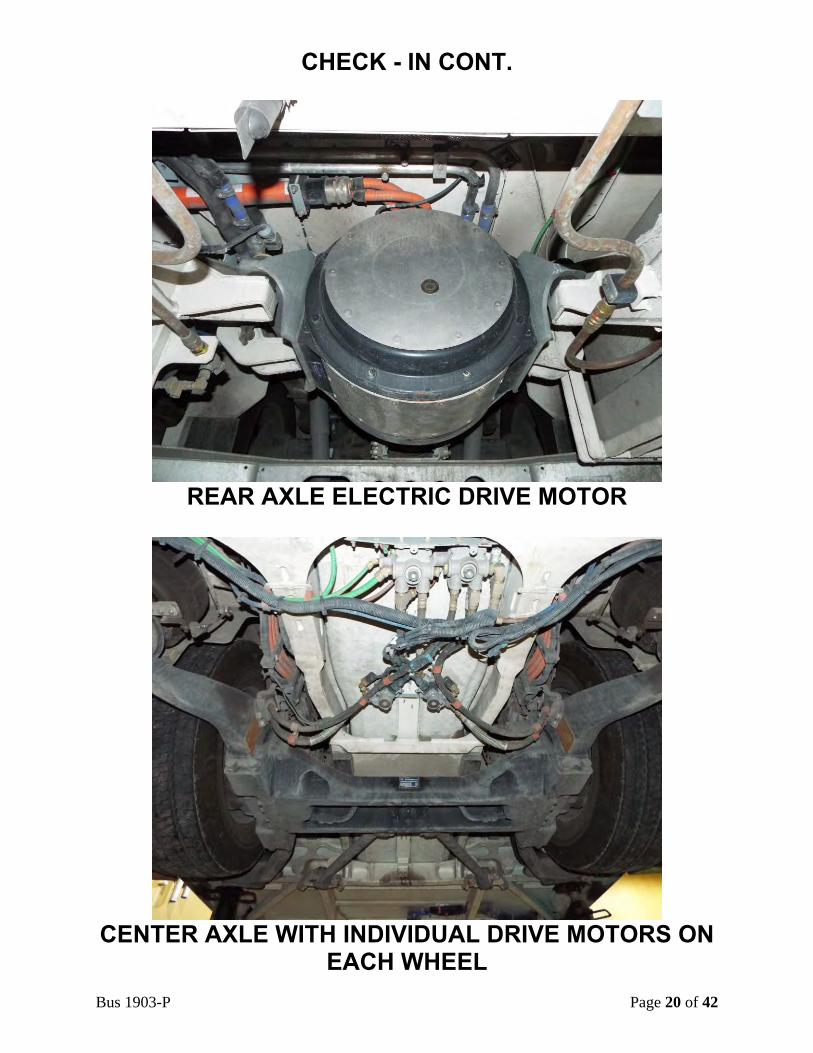
Bus 1903-P Page 20 of 42
CHECK - IN CONT.
REAR AXLE ELECTRIC DRIVE MOTOR
CENTER AXLE WITH INDIVIDUAL DRIVE MOTORS ON EACH WHEEL
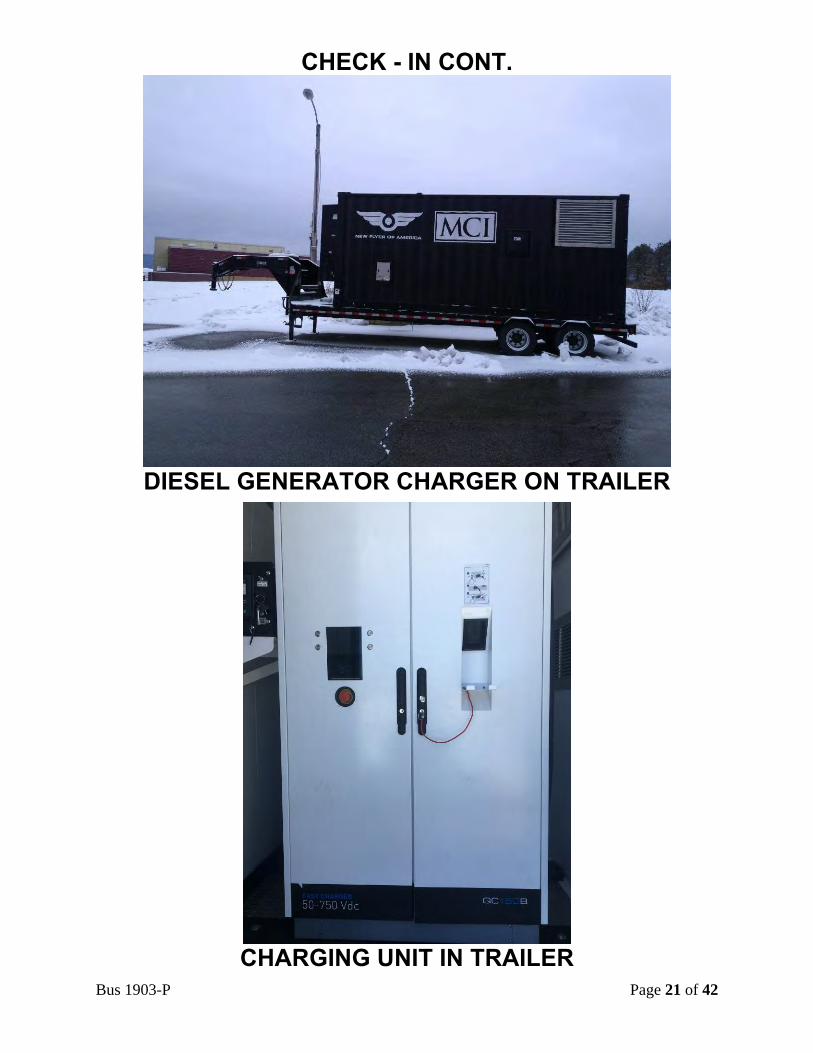
Bus 1903-P Page 21 of 42
CHECK - IN CONT.
DIESEL GENERATOR CHARGER ON TRAILER
CHARGING UNIT IN TRAILER
Bus 1903-P Page 22 of 42
3.1 SAFETY - A DOUBLE-LANE CHANGE
(OBSTACLE AVOIDANCE) 3.1-I. TEST OBJECTIVE
The objective of this test is to determine handling and stability of the bus by measuring speed through a double lane change test. 3.1-II. TEST DESCRIPTION
The Safety Test consisted of an obstacle avoidance maneuver to evaluate the handling and stability of the bus. The test was conducted at the LTI test track on the vehicle dynamics pad. The bus was driven through a double-lane change course at increasing speeds until the test was determined to be unsafe or a speed of 45 mph is reached. The test is determined unsafe if vehicle handling becomes unstable or if any of the tires lose contact with the pavement. This test is conducted at SLW.
The layout of the test course was defined by placing pylons along painted
guidelines that delineated the course. The guidelines marked off two 12 foot center-to-center lanes. Each lane had two 100 foot long gates with a spacing distance of 100 feet between them. The bus entered the test course in one lane, crossed over to the other lane within the 100 foot gate, traveled for 100 feet, and then returned back into the original lane within the next 100 foot gate. This maneuver was repeated from 20 mph with speed increasing in increments of 5 mph. The test was performed starting from both the right and left lanes.
A test run is considered valid if the bus is able to perform the maneuver at a
constant speed without deviating from the test course or striking pylons. If the bus is not able to successfully complete the maneuver due to vehicle instability, the test will be terminated. The highest speed at which the maneuver can be successfully performed up to a maximum speed of 45 mph is recorded on the Safety Data Form. 3.1-III. DISCUSSION
The double-lane change was performed in both right-hand and left-hand directions. The bus was able to safely negotiate the test course in both the right-hand and left-hand directions up to the maximum test speed of 45 mph.
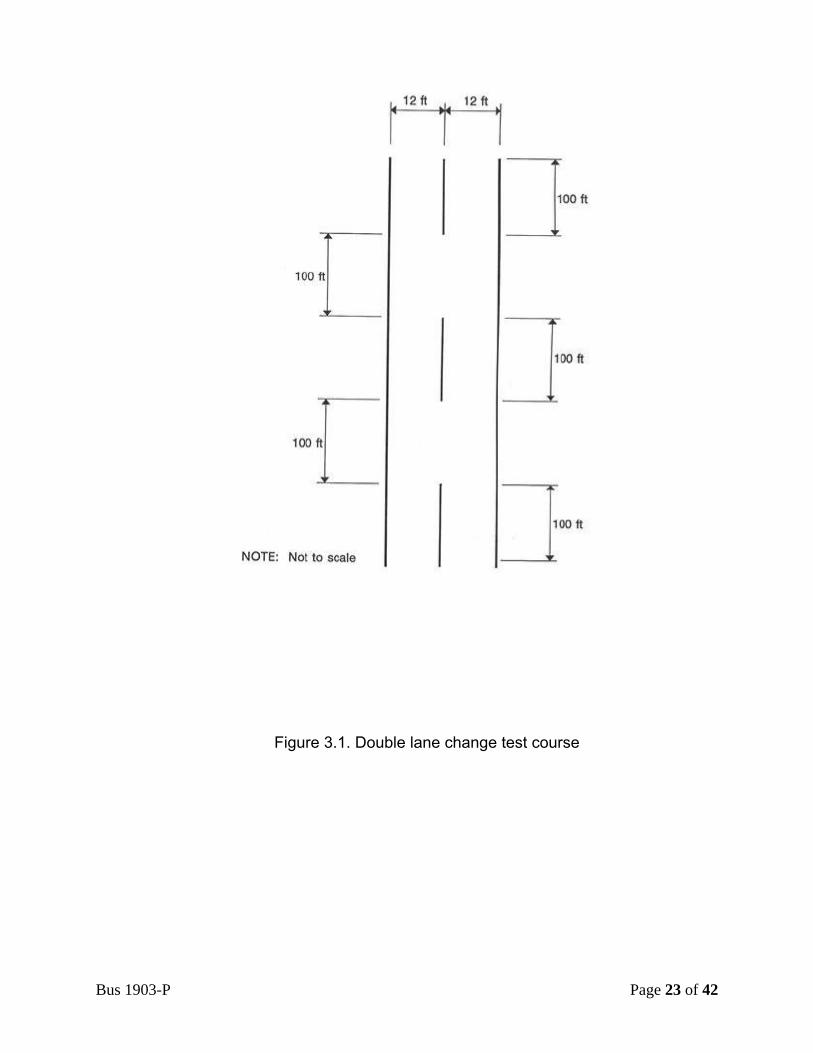
Bus 1903-P Page 23 of 42
Figure 3.1. Double lane change test course
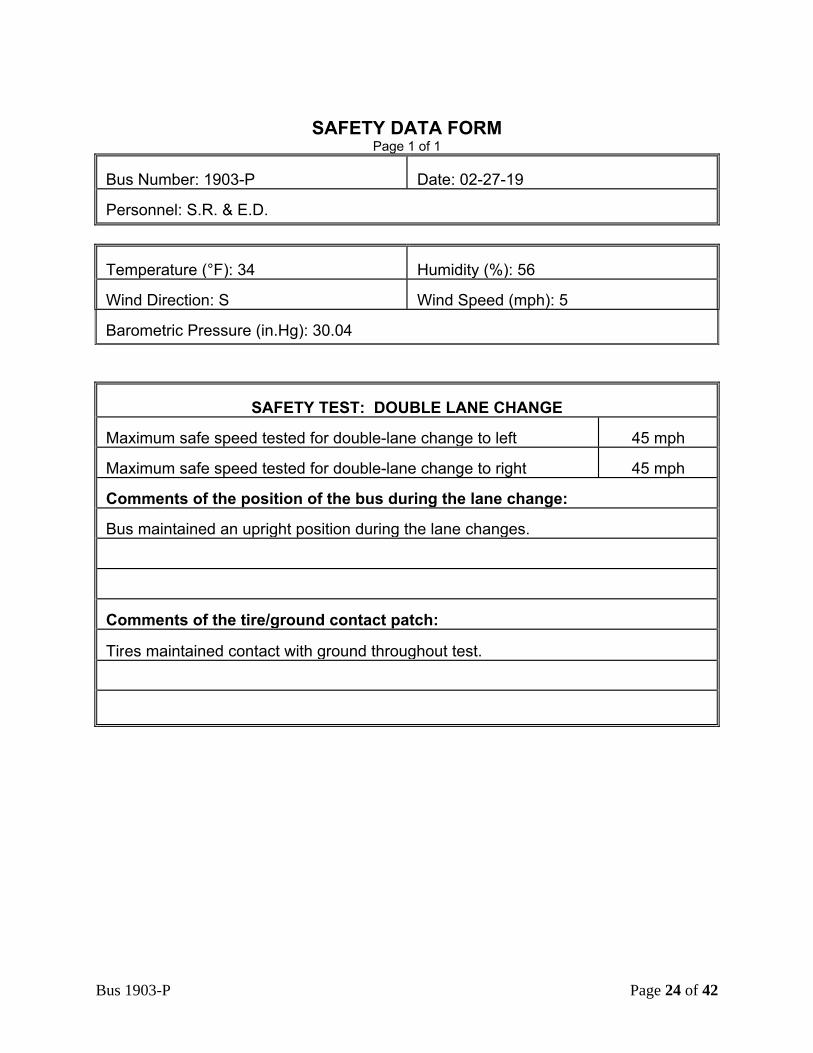
Bus 1903-P Page 24 of 42
SAFETY DATA FORM
Page 1 of 1 Bus Number: 1903-P Date: 02-27-19 Personnel: S.R. & E.D.
Temperature (°F): 34 Humidity (%): 56 Wind Direction: S Wind Speed (mph): 5 Barometric Pressure (in.Hg): 30.04
SAFETY TEST: DOUBLE LANE CHANGE
Maximum safe speed tested for double-lane change to left 45 mph Maximum safe speed tested for double-lane change to right 45 mph Comments of the position of the bus during the lane change: Bus maintained an upright position during the lane changes. Comments of the tire/ground contact patch:
Tires maintained contact with ground throughout test.
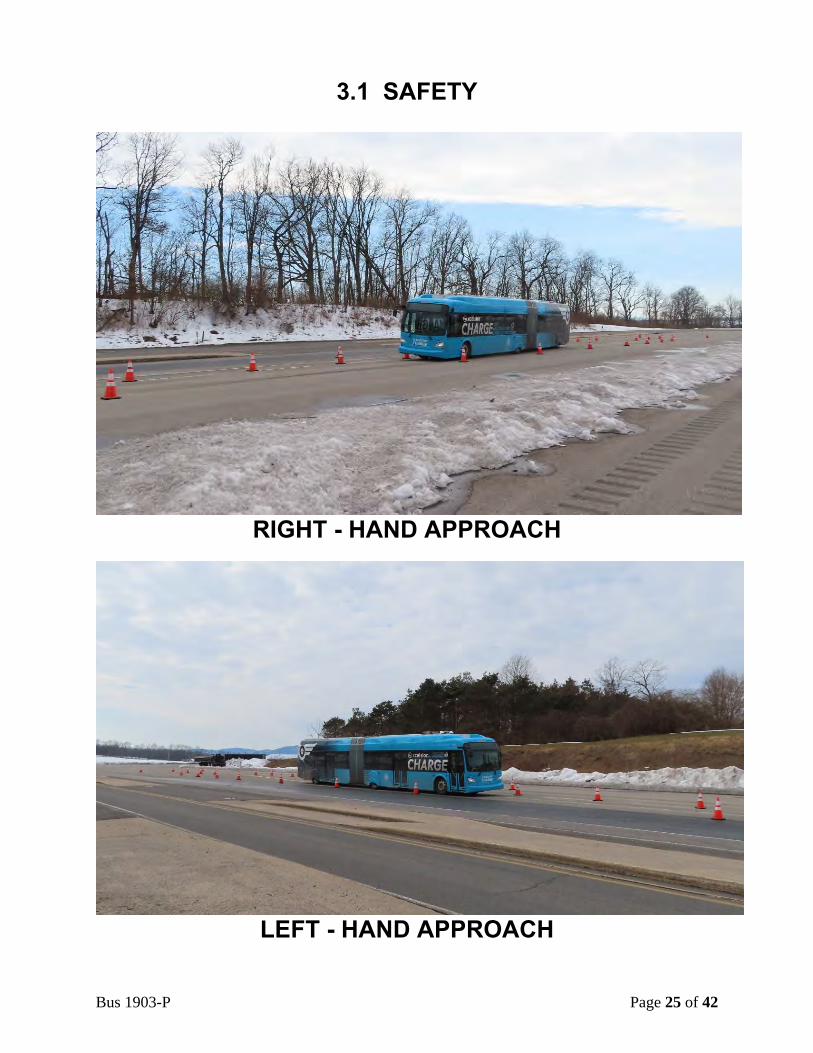
Bus 1903-P Page 25 of 42
3.1 SAFETY
RIGHT - HAND APPROACH
LEFT - HAND APPROACH
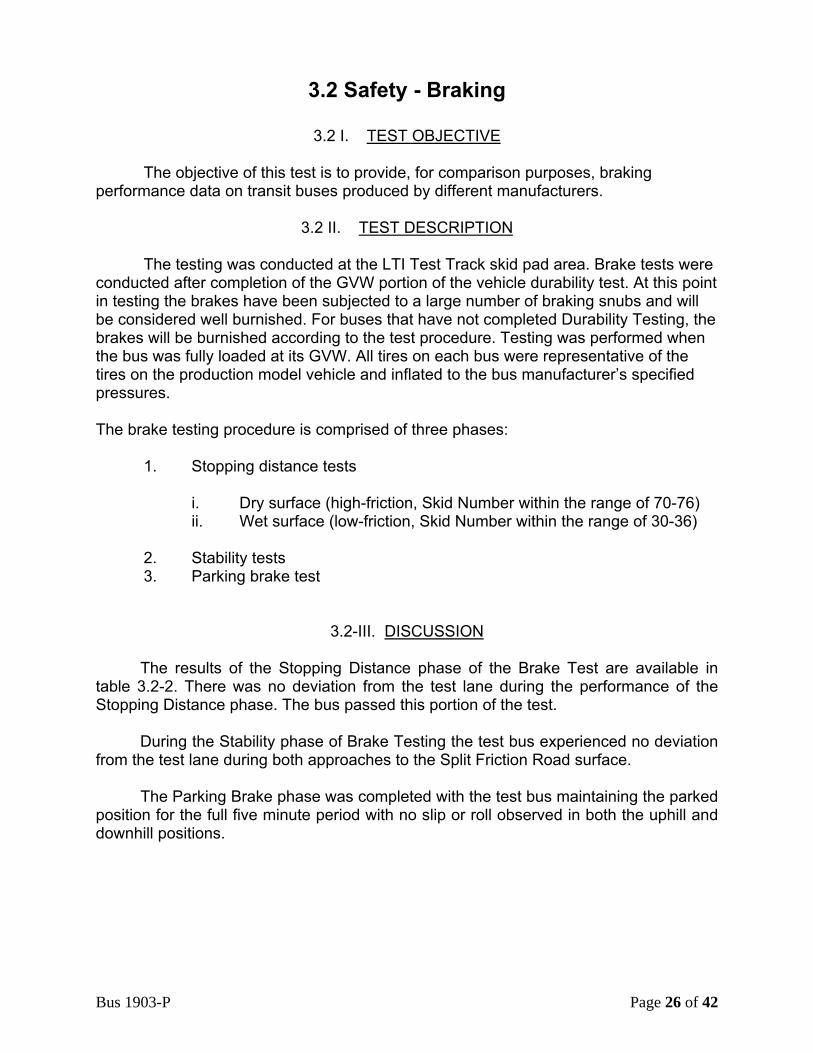
Bus 1903-P Page 26 of 42
3.2 Safety - Braking
3.2 I. TEST OBJECTIVE
The objective of this test is to provide, for comparison purposes, braking performance data on transit buses produced by different manufacturers.
3.2 II. TEST DESCRIPTION
The testing was conducted at the LTI Test Track skid pad area. Brake tests were conducted after completion of the GVW portion of the vehicle durability test. At this point in testing the brakes have been subjected to a large number of braking snubs and will be considered well burnished. For buses that have not completed Durability Testing, the brakes will be burnished according to the test procedure. Testing was performed when the bus was fully loaded at its GVW. All tires on each bus were representative of the tires on the production model vehicle and inflated to the bus manufacturer’s specified pressures. The brake testing procedure is comprised of three phases:
1. Stopping distance tests
i. Dry surface (high-friction, Skid Number within the range of 70-76) ii. Wet surface (low-friction, Skid Number within the range of 30-36)
2. Stability tests 3. Parking brake test
3.2-III. DISCUSSION The results of the Stopping Distance phase of the Brake Test are available in table 3.2-2. There was no deviation from the test lane during the performance of the Stopping Distance phase. The bus passed this portion of the test. During the Stability phase of Brake Testing the test bus experienced no deviation from the test lane during both approaches to the Split Friction Road surface. The Parking Brake phase was completed with the test bus maintaining the parked position for the full five minute period with no slip or roll observed in both the uphill and downhill positions.
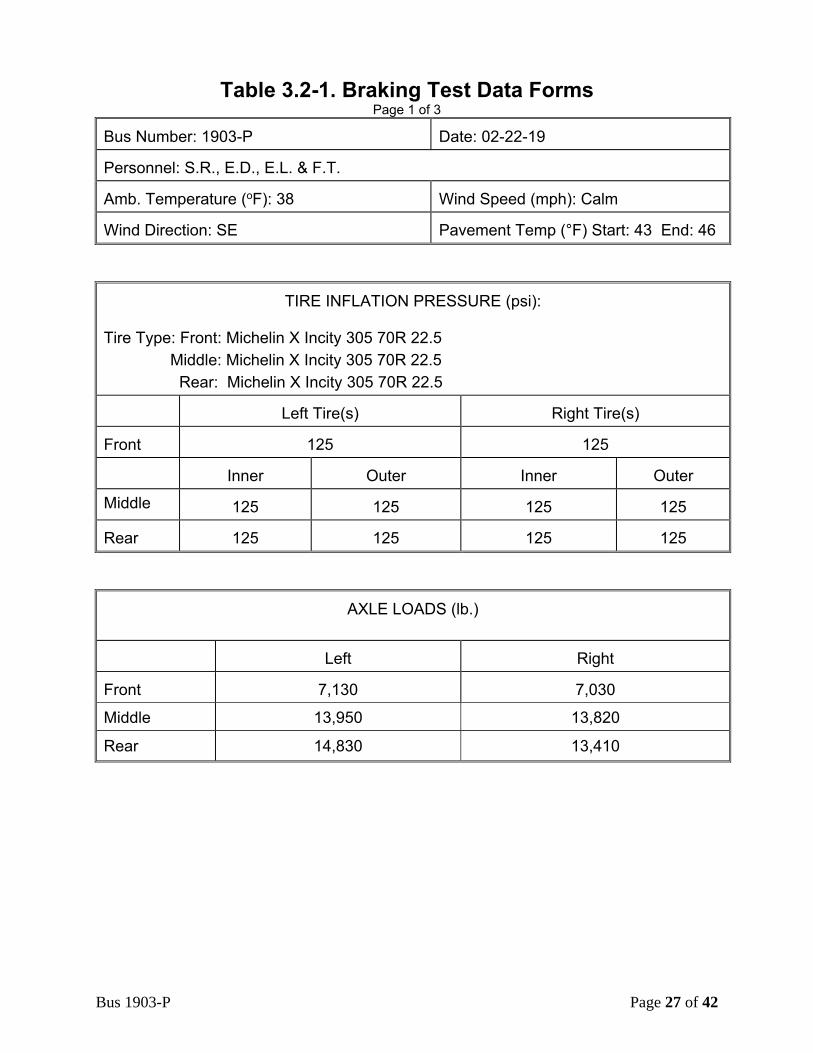
Bus 1903-P Page 27 of 42
Table 3.2-1. Braking Test Data Forms Page 1 of 3
Bus Number: 1903-P Date: 02-22-19 Personnel: S.R., E.D., E.L. & F.T. Amb. Temperature (oF): 38 Wind Speed (mph): Calm Wind Direction: SE Pavement Temp (°F) Start: 43 End: 46
TIRE INFLATION PRESSURE (psi):
Tire Type: Front: Michelin X Incity 305 70R 22.5 Middle: Michelin X Incity 305 70R 22.5 Rear: Michelin X Incity 305 70R 22.5
Left Tire(s) Right Tire(s)
Front
125
125
Inner
Outer Inner
Outer
Middle
125 125 125 125 Rear
125 125 125 125
AXLE LOADS (lb.)
Left
Right
Front 7,130 7,030
Middle 13,950 13,820
Rear 14,830 13,410
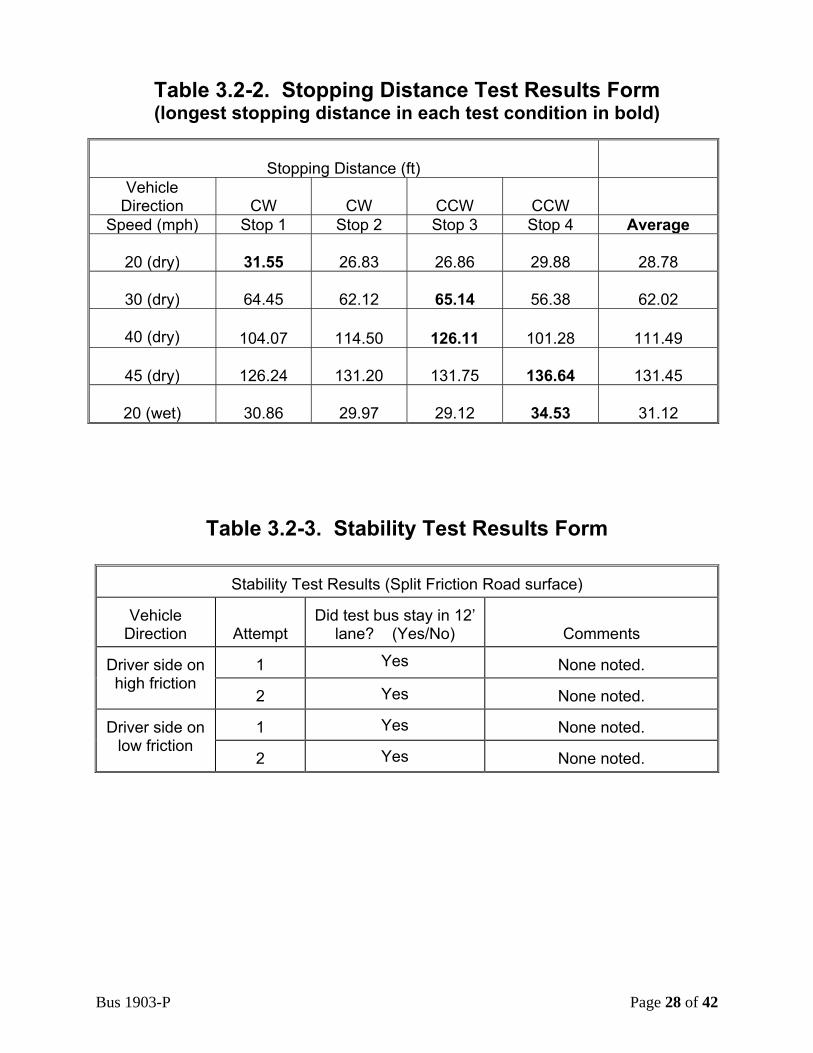
Bus 1903-P Page 28 of 42
Table 3.2-2. Stopping Distance Test Results Form (longest stopping distance in each test condition in bold)
Stopping Distance (ft)
Vehicle Direction
CW
CW
CCW
CCW
Speed (mph) Stop 1 Stop 2 Stop 3 Stop 4 Average
20 (dry) 31.55 26.83 26.86 29.88 28.78
30 (dry) 64.45 62.12 65.14 56.38 62.02
40 (dry) 104.07 114.50 126.11 101.28 111.49
45 (dry) 126.24 131.20 131.75 136.64 131.45
20 (wet) 30.86 29.97 29.12 34.53 31.12
Table 3.2-3. Stability Test Results Form
Stability Test Results (Split Friction Road surface)
Vehicle
Direction
Attempt
Did test bus stay in 12’
lane? (Yes/No) Comments
Driver side on high friction
1 Yes None noted.
2 Yes None noted.
Driver side on
low friction
1 Yes None noted.
2 Yes None noted.
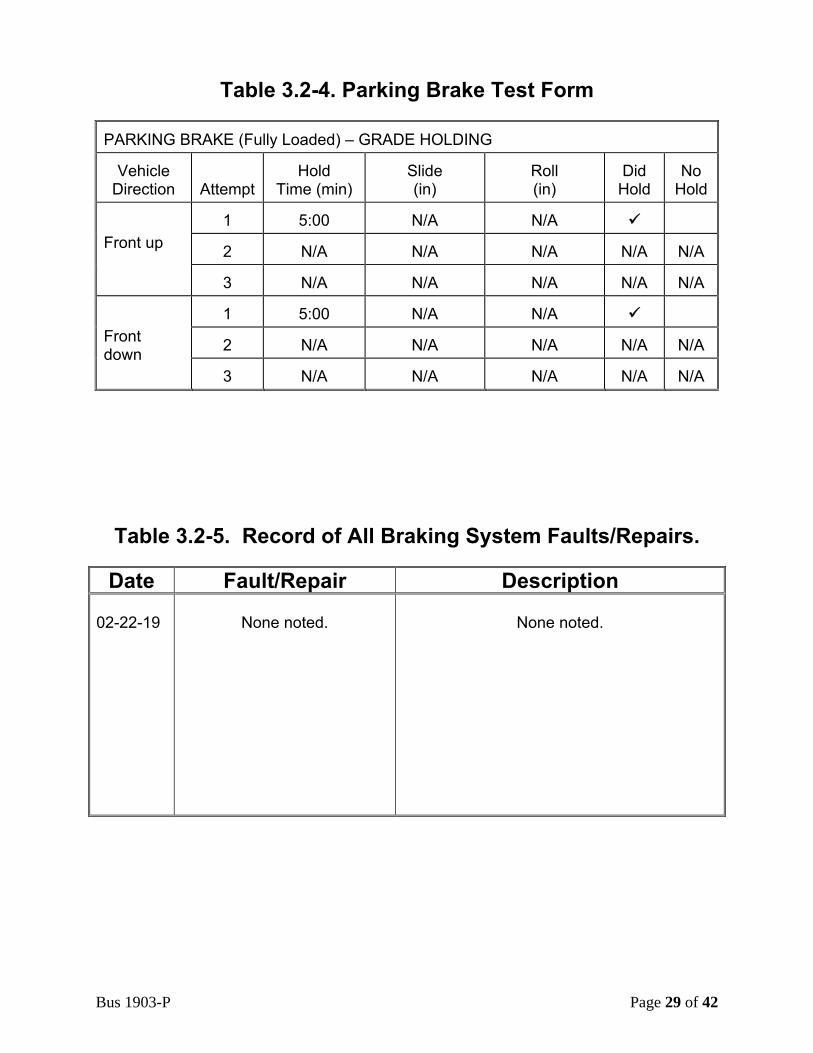
Bus 1903-P Page 29 of 42
Table 3.2-4. Parking Brake Test Form PARKING BRAKE (Fully Loaded) – GRADE HOLDING
Vehicle
Direction
Attempt
Hold
Time (min) Slide (in)
Roll (in)
Did
Hold No
Hold Front up
1 5:00 N/A N/A
2 N/A N/A N/A N/A N/A
3 N/A N/A N/A N/A N/A
Front down
1 5:00 N/A N/A
2 N/A N/A N/A N/A N/A
3 N/A N/A N/A N/A N/A
Table 3.2-5. Record of All Braking System Faults/Repairs.
Date Fault/Repair Description 02-22-19
None noted.
None noted.
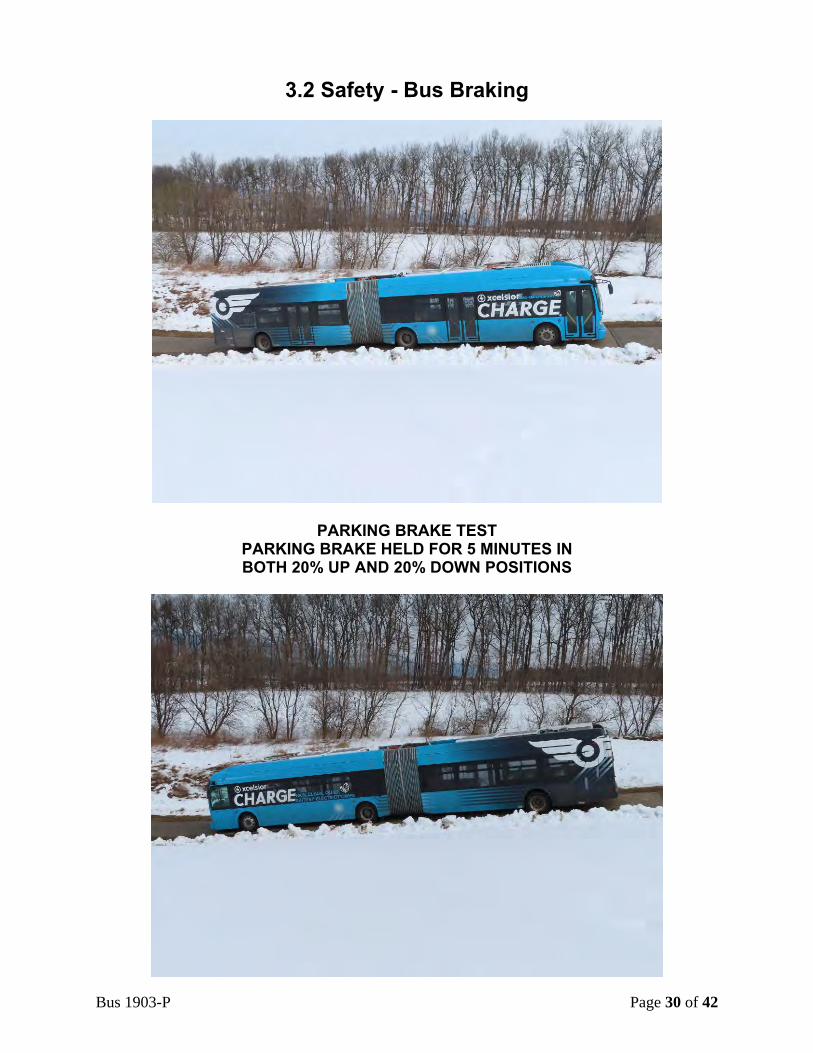
Bus 1903-P Page 30 of 42
3.2 Safety - Bus Braking
PARKING BRAKE TEST PARKING BRAKE HELD FOR 5 MINUTES IN BOTH 20% UP AND 20% DOWN POSITIONS
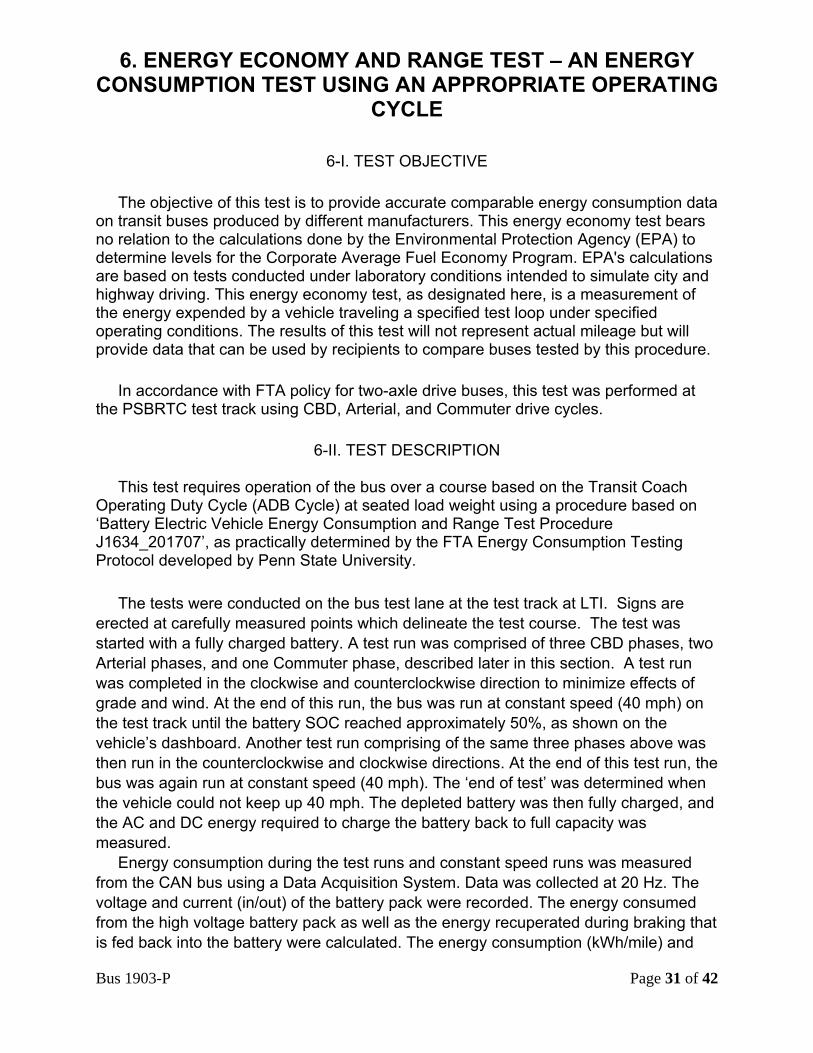
Bus 1903-P Page 31 of 42
6. ENERGY ECONOMY AND RANGE TEST – AN ENERGY CONSUMPTION TEST USING AN APPROPRIATE OPERATING
CYCLE
6-I. TEST OBJECTIVE The objective of this test is to provide accurate comparable energy consumption data on transit buses produced by different manufacturers. This energy economy test bears no relation to the calculations done by the Environmental Protection Agency (EPA) to determine levels for the Corporate Average Fuel Economy Program. EPA's calculations are based on tests conducted under laboratory conditions intended to simulate city and highway driving. This energy economy test, as designated here, is a measurement of the energy expended by a vehicle traveling a specified test loop under specified operating conditions. The results of this test will not represent actual mileage but will provide data that can be used by recipients to compare buses tested by this procedure. In accordance with FTA policy for two-axle drive buses, this test was performed at the PSBRTC test track using CBD, Arterial, and Commuter drive cycles.
6-II. TEST DESCRIPTION This test requires operation of the bus over a course based on the Transit Coach Operating Duty Cycle (ADB Cycle) at seated load weight using a procedure based on ‘Battery Electric Vehicle Energy Consumption and Range Test Procedure J1634_201707’, as practically determined by the FTA Energy Consumption Testing Protocol developed by Penn State University. The tests were conducted on the bus test lane at the test track at LTI. Signs are erected at carefully measured points which delineate the test course. The test was started with a fully charged battery. A test run was comprised of three CBD phases, two Arterial phases, and one Commuter phase, described later in this section. A test run was completed in the clockwise and counterclockwise direction to minimize effects of grade and wind. At the end of this run, the bus was run at constant speed (40 mph) on the test track until the battery SOC reached approximately 50%, as shown on the vehicle’s dashboard. Another test run comprising of the same three phases above was then run in the counterclockwise and clockwise directions. At the end of this test run, the bus was again run at constant speed (40 mph). The ‘end of test’ was determined when the vehicle could not keep up 40 mph. The depleted battery was then fully charged, and the AC and DC energy required to charge the battery back to full capacity was measured. Energy consumption during the test runs and constant speed runs was measured from the CAN bus using a Data Acquisition System. Data was collected at 20 Hz. The voltage and current (in/out) of the battery pack were recorded. The energy consumed from the high voltage battery pack as well as the energy recuperated during braking that is fed back into the battery were calculated. The energy consumption (kWh/mile) and
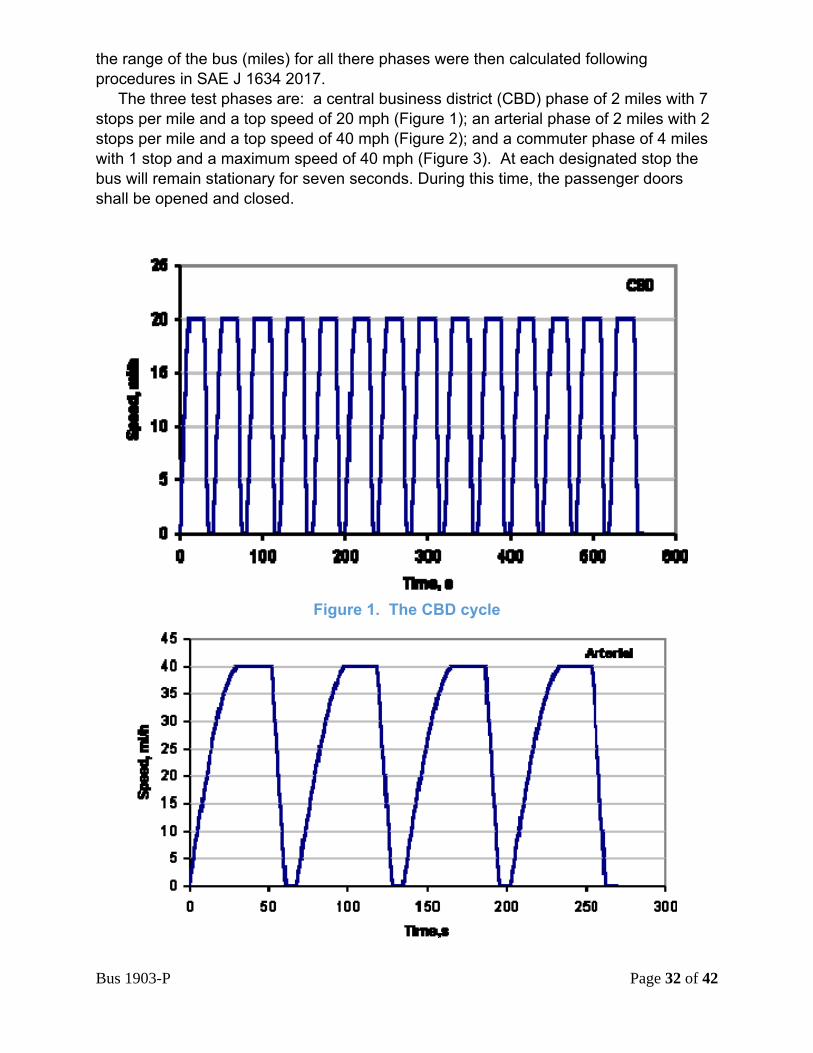
Bus 1903-P Page 32 of 42
the range of the bus (miles) for all there phases were then calculated following procedures in SAE J 1634 2017. The three test phases are: a central business district (CBD) phase of 2 miles with 7 stops per mile and a top speed of 20 mph (Figure 1); an arterial phase of 2 miles with 2 stops per mile and a top speed of 40 mph (Figure 2); and a commuter phase of 4 miles with 1 stop and a maximum speed of 40 mph (Figure 3). At each designated stop the bus will remain stationary for seven seconds. During this time, the passenger doors shall be opened and closed.
Figure 1. The CBD cycle
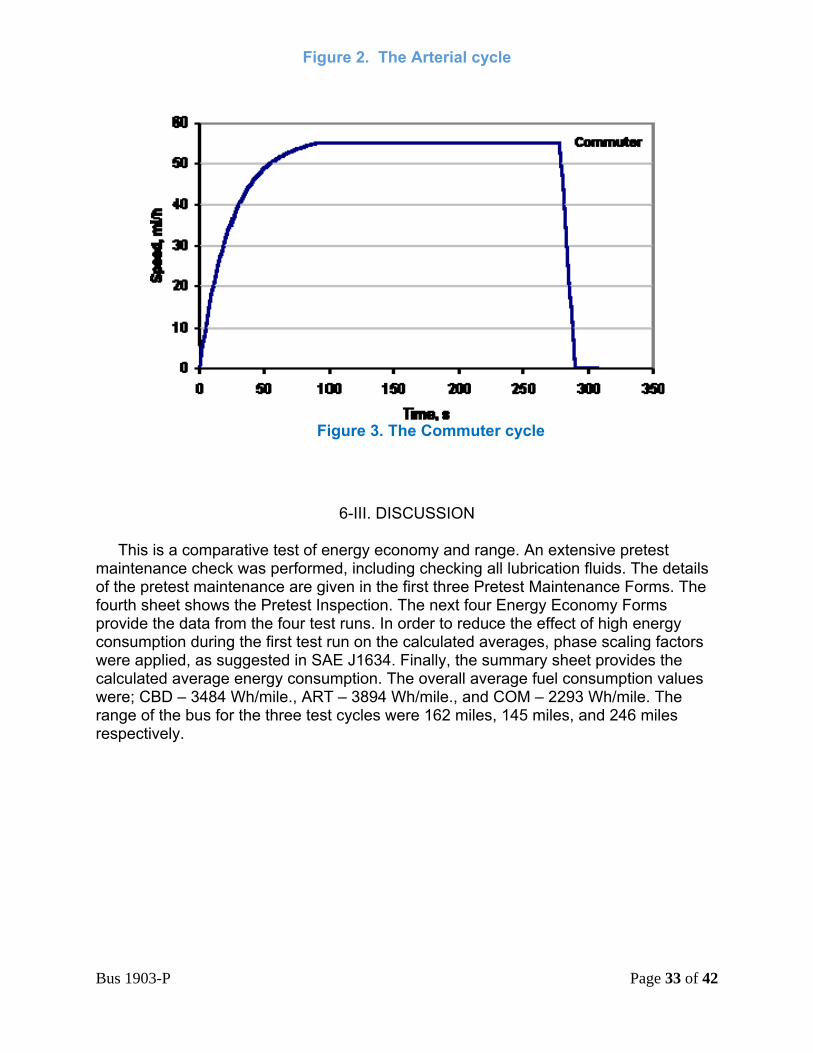
Bus 1903-P Page 33 of 42
Figure 2. The Arterial cycle
Figure 3. The Commuter cycle
6-III. DISCUSSION
This is a comparative test of energy economy and range. An extensive pretest maintenance check was performed, including checking all lubrication fluids. The details of the pretest maintenance are given in the first three Pretest Maintenance Forms. The fourth sheet shows the Pretest Inspection. The next four Energy Economy Forms provide the data from the four test runs. In order to reduce the effect of high energy consumption during the first test run on the calculated averages, phase scaling factors were applied, as suggested in SAE J1634. Finally, the summary sheet provides the calculated average energy consumption. The overall average fuel consumption values were; CBD – 3484 Wh/mile., ART – 3894 Wh/mile., and COM – 2293 Wh/mile. The range of the bus for the three test cycles were 162 miles, 145 miles, and 246 miles respectively.
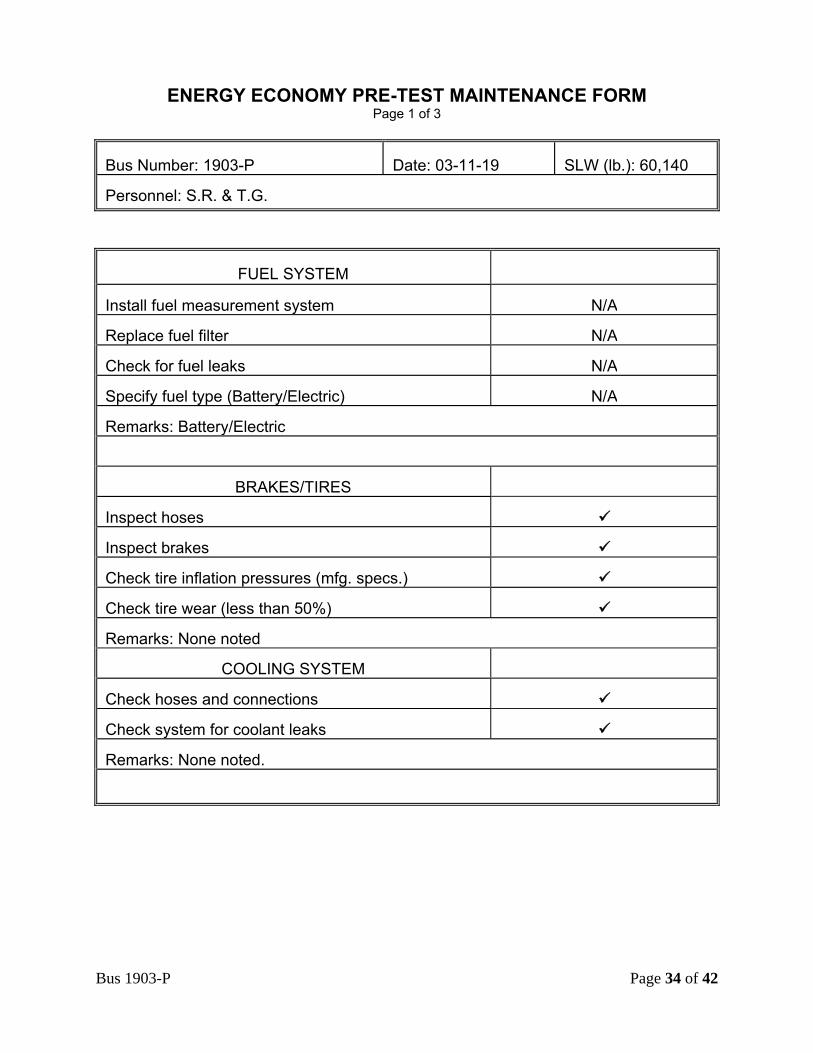
Bus 1903-P Page 34 of 42
ENERGY ECONOMY PRE-TEST MAINTENANCE FORM Page 1 of 3
Bus Number: 1903-P Date: 03-11-19 SLW (lb.): 60,140 Personnel: S.R. & T.G.
FUEL SYSTEM
Install fuel measurement system N/A Replace fuel filter N/A Check for fuel leaks N/A Specify fuel type (Battery/Electric) N/A Remarks: Battery/Electric
BRAKES/TIRES Inspect hoses Inspect brakes Check tire inflation pressures (mfg. specs.) Check tire wear (less than 50%) Remarks: None noted
COOLING SYSTEM Check hoses and connections Check system for coolant leaks Remarks: None noted.
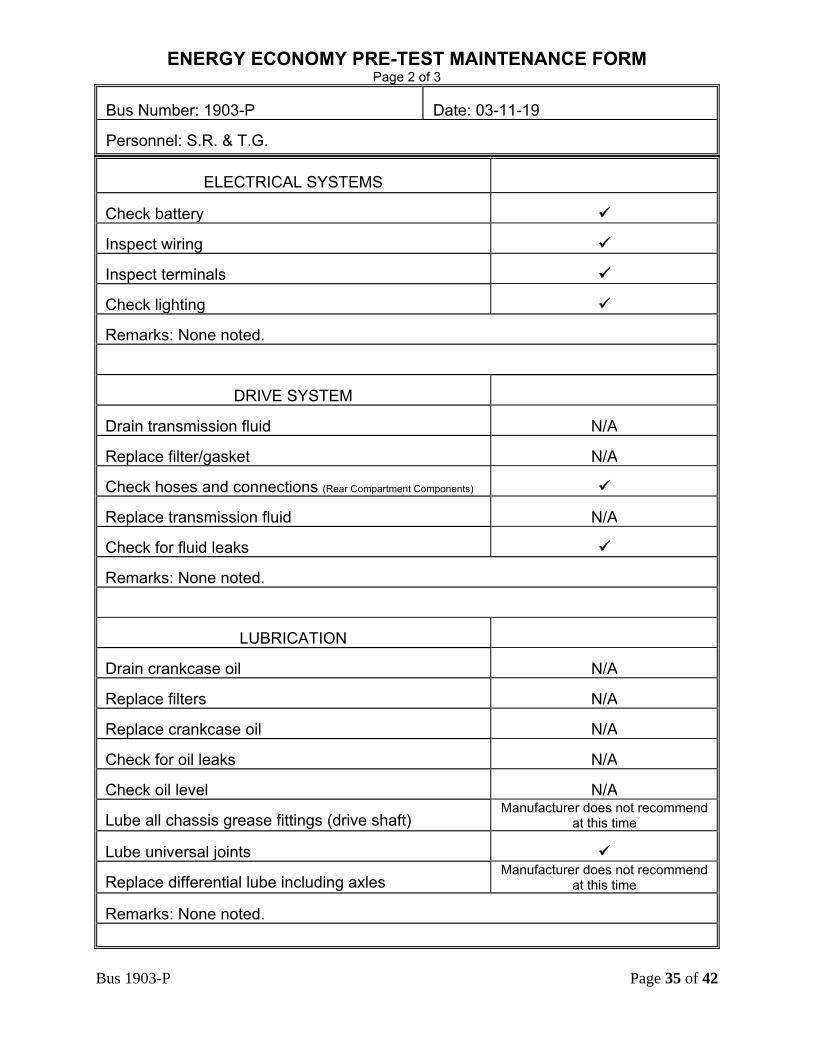
Bus 1903-P Page 35 of 42
ENERGY ECONOMY PRE-TEST MAINTENANCE FORM Page 2 of 3
Bus Number: 1903-P Date: 03-11-19 Personnel: S.R. & T.G.
ELECTRICAL SYSTEMS Check battery Inspect wiring Inspect terminals Check lighting Remarks: None noted.
DRIVE SYSTEM Drain transmission fluid N/A Replace filter/gasket N/A Check hoses and connections (Rear Compartment Components) Replace transmission fluid N/A Check for fluid leaks Remarks: None noted.
LUBRICATION Drain crankcase oil N/A Replace filters N/A Replace crankcase oil N/A Check for oil leaks N/A Check oil level N/A Lube all chassis grease fittings (drive shaft)
Manufacturer does not recommend at this time
Lube universal joints Replace differential lube including axles
Manufacturer does not recommend at this time
Remarks: None noted.
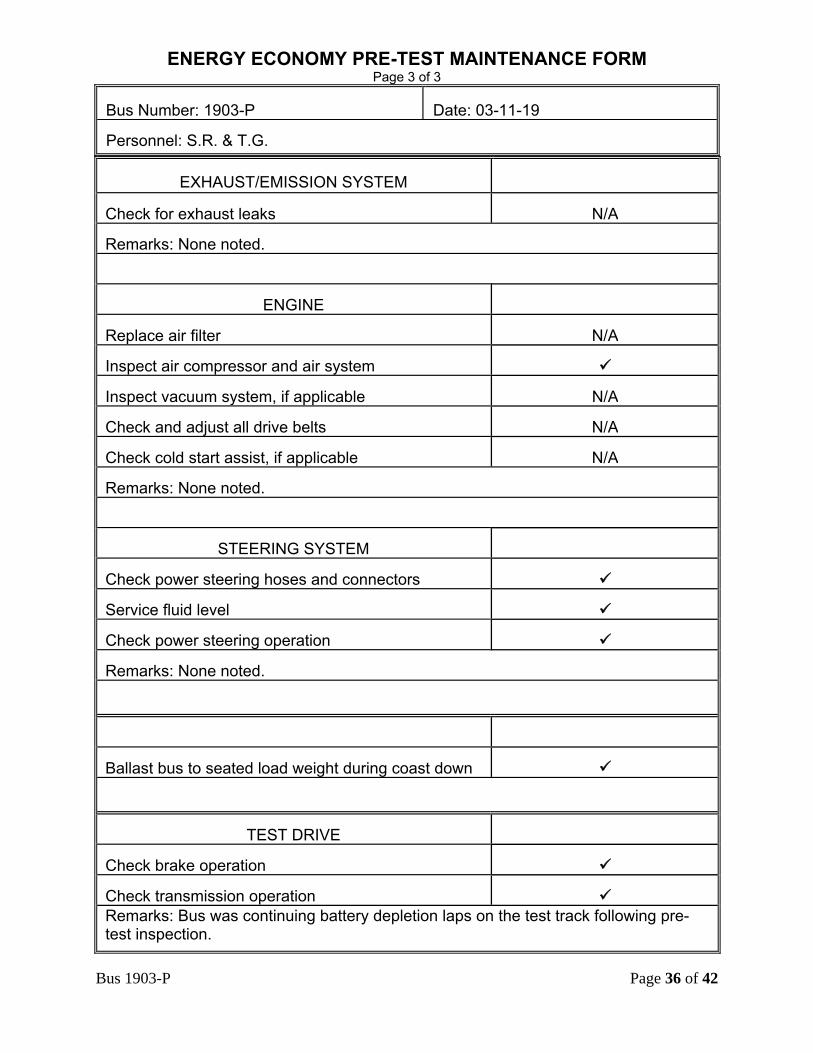
Bus 1903-P Page 36 of 42
ENERGY ECONOMY PRE-TEST MAINTENANCE FORM Page 3 of 3
Bus Number: 1903-P Date: 03-11-19 Personnel: S.R. & T.G.
EXHAUST/EMISSION SYSTEM Check for exhaust leaks N/A Remarks: None noted.
ENGINE Replace air filter N/A Inspect air compressor and air system Inspect vacuum system, if applicable N/A Check and adjust all drive belts N/A Check cold start assist, if applicable N/A Remarks: None noted.
STEERING SYSTEM Check power steering hoses and connectors Service fluid level Check power steering operation Remarks: None noted.
Ballast bus to seated load weight during coast down
TEST DRIVE Check brake operation Check transmission operation Remarks: Bus was continuing battery depletion laps on the test track following pre-test inspection.
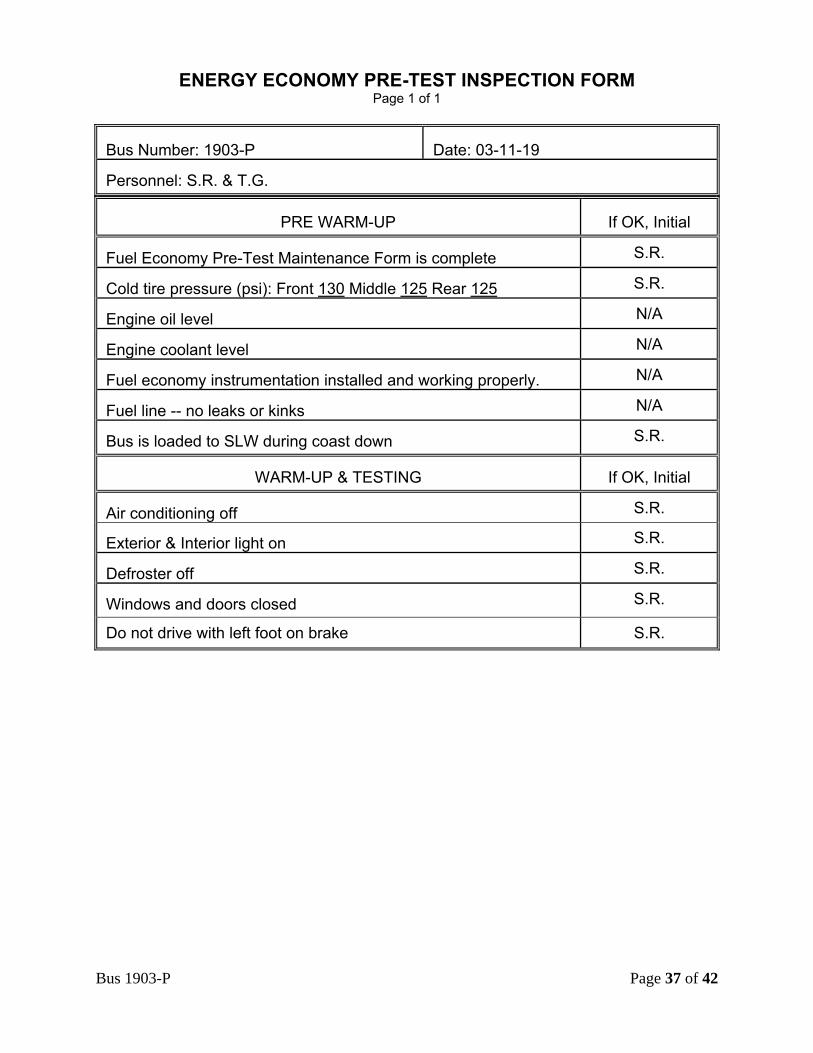
Bus 1903-P Page 37 of 42
ENERGY ECONOMY PRE-TEST INSPECTION FORM
Page 1 of 1
Bus Number: 1903-P Date: 03-11-19 Personnel: S.R. & T.G.
PRE WARM-UP
If OK, Initial Fuel Economy Pre-Test Maintenance Form is complete S.R. Cold tire pressure (psi): Front 130 Middle 125 Rear 125 S.R. Engine oil level N/A Engine coolant level N/A Fuel economy instrumentation installed and working properly. N/A Fuel line -- no leaks or kinks N/A Bus is loaded to SLW during coast down S.R.
WARM-UP & TESTING
If OK, Initial Air conditioning off S.R. Exterior & Interior light on S.R. Defroster off S.R. Windows and doors closed S.R.
Do not drive with left foot on brake S.R.
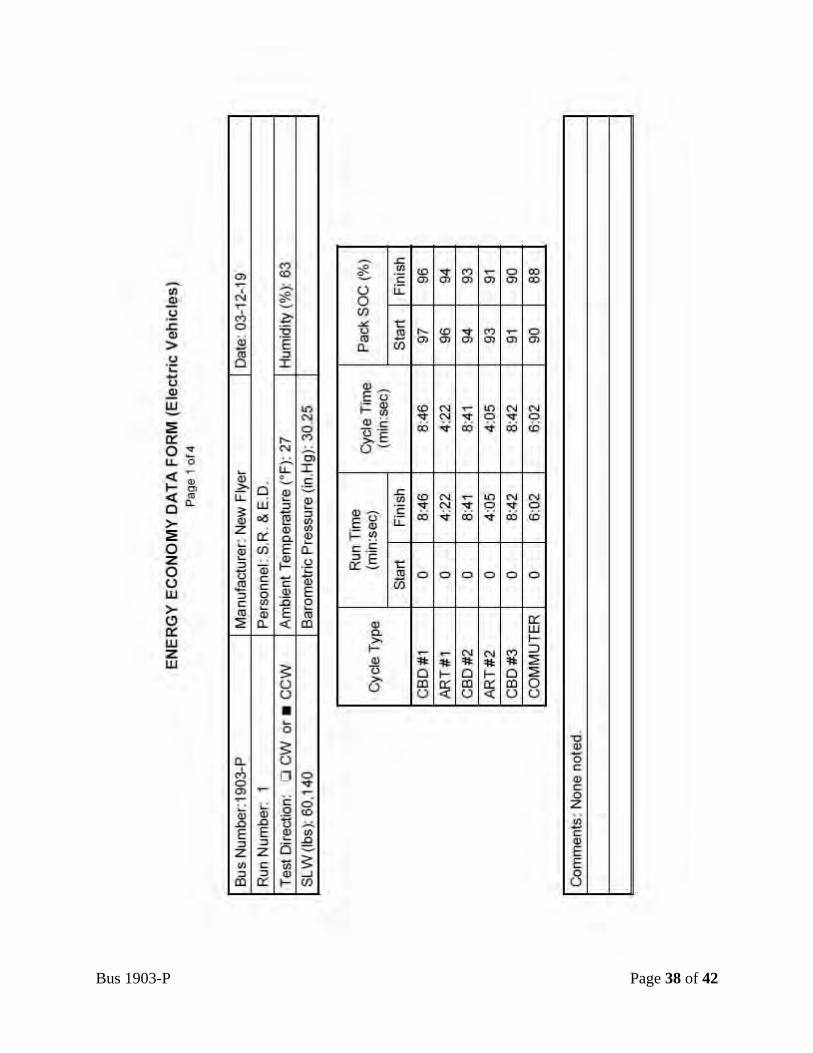
Bus 1903-P Page 38 of 42
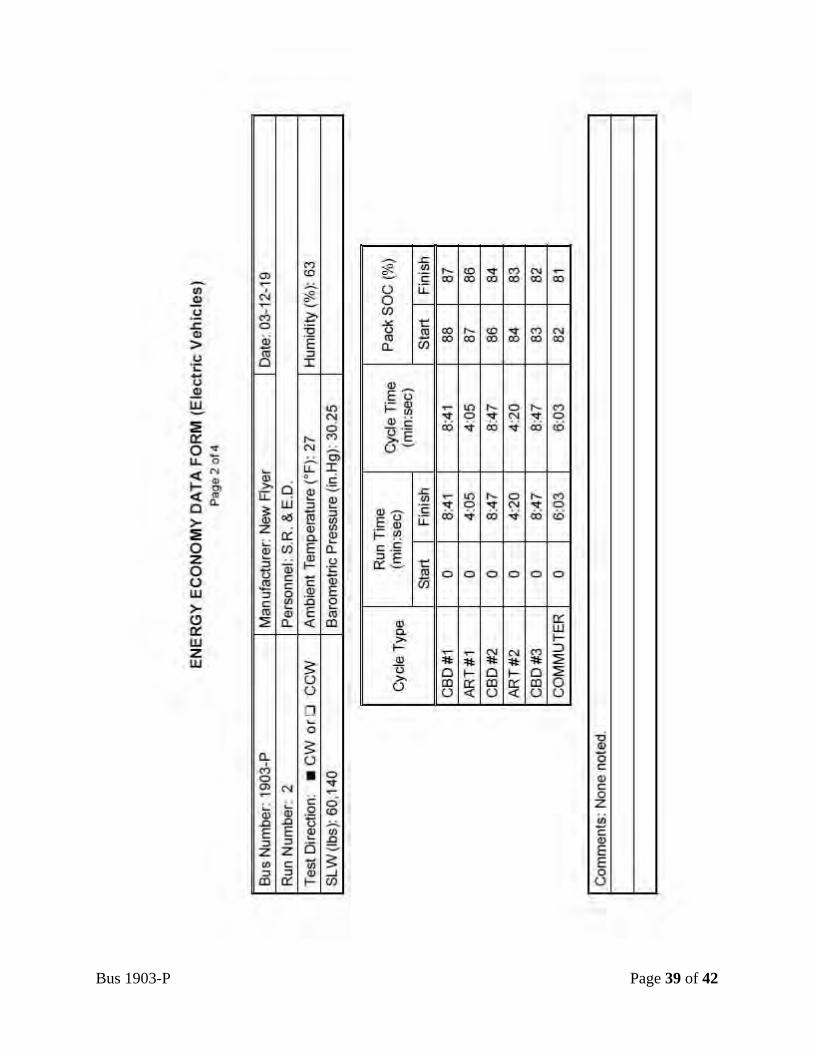
Bus 1903-P Page 39 of 42
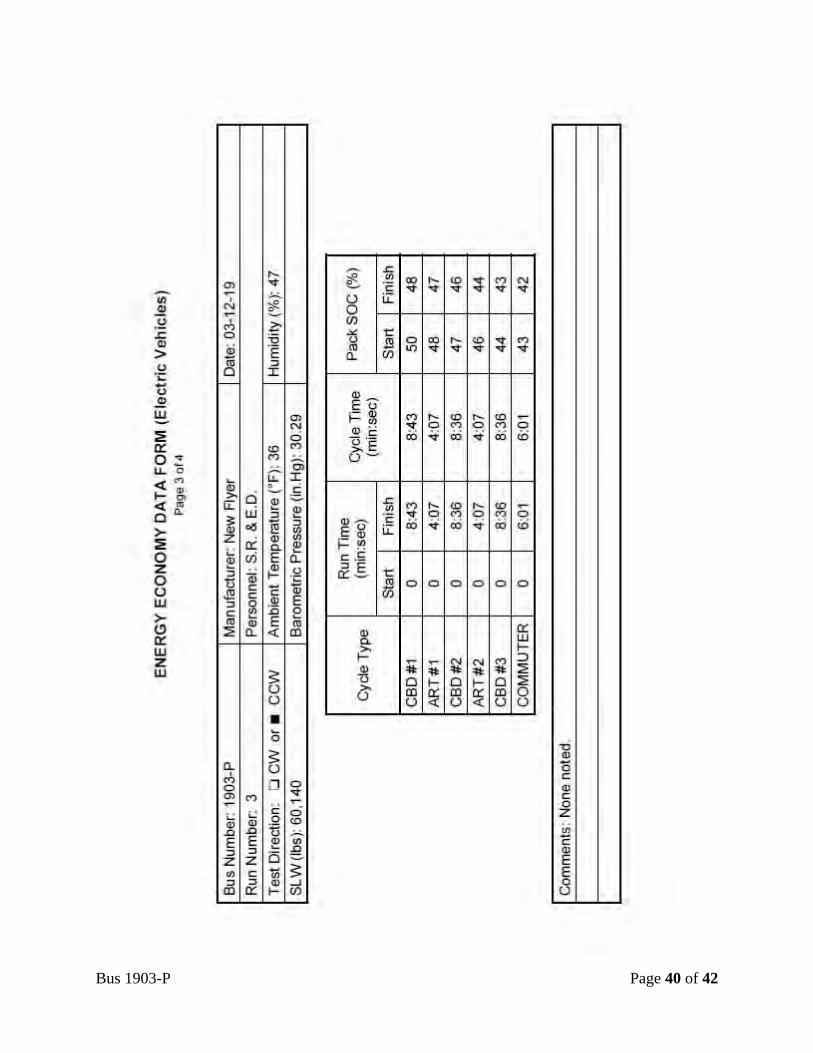
Bus 1903-P Page 40 of 42
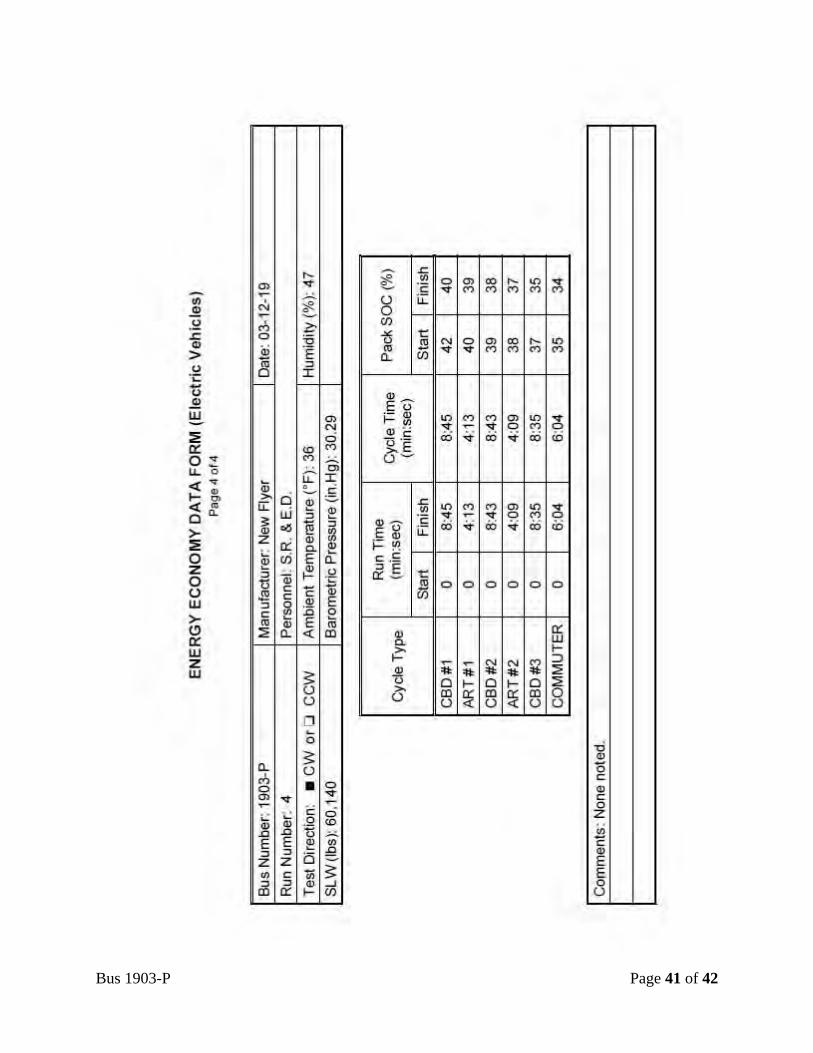
Bus 1903-P Page 41 of 42
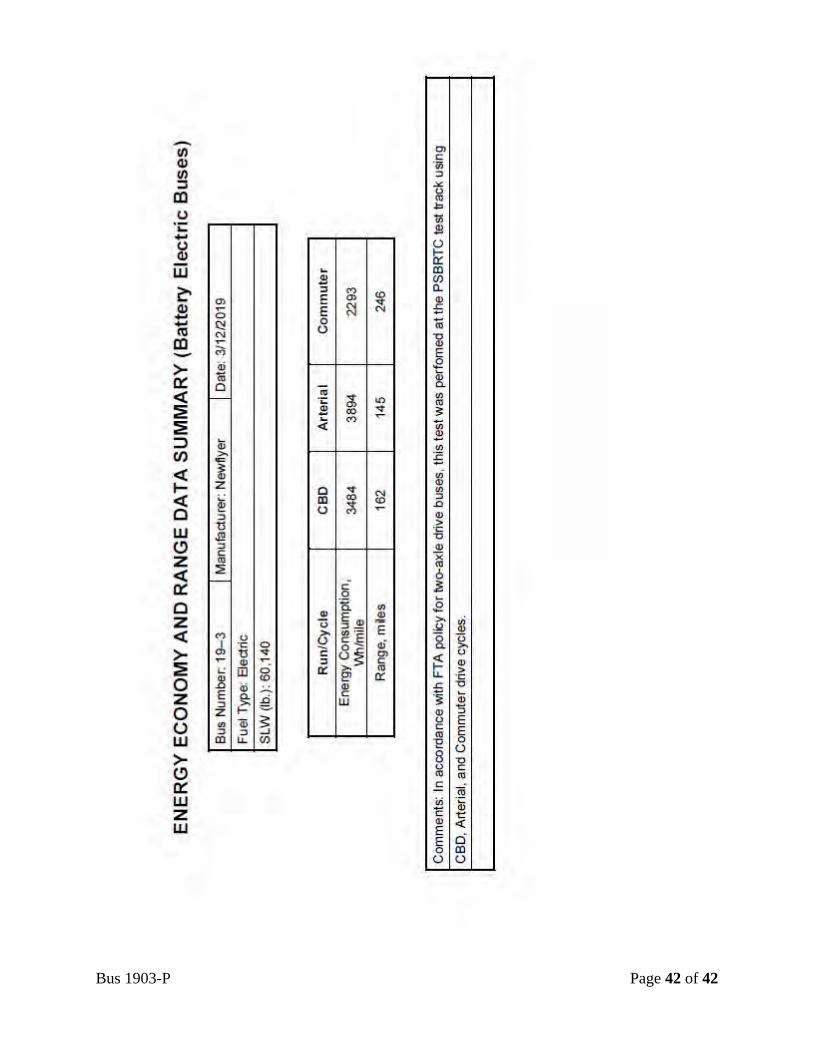
Bus 1903-P Page 42 of 42
PSTA– Pinellas Suncoast Transit Authority RFP 21-980369
Section 2N Solicitation Requirements:
TS 21.2 Crashworthiness Report.
New Flyer Response: Please refer to the attachments: Side impact test “TR09-31 Xcelsior Side Impact Test Roof crush test “TR10-05 Xcelsior Roof Crush Test Report”.
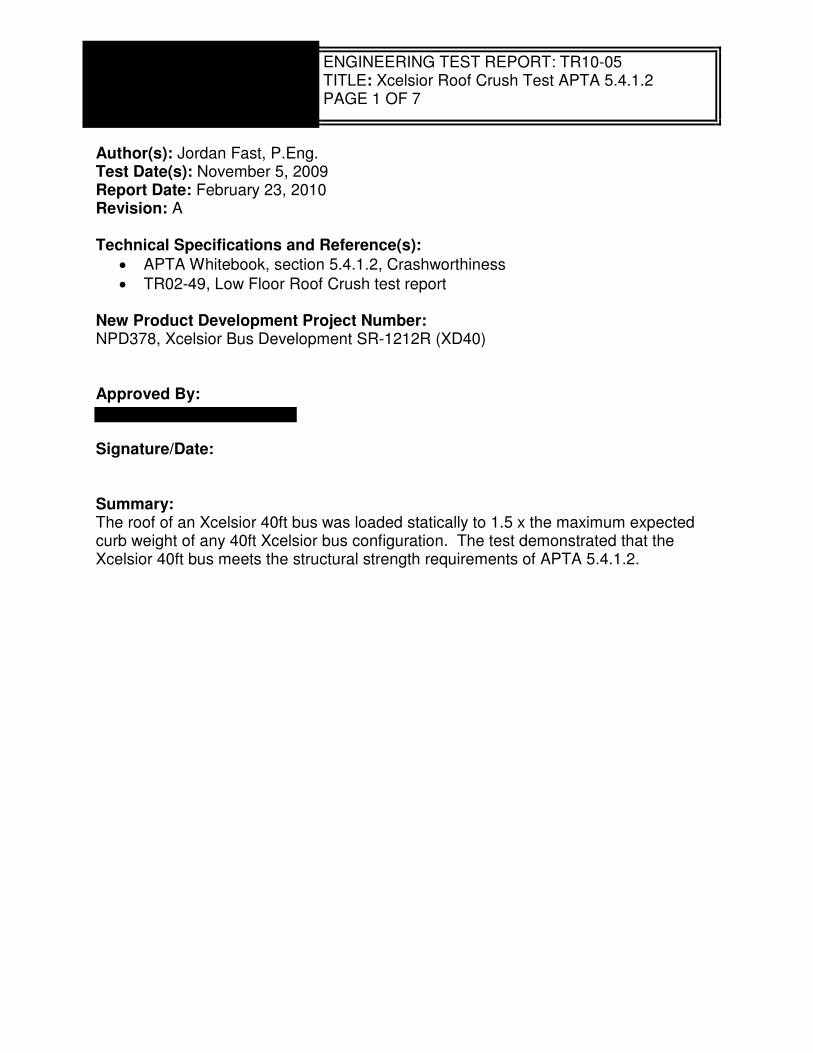
ENGINEERING TEST REPORT: TR10-05 TITLE: Xcelsior Roof Crush Test APTA 5.4.1.2 PAGE 1 OF 7
Author(s): Jordan Fast, P.Eng. Test Date(s): November 5, 2009 Report Date: February 23, 2010 Revision: A Technical Specifications and Reference(s):
• APTA Whitebook, section 5.4.1.2, Crashworthiness
• TR02-49, Low Floor Roof Crush test report New Product Development Project Number: NPD378, Xcelsior Bus Development SR-1212R (XD40) Approved By:
Signature/Date: Summary: The roof of an Xcelsior 40ft bus was loaded statically to 1.5 x the maximum expected curb weight of any 40ft Xcelsior bus configuration. The test demonstrated that the Xcelsior 40ft bus meets the structural strength requirements of APTA 5.4.1.2.
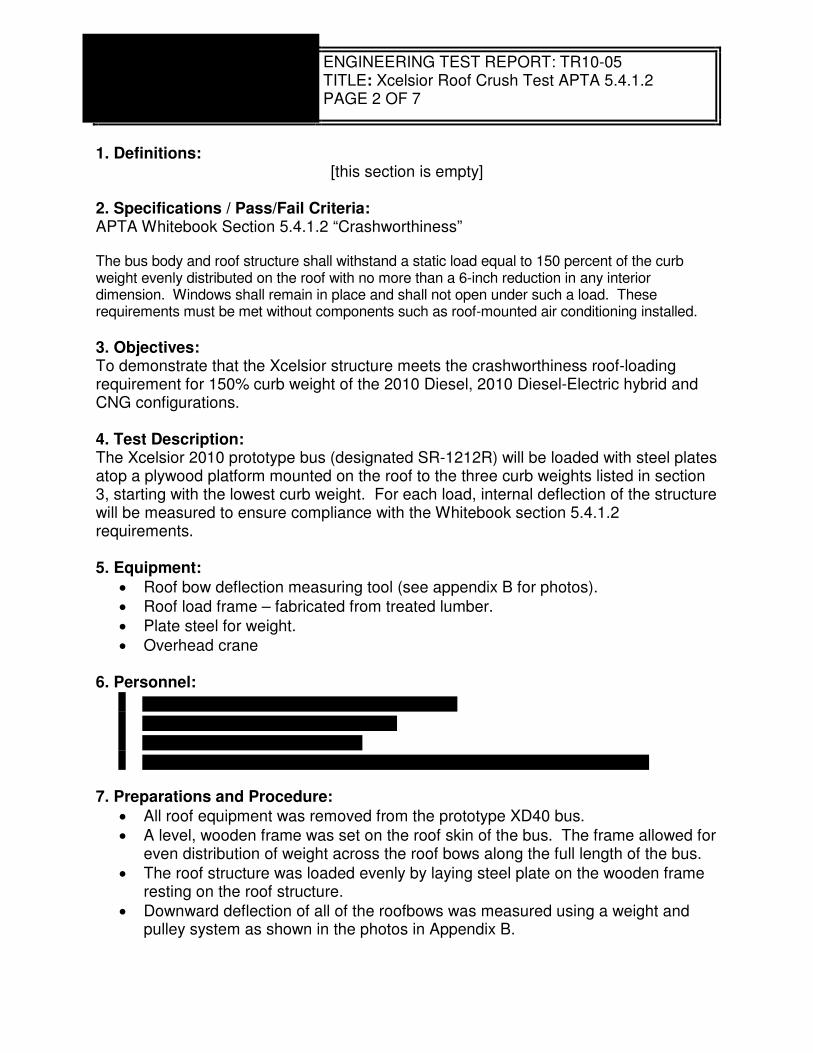
ENGINEERING TEST REPORT: TR10-05 TITLE: Xcelsior Roof Crush Test APTA 5.4.1.2 PAGE 2 OF 7
1. Definitions: [this section is empty]
2. Specifications / Pass/Fail Criteria: APTA Whitebook Section 5.4.1.2 “Crashworthiness” The bus body and roof structure shall withstand a static load equal to 150 percent of the curb weight evenly distributed on the roof with no more than a 6-inch reduction in any interior dimension. Windows shall remain in place and shall not open under such a load. These requirements must be met without components such as roof-mounted air conditioning installed.
3. Objectives: To demonstrate that the Xcelsior structure meets the crashworthiness roof-loading requirement for 150% curb weight of the 2010 Diesel, 2010 Diesel-Electric hybrid and CNG configurations. 4. Test Description: The Xcelsior 2010 prototype bus (designated SR-1212R) will be loaded with steel plates atop a plywood platform mounted on the roof to the three curb weights listed in section 3, starting with the lowest curb weight. For each load, internal deflection of the structure will be measured to ensure compliance with the Whitebook section 5.4.1.2 requirements. 5. Equipment:
• Roof bow deflection measuring tool (see appendix B for photos).
• Roof load frame – fabricated from treated lumber.
• Plate steel for weight.
• Overhead crane 6. Personnel:
7. Preparations and Procedure:
• All roof equipment was removed from the prototype XD40 bus.
• A level, wooden frame was set on the roof skin of the bus. The frame allowed for even distribution of weight across the roof bows along the full length of the bus.
• The roof structure was loaded evenly by laying steel plate on the wooden frame resting on the roof structure.
• Downward deflection of all of the roofbows was measured using a weight and pulley system as shown in the photos in Appendix B.
ENGINEERING TEST REPORT: TR10-05 TITLE: Xcelsior Roof Crush Test APTA 5.4.1.2 PAGE 3 OF 7
Load Layers: Roof loading of the bus was based on a target curb weights of 29,000lb for Xcelsior hybrid and 31,000lb for Xcelsior CNG. The APTA specification requires that the roof withstand a load of 1.5xcurbweight. Thus, the bus roof was loaded in two stages, first to 1.5x29,000lb (43,500lb) and then, 3,000lb were added to achieve 1.5x31,000lb (46,500lb). Table A, below shows the composition of layers to achieve these stages of loading. Steel plate was loaded on the roof of the bus in the following layers, evenly distributed front to rear of the bus:
Layer Plate Size (inches)
Qty Weight/sheet (lb) Total
1 3x96x240 1 19603 19603 1 3x96x98 1 8400 8400 1 0.5x96x48 3 653 1959
1 0.25x48x120 1 408 408
Layer 1 Total 30307
2 3x96x57 1 5472 5472 2 3x96x97 1 5282 5282 2 0.5x96x48 4 653 2615
Layer 2 Total 13369
Layer 1 + Layer 3: Hybrid curb weight x1.5 43676
3 Steel material size NA 3000 Layers 1 + 2 + 3: CNG curb weight x 1.5 46,676
Table A: Roof loads
8. Test Location:
• Russel Metals, 1510 Clarence Avenue, Winnipeg, MB 9. Results: See Table B.1, Appendix B for roof bow deflection results. Deflections did not exceed 6” and no permanent deformation was observed. Windows and doors functioned normally following the test. 10. Discussion: Roof bow deflection was measured using a system of weights and cables attached to each roof bow and run through the bus to a measuring board, as shown in Figure B.1 (Appendix B). The length and stretch of the cables introduces some error into the
ENGINEERING TEST REPORT: TR10-05 TITLE: Xcelsior Roof Crush Test APTA 5.4.1.2 PAGE 4 OF 7
measurement. However, the error is acceptable, given the nature of the measurement. Accuracy is +/- ½”. And the specification allows for up to 6” of structural dimensional change. 11. Conclusions: The Xclesior 40ft bus structure meets the crashworthiness requirements of APTA specification 5.4.1.2.
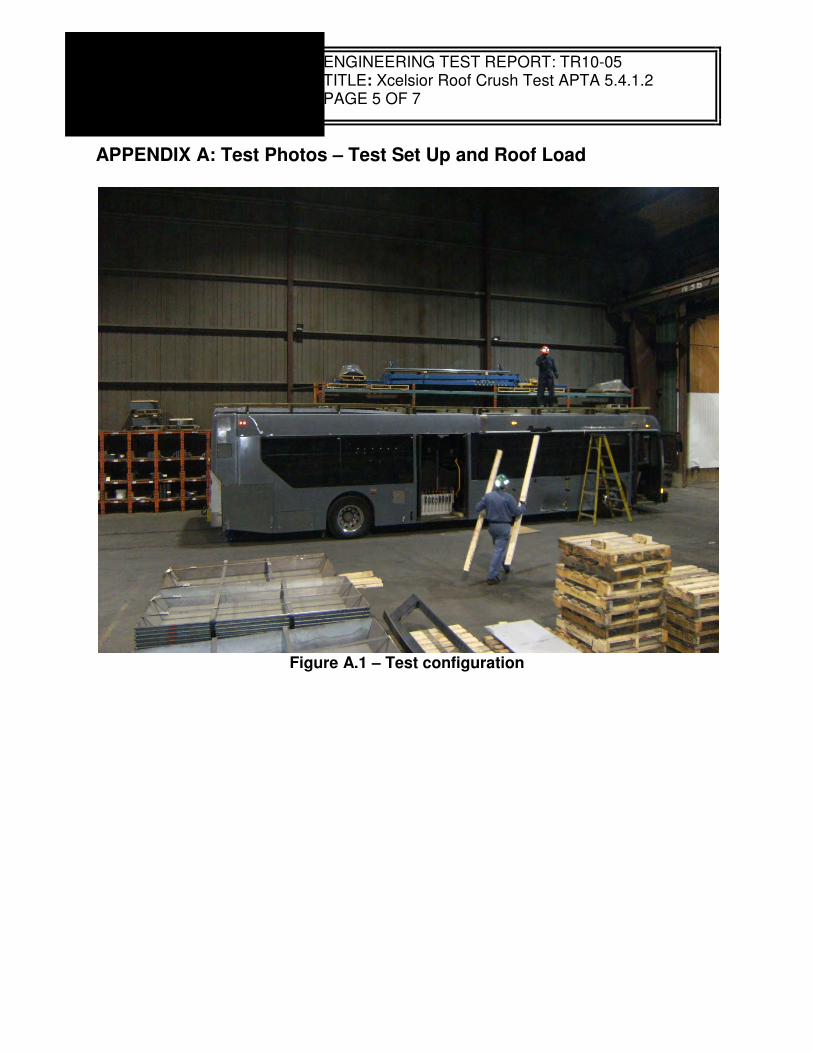
ENGINEERING TEST REPORT: TR10-05 TITLE: Xcelsior Roof Crush Test APTA 5.4.1.2 PAGE 5 OF 7
APPENDIX A: Test Photos – Test Set Up and Roof Load
Figure A.1 – Test configuration
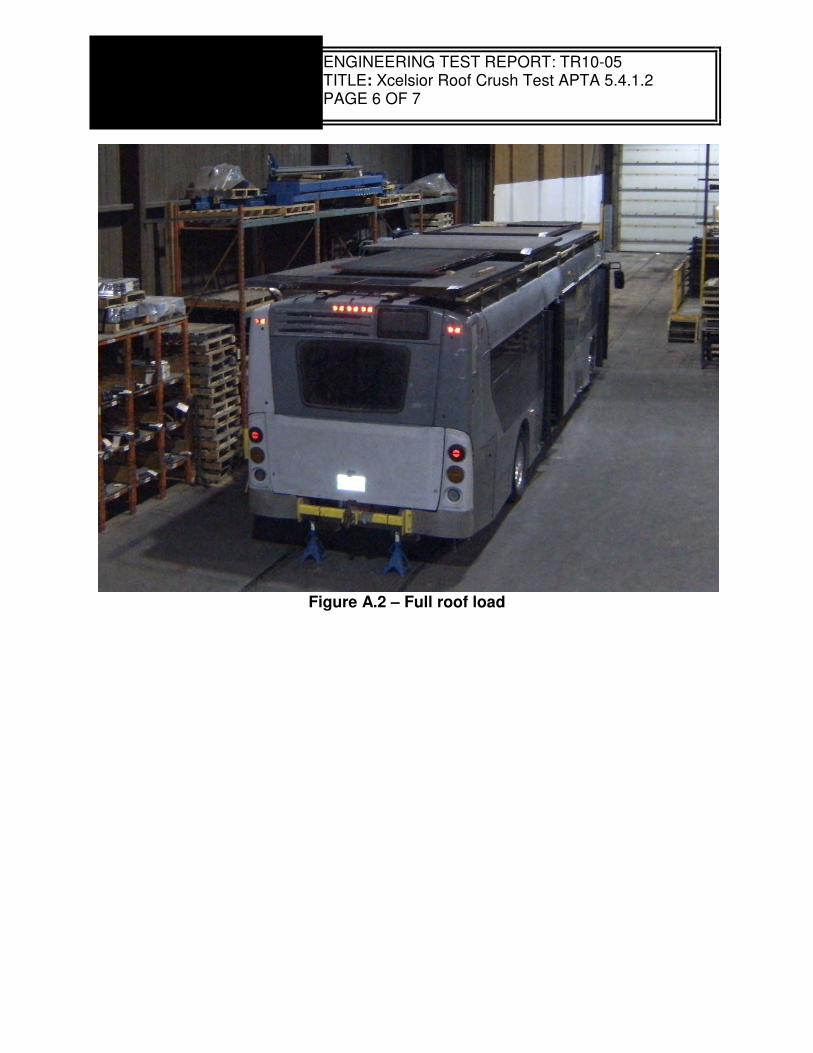
ENGINEERING TEST REPORT: TR10-05 TITLE: Xcelsior Roof Crush Test APTA 5.4.1.2 PAGE 6 OF 7
Figure A.2 – Full roof load
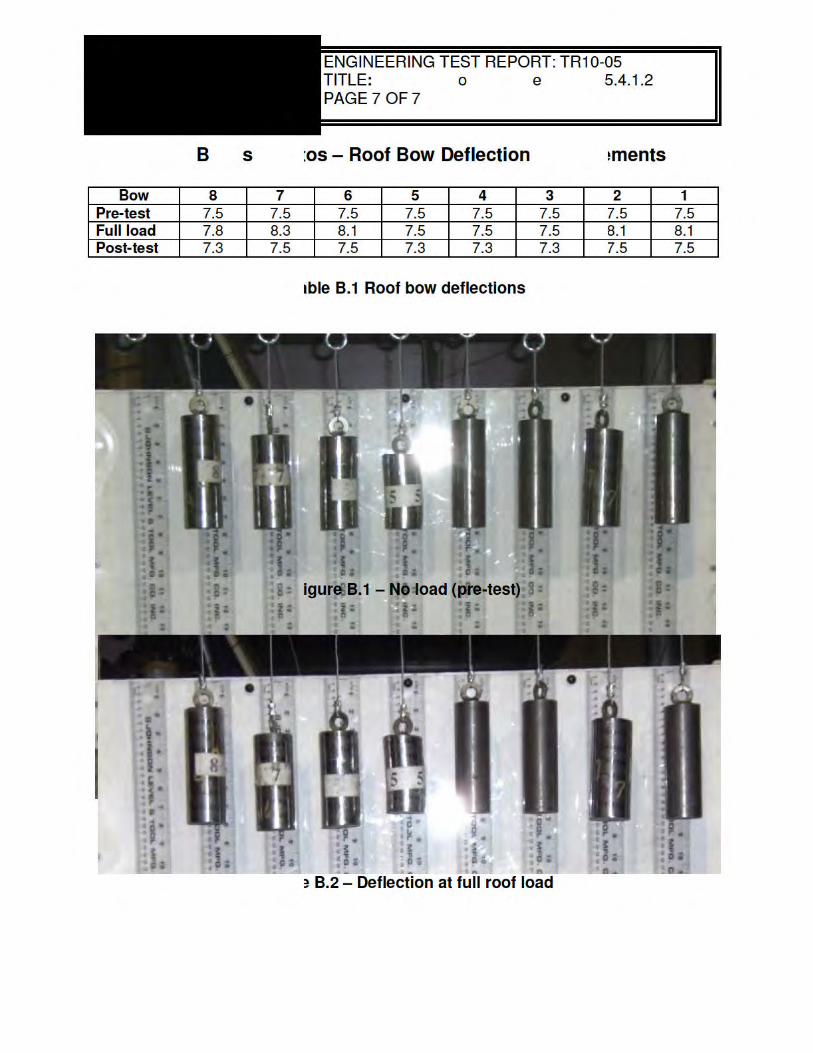
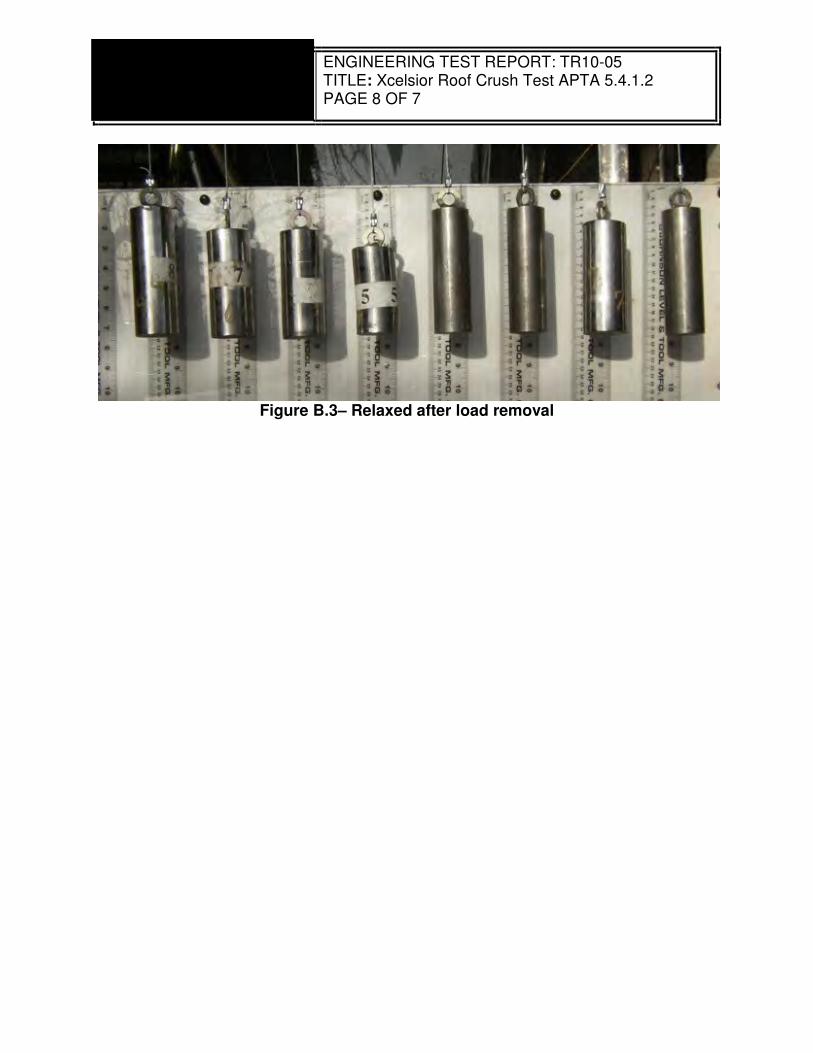
ENGINEERING TEST REPORT: TR10-05 TITLE: Xcelsior Roof Crush Test APTA 5.4.1.2 PAGE 8 OF 7
Figure B.3– Relaxed after load removal
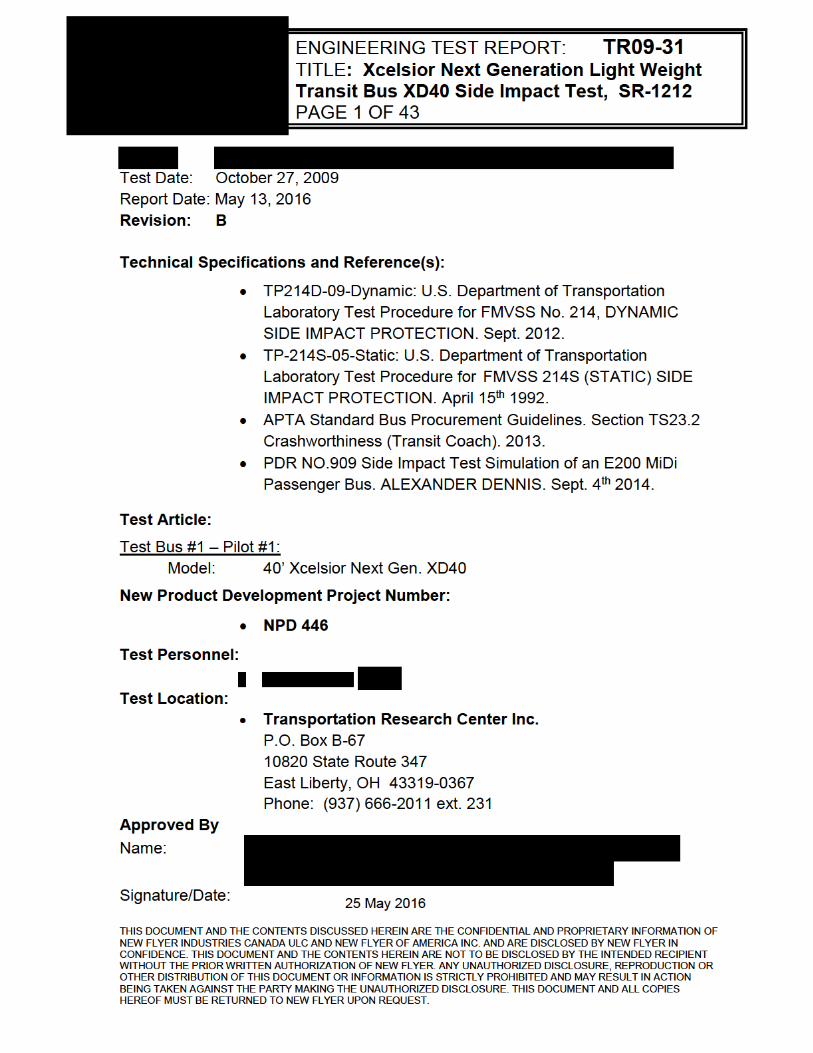


Crash Test of a 2001 Ford Taurus Into the Right Side of a
New Flyer Industries SR-1212, Xcelsior D40 2010 Engineering Bus at 25.6 mph
TRC Inc. Test Number: 091027-1
Prepared by: Transportation Research Center Inc.
10820 State Route 347 P.
O. Box B-67
East Liberty, OH 43319
Final Report October - November 2009
Prepared For: New Flyer Industries Limited
Unit #7, 45 Beghin Avenue Winnipeg, Manitoba, Canada R2J4B9
i
Table of Contents Section Description Page 1.0 Purpose and Test Procedure 1-1
2.0 Vehicle Information 2-1
3.0 Test Summary and Measurements 3-1
Appendix A Photographs A-1
ii
List of Photographs
Figure Title Page A-1 Pre-Test Bus Left Side View A-2
A-2 Post-Test Bus Left Side View A-2
A-3 Pre-Test Bus Rear View A-3
A-4 Post-Test Bus Rear View A-3
A-5 Pre-Test Bus Right Side View A-4
A-6 Post-Test Bus Right Side View A-4
A-7 Pre-Test Bus Right Side Close-up View A-5
A-8 Post-Test Bus Right Side Close-up View A-5
A-9 Pre-Test Vehicle to Bus Left Side View A-6
A-10 Post-Test Vehicle to Bus Left Side View A-6
A-11 Pre-Test Vehicle to Bus Left Side Close-up View A-7
A-12 Post-Test Vehicle to Bus Left Side Close-up View A-7
A-13 Pre-Test Vehicle to Bus Rear View A-8
A-14 Post-Test Vehicle to Bus Rear View A-8
A-15 Pre-Test Vehicle to Bus Right Side View A-9
A-16 Post-Test Vehicle to Bus Right Side View A-9
A-17 Pre-Test Vehicle to Bus Right Side Close-up View A-10
A-18 Post-Test Vehicle to Bus Right Side Close-up View A-10
A-19 Pre-Test Bus Floor Level Interior View A-11
A-20 Post-Test Bus Floor Level Interior - View 1 A-11
A-21 Post-Test Bus Floor Level Interior - View 2 A-12
A-22 Pre-Test Impact Point View A-13
A-23 Post-Test Impact Point View A-13
A-24 Pre-Test Impact Point Close-up View A-14
A-25 Post-Test Impact Point Close-up View A-14
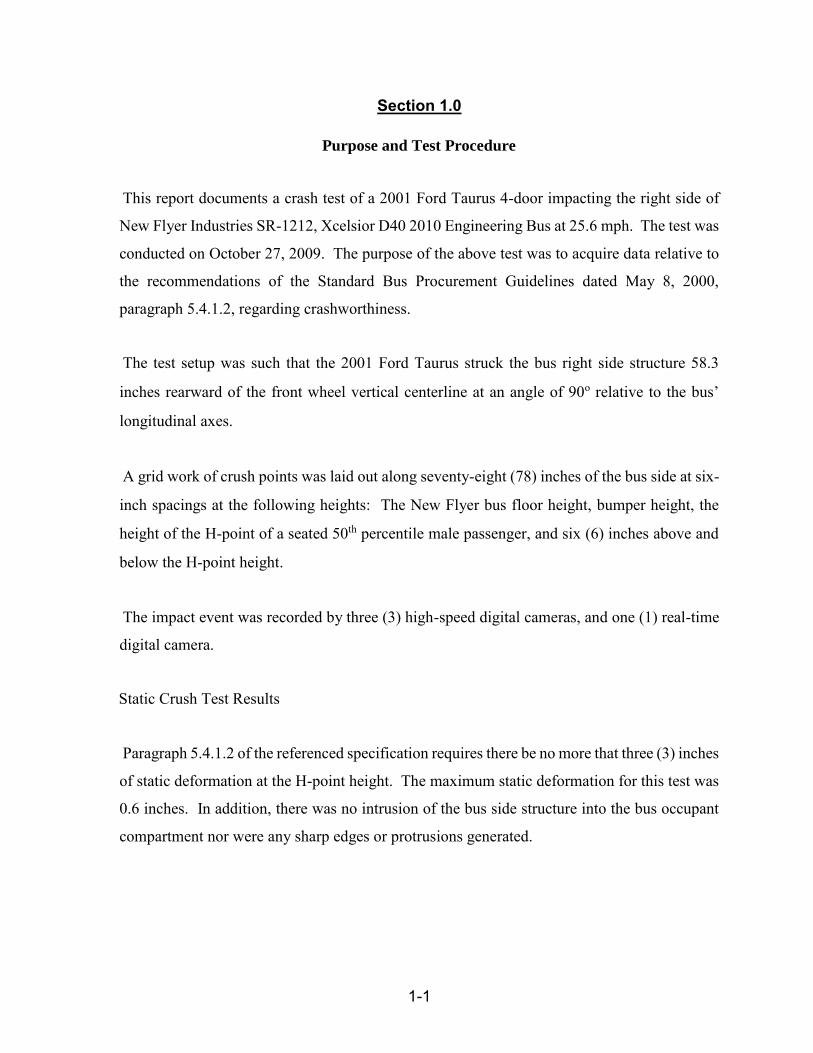
1-1
Section 1.0
Purpose and Test Procedure This report documents a crash test of a 2001 Ford Taurus 4-door impacting the right side of
New Flyer Industries SR-1212, Xcelsior D40 2010 Engineering Bus at 25.6 mph. The test was
conducted on October 27, 2009. The purpose of the above test was to acquire data relative to
the recommendations of the Standard Bus Procurement Guidelines dated May 8, 2000,
paragraph 5.4.1.2, regarding crashworthiness.
The test setup was such that the 2001 Ford Taurus struck the bus right side structure 58.3
inches rearward of the front wheel vertical centerline at an angle of 90o relative to the bus’
longitudinal axes.
A grid work of crush points was laid out along seventy-eight (78) inches of the bus side at six-
inch spacings at the following heights: The New Flyer bus floor height, bumper height, the
height of the H-point of a seated 50th percentile male passenger, and six (6) inches above and
below the H-point height.
The impact event was recorded by three (3) high-speed digital cameras, and one (1) real-time
digital camera.
Static Crush Test Results
Paragraph 5.4.1.2 of the referenced specification requires there be no more that three (3) inches
of static deformation at the H-point height. The maximum static deformation for this test was
0.6 inches. In addition, there was no intrusion of the bus side structure into the bus occupant
compartment nor were any sharp edges or protrusions generated.
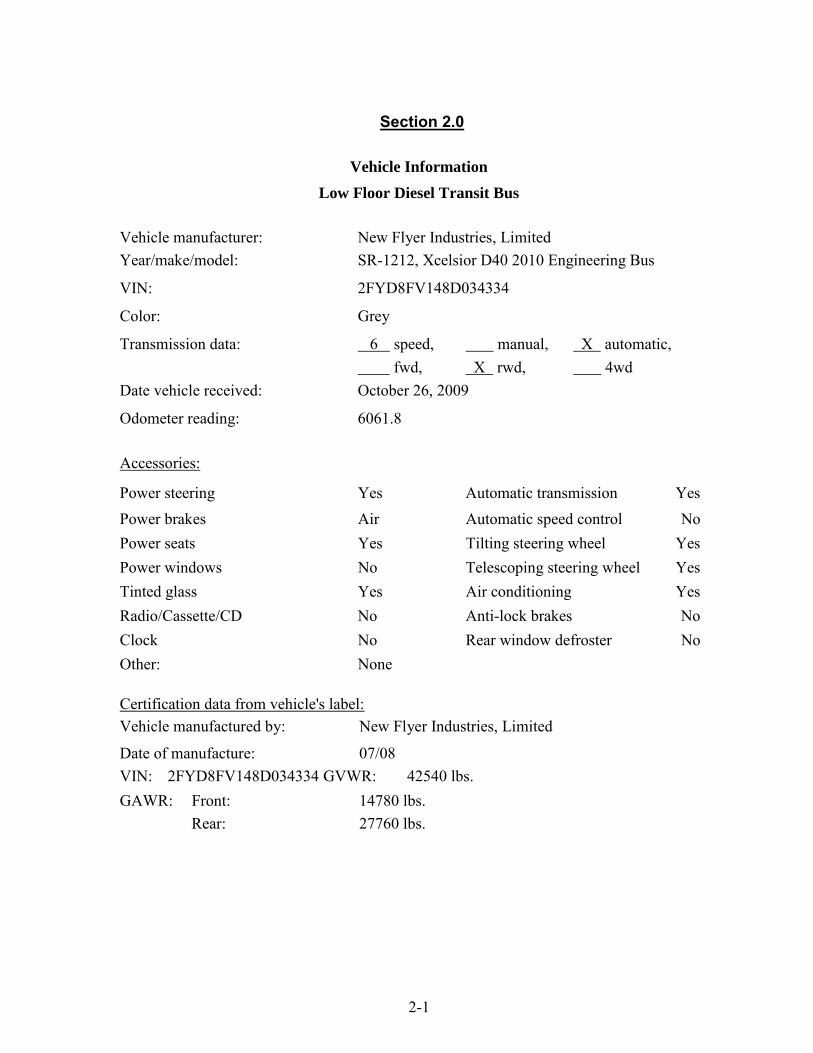
2-1
Section 2.0
Vehicle Information Low Floor Diesel Transit Bus
Vehicle manufacturer: New Flyer Industries, Limited Year/make/model: SR-1212, Xcelsior D40 2010 Engineering Bus
VIN: 2FYD8FV148D034334
Color: Grey
Transmission data: 6 speed, manual, X automatic, fwd, X rwd, 4wd Date vehicle received: October 26, 2009
Odometer reading: Accessories:
6061.8
Power steering Yes Automatic transmission Yes Power brakes Air Automatic speed control No Power seats Yes Tilting steering wheel Yes Power windows No Telescoping steering wheel Yes Tinted glass Yes Air conditioning Yes Radio/Cassette/CD No Anti-lock brakes No Clock No Rear window defroster No Other:
None
Certification data from vehicle's label: Vehicle manufactured by: New Flyer Industries, Limited Date of manufacture: 07/08 VIN: 2FYD8FV148D034334 GVWR: 42540 lbs. GAWR: Front: 14780 lbs. Rear: 27760 lbs.
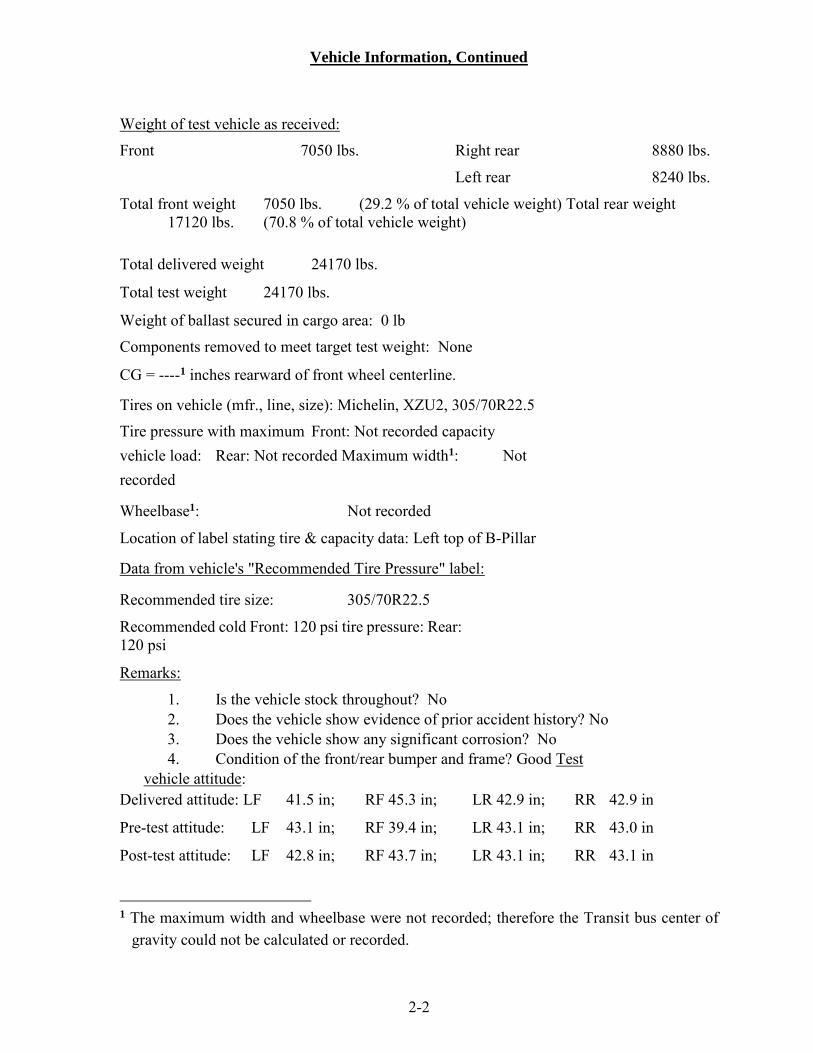
Vehicle Information, Continued
2-2
Weight of test vehicle as received: Front 7050 lbs. Right rear 8880 lbs. Left rear 8240 lbs. Total front weight 7050 lbs. (29.2 % of total vehicle weight) Total rear weight 17120 lbs. (70.8 % of total vehicle weight)
Total delivered weight 24170 lbs.
Total test weight 24170 lbs.
Weight of ballast secured in cargo area: 0 lb Components removed to meet target test weight: None
CG = ----1 inches rearward of front wheel centerline.
Tires on vehicle (mfr., line, size): Michelin, XZU2, 305/70R22.5 Tire pressure with maximum Front: Not recorded capacity vehicle load: Rear: Not recorded Maximum width1: Not recorded
Wheelbase1: Not recorded Location of label stating tire & capacity data: Left top of B-Pillar
Data from vehicle's "Recommended Tire Pressure" label:
Recommended tire size: 305/70R22.5 Recommended cold Front: 120 psi tire pressure: Rear: 120 psi
Remarks: 1. Is the vehicle stock throughout? No 2. Does the vehicle show evidence of prior accident history? No 3. Does the vehicle show any significant corrosion? No 4. Condition of the front/rear bumper and frame? Good Test
vehicle attitude:
Delivered attitude: LF 41.5 in; RF 45.3 in; LR 42.9 in; RR 42.9 in
Pre-test attitude: LF 43.1 in; RF 39.4 in; LR 43.1 in; RR 43.0 in
Post-test attitude: LF 42.8 in; RF 43.7 in; LR 43.1 in; RR 43.1 in 1 The maximum width and wheelbase were not recorded; therefore the Transit bus center of
gravity could not be calculated or recorded.
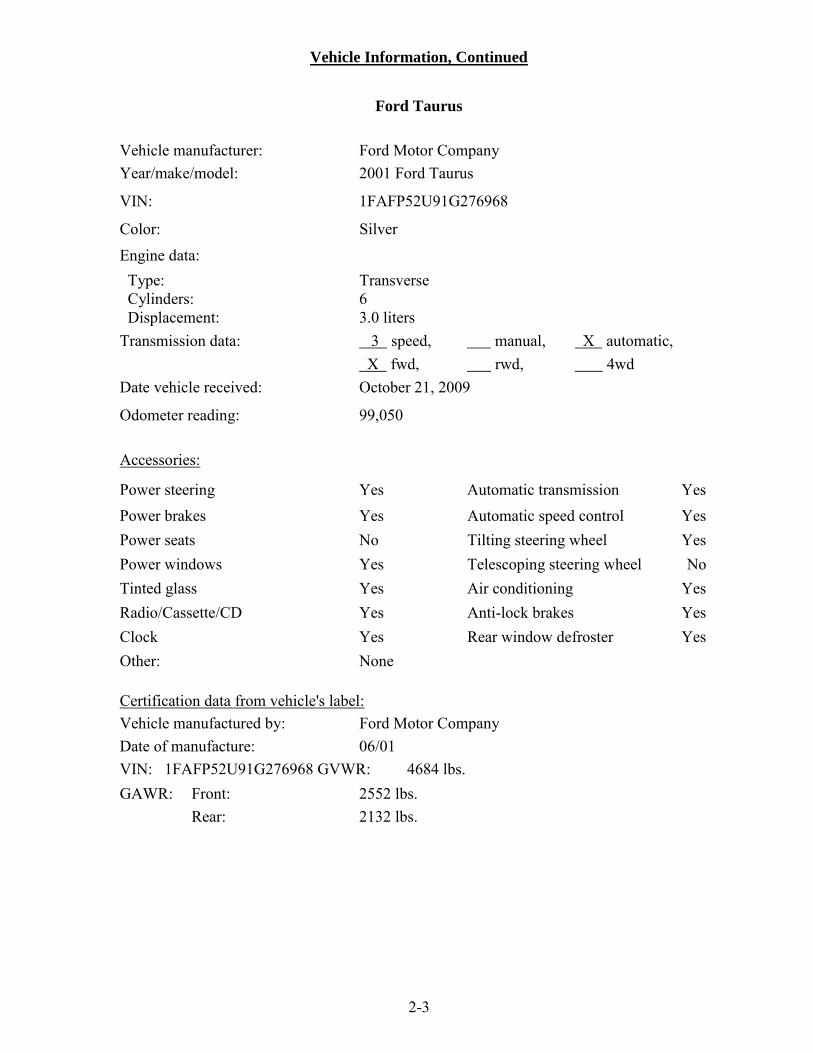
Vehicle Information, Continued
2-3
Ford Taurus
Vehicle manufacturer: Ford Motor Company Year/make/model: 2001 Ford Taurus
VIN: 1FAFP52U91G276968
Color: Engine data:
Silver
Type: Transverse Cylinders: 6 Displacement: 3.0 liters Transmission data: 3 speed, manual, X automatic, X fwd, rwd, 4wd Date vehicle received: October 21, 2009
Odometer reading: Accessories:
99,050
Power steering Yes Automatic transmission Yes Power brakes Yes Automatic speed control Yes Power seats No Tilting steering wheel Yes Power windows Yes Telescoping steering wheel No Tinted glass Yes Air conditioning Yes Radio/Cassette/CD Yes Anti-lock brakes Yes Clock Yes Rear window defroster Yes Other:
None
Certification data from vehicle's label: Vehicle manufactured by: Ford Motor Company Date of manufacture: 06/01 VIN: 1FAFP52U91G276968 GVWR: 4684 lbs. GAWR: Front: 2552 lbs. Rear: 2132 lbs.
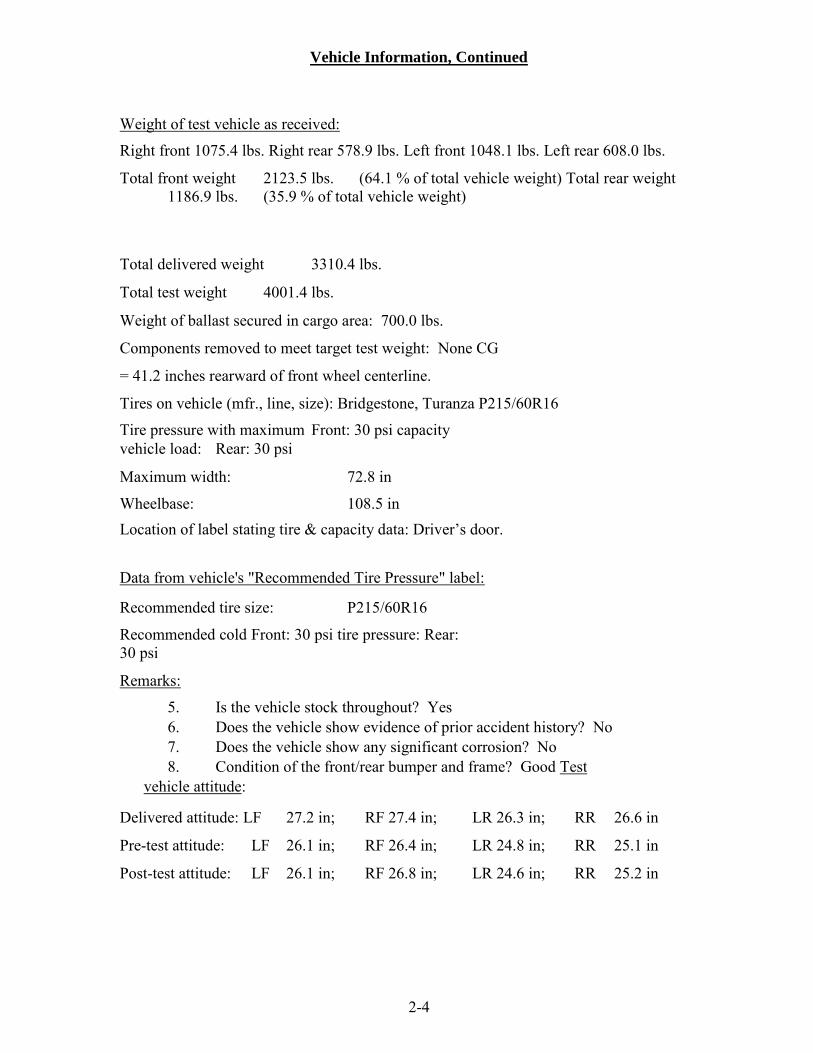
Vehicle Information, Continued
2-4
Weight of test vehicle as received: Right front 1075.4 lbs. Right rear 578.9 lbs. Left front 1048.1 lbs. Left rear 608.0 lbs.
Total front weight 2123.5 lbs. (64.1 % of total vehicle weight) Total rear weight 1186.9 lbs. (35.9 % of total vehicle weight)
Total delivered weight 3310.4 lbs.
Total test weight 4001.4 lbs.
Weight of ballast secured in cargo area: 700.0 lbs.
Components removed to meet target test weight: None CG
= 41.2 inches rearward of front wheel centerline.
Tires on vehicle (mfr., line, size): Bridgestone, Turanza P215/60R16 Tire pressure with maximum Front: 30 psi capacity vehicle load: Rear: 30 psi
Maximum width: 72.8 in Wheelbase: 108.5 in Location of label stating tire & capacity data: Driver’s door.
Data from vehicle's "Recommended Tire Pressure" label:
Recommended tire size: P215/60R16 Recommended cold Front: 30 psi tire pressure: Rear: 30 psi
Remarks: 5. Is the vehicle stock throughout? Yes 6. Does the vehicle show evidence of prior accident history? No 7. Does the vehicle show any significant corrosion? No 8. Condition of the front/rear bumper and frame? Good Test
vehicle attitude:
Delivered attitude: LF 27.2 in; RF 27.4 in; LR 26.3 in; RR 26.6 in
Pre-test attitude: LF 26.1 in; RF 26.4 in; LR 24.8 in; RR 25.1 in
Post-test attitude: LF 26.1 in; RF 26.8 in; LR 24.6 in; RR 25.2 in
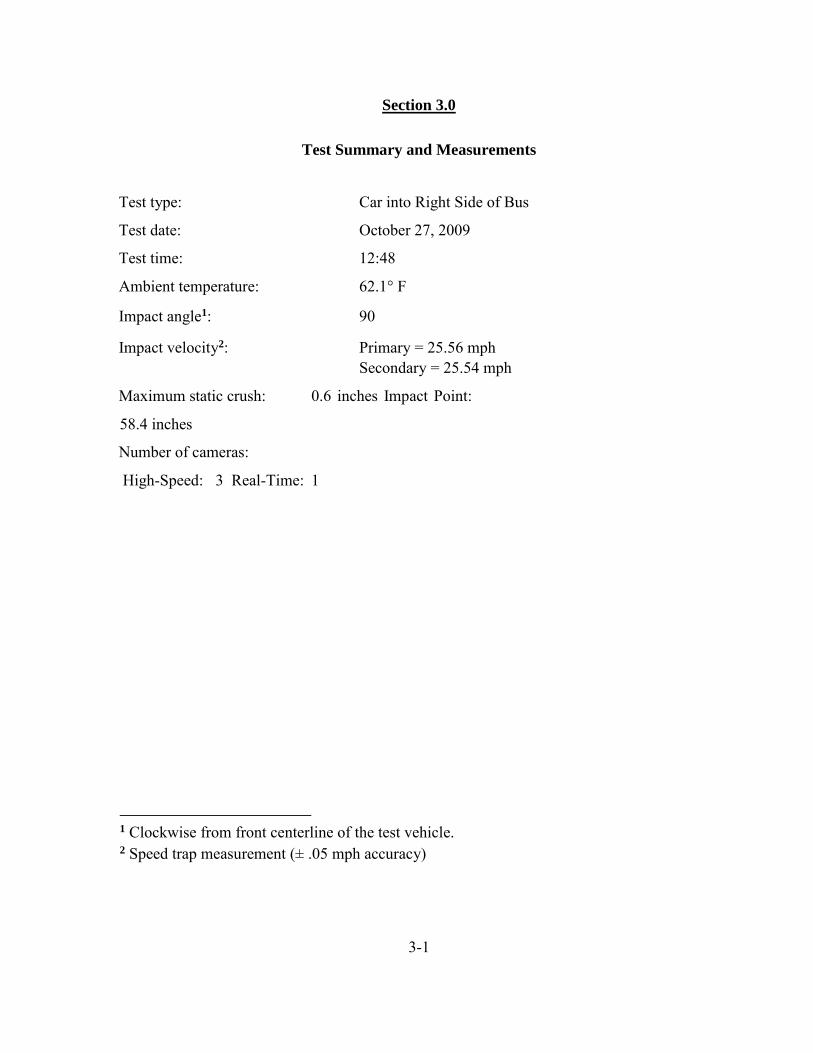
Section 3.0
Test Summary and Measurements Test type: Car into Right Side of Bus
Test date: October 27, 2009
Test time: 12:48
Ambient temperature: 62.1° F
Impact angle1: 90
Impact velocity2: Primary = 25.56 mph Secondary = 25.54 mph
Maximum static crush: 0.6 inches Impact Point:
58.4 inches
Number of cameras:
High-Speed: 3 Real-Time: 1
1 Clockwise from front centerline of the test vehicle. 2 Speed trap measurement (± .05 mph accuracy)
3-1

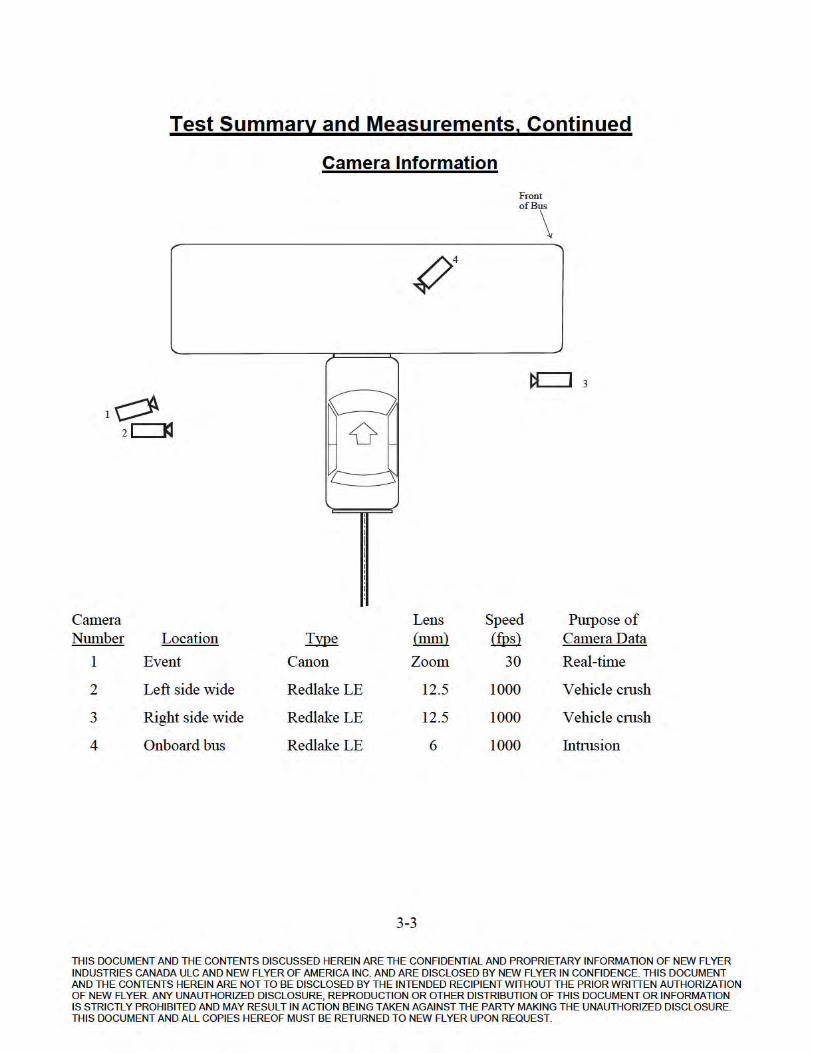

Appendix A
Photographs
A-1
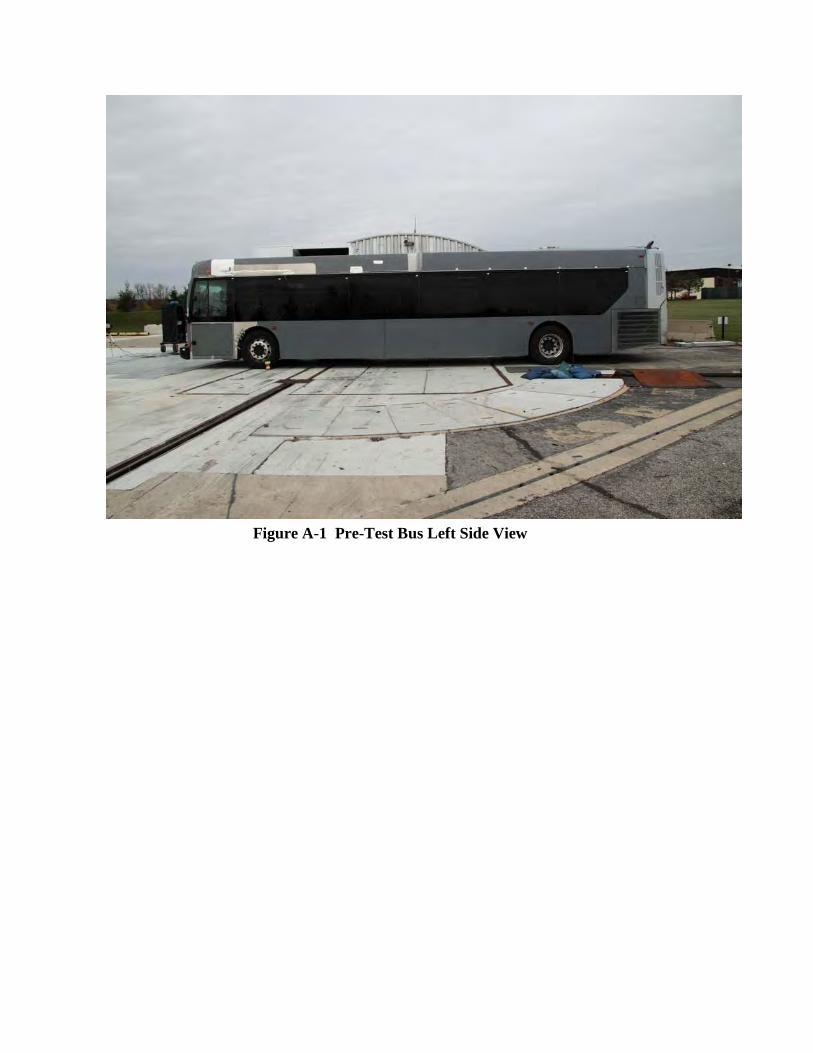
Figure A-1 Pre-Test Bus Left Side View
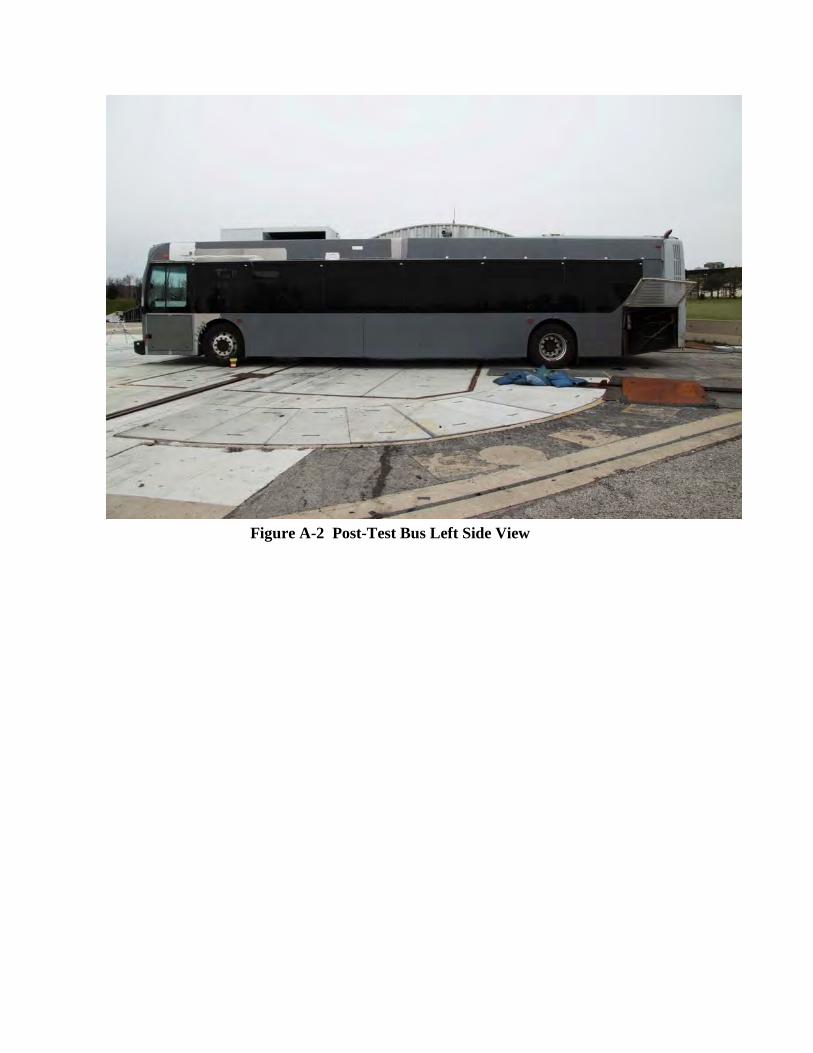
Figure A-2 Post-Test Bus Left Side View
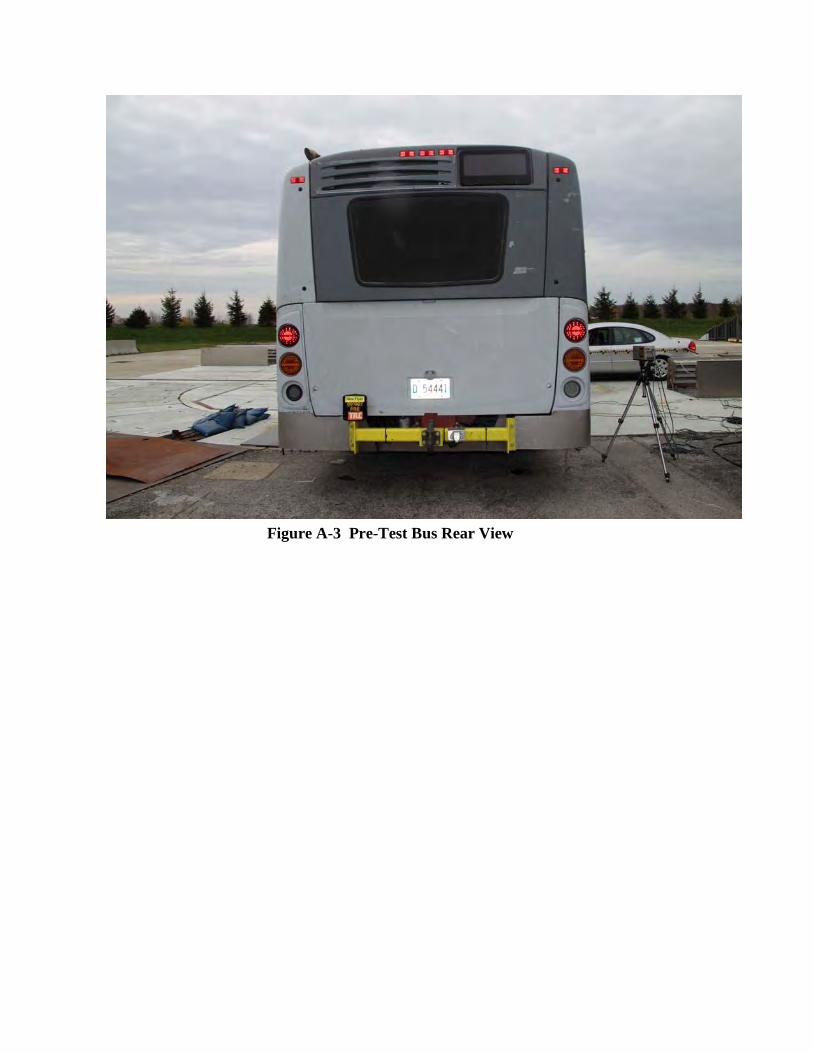
Figure A-3 Pre-Test Bus Rear View
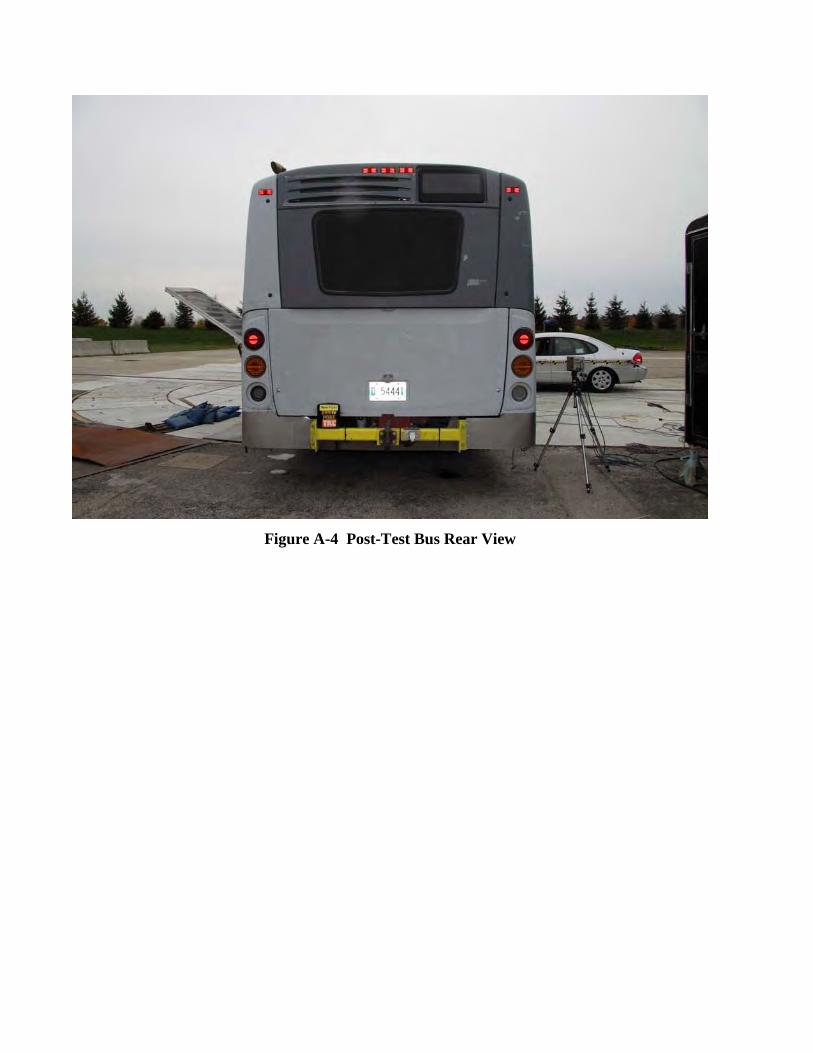
Figure A-4 Post-Test Bus Rear View
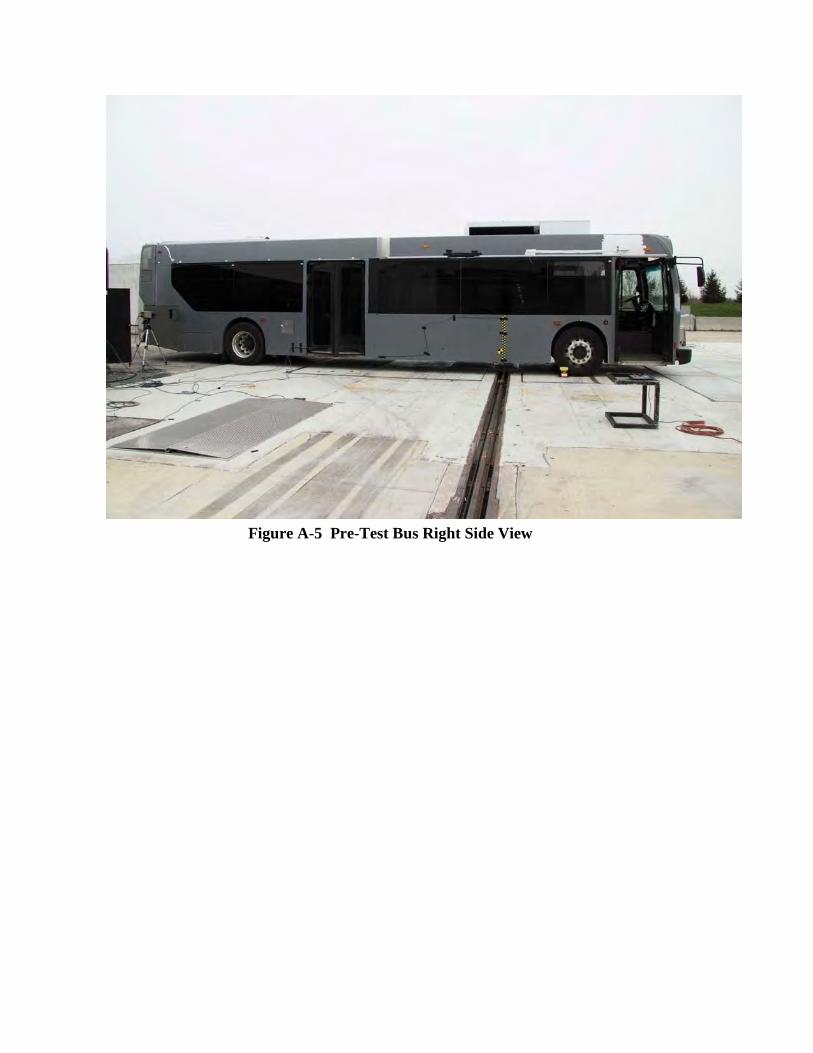
Figure A-5 Pre-Test Bus Right Side View
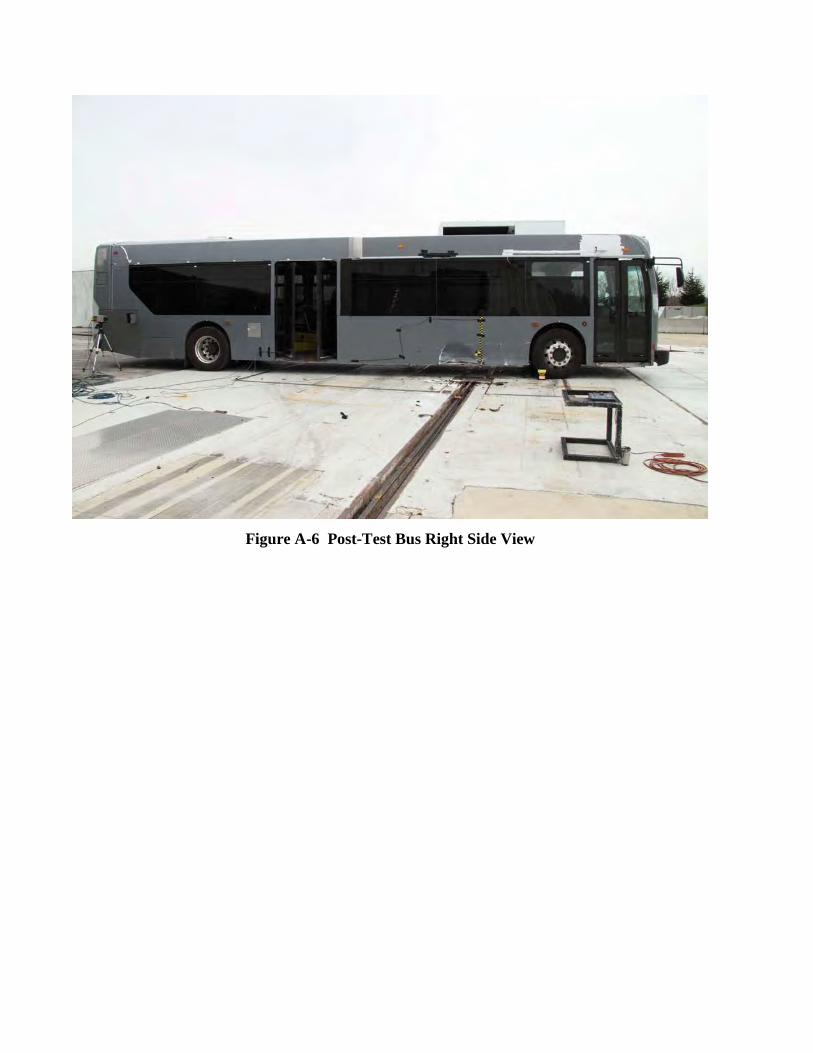
Figure A-6 Post-Test Bus Right Side View
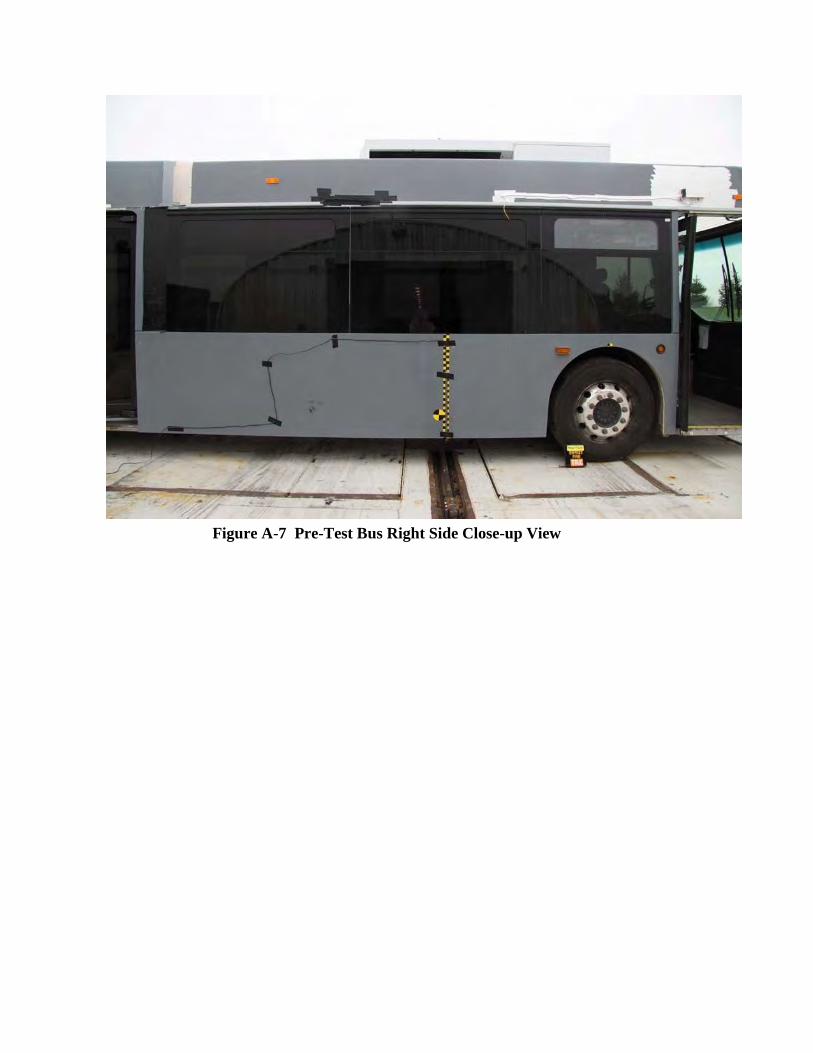
Figure A-7 Pre-Test Bus Right Side Close-up View
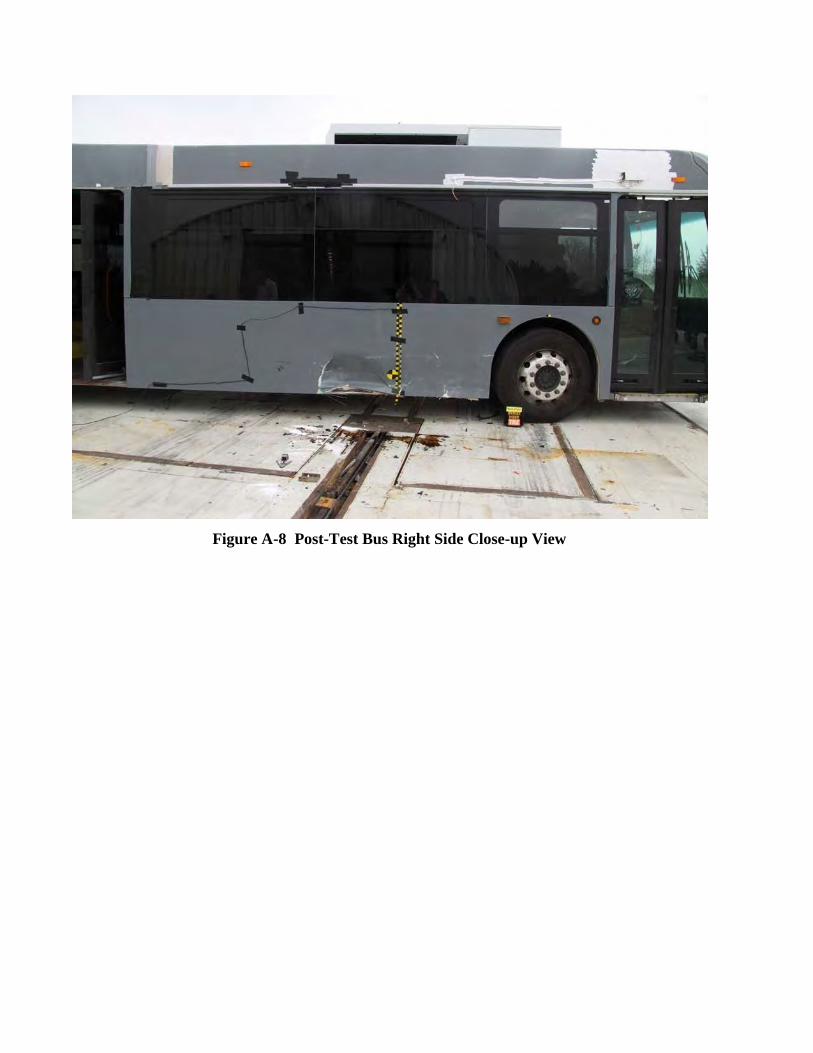
Figure A-8 Post-Test Bus Right Side Close-up View
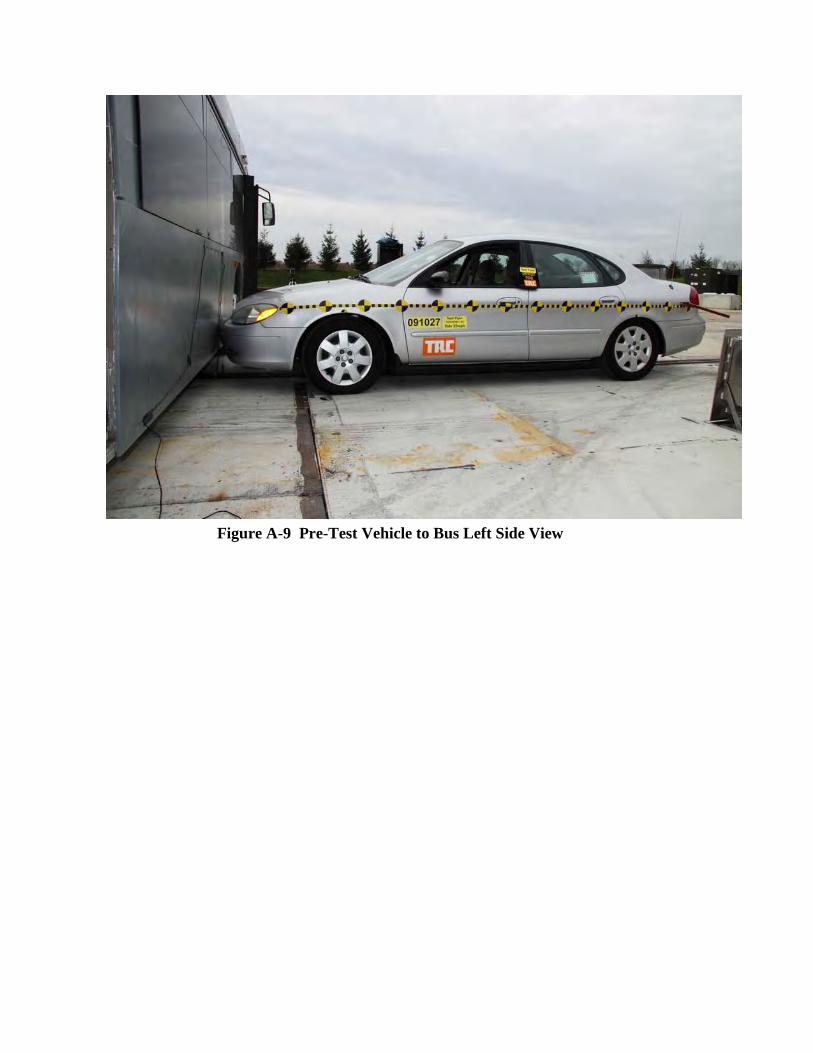
Figure A-9 Pre-Test Vehicle to Bus Left Side View
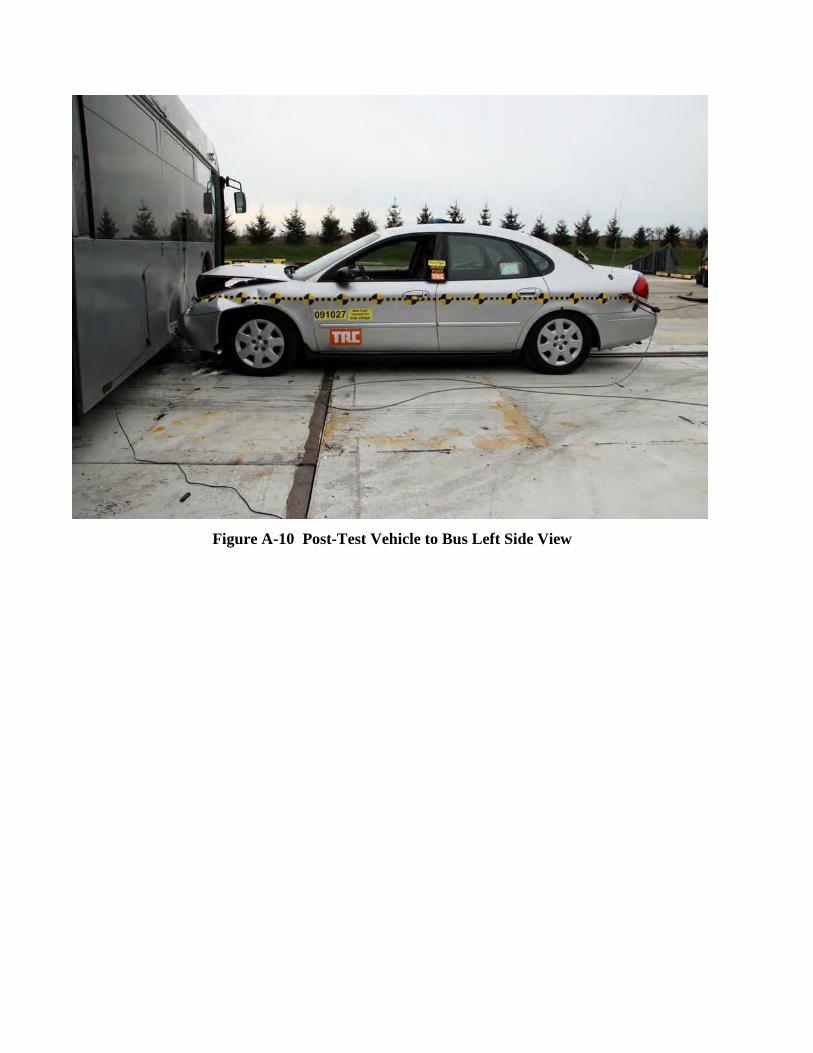
Figure A-10 Post-Test Vehicle to Bus Left Side View
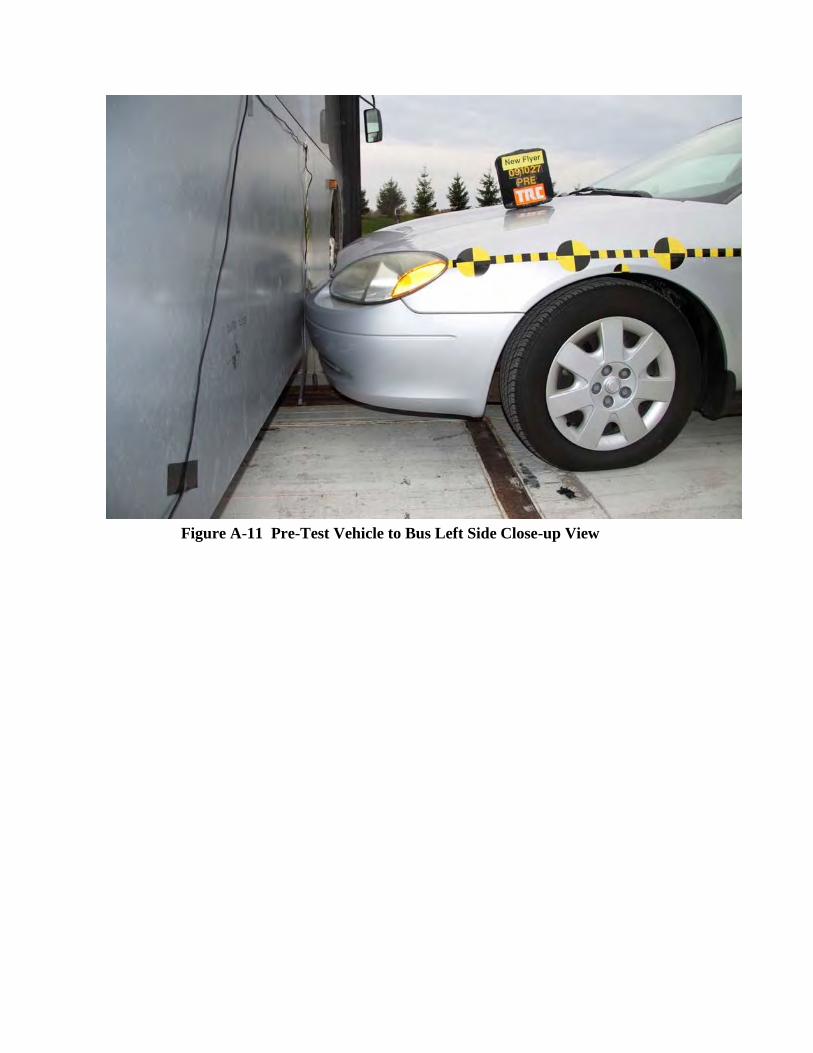
Figure A-11 Pre-Test Vehicle to Bus Left Side Close-up View
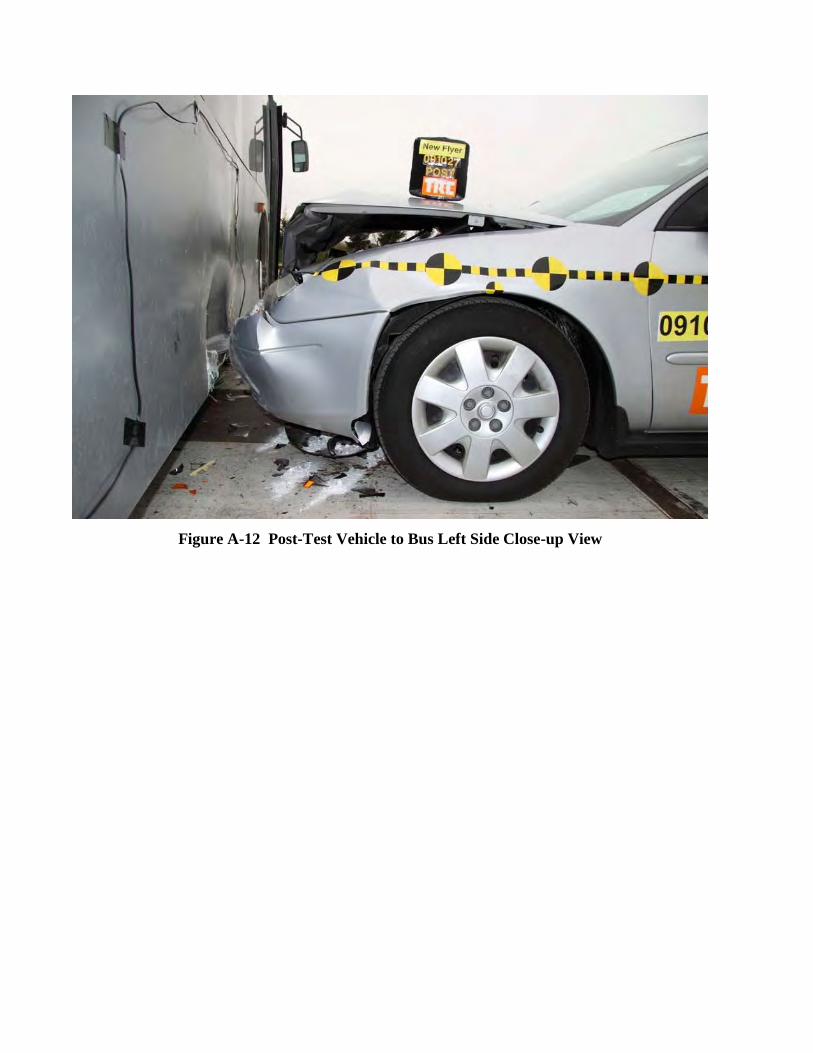
Figure A-12 Post-Test Vehicle to Bus Left Side Close-up View
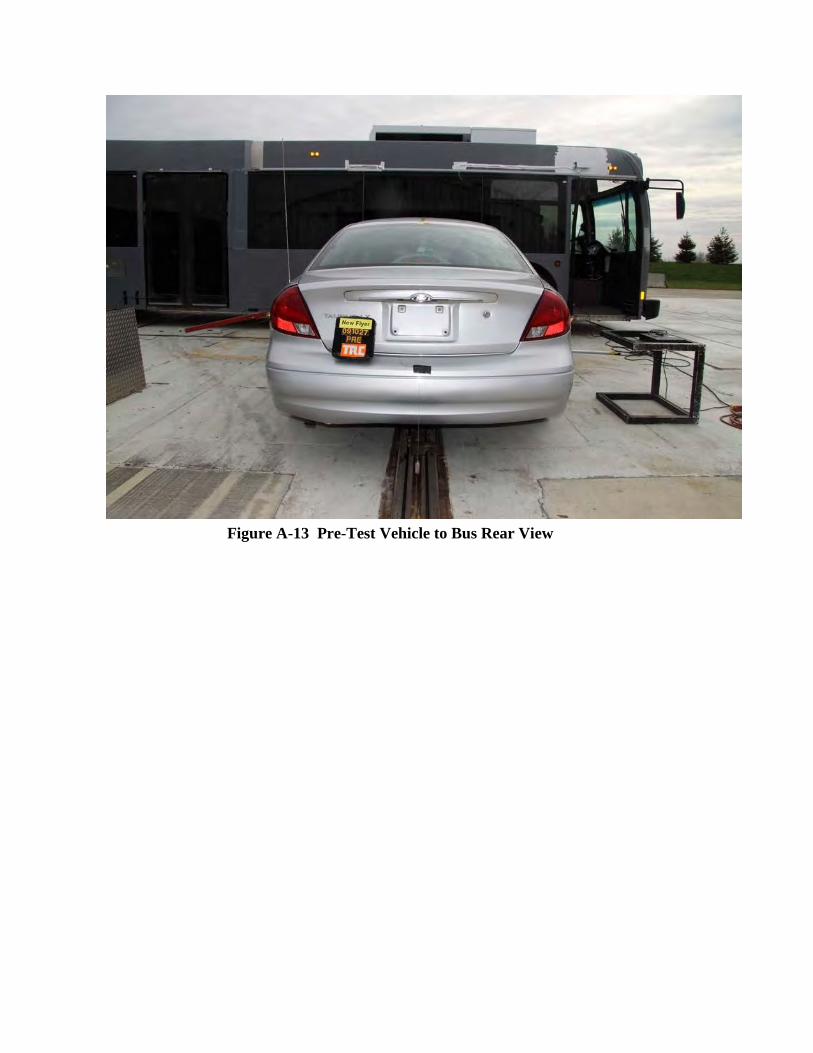
Figure A-13 Pre-Test Vehicle to Bus Rear View
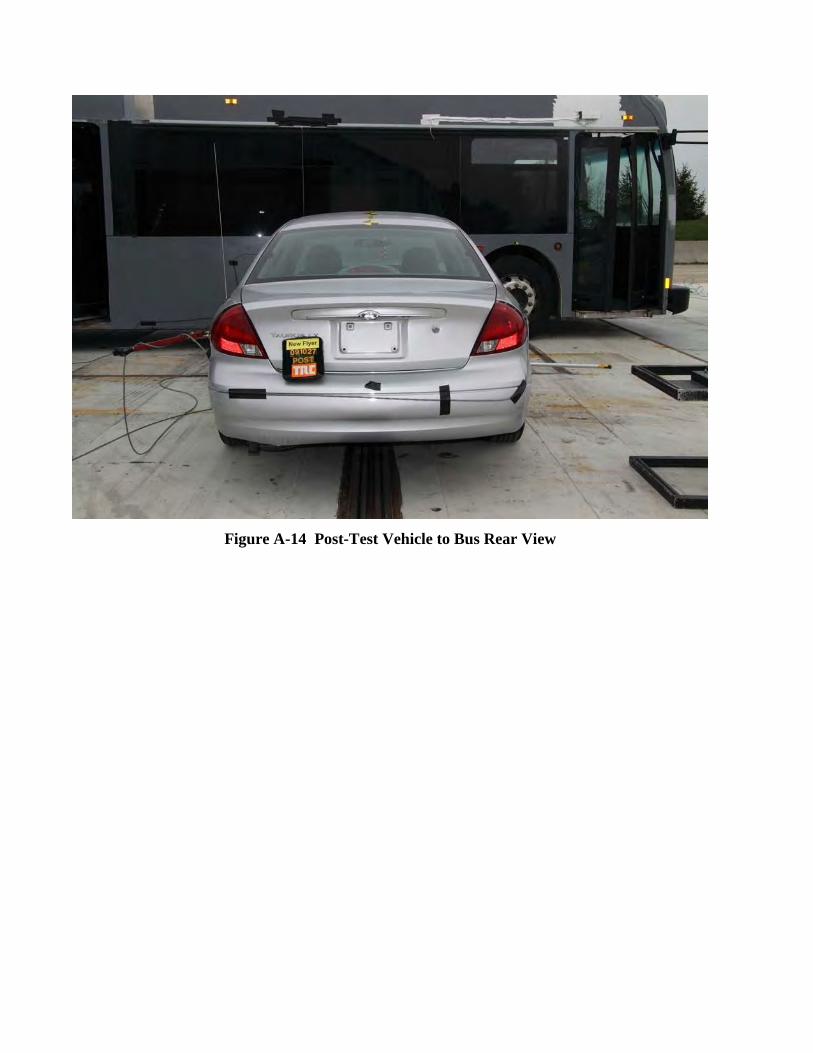
Figure A-14 Post-Test Vehicle to Bus Rear View
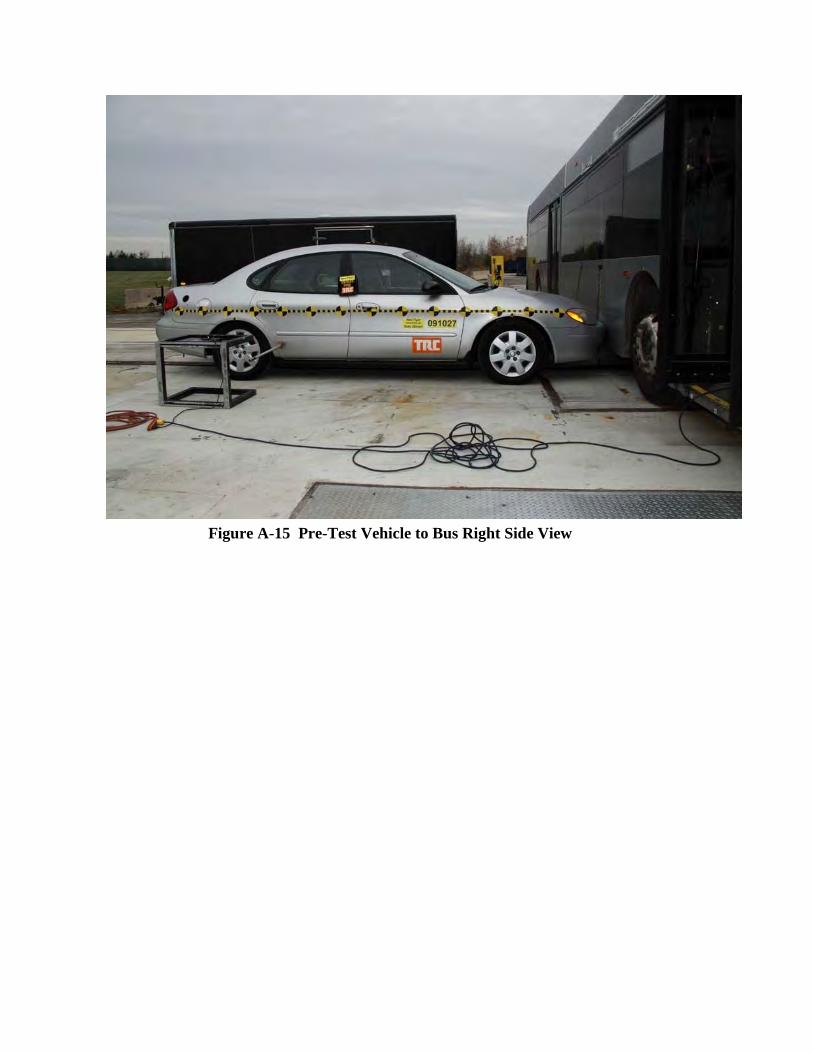
Figure A-15 Pre-Test Vehicle to Bus Right Side View
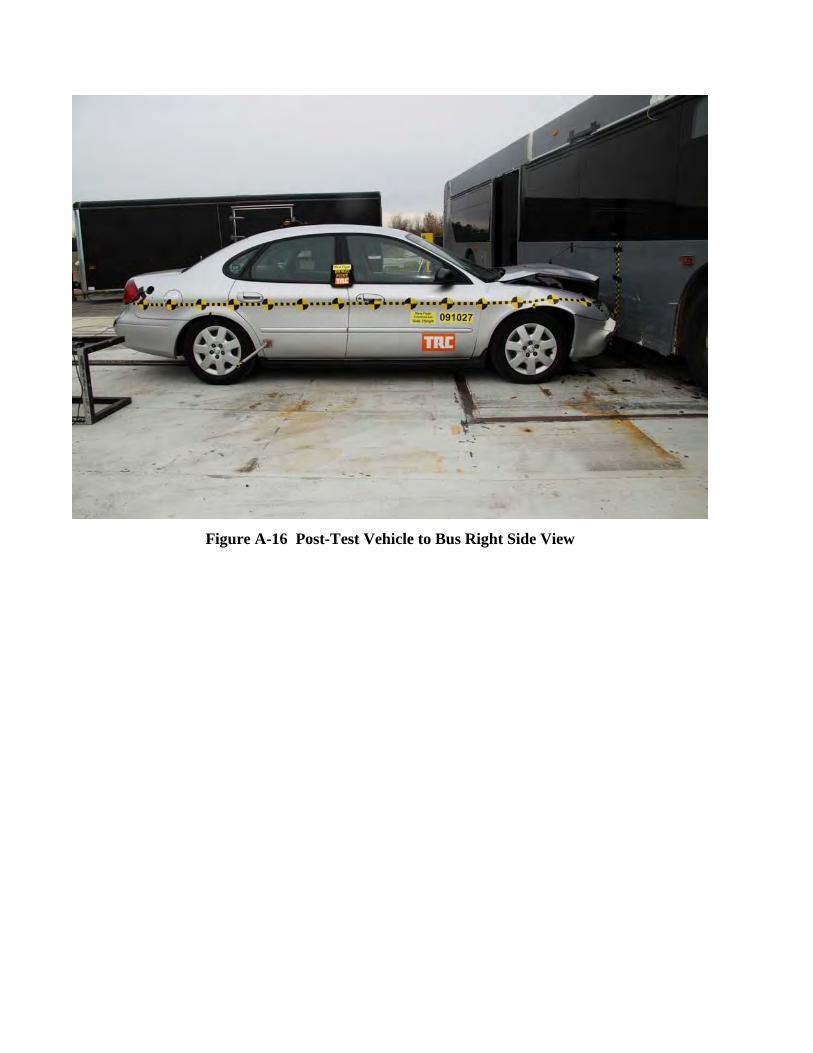
Figure A-16 Post-Test Vehicle to Bus Right Side View
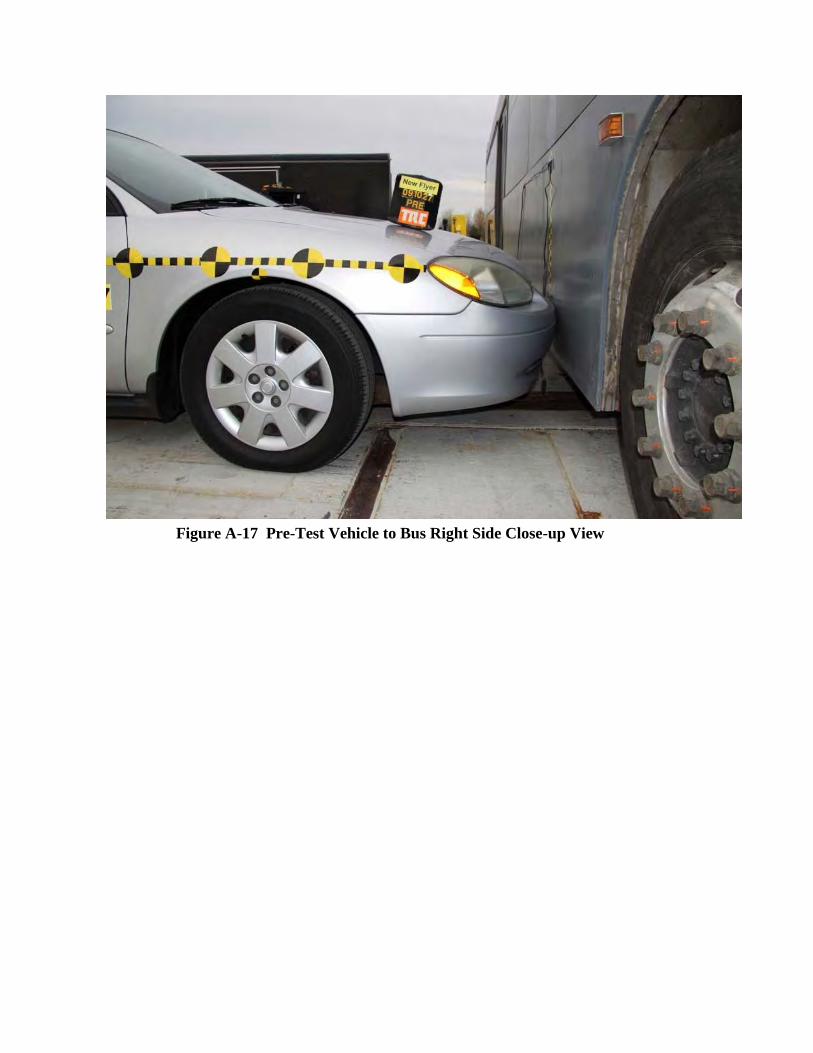
Figure A-17 Pre-Test Vehicle to Bus Right Side Close-up View
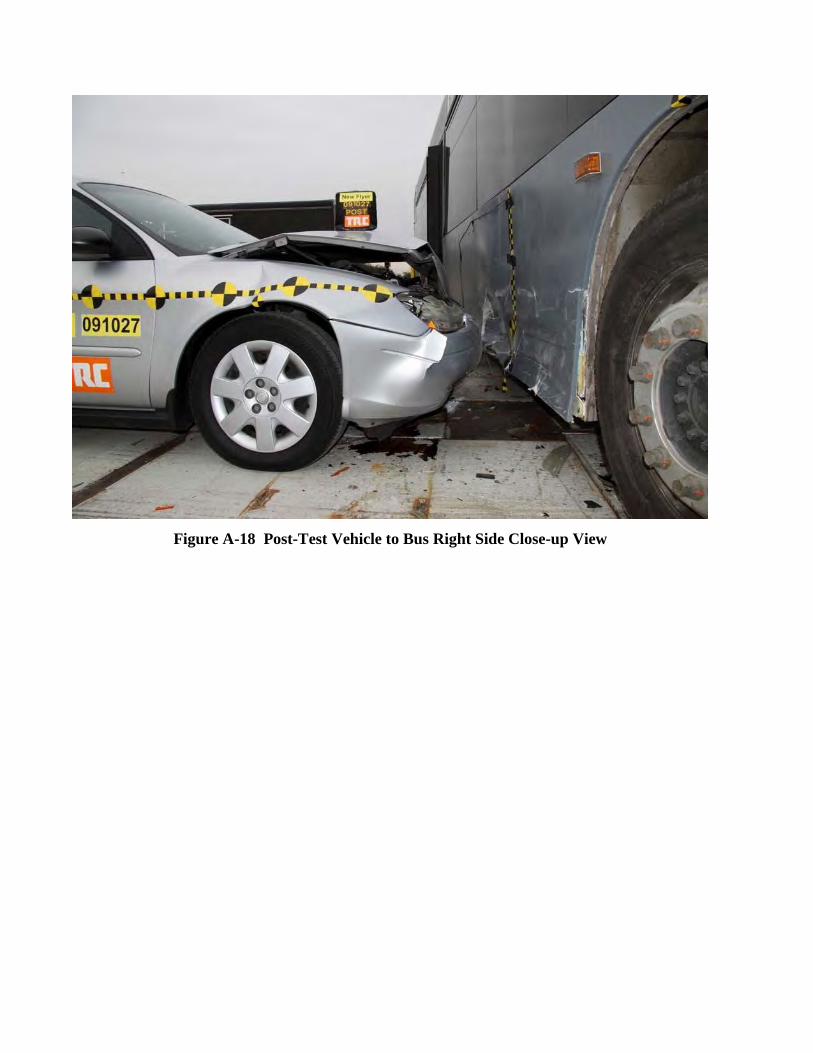
Figure A-18 Post-Test Vehicle to Bus Right Side Close-up View
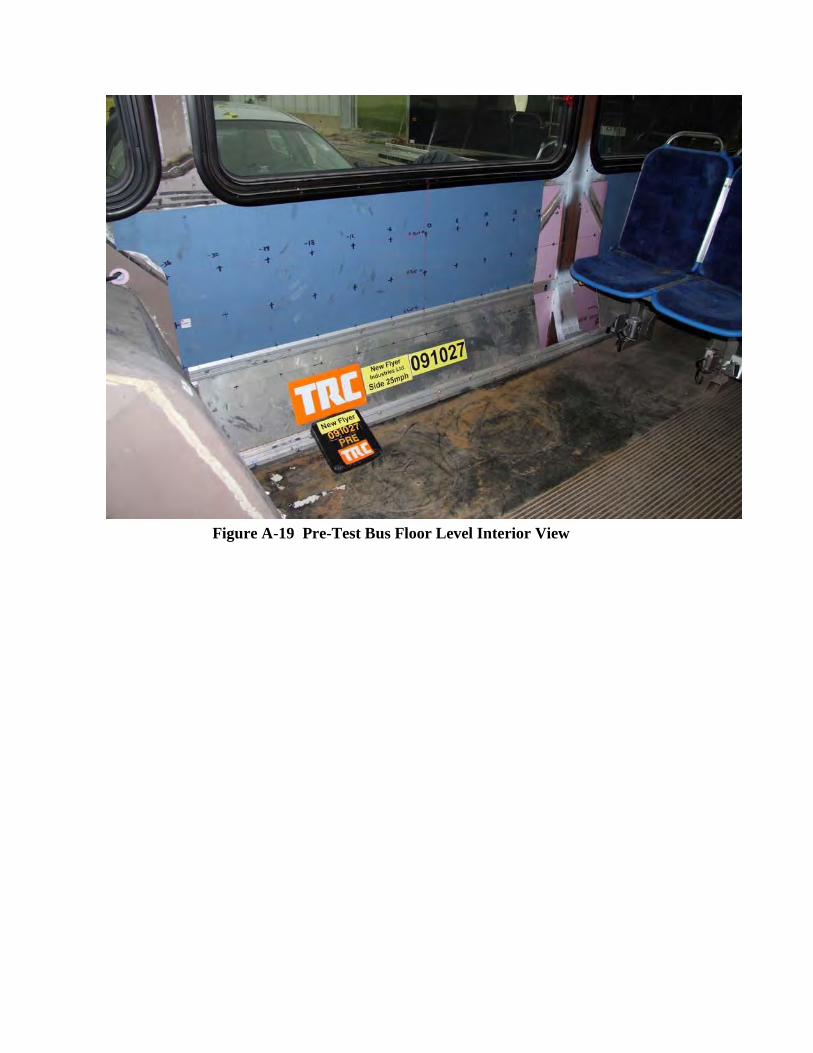
Figure A-19 Pre-Test Bus Floor Level Interior View
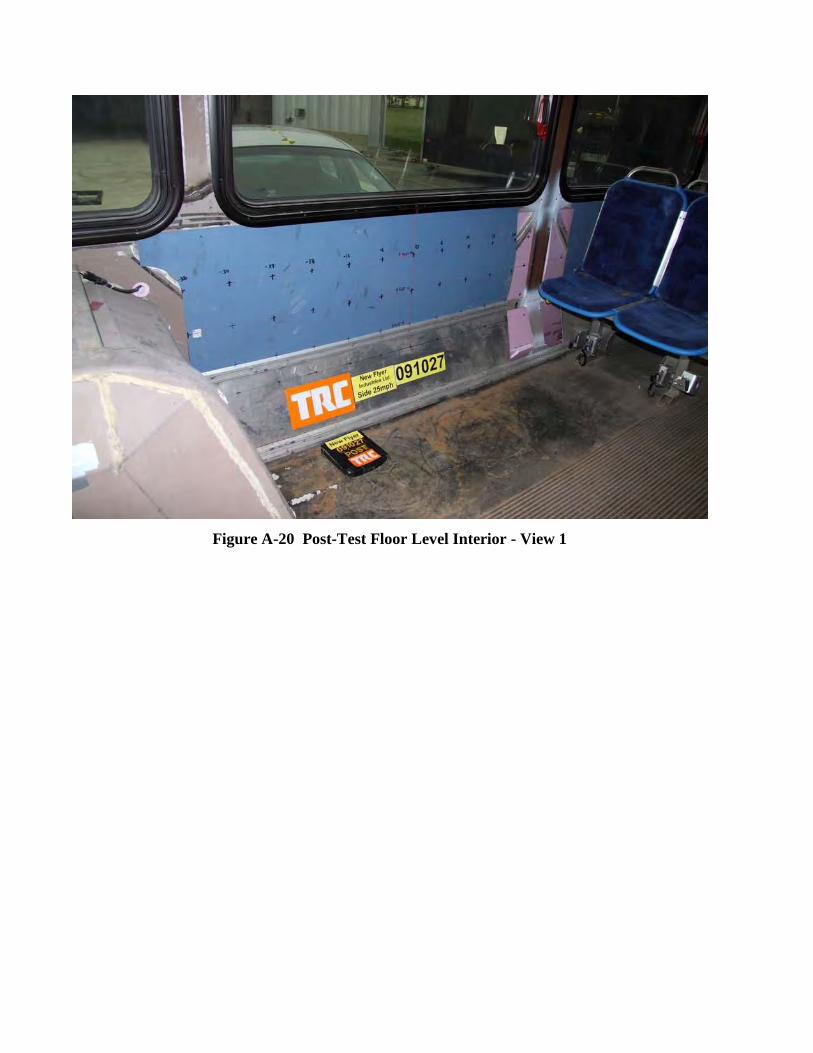
Figure A-20 Post-Test Floor Level Interior - View 1
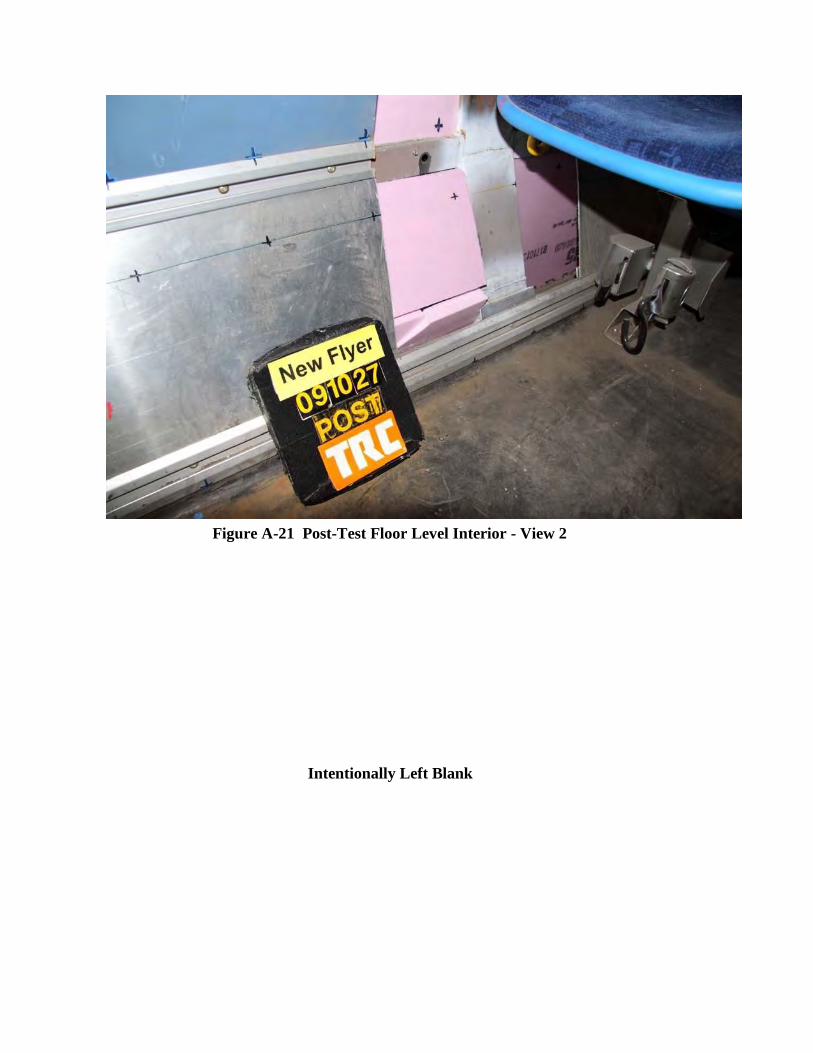
Figure A-21 Post-Test Floor Level Interior - View 2
Intentionally Left Blank
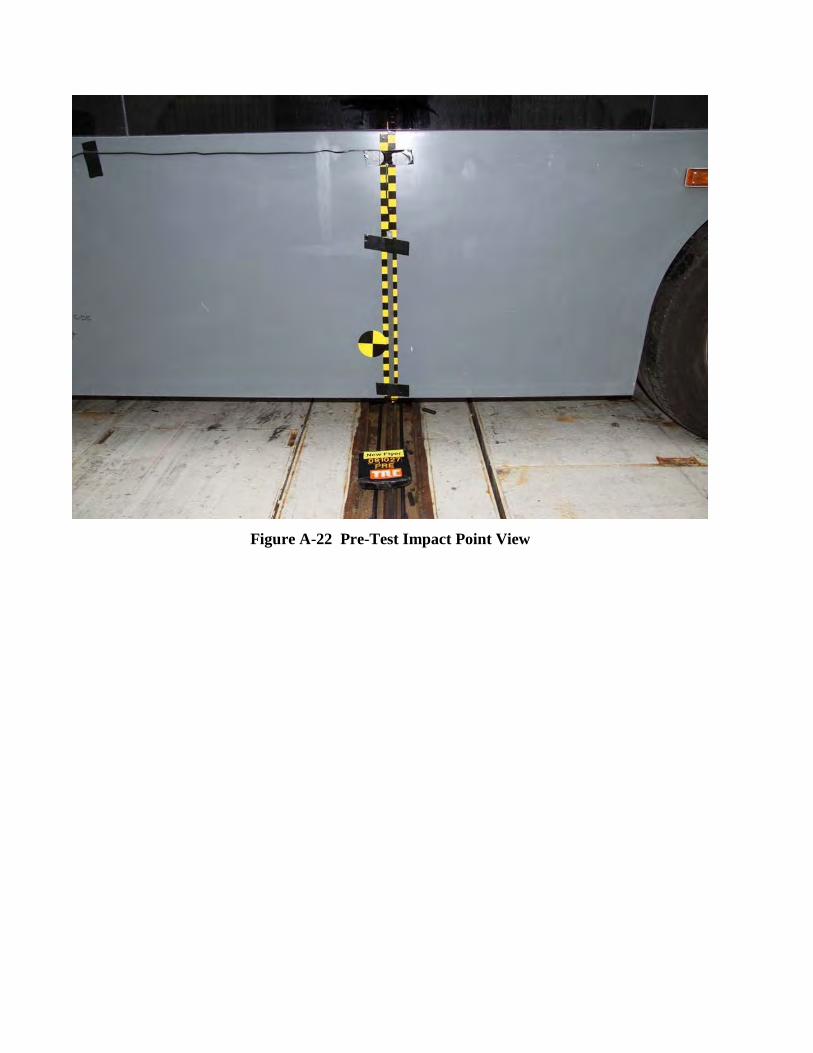
Figure A-22 Pre-Test Impact Point View
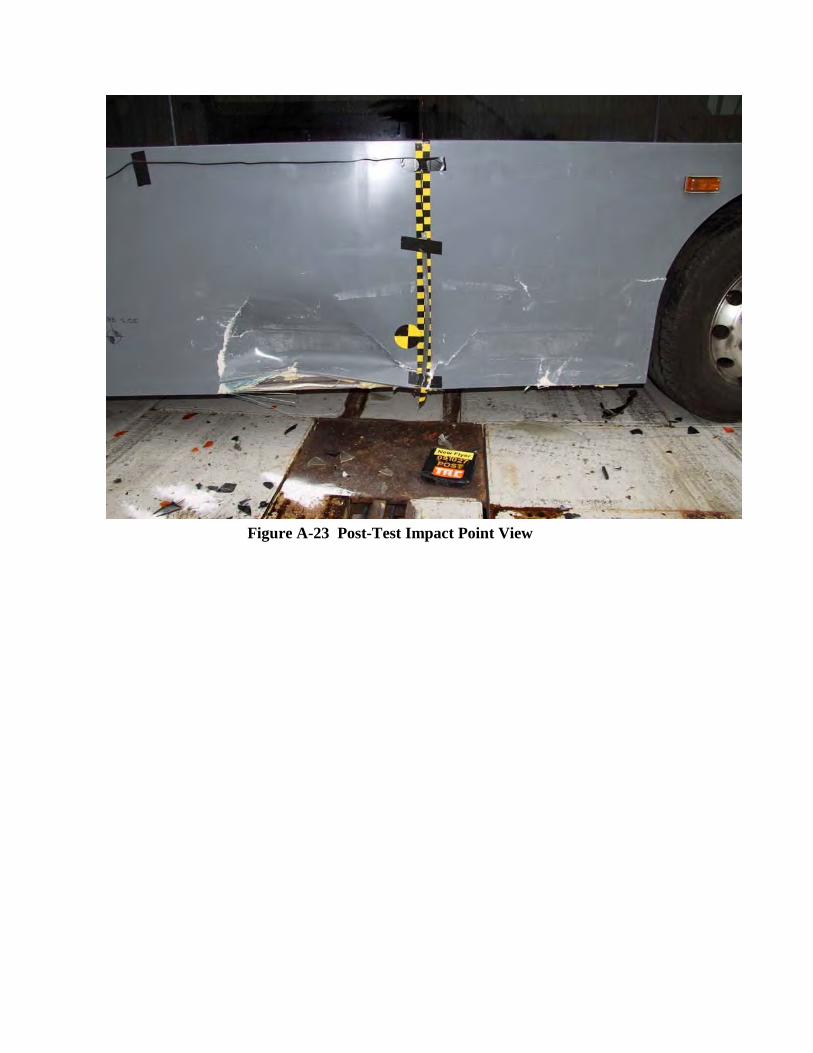
Figure A-23 Post-Test Impact Point View
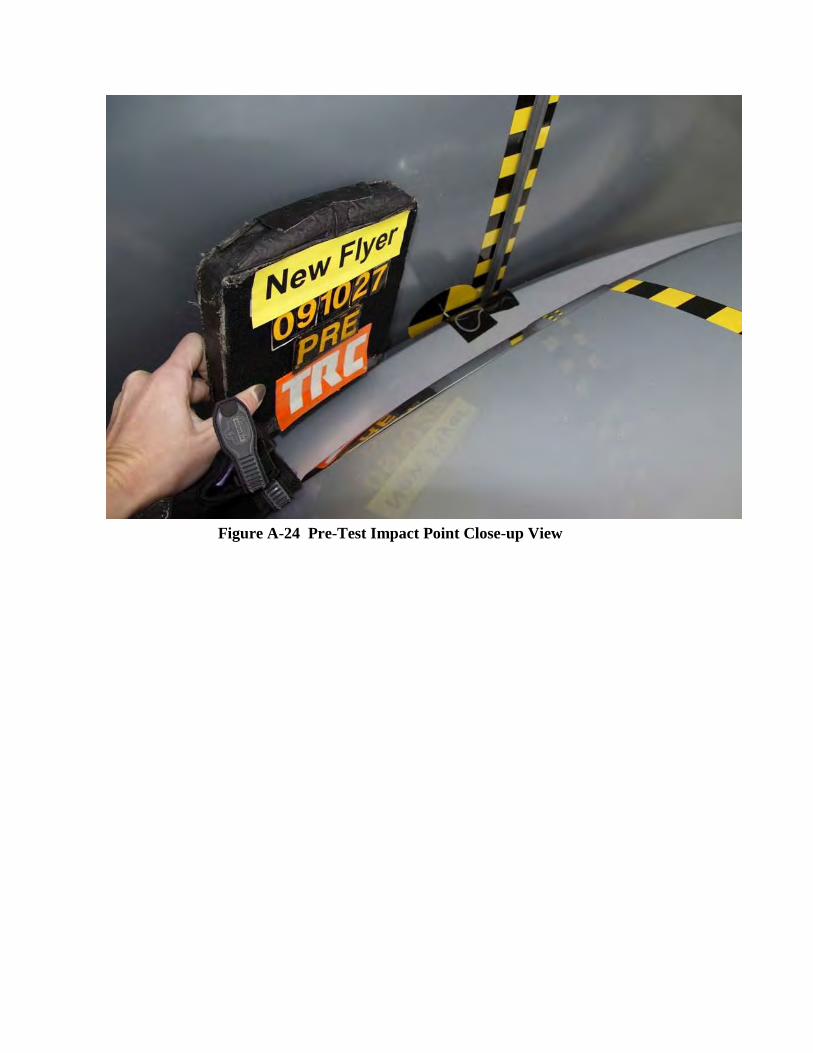
Figure A-24 Pre-Test Impact Point Close-up View
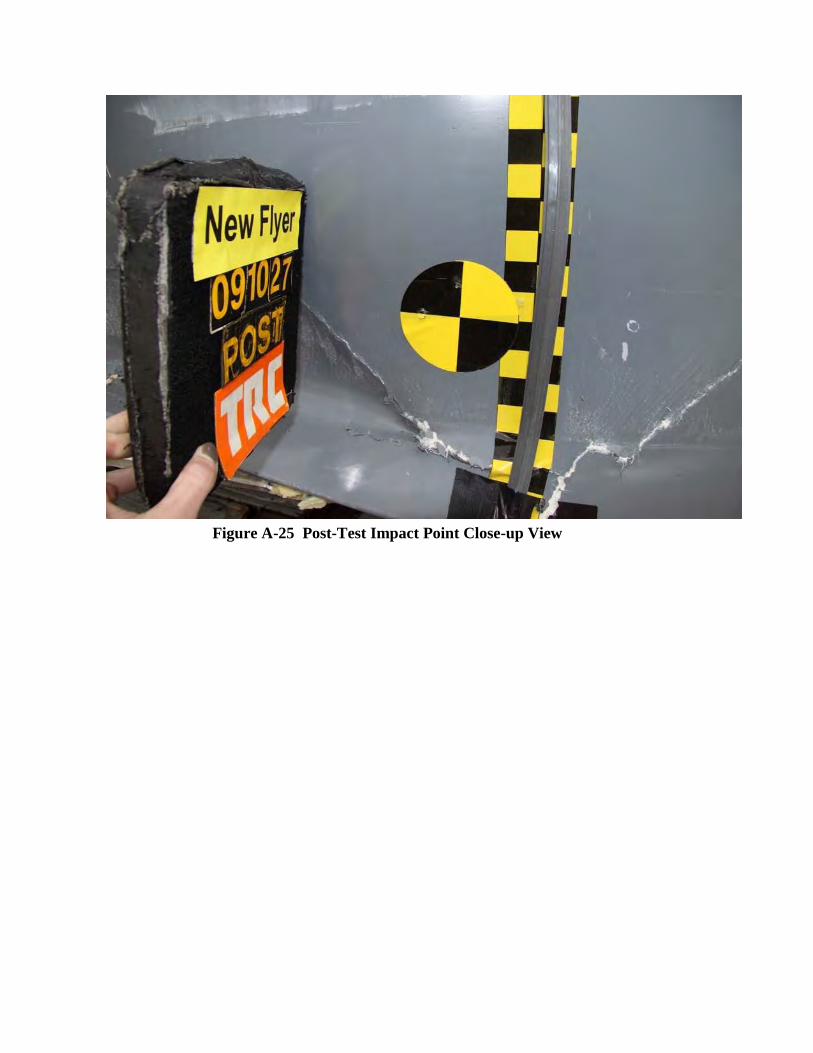
Figure A-25 Post-Test Impact Point Close-up View
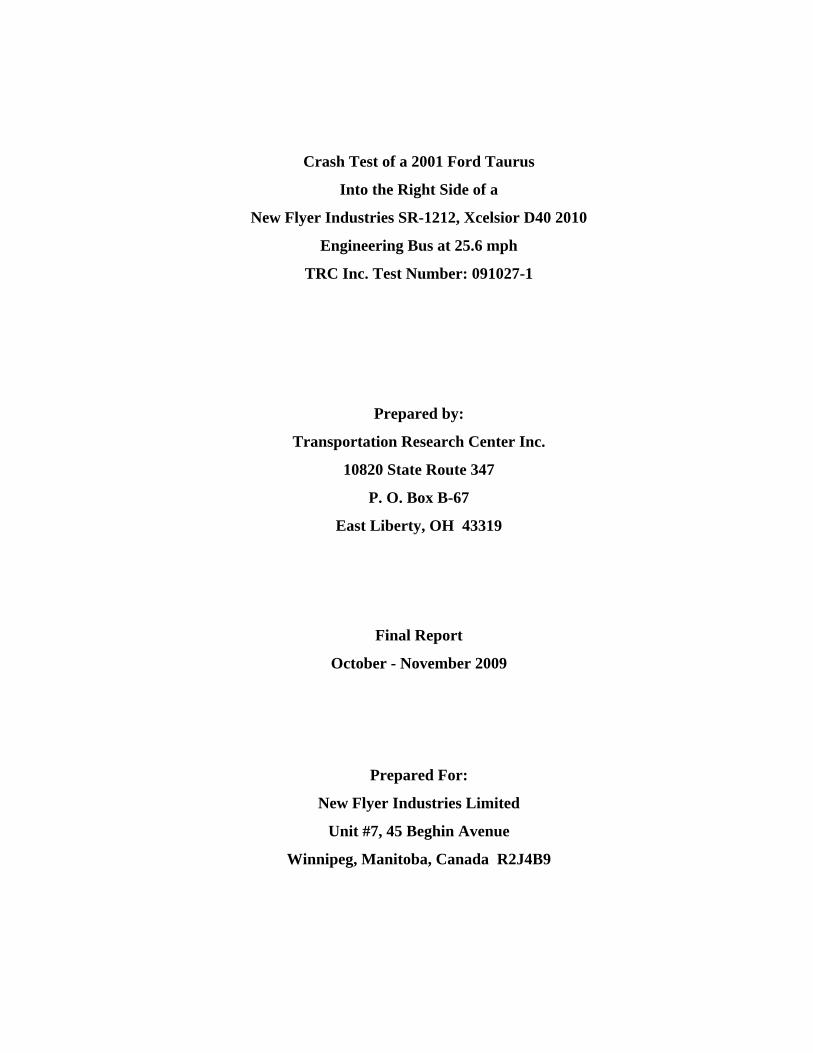
Crash Test of a 2001 Ford Taurus
Into the Right Side of a
New Flyer Industries SR-1212, Xcelsior D40 2010
Engineering Bus at 25.6 mph
TRC Inc. Test Number: 091027-1
Prepared by:
Transportation Research Center Inc.
10820 State Route 347
P. O. Box B-67
East Liberty, OH 43319
Final Report
October - November 2009
Prepared For:
New Flyer Industries Limited
Unit #7, 45 Beghin Avenue
Winnipeg, Manitoba, Canada R2J4B9
i
Table of Contents Section Description Page
1.0 Purpose and Test Procedure 1-1
2.0 Vehicle Information 2-1
3.0 Test Summary and Measurements 3-1
Appendix A Photographs A-1
ii
List of Photographs
Figure Title Page
A-1 Pre-Test Bus Left Side View A-2
A-2 Post-Test Bus Left Side View A-2
A-3 Pre-Test Bus Rear View A-3
A-4 Post-Test Bus Rear View A-3
A-5 Pre-Test Bus Right Side View A-4
A-6 Post-Test Bus Right Side View A-4
A-7 Pre-Test Bus Right Side Close-up View A-5
A-8 Post-Test Bus Right Side Close-up View A-5
A-9 Pre-Test Vehicle to Bus Left Side View A-6
A-10 Post-Test Vehicle to Bus Left Side View A-6
A-11 Pre-Test Vehicle to Bus Left Side Close-up View A-7
A-12 Post-Test Vehicle to Bus Left Side Close-up View A-7
A-13 Pre-Test Vehicle to Bus Rear View A-8
A-14 Post-Test Vehicle to Bus Rear View A-8
A-15 Pre-Test Vehicle to Bus Right Side View A-9
A-16 Post-Test Vehicle to Bus Right Side View A-9
A-17 Pre-Test Vehicle to Bus Right Side Close-up View A-10
A-18 Post-Test Vehicle to Bus Right Side Close-up View A-10
A-19 Pre-Test Bus Floor Level Interior View A-11
A-20 Post-Test Bus Floor Level Interior - View 1 A-11
A-21 Post-Test Bus Floor Level Interior - View 2 A-12
A-22 Pre-Test Impact Point View A-13
A-23 Post-Test Impact Point View A-13
A-24 Pre-Test Impact Point Close-up View A-14
A-25 Post-Test Impact Point Close-up View A-14
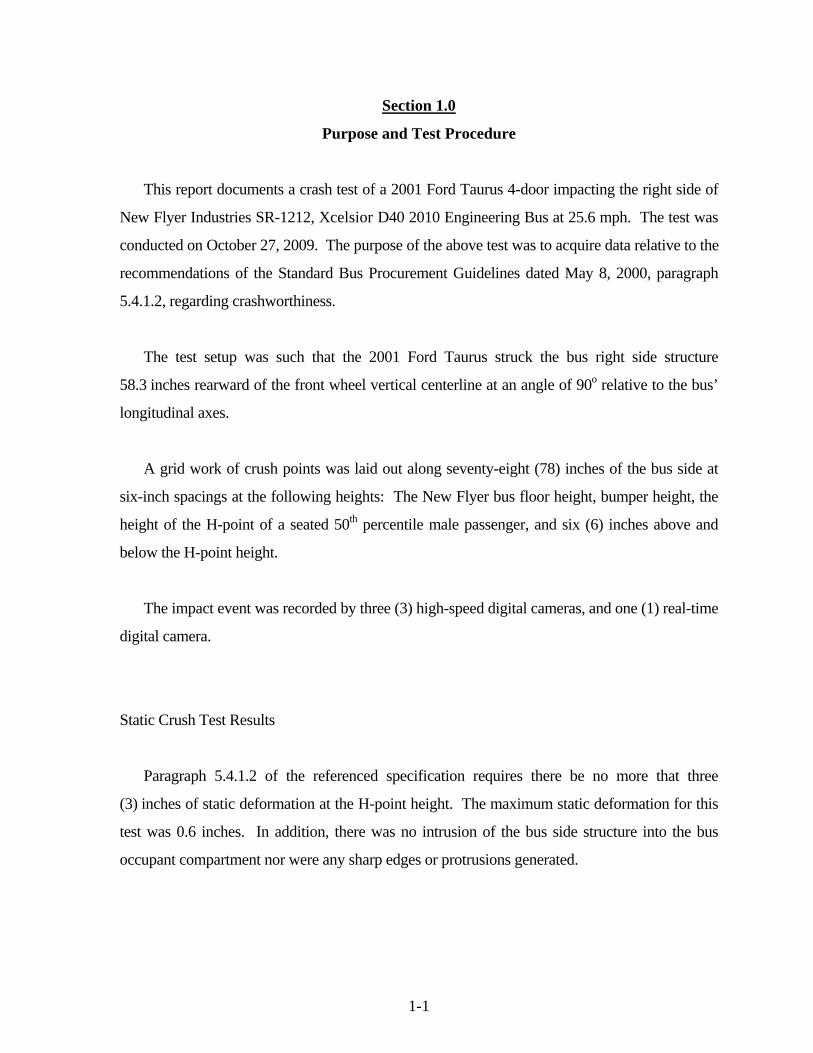
1-1
Section 1.0
Purpose and Test Procedure
This report documents a crash test of a 2001 Ford Taurus 4-door impacting the right side of
New Flyer Industries SR-1212, Xcelsior D40 2010 Engineering Bus at 25.6 mph. The test was
conducted on October 27, 2009. The purpose of the above test was to acquire data relative to the
recommendations of the Standard Bus Procurement Guidelines dated May 8, 2000, paragraph
5.4.1.2, regarding crashworthiness.
The test setup was such that the 2001 Ford Taurus struck the bus right side structure
58.3 inches rearward of the front wheel vertical centerline at an angle of 90o relative to the bus’
longitudinal axes.
A grid work of crush points was laid out along seventy-eight (78) inches of the bus side at
six-inch spacings at the following heights: The New Flyer bus floor height, bumper height, the
height of the H-point of a seated 50th percentile male passenger, and six (6) inches above and
below the H-point height.
The impact event was recorded by three (3) high-speed digital cameras, and one (1) real-time
digital camera.
Static Crush Test Results
Paragraph 5.4.1.2 of the referenced specification requires there be no more that three
(3) inches of static deformation at the H-point height. The maximum static deformation for this
test was 0.6 inches. In addition, there was no intrusion of the bus side structure into the bus
occupant compartment nor were any sharp edges or protrusions generated.
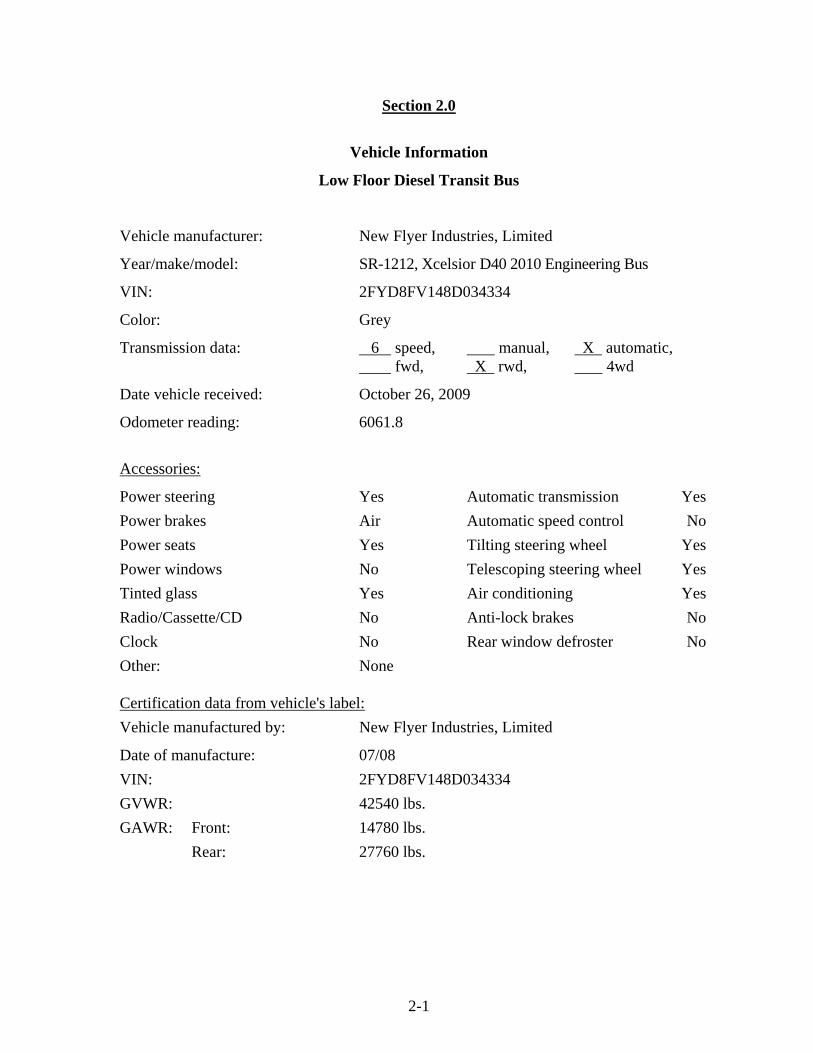
2-1
Section 2.0
Vehicle Information
Low Floor Diesel Transit Bus
Vehicle manufacturer: New Flyer Industries, Limited
Year/make/model: SR-1212, Xcelsior D40 2010 Engineering Bus
VIN: 2FYD8FV148D034334
Color: Grey
Transmission data: 6 speed, manual, X automatic, fwd, X rwd, 4wd
Date vehicle received: October 26, 2009
Odometer reading: 6061.8
Accessories:
Power steering Yes Automatic transmission Yes Power brakes Air Automatic speed control No Power seats Yes Tilting steering wheel Yes Power windows No Telescoping steering wheel Yes Tinted glass Yes Air conditioning Yes Radio/Cassette/CD No Anti-lock brakes No Clock No Rear window defroster No Other: None Certification data from vehicle's label:Vehicle manufactured by: New Flyer Industries, Limited
Date of manufacture: 07/08 VIN: 2FYD8FV148D034334 GVWR: 42540 lbs. GAWR: Front: 14780 lbs. Rear: 27760 lbs.
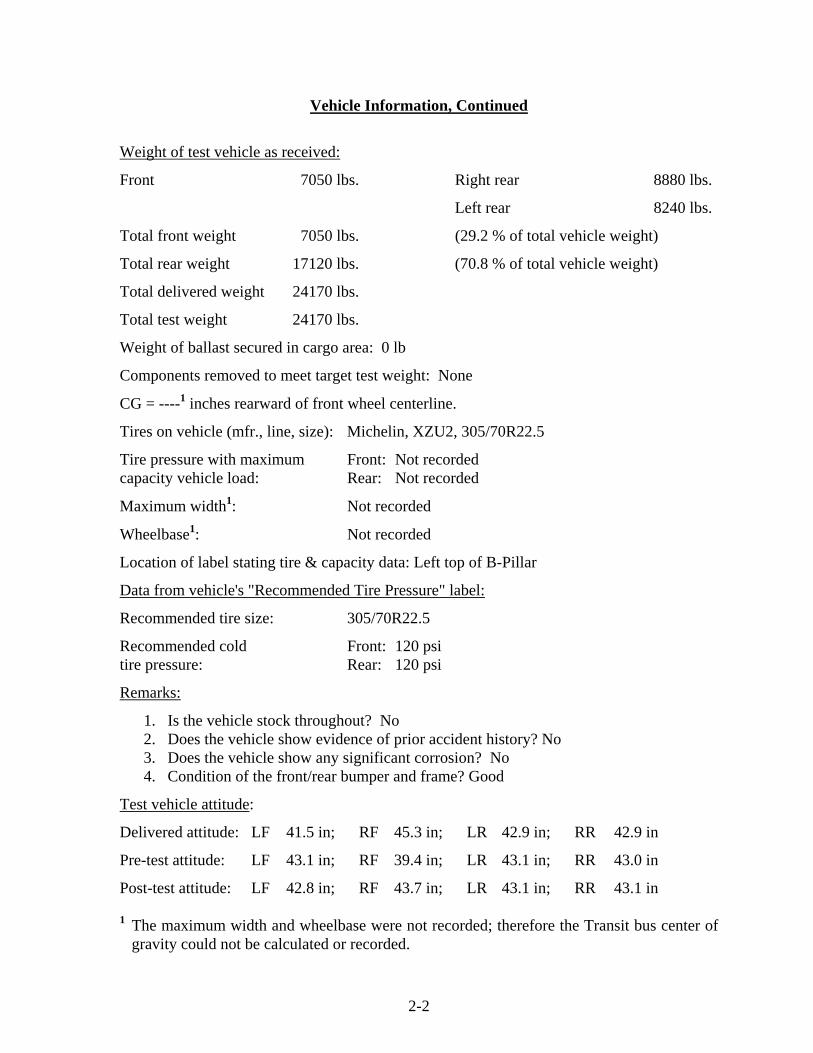
2-2
Vehicle Information, Continued
Weight of test vehicle as received:
Front 7050 lbs. Right rear 8880 lbs.
Left rear 8240 lbs.
Total front weight 7050 lbs. (29.2 % of total vehicle weight)
Total rear weight 17120 lbs. (70.8 % of total vehicle weight)
Total delivered weight 24170 lbs.
Total test weight 24170 lbs.
Weight of ballast secured in cargo area: 0 lb
Components removed to meet target test weight: None
CG = ----1 inches rearward of front wheel centerline.
Tires on vehicle (mfr., line, size): Michelin, XZU2, 305/70R22.5
Tire pressure with maximum Front: Not recorded capacity vehicle load: Rear: Not recorded
Maximum width1: Not recorded
Wheelbase1: Not recorded
Location of label stating tire & capacity data: Left top of B-Pillar
Data from vehicle's "Recommended Tire Pressure" label:
Recommended tire size: 305/70R22.5
Recommended cold Front: 120 psi tire pressure: Rear: 120 psi
Remarks:
1. Is the vehicle stock throughout? No 2. Does the vehicle show evidence of prior accident history? No 3. Does the vehicle show any significant corrosion? No 4. Condition of the front/rear bumper and frame? Good
Test vehicle attitude:
Delivered attitude: LF 41.5 in; RF 45.3 in; LR 42.9 in; RR 42.9 in
Pre-test attitude: LF 43.1 in; RF 39.4 in; LR 43.1 in; RR 43.0 in
Post-test attitude: LF 42.8 in; RF 43.7 in; LR 43.1 in; RR 43.1 in 1 The maximum width and wheelbase were not recorded; therefore the Transit bus center of
gravity could not be calculated or recorded.
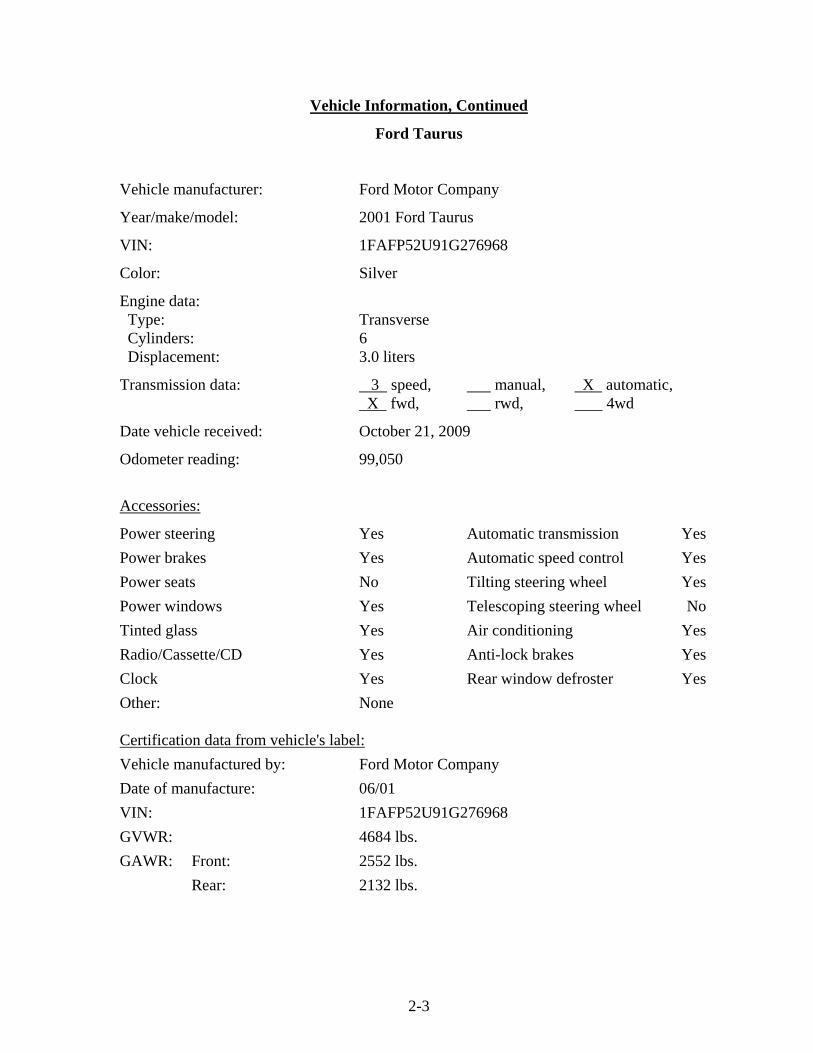
2-3
Vehicle Information, Continued
Ford Taurus
Vehicle manufacturer: Ford Motor Company
Year/make/model: 2001 Ford Taurus
VIN: 1FAFP52U91G276968
Color: Silver
Engine data: Type: Transverse Cylinders: 6 Displacement: 3.0 liters
Transmission data: 3 speed, manual, X automatic, X fwd, rwd, 4wd
Date vehicle received: October 21, 2009
Odometer reading: 99,050
Accessories:
Power steering Yes Automatic transmission Yes Power brakes Yes Automatic speed control Yes Power seats No Tilting steering wheel Yes Power windows Yes Telescoping steering wheel No Tinted glass Yes Air conditioning Yes Radio/Cassette/CD Yes Anti-lock brakes Yes Clock Yes Rear window defroster Yes Other: None Certification data from vehicle's label:Vehicle manufactured by: Ford Motor Company Date of manufacture: 06/01 VIN: 1FAFP52U91G276968 GVWR: 4684 lbs. GAWR: Front: 2552 lbs. Rear: 2132 lbs.
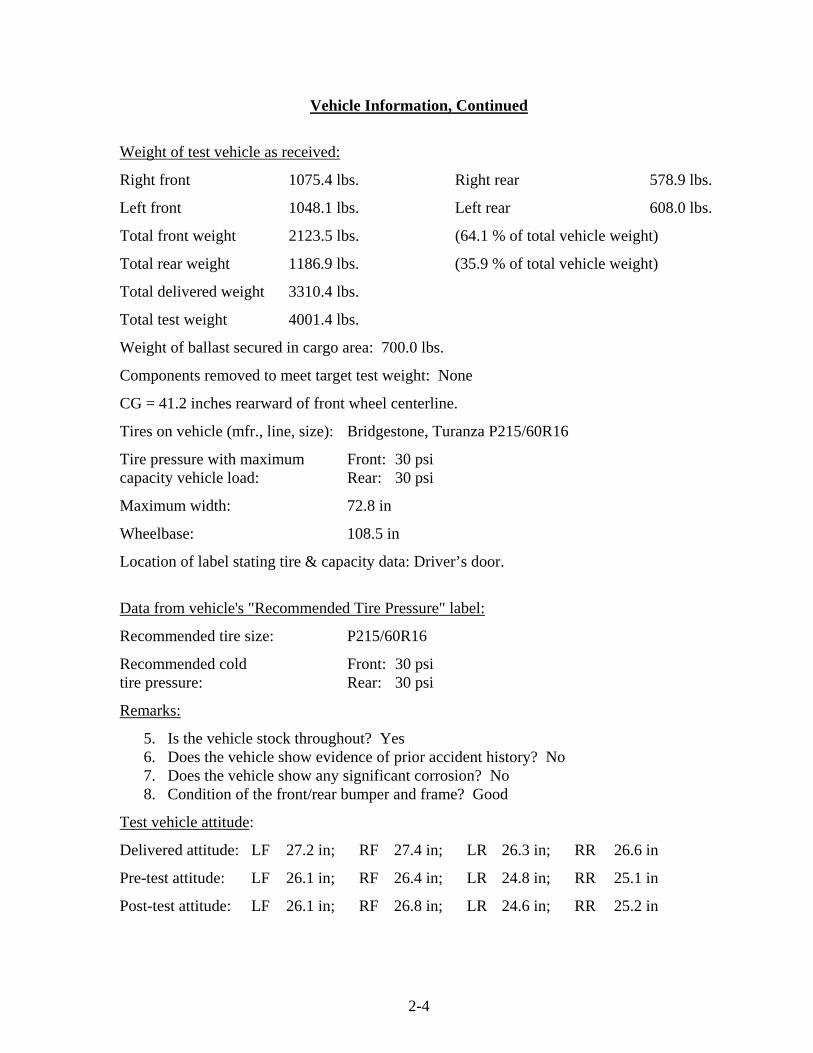
2-4
Vehicle Information, Continued
Weight of test vehicle as received:
Right front 1075.4 lbs. Right rear 578.9 lbs.
Left front 1048.1 lbs. Left rear 608.0 lbs.
Total front weight 2123.5 lbs. (64.1 % of total vehicle weight)
Total rear weight 1186.9 lbs. (35.9 % of total vehicle weight)
Total delivered weight 3310.4 lbs.
Total test weight 4001.4 lbs.
Weight of ballast secured in cargo area: 700.0 lbs.
Components removed to meet target test weight: None
CG = 41.2 inches rearward of front wheel centerline.
Tires on vehicle (mfr., line, size): Bridgestone, Turanza P215/60R16
Tire pressure with maximum Front: 30 psi capacity vehicle load: Rear: 30 psi
Maximum width: 72.8 in
Wheelbase: 108.5 in
Location of label stating tire & capacity data: Driver’s door.
Data from vehicle's "Recommended Tire Pressure" label:
Recommended tire size: P215/60R16
Recommended cold Front: 30 psi tire pressure: Rear: 30 psi
Remarks:
5. Is the vehicle stock throughout? Yes 6. Does the vehicle show evidence of prior accident history? No 7. Does the vehicle show any significant corrosion? No 8. Condition of the front/rear bumper and frame? Good
Test vehicle attitude:
Delivered attitude: LF 27.2 in; RF 27.4 in; LR 26.3 in; RR 26.6 in
Pre-test attitude: LF 26.1 in; RF 26.4 in; LR 24.8 in; RR 25.1 in
Post-test attitude: LF 26.1 in; RF 26.8 in; LR 24.6 in; RR 25.2 in
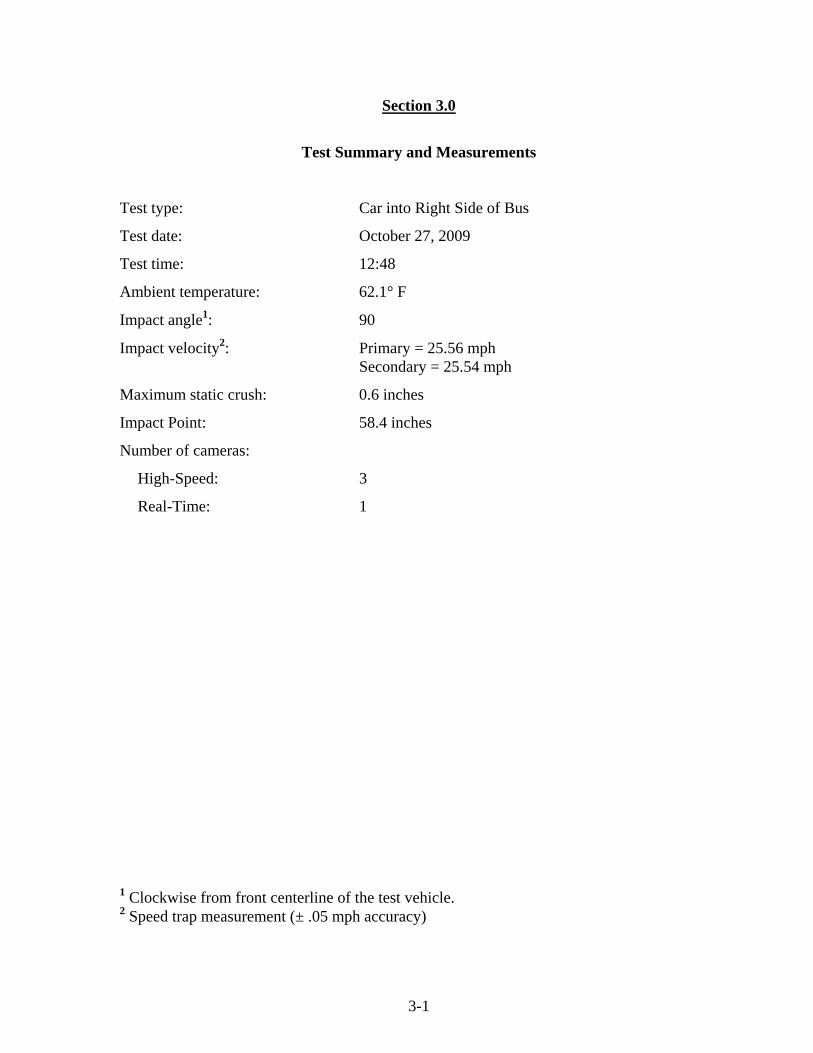
3-1
Section 3.0
Test Summary and Measurements
Test type: Car into Right Side of Bus
Test date: October 27, 2009
Test time: 12:48
Ambient temperature: 62.1° F
Impact angle1: 90
Impact velocity2: Primary = 25.56 mph Secondary = 25.54 mph
Maximum static crush: 0.6 inches
Impact Point: 58.4 inches
Number of cameras:
High-Speed: 3
Real-Time: 1
1 Clockwise from front centerline of the test vehicle. 2 Speed trap measurement (± .05 mph accuracy)
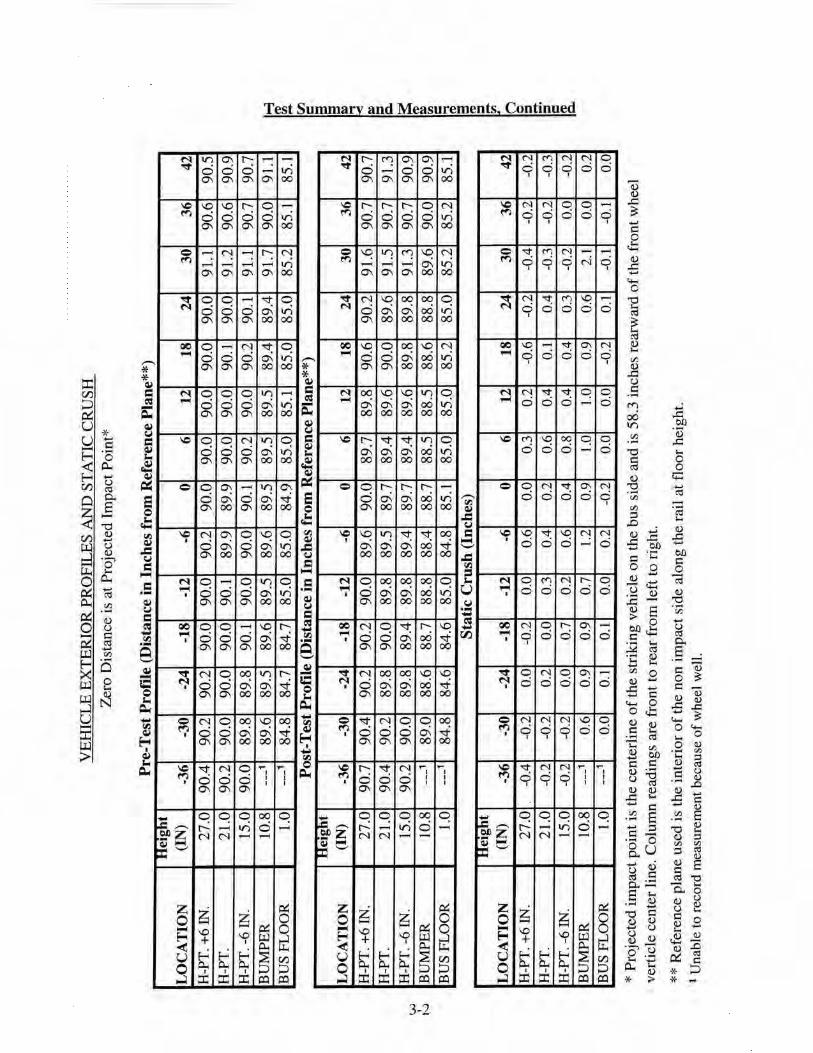
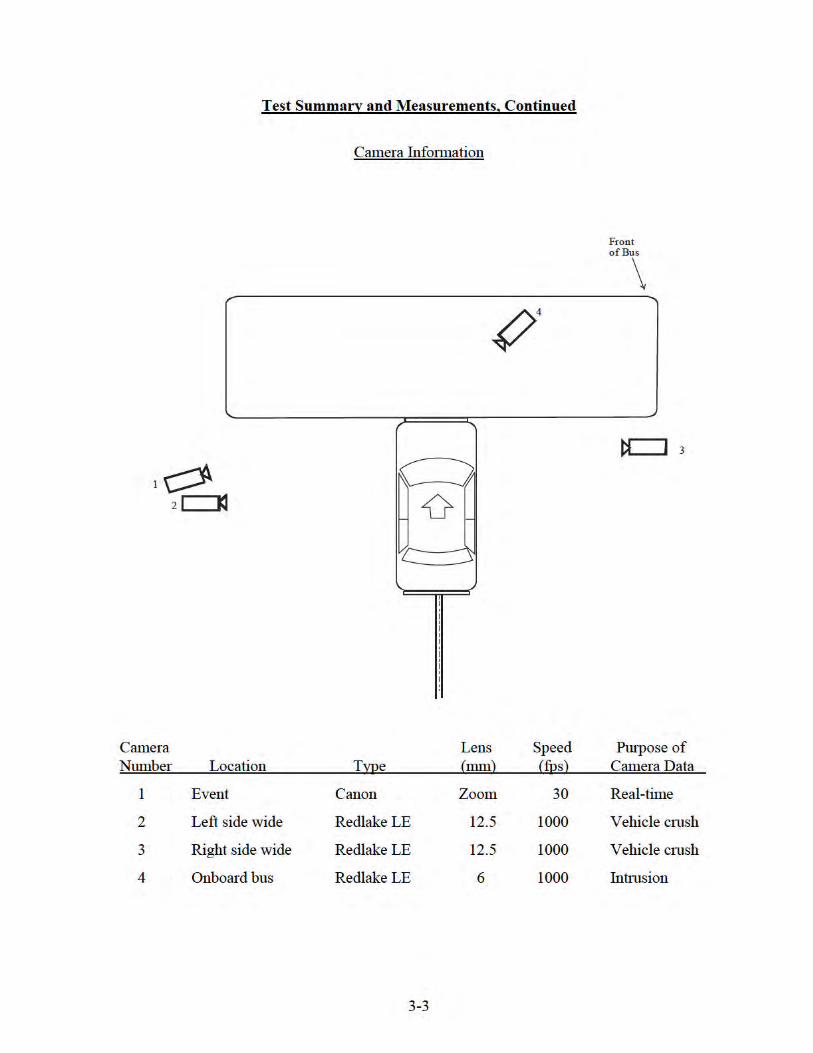

A-1
Appendix A
Photographs
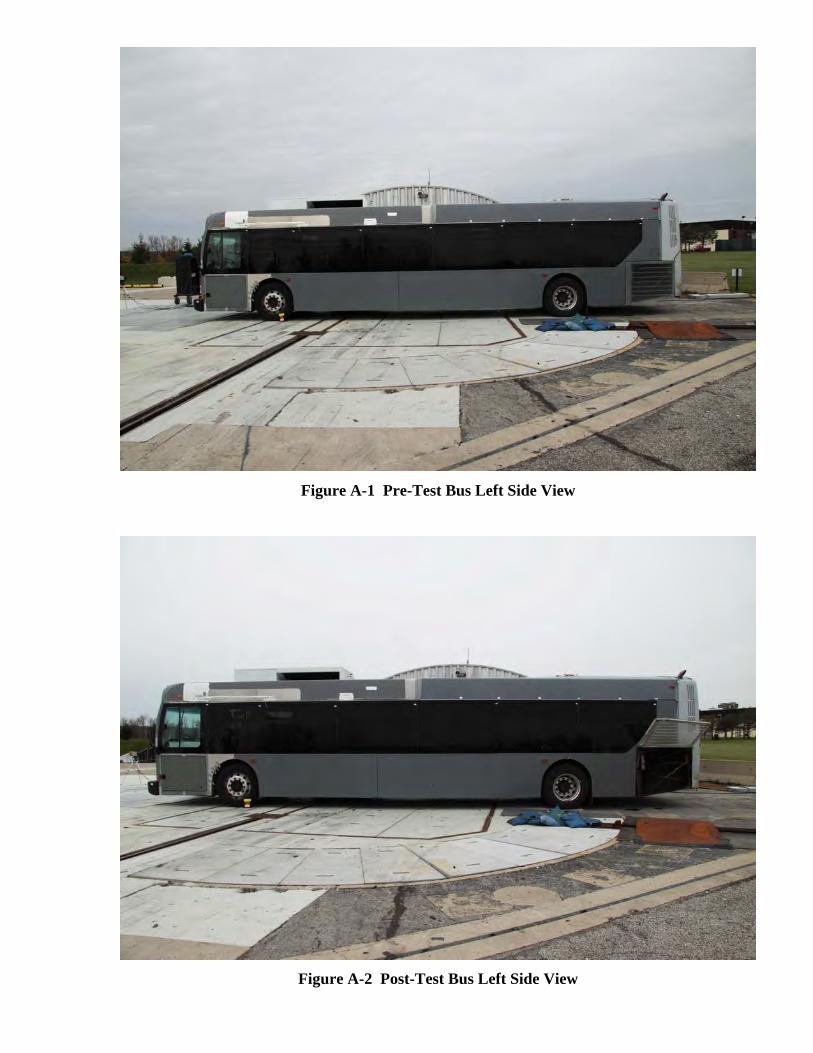
Figure A-1 Pre-Test Bus Left Side View
Figure A-2 Post-Test Bus Left Side View
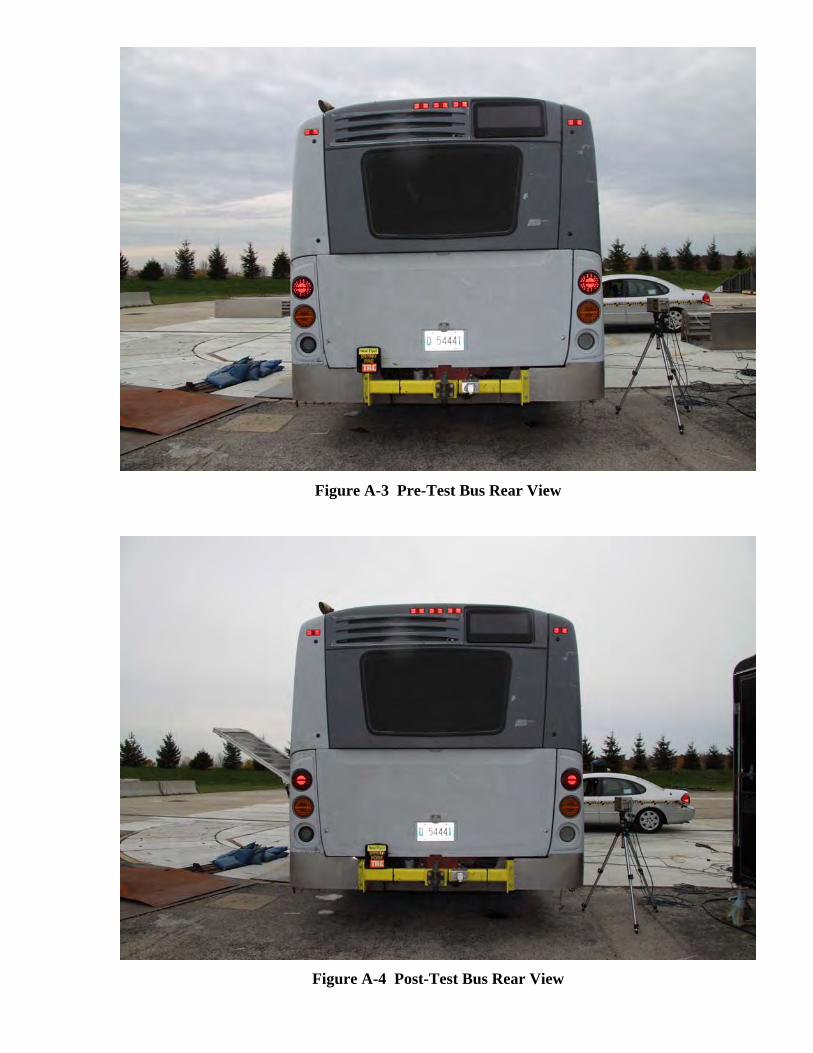
Figure A-3 Pre-Test Bus Rear View
Figure A-4 Post-Test Bus Rear View
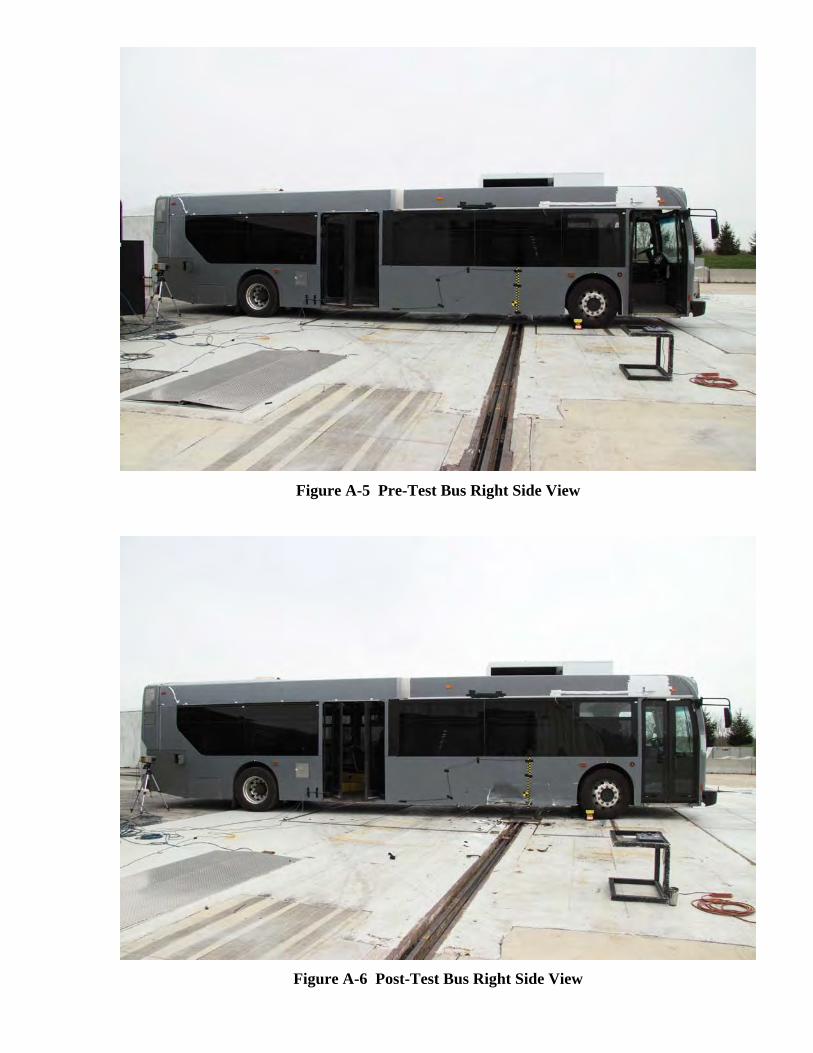
Figure A-5 Pre-Test Bus Right Side View
Figure A-6 Post-Test Bus Right Side View
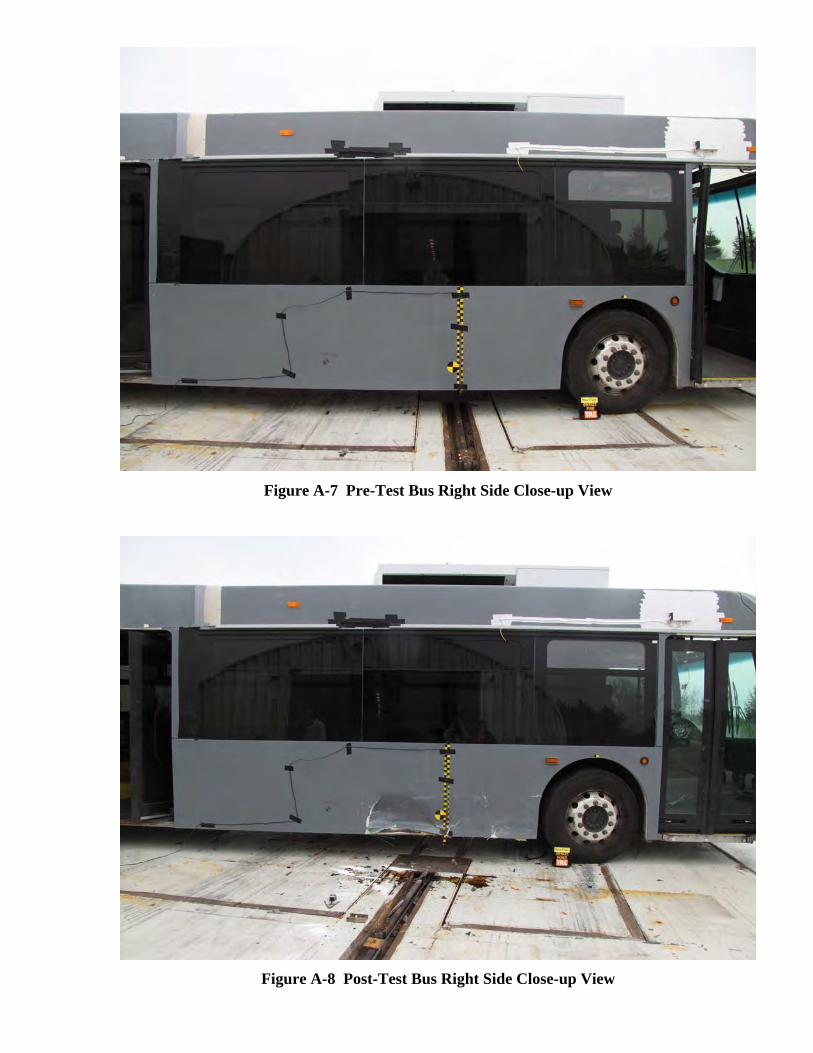
Figure A-7 Pre-Test Bus Right Side Close-up View
Figure A-8 Post-Test Bus Right Side Close-up View
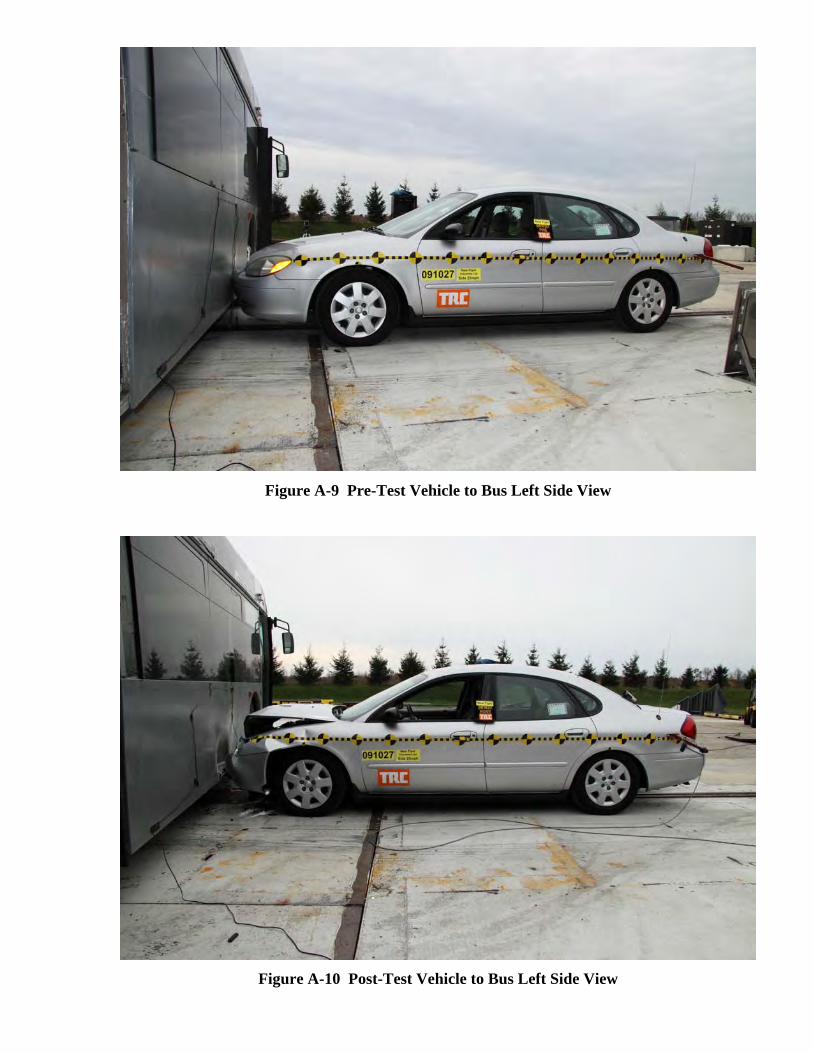
Figure A-9 Pre-Test Vehicle to Bus Left Side View
Figure A-10 Post-Test Vehicle to Bus Left Side View
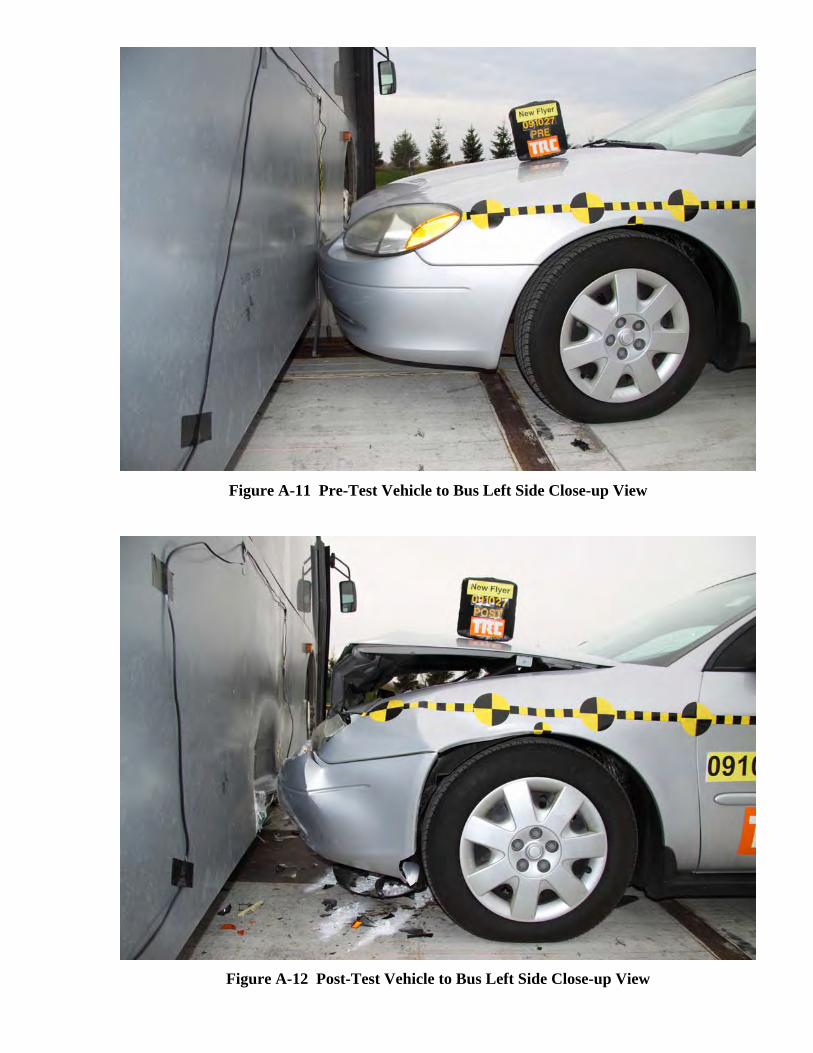
Figure A-11 Pre-Test Vehicle to Bus Left Side Close-up View
Figure A-12 Post-Test Vehicle to Bus Left Side Close-up View
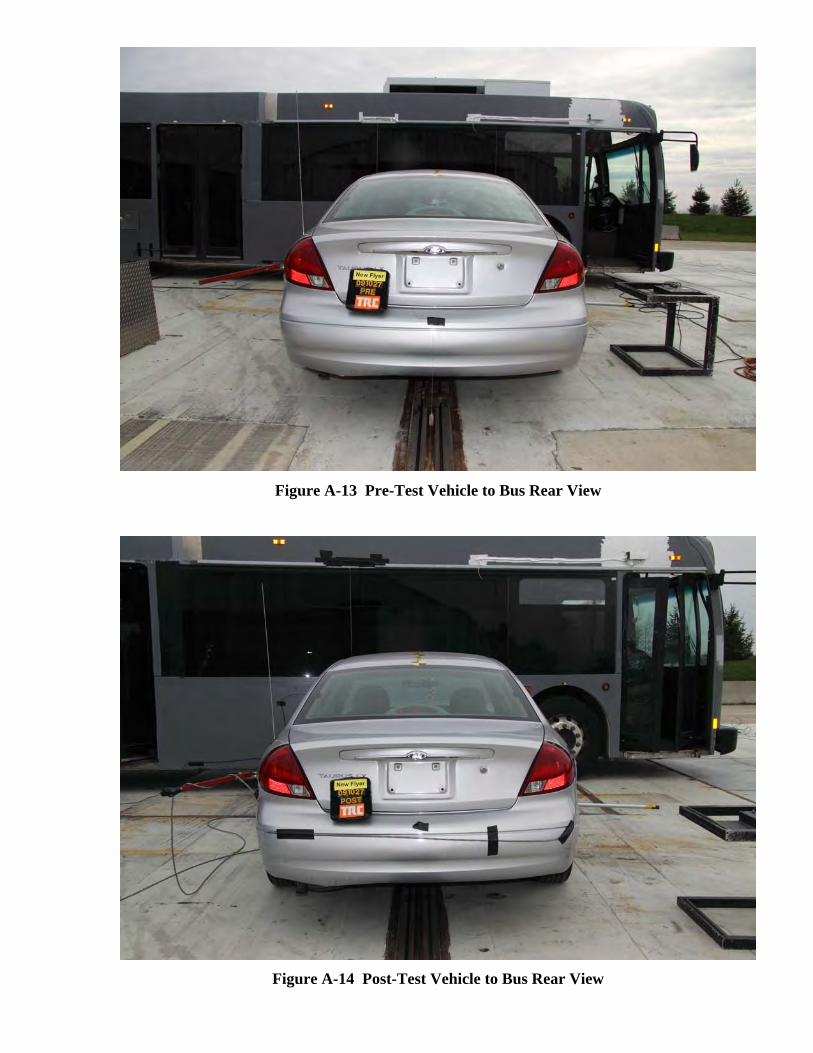
Figure A-13 Pre-Test Vehicle to Bus Rear View
Figure A-14 Post-Test Vehicle to Bus Rear View
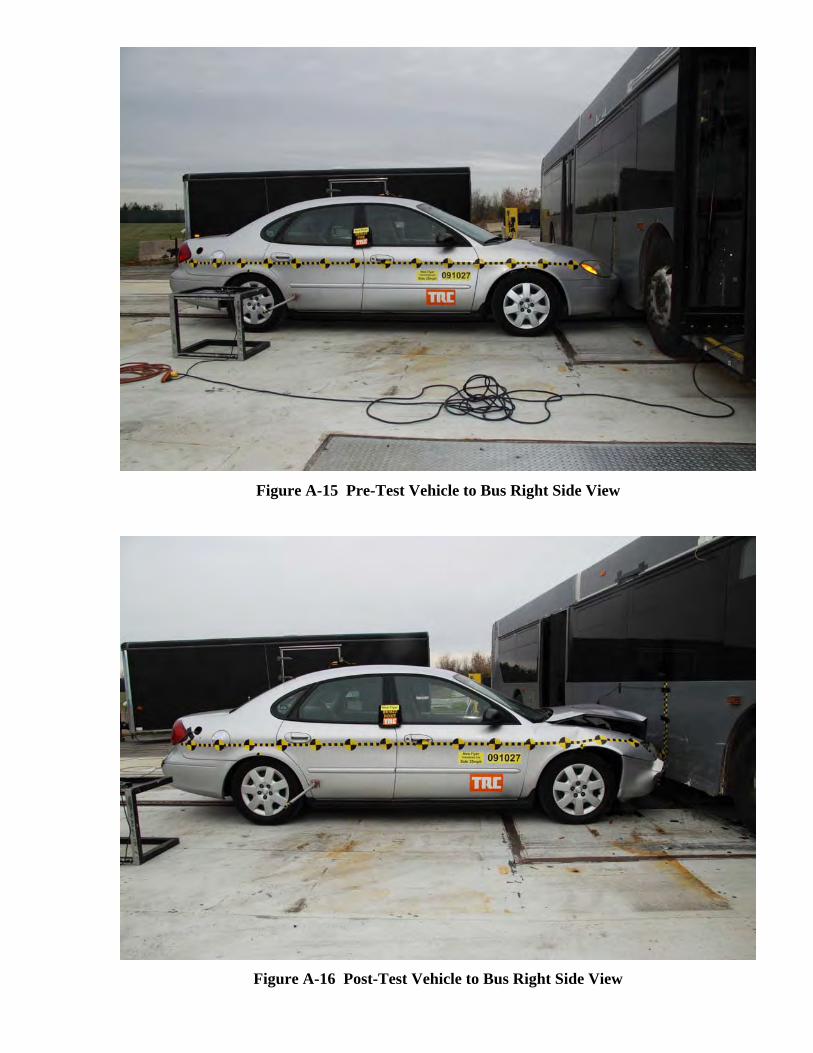
Figure A-15 Pre-Test Vehicle to Bus Right Side View
Figure A-16 Post-Test Vehicle to Bus Right Side View
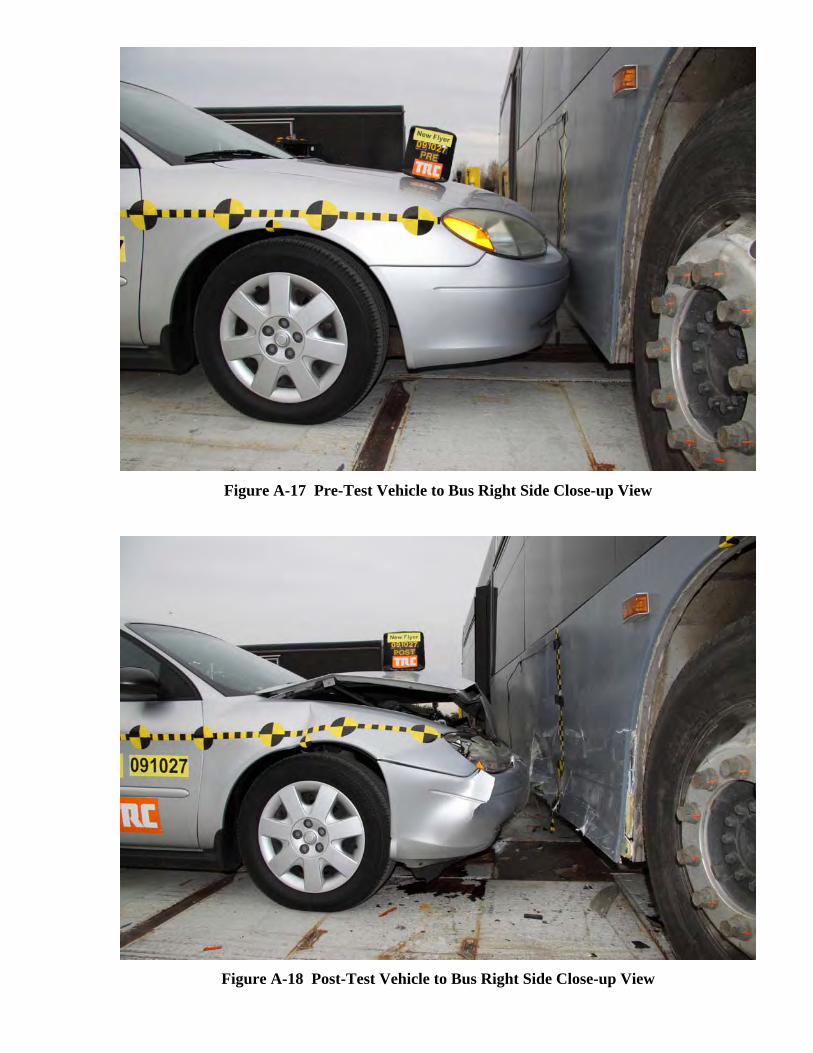
Figure A-17 Pre-Test Vehicle to Bus Right Side Close-up View
Figure A-18 Post-Test Vehicle to Bus Right Side Close-up View
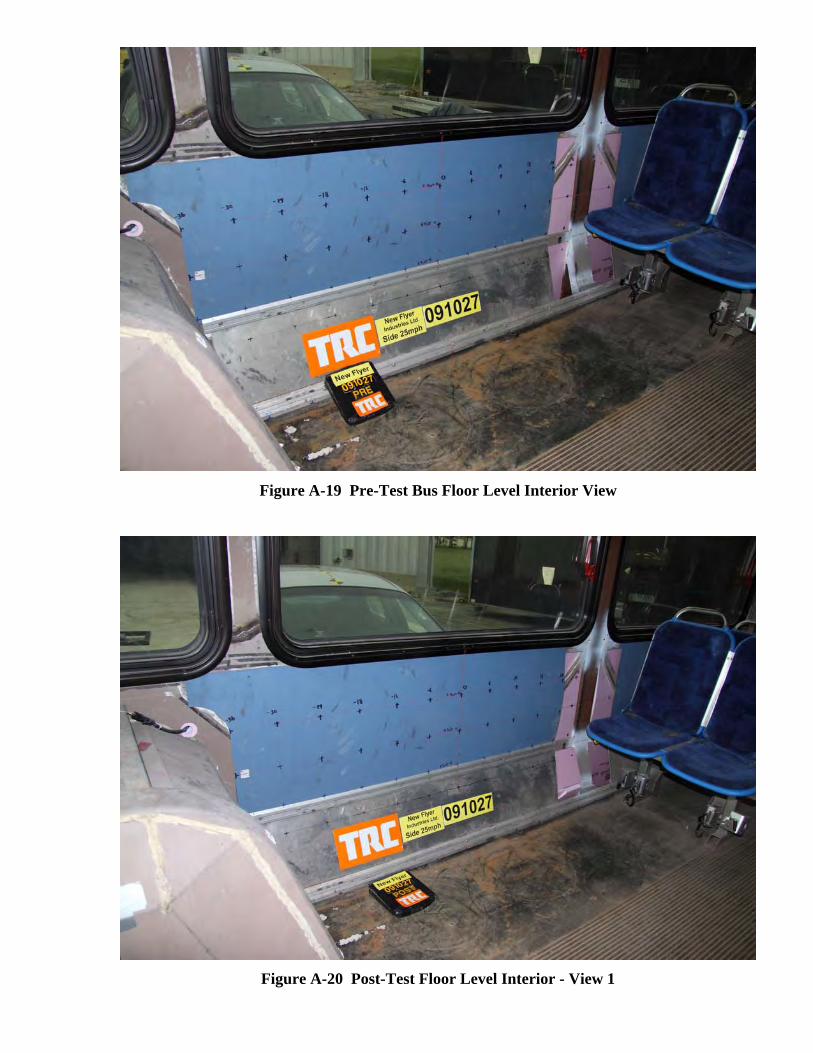
Figure A-19 Pre-Test Bus Floor Level Interior View
Figure A-20 Post-Test Floor Level Interior - View 1
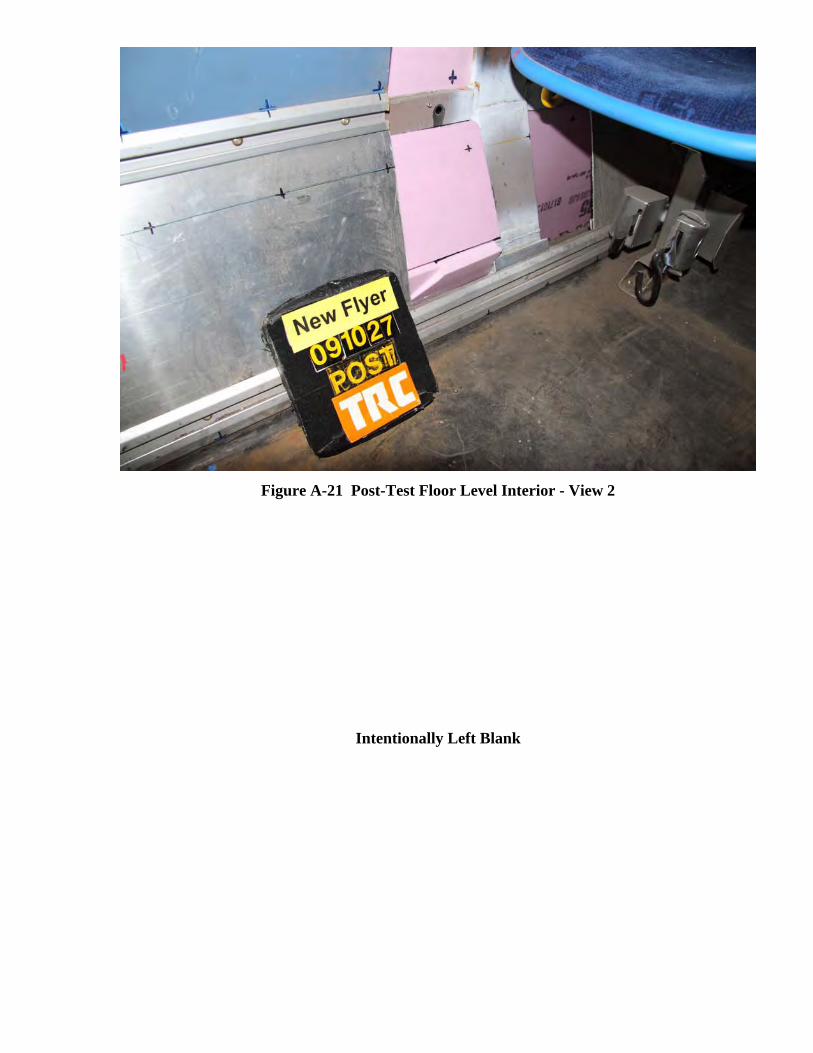
Figure A-21 Post-Test Floor Level Interior - View 2
Intentionally Left Blank
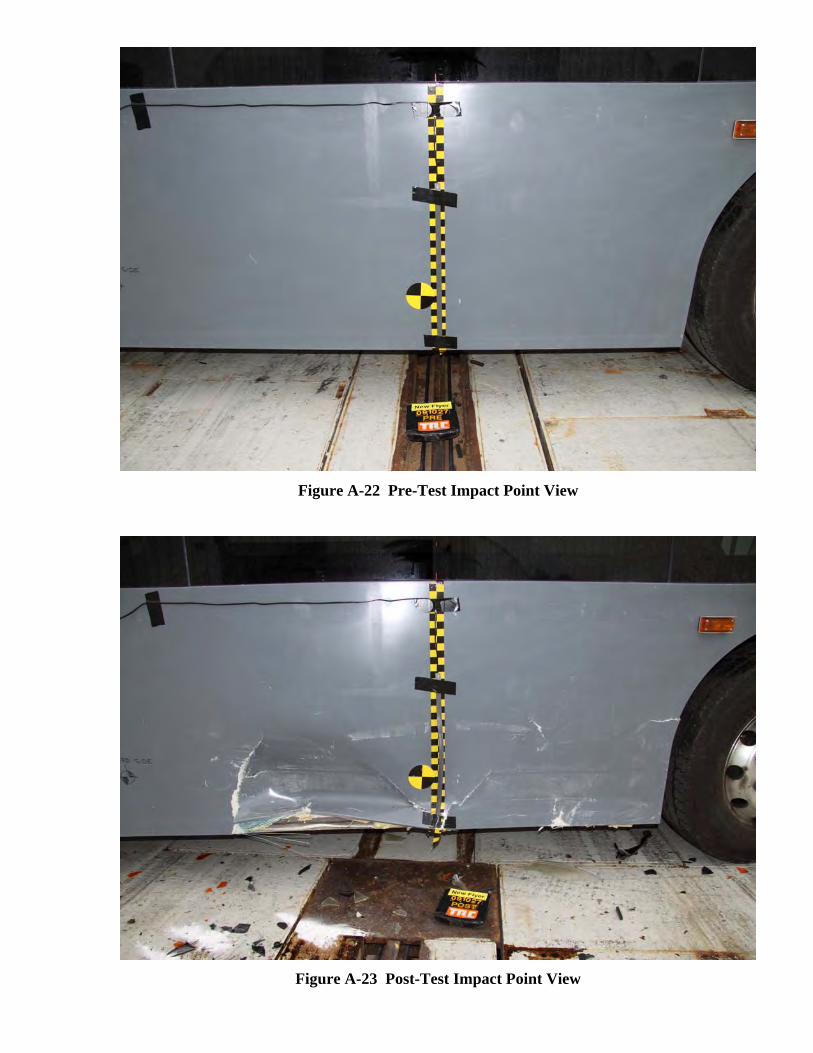
Figure A-22 Pre-Test Impact Point View
Figure A-23 Post-Test Impact Point View
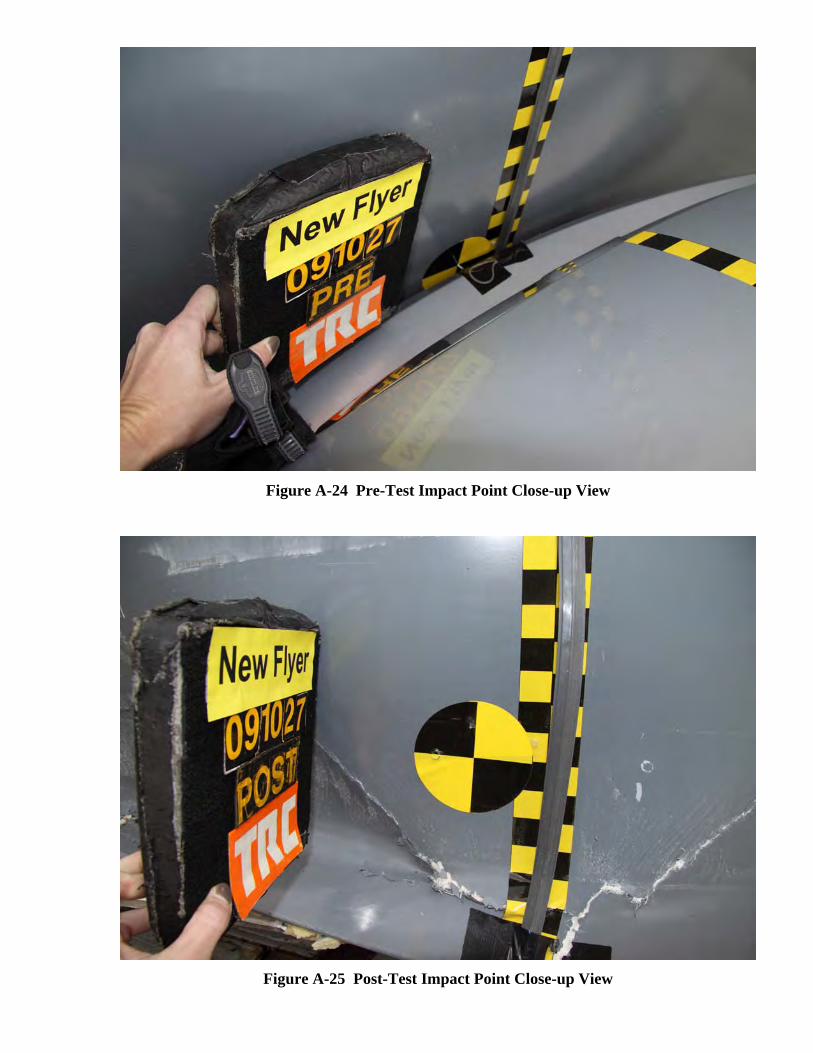
Figure A-24 Pre-Test Impact Point Close-up View
Figure A-25 Post-Test Impact Point Close-up View
PSTA– Pinellas Suncoast Transit Authority RFP 21-980369
Section 20
Solicitation Requirements:
TS 23 Towing - Provide the towing procedure.
New Flyer Response:
Please refer to the Service Information Bulletin #100-000 for the complete description of towing
procedures for the Xcelsior buses. This bulletin serves as material to assist in the towing of any of
the Xcelsior buses, if there are any situations that require assistance New Flyers RPSM will be
available to assist with any questions the agency may have.
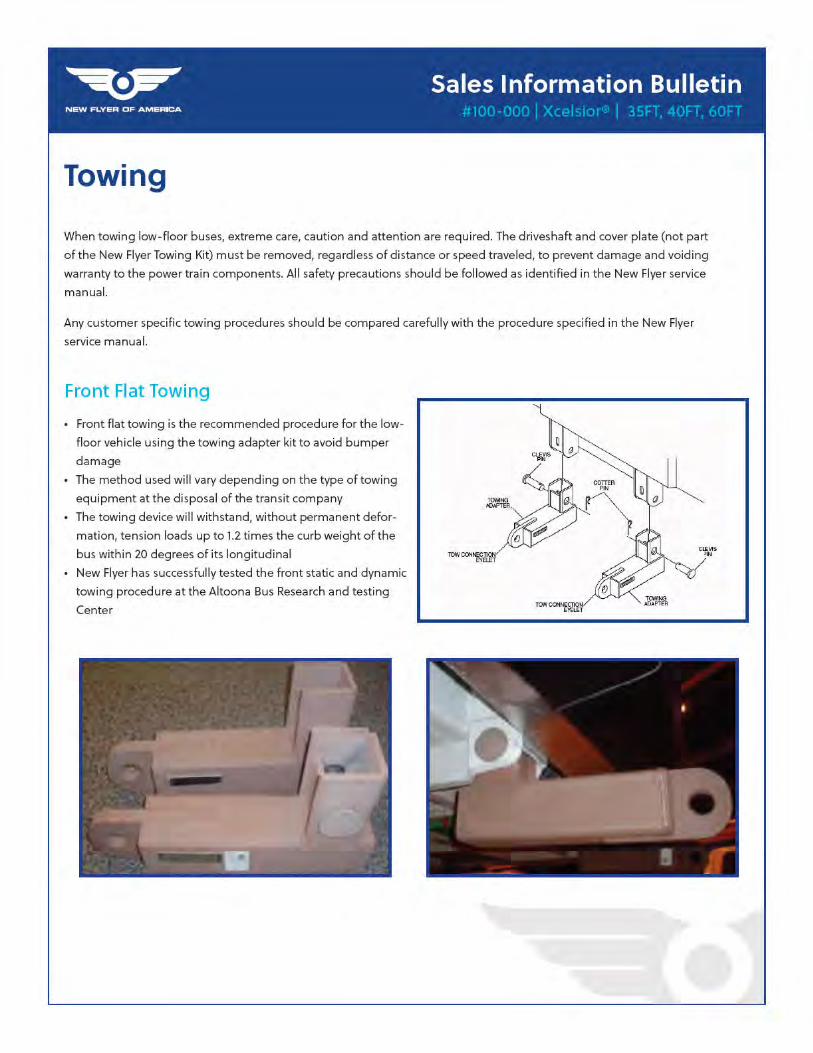

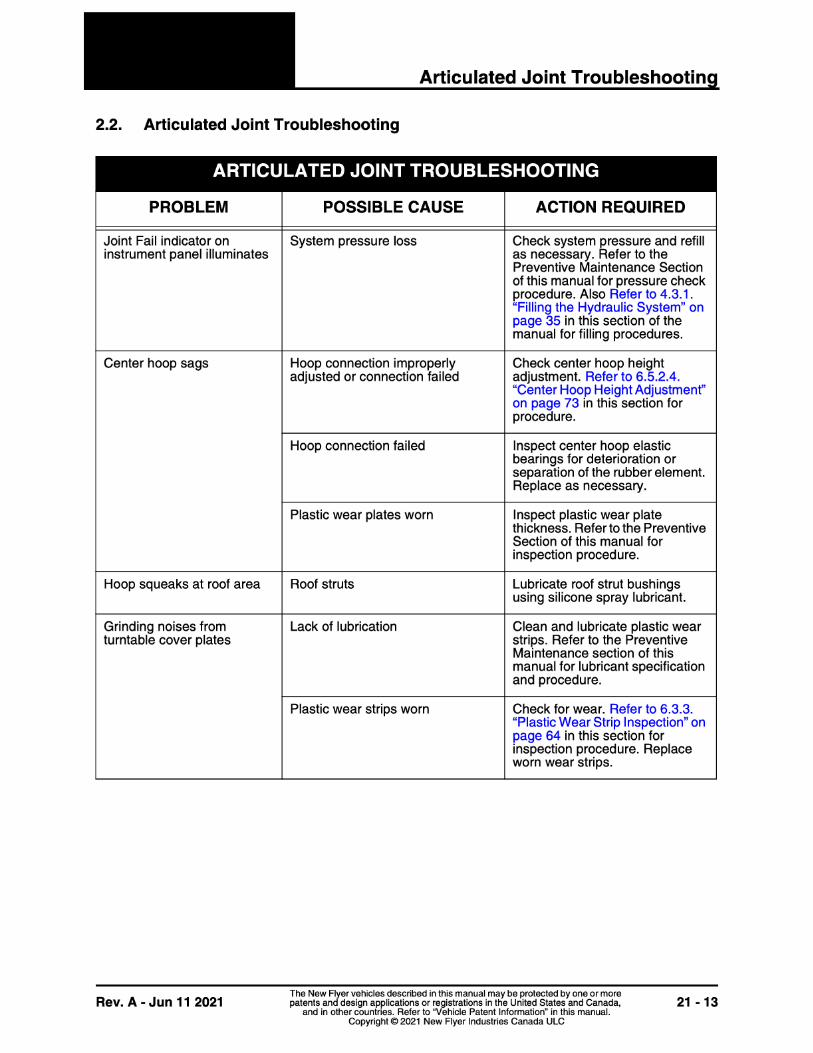
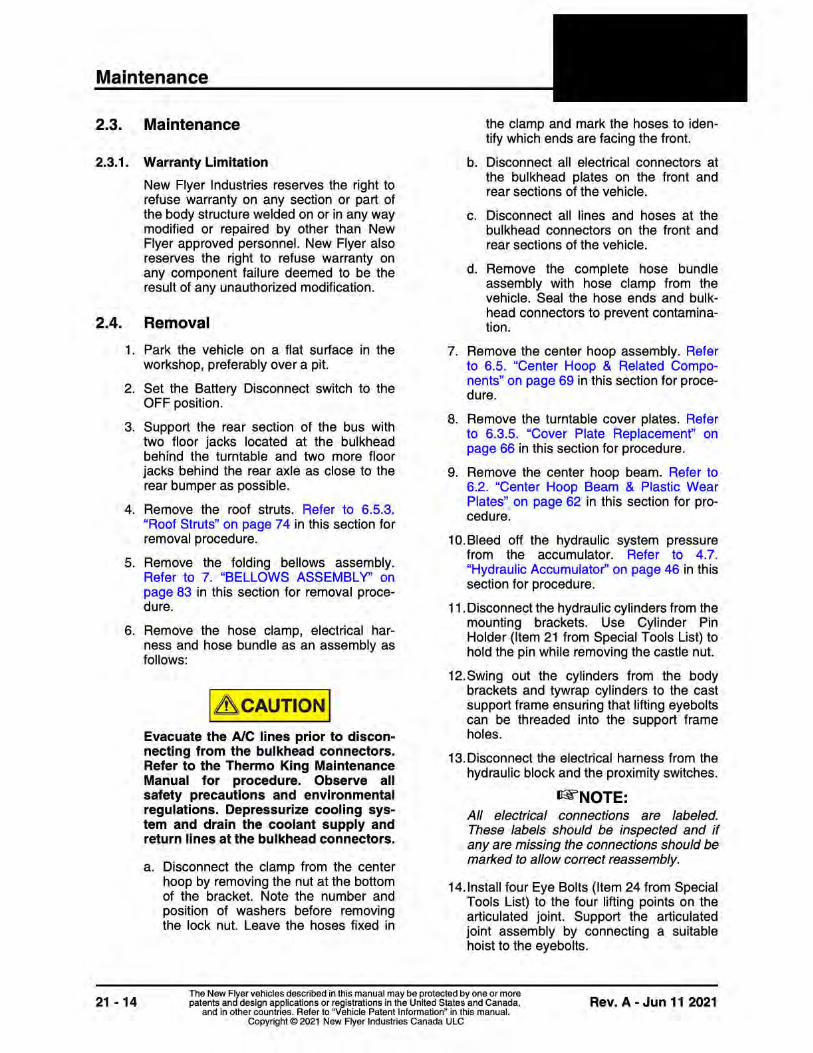
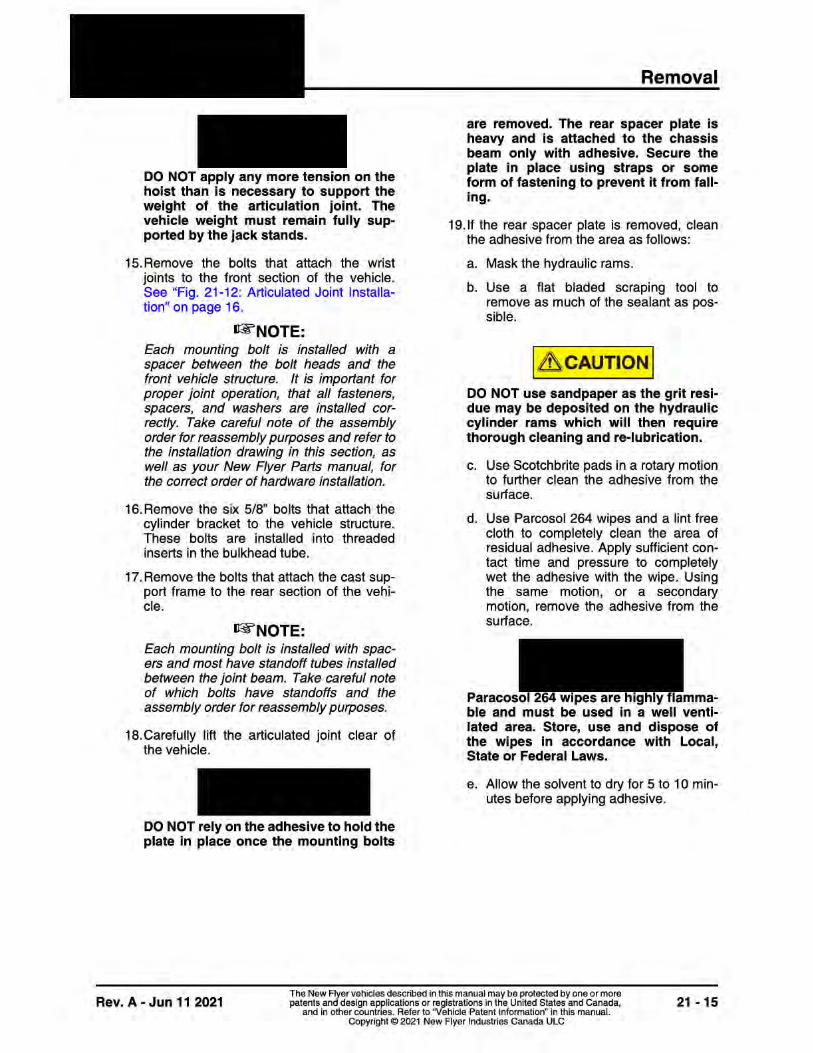

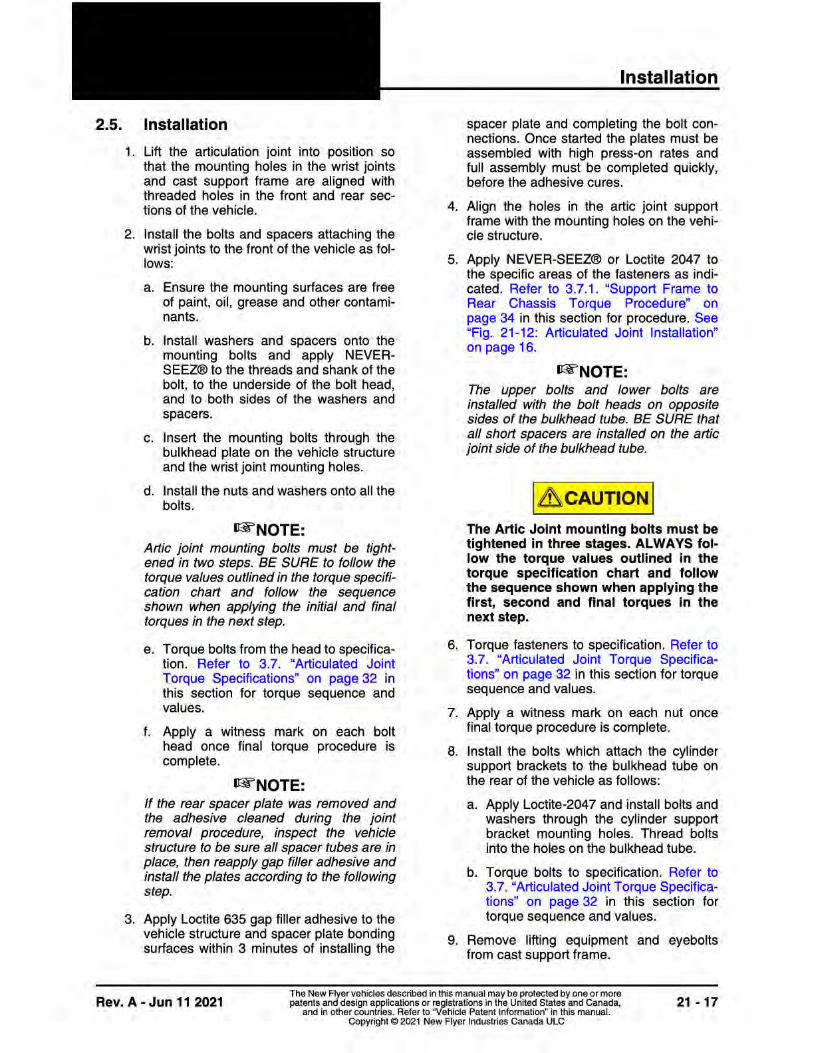


PSTA– Pinellas Suncoast Transit Authority RFP 21-980369
Section 2R
Solicitation Requirements:
TS 35.4 Hubs and Drums / Discs. Configuration to be included in proposal. New Flyer Response:
Please refer to attached Service Bulletin, SIB-246-060-X-Gemini MDx (Air Dryer) outlining the following:
- Product features - Equipment and Operation - Service and Repair - Warranty Testing


— PRO DUC T LE A FLE T
Electric Vehicle InfrastructureHVC-PD UL opportunity charging for electric buses
ABB’s HVC-PD opportunity charging system offers high-power charging via an automated rooftop connection. With typical charge times of 3 to 6 minutes the system can be easily integrated in existing operations by installing chargers at endpoints, terminals and intermediate stops.
A practical solution for route chargingABB’s Heavy Vehicle Charger (HVC) system architecture offers an ideal solution for opportunity charging, ensuring zero-emission public transit during the day without impacting daily route operations.
Future-proof modular designAdditional power cabinets can be installed at any time, allowing operators to scale their operation and flexibly spread out infrastructure investments as their fleet grows.
Safe and reliable operationABB fast chargers are designed to the highest international electrical, safety, and quality standards, and are certified by notified bodies - ensuring safe and reliable operation.
InteroperabilityABB HVC chargers are based on international standards for operational compatibility with multiple
Key Benefits+ Charge in 3 to 6 minutes
+ One charger serves many vehicle makes and models
+ Safe and reliable fully automated connection
+ SAE J3105-1 and OCPP 1.6 compliant
+ Remote diagnostics and management tools
—The HVC-PD charging system leverages an automated connection to enable extremely fast charge times.
vehicle types and brands. This allows operators to select vehicles from multiple vendors and not be locked into a single supplier.
Connectivity and remote servicesABB chargers come with an extensive suite of connectivity features including remote services such as monitoring, diagnostics and software upgrades. These advanced services provide equipment owners with powerful insights into their charging operations while delivering high uptime.
OCPP 1.6ABB HVC-PD charging systems can be connected to standardized charging infrastructure management platforms using OCPP 1.6. ABB’s HVC suite supports OCPP 1.6 Core and Smart Charging Profiles.
Buy AmericaABB can offer the HVC-PD Depot Charging Solution with compliance to the Buy America Act, Rule 49 CFR Part 661.5.
ABB is your experienced partnerABB HVC products are based on a decade of high-power experience in EV charging solutions. ABB has installed over 20,000 fast charging systems in more than 85 countries – and is the leading EV infrastructure technology supplier globally.
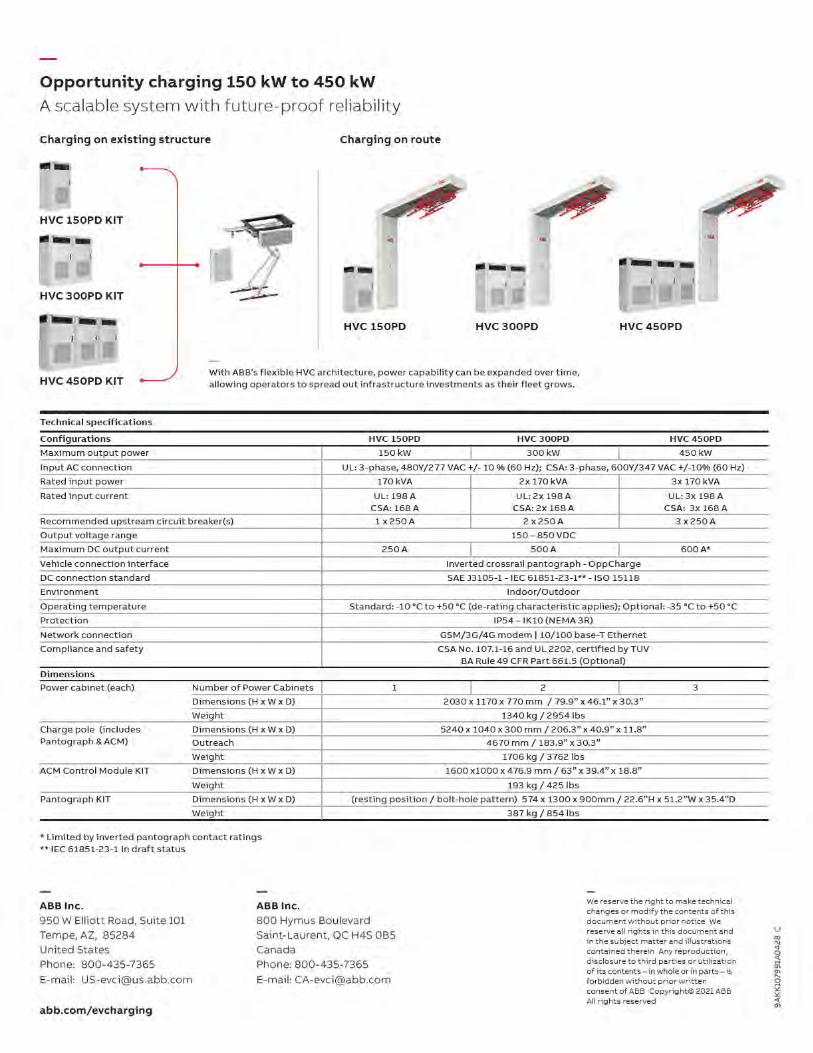
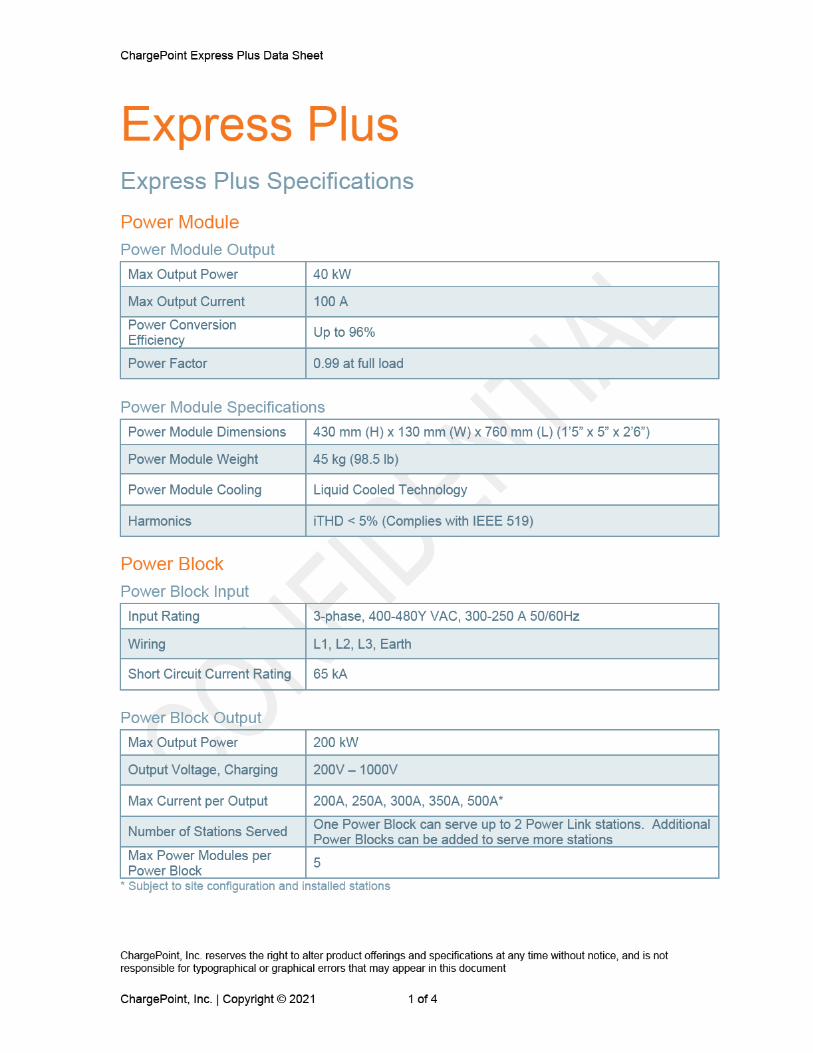
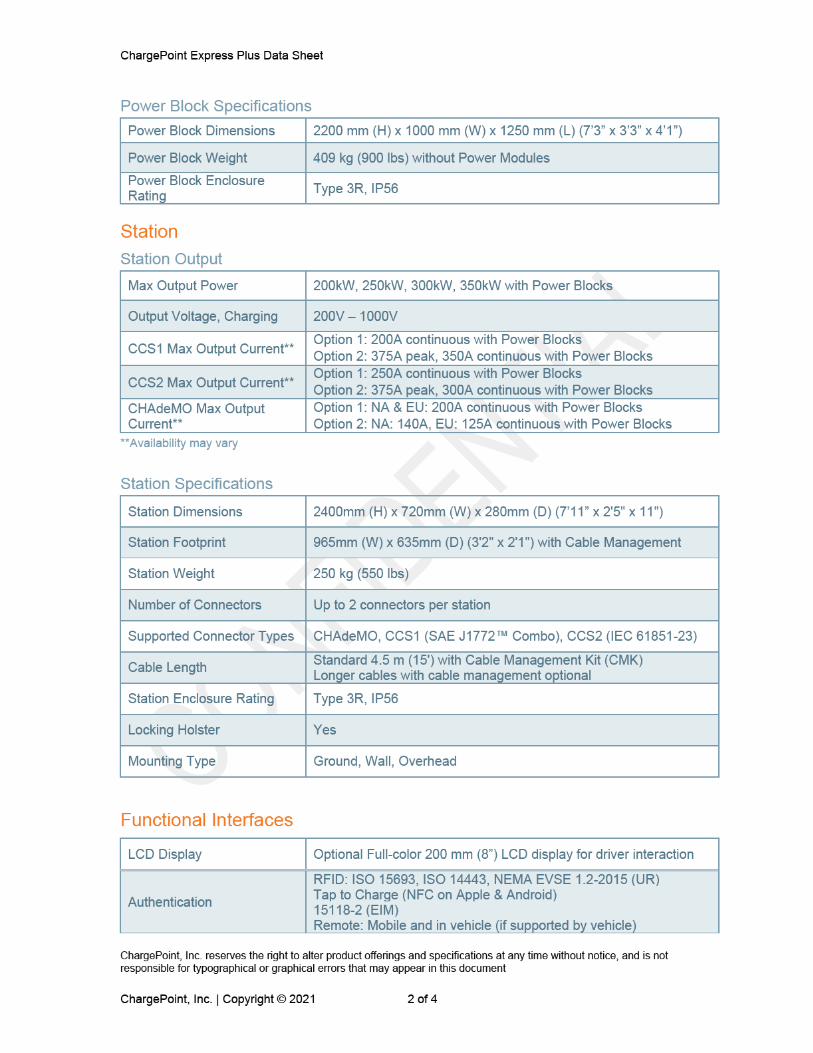
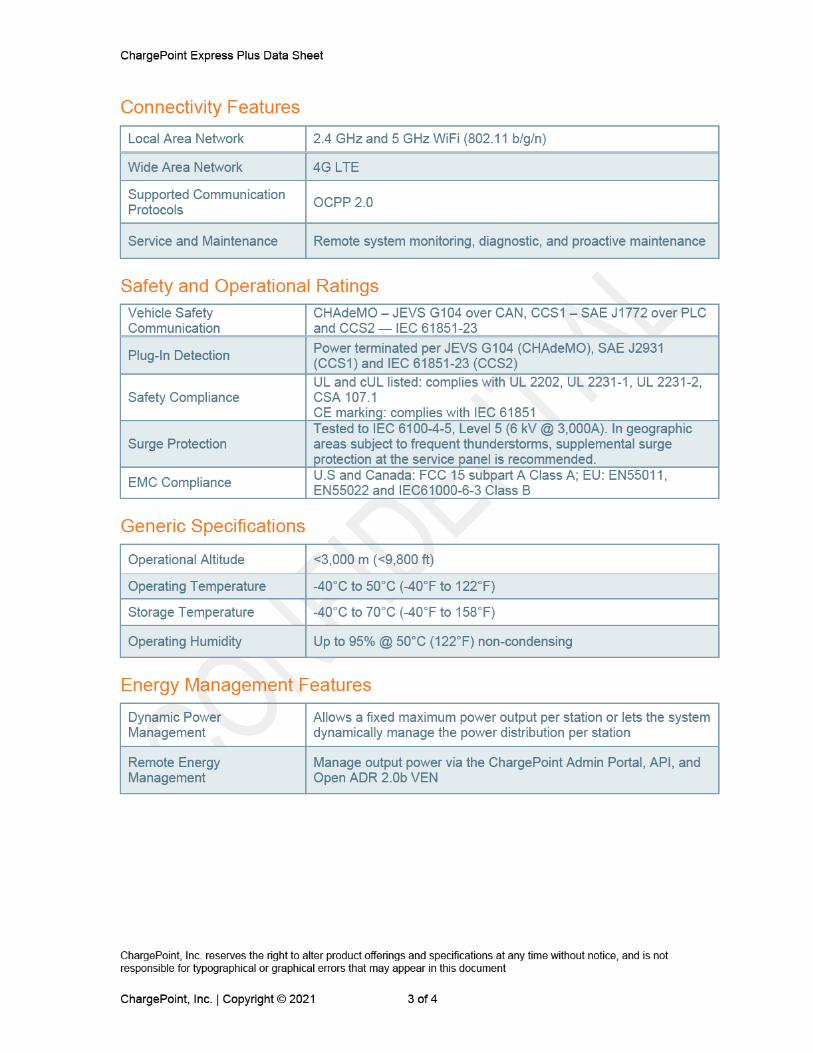
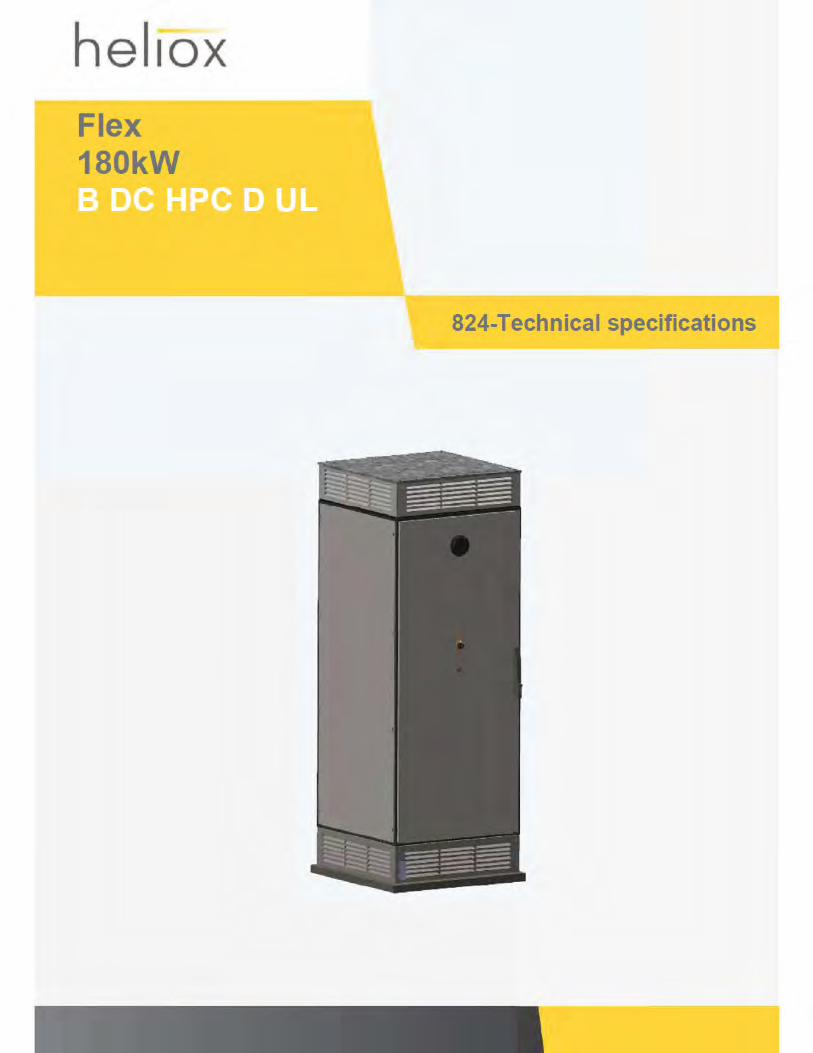

Flex 180kW B DC HPC D UL
Page 2 of 13 Doc-id: HE9821001-01-824-EN-002
Applicability
This document applies to a Flex 180KW B DC HPC D UL delivered by Heliox Technology Inc. or any of its Affiliates (Heliox Technology Inc. or the respective Affiliate hereinafter together and
affiliated with, or that directly or indirectly controls, is controlled by or is under common control
share capital or the right to exercise 50% (fifty percent) or more of the voting rights in the appointment of the directors of such company, firm, partnership or other legal entity, but any such legal entity shall be deemed to be an Affiliate only as long as such liaison exists.
Disclaimer By accessing and using information, data and materials or related graphics contained in this document, the user hereby agree to accept the following terms and conditions:
Heliox makes no warranty or guarantee regarding the accuracy or reliability in this document. In addition, the user hereby recognizes that the information, data, materials, graphics, and all other content incorporated in this document are subject to change. However, Heliox makes no commitment to update the information, data, materials, graphics and all other content contained in this document. The information, data, materials, graphics and all other content contained in this document, are made available by Heliox for informational purposes only and no action should be taken without first viewing the official records of, and regulations adopted by Heliox.
All information, data, materials, graphics and all other content contained in this document is
implied warranties of merchantability and fitness for a particular purpose, and non-infringement of proprietary rights. Heliox does not warrant, guarantee, or make any representations regarding the use, or the results of the use, of the information provided to you by Heliox in terms of correctness, accuracy, reliability, completeness, usefulness, timeliness or otherwise. The entire risk as to the results and performance of any information obtained from Heliox is entirely assumed by the user. Any person who uses any information made available by Heliox waives any and all claims for damages, costs and expenses, and agrees that there are no remedies for negligence, or under strict liability, or breach of warranty or contract, including but not limited to indirect, consequential, punitive or incidental damages, even if you give notice of the possibility of such damages.
This document is originally written in the English language. If this is written in any other language than English, Heliox shall not be liable for errors in the translation.
Copyright © Copyright 2021 Heliox. All rights reserved. Heliox has the right to revise this document from time to time without prior notification. The information in this document is property of Heliox. No part of this document may be reproduced, stored in a retrieval system, or transmitted in any form or by any means electronic or mechanical, including photocopying and recording, for any purpose, without the express written permission of Heliox.
Trademarks The copyright of the (registered) trademarks are the property of Heliox or the respective owners.
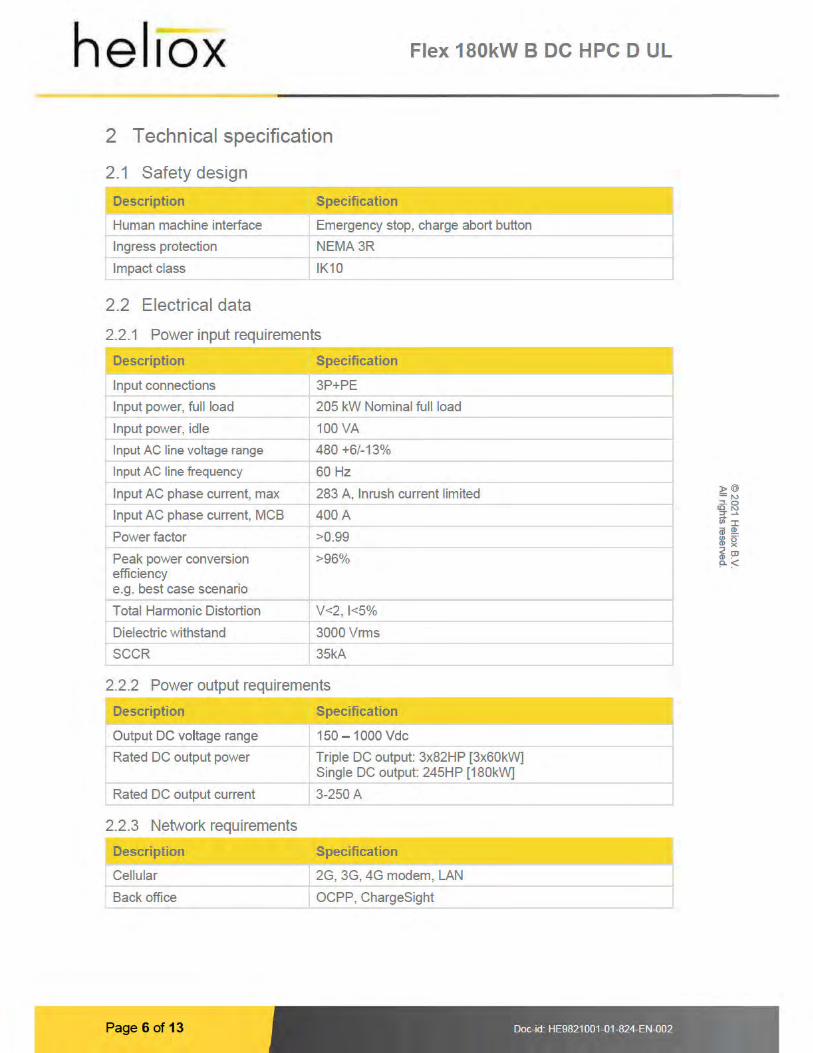


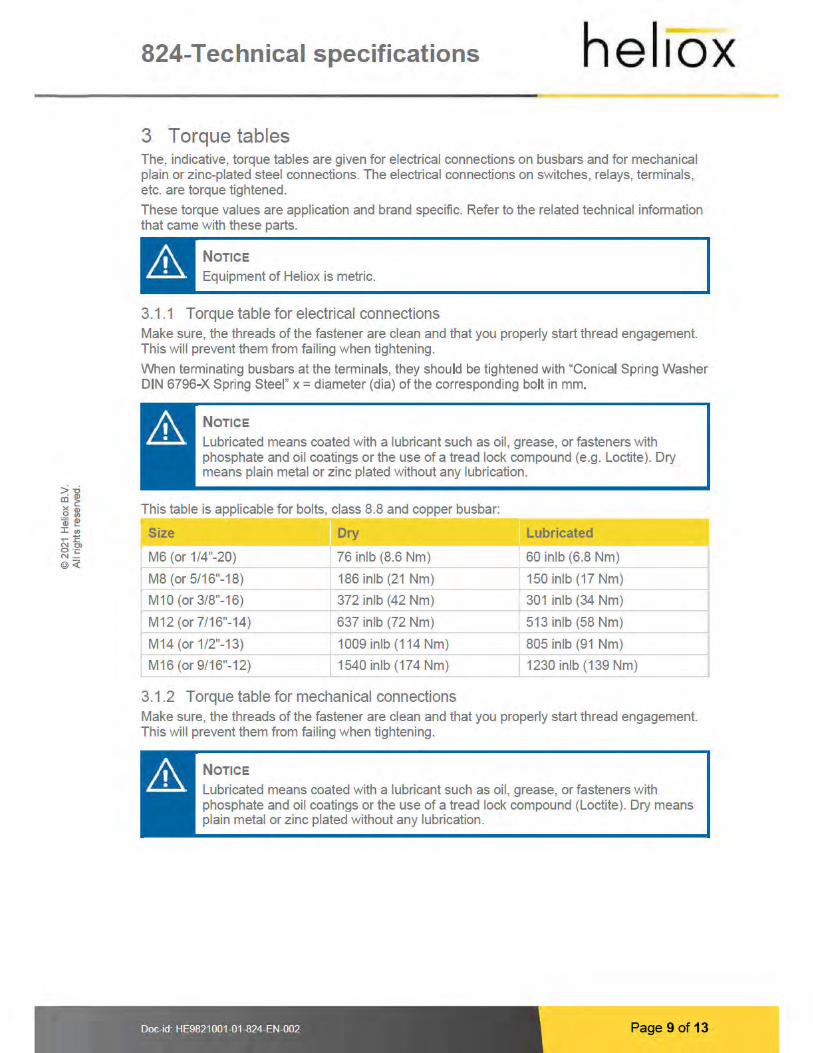

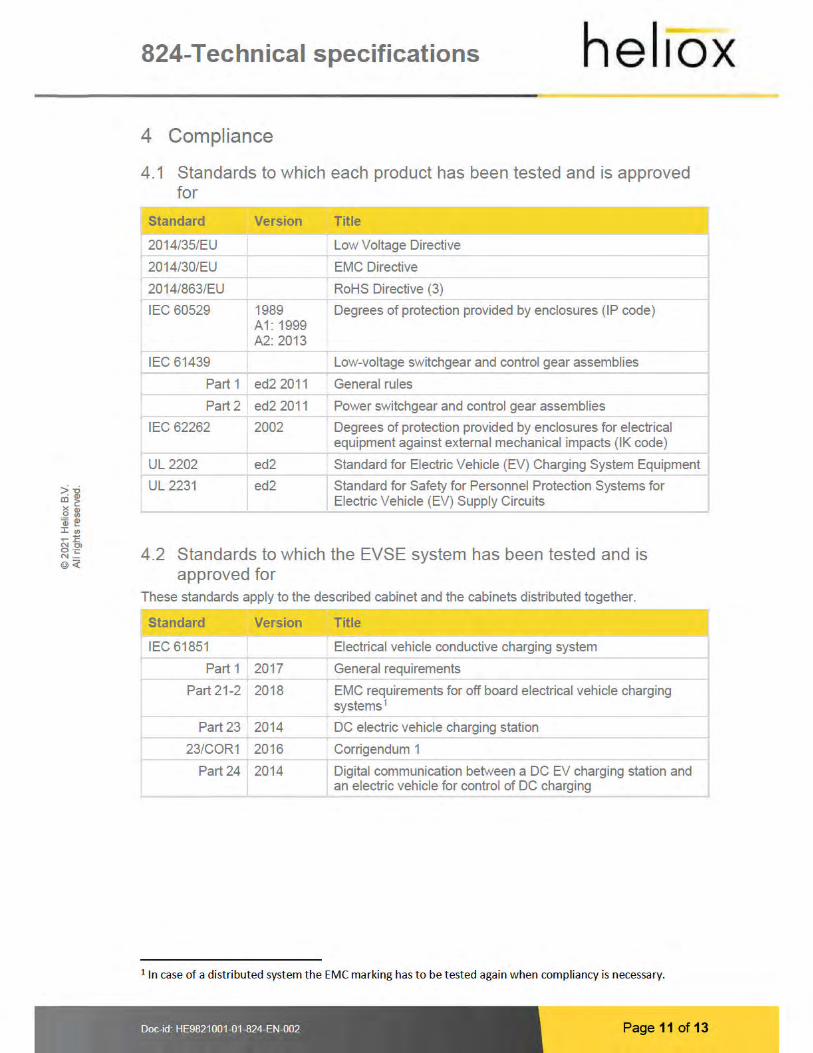
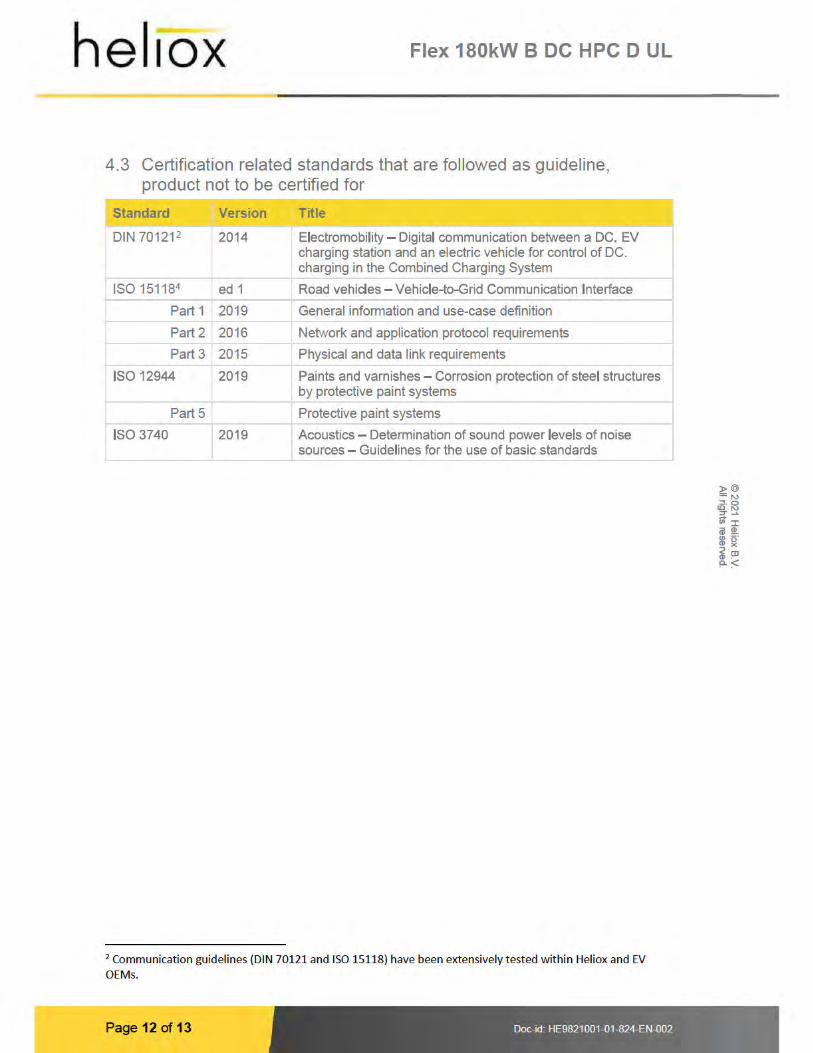

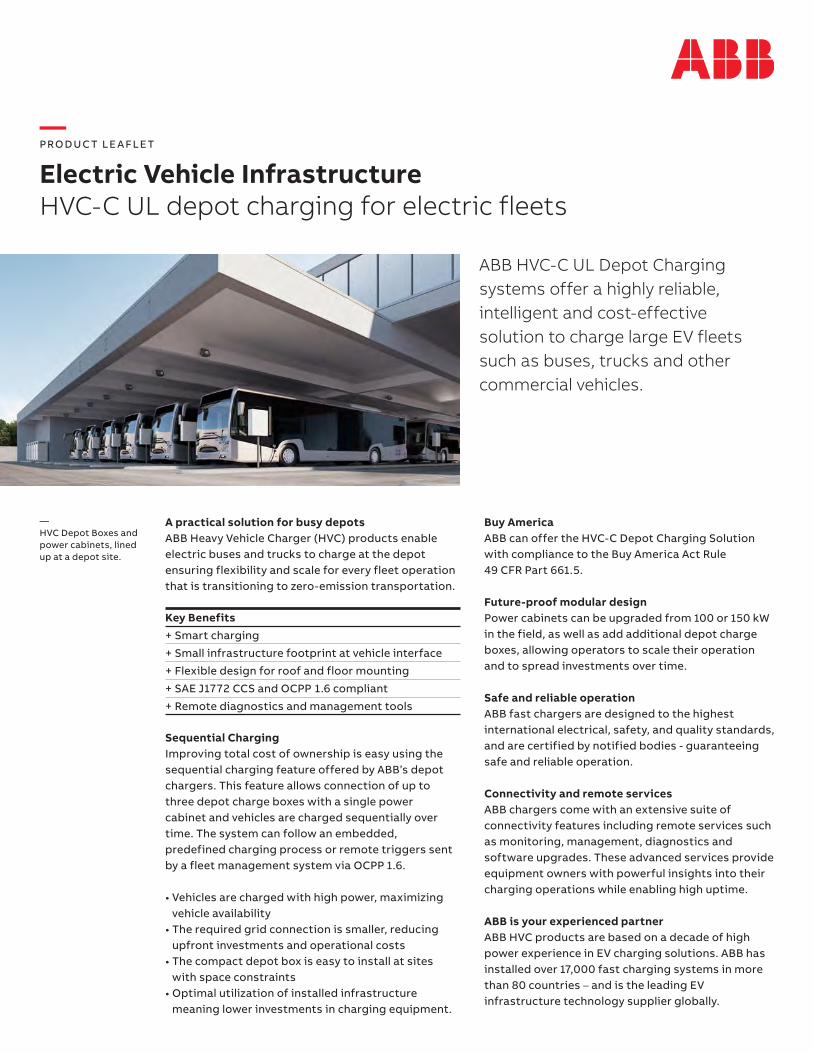
— PRO DUC T LE A FLE T
Electric Vehicle InfrastructureHVC-C UL depot charging for electric fleets
ABB HVC-C UL Depot Charging systems offer a highly reliable, intelligent and cost-effective solution to charge large EV fleets such as buses, trucks and other commercial vehicles.
A practical solution for busy depotsABB Heavy Vehicle Charger (HVC) products enable electric buses and trucks to charge at the depot ensuring flexibility and scale for every fleet operation that is transitioning to zero-emission transportation.
Sequential ChargingImproving total cost of ownership is easy using the sequential charging feature offered by ABB’s depot chargers. This feature allows connection of up to three depot charge boxes with a single power cabinet and vehicles are charged sequentially over time. The system can follow an embedded, predefined charging process or remote triggers sent by a fleet management system via OCPP 1.6.
• Vehicles are charged with high power, maximizing vehicle availability
• The required grid connection is smaller, reducing upfront investments and operational costs
• The compact depot box is easy to install at sites with space constraints
• Optimal utilization of installed infrastructure meaning lower investments in charging equipment.
Key Benefits+ Smart charging
+ Small infrastructure footprint at vehicle interface
+ Flexible design for roof and floor mounting
+ SAE J1772 CCS and OCPP 1.6 compliant
+ Remote diagnostics and management tools
—HVC Depot Boxes and power cabinets, lined up at a depot site.
Buy AmericaABB can offer the HVC-C Depot Charging Solution with compliance to the Buy America Act Rule 49 CFR Part 661.5.
Future-proof modular designPower cabinets can be upgraded from 100 or 150 kW in the field, as well as add additional depot charge boxes, allowing operators to scale their operation and to spread investments over time.
Safe and reliable operationABB fast chargers are designed to the highest international electrical, safety, and quality standards, and are certified by notified bodies - guaranteeing safe and reliable operation.
Connectivity and remote servicesABB chargers come with an extensive suite of connectivity features including remote services such as monitoring, management, diagnostics and software upgrades. These advanced services provide equipment owners with powerful insights into their charging operations while enabling high uptime.
ABB is your experienced partnerABB HVC products are based on a decade of high power experience in EV charging solutions. ABB has installed over 17,000 fast charging systems in more than 80 countries – and is the leading EV infrastructure technology supplier globally.
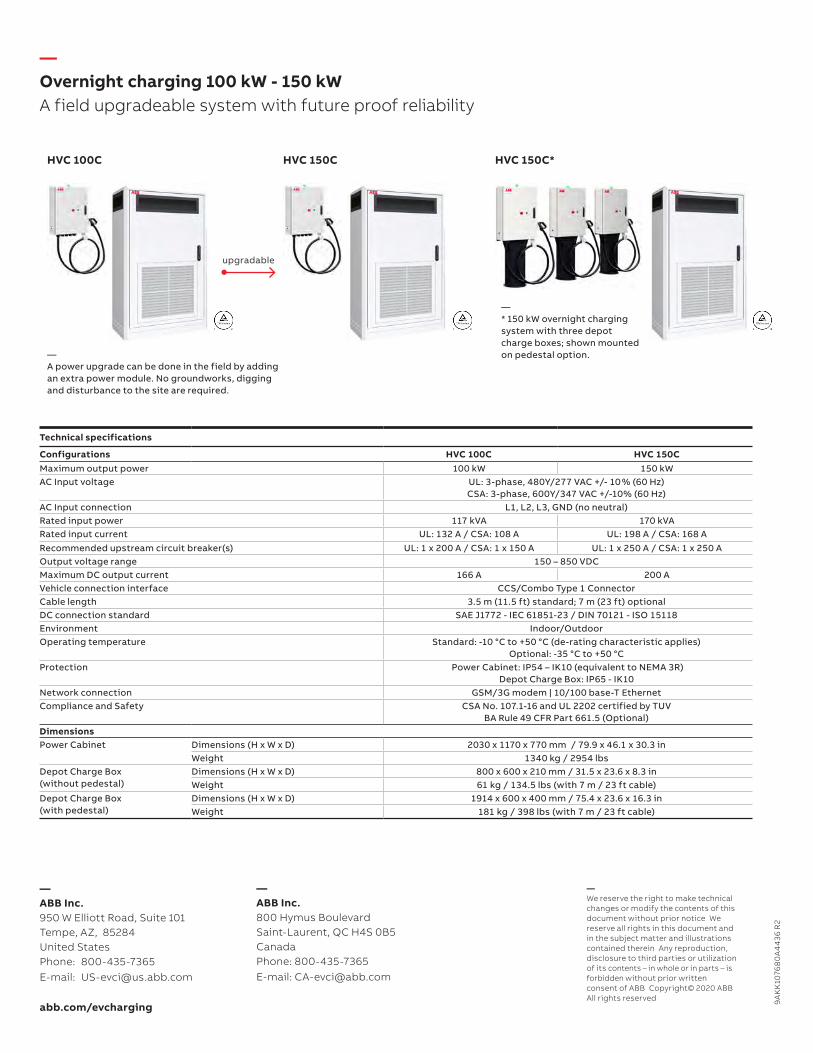
Technical specifications
Configurations HVC 100C HVC 150CMaximum output power 100 kW 150 kWAC Input voltage UL: 3-phase, 480Y/277 VAC +/- 10 % (60 Hz)
CSA: 3-phase, 600Y/347 VAC +/-10% (60 Hz)AC Input connection L1, L2, L3, GND (no neutral)Rated input power 117 kVA 170 kVARated input current UL: 132 A / CSA: 108 A UL: 198 A / CSA: 168 ARecommended upstream circuit breaker(s) UL: 1 x 200 A / CSA: 1 x 150 A UL: 1 x 250 A / CSA: 1 x 250 AOutput voltage range 150 – 850 VDCMaximum DC output current 166 A 200 AVehicle connection interface CCS/Combo Type 1 ConnectorCable length 3.5 m (11.5 ft) standard; 7 m (23 ft) optionalDC connection standard SAE J1772 - IEC 61851-23 / DIN 70121 - ISO 15118Environment Indoor/OutdoorOperating temperature Standard: -10 °C to +50 °C (de-rating characteristic applies)
Optional: -35 °C to +50 °CProtection Power Cabinet: IP54 – IK10 (equivalent to NEMA 3R)
Depot Charge Box: IP65 - IK10Network connection GSM/3G modem | 10/100 base-T EthernetCompliance and Safety CSA No. 107.1-16 and UL 2202 certified by TUV
BA Rule 49 CFR Part 661.5 (Optional)DimensionsPower Cabinet Dimensions (H x W x D) 2030 x 1170 x 770 mm / 79.9 x 46.1 x 30.3 in
Weight 1340 kg / 2954 lbsDepot Charge Box (without pedestal)
Dimensions (H x W x D) 800 x 600 x 210 mm / 31.5 x 23.6 x 8.3 inWeight 61 kg / 134.5 lbs (with 7 m / 23 ft cable)
Depot Charge Box (with pedestal)
Dimensions (H x W x D) 1914 x 600 x 400 mm / 75.4 x 23.6 x 16.3 inWeight 181 kg / 398 lbs (with 7 m / 23 ft cable)
—Overnight charging 100 kW - 150 kWA field upgradeable system with future proof reliability
—We reserve the right to make technical changes or modify the contents of this document without prior notice We reserve all rights in this document and in the subject matter and illustrations contained therein Any reproduction, disclosure to third parties or utilization of its contents – in whole or in parts – is forbidden without prior written consent of ABB Copyright© 2020 ABB All rights reserved
—ABB Inc.950 W Elliott Road, Suite 101Tempe, AZ, 85284United States Phone: 800-435-7365E-mail: [email protected]
abb.com/evcharging
—ABB Inc.800 Hymus BoulevardSaint-Laurent, QC H4S 0B5CanadaPhone: 800-435-7365E-mail: [email protected]
9A
KK
1076
80
A4
436
R2
— A power upgrade can be done in the field by adding an extra power module. No groundworks, digging and disturbance to the site are required.
HVC 100C HVC 150C HVC 150C*
—* 150 kW overnight charging system with three depot charge boxes; shown mounted on pedestal option.
upgradable


Terra fast chargers: The most deployed DC fast chargers in the world.
• Power sharing for high utilization• Future proof, high-voltage technology• Reliable, compact and flexible design• Always connected, always smart
— Terra 94/124/184 UL Product guide
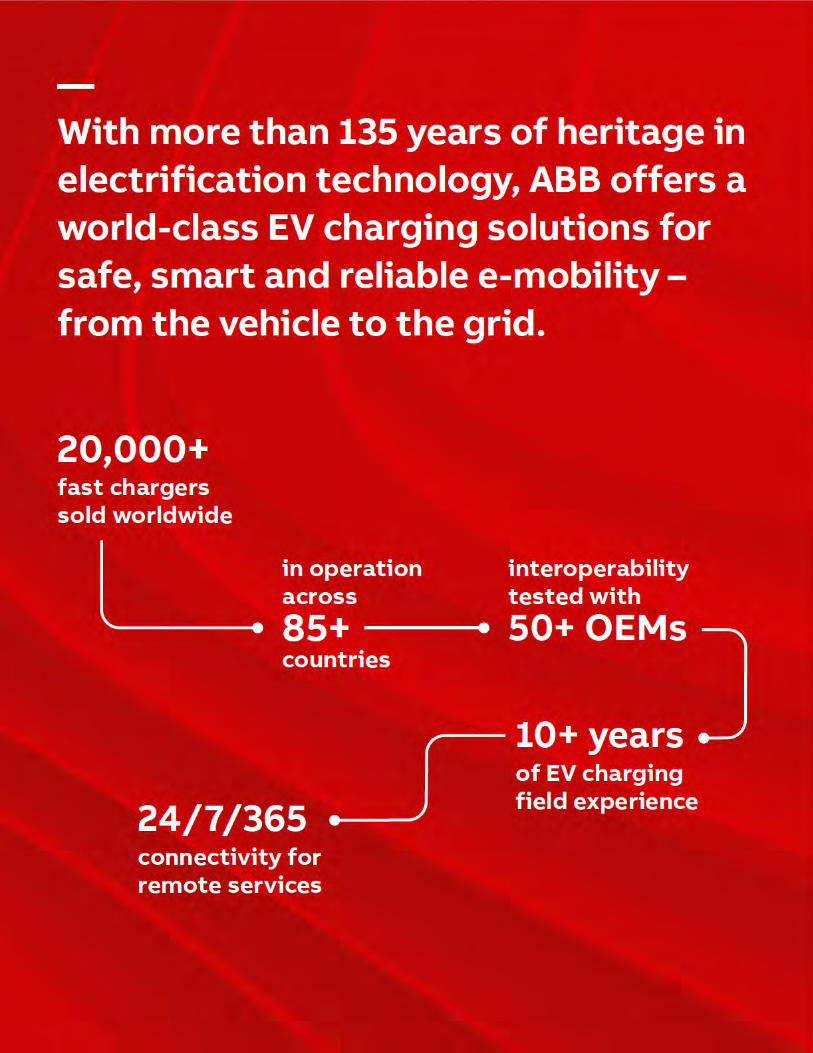
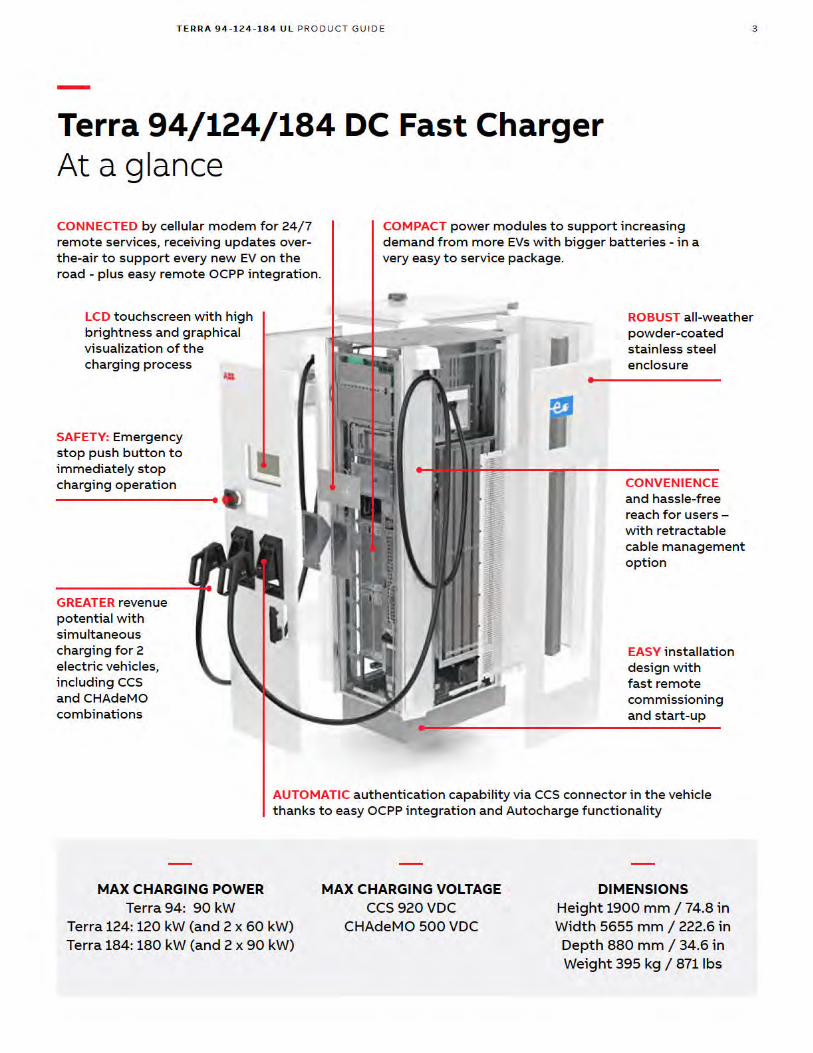
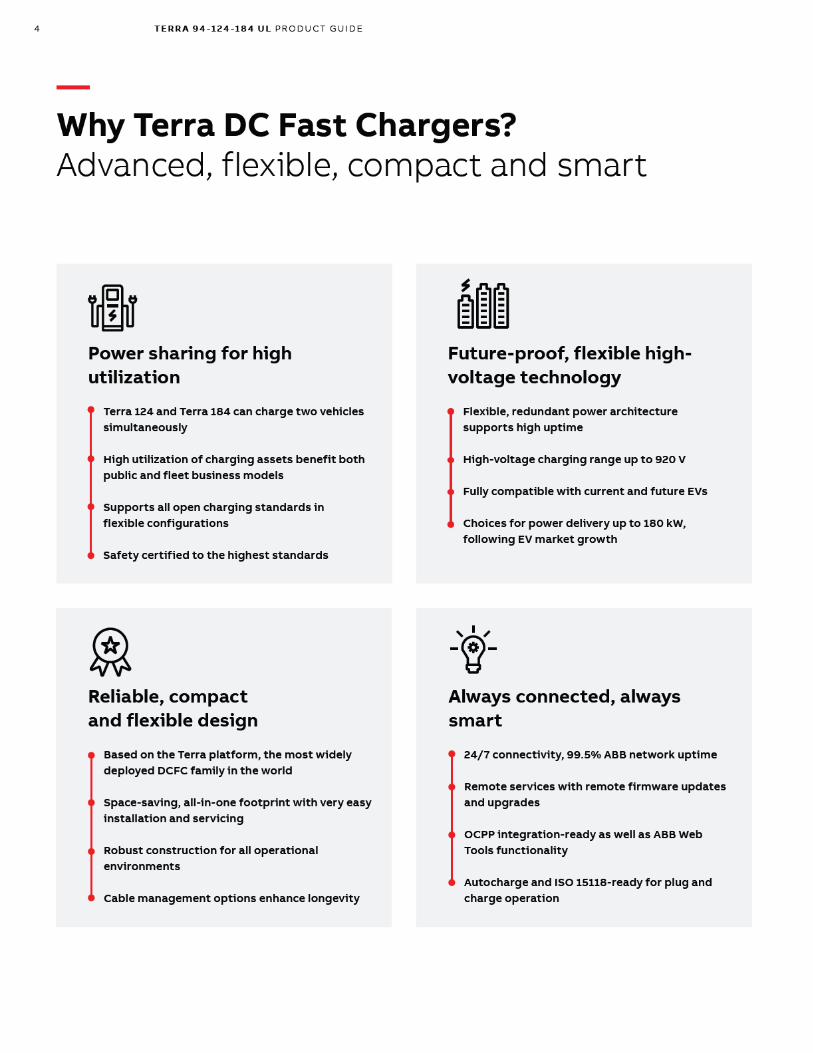


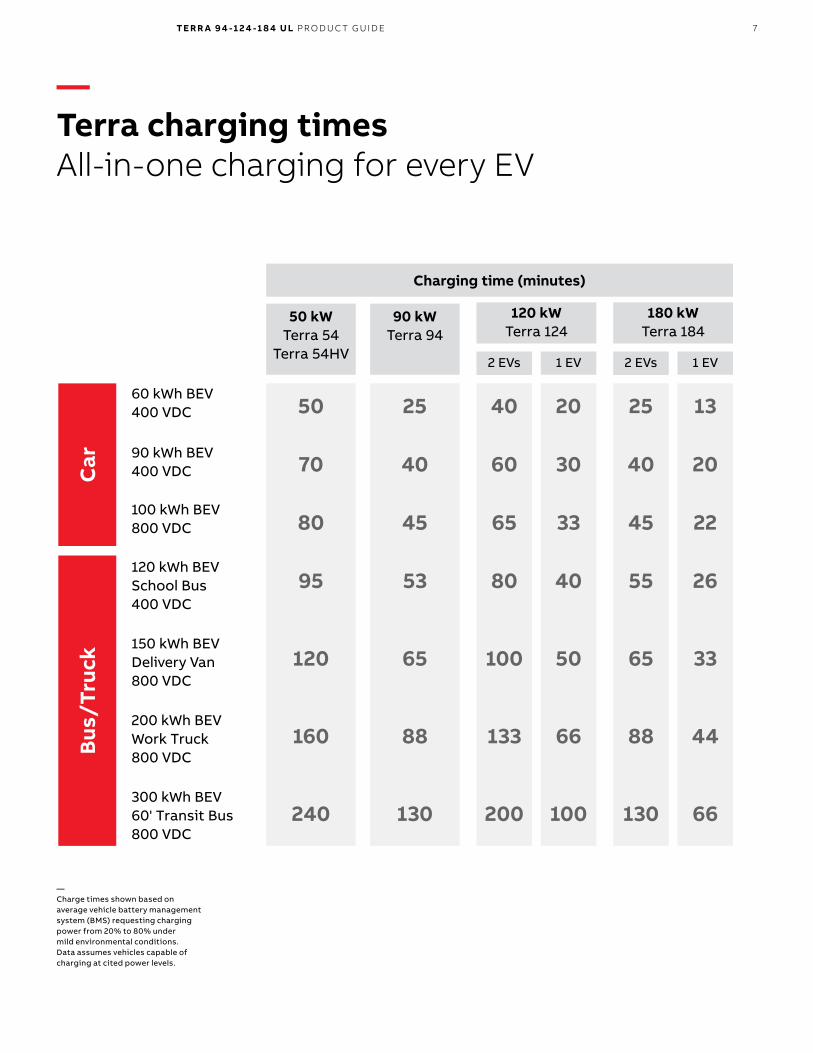
TE R R A 9 4 -1 2 4 -1 8 4 U L PR O D U C T G U I D E 7
60 kWh BEV400 VDC
90 kWh BEV400 VDC
100 kWh BEV800 VDC
150 kWh BEV Delivery Van800 VDC
Car
Bus
/Tru
ck
200 kWh BEV Work Truck800 VDC
300 kWh BEV 60' Transit Bus800 VDC
120 kWh BEV School Bus400 VDC
50 kWTerra 54
Terra 54HV
50
70
80
95
120
160
240
90 kWTerra 94
25
40
45
53
65
88
130
—Charge times shown based on average vehicle battery management system (BMS) requesting charging power from 20% to 80% under mild environmental conditions. Data assumes vehicles capable of charging at cited power levels.
—Terra charging times All-in-one charging for every EV
Charging time (minutes)
120 kWTerra 124
40
60
65
80
100
133
200
25
40
45
55
65
88
130
20
30
33
40
50
66
100
2 EVs 1 EV
180 kWTerra 184
2 EVs 1 EV
13
20
22
26
33
44
66

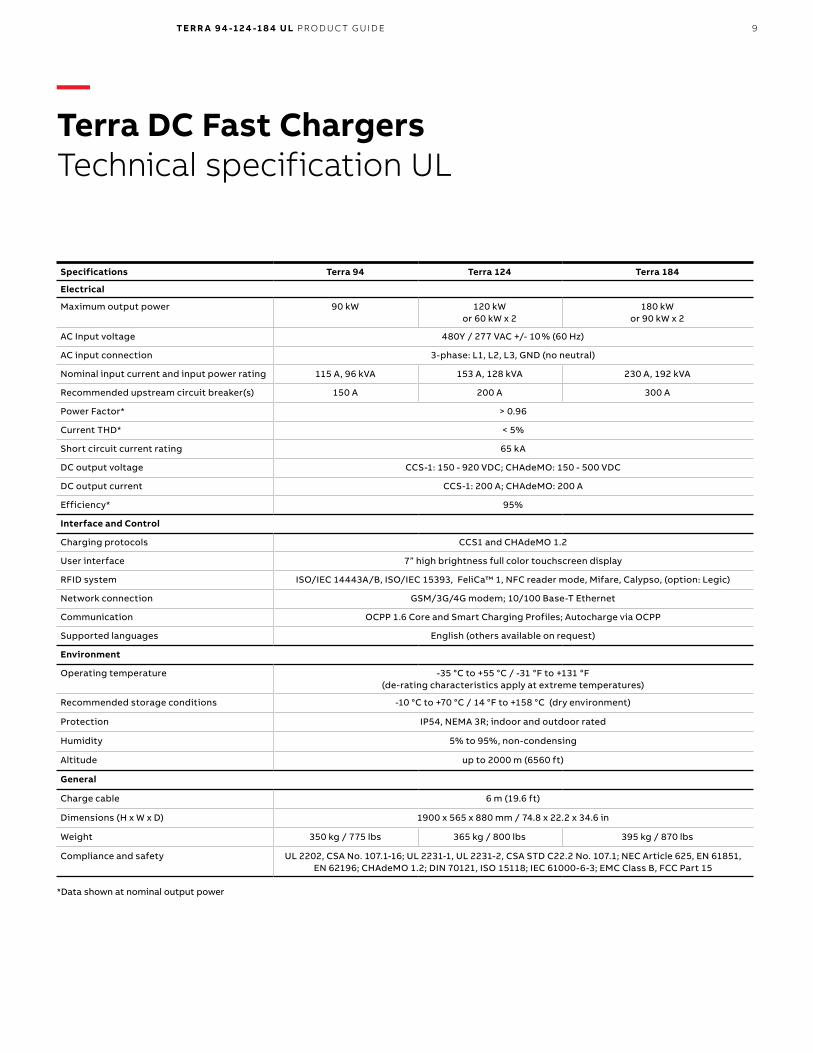
TE R R A 9 4 -1 2 4 -1 8 4 U L PR O D U C T G U I D E 9
—Terra DC Fast ChargersTechnical specification UL
Specifications Terra 94 Terra 124 Terra 184
Electrical
Maximum output power 90 kW 120 kW or 60 kW x 2
180 kW or 90 kW x 2
AC Input voltage 480Y / 277 VAC +/- 10 % (60 Hz)
AC input connection 3-phase: L1, L2, L3, GND (no neutral)
Nominal input current and input power rating 115 A, 96 kVA 153 A, 128 kVA 230 A, 192 kVA
Recommended upstream circuit breaker(s) 150 A 200 A 300 A
Power Factor* > 0.96
Current THD* < 5%
Short circuit current rating 65 kA
DC output voltage CCS-1: 150 - 920 VDC; CHAdeMO: 150 - 500 VDC
DC output current CCS-1: 200 A; CHAdeMO: 200 A
Efficiency* 95%
Interface and Control
Charging protocols CCS1 and CHAdeMO 1.2
User interface 7” high brightness full color touchscreen display
RFID system ISO/IEC 14443A/B, ISO/IEC 15393, FeliCa™ 1, NFC reader mode, Mifare, Calypso, (option: Legic)
Network connection GSM/3G/4G modem; 10/100 Base-T Ethernet
Communication OCPP 1.6 Core and Smart Charging Profiles; Autocharge via OCPP
Supported languages English (others available on request)
Environment
Operating temperature -35 °C to +55 °C / -31 °F to +131 °F(de-rating characteristics apply at extreme temperatures)
Recommended storage conditions -10 °C to +70 °C / 14 °F to +158 °C (dry environment)
Protection IP54, NEMA 3R; indoor and outdoor rated
Humidity 5% to 95%, non-condensing
Altitude up to 2000 m (6560 ft)
General
Charge cable 6 m (19.6 ft)
Dimensions (H x W x D) 1900 x 565 x 880 mm / 74.8 x 22.2 x 34.6 in
Weight 350 kg / 775 lbs 365 kg / 800 lbs 395 kg / 870 lbs
Compliance and safety UL 2202, CSA No. 107.1-16; UL 2231-1, UL 2231-2, CSA STD C22.2 No. 107.1; NEC Article 625, EN 61851, EN 62196; CHAdeMO 1.2; DIN 70121, ISO 15118; IEC 61000-6-3; EMC Class B, FCC Part 15
*Data shown at nominal output power
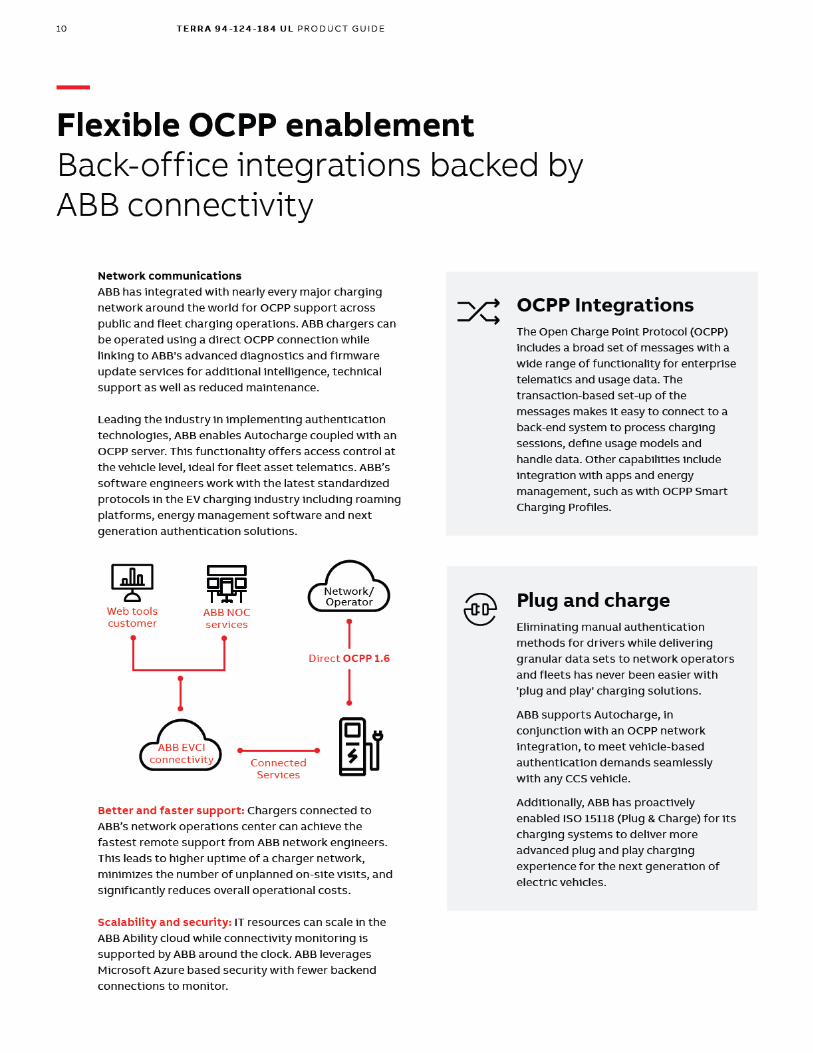


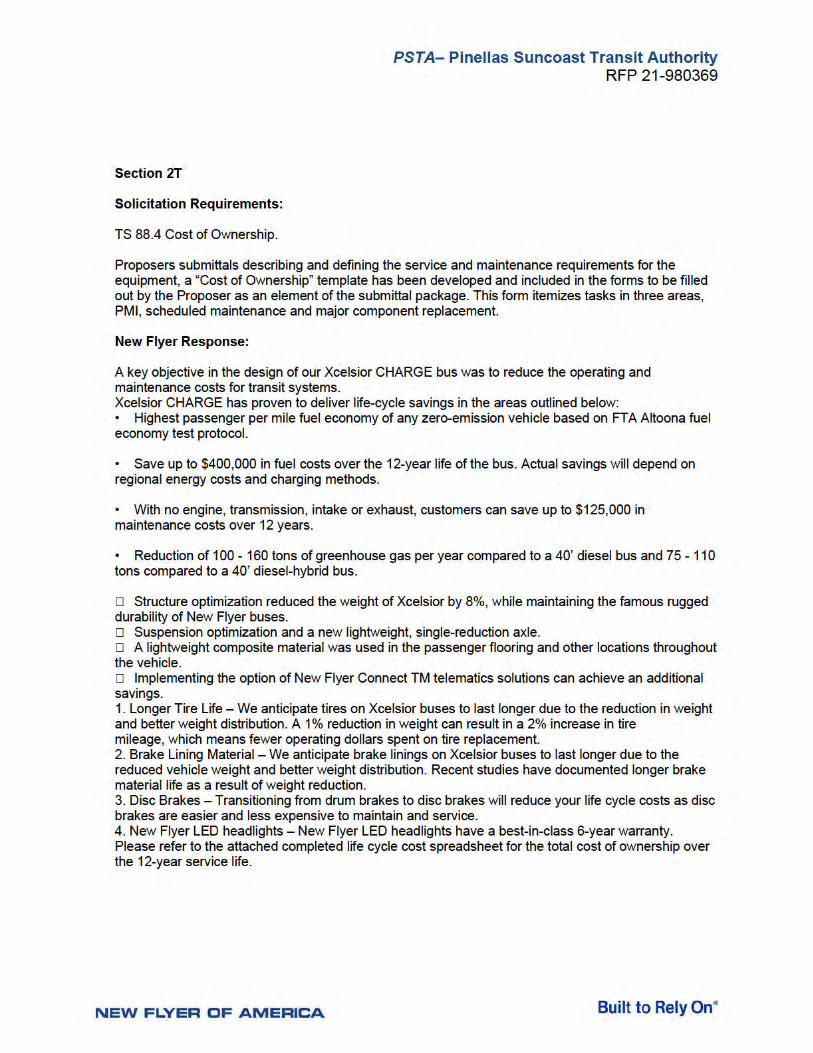
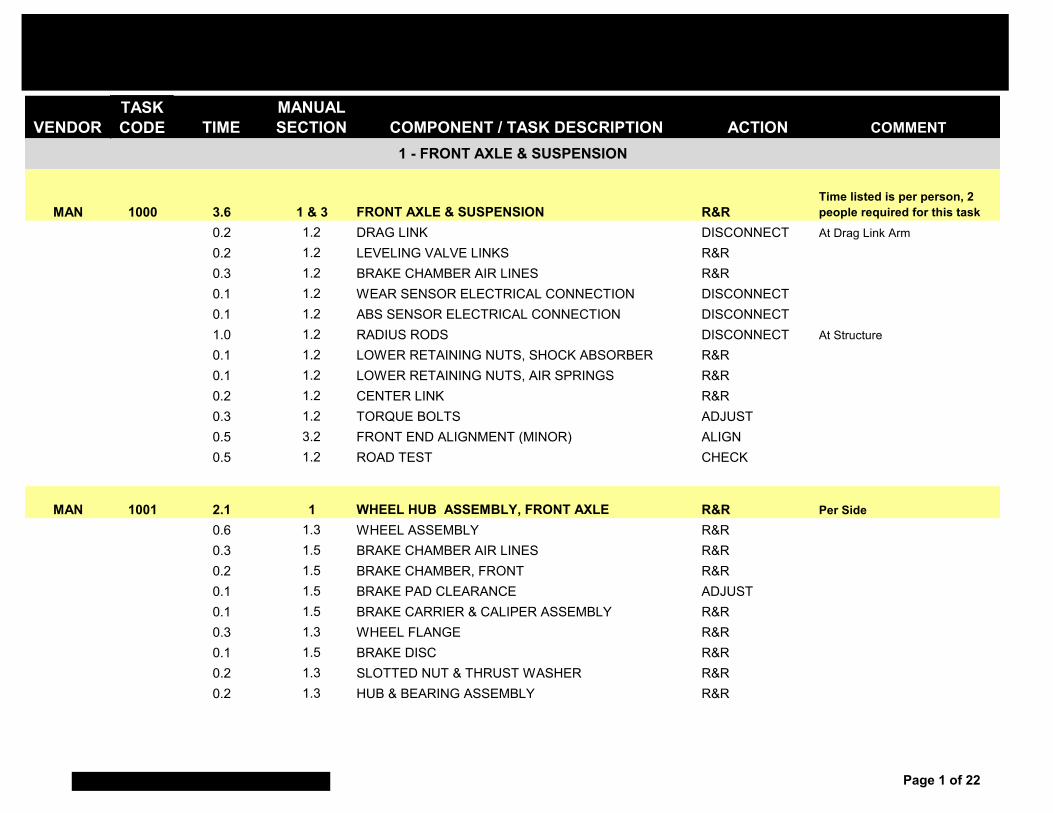
VENDORTASK CODE TIME
MANUAL SECTION COMPONENT / TASK DESCRIPTION ACTION COMMENT
MAN 1000 3.6 1 & 3 FRONT AXLE & SUSPENSION R&RTime listed is per person, 2 people required for this task
0.2 1.2 DRAG LINK DISCONNECT At Drag Link Arm
0.2 1.2 LEVELING VALVE LINKS R&R0.3 1.2 BRAKE CHAMBER AIR LINES R&R0.1 1.2 WEAR SENSOR ELECTRICAL CONNECTION DISCONNECT0.1 1.2 ABS SENSOR ELECTRICAL CONNECTION DISCONNECT1.0 1.2 RADIUS RODS DISCONNECT At Structure
0.1 1.2 LOWER RETAINING NUTS, SHOCK ABSORBER R&R0.1 1.2 LOWER RETAINING NUTS, AIR SPRINGS R&R0.2 1.2 CENTER LINK R&R0.3 1.2 TORQUE BOLTS ADJUST0.5 3.2 FRONT END ALIGNMENT (MINOR) ALIGN0.5 1.2 ROAD TEST CHECK
MAN 1001 2.1 1 WHEEL HUB ASSEMBLY, FRONT AXLE R&R Per Side0.6 1.3 WHEEL ASSEMBLY R&R0.3 1.5 BRAKE CHAMBER AIR LINES R&R0.2 1.5 BRAKE CHAMBER, FRONT R&R0.1 1.5 BRAKE PAD CLEARANCE ADJUST0.1 1.5 BRAKE CARRIER & CALIPER ASSEMBLY R&R0.3 1.3 WHEEL FLANGE R&R0.1 1.5 BRAKE DISC R&R0.2 1.3 SLOTTED NUT & THRUST WASHER R&R0.2 1.3 HUB & BEARING ASSEMBLY R&R
1 - FRONT AXLE & SUSPENSION
Page 1 of 22
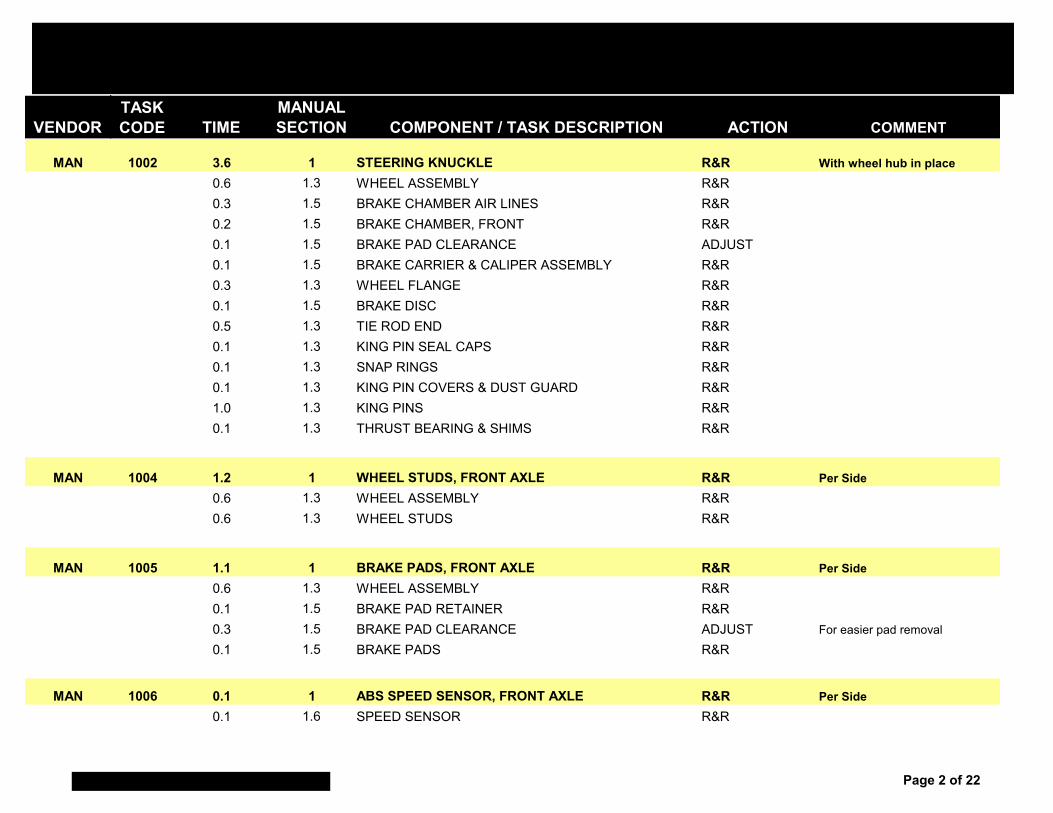
VENDORTASK CODE TIME
MANUAL SECTION COMPONENT / TASK DESCRIPTION ACTION COMMENT
MAN 1002 3.6 1 STEERING KNUCKLE R&R With wheel hub in place0.6 1.3 WHEEL ASSEMBLY R&R0.3 1.5 BRAKE CHAMBER AIR LINES R&R0.2 1.5 BRAKE CHAMBER, FRONT R&R0.1 1.5 BRAKE PAD CLEARANCE ADJUST0.1 1.5 BRAKE CARRIER & CALIPER ASSEMBLY R&R0.3 1.3 WHEEL FLANGE R&R0.1 1.5 BRAKE DISC R&R0.5 1.3 TIE ROD END R&R0.1 1.3 KING PIN SEAL CAPS R&R0.1 1.3 SNAP RINGS R&R0.1 1.3 KING PIN COVERS & DUST GUARD R&R1.0 1.3 KING PINS R&R0.1 1.3 THRUST BEARING & SHIMS R&R
MAN 1004 1.2 1 WHEEL STUDS, FRONT AXLE R&R Per Side0.6 1.3 WHEEL ASSEMBLY R&R0.6 1.3 WHEEL STUDS R&R
MAN 1005 1.1 1 BRAKE PADS, FRONT AXLE R&R Per Side0.6 1.3 WHEEL ASSEMBLY R&R0.1 1.5 BRAKE PAD RETAINER R&R0.3 1.5 BRAKE PAD CLEARANCE ADJUST For easier pad removal
0.1 1.5 BRAKE PADS R&R
MAN 1006 0.1 1 ABS SPEED SENSOR, FRONT AXLE R&R Per Side0.1 1.6 SPEED SENSOR R&R
Page 2 of 22
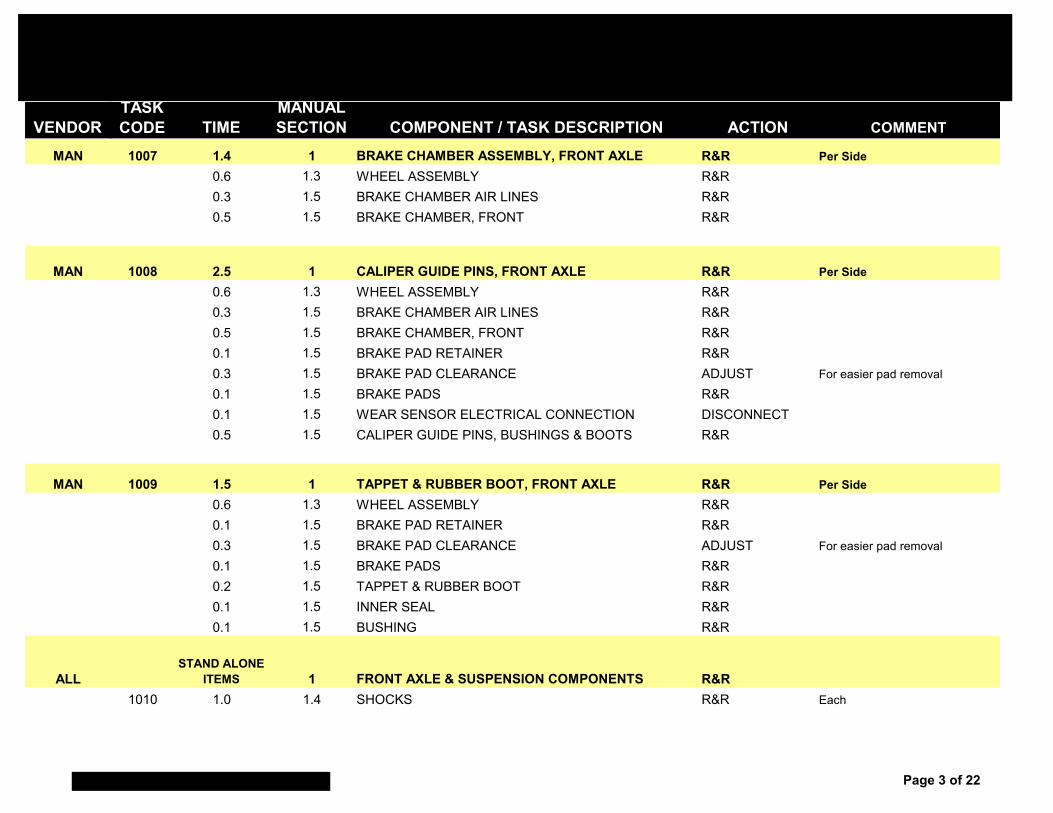
VENDORTASK CODE TIME
MANUAL SECTION COMPONENT / TASK DESCRIPTION ACTION COMMENT
MAN 1007 1.4 1 BRAKE CHAMBER ASSEMBLY, FRONT AXLE R&R Per Side0.6 1.3 WHEEL ASSEMBLY R&R0.3 1.5 BRAKE CHAMBER AIR LINES R&R0.5 1.5 BRAKE CHAMBER, FRONT R&R
MAN 1008 2.5 1 CALIPER GUIDE PINS, FRONT AXLE R&R Per Side0.6 1.3 WHEEL ASSEMBLY R&R0.3 1.5 BRAKE CHAMBER AIR LINES R&R0.5 1.5 BRAKE CHAMBER, FRONT R&R0.1 1.5 BRAKE PAD RETAINER R&R0.3 1.5 BRAKE PAD CLEARANCE ADJUST For easier pad removal
0.1 1.5 BRAKE PADS R&R0.1 1.5 WEAR SENSOR ELECTRICAL CONNECTION DISCONNECT0.5 1.5 CALIPER GUIDE PINS, BUSHINGS & BOOTS R&R
MAN 1009 1.5 1 TAPPET & RUBBER BOOT, FRONT AXLE R&R Per Side0.6 1.3 WHEEL ASSEMBLY R&R0.1 1.5 BRAKE PAD RETAINER R&R0.3 1.5 BRAKE PAD CLEARANCE ADJUST For easier pad removal
0.1 1.5 BRAKE PADS R&R0.2 1.5 TAPPET & RUBBER BOOT R&R0.1 1.5 INNER SEAL R&R0.1 1.5 BUSHING R&R
ALLSTAND ALONE
ITEMS 1 FRONT AXLE & SUSPENSION COMPONENTS R&R1010 1.0 1.4 SHOCKS R&R Each
Page 3 of 22
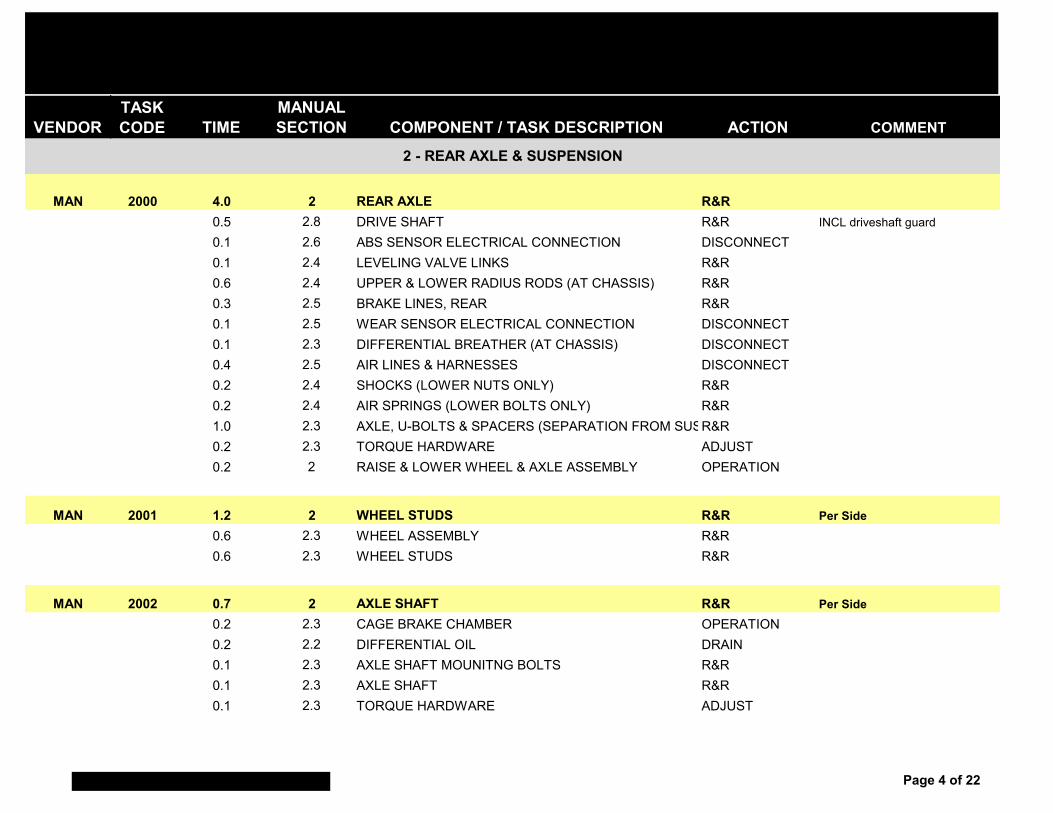
VENDORTASK CODE TIME
MANUAL SECTION COMPONENT / TASK DESCRIPTION ACTION COMMENT
MAN 2000 4.0 2 REAR AXLE R&R0.5 2.8 DRIVE SHAFT R&R INCL driveshaft guard
0.1 2.6 ABS SENSOR ELECTRICAL CONNECTION DISCONNECT0.1 2.4 LEVELING VALVE LINKS R&R0.6 2.4 UPPER & LOWER RADIUS RODS (AT CHASSIS) R&R0.3 2.5 BRAKE LINES, REAR R&R0.1 2.5 WEAR SENSOR ELECTRICAL CONNECTION DISCONNECT0.1 2.3 DIFFERENTIAL BREATHER (AT CHASSIS) DISCONNECT0.4 2.5 AIR LINES & HARNESSES DISCONNECT0.2 2.4 SHOCKS (LOWER NUTS ONLY) R&R0.2 2.4 AIR SPRINGS (LOWER BOLTS ONLY) R&R1.0 2.3 AXLE, U-BOLTS & SPACERS (SEPARATION FROM SUS R&R0.2 2.3 TORQUE HARDWARE ADJUST0.2 2 RAISE & LOWER WHEEL & AXLE ASSEMBLY OPERATION
MAN 2001 1.2 2 WHEEL STUDS R&R Per Side0.6 2.3 WHEEL ASSEMBLY R&R0.6 2.3 WHEEL STUDS R&R
MAN 2002 0.7 2 AXLE SHAFT R&R Per Side0.2 2.3 CAGE BRAKE CHAMBER OPERATION0.2 2.2 DIFFERENTIAL OIL DRAIN0.1 2.3 AXLE SHAFT MOUNITNG BOLTS R&R0.1 2.3 AXLE SHAFT R&R0.1 2.3 TORQUE HARDWARE ADJUST
2 - REAR AXLE & SUSPENSION
Page 4 of 22
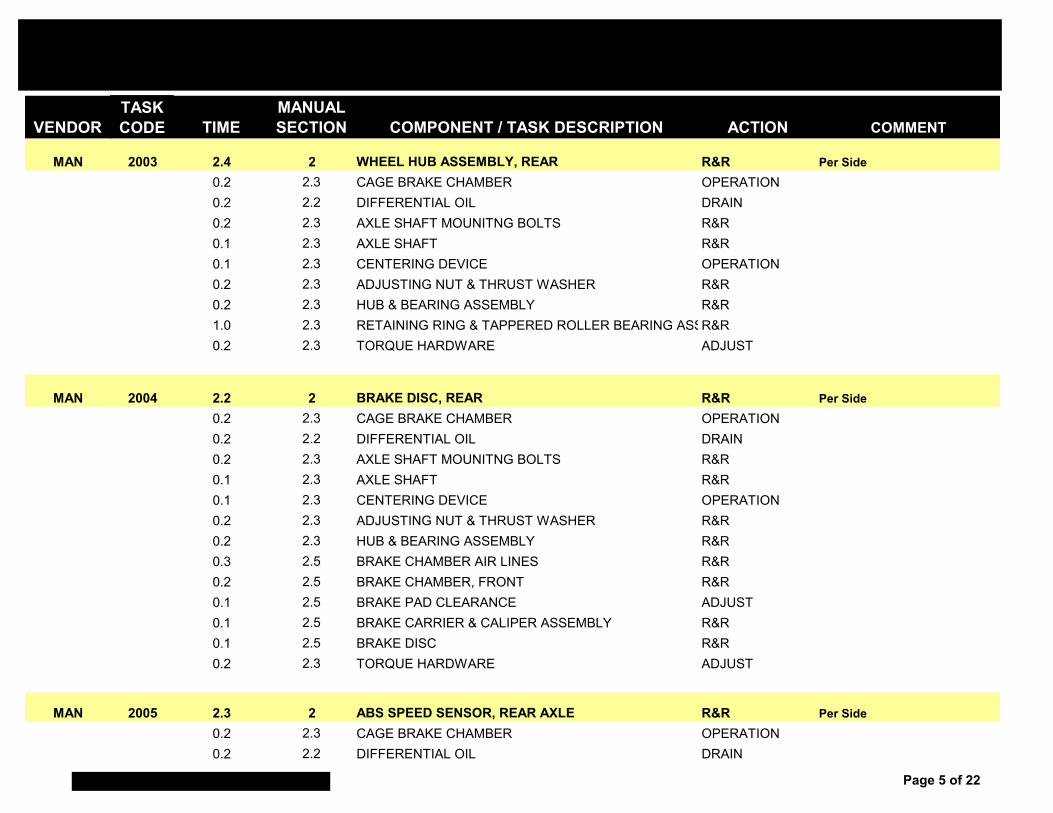
VENDORTASK CODE TIME
MANUAL SECTION COMPONENT / TASK DESCRIPTION ACTION COMMENT
MAN 2003 2.4 2 WHEEL HUB ASSEMBLY, REAR R&R Per Side0.2 2.3 CAGE BRAKE CHAMBER OPERATION0.2 2.2 DIFFERENTIAL OIL DRAIN0.2 2.3 AXLE SHAFT MOUNITNG BOLTS R&R0.1 2.3 AXLE SHAFT R&R0.1 2.3 CENTERING DEVICE OPERATION0.2 2.3 ADJUSTING NUT & THRUST WASHER R&R0.2 2.3 HUB & BEARING ASSEMBLY R&R1.0 2.3 RETAINING RING & TAPPERED ROLLER BEARING ASSR&R0.2 2.3 TORQUE HARDWARE ADJUST
MAN 2004 2.2 2 BRAKE DISC, REAR R&R Per Side0.2 2.3 CAGE BRAKE CHAMBER OPERATION0.2 2.2 DIFFERENTIAL OIL DRAIN0.2 2.3 AXLE SHAFT MOUNITNG BOLTS R&R0.1 2.3 AXLE SHAFT R&R0.1 2.3 CENTERING DEVICE OPERATION0.2 2.3 ADJUSTING NUT & THRUST WASHER R&R0.2 2.3 HUB & BEARING ASSEMBLY R&R0.3 2.5 BRAKE CHAMBER AIR LINES R&R0.2 2.5 BRAKE CHAMBER, FRONT R&R0.1 2.5 BRAKE PAD CLEARANCE ADJUST0.1 2.5 BRAKE CARRIER & CALIPER ASSEMBLY R&R0.1 2.5 BRAKE DISC R&R0.2 2.3 TORQUE HARDWARE ADJUST
MAN 2005 2.3 2 ABS SPEED SENSOR, REAR AXLE R&R Per Side0.2 2.3 CAGE BRAKE CHAMBER OPERATION0.2 2.2 DIFFERENTIAL OIL DRAIN
Page 5 of 22

VENDORTASK CODE TIME
MANUAL SECTION COMPONENT / TASK DESCRIPTION ACTION COMMENT
0.2 2.3 AXLE SHAFT MOUNITNG BOLTS R&R0.1 2.3 AXLE SHAFT R&R0.1 2.3 CENTERING DEVICE OPERATION0.2 2.3 ADJUSTING NUT & THRUST WASHER R&R0.2 2.3 HUB & BEARING ASSEMBLY R&R0.3 2.5 BRAKE CHAMBER AIR LINES R&R0.2 2.5 BRAKE CHAMBER, FRONT R&R0.1 2.5 BRAKE PAD CLEARANCE ADJUST0.1 2.5 BRAKE CARRIER & CALIPER ASSEMBLY R&R0.1 2.5 BRAKE DISC R&R0.1 2.6 SPEED SENSOR R&R0.2 2.3 TORQUE HARDWARE ADJUST
MAN 2006 1.1 2 BRAKE PADS, REAR AXLE R&R Per Side0.6 2.3 WHEEL ASSEMBLY R&R0.1 2.5 BRAKE PAD RETAINER R&R0.3 2.5 BRAKE PAD CLEARANCE ADJUST For easier pad removal
0.1 2.5 BRAKE PADS R&R
MAN 2007 1.6 2 BRAKE CHAMBER ASSEMBLY, REAR AXLE R&R Per Side0.6 2.3 WHEEL ASSEMBLY R&R0.3 2.3 BRAKE CHAMBER AIR LINES R&R0.2 2.3 CAGE BRAKE CHAMBER OPERATION0.5 2.5 BRAKE CHAMBER, REAR R&R
MAN 2008 2.7 2 CALIPER GUIDE PINS, REAR AXLE R&R Per Side0.6 2.3 WHEEL ASSEMBLY R&R0.3 2.3 BRAKE CHAMBER AIR LINES R&R0.2 2.3 CAGE BRAKE CHAMBER OPERATION
Page 6 of 22
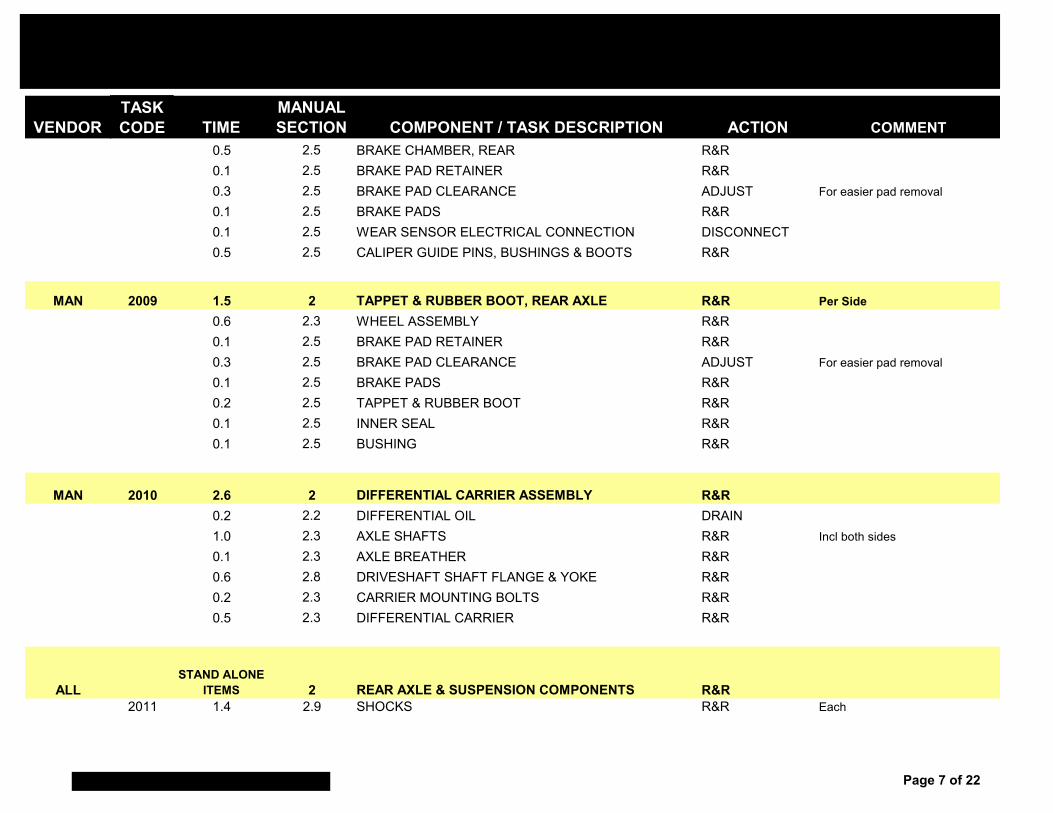
VENDORTASK CODE TIME
MANUAL SECTION COMPONENT / TASK DESCRIPTION ACTION COMMENT
0.5 2.5 BRAKE CHAMBER, REAR R&R0.1 2.5 BRAKE PAD RETAINER R&R0.3 2.5 BRAKE PAD CLEARANCE ADJUST For easier pad removal
0.1 2.5 BRAKE PADS R&R0.1 2.5 WEAR SENSOR ELECTRICAL CONNECTION DISCONNECT0.5 2.5 CALIPER GUIDE PINS, BUSHINGS & BOOTS R&R
MAN 2009 1.5 2 TAPPET & RUBBER BOOT, REAR AXLE R&R Per Side0.6 2.3 WHEEL ASSEMBLY R&R0.1 2.5 BRAKE PAD RETAINER R&R0.3 2.5 BRAKE PAD CLEARANCE ADJUST For easier pad removal
0.1 2.5 BRAKE PADS R&R0.2 2.5 TAPPET & RUBBER BOOT R&R0.1 2.5 INNER SEAL R&R0.1 2.5 BUSHING R&R
MAN 2010 2.6 2 DIFFERENTIAL CARRIER ASSEMBLY R&R0.2 2.2 DIFFERENTIAL OIL DRAIN1.0 2.3 AXLE SHAFTS R&R Incl both sides
0.1 2.3 AXLE BREATHER R&R0.6 2.8 DRIVESHAFT SHAFT FLANGE & YOKE R&R0.2 2.3 CARRIER MOUNTING BOLTS R&R0.5 2.3 DIFFERENTIAL CARRIER R&R
ALLSTAND ALONE
ITEMS 2 REAR AXLE & SUSPENSION COMPONENTS R&R2011 1.4 2.9 SHOCKS R&R Each
Page 7 of 22
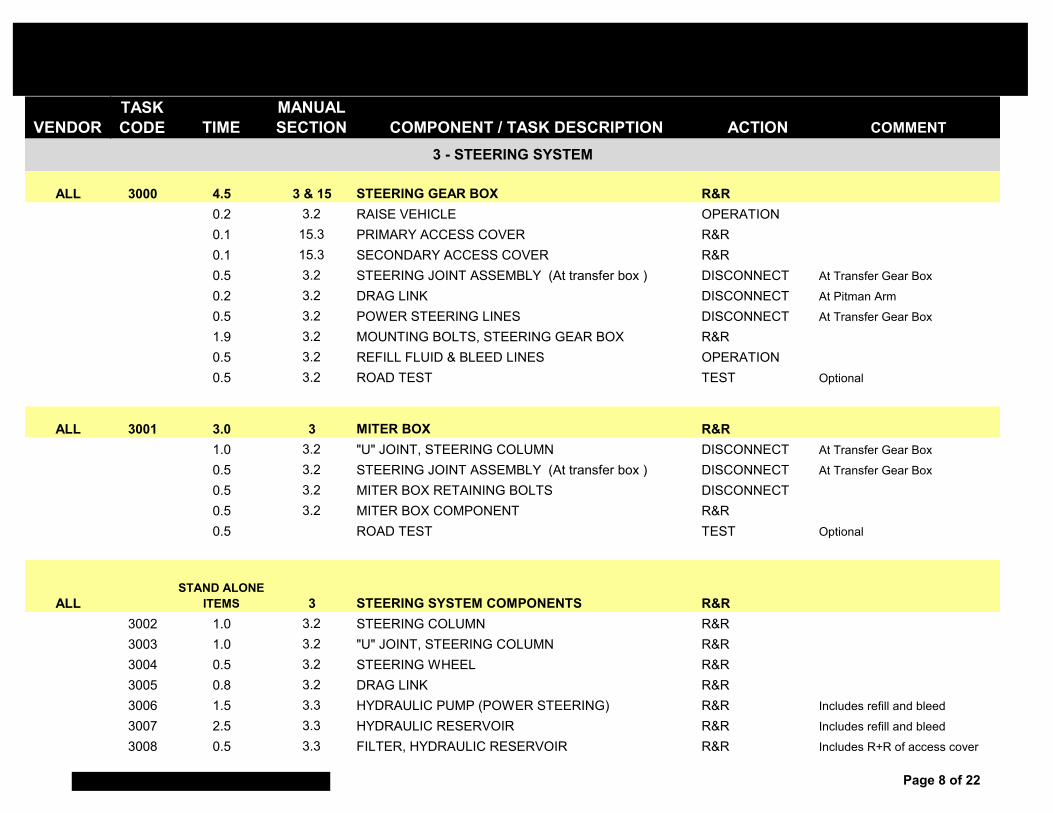
VENDORTASK CODE TIME
MANUAL SECTION COMPONENT / TASK DESCRIPTION ACTION COMMENT
ALL 3000 4.5 3 & 15 STEERING GEAR BOX R&R0.2 3.2 RAISE VEHICLE OPERATION0.1 15.3 PRIMARY ACCESS COVER R&R0.1 15.3 SECONDARY ACCESS COVER R&R0.5 3.2 STEERING JOINT ASSEMBLY (At transfer box ) DISCONNECT At Transfer Gear Box
0.2 3.2 DRAG LINK DISCONNECT At Pitman Arm
0.5 3.2 POWER STEERING LINES DISCONNECT At Transfer Gear Box
1.9 3.2 MOUNTING BOLTS, STEERING GEAR BOX R&R0.5 3.2 REFILL FLUID & BLEED LINES OPERATION0.5 3.2 ROAD TEST TEST Optional
ALL 3001 3.0 3 MITER BOX R&R1.0 3.2 "U" JOINT, STEERING COLUMN DISCONNECT At Transfer Gear Box
0.5 3.2 STEERING JOINT ASSEMBLY (At transfer box ) DISCONNECT At Transfer Gear Box
0.5 3.2 MITER BOX RETAINING BOLTS DISCONNECT0.5 3.2 MITER BOX COMPONENT R&R0.5 ROAD TEST TEST Optional
ALLSTAND ALONE
ITEMS 3 STEERING SYSTEM COMPONENTS R&R3002 1.0 3.2 STEERING COLUMN R&R3003 1.0 3.2 "U" JOINT, STEERING COLUMN R&R3004 0.5 3.2 STEERING WHEEL R&R3005 0.8 3.2 DRAG LINK R&R3006 1.5 3.3 HYDRAULIC PUMP (POWER STEERING) R&R Includes refill and bleed
3007 2.5 3.3 HYDRAULIC RESERVOIR R&R Includes refill and bleed
3008 0.5 3.3 FILTER, HYDRAULIC RESERVOIR R&R Includes R+R of access cover
3 - STEERING SYSTEM
Page 8 of 22
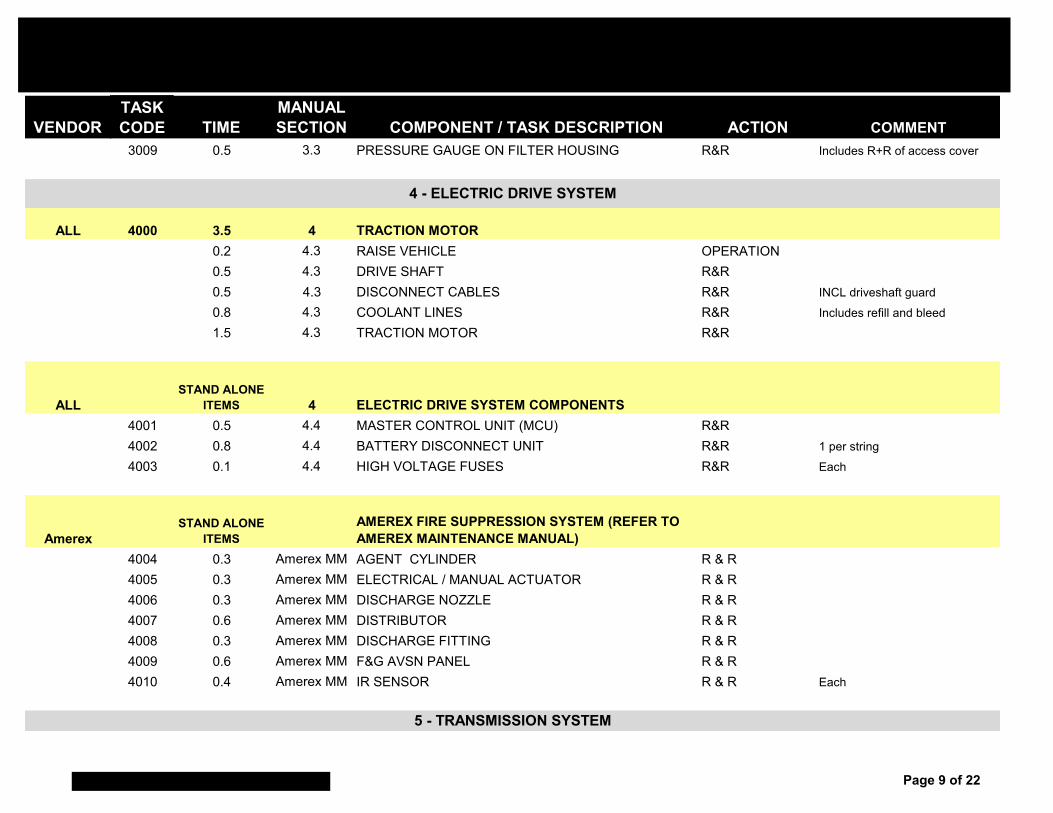
VENDORTASK CODE TIME
MANUAL SECTION COMPONENT / TASK DESCRIPTION ACTION COMMENT
3009 0.5 3.3 PRESSURE GAUGE ON FILTER HOUSING R&R Includes R+R of access cover
ALL 4000 3.5 4 TRACTION MOTOR0.2 4.3 RAISE VEHICLE OPERATION0.5 4.3 DRIVE SHAFT R&R0.5 4.3 DISCONNECT CABLES R&R INCL driveshaft guard
0.8 4.3 COOLANT LINES R&R Includes refill and bleed
1.5 4.3 TRACTION MOTOR R&R
ALLSTAND ALONE
ITEMS 4 ELECTRIC DRIVE SYSTEM COMPONENTS4001 0.5 4.4 MASTER CONTROL UNIT (MCU) R&R4002 0.8 4.4 BATTERY DISCONNECT UNIT R&R 1 per string
4003 0.1 4.4 HIGH VOLTAGE FUSES R&R Each
AmerexSTAND ALONE
ITEMSAMEREX FIRE SUPPRESSION SYSTEM (REFER TO AMEREX MAINTENANCE MANUAL)
4004 0.3 Amerex MM AGENT CYLINDER R & R4005 0.3 Amerex MM ELECTRICAL / MANUAL ACTUATOR R & R4006 0.3 Amerex MM DISCHARGE NOZZLE R & R4007 0.6 Amerex MM DISTRIBUTOR R & R4008 0.3 Amerex MM DISCHARGE FITTING R & R4009 0.6 Amerex MM F&G AVSN PANEL R & R4010 0.4 Amerex MM IR SENSOR R & R Each
4 - ELECTRIC DRIVE SYSTEM
5 - TRANSMISSION SYSTEM
Page 9 of 22
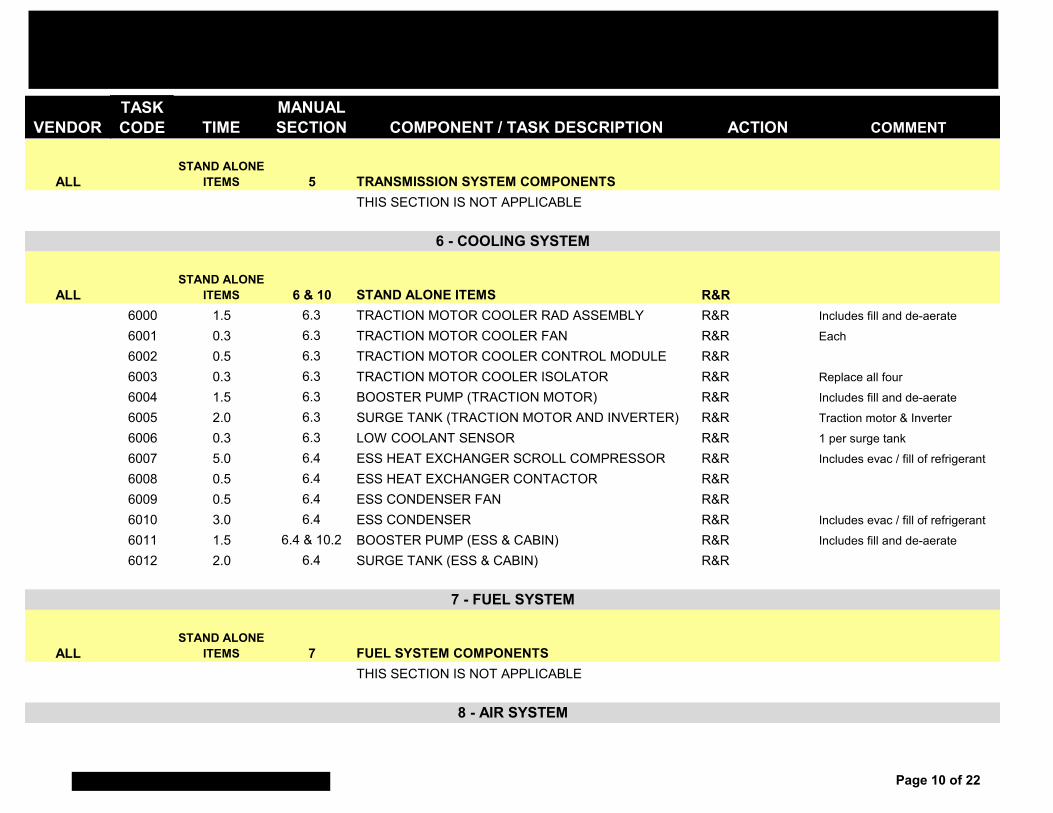
VENDORTASK CODE TIME
MANUAL SECTION COMPONENT / TASK DESCRIPTION ACTION COMMENT
ALLSTAND ALONE
ITEMS 5 TRANSMISSION SYSTEM COMPONENTSTHIS SECTION IS NOT APPLICABLE
ALLSTAND ALONE
ITEMS 6 & 10 STAND ALONE ITEMS R&R6000 1.5 6.3 TRACTION MOTOR COOLER RAD ASSEMBLY R&R Includes fill and de-aerate
6001 0.3 6.3 TRACTION MOTOR COOLER FAN R&R Each
6002 0.5 6.3 TRACTION MOTOR COOLER CONTROL MODULE R&R6003 0.3 6.3 TRACTION MOTOR COOLER ISOLATOR R&R Replace all four
6004 1.5 6.3 BOOSTER PUMP (TRACTION MOTOR) R&R Includes fill and de-aerate
6005 2.0 6.3 SURGE TANK (TRACTION MOTOR AND INVERTER) R&R Traction motor & Inverter
6006 0.3 6.3 LOW COOLANT SENSOR R&R 1 per surge tank
6007 5.0 6.4 ESS HEAT EXCHANGER SCROLL COMPRESSOR R&R Includes evac / fill of refrigerant
6008 0.5 6.4 ESS HEAT EXCHANGER CONTACTOR R&R6009 0.5 6.4 ESS CONDENSER FAN R&R6010 3.0 6.4 ESS CONDENSER R&R Includes evac / fill of refrigerant
6011 1.5 6.4 & 10.2 BOOSTER PUMP (ESS & CABIN) R&R Includes fill and de-aerate
6012 2.0 6.4 SURGE TANK (ESS & CABIN) R&R
ALLSTAND ALONE
ITEMS 7 FUEL SYSTEM COMPONENTSTHIS SECTION IS NOT APPLICABLE
7 - FUEL SYSTEM
8 - AIR SYSTEM
6 - COOLING SYSTEM
Page 10 of 22
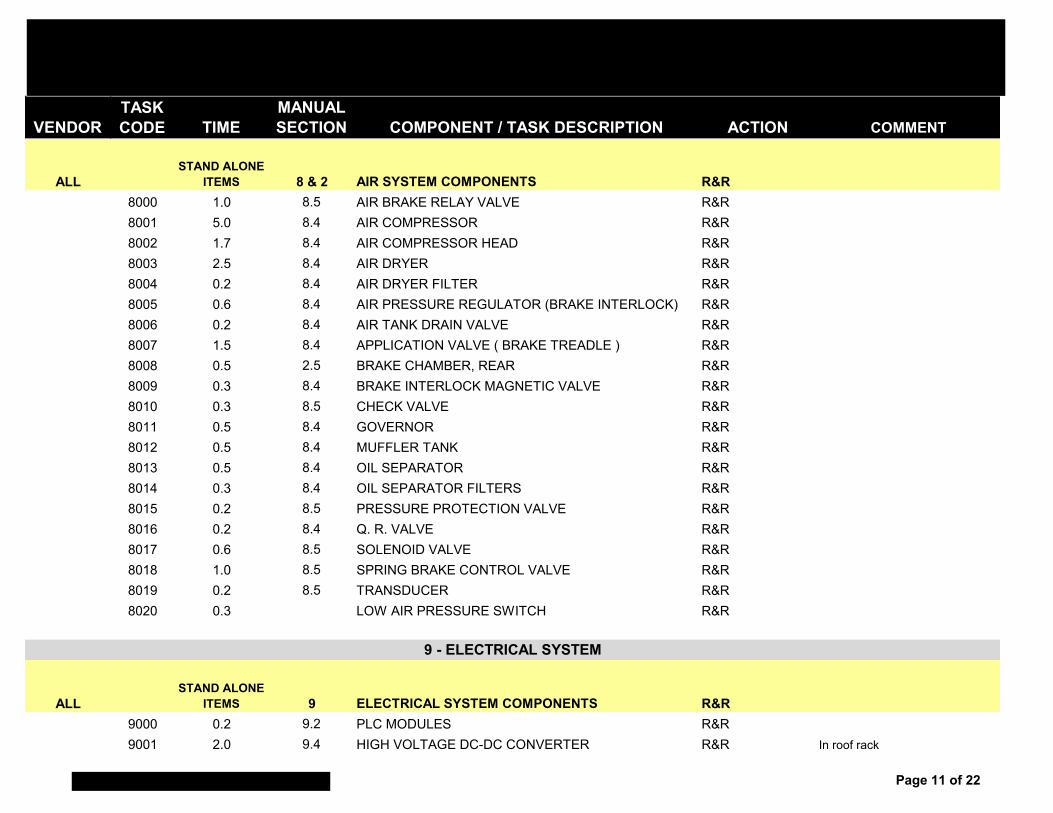
VENDORTASK CODE TIME
MANUAL SECTION COMPONENT / TASK DESCRIPTION ACTION COMMENT
ALLSTAND ALONE
ITEMS 8 & 2 AIR SYSTEM COMPONENTS R&R8000 1.0 8.5 AIR BRAKE RELAY VALVE R&R8001 5.0 8.4 AIR COMPRESSOR R&R8002 1.7 8.4 AIR COMPRESSOR HEAD R&R8003 2.5 8.4 AIR DRYER R&R8004 0.2 8.4 AIR DRYER FILTER R&R8005 0.6 8.4 AIR PRESSURE REGULATOR (BRAKE INTERLOCK) R&R8006 0.2 8.4 AIR TANK DRAIN VALVE R&R8007 1.5 8.4 APPLICATION VALVE ( BRAKE TREADLE ) R&R8008 0.5 2.5 BRAKE CHAMBER, REAR R&R8009 0.3 8.4 BRAKE INTERLOCK MAGNETIC VALVE R&R8010 0.3 8.5 CHECK VALVE R&R8011 0.5 8.4 GOVERNOR R&R8012 0.5 8.4 MUFFLER TANK R&R8013 0.5 8.4 OIL SEPARATOR R&R8014 0.3 8.4 OIL SEPARATOR FILTERS R&R8015 0.2 8.5 PRESSURE PROTECTION VALVE R&R8016 0.2 8.4 Q. R. VALVE R&R8017 0.6 8.5 SOLENOID VALVE R&R8018 1.0 8.5 SPRING BRAKE CONTROL VALVE R&R8019 0.2 8.5 TRANSDUCER R&R8020 0.3 LOW AIR PRESSURE SWITCH R&R
ALLSTAND ALONE
ITEMS 9 ELECTRICAL SYSTEM COMPONENTS R&R9000 0.2 9.2 PLC MODULES R&R9001 2.0 9.4 HIGH VOLTAGE DC-DC CONVERTER R&R In roof rack
9 - ELECTRICAL SYSTEM
Page 11 of 22
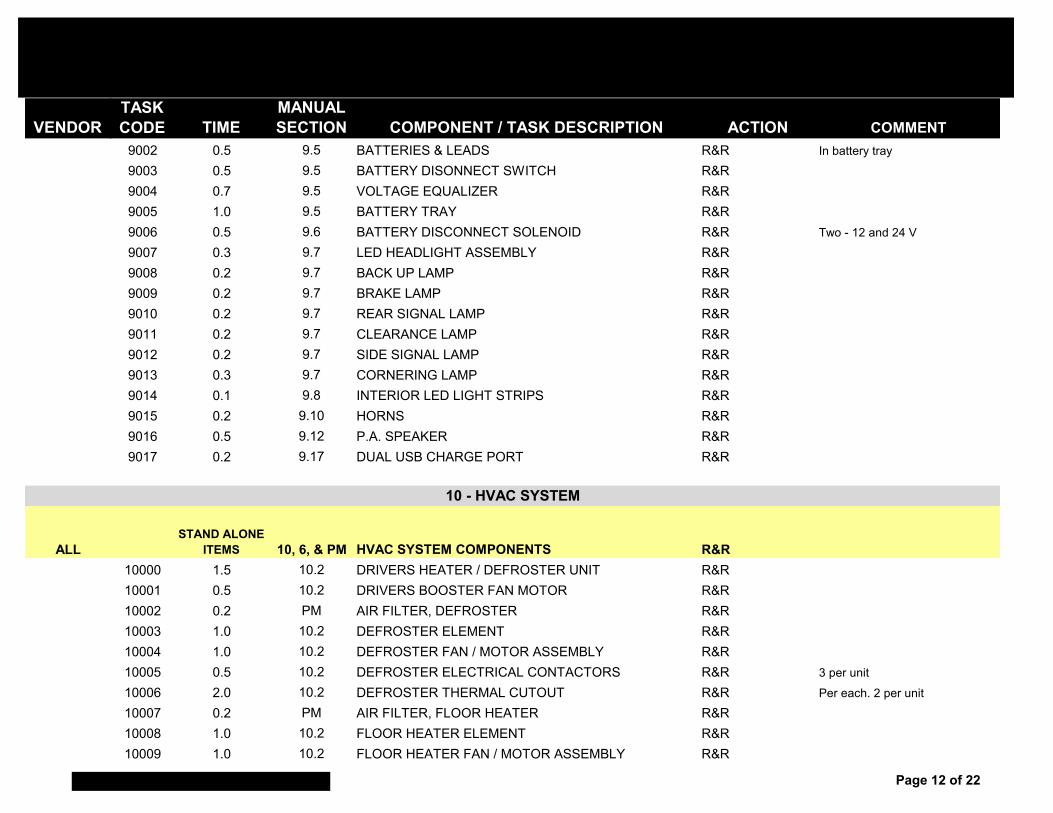
VENDORTASK CODE TIME
MANUAL SECTION COMPONENT / TASK DESCRIPTION ACTION COMMENT
9002 0.5 9.5 BATTERIES & LEADS R&R In battery tray
9003 0.5 9.5 BATTERY DISONNECT SWITCH R&R9004 0.7 9.5 VOLTAGE EQUALIZER R&R9005 1.0 9.5 BATTERY TRAY R&R9006 0.5 9.6 BATTERY DISCONNECT SOLENOID R&R Two - 12 and 24 V
9007 0.3 9.7 LED HEADLIGHT ASSEMBLY R&R9008 0.2 9.7 BACK UP LAMP R&R9009 0.2 9.7 BRAKE LAMP R&R9010 0.2 9.7 REAR SIGNAL LAMP R&R9011 0.2 9.7 CLEARANCE LAMP R&R9012 0.2 9.7 SIDE SIGNAL LAMP R&R9013 0.3 9.7 CORNERING LAMP R&R9014 0.1 9.8 INTERIOR LED LIGHT STRIPS R&R9015 0.2 9.10 HORNS R&R9016 0.5 9.12 P.A. SPEAKER R&R9017 0.2 9.17 DUAL USB CHARGE PORT R&R
ALLSTAND ALONE
ITEMS 10, 6, & PM HVAC SYSTEM COMPONENTS R&R10000 1.5 10.2 DRIVERS HEATER / DEFROSTER UNIT R&R10001 0.5 10.2 DRIVERS BOOSTER FAN MOTOR R&R10002 0.2 PM AIR FILTER, DEFROSTER R&R10003 1.0 10.2 DEFROSTER ELEMENT R&R10004 1.0 10.2 DEFROSTER FAN / MOTOR ASSEMBLY R&R10005 0.5 10.2 DEFROSTER ELECTRICAL CONTACTORS R&R 3 per unit
10006 2.0 10.2 DEFROSTER THERMAL CUTOUT R&R Per each. 2 per unit
10007 0.2 PM AIR FILTER, FLOOR HEATER R&R10008 1.0 10.2 FLOOR HEATER ELEMENT R&R10009 1.0 10.2 FLOOR HEATER FAN / MOTOR ASSEMBLY R&R
10 - HVAC SYSTEM
Page 12 of 22

VENDORTASK CODE TIME
MANUAL SECTION COMPONENT / TASK DESCRIPTION ACTION COMMENT
10010 0.5 10.2 FLOOR HEATER ELECTRICAL CONTACTORS R&R 2 per unit
10011 0.2 10.2 FLOOR HEATER THERMAL CUTOUT R&R Per each. 2 per unit
10012 1.5 6.4 & 10.2 HVAC BOOSTER PUMP R&R
Thermo KingSTAND ALONE
ITEMS TK MMTK HVAC SYSTEM COMPONENTS (REFER TO TK MAINTENANCE MANUAL)
10013 0.5 TK MM A C CLUTCH ASSEMBLY R&R10014 6.0 TK MM A C COMPRESSOR Rebuild Major overhaul
10015 3.2 TK MM CONDENSER R&R10016 1.5 TK MM CONDENSER FAN MOTOR R&R10017 0.7 TK MM CONDENSER FAN BLADES R&R10018 0.5 TK MM CONDENSER PRESSURE SWITCH R&R10019 1.8 TK MM FILTER DRIER R&R Incl evac, charge, leak check
10020 5.0 TK MM EVAPORATOR COIL AND PANEL R&R10021 0.8 TK MM EVAPORATOR FAN MOTOR R&R10022 0.5 TK MM EVAPORATOR HIGH PRESSURE SWITCH R&R10023 0.5 TK MM SIGHT GLASS R&R10024 1.0 TK MM DISCHARGE HOSE (A/C) R&R10025 1.7 TK MM EVAC-CHARGE & LEAK CHECK Operation10026 1.0 TK MM SUCTION HOSE R&R10027 0.5 TK MM THERMOSTAT -AMBIENT AIR R&R10028 0.8 TK MM THERMOSTAT - CAL/SET/RESET Operation10029 0.5 TK MM WATER TEMP SWITCH R&R10030 0.8 TK MM RETURN AIR SENSOR R&R
ALLSTAND ALONE
ITEMS 12 & 13 INTERIOR PANELS & APPLIED PARTS R&R12000 1.0 12.2 SIDEWALL PANEL R&R
12 - INTERIOR PANELS & APPLIED PARTS
Page 13 of 22
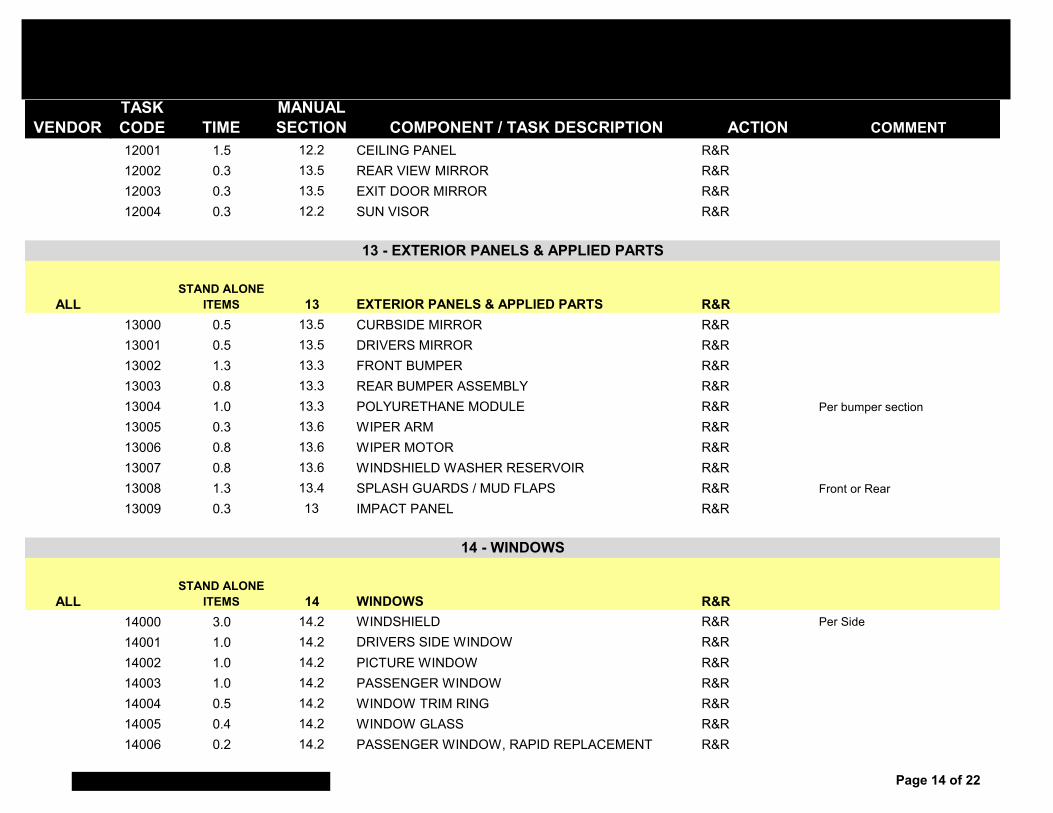
VENDORTASK CODE TIME
MANUAL SECTION COMPONENT / TASK DESCRIPTION ACTION COMMENT
12001 1.5 12.2 CEILING PANEL R&R12002 0.3 13.5 REAR VIEW MIRROR R&R12003 0.3 13.5 EXIT DOOR MIRROR R&R12004 0.3 12.2 SUN VISOR R&R
ALLSTAND ALONE
ITEMS 13 EXTERIOR PANELS & APPLIED PARTS R&R13000 0.5 13.5 CURBSIDE MIRROR R&R13001 0.5 13.5 DRIVERS MIRROR R&R13002 1.3 13.3 FRONT BUMPER R&R13003 0.8 13.3 REAR BUMPER ASSEMBLY R&R13004 1.0 13.3 POLYURETHANE MODULE R&R Per bumper section
13005 0.3 13.6 WIPER ARM R&R13006 0.8 13.6 WIPER MOTOR R&R13007 0.8 13.6 WINDSHIELD WASHER RESERVOIR R&R13008 1.3 13.4 SPLASH GUARDS / MUD FLAPS R&R Front or Rear
13009 0.3 13 IMPACT PANEL R&R
ALLSTAND ALONE
ITEMS 14 WINDOWS R&R14000 3.0 14.2 WINDSHIELD R&R Per Side
14001 1.0 14.2 DRIVERS SIDE WINDOW R&R14002 1.0 14.2 PICTURE WINDOW R&R14003 1.0 14.2 PASSENGER WINDOW R&R14004 0.5 14.2 WINDOW TRIM RING R&R14005 0.4 14.2 WINDOW GLASS R&R14006 0.2 14.2 PASSENGER WINDOW, RAPID REPLACEMENT R&R
13 - EXTERIOR PANELS & APPLIED PARTS
14 - WINDOWS
Page 14 of 22
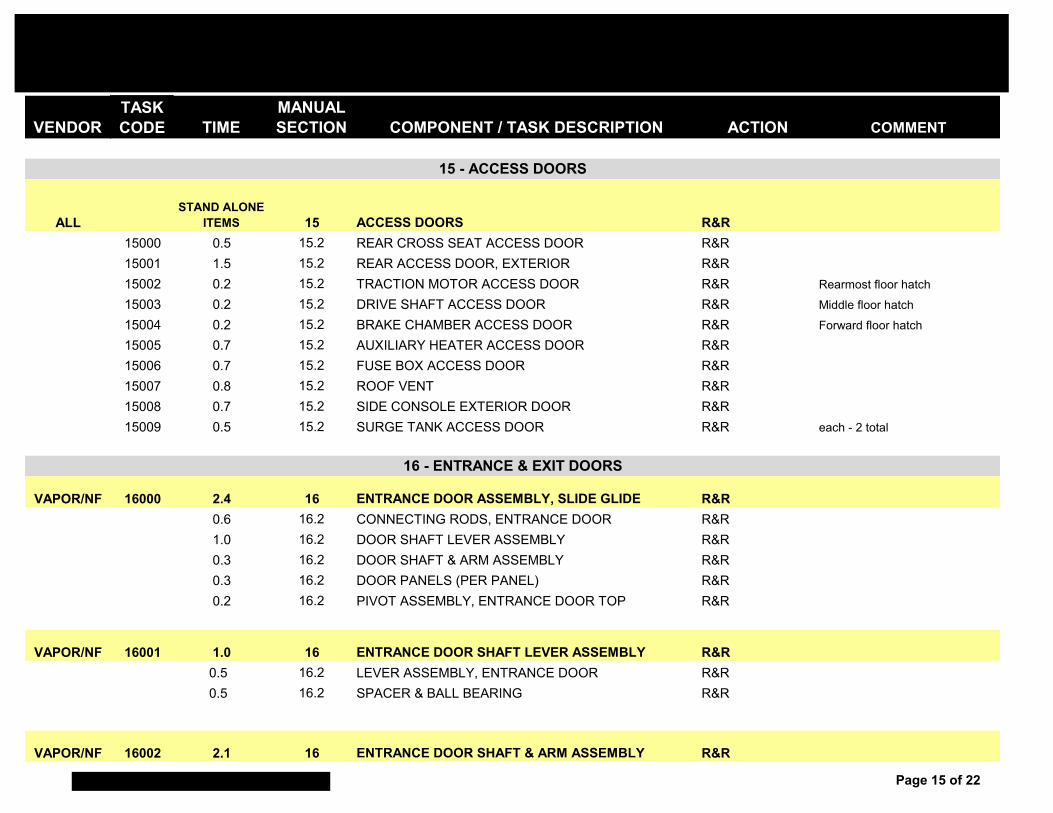
VENDORTASK CODE TIME
MANUAL SECTION COMPONENT / TASK DESCRIPTION ACTION COMMENT
ALLSTAND ALONE
ITEMS 15 ACCESS DOORS R&R15000 0.5 15.2 REAR CROSS SEAT ACCESS DOOR R&R15001 1.5 15.2 REAR ACCESS DOOR, EXTERIOR R&R15002 0.2 15.2 TRACTION MOTOR ACCESS DOOR R&R Rearmost floor hatch
15003 0.2 15.2 DRIVE SHAFT ACCESS DOOR R&R Middle floor hatch
15004 0.2 15.2 BRAKE CHAMBER ACCESS DOOR R&R Forward floor hatch
15005 0.7 15.2 AUXILIARY HEATER ACCESS DOOR R&R15006 0.7 15.2 FUSE BOX ACCESS DOOR R&R15007 0.8 15.2 ROOF VENT R&R15008 0.7 15.2 SIDE CONSOLE EXTERIOR DOOR R&R15009 0.5 15.2 SURGE TANK ACCESS DOOR R&R each - 2 total
VAPOR/NF 16000 2.4 16 ENTRANCE DOOR ASSEMBLY, SLIDE GLIDE R&R0.6 16.2 CONNECTING RODS, ENTRANCE DOOR R&R1.0 16.2 DOOR SHAFT LEVER ASSEMBLY R&R0.3 16.2 DOOR SHAFT & ARM ASSEMBLY R&R0.3 16.2 DOOR PANELS (PER PANEL) R&R0.2 16.2 PIVOT ASSEMBLY, ENTRANCE DOOR TOP R&R
VAPOR/NF 16001 1.0 16 ENTRANCE DOOR SHAFT LEVER ASSEMBLY R&R0.5 16.2 LEVER ASSEMBLY, ENTRANCE DOOR R&R0.5 16.2 SPACER & BALL BEARING R&R
VAPOR/NF 16002 2.1 16 ENTRANCE DOOR SHAFT & ARM ASSEMBLY R&R
15 - ACCESS DOORS
16 - ENTRANCE & EXIT DOORS
Page 15 of 22
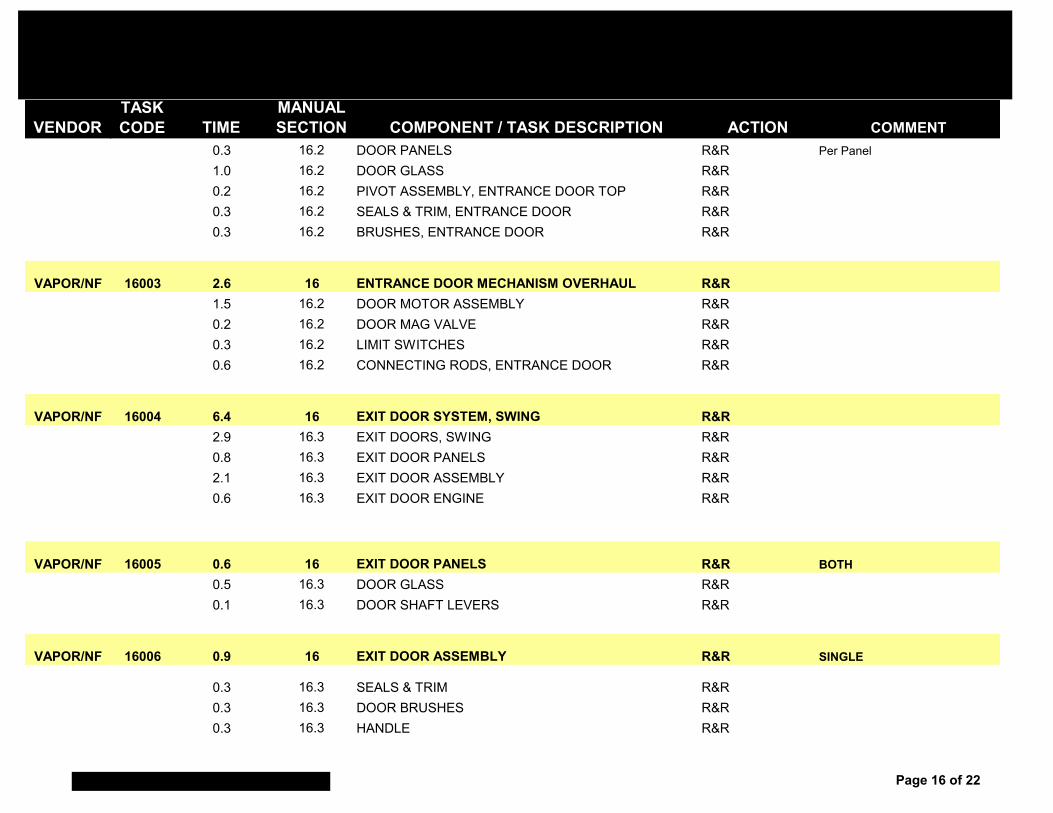
VENDORTASK CODE TIME
MANUAL SECTION COMPONENT / TASK DESCRIPTION ACTION COMMENT
0.3 16.2 DOOR PANELS R&R Per Panel
1.0 16.2 DOOR GLASS R&R0.2 16.2 PIVOT ASSEMBLY, ENTRANCE DOOR TOP R&R0.3 16.2 SEALS & TRIM, ENTRANCE DOOR R&R0.3 16.2 BRUSHES, ENTRANCE DOOR R&R
VAPOR/NF 16003 2.6 16 ENTRANCE DOOR MECHANISM OVERHAUL R&R1.5 16.2 DOOR MOTOR ASSEMBLY R&R0.2 16.2 DOOR MAG VALVE R&R0.3 16.2 LIMIT SWITCHES R&R0.6 16.2 CONNECTING RODS, ENTRANCE DOOR R&R
VAPOR/NF 16004 6.4 16 EXIT DOOR SYSTEM, SWING R&R2.9 16.3 EXIT DOORS, SWING R&R0.8 16.3 EXIT DOOR PANELS R&R2.1 16.3 EXIT DOOR ASSEMBLY R&R0.6 16.3 EXIT DOOR ENGINE R&R
VAPOR/NF 16005 0.6 16 EXIT DOOR PANELS R&R BOTH0.5 16.3 DOOR GLASS R&R0.1 16.3 DOOR SHAFT LEVERS R&R
VAPOR/NF 16006 0.9 16 EXIT DOOR ASSEMBLY R&R SINGLE
0.3 16.3 SEALS & TRIM R&R0.3 16.3 DOOR BRUSHES R&R0.3 16.3 HANDLE R&R
Page 16 of 22
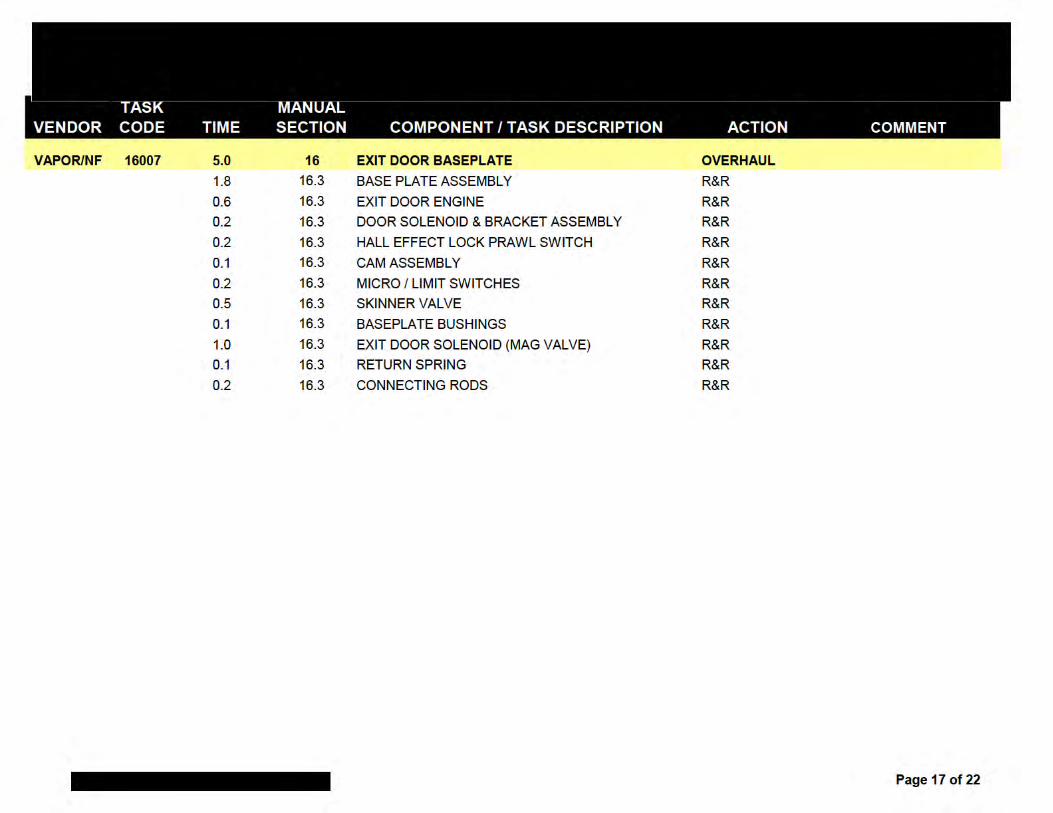
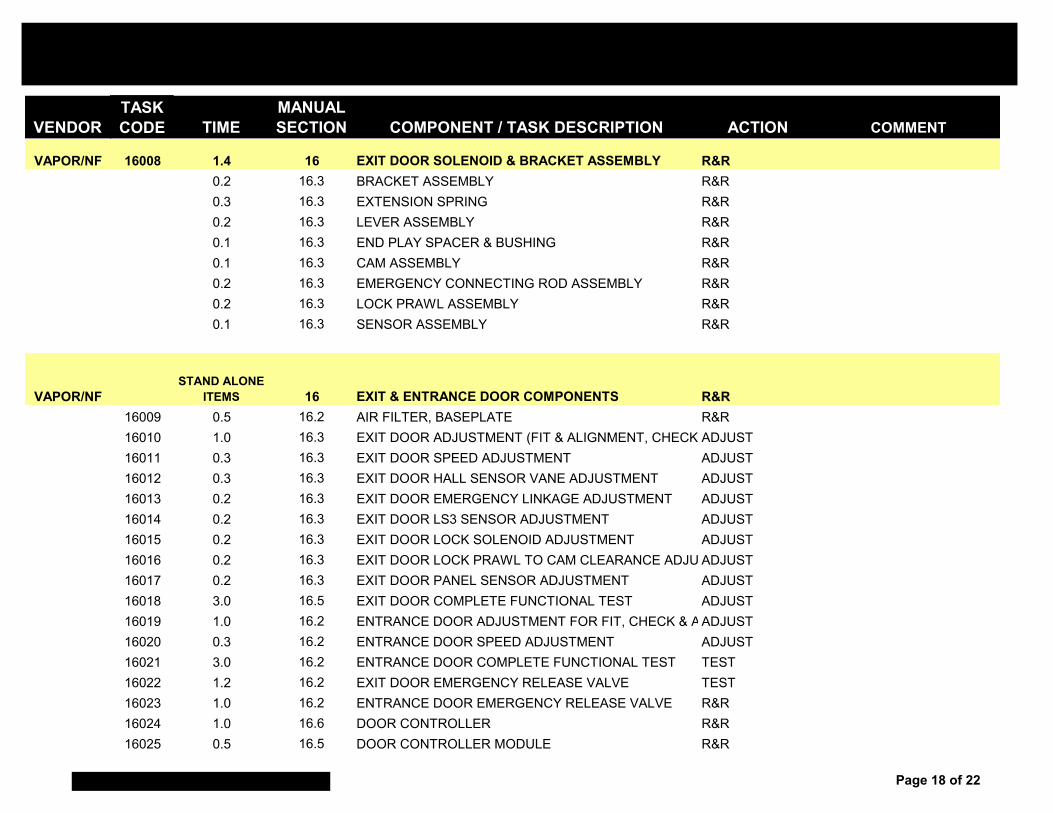
VENDORTASK CODE TIME
MANUAL SECTION COMPONENT / TASK DESCRIPTION ACTION COMMENT
VAPOR/NF 16008 1.4 16 EXIT DOOR SOLENOID & BRACKET ASSEMBLY R&R0.2 16.3 BRACKET ASSEMBLY R&R0.3 16.3 EXTENSION SPRING R&R0.2 16.3 LEVER ASSEMBLY R&R0.1 16.3 END PLAY SPACER & BUSHING R&R0.1 16.3 CAM ASSEMBLY R&R0.2 16.3 EMERGENCY CONNECTING ROD ASSEMBLY R&R0.2 16.3 LOCK PRAWL ASSEMBLY R&R0.1 16.3 SENSOR ASSEMBLY R&R
VAPOR/NFSTAND ALONE
ITEMS 16 EXIT & ENTRANCE DOOR COMPONENTS R&R16009 0.5 16.2 AIR FILTER, BASEPLATE R&R16010 1.0 16.3 EXIT DOOR ADJUSTMENT (FIT & ALIGNMENT, CHECK ADJUST16011 0.3 16.3 EXIT DOOR SPEED ADJUSTMENT ADJUST16012 0.3 16.3 EXIT DOOR HALL SENSOR VANE ADJUSTMENT ADJUST16013 0.2 16.3 EXIT DOOR EMERGENCY LINKAGE ADJUSTMENT ADJUST16014 0.2 16.3 EXIT DOOR LS3 SENSOR ADJUSTMENT ADJUST16015 0.2 16.3 EXIT DOOR LOCK SOLENOID ADJUSTMENT ADJUST16016 0.2 16.3 EXIT DOOR LOCK PRAWL TO CAM CLEARANCE ADJU ADJUST16017 0.2 16.3 EXIT DOOR PANEL SENSOR ADJUSTMENT ADJUST16018 3.0 16.5 EXIT DOOR COMPLETE FUNCTIONAL TEST ADJUST16019 1.0 16.2 ENTRANCE DOOR ADJUSTMENT FOR FIT, CHECK & AADJUST16020 0.3 16.2 ENTRANCE DOOR SPEED ADJUSTMENT ADJUST16021 3.0 16.2 ENTRANCE DOOR COMPLETE FUNCTIONAL TEST TEST16022 1.2 16.2 EXIT DOOR EMERGENCY RELEASE VALVE TEST16023 1.0 16.2 ENTRANCE DOOR EMERGENCY RELEASE VALVE R&R16024 1.0 16.6 DOOR CONTROLLER R&R16025 0.5 16.5 DOOR CONTROLLER MODULE R&R
Page 18 of 22
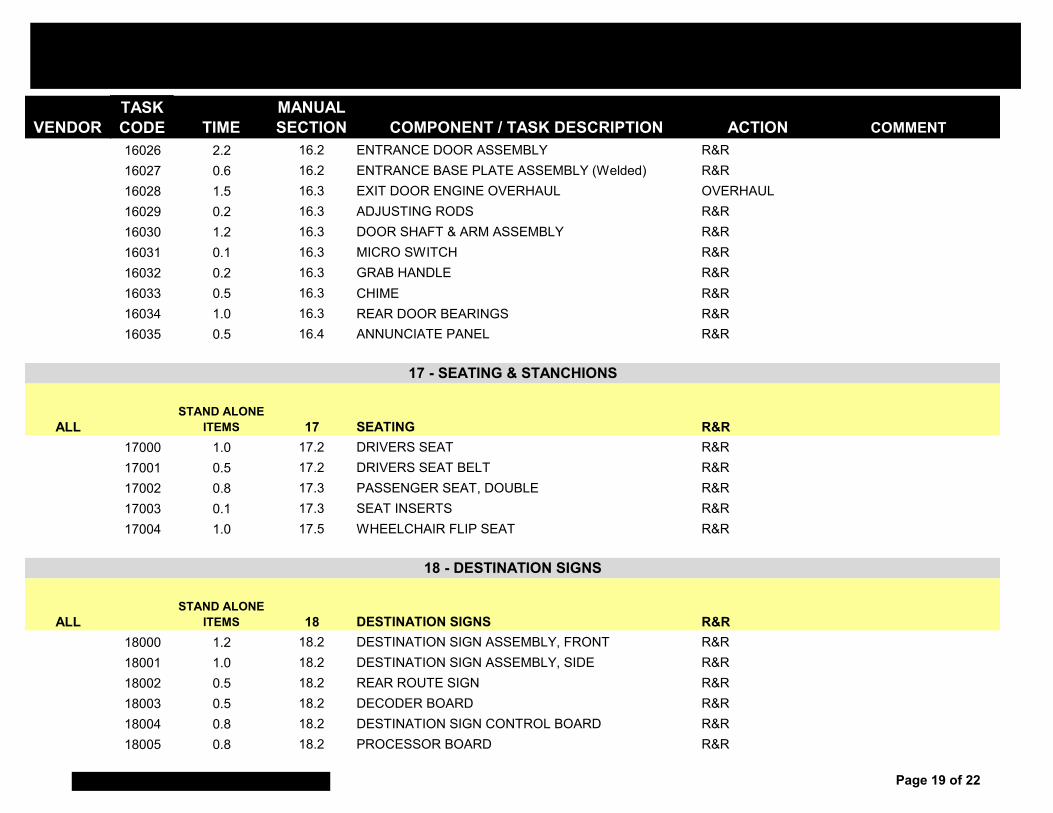
VENDORTASK CODE TIME
MANUAL SECTION COMPONENT / TASK DESCRIPTION ACTION COMMENT
16026 2.2 16.2 ENTRANCE DOOR ASSEMBLY R&R16027 0.6 16.2 ENTRANCE BASE PLATE ASSEMBLY (Welded) R&R16028 1.5 16.3 EXIT DOOR ENGINE OVERHAUL OVERHAUL16029 0.2 16.3 ADJUSTING RODS R&R16030 1.2 16.3 DOOR SHAFT & ARM ASSEMBLY R&R16031 0.1 16.3 MICRO SWITCH R&R16032 0.2 16.3 GRAB HANDLE R&R16033 0.5 16.3 CHIME R&R16034 1.0 16.3 REAR DOOR BEARINGS R&R16035 0.5 16.4 ANNUNCIATE PANEL R&R
ALLSTAND ALONE
ITEMS 17 SEATING R&R17000 1.0 17.2 DRIVERS SEAT R&R17001 0.5 17.2 DRIVERS SEAT BELT R&R17002 0.8 17.3 PASSENGER SEAT, DOUBLE R&R17003 0.1 17.3 SEAT INSERTS R&R17004 1.0 17.5 WHEELCHAIR FLIP SEAT R&R
ALLSTAND ALONE
ITEMS 18 DESTINATION SIGNS R&R18000 1.2 18.2 DESTINATION SIGN ASSEMBLY, FRONT R&R18001 1.0 18.2 DESTINATION SIGN ASSEMBLY, SIDE R&R18002 0.5 18.2 REAR ROUTE SIGN R&R18003 0.5 18.2 DECODER BOARD R&R18004 0.8 18.2 DESTINATION SIGN CONTROL BOARD R&R18005 0.8 18.2 PROCESSOR BOARD R&R
18 - DESTINATION SIGNS
17 - SEATING & STANCHIONS
Page 19 of 22

VENDORTASK CODE TIME
MANUAL SECTION COMPONENT / TASK DESCRIPTION ACTION COMMENT
18006 1.0 18.2 DESTINATION SIGN GLASS R&R
Page 20 of 22
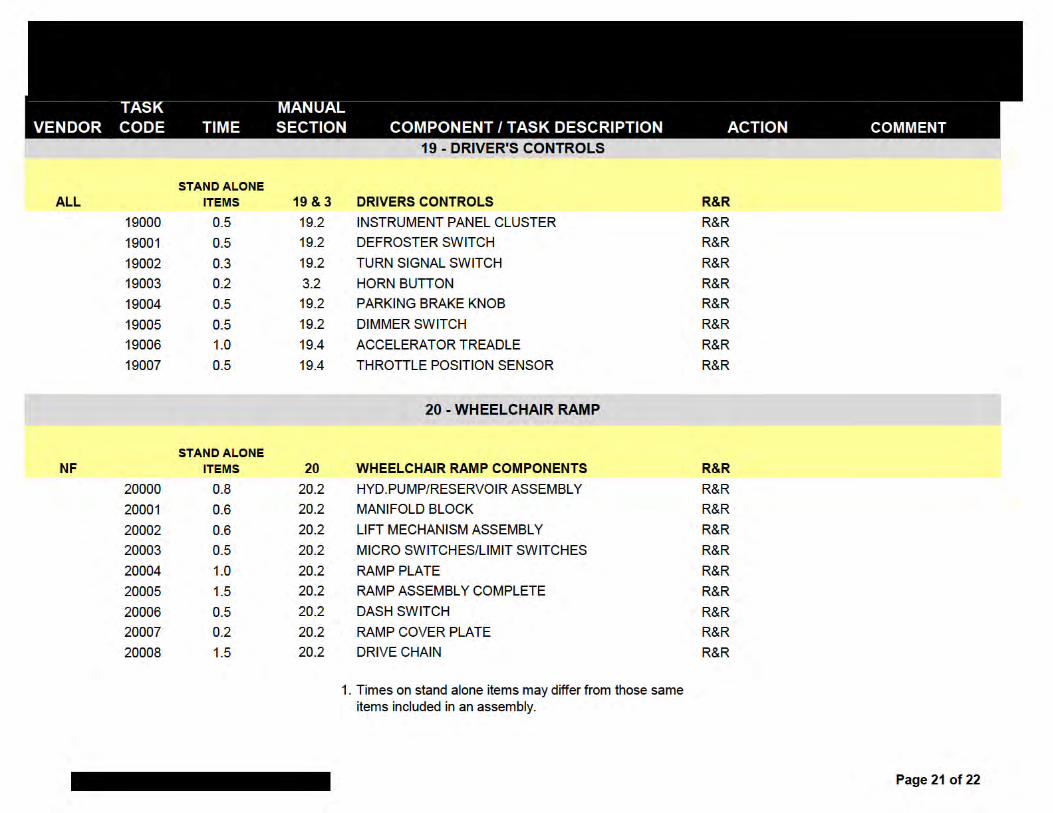
VENDORTASK CODE TIME
MANUAL SECTION COMPONENT / TASK DESCRIPTION ACTION COMMENT
2. Refer to each section of the New Flyer Service Manual or OEM supplier manual for identification of any Special Tools
Page 22 of 22
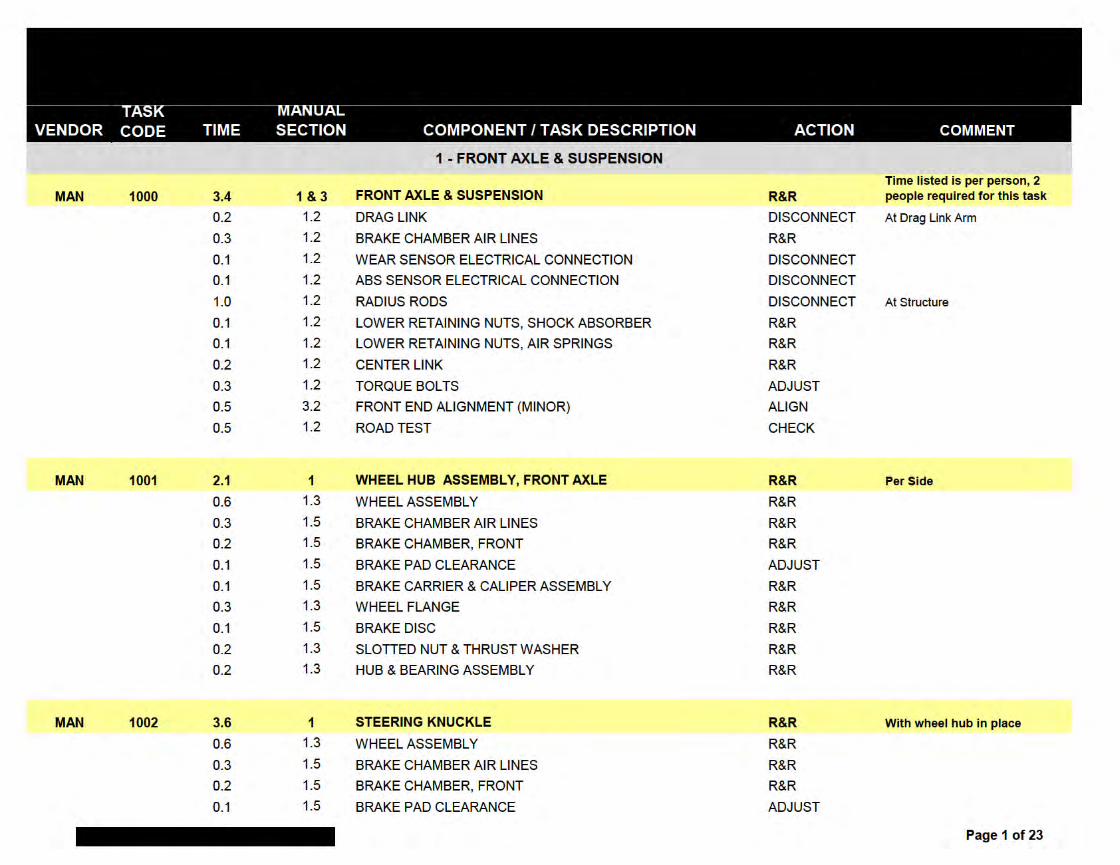
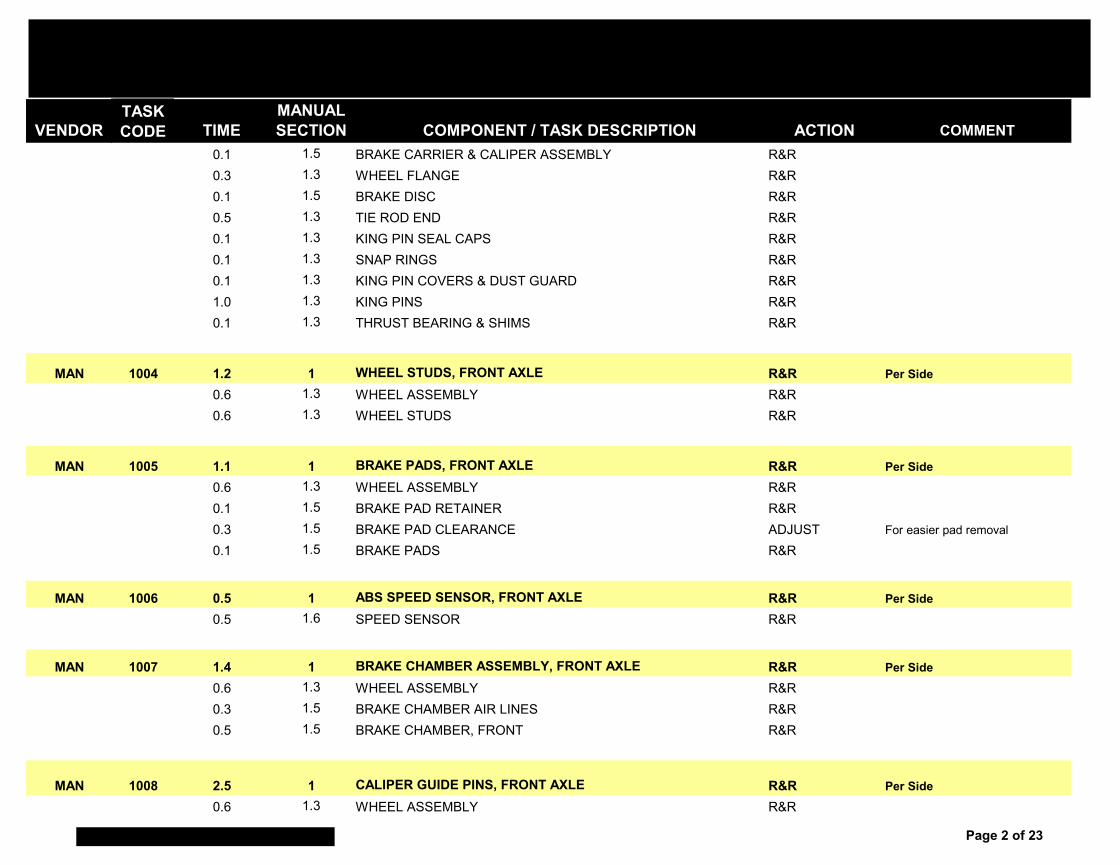
VENDORTASK CODE TIME
MANUAL SECTION COMPONENT / TASK DESCRIPTION ACTION COMMENT
0.1 1.5 BRAKE CARRIER & CALIPER ASSEMBLY R&R0.3 1.3 WHEEL FLANGE R&R0.1 1.5 BRAKE DISC R&R0.5 1.3 TIE ROD END R&R0.1 1.3 KING PIN SEAL CAPS R&R0.1 1.3 SNAP RINGS R&R0.1 1.3 KING PIN COVERS & DUST GUARD R&R1.0 1.3 KING PINS R&R0.1 1.3 THRUST BEARING & SHIMS R&R
MAN 1004 1.2 1 WHEEL STUDS, FRONT AXLE R&R Per Side0.6 1.3 WHEEL ASSEMBLY R&R0.6 1.3 WHEEL STUDS R&R
MAN 1005 1.1 1 BRAKE PADS, FRONT AXLE R&R Per Side0.6 1.3 WHEEL ASSEMBLY R&R0.1 1.5 BRAKE PAD RETAINER R&R0.3 1.5 BRAKE PAD CLEARANCE ADJUST For easier pad removal
0.1 1.5 BRAKE PADS R&R
MAN 1006 0.5 1 ABS SPEED SENSOR, FRONT AXLE R&R Per Side0.5 1.6 SPEED SENSOR R&R
MAN 1007 1.4 1 BRAKE CHAMBER ASSEMBLY, FRONT AXLE R&R Per Side0.6 1.3 WHEEL ASSEMBLY R&R0.3 1.5 BRAKE CHAMBER AIR LINES R&R0.5 1.5 BRAKE CHAMBER, FRONT R&R
MAN 1008 2.5 1 CALIPER GUIDE PINS, FRONT AXLE R&R Per Side0.6 1.3 WHEEL ASSEMBLY R&R
Page 2 of 23
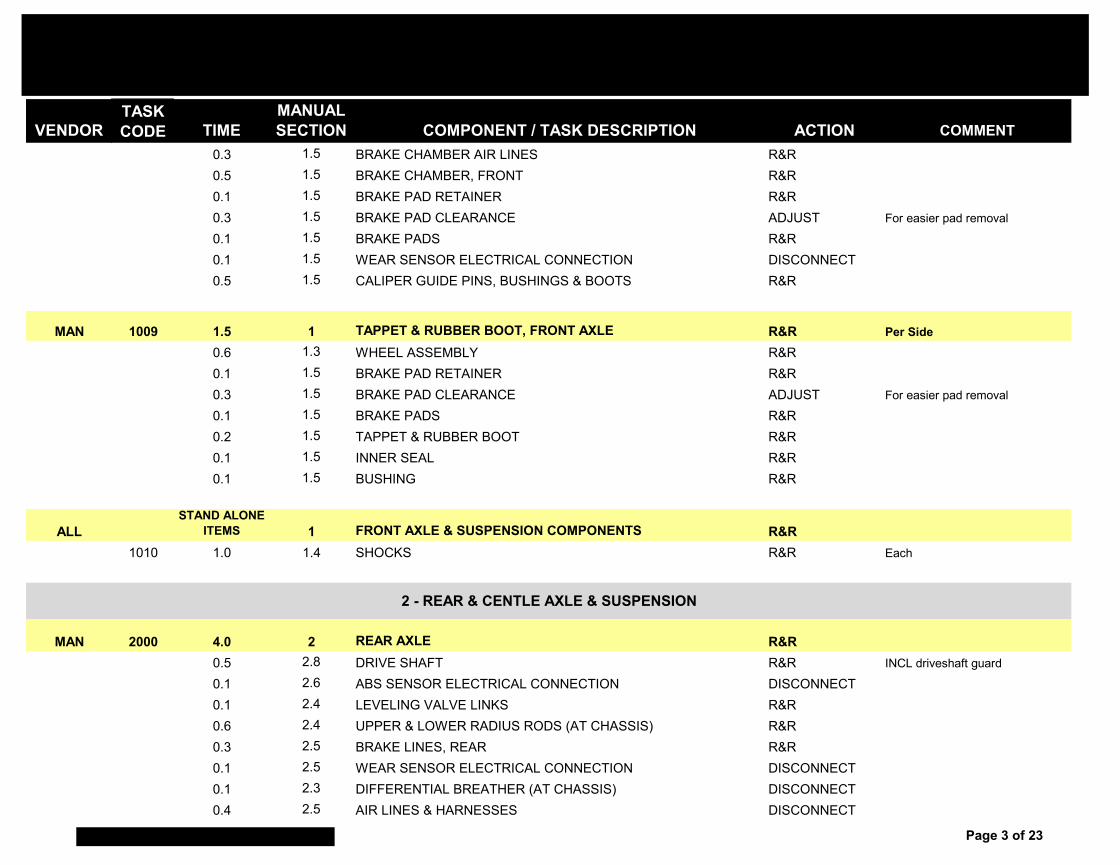
VENDORTASK CODE TIME
MANUAL SECTION COMPONENT / TASK DESCRIPTION ACTION COMMENT
0.3 1.5 BRAKE CHAMBER AIR LINES R&R0.5 1.5 BRAKE CHAMBER, FRONT R&R0.1 1.5 BRAKE PAD RETAINER R&R0.3 1.5 BRAKE PAD CLEARANCE ADJUST For easier pad removal
0.1 1.5 BRAKE PADS R&R0.1 1.5 WEAR SENSOR ELECTRICAL CONNECTION DISCONNECT0.5 1.5 CALIPER GUIDE PINS, BUSHINGS & BOOTS R&R
MAN 1009 1.5 1 TAPPET & RUBBER BOOT, FRONT AXLE R&R Per Side0.6 1.3 WHEEL ASSEMBLY R&R0.1 1.5 BRAKE PAD RETAINER R&R0.3 1.5 BRAKE PAD CLEARANCE ADJUST For easier pad removal
0.1 1.5 BRAKE PADS R&R0.2 1.5 TAPPET & RUBBER BOOT R&R0.1 1.5 INNER SEAL R&R0.1 1.5 BUSHING R&R
ALLSTAND ALONE
ITEMS 1 FRONT AXLE & SUSPENSION COMPONENTS R&R1010 1.0 1.4 SHOCKS R&R Each
MAN 2000 4.0 2 REAR AXLE R&R0.5 2.8 DRIVE SHAFT R&R INCL driveshaft guard
0.1 2.6 ABS SENSOR ELECTRICAL CONNECTION DISCONNECT0.1 2.4 LEVELING VALVE LINKS R&R0.6 2.4 UPPER & LOWER RADIUS RODS (AT CHASSIS) R&R0.3 2.5 BRAKE LINES, REAR R&R0.1 2.5 WEAR SENSOR ELECTRICAL CONNECTION DISCONNECT0.1 2.3 DIFFERENTIAL BREATHER (AT CHASSIS) DISCONNECT0.4 2.5 AIR LINES & HARNESSES DISCONNECT
2 - REAR & CENTLE AXLE & SUSPENSION
Page 3 of 23
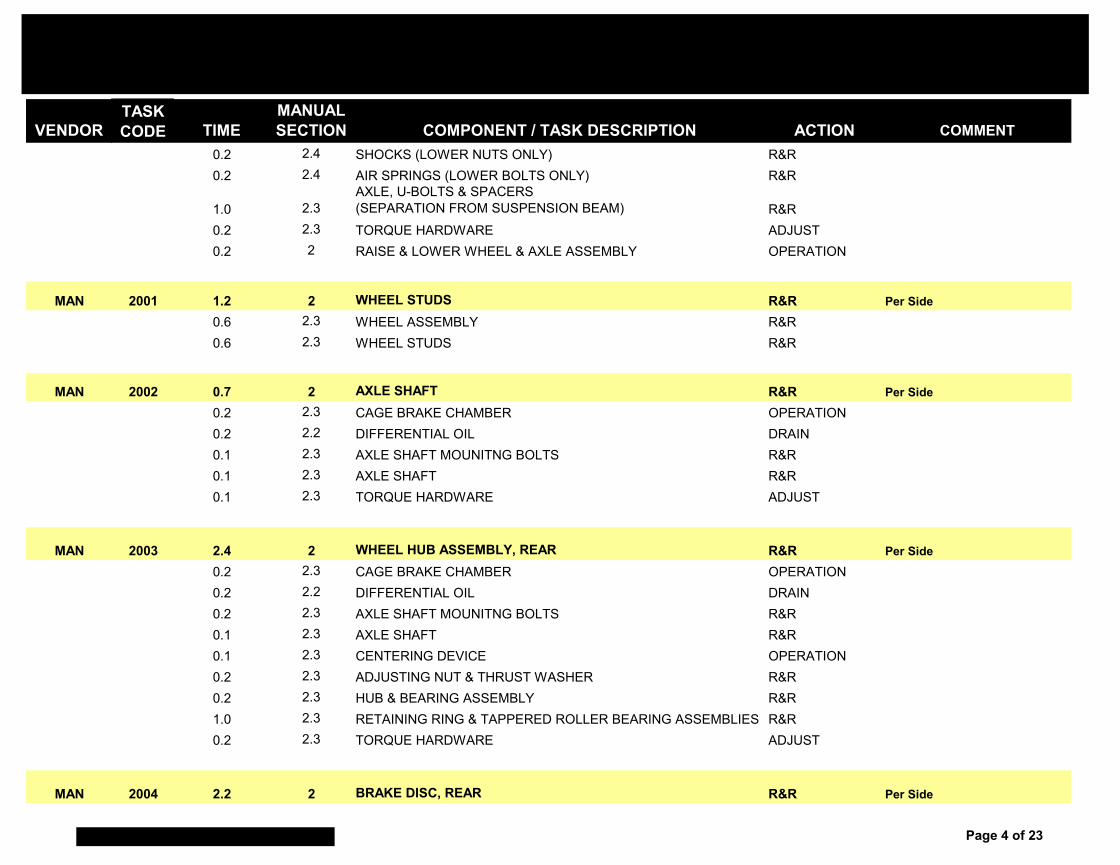
VENDORTASK CODE TIME
MANUAL SECTION COMPONENT / TASK DESCRIPTION ACTION COMMENT
0.2 2.4 SHOCKS (LOWER NUTS ONLY) R&R0.2 2.4 AIR SPRINGS (LOWER BOLTS ONLY) R&R
1.0 2.3AXLE, U-BOLTS & SPACERS (SEPARATION FROM SUSPENSION BEAM) R&R
0.2 2.3 TORQUE HARDWARE ADJUST0.2 2 RAISE & LOWER WHEEL & AXLE ASSEMBLY OPERATION
MAN 2001 1.2 2 WHEEL STUDS R&R Per Side0.6 2.3 WHEEL ASSEMBLY R&R0.6 2.3 WHEEL STUDS R&R
MAN 2002 0.7 2 AXLE SHAFT R&R Per Side0.2 2.3 CAGE BRAKE CHAMBER OPERATION0.2 2.2 DIFFERENTIAL OIL DRAIN0.1 2.3 AXLE SHAFT MOUNITNG BOLTS R&R0.1 2.3 AXLE SHAFT R&R0.1 2.3 TORQUE HARDWARE ADJUST
MAN 2003 2.4 2 WHEEL HUB ASSEMBLY, REAR R&R Per Side0.2 2.3 CAGE BRAKE CHAMBER OPERATION0.2 2.2 DIFFERENTIAL OIL DRAIN0.2 2.3 AXLE SHAFT MOUNITNG BOLTS R&R0.1 2.3 AXLE SHAFT R&R0.1 2.3 CENTERING DEVICE OPERATION0.2 2.3 ADJUSTING NUT & THRUST WASHER R&R0.2 2.3 HUB & BEARING ASSEMBLY R&R1.0 2.3 RETAINING RING & TAPPERED ROLLER BEARING ASSEMBLIES R&R0.2 2.3 TORQUE HARDWARE ADJUST
MAN 2004 2.2 2 BRAKE DISC, REAR R&R Per Side
Page 4 of 23
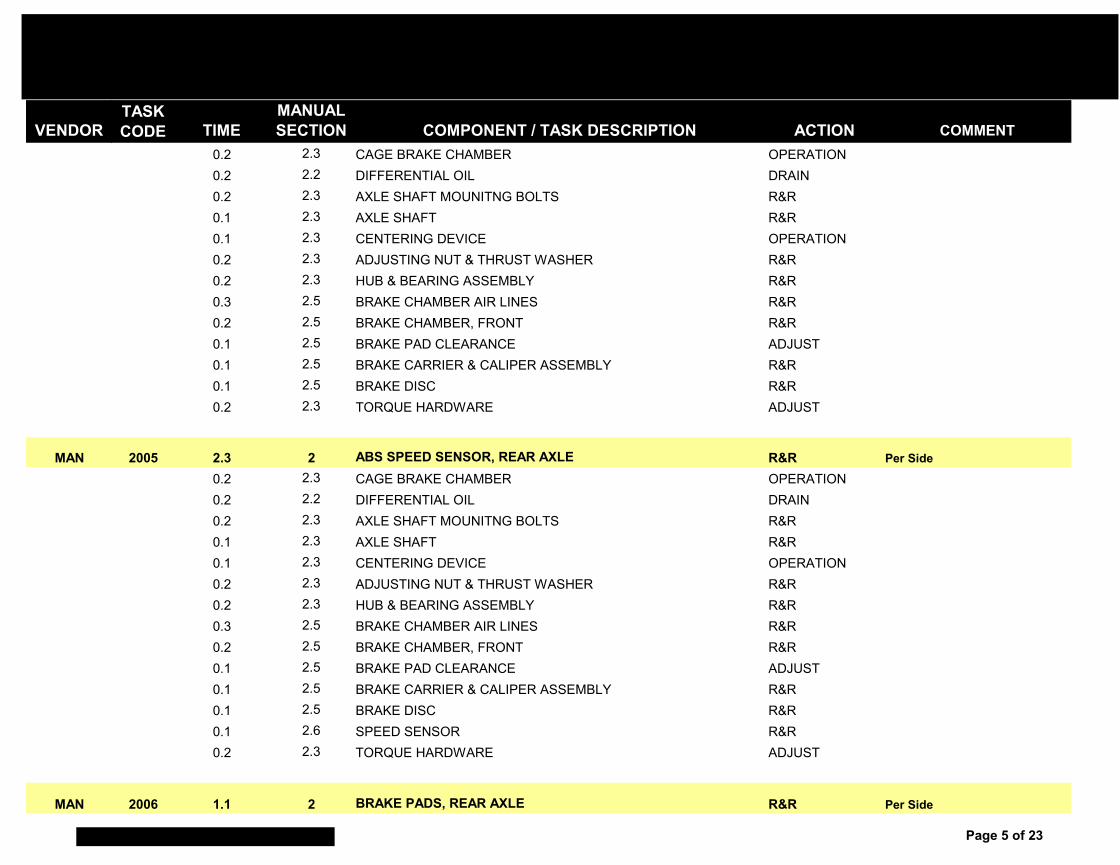
VENDORTASK CODE TIME
MANUAL SECTION COMPONENT / TASK DESCRIPTION ACTION COMMENT
0.2 2.3 CAGE BRAKE CHAMBER OPERATION0.2 2.2 DIFFERENTIAL OIL DRAIN0.2 2.3 AXLE SHAFT MOUNITNG BOLTS R&R0.1 2.3 AXLE SHAFT R&R0.1 2.3 CENTERING DEVICE OPERATION0.2 2.3 ADJUSTING NUT & THRUST WASHER R&R0.2 2.3 HUB & BEARING ASSEMBLY R&R0.3 2.5 BRAKE CHAMBER AIR LINES R&R0.2 2.5 BRAKE CHAMBER, FRONT R&R0.1 2.5 BRAKE PAD CLEARANCE ADJUST0.1 2.5 BRAKE CARRIER & CALIPER ASSEMBLY R&R0.1 2.5 BRAKE DISC R&R0.2 2.3 TORQUE HARDWARE ADJUST
MAN 2005 2.3 2 ABS SPEED SENSOR, REAR AXLE R&R Per Side0.2 2.3 CAGE BRAKE CHAMBER OPERATION0.2 2.2 DIFFERENTIAL OIL DRAIN0.2 2.3 AXLE SHAFT MOUNITNG BOLTS R&R0.1 2.3 AXLE SHAFT R&R0.1 2.3 CENTERING DEVICE OPERATION0.2 2.3 ADJUSTING NUT & THRUST WASHER R&R0.2 2.3 HUB & BEARING ASSEMBLY R&R0.3 2.5 BRAKE CHAMBER AIR LINES R&R0.2 2.5 BRAKE CHAMBER, FRONT R&R0.1 2.5 BRAKE PAD CLEARANCE ADJUST0.1 2.5 BRAKE CARRIER & CALIPER ASSEMBLY R&R0.1 2.5 BRAKE DISC R&R0.1 2.6 SPEED SENSOR R&R0.2 2.3 TORQUE HARDWARE ADJUST
MAN 2006 1.1 2 BRAKE PADS, REAR AXLE R&R Per Side
Page 5 of 23
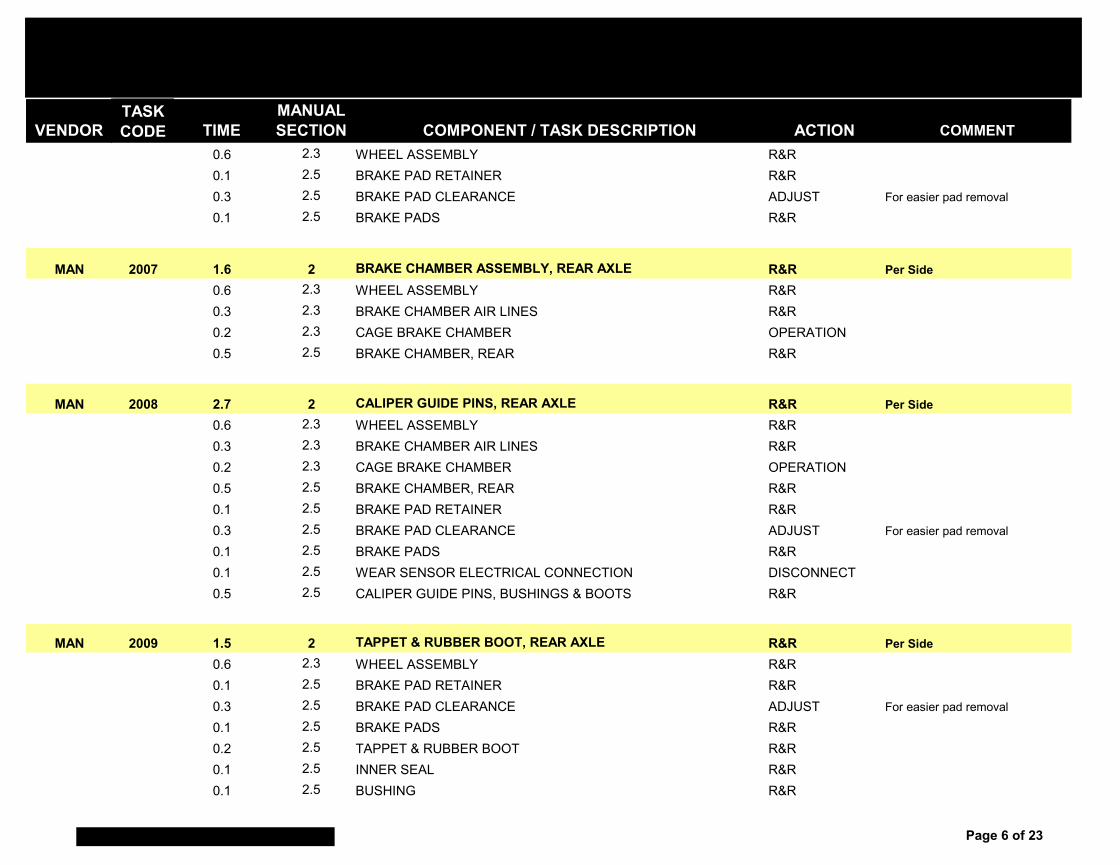
VENDORTASK CODE TIME
MANUAL SECTION COMPONENT / TASK DESCRIPTION ACTION COMMENT
0.6 2.3 WHEEL ASSEMBLY R&R0.1 2.5 BRAKE PAD RETAINER R&R0.3 2.5 BRAKE PAD CLEARANCE ADJUST For easier pad removal
0.1 2.5 BRAKE PADS R&R
MAN 2007 1.6 2 BRAKE CHAMBER ASSEMBLY, REAR AXLE R&R Per Side0.6 2.3 WHEEL ASSEMBLY R&R0.3 2.3 BRAKE CHAMBER AIR LINES R&R0.2 2.3 CAGE BRAKE CHAMBER OPERATION0.5 2.5 BRAKE CHAMBER, REAR R&R
MAN 2008 2.7 2 CALIPER GUIDE PINS, REAR AXLE R&R Per Side0.6 2.3 WHEEL ASSEMBLY R&R0.3 2.3 BRAKE CHAMBER AIR LINES R&R0.2 2.3 CAGE BRAKE CHAMBER OPERATION0.5 2.5 BRAKE CHAMBER, REAR R&R0.1 2.5 BRAKE PAD RETAINER R&R0.3 2.5 BRAKE PAD CLEARANCE ADJUST For easier pad removal
0.1 2.5 BRAKE PADS R&R0.1 2.5 WEAR SENSOR ELECTRICAL CONNECTION DISCONNECT0.5 2.5 CALIPER GUIDE PINS, BUSHINGS & BOOTS R&R
MAN 2009 1.5 2 TAPPET & RUBBER BOOT, REAR AXLE R&R Per Side0.6 2.3 WHEEL ASSEMBLY R&R0.1 2.5 BRAKE PAD RETAINER R&R0.3 2.5 BRAKE PAD CLEARANCE ADJUST For easier pad removal
0.1 2.5 BRAKE PADS R&R0.2 2.5 TAPPET & RUBBER BOOT R&R0.1 2.5 INNER SEAL R&R0.1 2.5 BUSHING R&R
Page 6 of 23

VENDORTASK CODE TIME
MANUAL SECTION COMPONENT / TASK DESCRIPTION ACTION COMMENT
MAN 2010 2.6 2 DIFFERENTIAL CARRIER ASSEMBLY R&R0.2 2.2 DIFFERENTIAL OIL DRAIN1.0 2.3 AXLE SHAFTS R&R Incl both sides
0.1 2.3 AXLE BREATHER R&R0.6 2.8 DRIVESHAFT SHAFT FLANGE & YOKE R&R0.2 2.3 CARRIER MOUNTING BOLTS R&R0.5 2.3 DIFFERENTIAL CARRIER R&R
ALLSTAND ALONE
ITEMS 2 REAR AXLE & SUSPENSION COMPONENTS R&R2011 1.4 2.4 SHOCKS R&R Each
ZFSTAND ALONE
ITEMS 2 CENTER AXLE (Electric Drive) R&R2012 0.6 2.9 WHEEL ASSEMBLY R&R2013 0.5 2.11 BRAKE CYLINDER R&R2014 0.8 2.11 BRAKE LININGS R&R2015 2.0 2.11 COMPLETE BRAKE CALIPER R&R2016 0.3 2.9 PLANETARY CARRIER R&R2017 0.5 2.9 PLANETARY GEAR R&R EACH
2018 0.3 2.9 RING GEAR R&R2019 0.8 2.9 HUB R&R2020 1.5 2.9 10 WHEEL BOLTS R&R2021 0.3 2.11 BRAKE DISC R&R2022 0.3 2.9 ABS - SENSOR R&R2023 1.0 2.9 HUB CARRIER R&R2024 4.0 2.9 ELECTRIC MOTOR R&R AXLE REMOVED
2025 1.0 2.10 RADIUS RODS R&R2026 1.4 2.10 SHOCKS R&R Each
3 - STEERING SYSTEM
Page 7 of 23
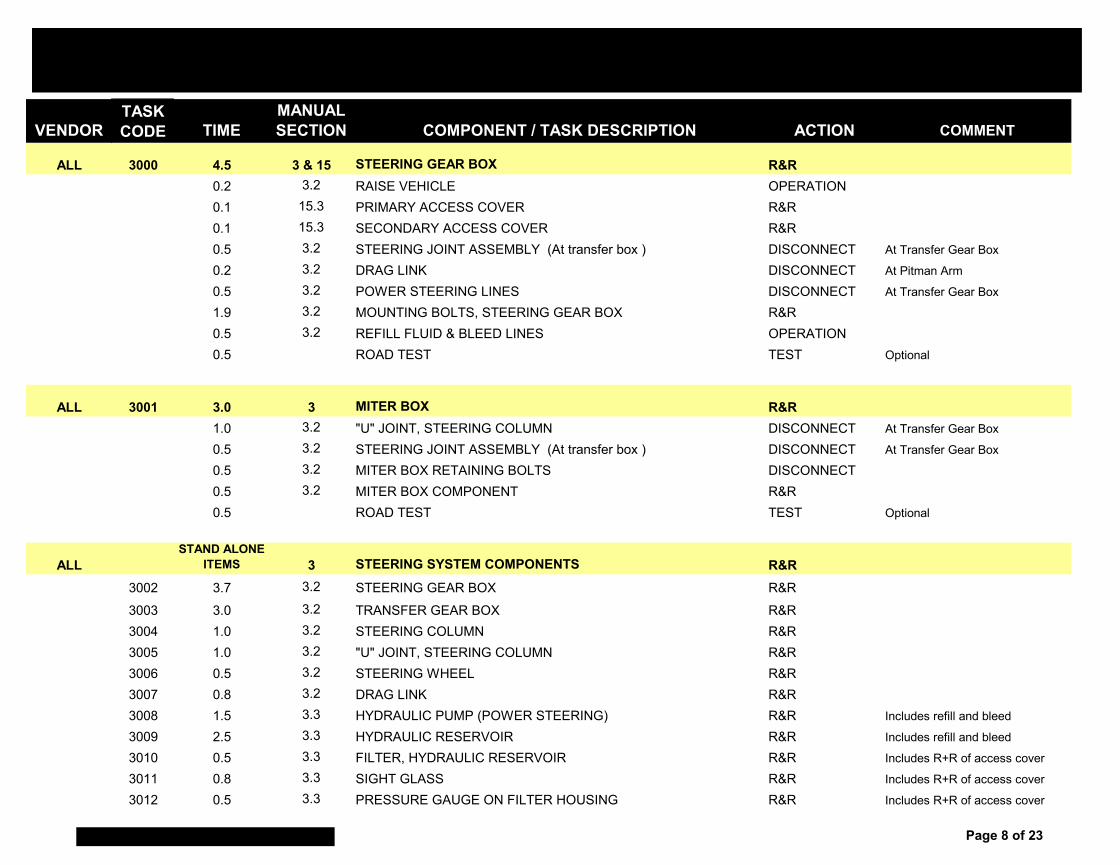
VENDORTASK CODE TIME
MANUAL SECTION COMPONENT / TASK DESCRIPTION ACTION COMMENT
ALL 3000 4.5 3 & 15 STEERING GEAR BOX R&R0.2 3.2 RAISE VEHICLE OPERATION0.1 15.3 PRIMARY ACCESS COVER R&R0.1 15.3 SECONDARY ACCESS COVER R&R0.5 3.2 STEERING JOINT ASSEMBLY (At transfer box ) DISCONNECT At Transfer Gear Box
0.2 3.2 DRAG LINK DISCONNECT At Pitman Arm
0.5 3.2 POWER STEERING LINES DISCONNECT At Transfer Gear Box
1.9 3.2 MOUNTING BOLTS, STEERING GEAR BOX R&R0.5 3.2 REFILL FLUID & BLEED LINES OPERATION0.5 ROAD TEST TEST Optional
ALL 3001 3.0 3 MITER BOX R&R1.0 3.2 "U" JOINT, STEERING COLUMN DISCONNECT At Transfer Gear Box
0.5 3.2 STEERING JOINT ASSEMBLY (At transfer box ) DISCONNECT At Transfer Gear Box
0.5 3.2 MITER BOX RETAINING BOLTS DISCONNECT0.5 3.2 MITER BOX COMPONENT R&R0.5 ROAD TEST TEST Optional
ALLSTAND ALONE
ITEMS 3 STEERING SYSTEM COMPONENTS R&R3002 3.7 3.2 STEERING GEAR BOX R&R3003 3.0 3.2 TRANSFER GEAR BOX R&R3004 1.0 3.2 STEERING COLUMN R&R3005 1.0 3.2 "U" JOINT, STEERING COLUMN R&R3006 0.5 3.2 STEERING WHEEL R&R3007 0.8 3.2 DRAG LINK R&R3008 1.5 3.3 HYDRAULIC PUMP (POWER STEERING) R&R Includes refill and bleed
3009 2.5 3.3 HYDRAULIC RESERVOIR R&R Includes refill and bleed
3010 0.5 3.3 FILTER, HYDRAULIC RESERVOIR R&R Includes R+R of access cover
3011 0.8 3.3 SIGHT GLASS R&R Includes R+R of access cover
3012 0.5 3.3 PRESSURE GAUGE ON FILTER HOUSING R&R Includes R+R of access cover
Page 8 of 23
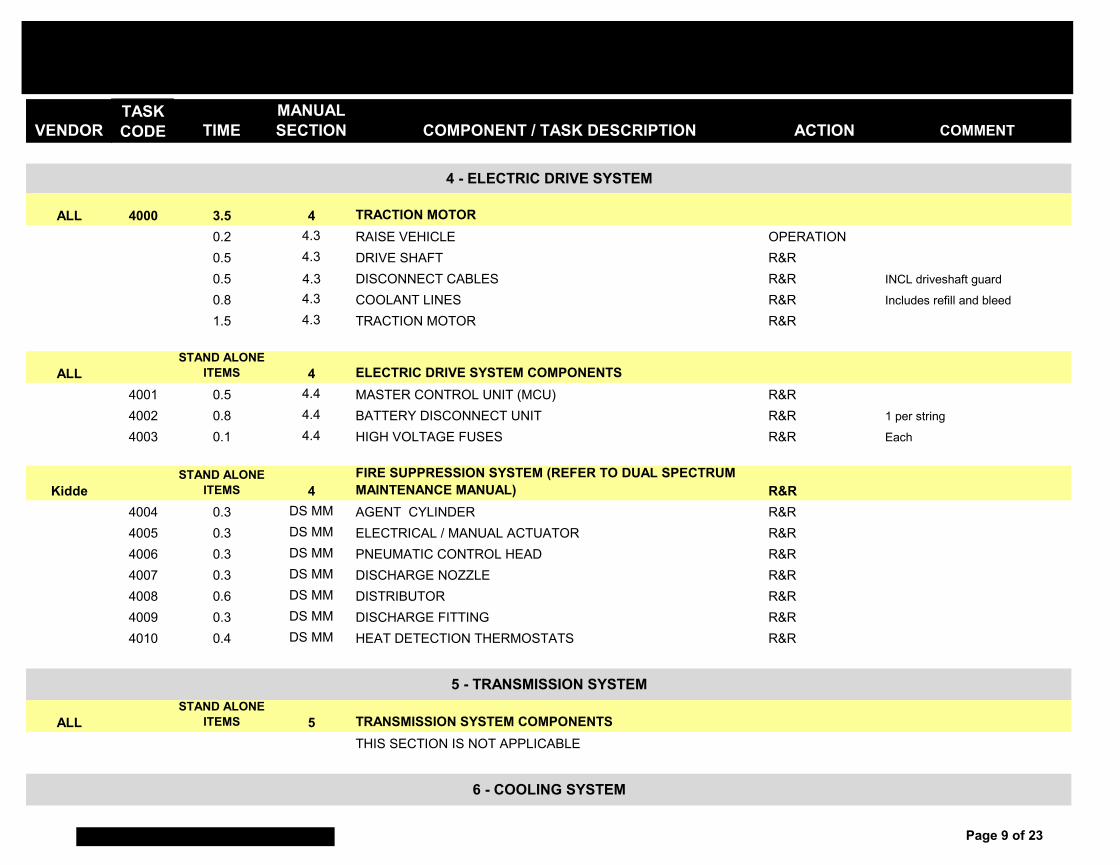
VENDORTASK CODE TIME
MANUAL SECTION COMPONENT / TASK DESCRIPTION ACTION COMMENT
ALL 4000 3.5 4 TRACTION MOTOR0.2 4.3 RAISE VEHICLE OPERATION0.5 4.3 DRIVE SHAFT R&R0.5 4.3 DISCONNECT CABLES R&R INCL driveshaft guard
0.8 4.3 COOLANT LINES R&R Includes refill and bleed
1.5 4.3 TRACTION MOTOR R&R
ALLSTAND ALONE
ITEMS 4 ELECTRIC DRIVE SYSTEM COMPONENTS4001 0.5 4.4 MASTER CONTROL UNIT (MCU) R&R4002 0.8 4.4 BATTERY DISCONNECT UNIT R&R 1 per string
4003 0.1 4.4 HIGH VOLTAGE FUSES R&R Each
KiddeSTAND ALONE
ITEMS 4FIRE SUPPRESSION SYSTEM (REFER TO DUAL SPECTRUM MAINTENANCE MANUAL) R&R
4004 0.3 DS MM AGENT CYLINDER R&R4005 0.3 DS MM ELECTRICAL / MANUAL ACTUATOR R&R4006 0.3 DS MM PNEUMATIC CONTROL HEAD R&R4007 0.3 DS MM DISCHARGE NOZZLE R&R4008 0.6 DS MM DISTRIBUTOR R&R4009 0.3 DS MM DISCHARGE FITTING R&R4010 0.4 DS MM HEAT DETECTION THERMOSTATS R&R
ALLSTAND ALONE
ITEMS 5 TRANSMISSION SYSTEM COMPONENTS THIS SECTION IS NOT APPLICABLE
4 - ELECTRIC DRIVE SYSTEM
6 - COOLING SYSTEM
5 - TRANSMISSION SYSTEM
Page 9 of 23
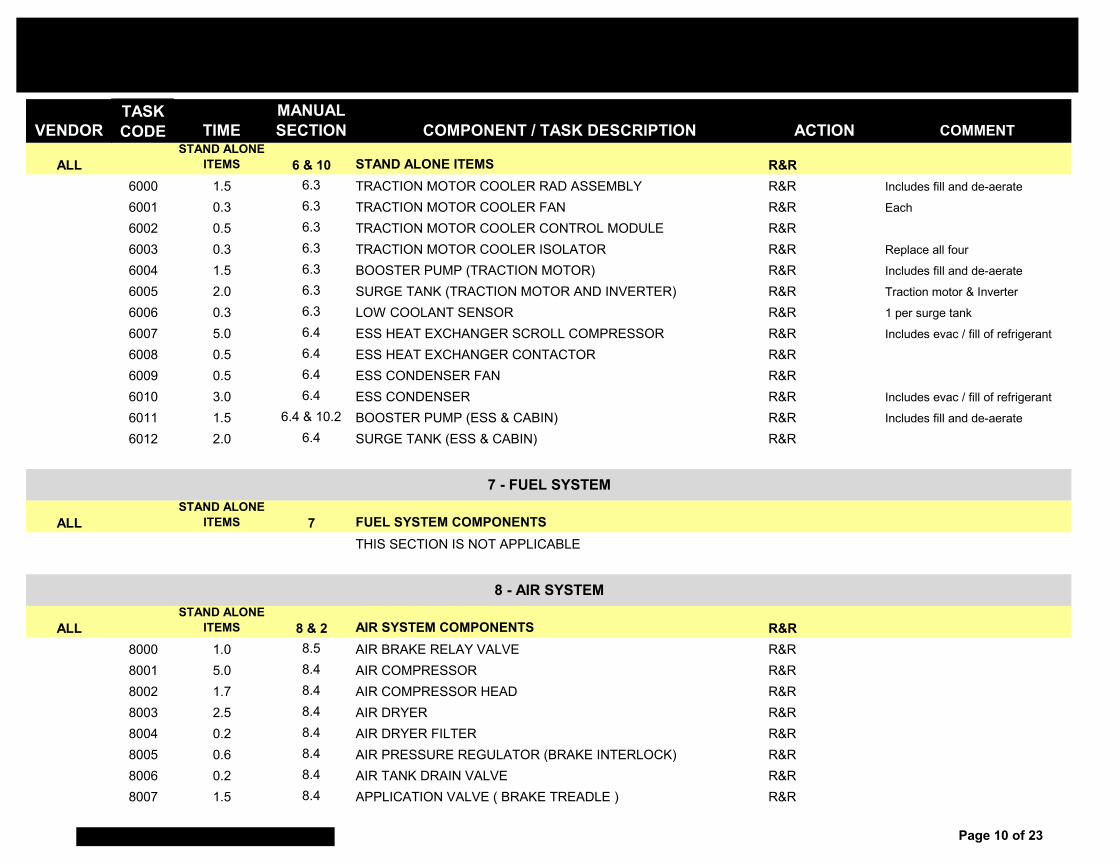
VENDORTASK CODE TIME
MANUAL SECTION COMPONENT / TASK DESCRIPTION ACTION COMMENT
ALLSTAND ALONE
ITEMS 6 & 10 STAND ALONE ITEMS R&R6000 1.5 6.3 TRACTION MOTOR COOLER RAD ASSEMBLY R&R Includes fill and de-aerate
6001 0.3 6.3 TRACTION MOTOR COOLER FAN R&R Each
6002 0.5 6.3 TRACTION MOTOR COOLER CONTROL MODULE R&R6003 0.3 6.3 TRACTION MOTOR COOLER ISOLATOR R&R Replace all four
6004 1.5 6.3 BOOSTER PUMP (TRACTION MOTOR) R&R Includes fill and de-aerate
6005 2.0 6.3 SURGE TANK (TRACTION MOTOR AND INVERTER) R&R Traction motor & Inverter
6006 0.3 6.3 LOW COOLANT SENSOR R&R 1 per surge tank
6007 5.0 6.4 ESS HEAT EXCHANGER SCROLL COMPRESSOR R&R Includes evac / fill of refrigerant
6008 0.5 6.4 ESS HEAT EXCHANGER CONTACTOR R&R6009 0.5 6.4 ESS CONDENSER FAN R&R6010 3.0 6.4 ESS CONDENSER R&R Includes evac / fill of refrigerant
6011 1.5 6.4 & 10.2 BOOSTER PUMP (ESS & CABIN) R&R Includes fill and de-aerate
6012 2.0 6.4 SURGE TANK (ESS & CABIN) R&R
ALLSTAND ALONE
ITEMS 7 FUEL SYSTEM COMPONENTSTHIS SECTION IS NOT APPLICABLE
ALLSTAND ALONE
ITEMS 8 & 2 AIR SYSTEM COMPONENTS R&R8000 1.0 8.5 AIR BRAKE RELAY VALVE R&R8001 5.0 8.4 AIR COMPRESSOR R&R8002 1.7 8.4 AIR COMPRESSOR HEAD R&R8003 2.5 8.4 AIR DRYER R&R8004 0.2 8.4 AIR DRYER FILTER R&R8005 0.6 8.4 AIR PRESSURE REGULATOR (BRAKE INTERLOCK) R&R8006 0.2 8.4 AIR TANK DRAIN VALVE R&R8007 1.5 8.4 APPLICATION VALVE ( BRAKE TREADLE ) R&R
8 - AIR SYSTEM
7 - FUEL SYSTEM
Page 10 of 23
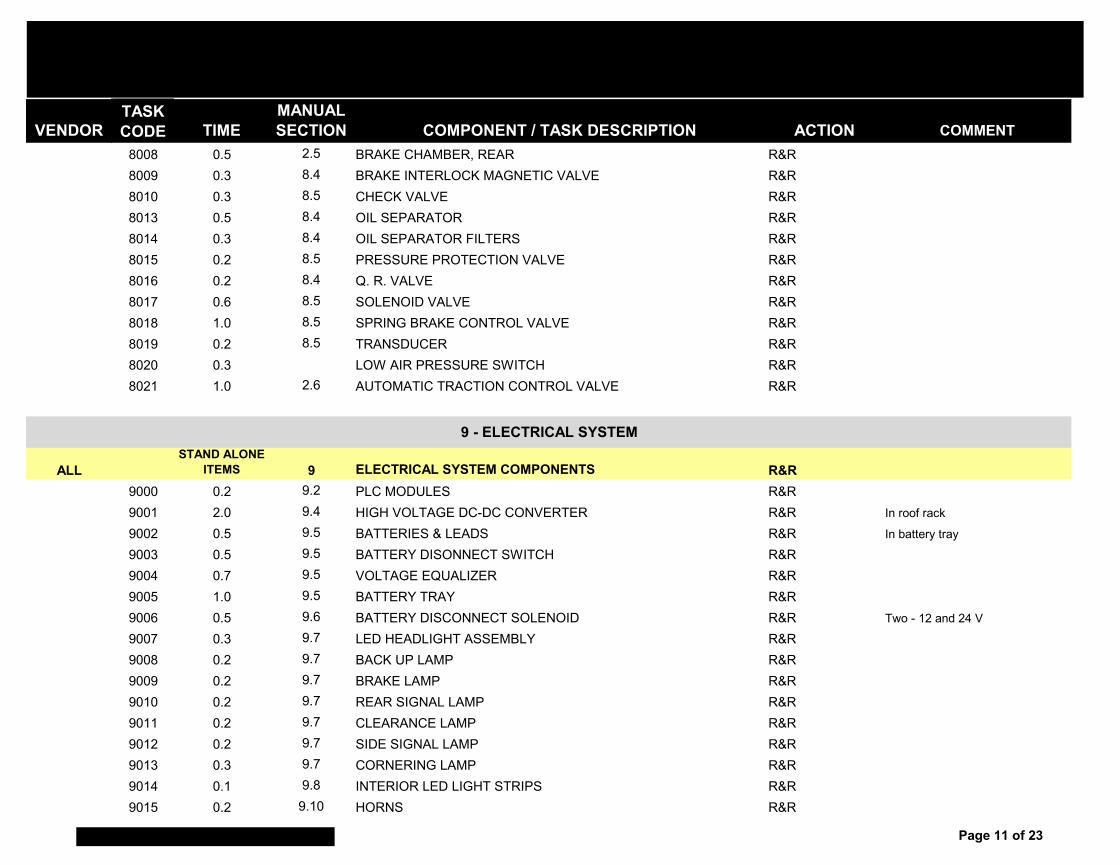
VENDORTASK CODE TIME
MANUAL SECTION COMPONENT / TASK DESCRIPTION ACTION COMMENT
8008 0.5 2.5 BRAKE CHAMBER, REAR R&R8009 0.3 8.4 BRAKE INTERLOCK MAGNETIC VALVE R&R8010 0.3 8.5 CHECK VALVE R&R8013 0.5 8.4 OIL SEPARATOR R&R8014 0.3 8.4 OIL SEPARATOR FILTERS R&R8015 0.2 8.5 PRESSURE PROTECTION VALVE R&R8016 0.2 8.4 Q. R. VALVE R&R8017 0.6 8.5 SOLENOID VALVE R&R8018 1.0 8.5 SPRING BRAKE CONTROL VALVE R&R8019 0.2 8.5 TRANSDUCER R&R8020 0.3 LOW AIR PRESSURE SWITCH R&R8021 1.0 2.6 AUTOMATIC TRACTION CONTROL VALVE R&R
ALLSTAND ALONE
ITEMS 9 ELECTRICAL SYSTEM COMPONENTS R&R9000 0.2 9.2 PLC MODULES R&R9001 2.0 9.4 HIGH VOLTAGE DC-DC CONVERTER R&R In roof rack
9002 0.5 9.5 BATTERIES & LEADS R&R In battery tray
9003 0.5 9.5 BATTERY DISONNECT SWITCH R&R9004 0.7 9.5 VOLTAGE EQUALIZER R&R9005 1.0 9.5 BATTERY TRAY R&R9006 0.5 9.6 BATTERY DISCONNECT SOLENOID R&R Two - 12 and 24 V
9007 0.3 9.7 LED HEADLIGHT ASSEMBLY R&R9008 0.2 9.7 BACK UP LAMP R&R9009 0.2 9.7 BRAKE LAMP R&R9010 0.2 9.7 REAR SIGNAL LAMP R&R9011 0.2 9.7 CLEARANCE LAMP R&R9012 0.2 9.7 SIDE SIGNAL LAMP R&R9013 0.3 9.7 CORNERING LAMP R&R9014 0.1 9.8 INTERIOR LED LIGHT STRIPS R&R9015 0.2 9.10 HORNS R&R
9 - ELECTRICAL SYSTEM
Page 11 of 23
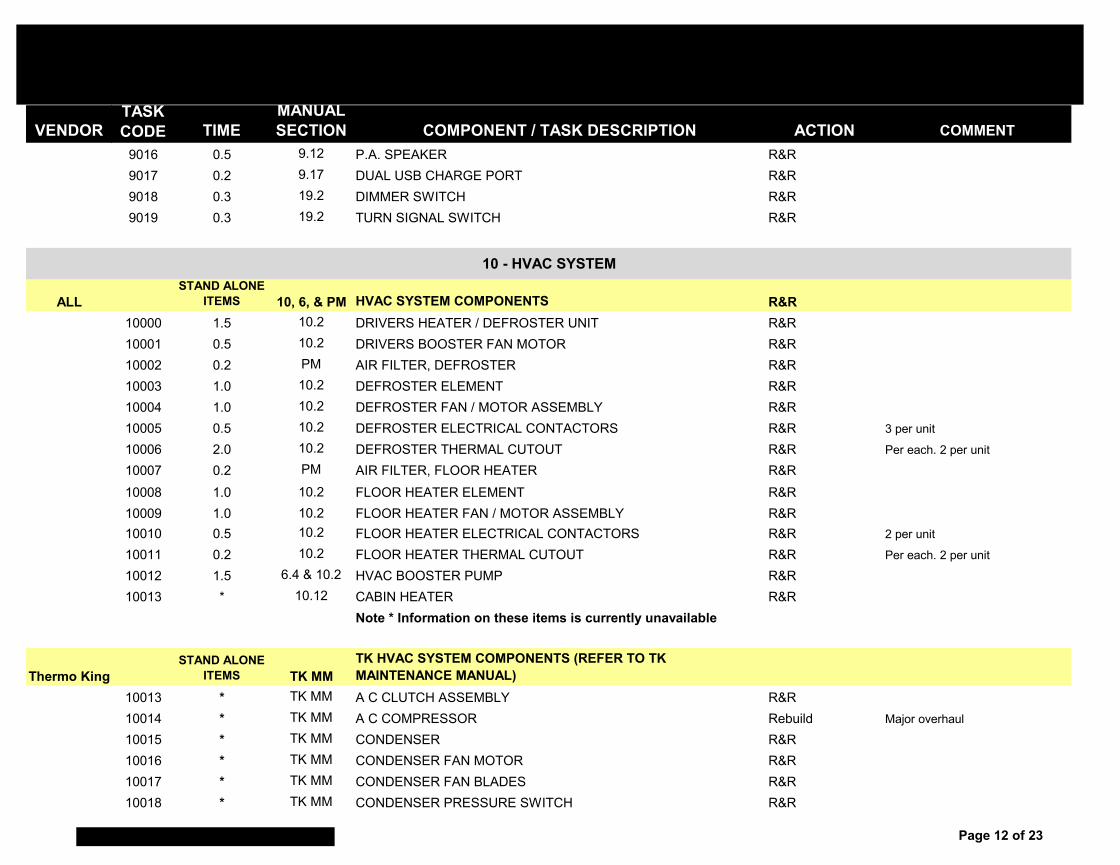
VENDORTASK CODE TIME
MANUAL SECTION COMPONENT / TASK DESCRIPTION ACTION COMMENT
9016 0.5 9.12 P.A. SPEAKER R&R9017 0.2 9.17 DUAL USB CHARGE PORT R&R9018 0.3 19.2 DIMMER SWITCH R&R9019 0.3 19.2 TURN SIGNAL SWITCH R&R
ALLSTAND ALONE
ITEMS 10, 6, & PM HVAC SYSTEM COMPONENTS R&R10000 1.5 10.2 DRIVERS HEATER / DEFROSTER UNIT R&R10001 0.5 10.2 DRIVERS BOOSTER FAN MOTOR R&R10002 0.2 PM AIR FILTER, DEFROSTER R&R10003 1.0 10.2 DEFROSTER ELEMENT R&R10004 1.0 10.2 DEFROSTER FAN / MOTOR ASSEMBLY R&R10005 0.5 10.2 DEFROSTER ELECTRICAL CONTACTORS R&R 3 per unit
10006 2.0 10.2 DEFROSTER THERMAL CUTOUT R&R Per each. 2 per unit
10007 0.2 PM AIR FILTER, FLOOR HEATER R&R10008 1.0 10.2 FLOOR HEATER ELEMENT R&R10009 1.0 10.2 FLOOR HEATER FAN / MOTOR ASSEMBLY R&R10010 0.5 10.2 FLOOR HEATER ELECTRICAL CONTACTORS R&R 2 per unit
10011 0.2 10.2 FLOOR HEATER THERMAL CUTOUT R&R Per each. 2 per unit
10012 1.5 6.4 & 10.2 HVAC BOOSTER PUMP R&R10013 * 10.12 CABIN HEATER R&R
Note * Information on these items is currently unavailable
Thermo KingSTAND ALONE
ITEMS TK MMTK HVAC SYSTEM COMPONENTS (REFER TO TK MAINTENANCE MANUAL)
10013 * TK MM A C CLUTCH ASSEMBLY R&R10014 * TK MM A C COMPRESSOR Rebuild Major overhaul
10015 * TK MM CONDENSER R&R10016 * TK MM CONDENSER FAN MOTOR R&R10017 * TK MM CONDENSER FAN BLADES R&R10018 * TK MM CONDENSER PRESSURE SWITCH R&R
10 - HVAC SYSTEM
Page 12 of 23

VENDORTASK CODE TIME
MANUAL SECTION COMPONENT / TASK DESCRIPTION ACTION COMMENT
10019 * TK MM FILTER DRIER R&R Incl evac, charge, leak check
10020 * TK MM EVAPORATOR COIL AND PANEL R&R10021 * TK MM EVAPORATOR FAN MOTOR R&R10022 * TK MM EVAPORATOR HIGH PRESSURE SWITCH R&R10023 * TK MM SIGHT GLASS R&R10024 * TK MM DISCHARGE HOSE (A/C) R&R10025 * TK MM EVAC-CHARGE & LEAK CHECK Operation10026 * TK MM SUCTION HOSE R&R10027 * TK MM THERMOSTAT -AMBIENT AIR R&R10028 * TK MM THERMOSTAT - CAL/SET/RESET Operation10029 * TK MM WATER TEMP SWITCH R&R10030 * TK MM RETURN AIR SENSOR R&R
Note * Information on these items is currently unavailable
ALLSTAND ALONE
ITEMS 12 & 13 INTERIOR PANELS & APPLIED PARTS R&R12000 1.0 12.2 SIDEWALL PANEL R&R12001 1.5 12.2 CEILING PANEL R&R12002 0.3 12.5 REAR VIEW MIRROR R&R12003 0.3 12.5 EXIT DOOR MIRROR R&R12004 0.3 12.2 SUN VISOR R&R
ALLSTAND ALONE
ITEMS 13 EXTERIOR PANELS & APPLIED PARTS R&R13000 0.5 13.5 CURBSIDE MIRROR R&R13001 0.5 13.5 DRIVERS MIRROR R&R13002 1.3 13.3 FRONT BUMPER R&R13003 0.8 13.3 REAR BUMPER ASSEMBLY R&R13004 1.0 13.3 POLYURETHANE MODULE R&R Per bumper section
13005 0.3 13.6 WIPER ARM R&R
12 - INTERIOR PANELS & APPLIED PARTS
13 - EXTERIOR PANELS & APPLIED PARTS
Page 13 of 23
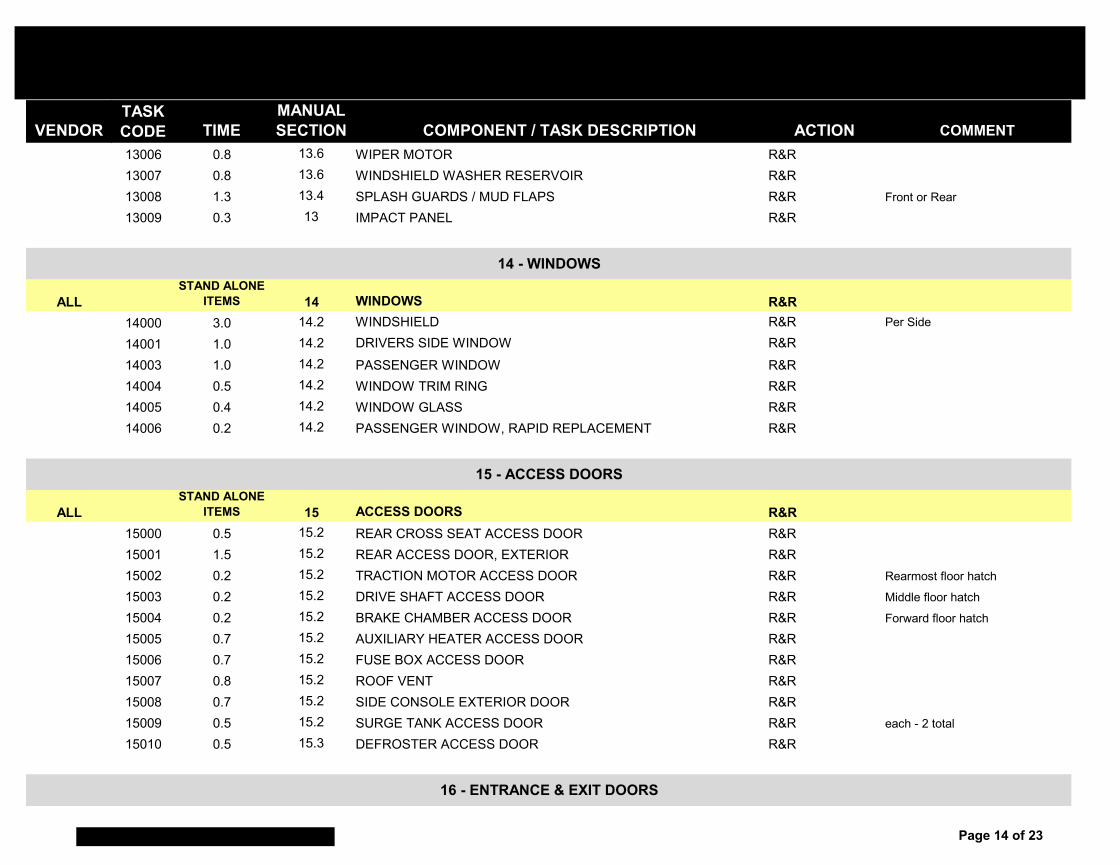
VENDORTASK CODE TIME
MANUAL SECTION COMPONENT / TASK DESCRIPTION ACTION COMMENT
13006 0.8 13.6 WIPER MOTOR R&R13007 0.8 13.6 WINDSHIELD WASHER RESERVOIR R&R13008 1.3 13.4 SPLASH GUARDS / MUD FLAPS R&R Front or Rear
13009 0.3 13 IMPACT PANEL R&R
ALLSTAND ALONE
ITEMS 14 WINDOWS R&R14000 3.0 14.2 WINDSHIELD R&R Per Side
14001 1.0 14.2 DRIVERS SIDE WINDOW R&R14003 1.0 14.2 PASSENGER WINDOW R&R14004 0.5 14.2 WINDOW TRIM RING R&R14005 0.4 14.2 WINDOW GLASS R&R14006 0.2 14.2 PASSENGER WINDOW, RAPID REPLACEMENT R&R
ALLSTAND ALONE
ITEMS 15 ACCESS DOORS R&R15000 0.5 15.2 REAR CROSS SEAT ACCESS DOOR R&R15001 1.5 15.2 REAR ACCESS DOOR, EXTERIOR R&R15002 0.2 15.2 TRACTION MOTOR ACCESS DOOR R&R Rearmost floor hatch
15003 0.2 15.2 DRIVE SHAFT ACCESS DOOR R&R Middle floor hatch
15004 0.2 15.2 BRAKE CHAMBER ACCESS DOOR R&R Forward floor hatch
15005 0.7 15.2 AUXILIARY HEATER ACCESS DOOR R&R15006 0.7 15.2 FUSE BOX ACCESS DOOR R&R15007 0.8 15.2 ROOF VENT R&R15008 0.7 15.2 SIDE CONSOLE EXTERIOR DOOR R&R15009 0.5 15.2 SURGE TANK ACCESS DOOR R&R each - 2 total
15010 0.5 15.3 DEFROSTER ACCESS DOOR R&R
15 - ACCESS DOORS
16 - ENTRANCE & EXIT DOORS
14 - WINDOWS
Page 14 of 23
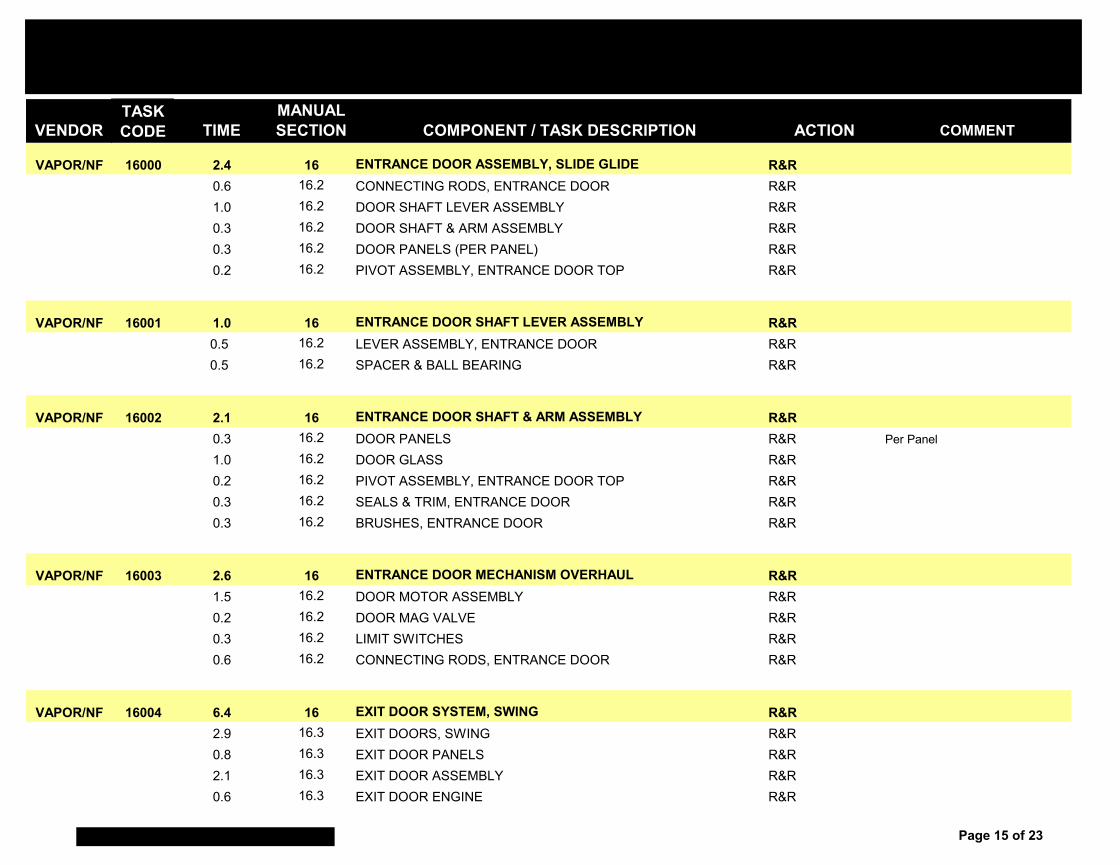
VENDORTASK CODE TIME
MANUAL SECTION COMPONENT / TASK DESCRIPTION ACTION COMMENT
VAPOR/NF 16000 2.4 16 ENTRANCE DOOR ASSEMBLY, SLIDE GLIDE R&R0.6 16.2 CONNECTING RODS, ENTRANCE DOOR R&R1.0 16.2 DOOR SHAFT LEVER ASSEMBLY R&R0.3 16.2 DOOR SHAFT & ARM ASSEMBLY R&R0.3 16.2 DOOR PANELS (PER PANEL) R&R0.2 16.2 PIVOT ASSEMBLY, ENTRANCE DOOR TOP R&R
VAPOR/NF 16001 1.0 16 ENTRANCE DOOR SHAFT LEVER ASSEMBLY R&R0.5 16.2 LEVER ASSEMBLY, ENTRANCE DOOR R&R0.5 16.2 SPACER & BALL BEARING R&R
VAPOR/NF 16002 2.1 16 ENTRANCE DOOR SHAFT & ARM ASSEMBLY R&R0.3 16.2 DOOR PANELS R&R Per Panel
1.0 16.2 DOOR GLASS R&R0.2 16.2 PIVOT ASSEMBLY, ENTRANCE DOOR TOP R&R0.3 16.2 SEALS & TRIM, ENTRANCE DOOR R&R0.3 16.2 BRUSHES, ENTRANCE DOOR R&R
VAPOR/NF 16003 2.6 16 ENTRANCE DOOR MECHANISM OVERHAUL R&R1.5 16.2 DOOR MOTOR ASSEMBLY R&R0.2 16.2 DOOR MAG VALVE R&R0.3 16.2 LIMIT SWITCHES R&R0.6 16.2 CONNECTING RODS, ENTRANCE DOOR R&R
VAPOR/NF 16004 6.4 16 EXIT DOOR SYSTEM, SWING R&R2.9 16.3 EXIT DOORS, SWING R&R0.8 16.3 EXIT DOOR PANELS R&R2.1 16.3 EXIT DOOR ASSEMBLY R&R0.6 16.3 EXIT DOOR ENGINE R&R
Page 15 of 23
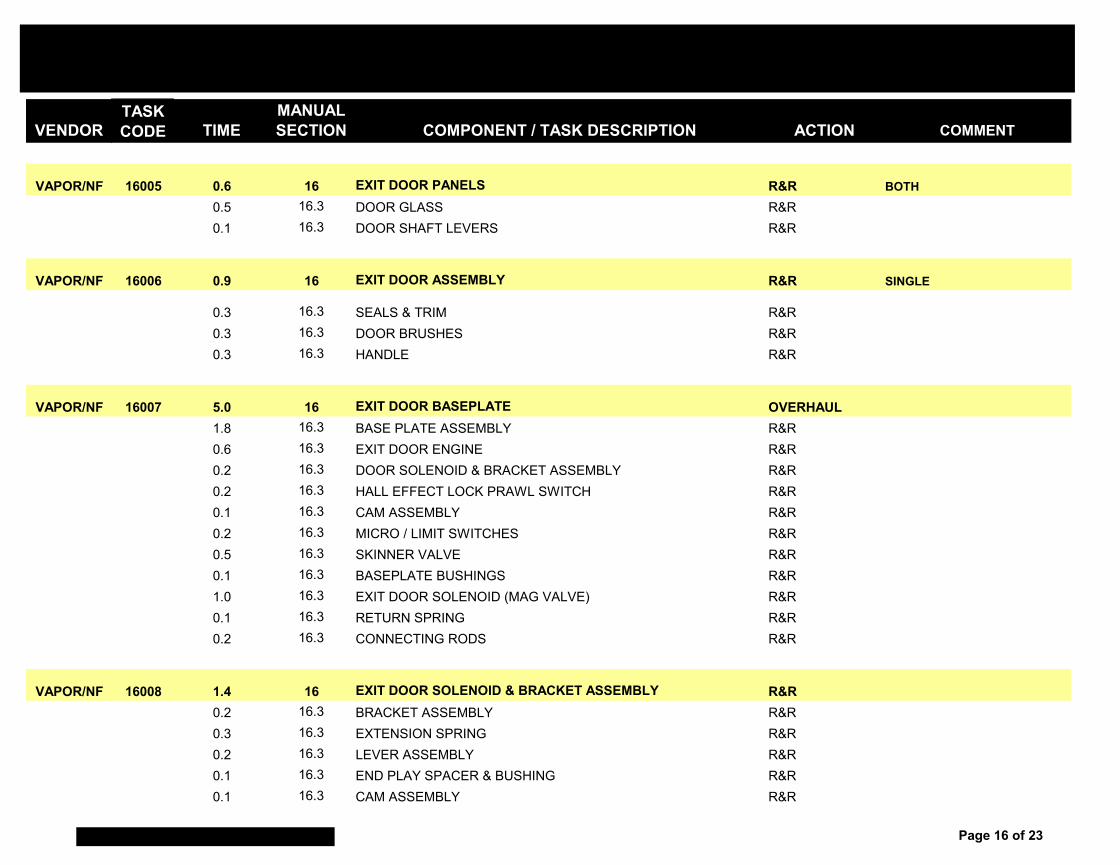
VENDORTASK CODE TIME
MANUAL SECTION COMPONENT / TASK DESCRIPTION ACTION COMMENT
VAPOR/NF 16005 0.6 16 EXIT DOOR PANELS R&R BOTH0.5 16.3 DOOR GLASS R&R0.1 16.3 DOOR SHAFT LEVERS R&R
VAPOR/NF 16006 0.9 16 EXIT DOOR ASSEMBLY R&R SINGLE
0.3 16.3 SEALS & TRIM R&R0.3 16.3 DOOR BRUSHES R&R0.3 16.3 HANDLE R&R
VAPOR/NF 16007 5.0 16 EXIT DOOR BASEPLATE OVERHAUL1.8 16.3 BASE PLATE ASSEMBLY R&R0.6 16.3 EXIT DOOR ENGINE R&R0.2 16.3 DOOR SOLENOID & BRACKET ASSEMBLY R&R0.2 16.3 HALL EFFECT LOCK PRAWL SWITCH R&R0.1 16.3 CAM ASSEMBLY R&R0.2 16.3 MICRO / LIMIT SWITCHES R&R0.5 16.3 SKINNER VALVE R&R0.1 16.3 BASEPLATE BUSHINGS R&R1.0 16.3 EXIT DOOR SOLENOID (MAG VALVE) R&R0.1 16.3 RETURN SPRING R&R0.2 16.3 CONNECTING RODS R&R
VAPOR/NF 16008 1.4 16 EXIT DOOR SOLENOID & BRACKET ASSEMBLY R&R0.2 16.3 BRACKET ASSEMBLY R&R0.3 16.3 EXTENSION SPRING R&R0.2 16.3 LEVER ASSEMBLY R&R0.1 16.3 END PLAY SPACER & BUSHING R&R0.1 16.3 CAM ASSEMBLY R&R
Page 16 of 23
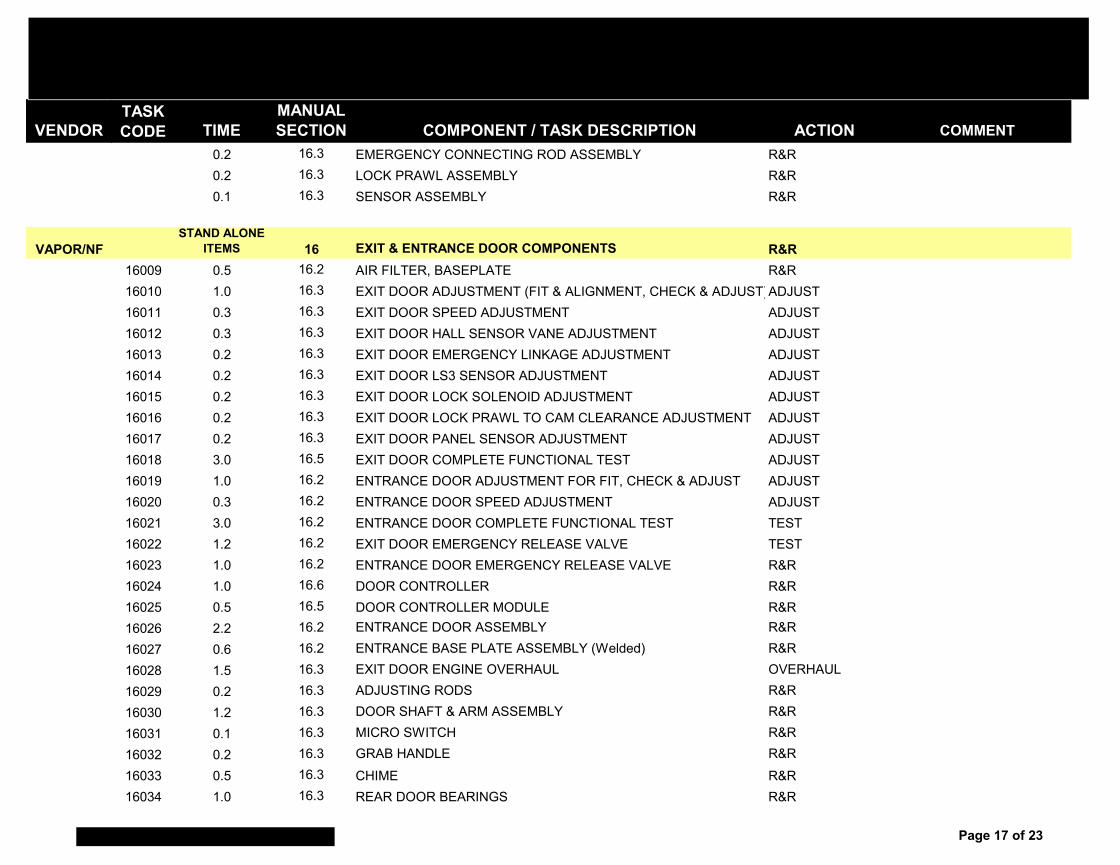
VENDORTASK CODE TIME
MANUAL SECTION COMPONENT / TASK DESCRIPTION ACTION COMMENT
0.2 16.3 EMERGENCY CONNECTING ROD ASSEMBLY R&R0.2 16.3 LOCK PRAWL ASSEMBLY R&R0.1 16.3 SENSOR ASSEMBLY R&R
VAPOR/NFSTAND ALONE
ITEMS 16 EXIT & ENTRANCE DOOR COMPONENTS R&R16009 0.5 16.2 AIR FILTER, BASEPLATE R&R16010 1.0 16.3 EXIT DOOR ADJUSTMENT (FIT & ALIGNMENT, CHECK & ADJUST)ADJUST16011 0.3 16.3 EXIT DOOR SPEED ADJUSTMENT ADJUST16012 0.3 16.3 EXIT DOOR HALL SENSOR VANE ADJUSTMENT ADJUST16013 0.2 16.3 EXIT DOOR EMERGENCY LINKAGE ADJUSTMENT ADJUST16014 0.2 16.3 EXIT DOOR LS3 SENSOR ADJUSTMENT ADJUST16015 0.2 16.3 EXIT DOOR LOCK SOLENOID ADJUSTMENT ADJUST16016 0.2 16.3 EXIT DOOR LOCK PRAWL TO CAM CLEARANCE ADJUSTMENT ADJUST16017 0.2 16.3 EXIT DOOR PANEL SENSOR ADJUSTMENT ADJUST16018 3.0 16.5 EXIT DOOR COMPLETE FUNCTIONAL TEST ADJUST16019 1.0 16.2 ENTRANCE DOOR ADJUSTMENT FOR FIT, CHECK & ADJUST ADJUST16020 0.3 16.2 ENTRANCE DOOR SPEED ADJUSTMENT ADJUST16021 3.0 16.2 ENTRANCE DOOR COMPLETE FUNCTIONAL TEST TEST16022 1.2 16.2 EXIT DOOR EMERGENCY RELEASE VALVE TEST16023 1.0 16.2 ENTRANCE DOOR EMERGENCY RELEASE VALVE R&R16024 1.0 16.6 DOOR CONTROLLER R&R16025 0.5 16.5 DOOR CONTROLLER MODULE R&R16026 2.2 16.2 ENTRANCE DOOR ASSEMBLY R&R16027 0.6 16.2 ENTRANCE BASE PLATE ASSEMBLY (Welded) R&R16028 1.5 16.3 EXIT DOOR ENGINE OVERHAUL OVERHAUL16029 0.2 16.3 ADJUSTING RODS R&R16030 1.2 16.3 DOOR SHAFT & ARM ASSEMBLY R&R16031 0.1 16.3 MICRO SWITCH R&R16032 0.2 16.3 GRAB HANDLE R&R16033 0.5 16.3 CHIME R&R16034 1.0 16.3 REAR DOOR BEARINGS R&R
Page 17 of 23
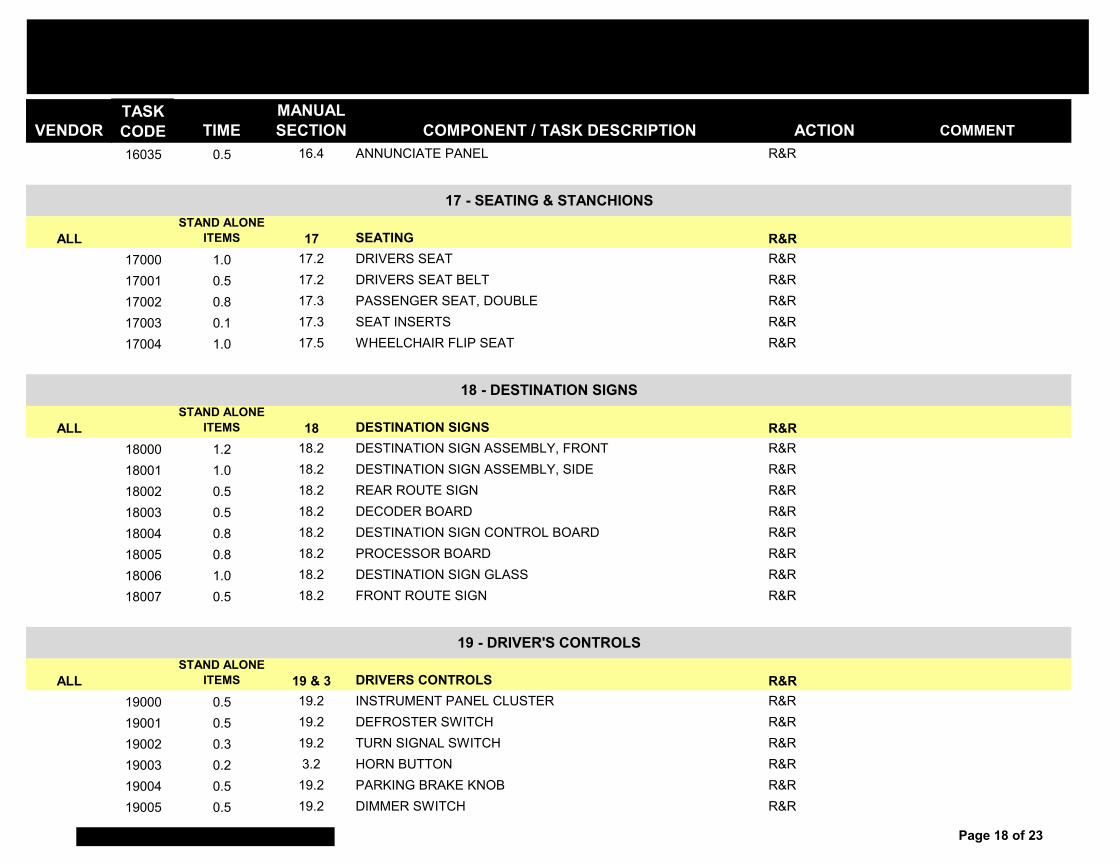
VENDORTASK CODE TIME
MANUAL SECTION COMPONENT / TASK DESCRIPTION ACTION COMMENT
16035 0.5 16.4 ANNUNCIATE PANEL R&R
ALLSTAND ALONE
ITEMS 17 SEATING R&R17000 1.0 17.2 DRIVERS SEAT R&R17001 0.5 17.2 DRIVERS SEAT BELT R&R17002 0.8 17.3 PASSENGER SEAT, DOUBLE R&R17003 0.1 17.3 SEAT INSERTS R&R17004 1.0 17.5 WHEELCHAIR FLIP SEAT R&R
ALLSTAND ALONE
ITEMS 18 DESTINATION SIGNS R&R18000 1.2 18.2 DESTINATION SIGN ASSEMBLY, FRONT R&R18001 1.0 18.2 DESTINATION SIGN ASSEMBLY, SIDE R&R18002 0.5 18.2 REAR ROUTE SIGN R&R18003 0.5 18.2 DECODER BOARD R&R18004 0.8 18.2 DESTINATION SIGN CONTROL BOARD R&R18005 0.8 18.2 PROCESSOR BOARD R&R18006 1.0 18.2 DESTINATION SIGN GLASS R&R18007 0.5 18.2 FRONT ROUTE SIGN R&R
ALLSTAND ALONE
ITEMS 19 & 3 DRIVERS CONTROLS R&R19000 0.5 19.2 INSTRUMENT PANEL CLUSTER R&R19001 0.5 19.2 DEFROSTER SWITCH R&R19002 0.3 19.2 TURN SIGNAL SWITCH R&R19003 0.2 3.2 HORN BUTTON R&R19004 0.5 19.2 PARKING BRAKE KNOB R&R19005 0.5 19.2 DIMMER SWITCH R&R
18 - DESTINATION SIGNS
19 - DRIVER'S CONTROLS
17 - SEATING & STANCHIONS
Page 18 of 23
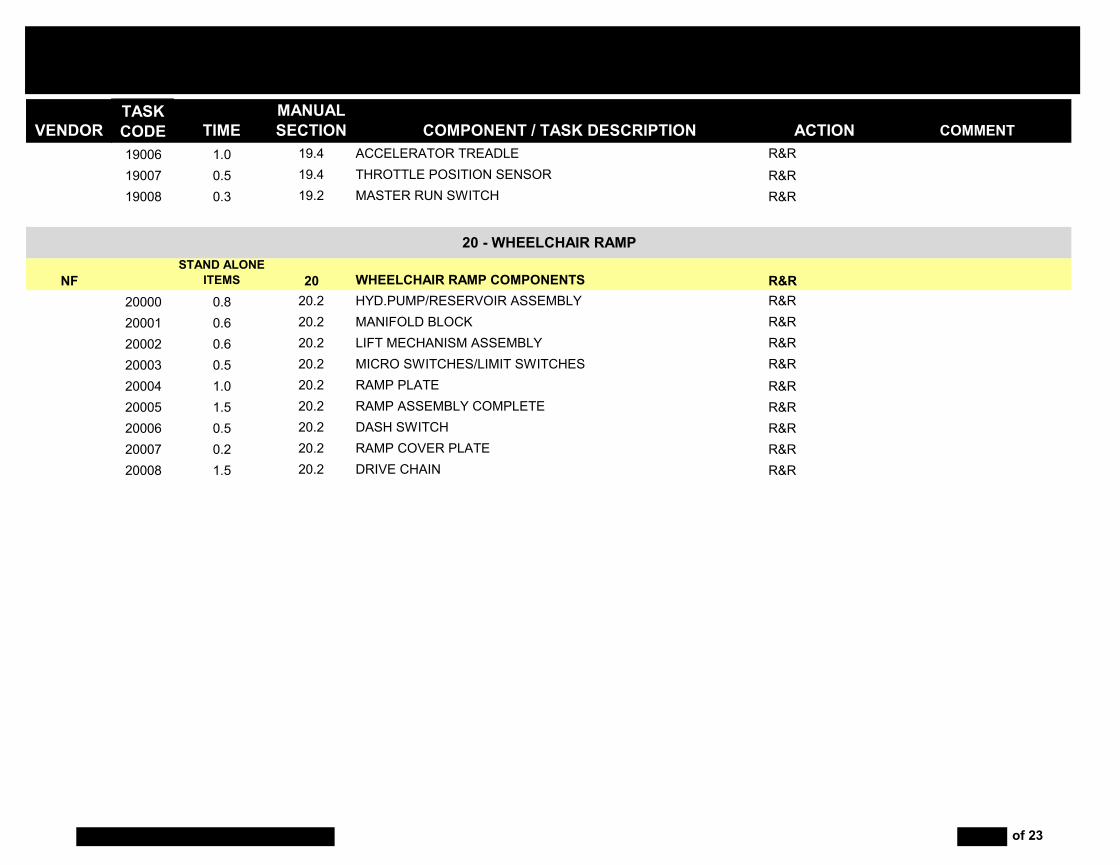
VENDORTASK CODE TIME
MANUAL SECTION COMPONENT / TASK DESCRIPTION ACTION COMMENT
19006 1.0 19.4 ACCELERATOR TREADLE R&R19007 0.5 19.4 THROTTLE POSITION SENSOR R&R19008 0.3 19.2 MASTER RUN SWITCH R&R
NFSTAND ALONE
ITEMS 20 WHEELCHAIR RAMP COMPONENTS R&R20000 0.8 20.2 HYD.PUMP/RESERVOIR ASSEMBLY R&R20001 0.6 20.2 MANIFOLD BLOCK R&R20002 0.6 20.2 LIFT MECHANISM ASSEMBLY R&R20003 0.5 20.2 MICRO SWITCHES/LIMIT SWITCHES R&R20004 1.0 20.2 RAMP PLATE R&R20005 1.5 20.2 RAMP ASSEMBLY COMPLETE R&R20006 0.5 20.2 DASH SWITCH R&R20007 0.2 20.2 RAMP COVER PLATE R&R20008 1.5 20.2 DRIVE CHAIN R&R
20 - WHEELCHAIR RAMP
of 23
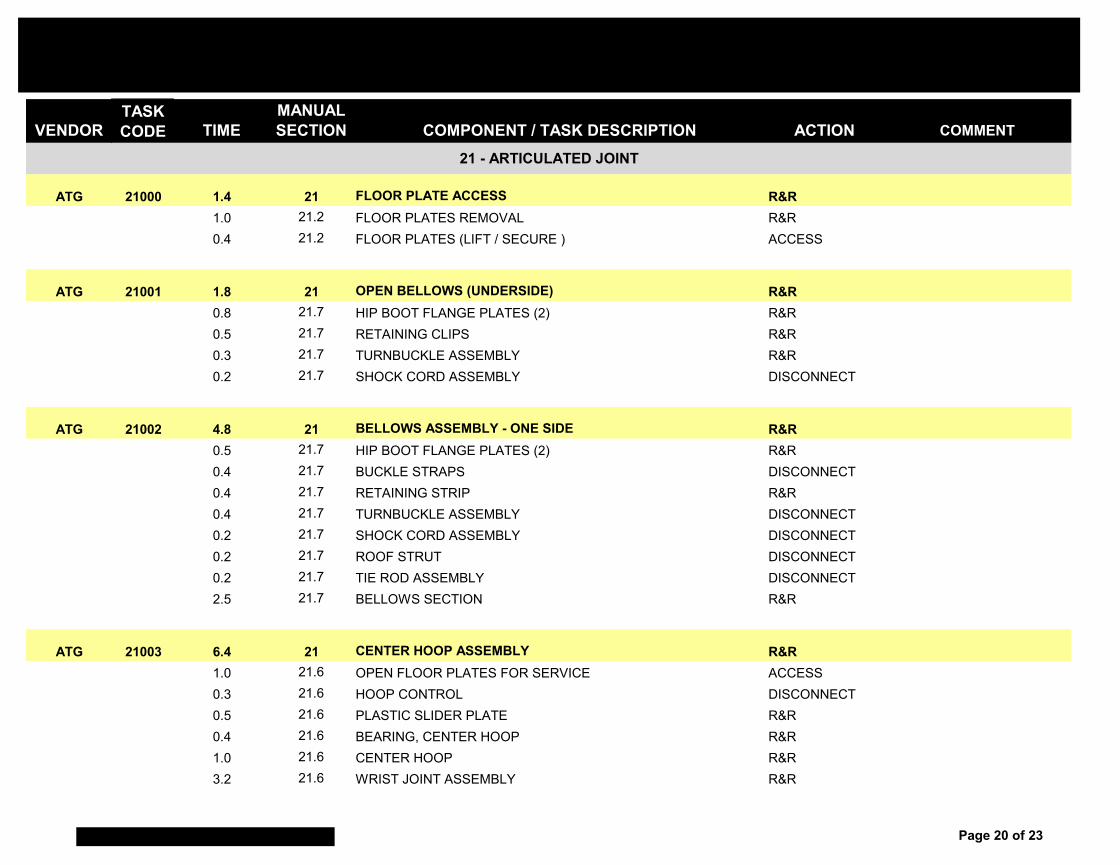
VENDORTASK CODE TIME
MANUAL SECTION COMPONENT / TASK DESCRIPTION ACTION COMMENT
ATG 21000 1.4 21 FLOOR PLATE ACCESS R&R1.0 21.2 FLOOR PLATES REMOVAL R&R0.4 21.2 FLOOR PLATES (LIFT / SECURE ) ACCESS
ATG 21001 1.8 21 OPEN BELLOWS (UNDERSIDE) R&R0.8 21.7 HIP BOOT FLANGE PLATES (2) R&R0.5 21.7 RETAINING CLIPS R&R0.3 21.7 TURNBUCKLE ASSEMBLY R&R0.2 21.7 SHOCK CORD ASSEMBLY DISCONNECT
ATG 21002 4.8 21 BELLOWS ASSEMBLY - ONE SIDE R&R0.5 21.7 HIP BOOT FLANGE PLATES (2) R&R0.4 21.7 BUCKLE STRAPS DISCONNECT0.4 21.7 RETAINING STRIP R&R0.4 21.7 TURNBUCKLE ASSEMBLY DISCONNECT0.2 21.7 SHOCK CORD ASSEMBLY DISCONNECT0.2 21.7 ROOF STRUT DISCONNECT0.2 21.7 TIE ROD ASSEMBLY DISCONNECT2.5 21.7 BELLOWS SECTION R&R
ATG 21003 6.4 21 CENTER HOOP ASSEMBLY R&R1.0 21.6 OPEN FLOOR PLATES FOR SERVICE ACCESS0.3 21.6 HOOP CONTROL DISCONNECT0.5 21.6 PLASTIC SLIDER PLATE R&R0.4 21.6 BEARING, CENTER HOOP R&R1.0 21.6 CENTER HOOP R&R3.2 21.6 WRIST JOINT ASSEMBLY R&R
21 - ARTICULATED JOINT
Page 20 of 23
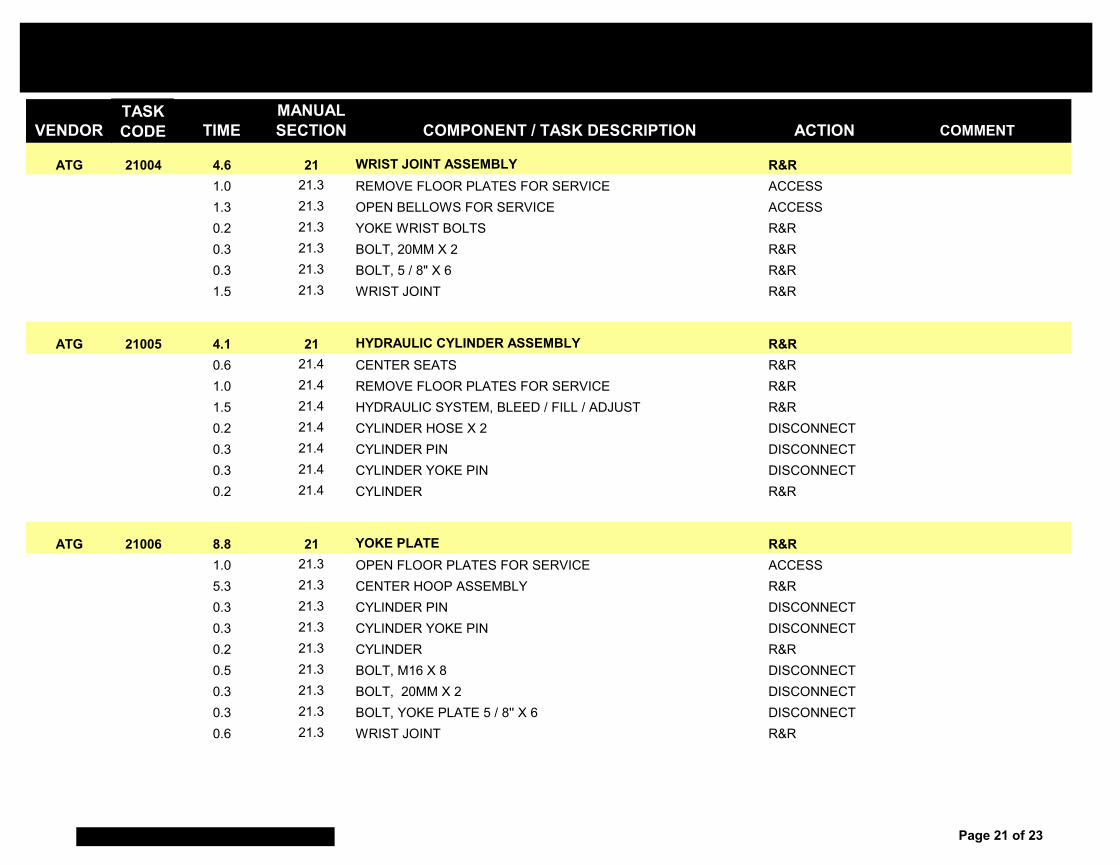
VENDORTASK CODE TIME
MANUAL SECTION COMPONENT / TASK DESCRIPTION ACTION COMMENT
ATG 21004 4.6 21 WRIST JOINT ASSEMBLY R&R1.0 21.3 REMOVE FLOOR PLATES FOR SERVICE ACCESS1.3 21.3 OPEN BELLOWS FOR SERVICE ACCESS0.2 21.3 YOKE WRIST BOLTS R&R0.3 21.3 BOLT, 20MM X 2 R&R0.3 21.3 BOLT, 5 / 8" X 6 R&R1.5 21.3 WRIST JOINT R&R
ATG 21005 4.1 21 HYDRAULIC CYLINDER ASSEMBLY R&R0.6 21.4 CENTER SEATS R&R1.0 21.4 REMOVE FLOOR PLATES FOR SERVICE R&R1.5 21.4 HYDRAULIC SYSTEM, BLEED / FILL / ADJUST R&R0.2 21.4 CYLINDER HOSE X 2 DISCONNECT0.3 21.4 CYLINDER PIN DISCONNECT0.3 21.4 CYLINDER YOKE PIN DISCONNECT0.2 21.4 CYLINDER R&R
ATG 21006 8.8 21 YOKE PLATE R&R1.0 21.3 OPEN FLOOR PLATES FOR SERVICE ACCESS5.3 21.3 CENTER HOOP ASSEMBLY R&R0.3 21.3 CYLINDER PIN DISCONNECT0.3 21.3 CYLINDER YOKE PIN DISCONNECT0.2 21.3 CYLINDER R&R0.5 21.3 BOLT, M16 X 8 DISCONNECT0.3 21.3 BOLT, 20MM X 2 DISCONNECT0.3 21.3 BOLT, YOKE PLATE 5 / 8'' X 6 DISCONNECT0.6 21.3 WRIST JOINT R&R
Page 21 of 23
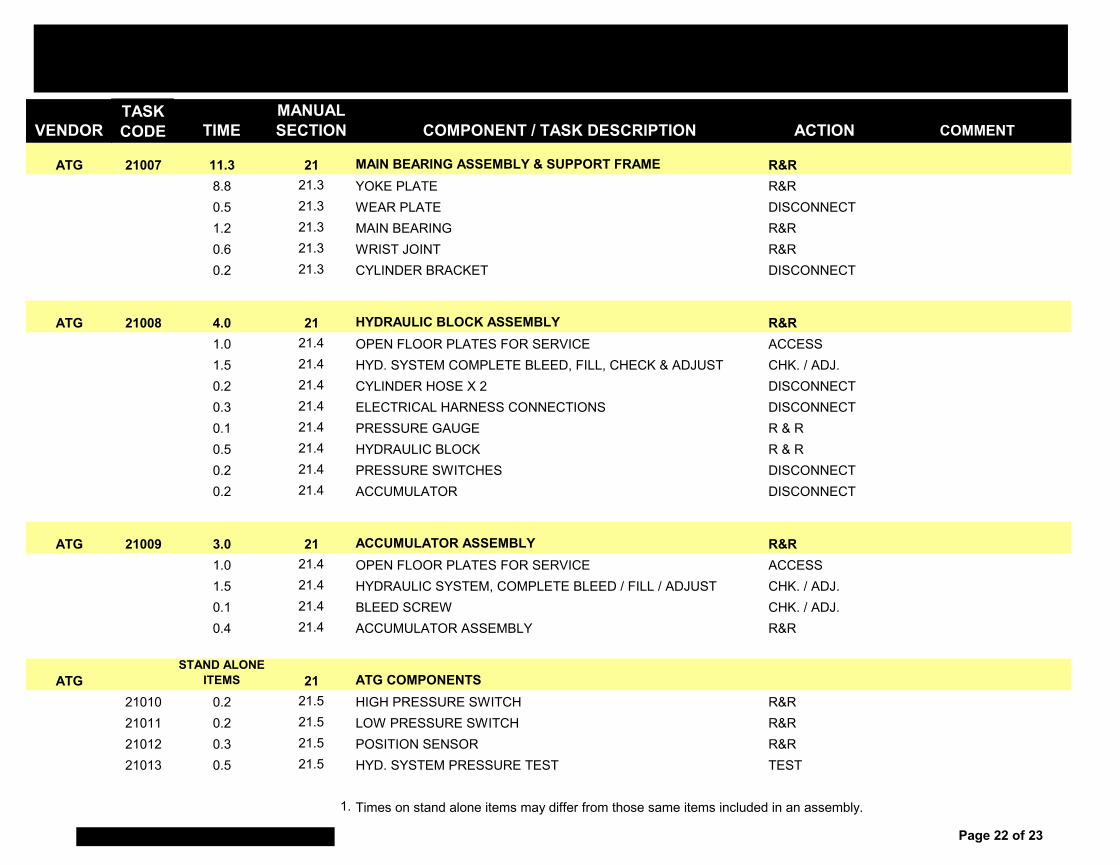
VENDORTASK CODE TIME
MANUAL SECTION COMPONENT / TASK DESCRIPTION ACTION COMMENT
ATG 21007 11.3 21 MAIN BEARING ASSEMBLY & SUPPORT FRAME R&R8.8 21.3 YOKE PLATE R&R0.5 21.3 WEAR PLATE DISCONNECT1.2 21.3 MAIN BEARING R&R0.6 21.3 WRIST JOINT R&R0.2 21.3 CYLINDER BRACKET DISCONNECT
ATG 21008 4.0 21 HYDRAULIC BLOCK ASSEMBLY R&R1.0 21.4 OPEN FLOOR PLATES FOR SERVICE ACCESS1.5 21.4 HYD. SYSTEM COMPLETE BLEED, FILL, CHECK & ADJUST CHK. / ADJ.0.2 21.4 CYLINDER HOSE X 2 DISCONNECT0.3 21.4 ELECTRICAL HARNESS CONNECTIONS DISCONNECT0.1 21.4 PRESSURE GAUGE R & R0.5 21.4 HYDRAULIC BLOCK R & R0.2 21.4 PRESSURE SWITCHES DISCONNECT0.2 21.4 ACCUMULATOR DISCONNECT
ATG 21009 3.0 21 ACCUMULATOR ASSEMBLY R&R1.0 21.4 OPEN FLOOR PLATES FOR SERVICE ACCESS1.5 21.4 HYDRAULIC SYSTEM, COMPLETE BLEED / FILL / ADJUST CHK. / ADJ.0.1 21.4 BLEED SCREW CHK. / ADJ.0.4 21.4 ACCUMULATOR ASSEMBLY R&R
ATGSTAND ALONE
ITEMS 21 ATG COMPONENTS21010 0.2 21.5 HIGH PRESSURE SWITCH R&R21011 0.2 21.5 LOW PRESSURE SWITCH R&R21012 0.3 21.5 POSITION SENSOR R&R21013 0.5 21.5 HYD. SYSTEM PRESSURE TEST TEST
1. Times on stand alone items may differ from those same items included in an assembly.
Page 22 of 23
VENDORTASK CODE TIME
MANUAL SECTION COMPONENT / TASK DESCRIPTION ACTION COMMENT
2. Refer to each section of the New Flyer Service Manual for identification of Special Tools.
Page 23 of 23
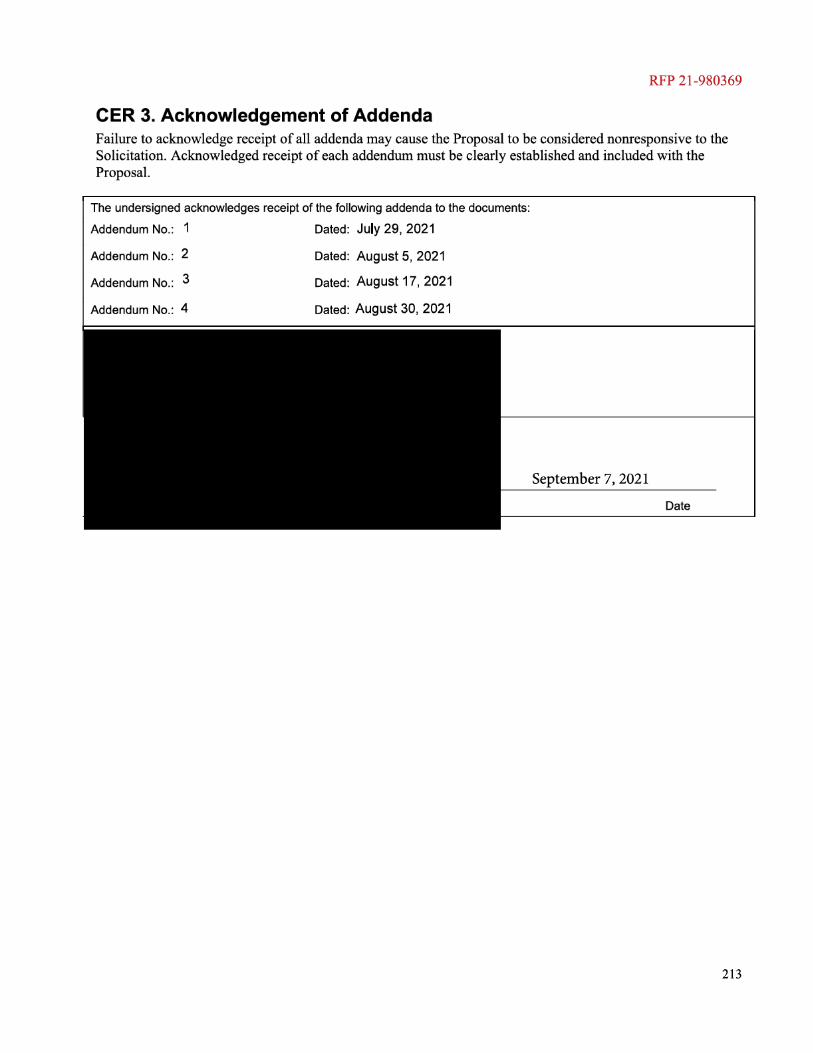
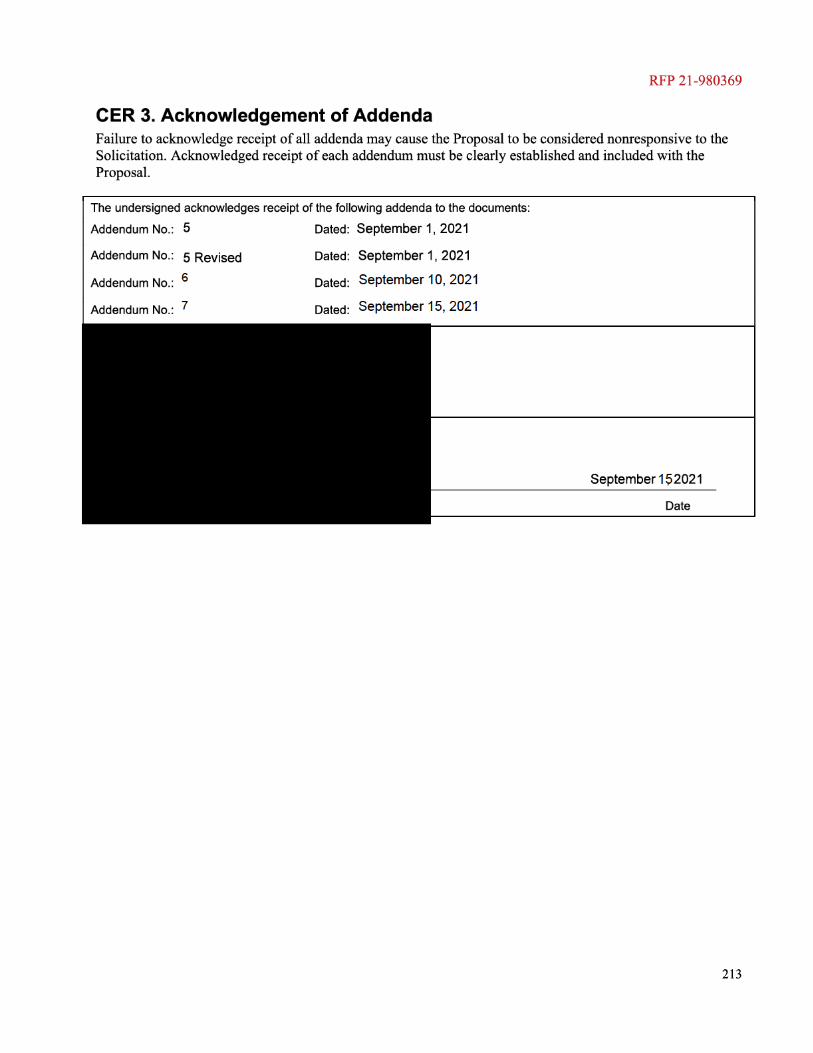
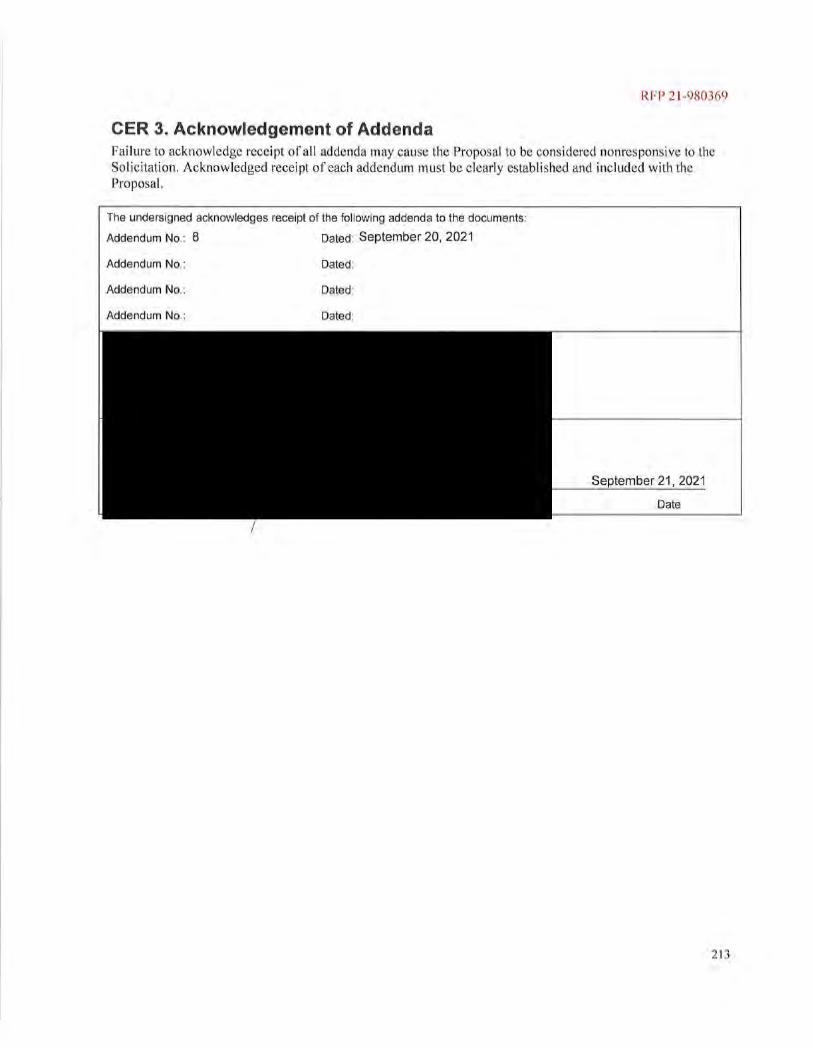
PSTA– Pinellas Suncoast Transit Authority RFP 21-980369
Section 4
Solicitation Requirements:
Contractor Service and Parts Support Data
New Flyer response:
Please refer to the attached Contractor Service and Parts Support Data.
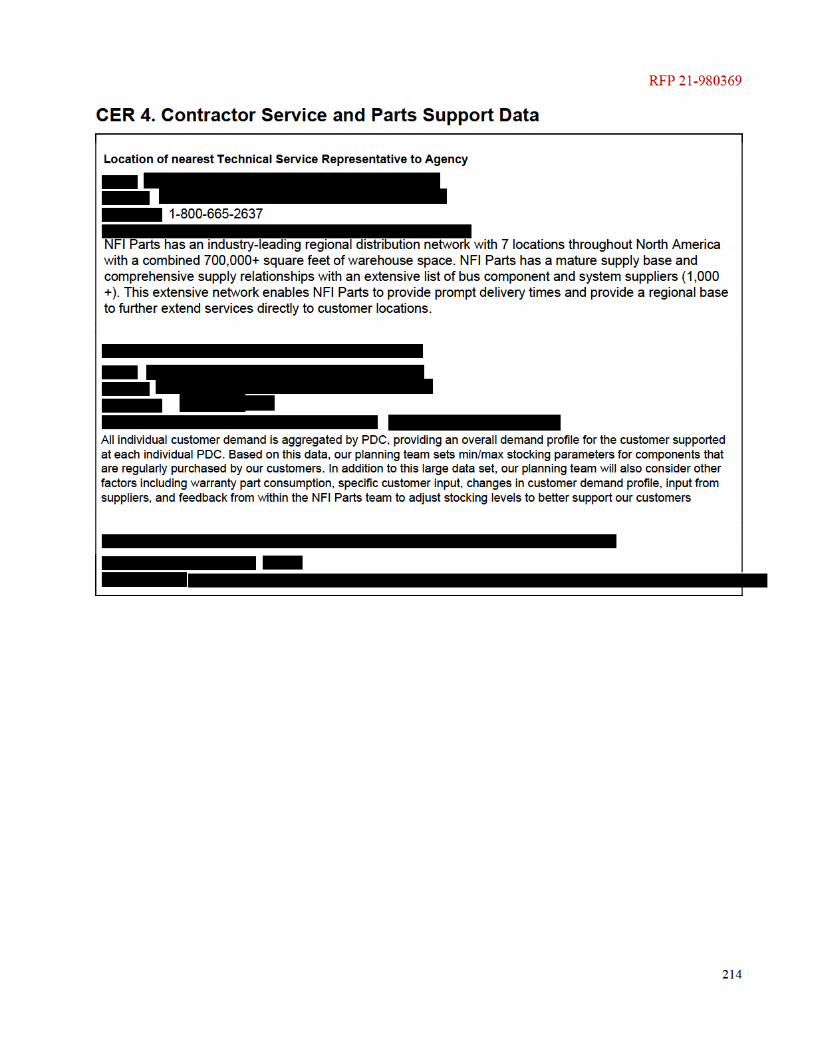
Location of nearest Technical Service Representative to The Agency
is the RPSM for numerous properties throughout the Central/Eastern US including the Agency. Lorenzo is responsible for the overall service management of these properties which includes coordinating bus acceptance and in-field service support for bus deliveries and the implementation of company policies, assisting in warranty situations, completing retrofits, gathering product failure information, training and general customer liaison.
Describe Technical Services Readily Available from Said Representative:
New Flyer provides a Regional Product Support Manager to work with the property on warranty related issues as needed. The Regional Product Support Manager is available via phone or e-mail and normally responds within 24 hours. If New Flyer representation is required on-site, New Flyer will have on-site support available as soon as possible.

Page | 3
Parts Support Team
Customer Service
Our commitment to Customer Service excellence begins with our systematic and detailed approach to employee recruiting. We employ individuals with extensive experience in manufacturing and transit parts who have the skills that will support and fulfill all service expectations. The high level of service delivered is facilitated through a combination of in-house and field representation. Customer Service Representatives (CSR) are accessible through the NFI Parts toll-free Customer Call Center.
NFI Parts employs a large team of dedicated CSR. Each individual has a wide range of skills, abilities, and job experience in transit, parts, and manufacturing industries. They have direct access to engineering build information and drawings, access to the physical product, and the ability to contact source suppliers to assist with any technical or supply inquiries. Individuals on this team are assigned to specific customers to ensure the customer has a designated point of contact.
Specialized training is provided to the team to ensure they have comprehensive product knowledge to enhance their understanding of all customer requirements. The CSRs also participate in on-site visits, allowing them to personally view the transit facility environment. This allows for a better understanding of the customer’s internal processes, requirements, and works to strengthen constructive working relationships.
On-Site Assistance NFI Parts Territory Sales Representatives and Technical Solutions Managers are located throughout Canada and the U.S. and conduct regular visits with our customers to better understand their needs as well as provide on-site assistance.
Product Support Team
A team of dedicated Technical Product Specialists maintain the specifications and engineering content of aftermarket parts, working closely with production engineers, suppliers, and customers. As an integral part of aftermarket product development, the Product Support Team, along with Quality Assurance, ensures industry standards are met and sustained through the life of the bus, and will offer engineered solutions to meet the current and future needs of all our customers.


Page | 5
Page | 9
Parts Provisioning List
NFI Parts will provide the customer with a Parts Provisioning List 30 (thirty) days following the approval of the draft parts manual. This listing will include the part number, item description, stocking status, lead time and 30-day pricing information which will assist in stocking parts that will support both regular and preventative bus maintenance programs. Prices for the parts listed will be held for 30 (thirty) days; for updated pricing beyond this period can be provided by the assigned NFI Parts CSR.
Manuals
New Flyer transit bus manuals are published with comprehensive information based specifically on your bus build. Manuals are located on DVD or USB and include the customized Transit Information View (TIV). The TIV is an electronic Technical Library which contains a compilation of technical documents and manuals, System Layout Drawings, and OEM supplier documents.
Disadvantaged Business Enterprise Program
NFI Group Inc. is committed to meeting and exceeding the goals of the Disadvantaged Business Enterprise Program, as set forth internally as well as through FTA and customer requirements. Ads are placed quarterly in trade magazines/journals to solicit business from DBEs, MBEs, and WBEs. In addition, we contact manufacturers, distributors and carriers that comply, and work to identify quality companies that are registered with individual transit authorities. Transactions that are performed with DBEs, MBEs and WBEs are calculated on a quarterly basis and are available to customers upon request.
PSTA– Pinellas Suncoast Transit Authority RFP 21-980369
Section 5
Solicitation Requirements:
Form for Proposal Deviation (without price data)
New Flyer response:
Please refer to the attached deviations and clarifications from New Flyer of America Inc. The packaged provided are:
Commercial Deviations and Clarifications Technical Deviations and Clarifications for Xcelsior 35’, 40’ and 60’ Electrical Buses Technical Deviations and Clarifications for MCI 45’ Electrical Buses.
Section 6

PSTA– Pinellas Suncoast Transit Authority RFP 21-980369
Solicitation Requirements: Vehicle Questionnaire New Flyer response: Please refer to the attached Vehicle questionnaires for the proposed Electrical Buses

PSTA– Pinellas Suncoast Transit Authority RFP 21-980369
Section 8 Solicitation Requirements: Engineering org chart, Engineering change control procedure, Field Modification process New Flyer response: Please refer to the attached Engineering org chart, Engineering change control procedure, Field Modification process
PSTA– Pinellas Suncoast Transit Authority RFP 21-980369
Section 9 Solicitation Requirements: Manufacturing Plant Layout, Other Contracts, Staffing New Flyer response: Please refer to the attached Manufacturing Plant Layout, Other Contracts, Staffing
PSTA– Pinellas Suncoast Transit Authority RFP 21-980369
Section 10 Solicitation Requirements: Production schedule, Other Contract Commitment for the duration of the contract New Flyer response: New Flyer’s proposal is based on providing the delivery of 1 unit 300 days from NTP. As the contract does not have firm order quantities, we can clarify that deliveries of 1-10 units will be completed 300 days from NTP. Order from 10-20 will be completed 365 days from NTP. For other commitments during the duration of the contract please refer to Package #3 Section 1.


PSTA– Pinellas Suncoast Transit Authority RFP 21-980369
Section 12 Solicitation Requirements: Quality Assurance New Flyer response: Please refer to the attached Quality Assurance Plan.
PSTA– Pinellas Suncoast Transit Authority RFP 21-980369
Section 5
Solicitation Requirements:
Form for Proposal Deviation (without price data)
New Flyer response:
Please refer to the attached deviations and clarifications from New Flyer of America Inc. The packaged provided are:
Commercial Deviations and Clarifications Technical Deviations and Clarifications for Xcelsior 35’, 40’ and 60’ Electrical Buses Technical Deviations and Clarifications for MCI 45’ Electrical Buses.

PSTA– Pinellas Suncoast Transit Authority RFP 21-980369
Commercial Clarifications and Deviations
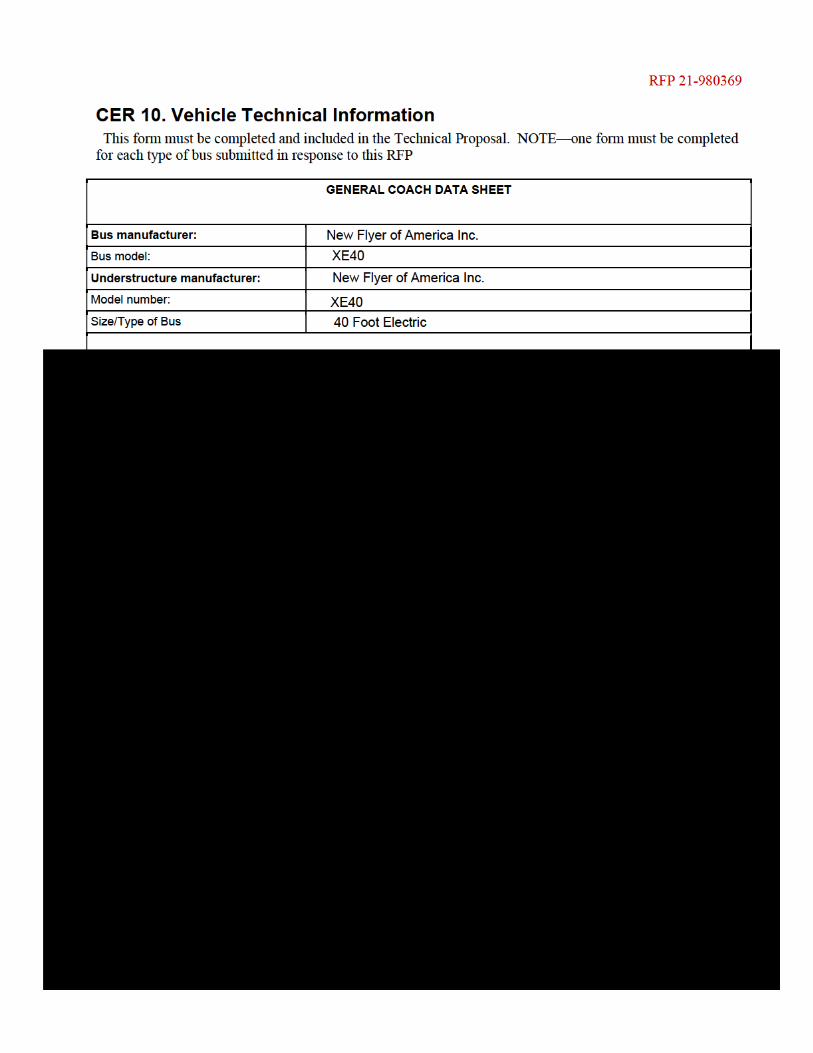


Engine Speed vs Road Speed
Motor RPM
Motor Speed [RPM]
Motor
0 500 1000 1500 2000 2500 3000
10
20
50
40
60
30
Whe
el S
peed
[mph
]
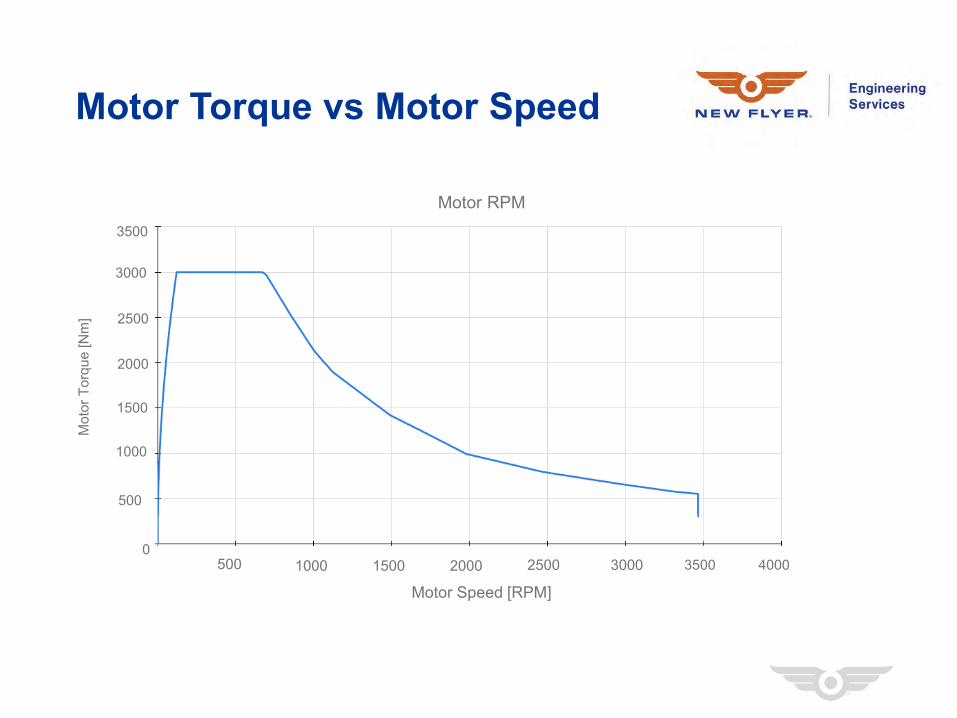
Motor Torque vs Motor Speed
Motor RPM
Motor Speed [RPM]
0500 1000 1500 2000 2500 3000
500
1000
2500
2000
3000
1500
Mot
or T
orqu
e [N
m]
3500
40003500
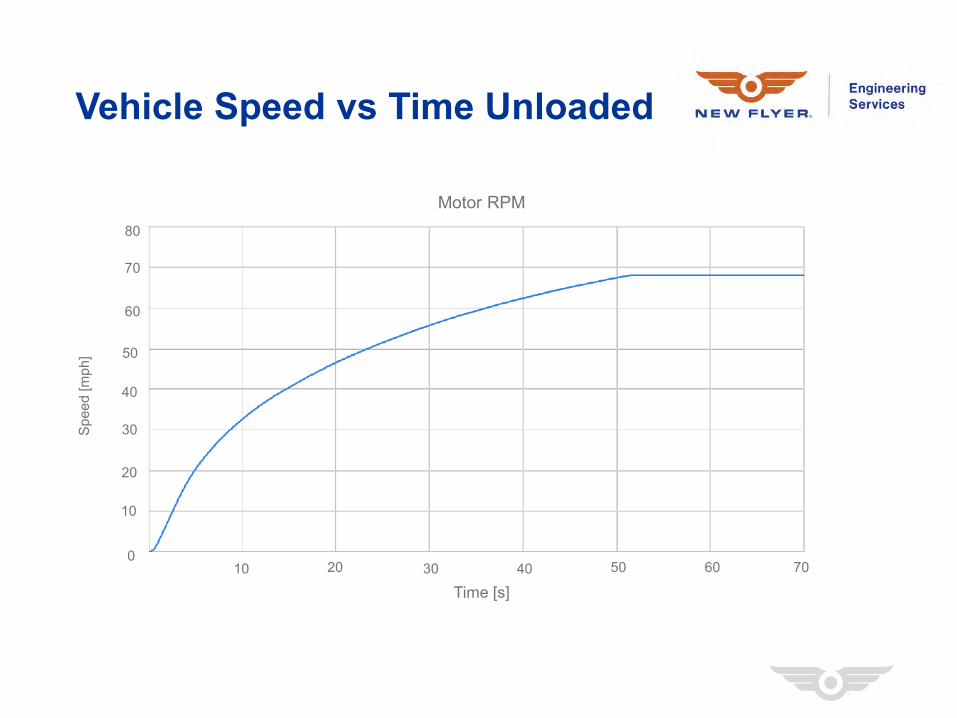
Vehicle Speed vs Time Unloaded
Motor RPM
Time [s]
Spee
d[m
ph]
10
20
50
40
60
30
70
80
010 20 30 40 50 60 70
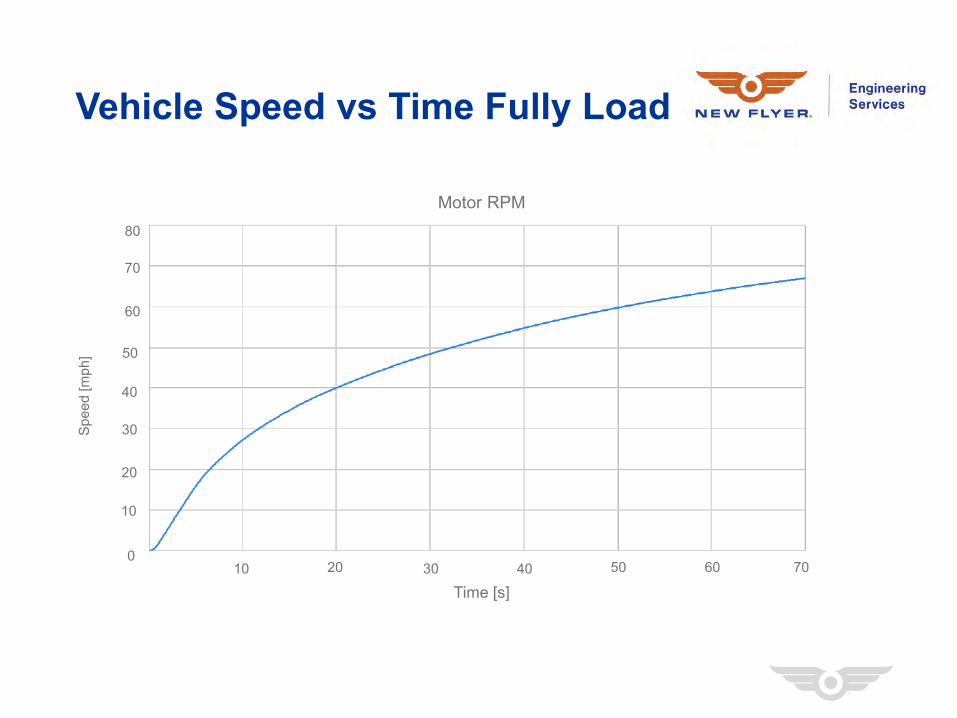
Vehicle Speed vs Time Fully Load
Motor RPM
Time [s]
Spee
d[m
ph]
10
20
50
40
60
30
70
80
010 20 30 40 50 60 70

Unloaded Speed vs Grade
Motor RPM
Speed [mph]
Max
imum
Gra
de [m
ph]
5%
10%
15%
20%
25%
010 20 30 40 50 60 70
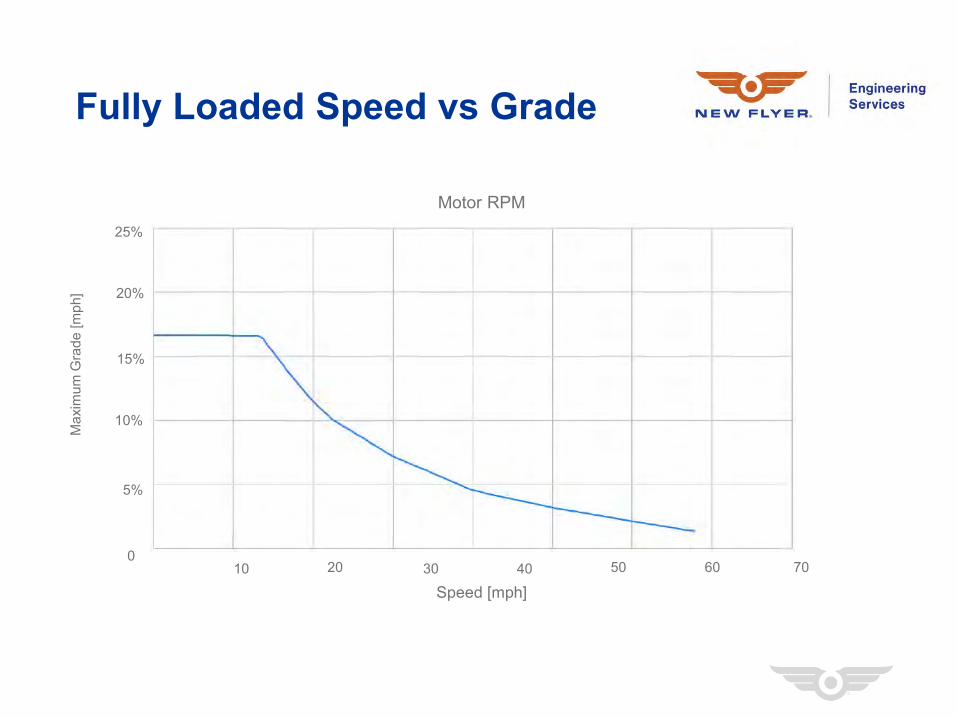
Fully Loaded Speed vs Grade
Motor RPM
Speed [mph]
Max
imum
Gra
de [m
ph]
5%
10%
15%
20%
25%
010 20 30 40 50 60 70


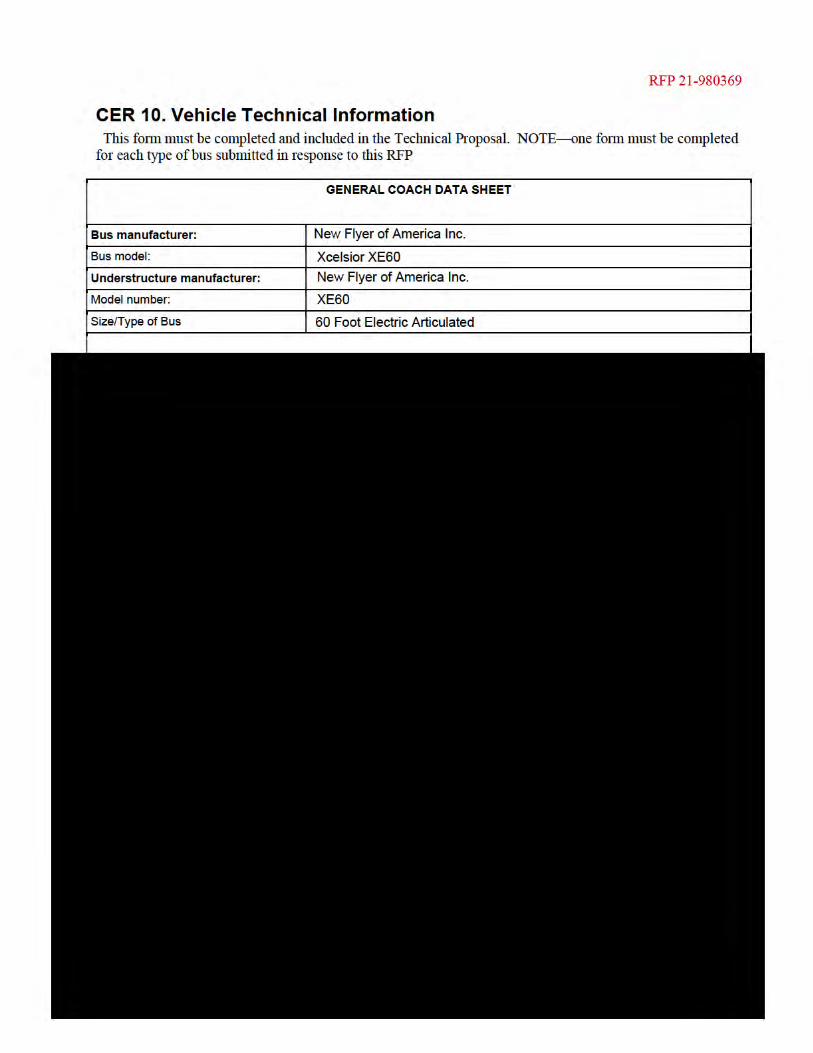


Motor Speed vs Vehicle Speed
Vehicle Speed [RPM]
0.010.0 20.0 30.0 40.0 50.0 60.0
2000.0
4000.0
10000.0
8000.0
12000.0
6000.0
Mot
orSp
eed
[RPM
]
ZF AVE 130
Siemens DB 2016
70.0 80.0

Motor Torque vs Motor Speed
Motor Torque vs Motor Speed
Vehicle Speed [RPM]
0
2000 4000 6000 8000 10000 12000
500
1000
2500
2000
1500
Mot
or T
orqu
e [N
m]
ZF AVE 130
Siemens DB 2016
3000
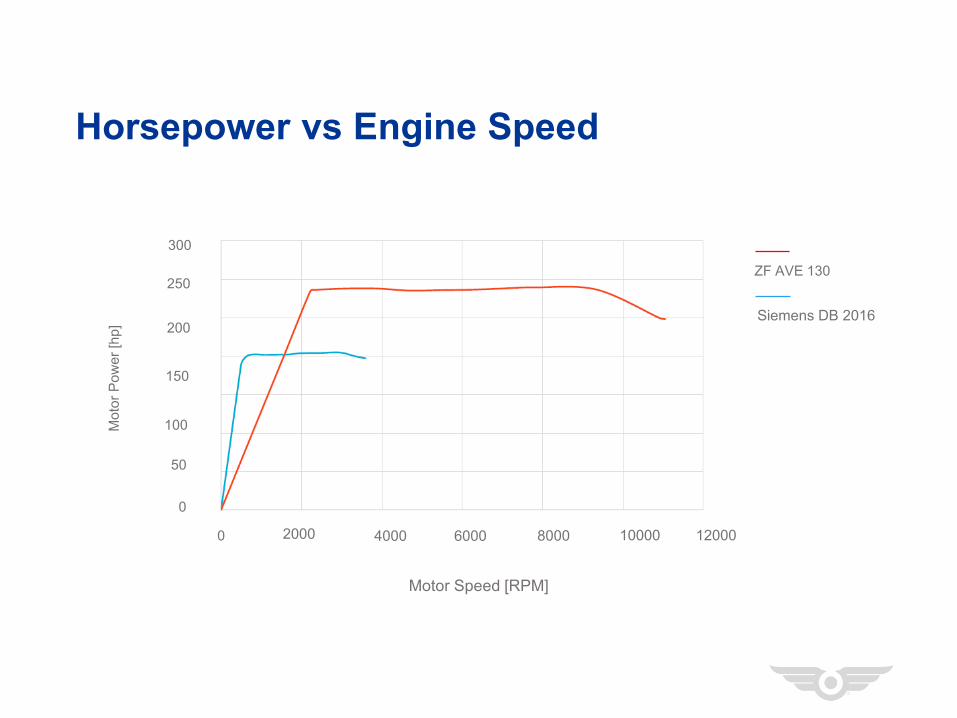
Horsepower vs Engine Speed
Motor Speed [RPM]
0
2000 4000 6000 8000 10000 12000
50
100
250
200
150
Mot
or P
ower
[hp]
ZF AVE 130
Siemens DB 2016
300
0

Energy Consumption vs Motor Speed
Motor Speed [RPM]
02000 3000 4000 6000 8000 9000
20
40
100
80
60Mot
or P
ower
[kW
]
ZF AVE 130
Siemens DB 2016
180
120
140
160
1000 5000 70000
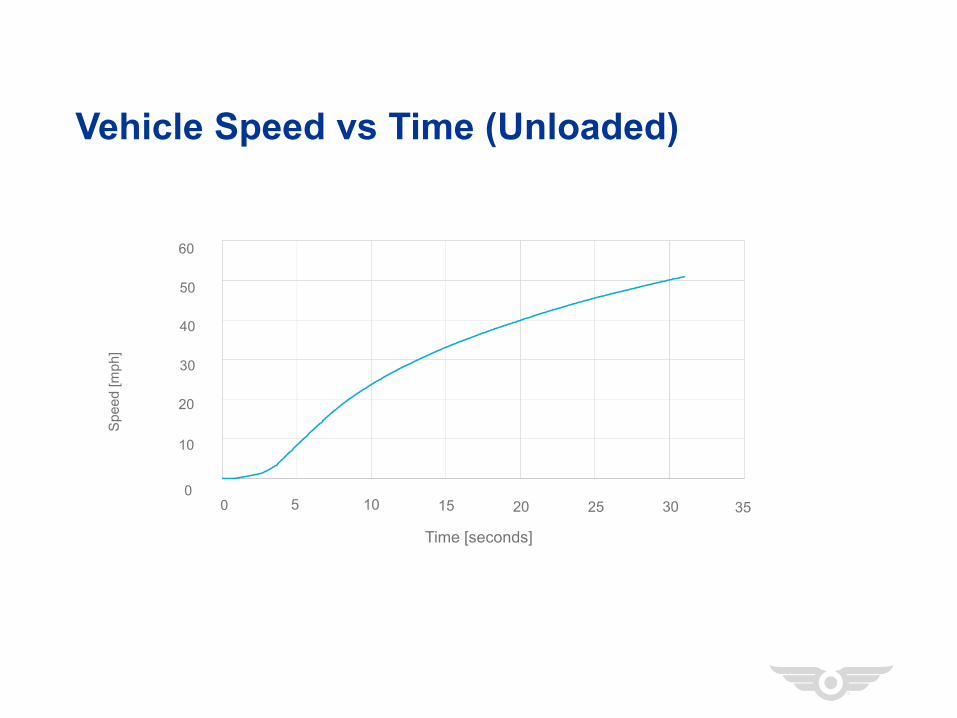
Vehicle Speed vs Time (Unloaded)
Time [seconds]
05 10 15 20 25 30
10
20
50
40
30
Spee
d[m
ph]
60
350

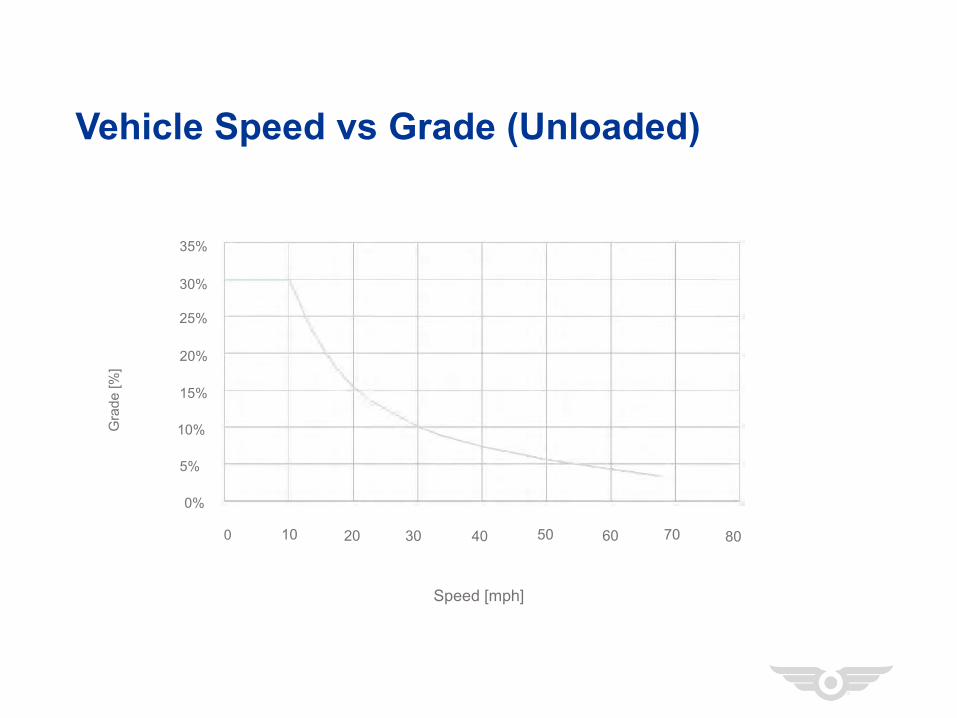
Vehicle Speed vs Grade (Unloaded)
Speed [mph]
0%
5%
10%
25%
20%
15%
Gra
de[%
]
30%
10 20 30 40 50 60 70 80
35%
0

Vehicle Speed vs Grade (Loaded)
Speed [mph]
0%
5%
10%
25%
20%
15%
Gra
de[%
]
10 20 30 40 50 60 70 800

Acceleration vs Time
Time [seconds]
05 10 15 20 25 30
0.51
4
2
1.5
Acce
lera
tion
[mph
/s]
5
35
2.5
3.5
3
4.5
0
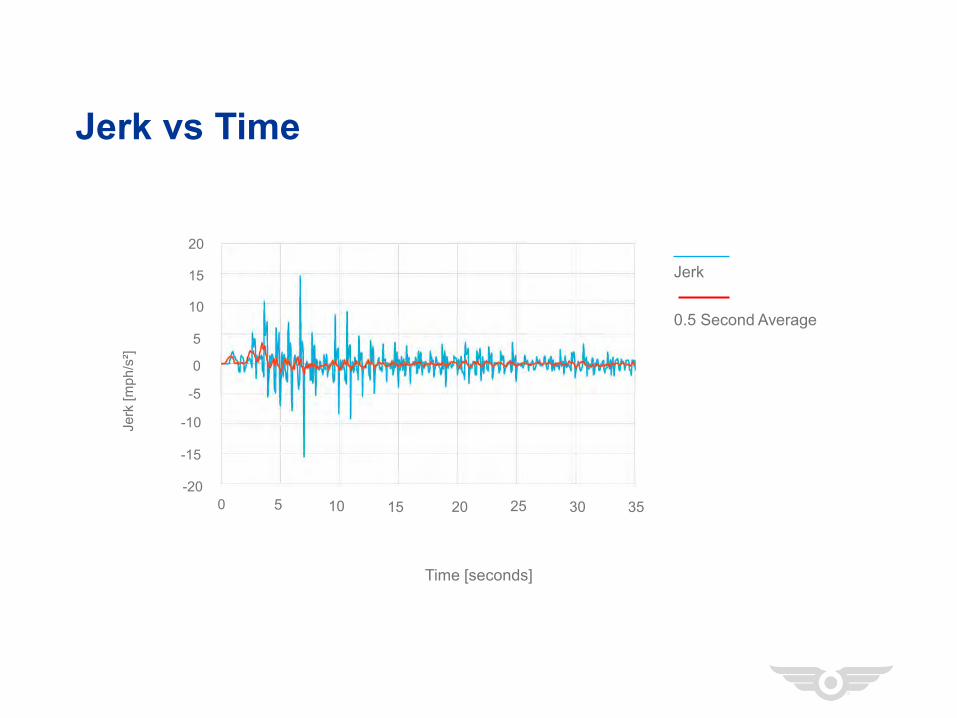
Jerk vs Time
Time [seconds]
-205 10 15 20 25 30
Jerk
[mph
/s²]
350
-15
-10
15
10
5
-5
0
20
Jerk
0.5 Second Average


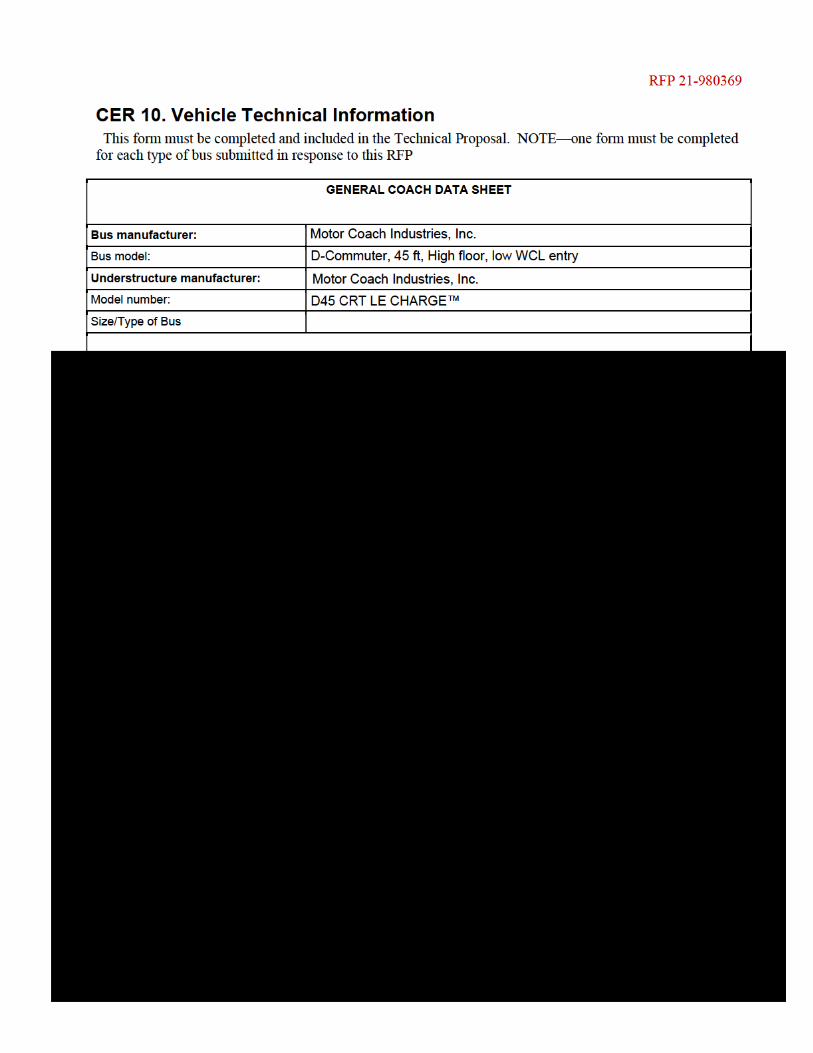


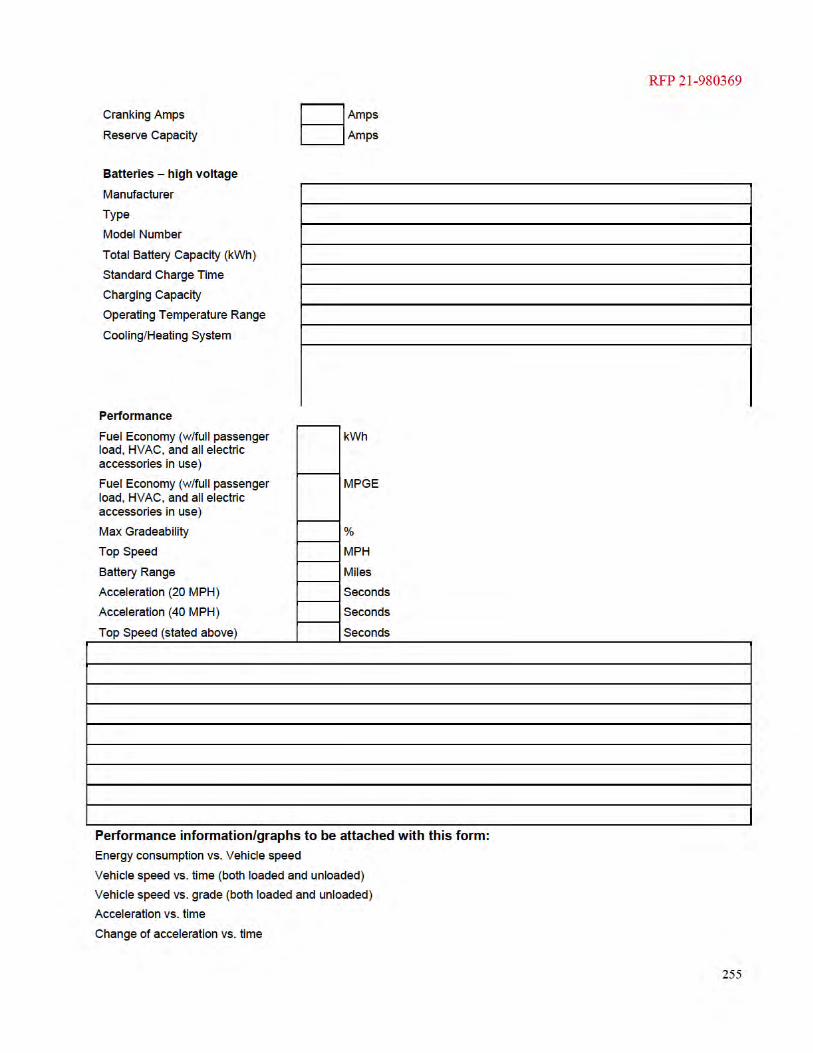
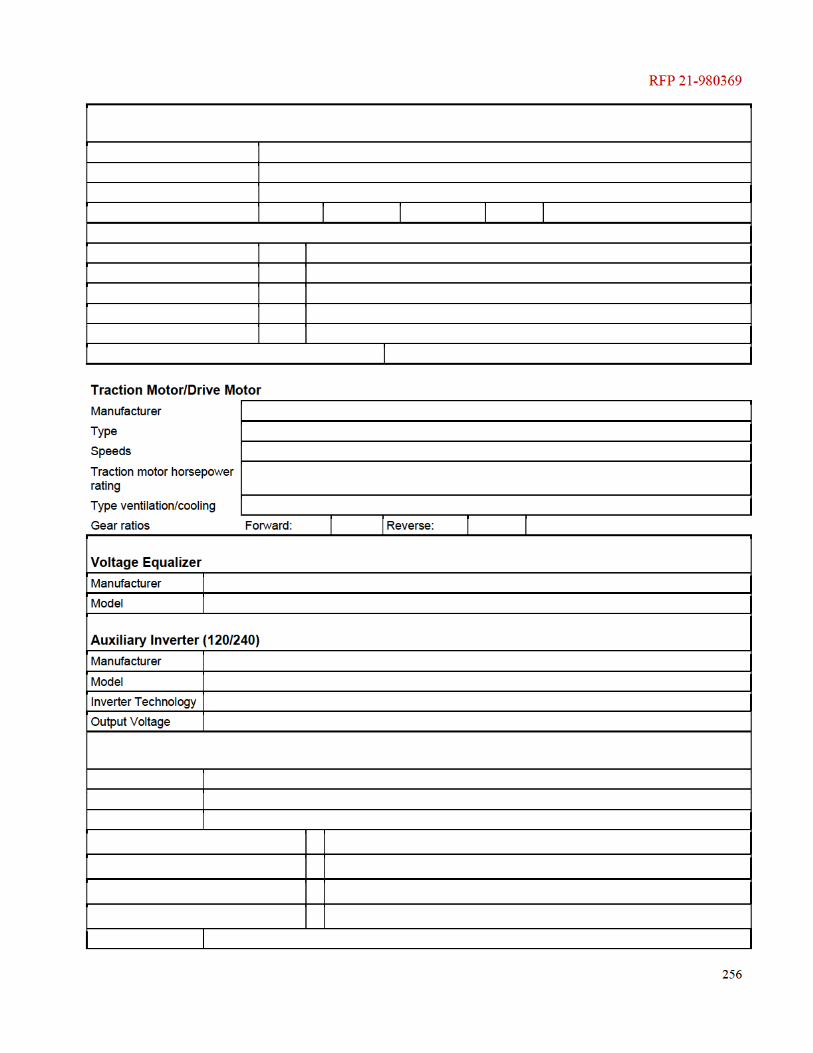

2020-10-P Page 29 of 51
PERFORMANCE DATA FORM Page 1 of 1
Bus Number: 2020-10-P
Date: 10/14/2020
Personnel: M.H. & S.I.
Temperature (°F): 71.8
Humidity (%): 37
Barometric Pressure (inHg): 28.8
INITIALS: Air Conditioning - OFF
Checked M.H.
Heater pump motor - OFF
Checked M.H.
Defroster - OFF
Checked M.H.
Exterior and interior lights - ON
Checked M.H.
Windows and doors - CLOSED Checked M.H.
ACCELERATION, GRADEABILITY, TOP SPEED
Recorded Interval Times
Speed
Run 1
Run 2
Run 3
10 mph 3.3 3.1 3.0
20 mph 5.6 5.3 5.3
30 mph 8.2 7.9 7.9
40 mph 14.4 14.2 14.3
50 mph 24.6 24.4 24.4
60 mph 40.7 40.5 40.6
70 mph 78.4 77.6 77.6 Maximum Speed (mph): 71.9 (maximum governed speed reached)

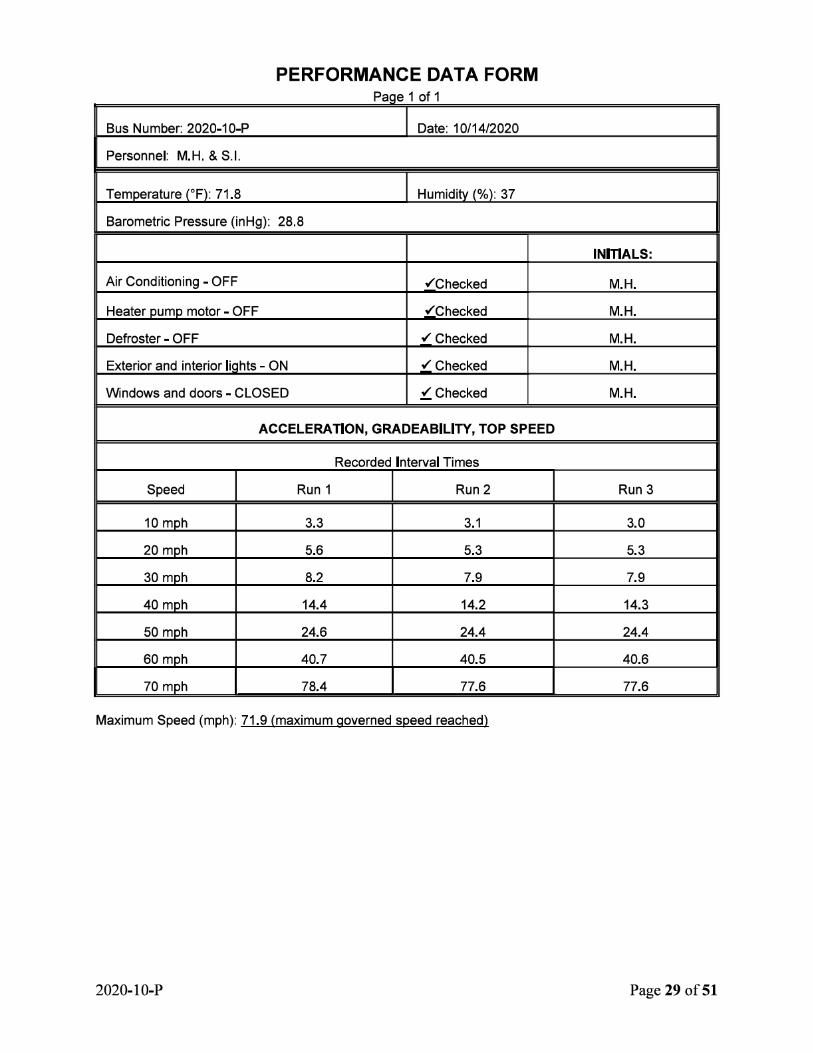
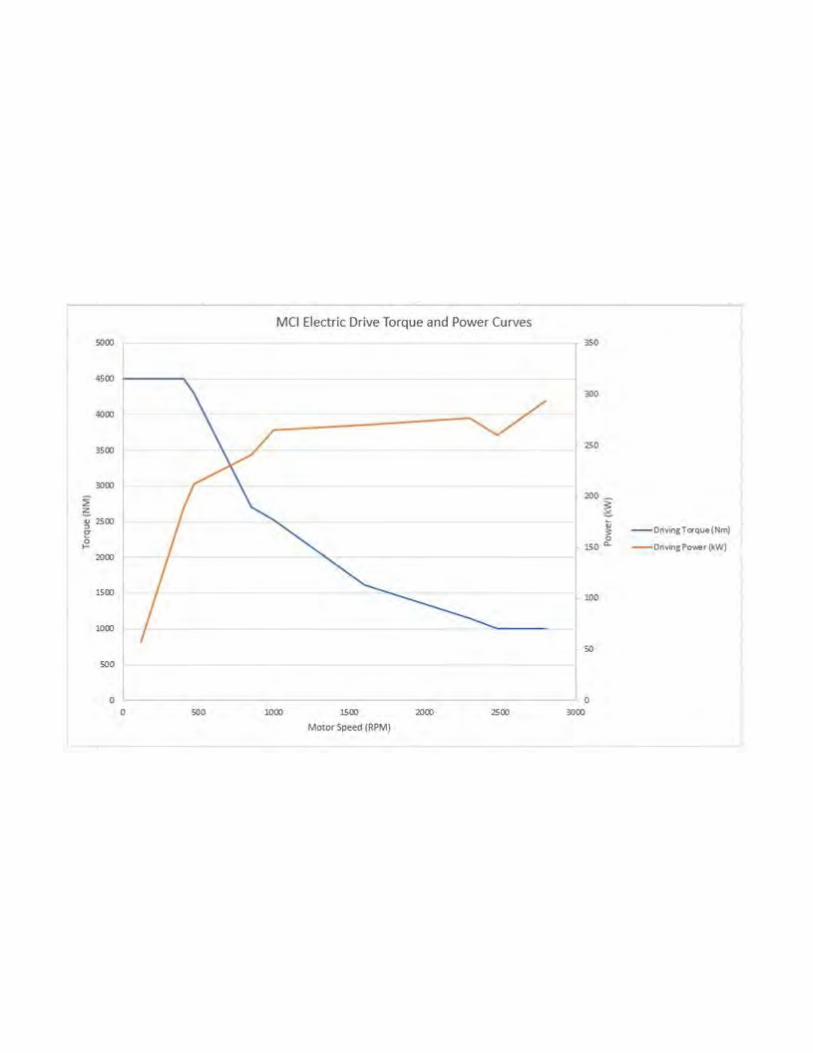

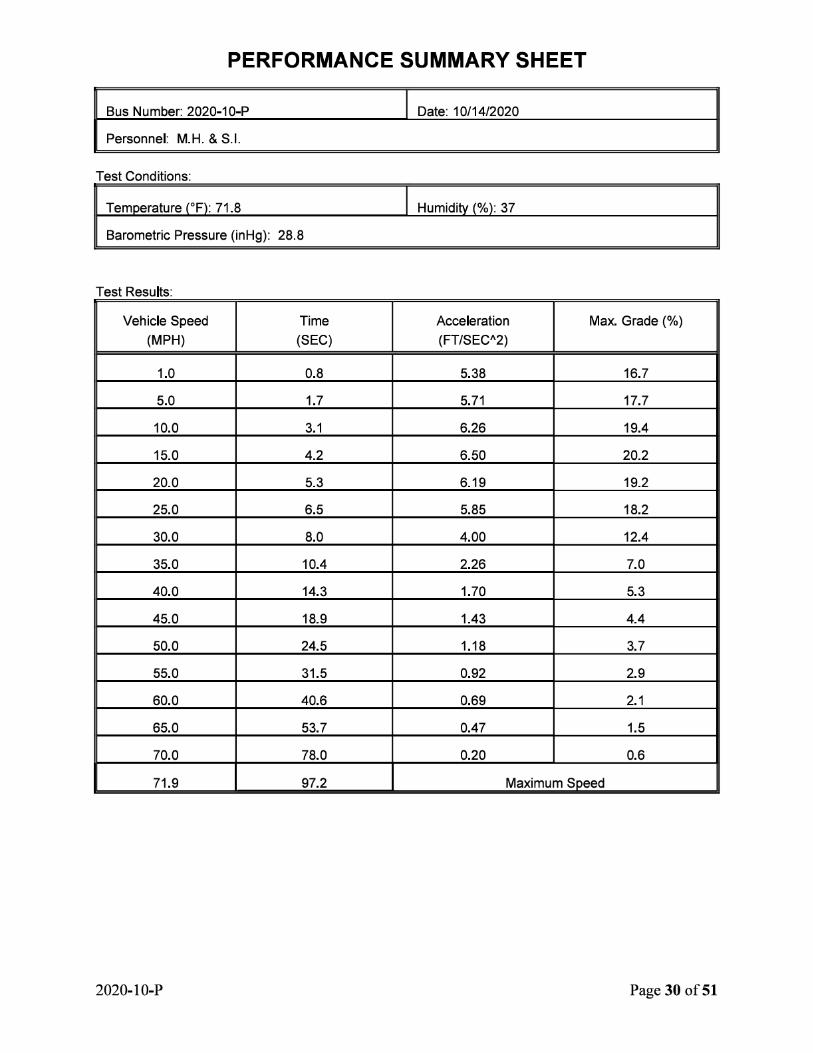
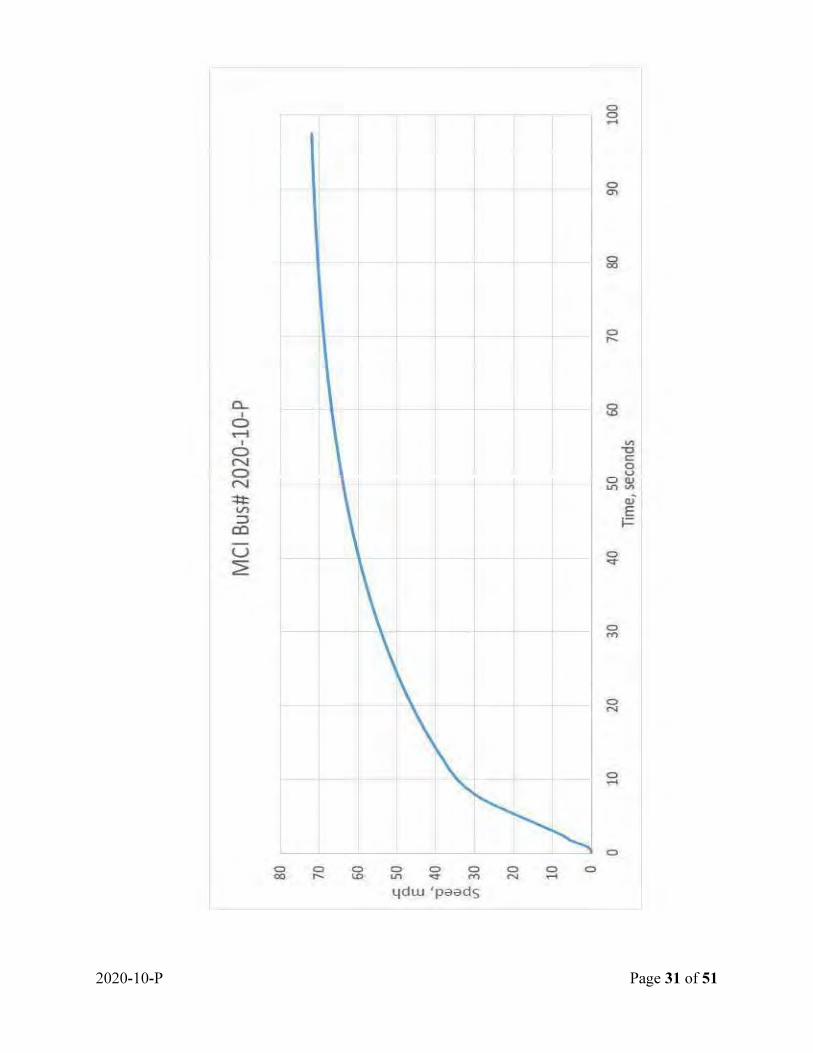


PSTA– Pinellas Suncoast Transit Authority RFP 21-980369
Section 9
Solicitation Requirements:
Manufacturing Plant Layout, Other Contracts, Staffing.
New Flyer response:
Please refer to the attached Manufacturing Plant Layout, Other Contracts, Staffing.


PSTA– Pinellas Suncoast Transit Authority RFP 21-980369
Section 10
Solicitation Requirements:
Production schedule, Other Contract Commitment for the duration of the contract.
New Flyer response:
New Flyer’s proposal is based on providing the delivery of 1 unit 300 days from NTP. As the contract does not have firm order quantities, we can clarify that deliveries of 1-10 units will be completed 300 days from NTP. Order from 10-20 will be completed 365 days from NTP. For other commitments during the duration of the contract please refer to Package #3 Section 1.


PSTA– Pinellas Suncoast Transit Authority RFP 21-980369
Section 1 Solicitation Requirement Letter of Transmittal New Flyer Response: Please refer to the attached Letter of Transmittal.
September 17, 2021
Alvin R. Burns Jr. Director of Procurement Pinellas Suncoast Transit Authority 3201 Scherer Drive, St. Petersburg, FL 33716 Subject: Request for Proposal for the Florida Electric Transit Buses with charging and associated equipment, RFP No. 21-980369
Dear Mr. Burns,
New Flyer of America Inc. (“New Flyer”) is honored to have the opportunity to submit our response to the Pinellas Suncoast Transit Authority (“PSTA”) for proposal No. 21-980369. This proposal is for the manufacture and delivery of 35-foot, 40-foot, 45-foot, 60-foot electric buses, and charging equipment.
We understand the importance of connecting people safely and on time to places for PSTA, based on that, we believe our most advanced product line under the Xcelsior® brand which includes our battery-electric 35, 40, 45 and 60 foot heavy-duty transit buses, charging options and our aftermarket service are the perfect combination of technology and lifetime support that will best help PSTA reach its goal.
New Flyer will partner with PSTA to achieve the following goals:
- Looking for innovative ways to make sure our riders get to their destinations on time, this will assist PSTA’s goal to increase ridership.
- PSTA’s mission is to be people’s first choice for transportation and a driving force for social, environmental, and economic vitality in the community through innovation and partnership. This is what drives us, and our buses, to safely connect people to places.
- Provide transportation options to meet the needs of disadvantaged communities.

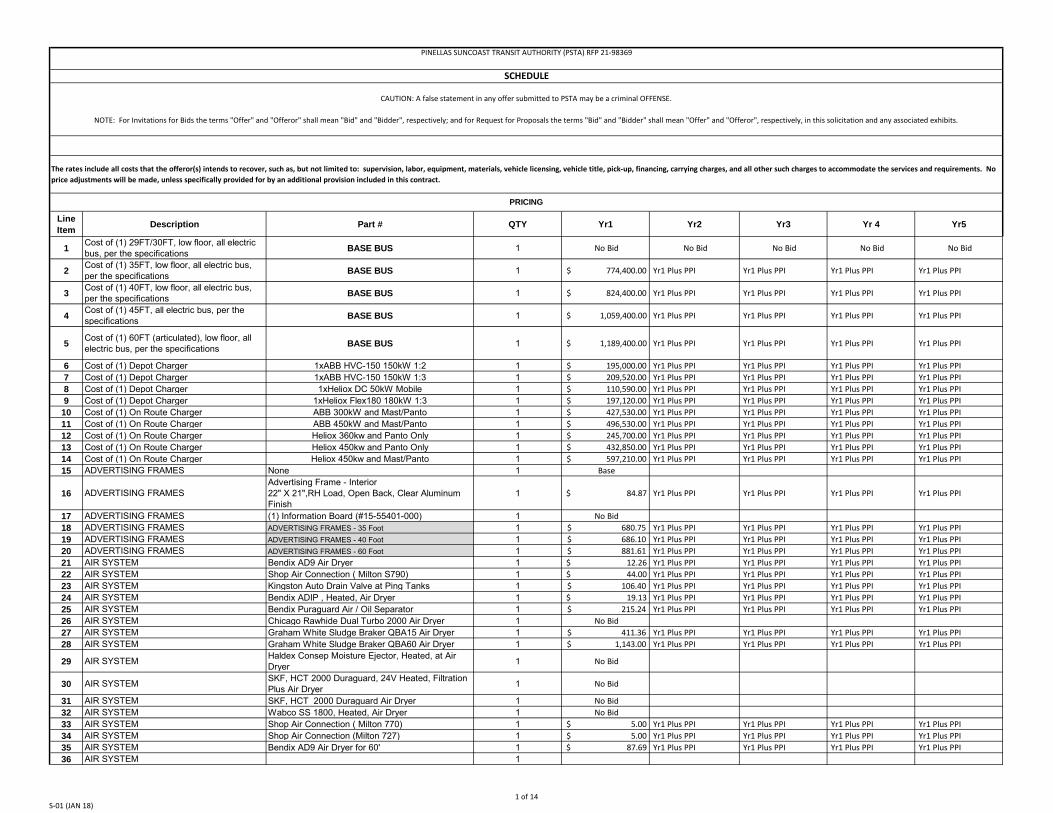
Line Item Description Part # QTY Yr1 Yr2 Yr3 Yr 4 Yr5
1 Cost of (1) 29FT/30FT, low floor, all electric bus, per the specifications BASE BUS 1 No Bid No Bid No Bid No Bid No Bid
2 Cost of (1) 35FT, low floor, all electric bus, per the specifications BASE BUS 1 $ 774,400.00 Yr1 Plus PPI Yr1 Plus PPI Yr1 Plus PPI Yr1 Plus PPI
3 Cost of (1) 40FT, low floor, all electric bus, per the specifications BASE BUS 1 $ 824,400.00 Yr1 Plus PPI Yr1 Plus PPI Yr1 Plus PPI Yr1 Plus PPI
4 Cost of (1) 45FT, all electric bus, per the specifications BASE BUS 1 $ 1,059,400.00 Yr1 Plus PPI Yr1 Plus PPI Yr1 Plus PPI Yr1 Plus PPI
5 Cost of (1) 60FT (articulated), low floor, all electric bus, per the specifications BASE BUS 1 $ 1,189,400.00 Yr1 Plus PPI Yr1 Plus PPI Yr1 Plus PPI Yr1 Plus PPI
6 Cost of (1) Depot Charger 1xABB HVC-150 150kW 1:2 1 $ 195,000.00 Yr1 Plus PPI Yr1 Plus PPI Yr1 Plus PPI Yr1 Plus PPI 7 Cost of (1) Depot Charger 1xABB HVC-150 150kW 1:3 1 $ 209,520.00 Yr1 Plus PPI Yr1 Plus PPI Yr1 Plus PPI Yr1 Plus PPI 8 Cost of (1) Depot Charger 1xHeliox DC 50kW Mobile 1 $ 110,590.00 Yr1 Plus PPI Yr1 Plus PPI Yr1 Plus PPI Yr1 Plus PPI 9 Cost of (1) Depot Charger 1xHeliox Flex180 180kW 1:3 1 $ 197,120.00 Yr1 Plus PPI Yr1 Plus PPI Yr1 Plus PPI Yr1 Plus PPI
10 Cost of (1) On Route Charger ABB 300kW and Mast/Panto 1 $ 427,530.00 Yr1 Plus PPI Yr1 Plus PPI Yr1 Plus PPI Yr1 Plus PPI 11 Cost of (1) On Route Charger ABB 450kW and Mast/Panto 1 $ 496,530.00 Yr1 Plus PPI Yr1 Plus PPI Yr1 Plus PPI Yr1 Plus PPI 12 Cost of (1) On Route Charger Heliox 360kw and Panto Only 1 $ 245,700.00 Yr1 Plus PPI Yr1 Plus PPI Yr1 Plus PPI Yr1 Plus PPI 13 Cost of (1) On Route Charger Heliox 450kw and Panto Only 1 $ 432,850.00 Yr1 Plus PPI Yr1 Plus PPI Yr1 Plus PPI Yr1 Plus PPI 14 Cost of (1) On Route Charger Heliox 450kw and Mast/Panto 1 $ 597,210.00 Yr1 Plus PPI Yr1 Plus PPI Yr1 Plus PPI Yr1 Plus PPI 15 ADVERTISING FRAMES None 1 Base
16 ADVERTISING FRAMESAdvertising Frame - Interior22" X 21",RH Load, Open Back, Clear Aluminum Finish
1 $ 84.87 Yr1 Plus PPI Yr1 Plus PPI Yr1 Plus PPI Yr1 Plus PPI
17 ADVERTISING FRAMES (1) Information Board (#15-55401-000) 1 No Bid 18 ADVERTISING FRAMES ADVERTISING FRAMES - 35 Foot 1 $ 680.75 Yr1 Plus PPI Yr1 Plus PPI Yr1 Plus PPI Yr1 Plus PPI 19 ADVERTISING FRAMES ADVERTISING FRAMES - 40 Foot 1 $ 686.10 Yr1 Plus PPI Yr1 Plus PPI Yr1 Plus PPI Yr1 Plus PPI 20 ADVERTISING FRAMES ADVERTISING FRAMES - 60 Foot 1 $ 881.61 Yr1 Plus PPI Yr1 Plus PPI Yr1 Plus PPI Yr1 Plus PPI 21 AIR SYSTEM Bendix AD9 Air Dryer 1 $ 12.26 Yr1 Plus PPI Yr1 Plus PPI Yr1 Plus PPI Yr1 Plus PPI 22 AIR SYSTEM Shop Air Connection ( Milton S790) 1 $ 44.00 Yr1 Plus PPI Yr1 Plus PPI Yr1 Plus PPI Yr1 Plus PPI 23 AIR SYSTEM Kingston Auto Drain Valve at Ping Tanks 1 $ 106.40 Yr1 Plus PPI Yr1 Plus PPI Yr1 Plus PPI Yr1 Plus PPI 24 AIR SYSTEM Bendix ADIP , Heated, Air Dryer 1 $ 19.13 Yr1 Plus PPI Yr1 Plus PPI Yr1 Plus PPI Yr1 Plus PPI 25 AIR SYSTEM Bendix Puraguard Air / Oil Separator 1 $ 215.24 Yr1 Plus PPI Yr1 Plus PPI Yr1 Plus PPI Yr1 Plus PPI 26 AIR SYSTEM Chicago Rawhide Dual Turbo 2000 Air Dryer 1 No Bid 27 AIR SYSTEM Graham White Sludge Braker QBA15 Air Dryer 1 $ 411.36 Yr1 Plus PPI Yr1 Plus PPI Yr1 Plus PPI Yr1 Plus PPI 28 AIR SYSTEM Graham White Sludge Braker QBA60 Air Dryer 1 $ 1,143.00 Yr1 Plus PPI Yr1 Plus PPI Yr1 Plus PPI Yr1 Plus PPI
29 AIR SYSTEM Haldex Consep Moisture Ejector, Heated, at Air Dryer 1 No Bid
30 AIR SYSTEM SKF, HCT 2000 Duraguard, 24V Heated, Filtration Plus Air Dryer 1 No Bid
31 AIR SYSTEM SKF, HCT_2000 Duraguard Air Dryer 1 No Bid 32 AIR SYSTEM Wabco SS 1800, Heated, Air Dryer 1 No Bid 33 AIR SYSTEM Shop Air Connection ( Milton 770) 1 $ 5.00 Yr1 Plus PPI Yr1 Plus PPI Yr1 Plus PPI Yr1 Plus PPI 34 AIR SYSTEM Shop Air Connection (Milton 727) 1 $ 5.00 Yr1 Plus PPI Yr1 Plus PPI Yr1 Plus PPI Yr1 Plus PPI 35 AIR SYSTEM Bendix AD9 Air Dryer for 60' 1 $ 87.69 Yr1 Plus PPI Yr1 Plus PPI Yr1 Plus PPI Yr1 Plus PPI 36 AIR SYSTEM 1
The rates include all costs that the offeror(s) intends to recover, such as, but not limited to: supervision, labor, equipment, materials, vehicle licensing, vehicle title, pick-up, financing, carrying charges, and all other such charges to accommodate the services and requirements. No price adjustments will be made, unless specifically provided for by an additional provision included in this contract.
PRICING
PINELLAS SUNCOAST TRANSIT AUTHORITY (PSTA) RFP 21-98369
SCHEDULE
CAUTION: A false statement in any offer submitted to PSTA may be a criminal OFFENSE.
NOTE: For Invitations for Bids the terms "Offer" and "Offeror" shall mean "Bid" and "Bidder", respectively; and for Request for Proposals the terms "Bid" and "Bidder" shall mean "Offer" and "Offeror", respectively, in this solicitation and any associated exhibits.
S-01 (JAN 18)1 of 14
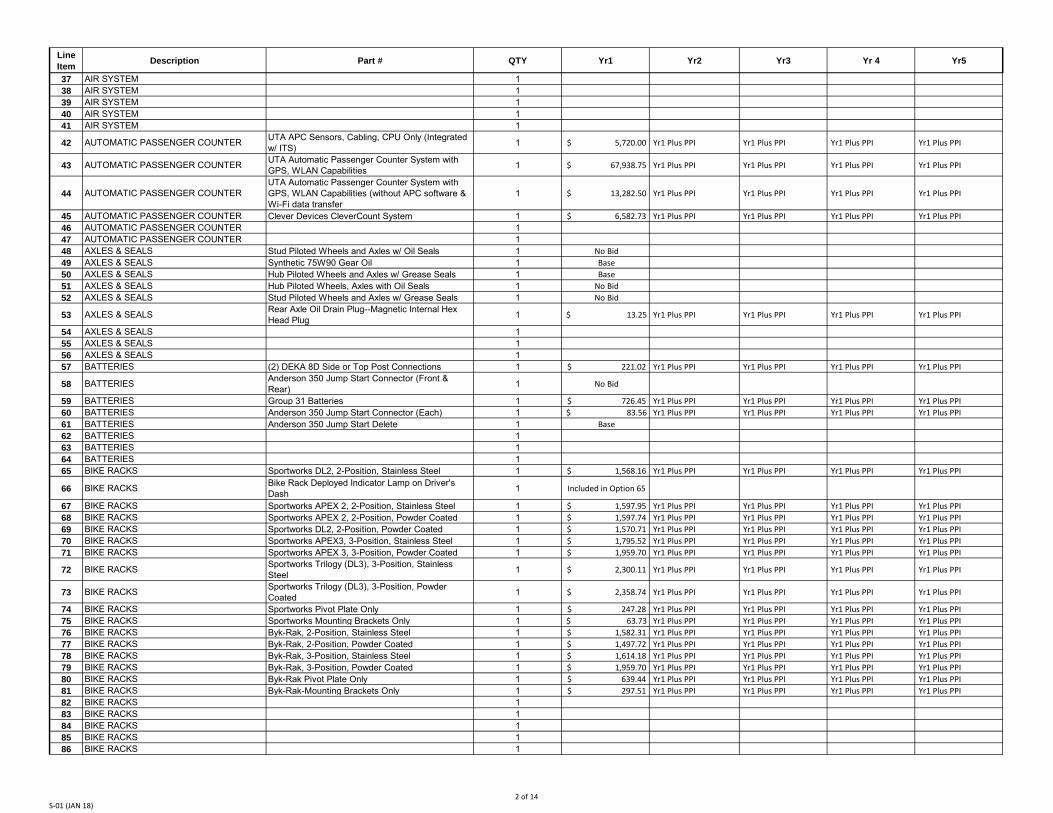
Line Item Description Part # QTY Yr1 Yr2 Yr3 Yr 4 Yr5
37 AIR SYSTEM 138 AIR SYSTEM 139 AIR SYSTEM 140 AIR SYSTEM 141 AIR SYSTEM 1
42 AUTOMATIC PASSENGER COUNTER UTA APC Sensors, Cabling, CPU Only (Integrated w/ ITS) 1 $ 5,720.00 Yr1 Plus PPI Yr1 Plus PPI Yr1 Plus PPI Yr1 Plus PPI
43 AUTOMATIC PASSENGER COUNTER UTA Automatic Passenger Counter System with GPS, WLAN Capabilities 1 $ 67,938.75 Yr1 Plus PPI Yr1 Plus PPI Yr1 Plus PPI Yr1 Plus PPI
44 AUTOMATIC PASSENGER COUNTERUTA Automatic Passenger Counter System with GPS, WLAN Capabilities (without APC software & Wi-Fi data transfer
1 $ 13,282.50 Yr1 Plus PPI Yr1 Plus PPI Yr1 Plus PPI Yr1 Plus PPI
45 AUTOMATIC PASSENGER COUNTER Clever Devices CleverCount System 1 $ 6,582.73 Yr1 Plus PPI Yr1 Plus PPI Yr1 Plus PPI Yr1 Plus PPI 46 AUTOMATIC PASSENGER COUNTER 147 AUTOMATIC PASSENGER COUNTER 148 AXLES & SEALS Stud Piloted Wheels and Axles w/ Oil Seals 1 No Bid 49 AXLES & SEALS Synthetic 75W90 Gear Oil 1 Base 50 AXLES & SEALS Hub Piloted Wheels and Axles w/ Grease Seals 1 Base 51 AXLES & SEALS Hub Piloted Wheels, Axles with Oil Seals 1 No Bid 52 AXLES & SEALS Stud Piloted Wheels and Axles w/ Grease Seals 1 No Bid
53 AXLES & SEALS Rear Axle Oil Drain Plug--Magnetic Internal Hex Head Plug 1 $ 13.25 Yr1 Plus PPI Yr1 Plus PPI Yr1 Plus PPI Yr1 Plus PPI
54 AXLES & SEALS 155 AXLES & SEALS 156 AXLES & SEALS 157 BATTERIES (2) DEKA 8D Side or Top Post Connections 1 $ 221.02 Yr1 Plus PPI Yr1 Plus PPI Yr1 Plus PPI Yr1 Plus PPI
58 BATTERIES Anderson 350 Jump Start Connector (Front & Rear) 1 No Bid
59 BATTERIES Group 31 Batteries 1 $ 726.45 Yr1 Plus PPI Yr1 Plus PPI Yr1 Plus PPI Yr1 Plus PPI 60 BATTERIES Anderson 350 Jump Start Connector (Each) 1 $ 83.56 Yr1 Plus PPI Yr1 Plus PPI Yr1 Plus PPI Yr1 Plus PPI 61 BATTERIES Anderson 350 Jump Start Delete 1 Base 62 BATTERIES 163 BATTERIES 164 BATTERIES 165 BIKE RACKS Sportworks DL2, 2-Position, Stainless Steel 1 $ 1,568.16 Yr1 Plus PPI Yr1 Plus PPI Yr1 Plus PPI Yr1 Plus PPI
66 BIKE RACKS Bike Rack Deployed Indicator Lamp on Driver's Dash 1 Included in Option 65
67 BIKE RACKS Sportworks APEX 2, 2-Position, Stainless Steel 1 $ 1,597.95 Yr1 Plus PPI Yr1 Plus PPI Yr1 Plus PPI Yr1 Plus PPI 68 BIKE RACKS Sportworks APEX 2, 2-Position, Powder Coated 1 $ 1,597.74 Yr1 Plus PPI Yr1 Plus PPI Yr1 Plus PPI Yr1 Plus PPI 69 BIKE RACKS Sportworks DL2, 2-Position, Powder Coated 1 $ 1,570.71 Yr1 Plus PPI Yr1 Plus PPI Yr1 Plus PPI Yr1 Plus PPI 70 BIKE RACKS Sportworks APEX3, 3-Position, Stainless Steel 1 $ 1,795.52 Yr1 Plus PPI Yr1 Plus PPI Yr1 Plus PPI Yr1 Plus PPI 71 BIKE RACKS Sportworks APEX 3, 3-Position, Powder Coated 1 $ 1,959.70 Yr1 Plus PPI Yr1 Plus PPI Yr1 Plus PPI Yr1 Plus PPI
72 BIKE RACKS Sportworks Trilogy (DL3), 3-Position, Stainless Steel 1 $ 2,300.11 Yr1 Plus PPI Yr1 Plus PPI Yr1 Plus PPI Yr1 Plus PPI
73 BIKE RACKS Sportworks Trilogy (DL3), 3-Position, Powder Coated 1 $ 2,358.74 Yr1 Plus PPI Yr1 Plus PPI Yr1 Plus PPI Yr1 Plus PPI
74 BIKE RACKS Sportworks Pivot Plate Only 1 $ 247.28 Yr1 Plus PPI Yr1 Plus PPI Yr1 Plus PPI Yr1 Plus PPI 75 BIKE RACKS Sportworks Mounting Brackets Only 1 $ 63.73 Yr1 Plus PPI Yr1 Plus PPI Yr1 Plus PPI Yr1 Plus PPI 76 BIKE RACKS Byk-Rak, 2-Position, Stainless Steel 1 $ 1,582.31 Yr1 Plus PPI Yr1 Plus PPI Yr1 Plus PPI Yr1 Plus PPI 77 BIKE RACKS Byk-Rak, 2-Position, Powder Coated 1 $ 1,497.72 Yr1 Plus PPI Yr1 Plus PPI Yr1 Plus PPI Yr1 Plus PPI 78 BIKE RACKS Byk-Rak, 3-Position, Stainless Steel 1 $ 1,614.18 Yr1 Plus PPI Yr1 Plus PPI Yr1 Plus PPI Yr1 Plus PPI 79 BIKE RACKS Byk-Rak, 3-Position, Powder Coated 1 $ 1,959.70 Yr1 Plus PPI Yr1 Plus PPI Yr1 Plus PPI Yr1 Plus PPI 80 BIKE RACKS Byk-Rak Pivot Plate Only 1 $ 639.44 Yr1 Plus PPI Yr1 Plus PPI Yr1 Plus PPI Yr1 Plus PPI 81 BIKE RACKS Byk-Rak-Mounting Brackets Only 1 $ 297.51 Yr1 Plus PPI Yr1 Plus PPI Yr1 Plus PPI Yr1 Plus PPI 82 BIKE RACKS 183 BIKE RACKS 184 BIKE RACKS 185 BIKE RACKS 186 BIKE RACKS 1
S-01 (JAN 18)2 of 14
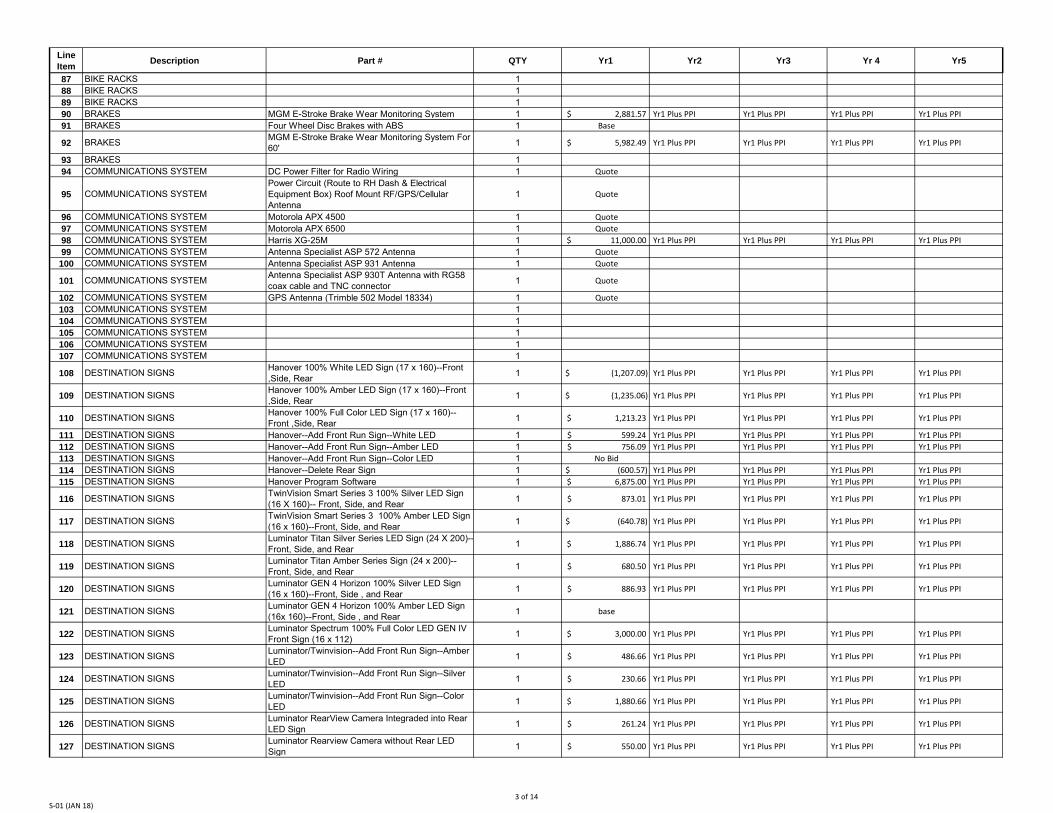
Line Item Description Part # QTY Yr1 Yr2 Yr3 Yr 4 Yr5
87 BIKE RACKS 188 BIKE RACKS 189 BIKE RACKS 190 BRAKES MGM E-Stroke Brake Wear Monitoring System 1 $ 2,881.57 Yr1 Plus PPI Yr1 Plus PPI Yr1 Plus PPI Yr1 Plus PPI 91 BRAKES Four Wheel Disc Brakes with ABS 1 Base
92 BRAKES MGM E-Stroke Brake Wear Monitoring System For 60' 1 $ 5,982.49 Yr1 Plus PPI Yr1 Plus PPI Yr1 Plus PPI Yr1 Plus PPI
93 BRAKES 194 COMMUNICATIONS SYSTEM DC Power Filter for Radio Wiring 1 Quote
95 COMMUNICATIONS SYSTEMPower Circuit (Route to RH Dash & Electrical Equipment Box) Roof Mount RF/GPS/Cellular Antenna
1 Quote
96 COMMUNICATIONS SYSTEM Motorola APX 4500 1 Quote 97 COMMUNICATIONS SYSTEM Motorola APX 6500 1 Quote 98 COMMUNICATIONS SYSTEM Harris XG-25M 1 $ 11,000.00 Yr1 Plus PPI Yr1 Plus PPI Yr1 Plus PPI Yr1 Plus PPI 99 COMMUNICATIONS SYSTEM Antenna Specialist ASP 572 Antenna 1 Quote 100 COMMUNICATIONS SYSTEM Antenna Specialist ASP 931 Antenna 1 Quote
101 COMMUNICATIONS SYSTEM Antenna Specialist ASP 930T Antenna with RG58 coax cable and TNC connector 1 Quote
102 COMMUNICATIONS SYSTEM GPS Antenna (Trimble 502 Model 18334) 1 Quote 103 COMMUNICATIONS SYSTEM 1104 COMMUNICATIONS SYSTEM 1105 COMMUNICATIONS SYSTEM 1106 COMMUNICATIONS SYSTEM 1107 COMMUNICATIONS SYSTEM 1
108 DESTINATION SIGNS Hanover 100% White LED Sign (17 x 160)--Front ,Side, Rear 1 $ (1,207.09) Yr1 Plus PPI Yr1 Plus PPI Yr1 Plus PPI Yr1 Plus PPI
109 DESTINATION SIGNS Hanover 100% Amber LED Sign (17 x 160)--Front ,Side, Rear 1 $ (1,235.06) Yr1 Plus PPI Yr1 Plus PPI Yr1 Plus PPI Yr1 Plus PPI
110 DESTINATION SIGNS Hanover 100% Full Color LED Sign (17 x 160)--Front ,Side, Rear 1 $ 1,213.23 Yr1 Plus PPI Yr1 Plus PPI Yr1 Plus PPI Yr1 Plus PPI
111 DESTINATION SIGNS Hanover--Add Front Run Sign--White LED 1 $ 599.24 Yr1 Plus PPI Yr1 Plus PPI Yr1 Plus PPI Yr1 Plus PPI 112 DESTINATION SIGNS Hanover--Add Front Run Sign--Amber LED 1 $ 756.09 Yr1 Plus PPI Yr1 Plus PPI Yr1 Plus PPI Yr1 Plus PPI 113 DESTINATION SIGNS Hanover--Add Front Run Sign--Color LED 1 No Bid 114 DESTINATION SIGNS Hanover--Delete Rear Sign 1 $ (600.57) Yr1 Plus PPI Yr1 Plus PPI Yr1 Plus PPI Yr1 Plus PPI 115 DESTINATION SIGNS Hanover Program Software 1 $ 6,875.00 Yr1 Plus PPI Yr1 Plus PPI Yr1 Plus PPI Yr1 Plus PPI
116 DESTINATION SIGNS TwinVision Smart Series 3 100% Silver LED Sign (16 X 160)-- Front, Side, and Rear 1 $ 873.01 Yr1 Plus PPI Yr1 Plus PPI Yr1 Plus PPI Yr1 Plus PPI
117 DESTINATION SIGNS TwinVision Smart Series 3 100% Amber LED Sign (16 x 160)--Front, Side, and Rear 1 $ (640.78) Yr1 Plus PPI Yr1 Plus PPI Yr1 Plus PPI Yr1 Plus PPI
118 DESTINATION SIGNS Luminator Titan Silver Series LED Sign (24 X 200)--Front, Side, and Rear 1 $ 1,886.74 Yr1 Plus PPI Yr1 Plus PPI Yr1 Plus PPI Yr1 Plus PPI
119 DESTINATION SIGNS Luminator Titan Amber Series Sign (24 x 200)--Front, Side, and Rear 1 $ 680.50 Yr1 Plus PPI Yr1 Plus PPI Yr1 Plus PPI Yr1 Plus PPI
120 DESTINATION SIGNS Luminator GEN 4 Horizon 100% Silver LED Sign (16 x 160)--Front, Side , and Rear 1 $ 886.93 Yr1 Plus PPI Yr1 Plus PPI Yr1 Plus PPI Yr1 Plus PPI
121 DESTINATION SIGNS Luminator GEN 4 Horizon 100% Amber LED Sign (16x 160)--Front, Side , and Rear 1 base
122 DESTINATION SIGNS Luminator Spectrum 100% Full Color LED GEN IV Front Sign (16 x 112) 1 $ 3,000.00 Yr1 Plus PPI Yr1 Plus PPI Yr1 Plus PPI Yr1 Plus PPI
123 DESTINATION SIGNS Luminator/Twinvision--Add Front Run Sign--Amber LED 1 $ 486.66 Yr1 Plus PPI Yr1 Plus PPI Yr1 Plus PPI Yr1 Plus PPI
124 DESTINATION SIGNS Luminator/Twinvision--Add Front Run Sign--Silver LED 1 $ 230.66 Yr1 Plus PPI Yr1 Plus PPI Yr1 Plus PPI Yr1 Plus PPI
125 DESTINATION SIGNS Luminator/Twinvision--Add Front Run Sign--Color LED 1 $ 1,880.66 Yr1 Plus PPI Yr1 Plus PPI Yr1 Plus PPI Yr1 Plus PPI
126 DESTINATION SIGNS Luminator RearView Camera Integraded into Rear LED Sign 1 $ 261.24 Yr1 Plus PPI Yr1 Plus PPI Yr1 Plus PPI Yr1 Plus PPI
127 DESTINATION SIGNS Luminator Rearview Camera without Rear LED Sign 1 $ 550.00 Yr1 Plus PPI Yr1 Plus PPI Yr1 Plus PPI Yr1 Plus PPI
S-01 (JAN 18)3 of 14
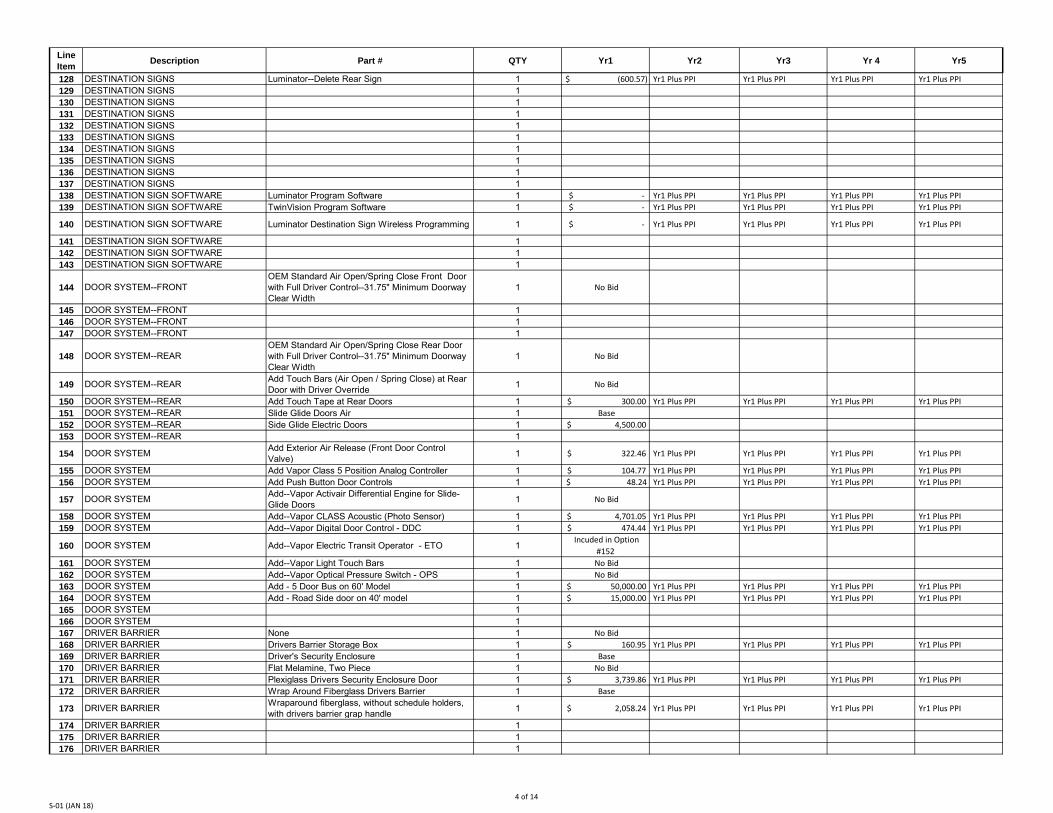
Line Item Description Part # QTY Yr1 Yr2 Yr3 Yr 4 Yr5
128 DESTINATION SIGNS Luminator--Delete Rear Sign 1 $ (600.57) Yr1 Plus PPI Yr1 Plus PPI Yr1 Plus PPI Yr1 Plus PPI 129 DESTINATION SIGNS 1130 DESTINATION SIGNS 1131 DESTINATION SIGNS 1132 DESTINATION SIGNS 1133 DESTINATION SIGNS 1134 DESTINATION SIGNS 1135 DESTINATION SIGNS 1136 DESTINATION SIGNS 1137 DESTINATION SIGNS 1138 DESTINATION SIGN SOFTWARE Luminator Program Software 1 $ - Yr1 Plus PPI Yr1 Plus PPI Yr1 Plus PPI Yr1 Plus PPI 139 DESTINATION SIGN SOFTWARE TwinVision Program Software 1 $ - Yr1 Plus PPI Yr1 Plus PPI Yr1 Plus PPI Yr1 Plus PPI
140 DESTINATION SIGN SOFTWARE Luminator Destination Sign Wireless Programming 1 $ - Yr1 Plus PPI Yr1 Plus PPI Yr1 Plus PPI Yr1 Plus PPI
141 DESTINATION SIGN SOFTWARE 1142 DESTINATION SIGN SOFTWARE 1143 DESTINATION SIGN SOFTWARE 1
144 DOOR SYSTEM--FRONTOEM Standard Air Open/Spring Close Front Door with Full Driver Control--31.75" Minimum Doorway Clear Width
1 No Bid
145 DOOR SYSTEM--FRONT 1146 DOOR SYSTEM--FRONT 1147 DOOR SYSTEM--FRONT 1
148 DOOR SYSTEM--REAROEM Standard Air Open/Spring Close Rear Door with Full Driver Control--31.75" Minimum Doorway Clear Width
1 No Bid
149 DOOR SYSTEM--REAR Add Touch Bars (Air Open / Spring Close) at Rear Door with Driver Override 1 No Bid
150 DOOR SYSTEM--REAR Add Touch Tape at Rear Doors 1 $ 300.00 Yr1 Plus PPI Yr1 Plus PPI Yr1 Plus PPI Yr1 Plus PPI 151 DOOR SYSTEM--REAR Slide Glide Doors Air 1 Base 152 DOOR SYSTEM--REAR Side Glide Electric Doors 1 $ 4,500.00 153 DOOR SYSTEM--REAR 1
154 DOOR SYSTEM Add Exterior Air Release (Front Door Control Valve) 1 $ 322.46 Yr1 Plus PPI Yr1 Plus PPI Yr1 Plus PPI Yr1 Plus PPI
155 DOOR SYSTEM Add Vapor Class 5 Position Analog Controller 1 $ 104.77 Yr1 Plus PPI Yr1 Plus PPI Yr1 Plus PPI Yr1 Plus PPI 156 DOOR SYSTEM Add Push Button Door Controls 1 $ 48.24 Yr1 Plus PPI Yr1 Plus PPI Yr1 Plus PPI Yr1 Plus PPI
157 DOOR SYSTEM Add--Vapor Activair Differential Engine for Slide-Glide Doors 1 No Bid
158 DOOR SYSTEM Add--Vapor CLASS Acoustic (Photo Sensor) 1 $ 4,701.05 Yr1 Plus PPI Yr1 Plus PPI Yr1 Plus PPI Yr1 Plus PPI 159 DOOR SYSTEM Add--Vapor Digital Door Control - DDC 1 $ 474.44 Yr1 Plus PPI Yr1 Plus PPI Yr1 Plus PPI Yr1 Plus PPI
160 DOOR SYSTEM Add--Vapor Electric Transit Operator - ETO 1 Incuded in Option #152
161 DOOR SYSTEM Add--Vapor Light Touch Bars 1 No Bid 162 DOOR SYSTEM Add--Vapor Optical Pressure Switch - OPS 1 No Bid 163 DOOR SYSTEM Add - 5 Door Bus on 60' Model 1 $ 50,000.00 Yr1 Plus PPI Yr1 Plus PPI Yr1 Plus PPI Yr1 Plus PPI 164 DOOR SYSTEM Add - Road Side door on 40' model 1 $ 15,000.00 Yr1 Plus PPI Yr1 Plus PPI Yr1 Plus PPI Yr1 Plus PPI 165 DOOR SYSTEM 1166 DOOR SYSTEM 1167 DRIVER BARRIER None 1 No Bid 168 DRIVER BARRIER Drivers Barrier Storage Box 1 $ 160.95 Yr1 Plus PPI Yr1 Plus PPI Yr1 Plus PPI Yr1 Plus PPI 169 DRIVER BARRIER Driver's Security Enclosure 1 Base 170 DRIVER BARRIER Flat Melamine, Two Piece 1 No Bid 171 DRIVER BARRIER Plexiglass Drivers Security Enclosure Door 1 $ 3,739.86 Yr1 Plus PPI Yr1 Plus PPI Yr1 Plus PPI Yr1 Plus PPI 172 DRIVER BARRIER Wrap Around Fiberglass Drivers Barrier 1 Base
173 DRIVER BARRIER Wraparound fiberglass, without schedule holders, with drivers barrier grap handle 1 $ 2,058.24 Yr1 Plus PPI Yr1 Plus PPI Yr1 Plus PPI Yr1 Plus PPI
174 DRIVER BARRIER 1175 DRIVER BARRIER 1176 DRIVER BARRIER 1
S-01 (JAN 18)4 of 14
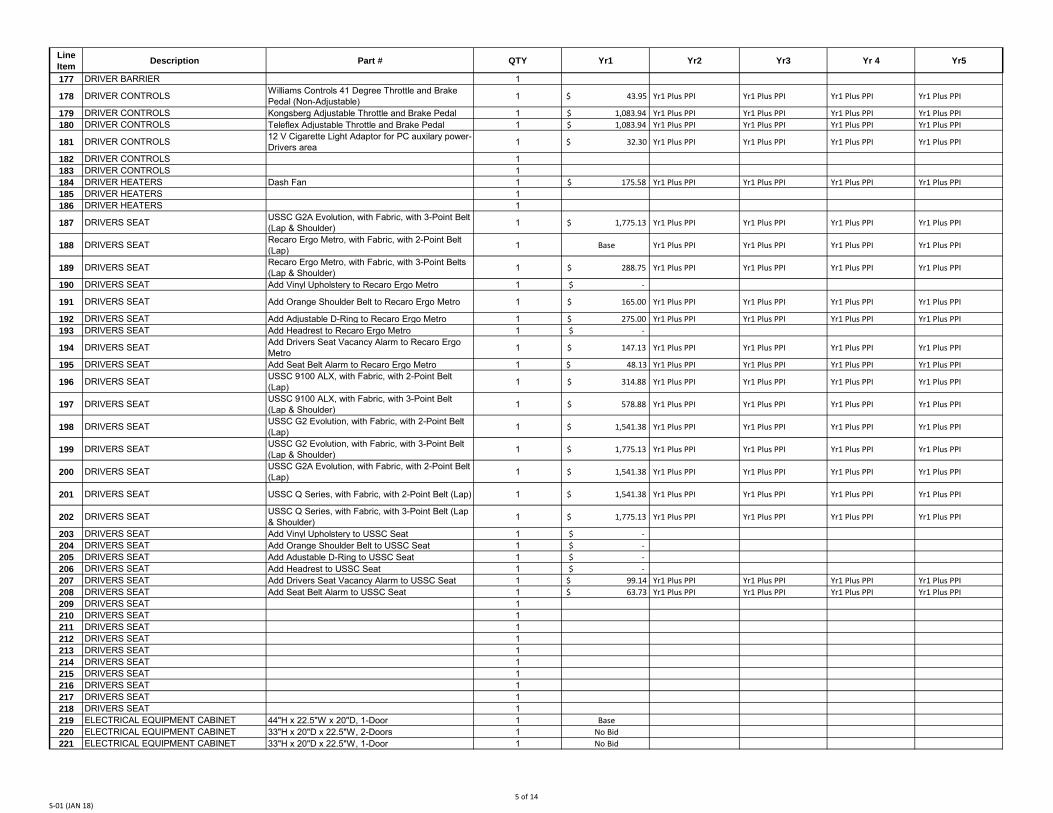
Line Item Description Part # QTY Yr1 Yr2 Yr3 Yr 4 Yr5
177 DRIVER BARRIER 1
178 DRIVER CONTROLS Williams Controls 41 Degree Throttle and Brake Pedal (Non-Adjustable) 1 $ 43.95 Yr1 Plus PPI Yr1 Plus PPI Yr1 Plus PPI Yr1 Plus PPI
179 DRIVER CONTROLS Kongsberg Adjustable Throttle and Brake Pedal 1 $ 1,083.94 Yr1 Plus PPI Yr1 Plus PPI Yr1 Plus PPI Yr1 Plus PPI 180 DRIVER CONTROLS Teleflex Adjustable Throttle and Brake Pedal 1 $ 1,083.94 Yr1 Plus PPI Yr1 Plus PPI Yr1 Plus PPI Yr1 Plus PPI
181 DRIVER CONTROLS 12 V Cigarette Light Adaptor for PC auxilary power- Drivers area 1 $ 32.30 Yr1 Plus PPI Yr1 Plus PPI Yr1 Plus PPI Yr1 Plus PPI
182 DRIVER CONTROLS 1183 DRIVER CONTROLS 1184 DRIVER HEATERS Dash Fan 1 $ 175.58 Yr1 Plus PPI Yr1 Plus PPI Yr1 Plus PPI Yr1 Plus PPI 185 DRIVER HEATERS 1186 DRIVER HEATERS 1
187 DRIVERS SEAT USSC G2A Evolution, with Fabric, with 3-Point Belt (Lap & Shoulder) 1 $ 1,775.13 Yr1 Plus PPI Yr1 Plus PPI Yr1 Plus PPI Yr1 Plus PPI
188 DRIVERS SEAT Recaro Ergo Metro, with Fabric, with 2-Point Belt (Lap) 1 Base Yr1 Plus PPI Yr1 Plus PPI Yr1 Plus PPI Yr1 Plus PPI
189 DRIVERS SEAT Recaro Ergo Metro, with Fabric, with 3-Point Belts (Lap & Shoulder) 1 $ 288.75 Yr1 Plus PPI Yr1 Plus PPI Yr1 Plus PPI Yr1 Plus PPI
190 DRIVERS SEAT Add Vinyl Upholstery to Recaro Ergo Metro 1 $ -
191 DRIVERS SEAT Add Orange Shoulder Belt to Recaro Ergo Metro 1 $ 165.00 Yr1 Plus PPI Yr1 Plus PPI Yr1 Plus PPI Yr1 Plus PPI
192 DRIVERS SEAT Add Adjustable D-Ring to Recaro Ergo Metro 1 $ 275.00 Yr1 Plus PPI Yr1 Plus PPI Yr1 Plus PPI Yr1 Plus PPI 193 DRIVERS SEAT Add Headrest to Recaro Ergo Metro 1 $ -
194 DRIVERS SEAT Add Drivers Seat Vacancy Alarm to Recaro Ergo Metro 1 $ 147.13 Yr1 Plus PPI Yr1 Plus PPI Yr1 Plus PPI Yr1 Plus PPI
195 DRIVERS SEAT Add Seat Belt Alarm to Recaro Ergo Metro 1 $ 48.13 Yr1 Plus PPI Yr1 Plus PPI Yr1 Plus PPI Yr1 Plus PPI
196 DRIVERS SEAT USSC 9100 ALX, with Fabric, with 2-Point Belt (Lap) 1 $ 314.88 Yr1 Plus PPI Yr1 Plus PPI Yr1 Plus PPI Yr1 Plus PPI
197 DRIVERS SEAT USSC 9100 ALX, with Fabric, with 3-Point Belt (Lap & Shoulder) 1 $ 578.88 Yr1 Plus PPI Yr1 Plus PPI Yr1 Plus PPI Yr1 Plus PPI
198 DRIVERS SEAT USSC G2 Evolution, with Fabric, with 2-Point Belt (Lap) 1 $ 1,541.38 Yr1 Plus PPI Yr1 Plus PPI Yr1 Plus PPI Yr1 Plus PPI
199 DRIVERS SEAT USSC G2 Evolution, with Fabric, with 3-Point Belt (Lap & Shoulder) 1 $ 1,775.13 Yr1 Plus PPI Yr1 Plus PPI Yr1 Plus PPI Yr1 Plus PPI
200 DRIVERS SEAT USSC G2A Evolution, with Fabric, with 2-Point Belt (Lap) 1 $ 1,541.38 Yr1 Plus PPI Yr1 Plus PPI Yr1 Plus PPI Yr1 Plus PPI
201 DRIVERS SEAT USSC Q Series, with Fabric, with 2-Point Belt (Lap) 1 $ 1,541.38 Yr1 Plus PPI Yr1 Plus PPI Yr1 Plus PPI Yr1 Plus PPI
202 DRIVERS SEAT USSC Q Series, with Fabric, with 3-Point Belt (Lap & Shoulder) 1 $ 1,775.13 Yr1 Plus PPI Yr1 Plus PPI Yr1 Plus PPI Yr1 Plus PPI
203 DRIVERS SEAT Add Vinyl Upholstery to USSC Seat 1 $ - 204 DRIVERS SEAT Add Orange Shoulder Belt to USSC Seat 1 $ - 205 DRIVERS SEAT Add Adustable D-Ring to USSC Seat 1 $ - 206 DRIVERS SEAT Add Headrest to USSC Seat 1 $ - 207 DRIVERS SEAT Add Drivers Seat Vacancy Alarm to USSC Seat 1 $ 99.14 Yr1 Plus PPI Yr1 Plus PPI Yr1 Plus PPI Yr1 Plus PPI 208 DRIVERS SEAT Add Seat Belt Alarm to USSC Seat 1 $ 63.73 Yr1 Plus PPI Yr1 Plus PPI Yr1 Plus PPI Yr1 Plus PPI 209 DRIVERS SEAT 1210 DRIVERS SEAT 1211 DRIVERS SEAT 1212 DRIVERS SEAT 1213 DRIVERS SEAT 1214 DRIVERS SEAT 1215 DRIVERS SEAT 1216 DRIVERS SEAT 1217 DRIVERS SEAT 1218 DRIVERS SEAT 1219 ELECTRICAL EQUIPMENT CABINET 44"H x 22.5"W x 20"D, 1-Door 1 Base 220 ELECTRICAL EQUIPMENT CABINET 33"H x 20"D x 22.5"W, 2-Doors 1 No Bid 221 ELECTRICAL EQUIPMENT CABINET 33"H x 20"D x 22.5"W, 1-Door 1 No Bid
S-01 (JAN 18)5 of 14
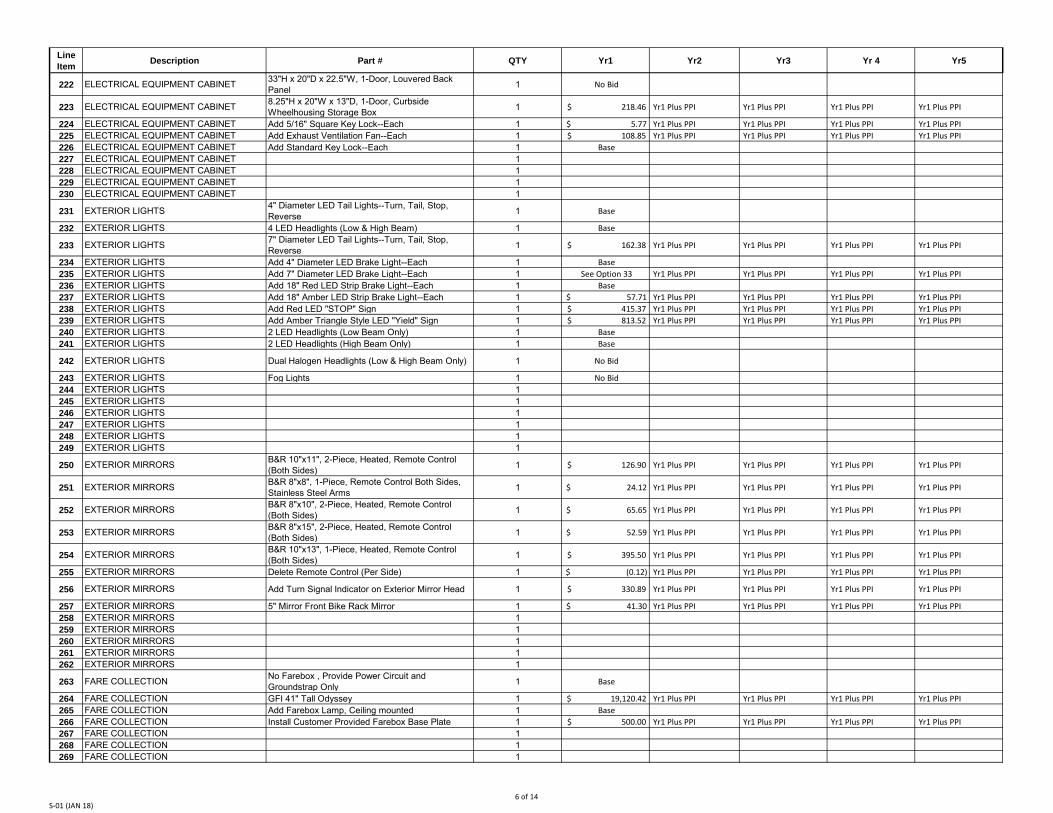
Line Item Description Part # QTY Yr1 Yr2 Yr3 Yr 4 Yr5
222 ELECTRICAL EQUIPMENT CABINET 33"H x 20"D x 22.5"W, 1-Door, Louvered Back Panel 1 No Bid
223 ELECTRICAL EQUIPMENT CABINET 8.25"H x 20"W x 13"D, 1-Door, Curbside Wheelhousing Storage Box 1 $ 218.46 Yr1 Plus PPI Yr1 Plus PPI Yr1 Plus PPI Yr1 Plus PPI
224 ELECTRICAL EQUIPMENT CABINET Add 5/16" Square Key Lock--Each 1 $ 5.77 Yr1 Plus PPI Yr1 Plus PPI Yr1 Plus PPI Yr1 Plus PPI 225 ELECTRICAL EQUIPMENT CABINET Add Exhaust Ventilation Fan--Each 1 $ 108.85 Yr1 Plus PPI Yr1 Plus PPI Yr1 Plus PPI Yr1 Plus PPI 226 ELECTRICAL EQUIPMENT CABINET Add Standard Key Lock--Each 1 Base 227 ELECTRICAL EQUIPMENT CABINET 1228 ELECTRICAL EQUIPMENT CABINET 1229 ELECTRICAL EQUIPMENT CABINET 1230 ELECTRICAL EQUIPMENT CABINET 1
231 EXTERIOR LIGHTS 4" Diameter LED Tail Lights--Turn, Tail, Stop, Reverse 1 Base
232 EXTERIOR LIGHTS 4 LED Headlights (Low & High Beam) 1 Base
233 EXTERIOR LIGHTS 7" Diameter LED Tail Lights--Turn, Tail, Stop, Reverse 1 $ 162.38 Yr1 Plus PPI Yr1 Plus PPI Yr1 Plus PPI Yr1 Plus PPI
234 EXTERIOR LIGHTS Add 4" Diameter LED Brake Light--Each 1 Base 235 EXTERIOR LIGHTS Add 7" Diameter LED Brake Light--Each 1 See Option 33 Yr1 Plus PPI Yr1 Plus PPI Yr1 Plus PPI Yr1 Plus PPI 236 EXTERIOR LIGHTS Add 18" Red LED Strip Brake Light--Each 1 Base 237 EXTERIOR LIGHTS Add 18" Amber LED Strip Brake Light--Each 1 $ 57.71 Yr1 Plus PPI Yr1 Plus PPI Yr1 Plus PPI Yr1 Plus PPI 238 EXTERIOR LIGHTS Add Red LED "STOP" Sign 1 $ 415.37 Yr1 Plus PPI Yr1 Plus PPI Yr1 Plus PPI Yr1 Plus PPI 239 EXTERIOR LIGHTS Add Amber Triangle Style LED "Yield" Sign 1 $ 813.52 Yr1 Plus PPI Yr1 Plus PPI Yr1 Plus PPI Yr1 Plus PPI 240 EXTERIOR LIGHTS 2 LED Headlights (Low Beam Only) 1 Base 241 EXTERIOR LIGHTS 2 LED Headlights (High Beam Only) 1 Base
242 EXTERIOR LIGHTS Dual Halogen Headlights (Low & High Beam Only) 1 No Bid
243 EXTERIOR LIGHTS Fog Lights 1 No Bid 244 EXTERIOR LIGHTS 1245 EXTERIOR LIGHTS 1246 EXTERIOR LIGHTS 1247 EXTERIOR LIGHTS 1248 EXTERIOR LIGHTS 1249 EXTERIOR LIGHTS 1
250 EXTERIOR MIRRORS B&R 10"x11", 2-Piece, Heated, Remote Control (Both Sides) 1 $ 126.90 Yr1 Plus PPI Yr1 Plus PPI Yr1 Plus PPI Yr1 Plus PPI
251 EXTERIOR MIRRORS B&R 8"x8", 1-Piece, Remote Control Both Sides, Stainless Steel Arms 1 $ 24.12 Yr1 Plus PPI Yr1 Plus PPI Yr1 Plus PPI Yr1 Plus PPI
252 EXTERIOR MIRRORS B&R 8"x10", 2-Piece, Heated, Remote Control (Both Sides) 1 $ 65.65 Yr1 Plus PPI Yr1 Plus PPI Yr1 Plus PPI Yr1 Plus PPI
253 EXTERIOR MIRRORS B&R 8"x15", 2-Piece, Heated, Remote Control (Both Sides) 1 $ 52.59 Yr1 Plus PPI Yr1 Plus PPI Yr1 Plus PPI Yr1 Plus PPI
254 EXTERIOR MIRRORS B&R 10"x13", 1-Piece, Heated, Remote Control (Both Sides) 1 $ 395.50 Yr1 Plus PPI Yr1 Plus PPI Yr1 Plus PPI Yr1 Plus PPI
255 EXTERIOR MIRRORS Delete Remote Control (Per Side) 1 $ (0.12) Yr1 Plus PPI Yr1 Plus PPI Yr1 Plus PPI Yr1 Plus PPI
256 EXTERIOR MIRRORS Add Turn Signal Indicator on Exterior Mirror Head 1 $ 330.89 Yr1 Plus PPI Yr1 Plus PPI Yr1 Plus PPI Yr1 Plus PPI
257 EXTERIOR MIRRORS 5" Mirror Front Bike Rack Mirror 1 $ 41.30 Yr1 Plus PPI Yr1 Plus PPI Yr1 Plus PPI Yr1 Plus PPI 258 EXTERIOR MIRRORS 1259 EXTERIOR MIRRORS 1260 EXTERIOR MIRRORS 1261 EXTERIOR MIRRORS 1262 EXTERIOR MIRRORS 1
263 FARE COLLECTION No Farebox , Provide Power Circuit and Groundstrap Only 1 Base
264 FARE COLLECTION GFI 41" Tall Odyssey 1 $ 19,120.42 Yr1 Plus PPI Yr1 Plus PPI Yr1 Plus PPI Yr1 Plus PPI 265 FARE COLLECTION Add Farebox Lamp, Ceiling mounted 1 Base 266 FARE COLLECTION Install Customer Provided Farebox Base Plate 1 $ 500.00 Yr1 Plus PPI Yr1 Plus PPI Yr1 Plus PPI Yr1 Plus PPI 267 FARE COLLECTION 1268 FARE COLLECTION 1269 FARE COLLECTION 1
S-01 (JAN 18)6 of 14
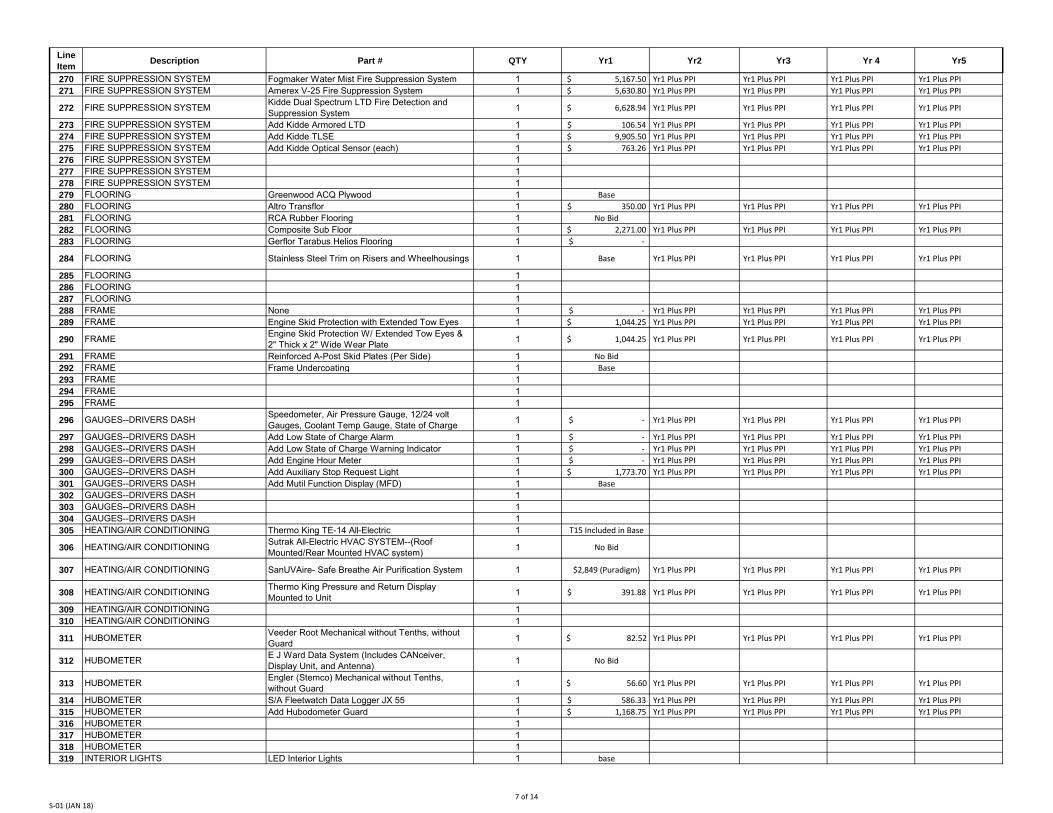
Line Item Description Part # QTY Yr1 Yr2 Yr3 Yr 4 Yr5
270 FIRE SUPPRESSION SYSTEM Fogmaker Water Mist Fire Suppression System 1 $ 5,167.50 Yr1 Plus PPI Yr1 Plus PPI Yr1 Plus PPI Yr1 Plus PPI 271 FIRE SUPPRESSION SYSTEM Amerex V-25 Fire Suppression System 1 $ 5,630.80 Yr1 Plus PPI Yr1 Plus PPI Yr1 Plus PPI Yr1 Plus PPI
272 FIRE SUPPRESSION SYSTEM Kidde Dual Spectrum LTD Fire Detection and Suppression System 1 $ 6,628.94 Yr1 Plus PPI Yr1 Plus PPI Yr1 Plus PPI Yr1 Plus PPI
273 FIRE SUPPRESSION SYSTEM Add Kidde Armored LTD 1 $ 106.54 Yr1 Plus PPI Yr1 Plus PPI Yr1 Plus PPI Yr1 Plus PPI 274 FIRE SUPPRESSION SYSTEM Add Kidde TLSE 1 $ 9,905.50 Yr1 Plus PPI Yr1 Plus PPI Yr1 Plus PPI Yr1 Plus PPI 275 FIRE SUPPRESSION SYSTEM Add Kidde Optical Sensor (each) 1 $ 763.26 Yr1 Plus PPI Yr1 Plus PPI Yr1 Plus PPI Yr1 Plus PPI 276 FIRE SUPPRESSION SYSTEM 1277 FIRE SUPPRESSION SYSTEM 1278 FIRE SUPPRESSION SYSTEM 1279 FLOORING Greenwood ACQ Plywood 1 Base 280 FLOORING Altro Transflor 1 $ 350.00 Yr1 Plus PPI Yr1 Plus PPI Yr1 Plus PPI Yr1 Plus PPI 281 FLOORING RCA Rubber Flooring 1 No Bid 282 FLOORING Composite Sub Floor 1 $ 2,271.00 Yr1 Plus PPI Yr1 Plus PPI Yr1 Plus PPI Yr1 Plus PPI 283 FLOORING Gerflor Tarabus Helios Flooring 1 $ -
284 FLOORING Stainless Steel Trim on Risers and Wheelhousings 1 Base Yr1 Plus PPI Yr1 Plus PPI Yr1 Plus PPI Yr1 Plus PPI
285 FLOORING 1286 FLOORING 1287 FLOORING 1288 FRAME None 1 $ - Yr1 Plus PPI Yr1 Plus PPI Yr1 Plus PPI Yr1 Plus PPI 289 FRAME Engine Skid Protection with Extended Tow Eyes 1 $ 1,044.25 Yr1 Plus PPI Yr1 Plus PPI Yr1 Plus PPI Yr1 Plus PPI
290 FRAME Engine Skid Protection W/ Extended Tow Eyes & 2" Thick x 2" Wide Wear Plate 1 $ 1,044.25 Yr1 Plus PPI Yr1 Plus PPI Yr1 Plus PPI Yr1 Plus PPI
291 FRAME Reinforced A-Post Skid Plates (Per Side) 1 No Bid 292 FRAME Frame Undercoating 1 Base 293 FRAME 1294 FRAME 1295 FRAME 1
296 GAUGES--DRIVERS DASH Speedometer, Air Pressure Gauge, 12/24 volt Gauges, Coolant Temp Gauge, State of Charge 1 $ - Yr1 Plus PPI Yr1 Plus PPI Yr1 Plus PPI Yr1 Plus PPI
297 GAUGES--DRIVERS DASH Add Low State of Charge Alarm 1 $ - Yr1 Plus PPI Yr1 Plus PPI Yr1 Plus PPI Yr1 Plus PPI 298 GAUGES--DRIVERS DASH Add Low State of Charge Warning Indicator 1 $ - Yr1 Plus PPI Yr1 Plus PPI Yr1 Plus PPI Yr1 Plus PPI 299 GAUGES--DRIVERS DASH Add Engine Hour Meter 1 $ - Yr1 Plus PPI Yr1 Plus PPI Yr1 Plus PPI Yr1 Plus PPI 300 GAUGES--DRIVERS DASH Add Auxiliary Stop Request Light 1 $ 1,773.70 Yr1 Plus PPI Yr1 Plus PPI Yr1 Plus PPI Yr1 Plus PPI 301 GAUGES--DRIVERS DASH Add Mutil Function Display (MFD) 1 Base 302 GAUGES--DRIVERS DASH 1303 GAUGES--DRIVERS DASH 1304 GAUGES--DRIVERS DASH 1305 HEATING/AIR CONDITIONING Thermo King TE-14 All-Electric 1 T15 Included in Base
306 HEATING/AIR CONDITIONING Sutrak All-Electric HVAC SYSTEM--(Roof Mounted/Rear Mounted HVAC system) 1 No Bid
307 HEATING/AIR CONDITIONING SanUVAire- Safe Breathe Air Purification System 1 $2,849 (Puradigm) Yr1 Plus PPI Yr1 Plus PPI Yr1 Plus PPI Yr1 Plus PPI
308 HEATING/AIR CONDITIONING Thermo King Pressure and Return Display Mounted to Unit 1 $ 391.88 Yr1 Plus PPI Yr1 Plus PPI Yr1 Plus PPI Yr1 Plus PPI
309 HEATING/AIR CONDITIONING 1310 HEATING/AIR CONDITIONING 1
311 HUBOMETER Veeder Root Mechanical without Tenths, without Guard 1 $ 82.52 Yr1 Plus PPI Yr1 Plus PPI Yr1 Plus PPI Yr1 Plus PPI
312 HUBOMETER E J Ward Data System (Includes CANceiver, Display Unit, and Antenna) 1 No Bid
313 HUBOMETER Engler (Stemco) Mechanical without Tenths, without Guard 1 $ 56.60 Yr1 Plus PPI Yr1 Plus PPI Yr1 Plus PPI Yr1 Plus PPI
314 HUBOMETER S/A Fleetwatch Data Logger JX 55 1 $ 586.33 Yr1 Plus PPI Yr1 Plus PPI Yr1 Plus PPI Yr1 Plus PPI 315 HUBOMETER Add Hubodometer Guard 1 $ 1,168.75 Yr1 Plus PPI Yr1 Plus PPI Yr1 Plus PPI Yr1 Plus PPI 316 HUBOMETER 1317 HUBOMETER 1318 HUBOMETER 1319 INTERIOR LIGHTS LED Interior Lights 1 base
S-01 (JAN 18)7 of 14
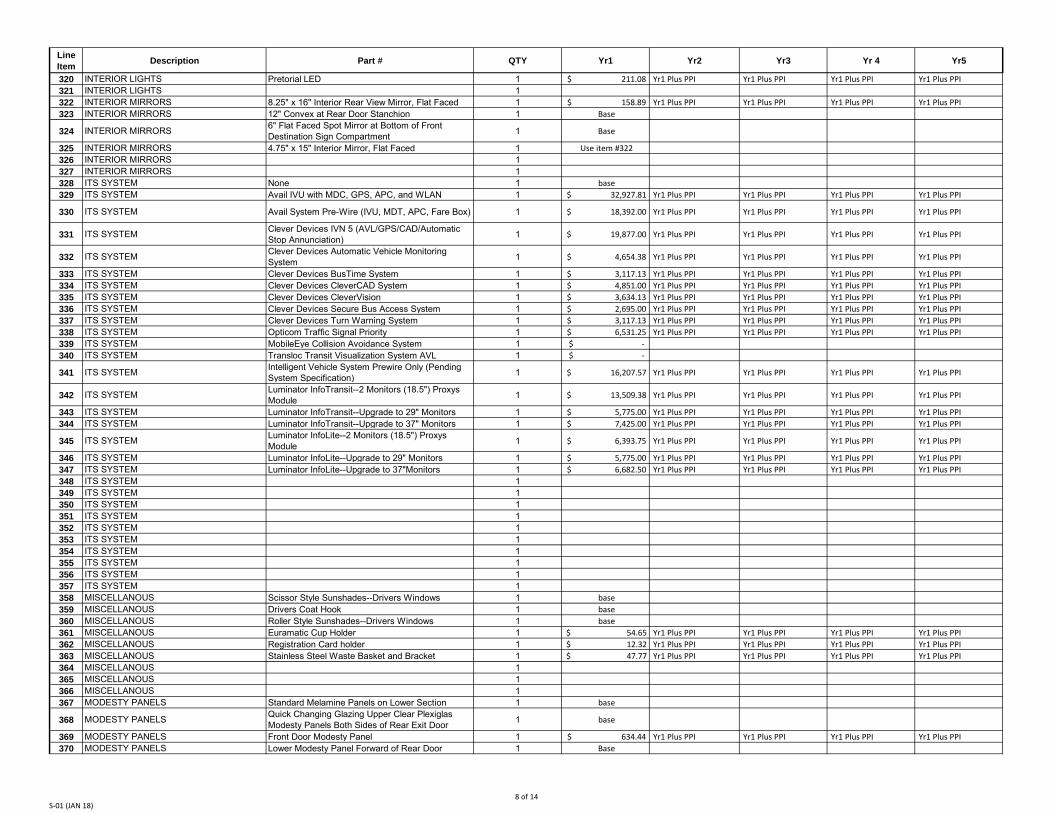
Line Item Description Part # QTY Yr1 Yr2 Yr3 Yr 4 Yr5
320 INTERIOR LIGHTS Pretorial LED 1 $ 211.08 Yr1 Plus PPI Yr1 Plus PPI Yr1 Plus PPI Yr1 Plus PPI 321 INTERIOR LIGHTS 1322 INTERIOR MIRRORS 8.25" x 16" Interior Rear View Mirror, Flat Faced 1 $ 158.89 Yr1 Plus PPI Yr1 Plus PPI Yr1 Plus PPI Yr1 Plus PPI 323 INTERIOR MIRRORS 12" Convex at Rear Door Stanchion 1 Base
324 INTERIOR MIRRORS 6" Flat Faced Spot Mirror at Bottom of Front Destination Sign Compartment 1 Base
325 INTERIOR MIRRORS 4.75" x 15" Interior Mirror, Flat Faced 1 Use item #322 326 INTERIOR MIRRORS 1327 INTERIOR MIRRORS 1328 ITS SYSTEM None 1 base 329 ITS SYSTEM Avail IVU with MDC, GPS, APC, and WLAN 1 $ 32,927.81 Yr1 Plus PPI Yr1 Plus PPI Yr1 Plus PPI Yr1 Plus PPI
330 ITS SYSTEM Avail System Pre-Wire (IVU, MDT, APC, Fare Box) 1 $ 18,392.00 Yr1 Plus PPI Yr1 Plus PPI Yr1 Plus PPI Yr1 Plus PPI
331 ITS SYSTEM Clever Devices IVN 5 (AVL/GPS/CAD/Automatic Stop Annunciation) 1 $ 19,877.00 Yr1 Plus PPI Yr1 Plus PPI Yr1 Plus PPI Yr1 Plus PPI
332 ITS SYSTEM Clever Devices Automatic Vehicle Monitoring System 1 $ 4,654.38 Yr1 Plus PPI Yr1 Plus PPI Yr1 Plus PPI Yr1 Plus PPI
333 ITS SYSTEM Clever Devices BusTime System 1 $ 3,117.13 Yr1 Plus PPI Yr1 Plus PPI Yr1 Plus PPI Yr1 Plus PPI 334 ITS SYSTEM Clever Devices CleverCAD System 1 $ 4,851.00 Yr1 Plus PPI Yr1 Plus PPI Yr1 Plus PPI Yr1 Plus PPI 335 ITS SYSTEM Clever Devices CleverVision 1 $ 3,634.13 Yr1 Plus PPI Yr1 Plus PPI Yr1 Plus PPI Yr1 Plus PPI 336 ITS SYSTEM Clever Devices Secure Bus Access System 1 $ 2,695.00 Yr1 Plus PPI Yr1 Plus PPI Yr1 Plus PPI Yr1 Plus PPI 337 ITS SYSTEM Clever Devices Turn Warning System 1 $ 3,117.13 Yr1 Plus PPI Yr1 Plus PPI Yr1 Plus PPI Yr1 Plus PPI 338 ITS SYSTEM Opticom Traffic Signal Priority 1 $ 6,531.25 Yr1 Plus PPI Yr1 Plus PPI Yr1 Plus PPI Yr1 Plus PPI 339 ITS SYSTEM MobileEye Collision Avoidance System 1 $ - 340 ITS SYSTEM Transloc Transit Visualization System AVL 1 $ -
341 ITS SYSTEM Intelligent Vehicle System Prewire Only (Pending System Specification) 1 $ 16,207.57 Yr1 Plus PPI Yr1 Plus PPI Yr1 Plus PPI Yr1 Plus PPI
342 ITS SYSTEM Luminator InfoTransit--2 Monitors (18.5") Proxys Module 1 $ 13,509.38 Yr1 Plus PPI Yr1 Plus PPI Yr1 Plus PPI Yr1 Plus PPI
343 ITS SYSTEM Luminator InfoTransit--Upgrade to 29" Monitors 1 $ 5,775.00 Yr1 Plus PPI Yr1 Plus PPI Yr1 Plus PPI Yr1 Plus PPI 344 ITS SYSTEM Luminator InfoTransit--Upgrade to 37" Monitors 1 $ 7,425.00 Yr1 Plus PPI Yr1 Plus PPI Yr1 Plus PPI Yr1 Plus PPI
345 ITS SYSTEM Luminator InfoLite--2 Monitors (18.5") Proxys Module 1 $ 6,393.75 Yr1 Plus PPI Yr1 Plus PPI Yr1 Plus PPI Yr1 Plus PPI
346 ITS SYSTEM Luminator InfoLite--Upgrade to 29" Monitors 1 $ 5,775.00 Yr1 Plus PPI Yr1 Plus PPI Yr1 Plus PPI Yr1 Plus PPI 347 ITS SYSTEM Luminator InfoLite--Upgrade to 37"Monitors 1 $ 6,682.50 Yr1 Plus PPI Yr1 Plus PPI Yr1 Plus PPI Yr1 Plus PPI 348 ITS SYSTEM 1349 ITS SYSTEM 1350 ITS SYSTEM 1351 ITS SYSTEM 1352 ITS SYSTEM 1353 ITS SYSTEM 1354 ITS SYSTEM 1355 ITS SYSTEM 1356 ITS SYSTEM 1357 ITS SYSTEM 1358 MISCELLANOUS Scissor Style Sunshades--Drivers Windows 1 base 359 MISCELLANOUS Drivers Coat Hook 1 base 360 MISCELLANOUS Roller Style Sunshades--Drivers Windows 1 base 361 MISCELLANOUS Euramatic Cup Holder 1 $ 54.65 Yr1 Plus PPI Yr1 Plus PPI Yr1 Plus PPI Yr1 Plus PPI 362 MISCELLANOUS Registration Card holder 1 $ 12.32 Yr1 Plus PPI Yr1 Plus PPI Yr1 Plus PPI Yr1 Plus PPI 363 MISCELLANOUS Stainless Steel Waste Basket and Bracket 1 $ 47.77 Yr1 Plus PPI Yr1 Plus PPI Yr1 Plus PPI Yr1 Plus PPI 364 MISCELLANOUS 1365 MISCELLANOUS 1366 MISCELLANOUS 1367 MODESTY PANELS Standard Melamine Panels on Lower Section 1 base
368 MODESTY PANELS Quick Changing Glazing Upper Clear Plexiglas Modesty Panels Both Sides of Rear Exit Door 1 base
369 MODESTY PANELS Front Door Modesty Panel 1 $ 634.44 Yr1 Plus PPI Yr1 Plus PPI Yr1 Plus PPI Yr1 Plus PPI 370 MODESTY PANELS Lower Modesty Panel Forward of Rear Door 1 Base
S-01 (JAN 18)8 of 14
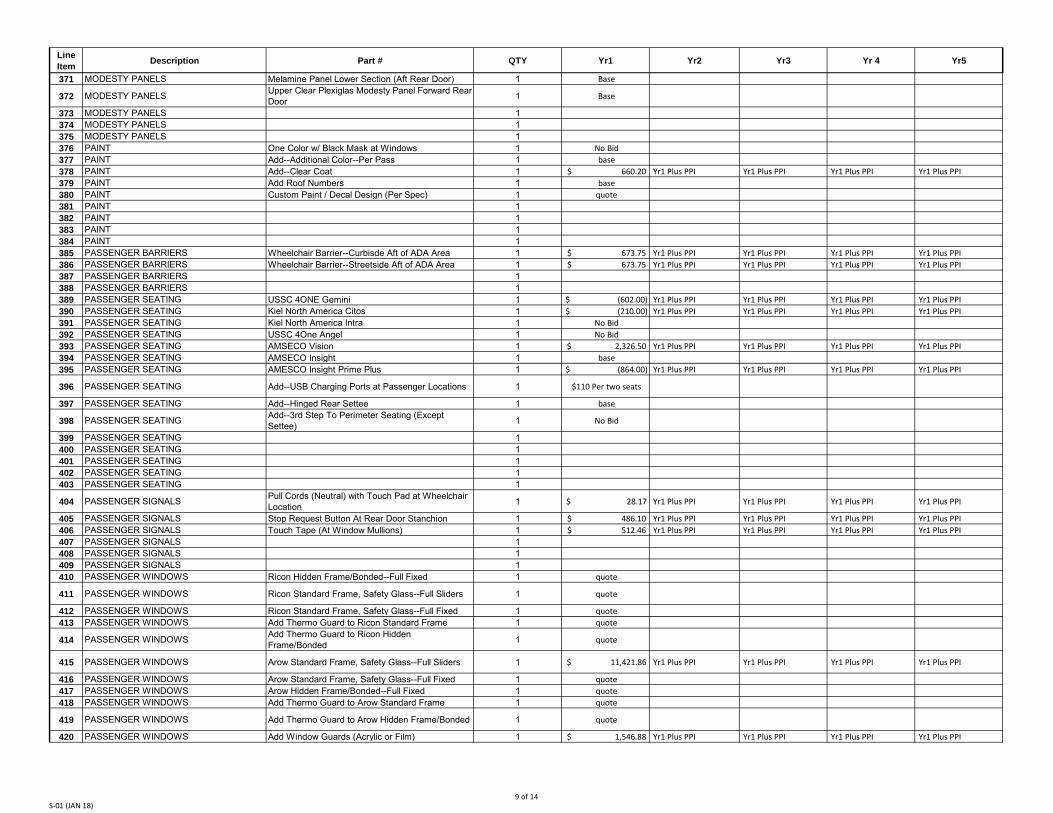
Line Item Description Part # QTY Yr1 Yr2 Yr3 Yr 4 Yr5
371 MODESTY PANELS Melamine Panel Lower Section (Aft Rear Door) 1 Base
372 MODESTY PANELS Upper Clear Plexiglas Modesty Panel Forward Rear Door 1 Base
373 MODESTY PANELS 1374 MODESTY PANELS 1375 MODESTY PANELS 1376 PAINT One Color w/ Black Mask at Windows 1 No Bid 377 PAINT Add--Additional Color--Per Pass 1 base 378 PAINT Add--Clear Coat 1 $ 660.20 Yr1 Plus PPI Yr1 Plus PPI Yr1 Plus PPI Yr1 Plus PPI 379 PAINT Add Roof Numbers 1 base 380 PAINT Custom Paint / Decal Design (Per Spec) 1 quote 381 PAINT 1382 PAINT 1383 PAINT 1384 PAINT 1385 PASSENGER BARRIERS Wheelchair Barrier--Curbisde Aft of ADA Area 1 $ 673.75 Yr1 Plus PPI Yr1 Plus PPI Yr1 Plus PPI Yr1 Plus PPI 386 PASSENGER BARRIERS Wheelchair Barrier--Streetside Aft of ADA Area 1 $ 673.75 Yr1 Plus PPI Yr1 Plus PPI Yr1 Plus PPI Yr1 Plus PPI 387 PASSENGER BARRIERS 1388 PASSENGER BARRIERS 1389 PASSENGER SEATING USSC 4ONE Gemini 1 $ (602.00) Yr1 Plus PPI Yr1 Plus PPI Yr1 Plus PPI Yr1 Plus PPI 390 PASSENGER SEATING Kiel North America Citos 1 $ (210.00) Yr1 Plus PPI Yr1 Plus PPI Yr1 Plus PPI Yr1 Plus PPI 391 PASSENGER SEATING Kiel North America Intra 1 No Bid 392 PASSENGER SEATING USSC 4One Angel 1 No Bid 393 PASSENGER SEATING AMSECO Vision 1 $ 2,326.50 Yr1 Plus PPI Yr1 Plus PPI Yr1 Plus PPI Yr1 Plus PPI 394 PASSENGER SEATING AMSECO Insight 1 base 395 PASSENGER SEATING AMESCO Insight Prime Plus 1 $ (864.00) Yr1 Plus PPI Yr1 Plus PPI Yr1 Plus PPI Yr1 Plus PPI
396 PASSENGER SEATING Add--USB Charging Ports at Passenger Locations 1 $110 Per two seats
397 PASSENGER SEATING Add--Hinged Rear Settee 1 base
398 PASSENGER SEATING Add--3rd Step To Perimeter Seating (Except Settee) 1 No Bid
399 PASSENGER SEATING 1400 PASSENGER SEATING 1401 PASSENGER SEATING 1402 PASSENGER SEATING 1403 PASSENGER SEATING 1
404 PASSENGER SIGNALS Pull Cords (Neutral) with Touch Pad at Wheelchair Location 1 $ 28.17 Yr1 Plus PPI Yr1 Plus PPI Yr1 Plus PPI Yr1 Plus PPI
405 PASSENGER SIGNALS Stop Request Button At Rear Door Stanchion 1 $ 486.10 Yr1 Plus PPI Yr1 Plus PPI Yr1 Plus PPI Yr1 Plus PPI 406 PASSENGER SIGNALS Touch Tape (At Window Mullions) 1 $ 512.46 Yr1 Plus PPI Yr1 Plus PPI Yr1 Plus PPI Yr1 Plus PPI 407 PASSENGER SIGNALS 1408 PASSENGER SIGNALS 1409 PASSENGER SIGNALS 1410 PASSENGER WINDOWS Ricon Hidden Frame/Bonded--Full Fixed 1 quote
411 PASSENGER WINDOWS Ricon Standard Frame, Safety Glass--Full Sliders 1 quote
412 PASSENGER WINDOWS Ricon Standard Frame, Safety Glass--Full Fixed 1 quote 413 PASSENGER WINDOWS Add Thermo Guard to Ricon Standard Frame 1 quote
414 PASSENGER WINDOWS Add Thermo Guard to Ricon Hidden Frame/Bonded 1 quote
415 PASSENGER WINDOWS Arow Standard Frame, Safety Glass--Full Sliders 1 $ 11,421.86 Yr1 Plus PPI Yr1 Plus PPI Yr1 Plus PPI Yr1 Plus PPI
416 PASSENGER WINDOWS Arow Standard Frame, Safety Glass--Full Fixed 1 quote 417 PASSENGER WINDOWS Arow Hidden Frame/Bonded--Full Fixed 1 quote 418 PASSENGER WINDOWS Add Thermo Guard to Arow Standard Frame 1 quote
419 PASSENGER WINDOWS Add Thermo Guard to Arow Hidden Frame/Bonded 1 quote
420 PASSENGER WINDOWS Add Window Guards (Acrylic or Film) 1 $ 1,546.88 Yr1 Plus PPI Yr1 Plus PPI Yr1 Plus PPI Yr1 Plus PPI
S-01 (JAN 18)9 of 14
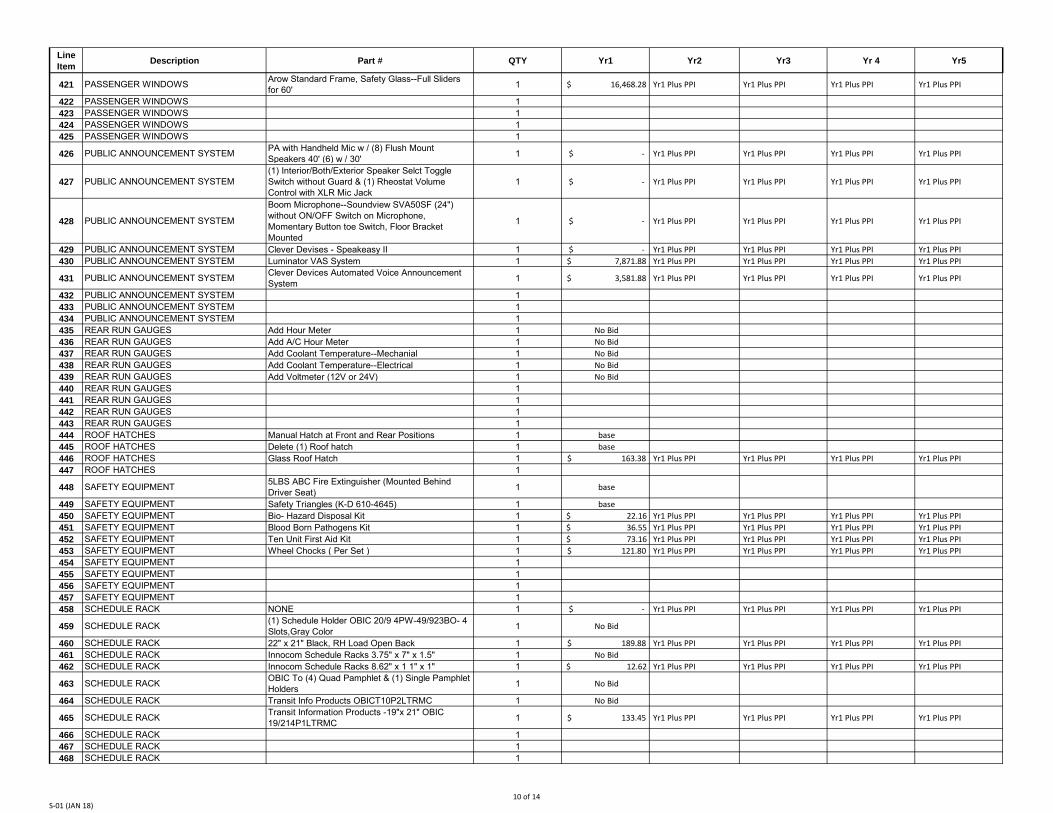
Line Item Description Part # QTY Yr1 Yr2 Yr3 Yr 4 Yr5
421 PASSENGER WINDOWS Arow Standard Frame, Safety Glass--Full Sliders for 60' 1 $ 16,468.28 Yr1 Plus PPI Yr1 Plus PPI Yr1 Plus PPI Yr1 Plus PPI
422 PASSENGER WINDOWS 1423 PASSENGER WINDOWS 1424 PASSENGER WINDOWS 1425 PASSENGER WINDOWS 1
426 PUBLIC ANNOUNCEMENT SYSTEM PA with Handheld Mic w / (8) Flush Mount Speakers 40' (6) w / 30' 1 $ - Yr1 Plus PPI Yr1 Plus PPI Yr1 Plus PPI Yr1 Plus PPI
427 PUBLIC ANNOUNCEMENT SYSTEM(1) Interior/Both/Exterior Speaker Selct Toggle Switch without Guard & (1) Rheostat Volume Control with XLR Mic Jack
1 $ - Yr1 Plus PPI Yr1 Plus PPI Yr1 Plus PPI Yr1 Plus PPI
428 PUBLIC ANNOUNCEMENT SYSTEM
Boom Microphone--Soundview SVA50SF (24") without ON/OFF Switch on Microphone, Momentary Button toe Switch, Floor Bracket Mounted
1 $ - Yr1 Plus PPI Yr1 Plus PPI Yr1 Plus PPI Yr1 Plus PPI
429 PUBLIC ANNOUNCEMENT SYSTEM Clever Devises - Speakeasy II 1 $ - Yr1 Plus PPI Yr1 Plus PPI Yr1 Plus PPI Yr1 Plus PPI 430 PUBLIC ANNOUNCEMENT SYSTEM Luminator VAS System 1 $ 7,871.88 Yr1 Plus PPI Yr1 Plus PPI Yr1 Plus PPI Yr1 Plus PPI
431 PUBLIC ANNOUNCEMENT SYSTEM Clever Devices Automated Voice Announcement System 1 $ 3,581.88 Yr1 Plus PPI Yr1 Plus PPI Yr1 Plus PPI Yr1 Plus PPI
432 PUBLIC ANNOUNCEMENT SYSTEM 1433 PUBLIC ANNOUNCEMENT SYSTEM 1434 PUBLIC ANNOUNCEMENT SYSTEM 1435 REAR RUN GAUGES Add Hour Meter 1 No Bid 436 REAR RUN GAUGES Add A/C Hour Meter 1 No Bid 437 REAR RUN GAUGES Add Coolant Temperature--Mechanial 1 No Bid 438 REAR RUN GAUGES Add Coolant Temperature--Electrical 1 No Bid 439 REAR RUN GAUGES Add Voltmeter (12V or 24V) 1 No Bid 440 REAR RUN GAUGES 1441 REAR RUN GAUGES 1442 REAR RUN GAUGES 1443 REAR RUN GAUGES 1444 ROOF HATCHES Manual Hatch at Front and Rear Positions 1 base 445 ROOF HATCHES Delete (1) Roof hatch 1 base 446 ROOF HATCHES Glass Roof Hatch 1 $ 163.38 Yr1 Plus PPI Yr1 Plus PPI Yr1 Plus PPI Yr1 Plus PPI 447 ROOF HATCHES 1
448 SAFETY EQUIPMENT 5LBS ABC Fire Extinguisher (Mounted Behind Driver Seat) 1 base
449 SAFETY EQUIPMENT Safety Triangles (K-D 610-4645) 1 base 450 SAFETY EQUIPMENT Bio- Hazard Disposal Kit 1 $ 22.16 Yr1 Plus PPI Yr1 Plus PPI Yr1 Plus PPI Yr1 Plus PPI 451 SAFETY EQUIPMENT Blood Born Pathogens Kit 1 $ 36.55 Yr1 Plus PPI Yr1 Plus PPI Yr1 Plus PPI Yr1 Plus PPI 452 SAFETY EQUIPMENT Ten Unit First Aid Kit 1 $ 73.16 Yr1 Plus PPI Yr1 Plus PPI Yr1 Plus PPI Yr1 Plus PPI 453 SAFETY EQUIPMENT Wheel Chocks ( Per Set ) 1 $ 121.80 Yr1 Plus PPI Yr1 Plus PPI Yr1 Plus PPI Yr1 Plus PPI 454 SAFETY EQUIPMENT 1455 SAFETY EQUIPMENT 1456 SAFETY EQUIPMENT 1457 SAFETY EQUIPMENT 1458 SCHEDULE RACK NONE 1 $ - Yr1 Plus PPI Yr1 Plus PPI Yr1 Plus PPI Yr1 Plus PPI
459 SCHEDULE RACK (1) Schedule Holder OBIC 20/9 4PW-49/923BO- 4 Slots,Gray Color 1 No Bid
460 SCHEDULE RACK 22" x 21" Black, RH Load Open Back 1 $ 189.88 Yr1 Plus PPI Yr1 Plus PPI Yr1 Plus PPI Yr1 Plus PPI 461 SCHEDULE RACK Innocom Schedule Racks 3.75" x 7" x 1.5" 1 No Bid 462 SCHEDULE RACK Innocom Schedule Racks 8.62" x 1 1" x 1" 1 $ 12.62 Yr1 Plus PPI Yr1 Plus PPI Yr1 Plus PPI Yr1 Plus PPI
463 SCHEDULE RACK OBIC To (4) Quad Pamphlet & (1) Single Pamphlet Holders 1 No Bid
464 SCHEDULE RACK Transit Info Products OBICT10P2LTRMC 1 No Bid
465 SCHEDULE RACK Transit Information Products -19"x 21" OBIC 19/214P1LTRMC 1 $ 133.45 Yr1 Plus PPI Yr1 Plus PPI Yr1 Plus PPI Yr1 Plus PPI
466 SCHEDULE RACK 1467 SCHEDULE RACK 1468 SCHEDULE RACK 1
S-01 (JAN 18)10 of 14
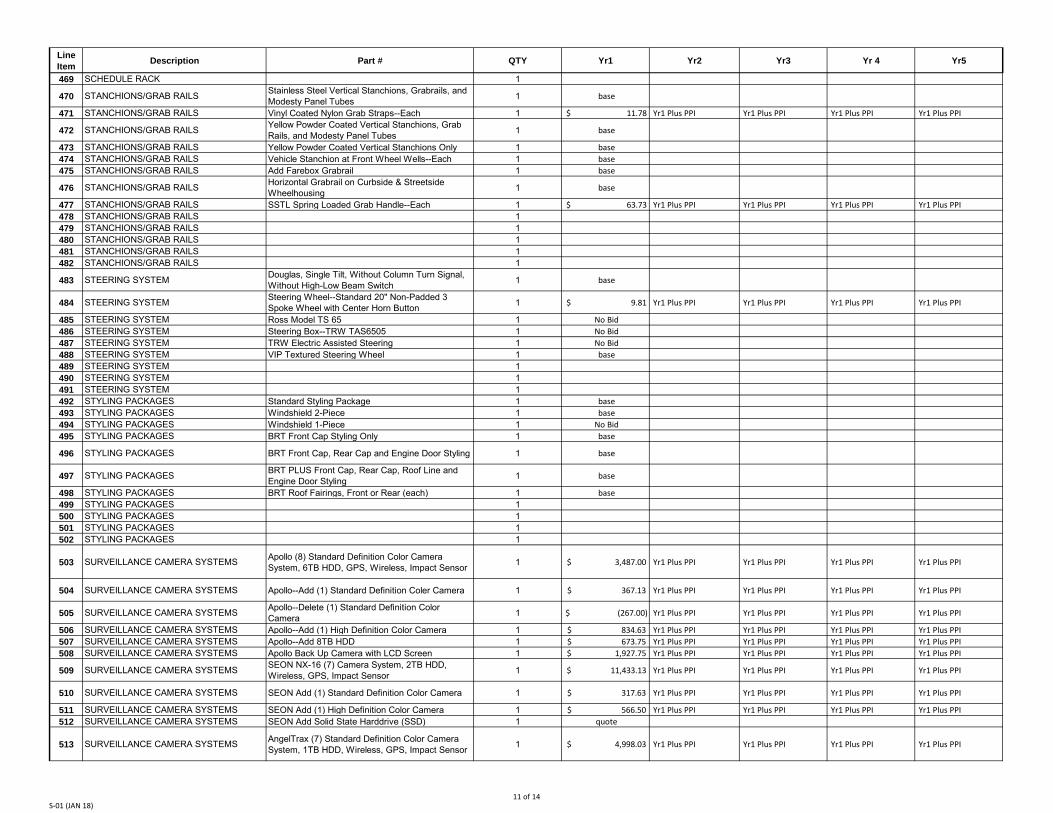
Line Item Description Part # QTY Yr1 Yr2 Yr3 Yr 4 Yr5
469 SCHEDULE RACK 1
470 STANCHIONS/GRAB RAILS Stainless Steel Vertical Stanchions, Grabrails, and Modesty Panel Tubes 1 base
471 STANCHIONS/GRAB RAILS Vinyl Coated Nylon Grab Straps--Each 1 $ 11.78 Yr1 Plus PPI Yr1 Plus PPI Yr1 Plus PPI Yr1 Plus PPI
472 STANCHIONS/GRAB RAILS Yellow Powder Coated Vertical Stanchions, Grab Rails, and Modesty Panel Tubes 1 base
473 STANCHIONS/GRAB RAILS Yellow Powder Coated Vertical Stanchions Only 1 base 474 STANCHIONS/GRAB RAILS Vehicle Stanchion at Front Wheel Wells--Each 1 base 475 STANCHIONS/GRAB RAILS Add Farebox Grabrail 1 base
476 STANCHIONS/GRAB RAILS Horizontal Grabrail on Curbside & Streetside Wheelhousing 1 base
477 STANCHIONS/GRAB RAILS SSTL Spring Loaded Grab Handle--Each 1 $ 63.73 Yr1 Plus PPI Yr1 Plus PPI Yr1 Plus PPI Yr1 Plus PPI 478 STANCHIONS/GRAB RAILS 1479 STANCHIONS/GRAB RAILS 1480 STANCHIONS/GRAB RAILS 1481 STANCHIONS/GRAB RAILS 1482 STANCHIONS/GRAB RAILS 1
483 STEERING SYSTEM Douglas, Single Tilt, Without Column Turn Signal, Without High-Low Beam Switch 1 base
484 STEERING SYSTEM Steering Wheel--Standard 20" Non-Padded 3 Spoke Wheel with Center Horn Button 1 $ 9.81 Yr1 Plus PPI Yr1 Plus PPI Yr1 Plus PPI Yr1 Plus PPI
485 STEERING SYSTEM Ross Model TS 65 1 No Bid 486 STEERING SYSTEM Steering Box--TRW TAS6505 1 No Bid 487 STEERING SYSTEM TRW Electric Assisted Steering 1 No Bid 488 STEERING SYSTEM VIP Textured Steering Wheel 1 base 489 STEERING SYSTEM 1490 STEERING SYSTEM 1491 STEERING SYSTEM 1492 STYLING PACKAGES Standard Styling Package 1 base 493 STYLING PACKAGES Windshield 2-Piece 1 base 494 STYLING PACKAGES Windshield 1-Piece 1 No Bid 495 STYLING PACKAGES BRT Front Cap Styling Only 1 base
496 STYLING PACKAGES BRT Front Cap, Rear Cap and Engine Door Styling 1 base
497 STYLING PACKAGES BRT PLUS Front Cap, Rear Cap, Roof Line and Engine Door Styling 1 base
498 STYLING PACKAGES BRT Roof Fairings, Front or Rear (each) 1 base 499 STYLING PACKAGES 1500 STYLING PACKAGES 1501 STYLING PACKAGES 1502 STYLING PACKAGES 1
503 SURVEILLANCE CAMERA SYSTEMS Apollo (8) Standard Definition Color Camera System, 6TB HDD, GPS, Wireless, Impact Sensor 1 $ 3,487.00 Yr1 Plus PPI Yr1 Plus PPI Yr1 Plus PPI Yr1 Plus PPI
504 SURVEILLANCE CAMERA SYSTEMS Apollo--Add (1) Standard Definition Coler Camera 1 $ 367.13 Yr1 Plus PPI Yr1 Plus PPI Yr1 Plus PPI Yr1 Plus PPI
505 SURVEILLANCE CAMERA SYSTEMS Apollo--Delete (1) Standard Definition Color Camera 1 $ (267.00) Yr1 Plus PPI Yr1 Plus PPI Yr1 Plus PPI Yr1 Plus PPI
506 SURVEILLANCE CAMERA SYSTEMS Apollo--Add (1) High Definition Color Camera 1 $ 834.63 Yr1 Plus PPI Yr1 Plus PPI Yr1 Plus PPI Yr1 Plus PPI 507 SURVEILLANCE CAMERA SYSTEMS Apollo--Add 8TB HDD 1 $ 673.75 Yr1 Plus PPI Yr1 Plus PPI Yr1 Plus PPI Yr1 Plus PPI 508 SURVEILLANCE CAMERA SYSTEMS Apollo Back Up Camera with LCD Screen 1 $ 1,927.75 Yr1 Plus PPI Yr1 Plus PPI Yr1 Plus PPI Yr1 Plus PPI
509 SURVEILLANCE CAMERA SYSTEMS SEON NX-16 (7) Camera System, 2TB HDD, Wireless, GPS, Impact Sensor 1 $ 11,433.13 Yr1 Plus PPI Yr1 Plus PPI Yr1 Plus PPI Yr1 Plus PPI
510 SURVEILLANCE CAMERA SYSTEMS SEON Add (1) Standard Definition Color Camera 1 $ 317.63 Yr1 Plus PPI Yr1 Plus PPI Yr1 Plus PPI Yr1 Plus PPI
511 SURVEILLANCE CAMERA SYSTEMS SEON Add (1) High Definition Color Camera 1 $ 566.50 Yr1 Plus PPI Yr1 Plus PPI Yr1 Plus PPI Yr1 Plus PPI 512 SURVEILLANCE CAMERA SYSTEMS SEON Add Solid State Harddrive (SSD) 1 quote
513 SURVEILLANCE CAMERA SYSTEMS AngelTrax (7) Standard Definition Color Camera System, 1TB HDD, Wireless, GPS, Impact Sensor 1 $ 4,998.03 Yr1 Plus PPI Yr1 Plus PPI Yr1 Plus PPI Yr1 Plus PPI
S-01 (JAN 18)11 of 14
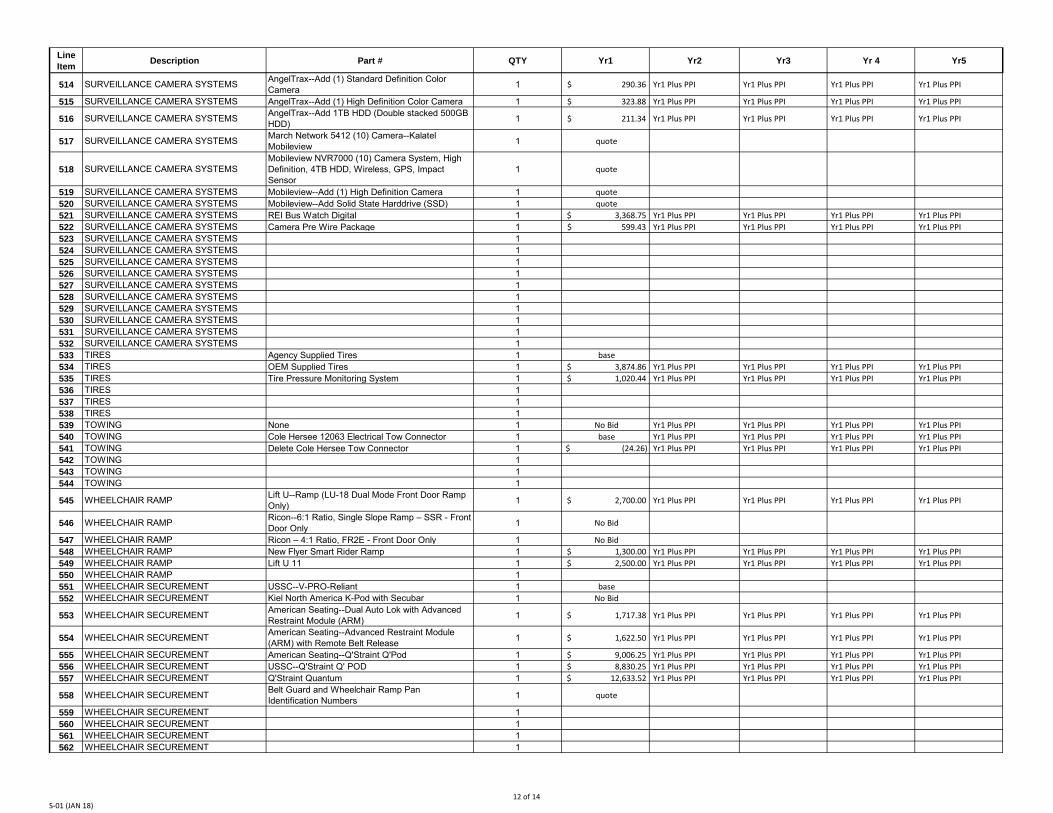
Line Item Description Part # QTY Yr1 Yr2 Yr3 Yr 4 Yr5
514 SURVEILLANCE CAMERA SYSTEMS AngelTrax--Add (1) Standard Definition Color Camera 1 $ 290.36 Yr1 Plus PPI Yr1 Plus PPI Yr1 Plus PPI Yr1 Plus PPI
515 SURVEILLANCE CAMERA SYSTEMS AngelTrax--Add (1) High Definition Color Camera 1 $ 323.88 Yr1 Plus PPI Yr1 Plus PPI Yr1 Plus PPI Yr1 Plus PPI
516 SURVEILLANCE CAMERA SYSTEMS AngelTrax--Add 1TB HDD (Double stacked 500GB HDD) 1 $ 211.34 Yr1 Plus PPI Yr1 Plus PPI Yr1 Plus PPI Yr1 Plus PPI
517 SURVEILLANCE CAMERA SYSTEMS March Network 5412 (10) Camera--Kalatel Mobileview 1 quote
518 SURVEILLANCE CAMERA SYSTEMSMobileview NVR7000 (10) Camera System, High Definition, 4TB HDD, Wireless, GPS, Impact Sensor
1 quote
519 SURVEILLANCE CAMERA SYSTEMS Mobileview--Add (1) High Definition Camera 1 quote 520 SURVEILLANCE CAMERA SYSTEMS Mobileview--Add Solid State Harddrive (SSD) 1 quote 521 SURVEILLANCE CAMERA SYSTEMS REI Bus Watch Digital 1 $ 3,368.75 Yr1 Plus PPI Yr1 Plus PPI Yr1 Plus PPI Yr1 Plus PPI 522 SURVEILLANCE CAMERA SYSTEMS Camera Pre Wire Package 1 $ 599.43 Yr1 Plus PPI Yr1 Plus PPI Yr1 Plus PPI Yr1 Plus PPI 523 SURVEILLANCE CAMERA SYSTEMS 1524 SURVEILLANCE CAMERA SYSTEMS 1525 SURVEILLANCE CAMERA SYSTEMS 1526 SURVEILLANCE CAMERA SYSTEMS 1527 SURVEILLANCE CAMERA SYSTEMS 1528 SURVEILLANCE CAMERA SYSTEMS 1529 SURVEILLANCE CAMERA SYSTEMS 1530 SURVEILLANCE CAMERA SYSTEMS 1531 SURVEILLANCE CAMERA SYSTEMS 1532 SURVEILLANCE CAMERA SYSTEMS 1533 TIRES Agency Supplied Tires 1 base 534 TIRES OEM Supplied Tires 1 $ 3,874.86 Yr1 Plus PPI Yr1 Plus PPI Yr1 Plus PPI Yr1 Plus PPI 535 TIRES Tire Pressure Monitoring System 1 $ 1,020.44 Yr1 Plus PPI Yr1 Plus PPI Yr1 Plus PPI Yr1 Plus PPI 536 TIRES 1537 TIRES 1538 TIRES 1539 TOWING None 1 No Bid Yr1 Plus PPI Yr1 Plus PPI Yr1 Plus PPI Yr1 Plus PPI 540 TOWING Cole Hersee 12063 Electrical Tow Connector 1 base Yr1 Plus PPI Yr1 Plus PPI Yr1 Plus PPI Yr1 Plus PPI 541 TOWING Delete Cole Hersee Tow Connector 1 $ (24.26) Yr1 Plus PPI Yr1 Plus PPI Yr1 Plus PPI Yr1 Plus PPI 542 TOWING 1543 TOWING 1544 TOWING 1
545 WHEELCHAIR RAMP Lift U--Ramp (LU-18 Dual Mode Front Door Ramp Only) 1 $ 2,700.00 Yr1 Plus PPI Yr1 Plus PPI Yr1 Plus PPI Yr1 Plus PPI
546 WHEELCHAIR RAMP Ricon--6:1 Ratio, Single Slope Ramp – SSR - Front Door Only 1 No Bid
547 WHEELCHAIR RAMP Ricon – 4:1 Ratio, FR2E - Front Door Only 1 No Bid 548 WHEELCHAIR RAMP New Flyer Smart Rider Ramp 1 $ 1,300.00 Yr1 Plus PPI Yr1 Plus PPI Yr1 Plus PPI Yr1 Plus PPI 549 WHEELCHAIR RAMP Lift U 11 1 $ 2,500.00 Yr1 Plus PPI Yr1 Plus PPI Yr1 Plus PPI Yr1 Plus PPI 550 WHEELCHAIR RAMP 1551 WHEELCHAIR SECUREMENT USSC--V-PRO-Reliant 1 base 552 WHEELCHAIR SECUREMENT Kiel North America K-Pod with Secubar 1 No Bid
553 WHEELCHAIR SECUREMENT American Seating--Dual Auto Lok with Advanced Restraint Module (ARM) 1 $ 1,717.38 Yr1 Plus PPI Yr1 Plus PPI Yr1 Plus PPI Yr1 Plus PPI
554 WHEELCHAIR SECUREMENT American Seating--Advanced Restraint Module (ARM) with Remote Belt Release 1 $ 1,622.50 Yr1 Plus PPI Yr1 Plus PPI Yr1 Plus PPI Yr1 Plus PPI
555 WHEELCHAIR SECUREMENT American Seating--Q'Straint Q'Pod 1 $ 9,006.25 Yr1 Plus PPI Yr1 Plus PPI Yr1 Plus PPI Yr1 Plus PPI 556 WHEELCHAIR SECUREMENT USSC--Q'Straint Q' POD 1 $ 8,830.25 Yr1 Plus PPI Yr1 Plus PPI Yr1 Plus PPI Yr1 Plus PPI 557 WHEELCHAIR SECUREMENT Q'Straint Quantum 1 $ 12,633.52 Yr1 Plus PPI Yr1 Plus PPI Yr1 Plus PPI Yr1 Plus PPI
558 WHEELCHAIR SECUREMENT Belt Guard and Wheelchair Ramp Pan Identification Numbers 1 quote
559 WHEELCHAIR SECUREMENT 1560 WHEELCHAIR SECUREMENT 1561 WHEELCHAIR SECUREMENT 1562 WHEELCHAIR SECUREMENT 1
S-01 (JAN 18)12 of 14
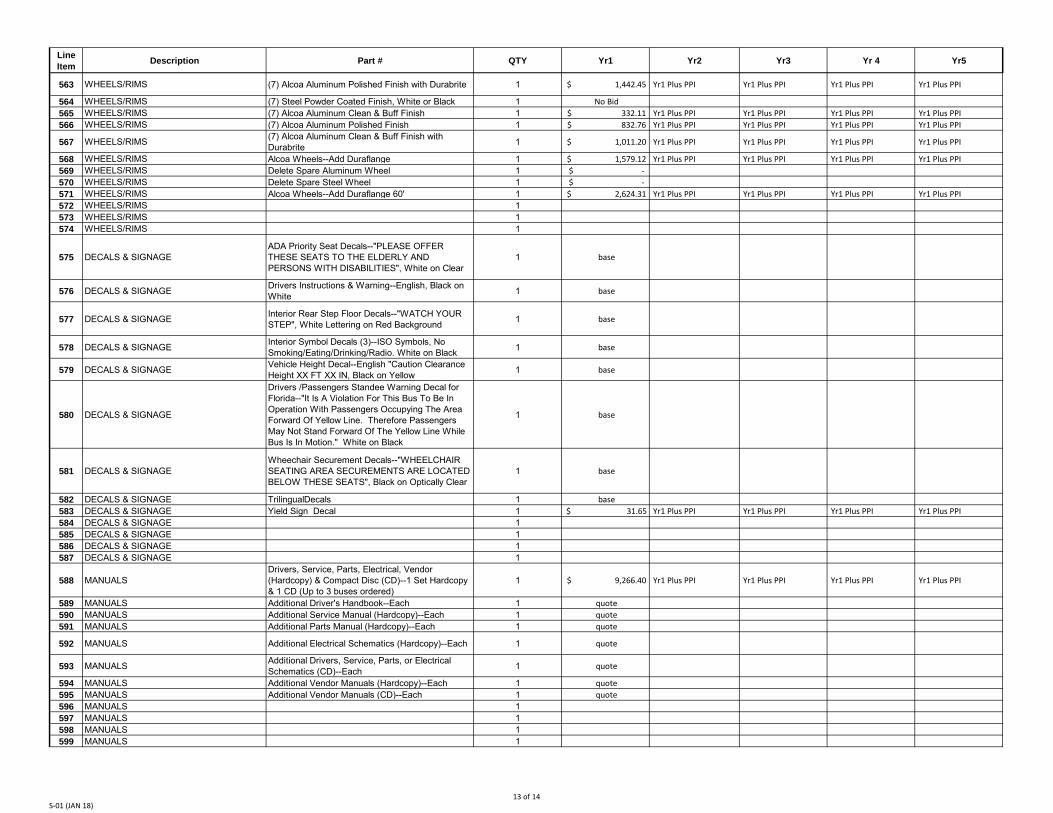
Line Item Description Part # QTY Yr1 Yr2 Yr3 Yr 4 Yr5
563 WHEELS/RIMS (7) Alcoa Aluminum Polished Finish with Durabrite 1 $ 1,442.45 Yr1 Plus PPI Yr1 Plus PPI Yr1 Plus PPI Yr1 Plus PPI
564 WHEELS/RIMS (7) Steel Powder Coated Finish, White or Black 1 No Bid 565 WHEELS/RIMS (7) Alcoa Aluminum Clean & Buff Finish 1 $ 332.11 Yr1 Plus PPI Yr1 Plus PPI Yr1 Plus PPI Yr1 Plus PPI 566 WHEELS/RIMS (7) Alcoa Aluminum Polished Finish 1 $ 832.76 Yr1 Plus PPI Yr1 Plus PPI Yr1 Plus PPI Yr1 Plus PPI
567 WHEELS/RIMS (7) Alcoa Aluminum Clean & Buff Finish with Durabrite 1 $ 1,011.20 Yr1 Plus PPI Yr1 Plus PPI Yr1 Plus PPI Yr1 Plus PPI
568 WHEELS/RIMS Alcoa Wheels--Add Duraflange 1 $ 1,579.12 Yr1 Plus PPI Yr1 Plus PPI Yr1 Plus PPI Yr1 Plus PPI 569 WHEELS/RIMS Delete Spare Aluminum Wheel 1 $ - 570 WHEELS/RIMS Delete Spare Steel Wheel 1 $ - 571 WHEELS/RIMS Alcoa Wheels--Add Duraflange 60' 1 $ 2,624.31 Yr1 Plus PPI Yr1 Plus PPI Yr1 Plus PPI Yr1 Plus PPI 572 WHEELS/RIMS 1573 WHEELS/RIMS 1574 WHEELS/RIMS 1
575 DECALS & SIGNAGEADA Priority Seat Decals--"PLEASE OFFER THESE SEATS TO THE ELDERLY AND PERSONS WITH DISABILITIES", White on Clear
1 base
576 DECALS & SIGNAGE Drivers Instructions & Warning--English, Black on White 1 base
577 DECALS & SIGNAGE Interior Rear Step Floor Decals--"WATCH YOUR STEP", White Lettering on Red Background 1 base
578 DECALS & SIGNAGE Interior Symbol Decals (3)--ISO Symbols, No Smoking/Eating/Drinking/Radio. White on Black 1 base
579 DECALS & SIGNAGE Vehicle Height Decal--English "Caution Clearance Height XX FT XX IN, Black on Yellow 1 base
580 DECALS & SIGNAGE
Drivers /Passengers Standee Warning Decal for Florida--"It Is A Violation For This Bus To Be In Operation With Passengers Occupying The Area Forward Of Yellow Line. Therefore Passengers May Not Stand Forward Of The Yellow Line While Bus Is In Motion." White on Black
1 base
581 DECALS & SIGNAGEWheechair Securement Decals--"WHEELCHAIR SEATING AREA SECUREMENTS ARE LOCATED BELOW THESE SEATS", Black on Optically Clear
1 base
582 DECALS & SIGNAGE TrilingualDecals 1 base 583 DECALS & SIGNAGE Yield Sign Decal 1 $ 31.65 Yr1 Plus PPI Yr1 Plus PPI Yr1 Plus PPI Yr1 Plus PPI 584 DECALS & SIGNAGE 1585 DECALS & SIGNAGE 1586 DECALS & SIGNAGE 1587 DECALS & SIGNAGE 1
588 MANUALSDrivers, Service, Parts, Electrical, Vendor (Hardcopy) & Compact Disc (CD)--1 Set Hardcopy & 1 CD (Up to 3 buses ordered)
1 $ 9,266.40 Yr1 Plus PPI Yr1 Plus PPI Yr1 Plus PPI Yr1 Plus PPI
589 MANUALS Additional Driver's Handbook--Each 1 quote 590 MANUALS Additional Service Manual (Hardcopy)--Each 1 quote 591 MANUALS Additional Parts Manual (Hardcopy)--Each 1 quote
592 MANUALS Additional Electrical Schematics (Hardcopy)--Each 1 quote
593 MANUALS Additional Drivers, Service, Parts, or Electrical Schematics (CD)--Each 1 quote
594 MANUALS Additional Vendor Manuals (Hardcopy)--Each 1 quote 595 MANUALS Additional Vendor Manuals (CD)--Each 1 quote 596 MANUALS 1597 MANUALS 1598 MANUALS 1599 MANUALS 1
S-01 (JAN 18)13 of 14
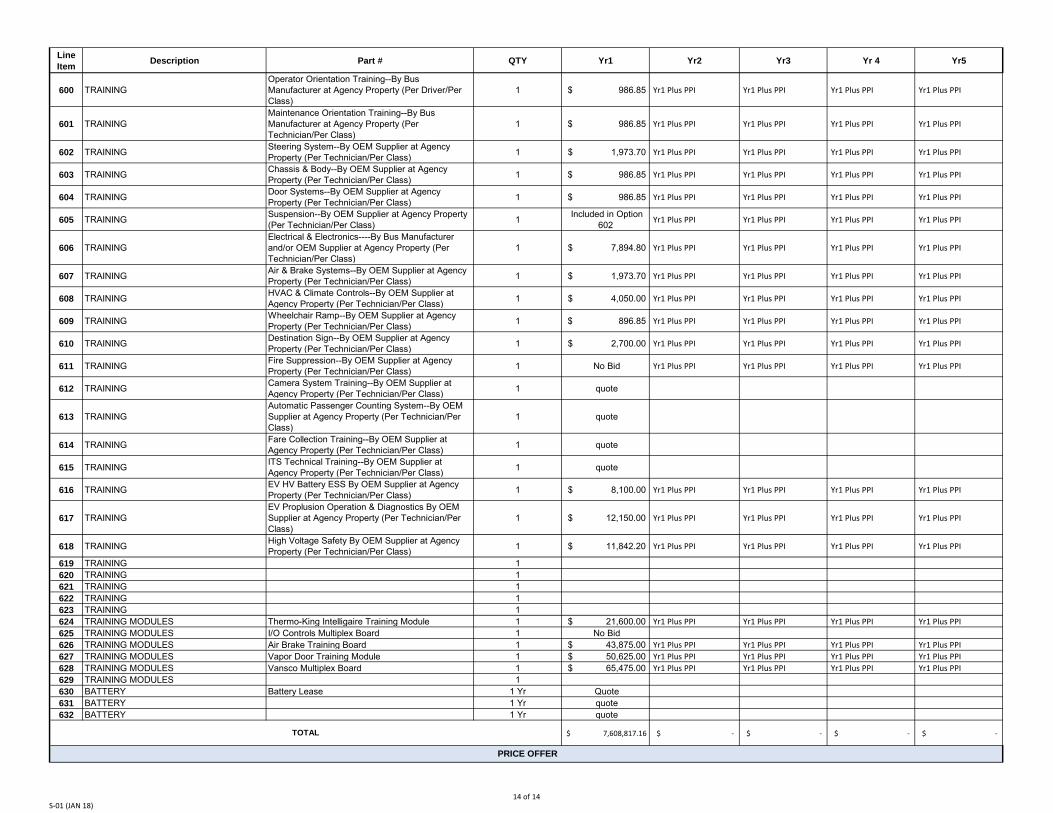
Line Item Description Part # QTY Yr1 Yr2 Yr3 Yr 4 Yr5
600 TRAININGOperator Orientation Training--By Bus Manufacturer at Agency Property (Per Driver/Per Class)
1 $ 986.85 Yr1 Plus PPI Yr1 Plus PPI Yr1 Plus PPI Yr1 Plus PPI
601 TRAININGMaintenance Orientation Training--By Bus Manufacturer at Agency Property (Per Technician/Per Class)
1 $ 986.85 Yr1 Plus PPI Yr1 Plus PPI Yr1 Plus PPI Yr1 Plus PPI
602 TRAINING Steering System--By OEM Supplier at Agency Property (Per Technician/Per Class) 1 $ 1,973.70 Yr1 Plus PPI Yr1 Plus PPI Yr1 Plus PPI Yr1 Plus PPI
603 TRAINING Chassis & Body--By OEM Supplier at Agency Property (Per Technician/Per Class) 1 $ 986.85 Yr1 Plus PPI Yr1 Plus PPI Yr1 Plus PPI Yr1 Plus PPI
604 TRAINING Door Systems--By OEM Supplier at Agency Property (Per Technician/Per Class) 1 $ 986.85 Yr1 Plus PPI Yr1 Plus PPI Yr1 Plus PPI Yr1 Plus PPI
605 TRAINING Suspension--By OEM Supplier at Agency Property (Per Technician/Per Class) 1 Included in Option
602 Yr1 Plus PPI Yr1 Plus PPI Yr1 Plus PPI Yr1 Plus PPI
606 TRAININGElectrical & Electronics----By Bus Manufacturer and/or OEM Supplier at Agency Property (Per Technician/Per Class)
1 $ 7,894.80 Yr1 Plus PPI Yr1 Plus PPI Yr1 Plus PPI Yr1 Plus PPI
607 TRAINING Air & Brake Systems--By OEM Supplier at Agency Property (Per Technician/Per Class) 1 $ 1,973.70 Yr1 Plus PPI Yr1 Plus PPI Yr1 Plus PPI Yr1 Plus PPI
608 TRAINING HVAC & Climate Controls--By OEM Supplier at Agency Property (Per Technician/Per Class) 1 $ 4,050.00 Yr1 Plus PPI Yr1 Plus PPI Yr1 Plus PPI Yr1 Plus PPI
609 TRAINING Wheelchair Ramp--By OEM Supplier at Agency Property (Per Technician/Per Class) 1 $ 896.85 Yr1 Plus PPI Yr1 Plus PPI Yr1 Plus PPI Yr1 Plus PPI
610 TRAINING Destination Sign--By OEM Supplier at Agency Property (Per Technician/Per Class) 1 $ 2,700.00 Yr1 Plus PPI Yr1 Plus PPI Yr1 Plus PPI Yr1 Plus PPI
611 TRAINING Fire Suppression--By OEM Supplier at Agency Property (Per Technician/Per Class) 1 No Bid Yr1 Plus PPI Yr1 Plus PPI Yr1 Plus PPI Yr1 Plus PPI
612 TRAINING Camera System Training--By OEM Supplier at Agency Property (Per Technician/Per Class) 1 quote
613 TRAININGAutomatic Passenger Counting System--By OEM Supplier at Agency Property (Per Technician/Per Class)
1 quote
614 TRAINING Fare Collection Training--By OEM Supplier at Agency Property (Per Technician/Per Class) 1 quote
615 TRAINING ITS Technical Training--By OEM Supplier at Agency Property (Per Technician/Per Class) 1 quote
616 TRAINING EV HV Battery ESS By OEM Supplier at Agency Property (Per Technician/Per Class) 1 $ 8,100.00 Yr1 Plus PPI Yr1 Plus PPI Yr1 Plus PPI Yr1 Plus PPI
617 TRAININGEV Proplusion Operation & Diagnostics By OEM Supplier at Agency Property (Per Technician/Per Class)
1 $ 12,150.00 Yr1 Plus PPI Yr1 Plus PPI Yr1 Plus PPI Yr1 Plus PPI
618 TRAINING High Voltage Safety By OEM Supplier at Agency Property (Per Technician/Per Class) 1 $ 11,842.20 Yr1 Plus PPI Yr1 Plus PPI Yr1 Plus PPI Yr1 Plus PPI
619 TRAINING 1620 TRAINING 1621 TRAINING 1622 TRAINING 1623 TRAINING 1624 TRAINING MODULES Thermo-King Intelligaire Training Module 1 $ 21,600.00 Yr1 Plus PPI Yr1 Plus PPI Yr1 Plus PPI Yr1 Plus PPI 625 TRAINING MODULES I/O Controls Multiplex Board 1 No Bid 626 TRAINING MODULES Air Brake Training Board 1 $ 43,875.00 Yr1 Plus PPI Yr1 Plus PPI Yr1 Plus PPI Yr1 Plus PPI 627 TRAINING MODULES Vapor Door Training Module 1 $ 50,625.00 Yr1 Plus PPI Yr1 Plus PPI Yr1 Plus PPI Yr1 Plus PPI 628 TRAINING MODULES Vansco Multiplex Board 1 $ 65,475.00 Yr1 Plus PPI Yr1 Plus PPI Yr1 Plus PPI Yr1 Plus PPI 629 TRAINING MODULES 1630 BATTERY Battery Lease 1 Yr Quote 631 BATTERY 1 Yr quote 632 BATTERY 1 Yr quote
$ 7,608,817.16 $ - $ - $ - $ - TOTAL
PRICE OFFER
S-01 (JAN 18)14 of 14
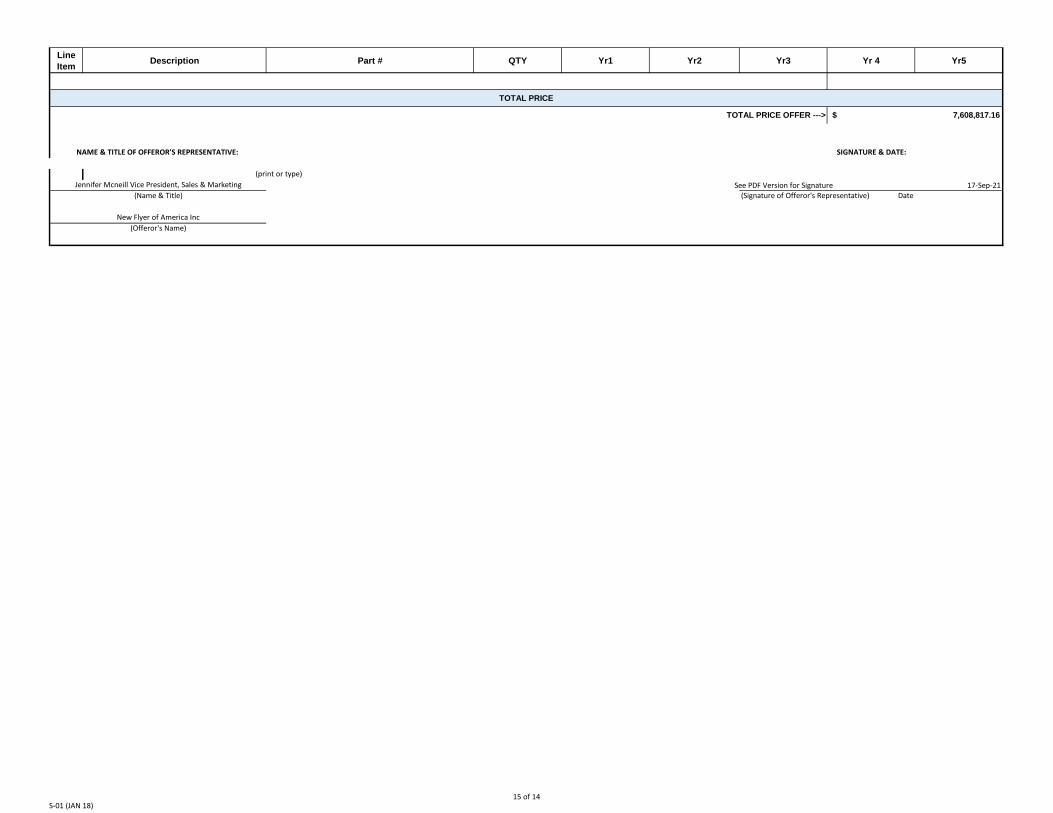
Line Item Description Part # QTY Yr1 Yr2 Yr3 Yr 4 Yr5
See PDF Version for Signature 17-Sep-21
TOTAL PRICE
TOTAL PRICE OFFER --->
New Flyer of America Inc(Offeror's Name)
$ 7,608,817.16
(print or type)
(Name & Title) (Signature of Offeror's Representative) DateJennifer Mcneill Vice President, Sales & Marketing
NAME & TITLE OF OFFEROR'S REPRESENTATIVE: SIGNATURE & DATE:
S-01 (JAN 18)15 of 14

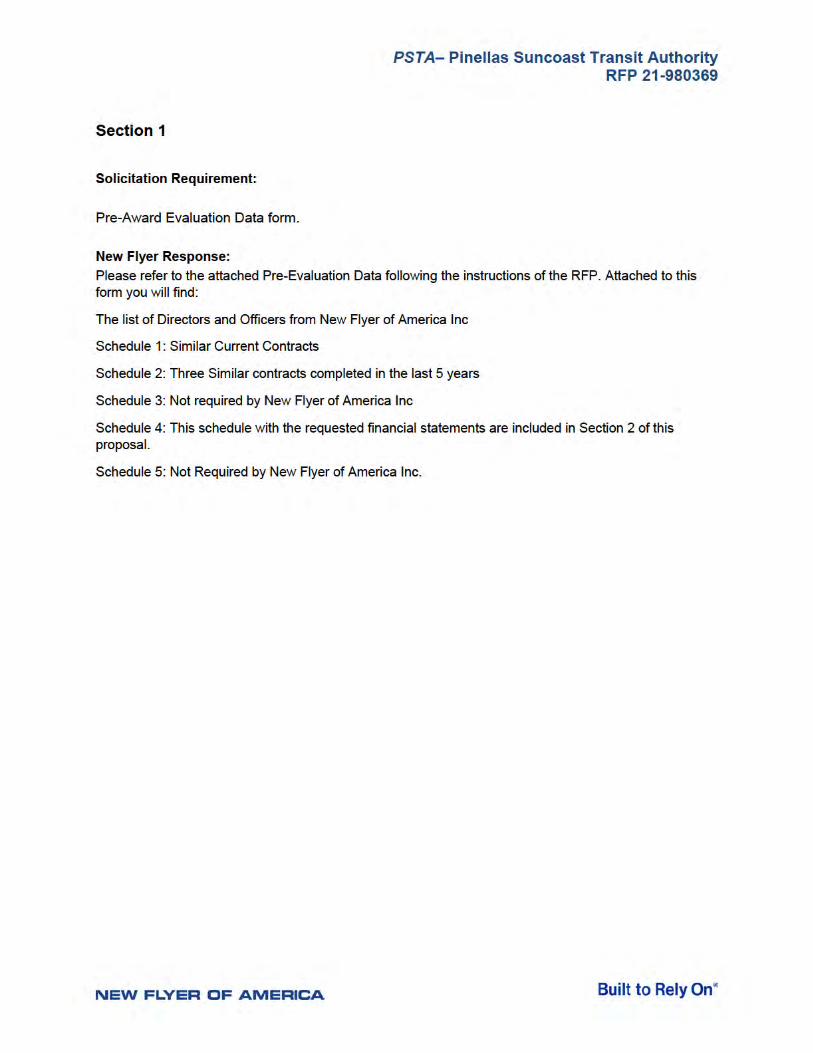
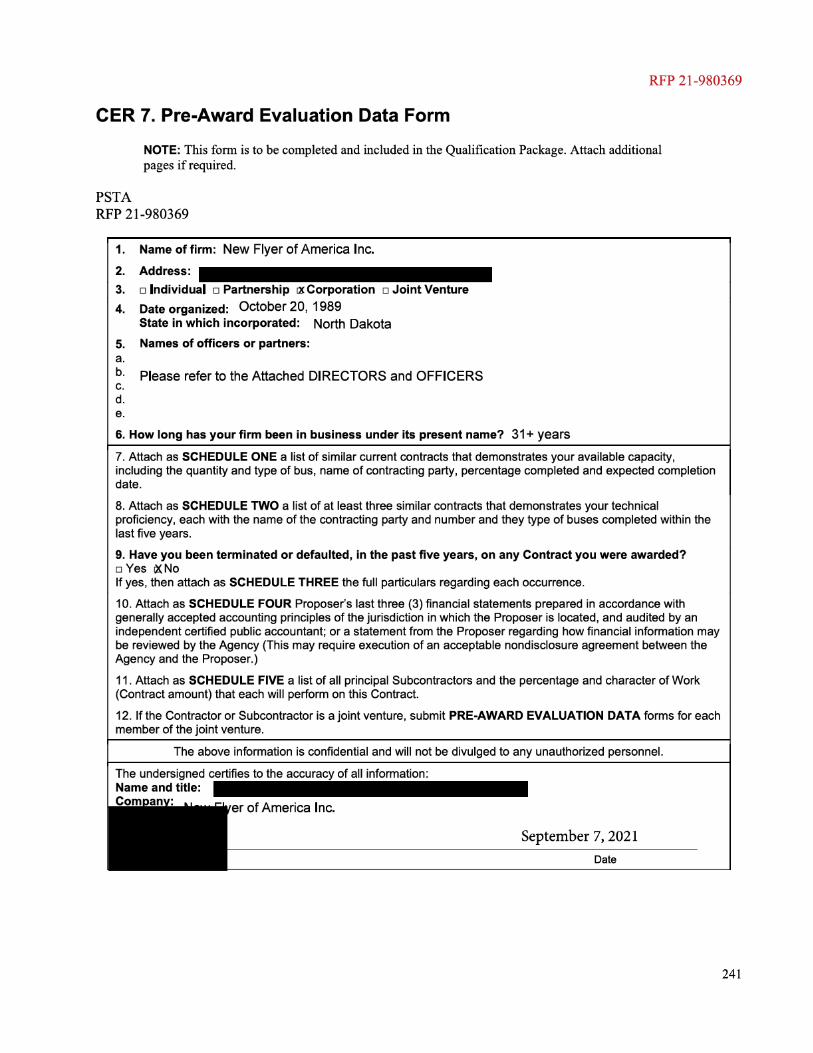


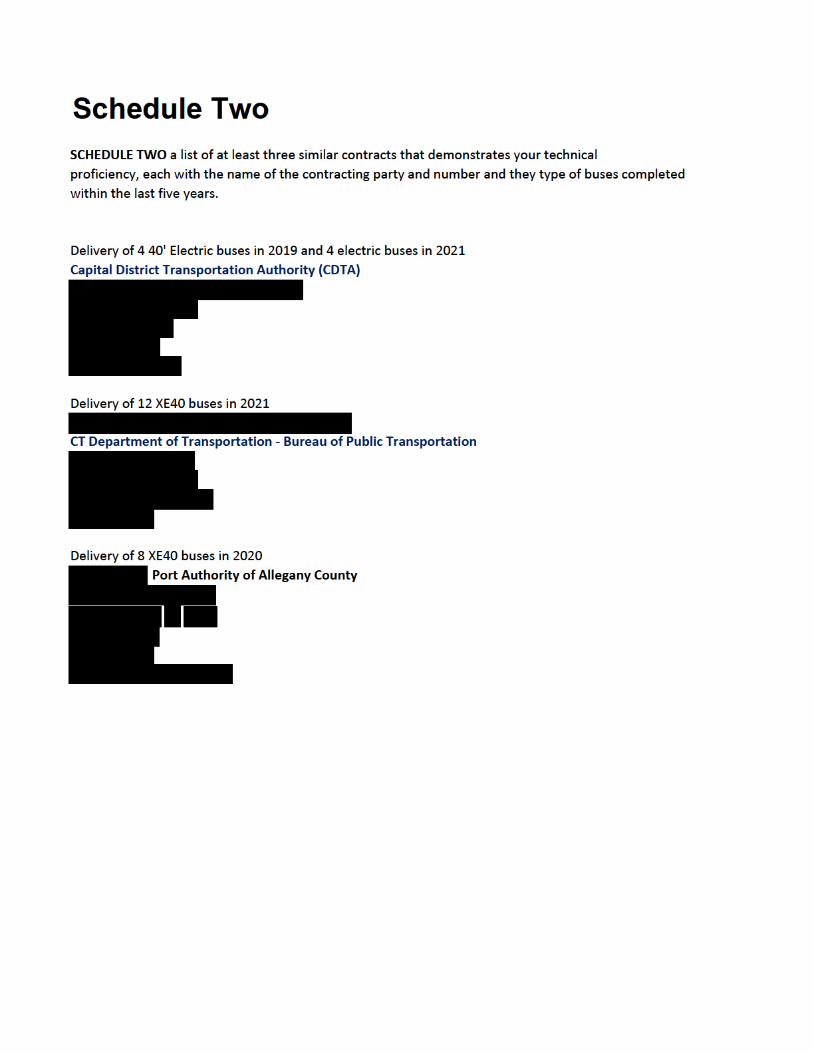

PSTA– Pinellas Suncoast Transit Authority RFP 21-980369
Section 2
Solicitation Requirement:
A copy of the three (3) most recent financial statements audited by an independent third party or a
statement from the Proposer regarding how financial information may be reviewed by the Agency.
New Flyer Response: Please refer to the attached financial reports from the last three (3) years from NFI Group. These reports are also available in our web site:
https://www.nfigroup.com/investor-relations/performance-reports/

Financial Results Fiscal 2020
March 4, 2021

NFI continues changing the game.
2 www.nfigroup.comNFI GROUP INC. 2020 REPORT
We continue to innovate and drive forward.
3 www.nfigroup.comNFI GROUP INC. 2020 REPORT

We provide comprehensive mobility solutions.
4 www.nfigroup.comNFI GROUP INC. 2020 REPORT
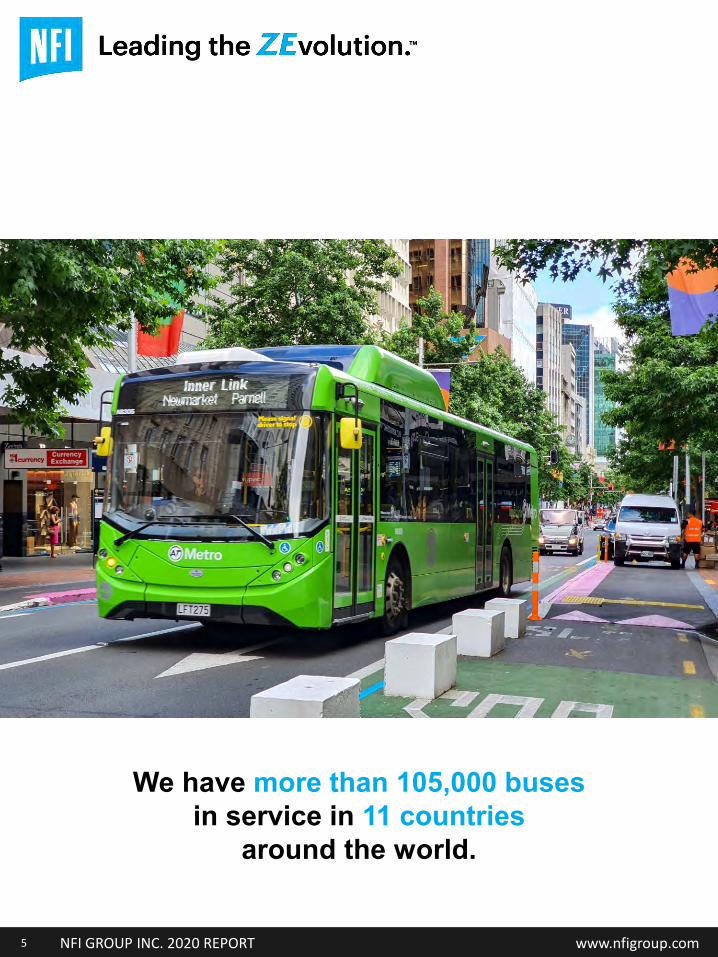
We have more than 105,000 buses in service in 11 countries
around the world.
5 www.nfigroup.comNFI GROUP INC. 2020 REPORT

We are leading the evolution to a zero-emission future.
6 www.nfigroup.comNFI GROUP INC. 2020 REPORT
NOTES TO READERSMANAGEMENT'S DISCUSSION AND ANALYSIS OF FINANCIAL CONDITION AND RESULTS OF OPERATIONS FORTHE 13-WEEKS AND 52-WEEKS ENDED DECEMBER 27, 2020
Information in this Management’s Discussion and Analysis (“MD&A”) relating to the financial condition and results ofoperations of NFI Group Inc. (“NFI” or the "Company") is supplemental to, and should be read in conjunction with, NFI’saudited consolidated financial statements (including notes) (the “Financial Statements”) for the 52-week period endedDecember 27, 2020.
This MD&A contains forward-looking statements, which are subject to a variety of factors that could cause actual results todiffer materially from those contemplated by such forward-looking statements, including, but not limited to, the factorsdescribed in the Company's public filings available on SEDAR at www.sedar.com. See “Forward-Looking Statements” inAppendix A. The Financial Statements have been prepared in accordance with International Financial ReportingStandards (“IFRS”) and, except where otherwise indicated, are presented in U.S. dollars, which is the functional currencyof NFI. Unless otherwise indicated, the financial information contained in this MD&A has been prepared in accordancewith IFRS and references to “$” or “dollars” mean U.S. dollars.
QUARTERLY AND ANNUAL REPORTING PERIODS
The quarterly and annual reporting periods for the current and prior year are as follows:
Period from December 30, 2019 to December 27, 2020 Period from December 31, 2018 to December 29, 2019
(“Fiscal 2020”) (“Fiscal 2019”)
Period End Date# of
Calendar Weeks
Period End Date# of
Calendar Weeks
Quarter 1 March 29, 2020 ("2020 Q1") 13 March 31, 2019 ("2019 Q1") 13
Quarter 2 June 28, 2020 ("2020 Q2") 13 June 30, 2019 ("2019 Q2") 13
Quarter 3 September 27, 2020 ("2020 Q3") 13 September 29, 2019 ("2019 Q3") 13
Quarter 4 December 27, 2020 ("2020 Q4") 13 December 29, 2019 ("2019 Q4") 13
Fiscal year December 27, 2020 52 December 29, 2019 52
7 www.nfigroup.comNFI GROUP INC. 2020 REPORT
Period from December 28, 2020 to January 2, 2022
(“Fiscal 2021”)
Period End Date# of
Calendar Weeks
Quarter 1 March 28, 2021 ("2021 Q1") 13
Quarter 2 June 27, 2021 ("2021 Q2") 13
Quarter 3 September 26, 2021 ("2021 Q3") 13
Quarter 4 January 2, 2022 ("2021 Q4") 14
Fiscal year January 2, 2022 53
The quarterly and annual reporting periods for Fiscal 2021 will be as follows:
NOTES TO READERSSpecific references and definitions are used throughout this MD&A, please see "Meaning of Certain References" and"Definitions of Adjusted EBITDA, return-on-invested-capital ("ROIC"), Free Cash Flow, Adjusted Net Earnings, AdjustedEarnings per Share, and Regions including: North America, UK and Europe, Asia Pacific, and Other" in Appendix A.References to LTM mean last-twelve months ("LTM"). Adjusted EBITDA, ROIC, Free Cash Flow, Adjusted Net Earningsand Adjusted Earnings per Share are non-IFRS measures and should not be considered substitutes or alternatives forIFRS measures. These are not defined terms under IFRS and do not have standard meanings, so may not be a reliableway to compare NFI to other companies. See the heading entitled: “Definitions of Adjusted EBITDA, ROIC, Free CashFlow, Adjusted Net Earnings, Adjusted Earnings Per Share, regions including: North America, UK and Europe, AsiaPacific, and Other" in Appendix A for information about these measures, including how they are calculated and the way inwhich they are used.
Buses manufactured by New Flyer and ADL's single and double deck buses are classified as "transit buses". ARBOCmanufactures body on-chassis or “cutaway” and "medium-duty" buses that service transit, paratransit, and shuttleapplications. Collectively, transit buses, medium-duty buses and cutaways, are referred to as "buses". A “motor coach” or“coach” is a 35-foot to 45-foot over-the-highway bus typically used for intercity transportation and travel over longerdistances than heavy-duty transit buses, and is typically characterized by (i) one or two axles in the rear (related to theweight of the vehicle), (ii) high deck floor, (iii) baggage compartment under the floor, (iv) high-backed seats with a coach-style interior (often including a lavatory), and (v) no room for standing passengers. “Product lines” include heavy-dutytransit buses, motor coaches, pre-owned coaches, cutaway and medium-duty buses.
Zero-emission buses ("ZEBs") consist of trolley-electric, hydrogen fuel cell-electric, and battery-electric buses. All of thedata presented in this MD&A with respect to the number of transit buses, medium-duty buses, cutaways and motorcoaches in service and delivered, is measured in, or based on, “equivalent units”. One equivalent unit (or “EU”) representsone production slot, being one 30-foot, 35-foot, 40-foot, 45-foot heavy-duty transit bus, one double deck bus, one medium-duty bus, one cutaway bus or one motor coach, whereas one articulated transit bus represents two equivalent units. Anarticulated transit bus is an extra-long transit bus (approximately 60-feet in length), composed of two passengercompartments connected by a joint mechanism. The joint mechanism allows the vehicle to bend when the bus turns acorner, yet have a continuous interior.
A summary of the Company’s order, delivery and backlog information can be found in Appendix B.
8 www.nfigroup.comNFI GROUP INC. 2020 REPORT
Dear Shareholders,
2020 is a year that none of us will ever forget.
As we began the year, we had a plan that would see us deliver record results, and were off toa great start with a solid first quarter. Then the COVID-19 global pandemic became ourreality. As the pandemic took hold in our geographies, few of us could ever have imaginedthe dramatic impact it would have on our world, our customers, our people, and ourbusiness.
While 2020 was a period of challenges, including an immediate standstill of private coachoperations, delayed public customer orders, idled facilities and furloughs, organizationalchanges, economic shocks, closed borders, and stay-at-home orders, we were extremelyproud to see the response of the NFI team around the world. In the midst of anunprecedented global pandemic, our people focused on the health and safety of their fellowteam members and on delivering for our customers. Transit is the spinal cord of cities,and most of our customers provide an essential service - one that connects cities andpeople, drives economic activity, and improves congestion and air quality. Throughout thepandemic, these operators delivered for their customers and ensured that, while the worldstopped, public transit kept moving. We're proud to be able to support these individuals ineverything they do, and we remain committed to ensuring our vehicles perform safely,reliably and meet all of our customers' expectations.
Our team worked tirelessly to achieve a balance in our decision-making and in dealing withthe realities of the pandemic. This included some very difficult decisions to reduce ouroperating costs, headcount and facility footprint. While there were no easy answers, ourpeople responded to the challenge and drove the NFI Forward initiative ("NFI Forward"), agroup-wide series of projects that is expected to transition NFI from a holding companystructure into a more integrated and efficient systems-driven organization.
The pandemic continues to disrupt all aspects of our daily lives, but there is hope on thehorizon. We are seeing ridership start to return and vaccines are now being deployed. Thereis enthusiasm and desire to re-open cities and start moving again. At NFI, we arecommitted to doing everything we can to make sure our vehicles are ready for the recoveryby offering products to increase onboard safety and cleanliness for our customers.
Looking beyond the pandemic, we held our annual Investor Day on January 11, 2021, wherewe outlined the future of NFI and had an opportunity to successfully connect virtually with ourstakeholder community. We received fantastic feedback from the event, so much so that wewill aim to make this an annual virtual event to continue to provide you with qualityinformation, insights and updates.
NFI is Leading the ZEvolutionTM: the evolution to a zero-emission future. (continued->)
9 www.nfigroup.comNFI GROUP INC. 2020 REPORT
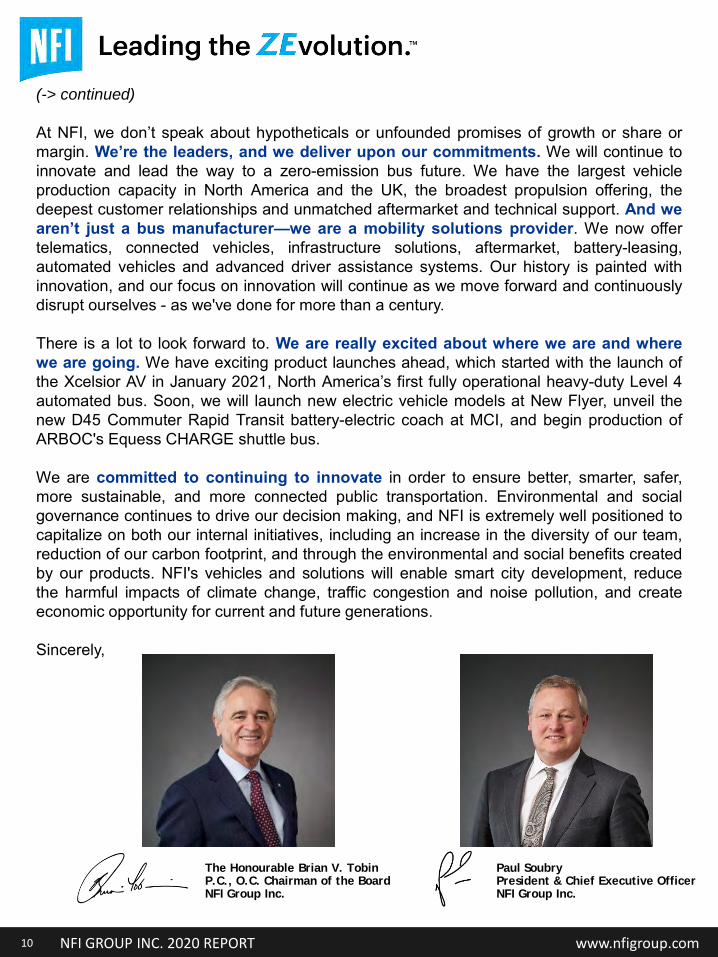
(-> continued)
At NFI, we don’t speak about hypotheticals or unfounded promises of growth or share ormargin. We’re the leaders, and we deliver upon our commitments. We will continue toinnovate and lead the way to a zero-emission bus future. We have the largest vehicleproduction capacity in North America and the UK, the broadest propulsion offering, thedeepest customer relationships and unmatched aftermarket and technical support. And wearen’t just a bus manufacturer—we are a mobility solutions provider. We now offertelematics, connected vehicles, infrastructure solutions, aftermarket, battery-leasing,automated vehicles and advanced driver assistance systems. Our history is painted withinnovation, and our focus on innovation will continue as we move forward and continuouslydisrupt ourselves - as we've done for more than a century.
There is a lot to look forward to. We are really excited about where we are and wherewe are going. We have exciting product launches ahead, which started with the launch ofthe Xcelsior AV in January 2021, North America’s first fully operational heavy-duty Level 4automated bus. Soon, we will launch new electric vehicle models at New Flyer, unveil thenew D45 Commuter Rapid Transit battery-electric coach at MCI, and begin production ofARBOC's Equess CHARGE shuttle bus.
We are committed to continuing to innovate in order to ensure better, smarter, safer,more sustainable, and more connected public transportation. Environmental and socialgovernance continues to drive our decision making, and NFI is extremely well positioned tocapitalize on both our internal initiatives, including an increase in the diversity of our team,reduction of our carbon footprint, and through the environmental and social benefits createdby our products. NFI's vehicles and solutions will enable smart city development, reducethe harmful impacts of climate change, traffic congestion and noise pollution, and createeconomic opportunity for current and future generations.
Sincerely,
The Honourable Brian V. Tobin P.C., O.C. Chairman of the Board NFI Group Inc.
Paul Soubry President & Chief Executive Officer NFI Group Inc.
10 www.nfigroup.comNFI GROUP INC. 2020 REPORT
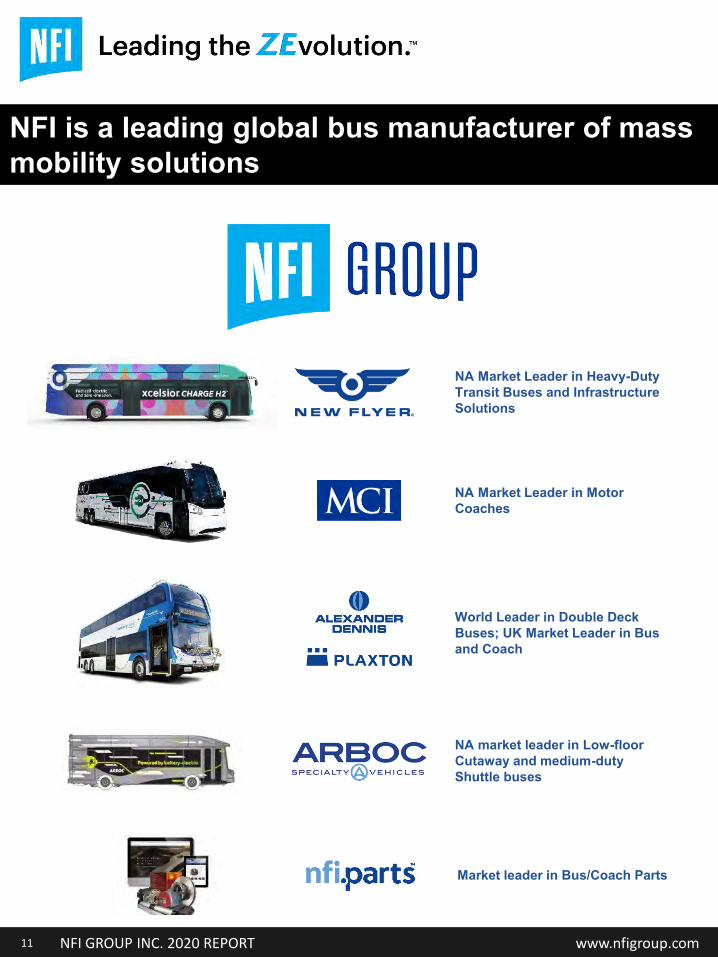
NA Market Leader in Heavy-Duty Transit Buses and Infrastructure Solutions
World Leader in Double Deck Buses; UK Market Leader in Bus and Coach
NA Market Leader in Motor Coaches
NA market leader in Low-floor Cutaway and medium-duty Shuttle buses
Market leader in Bus/Coach Parts
11 www.nfigroup.comNFI GROUP INC. 2020 REPORT
NFI is a leading global bus manufacturer of mass mobility solutions
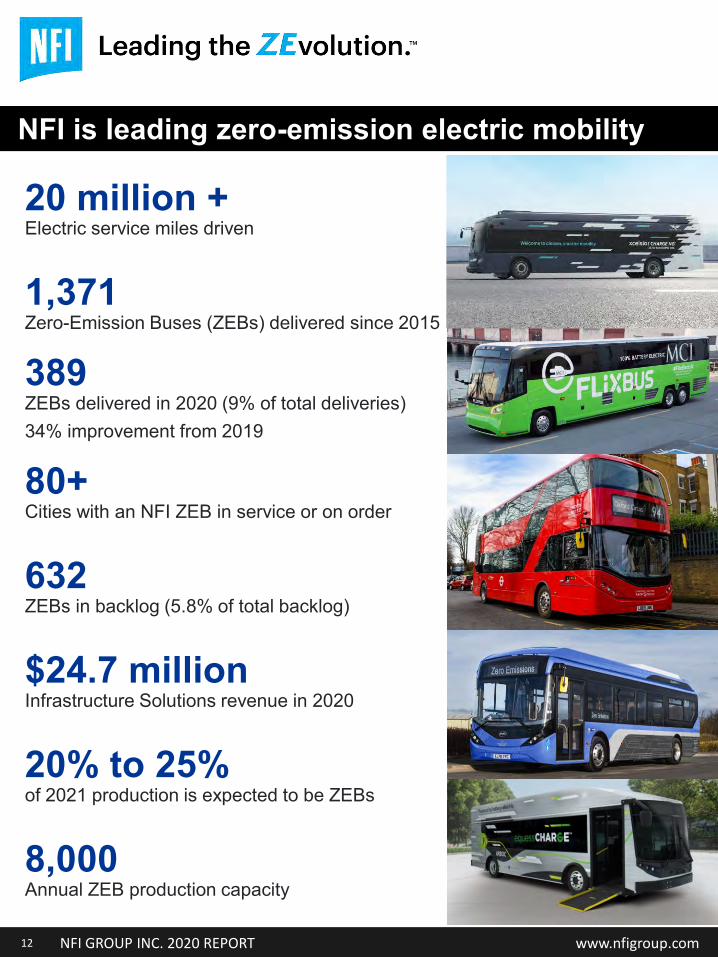
20 million +Electric service miles driven
1,371 Zero-Emission Buses (ZEBs) delivered since 2015
389ZEBs delivered in 2020 (9% of total deliveries) 34% improvement from 2019
80+Cities with an NFI ZEB in service or on order
632ZEBs in backlog (5.8% of total backlog)
$24.7 millionInfrastructure Solutions revenue in 2020
20% to 25% of 2021 production is expected to be ZEBs
8,000Annual ZEB production capacity
NFI is leading zero-emission electric mobility
12 www.nfigroup.comNFI GROUP INC. 2020 REPORT
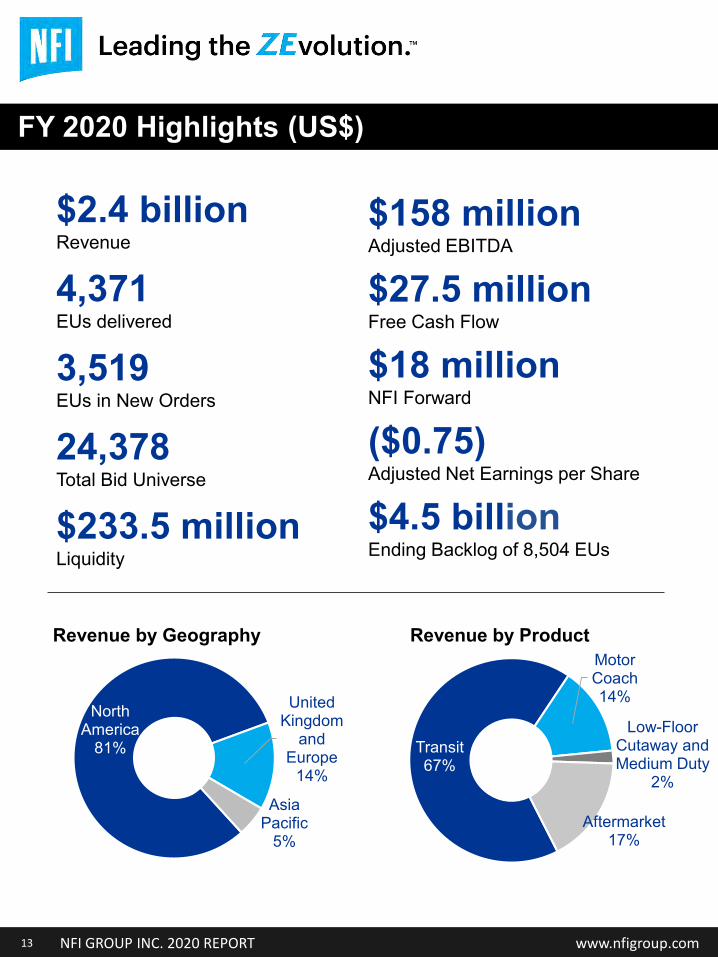
13
FY 2020 Highlights (US$)
North America
81%
United Kingdom
and Europe
14%
Asia Pacific
5%
Transit67%
Motor Coach14%
Low-Floor Cutaway and Medium Duty
2%
Aftermarket17%
Revenue by Geography Revenue by Product
24,378Total Bid Universe
$2.4 billionRevenue
4,371EUs delivered
3,519EUs in New Orders
$233.5 millionLiquidity
$27.5 millionFree Cash Flow
($0.75)Adjusted Net Earnings per Share
$4.5 billionEnding Backlog of 8,504 EUs
$158 millionAdjusted EBITDA
$18 millionNFI Forward
www.nfigroup.comNFI GROUP INC. 2020 REPORT
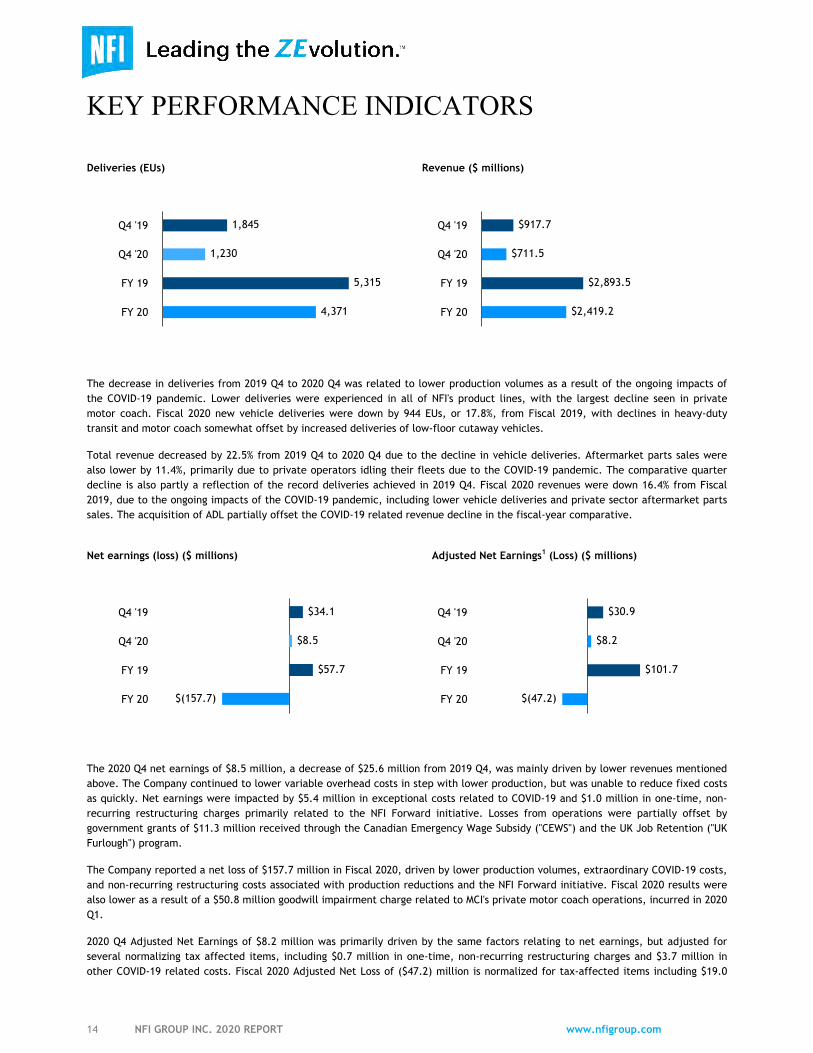
KEY PERFORMANCE INDICATORS
Deliveries (EUs) Revenue ($ millions)
1,845
1,230
5,315
4,371
Q4 '19
Q4 '20
FY 19
FY 20
$917.7
$711.5
$2,893.5
$2,419.2
Q4 '19
Q4 '20
FY 19
FY 20
The decrease in deliveries from 2019 Q4 to 2020 Q4 was related to lower production volumes as a result of the ongoing impacts of the COVID-19 pandemic. Lower deliveries were experienced in all of NFI's product lines, with the largest decline seen in private motor coach. Fiscal 2020 new vehicle deliveries were down by 944 EUs, or 17.8%, from Fiscal 2019, with declines in heavy-duty transit and motor coach somewhat offset by increased deliveries of low-floor cutaway vehicles.
Total revenue decreased by 22.5% from 2019 Q4 to 2020 Q4 due to the decline in vehicle deliveries. Aftermarket parts sales were also lower by 11.4%, primarily due to private operators idling their fleets due to the COVID-19 pandemic. The comparative quarter decline is also partly a reflection of the record deliveries achieved in 2019 Q4. Fiscal 2020 revenues were down 16.4% from Fiscal 2019, due to the ongoing impacts of the COVID-19 pandemic, including lower vehicle deliveries and private sector aftermarket parts sales. The acquisition of ADL partially offset the COVID-19 related revenue decline in the fiscal-year comparative.
Net earnings (loss) ($ millions) Adjusted Net Earnings1 (Loss) ($ millions)
$34.1
$8.5
$57.7
$(157.7)
Q4 '19
Q4 '20
FY 19
FY 20
$30.9
$8.2
$101.7
$(47.2)
Q4 '19
Q4 '20
FY 19
FY 20
The 2020 Q4 net earnings of $8.5 million, a decrease of $25.6 million from 2019 Q4, was mainly driven by lower revenues mentioned above. The Company continued to lower variable overhead costs in step with lower production, but was unable to reduce fixed costs as quickly. Net earnings were impacted by $5.4 million in exceptional costs related to COVID-19 and $1.0 million in one-time, non-recurring restructuring charges primarily related to the NFI Forward initiative. Losses from operations were partially offset by government grants of $11.3 million received through the Canadian Emergency Wage Subsidy ("CEWS") and the UK Job Retention ("UK Furlough") program.
The Company reported a net loss of $157.7 million in Fiscal 2020, driven by lower production volumes, extraordinary COVID-19 costs, and non-recurring restructuring costs associated with production reductions and the NFI Forward initiative. Fiscal 2020 results were also lower as a result of a $50.8 million goodwill impairment charge related to MCI's private motor coach operations, incurred in 2020 Q1.
2020 Q4 Adjusted Net Earnings of $8.2 million was primarily driven by the same factors relating to net earnings, but adjusted for several normalizing tax affected items, including $0.7 million in one-time, non-recurring restructuring charges and $3.7 million in other COVID-19 related costs. Fiscal 2020 Adjusted Net Loss of ($47.2) million is normalized for tax-affected items including $19.0
14 NFI GROUP INC. 2020 REPORT www.nfigroup.com
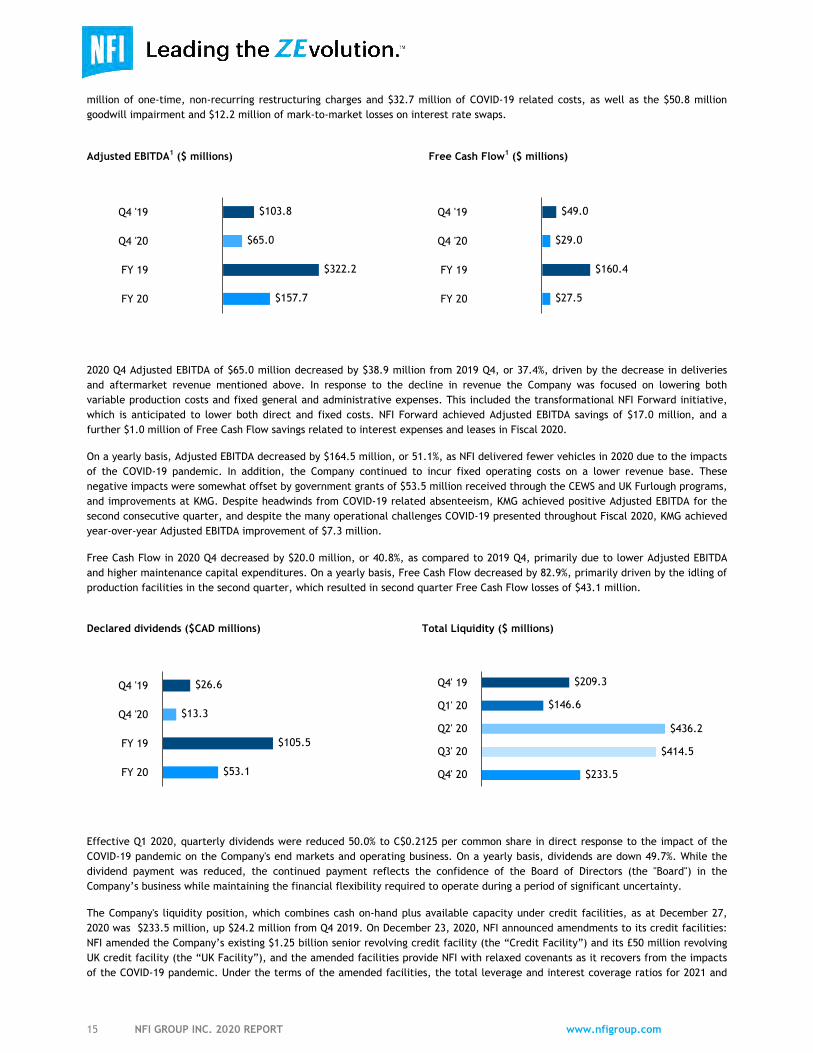
million of one-time, non-recurring restructuring charges and $32.7 million of COVID-19 related costs, as well as the $50.8 million goodwill impairment and $12.2 million of mark-to-market losses on interest rate swaps.
Adjusted EBITDA1 ($ millions) Free Cash Flow1 ($ millions)
$103.8
$65.0
$322.2
$157.7
Q4 '19
Q4 '20
FY 19
FY 20
$49.0
$29.0
$160.4
$27.5
Q4 '19
Q4 '20
FY 19
FY 20
2020 Q4 Adjusted EBITDA of $65.0 million decreased by $38.9 million from 2019 Q4, or 37.4%, driven by the decrease in deliveries and aftermarket revenue mentioned above. In response to the decline in revenue the Company was focused on lowering both variable production costs and fixed general and administrative expenses. This included the transformational NFI Forward initiative, which is anticipated to lower both direct and fixed costs. NFI Forward achieved Adjusted EBITDA savings of $17.0 million, and a further $1.0 million of Free Cash Flow savings related to interest expenses and leases in Fiscal 2020.
On a yearly basis, Adjusted EBITDA decreased by $164.5 million, or 51.1%, as NFI delivered fewer vehicles in 2020 due to the impacts of the COVID-19 pandemic. In addition, the Company continued to incur fixed operating costs on a lower revenue base. These negative impacts were somewhat offset by government grants of $53.5 million received through the CEWS and UK Furlough programs, and improvements at KMG. Despite headwinds from COVID-19 related absenteeism, KMG achieved positive Adjusted EBITDA for the second consecutive quarter, and despite the many operational challenges COVID-19 presented throughout Fiscal 2020, KMG achieved year-over-year Adjusted EBITDA improvement of $7.3 million.
Free Cash Flow in 2020 Q4 decreased by $20.0 million, or 40.8%, as compared to 2019 Q4, primarily due to lower Adjusted EBITDA and higher maintenance capital expenditures. On a yearly basis, Free Cash Flow decreased by 82.9%, primarily driven by the idling of production facilities in the second quarter, which resulted in second quarter Free Cash Flow losses of $43.1 million.
Declared dividends ($CAD millions) Total Liquidity ($ millions)
$26.6
$13.3
$105.5
$53.1
Q4 '19
Q4 '20
FY 19
FY 20
$209.3
$146.6
$436.2
$414.5
$233.5
Q4' 19
Q1' 20
Q2' 20
Q3' 20
Q4' 20
Effective Q1 2020, quarterly dividends were reduced 50.0% to C$0.2125 per common share in direct response to the impact of the COVID-19 pandemic on the Company's end markets and operating business. On a yearly basis, dividends are down 49.7%. While the dividend payment was reduced, the continued payment reflects the confidence of the Board of Directors (the "Board") in the Company’s business while maintaining the financial flexibility required to operate during a period of significant uncertainty.
The Company's liquidity position, which combines cash on-hand plus available capacity under credit facilities, as at December 27, 2020 was $233.5 million, up $24.2 million from Q4 2019. On December 23, 2020, NFI announced amendments to its credit facilities: NFI amended the Company’s existing $1.25 billion senior revolving credit facility (the “Credit Facility”) and its £50 million revolving UK credit facility (the “UK Facility”), and the amended facilities provide NFI with relaxed covenants as it recovers from the impacts of the COVID-19 pandemic. Under the terms of the amended facilities, the total leverage and interest coverage ratios for 2021 and
15 NFI GROUP INC. 2020 REPORT www.nfigroup.com
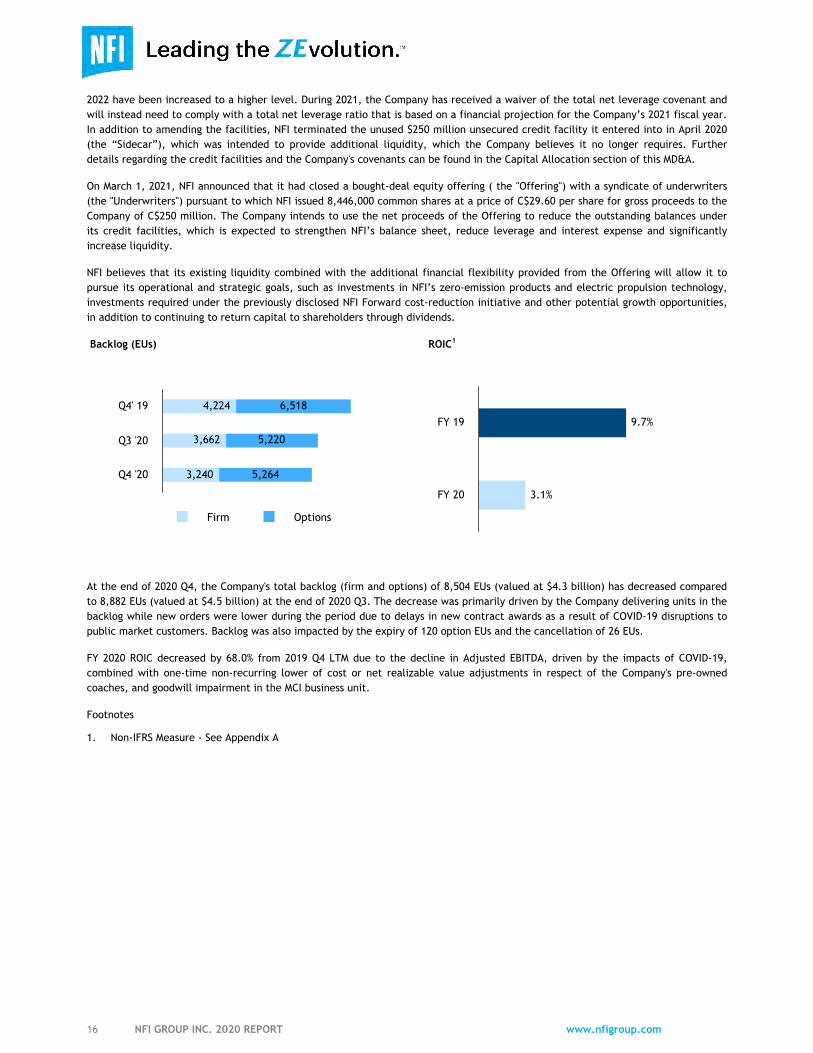
2022 have been increased to a higher level. During 2021, the Company has received a waiver of the total net leverage covenant and will instead need to comply with a total net leverage ratio that is based on a financial projection for the Company’s 2021 fiscal year. In addition to amending the facilities, NFI terminated the unused $250 million unsecured credit facility it entered into in April 2020 (the “Sidecar”), which was intended to provide additional liquidity, which the Company believes it no longer requires. Further details regarding the credit facilities and the Company's covenants can be found in the Capital Allocation section of this MD&A.
On March 1, 2021, NFI announced that it had closed a bought-deal equity offering ( the "Offering") with a syndicate of underwriters (the "Underwriters") pursuant to which NFI issued 8,446,000 common shares at a price of C$29.60 per share for gross proceeds to the Company of C$250 million. The Company intends to use the net proceeds of the Offering to reduce the outstanding balances under its credit facilities, which is expected to strengthen NFI’s balance sheet, reduce leverage and interest expense and significantly increase liquidity.
NFI believes that its existing liquidity combined with the additional financial flexibility provided from the Offering will allow it to pursue its operational and strategic goals, such as investments in NFI’s zero-emission products and electric propulsion technology, investments required under the previously disclosed NFI Forward cost-reduction initiative and other potential growth opportunities, in addition to continuing to return capital to shareholders through dividends.
Backlog (EUs) ROIC1
4,224
3,662
3,240
6,518
5,220
5,264
Firm Options
Q4' 19
Q3 '20
Q4 '20
9.7%
3.1%
FY 19
FY 20
At the end of 2020 Q4, the Company's total backlog (firm and options) of 8,504 EUs (valued at $4.3 billion) has decreased compared to 8,882 EUs (valued at $4.5 billion) at the end of 2020 Q3. The decrease was primarily driven by the Company delivering units in the backlog while new orders were lower during the period due to delays in new contract awards as a result of COVID-19 disruptions to public market customers. Backlog was also impacted by the expiry of 120 option EUs and the cancellation of 26 EUs.
FY 2020 ROIC decreased by 68.0% from 2019 Q4 LTM due to the decline in Adjusted EBITDA, driven by the impacts of COVID-19, combined with one-time non-recurring lower of cost or net realizable value adjustments in respect of the Company's pre-owned coaches, and goodwill impairment in the MCI business unit.
Footnotes
1. Non-IFRS Measure - See Appendix A
16 NFI GROUP INC. 2020 REPORT www.nfigroup.com
2020 Q4 HIGHLIGHTSThe fourth quarter of 2020 saw NFI continue to recover from the impacts of COVID-19 and deliver significant improvement over both the third quarter, as well as over the second quarter of idled production. While results improved in 2020 Q4, the ongoing COVID-19 pandemic continued to challenge NFI’s customers and end markets. Rising COVID-19 rates in the U.S., Canada, and the UK, combined with mutations of the virus, ongoing work-from-home mandates and the dramatic decline in travel slowed the announcement of new vehicle awards, and delayed or deferred purchases, especially in private coach and UK transit markets.
As a result of the pandemic and in order to achieve the anticipated benefits from the ongoing NFI Forward initiative, the Company incurred several one-time costs that have been normalized within Adjusted EBITDA and Adjusted Net Earnings. These adjustments (tax effected) include:
• Restructuring
• $1.0 million in severance costs and asset impairments primarily related to the NFI Forward initiative.
• COVID-19• $4.6 million in asset impairments from aftermarket parts inventory and ADL private coach.• $0.8 million of COVID-19 operating costs that include, but are not limited to, the purchase of personal protective
equipment, plant sanitation activities and incremental cleaning activities.
Adjusted Net Earnings are also normalized for other related items including:
• $2.3 million mark-to-market loss on interest rate swap• $2.2 million unrealized foreign exchange gains• $1.1 million fair value adjustments to the total return swap
After adjusting for these items, Adjusted Net Earnings is $8.2 million or $0.13 per share.
While the pandemic continued to create challenges during the fourth quarter, it was a busy period for NFI that saw the Company experience several events and achieve significant milestones, including the following:
• In November, ADL expressed support for the UK Government’s Ten Point Plan for a Green Industrial Revolution and the commitment to invest £120 million to begin the introduction of at least 4,000 more British built ZEBs. ADL is the UK’s leader in ZEBs and is extremely well positioned to capitalize on the transition to zero-emission vehicles. An example of this leadership position was the ADL BYD partnership's electric vehicles completing 600,000 zero-emission service miles in December 2020.
• NFI’s North-American ZEB strategy continued in earnest with awards in Nashville for vehicles and the associated charging infrastructure. The California Air Resources Board also approved MCI’s zero-emission coaches to be eligible to avail of the Hybrid and Zero-Emission Truck and Bus Voucher Incentive Program.
• ADL’s new market growth strategy continued with the delivery of the first Enviro500 double-deck vehicles to Berlin, Ireland and New Zealand. In Berlin, ADL expects to receive an order for an additional 198 units following completion of a testing program. In Ireland, there are another 180 EUs on order for 2021 delivery, and ADL delivered two electric vehicles to New Zealand.
• NFI’s commitment to the communities in which it operates was more important than ever in 2020, and NFI and its employees were pleased to raise over C$400,000 through its annual United Way fundraising campaign, providing support to 19 communities across North America.
• In December, MCI announced that the MCI Academy had received its fourth consecutive ASE Training Managers Council National Excellence in Training Award, the Grand Award, for its High Voltage Safety Program.
• Throughout the quarter, NFI’s Clean and Protect product line helped customers provide a safer transportation experience as customers equipped their vehicles with sanitization, cleaning and air purification products.
• ARBOC’s low-floor cutaway growth strategy took significant steps forward as the Company received an order for 53 low-floor Spirit of Freedom buses from British Columbia’s TransLink, and Transit St. Louis added 13 new Metro Call-A-Ride vans to its fleet.
• On December 23, 2020, NFI announced amendments to its $1.25 billion Credit Facility and its £50 million UK Facility. The amended facilities provide NFI with relaxed covenants as it recovers from the impacts of the COVID-19 pandemic. In addition to amending the facilities, NFI terminated the unused $250 million Sidecar, which was intended to provide additional liquidity in 2020, which the Company believes it no longer needs.
17 NFI GROUP INC. 2020 REPORT www.nfigroup.com
The Company continued to pay its quarterly dividend of C$0.2125 per share (annual rate of C$0.85 per share), resulting in a payout ratio for Fiscal 2020 of 153.0%%. The Board expects to maintain dividends on a quarterly basis, although such dividends are not assured.
Leading the ZEvolutionTM
On January 11, 2021, NFI held its virtual Investor Day 2021, where NFI’s Senior Leadership Team and Board provided detailed presentations regarding NFI’s business and strategy, with a focus on NFI’s vision to drive the increased adoption of ZEBs, what NFI is calling the ZEvolutionTM. The event also featured an informative discussion by a panel made up of mobility experts from Canada, the United States, and the United Kingdom. During the event, NFI announced its 2021 guidance, 2025 targets and longer-term financial outlook, details of which can be found in the Outlook section of this MD&A.
18 NFI GROUP INC. 2020 REPORT www.nfigroup.com
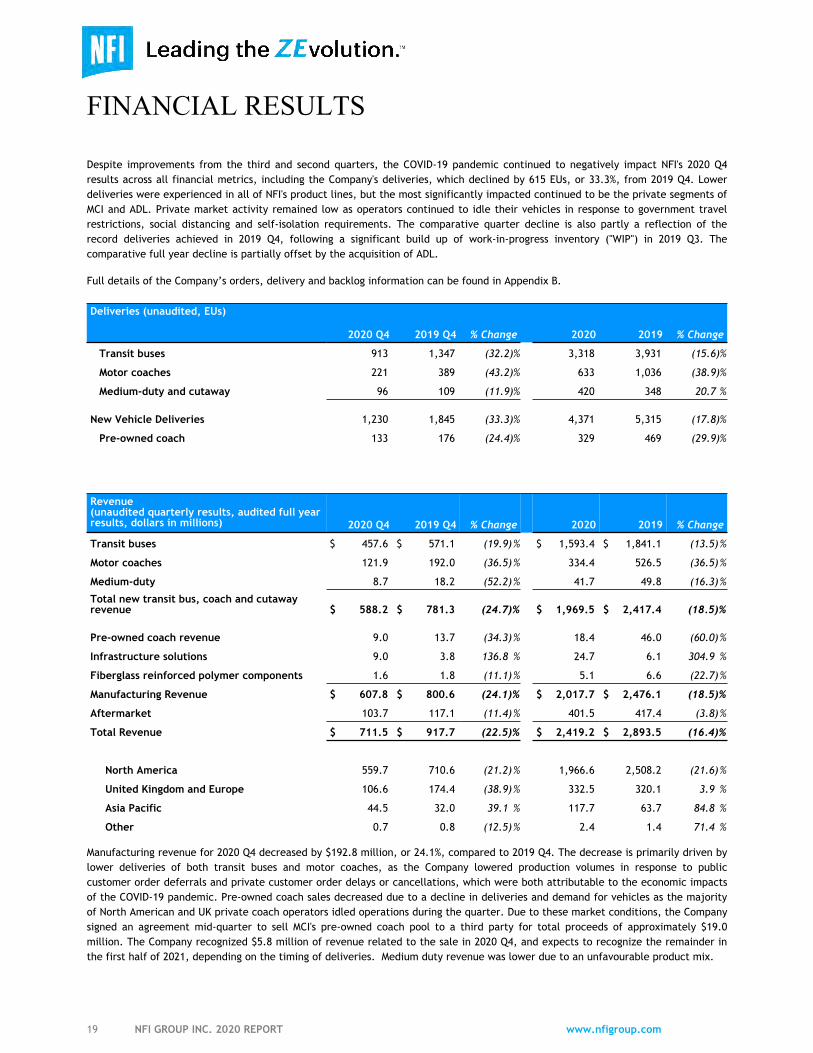
FINANCIAL RESULTS
Despite improvements from the third and second quarters, the COVID-19 pandemic continued to negatively impact NFI's 2020 Q4 results across all financial metrics, including the Company's deliveries, which declined by 615 EUs, or 33.3%, from 2019 Q4. Lower deliveries were experienced in all of NFI's product lines, but the most significantly impacted continued to be the private segments of MCI and ADL. Private market activity remained low as operators continued to idle their vehicles in response to government travel restrictions, social distancing and self-isolation requirements. The comparative quarter decline is also partly a reflection of the record deliveries achieved in 2019 Q4, following a significant build up of work-in-progress inventory ("WIP") in 2019 Q3. The comparative full year decline is partially offset by the acquisition of ADL.
Full details of the Company’s orders, delivery and backlog information can be found in Appendix B.
Deliveries (unaudited, EUs)
2020 Q4 2019 Q4 % Change 2020 2019 % Change
Transit buses 913 1,347 (32.2) % 3,318 3,931 (15.6) %
Motor coaches 221 389 (43.2) % 633 1,036 (38.9) %
Medium-duty and cutaway 96 109 (11.9) % 420 348 20.7 %
New Vehicle Deliveries 1,230 1,845 (33.3) % 4,371 5,315 (17.8) %
Pre-owned coach 133 176 (24.4) % 329 469 (29.9) %
Revenue (unaudited quarterly results, audited full year results, dollars in millions) 2020 Q4 2019 Q4 % Change 2020 2019 % Change
Transit buses $ 457.6 $ 571.1 (19.9) % $ 1,593.4 $ 1,841.1 (13.5) %
Motor coaches 121.9 192.0 (36.5) % 334.4 526.5 (36.5) %
Medium-duty 8.7 18.2 (52.2) % 41.7 49.8 (16.3) %
Total new transit bus, coach and cutaway revenue $ 588.2 $ 781.3 (24.7) % $ 1,969.5 $ 2,417.4 (18.5) %
Pre-owned coach revenue 9.0 13.7 (34.3) % 18.4 46.0 (60.0) %
Infrastructure solutions 9.0 3.8 136.8 % 24.7 6.1 304.9 %
Fiberglass reinforced polymer components 1.6 1.8 (11.1) % 5.1 6.6 (22.7) %
Manufacturing Revenue $ 607.8 $ 800.6 (24.1) % $ 2,017.7 $ 2,476.1 (18.5) %
Aftermarket 103.7 117.1 (11.4) % 401.5 417.4 (3.8) %
Total Revenue $ 711.5 $ 917.7 (22.5) % $ 2,419.2 $ 2,893.5 (16.4) %
North America 559.7 710.6 (21.2) % 1,966.6 2,508.2 (21.6) %
United Kingdom and Europe 106.6 174.4 (38.9) % 332.5 320.1 3.9 %
Asia Pacific 44.5 32.0 39.1 % 117.7 63.7 84.8 %
Other 0.7 0.8 (12.5) % 2.4 1.4 71.4 %
Manufacturing revenue for 2020 Q4 decreased by $192.8 million, or 24.1%, compared to 2019 Q4. The decrease is primarily driven by lower deliveries of both transit buses and motor coaches, as the Company lowered production volumes in response to public customer order deferrals and private customer order delays or cancellations, which were both attributable to the economic impacts of the COVID-19 pandemic. Pre-owned coach sales decreased due to a decline in deliveries and demand for vehicles as the majority of North American and UK private coach operators idled operations during the quarter. Due to these market conditions, the Company signed an agreement mid-quarter to sell MCI's pre-owned coach pool to a third party for total proceeds of approximately $19.0 million. The Company recognized $5.8 million of revenue related to the sale in 2020 Q4, and expects to recognize the remainder in the first half of 2021, depending on the timing of deliveries. Medium duty revenue was lower due to an unfavourable product mix.
19 NFI GROUP INC. 2020 REPORT www.nfigroup.com
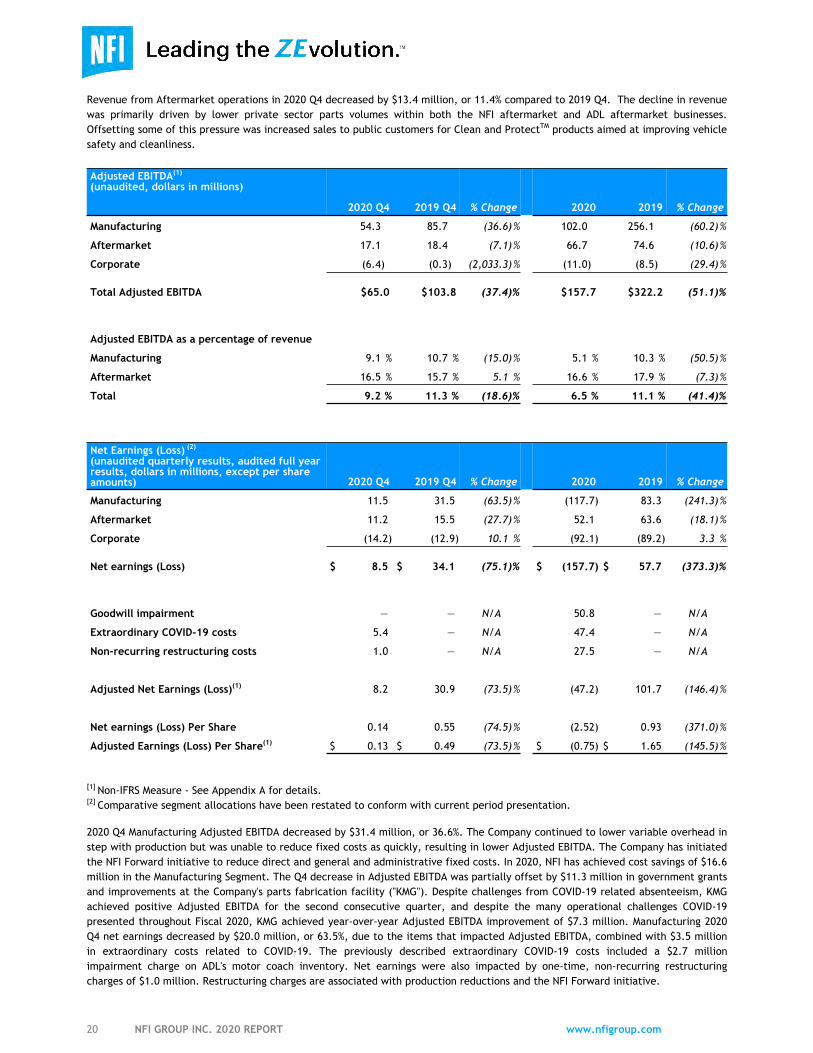
Revenue from Aftermarket operations in 2020 Q4 decreased by $13.4 million, or 11.4% compared to 2019 Q4. The decline in revenue was primarily driven by lower private sector parts volumes within both the NFI aftermarket and ADL aftermarket businesses. Offsetting some of this pressure was increased sales to public customers for Clean and ProtectTM products aimed at improving vehicle safety and cleanliness.
Adjusted EBITDA(1)
(unaudited, dollars in millions)
2020 Q4 2019 Q4 % Change 2020 2019 % Change
Manufacturing 54.3 85.7 (36.6) % 102.0 256.1 (60.2) %
Aftermarket 17.1 18.4 (7.1) % 66.7 74.6 (10.6) %
Corporate (6.4) (0.3) (2,033.3) % (11.0) (8.5) (29.4) %
Total Adjusted EBITDA $65.0 $103.8 (37.4) % $157.7 $322.2 (51.1) %
Adjusted EBITDA as a percentage of revenue
Manufacturing 9.1 % 10.7 % (15.0) % 5.1 % 10.3 % (50.5) %
Aftermarket 16.5 % 15.7 % 5.1 % 16.6 % 17.9 % (7.3) %
Total 9.2 % 11.3 % (18.6) % 6.5 % 11.1 % (41.4) %
Net Earnings (Loss) (2)
(unaudited quarterly results, audited full year results, dollars in millions, except per share amounts) 2020 Q4 2019 Q4 % Change 2020 2019 % Change
Manufacturing 11.5 31.5 (63.5) % (117.7) 83.3 (241.3) %
Aftermarket 11.2 15.5 (27.7) % 52.1 63.6 (18.1) %
Corporate (14.2) (12.9) 10.1 % (92.1) (89.2) 3.3 %
Net earnings (Loss) $ 8.5 $ 34.1 (75.1) % $ (157.7) $ 57.7 (373.3) %
Goodwill impairment — — N/A 50.8 — N/A
Extraordinary COVID-19 costs 5.4 — N/A 47.4 — N/A
Non-recurring restructuring costs 1.0 — N/A 27.5 — N/A
Adjusted Net Earnings (Loss)(1) 8.2 30.9 (73.5) % (47.2) 101.7 (146.4) %
Net earnings (Loss) Per Share 0.14 0.55 (74.5) % (2.52) 0.93 (371.0) %
Adjusted Earnings (Loss) Per Share(1) $ 0.13 $ 0.49 (73.5) % $ (0.75) $ 1.65 (145.5) %
[1] Non-IFRS Measure - See Appendix A for details. [2] Comparative segment allocations have been restated to conform with current period presentation.
2020 Q4 Manufacturing Adjusted EBITDA decreased by $31.4 million, or 36.6%. The Company continued to lower variable overhead in step with production but was unable to reduce fixed costs as quickly, resulting in lower Adjusted EBITDA. The Company has initiated the NFI Forward initiative to reduce direct and general and administrative fixed costs. In 2020, NFI has achieved cost savings of $16.6 million in the Manufacturing Segment. The Q4 decrease in Adjusted EBITDA was partially offset by $11.3 million in government grants and improvements at the Company's parts fabrication facility ("KMG"). Despite challenges from COVID-19 related absenteeism, KMG achieved positive Adjusted EBITDA for the second consecutive quarter, and despite the many operational challenges COVID-19 presented throughout Fiscal 2020, KMG achieved year-over-year Adjusted EBITDA improvement of $7.3 million. Manufacturing 2020 Q4 net earnings decreased by $20.0 million, or 63.5%, due to the items that impacted Adjusted EBITDA, combined with $3.5 million in extraordinary costs related to COVID-19. The previously described extraordinary COVID-19 costs included a $2.7 million impairment charge on ADL's motor coach inventory. Net earnings were also impacted by one-time, non-recurring restructuring charges of $1.0 million. Restructuring charges are associated with production reductions and the NFI Forward initiative.
20 NFI GROUP INC. 2020 REPORT www.nfigroup.com
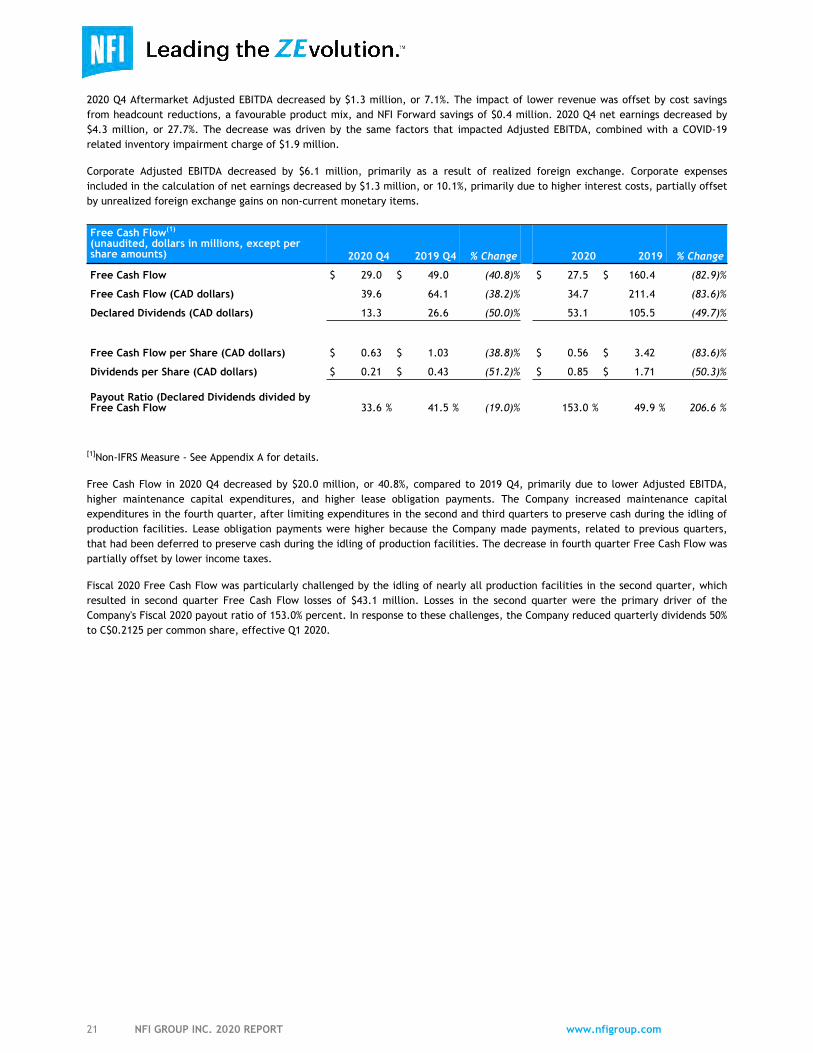
2020 Q4 Aftermarket Adjusted EBITDA decreased by $1.3 million, or 7.1%. The impact of lower revenue was offset by cost savings from headcount reductions, a favourable product mix, and NFI Forward savings of $0.4 million. 2020 Q4 net earnings decreased by $4.3 million, or 27.7%. The decrease was driven by the same factors that impacted Adjusted EBITDA, combined with a COVID-19 related inventory impairment charge of $1.9 million.
Corporate Adjusted EBITDA decreased by $6.1 million, primarily as a result of realized foreign exchange. Corporate expenses included in the calculation of net earnings decreased by $1.3 million, or 10.1%, primarily due to higher interest costs, partially offset by unrealized foreign exchange gains on non-current monetary items.
Free Cash Flow(1)
(unaudited, dollars in millions, except per share amounts) 2020 Q4 2019 Q4 % Change 2020 2019 % Change
Free Cash Flow $ 29.0 $ 49.0 (40.8) % $ 27.5 $ 160.4 (82.9) %
Free Cash Flow (CAD dollars) 39.6 64.1 (38.2) % 34.7 211.4 (83.6) %
Declared Dividends (CAD dollars) 13.3 26.6 (50.0) % 53.1 105.5 (49.7) %
Free Cash Flow per Share (CAD dollars) $ 0.63 $ 1.03 (38.8) % $ 0.56 $ 3.42 (83.6) %
Dividends per Share (CAD dollars) $ 0.21 $ 0.43 (51.2) % $ 0.85 $ 1.71 (50.3) %
Payout Ratio (Declared Dividends divided by Free Cash Flow 33.6 % 41.5 % (19.0) % 153.0 % 49.9 % 206.6 %
[1]Non-IFRS Measure - See Appendix A for details.
Free Cash Flow in 2020 Q4 decreased by $20.0 million, or 40.8%, compared to 2019 Q4, primarily due to lower Adjusted EBITDA, higher maintenance capital expenditures, and higher lease obligation payments. The Company increased maintenance capital expenditures in the fourth quarter, after limiting expenditures in the second and third quarters to preserve cash during the idling of production facilities. Lease obligation payments were higher because the Company made payments, related to previous quarters, that had been deferred to preserve cash during the idling of production facilities. The decrease in fourth quarter Free Cash Flow was partially offset by lower income taxes.
Fiscal 2020 Free Cash Flow was particularly challenged by the idling of nearly all production facilities in the second quarter, which resulted in second quarter Free Cash Flow losses of $43.1 million. Losses in the second quarter were the primary driver of the Company's Fiscal 2020 payout ratio of 153.0% percent. In response to these challenges, the Company reduced quarterly dividends 50% to C$0.2125 per common share, effective Q1 2020.
21 NFI GROUP INC. 2020 REPORT www.nfigroup.com
OUTLOOK
Management anticipates that NFI’s end markets will continue to be impacted by COVID-19 in 2021; however, the Company expects improvement in its financial results as markets recover and the NFI Forward initiative continues to deliver improvements to operating metrics. Market recovery will be dependent upon several factors, including government recovery and green fleet investments, COVID-19 case rates, vaccine distribution, the length of the pandemic, mutations of the virus, travel restrictions, and economic reopening activity. These factors will differ by product and geography. The Company’s vehicle product lines (New Flyer, ARBOC, MCI public motor coach, and ADL) are primarily used for public transit, which remains a critical method of transportation for millions of users in the Company's markets and is an economic enabler in cities. Within the North American heavy-duty transit and public coach businesses, near- and longer-term demand is expected to return, although the duration of the recovery from COVID-19 may affect vehicle awards and delivery timing. Management’s recovery expectations are supported by continued support for transit operations by all levels of government and the Company’s North American bid universe, which includes 4,032 EUs in active procurements. Management also believes recent advancements in COVID-19 vaccines and the commencement of vaccine rollouts are positive signs for continued market recovery.
NFI is Leading the ZEvolutionTM
At its January 2021 Investor Day, NFI unveiled its vision to drive the increased adoption of ZEBs, what the Company is calling the ZEvolutionTM. NFI envisions a consistent adoption of zero-emission vehicles over the next 10 to 15 years as operators in North America, the UK, Europe and Asia Pacific markets transition their fleets to electric vehicles. NFI has been building electric vehicles since 1969 and offers the broadest offering of ZEBs, including battery-electric buses and coaches, hydrogen fuel-cell buses and electric trolleys.
NFI is the leader in North America and the UK for ZEBs and is expected to be a significant beneficiary from the increased acceleration to ZEBs. Currently, ZEBs make up 7.4% of NFI’s backlog (up from 3.6% at the end of 2019 Q4), and make up 30% of the Company’s total North American bid universe.
A critical component of NFI’s strategy is to provide complete mobility solutions, including vehicles, infrastructure installation, telematics, and aftermarket support. NFI has the largest vehicle production capacity in North America and the UK, and can manufacture ZEBs at all of its vehicle facilities. NFI has electric vehicles in service with 15 of the top 25 transit agencies in North America, and the Company's battery-electric and fuel-cell electric vehicles have completed over 4.5 million miles of zero-emission service in North America, and more than 16.0 million zero-emission miles in the UK. The Company has also installed infrastructure with numerous agencies, which saw the Company grow its Infrastructure SolutionsTM revenue by more than 300% year-over-year, from 2019 to 2020. The Company has delivered more ZEBs than any competitor in the UK, and is also now selling its innovative battery-electric coach in the US and Canada, with the first public order for 25 coaches to be delivered in 2021. ARBOC’s zero-emission battery electric bus, the Equess CHARGETM, will begin production in the second half of 2021, following completion of Altoona testing. Management anticipates that based on the Company’s leadership position, product offering, experience and customer relationships it is well positioned to capitalize on the long-term transition to ZEBs in both core and new markets.
Government Support for Recovery and Zero-Emission Transition
During the global pandemic, government support for transit operations has remained strong, recognizing the critical role transit plays in re-mobilizing cities and supporting economic recovery. In addition to billions of dollars in COVID-19 operations relief funds, governments have also committed billions for long-term fleet investments and the transition to zero-emission, battery-electric vehicles.
In the United States, the Fixing America's Surface Transportation Act ("FAST Act"), which is the primary federal funding mechanism, was extended for one year. The FAST Act extension includes funds to maintain the Highway Trust Fund's solvency at current funding levels, which equates to $12.3 billion for transit programs through fiscal year 2021, with dedicated funding of $1.2 billion for bus appropriations in 2021. The proposed successor to the FAST Act is the $494 billion Investing in a New Vision for the Environment and Surface Transportation in America Act (“INVEST in America Act”) drafted early in 2020. This new draft Act includes $105 billion for transit capital purchases, including a five-time increase in funding for zero-emission buses from the previous FAST Act.
In October 2020, the Canadian federal government announced $1.5 billion in financing through the Canada Infrastructure Bank to support the adoption of ZEBs and charging infrastructure; the financing is expected to be delivered over a 24- to 36-month period. The Canadian government followed this with a landmark announcement in February 2021 that will see $14.9 billion invested in Canadian public transit. The program includes $5.9 billion in dedicated project funds starting in 2021, and ongoing permanent funding of $3 billion per year beginning in 2026-2027.
22 NFI GROUP INC. 2020 REPORT www.nfigroup.com
The UK, despite numerous headwinds faced in 2020, saw an increase in government support and more subsidies available to bus operators than ever before. The government’s new Ten Point Plan for a Green Industrial Revolution, announced November 18, 2020, is a follow-up to the UK government's original plan to invest £5 billion for buses, cycling and walking, and continued to highlight the government's commitment to introduce 4,000 more British-built zero-emission buses into service.
In Asia Pacific markets, the New Zealand government provided an election pledge that only zero-emission buses will be purchased by 2025, and that they will target decarbonizing their entire public transit fleet by 2035. ADL’s partnership with BYD has a solid position in the New Zealand market and management expects it will be a beneficiary of this transition. The Hong Kong government continues to advance trials and applications for electric commercial vehicles which may provide opportunities for ADL given its strong relationships with the largest commercial operators in the market.
Looking forward, management is encouraged by the desire of President Biden to rebuild a cleaner and more resilient economy through investments in zero-emission and low-carbon public transportation. A campaign priority of the new Biden administration is to “provide every American city with 100,000 or more residents with high-quality zero-emission public transportation options through flexible federal investments,” and Prime Minister Trudeau’s plan has an aggressive target of 5,000 zero-emission buses and coaches by 2025.
As the market leader in North American transit and coach operations and the UK's leading provider of zero-emission buses through the ADL BYD partnership, management believes NFI is extremely well positioned for both the near- and long-term based on the multi-year commitments being made by governments in all of the Company's core markets. Management anticipates significant opportunities for NFI to grow top-line revenue from increased market demand for its products with strong underlying financial support from government bodies.
Financial Guidance
As management anticipates market recovery, geographic expansion, increased sales of ZEBs, and continued realization of savings from the NFI Forward Initiative, in January 2021 it provided Adjusted EBITDA guidance for Fiscal 2021 with a range of $220 million to $240 million. This range could represent growth in Adjusted EBITDA of over 50% on a year-over-year basis when compared to Fiscal 2020. Management and the Board remain confident in the following guidance:
2021 Financial Guidance
Revenue $2.8 billion to $2.9 billion
ZEB (electric) as a percentage of manufacturing sales 20% to 25%
Adjusted EBITDA1 $220 million to $240 million
Cash Capital Expenditures – including NFI Forward $50 million
Adjusted Effective Tax Rate (“ETR”) ~31%
Seasonality Decline in Q1; year-over-year growth in Revenue and Adjusted EBITDA in Q2, Q3 and Q4
1
The above table outlines guidance ranges for selected Fiscal 2021 consolidated financial metrics. These ranges take into consideration management's current outlook combined with Fiscal 2020 results and are based on the assumptions set out below. The purpose of the financial guidance is to assist investors, shareholders, and others in understanding certain financial metrics relating to expected Fiscal 2021 financial results for evaluating the performance of NFI's business. The information may not be appropriate for other purposes. Information about guidance, including the various assumptions underlying it, is forward-looking and should be read in conjunction with the section “Forward-Looking Statements” in Appendix A and the related disclosure and information about various economic competitive and regulatory assumptions, factors, and risks that may cause actual future financial and operating results to differ from management’s current expectations.
The guidance provided above is driven by numerous expectations and assumptions including, but not limited to, the following:
• Revenue: Growth is expected to be driven by the Company’s solid backlog, strong government financial support, new order growth from the anticipated recovery within North American public transit markets and the United Kingdom transit market, combined with an expected increase in sales activity in Asia Pacific and European markets. In addition, management believes there is potential for improvement in private coach aftermarket parts sales.
• ZEB sales: Growth in ZEB sales is based on the Company’s backlog and expected new orders from increased market demand for zero-emission vehicles.
23 NFI GROUP INC. 2020 REPORT www.nfigroup.com
• Adjusted EBITDA: Adjusted EBITDA growth is based on expected revenue growth, anticipated margins from vehicles in the Company’s current backlog and anticipated new orders, expected increases in the sales of ZEBs and cost reductions from the NFI Forward initiative. NFI expects to realize approximately $30 million of savings from NFI Forward in 2021, and to reach cumulative savings of approximately $47 million at the end of 2021, starting from the inception of the program in the third quarter of 2020. The lower end of the Adjusted EBITDA range is based on scenarios where production is negatively impacted by slower market recovery, limited ongoing impacts of COVID-19 and delays in achieving cost reductions from the NFI Forward initiative.
• Cash Capital Expenditures: Fiscal 2021 cash capital expenditures are expected to be allocated between maintenance and NFI Forward projects, based on approximately a seventy/thirty percent split.
• Adjusted ETR: The Adjusted Effective Tax Rate is based on current tax rates in the jurisdictions in which NFI operates, anticipated financial results, the Company’s corporate structure and the assumption that there will not be significant changes in applicable tax rates in 2021.
• COVID-19: Management has assumed that the impact of COVID-19 on the Company’s business in 2021 will be significantly lower than in 2020, including no significant idling of any of the Company’s facilities, increased buying activity from customers and limited supply disruptions. The overall impact of COVID-19 is expected to reduce steadily through the end of 2021.
Management cautions readers that the consolidated NFI Group's annual results have an element of seasonality due to the nature of each unique market segment and the varied annual production and vacation schedule of each production facility. With the addition of ADL, this has become even more pronounced with the third and fourth quarters now being periods with higher delivery volumes. Management anticipates that on a year-over-year basis the first quarter of 2021 results will be lower than the same period in 2020, while the other three quarters of the year should see improvement from 2020 results. Management also advises readers that NFI's first quarter, second and third quarters are 13-week periods, while the fourth quarter is a 14-week period for a 53-week fiscal year.
Strengthening the Balance Sheet
Proceeds of C$250 million received from the Company’s Offering are being utilized to reduce the outstanding balance under NFI’s revolving senior credit facility. This is expected to strengthen NFI’s balance sheet, reduce leverage and interest expense, and significantly increase liquidity. NFI believes that this will provide the Company with additional financial flexibility to attract new investors and to pursue its operational and strategic objectives, which include investments in NFI’s zero-emission products and electric propulsion technology, investments required under the previously disclosed NFI Forward cost-reduction initiative and investigating other potential growth opportunities, in addition to continuing to return capital to shareholders through dividends.
NFI Forward Update
On July 27, 2020, NFI responded to the impacts of COVID-19 by launching its transformative cost reduction initiative, NFI Forward, to significantly reduce manufacturing overhead and selling, general and administration ("SG&A") from 2019 levels. NFI Forward initiatives are on track to meet management’s previously announced expectations.
Management continues to expect that the aggregate programs of NFI Forward will drive approximately $67.0 million in annual Adjusted EBITDA savings, plus an additional $10.0 million in annualized Free Cash Flow generation, driven by interest savings and lower lease payments. NFI Forward is expected to deliver an 8% to 10% reduction in both manufacturing overhead and SG&A expenses, based on 2019 production rates, with investments of approximately $15 million to $20 million required to deliver these savings. In 2020, the NFI Forward initiative has achieved approximately $17.0 million in Adjusted EBITDA savings, and a further $1.0 million in Free Cash Flow savings. These savings appear in NFI’s gross margins and Adjusted EBITDA, as a reduction to direct material costs, manufacturing overhead, and SG&A.
In addition to the focus on cost savings and additional Free Cash Flow generation, management is also prioritizing working capital improvements through the NFI Forward initiative and other strategic projects aimed at improving supplier payment terms, accounts payable turns and inventory turnover, with specific focus on private vehicle inventory.
24 NFI GROUP INC. 2020 REPORT www.nfigroup.com
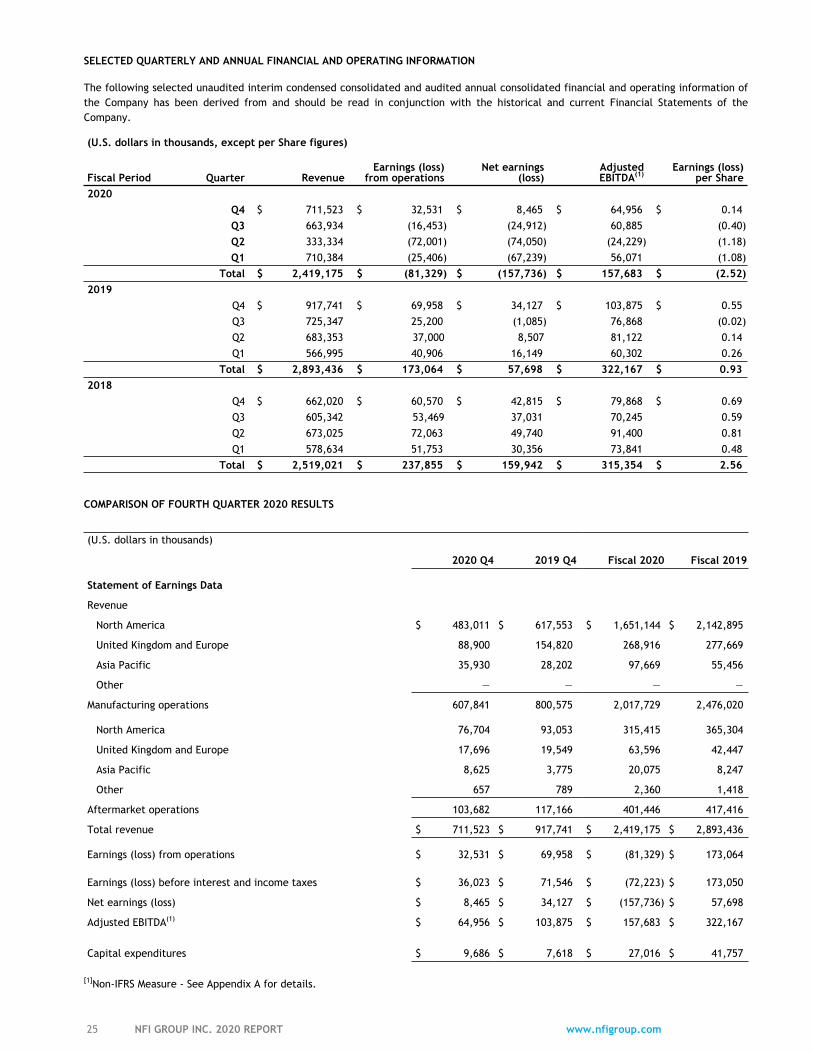
SELECTED QUARTERLY AND ANNUAL FINANCIAL AND OPERATING INFORMATION
The following selected unaudited interim condensed consolidated and audited annual consolidated financial and operating information of the Company has been derived from and should be read in conjunction with the historical and current Financial Statements of the Company.
(U.S. dollars in thousands, except per Share figures)
Fiscal Period Quarter RevenueEarnings (loss)
from operationsNet earnings
(loss)Adjusted EBITDA(1)
Earnings (loss) per Share
2020Q4 $ 711,523 $ 32,531 $ 8,465 $ 64,956 $ 0.14 Q3 663,934 (16,453) (24,912) 60,885 (0.40) Q2 333,334 (72,001) (74,050) (24,229) (1.18) Q1 710,384 (25,406) (67,239) 56,071 (1.08)
Total $ 2,419,175 $ (81,329) $ (157,736) $ 157,683 $ (2.52) 2019
Q4 $ 917,741 $ 69,958 $ 34,127 $ 103,875 $ 0.55 Q3 725,347 25,200 (1,085) 76,868 (0.02) Q2 683,353 37,000 8,507 81,122 0.14 Q1 566,995 40,906 16,149 60,302 0.26
Total $ 2,893,436 $ 173,064 $ 57,698 $ 322,167 $ 0.93 2018
Q4 $ 662,020 $ 60,570 $ 42,815 $ 79,868 $ 0.69 Q3 605,342 53,469 37,031 70,245 0.59 Q2 673,025 72,063 49,740 91,400 0.81 Q1 578,634 51,753 30,356 73,841 0.48
Total $ 2,519,021 $ 237,855 $ 159,942 $ 315,354 $ 2.56
COMPARISON OF FOURTH QUARTER 2020 RESULTS
(U.S. dollars in thousands)
2020 Q4 2019 Q4 Fiscal 2020 Fiscal 2019
Statement of Earnings Data
Revenue
North America $ 483,011 $ 617,553 $ 1,651,144 $ 2,142,895
United Kingdom and Europe 88,900 154,820 268,916 277,669
Asia Pacific 35,930 28,202 97,669 55,456
Other — — — —
Manufacturing operations 607,841 800,575 2,017,729 2,476,020
North America 76,704 93,053 315,415 365,304
United Kingdom and Europe 17,696 19,549 63,596 42,447
Asia Pacific 8,625 3,775 20,075 8,247
Other 657 789 2,360 1,418
Aftermarket operations 103,682 117,166 401,446 417,416
Total revenue $ 711,523 $ 917,741 $ 2,419,175 $ 2,893,436
Earnings (loss) from operations $ 32,531 $ 69,958 $ (81,329) $ 173,064
Earnings (loss) before interest and income taxes $ 36,023 $ 71,546 $ (72,223) $ 173,050
Net earnings (loss) $ 8,465 $ 34,127 $ (157,736) $ 57,698
Adjusted EBITDA(1) $ 64,956 $ 103,875 $ 157,683 $ 322,167
Capital expenditures $ 9,686 $ 7,618 $ 27,016 $ 41,757
[1]Non-IFRS Measure - See Appendix A for details.
25 NFI GROUP INC. 2020 REPORT www.nfigroup.com
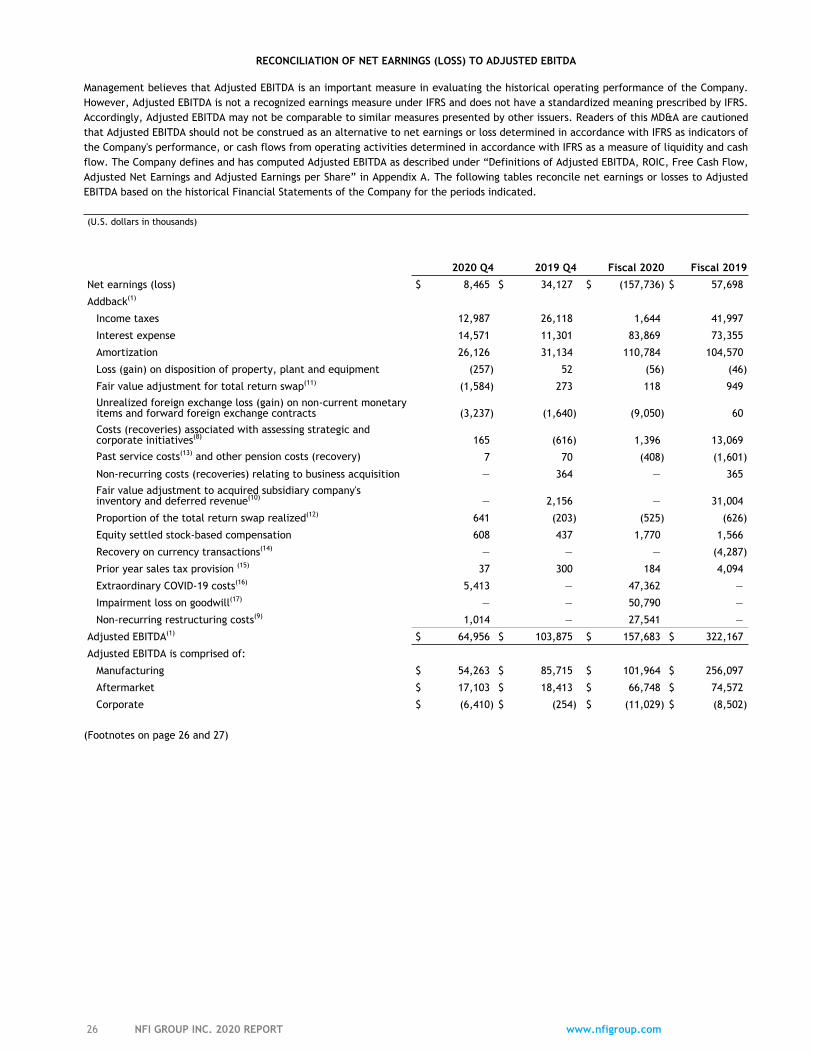
RECONCILIATION OF NET EARNINGS (LOSS) TO ADJUSTED EBITDA
Management believes that Adjusted EBITDA is an important measure in evaluating the historical operating performance of the Company. However, Adjusted EBITDA is not a recognized earnings measure under IFRS and does not have a standardized meaning prescribed by IFRS. Accordingly, Adjusted EBITDA may not be comparable to similar measures presented by other issuers. Readers of this MD&A are cautioned that Adjusted EBITDA should not be construed as an alternative to net earnings or loss determined in accordance with IFRS as indicators of the Company's performance, or cash flows from operating activities determined in accordance with IFRS as a measure of liquidity and cash flow. The Company defines and has computed Adjusted EBITDA as described under “Definitions of Adjusted EBITDA, ROIC, Free Cash Flow, Adjusted Net Earnings and Adjusted Earnings per Share” in Appendix A. The following tables reconcile net earnings or losses to Adjusted EBITDA based on the historical Financial Statements of the Company for the periods indicated.
(U.S. dollars in thousands)
2020 Q4 2019 Q4 Fiscal 2020 Fiscal 2019
Net earnings (loss) $ 8,465 $ 34,127 $ (157,736) $ 57,698
Addback(1)
Income taxes 12,987 26,118 1,644 41,997
Interest expense 14,571 11,301 83,869 73,355
Amortization 26,126 31,134 110,784 104,570
Loss (gain) on disposition of property, plant and equipment (257) 52 (56) (46)
Fair value adjustment for total return swap(11) (1,584) 273 118 949
Unrealized foreign exchange loss (gain) on non-current monetary items and forward foreign exchange contracts (3,237) (1,640) (9,050) 60
Costs (recoveries) associated with assessing strategic and corporate initiatives(8) 165 (616) 1,396 13,069
Past service costs(13) and other pension costs (recovery) 7 70 (408) (1,601)
Non-recurring costs (recoveries) relating to business acquisition — 364 — 365
Fair value adjustment to acquired subsidiary company's inventory and deferred revenue(10) — 2,156 — 31,004
Proportion of the total return swap realized(12) 641 (203) (525) (626)
Equity settled stock-based compensation 608 437 1,770 1,566
Recovery on currency transactions(14) — — — (4,287)
Prior year sales tax provision (15) 37 300 184 4,094
Extraordinary COVID-19 costs(16) 5,413 — 47,362 —
Impairment loss on goodwill(17) — — 50,790 —
Non-recurring restructuring costs(9) 1,014 — 27,541 —
Adjusted EBITDA(1) $ 64,956 $ 103,875 $ 157,683 $ 322,167
Adjusted EBITDA is comprised of:
Manufacturing $ 54,263 $ 85,715 $ 101,964 $ 256,097
Aftermarket $ 17,103 $ 18,413 $ 66,748 $ 74,572
Corporate $ (6,410) $ (254) $ (11,029) $ (8,502)
(Footnotes on page 26 and 27)
26 NFI GROUP INC. 2020 REPORT www.nfigroup.com
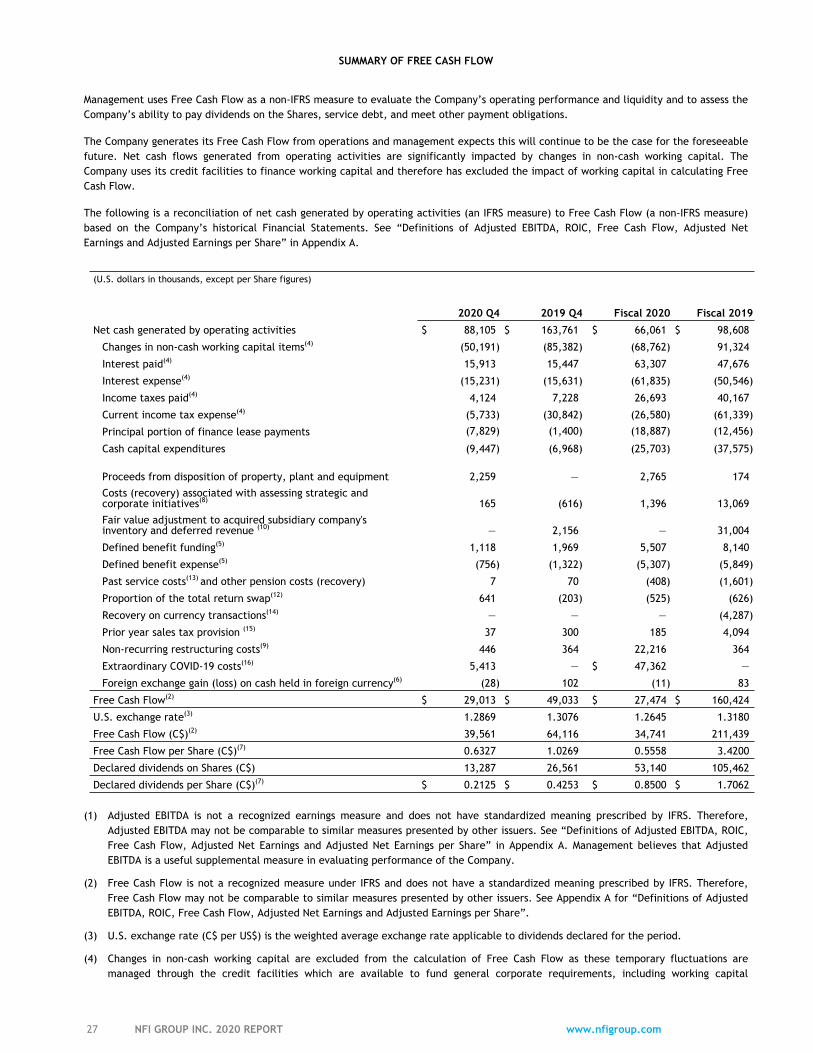
SUMMARY OF FREE CASH FLOW
Management uses Free Cash Flow as a non-IFRS measure to evaluate the Company’s operating performance and liquidity and to assess the Company’s ability to pay dividends on the Shares, service debt, and meet other payment obligations.
The Company generates its Free Cash Flow from operations and management expects this will continue to be the case for the foreseeable future. Net cash flows generated from operating activities are significantly impacted by changes in non-cash working capital. The Company uses its credit facilities to finance working capital and therefore has excluded the impact of working capital in calculating Free Cash Flow.
The following is a reconciliation of net cash generated by operating activities (an IFRS measure) to Free Cash Flow (a non-IFRS measure) based on the Company’s historical Financial Statements. See “Definitions of Adjusted EBITDA, ROIC, Free Cash Flow, Adjusted Net Earnings and Adjusted Earnings per Share” in Appendix A.
(U.S. dollars in thousands, except per Share figures)
2020 Q4 2019 Q4 Fiscal 2020 Fiscal 2019
Net cash generated by operating activities $ 88,105 $ 163,761 $ 66,061 $ 98,608
Changes in non-cash working capital items(4) (50,191) (85,382) (68,762) 91,324
Interest paid(4) 15,913 15,447 63,307 47,676
Interest expense(4) (15,231) (15,631) (61,835) (50,546)
Income taxes paid(4) 4,124 7,228 26,693 40,167
Current income tax expense(4) (5,733) (30,842) (26,580) (61,339)
Principal portion of finance lease payments (7,829) (1,400) (18,887) (12,456)
Cash capital expenditures (9,447) (6,968) (25,703) (37,575)
Proceeds from disposition of property, plant and equipment 2,259 — 2,765 174
Costs (recovery) associated with assessing strategic and corporate initiatives(8) 165 (616) 1,396 13,069
Fair value adjustment to acquired subsidiary company's inventory and deferred revenue (10) — 2,156 — 31,004
Defined benefit funding(5) 1,118 1,969 5,507 8,140
Defined benefit expense(5) (756) (1,322) (5,307) (5,849)
Past service costs(13) and other pension costs (recovery) 7 70 (408) (1,601)
Proportion of the total return swap(12) 641 (203) (525) (626)
Recovery on currency transactions(14) — — — (4,287)
Prior year sales tax provision (15) 37 300 185 4,094
Non-recurring restructuring costs(9) 446 364 22,216 364
Extraordinary COVID-19 costs(16) 5,413 — $ 47,362 —
Foreign exchange gain (loss) on cash held in foreign currency(6) (28) 102 (11) 83
Free Cash Flow(2) $ 29,013 $ 49,033 $ 27,474 $ 160,424
U.S. exchange rate(3) 1.2869 1.3076 1.2645 1.3180
Free Cash Flow (C$)(2) 39,561 64,116 34,741 211,439
Free Cash Flow per Share (C$)(7) 0.6327 1.0269 0.5558 3.4200
Declared dividends on Shares (C$) 13,287 26,561 53,140 105,462
Declared dividends per Share (C$)(7) $ 0.2125 $ 0.4253 $ 0.8500 $ 1.7062
(1) Adjusted EBITDA is not a recognized earnings measure and does not have standardized meaning prescribed by IFRS. Therefore, Adjusted EBITDA may not be comparable to similar measures presented by other issuers. See “Definitions of Adjusted EBITDA, ROIC, Free Cash Flow, Adjusted Net Earnings and Adjusted Net Earnings per Share” in Appendix A. Management believes that Adjusted EBITDA is a useful supplemental measure in evaluating performance of the Company.
(2) Free Cash Flow is not a recognized measure under IFRS and does not have a standardized meaning prescribed by IFRS. Therefore, Free Cash Flow may not be comparable to similar measures presented by other issuers. See Appendix A for “Definitions of Adjusted EBITDA, ROIC, Free Cash Flow, Adjusted Net Earnings and Adjusted Earnings per Share”.
(3) U.S. exchange rate (C$ per US$) is the weighted average exchange rate applicable to dividends declared for the period.
(4) Changes in non-cash working capital are excluded from the calculation of Free Cash Flow as these temporary fluctuations are managed through the credit facilities which are available to fund general corporate requirements, including working capital
27 NFI GROUP INC. 2020 REPORT www.nfigroup.com
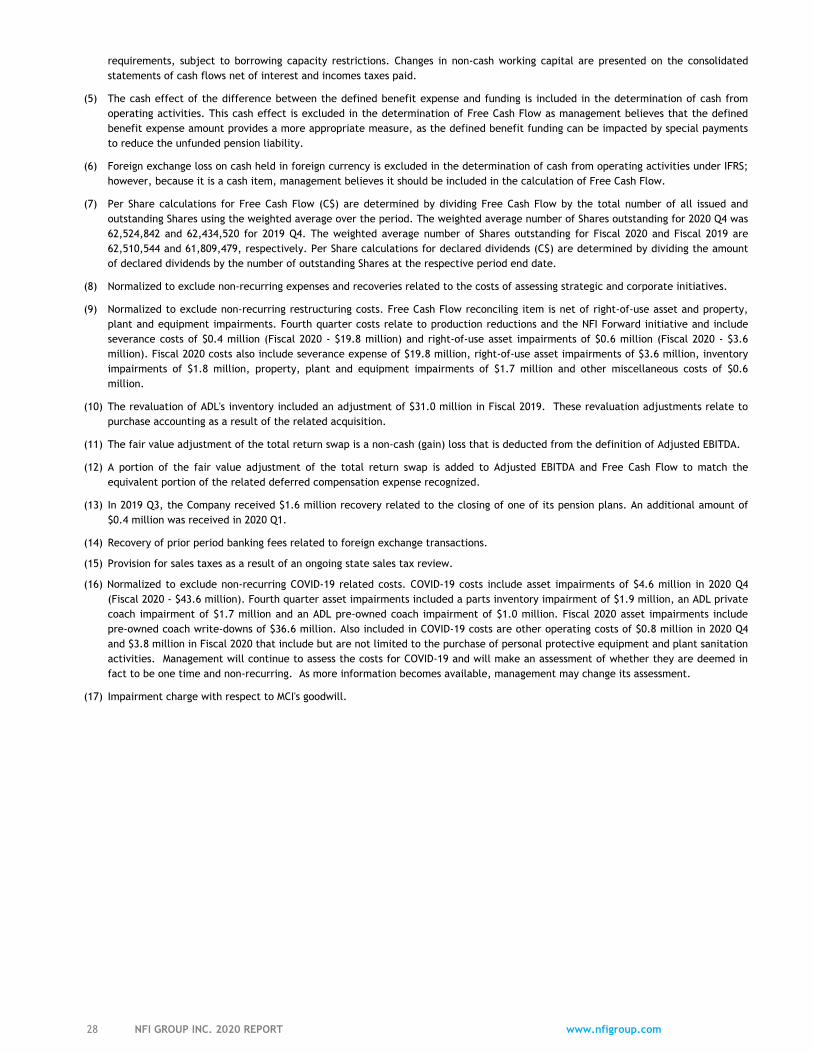
requirements, subject to borrowing capacity restrictions. Changes in non-cash working capital are presented on the consolidated statements of cash flows net of interest and incomes taxes paid.
(5) The cash effect of the difference between the defined benefit expense and funding is included in the determination of cash from operating activities. This cash effect is excluded in the determination of Free Cash Flow as management believes that the defined benefit expense amount provides a more appropriate measure, as the defined benefit funding can be impacted by special payments to reduce the unfunded pension liability.
(6) Foreign exchange loss on cash held in foreign currency is excluded in the determination of cash from operating activities under IFRS; however, because it is a cash item, management believes it should be included in the calculation of Free Cash Flow.
(7) Per Share calculations for Free Cash Flow (C$) are determined by dividing Free Cash Flow by the total number of all issued and outstanding Shares using the weighted average over the period. The weighted average number of Shares outstanding for 2020 Q4 was 62,524,842 and 62,434,520 for 2019 Q4. The weighted average number of Shares outstanding for Fiscal 2020 and Fiscal 2019 are 62,510,544 and 61,809,479, respectively. Per Share calculations for declared dividends (C$) are determined by dividing the amount of declared dividends by the number of outstanding Shares at the respective period end date.
(8) Normalized to exclude non-recurring expenses and recoveries related to the costs of assessing strategic and corporate initiatives.
(9) Normalized to exclude non-recurring restructuring costs. Free Cash Flow reconciling item is net of right-of-use asset and property, plant and equipment impairments. Fourth quarter costs relate to production reductions and the NFI Forward initiative and include severance costs of $0.4 million (Fiscal 2020 - $19.8 million) and right-of-use asset impairments of $0.6 million (Fiscal 2020 - $3.6 million). Fiscal 2020 costs also include severance expense of $19.8 million, right-of-use asset impairments of $3.6 million, inventory impairments of $1.8 million, property, plant and equipment impairments of $1.7 million and other miscellaneous costs of $0.6 million.
(10) The revaluation of ADL's inventory included an adjustment of $31.0 million in Fiscal 2019. These revaluation adjustments relate to purchase accounting as a result of the related acquisition.
(11) The fair value adjustment of the total return swap is a non-cash (gain) loss that is deducted from the definition of Adjusted EBITDA.
(12) A portion of the fair value adjustment of the total return swap is added to Adjusted EBITDA and Free Cash Flow to match the equivalent portion of the related deferred compensation expense recognized.
(13) In 2019 Q3, the Company received $1.6 million recovery related to the closing of one of its pension plans. An additional amount of $0.4 million was received in 2020 Q1.
(14) Recovery of prior period banking fees related to foreign exchange transactions.
(15) Provision for sales taxes as a result of an ongoing state sales tax review.
(16) Normalized to exclude non-recurring COVID-19 related costs. COVID-19 costs include asset impairments of $4.6 million in 2020 Q4 (Fiscal 2020 - $43.6 million). Fourth quarter asset impairments included a parts inventory impairment of $1.9 million, an ADL private coach impairment of $1.7 million and an ADL pre-owned coach impairment of $1.0 million. Fiscal 2020 asset impairments include pre-owned coach write-downs of $36.6 million. Also included in COVID-19 costs are other operating costs of $0.8 million in 2020 Q4 and $3.8 million in Fiscal 2020 that include but are not limited to the purchase of personal protective equipment and plant sanitation activities. Management will continue to assess the costs for COVID-19 and will make an assessment of whether they are deemed in fact to be one time and non-recurring. As more information becomes available, management may change its assessment.
(17) Impairment charge with respect to MCI's goodwill.
28 NFI GROUP INC. 2020 REPORT www.nfigroup.com
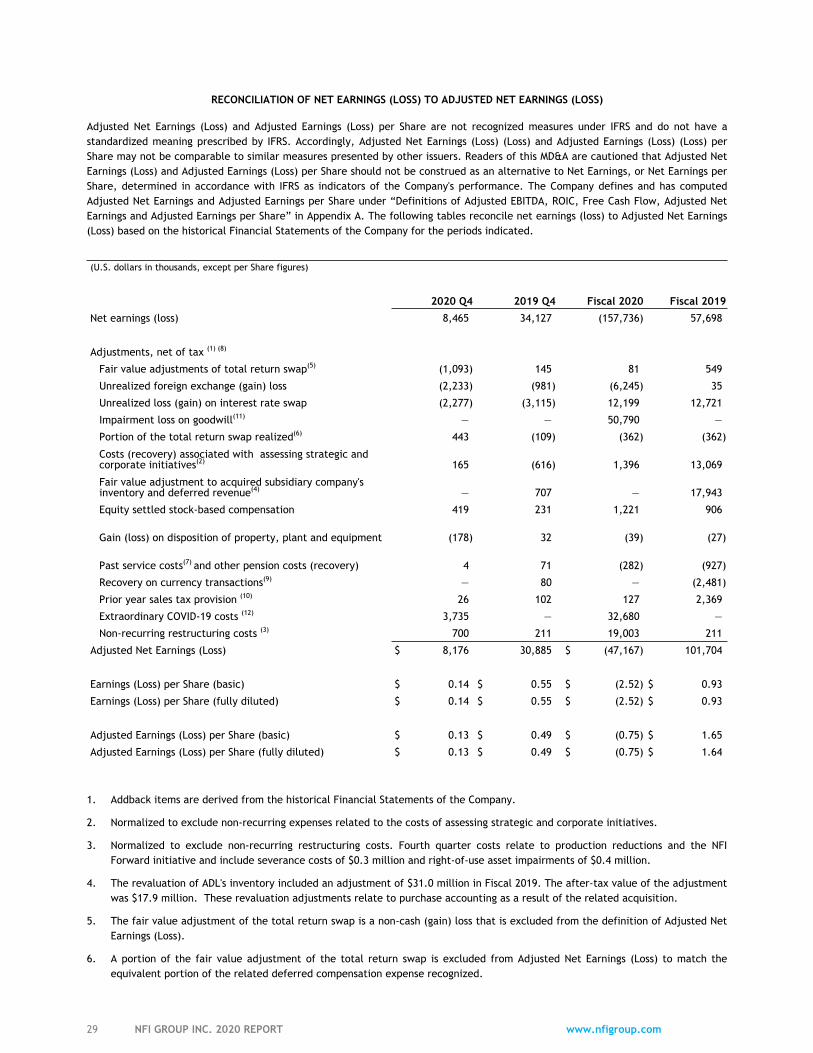
RECONCILIATION OF NET EARNINGS (LOSS) TO ADJUSTED NET EARNINGS (LOSS)
Adjusted Net Earnings (Loss) and Adjusted Earnings (Loss) per Share are not recognized measures under IFRS and do not have a standardized meaning prescribed by IFRS. Accordingly, Adjusted Net Earnings (Loss) (Loss) and Adjusted Earnings (Loss) (Loss) per Share may not be comparable to similar measures presented by other issuers. Readers of this MD&A are cautioned that Adjusted Net Earnings (Loss) and Adjusted Earnings (Loss) per Share should not be construed as an alternative to Net Earnings, or Net Earnings per Share, determined in accordance with IFRS as indicators of the Company's performance. The Company defines and has computed Adjusted Net Earnings and Adjusted Earnings per Share under “Definitions of Adjusted EBITDA, ROIC, Free Cash Flow, Adjusted Net Earnings and Adjusted Earnings per Share” in Appendix A. The following tables reconcile net earnings (loss) to Adjusted Net Earnings (Loss) based on the historical Financial Statements of the Company for the periods indicated.
(U.S. dollars in thousands, except per Share figures)
2020 Q4 2019 Q4 Fiscal 2020 Fiscal 2019
Net earnings (loss) 8,465 34,127 (157,736) 57,698
Adjustments, net of tax (1) (8)
Fair value adjustments of total return swap(5) (1,093) 145 81 549
Unrealized foreign exchange (gain) loss (2,233) (981) (6,245) 35
Unrealized loss (gain) on interest rate swap (2,277) (3,115) 12,199 12,721
Impairment loss on goodwill(11) — — 50,790 —
Portion of the total return swap realized(6) 443 (109) (362) (362)
Costs (recovery) associated with assessing strategic and corporate initiatives(2) 165 (616) 1,396 13,069
Fair value adjustment to acquired subsidiary company's inventory and deferred revenue(4) — 707 — 17,943
Equity settled stock-based compensation 419 231 1,221 906
Gain (loss) on disposition of property, plant and equipment (178) 32 (39) (27)
Past service costs(7) and other pension costs (recovery) 4 71 (282) (927)
Recovery on currency transactions(9) — 80 — (2,481)
Prior year sales tax provision (10) 26 102 127 2,369
Extraordinary COVID-19 costs (12) 3,735 — 32,680 —
Non-recurring restructuring costs (3) 700 211 19,003 211
Adjusted Net Earnings (Loss) $ 8,176 30,885 $ (47,167) 101,704
Earnings (Loss) per Share (basic) $ 0.14 $ 0.55 $ (2.52) $ 0.93
Earnings (Loss) per Share (fully diluted) $ 0.14 $ 0.55 $ (2.52) $ 0.93
Adjusted Earnings (Loss) per Share (basic) $ 0.13 $ 0.49 $ (0.75) $ 1.65
Adjusted Earnings (Loss) per Share (fully diluted) $ 0.13 $ 0.49 $ (0.75) $ 1.64
1. Addback items are derived from the historical Financial Statements of the Company.
2. Normalized to exclude non-recurring expenses related to the costs of assessing strategic and corporate initiatives.
3. Normalized to exclude non-recurring restructuring costs. Fourth quarter costs relate to production reductions and the NFI Forward initiative and include severance costs of $0.3 million and right-of-use asset impairments of $0.4 million.
4. The revaluation of ADL's inventory included an adjustment of $31.0 million in Fiscal 2019. The after-tax value of the adjustment was $17.9 million. These revaluation adjustments relate to purchase accounting as a result of the related acquisition.
5. The fair value adjustment of the total return swap is a non-cash (gain) loss that is excluded from the definition of Adjusted Net Earnings (Loss).
6. A portion of the fair value adjustment of the total return swap is excluded from Adjusted Net Earnings (Loss) to match the equivalent portion of the related deferred compensation expense recognized.
29 NFI GROUP INC. 2020 REPORT www.nfigroup.com
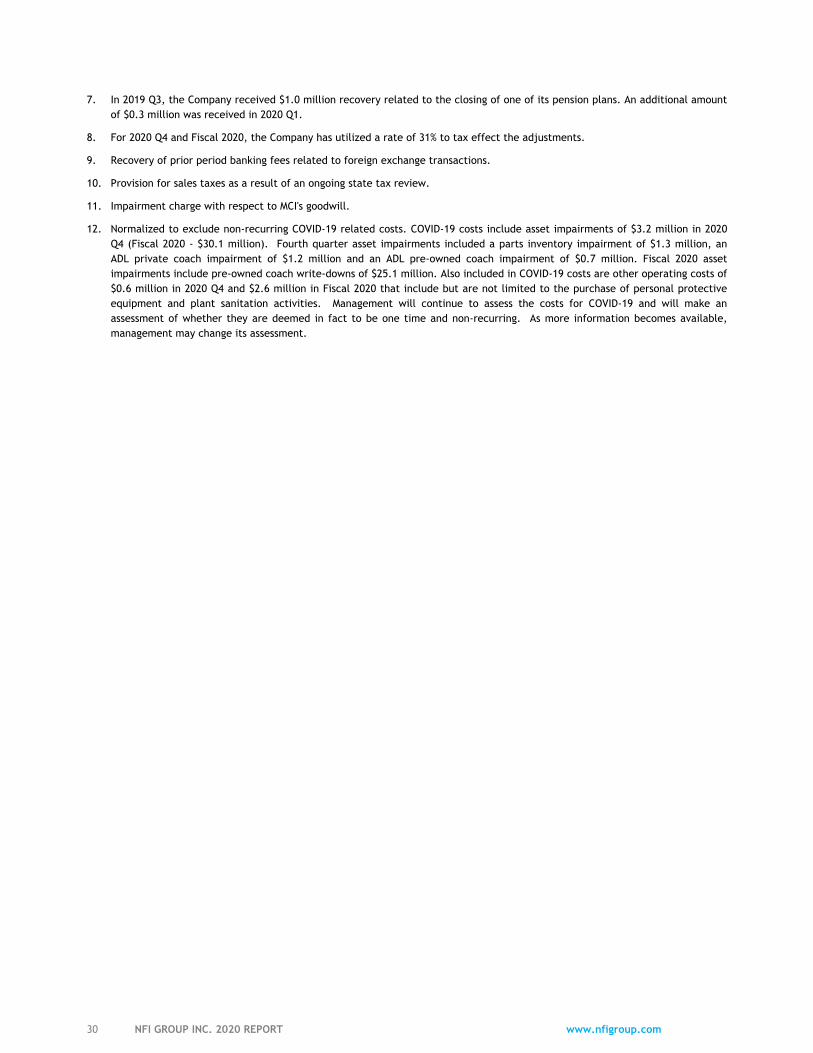
7. In 2019 Q3, the Company received $1.0 million recovery related to the closing of one of its pension plans. An additional amount of $0.3 million was received in 2020 Q1.
8. For 2020 Q4 and Fiscal 2020, the Company has utilized a rate of 31% to tax effect the adjustments.
9. Recovery of prior period banking fees related to foreign exchange transactions.
10. Provision for sales taxes as a result of an ongoing state tax review.
11. Impairment charge with respect to MCI's goodwill.
12. Normalized to exclude non-recurring COVID-19 related costs. COVID-19 costs include asset impairments of $3.2 million in 2020 Q4 (Fiscal 2020 - $30.1 million). Fourth quarter asset impairments included a parts inventory impairment of $1.3 million, an ADL private coach impairment of $1.2 million and an ADL pre-owned coach impairment of $0.7 million. Fiscal 2020 asset impairments include pre-owned coach write-downs of $25.1 million. Also included in COVID-19 costs are other operating costs of $0.6 million in 2020 Q4 and $2.6 million in Fiscal 2020 that include but are not limited to the purchase of personal protective equipment and plant sanitation activities. Management will continue to assess the costs for COVID-19 and will make an assessment of whether they are deemed in fact to be one time and non-recurring. As more information becomes available, management may change its assessment.
30 NFI GROUP INC. 2020 REPORT www.nfigroup.com
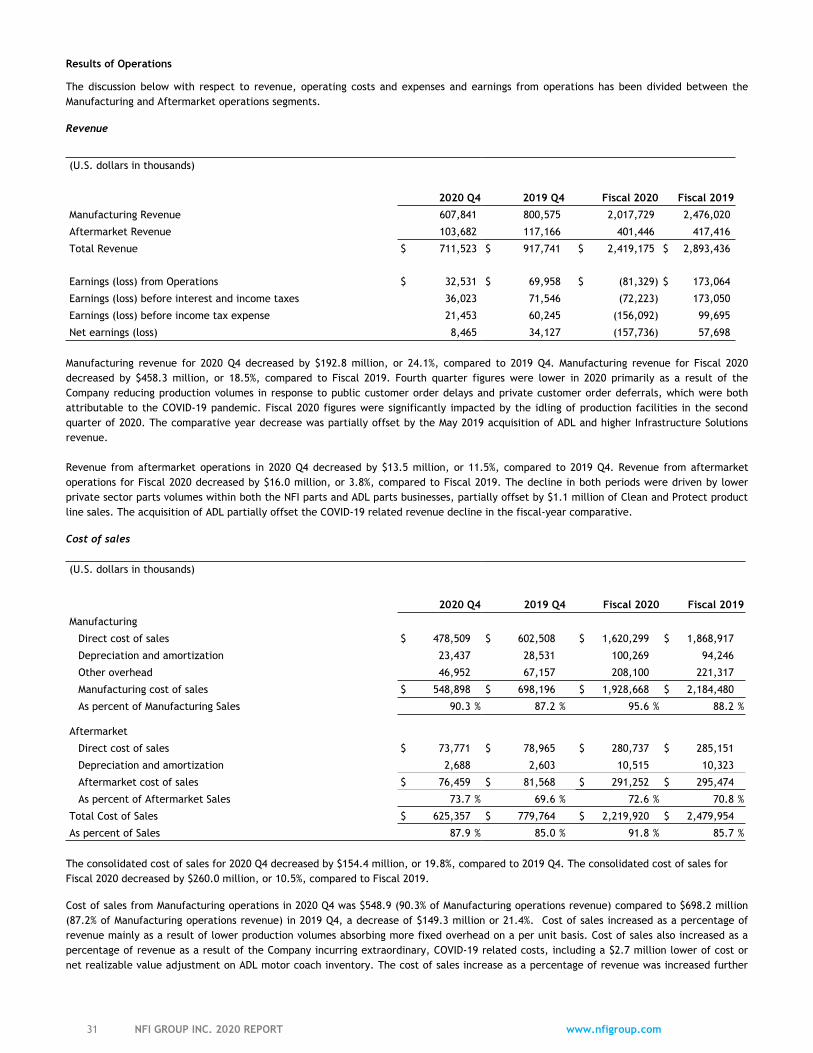
Results of Operations
The discussion below with respect to revenue, operating costs and expenses and earnings from operations has been divided between the Manufacturing and Aftermarket operations segments.
Revenue
(U.S. dollars in thousands)
2020 Q4 2019 Q4 Fiscal 2020 Fiscal 2019
Manufacturing Revenue 607,841 800,575 2,017,729 2,476,020
Aftermarket Revenue 103,682 117,166 401,446 417,416
Total Revenue $ 711,523 $ 917,741 $ 2,419,175 $ 2,893,436
Earnings (loss) from Operations $ 32,531 $ 69,958 $ (81,329) $ 173,064
Earnings (loss) before interest and income taxes 36,023 71,546 (72,223) 173,050
Earnings (loss) before income tax expense 21,453 60,245 (156,092) 99,695
Net earnings (loss) 8,465 34,127 (157,736) 57,698
Manufacturing revenue for 2020 Q4 decreased by $192.8 million, or 24.1%, compared to 2019 Q4. Manufacturing revenue for Fiscal 2020 decreased by $458.3 million, or 18.5%, compared to Fiscal 2019. Fourth quarter figures were lower in 2020 primarily as a result of the Company reducing production volumes in response to public customer order delays and private customer order deferrals, which were both attributable to the COVID-19 pandemic. Fiscal 2020 figures were significantly impacted by the idling of production facilities in the second quarter of 2020. The comparative year decrease was partially offset by the May 2019 acquisition of ADL and higher Infrastructure Solutions revenue.
Revenue from aftermarket operations in 2020 Q4 decreased by $13.5 million, or 11.5%, compared to 2019 Q4. Revenue from aftermarket operations for Fiscal 2020 decreased by $16.0 million, or 3.8%, compared to Fiscal 2019. The decline in both periods were driven by lower private sector parts volumes within both the NFI parts and ADL parts businesses, partially offset by $1.1 million of Clean and Protect product line sales. The acquisition of ADL partially offset the COVID-19 related revenue decline in the fiscal-year comparative.
Cost of sales
(U.S. dollars in thousands)
2020 Q4 2019 Q4 Fiscal 2020 Fiscal 2019
Manufacturing
Direct cost of sales $ 478,509 $ 602,508 $ 1,620,299 $ 1,868,917
Depreciation and amortization 23,437 28,531 100,269 94,246
Other overhead 46,952 67,157 208,100 221,317
Manufacturing cost of sales $ 548,898 $ 698,196 $ 1,928,668 $ 2,184,480
As percent of Manufacturing Sales 90.3 % 87.2 % 95.6 % 88.2 %
Aftermarket
Direct cost of sales $ 73,771 $ 78,965 $ 280,737 $ 285,151
Depreciation and amortization 2,688 2,603 10,515 10,323
Aftermarket cost of sales $ 76,459 $ 81,568 $ 291,252 $ 295,474
As percent of Aftermarket Sales 73.7 % 69.6 % 72.6 % 70.8 %
Total Cost of Sales $ 625,357 $ 779,764 $ 2,219,920 $ 2,479,954
As percent of Sales 87.9 % 85.0 % 91.8 % 85.7 %
The consolidated cost of sales for 2020 Q4 decreased by $154.4 million, or 19.8%, compared to 2019 Q4. The consolidated cost of sales for Fiscal 2020 decreased by $260.0 million, or 10.5%, compared to Fiscal 2019.
Cost of sales from Manufacturing operations in 2020 Q4 was $548.9 (90.3% of Manufacturing operations revenue) compared to $698.2 million (87.2% of Manufacturing operations revenue) in 2019 Q4, a decrease of $149.3 million or 21.4%. Cost of sales increased as a percentage of revenue mainly as a result of lower production volumes absorbing more fixed overhead on a per unit basis. Cost of sales also increased as a percentage of revenue as a result of the Company incurring extraordinary, COVID-19 related costs, including a $2.7 million lower of cost or net realizable value adjustment on ADL motor coach inventory. The cost of sales increase as a percentage of revenue was increased further
31 NFI GROUP INC. 2020 REPORT www.nfigroup.com
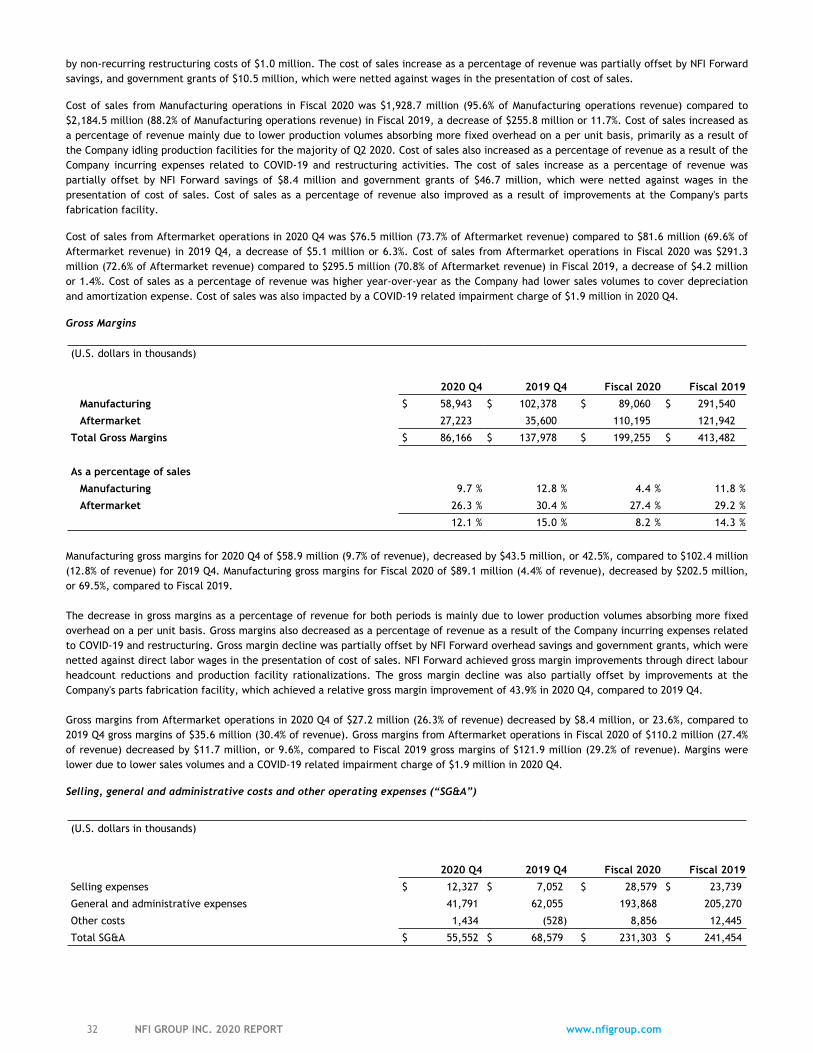
by non-recurring restructuring costs of $1.0 million. The cost of sales increase as a percentage of revenue was partially offset by NFI Forward savings, and government grants of $10.5 million, which were netted against wages in the presentation of cost of sales.
Cost of sales from Manufacturing operations in Fiscal 2020 was $1,928.7 million (95.6% of Manufacturing operations revenue) compared to $2,184.5 million (88.2% of Manufacturing operations revenue) in Fiscal 2019, a decrease of $255.8 million or 11.7%. Cost of sales increased as a percentage of revenue mainly due to lower production volumes absorbing more fixed overhead on a per unit basis, primarily as a result of the Company idling production facilities for the majority of Q2 2020. Cost of sales also increased as a percentage of revenue as a result of the Company incurring expenses related to COVID-19 and restructuring activities. The cost of sales increase as a percentage of revenue was partially offset by NFI Forward savings of $8.4 million and government grants of $46.7 million, which were netted against wages in the presentation of cost of sales. Cost of sales as a percentage of revenue also improved as a result of improvements at the Company's parts fabrication facility.
Cost of sales from Aftermarket operations in 2020 Q4 was $76.5 million (73.7% of Aftermarket revenue) compared to $81.6 million (69.6% of Aftermarket revenue) in 2019 Q4, a decrease of $5.1 million or 6.3%. Cost of sales from Aftermarket operations in Fiscal 2020 was $291.3 million (72.6% of Aftermarket revenue) compared to $295.5 million (70.8% of Aftermarket revenue) in Fiscal 2019, a decrease of $4.2 million or 1.4%. Cost of sales as a percentage of revenue was higher year-over-year as the Company had lower sales volumes to cover depreciation and amortization expense. Cost of sales was also impacted by a COVID-19 related impairment charge of $1.9 million in 2020 Q4.
Gross Margins
(U.S. dollars in thousands)
2020 Q4 2019 Q4 Fiscal 2020 Fiscal 2019
Manufacturing $ 58,943 $ 102,378 $ 89,060 $ 291,540
Aftermarket 27,223 35,600 110,195 121,942
Total Gross Margins $ 86,166 $ 137,978 $ 199,255 $ 413,482
As a percentage of sales
Manufacturing 9.7 % 12.8 % 4.4 % 11.8 %
Aftermarket 26.3 % 30.4 % 27.4 % 29.2 %
12.1 % 15.0 % 8.2 % 14.3 %
Manufacturing gross margins for 2020 Q4 of $58.9 million (9.7% of revenue), decreased by $43.5 million, or 42.5%, compared to $102.4 million (12.8% of revenue) for 2019 Q4. Manufacturing gross margins for Fiscal 2020 of $89.1 million (4.4% of revenue), decreased by $202.5 million, or 69.5%, compared to Fiscal 2019.
The decrease in gross margins as a percentage of revenue for both periods is mainly due to lower production volumes absorbing more fixed overhead on a per unit basis. Gross margins also decreased as a percentage of revenue as a result of the Company incurring expenses related to COVID-19 and restructuring. Gross margin decline was partially offset by NFI Forward overhead savings and government grants, which were netted against direct labor wages in the presentation of cost of sales. NFI Forward achieved gross margin improvements through direct labour headcount reductions and production facility rationalizations. The gross margin decline was also partially offset by improvements at the Company's parts fabrication facility, which achieved a relative gross margin improvement of 43.9% in 2020 Q4, compared to 2019 Q4.
Gross margins from Aftermarket operations in 2020 Q4 of $27.2 million (26.3% of revenue) decreased by $8.4 million, or 23.6%, compared to 2019 Q4 gross margins of $35.6 million (30.4% of revenue). Gross margins from Aftermarket operations in Fiscal 2020 of $110.2 million (27.4% of revenue) decreased by $11.7 million, or 9.6%, compared to Fiscal 2019 gross margins of $121.9 million (29.2% of revenue). Margins were lower due to lower sales volumes and a COVID-19 related impairment charge of $1.9 million in 2020 Q4.
Selling, general and administrative costs and other operating expenses (“SG&A”)
(U.S. dollars in thousands)
2020 Q4 2019 Q4 Fiscal 2020 Fiscal 2019
Selling expenses $ 12,327 $ 7,052 $ 28,579 $ 23,739
General and administrative expenses 41,791 62,055 193,868 205,270
Other costs 1,434 (528) 8,856 12,445
Total SG&A $ 55,552 $ 68,579 $ 231,303 $ 241,454
32 NFI GROUP INC. 2020 REPORT www.nfigroup.com
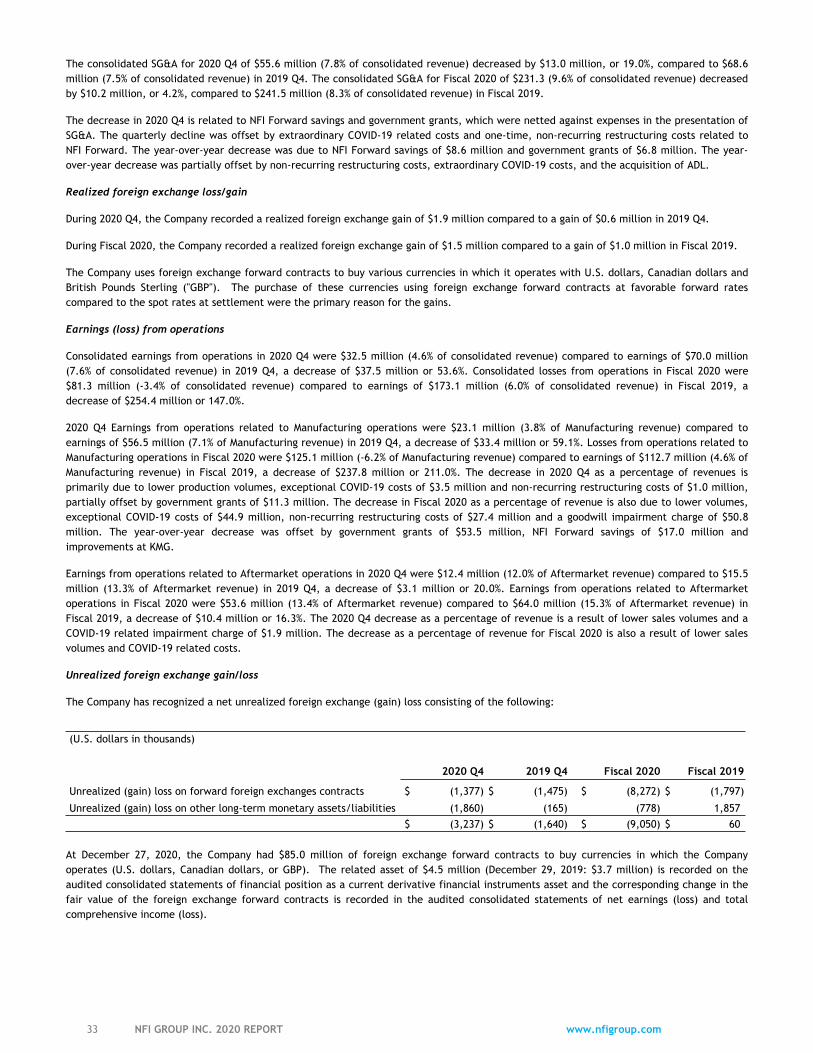
The consolidated SG&A for 2020 Q4 of $55.6 million (7.8% of consolidated revenue) decreased by $13.0 million, or 19.0%, compared to $68.6 million (7.5% of consolidated revenue) in 2019 Q4. The consolidated SG&A for Fiscal 2020 of $231.3 (9.6% of consolidated revenue) decreased by $10.2 million, or 4.2%, compared to $241.5 million (8.3% of consolidated revenue) in Fiscal 2019.
The decrease in 2020 Q4 is related to NFI Forward savings and government grants, which were netted against expenses in the presentation of SG&A. The quarterly decline was offset by extraordinary COVID-19 related costs and one-time, non-recurring restructuring costs related to NFI Forward. The year-over-year decrease was due to NFI Forward savings of $8.6 million and government grants of $6.8 million. The year-over-year decrease was partially offset by non-recurring restructuring costs, extraordinary COVID-19 costs, and the acquisition of ADL.
Realized foreign exchange loss/gain
During 2020 Q4, the Company recorded a realized foreign exchange gain of $1.9 million compared to a gain of $0.6 million in 2019 Q4.
During Fiscal 2020, the Company recorded a realized foreign exchange gain of $1.5 million compared to a gain of $1.0 million in Fiscal 2019.
The Company uses foreign exchange forward contracts to buy various currencies in which it operates with U.S. dollars, Canadian dollars and British Pounds Sterling ("GBP"). The purchase of these currencies using foreign exchange forward contracts at favorable forward rates compared to the spot rates at settlement were the primary reason for the gains.
Earnings (loss) from operations
Consolidated earnings from operations in 2020 Q4 were $32.5 million (4.6% of consolidated revenue) compared to earnings of $70.0 million (7.6% of consolidated revenue) in 2019 Q4, a decrease of $37.5 million or 53.6%. Consolidated losses from operations in Fiscal 2020 were $81.3 million (-3.4% of consolidated revenue) compared to earnings of $173.1 million (6.0% of consolidated revenue) in Fiscal 2019, a decrease of $254.4 million or 147.0%.
2020 Q4 Earnings from operations related to Manufacturing operations were $23.1 million (3.8% of Manufacturing revenue) compared to earnings of $56.5 million (7.1% of Manufacturing revenue) in 2019 Q4, a decrease of $33.4 million or 59.1%. Losses from operations related to Manufacturing operations in Fiscal 2020 were $125.1 million (-6.2% of Manufacturing revenue) compared to earnings of $112.7 million (4.6% of Manufacturing revenue) in Fiscal 2019, a decrease of $237.8 million or 211.0%. The decrease in 2020 Q4 as a percentage of revenues is primarily due to lower production volumes, exceptional COVID-19 costs of $3.5 million and non-recurring restructuring costs of $1.0 million, partially offset by government grants of $11.3 million. The decrease in Fiscal 2020 as a percentage of revenue is also due to lower volumes, exceptional COVID-19 costs of $44.9 million, non-recurring restructuring costs of $27.4 million and a goodwill impairment charge of $50.8 million. The year-over-year decrease was offset by government grants of $53.5 million, NFI Forward savings of $17.0 million and improvements at KMG.
Earnings from operations related to Aftermarket operations in 2020 Q4 were $12.4 million (12.0% of Aftermarket revenue) compared to $15.5 million (13.3% of Aftermarket revenue) in 2019 Q4, a decrease of $3.1 million or 20.0%. Earnings from operations related to Aftermarket operations in Fiscal 2020 were $53.6 million (13.4% of Aftermarket revenue) compared to $64.0 million (15.3% of Aftermarket revenue) in Fiscal 2019, a decrease of $10.4 million or 16.3%. The 2020 Q4 decrease as a percentage of revenue is a result of lower sales volumes and a COVID-19 related impairment charge of $1.9 million. The decrease as a percentage of revenue for Fiscal 2020 is also a result of lower sales volumes and COVID-19 related costs.
Unrealized foreign exchange gain/loss
The Company has recognized a net unrealized foreign exchange (gain) loss consisting of the following:
(U.S. dollars in thousands)
2020 Q4 2019 Q4 Fiscal 2020 Fiscal 2019
Unrealized (gain) loss on forward foreign exchanges contracts $ (1,377) $ (1,475) $ (8,272) $ (1,797)
Unrealized (gain) loss on other long-term monetary assets/liabilities (1,860) (165) (778) 1,857 $ (3,237) $ (1,640) $ (9,050) $ 60
At December 27, 2020, the Company had $85.0 million of foreign exchange forward contracts to buy currencies in which the Company operates (U.S. dollars, Canadian dollars, or GBP). The related asset of $4.5 million (December 29, 2019: $3.7 million) is recorded on the audited consolidated statements of financial position as a current derivative financial instruments asset and the corresponding change in the fair value of the foreign exchange forward contracts is recorded in the audited consolidated statements of net earnings (loss) and total comprehensive income (loss).
33 NFI GROUP INC. 2020 REPORT www.nfigroup.com
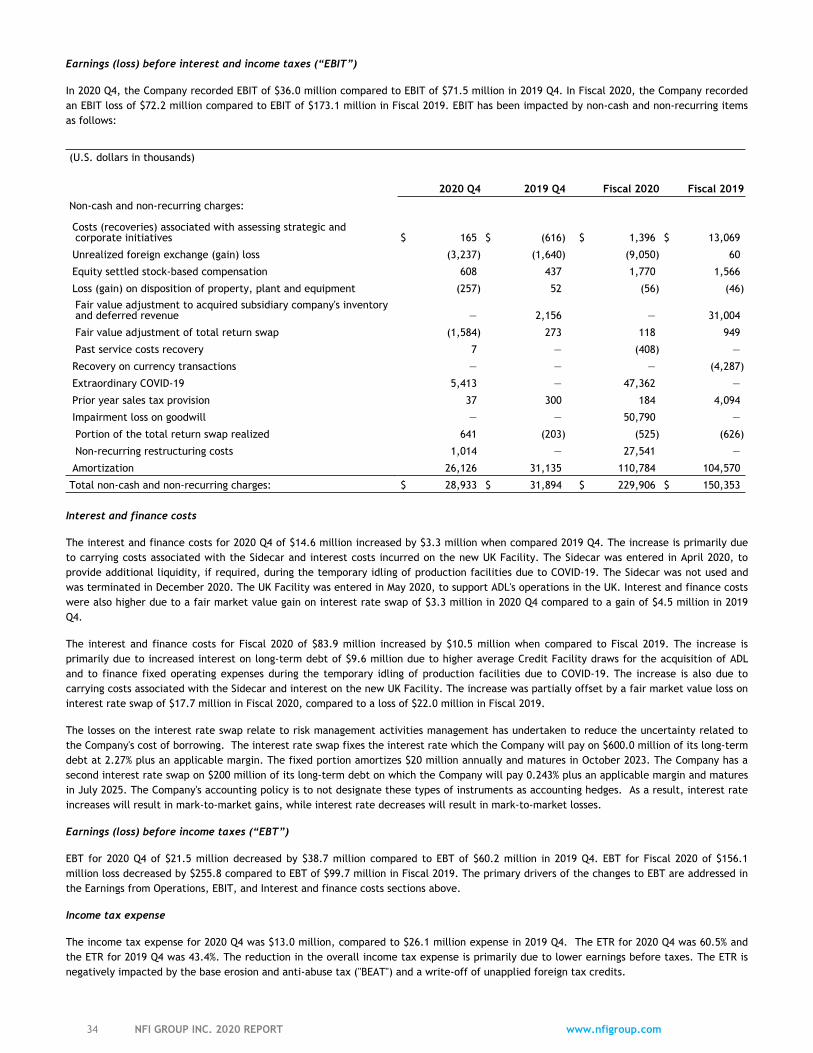
Earnings (loss) before interest and income taxes (“EBIT”)
In 2020 Q4, the Company recorded EBIT of $36.0 million compared to EBIT of $71.5 million in 2019 Q4. In Fiscal 2020, the Company recorded an EBIT loss of $72.2 million compared to EBIT of $173.1 million in Fiscal 2019. EBIT has been impacted by non-cash and non-recurring items as follows:
(U.S. dollars in thousands)
2020 Q4 2019 Q4 Fiscal 2020 Fiscal 2019
Non-cash and non-recurring charges:
Costs (recoveries) associated with assessing strategic and corporate initiatives $ 165 $ (616) $ 1,396 $ 13,069
Unrealized foreign exchange (gain) loss (3,237) (1,640) (9,050) 60
Equity settled stock-based compensation 608 437 1,770 1,566
Loss (gain) on disposition of property, plant and equipment (257) 52 (56) (46)
Fair value adjustment to acquired subsidiary company's inventory and deferred revenue — 2,156 — 31,004
Fair value adjustment of total return swap (1,584) 273 118 949
Past service costs recovery 7 — (408) —
Recovery on currency transactions — — — (4,287)
Extraordinary COVID-19 5,413 — 47,362 —
Prior year sales tax provision 37 300 184 4,094
Impairment loss on goodwill — — 50,790 —
Portion of the total return swap realized 641 (203) (525) (626)
Non-recurring restructuring costs 1,014 — 27,541 —
Amortization 26,126 31,135 110,784 104,570
Total non-cash and non-recurring charges: $ 28,933 $ 31,894 $ 229,906 $ 150,353
Interest and finance costs
The interest and finance costs for 2020 Q4 of $14.6 million increased by $3.3 million when compared 2019 Q4. The increase is primarily due to carrying costs associated with the Sidecar and interest costs incurred on the new UK Facility. The Sidecar was entered in April 2020, to provide additional liquidity, if required, during the temporary idling of production facilities due to COVID-19. The Sidecar was not used and was terminated in December 2020. The UK Facility was entered in May 2020, to support ADL's operations in the UK. Interest and finance costs were also higher due to a fair market value gain on interest rate swap of $3.3 million in 2020 Q4 compared to a gain of $4.5 million in 2019 Q4.
The interest and finance costs for Fiscal 2020 of $83.9 million increased by $10.5 million when compared to Fiscal 2019. The increase is primarily due to increased interest on long-term debt of $9.6 million due to higher average Credit Facility draws for the acquisition of ADL and to finance fixed operating expenses during the temporary idling of production facilities due to COVID-19. The increase is also due to carrying costs associated with the Sidecar and interest on the new UK Facility. The increase was partially offset by a fair market value loss on interest rate swap of $17.7 million in Fiscal 2020, compared to a loss of $22.0 million in Fiscal 2019.
The losses on the interest rate swap relate to risk management activities management has undertaken to reduce the uncertainty related to the Company's cost of borrowing. The interest rate swap fixes the interest rate which the Company will pay on $600.0 million of its long-term debt at 2.27% plus an applicable margin. The fixed portion amortizes $20 million annually and matures in October 2023. The Company has a second interest rate swap on $200 million of its long-term debt on which the Company will pay 0.243% plus an applicable margin and matures in July 2025. The Company's accounting policy is to not designate these types of instruments as accounting hedges. As a result, interest rate increases will result in mark-to-market gains, while interest rate decreases will result in mark-to-market losses.
Earnings (loss) before income taxes (“EBT”)
EBT for 2020 Q4 of $21.5 million decreased by $38.7 million compared to EBT of $60.2 million in 2019 Q4. EBT for Fiscal 2020 of $156.1 million loss decreased by $255.8 compared to EBT of $99.7 million in Fiscal 2019. The primary drivers of the changes to EBT are addressed in the Earnings from Operations, EBIT, and Interest and finance costs sections above.
Income tax expense
The income tax expense for 2020 Q4 was $13.0 million, compared to $26.1 million expense in 2019 Q4. The ETR for 2020 Q4 was 60.5% and the ETR for 2019 Q4 was 43.4%. The reduction in the overall income tax expense is primarily due to lower earnings before taxes. The ETR is negatively impacted by the base erosion and anti-abuse tax ("BEAT") and a write-off of unapplied foreign tax credits.
34 NFI GROUP INC. 2020 REPORT www.nfigroup.com
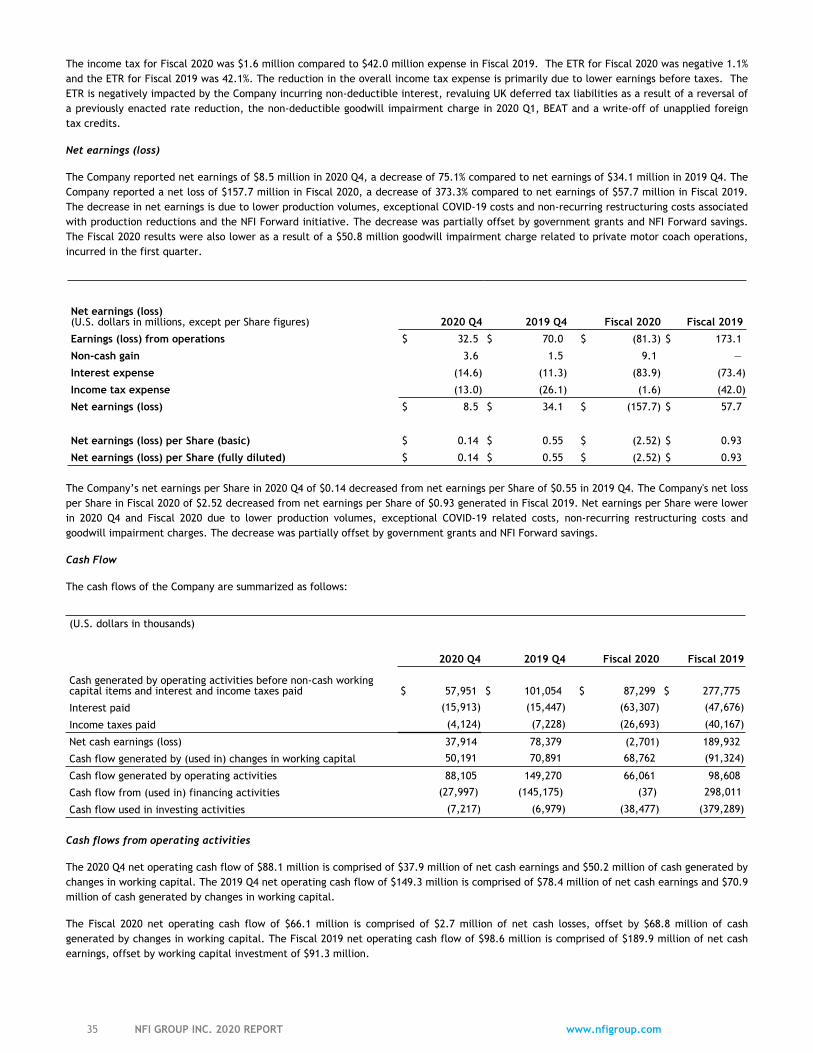
The income tax for Fiscal 2020 was $1.6 million compared to $42.0 million expense in Fiscal 2019. The ETR for Fiscal 2020 was negative 1.1% and the ETR for Fiscal 2019 was 42.1%. The reduction in the overall income tax expense is primarily due to lower earnings before taxes. The ETR is negatively impacted by the Company incurring non-deductible interest, revaluing UK deferred tax liabilities as a result of a reversal of a previously enacted rate reduction, the non-deductible goodwill impairment charge in 2020 Q1, BEAT and a write-off of unapplied foreign tax credits.
Net earnings (loss)
The Company reported net earnings of $8.5 million in 2020 Q4, a decrease of 75.1% compared to net earnings of $34.1 million in 2019 Q4. The Company reported a net loss of $157.7 million in Fiscal 2020, a decrease of 373.3% compared to net earnings of $57.7 million in Fiscal 2019. The decrease in net earnings is due to lower production volumes, exceptional COVID-19 costs and non-recurring restructuring costs associated with production reductions and the NFI Forward initiative. The decrease was partially offset by government grants and NFI Forward savings. The Fiscal 2020 results were also lower as a result of a $50.8 million goodwill impairment charge related to private motor coach operations, incurred in the first quarter.
Net earnings (loss)(U.S. dollars in millions, except per Share figures) 2020 Q4 2019 Q4 Fiscal 2020 Fiscal 2019
Earnings (loss) from operations $ 32.5 $ 70.0 $ (81.3) $ 173.1
Non-cash gain 3.6 1.5 9.1 —
Interest expense (14.6) (11.3) (83.9) (73.4)
Income tax expense (13.0) (26.1) (1.6) (42.0)
Net earnings (loss) $ 8.5 $ 34.1 $ (157.7) $ 57.7
Net earnings (loss) per Share (basic) $ 0.14 $ 0.55 $ (2.52) $ 0.93
Net earnings (loss) per Share (fully diluted) $ 0.14 $ 0.55 $ (2.52) $ 0.93
The Company’s net earnings per Share in 2020 Q4 of $0.14 decreased from net earnings per Share of $0.55 in 2019 Q4. The Company's net loss per Share in Fiscal 2020 of $2.52 decreased from net earnings per Share of $0.93 generated in Fiscal 2019. Net earnings per Share were lower in 2020 Q4 and Fiscal 2020 due to lower production volumes, exceptional COVID-19 related costs, non-recurring restructuring costs and goodwill impairment charges. The decrease was partially offset by government grants and NFI Forward savings.
Cash Flow
The cash flows of the Company are summarized as follows:
(U.S. dollars in thousands)
2020 Q4 2019 Q4 Fiscal 2020 Fiscal 2019
Cash generated by operating activities before non-cash working capital items and interest and income taxes paid $ 57,951 $ 101,054 $ 87,299 $ 277,775
Interest paid (15,913) (15,447) (63,307) (47,676)
Income taxes paid (4,124) (7,228) (26,693) (40,167)
Net cash earnings (loss) 37,914 78,379 (2,701) 189,932
Cash flow generated by (used in) changes in working capital 50,191 70,891 68,762 (91,324)
Cash flow generated by operating activities 88,105 149,270 66,061 98,608
Cash flow from (used in) financing activities (27,997) (145,175) (37) 298,011
Cash flow used in investing activities (7,217) (6,979) (38,477) (379,289)
Cash flows from operating activities
The 2020 Q4 net operating cash flow of $88.1 million is comprised of $37.9 million of net cash earnings and $50.2 million of cash generated by changes in working capital. The 2019 Q4 net operating cash flow of $149.3 million is comprised of $78.4 million of net cash earnings and $70.9 million of cash generated by changes in working capital.
The Fiscal 2020 net operating cash flow of $66.1 million is comprised of $2.7 million of net cash losses, offset by $68.8 million of cash generated by changes in working capital. The Fiscal 2019 net operating cash flow of $98.6 million is comprised of $189.9 million of net cash earnings, offset by working capital investment of $91.3 million.
35 NFI GROUP INC. 2020 REPORT www.nfigroup.com
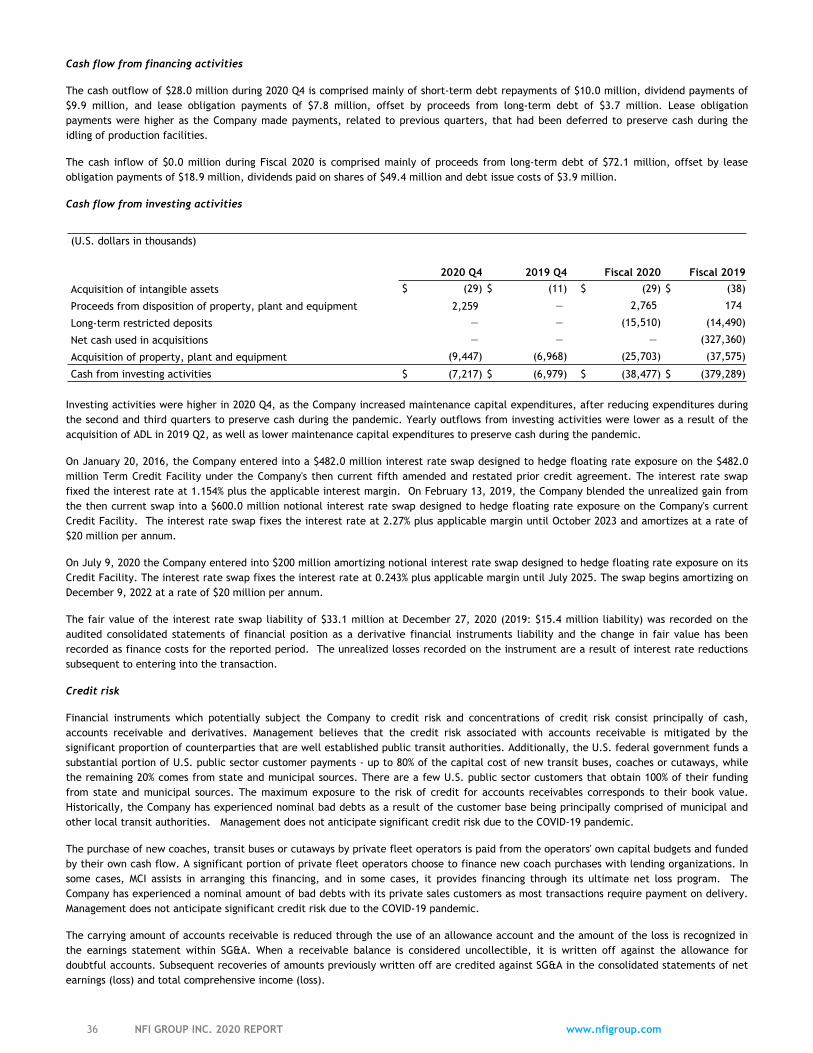
Cash flow from financing activities
The cash outflow of $28.0 million during 2020 Q4 is comprised mainly of short-term debt repayments of $10.0 million, dividend payments of $9.9 million, and lease obligation payments of $7.8 million, offset by proceeds from long-term debt of $3.7 million. Lease obligation payments were higher as the Company made payments, related to previous quarters, that had been deferred to preserve cash during the idling of production facilities.
The cash inflow of $0.0 million during Fiscal 2020 is comprised mainly of proceeds from long-term debt of $72.1 million, offset by lease obligation payments of $18.9 million, dividends paid on shares of $49.4 million and debt issue costs of $3.9 million.
Cash flow from investing activities
(U.S. dollars in thousands)
2020 Q4 2019 Q4 Fiscal 2020 Fiscal 2019
Acquisition of intangible assets $ (29) $ (11) $ (29) $ (38)
Proceeds from disposition of property, plant and equipment 2,259 — 2,765 174
Long-term restricted deposits — — (15,510) (14,490)
Net cash used in acquisitions — — — (327,360)
Acquisition of property, plant and equipment (9,447) (6,968) (25,703) (37,575)
Cash from investing activities $ (7,217) $ (6,979) $ (38,477) $ (379,289)
Investing activities were higher in 2020 Q4, as the Company increased maintenance capital expenditures, after reducing expenditures during the second and third quarters to preserve cash during the pandemic. Yearly outflows from investing activities were lower as a result of the acquisition of ADL in 2019 Q2, as well as lower maintenance capital expenditures to preserve cash during the pandemic.
On January 20, 2016, the Company entered into a $482.0 million interest rate swap designed to hedge floating rate exposure on the $482.0 million Term Credit Facility under the Company's then current fifth amended and restated prior credit agreement. The interest rate swap fixed the interest rate at 1.154% plus the applicable interest margin. On February 13, 2019, the Company blended the unrealized gain from the then current swap into a $600.0 million notional interest rate swap designed to hedge floating rate exposure on the Company's current Credit Facility. The interest rate swap fixes the interest rate at 2.27% plus applicable margin until October 2023 and amortizes at a rate of $20 million per annum.
On July 9, 2020 the Company entered into $200 million amortizing notional interest rate swap designed to hedge floating rate exposure on its Credit Facility. The interest rate swap fixes the interest rate at 0.243% plus applicable margin until July 2025. The swap begins amortizing on December 9, 2022 at a rate of $20 million per annum.
The fair value of the interest rate swap liability of $33.1 million at December 27, 2020 (2019: $15.4 million liability) was recorded on the audited consolidated statements of financial position as a derivative financial instruments liability and the change in fair value has been recorded as finance costs for the reported period. The unrealized losses recorded on the instrument are a result of interest rate reductions subsequent to entering into the transaction.
Credit risk
Financial instruments which potentially subject the Company to credit risk and concentrations of credit risk consist principally of cash, accounts receivable and derivatives. Management believes that the credit risk associated with accounts receivable is mitigated by the significant proportion of counterparties that are well established public transit authorities. Additionally, the U.S. federal government funds a substantial portion of U.S. public sector customer payments - up to 80% of the capital cost of new transit buses, coaches or cutaways, while the remaining 20% comes from state and municipal sources. There are a few U.S. public sector customers that obtain 100% of their funding from state and municipal sources. The maximum exposure to the risk of credit for accounts receivables corresponds to their book value. Historically, the Company has experienced nominal bad debts as a result of the customer base being principally comprised of municipal and other local transit authorities. Management does not anticipate significant credit risk due to the COVID-19 pandemic.
The purchase of new coaches, transit buses or cutaways by private fleet operators is paid from the operators' own capital budgets and funded by their own cash flow. A significant portion of private fleet operators choose to finance new coach purchases with lending organizations. In some cases, MCI assists in arranging this financing, and in some cases, it provides financing through its ultimate net loss program. The Company has experienced a nominal amount of bad debts with its private sales customers as most transactions require payment on delivery. Management does not anticipate significant credit risk due to the COVID-19 pandemic.
The carrying amount of accounts receivable is reduced through the use of an allowance account and the amount of the loss is recognized in the earnings statement within SG&A. When a receivable balance is considered uncollectible, it is written off against the allowance for doubtful accounts. Subsequent recoveries of amounts previously written off are credited against SG&A in the consolidated statements of net earnings (loss) and total comprehensive income (loss).
36 NFI GROUP INC. 2020 REPORT www.nfigroup.com
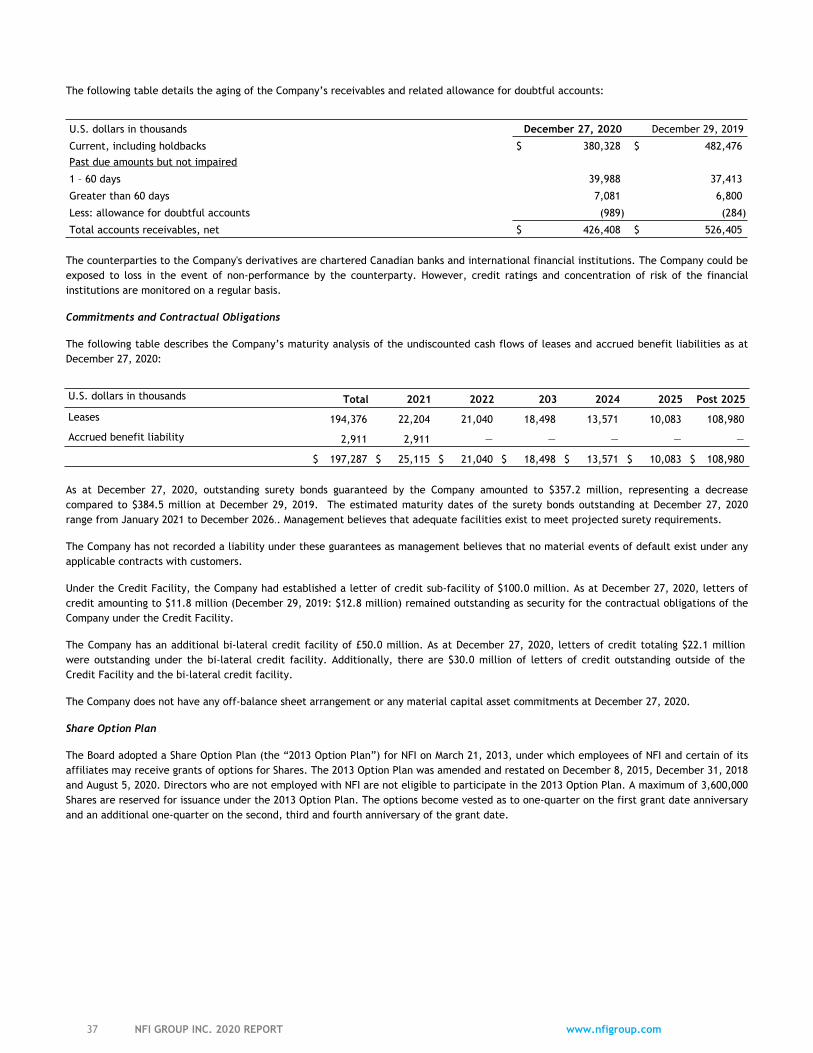
The following table details the aging of the Company’s receivables and related allowance for doubtful accounts:
U.S. dollars in thousands December 27, 2020 December 29, 2019
Current, including holdbacks $ 380,328 $ 482,476 Past due amounts but not impaired
1 – 60 days 39,988 37,413
Greater than 60 days 7,081 6,800
Less: allowance for doubtful accounts (989) (284)
Total accounts receivables, net $ 426,408 $ 526,405
The counterparties to the Company's derivatives are chartered Canadian banks and international financial institutions. The Company could be exposed to loss in the event of non-performance by the counterparty. However, credit ratings and concentration of risk of the financial institutions are monitored on a regular basis.
Commitments and Contractual Obligations
The following table describes the Company’s maturity analysis of the undiscounted cash flows of leases and accrued benefit liabilities as at December 27, 2020:
U.S. dollars in thousands Total 2021 2022 203 2024 2025 Post 2025
Leases 194,376 22,204 21,040 18,498 13,571 10,083 108,980
Accrued benefit liability 2,911 2,911 — — — — —
$ 197,287 $ 25,115 $ 21,040 $ 18,498 $ 13,571 $ 10,083 $ 108,980
As at December 27, 2020, outstanding surety bonds guaranteed by the Company amounted to $357.2 million, representing a decrease compared to $384.5 million at December 29, 2019. The estimated maturity dates of the surety bonds outstanding at December 27, 2020 range from January 2021 to December 2026.. Management believes that adequate facilities exist to meet projected surety requirements.
The Company has not recorded a liability under these guarantees as management believes that no material events of default exist under any applicable contracts with customers.
Under the Credit Facility, the Company had established a letter of credit sub-facility of $100.0 million. As at December 27, 2020, letters of credit amounting to $11.8 million (December 29, 2019: $12.8 million) remained outstanding as security for the contractual obligations of the Company under the Credit Facility.
The Company has an additional bi-lateral credit facility of £50.0 million. As at December 27, 2020, letters of credit totaling $22.1 million were outstanding under the bi-lateral credit facility. Additionally, there are $30.0 million of letters of credit outstanding outside of the Credit Facility and the bi-lateral credit facility.
The Company does not have any off-balance sheet arrangement or any material capital asset commitments at December 27, 2020.
Share Option Plan
The Board adopted a Share Option Plan (the “2013 Option Plan”) for NFI on March 21, 2013, under which employees of NFI and certain of its affiliates may receive grants of options for Shares. The 2013 Option Plan was amended and restated on December 8, 2015, December 31, 2018 and August 5, 2020. Directors who are not employed with NFI are not eligible to participate in the 2013 Option Plan. A maximum of 3,600,000 Shares are reserved for issuance under the 2013 Option Plan. The options become vested as to one-quarter on the first grant date anniversary and an additional one-quarter on the second, third and fourth anniversary of the grant date.
37 NFI GROUP INC. 2020 REPORT www.nfigroup.com
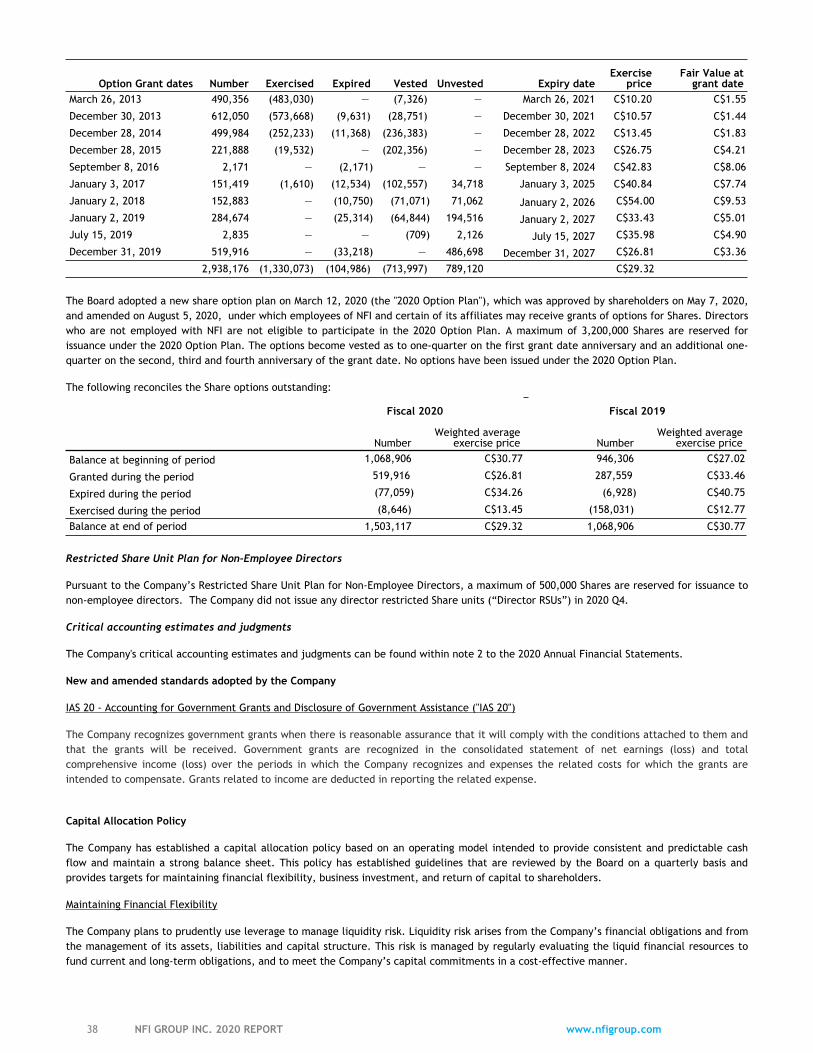
Option Grant dates Number Exercised Expired Vested Unvested Expiry dateExercise
priceFair Value at
grant dateMarch 26, 2013 490,356 (483,030) — (7,326) — March 26, 2021 C$10.20 C$1.55
December 30, 2013 612,050 (573,668) (9,631) (28,751) — December 30, 2021 C$10.57 C$1.44
December 28, 2014 499,984 (252,233) (11,368) (236,383) — December 28, 2022 C$13.45 C$1.83
December 28, 2015 221,888 (19,532) — (202,356) — December 28, 2023 C$26.75 C$4.21
September 8, 2016 2,171 — (2,171) — — September 8, 2024 C$42.83 C$8.06
January 3, 2017 151,419 (1,610) (12,534) (102,557) 34,718 January 3, 2025 C$40.84 C$7.74
January 2, 2018 152,883 — (10,750) (71,071) 71,062 January 2, 2026 C$54.00 C$9.53
January 2, 2019 284,674 — (25,314) (64,844) 194,516 January 2, 2027 C$33.43 C$5.01
July 15, 2019 2,835 — — (709) 2,126 July 15, 2027 C$35.98 C$4.90
December 31, 2019 519,916 — (33,218) — 486,698 December 31, 2027 C$26.81 C$3.36
2,938,176 (1,330,073) (104,986) (713,997) 789,120 C$29.32
The Board adopted a new share option plan on March 12, 2020 (the "2020 Option Plan"), which was approved by shareholders on May 7, 2020, and amended on August 5, 2020, under which employees of NFI and certain of its affiliates may receive grants of options for Shares. Directors who are not employed with NFI are not eligible to participate in the 2020 Option Plan. A maximum of 3,200,000 Shares are reserved for issuance under the 2020 Option Plan. The options become vested as to one-quarter on the first grant date anniversary and an additional one-quarter on the second, third and fourth anniversary of the grant date. No options have been issued under the 2020 Option Plan.
The following reconciles the Share options outstanding:
Fiscal 2020 Fiscal 2019
NumberWeighted average
exercise price NumberWeighted average
exercise price
Balance at beginning of period 1,068,906 C$30.77 946,306 C$27.02
Granted during the period 519,916 C$26.81 287,559 C$33.46
Expired during the period (77,059) C$34.26 (6,928) C$40.75
Exercised during the period (8,646) C$13.45 (158,031) C$12.77
Balance at end of period 1,503,117 C$29.32 1,068,906 C$30.77
Restricted Share Unit Plan for Non-Employee Directors
Pursuant to the Company’s Restricted Share Unit Plan for Non-Employee Directors, a maximum of 500,000 Shares are reserved for issuance to non-employee directors. The Company did not issue any director restricted Share units (“Director RSUs”) in 2020 Q4.
Critical accounting estimates and judgments
The Company's critical accounting estimates and judgments can be found within note 2 to the 2020 Annual Financial Statements.
New and amended standards adopted by the Company
IAS 20 - Accounting for Government Grants and Disclosure of Government Assistance ("IAS 20")
The Company recognizes government grants when there is reasonable assurance that it will comply with the conditions attached to them and that the grants will be received. Government grants are recognized in the consolidated statement of net earnings (loss) and total comprehensive income (loss) over the periods in which the Company recognizes and expenses the related costs for which the grants are intended to compensate. Grants related to income are deducted in reporting the related expense.
Capital Allocation Policy
The Company has established a capital allocation policy based on an operating model intended to provide consistent and predictable cash flow and maintain a strong balance sheet. This policy has established guidelines that are reviewed by the Board on a quarterly basis and provides targets for maintaining financial flexibility, business investment, and return of capital to shareholders.
Maintaining Financial Flexibility
The Company plans to prudently use leverage to manage liquidity risk. Liquidity risk arises from the Company’s financial obligations and from the management of its assets, liabilities and capital structure. This risk is managed by regularly evaluating the liquid financial resources to fund current and long-term obligations, and to meet the Company’s capital commitments in a cost-effective manner.
38 NFI GROUP INC. 2020 REPORT www.nfigroup.com
The main factors that affect liquidity include sales mix, production levels, cash production costs, working capital requirements, capital expenditure requirements, scheduled repayments of long-term debt obligations, funding requirements of the Company’s pension plans, income taxes, credit capacity, expected future debt and equity capital market conditions.
The Company’s liquidity requirements are met through a variety of sources, including cash on hand, cash generated from operations, the credit facilities, leases, and debt and equity capital markets.
On December 23, 2020, the Company amended its credit facilities, including the Company’s existing $1.25 billion Credit Facility and its £50 million UK Facility. The amended facilities provide NFI with relaxed covenants as it recovers from the impacts of the COVID-19 pandemic. In addition to amending the facilities, NFI terminated the unused $250 million Sidecar facility, which was intended to provide additional liquidity in 2020, which the Company believes it no longer requires.
Under the terms of the amended facilities, the total leverage and interest coverage ratios for 2021 and 2022 have been relaxed. During 2021, the Company has received a waiver of the total net leverage covenant and will instead need to comply with a total net leverage ratio that is based on a conservative financial projection for the Company’s 2021 fiscal year.
Beginning in 2022, the Company will be required to maintain a total net leverage ratio at follows:
January 3, 2022 - April 3, 2022 <5.00
April 4, 2022 - July 3, 2022 <4.50
July 4, 2022 - October 2, 2022 <4.25
October 3, 2022 and thereafter <3.75
The Company will also have to comply with a $50 million minimum liquidity covenant at all times until the total net leverage covenant is less than 3.75x, a total net debt to capitalization ratio of less than 0.70:1.00 during 2021, and an interest coverage ratio of at least 2.25x during 2021 and 3.00x beginning in the first quarter 2022. The amended facilities require the dividend payment not exceed the current level.
Adjusted EBITDA is calculated on a rolling last twelve-month basis, provided that for those calculations required on April 4, 2021, the rolling period is calculated as Adjusted EBITDA for the three Fiscal Quarters ending April 4, 2021, December 27, 2020 and September 27, 2020 multiplied by 4/3.
Management believes the Company’s cash position, anticipated future revenues, liquidity from credit facilities together with access to equity markets and other borrowings capacity are sufficient to support current operations, dividends and strategic initiatives.
Subsequent to quarter- and year-end, on March 1, 2021 NFI announced that it had closed a bought-deal equity offering ( the "Offering") with a syndicate of underwriters (the "Underwriters") pursuant to which NFI issued 8,446,000 common shares at a price of C$29.60 per share for gross proceeds to the Company of C$250 million. The Company intends to use the net proceeds of the Offering to reduce the outstanding balances under its credit facilities, which is expected to strengthen NFI’s balance sheet, reduce leverage and interest expense and significantly increase liquidity.
NFI believes that its existing liquidity combined with the additional financial flexibility provided from the Offering will allow it to pursue its operational and strategic goals, such as investments in NFI’s zero-emission products and electric propulsion technology, investments required under the previously disclosed NFI Forward cost-reduction initiative and other potential growth opportunities, in addition to continuing to return capital to shareholders through dividends.
The calculation of the financial covenants for Fiscal 2020 are provided for information purposes below:
December 27, 2020 December 29, 2019
Total Leverage Ratio (must be less than 6.25 [2019: 4.25]) 4.90 3.24
Interest Coverage Ratio (must be greater than 3.00 [2019: 3.00]) 4.11 7.73
US dollars in thousands December 27, 2020
Liquidity Position (must be greater than $50 million) $ 233,459
The Company remains focused on deleveraging its balance sheet and returning to its target leverage of 2.0x to 2.5x total debt to EBITDA. Management had originally expected the Company to return to those levels 18 to 24 months following the acquisition of ADL in May 2019, but the impact of COVID-19 has extended the expected timing of deleveraging. The Company has executed upon a variety of initiatives focused on lowering cash outflows to help mitigate the impacts of COVID-19 including:
• Permanent workforce reductions across NFI Group, generating savings of $17 million in fiscal 2020;
39 NFI GROUP INC. 2020 REPORT www.nfigroup.com
• A reduction in planned 2020 cash capital expenditures from $45 million to $25 million;• The 50% reduction in the Company's quarterly dividend in 2020 Q1; and• Reducing working capital
Management expects to reduce the Company's total leverage over time as the recovery from COVID-19 continues, and the Company achieves the benefits of the NFI Forward strategic cost reduction initiatives.
Compliance with financial covenants is reviewed monthly by the Executive team and reported quarterly to the Board. Other than the requirements imposed by borrowing agreements, the Company is not subject to any externally imposed capital requirements. Capital management objectives are reviewed on an annual basis or when strategic capital transactions arise.
Business Investment
The Company plans to invest in the current business for future growth and will continue to invest in common systems and lean manufacturing operations to improve quality and cost effectiveness, and to continue to invest in ZEB, Infrastructure Solutions and Advanced Driver Assistance Systems ("ADAS") and automated vehicles. The Company has made significant investments in its ZEB production capabilities to be prepared for the expected longer-term transition to a more electrified fleet. New Flyer now has the capability to manufacture ZEBs at all of its North American facilities. ADL is the market leader in ZEBs with production capabilities at all of its UK facilities, MCI has invested in model upgrades to generate its first electric coach offering, which has been well received by the market and ARBOC is commencing production of its medium-duty Equess CHARGE electric bus in the second quarter of 2021, subject to completion of Altoona testing. To support customers making the transition to zero-emission fleets, New Flyer launched an Infrastructure Solutions business in 2019 that has helped numerous agencies develop and launch infrastructure installation projects.
The Company has a number of autonomous bus projects in development with specialized partners who have a deep understanding of artificial intelligence and ADAS. As part of this program to advance automated and ADAS, subsequent to quarter-end, on January 29, 2021, NFI announced the launch of the New Flyer Xcelsior AV, North America's first automated transit bus. ARBOC’s zero-emission battery electric bus, the Equess CHARGETM, will begin production in the second half of 2021, following completion of Altoona testing. The Company has also made numerous investments into telematics solutions to ensure customers can track detailed performance and maintenance metrics associated with their vehicles.
In addition to internal investments, business acquisitions will be considered to further grow and diversify the business and to contribute to the long-term competitiveness and stability of the Company. Investment decisions are based on several criteria, including but not limited to: investment required to maintain or enhance operations; enhancement of cost effectiveness through vertical integration of critical supply and sub-assembly in-sourcing; and acquisitions in current or adjacent markets that are considered accretive to the business.
Return of Capital to Shareholders
The Company intends to have a Share dividend policy that is consistent with the Company`s financial performance and the desire to retain certain cash flows to support the ongoing requirements of the business and to provide the financial flexibility to pursue revenue diversification and growth opportunities.
The Company's 2020 Q4 Free Cash Flow was C$39.6 million compared to declared dividends of C$13.3 million during this period. For 2019 Q4 Free Cash Flow was C$64.1 million compared to declared dividends of C$26.6 million. This resulted in a payout ratio of 33.6% in 2020 Q4 compared to 41.5% in 2019 Q4.
To support cash management efforts while the Company's operations are impacted by COVID-19, in 2020 Q1 the Board reduced the Company’s quarterly dividend to C$0.2125 per Share. While the dividend payment was reduced, the continued payment reflects the Board’s confidence in the Company’s business while maintaining the financial flexibility required to operate during a period of significant economic uncertainty.
On June 11, 2018, the Company announced that the TSX had accepted a notice filed by the Company of its intention to implement the previous Normal Course Issuer Bid (the "Former NCIB") to repurchase its Shares through the facilities of the TSX and any alternative Canadian trading systems on which the Shares are traded. On January 17, 2019 the Company amended the Former NCIB. Pursuant to the amended Former NCIB, the Company was permitted to repurchase for cancellation up to 5,549,465 Shares, representing approximately 10% of the outstanding public float of Shares on June 4, 2018. The Company was permitted to repurchase Shares commencing on June 14, 2018 up to June 13, 2019, or earlier should the Company have completed its repurchases prior to such date. The Former NCIB expired June 13, 2019.
On June 12, 2019 the Company announced that the TSX had accepted a notice filed by the Company of its intention to implement a Normal Course Issuer Bid to replace the Former NCIB to repurchase its Shares (the "Second NCIB"). The Company was permitted to repurchase for cancellation up to 5,357,914 Shares, representing approximately 10% of the outstanding public float of Shares on June 4, 2019. The Company was permitted to repurchase Shares commencing on June 17, 2019 up to June 16, 2020, or earlier should the Company complete its repurchases prior to such date.
During 2019 Q1, the Company repurchased 232,100 Shares under the Former NCIB at an average price of C$31.82 per Share for a total repurchase of C$7.4 million. The Company canceled 986,075 Shares during 2019 Q1, including 232,100 Shares purchased in 2019 Q1 and 753,975 Shares that were purchased in 2018 Q4. There were no shares purchased or canceled under the Former NCIB or the Second NCIB
40 NFI GROUP INC. 2020 REPORT www.nfigroup.com
subsequent to 2019 Q2. The Second NCIB expired on June 16, 2020. The Company did not file for another normal course issuer bid to replace the expired Second NCIB.
Total Capital Distributions to Shareholders(U.S. dollars in millions)
2020 Q4 2019 Q4 Fiscal 2020 Fiscal 2019
Dividends paid $ 9.9 $ 20.0 $ 49.4 $76.4
NCIB Share repurchase — — — 5.7
Total $ 9.9 $ 20.0 $ 49.4 $ 82.1
Controls and Procedures
Internal Controls over Financial Reporting
Management is responsible for establishing and maintaining internal controls over financial reporting (“ICFR”), as defined under rules adopted by the Canadian Securities Administrators. ICFR were designed under the supervision of, and with the participation of, the President and Chief Executive Officer (“CEO”) and the Chief Financial Officer (“CFO”). The Company’s ICFR are designed to provide reasonable assurance regarding the reliability of financial reporting and the preparation of Financial Statements for external purposes in accordance with IFRS.
On December 15, 2014, management adopted the “Internal Control – Integrated Framework 2013” (“COSO 2013”) from the Committee of Sponsoring Organizations of the Treadway Commission, which replaces the previously issued COSO framework, COSO 1992. This new framework necessitated a re-evaluation of the controls that management relies upon to support its conclusions, as well as changes to the Company’s testing programs.
Management, under the supervision of the CEO and CFO, evaluated the design and operational effectiveness of the Company’s ICFR as of December 27, 2020 in accordance with the criteria established in COSO 2013, and concluded that the Company’s ICFR are effective.
ICFR, no matter how well designed, have inherent limitations. Therefore, ICFR can provide only reasonable assurance with respect to financial statement preparation and may not prevent or detect all misstatements.
There have been no changes in our internal control over financial reporting during the quarter ended December 27, 2020 that have materially affected, or are reasonably likely to materially affect, our internal control over financial reporting.
Disclosure Controls
Management is responsible for establishing and maintaining disclosure controls and procedures in order to provide reasonable assurance that material information relating to the Company is made known to them in a timely manner and that information required to be disclosed is reported within time periods prescribed by applicable securities legislation. There are inherent limitations to the effectiveness of any system of disclosure controls and procedures, including the possibility of human error and the circumvention or overriding of the controls and procedures. Accordingly, even effective disclosure controls and procedures can only provide reasonable assurance of achieving their control objectives. The Company’s CEO and CFO have concluded that disclosure controls and procedures as at December 27, 2020 were effective.
41 NFI GROUP INC. 2020 REPORT www.nfigroup.com
Appendix A - Meaning of Certain References
References in this MD&A to the “Company” are to NFI and all of its direct or indirect subsidiaries, including New Flyer Industries Canada ULC (“NFI ULC”), New Flyer of America Inc. (“NFAI”), The Aftermarket Parts Company, LLC (“TAPC”), TCB Enterprises, LLC ("TCB"), KMG Fabrication, Inc. ("KMG"), Carfair Composites Inc. (“CCI”) and Carfair Composites USA, Inc. (“CCUI”, and together with "CCI", "Carfair"), The Reliable Insurance Company Limited, ARBOC Specialty Vehicles, LLC ("ARBOC"), New MCI Holdings, Inc. and its affiliated entities (collectively, "MCI”), NFI Holdings Luxembourg s.a.r.l., and Alexander Dennis Limited and its affiliated entities (collectively, "ADL") References to “New Flyer” generally refer to NFI ULC, NFAI, TAPC, KMG, CCI, CCUI and TCB. References in this MD&A to “management” are to senior management of NFI and the Company.
The common shares of NFI (“Shares”) are traded on the Toronto Stock Exchange ("TSX") under the symbol “NFI”. As at December 27, 2020, 62,524,842 Shares were issued and outstanding. Additional information about NFI and the Company, including NFI’s annual information form, is available on SEDAR at www.sedar.com.
Buses manufactured by New Flyer and ADL's single and double deck buses are classified as "transit buses". ARBOC manufactures body-on-chassis or “cutaway” and "medium-duty" buses that service transit, paratransit, and shuttle applications. Collectively, transit buses, medium-duty buses and cutaways, are referred to as "buses".
A “motor coach” or “coach” is a 35-foot to 45-foot over-the-highway bus typically used for intercity transportation and travel over longer distances than heavy-duty transit buses, and is typically characterized by (i) one or two axles in the rear (related to the weight of the vehicle), (ii) high deck floor, (iii) baggage compartment under the floor, (iv) high-backed seats with a coach-style interior (often including a lavatory and underfloor baggage compartments), and (v) no room for standing passengers.
All of the data presented in this MD&A with respect to the number of transit buses, medium-duty buses, cutaways and motor coaches in service and delivered, is measured in, or based on, “equivalent units”. One equivalent unit (or “EU”) represents one production slot, being one 30-foot, 35-foot, 40-foot, 45-foot heavy-duty transit bus, one double deck bus, one medium-duty bus, one cutaway bus or one motor coach, whereas one articulated transit bus represents two equivalent units. An articulated transit bus is an extra-long transit bus (approximately 60-feet in length), composed of two passenger compartments connected by a joint mechanism. The joint mechanism allows the vehicle to bend when the bus turns a corner, yet have a continuous interior.
Forward‑Looking Statements
This MD&A contains “forward-looking information” and “forward-looking statements”, within the meaning of applicable Canadian securities laws, which reflect the expectations of management regarding the Company’s future growth, financial performance and financial position and the Company’s strategic initiatives, plans, business prospects and opportunities, including the duration, impact of and recovery from the COVID-19 pandemic. The words “believes”, “views”, “anticipates”, “plans”, “expects”, “intends”, “projects”, “forecasts”, “estimates”, “guidance” and “targets”, “may”, “will” and similar expressions are intended to identify forward looking statements. These forward-looking statements reflect management’s current expectations regarding future events (including the recovery of the Company’s markets and the expected benefits to be obtained through its “NFI Forward” initiative) and the Company’s financial and operating performance and speak only as of the date of this MD&A. Forward-looking statements involve significant risks and uncertainties, should not be read as guarantees of future events, performance or results, and will not necessarily be accurate indications of whether or not or the times at or by which such performance or results will be achieved.
A number of factors that may cause actual results to differ materially from the results discussed in the forward-looking statements include: the anticipated use of proceeds of the Offering; the Company may not be able to achieve its targets for sales growth; funding may not continue to be available to the Company’s customers at current levels or at all; the Company’s business is affected by economic factors and adverse developments in economic conditions could have an adverse effect on the for the Company’s products and the results of its operations; currency fluctuations could adversely affect the Company’s financial results or competitive position; interest rates could change substantially, materially impacting the Company’s revenue and profitability; an active, liquid trading market for the Shares may cease to exist, which may limit the ability of shareholders to trade Shares; the market price for the Shares may be volatile; if securities or industry analysts do not publish research or reports about the Company and its business, if they adversely change their recommendations regarding the Shares or if the Company’s results of operations do not meet their expectations, the Share price and trading volume could decline; in addition, if securities or industry analysts publish inaccurate or unfavorable research about the Company or its business, the Share price and trading volume of the Shares could decline; competition in the industry and entrance of new competitors; current requirements under "Buy America" regulations may change and/or become more onerous or suppliers’ “Buy America” content may change; failure of the Company to comply with the U.S. Disadvantaged Business Enterprise (“DBE”) program requirements or the failure to have its DBE goals approved by the U.S. Federal Transit Administration; absence of fixed term customer contracts, exercise of options and customer suspension or termination for convenience; local content bidding preferences in the United States may create a competitive disadvantage; uncertainty resulting from the exit of the UK from the European Union; requirements under Canadian content policies may change and/or become more onerous; operational risk resulting from inadequate or failed internal processes, people and/or systems or from
42 NFI GROUP INC. 2020 REPORT www.nfigroup.com
external events, including fiduciary breaches, regulatory compliance failures, legal disputes, business disruption, pandemics, floods, technology failures, processing errors, business integration, damage to physical assets, employee safety and insurance coverage; international operations subject the Company to additional risks and costs and may cause profitability to decline; compliance with international trade regulations, tariffs and duties; dependence on limited sources or unique sources of supply; a disruption of the supply of components containing microprocessors and other computer chips could materially adversely affect the production and sale of the Company's vehicles and certain other products; dependence on supply of engines that comply with emission regulations; a disruption, termination or alteration of the supply of vehicle chassis or other critical components from third-party suppliers could materially adversely affect the sales of certain of the Company’s products; the Company's profitability can be adversely affected by increases in raw material and component costs; the Company may incur material losses and costs as a result of product warranty costs, recalls and remediation of transit buses and motor coaches; production delays may result in liquidated damages under the Company's contracts with its customers; catastrophic events may lead to production curtailments or shutdowns; the Company may not be able to successfully renegotiate collective bargaining agreements when they expire and may be adversely affected by labour disruptions and shortages of labour; the Company's operations are subject to risks and hazards that may result in monetary losses and liabilities not covered by insurance or which exceed its insurance coverage; the Company may be adversely affected by rising insurance costs; the Company may not be able to maintain performance bonds or letters of credit required by its contracts or obtain performance bonds and letters of credit required for new contracts; the Company is subject to litigation in the ordinary course of business and may incur material losses and costs as a result of product liability claims; the Company may have difficulty selling pre-owned coaches and realizing expected resale values; the Company may incur costs in connection with regulations relating to axle weight restrictions and vehicle lengths; the Company may be subject to claims and liabilities under environmental, health and safety laws; dependence on management information systems and cyber security risks; the Company's ability to execute its strategy and conduct operations is dependent upon its ability to attract, train and retain qualified personnel, including its ability to retain and attract executives, senior management and key employees; the Company may be exposed to liabilities under applicable anti-corruption laws and any determination that it violated these laws could have a material adverse effect on its business; the Company's risk management policies and procedures may not be fully effective in achieving their intended purposes; internal controls over financial reporting, no matter how well designed, have inherent limitations; there are inherent limitations to the effectiveness of any system of disclosure controls and procedures, including the possibility of human error and the circumvention or overriding of the controls and procedures; ability to successfully execute strategic plans and maintain profitability; development of competitive or disruptive products, services or technology; development and testing of new products or model variants; acquisition risk; reliance on third party manufacturers; third-party distribution/dealer agreements; availability to the Company of future financing; the Company may not be able to generate the necessary amount of cash to service its existing debt, which may require the Company to refinance its debt; the restrictive covenants in the credit facilities could impact the Company's business and affect its ability to pursue its business strategies; payment of dividends is not guaranteed; a significant amount of the Company's cash is distributed, which may restrict potential growth; the Company is dependent on its subsidiaries for all cash available for distributions; future sales or the possibility of future sales of a substantial number of Shares may impact the price of the Shares and could result in dilution; if the Company is required to write down goodwill or other intangible assets, its financial condition and operating results would be negatively affected; income tax risk due to the Company's operations being complex and income tax interpretations, regulations and legislation that pertain to its activities are subject to continual change; investment eligibility and Canadian federal income tax risks; certain U.S. tax rules may limit the ability of New Flyer Holdings, Inc. and its U.S. subsidiaries (the "NF Group") to deduct interest expense for U.S. federal income tax purposes and may increase the NF Group's tax liability and certain financing transactions could be characterized as "hybrid transactions" for U.S. tax purposes, which could increase the NF Group's tax liability.
Factors relating to the global COVID-19 pandemic include: the magnitude and duration of the global, national and regional economic and social disruption being caused as a result of the pandemic; the impact of national, regional and local governmental laws, regulations and “shelter in place” or similar orders relating to the pandemic which may materially adversely impact the Company’s ability to continue operations; partial or complete closures of one, more or all of the Company’s facilities and work locations or the reduction of production rates (including due to government mandates and to protect the health and safety of the Company’s employees or as a result of employees being unable to come to work due to COVID-19 infections with respect to them or their family members); production rates may be further decreased as a result of the pandemic; supply delays and shortages of parts and components and disruption to labour supply as a result of the pandemic; the pandemic will likely adversely affect operations of customers and reduce and delay, for an unknown period, customers’ purchases of the Company’s products; the anticipated recovery of the Company’s markets in the future may be delayed or increase in demand may be lower than expected as a result of the continuing effects of the pandemic; the Company’s ability to obtain access to additional capital if required; and the Company’s financial performance and condition, obligations, cash flow and liquidity and its ability to maintain compliance with the covenants under its credit facilities, which may also negatively impact the ability of the Company to pay dividends. There can be no assurance that the Company will be able to maintain sufficient liquidity for an extended period, obtain future satisfactory covenant relief under its credit facilities, if required, or access to additional capital or access to government financial support or as to when production operations will return to previous production rates. There is also no assurance that governments will provide continued or adequate stimulus funding during or after the pandemic for public transit agencies to purchase transit vehicles or that public or private demand for the Company’s vehicles will return to pre-pandemic levels in the anticipated period of time. The Company cautions that due to the dynamic, fluid and highly unpredictable nature of the pandemic and its impact on global and local
43 NFI GROUP INC. 2020 REPORT www.nfigroup.com
economies, businesses and individuals, it is impossible to predict the severity of the impact on the Company’s business, operating performance, financial condition and ability to generate sufficient cash flow and maintain adequate liquidity and any material adverse effects could very well be rapid, unexpected and may continue for an extended and unknown period of time.
Factors relating to the Company's “NFI Forward” initiative include: the Company's ability to successfully execute the initiative and to generate the planned savings in the expected time frame or at all; management may have overestimated the amount of savings and production efficiencies that can be generated or may have underestimated the amount of costs to be expended; the implementation of the initiative may take longer than planned to achieve the expected savings; further restructuring and cost-cutting may be required in order to achieve the objectives of the initiative; the estimated amount of savings generated under the initiative may not be sufficient to achieve the planned benefits; combining business units and/or reducing the number of production or parts facilities may not achieve the efficiencies anticipated; and the impact of the continuing global COVID-19 pandemic. There can be no assurance that the Company will be able to achieve the anticipated financial and operational benefits, cost savings or other benefits of the initiative.
Factors relating to the Company’s January 11, 2021 financial guidance (the "Guidance") include the degree to which actual future events accord with, or vary from, the expectations of, and assumptions used by, NFI’s management in preparing the Guidance and the Company’s ability to successfully execute the “NFI Forward” initiative and to generate the planned savings in the expected time frame or at all. Although the Company has attempted to identify important factors that could cause actual actions, events or results to differ materially from those described in the Guidance, there may be other factors that could cause actions, events or results not to be as anticipated, estimated or intended. Specific reference is made to “Risk Factors” in the Annual Information Form ("AIF") for a discussion of the factors that may affect forward-looking statements and information. Should one or more of these risks or uncertainties materialize, or should any of the underlying assumptions used by the Company in preparing any of the forward-looking statements and information contained in the Guidance prove incorrect, NFI’s actual results may vary from those described in the Guidance and any such variations may be material. The forward-looking statements and information contained in the Guidance were made as of January 11, 2021 and the Company disclaims any intent or obligation to update any such forward-looking statements or information except as required by law. The Company provides no assurance that forward-looking statements and information contained in the Guidance will prove to be accurate, as actual results and future events could differ materially from those anticipated in such statements. Accordingly, readers should not place undue reliance on such forward-looking statements and information.
Although the Company has attempted to identify important factors that could cause actual actions, events or results to differ materially from those described in forward-looking statements, there may be other factors that could cause actions, events or results not to be as anticipated, estimated or intended. Specific reference is made to “Risk Factors” in the AIF for a discussion of the factors that may affect forward-looking statements and information. Should one or more of these risks or uncertainties materialize, or should underlying assumptions prove incorrect, actual results may vary materially from those described in forward-looking statements and information. The forward-looking statements and information contained herein are made as of the date of this MD&A (or as otherwise indicated) and the Company disclaims any intent or obligation to update forward-looking statements or information except as required by law. The Company provides no assurance that forward-looking statements and information will prove to be accurate, as actual results and future events could differ materially from those anticipated in such statements. Accordingly, readers should not place undue reliance on forward-looking statements and information.
DEFINITIONS OF ADJUSTED EBITDA, ROIC, FREE CASH FLOW, ADJUSTED NET EARNINGS (LOSS), ADJUSTED EARNINGS (LOSS) PER SHARE, REGIONS INCLUDING: NORTH AMERICA, UK AND EUROPE, ASIA PACIFIC, AND OTHER
References to “Adjusted EBITDA” are to earnings before interest, income taxes, depreciation and amortization after adjusting for the effects of certain non-recurring and/or non-operations related items that do not reflect the current ongoing cash operations of the Company. These adjustments include gains or losses on disposal of property, plant and equipment, fair value adjustment for total return swap, unrealized foreign exchange losses or gains on non-current monetary items and forward foreign exchange contracts, costs associated with assessing strategic and corporate initiatives, past service costs and other pension costs or recovery, non-recurring costs or recoveries related to business acquisition, fair value adjustment to acquired subsidiary company's inventory and deferred revenue, proportion of the total return swap realized, equity settled stock-based compensation, recovery of currency transactions, prior year sales tax provision, , COVID-19 costs and impairment loss on goodwill and non-recurring restructuring costs.
“Free Cash Flow” means net cash generated by or used in operating activities adjusted for changes in non-cash working capital items, interest paid, interest expense, income taxes paid, current income tax expense, principal portion of finance lease payments, cash capital expenditures, proceeds from disposition of property, plant and equipment, costs associated with assessing strategic and corporate initiatives, fair value adjustment to acquired subsidiary company's inventory and deferred revenue, defined benefit funding, defined benefit expense, past service costs and other pension costs or recovery, proportion of total return swap, recovery on currency transactions, prior year sales tax provision, non-recurring restructuring costs, COVID-19 costs, foreign exchange gain or loss on cash held in foreign currency.
44 NFI GROUP INC. 2020 REPORT www.nfigroup.com
References to "ROIC" are to net operating profit after taxes (calculated as Adjusted EBITDA less depreciation of plant and equipment, depreciation of right-of-use assets and income taxes at a rate of 31%) divided by average invested capital for the last 12-month period (calculated as to shareholders’ equity plus long-term debt, obligations under leases, other long-term liabilities and derivative financial instrument liabilities less cash).
References to "Adjusted Net Earnings (Loss)" are to net earnings (loss) after adjusting for the after tax effects of certain non-recurring and/or non-operational related items that do not reflect the current ongoing cash operations of the Company including: fair value adjustments of total return swap, unrealized foreign exchange loss or gain, unrealized gain or loss on the interest rate swap, impairment loss on goodwill, portion of the total return swap realized, costs associated with assessing strategic and corporate initiatives, fair value adjustment to acquired subsidiary company's inventory and deferred revenue, equity settled stock-based compensation, gain or loss on disposal of property, plant and equipment, past service costs and other pension costs or recovery, recovery on currency transactions, prior year sales tax provision, COVID-19 costs and non-recurring restructuring costs .
References to "Adjusted Earnings (Loss) per Share" are to Adjusted Net Earnings (Loss) divided by the average number of Shares outstanding.
Management believes Adjusted EBITDA, ROIC, Free Cash Flow, Adjusted Net Earnings (Loss) and Adjusted Earnings (Loss) per Share are useful measures in evaluating the performance of the Company. However, Adjusted EBITDA, ROIC, Free Cash Flow, Adjusted Net Earnings (Loss) and Adjusted Earnings (Loss) per Share are not recognized earnings measures under IFRS and do not have standardized meanings prescribed by IFRS. Readers of this MD&A are cautioned that ROIC, Adjusted Net Earnings (Loss) and Adjusted EBITDA should not be construed as an alternative to net earnings or loss or cash flows from operating activities determined in accordance with IFRS as an indicator of NFI’s performance, and Free Cash Flow should not be construed as an alternative to cash flows from operating, investing and financing activities determined in accordance with IFRS as a measure of liquidity and cash flows. A reconciliation of net earnings to Adjusted EBITDA, based on the Financial Statements, has been provided under the headings “Reconciliation of Net Earnings (Loss) to Adjusted EBITDA”. A reconciliation of Free Cash Flow to cash flows from operations is provided under the heading “Summary of Free Cash Flow”. A reconciliation of net earnings to Adjusted Net Earnings (Loss) is provided under the heading “Reconciliation of Net Earnings (Loss) to Adjusted Net Earnings (Loss)”.
NFI's method of calculating Adjusted EBITDA, ROIC, Free Cash Flow, Adjusted Net Earnings (Loss) and Adjusted Earnings (Loss) per Share may differ materially from the methods used by other issuers and, accordingly, may not be comparable to similarly titled measures used by other issuers. Dividends paid from Free Cash Flow are not assured, and the actual amount of dividends received by holders of Shares will depend on, among other things, the Company's financial performance, debt covenants and obligations, working capital requirements and future capital requirements, all of which are susceptible to a number of risks, as described in NFI’s public filings available on SEDAR at www.sedar.com.
References to NFI's geographic regions for the purpose of reporting global revenues are as follows: "North America" refers to Canada, United States, and Mexico; United Kingdom and Europe refer to the United Kingdom and Europe; "Asia Pacific" or "APAC" refers to Hong Kong, Malaysia, Singapore, Australia, and New Zealand; and the "Other" category includes any sales that do not fall into the categories above.
45 NFI GROUP INC. 2020 REPORT www.nfigroup.com
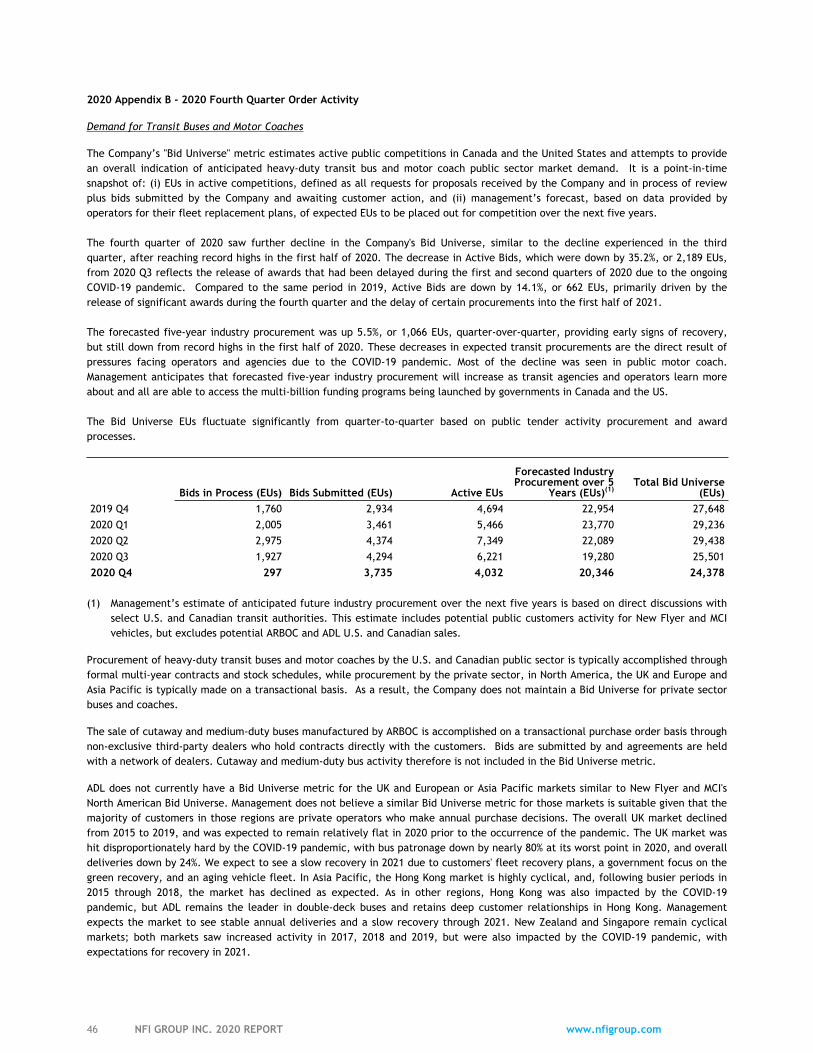
2020 Appendix B - 2020 Fourth Quarter Order Activity
Demand for Transit Buses and Motor Coaches
The Company’s "Bid Universe" metric estimates active public competitions in Canada and the United States and attempts to provide an overall indication of anticipated heavy-duty transit bus and motor coach public sector market demand. It is a point-in-time snapshot of: (i) EUs in active competitions, defined as all requests for proposals received by the Company and in process of review plus bids submitted by the Company and awaiting customer action, and (ii) management’s forecast, based on data provided by operators for their fleet replacement plans, of expected EUs to be placed out for competition over the next five years.
The fourth quarter of 2020 saw further decline in the Company's Bid Universe, similar to the decline experienced in the third quarter, after reaching record highs in the first half of 2020. The decrease in Active Bids, which were down by 35.2%, or 2,189 EUs, from 2020 Q3 reflects the release of awards that had been delayed during the first and second quarters of 2020 due to the ongoing COVID-19 pandemic. Compared to the same period in 2019, Active Bids are down by 14.1%, or 662 EUs, primarily driven by the release of significant awards during the fourth quarter and the delay of certain procurements into the first half of 2021.
The forecasted five-year industry procurement was up 5.5%, or 1,066 EUs, quarter-over-quarter, providing early signs of recovery, but still down from record highs in the first half of 2020. These decreases in expected transit procurements are the direct result of pressures facing operators and agencies due to the COVID-19 pandemic. Most of the decline was seen in public motor coach. Management anticipates that forecasted five-year industry procurement will increase as transit agencies and operators learn more about and all are able to access the multi-billion funding programs being launched by governments in Canada and the US.
The Bid Universe EUs fluctuate significantly from quarter-to-quarter based on public tender activity procurement and award processes.
Bids in Process (EUs) Bids Submitted (EUs) Active EUs
Forecasted Industry Procurement over 5
Years (EUs)(1) Total Bid Universe
(EUs)2019 Q4 1,760 2,934 4,694 22,954 27,6482020 Q1 2,005 3,461 5,466 23,770 29,2362020 Q2 2,975 4,374 7,349 22,089 29,4382020 Q3 1,927 4,294 6,221 19,280 25,5012020 Q4 297 3,735 4,032 20,346 24,378
(1) Management’s estimate of anticipated future industry procurement over the next five years is based on direct discussions with select U.S. and Canadian transit authorities. This estimate includes potential public customers activity for New Flyer and MCI vehicles, but excludes potential ARBOC and ADL U.S. and Canadian sales.
Procurement of heavy-duty transit buses and motor coaches by the U.S. and Canadian public sector is typically accomplished through formal multi-year contracts and stock schedules, while procurement by the private sector, in North America, the UK and Europe and Asia Pacific is typically made on a transactional basis. As a result, the Company does not maintain a Bid Universe for private sector buses and coaches.
The sale of cutaway and medium-duty buses manufactured by ARBOC is accomplished on a transactional purchase order basis through non-exclusive third-party dealers who hold contracts directly with the customers. Bids are submitted by and agreements are held with a network of dealers. Cutaway and medium-duty bus activity therefore is not included in the Bid Universe metric.
ADL does not currently have a Bid Universe metric for the UK and European or Asia Pacific markets similar to New Flyer and MCI's North American Bid Universe. Management does not believe a similar Bid Universe metric for those markets is suitable given that the majority of customers in those regions are private operators who make annual purchase decisions. The overall UK market declined from 2015 to 2019, and was expected to remain relatively flat in 2020 prior to the occurrence of the pandemic. The UK market was hit disproportionately hard by the COVID-19 pandemic, with bus patronage down by nearly 80% at its worst point in 2020, and overall deliveries down by 24%. We expect to see a slow recovery in 2021 due to customers' fleet recovery plans, a government focus on the green recovery, and an aging vehicle fleet. In Asia Pacific, the Hong Kong market is highly cyclical, and, following busier periods in 2015 through 2018, the market has declined as expected. As in other regions, Hong Kong was also impacted by the COVID-19 pandemic, but ADL remains the leader in double-deck buses and retains deep customer relationships in Hong Kong. Management expects the market to see stable annual deliveries and a slow recovery through 2021. New Zealand and Singapore remain cyclical markets; both markets saw increased activity in 2017, 2018 and 2019, but were also impacted by the COVID-19 pandemic, with expectations for recovery in 2021.
46 NFI GROUP INC. 2020 REPORT www.nfigroup.com
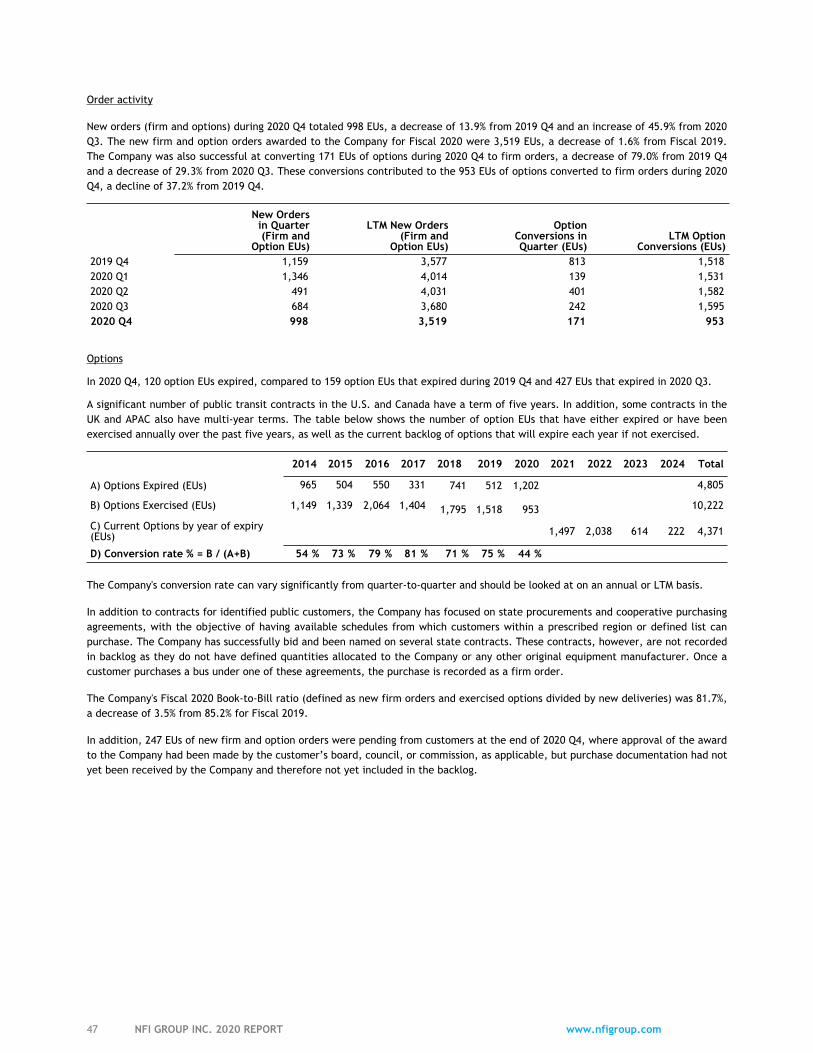
Order activity
New orders (firm and options) during 2020 Q4 totaled 998 EUs, a decrease of 13.9% from 2019 Q4 and an increase of 45.9% from 2020 Q3. The new firm and option orders awarded to the Company for Fiscal 2020 were 3,519 EUs, a decrease of 1.6% from Fiscal 2019. The Company was also successful at converting 171 EUs of options during 2020 Q4 to firm orders, a decrease of 79.0% from 2019 Q4 and a decrease of 29.3% from 2020 Q3. These conversions contributed to the 953 EUs of options converted to firm orders during 2020 Q4, a decline of 37.2% from 2019 Q4.
New Orders in Quarter (Firm and
Option EUs)
LTM New Orders (Firm and
Option EUs)
Option Conversions in Quarter (EUs)
LTM Option Conversions (EUs)
2019 Q4 1,159 3,577 813 1,518 2020 Q1 1,346 4,014 139 1,531 2020 Q2 491 4,031 401 1,582 2020 Q3 684 3,680 242 1,595 2020 Q4 998 3,519 171 953
Options
In 2020 Q4, 120 option EUs expired, compared to 159 option EUs that expired during 2019 Q4 and 427 EUs that expired in 2020 Q3.
A significant number of public transit contracts in the U.S. and Canada have a term of five years. In addition, some contracts in the UK and APAC also have multi-year terms. The table below shows the number of option EUs that have either expired or have been exercised annually over the past five years, as well as the current backlog of options that will expire each year if not exercised.
2014 2015 2016 2017 2018 2019 2020 2021 2022 2023 2024 Total
A) Options Expired (EUs) 965 504 550 331 741 512 1,202 4,805
B) Options Exercised (EUs) 1,149 1,339 2,064 1,404 1,795 1,518 953 10,222
C) Current Options by year of expiry (EUs) 1,497 2,038 614 222 4,371
D) Conversion rate % = B / (A+B) 54 % 73 % 79 % 81 % 71 % 75 % 44 %
The Company's conversion rate can vary significantly from quarter-to-quarter and should be looked at on an annual or LTM basis.
In addition to contracts for identified public customers, the Company has focused on state procurements and cooperative purchasing agreements, with the objective of having available schedules from which customers within a prescribed region or defined list can purchase. The Company has successfully bid and been named on several state contracts. These contracts, however, are not recorded in backlog as they do not have defined quantities allocated to the Company or any other original equipment manufacturer. Once a customer purchases a bus under one of these agreements, the purchase is recorded as a firm order.
The Company's Fiscal 2020 Book-to-Bill ratio (defined as new firm orders and exercised options divided by new deliveries) was 81.7%, a decrease of 3.5% from 85.2% for Fiscal 2019.
In addition, 247 EUs of new firm and option orders were pending from customers at the end of 2020 Q4, where approval of the award to the Company had been made by the customer’s board, council, or commission, as applicable, but purchase documentation had not yet been received by the Company and therefore not yet included in the backlog.
47 NFI GROUP INC. 2020 REPORT www.nfigroup.com
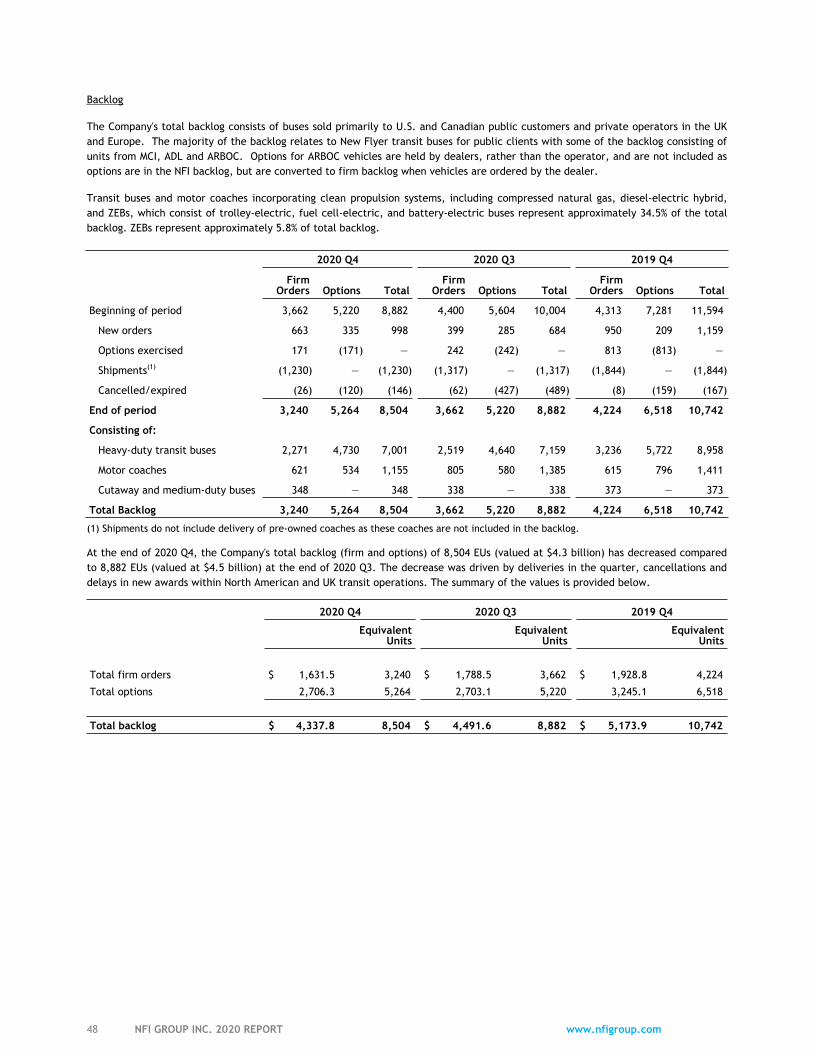
Backlog
The Company's total backlog consists of buses sold primarily to U.S. and Canadian public customers and private operators in the UK and Europe. The majority of the backlog relates to New Flyer transit buses for public clients with some of the backlog consisting of units from MCI, ADL and ARBOC. Options for ARBOC vehicles are held by dealers, rather than the operator, and are not included as options are in the NFI backlog, but are converted to firm backlog when vehicles are ordered by the dealer.
Transit buses and motor coaches incorporating clean propulsion systems, including compressed natural gas, diesel-electric hybrid, and ZEBs, which consist of trolley-electric, fuel cell-electric, and battery-electric buses represent approximately 34.5% of the total backlog. ZEBs represent approximately 5.8% of total backlog.
2020 Q4 2020 Q3 2019 Q4
Firm Orders Options Total
Firm Orders Options Total
Firm Orders Options Total
Beginning of period 3,662 5,220 8,882 4,400 5,604 10,004 4,313 7,281 11,594
New orders 663 335 998 399 285 684 950 209 1,159
Options exercised 171 (171) — 242 (242) — 813 (813) —
Shipments(1) (1,230) — (1,230) (1,317) — (1,317) (1,844) — (1,844)
Cancelled/expired (26) (120) (146) (62) (427) (489) (8) (159) (167)
End of period 3,240 5,264 8,504 3,662 5,220 8,882 4,224 6,518 10,742
Consisting of:
Heavy-duty transit buses 2,271 4,730 7,001 2,519 4,640 7,159 3,236 5,722 8,958
Motor coaches 621 534 1,155 805 580 1,385 615 796 1,411
Cutaway and medium-duty buses 348 — 348 338 — 338 373 — 373
Total Backlog 3,240 5,264 8,504 3,662 5,220 8,882 4,224 6,518 10,742
(1) Shipments do not include delivery of pre-owned coaches as these coaches are not included in the backlog.
At the end of 2020 Q4, the Company's total backlog (firm and options) of 8,504 EUs (valued at $4.3 billion) has decreased compared to 8,882 EUs (valued at $4.5 billion) at the end of 2020 Q3. The decrease was driven by deliveries in the quarter, cancellations and delays in new awards within North American and UK transit operations. The summary of the values is provided below.
2020 Q4 2020 Q3 2019 Q4
Equivalent Units
Equivalent Units
Equivalent Units
Total firm orders $ 1,631.5 3,240 $ 1,788.5 3,662 $ 1,928.8 4,224
Total options 2,706.3 5,264 2,703.1 5,220 3,245.1 6,518
Total backlog $ 4,337.8 8,504 $ 4,491.6 8,882 $ 5,173.9 10,742
48 NFI GROUP INC. 2020 REPORT www.nfigroup.com
Consolidated Financial Statements of
NFI GROUP INC. December 27, 2020
TABLE OF CONTENTS
Page
Consolidated Statements of Net Earnings (Loss) and Total Comprehensive Income (Loss) 5
Consolidated Statements of Financial Position 6
Consolidated Statements of Changes in Equity 7
Consolidated Statements of Cash Flows 8
Notes to the Consolidated Financial Statements 9 - 39
1
Independent Auditor’s Report
To the Shareholders of NFI Group Inc.
Opinion We have audited the consolidated financial statements of NFI Group Inc. (the “Company”), which comprise the consolidated statements of financial position as at December 27, 2020 and December 29, 2019, and the consolidated statements of net earnings (loss) and total comprehensive income (loss), changes in equity and cash flows for the years then ended, and notes to the consolidated financial statements, including a summary of significant accounting policies (collectively referred to as the “financial statements”).
In our opinion, the accompanying financial statements present fairly, in all material respects, the financial position of the Company as at December 27, 2020 and December 29, 2019, and its financial performance and its cash flows for the years then ended in accordance with International Financial Reporting Standards (“IFRS”).
Basis for Opinion We conducted our audit in accordance with Canadian generally accepted auditing standards (“Canadian GAAS”). Our responsibilities under those standards are further described in the Auditor’s Responsibilities for the Audit of the Financial Statements section of our report. We are independent of the Company in accordance with the ethical requirements that are relevant to our audit of the financial statements in Canada, and we have fulfilled our other ethical responsibilities in accordance with these requirements. We believe that the audit evidence we have obtained is sufficient and appropriate to provide a basis for our opinion.
Key Audit Matters A key audit matter is a matter that, in our professional judgment, was of most significance in our audit of the consolidated financial statements for the year ended December 27, 2020. This matter was addressed in the context of our audit of the consolidated financial statements as a whole, and in forming our opinion thereon, and we do not provide a separate opinion on this matter.
Goodwill – Motor Coach Manufacturing CGU (pre-restructuring), ADL Aftermarket Parts CGU, ADL Manufacturing CGU — Refer to Notes 2.14, 2.15, 2.22 and 7 of the financial statements Key Audit Matter Description The Company’s evaluation of goodwill for impairment involves the comparison of the recoverable amount of each cash generating units (“CGU”) to their carrying value. The Company used the discounted cash flow model to estimate the value-in-use of each CGU. This requires management to make significant estimates and assumptions including those with respect to future cash inflows and outflows, growth rates and discount rates. Changes in these assumptions could have a significant impact on either the recoverable amount, the amount of any goodwill impairment charge, or both. During the first quarter of 2020, the carrying amount of the motor coach manufacturing CGU exceeded its recoverable amount which resulted in an impairment charge of $50.8 million to goodwill. At the evaluation date, the recoverable amounts of the CGUs exceeded their carrying amounts and no other impairments
Deloitte LLP 360 Main Street Suite 2300 Winnipeg MB R3C 3Z3 Canada
Tel: 204-942-0051 Fax: 204-947-9390 www.deloitte.ca
2
Specifically, due to the impact of COVID-19 on the motor coach manufacturing CGU operations and the resulting change in short term demand in the private coach market, and the sensitivity of the ADL manufacturing and ADL aftermarket parts operations due to short term changes in demand, we have identified the goodwill impairment analysis as a key audit matter for the following CGUs (collectively “identified CGUs”): We have identified the goodwill impairment analysis as a key audit matter for the following CGUs:
• Motor coach manufacturing, prior to the Company's restructuring and combination with the bus manufacturing CGU in the third quarter of 2020
• ADL Manufacturing • ADL Manufacturing Parts
While there are several key assumptions that are required to estimate the recoverable amount of the identified CGUs, the assumptions with the highest degree of subjectivity and impact on the recoverable amounts are related to the determination of the discount rates, forecasts of future revenues, revenue growth rates, and operating margins. This required a high degree of significant auditor attention as these estimates are subject to estimation uncertainty. Auditing these estimates and assumptions required a high degree of subjectivity in applying audit procedures and in evaluating the results of those procedures. This resulted in an increased extent of audit effort including the involvement of fair value specialists. How the Key Audit Matter Was Addressed in the Audit Our audit procedures related to the determination of the discount rates, forecasts of future revenues, revenue growth rates and operating margins used to estimate the recoverable amount of the identified CGU’s included the following, among others:
• Evaluated management’s ability to accurately forecast future revenues, revenue growth rates and operating margins by comparing actual results to management’s historical forecasts.
• Evaluated the reasonableness of the forecast of future revenues, revenue growth rates and operating margins by comparing the forecasts to:
o Historical revenues and operating margins. o Known changes in the Company’s operations and its industry, including the impact of the
COVID-19 pandemic, which are expected to impact future operating performance; o Internal reports including production and backlog; o Internal communications to management and the Board of Directors; and o Forecasted information included in the Company’s press releases as well as in analyst and
industry reports for the Company and peer companies. • With the assistance of fair value specialists, evaluated the reasonableness of the discount rates by
testing the source information underlying the determination of the discount rates, developing a range of independent estimates and comparing those to the discount rates selected by management.
Other Information Management is responsible for the other information. The other information comprises:
● Management’s Discussion and Analysis
Our opinion on the financial statements does not cover the other information and we do not and will not express any form of assurance conclusion thereon. In connection with our audit of the financial statements, our responsibility is to read the other information identified above and, in doing so, consider whether the other information is materially inconsistent with the financial statements or our knowledge obtained in the audit, or otherwise appears to be materially misstated.
3
We obtained Management’s Discussion and Analysis prior to the date of this auditor’s report. If, based on the work we have performed on this other information, we conclude that there is a material misstatement of this other information, we are required to report that fact in this auditor’s report. We have nothing to report in this regard.
Responsibilities of Management and Those Charged with Governance for the Financial Statements Management is responsible for the preparation and fair presentation of the financial statements in accordance with IFRS, and for such internal control as management determines is necessary to enable the preparation of financial statements that are free from material misstatement, whether due to fraud or error.
In preparing the financial statements, management is responsible for assessing the Company’s ability to continue as a going concern, disclosing, as applicable, matters related to going concern and using the going concern basis of accounting unless management either intends to liquidate the Company or to cease operations, or has no realistic alternative but to do so.
Those charged with governance are responsible for overseeing the Company’s financial reporting process.
Auditor’s Responsibilities for the Audit of the Financial Statements Our objectives are to obtain reasonable assurance about whether the financial statements as a whole are free from material misstatement, whether due to fraud or error, and to issue an auditor’s report that includes our opinion. Reasonable assurance is a high level of assurance, but is not a guarantee that an audit conducted in accordance with Canadian GAAS will always detect a material misstatement when it exists. Misstatements can arise from fraud or error and are considered material if, individually or in the aggregate, they could reasonably be expected to influence the economic decisions of users taken on the basis of these financial statements.
As part of an audit in accordance with Canadian GAAS, we exercise professional judgment and maintain professional skepticism throughout the audit. We also:
● Identify and assess the risks of material misstatement of the financial statements, whether due to fraud or error, design and perform audit procedures responsive to those risks, and obtain audit evidence that is sufficient and appropriate to provide a basis for our opinion. The risk of not detecting a material misstatement resulting from fraud is higher than for one resulting from error, as fraud may involve collusion, forgery, intentional omissions, misrepresentations, or the override of internal control.
● Obtain an understanding of internal control relevant to the audit in order to design audit procedures that are appropriate in the circumstances, but not for the purpose of expressing an opinion on the effectiveness of the Company’s internal control.
● Evaluate the appropriateness of accounting policies used and the reasonableness of accounting estimates and related disclosures made by management.
● Conclude on the appropriateness of management’s use of the going concern basis of accounting and, based on the audit evidence obtained, whether a material uncertainty exists related to events or conditions that may cast significant doubt on the Company’s ability to continue as a going concern. If we conclude that a material uncertainty exists, we are required to draw attention in our auditor’s report to the related disclosures in the financial statements or, if such disclosures are inadequate, to modify our opinion. Our conclusions are based on the audit evidence obtained up to the date of our auditor’s report. However, future events or conditions may cause the Company to cease to continue as a going concern.
4
● Evaluate the overall presentation, structure and content of the financial statements, including the disclosures, and whether the financial statements represent the underlying transactions and events in a manner that achieves fair presentation.
● Obtain sufficient appropriate audit evidence regarding the financial information of the entities or business activities within the Company to express an opinion on the financial statements. We are responsible for the direction, supervision and performance of the group audit. We remain solely responsible for our audit opinion.
We communicate with those charged with governance regarding, among other matters, the planned scope and timing of the audit and significant audit findings, including any significant deficiencies in internal control that we identify during our audit.
We also provide those charged with governance with a statement that we have complied with relevant ethical requirements regarding independence, and to communicate with them all relationships and other matters that may reasonably be thought to bear on our independence, and where applicable, related safeguards.
From the matters communicated with those charged with governance, we determine those matters that were of most significance in the audit of the consolidated financial statements of the current period and are therefore the key audit matters. We describe these matters in our auditor's report unless law or regulation precludes public disclosure about the matter or when, in extremely rare circumstances, we determine that a matter should not be communicated in our report because the adverse consequences of doing so would reasonably be expected to outweigh the public interest benefits of such communication.
The engagement partner on the audit resulting in this independent auditor’s report is Michael Boucher.
/s/ Deloitte LLP
Chartered Professional Accountants Winnipeg, Manitoba March 3, 2021
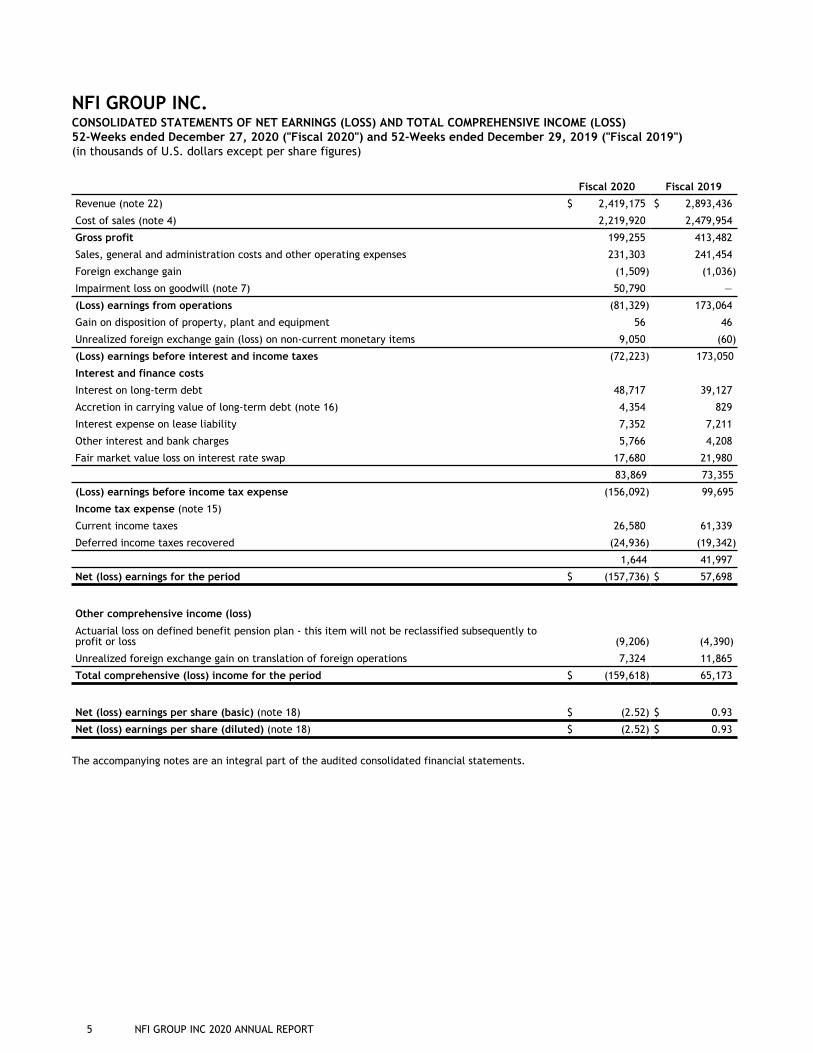
NFI GROUP INC. CONSOLIDATED STATEMENTS OF NET EARNINGS (LOSS) AND TOTAL COMPREHENSIVE INCOME (LOSS) 52-Weeks ended December 27, 2020 ("Fiscal 2020") and 52-Weeks ended December 29, 2019 ("Fiscal 2019")(in thousands of U.S. dollars except per share figures)
Fiscal 2020 Fiscal 2019
Revenue (note 22) $ 2,419,175 $ 2,893,436
Cost of sales (note 4) 2,219,920 2,479,954
Gross profit 199,255 413,482
Sales, general and administration costs and other operating expenses 231,303 241,454
Foreign exchange gain (1,509) (1,036)
Impairment loss on goodwill (note 7) 50,790 —
(Loss) earnings from operations (81,329) 173,064
Gain on disposition of property, plant and equipment 56 46
Unrealized foreign exchange gain (loss) on non-current monetary items 9,050 (60)
(Loss) earnings before interest and income taxes (72,223) 173,050
Interest and finance costs
Interest on long-term debt 48,717 39,127
Accretion in carrying value of long-term debt (note 16) 4,354 829
Interest expense on lease liability 7,352 7,211
Other interest and bank charges 5,766 4,208
Fair market value loss on interest rate swap 17,680 21,980
83,869 73,355
(Loss) earnings before income tax expense (156,092) 99,695
Income tax expense (note 15)
Current income taxes 26,580 61,339
Deferred income taxes recovered (24,936) (19,342)
1,644 41,997
Net (loss) earnings for the period $ (157,736) $ 57,698
Other comprehensive income (loss)
Actuarial loss on defined benefit pension plan - this item will not be reclassified subsequently to profit or loss (9,206) (4,390)
Unrealized foreign exchange gain on translation of foreign operations 7,324 11,865
Total comprehensive (loss) income for the period $ (159,618) 65,173
Net (loss) earnings per share (basic) (note 18) $ (2.52) $ 0.93
Net (loss) earnings per share (diluted) (note 18) $ (2.52) $ 0.93
The accompanying notes are an integral part of the audited consolidated financial statements.
5 NFI GROUP INC 2020 ANNUAL REPORT
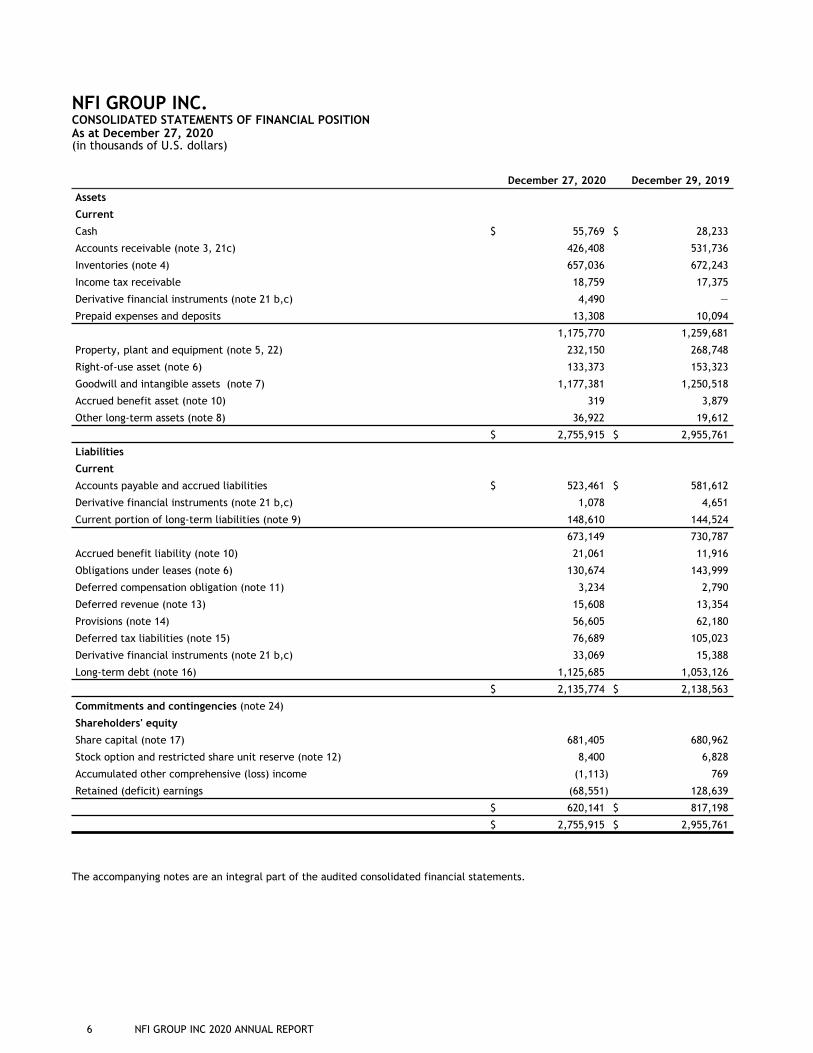
NFI GROUP INC.CONSOLIDATED STATEMENTS OF FINANCIAL POSITION As at December 27, 2020 (in thousands of U.S. dollars)
December 27, 2020 December 29, 2019
Assets
Current
Cash $ 55,769 $ 28,233
Accounts receivable (note 3, 21c) 426,408 531,736
Inventories (note 4) 657,036 672,243
Income tax receivable 18,759 17,375
Derivative financial instruments (note 21 b,c) 4,490 —
Prepaid expenses and deposits 13,308 10,094
1,175,770 1,259,681
Property, plant and equipment (note 5, 22) 232,150 268,748
Right-of-use asset (note 6) 133,373 153,323
Goodwill and intangible assets (note 7) 1,177,381 1,250,518
Accrued benefit asset (note 10) 319 3,879
Other long-term assets (note 8) 36,922 19,612
$ 2,755,915 $ 2,955,761
Liabilities
Current
Accounts payable and accrued liabilities $ 523,461 $ 581,612
Derivative financial instruments (note 21 b,c) 1,078 4,651
Current portion of long-term liabilities (note 9) 148,610 144,524
673,149 730,787
Accrued benefit liability (note 10) 21,061 11,916
Obligations under leases (note 6) 130,674 143,999
Deferred compensation obligation (note 11) 3,234 2,790
Deferred revenue (note 13) 15,608 13,354
Provisions (note 14) 56,605 62,180
Deferred tax liabilities (note 15) 76,689 105,023
Derivative financial instruments (note 21 b,c) 33,069 15,388
Long-term debt (note 16) 1,125,685 1,053,126
$ 2,135,774 $ 2,138,563
Commitments and contingencies (note 24)
Shareholders' equity
Share capital (note 17) 681,405 680,962
Stock option and restricted share unit reserve (note 12) 8,400 6,828
Accumulated other comprehensive (loss) income (1,113) 769
Retained (deficit) earnings (68,551) 128,639
$ 620,141 $ 817,198
$ 2,755,915 $ 2,955,761
The accompanying notes are an integral part of the audited consolidated financial statements.
6 NFI GROUP INC 2020 ANNUAL REPORT
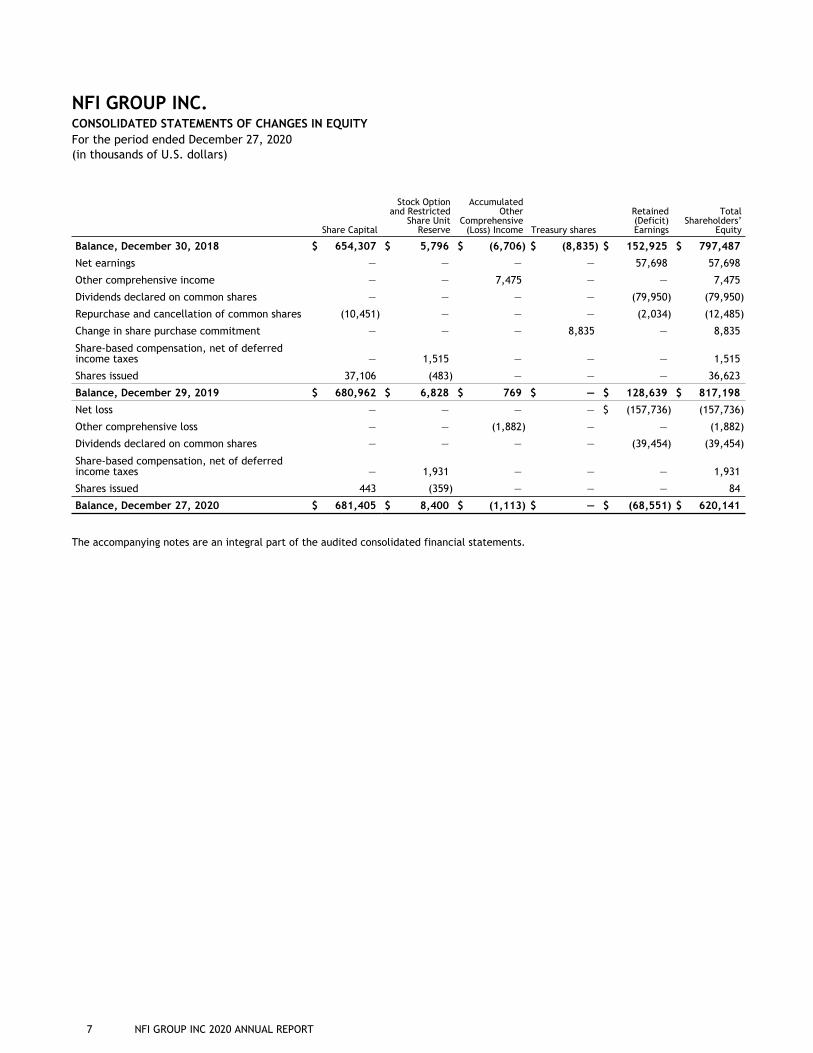
NFI GROUP INC.CONSOLIDATED STATEMENTS OF CHANGES IN EQUITY For the period ended December 27, 2020 (in thousands of U.S. dollars)
Share Capital
Stock Option and Restricted
Share Unit Reserve
Accumulated Other
Comprehensive (Loss) Income Treasury shares
Retained (Deficit) Earnings
Total Shareholders’
Equity
Balance, December 30, 2018 $ 654,307 $ 5,796 $ (6,706) $ (8,835) $ 152,925 $ 797,487
Net earnings — — — — 57,698 57,698
Other comprehensive income — — 7,475 — — 7,475
Dividends declared on common shares — — — — (79,950) (79,950)
Repurchase and cancellation of common shares (10,451) — — — (2,034) (12,485)
Change in share purchase commitment — — — 8,835 — 8,835
Share-based compensation, net of deferred income taxes — 1,515 — — — 1,515
Shares issued 37,106 (483) — — — 36,623
Balance, December 29, 2019 $ 680,962 $ 6,828 $ 769 $ — $ 128,639 $ 817,198
Net loss — — — — $ (157,736) (157,736)
Other comprehensive loss — — (1,882) — — (1,882)
Dividends declared on common shares — — — — (39,454) (39,454)
Share-based compensation, net of deferred income taxes — 1,931 — — — 1,931
Shares issued 443 (359) — — — 84
Balance, December 27, 2020 $ 681,405 $ 8,400 $ (1,113) $ — $ (68,551) $ 620,141
The accompanying notes are an integral part of the audited consolidated financial statements.
7 NFI GROUP INC 2020 ANNUAL REPORT
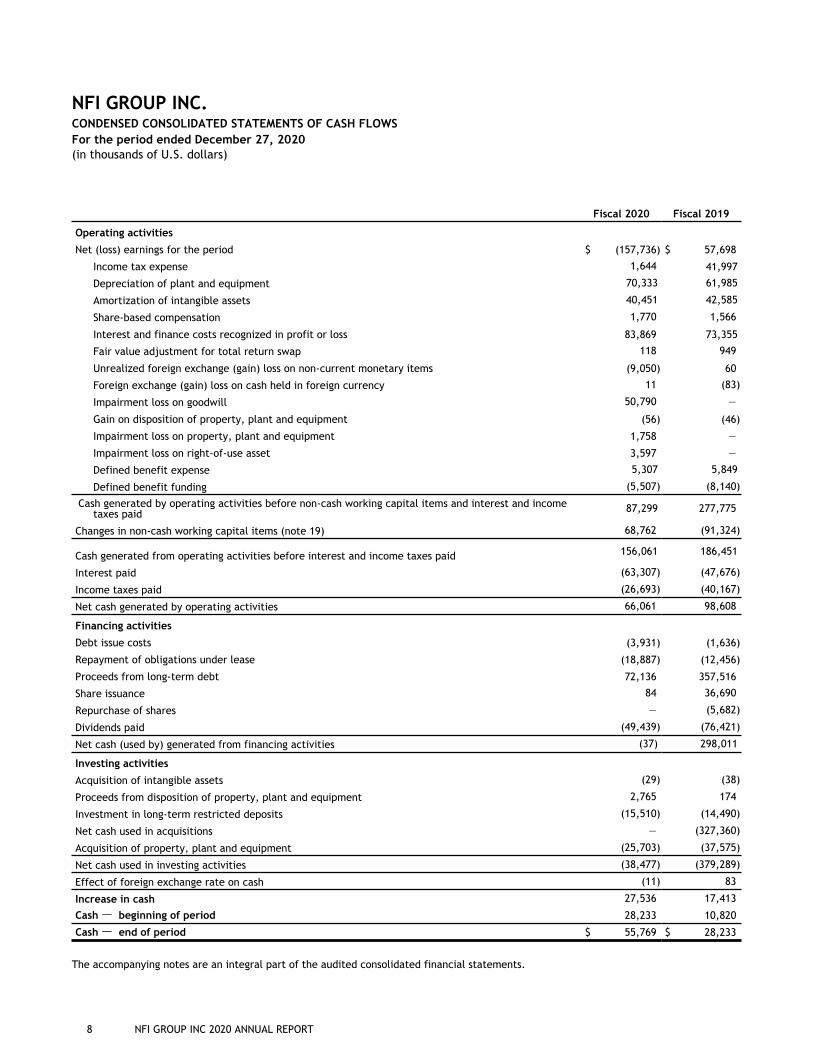
NFI GROUP INC.CONDENSED CONSOLIDATED STATEMENTS OF CASH FLOWS For the period ended December 27, 2020(in thousands of U.S. dollars)
Fiscal 2020 Fiscal 2019
Operating activities
Net (loss) earnings for the period $ (157,736) $ 57,698
Income tax expense 1,644 41,997
Depreciation of plant and equipment 70,333 61,985
Amortization of intangible assets 40,451 42,585
Share-based compensation 1,770 1,566
Interest and finance costs recognized in profit or loss 83,869 73,355
Fair value adjustment for total return swap 118 949
Unrealized foreign exchange (gain) loss on non-current monetary items (9,050) 60
Foreign exchange (gain) loss on cash held in foreign currency 11 (83)
Impairment loss on goodwill 50,790 —
Gain on disposition of property, plant and equipment (56) (46)
Impairment loss on property, plant and equipment 1,758 —
Impairment loss on right-of-use asset 3,597 —
Defined benefit expense 5,307 5,849
Defined benefit funding (5,507) (8,140)
Cash generated by operating activities before non-cash working capital items and interest and income taxes paid 87,299 277,775
Changes in non-cash working capital items (note 19) 68,762 (91,324)
Cash generated from operating activities before interest and income taxes paid 156,061 186,451
Interest paid (63,307) (47,676)
Income taxes paid (26,693) (40,167)
Net cash generated by operating activities 66,061 98,608
Financing activities
Debt issue costs (3,931) (1,636)
Repayment of obligations under lease (18,887) (12,456)
Proceeds from long-term debt 72,136 357,516
Share issuance 84 36,690
Repurchase of shares — (5,682)
Dividends paid (49,439) (76,421)
Net cash (used by) generated from financing activities (37) 298,011
Investing activities
Acquisition of intangible assets (29) (38)
Proceeds from disposition of property, plant and equipment 2,765 174
Investment in long-term restricted deposits (15,510) (14,490)
Net cash used in acquisitions — (327,360)
Acquisition of property, plant and equipment (25,703) (37,575)
Net cash used in investing activities (38,477) (379,289)
Effect of foreign exchange rate on cash (11) 83
Increase in cash 27,536 17,413
Cash — beginning of period 28,233 10,820
Cash — end of period $ 55,769 $ 28,233
The accompanying notes are an integral part of the audited consolidated financial statements.
8 NFI GROUP INC 2020 ANNUAL REPORT
1. CORPORATE INFORMATION
NFI Group Inc. (“NFI” or the “Company”) was incorporated on June 16, 2005 as New Flyer Industries Inc. under the laws of the Province of Ontario. The name of the Company was changed to "NFI Group Inc." on May 14, 2018 to better reflect the multi-platform nature of the Company's business. NFI is a leading independent global bus manufacturer providing a comprehensive suite of mass transportation solutions under brands: New Flyer® (heavy-duty transit buses), Alexander Dennis Limited (single and double-deck buses), Plaxton (motor coaches), MCI® (motor coaches), ARBOC® (low-floor cutaway and medium-duty buses) and NFI Parts™ (aftermarket parts sales). The Company’s common shares (the “Shares”) are listed on the Toronto Stock Exchange (“TSX”) under the symbol “NFI”.
These audited consolidated financial statements (the "Statements") were approved by the Company's board of directors (the "Board") on March 3, 2021.
2. SUMMARY OF SIGNIFICANT ACCOUNTING POLICIES
The principal accounting policies applied in the preparation of these Statements are set out below. These policies have been consistently applied to all periods presented, unless otherwise stated.
2.1 Basis of preparation
The Statements were prepared on a going concern basis in accordance with International Financial Reporting Standards (“IFRS”) which require management to make judgments, estimates and assumptions that affect the application of accounting policies and the reported amounts of assets and liabilities, revenue and expenses. Actual results may differ from these estimates.
2.2 Principles of consolidation
The Statements include the accounts of the Company's subsidiaries.
Subsidiaries
Subsidiaries are entities over which the Company has control, where control is achieved when the Company: has power over the investee; is exposed, or has rights, to variable returns from its involvement with the investee; and has the ability to use its power to affect its returns. The Company holds 100% of the voting rights in, and therefore controls, its subsidiaries.
The effects of potential voting rights that are currently exercisable are considered when assessing whether control exists. Subsidiaries are fully consolidated from the date control is transferred to the Company, and are de-consolidated from the date control ceases.
The acquisition method of accounting is used to account for the acquisition of subsidiaries as follows:
• cost is measured as the fair value of the assets given, equity instruments issued and liabilities incurred or assumed at the date of exchange, and business acquisition related expenses are expensed as incurred;
• identifiable assets acquired and liabilities assumed are measured at their fair values at the acquisition date;
• the excess of acquisition cost over the fair value of the identifiable net assets acquired is recorded as goodwill; and
• if the acquisition cost is less than the fair value of the net assets acquired, the fair value of the net assets is reassessed and any remaining difference is recognized directly in the consolidated statements of net earnings and comprehensive income.
Inter-company transactions between subsidiaries are eliminated on consolidation.
2.3 New and amended standards adopted by the Company
IAS 20 - Accounting for Government Grants and Disclosure of Government Assistance ("IAS 20")
The Company recognizes government grants when there is reasonable assurance that it will comply with the conditions attached to them and that the grants will be received. Government grants are recognized in the consolidated statement of net earnings (loss) and total comprehensive income (loss) over the periods in which the Company recognizes as expenses the related costs for which the grants are intended to compensate. Grants related to income are deducted in reporting the related expense.
2.4 Reportable Segments
The Company’s reportable segments are organized around the markets it serves and are reported in a manner consistent with the internal reporting provided to the chief operating decision-maker (“CODM”). The President and Chief Executive Officer of the Company has authority for resource allocation and assessment of the Company’s performance and therefore acts as the CODM.
NFI GROUP INC. NOTES TO THE CONSOLIDATED FINANCIAL STATEMENTS As at December 27, 2020(in thousands of U.S. dollars except per share figures)
9 NFI GROUP INC 2020 ANNUAL REPORT
2. SUMMARY OF SIGNIFICANT ACCOUNTING POLICIES (Continued)
2.5 Foreign currency
The Company operates with multiple functional currencies. The Company’s consolidated financial statements are presented in U.S. dollars as this presentation is most meaningful to financial statement users. References to “$” are to U.S. dollars, references to “C$” are to Canadian dollars, references to "£" are to British pounds sterling. For those subsidiaries with different functional currencies, exchange rate differences arising from the translation of items that form part of the net investment in the foreign operation are recorded in unrealized foreign exchange gains (losses) on translation of foreign operations in other comprehensive income.
Monetary balances denominated in a currency other than U.S. dollars are translated at the period end rates of exchange, and the results of the operations are translated at average rates of exchange for the period. Non-monetary balances are translated at the exchange rate prevailing at the date of the transaction.
Foreign exchange gains and losses that relate to borrowings, non-current monetary items and non-current forward foreign exchange contracts are presented in the consolidated statements of net earning (loss) and comprehensive income (loss) within “unrealized foreign exchange loss (gain) on non-current monetary items”.
All other foreign exchange gains and losses are presented in the consolidated statements of net earnings (loss) and comprehensive income (loss) within “foreign exchange gain”.
2.6 Revenue recognition
Manufacturing Operations
Persuasive evidence of an arrangement exists in the form of a written contract. A process is in place that initiates a pre-shipment acceptance by the customer at the Company’s plant. This acceptance prior to shipment mitigates the likelihood of customer’s dissatisfaction with the final product upon delivery to the customer. Revenue is recorded when the vehicle is delivered or shipped. The customer does not have a legal right to return the delivered products after the acceptance period, or deviate from the agreed upon price. The Company’s contract clearly identifies a fixed and determinable price.
In connection with its sales of new coaches, the Company at times agrees to accept a pre-owned coach in exchange and gives the buyer a credit equal to the pre-owned coach's then-current fair value. Any credit provided to the customer in excess of the fair value of the pre-owned coach is deducted from the selling price of the new coach.
Operating lease revenue is recorded on a straight-line basis in the period earned over the life of the contract and is recognized in revenue in the consolidated statements of net earnings (loss) and comprehensive income (loss) due to its operating nature.
When a single sale transaction requires the delivery of more than one product or service (multiple performance obligations), the revenue recognition criteria are applied to the separately identifiable performance obligations. A performance obligation is considered to be separately identifiable if the product or service delivered has stand-alone value to that customer and the fair value associated with the product or service can be measured reliably. The amount recognized as revenue for each performance obligation is its fair value in relation to the fair value of the contract as a whole. Management has determined that the standard base warranty included in the bus or coach purchase is not a separate performance obligation and therefore recognized upon delivery of the vehicle.
The Company sells extended warranty contracts that provide coverage in addition to the basic coverage. Proceeds from the sale of these contracts are deferred and amortized into revenue over the extended warranty period commencing at the end of the basic warranty period. The Company also receives proceeds from the sale of extended warranties relating to major subsystems such as engines, transmissions, axles and air conditioning that are purchased for the customer from the original equipment manufacturer (“OEM”). The related cost to purchase the OEM warranty contracts have been recorded as a reduction of revenue as the Company is an agent to the transaction.
The Company, from time-to-time, may enter into arrangements with customers where the customer has requested that the Company defer shipping a vehicle and instead hold it for a specified period until the customer is able to take possession. The Company recognizes revenue for bill and hold arrangements when the arrangement is substantive, the product is identified separately as belonging to the customer and ready for physical transfer to the customer, and the Company cannot use the product or allocate it to another customer.
The Company does not recognize revenue on any bus or coach firm or option orders that have not yet been delivered except on bill and hold arrangements.
NFI GROUP INC. NOTES TO THE CONSOLIDATED FINANCIAL STATEMENTS As at December 27, 2020(in thousands of U.S. dollars except per share figures)
10 NFI GROUP INC 2020 ANNUAL REPORT
2. SUMMARY OF SIGNIFICANT ACCOUNTING POLICIES (Continued)
The Infrastructure SolutionsTM division supplies, installs and commissions electric vehicle chargers, and constructs the related charging infrastructure. Revenues related to the supply, installation and commissioning of electric vehicle chargers are recognized once the chargers pass final customer acceptance testing. Revenues related to construction of charging infrastructure are recognized over time using the cost-to-cost input method. The cost-to-cost method measures the Company's progress toward completion based on the total costs incurred relative to the total estimated contract costs.
Aftermarket Operations
Persuasive evidence of an arrangement exists in the form of an authorized sales order. The customer is invoiced, and revenue is recorded at the time the part is delivered using a commercial shipper. The price list for parts clearly identifies a fixed and determinable price, while also describing that the Company has no legal obligation to accept the return of goods other than on defective and/or warrantable parts product. Aftermarket parts revenue does not contain any revenue related to the bus or coach warranty.
2.7 Employee benefits
For defined benefit pension plans and other post-employment benefits, the net periodic pension expense is actuarially determined by independent actuaries using the projected unit credit method. Actuarial remeasurement is comprised of actuarial gains and losses, the effect of the changes to the asset ceiling (if applicable) and the return on plan assets (excluding interest), and is reflected immediately in the statement of financial position with a charge or credit recognized in other comprehensive income in the period in which they occur. Remeasurement recognized in other comprehensive income is reflected immediately in accumulated other comprehensive loss and will not be reclassified to profit or loss. Past service cost is recognized in profit or loss in the period of a plan amendment. Net interest is calculated by applying the discount rate at the beginning of the period to the net defined benefit liability or asset. Defined benefit costs are comprised of service costs (including current service cost, past service cost and gain or losses on curtailments and settlements), net interest expense or income and remeasurement.
The asset or liability recognized in the consolidated statements of financial position is the present value of the defined benefit obligation at the end of the reporting period less the fair value of plan assets, together with adjustments for past service costs. The present value of the defined benefit obligation is determined by discounting the estimated future cash outflows using interest rates of high-quality corporate bonds that are denominated in the currency in which the benefits will be paid and that have terms to maturity approximating the terms of the related pension liability. For funded plans, surpluses are recognized only to the extent that the surplus is considered recoverable. Recoverability is primarily based on the extent to which the Company can unilaterally reduce future contributions to the plan.
Payments to defined contribution plans are expensed as incurred, which is as the related employee service is rendered.
2.8 Share-based compensation plans
The Company operates cash-settled and equity-settled share-based compensation plans under which it receives services from senior management and non-employee members of the Board.
For the cash-settled plans (note 11), the expense is determined based on the fair value of the liability at the end of the reporting period until the awards are settled. Certain share-based compensation plans include non-market performance conditions. The Company`s accounting policy is to recognize the impact of non-market performance conditions by adjusting the number of awards that are expected to vest. At the end of each reporting period, the Company re-assesses its estimates of the number of awards that are expected to vest and recognizes the impact of the revisions on compensation expense (note 23) in the consolidated statements of net earnings (loss) and comprehensive income (loss).
For the equity-settled plans (note 12), share-based payments to senior management are measured at the fair value of the equity instruments at the grant date. The fair value is measured at grant date and each tranche is recognized on a graded-vesting basis over the period in which the options vest. The offset to the recorded cost is the stock option reserve. Consideration received on the exercise of stock options is recorded as share capital and the related stock option reserve is transferred to share capital. Upon expiry, the recorded value is transferred to retained earnings. At the end of each reporting period, the Company revises its estimate of the number of equity instruments expected to vest. The impact of the revision of the original estimates, if any, is recognized in the consolidated statements of net earnings (loss) and comprehensive income (loss) such that the cumulative expense reflects the revised estimate, with a corresponding adjustment to the stock option reserve. Where the terms and conditions of options are modified, the increase in the fair value of the options, measured immediately before and after the modification, is also charged to the consolidated statements of net earnings (loss) and comprehensive income (loss).
2.9 Cash
Cash and cash equivalents comprise cash on hand, demand deposits and investments with an original maturity at the date of purchase of three months or less.
NFI GROUP INC. NOTES TO THE CONSOLIDATED FINANCIAL STATEMENTS As at December 27, 2020(in thousands of U.S. dollars except per share figures)
11 NFI GROUP INC 2020 ANNUAL REPORT
2. SUMMARY OF SIGNIFICANT ACCOUNTING POLICIES (Continued)
2.10 Accounts receivables
Accounts receivables are amounts due from customers from the rendering of services or sale of goods in the ordinary course of business. Accounts receivables are classified as current assets if payment is due within one year or less. Accounts receivables are recognized initially at fair value and subsequently measured at amortized cost, less impairment, if any.
The Company maintains an allowance for doubtful accounts and sales adjustments to provide for impairment of trade receivables. The expense relating to doubtful accounts is included within “Sales, general and administration costs and other operating expenses” in the consolidated statements of net earnings (loss) and comprehensive income (loss).
2.11 Inventories
Inventories are measured at the lower of cost and net realizable value. The cost of inventories is based on the first-in first-out principle, and includes expenditures incurred in acquiring the inventories, production or conversion costs and other costs incurred in bringing them to their existing location and condition. In the case of finished goods inventories and work in progress, cost includes an appropriate share of production overheads based on normal operating capacity. Net realizable value is the estimated selling price in the ordinary course of business, less the estimated costs of completion and selling expenses.
2.12 Property, plant and equipment
Property, plant and equipment are recorded at cost reduced by applicable investment tax credits, less accumulated depreciation. Depreciation is calculated at the following annual rates:
Building and building improvements 4% declining‑balance basis
Machinery and equipment 25% declining‑balance basis
Demo buses and coaches 20% - 50% straight-line basis
Computer hardware and software 30% declining‑balance basis
Office equipment 20% declining‑balance basis
Buses and coaches available for lease 20% - 50% straight-line basis
Property, plant and equipment are tested for impairment as described under “Impairment of non-financial assets” in note 2.15.
2.13 Intangible assets
Identifiable intangible assets are initially recorded at fair value. Based on management’s forecasts and business plans and the going concern of the Company, the trade names intangible asset (note 7) has been deemed to have an indefinite life, except for the "NABI Parts" tradename which is amortized over its useful life of 12 years. For purposes of impairment testing, the fair value of trade names is determined using an income approach.
Intangible assets that have a finite life are amortized using the straight-line method over the estimated useful lives of the assets as follows:
Patents and Licenses 5-12 years
Backlog of sales orders 1-2 years
Customer relationships 21 years
Identifiable intangible assets with finite and indefinite lives are tested for impairment as described under “Impairment of non-financial assets” in note 2.15.
2.14 Goodwill
Goodwill represents the excess of the cost of an acquisition over the fair value of the Company’s share of the net identifiable assets of the acquired business at the date of acquisition. Separately recognized goodwill is tested at the end of every reporting period for possible impairment when there are events or changes in circumstances that indicate that their carrying amounts may not be recoverable and also tested annually for impairment. Goodwill is carried at cost less accumulated impairment losses. Gains and losses on the disposal of an entity include the carrying amount of goodwill relating to the entity sold.
NFI GROUP INC. NOTES TO THE CONSOLIDATED FINANCIAL STATEMENTS As at December 27, 2020(in thousands of U.S. dollars except per share figures)
12 NFI GROUP INC 2020 ANNUAL REPORT
2. SUMMARY OF SIGNIFICANT ACCOUNTING POLICIES (Continued)
2.15 Impairment of non-financial assets
Non-financial assets with finite lives are tested at the end of every reporting period for possible impairment when there are events or changes in circumstances that indicate that their carrying amounts may not be recoverable. In addition, non-financial assets that are not amortized are subject to an annual impairment assessment. The carrying values of identifiable intangible assets with indefinite lives are tested annually for impairment because they are not amortized. Impairment is determined by comparing the recoverable amount of such assets with their carrying amounts. Any impairment loss is recognized for the amount by which the asset’s carrying amount exceeds its recoverable amount within earnings of continuing or discontinued operations, as appropriate.
The recoverable amount is the higher of an asset’s fair value less cost to sell or its value in use. For the purpose of assessing impairment, assets are grouped at the lowest levels for which there are separately identifiable cash inflows or cash generating units (“CGUs”). The Company evaluates impairment losses for potential reversals, other than goodwill impairment, when events or changes in circumstances warrant such consideration.
2.16 Provisions
Provisions represent liabilities to the Company for which the amount or timing is uncertain. Provisions are recognized when the Company has a present legal or constructive obligation as a result of past events, it is probable that an outflow of resources will be required to settle the obligation and the amount can be reliably estimated. Provisions are not recognized for future operating losses, unless the losses relate to an onerous contract. Provisions are measured at the present value of the expenditures expected to be required to settle the obligation using a discount rate that reflects current market assessments of the time value of money and the risks specific to the obligation. Provisions are re-measured at each consolidated statements of financial position date using the current discount rate. The increase in the provision due to passage of time is recognized as interest expense.
At the time of sale, a provision for warranty claims relating to the base warranty on the entire bus or motor coach and a corrosion warranty on the related structure, is recorded and charged against operations. This warranty provision is based upon management's best estimate of expected future warranty costs utilizing past claims experience. Actual warranty expenditures are charged against the provision as incurred.
A provision for onerous contracts is recognized when the expected benefits to be derived by the Company from a contract are lower than the unavoidable cost of meeting its obligations under the contract. The provision is measured at the present value of the lower of the expected cost of terminating the contract and the expected net cost of continuing with the contract. Before a provision is established, the Company recognizes any impairment loss on the assets associated with that contract.
2.17 Long-term debt
Long-term debt is recognized initially at fair value, net of transaction costs incurred. Debt is subsequently stated at amortized cost with any difference between the proceeds and the amortized cost recognized in the consolidated statements of net earnings (loss) and comprehensive income (loss) over the term of the debt using the effective interest method.
Debt is classified as a current liability unless the Company has an unconditional right to defer settlement for at least 12 months after the date of the consolidated statements of financial position.
2.18 Financial instruments
Financial assets
Purchases and sales of financial assets are recognized on the settlement date, which is the date on which the asset is delivered to or by the Company. Financial assets are derecognized when the rights to receive cash flows from the investments have expired or were transferred and the Company has transferred substantially all risks and rewards of ownership. Financial assets are classified in the following categories at the time of initial recognition based on the purpose for which the financial assets were acquired:
Financial assets at fair value through profit or loss
Classification
Financial assets at fair value through profit or loss are financial assets held for trading or designated as fair value through profit or loss. A financial asset is classified in this category if acquired principally for the purpose of selling in the short-term or if so designated by management. Assets in this category include derivative financial instruments and are classified as short or long term assets in the consolidated statements of financial position.
NFI GROUP INC. NOTES TO THE CONSOLIDATED FINANCIAL STATEMENTS As at December 27, 2020(in thousands of U.S. dollars except per share figures)
13 NFI GROUP INC 2020 ANNUAL REPORT
2. SUMMARY OF SIGNIFICANT ACCOUNTING POLICIES (Continued)
Recognition and measurement
Financial assets are initially recognized at fair value and subsequently carried at fair value through profit and loss, with changes recognized in the consolidated statements of net earnings (loss) and comprehensive income (loss). Transaction costs are expensed as incurred.
Financial assets carried at amortized cost
Classification
Financial assets classified as amortized cost are non-derivative financial assets that the Company intends to hold in order to collect the contractual cash flows and have fixed or determinable payments that are not quoted in an active market. They are included in current assets, except for those with maturities greater than 12 months after the consolidated statements of financial position date, which are classified as non-current assets. Assets in this category include accounts receivables, deposits and cash and are classified as current assets in the consolidated statements of financial position.
Recognition and measurement
Financial assets carried at amortized cost are initially recognized at fair value plus transaction costs and subsequently carried at amortized cost using the effective interest method.
Financial liabilities carried at amortized cost
Financial liabilities primarily consist of accounts payable and accrued liabilities, derivative financial instruments, other long-term liabilities and long-term debt. Financial liabilities are initially measured at fair value and subsequently measured at amortized cost unless classified as fair value through profit or loss.
Derivative instruments
Derivatives are initially recognized at fair value on the date a contract is entered into and are subsequently re-measured at their fair value. The Company’s derivative instruments, while providing effective economic hedges, are not designated as hedges for accounting purposes. Changes in the fair value of any derivatives that are not designated as hedges for accounting purposes are recognized within “Fair market value gain (loss) on interest rate swap” or “unrealized foreign exchange (loss) gain on non-current monetary items” in the consolidated statements of net earnings (loss) and comprehensive income (loss)consistent with the underlying nature and purpose of the derivative instruments.
2.19 Taxation
Tax expense comprises current and deferred tax. Tax is recognized in the consolidated statements of net earnings (loss) and total comprehensive income (loss) except to the extent it relates to items recognized directly in equity, in which case the related tax is recognized in equity.
Current tax expense is based on the results for the period as adjusted for items that are not taxable or not deductible. Current tax is calculated using the tax rates under the laws that were enacted or substantively enacted at the date of the consolidated statements of financial position.
Deferred tax is accounted for using the liability approach and is the tax expected to be payable or recoverable on temporary differences between the carrying amount of assets and liabilities in the consolidated statements of financial position and the corresponding tax base used in the computation of taxable profit. Deferred tax is calculated based on the expected manner of realization or settlement of the carrying amount of assets and liabilities, using tax rates that are expected to apply to the year of realization or settlement based on tax rates and laws enacted or substantively enacted at the date of the consolidated statements of financial position.
Deferred tax assets are recognized to the extent it is probable that taxable profits will be available against which the deductible temporary differences can be utilized, unless the deferred tax asset arises from the initial recognition of an asset or liability in a transaction that is not a business combination, and at the time of the transaction, affects neither accounting profit nor taxable profit (tax loss). The carrying amount of deferred tax assets is reviewed at each consolidated statements of financial position date and reduced to the extent that it is no longer probable that sufficient taxable profits will be available to allow all or part of the asset to be recovered.
NFI GROUP INC. NOTES TO THE CONSOLIDATED FINANCIAL STATEMENTS As at December 27, 2020(in thousands of U.S. dollars except per share figures)
14 NFI GROUP INC 2020 ANNUAL REPORT
2. SUMMARY OF SIGNIFICANT ACCOUNTING POLICIES (Continued)
Deferred tax liabilities are generally recognized for all taxable temporary differences except to the extent that the deferred tax liability arises from: the initial recognition of goodwill; or the initial recognition of an asset or liability in a transaction which is not a business combination and, at the time of the transaction, affects neither accounting profit nor taxable profit (tax loss). As well, deferred tax liabilities are recognized for taxable temporary differences arising on investments in subsidiaries except where the reversal of the temporary difference can be controlled and it is probable that the difference will not reverse in the foreseeable future.
2.20 Investment tax credits
The Company has earned investment tax credits (“ITCs”) relating to a percentage of eligible current and capital research and development expenditures incurred in each taxation year. Investment tax credits are recognized when there is reasonable assurance that the Company will comply with the associated conditions and the grants will be received. The investment tax credits are recognized either as a reduction in cost of sales on the consolidated statements of net earnings (loss) and comprehensive income (loss), or as a reduction in property, plant and equipment, depending on where the original costs which gave rise to the credits were recorded.
2.21 Vendor Rebates
The Company records certain consideration received from a vendor, which is probable and can be reasonably estimated, as a reduction of the cost of purchases during the period.
2.22 Critical accounting estimates and judgments
Estimates and judgments are continually evaluated and are based on historical experience and other factors, including expectations of future events that are believed to be reasonable under the circumstances.
Critical accounting estimates and assumptions
Management makes estimates and assumptions concerning the future. The resulting accounting estimates will, by definition, seldom equal the actual results. Estimates are reviewed on a regular basis and, as adjustments become necessary, they are reported in the consolidated statements of net earnings and comprehensive income in the periods in which they become known. The assets and liabilities which require management to make significant estimates and assumptions in determining carrying values include, inventories, derivative financial instruments, property, plant and equipment, intangible assets, goodwill, provisions, accrued benefit liability, deferred compensation obligation, government grants and deferred income taxes.
Information about assumptions and estimation uncertainties that have a significant risk of resulting in a material adjustment are addressed below.
Intangible assets and goodwill
The values associated with the initial recognition and impairment tests of the intangible assets and goodwill involve significant estimates and assumptions, including those with respect to future cash inflows and outflows, discount rates and asset lives.
These significant estimates are subject to the Company’s future results. These determinations will affect the amount of amortization expense on intangible assets recognized in future periods.
Management assesses impairment by comparing the recoverable amount of an intangible asset or goodwill with its carrying value. The determination of the recoverable amount involves significant estimation by management.
Management has determined that for purposes of this evaluation the Company has five CGUs: North American bus/coach manufacturing, ARBOC, ADL manufacturing, ADL aftermarket parts operations, and aftermarket parts operations.
Goodwill is allocated to the Company’s five CGUs for the purpose of impairment testing. The Company performs its annual test for impairment of goodwill in the fourth quarter of each year and also when indicators of impairment exist.
Accrued benefit liability
The present value of the defined benefit obligation is determined by discounting the estimated future cash outflows using interest rates of high-quality corporate bonds that are denominated in the currency in which the benefits will be paid and that have terms to maturity approximating the terms of the related pension liability. Determination of benefit expense requires assumptions such as the discount rate to measure obligations and return on assets, the projected age of employees upon retirement, life expectancy and the expected rate of future compensation changes.
Actual results will differ from results which are estimated based on assumptions. See note 2.7 for certain assumptions made with respect to employee benefits.
NFI GROUP INC. NOTES TO THE CONSOLIDATED FINANCIAL STATEMENTS As at December 27, 2020(in thousands of U.S. dollars except per share figures)
15 NFI GROUP INC 2020 ANNUAL REPORT
2. SUMMARY OF SIGNIFICANT ACCOUNTING POLICIES (Continued)
Income Taxes
Estimation of income taxes includes evaluating the recoverability of deferred tax assets based on an assessment of the Company’s ability to utilize the underlying future tax deductions against future taxable income before they expire. Management’s assessment is based upon existing tax laws and estimates of future taxable income. If the assessment of the Company’s ability to utilize the underlying future tax deductions changes, the Company would be required to recognize more or fewer of the tax deductions as assets, which would decrease or increase the income tax expense in the period in which this is determined.
The Company is subject to taxation in multiple jurisdictions. Significant judgment is required in determining the worldwide provision for taxation. There are many transactions and calculations for which the ultimate tax determination is uncertain during the ordinary course of business. The Company maintains provisions for uncertain tax positions that it believes appropriately reflect its risk with respect to tax matters under active discussion, audit, dispute or appeal with tax authorities, or which are otherwise considered to involve uncertainty. These provisions for uncertain tax positions are made using management’s best estimate of the amount expected to be paid based on a qualitative assessment of all relevant factors. Management reviews the adequacy of these provisions at the date of each consolidated statements of financial position. However, it is possible that at some future date an additional liability could result from audits by taxing authorities. Where the final tax outcome of these matters is different from the amounts that were initially recorded, such differences will affect the tax provisions in the period in which such determination is made.
Provision for Warranty Costs
The Company offers warranties on the buses and coaches it sells. Management estimates the related provision for future warranty claims based on historical warranty claim information, as well as recent trends that might suggest that past cost information may differ from future claims. Factors that could impact the estimated claim information include quality initiatives, as well as parts and labour costs.
Critical judgments in applying accounting policies
The following critical judgments that were made by management have the most significant effect on the amounts recognized in the financial statements.
Revenue recognition
As described in note 2.6, management assessed the criteria for the recognition of revenue related to arrangements that have multiple components as set out in IFRS 15. Also, judgment is necessary to determine when components can be recognized separately and the allocation of the related consideration allocated to each component.
Also described in note 2.6, management assessed the criteria for the recognition of revenue in an agency relationship related to the sale of extended warranties that are purchased for the customer from the OEM as set out in IFRS 15.
Functional currency
Management assessed the criteria for the determination of functional currency as set out in IAS 21. An entity is required to place the greatest weight on the currency that influences the pricing of the transactions that it undertakes rather than focusing on the currency in which the transactions are denominated in. The functional currency of the Company is the United States dollar as it is the currency of the primary economic environment in which the Company operates. In addition, it is the competitive forces of the United States marketplace that determines the sales prices of its goods and services. Predominantly, the costs for labour, material and overhead that address the needs and support the Company’s customers are incurred in United States dollars, and hence the pricing of goods and services to the customer is more greatly influenced from operations and the competitive forces in the United States.
Goodwill
Judgment is required in the selection of CGUs and the allocation of assets and liabilities to these CGUs, which is necessary to assess the impairment of long-term assets, goodwill and intangible assets.
NFI GROUP INC. NOTES TO THE CONSOLIDATED FINANCIAL STATEMENTS As at December 27, 2020(in thousands of U.S. dollars except per share figures)
16 NFI GROUP INC 2020 ANNUAL REPORT

3. ACCOUNTS RECEIVABLE
December 27, 2020 December 29, 2019Trade, net of allowance for doubtful accounts $ 383,086 $ 471,552 Other 43,322 60,184
$ 426,408 $ 531,736
4. INVENTORIES
December 27, 2020 December 29, 2019
Raw materials $ 299,476 $ 300,447
Work in process 216,311 263,343
Finished goods 141,249 108,453
$ 657,036 $ 672,243
Fiscal 2020 Fiscal 2019
Cost of inventories recognized as expense and included in cost of sales $ 2,107,143 $ 2,452,170 Write-down of inventory to net realizable value in cost of sales 47,274 4,538
Reversals of a previous write-down in inventory 403 471
The write-down of inventory for Manufacturing is $44.7 million (2019: $2.6 million), of which $38.6 million pertains to pre-owned coach, $2.9 million for bus and $1.7 million for new coach impairment. Aftermarket write-down of inventory is $2.6 million (2019: $1.9 million).
5. PROPERTY, PLANT AND EQUIPMENT
Land, building and building
improvements
Machinery and
equipment
Computer hardware
and software
Office equipment
Demo buses
and coaches
Buses and coaches
available for lease Total
Cost $ 102,202 $ 192,983 $ 54,002 $ 7,615 $ 26,421 $ 24,615 $ 407,838
Accumulated depreciation 11,875 92,410 33,654 3,571 12,705 5,680 159,895
December 30, 2018 net book value 90,327 100,573 20,348 4,044 13,716 18,935 247,943
Transition to IFRS 16 (3,013) (22,734) (1,572) — — — (27,319)
Adjusted December 31, 2018 net book value 87,314 77,839 18,776 4,044 13,716 18,935 220,624
Assumed as a result of business acquisitions 15,490 19,166 2,587 — 6,405 — 43,648
Additions 4,151 18,792 6,728 254 4,759 2,892 37,576
Transfers from inventory — — — — 6,646 3,931 10,577
Disposals (27) (117) (33) (44) (159) — (380)
Depreciation charge (3,387) (21,369) (5,797) (746) (7,252) (6,119) (44,670)
Cumulative translation adjustment 500 558 86 — 229 — 1,373
December 29, 2019 net book value 104,041 94,869 22,347 3,508 24,344 19,639 268,748
Additions 1,434 12,862 3,608 13 7,328 458 25,703
Transfer from inventory (1,827) (137) (8) (14) (3,744) (6,265) (11,995)
Disposals (22) (659) (136) (13) (1,878) — (2,708)
Depreciation charge (3,551) (23,411) (5,346) (700) (9,219) (5,199) (47,426)
Impairment — (782) (976) — — — (1,758)
Cumulative translation adjustment 278 864 93 — 351 — 1,586
December 27, 2020 net book value $ 100,353 $ 83,606 $ 19,582 $ 2,794 $ 17,182 $ 8,633 $ 232,150
NFI GROUP INC. NOTES TO THE CONSOLIDATED FINANCIAL STATEMENTS As at December 27, 2020(in thousands of U.S. dollars except per share figures)
17 NFI GROUP INC 2020 ANNUAL REPORT
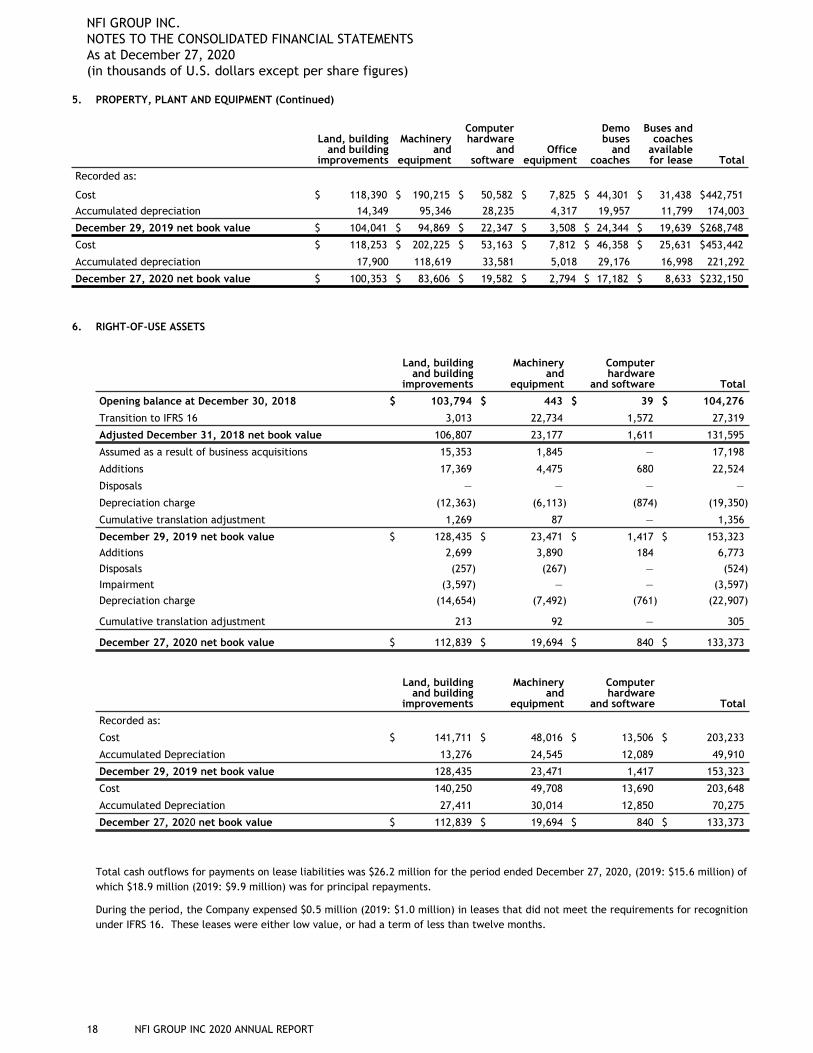
5. PROPERTY, PLANT AND EQUIPMENT (Continued)
Land, building and building
improvements
Machinery and
equipment
Computer hardware
and software
Office equipment
Demo buses
and coaches
Buses and coaches
available for lease Total
Recorded as:
Cost $ 118,390 $ 190,215 $ 50,582 $ 7,825 $ 44,301 $ 31,438 $ 442,751 Accumulated depreciation 14,349 95,346 28,235 4,317 19,957 11,799 174,003
December 29, 2019 net book value $ 104,041 $ 94,869 $ 22,347 $ 3,508 $ 24,344 $ 19,639 $ 268,748
Cost $ 118,253 $ 202,225 $ 53,163 $ 7,812 $ 46,358 $ 25,631 $ 453,442
Accumulated depreciation 17,900 118,619 33,581 5,018 29,176 16,998 221,292
December 27, 2020 net book value $ 100,353 $ 83,606 $ 19,582 $ 2,794 $ 17,182 $ 8,633 $ 232,150
6. RIGHT-OF-USE ASSETS
Land, building and building
improvements
Machinery and
equipment
Computer hardware
and software Total
Opening balance at December 30, 2018 $ 103,794 $ 443 $ 39 $ 104,276
Transition to IFRS 16 3,013 22,734 1,572 27,319
Adjusted December 31, 2018 net book value 106,807 23,177 1,611 131,595
Assumed as a result of business acquisitions 15,353 1,845 — 17,198
Additions 17,369 4,475 680 22,524
Disposals — — — —
Depreciation charge (12,363) (6,113) (874) (19,350)
Cumulative translation adjustment 1,269 87 — 1,356
December 29, 2019 net book value $ 128,435 $ 23,471 $ 1,417 $ 153,323 Additions 2,699 3,890 184 6,773 Disposals (257) (267) — (524) Impairment (3,597) — — (3,597) Depreciation charge (14,654) (7,492) (761) (22,907)
Cumulative translation adjustment 213 92 — 305
December 27, 2020 net book value $ 112,839 $ 19,694 $ 840 $ 133,373
Land, building and building
improvements
Machinery and
equipment
Computer hardware
and software Total
Recorded as:
Cost $ 141,711 $ 48,016 $ 13,506 $ 203,233
Accumulated Depreciation 13,276 24,545 12,089 49,910
December 29, 2019 net book value 128,435 23,471 1,417 153,323
Cost 140,250 49,708 13,690 203,648
Accumulated Depreciation 27,411 30,014 12,850 70,275
December 27, 2020 net book value $ 112,839 $ 19,694 $ 840 $ 133,373
Total cash outflows for payments on lease liabilities was $26.2 million for the period ended December 27, 2020, (2019: $15.6 million) of which $18.9 million (2019: $9.9 million) was for principal repayments.
During the period, the Company expensed $0.5 million (2019: $1.0 million) in leases that did not meet the requirements for recognition under IFRS 16. These leases were either low value, or had a term of less than twelve months.
NFI GROUP INC. NOTES TO THE CONSOLIDATED FINANCIAL STATEMENTS As at December 27, 2020(in thousands of U.S. dollars except per share figures)
18 NFI GROUP INC 2020 ANNUAL REPORT
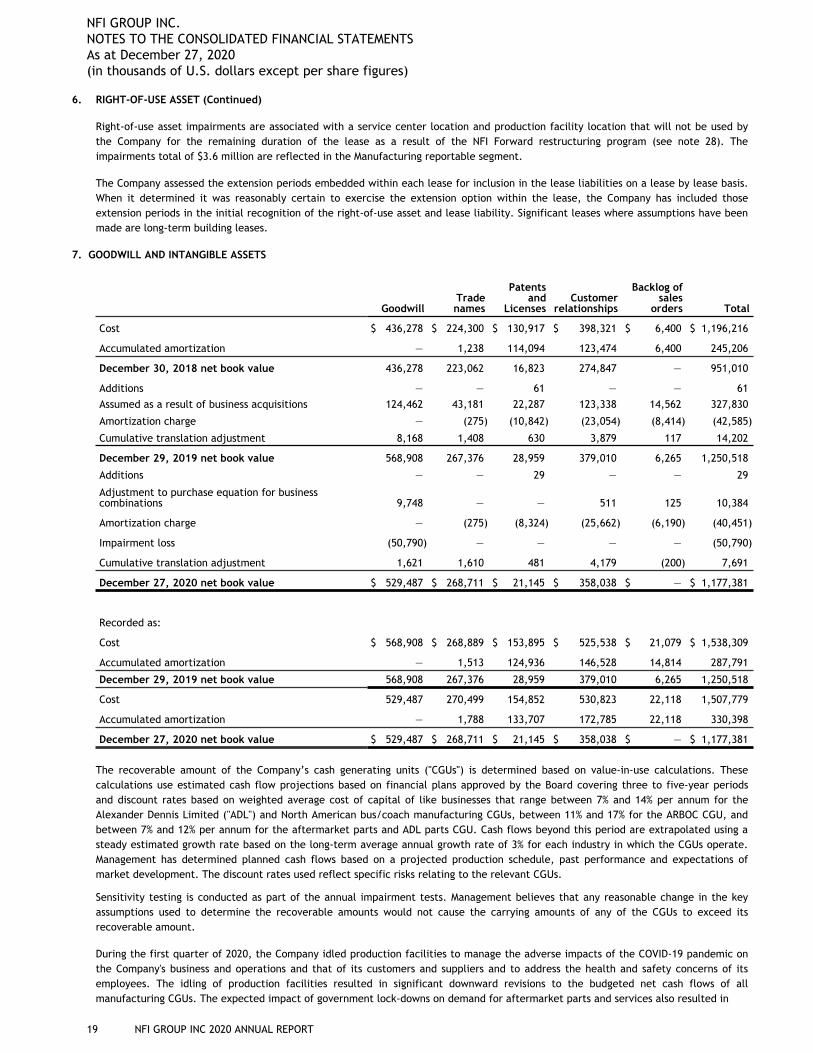
6. RIGHT-OF-USE ASSET (Continued)
Right-of-use asset impairments are associated with a service center location and production facility location that will not be used by the Company for the remaining duration of the lease as a result of the NFI Forward restructuring program (see note 28). The impairments total of $3.6 million are reflected in the Manufacturing reportable segment.
The Company assessed the extension periods embedded within each lease for inclusion in the lease liabilities on a lease by lease basis. When it determined it was reasonably certain to exercise the extension option within the lease, the Company has included those extension periods in the initial recognition of the right-of-use asset and lease liability. Significant leases where assumptions have been made are long-term building leases.
7. GOODWILL AND INTANGIBLE ASSETS
GoodwillTrade names
Patents and
LicensesCustomer
relationships
Backlog of sales
orders Total
Cost $ 436,278 $ 224,300 $ 130,917 $ 398,321 $ 6,400 $ 1,196,216
Accumulated amortization — 1,238 114,094 123,474 6,400 245,206
December 30, 2018 net book value 436,278 223,062 16,823 274,847 — 951,010
Additions — — 61 — — 61 Assumed as a result of business acquisitions 124,462 43,181 22,287 123,338 14,562 327,830
Amortization charge — (275) (10,842) (23,054) (8,414) (42,585)
Cumulative translation adjustment 8,168 1,408 630 3,879 117 14,202
December 29, 2019 net book value 568,908 267,376 28,959 379,010 6,265 1,250,518
Additions — — 29 — — 29
Adjustment to purchase equation for business combinations 9,748 — — 511 125 10,384
Amortization charge — (275) (8,324) (25,662) (6,190) (40,451)
Impairment loss (50,790) — — — — (50,790)
Cumulative translation adjustment 1,621 1,610 481 4,179 (200) 7,691
December 27, 2020 net book value $ 529,487 $ 268,711 $ 21,145 $ 358,038 $ — $ 1,177,381
Recorded as:
Cost $ 568,908 $ 268,889 $ 153,895 $ 525,538 $ 21,079 $ 1,538,309
Accumulated amortization — 1,513 124,936 146,528 14,814 287,791
December 29, 2019 net book value 568,908 267,376 28,959 379,010 6,265 1,250,518
Cost 529,487 270,499 154,852 530,823 22,118 1,507,779
Accumulated amortization — 1,788 133,707 172,785 22,118 330,398
December 27, 2020 net book value $ 529,487 $ 268,711 $ 21,145 $ 358,038 $ — $ 1,177,381
The recoverable amount of the Company’s cash generating units ("CGUs") is determined based on value-in-use calculations. These calculations use estimated cash flow projections based on financial plans approved by the Board covering three to five-year periods and discount rates based on weighted average cost of capital of like businesses that range between 7% and 14% per annum for the Alexander Dennis Limited ("ADL") and North American bus/coach manufacturing CGUs, between 11% and 17% for the ARBOC CGU, and between 7% and 12% per annum for the aftermarket parts and ADL parts CGU. Cash flows beyond this period are extrapolated using a steady estimated growth rate based on the long-term average annual growth rate of 3% for each industry in which the CGUs operate. Management has determined planned cash flows based on a projected production schedule, past performance and expectations of market development. The discount rates used reflect specific risks relating to the relevant CGUs.
Sensitivity testing is conducted as part of the annual impairment tests. Management believes that any reasonable change in the key assumptions used to determine the recoverable amounts would not cause the carrying amounts of any of the CGUs to exceed its recoverable amount.
During the first quarter of 2020, the Company idled production facilities to manage the adverse impacts of the COVID-19 pandemic on the Company's business and operations and that of its customers and suppliers and to address the health and safety concerns of its employees. The idling of production facilities resulted in significant downward revisions to the budgeted net cash flows of all manufacturing CGUs. The expected impact of government lock-downs on demand for aftermarket parts and services also resulted in
NFI GROUP INC. NOTES TO THE CONSOLIDATED FINANCIAL STATEMENTS As at December 27, 2020(in thousands of U.S. dollars except per share figures)
19 NFI GROUP INC 2020 ANNUAL REPORT
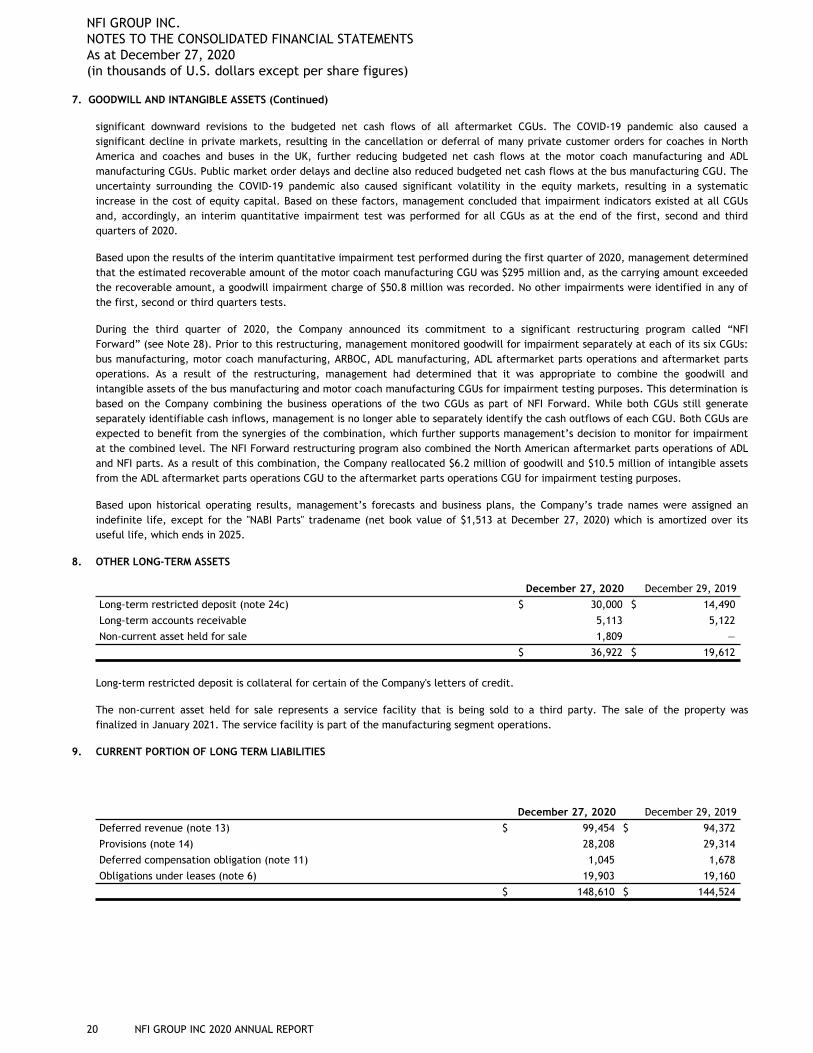
7. GOODWILL AND INTANGIBLE ASSETS (Continued)
significant downward revisions to the budgeted net cash flows of all aftermarket CGUs. The COVID-19 pandemic also caused a significant decline in private markets, resulting in the cancellation or deferral of many private customer orders for coaches in North America and coaches and buses in the UK, further reducing budgeted net cash flows at the motor coach manufacturing and ADL manufacturing CGUs. Public market order delays and decline also reduced budgeted net cash flows at the bus manufacturing CGU. The uncertainty surrounding the COVID-19 pandemic also caused significant volatility in the equity markets, resulting in a systematic increase in the cost of equity capital. Based on these factors, management concluded that impairment indicators existed at all CGUs and, accordingly, an interim quantitative impairment test was performed for all CGUs as at the end of the first, second and third quarters of 2020.
Based upon the results of the interim quantitative impairment test performed during the first quarter of 2020, management determined that the estimated recoverable amount of the motor coach manufacturing CGU was $295 million and, as the carrying amount exceeded the recoverable amount, a goodwill impairment charge of $50.8 million was recorded. No other impairments were identified in any of the first, second or third quarters tests.
During the third quarter of 2020, the Company announced its commitment to a significant restructuring program called “NFI Forward” (see Note 28). Prior to this restructuring, management monitored goodwill for impairment separately at each of its six CGUs: bus manufacturing, motor coach manufacturing, ARBOC, ADL manufacturing, ADL aftermarket parts operations and aftermarket parts operations. As a result of the restructuring, management had determined that it was appropriate to combine the goodwill and intangible assets of the bus manufacturing and motor coach manufacturing CGUs for impairment testing purposes. This determination is based on the Company combining the business operations of the two CGUs as part of NFI Forward. While both CGUs still generate separately identifiable cash inflows, management is no longer able to separately identify the cash outflows of each CGU. Both CGUs are expected to benefit from the synergies of the combination, which further supports management’s decision to monitor for impairment at the combined level. The NFI Forward restructuring program also combined the North American aftermarket parts operations of ADL and NFI parts. As a result of this combination, the Company reallocated $6.2 million of goodwill and $10.5 million of intangible assets from the ADL aftermarket parts operations CGU to the aftermarket parts operations CGU for impairment testing purposes.
Based upon historical operating results, management’s forecasts and business plans, the Company’s trade names were assigned an indefinite life, except for the "NABI Parts" tradename (net book value of $1,513 at December 27, 2020) which is amortized over its useful life, which ends in 2025.
8. OTHER LONG-TERM ASSETS
December 27, 2020 December 29, 2019Long-term restricted deposit (note 24c) $ 30,000 $ 14,490 Long-term accounts receivable 5,113 5,122 Non-current asset held for sale 1,809 —
$ 36,922 $ 19,612
Long-term restricted deposit is collateral for certain of the Company's letters of credit.
The non-current asset held for sale represents a service facility that is being sold to a third party. The sale of the property was finalized in January 2021. The service facility is part of the manufacturing segment operations.
9. CURRENT PORTION OF LONG TERM LIABILITIES
December 27, 2020 December 29, 2019Deferred revenue (note 13) $ 99,454 $ 94,372 Provisions (note 14) 28,208 29,314 Deferred compensation obligation (note 11) 1,045 1,678 Obligations under leases (note 6) 19,903 19,160
$ 148,610 $ 144,524
NFI GROUP INC. NOTES TO THE CONSOLIDATED FINANCIAL STATEMENTS As at December 27, 2020(in thousands of U.S. dollars except per share figures)
20 NFI GROUP INC 2020 ANNUAL REPORT
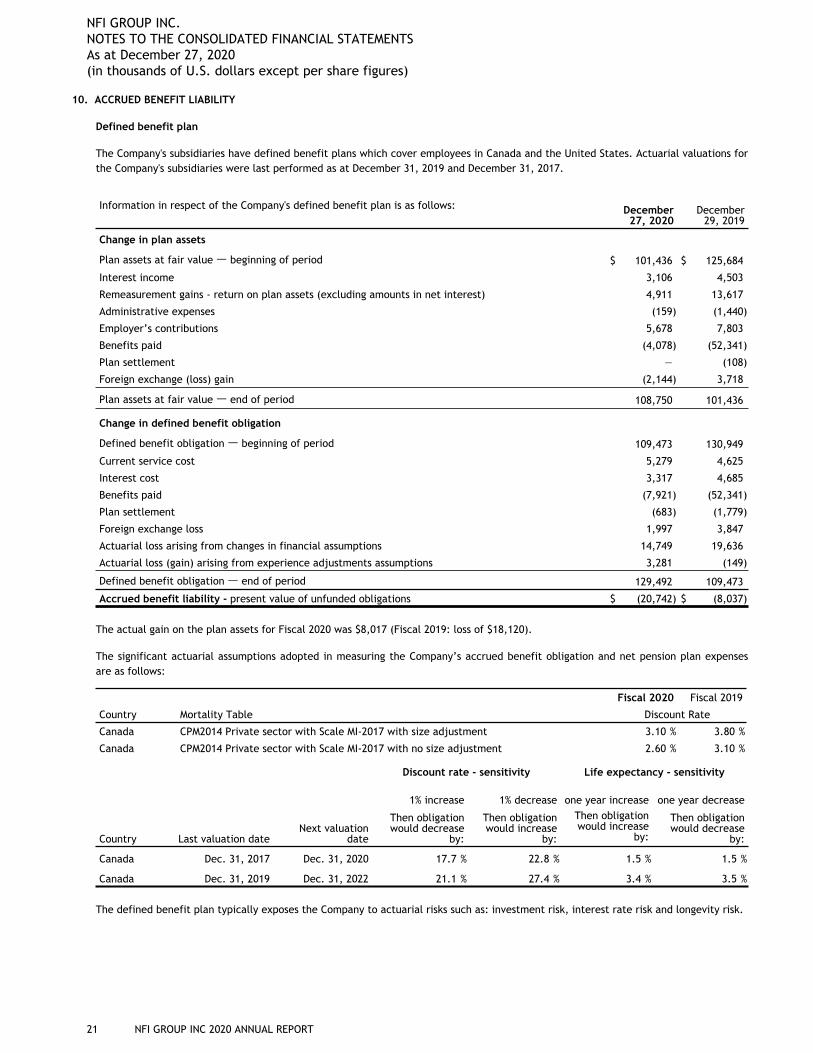
10. ACCRUED BENEFIT LIABILITY
Defined benefit plan
The Company's subsidiaries have defined benefit plans which cover employees in Canada and the United States. Actuarial valuations for the Company's subsidiaries were last performed as at December 31, 2019 and December 31, 2017.
Information in respect of the Company's defined benefit plan is as follows: December 27, 2020
December 29, 2019
Change in plan assets
Plan assets at fair value — beginning of period $ 101,436 $ 125,684
Interest income 3,106 4,503
Remeasurement gains - return on plan assets (excluding amounts in net interest) 4,911 13,617
Administrative expenses (159) (1,440)
Employer’s contributions 5,678 7,803
Benefits paid (4,078) (52,341)
Plan settlement — (108)
Foreign exchange (loss) gain (2,144) 3,718
Plan assets at fair value — end of period 108,750 101,436
Change in defined benefit obligation
Defined benefit obligation — beginning of period 109,473 130,949
Current service cost 5,279 4,625
Interest cost 3,317 4,685
Benefits paid (7,921) (52,341)
Plan settlement (683) (1,779)
Foreign exchange loss 1,997 3,847
Actuarial loss arising from changes in financial assumptions 14,749 19,636
Actuarial loss (gain) arising from experience adjustments assumptions 3,281 (149)
Defined benefit obligation — end of period 129,492 109,473
Accrued benefit liability - present value of unfunded obligations $ (20,742) $ (8,037)
The actual gain on the plan assets for Fiscal 2020 was $8,017 (Fiscal 2019: loss of $18,120).
The significant actuarial assumptions adopted in measuring the Company’s accrued benefit obligation and net pension plan expenses are as follows:
Fiscal 2020 Fiscal 2019
Country Mortality Table Discount Rate
Canada CPM2014 Private sector with Scale MI-2017 with size adjustment 3.10 % 3.80 %
Canada CPM2014 Private sector with Scale MI-2017 with no size adjustment 2.60 % 3.10 %
Discount rate - sensitivity Life expectancy - sensitivity
1% increase 1% decrease one year increase one year decrease
Country Last valuation dateNext valuation
date
Then obligation would decrease
by:
Then obligation would increase
by:
Then obligation would increase
by:
Then obligation would decrease
by:
Canada Dec. 31, 2017 Dec. 31, 2020 17.7 % 22.8 % 1.5 % 1.5 %
Canada Dec. 31, 2019 Dec. 31, 2022 21.1 % 27.4 % 3.4 % 3.5 %
The defined benefit plan typically exposes the Company to actuarial risks such as: investment risk, interest rate risk and longevity risk.
NFI GROUP INC. NOTES TO THE CONSOLIDATED FINANCIAL STATEMENTS As at December 27, 2020(in thousands of U.S. dollars except per share figures)
21 NFI GROUP INC 2020 ANNUAL REPORT
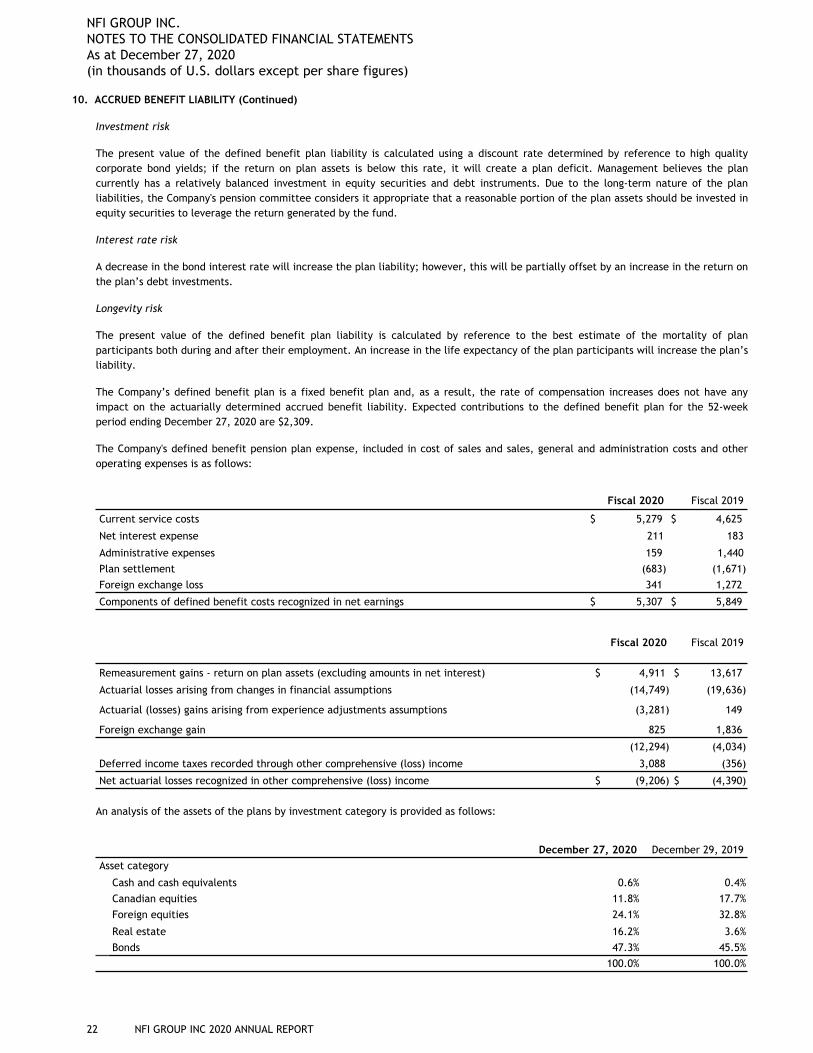
10. ACCRUED BENEFIT LIABILITY (Continued)
Investment risk
The present value of the defined benefit plan liability is calculated using a discount rate determined by reference to high quality corporate bond yields; if the return on plan assets is below this rate, it will create a plan deficit. Management believes the plan currently has a relatively balanced investment in equity securities and debt instruments. Due to the long-term nature of the plan liabilities, the Company's pension committee considers it appropriate that a reasonable portion of the plan assets should be invested in equity securities to leverage the return generated by the fund.
Interest rate risk
A decrease in the bond interest rate will increase the plan liability; however, this will be partially offset by an increase in the return on the plan’s debt investments.
Longevity risk
The present value of the defined benefit plan liability is calculated by reference to the best estimate of the mortality of plan participants both during and after their employment. An increase in the life expectancy of the plan participants will increase the plan’s liability.
The Company’s defined benefit plan is a fixed benefit plan and, as a result, the rate of compensation increases does not have any impact on the actuarially determined accrued benefit liability. Expected contributions to the defined benefit plan for the 52-week period ending December 27, 2020 are $2,309.
The Company's defined benefit pension plan expense, included in cost of sales and sales, general and administration costs and other operating expenses is as follows:
Fiscal 2020 Fiscal 2019
Current service costs $ 5,279 $ 4,625
Net interest expense 211 183
Administrative expenses 159 1,440Plan settlement (683) (1,671) Foreign exchange loss 341 1,272
Components of defined benefit costs recognized in net earnings $ 5,307 $ 5,849
Fiscal 2020 Fiscal 2019
Remeasurement gains - return on plan assets (excluding amounts in net interest) $ 4,911 $ 13,617
Actuarial losses arising from changes in financial assumptions (14,749) (19,636)
Actuarial (losses) gains arising from experience adjustments assumptions (3,281) 149
Foreign exchange gain 825 1,836
(12,294) (4,034)
Deferred income taxes recorded through other comprehensive (loss) income 3,088 (356)
Net actuarial losses recognized in other comprehensive (loss) income $ (9,206) $ (4,390)
An analysis of the assets of the plans by investment category is provided as follows:
December 27, 2020 December 29, 2019Asset category
Cash and cash equivalents 0.6 % 0.4 %Canadian equities 11.8 % 17.7 %Foreign equities 24.1 % 32.8 %
Real estate 16.2 % 3.6 %Bonds 47.3 % 45.5 %
100.0 % 100.0 %
NFI GROUP INC. NOTES TO THE CONSOLIDATED FINANCIAL STATEMENTS As at December 27, 2020(in thousands of U.S. dollars except per share figures)
22 NFI GROUP INC 2020 ANNUAL REPORT
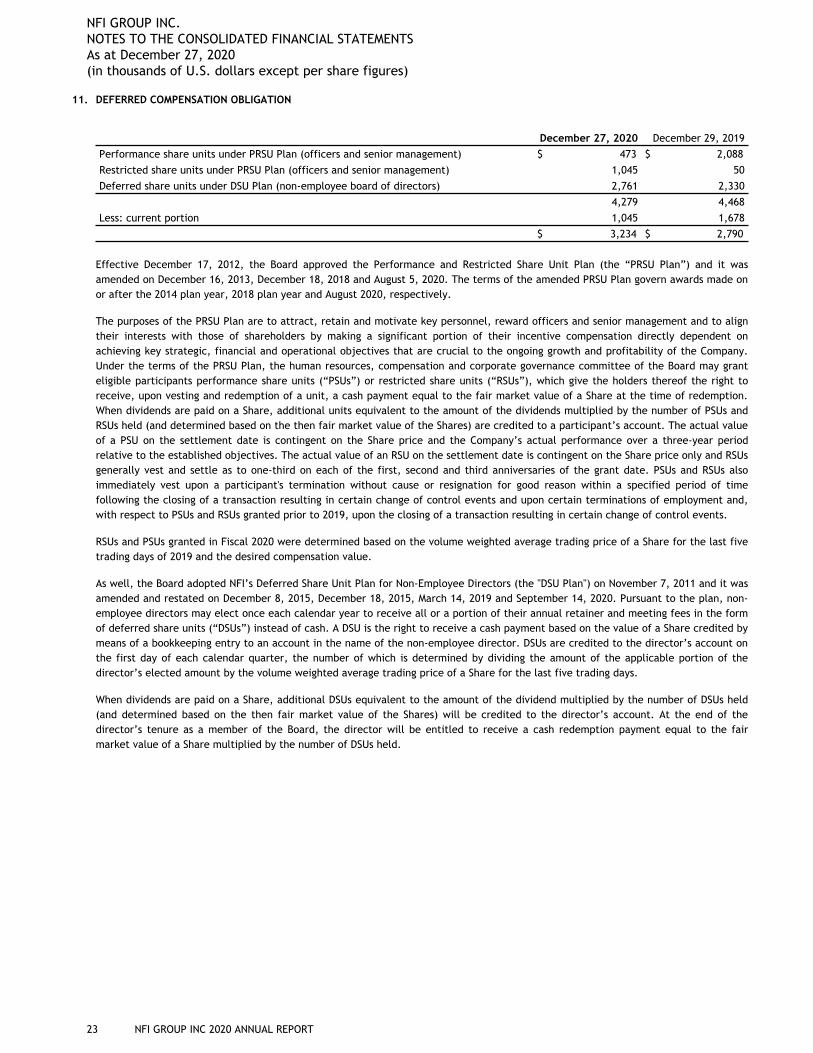
11. DEFERRED COMPENSATION OBLIGATION
December 27, 2020 December 29, 2019Performance share units under PRSU Plan (officers and senior management) $ 473 $ 2,088 Restricted share units under PRSU Plan (officers and senior management) 1,045 50Deferred share units under DSU Plan (non-employee board of directors) 2,761 2,330
4,279 4,468Less: current portion 1,045 1,678
$ 3,234 $ 2,790
Effective December 17, 2012, the Board approved the Performance and Restricted Share Unit Plan (the “PRSU Plan”) and it was amended on December 16, 2013, December 18, 2018 and August 5, 2020. The terms of the amended PRSU Plan govern awards made on or after the 2014 plan year, 2018 plan year and August 2020, respectively.
The purposes of the PRSU Plan are to attract, retain and motivate key personnel, reward officers and senior management and to align their interests with those of shareholders by making a significant portion of their incentive compensation directly dependent on achieving key strategic, financial and operational objectives that are crucial to the ongoing growth and profitability of the Company. Under the terms of the PRSU Plan, the human resources, compensation and corporate governance committee of the Board may grant eligible participants performance share units (“PSUs”) or restricted share units (“RSUs”), which give the holders thereof the right to receive, upon vesting and redemption of a unit, a cash payment equal to the fair market value of a Share at the time of redemption. When dividends are paid on a Share, additional units equivalent to the amount of the dividends multiplied by the number of PSUs and RSUs held (and determined based on the then fair market value of the Shares) are credited to a participant’s account. The actual value of a PSU on the settlement date is contingent on the Share price and the Company’s actual performance over a three-year period relative to the established objectives. The actual value of an RSU on the settlement date is contingent on the Share price only and RSUs generally vest and settle as to one-third on each of the first, second and third anniversaries of the grant date. PSUs and RSUs also immediately vest upon a participant's termination without cause or resignation for good reason within a specified period of time following the closing of a transaction resulting in certain change of control events and upon certain terminations of employment and, with respect to PSUs and RSUs granted prior to 2019, upon the closing of a transaction resulting in certain change of control events.
RSUs and PSUs granted in Fiscal 2020 were determined based on the volume weighted average trading price of a Share for the last five trading days of 2019 and the desired compensation value.
As well, the Board adopted NFI’s Deferred Share Unit Plan for Non-Employee Directors (the "DSU Plan") on November 7, 2011 and it was amended and restated on December 8, 2015, December 18, 2015, March 14, 2019 and September 14, 2020. Pursuant to the plan, non-employee directors may elect once each calendar year to receive all or a portion of their annual retainer and meeting fees in the form of deferred share units (“DSUs”) instead of cash. A DSU is the right to receive a cash payment based on the value of a Share credited by means of a bookkeeping entry to an account in the name of the non-employee director. DSUs are credited to the director’s account on the first day of each calendar quarter, the number of which is determined by dividing the amount of the applicable portion of the director’s elected amount by the volume weighted average trading price of a Share for the last five trading days.
When dividends are paid on a Share, additional DSUs equivalent to the amount of the dividend multiplied by the number of DSUs held (and determined based on the then fair market value of the Shares) will be credited to the director’s account. At the end of the director’s tenure as a member of the Board, the director will be entitled to receive a cash redemption payment equal to the fair market value of a Share multiplied by the number of DSUs held.
NFI GROUP INC. NOTES TO THE CONSOLIDATED FINANCIAL STATEMENTS As at December 27, 2020(in thousands of U.S. dollars except per share figures)
23 NFI GROUP INC 2020 ANNUAL REPORT
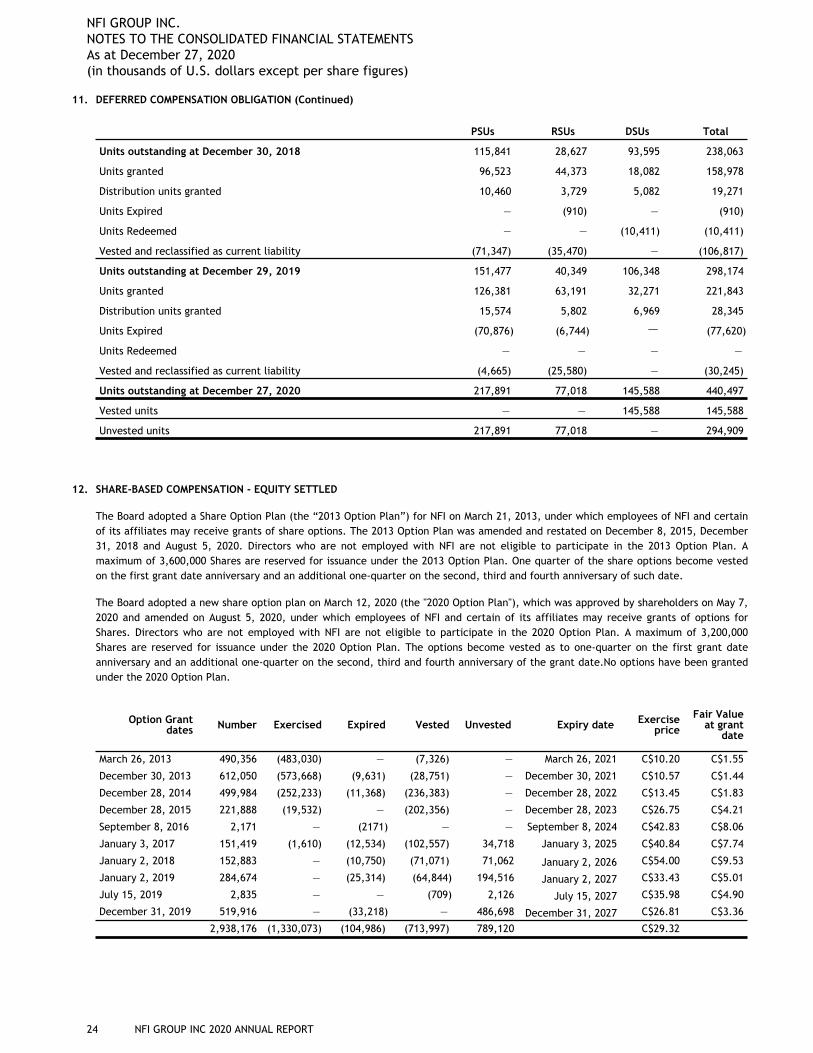
11. DEFERRED COMPENSATION OBLIGATION (Continued)
PSUs RSUs DSUs Total
Units outstanding at December 30, 2018 115,841 28,627 93,595 238,063
Units granted 96,523 44,373 18,082 158,978
Distribution units granted 10,460 3,729 5,082 19,271
Units Expired — (910) — (910)
Units Redeemed — — (10,411) (10,411)
Vested and reclassified as current liability (71,347) (35,470) — (106,817)
Units outstanding at December 29, 2019 151,477 40,349 106,348 298,174
Units granted 126,381 63,191 32,271 221,843
Distribution units granted 15,574 5,802 6,969 28,345
Units Expired (70,876) (6,744) — (77,620)
Units Redeemed — — — —
Vested and reclassified as current liability (4,665) (25,580) — (30,245)
Units outstanding at December 27, 2020 217,891 77,018 145,588 440,497
Vested units — — 145,588 145,588
Unvested units 217,891 77,018 — 294,909
12. SHARE-BASED COMPENSATION - EQUITY SETTLED
The Board adopted a Share Option Plan (the “2013 Option Plan”) for NFI on March 21, 2013, under which employees of NFI and certain of its affiliates may receive grants of share options. The 2013 Option Plan was amended and restated on December 8, 2015, December 31, 2018 and August 5, 2020. Directors who are not employed with NFI are not eligible to participate in the 2013 Option Plan. A maximum of 3,600,000 Shares are reserved for issuance under the 2013 Option Plan. One quarter of the share options become vested on the first grant date anniversary and an additional one-quarter on the second, third and fourth anniversary of such date.
The Board adopted a new share option plan on March 12, 2020 (the "2020 Option Plan"), which was approved by shareholders on May 7, 2020 and amended on August 5, 2020, under which employees of NFI and certain of its affiliates may receive grants of options for Shares. Directors who are not employed with NFI are not eligible to participate in the 2020 Option Plan. A maximum of 3,200,000 Shares are reserved for issuance under the 2020 Option Plan. The options become vested as to one-quarter on the first grant date anniversary and an additional one-quarter on the second, third and fourth anniversary of the grant date.No options have been granted under the 2020 Option Plan.
Option Grant dates Number Exercised Expired Vested Unvested Expiry date Exercise
priceFair Value
at grant date
March 26, 2013 490,356 (483,030) — (7,326) — March 26, 2021 C$10.20 C$1.55
December 30, 2013 612,050 (573,668) (9,631) (28,751) — December 30, 2021 C$10.57 C$1.44
December 28, 2014 499,984 (252,233) (11,368) (236,383) — December 28, 2022 C$13.45 C$1.83
December 28, 2015 221,888 (19,532) — (202,356) — December 28, 2023 C$26.75 C$4.21
September 8, 2016 2,171 — (2171) — — September 8, 2024 C$42.83 C$8.06
January 3, 2017 151,419 (1,610) (12,534) (102,557) 34,718 January 3, 2025 C$40.84 C$7.74
January 2, 2018 152,883 — (10,750) (71,071) 71,062 January 2, 2026 C$54.00 C$9.53
January 2, 2019 284,674 — (25,314) (64,844) 194,516 January 2, 2027 C$33.43 C$5.01
July 15, 2019 2,835 — — (709) 2,126 July 15, 2027 C$35.98 C$4.90
December 31, 2019 519,916 — (33,218) — 486,698 December 31, 2027 C$26.81 C$3.36
2,938,176 (1,330,073) (104,986) (713,997) 789,120 C$29.32
NFI GROUP INC. NOTES TO THE CONSOLIDATED FINANCIAL STATEMENTS As at December 27, 2020(in thousands of U.S. dollars except per share figures)
24 NFI GROUP INC 2020 ANNUAL REPORT
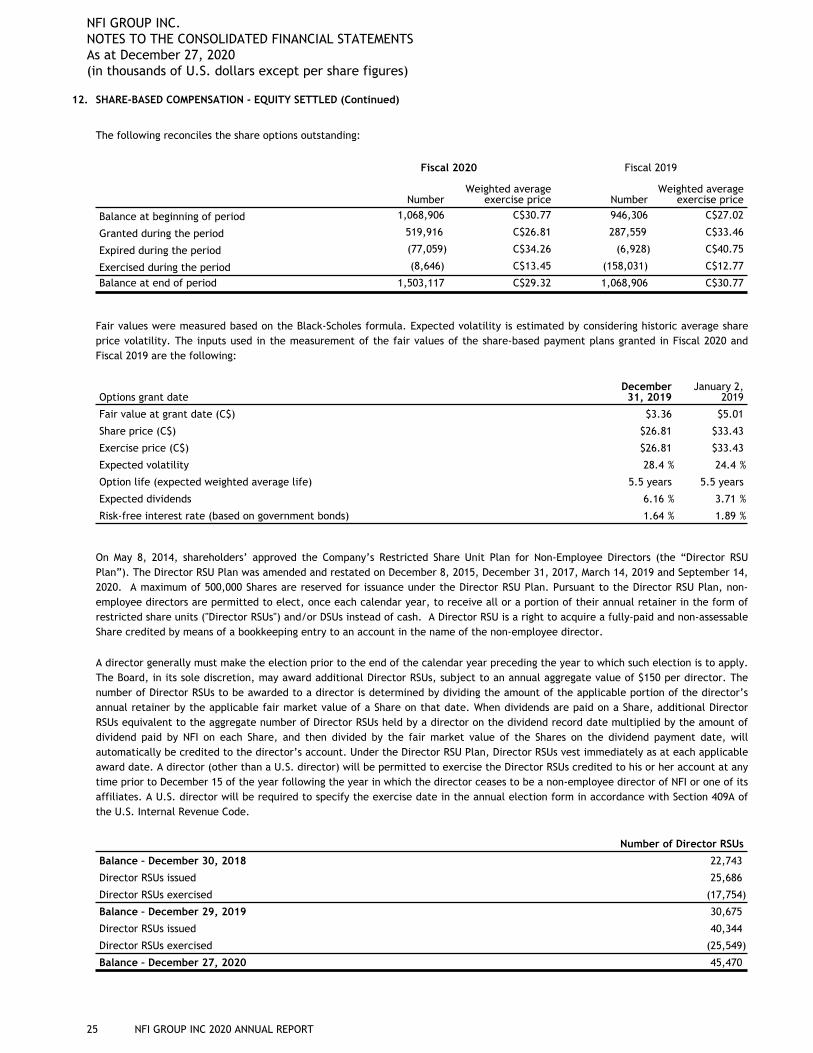
12. SHARE-BASED COMPENSATION - EQUITY SETTLED (Continued)
The following reconciles the share options outstanding:
Fiscal 2020 Fiscal 2019
NumberWeighted average
exercise price NumberWeighted average
exercise price
Balance at beginning of period 1,068,906 C$30.77 946,306 C$27.02
Granted during the period 519,916 C$26.81 287,559 C$33.46
Expired during the period (77,059) C$34.26 (6,928) C$40.75
Exercised during the period (8,646) C$13.45 (158,031) C$12.77
Balance at end of period 1,503,117 C$29.32 1,068,906 C$30.77
Fair values were measured based on the Black-Scholes formula. Expected volatility is estimated by considering historic average share price volatility. The inputs used in the measurement of the fair values of the share-based payment plans granted in Fiscal 2020 and Fiscal 2019 are the following:
Options grant dateDecember 31, 2019
January 2, 2019
Fair value at grant date (C$) $3.36 $5.01
Share price (C$) $26.81 $33.43
Exercise price (C$) $26.81 $33.43
Expected volatility 28.4 % 24.4 %
Option life (expected weighted average life) 5.5 years 5.5 years
Expected dividends 6.16 % 3.71 %
Risk-free interest rate (based on government bonds) 1.64 % 1.89 %
On May 8, 2014, shareholders’ approved the Company’s Restricted Share Unit Plan for Non-Employee Directors (the “Director RSU Plan”). The Director RSU Plan was amended and restated on December 8, 2015, December 31, 2017, March 14, 2019 and September 14, 2020. A maximum of 500,000 Shares are reserved for issuance under the Director RSU Plan. Pursuant to the Director RSU Plan, non-employee directors are permitted to elect, once each calendar year, to receive all or a portion of their annual retainer in the form of restricted share units ("Director RSUs") and/or DSUs instead of cash. A Director RSU is a right to acquire a fully-paid and non-assessable Share credited by means of a bookkeeping entry to an account in the name of the non-employee director.
A director generally must make the election prior to the end of the calendar year preceding the year to which such election is to apply. The Board, in its sole discretion, may award additional Director RSUs, subject to an annual aggregate value of $150 per director. The number of Director RSUs to be awarded to a director is determined by dividing the amount of the applicable portion of the director’s annual retainer by the applicable fair market value of a Share on that date. When dividends are paid on a Share, additional Director RSUs equivalent to the aggregate number of Director RSUs held by a director on the dividend record date multiplied by the amount of dividend paid by NFI on each Share, and then divided by the fair market value of the Shares on the dividend payment date, will automatically be credited to the director’s account. Under the Director RSU Plan, Director RSUs vest immediately as at each applicable award date. A director (other than a U.S. director) will be permitted to exercise the Director RSUs credited to his or her account at any time prior to December 15 of the year following the year in which the director ceases to be a non-employee director of NFI or one of its affiliates. A U.S. director will be required to specify the exercise date in the annual election form in accordance with Section 409A of the U.S. Internal Revenue Code.
Number of Director RSUs
Balance – December 30, 2018 22,743
Director RSUs issued 25,686
Director RSUs exercised (17,754)
Balance – December 29, 2019 30,675
Director RSUs issued 40,344
Director RSUs exercised (25,549)
Balance – December 27, 2020 45,470
NFI GROUP INC. NOTES TO THE CONSOLIDATED FINANCIAL STATEMENTS As at December 27, 2020(in thousands of U.S. dollars except per share figures)
25 NFI GROUP INC 2020 ANNUAL REPORT
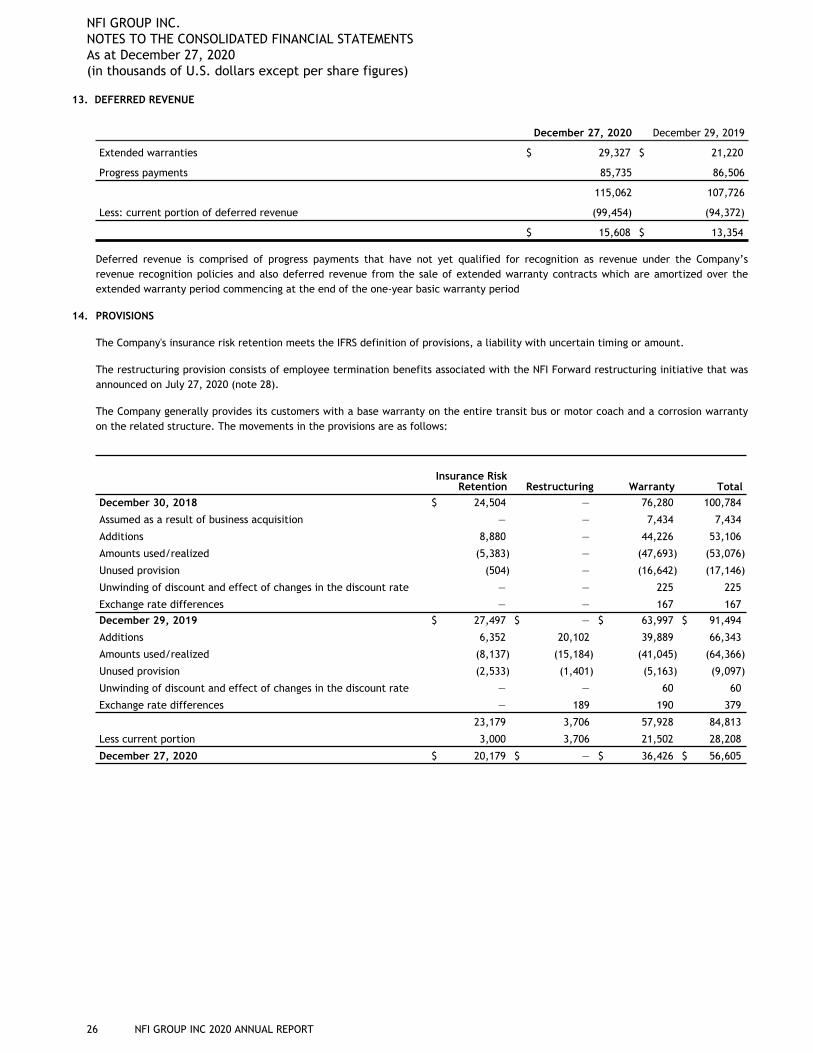
13. DEFERRED REVENUE
December 27, 2020 December 29, 2019
Extended warranties $ 29,327 $ 21,220
Progress payments 85,735 86,506
115,062 107,726
Less: current portion of deferred revenue (99,454) (94,372)
$ 15,608 $ 13,354
Deferred revenue is comprised of progress payments that have not yet qualified for recognition as revenue under the Company’s revenue recognition policies and also deferred revenue from the sale of extended warranty contracts which are amortized over the extended warranty period commencing at the end of the one-year basic warranty period
14. PROVISIONS
The Company's insurance risk retention meets the IFRS definition of provisions, a liability with uncertain timing or amount.
The restructuring provision consists of employee termination benefits associated with the NFI Forward restructuring initiative that was announced on July 27, 2020 (note 28).
The Company generally provides its customers with a base warranty on the entire transit bus or motor coach and a corrosion warranty on the related structure. The movements in the provisions are as follows:
Insurance Risk Retention Restructuring Warranty Total
December 30, 2018 $ 24,504 — 76,280 100,784
Assumed as a result of business acquisition — — 7,434 7,434
Additions 8,880 — 44,226 53,106
Amounts used/realized (5,383) — (47,693) (53,076)
Unused provision (504) — (16,642) (17,146)
Unwinding of discount and effect of changes in the discount rate — — 225 225
Exchange rate differences — — 167 167 December 29, 2019 $ 27,497 $ — $ 63,997 $ 91,494
Additions 6,352 20,102 39,889 66,343
Amounts used/realized (8,137) (15,184) (41,045) (64,366)
Unused provision (2,533) (1,401) (5,163) (9,097)
Unwinding of discount and effect of changes in the discount rate — — 60 60
Exchange rate differences — 189 190 379
23,179 3,706 57,928 84,813
Less current portion 3,000 3,706 21,502 28,208
December 27, 2020 $ 20,179 $ — $ 36,426 $ 56,605
NFI GROUP INC. NOTES TO THE CONSOLIDATED FINANCIAL STATEMENTS As at December 27, 2020(in thousands of U.S. dollars except per share figures)
26 NFI GROUP INC 2020 ANNUAL REPORT
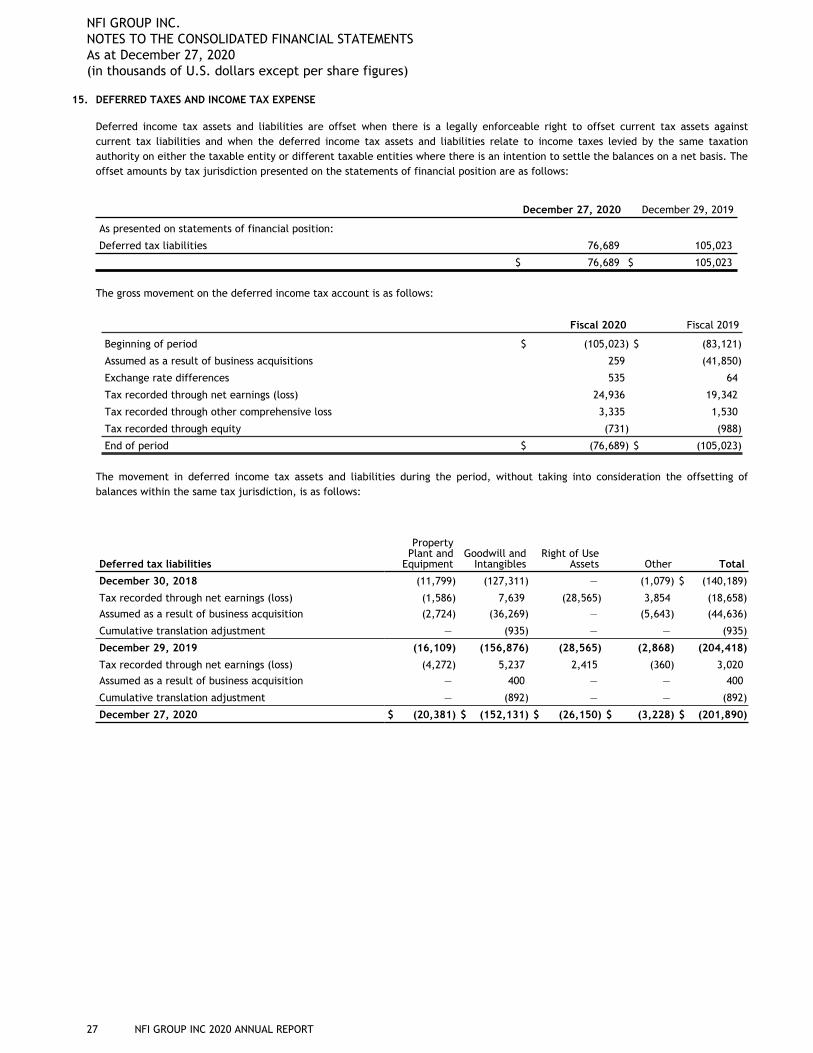
15. DEFERRED TAXES AND INCOME TAX EXPENSE
Deferred income tax assets and liabilities are offset when there is a legally enforceable right to offset current tax assets against current tax liabilities and when the deferred income tax assets and liabilities relate to income taxes levied by the same taxation authority on either the taxable entity or different taxable entities where there is an intention to settle the balances on a net basis. The offset amounts by tax jurisdiction presented on the statements of financial position are as follows:
December 27, 2020 December 29, 2019
As presented on statements of financial position:
Deferred tax liabilities 76,689 105,023
$ 76,689 $ 105,023
The gross movement on the deferred income tax account is as follows:
Fiscal 2020 Fiscal 2019
Beginning of period $ (105,023) $ (83,121)
Assumed as a result of business acquisitions 259 (41,850)
Exchange rate differences 535 64
Tax recorded through net earnings (loss) 24,936 19,342
Tax recorded through other comprehensive loss 3,335 1,530
Tax recorded through equity (731) (988)
End of period $ (76,689) $ (105,023)
The movement in deferred income tax assets and liabilities during the period, without taking into consideration the offsetting of balances within the same tax jurisdiction, is as follows:
Deferred tax liabilities
Property Plant and
EquipmentGoodwill and
IntangiblesRight of Use
Assets Other Total
December 30, 2018 (11,799) (127,311) — (1,079) $ (140,189)
Tax recorded through net earnings (loss) (1,586) 7,639 (28,565) 3,854 (18,658) Assumed as a result of business acquisition (2,724) (36,269) — (5,643) (44,636)
Cumulative translation adjustment — (935) — — (935)
December 29, 2019 (16,109) (156,876) (28,565) (2,868) (204,418)
Tax recorded through net earnings (loss) (4,272) 5,237 2,415 (360) 3,020 Assumed as a result of business acquisition — 400 — — 400
Cumulative translation adjustment — (892) — — (892)
December 27, 2020 $ (20,381) $ (152,131) $ (26,150) $ (3,228) $ (201,890)
NFI GROUP INC. NOTES TO THE CONSOLIDATED FINANCIAL STATEMENTS As at December 27, 2020(in thousands of U.S. dollars except per share figures)
27 NFI GROUP INC 2020 ANNUAL REPORT
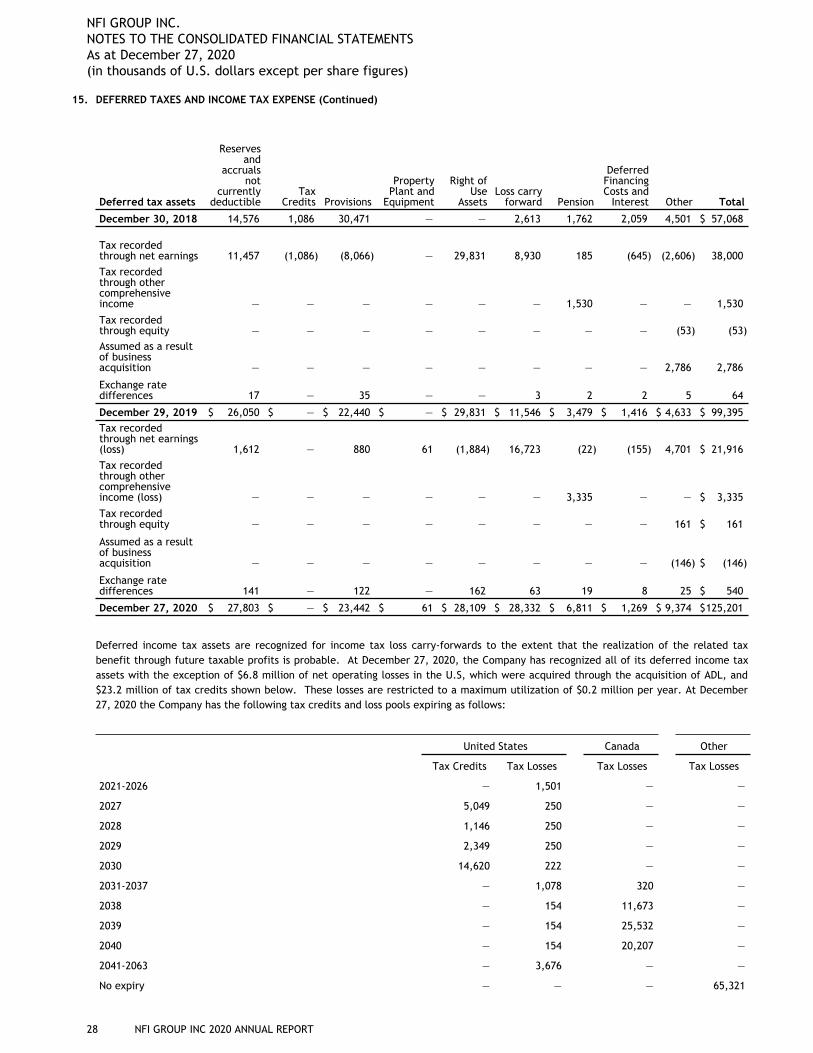
15. DEFERRED TAXES AND INCOME TAX EXPENSE (Continued)
Deferred tax assets
Reserves and
accruals not
currently deductible
Tax Credits Provisions
Property Plant and
Equipment
Right of Use
AssetsLoss carry
forward Pension
Deferred Financing Costs and
Interest Other Total
December 30, 2018 14,576 1,086 30,471 — — 2,613 1,762 2,059 4,501 $ 57,068
Tax recorded through net earnings 11,457 (1,086) (8,066) — 29,831 8,930 185 (645) (2,606) 38,000 Tax recorded through other comprehensive income — — — — — — 1,530 — — 1,530
Tax recorded through equity — — — — — — — — (53) (53) Assumed as a result of business acquisition — — — — — — — — 2,786 2,786
Exchange rate differences 17 — 35 — — 3 2 2 5 64
December 29, 2019 $ 26,050 $ — $ 22,440 $ — $ 29,831 $ 11,546 $ 3,479 $ 1,416 $ 4,633 $ 99,395 Tax recorded through net earnings (loss) 1,612 — 880 61 (1,884) 16,723 (22) (155) 4,701 $ 21,916 Tax recorded through other comprehensive income (loss) — — — — — — 3,335 — — $ 3,335
Tax recorded through equity — — — — — — — — 161 $ 161
Assumed as a result of business acquisition — — — — — — — — (146) $ (146)
Exchange rate differences 141 — 122 — 162 63 19 8 25 $ 540
December 27, 2020 $ 27,803 $ — $ 23,442 $ 61 $ 28,109 $ 28,332 $ 6,811 $ 1,269 $ 9,374 $ 125,201
Deferred income tax assets are recognized for income tax loss carry-forwards to the extent that the realization of the related tax benefit through future taxable profits is probable. At December 27, 2020, the Company has recognized all of its deferred income tax assets with the exception of $6.8 million of net operating losses in the U.S, which were acquired through the acquisition of ADL, and $23.2 million of tax credits shown below. These losses are restricted to a maximum utilization of $0.2 million per year. At December 27, 2020 the Company has the following tax credits and loss pools expiring as follows:
United States Canada Other
Tax Credits Tax Losses Tax Losses Tax Losses
2021-2026 — 1,501 — —
2027 5,049 250 — —
2028 1,146 250 — —
2029 2,349 250 — —
2030 14,620 222 — —
2031-2037 — 1,078 320 —
2038 — 154 11,673 —
2039 — 154 25,532 —
2040 — 154 20,207 —
2041-2063 — 3,676 — —
No expiry — — — 65,321
NFI GROUP INC. NOTES TO THE CONSOLIDATED FINANCIAL STATEMENTS As at December 27, 2020(in thousands of U.S. dollars except per share figures)
28 NFI GROUP INC 2020 ANNUAL REPORT
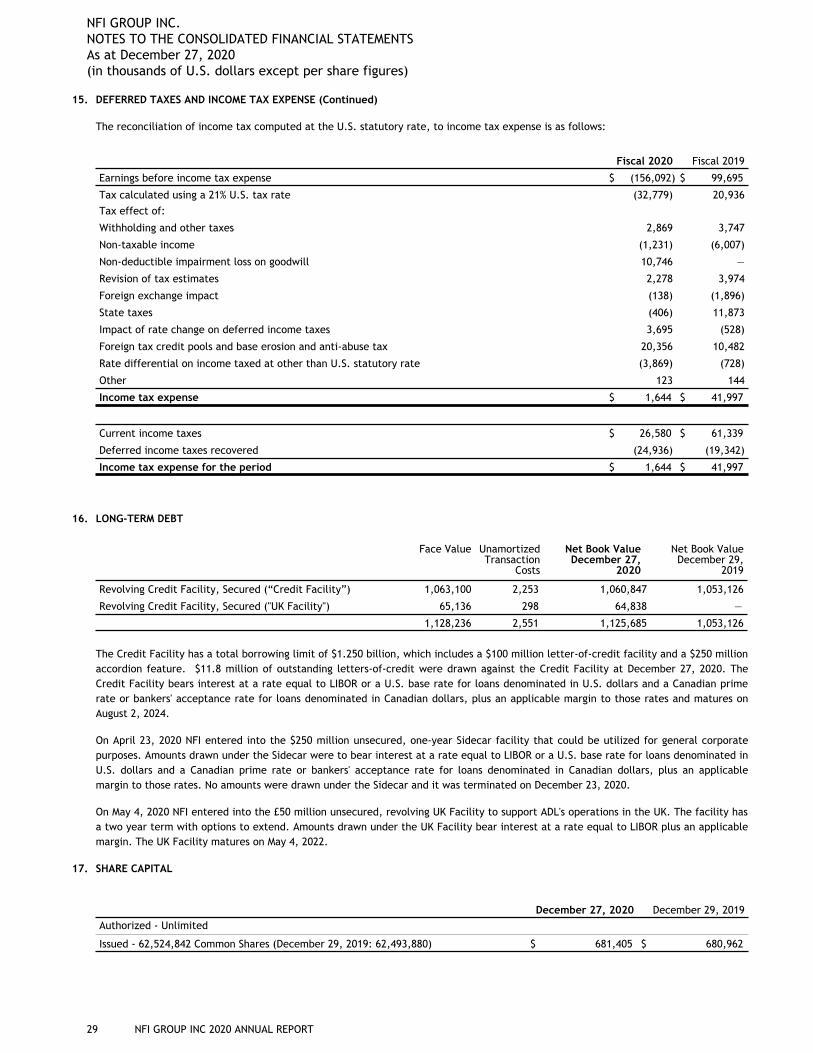
15. DEFERRED TAXES AND INCOME TAX EXPENSE (Continued)
The reconciliation of income tax computed at the U.S. statutory rate, to income tax expense is as follows:
Fiscal 2020 Fiscal 2019
Earnings before income tax expense $ (156,092) $ 99,695
Tax calculated using a 21% U.S. tax rate (32,779) 20,936Tax effect of:
Withholding and other taxes 2,869 3,747
Non-taxable income (1,231) (6,007)
Non-deductible impairment loss on goodwill 10,746 —
Revision of tax estimates 2,278 3,974
Foreign exchange impact (138) (1,896)
State taxes (406) 11,873
Impact of rate change on deferred income taxes 3,695 (528)
Foreign tax credit pools and base erosion and anti-abuse tax 20,356 10,482
Rate differential on income taxed at other than U.S. statutory rate (3,869) (728)
Other 123 144
Income tax expense $ 1,644 $ 41,997
Current income taxes $ 26,580 $ 61,339
Deferred income taxes recovered (24,936) (19,342)
Income tax expense for the period $ 1,644 $ 41,997
16. LONG-TERM DEBT
Face Value Unamortized Transaction
Costs
Net Book ValueDecember 27,
2020
Net Book ValueDecember 29,
2019
Revolving Credit Facility, Secured (“Credit Facility”) 1,063,100 2,253 1,060,847 1,053,126
Revolving Credit Facility, Secured ("UK Facility") 65,136 298 64,838 —
1,128,236 2,551 1,125,685 1,053,126
The Credit Facility has a total borrowing limit of $1.250 billion, which includes a $100 million letter-of-credit facility and a $250 million accordion feature. $11.8 million of outstanding letters-of-credit were drawn against the Credit Facility at December 27, 2020. The Credit Facility bears interest at a rate equal to LIBOR or a U.S. base rate for loans denominated in U.S. dollars and a Canadian prime rate or bankers' acceptance rate for loans denominated in Canadian dollars, plus an applicable margin to those rates and matures on August 2, 2024.
On April 23, 2020 NFI entered into the $250 million unsecured, one-year Sidecar facility that could be utilized for general corporate purposes. Amounts drawn under the Sidecar were to bear interest at a rate equal to LIBOR or a U.S. base rate for loans denominated in U.S. dollars and a Canadian prime rate or bankers' acceptance rate for loans denominated in Canadian dollars, plus an applicable margin to those rates. No amounts were drawn under the Sidecar and it was terminated on December 23, 2020.
On May 4, 2020 NFI entered into the £50 million unsecured, revolving UK Facility to support ADL's operations in the UK. The facility has a two year term with options to extend. Amounts drawn under the UK Facility bear interest at a rate equal to LIBOR plus an applicable margin. The UK Facility matures on May 4, 2022.
17. SHARE CAPITAL
December 27, 2020 December 29, 2019Authorized - Unlimited
Issued - 62,524,842 Common Shares (December 29, 2019: 62,493,880) $ 681,405 $ 680,962
NFI GROUP INC. NOTES TO THE CONSOLIDATED FINANCIAL STATEMENTS As at December 27, 2020(in thousands of U.S. dollars except per share figures)
29 NFI GROUP INC 2020 ANNUAL REPORT
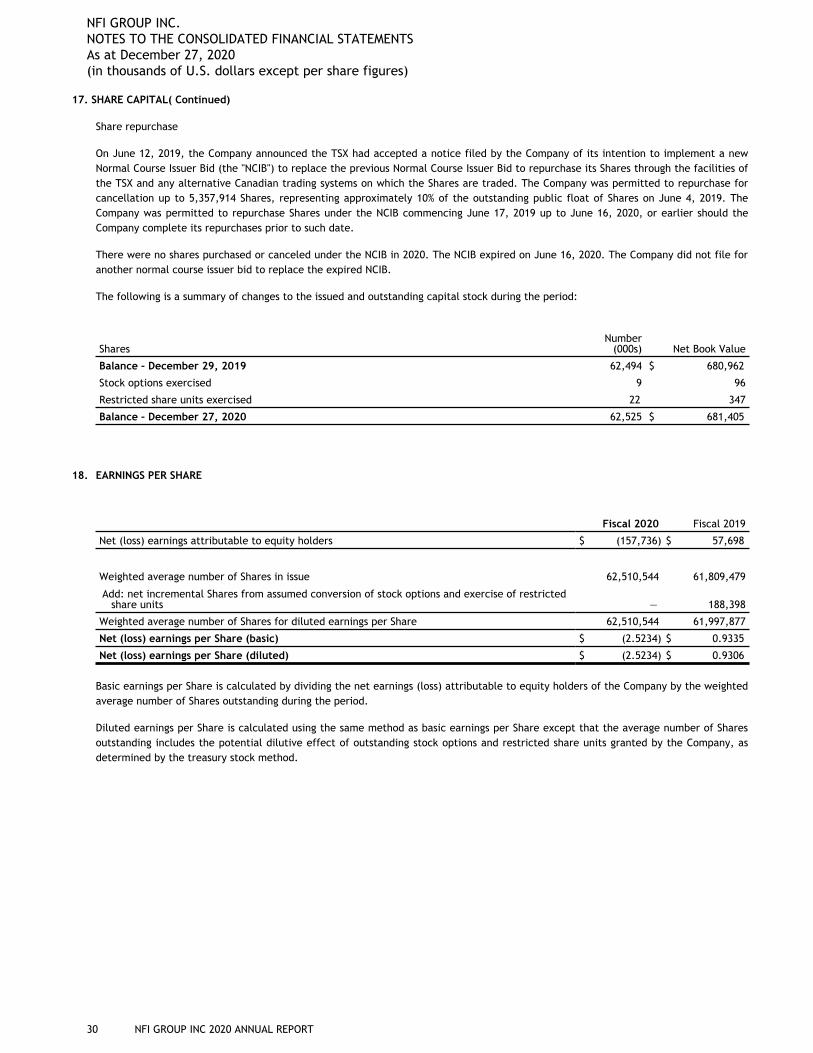
17. SHARE CAPITAL( Continued)
Share repurchase
On June 12, 2019, the Company announced the TSX had accepted a notice filed by the Company of its intention to implement a new Normal Course Issuer Bid (the "NCIB") to replace the previous Normal Course Issuer Bid to repurchase its Shares through the facilities of the TSX and any alternative Canadian trading systems on which the Shares are traded. The Company was permitted to repurchase for cancellation up to 5,357,914 Shares, representing approximately 10% of the outstanding public float of Shares on June 4, 2019. The Company was permitted to repurchase Shares under the NCIB commencing June 17, 2019 up to June 16, 2020, or earlier should the Company complete its repurchases prior to such date.
There were no shares purchased or canceled under the NCIB in 2020. The NCIB expired on June 16, 2020. The Company did not file for another normal course issuer bid to replace the expired NCIB.
The following is a summary of changes to the issued and outstanding capital stock during the period:
SharesNumber
(000s) Net Book Value
Balance – December 29, 2019 62,494 $ 680,962
Stock options exercised 9 96
Restricted share units exercised 22 347
Balance – December 27, 2020 62,525 $ 681,405
18. EARNINGS PER SHARE
Fiscal 2020 Fiscal 2019
Net (loss) earnings attributable to equity holders $ (157,736) $ 57,698
Weighted average number of Shares in issue 62,510,544 61,809,479
Add: net incremental Shares from assumed conversion of stock options and exercise of restricted share units — 188,398
Weighted average number of Shares for diluted earnings per Share 62,510,544 61,997,877
Net (loss) earnings per Share (basic) $ (2.5234) $ 0.9335
Net (loss) earnings per Share (diluted) $ (2.5234) $ 0.9306
Basic earnings per Share is calculated by dividing the net earnings (loss) attributable to equity holders of the Company by the weighted average number of Shares outstanding during the period.
Diluted earnings per Share is calculated using the same method as basic earnings per Share except that the average number of Shares outstanding includes the potential dilutive effect of outstanding stock options and restricted share units granted by the Company, as determined by the treasury stock method.
NFI GROUP INC. NOTES TO THE CONSOLIDATED FINANCIAL STATEMENTS As at December 27, 2020(in thousands of U.S. dollars except per share figures)
30 NFI GROUP INC 2020 ANNUAL REPORT
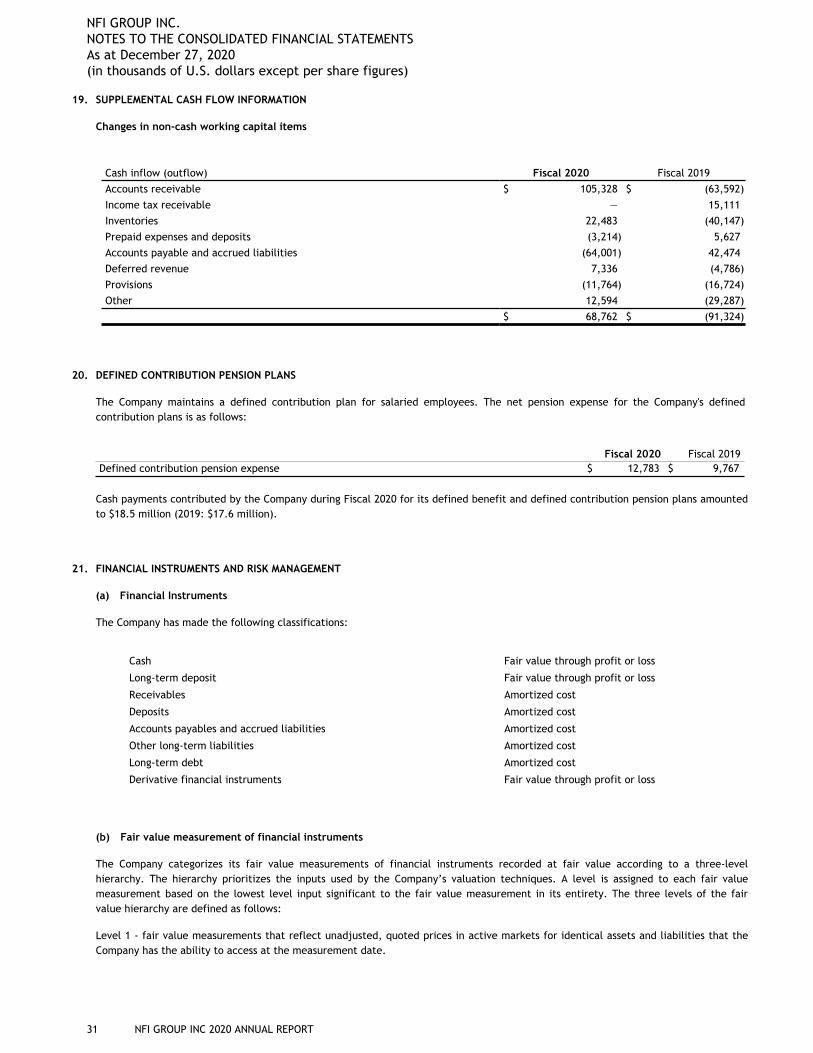
19. SUPPLEMENTAL CASH FLOW INFORMATION
Changes in non-cash working capital items
Cash inflow (outflow) Fiscal 2020 Fiscal 2019Accounts receivable $ 105,328 $ (63,592) Income tax receivable — 15,111 Inventories 22,483 (40,147) Prepaid expenses and deposits (3,214) 5,627 Accounts payable and accrued liabilities (64,001) 42,474 Deferred revenue 7,336 (4,786) Provisions (11,764) (16,724) Other 12,594 (29,287)
$ 68,762 $ (91,324)
20. DEFINED CONTRIBUTION PENSION PLANS
The Company maintains a defined contribution plan for salaried employees. The net pension expense for the Company's defined contribution plans is as follows:
Fiscal 2020 Fiscal 2019Defined contribution pension expense $ 12,783 $ 9,767
Cash payments contributed by the Company during Fiscal 2020 for its defined benefit and defined contribution pension plans amounted to $18.5 million (2019: $17.6 million).
21. FINANCIAL INSTRUMENTS AND RISK MANAGEMENT
(a) Financial Instruments
The Company has made the following classifications:
Cash Fair value through profit or loss
Long-term deposit Fair value through profit or loss
Receivables Amortized cost
Deposits Amortized cost
Accounts payables and accrued liabilities Amortized cost
Other long-term liabilities Amortized cost
Long-term debt Amortized cost
Derivative financial instruments Fair value through profit or loss
(b) Fair value measurement of financial instruments
The Company categorizes its fair value measurements of financial instruments recorded at fair value according to a three-level hierarchy. The hierarchy prioritizes the inputs used by the Company’s valuation techniques. A level is assigned to each fair value measurement based on the lowest level input significant to the fair value measurement in its entirety. The three levels of the fair value hierarchy are defined as follows:
Level 1 - fair value measurements that reflect unadjusted, quoted prices in active markets for identical assets and liabilities that the Company has the ability to access at the measurement date.
NFI GROUP INC. NOTES TO THE CONSOLIDATED FINANCIAL STATEMENTS As at December 27, 2020(in thousands of U.S. dollars except per share figures)
31 NFI GROUP INC 2020 ANNUAL REPORT
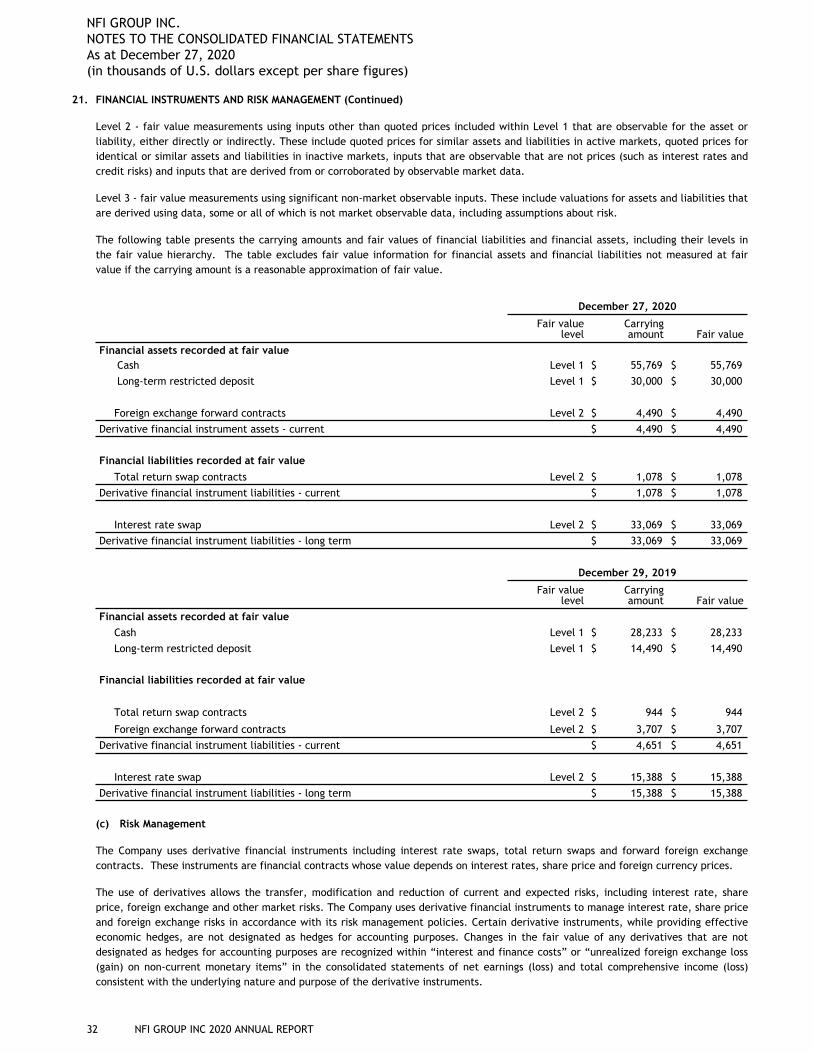
21. FINANCIAL INSTRUMENTS AND RISK MANAGEMENT (Continued)
Level 2 - fair value measurements using inputs other than quoted prices included within Level 1 that are observable for the asset or liability, either directly or indirectly. These include quoted prices for similar assets and liabilities in active markets, quoted prices for identical or similar assets and liabilities in inactive markets, inputs that are observable that are not prices (such as interest rates and credit risks) and inputs that are derived from or corroborated by observable market data.
Level 3 - fair value measurements using significant non-market observable inputs. These include valuations for assets and liabilities that are derived using data, some or all of which is not market observable data, including assumptions about risk.
The following table presents the carrying amounts and fair values of financial liabilities and financial assets, including their levels in the fair value hierarchy. The table excludes fair value information for financial assets and financial liabilities not measured at fair value if the carrying amount is a reasonable approximation of fair value.
December 27, 2020
Fair value level
Carrying amount Fair value
Financial assets recorded at fair valueCash Level 1 $ 55,769 $ 55,769 Long-term restricted deposit Level 1 $ 30,000 $ 30,000
Foreign exchange forward contracts Level 2 $ 4,490 $ 4,490 Derivative financial instrument assets - current $ 4,490 $ 4,490
Financial liabilities recorded at fair valueTotal return swap contracts Level 2 $ 1,078 $ 1,078
Derivative financial instrument liabilities - current $ 1,078 $ 1,078
Interest rate swap Level 2 $ 33,069 $ 33,069 Derivative financial instrument liabilities - long term $ 33,069 $ 33,069
December 29, 2019
Fair value level
Carrying amount Fair value
Financial assets recorded at fair valueCash Level 1 $ 28,233 $ 28,233 Long-term restricted deposit Level 1 $ 14,490 $ 14,490
Financial liabilities recorded at fair value
Total return swap contracts Level 2 $ 944 $ 944
Foreign exchange forward contracts Level 2 $ 3,707 $ 3,707 Derivative financial instrument liabilities - current $ 4,651 $ 4,651
Interest rate swap Level 2 $ 15,388 $ 15,388 Derivative financial instrument liabilities - long term $ 15,388 $ 15,388
(c) Risk Management
The Company uses derivative financial instruments including interest rate swaps, total return swaps and forward foreign exchange contracts. These instruments are financial contracts whose value depends on interest rates, share price and foreign currency prices.
The use of derivatives allows the transfer, modification and reduction of current and expected risks, including interest rate, share price, foreign exchange and other market risks. The Company uses derivative financial instruments to manage interest rate, share price and foreign exchange risks in accordance with its risk management policies. Certain derivative instruments, while providing effective economic hedges, are not designated as hedges for accounting purposes. Changes in the fair value of any derivatives that are not designated as hedges for accounting purposes are recognized within “interest and finance costs” or “unrealized foreign exchange loss (gain) on non-current monetary items” in the consolidated statements of net earnings (loss) and total comprehensive income (loss) consistent with the underlying nature and purpose of the derivative instruments.
NFI GROUP INC. NOTES TO THE CONSOLIDATED FINANCIAL STATEMENTS As at December 27, 2020(in thousands of U.S. dollars except per share figures)
32 NFI GROUP INC 2020 ANNUAL REPORT
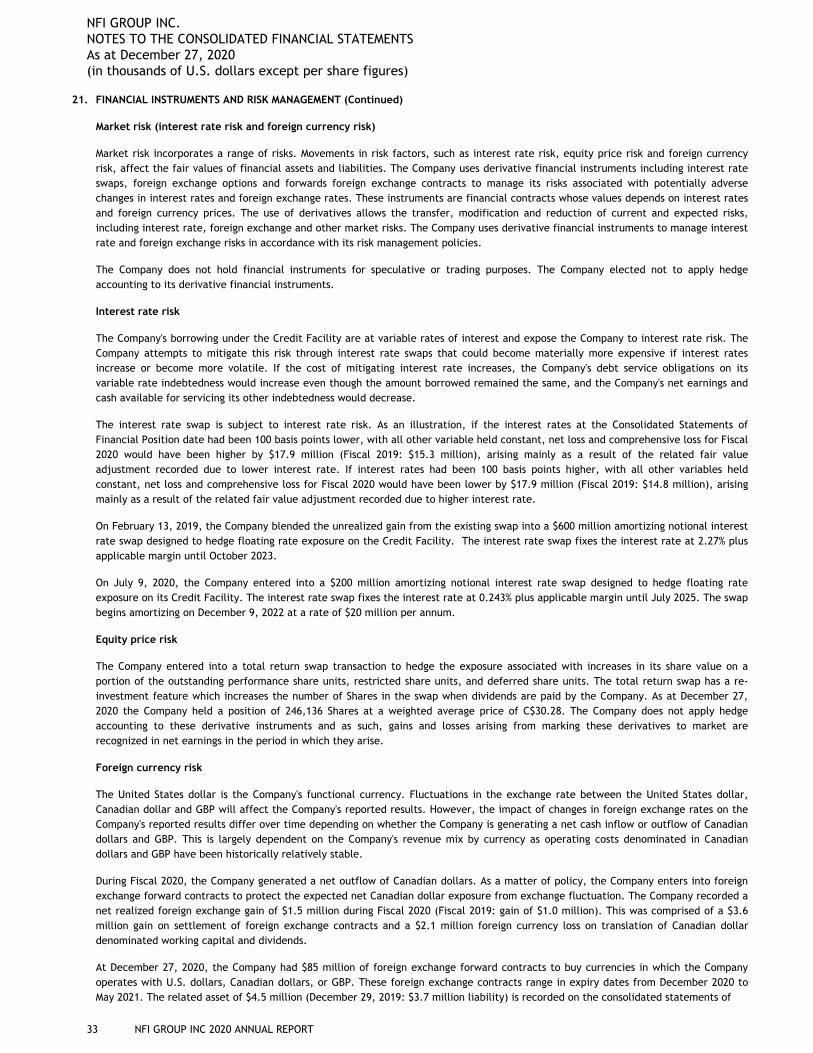
21. FINANCIAL INSTRUMENTS AND RISK MANAGEMENT (Continued)
Market risk (interest rate risk and foreign currency risk)
Market risk incorporates a range of risks. Movements in risk factors, such as interest rate risk, equity price risk and foreign currency risk, affect the fair values of financial assets and liabilities. The Company uses derivative financial instruments including interest rate swaps, foreign exchange options and forwards foreign exchange contracts to manage its risks associated with potentially adverse changes in interest rates and foreign exchange rates. These instruments are financial contracts whose values depends on interest rates and foreign currency prices. The use of derivatives allows the transfer, modification and reduction of current and expected risks, including interest rate, foreign exchange and other market risks. The Company uses derivative financial instruments to manage interest rate and foreign exchange risks in accordance with its risk management policies.
The Company does not hold financial instruments for speculative or trading purposes. The Company elected not to apply hedge accounting to its derivative financial instruments.
Interest rate risk
The Company's borrowing under the Credit Facility are at variable rates of interest and expose the Company to interest rate risk. The Company attempts to mitigate this risk through interest rate swaps that could become materially more expensive if interest rates increase or become more volatile. If the cost of mitigating interest rate increases, the Company's debt service obligations on its variable rate indebtedness would increase even though the amount borrowed remained the same, and the Company's net earnings and cash available for servicing its other indebtedness would decrease.
The interest rate swap is subject to interest rate risk. As an illustration, if the interest rates at the Consolidated Statements of Financial Position date had been 100 basis points lower, with all other variable held constant, net loss and comprehensive loss for Fiscal 2020 would have been higher by $17.9 million (Fiscal 2019: $15.3 million), arising mainly as a result of the related fair value adjustment recorded due to lower interest rate. If interest rates had been 100 basis points higher, with all other variables held constant, net loss and comprehensive loss for Fiscal 2020 would have been lower by $17.9 million (Fiscal 2019: $14.8 million), arising mainly as a result of the related fair value adjustment recorded due to higher interest rate.
On February 13, 2019, the Company blended the unrealized gain from the existing swap into a $600 million amortizing notional interest rate swap designed to hedge floating rate exposure on the Credit Facility. The interest rate swap fixes the interest rate at 2.27% plus applicable margin until October 2023.
On July 9, 2020, the Company entered into a $200 million amortizing notional interest rate swap designed to hedge floating rate exposure on its Credit Facility. The interest rate swap fixes the interest rate at 0.243% plus applicable margin until July 2025. The swap begins amortizing on December 9, 2022 at a rate of $20 million per annum.
Equity price risk
The Company entered into a total return swap transaction to hedge the exposure associated with increases in its share value on a portion of the outstanding performance share units, restricted share units, and deferred share units. The total return swap has a re-investment feature which increases the number of Shares in the swap when dividends are paid by the Company. As at December 27, 2020 the Company held a position of 246,136 Shares at a weighted average price of C$30.28. The Company does not apply hedge accounting to these derivative instruments and as such, gains and losses arising from marking these derivatives to market are recognized in net earnings in the period in which they arise.
Foreign currency risk
The United States dollar is the Company's functional currency. Fluctuations in the exchange rate between the United States dollar, Canadian dollar and GBP will affect the Company's reported results. However, the impact of changes in foreign exchange rates on the Company's reported results differ over time depending on whether the Company is generating a net cash inflow or outflow of Canadian dollars and GBP. This is largely dependent on the Company's revenue mix by currency as operating costs denominated in Canadian dollars and GBP have been historically relatively stable.
During Fiscal 2020, the Company generated a net outflow of Canadian dollars. As a matter of policy, the Company enters into foreign exchange forward contracts to protect the expected net Canadian dollar exposure from exchange fluctuation. The Company recorded a net realized foreign exchange gain of $1.5 million during Fiscal 2020 (Fiscal 2019: gain of $1.0 million). This was comprised of a $3.6 million gain on settlement of foreign exchange contracts and a $2.1 million foreign currency loss on translation of Canadian dollar denominated working capital and dividends.
At December 27, 2020, the Company had $85 million of foreign exchange forward contracts to buy currencies in which the Company operates with U.S. dollars, Canadian dollars, or GBP. These foreign exchange contracts range in expiry dates from December 2020 to May 2021. The related asset of $4.5 million (December 29, 2019: $3.7 million liability) is recorded on the consolidated statements of
NFI GROUP INC. NOTES TO THE CONSOLIDATED FINANCIAL STATEMENTS As at December 27, 2020(in thousands of U.S. dollars except per share figures)
33 NFI GROUP INC 2020 ANNUAL REPORT
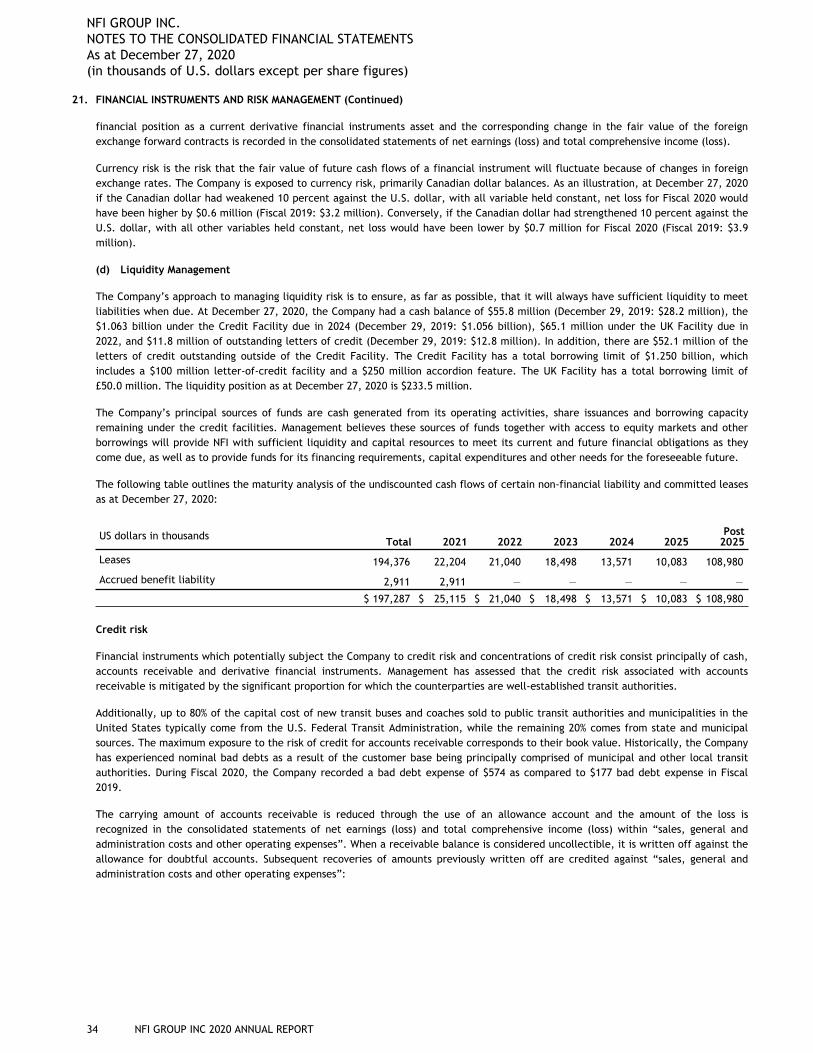
21. FINANCIAL INSTRUMENTS AND RISK MANAGEMENT (Continued)
financial position as a current derivative financial instruments asset and the corresponding change in the fair value of the foreign exchange forward contracts is recorded in the consolidated statements of net earnings (loss) and total comprehensive income (loss).
Currency risk is the risk that the fair value of future cash flows of a financial instrument will fluctuate because of changes in foreign exchange rates. The Company is exposed to currency risk, primarily Canadian dollar balances. As an illustration, at December 27, 2020 if the Canadian dollar had weakened 10 percent against the U.S. dollar, with all variable held constant, net loss for Fiscal 2020 would have been higher by $0.6 million (Fiscal 2019: $3.2 million). Conversely, if the Canadian dollar had strengthened 10 percent against the U.S. dollar, with all other variables held constant, net loss would have been lower by $0.7 million for Fiscal 2020 (Fiscal 2019: $3.9 million).
(d) Liquidity Management
The Company’s approach to managing liquidity risk is to ensure, as far as possible, that it will always have sufficient liquidity to meet liabilities when due. At December 27, 2020, the Company had a cash balance of $55.8 million (December 29, 2019: $28.2 million), the $1.063 billion under the Credit Facility due in 2024 (December 29, 2019: $1.056 billion), $65.1 million under the UK Facility due in 2022, and $11.8 million of outstanding letters of credit (December 29, 2019: $12.8 million). In addition, there are $52.1 million of the letters of credit outstanding outside of the Credit Facility. The Credit Facility has a total borrowing limit of $1.250 billion, which includes a $100 million letter-of-credit facility and a $250 million accordion feature. The UK Facility has a total borrowing limit of £50.0 million. The liquidity position as at December 27, 2020 is $233.5 million.
The Company’s principal sources of funds are cash generated from its operating activities, share issuances and borrowing capacity remaining under the credit facilities. Management believes these sources of funds together with access to equity markets and other borrowings will provide NFI with sufficient liquidity and capital resources to meet its current and future financial obligations as they come due, as well as to provide funds for its financing requirements, capital expenditures and other needs for the foreseeable future.
The following table outlines the maturity analysis of the undiscounted cash flows of certain non-financial liability and committed leases as at December 27, 2020:
US dollars in thousands Total 2021 2022 2023 2024 2025Post
2025
Leases 194,376 22,204 21,040 18,498 13,571 10,083 108,980
Accrued benefit liability 2,911 2,911 — — — — —
$ 197,287 $ 25,115 $ 21,040 $ 18,498 $ 13,571 $ 10,083 $ 108,980
Credit risk
Financial instruments which potentially subject the Company to credit risk and concentrations of credit risk consist principally of cash, accounts receivable and derivative financial instruments. Management has assessed that the credit risk associated with accounts receivable is mitigated by the significant proportion for which the counterparties are well-established transit authorities.
Additionally, up to 80% of the capital cost of new transit buses and coaches sold to public transit authorities and municipalities in the United States typically come from the U.S. Federal Transit Administration, while the remaining 20% comes from state and municipal sources. The maximum exposure to the risk of credit for accounts receivable corresponds to their book value. Historically, the Company has experienced nominal bad debts as a result of the customer base being principally comprised of municipal and other local transit authorities. During Fiscal 2020, the Company recorded a bad debt expense of $574 as compared to $177 bad debt expense in Fiscal 2019.
The carrying amount of accounts receivable is reduced through the use of an allowance account and the amount of the loss is recognized in the consolidated statements of net earnings (loss) and total comprehensive income (loss) within “sales, general and administration costs and other operating expenses”. When a receivable balance is considered uncollectible, it is written off against the allowance for doubtful accounts. Subsequent recoveries of amounts previously written off are credited against “sales, general and administration costs and other operating expenses”:
NFI GROUP INC. NOTES TO THE CONSOLIDATED FINANCIAL STATEMENTS As at December 27, 2020(in thousands of U.S. dollars except per share figures)
34 NFI GROUP INC 2020 ANNUAL REPORT
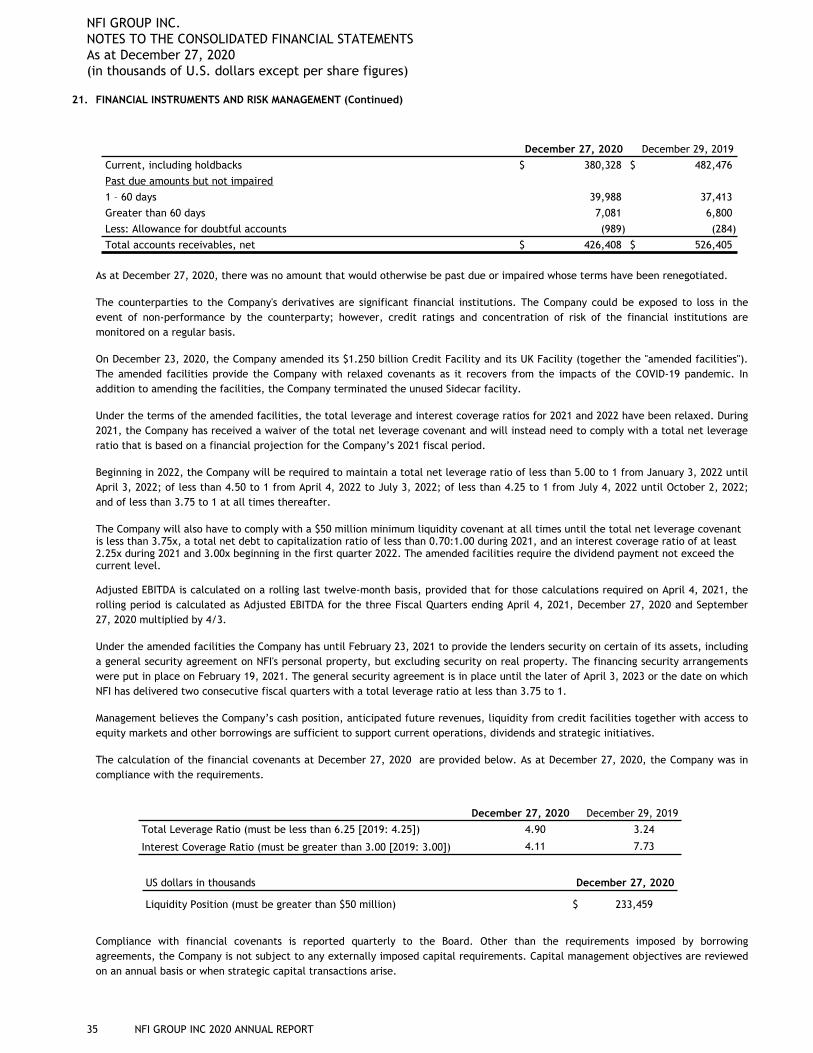
21. FINANCIAL INSTRUMENTS AND RISK MANAGEMENT (Continued)
December 27, 2020 December 29, 2019Current, including holdbacks $ 380,328 $ 482,476 Past due amounts but not impaired1 – 60 days 39,988 37,413 Greater than 60 days 7,081 6,800 Less: Allowance for doubtful accounts (989) (284) Total accounts receivables, net $ 426,408 $ 526,405
As at December 27, 2020, there was no amount that would otherwise be past due or impaired whose terms have been renegotiated.
The counterparties to the Company's derivatives are significant financial institutions. The Company could be exposed to loss in the event of non-performance by the counterparty; however, credit ratings and concentration of risk of the financial institutions are monitored on a regular basis.
On December 23, 2020, the Company amended its $1.250 billion Credit Facility and its UK Facility (together the "amended facilities"). The amended facilities provide the Company with relaxed covenants as it recovers from the impacts of the COVID-19 pandemic. In addition to amending the facilities, the Company terminated the unused Sidecar facility.
Under the terms of the amended facilities, the total leverage and interest coverage ratios for 2021 and 2022 have been relaxed. During 2021, the Company has received a waiver of the total net leverage covenant and will instead need to comply with a total net leverage ratio that is based on a financial projection for the Company’s 2021 fiscal period.
Beginning in 2022, the Company will be required to maintain a total net leverage ratio of less than 5.00 to 1 from January 3, 2022 until April 3, 2022; of less than 4.50 to 1 from April 4, 2022 to July 3, 2022; of less than 4.25 to 1 from July 4, 2022 until October 2, 2022; and of less than 3.75 to 1 at all times thereafter.
The Company will also have to comply with a $50 million minimum liquidity covenant at all times until the total net leverage covenant is less than 3.75x, a total net debt to capitalization ratio of less than 0.70:1.00 during 2021, and an interest coverage ratio of at least 2.25x during 2021 and 3.00x beginning in the first quarter 2022. The amended facilities require the dividend payment not exceed the current level.
Adjusted EBITDA is calculated on a rolling last twelve-month basis, provided that for those calculations required on April 4, 2021, the rolling period is calculated as Adjusted EBITDA for the three Fiscal Quarters ending April 4, 2021, December 27, 2020 and September 27, 2020 multiplied by 4/3.
Under the amended facilities the Company has until February 23, 2021 to provide the lenders security on certain of its assets, including a general security agreement on NFI's personal property, but excluding security on real property. The financing security arrangements were put in place on February 19, 2021. The general security agreement is in place until the later of April 3, 2023 or the date on which NFI has delivered two consecutive fiscal quarters with a total leverage ratio at less than 3.75 to 1.
Management believes the Company’s cash position, anticipated future revenues, liquidity from credit facilities together with access to equity markets and other borrowings are sufficient to support current operations, dividends and strategic initiatives.
The calculation of the financial covenants at December 27, 2020 are provided below. As at December 27, 2020, the Company was in compliance with the requirements.
December 27, 2020 December 29, 2019
Total Leverage Ratio (must be less than 6.25 [2019: 4.25]) 4.90 3.24
Interest Coverage Ratio (must be greater than 3.00 [2019: 3.00]) 4.11 7.73
US dollars in thousands December 27, 2020
Liquidity Position (must be greater than $50 million) $ 233,459
Compliance with financial covenants is reported quarterly to the Board. Other than the requirements imposed by borrowing agreements, the Company is not subject to any externally imposed capital requirements. Capital management objectives are reviewed on an annual basis or when strategic capital transactions arise.
NFI GROUP INC. NOTES TO THE CONSOLIDATED FINANCIAL STATEMENTS As at December 27, 2020(in thousands of U.S. dollars except per share figures)
35 NFI GROUP INC 2020 ANNUAL REPORT
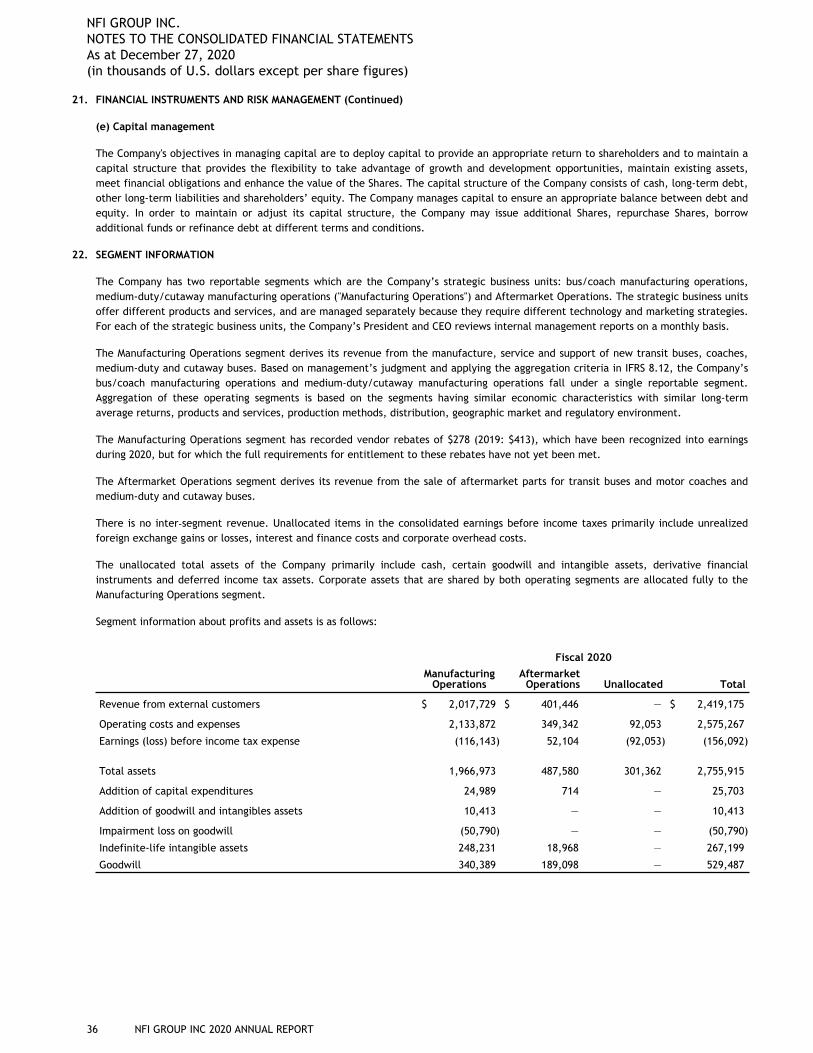
21. FINANCIAL INSTRUMENTS AND RISK MANAGEMENT (Continued)
(e) Capital management
The Company's objectives in managing capital are to deploy capital to provide an appropriate return to shareholders and to maintain a capital structure that provides the flexibility to take advantage of growth and development opportunities, maintain existing assets, meet financial obligations and enhance the value of the Shares. The capital structure of the Company consists of cash, long-term debt, other long-term liabilities and shareholders’ equity. The Company manages capital to ensure an appropriate balance between debt and equity. In order to maintain or adjust its capital structure, the Company may issue additional Shares, repurchase Shares, borrow additional funds or refinance debt at different terms and conditions.
22. SEGMENT INFORMATION
The Company has two reportable segments which are the Company’s strategic business units: bus/coach manufacturing operations, medium-duty/cutaway manufacturing operations ("Manufacturing Operations") and Aftermarket Operations. The strategic business units offer different products and services, and are managed separately because they require different technology and marketing strategies. For each of the strategic business units, the Company’s President and CEO reviews internal management reports on a monthly basis.
The Manufacturing Operations segment derives its revenue from the manufacture, service and support of new transit buses, coaches, medium-duty and cutaway buses. Based on management’s judgment and applying the aggregation criteria in IFRS 8.12, the Company’s bus/coach manufacturing operations and medium-duty/cutaway manufacturing operations fall under a single reportable segment. Aggregation of these operating segments is based on the segments having similar economic characteristics with similar long-term average returns, products and services, production methods, distribution, geographic market and regulatory environment.
The Manufacturing Operations segment has recorded vendor rebates of $278 (2019: $413), which have been recognized into earnings during 2020, but for which the full requirements for entitlement to these rebates have not yet been met.
The Aftermarket Operations segment derives its revenue from the sale of aftermarket parts for transit buses and motor coaches and medium-duty and cutaway buses.
There is no inter‑segment revenue. Unallocated items in the consolidated earnings before income taxes primarily include unrealized foreign exchange gains or losses, interest and finance costs and corporate overhead costs.
The unallocated total assets of the Company primarily include cash, certain goodwill and intangible assets, derivative financial instruments and deferred income tax assets. Corporate assets that are shared by both operating segments are allocated fully to the Manufacturing Operations segment.
Segment information about profits and assets is as follows:
Fiscal 2020Manufacturing
OperationsAftermarket
Operations Unallocated Total
Revenue from external customers $ 2,017,729 $ 401,446 — $ 2,419,175
Operating costs and expenses 2,133,872 349,342 92,053 2,575,267
Earnings (loss) before income tax expense (116,143) 52,104 (92,053) (156,092)
Total assets 1,966,973 487,580 301,362 2,755,915
Addition of capital expenditures 24,989 714 — 25,703
Addition of goodwill and intangibles assets 10,413 — — 10,413
Impairment loss on goodwill (50,790) — — (50,790)
Indefinite-life intangible assets 248,231 18,968 — 267,199
Goodwill 340,389 189,098 — 529,487
NFI GROUP INC. NOTES TO THE CONSOLIDATED FINANCIAL STATEMENTS As at December 27, 2020(in thousands of U.S. dollars except per share figures)
36 NFI GROUP INC 2020 ANNUAL REPORT
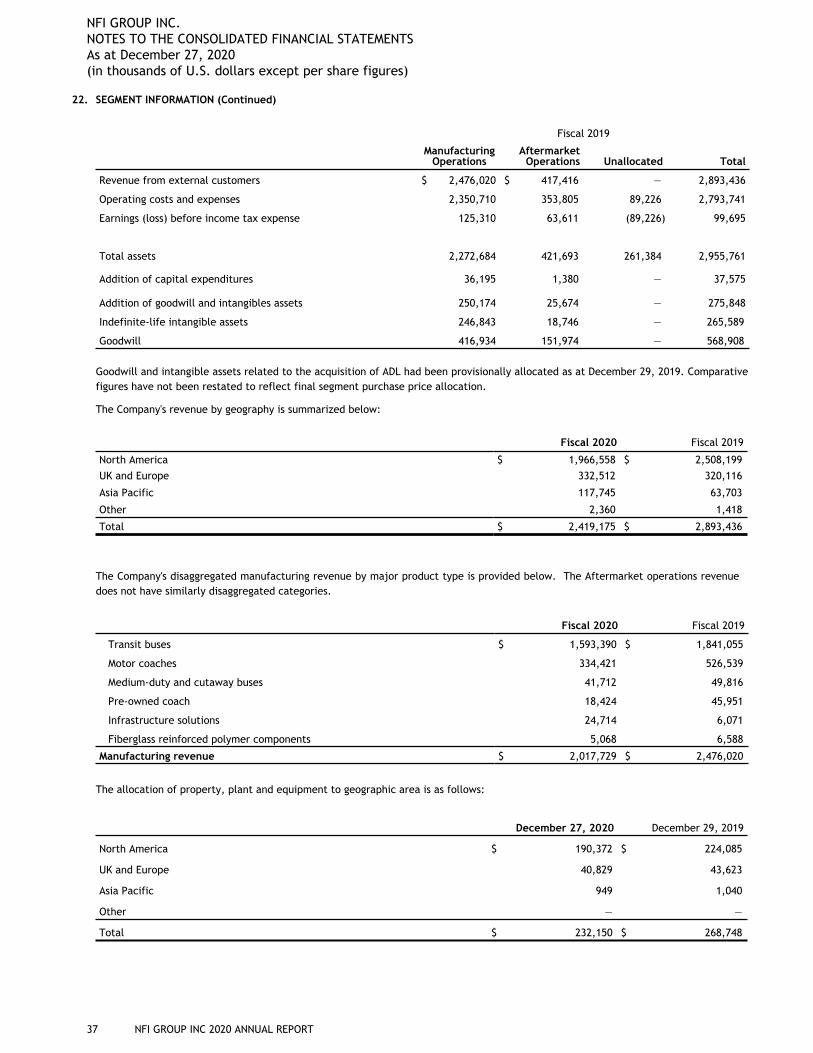
22. SEGMENT INFORMATION (Continued)
Fiscal 2019
Manufacturing Operations
Aftermarket Operations Unallocated Total
Revenue from external customers $ 2,476,020 $ 417,416 — 2,893,436
Operating costs and expenses 2,350,710 353,805 89,226 2,793,741
Earnings (loss) before income tax expense 125,310 63,611 (89,226) 99,695
Total assets 2,272,684 421,693 261,384 2,955,761
Addition of capital expenditures 36,195 1,380 — 37,575
Addition of goodwill and intangibles assets 250,174 25,674 — 275,848
Indefinite-life intangible assets 246,843 18,746 — 265,589
Goodwill 416,934 151,974 — 568,908
Goodwill and intangible assets related to the acquisition of ADL had been provisionally allocated as at December 29, 2019. Comparative figures have not been restated to reflect final segment purchase price allocation.
The Company's revenue by geography is summarized below:
Fiscal 2020 Fiscal 2019
North America $ 1,966,558 $ 2,508,199 UK and Europe 332,512 320,116
Asia Pacific 117,745 63,703
Other 2,360 1,418
Total $ 2,419,175 $ 2,893,436
The Company's disaggregated manufacturing revenue by major product type is provided below. The Aftermarket operations revenue does not have similarly disaggregated categories.
Fiscal 2020 Fiscal 2019
Transit buses $ 1,593,390 $ 1,841,055
Motor coaches 334,421 526,539
Medium-duty and cutaway buses 41,712 49,816
Pre-owned coach 18,424 45,951
Infrastructure solutions 24,714 6,071
Fiberglass reinforced polymer components 5,068 6,588
Manufacturing revenue $ 2,017,729 $ 2,476,020
The allocation of property, plant and equipment to geographic area is as follows:
December 27, 2020 December 29, 2019
North America $ 190,372 $ 224,085
UK and Europe 40,829 43,623
Asia Pacific 949 1,040
Other — —
Total $ 232,150 $ 268,748
NFI GROUP INC. NOTES TO THE CONSOLIDATED FINANCIAL STATEMENTS As at December 27, 2020(in thousands of U.S. dollars except per share figures)
37 NFI GROUP INC 2020 ANNUAL REPORT
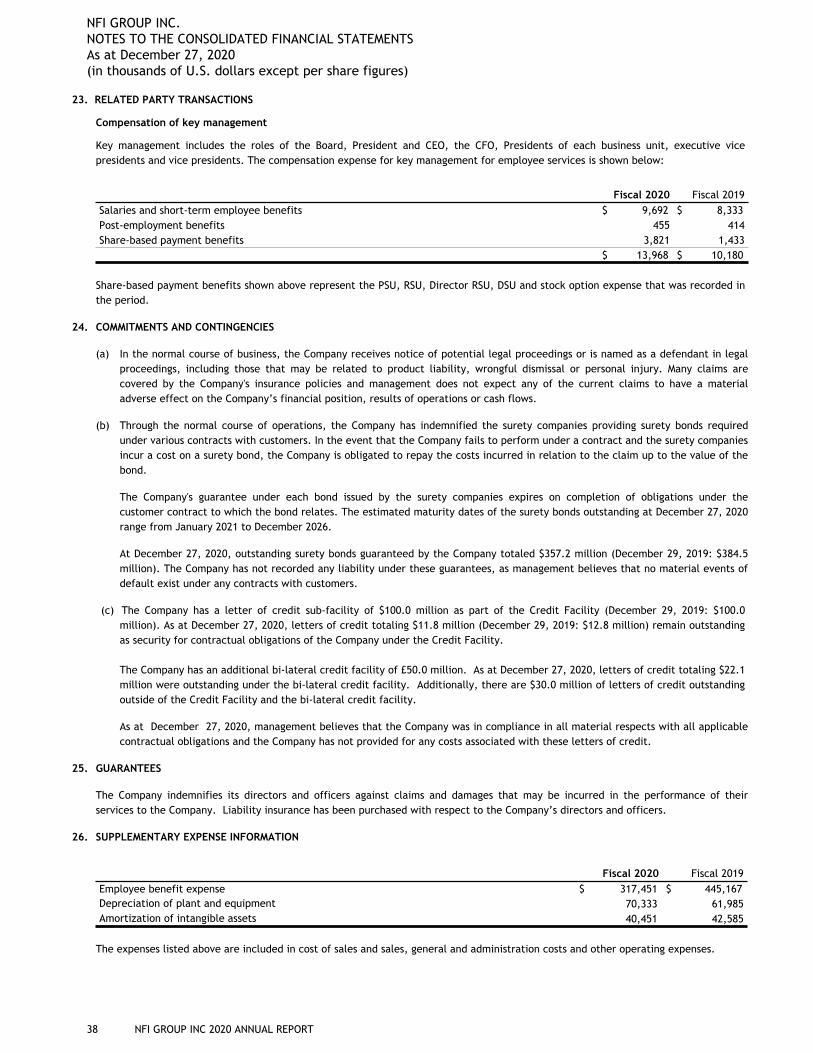
23. RELATED PARTY TRANSACTIONS
Compensation of key management
Key management includes the roles of the Board, President and CEO, the CFO, Presidents of each business unit, executive vice presidents and vice presidents. The compensation expense for key management for employee services is shown below:
Fiscal 2020 Fiscal 2019Salaries and short-term employee benefits $ 9,692 $ 8,333 Post-employment benefits 455 414Share-based payment benefits 3,821 1,433
$ 13,968 $ 10,180
Share-based payment benefits shown above represent the PSU, RSU, Director RSU, DSU and stock option expense that was recorded in the period.
24. COMMITMENTS AND CONTINGENCIES
(a) In the normal course of business, the Company receives notice of potential legal proceedings or is named as a defendant in legal proceedings, including those that may be related to product liability, wrongful dismissal or personal injury. Many claims are covered by the Company's insurance policies and management does not expect any of the current claims to have a material adverse effect on the Company’s financial position, results of operations or cash flows.
(b) Through the normal course of operations, the Company has indemnified the surety companies providing surety bonds required under various contracts with customers. In the event that the Company fails to perform under a contract and the surety companies incur a cost on a surety bond, the Company is obligated to repay the costs incurred in relation to the claim up to the value of the bond.
The Company's guarantee under each bond issued by the surety companies expires on completion of obligations under the customer contract to which the bond relates. The estimated maturity dates of the surety bonds outstanding at December 27, 2020 range from January 2021 to December 2026.
At December 27, 2020, outstanding surety bonds guaranteed by the Company totaled $357.2 million (December 29, 2019: $384.5 million). The Company has not recorded any liability under these guarantees, as management believes that no material events of default exist under any contracts with customers.
(c) The Company has a letter of credit sub-facility of $100.0 million as part of the Credit Facility (December 29, 2019: $100.0 million). As at December 27, 2020, letters of credit totaling $11.8 million (December 29, 2019: $12.8 million) remain outstanding as security for contractual obligations of the Company under the Credit Facility.
The Company has an additional bi-lateral credit facility of £50.0 million. As at December 27, 2020, letters of credit totaling $22.1 million were outstanding under the bi-lateral credit facility. Additionally, there are $30.0 million of letters of credit outstanding outside of the Credit Facility and the bi-lateral credit facility.
As at December 27, 2020, management believes that the Company was in compliance in all material respects with all applicable contractual obligations and the Company has not provided for any costs associated with these letters of credit.
25. GUARANTEES
The Company indemnifies its directors and officers against claims and damages that may be incurred in the performance of their services to the Company. Liability insurance has been purchased with respect to the Company’s directors and officers.
26. SUPPLEMENTARY EXPENSE INFORMATION
Fiscal 2020 Fiscal 2019Employee benefit expense $ 317,451 $ 445,167 Depreciation of plant and equipment 70,333 61,985Amortization of intangible assets 40,451 42,585
The expenses listed above are included in cost of sales and sales, general and administration costs and other operating expenses.
NFI GROUP INC. NOTES TO THE CONSOLIDATED FINANCIAL STATEMENTS As at December 27, 2020(in thousands of U.S. dollars except per share figures)
38 NFI GROUP INC 2020 ANNUAL REPORT
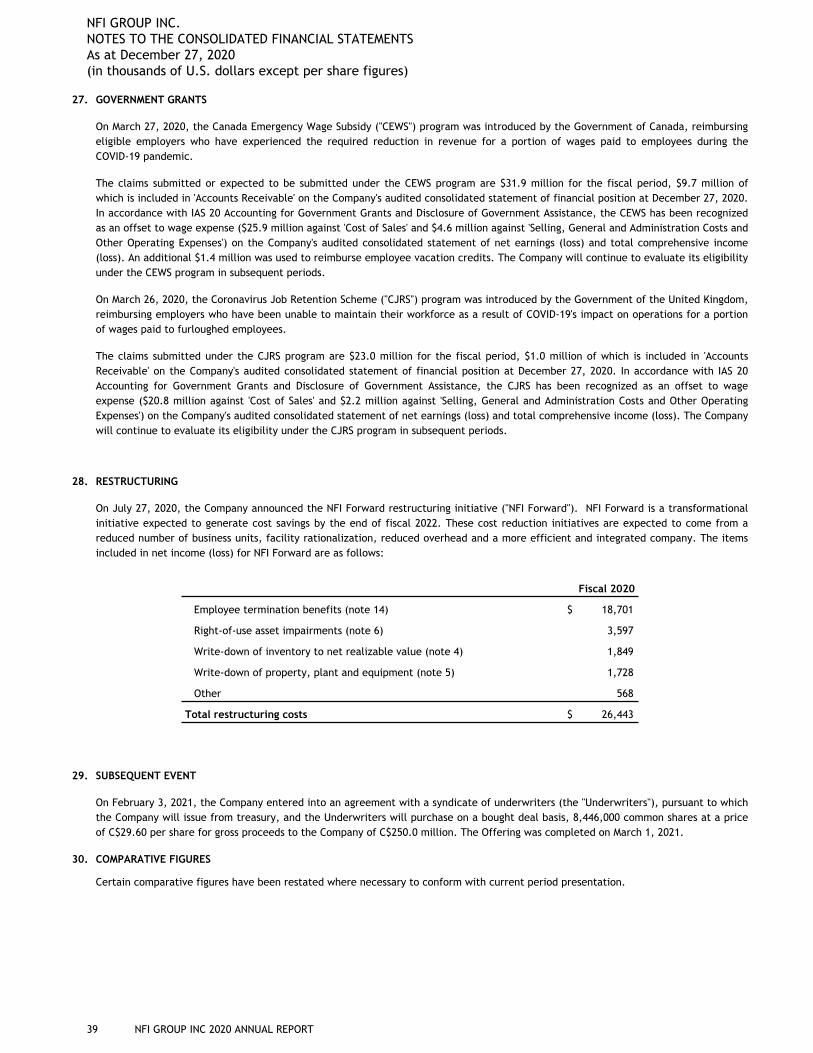
27. GOVERNMENT GRANTS
On March 27, 2020, the Canada Emergency Wage Subsidy ("CEWS") program was introduced by the Government of Canada, reimbursing eligible employers who have experienced the required reduction in revenue for a portion of wages paid to employees during the COVID-19 pandemic.
The claims submitted or expected to be submitted under the CEWS program are $31.9 million for the fiscal period, $9.7 million of which is included in 'Accounts Receivable' on the Company's audited consolidated statement of financial position at December 27, 2020. In accordance with IAS 20 Accounting for Government Grants and Disclosure of Government Assistance, the CEWS has been recognized as an offset to wage expense ($25.9 million against 'Cost of Sales' and $4.6 million against 'Selling, General and Administration Costs and Other Operating Expenses') on the Company's audited consolidated statement of net earnings (loss) and total comprehensive income (loss). An additional $1.4 million was used to reimburse employee vacation credits. The Company will continue to evaluate its eligibility under the CEWS program in subsequent periods.
On March 26, 2020, the Coronavirus Job Retention Scheme ("CJRS") program was introduced by the Government of the United Kingdom, reimbursing employers who have been unable to maintain their workforce as a result of COVID-19's impact on operations for a portion of wages paid to furloughed employees.
The claims submitted under the CJRS program are $23.0 million for the fiscal period, $1.0 million of which is included in 'Accounts Receivable' on the Company's audited consolidated statement of financial position at December 27, 2020. In accordance with IAS 20 Accounting for Government Grants and Disclosure of Government Assistance, the CJRS has been recognized as an offset to wage expense ($20.8 million against 'Cost of Sales' and $2.2 million against 'Selling, General and Administration Costs and Other Operating Expenses') on the Company's audited consolidated statement of net earnings (loss) and total comprehensive income (loss). The Company will continue to evaluate its eligibility under the CJRS program in subsequent periods.
28. RESTRUCTURING
On July 27, 2020, the Company announced the NFI Forward restructuring initiative ("NFI Forward"). NFI Forward is a transformational initiative expected to generate cost savings by the end of fiscal 2022. These cost reduction initiatives are expected to come from a reduced number of business units, facility rationalization, reduced overhead and a more efficient and integrated company. The items included in net income (loss) for NFI Forward are as follows:
Fiscal 2020
Employee termination benefits (note 14) $ 18,701
Right-of-use asset impairments (note 6) 3,597
Write-down of inventory to net realizable value (note 4) 1,849
Write-down of property, plant and equipment (note 5) 1,728
Other 568
Total restructuring costs $ 26,443
29. SUBSEQUENT EVENT
On February 3, 2021, the Company entered into an agreement with a syndicate of underwriters (the "Underwriters"), pursuant to which the Company will issue from treasury, and the Underwriters will purchase on a bought deal basis, 8,446,000 common shares at a price of C$29.60 per share for gross proceeds to the Company of C$250.0 million. The Offering was completed on March 1, 2021.
30. COMPARATIVE FIGURES
Certain comparative figures have been restated where necessary to conform with current period presentation.
NFI GROUP INC. NOTES TO THE CONSOLIDATED FINANCIAL STATEMENTS As at December 27, 2020(in thousands of U.S. dollars except per share figures)
39 NFI GROUP INC 2020 ANNUAL REPORT

Financial Results Fiscal 2019March 11, 2020
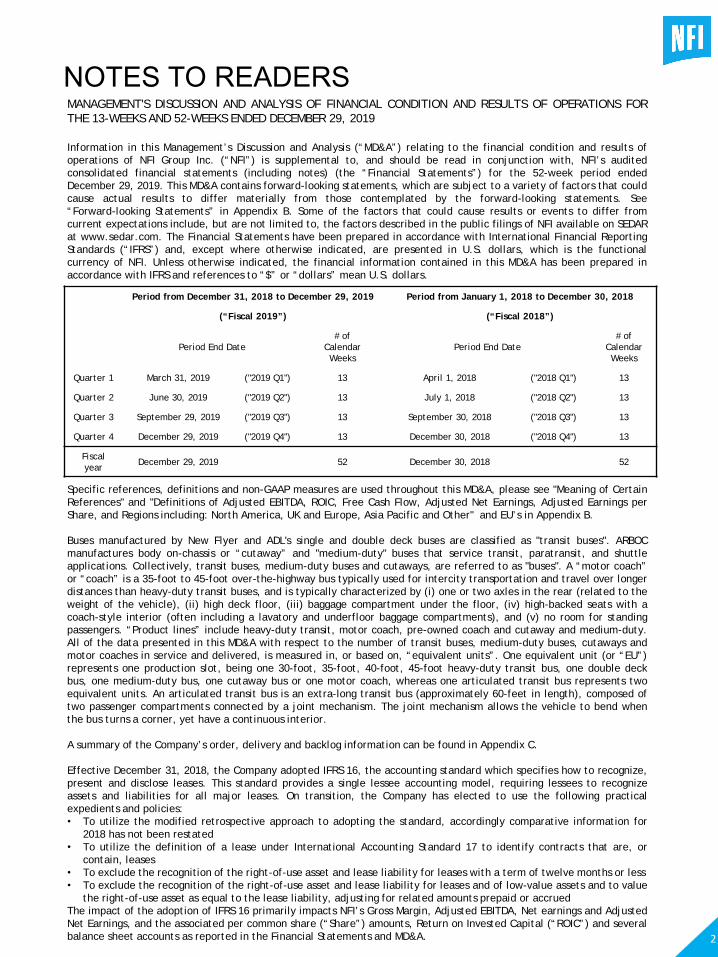
NOTES TO READERSMANAGEMENT'S DISCUSSION AND ANALYSIS OF FINANCIAL CONDITION AND RESULTS OF OPERATIONS FORTHE 13-WEEKS AND 52-WEEKS ENDED DECEMBER 29, 2019
Information in this Management’s Discussion and Analysis (“MD&A”) relating to the financial condition and results ofoperations of NFI Group Inc. (“NFI”) is supplemental to, and should be read in conjunction with, NFI’s auditedconsolidated financial statements (including notes) (the “Financial Statements”) for the 52-week period endedDecember 29, 2019. This MD&A contains forward-looking statements, which are subject to a variety of factors that couldcause actual results to differ materially from those contemplated by the forward-looking statements. See“Forward-looking Statements” in Appendix B. Some of the factors that could cause results or events to differ fromcurrent expectations include, but are not limited to, the factors described in the public filings of NFI available on SEDARat www.sedar.com. The Financial Statements have been prepared in accordance with International Financial ReportingStandards (“IFRS”) and, except where otherwise indicated, are presented in U.S. dollars, which is the functionalcurrency of NFI. Unless otherwise indicated, the financial information contained in this MD&A has been prepared inaccordance with IFRS and references to “$” or “dollars” mean U.S. dollars.
Period from December 31, 2018 to December 29, 2019 Period from January 1, 2018 to December 30, 2018
(“Fiscal 2019”) (“Fiscal 2018”)
Period End Date# of
Calendar Weeks
Period End Date# of
Calendar Weeks
Quarter 1 March 31, 2019 ("2019 Q1") 13 April 1, 2018 ("2018 Q1") 13
Quarter 2 June 30, 2019 ("2019 Q2") 13 July 1, 2018 ("2018 Q2") 13
Quarter 3 September 29, 2019 ("2019 Q3") 13 September 30, 2018 ("2018 Q3") 13
Quarter 4 December 29, 2019 ("2019 Q4") 13 December 30, 2018 ("2018 Q4") 13
Fiscal year December 29, 2019 52 December 30, 2018 52
Specific references, definitions and non-GAAP measures are used throughout this MD&A, please see "Meaning of CertainReferences" and "Definitions of Adjusted EBITDA, ROIC, Free Cash Flow, Adjusted Net Earnings, Adjusted Earnings perShare, and Regions including: North America, UK and Europe, Asia Pacific and Other" and EU’s in Appendix B.
Buses manufactured by New Flyer and ADL's single and double deck buses are classified as "transit buses". ARBOCmanufactures body on-chassis or “cutaway” and "medium-duty" buses that service transit, paratransit, and shuttleapplications. Collectively, transit buses, medium-duty buses and cutaways, are referred to as "buses". A “motor coach”or “coach” is a 35-foot to 45-foot over-the-highway bus typically used for intercity transportation and travel over longerdistances than heavy-duty transit buses, and is typically characterized by (i) one or two axles in the rear (related to theweight of the vehicle), (ii) high deck floor, (iii) baggage compartment under the floor, (iv) high-backed seats with acoach-style interior (often including a lavatory and underfloor baggage compartments), and (v) no room for standingpassengers. “Product lines” include heavy-duty transit, motor coach, pre-owned coach and cutaway and medium-duty.All of the data presented in this MD&A with respect to the number of transit buses, medium-duty buses, cutaways andmotor coaches in service and delivered, is measured in, or based on, “equivalent units”. One equivalent unit (or “EU”)represents one production slot, being one 30-foot, 35-foot, 40-foot, 45-foot heavy-duty transit bus, one double deckbus, one medium-duty bus, one cutaway bus or one motor coach, whereas one articulated transit bus represents twoequivalent units. An articulated transit bus is an extra-long transit bus (approximately 60-feet in length), composed oftwo passenger compartments connected by a joint mechanism. The joint mechanism allows the vehicle to bend whenthe bus turns a corner, yet have a continuous interior.
A summary of the Company’s order, delivery and backlog information can be found in Appendix C.
Effective December 31, 2018, the Company adopted IFRS 16, the accounting standard which specifies how to recognize,present and disclose leases. This standard provides a single lessee accounting model, requiring lessees to recognizeassets and liabilities for all major leases. On transition, the Company has elected to use the following practicalexpedients and policies:• To utilize the modified retrospective approach to adopting the standard, accordingly comparative information for
2018 has not been restated• To utilize the definition of a lease under International Accounting Standard 17 to identify contracts that are, or
contain, leases• To exclude the recognition of the right-of-use asset and lease liability for leases with a term of twelve months or less• To exclude the recognition of the right-of-use asset and lease liability for leases and of low-value assets and to value
the right-of-use asset as equal to the lease liability, adjusting for related amounts prepaid or accruedThe impact of the adoption of IFRS 16 primarily impacts NFI’s Gross Margin, Adjusted EBITDA, Net earnings and AdjustedNet Earnings, and the associated per common share (“Share”) amounts, Return on Invested Capital (“ROIC”) and severalbalance sheet accounts as reported in the Financial Statements and MD&A. 2
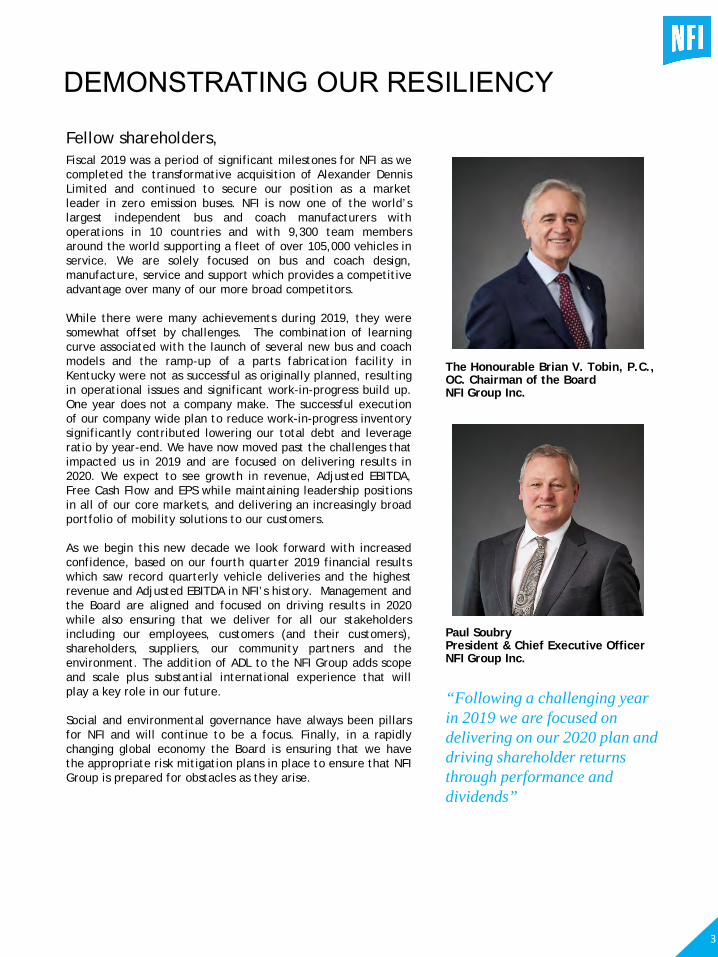
DEMONSTRATING OUR RESILIENCY
Fiscal 2019 was a period of significant milestones for NFI as wecompleted the transformative acquisition of Alexander DennisLimited and continued to secure our position as a marketleader in zero emission buses. NFI is now one of the world’slargest independent bus and coach manufacturers withoperations in 10 countries and with 9,300 team membersaround the world supporting a fleet of over 105,000 vehicles inservice. We are solely focused on bus and coach design,manufacture, service and support which provides a competitiveadvantage over many of our more broad competitors.
While there were many achievements during 2019, they weresomewhat offset by challenges. The combination of learningcurve associated with the launch of several new bus and coachmodels and the ramp-up of a parts fabrication facility inKentucky were not as successful as originally planned, resultingin operational issues and significant work-in-progress build up.One year does not a company make. The successful executionof our company wide plan to reduce work-in-progress inventorysignificantly contributed lowering our total debt and leverageratio by year-end. We have now moved past the challenges thatimpacted us in 2019 and are focused on delivering results in2020. We expect to see growth in revenue, Adjusted EBITDA,Free Cash Flow and EPS while maintaining leadership positionsin all of our core markets, and delivering an increasingly broadportfolio of mobility solutions to our customers.
As we begin this new decade we look forward with increasedconfidence, based on our fourth quarter 2019 financial resultswhich saw record quarterly vehicle deliveries and the highestrevenue and Adjusted EBITDA in NFI’s history. Management andthe Board are aligned and focused on driving results in 2020while also ensuring that we deliver for all our stakeholdersincluding our employees, customers (and their customers),shareholders, suppliers, our community partners and theenvironment. The addition of ADL to the NFI Group adds scopeand scale plus substantial international experience that willplay a key role in our future.
Social and environmental governance have always been pillarsfor NFI and will continue to be a focus. Finally, in a rapidlychanging global economy the Board is ensuring that we havethe appropriate risk mitigation plans in place to ensure that NFIGroup is prepared for obstacles as they arise.
“Following a challenging year in 2019 we are focused on delivering on our 2020 plan and driving shareholder returns through performance and dividends”
Fellow shareholders,
The Honourable Brian V. Tobin, P.C., OC. Chairman of the Board NFI Group Inc.
Paul Soubry President & Chief Executive Officer NFI Group Inc.
3
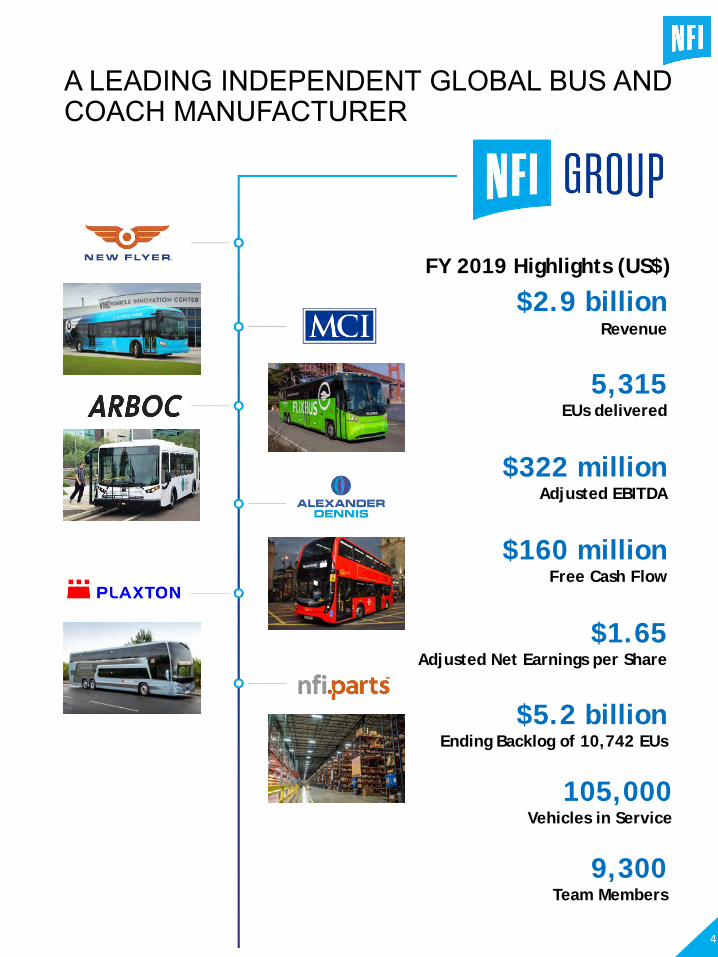
A LEADING INDEPENDENT GLOBAL BUS AND COACH MANUFACTURER
4
FY 2019 Highlights (US$)
$2.9 billionRevenue
105,000Vehicles in Service
9,300 Team Members
5,315EUs delivered
$322 millionAdjusted EBITDA
$160 millionFree Cash Flow
$1.65Adjusted Net Earnings per Share
$5.2 billionEnding Backlog of 10,742 EUs
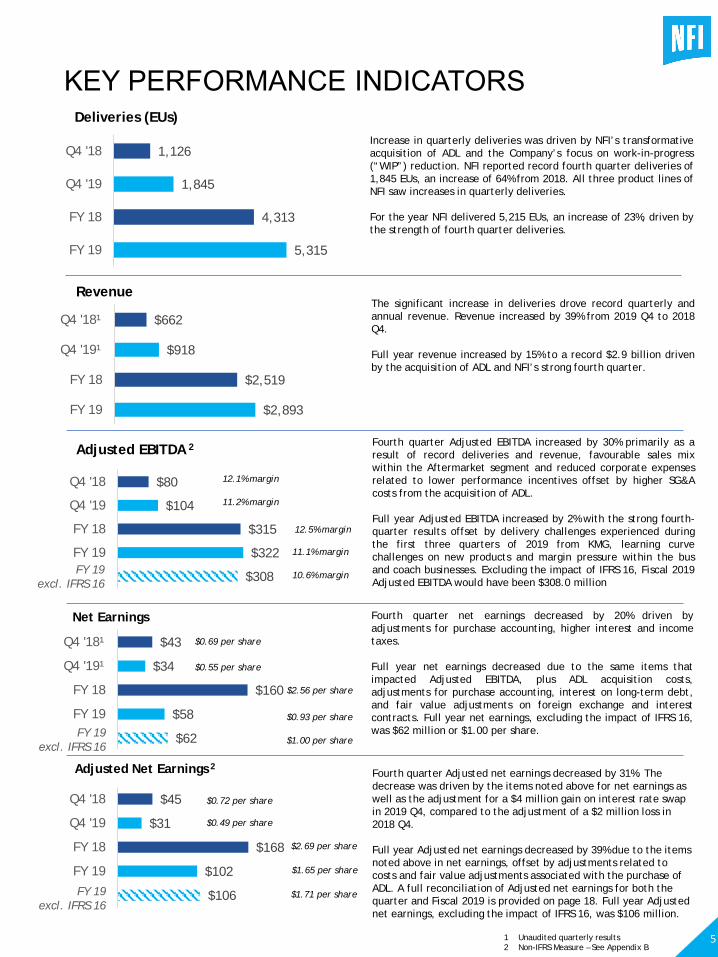
Deliveries (EUs)
Increase in quarterly deliveries was driven by NFI’s transformativeacquisition of ADL and the Company’s focus on work-in-progress(“WIP”) reduction. NFI reported record fourth quarter deliveries of1,845 EUs, an increase of 64% from 2018. All three product lines ofNFI saw increases in quarterly deliveries.
For the year NFI delivered 5,215 EUs, an increase of 23%, driven bythe strength of fourth quarter deliveries.
RevenueThe significant increase in deliveries drove record quarterly andannual revenue. Revenue increased by 39% from 2019 Q4 to 2018Q4.
Full year revenue increased by 15% to a record $2.9 billion drivenby the acquisition of ADL and NFI’s strong fourth quarter.
$2,893
$2,519
$918
$662
FY 19
FY 18
Q4 '19¹
Q4 '18¹
Adjusted EBITDA 2Fourth quarter Adjusted EBITDA increased by 30% primarily as aresult of record deliveries and revenue, favourable sales mixwithin the Aftermarket segment and reduced corporate expensesrelated to lower performance incentives offset by higher SG&Acosts from the acquisition of ADL.
Full year Adjusted EBITDA increased by 2% with the strong fourth-quarter results offset by delivery challenges experienced duringthe first three quarters of 2019 from KMG, learning curvechallenges on new products and margin pressure within the busand coach businesses. Excluding the impact of IFRS 16, Fiscal 2019Adjusted EBITDA would have been $308.0 million$308
$322
$315
$104
$80
FY 19
FY 18
Q4 '19
Q4 '18
Net Earnings Fourth quarter net earnings decreased by 20% driven byadjustments for purchase accounting, higher interest and incometaxes.
Full year net earnings decreased due to the same items thatimpacted Adjusted EBITDA, plus ADL acquisition costs,adjustments for purchase accounting, interest on long-term debt,and fair value adjustments on foreign exchange and interestcontracts. Full year net earnings, excluding the impact of IFRS 16,was $62 million or $1.00 per share.
$62
$58
$160
$34
$43
FY 19
FY 18
Q4 '19¹
Q4 '18¹
Adjusted Net Earnings 2Fourth quarter Adjusted net earnings decreased by 31%. The decrease was driven by the items noted above for net earnings as well as the adjustment for a $4 million gain on interest rate swap in 2019 Q4, compared to the adjustment of a $2 million loss in 2018 Q4.
Full year Adjusted net earnings decreased by 39% due to the items noted above in net earnings, offset by adjustments related to costs and fair value adjustments associated with the purchase of ADL. A full reconciliation of Adjusted net earnings for both the quarter and Fiscal 2019 is provided on page 18. Full year Adjusted net earnings, excluding the impact of IFRS 16, was $106 million.
$106
$102
$168
$31
$45
FY 19
FY 18
Q4 '19
Q4 '18
$0.69 per share
$0.55 per share
12.1% margin
11.2% margin
5,315
4,313
1,845
1,126
FY 19
FY 18
Q4 '19
Q4 '18
$2.56 per share
$0.93 per share
12.5% margin
11.1% margin
$0.72 per share
$0.49 per share
$2.69 per share
$1.65 per share
1 Unaudited quarterly results2 Non-IFRS Measure – See Appendix B
10.6% margin
$1.00 per share
$1.71 per share
FY 19excl. IFRS 16
FY 19excl. IFRS 16
FY 19excl. IFRS 16
5
KEY PERFORMANCE INDICATORS
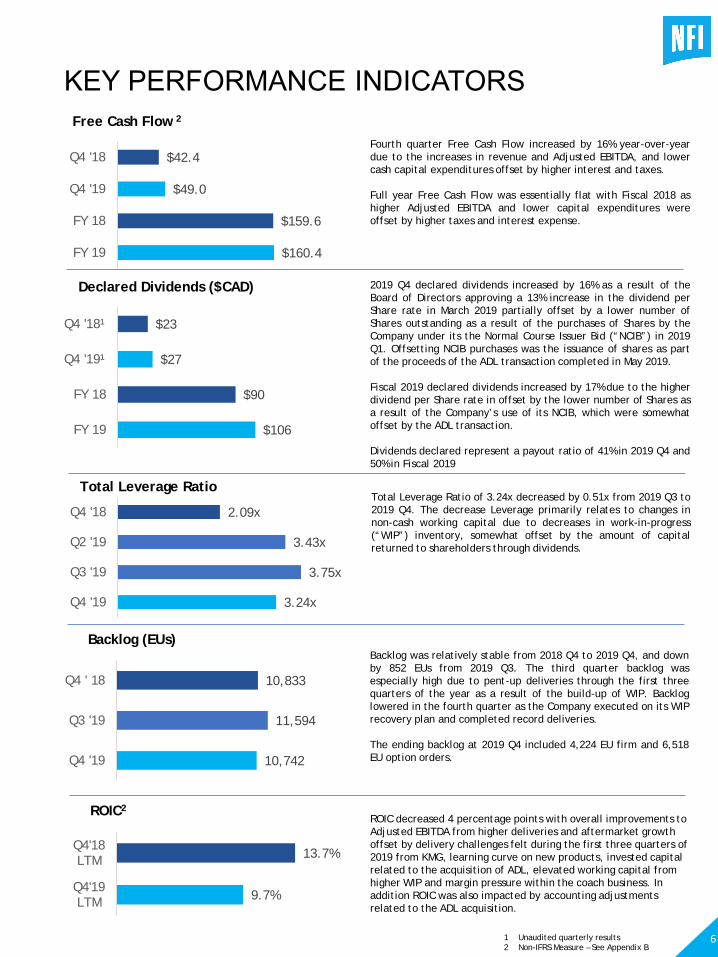
Free Cash Flow 2
Fourth quarter Free Cash Flow increased by 16% year-over-yeardue to the increases in revenue and Adjusted EBITDA, and lowercash capital expenditures offset by higher interest and taxes.
Full year Free Cash Flow was essentially flat with Fiscal 2018 ashigher Adjusted EBITDA and lower capital expenditures wereoffset by higher taxes and interest expense.
Declared Dividends ($CAD) 2019 Q4 declared dividends increased by 16% as a result of theBoard of Directors approving a 13% increase in the dividend perShare rate in March 2019 partially offset by a lower number ofShares outstanding as a result of the purchases of Shares by theCompany under its the Normal Course Issuer Bid (“NCIB”) in 2019Q1. Offsetting NCIB purchases was the issuance of shares as partof the proceeds of the ADL transaction completed in May 2019.
Fiscal 2019 declared dividends increased by 17% due to the higherdividend per Share rate in offset by the lower number of Shares asa result of the Company’s use of its NCIB, which were somewhatoffset by the ADL transaction.
Dividends declared represent a payout ratio of 41% in 2019 Q4 and50% in Fiscal 2019
3.24x
3.75x
3.43x
2.09x
Q4 '19
Q3 '19
Q2 '19
Q4 '18
$106
$90
$27
$23
FY 19
FY 18
Q4 '19¹
Q4 '18¹
Total Leverage RatioTotal Leverage Ratio of 3.24x decreased by 0.51x from 2019 Q3 to2019 Q4. The decrease Leverage primarily relates to changes innon-cash working capital due to decreases in work-in-progress(“WIP”) inventory, somewhat offset by the amount of capitalreturned to shareholders through dividends.
Backlog (EUs) Backlog was relatively stable from 2018 Q4 to 2019 Q4, and downby 852 EUs from 2019 Q3. The third quarter backlog wasespecially high due to pent-up deliveries through the first threequarters of the year as a result of the build-up of WIP. Backloglowered in the fourth quarter as the Company executed on its WIPrecovery plan and completed record deliveries.
The ending backlog at 2019 Q4 included 4,224 EU firm and 6,518EU option orders.10,742
11,594
10,833
Q4 '19
Q3 '19
Q4 ' 18
ROIC2
ROIC decreased 4 percentage points with overall improvements to Adjusted EBITDA from higher deliveries and aftermarket growth offset by delivery challenges felt during the first three quarters of 2019 from KMG, learning curve on new products, invested capital related to the acquisition of ADL, elevated working capital from higher WIP and margin pressure within the coach business. In addition ROIC was also impacted by accounting adjustments related to the ADL acquisition.
9.7%
13.7%
Q4'19LTM
Q4'18LTM
$160.4
$159.6
$49.0
$42.4
FY 19
FY 18
Q4 '19
Q4 '18
1 Unaudited quarterly results2 Non-IFRS Measure – See Appendix B
6
KEY PERFORMANCE INDICATORS
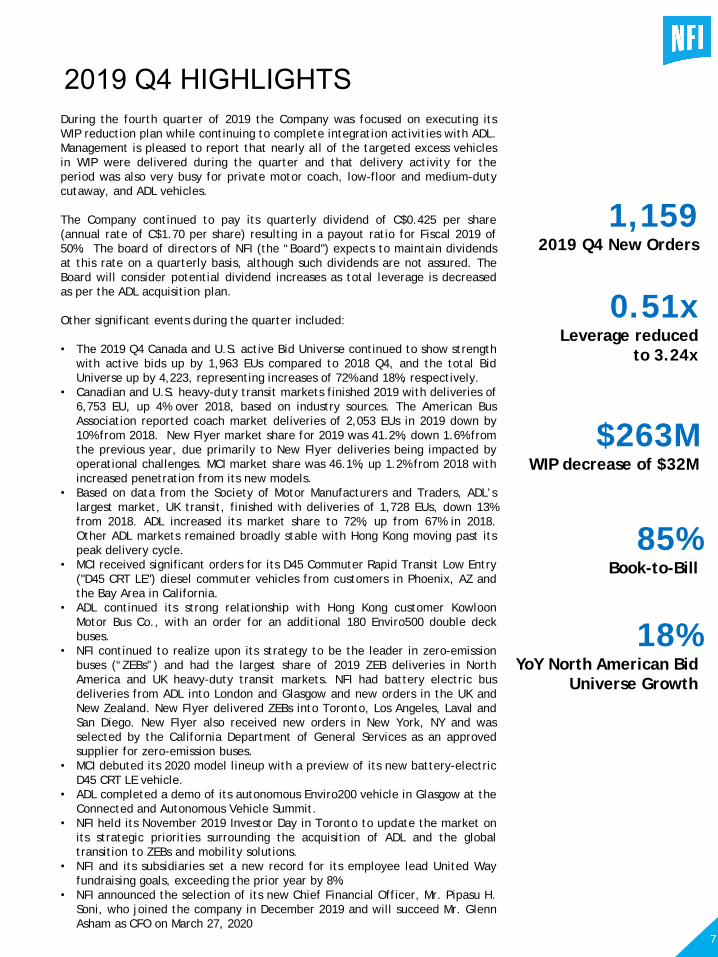
During the fourth quarter of 2019 the Company was focused on executing itsWIP reduction plan while continuing to complete integration activities with ADL.Management is pleased to report that nearly all of the targeted excess vehiclesin WIP were delivered during the quarter and that delivery activity for theperiod was also very busy for private motor coach, low-floor and medium-dutycutaway, and ADL vehicles.
The Company continued to pay its quarterly dividend of C$0.425 per share(annual rate of C$1.70 per share) resulting in a payout ratio for Fiscal 2019 of50%. The board of directors of NFI (the “Board") expects to maintain dividendsat this rate on a quarterly basis, although such dividends are not assured. TheBoard will consider potential dividend increases as total leverage is decreasedas per the ADL acquisition plan.
Other significant events during the quarter included:
• The 2019 Q4 Canada and U.S. active Bid Universe continued to show strengthwith active bids up by 1,963 EUs compared to 2018 Q4, and the total BidUniverse up by 4,223, representing increases of 72% and 18%, respectively.
• Canadian and U.S. heavy-duty transit markets finished 2019 with deliveries of6,753 EU, up 4% over 2018, based on industry sources. The American BusAssociation reported coach market deliveries of 2,053 EUs in 2019 down by10% from 2018. New Flyer market share for 2019 was 41.2%, down 1.6% fromthe previous year, due primarily to New Flyer deliveries being impacted byoperational challenges. MCI market share was 46.1%, up 1.2% from 2018 withincreased penetration from its new models.
• Based on data from the Society of Motor Manufacturers and Traders, ADL’slargest market, UK transit, finished with deliveries of 1,728 EUs, down 13%from 2018. ADL increased its market share to 72%, up from 67% in 2018.Other ADL markets remained broadly stable with Hong Kong moving past itspeak delivery cycle.
• MCI received significant orders for its D45 Commuter Rapid Transit Low Entry("D45 CRT LE") diesel commuter vehicles from customers in Phoenix, AZ andthe Bay Area in California.
• ADL continued its strong relationship with Hong Kong customer KowloonMotor Bus Co., with an order for an additional 180 Enviro500 double deckbuses.
• NFI continued to realize upon its strategy to be the leader in zero-emissionbuses (“ZEBs”) and had the largest share of 2019 ZEB deliveries in NorthAmerica and UK heavy-duty transit markets. NFI had battery electric busdeliveries from ADL into London and Glasgow and new orders in the UK andNew Zealand. New Flyer delivered ZEBs into Toronto, Los Angeles, Laval andSan Diego. New Flyer also received new orders in New York, NY and wasselected by the California Department of General Services as an approvedsupplier for zero-emission buses.
• MCI debuted its 2020 model lineup with a preview of its new battery-electricD45 CRT LE vehicle.
• ADL completed a demo of its autonomous Enviro200 vehicle in Glasgow at theConnected and Autonomous Vehicle Summit.
• NFI held its November 2019 Investor Day in Toronto to update the market onits strategic priorities surrounding the acquisition of ADL and the globaltransition to ZEBs and mobility solutions.
• NFI and its subsidiaries set a new record for its employee lead United Wayfundraising goals, exceeding the prior year by 8%.
• NFI announced the selection of its new Chief Financial Officer, Mr. Pipasu H.Soni, who joined the company in December 2019 and will succeed Mr. GlennAsham as CFO on March 27, 2020
1,1592019 Q4 New Orders
0.51xLeverage reduced
to 3.24x
$263MWIP decrease of $32M
85%Book-to-Bill
18%YoY North American Bid
Universe Growth
2019 Q4 HIGHLIGHTS
7
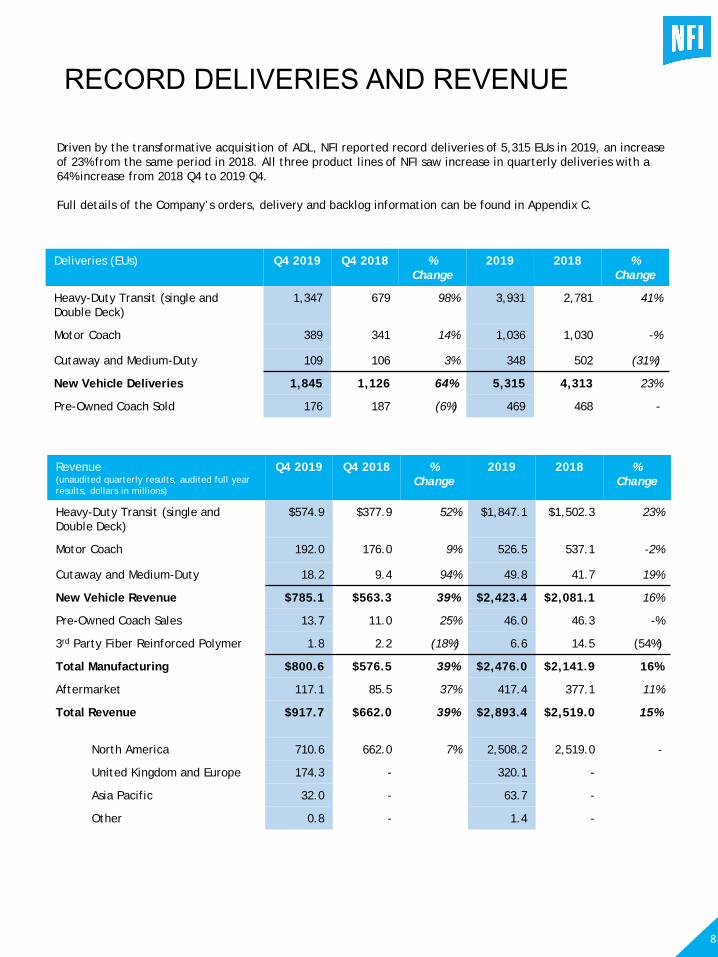
Deliveries (EUs) Q4 2019 Q4 2018 % Change
2019 2018 % Change
Heavy-Duty Transit (single and Double Deck)
1,347 679 98% 3,931 2,781 41%
Motor Coach 389 341 14% 1,036 1,030 -%
Cutaway and Medium-Duty 109 106 3% 348 502 (31%)
New Vehicle Deliveries 1,845 1,126 64% 5,315 4,313 23%
Pre-Owned Coach Sold 176 187 (6%) 469 468 -
Driven by the transformative acquisition of ADL, NFI reported record deliveries of 5,315 EUs in 2019, an increase of 23% from the same period in 2018. All three product lines of NFI saw increase in quarterly deliveries with a 64% increase from 2018 Q4 to 2019 Q4.
Full details of the Company’s orders, delivery and backlog information can be found in Appendix C.
Revenue (unaudited quarterly results, audited full year results, dollars in millions)
Q4 2019 Q4 2018 % Change
2019 2018 % Change
Heavy-Duty Transit (single and Double Deck)
$574.9 $377.9 52% $1,847.1 $1,502.3 23%
Motor Coach 192.0 176.0 9% 526.5 537.1 -2%
Cutaway and Medium-Duty 18.2 9.4 94% 49.8 41.7 19%
New Vehicle Revenue $785.1 $563.3 39% $2,423.4 $2,081.1 16%
Pre-Owned Coach Sales 13.7 11.0 25% 46.0 46.3 -%
3rd Party Fiber Reinforced Polymer 1.8 2.2 (18%) 6.6 14.5 (54%)
Total Manufacturing $800.6 $576.5 39% $2,476.0 $2,141.9 16%
Aftermarket 117.1 85.5 37% 417.4 377.1 11%
Total Revenue $917.7 $662.0 39% $2,893.4 $2,519.0 15%
North America 710.6 662.0 7% 2,508.2 2,519.0 -
United Kingdom and Europe 174.3 - 320.1 -
Asia Pacific 32.0 - 63.7 -
Other 0.8 - 1.4 -
RECORD DELIVERIES AND REVENUE
8
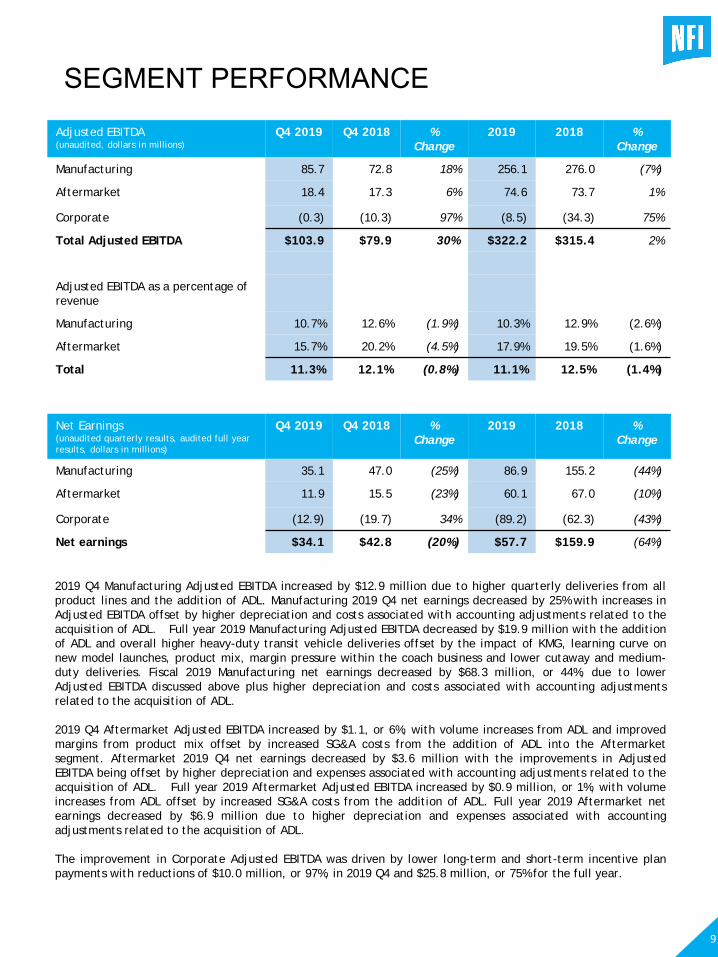
Net Earnings(unaudited quarterly results, audited full year results, dollars in millions)
Q4 2019 Q4 2018 % Change
2019 2018 % Change
Manufacturing 35.1 47.0 (25%) 86.9 155.2 (44%)
Aftermarket 11.9 15.5 (23%) 60.1 67.0 (10%)
Corporate (12.9) (19.7) 34% (89.2) (62.3) (43%)
Net earnings $34.1 $42.8 (20%) $57.7 $159.9 (64%)
Adjusted EBITDA(unaudited, dollars in millions)
Q4 2019 Q4 2018 % Change
2019 2018 % Change
Manufacturing 85.7 72.8 18% 256.1 276.0 (7%)
Aftermarket 18.4 17.3 6% 74.6 73.7 1%
Corporate (0.3) (10.3) 97% (8.5) (34.3) 75%
Total Adjusted EBITDA $103.9 $79.9 30% $322.2 $315.4 2%
Adjusted EBITDA as a percentage of revenue
Manufacturing 10.7% 12.6% (1.9%) 10.3% 12.9% (2.6%)
Aftermarket 15.7% 20.2% (4.5%) 17.9% 19.5% (1.6%)
Total 11.3% 12.1% (0.8%) 11.1% 12.5% (1.4%)
2019 Q4 Manufacturing Adjusted EBITDA increased by $12.9 million due to higher quarterly deliveries from allproduct lines and the addition of ADL. Manufacturing 2019 Q4 net earnings decreased by 25% with increases inAdjusted EBITDA offset by higher depreciation and costs associated with accounting adjustments related to theacquisition of ADL. Full year 2019 Manufacturing Adjusted EBITDA decreased by $19.9 million with the additionof ADL and overall higher heavy-duty transit vehicle deliveries offset by the impact of KMG, learning curve onnew model launches, product mix, margin pressure within the coach business and lower cutaway and medium-duty deliveries. Fiscal 2019 Manufacturing net earnings decreased by $68.3 million, or 44%, due to lowerAdjusted EBITDA discussed above plus higher depreciation and costs associated with accounting adjustmentsrelated to the acquisition of ADL.
2019 Q4 Aftermarket Adjusted EBITDA increased by $1.1, or 6%, with volume increases from ADL and improvedmargins from product mix offset by increased SG&A costs from the addition of ADL into the Aftermarketsegment. Aftermarket 2019 Q4 net earnings decreased by $3.6 million with the improvements in AdjustedEBITDA being offset by higher depreciation and expenses associated with accounting adjustments related to theacquisition of ADL. Full year 2019 Aftermarket Adjusted EBITDA increased by $0.9 million, or 1%, with volumeincreases from ADL offset by increased SG&A costs from the addition of ADL. Full year 2019 Aftermarket netearnings decreased by $6.9 million due to higher depreciation and expenses associated with accountingadjustments related to the acquisition of ADL.
The improvement in Corporate Adjusted EBITDA was driven by lower long-term and short-term incentive planpayments with reductions of $10.0 million, or 97%, in 2019 Q4 and $25.8 million, or 75% for the full year.
SEGMENT PERFORMANCE
9
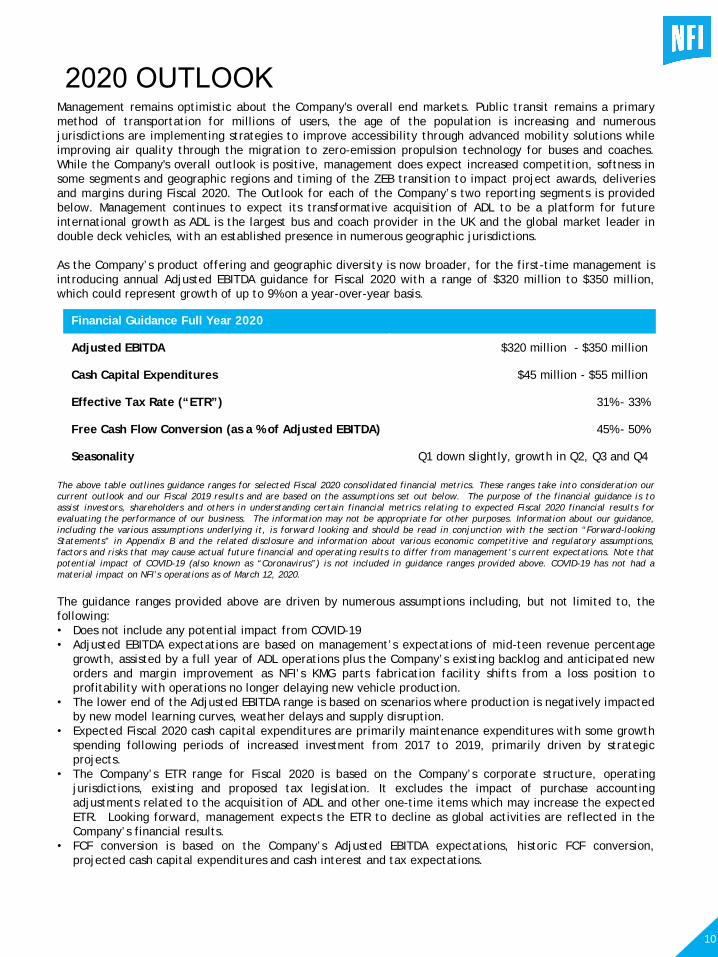
2020 OUTLOOK Management remains optimistic about the Company's overall end markets. Public transit remains a primarymethod of transportation for millions of users, the age of the population is increasing and numerousjurisdictions are implementing strategies to improve accessibility through advanced mobility solutions whileimproving air quality through the migration to zero-emission propulsion technology for buses and coaches.While the Company's overall outlook is positive, management does expect increased competition, softness insome segments and geographic regions and timing of the ZEB transition to impact project awards, deliveriesand margins during Fiscal 2020. The Outlook for each of the Company’s two reporting segments is providedbelow. Management continues to expect its transformative acquisition of ADL to be a platform for futureinternational growth as ADL is the largest bus and coach provider in the UK and the global market leader indouble deck vehicles, with an established presence in numerous geographic jurisdictions.
As the Company’s product offering and geographic diversity is now broader, for the first-time management isintroducing annual Adjusted EBITDA guidance for Fiscal 2020 with a range of $320 million to $350 million,which could represent growth of up to 9% on a year-over-year basis.
The above table outlines guidance ranges for selected Fiscal 2020 consolidated financial metrics. These ranges take into consideration ourcurrent outlook and our Fiscal 2019 results and are based on the assumptions set out below. The purpose of the financial guidance is toassist investors, shareholders and others in understanding certain financial metrics relating to expected Fiscal 2020 financial results forevaluating the performance of our business. The information may not be appropriate for other purposes. Information about our guidance,including the various assumptions underlying it, is forward looking and should be read in conjunction with the section “Forward-lookingStatements” in Appendix B and the related disclosure and information about various economic competitive and regulatory assumptions,factors and risks that may cause actual future financial and operating results to differ from management’s current expectations. Note thatpotential impact of COVID-19 (also known as “Coronavirus”) is not included in guidance ranges provided above. COVID-19 has not had amaterial impact on NFI’s operations as of March 12, 2020.
The guidance ranges provided above are driven by numerous assumptions including, but not limited to, thefollowing:• Does not include any potential impact from COVID-19• Adjusted EBITDA expectations are based on management’s expectations of mid-teen revenue percentage
growth, assisted by a full year of ADL operations plus the Company’s existing backlog and anticipated neworders and margin improvement as NFI’s KMG parts fabrication facility shifts from a loss position toprofitability with operations no longer delaying new vehicle production.
• The lower end of the Adjusted EBITDA range is based on scenarios where production is negatively impactedby new model learning curves, weather delays and supply disruption.
• Expected Fiscal 2020 cash capital expenditures are primarily maintenance expenditures with some growthspending following periods of increased investment from 2017 to 2019, primarily driven by strategicprojects.
• The Company’s ETR range for Fiscal 2020 is based on the Company’s corporate structure, operatingjurisdictions, existing and proposed tax legislation. It excludes the impact of purchase accountingadjustments related to the acquisition of ADL and other one-time items which may increase the expectedETR. Looking forward, management expects the ETR to decline as global activities are reflected in theCompany’s financial results.
• FCF conversion is based on the Company’s Adjusted EBITDA expectations, historic FCF conversion,projected cash capital expenditures and cash interest and tax expectations.
Financial Guidance Full Year 2020
Adjusted EBITDA $320 million - $350 million
Cash Capital Expenditures $45 million - $55 million
Effective Tax Rate (“ETR”) 31% - 33%
Free Cash Flow Conversion (as a % of Adjusted EBITDA) 45% - 50%
Seasonality Q1 down slightly, growth in Q2, Q3 and Q4
10
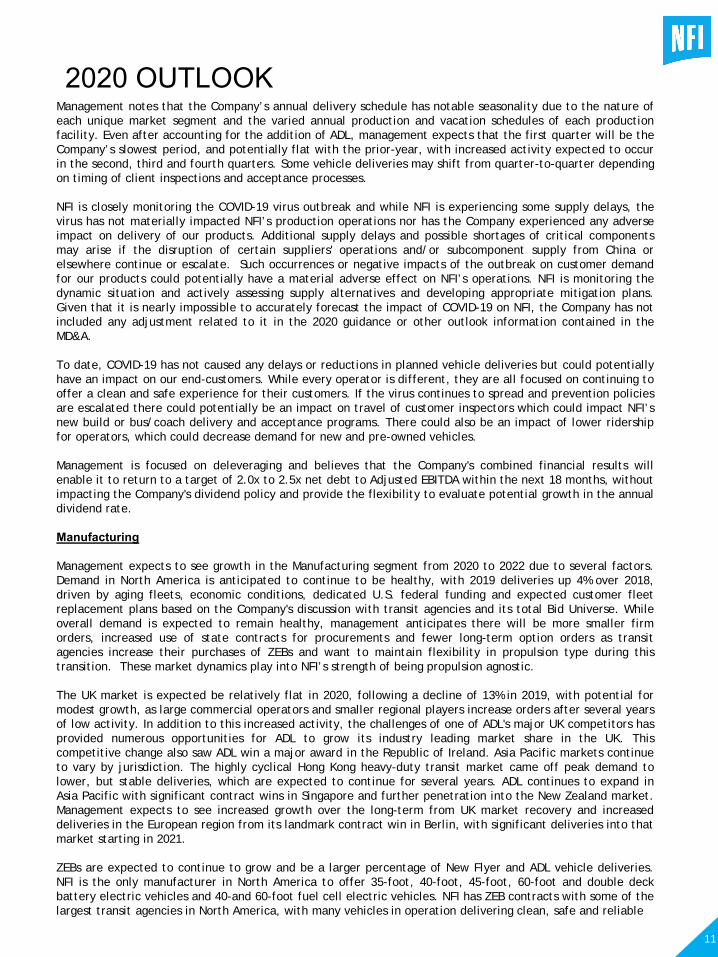
Management notes that the Company’s annual delivery schedule has notable seasonality due to the nature ofeach unique market segment and the varied annual production and vacation schedules of each productionfacility. Even after accounting for the addition of ADL, management expects that the first quarter will be theCompany’s slowest period, and potentially flat with the prior-year, with increased activity expected to occurin the second, third and fourth quarters. Some vehicle deliveries may shift from quarter-to-quarter dependingon timing of client inspections and acceptance processes.
NFI is closely monitoring the COVID-19 virus outbreak and while NFI is experiencing some supply delays, thevirus has not materially impacted NFI’s production operations nor has the Company experienced any adverseimpact on delivery of our products. Additional supply delays and possible shortages of critical componentsmay arise if the disruption of certain suppliers' operations and/or subcomponent supply from China orelsewhere continue or escalate. Such occurrences or negative impacts of the outbreak on customer demandfor our products could potentially have a material adverse effect on NFI’s operations. NFI is monitoring thedynamic situation and actively assessing supply alternatives and developing appropriate mitigation plans.Given that it is nearly impossible to accurately forecast the impact of COVID-19 on NFI, the Company has notincluded any adjustment related to it in the 2020 guidance or other outlook information contained in theMD&A.
To date, COVID-19 has not caused any delays or reductions in planned vehicle deliveries but could potentiallyhave an impact on our end-customers. While every operator is different, they are all focused on continuing tooffer a clean and safe experience for their customers. If the virus continues to spread and prevention policiesare escalated there could potentially be an impact on travel of customer inspectors which could impact NFI’snew build or bus/coach delivery and acceptance programs. There could also be an impact of lower ridershipfor operators, which could decrease demand for new and pre-owned vehicles.
Management is focused on deleveraging and believes that the Company's combined financial results willenable it to return to a target of 2.0x to 2.5x net debt to Adjusted EBITDA within the next 18 months, withoutimpacting the Company's dividend policy and provide the flexibility to evaluate potential growth in the annualdividend rate.
Manufacturing
Management expects to see growth in the Manufacturing segment from 2020 to 2022 due to several factors.Demand in North America is anticipated to continue to be healthy, with 2019 deliveries up 4% over 2018,driven by aging fleets, economic conditions, dedicated U.S. federal funding and expected customer fleetreplacement plans based on the Company's discussion with transit agencies and its total Bid Universe. Whileoverall demand is expected to remain healthy, management anticipates there will be more smaller firmorders, increased use of state contracts for procurements and fewer long-term option orders as transitagencies increase their purchases of ZEBs and want to maintain flexibility in propulsion type during thistransition. These market dynamics play into NFI’s strength of being propulsion agnostic.
The UK market is expected be relatively flat in 2020, following a decline of 13% in 2019, with potential formodest growth, as large commercial operators and smaller regional players increase orders after several yearsof low activity. In addition to this increased activity, the challenges of one of ADL's major UK competitors hasprovided numerous opportunities for ADL to grow its industry leading market share in the UK. Thiscompetitive change also saw ADL win a major award in the Republic of Ireland. Asia Pacific markets continueto vary by jurisdiction. The highly cyclical Hong Kong heavy-duty transit market came off peak demand tolower, but stable deliveries, which are expected to continue for several years. ADL continues to expand inAsia Pacific with significant contract wins in Singapore and further penetration into the New Zealand market.Management expects to see increased growth over the long-term from UK market recovery and increaseddeliveries in the European region from its landmark contract win in Berlin, with significant deliveries into thatmarket starting in 2021.
ZEBs are expected to continue to grow and be a larger percentage of New Flyer and ADL vehicle deliveries.NFI is the only manufacturer in North America to offer 35-foot, 40-foot, 45-foot, 60-foot and double deckbattery electric vehicles and 40-and 60-foot fuel cell electric vehicles. NFI has ZEB contracts with some of thelargest transit agencies in North America, with many vehicles in operation delivering clean, safe and reliable
11
2020 OUTLOOK
transportation on the proven Xcelsior platform. NFI's Infrastructure Solutions offering is also expected to growas it supports transit agencies charging infrastructure requirements. ADL through its partnership with BYD isthe market leader for ZEBs in the UK and is growing its presence in New Zealand. ZEBs represented 7% ofADL’s total 2019 deliveries. MCI is continuing the development and testing of its battery-electric motorcoaches and ARBOC has recently launched an electrification program for the Equess medium-duty bus.
While overall motor coach deliveries in North America declined by 10% in 2019, and are expected to declineagain in 2020, management expects that the Company can continue to gain market share, which was up 1.3%in 2019, from its expanded product portfolio. Management anticipates competitive factors will placeincreased pressure on margins in the North American coach market during 2020 and potentially into 2021.ADL's coach manufacturing business, Plaxton (which builds coach bodies on third-party chassis), is primarilyfocused on the UK market which is a very small component of the segment. MCI and Plaxton closely monitorpre-owned coach valuations and ensure that products obtained through trades are accurately reflected attheir fair market value on the Company’s balance sheet. Management believes the overall demand for low-floor cutaway and medium-duty buses remains encouraging, driven by changing population demographics,which could increase the demand for ARBOC's market leading products. Management does not anticipate anychassis related supply disruptions in 2020 for its low-floor cutaway vehicles. ARBOC is also focused on itsmedium-duty transit bus offerings, which generates a higher gross margin than its low-floor cutaway vehiclesand has been very well received by numerous public and private customers.
Aftermarket
NFI Parts continues to focus on numerous strategic initiatives to counter adverse market pressures, adecreasing installed base of NFI vehicles, from the expected retirement of NABI and Orion buses, andincreasing competitive intensity. These initiatives include additional focus on vendor managed inventory(“VMI”) programs, an enhanced product offering and capitalizing on the implementation of a common ITplatform. In 2020, NFI parts is looking to expand sales of ARBOC and cutaway spare parts and is exploringNorth American co-operation with ADL parts.
ADL’s Parts business continues to focus on enhancing its online parts and services platform AD 24, whichprovides industry leading aftermarket support to customers in the UK. Management expects ADL Aftermarketrevenue to grow as ADL expands its installed base. Due to the nature of the parts business, parts sales remaindifficult to forecast resulting in quarter-to-quarter volatility which at times can be material.
12
2020 OUTLOOK
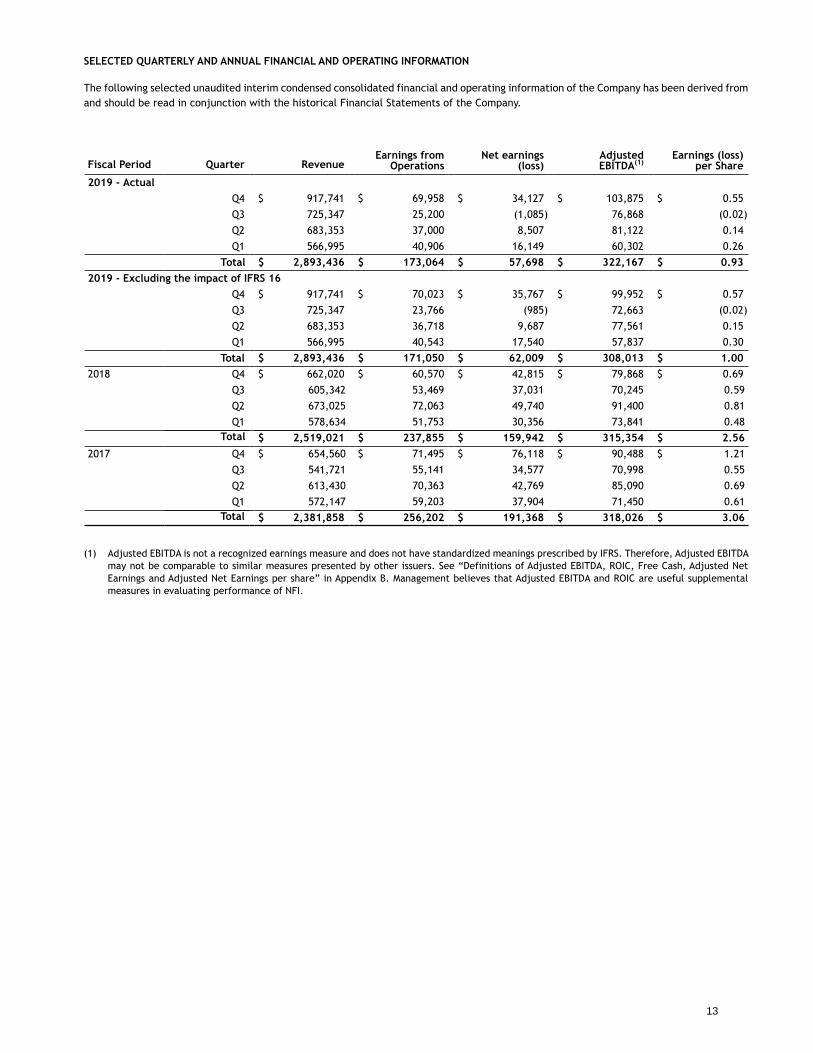
SELECTED QUARTERLY AND ANNUAL FINANCIAL AND OPERATING INFORMATION
The following selected unaudited interim condensed consolidated financial and operating information of the Company has been derived from and should be read in conjunction with the historical Financial Statements of the Company.
Fiscal Period Quarter RevenueEarnings from
OperationsNet earnings
(loss)Adjusted EBITDA(1)
Earnings (loss)per Share
2019 - Actual
Q4 $ 917,741 $ 69,958 $ 34,127 $ 103,875 $ 0.55
Q3 725,347 25,200 (1,085) 76,868 (0.02)
Q2 683,353 37,000 8,507 81,122 0.14
Q1 566,995 40,906 16,149 60,302 0.26
Total $ 2,893,436 $ 173,064 $ 57,698 $ 322,167 $ 0.93
2019 - Excluding the impact of IFRS 16
Q4 $ 917,741 $ 70,023 $ 35,767 $ 99,952 $ 0.57
Q3 725,347 23,766 (985) 72,663 (0.02)
Q2 683,353 36,718 9,687 77,561 0.15
Q1 566,995 40,543 17,540 57,837 0.30
Total $ 2,893,436 $ 171,050 $ 62,009 $ 308,013 $ 1.00
2018 Q4 $ 662,020 $ 60,570 $ 42,815 $ 79,868 $ 0.69
Q3 605,342 53,469 37,031 70,245 0.59
Q2 673,025 72,063 49,740 91,400 0.81
Q1 578,634 51,753 30,356 73,841 0.48Total $ 2,519,021 $ 237,855 $ 159,942 $ 315,354 $ 2.56
2017 Q4 $ 654,560 $ 71,495 $ 76,118 $ 90,488 $ 1.21
Q3 541,721 55,141 34,577 70,998 0.55
Q2 613,430 70,363 42,769 85,090 0.69
Q1 572,147 59,203 37,904 71,450 0.61Total $ 2,381,858 $ 256,202 $ 191,368 $ 318,026 $ 3.06
(1) Adjusted EBITDA is not a recognized earnings measure and does not have standardized meanings prescribed by IFRS. Therefore, Adjusted EBITDA may not be comparable to similar measures presented by other issuers. See “Definitions of Adjusted EBITDA, ROIC, Free Cash, Adjusted NetEarnings and Adjusted Net Earnings per share” in Appendix B. Management believes that Adjusted EBITDA and ROIC are useful supplementalmeasures in evaluating performance of NFI.
13
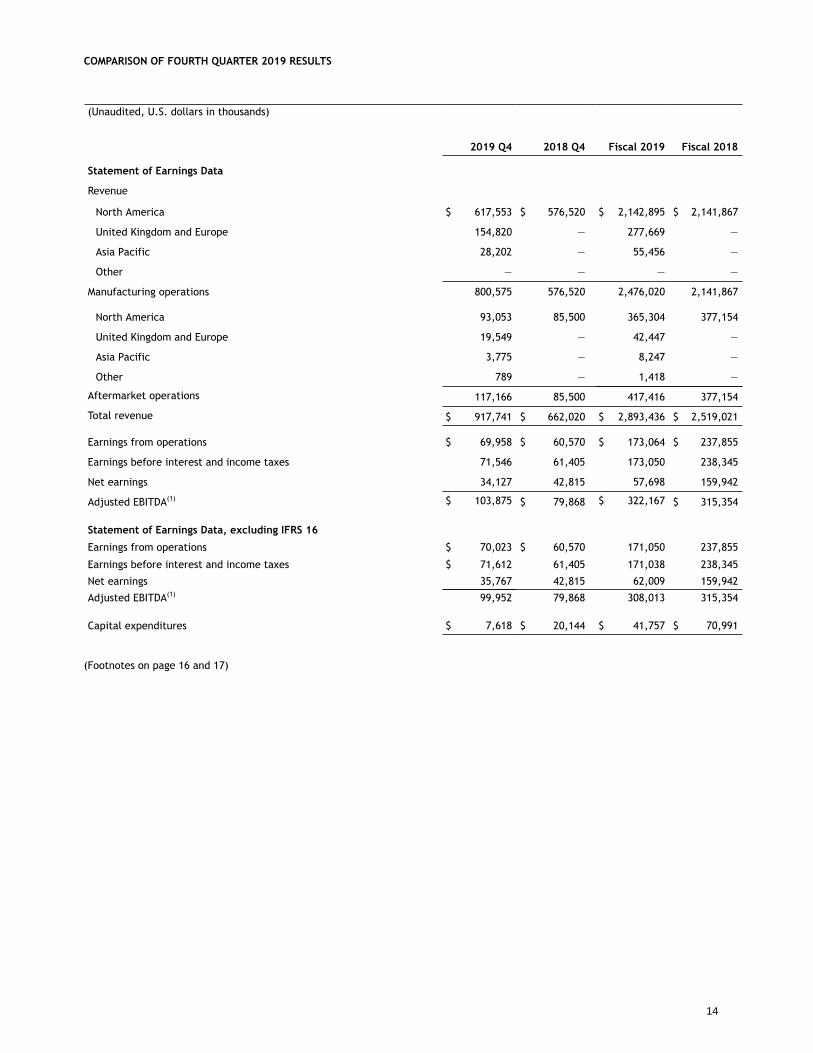
COMPARISON OF FOURTH QUARTER 2019 RESULTS
(Unaudited, U.S. dollars in thousands)
2019 Q4 2018 Q4 Fiscal 2019 Fiscal 2018
Statement of Earnings Data
Revenue
North America $ 617,553 $ 576,520 $ 2,142,895 $ 2,141,867
United Kingdom and Europe 154,820 — 277,669 —
Asia Pacific 28,202 — 55,456 —
Other — — — —
Manufacturing operations 800,575 576,520 2,476,020 2,141,867
North America 93,053 85,500 365,304 377,154
United Kingdom and Europe 19,549 — 42,447 —
Asia Pacific 3,775 — 8,247 —
Other 789 — 1,418 —
Aftermarket operations 117,166 85,500 417,416 377,154
Total revenue $ 917,741 $ 662,020 $ 2,893,436 $ 2,519,021
Earnings from operations $ 69,958 $ 60,570 $ 173,064 $ 237,855
Earnings before interest and income taxes 71,546 61,405 173,050 238,345
Net earnings 34,127 42,815 57,698 159,942
Adjusted EBITDA(1) $ 103,875 $ 79,868 $ 322,167 $ 315,354
Statement of Earnings Data, excluding IFRS 16
Earnings from operations $ 70,023 $ 60,570 171,050 237,855
Earnings before interest and income taxes $ 71,612 61,405 171,038 238,345
Net earnings 35,767 42,815 62,009 159,942
Adjusted EBITDA(1) 99,952 79,868 308,013 315,354
Capital expenditures $ 7,618 $ 20,144 $ 41,757 $ 70,991
(Footnotes on page 16 and 17)
14
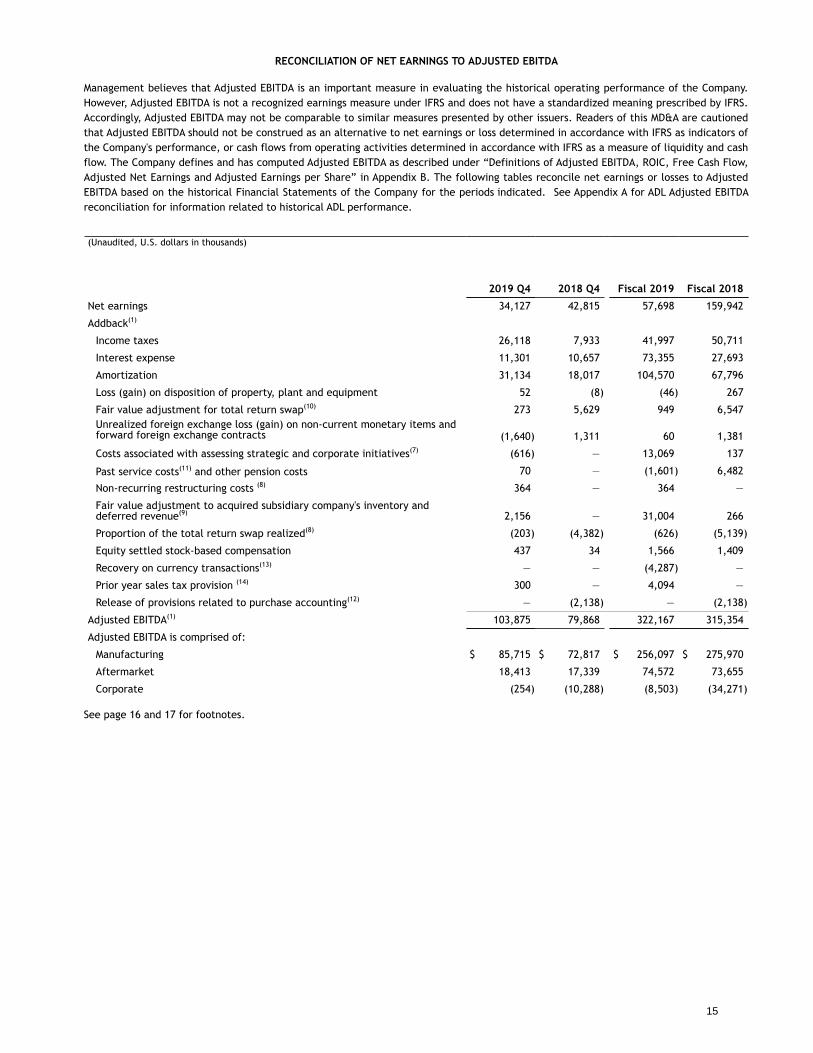
RECONCILIATION OF NET EARNINGS TO ADJUSTED EBITDA
Management believes that Adjusted EBITDA is an important measure in evaluating the historical operating performance of the Company. However, Adjusted EBITDA is not a recognized earnings measure under IFRS and does not have a standardized meaning prescribed by IFRS. Accordingly, Adjusted EBITDA may not be comparable to similar measures presented by other issuers. Readers of this MD&A are cautioned that Adjusted EBITDA should not be construed as an alternative to net earnings or loss determined in accordance with IFRS as indicators of the Company's performance, or cash flows from operating activities determined in accordance with IFRS as a measure of liquidity and cash flow. The Company defines and has computed Adjusted EBITDA as described under “Definitions of Adjusted EBITDA, ROIC, Free Cash Flow, Adjusted Net Earnings and Adjusted Earnings per Share” in Appendix B. The following tables reconcile net earnings or losses to Adjusted EBITDA based on the historical Financial Statements of the Company for the periods indicated. See Appendix A for ADL Adjusted EBITDA reconciliation for information related to historical ADL performance.
(Unaudited, U.S. dollars in thousands)
2019 Q4 2018 Q4 Fiscal 2019 Fiscal 2018
Net earnings 34,127 42,815 57,698 159,942
Addback(1)
Income taxes 26,118 7,933 41,997 50,711
Interest expense 11,301 10,657 73,355 27,693
Amortization 31,134 18,017 104,570 67,796
Loss (gain) on disposition of property, plant and equipment 52 (8) (46) 267
Fair value adjustment for total return swap(10) 273 5,629 949 6,547Unrealized foreign exchange loss (gain) on non-current monetary items andforward foreign exchange contracts (1,640) 1,311 60 1,381
Costs associated with assessing strategic and corporate initiatives(7) (616) — 13,069 137
Past service costs(11) and other pension costs 70 — (1,601) 6,482
Non-recurring restructuring costs (8) 364 — 364 —
Fair value adjustment to acquired subsidiary company's inventory and deferred revenue(9) 2,156 — 31,004 266
Proportion of the total return swap realized(8) (203) (4,382) (626) (5,139)
Equity settled stock-based compensation 437 34 1,566 1,409
Recovery on currency transactions(13) — — (4,287) —
Prior year sales tax provision (14) 300 — 4,094 —
Release of provisions related to purchase accounting(12) — (2,138) — (2,138)
Adjusted EBITDA(1) 103,875 79,868 322,167 315,354
Adjusted EBITDA is comprised of:
Manufacturing $ 85,715 $ 72,817 $ 256,097 $ 275,970
Aftermarket 18,413 17,339 74,572 73,655
Corporate (254) (10,288) (8,503) (34,271)
See page 16 and 17 for footnotes.
15
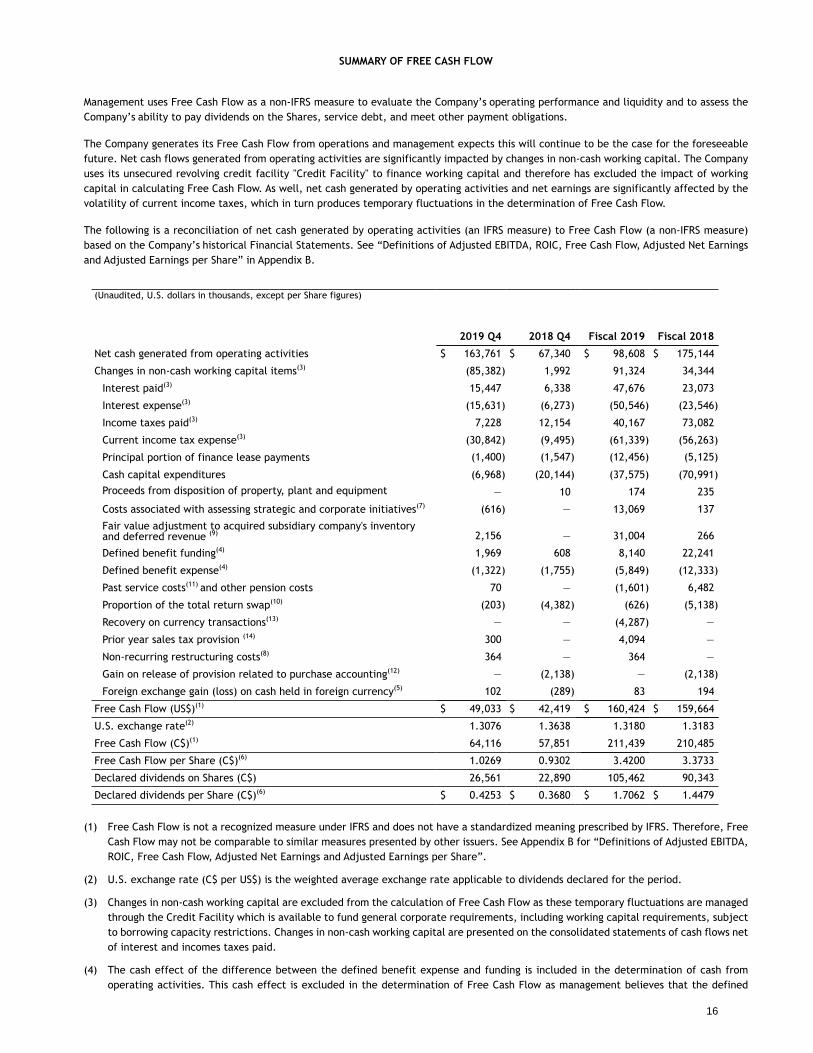
SUMMARY OF FREE CASH FLOW
Management uses Free Cash Flow as a non-IFRS measure to evaluate the Company’s operating performance and liquidity and to assess the Company’s ability to pay dividends on the Shares, service debt, and meet other payment obligations.
The Company generates its Free Cash Flow from operations and management expects this will continue to be the case for the foreseeable future. Net cash flows generated from operating activities are significantly impacted by changes in non-cash working capital. The Company uses its unsecured revolving credit facility "Credit Facility" to finance working capital and therefore has excluded the impact of working capital in calculating Free Cash Flow. As well, net cash generated by operating activities and net earnings are significantly affected by the volatility of current income taxes, which in turn produces temporary fluctuations in the determination of Free Cash Flow.
The following is a reconciliation of net cash generated by operating activities (an IFRS measure) to Free Cash Flow (a non-IFRS measure) based on the Company’s historical Financial Statements. See “Definitions of Adjusted EBITDA, ROIC, Free Cash Flow, Adjusted Net Earnings and Adjusted Earnings per Share” in Appendix B.
(Unaudited, U.S. dollars in thousands, except per Share figures)
2019 Q4 2018 Q4 Fiscal 2019 Fiscal 2018
Net cash generated from operating activities $ 163,761 $ 67,340 $ 98,608 $ 175,144
Changes in non-cash working capital items(3) (85,382) 1,992 91,324 34,344
Interest paid(3) 15,447 6,338 47,676 23,073
Interest expense(3) (15,631) (6,273) (50,546) (23,546)
Income taxes paid(3) 7,228 12,154 40,167 73,082
Current income tax expense(3) (30,842) (9,495) (61,339) (56,263)
Principal portion of finance lease payments (1,400) (1,547) (12,456) (5,125)
Cash capital expenditures (6,968) (20,144) (37,575) (70,991)
Proceeds from disposition of property, plant and equipment — 10 174 235
Costs associated with assessing strategic and corporate initiatives(7) (616) — 13,069 137
Fair value adjustment to acquired subsidiary company's inventory and deferred revenue (9) 2,156 — 31,004 266
Defined benefit funding(4) 1,969 608 8,140 22,241
Defined benefit expense(4) (1,322) (1,755) (5,849) (12,333)
Past service costs(11) and other pension costs 70 — (1,601) 6,482
Proportion of the total return swap(10) (203) (4,382) (626) (5,138)
Recovery on currency transactions(13) — — (4,287) —
Prior year sales tax provision (14) 300 — 4,094 —
Non-recurring restructuring costs(8) 364 — 364 —
Gain on release of provision related to purchase accounting(12) — (2,138) — (2,138)
Foreign exchange gain (loss) on cash held in foreign currency(5) 102 (289) 83 194
Free Cash Flow (US$)(1) $ 49,033 $ 42,419 $ 160,424 $ 159,664
U.S. exchange rate(2) 1.3076 1.3638 1.3180 1.3183
Free Cash Flow (C$)(1) 64,116 57,851 211,439 210,485
Free Cash Flow per Share (C$)(6) 1.0269 0.9302 3.4200 3.3733
Declared dividends on Shares (C$) 26,561 22,890 105,462 90,343
Declared dividends per Share (C$)(6) $ 0.4253 $ 0.3680 $ 1.7062 $ 1.4479
(1) Free Cash Flow is not a recognized measure under IFRS and does not have a standardized meaning prescribed by IFRS. Therefore, Free Cash Flow may not be comparable to similar measures presented by other issuers. See Appendix B for “Definitions of Adjusted EBITDA, ROIC, Free Cash Flow, Adjusted Net Earnings and Adjusted Earnings per Share”.
(2) U.S. exchange rate (C$ per US$) is the weighted average exchange rate applicable to dividends declared for the period.
(3) Changes in non-cash working capital are excluded from the calculation of Free Cash Flow as these temporary fluctuations are managed through the Credit Facility which is available to fund general corporate requirements, including working capital requirements, subject to borrowing capacity restrictions. Changes in non-cash working capital are presented on the consolidated statements of cash flows net of interest and incomes taxes paid.
(4) The cash effect of the difference between the defined benefit expense and funding is included in the determination of cash from operating activities. This cash effect is excluded in the determination of Free Cash Flow as management believes that the defined
16
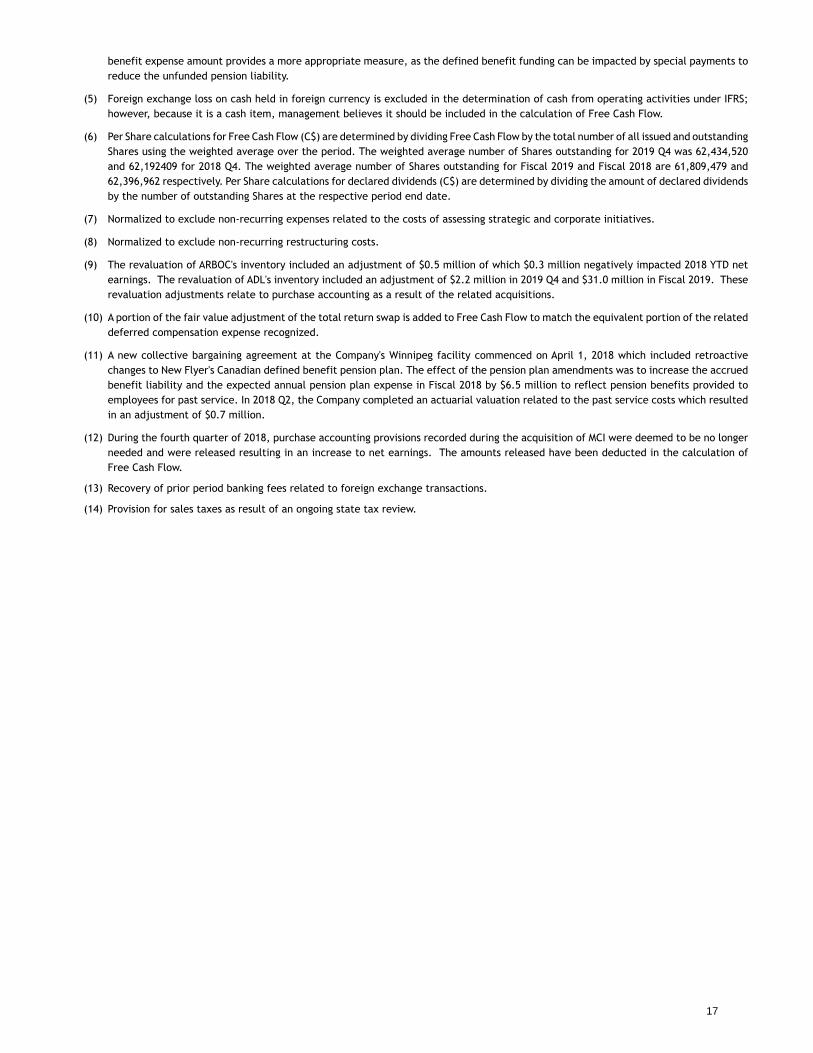
benefit expense amount provides a more appropriate measure, as the defined benefit funding can be impacted by special payments to reduce the unfunded pension liability.
(5) Foreign exchange loss on cash held in foreign currency is excluded in the determination of cash from operating activities under IFRS; however, because it is a cash item, management believes it should be included in the calculation of Free Cash Flow.
(6) Per Share calculations for Free Cash Flow (C$) are determined by dividing Free Cash Flow by the total number of all issued and outstanding Shares using the weighted average over the period. The weighted average number of Shares outstanding for 2019 Q4 was 62,434,520 and 62,192409 for 2018 Q4. The weighted average number of Shares outstanding for Fiscal 2019 and Fiscal 2018 are 61,809,479 and 62,396,962 respectively. Per Share calculations for declared dividends (C$) are determined by dividing the amount of declared dividends by the number of outstanding Shares at the respective period end date.
(7) Normalized to exclude non-recurring expenses related to the costs of assessing strategic and corporate initiatives.
(8) Normalized to exclude non-recurring restructuring costs.
(9) The revaluation of ARBOC's inventory included an adjustment of $0.5 million of which $0.3 million negatively impacted 2018 YTD net earnings. The revaluation of ADL's inventory included an adjustment of $2.2 million in 2019 Q4 and $31.0 million in Fiscal 2019. These revaluation adjustments relate to purchase accounting as a result of the related acquisitions.
(10) A portion of the fair value adjustment of the total return swap is added to Free Cash Flow to match the equivalent portion of the related deferred compensation expense recognized.
(11) A new collective bargaining agreement at the Company's Winnipeg facility commenced on April 1, 2018 which included retroactive changes to New Flyer's Canadian defined benefit pension plan. The effect of the pension plan amendments was to increase the accrued benefit liability and the expected annual pension plan expense in Fiscal 2018 by $6.5 million to reflect pension benefits provided to employees for past service. In 2018 Q2, the Company completed an actuarial valuation related to the past service costs which resulted in an adjustment of $0.7 million.
(12) During the fourth quarter of 2018, purchase accounting provisions recorded during the acquisition of MCI were deemed to be no longer needed and were released resulting in an increase to net earnings. The amounts released have been deducted in the calculation of Free Cash Flow.
(13) Recovery of prior period banking fees related to foreign exchange transactions.
(14) Provision for sales taxes as result of an ongoing state tax review.
17
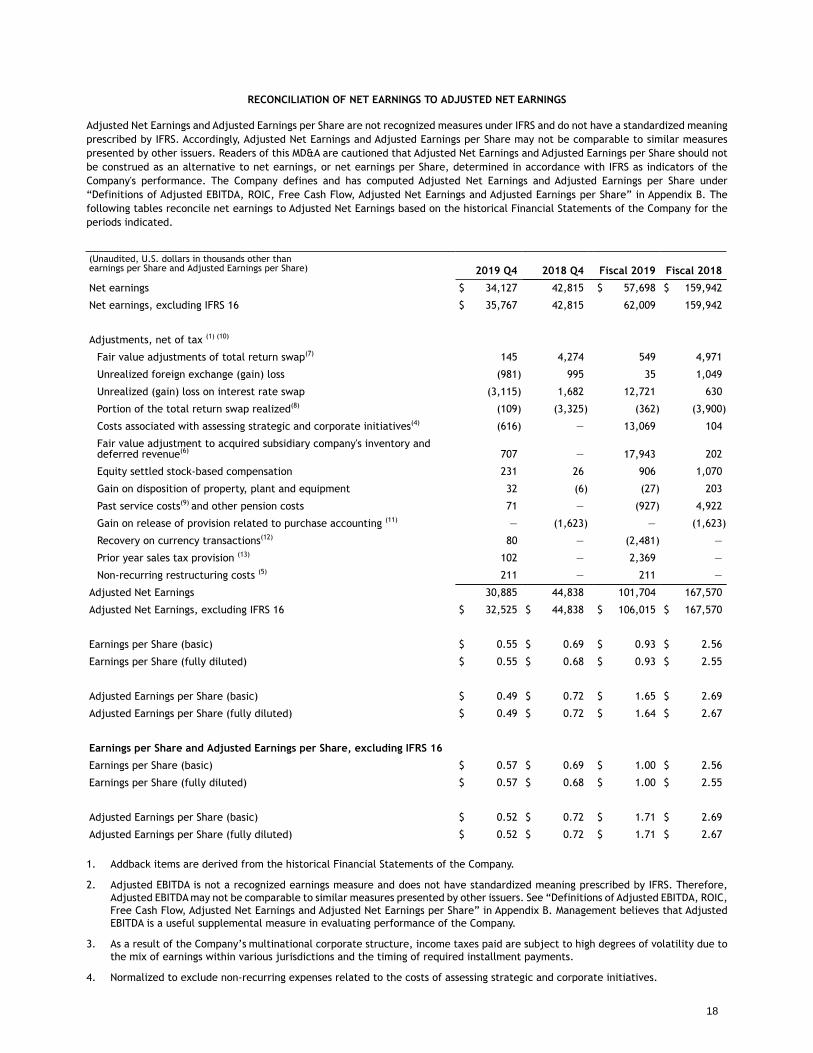
RECONCILIATION OF NET EARNINGS TO ADJUSTED NET EARNINGS
Adjusted Net Earnings and Adjusted Earnings per Share are not recognized measures under IFRS and do not have a standardized meaning prescribed by IFRS. Accordingly, Adjusted Net Earnings and Adjusted Earnings per Share may not be comparable to similar measures presented by other issuers. Readers of this MD&A are cautioned that Adjusted Net Earnings and Adjusted Earnings per Share should not be construed as an alternative to net earnings, or net earnings per Share, determined in accordance with IFRS as indicators of the Company's performance. The Company defines and has computed Adjusted Net Earnings and Adjusted Earnings per Share under “Definitions of Adjusted EBITDA, ROIC, Free Cash Flow, Adjusted Net Earnings and Adjusted Earnings per Share” in Appendix B. The following tables reconcile net earnings to Adjusted Net Earnings based on the historical Financial Statements of the Company for the periods indicated.
(Unaudited, U.S. dollars in thousands other thanearnings per Share and Adjusted Earnings per Share) 2019 Q4 2018 Q4 Fiscal 2019 Fiscal 2018
Net earnings $ 34,127 42,815 $ 57,698 $ 159,942
Net earnings, excluding IFRS 16 $ 35,767 42,815 62,009 159,942
Adjustments, net of tax (1) (10)
Fair value adjustments of total return swap(7) 145 4,274 549 4,971
Unrealized foreign exchange (gain) loss (981) 995 35 1,049
Unrealized (gain) loss on interest rate swap (3,115) 1,682 12,721 630
Portion of the total return swap realized(8) (109) (3,325) (362) (3,900)
Costs associated with assessing strategic and corporate initiatives(4) (616) — 13,069 104
Fair value adjustment to acquired subsidiary company's inventory and deferred revenue(6) 707 — 17,943 202
Equity settled stock-based compensation 231 26 906 1,070
Gain on disposition of property, plant and equipment 32 (6) (27) 203
Past service costs(9) and other pension costs 71 — (927) 4,922
Gain on release of provision related to purchase accounting (11) — (1,623) — (1,623)
Recovery on currency transactions(12) 80 — (2,481) —
Prior year sales tax provision (13) 102 — 2,369 —
Non-recurring restructuring costs (5) 211 — 211 —
Adjusted Net Earnings 30,885 44,838 101,704 167,570
Adjusted Net Earnings, excluding IFRS 16 $ 32,525 $ 44,838 $ 106,015 $ 167,570
Earnings per Share (basic) $ 0.55 $ 0.69 $ 0.93 $ 2.56
Earnings per Share (fully diluted) $ 0.55 $ 0.68 $ 0.93 $ 2.55
Adjusted Earnings per Share (basic) $ 0.49 $ 0.72 $ 1.65 $ 2.69
Adjusted Earnings per Share (fully diluted) $ 0.49 $ 0.72 $ 1.64 $ 2.67
Earnings per Share and Adjusted Earnings per Share, excluding IFRS 16
Earnings per Share (basic) $ 0.57 $ 0.69 $ 1.00 $ 2.56
Earnings per Share (fully diluted) $ 0.57 $ 0.68 $ 1.00 $ 2.55
Adjusted Earnings per Share (basic) $ 0.52 $ 0.72 $ 1.71 $ 2.69
Adjusted Earnings per Share (fully diluted) $ 0.52 $ 0.72 $ 1.71 $ 2.67
1. Addback items are derived from the historical Financial Statements of the Company.
2. Adjusted EBITDA is not a recognized earnings measure and does not have standardized meaning prescribed by IFRS. Therefore, Adjusted EBITDA may not be comparable to similar measures presented by other issuers. See “Definitions of Adjusted EBITDA, ROIC, Free Cash Flow, Adjusted Net Earnings and Adjusted Net Earnings per Share” in Appendix B. Management believes that Adjusted EBITDA is a useful supplemental measure in evaluating performance of the Company.
3. As a result of the Company’s multinational corporate structure, income taxes paid are subject to high degrees of volatility due to the mix of earnings within various jurisdictions and the timing of required installment payments.
4. Normalized to exclude non-recurring expenses related to the costs of assessing strategic and corporate initiatives.
18
5. Normalized to exclude non-recurring restructuring costs.
6. The revaluation of ADL's inventory included an adjustment of $2.2 million in 2019 Q4 after-tax value of $(0.5) million and $31.0 million in Fiscal 2019 after-tax value of $16.7 million. ARBOC's inventory included an adjustment of $0.3 million or $0.2 million after-tax in 2018 Q2. These revaluation adjustments relate to purchase accounting as a result of the related acquisitions.
7. The fair value adjustment of the total return swap is a non-cash gain that is deducted from the definition of Adjusted EBITDA.
8. A portion of the gain from the fair value adjustment of the total return swap is added to Adjusted EBITDA to match the equivalent portion of the related deferred compensation expense recognized.
9. A new collective bargaining agreement at the Company's Winnipeg facility commenced on April 1, 2018 which included retroactive changes to New Flyer's Canadian defined benefit pension plan. The effect of the pension plan amendments was to increase the accrued benefit liability and the expected annual pension plan expense in Fiscal 2018 by $6.5 million to reflect pension benefits provided to employees for past service. In 2018 Q2, the Company completed an actuarial valuation which resulted in an adjustment of $0.7 million for past service costs.
10. The expected ETR normalized for the acquisition of ADL, in each respective quarterly period is used to calculate adjustments, net of tax.
11. During 2018 Q4 purchase accounting provisions recorded during the acquisition of MCI were deemed to be no longer needed and were released resulting in an increase to net earnings. The amounts released have been deducted in the calculation of Adjusted EBITDA.
12. Recovery of prior period banking fees related to foreign exchange transactions.
13. Provision for sales taxes as a result of an ongoing state tax review.
19
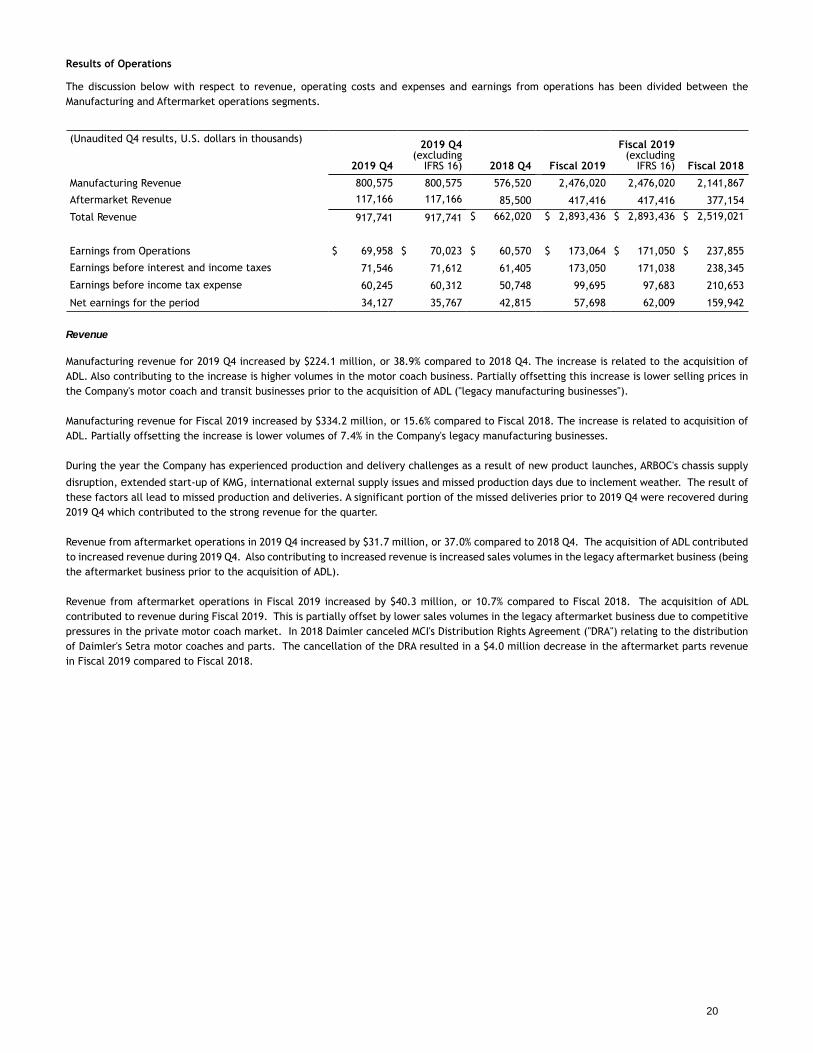
Results of Operations
The discussion below with respect to revenue, operating costs and expenses and earnings from operations has been divided between the Manufacturing and Aftermarket operations segments.
(Unaudited Q4 results, U.S. dollars in thousands)
2019 Q4
2019 Q4 (excluding
IFRS 16) 2018 Q4 Fiscal 2019
Fiscal 2019 (excluding
IFRS 16) Fiscal 2018
Manufacturing Revenue 800,575 800,575 576,520 2,476,020 2,476,020 2,141,867
Aftermarket Revenue 117,166 117,166 85,500 417,416 417,416 377,154
Total Revenue 917,741 917,741 $ 662,020 $ 2,893,436 $ 2,893,436 $ 2,519,021
Earnings from Operations $ 69,958 $ 70,023 $ 60,570 $ 173,064 $ 171,050 $ 237,855
Earnings before interest and income taxes 71,546 71,612 61,405 173,050 171,038 238,345
Earnings before income tax expense 60,245 60,312 50,748 99,695 97,683 210,653
Net earnings for the period 34,127 35,767 42,815 57,698 62,009 159,942
Revenue
Manufacturing revenue for 2019 Q4 increased by $224.1 million, or 38.9% compared to 2018 Q4. The increase is related to the acquisition of ADL. Also contributing to the increase is higher volumes in the motor coach business. Partially offsetting this increase is lower selling prices in the Company's motor coach and transit businesses prior to the acquisition of ADL ("legacy manufacturing businesses").
Manufacturing revenue for Fiscal 2019 increased by $334.2 million, or 15.6% compared to Fiscal 2018. The increase is related to acquisition of ADL. Partially offsetting the increase is lower volumes of 7.4% in the Company's legacy manufacturing businesses.
During the year the Company has experienced production and delivery challenges as a result of new product launches, ARBOC's chassis supply
disruption, extended start-up of KMG, international external supply issues and missed production days due to inclement weather. The result of these factors all lead to missed production and deliveries. A significant portion of the missed deliveries prior to 2019 Q4 were recovered during 2019 Q4 which contributed to the strong revenue for the quarter.
Revenue from aftermarket operations in 2019 Q4 increased by $31.7 million, or 37.0% compared to 2018 Q4. The acquisition of ADL contributed to increased revenue during 2019 Q4. Also contributing to increased revenue is increased sales volumes in the legacy aftermarket business (being the aftermarket business prior to the acquisition of ADL).
Revenue from aftermarket operations in Fiscal 2019 increased by $40.3 million, or 10.7% compared to Fiscal 2018. The acquisition of ADL contributed to revenue during Fiscal 2019. This is partially offset by lower sales volumes in the legacy aftermarket business due to competitive pressures in the private motor coach market. In 2018 Daimler canceled MCI's Distribution Rights Agreement ("DRA") relating to the distribution of Daimler's Setra motor coaches and parts. The cancellation of the DRA resulted in a $4.0 million decrease in the aftermarket parts revenue in Fiscal 2019 compared to Fiscal 2018.
20
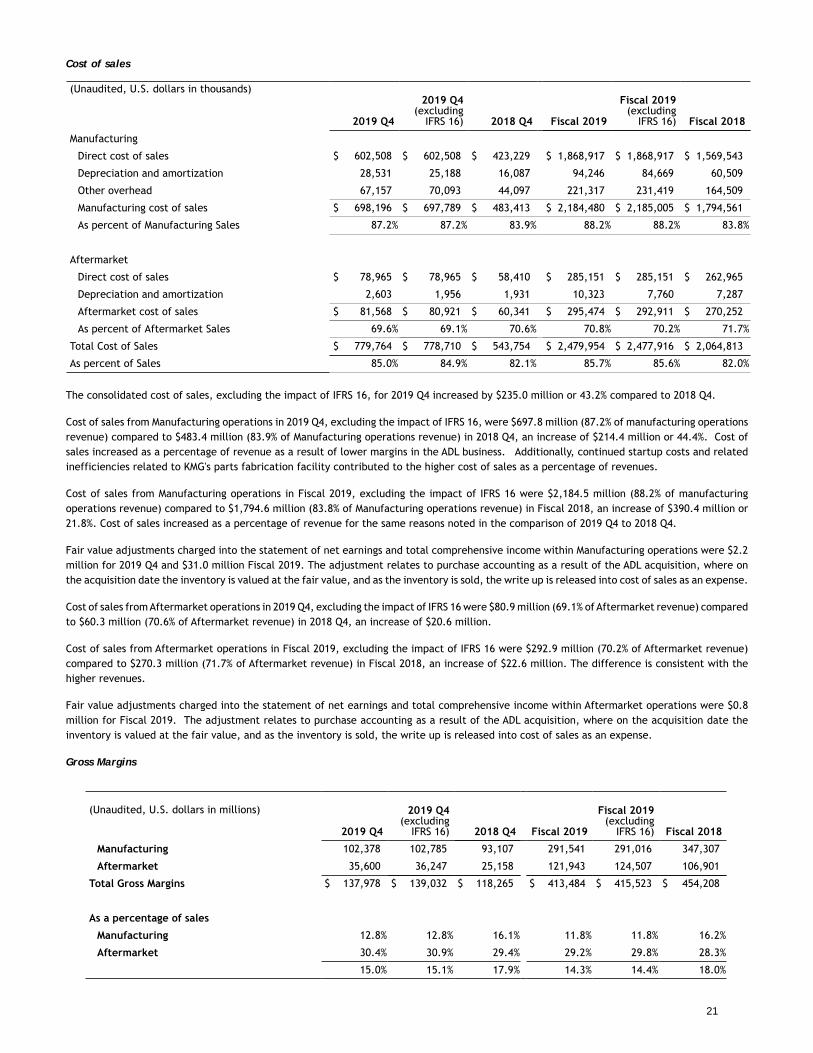
Cost of sales
(Unaudited, U.S. dollars in thousands)
2019 Q4
2019 Q4 (excluding
IFRS 16) 2018 Q4 Fiscal 2019
Fiscal 2019 (excluding
IFRS 16) Fiscal 2018
Manufacturing
Direct cost of sales $ 602,508 $ 602,508 $ 423,229 $ 1,868,917 $ 1,868,917 $ 1,569,543
Depreciation and amortization 28,531 25,188 16,087 94,246 84,669 60,509
Other overhead 67,157 70,093 44,097 221,317 231,419 164,509
Manufacturing cost of sales $ 698,196 $ 697,789 $ 483,413 $ 2,184,480 $ 2,185,005 $ 1,794,561
As percent of Manufacturing Sales 87.2% 87.2% 83.9% 88.2% 88.2% 83.8%
Aftermarket
Direct cost of sales $ 78,965 $ 78,965 $ 58,410 $ 285,151 $ 285,151 $ 262,965
Depreciation and amortization 2,603 1,956 1,931 10,323 7,760 7,287
Aftermarket cost of sales $ 81,568 $ 80,921 $ 60,341 $ 295,474 $ 292,911 $ 270,252
As percent of Aftermarket Sales 69.6% 69.1% 70.6% 70.8% 70.2% 71.7%
Total Cost of Sales $ 779,764 $ 778,710 $ 543,754 $ 2,479,954 $ 2,477,916 $ 2,064,813
As percent of Sales 85.0% 84.9% 82.1% 85.7% 85.6% 82.0%
The consolidated cost of sales, excluding the impact of IFRS 16, for 2019 Q4 increased by $235.0 million or 43.2% compared to 2018 Q4.
Cost of sales from Manufacturing operations in 2019 Q4, excluding the impact of IFRS 16, were $697.8 million (87.2% of manufacturing operations revenue) compared to $483.4 million (83.9% of Manufacturing operations revenue) in 2018 Q4, an increase of $214.4 million or 44.4%. Cost of sales increased as a percentage of revenue as a result of lower margins in the ADL business. Additionally, continued startup costs and related inefficiencies related to KMG's parts fabrication facility contributed to the higher cost of sales as a percentage of revenues.
Cost of sales from Manufacturing operations in Fiscal 2019, excluding the impact of IFRS 16 were $2,184.5 million (88.2% of manufacturing operations revenue) compared to $1,794.6 million (83.8% of Manufacturing operations revenue) in Fiscal 2018, an increase of $390.4 million or 21.8%. Cost of sales increased as a percentage of revenue for the same reasons noted in the comparison of 2019 Q4 to 2018 Q4.
Fair value adjustments charged into the statement of net earnings and total comprehensive income within Manufacturing operations were $2.2 million for 2019 Q4 and $31.0 million Fiscal 2019. The adjustment relates to purchase accounting as a result of the ADL acquisition, where on the acquisition date the inventory is valued at the fair value, and as the inventory is sold, the write up is released into cost of sales as an expense.
Cost of sales from Aftermarket operations in 2019 Q4, excluding the impact of IFRS 16 were $80.9 million (69.1% of Aftermarket revenue) compared to $60.3 million (70.6% of Aftermarket revenue) in 2018 Q4, an increase of $20.6 million.
Cost of sales from Aftermarket operations in Fiscal 2019, excluding the impact of IFRS 16 were $292.9 million (70.2% of Aftermarket revenue) compared to $270.3 million (71.7% of Aftermarket revenue) in Fiscal 2018, an increase of $22.6 million. The difference is consistent with the higher revenues.
Fair value adjustments charged into the statement of net earnings and total comprehensive income within Aftermarket operations were $0.8 million for Fiscal 2019. The adjustment relates to purchase accounting as a result of the ADL acquisition, where on the acquisition date the inventory is valued at the fair value, and as the inventory is sold, the write up is released into cost of sales as an expense.
Gross Margins
(Unaudited, U.S. dollars in millions)
2019 Q4
2019 Q4 (excluding
IFRS 16) 2018 Q4 Fiscal 2019
Fiscal 2019 (excluding
IFRS 16) Fiscal 2018
Manufacturing 102,378 102,785 93,107 291,541 291,016 347,307
Aftermarket 35,600 36,247 25,158 121,943 124,507 106,901
Total Gross Margins $ 137,978 $ 139,032 $ 118,265 $ 413,484 $ 415,523 $ 454,208
As a percentage of sales
Manufacturing 12.8% 12.8% 16.1% 11.8% 11.8% 16.2%
Aftermarket 30.4% 30.9% 29.4% 29.2% 29.8% 28.3%
15.0% 15.1% 17.9% 14.3% 14.4% 18.0%
21
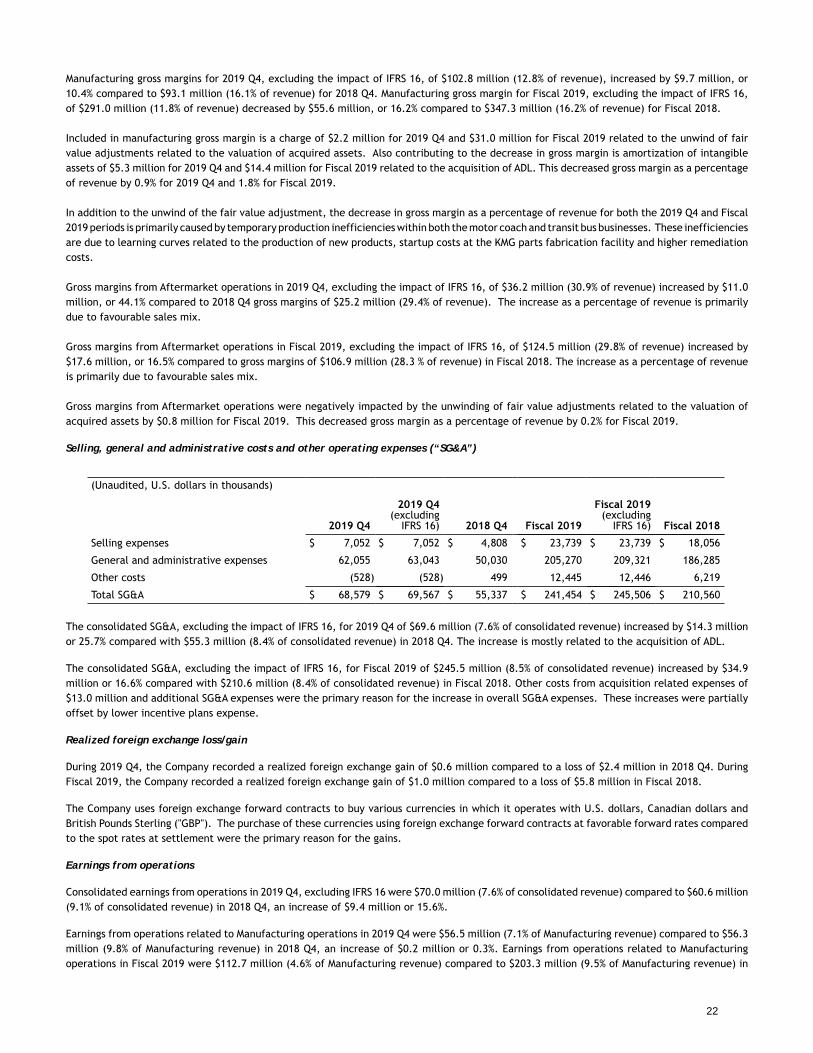
Manufacturing gross margins for 2019 Q4, excluding the impact of IFRS 16, of $102.8 million (12.8% of revenue), increased by $9.7 million, or 10.4% compared to $93.1 million (16.1% of revenue) for 2018 Q4. Manufacturing gross margin for Fiscal 2019, excluding the impact of IFRS 16, of $291.0 million (11.8% of revenue) decreased by $55.6 million, or 16.2% compared to $347.3 million (16.2% of revenue) for Fiscal 2018.
Included in manufacturing gross margin is a charge of $2.2 million for 2019 Q4 and $31.0 million for Fiscal 2019 related to the unwind of fair value adjustments related to the valuation of acquired assets. Also contributing to the decrease in gross margin is amortization of intangible assets of $5.3 million for 2019 Q4 and $14.4 million for Fiscal 2019 related to the acquisition of ADL. This decreased gross margin as a percentage of revenue by 0.9% for 2019 Q4 and 1.8% for Fiscal 2019.
In addition to the unwind of the fair value adjustment, the decrease in gross margin as a percentage of revenue for both the 2019 Q4 and Fiscal 2019 periods is primarily caused by temporary production inefficiencies within both the motor coach and transit bus businesses. These inefficiencies are due to learning curves related to the production of new products, startup costs at the KMG parts fabrication facility and higher remediation costs.
Gross margins from Aftermarket operations in 2019 Q4, excluding the impact of IFRS 16, of $36.2 million (30.9% of revenue) increased by $11.0 million, or 44.1% compared to 2018 Q4 gross margins of $25.2 million (29.4% of revenue). The increase as a percentage of revenue is primarily due to favourable sales mix.
Gross margins from Aftermarket operations in Fiscal 2019, excluding the impact of IFRS 16, of $124.5 million (29.8% of revenue) increased by $17.6 million, or 16.5% compared to gross margins of $106.9 million (28.3 % of revenue) in Fiscal 2018. The increase as a percentage of revenue is primarily due to favourable sales mix.
Gross margins from Aftermarket operations were negatively impacted by the unwinding of fair value adjustments related to the valuation of acquired assets by $0.8 million for Fiscal 2019. This decreased gross margin as a percentage of revenue by 0.2% for Fiscal 2019.
Selling, general and administrative costs and other operating expenses (“SG&A”)
(Unaudited, U.S. dollars in thousands)
2019 Q4
2019 Q4 (excluding
IFRS 16) 2018 Q4 Fiscal 2019
Fiscal 2019 (excluding
IFRS 16) Fiscal 2018
Selling expenses $ 7,052 $ 7,052 $ 4,808 $ 23,739 $ 23,739 $ 18,056
General and administrative expenses 62,055 63,043 50,030 205,270 209,321 186,285
Other costs (528) (528) 499 12,445 12,446 6,219
Total SG&A $ 68,579 $ 69,567 $ 55,337 $ 241,454 $ 245,506 $ 210,560
The consolidated SG&A, excluding the impact of IFRS 16, for 2019 Q4 of $69.6 million (7.6% of consolidated revenue) increased by $14.3 million or 25.7% compared with $55.3 million (8.4% of consolidated revenue) in 2018 Q4. The increase is mostly related to the acquisition of ADL.
The consolidated SG&A, excluding the impact of IFRS 16, for Fiscal 2019 of $245.5 million (8.5% of consolidated revenue) increased by $34.9 million or 16.6% compared with $210.6 million (8.4% of consolidated revenue) in Fiscal 2018. Other costs from acquisition related expenses of $13.0 million and additional SG&A expenses were the primary reason for the increase in overall SG&A expenses. These increases were partially offset by lower incentive plans expense.
Realized foreign exchange loss/gain
During 2019 Q4, the Company recorded a realized foreign exchange gain of $0.6 million compared to a loss of $2.4 million in 2018 Q4. During Fiscal 2019, the Company recorded a realized foreign exchange gain of $1.0 million compared to a loss of $5.8 million in Fiscal 2018.
The Company uses foreign exchange forward contracts to buy various currencies in which it operates with U.S. dollars, Canadian dollars and British Pounds Sterling ("GBP"). The purchase of these currencies using foreign exchange forward contracts at favorable forward rates compared to the spot rates at settlement were the primary reason for the gains.
Earnings from operations
Consolidated earnings from operations in 2019 Q4, excluding IFRS 16 were $70.0 million (7.6% of consolidated revenue) compared to $60.6 million (9.1% of consolidated revenue) in 2018 Q4, an increase of $9.4 million or 15.6%.
Earnings from operations related to Manufacturing operations in 2019 Q4 were $56.5 million (7.1% of Manufacturing revenue) compared to $56.3 million (9.8% of Manufacturing revenue) in 2018 Q4, an increase of $0.2 million or 0.3%. Earnings from operations related to Manufacturing operations in Fiscal 2019 were $112.7 million (4.6% of Manufacturing revenue) compared to $203.3 million (9.5% of Manufacturing revenue) in
22
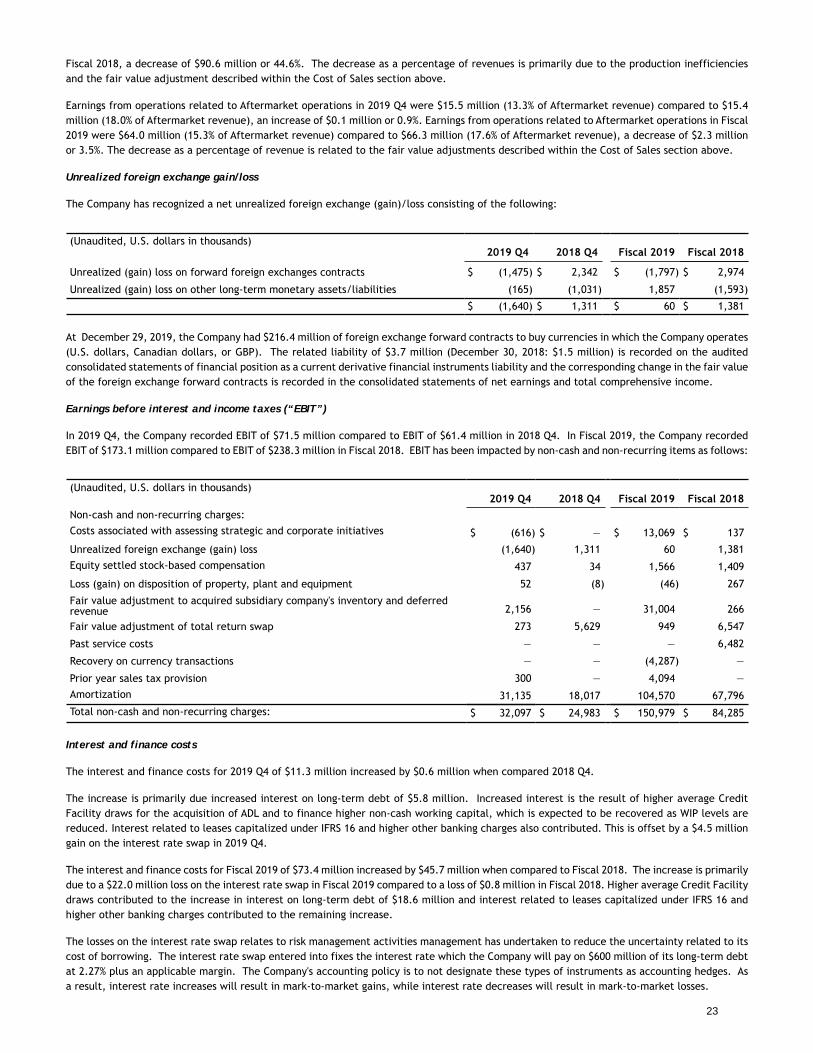
Fiscal 2018, a decrease of $90.6 million or 44.6%. The decrease as a percentage of revenues is primarily due to the production inefficiencies and the fair value adjustment described within the Cost of Sales section above.
Earnings from operations related to Aftermarket operations in 2019 Q4 were $15.5 million (13.3% of Aftermarket revenue) compared to $15.4 million (18.0% of Aftermarket revenue), an increase of $0.1 million or 0.9%. Earnings from operations related to Aftermarket operations in Fiscal 2019 were $64.0 million (15.3% of Aftermarket revenue) compared to $66.3 million (17.6% of Aftermarket revenue), a decrease of $2.3 million or 3.5%. The decrease as a percentage of revenue is related to the fair value adjustments described within the Cost of Sales section above.
Unrealized foreign exchange gain/loss
The Company has recognized a net unrealized foreign exchange (gain)/loss consisting of the following:
(Unaudited, U.S. dollars in thousands)2019 Q4 2018 Q4 Fiscal 2019 Fiscal 2018
Unrealized (gain) loss on forward foreign exchanges contracts $ (1,475) $ 2,342 $ (1,797) $ 2,974
Unrealized (gain) loss on other long-term monetary assets/liabilities (165) (1,031) 1,857 (1,593)
$ (1,640) $ 1,311 $ 60 $ 1,381
At December 29, 2019, the Company had $216.4 million of foreign exchange forward contracts to buy currencies in which the Company operates (U.S. dollars, Canadian dollars, or GBP). The related liability of $3.7 million (December 30, 2018: $1.5 million) is recorded on the audited consolidated statements of financial position as a current derivative financial instruments liability and the corresponding change in the fair value of the foreign exchange forward contracts is recorded in the consolidated statements of net earnings and total comprehensive income.
Earnings before interest and income taxes (“EBIT”)
In 2019 Q4, the Company recorded EBIT of $71.5 million compared to EBIT of $61.4 million in 2018 Q4. In Fiscal 2019, the Company recorded EBIT of $173.1 million compared to EBIT of $238.3 million in Fiscal 2018. EBIT has been impacted by non-cash and non-recurring items as follows:
(Unaudited, U.S. dollars in thousands)2019 Q4 2018 Q4 Fiscal 2019 Fiscal 2018
Non-cash and non-recurring charges:
Costs associated with assessing strategic and corporate initiatives $ (616) $ — $ 13,069 $ 137
Unrealized foreign exchange (gain) loss (1,640) 1,311 60 1,381
Equity settled stock-based compensation 437 34 1,566 1,409
Loss (gain) on disposition of property, plant and equipment 52 (8) (46) 267
Fair value adjustment to acquired subsidiary company's inventory and deferredrevenue 2,156 — 31,004 266
Fair value adjustment of total return swap 273 5,629 949 6,547
Past service costs — — — 6,482
Recovery on currency transactions — — (4,287) —
Prior year sales tax provision 300 — 4,094 —
Amortization 31,135 18,017 104,570 67,796
Total non-cash and non-recurring charges: $ 32,097 $ 24,983 $ 150,979 $ 84,285
Interest and finance costs
The interest and finance costs for 2019 Q4 of $11.3 million increased by $0.6 million when compared 2018 Q4.
The increase is primarily due increased interest on long-term debt of $5.8 million. Increased interest is the result of higher average Credit Facility draws for the acquisition of ADL and to finance higher non-cash working capital, which is expected to be recovered as WIP levels are reduced. Interest related to leases capitalized under IFRS 16 and higher other banking charges also contributed. This is offset by a $4.5 million gain on the interest rate swap in 2019 Q4.
The interest and finance costs for Fiscal 2019 of $73.4 million increased by $45.7 million when compared to Fiscal 2018. The increase is primarily due to a $22.0 million loss on the interest rate swap in Fiscal 2019 compared to a loss of $0.8 million in Fiscal 2018. Higher average Credit Facility draws contributed to the increase in interest on long-term debt of $18.6 million and interest related to leases capitalized under IFRS 16 and higher other banking charges contributed to the remaining increase.
The losses on the interest rate swap relates to risk management activities management has undertaken to reduce the uncertainty related to its cost of borrowing. The interest rate swap entered into fixes the interest rate which the Company will pay on $600 million of its long-term debt at 2.27% plus an applicable margin. The Company's accounting policy is to not designate these types of instruments as accounting hedges. As a result, interest rate increases will result in mark-to-market gains, while interest rate decreases will result in mark-to-market losses.
23
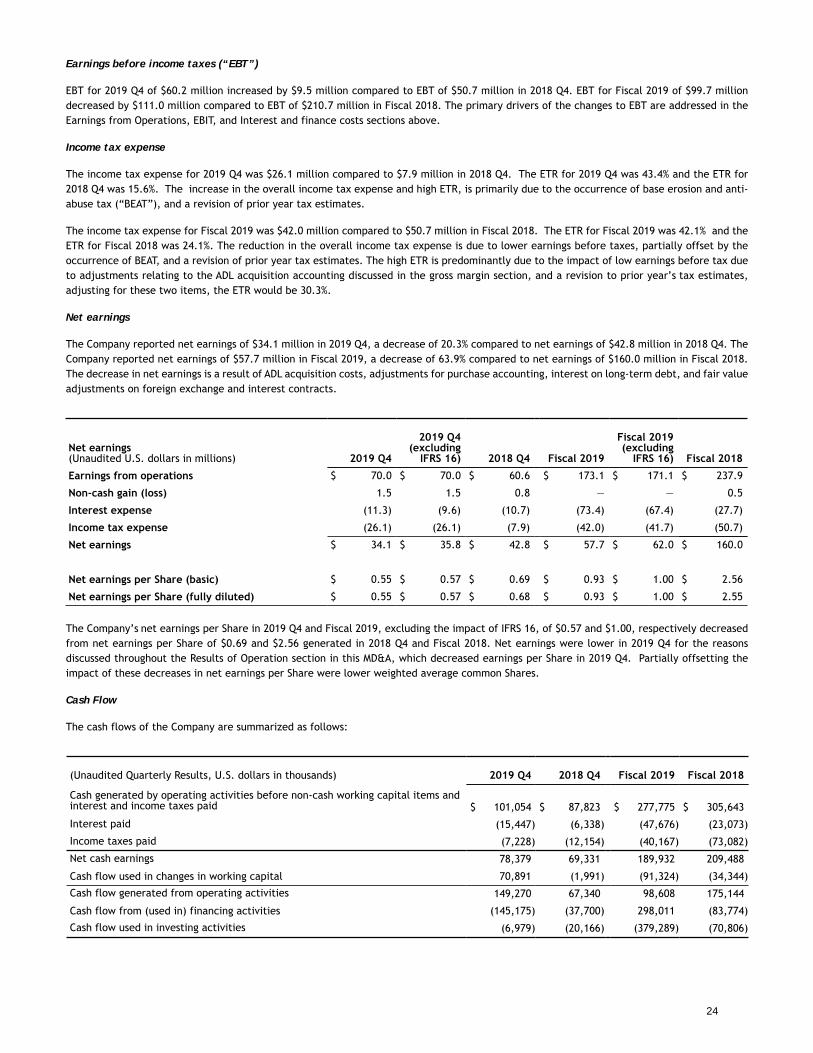
Earnings before income taxes (“EBT”)
EBT for 2019 Q4 of $60.2 million increased by $9.5 million compared to EBT of $50.7 million in 2018 Q4. EBT for Fiscal 2019 of $99.7 million decreased by $111.0 million compared to EBT of $210.7 million in Fiscal 2018. The primary drivers of the changes to EBT are addressed in the Earnings from Operations, EBIT, and Interest and finance costs sections above.
Income tax expense
The income tax expense for 2019 Q4 was $26.1 million compared to $7.9 million in 2018 Q4. The ETR for 2019 Q4 was 43.4% and the ETR for 2018 Q4 was 15.6%. The increase in the overall income tax expense and high ETR, is primarily due to the occurrence of base erosion and anti-abuse tax (“BEAT”), and a revision of prior year tax estimates.
The income tax expense for Fiscal 2019 was $42.0 million compared to $50.7 million in Fiscal 2018. The ETR for Fiscal 2019 was 42.1% and theETR for Fiscal 2018 was 24.1%. The reduction in the overall income tax expense is due to lower earnings before taxes, partially offset by the occurrence of BEAT, and a revision of prior year tax estimates. The high ETR is predominantly due to the impact of low earnings before tax due to adjustments relating to the ADL acquisition accounting discussed in the gross margin section, and a revision to prior year’s tax estimates, adjusting for these two items, the ETR would be 30.3%.
Net earnings
The Company reported net earnings of $34.1 million in 2019 Q4, a decrease of 20.3% compared to net earnings of $42.8 million in 2018 Q4. The Company reported net earnings of $57.7 million in Fiscal 2019, a decrease of 63.9% compared to net earnings of $160.0 million in Fiscal 2018. The decrease in net earnings is a result of ADL acquisition costs, adjustments for purchase accounting, interest on long-term debt, and fair value adjustments on foreign exchange and interest contracts.
Net earnings (Unaudited U.S. dollars in millions) 2019 Q4
2019 Q4(excluding
IFRS 16) 2018 Q4 Fiscal 2019
Fiscal 2019(excluding
IFRS 16) Fiscal 2018
Earnings from operations $ 70.0 $ 70.0 $ 60.6 $ 173.1 $ 171.1 $ 237.9
Non-cash gain (loss) 1.5 1.5 0.8 — — 0.5
Interest expense (11.3) (9.6) (10.7) (73.4) (67.4) (27.7)
Income tax expense (26.1) (26.1) (7.9) (42.0) (41.7) (50.7)
Net earnings $ 34.1 $ 35.8 $ 42.8 $ 57.7 $ 62.0 $ 160.0
Net earnings per Share (basic) $ 0.55 $ 0.57 $ 0.69 $ 0.93 $ 1.00 $ 2.56
Net earnings per Share (fully diluted) $ 0.55 $ 0.57 $ 0.68 $ 0.93 $ 1.00 $ 2.55
The Company’s net earnings per Share in 2019 Q4 and Fiscal 2019, excluding the impact of IFRS 16, of $0.57 and $1.00, respectively decreased from net earnings per Share of $0.69 and $2.56 generated in 2018 Q4 and Fiscal 2018. Net earnings were lower in 2019 Q4 for the reasons discussed throughout the Results of Operation section in this MD&A, which decreased earnings per Share in 2019 Q4. Partially offsetting the impact of these decreases in net earnings per Share were lower weighted average common Shares.
Cash Flow
The cash flows of the Company are summarized as follows:
(Unaudited Quarterly Results, U.S. dollars in thousands) 2019 Q4 2018 Q4 Fiscal 2019 Fiscal 2018
Cash generated by operating activities before non-cash working capital items andinterest and income taxes paid $ 101,054 $ 87,823 $ 277,775 $ 305,643
Interest paid (15,447) (6,338) (47,676) (23,073)
Income taxes paid (7,228) (12,154) (40,167) (73,082)
Net cash earnings 78,379 69,331 189,932 209,488
Cash flow used in changes in working capital 70,891 (1,991) (91,324) (34,344)
Cash flow generated from operating activities 149,270 67,340 98,608 175,144
Cash flow from (used in) financing activities (145,175) (37,700) 298,011 (83,774)
Cash flow used in investing activities (6,979) (20,166) (379,289) (70,806)
24
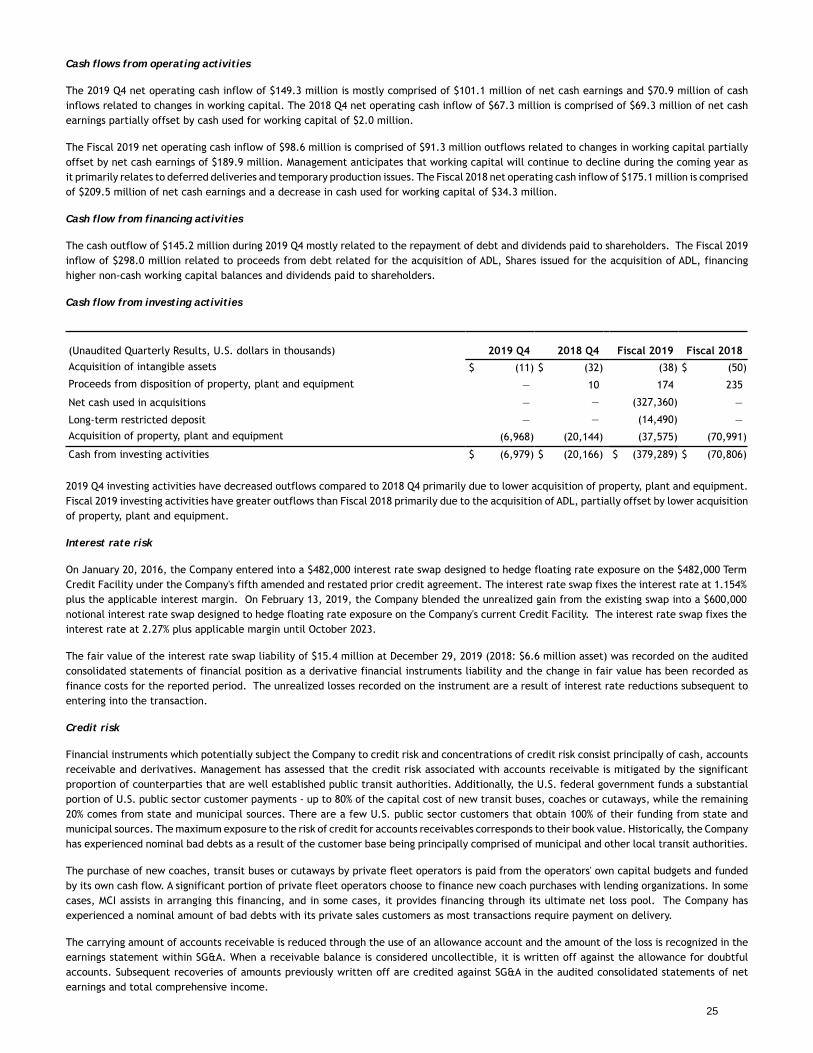
Cash flows from operating activities
The 2019 Q4 net operating cash inflow of $149.3 million is mostly comprised of $101.1 million of net cash earnings and $70.9 million of cash inflows related to changes in working capital. The 2018 Q4 net operating cash inflow of $67.3 million is comprised of $69.3 million of net cash earnings partially offset by cash used for working capital of $2.0 million.
The Fiscal 2019 net operating cash inflow of $98.6 million is comprised of $91.3 million outflows related to changes in working capital partially offset by net cash earnings of $189.9 million. Management anticipates that working capital will continue to decline during the coming year as it primarily relates to deferred deliveries and temporary production issues. The Fiscal 2018 net operating cash inflow of $175.1 million is comprised of $209.5 million of net cash earnings and a decrease in cash used for working capital of $34.3 million.
Cash flow from financing activities
The cash outflow of $145.2 million during 2019 Q4 mostly related to the repayment of debt and dividends paid to shareholders. The Fiscal 2019 inflow of $298.0 million related to proceeds from debt related for the acquisition of ADL, Shares issued for the acquisition of ADL, financing higher non-cash working capital balances and dividends paid to shareholders.
Cash flow from investing activities
(Unaudited Quarterly Results, U.S. dollars in thousands) 2019 Q4 2018 Q4 Fiscal 2019 Fiscal 2018
Acquisition of intangible assets $ (11) $ (32) (38) $ (50)
Proceeds from disposition of property, plant and equipment — 10 174 235
Net cash used in acquisitions — — (327,360) —
Long-term restricted deposit — — (14,490) —
Acquisition of property, plant and equipment (6,968) (20,144) (37,575) (70,991)
Cash from investing activities $ (6,979) $ (20,166) $ (379,289) $ (70,806)
2019 Q4 investing activities have decreased outflows compared to 2018 Q4 primarily due to lower acquisition of property, plant and equipment. Fiscal 2019 investing activities have greater outflows than Fiscal 2018 primarily due to the acquisition of ADL, partially offset by lower acquisition of property, plant and equipment.
Interest rate risk
On January 20, 2016, the Company entered into a $482,000 interest rate swap designed to hedge floating rate exposure on the $482,000 Term Credit Facility under the Company's fifth amended and restated prior credit agreement. The interest rate swap fixes the interest rate at 1.154% plus the applicable interest margin. On February 13, 2019, the Company blended the unrealized gain from the existing swap into a $600,000 notional interest rate swap designed to hedge floating rate exposure on the Company's current Credit Facility. The interest rate swap fixes the interest rate at 2.27% plus applicable margin until October 2023.
The fair value of the interest rate swap liability of $15.4 million at December 29, 2019 (2018: $6.6 million asset) was recorded on the audited consolidated statements of financial position as a derivative financial instruments liability and the change in fair value has been recorded as finance costs for the reported period. The unrealized losses recorded on the instrument are a result of interest rate reductions subsequent to entering into the transaction.
Credit risk
Financial instruments which potentially subject the Company to credit risk and concentrations of credit risk consist principally of cash, accounts receivable and derivatives. Management has assessed that the credit risk associated with accounts receivable is mitigated by the significant proportion of counterparties that are well established public transit authorities. Additionally, the U.S. federal government funds a substantial portion of U.S. public sector customer payments - up to 80% of the capital cost of new transit buses, coaches or cutaways, while the remaining 20% comes from state and municipal sources. There are a few U.S. public sector customers that obtain 100% of their funding from state and municipal sources. The maximum exposure to the risk of credit for accounts receivables corresponds to their book value. Historically, the Company has experienced nominal bad debts as a result of the customer base being principally comprised of municipal and other local transit authorities.
The purchase of new coaches, transit buses or cutaways by private fleet operators is paid from the operators' own capital budgets and funded by its own cash flow. A significant portion of private fleet operators choose to finance new coach purchases with lending organizations. In some cases, MCI assists in arranging this financing, and in some cases, it provides financing through its ultimate net loss pool. The Company has experienced a nominal amount of bad debts with its private sales customers as most transactions require payment on delivery.
The carrying amount of accounts receivable is reduced through the use of an allowance account and the amount of the loss is recognized in the earnings statement within SG&A. When a receivable balance is considered uncollectible, it is written off against the allowance for doubtful accounts. Subsequent recoveries of amounts previously written off are credited against SG&A in the audited consolidated statements of net earnings and total comprehensive income.
25
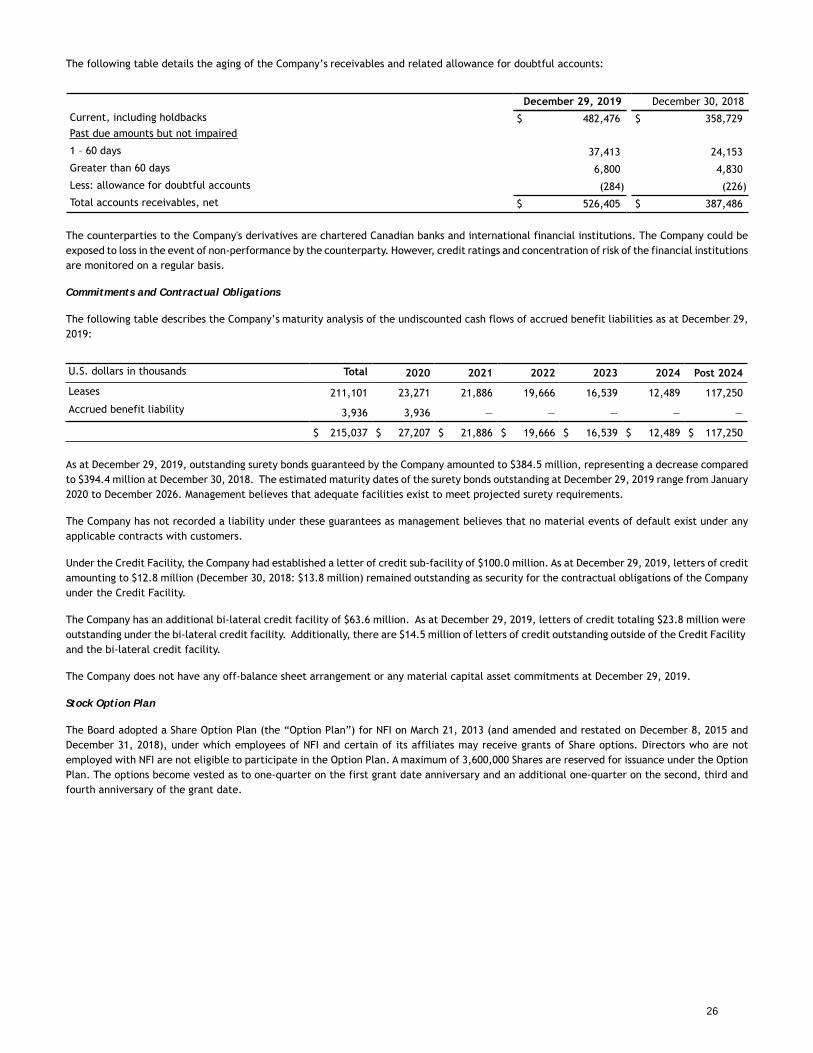
The following table details the aging of the Company’s receivables and related allowance for doubtful accounts:
December 29, 2019 December 30, 2018
Current, including holdbacks $ 482,476 $ 358,729Past due amounts but not impaired
1 – 60 days 37,413 24,153
Greater than 60 days 6,800 4,830
Less: allowance for doubtful accounts (284) (226)
Total accounts receivables, net $ 526,405 $ 387,486
The counterparties to the Company's derivatives are chartered Canadian banks and international financial institutions. The Company could be exposed to loss in the event of non-performance by the counterparty. However, credit ratings and concentration of risk of the financial institutions are monitored on a regular basis.
Commitments and Contractual Obligations
The following table describes the Company’s maturity analysis of the undiscounted cash flows of accrued benefit liabilities as at December 29, 2019:
U.S. dollars in thousands Total 2020 2021 2022 2023 2024 Post 2024
Leases 211,101 23,271 21,886 19,666 16,539 12,489 117,250
Accrued benefit liability 3,936 3,936 — — — — —
$ 215,037 $ 27,207 $ 21,886 $ 19,666 $ 16,539 $ 12,489 $ 117,250
As at December 29, 2019, outstanding surety bonds guaranteed by the Company amounted to $384.5 million, representing a decrease compared to $394.4 million at December 30, 2018. The estimated maturity dates of the surety bonds outstanding at December 29, 2019 range from January 2020 to December 2026. Management believes that adequate facilities exist to meet projected surety requirements.
The Company has not recorded a liability under these guarantees as management believes that no material events of default exist under any applicable contracts with customers.
Under the Credit Facility, the Company had established a letter of credit sub-facility of $100.0 million. As at December 29, 2019, letters of credit amounting to $12.8 million (December 30, 2018: $13.8 million) remained outstanding as security for the contractual obligations of the Company under the Credit Facility.
The Company has an additional bi-lateral credit facility of $63.6 million. As at December 29, 2019, letters of credit totaling $23.8 million were outstanding under the bi-lateral credit facility. Additionally, there are $14.5 million of letters of credit outstanding outside of the Credit Facility and the bi-lateral credit facility.
The Company does not have any off-balance sheet arrangement or any material capital asset commitments at December 29, 2019.
Stock Option Plan
The Board adopted a Share Option Plan (the “Option Plan”) for NFI on March 21, 2013 (and amended and restated on December 8, 2015 and December 31, 2018), under which employees of NFI and certain of its affiliates may receive grants of Share options. Directors who are not employed with NFI are not eligible to participate in the Option Plan. A maximum of 3,600,000 Shares are reserved for issuance under the Option Plan. The options become vested as to one-quarter on the first grant date anniversary and an additional one-quarter on the second, third and fourth anniversary of the grant date.
26
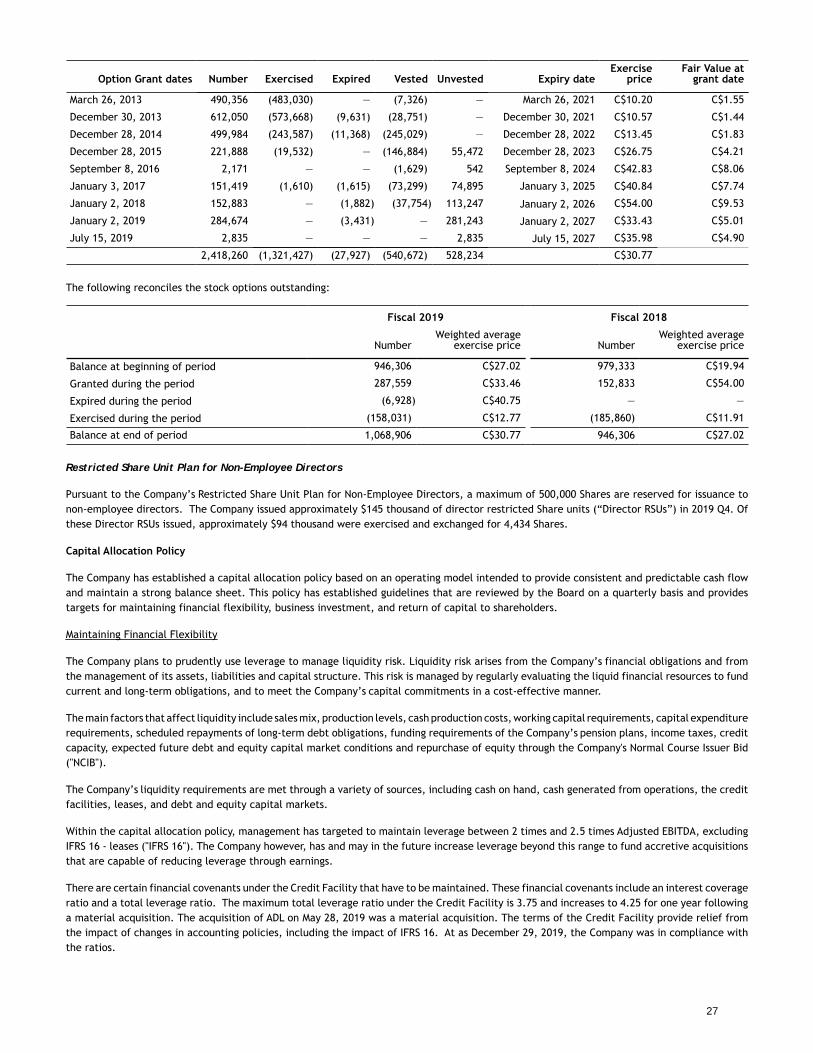
Option Grant dates Number Exercised Expired Vested Unvested Expiry dateExercise
priceFair Value at
grant date
March 26, 2013 490,356 (483,030) — (7,326) — March 26, 2021 C$10.20 C$1.55
December 30, 2013 612,050 (573,668) (9,631) (28,751) — December 30, 2021 C$10.57 C$1.44
December 28, 2014 499,984 (243,587) (11,368) (245,029) — December 28, 2022 C$13.45 C$1.83
December 28, 2015 221,888 (19,532) — (146,884) 55,472 December 28, 2023 C$26.75 C$4.21
September 8, 2016 2,171 — — (1,629) 542 September 8, 2024 C$42.83 C$8.06
January 3, 2017 151,419 (1,610) (1,615) (73,299) 74,895 January 3, 2025 C$40.84 C$7.74
January 2, 2018 152,883 — (1,882) (37,754) 113,247 January 2, 2026 C$54.00 C$9.53
January 2, 2019 284,674 — (3,431) — 281,243 January 2, 2027 C$33.43 C$5.01
July 15, 2019 2,835 — — — 2,835 July 15, 2027 C$35.98 C$4.90
2,418,260 (1,321,427) (27,927) (540,672) 528,234 C$30.77
The following reconciles the stock options outstanding:
Fiscal 2019 Fiscal 2018
NumberWeighted average
exercise price NumberWeighted average
exercise price
Balance at beginning of period 946,306 C$27.02 979,333 C$19.94
Granted during the period 287,559 C$33.46 152,833 C$54.00
Expired during the period (6,928) C$40.75 — —
Exercised during the period (158,031) C$12.77 (185,860) C$11.91
Balance at end of period 1,068,906 C$30.77 946,306 C$27.02
Restricted Share Unit Plan for Non-Employee Directors
Pursuant to the Company’s Restricted Share Unit Plan for Non-Employee Directors, a maximum of 500,000 Shares are reserved for issuance to non-employee directors. The Company issued approximately $145 thousand of director restricted Share units (“Director RSUs”) in 2019 Q4. Of these Director RSUs issued, approximately $94 thousand were exercised and exchanged for 4,434 Shares.
Capital Allocation Policy
The Company has established a capital allocation policy based on an operating model intended to provide consistent and predictable cash flow and maintain a strong balance sheet. This policy has established guidelines that are reviewed by the Board on a quarterly basis and provides targets for maintaining financial flexibility, business investment, and return of capital to shareholders.
Maintaining Financial Flexibility
The Company plans to prudently use leverage to manage liquidity risk. Liquidity risk arises from the Company’s financial obligations and from the management of its assets, liabilities and capital structure. This risk is managed by regularly evaluating the liquid financial resources to fund current and long-term obligations, and to meet the Company’s capital commitments in a cost-effective manner.
The main factors that affect liquidity include sales mix, production levels, cash production costs, working capital requirements, capital expenditure requirements, scheduled repayments of long-term debt obligations, funding requirements of the Company’s pension plans, income taxes, credit capacity, expected future debt and equity capital market conditions and repurchase of equity through the Company's Normal Course Issuer Bid ("NCIB").
The Company’s liquidity requirements are met through a variety of sources, including cash on hand, cash generated from operations, the credit facilities, leases, and debt and equity capital markets.
Within the capital allocation policy, management has targeted to maintain leverage between 2 times and 2.5 times Adjusted EBITDA, excluding IFRS 16 - leases ("IFRS 16"). The Company however, has and may in the future increase leverage beyond this range to fund accretive acquisitions that are capable of reducing leverage through earnings.
There are certain financial covenants under the Credit Facility that have to be maintained. These financial covenants include an interest coverage ratio and a total leverage ratio. The maximum total leverage ratio under the Credit Facility is 3.75 and increases to 4.25 for one year following a material acquisition. The acquisition of ADL on May 28, 2019 was a material acquisition. The terms of the Credit Facility provide relief from the impact of changes in accounting policies, including the impact of IFRS 16. At as December 29, 2019, the Company was in compliance with the ratios.
27
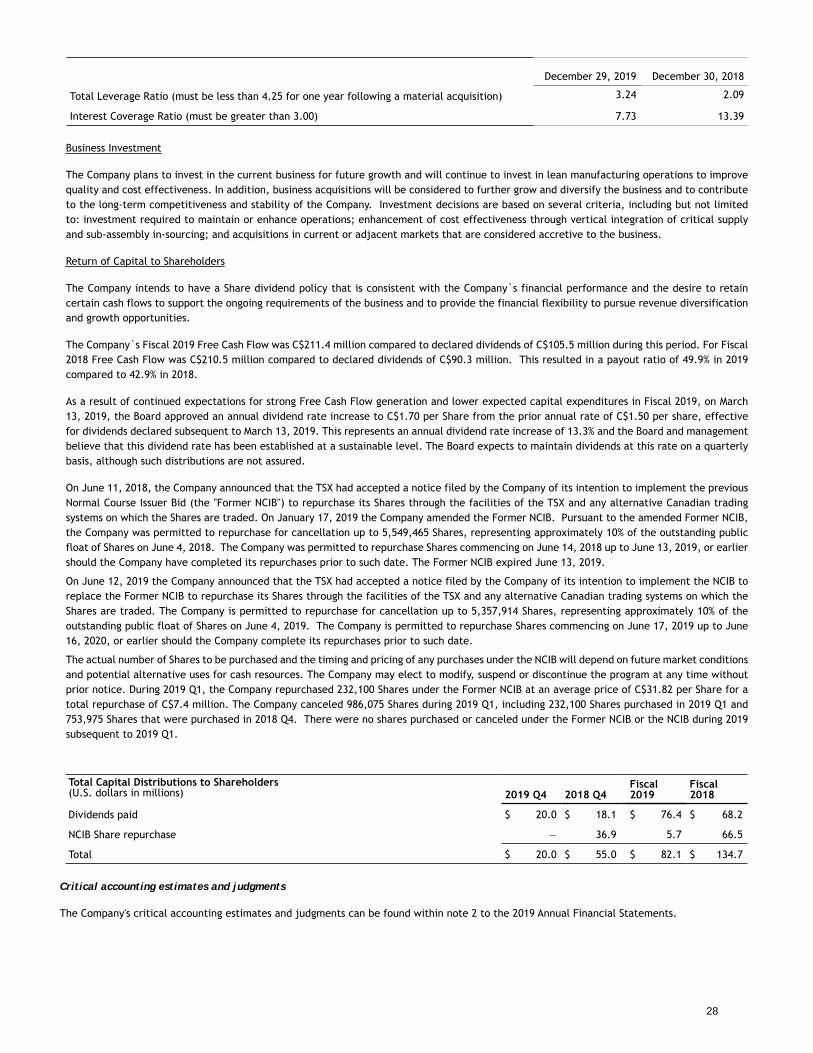
December 29, 2019 December 30, 2018
Total Leverage Ratio (must be less than 4.25 for one year following a material acquisition) 3.24 2.09
Interest Coverage Ratio (must be greater than 3.00) 7.73 13.39
Business Investment
The Company plans to invest in the current business for future growth and will continue to invest in lean manufacturing operations to improve quality and cost effectiveness. In addition, business acquisitions will be considered to further grow and diversify the business and to contribute to the long-term competitiveness and stability of the Company. Investment decisions are based on several criteria, including but not limited to: investment required to maintain or enhance operations; enhancement of cost effectiveness through vertical integration of critical supply and sub-assembly in-sourcing; and acquisitions in current or adjacent markets that are considered accretive to the business.
Return of Capital to Shareholders
The Company intends to have a Share dividend policy that is consistent with the Company`s financial performance and the desire to retain certain cash flows to support the ongoing requirements of the business and to provide the financial flexibility to pursue revenue diversification and growth opportunities.
The Company`s Fiscal 2019 Free Cash Flow was C$211.4 million compared to declared dividends of C$105.5 million during this period. For Fiscal 2018 Free Cash Flow was C$210.5 million compared to declared dividends of C$90.3 million. This resulted in a payout ratio of 49.9% in 2019 compared to 42.9% in 2018.
As a result of continued expectations for strong Free Cash Flow generation and lower expected capital expenditures in Fiscal 2019, on March 13, 2019, the Board approved an annual dividend rate increase to C$1.70 per Share from the prior annual rate of C$1.50 per share, effective for dividends declared subsequent to March 13, 2019. This represents an annual dividend rate increase of 13.3% and the Board and management believe that this dividend rate has been established at a sustainable level. The Board expects to maintain dividends at this rate on a quarterly basis, although such distributions are not assured.
On June 11, 2018, the Company announced that the TSX had accepted a notice filed by the Company of its intention to implement the previous Normal Course Issuer Bid (the "Former NCIB") to repurchase its Shares through the facilities of the TSX and any alternative Canadian trading systems on which the Shares are traded. On January 17, 2019 the Company amended the Former NCIB. Pursuant to the amended Former NCIB, the Company was permitted to repurchase for cancellation up to 5,549,465 Shares, representing approximately 10% of the outstanding public float of Shares on June 4, 2018. The Company was permitted to repurchase Shares commencing on June 14, 2018 up to June 13, 2019, or earlier should the Company have completed its repurchases prior to such date. The Former NCIB expired June 13, 2019.
On June 12, 2019 the Company announced that the TSX had accepted a notice filed by the Company of its intention to implement the NCIB to replace the Former NCIB to repurchase its Shares through the facilities of the TSX and any alternative Canadian trading systems on which the Shares are traded. The Company is permitted to repurchase for cancellation up to 5,357,914 Shares, representing approximately 10% of the outstanding public float of Shares on June 4, 2019. The Company is permitted to repurchase Shares commencing on June 17, 2019 up to June 16, 2020, or earlier should the Company complete its repurchases prior to such date.
The actual number of Shares to be purchased and the timing and pricing of any purchases under the NCIB will depend on future market conditions and potential alternative uses for cash resources. The Company may elect to modify, suspend or discontinue the program at any time without prior notice. During 2019 Q1, the Company repurchased 232,100 Shares under the Former NCIB at an average price of C$31.82 per Share for a total repurchase of C$7.4 million. The Company canceled 986,075 Shares during 2019 Q1, including 232,100 Shares purchased in 2019 Q1 and 753,975 Shares that were purchased in 2018 Q4. There were no shares purchased or canceled under the Former NCIB or the NCIB during 2019 subsequent to 2019 Q1.
Total Capital Distributions to Shareholders(U.S. dollars in millions) 2019 Q4 2018 Q4
Fiscal 2019
Fiscal 2018
Dividends paid $ 20.0 $ 18.1 $ 76.4 $ 68.2
NCIB Share repurchase — 36.9 5.7 66.5
Total $ 20.0 $ 55.0 $ 82.1 $ 134.7
Critical accounting estimates and judgments
The Company's critical accounting estimates and judgments can be found within note 2 to the 2019 Annual Financial Statements.
28
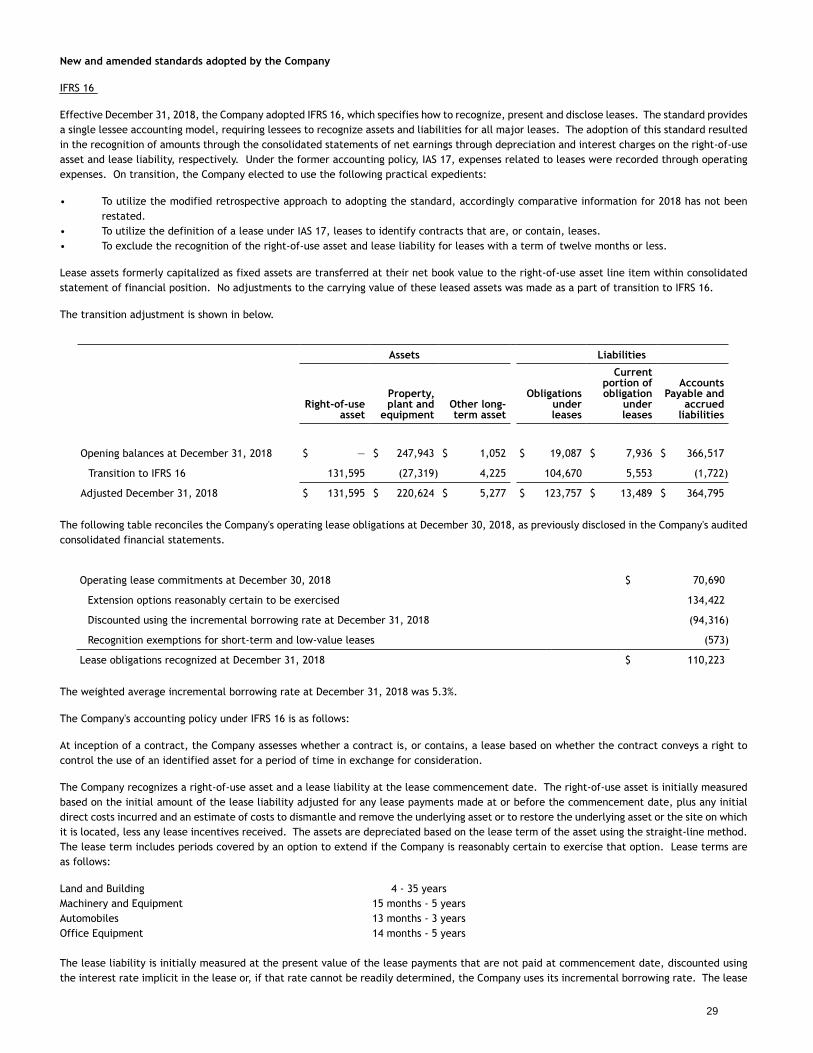
New and amended standards adopted by the Company
IFRS 16
Effective December 31, 2018, the Company adopted IFRS 16, which specifies how to recognize, present and disclose leases. The standard provides a single lessee accounting model, requiring lessees to recognize assets and liabilities for all major leases. The adoption of this standard resulted in the recognition of amounts through the consolidated statements of net earnings through depreciation and interest charges on the right-of-use asset and lease liability, respectively. Under the former accounting policy, IAS 17, expenses related to leases were recorded through operating expenses. On transition, the Company elected to use the following practical expedients:
• To utilize the modified retrospective approach to adopting the standard, accordingly comparative information for 2018 has not been restated.
• To utilize the definition of a lease under IAS 17, leases to identify contracts that are, or contain, leases.• To exclude the recognition of the right-of-use asset and lease liability for leases with a term of twelve months or less.
Lease assets formerly capitalized as fixed assets are transferred at their net book value to the right-of-use asset line item within consolidated statement of financial position. No adjustments to the carrying value of these leased assets was made as a part of transition to IFRS 16.
The transition adjustment is shown in below.
Assets Liabilities
Right-of-useasset
Property,plant and
equipmentOther long-term asset
Obligationsunderleases
Currentportion ofobligation
underleases
AccountsPayable and
accruedliabilities
Opening balances at December 31, 2018 $ — $ 247,943 $ 1,052 $ 19,087 $ 7,936 $ 366,517
Transition to IFRS 16 131,595 (27,319) 4,225 104,670 5,553 (1,722)
Adjusted December 31, 2018 $ 131,595 $ 220,624 $ 5,277 $ 123,757 $ 13,489 $ 364,795
The following table reconciles the Company's operating lease obligations at December 30, 2018, as previously disclosed in the Company's audited consolidated financial statements.
Operating lease commitments at December 30, 2018 $ 70,690
Extension options reasonably certain to be exercised 134,422
Discounted using the incremental borrowing rate at December 31, 2018 (94,316)
Recognition exemptions for short-term and low-value leases (573)
Lease obligations recognized at December 31, 2018 $ 110,223
The weighted average incremental borrowing rate at December 31, 2018 was 5.3%.
The Company's accounting policy under IFRS 16 is as follows:
At inception of a contract, the Company assesses whether a contract is, or contains, a lease based on whether the contract conveys a right to control the use of an identified asset for a period of time in exchange for consideration.
The Company recognizes a right-of-use asset and a lease liability at the lease commencement date. The right-of-use asset is initially measured based on the initial amount of the lease liability adjusted for any lease payments made at or before the commencement date, plus any initial direct costs incurred and an estimate of costs to dismantle and remove the underlying asset or to restore the underlying asset or the site on which it is located, less any lease incentives received. The assets are depreciated based on the lease term of the asset using the straight-line method. The lease term includes periods covered by an option to extend if the Company is reasonably certain to exercise that option. Lease terms are as follows:
Land and Building 4 - 35 yearsMachinery and Equipment 15 months - 5 yearsAutomobiles 13 months - 3 yearsOffice Equipment 14 months - 5 years
The lease liability is initially measured at the present value of the lease payments that are not paid at commencement date, discounted using the interest rate implicit in the lease or, if that rate cannot be readily determined, the Company uses its incremental borrowing rate. The lease
29
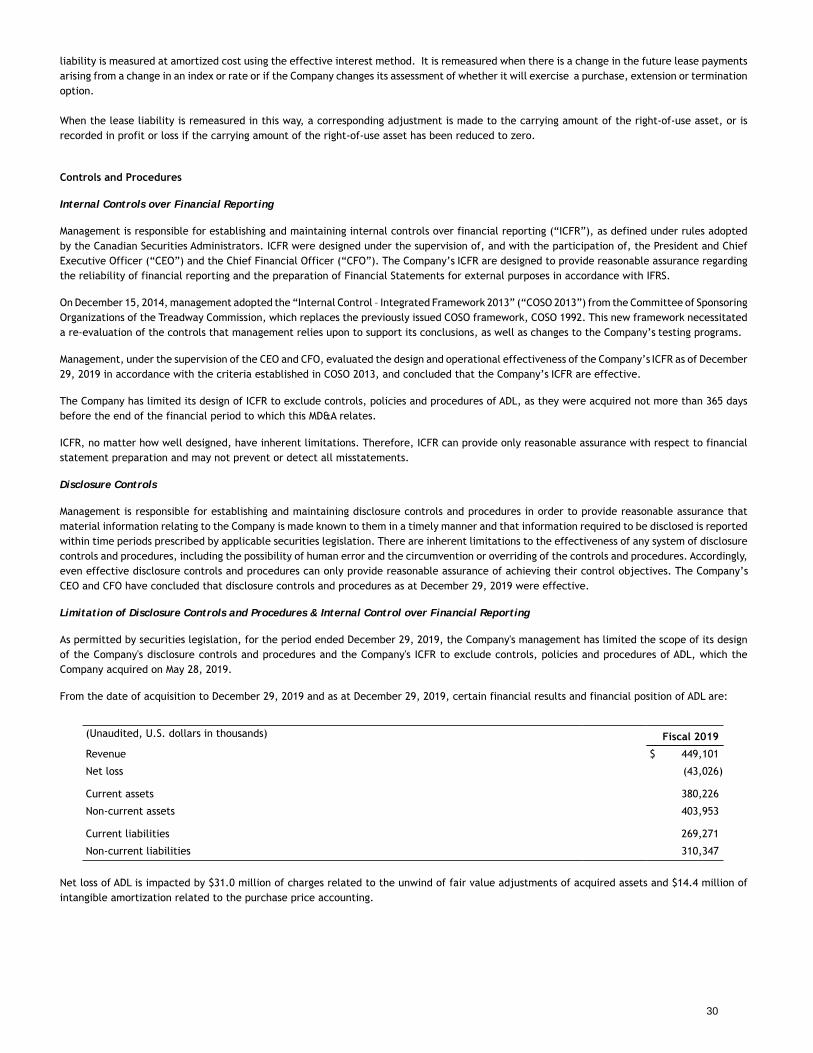
liability is measured at amortized cost using the effective interest method. It is remeasured when there is a change in the future lease payments arising from a change in an index or rate or if the Company changes its assessment of whether it will exercise a purchase, extension or termination option.
When the lease liability is remeasured in this way, a corresponding adjustment is made to the carrying amount of the right-of-use asset, or is recorded in profit or loss if the carrying amount of the right-of-use asset has been reduced to zero.
Controls and Procedures
Internal Controls over Financial Reporting
Management is responsible for establishing and maintaining internal controls over financial reporting (“ICFR”), as defined under rules adopted by the Canadian Securities Administrators. ICFR were designed under the supervision of, and with the participation of, the President and Chief Executive Officer (“CEO”) and the Chief Financial Officer (“CFO”). The Company’s ICFR are designed to provide reasonable assurance regarding the reliability of financial reporting and the preparation of Financial Statements for external purposes in accordance with IFRS.
On December 15, 2014, management adopted the “Internal Control – Integrated Framework 2013” (“COSO 2013”) from the Committee of Sponsoring Organizations of the Treadway Commission, which replaces the previously issued COSO framework, COSO 1992. This new framework necessitated a re-evaluation of the controls that management relies upon to support its conclusions, as well as changes to the Company’s testing programs.
Management, under the supervision of the CEO and CFO, evaluated the design and operational effectiveness of the Company’s ICFR as of December 29, 2019 in accordance with the criteria established in COSO 2013, and concluded that the Company’s ICFR are effective.
The Company has limited its design of ICFR to exclude controls, policies and procedures of ADL, as they were acquired not more than 365 days before the end of the financial period to which this MD&A relates.
ICFR, no matter how well designed, have inherent limitations. Therefore, ICFR can provide only reasonable assurance with respect to financial statement preparation and may not prevent or detect all misstatements.
Disclosure Controls
Management is responsible for establishing and maintaining disclosure controls and procedures in order to provide reasonable assurance that material information relating to the Company is made known to them in a timely manner and that information required to be disclosed is reported within time periods prescribed by applicable securities legislation. There are inherent limitations to the effectiveness of any system of disclosure controls and procedures, including the possibility of human error and the circumvention or overriding of the controls and procedures. Accordingly, even effective disclosure controls and procedures can only provide reasonable assurance of achieving their control objectives. The Company’s CEO and CFO have concluded that disclosure controls and procedures as at December 29, 2019 were effective.
Limitation of Disclosure Controls and Procedures & Internal Control over Financial Reporting
As permitted by securities legislation, for the period ended December 29, 2019, the Company's management has limited the scope of its design of the Company's disclosure controls and procedures and the Company's ICFR to exclude controls, policies and procedures of ADL, which the Company acquired on May 28, 2019.
From the date of acquisition to December 29, 2019 and as at December 29, 2019, certain financial results and financial position of ADL are:
(Unaudited, U.S. dollars in thousands) Fiscal 2019
Revenue $ 449,101
Net loss (43,026)
Current assets 380,226
Non-current assets 403,953
Current liabilities 269,271
Non-current liabilities 310,347
Net loss of ADL is impacted by $31.0 million of charges related to the unwind of fair value adjustments of acquired assets and $14.4 million of intangible amortization related to the purchase price accounting.
30
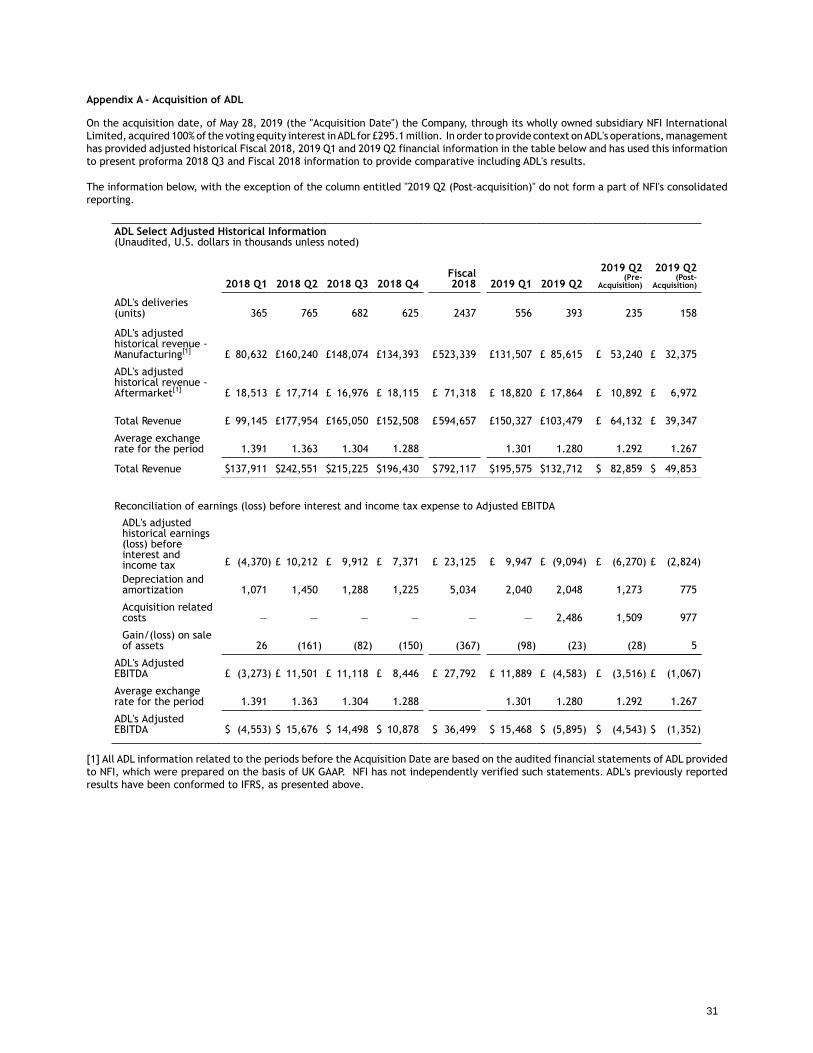
Appendix A - Acquisition of ADL
On the acquisition date, of May 28, 2019 (the "Acquisition Date") the Company, through its wholly owned subsidiary NFI International Limited, acquired 100% of the voting equity interest in ADL for £295.1 million. In order to provide context on ADL's operations, management has provided adjusted historical Fiscal 2018, 2019 Q1 and 2019 Q2 financial information in the table below and has used this information to present proforma 2018 Q3 and Fiscal 2018 information to provide comparative including ADL's results.
The information below, with the exception of the column entitled "2019 Q2 (Post-acquisition)" do not form a part of NFI's consolidated reporting.
ADL Select Adjusted Historical Information(Unaudited, U.S. dollars in thousands unless noted)
2018 Q1 2018 Q2 2018 Q3 2018 Q4Fiscal2018 2019 Q1 2019 Q2
2019 Q2 (Pre-
Acquisition)
2019 Q2 (Post-
Acquisition)
ADL's deliveries(units) 365 765 682 625 2437 556 393 235 158
ADL's adjusted historical revenue - Manufacturing[1] £ 80,632 £160,240 £148,074 £134,393 £523,339 £131,507 £ 85,615 £ 53,240 £ 32,375
ADL's adjusted historical revenue - Aftermarket[1] £ 18,513 £ 17,714 £ 16,976 £ 18,115 £ 71,318 £ 18,820 £ 17,864 £ 10,892 £ 6,972
Total Revenue £ 99,145 £177,954 £165,050 £152,508 £594,657 £150,327 £103,479 £ 64,132 £ 39,347
Average exchangerate for the period 1.391 1.363 1.304 1.288 1.301 1.280 1.292 1.267
Total Revenue $137,911 $242,551 $215,225 $196,430 $792,117 $195,575 $132,712 $ 82,859 $ 49,853
Reconciliation of earnings (loss) before interest and income tax expense to Adjusted EBITDA
ADL's adjusted historical earnings (loss) before interest and income tax £ (4,370) £ 10,212 £ 9,912 £ 7,371 £ 23,125 £ 9,947 £ (9,094) £ (6,270) £ (2,824)
Depreciation andamortization 1,071 1,450 1,288 1,225 5,034 2,040 2,048 1,273 775
Acquisition relatedcosts — — — — — — 2,486 1,509 977
Gain/(loss) on saleof assets 26 (161) (82) (150) (367) (98) (23) (28) 5
ADL's AdjustedEBITDA £ (3,273) £ 11,501 £ 11,118 £ 8,446 £ 27,792 £ 11,889 £ (4,583) £ (3,516) £ (1,067)
Average exchangerate for the period 1.391 1.363 1.304 1.288 1.301 1.280 1.292 1.267
ADL's AdjustedEBITDA $ (4,553) $ 15,676 $ 14,498 $ 10,878 $ 36,499 $ 15,468 $ (5,895) $ (4,543) $ (1,352)
[1] All ADL information related to the periods before the Acquisition Date are based on the audited financial statements of ADL provided to NFI, which were prepared on the basis of UK GAAP. NFI has not independently verified such statements. ADL's previously reported results have been conformed to IFRS, as presented above.
31
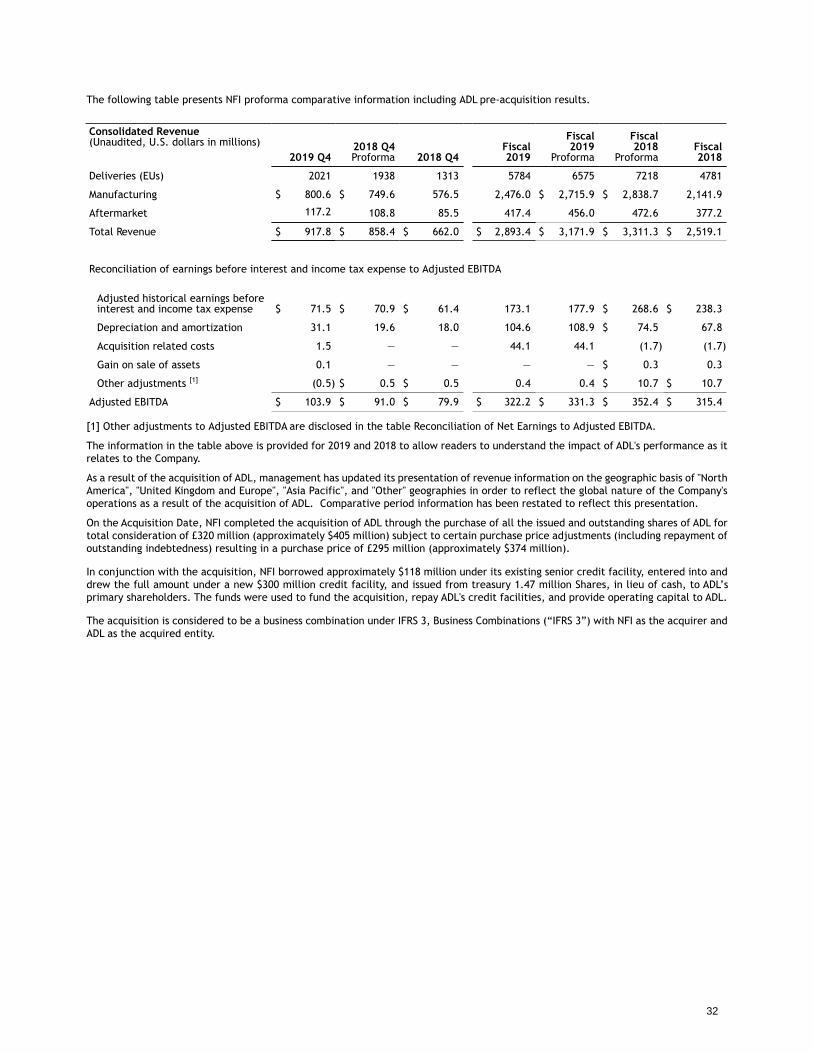
The following table presents NFI proforma comparative information including ADL pre-acquisition results.
Consolidated Revenue(Unaudited, U.S. dollars in millions)
2019 Q42018 Q4 Proforma 2018 Q4
Fiscal2019
Fiscal 2019
Proforma
Fiscal 2018
ProformaFiscal2018
Deliveries (EUs) 2021 1938 1313 5784 6575 7218 4781
Manufacturing $ 800.6 $ 749.6 576.5 2,476.0 $ 2,715.9 $ 2,838.7 2,141.9
Aftermarket 117.2 108.8 85.5 417.4 456.0 472.6 377.2
Total Revenue $ 917.8 $ 858.4 $ 662.0 $ 2,893.4 $ 3,171.9 $ 3,311.3 $ 2,519.1
Reconciliation of earnings before interest and income tax expense to Adjusted EBITDA
Adjusted historical earnings beforeinterest and income tax expense $ 71.5 $ 70.9 $ 61.4 173.1 177.9 $ 268.6 $ 238.3
Depreciation and amortization 31.1 19.6 18.0 104.6 108.9 $ 74.5 67.8
Acquisition related costs 1.5 — — 44.1 44.1 (1.7) (1.7)
Gain on sale of assets 0.1 — — — — $ 0.3 0.3
Other adjustments [1] (0.5) $ 0.5 $ 0.5 0.4 0.4 $ 10.7 $ 10.7
Adjusted EBITDA $ 103.9 $ 91.0 $ 79.9 $ 322.2 $ 331.3 $ 352.4 $ 315.4
[1] Other adjustments to Adjusted EBITDA are disclosed in the table Reconciliation of Net Earnings to Adjusted EBITDA.
The information in the table above is provided for 2019 and 2018 to allow readers to understand the impact of ADL's performance as it relates to the Company.
As a result of the acquisition of ADL, management has updated its presentation of revenue information on the geographic basis of "North America", "United Kingdom and Europe", "Asia Pacific", and "Other" geographies in order to reflect the global nature of the Company's operations as a result of the acquisition of ADL. Comparative period information has been restated to reflect this presentation.
On the Acquisition Date, NFI completed the acquisition of ADL through the purchase of all the issued and outstanding shares of ADL for total consideration of £320 million (approximately $405 million) subject to certain purchase price adjustments (including repayment of outstanding indebtedness) resulting in a purchase price of £295 million (approximately $374 million).
In conjunction with the acquisition, NFI borrowed approximately $118 million under its existing senior credit facility, entered into and drew the full amount under a new $300 million credit facility, and issued from treasury 1.47 million Shares, in lieu of cash, to ADL’s primary shareholders. The funds were used to fund the acquisition, repay ADL's credit facilities, and provide operating capital to ADL.
The acquisition is considered to be a business combination under IFRS 3, Business Combinations (“IFRS 3”) with NFI as the acquirer and ADL as the acquired entity.
32
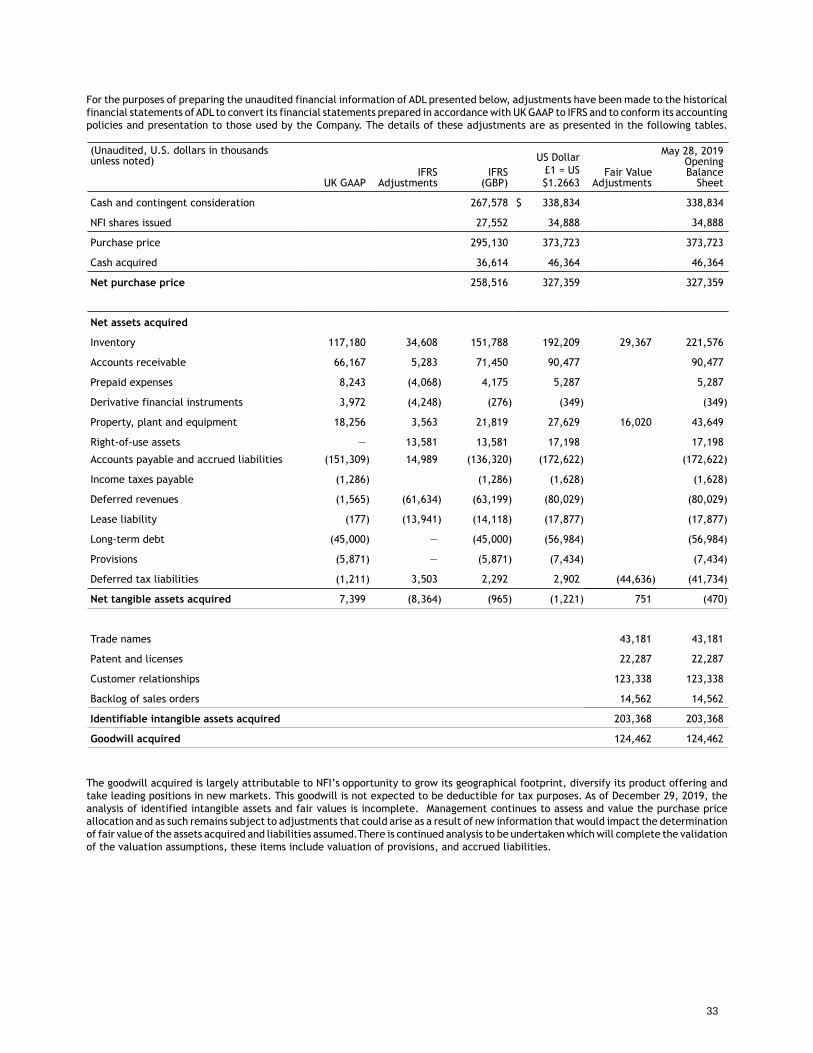
For the purposes of preparing the unaudited financial information of ADL presented below, adjustments have been made to the historical financial statements of ADL to convert its financial statements prepared in accordance with UK GAAP to IFRS and to conform its accounting policies and presentation to those used by the Company. The details of these adjustments are as presented in the following tables.
(Unaudited, U.S. dollars in thousandsunless noted)
UK GAAPIFRS
AdjustmentsIFRS
(GBP)
US Dollar£1 = US$1.2663
Fair ValueAdjustments
May 28, 2019OpeningBalance
Sheet
Cash and contingent consideration 267,578 $ 338,834 338,834
NFI shares issued 27,552 34,888 34,888
Purchase price 295,130 373,723 373,723
Cash acquired 36,614 46,364 46,364
Net purchase price 258,516 327,359 327,359
Net assets acquired
Inventory 117,180 34,608 151,788 192,209 29,367 221,576
Accounts receivable 66,167 5,283 71,450 90,477 90,477
Prepaid expenses 8,243 (4,068) 4,175 5,287 5,287
Derivative financial instruments 3,972 (4,248) (276) (349) (349)
Property, plant and equipment 18,256 3,563 21,819 27,629 16,020 43,649
Right-of-use assets — 13,581 13,581 17,198 17,198
Accounts payable and accrued liabilities (151,309) 14,989 (136,320) (172,622) (172,622)
Income taxes payable (1,286) (1,286) (1,628) (1,628)
Deferred revenues (1,565) (61,634) (63,199) (80,029) (80,029)
Lease liability (177) (13,941) (14,118) (17,877) (17,877)
Long-term debt (45,000) — (45,000) (56,984) (56,984)
Provisions (5,871) — (5,871) (7,434) (7,434)
Deferred tax liabilities (1,211) 3,503 2,292 2,902 (44,636) (41,734)
Net tangible assets acquired 7,399 (8,364) (965) (1,221) 751 (470)
Trade names 43,181 43,181
Patent and licenses 22,287 22,287
Customer relationships 123,338 123,338
Backlog of sales orders 14,562 14,562
Identifiable intangible assets acquired 203,368 203,368
Goodwill acquired 124,462 124,462
The goodwill acquired is largely attributable to NFI’s opportunity to grow its geographical footprint, diversify its product offering and take leading positions in new markets. This goodwill is not expected to be deductible for tax purposes. As of December 29, 2019, the analysis of identified intangible assets and fair values is incomplete. Management continues to assess and value the purchase price allocation and as such remains subject to adjustments that could arise as a result of new information that would impact the determination of fair value of the assets acquired and liabilities assumed.There is continued analysis to be undertaken which will complete the validation of the valuation assumptions, these items include valuation of provisions, and accrued liabilities.
33
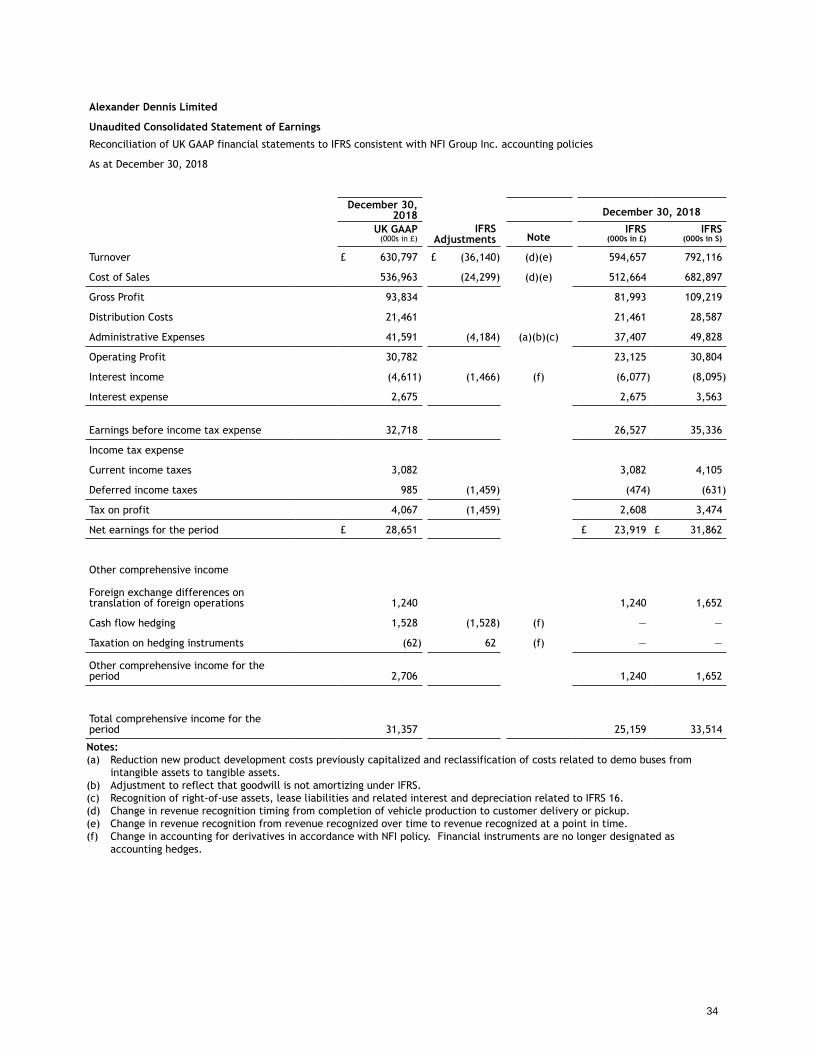
Alexander Dennis Limited
Unaudited Consolidated Statement of Earnings
Reconciliation of UK GAAP financial statements to IFRS consistent with NFI Group Inc. accounting policies
As at December 30, 2018
December 30,2018 December 30, 2018
UK GAAP (000s in £)
IFRS Adjustments Note
IFRS (000s in £)
IFRS (000s in S)
Turnover £ 630,797 £ (36,140) (d)(e) 594,657 792,116
Cost of Sales 536,963 (24,299) (d)(e) 512,664 682,897
Gross Profit 93,834 81,993 109,219
Distribution Costs 21,461 21,461 28,587
Administrative Expenses 41,591 (4,184) (a)(b)(c) 37,407 49,828
Operating Profit 30,782 23,125 30,804
Interest income (4,611) (1,466) (f) (6,077) (8,095)
Interest expense 2,675 2,675 3,563
Earnings before income tax expense 32,718 26,527 35,336
Income tax expense
Current income taxes 3,082 3,082 4,105
Deferred income taxes 985 (1,459) (474) (631)
Tax on profit 4,067 (1,459) 2,608 3,474
Net earnings for the period £ 28,651 £ 23,919 £ 31,862
Other comprehensive income
Foreign exchange differences on translation of foreign operations 1,240 1,240 1,652
Cash flow hedging 1,528 (1,528) (f) — —
Taxation on hedging instruments (62) 62 (f) — —
Other comprehensive income for the period 2,706 1,240 1,652
Total comprehensive income for the period 31,357 25,159 33,514
Notes:(a) Reduction new product development costs previously capitalized and reclassification of costs related to demo buses from
intangible assets to tangible assets.(b) Adjustment to reflect that goodwill is not amortizing under IFRS.(c) Recognition of right-of-use assets, lease liabilities and related interest and depreciation related to IFRS 16.(d) Change in revenue recognition timing from completion of vehicle production to customer delivery or pickup.(e) Change in revenue recognition from revenue recognized over time to revenue recognized at a point in time.(f) Change in accounting for derivatives in accordance with NFI policy. Financial instruments are no longer designated as
accounting hedges.
34
Appendix B - Meaning of Certain References
References in this MD&A to the “Company” are to NFI and all of its direct or indirect subsidiaries, including New Flyer Industries Canada ULC (“NFI ULC”), New Flyer of America Inc. (“NFAI”), The Aftermarket Parts Company, LLC (“TAPC”), TCB Enterprises, LLC ("TCB"), KMG Fabrication, Inc. ("KMG"), Carfair Composites Inc. (“CCI”) and Carfair Composites USA, Inc. (“CCUI”, and together with "CCI", "Carfair"), The Reliable Insurance Company Limited, ARBOC Specialty Vehicles, LLC ("ARBOC"), New MCI Holdings, Inc. and its affiliated entities (collectively, "MCI”), NFI Holdings Luxembourg s.a.r.l., and Alexander Dennis Limited and its affiliated entities (collectively, "ADL") References to “New Flyer” generally refer to NFI ULC, NFAI, TAPC, KMG, CCI, CCUI and TCB. References in this MD&A to “management” are to senior management of NFI and the Company.
The common shares of NFI (“Shares”) are traded on the Toronto Stock Exchange ("TSX") under the symbol “NFI”. As at December 29, 2019, 62,493,880 Shares were issued and outstanding. Additional information about NFI and the Company, including NFI’s annual information form, is available on SEDAR at www.sedar.com.
Buses manufactured by New Flyer and ADL's single and double deck buses are classified as "transit buses". ARBOC manufactures body-on-chassis or “cutaway” and "medium-duty" buses that service transit, paratransit, and shuttle applications. Collectively, transit buses, medium-duty buses and cutaways, are referred to as "buses".
A “motor coach” or “coach” is a 35-foot to 45-foot over-the-highway bus typically used for intercity transportation and travel over longer distances than heavy-duty transit buses, and is typically characterized by (i) one or two axles in the rear (related to the weight of the vehicle), (ii) high deck floor, (iii) baggage compartment under the floor, (iv) high-backed seats with a coach-style interior (often including a lavatory and underfloor baggage compartments), and (v) no room for standing passengers.
All of the data presented in this MD&A with respect to the number of transit buses, medium-duty buses, cutaways and motor coaches in service and delivered, is measured in, or based on, “equivalent units”. One equivalent unit (or “EU”) represents one production slot, being one 30-foot, 35-foot, 40-foot, 45-foot heavy-duty transit bus, one double deck bus, one medium-duty bus, one cutaway bus or one motor coach, whereas one articulated transit bus represents two equivalent units. An articulated transit bus is an extra-long transit bus (approximately 60-feet in length), composed of two passenger compartments connected by a joint mechanism. The joint mechanism allows the vehicle to bend when the bus turns a corner, yet have a continuous interior.
Forward looking Statements
Certain statements in this MD&A are “forward looking statements”, which reflect the expectations of management regarding the Company's future growth, results of operations, performance and business prospects and opportunities. The words “believes”, “anticipates”, “plans”, “expects”, “intends”, “projects”, “forecasts”, “estimates” and similar expressions are intended to identify forward looking statements. These forward-looking statements reflect management's current expectations regarding future events and operating performance and speak only as of the date of this MD&A. Forward-looking statements involve significant risks and uncertainties, should not be read as guarantees of future performance or results, and will not necessarily be accurate indications of whether or not or the times at or by which such performance or results will be achieved. A number of factors could cause actual results to differ materially from the results discussed in the forward-looking statements. Such differences may be caused by factors which include, but are not limited to, funding may not continue to be available to the Company’s customers at current levels or at all; the Company’s business is affected by economic factors and adverse developments in economic conditions which could have an adverse effect on the demand for the Company’s products and the results of its operations (including the effect on demand for the Company's products and services as a result of the impact of the COVID-19 virus on customers); currency fluctuations could adversely affect the Company’s financial results or competitive position; interest rates could change substantially, materially impacting the Company’s revenue and profitability; an active, liquid trading market for the Shares may cease to exist, which may limit the ability of shareholders to trade Shares; the market price for the Shares may be volatile; if securities or industry analysts do not publish research or reports about the Company or if their reports are inaccurate or unfavorable to the Company or its business, or if they adversely change their recommendations regarding the Shares or if the Company’s results of operations do not meet their expectations, the Share price and trading volume could decline. In addition, other risk factors may include entrance of new competitors; failure of the ratification of the United States-Mexico-Canada Agreement (USMCA) could be materially adverse to NFI; current requirements under “Buy America” regulations may change and/or become more onerous or suppliers’ “Buy America” content may change; changes resulting from a hard exit of United Kingdom (UK) from the European Union (commonly referred to as "Brexit")and/or changes to the US Federal Funding mechanism (FAST Act) or Trade Policies may result in supply chain disruption and a potential downturn in the UK and US economies that may suppress demand; failure of the Company to comply with the disadvantaged business enterprise ("DBE") program requirements or the failure to have its DBE goals approved by the FTA; absence of fixed term customer contracts; exercise of options and customer suspension or termination for convenience; United States content bidding preference rules may create a competitive disadvantage; local content bidding preferences in the United States may create a competitive disadvantage; requirements under Canadian content policies may change and/or become more onerous; operational risk, dependence on limited sources or unique sources of supply (including the risk of supply disruption due to suppliers affected by the COVID-19 virus); dependence on supply of engines that comply with emission regulations; a disruption, termination or alteration of the supply of vehicle chassis or other critical components from third-party suppliers
35
could materially adversely affect the sales of certain of the Company’s products; the Company’s profitability can be adversely affected by increases in raw material and component costs as well as the imposition of tariffs and surtaxes on material imports; the Company may incur material losses and costs as a result of product warranty costs, recalls and remediation of buses; production delays may result in liquidated damages under the Company’s contracts with its customers; catastrophic events may lead to production curtailments or shutdowns; the Company may not be able to successfully renegotiate collective bargaining agreements when they expire and may be adversely affected by labour disruptions and shortages of labour; the Company’s operations are subject to risks and hazards that may result in monetary losses and liabilities not covered by insurance or which exceed its insurance coverage; the Company may be adversely affected by rising insurance costs; the Company may not be able to maintain performance bonds or letters of credit required by its contracts or obtain performance bonds and letters of credit required for new contracts; the Company is subject to litigation in the ordinary course of business and may incur material losses and costs as a result of product liability claims; the Company may have difficulty selling pre-owned coaches and realizing expected resale values; the Company may incur costs in connection with provincial, state or federal regulations relating to axle weight restrictions and vehicle lengths; the Company may be subject to claims and liabilities under environmental, health and safety laws; dependence on management information systems and cyber security risks; the Company’s ability to execute its strategy and conduct operations is dependent upon its ability to attract, train and retain qualified personnel, including its ability to retain and attract executives, senior management and key employees; the Company may be exposed to liabilities under applicable anti-corruption laws and any determination that it violated these laws could have a material adverse effect on its business; the Company’s risk management policies and procedures may not be fully effective in achieving their intended purposes; internal controls over financial reporting, disclosure controls and procedures; ability to successfully execute strategic plans and maintain profitability; development of competitive or disruptive products, services or technology; development and testing of new products; acquisition risk; third-party distribution/dealer agreements; availability to the Company of future financing; the Company may not be able to generate the necessary amount of cash to service its existing debt, which may require the Company to refinance its debt; the Company’s substantial consolidated indebtedness could negatively impact the business; the restrictive covenants in the Company's credit facilities could impact the Company’s business and affect its ability to pursue its business strategies; payment of dividends is not guaranteed; a significant amount of the Company’s cash is distributed, which may restrict potential growth; NFI is dependent on its subsidiaries for all cash available for distributions; future sales or the possibility of future sales of a substantial number of Shares may impact the price of the Shares and could result in dilution; if the Company is required to write down goodwill or other intangible assets, its financial condition and operating results would be negatively affected; income tax risk, investment eligibility and Canadian Federal Income Tax risks; the effect of comprehensive U.S. tax reform legislation on the NF Holdings and its U.S. subsidiaries (the “NF Group”), whether adverse or favorable, is uncertain; certain U.S. tax rules may limit the ability of NF Group to deduct interest expense for U.S. federal income tax purposes and may increase the NF Group’s tax liability; certain financing transactions could be characterized as “hybrid transactions” for U.S. tax purposes, which could increase the NF Group’s tax liability. NFI cautions that this list of factors is not exhaustive. These factors and other risks and uncertainties are discussed in NFI’s press releases, Annual Information Form and materials filed with the Canadian securities regulatory authorities which are available on SEDAR at www.sedar.com.
Although the forward looking statements contained in this MD&A are based upon what management believes to be reasonable assumptions, investors cannot be assured that actual results will be consistent with these forward looking statements, and the differences may be material. These forward looking statements are made as of the date of this MD&A and NFI assumes no obligation to update or revise them to reflect new events or circumstances, except as required by applicable securities laws.
DEFINITIONS OF ADJUSTED EBITDA, ROIC, FREE CASH FLOW, ADJUSTED NET EARNINGS, ADJUSTED EARNINGS PER SHARE, REGIONS INCLUDING: NORTH AMERICA, UK AND EUROPE, ASIA PACIFIC, AND OTHER
References to “Adjusted EBITDA” are to earnings before interest, income taxes, depreciation and amortization after adjusting for the effects of certain non-recurring and/or non-operations related items that do not reflect the current ongoing cash operations of the Company. These adjustments include gains or losses on disposal of property, plant and equipment, fair value adjustment for total return swap, unrealized foreign exchange losses or gains on non-current monetary items and forward foreign exchange contracts, costs associated with assessing strategic and corporate initiatives, past service costs and other pension costs, non-recurring restructuring costs, fair value adjustment to acquired subsidiary company's inventory and deferred revenue, proportion of the total return swap realized, equity settled stock-based compensation, recovery of currency transactions, prior year sales tax provision, and release of provision related to purchase accounting.
“Free Cash Flow” means net cash generated by operating activities adjusted for changes in non-cash working capital items, interest paid, interest expense, income taxes paid, current income tax expense, principal portion of finance lease payments, cash capital expenditures, proceeds from disposition of property, plant and equipment, costs associated with assessing strategic and corporate initiatives, fair value adjustment to acquired subsidiary company's inventory and deferred revenue, defined benefit funding, defined benefit expense, past service costs, proportion of total return swap, recovery on currency transactions, prior year sales tax provision, non-recurring restructuring costs, gain on release of provision related to purchase accounting, foreign exchange gain (loss) on cash held in foreign currency.
References to "ROIC" are to net operating profit after taxes (calculated as Adjusted EBITDA less depreciation of plant and equipment, depreciation of right-of-use assets and income taxes at the expected effective tax rate) divided by average invested capital for the last
36
twelve month period (calculated as to shareholders’ equity plus long-term debt, obligations under leases, other long-term liabilities and derivative financial instrument liabilities less cash).
References to "Adjusted Net Earnings" are to net earnings after adjusting for the after tax effects of certain non-recurring and/or non-operational related items that do not reflect the current ongoing cash operations of the Company including: fair value adjustments of total return swap, unrealized foreign exchange loss or gain, unrealized gain or loss on the interest rate swap, portion of the total return swap realized, costs associated with assessing strategic and corporate initiatives, fair value adjustment to acquired subsidiary company's inventory and deferred revenue, equity settled stock-based compensation, gain or loss on disposal of property, plant and equipment, past service costs and other pension costs, gain on release of provision related to purchase accounting, recovery on currency transactions, prior year sales tax provision, and non-recurring restructuring costs .
References to "Adjusted Earnings per Share" are to Adjusted Net Earnings divided by the average number of Shares outstanding.
Management believes Adjusted EBITDA, ROIC, Free Cash Flow, Adjusted Net Earnings and Adjusted Earnings per Share are useful measures in evaluating the performance of the Company. However, Adjusted EBITDA, ROIC, Free Cash Flow, Adjusted Net Earnings and Adjusted Earnings per Share are not recognized earnings measures under IFRS and do not have standardized meanings prescribed by IFRS. Readers of this MD&A are cautioned that ROIC, Adjusted Net Earnings and Adjusted EBITDA should not be construed as an alternative to net earnings or loss or cash flows from operating activities determined in accordance with IFRS as an indicator of NFI’s performance, and Free Cash Flow should not be construed as an alternative to cash flows from operating, investing and financing activities determined in accordance with IFRS as a measure of liquidity and cash flows. A reconciliation of net earnings to Adjusted EBITDA, based on the Financial Statements, has been provided under the headings “Reconciliation of Net Earnings to Adjusted EBITDA”. A reconciliation of Free Cash Flow to cash flows from operations is provided under the heading “Summary of Free Cash Flow”. A reconciliation of net earnings to Adjusted Net Earnings is provided under the heading “Reconciliation of Net Earnings to Adjusted Net Earnings”.
NFI's method of calculating Adjusted EBITDA, ROIC, Free Cash Flow, Adjusted Net Earnings and Adjusted Earnings per Share may differ materially from the methods used by other issuers and, accordingly, may not be comparable to similarly titled measures used by other issuers. Dividends paid from Free Cash Flow are not assured, and the actual amount of dividends received by holders of Shares will depend on, among other things, the Company's financial performance, debt covenants and obligations, working capital requirements and future capital requirements, all of which are susceptible to a number of risks, as described in NFI’s public filings available on SEDAR at www.sedar.com.
Effective December 31, 2018, the Company has adopted IFRS 16, which specifies how to recognize, present and disclose leases. The standard provides a single lessee accounting model, requiring lessees to recognize assets and liabilities for all major leases. This MD&A separately presents 2019 Q4 and Fiscal 2019 information, excluding the impact of IFRS 16 in areas where the impact is significant. See "Critical Accounting Estimates and Judgments" in Note 2 to the Consolidated Financial Statements .
References to NFI's geographic regions for the purpose of reporting global revenues are as follows: North America refers to Canada, United States, and Mexico; United Kingdom and Europe refer to the United Kingdom and Europe; Asia Pacific refers to Hong Kong, Malaysia, Singapore, Australia, and New Zealand; and the Other category includes any sales that do not fall into the categories above.
37
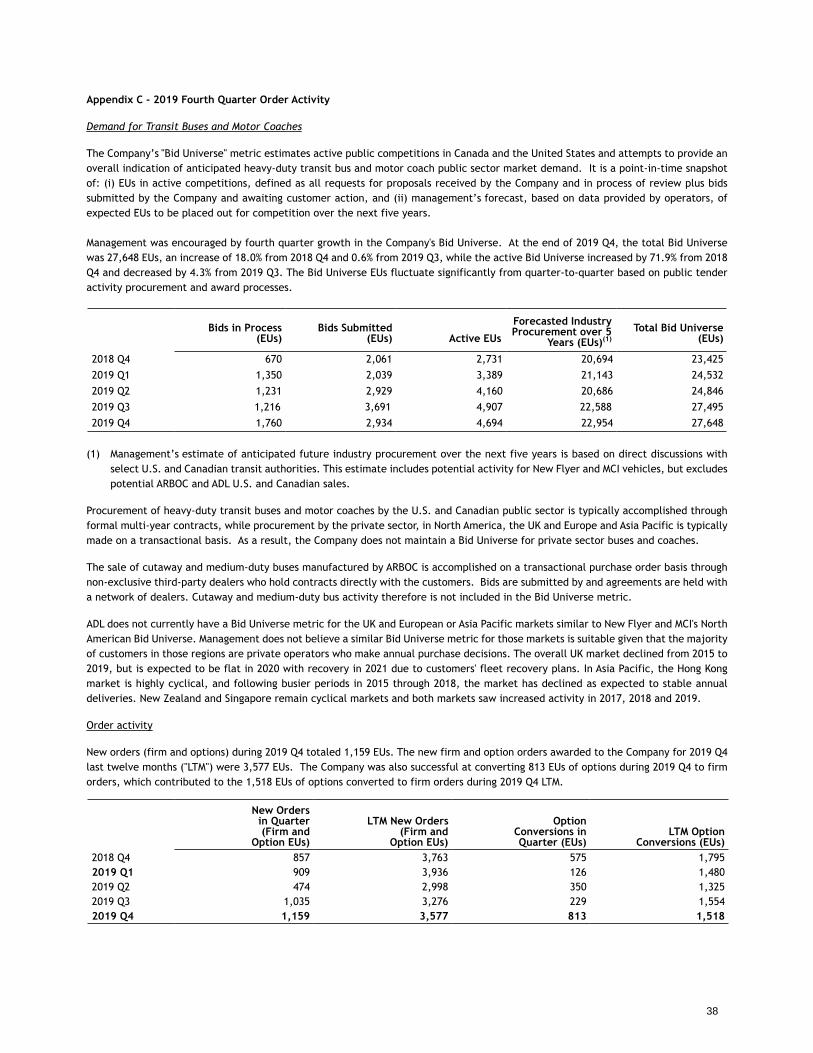
Appendix C - 2019 Fourth Quarter Order Activity
Demand for Transit Buses and Motor Coaches
The Company’s "Bid Universe" metric estimates active public competitions in Canada and the United States and attempts to provide an overall indication of anticipated heavy-duty transit bus and motor coach public sector market demand. It is a point-in-time snapshot of: (i) EUs in active competitions, defined as all requests for proposals received by the Company and in process of review plus bids submitted by the Company and awaiting customer action, and (ii) management’s forecast, based on data provided by operators, of expected EUs to be placed out for competition over the next five years.
Management was encouraged by fourth quarter growth in the Company's Bid Universe. At the end of 2019 Q4, the total Bid Universe was 27,648 EUs, an increase of 18.0% from 2018 Q4 and 0.6% from 2019 Q3, while the active Bid Universe increased by 71.9% from 2018 Q4 and decreased by 4.3% from 2019 Q3. The Bid Universe EUs fluctuate significantly from quarter-to-quarter based on public tender activity procurement and award processes.
Bids in Process(EUs)
Bids Submitted(EUs) Active EUs
Forecasted Industry Procurement over 5
Years (EUs)(1) Total Bid Universe
(EUs)
2018 Q4 670 2,061 2,731 20,694 23,425
2019 Q1 1,350 2,039 3,389 21,143 24,532
2019 Q2 1,231 2,929 4,160 20,686 24,846
2019 Q3 1,216 3,691 4,907 22,588 27,495
2019 Q4 1,760 2,934 4,694 22,954 27,648
(1) Management’s estimate of anticipated future industry procurement over the next five years is based on direct discussions with select U.S. and Canadian transit authorities. This estimate includes potential activity for New Flyer and MCI vehicles, but excludes potential ARBOC and ADL U.S. and Canadian sales.
Procurement of heavy-duty transit buses and motor coaches by the U.S. and Canadian public sector is typically accomplished through formal multi-year contracts, while procurement by the private sector, in North America, the UK and Europe and Asia Pacific is typically made on a transactional basis. As a result, the Company does not maintain a Bid Universe for private sector buses and coaches.
The sale of cutaway and medium-duty buses manufactured by ARBOC is accomplished on a transactional purchase order basis through non-exclusive third-party dealers who hold contracts directly with the customers. Bids are submitted by and agreements are held with a network of dealers. Cutaway and medium-duty bus activity therefore is not included in the Bid Universe metric.
ADL does not currently have a Bid Universe metric for the UK and European or Asia Pacific markets similar to New Flyer and MCI's North American Bid Universe. Management does not believe a similar Bid Universe metric for those markets is suitable given that the majority of customers in those regions are private operators who make annual purchase decisions. The overall UK market declined from 2015 to 2019, but is expected to be flat in 2020 with recovery in 2021 due to customers' fleet recovery plans. In Asia Pacific, the Hong Kong market is highly cyclical, and following busier periods in 2015 through 2018, the market has declined as expected to stable annual deliveries. New Zealand and Singapore remain cyclical markets and both markets saw increased activity in 2017, 2018 and 2019.
Order activity
New orders (firm and options) during 2019 Q4 totaled 1,159 EUs. The new firm and option orders awarded to the Company for 2019 Q4 last twelve months ("LTM") were 3,577 EUs. The Company was also successful at converting 813 EUs of options during 2019 Q4 to firm orders, which contributed to the 1,518 EUs of options converted to firm orders during 2019 Q4 LTM.
New Ordersin Quarter(Firm and
Option EUs)
LTM New Orders(Firm and
Option EUs)
OptionConversions inQuarter (EUs)
LTM OptionConversions (EUs)
2018 Q4 857 3,763 575 1,7952019 Q1 909 3,936 126 1,4802019 Q2 474 2,998 350 1,3252019 Q3 1,035 3,276 229 1,5542019 Q4 1,159 3,577 813 1,518
38
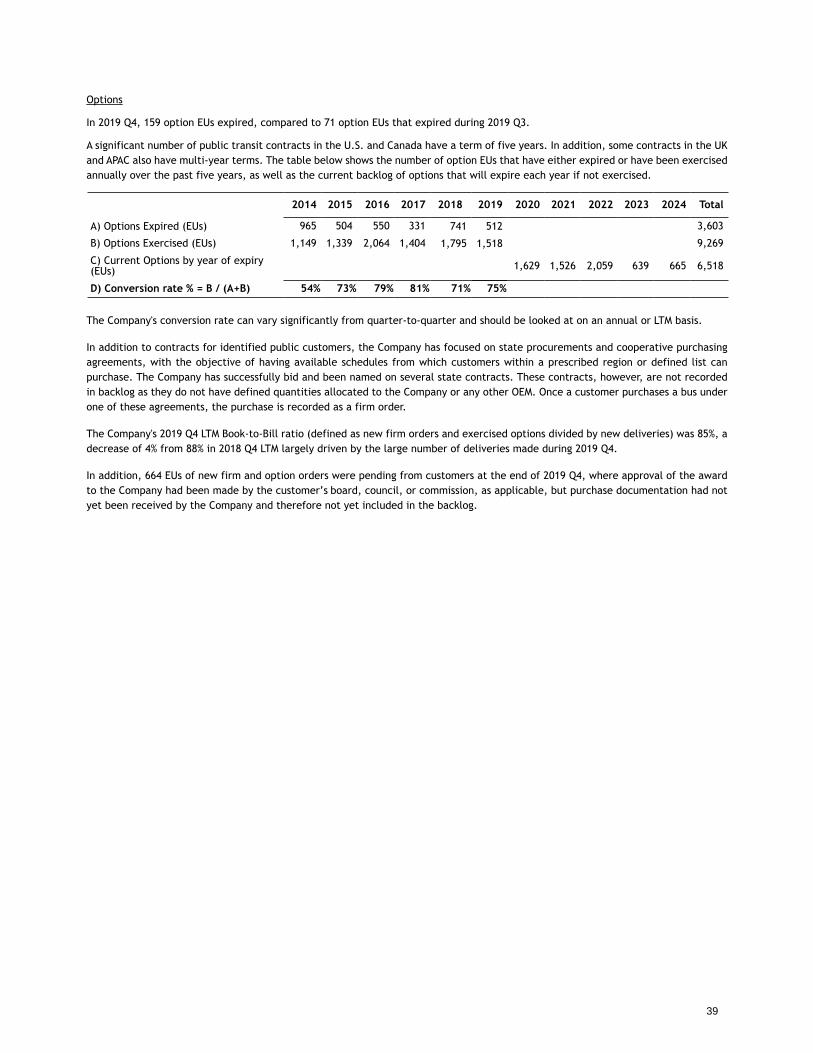
Options
In 2019 Q4, 159 option EUs expired, compared to 71 option EUs that expired during 2019 Q3.
A significant number of public transit contracts in the U.S. and Canada have a term of five years. In addition, some contracts in the UK and APAC also have multi-year terms. The table below shows the number of option EUs that have either expired or have been exercised annually over the past five years, as well as the current backlog of options that will expire each year if not exercised.
2014 2015 2016 2017 2018 2019 2020 2021 2022 2023 2024 Total
A) Options Expired (EUs) 965 504 550 331 741 512 3,603
B) Options Exercised (EUs) 1,149 1,339 2,064 1,404 1,795 1,518 9,269
C) Current Options by year of expiry(EUs) 1,629 1,526 2,059 639 665 6,518
D) Conversion rate % = B / (A+B) 54% 73% 79% 81% 71% 75%
The Company's conversion rate can vary significantly from quarter-to-quarter and should be looked at on an annual or LTM basis.
In addition to contracts for identified public customers, the Company has focused on state procurements and cooperative purchasing agreements, with the objective of having available schedules from which customers within a prescribed region or defined list can purchase. The Company has successfully bid and been named on several state contracts. These contracts, however, are not recorded in backlog as they do not have defined quantities allocated to the Company or any other OEM. Once a customer purchases a bus under one of these agreements, the purchase is recorded as a firm order.
The Company's 2019 Q4 LTM Book-to-Bill ratio (defined as new firm orders and exercised options divided by new deliveries) was 85%, a decrease of 4% from 88% in 2018 Q4 LTM largely driven by the large number of deliveries made during 2019 Q4.
In addition, 664 EUs of new firm and option orders were pending from customers at the end of 2019 Q4, where approval of the award to the Company had been made by the customer’s board, council, or commission, as applicable, but purchase documentation had not yet been received by the Company and therefore not yet included in the backlog.
39
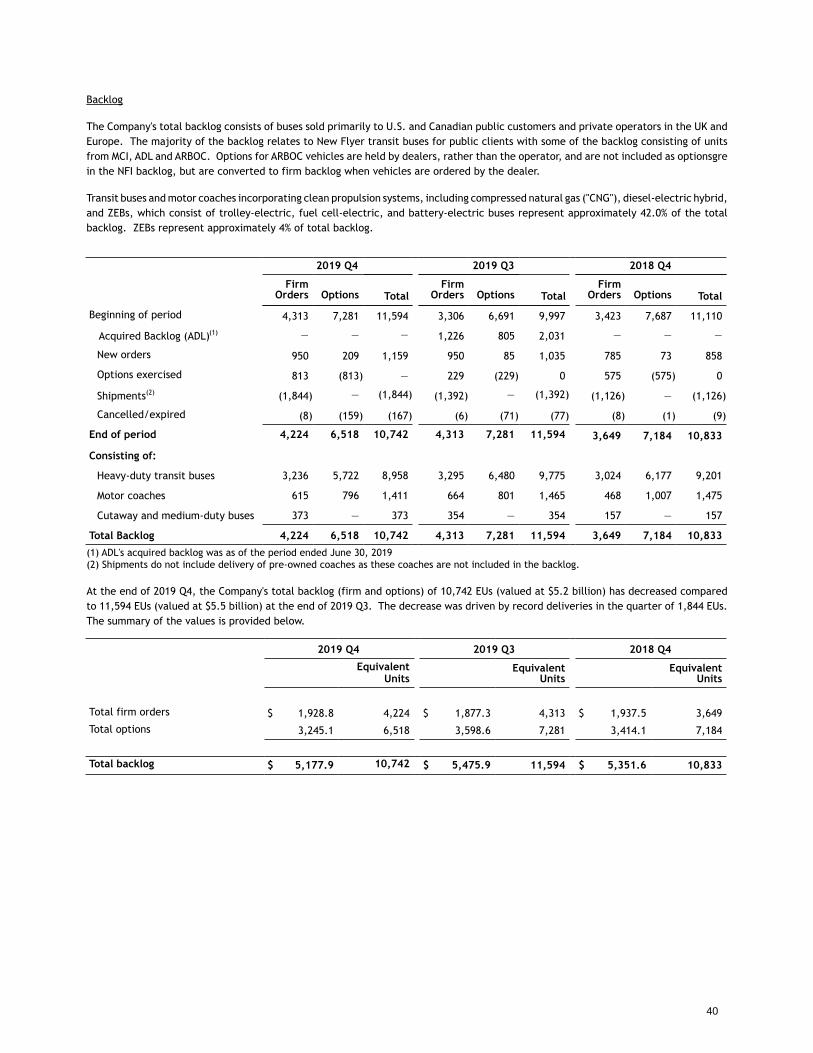
Backlog
The Company's total backlog consists of buses sold primarily to U.S. and Canadian public customers and private operators in the UK and Europe. The majority of the backlog relates to New Flyer transit buses for public clients with some of the backlog consisting of units from MCI, ADL and ARBOC. Options for ARBOC vehicles are held by dealers, rather than the operator, and are not included as optionsgre in the NFI backlog, but are converted to firm backlog when vehicles are ordered by the dealer.
Transit buses and motor coaches incorporating clean propulsion systems, including compressed natural gas ("CNG"), diesel-electric hybrid, and ZEBs, which consist of trolley-electric, fuel cell-electric, and battery-electric buses represent approximately 42.0% of the total backlog. ZEBs represent approximately 4% of total backlog.
2019 Q4 2019 Q3 2018 Q4
FirmOrders Options Total
FirmOrders Options Total
FirmOrders Options Total
Beginning of period 4,313 7,281 11,594 3,306 6,691 9,997 3,423 7,687 11,110
Acquired Backlog (ADL)(1) — — — 1,226 805 2,031 — — —
New orders 950 209 1,159 950 85 1,035 785 73 858
Options exercised 813 (813) — 229 (229) 0 575 (575) 0
Shipments(2) (1,844) — (1,844) (1,392) — (1,392) (1,126) — (1,126)
Cancelled/expired (8) (159) (167) (6) (71) (77) (8) (1) (9)
End of period 4,224 6,518 10,742 4,313 7,281 11,594 3,649 7,184 10,833
Consisting of:
Heavy-duty transit buses 3,236 5,722 8,958 3,295 6,480 9,775 3,024 6,177 9,201
Motor coaches 615 796 1,411 664 801 1,465 468 1,007 1,475
Cutaway and medium-duty buses 373 — 373 354 — 354 157 — 157
Total Backlog 4,224 6,518 10,742 4,313 7,281 11,594 3,649 7,184 10,833
(1) ADL's acquired backlog was as of the period ended June 30, 2019 (2) Shipments do not include delivery of pre-owned coaches as these coaches are not included in the backlog.
At the end of 2019 Q4, the Company's total backlog (firm and options) of 10,742 EUs (valued at $5.2 billion) has decreased compared to 11,594 EUs (valued at $5.5 billion) at the end of 2019 Q3. The decrease was driven by record deliveries in the quarter of 1,844 EUs. The summary of the values is provided below.
2019 Q4 2019 Q3 2018 Q4
Equivalent Units
EquivalentUnits
EquivalentUnits
Total firm orders $ 1,928.8 4,224 $ 1,877.3 4,313 $ 1,937.5 3,649
Total options 3,245.1 6,518 3,598.6 7,281 3,414.1 7,184
Total backlog $ 5,177.9 10,742 $ 5,475.9 11,594 $ 5,351.6 10,833
40
Consolidated Financial Statements of
NFI GROUP INC. December 29, 2019
TABLE OF CONTENTS
Page
Consolidated Statements of Net Earnings and Total Comprehensive Income4
Consolidated Statements of Financial Position5
Consolidated Statements of Changes in Equity6
Consolidated Statements of Cash Flows7
Notes to the Consolidated Financial Statements8 - 40
Independent Auditor’s Report To the Shareholders of NFI Group Inc.
Opinion We have audited the consolidated financial statements of NFI Group Inc. (the “Company”), which comprise the consolidated statements of financial position at December 29, 2019 and December 30, 2018, and the consolidated statements of net earnings and total comprehensive income, changes in equity and cash flows for the years then ended, and notes to the consolidated financial statements, including a summary of significant accounting policies (collectively referred to as the “financial statements”). In our opinion, the accompanying financial statements present fairly, in all material respects, the financial position of the Company as at December 29, 2019 and December 30, 2018, and its financial performance and its cash flows for the years then ended in accordance with International Financial Reporting Standards (“IFRS”).
Basis for Opinion We conducted our audit in accordance with Canadian generally accepted auditing standards (“Canadian GAAS”). Our responsibilities under those standards are further described in the Auditor’s Responsibilities for the Audit of the Financial Statements section of our report. We are independent of the Company in accordance with the ethical requirements that are relevant to our audit of the financial statements in Canada, and we have fulfilled our other ethical responsibilities in accordance with these requirements. We believe that the audit evidence we have obtained is sufficient and appropriate to provide a basis for our opinion.
Other Information Management is responsible for the other information. The other information comprises:
Management’s Discussion and Analysis
Our opinion on the financial statements does not cover the other information and we do not and will not express any form of assurance conclusion thereon. In connection with our audit of the financial statements, our responsibility is to read the other information identified above and, in doing so, consider whether the other information is materially inconsistent with the financial statements or our knowledge obtained in the audit, or otherwise appears to be materially misstated.
We obtained Management’s Discussion and Analysis prior to the date of this auditor’s report. If, based on the work we have performed on this other information, we conclude that there is a material misstatement of this other information, we are required to report that fact in this auditor’s report. We have nothing to report in this regard.
Responsibilities of Management and Those Charged with Governance for the Financial Statements Management is responsible for the preparation and fair presentation of the financial statements in accordance with IFRS, and for such internal control as management determines is necessary to enable the preparation of financial statements that are free from material misstatement, whether due to fraud or error.
Deloitte LLP 360 Main Street Suite 2300 Winnipeg MB R3C 3Z3 Canada
Tel: 1-204-942-0051 Fax: 1-204-947-9390 www.deloitte.ca
1
In preparing the financial statements, management is responsible for assessing the Company’s ability to continue as a going concern, disclosing, as applicable, matters related to going concern and using the going concern basis of accounting unless management either intends to liquidate the Company or to cease operations, or has no realistic alternative but to do so.
Those charged with governance are responsible for overseeing the Company’s financial reporting process.
Auditor’s Responsibilities for the Audit of the Financial Statements Our objectives are to obtain reasonable assurance about whether the financial statements as a whole are free from material misstatement, whether due to fraud or error, and to issue an auditor’s report that includes our opinion. Reasonable assurance is a high level of assurance, but is not a guarantee that an audit conducted in accordance with Canadian GAAS will always detect a material misstatement when it exists. Misstatements can arise from fraud or error and are considered material if, individually or in the aggregate, they could reasonably be expected to influence the economic decisions of users taken on the basis of these financial statements.
As part of an audit in accordance with Canadian GAAS, we exercise professional judgment and maintain professional skepticism throughout the audit. We also:
Identify and assess the risks of material misstatement of the financial statements, whether due to fraud or error, design and perform audit procedures responsive to those risks, and obtain audit evidence that is sufficient and appropriate to provide a basis for our opinion. The risk of not detecting a material misstatement resulting from fraud is higher than for one resulting from error, as fraud may involve collusion, forgery, intentional omissions, misrepresentations, or the override of internal control.
Obtain an understanding of internal control relevant to the audit in order to design audit procedures that are appropriate in the circumstances, but not for the purpose of expressing an opinion on the effectiveness of the Company’s internal control.
Evaluate the appropriateness of accounting policies used and the reasonableness of accounting estimates and related disclosures made by management.
Conclude on the appropriateness of management’s use of the going concern basis of accounting and, based on the audit evidence obtained, whether a material uncertainty exists related to events or conditions that may cast significant doubt on the Company’s ability to continue as a going concern. If we conclude that a material uncertainty exists, we are required to draw attention in our auditor’s report to the related disclosures in the financial statements or, if such disclosures are inadequate, to modify our opinion. Our conclusions are based on the audit evidence obtained up to the date of our auditor’s report. However, future events or conditions may cause the Company to cease to continue as a going concern.
Evaluate the overall presentation, structure and content of the financial statements, including the disclosures, and whether the financial statements represent the underlying transactions and events in a manner that achieves fair presentation.
Obtain sufficient appropriate audit evidence regarding the financial information of the entities or business activities within the Company to express an opinion on the financial statements. We are responsible for the direction, supervision and performance of the group audit. We remain solely responsible for our audit opinion.
We communicate with those charged with governance regarding, among other matters, the planned scope and timing of the audit and significant audit findings, including any significant deficiencies in internal control that we identify during our audit.
2
We also provide those charged with governance with a statement that we have complied with relevant ethical requirements regarding independence, and to communicate with them all relationships and other matters that may reasonably be thought to bear on our independence, and where applicable, related safeguards.
The engagement partner on the audit resulting in this independent auditor’s report is Michael Boucher.
Chartered Professional Accountants Winnipeg, Manitoba March 11, 2020
3
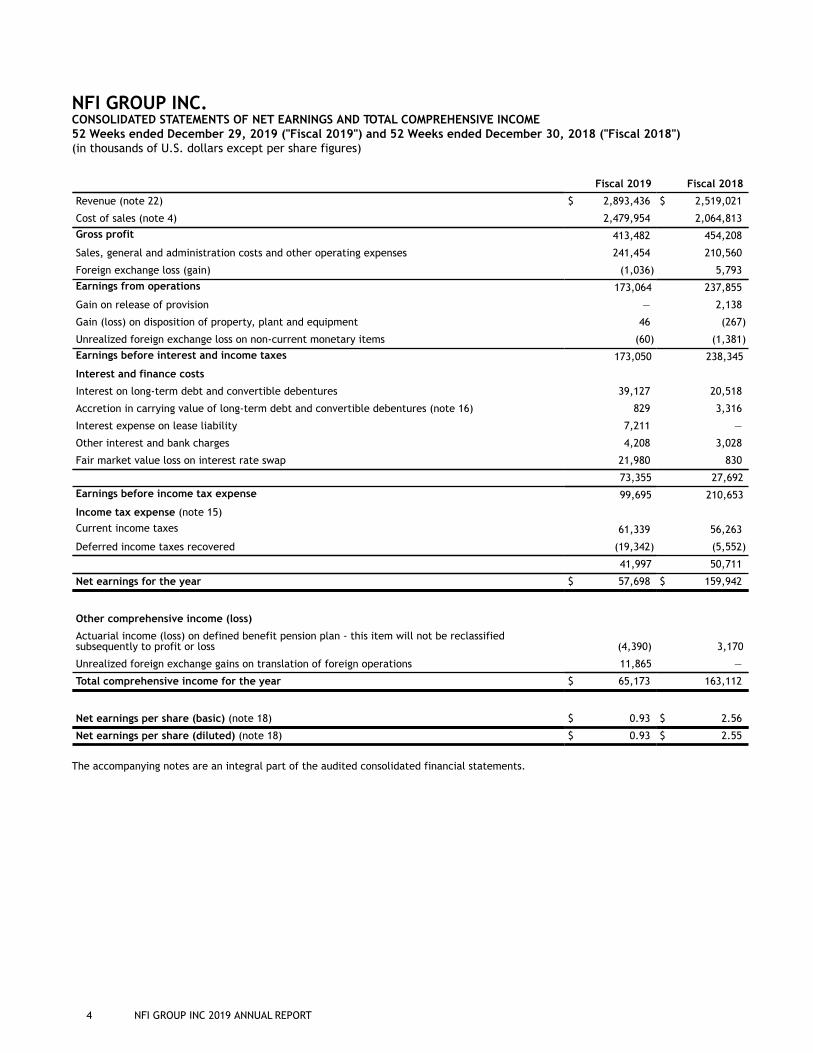
4 NFI GROUP INC 2019 ANNUAL REPORT
NFI GROUP INC. CONSOLIDATED STATEMENTS OF NET EARNINGS AND TOTAL COMPREHENSIVE INCOME 52 Weeks ended December 29, 2019 ("Fiscal 2019") and 52 Weeks ended December 30, 2018 ("Fiscal 2018")(in thousands of U.S. dollars except per share figures)
Fiscal 2019 Fiscal 2018
Revenue (note 22) $ 2,893,436 $ 2,519,021
Cost of sales (note 4) 2,479,954 2,064,813
Gross profit 413,482 454,208
Sales, general and administration costs and other operating expenses 241,454 210,560
Foreign exchange loss (gain) (1,036) 5,793
Earnings from operations 173,064 237,855
Gain on release of provision — 2,138
Gain (loss) on disposition of property, plant and equipment 46 (267)
Unrealized foreign exchange loss on non-current monetary items (60) (1,381)
Earnings before interest and income taxes 173,050 238,345
Interest and finance costs
Interest on long-term debt and convertible debentures 39,127 20,518
Accretion in carrying value of long-term debt and convertible debentures (note 16) 829 3,316
Interest expense on lease liability 7,211 —
Other interest and bank charges 4,208 3,028
Fair market value loss on interest rate swap 21,980 830
73,355 27,692
Earnings before income tax expense 99,695 210,653
Income tax expense (note 15)
Current income taxes 61,339 56,263
Deferred income taxes recovered (19,342) (5,552)
41,997 50,711
Net earnings for the year $ 57,698 $ 159,942
Other comprehensive income (loss)
Actuarial income (loss) on defined benefit pension plan - this item will not be reclassifiedsubsequently to profit or loss (4,390) 3,170
Unrealized foreign exchange gains on translation of foreign operations 11,865 —
Total comprehensive income for the year $ 65,173 163,112
Net earnings per share (basic) (note 18) $ 0.93 $ 2.56
Net earnings per share (diluted) (note 18) $ 0.93 $ 2.55
The accompanying notes are an integral part of the audited consolidated financial statements.
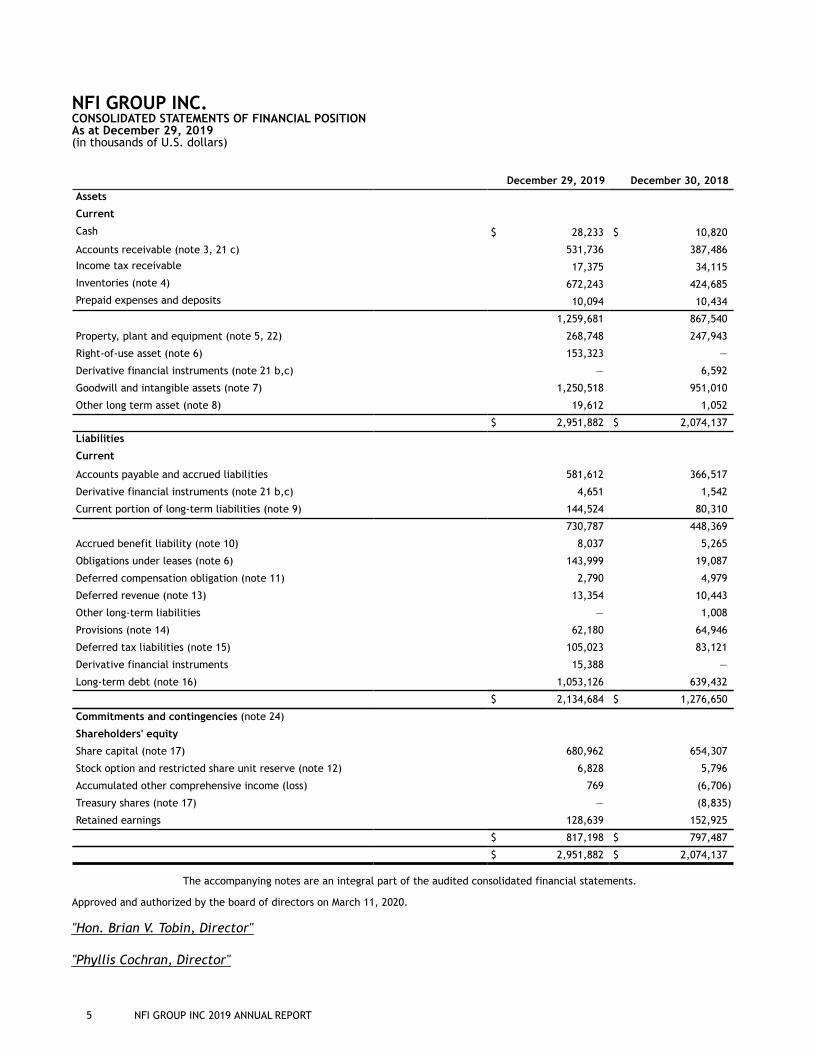
5 NFI GROUP INC 2019 ANNUAL REPORT
NFI GROUP INC.CONSOLIDATED STATEMENTS OF FINANCIAL POSITION As at December 29, 2019 (in thousands of U.S. dollars)
December 29, 2019 December 30, 2018
Assets
Current
Cash $ 28,233 $ 10,820
Accounts receivable (note 3, 21 c) 531,736 387,486
Income tax receivable 17,375 34,115
Inventories (note 4) 672,243 424,685
Prepaid expenses and deposits 10,094 10,434
1,259,681 867,540
Property, plant and equipment (note 5, 22) 268,748 247,943
Right-of-use asset (note 6) 153,323 —
Derivative financial instruments (note 21 b,c) — 6,592
Goodwill and intangible assets (note 7) 1,250,518 951,010
Other long term asset (note 8) 19,612 1,052
$ 2,951,882 $ 2,074,137
Liabilities
Current
Accounts payable and accrued liabilities 581,612 366,517
Derivative financial instruments (note 21 b,c) 4,651 1,542
Current portion of long-term liabilities (note 9) 144,524 80,310
730,787 448,369
Accrued benefit liability (note 10) 8,037 5,265
Obligations under leases (note 6) 143,999 19,087
Deferred compensation obligation (note 11) 2,790 4,979
Deferred revenue (note 13) 13,354 10,443
Other long-term liabilities — 1,008
Provisions (note 14) 62,180 64,946
Deferred tax liabilities (note 15) 105,023 83,121
Derivative financial instruments 15,388 —
Long-term debt (note 16) 1,053,126 639,432
$ 2,134,684 $ 1,276,650
Commitments and contingencies (note 24)
Shareholders' equity
Share capital (note 17) 680,962 654,307
Stock option and restricted share unit reserve (note 12) 6,828 5,796
Accumulated other comprehensive income (loss) 769 (6,706)
Treasury shares (note 17) — (8,835)
Retained earnings 128,639 152,925
$ 817,198 $ 797,487
$ 2,951,882 $ 2,074,137
The accompanying notes are an integral part of the audited consolidated financial statements.
Approved and authorized by the board of directors on March 11, 2020.
"Hon. Brian V. Tobin, Director"
"Phyllis Cochran, Director"
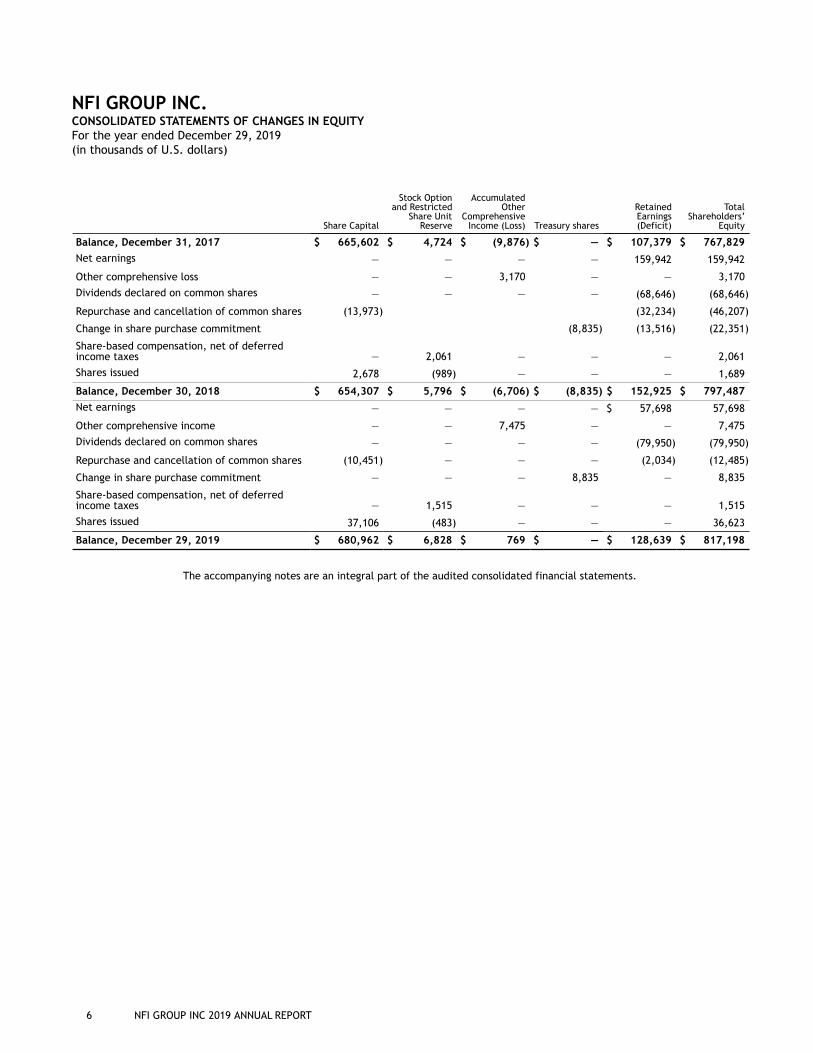
6 NFI GROUP INC 2019 ANNUAL REPORT
NFI GROUP INC.CONSOLIDATED STATEMENTS OF CHANGES IN EQUITY For the year ended December 29, 2019 (in thousands of U.S. dollars)
Share Capital
Stock Optionand Restricted
Share UnitReserve
AccumulatedOther
ComprehensiveIncome (Loss) Treasury shares
RetainedEarnings(Deficit)
TotalShareholders’
Equity
Balance, December 31, 2017 $ 665,602 $ 4,724 $ (9,876) $ — $ 107,379 $ 767,829
Net earnings — — — — 159,942 159,942
Other comprehensive loss — — 3,170 — — 3,170
Dividends declared on common shares — — — — (68,646) (68,646)
Repurchase and cancellation of common shares (13,973) (32,234) (46,207)
Change in share purchase commitment (8,835) (13,516) (22,351)
Share-based compensation, net of deferredincome taxes — 2,061 — — — 2,061
Shares issued 2,678 (989) — — — 1,689
Balance, December 30, 2018 $ 654,307 $ 5,796 $ (6,706) $ (8,835) $ 152,925 $ 797,487
Net earnings — — — — $ 57,698 57,698
Other comprehensive income — — 7,475 — — 7,475
Dividends declared on common shares — — — — (79,950) (79,950)
Repurchase and cancellation of common shares (10,451) — — — (2,034) (12,485)
Change in share purchase commitment — — — 8,835 — 8,835
Share-based compensation, net of deferredincome taxes — 1,515 — — — 1,515
Shares issued 37,106 (483) — — — 36,623
Balance, December 29, 2019 $ 680,962 $ 6,828 $ 769 $ — $ 128,639 $ 817,198
The accompanying notes are an integral part of the audited consolidated financial statements.
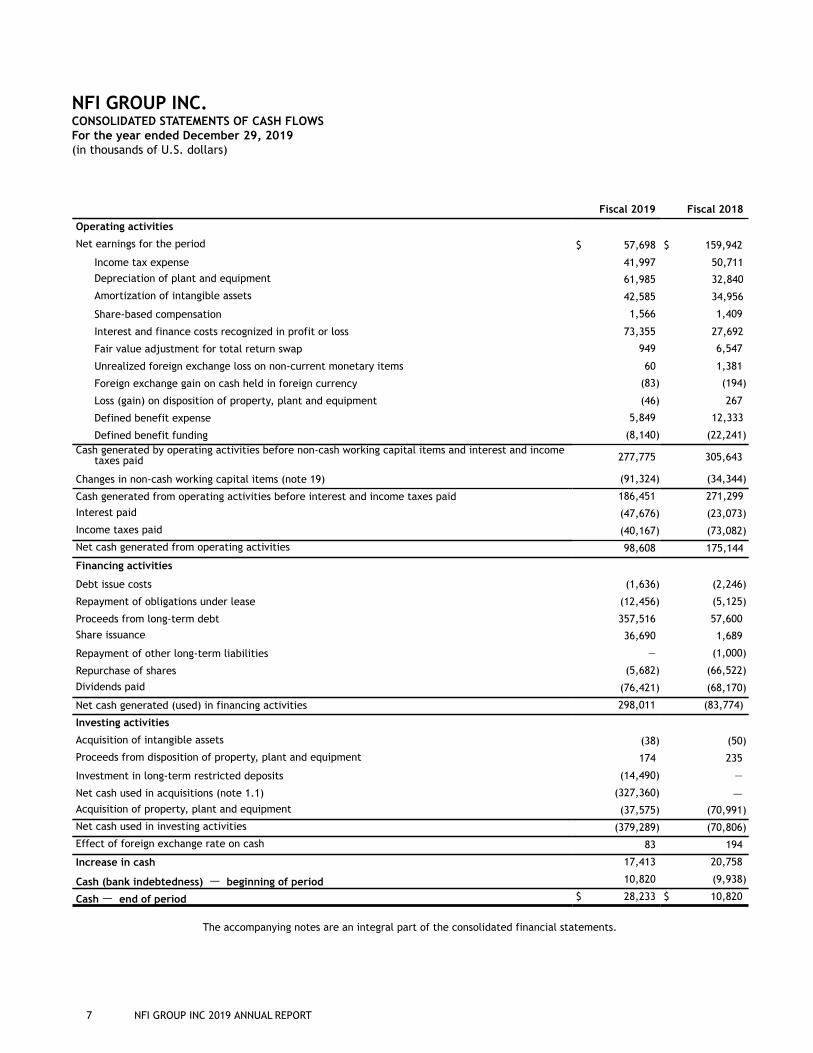
7 NFI GROUP INC 2019 ANNUAL REPORT
NFI GROUP INC.CONSOLIDATED STATEMENTS OF CASH FLOWS For the year ended December 29, 2019 (in thousands of U.S. dollars)
Fiscal 2019 Fiscal 2018
Operating activities
Net earnings for the period $ 57,698 $ 159,942
Income tax expense 41,997 50,711
Depreciation of plant and equipment 61,985 32,840
Amortization of intangible assets 42,585 34,956
Share-based compensation 1,566 1,409
Interest and finance costs recognized in profit or loss 73,355 27,692
Fair value adjustment for total return swap 949 6,547
Unrealized foreign exchange loss on non-current monetary items 60 1,381
Foreign exchange gain on cash held in foreign currency (83) (194)
Loss (gain) on disposition of property, plant and equipment (46) 267
Defined benefit expense 5,849 12,333
Defined benefit funding (8,140) (22,241)Cash generated by operating activities before non-cash working capital items and interest and income
taxes paid 277,775 305,643
Changes in non-cash working capital items (note 19) (91,324) (34,344)
Cash generated from operating activities before interest and income taxes paid 186,451 271,299
Interest paid (47,676) (23,073)
Income taxes paid (40,167) (73,082)
Net cash generated from operating activities 98,608 175,144
Financing activities
Debt issue costs (1,636) (2,246)
Repayment of obligations under lease (12,456) (5,125)
Proceeds from long-term debt 357,516 57,600
Share issuance 36,690 1,689
Repayment of other long-term liabilities — (1,000)
Repurchase of shares (5,682) (66,522)
Dividends paid (76,421) (68,170)
Net cash generated (used) in financing activities 298,011 (83,774)
Investing activities
Acquisition of intangible assets (38) (50)
Proceeds from disposition of property, plant and equipment 174 235
Investment in long-term restricted deposits (14,490) —
Net cash used in acquisitions (note 1.1) (327,360) —Acquisition of property, plant and equipment (37,575) (70,991)
Net cash used in investing activities (379,289) (70,806)
Effect of foreign exchange rate on cash 83 194
Increase in cash 17,413 20,758
Cash (bank indebtedness) — beginning of period 10,820 (9,938)
Cash — end of period $ 28,233 $ 10,820
The accompanying notes are an integral part of the consolidated financial statements.
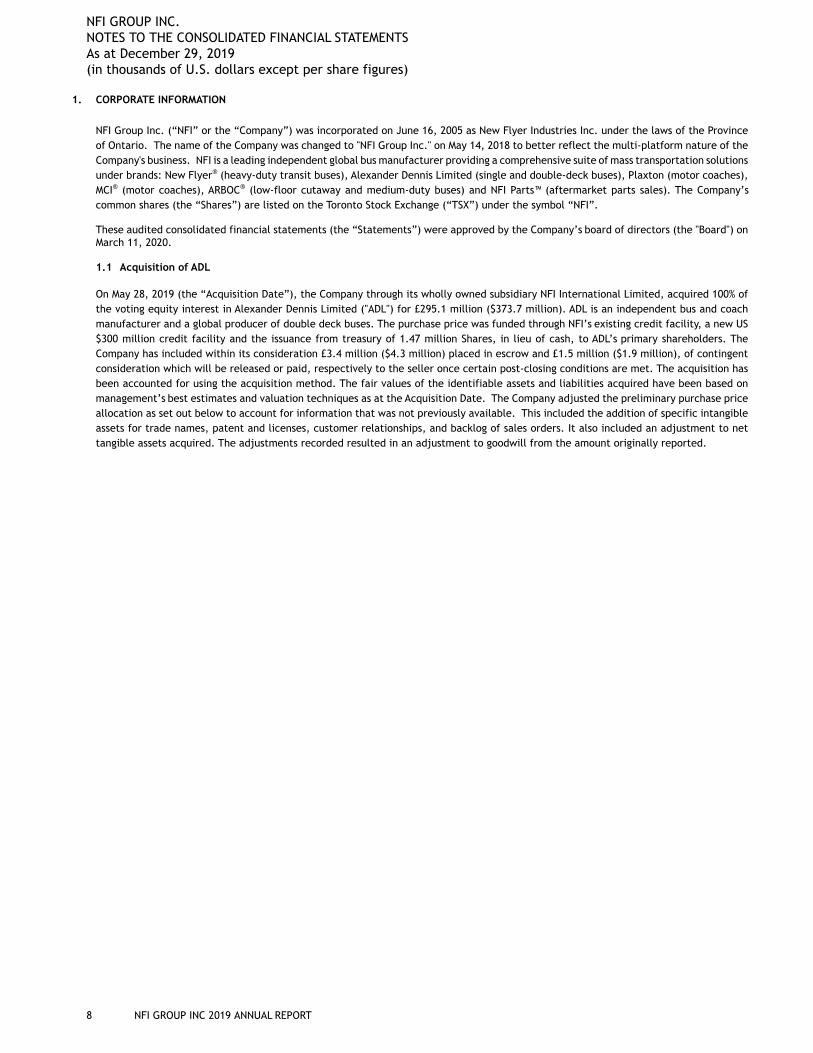
NFI GROUP INC. NOTES TO THE CONSOLIDATED FINANCIAL STATEMENTS As at December 29, 2019(in thousands of U.S. dollars except per share figures)
8 NFI GROUP INC 2019 ANNUAL REPORT
1. CORPORATE INFORMATION
NFI Group Inc. (“NFI” or the “Company”) was incorporated on June 16, 2005 as New Flyer Industries Inc. under the laws of the Province of Ontario. The name of the Company was changed to "NFI Group Inc." on May 14, 2018 to better reflect the multi-platform nature of the Company's business. NFI is a leading independent global bus manufacturer providing a comprehensive suite of mass transportation solutions under brands: New Flyer® (heavy-duty transit buses), Alexander Dennis Limited (single and double-deck buses), Plaxton (motor coaches), MCI® (motor coaches), ARBOC® (low-floor cutaway and medium-duty buses) and NFI Parts™ (aftermarket parts sales). The Company’s common shares (the “Shares”) are listed on the Toronto Stock Exchange (“TSX”) under the symbol “NFI”.
These audited consolidated financial statements (the “Statements”) were approved by the Company’s board of directors (the "Board") on March 11, 2020.
1.1 Acquisition of ADL
On May 28, 2019 (the “Acquisition Date”), the Company through its wholly owned subsidiary NFI International Limited, acquired 100% of the voting equity interest in Alexander Dennis Limited ("ADL") for £295.1 million ($373.7 million). ADL is an independent bus and coach manufacturer and a global producer of double deck buses. The purchase price was funded through NFI’s existing credit facility, a new US$300 million credit facility and the issuance from treasury of 1.47 million Shares, in lieu of cash, to ADL’s primary shareholders. The Company has included within its consideration £3.4 million ($4.3 million) placed in escrow and £1.5 million ($1.9 million), of contingent consideration which will be released or paid, respectively to the seller once certain post-closing conditions are met. The acquisition has been accounted for using the acquisition method. The fair values of the identifiable assets and liabilities acquired have been based on management’s best estimates and valuation techniques as at the Acquisition Date. The Company adjusted the preliminary purchase price allocation as set out below to account for information that was not previously available. This included the addition of specific intangible assets for trade names, patent and licenses, customer relationships, and backlog of sales orders. It also included an adjustment to net tangible assets acquired. The adjustments recorded resulted in an adjustment to goodwill from the amount originally reported.
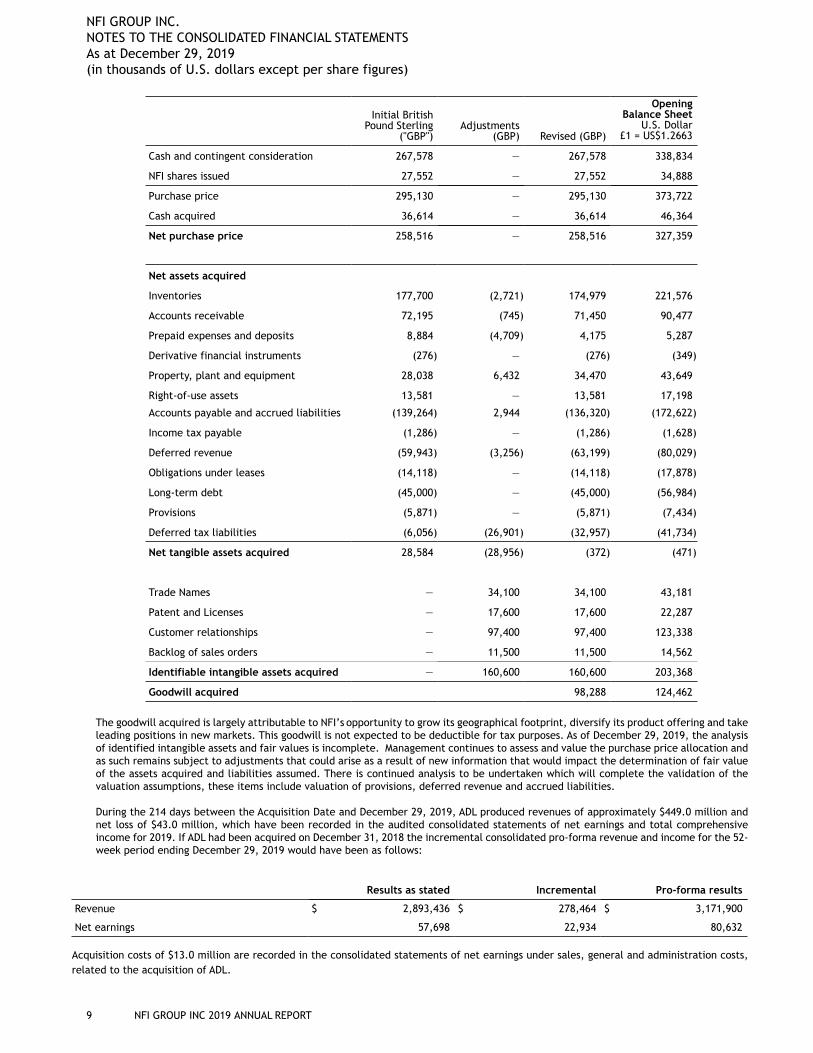
NFI GROUP INC. NOTES TO THE CONSOLIDATED FINANCIAL STATEMENTS As at December 29, 2019(in thousands of U.S. dollars except per share figures)
9 NFI GROUP INC 2019 ANNUAL REPORT
Initial British Pound Sterling
("GBP")Adjustments
(GBP) Revised (GBP)
Opening Balance Sheet
U.S. Dollar£1 = US$1.2663
Cash and contingent consideration 267,578 — 267,578 338,834
NFI shares issued 27,552 — 27,552 34,888
Purchase price 295,130 — 295,130 373,722
Cash acquired 36,614 — 36,614 46,364
Net purchase price 258,516 — 258,516 327,359
Net assets acquired
Inventories 177,700 (2,721) 174,979 221,576
Accounts receivable 72,195 (745) 71,450 90,477
Prepaid expenses and deposits 8,884 (4,709) 4,175 5,287
Derivative financial instruments (276) — (276) (349)
Property, plant and equipment 28,038 6,432 34,470 43,649
Right-of-use assets 13,581 — 13,581 17,198
Accounts payable and accrued liabilities (139,264) 2,944 (136,320) (172,622)
Income tax payable (1,286) — (1,286) (1,628)
Deferred revenue (59,943) (3,256) (63,199) (80,029)
Obligations under leases (14,118) — (14,118) (17,878)
Long-term debt (45,000) — (45,000) (56,984)
Provisions (5,871) — (5,871) (7,434)
Deferred tax liabilities (6,056) (26,901) (32,957) (41,734)
Net tangible assets acquired 28,584 (28,956) (372) (471)
Trade Names — 34,100 34,100 43,181
Patent and Licenses — 17,600 17,600 22,287
Customer relationships — 97,400 97,400 123,338
Backlog of sales orders — 11,500 11,500 14,562
Identifiable intangible assets acquired — 160,600 160,600 203,368
Goodwill acquired 98,288 124,462
The goodwill acquired is largely attributable to NFI’s opportunity to grow its geographical footprint, diversify its product offering and take leading positions in new markets. This goodwill is not expected to be deductible for tax purposes. As of December 29, 2019, the analysis of identified intangible assets and fair values is incomplete. Management continues to assess and value the purchase price allocation and as such remains subject to adjustments that could arise as a result of new information that would impact the determination of fair value of the assets acquired and liabilities assumed. There is continued analysis to be undertaken which will complete the validation of the valuation assumptions, these items include valuation of provisions, deferred revenue and accrued liabilities.
During the 214 days between the Acquisition Date and December 29, 2019, ADL produced revenues of approximately $449.0 million and net loss of $43.0 million, which have been recorded in the audited consolidated statements of net earnings and total comprehensive income for 2019. If ADL had been acquired on December 31, 2018 the incremental consolidated pro-forma revenue and income for the 52-week period ending December 29, 2019 would have been as follows:
Results as stated Incremental Pro-forma results
Revenue $ 2,893,436 $ 278,464 $ 3,171,900
Net earnings 57,698 22,934 80,632
Acquisition costs of $13.0 million are recorded in the consolidated statements of net earnings under sales, general and administration costs, related to the acquisition of ADL.
NFI GROUP INC. NOTES TO THE CONSOLIDATED FINANCIAL STATEMENTS As at December 29, 2019(in thousands of U.S. dollars except per share figures)
10 NFI GROUP INC 2019 ANNUAL REPORT
2. SUMMARY OF SIGNIFICANT ACCOUNTING POLICIES
The principal accounting policies applied in the preparation of these Statements are set out below. These policies have been consistently applied to all periods presented, unless otherwise stated.
2.1 Basis of preparation
The Statements were prepared on a going concern basis in accordance with International Financial Reporting Standards (“IFRS”) which requires management to make judgments, estimates and assumptions that affect the application of accounting policies and the reported amounts of assets and liabilities, revenue and expenses. Actual results may differ from these estimates.
2.2 Principles of consolidation
The Statements include the accounts of the Company's subsidiaries.
Subsidiaries
Subsidiaries are entities over which the Company has control, where control is achieved when the Company: has power over the investee; is exposed, or has rights, to variable returns from its involvement with the investee; and has the ability to use its power to affect its returns. The Company holds 100% of the voting rights in, and therefore controls, its subsidiaries.
The effects of potential voting rights that are currently exercisable are considered when assessing whether control exists. Subsidiaries are fully consolidated from the date control is transferred to the Company, and are de-consolidated from the date control ceases.
The acquisition method of accounting is used to account for the acquisition of subsidiaries as follows:
• cost is measured as the fair value of the assets given, equity instruments issued and liabilities incurred or assumed at the date of exchange, and business acquisition related expenses are expensed as incurred;
• identifiable assets acquired and liabilities assumed are measured at their fair values at the acquisition date;
• the excess of acquisition cost over the fair value of the identifiable net assets acquired is recorded as goodwill; and
• if the acquisition cost is less than the fair value of the net assets acquired, the fair value of the net assets is reassessed and any remaining difference is recognized directly in the consolidated statements of net earnings and comprehensive income.
Inter-company transactions between subsidiaries are eliminated on consolidation.
2.3 New and amended standards adopted by the Company
IFRS 16 - Leases ("IFRS 16")
Effective December 31, 2018, the Company adopted IFRS 16, which specifies how to recognize, present and disclose leases. The standard provides a single lessee accounting model, requiring lessees to recognize assets and liabilities for all major leases. The adoption of this standard resulted in the recognition of amounts through the consolidated statements of net earnings through depreciation and interest charges on the right-of-use asset and lease liability, respectively. Under the former accounting policy, IAS 17, leases ("IAS 17"), expenses related to leases were recorded through operating expenses. On transition, the Company has elected to use the following practical expedients:
• To utilize the modified retrospective approach to adopting the standard, accordingly comparative information for 2018 has not been restated.
• To utilize the definition of a lease under IAS 17, to identify contracts that are, or contain, leases.• To exclude the recognition of the right-of-use asset and lease liability for leases with a term of twelve months or less.
Lease assets formerly capitalized as fixed assets are transferred at their net book value to the right-of-use asset line item within consolidated statement of financial position. No adjustments to the carrying value of these leased assets was made as a part of transition to IFRS 16.
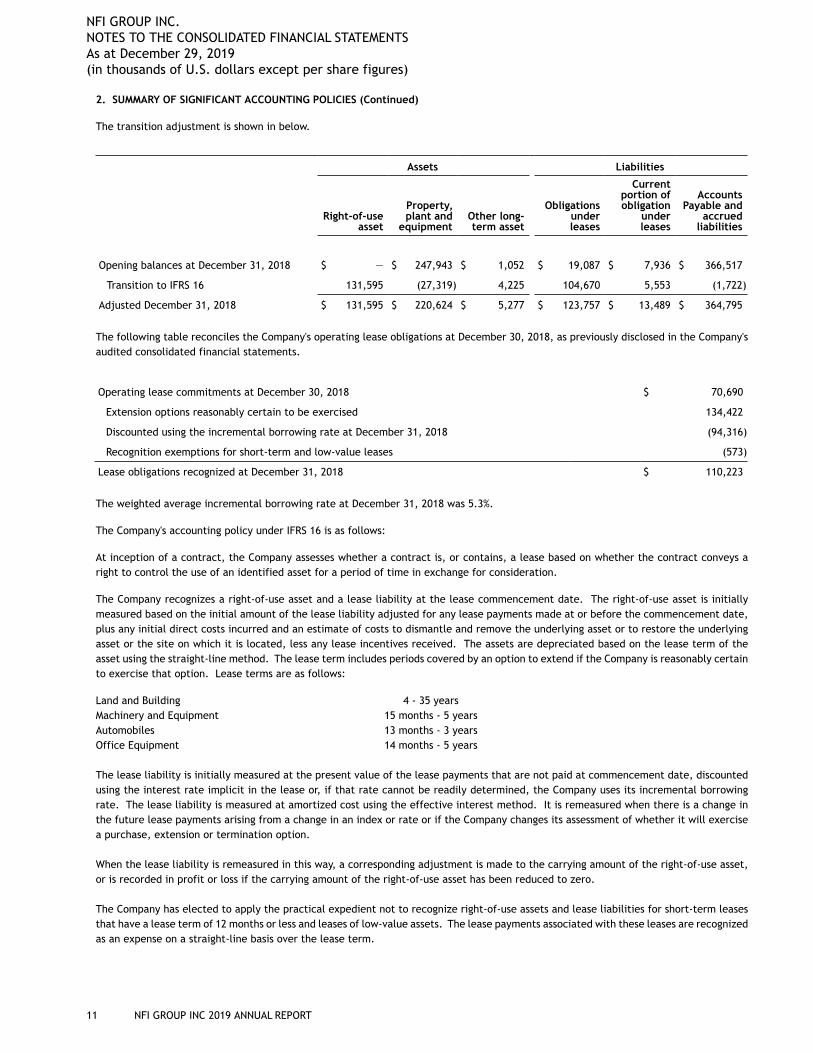
NFI GROUP INC. NOTES TO THE CONSOLIDATED FINANCIAL STATEMENTS As at December 29, 2019(in thousands of U.S. dollars except per share figures)
11 NFI GROUP INC 2019 ANNUAL REPORT
2. SUMMARY OF SIGNIFICANT ACCOUNTING POLICIES (Continued)
The transition adjustment is shown in below.
Assets Liabilities
Right-of-useasset
Property,plant and
equipmentOther long-term asset
Obligationsunderleases
Currentportion ofobligation
underleases
AccountsPayable and
accruedliabilities
Opening balances at December 31, 2018 $ — $ 247,943 $ 1,052 $ 19,087 $ 7,936 $ 366,517
Transition to IFRS 16 131,595 (27,319) 4,225 104,670 5,553 (1,722)
Adjusted December 31, 2018 $ 131,595 $ 220,624 $ 5,277 $ 123,757 $ 13,489 $ 364,795
The following table reconciles the Company's operating lease obligations at December 30, 2018, as previously disclosed in the Company's audited consolidated financial statements.
Operating lease commitments at December 30, 2018 $ 70,690
Extension options reasonably certain to be exercised 134,422
Discounted using the incremental borrowing rate at December 31, 2018 (94,316)
Recognition exemptions for short-term and low-value leases (573)
Lease obligations recognized at December 31, 2018 $ 110,223
The weighted average incremental borrowing rate at December 31, 2018 was 5.3%.
The Company's accounting policy under IFRS 16 is as follows:
At inception of a contract, the Company assesses whether a contract is, or contains, a lease based on whether the contract conveys a right to control the use of an identified asset for a period of time in exchange for consideration.
The Company recognizes a right-of-use asset and a lease liability at the lease commencement date. The right-of-use asset is initially measured based on the initial amount of the lease liability adjusted for any lease payments made at or before the commencement date, plus any initial direct costs incurred and an estimate of costs to dismantle and remove the underlying asset or to restore the underlying asset or the site on which it is located, less any lease incentives received. The assets are depreciated based on the lease term of the asset using the straight-line method. The lease term includes periods covered by an option to extend if the Company is reasonably certain to exercise that option. Lease terms are as follows:
Land and Building 4 - 35 yearsMachinery and Equipment 15 months - 5 yearsAutomobiles 13 months - 3 yearsOffice Equipment 14 months - 5 years
The lease liability is initially measured at the present value of the lease payments that are not paid at commencement date, discounted using the interest rate implicit in the lease or, if that rate cannot be readily determined, the Company uses its incremental borrowing rate. The lease liability is measured at amortized cost using the effective interest method. It is remeasured when there is a change in the future lease payments arising from a change in an index or rate or if the Company changes its assessment of whether it will exercise a purchase, extension or termination option.
When the lease liability is remeasured in this way, a corresponding adjustment is made to the carrying amount of the right-of-use asset, or is recorded in profit or loss if the carrying amount of the right-of-use asset has been reduced to zero.
The Company has elected to apply the practical expedient not to recognize right-of-use assets and lease liabilities for short-term leases that have a lease term of 12 months or less and leases of low-value assets. The lease payments associated with these leases are recognized as an expense on a straight-line basis over the lease term.
NFI GROUP INC. NOTES TO THE CONSOLIDATED FINANCIAL STATEMENTS As at December 29, 2019(in thousands of U.S. dollars except per share figures)
12 NFI GROUP INC 2019 ANNUAL REPORT
2. SUMMARY OF SIGNIFICANT ACCOUNTING POLICIES (Continued)
2.4 Reportable Segments
The Company’s reportable segments are organized around the markets it serves and are reported in a manner consistent with the internal reporting provided to the chief operating decision-maker (“CODM”). The President and Chief Executive Officer of the Company has authority for resource allocation and assessment of the Company’s performance and therefore acts as the CODM.
2.5 Foreign currency
The Company operates with multiple functional currencies. The Company’s consolidated financial statements are presented in U.S. dollars as this presentation is most meaningful to financial statement users. References to “$” are to U.S. dollars, references to “C$” are to Canadian dollars, references to "£" are to British pounds sterling. For those subsidiaries with different functional currencies, exchange rate differences arising from the translation of items that form part of the net investment in the foreign operation are recorded in unrealized foreign exchange gains (losses) on translation of foreign operations in other comprehensive income.
Monetary balances denominated in a currency other than U.S. dollars are translated at the period end rates of exchange, and the results of the operations are translated at average rates of exchange for the period. Non-monetary balances are translated at the exchange rate prevailing at the date of the transaction.
Foreign exchange gains and losses that relate to borrowings, non-current monetary items and non-current forward foreign exchange contracts are presented in the consolidated statements of net earnings and comprehensive income within “unrealized foreign exchange loss (gain) on non-current monetary items”.
All other foreign exchange gains and losses are presented in the consolidated statements of net earnings and comprehensive income within “foreign exchange (loss) gain”.
2.6 Revenue recognition
Manufacturing Operations
Persuasive evidence of an arrangement exists in the form of a written contract. A process is in place that initiates a pre-shipment acceptance by the customer at the Company’s plant. This acceptance prior to shipment mitigates the likelihood of customer’s dissatisfaction with the final product upon delivery to the customer. Revenue is recorded when the buses or coaches are delivered or shipped. The customer does not have a legal right to return the delivered products after the acceptance period, or deviate from the agreed upon price. The Company’s contract clearly identifies a fixed and determinable price.
In connection with its sales of new coaches, the Company at times agrees to accept a pre-owned coach in exchange and gives the buyer a credit equal to the pre-owned coach's then-current fair value. Any credit provided to the customer in excess of the fair value of the pre-owned coach is deducted from the selling price of the new coach.
Operating lease revenue is recorded on a straight-line basis in the period earned over the life of the contract and is recognized in revenue in the consolidated statements of net earnings and comprehensive income due to its operating nature.
When a single sale transaction requires the delivery of more than one product or service (multiple performance obligations), the revenue recognition criteria are applied to the separately identifiable performance obligations. A performance obligation is considered to be separately identifiable if the product or service delivered has stand-alone value to that customer and the fair value associated with the product or service can be measured reliably. The amount recognized as revenue for each performance obligation is its fair value in relation to the fair value of the contract as a whole. Management has determined that the standard base warranty included in the bus or coach purchase is not a separate performance obligation and therefore recognized upon delivery of the bus or coach.
The Company sells extended warranty contracts that provide coverage in addition to the basic coverage. Proceeds from the sale of these contracts are deferred and amortized into revenue over the extended warranty period commencing at the end of the basic warranty period. The Company also receives proceeds from the sale of extended warranties relating to major subsystems such as engines, transmissions, axles and air conditioning that are purchased for the customer from the original equipment manufacturer (“OEM”). The related cost to purchase the OEM warranty contracts have been recorded as a reduction of revenue as the Company is an agent to the transaction.
The Company does not recognize revenue on any bus or coach firm or option orders that have not yet been delivered.
Aftermarket Operations
Persuasive evidence of an arrangement exists in the form of an authorized sales order. The customer is invoiced, and revenue is recorded at the time the part is delivered using a commercial shipper. The price list for parts clearly identifies a fixed and determinable price,
NFI GROUP INC. NOTES TO THE CONSOLIDATED FINANCIAL STATEMENTS As at December 29, 2019(in thousands of U.S. dollars except per share figures)
13 NFI GROUP INC 2019 ANNUAL REPORT
2. SUMMARY OF SIGNIFICANT ACCOUNTING POLICIES (Continued)
while also describing that the Company has no legal obligation to accept the return of goods other than on defective and/or warrantable parts product. Aftermarket parts revenue does not contain any revenue related to the bus or coach warranty.
2.7 Employee benefits
For defined benefit pension plans and other post-employment benefits, the net periodic pension expense is actuarially determined by independent actuaries using the projected unit credit method. Actuarial remeasurement is comprised of actuarial gains and losses, the effect of the changes to the asset ceiling (if applicable) and the return on plan assets (excluding interest), and is reflected immediately in the statement of financial position with a charge or credit recognized in other comprehensive income in the period in which they occur. Remeasurement recognized in other comprehensive income is reflected immediately in accumulated other comprehensive loss and will not be reclassified to profit or loss. Past service cost is recognized in profit or loss in the period of a plan amendment. Net interest is calculated by applying the discount rate at the beginning of the period to the net defined benefit liability or asset. Defined benefit costs are comprised of service costs (including current service cost, past service cost and gain or losses on curtailments and settlements), net interest expense or income and remeasurement.
The asset or liability recognized in the consolidated statements of financial position is the present value of the defined benefit obligation at the end of the reporting period less the fair value of plan assets, together with adjustments for past service costs. The present value of the defined benefit obligation is determined by discounting the estimated future cash outflows using interest rates of high-quality corporate bonds that are denominated in the currency in which the benefits will be paid and that have terms to maturity approximating the terms of the related pension liability. For funded plans, surpluses are recognized only to the extent that the surplus is considered recoverable. Recoverability is primarily based on the extent to which the Company can unilaterally reduce future contributions to the plan.
Payments to defined contribution plans are expensed as incurred, which is as the related employee service is rendered.
2.8 Share-based compensation plans
The Company operates cash-settled and equity-settled share-based compensation plans under which it receives services from senior managment and non-employee members of the Board.
For the cash-settled plans (note 11), the expense is determined based on the fair value of the liability at the end of the reporting period until the awards are settled. Certain share-based compensation plans include non-market performance conditions. The Company`s accounting policy is to recognize the impact of non-market performance conditions by adjusting the number of awards that are expected to vest. At the end of each reporting period, the Company re-assesses its estimates of the number of awards that are expected to vest and recognizes the impact of the revisions on compensation expense (note 22) in the consolidated statements of net earnings and comprehensive income.
For the equity-settled plans (note 12), share-based payments to senior management are measured at the fair value of the equity instruments at the grant date. The fair value is measured at grant date and each tranche is recognized on a graded-vesting basis over the period in which the options vest. The offset to the recorded cost is the stock option reserve. Consideration received on the exercise of stock options is recorded as share capital and the related stock option reserve is transferred to share capital. Upon expiry, the recorded value is transferred to retained earnings. At the end of each reporting period, the Company revises its estimate of the number of equity instruments expected to vest. The impact of the revision of the original estimates, if any, is recognized in the consolidated statements of net earnings and comprehensive income such that the cumulative expense reflects the revised estimate, with a corresponding adjustment to the stock option reserve. Where the terms and conditions of options are modified, the increase in the fair value of the options, measured immediately before and after the modification, is also charged to the consolidated statements of net earnings and comprehensive income.
2.9 Cash
Cash and cash equivalents comprise cash on hand, demand deposits and investments with an original maturity at the date of purchase of three months or less.
2.10 Accounts receivables
Accounts receivables are amounts due from customers from the rendering of services or sale of goods in the ordinary course of business. Accounts receivables are classified as current assets if payment is due within one year or less. Accounts receivables are recognized initially at fair value and subsequently measured at amortized cost, less impairment, if any.
The Company maintains an allowance for doubtful accounts and sales adjustments to provide for impairment of trade receivables. The expense relating to doubtful accounts is included within “Sales, general and administration costs and other operating expenses” in the consolidated statements of net earnings and comprehensive income.
2.11 Inventories
Inventories are measured at the lower of cost and net realizable value. The cost of inventories is based on the first-in first-out principle, and includes expenditures incurred in acquiring the inventories, production or conversion costs and other costs incurred in bringing them
NFI GROUP INC. NOTES TO THE CONSOLIDATED FINANCIAL STATEMENTS As at December 29, 2019(in thousands of U.S. dollars except per share figures)
14 NFI GROUP INC 2019 ANNUAL REPORT
2. SUMMARY OF SIGNIFICANT ACCOUNTING POLICIES (Continued)
to their existing location and condition. In the case of manufactured inventories and work in progress, cost includes an appropriate share of production overheads based on normal operating capacity. Net realizable value is the estimated selling price in the ordinary course of business, less the estimated costs of completion and selling expenses.
2.12 Property, plant and equipment
Property, plant and equipment are recorded at cost reduced by applicable investment tax credits, less accumulated depreciation. Depreciation is calculated at the following annual rates:
Building and building improvements
Machinery and equipment
Demo buses and coaches 20% - 50% straight-line basis
Computer hardware and software
Office equipment
Buses and coaches available for lease 20% - 50% straight-line basis
Depreciation of equipment under finance leases is based on the lesser of the equipment’s useful life or the term of the finance lease.
Property, plant and equipment are tested for impairment as described under “Impairment of non-financial assets” in note 2.15.
2.13 Intangible assets
Identifiable intangible assets are initially recorded at fair value. Based on management’s forecasts and business plans and the going concern of the Company, the trade names intangible asset (note 7) has been deemed to have an indefinite life, except for the "NABI Parts" tradename which is amortized over its useful life of 12 years. For purposes of impairment testing, the fair value of trade names is determined using an income approach.
Intangible assets that have a finite life are amortized using the straight-line method over the estimated useful lives of the assets as follows:
Patents and Licenses 5-12 years
Backlog of sales orders 1-2 years
Customer relationships 21 years
Identifiable intangible assets with finite and indefinite lives are tested for impairment as described under “Impairment of non-financial assets” in note 2.15.
2.14 Goodwill
Goodwill represents the excess of the cost of an acquisition over the fair value of the Company’s share of the net identifiable assets of the acquired business at the date of acquisition. Separately recognized goodwill is tested at the end of every reporting period for possible impairment when there are events or changes in circumstances that indicate that their carrying amounts may not be recoverable and also tested annually for impairment. Goodwill is carried at cost less accumulated impairment losses. Gains and losses on the disposal of an entity include the carrying amount of goodwill relating to the entity sold.
2.15 Impairment of non-financial assets
Non-financial assets with finite lives are tested at the end of every reporting period for possible impairment when there are events or changes in circumstances that indicate that their carrying amounts may not be recoverable. In addition, non-financial assets that are not amortized are subject to an annual impairment assessment. The carrying values of identifiable intangible assets with indefinite lives are tested annually for impairment because they are not amortized. Impairment is determined by comparing the recoverable amount of such assets with their carrying amounts. Any impairment loss is recognized for the amount by which the asset’s carrying amount exceeds its recoverable amount within earnings of continuing or discontinued operations, as appropriate.
The recoverable amount is the higher of an asset’s fair value less cost to sell or its value in use. For the purpose of assessing impairment, assets are grouped at the lowest levels for which there are separately identifiable cash inflows or cash generating units (“CGUs”). The Company evaluates impairment losses for potential reversals, other than goodwill impairment, when events or changes in circumstances warrant such consideration.
NFI GROUP INC. NOTES TO THE CONSOLIDATED FINANCIAL STATEMENTS As at December 29, 2019(in thousands of U.S. dollars except per share figures)
15 NFI GROUP INC 2019 ANNUAL REPORT
2. SUMMARY OF SIGNIFICANT ACCOUNTING POLICIES (Continued)
2.16 Provisions
Provisions represent liabilities to the Company for which the amount or timing is uncertain. Provisions are recognized when the Company has a present legal or constructive obligation as a result of past events, it is probable that an outflow of resources will be required to settle the obligation and the amount can be reliably estimated. Provisions are not recognized for future operating losses, unless the losses relate to an onerous contract. Provisions are measured at the present value of the expenditures expected to be required to settle the obligation using a discount rate that reflects current market assessments of the time value of money and the risks specific to the obligation. Provisions are re-measured at each consolidated statements of financial position date using the current discount rate. The increase in the provision due to passage of time is recognized as interest expense.
At the time of sale, a provision for warranty claims relating to the base warranty on the entire bus or motor coach and a corrosion warranty on the related structure, is recorded and charged against operations. This warranty provision is based upon management's best estimate of expected future warranty costs utilizing past claims experience. Actual warranty expenditures are charged against the provision as incurred.
A provision for onerous contracts is recognized when the expected benefits to be derived by the Company from a contract are lower than the unavoidable cost of meeting its obligations under the contract. The provision is measured at the present value of the lower of the expected cost of terminating the contract and the expected net cost of continuing with the contract. Before a provision is established, the Company recognizes any impairment loss on the assets associated with that contract.
2.17 Long-term debt
Long-term debt is recognized initially at fair value, net of transaction costs incurred. Debt is subsequently stated at amortized cost with any difference between the proceeds and the amortized cost recognized in the consolidated statements of net earnings and comprehensive income over the term of the debt using the effective interest method.
Debt is classified as a current liability unless the Company has an unconditional right to defer settlement for at least 12 months after the date of the consolidated statements of financial position.
2.18 Financial instruments
Financial assets
Purchases and sales of financial assets are recognized on the settlement date, which is the date on which the asset is delivered to or by the Company. Financial assets are derecognized when the rights to receive cash flows from the investments have expired or were transferred and the Company has transferred substantially all risks and rewards of ownership. Financial assets are classified in the following categories at the time of initial recognition based on the purpose for which the financial assets were acquired:
Financial assets at fair value through profit or loss
Classification
Financial assets at fair value through profit or loss are financial assets held for trading or designated as fair value through profit or loss. A financial asset is classified in this category if acquired principally for the purpose of selling in the short-term or if so designated by management. Assets in this category include derivative financial instruments and are classified as short or long term assets in the consolidated statements of financial position.
Recognition and measurement
Financial assets are initially recognized at fair value and subsequently carried at fair value through profit and loss, with changes recognized in the consolidated statements of net earnings and comprehensive income. Transaction costs are expensed as incurred.
Financial assets carried at amortized cost
Classification
Financial assets classified as amortized cost are non-derivative financial assets that the Company intends to hold in order to collect the contractual cash flows and have fixed or determinable payments that are not quoted in an active market. They are included in current assets, except for those with maturities greater than 12 months after the consolidated statements of financial position date, which are classified as non-current assets. Assets in this category include accounts receivables, deposits and cash and are classified as current assets in the consolidated statements of financial position.
NFI GROUP INC. NOTES TO THE CONSOLIDATED FINANCIAL STATEMENTS As at December 29, 2019(in thousands of U.S. dollars except per share figures)
16 NFI GROUP INC 2019 ANNUAL REPORT
2. SUMMARY OF SIGNIFICANT ACCOUNTING POLICIES (Continued)
Recognition and measurement
Financial assets carried at amortized cost are initially recognized at fair value plus transaction costs and subsequently carried at amortized cost using the effective interest method.
Financial liabilities carried at amortized cost
Financial liabilities primarily consist of bank indebtedness, accounts payable and accrued liabilities, derivative financial instruments, other long-term liabilities and long-term debt. Financial liabilities are initially measured at fair value and subsequently measured at amortized cost unless classified as fair value through profit or loss.
Derivative instruments
Derivatives are initially recognized at fair value on the date a contract is entered into and are subsequently re-measured at their fair value. The Company’s derivative instruments, while providing effective economic hedges, are not designated as hedges for accounting purposes. Changes in the fair value of any derivatives that are not designated as hedges for accounting purposes are recognized within “Fair market value gain (loss) on interest rate swap” or “unrealized foreign exchange (loss) gain on non-current monetary items” in the consolidated statements of net earnings and comprehensive income consistent with the underlying nature and purpose of the derivative instruments.
2.19 Taxation
Tax expense comprises current and deferred tax. Tax is recognized in the consolidated statements of net earnings and total comprehensive income except to the extent it relates to items recognized directly in equity, in which case the related tax is recognized in equity.
Current tax expense is based on the results for the period as adjusted for items that are not taxable or not deductible. Current tax is calculated using the tax rates under the laws that were enacted or substantively enacted at the date of the consolidated statements of financial position.
Deferred tax is accounted for using the liability approach and is the tax expected to be payable or recoverable on temporary differences between the carrying amount of assets and liabilities in the consolidated statements of financial position and the corresponding tax base used in the computation of taxable profit. Deferred tax is calculated based on the expected manner of realization or settlement of the carrying amount of assets and liabilities, using tax rates that are expected to apply to the year of realization or settlement based on tax rates and laws enacted or substantively enacted at the date of the consolidated statements of financial position.
Deferred tax assets are recognized to the extent it is probable that taxable profits will be available against which the deductible temporary differences can be utilized, unless the deferred tax asset arises from the initial recognition of an asset or liability in a transaction that is not a business combination, and at the time of the transaction, affects neither accounting profit nor taxable profit (tax loss). The carrying amount of deferred tax assets is reviewed at each consolidated statements of financial position date and reduced to the extent that it is no longer probable that sufficient taxable profits will be available to allow all or part of the asset to be recovered.
Deferred tax liabilities are generally recognized for all taxable temporary differences except to the extent that the deferred tax liability arises from: the initial recognition of goodwill; or the initial recognition of an asset or liability in a transaction which is not a business combination and, at the time of the transaction, affects neither accounting profit nor taxable profit (tax loss). As well, deferred tax liabilities are recognized for taxable temporary differences arising on investments in subsidiaries except where the reversal of the temporary difference can be controlled and it is probable that the difference will not reverse in the foreseeable future.
2.20 Investment tax credits
The Company has earned investment tax credits (“ITCs”) relating to a percentage of eligible current and capital research and development expenditures incurred in each taxation year. Investment tax credits are recognized when there is reasonable assurance that the Company will comply with the associated conditions and the grants will be received. The investment tax credits are recognized either as a reduction in cost of sales on the consolidated statements of net earnings and comprehensive income, or as a reduction in property, plant and equipment, depending on where the original costs which gave rise to the credits were recorded.
2.21 Vendor Rebates
The Company records certain consideration received from a vendor, which is probable and can be reasonably estimated, as a reduction of the cost of purchases during the period.
NFI GROUP INC. NOTES TO THE CONSOLIDATED FINANCIAL STATEMENTS As at December 29, 2019(in thousands of U.S. dollars except per share figures)
17 NFI GROUP INC 2019 ANNUAL REPORT
2. SUMMARY OF SIGNIFICANT ACCOUNTING POLICIES (Continued)
2.22 Critical accounting estimates and judgments
Estimates and judgments are continually evaluated and are based on historical experience and other factors, including expectations of future events that are believed to be reasonable under the circumstances.
Critical accounting estimates and assumptions
Management makes estimates and assumptions concerning the future. The resulting accounting estimates will, by definition, seldom equal the actual results. Estimates are reviewed on a regular basis and, as adjustments become necessary, they are reported in the consolidated statements of net earnings and comprehensive income in the periods in which they become known. The assets and liabilities which require management to make significant estimates and assumptions in determining carrying values include, inventories, derivative financial instruments, property, plant and equipment, intangible assets, goodwill, provisions, accrued benefit liability, deferred compensation obligation and deferred income taxes.
Information about assumptions and estimation uncertainties that have a significant risk of resulting in a material adjustment are addressed below.
Intangible assets and goodwill
The values associated with the initial recognition and impairment tests of the intangible assets and goodwill involve significant estimates and assumptions, including those with respect to future cash inflows and outflows, discount rates and asset lives.
These significant estimates are subject to the Company’s future results. These determinations will affect the amount of amortization expense on intangible assets recognized in future periods.
Management assesses impairment by comparing the recoverable amount of an intangible asset or goodwill with its carrying value. The determination of the recoverable amount involves significant estimation by management.
Management has determined that for purposes of this evaluation the Company has six CGUs: bus manufacturing, motor coach manufacturing, ARBOC, ADL manufacturing, ADL aftermarket parts operations and aftermarket parts operations.
Goodwill is allocated to the Company’s six CGUs for the purpose of impairment testing. The Company performs its annual test for impairment of goodwill in the fourth quarter of each year and also when indicators of impairment exist.
Accrued benefit liability
The present value of the defined benefit obligation is determined by discounting the estimated future cash outflows using interest rates of high-quality corporate bonds that are denominated in the currency in which the benefits will be paid and that have terms to maturity approximating the terms of the related pension liability. Determination of benefit expense requires assumptions such as the discount rate to measure obligations and return on assets, the projected age of employees upon retirement, life expectancy and the expected rate of future compensation changes.
Actual results will differ from results which are estimated based on assumptions. See note 2.7 for certain assumptions made with respect to employee benefits.
Income Taxes
Estimation of income taxes includes evaluating the recoverability of deferred tax assets based on an assessment of the Company’s ability to utilize the underlying future tax deductions against future taxable income before they expire. Management’s assessment is based upon existing tax laws and estimates of future taxable income. If the assessment of the Company’s ability to utilize the underlying future tax deductions changes, the Company would be required to recognize more or fewer of the tax deductions as assets, which would decrease or increase the income tax expense in the period in which this is determined.
The Company is subject to taxation in multiple jurisdictions. Significant judgment is required in determining the worldwide provision for taxation. There are many transactions and calculations for which the ultimate tax determination is uncertain during the ordinary course of business. The Company maintains provisions for uncertain tax positions that it believes appropriately reflect its risk with respect to tax matters under active discussion, audit, dispute or appeal with tax authorities, or which are otherwise considered to involve uncertainty. These provisions for uncertain tax positions are made using management’s best estimate of the amount expected to be paid based on a qualitative assessment of all relevant factors. Management reviews the adequacy of these provisions at the date of each consolidated statements of financial position. However, it is possible that at some future date an additional liability could result from audits by taxing authorities. Where the final tax outcome of these matters is different from the amounts that were initially recorded, such differences will affect the tax provisions in the period in which such determination is made.
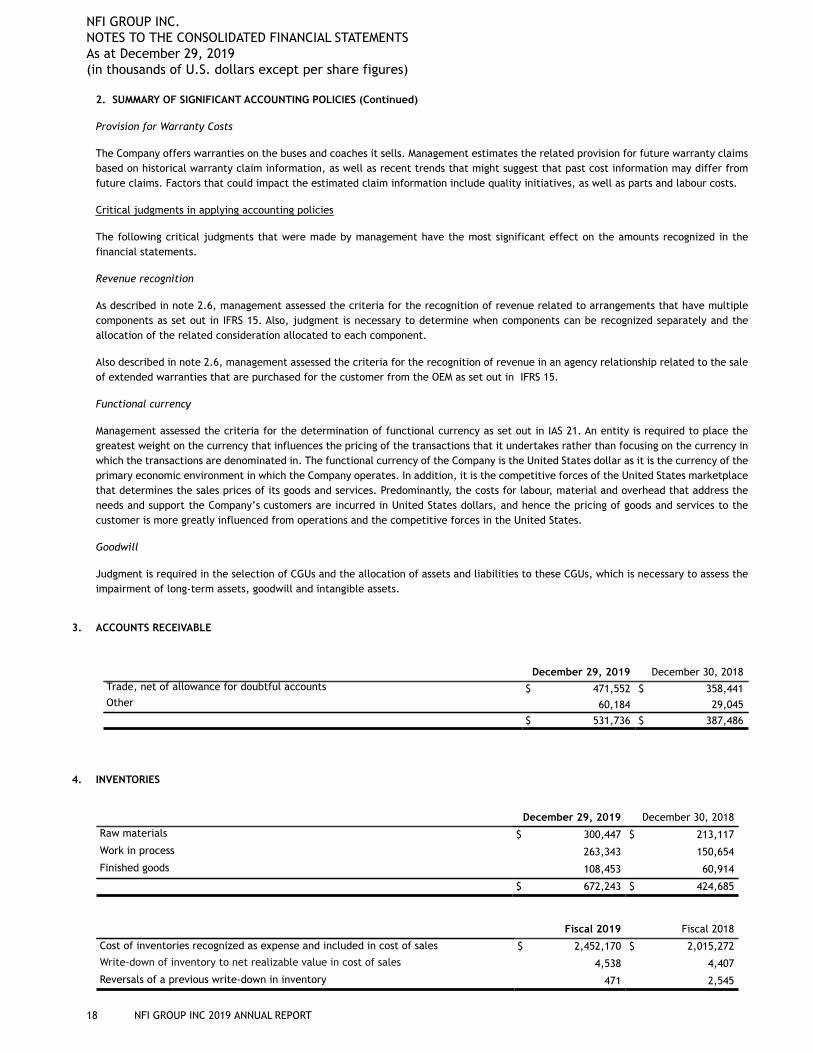
NFI GROUP INC. NOTES TO THE CONSOLIDATED FINANCIAL STATEMENTS As at December 29, 2019(in thousands of U.S. dollars except per share figures)
18 NFI GROUP INC 2019 ANNUAL REPORT
2. SUMMARY OF SIGNIFICANT ACCOUNTING POLICIES (Continued)
Provision for Warranty Costs
The Company offers warranties on the buses and coaches it sells. Management estimates the related provision for future warranty claims based on historical warranty claim information, as well as recent trends that might suggest that past cost information may differ from future claims. Factors that could impact the estimated claim information include quality initiatives, as well as parts and labour costs.
Critical judgments in applying accounting policies
The following critical judgments that were made by management have the most significant effect on the amounts recognized in the financial statements.
Revenue recognition
As described in note 2.6, management assessed the criteria for the recognition of revenue related to arrangements that have multiple components as set out in IFRS 15. Also, judgment is necessary to determine when components can be recognized separately and the allocation of the related consideration allocated to each component.
Also described in note 2.6, management assessed the criteria for the recognition of revenue in an agency relationship related to the sale of extended warranties that are purchased for the customer from the OEM as set out in IFRS 15.
Functional currency
Management assessed the criteria for the determination of functional currency as set out in IAS 21. An entity is required to place the greatest weight on the currency that influences the pricing of the transactions that it undertakes rather than focusing on the currency in which the transactions are denominated in. The functional currency of the Company is the United States dollar as it is the currency of the primary economic environment in which the Company operates. In addition, it is the competitive forces of the United States marketplace that determines the sales prices of its goods and services. Predominantly, the costs for labour, material and overhead that address the needs and support the Company’s customers are incurred in United States dollars, and hence the pricing of goods and services to the customer is more greatly influenced from operations and the competitive forces in the United States.
Goodwill
Judgment is required in the selection of CGUs and the allocation of assets and liabilities to these CGUs, which is necessary to assess the impairment of long-term assets, goodwill and intangible assets.
3. ACCOUNTS RECEIVABLE
December 29, 2019 December 30, 2018Trade, net of allowance for doubtful accounts $ 471,552 $ 358,441Other 60,184 29,045
$ 531,736 $ 387,486
4. INVENTORIES
December 29, 2019 December 30, 2018
Raw materials $ 300,447 $ 213,117
Work in process 263,343 150,654
Finished goods 108,453 60,914
$ 672,243 $ 424,685
Fiscal 2019 Fiscal 2018
Cost of inventories recognized as expense and included in cost of sales $ 2,452,170 $ 2,015,272
Write-down of inventory to net realizable value in cost of sales 4,538 4,407
Reversals of a previous write-down in inventory 471 2,545
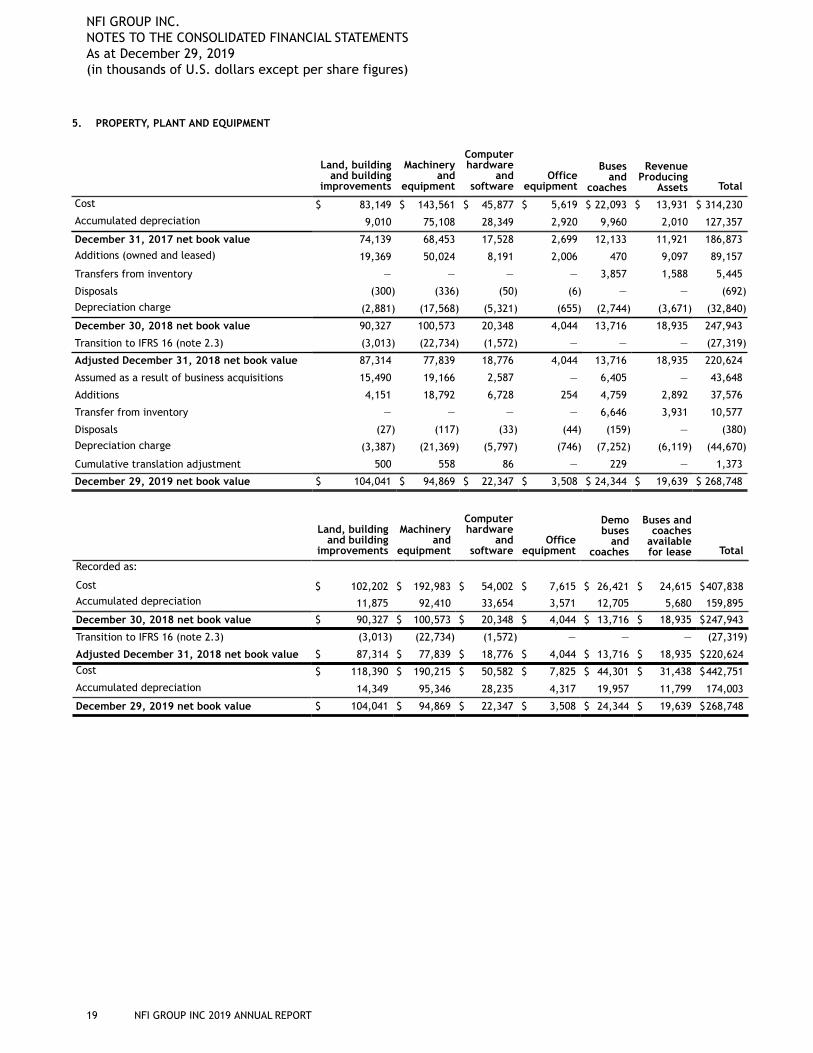
NFI GROUP INC. NOTES TO THE CONSOLIDATED FINANCIAL STATEMENTS As at December 29, 2019(in thousands of U.S. dollars except per share figures)
19 NFI GROUP INC 2019 ANNUAL REPORT
5. PROPERTY, PLANT AND EQUIPMENT
Land, buildingand building
improvements
Machineryand
equipment
Computerhardware
andsoftware
Officeequipment
Busesand
coaches
RevenueProducing
Assets Total
Cost $ 83,149 $ 143,561 $ 45,877 $ 5,619 $ 22,093 $ 13,931 $ 314,230
Accumulated depreciation 9,010 75,108 28,349 2,920 9,960 2,010 127,357
December 31, 2017 net book value 74,139 68,453 17,528 2,699 12,133 11,921 186,873
Additions (owned and leased) 19,369 50,024 8,191 2,006 470 9,097 89,157
Transfers from inventory — — — — 3,857 1,588 5,445
Disposals (300) (336) (50) (6) — — (692)
Depreciation charge (2,881) (17,568) (5,321) (655) (2,744) (3,671) (32,840)
December 30, 2018 net book value 90,327 100,573 20,348 4,044 13,716 18,935 247,943
Transition to IFRS 16 (note 2.3) (3,013) (22,734) (1,572) — — — (27,319)
Adjusted December 31, 2018 net book value 87,314 77,839 18,776 4,044 13,716 18,935 220,624
Assumed as a result of business acquisitions 15,490 19,166 2,587 — 6,405 — 43,648
Additions 4,151 18,792 6,728 254 4,759 2,892 37,576
Transfer from inventory — — — — 6,646 3,931 10,577
Disposals (27) (117) (33) (44) (159) — (380)
Depreciation charge (3,387) (21,369) (5,797) (746) (7,252) (6,119) (44,670)
Cumulative translation adjustment 500 558 86 — 229 — 1,373
December 29, 2019 net book value $ 104,041 $ 94,869 $ 22,347 $ 3,508 $ 24,344 $ 19,639 $ 268,748
Land, buildingand building
improvements
Machineryand
equipment
Computerhardware
andsoftware
Officeequipment
Demobuses
andcoaches
Buses andcoaches
availablefor lease Total
Recorded as:
Cost $ 102,202 $ 192,983 $ 54,002 $ 7,615 $ 26,421 $ 24,615 $407,838Accumulated depreciation 11,875 92,410 33,654 3,571 12,705 5,680 159,895
December 30, 2018 net book value $ 90,327 $ 100,573 $ 20,348 $ 4,044 $ 13,716 $ 18,935 $247,943
Transition to IFRS 16 (note 2.3) (3,013) (22,734) (1,572) — — — (27,319)
Adjusted December 31, 2018 net book value $ 87,314 $ 77,839 $ 18,776 $ 4,044 $ 13,716 $ 18,935 $220,624
Cost $ 118,390 $ 190,215 $ 50,582 $ 7,825 $ 44,301 $ 31,438 $442,751
Accumulated depreciation 14,349 95,346 28,235 4,317 19,957 11,799 174,003
December 29, 2019 net book value $ 104,041 $ 94,869 $ 22,347 $ 3,508 $ 24,344 $ 19,639 $268,748
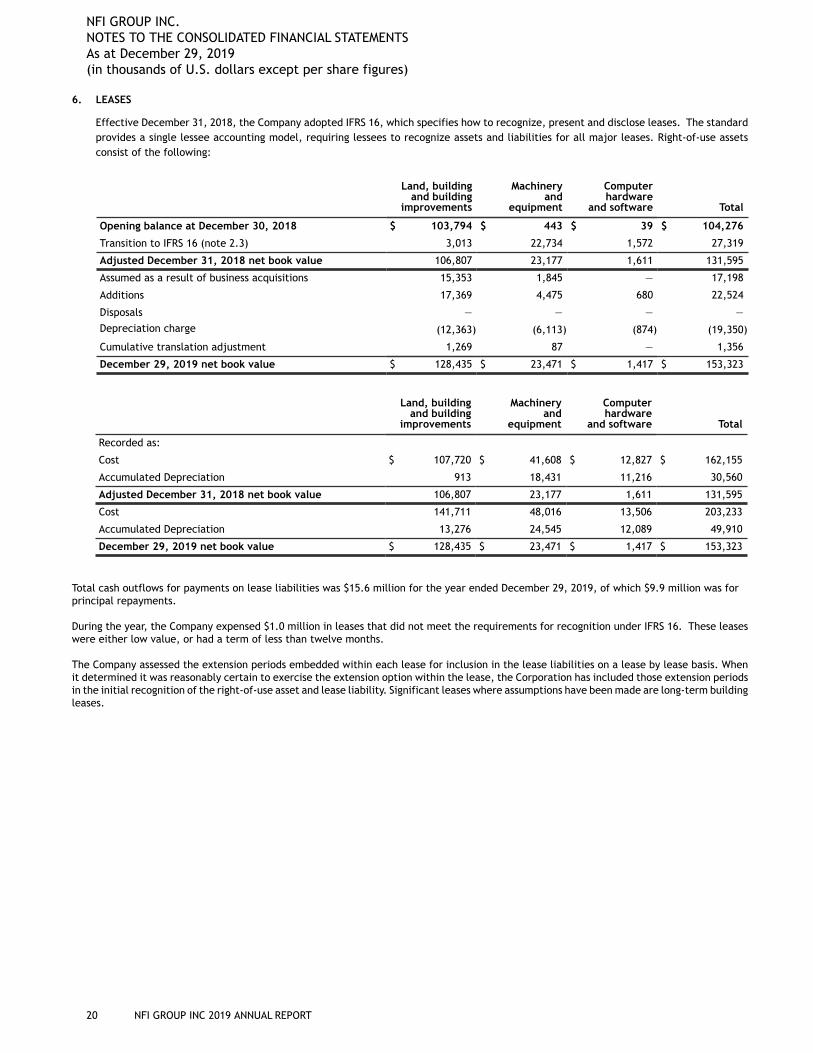
NFI GROUP INC. NOTES TO THE CONSOLIDATED FINANCIAL STATEMENTS As at December 29, 2019(in thousands of U.S. dollars except per share figures)
20 NFI GROUP INC 2019 ANNUAL REPORT
6. LEASES
Effective December 31, 2018, the Company adopted IFRS 16, which specifies how to recognize, present and disclose leases. The standard provides a single lessee accounting model, requiring lessees to recognize assets and liabilities for all major leases. Right-of-use assets consist of the following:
Land, buildingand building
improvements
Machineryand
equipment
Computerhardware
and software Total
Opening balance at December 30, 2018 $ 103,794 $ 443 $ 39 $ 104,276
Transition to IFRS 16 (note 2.3) 3,013 22,734 1,572 27,319
Adjusted December 31, 2018 net book value 106,807 23,177 1,611 131,595
Assumed as a result of business acquisitions 15,353 1,845 — 17,198
Additions 17,369 4,475 680 22,524
Disposals — — — —
Depreciation charge (12,363) (6,113) (874) (19,350)
Cumulative translation adjustment 1,269 87 — 1,356
December 29, 2019 net book value $ 128,435 $ 23,471 $ 1,417 $ 153,323
Land, buildingand building
improvements
Machineryand
equipment
Computerhardware
and software Total
Recorded as:
Cost $ 107,720 $ 41,608 $ 12,827 $ 162,155
Accumulated Depreciation 913 18,431 11,216 30,560
Adjusted December 31, 2018 net book value 106,807 23,177 1,611 131,595
Cost 141,711 48,016 13,506 203,233
Accumulated Depreciation 13,276 24,545 12,089 49,910
December 29, 2019 net book value $ 128,435 $ 23,471 $ 1,417 $ 153,323
Total cash outflows for payments on lease liabilities was $15.6 million for the year ended December 29, 2019, of which $9.9 million was for principal repayments.
During the year, the Company expensed $1.0 million in leases that did not meet the requirements for recognition under IFRS 16. These leases were either low value, or had a term of less than twelve months.
The Company assessed the extension periods embedded within each lease for inclusion in the lease liabilities on a lease by lease basis. When it determined it was reasonably certain to exercise the extension option within the lease, the Corporation has included those extension periods in the initial recognition of the right-of-use asset and lease liability. Significant leases where assumptions have been made are long-term building leases.
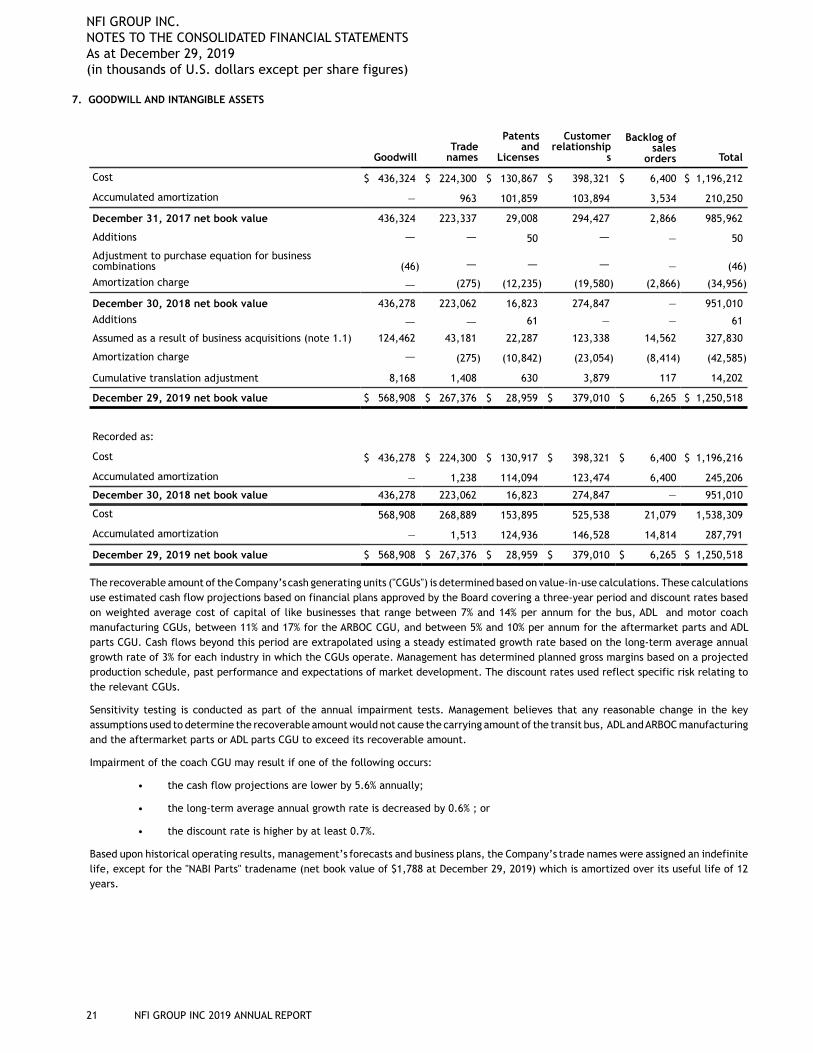
NFI GROUP INC. NOTES TO THE CONSOLIDATED FINANCIAL STATEMENTS As at December 29, 2019(in thousands of U.S. dollars except per share figures)
21 NFI GROUP INC 2019 ANNUAL REPORT
7. GOODWILL AND INTANGIBLE ASSETS
GoodwillTrade
names
Patentsand
Licenses
Customerrelationship
s
Backlog ofsales
orders Total
Cost $ 436,324 $ 224,300 $ 130,867 $ 398,321 $ 6,400 $ 1,196,212
Accumulated amortization — 963 101,859 103,894 3,534 210,250
December 31, 2017 net book value 436,324 223,337 29,008 294,427 2,866 985,962
Additions — — 50 — — 50
Adjustment to purchase equation for businesscombinations (46) — — — — (46)
Amortization charge — (275) (12,235) (19,580) (2,866) (34,956)
December 30, 2018 net book value 436,278 223,062 16,823 274,847 — 951,010
Additions — — 61 — — 61
Assumed as a result of business acquisitions (note 1.1) 124,462 43,181 22,287 123,338 14,562 327,830
Amortization charge — (275) (10,842) (23,054) (8,414) (42,585)
Cumulative translation adjustment 8,168 1,408 630 3,879 117 14,202
December 29, 2019 net book value $ 568,908 $ 267,376 $ 28,959 $ 379,010 $ 6,265 $ 1,250,518
Recorded as:
Cost $ 436,278 $ 224,300 $ 130,917 $ 398,321 $ 6,400 $ 1,196,216
Accumulated amortization — 1,238 114,094 123,474 6,400 245,206
December 30, 2018 net book value 436,278 223,062 16,823 274,847 — 951,010
Cost 568,908 268,889 153,895 525,538 21,079 1,538,309
Accumulated amortization — 1,513 124,936 146,528 14,814 287,791
December 29, 2019 net book value $ 568,908 $ 267,376 $ 28,959 $ 379,010 $ 6,265 $ 1,250,518
The recoverable amount of the Company’s cash generating units ("CGUs") is determined based on value-in-use calculations. These calculations use estimated cash flow projections based on financial plans approved by the Board covering a three-year period and discount rates based on weighted average cost of capital of like businesses that range between 7% and 14% per annum for the bus, ADL and motor coach manufacturing CGUs, between 11% and 17% for the ARBOC CGU, and between 5% and 10% per annum for the aftermarket parts and ADL parts CGU. Cash flows beyond this period are extrapolated using a steady estimated growth rate based on the long-term average annual growth rate of 3% for each industry in which the CGUs operate. Management has determined planned gross margins based on a projected production schedule, past performance and expectations of market development. The discount rates used reflect specific risk relating to the relevant CGUs.
Sensitivity testing is conducted as part of the annual impairment tests. Management believes that any reasonable change in the key assumptions used to determine the recoverable amount would not cause the carrying amount of the transit bus, ADL and ARBOC manufacturing and the aftermarket parts or ADL parts CGU to exceed its recoverable amount.
Impairment of the coach CGU may result if one of the following occurs:
• the cash flow projections are lower by 5.6% annually;
• the long-term average annual growth rate is decreased by 0.6% ; or
• the discount rate is higher by at least 0.7%.
Based upon historical operating results, management’s forecasts and business plans, the Company’s trade names were assigned an indefinite life, except for the "NABI Parts" tradename (net book value of $1,788 at December 29, 2019) which is amortized over its useful life of 12 years.
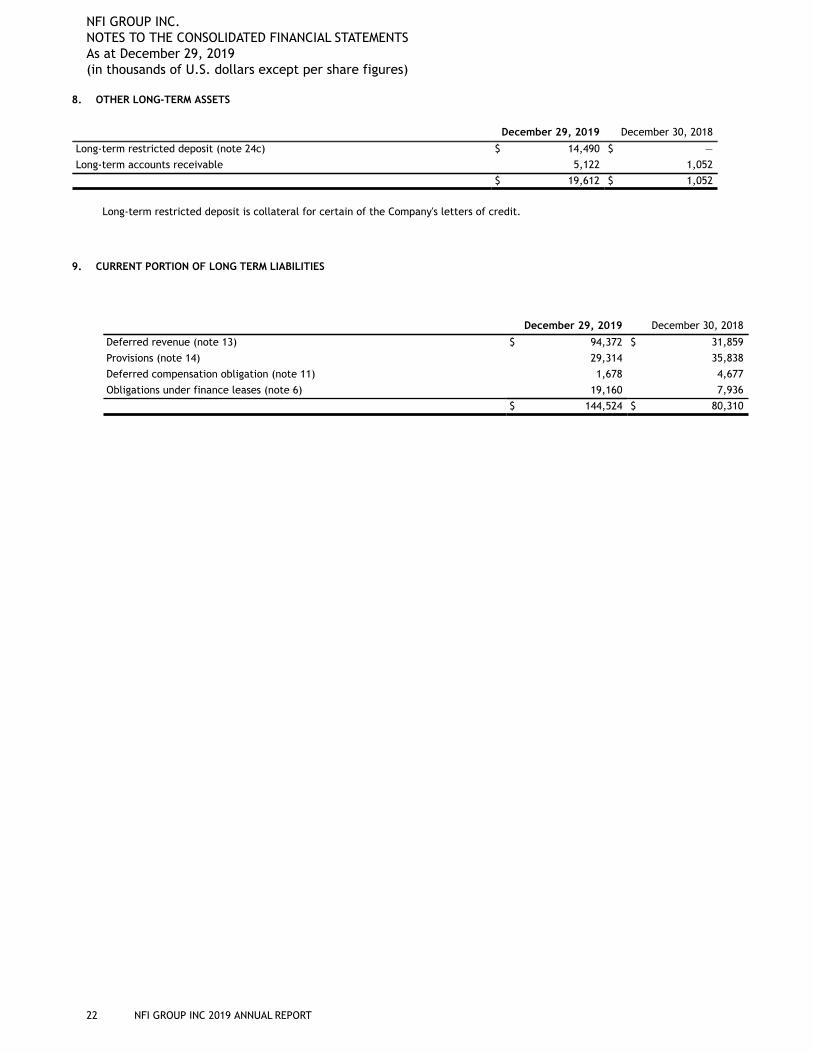
NFI GROUP INC. NOTES TO THE CONSOLIDATED FINANCIAL STATEMENTS As at December 29, 2019(in thousands of U.S. dollars except per share figures)
22 NFI GROUP INC 2019 ANNUAL REPORT
8. OTHER LONG-TERM ASSETS
December 29, 2019 December 30, 2018
Long-term restricted deposit (note 24c) $ 14,490 $ —
Long-term accounts receivable 5,122 1,052
$ 19,612 $ 1,052
Long-term restricted deposit is collateral for certain of the Company's letters of credit.
9. CURRENT PORTION OF LONG TERM LIABILITIES
December 29, 2019 December 30, 2018
Deferred revenue (note 13) $ 94,372 $ 31,859
Provisions (note 14) 29,314 35,838
Deferred compensation obligation (note 11) 1,678 4,677
Obligations under finance leases (note 6) 19,160 7,936
$ 144,524 $ 80,310
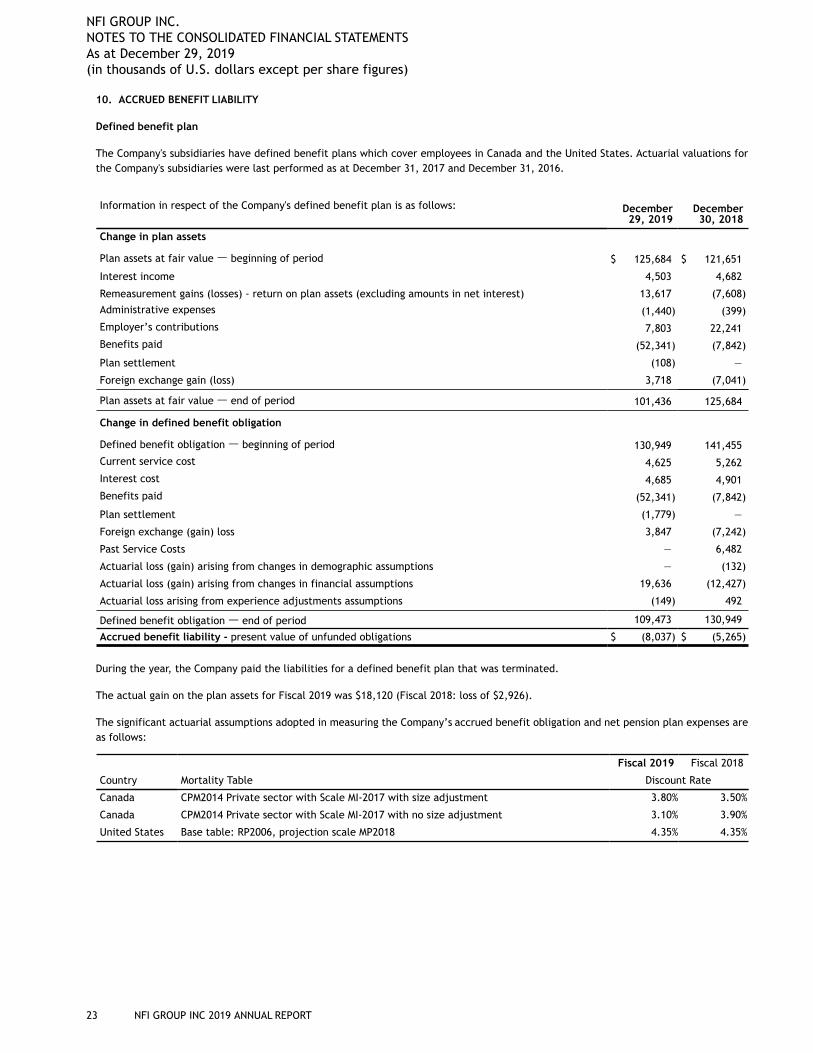
NFI GROUP INC. NOTES TO THE CONSOLIDATED FINANCIAL STATEMENTS As at December 29, 2019(in thousands of U.S. dollars except per share figures)
23 NFI GROUP INC 2019 ANNUAL REPORT
10. ACCRUED BENEFIT LIABILITY
Defined benefit plan
The Company's subsidiaries have defined benefit plans which cover employees in Canada and the United States. Actuarial valuations for the Company's subsidiaries were last performed as at December 31, 2017 and December 31, 2016.
Information in respect of the Company's defined benefit plan is as follows: December29, 2019
December30, 2018
Change in plan assets
Plan assets at fair value — beginning of period $ 125,684 $ 121,651
Interest income 4,503 4,682
Remeasurement gains (losses) - return on plan assets (excluding amounts in net interest) 13,617 (7,608)
Administrative expenses (1,440) (399)
Employer’s contributions 7,803 22,241
Benefits paid (52,341) (7,842)
Plan settlement (108) —
Foreign exchange gain (loss) 3,718 (7,041)
Plan assets at fair value — end of period 101,436 125,684
Change in defined benefit obligation
Defined benefit obligation — beginning of period 130,949 141,455
Current service cost 4,625 5,262
Interest cost 4,685 4,901
Benefits paid (52,341) (7,842)
Plan settlement (1,779) —
Foreign exchange (gain) loss 3,847 (7,242)
Past Service Costs — 6,482
Actuarial loss (gain) arising from changes in demographic assumptions — (132)
Actuarial loss (gain) arising from changes in financial assumptions 19,636 (12,427)
Actuarial loss arising from experience adjustments assumptions (149) 492
Defined benefit obligation — end of period 109,473 130,949
Accrued benefit liability - present value of unfunded obligations $ (8,037) $ (5,265)
During the year, the Company paid the liabilities for a defined benefit plan that was terminated.
The actual gain on the plan assets for Fiscal 2019 was $18,120 (Fiscal 2018: loss of $2,926).
The significant actuarial assumptions adopted in measuring the Company’s accrued benefit obligation and net pension plan expenses are as follows:
Fiscal 2019 Fiscal 2018
Country Mortality Table Discount Rate
Canada CPM2014 Private sector with Scale MI-2017 with size adjustment 3.80% 3.50%
Canada CPM2014 Private sector with Scale MI-2017 with no size adjustment 3.10% 3.90%
United States Base table: RP2006, projection scale MP2018 4.35% 4.35%
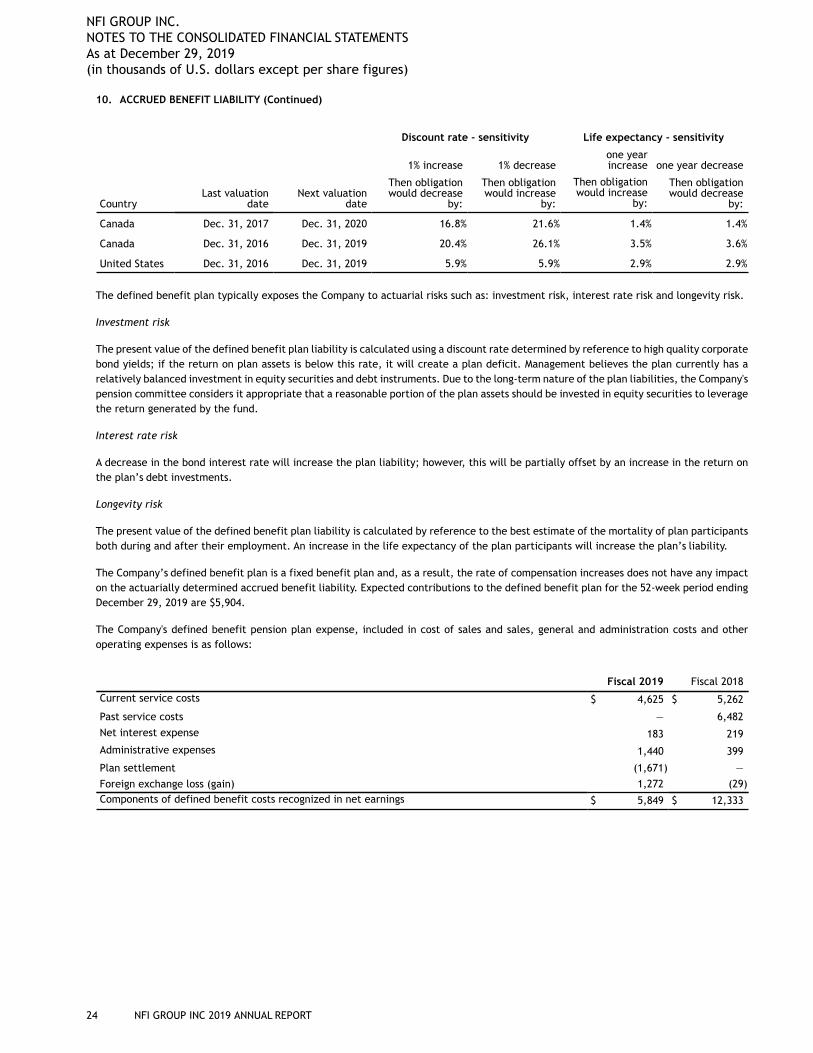
NFI GROUP INC. NOTES TO THE CONSOLIDATED FINANCIAL STATEMENTS As at December 29, 2019(in thousands of U.S. dollars except per share figures)
24 NFI GROUP INC 2019 ANNUAL REPORT
10. ACCRUED BENEFIT LIABILITY (Continued)
Discount rate - sensitivity Life expectancy - sensitivity
1% increase 1% decreaseone yearincrease one year decrease
CountryLast valuation
dateNext valuation
date
Then obligationwould decrease
by:
Then obligationwould increase
by:
Then obligationwould increase
by:
Then obligationwould decrease
by:
Canada Dec. 31, 2017 Dec. 31, 2020 16.8% 21.6% 1.4% 1.4%
Canada Dec. 31, 2016 Dec. 31, 2019 20.4% 26.1% 3.5% 3.6%
United States Dec. 31, 2016 Dec. 31, 2019 5.9% 5.9% 2.9% 2.9%
The defined benefit plan typically exposes the Company to actuarial risks such as: investment risk, interest rate risk and longevity risk.
Investment risk
The present value of the defined benefit plan liability is calculated using a discount rate determined by reference to high quality corporate bond yields; if the return on plan assets is below this rate, it will create a plan deficit. Management believes the plan currently has a relatively balanced investment in equity securities and debt instruments. Due to the long-term nature of the plan liabilities, the Company's pension committee considers it appropriate that a reasonable portion of the plan assets should be invested in equity securities to leverage the return generated by the fund.
Interest rate risk
A decrease in the bond interest rate will increase the plan liability; however, this will be partially offset by an increase in the return on the plan’s debt investments.
Longevity risk
The present value of the defined benefit plan liability is calculated by reference to the best estimate of the mortality of plan participants both during and after their employment. An increase in the life expectancy of the plan participants will increase the plan’s liability.
The Company’s defined benefit plan is a fixed benefit plan and, as a result, the rate of compensation increases does not have any impact on the actuarially determined accrued benefit liability. Expected contributions to the defined benefit plan for the 52-week period ending December 29, 2019 are $5,904.
The Company's defined benefit pension plan expense, included in cost of sales and sales, general and administration costs and other operating expenses is as follows:
Fiscal 2019 Fiscal 2018
Current service costs $ 4,625 $ 5,262
Past service costs — 6,482
Net interest expense 183 219
Administrative expenses 1,440 399
Plan settlement (1,671) —
Foreign exchange loss (gain) 1,272 (29)Components of defined benefit costs recognized in net earnings $ 5,849 $ 12,333
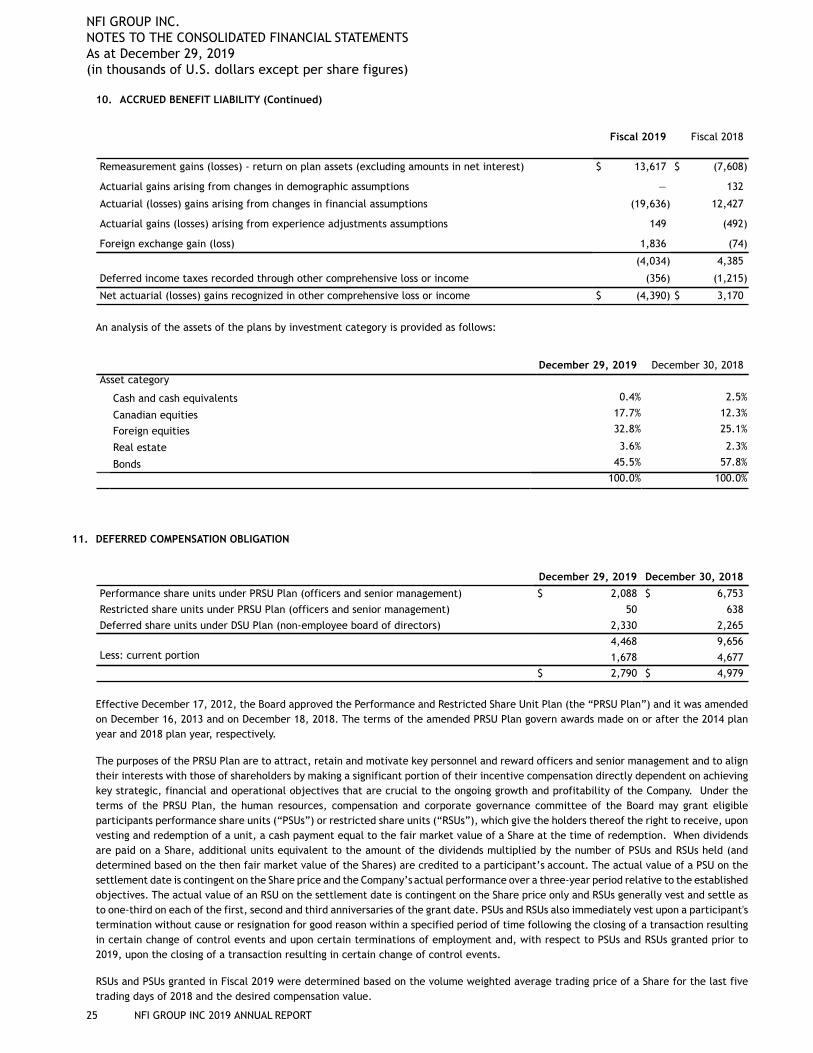
NFI GROUP INC. NOTES TO THE CONSOLIDATED FINANCIAL STATEMENTS As at December 29, 2019(in thousands of U.S. dollars except per share figures)
25 NFI GROUP INC 2019 ANNUAL REPORT
10. ACCRUED BENEFIT LIABILITY (Continued)
Fiscal 2019 Fiscal 2018
Remeasurement gains (losses) - return on plan assets (excluding amounts in net interest) $ 13,617 $ (7,608)
Actuarial gains arising from changes in demographic assumptions — 132
Actuarial (losses) gains arising from changes in financial assumptions (19,636) 12,427
Actuarial gains (losses) arising from experience adjustments assumptions 149 (492)
Foreign exchange gain (loss) 1,836 (74)
(4,034) 4,385
Deferred income taxes recorded through other comprehensive loss or income (356) (1,215)
Net actuarial (losses) gains recognized in other comprehensive loss or income $ (4,390) $ 3,170
An analysis of the assets of the plans by investment category is provided as follows:
December 29, 2019 December 30, 2018Asset category
Cash and cash equivalents 0.4% 2.5%
Canadian equities 17.7% 12.3%
Foreign equities 32.8% 25.1%
Real estate 3.6% 2.3%
Bonds 45.5% 57.8%
100.0% 100.0%
11. DEFERRED COMPENSATION OBLIGATION
December 29, 2019 December 30, 2018
Performance share units under PRSU Plan (officers and senior management) $ 2,088 $ 6,753
Restricted share units under PRSU Plan (officers and senior management) 50 638
Deferred share units under DSU Plan (non-employee board of directors) 2,330 2,265
4,468 9,656Less: current portion 1,678 4,677
$ 2,790 $ 4,979
Effective December 17, 2012, the Board approved the Performance and Restricted Share Unit Plan (the “PRSU Plan”) and it was amended on December 16, 2013 and on December 18, 2018. The terms of the amended PRSU Plan govern awards made on or after the 2014 plan year and 2018 plan year, respectively.
The purposes of the PRSU Plan are to attract, retain and motivate key personnel and reward officers and senior management and to align their interests with those of shareholders by making a significant portion of their incentive compensation directly dependent on achieving key strategic, financial and operational objectives that are crucial to the ongoing growth and profitability of the Company. Under the terms of the PRSU Plan, the human resources, compensation and corporate governance committee of the Board may grant eligible participants performance share units (“PSUs”) or restricted share units (“RSUs”), which give the holders thereof the right to receive, upon vesting and redemption of a unit, a cash payment equal to the fair market value of a Share at the time of redemption. When dividends are paid on a Share, additional units equivalent to the amount of the dividends multiplied by the number of PSUs and RSUs held (and determined based on the then fair market value of the Shares) are credited to a participant’s account. The actual value of a PSU on the settlement date is contingent on the Share price and the Company’s actual performance over a three-year period relative to the established objectives. The actual value of an RSU on the settlement date is contingent on the Share price only and RSUs generally vest and settle as to one-third on each of the first, second and third anniversaries of the grant date. PSUs and RSUs also immediately vest upon a participant's termination without cause or resignation for good reason within a specified period of time following the closing of a transaction resulting in certain change of control events and upon certain terminations of employment and, with respect to PSUs and RSUs granted prior to 2019, upon the closing of a transaction resulting in certain change of control events.
RSUs and PSUs granted in Fiscal 2019 were determined based on the volume weighted average trading price of a Share for the last five trading days of 2018 and the desired compensation value.
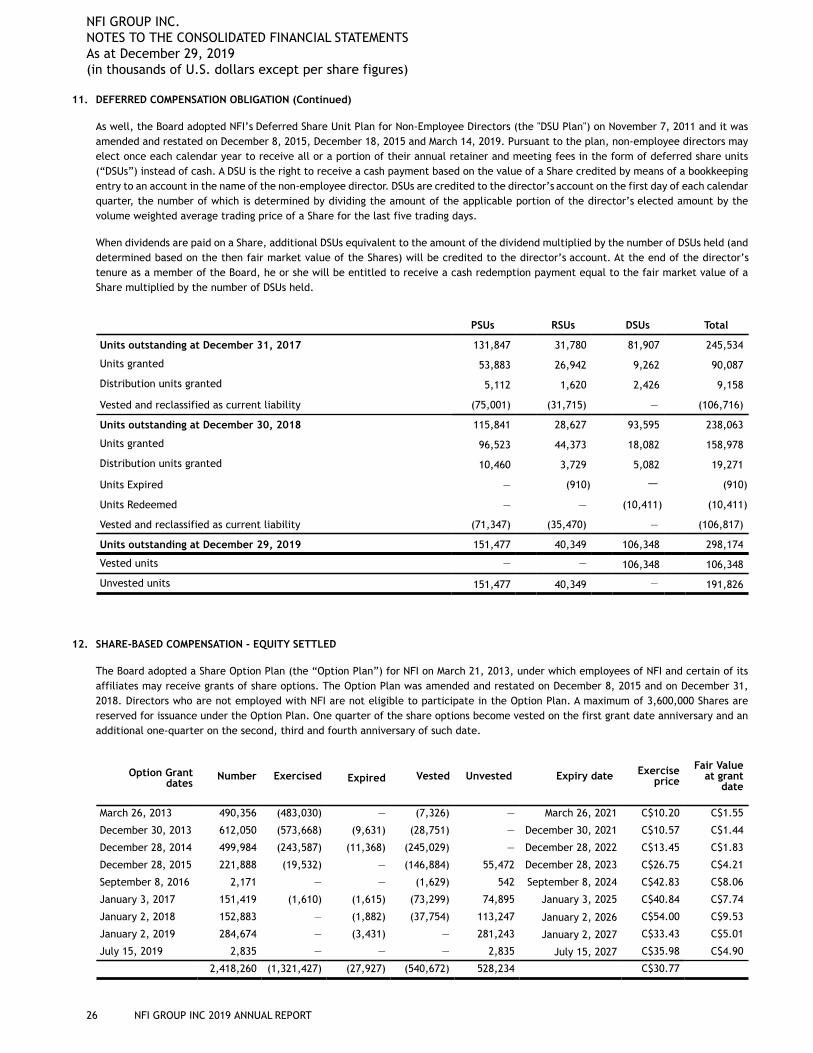
NFI GROUP INC. NOTES TO THE CONSOLIDATED FINANCIAL STATEMENTS As at December 29, 2019(in thousands of U.S. dollars except per share figures)
26 NFI GROUP INC 2019 ANNUAL REPORT
11. DEFERRED COMPENSATION OBLIGATION (Continued)
As well, the Board adopted NFI’s Deferred Share Unit Plan for Non-Employee Directors (the "DSU Plan") on November 7, 2011 and it was amended and restated on December 8, 2015, December 18, 2015 and March 14, 2019. Pursuant to the plan, non-employee directors may elect once each calendar year to receive all or a portion of their annual retainer and meeting fees in the form of deferred share units (“DSUs”) instead of cash. A DSU is the right to receive a cash payment based on the value of a Share credited by means of a bookkeeping entry to an account in the name of the non-employee director. DSUs are credited to the director’s account on the first day of each calendar quarter, the number of which is determined by dividing the amount of the applicable portion of the director’s elected amount by the volume weighted average trading price of a Share for the last five trading days.
When dividends are paid on a Share, additional DSUs equivalent to the amount of the dividend multiplied by the number of DSUs held (and determined based on the then fair market value of the Shares) will be credited to the director’s account. At the end of the director’s tenure as a member of the Board, he or she will be entitled to receive a cash redemption payment equal to the fair market value of a Share multiplied by the number of DSUs held.
PSUs RSUs DSUs Total
Units outstanding at December 31, 2017 131,847 31,780 81,907 245,534
Units granted 53,883 26,942 9,262 90,087
Distribution units granted 5,112 1,620 2,426 9,158
Vested and reclassified as current liability (75,001) (31,715) — (106,716)
Units outstanding at December 30, 2018 115,841 28,627 93,595 238,063
Units granted 96,523 44,373 18,082 158,978
Distribution units granted 10,460 3,729 5,082 19,271
Units Expired — (910) — (910)
Units Redeemed — — (10,411) (10,411)
Vested and reclassified as current liability (71,347) (35,470) — (106,817)
Units outstanding at December 29, 2019 151,477 40,349 106,348 298,174
Vested units — — 106,348 106,348
Unvested units 151,477 40,349 — 191,826
12. SHARE-BASED COMPENSATION - EQUITY SETTLED
The Board adopted a Share Option Plan (the “Option Plan”) for NFI on March 21, 2013, under which employees of NFI and certain of its affiliates may receive grants of share options. The Option Plan was amended and restated on December 8, 2015 and on December 31, 2018. Directors who are not employed with NFI are not eligible to participate in the Option Plan. A maximum of 3,600,000 Shares are reserved for issuance under the Option Plan. One quarter of the share options become vested on the first grant date anniversary and an additional one-quarter on the second, third and fourth anniversary of such date.
Option Grantdates
Number Exercised Expired Vested Unvested Expiry date Exerciseprice
Fair Valueat grant
date
March 26, 2013 490,356 (483,030) — (7,326) — March 26, 2021 C$10.20 C$1.55
December 30, 2013 612,050 (573,668) (9,631) (28,751) — December 30, 2021 C$10.57 C$1.44
December 28, 2014 499,984 (243,587) (11,368) (245,029) — December 28, 2022 C$13.45 C$1.83
December 28, 2015 221,888 (19,532) — (146,884) 55,472 December 28, 2023 C$26.75 C$4.21
September 8, 2016 2,171 — — (1,629) 542 September 8, 2024 C$42.83 C$8.06
January 3, 2017 151,419 (1,610) (1,615) (73,299) 74,895 January 3, 2025 C$40.84 C$7.74
January 2, 2018 152,883 — (1,882) (37,754) 113,247 January 2, 2026 C$54.00 C$9.53
January 2, 2019 284,674 — (3,431) — 281,243 January 2, 2027 C$33.43 C$5.01
July 15, 2019 2,835 — — — 2,835 July 15, 2027 C$35.98 C$4.90
2,418,260 (1,321,427) (27,927) (540,672) 528,234 C$30.77
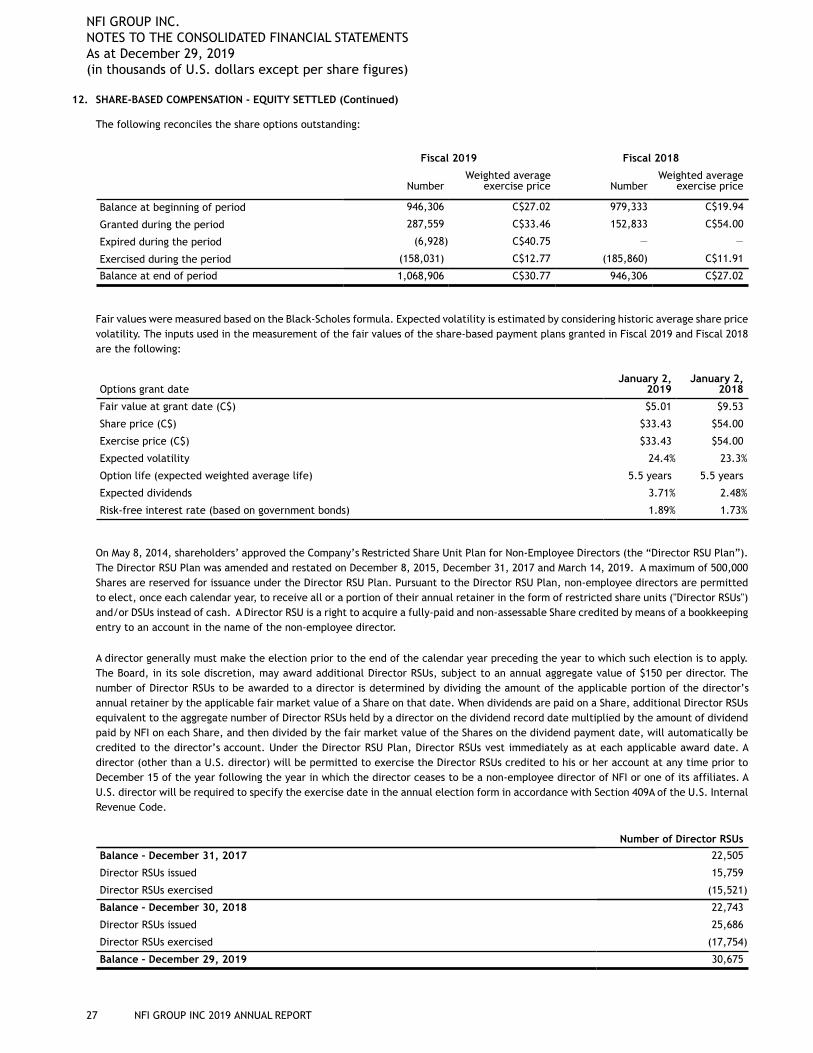
NFI GROUP INC. NOTES TO THE CONSOLIDATED FINANCIAL STATEMENTS As at December 29, 2019(in thousands of U.S. dollars except per share figures)
27 NFI GROUP INC 2019 ANNUAL REPORT
12. SHARE-BASED COMPENSATION - EQUITY SETTLED (Continued)
The following reconciles the share options outstanding:
Fiscal 2019 Fiscal 2018
NumberWeighted average
exercise price NumberWeighted average
exercise price
Balance at beginning of period 946,306 C$27.02 979,333 C$19.94
Granted during the period 287,559 C$33.46 152,833 C$54.00
Expired during the period (6,928) C$40.75 — —
Exercised during the period (158,031) C$12.77 (185,860) C$11.91
Balance at end of period 1,068,906 C$30.77 946,306 C$27.02
Fair values were measured based on the Black-Scholes formula. Expected volatility is estimated by considering historic average share price volatility. The inputs used in the measurement of the fair values of the share-based payment plans granted in Fiscal 2019 and Fiscal 2018 are the following:
Options grant dateJanuary 2,
2019January 2,
2018
Fair value at grant date (C$) $5.01 $9.53
Share price (C$) $33.43 $54.00
Exercise price (C$) $33.43 $54.00
Expected volatility 24.4% 23.3%
Option life (expected weighted average life) 5.5 years 5.5 years
Expected dividends 3.71% 2.48%
Risk-free interest rate (based on government bonds) 1.89% 1.73%
On May 8, 2014, shareholders’ approved the Company’s Restricted Share Unit Plan for Non-Employee Directors (the “Director RSU Plan”). The Director RSU Plan was amended and restated on December 8, 2015, December 31, 2017 and March 14, 2019. A maximum of 500,000 Shares are reserved for issuance under the Director RSU Plan. Pursuant to the Director RSU Plan, non-employee directors are permitted to elect, once each calendar year, to receive all or a portion of their annual retainer in the form of restricted share units ("Director RSUs") and/or DSUs instead of cash. A Director RSU is a right to acquire a fully-paid and non-assessable Share credited by means of a bookkeeping entry to an account in the name of the non-employee director.
A director generally must make the election prior to the end of the calendar year preceding the year to which such election is to apply. The Board, in its sole discretion, may award additional Director RSUs, subject to an annual aggregate value of $150 per director. The number of Director RSUs to be awarded to a director is determined by dividing the amount of the applicable portion of the director’s annual retainer by the applicable fair market value of a Share on that date. When dividends are paid on a Share, additional Director RSUs equivalent to the aggregate number of Director RSUs held by a director on the dividend record date multiplied by the amount of dividend paid by NFI on each Share, and then divided by the fair market value of the Shares on the dividend payment date, will automatically be credited to the director’s account. Under the Director RSU Plan, Director RSUs vest immediately as at each applicable award date. A director (other than a U.S. director) will be permitted to exercise the Director RSUs credited to his or her account at any time prior to December 15 of the year following the year in which the director ceases to be a non-employee director of NFI or one of its affiliates. A U.S. director will be required to specify the exercise date in the annual election form in accordance with Section 409A of the U.S. Internal Revenue Code.
Number of Director RSUs
Balance – December 31, 2017 22,505
Director RSUs issued 15,759
Director RSUs exercised (15,521)
Balance – December 30, 2018 22,743
Director RSUs issued 25,686
Director RSUs exercised (17,754)
Balance – December 29, 2019 30,675
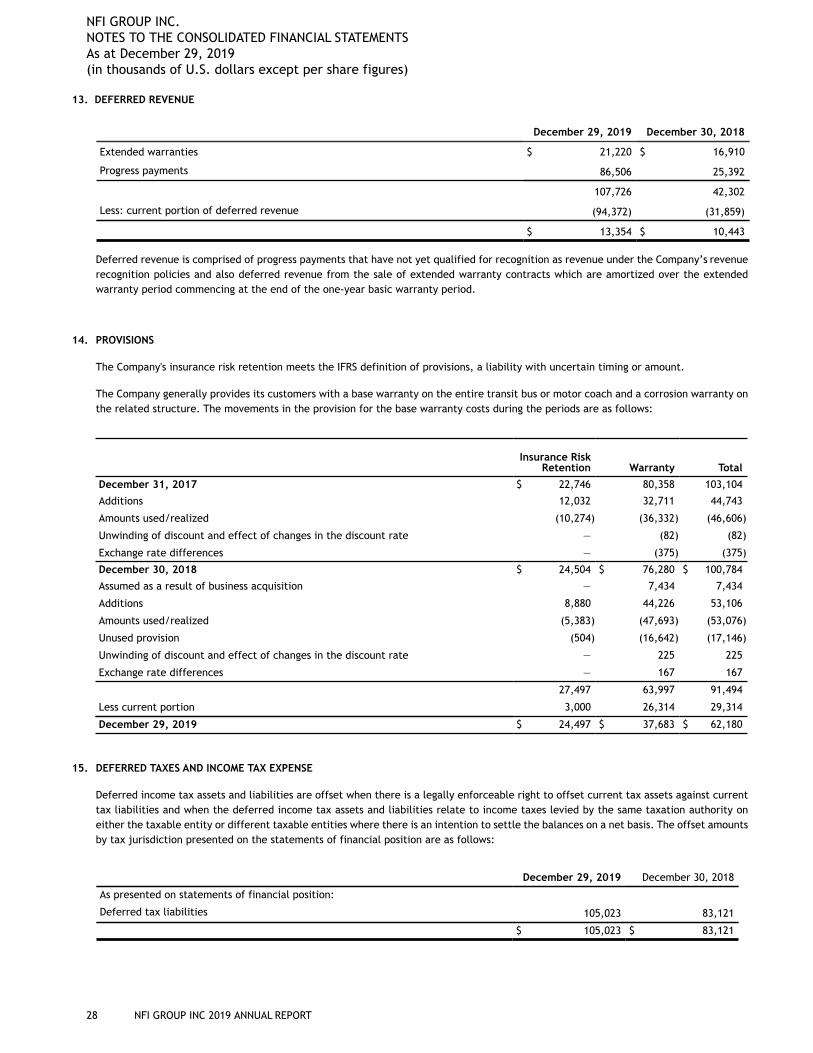
NFI GROUP INC. NOTES TO THE CONSOLIDATED FINANCIAL STATEMENTS As at December 29, 2019(in thousands of U.S. dollars except per share figures)
28 NFI GROUP INC 2019 ANNUAL REPORT
13. DEFERRED REVENUE
December 29, 2019 December 30, 2018
Extended warranties $ 21,220 $ 16,910
Progress payments 86,506 25,392
107,726 42,302
Less: current portion of deferred revenue (94,372) (31,859)
$ 13,354 $ 10,443
Deferred revenue is comprised of progress payments that have not yet qualified for recognition as revenue under the Company’s revenue recognition policies and also deferred revenue from the sale of extended warranty contracts which are amortized over the extended warranty period commencing at the end of the one-year basic warranty period.
14. PROVISIONS
The Company's insurance risk retention meets the IFRS definition of provisions, a liability with uncertain timing or amount.
The Company generally provides its customers with a base warranty on the entire transit bus or motor coach and a corrosion warranty on the related structure. The movements in the provision for the base warranty costs during the periods are as follows:
Insurance RiskRetention Warranty Total
December 31, 2017 $ 22,746 80,358 103,104
Additions 12,032 32,711 44,743
Amounts used/realized (10,274) (36,332) (46,606)
Unwinding of discount and effect of changes in the discount rate — (82) (82)
Exchange rate differences — (375) (375)
December 30, 2018 $ 24,504 $ 76,280 $ 100,784
Assumed as a result of business acquisition — 7,434 7,434
Additions 8,880 44,226 53,106
Amounts used/realized (5,383) (47,693) (53,076)
Unused provision (504) (16,642) (17,146)
Unwinding of discount and effect of changes in the discount rate — 225 225
Exchange rate differences — 167 167
27,497 63,997 91,494
Less current portion 3,000 26,314 29,314
December 29, 2019 $ 24,497 $ 37,683 $ 62,180
15. DEFERRED TAXES AND INCOME TAX EXPENSE
Deferred income tax assets and liabilities are offset when there is a legally enforceable right to offset current tax assets against current tax liabilities and when the deferred income tax assets and liabilities relate to income taxes levied by the same taxation authority on either the taxable entity or different taxable entities where there is an intention to settle the balances on a net basis. The offset amounts by tax jurisdiction presented on the statements of financial position are as follows:
December 29, 2019 December 30, 2018
As presented on statements of financial position:
Deferred tax liabilities 105,023 83,121
$ 105,023 $ 83,121
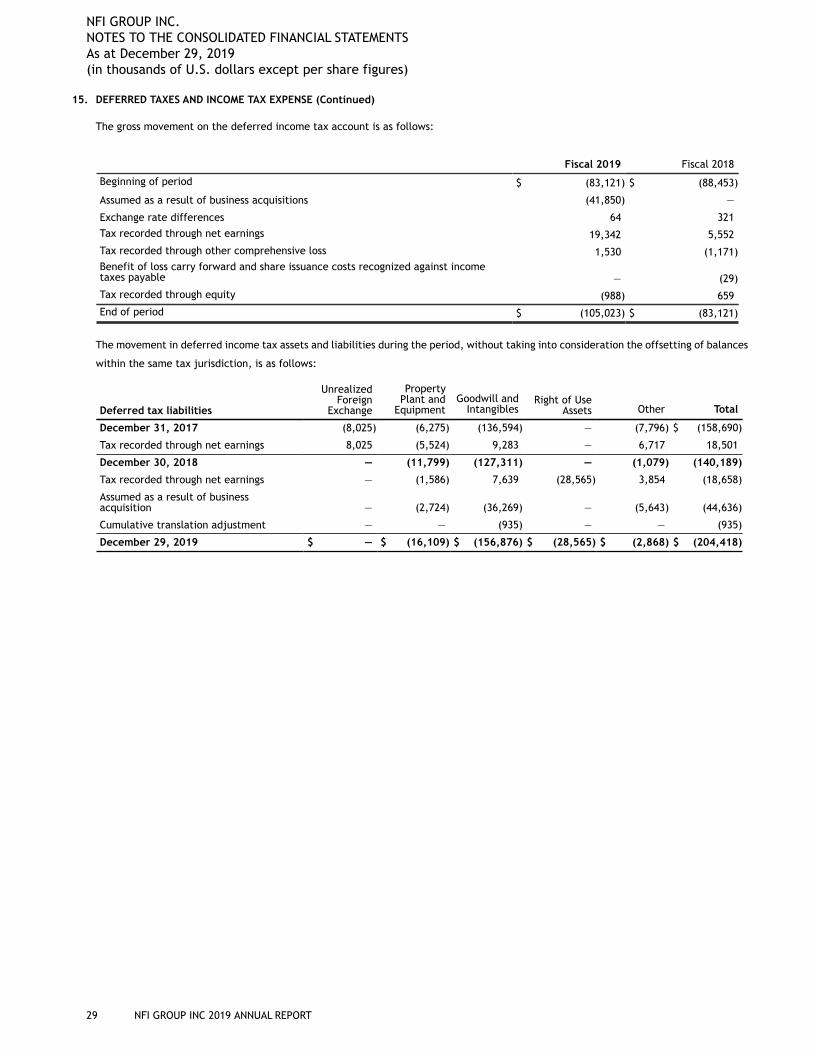
NFI GROUP INC. NOTES TO THE CONSOLIDATED FINANCIAL STATEMENTS As at December 29, 2019(in thousands of U.S. dollars except per share figures)
29 NFI GROUP INC 2019 ANNUAL REPORT
15. DEFERRED TAXES AND INCOME TAX EXPENSE (Continued)
The gross movement on the deferred income tax account is as follows:
Fiscal 2019 Fiscal 2018
Beginning of period $ (83,121) $ (88,453)
Assumed as a result of business acquisitions (41,850) —
Exchange rate differences 64 321
Tax recorded through net earnings 19,342 5,552
Tax recorded through other comprehensive loss 1,530 (1,171)Benefit of loss carry forward and share issuance costs recognized against incometaxes payable — (29)
Tax recorded through equity (988) 659
End of period $ (105,023) $ (83,121)
The movement in deferred income tax assets and liabilities during the period, without taking into consideration the offsetting of balances
within the same tax jurisdiction, is as follows:
Deferred tax liabilities
UnrealizedForeign
Exchange
PropertyPlant and
EquipmentGoodwill and
IntangiblesRight of Use
Assets Other Total
December 31, 2017 (8,025) (6,275) (136,594) — (7,796) $ (158,690)
Tax recorded through net earnings 8,025 (5,524) 9,283 — 6,717 18,501
December 30, 2018 — (11,799) (127,311) — (1,079) (140,189)
Tax recorded through net earnings — (1,586) 7,639 (28,565) 3,854 (18,658)
Assumed as a result of businessacquisition — (2,724) (36,269) — (5,643) (44,636)
Cumulative translation adjustment — — (935) — — (935)
December 29, 2019 $ — $ (16,109) $ (156,876) $ (28,565) $ (2,868) $ (204,418)
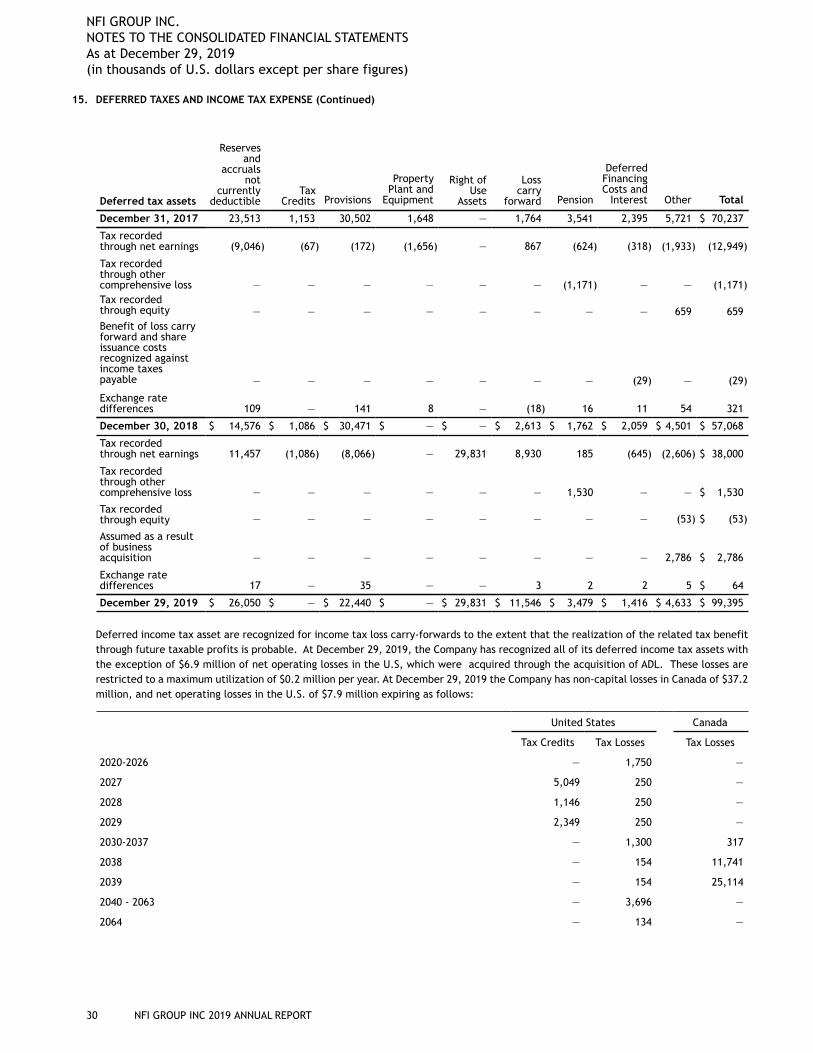
NFI GROUP INC. NOTES TO THE CONSOLIDATED FINANCIAL STATEMENTS As at December 29, 2019(in thousands of U.S. dollars except per share figures)
30 NFI GROUP INC 2019 ANNUAL REPORT
15. DEFERRED TAXES AND INCOME TAX EXPENSE (Continued)
Deferred tax assets
Reservesand
accrualsnot
currentlydeductible
TaxCredits Provisions
PropertyPlant and
Equipment
Right ofUse
Assets
Losscarry
forward Pension
DeferredFinancingCosts and
Interest Other Total
December 31, 2017 23,513 1,153 30,502 1,648 — 1,764 3,541 2,395 5,721 $ 70,237
Tax recordedthrough net earnings (9,046) (67) (172) (1,656) — 867 (624) (318) (1,933) (12,949)
Tax recordedthrough othercomprehensive loss — — — — — — (1,171) — — (1,171)Tax recordedthrough equity — — — — — — — — 659 659Benefit of loss carryforward and shareissuance costsrecognized againstincome taxespayable — — — — — — — (29) — (29)
Exchange ratedifferences 109 — 141 8 — (18) 16 11 54 321
December 30, 2018 $ 14,576 $ 1,086 $ 30,471 $ — $ — $ 2,613 $ 1,762 $ 2,059 $ 4,501 $ 57,068
Tax recordedthrough net earnings 11,457 (1,086) (8,066) — 29,831 8,930 185 (645) (2,606) $ 38,000
Tax recordedthrough othercomprehensive loss — — — — — — 1,530 — — $ 1,530
Tax recordedthrough equity — — — — — — — — (53) $ (53)
Assumed as a resultof businessacquisition — — — — — — — — 2,786 $ 2,786
Exchange ratedifferences 17 — 35 — — 3 2 2 5 $ 64
December 29, 2019 $ 26,050 $ — $ 22,440 $ — $ 29,831 $ 11,546 $ 3,479 $ 1,416 $ 4,633 $ 99,395
Deferred income tax asset are recognized for income tax loss carry-forwards to the extent that the realization of the related tax benefit through future taxable profits is probable. At December 29, 2019, the Company has recognized all of its deferred income tax assets with the exception of $6.9 million of net operating losses in the U.S, which were acquired through the acquisition of ADL. These losses are restricted to a maximum utilization of $0.2 million per year. At December 29, 2019 the Company has non-capital losses in Canada of $37.2 million, and net operating losses in the U.S. of $7.9 million expiring as follows:
United States Canada
Tax Credits Tax Losses Tax Losses
2020-2026 — 1,750 —
2027 5,049 250 —
2028 1,146 250 —
2029 2,349 250 —
2030-2037 — 1,300 317
2038 — 154 11,741
2039 — 154 25,114
2040 - 2063 — 3,696 —
2064 — 134 —
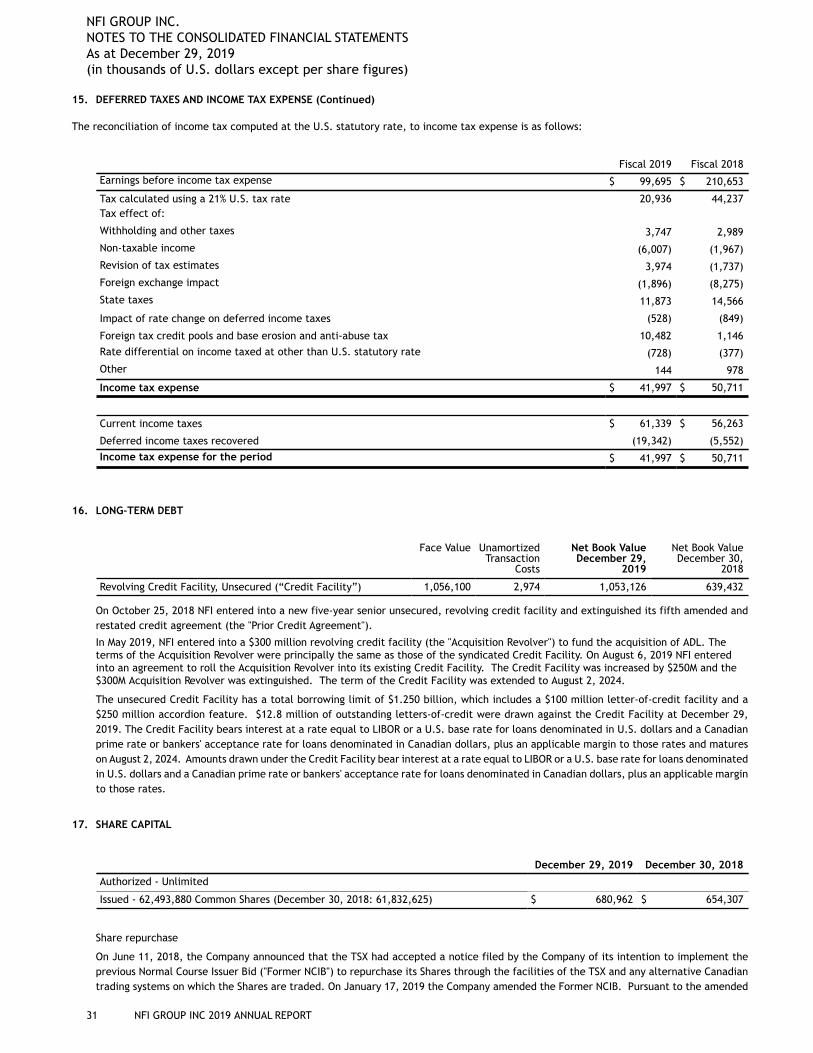
NFI GROUP INC. NOTES TO THE CONSOLIDATED FINANCIAL STATEMENTS As at December 29, 2019(in thousands of U.S. dollars except per share figures)
31 NFI GROUP INC 2019 ANNUAL REPORT
15. DEFERRED TAXES AND INCOME TAX EXPENSE (Continued)
The reconciliation of income tax computed at the U.S. statutory rate, to income tax expense is as follows:
Fiscal 2019 Fiscal 2018
Earnings before income tax expense $ 99,695 $ 210,653
Tax calculated using a 21% U.S. tax rate 20,936 44,237Tax effect of:
Withholding and other taxes 3,747 2,989
Non-taxable income (6,007) (1,967)
Revision of tax estimates 3,974 (1,737)
Foreign exchange impact (1,896) (8,275)
State taxes 11,873 14,566
Impact of rate change on deferred income taxes (528) (849)
Foreign tax credit pools and base erosion and anti-abuse tax 10,482 1,146
Rate differential on income taxed at other than U.S. statutory rate (728) (377)
Other 144 978
Income tax expense $ 41,997 $ 50,711
Current income taxes $ 61,339 $ 56,263
Deferred income taxes recovered (19,342) (5,552)
Income tax expense for the period $ 41,997 $ 50,711
16. LONG-TERM DEBT
Face Value UnamortizedTransaction
Costs
Net Book ValueDecember 29,
2019
Net Book ValueDecember 30,
2018
Revolving Credit Facility, Unsecured (“Credit Facility”) 1,056,100 2,974 1,053,126 639,432
On October 25, 2018 NFI entered into a new five-year senior unsecured, revolving credit facility and extinguished its fifth amended and restated credit agreement (the "Prior Credit Agreement").
In May 2019, NFI entered into a $300 million revolving credit facility (the "Acquisition Revolver") to fund the acquisition of ADL. The terms of the Acquisition Revolver were principally the same as those of the syndicated Credit Facility. On August 6, 2019 NFI entered into an agreement to roll the Acquisition Revolver into its existing Credit Facility. The Credit Facility was increased by $250M and the $300M Acquisition Revolver was extinguished. The term of the Credit Facility was extended to August 2, 2024.
The unsecured Credit Facility has a total borrowing limit of $1.250 billion, which includes a $100 million letter-of-credit facility and a $250 million accordion feature. $12.8 million of outstanding letters-of-credit were drawn against the Credit Facility at December 29, 2019. The Credit Facility bears interest at a rate equal to LIBOR or a U.S. base rate for loans denominated in U.S. dollars and a Canadian prime rate or bankers' acceptance rate for loans denominated in Canadian dollars, plus an applicable margin to those rates and matures on August 2, 2024. Amounts drawn under the Credit Facility bear interest at a rate equal to LIBOR or a U.S. base rate for loans denominated in U.S. dollars and a Canadian prime rate or bankers' acceptance rate for loans denominated in Canadian dollars, plus an applicable margin to those rates.
17. SHARE CAPITAL
December 29, 2019 December 30, 2018
Authorized - Unlimited
Issued - 62,493,880 Common Shares (December 30, 2018: 61,832,625) $ 680,962 $ 654,307
Share repurchase
On June 11, 2018, the Company announced that the TSX had accepted a notice filed by the Company of its intention to implement the previous Normal Course Issuer Bid ("Former NCIB") to repurchase its Shares through the facilities of the TSX and any alternative Canadian trading systems on which the Shares are traded. On January 17, 2019 the Company amended the Former NCIB. Pursuant to the amended
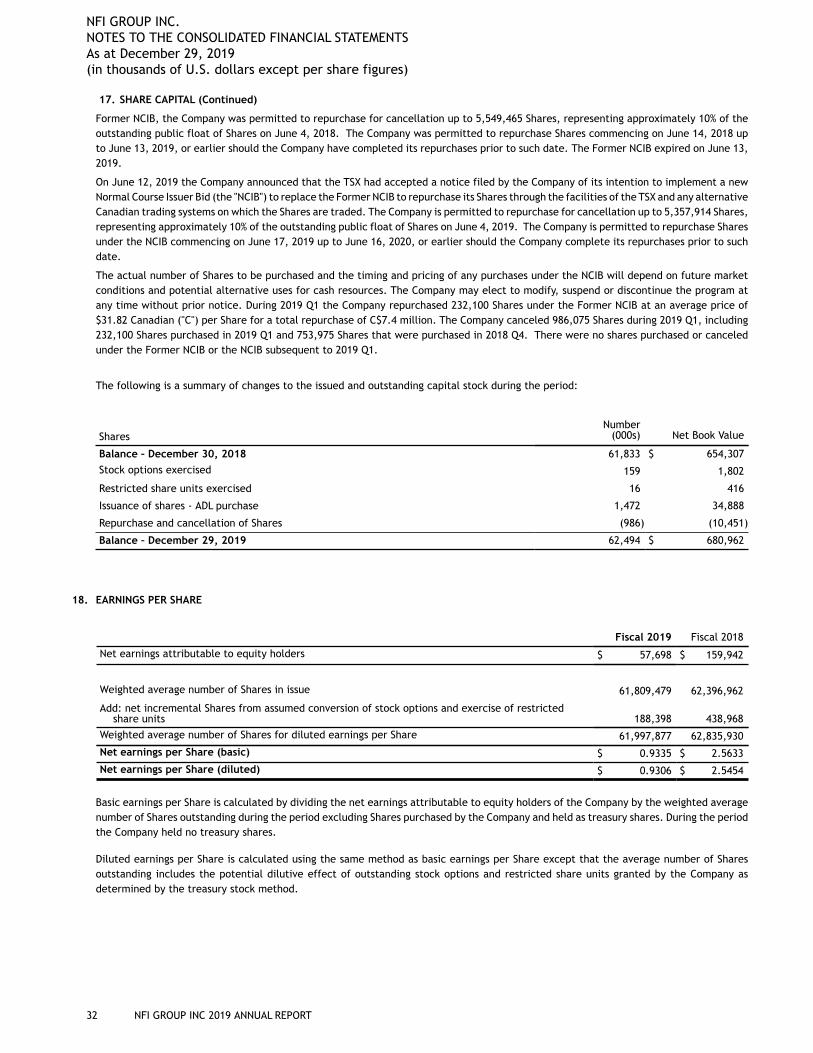
NFI GROUP INC. NOTES TO THE CONSOLIDATED FINANCIAL STATEMENTS As at December 29, 2019(in thousands of U.S. dollars except per share figures)
32 NFI GROUP INC 2019 ANNUAL REPORT
17. SHARE CAPITAL (Continued)
Former NCIB, the Company was permitted to repurchase for cancellation up to 5,549,465 Shares, representing approximately 10% of the outstanding public float of Shares on June 4, 2018. The Company was permitted to repurchase Shares commencing on June 14, 2018 up to June 13, 2019, or earlier should the Company have completed its repurchases prior to such date. The Former NCIB expired on June 13, 2019.
On June 12, 2019 the Company announced that the TSX had accepted a notice filed by the Company of its intention to implement a new Normal Course Issuer Bid (the "NCIB") to replace the Former NCIB to repurchase its Shares through the facilities of the TSX and any alternative Canadian trading systems on which the Shares are traded. The Company is permitted to repurchase for cancellation up to 5,357,914 Shares, representing approximately 10% of the outstanding public float of Shares on June 4, 2019. The Company is permitted to repurchase Shares under the NCIB commencing on June 17, 2019 up to June 16, 2020, or earlier should the Company complete its repurchases prior to such date.
The actual number of Shares to be purchased and the timing and pricing of any purchases under the NCIB will depend on future market conditions and potential alternative uses for cash resources. The Company may elect to modify, suspend or discontinue the program at any time without prior notice. During 2019 Q1 the Company repurchased 232,100 Shares under the Former NCIB at an average price of $31.82 Canadian ("C") per Share for a total repurchase of C$7.4 million. The Company canceled 986,075 Shares during 2019 Q1, including 232,100 Shares purchased in 2019 Q1 and 753,975 Shares that were purchased in 2018 Q4. There were no shares purchased or canceled under the Former NCIB or the NCIB subsequent to 2019 Q1.
The following is a summary of changes to the issued and outstanding capital stock during the period:
SharesNumber
(000s) Net Book Value
Balance – December 30, 2018 61,833 $ 654,307
Stock options exercised 159 1,802
Restricted share units exercised 16 416
Issuance of shares - ADL purchase 1,472 34,888
Repurchase and cancellation of Shares (986) (10,451)
Balance – December 29, 2019 62,494 $ 680,962
18. EARNINGS PER SHARE
Fiscal 2019 Fiscal 2018
Net earnings attributable to equity holders $ 57,698 $ 159,942
Weighted average number of Shares in issue 61,809,479 62,396,962
Add: net incremental Shares from assumed conversion of stock options and exercise of restrictedshare units 188,398 438,968
Weighted average number of Shares for diluted earnings per Share 61,997,877 62,835,930
Net earnings per Share (basic) $ 0.9335 $ 2.5633
Net earnings per Share (diluted) $ 0.9306 $ 2.5454
Basic earnings per Share is calculated by dividing the net earnings attributable to equity holders of the Company by the weighted average number of Shares outstanding during the period excluding Shares purchased by the Company and held as treasury shares. During the period the Company held no treasury shares.
Diluted earnings per Share is calculated using the same method as basic earnings per Share except that the average number of Shares outstanding includes the potential dilutive effect of outstanding stock options and restricted share units granted by the Company as determined by the treasury stock method.
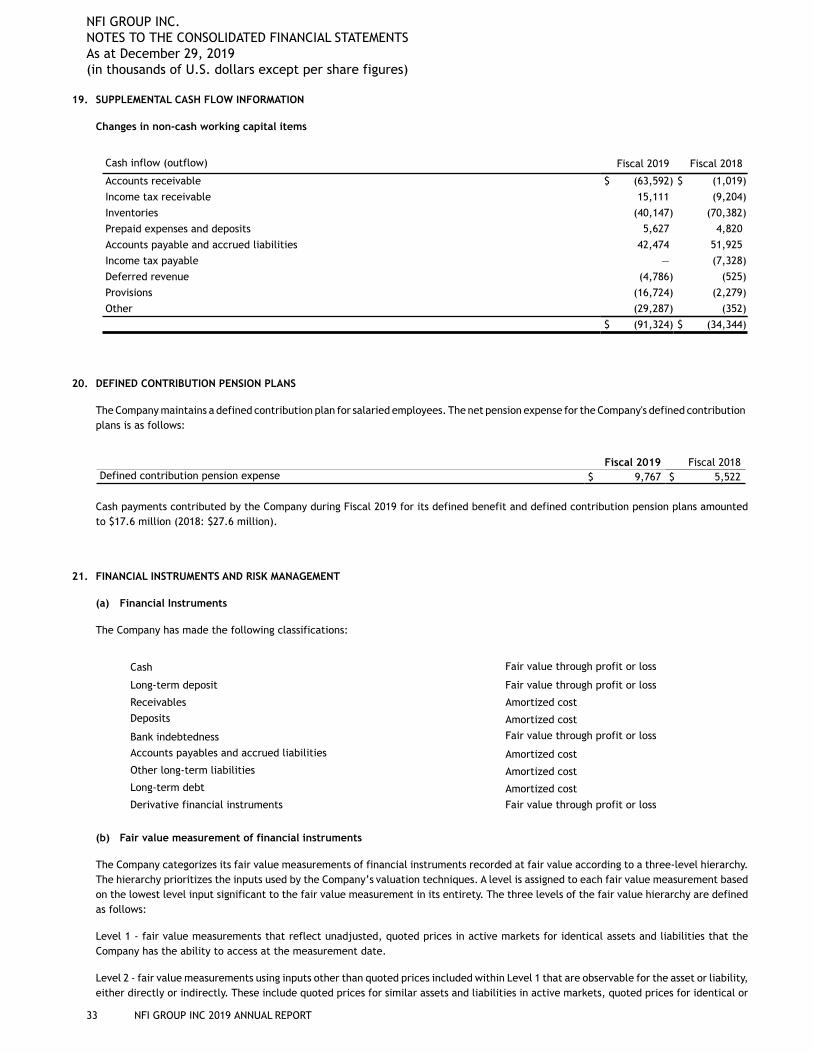
NFI GROUP INC. NOTES TO THE CONSOLIDATED FINANCIAL STATEMENTS As at December 29, 2019(in thousands of U.S. dollars except per share figures)
33 NFI GROUP INC 2019 ANNUAL REPORT
19. SUPPLEMENTAL CASH FLOW INFORMATION
Changes in non-cash working capital items
Cash inflow (outflow) Fiscal 2019 Fiscal 2018
Accounts receivable $ (63,592) $ (1,019)
Income tax receivable 15,111 (9,204)
Inventories (40,147) (70,382)
Prepaid expenses and deposits 5,627 4,820
Accounts payable and accrued liabilities 42,474 51,925
Income tax payable — (7,328)
Deferred revenue (4,786) (525)
Provisions (16,724) (2,279)
Other (29,287) (352)
$ (91,324) $ (34,344)
20. DEFINED CONTRIBUTION PENSION PLANS
The Company maintains a defined contribution plan for salaried employees. The net pension expense for the Company's defined contribution plans is as follows:
Fiscal 2019 Fiscal 2018Defined contribution pension expense $ 9,767 $ 5,522
Cash payments contributed by the Company during Fiscal 2019 for its defined benefit and defined contribution pension plans amounted to $17.6 million (2018: $27.6 million).
21. FINANCIAL INSTRUMENTS AND RISK MANAGEMENT
(a) Financial Instruments
The Company has made the following classifications:
Cash Fair value through profit or loss
Long-term deposit Fair value through profit or loss
Receivables Amortized cost
Deposits Amortized cost
Bank indebtedness Fair value through profit or loss
Accounts payables and accrued liabilities Amortized cost
Other long-term liabilities Amortized cost
Long-term debt Amortized cost
Derivative financial instruments Fair value through profit or loss
(b) Fair value measurement of financial instruments
The Company categorizes its fair value measurements of financial instruments recorded at fair value according to a three-level hierarchy. The hierarchy prioritizes the inputs used by the Company’s valuation techniques. A level is assigned to each fair value measurement based on the lowest level input significant to the fair value measurement in its entirety. The three levels of the fair value hierarchy are defined as follows:
Level 1 - fair value measurements that reflect unadjusted, quoted prices in active markets for identical assets and liabilities that the Company has the ability to access at the measurement date.
Level 2 - fair value measurements using inputs other than quoted prices included within Level 1 that are observable for the asset or liability, either directly or indirectly. These include quoted prices for similar assets and liabilities in active markets, quoted prices for identical or
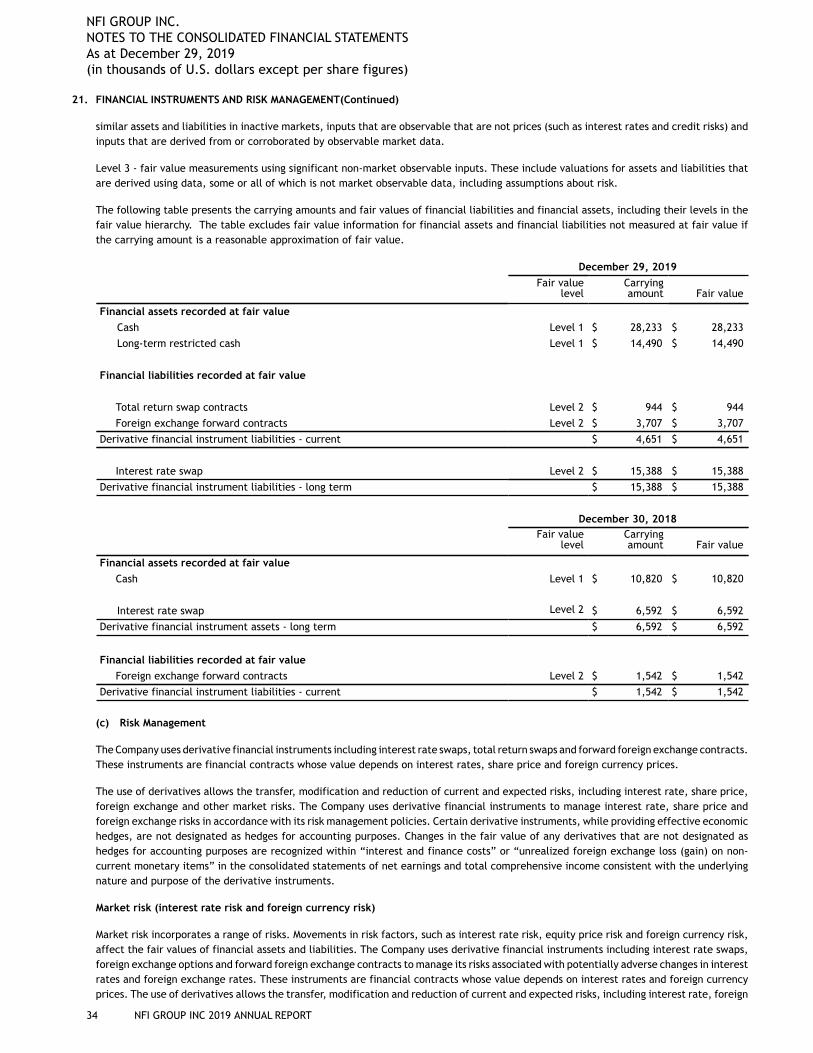
NFI GROUP INC. NOTES TO THE CONSOLIDATED FINANCIAL STATEMENTS As at December 29, 2019(in thousands of U.S. dollars except per share figures)
34 NFI GROUP INC 2019 ANNUAL REPORT
21. FINANCIAL INSTRUMENTS AND RISK MANAGEMENT(Continued)
similar assets and liabilities in inactive markets, inputs that are observable that are not prices (such as interest rates and credit risks) and inputs that are derived from or corroborated by observable market data.
Level 3 - fair value measurements using significant non-market observable inputs. These include valuations for assets and liabilities that are derived using data, some or all of which is not market observable data, including assumptions about risk.
The following table presents the carrying amounts and fair values of financial liabilities and financial assets, including their levels in the fair value hierarchy. The table excludes fair value information for financial assets and financial liabilities not measured at fair value if the carrying amount is a reasonable approximation of fair value.
December 29, 2019
Fair valuelevel
Carryingamount Fair value
Financial assets recorded at fair value
Cash Level 1 $ 28,233 $ 28,233
Long-term restricted cash Level 1 $ 14,490 $ 14,490
Financial liabilities recorded at fair value
Total return swap contracts Level 2 $ 944 $ 944
Foreign exchange forward contracts Level 2 $ 3,707 $ 3,707
Derivative financial instrument liabilities - current $ 4,651 $ 4,651
Interest rate swap Level 2 $ 15,388 $ 15,388
Derivative financial instrument liabilities - long term $ 15,388 $ 15,388
December 30, 2018Fair value
levelCarryingamount Fair value
Financial assets recorded at fair value
Cash Level 1 $ 10,820 $ 10,820
Interest rate swap Level 2 $ 6,592 $ 6,592
Derivative financial instrument assets - long term $ 6,592 $ 6,592
Financial liabilities recorded at fair value
Foreign exchange forward contracts Level 2 $ 1,542 $ 1,542
Derivative financial instrument liabilities - current $ 1,542 $ 1,542
(c) Risk Management
The Company uses derivative financial instruments including interest rate swaps, total return swaps and forward foreign exchange contracts. These instruments are financial contracts whose value depends on interest rates, share price and foreign currency prices.
The use of derivatives allows the transfer, modification and reduction of current and expected risks, including interest rate, share price, foreign exchange and other market risks. The Company uses derivative financial instruments to manage interest rate, share price and foreign exchange risks in accordance with its risk management policies. Certain derivative instruments, while providing effective economic hedges, are not designated as hedges for accounting purposes. Changes in the fair value of any derivatives that are not designated as hedges for accounting purposes are recognized within “interest and finance costs” or “unrealized foreign exchange loss (gain) on non-current monetary items” in the consolidated statements of net earnings and total comprehensive income consistent with the underlying nature and purpose of the derivative instruments.
Market risk (interest rate risk and foreign currency risk)
Market risk incorporates a range of risks. Movements in risk factors, such as interest rate risk, equity price risk and foreign currency risk, affect the fair values of financial assets and liabilities. The Company uses derivative financial instruments including interest rate swaps, foreign exchange options and forward foreign exchange contracts to manage its risks associated with potentially adverse changes in interest rates and foreign exchange rates. These instruments are financial contracts whose value depends on interest rates and foreign currency prices. The use of derivatives allows the transfer, modification and reduction of current and expected risks, including interest rate, foreign
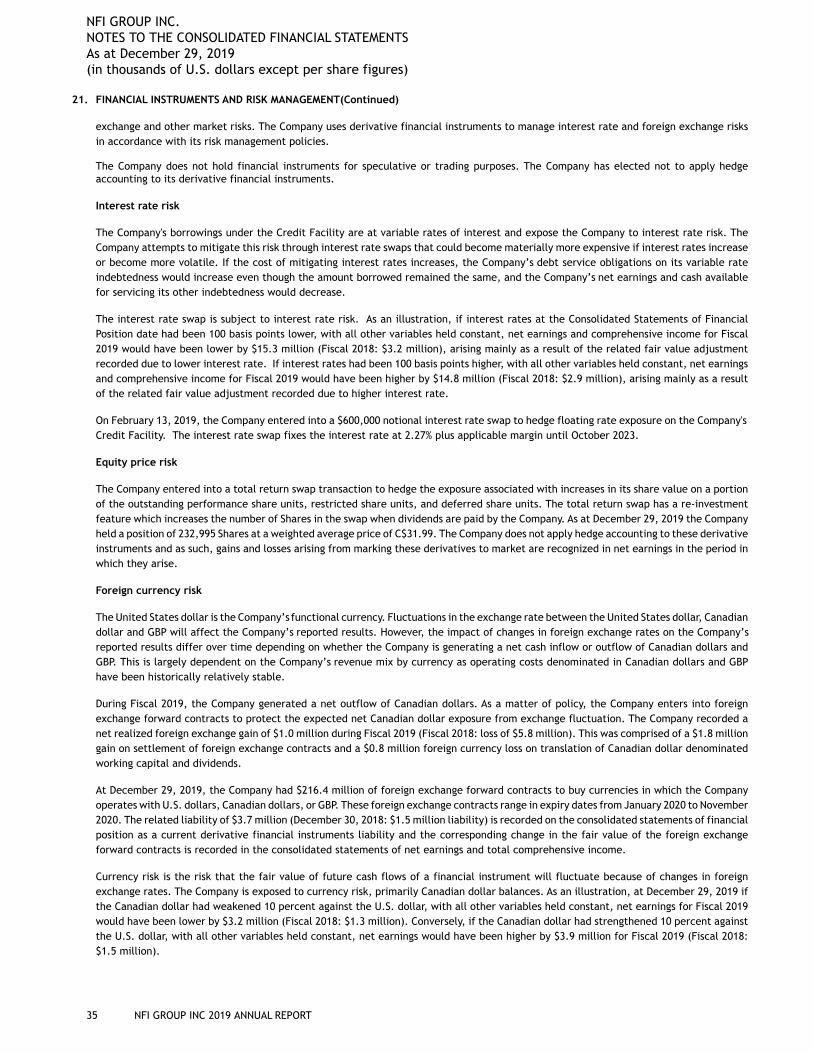
NFI GROUP INC. NOTES TO THE CONSOLIDATED FINANCIAL STATEMENTS As at December 29, 2019(in thousands of U.S. dollars except per share figures)
35 NFI GROUP INC 2019 ANNUAL REPORT
21. FINANCIAL INSTRUMENTS AND RISK MANAGEMENT(Continued)
exchange and other market risks. The Company uses derivative financial instruments to manage interest rate and foreign exchange risks in accordance with its risk management policies.
The Company does not hold financial instruments for speculative or trading purposes. The Company has elected not to apply hedge accounting to its derivative financial instruments.
Interest rate risk
The Company's borrowings under the Credit Facility are at variable rates of interest and expose the Company to interest rate risk. The Company attempts to mitigate this risk through interest rate swaps that could become materially more expensive if interest rates increase or become more volatile. If the cost of mitigating interest rates increases, the Company’s debt service obligations on its variable rate indebtedness would increase even though the amount borrowed remained the same, and the Company’s net earnings and cash available for servicing its other indebtedness would decrease.
The interest rate swap is subject to interest rate risk. As an illustration, if interest rates at the Consolidated Statements of Financial Position date had been 100 basis points lower, with all other variables held constant, net earnings and comprehensive income for Fiscal 2019 would have been lower by $15.3 million (Fiscal 2018: $3.2 million), arising mainly as a result of the related fair value adjustment recorded due to lower interest rate. If interest rates had been 100 basis points higher, with all other variables held constant, net earnings and comprehensive income for Fiscal 2019 would have been higher by $14.8 million (Fiscal 2018: $2.9 million), arising mainly as a result of the related fair value adjustment recorded due to higher interest rate.
On February 13, 2019, the Company entered into a $600,000 notional interest rate swap to hedge floating rate exposure on the Company's Credit Facility. The interest rate swap fixes the interest rate at 2.27% plus applicable margin until October 2023.
Equity price risk
The Company entered into a total return swap transaction to hedge the exposure associated with increases in its share value on a portion of the outstanding performance share units, restricted share units, and deferred share units. The total return swap has a re-investment feature which increases the number of Shares in the swap when dividends are paid by the Company. As at December 29, 2019 the Company held a position of 232,995 Shares at a weighted average price of C$31.99. The Company does not apply hedge accounting to these derivative instruments and as such, gains and losses arising from marking these derivatives to market are recognized in net earnings in the period in which they arise.
Foreign currency risk
The United States dollar is the Company’s functional currency. Fluctuations in the exchange rate between the United States dollar, Canadian dollar and GBP will affect the Company’s reported results. However, the impact of changes in foreign exchange rates on the Company’s reported results differ over time depending on whether the Company is generating a net cash inflow or outflow of Canadian dollars and GBP. This is largely dependent on the Company’s revenue mix by currency as operating costs denominated in Canadian dollars and GBP have been historically relatively stable.
During Fiscal 2019, the Company generated a net outflow of Canadian dollars. As a matter of policy, the Company enters into foreign exchange forward contracts to protect the expected net Canadian dollar exposure from exchange fluctuation. The Company recorded a net realized foreign exchange gain of $1.0 million during Fiscal 2019 (Fiscal 2018: loss of $5.8 million). This was comprised of a $1.8 million gain on settlement of foreign exchange contracts and a $0.8 million foreign currency loss on translation of Canadian dollar denominated working capital and dividends.
At December 29, 2019, the Company had $216.4 million of foreign exchange forward contracts to buy currencies in which the Company operates with U.S. dollars, Canadian dollars, or GBP. These foreign exchange contracts range in expiry dates from January 2020 to November 2020. The related liability of $3.7 million (December 30, 2018: $1.5 million liability) is recorded on the consolidated statements of financial position as a current derivative financial instruments liability and the corresponding change in the fair value of the foreign exchange forward contracts is recorded in the consolidated statements of net earnings and total comprehensive income.
Currency risk is the risk that the fair value of future cash flows of a financial instrument will fluctuate because of changes in foreign exchange rates. The Company is exposed to currency risk, primarily Canadian dollar balances. As an illustration, at December 29, 2019 if the Canadian dollar had weakened 10 percent against the U.S. dollar, with all other variables held constant, net earnings for Fiscal 2019 would have been lower by $3.2 million (Fiscal 2018: $1.3 million). Conversely, if the Canadian dollar had strengthened 10 percent against the U.S. dollar, with all other variables held constant, net earnings would have been higher by $3.9 million for Fiscal 2019 (Fiscal 2018: $1.5 million).
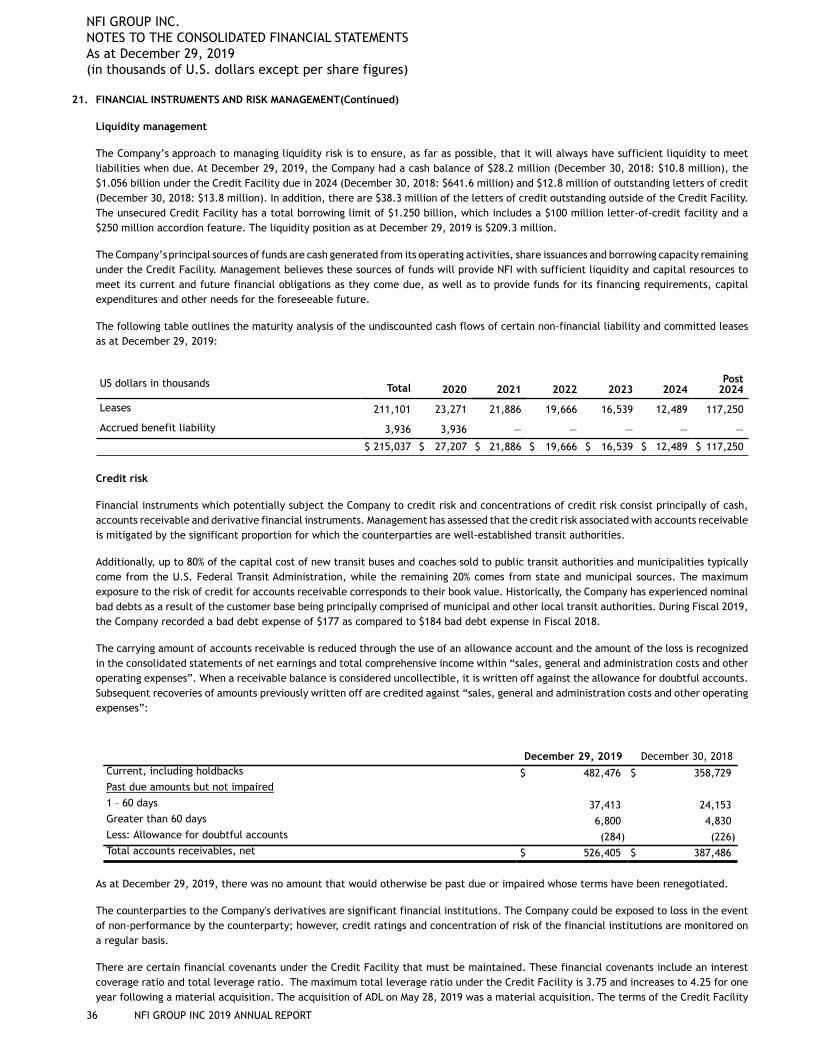
NFI GROUP INC. NOTES TO THE CONSOLIDATED FINANCIAL STATEMENTS As at December 29, 2019(in thousands of U.S. dollars except per share figures)
36 NFI GROUP INC 2019 ANNUAL REPORT
21. FINANCIAL INSTRUMENTS AND RISK MANAGEMENT(Continued)
Liquidity management
The Company’s approach to managing liquidity risk is to ensure, as far as possible, that it will always have sufficient liquidity to meet liabilities when due. At December 29, 2019, the Company had a cash balance of $28.2 million (December 30, 2018: $10.8 million), the $1.056 billion under the Credit Facility due in 2024 (December 30, 2018: $641.6 million) and $12.8 million of outstanding letters of credit (December 30, 2018: $13.8 million). In addition, there are $38.3 million of the letters of credit outstanding outside of the Credit Facility. The unsecured Credit Facility has a total borrowing limit of $1.250 billion, which includes a $100 million letter-of-credit facility and a $250 million accordion feature. The liquidity position as at December 29, 2019 is $209.3 million.
The Company’s principal sources of funds are cash generated from its operating activities, share issuances and borrowing capacity remaining under the Credit Facility. Management believes these sources of funds will provide NFI with sufficient liquidity and capital resources to meet its current and future financial obligations as they come due, as well as to provide funds for its financing requirements, capital expenditures and other needs for the foreseeable future.
The following table outlines the maturity analysis of the undiscounted cash flows of certain non-financial liability and committed leases as at December 29, 2019:
US dollars in thousands Total 2020 2021 2022 2023 2024Post
2024
Leases 211,101 23,271 21,886 19,666 16,539 12,489 117,250
Accrued benefit liability 3,936 3,936 — — — — —
$ 215,037 $ 27,207 $ 21,886 $ 19,666 $ 16,539 $ 12,489 $ 117,250
Credit risk
Financial instruments which potentially subject the Company to credit risk and concentrations of credit risk consist principally of cash, accounts receivable and derivative financial instruments. Management has assessed that the credit risk associated with accounts receivable is mitigated by the significant proportion for which the counterparties are well-established transit authorities.
Additionally, up to 80% of the capital cost of new transit buses and coaches sold to public transit authorities and municipalities typically come from the U.S. Federal Transit Administration, while the remaining 20% comes from state and municipal sources. The maximum exposure to the risk of credit for accounts receivable corresponds to their book value. Historically, the Company has experienced nominal bad debts as a result of the customer base being principally comprised of municipal and other local transit authorities. During Fiscal 2019, the Company recorded a bad debt expense of $177 as compared to $184 bad debt expense in Fiscal 2018.
The carrying amount of accounts receivable is reduced through the use of an allowance account and the amount of the loss is recognized in the consolidated statements of net earnings and total comprehensive income within “sales, general and administration costs and other operating expenses”. When a receivable balance is considered uncollectible, it is written off against the allowance for doubtful accounts. Subsequent recoveries of amounts previously written off are credited against “sales, general and administration costs and other operating expenses”:
December 29, 2019 December 30, 2018Current, including holdbacks $ 482,476 $ 358,729Past due amounts but not impaired
1 – 60 days 37,413 24,153Greater than 60 days 6,800 4,830Less: Allowance for doubtful accounts (284) (226)Total accounts receivables, net $ 526,405 $ 387,486
As at December 29, 2019, there was no amount that would otherwise be past due or impaired whose terms have been renegotiated.
The counterparties to the Company's derivatives are significant financial institutions. The Company could be exposed to loss in the event of non-performance by the counterparty; however, credit ratings and concentration of risk of the financial institutions are monitored on a regular basis.
There are certain financial covenants under the Credit Facility that must be maintained. These financial covenants include an interest coverage ratio and total leverage ratio. The maximum total leverage ratio under the Credit Facility is 3.75 and increases to 4.25 for one year following a material acquisition. The acquisition of ADL on May 28, 2019 was a material acquisition. The terms of the Credit Facility
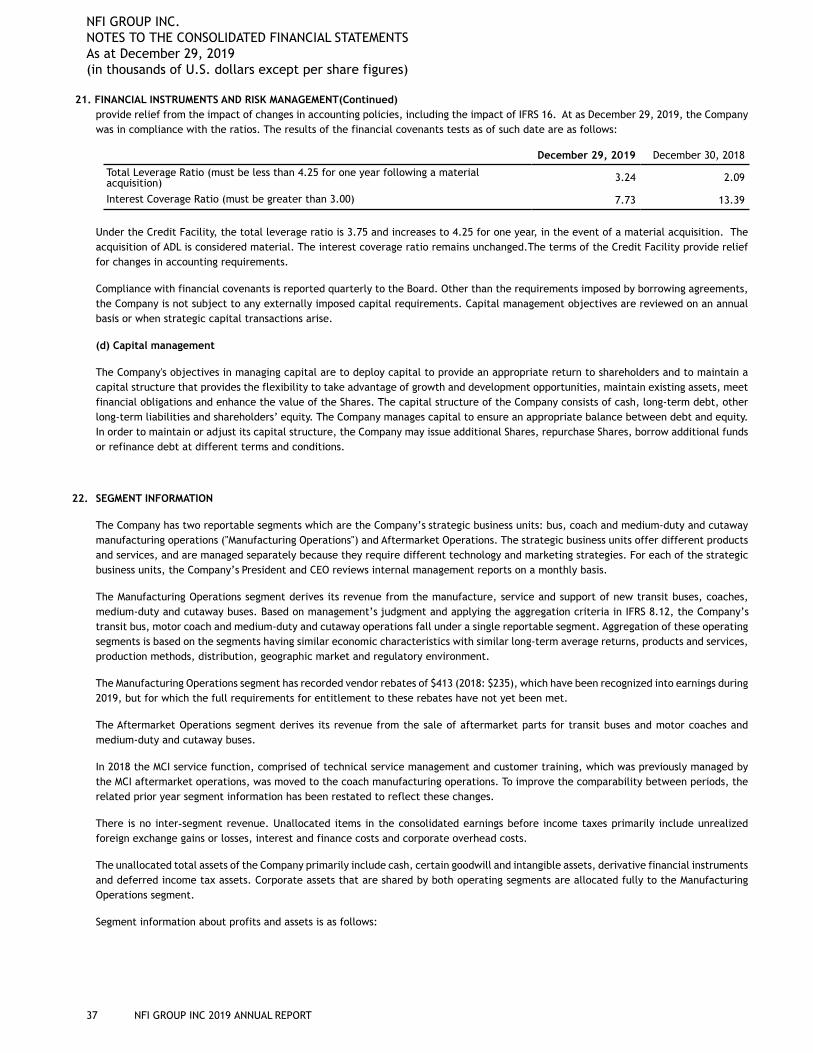
NFI GROUP INC. NOTES TO THE CONSOLIDATED FINANCIAL STATEMENTS As at December 29, 2019(in thousands of U.S. dollars except per share figures)
37 NFI GROUP INC 2019 ANNUAL REPORT
21. FINANCIAL INSTRUMENTS AND RISK MANAGEMENT(Continued)provide relief from the impact of changes in accounting policies, including the impact of IFRS 16. At as December 29, 2019, the Company was in compliance with the ratios. The results of the financial covenants tests as of such date are as follows:
December 29, 2019 December 30, 2018
Total Leverage Ratio (must be less than 4.25 for one year following a materialacquisition) 3.24 2.09
Interest Coverage Ratio (must be greater than 3.00) 7.73 13.39
Under the Credit Facility, the total leverage ratio is 3.75 and increases to 4.25 for one year, in the event of a material acquisition. The acquisition of ADL is considered material. The interest coverage ratio remains unchanged.The terms of the Credit Facility provide relief for changes in accounting requirements.
Compliance with financial covenants is reported quarterly to the Board. Other than the requirements imposed by borrowing agreements, the Company is not subject to any externally imposed capital requirements. Capital management objectives are reviewed on an annual basis or when strategic capital transactions arise.
(d) Capital management
The Company's objectives in managing capital are to deploy capital to provide an appropriate return to shareholders and to maintain a capital structure that provides the flexibility to take advantage of growth and development opportunities, maintain existing assets, meet financial obligations and enhance the value of the Shares. The capital structure of the Company consists of cash, long-term debt, other long-term liabilities and shareholders’ equity. The Company manages capital to ensure an appropriate balance between debt and equity. In order to maintain or adjust its capital structure, the Company may issue additional Shares, repurchase Shares, borrow additional funds or refinance debt at different terms and conditions.
22. SEGMENT INFORMATION
The Company has two reportable segments which are the Company’s strategic business units: bus, coach and medium-duty and cutaway manufacturing operations ("Manufacturing Operations") and Aftermarket Operations. The strategic business units offer different products and services, and are managed separately because they require different technology and marketing strategies. For each of the strategic business units, the Company’s President and CEO reviews internal management reports on a monthly basis.
The Manufacturing Operations segment derives its revenue from the manufacture, service and support of new transit buses, coaches, medium-duty and cutaway buses. Based on management’s judgment and applying the aggregation criteria in IFRS 8.12, the Company’s transit bus, motor coach and medium-duty and cutaway operations fall under a single reportable segment. Aggregation of these operating segments is based on the segments having similar economic characteristics with similar long-term average returns, products and services, production methods, distribution, geographic market and regulatory environment.
The Manufacturing Operations segment has recorded vendor rebates of $413 (2018: $235), which have been recognized into earnings during 2019, but for which the full requirements for entitlement to these rebates have not yet been met.
The Aftermarket Operations segment derives its revenue from the sale of aftermarket parts for transit buses and motor coaches and medium-duty and cutaway buses.
In 2018 the MCI service function, comprised of technical service management and customer training, which was previously managed by the MCI aftermarket operations, was moved to the coach manufacturing operations. To improve the comparability between periods, the related prior year segment information has been restated to reflect these changes.
There is no inter segment revenue. Unallocated items in the consolidated earnings before income taxes primarily include unrealized foreign exchange gains or losses, interest and finance costs and corporate overhead costs.
The unallocated total assets of the Company primarily include cash, certain goodwill and intangible assets, derivative financial instruments and deferred income tax assets. Corporate assets that are shared by both operating segments are allocated fully to the Manufacturing Operations segment.
Segment information about profits and assets is as follows:
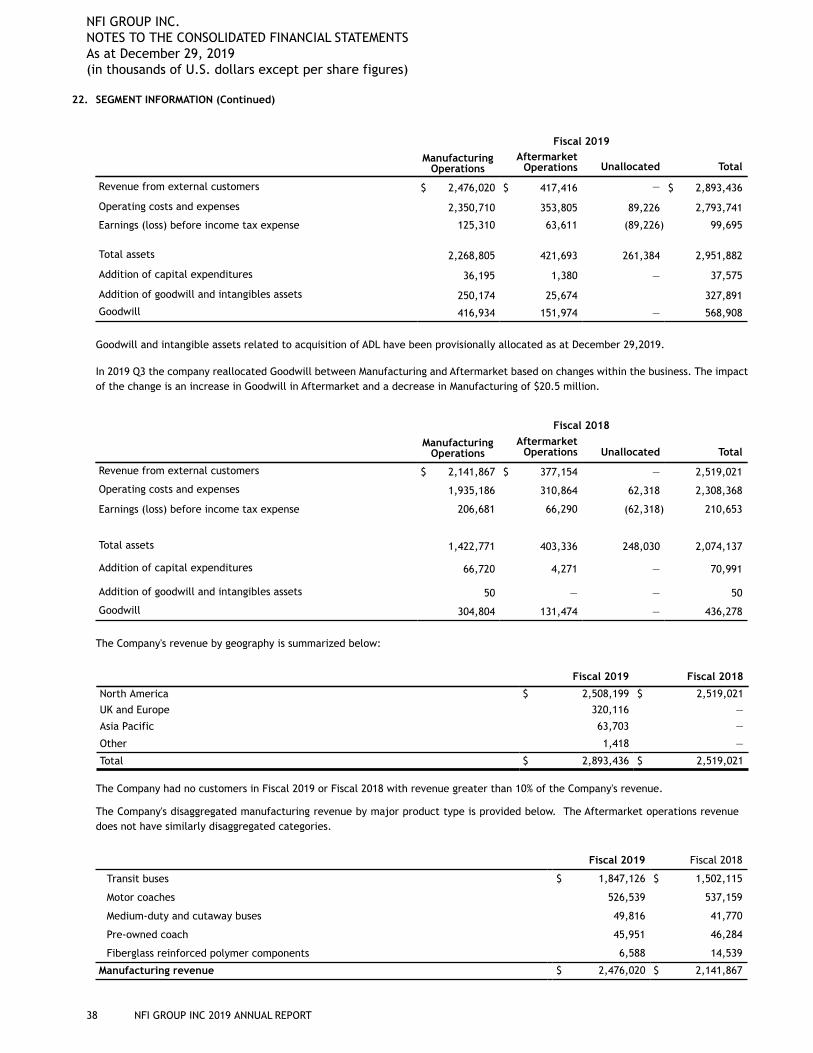
NFI GROUP INC. NOTES TO THE CONSOLIDATED FINANCIAL STATEMENTS As at December 29, 2019(in thousands of U.S. dollars except per share figures)
38 NFI GROUP INC 2019 ANNUAL REPORT
22. SEGMENT INFORMATION (Continued)
Fiscal 2019
ManufacturingOperations
AftermarketOperations Unallocated Total
Revenue from external customers $ 2,476,020 $ 417,416 — $ 2,893,436
Operating costs and expenses 2,350,710 353,805 89,226 2,793,741
Earnings (loss) before income tax expense 125,310 63,611 (89,226) 99,695
Total assets 2,268,805 421,693 261,384 2,951,882
Addition of capital expenditures 36,195 1,380 — 37,575
Addition of goodwill and intangibles assets 250,174 25,674 327,891
Goodwill 416,934 151,974 — 568,908
Goodwill and intangible assets related to acquisition of ADL have been provisionally allocated as at December 29,2019.
In 2019 Q3 the company reallocated Goodwill between Manufacturing and Aftermarket based on changes within the business. The impact of the change is an increase in Goodwill in Aftermarket and a decrease in Manufacturing of $20.5 million.
Fiscal 2018
ManufacturingOperations
AftermarketOperations Unallocated Total
Revenue from external customers $ 2,141,867 $ 377,154 — 2,519,021
Operating costs and expenses 1,935,186 310,864 62,318 2,308,368
Earnings (loss) before income tax expense 206,681 66,290 (62,318) 210,653
Total assets 1,422,771 403,336 248,030 2,074,137
Addition of capital expenditures 66,720 4,271 — 70,991
Addition of goodwill and intangibles assets 50 — — 50
Goodwill 304,804 131,474 — 436,278
The Company's revenue by geography is summarized below:
Fiscal 2019 Fiscal 2018
North America $ 2,508,199 $ 2,519,021
UK and Europe 320,116 —
Asia Pacific 63,703 —
Other 1,418 —
Total $ 2,893,436 $ 2,519,021
The Company had no customers in Fiscal 2019 or Fiscal 2018 with revenue greater than 10% of the Company's revenue.
The Company's disaggregated manufacturing revenue by major product type is provided below. The Aftermarket operations revenue does not have similarly disaggregated categories.
Fiscal 2019 Fiscal 2018
Transit buses $ 1,847,126 $ 1,502,115
Motor coaches 526,539 537,159
Medium-duty and cutaway buses 49,816 41,770
Pre-owned coach 45,951 46,284
Fiberglass reinforced polymer components 6,588 14,539
Manufacturing revenue $ 2,476,020 $ 2,141,867
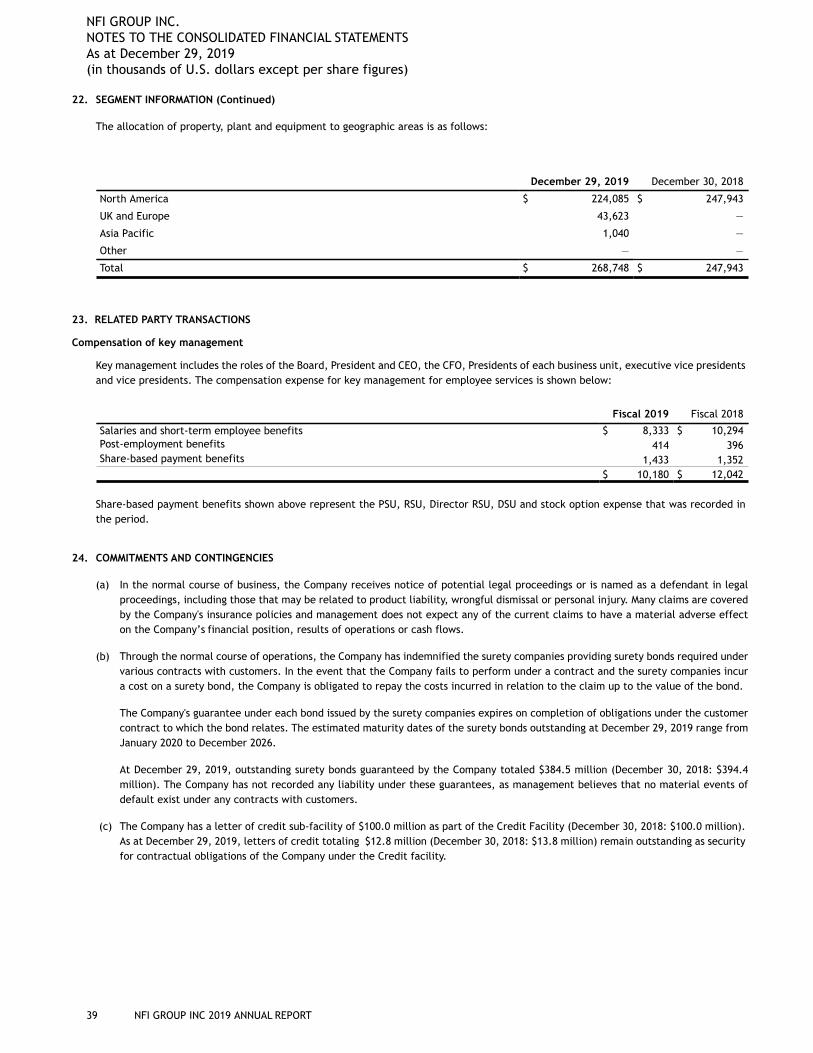
NFI GROUP INC. NOTES TO THE CONSOLIDATED FINANCIAL STATEMENTS As at December 29, 2019(in thousands of U.S. dollars except per share figures)
39 NFI GROUP INC 2019 ANNUAL REPORT
22. SEGMENT INFORMATION (Continued)
The allocation of property, plant and equipment to geographic areas is as follows:
December 29, 2019 December 30, 2018
North America $ 224,085 $ 247,943
UK and Europe 43,623 —
Asia Pacific 1,040 —
Other — —
Total $ 268,748 $ 247,943
23. RELATED PARTY TRANSACTIONS
Compensation of key management
Key management includes the roles of the Board, President and CEO, the CFO, Presidents of each business unit, executive vice presidents and vice presidents. The compensation expense for key management for employee services is shown below:
Fiscal 2019 Fiscal 2018
Salaries and short-term employee benefits $ 8,333 $ 10,294Post-employment benefits 414 396Share-based payment benefits 1,433 1,352
$ 10,180 $ 12,042
Share-based payment benefits shown above represent the PSU, RSU, Director RSU, DSU and stock option expense that was recorded in the period.
24. COMMITMENTS AND CONTINGENCIES
(a) In the normal course of business, the Company receives notice of potential legal proceedings or is named as a defendant in legal proceedings, including those that may be related to product liability, wrongful dismissal or personal injury. Many claims are covered by the Company's insurance policies and management does not expect any of the current claims to have a material adverse effect on the Company’s financial position, results of operations or cash flows.
(b) Through the normal course of operations, the Company has indemnified the surety companies providing surety bonds required under various contracts with customers. In the event that the Company fails to perform under a contract and the surety companies incur a cost on a surety bond, the Company is obligated to repay the costs incurred in relation to the claim up to the value of the bond.
The Company's guarantee under each bond issued by the surety companies expires on completion of obligations under the customer contract to which the bond relates. The estimated maturity dates of the surety bonds outstanding at December 29, 2019 range from January 2020 to December 2026.
At December 29, 2019, outstanding surety bonds guaranteed by the Company totaled $384.5 million (December 30, 2018: $394.4 million). The Company has not recorded any liability under these guarantees, as management believes that no material events of default exist under any contracts with customers.
(c) The Company has a letter of credit sub-facility of $100.0 million as part of the Credit Facility (December 30, 2018: $100.0 million). As at December 29, 2019, letters of credit totaling $12.8 million (December 30, 2018: $13.8 million) remain outstanding as security for contractual obligations of the Company under the Credit facility.
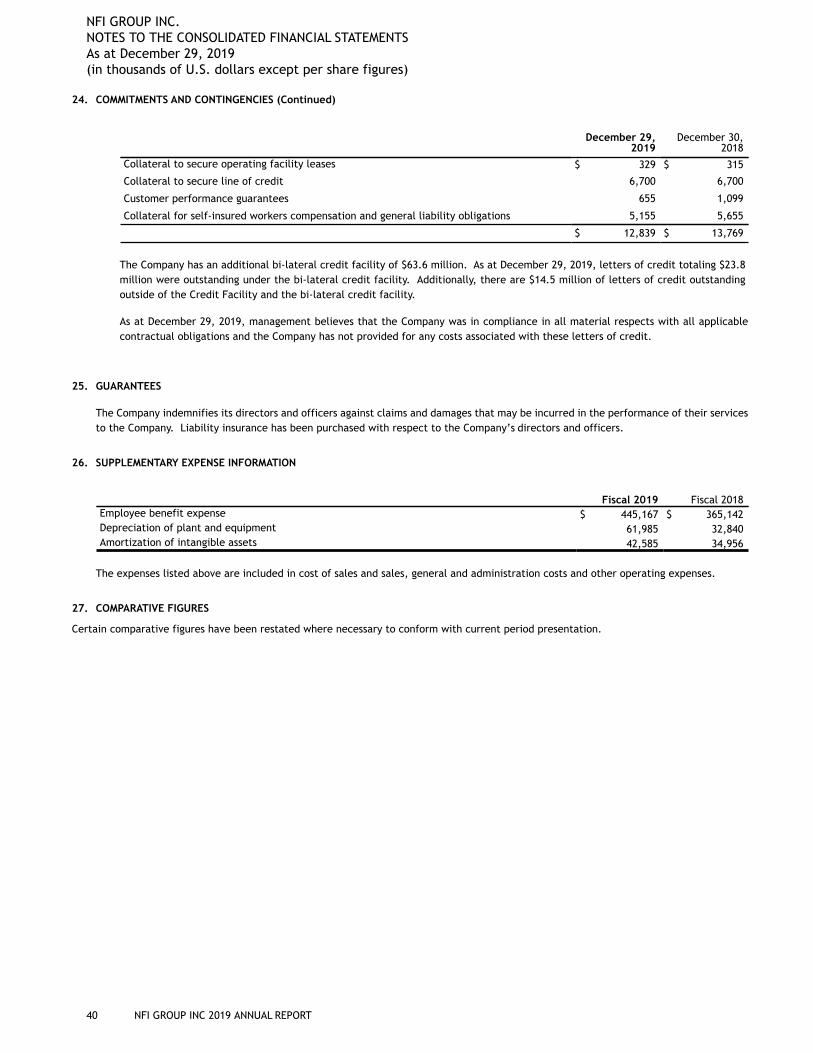
NFI GROUP INC. NOTES TO THE CONSOLIDATED FINANCIAL STATEMENTS As at December 29, 2019(in thousands of U.S. dollars except per share figures)
40 NFI GROUP INC 2019 ANNUAL REPORT
24. COMMITMENTS AND CONTINGENCIES (Continued)
December 29,2019
December 30,2018
Collateral to secure operating facility leases $ 329 $ 315
Collateral to secure line of credit 6,700 6,700
Customer performance guarantees 655 1,099
Collateral for self-insured workers compensation and general liability obligations 5,155 5,655
$ 12,839 $ 13,769
The Company has an additional bi-lateral credit facility of $63.6 million. As at December 29, 2019, letters of credit totaling $23.8 million were outstanding under the bi-lateral credit facility. Additionally, there are $14.5 million of letters of credit outstanding outside of the Credit Facility and the bi-lateral credit facility.
As at December 29, 2019, management believes that the Company was in compliance in all material respects with all applicable contractual obligations and the Company has not provided for any costs associated with these letters of credit.
25. GUARANTEES
The Company indemnifies its directors and officers against claims and damages that may be incurred in the performance of their services to the Company. Liability insurance has been purchased with respect to the Company’s directors and officers.
26. SUPPLEMENTARY EXPENSE INFORMATION
Fiscal 2019 Fiscal 2018Employee benefit expense $ 445,167 $ 365,142Depreciation of plant and equipment 61,985 32,840Amortization of intangible assets 42,585 34,956
The expenses listed above are included in cost of sales and sales, general and administration costs and other operating expenses.
27. COMPARATIVE FIGURES
Certain comparative figures have been restated where necessary to conform with current period presentation.
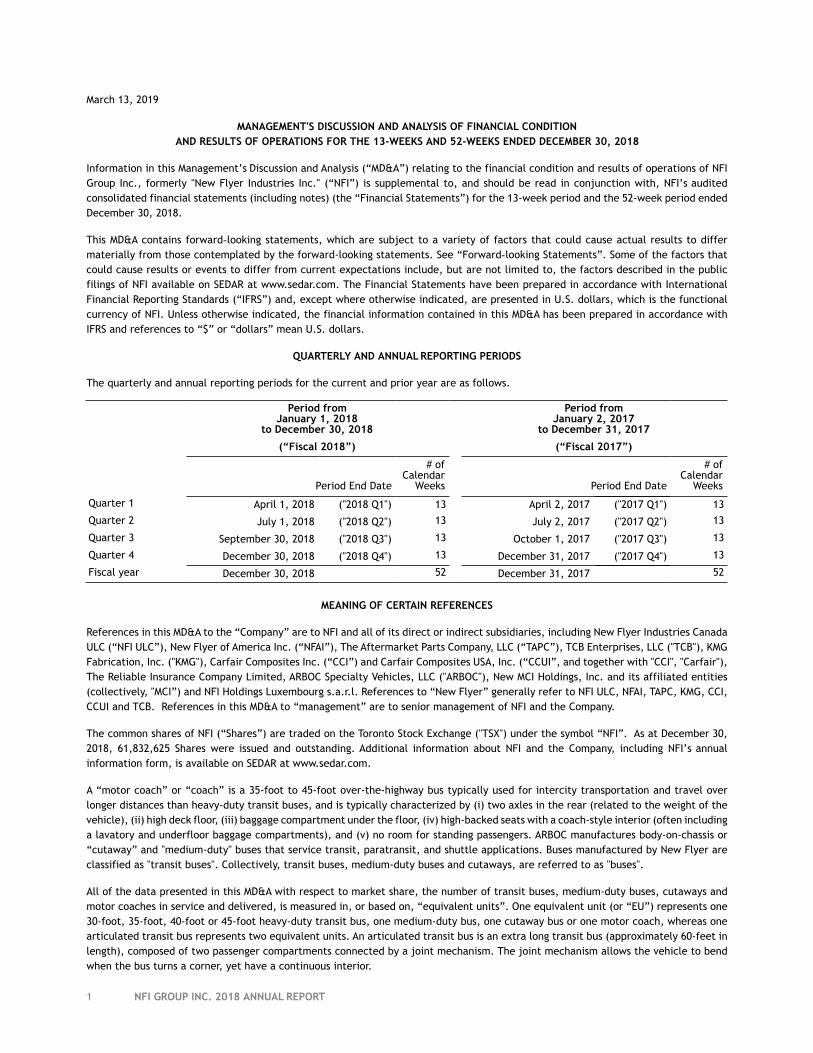
1 NFI GROUP INC. 2018 ANNUAL REPORT
March 13, 2019
MANAGEMENT'S DISCUSSION AND ANALYSIS OF FINANCIAL CONDITIONAND RESULTS OF OPERATIONS FOR THE 13-WEEKS AND 52-WEEKS ENDED DECEMBER 30, 2018
Information in this Management’s Discussion and Analysis (“MD&A”) relating to the financial condition and results of operations of NFI Group Inc., formerly "New Flyer Industries Inc." (“NFI”) is supplemental to, and should be read in conjunction with, NFI’s audited consolidated financial statements (including notes) (the “Financial Statements”) for the 13-week period and the 52-week period ended December 30, 2018.
This MD&A contains forward looking statements, which are subject to a variety of factors that could cause actual results to differ materially from those contemplated by the forward-looking statements. See “Forward looking Statements”. Some of the factors that could cause results or events to differ from current expectations include, but are not limited to, the factors described in the public filings of NFI available on SEDAR at www.sedar.com. The Financial Statements have been prepared in accordance with International Financial Reporting Standards (“IFRS”) and, except where otherwise indicated, are presented in U.S. dollars, which is the functional currency of NFI. Unless otherwise indicated, the financial information contained in this MD&A has been prepared in accordance with IFRS and references to “$” or “dollars” mean U.S. dollars.
QUARTERLY AND ANNUAL REPORTING PERIODS
The quarterly and annual reporting periods for the current and prior year are as follows.
Period fromJanuary 1, 2018
to December 30, 2018
Period fromJanuary 2, 2017
to December 31, 2017
(“Fiscal 2018”) (“Fiscal 2017”)
Period End Date
# ofCalendar
Weeks Period End Date
# ofCalendar
Weeks
Quarter 1 April 1, 2018 ("2018 Q1") 13 April 2, 2017 ("2017 Q1") 13
Quarter 2 July 1, 2018 ("2018 Q2") 13 July 2, 2017 ("2017 Q2") 13
Quarter 3 September 30, 2018 ("2018 Q3") 13 October 1, 2017 ("2017 Q3") 13
Quarter 4 December 30, 2018 ("2018 Q4") 13 December 31, 2017 ("2017 Q4") 13
Fiscal year December 30, 2018 52 December 31, 2017 52
MEANING OF CERTAIN REFERENCES
References in this MD&A to the “Company” are to NFI and all of its direct or indirect subsidiaries, including New Flyer Industries Canada ULC (“NFI ULC”), New Flyer of America Inc. (“NFAI”), The Aftermarket Parts Company, LLC (“TAPC”), TCB Enterprises, LLC ("TCB"), KMG Fabrication, Inc. ("KMG"), Carfair Composites Inc. (“CCI”) and Carfair Composites USA, Inc. (“CCUI”, and together with "CCI", "Carfair"), The Reliable Insurance Company Limited, ARBOC Specialty Vehicles, LLC ("ARBOC"), New MCI Holdings, Inc. and its affiliated entities (collectively, "MCI”) and NFI Holdings Luxembourg s.a.r.l. References to “New Flyer” generally refer to NFI ULC, NFAI, TAPC, KMG, CCI, CCUI and TCB. References in this MD&A to “management” are to senior management of NFI and the Company.
The common shares of NFI (“Shares”) are traded on the Toronto Stock Exchange ("TSX") under the symbol “NFI”. As at December 30, 2018, 61,832,625 Shares were issued and outstanding. Additional information about NFI and the Company, including NFI’s annual information form, is available on SEDAR at www.sedar.com.
A “motor coach” or “coach” is a 35-foot to 45-foot over-the-highway bus typically used for intercity transportation and travel over longer distances than heavy-duty transit buses, and is typically characterized by (i) two axles in the rear (related to the weight of the vehicle), (ii) high deck floor, (iii) baggage compartment under the floor, (iv) high-backed seats with a coach-style interior (often including a lavatory and underfloor baggage compartments), and (v) no room for standing passengers. ARBOC manufactures body-on-chassis or “cutaway” and "medium-duty" buses that service transit, paratransit, and shuttle applications. Buses manufactured by New Flyer are classified as "transit buses". Collectively, transit buses, medium-duty buses and cutaways, are referred to as "buses".
All of the data presented in this MD&A with respect to market share, the number of transit buses, medium-duty buses, cutaways and motor coaches in service and delivered, is measured in, or based on, “equivalent units”. One equivalent unit (or “EU”) represents one 30-foot, 35-foot, 40-foot or 45-foot heavy-duty transit bus, one medium-duty bus, one cutaway bus or one motor coach, whereas one articulated transit bus represents two equivalent units. An articulated transit bus is an extra long transit bus (approximately 60-feet in length), composed of two passenger compartments connected by a joint mechanism. The joint mechanism allows the vehicle to bend when the bus turns a corner, yet have a continuous interior.
2 NFI GROUP INC. 2018 ANNUAL REPORT
Forward looking Statements
Certain statements in this MD&A are “forward looking statements”, which reflect the expectations of management regarding the Company's future growth, results of operations, performance and business prospects and opportunities. The words “believes”, “anticipates”, “plans”, “expects”, “intends”, “projects”, “forecasts”, “estimates” and similar expressions are intended to identify forward looking statements. These forward looking statements reflect management's current expectations regarding future events and operating performance and speak only as of the date of this MD&A. Forward-looking statements involve significant risks and uncertainties, should not be read as guarantees of future performance or results, and will not necessarily be accurate indications of whether or not or the times at or by which such performance or results will be achieved. A number of factors could cause actual results to differ materially from the results discussed in the forward-looking statements. Such differences may be caused by factors which include, but are not limited to, availability of funding to the Company's customers to purchase transit buses and coaches and to exercise options and to purchase parts or services at current levels or at all, aggressive competition and reduced pricing in the industry, material losses and costs may be incurred as a result of product warranty issues and product liability claims, changes in Canadian or United States tax legislation, the absence of fixed term customer contracts and the suspension or the termination of contracts by customers for convenience, the current U.S. federal "Buy-America" legislation may change and/or become more onerous, inability to achieve U.S. Disadvantaged Business Enterprise Program requirements, local content bidding preferences and requirements under Canadian content policies may change and/or become more onerous, trade policies in the United States and Canada (including USMCA, tariffs, duties, surtaxes and the Canadian federal Duties Relief Program) may undergo significant change, potentially in a manner materially adverse to the Company, production delays may result in liquidated damages under the Company's contracts with its customers, inability of the Company to execute its planned production targets as required for current business and operational needs, currency fluctuations could adversely affect the Company's financial results or competitive position in the industry, the Company may not be able to maintain performance bonds or letters of credit required by its existing contracts or obtain performance bonds and letters of credit required for new contracts, third party debt service obligations may have important consequences to the Company, the covenants contained in the Company’s senior credit facility could impact the ability of the Company to fund dividends and take certain other actions, interest rates could change substantially and materially impact the Company's profitability, the dependence on limited or unique sources of supply, the timely supply of materials from suppliers, the possibility of fluctuations in the market prices of the pension plan investments and discount rates used in the actuarial calculations will impact pension expense and funding requirements, the Company's profitability and performance can be adversely affected by increases in raw material and component costs, the availability of labor could have an impact on production levels, new products must be tested and proven in operating conditions and there may be limited demand for such new products from customers, the Company may have difficulty selling pre-owned coaches and realizing expected resale values, inability of the Company to successfully execute strategic plans and maintain profitability, development of competitive products or technologies, catastrophic events may lead to production curtailments or shutdowns, dependence on management information systems and risks related to cyber security, dependence on a limited number of key executives who may not be able to be adequately replaced if they leave the Company, employee related disruptions as a result of an inability to successfully renegotiate collective bargaining agreements when they expire, risks related to acquisitions and other strategic relationships with third parties, inability to successfully integrate acquired businesses and assets into the Company’s existing business and to generate accretive effects to income and cash flow as a result of integrating these acquired businesses and assets. NFI cautions that this list of factors is not exhaustive. These factors and other risks and uncertainties are discussed in NFI’s press releases and materials filed with the Canadian securities regulatory authorities which are available on SEDAR at www.sedar.com.
Although the forward looking statements contained in this MD&A are based upon what management believes to be reasonable assumptions, investors cannot be assured that actual results will be consistent with these forward looking statements, and the differences may be material. These forward looking statements are made as of the date of this MD&A and NFI assumes no obligation to update or revise them to reflect new events or circumstances, except as required by applicable securities laws.
DEFINITIONS OF ADJUSTED EBITDA, ROIC, FREE CASH FLOW, ADJUSTED NET EARNINGS AND ADJUSTED EARNINGS PER SHARE
References to “Adjusted EBITDA” are to earnings before interest, income taxes, depreciation and amortization after adjusting for the effects of certain non-recurring and/or non-operations related items that do not reflect the current ongoing cash operations of the Company including: gains or losses on disposal of property, plant and equipment, fair value adjustment for total return swap, unrealized foreign exchange losses or gains on non-current monetary items and forward foreign exchange contracts, costs associated with assessing strategic and corporate initiatives, past service costs, non-recurring costs or recoveries relating to business acquisitions, fair value adjustment to acquired subsidiary company's inventory and deferred revenue, proportion of the total return swap realized, equity settled stock-based compensation, gain on bargain purchase of subsidiary company, and provision release related to purchase accounting. “Free Cash Flow” means net cash generated by operating activities adjusted for changes in non-cash working capital items, interest paid, interest expense, income taxes paid, current income tax expense, principal portion of finance lease payments, cash capital expenditures, proceeds from disposition of property, plant and equipment, costs associated with assessing strategic and corporate initiatives, non-recurring transitional costs related to business acquisition, fair value adjustment to acquired subsidiary company's inventory and deferred revenue, defined benefit funding, defined benefit expense, past service costs, gain received on total return
3 NFI GROUP INC. 2018 ANNUAL REPORT
swap, foreign exchange gain (loss) on cash held in foreign currency. References to "ROIC" are to net operating profit after taxes (calculated as Adjusted EBITDA less depreciation of plant and equipment and income taxes at the expected effective tax rate) divided by average invested capital for the last twelve month period (calculated as to shareholders’ equity plus long-term debt, obligations under finance leases, other long-term liabilities, convertible debentures and derivative financial instrument liabilities less cash). References to "Adjusted Net Earnings" are to net earnings after adjusting for the after tax effects of certain non-recurring and/or non-operational related items that do not reflect the current ongoing cash operations of the Company including: gains or losses on disposal of property, plant and equipment, unrealized foreign exchange losses or gains on non-current monetary items, fair value adjustment for total return swap, non-recurring transitional costs or recoveries relating to business acquisitions, equity settled stock-based compensation, gain on bargain purchase of subsidiary company, fair value adjustment to acquired subsidiary company's inventory and deferred revenue, past service costs, costs associated with assessing strategic and corporate initiatives and proportion of the total return swap realized. References to "Adjusted Earnings per Share" are to Adjusted Net Earnings divided by the average number of Shares outstanding.
Management believes Adjusted EBITDA, ROIC, Free Cash Flow, Adjusted Net Earnings and Adjusted Earnings per Share are useful measures in evaluating the performance of the Company. However, Adjusted EBITDA, ROIC, Free Cash Flow, Adjusted Net Earnings and Adjusted Earnings per Share are not recognized earnings measures under IFRS and do not have standardized meanings prescribed by IFRS. Readers of this MD&A are cautioned that ROIC, Adjusted Net Earnings and Adjusted EBITDA should not be construed as an alternative to net earnings or loss or cash flows from operating activities determined in accordance with IFRS as an indicator of NFI’s performance, and Free Cash Flow should not be construed as an alternative to cash flows from operating, investing and financing activities determined in accordance with IFRS as a measure of liquidity and cash flows. A reconciliation of net earnings and cash flows to Adjusted EBITDA, based on the Financial Statements, has been provided under the headings “Reconciliation of Net Earnings to Adjusted EBITDA” and “Reconciliation of Cash Flow to Adjusted EBITDA”, respectively. A reconciliation of Free Cash Flow to cash flows from operations is provided under the heading “Summary of Free Cash Flow”. A reconciliation of net earnings to Adjusted Net Earnings is provided under the heading “Reconciliation of Net Earnings to Adjusted Net Earnings”.
NFI's method of calculating Adjusted EBITDA, ROIC, Free Cash Flow, Adjusted Net Earnings and Adjusted Earnings per Share may differ materially from the methods used by other issuers and, accordingly, may not be comparable to similarly titled measures used by other issuers. Dividends paid from Free Cash Flow are not assured, and the actual amount of dividends received by holders of Shares will depend on, among other things, the Company's financial performance, debt covenants and obligations, working capital requirements and future capital requirements, all of which are susceptible to a number of risks, as described in NFI’s public filings available on SEDAR at www.sedar.com.
Business Overview
The Company is North America’s largest bus and coach manufacturer and parts distributor providing a comprehensive suite of mass transportation solutions under brands: New Flyer® (heavy-duty transit buses), ARBOC® (low-floor cutaway and medium-duty buses), MCI®
(motor coaches), NFI Parts™ (parts, support, and service) and Carfair® (fibre-reinforced plastic and composites). The Company has over 6,000 team members, operating from 31 facilities across Canada and the United States, and can trace its roots back to 1930.
On May 14, 2018, the articles of incorporation of New Flyer Industries Inc. were amended to change the name to "NFI Group Inc.". The Company believes the new name better reflects the multi-platform nature of its business.
The Company’s buses incorporate the widest range of drive systems available including: clean diesel, natural gas, diesel-electric hybrid, and zero-emission electric (trolley, battery, and fuel cell) on proven bus platforms. It also supports infrastructure development through New Flyer Infrastructure Solutions™, a service dedicated to providing safe and reliable charging and mobility solutions.
In total, the Company supports over 74,000 buses and coaches currently in service across North America. The Company’s Shares are traded on the Toronto Stock Exchange under the symbol NFI.
New Flyer is North America's heavy-duty transit bus leader and offers the most advanced product line under the Xcelsior® and Xcelsior CHARGE™ brands. New Flyer actively supports over 41,000 heavy-duty transit buses (New Flyer, NABI, and Orion) currently in service, of which 7,300 are powered by electric motors and battery propulsion and 1,600 are zero-emission.
MCI is North America’s public and private market motor coach leader, building the J4500 (the industry’s best-seller for 13 consecutive years), the all-new 35-foot J3500 model, and the workhorse D-Series including the breakthrough ADA-accessible MCI D45 Commuter Rapid Transit (CRT) Low Entry Commuter Coach offering lower dwell times. With nearly 30,000 MCI coaches on the road, MCI also provides maintenance, repair, 24-hour roadside assistance, parts supply through NFI Parts, and technician training through the industry’s only Automotive Service Excellence (ASE) accredited MCI Academy.
ARBOC is North America’s low-floor cutaway bus leader serving transit, paratransit, and shuttle applications. With more than 3,000 buses produced, ARBOC leads the low-floor cutaway bus market providing unsurpassed passenger accessibility and comfort. ARBOC also offers the Spirit of Equess® ("Equess"), Spirit of Liberty® and Spirit of America® medium-duty buses for transit and shuttle applications.
4 NFI GROUP INC. 2018 ANNUAL REPORT
NFI Parts is North America's most comprehensive bus and motor coach parts organization, providing replacement parts, technical publications, training, service, and support.
Carfair is a leader in fibre-reinforced plastic ("FRP") composites manufacturing and has over 700 dedicated team members located in facilities in Canada and the U.S. As a comprehensive manufacturer of engineered composite products, Carfair supplies to original equipment manufacturers ("OEM") in agriculture, construction, transportation, commercial, and medical industries, and is primarily focused on supplying NFI Group companies. Carfair brings together the strength of historic North American composite leaders formerly known as Carlson Composites, Frank Fair Industries and Sintex-Wausaukee Composites.
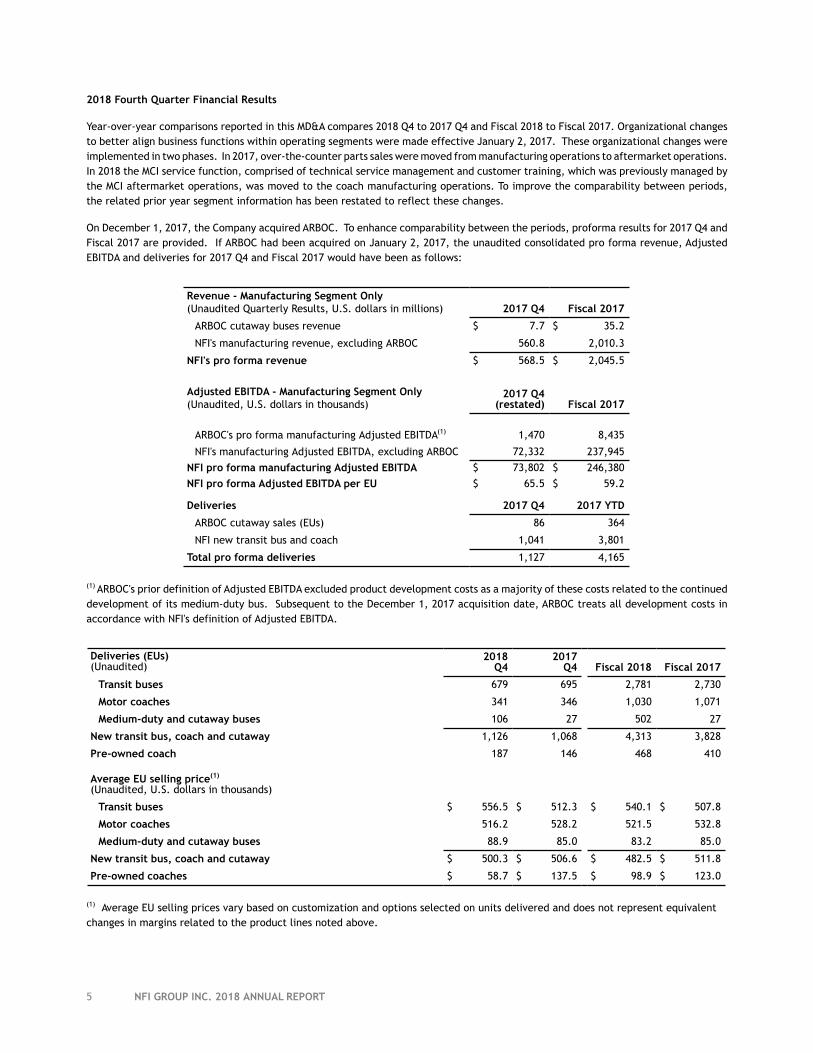
5 NFI GROUP INC. 2018 ANNUAL REPORT
2018 Fourth Quarter Financial Results
Year-over-year comparisons reported in this MD&A compares 2018 Q4 to 2017 Q4 and Fiscal 2018 to Fiscal 2017. Organizational changes to better align business functions within operating segments were made effective January 2, 2017. These organizational changes were implemented in two phases. In 2017, over-the-counter parts sales were moved from manufacturing operations to aftermarket operations. In 2018 the MCI service function, comprised of technical service management and customer training, which was previously managed by the MCI aftermarket operations, was moved to the coach manufacturing operations. To improve the comparability between periods, the related prior year segment information has been restated to reflect these changes.
On December 1, 2017, the Company acquired ARBOC. To enhance comparability between the periods, proforma results for 2017 Q4 and Fiscal 2017 are provided. If ARBOC had been acquired on January 2, 2017, the unaudited consolidated pro forma revenue, Adjusted EBITDA and deliveries for 2017 Q4 and Fiscal 2017 would have been as follows:
Revenue - Manufacturing Segment Only (Unaudited Quarterly Results, U.S. dollars in millions) 2017 Q4 Fiscal 2017
ARBOC cutaway buses revenue $ 7.7 $ 35.2
NFI's manufacturing revenue, excluding ARBOC 560.8 2,010.3
NFI's pro forma revenue $ 568.5 $ 2,045.5
Adjusted EBITDA - Manufacturing Segment Only (Unaudited, U.S. dollars in thousands)
2017 Q4(restated) Fiscal 2017
ARBOC's pro forma manufacturing Adjusted EBITDA(1) 1,470 8,435
NFI's manufacturing Adjusted EBITDA, excluding ARBOC 72,332 237,945
NFI pro forma manufacturing Adjusted EBITDA $ 73,802 $ 246,380
NFI pro forma Adjusted EBITDA per EU $ 65.5 $ 59.2
Deliveries 2017 Q4 2017 YTD
ARBOC cutaway sales (EUs) 86 364
NFI new transit bus and coach 1,041 3,801
Total pro forma deliveries 1,127 4,165
(1) ARBOC's prior definition of Adjusted EBITDA excluded product development costs as a majority of these costs related to the continued development of its medium-duty bus. Subsequent to the December 1, 2017 acquisition date, ARBOC treats all development costs in accordance with NFI's definition of Adjusted EBITDA.
Deliveries (EUs)(Unaudited)
2018Q4
2017Q4 Fiscal 2018 Fiscal 2017
Transit buses 679 695 2,781 2,730
Motor coaches 341 346 1,030 1,071
Medium-duty and cutaway buses 106 27 502 27
New transit bus, coach and cutaway 1,126 1,068 4,313 3,828
Pre-owned coach 187 146 468 410
Average EU selling price(1) (Unaudited, U.S. dollars in thousands)
Transit buses $ 556.5 $ 512.3 $ 540.1 $ 507.8
Motor coaches 516.2 528.2 521.5 532.8
Medium-duty and cutaway buses 88.9 85.0 83.2 85.0
New transit bus, coach and cutaway $ 500.3 $ 506.6 $ 482.5 $ 511.8
Pre-owned coaches $ 58.7 $ 137.5 $ 98.9 $ 123.0
(1) Average EU selling prices vary based on customization and options selected on units delivered and does not represent equivalent changes in margins related to the product lines noted above.
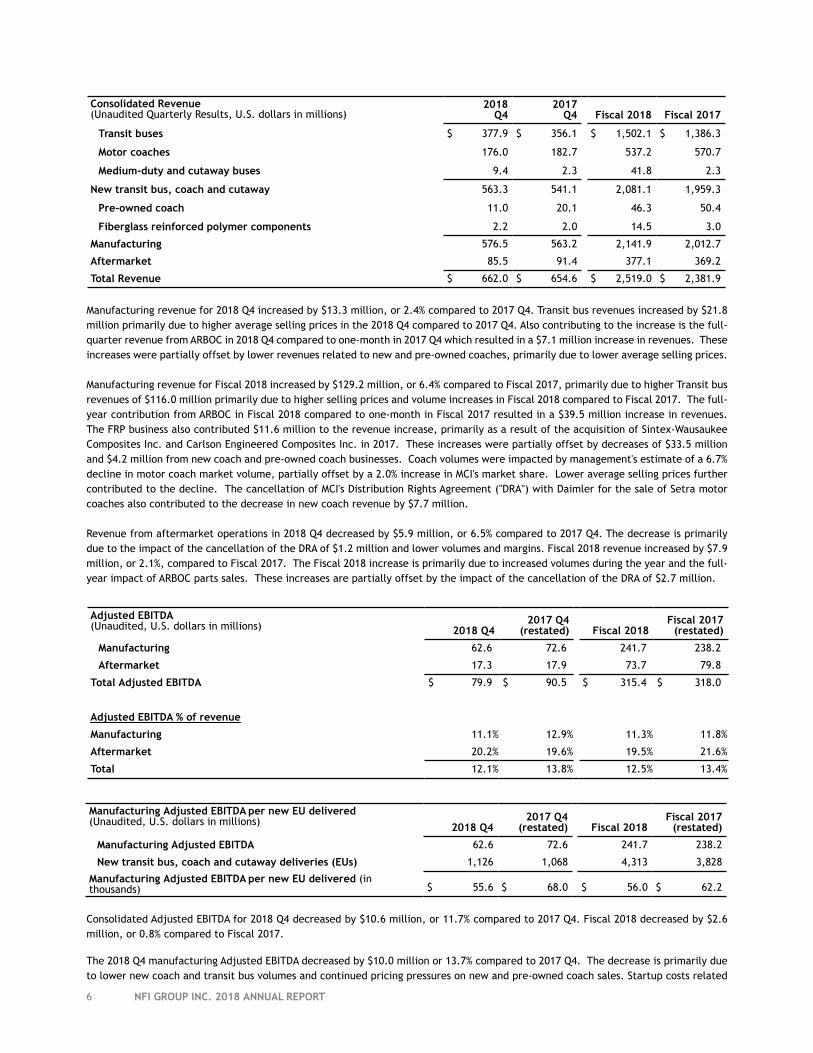
6 NFI GROUP INC. 2018 ANNUAL REPORT
Consolidated Revenue(Unaudited Quarterly Results, U.S. dollars in millions)
2018Q4
2017Q4 Fiscal 2018 Fiscal 2017
Transit buses $ 377.9 $ 356.1 $ 1,502.1 $ 1,386.3
Motor coaches 176.0 182.7 537.2 570.7
Medium-duty and cutaway buses 9.4 2.3 41.8 2.3
New transit bus, coach and cutaway 563.3 541.1 2,081.1 1,959.3
Pre-owned coach 11.0 20.1 46.3 50.4
Fiberglass reinforced polymer components 2.2 2.0 14.5 3.0
Manufacturing 576.5 563.2 2,141.9 2,012.7
Aftermarket 85.5 91.4 377.1 369.2
Total Revenue $ 662.0 $ 654.6 $ 2,519.0 $ 2,381.9
Manufacturing revenue for 2018 Q4 increased by $13.3 million, or 2.4% compared to 2017 Q4. Transit bus revenues increased by $21.8 million primarily due to higher average selling prices in the 2018 Q4 compared to 2017 Q4. Also contributing to the increase is the full-quarter revenue from ARBOC in 2018 Q4 compared to one-month in 2017 Q4 which resulted in a $7.1 million increase in revenues. These increases were partially offset by lower revenues related to new and pre-owned coaches, primarily due to lower average selling prices.
Manufacturing revenue for Fiscal 2018 increased by $129.2 million, or 6.4% compared to Fiscal 2017, primarily due to higher Transit bus revenues of $116.0 million primarily due to higher selling prices and volume increases in Fiscal 2018 compared to Fiscal 2017. The full-year contribution from ARBOC in Fiscal 2018 compared to one-month in Fiscal 2017 resulted in a $39.5 million increase in revenues. The FRP business also contributed $11.6 million to the revenue increase, primarily as a result of the acquisition of Sintex-Wausaukee Composites Inc. and Carlson Engineered Composites Inc. in 2017. These increases were partially offset by decreases of $33.5 million and $4.2 million from new coach and pre-owned coach businesses. Coach volumes were impacted by management's estimate of a 6.7% decline in motor coach market volume, partially offset by a 2.0% increase in MCI's market share. Lower average selling prices further contributed to the decline. The cancellation of MCI's Distribution Rights Agreement ("DRA") with Daimler for the sale of Setra motor coaches also contributed to the decrease in new coach revenue by $7.7 million.
Revenue from aftermarket operations in 2018 Q4 decreased by $5.9 million, or 6.5% compared to 2017 Q4. The decrease is primarily due to the impact of the cancellation of the DRA of $1.2 million and lower volumes and margins. Fiscal 2018 revenue increased by $7.9 million, or 2.1%, compared to Fiscal 2017. The Fiscal 2018 increase is primarily due to increased volumes during the year and the full-year impact of ARBOC parts sales. These increases are partially offset by the impact of the cancellation of the DRA of $2.7 million.
Adjusted EBITDA(Unaudited, U.S. dollars in millions) 2018 Q4
2017 Q4(restated) Fiscal 2018
Fiscal 2017(restated)
Manufacturing 62.6 72.6 241.7 238.2
Aftermarket 17.3 17.9 73.7 79.8
Total Adjusted EBITDA $ 79.9 $ 90.5 $ 315.4 $ 318.0
Adjusted EBITDA % of revenue
Manufacturing 11.1% 12.9% 11.3% 11.8%
Aftermarket 20.2% 19.6% 19.5% 21.6%
Total 12.1% 13.8% 12.5% 13.4%
Manufacturing Adjusted EBITDA per new EU delivered(Unaudited, U.S. dollars in millions) 2018 Q4
2017 Q4(restated) Fiscal 2018
Fiscal 2017(restated)
Manufacturing Adjusted EBITDA 62.6 72.6 241.7 238.2
New transit bus, coach and cutaway deliveries (EUs) 1,126 1,068 4,313 3,828
Manufacturing Adjusted EBITDA per new EU delivered (in thousands) $ 55.6 $ 68.0 $ 56.0 $ 62.2
Consolidated Adjusted EBITDA for 2018 Q4 decreased by $10.6 million, or 11.7% compared to 2017 Q4. Fiscal 2018 decreased by $2.6 million, or 0.8% compared to Fiscal 2017.
The 2018 Q4 manufacturing Adjusted EBITDA decreased by $10.0 million or 13.7% compared to 2017 Q4. The decrease is primarily due to lower new coach and transit bus volumes and continued pricing pressures on new and pre-owned coach sales. Startup costs related
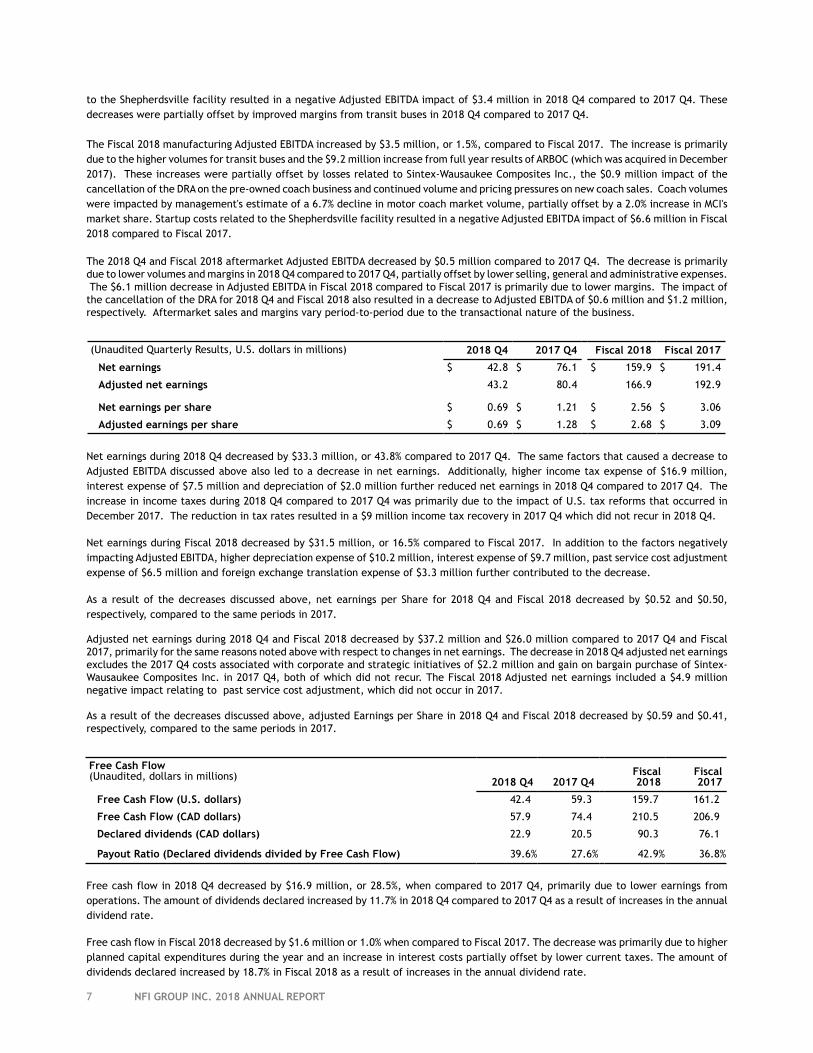
7 NFI GROUP INC. 2018 ANNUAL REPORT
to the Shepherdsville facility resulted in a negative Adjusted EBITDA impact of $3.4 million in 2018 Q4 compared to 2017 Q4. These decreases were partially offset by improved margins from transit buses in 2018 Q4 compared to 2017 Q4.
The Fiscal 2018 manufacturing Adjusted EBITDA increased by $3.5 million, or 1.5%, compared to Fiscal 2017. The increase is primarily due to the higher volumes for transit buses and the $9.2 million increase from full year results of ARBOC (which was acquired in December 2017). These increases were partially offset by losses related to Sintex-Wausaukee Composites Inc., the $0.9 million impact of the cancellation of the DRA on the pre-owned coach business and continued volume and pricing pressures on new coach sales. Coach volumes were impacted by management's estimate of a 6.7% decline in motor coach market volume, partially offset by a 2.0% increase in MCI's market share. Startup costs related to the Shepherdsville facility resulted in a negative Adjusted EBITDA impact of $6.6 million in Fiscal 2018 compared to Fiscal 2017.
The 2018 Q4 and Fiscal 2018 aftermarket Adjusted EBITDA decreased by $0.5 million compared to 2017 Q4. The decrease is primarily due to lower volumes and margins in 2018 Q4 compared to 2017 Q4, partially offset by lower selling, general and administrative expenses. The $6.1 million decrease in Adjusted EBITDA in Fiscal 2018 compared to Fiscal 2017 is primarily due to lower margins. The impact of the cancellation of the DRA for 2018 Q4 and Fiscal 2018 also resulted in a decrease to Adjusted EBITDA of $0.6 million and $1.2 million, respectively. Aftermarket sales and margins vary period-to-period due to the transactional nature of the business.
(Unaudited Quarterly Results, U.S. dollars in millions) 2018 Q4 2017 Q4 Fiscal 2018 Fiscal 2017
Net earnings $ 42.8 $ 76.1 $ 159.9 $ 191.4
Adjusted net earnings 43.2 80.4 166.9 192.9
Net earnings per share $ 0.69 $ 1.21 $ 2.56 $ 3.06
Adjusted earnings per share $ 0.69 $ 1.28 $ 2.68 $ 3.09
Net earnings during 2018 Q4 decreased by $33.3 million, or 43.8% compared to 2017 Q4. The same factors that caused a decrease to Adjusted EBITDA discussed above also led to a decrease in net earnings. Additionally, higher income tax expense of $16.9 million, interest expense of $7.5 million and depreciation of $2.0 million further reduced net earnings in 2018 Q4 compared to 2017 Q4. The increase in income taxes during 2018 Q4 compared to 2017 Q4 was primarily due to the impact of U.S. tax reforms that occurred in December 2017. The reduction in tax rates resulted in a $9 million income tax recovery in 2017 Q4 which did not recur in 2018 Q4.
Net earnings during Fiscal 2018 decreased by $31.5 million, or 16.5% compared to Fiscal 2017. In addition to the factors negatively impacting Adjusted EBITDA, higher depreciation expense of $10.2 million, interest expense of $9.7 million, past service cost adjustment expense of $6.5 million and foreign exchange translation expense of $3.3 million further contributed to the decrease.
As a result of the decreases discussed above, net earnings per Share for 2018 Q4 and Fiscal 2018 decreased by $0.52 and $0.50, respectively, compared to the same periods in 2017.
Adjusted net earnings during 2018 Q4 and Fiscal 2018 decreased by $37.2 million and $26.0 million compared to 2017 Q4 and Fiscal 2017, primarily for the same reasons noted above with respect to changes in net earnings. The decrease in 2018 Q4 adjusted net earnings excludes the 2017 Q4 costs associated with corporate and strategic initiatives of $2.2 million and gain on bargain purchase of Sintex-Wausaukee Composites Inc. in 2017 Q4, both of which did not recur. The Fiscal 2018 Adjusted net earnings included a $4.9 million negative impact relating to past service cost adjustment, which did not occur in 2017.
As a result of the decreases discussed above, adjusted Earnings per Share in 2018 Q4 and Fiscal 2018 decreased by $0.59 and $0.41, respectively, compared to the same periods in 2017.
Free Cash Flow (Unaudited, dollars in millions) 2018 Q4 2017 Q4
Fiscal2018
Fiscal2017
Free Cash Flow (U.S. dollars) 42.4 59.3 159.7 161.2
Free Cash Flow (CAD dollars) 57.9 74.4 210.5 206.9
Declared dividends (CAD dollars) 22.9 20.5 90.3 76.1
Payout Ratio (Declared dividends divided by Free Cash Flow) 39.6% 27.6% 42.9% 36.8%
Free cash flow in 2018 Q4 decreased by $16.9 million, or 28.5%, when compared to 2017 Q4, primarily due to lower earnings from operations. The amount of dividends declared increased by 11.7% in 2018 Q4 compared to 2017 Q4 as a result of increases in the annual dividend rate.
Free cash flow in Fiscal 2018 decreased by $1.6 million or 1.0% when compared to Fiscal 2017. The decrease was primarily due to higher planned capital expenditures during the year and an increase in interest costs partially offset by lower current taxes. The amount of dividends declared increased by 18.7% in Fiscal 2018 as a result of increases in the annual dividend rate.
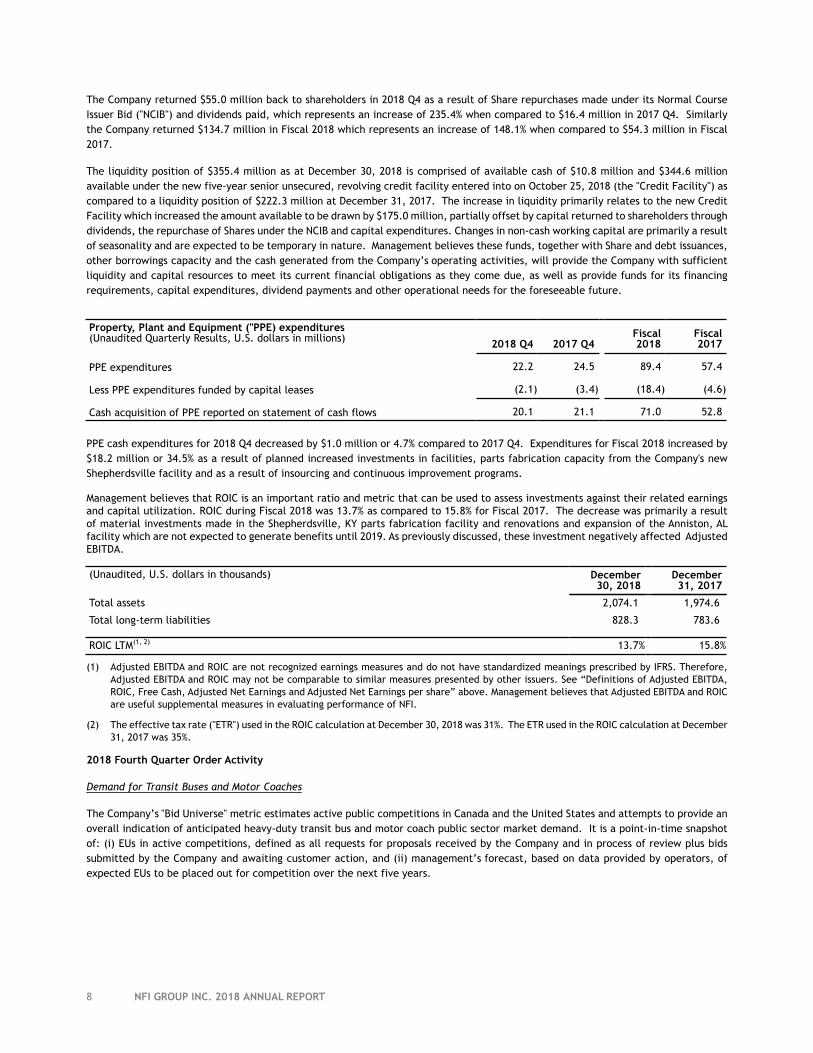
8 NFI GROUP INC. 2018 ANNUAL REPORT
The Company returned $55.0 million back to shareholders in 2018 Q4 as a result of Share repurchases made under its Normal Course Issuer Bid ("NCIB") and dividends paid, which represents an increase of 235.4% when compared to $16.4 million in 2017 Q4. Similarly the Company returned $134.7 million in Fiscal 2018 which represents an increase of 148.1% when compared to $54.3 million in Fiscal 2017.
The liquidity position of $355.4 million as at December 30, 2018 is comprised of available cash of $10.8 million and $344.6 million available under the new five-year senior unsecured, revolving credit facility entered into on October 25, 2018 (the "Credit Facility") as compared to a liquidity position of $222.3 million at December 31, 2017. The increase in liquidity primarily relates to the new Credit Facility which increased the amount available to be drawn by $175.0 million, partially offset by capital returned to shareholders through dividends, the repurchase of Shares under the NCIB and capital expenditures. Changes in non-cash working capital are primarily a result of seasonality and are expected to be temporary in nature. Management believes these funds, together with Share and debt issuances, other borrowings capacity and the cash generated from the Company’s operating activities, will provide the Company with sufficient liquidity and capital resources to meet its current financial obligations as they come due, as well as provide funds for its financing requirements, capital expenditures, dividend payments and other operational needs for the foreseeable future.
Property, Plant and Equipment ("PPE) expenditures(Unaudited Quarterly Results, U.S. dollars in millions) 2018 Q4 2017 Q4
Fiscal2018
Fiscal2017
PPE expenditures 22.2 24.5 89.4 57.4
Less PPE expenditures funded by capital leases (2.1) (3.4) (18.4) (4.6)
Cash acquisition of PPE reported on statement of cash flows 20.1 21.1 71.0 52.8
PPE cash expenditures for 2018 Q4 decreased by $1.0 million or 4.7% compared to 2017 Q4. Expenditures for Fiscal 2018 increased by $18.2 million or 34.5% as a result of planned increased investments in facilities, parts fabrication capacity from the Company's new Shepherdsville facility and as a result of insourcing and continuous improvement programs.
Management believes that ROIC is an important ratio and metric that can be used to assess investments against their related earnings and capital utilization. ROIC during Fiscal 2018 was 13.7% as compared to 15.8% for Fiscal 2017. The decrease was primarily a result of material investments made in the Shepherdsville, KY parts fabrication facility and renovations and expansion of the Anniston, AL facility which are not expected to generate benefits until 2019. As previously discussed, these investment negatively affected Adjusted EBITDA.
(Unaudited, U.S. dollars in thousands) December30, 2018
December31, 2017
Total assets 2,074.1 1,974.6
Total long-term liabilities 828.3 783.6
ROIC LTM(1, 2) 13.7% 15.8%
(1) Adjusted EBITDA and ROIC are not recognized earnings measures and do not have standardized meanings prescribed by IFRS. Therefore, Adjusted EBITDA and ROIC may not be comparable to similar measures presented by other issuers. See “Definitions of Adjusted EBITDA, ROIC, Free Cash, Adjusted Net Earnings and Adjusted Net Earnings per share” above. Management believes that Adjusted EBITDA and ROIC are useful supplemental measures in evaluating performance of NFI.
(2) The effective tax rate ("ETR") used in the ROIC calculation at December 30, 2018 was 31%. The ETR used in the ROIC calculation at December 31, 2017 was 35%.
2018 Fourth Quarter Order Activity
Demand for Transit Buses and Motor Coaches
The Company’s "Bid Universe" metric estimates active public competitions in Canada and the United States and attempts to provide an overall indication of anticipated heavy-duty transit bus and motor coach public sector market demand. It is a point-in-time snapshot of: (i) EUs in active competitions, defined as all requests for proposals received by the Company and in process of review plus bids submitted by the Company and awaiting customer action, and (ii) management’s forecast, based on data provided by operators, of expected EUs to be placed out for competition over the next five years.
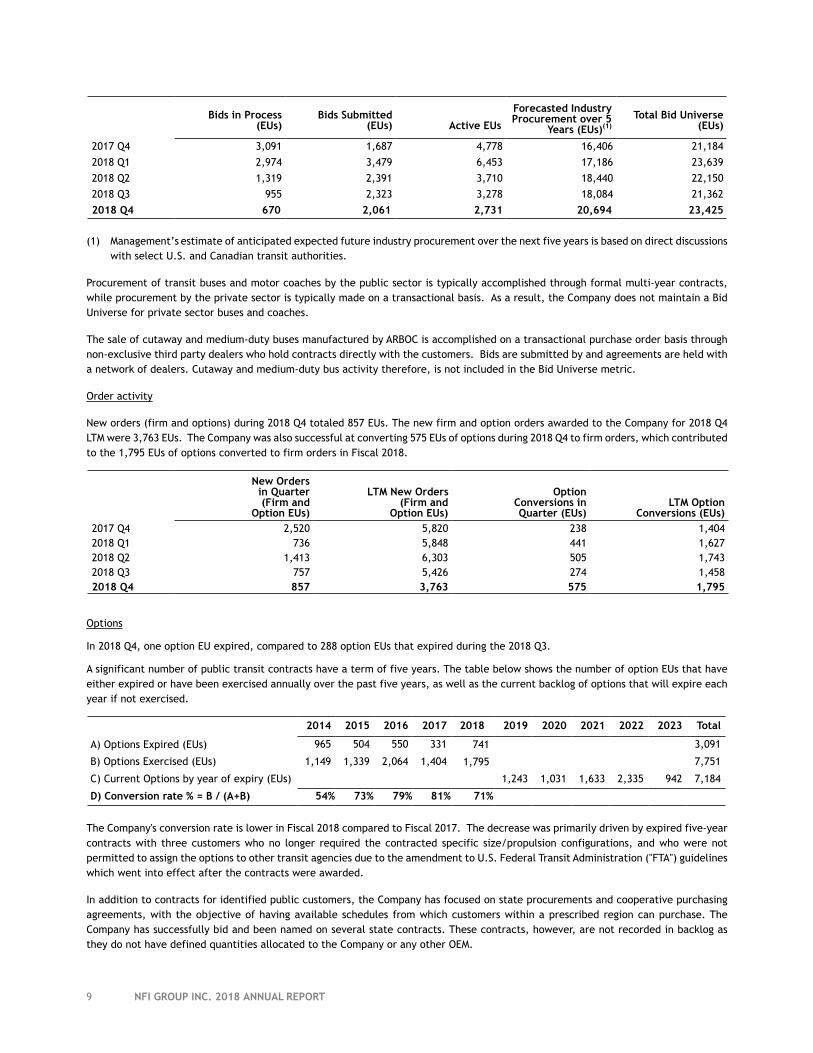
9 NFI GROUP INC. 2018 ANNUAL REPORT
Bids in Process(EUs)
Bids Submitted(EUs) Active EUs
Forecasted Industry Procurement over 5
Years (EUs)(1) Total Bid Universe
(EUs)
2017 Q4 3,091 1,687 4,778 16,406 21,184
2018 Q1 2,974 3,479 6,453 17,186 23,639
2018 Q2 1,319 2,391 3,710 18,440 22,150
2018 Q3 955 2,323 3,278 18,084 21,362
2018 Q4 670 2,061 2,731 20,694 23,425
(1) Management’s estimate of anticipated expected future industry procurement over the next five years is based on direct discussions with select U.S. and Canadian transit authorities.
Procurement of transit buses and motor coaches by the public sector is typically accomplished through formal multi-year contracts, while procurement by the private sector is typically made on a transactional basis. As a result, the Company does not maintain a Bid Universe for private sector buses and coaches.
The sale of cutaway and medium-duty buses manufactured by ARBOC is accomplished on a transactional purchase order basis through non-exclusive third party dealers who hold contracts directly with the customers. Bids are submitted by and agreements are held with a network of dealers. Cutaway and medium-duty bus activity therefore, is not included in the Bid Universe metric.
Order activity
New orders (firm and options) during 2018 Q4 totaled 857 EUs. The new firm and option orders awarded to the Company for 2018 Q4LTM were 3,763 EUs. The Company was also successful at converting 575 EUs of options during 2018 Q4 to firm orders, which contributed to the 1,795 EUs of options converted to firm orders in Fiscal 2018.
New Ordersin Quarter(Firm and
Option EUs)
LTM New Orders(Firm and
Option EUs)
OptionConversions inQuarter (EUs)
LTM OptionConversions (EUs)
2017 Q4 2,520 5,820 238 1,4042018 Q1 736 5,848 441 1,6272018 Q2 1,413 6,303 505 1,7432018 Q3 757 5,426 274 1,4582018 Q4 857 3,763 575 1,795
Options
In 2018 Q4, one option EU expired, compared to 288 option EUs that expired during the 2018 Q3.
A significant number of public transit contracts have a term of five years. The table below shows the number of option EUs that have either expired or have been exercised annually over the past five years, as well as the current backlog of options that will expire each year if not exercised.
2014 2015 2016 2017 2018 2019 2020 2021 2022 2023 Total
A) Options Expired (EUs) 965 504 550 331 741 3,091
B) Options Exercised (EUs) 1,149 1,339 2,064 1,404 1,795 7,751
C) Current Options by year of expiry (EUs) 1,243 1,031 1,633 2,335 942 7,184
D) Conversion rate % = B / (A+B) 54% 73% 79% 81% 71%
The Company's conversion rate is lower in Fiscal 2018 compared to Fiscal 2017. The decrease was primarily driven by expired five-year contracts with three customers who no longer required the contracted specific size/propulsion configurations, and who were not permitted to assign the options to other transit agencies due to the amendment to U.S. Federal Transit Administration ("FTA") guidelines which went into effect after the contracts were awarded.
In addition to contracts for identified public customers, the Company has focused on state procurements and cooperative purchasing agreements, with the objective of having available schedules from which customers within a prescribed region can purchase. The Company has successfully bid and been named on several state contracts. These contracts, however, are not recorded in backlog as they do not have defined quantities allocated to the Company or any other OEM.
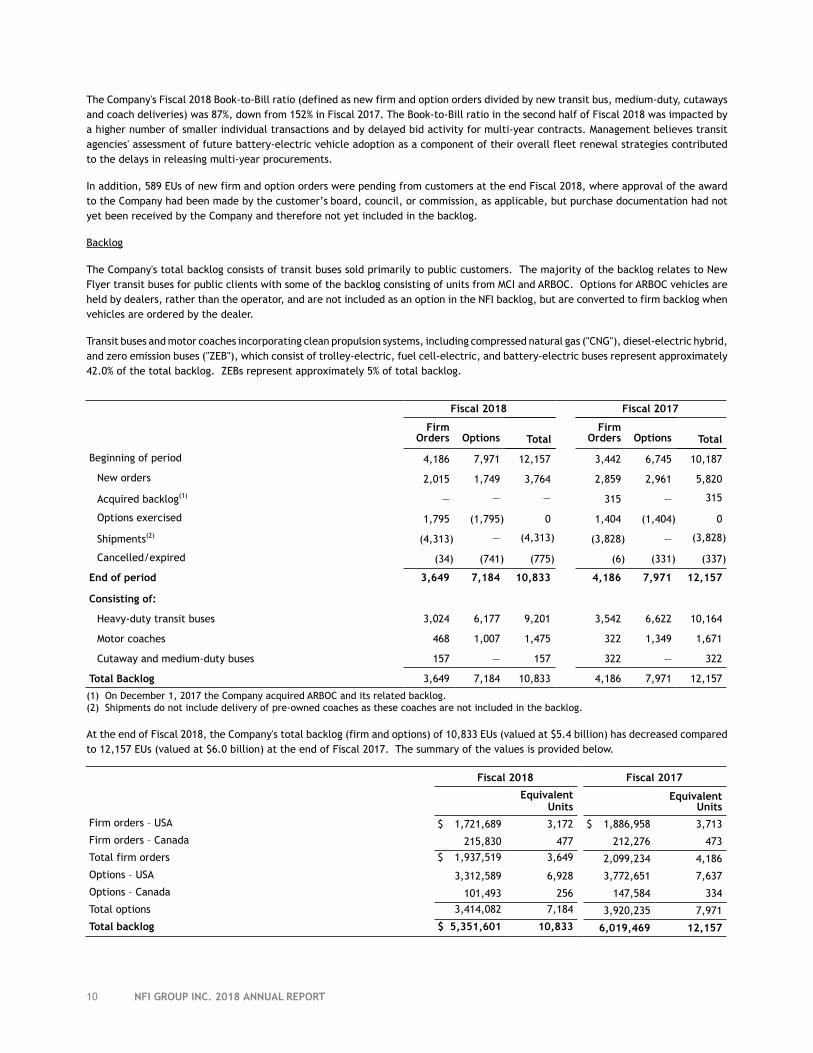
10 NFI GROUP INC. 2018 ANNUAL REPORT
The Company's Fiscal 2018 Book-to-Bill ratio (defined as new firm and option orders divided by new transit bus, medium-duty, cutaways and coach deliveries) was 87%, down from 152% in Fiscal 2017. The Book-to-Bill ratio in the second half of Fiscal 2018 was impacted by a higher number of smaller individual transactions and by delayed bid activity for multi-year contracts. Management believes transit agencies' assessment of future battery-electric vehicle adoption as a component of their overall fleet renewal strategies contributed to the delays in releasing multi-year procurements.
In addition, 589 EUs of new firm and option orders were pending from customers at the end Fiscal 2018, where approval of the award to the Company had been made by the customer’s board, council, or commission, as applicable, but purchase documentation had not yet been received by the Company and therefore not yet included in the backlog.
Backlog
The Company's total backlog consists of transit buses sold primarily to public customers. The majority of the backlog relates to New Flyer transit buses for public clients with some of the backlog consisting of units from MCI and ARBOC. Options for ARBOC vehicles are held by dealers, rather than the operator, and are not included as an option in the NFI backlog, but are converted to firm backlog when vehicles are ordered by the dealer.
Transit buses and motor coaches incorporating clean propulsion systems, including compressed natural gas ("CNG"), diesel-electric hybrid, and zero emission buses ("ZEB"), which consist of trolley-electric, fuel cell-electric, and battery-electric buses represent approximately 42.0% of the total backlog. ZEBs represent approximately 5% of total backlog.
Fiscal 2018 Fiscal 2017
FirmOrders Options Total
FirmOrders Options Total
Beginning of period 4,186 7,971 12,157 3,442 6,745 10,187
New orders 2,015 1,749 3,764 2,859 2,961 5,820
Acquired backlog(1) — — — 315 — 315
Options exercised 1,795 (1,795) 0 1,404 (1,404) 0
Shipments(2) (4,313) — (4,313) (3,828) — (3,828)
Cancelled/expired (34) (741) (775) (6) (331) (337)
End of period 3,649 7,184 10,833 4,186 7,971 12,157
Consisting of:
Heavy-duty transit buses 3,024 6,177 9,201 3,542 6,622 10,164
Motor coaches 468 1,007 1,475 322 1,349 1,671
Cutaway and medium-duty buses 157 — 157 322 — 322
Total Backlog 3,649 7,184 10,833 4,186 7,971 12,157
(1) On December 1, 2017 the Company acquired ARBOC and its related backlog.(2) Shipments do not include delivery of pre-owned coaches as these coaches are not included in the backlog.
At the end of Fiscal 2018, the Company's total backlog (firm and options) of 10,833 EUs (valued at $5.4 billion) has decreased compared to 12,157 EUs (valued at $6.0 billion) at the end of Fiscal 2017. The summary of the values is provided below.
Fiscal 2018 Fiscal 2017
Equivalent Units
EquivalentUnits
Firm orders – USA $ 1,721,689 3,172 $ 1,886,958 3,713
Firm orders – Canada 215,830 477 212,276 473
Total firm orders $ 1,937,519 3,649 2,099,234 4,186
Options – USA 3,312,589 6,928 3,772,651 7,637
Options – Canada 101,493 256 147,584 334
Total options 3,414,082 7,184 3,920,235 7,971
Total backlog $ 5,351,601 10,833 6,019,469 12,157
11 NFI GROUP INC. 2018 ANNUAL REPORT
Parts shipment activity during 2018 Q4
Total aftermarket shipments for 2018 Q4 decreased by 8.2% compared to the previous quarter, and decreased by 6.9% compared to 2017 Q4. The lower shipments in 2018 Q4 compared to 2018 Q3 were largely due to lower bid activity and cancellation of the DRA during the period. The win rate for aftermarket during 2018 Q4 was within historical ranges. Aftermarket parts orders from ARBOC are not included in these figures as they are not material.
Outlook
Management’s outlook for the heavy-duty transit bus market remains healthy, while private motor coach is expected to continue to
experience some headwinds. Overall, demand for low-floor cutaway and medium-duty buses is encouraging.
NFI Parts continues to focus on numerous strategic initiatives to counter adverse market pressures and competitive intensity. These
initiatives include additional focus on vendor managed inventory (“VMI”) programs, an enhanced product offering, and capitalizing on
the implementation of a common IT platform across the aftermarket business. During Fiscal 2018, NFI secured six VMI programs and
continues to pursue other VMI opportunities across Canada and the U.S.
Management believes the significant investments the Company has made in new product models, ZEBs, facility upgrades and LEAN
processes, parts fabrication, and IT harmonization will allow NFI to defend its leading positions in core markets, improve profit margins
and generate free cash flow.
Heavy-Duty Transit
Aging fleets, healthy economic conditions, defined U.S. federal funding and expected customer fleet replacement plans support
management’s expectation that transit bus procurement activity throughout the U.S. and Canada will remain healthy. Management’s
view is reinforced by estimated 2018 heavy-duty transit delivery data which shows overall deliveries were 6,504 EUs, an increase of
2.7% from 2017. New Flyer maintained its leading share of 43% of market deliveries in Fiscal 2018 and expects to continue its leading
position in Fiscal 2019.
ZEBs continue to be an area of growing focus for New Flyer customers. ZEBs currently represent approximately 5% of New Flyer’s total
backlog, with significant orders from major cities including: Toronto, Boston, Minneapolis, San Diego, New York, Seattle, Portland,
Oakland, and Vancouver. In August of 2018, New Flyer also received Canada’s largest ever battery-electric bus order from two Quebec
operators. To further strengthen NFI’s ZEB offering, in the quarter ended March 31, 2019 ("2019 Q1") the Company launched New Flyer
Infrastructure Solutions™, a service aimed at providing safe, reliable, smart and sustainable charging and mobility solutions to public
transit customers.
Management's ongoing discussions with several public transit customers throughout the US and Canada suggests there may be an increase
in active bids issued in Fiscal 2019, however, individual awards may be smaller in size with fewer options or shorter contract terms.
Management believes this is primarily due to transit agencies assessing their fleet replacement plans and their approach to ZEB programs.
Motor Coach
Management estimates that U.S. and Canadian motor coach deliveries declined by 165 units, or 6.7% from 2017 to 2018, but MCI’s market
share increased by 2% to 45%. In 2019, management anticipates that overall market demand for private motor coaches will also decline
slightly, but that MCI can continue to gain share based on its market leading and expanding product portfolio.
Low-floor Cutaway and Medium-duty
Management expects continued growth in the low-floor cutaway and medium-duty bus markets driven by changing population
demographics that are anticipated to increase the demand for ARBOC’s market leading products. ARBOC’s new Spirit of Equess® offering,
which has a higher EBITDA/EU contribution than it’s low-floor cutaway vehicles, is the first and only medium-duty transit bus to
successfully complete the U.S. Federal Transit Administration’s mandated Altoona bus testing program. The Equess is now in production
and management expects this model to account for 10% to 15% of ARBOC deliveries in Fiscal 2019.
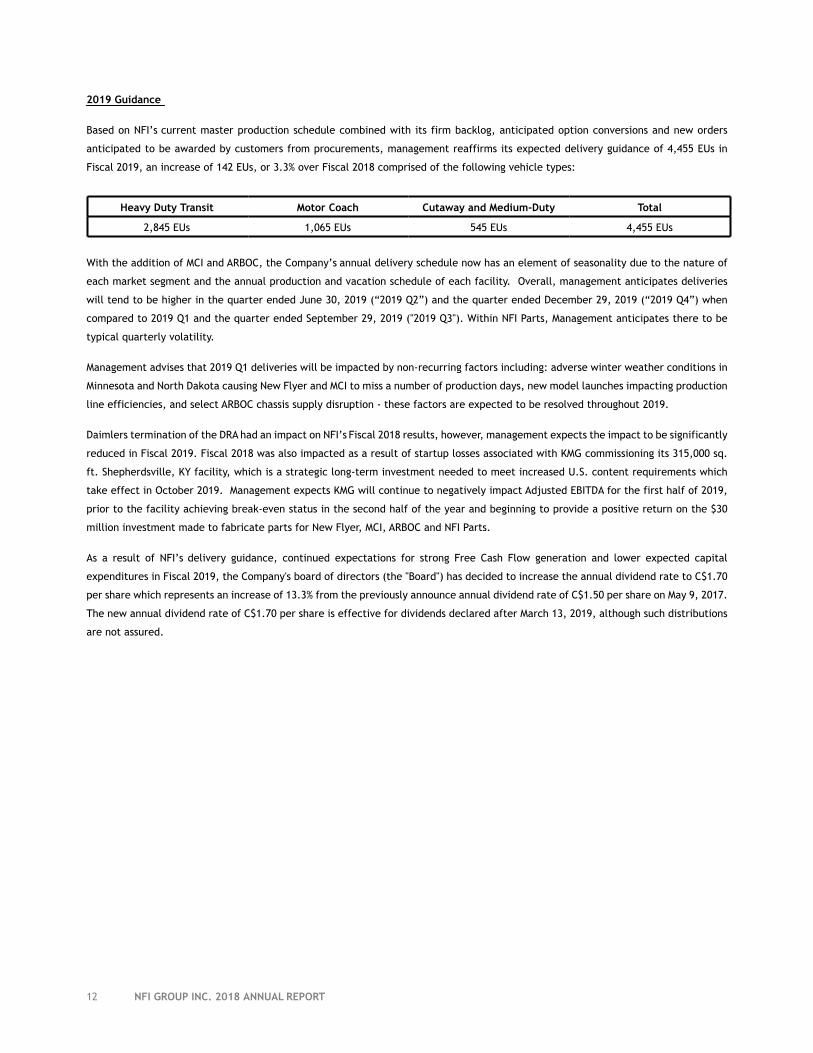
12 NFI GROUP INC. 2018 ANNUAL REPORT
2019 Guidance
Based on NFI’s current master production schedule combined with its firm backlog, anticipated option conversions and new orders
anticipated to be awarded by customers from procurements, management reaffirms its expected delivery guidance of 4,455 EUs in
Fiscal 2019, an increase of 142 EUs, or 3.3% over Fiscal 2018 comprised of the following vehicle types:
Heavy Duty Transit Motor Coach Cutaway and Medium-Duty Total
2,845 EUs 1,065 EUs 545 EUs 4,455 EUs
With the addition of MCI and ARBOC, the Company’s annual delivery schedule now has an element of seasonality due to the nature of
each market segment and the annual production and vacation schedule of each facility. Overall, management anticipates deliveries
will tend to be higher in the quarter ended June 30, 2019 (“2019 Q2”) and the quarter ended December 29, 2019 (“2019 Q4”) when
compared to 2019 Q1 and the quarter ended September 29, 2019 ("2019 Q3"). Within NFI Parts, Management anticipates there to be
typical quarterly volatility.
Management advises that 2019 Q1 deliveries will be impacted by non-recurring factors including: adverse winter weather conditions in
Minnesota and North Dakota causing New Flyer and MCI to miss a number of production days, new model launches impacting production
line efficiencies, and select ARBOC chassis supply disruption - these factors are expected to be resolved throughout 2019.
Daimlers termination of the DRA had an impact on NFI’s Fiscal 2018 results, however, management expects the impact to be significantly
reduced in Fiscal 2019. Fiscal 2018 was also impacted as a result of startup losses associated with KMG commissioning its 315,000 sq.
ft. Shepherdsville, KY facility, which is a strategic long-term investment needed to meet increased U.S. content requirements which
take effect in October 2019. Management expects KMG will continue to negatively impact Adjusted EBITDA for the first half of 2019,
prior to the facility achieving break-even status in the second half of the year and beginning to provide a positive return on the $30
million investment made to fabricate parts for New Flyer, MCI, ARBOC and NFI Parts.
As a result of NFI’s delivery guidance, continued expectations for strong Free Cash Flow generation and lower expected capital
expenditures in Fiscal 2019, the Company's board of directors (the "Board") has decided to increase the annual dividend rate to C$1.70
per share which represents an increase of 13.3% from the previously announce annual dividend rate of C$1.50 per share on May 9, 2017.
The new annual dividend rate of C$1.70 per share is effective for dividends declared after March 13, 2019, although such distributions
are not assured.
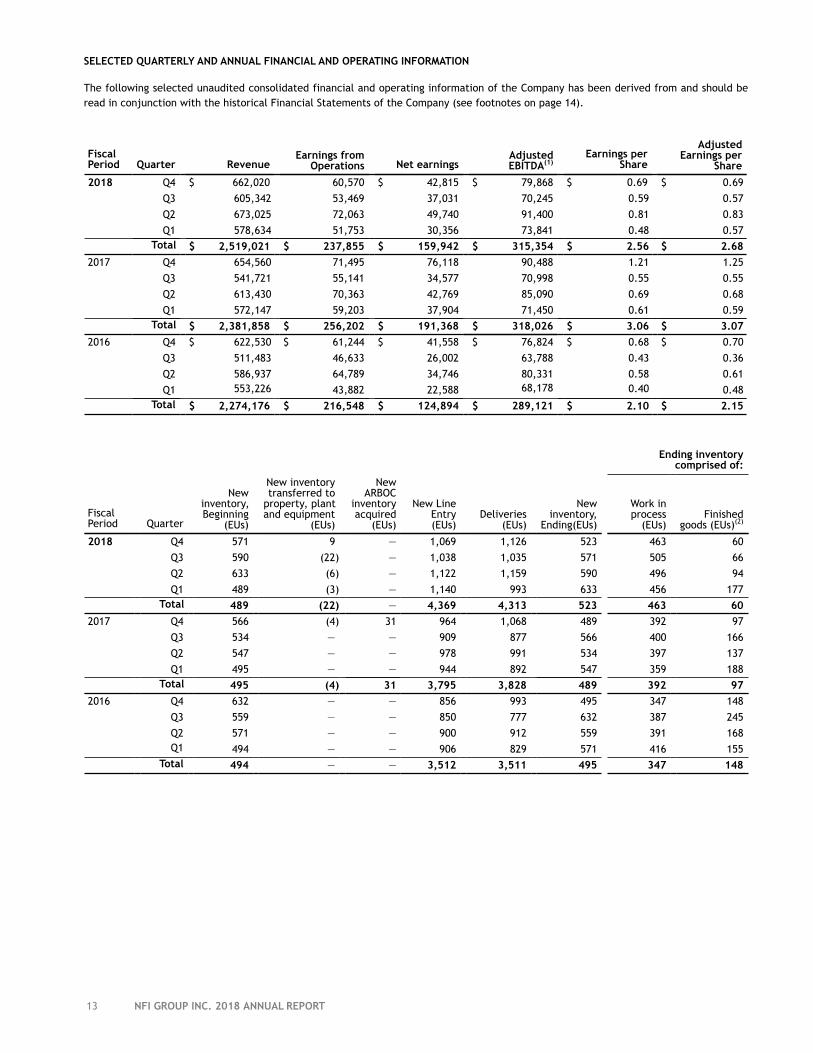
13 NFI GROUP INC. 2018 ANNUAL REPORT
SELECTED QUARTERLY AND ANNUAL FINANCIAL AND OPERATING INFORMATION
The following selected unaudited consolidated financial and operating information of the Company has been derived from and should be read in conjunction with the historical Financial Statements of the Company (see footnotes on page 14).
FiscalPeriod Quarter Revenue
Earnings fromOperations Net earnings
Adjusted EBITDA(1)
Earnings perShare
AdjustedEarnings per
Share
2018 Q4 $ 662,020 60,570 $ 42,815 $ 79,868 $ 0.69 $ 0.69
Q3 605,342 53,469 37,031 70,245 0.59 0.57
Q2 673,025 72,063 49,740 91,400 0.81 0.83
Q1 578,634 51,753 30,356 73,841 0.48 0.57Total $ 2,519,021 $ 237,855 $ 159,942 $ 315,354 $ 2.56 $ 2.68
2017 Q4 654,560 71,495 76,118 90,488 1.21 1.25
Q3 541,721 55,141 34,577 70,998 0.55 0.55
Q2 613,430 70,363 42,769 85,090 0.69 0.68
Q1 572,147 59,203 37,904 71,450 0.61 0.59Total $ 2,381,858 $ 256,202 $ 191,368 $ 318,026 $ 3.06 $ 3.07
2016 Q4 $ 622,530 $ 61,244 $ 41,558 $ 76,824 $ 0.68 $ 0.70
Q3 511,483 46,633 26,002 63,788 0.43 0.36
Q2 586,937 64,789 34,746 80,331 0.58 0.61
Q1 553,226 43,882 22,588 68,178 0.40 0.48Total $ 2,274,176 $ 216,548 $ 124,894 $ 289,121 $ 2.10 $ 2.15
Ending inventorycomprised of:
FiscalPeriod Quarter
Newinventory,Beginning
(EUs)
New inventorytransferred to
property, plantand equipment
(EUs)
NewARBOC
inventoryacquired
(EUs)
New LineEntry(EUs)
Deliveries(EUs)
New inventory,
Ending(EUs)
Work inprocess
(EUs)Finished
goods (EUs)(2)
2018 Q4 571 9 — 1,069 1,126 523 463 60
Q3 590 (22) — 1,038 1,035 571 505 66
Q2 633 (6) — 1,122 1,159 590 496 94
Q1 489 (3) — 1,140 993 633 456 177Total 489 (22) — 4,369 4,313 523 463 60
2017 Q4 566 (4) 31 964 1,068 489 392 97
Q3 534 — — 909 877 566 400 166
Q2 547 — — 978 991 534 397 137
Q1 495 — — 944 892 547 359 188Total 495 (4) 31 3,795 3,828 489 392 97
2016 Q4 632 — — 856 993 495 347 148
Q3 559 — — 850 777 632 387 245
Q2 571 — — 900 912 559 391 168Q1 494 — — 906 829 571 416 155
Total 494 — — 3,512 3,511 495 347 148
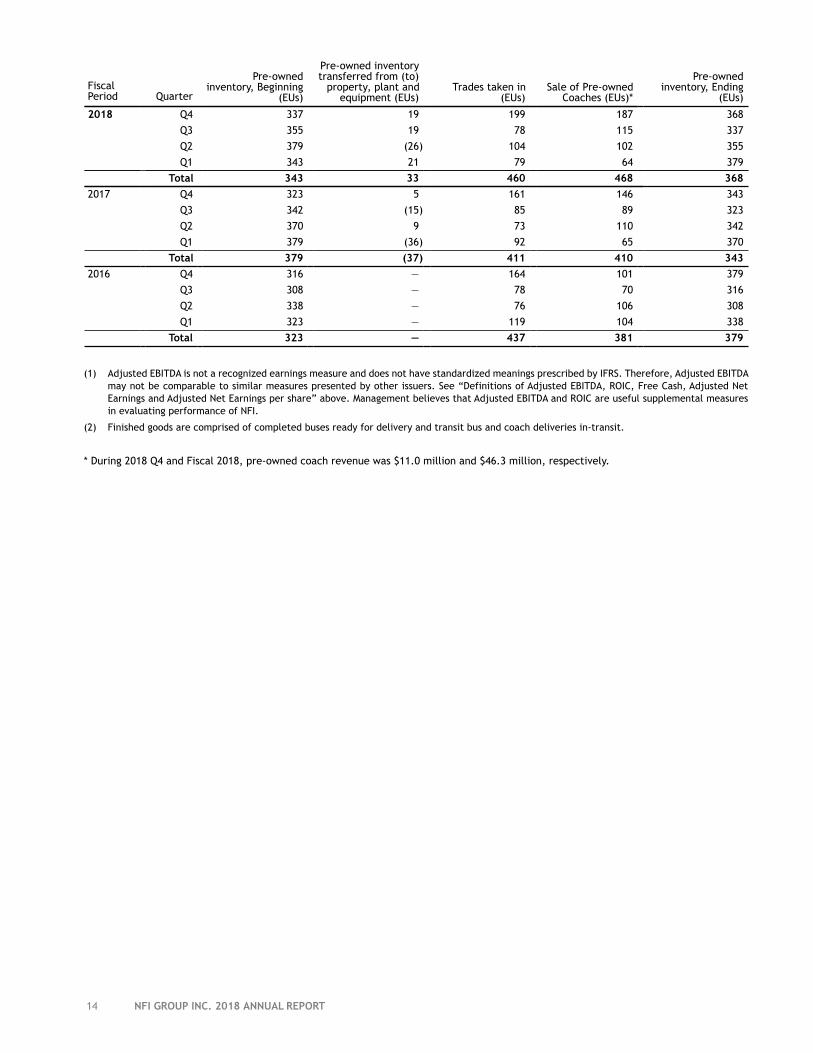
14 NFI GROUP INC. 2018 ANNUAL REPORT
FiscalPeriod Quarter
Pre-owned inventory, Beginning
(EUs)
Pre-owned inventorytransferred from (to)
property, plant andequipment (EUs)
Trades taken in(EUs)
Sale of Pre-ownedCoaches (EUs)*
Pre-ownedinventory, Ending
(EUs)
2018 Q4 337 19 199 187 368
Q3 355 19 78 115 337
Q2 379 (26) 104 102 355
Q1 343 21 79 64 379
Total 343 33 460 468 368
2017 Q4 323 5 161 146 343
Q3 342 (15) 85 89 323
Q2 370 9 73 110 342
Q1 379 (36) 92 65 370
Total 379 (37) 411 410 343
2016 Q4 316 — 164 101 379
Q3 308 — 78 70 316
Q2 338 — 76 106 308
Q1 323 — 119 104 338
Total 323 — 437 381 379
(1) Adjusted EBITDA is not a recognized earnings measure and does not have standardized meanings prescribed by IFRS. Therefore, Adjusted EBITDA may not be comparable to similar measures presented by other issuers. See “Definitions of Adjusted EBITDA, ROIC, Free Cash, Adjusted Net Earnings and Adjusted Net Earnings per share” above. Management believes that Adjusted EBITDA and ROIC are useful supplemental measures in evaluating performance of NFI.
(2) Finished goods are comprised of completed buses ready for delivery and transit bus and coach deliveries in-transit.
* During 2018 Q4 and Fiscal 2018, pre-owned coach revenue was $11.0 million and $46.3 million, respectively.
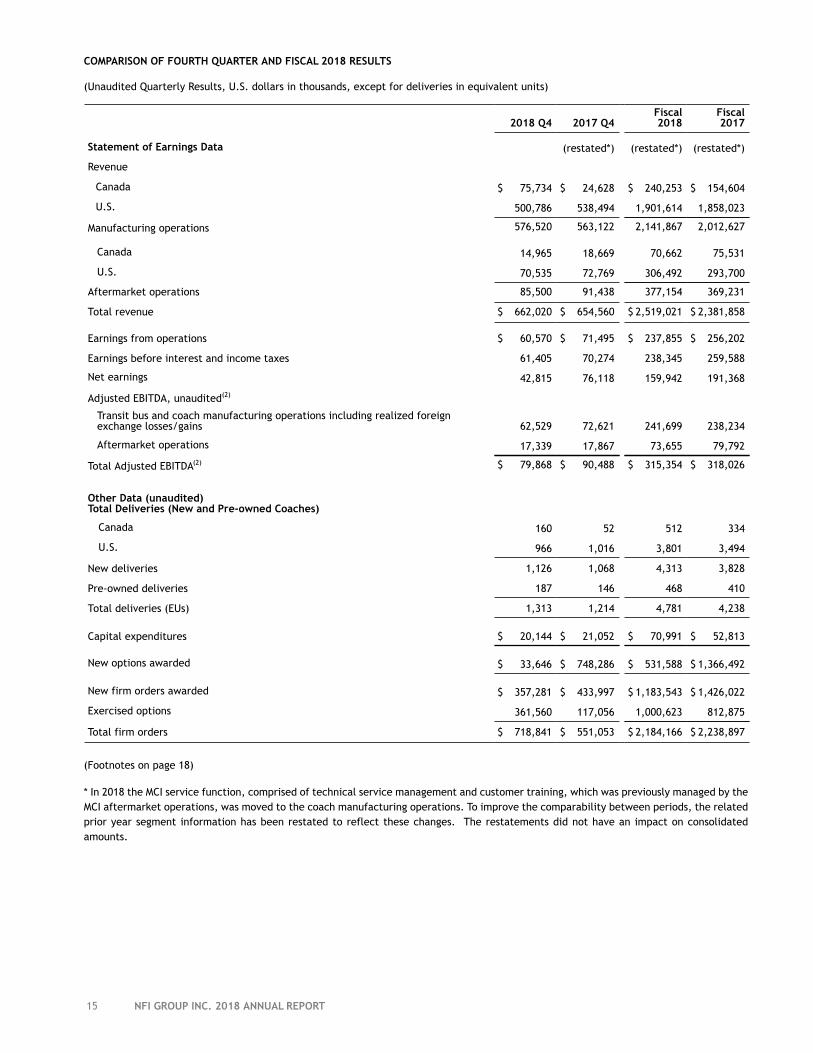
15 NFI GROUP INC. 2018 ANNUAL REPORT
COMPARISON OF FOURTH QUARTER AND FISCAL 2018 RESULTS
(Unaudited Quarterly Results, U.S. dollars in thousands, except for deliveries in equivalent units)
2018 Q4 2017 Q4Fiscal2018
Fiscal2017
Statement of Earnings Data (restated*) (restated*) (restated*)
Revenue
Canada $ 75,734 $ 24,628 $ 240,253 $ 154,604
U.S. 500,786 538,494 1,901,614 1,858,023
Manufacturing operations 576,520 563,122 2,141,867 2,012,627
Canada 14,965 18,669 70,662 75,531
U.S. 70,535 72,769 306,492 293,700
Aftermarket operations 85,500 91,438 377,154 369,231
Total revenue $ 662,020 $ 654,560 $ 2,519,021 $ 2,381,858
Earnings from operations $ 60,570 $ 71,495 $ 237,855 $ 256,202
Earnings before interest and income taxes 61,405 70,274 238,345 259,588
Net earnings 42,815 76,118 159,942 191,368
Adjusted EBITDA, unaudited(2)
Transit bus and coach manufacturing operations including realized foreignexchange losses/gains 62,529 72,621 241,699 238,234
Aftermarket operations 17,339 17,867 73,655 79,792
Total Adjusted EBITDA(2) $ 79,868 $ 90,488 $ 315,354 $ 318,026
Other Data (unaudited)Total Deliveries (New and Pre-owned Coaches)
Canada 160 52 512 334
U.S. 966 1,016 3,801 3,494
New deliveries 1,126 1,068 4,313 3,828
Pre-owned deliveries 187 146 468 410
Total deliveries (EUs) 1,313 1,214 4,781 4,238
Capital expenditures $ 20,144 $ 21,052 $ 70,991 $ 52,813
New options awarded $ 33,646 $ 748,286 $ 531,588 $ 1,366,492
New firm orders awarded $ 357,281 $ 433,997 $ 1,183,543 $ 1,426,022
Exercised options 361,560 117,056 1,000,623 812,875
Total firm orders $ 718,841 $ 551,053 $ 2,184,166 $ 2,238,897
(Footnotes on page 18)
* In 2018 the MCI service function, comprised of technical service management and customer training, which was previously managed by the MCI aftermarket operations, was moved to the coach manufacturing operations. To improve the comparability between periods, the related prior year segment information has been restated to reflect these changes. The restatements did not have an impact on consolidated amounts.
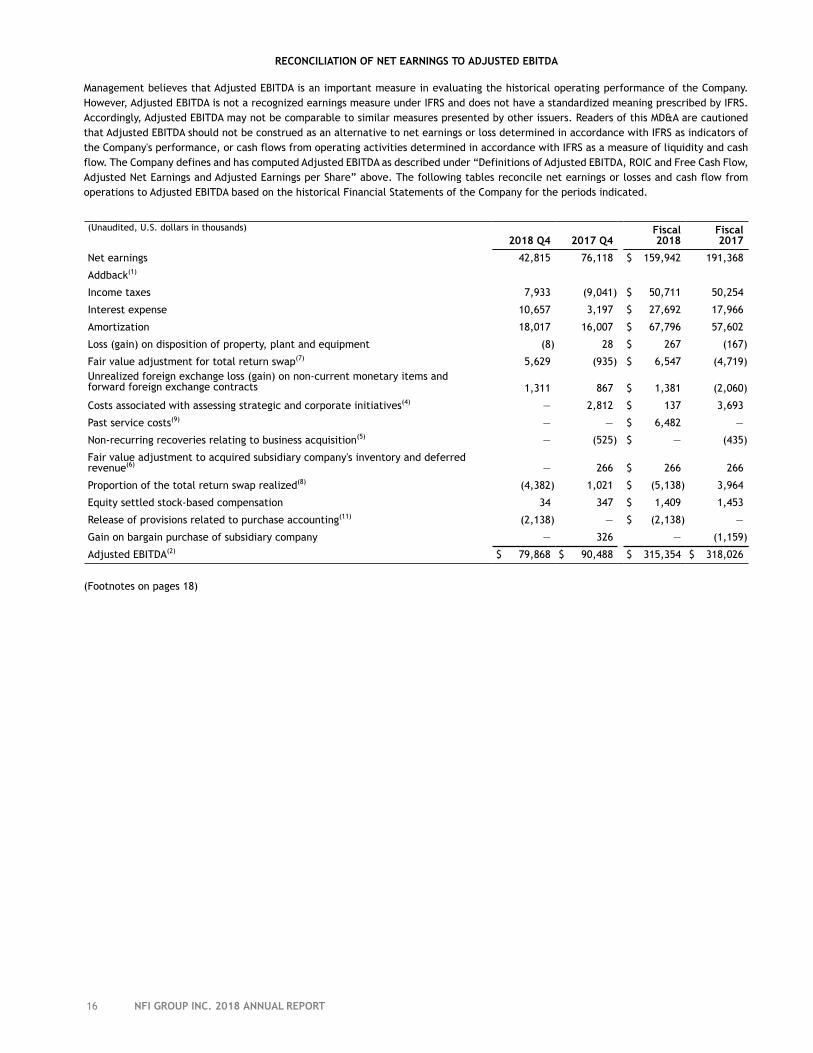
16 NFI GROUP INC. 2018 ANNUAL REPORT
RECONCILIATION OF NET EARNINGS TO ADJUSTED EBITDA
Management believes that Adjusted EBITDA is an important measure in evaluating the historical operating performance of the Company. However, Adjusted EBITDA is not a recognized earnings measure under IFRS and does not have a standardized meaning prescribed by IFRS. Accordingly, Adjusted EBITDA may not be comparable to similar measures presented by other issuers. Readers of this MD&A are cautioned that Adjusted EBITDA should not be construed as an alternative to net earnings or loss determined in accordance with IFRS as indicators of the Company's performance, or cash flows from operating activities determined in accordance with IFRS as a measure of liquidity and cash flow. The Company defines and has computed Adjusted EBITDA as described under “Definitions of Adjusted EBITDA, ROIC and Free Cash Flow, Adjusted Net Earnings and Adjusted Earnings per Share” above. The following tables reconcile net earnings or losses and cash flow from operations to Adjusted EBITDA based on the historical Financial Statements of the Company for the periods indicated.
(Unaudited, U.S. dollars in thousands)
2018 Q4 2017 Q4Fiscal2018
Fiscal2017
Net earnings 42,815 76,118 $ 159,942 191,368
Addback(1)
Income taxes 7,933 (9,041) $ 50,711 50,254
Interest expense 10,657 3,197 $ 27,692 17,966
Amortization 18,017 16,007 $ 67,796 57,602
Loss (gain) on disposition of property, plant and equipment (8) 28 $ 267 (167)
Fair value adjustment for total return swap(7) 5,629 (935) $ 6,547 (4,719)Unrealized foreign exchange loss (gain) on non-current monetary items andforward foreign exchange contracts 1,311 867 $ 1,381 (2,060)
Costs associated with assessing strategic and corporate initiatives(4) — 2,812 $ 137 3,693
Past service costs(9) — — $ 6,482 —
Non-recurring recoveries relating to business acquisition(5) — (525) $ — (435)
Fair value adjustment to acquired subsidiary company's inventory and deferred revenue(6) — 266 $ 266 266
Proportion of the total return swap realized(8) (4,382) 1,021 $ (5,138) 3,964
Equity settled stock-based compensation 34 347 $ 1,409 1,453
Release of provisions related to purchase accounting(11) (2,138) — $ (2,138) —
Gain on bargain purchase of subsidiary company — 326 — (1,159)
Adjusted EBITDA(2) $ 79,868 $ 90,488 $ 315,354 $ 318,026
(Footnotes on pages 18)
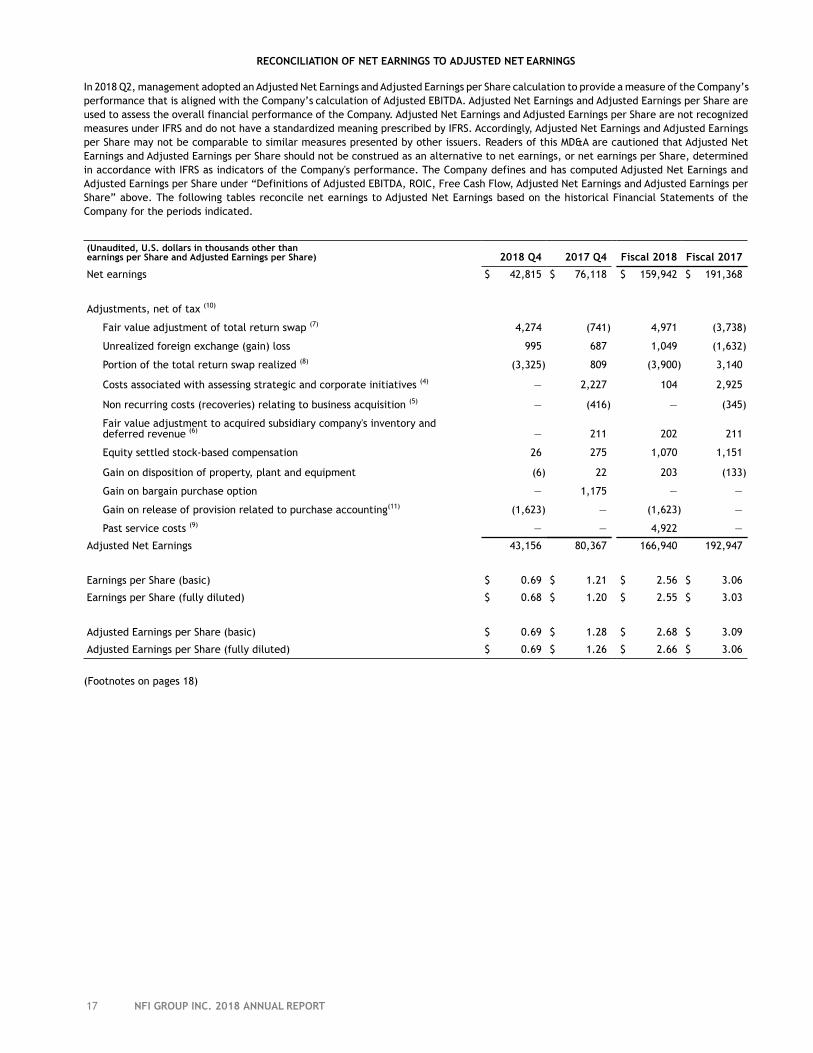
17 NFI GROUP INC. 2018 ANNUAL REPORT
RECONCILIATION OF NET EARNINGS TO ADJUSTED NET EARNINGS
In 2018 Q2, management adopted an Adjusted Net Earnings and Adjusted Earnings per Share calculation to provide a measure of the Company’s performance that is aligned with the Company’s calculation of Adjusted EBITDA. Adjusted Net Earnings and Adjusted Earnings per Share are used to assess the overall financial performance of the Company. Adjusted Net Earnings and Adjusted Earnings per Share are not recognized measures under IFRS and do not have a standardized meaning prescribed by IFRS. Accordingly, Adjusted Net Earnings and Adjusted Earnings per Share may not be comparable to similar measures presented by other issuers. Readers of this MD&A are cautioned that Adjusted Net Earnings and Adjusted Earnings per Share should not be construed as an alternative to net earnings, or net earnings per Share, determined in accordance with IFRS as indicators of the Company's performance. The Company defines and has computed Adjusted Net Earnings and Adjusted Earnings per Share under “Definitions of Adjusted EBITDA, ROIC, Free Cash Flow, Adjusted Net Earnings and Adjusted Earnings per Share” above. The following tables reconcile net earnings to Adjusted Net Earnings based on the historical Financial Statements of the Company for the periods indicated.
(Unaudited, U.S. dollars in thousands other than earnings per Share and Adjusted Earnings per Share) 2018 Q4 2017 Q4 Fiscal 2018 Fiscal 2017
Net earnings $ 42,815 $ 76,118 $ 159,942 $ 191,368
Adjustments, net of tax (10)
Fair value adjustment of total return swap (7) 4,274 (741) 4,971 (3,738)
Unrealized foreign exchange (gain) loss 995 687 1,049 (1,632)
Portion of the total return swap realized (8) (3,325) 809 (3,900) 3,140
Costs associated with assessing strategic and corporate initiatives (4) — 2,227 104 2,925
Non recurring costs (recoveries) relating to business acquisition (5) — (416) — (345)
Fair value adjustment to acquired subsidiary company's inventory and deferred revenue (6) — 211 202 211
Equity settled stock-based compensation 26 275 1,070 1,151
Gain on disposition of property, plant and equipment (6) 22 203 (133)
Gain on bargain purchase option — 1,175 — —
Gain on release of provision related to purchase accounting(11) (1,623) — (1,623) —
Past service costs (9) — — 4,922 —
Adjusted Net Earnings 43,156 80,367 166,940 192,947
Earnings per Share (basic) $ 0.69 $ 1.21 $ 2.56 $ 3.06
Earnings per Share (fully diluted) $ 0.68 $ 1.20 $ 2.55 $ 3.03
Adjusted Earnings per Share (basic) $ 0.69 $ 1.28 $ 2.68 $ 3.09
Adjusted Earnings per Share (fully diluted) $ 0.69 $ 1.26 $ 2.66 $ 3.06
(Footnotes on pages 18)
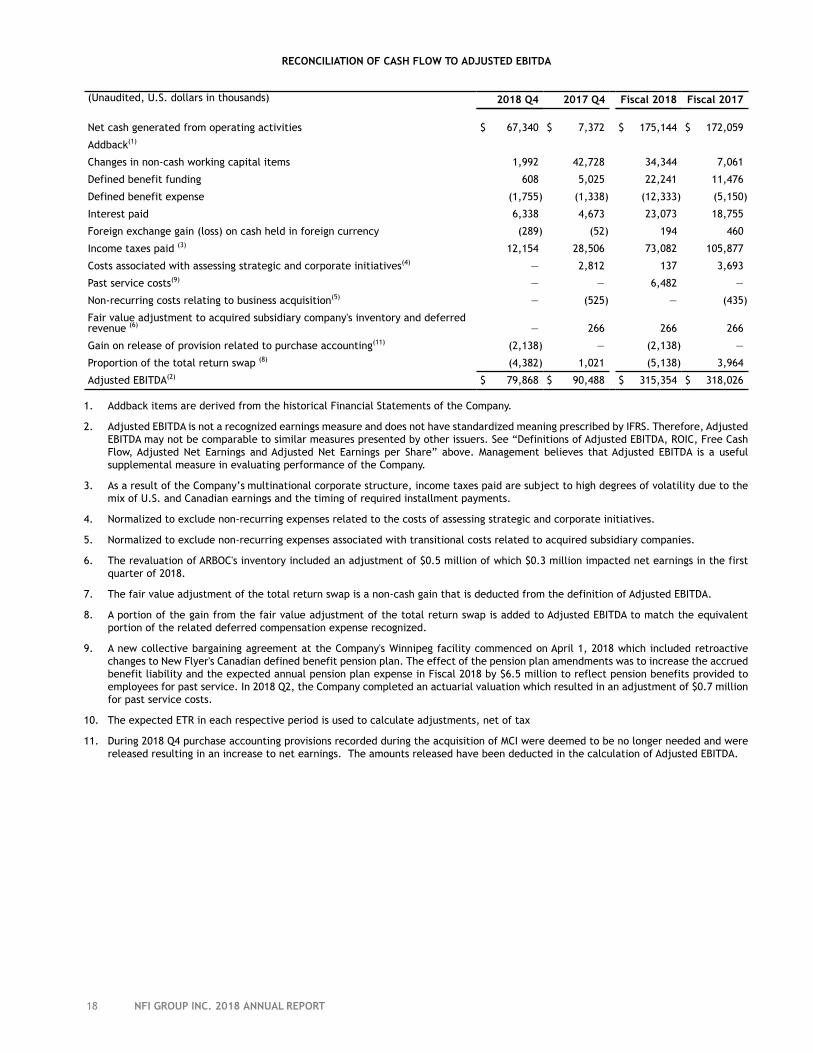
18 NFI GROUP INC. 2018 ANNUAL REPORT
RECONCILIATION OF CASH FLOW TO ADJUSTED EBITDA
(Unaudited, U.S. dollars in thousands) 2018 Q4 2017 Q4 Fiscal 2018 Fiscal 2017
Net cash generated from operating activities $ 67,340 $ 7,372 $ 175,144 $ 172,059
Addback(1)
Changes in non-cash working capital items 1,992 42,728 34,344 7,061
Defined benefit funding 608 5,025 22,241 11,476
Defined benefit expense (1,755) (1,338) (12,333) (5,150)
Interest paid 6,338 4,673 23,073 18,755
Foreign exchange gain (loss) on cash held in foreign currency (289) (52) 194 460
Income taxes paid (3) 12,154 28,506 73,082 105,877
Costs associated with assessing strategic and corporate initiatives(4) — 2,812 137 3,693
Past service costs(9) — — 6,482 —
Non-recurring costs relating to business acquisition(5) — (525) — (435)
Fair value adjustment to acquired subsidiary company's inventory and deferred revenue (6) — 266 266 266
Gain on release of provision related to purchase accounting(11) (2,138) — (2,138) —
Proportion of the total return swap (8) (4,382) 1,021 (5,138) 3,964
Adjusted EBITDA(2) $ 79,868 $ 90,488 $ 315,354 $ 318,026
1. Addback items are derived from the historical Financial Statements of the Company.
2. Adjusted EBITDA is not a recognized earnings measure and does not have standardized meaning prescribed by IFRS. Therefore, Adjusted EBITDA may not be comparable to similar measures presented by other issuers. See “Definitions of Adjusted EBITDA, ROIC, Free Cash Flow, Adjusted Net Earnings and Adjusted Net Earnings per Share” above. Management believes that Adjusted EBITDA is a useful supplemental measure in evaluating performance of the Company.
3. As a result of the Company’s multinational corporate structure, income taxes paid are subject to high degrees of volatility due to the mix of U.S. and Canadian earnings and the timing of required installment payments.
4. Normalized to exclude non-recurring expenses related to the costs of assessing strategic and corporate initiatives.
5. Normalized to exclude non-recurring expenses associated with transitional costs related to acquired subsidiary companies.
6. The revaluation of ARBOC's inventory included an adjustment of $0.5 million of which $0.3 million impacted net earnings in the first quarter of 2018.
7. The fair value adjustment of the total return swap is a non-cash gain that is deducted from the definition of Adjusted EBITDA.
8. A portion of the gain from the fair value adjustment of the total return swap is added to Adjusted EBITDA to match the equivalent portion of the related deferred compensation expense recognized.
9. A new collective bargaining agreement at the Company's Winnipeg facility commenced on April 1, 2018 which included retroactive changes to New Flyer's Canadian defined benefit pension plan. The effect of the pension plan amendments was to increase the accrued benefit liability and the expected annual pension plan expense in Fiscal 2018 by $6.5 million to reflect pension benefits provided to employees for past service. In 2018 Q2, the Company completed an actuarial valuation which resulted in an adjustment of $0.7 million for past service costs.
10. The expected ETR in each respective period is used to calculate adjustments, net of tax
11. During 2018 Q4 purchase accounting provisions recorded during the acquisition of MCI were deemed to be no longer needed and were released resulting in an increase to net earnings. The amounts released have been deducted in the calculation of Adjusted EBITDA.
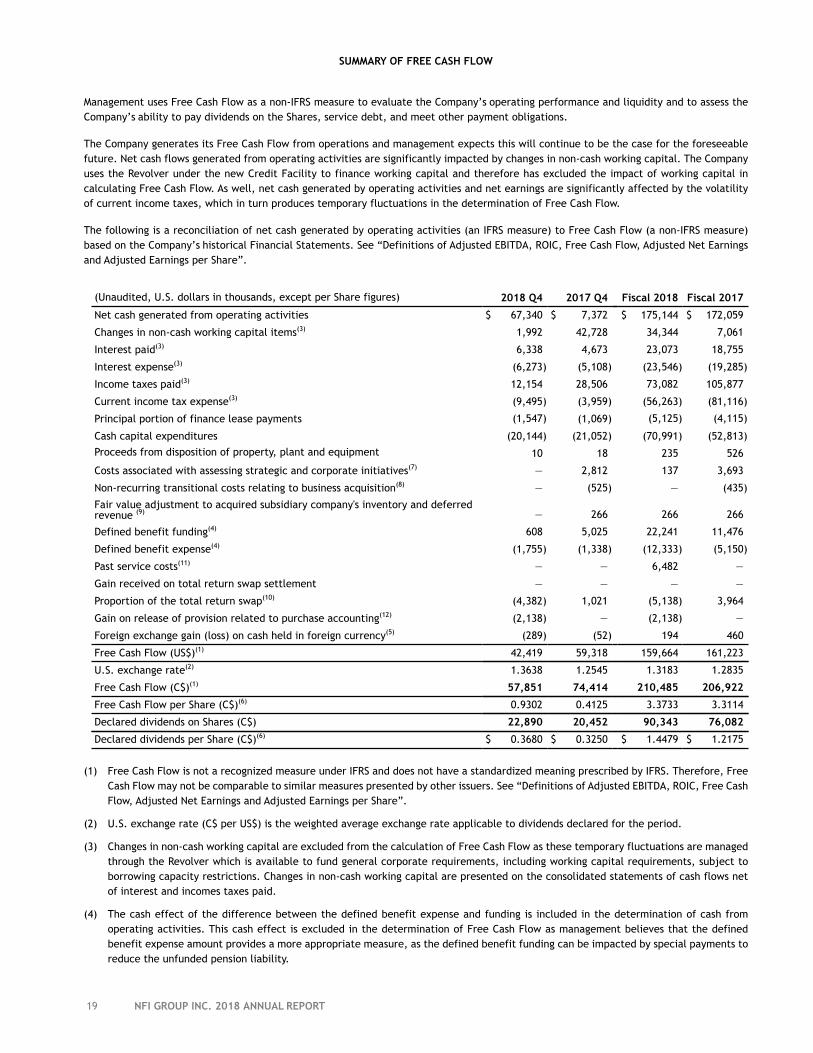
19 NFI GROUP INC. 2018 ANNUAL REPORT
SUMMARY OF FREE CASH FLOW
Management uses Free Cash Flow as a non-IFRS measure to evaluate the Company’s operating performance and liquidity and to assess the Company’s ability to pay dividends on the Shares, service debt, and meet other payment obligations.
The Company generates its Free Cash Flow from operations and management expects this will continue to be the case for the foreseeable future. Net cash flows generated from operating activities are significantly impacted by changes in non-cash working capital. The Company uses the Revolver under the new Credit Facility to finance working capital and therefore has excluded the impact of working capital in calculating Free Cash Flow. As well, net cash generated by operating activities and net earnings are significantly affected by the volatility of current income taxes, which in turn produces temporary fluctuations in the determination of Free Cash Flow.
The following is a reconciliation of net cash generated by operating activities (an IFRS measure) to Free Cash Flow (a non-IFRS measure) based on the Company’s historical Financial Statements. See “Definitions of Adjusted EBITDA, ROIC, Free Cash Flow, Adjusted Net Earnings and Adjusted Earnings per Share”.
(Unaudited, U.S. dollars in thousands, except per Share figures) 2018 Q4 2017 Q4 Fiscal 2018 Fiscal 2017
Net cash generated from operating activities $ 67,340 $ 7,372 $ 175,144 $ 172,059
Changes in non-cash working capital items(3) 1,992 42,728 34,344 7,061
Interest paid(3) 6,338 4,673 23,073 18,755
Interest expense(3) (6,273) (5,108) (23,546) (19,285)
Income taxes paid(3) 12,154 28,506 73,082 105,877
Current income tax expense(3) (9,495) (3,959) (56,263) (81,116)
Principal portion of finance lease payments (1,547) (1,069) (5,125) (4,115)
Cash capital expenditures (20,144) (21,052) (70,991) (52,813)
Proceeds from disposition of property, plant and equipment 10 18 235 526
Costs associated with assessing strategic and corporate initiatives(7) — 2,812 137 3,693
Non-recurring transitional costs relating to business acquisition(8) — (525) — (435)
Fair value adjustment to acquired subsidiary company's inventory and deferred revenue (9) — 266 266 266
Defined benefit funding(4) 608 5,025 22,241 11,476
Defined benefit expense(4) (1,755) (1,338) (12,333) (5,150)
Past service costs(11) — — 6,482 —
Gain received on total return swap settlement — — — —
Proportion of the total return swap(10) (4,382) 1,021 (5,138) 3,964
Gain on release of provision related to purchase accounting(12) (2,138) — (2,138) —
Foreign exchange gain (loss) on cash held in foreign currency(5) (289) (52) 194 460
Free Cash Flow (US$)(1) 42,419 59,318 159,664 161,223
U.S. exchange rate(2) 1.3638 1.2545 1.3183 1.2835
Free Cash Flow (C$)(1) 57,851 74,414 210,485 206,922
Free Cash Flow per Share (C$)(6) 0.9302 0.4125 3.3733 3.3114
Declared dividends on Shares (C$) 22,890 20,452 90,343 76,082
Declared dividends per Share (C$)(6) $ 0.3680 $ 0.3250 $ 1.4479 $ 1.2175
(1) Free Cash Flow is not a recognized measure under IFRS and does not have a standardized meaning prescribed by IFRS. Therefore, Free Cash Flow may not be comparable to similar measures presented by other issuers. See “Definitions of Adjusted EBITDA, ROIC, Free Cash Flow, Adjusted Net Earnings and Adjusted Earnings per Share”.
(2) U.S. exchange rate (C$ per US$) is the weighted average exchange rate applicable to dividends declared for the period.
(3) Changes in non-cash working capital are excluded from the calculation of Free Cash Flow as these temporary fluctuations are managed through the Revolver which is available to fund general corporate requirements, including working capital requirements, subject to borrowing capacity restrictions. Changes in non-cash working capital are presented on the consolidated statements of cash flows net of interest and incomes taxes paid.
(4) The cash effect of the difference between the defined benefit expense and funding is included in the determination of cash from operating activities. This cash effect is excluded in the determination of Free Cash Flow as management believes that the defined benefit expense amount provides a more appropriate measure, as the defined benefit funding can be impacted by special payments to reduce the unfunded pension liability.
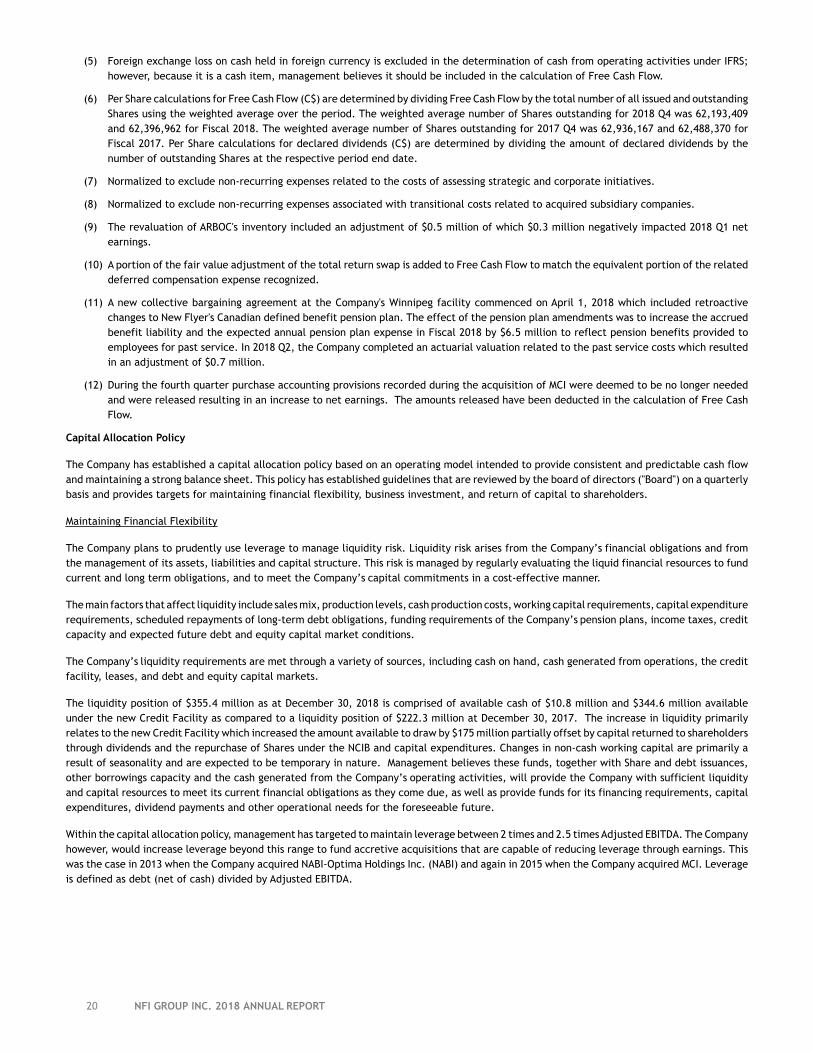
20 NFI GROUP INC. 2018 ANNUAL REPORT
(5) Foreign exchange loss on cash held in foreign currency is excluded in the determination of cash from operating activities under IFRS; however, because it is a cash item, management believes it should be included in the calculation of Free Cash Flow.
(6) Per Share calculations for Free Cash Flow (C$) are determined by dividing Free Cash Flow by the total number of all issued and outstanding Shares using the weighted average over the period. The weighted average number of Shares outstanding for 2018 Q4 was 62,193,409 and 62,396,962 for Fiscal 2018. The weighted average number of Shares outstanding for 2017 Q4 was 62,936,167 and 62,488,370 for Fiscal 2017. Per Share calculations for declared dividends (C$) are determined by dividing the amount of declared dividends by the number of outstanding Shares at the respective period end date.
(7) Normalized to exclude non-recurring expenses related to the costs of assessing strategic and corporate initiatives.
(8) Normalized to exclude non-recurring expenses associated with transitional costs related to acquired subsidiary companies.
(9) The revaluation of ARBOC's inventory included an adjustment of $0.5 million of which $0.3 million negatively impacted 2018 Q1 net earnings.
(10) A portion of the fair value adjustment of the total return swap is added to Free Cash Flow to match the equivalent portion of the related deferred compensation expense recognized.
(11) A new collective bargaining agreement at the Company's Winnipeg facility commenced on April 1, 2018 which included retroactive changes to New Flyer's Canadian defined benefit pension plan. The effect of the pension plan amendments was to increase the accrued benefit liability and the expected annual pension plan expense in Fiscal 2018 by $6.5 million to reflect pension benefits provided to employees for past service. In 2018 Q2, the Company completed an actuarial valuation related to the past service costs which resulted in an adjustment of $0.7 million.
(12) During the fourth quarter purchase accounting provisions recorded during the acquisition of MCI were deemed to be no longer needed and were released resulting in an increase to net earnings. The amounts released have been deducted in the calculation of Free Cash Flow.
Capital Allocation Policy
The Company has established a capital allocation policy based on an operating model intended to provide consistent and predictable cash flow and maintaining a strong balance sheet. This policy has established guidelines that are reviewed by the board of directors ("Board") on a quarterly basis and provides targets for maintaining financial flexibility, business investment, and return of capital to shareholders.
Maintaining Financial Flexibility
The Company plans to prudently use leverage to manage liquidity risk. Liquidity risk arises from the Company’s financial obligations and from the management of its assets, liabilities and capital structure. This risk is managed by regularly evaluating the liquid financial resources to fund current and long term obligations, and to meet the Company’s capital commitments in a cost-effective manner.
The main factors that affect liquidity include sales mix, production levels, cash production costs, working capital requirements, capital expenditure requirements, scheduled repayments of long-term debt obligations, funding requirements of the Company’s pension plans, income taxes, credit capacity and expected future debt and equity capital market conditions.
The Company’s liquidity requirements are met through a variety of sources, including cash on hand, cash generated from operations, the credit facility, leases, and debt and equity capital markets.
The liquidity position of $355.4 million as at December 30, 2018 is comprised of available cash of $10.8 million and $344.6 million available under the new Credit Facility as compared to a liquidity position of $222.3 million at December 30, 2017. The increase in liquidity primarily relates to the new Credit Facility which increased the amount available to draw by $175 million partially offset by capital returned to shareholders through dividends and the repurchase of Shares under the NCIB and capital expenditures. Changes in non-cash working capital are primarily a result of seasonality and are expected to be temporary in nature. Management believes these funds, together with Share and debt issuances, other borrowings capacity and the cash generated from the Company’s operating activities, will provide the Company with sufficient liquidity and capital resources to meet its current financial obligations as they come due, as well as provide funds for its financing requirements, capital expenditures, dividend payments and other operational needs for the foreseeable future.
Within the capital allocation policy, management has targeted to maintain leverage between 2 times and 2.5 times Adjusted EBITDA. The Company however, would increase leverage beyond this range to fund accretive acquisitions that are capable of reducing leverage through earnings. This was the case in 2013 when the Company acquired NABI-Optima Holdings Inc. (NABI) and again in 2015 when the Company acquired MCI. Leverage is defined as debt (net of cash) divided by Adjusted EBITDA.
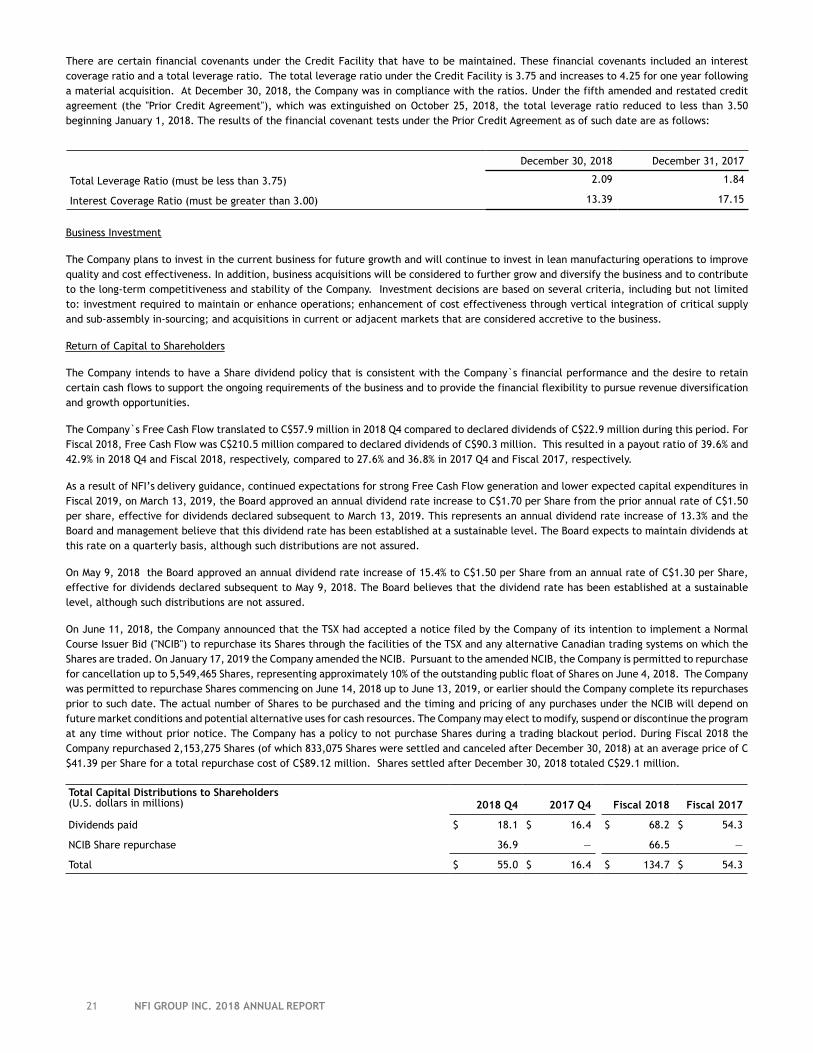
21 NFI GROUP INC. 2018 ANNUAL REPORT
There are certain financial covenants under the Credit Facility that have to be maintained. These financial covenants included an interest coverage ratio and a total leverage ratio. The total leverage ratio under the Credit Facility is 3.75 and increases to 4.25 for one year following a material acquisition. At December 30, 2018, the Company was in compliance with the ratios. Under the fifth amended and restated credit agreement (the "Prior Credit Agreement"), which was extinguished on October 25, 2018, the total leverage ratio reduced to less than 3.50 beginning January 1, 2018. The results of the financial covenant tests under the Prior Credit Agreement as of such date are as follows:
December 30, 2018 December 31, 2017
Total Leverage Ratio (must be less than 3.75) 2.09 1.84
Interest Coverage Ratio (must be greater than 3.00) 13.39 17.15
Business Investment
The Company plans to invest in the current business for future growth and will continue to invest in lean manufacturing operations to improve quality and cost effectiveness. In addition, business acquisitions will be considered to further grow and diversify the business and to contribute to the long-term competitiveness and stability of the Company. Investment decisions are based on several criteria, including but not limited to: investment required to maintain or enhance operations; enhancement of cost effectiveness through vertical integration of critical supply and sub-assembly in-sourcing; and acquisitions in current or adjacent markets that are considered accretive to the business.
Return of Capital to Shareholders
The Company intends to have a Share dividend policy that is consistent with the Company`s financial performance and the desire to retain certain cash flows to support the ongoing requirements of the business and to provide the financial flexibility to pursue revenue diversification and growth opportunities.
The Company`s Free Cash Flow translated to C$57.9 million in 2018 Q4 compared to declared dividends of C$22.9 million during this period. For Fiscal 2018, Free Cash Flow was C$210.5 million compared to declared dividends of C$90.3 million. This resulted in a payout ratio of 39.6% and 42.9% in 2018 Q4 and Fiscal 2018, respectively, compared to 27.6% and 36.8% in 2017 Q4 and Fiscal 2017, respectively.
As a result of NFI’s delivery guidance, continued expectations for strong Free Cash Flow generation and lower expected capital expenditures in Fiscal 2019, on March 13, 2019, the Board approved an annual dividend rate increase to C$1.70 per Share from the prior annual rate of C$1.50 per share, effective for dividends declared subsequent to March 13, 2019. This represents an annual dividend rate increase of 13.3% and the Board and management believe that this dividend rate has been established at a sustainable level. The Board expects to maintain dividends at this rate on a quarterly basis, although such distributions are not assured.
On May 9, 2018 the Board approved an annual dividend rate increase of 15.4% to C$1.50 per Share from an annual rate of C$1.30 per Share, effective for dividends declared subsequent to May 9, 2018. The Board believes that the dividend rate has been established at a sustainable level, although such distributions are not assured.
On June 11, 2018, the Company announced that the TSX had accepted a notice filed by the Company of its intention to implement a Normal Course Issuer Bid ("NCIB") to repurchase its Shares through the facilities of the TSX and any alternative Canadian trading systems on which the Shares are traded. On January 17, 2019 the Company amended the NCIB. Pursuant to the amended NCIB, the Company is permitted to repurchase for cancellation up to 5,549,465 Shares, representing approximately 10% of the outstanding public float of Shares on June 4, 2018. The Company was permitted to repurchase Shares commencing on June 14, 2018 up to June 13, 2019, or earlier should the Company complete its repurchases prior to such date. The actual number of Shares to be purchased and the timing and pricing of any purchases under the NCIB will depend on future market conditions and potential alternative uses for cash resources. The Company may elect to modify, suspend or discontinue the program at any time without prior notice. The Company has a policy to not purchase Shares during a trading blackout period. During Fiscal 2018 the Company repurchased 2,153,275 Shares (of which 833,075 Shares were settled and canceled after December 30, 2018) at an average price of C$41.39 per Share for a total repurchase cost of C$89.12 million. Shares settled after December 30, 2018 totaled C$29.1 million.
Total Capital Distributions to Shareholders(U.S. dollars in millions) 2018 Q4 2017 Q4 Fiscal 2018 Fiscal 2017
Dividends paid $ 18.1 $ 16.4 $ 68.2 $ 54.3
NCIB Share repurchase 36.9 — 66.5 —
Total $ 55.0 $ 16.4 $ 134.7 $ 54.3
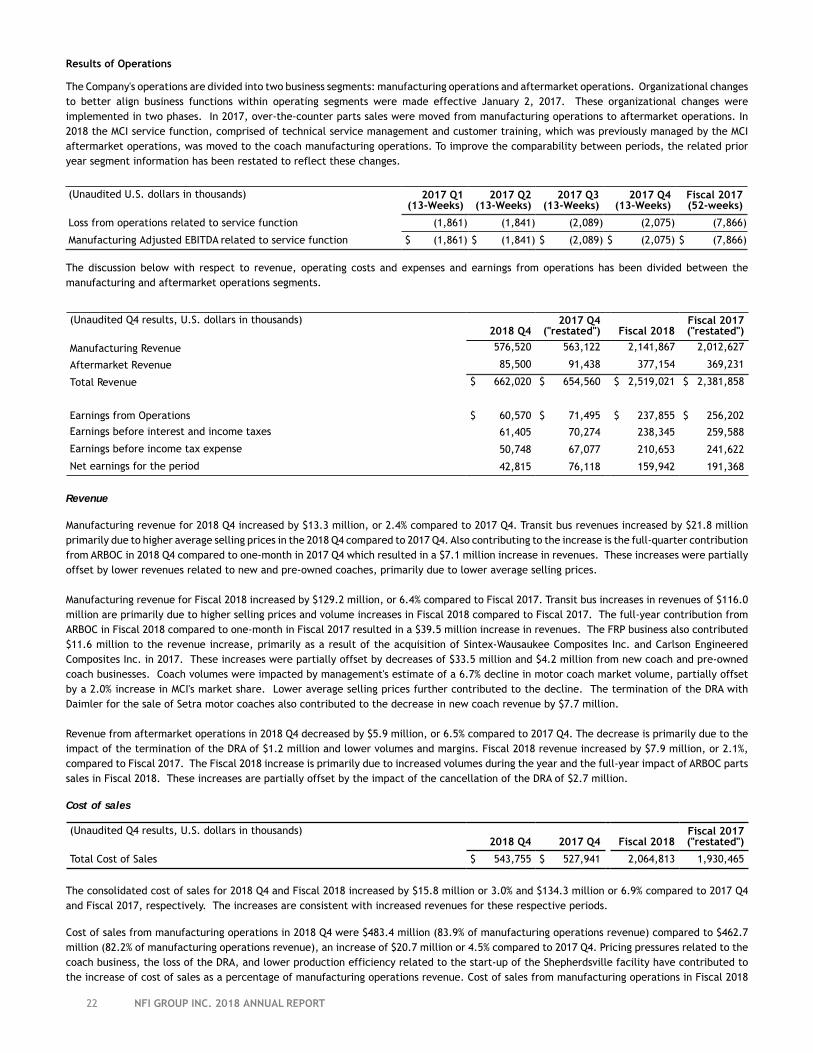
22 NFI GROUP INC. 2018 ANNUAL REPORT
Results of Operations
The Company's operations are divided into two business segments: manufacturing operations and aftermarket operations. Organizational changes to better align business functions within operating segments were made effective January 2, 2017. These organizational changes were implemented in two phases. In 2017, over-the-counter parts sales were moved from manufacturing operations to aftermarket operations. In 2018 the MCI service function, comprised of technical service management and customer training, which was previously managed by the MCI aftermarket operations, was moved to the coach manufacturing operations. To improve the comparability between periods, the related prior year segment information has been restated to reflect these changes.
(Unaudited U.S. dollars in thousands) 2017 Q1(13-Weeks)
2017 Q2(13-Weeks)
2017 Q3(13-Weeks)
2017 Q4(13-Weeks)
Fiscal 2017(52-weeks)
Loss from operations related to service function (1,861) (1,841) (2,089) (2,075) (7,866)
Manufacturing Adjusted EBITDA related to service function $ (1,861) $ (1,841) $ (2,089) $ (2,075) $ (7,866)
The discussion below with respect to revenue, operating costs and expenses and earnings from operations has been divided between the manufacturing and aftermarket operations segments.
(Unaudited Q4 results, U.S. dollars in thousands)2018 Q4
2017 Q4("restated") Fiscal 2018
Fiscal 2017("restated")
Manufacturing Revenue 576,520 563,122 2,141,867 2,012,627
Aftermarket Revenue 85,500 91,438 377,154 369,231
Total Revenue $ 662,020 $ 654,560 $ 2,519,021 $ 2,381,858
Earnings from Operations $ 60,570 $ 71,495 $ 237,855 $ 256,202
Earnings before interest and income taxes 61,405 70,274 238,345 259,588
Earnings before income tax expense 50,748 67,077 210,653 241,622
Net earnings for the period 42,815 76,118 159,942 191,368
Revenue
Manufacturing revenue for 2018 Q4 increased by $13.3 million, or 2.4% compared to 2017 Q4. Transit bus revenues increased by $21.8 million primarily due to higher average selling prices in the 2018 Q4 compared to 2017 Q4. Also contributing to the increase is the full-quarter contribution from ARBOC in 2018 Q4 compared to one-month in 2017 Q4 which resulted in a $7.1 million increase in revenues. These increases were partially offset by lower revenues related to new and pre-owned coaches, primarily due to lower average selling prices.
Manufacturing revenue for Fiscal 2018 increased by $129.2 million, or 6.4% compared to Fiscal 2017. Transit bus increases in revenues of $116.0 million are primarily due to higher selling prices and volume increases in Fiscal 2018 compared to Fiscal 2017. The full-year contribution from ARBOC in Fiscal 2018 compared to one-month in Fiscal 2017 resulted in a $39.5 million increase in revenues. The FRP business also contributed $11.6 million to the revenue increase, primarily as a result of the acquisition of Sintex-Wausaukee Composites Inc. and Carlson Engineered Composites Inc. in 2017. These increases were partially offset by decreases of $33.5 million and $4.2 million from new coach and pre-owned coach businesses. Coach volumes were impacted by management's estimate of a 6.7% decline in motor coach market volume, partially offset by a 2.0% increase in MCI's market share. Lower average selling prices further contributed to the decline. The termination of the DRA with Daimler for the sale of Setra motor coaches also contributed to the decrease in new coach revenue by $7.7 million.
Revenue from aftermarket operations in 2018 Q4 decreased by $5.9 million, or 6.5% compared to 2017 Q4. The decrease is primarily due to the impact of the termination of the DRA of $1.2 million and lower volumes and margins. Fiscal 2018 revenue increased by $7.9 million, or 2.1%, compared to Fiscal 2017. The Fiscal 2018 increase is primarily due to increased volumes during the year and the full-year impact of ARBOC parts sales in Fiscal 2018. These increases are partially offset by the impact of the cancellation of the DRA of $2.7 million.
Cost of sales
(Unaudited Q4 results, U.S. dollars in thousands)2018 Q4 2017 Q4 Fiscal 2018
Fiscal 2017("restated")
Total Cost of Sales $ 543,755 $ 527,941 2,064,813 1,930,465
The consolidated cost of sales for 2018 Q4 and Fiscal 2018 increased by $15.8 million or 3.0% and $134.3 million or 6.9% compared to 2017 Q4 and Fiscal 2017, respectively. The increases are consistent with increased revenues for these respective periods.
Cost of sales from manufacturing operations in 2018 Q4 were $483.4 million (83.9% of manufacturing operations revenue) compared to $462.7 million (82.2% of manufacturing operations revenue), an increase of $20.7 million or 4.5% compared to 2017 Q4. Pricing pressures related to the coach business, the loss of the DRA, and lower production efficiency related to the start-up of the Shepherdsville facility have contributed to the increase of cost of sales as a percentage of manufacturing operations revenue. Cost of sales from manufacturing operations in Fiscal 2018
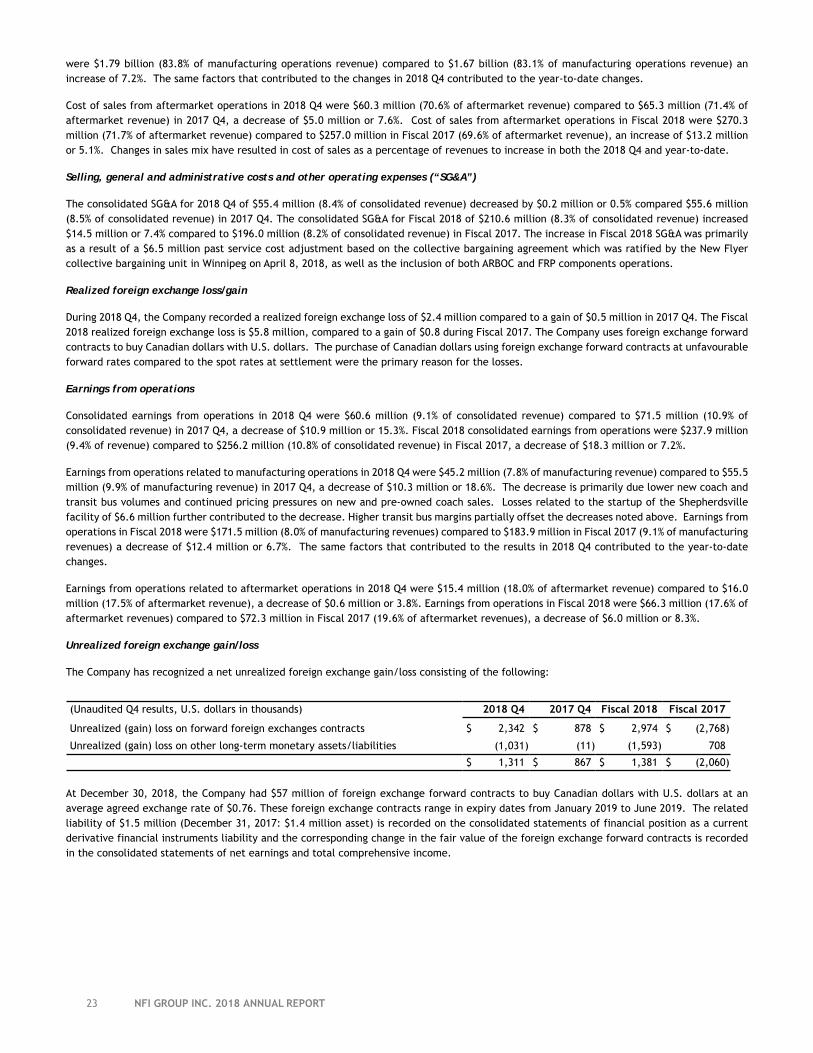
23 NFI GROUP INC. 2018 ANNUAL REPORT
were $1.79 billion (83.8% of manufacturing operations revenue) compared to $1.67 billion (83.1% of manufacturing operations revenue) an increase of 7.2%. The same factors that contributed to the changes in 2018 Q4 contributed to the year-to-date changes.
Cost of sales from aftermarket operations in 2018 Q4 were $60.3 million (70.6% of aftermarket revenue) compared to $65.3 million (71.4% of aftermarket revenue) in 2017 Q4, a decrease of $5.0 million or 7.6%. Cost of sales from aftermarket operations in Fiscal 2018 were $270.3 million (71.7% of aftermarket revenue) compared to $257.0 million in Fiscal 2017 (69.6% of aftermarket revenue), an increase of $13.2 million or 5.1%. Changes in sales mix have resulted in cost of sales as a percentage of revenues to increase in both the 2018 Q4 and year-to-date.
Selling, general and administrative costs and other operating expenses (“SG&A”)
The consolidated SG&A for 2018 Q4 of $55.4 million (8.4% of consolidated revenue) decreased by $0.2 million or 0.5% compared $55.6 million (8.5% of consolidated revenue) in 2017 Q4. The consolidated SG&A for Fiscal 2018 of $210.6 million (8.3% of consolidated revenue) increased $14.5 million or 7.4% compared to $196.0 million (8.2% of consolidated revenue) in Fiscal 2017. The increase in Fiscal 2018 SG&A was primarily as a result of a $6.5 million past service cost adjustment based on the collective bargaining agreement which was ratified by the New Flyer collective bargaining unit in Winnipeg on April 8, 2018, as well as the inclusion of both ARBOC and FRP components operations.
Realized foreign exchange loss/gain
During 2018 Q4, the Company recorded a realized foreign exchange loss of $2.4 million compared to a gain of $0.5 million in 2017 Q4. The Fiscal 2018 realized foreign exchange loss is $5.8 million, compared to a gain of $0.8 during Fiscal 2017. The Company uses foreign exchange forward contracts to buy Canadian dollars with U.S. dollars. The purchase of Canadian dollars using foreign exchange forward contracts at unfavourable forward rates compared to the spot rates at settlement were the primary reason for the losses.
Earnings from operations
Consolidated earnings from operations in 2018 Q4 were $60.6 million (9.1% of consolidated revenue) compared to $71.5 million (10.9% of consolidated revenue) in 2017 Q4, a decrease of $10.9 million or 15.3%. Fiscal 2018 consolidated earnings from operations were $237.9 million (9.4% of revenue) compared to $256.2 million (10.8% of consolidated revenue) in Fiscal 2017, a decrease of $18.3 million or 7.2%.
Earnings from operations related to manufacturing operations in 2018 Q4 were $45.2 million (7.8% of manufacturing revenue) compared to $55.5 million (9.9% of manufacturing revenue) in 2017 Q4, a decrease of $10.3 million or 18.6%. The decrease is primarily due lower new coach and transit bus volumes and continued pricing pressures on new and pre-owned coach sales. Losses related to the startup of the Shepherdsville facility of $6.6 million further contributed to the decrease. Higher transit bus margins partially offset the decreases noted above. Earnings from operations in Fiscal 2018 were $171.5 million (8.0% of manufacturing revenues) compared to $183.9 million in Fiscal 2017 (9.1% of manufacturing revenues) a decrease of $12.4 million or 6.7%. The same factors that contributed to the results in 2018 Q4 contributed to the year-to-date changes.
Earnings from operations related to aftermarket operations in 2018 Q4 were $15.4 million (18.0% of aftermarket revenue) compared to $16.0 million (17.5% of aftermarket revenue), a decrease of $0.6 million or 3.8%. Earnings from operations in Fiscal 2018 were $66.3 million (17.6% of aftermarket revenues) compared to $72.3 million in Fiscal 2017 (19.6% of aftermarket revenues), a decrease of $6.0 million or 8.3%.
Unrealized foreign exchange gain/loss
The Company has recognized a net unrealized foreign exchange gain/loss consisting of the following:
(Unaudited Q4 results, U.S. dollars in thousands) 2018 Q4 2017 Q4 Fiscal 2018 Fiscal 2017
Unrealized (gain) loss on forward foreign exchanges contracts $ 2,342 $ 878 $ 2,974 $ (2,768)
Unrealized (gain) loss on other long-term monetary assets/liabilities (1,031) (11) (1,593) 708
$ 1,311 $ 867 $ 1,381 $ (2,060)
At December 30, 2018, the Company had $57 million of foreign exchange forward contracts to buy Canadian dollars with U.S. dollars at an average agreed exchange rate of $0.76. These foreign exchange contracts range in expiry dates from January 2019 to June 2019. The related liability of $1.5 million (December 31, 2017: $1.4 million asset) is recorded on the consolidated statements of financial position as a current derivative financial instruments liability and the corresponding change in the fair value of the foreign exchange forward contracts is recorded in the consolidated statements of net earnings and total comprehensive income.
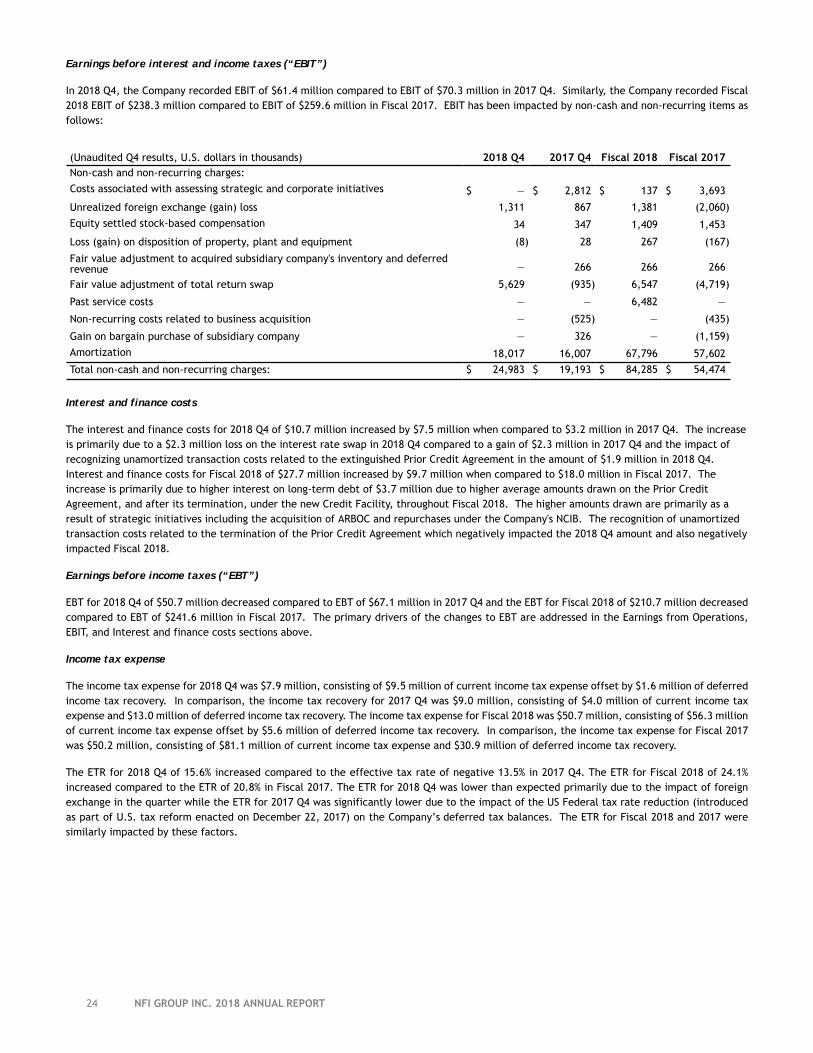
24 NFI GROUP INC. 2018 ANNUAL REPORT
Earnings before interest and income taxes (“EBIT”)
In 2018 Q4, the Company recorded EBIT of $61.4 million compared to EBIT of $70.3 million in 2017 Q4. Similarly, the Company recorded Fiscal 2018 EBIT of $238.3 million compared to EBIT of $259.6 million in Fiscal 2017. EBIT has been impacted by non-cash and non-recurring items as follows:
(Unaudited Q4 results, U.S. dollars in thousands) 2018 Q4 2017 Q4 Fiscal 2018 Fiscal 2017Non-cash and non-recurring charges:
Costs associated with assessing strategic and corporate initiatives $ — $ 2,812 $ 137 $ 3,693
Unrealized foreign exchange (gain) loss 1,311 867 1,381 (2,060)
Equity settled stock-based compensation 34 347 1,409 1,453
Loss (gain) on disposition of property, plant and equipment (8) 28 267 (167)
Fair value adjustment to acquired subsidiary company's inventory and deferredrevenue — 266 266 266
Fair value adjustment of total return swap 5,629 (935) 6,547 (4,719)
Past service costs — — 6,482 —
Non-recurring costs related to business acquisition — (525) — (435)
Gain on bargain purchase of subsidiary company — 326 — (1,159)
Amortization 18,017 16,007 67,796 57,602
Total non-cash and non-recurring charges: $ 24,983 $ 19,193 $ 84,285 $ 54,474
Interest and finance costs
The interest and finance costs for 2018 Q4 of $10.7 million increased by $7.5 million when compared to $3.2 million in 2017 Q4. The increase is primarily due to a $2.3 million loss on the interest rate swap in 2018 Q4 compared to a gain of $2.3 million in 2017 Q4 and the impact of recognizing unamortized transaction costs related to the extinguished Prior Credit Agreement in the amount of $1.9 million in 2018 Q4. Interest and finance costs for Fiscal 2018 of $27.7 million increased by $9.7 million when compared to $18.0 million in Fiscal 2017. The increase is primarily due to higher interest on long-term debt of $3.7 million due to higher average amounts drawn on the Prior Credit Agreement, and after its termination, under the new Credit Facility, throughout Fiscal 2018. The higher amounts drawn are primarily as a result of strategic initiatives including the acquisition of ARBOC and repurchases under the Company's NCIB. The recognition of unamortized transaction costs related to the termination of the Prior Credit Agreement which negatively impacted the 2018 Q4 amount and also negatively impacted Fiscal 2018.
Earnings before income taxes (“EBT”)
EBT for 2018 Q4 of $50.7 million decreased compared to EBT of $67.1 million in 2017 Q4 and the EBT for Fiscal 2018 of $210.7 million decreased compared to EBT of $241.6 million in Fiscal 2017. The primary drivers of the changes to EBT are addressed in the Earnings from Operations, EBIT, and Interest and finance costs sections above.
Income tax expense
The income tax expense for 2018 Q4 was $7.9 million, consisting of $9.5 million of current income tax expense offset by $1.6 million of deferred income tax recovery. In comparison, the income tax recovery for 2017 Q4 was $9.0 million, consisting of $4.0 million of current income tax expense and $13.0 million of deferred income tax recovery. The income tax expense for Fiscal 2018 was $50.7 million, consisting of $56.3 million of current income tax expense offset by $5.6 million of deferred income tax recovery. In comparison, the income tax expense for Fiscal 2017 was $50.2 million, consisting of $81.1 million of current income tax expense and $30.9 million of deferred income tax recovery.
The ETR for 2018 Q4 of 15.6% increased compared to the effective tax rate of negative 13.5% in 2017 Q4. The ETR for Fiscal 2018 of 24.1% increased compared to the ETR of 20.8% in Fiscal 2017. The ETR for 2018 Q4 was lower than expected primarily due to the impact of foreign exchange in the quarter while the ETR for 2017 Q4 was significantly lower due to the impact of the US Federal tax rate reduction (introduced as part of U.S. tax reform enacted on December 22, 2017) on the Company’s deferred tax balances. The ETR for Fiscal 2018 and 2017 were similarly impacted by these factors.
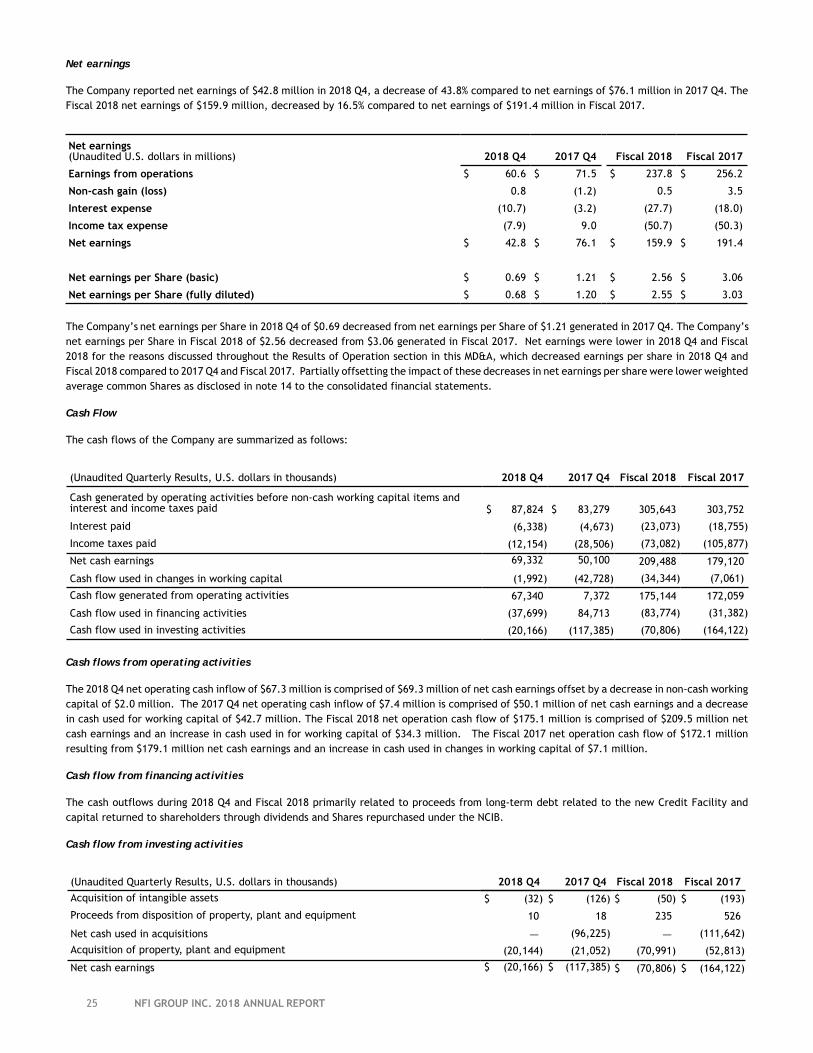
25 NFI GROUP INC. 2018 ANNUAL REPORT
Net earnings
The Company reported net earnings of $42.8 million in 2018 Q4, a decrease of 43.8% compared to net earnings of $76.1 million in 2017 Q4. The Fiscal 2018 net earnings of $159.9 million, decreased by 16.5% compared to net earnings of $191.4 million in Fiscal 2017.
Net earnings (Unaudited U.S. dollars in millions) 2018 Q4 2017 Q4 Fiscal 2018 Fiscal 2017
Earnings from operations $ 60.6 $ 71.5 $ 237.8 $ 256.2
Non-cash gain (loss) 0.8 (1.2) 0.5 3.5
Interest expense (10.7) (3.2) (27.7) (18.0)
Income tax expense (7.9) 9.0 (50.7) (50.3)
Net earnings $ 42.8 $ 76.1 $ 159.9 $ 191.4
Net earnings per Share (basic) $ 0.69 $ 1.21 $ 2.56 $ 3.06
Net earnings per Share (fully diluted) $ 0.68 $ 1.20 $ 2.55 $ 3.03
The Company’s net earnings per Share in 2018 Q4 of $0.69 decreased from net earnings per Share of $1.21 generated in 2017 Q4. The Company’s net earnings per Share in Fiscal 2018 of $2.56 decreased from $3.06 generated in Fiscal 2017. Net earnings were lower in 2018 Q4 and Fiscal 2018 for the reasons discussed throughout the Results of Operation section in this MD&A, which decreased earnings per share in 2018 Q4 and Fiscal 2018 compared to 2017 Q4 and Fiscal 2017. Partially offsetting the impact of these decreases in net earnings per share were lower weighted average common Shares as disclosed in note 14 to the consolidated financial statements.
Cash Flow
The cash flows of the Company are summarized as follows:
(Unaudited Quarterly Results, U.S. dollars in thousands) 2018 Q4 2017 Q4 Fiscal 2018 Fiscal 2017
Cash generated by operating activities before non-cash working capital items andinterest and income taxes paid $ 87,824 $ 83,279 305,643 303,752
Interest paid (6,338) (4,673) (23,073) (18,755)
Income taxes paid (12,154) (28,506) (73,082) (105,877)
Net cash earnings 69,332 50,100 209,488 179,120
Cash flow used in changes in working capital (1,992) (42,728) (34,344) (7,061)
Cash flow generated from operating activities 67,340 7,372 175,144 172,059
Cash flow used in financing activities (37,699) 84,713 (83,774) (31,382)
Cash flow used in investing activities (20,166) (117,385) (70,806) (164,122)
Cash flows from operating activities
The 2018 Q4 net operating cash inflow of $67.3 million is comprised of $69.3 million of net cash earnings offset by a decrease in non-cash working capital of $2.0 million. The 2017 Q4 net operating cash inflow of $7.4 million is comprised of $50.1 million of net cash earnings and a decrease in cash used for working capital of $42.7 million. The Fiscal 2018 net operation cash flow of $175.1 million is comprised of $209.5 million net cash earnings and an increase in cash used in for working capital of $34.3 million. The Fiscal 2017 net operation cash flow of $172.1 million resulting from $179.1 million net cash earnings and an increase in cash used in changes in working capital of $7.1 million.
Cash flow from financing activities
The cash outflows during 2018 Q4 and Fiscal 2018 primarily related to proceeds from long-term debt related to the new Credit Facility and capital returned to shareholders through dividends and Shares repurchased under the NCIB.
Cash flow from investing activities
(Unaudited Quarterly Results, U.S. dollars in thousands) 2018 Q4 2017 Q4 Fiscal 2018 Fiscal 2017
Acquisition of intangible assets $ (32) $ (126) $ (50) $ (193)
Proceeds from disposition of property, plant and equipment 10 18 235 526
Net cash used in acquisitions — (96,225) — (111,642)
Acquisition of property, plant and equipment (20,144) (21,052) (70,991) (52,813)
Net cash earnings $ (20,166) $ (117,385) $ (70,806) $ (164,122)
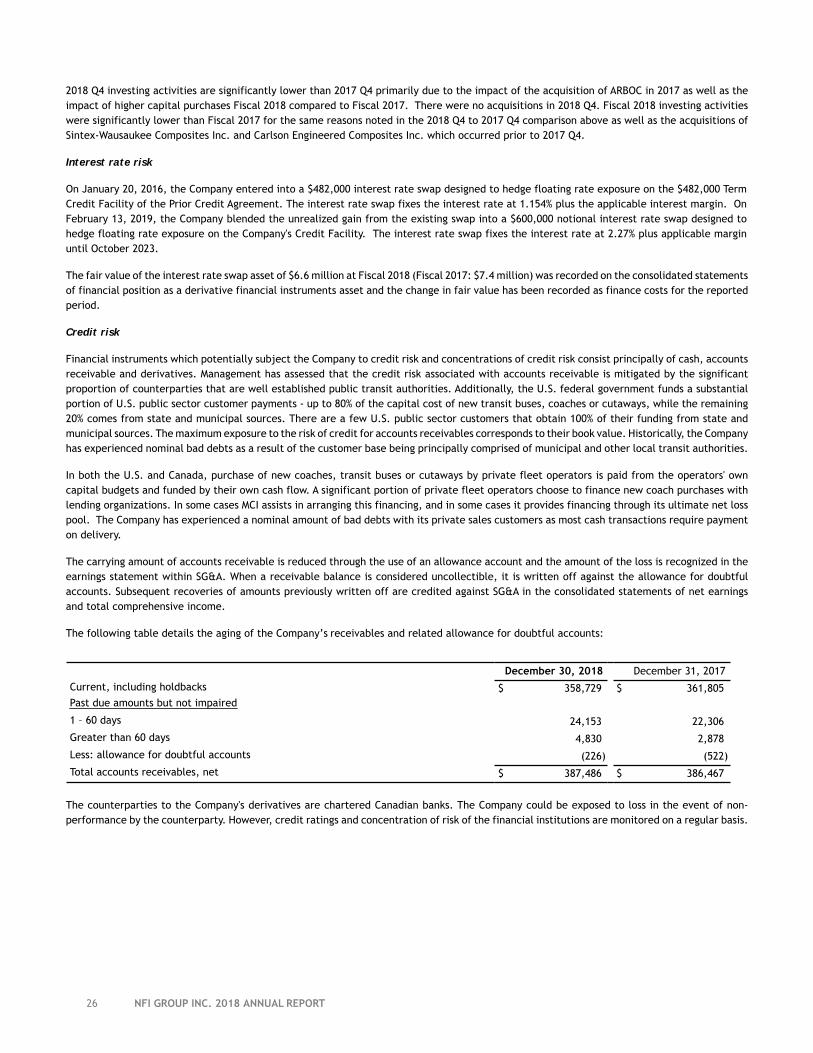
26 NFI GROUP INC. 2018 ANNUAL REPORT
2018 Q4 investing activities are significantly lower than 2017 Q4 primarily due to the impact of the acquisition of ARBOC in 2017 as well as the impact of higher capital purchases Fiscal 2018 compared to Fiscal 2017. There were no acquisitions in 2018 Q4. Fiscal 2018 investing activities were significantly lower than Fiscal 2017 for the same reasons noted in the 2018 Q4 to 2017 Q4 comparison above as well as the acquisitions of Sintex-Wausaukee Composites Inc. and Carlson Engineered Composites Inc. which occurred prior to 2017 Q4.
Interest rate risk
On January 20, 2016, the Company entered into a $482,000 interest rate swap designed to hedge floating rate exposure on the $482,000 Term Credit Facility of the Prior Credit Agreement. The interest rate swap fixes the interest rate at 1.154% plus the applicable interest margin. On February 13, 2019, the Company blended the unrealized gain from the existing swap into a $600,000 notional interest rate swap designed to hedge floating rate exposure on the Company's Credit Facility. The interest rate swap fixes the interest rate at 2.27% plus applicable margin until October 2023.
The fair value of the interest rate swap asset of $6.6 million at Fiscal 2018 (Fiscal 2017: $7.4 million) was recorded on the consolidated statements of financial position as a derivative financial instruments asset and the change in fair value has been recorded as finance costs for the reported period.
Credit risk
Financial instruments which potentially subject the Company to credit risk and concentrations of credit risk consist principally of cash, accounts receivable and derivatives. Management has assessed that the credit risk associated with accounts receivable is mitigated by the significant proportion of counterparties that are well established public transit authorities. Additionally, the U.S. federal government funds a substantial portion of U.S. public sector customer payments - up to 80% of the capital cost of new transit buses, coaches or cutaways, while the remaining 20% comes from state and municipal sources. There are a few U.S. public sector customers that obtain 100% of their funding from state and municipal sources. The maximum exposure to the risk of credit for accounts receivables corresponds to their book value. Historically, the Company has experienced nominal bad debts as a result of the customer base being principally comprised of municipal and other local transit authorities.
In both the U.S. and Canada, purchase of new coaches, transit buses or cutaways by private fleet operators is paid from the operators' own capital budgets and funded by their own cash flow. A significant portion of private fleet operators choose to finance new coach purchases with lending organizations. In some cases MCI assists in arranging this financing, and in some cases it provides financing through its ultimate net loss pool. The Company has experienced a nominal amount of bad debts with its private sales customers as most cash transactions require payment on delivery.
The carrying amount of accounts receivable is reduced through the use of an allowance account and the amount of the loss is recognized in the earnings statement within SG&A. When a receivable balance is considered uncollectible, it is written off against the allowance for doubtful accounts. Subsequent recoveries of amounts previously written off are credited against SG&A in the consolidated statements of net earnings and total comprehensive income.
The following table details the aging of the Company’s receivables and related allowance for doubtful accounts:
December 30, 2018 December 31, 2017
Current, including holdbacks $ 358,729 $ 361,805Past due amounts but not impaired
1 – 60 days 24,153 22,306
Greater than 60 days 4,830 2,878
Less: allowance for doubtful accounts (226) (522)
Total accounts receivables, net $ 387,486 $ 386,467
The counterparties to the Company's derivatives are chartered Canadian banks. The Company could be exposed to loss in the event of non-performance by the counterparty. However, credit ratings and concentration of risk of the financial institutions are monitored on a regular basis.
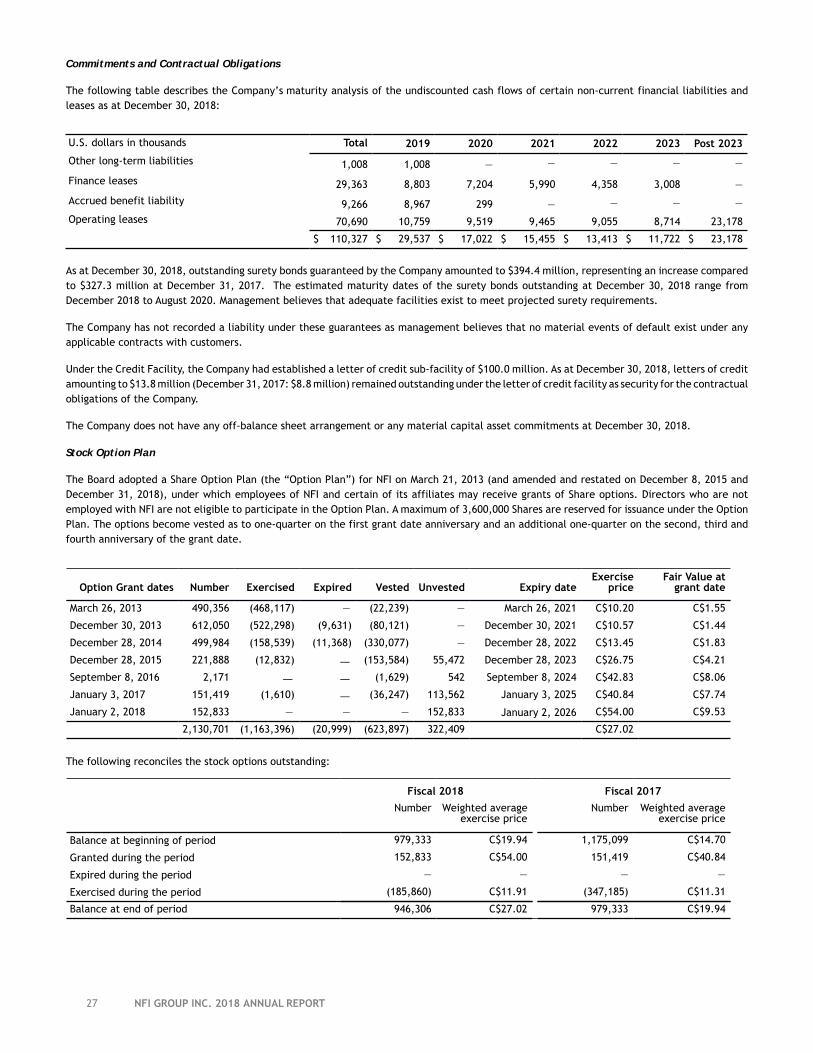
27 NFI GROUP INC. 2018 ANNUAL REPORT
Commitments and Contractual Obligations
The following table describes the Company’s maturity analysis of the undiscounted cash flows of certain non-current financial liabilities and leases as at December 30, 2018:
U.S. dollars in thousands Total 2019 2020 2021 2022 2023 Post 2023
Other long-term liabilities 1,008 1,008 — — — — —
Finance leases 29,363 8,803 7,204 5,990 4,358 3,008 —
Accrued benefit liability 9,266 8,967 299 — — — —
Operating leases 70,690 10,759 9,519 9,465 9,055 8,714 23,178
$ 110,327 $ 29,537 $ 17,022 $ 15,455 $ 13,413 $ 11,722 $ 23,178
As at December 30, 2018, outstanding surety bonds guaranteed by the Company amounted to $394.4 million, representing an increase compared to $327.3 million at December 31, 2017. The estimated maturity dates of the surety bonds outstanding at December 30, 2018 range from December 2018 to August 2020. Management believes that adequate facilities exist to meet projected surety requirements.
The Company has not recorded a liability under these guarantees as management believes that no material events of default exist under any applicable contracts with customers.
Under the Credit Facility, the Company had established a letter of credit sub-facility of $100.0 million. As at December 30, 2018, letters of credit amounting to $13.8 million (December 31, 2017: $8.8 million) remained outstanding under the letter of credit facility as security for the contractual obligations of the Company.
The Company does not have any off-balance sheet arrangement or any material capital asset commitments at December 30, 2018.
Stock Option Plan
The Board adopted a Share Option Plan (the “Option Plan”) for NFI on March 21, 2013 (and amended and restated on December 8, 2015 and December 31, 2018), under which employees of NFI and certain of its affiliates may receive grants of Share options. Directors who are not employed with NFI are not eligible to participate in the Option Plan. A maximum of 3,600,000 Shares are reserved for issuance under the Option Plan. The options become vested as to one-quarter on the first grant date anniversary and an additional one-quarter on the second, third and fourth anniversary of the grant date.
Option Grant dates Number Exercised Expired Vested Unvested Expiry dateExercise
priceFair Value at
grant date
March 26, 2013 490,356 (468,117) — (22,239) — March 26, 2021 C$10.20 C$1.55
December 30, 2013 612,050 (522,298) (9,631) (80,121) — December 30, 2021 C$10.57 C$1.44
December 28, 2014 499,984 (158,539) (11,368) (330,077) — December 28, 2022 C$13.45 C$1.83
December 28, 2015 221,888 (12,832) — (153,584) 55,472 December 28, 2023 C$26.75 C$4.21
September 8, 2016 2,171 — — (1,629) 542 September 8, 2024 C$42.83 C$8.06
January 3, 2017 151,419 (1,610) — (36,247) 113,562 January 3, 2025 C$40.84 C$7.74
January 2, 2018 152,833 — — — 152,833 January 2, 2026 C$54.00 C$9.53
2,130,701 (1,163,396) (20,999) (623,897) 322,409 C$27.02
The following reconciles the stock options outstanding:
Fiscal 2018 Fiscal 2017
Number Weighted averageexercise price
Number Weighted averageexercise price
Balance at beginning of period 979,333 C$19.94 1,175,099 C$14.70
Granted during the period 152,833 C$54.00 151,419 C$40.84
Expired during the period — — — —
Exercised during the period (185,860) C$11.91 (347,185) C$11.31
Balance at end of period 946,306 C$27.02 979,333 C$19.94
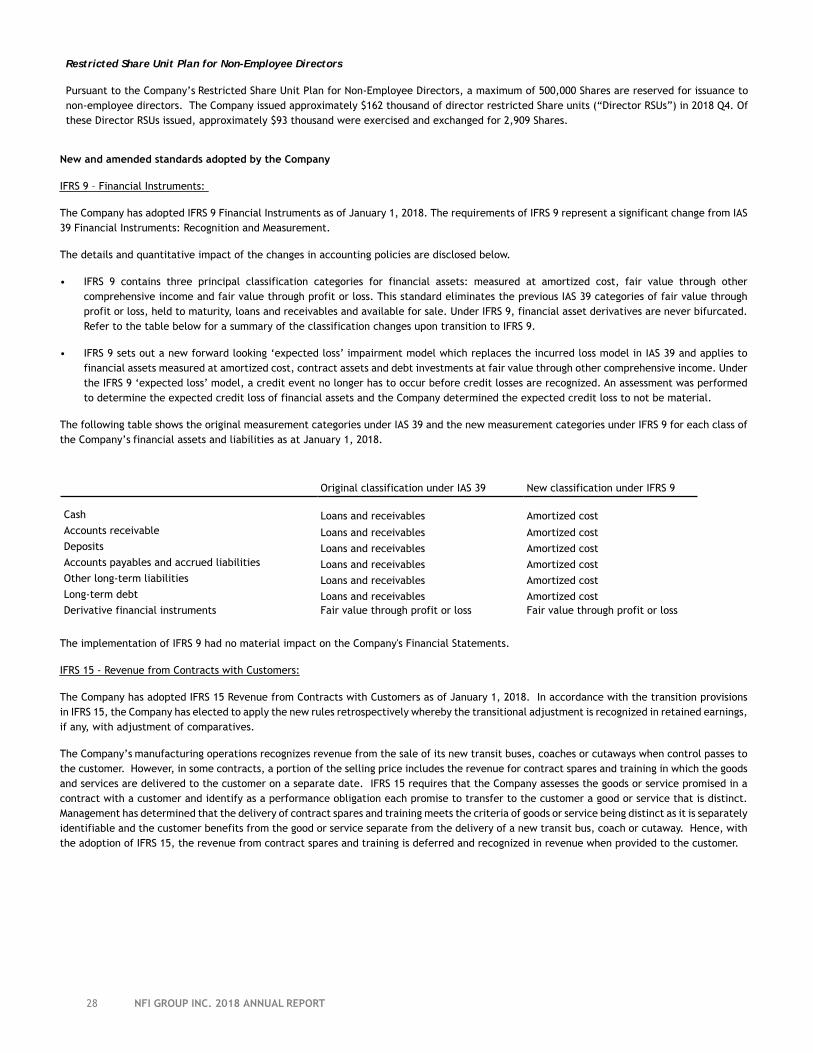
28 NFI GROUP INC. 2018 ANNUAL REPORT
Restricted Share Unit Plan for Non-Employee Directors
Pursuant to the Company’s Restricted Share Unit Plan for Non-Employee Directors, a maximum of 500,000 Shares are reserved for issuance to non-employee directors. The Company issued approximately $162 thousand of director restricted Share units (“Director RSUs”) in 2018 Q4. Of these Director RSUs issued, approximately $93 thousand were exercised and exchanged for 2,909 Shares.
New and amended standards adopted by the Company
IFRS 9 – Financial Instruments:
The Company has adopted IFRS 9 Financial Instruments as of January 1, 2018. The requirements of IFRS 9 represent a significant change from IAS 39 Financial Instruments: Recognition and Measurement.
The details and quantitative impact of the changes in accounting policies are disclosed below.
• IFRS 9 contains three principal classification categories for financial assets: measured at amortized cost, fair value through other comprehensive income and fair value through profit or loss. This standard eliminates the previous IAS 39 categories of fair value through profit or loss, held to maturity, loans and receivables and available for sale. Under IFRS 9, financial asset derivatives are never bifurcated. Refer to the table below for a summary of the classification changes upon transition to IFRS 9.
• IFRS 9 sets out a new forward looking ‘expected loss’ impairment model which replaces the incurred loss model in IAS 39 and applies to financial assets measured at amortized cost, contract assets and debt investments at fair value through other comprehensive income. Under the IFRS 9 ‘expected loss’ model, a credit event no longer has to occur before credit losses are recognized. An assessment was performed to determine the expected credit loss of financial assets and the Company determined the expected credit loss to not be material.
The following table shows the original measurement categories under IAS 39 and the new measurement categories under IFRS 9 for each class of the Company’s financial assets and liabilities as at January 1, 2018.
Original classification under IAS 39 New classification under IFRS 9
Cash Loans and receivables Amortized costAccounts receivable Loans and receivables Amortized costDeposits Loans and receivables Amortized costAccounts payables and accrued liabilities Loans and receivables Amortized costOther long-term liabilities Loans and receivables Amortized costLong-term debt Loans and receivables Amortized costDerivative financial instruments Fair value through profit or loss Fair value through profit or loss
The implementation of IFRS 9 had no material impact on the Company's Financial Statements.
IFRS 15 - Revenue from Contracts with Customers:
The Company has adopted IFRS 15 Revenue from Contracts with Customers as of January 1, 2018. In accordance with the transition provisions in IFRS 15, the Company has elected to apply the new rules retrospectively whereby the transitional adjustment is recognized in retained earnings, if any, with adjustment of comparatives.
The Company’s manufacturing operations recognizes revenue from the sale of its new transit buses, coaches or cutaways when control passes to the customer. However, in some contracts, a portion of the selling price includes the revenue for contract spares and training in which the goods and services are delivered to the customer on a separate date. IFRS 15 requires that the Company assesses the goods or service promised in a contract with a customer and identify as a performance obligation each promise to transfer to the customer a good or service that is distinct. Management has determined that the delivery of contract spares and training meets the criteria of goods or service being distinct as it is separately identifiable and the customer benefits from the good or service separate from the delivery of a new transit bus, coach or cutaway. Hence, with the adoption of IFRS 15, the revenue from contract spares and training is deferred and recognized in revenue when provided to the customer.
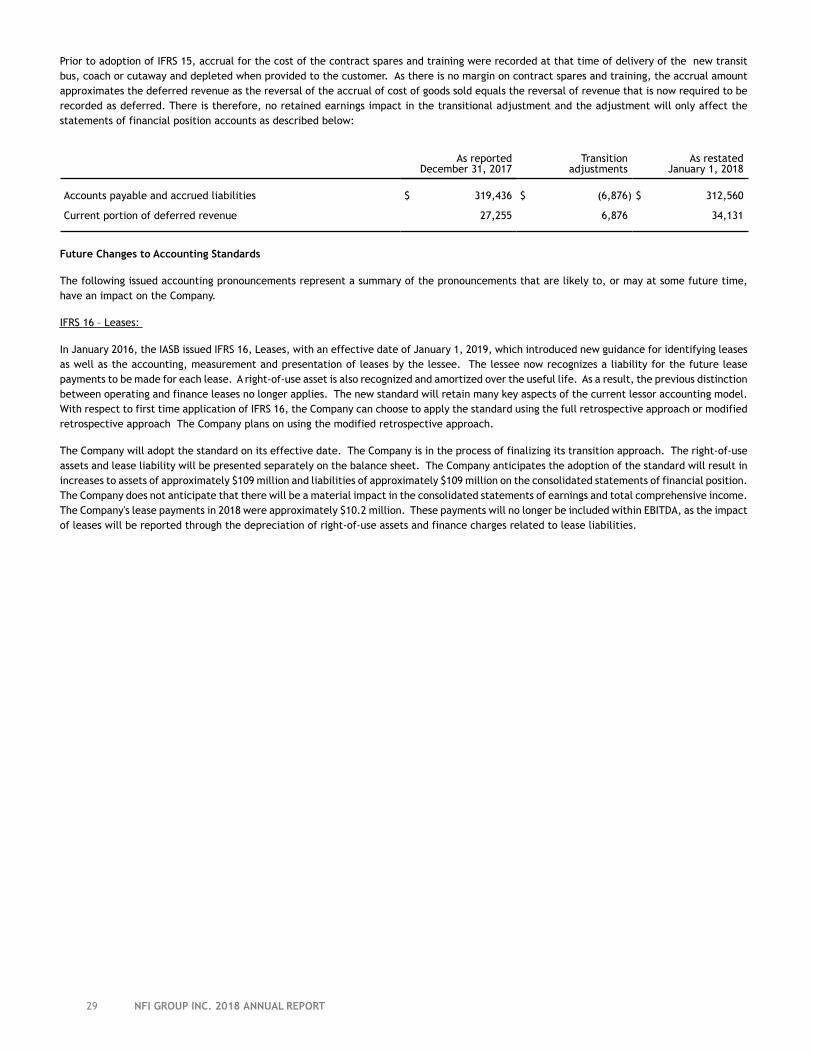
29 NFI GROUP INC. 2018 ANNUAL REPORT
Prior to adoption of IFRS 15, accrual for the cost of the contract spares and training were recorded at that time of delivery of the new transit bus, coach or cutaway and depleted when provided to the customer. As there is no margin on contract spares and training, the accrual amount approximates the deferred revenue as the reversal of the accrual of cost of goods sold equals the reversal of revenue that is now required to be recorded as deferred. There is therefore, no retained earnings impact in the transitional adjustment and the adjustment will only affect the statements of financial position accounts as described below:
As reported December 31, 2017
Transition adjustments
As restatedJanuary 1, 2018
Accounts payable and accrued liabilities $ 319,436 $ (6,876) $ 312,560
Current portion of deferred revenue 27,255 6,876 34,131
Future Changes to Accounting Standards
The following issued accounting pronouncements represent a summary of the pronouncements that are likely to, or may at some future time, have an impact on the Company.
IFRS 16 – Leases:
In January 2016, the IASB issued IFRS 16, Leases, with an effective date of January 1, 2019, which introduced new guidance for identifying leases as well as the accounting, measurement and presentation of leases by the lessee. The lessee now recognizes a liability for the future lease payments to be made for each lease. A right-of-use asset is also recognized and amortized over the useful life. As a result, the previous distinction between operating and finance leases no longer applies. The new standard will retain many key aspects of the current lessor accounting model. With respect to first time application of IFRS 16, the Company can choose to apply the standard using the full retrospective approach or modified retrospective approach The Company plans on using the modified retrospective approach.
The Company will adopt the standard on its effective date. The Company is in the process of finalizing its transition approach. The right-of-use assets and lease liability will be presented separately on the balance sheet. The Company anticipates the adoption of the standard will result in increases to assets of approximately $109 million and liabilities of approximately $109 million on the consolidated statements of financial position. The Company does not anticipate that there will be a material impact in the consolidated statements of earnings and total comprehensive income. The Company's lease payments in 2018 were approximately $10.2 million. These payments will no longer be included within EBITDA, as the impact of leases will be reported through the depreciation of right-of-use assets and finance charges related to lease liabilities.
30 NFI GROUP INC. 2018 ANNUAL REPORT
Controls and Procedures
Internal Controls over Financial Reporting
Management is responsible for establishing and maintaining internal controls over financial reporting (“ICFR”), as defined under rules adopted by the Canadian Securities Administrators. ICFR were designed under the supervision of, and with the participation of, the President and Chief Executive Officer (“CEO”) and the Chief Financial Officer (“CFO”). The Company’s ICFR are designed to provide reasonable assurance regarding the reliability of financial reporting and the preparation of Financial Statements for external purposes in accordance with IFRS.
On December 15, 2014, management adopted the “Internal Control – Integrated Framework 2013” (“COSO 2013”) from the Committee of Sponsoring Organizations of the Treadway Commission, which replaces the previously issued COSO framework, COSO 1992. This new framework necessitated a re-evaluation of the controls that management relies upon to support its conclusions, as well as changes to the Company’s testing programs.
Management, under the supervision of the CEO and CFO, evaluated the design and operational effectiveness of the Company’s ICFR as of December 30, 2018 in accordance with the criteria established in COSO 2013, and concluded that the Company’s ICFR are effective.
Management believes there have been no changes in the Company’s ICFR during 2018 Q4 that have materially affected, or are reasonably likely to materially affect, the Company’s ICFR.
ICFR, no matter how well designed, have inherent limitations. Therefore, ICFR can provide only reasonable assurance with respect to financial statement preparation and may not prevent or detect all misstatements.
Disclosure Controls
Management is responsible for establishing and maintaining disclosure controls and procedures in order to provide reasonable assurance that material information relating to the Company is made known to them in a timely manner and that information required to be disclosed is reported within time periods prescribed by applicable securities legislation. There are inherent limitations to the effectiveness of any system of disclosure controls and procedures, including the possibility of human error and the circumvention or overriding of the controls and procedures. Accordingly, even effective disclosure controls and procedures can only provide reasonable assurance of achieving their control objectives. The Company’s CEO and CFO have concluded that disclosure controls and procedures as at December 30, 2018 were effective.
Consolidated Financial Statements of
NFI GROUP INC.
(FORMERLY NEW FLYER INDUSTRIES INC.)December 30, 2018

TABLE OF CONTENTS
Page
Consolidated Statements of Net Earnings and Total Comprehensive Income1
Consolidated Statements of Financial Position2
Consolidated Statements of Changes in Equity3
Consolidated Statements of Cash Flows4
Notes to the Consolidated Financial Statements5 - 36
1
Independent Auditor’s Report
To the Shareholders of NFI Group Inc.
Opinion We have audited the consolidated financial statements of NFI Group Inc. (the “Company”), which comprise the consolidated statements of financial position at December 30, 2018 and December 31, 2017, and the consolidated statements of net earnings and total comprehensive income, changes in equity and cash flows for the years then ended, and notes to the consolidated financial statements, including a summary of significant accounting policies (collectively referred to as the “financial statements”).
In our opinion, the accompanying financial statements present fairly, in all material respects, the financial position of the Company as at December 30, 2018 and December 31, 2017, and its financial performance and its cash flows for the years then ended in accordance with International Financial Reporting Standards (“IFRS”).
Basis for Opinion We conducted our audit in accordance with Canadian generally accepted auditing standards (“Canadian
GAAS”). Our responsibilities under those standards are further described in the Auditor’s Responsibilities for the Audit of the Financial Statements section of our report. We are independent of the Company in accordance with the ethical requirements that are relevant to our audit of the financial statements in Canada, and we have fulfilled our other ethical responsibilities in accordance with these requirements. We believe that the audit evidence we have obtained is sufficient and appropriate to provide a basis for our opinion.
Other Information Management is responsible for the other information. The other information comprises:
● Management’s Discussion and Analysis
Our opinion on the financial statements does not cover the other information and we do not and will not express any form of assurance conclusion thereon. In connection with our audit of the financial statements, our responsibility is to read the other information identified above and, in doing so, consider whether the other information is materially inconsistent with the financial statements or our knowledge obtained in the audit, or otherwise appears to be materially misstated.
We obtained Management’s Discussion and Analysis prior to the date of this auditor’s report. If, based on the work we have performed on this other information, we conclude that there is a material misstatement of this other information, we are required to report that fact in this auditor’s report. We have nothing to report in this regard.
Responsibilities of Management and Those Charged with Governance for the Financial Statements Management is responsible for the preparation and fair presentation of the financial statements in accordance with IFRS, and for such internal control as management determines is necessary to enable the preparation of financial statements that are free from material misstatement, whether due to fraud or error.
Deloitte LLP 360 Main Street Suite 2300 Winnipeg MB R3C 3Z3 Canada Tel: 1-204-942-0051 Fax: 1-204-947-9390 www.deloitte.ca
2
In preparing the financial statements, management is responsible for assessing the Company’s ability to continue as a going concern, disclosing, as applicable, matters related to going concern and using the going concern basis of accounting unless management either intends to liquidate the Company or to cease operations, or has no realistic alternative but to do so.
Those charged with governance are responsible for overseeing the Company’s financial reporting process.
Auditor’s Responsibilities for the Audit of the Financial Statements Our objectives are to obtain reasonable assurance about whether the financial statements as a whole are free from material misstatement, whether due to fraud or error, and to issue an auditor’s report that includes our opinion. Reasonable assurance is a high level of assurance, but is not a guarantee that an audit conducted in accordance with Canadian GAAS will always detect a material misstatement when it exists. Misstatements can arise from fraud or error and are considered material if, individually or in the aggregate, they could reasonably be expected to influence the economic decisions of users taken on the basis of these financial statements.
As part of an audit in accordance with Canadian GAAS, we exercise professional judgment and maintain professional skepticism throughout the audit. We also:
● Identify and assess the risks of material misstatement of the financial statements, whether due to fraud or error, design and perform audit procedures responsive to those risks, and obtain audit evidence that is sufficient and appropriate to provide a basis for our opinion. The risk of not detecting a material misstatement resulting from fraud is higher than for one resulting from error, as fraud may involve collusion, forgery, intentional omissions, misrepresentations, or the override of internal control.
● Obtain an understanding of internal control relevant to the audit in order to design audit procedures that are appropriate in the circumstances, but not for the purpose of expressing an opinion on the effectiveness of the Company’s internal control.
● Evaluate the appropriateness of accounting policies used and the reasonableness of accounting estimates and related disclosures made by management.
● Conclude on the appropriateness of management’s use of the going concern basis of accounting and, based on the audit evidence obtained, whether a material uncertainty exists related to events or conditions that may cast significant doubt on the Company’s ability to continue as a going concern. If
we conclude that a material uncertainty exists, we are required to draw attention in our auditor’s
report to the related disclosures in the financial statements or, if such disclosures are inadequate, to modify our opinion. Our conclusions are based on the audit evidence obtained up to the date of our auditor’s report. However, future events or conditions may cause the Company to cease to continue as
a going concern.
● Evaluate the overall presentation, structure and content of the financial statements, including the disclosures, and whether the financial statements represent the underlying transactions and events in a manner that achieves fair presentation.
● Obtain sufficient appropriate audit evidence regarding the financial information of the entities or business activities within the Company to express an opinion on the financial statements. We are responsible for the direction, supervision and performance of the group audit. We remain solely responsible for our audit opinion.
3
We communicate with those charged with governance regarding, among other matters, the planned scope and timing of the audit and significant audit findings, including any significant deficiencies in internal control that we identify during our audit.
We also provide those charged with governance with a statement that we have complied with relevant ethical requirements regarding independence, and to communicate with them all relationships and other matters that may reasonably be thought to bear on our independence, and where applicable, related safeguards.
The engagement partner on the audit resulting in this independent auditor’s report is Haik (Haig) Vanlian.
Chartered Professional Accountants Winnipeg, Manitoba March 13, 2019
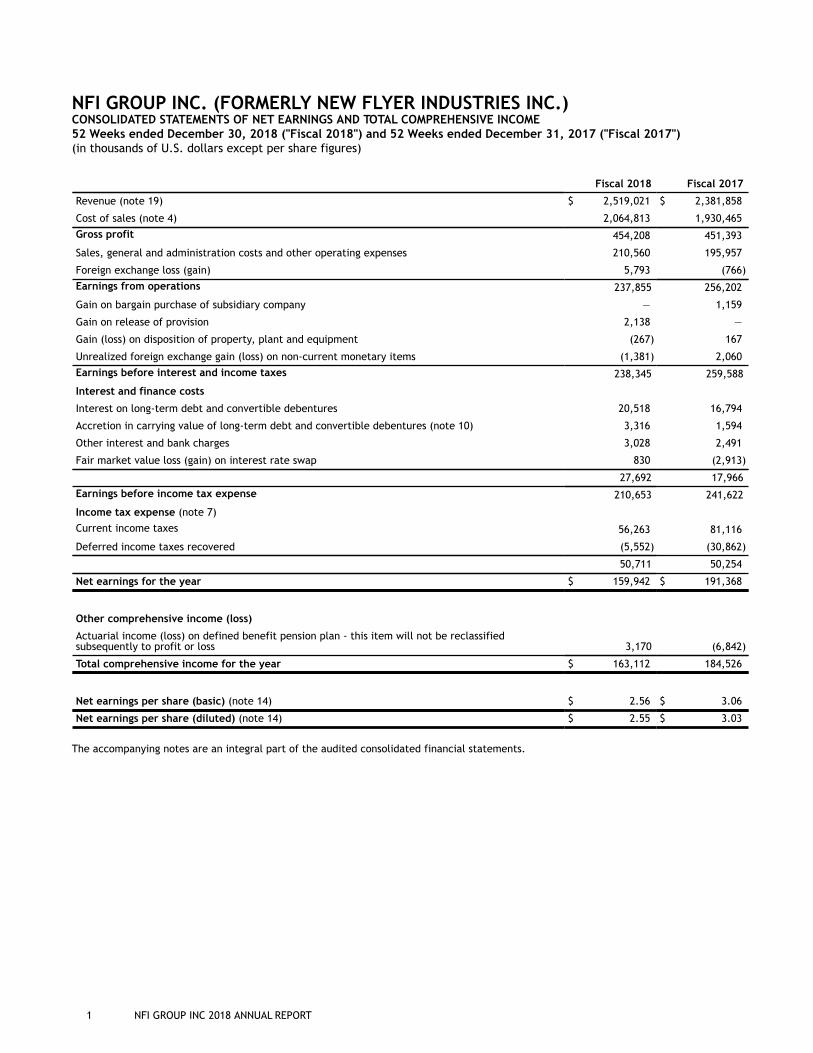
1 NFI GROUP INC 2018 ANNUAL REPORT
NFI GROUP INC. (FORMERLY NEW FLYER INDUSTRIES INC.) CONSOLIDATED STATEMENTS OF NET EARNINGS AND TOTAL COMPREHENSIVE INCOME 52 Weeks ended December 30, 2018 ("Fiscal 2018") and 52 Weeks ended December 31, 2017 ("Fiscal 2017")(in thousands of U.S. dollars except per share figures)
Fiscal 2018 Fiscal 2017
Revenue (note 19) $ 2,519,021 $ 2,381,858
Cost of sales (note 4) 2,064,813 1,930,465
Gross profit 454,208 451,393
Sales, general and administration costs and other operating expenses 210,560 195,957
Foreign exchange loss (gain) 5,793 (766)
Earnings from operations 237,855 256,202
Gain on bargain purchase of subsidiary company — 1,159
Gain on release of provision 2,138 —
Gain (loss) on disposition of property, plant and equipment (267) 167
Unrealized foreign exchange gain (loss) on non-current monetary items (1,381) 2,060
Earnings before interest and income taxes 238,345 259,588
Interest and finance costs
Interest on long-term debt and convertible debentures 20,518 16,794
Accretion in carrying value of long-term debt and convertible debentures (note 10) 3,316 1,594
Other interest and bank charges 3,028 2,491
Fair market value loss (gain) on interest rate swap 830 (2,913)
27,692 17,966
Earnings before income tax expense 210,653 241,622
Income tax expense (note 7)
Current income taxes 56,263 81,116
Deferred income taxes recovered (5,552) (30,862)
50,711 50,254
Net earnings for the year $ 159,942 $ 191,368
Other comprehensive income (loss)
Actuarial income (loss) on defined benefit pension plan - this item will not be reclassifiedsubsequently to profit or loss 3,170 (6,842)
Total comprehensive income for the year $ 163,112 184,526
Net earnings per share (basic) (note 14) $ 2.56 $ 3.06
Net earnings per share (diluted) (note 14) $ 2.55 $ 3.03
The accompanying notes are an integral part of the audited consolidated financial statements.
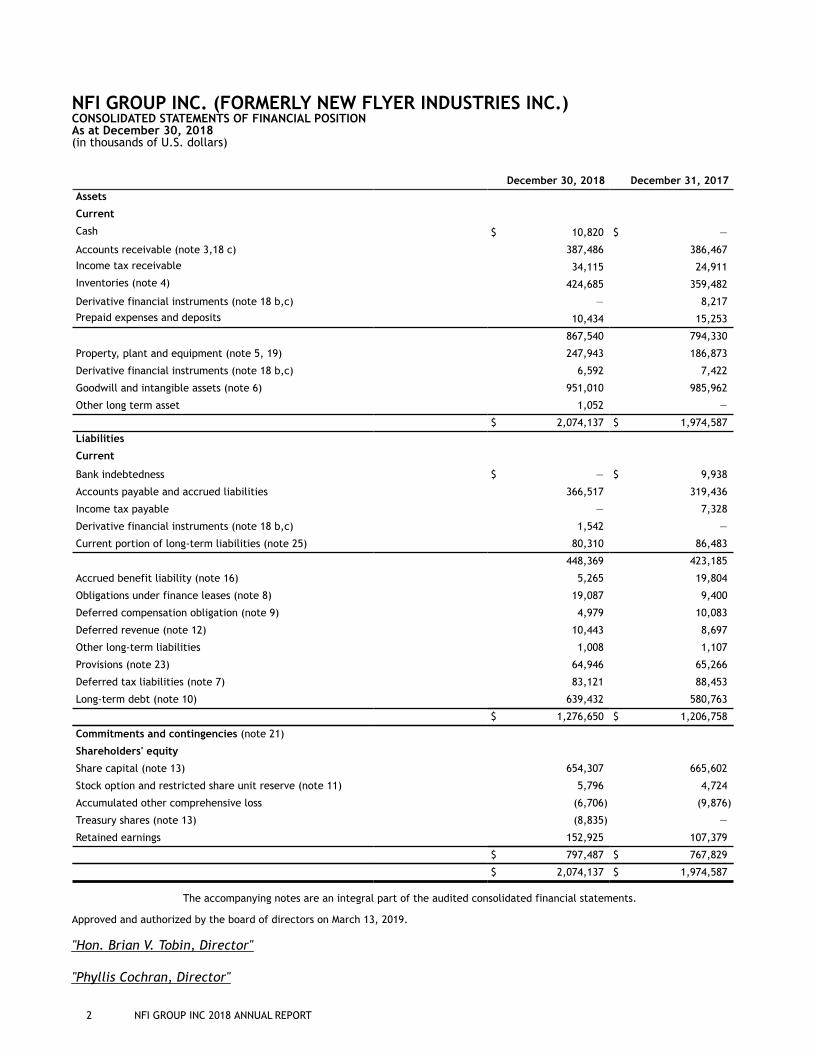
2 NFI GROUP INC 2018 ANNUAL REPORT
NFI GROUP INC. (FORMERLY NEW FLYER INDUSTRIES INC.) CONSOLIDATED STATEMENTS OF FINANCIAL POSITION As at December 30, 2018 (in thousands of U.S. dollars)
December 30, 2018 December 31, 2017
Assets
Current
Cash $ 10,820 $ —
Accounts receivable (note 3,18 c) 387,486 386,467
Income tax receivable 34,115 24,911
Inventories (note 4) 424,685 359,482
Derivative financial instruments (note 18 b,c) — 8,217
Prepaid expenses and deposits 10,434 15,253
867,540 794,330
Property, plant and equipment (note 5, 19) 247,943 186,873
Derivative financial instruments (note 18 b,c) 6,592 7,422
Goodwill and intangible assets (note 6) 951,010 985,962
Other long term asset 1,052 —
$ 2,074,137 $ 1,974,587
Liabilities
Current
Bank indebtedness $ — $ 9,938
Accounts payable and accrued liabilities 366,517 319,436
Income tax payable — 7,328
Derivative financial instruments (note 18 b,c) 1,542 —
Current portion of long-term liabilities (note 25) 80,310 86,483
448,369 423,185
Accrued benefit liability (note 16) 5,265 19,804
Obligations under finance leases (note 8) 19,087 9,400
Deferred compensation obligation (note 9) 4,979 10,083
Deferred revenue (note 12) 10,443 8,697
Other long-term liabilities 1,008 1,107
Provisions (note 23) 64,946 65,266
Deferred tax liabilities (note 7) 83,121 88,453
Long-term debt (note 10) 639,432 580,763
$ 1,276,650 $ 1,206,758
Commitments and contingencies (note 21)
Shareholders' equity
Share capital (note 13) 654,307 665,602
Stock option and restricted share unit reserve (note 11) 5,796 4,724
Accumulated other comprehensive loss (6,706) (9,876)
Treasury shares (note 13) (8,835) —
Retained earnings 152,925 107,379
$ 797,487 $ 767,829
$ 2,074,137 $ 1,974,587
The accompanying notes are an integral part of the audited consolidated financial statements.
Approved and authorized by the board of directors on March 13, 2019.
"Hon. Brian V. Tobin, Director"
"Phyllis Cochran, Director"
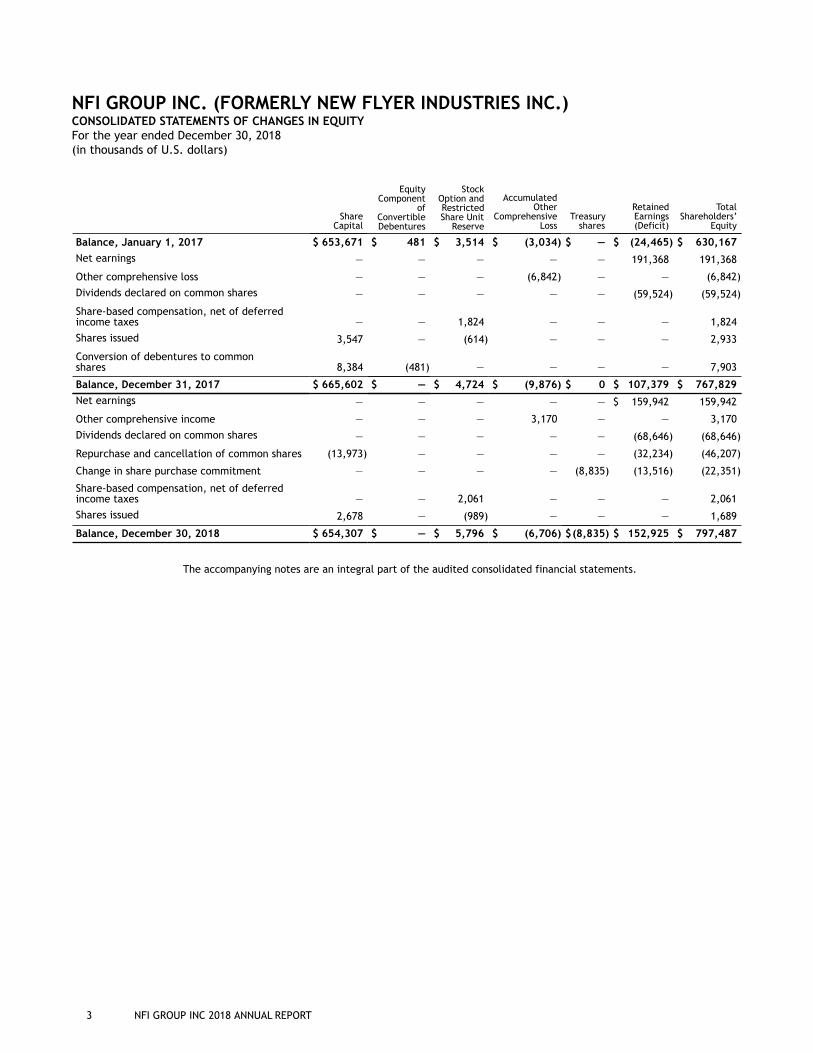
3 NFI GROUP INC 2018 ANNUAL REPORT
NFI GROUP INC. (FORMERLY NEW FLYER INDUSTRIES INC.) CONSOLIDATED STATEMENTS OF CHANGES IN EQUITY For the year ended December 30, 2018 (in thousands of U.S. dollars)
ShareCapital
EquityComponent
ofConvertibleDebentures
StockOption andRestrictedShare Unit
Reserve
AccumulatedOther
ComprehensiveLoss
Treasuryshares
RetainedEarnings(Deficit)
TotalShareholders’
Equity
Balance, January 1, 2017 $ 653,671 $ 481 $ 3,514 $ (3,034) $ — $ (24,465) $ 630,167
Net earnings — — — — — 191,368 191,368
Other comprehensive loss — — — (6,842) — — (6,842)
Dividends declared on common shares — — — — — (59,524) (59,524)
Share-based compensation, net of deferredincome taxes — — 1,824 — — — 1,824
Shares issued 3,547 — (614) — — — 2,933
Conversion of debentures to commonshares 8,384 (481) — — — — 7,903
Balance, December 31, 2017 $ 665,602 $ — $ 4,724 $ (9,876) $ 0 $ 107,379 $ 767,829
Net earnings — — — — — $ 159,942 159,942
Other comprehensive income — — — 3,170 — — 3,170
Dividends declared on common shares — — — — — (68,646) (68,646)
Repurchase and cancellation of common shares (13,973) — — — — (32,234) (46,207)
Change in share purchase commitment — — — — (8,835) (13,516) (22,351)
Share-based compensation, net of deferredincome taxes — — 2,061 — — — 2,061
Shares issued 2,678 — (989) — — — 1,689
Balance, December 30, 2018 $ 654,307 $ — $ 5,796 $ (6,706) $(8,835) $ 152,925 $ 797,487
The accompanying notes are an integral part of the audited consolidated financial statements.
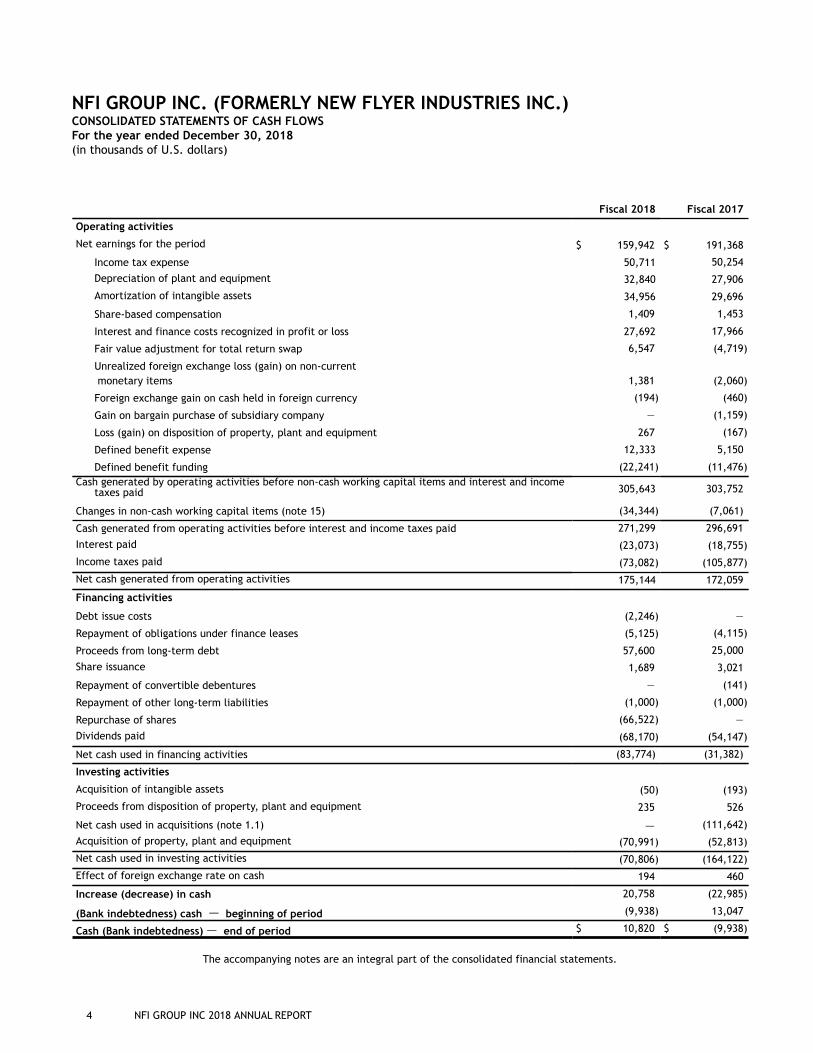
4 NFI GROUP INC 2018 ANNUAL REPORT
NFI GROUP INC. (FORMERLY NEW FLYER INDUSTRIES INC.) CONSOLIDATED STATEMENTS OF CASH FLOWS For the year ended December 30, 2018 (in thousands of U.S. dollars)
Fiscal 2018 Fiscal 2017
Operating activities
Net earnings for the period $ 159,942 $ 191,368
Income tax expense 50,711 50,254
Depreciation of plant and equipment 32,840 27,906
Amortization of intangible assets 34,956 29,696
Share-based compensation 1,409 1,453
Interest and finance costs recognized in profit or loss 27,692 17,966
Fair value adjustment for total return swap 6,547 (4,719)
Unrealized foreign exchange loss (gain) on non-current monetary items 1,381 (2,060)
Foreign exchange gain on cash held in foreign currency (194) (460)
Gain on bargain purchase of subsidiary company — (1,159)
Loss (gain) on disposition of property, plant and equipment 267 (167)
Defined benefit expense 12,333 5,150
Defined benefit funding (22,241) (11,476)Cash generated by operating activities before non-cash working capital items and interest and income
taxes paid 305,643 303,752
Changes in non-cash working capital items (note 15) (34,344) (7,061)
Cash generated from operating activities before interest and income taxes paid 271,299 296,691
Interest paid (23,073) (18,755)
Income taxes paid (73,082) (105,877)
Net cash generated from operating activities 175,144 172,059
Financing activities
Debt issue costs (2,246) —
Repayment of obligations under finance leases (5,125) (4,115)
Proceeds from long-term debt 57,600 25,000
Share issuance 1,689 3,021
Repayment of convertible debentures — (141)
Repayment of other long-term liabilities (1,000) (1,000)
Repurchase of shares (66,522) —
Dividends paid (68,170) (54,147)
Net cash used in financing activities (83,774) (31,382)
Investing activities
Acquisition of intangible assets (50) (193)
Proceeds from disposition of property, plant and equipment 235 526
Net cash used in acquisitions (note 1.1) — (111,642)
Acquisition of property, plant and equipment (70,991) (52,813)
Net cash used in investing activities (70,806) (164,122)
Effect of foreign exchange rate on cash 194 460
Increase (decrease) in cash 20,758 (22,985)
(Bank indebtedness) cash — beginning of period (9,938) 13,047
Cash (Bank indebtedness) — end of period $ 10,820 $ (9,938)
The accompanying notes are an integral part of the consolidated financial statements.
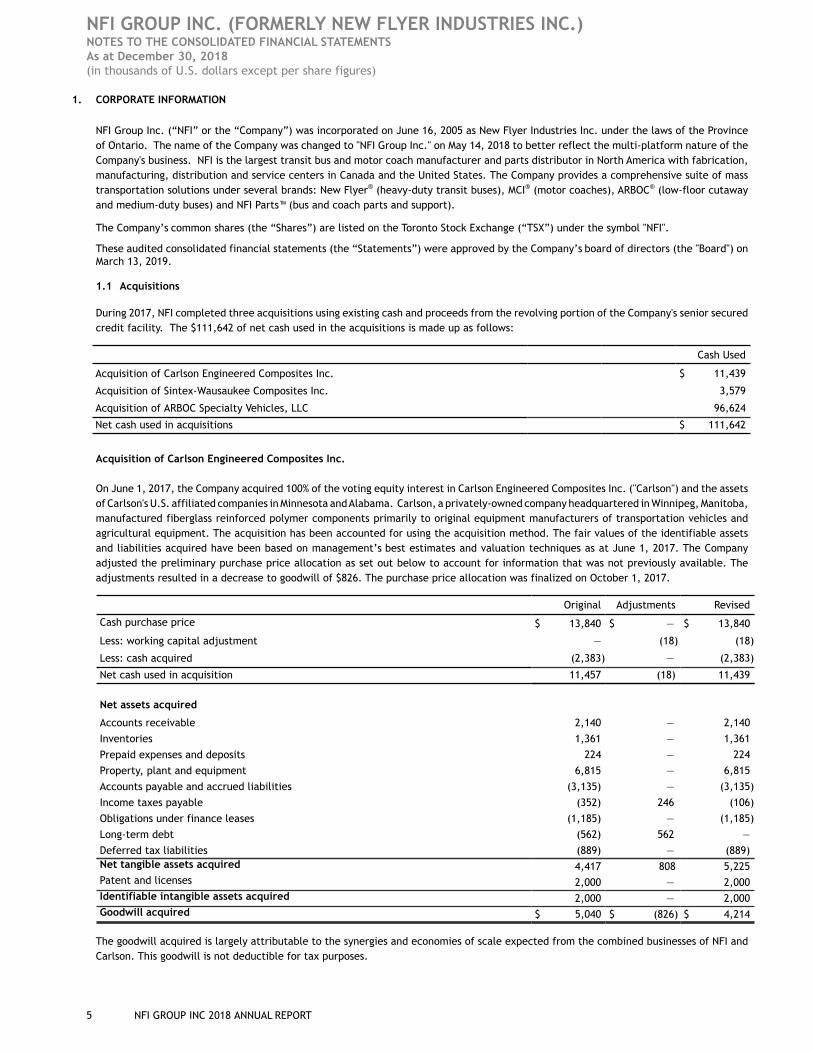
NFI GROUP INC. (FORMERLY NEW FLYER INDUSTRIES INC.) NOTES TO THE CONSOLIDATED FINANCIAL STATEMENTS As at December 30, 2018(in thousands of U.S. dollars except per share figures)
5 NFI GROUP INC 2018 ANNUAL REPORT
1. CORPORATE INFORMATION
NFI Group Inc. (“NFI” or the “Company”) was incorporated on June 16, 2005 as New Flyer Industries Inc. under the laws of the Province of Ontario. The name of the Company was changed to "NFI Group Inc." on May 14, 2018 to better reflect the multi-platform nature of the Company's business. NFI is the largest transit bus and motor coach manufacturer and parts distributor in North America with fabrication, manufacturing, distribution and service centers in Canada and the United States. The Company provides a comprehensive suite of mass transportation solutions under several brands: New Flyer® (heavy-duty transit buses), MCI® (motor coaches), ARBOC® (low-floor cutaway and medium-duty buses) and NFI Parts™ (bus and coach parts and support).
The Company’s common shares (the “Shares”) are listed on the Toronto Stock Exchange (“TSX”) under the symbol "NFI".
These audited consolidated financial statements (the “Statements”) were approved by the Company’s board of directors (the "Board") on March 13, 2019.
1.1 Acquisitions
During 2017, NFI completed three acquisitions using existing cash and proceeds from the revolving portion of the Company's senior secured credit facility. The $111,642 of net cash used in the acquisitions is made up as follows:
Cash Used
Acquisition of Carlson Engineered Composites Inc. $ 11,439
Acquisition of Sintex-Wausaukee Composites Inc. 3,579
Acquisition of ARBOC Specialty Vehicles, LLC 96,624
Net cash used in acquisitions $ 111,642
Acquisition of Carlson Engineered Composites Inc.
On June 1, 2017, the Company acquired 100% of the voting equity interest in Carlson Engineered Composites Inc. ("Carlson") and the assets of Carlson's U.S. affiliated companies in Minnesota and Alabama. Carlson, a privately-owned company headquartered in Winnipeg, Manitoba, manufactured fiberglass reinforced polymer components primarily to original equipment manufacturers of transportation vehicles and agricultural equipment. The acquisition has been accounted for using the acquisition method. The fair values of the identifiable assets and liabilities acquired have been based on management’s best estimates and valuation techniques as at June 1, 2017. The Company adjusted the preliminary purchase price allocation as set out below to account for information that was not previously available. The adjustments resulted in a decrease to goodwill of $826. The purchase price allocation was finalized on October 1, 2017.
Original Adjustments Revised
Cash purchase price $ 13,840 $ — $ 13,840
Less: working capital adjustment — (18) (18)
Less: cash acquired (2,383) — (2,383)
Net cash used in acquisition 11,457 (18) 11,439
Net assets acquired
Accounts receivable 2,140 — 2,140
Inventories 1,361 — 1,361
Prepaid expenses and deposits 224 — 224
Property, plant and equipment 6,815 — 6,815
Accounts payable and accrued liabilities (3,135) — (3,135)
Income taxes payable (352) 246 (106)
Obligations under finance leases (1,185) — (1,185)
Long-term debt (562) 562 —
Deferred tax liabilities (889) — (889)Net tangible assets acquired 4,417 808 5,225Patent and licenses 2,000 — 2,000Identifiable intangible assets acquired 2,000 — 2,000Goodwill acquired $ 5,040 $ (826) $ 4,214
The goodwill acquired is largely attributable to the synergies and economies of scale expected from the combined businesses of NFI and Carlson. This goodwill is not deductible for tax purposes.
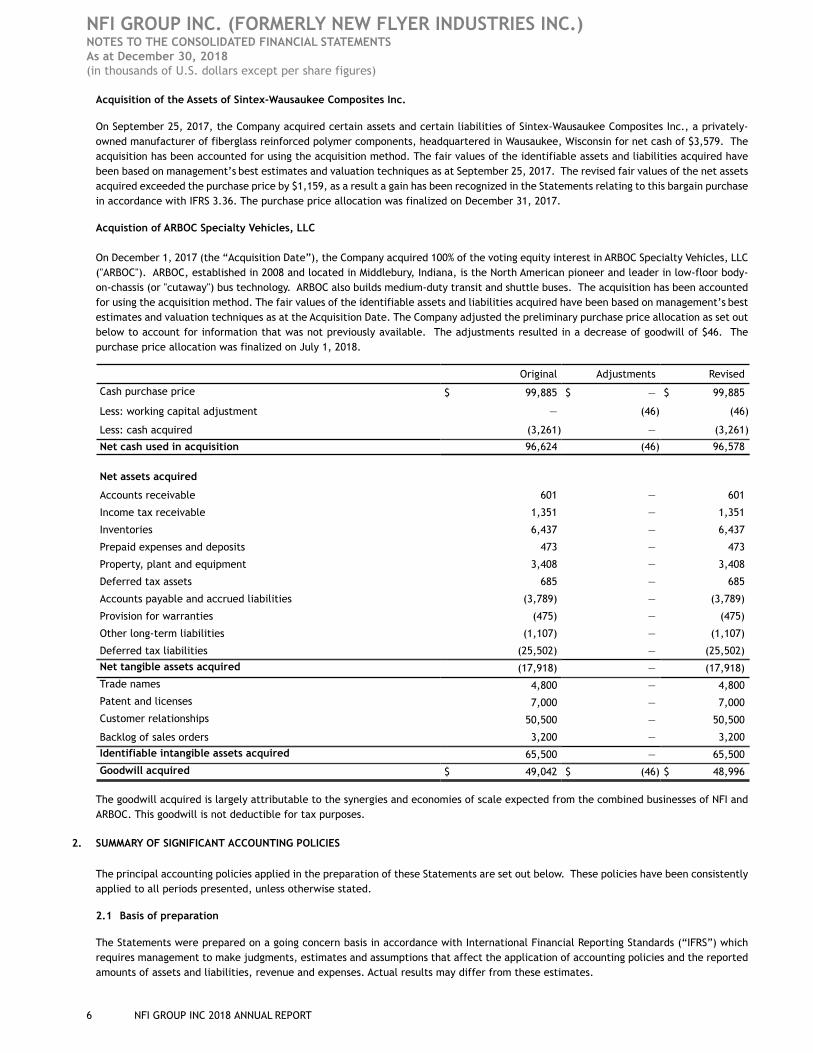
NFI GROUP INC. (FORMERLY NEW FLYER INDUSTRIES INC.) NOTES TO THE CONSOLIDATED FINANCIAL STATEMENTS As at December 30, 2018(in thousands of U.S. dollars except per share figures)
6 NFI GROUP INC 2018 ANNUAL REPORT
Acquisition of the Assets of Sintex-Wausaukee Composites Inc.
On September 25, 2017, the Company acquired certain assets and certain liabilities of Sintex-Wausaukee Composites Inc., a privately-owned manufacturer of fiberglass reinforced polymer components, headquartered in Wausaukee, Wisconsin for net cash of $3,579. The acquisition has been accounted for using the acquisition method. The fair values of the identifiable assets and liabilities acquired have been based on management’s best estimates and valuation techniques as at September 25, 2017. The revised fair values of the net assets acquired exceeded the purchase price by $1,159, as a result a gain has been recognized in the Statements relating to this bargain purchase in accordance with IFRS 3.36. The purchase price allocation was finalized on December 31, 2017.
Acquistion of ARBOC Specialty Vehicles, LLC
On December 1, 2017 (the “Acquisition Date”), the Company acquired 100% of the voting equity interest in ARBOC Specialty Vehicles, LLC ("ARBOC"). ARBOC, established in 2008 and located in Middlebury, Indiana, is the North American pioneer and leader in low-floor body-on-chassis (or "cutaway") bus technology. ARBOC also builds medium-duty transit and shuttle buses. The acquisition has been accounted for using the acquisition method. The fair values of the identifiable assets and liabilities acquired have been based on management’s best estimates and valuation techniques as at the Acquisition Date. The Company adjusted the preliminary purchase price allocation as set out below to account for information that was not previously available. The adjustments resulted in a decrease of goodwill of $46. The purchase price allocation was finalized on July 1, 2018.
Original Adjustments Revised
Cash purchase price $ 99,885 $ — $ 99,885
Less: working capital adjustment — (46) (46)
Less: cash acquired (3,261) — (3,261)
Net cash used in acquisition 96,624 (46) 96,578
Net assets acquired
Accounts receivable 601 — 601
Income tax receivable 1,351 — 1,351
Inventories 6,437 — 6,437
Prepaid expenses and deposits 473 — 473
Property, plant and equipment 3,408 — 3,408
Deferred tax assets 685 — 685
Accounts payable and accrued liabilities (3,789) — (3,789)
Provision for warranties (475) — (475)
Other long-term liabilities (1,107) — (1,107)
Deferred tax liabilities (25,502) — (25,502)
Net tangible assets acquired (17,918) — (17,918)
Trade names 4,800 — 4,800
Patent and licenses 7,000 — 7,000
Customer relationships 50,500 — 50,500
Backlog of sales orders 3,200 — 3,200
Identifiable intangible assets acquired 65,500 — 65,500
Goodwill acquired $ 49,042 $ (46) $ 48,996
The goodwill acquired is largely attributable to the synergies and economies of scale expected from the combined businesses of NFI and ARBOC. This goodwill is not deductible for tax purposes.
2. SUMMARY OF SIGNIFICANT ACCOUNTING POLICIES
The principal accounting policies applied in the preparation of these Statements are set out below. These policies have been consistently applied to all periods presented, unless otherwise stated.
2.1 Basis of preparation
The Statements were prepared on a going concern basis in accordance with International Financial Reporting Standards (“IFRS”) which requires management to make judgments, estimates and assumptions that affect the application of accounting policies and the reported amounts of assets and liabilities, revenue and expenses. Actual results may differ from these estimates.
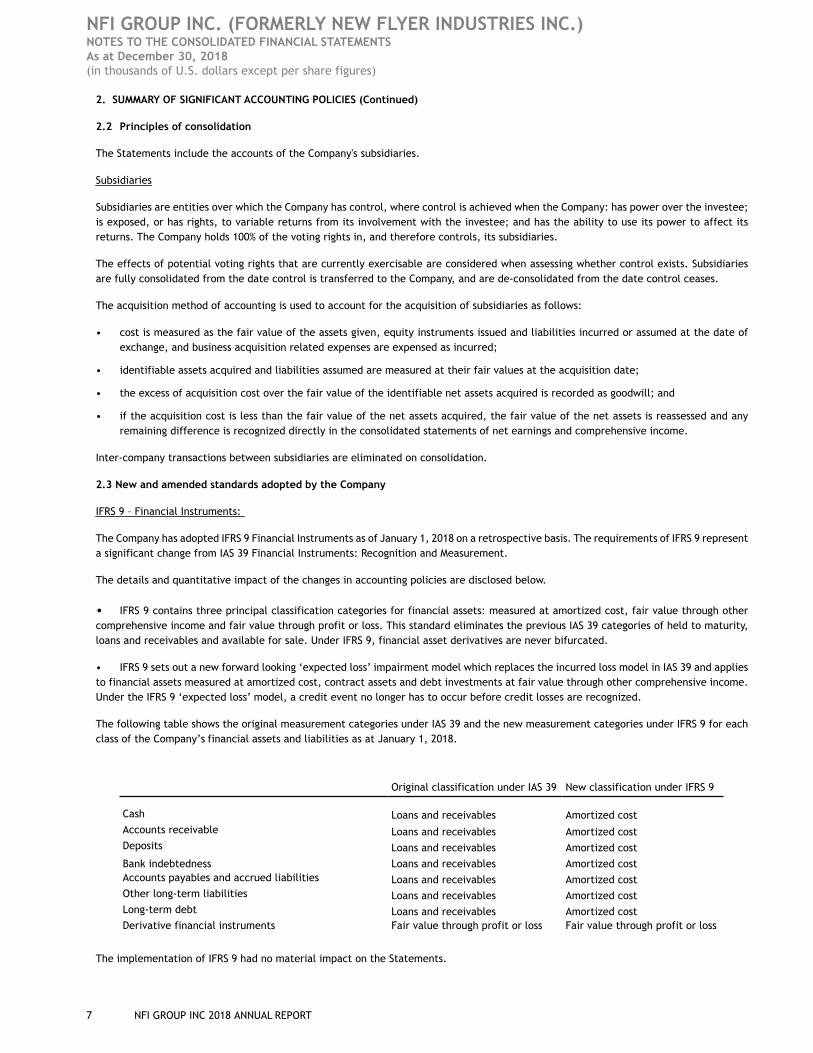
NFI GROUP INC. (FORMERLY NEW FLYER INDUSTRIES INC.) NOTES TO THE CONSOLIDATED FINANCIAL STATEMENTS As at December 30, 2018(in thousands of U.S. dollars except per share figures)
7 NFI GROUP INC 2018 ANNUAL REPORT
2. SUMMARY OF SIGNIFICANT ACCOUNTING POLICIES (Continued)
2.2 Principles of consolidation
The Statements include the accounts of the Company's subsidiaries.
Subsidiaries
Subsidiaries are entities over which the Company has control, where control is achieved when the Company: has power over the investee; is exposed, or has rights, to variable returns from its involvement with the investee; and has the ability to use its power to affect its returns. The Company holds 100% of the voting rights in, and therefore controls, its subsidiaries.
The effects of potential voting rights that are currently exercisable are considered when assessing whether control exists. Subsidiaries are fully consolidated from the date control is transferred to the Company, and are de-consolidated from the date control ceases.
The acquisition method of accounting is used to account for the acquisition of subsidiaries as follows:
• cost is measured as the fair value of the assets given, equity instruments issued and liabilities incurred or assumed at the date of exchange, and business acquisition related expenses are expensed as incurred;
• identifiable assets acquired and liabilities assumed are measured at their fair values at the acquisition date;
• the excess of acquisition cost over the fair value of the identifiable net assets acquired is recorded as goodwill; and
• if the acquisition cost is less than the fair value of the net assets acquired, the fair value of the net assets is reassessed and any remaining difference is recognized directly in the consolidated statements of net earnings and comprehensive income.
Inter-company transactions between subsidiaries are eliminated on consolidation.
2.3 New and amended standards adopted by the Company
IFRS 9 – Financial Instruments:
The Company has adopted IFRS 9 Financial Instruments as of January 1, 2018 on a retrospective basis. The requirements of IFRS 9 represent a significant change from IAS 39 Financial Instruments: Recognition and Measurement.
The details and quantitative impact of the changes in accounting policies are disclosed below.
• IFRS 9 contains three principal classification categories for financial assets: measured at amortized cost, fair value through other comprehensive income and fair value through profit or loss. This standard eliminates the previous IAS 39 categories of held to maturity, loans and receivables and available for sale. Under IFRS 9, financial asset derivatives are never bifurcated.
• IFRS 9 sets out a new forward looking ‘expected loss’ impairment model which replaces the incurred loss model in IAS 39 and applies to financial assets measured at amortized cost, contract assets and debt investments at fair value through other comprehensive income. Under the IFRS 9 ‘expected loss’ model, a credit event no longer has to occur before credit losses are recognized.
The following table shows the original measurement categories under IAS 39 and the new measurement categories under IFRS 9 for each class of the Company’s financial assets and liabilities as at January 1, 2018.
Original classification under IAS 39 New classification under IFRS 9
Cash Loans and receivables Amortized costAccounts receivable Loans and receivables Amortized costDeposits Loans and receivables Amortized cost
Bank indebtedness Loans and receivables Amortized costAccounts payables and accrued liabilities Loans and receivables Amortized costOther long-term liabilities Loans and receivables Amortized costLong-term debt Loans and receivables Amortized costDerivative financial instruments Fair value through profit or loss Fair value through profit or loss
The implementation of IFRS 9 had no material impact on the Statements.
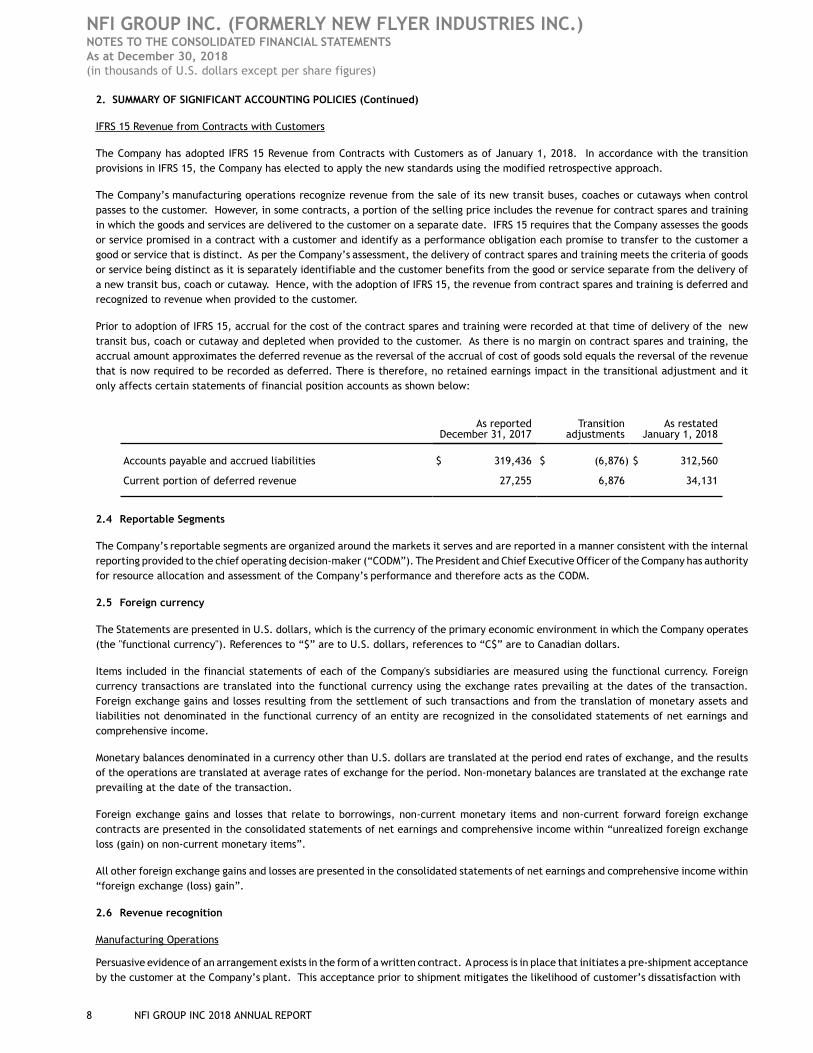
NFI GROUP INC. (FORMERLY NEW FLYER INDUSTRIES INC.) NOTES TO THE CONSOLIDATED FINANCIAL STATEMENTS As at December 30, 2018(in thousands of U.S. dollars except per share figures)
8 NFI GROUP INC 2018 ANNUAL REPORT
2. SUMMARY OF SIGNIFICANT ACCOUNTING POLICIES (Continued)
IFRS 15 Revenue from Contracts with Customers
The Company has adopted IFRS 15 Revenue from Contracts with Customers as of January 1, 2018. In accordance with the transition provisions in IFRS 15, the Company has elected to apply the new standards using the modified retrospective approach.
The Company’s manufacturing operations recognize revenue from the sale of its new transit buses, coaches or cutaways when control passes to the customer. However, in some contracts, a portion of the selling price includes the revenue for contract spares and training in which the goods and services are delivered to the customer on a separate date. IFRS 15 requires that the Company assesses the goods or service promised in a contract with a customer and identify as a performance obligation each promise to transfer to the customer a good or service that is distinct. As per the Company’s assessment, the delivery of contract spares and training meets the criteria of goods or service being distinct as it is separately identifiable and the customer benefits from the good or service separate from the delivery of a new transit bus, coach or cutaway. Hence, with the adoption of IFRS 15, the revenue from contract spares and training is deferred and recognized to revenue when provided to the customer.
Prior to adoption of IFRS 15, accrual for the cost of the contract spares and training were recorded at that time of delivery of the new transit bus, coach or cutaway and depleted when provided to the customer. As there is no margin on contract spares and training, the accrual amount approximates the deferred revenue as the reversal of the accrual of cost of goods sold equals the reversal of the revenue that is now required to be recorded as deferred. There is therefore, no retained earnings impact in the transitional adjustment and it only affects certain statements of financial position accounts as shown below:
As reported December 31, 2017
Transition adjustments
As restatedJanuary 1, 2018
Accounts payable and accrued liabilities $ 319,436 $ (6,876) $ 312,560
Current portion of deferred revenue 27,255 6,876 34,131
2.4 Reportable Segments
The Company’s reportable segments are organized around the markets it serves and are reported in a manner consistent with the internal reporting provided to the chief operating decision-maker (“CODM”). The President and Chief Executive Officer of the Company has authority for resource allocation and assessment of the Company’s performance and therefore acts as the CODM.
2.5 Foreign currency
The Statements are presented in U.S. dollars, which is the currency of the primary economic environment in which the Company operates (the "functional currency"). References to “$” are to U.S. dollars, references to “C$” are to Canadian dollars.
Items included in the financial statements of each of the Company's subsidiaries are measured using the functional currency. Foreign currency transactions are translated into the functional currency using the exchange rates prevailing at the dates of the transaction. Foreign exchange gains and losses resulting from the settlement of such transactions and from the translation of monetary assets and liabilities not denominated in the functional currency of an entity are recognized in the consolidated statements of net earnings and comprehensive income.
Monetary balances denominated in a currency other than U.S. dollars are translated at the period end rates of exchange, and the results of the operations are translated at average rates of exchange for the period. Non-monetary balances are translated at the exchange rate prevailing at the date of the transaction.
Foreign exchange gains and losses that relate to borrowings, non-current monetary items and non-current forward foreign exchange contracts are presented in the consolidated statements of net earnings and comprehensive income within “unrealized foreign exchange loss (gain) on non-current monetary items”.
All other foreign exchange gains and losses are presented in the consolidated statements of net earnings and comprehensive income within “foreign exchange (loss) gain”.
2.6 Revenue recognition
Manufacturing Operations
Persuasive evidence of an arrangement exists in the form of a written contract. A process is in place that initiates a pre-shipment acceptance by the customer at the Company’s plant. This acceptance prior to shipment mitigates the likelihood of customer’s dissatisfaction with
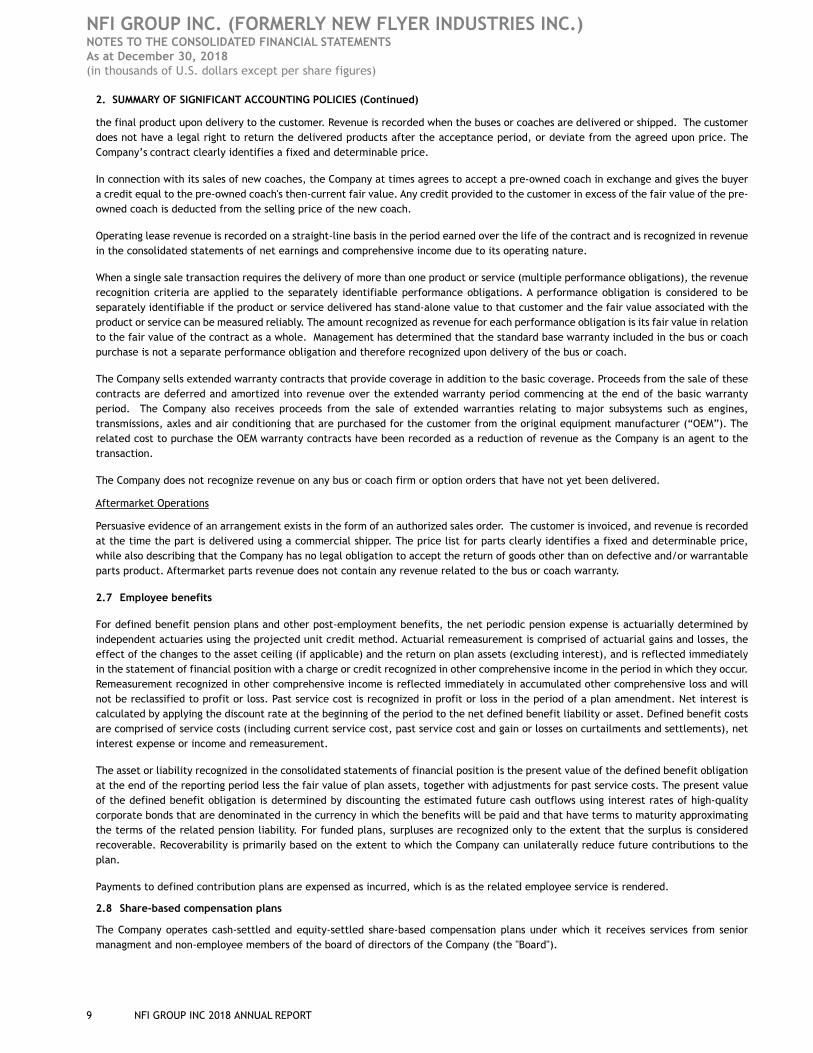
NFI GROUP INC. (FORMERLY NEW FLYER INDUSTRIES INC.) NOTES TO THE CONSOLIDATED FINANCIAL STATEMENTS As at December 30, 2018(in thousands of U.S. dollars except per share figures)
9 NFI GROUP INC 2018 ANNUAL REPORT
2. SUMMARY OF SIGNIFICANT ACCOUNTING POLICIES (Continued)
the final product upon delivery to the customer. Revenue is recorded when the buses or coaches are delivered or shipped. The customer does not have a legal right to return the delivered products after the acceptance period, or deviate from the agreed upon price. The Company’s contract clearly identifies a fixed and determinable price.
In connection with its sales of new coaches, the Company at times agrees to accept a pre-owned coach in exchange and gives the buyer a credit equal to the pre-owned coach's then-current fair value. Any credit provided to the customer in excess of the fair value of the pre-owned coach is deducted from the selling price of the new coach.
Operating lease revenue is recorded on a straight-line basis in the period earned over the life of the contract and is recognized in revenue in the consolidated statements of net earnings and comprehensive income due to its operating nature.
When a single sale transaction requires the delivery of more than one product or service (multiple performance obligations), the revenue recognition criteria are applied to the separately identifiable performance obligations. A performance obligation is considered to be separately identifiable if the product or service delivered has stand-alone value to that customer and the fair value associated with the product or service can be measured reliably. The amount recognized as revenue for each performance obligation is its fair value in relation to the fair value of the contract as a whole. Management has determined that the standard base warranty included in the bus or coach purchase is not a separate performance obligation and therefore recognized upon delivery of the bus or coach.
The Company sells extended warranty contracts that provide coverage in addition to the basic coverage. Proceeds from the sale of these contracts are deferred and amortized into revenue over the extended warranty period commencing at the end of the basic warranty period. The Company also receives proceeds from the sale of extended warranties relating to major subsystems such as engines, transmissions, axles and air conditioning that are purchased for the customer from the original equipment manufacturer (“OEM”). The related cost to purchase the OEM warranty contracts have been recorded as a reduction of revenue as the Company is an agent to the transaction.
The Company does not recognize revenue on any bus or coach firm or option orders that have not yet been delivered.
Aftermarket Operations
Persuasive evidence of an arrangement exists in the form of an authorized sales order. The customer is invoiced, and revenue is recorded at the time the part is delivered using a commercial shipper. The price list for parts clearly identifies a fixed and determinable price, while also describing that the Company has no legal obligation to accept the return of goods other than on defective and/or warrantable parts product. Aftermarket parts revenue does not contain any revenue related to the bus or coach warranty.
2.7 Employee benefits
For defined benefit pension plans and other post-employment benefits, the net periodic pension expense is actuarially determined by independent actuaries using the projected unit credit method. Actuarial remeasurement is comprised of actuarial gains and losses, the effect of the changes to the asset ceiling (if applicable) and the return on plan assets (excluding interest), and is reflected immediately in the statement of financial position with a charge or credit recognized in other comprehensive income in the period in which they occur. Remeasurement recognized in other comprehensive income is reflected immediately in accumulated other comprehensive loss and will not be reclassified to profit or loss. Past service cost is recognized in profit or loss in the period of a plan amendment. Net interest is calculated by applying the discount rate at the beginning of the period to the net defined benefit liability or asset. Defined benefit costs are comprised of service costs (including current service cost, past service cost and gain or losses on curtailments and settlements), net interest expense or income and remeasurement.
The asset or liability recognized in the consolidated statements of financial position is the present value of the defined benefit obligation at the end of the reporting period less the fair value of plan assets, together with adjustments for past service costs. The present value of the defined benefit obligation is determined by discounting the estimated future cash outflows using interest rates of high-quality corporate bonds that are denominated in the currency in which the benefits will be paid and that have terms to maturity approximating the terms of the related pension liability. For funded plans, surpluses are recognized only to the extent that the surplus is considered recoverable. Recoverability is primarily based on the extent to which the Company can unilaterally reduce future contributions to the plan.
Payments to defined contribution plans are expensed as incurred, which is as the related employee service is rendered.
2.8 Share-based compensation plans
The Company operates cash-settled and equity-settled share-based compensation plans under which it receives services from senior managment and non-employee members of the board of directors of the Company (the "Board").
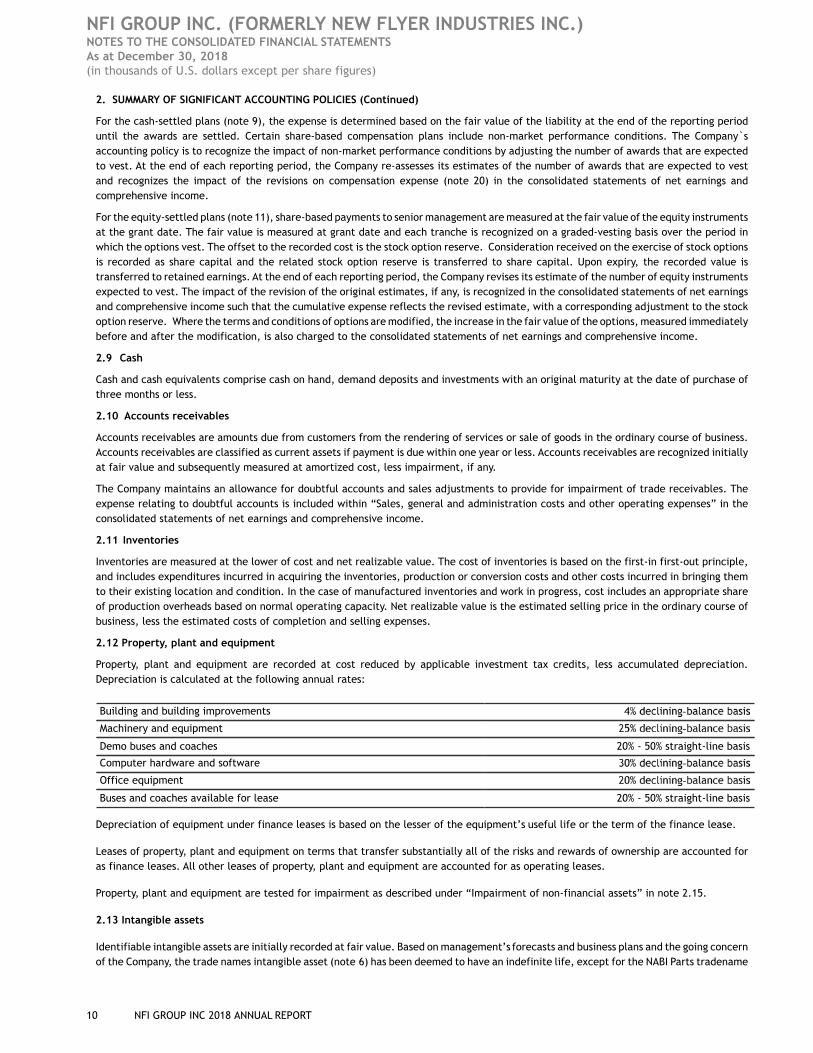
NFI GROUP INC. (FORMERLY NEW FLYER INDUSTRIES INC.) NOTES TO THE CONSOLIDATED FINANCIAL STATEMENTS As at December 30, 2018(in thousands of U.S. dollars except per share figures)
10 NFI GROUP INC 2018 ANNUAL REPORT
2. SUMMARY OF SIGNIFICANT ACCOUNTING POLICIES (Continued)
For the cash-settled plans (note 9), the expense is determined based on the fair value of the liability at the end of the reporting period until the awards are settled. Certain share-based compensation plans include non-market performance conditions. The Company`s accounting policy is to recognize the impact of non-market performance conditions by adjusting the number of awards that are expected to vest. At the end of each reporting period, the Company re-assesses its estimates of the number of awards that are expected to vest and recognizes the impact of the revisions on compensation expense (note 20) in the consolidated statements of net earnings and comprehensive income.
For the equity-settled plans (note 11), share-based payments to senior management are measured at the fair value of the equity instruments at the grant date. The fair value is measured at grant date and each tranche is recognized on a graded-vesting basis over the period in which the options vest. The offset to the recorded cost is the stock option reserve. Consideration received on the exercise of stock options is recorded as share capital and the related stock option reserve is transferred to share capital. Upon expiry, the recorded value is transferred to retained earnings. At the end of each reporting period, the Company revises its estimate of the number of equity instruments expected to vest. The impact of the revision of the original estimates, if any, is recognized in the consolidated statements of net earnings and comprehensive income such that the cumulative expense reflects the revised estimate, with a corresponding adjustment to the stock option reserve. Where the terms and conditions of options are modified, the increase in the fair value of the options, measured immediately before and after the modification, is also charged to the consolidated statements of net earnings and comprehensive income.
2.9 Cash
Cash and cash equivalents comprise cash on hand, demand deposits and investments with an original maturity at the date of purchase of three months or less.
2.10 Accounts receivables
Accounts receivables are amounts due from customers from the rendering of services or sale of goods in the ordinary course of business. Accounts receivables are classified as current assets if payment is due within one year or less. Accounts receivables are recognized initially at fair value and subsequently measured at amortized cost, less impairment, if any.
The Company maintains an allowance for doubtful accounts and sales adjustments to provide for impairment of trade receivables. The expense relating to doubtful accounts is included within “Sales, general and administration costs and other operating expenses” in the consolidated statements of net earnings and comprehensive income.
2.11 Inventories
Inventories are measured at the lower of cost and net realizable value. The cost of inventories is based on the first-in first-out principle, and includes expenditures incurred in acquiring the inventories, production or conversion costs and other costs incurred in bringing them to their existing location and condition. In the case of manufactured inventories and work in progress, cost includes an appropriate share of production overheads based on normal operating capacity. Net realizable value is the estimated selling price in the ordinary course of business, less the estimated costs of completion and selling expenses.
2.12 Property, plant and equipment
Property, plant and equipment are recorded at cost reduced by applicable investment tax credits, less accumulated depreciation. Depreciation is calculated at the following annual rates:
Building and building improvements
Machinery and equipment
Demo buses and coaches 20% - 50% straight-line basis
Computer hardware and software
Office equipment
Buses and coaches available for lease 20% - 50% straight-line basis
Depreciation of equipment under finance leases is based on the lesser of the equipment’s useful life or the term of the finance lease.
Leases of property, plant and equipment on terms that transfer substantially all of the risks and rewards of ownership are accounted for as finance leases. All other leases of property, plant and equipment are accounted for as operating leases.
Property, plant and equipment are tested for impairment as described under “Impairment of non-financial assets” in note 2.15.
2.13 Intangible assets
Identifiable intangible assets are initially recorded at fair value. Based on management’s forecasts and business plans and the going concern of the Company, the trade names intangible asset (note 6) has been deemed to have an indefinite life, except for the NABI Parts tradename
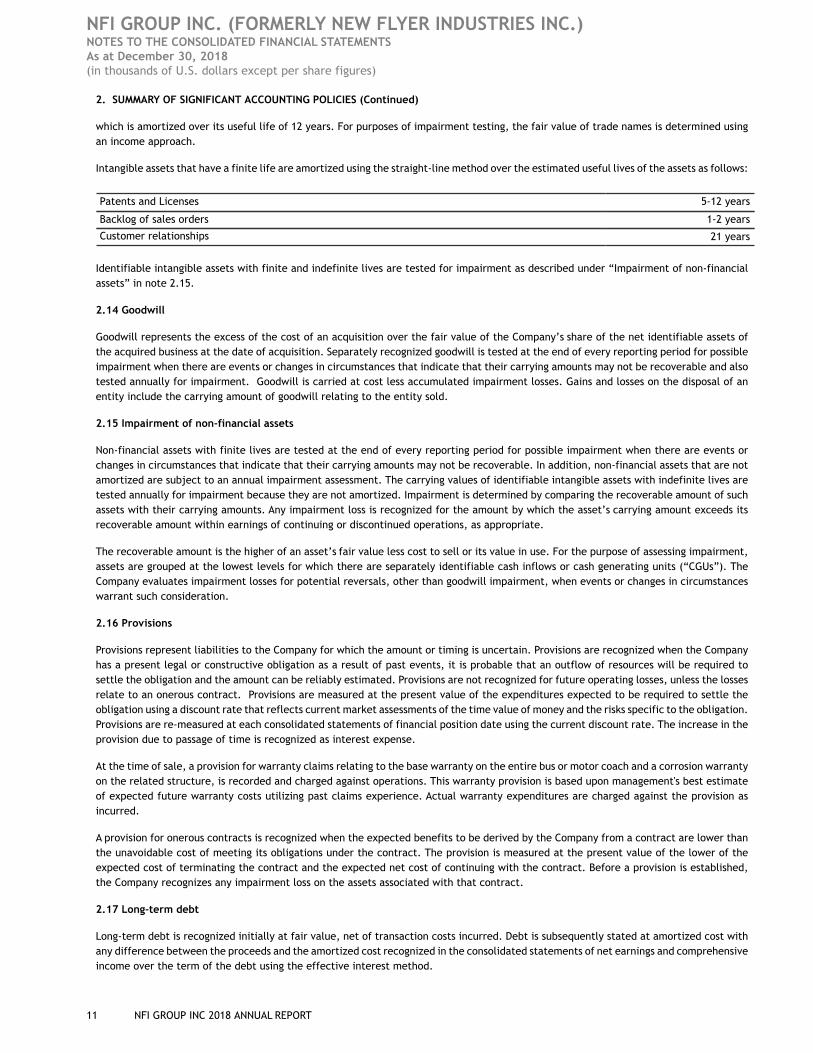
NFI GROUP INC. (FORMERLY NEW FLYER INDUSTRIES INC.) NOTES TO THE CONSOLIDATED FINANCIAL STATEMENTS As at December 30, 2018(in thousands of U.S. dollars except per share figures)
11 NFI GROUP INC 2018 ANNUAL REPORT
2. SUMMARY OF SIGNIFICANT ACCOUNTING POLICIES (Continued)
which is amortized over its useful life of 12 years. For purposes of impairment testing, the fair value of trade names is determined using an income approach.
Intangible assets that have a finite life are amortized using the straight-line method over the estimated useful lives of the assets as follows:
Patents and Licenses 5-12 years
Backlog of sales orders 1-2 years
Customer relationships 21 years
Identifiable intangible assets with finite and indefinite lives are tested for impairment as described under “Impairment of non-financial assets” in note 2.15.
2.14 Goodwill
Goodwill represents the excess of the cost of an acquisition over the fair value of the Company’s share of the net identifiable assets of the acquired business at the date of acquisition. Separately recognized goodwill is tested at the end of every reporting period for possible impairment when there are events or changes in circumstances that indicate that their carrying amounts may not be recoverable and also tested annually for impairment. Goodwill is carried at cost less accumulated impairment losses. Gains and losses on the disposal of an entity include the carrying amount of goodwill relating to the entity sold.
2.15 Impairment of non-financial assets
Non-financial assets with finite lives are tested at the end of every reporting period for possible impairment when there are events or changes in circumstances that indicate that their carrying amounts may not be recoverable. In addition, non-financial assets that are not amortized are subject to an annual impairment assessment. The carrying values of identifiable intangible assets with indefinite lives are tested annually for impairment because they are not amortized. Impairment is determined by comparing the recoverable amount of such assets with their carrying amounts. Any impairment loss is recognized for the amount by which the asset’s carrying amount exceeds its recoverable amount within earnings of continuing or discontinued operations, as appropriate.
The recoverable amount is the higher of an asset’s fair value less cost to sell or its value in use. For the purpose of assessing impairment, assets are grouped at the lowest levels for which there are separately identifiable cash inflows or cash generating units (“CGUs”). The Company evaluates impairment losses for potential reversals, other than goodwill impairment, when events or changes in circumstances warrant such consideration.
2.16 Provisions
Provisions represent liabilities to the Company for which the amount or timing is uncertain. Provisions are recognized when the Company has a present legal or constructive obligation as a result of past events, it is probable that an outflow of resources will be required to settle the obligation and the amount can be reliably estimated. Provisions are not recognized for future operating losses, unless the losses relate to an onerous contract. Provisions are measured at the present value of the expenditures expected to be required to settle the obligation using a discount rate that reflects current market assessments of the time value of money and the risks specific to the obligation. Provisions are re-measured at each consolidated statements of financial position date using the current discount rate. The increase in the provision due to passage of time is recognized as interest expense.
At the time of sale, a provision for warranty claims relating to the base warranty on the entire bus or motor coach and a corrosion warranty on the related structure, is recorded and charged against operations. This warranty provision is based upon management's best estimate of expected future warranty costs utilizing past claims experience. Actual warranty expenditures are charged against the provision as incurred.
A provision for onerous contracts is recognized when the expected benefits to be derived by the Company from a contract are lower than the unavoidable cost of meeting its obligations under the contract. The provision is measured at the present value of the lower of the expected cost of terminating the contract and the expected net cost of continuing with the contract. Before a provision is established, the Company recognizes any impairment loss on the assets associated with that contract.
2.17 Long-term debt
Long-term debt is recognized initially at fair value, net of transaction costs incurred. Debt is subsequently stated at amortized cost with any difference between the proceeds and the amortized cost recognized in the consolidated statements of net earnings and comprehensive income over the term of the debt using the effective interest method.
NFI GROUP INC. (FORMERLY NEW FLYER INDUSTRIES INC.) NOTES TO THE CONSOLIDATED FINANCIAL STATEMENTS As at December 30, 2018(in thousands of U.S. dollars except per share figures)
12 NFI GROUP INC 2018 ANNUAL REPORT
2. SUMMARY OF SIGNIFICANT ACCOUNTING POLICIES (Continued)
Debt is classified as a current liability unless the Company has an unconditional right to defer settlement for at least 12 months after the date of the consolidated statements of financial position.
2.18 Financial instruments
Financial assets
Purchases and sales of financial assets are recognized on the settlement date, which is the date on which the asset is delivered to or by the Company. Financial assets are derecognized when the rights to receive cash flows from the investments have expired or were transferred and the Company has transferred substantially all risks and rewards of ownership. Financial assets are classified in the following categories at the time of initial recognition based on the purpose for which the financial assets were acquired:
Financial assets at fair value through profit or loss
Classification
Financial assets at fair value through profit or loss are financial assets held for trading or designated as fair value through profit or loss. A financial asset is classified in this category if acquired principally for the purpose of selling in the short-term or if so designated by management. Assets in this category include derivative financial instruments and are classified as short or long term assets in the consolidated statements of financial position.
Recognition and measurement
Financial assets are initially recognized at fair value and subsequently carried at fair value through profit and loss, with changes recognized in the consolidated statements of net earnings and comprehensive income. Transaction costs are expensed as incurred.
Financial assets carried at amortized cost
Classification
Financial assets classified as amortized cost are non-derivative financial assets that the Company intends to hold in order to collect the contractual cash flows and have fixed or determinable payments that are not quoted in an active market. They are included in current assets, except for those with maturities greater than 12 months after the consolidated statements of financial position date, which are classified as non-current assets. Assets in this category include accounts receivables, deposits and cash and are classified as current assets in the consolidated statements of financial position.
Recognition and measurement
Financial assets carried at amortized cost are initially recognized at fair value plus transaction costs and subsequently carried at amortized cost using the effective interest method.
Financial liabilities carried at amortized cost
Financial liabilities primarily consist of bank indebtedness, accounts payable and accrued liabilities, derivative financial instruments, other long-term liabilities and long-term debt. Financial liabilities are initially measured at fair value and subsequently measured at amortized cost unless classified as fair value through profit or loss.
Derivative instruments
Derivatives are initially recognized at fair value on the date a contract is entered into and are subsequently re-measured at their fair value. The Company’s derivative instruments, while providing effective economic hedges, are not designated as hedges for accounting purposes. Changes in the fair value of any derivatives that are not designated as hedges for accounting purposes are recognized within “Fair market value gain (loss) on interest rate swap” or “unrealized foreign exchange (loss) gain on non-current monetary items” in the consolidated statements of net earnings and comprehensive income consistent with the underlying nature and purpose of the derivative instruments.
2.19 Taxation
Tax expense comprises current and deferred tax. Tax is recognized in the consolidated statements of net earnings and total comprehensive income except to the extent it relates to items recognized directly in equity, in which case the related tax is recognized in equity.
NFI GROUP INC. (FORMERLY NEW FLYER INDUSTRIES INC.) NOTES TO THE CONSOLIDATED FINANCIAL STATEMENTS As at December 30, 2018(in thousands of U.S. dollars except per share figures)
13 NFI GROUP INC 2018 ANNUAL REPORT
2. SUMMARY OF SIGNIFICANT ACCOUNTING POLICIES (Continued)
Current tax expense is based on the results for the period as adjusted for items that are not taxable or not deductible. Current tax is calculated using the tax rates under the laws that were enacted or substantively enacted at the date of the consolidated statements of financial position.
Deferred tax is accounted for using the liability approach and is the tax expected to be payable or recoverable on temporary differences between the carrying amount of assets and liabilities in the consolidated statements of financial position and the corresponding tax base used in the computation of taxable profit. Deferred tax is calculated based on the expected manner of realization or settlement of the carrying amount of assets and liabilities, using tax rates that are expected to apply to the year of realization or settlement based on tax rates and laws enacted or substantively enacted at the date of the consolidated statements of financial position.
Deferred tax assets are recognized to the extent it is probable that taxable profits will be available against which the deductible temporary differences can be utilized, unless the deferred tax asset arises from the initial recognition of an asset or liability in a transaction that is not a business combination, and at the time of the transaction, affects neither accounting profit nor taxable profit (tax loss). The carrying amount of deferred tax assets is reviewed at each consolidated statements of financial position date and reduced to the extent that it is no longer probable that sufficient taxable profits will be available to allow all or part of the asset to be recovered.
Deferred tax liabilities are generally recognized for all taxable temporary differences except to the extent that the deferred tax liability arises from: the initial recognition of goodwill; or the initial recognition of an asset or liability in a transaction which is not a business combination and, at the time of the transaction, affects neither accounting profit nor taxable profit (tax loss). As well, deferred tax liabilities are recognized for taxable temporary differences arising on investments in subsidiaries except where the reversal of the temporary difference can be controlled and it is probable that the difference will not reverse in the foreseeable future.
2.20 Investment tax credits
The Company has earned investment tax credits (“ITCs”) relating to a percentage of eligible current and capital research and development expenditures incurred in each taxation year. Investment tax credits are recognized when there is reasonable assurance that the Company will comply with the associated conditions and the grants will be received. The investment tax credits are recognized either as a reduction in cost of sales on the consolidated statements of net earnings and comprehensive income, or as a reduction in property, plant and equipment, depending on where the original costs which gave rise to the credits were recorded.
2.21 Vendor Rebates
The Company records certain consideration received from a vendor, which is probable and can be reasonably estimated, as a reduction of the cost of purchases during the period.
2.22 Critical accounting estimates and judgments
Estimates and judgments are continually evaluated and are based on historical experience and other factors, including expectations of future events that are believed to be reasonable under the circumstances.
Critical accounting estimates and assumptions
Management makes estimates and assumptions concerning the future. The resulting accounting estimates will, by definition, seldom equal the actual results. Estimates are reviewed on a regular basis and, as adjustments become necessary, they are reported in the consolidated statements of net earnings and comprehensive income in the periods in which they become known. The assets and liabilities which require management to make significant estimates and assumptions in determining carrying values include, inventories, derivative financial instruments, property, plant and equipment, intangible assets, goodwill, provisions, accrued benefit liability, deferred compensation obligation and deferred income taxes.
Information about assumptions and estimation uncertainties that have a significant risk of resulting in a material adjustment are addressed below.
Intangible assets and goodwill
The values associated with the initial recognition and impairment tests of the intangible assets and goodwill involve significant estimates and assumptions, including those with respect to future cash inflows and outflows, discount rates and asset lives.
These significant estimates are subject to the Company’s future results. These determinations will affect the amount of amortization expense on intangible assets recognized in future periods.
Management assesses impairment by comparing the recoverable amount of an intangible asset or goodwill with its carrying value. The determination of the recoverable amount involves significant estimation by management.
NFI GROUP INC. (FORMERLY NEW FLYER INDUSTRIES INC.) NOTES TO THE CONSOLIDATED FINANCIAL STATEMENTS As at December 30, 2018(in thousands of U.S. dollars except per share figures)
14 NFI GROUP INC 2018 ANNUAL REPORT
2. SUMMARY OF SIGNIFICANT ACCOUNTING POLICIES (Continued)
Management has determined that for purposes of this evaluation the Company has four CGUs: bus manufacturing, motor coach manufacturing, ARBOC and aftermarket parts operations.
Goodwill is allocated to the Company’s four CGUs for the purpose of impairment testing. The Company performs its annual test for impairment of goodwill and trade names in the fourth quarter of each year and also when indicators of impairment exist.
Accrued benefit liability
The present value of the defined benefit obligation is determined by discounting the estimated future cash outflows using interest rates of high-quality corporate bonds that are denominated in the currency in which the benefits will be paid and that have terms to maturity approximating the terms of the related pension liability. Determination of benefit expense requires assumptions such as the discount rate to measure obligations and return on assets, the projected age of employees upon retirement, life expectancy and the expected rate of future compensation changes.
Actual results will differ from results which are estimated based on assumptions. See note 2.7 for certain assumptions made with respect to employee benefits.
Income Taxes
Estimation of income taxes includes evaluating the recoverability of deferred tax assets based on an assessment of the Company’s ability to utilize the underlying future tax deductions against future taxable income before they expire. Management’s assessment is based upon existing tax laws and estimates of future taxable income. If the assessment of the Company’s ability to utilize the underlying future tax deductions changes, the Company would be required to recognize more or fewer of the tax deductions as assets, which would decrease or increase the income tax expense in the period in which this is determined.
The Company is subject to taxation in multiple jurisdictions. Significant judgment is required in determining the worldwide provision for taxation. There are many transactions and calculations for which the ultimate tax determination is uncertain during the ordinary course of business. The Company maintains provisions for uncertain tax positions that it believes appropriately reflect its risk with respect to tax matters under active discussion, audit, dispute or appeal with tax authorities, or which are otherwise considered to involve uncertainty. These provisions for uncertain tax positions are made using management’s best estimate of the amount expected to be paid based on a qualitative assessment of all relevant factors. Management reviews the adequacy of these provisions at the date of each consolidated statements of financial position. However, it is possible that at some future date an additional liability could result from audits by taxing authorities. Where the final tax outcome of these matters is different from the amounts that were initially recorded, such differences will affect the tax provisions in the period in which such determination is made.
Provision for Warranty Costs
The Company offers warranties on the buses and coaches it sells. Management estimates the related provision for future warranty claims based on historical warranty claim information, as well as recent trends that might suggest that past cost information may differ from future claims. Factors that could impact the estimated claim information include quality initiatives, as well as parts and labour costs.
Critical judgments in applying accounting policies
The following critical judgments that were made by management have the most significant effect on the amounts recognized in the financial statements.
Revenue recognition
As described in note 2.6, management assessed the criteria for the recognition of revenue related to arrangements that have multiple components as set out in IFRS 15. Also, judgment is necessary to determine when components can be recognized separately and the allocation of the related consideration allocated to each component.
Also described in note 2.6, management assessed the criteria for the recognition of revenue in an agency relationship related to the sale of extended warranties that are purchased for the customer from the OEM as set out in IFRS 15.
Functional currency
Management assessed the criteria for the determination of functional currency as set out in IAS 21. An entity is required to place the greatest weight on the currency that influences the pricing of the transactions that it undertakes rather than focusing on the currency in which the transactions are denominated in. The functional currency of the Company is the United States dollar as it is the currency of the primary economic environment in which the Company operates. In addition, it is the competitive forces of the United States marketplace that determines the sales prices of its goods and services. Predominantly, the costs for labour, material and overhead that address the
NFI GROUP INC. (FORMERLY NEW FLYER INDUSTRIES INC.) NOTES TO THE CONSOLIDATED FINANCIAL STATEMENTS As at December 30, 2018(in thousands of U.S. dollars except per share figures)
15 NFI GROUP INC 2018 ANNUAL REPORT
2. SUMMARY OF SIGNIFICANT ACCOUNTING POLICIES (Continued)
needs and support the Company’s customers are incurred in United States dollars, and hence the pricing of goods and services to the customer is more greatly influenced from operations and the competitive forces in the United States.
Goodwill
Judgment is required in the selection of CGUs and the allocation of assets and liabilities to these CGUs, which is necessary to assess the impairment of long-term assets, goodwill and intangible assets.
2.23 Standards issued but not yet adopted
IFRS 16 – Leases:
In January 2016, the IASB issued IFRS 16, Leases, with an effective date of January 1, 2019, which introduced new guidance for identifying leases as well as the accounting, measurement and presentation of leases by the lessee. The lessee now recognizes a liability for the future lease payments to be made for each lease. A right-of-use asset is also recognized and amortized over the useful life. As a result, the previous distinction between operating and finance leases no longer applies. The new standard will retain many key aspects of the current lessor accounting model. With respect to first time application of IFRS 16, the Company can choose to apply the standard using the full retrospective approach or modified retrospective approach The Company plans on using the modified retrospective approach.
The Company will adopt the standard on its effective date. The Company is in the process of finalizing its transition approach. The right-of-use assets and lease liability will be presented separately on the balance sheet. Management anticipates the adoption of the standard will result in increases to assets of approximately $109 million and liabilities of approximately $109 million on the consolidated statements of financial position. Management does not anticipate there will be a material impact in the consolidated statements of net earnings and total comprehensive income.
3. ACCOUNTS RECEIVABLE
December 30, 2018 December 31, 2017Trade, net of allowance for doubtful accounts $ 358,441 $ 349,036Other 29,045 37,431
$ 387,486 $ 386,467
4. INVENTORIES
December 30, 2018 December 31, 2017
Raw materials $ 213,117 $ 182,240
Work in process 150,654 101,611
Finished goods 60,914 75,631
$ 424,685 $ 359,482
Fiscal 2018 Fiscal 2017
Cost of inventories recognized as expense and included in cost of sales $ 2,015,272 $ 1,856,223
Write-down of inventory to net realizable value in cost of sales 4,407 9,186
Reversals of a previous write-down in inventory 2,545 1,108
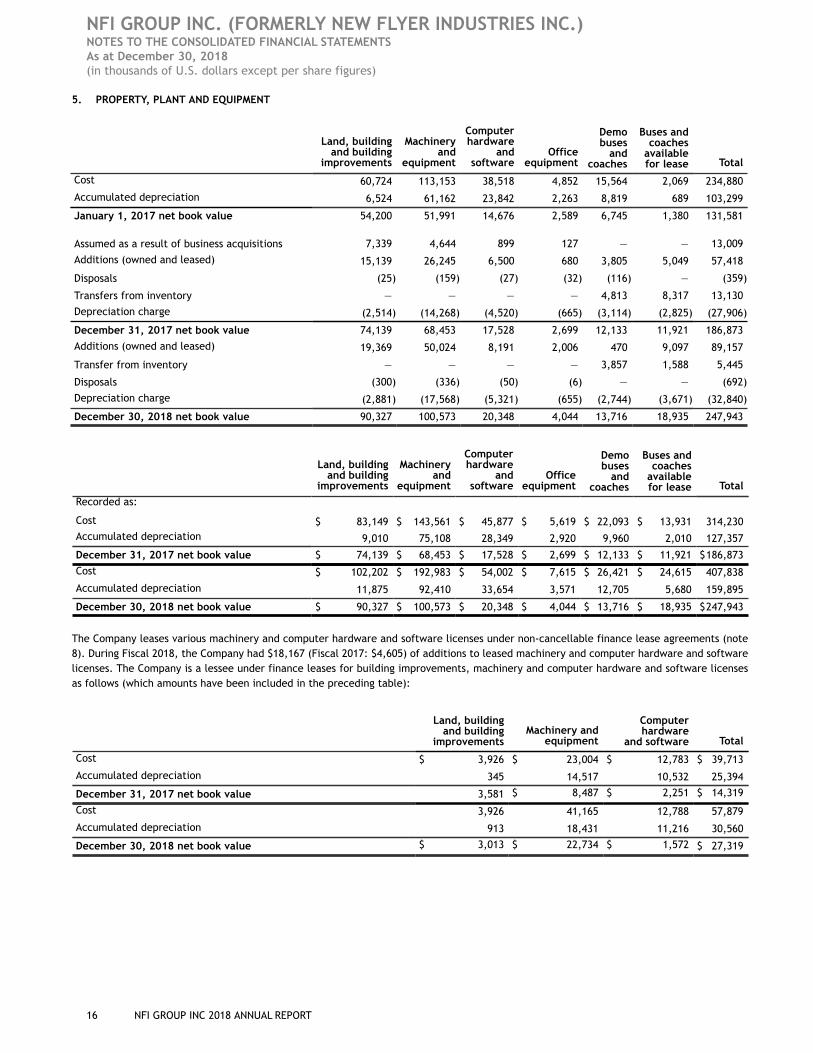
NFI GROUP INC. (FORMERLY NEW FLYER INDUSTRIES INC.) NOTES TO THE CONSOLIDATED FINANCIAL STATEMENTS As at December 30, 2018(in thousands of U.S. dollars except per share figures)
16 NFI GROUP INC 2018 ANNUAL REPORT
5. PROPERTY, PLANT AND EQUIPMENT
Land, buildingand building
improvements
Machineryand
equipment
Computerhardware
andsoftware
Officeequipment
Demobuses
andcoaches
Buses andcoaches
availablefor lease Total
Cost 60,724 113,153 38,518 4,852 15,564 2,069 234,880
Accumulated depreciation 6,524 61,162 23,842 2,263 8,819 689 103,299
January 1, 2017 net book value 54,200 51,991 14,676 2,589 6,745 1,380 131,581
Assumed as a result of business acquisitions 7,339 4,644 899 127 — — 13,009
Additions (owned and leased) 15,139 26,245 6,500 680 3,805 5,049 57,418
Disposals (25) (159) (27) (32) (116) — (359)
Transfers from inventory — — — — 4,813 8,317 13,130
Depreciation charge (2,514) (14,268) (4,520) (665) (3,114) (2,825) (27,906)
December 31, 2017 net book value 74,139 68,453 17,528 2,699 12,133 11,921 186,873
Additions (owned and leased) 19,369 50,024 8,191 2,006 470 9,097 89,157
Transfer from inventory — — — — 3,857 1,588 5,445
Disposals (300) (336) (50) (6) — — (692)
Depreciation charge (2,881) (17,568) (5,321) (655) (2,744) (3,671) (32,840)
December 30, 2018 net book value 90,327 100,573 20,348 4,044 13,716 18,935 247,943
Land, buildingand building
improvements
Machineryand
equipment
Computerhardware
andsoftware
Officeequipment
Demobuses
andcoaches
Buses andcoaches
availablefor lease Total
Recorded as:
Cost $ 83,149 $ 143,561 $ 45,877 $ 5,619 $ 22,093 $ 13,931 314,230Accumulated depreciation 9,010 75,108 28,349 2,920 9,960 2,010 127,357
December 31, 2017 net book value $ 74,139 $ 68,453 $ 17,528 $ 2,699 $ 12,133 $ 11,921 $186,873
Cost $ 102,202 $ 192,983 $ 54,002 $ 7,615 $ 26,421 $ 24,615 407,838
Accumulated depreciation 11,875 92,410 33,654 3,571 12,705 5,680 159,895
December 30, 2018 net book value $ 90,327 $ 100,573 $ 20,348 $ 4,044 $ 13,716 $ 18,935 $247,943
The Company leases various machinery and computer hardware and software licenses under non-cancellable finance lease agreements (note 8). During Fiscal 2018, the Company had $18,167 (Fiscal 2017: $4,605) of additions to leased machinery and computer hardware and software licenses. The Company is a lessee under finance leases for building improvements, machinery and computer hardware and software licenses as follows (which amounts have been included in the preceding table):
Land, buildingand building
improvementsMachinery and
equipment
Computerhardware
and software Total
Cost $ 3,926 $ 23,004 $ 12,783 $ 39,713
Accumulated depreciation 345 14,517 10,532 25,394
December 31, 2017 net book value 3,581 $ 8,487 $ 2,251 $ 14,319
Cost 3,926 41,165 12,788 57,879
Accumulated depreciation 913 18,431 11,216 30,560
December 30, 2018 net book value $ 3,013 $ 22,734 $ 1,572 $ 27,319
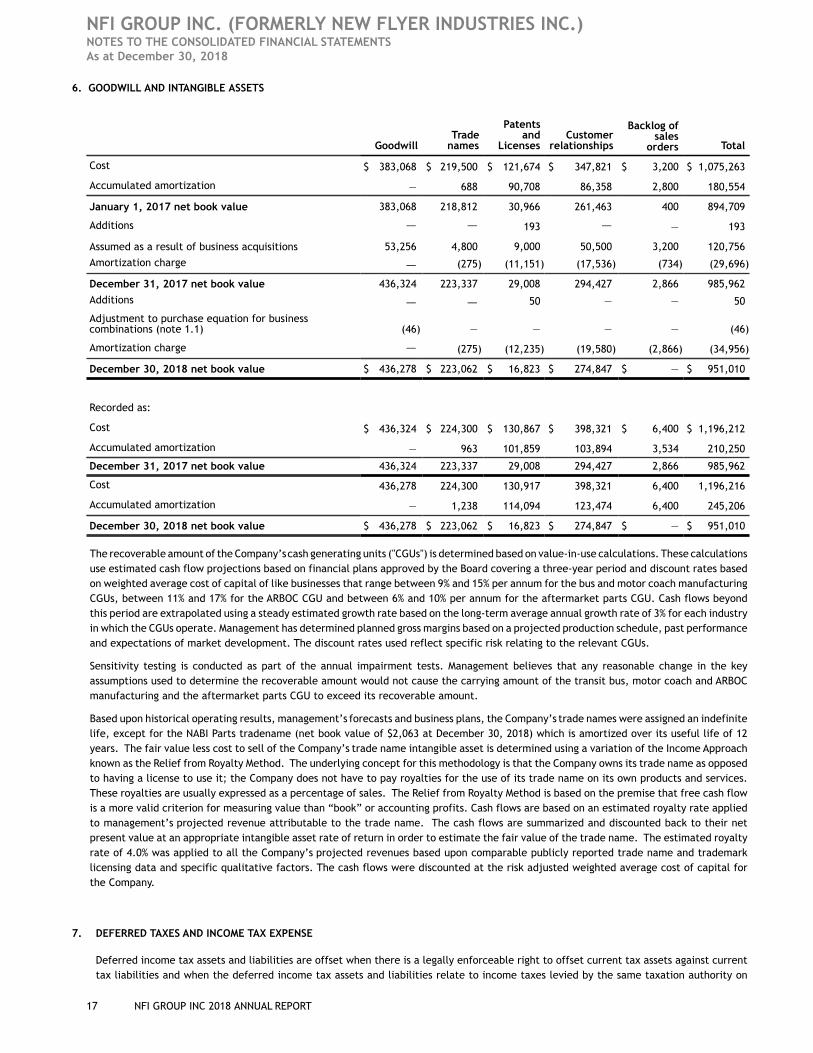
NFI GROUP INC. (FORMERLY NEW FLYER INDUSTRIES INC.) NOTES TO THE CONSOLIDATED FINANCIAL STATEMENTS As at December 30, 2018
17 NFI GROUP INC 2018 ANNUAL REPORT
6. GOODWILL AND INTANGIBLE ASSETS
GoodwillTrade
names
Patentsand
LicensesCustomer
relationships
Backlog ofsales
orders Total
Cost $ 383,068 $ 219,500 $ 121,674 $ 347,821 $ 3,200 $ 1,075,263
Accumulated amortization — 688 90,708 86,358 2,800 180,554
January 1, 2017 net book value 383,068 218,812 30,966 261,463 400 894,709
Additions — — 193 — — 193
Assumed as a result of business acquisitions 53,256 4,800 9,000 50,500 3,200 120,756
Amortization charge — (275) (11,151) (17,536) (734) (29,696)
December 31, 2017 net book value 436,324 223,337 29,008 294,427 2,866 985,962
Additions — — 50 — — 50
Adjustment to purchase equation for businesscombinations (note 1.1) (46) — — — — (46)
Amortization charge — (275) (12,235) (19,580) (2,866) (34,956)
December 30, 2018 net book value $ 436,278 $ 223,062 $ 16,823 $ 274,847 $ — $ 951,010
Recorded as:
Cost $ 436,324 $ 224,300 $ 130,867 $ 398,321 $ 6,400 $ 1,196,212
Accumulated amortization — 963 101,859 103,894 3,534 210,250
December 31, 2017 net book value 436,324 223,337 29,008 294,427 2,866 985,962
Cost 436,278 224,300 130,917 398,321 6,400 1,196,216
Accumulated amortization — 1,238 114,094 123,474 6,400 245,206
December 30, 2018 net book value $ 436,278 $ 223,062 $ 16,823 $ 274,847 $ — $ 951,010
The recoverable amount of the Company’s cash generating units ("CGUs") is determined based on value-in-use calculations. These calculations use estimated cash flow projections based on financial plans approved by the Board covering a three-year period and discount rates based on weighted average cost of capital of like businesses that range between 9% and 15% per annum for the bus and motor coach manufacturing CGUs, between 11% and 17% for the ARBOC CGU and between 6% and 10% per annum for the aftermarket parts CGU. Cash flows beyond this period are extrapolated using a steady estimated growth rate based on the long-term average annual growth rate of 3% for each industry in which the CGUs operate. Management has determined planned gross margins based on a projected production schedule, past performance and expectations of market development. The discount rates used reflect specific risk relating to the relevant CGUs.
Sensitivity testing is conducted as part of the annual impairment tests. Management believes that any reasonable change in the key assumptions used to determine the recoverable amount would not cause the carrying amount of the transit bus, motor coach and ARBOC manufacturing and the aftermarket parts CGU to exceed its recoverable amount.
Based upon historical operating results, management’s forecasts and business plans, the Company’s trade names were assigned an indefinite life, except for the NABI Parts tradename (net book value of $2,063 at December 30, 2018) which is amortized over its useful life of 12 years. The fair value less cost to sell of the Company’s trade name intangible asset is determined using a variation of the Income Approach known as the Relief from Royalty Method. The underlying concept for this methodology is that the Company owns its trade name as opposed to having a license to use it; the Company does not have to pay royalties for the use of its trade name on its own products and services. These royalties are usually expressed as a percentage of sales. The Relief from Royalty Method is based on the premise that free cash flow is a more valid criterion for measuring value than “book” or accounting profits. Cash flows are based on an estimated royalty rate applied to management’s projected revenue attributable to the trade name. The cash flows are summarized and discounted back to their net present value at an appropriate intangible asset rate of return in order to estimate the fair value of the trade name. The estimated royalty rate of 4.0% was applied to all the Company’s projected revenues based upon comparable publicly reported trade name and trademark licensing data and specific qualitative factors. The cash flows were discounted at the risk adjusted weighted average cost of capital for the Company.
7. DEFERRED TAXES AND INCOME TAX EXPENSE
Deferred income tax assets and liabilities are offset when there is a legally enforceable right to offset current tax assets against current tax liabilities and when the deferred income tax assets and liabilities relate to income taxes levied by the same taxation authority on
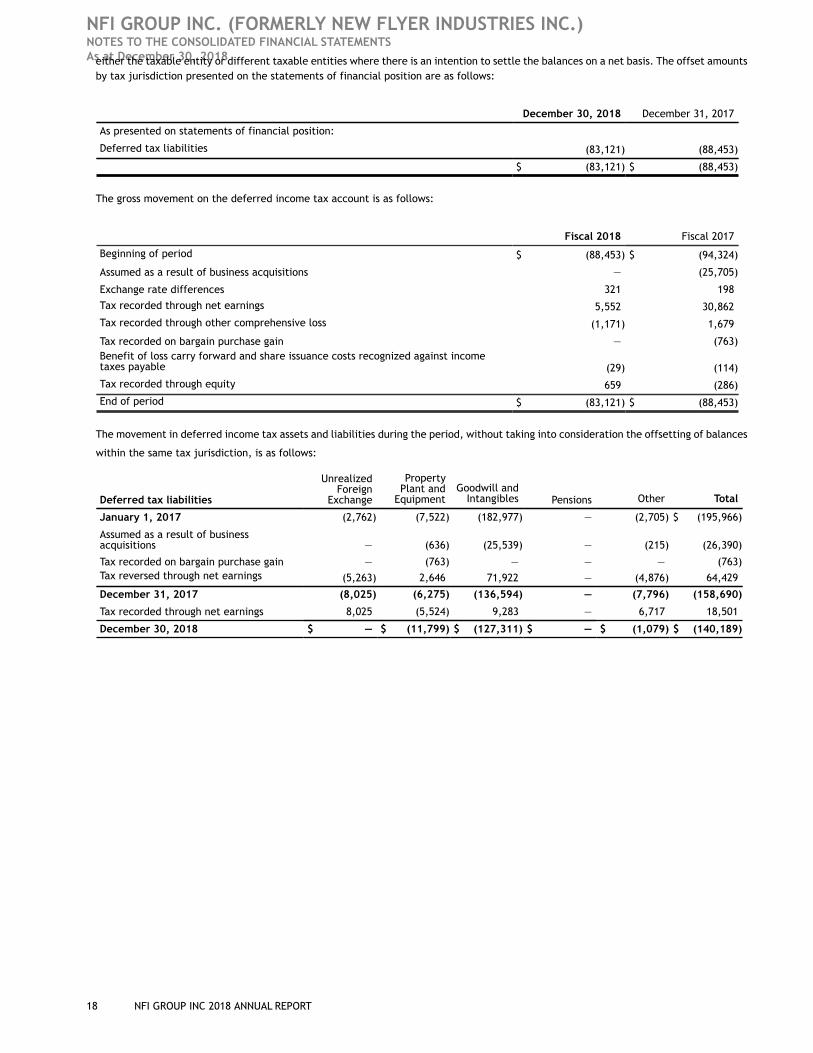
NFI GROUP INC. (FORMERLY NEW FLYER INDUSTRIES INC.) NOTES TO THE CONSOLIDATED FINANCIAL STATEMENTS As at December 30, 2018
18 NFI GROUP INC 2018 ANNUAL REPORT
either the taxable entity or different taxable entities where there is an intention to settle the balances on a net basis. The offset amounts by tax jurisdiction presented on the statements of financial position are as follows:
December 30, 2018 December 31, 2017
As presented on statements of financial position:
Deferred tax liabilities (83,121) (88,453)
$ (83,121) $ (88,453)
The gross movement on the deferred income tax account is as follows:
Fiscal 2018 Fiscal 2017
Beginning of period $ (88,453) $ (94,324)
Assumed as a result of business acquisitions — (25,705)
Exchange rate differences 321 198
Tax recorded through net earnings 5,552 30,862
Tax recorded through other comprehensive loss (1,171) 1,679
Tax recorded on bargain purchase gain — (763)Benefit of loss carry forward and share issuance costs recognized against incometaxes payable (29) (114)
Tax recorded through equity 659 (286)
End of period $ (83,121) $ (88,453)
The movement in deferred income tax assets and liabilities during the period, without taking into consideration the offsetting of balances
within the same tax jurisdiction, is as follows:
Deferred tax liabilities
UnrealizedForeign
Exchange
PropertyPlant and
EquipmentGoodwill and
Intangibles Pensions Other Total
January 1, 2017 (2,762) (7,522) (182,977) — (2,705) $ (195,966)
Assumed as a result of businessacquisitions — (636) (25,539) — (215) (26,390)
Tax recorded on bargain purchase gain — (763) — — — (763)Tax reversed through net earnings (5,263) 2,646 71,922 — (4,876) 64,429
December 31, 2017 (8,025) (6,275) (136,594) — (7,796) (158,690)
Tax recorded through net earnings 8,025 (5,524) 9,283 — 6,717 18,501
December 30, 2018 $ — $ (11,799) $ (127,311) $ — $ (1,079) $ (140,189)
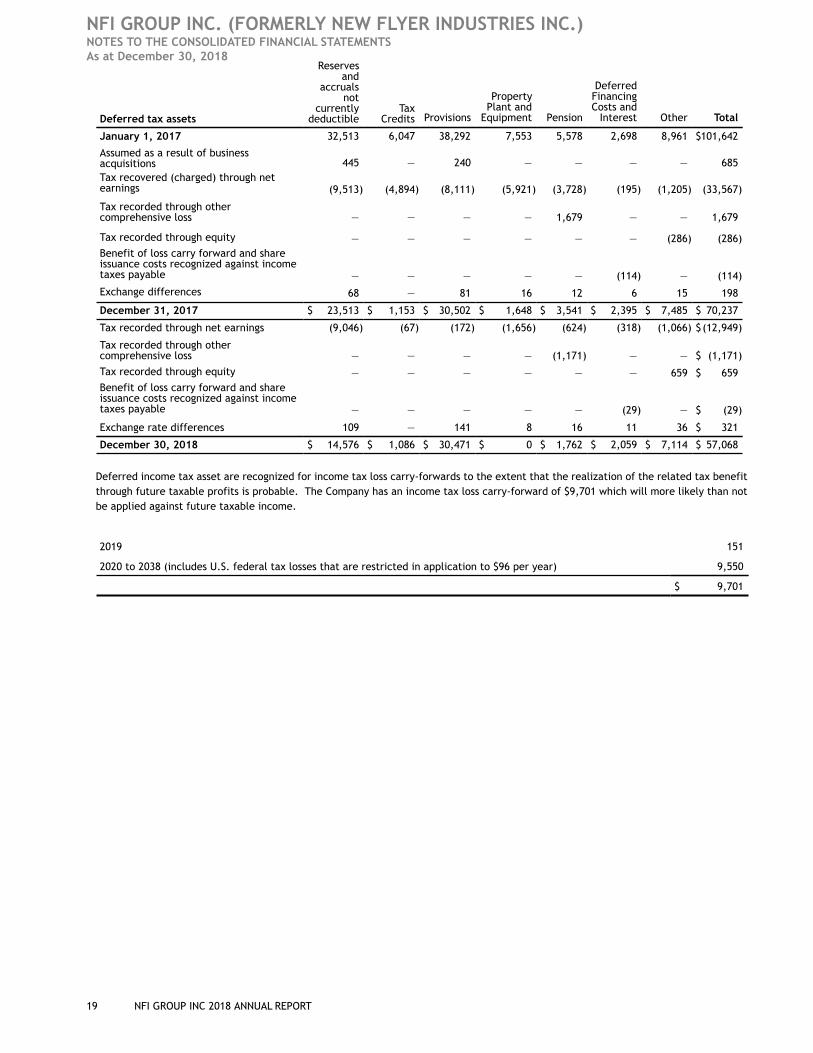
NFI GROUP INC. (FORMERLY NEW FLYER INDUSTRIES INC.) NOTES TO THE CONSOLIDATED FINANCIAL STATEMENTS As at December 30, 2018
19 NFI GROUP INC 2018 ANNUAL REPORT
Deferred tax assets
Reservesand
accrualsnot
currentlydeductible
TaxCredits Provisions
PropertyPlant and
Equipment Pension
DeferredFinancingCosts and
Interest Other Total
January 1, 2017 32,513 6,047 38,292 7,553 5,578 2,698 8,961 $101,642
Assumed as a result of businessacquisitions 445 — 240 — — — — 685Tax recovered (charged) through netearnings (9,513) (4,894) (8,111) (5,921) (3,728) (195) (1,205) (33,567)
Tax recorded through othercomprehensive loss — — — — 1,679 — — 1,679
Tax recorded through equity — — — — — — (286) (286)Benefit of loss carry forward and shareissuance costs recognized against incometaxes payable — — — — — (114) — (114)
Exchange differences 68 — 81 16 12 6 15 198
December 31, 2017 $ 23,513 $ 1,153 $ 30,502 $ 1,648 $ 3,541 $ 2,395 $ 7,485 $ 70,237
Tax recorded through net earnings (9,046) (67) (172) (1,656) (624) (318) (1,066) $(12,949)
Tax recorded through othercomprehensive loss — — — — (1,171) — — $ (1,171)
Tax recorded through equity — — — — — — 659 $ 659Benefit of loss carry forward and shareissuance costs recognized against incometaxes payable — — — — — (29) — $ (29)
Exchange rate differences 109 — 141 8 16 11 36 $ 321
December 30, 2018 $ 14,576 $ 1,086 $ 30,471 $ 0 $ 1,762 $ 2,059 $ 7,114 $ 57,068
Deferred income tax asset are recognized for income tax loss carry-forwards to the extent that the realization of the related tax benefit through future taxable profits is probable. The Company has an income tax loss carry-forward of $9,701 which will more likely than not be applied against future taxable income.
2019 151
2020 to 2038 (includes U.S. federal tax losses that are restricted in application to $96 per year) 9,550
$ 9,701
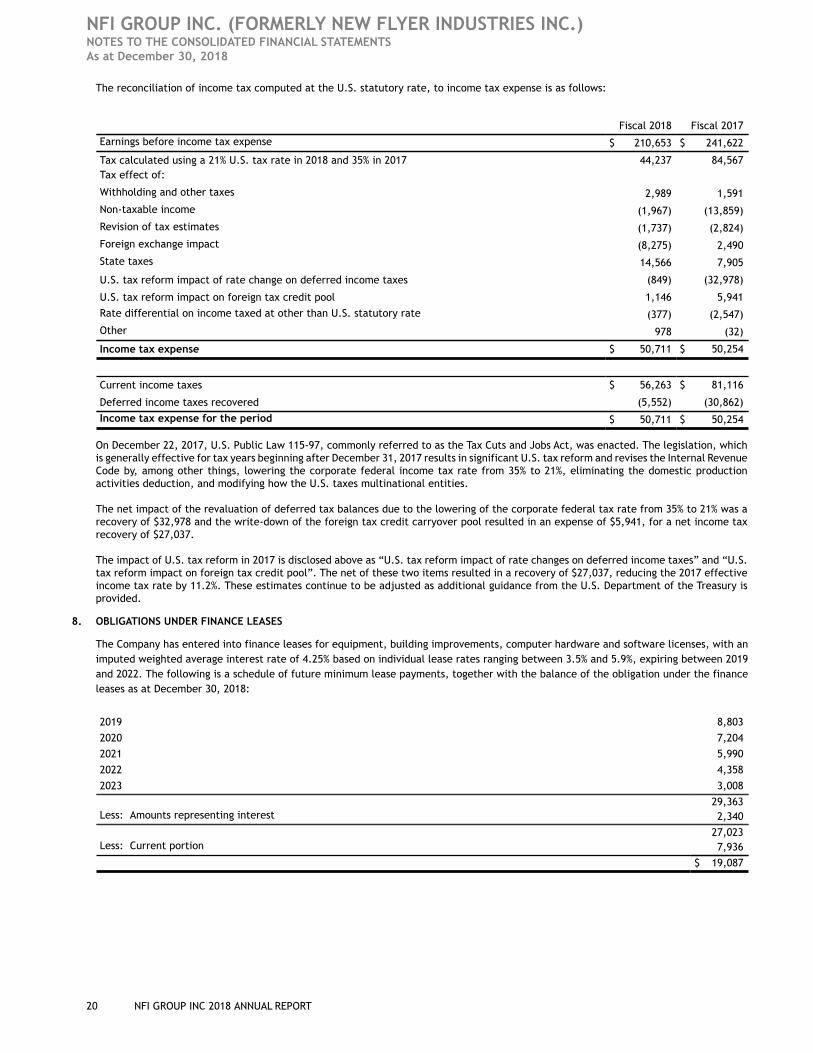
NFI GROUP INC. (FORMERLY NEW FLYER INDUSTRIES INC.) NOTES TO THE CONSOLIDATED FINANCIAL STATEMENTS As at December 30, 2018
20 NFI GROUP INC 2018 ANNUAL REPORT
The reconciliation of income tax computed at the U.S. statutory rate, to income tax expense is as follows:
Fiscal 2018 Fiscal 2017
Earnings before income tax expense $ 210,653 $ 241,622
Tax calculated using a 21% U.S. tax rate in 2018 and 35% in 2017 44,237 84,567Tax effect of:
Withholding and other taxes 2,989 1,591
Non-taxable income (1,967) (13,859)
Revision of tax estimates (1,737) (2,824)
Foreign exchange impact (8,275) 2,490
State taxes 14,566 7,905
U.S. tax reform impact of rate change on deferred income taxes (849) (32,978)
U.S. tax reform impact on foreign tax credit pool 1,146 5,941
Rate differential on income taxed at other than U.S. statutory rate (377) (2,547)
Other 978 (32)
Income tax expense $ 50,711 $ 50,254
Current income taxes $ 56,263 $ 81,116
Deferred income taxes recovered (5,552) (30,862)
Income tax expense for the period $ 50,711 $ 50,254
On December 22, 2017, U.S. Public Law 115-97, commonly referred to as the Tax Cuts and Jobs Act, was enacted. The legislation, which is generally effective for tax years beginning after December 31, 2017 results in significant U.S. tax reform and revises the Internal Revenue Code by, among other things, lowering the corporate federal income tax rate from 35% to 21%, eliminating the domestic production activities deduction, and modifying how the U.S. taxes multinational entities.
The net impact of the revaluation of deferred tax balances due to the lowering of the corporate federal tax rate from 35% to 21% was a recovery of $32,978 and the write-down of the foreign tax credit carryover pool resulted in an expense of $5,941, for a net income tax recovery of $27,037.
The impact of U.S. tax reform in 2017 is disclosed above as “U.S. tax reform impact of rate changes on deferred income taxes” and “U.S. tax reform impact on foreign tax credit pool”. The net of these two items resulted in a recovery of $27,037, reducing the 2017 effective income tax rate by 11.2%. These estimates continue to be adjusted as additional guidance from the U.S. Department of the Treasury is provided.
8. OBLIGATIONS UNDER FINANCE LEASES
The Company has entered into finance leases for equipment, building improvements, computer hardware and software licenses, with an imputed weighted average interest rate of 4.25% based on individual lease rates ranging between 3.5% and 5.9%, expiring between 2019 and 2022. The following is a schedule of future minimum lease payments, together with the balance of the obligation under the finance leases as at December 30, 2018:
2019 8,803
2020 7,204
2021 5,990
2022 4,358
2023 3,008
29,363Less: Amounts representing interest 2,340
27,023Less: Current portion 7,936
$ 19,087
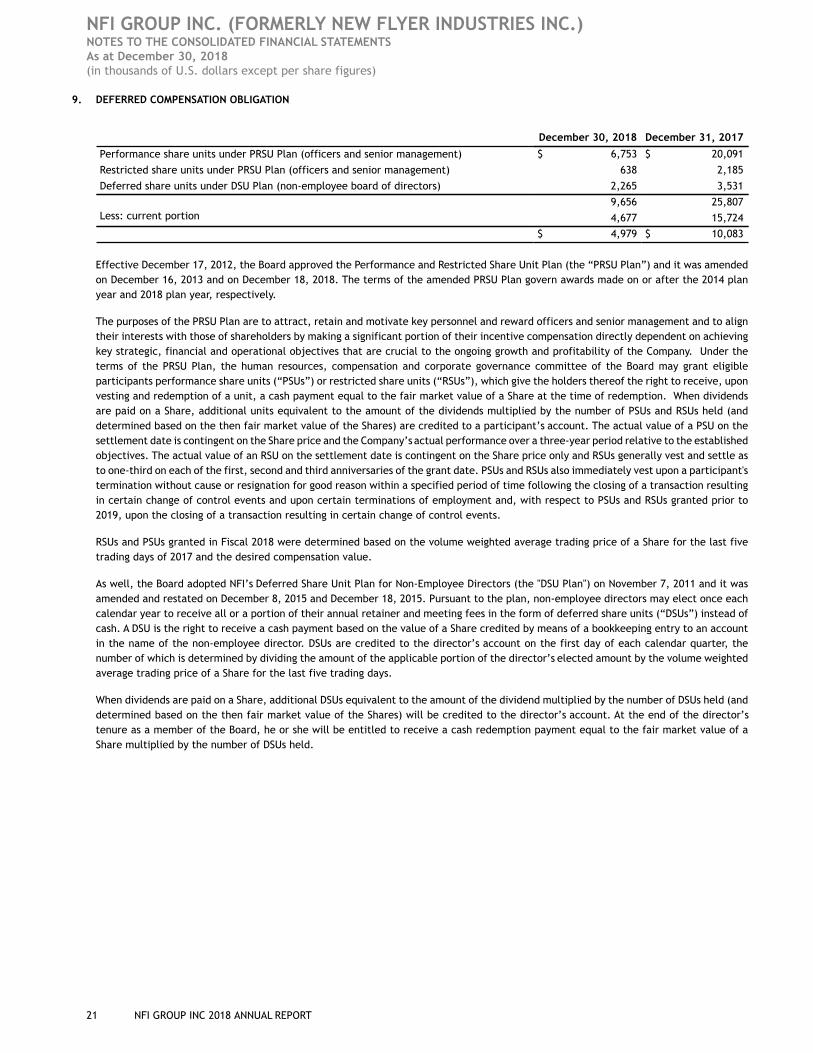
NFI GROUP INC. (FORMERLY NEW FLYER INDUSTRIES INC.) NOTES TO THE CONSOLIDATED FINANCIAL STATEMENTS As at December 30, 2018(in thousands of U.S. dollars except per share figures)
21 NFI GROUP INC 2018 ANNUAL REPORT
9. DEFERRED COMPENSATION OBLIGATION
December 30, 2018 December 31, 2017
Performance share units under PRSU Plan (officers and senior management) $ 6,753 $ 20,091
Restricted share units under PRSU Plan (officers and senior management) 638 2,185
Deferred share units under DSU Plan (non-employee board of directors) 2,265 3,531
9,656 25,807Less: current portion 4,677 15,724
$ 4,979 $ 10,083
Effective December 17, 2012, the Board approved the Performance and Restricted Share Unit Plan (the “PRSU Plan”) and it was amended on December 16, 2013 and on December 18, 2018. The terms of the amended PRSU Plan govern awards made on or after the 2014 plan year and 2018 plan year, respectively.
The purposes of the PRSU Plan are to attract, retain and motivate key personnel and reward officers and senior management and to align their interests with those of shareholders by making a significant portion of their incentive compensation directly dependent on achieving key strategic, financial and operational objectives that are crucial to the ongoing growth and profitability of the Company. Under the terms of the PRSU Plan, the human resources, compensation and corporate governance committee of the Board may grant eligible participants performance share units (“PSUs”) or restricted share units (“RSUs”), which give the holders thereof the right to receive, upon vesting and redemption of a unit, a cash payment equal to the fair market value of a Share at the time of redemption. When dividends are paid on a Share, additional units equivalent to the amount of the dividends multiplied by the number of PSUs and RSUs held (and determined based on the then fair market value of the Shares) are credited to a participant’s account. The actual value of a PSU on the settlement date is contingent on the Share price and the Company’s actual performance over a three-year period relative to the established objectives. The actual value of an RSU on the settlement date is contingent on the Share price only and RSUs generally vest and settle as to one-third on each of the first, second and third anniversaries of the grant date. PSUs and RSUs also immediately vest upon a participant's termination without cause or resignation for good reason within a specified period of time following the closing of a transaction resulting in certain change of control events and upon certain terminations of employment and, with respect to PSUs and RSUs granted prior to 2019, upon the closing of a transaction resulting in certain change of control events.
RSUs and PSUs granted in Fiscal 2018 were determined based on the volume weighted average trading price of a Share for the last five trading days of 2017 and the desired compensation value.
As well, the Board adopted NFI’s Deferred Share Unit Plan for Non-Employee Directors (the "DSU Plan") on November 7, 2011 and it was amended and restated on December 8, 2015 and December 18, 2015. Pursuant to the plan, non-employee directors may elect once each calendar year to receive all or a portion of their annual retainer and meeting fees in the form of deferred share units (“DSUs”) instead of cash. A DSU is the right to receive a cash payment based on the value of a Share credited by means of a bookkeeping entry to an account in the name of the non-employee director. DSUs are credited to the director’s account on the first day of each calendar quarter, the number of which is determined by dividing the amount of the applicable portion of the director’s elected amount by the volume weighted average trading price of a Share for the last five trading days.
When dividends are paid on a Share, additional DSUs equivalent to the amount of the dividend multiplied by the number of DSUs held (and determined based on the then fair market value of the Shares) will be credited to the director’s account. At the end of the director’s tenure as a member of the Board, he or she will be entitled to receive a cash redemption payment equal to the fair market value of a Share multiplied by the number of DSUs held.
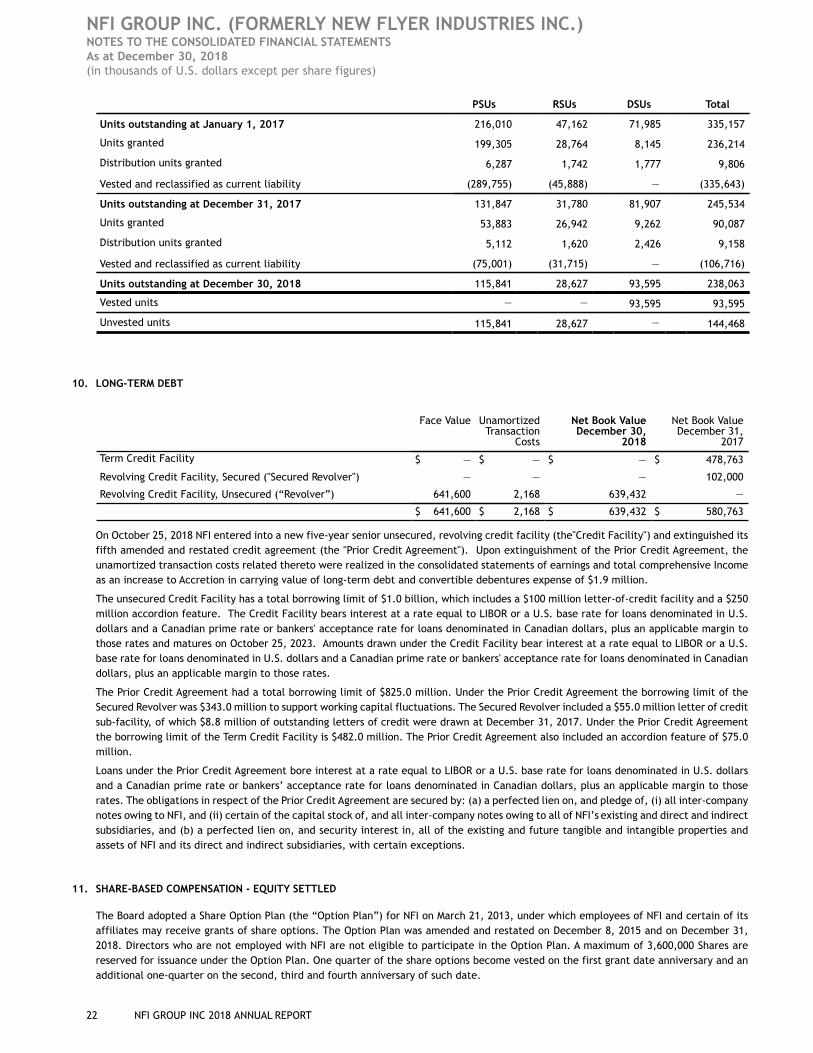
NFI GROUP INC. (FORMERLY NEW FLYER INDUSTRIES INC.) NOTES TO THE CONSOLIDATED FINANCIAL STATEMENTS As at December 30, 2018(in thousands of U.S. dollars except per share figures)
22 NFI GROUP INC 2018 ANNUAL REPORT
PSUs RSUs DSUs Total
Units outstanding at January 1, 2017 216,010 47,162 71,985 335,157
Units granted 199,305 28,764 8,145 236,214
Distribution units granted 6,287 1,742 1,777 9,806
Vested and reclassified as current liability (289,755) (45,888) — (335,643)
Units outstanding at December 31, 2017 131,847 31,780 81,907 245,534
Units granted 53,883 26,942 9,262 90,087
Distribution units granted 5,112 1,620 2,426 9,158
Vested and reclassified as current liability (75,001) (31,715) — (106,716)
Units outstanding at December 30, 2018 115,841 28,627 93,595 238,063
Vested units — — 93,595 93,595
Unvested units 115,841 28,627 — 144,468
10. LONG-TERM DEBT
Face Value UnamortizedTransaction
Costs
Net Book ValueDecember 30,
2018
Net Book ValueDecember 31,
2017
Term Credit Facility $ — $ — $ — $ 478,763
Revolving Credit Facility, Secured ("Secured Revolver") — — — 102,000
Revolving Credit Facility, Unsecured (“Revolver”) 641,600 2,168 639,432 —
$ 641,600 $ 2,168 $ 639,432 $ 580,763
On October 25, 2018 NFI entered into a new five-year senior unsecured, revolving credit facility (the"Credit Facility") and extinguished its fifth amended and restated credit agreement (the "Prior Credit Agreement"). Upon extinguishment of the Prior Credit Agreement, the unamortized transaction costs related thereto were realized in the consolidated statements of earnings and total comprehensive Income as an increase to Accretion in carrying value of long-term debt and convertible debentures expense of $1.9 million.
The unsecured Credit Facility has a total borrowing limit of $1.0 billion, which includes a $100 million letter-of-credit facility and a $250 million accordion feature. The Credit Facility bears interest at a rate equal to LIBOR or a U.S. base rate for loans denominated in U.S. dollars and a Canadian prime rate or bankers' acceptance rate for loans denominated in Canadian dollars, plus an applicable margin to those rates and matures on October 25, 2023. Amounts drawn under the Credit Facility bear interest at a rate equal to LIBOR or a U.S. base rate for loans denominated in U.S. dollars and a Canadian prime rate or bankers' acceptance rate for loans denominated in Canadian dollars, plus an applicable margin to those rates.
The Prior Credit Agreement had a total borrowing limit of $825.0 million. Under the Prior Credit Agreement the borrowing limit of the Secured Revolver was $343.0 million to support working capital fluctuations. The Secured Revolver included a $55.0 million letter of credit sub-facility, of which $8.8 million of outstanding letters of credit were drawn at December 31, 2017. Under the Prior Credit Agreement the borrowing limit of the Term Credit Facility is $482.0 million. The Prior Credit Agreement also included an accordion feature of $75.0 million.
Loans under the Prior Credit Agreement bore interest at a rate equal to LIBOR or a U.S. base rate for loans denominated in U.S. dollars and a Canadian prime rate or bankers’ acceptance rate for loans denominated in Canadian dollars, plus an applicable margin to those rates. The obligations in respect of the Prior Credit Agreement are secured by: (a) a perfected lien on, and pledge of, (i) all inter-company notes owing to NFI, and (ii) certain of the capital stock of, and all inter-company notes owing to all of NFI’s existing and direct and indirect subsidiaries, and (b) a perfected lien on, and security interest in, all of the existing and future tangible and intangible properties and assets of NFI and its direct and indirect subsidiaries, with certain exceptions.
11. SHARE-BASED COMPENSATION - EQUITY SETTLED
The Board adopted a Share Option Plan (the “Option Plan”) for NFI on March 21, 2013, under which employees of NFI and certain of its affiliates may receive grants of share options. The Option Plan was amended and restated on December 8, 2015 and on December 31, 2018. Directors who are not employed with NFI are not eligible to participate in the Option Plan. A maximum of 3,600,000 Shares are reserved for issuance under the Option Plan. One quarter of the share options become vested on the first grant date anniversary and an additional one-quarter on the second, third and fourth anniversary of such date.
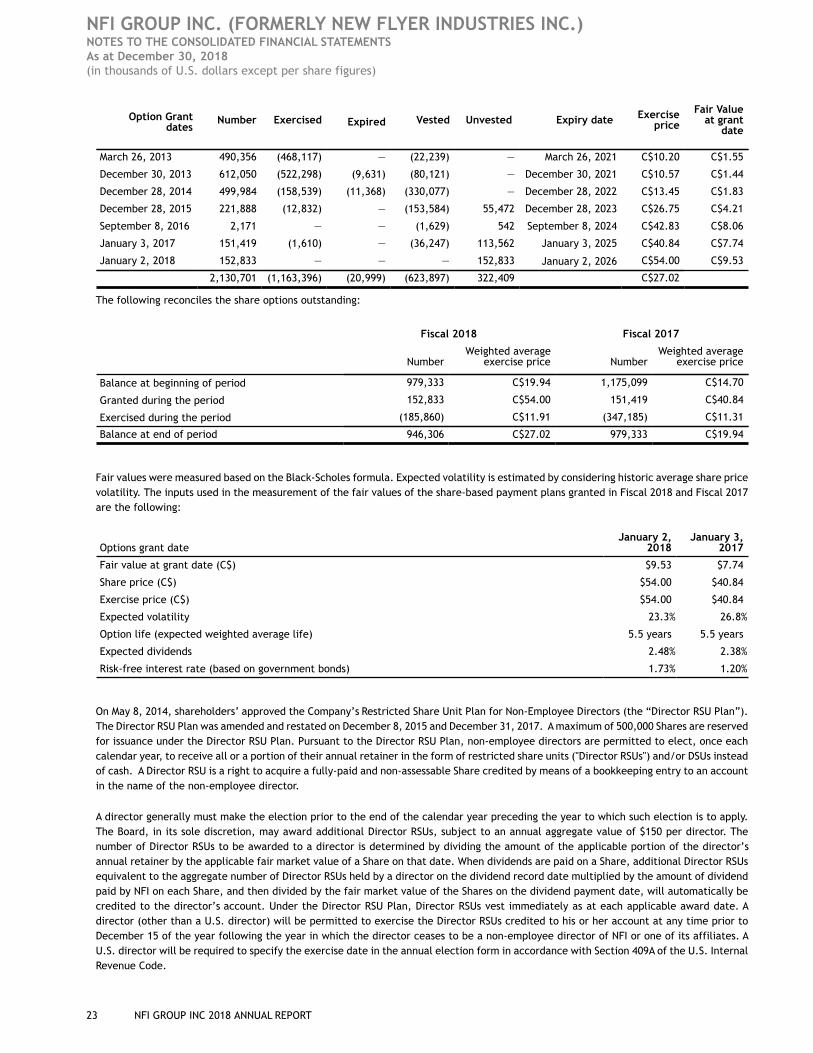
NFI GROUP INC. (FORMERLY NEW FLYER INDUSTRIES INC.) NOTES TO THE CONSOLIDATED FINANCIAL STATEMENTS As at December 30, 2018(in thousands of U.S. dollars except per share figures)
23 NFI GROUP INC 2018 ANNUAL REPORT
Option Grantdates
Number Exercised Expired Vested Unvested Expiry date Exerciseprice
Fair Valueat grant
date
March 26, 2013 490,356 (468,117) — (22,239) — March 26, 2021 C$10.20 C$1.55
December 30, 2013 612,050 (522,298) (9,631) (80,121) — December 30, 2021 C$10.57 C$1.44
December 28, 2014 499,984 (158,539) (11,368) (330,077) — December 28, 2022 C$13.45 C$1.83
December 28, 2015 221,888 (12,832) — (153,584) 55,472 December 28, 2023 C$26.75 C$4.21
September 8, 2016 2,171 — — (1,629) 542 September 8, 2024 C$42.83 C$8.06
January 3, 2017 151,419 (1,610) — (36,247) 113,562 January 3, 2025 C$40.84 C$7.74
January 2, 2018 152,833 — — — 152,833 January 2, 2026 C$54.00 C$9.53
2,130,701 (1,163,396) (20,999) (623,897) 322,409 C$27.02
The following reconciles the share options outstanding:
Fiscal 2018 Fiscal 2017
NumberWeighted average
exercise price NumberWeighted average
exercise price
Balance at beginning of period 979,333 C$19.94 1,175,099 C$14.70
Granted during the period 152,833 C$54.00 151,419 C$40.84
Exercised during the period (185,860) C$11.91 (347,185) C$11.31
Balance at end of period 946,306 C$27.02 979,333 C$19.94
Fair values were measured based on the Black-Scholes formula. Expected volatility is estimated by considering historic average share price volatility. The inputs used in the measurement of the fair values of the share-based payment plans granted in Fiscal 2018 and Fiscal 2017 are the following:
Options grant dateJanuary 2,
2018January 3,
2017
Fair value at grant date (C$) $9.53 $7.74
Share price (C$) $54.00 $40.84
Exercise price (C$) $54.00 $40.84
Expected volatility 23.3% 26.8%
Option life (expected weighted average life) 5.5 years 5.5 years
Expected dividends 2.48% 2.38%
Risk-free interest rate (based on government bonds) 1.73% 1.20%
On May 8, 2014, shareholders’ approved the Company’s Restricted Share Unit Plan for Non-Employee Directors (the “Director RSU Plan”). The Director RSU Plan was amended and restated on December 8, 2015 and December 31, 2017. A maximum of 500,000 Shares are reserved for issuance under the Director RSU Plan. Pursuant to the Director RSU Plan, non-employee directors are permitted to elect, once each calendar year, to receive all or a portion of their annual retainer in the form of restricted share units ("Director RSUs") and/or DSUs instead of cash. A Director RSU is a right to acquire a fully-paid and non-assessable Share credited by means of a bookkeeping entry to an account in the name of the non-employee director.
A director generally must make the election prior to the end of the calendar year preceding the year to which such election is to apply. The Board, in its sole discretion, may award additional Director RSUs, subject to an annual aggregate value of $150 per director. The number of Director RSUs to be awarded to a director is determined by dividing the amount of the applicable portion of the director’s annual retainer by the applicable fair market value of a Share on that date. When dividends are paid on a Share, additional Director RSUs equivalent to the aggregate number of Director RSUs held by a director on the dividend record date multiplied by the amount of dividend paid by NFI on each Share, and then divided by the fair market value of the Shares on the dividend payment date, will automatically be credited to the director’s account. Under the Director RSU Plan, Director RSUs vest immediately as at each applicable award date. A director (other than a U.S. director) will be permitted to exercise the Director RSUs credited to his or her account at any time prior to December 15 of the year following the year in which the director ceases to be a non-employee director of NFI or one of its affiliates. A U.S. director will be required to specify the exercise date in the annual election form in accordance with Section 409A of the U.S. Internal Revenue Code.
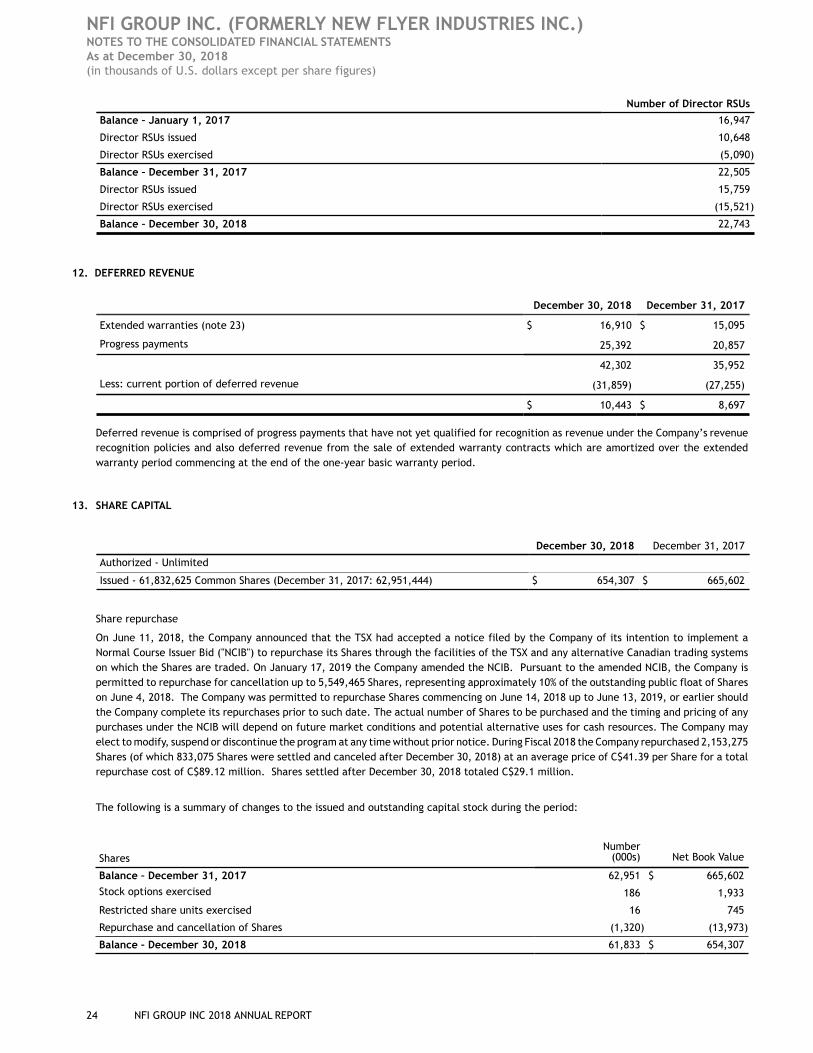
NFI GROUP INC. (FORMERLY NEW FLYER INDUSTRIES INC.) NOTES TO THE CONSOLIDATED FINANCIAL STATEMENTS As at December 30, 2018(in thousands of U.S. dollars except per share figures)
24 NFI GROUP INC 2018 ANNUAL REPORT
Number of Director RSUs
Balance – January 1, 2017 16,947
Director RSUs issued 10,648
Director RSUs exercised (5,090)
Balance – December 31, 2017 22,505
Director RSUs issued 15,759
Director RSUs exercised (15,521)
Balance – December 30, 2018 22,743
12. DEFERRED REVENUE
December 30, 2018 December 31, 2017
Extended warranties (note 23) $ 16,910 $ 15,095
Progress payments 25,392 20,857
42,302 35,952
Less: current portion of deferred revenue (31,859) (27,255)
$ 10,443 $ 8,697
Deferred revenue is comprised of progress payments that have not yet qualified for recognition as revenue under the Company’s revenue recognition policies and also deferred revenue from the sale of extended warranty contracts which are amortized over the extended warranty period commencing at the end of the one-year basic warranty period.
13. SHARE CAPITAL
December 30, 2018 December 31, 2017
Authorized - Unlimited
Issued - 61,832,625 Common Shares (December 31, 2017: 62,951,444) $ 654,307 $ 665,602
Share repurchase
On June 11, 2018, the Company announced that the TSX had accepted a notice filed by the Company of its intention to implement a Normal Course Issuer Bid ("NCIB") to repurchase its Shares through the facilities of the TSX and any alternative Canadian trading systems on which the Shares are traded. On January 17, 2019 the Company amended the NCIB. Pursuant to the amended NCIB, the Company is permitted to repurchase for cancellation up to 5,549,465 Shares, representing approximately 10% of the outstanding public float of Shares on June 4, 2018. The Company was permitted to repurchase Shares commencing on June 14, 2018 up to June 13, 2019, or earlier should the Company complete its repurchases prior to such date. The actual number of Shares to be purchased and the timing and pricing of any purchases under the NCIB will depend on future market conditions and potential alternative uses for cash resources. The Company may elect to modify, suspend or discontinue the program at any time without prior notice. During Fiscal 2018 the Company repurchased 2,153,275 Shares (of which 833,075 Shares were settled and canceled after December 30, 2018) at an average price of C$41.39 per Share for a total repurchase cost of C$89.12 million. Shares settled after December 30, 2018 totaled C$29.1 million.
The following is a summary of changes to the issued and outstanding capital stock during the period:
SharesNumber
(000s) Net Book Value
Balance – December 31, 2017 62,951 $ 665,602
Stock options exercised 186 1,933
Restricted share units exercised 16 745
Repurchase and cancellation of Shares (1,320) (13,973)
Balance – December 30, 2018 61,833 $ 654,307
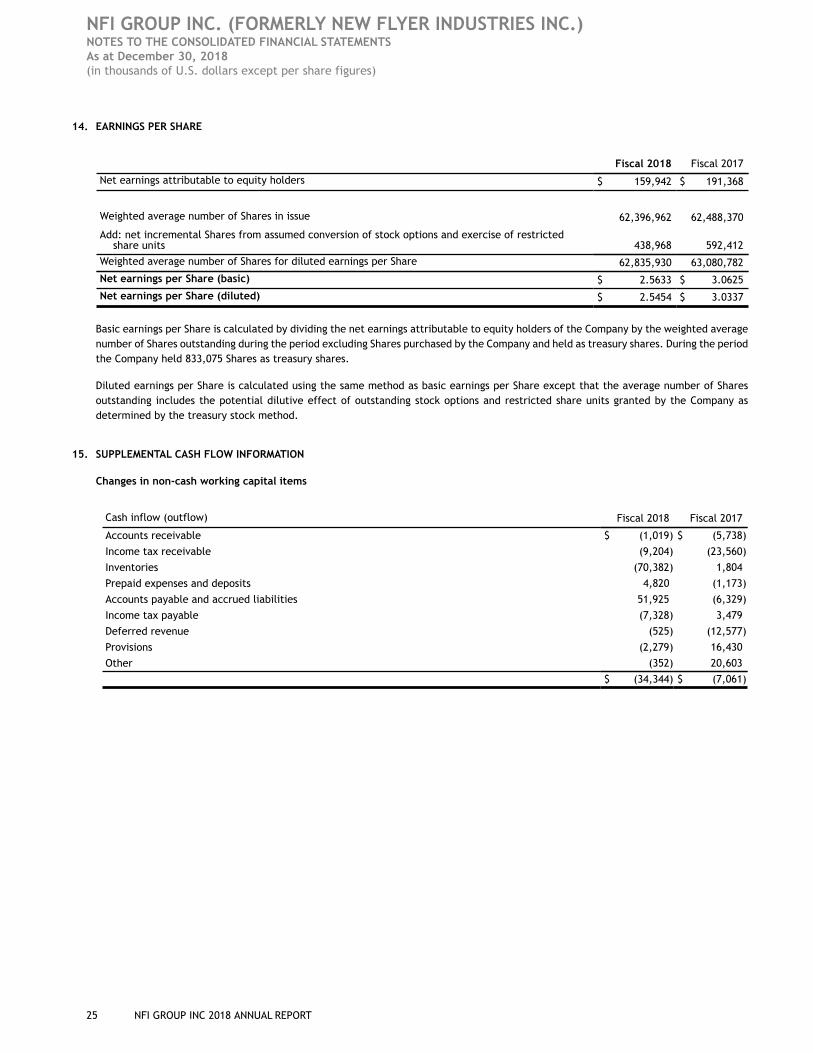
NFI GROUP INC. (FORMERLY NEW FLYER INDUSTRIES INC.) NOTES TO THE CONSOLIDATED FINANCIAL STATEMENTS As at December 30, 2018(in thousands of U.S. dollars except per share figures)
25 NFI GROUP INC 2018 ANNUAL REPORT
14. EARNINGS PER SHARE
Fiscal 2018 Fiscal 2017
Net earnings attributable to equity holders $ 159,942 $ 191,368
Weighted average number of Shares in issue 62,396,962 62,488,370
Add: net incremental Shares from assumed conversion of stock options and exercise of restrictedshare units 438,968 592,412
Weighted average number of Shares for diluted earnings per Share 62,835,930 63,080,782
Net earnings per Share (basic) $ 2.5633 $ 3.0625
Net earnings per Share (diluted) $ 2.5454 $ 3.0337
Basic earnings per Share is calculated by dividing the net earnings attributable to equity holders of the Company by the weighted average number of Shares outstanding during the period excluding Shares purchased by the Company and held as treasury shares. During the period the Company held 833,075 Shares as treasury shares.
Diluted earnings per Share is calculated using the same method as basic earnings per Share except that the average number of Shares outstanding includes the potential dilutive effect of outstanding stock options and restricted share units granted by the Company as determined by the treasury stock method.
15. SUPPLEMENTAL CASH FLOW INFORMATION
Changes in non-cash working capital items
Cash inflow (outflow) Fiscal 2018 Fiscal 2017
Accounts receivable $ (1,019) $ (5,738)
Income tax receivable (9,204) (23,560)
Inventories (70,382) 1,804
Prepaid expenses and deposits 4,820 (1,173)
Accounts payable and accrued liabilities 51,925 (6,329)
Income tax payable (7,328) 3,479
Deferred revenue (525) (12,577)
Provisions (2,279) 16,430
Other (352) 20,603
$ (34,344) $ (7,061)
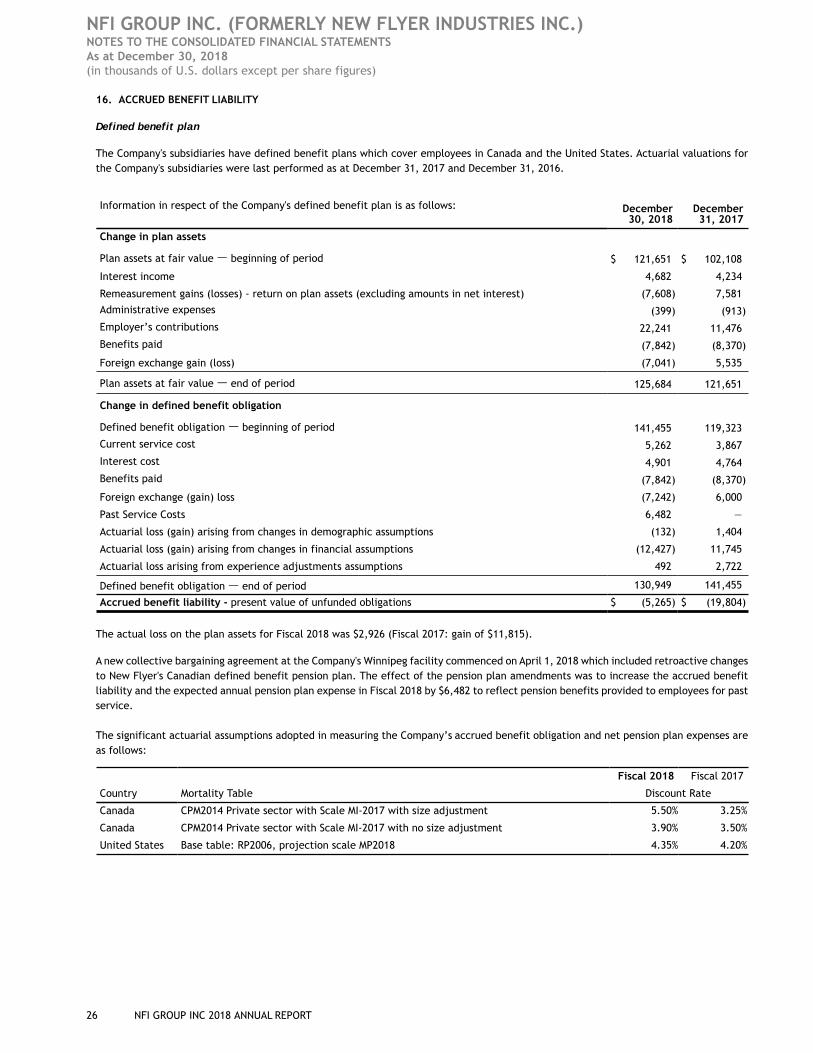
NFI GROUP INC. (FORMERLY NEW FLYER INDUSTRIES INC.) NOTES TO THE CONSOLIDATED FINANCIAL STATEMENTS As at December 30, 2018(in thousands of U.S. dollars except per share figures)
26 NFI GROUP INC 2018 ANNUAL REPORT
16. ACCRUED BENEFIT LIABILITY
Defined benefit plan
The Company's subsidiaries have defined benefit plans which cover employees in Canada and the United States. Actuarial valuations for the Company's subsidiaries were last performed as at December 31, 2017 and December 31, 2016.
Information in respect of the Company's defined benefit plan is as follows: December30, 2018
December31, 2017
Change in plan assets
Plan assets at fair value — beginning of period $ 121,651 $ 102,108
Interest income 4,682 4,234
Remeasurement gains (losses) - return on plan assets (excluding amounts in net interest) (7,608) 7,581
Administrative expenses (399) (913)
Employer’s contributions 22,241 11,476
Benefits paid (7,842) (8,370)
Foreign exchange gain (loss) (7,041) 5,535
Plan assets at fair value — end of period 125,684 121,651
Change in defined benefit obligation
Defined benefit obligation — beginning of period 141,455 119,323
Current service cost 5,262 3,867
Interest cost 4,901 4,764
Benefits paid (7,842) (8,370)
Foreign exchange (gain) loss (7,242) 6,000
Past Service Costs 6,482 —
Actuarial loss (gain) arising from changes in demographic assumptions (132) 1,404
Actuarial loss (gain) arising from changes in financial assumptions (12,427) 11,745
Actuarial loss arising from experience adjustments assumptions 492 2,722
Defined benefit obligation — end of period 130,949 141,455
Accrued benefit liability - present value of unfunded obligations $ (5,265) $ (19,804)
The actual loss on the plan assets for Fiscal 2018 was $2,926 (Fiscal 2017: gain of $11,815).
A new collective bargaining agreement at the Company's Winnipeg facility commenced on April 1, 2018 which included retroactive changes to New Flyer's Canadian defined benefit pension plan. The effect of the pension plan amendments was to increase the accrued benefit liability and the expected annual pension plan expense in Fiscal 2018 by $6,482 to reflect pension benefits provided to employees for past service.
The significant actuarial assumptions adopted in measuring the Company’s accrued benefit obligation and net pension plan expenses are as follows:
Fiscal 2018 Fiscal 2017
Country Mortality Table Discount Rate
Canada CPM2014 Private sector with Scale MI-2017 with size adjustment 5.50% 3.25%
Canada CPM2014 Private sector with Scale MI-2017 with no size adjustment 3.90% 3.50%
United States Base table: RP2006, projection scale MP2018 4.35% 4.20%
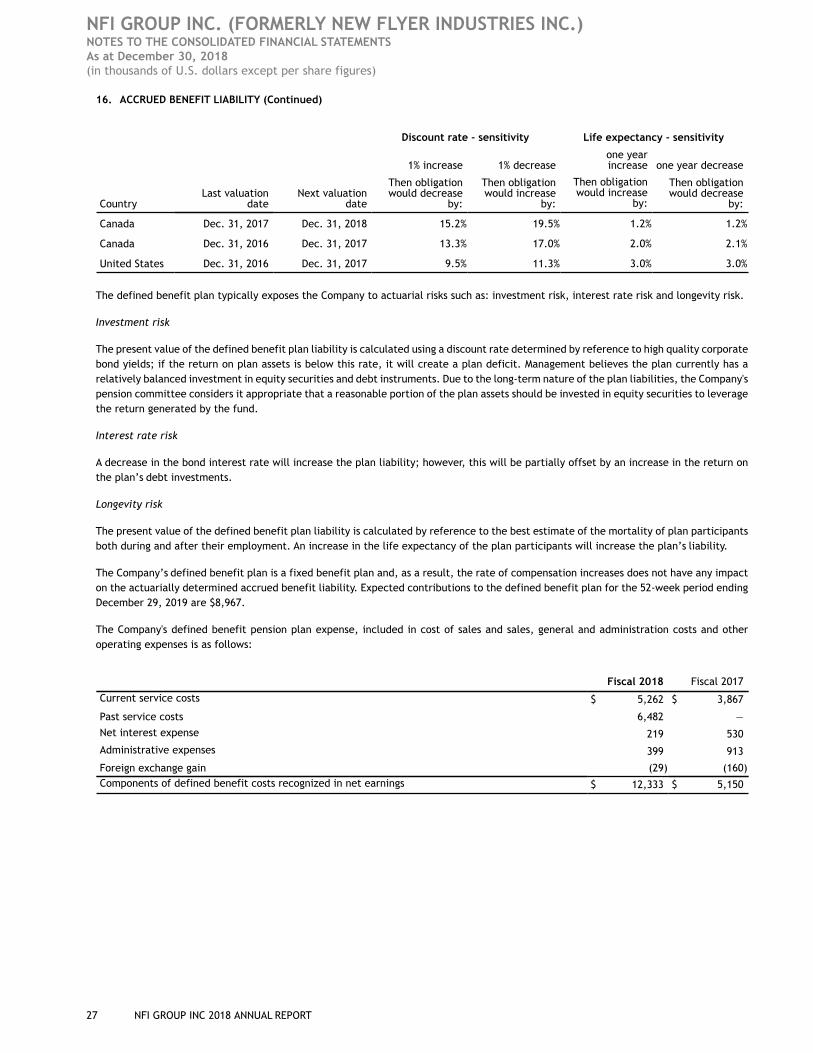
NFI GROUP INC. (FORMERLY NEW FLYER INDUSTRIES INC.) NOTES TO THE CONSOLIDATED FINANCIAL STATEMENTS As at December 30, 2018(in thousands of U.S. dollars except per share figures)
27 NFI GROUP INC 2018 ANNUAL REPORT
16. ACCRUED BENEFIT LIABILITY (Continued)
Discount rate - sensitivity Life expectancy - sensitivity
1% increase 1% decreaseone yearincrease one year decrease
CountryLast valuation
dateNext valuation
date
Then obligationwould decrease
by:
Then obligationwould increase
by:
Then obligationwould increase
by:
Then obligationwould decrease
by:
Canada Dec. 31, 2017 Dec. 31, 2018 15.2% 19.5% 1.2% 1.2%
Canada Dec. 31, 2016 Dec. 31, 2017 13.3% 17.0% 2.0% 2.1%
United States Dec. 31, 2016 Dec. 31, 2017 9.5% 11.3% 3.0% 3.0%
The defined benefit plan typically exposes the Company to actuarial risks such as: investment risk, interest rate risk and longevity risk.
Investment risk
The present value of the defined benefit plan liability is calculated using a discount rate determined by reference to high quality corporate bond yields; if the return on plan assets is below this rate, it will create a plan deficit. Management believes the plan currently has a relatively balanced investment in equity securities and debt instruments. Due to the long-term nature of the plan liabilities, the Company's pension committee considers it appropriate that a reasonable portion of the plan assets should be invested in equity securities to leverage the return generated by the fund.
Interest rate risk
A decrease in the bond interest rate will increase the plan liability; however, this will be partially offset by an increase in the return on the plan’s debt investments.
Longevity risk
The present value of the defined benefit plan liability is calculated by reference to the best estimate of the mortality of plan participants both during and after their employment. An increase in the life expectancy of the plan participants will increase the plan’s liability.
The Company’s defined benefit plan is a fixed benefit plan and, as a result, the rate of compensation increases does not have any impact on the actuarially determined accrued benefit liability. Expected contributions to the defined benefit plan for the 52-week period ending December 29, 2019 are $8,967.
The Company's defined benefit pension plan expense, included in cost of sales and sales, general and administration costs and other operating expenses is as follows:
Fiscal 2018 Fiscal 2017
Current service costs $ 5,262 $ 3,867
Past service costs 6,482 —
Net interest expense 219 530
Administrative expenses 399 913
Foreign exchange gain (29) (160)Components of defined benefit costs recognized in net earnings $ 12,333 $ 5,150
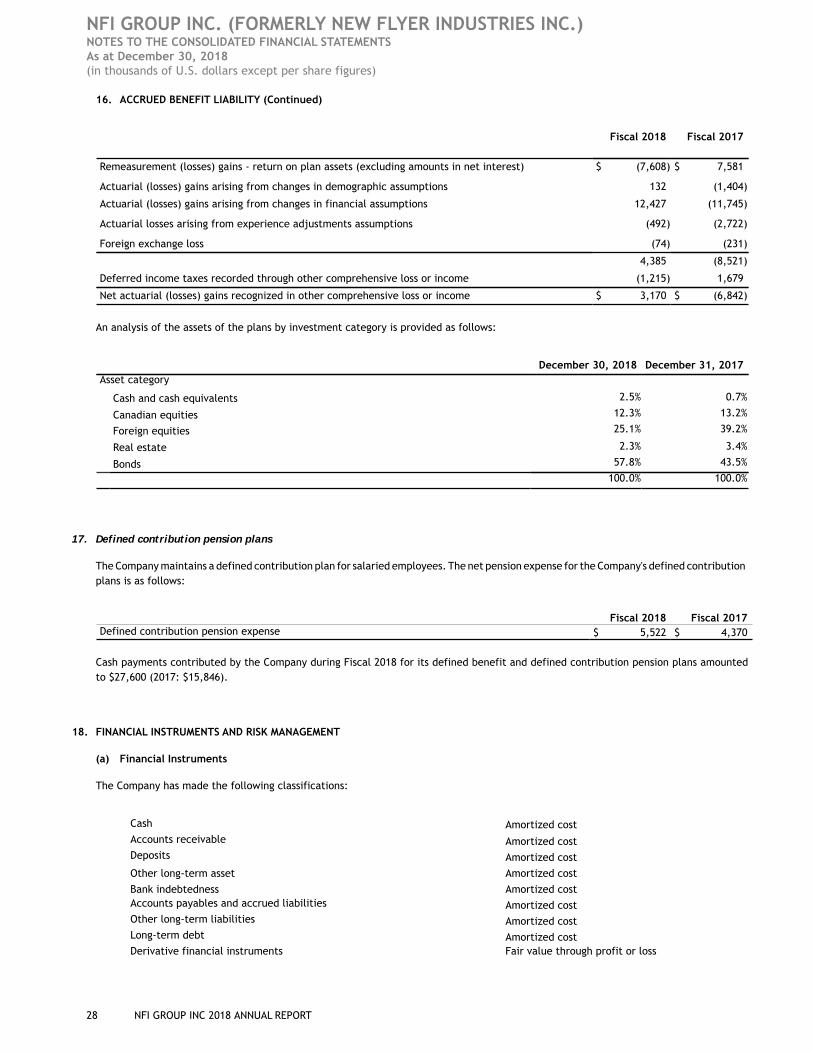
NFI GROUP INC. (FORMERLY NEW FLYER INDUSTRIES INC.) NOTES TO THE CONSOLIDATED FINANCIAL STATEMENTS As at December 30, 2018(in thousands of U.S. dollars except per share figures)
28 NFI GROUP INC 2018 ANNUAL REPORT
16. ACCRUED BENEFIT LIABILITY (Continued)
Fiscal 2018 Fiscal 2017
Remeasurement (losses) gains - return on plan assets (excluding amounts in net interest) $ (7,608) $ 7,581
Actuarial (losses) gains arising from changes in demographic assumptions 132 (1,404)
Actuarial (losses) gains arising from changes in financial assumptions 12,427 (11,745)
Actuarial losses arising from experience adjustments assumptions (492) (2,722)
Foreign exchange loss (74) (231)
4,385 (8,521)
Deferred income taxes recorded through other comprehensive loss or income (1,215) 1,679
Net actuarial (losses) gains recognized in other comprehensive loss or income $ 3,170 $ (6,842)
An analysis of the assets of the plans by investment category is provided as follows:
December 30, 2018 December 31, 2017Asset category
Cash and cash equivalents 2.5% 0.7%
Canadian equities 12.3% 13.2%
Foreign equities 25.1% 39.2%
Real estate 2.3% 3.4%
Bonds 57.8% 43.5%
100.0% 100.0%
17. Defined contribution pension plans
The Company maintains a defined contribution plan for salaried employees. The net pension expense for the Company's defined contribution plans is as follows:
Fiscal 2018 Fiscal 2017Defined contribution pension expense $ 5,522 $ 4,370
Cash payments contributed by the Company during Fiscal 2018 for its defined benefit and defined contribution pension plans amounted to $27,600 (2017: $15,846).
18. FINANCIAL INSTRUMENTS AND RISK MANAGEMENT
(a) Financial Instruments
The Company has made the following classifications:
Cash Amortized costAccounts receivable Amortized costDeposits Amortized cost
Other long-term asset Amortized cost
Bank indebtedness Amortized costAccounts payables and accrued liabilities Amortized costOther long-term liabilities Amortized costLong-term debt Amortized costDerivative financial instruments Fair value through profit or loss
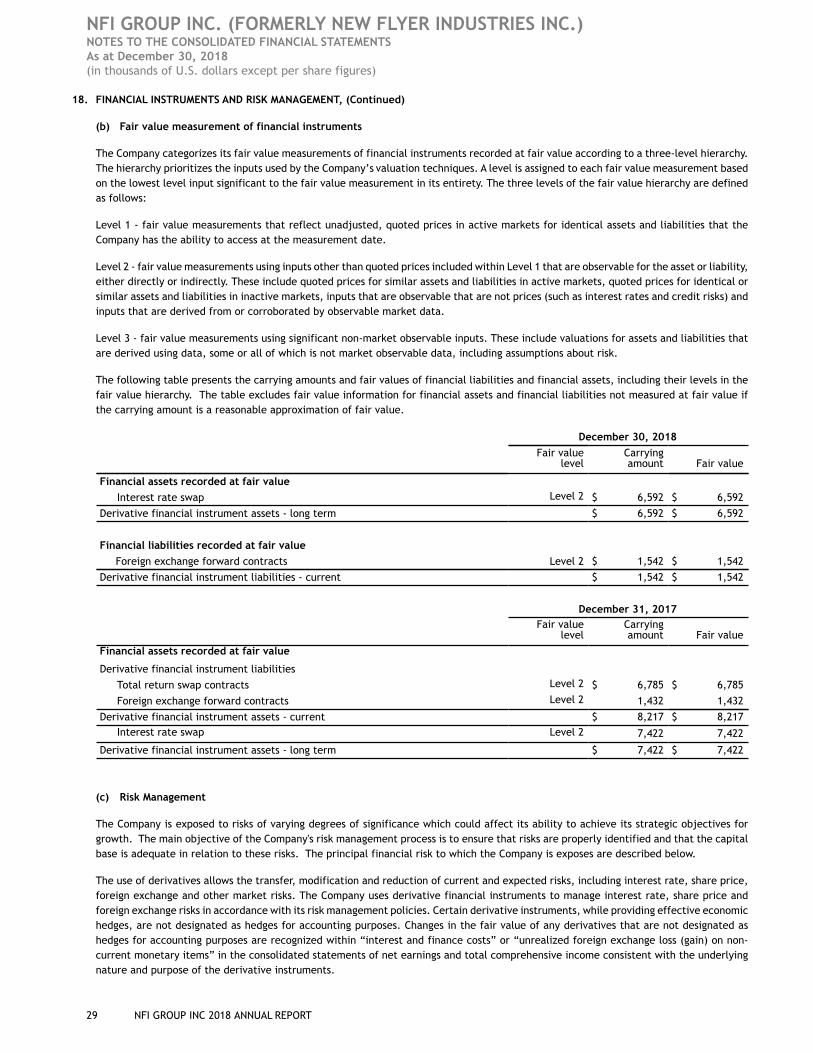
NFI GROUP INC. (FORMERLY NEW FLYER INDUSTRIES INC.) NOTES TO THE CONSOLIDATED FINANCIAL STATEMENTS As at December 30, 2018(in thousands of U.S. dollars except per share figures)
29 NFI GROUP INC 2018 ANNUAL REPORT
18. FINANCIAL INSTRUMENTS AND RISK MANAGEMENT, (Continued)
(b) Fair value measurement of financial instruments
The Company categorizes its fair value measurements of financial instruments recorded at fair value according to a three-level hierarchy. The hierarchy prioritizes the inputs used by the Company’s valuation techniques. A level is assigned to each fair value measurement based on the lowest level input significant to the fair value measurement in its entirety. The three levels of the fair value hierarchy are defined as follows:
Level 1 - fair value measurements that reflect unadjusted, quoted prices in active markets for identical assets and liabilities that the Company has the ability to access at the measurement date.
Level 2 - fair value measurements using inputs other than quoted prices included within Level 1 that are observable for the asset or liability, either directly or indirectly. These include quoted prices for similar assets and liabilities in active markets, quoted prices for identical or similar assets and liabilities in inactive markets, inputs that are observable that are not prices (such as interest rates and credit risks) and inputs that are derived from or corroborated by observable market data.
Level 3 - fair value measurements using significant non-market observable inputs. These include valuations for assets and liabilities that are derived using data, some or all of which is not market observable data, including assumptions about risk.
The following table presents the carrying amounts and fair values of financial liabilities and financial assets, including their levels in the fair value hierarchy. The table excludes fair value information for financial assets and financial liabilities not measured at fair value if the carrying amount is a reasonable approximation of fair value.
December 30, 2018
Fair valuelevel
Carryingamount Fair value
Financial assets recorded at fair value
Interest rate swap Level 2 $ 6,592 $ 6,592
Derivative financial instrument assets - long term $ 6,592 $ 6,592
Financial liabilities recorded at fair value
Foreign exchange forward contracts Level 2 $ 1,542 $ 1,542
Derivative financial instrument liabilities - current $ 1,542 $ 1,542
December 31, 2017Fair value
levelCarryingamount Fair value
Financial assets recorded at fair value
Derivative financial instrument liabilities
Total return swap contracts Level 2 $ 6,785 $ 6,785
Foreign exchange forward contracts Level 2 1,432 1,432
Derivative financial instrument assets - current $ 8,217 $ 8,217Interest rate swap Level 2 7,422 7,422
Derivative financial instrument assets - long term $ 7,422 $ 7,422
(c) Risk Management
The Company is exposed to risks of varying degrees of significance which could affect its ability to achieve its strategic objectives for growth. The main objective of the Company's risk management process is to ensure that risks are properly identified and that the capital base is adequate in relation to these risks. The principal financial risk to which the Company is exposes are described below.
The use of derivatives allows the transfer, modification and reduction of current and expected risks, including interest rate, share price, foreign exchange and other market risks. The Company uses derivative financial instruments to manage interest rate, share price and foreign exchange risks in accordance with its risk management policies. Certain derivative instruments, while providing effective economic hedges, are not designated as hedges for accounting purposes. Changes in the fair value of any derivatives that are not designated as hedges for accounting purposes are recognized within “interest and finance costs” or “unrealized foreign exchange loss (gain) on non-current monetary items” in the consolidated statements of net earnings and total comprehensive income consistent with the underlying nature and purpose of the derivative instruments.
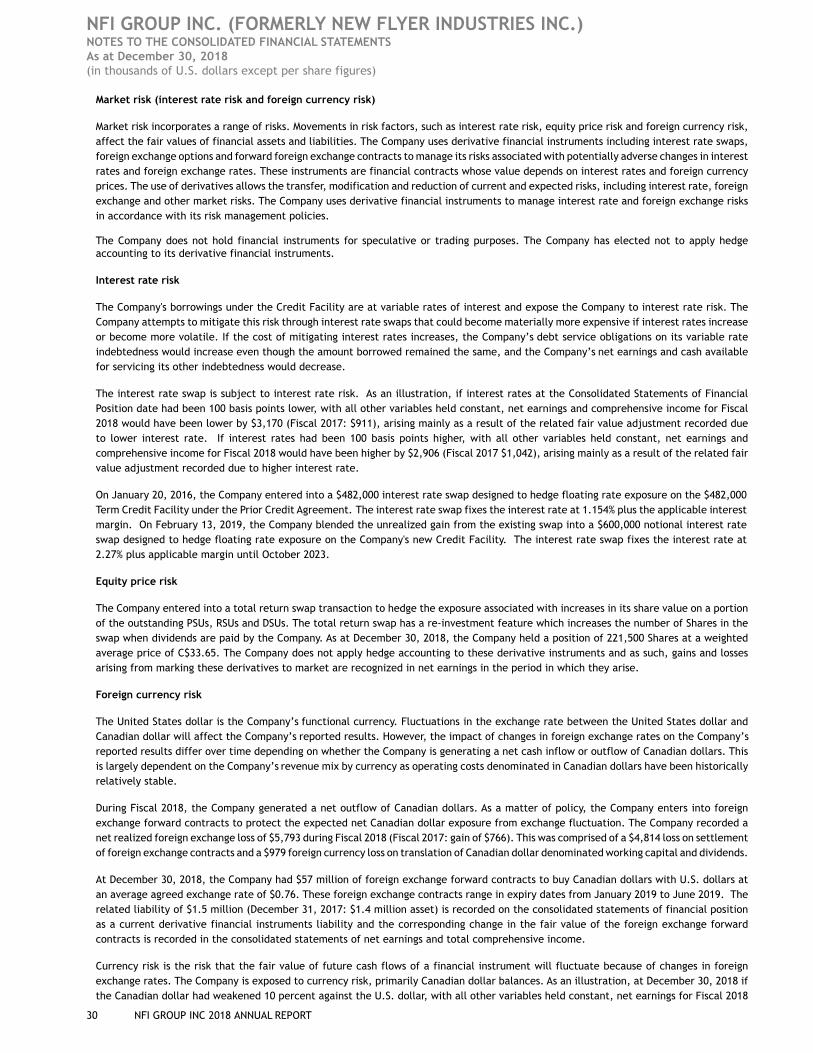
NFI GROUP INC. (FORMERLY NEW FLYER INDUSTRIES INC.) NOTES TO THE CONSOLIDATED FINANCIAL STATEMENTS As at December 30, 2018(in thousands of U.S. dollars except per share figures)
30 NFI GROUP INC 2018 ANNUAL REPORT
Market risk (interest rate risk and foreign currency risk)
Market risk incorporates a range of risks. Movements in risk factors, such as interest rate risk, equity price risk and foreign currency risk, affect the fair values of financial assets and liabilities. The Company uses derivative financial instruments including interest rate swaps, foreign exchange options and forward foreign exchange contracts to manage its risks associated with potentially adverse changes in interest rates and foreign exchange rates. These instruments are financial contracts whose value depends on interest rates and foreign currency prices. The use of derivatives allows the transfer, modification and reduction of current and expected risks, including interest rate, foreign exchange and other market risks. The Company uses derivative financial instruments to manage interest rate and foreign exchange risks in accordance with its risk management policies.
The Company does not hold financial instruments for speculative or trading purposes. The Company has elected not to apply hedge accounting to its derivative financial instruments.
Interest rate risk
The Company's borrowings under the Credit Facility are at variable rates of interest and expose the Company to interest rate risk. The Company attempts to mitigate this risk through interest rate swaps that could become materially more expensive if interest rates increase or become more volatile. If the cost of mitigating interest rates increases, the Company’s debt service obligations on its variable rate indebtedness would increase even though the amount borrowed remained the same, and the Company’s net earnings and cash available for servicing its other indebtedness would decrease.
The interest rate swap is subject to interest rate risk. As an illustration, if interest rates at the Consolidated Statements of Financial Position date had been 100 basis points lower, with all other variables held constant, net earnings and comprehensive income for Fiscal 2018 would have been lower by $3,170 (Fiscal 2017: $911), arising mainly as a result of the related fair value adjustment recorded due to lower interest rate. If interest rates had been 100 basis points higher, with all other variables held constant, net earnings and comprehensive income for Fiscal 2018 would have been higher by $2,906 (Fiscal 2017 $1,042), arising mainly as a result of the related fair value adjustment recorded due to higher interest rate.
On January 20, 2016, the Company entered into a $482,000 interest rate swap designed to hedge floating rate exposure on the $482,000 Term Credit Facility under the Prior Credit Agreement. The interest rate swap fixes the interest rate at 1.154% plus the applicable interest margin. On February 13, 2019, the Company blended the unrealized gain from the existing swap into a $600,000 notional interest rate swap designed to hedge floating rate exposure on the Company's new Credit Facility. The interest rate swap fixes the interest rate at 2.27% plus applicable margin until October 2023.
Equity price risk
The Company entered into a total return swap transaction to hedge the exposure associated with increases in its share value on a portion of the outstanding PSUs, RSUs and DSUs. The total return swap has a re-investment feature which increases the number of Shares in the swap when dividends are paid by the Company. As at December 30, 2018, the Company held a position of 221,500 Shares at a weighted average price of C$33.65. The Company does not apply hedge accounting to these derivative instruments and as such, gains and losses arising from marking these derivatives to market are recognized in net earnings in the period in which they arise.
Foreign currency risk
The United States dollar is the Company’s functional currency. Fluctuations in the exchange rate between the United States dollar and Canadian dollar will affect the Company’s reported results. However, the impact of changes in foreign exchange rates on the Company’s reported results differ over time depending on whether the Company is generating a net cash inflow or outflow of Canadian dollars. This is largely dependent on the Company’s revenue mix by currency as operating costs denominated in Canadian dollars have been historically relatively stable.
During Fiscal 2018, the Company generated a net outflow of Canadian dollars. As a matter of policy, the Company enters into foreign exchange forward contracts to protect the expected net Canadian dollar exposure from exchange fluctuation. The Company recorded a net realized foreign exchange loss of $5,793 during Fiscal 2018 (Fiscal 2017: gain of $766). This was comprised of a $4,814 loss on settlement of foreign exchange contracts and a $979 foreign currency loss on translation of Canadian dollar denominated working capital and dividends.
At December 30, 2018, the Company had $57 million of foreign exchange forward contracts to buy Canadian dollars with U.S. dollars at an average agreed exchange rate of $0.76. These foreign exchange contracts range in expiry dates from January 2019 to June 2019. The related liability of $1.5 million (December 31, 2017: $1.4 million asset) is recorded on the consolidated statements of financial position as a current derivative financial instruments liability and the corresponding change in the fair value of the foreign exchange forward contracts is recorded in the consolidated statements of net earnings and total comprehensive income.
Currency risk is the risk that the fair value of future cash flows of a financial instrument will fluctuate because of changes in foreign exchange rates. The Company is exposed to currency risk, primarily Canadian dollar balances. As an illustration, at December 30, 2018 if the Canadian dollar had weakened 10 percent against the U.S. dollar, with all other variables held constant, net earnings for Fiscal 2018
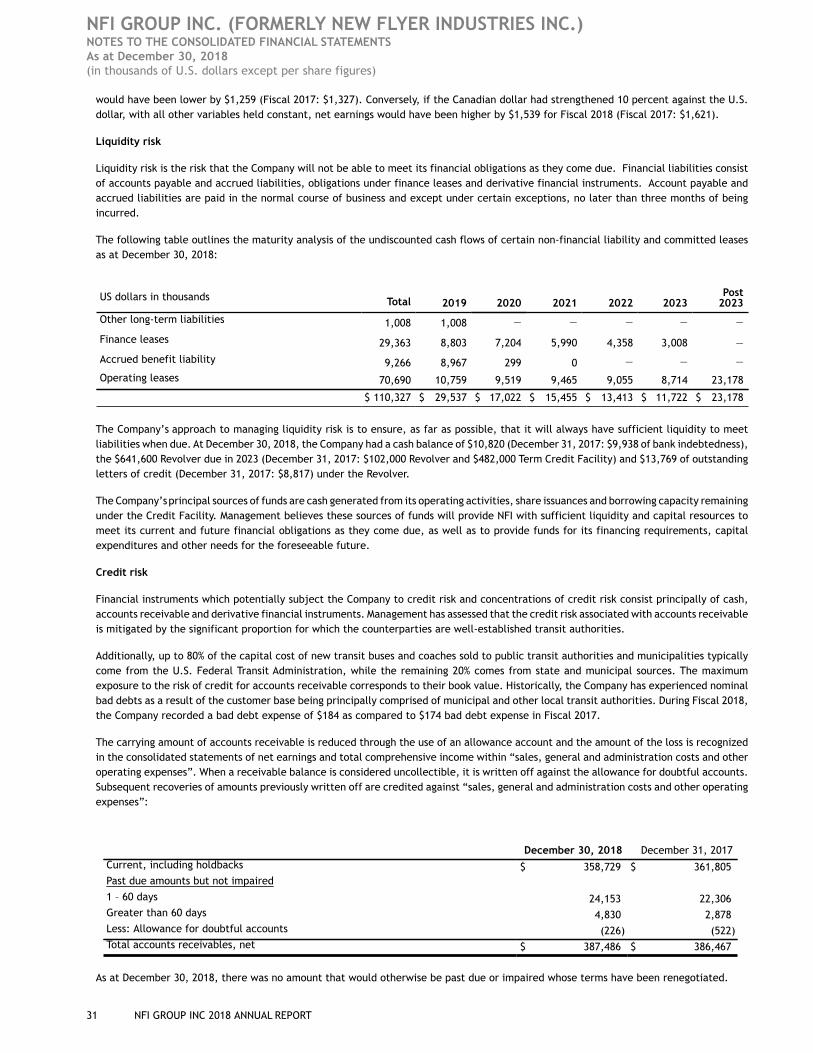
NFI GROUP INC. (FORMERLY NEW FLYER INDUSTRIES INC.) NOTES TO THE CONSOLIDATED FINANCIAL STATEMENTS As at December 30, 2018(in thousands of U.S. dollars except per share figures)
31 NFI GROUP INC 2018 ANNUAL REPORT
would have been lower by $1,259 (Fiscal 2017: $1,327). Conversely, if the Canadian dollar had strengthened 10 percent against the U.S. dollar, with all other variables held constant, net earnings would have been higher by $1,539 for Fiscal 2018 (Fiscal 2017: $1,621).
Liquidity risk
Liquidity risk is the risk that the Company will not be able to meet its financial obligations as they come due. Financial liabilities consist of accounts payable and accrued liabilities, obligations under finance leases and derivative financial instruments. Account payable and accrued liabilities are paid in the normal course of business and except under certain exceptions, no later than three months of being incurred.
The following table outlines the maturity analysis of the undiscounted cash flows of certain non-financial liability and committed leases as at December 30, 2018:
US dollars in thousands Total 2019 2020 2021 2022 2023Post
2023
Other long-term liabilities 1,008 1,008 — — — — —
Finance leases 29,363 8,803 7,204 5,990 4,358 3,008 —
Accrued benefit liability 9,266 8,967 299 0 — — —
Operating leases 70,690 10,759 9,519 9,465 9,055 8,714 23,178
$ 110,327 $ 29,537 $ 17,022 $ 15,455 $ 13,413 $ 11,722 $ 23,178
The Company’s approach to managing liquidity risk is to ensure, as far as possible, that it will always have sufficient liquidity to meet liabilities when due. At December 30, 2018, the Company had a cash balance of $10,820 (December 31, 2017: $9,938 of bank indebtedness), the $641,600 Revolver due in 2023 (December 31, 2017: $102,000 Revolver and $482,000 Term Credit Facility) and $13,769 of outstanding letters of credit (December 31, 2017: $8,817) under the Revolver.
The Company’s principal sources of funds are cash generated from its operating activities, share issuances and borrowing capacity remaining under the Credit Facility. Management believes these sources of funds will provide NFI with sufficient liquidity and capital resources to meet its current and future financial obligations as they come due, as well as to provide funds for its financing requirements, capital expenditures and other needs for the foreseeable future.
Credit risk
Financial instruments which potentially subject the Company to credit risk and concentrations of credit risk consist principally of cash, accounts receivable and derivative financial instruments. Management has assessed that the credit risk associated with accounts receivable is mitigated by the significant proportion for which the counterparties are well-established transit authorities.
Additionally, up to 80% of the capital cost of new transit buses and coaches sold to public transit authorities and municipalities typically come from the U.S. Federal Transit Administration, while the remaining 20% comes from state and municipal sources. The maximum exposure to the risk of credit for accounts receivable corresponds to their book value. Historically, the Company has experienced nominal bad debts as a result of the customer base being principally comprised of municipal and other local transit authorities. During Fiscal 2018, the Company recorded a bad debt expense of $184 as compared to $174 bad debt expense in Fiscal 2017.
The carrying amount of accounts receivable is reduced through the use of an allowance account and the amount of the loss is recognized in the consolidated statements of net earnings and total comprehensive income within “sales, general and administration costs and other operating expenses”. When a receivable balance is considered uncollectible, it is written off against the allowance for doubtful accounts. Subsequent recoveries of amounts previously written off are credited against “sales, general and administration costs and other operating expenses”:
December 30, 2018 December 31, 2017Current, including holdbacks $ 358,729 $ 361,805Past due amounts but not impaired
1 – 60 days 24,153 22,306Greater than 60 days 4,830 2,878Less: Allowance for doubtful accounts (226) (522)Total accounts receivables, net $ 387,486 $ 386,467
As at December 30, 2018, there was no amount that would otherwise be past due or impaired whose terms have been renegotiated.
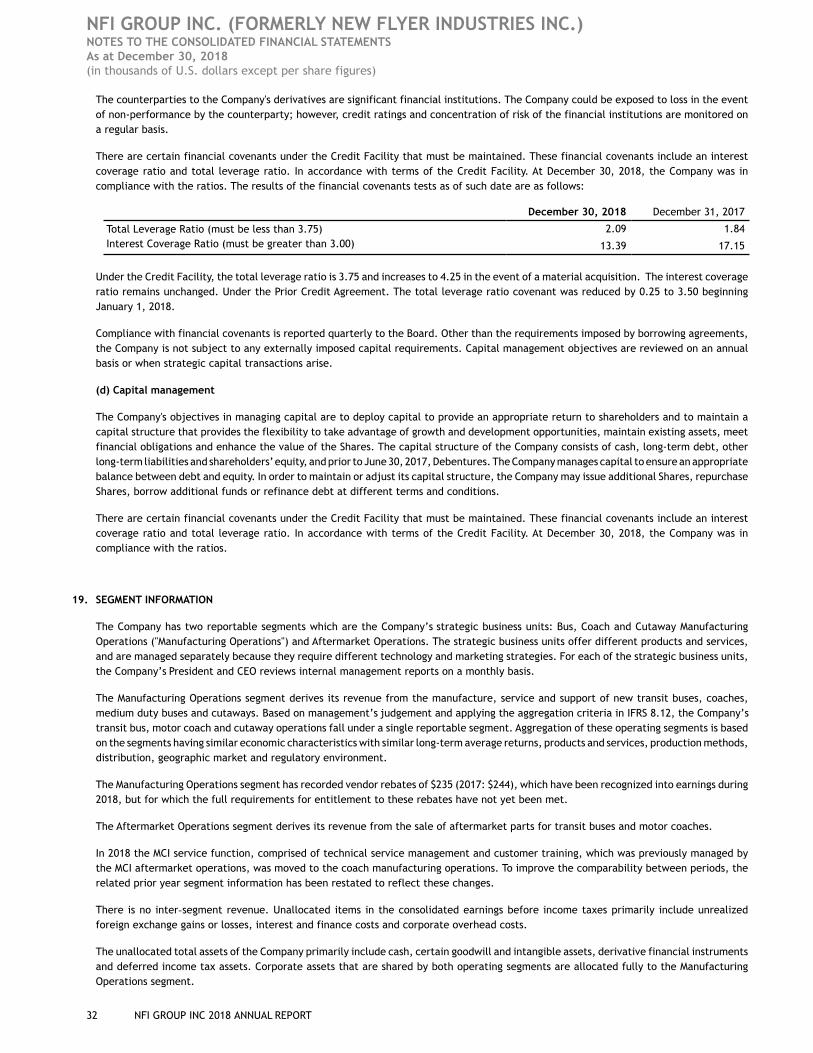
NFI GROUP INC. (FORMERLY NEW FLYER INDUSTRIES INC.) NOTES TO THE CONSOLIDATED FINANCIAL STATEMENTS As at December 30, 2018(in thousands of U.S. dollars except per share figures)
32 NFI GROUP INC 2018 ANNUAL REPORT
The counterparties to the Company's derivatives are significant financial institutions. The Company could be exposed to loss in the event of non-performance by the counterparty; however, credit ratings and concentration of risk of the financial institutions are monitored on a regular basis.
There are certain financial covenants under the Credit Facility that must be maintained. These financial covenants include an interest coverage ratio and total leverage ratio. In accordance with terms of the Credit Facility. At December 30, 2018, the Company was in compliance with the ratios. The results of the financial covenants tests as of such date are as follows:
December 30, 2018 December 31, 2017
Total Leverage Ratio (must be less than 3.75) 2.09 1.84Interest Coverage Ratio (must be greater than 3.00) 13.39 17.15
Under the Credit Facility, the total leverage ratio is 3.75 and increases to 4.25 in the event of a material acquisition. The interest coverage ratio remains unchanged. Under the Prior Credit Agreement. The total leverage ratio covenant was reduced by 0.25 to 3.50 beginning January 1, 2018.
Compliance with financial covenants is reported quarterly to the Board. Other than the requirements imposed by borrowing agreements, the Company is not subject to any externally imposed capital requirements. Capital management objectives are reviewed on an annual basis or when strategic capital transactions arise.
(d) Capital management
The Company's objectives in managing capital are to deploy capital to provide an appropriate return to shareholders and to maintain a capital structure that provides the flexibility to take advantage of growth and development opportunities, maintain existing assets, meet financial obligations and enhance the value of the Shares. The capital structure of the Company consists of cash, long-term debt, other long-term liabilities and shareholders’ equity, and prior to June 30, 2017, Debentures. The Company manages capital to ensure an appropriate balance between debt and equity. In order to maintain or adjust its capital structure, the Company may issue additional Shares, repurchase Shares, borrow additional funds or refinance debt at different terms and conditions.
There are certain financial covenants under the Credit Facility that must be maintained. These financial covenants include an interest coverage ratio and total leverage ratio. In accordance with terms of the Credit Facility. At December 30, 2018, the Company was in compliance with the ratios.
19. SEGMENT INFORMATION
The Company has two reportable segments which are the Company’s strategic business units: Bus, Coach and Cutaway Manufacturing Operations ("Manufacturing Operations") and Aftermarket Operations. The strategic business units offer different products and services, and are managed separately because they require different technology and marketing strategies. For each of the strategic business units, the Company’s President and CEO reviews internal management reports on a monthly basis.
The Manufacturing Operations segment derives its revenue from the manufacture, service and support of new transit buses, coaches, medium duty buses and cutaways. Based on management’s judgement and applying the aggregation criteria in IFRS 8.12, the Company’s transit bus, motor coach and cutaway operations fall under a single reportable segment. Aggregation of these operating segments is based on the segments having similar economic characteristics with similar long-term average returns, products and services, production methods, distribution, geographic market and regulatory environment.
The Manufacturing Operations segment has recorded vendor rebates of $235 (2017: $244), which have been recognized into earnings during 2018, but for which the full requirements for entitlement to these rebates have not yet been met.
The Aftermarket Operations segment derives its revenue from the sale of aftermarket parts for transit buses and motor coaches.
In 2018 the MCI service function, comprised of technical service management and customer training, which was previously managed by the MCI aftermarket operations, was moved to the coach manufacturing operations. To improve the comparability between periods, the related prior year segment information has been restated to reflect these changes.
There is no inter segment revenue. Unallocated items in the consolidated earnings before income taxes primarily include unrealized foreign exchange gains or losses, interest and finance costs and corporate overhead costs.
The unallocated total assets of the Company primarily include cash, certain goodwill and intangible assets, derivative financial instruments and deferred income tax assets. Corporate assets that are shared by both operating segments are allocated fully to the Manufacturing Operations segment.
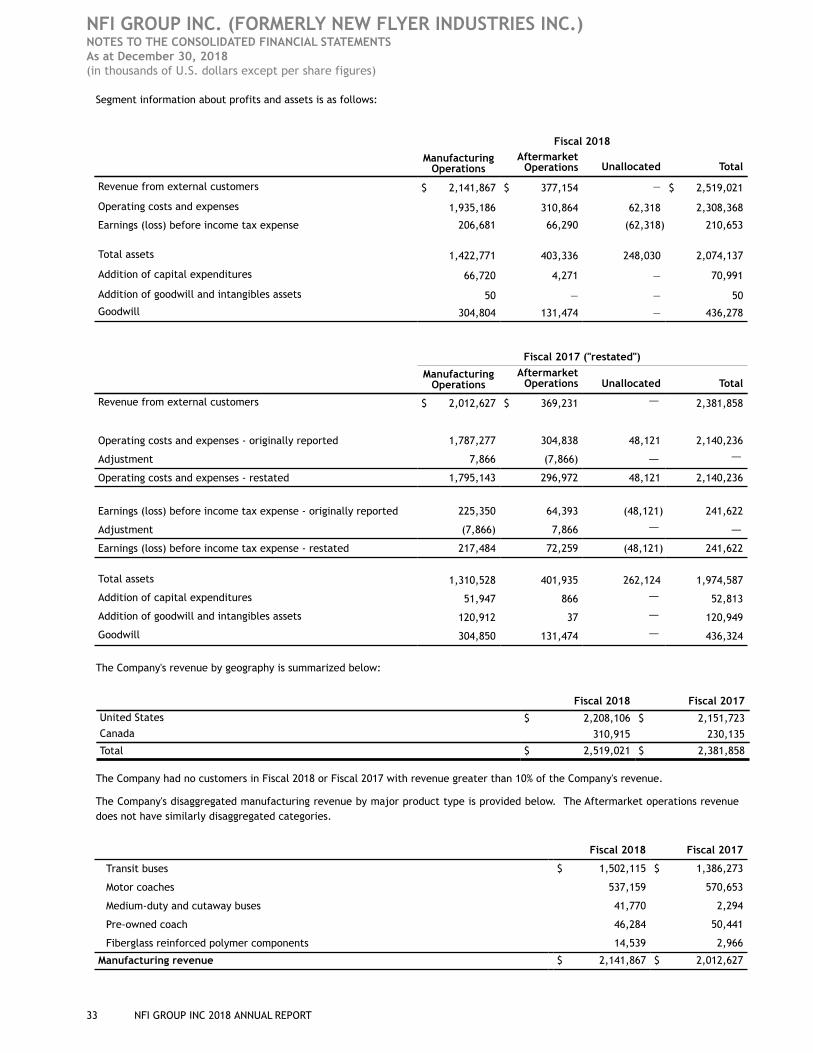
NFI GROUP INC. (FORMERLY NEW FLYER INDUSTRIES INC.) NOTES TO THE CONSOLIDATED FINANCIAL STATEMENTS As at December 30, 2018(in thousands of U.S. dollars except per share figures)
33 NFI GROUP INC 2018 ANNUAL REPORT
Segment information about profits and assets is as follows:
Fiscal 2018
ManufacturingOperations
AftermarketOperations Unallocated Total
Revenue from external customers $ 2,141,867 $ 377,154 — $ 2,519,021
Operating costs and expenses 1,935,186 310,864 62,318 2,308,368
Earnings (loss) before income tax expense 206,681 66,290 (62,318) 210,653
Total assets 1,422,771 403,336 248,030 2,074,137
Addition of capital expenditures 66,720 4,271 — 70,991
Addition of goodwill and intangibles assets 50 — — 50
Goodwill 304,804 131,474 — 436,278
Fiscal 2017 ("restated")
ManufacturingOperations
AftermarketOperations Unallocated Total
Revenue from external customers $ 2,012,627 $ 369,231 — 2,381,858
Operating costs and expenses - originally reported 1,787,277 304,838 48,121 2,140,236
Adjustment 7,866 (7,866) — —Operating costs and expenses - restated 1,795,143 296,972 48,121 2,140,236
Earnings (loss) before income tax expense - originally reported 225,350 64,393 (48,121) 241,622
Adjustment (7,866) 7,866 — —Earnings (loss) before income tax expense - restated 217,484 72,259 (48,121) 241,622
Total assets 1,310,528 401,935 262,124 1,974,587
Addition of capital expenditures 51,947 866 — 52,813
Addition of goodwill and intangibles assets 120,912 37 — 120,949
Goodwill 304,850 131,474 — 436,324
The Company's revenue by geography is summarized below:
Fiscal 2018 Fiscal 2017
United States $ 2,208,106 $ 2,151,723Canada 310,915 230,135
Total $ 2,519,021 $ 2,381,858
The Company had no customers in Fiscal 2018 or Fiscal 2017 with revenue greater than 10% of the Company's revenue.
The Company's disaggregated manufacturing revenue by major product type is provided below. The Aftermarket operations revenue does not have similarly disaggregated categories.
Fiscal 2018 Fiscal 2017
Transit buses $ 1,502,115 $ 1,386,273
Motor coaches 537,159 570,653
Medium-duty and cutaway buses 41,770 2,294
Pre-owned coach 46,284 50,441
Fiberglass reinforced polymer components 14,539 2,966
Manufacturing revenue $ 2,141,867 $ 2,012,627
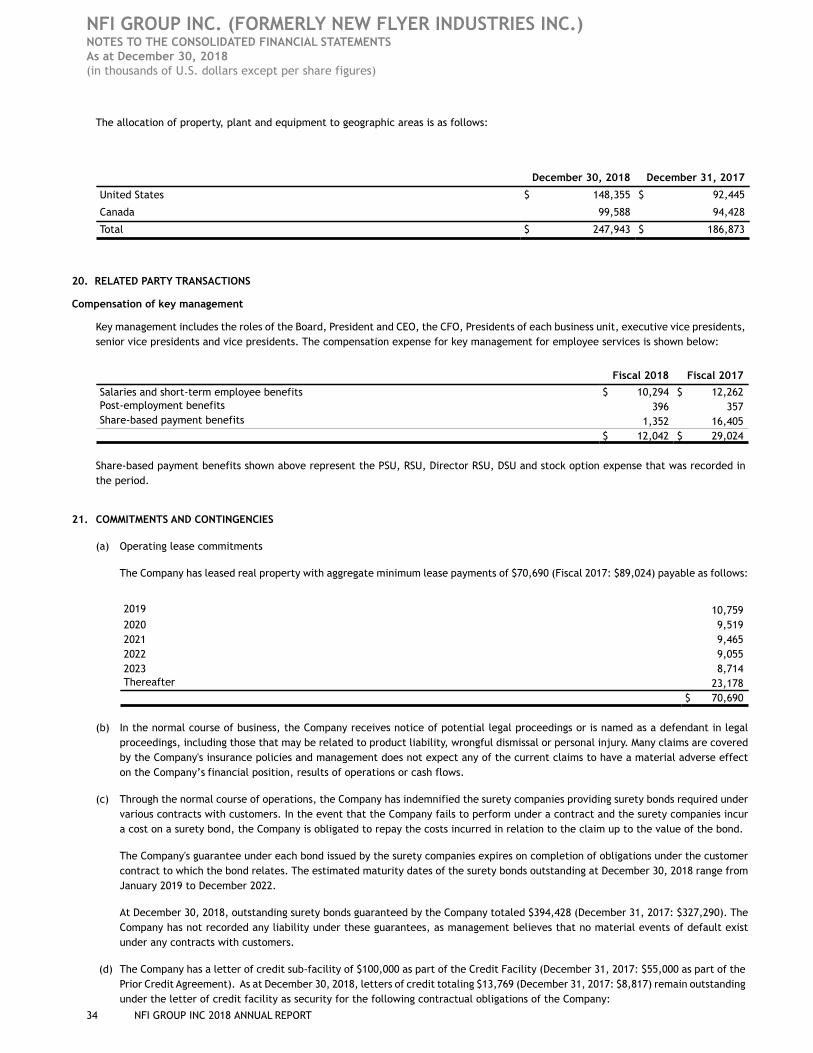
NFI GROUP INC. (FORMERLY NEW FLYER INDUSTRIES INC.) NOTES TO THE CONSOLIDATED FINANCIAL STATEMENTS As at December 30, 2018(in thousands of U.S. dollars except per share figures)
34 NFI GROUP INC 2018 ANNUAL REPORT
The allocation of property, plant and equipment to geographic areas is as follows:
December 30, 2018 December 31, 2017
United States $ 148,355 $ 92,445
Canada 99,588 94,428
Total $ 247,943 $ 186,873
20. RELATED PARTY TRANSACTIONS
Compensation of key management
Key management includes the roles of the Board, President and CEO, the CFO, Presidents of each business unit, executive vice presidents, senior vice presidents and vice presidents. The compensation expense for key management for employee services is shown below:
Fiscal 2018 Fiscal 2017
Salaries and short-term employee benefits $ 10,294 $ 12,262Post-employment benefits 396 357Share-based payment benefits 1,352 16,405
$ 12,042 $ 29,024
Share-based payment benefits shown above represent the PSU, RSU, Director RSU, DSU and stock option expense that was recorded in the period.
21. COMMITMENTS AND CONTINGENCIES
(a) Operating lease commitments
The Company has leased real property with aggregate minimum lease payments of $70,690 (Fiscal 2017: $89,024) payable as follows:
2019 10,7592020 9,5192021 9,4652022 9,0552023 8,714Thereafter 23,178
$ 70,690
(b) In the normal course of business, the Company receives notice of potential legal proceedings or is named as a defendant in legal proceedings, including those that may be related to product liability, wrongful dismissal or personal injury. Many claims are covered by the Company's insurance policies and management does not expect any of the current claims to have a material adverse effect on the Company’s financial position, results of operations or cash flows.
(c) Through the normal course of operations, the Company has indemnified the surety companies providing surety bonds required under various contracts with customers. In the event that the Company fails to perform under a contract and the surety companies incur a cost on a surety bond, the Company is obligated to repay the costs incurred in relation to the claim up to the value of the bond.
The Company's guarantee under each bond issued by the surety companies expires on completion of obligations under the customer contract to which the bond relates. The estimated maturity dates of the surety bonds outstanding at December 30, 2018 range from January 2019 to December 2022.
At December 30, 2018, outstanding surety bonds guaranteed by the Company totaled $394,428 (December 31, 2017: $327,290). The Company has not recorded any liability under these guarantees, as management believes that no material events of default exist under any contracts with customers.
(d) The Company has a letter of credit sub-facility of $100,000 as part of the Credit Facility (December 31, 2017: $55,000 as part of the Prior Credit Agreement). As at December 30, 2018, letters of credit totaling $13,769 (December 31, 2017: $8,817) remain outstanding under the letter of credit facility as security for the following contractual obligations of the Company:
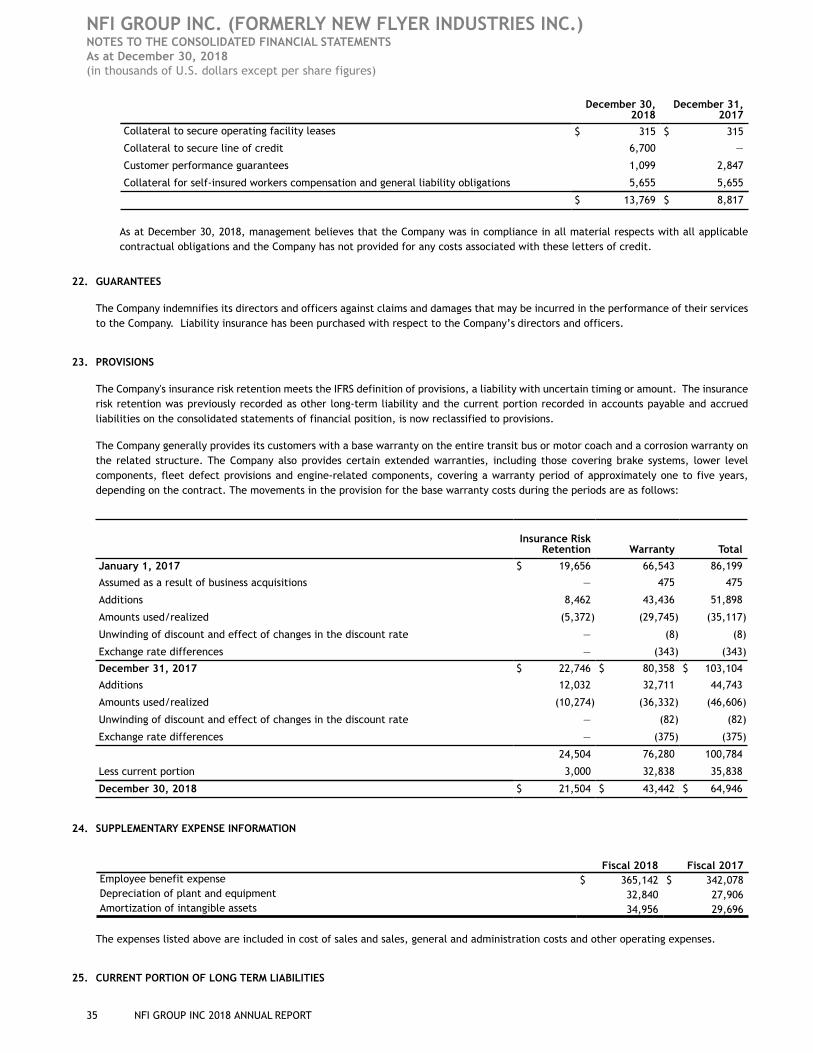
NFI GROUP INC. (FORMERLY NEW FLYER INDUSTRIES INC.) NOTES TO THE CONSOLIDATED FINANCIAL STATEMENTS As at December 30, 2018(in thousands of U.S. dollars except per share figures)
35 NFI GROUP INC 2018 ANNUAL REPORT
December 30,2018
December 31,2017
Collateral to secure operating facility leases $ 315 $ 315
Collateral to secure line of credit 6,700 —
Customer performance guarantees 1,099 2,847
Collateral for self-insured workers compensation and general liability obligations 5,655 5,655
$ 13,769 $ 8,817
As at December 30, 2018, management believes that the Company was in compliance in all material respects with all applicable contractual obligations and the Company has not provided for any costs associated with these letters of credit.
22. GUARANTEES
The Company indemnifies its directors and officers against claims and damages that may be incurred in the performance of their services to the Company. Liability insurance has been purchased with respect to the Company’s directors and officers.
23. PROVISIONS
The Company's insurance risk retention meets the IFRS definition of provisions, a liability with uncertain timing or amount. The insurance risk retention was previously recorded as other long-term liability and the current portion recorded in accounts payable and accrued liabilities on the consolidated statements of financial position, is now reclassified to provisions.
The Company generally provides its customers with a base warranty on the entire transit bus or motor coach and a corrosion warranty on the related structure. The Company also provides certain extended warranties, including those covering brake systems, lower level components, fleet defect provisions and engine-related components, covering a warranty period of approximately one to five years, depending on the contract. The movements in the provision for the base warranty costs during the periods are as follows:
Insurance RiskRetention Warranty Total
January 1, 2017 $ 19,656 66,543 86,199
Assumed as a result of business acquisitions — 475 475
Additions 8,462 43,436 51,898
Amounts used/realized (5,372) (29,745) (35,117)
Unwinding of discount and effect of changes in the discount rate — (8) (8)
Exchange rate differences — (343) (343)
December 31, 2017 $ 22,746 $ 80,358 $ 103,104
Additions 12,032 32,711 44,743
Amounts used/realized (10,274) (36,332) (46,606)
Unwinding of discount and effect of changes in the discount rate — (82) (82)
Exchange rate differences — (375) (375)
24,504 76,280 100,784
Less current portion 3,000 32,838 35,838
December 30, 2018 $ 21,504 $ 43,442 $ 64,946
24. SUPPLEMENTARY EXPENSE INFORMATION
Fiscal 2018 Fiscal 2017Employee benefit expense $ 365,142 $ 342,078Depreciation of plant and equipment 32,840 27,906Amortization of intangible assets 34,956 29,696
The expenses listed above are included in cost of sales and sales, general and administration costs and other operating expenses.
25. CURRENT PORTION OF LONG TERM LIABILITIES
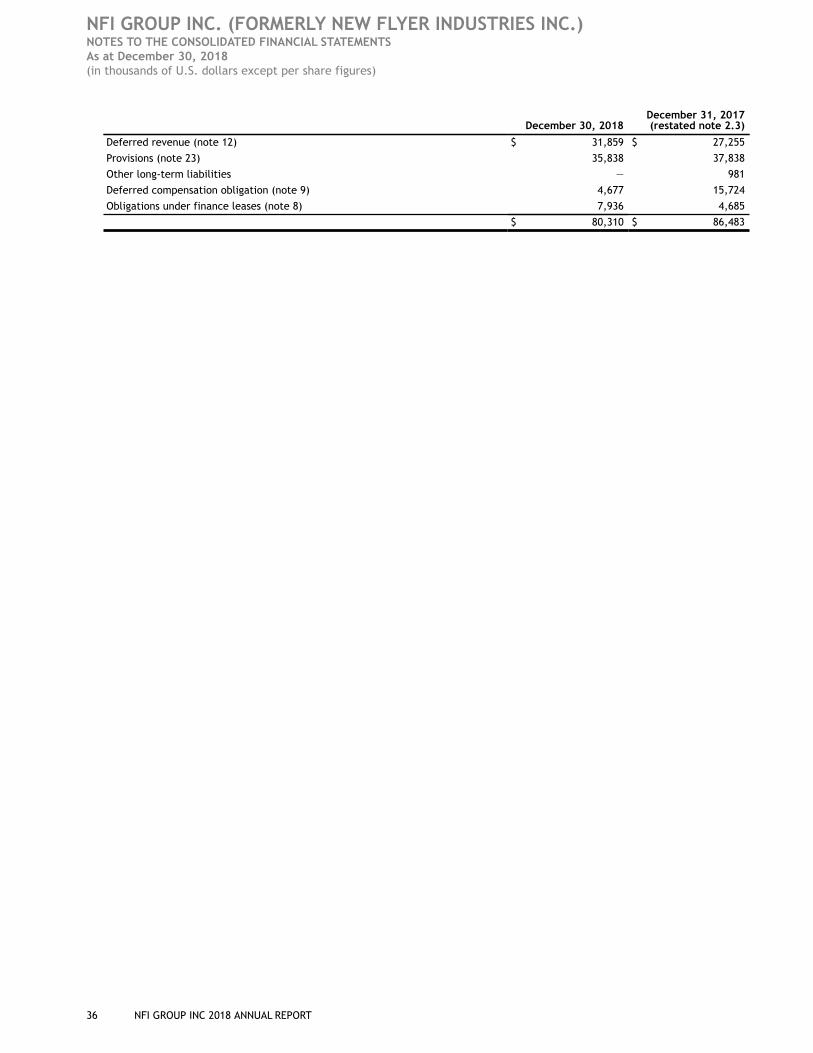
NFI GROUP INC. (FORMERLY NEW FLYER INDUSTRIES INC.) NOTES TO THE CONSOLIDATED FINANCIAL STATEMENTS As at December 30, 2018(in thousands of U.S. dollars except per share figures)
36 NFI GROUP INC 2018 ANNUAL REPORT
December 30, 2018December 31, 2017(restated note 2.3)
Deferred revenue (note 12) $ 31,859 $ 27,255
Provisions (note 23) 35,838 37,838
Other long-term liabilities — 981
Deferred compensation obligation (note 9) 4,677 15,724
Obligations under finance leases (note 8) 7,936 4,685
$ 80,310 $ 86,483


PSTA– Pinellas Suncoast Transit Authority RFP 21-980369
Section 5
Solicitation Requirements:
Form for Proposal Deviation (without price data)
New Flyer response:
Please refer to the attached deviations and clarifications from New Flyer of America Inc. The packaged provided are:
Commercial Deviations and Clarifications Technical Deviations and Clarifications for Xcelsior 35’, 40’ and 60’ Electrical Buses Technical Deviations and Clarifications for MCI 45’ Electrical Buses.
PSTA– Pinellas Suncoast Transit Authority RFP 21-980369
Commercial Clarifications and Deviations