Embed Size (px)
Citation preview


Network Automation Made Easy
Ivo Pinto, CCIE No. 57162
Cisco Press
9780137506736_web.indb 1 27/09/21 6:31 PM
ii Network Automation Made Easy
Network Automation Made EasyIvo Pinto
Copyright© 2022 Cisco Systems, Inc.
Cisco Press logo is a trademark of Cisco Systems, Inc.
Published by: Cisco Press
All rights reserved. This publication is protected by copyright, and permission must be obtained from the publisher prior to any prohibited reproduction, storage in a retrieval system, or transmission in any form or by any means, electronic, mechanical, photocopying, recording, or likewise. For information regarding permissions, request forms, and the appropriate contacts within the Pearson Education Global Rights & Permissions Department, please visit www.pearson.com/permissions.
No patent liability is assumed with respect to the use of the information contained herein. Although every precaution has been taken in the preparation of this book, the publisher and author assume no responsibility for errors or omissions. Nor is any liability assumed for damages resulting from the use of the information contained herein.
ScoutAutomatedPrintCode
Library of Congress Control Number: 2021915881
ISBN-13: 978-0-13-750673-6
ISBN-10: 0-13-750673-2
Warning and DisclaimerThis book is designed to provide information about network automation, it covers the current landscape, practical applications, tools, and techniques. Every effort has been made to make this book as complete and as accurate as possible, but no warranty or fitness is implied.
The information is provided on an “as is” basis. The authors, Cisco Press, and Cisco Systems, Inc. shall have neither liability nor responsibility to any person or entity with respect to any loss or damages arising from the information contained in this book or from the use of the discs or programs that may accompany it.
The opinions expressed in this book belong to the author and are not necessarily those of Cisco Systems, Inc.
Feedback InformationAt Cisco Press, our goal is to create in-depth technical books of the highest quality and value. Each book is crafted with care and precision, undergoing rigorous development that involves the unique expertise of members from the professional technical community.
Readers’ feedback is a natural continuation of this process. If you have any comments regarding how we could improve the quality of this book or otherwise alter it to better suit your needs, you can contact us through email at [email protected]. Please make sure to include the book title and ISBN in your message.
We greatly appreciate your assistance.
9780137506736_web.indb 2 27/09/21 6:31 PM

iii
Editor-in-Chief: Mark Taub
Alliances Manager, Cisco Press: Arezou Gol
Director, ITP Product Management: Brett Bartow
Managing Editor: Sandra Schroeder
Development Editor: Ellie C. Bru
Project Editor: Mandie Frank
Copy Editor: Kitty Wilson
Technical Editors: Asier Arlegui Lacunza; Celia Ortega Gomez
Editorial Assistant: Cindy Teeters
Designer: Chuti Prasertsith
Composition: codeMantra
Indexer: Erika Millen
Proofreader: Donna E. Mulder
Trademark AcknowledgmentsAll terms mentioned in this book that are known to be trademarks or service marks have been appropri-ately capitalized. Cisco Press or Cisco Systems, Inc. cannot attest to the accuracy of this information. Use of a term in this book should not be regarded as affecting the validity of any trademark or service mark.
Americas HeadquartersCisco Systems, Inc.San Jose, CA
Asia Pacific HeadquartersCisco Systems (USA) Pte. Ltd.Singapore
Europe HeadquartersCisco Systems International BV Amsterdam, The Netherlands
Cisco has more than 200 offices worldwide. Addresses, phone numbers, and fax numbers are listed on the Cisco Website at www.cisco.com/go/offices.
Cisco and the Cisco logo are trademarks or registered trademarks of Cisco and/or its affiliates in the U.S. and other countries. To view a list of Cisco trademarks, go to this URL: www.cisco.com/go/trademarks. Third party trademarks mentioned are the property of their respective owners. The use of the word partner does not imply a partnership relationship between Cisco and any other company. (1110R)
Cisco and the Cisco logo are trademarks or registered trademarks of Cisco and/or its affiliates in the U.S. and other countries. To view a list of Cisco trademarks, go to this URL: www.cisco.com/go/trademarks. Third party trademarks mentioned are the property of their respective owners. The use of the word partner does
not imply a partnership relationship between Cisco and any other company. (1110R)
Americas HeadquartersCisco Systems, Inc.San Jose, CA
Asia Pacific HeadquartersCisco Systems (USA) Pte. Ltd.Singapore
Europe HeadquartersCisco Systems International BV Amsterdam, The Netherlands
Cisco has more than 200 offices worldwide. Addresses, phone numbers, and fax numbers are listed on the Cisco Website at www.cisco.com/go/offices.
9780137506736_web.indb 3 27/09/21 6:31 PM

iv Network Automation Made Easy
Pearson’s Commitment to Diversity, Equity, and Inclusion
Pearson is dedicated to creating bias-free content that reflects the diversity of all learners. We embrace the many dimensions of diversity, including but not limited to race, ethnic-ity, gender, socioeconomic status, ability, age, sexual orientation, and religious or political beliefs.
Education is a powerful force for equity and change in our world. It has the potential to deliver opportunities that improve lives and enable economic mobility. As we work with authors to create content for every product and service, we acknowledge our responsibil-ity to demonstrate inclusivity and incorporate diverse scholarship so that everyone can achieve their potential through learning. As the world’s leading learning company, we have a duty to help drive change and live up to our purpose to help more people create a bet-ter life for themselves and to create a better world.
Our ambition is to purposefully contribute to a world where:
■■ Everyone has an equitable and lifelong opportunity to succeed through learning.
■■ Our educational products and services are inclusive and represent the rich diversity of learners.
■■ Our educational content accurately reflects the histories and experiences of the learners we serve.
■■ Our educational content prompts deeper discussions with learners and motivates them to expand their own learning (and worldview).
While we work hard to present unbiased content, we want to hear from you about any concerns or needs with this Pearson product so that we can investigate and address them.
■■ Please contact us with concerns about any potential bias at https://www.pearson.com/report-bias.html.
9780137506736_web.indb 4 27/09/21 6:31 PM

v
CreditsFigure 1-8 Screenshot of Kibana search dashboard © 2021 Elasticsearch B.V.
Figure 1-9 Screenshot of Grafana dashboard © 2021 Grafana Labs
Figure 1-10 Screenshot of Splunk firewall information dashboard © 2005–2021 Splunk Inc.
Figure 2-2 Screenshot of AWS traffic Flow logs © 2021, Amazon Web Services, Inc.
Figure 2-4 Screenshot of REST API GET using Postman ©2021 Postman, Inc.
Figure 2-7 Screenshot of Splunk Syslog view © 2005–2021 Splunk Inc.
Figure 3-3 Screenshot of Grafana displaying a router CPU utilization graph per minute © 2021 Grafana Labs
Figure 3-8 Screenshot of Setting Up a Grafana Alarm for 55 MBs Disk I/O © 2021 Grafana Labs
Figure 3-9 Screenshot of Setting Up a Kibana Alarm for Syslog Data © 2021 Elasticsearch B.V.
Figure 6-11 Screenshot of Jenkins Pipeline stages © Jenkins
Figure 7-5 Screenshot of Gantt chart of tasks © 2021 - Gantt.com
9780137506736_web.indb 5 27/09/21 6:31 PM

vi Network Automation Made Easy
About the AuthorIvo Pinto, CCIE No. 57162 (R&S, Security, and Data Center), CISSP, is a Solutions Architect with many years of experience in the fields of multicloud, automation, and enterprise and data center networking. Ivo has worked at Cisco in different roles and different geographies, and he has led the architecture creation and deployment of many automated global-scale solutions for Fortune 50 companies that are in production today. In his latest role, he is responsible for multicloud innovation at the Customer Experience CTO office. Ivo is the founder of IT OnTrack (www.itontrack.com), a provider of services to young professionals who are looking to further their careers in IT. Ivo has authored Cisco white papers and multiple Cisco exam questions.
Follow Ivo on LinkedIn @ivopinto01.
9780137506736_web.indb 6 27/09/21 6:31 PM

vii
About the Technical ReviewersAsier Arlegui Lacunza, CCIE No. 5921, has been with Cisco since 1998 and currently works as a Principal Architect in the Cisco Customer Experience organization. In the past 20+ years of his career at Cisco, he has worked as a technical architect on a wide range of enterprise (data center, campus, and enterprise WAN) and service provider (access and core networking) technology projects, with a focus on network automation. He holds a master’s degree in telecommunications engineering from Public University of Navarra, Spain.
Celia Ortega Gomez joined Cisco in the Network Consulting Engineer Associate Program in 2017. She has been working as a consulting engineer, focusing on network automation, routing and switching, and visibility technologies in the Cisco Customer Experience organization for EMEAR customers. She holds several industry certifications and is now working as the manager for South PMO Office and High Touch services.
9780137506736_web.indb 7 27/09/21 6:31 PM

viii Network Automation Made Easy
DedicationsI would like to dedicate this book to my family, who has supported me on every step of this long journey. To my loving mother, thank you for believing that one day I would write a book. To my wonderful wife, thank you for the tireless encouragement through-out the process. And last but not least, to my two cats, Oscar and Tofu, who kept me company during the countless all-nighters I pulled to finish the book.
9780137506736_web.indb 8 27/09/21 6:31 PM

ix
AcknowledgmentsSpecial thanks to the technical reviewers, Asier Arlegui Lacunza and Celia Ortega Gomez, who contributed to a substantial increase in quality not only with their correc-tions but also suggestions for the content of this book. Also, special thanks to Pedro Marques, Pedro Trigueira, and Miguel Santos for their guidance and advice throughout the process. I would like to thank my former and my current leadership at Cisco, Stefaan de Haan, Mark Perry, Carlos Pignataro, Adele Trombeta, and Steve Pickavance, for supporting me during the lengthy process of writing a book.
This book wouldn’t have been possible without the support of many people on the Cisco Press team. Brett Bartow, Director, Pearson IT Professional Group, was instrumental in sponsoring the book and driving it to execution. Eleanor Bru, Development Editor, has done an amazing job in the technical review cycle, and it has been an absolute pleasure working with you. Also, many thanks to the numerous Cisco Press unknown soldiers working behind the scenes to make this book happen.
9780137506736_web.indb 9 27/09/21 6:31 PM

x Network Automation Made Easy
Contents at a Glance
Introduction xvii
Chapter1 TypesofNetworkAutomation 1
Chapter2 DataforNetworkAutomation 43
Chapter3 UsingDatafromYourNetwork 87
Chapter4 AnsibleBasics 119
Chapter5 UsingAnsibleforNetworkAutomation 155
Chapter6 NetworkDevOps 199
Chapter7 AutomationStrategies 241
AppendixA AnswerstoReviewQuestions 273
Index 279
9780137506736_web.indb 10 27/09/21 6:31 PM
xi
ContentsIntroduction xvii
Chapter 1 Types of Network Automation 1
Data-Driven Automation 2
What Data-Driven Automation Is 3
Data-Driven Automation Use Cases 4
Monitoring Devices 5
Compliance Checking 6
Optimization 7
Predictive Maintenance 8
Troubleshooting 9
Task-Based Automation 11
What Task-Based Automation Is 11
Task-Based Automation Use Cases 12
Interaction 12
Data Collection 12
Configuration 13
Provisioning 14
Reporting 15
End-to-End Automation 16
What End-to-End Automation Is 16
End-to-End Automation Use Cases 17
Migration 18
Configuration 19
Provisioning 20
Testing 21
Tools 22
DNA Center 22
Cloud Event-Driven Functions 23
Terraform 24
Ansible 31
Chef 33
Kibana 34
Grafana 35
9780137506736_web.indb 11 27/09/21 6:31 PM

xii Network Automation Made Easy
Splunk 36
Python 38
Summary 39
Review Questions 40
Chapter 2 Data for Network Automation 43
The Importance of Data 43
Data Formats and Models 44
YAML 44
XML 48
JSON 53
Syslog 57
NetFlow 59
IPFIX 60
Cloud Flows 60
YANG 61
Methods for Gathering Data 66
APIs 66
Model-Driven Techniques 72
NETCONF 72
RESTCONF 77
Telemetry 80
Log Exporters 81
Summary 84
End Notes 84
Review Questions 85
Chapter 3 Using Data from Your Network 87
Data Preparation 87
Parsing 88
Aggregation 98
Data Visualization 100
Data Insights 104
Alarms 105
Configuration Drift 107
AI/ML Predictions 110
9780137506736_web.indb 12 27/09/21 6:31 PM
xiii
Case Studies 112
Creating a Machine Learning Model with Raw Data 112
How a Data Center Reduced Its Mean Time to Repair 113
Network Migrations at an Electricity Provider 115
Summary 116
Review Questions 117
Chapter 4 Ansible Basics 119
Ansible Characteristics 119
Installing Ansible 120
Inventory 122
Variables 126
Playbooks 131
Conditionals 133
Loops 136
Handlers 140
Executing a Playbook 143
Roles 149
Summary 152
Review Questions 153
Chapter 5 Using Ansible for Network Automation 155
Interacting with Files 155
Reading 155
Writing 158
Interacting with Devices 160
Networking (Routers, Switches, Firewalls) 160
Using SSH 160
Using NETCONF 165
Using RESTCONF 169
Computing (Servers, Virtual Machines, and Containers) 174
Servers and Virtual machines 174
Containers 181
Cloud (AWS, GCP) 183
Interacting with APIs 187
9780137506736_web.indb 13 27/09/21 6:31 PM
xiv Network Automation Made Easy
Case Studies 189
Configuration Changes Across 100,000 Devices 189
Quality of Service Across a Heterogenous Installed Base 193
Disaster Recovery at a European Bank 194
Summary 195
Review Questions 196
Chapter 6 Network DevOps 199
What NetDevOps Is 199
Source Control 202
Infrastructure as Code (IaC) 205
Continuous Integration and Continuous Deployment/Delivery (CI/CD) 208
Why Use NetDevOps 210
When to Use NetDevOps 211
NetDevOps Tools 214
Git 215
GitLab CI/CD 224
Jenkins 226
How to Build Your Own NetDevOps Environment 228
NetDevOps Environment Requirements 228
NetDevOps Stages 230
NetDevOps Operations 232
Case Studies 233
Pipelines in One of the World’s Largest Banks 233
New Technology Trainings at a Fortune 50 Company 234
New Service Implementations in a Tier 1 Service Provider 236
Summary 238
Review Questions 238
Chapter 7 Automation Strategies 241
What an Automation Strategy Is 241
Assessment 244
KPIs 245
Other Strategy Documents 248
Summary 250
9780137506736_web.indb 14 27/09/21 6:31 PM

xv
Why You Need an Automation Strategy 250
How to Build Your Own Automation Strategy 251
Assessment 252
Culture and Skills 257
Goals, Objectives, Strategies, and Tactics 258
ABD Case Study 264
How to Use an Automation Strategy 268
Summary 270
Review Questions 271
Appendix A Answers to Review Questions 273
Index 279
9780137506736_web.indb 15 27/09/21 6:31 PM
xvi Network Automation Made Easy
Icons Used in This Book
Server Farm Detector Laptop Cloud
Cisco Nexus9000 in NX-OS
Firewall
Cisco Nexus5000
Cisco Nexus7000
Server Router
Command Syntax ConventionsThe conventions used to present command syntax in this book are the same conventions used in Cisco’s Command Reference. The Command Reference describes these conven-tions as follows:
■■ Boldface indicates commands and keywords that are entered literally as shown. In actual configuration examples and output (not general command syntax), boldface indicates commands that are manually input by the user (such as a show command).
■■ Italics indicate arguments for which you supply actual values.
■■ Vertical bars (|) separate alternative, mutually exclusive elements.
■■ Square brackets [ ] indicate optional elements.
■■ Braces { } indicate a required choice.
■■ Braces within brackets [{ }] indicate a required choice within an optional element.
9780137506736_web.indb 16 27/09/21 6:31 PM

xvii
IntroductionFrom the moment networks appeared, they steadily grew bigger and became increasing-ly complex. Engineers have sought to automate any possible activity since then. Network automation is the process of automating the configuration, management, testing, deploy-ment, and operation of physical and virtual devices in a network. By eliminating tedious and manual processes, it is possible to reduce operational expenses, reduce human error, and achieve better time to market.
Network automation is not a new topic, but in recent years, it has exponentially increased in importance due to external factors such as the need for agility in responding to growth. Although it’s still in its infancy, network automation is already a critical pillar of an organization’s strategy. Companies are redesigning and rethinking their network strategies, and some are even being pushed toward automation without clear processes or goals.
This book approaches the topic from the point of view of an IT professional who is well versed in networking and related topics—including cloud, compute, and other compo-nents in today’s networks—and is trying to take both physical and virtual infrastructure to a semi- or fully automated state. The book explains the fundamentals of network auto-mation, including a variety of tools and their use cases and data and how to extract value from it. This book also takes a deep dive into a specific tool, Ansible, showing how to use it to solve a number of common use cases in networking.
A key aspect of the book is its practical approach to the topic. It is filled with code snip-pets you can reuse for your own use cases, as well as real case studies that show practical applications of all this knowledge.
Although this is a Cisco Press book, it takes a vendor-neutral approach to automation tools and techniques. It will give you the knowledge you need to make informed deci-sions when automating your own use cases.
Last but not least, the book explains how to produce a network automation strategy, which is a key piece that is notoriously missing in many enterprises today. It helps a reader focus automation efforts on a fruitful network automation journey rather than a journey without a clear purpose.
Goals and Methods
IT professionals are now more than ever before challenged by their businesses to meet a level of network agility and elasticity that only automation can solve. Furthermore, as networks have expanded to the cloud, they have become increasingly dynamic and complex. To address this, vendors introduce new tools every other day, many of them overlapping in the problems they address. This makes it very challenging for the IT professionals to choose the correct tool for their use case.
9780137506736_web.indb 17 27/09/21 6:31 PM
xviii Network Automation Made Easy
The goal of this book is to help you understand what can and should be automated in your network environment, what benefits automation would bring, and how you can achieve it. Furthermore, it compares and contrasts some of the available tools to help you understand where to use each of them and why. This knowledge will allow you to make informed network automation decisions in your company.
Who Should Read This Book?
Network automation typically touches several network components, such as routers, switches, firewalls, virtual machines, and cloud infrastructure. In general, IT professionals are divided in their areas of expertise. Individuals are spread into focus areas such as the following, which in some cases overlap:
■■ Servers and virtualization
■■ Storage
■■ Switching and routing
■■ Security
■■ Software applications
■■ Cloud
As the focus of this book is network automation, the audience is the sum of all system administrators, storage administrators, networking engineers, software virtualization engi-neers, and network management engineers. Because this book also approaches real case studies and network automation strategy, IT managers will also benefit from reading it as it will help them understand how automation can greatly improve their ecosystem and how to plan for the journey.
How This Book Is Organized
This book is set up to help you understand and replicate the use cases on your own. It is recommended that you read through the chapters in order to get the full benefit of the book.
Networking, storage, compute, virtualization, and cloud are complex topics and are get-ting more complex every day. System administrators, networking engineers, cloud engi-neers, and virtualization engineers are asked to master their field and also to automate the solutions in their field. This book helps you understand the fundamentals of network automation and apply it to your job needs, using state-of-the-art tools and techniques. This book offers a number of advantages:
■■ An easy reading style with no marketing
■■ Comprehensive coverage of the topic, from fundamentals to advanced techniques
9780137506736_web.indb 18 27/09/21 6:31 PM
xix
■■ Real case studies, instead of hypothetical situations, of projects the author led
■■ Coverage of the latest network automation trends, such as NetDevOps
■■ Reusable code snippets
■■ Explanations of tools and their applications with neutrality
This book is beneficial to IT professionals trying to understand how to implement network automation solutions as well as to IT management trying to understand the benefits of network automation and where to apply it.
Book Structure
The book is organized into seven chapters:
■■ Chapter 1, “Types of Network Automation”: This chapter describes the different network automation types and the use cases they address. This chapter also com-pares and contrasts some of the common automation tools used by modern enter-prises, including their advantages and shortcomings, in a vendor-neutral way.
■■ Chapter 2, “Data for Network Automation”: This chapter provides fundamen-tal background on data and the role it plays in network automation. The chapter describes commonly seen data formats, such as JSON, XML, and YAML, in detail. Finally, it consolidates the topic by describing methods and techniques to gather data from your network.
■■ Chapter 3, “Using Data from Your Network”: This chapter provides an overview of what you can do with the data that you gather from your network. The chapter starts by defining common data preparation techniques, such as parsing and aggregation, followed by data visualization techniques. Finally, it describes possible insights you can derive from your gathered data. The chapter also describes three case studies about enterprises that have created notable value from network data.
■■ Chapter 4, “Ansible Basics”: This chapter examines Ansible, which is the most com-monly used automation tool in enterprises. It describes all the fundamental buildings blocks of Ansible, including the tool’s installation as well as its architecture and com-ponents, such as plays, tasks, modules, variables, conditionals, loops, and roles.
■■ Chapter 5, “Using Ansible for Network Automation”: This chapter examines Ansible as a network automation tool. It illustrates how to achieve common net-working tasks with Ansible playbooks across a variety of components, such as files, networking devices, virtual machines, cloud constructs, and APIs. Furthermore, the chapter describes three use cases where Ansible was used to automate global-scale network architectures.
■■ Chapter 6, “Network DevOps”: This chapter introduces NetDevOps and how it is changing the automation paradigm in networking. It covers the fundamentals of what NetDevOps is, why you would use it, and where you would use it. The chapter also
9780137506736_web.indb 19 27/09/21 6:31 PM

xx Network Automation Made Easy
guides you through the step-by-step process of creating your own NetDevOps pipe-line. The chapter finishes with three case studies that give you a feel for the benefits NetDevOps has brought to some large enterprises.
■■ Chapter 7, “Automation Strategies”: This chapter defines network automation strat-egy and delves into its functionality. It provides a detailed description of what an automation strategy is and its components. This chapter also includes a methodology to build an automation strategy from scratch, along with tips and lessons learned from applying automation in large enterprises. It finishes with an overview of how to plan the execution of a newly created strategy.
9780137506736_web.indb 20 27/09/21 6:31 PM
In Chapter 2, “Data for Network Automation,” you learned about data types and data models, as well as common methods to gather data from your network infrastructure. After you have stored your network data, what do you do with it? Are you currently stor-ing any of your network’s data (logs, metrics, configurations)? If so, which data? What for?
You typically store data in order to find insights in it and to comply with regulatory requirements. An insight, in this sense, can be any useful information or action.
This chapter helps you understand how to use the collected data from your network and derive value from it. In the context of enterprise networks, this chapter covers the follow-ing topics:
■ Data preparation techniques
■ Data visualization techniques
■ Network insights
At the end of this chapter are some real case studies that are meant to inspire you to implement automation solutions in your own network.
Data PreparationData comes in various formats, such as XML, JSON, and flow logs (refer to Chapter 2). It would be nice if we could gather bread from a field, but we must gather wheat and process it into bread. Similarly, after we gather data from a variety of devices, we need to prepare it. When you have a heterogeneous network, even if you are gathering the same type of data from different places, it may come in different formats (for example, NetFlow on a Cisco device and IPFIX on an HPE device). Data preparation involves tailoring gathered data to your needs.
Using Data from Your Network
Chapter 3
9780137506736_web.indb 87 27/09/21 6:32 PM
88 Chapter 3: Using Data from Your Network
There are a number of data preparation methods. Data preparation can involve simple actions such as normalizing the date format to a common one as well as more complex actions such as aggregating different data points. The following sections discuss some popular data preparation methods that you should be familiar with.
Parsing
Most of the times when you gather data, it does not come exactly as you need it. It may be in different units, it may be too verbose, or you might want to split it in order to store different components separately in a database. In such cases, you can use parsing tech-niques.
There are many ways you can parse data, including the following:
■ Type formatting: You might want to change the type, such as changing seconds to minutes.
■ Splitting into parts: You might want to divide a bigger piece of information into smaller pieces, such as changing a sentence into words.
■ Tokenizing: You might want to transform a data field into something less sensitive, such as when you store payment information.
You can parse data before storage or when consuming it from storage. There is really no preferred way, and the best method depends on the architecture and storage capabilities. For example, if you store raw data, it is possible that afterward, you might parse it in dif-ferent ways for different uses. If you store raw data, you have many options for how to work with that data later; however, it will occupy more storage space, and those different uses may never occur. If you choose to parse data and then store it, you limit what you store, which saves space. However, you might discard or filter a field that you may later need for a new use case.
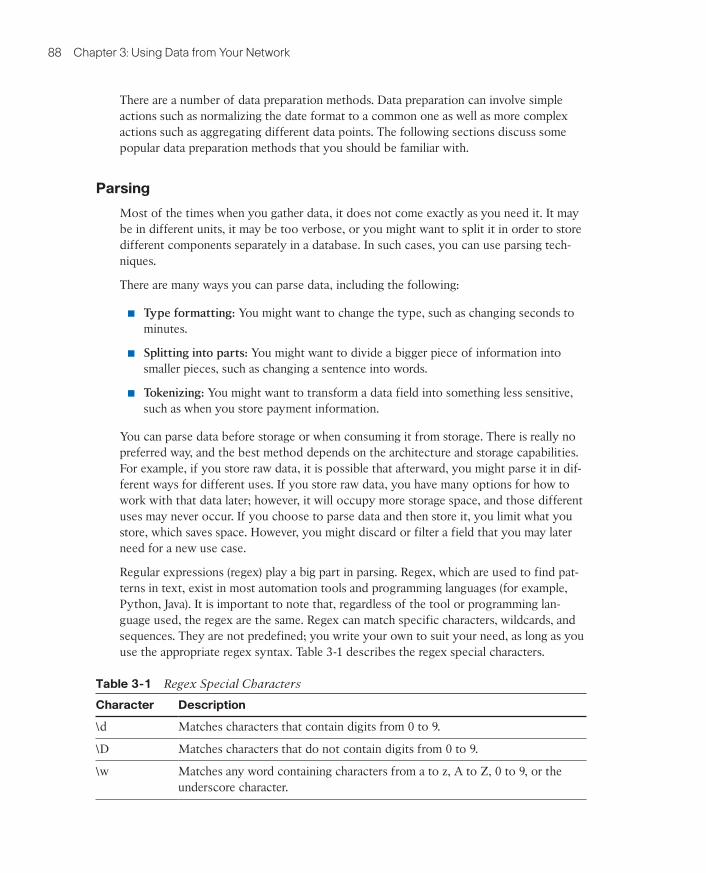
Regular expressions (regex) play a big part in parsing. Regex, which are used to find pat-terns in text, exist in most automation tools and programming languages (for example, Python, Java). It is important to note that, regardless of the tool or programming lan-guage used, the regex are the same. Regex can match specific characters, wildcards, and sequences. They are not predefined; you write your own to suit your need, as long as you use the appropriate regex syntax. Table 3-1 describes the regex special characters.
Table 3-1 Regex Special Characters
Character Description
\d Matches characters that contain digits from 0 to 9.
\D Matches characters that do not contain digits from 0 to 9.
\w Matches any word containing characters from a to z, A to Z, 0 to 9, or the underscore character.
9780137506736_web.indb 88 27/09/21 6:32 PM
Data Preparation 89
Character Description
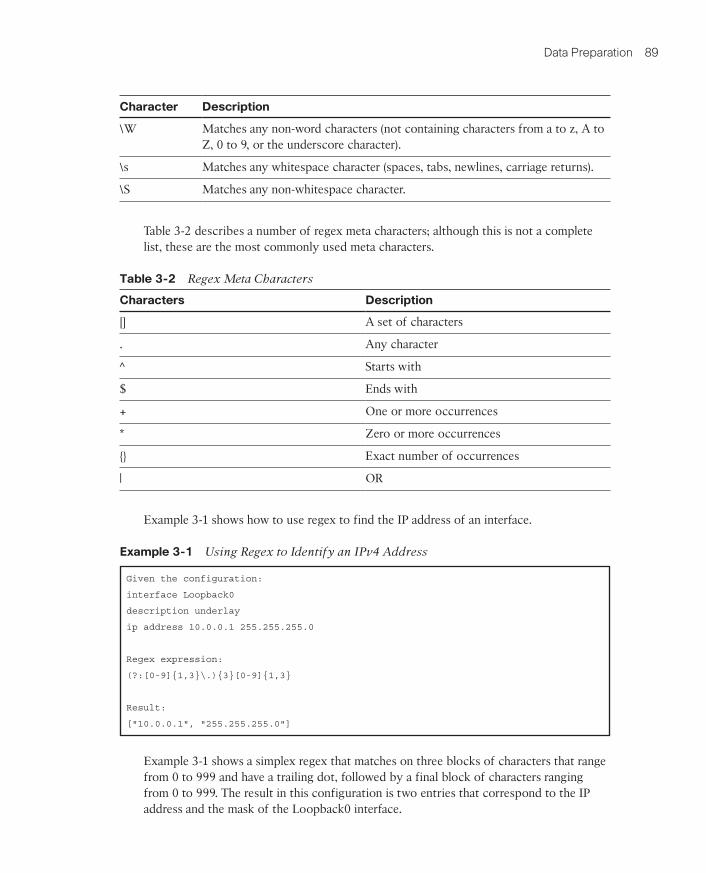
\W Matches any non-word characters (not containing characters from a to z, A to Z, 0 to 9, or the underscore character).
\s Matches any whitespace character (spaces, tabs, newlines, carriage returns).
\S Matches any non-whitespace character.
Table 3-2 describes a number of regex meta characters; although this is not a complete list, these are the most commonly used meta characters.
Table 3-2 Regex Meta Characters
Characters Description
[] A set of characters
. Any character
^ Starts with
$ Ends with
+ One or more occurrences
* Zero or more occurrences
{} Exact number of occurrences
| OR
Example 3-1 shows how to use regex to find the IP address of an interface.
Example 3-1 Using Regex to Identify an IPv4 Address
Given the configuration:
interface Loopback0
description underlay
ip address 10.0.0.1 255.255.255.0
Regex expression:
(?:[0-9]{1,3}\.){3}[0-9]{1,3}
Result:
["10.0.0.1", "255.255.255.0"]
Example 3-1 shows a simplex regex that matches on three blocks of characters that range from 0 to 999 and have a trailing dot, followed by a final block of characters ranging from 0 to 999. The result in this configuration is two entries that correspond to the IP address and the mask of the Loopback0 interface.
9780137506736_web.indb 89 27/09/21 6:32 PM

90 Chapter 3: Using Data from Your Network
IP addresses are octets, with each unit consisting of 8 bits ranging from 0 to 255. As an exercise, improve the regex in Example 3-1 to match only the specific 0 to 255 range in each IP octet. To try it out, find one of the many websites that let you insert text and a regex and then show you the resulting match.
You can also use a number of tools, such as Python and Ansible, to parse data. Example 3-2 shows how to use Ansible for parsing. Firstly, it lists all the network interfaces available in a Mac Book laptop, using the code in the file all_interfaces.yml. Next, it uses the regex ˆen to display only interfaces prefixed with en. This is the code in en_only.yml.
Example 3-2 Using Ansible to Parse Device Facts
$ cat all_interfaces.yml
---
- hosts: all
tasks:
- name: print interfaces
debug:
msg: "{{ ansible_interfaces }}"
$ ansible-playbook -c local -i 'localhost,' all_interfaces.yml
PLAY [all] *************************************************************************
TASK [Gathering Facts] *************************************************************
ok: [localhost]
TASK [print interfaces] ************************************************************
ok: [localhost] => {
"msg": [
"awdl0",
"bridge0",
"en0",
"en1",
"en2",
"en3",
"en4",
"en5",
"gif0",
"llw0",
"lo0",
"p2p0",
"stf0",
"utun0",
"utun1"
]
}
9780137506736_web.indb 90 27/09/21 6:32 PM

Data Preparation 91
PLAY RECAP *************************************************************************
localhost : ok=2 changed=0 unreachable=0 failed=0 skipped=0 rescued=0 ignored=0
$ cat en_only.yml
---
- hosts: all
tasks:
- name: print interfaces
debug:
msg: "{{ ansible_interfaces | select('match', '^en') | list }}"
$ ansible-playbook -c local -i 'localhost,' en_only.yml
PLAY [all] *************************************************************************
TASK [Gathering Facts] *************************************************************
ok: [localhost]
TASK [print interfaces] ************************************************************
ok: [localhost] => {
"msg": [
"en0",
"en1",
"en2",
"en3",
"en4",
"en5"
]
}
PLAY RECAP *************************************************************************
localhost : ok=2 changed=0 unreachable=0 failed=0 skipped=0 rescued=0 ignored=0
What if you need to apply modifications to interface names, such as replacing en with Ethernet? In such a case, you can apply mapping functions or regex, as shown with Ansible in Example 3-3.
9780137506736_web.indb 91 27/09/21 6:32 PM

92 Chapter 3: Using Data from Your Network
Example 3-3 Using Ansible to Parse and Alter Interface Names
$ cat replace_ints.yml
---
- hosts: all
tasks:
- name: print interfaces
debug:
msg: "{{ ansible_interfaces | regex_replace('en', 'Ethernet') }}"
$ ansible-playbook -c local -i 'localhost,' replace_ints.yml
PLAY [all] *************************************************************************
TASK [Gathering Facts] *************************************************************
ok: [localhost]
TASK [print interfaces] ************************************************************
ok: [localhost] => {
"msg": [
"awdl0",
"bridge0",
"Ethernet0",
"Ethernet1",
"Ethernet2",
"Ethernet3",
"Ethernet4",
"Ethernet5",
"gif0",
"llw0",
"lo0",
"p2p0",
"stf0",
"utun0",
"utun1"
]
}
PLAY RECAP *************************************************************************
localhost : ok=2 changed=0 unreachable=0 failed=0 skipped=0 rescued=0 ignored=0
9780137506736_web.indb 92 27/09/21 6:32 PM
Data Preparation 93
Note Ansible is covered in Chapters 4, “Ansible Basics,” and 5, “Using Ansible for Network Automation.” When you finish reading those chapters, circle back to this example for a better understanding.
Another technique that can be considered parsing is enhancing data with other fields. Although this is typically done before storage and not before usage, consider that some-times the data you gather might not have all the information you need to derive insights. For example, flow data might have SRC IP, DST IP, SRC port, and DST port information but no date. If you store that data as is, you might be able to get insights from it on the events but not when they happened. Something you could consider doing in this scenario is appending or prepending the current date to each flow and then storing the flow data.
As in the previous example, there are many use cases where adding extra data fields can be helpful—for example during a maintenance window having sensor data that includes the sensor’s location. Adding extra data fields is a commonly used technique when you know you will need something more than just the available exported data.
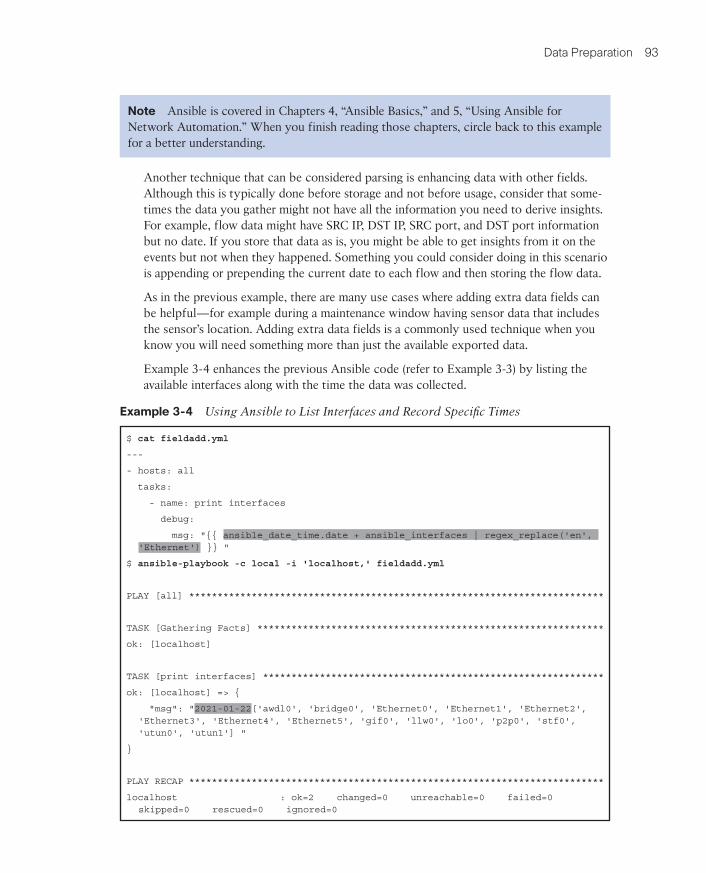
Example 3-4 enhances the previous Ansible code (refer to Example 3-3) by listing the available interfaces along with the time the data was collected.
Example 3-4 Using Ansible to List Interfaces and Record Specific Times
$ cat fieldadd.yml
---
- hosts: all
tasks:
- name: print interfaces
debug:
msg: "{{ ansible_date_time.date + ansible_interfaces | regex_replace('en', 'Ethernet') }} "
$ ansible-playbook -c local -i 'localhost,' fieldadd.yml
PLAY [all] *************************************************************************
TASK [Gathering Facts] *************************************************************
ok: [localhost]
TASK [print interfaces] ************************************************************
ok: [localhost] => {
"msg": "2021-01-22['awdl0', 'bridge0', 'Ethernet0', 'Ethernet1', 'Ethernet2', 'Ethernet3', 'Ethernet4', 'Ethernet5', 'gif0', 'llw0', 'lo0', 'p2p0', 'stf0', 'utun0', 'utun1'] "
}
PLAY RECAP *************************************************************************
localhost : ok=2 changed=0 unreachable=0 failed=0 skipped=0 rescued=0 ignored=0
M03_Ivo_C03_p087-118.indd 93 30/09/21 4:26 PM
94 Chapter 3: Using Data from Your Network
As part of parsing, you might choose to ignore some data. That is, you might simply drop it instead of storing or using it. Why would you do this? Well, you might know that some of the events that are taking place taint your data. For example, say that during a maintenance window you must physically replace a switch. If you have two redundant switches in your architecture, while you are replacing one of them, all your traffic is going through the other one. The data collected will reflect this, but it is not a normal scenario, and you know why it is happening. In such scenarios, ignoring data points can be useful, especially to prevent outliers on later analysis.
So far, we have mostly looked at examples of using Ansible to parse data. However, as mentioned earlier, you can use a variety of tools for parsing.
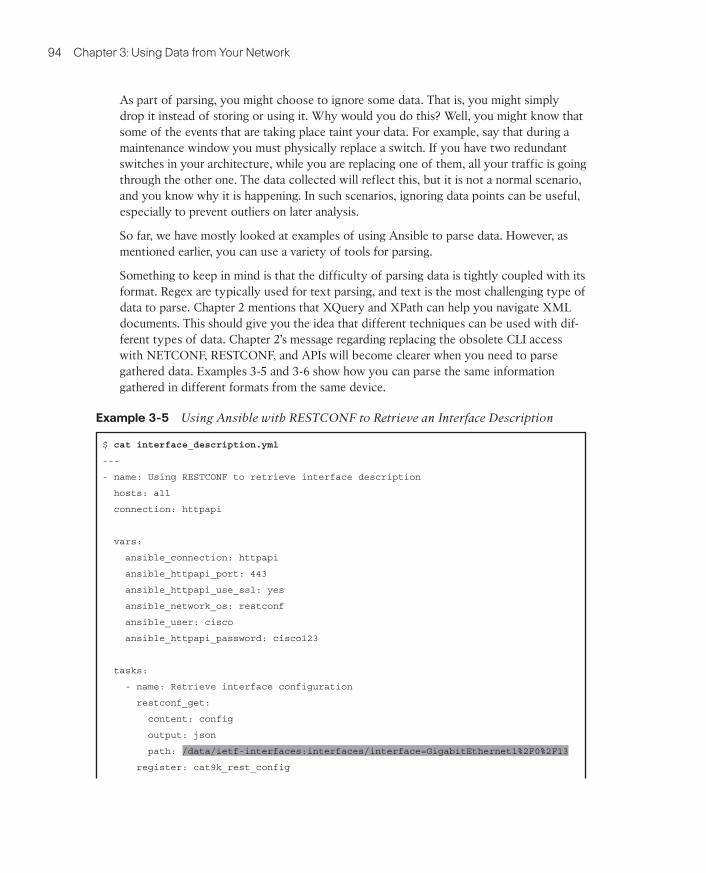
Something to keep in mind is that the difficulty of parsing data is tightly coupled with its format. Regex are typically used for text parsing, and text is the most challenging type of data to parse. Chapter 2 mentions that XQuery and XPath can help you navigate XML documents. This should give you the idea that different techniques can be used with dif-ferent types of data. Chapter 2’s message regarding replacing the obsolete CLI access with NETCONF, RESTCONF, and APIs will become clearer when you need to parse gathered data. Examples 3-5 and 3-6 show how you can parse the same information gathered in different formats from the same device.
Example 3-5 Using Ansible with RESTCONF to Retrieve an Interface Description
$ cat interface_description.yml
---
- name: Using RESTCONF to retrieve interface description
hosts: all
connection: httpapi
vars:
ansible_connection: httpapi
ansible_httpapi_port: 443
ansible_httpapi_use_ssl: yes
ansible_network_os: restconf
ansible_user: cisco
ansible_httpapi_password: cisco123
tasks:
- name: Retrieve interface configuration
restconf_get:
content: config
output: json
path: /data/ietf-interfaces:interfaces/interface=GigabitEthernet1%2F0%2F13
register: cat9k_rest_config
9780137506736_web.indb 94 27/09/21 6:32 PM
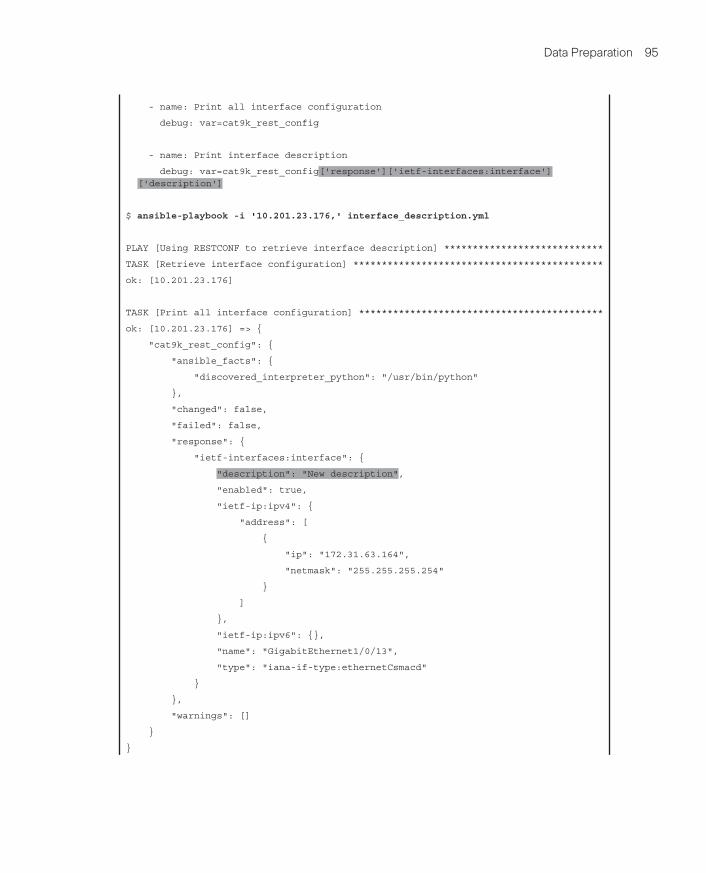
Data Preparation 95
- name: Print all interface configuration
debug: var=cat9k_rest_config
- name: Print interface description
debug: var=cat9k_rest_config['response']['ietf-interfaces:interface']['description']
$ ansible-playbook -i '10.201.23.176,' interface_description.yml
PLAY [Using RESTCONF to retrieve interface description] ****************************
TASK [Retrieve interface configuration] ********************************************
ok: [10.201.23.176]
TASK [Print all interface configuration] *******************************************
ok: [10.201.23.176] => {
"cat9k_rest_config": {
"ansible_facts": {
"discovered_interpreter_python": "/usr/bin/python"
},
"changed": false,
"failed": false,
"response": {
"ietf-interfaces:interface": {
"description": "New description",
"enabled": true,
"ietf-ip:ipv4": {
"address": [
{
"ip": "172.31.63.164",
"netmask": "255.255.255.254"
}
]
},
"ietf-ip:ipv6": {},
"name": "GigabitEthernet1/0/13",
"type": "iana-if-type:ethernetCsmacd"
}
},
"warnings": []
}
}
9780137506736_web.indb 95 27/09/21 6:32 PM
96 Chapter 3: Using Data from Your Network
TASK [Print interface description] *********************************************
ok: [10.201.23.176] => {
"cat9k_rest_config['response']['ietf-interfaces:interface']['description']": "New description"
}
PLAY RECAP *********************************************************************
10.201.23.176 : ok=3 changed=0 unreachable=0 failed=0 skipped=0 rescued=0 ignored=0
In Example 3-5, you can see that when using a RESTCONF module, you receive the inter-face information in JSON format. Using Ansible, you can navigate through the JSON syn-tax by using the square bracket syntax. It is quite simple to access the interface descrip-tion, and if you needed to access some other field, such as the IP address field, you would need to make only a minimal change:
debug: var=cat9k_rest_config['response']['ietf-interfaces:interface']['ietf-ip:ipv4']
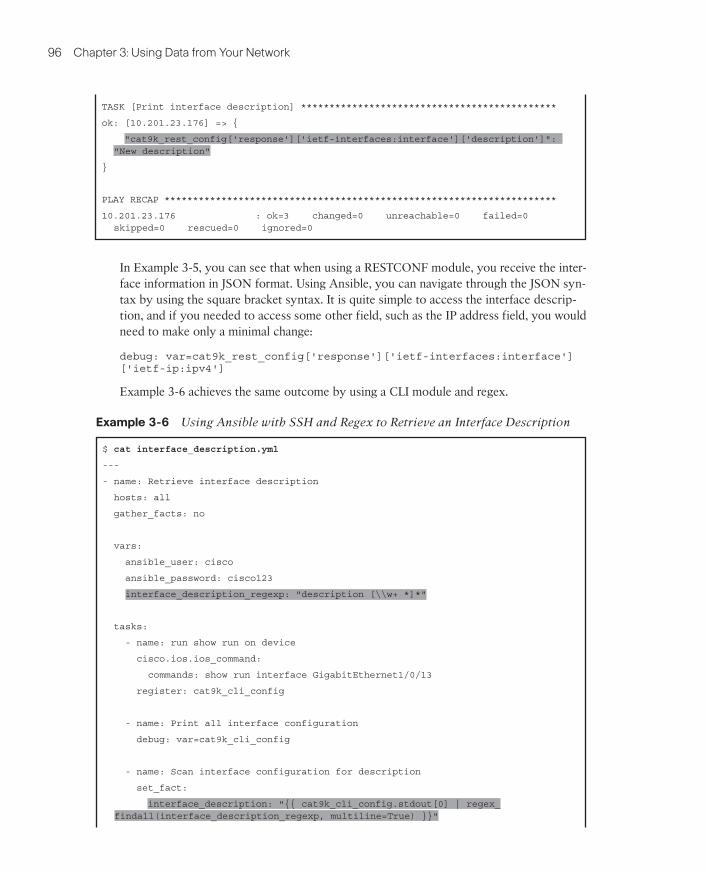
Example 3-6 achieves the same outcome by using a CLI module and regex.
Example 3-6 Using Ansible with SSH and Regex to Retrieve an Interface Description
$ cat interface_description.yml
---
- name: Retrieve interface description
hosts: all
gather_facts: no
vars:
ansible_user: cisco
ansible_password: cisco123
interface_description_regexp: "description [\\w+ *]*"
tasks:
- name: run show run on device
cisco.ios.ios_command:
commands: show run interface GigabitEthernet1/0/13
register: cat9k_cli_config
- name: Print all interface configuration
debug: var=cat9k_cli_config
- name: Scan interface configuration for description
set_fact:
interface_description: "{{ cat9k_cli_config.stdout[0] | regex_findall(interface_description_regexp, multiline=True) }}"
9780137506736_web.indb 96 27/09/21 6:32 PM
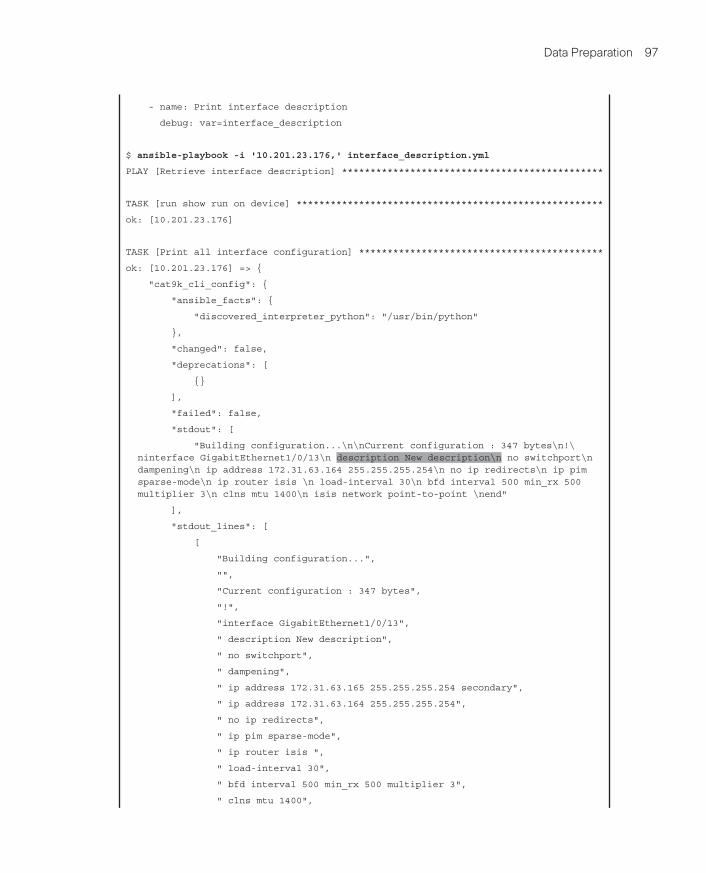
Data Preparation 97
- name: Print interface description
debug: var=interface_description
$ ansible-playbook -i '10.201.23.176,' interface_description.yml
PLAY [Retrieve interface description] **********************************************
TASK [run show run on device] ******************************************************
ok: [10.201.23.176]
TASK [Print all interface configuration] *******************************************
ok: [10.201.23.176] => {
"cat9k_cli_config": {
"ansible_facts": {
"discovered_interpreter_python": "/usr/bin/python"
},
"changed": false,
"deprecations": [
{}
],
"failed": false,
"stdout": [
"Building configuration...\n\nCurrent configuration : 347 bytes\n!\ninterface GigabitEthernet1/0/13\n description New description\n no switchport\n dampening\n ip address 172.31.63.164 255.255.255.254\n no ip redirects\n ip pim sparse-mode\n ip router isis \n load-interval 30\n bfd interval 500 min_rx 500 multiplier 3\n clns mtu 1400\n isis network point-to-point \nend"
],
"stdout_lines": [
[
"Building configuration...",
"",
"Current configuration : 347 bytes",
"!",
"interface GigabitEthernet1/0/13",
" description New description",
" no switchport",
" dampening",
" ip address 172.31.63.165 255.255.255.254 secondary",
" ip address 172.31.63.164 255.255.255.254",
" no ip redirects",
" ip pim sparse-mode",
" ip router isis ",
" load-interval 30",
" bfd interval 500 min_rx 500 multiplier 3",
" clns mtu 1400",
9780137506736_web.indb 97 27/09/21 6:32 PM

98 Chapter 3: Using Data from Your Network
" isis network point-to-point ",
"end"
]
],
"warnings": []
}
}
TASK [Scan interface configuration for description] ********************************
ok: [10.201.23.176]
TASK [Print interface description] *************************************************
ok: [10.201.23.176] => {
"interface_description": [
"description New description"
]
}
PLAY RECAP *************************************************************************
10.201.23.176 : ok=4 changed=0 unreachable=0 failed=0 skipped=0 rescued=0 ignored=0
Example 3-6 uses the following regex:
"description [\\w+ *]*"
This is a simple regex example, but things start to get complicated when you need to parse several values or complex values. Modifications to the expected values might require building new regex, which can be troublesome.
By now you should be seeing the value of the structured information you saw in Chapter 2.
Aggregation
Data can be aggregated—that is, used in a summarized format—from multiple sources or from a single source. There are multiple reasons you might need to aggregate data, such as when you do not have enough computing power or networking bandwidth to use all the data points or when single data points without the bigger context can lead to incor-rect insights.
Let’s look at a networking example focused on the CPU utilization percentage in a router. If you are polling the device for this percentage every second, it is possible that for some reason (such as a traffic burst punted to CPU), it could be at 100%, but then, in the next second, it drops to around 20% and stays there. In this case, if you have an automated system to act on the monitored metric, you will execute a preventive measure that is not needed. Figures 3-1 and 3-2 show exactly this, where a defined threshold for 80% CPU
9780137506736_web.indb 98 27/09/21 6:32 PM

Data Preparation 99
utilization would trigger if you were measuring each data point separately but wouldn’t if you aggregated the data and used the average of the three data points.
% CPU utilization
T0 T1 T2 T3 T4 T5 T6 T7 T8 T9 T10
100
90
80
70
60
50
40
30
20
10
0
Figure 3-1 % CPU Utilization Graph per Time Measure T
% CPU utilization
T9, T10 T11T6, T7 T8T3, T4 T5T0, T1 T2
100
70
50
25
0
Figure 3-2 % CPU Utilization Graph per Aggregated Time Measure T
9780137506736_web.indb 99 27/09/21 6:32 PM
100 Chapter 3: Using Data from Your Network
In the monitoring use case, it is typical to monitor using aggregated results at time intervals (for example, 15 or 30 seconds). If the aggregated result is over a defined CPU utilization threshold, it is a more accurate metric to act on. Tools like Kibana support aggregation natively.
As another example of aggregating data from multiple sources to achieve better insights, consider the following scenario: You have two interfaces connecting the same two devic-es, and you are monitoring all interfaces for bandwidth utilization. Your monitoring tool has a defined threshold for bandwidth utilization percentage and automatically provisions a new interface if the threshold is reached. For some reason, most of your traffic is taking one of the interfaces, which triggers your monitoring tool’s threshold. However, you still have the other interface bandwidth available. A more accurate aggregated metric would be the combined bandwidth available for the path (an aggregate of the data on both interfaces).
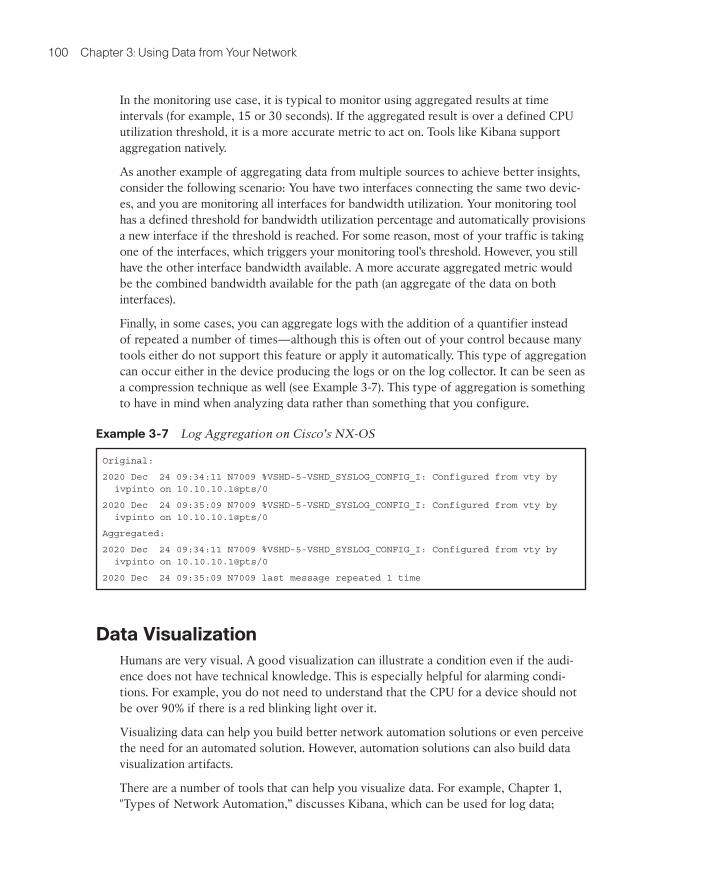
Finally, in some cases, you can aggregate logs with the addition of a quantifier instead of repeated a number of times—although this is often out of your control because many tools either do not support this feature or apply it automatically. This type of aggregation can occur either in the device producing the logs or on the log collector. It can be seen as a compression technique as well (see Example 3-7). This type of aggregation is something to have in mind when analyzing data rather than something that you configure.
Example 3-7 Log Aggregation on Cisco’s NX-OS
Original:
2020 Dec 24 09:34:11 N7009 %VSHD-5-VSHD_SYSLOG_CONFIG_I: Configured from vty by ivpinto on 10.10.10.1@pts/0
2020 Dec 24 09:35:09 N7009 %VSHD-5-VSHD_SYSLOG_CONFIG_I: Configured from vty by ivpinto on 10.10.10.1@pts/0
Aggregated:
2020 Dec 24 09:34:11 N7009 %VSHD-5-VSHD_SYSLOG_CONFIG_I: Configured from vty by ivpinto on 10.10.10.1@pts/0
2020 Dec 24 09:35:09 N7009 last message repeated 1 time
Data VisualizationHumans are very visual. A good visualization can illustrate a condition even if the audi-ence does not have technical knowledge. This is especially helpful for alarming condi-tions. For example, you do not need to understand that the CPU for a device should not be over 90% if there is a red blinking light over it.
Visualizing data can help you build better network automation solutions or even perceive the need for an automated solution. However, automation solutions can also build data visualization artifacts.
There are a number of tools that can help you visualize data. For example, Chapter 1, "Types of Network Automation,” discusses Kibana, which can be used for log data;
9780137506736_web.indb 100 27/09/21 6:32 PM
Data Visualization 101
Grafana, which can be used for metric data; and Splunk, which can be used for most data types. There are also data visualization tools specific for NetFlow or IPFIX data; for example, Cisco’s Tetration. This type of flow data is typically exported to specialized tools to allow you to visualize who the endpoints are talking to, what protocols they are using, and what ports they are using.
Tip When you automate actions, base the actions on data rather than on assumptions.
Say that you want to visualize the CPU utilization of routers. The best data gathering method in this scenario would be model-driven telemetry (but if telemetry is not avail-able, SNMP can also work), and Grafana would be a good visualization choice. Grafana integrates with all kinds of databases, but for this type of time-series data, InfluxDB is a good fit. The configuration steps would be as follows:
Step 1. Configure a telemetry subscription in the router.
Step 2. Configure a telemetry server (for example, Telegraf) to listen in.
Step 3. Store the data in a database (for example, InfluxDB).
Step 4. Configure Grafana’s data source as the database table.
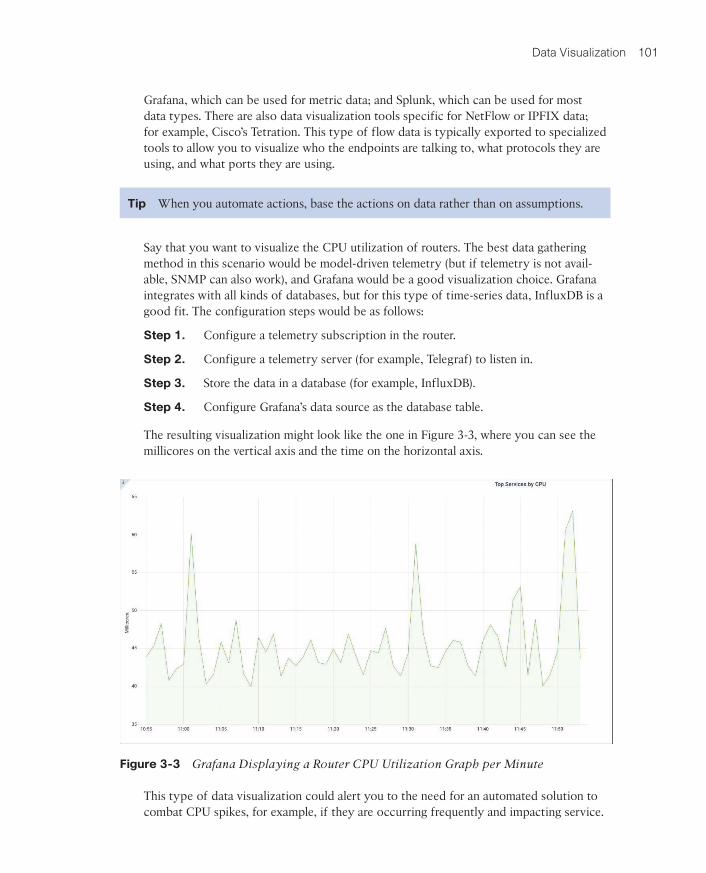
The resulting visualization might look like the one in Figure 3-3, where you can see the millicores on the vertical axis and the time on the horizontal axis.
Figure 3-3 Grafana Displaying a Router CPU Utilization Graph per Minute
This type of data visualization could alert you to the need for an automated solution to combat CPU spikes, for example, if they are occurring frequently and impacting service.
9780137506736_web.indb 101 27/09/21 6:32 PM

102 Chapter 3: Using Data from Your Network
Many times, it is difficult to perceive a need until you see data represented in a visual format.
Although data visualization is a discipline on its own and we only touch on a very small part of it, there are a couple things to have in mind when creating visualizations. For one thing, you should choose metrics that clearly represent the underlying status. For example, for CPU utilization, typically the percentage is shown and not cores or threads. This is because interpreting a percentage is much easier than knowing how many cores are available on a specific device and contrasting that information with the devices being used. On the other hand, when we are looking at memory, most of the time we represent it with a storage metric (such as GB or MB) rather than a percentage. Consider that 10% of memory left can mean a lot in a server with 100 TB but very little in a server with 1 TB; therefore, representing this metric as 10 TB left or 100 GB left would be more illustrative.
Choosing the right metric scale can be challenging. Table 3-3 illustrates commonly used scales for enterprise network component visualizations.
Table 3-3 Data Visualization Scales
Metric Scale
CPU utilization Percentage over time
Memory utilization Specific storage in time (for example, GB)
Disk operations Operations over time
Network traffic Specific transmission over time (for example Gbps)
Another important decision is visualization type. There are many commonly used visual-izations. The following types are commonly used in networking:
■ Line charts
■ Stat panels/gauges
■ Bar charts
Your choice of visualization will mostly come down to two answers:
■ Are you trying to compare several things?
■ Do you need historical context?
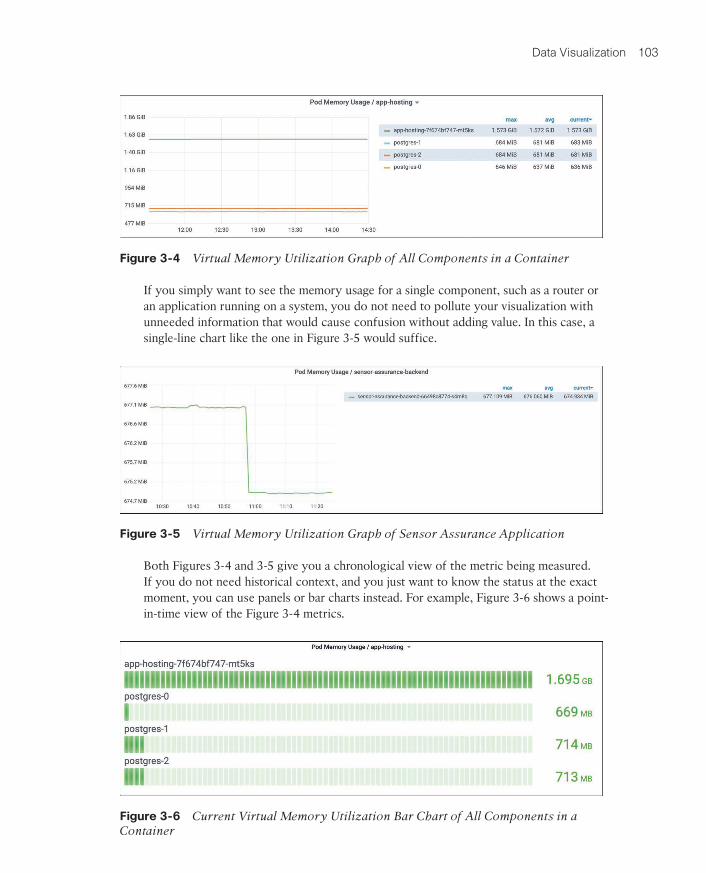
The answer to the first question indicates whether you need multiple- or single-line visu-alizations. For example, if you want to visualize the memory usage of all components within a system, you could plot it as shown in Figure 3-4. This line chart with multiple lines would allow you to compare the components and get a broader perspective. In this figure, you can see that the app-hosting application is consuming more than twice as much memory as any other running application.
9780137506736_web.indb 102 27/09/21 6:32 PM
Data Visualization 103
Figure 3-4 Virtual Memory Utilization Graph of All Components in a Container
If you simply want to see the memory usage for a single component, such as a router or an application running on a system, you do not need to pollute your visualization with unneeded information that would cause confusion without adding value. In this case, a single-line chart like the one in Figure 3-5 would suffice.
Figure 3-5 Virtual Memory Utilization Graph of Sensor Assurance Application
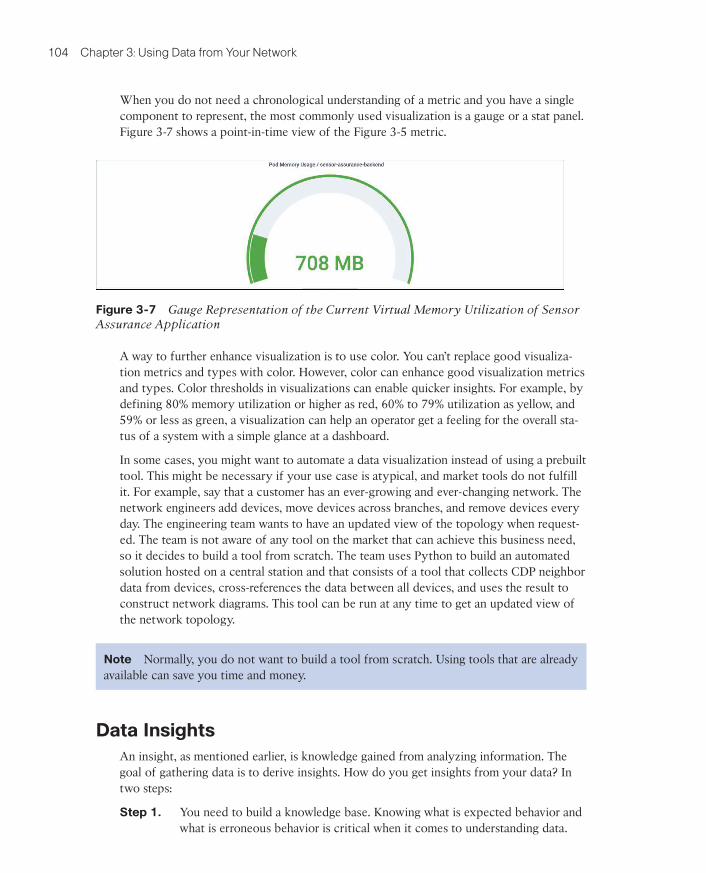
Both Figures 3-4 and 3-5 give you a chronological view of the metric being measured. If you do not need historical context, and you just want to know the status at the exact moment, you can use panels or bar charts instead. For example, Figure 3-6 shows a point-in-time view of the Figure 3-4 metrics.
Figure 3-6 Current Virtual Memory Utilization Bar Chart of All Components in a Container
9780137506736_web.indb 103 27/09/21 6:32 PM
104 Chapter 3: Using Data from Your Network
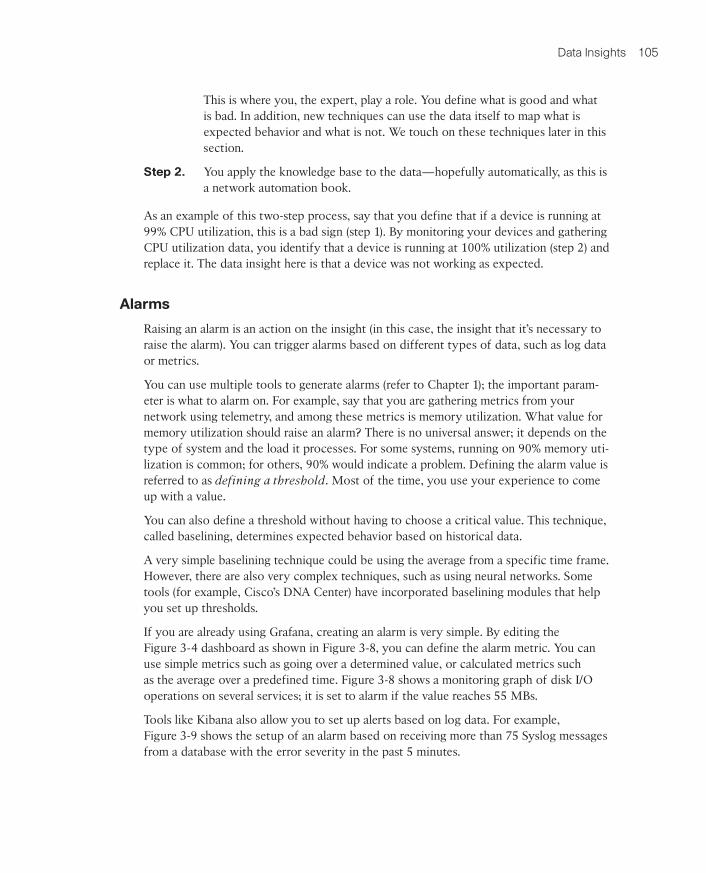
When you do not need a chronological understanding of a metric and you have a single component to represent, the most commonly used visualization is a gauge or a stat panel. Figure 3-7 shows a point-in-time view of the Figure 3-5 metric.
Figure 3-7 Gauge Representation of the Current Virtual Memory Utilization of Sensor Assurance Application
A way to further enhance visualization is to use color. You can’t replace good visualiza-tion metrics and types with color. However, color can enhance good visualization metrics and types. Color thresholds in visualizations can enable quicker insights. For example, by defining 80% memory utilization or higher as red, 60% to 79% utilization as yellow, and 59% or less as green, a visualization can help an operator get a feeling for the overall sta-tus of a system with a simple glance at a dashboard.
In some cases, you might want to automate a data visualization instead of using a prebuilt tool. This might be necessary if your use case is atypical, and market tools do not fulfill it. For example, say that a customer has an ever-growing and ever-changing network. The network engineers add devices, move devices across branches, and remove devices every day. The engineering team wants to have an updated view of the topology when request-ed. The team is not aware of any tool on the market that can achieve this business need, so it decides to build a tool from scratch. The team uses Python to build an automated solution hosted on a central station and that consists of a tool that collects CDP neighbor data from devices, cross-references the data between all devices, and uses the result to construct network diagrams. This tool can be run at any time to get an updated view of the network topology.
Note Normally, you do not want to build a tool from scratch. Using tools that are already available can save you time and money.
Data InsightsAn insight, as mentioned earlier, is knowledge gained from analyzing information. The goal of gathering data is to derive insights. How do you get insights from your data? In two steps:
Step 1. You need to build a knowledge base. Knowing what is expected behavior and what is erroneous behavior is critical when it comes to understanding data.
9780137506736_web.indb 104 27/09/21 6:32 PM
Data Insights 105
This is where you, the expert, play a role. You define what is good and what is bad. In addition, new techniques can use the data itself to map what is expected behavior and what is not. We touch on these techniques later in this section.
Step 2. You apply the knowledge base to the data—hopefully automatically, as this is a network automation book.
As an example of this two-step process, say that you define that if a device is running at 99% CPU utilization, this is a bad sign (step 1). By monitoring your devices and gathering CPU utilization data, you identify that a device is running at 100% utilization (step 2) and replace it. The data insight here is that a device was not working as expected.
Alarms
Raising an alarm is an action on the insight (in this case, the insight that it’s necessary to raise the alarm). You can trigger alarms based on different types of data, such as log data or metrics.
You can use multiple tools to generate alarms (refer to Chapter 1); the important param-eter is what to alarm on. For example, say that you are gathering metrics from your network using telemetry, and among these metrics is memory utilization. What value for memory utilization should raise an alarm? There is no universal answer; it depends on the type of system and the load it processes. For some systems, running on 90% memory uti-lization is common; for others, 90% would indicate a problem. Defining the alarm value is referred to as defining a threshold. Most of the time, you use your experience to come up with a value.
You can also define a threshold without having to choose a critical value. This technique, called baselining, determines expected behavior based on historical data.
A very simple baselining technique could be using the average from a specific time frame. However, there are also very complex techniques, such as using neural networks. Some tools (for example, Cisco’s DNA Center) have incorporated baselining modules that help you set up thresholds.
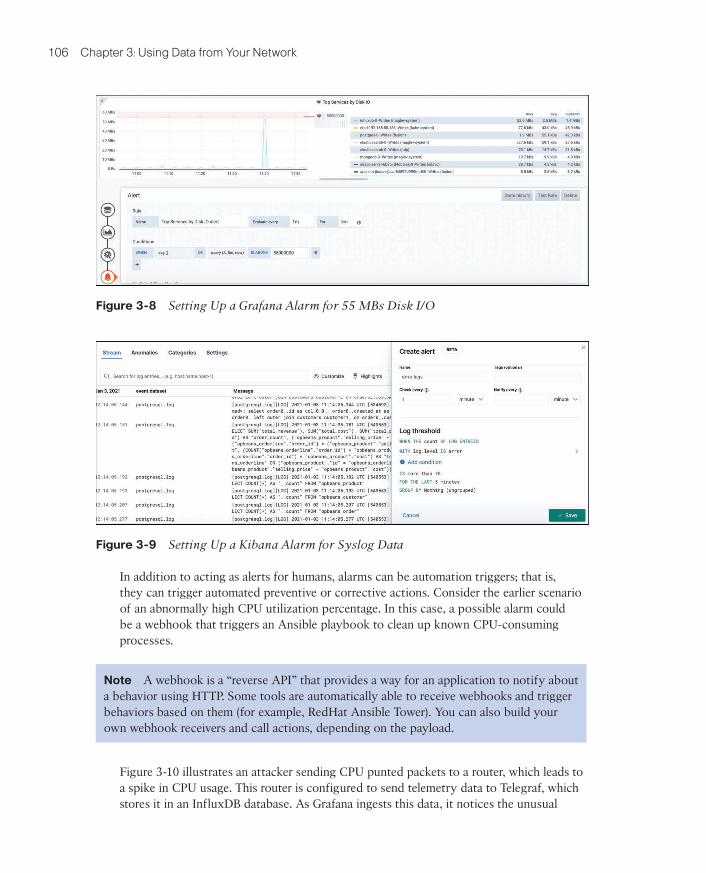
If you are already using Grafana, creating an alarm is very simple. By editing the Figure 3-4 dashboard as shown in Figure 3-8, you can define the alarm metric. You can use simple metrics such as going over a determined value, or calculated metrics such as the average over a predefined time. Figure 3-8 shows a monitoring graph of disk I/O operations on several services; it is set to alarm if the value reaches 55 MBs.
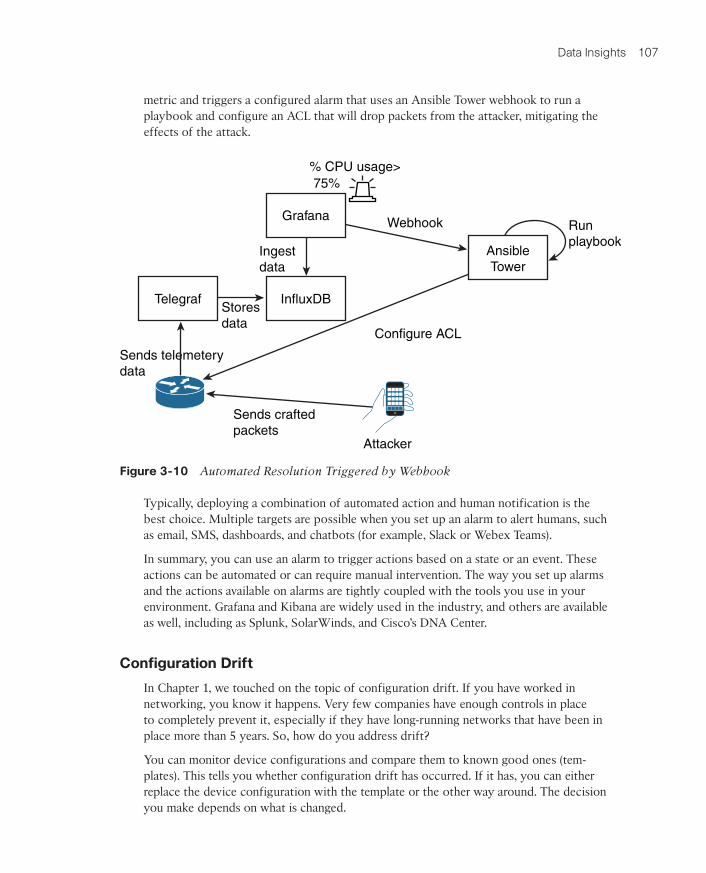
Tools like Kibana also allow you to set up alerts based on log data. For example, Figure 3-9 shows the setup of an alarm based on receiving more than 75 Syslog messages from a database with the error severity in the past 5 minutes.
9780137506736_web.indb 105 27/09/21 6:32 PM
106 Chapter 3: Using Data from Your Network
Figure 3-8 Setting Up a Grafana Alarm for 55 MBs Disk I/O
Figure 3-9 Setting Up a Kibana Alarm for Syslog Data
In addition to acting as alerts for humans, alarms can be automation triggers; that is, they can trigger automated preventive or corrective actions. Consider the earlier scenario of an abnormally high CPU utilization percentage. In this case, a possible alarm could be a webhook that triggers an Ansible playbook to clean up known CPU-consuming processes.
Note A webhook is a “reverse API” that provides a way for an application to notify about a behavior using HTTP. Some tools are automatically able to receive webhooks and trigger behaviors based on them (for example, RedHat Ansible Tower). You can also build your own webhook receivers and call actions, depending on the payload.
Figure 3-10 illustrates an attacker sending CPU punted packets to a router, which leads to a spike in CPU usage. This router is configured to send telemetry data to Telegraf, which stores it in an InfluxDB database. As Grafana ingests this data, it notices the unusual
9780137506736_web.indb 106 27/09/21 6:32 PM
Data Insights 107
metric and triggers a configured alarm that uses an Ansible Tower webhook to run a playbook and configure an ACL that will drop packets from the attacker, mitigating the effects of the attack.
% CPU usage>
Webhook
Configure ACL
Runplaybook
Ingestdata
Storesdata
Sends telemeterydata
Sends craftedpackets
Attacker
75%
Grafana
InfluxDB
AnsibleTower
Telegraf
Figure 3-10 Automated Resolution Triggered by Webhook
Typically, deploying a combination of automated action and human notification is the best choice. Multiple targets are possible when you set up an alarm to alert humans, such as email, SMS, dashboards, and chatbots (for example, Slack or Webex Teams).
In summary, you can use an alarm to trigger actions based on a state or an event. These actions can be automated or can require manual intervention. The way you set up alarms and the actions available on alarms are tightly coupled with the tools you use in your environment. Grafana and Kibana are widely used in the industry, and others are available as well, including as Splunk, SolarWinds, and Cisco’s DNA Center.
Configuration Drift
In Chapter 1, we touched on the topic of configuration drift. If you have worked in networking, you know it happens. Very few companies have enough controls in place to completely prevent it, especially if they have long-running networks that have been in place more than 5 years. So, how do you address drift?
You can monitor device configurations and compare them to known good ones (tem-plates). This tells you whether configuration drift has occurred. If it has, you can either replace the device configuration with the template or the other way around. The decision you make depends on what is changed.
9780137506736_web.indb 107 27/09/21 6:32 PM
108 Chapter 3: Using Data from Your Network
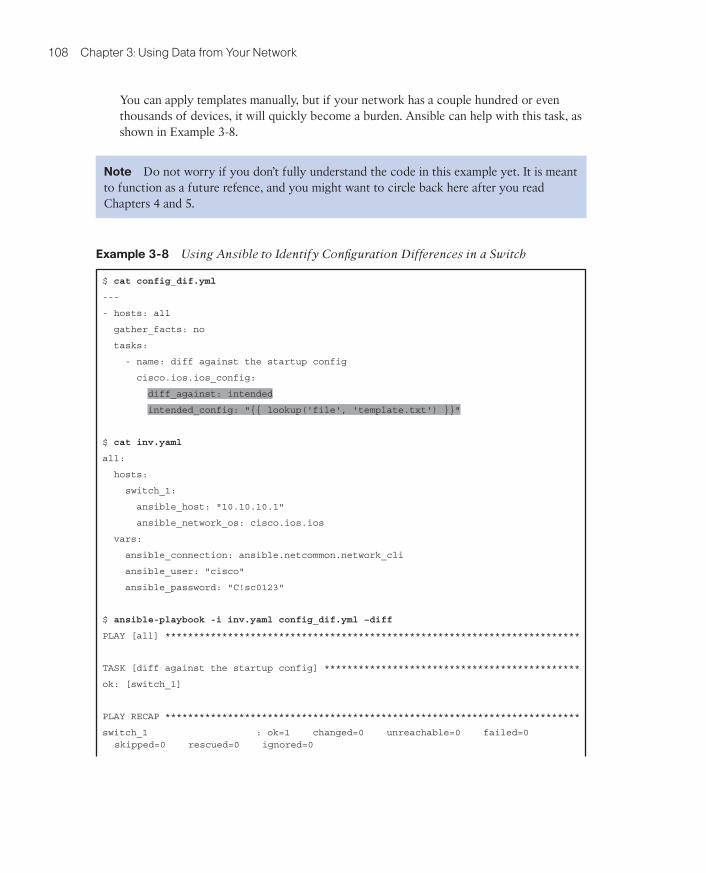
You can apply templates manually, but if your network has a couple hundred or even thousands of devices, it will quickly become a burden. Ansible can help with this task, as shown in Example 3-8.
Note Do not worry if you don’t fully understand the code in this example yet. It is meant to function as a future refence, and you might want to circle back here after you read Chapters 4 and 5.
Example 3-8 Using Ansible to Identify Configuration Differences in a Switch
$ cat config_dif.yml
---
- hosts: all
gather_facts: no
tasks:
- name: diff against the startup config
cisco.ios.ios_config:
diff_against: intended
intended_config: "{{ lookup('file', 'template.txt') }}"
$ cat inv.yaml
all:
hosts:
switch_1:
ansible_host: "10.10.10.1"
ansible_network_os: cisco.ios.ios
vars:
ansible_connection: ansible.netcommon.network_cli
ansible_user: "cisco"
ansible_password: "C!sc0123"
$ ansible-playbook -i inv.yaml config_dif.yml –diff
PLAY [all] *************************************************************************
TASK [diff against the startup config] *********************************************
ok: [switch_1]
PLAY RECAP *************************************************************************
switch_1 : ok=1 changed=0 unreachable=0 failed=0 skipped=0 rescued=0 ignored=0
9780137506736_web.indb 108 27/09/21 6:32 PM
Data Insights 109
Modified the ssh version to 1 instead of 2 on the template file (template.txt)
$ cat template.txt
#output omitted#
ip ssh version 1
#output omitted#
$ ansible-playbook -i inv.yaml config_dif.yml --diff
PLAY [all] *************************************************************************
TASK [diff against the startup config] *********************************************
--- before
+++ after
@@ -253,7 +253,7 @@
no ip http secure-server
ip route vrf Mgmt-vrf 0.0.0.0 0.0.0.0 3.6.0.254 name LAB-MGMT-GW
ip tacacs source-interface Vlan41
-ip ssh version 2
+ip ssh version 1
ip scp server enable
tacacs-server host 192.168.48.165
tacacs-server host 1.1.1.1
changed: [switch_1]
PLAY RECAP *************************************************************************
switch_1 : ok=1 changed=1 unreachable=0 failed=0 skipped=0 rescued=0 ignored=0
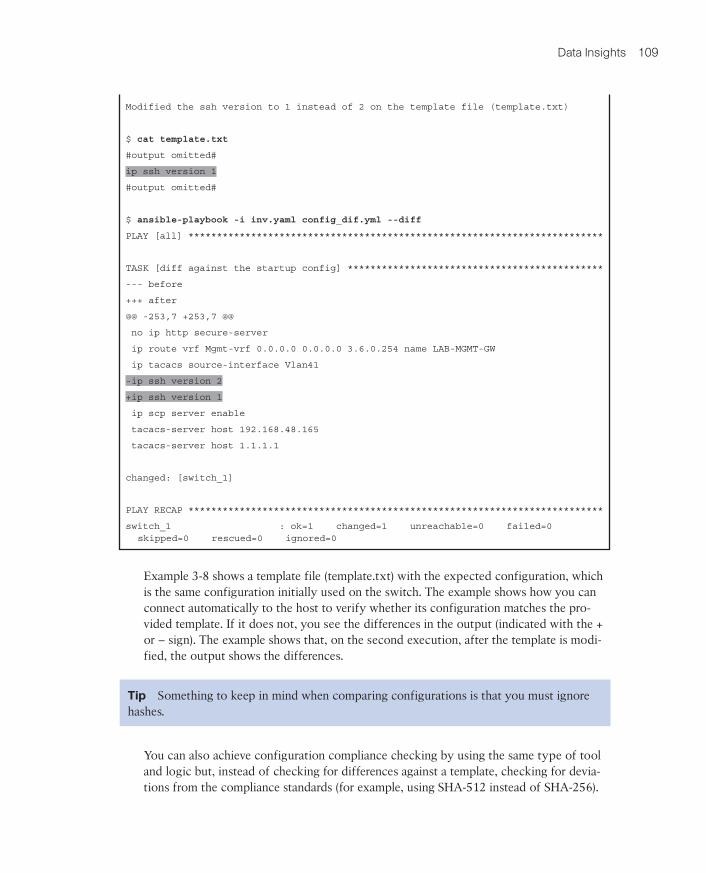
Example 3-8 shows a template file (template.txt) with the expected configuration, which is the same configuration initially used on the switch. The example shows how you can connect automatically to the host to verify whether its configuration matches the pro-vided template. If it does not, you see the differences in the output (indicated with the + or – sign). The example shows that, on the second execution, after the template is modi-fied, the output shows the differences.
Tip Something to keep in mind when comparing configurations is that you must ignore hashes.
You can also achieve configuration compliance checking by using the same type of tool and logic but, instead of checking for differences against a template, checking for devia-tions from the compliance standards (for example, using SHA-512 instead of SHA-256).
9780137506736_web.indb 109 27/09/21 6:32 PM
110 Chapter 3: Using Data from Your Network
AI/ML Predictions
Insights can come from artificial intelligent (AI) or machine learning (ML) techniques. AI and ML have been applied extensively in the past few years in many contexts (for exam-ple, for financial fraud detection, image recognition, and natural language processing). They can also play a role in networking.
ML involves constructing algorithms and models that can learn to make decisions/predic-tions directly from data without following predefined rules. Currently, ML algorithms can be divided into three major categories: supervised, unsupervised, and reinforcement learning. Here we focus on the first two categories because reinforcement learning is about training agents to take actions, and that type of ML is very rarely applied to net-working use cases.
Supervised algorithms are typically used for classification and regression tasks, based on labeled data (where labels are the expected result). Classification involves predicting a result from a predefined set (for example, predicting malicious out of the possibilities malicious or benign). Regression involves predicting a value (for example, predicting how many battery cycles a router will live through).
Unsupervised algorithms try to group data into related clusters. For example, given a set of NetFlow log data, grouping it with the intent of trying to identify malicious flows would be considered unsupervised learning.
On the other hand, given a set of NetFlow log data where you have previously identi-fied which subset of flows is malicious and using it to predict whether if future flows are malicious would be considered supervised learning.
One type is not better than the other; supervised and unsupervised learning aims to address different types of situations.
There are three major ways you can use machine learning:
■ Retraining models
■ Training your own models with automated machine learning (AutoML)
■ Training your models manually
Before you learn about each of these ways, you need to understand the steps involved in training and using a model:
Step 1. Define the problem (for example, prediction, regression, clustering). You need to define the problem you are trying to solve, the data that you need to solve it, and possible algorithms to use.
Step 2. Gather data (for example, API, Syslog, telemetry). Typically you need a lot of data, and gathering data can take weeks or months.
Step 3. Prepare the data (for example, parsing, aggregation). There is a whole disci-pline called data engineering that tries to accomplish the most with data in a machine learning context.
9780137506736_web.indb 110 27/09/21 6:32 PM

Data Insights 111
Step 4. Train the model. This is often a trial-and-error adventure, involving different algorithms and architectures.
Step 5. Test the model. The resulting models need to be tested with sample data sets to see how they perform at predicting the problem you defined previously.
Step 6. Deploy/use the model. Depending on the results of testing, you might have to repeat steps 4 and 5; when the results are satisfactory, you can finally deploy and use the model.
These steps can take a long time to work through, and the process can be expensive. The process also seems complicated, doesn’t it? What if someone already addressed the problem you are trying to solve? These is where pretrained models come in. You find these models inside products and in cloud marketplaces. These models have been trained and are ready to be used so you can skip directly to step 6. The major inconvenience with using pretrained models is that if your data is very different from what the model was trained with, the results will not be ideal. For example, a model for detecting whether people were wearing face masks was trained with images at 4K resolution. When predic-tions were made with CCTV footage (at very low resolution), there was a high false posi-tive rate. Although it may provide inaccurate results, using pretrained models is typically the quickest way to get machine learning insights in a network.
If you are curious and want to try a pretrained model, check out Amazon Rekognition, which is a service that identifies objects within images. Another example is Amazon Monitron, a service with which you must install Amazon-provided sensors that analyze industrial machinery behavior and alert you when they detect anomalies.
AutoML goes a step beyond pretrained models. There are tools available that allow you to train your own model, using your own data but with minimal machine learning knowl-edge. You need to provide minimal inputs. You typically have to provide the data that you want to use and the problem you are trying to solve. AutoML tools prepare the data as they see fit and train several models. These tools present the best-performing models to you, and you can then use them to make predictions.
With AutoML, you skip steps 3 through 5, which is where the most AI/ML knowledge is required. AutoML is commonly available from cloud providers.
Finally, you can train models in-house. This option requires more knowledge than the other options. Python is the tool most commonly used for training models in-house. When you choose this option, all the steps apply.
An interesting use case of machine learning that may spark your imagination is in regard to log data. When something goes wrong—for example, an access switch reboots—you may receive many different logs from many different components, from routing neighbor-ships going down to applications losing connectivity and so on. However, the real prob-lem is that a switch is not active. Machine learning can detect that many of those logs are consequences of a problem and not the actual problem, and it can group them accord-ingly. This is part of a new discipline called AIOps (artificial intelligence operations). A tool not mentioned in Chapter 1 that tries to achieve AIOps is Moogsoft.
9780137506736_web.indb 111 27/09/21 6:32 PM
112 Chapter 3: Using Data from Your Network
Here are a couple examples of machine learning applications for networks:
■ Malicious traffic classification based on k-means clustering.
■ Interface bandwidth saturation forecast based on recurrent neural networks.
■ Log correlation based on natural language processing.
■ Traffic steering based on time-series forecasting.
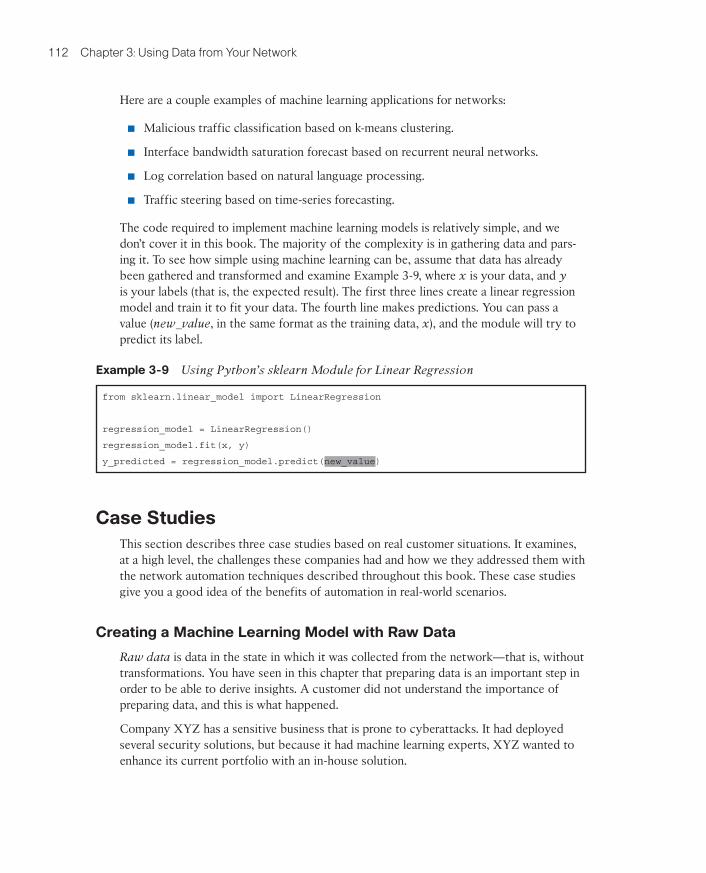
The code required to implement machine learning models is relatively simple, and we don’t cover it in this book. The majority of the complexity is in gathering data and pars-ing it. To see how simple using machine learning can be, assume that data has already been gathered and transformed and examine Example 3-9, where x is your data, and y is your labels (that is, the expected result). The first three lines create a linear regression model and train it to fit your data. The fourth line makes predictions. You can pass a value (new_value, in the same format as the training data, x), and the module will try to predict its label.
Example 3-9 Using Python’s sklearn Module for Linear Regression
from sklearn.linear_model import LinearRegression
regression_model = LinearRegression()
regression_model.fit(x, y)
y_predicted = regression_model.predict(new_value)
Case StudiesThis section describes three case studies based on real customer situations. It examines, at a high level, the challenges these companies had and how we they addressed them with the network automation techniques described throughout this book. These case studies give you a good idea of the benefits of automation in real-world scenarios.
Creating a Machine Learning Model with Raw Data
Raw data is data in the state in which it was collected from the network—that is, without transformations. You have seen in this chapter that preparing data is an important step in order to be able to derive insights. A customer did not understand the importance of preparing data, and this is what happened.
Company XYZ has a sensitive business that is prone to cyberattacks. It had deployed several security solutions, but because it had machine learning experts, XYZ wanted to enhance its current portfolio with an in-house solution.
9780137506736_web.indb 112 27/09/21 6:32 PM
Case Studies 113
The initial step taken was to decide which part of the network was going to be used, and XYZ decided that the data center was the best fit. XYZ decided that it wanted to predict network intrusion attacks based on flow data from network traffic.
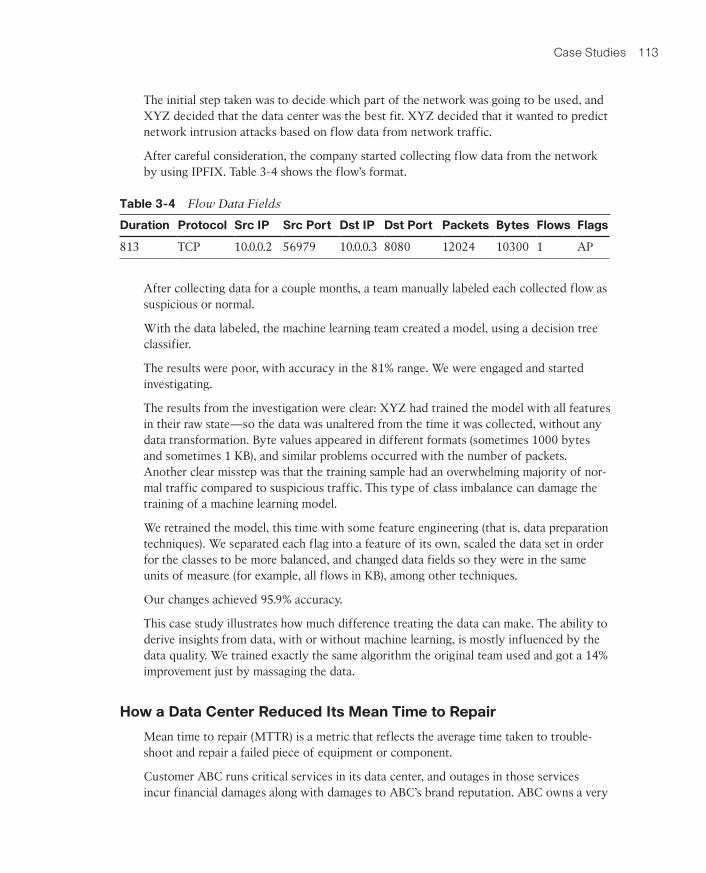
After careful consideration, the company started collecting flow data from the network by using IPFIX. Table 3-4 shows the flow’s format.
Table 3-4 Flow Data Fields
Duration Protocol Src IP Src Port Dst IP Dst Port Packets Bytes Flows Flags
813 TCP 10.0.0.2 56979 10.0.0.3 8080 12024 10300 1 AP
After collecting data for a couple months, a team manually labeled each collected flow as suspicious or normal.
With the data labeled, the machine learning team created a model, using a decision tree classifier.
The results were poor, with accuracy in the 81% range. We were engaged and started investigating.
The results from the investigation were clear: XYZ had trained the model with all features in their raw state—so the data was unaltered from the time it was collected, without any data transformation. Byte values appeared in different formats (sometimes 1000 bytes and sometimes 1 KB), and similar problems occurred with the number of packets. Another clear misstep was that the training sample had an overwhelming majority of nor-mal traffic compared to suspicious traffic. This type of class imbalance can damage the training of a machine learning model.
We retrained the model, this time with some feature engineering (that is, data preparation techniques). We separated each flag into a feature of its own, scaled the data set in order for the classes to be more balanced, and changed data fields so they were in the same units of measure (for example, all flows in KB), among other techniques.
Our changes achieved 95.9% accuracy.
This case study illustrates how much difference treating the data can make. The ability to derive insights from data, with or without machine learning, is mostly influenced by the data quality. We trained exactly the same algorithm the original team used and got a 14% improvement just by massaging the data.
How a Data Center Reduced Its Mean Time to Repair
Mean time to repair (MTTR) is a metric that reflects the average time taken to trouble-shoot and repair a failed piece of equipment or component.
Customer ABC runs critical services in its data center, and outages in those services incur financial damages along with damages to ABC’s brand reputation. ABC owns a very
9780137506736_web.indb 113 27/09/21 6:32 PM

114 Chapter 3: Using Data from Your Network
complex data center topology with a mix of platforms, vendors, and versions. All of its services are highly redundant due to the fact that the company’s MTTR was high.
We were involved to try to drive down the MTTR as doing so could have a big impact on ABC’s business operations. The main reason we could pinpoint as causing the high MTTR metric was the amount of knowledge needed to triage and troubleshoot any situation. In an ecosystem with so many different vendors and platforms, data was really sparse.
We developed an automation solution using Python and natural language processing (NLP) that correlated logs across these platforms and deduplicated them. This really enabled ABC’s engineers to understand the logs in a common language.
In addition, we used Ansible playbooks to apply configurations after a device was replaced. The initial workflow consisted of replacing faulty devices with new ones and manually configuring them using the configuration of the replaced device. This process was slow and error prone.
Now after a device is identified for replacement at ABC, the following workflow occurs:
Step 1. Collect the configuration of the faulty device (using Ansible).
Step 2. Collect information about endpoints connected to the faulty device (using Ansible).
Step 3. Manually connect/cable the new device (manually).
Step 4. Assign the new device a management connection (manually).
Step 5. Configure the new device (using Ansible).
Step 6. Validate that the endpoint information from the faulty device from Step 2 matches (using Ansible).
This new approach allows ABC to ensure that the configurations are consistent when devices are replaced and applied in a quick manner. Furthermore, it provides assurance regarding the number and type of connected endpoints, which should be the same before and after the replacement.
In Chapter 5, you will see how to create your own playbooks to collect information and configure network devices. In the case of ABC, two playbooks were used: one to retrieve configuration and endpoint information from the faulty device and store it and another to configure and validate the replacement device using the previously collected information. These playbooks are executed manually from a central server.
Both solutions together greatly reduced the time ABC takes to repair network compo-nents. It is important to note that this customer replaced faulty devices with similar ones, in terms of hardware and software. If a replacement involves a different type of hardware or software, some of the collected configurations might need to be altered before they can be applied.
9780137506736_web.indb 114 27/09/21 6:32 PM
Case Studies 115
Network Migrations at an Electricity Provider
A large electricity provider was responsible for a whole country. It had gone through a series of campus network migrations to a new technology, but after a couple months, it had experienced several outages. This led to the decision to remove this new technology, which entailed yet another series of migrations. These migrations had a twist: They had to be done in a much shorter period of time due to customer sentiment and possibility of outages while on the current technology stack.
Several automations were applied, mostly for validation, as the migration activities entailed physical moves, and automating configuration steps wasn’t possible.
The buildings at the electricity provider had many floors, and the floors had many devic-es, including the following:
■ IP cameras
■ Badge readers
■ IP phones
■ Desktops
■ Building management systems (such as heating, air, and water)
The procedure consisted of four steps:
Step 1. Isolate the device from the network (by unplugging its uplinks).
Step 2. Change the device software version.
Step 3. Change the device configuration.
Step 4. Plug in the device to a parallel network segment.
The maintenance windows were short—around 6 hours—but the go-ahead or rollback decision had to be made at least 3 hours after the window start. This was due to the time required to roll back to the previous known good state.
We executed the first migration (a single floor) without any automation. The biggest hurdle we faced was verifying that every single endpoint device that was working before was still working afterward. (Some devices may have not been working before, and mak-ing them work on the new network was considered out of scope.) Some floors had over 1000 endpoints connected, and we did not know which of them were working before. We found ourselves—a team of around 30 people—manually testing these endpoints, typi-cally by making a call from an IP phone or swiping a badge in a reader. It was a terrible all-nighter.
9780137506736_web.indb 115 27/09/21 6:32 PM
116 Chapter 3: Using Data from Your Network
After the first migration, we decided to automate verifications. This automation collected many outputs from the network before the migration, including the following:
■ CDP neighbors
■ ARP table
■ MAC address table
■ Specific connectivity tests (such as ICMP tests)
Having this information on what was working before enabled us to save tens of person-hours.
We parsed this data into tables. After devices were migrated (manually), we ran the col-lection mechanisms again. We therefore had a picture of the before and a picture of the after. From there, it was easy to tell which endpoint devices were working before and not working afterward, so we could act on only those devices.
We developed the scripts in Python instead of Ansible. The reason for this choice was the team’s expertise. It would be possible to achieve the same with Ansible. (Refer to Example 1-9 in Chapter 1 for a partial snippet of this script.)
There were many migration windows for this project. The first 8-hour maintenance window was dedicated to a single floor. In our 8-hour window, we successfully migrated and verified six floors.
The time savings due to automating the validations were a crucial part of the success of the project. The stress reduction was substantial as well. At the end of each migration window, the team was able to leave, knowing that things were working instead of fearing being called the next morning for nonworking endpoints that were left unvalidated.
SummaryThis chapter covers what to do after you have collected data. It explains common data preparation methods, such as parsing and aggregation, and discusses how helpful it can be to visualize data.
In this chapter, you have seen that data by itself has little value, but insights derived from high-quality data can be invaluable when it comes to making decisions. In particular, this chapter highlights alarms, configuration drift, and AI/ML techniques.
Finally, this chapter presents real case studies of data automation solutions put in place to improve business outcomes.
Chapter 4 covers Ansible. You have already seen a few examples of what you can accom-plish with Ansible, and after you read Chapter 4, you will understand the components of this tool and how you can use it. Be sure to come back and revisit the examples in this chapter after you master the Ansible concepts in Chapters 4 and 5.
9780137506736_web.indb 116 27/09/21 6:32 PM

Review Questions 117
Review QuestionsYou can find answers to these questions in Appendix A, “Answers to Review Questions.”
1. If you need to parse log data by using regex, which symbol should you use to match any characters containing the digits 0 through 9?a. \db. \Dc. \sd. \W
2. If you need to parse log data by using regex, which symbol should you use to match any whitespace characters?a. \db. \Dc. \sd. \W
3. Which of the IP-like strings match the following regex? (Choose two.) \d+\.\d+\.\d+\.\d+
a. 255.257.255.255b. 10.00.0.1c. 10.0.0.1/24d. 8.8,8.8
4. You work for a company that has very few network devices but that has grown sub-stantially lately in terms of users. Due to this growth, your network has run at nearly its maximum capacity. A new project is being implemented to monitor your devices and applications. Which technique can you use to reduce the impact of this new project in your infrastructure?a. Data parsingb. Data aggregationc. Data visualization
5. You are building a new Grafana dashboard. Which of the following is the most suitable method for representing a single device’s CPU utilization?a. Bar chartb. Line chartc. Gauged. Pie chart
9780137506736_web.indb 117 27/09/21 6:32 PM

118 Chapter 3: Using Data from Your Network
6. You are building a new Grafana dashboard. Which of the following is the most suitable method for representing the memory utilization of all components in a system?a. Bar chartb. Line chartc. Gauged. Pie chart
7. True or false: With automated systems, alarms can only trigger human intervention.a. Trueb. False
8. Your company asks you to train a machine learning model to identify unexpected logs, because it has been storing logs for the past years. However, you lack machine learning expertise. Which of the following is the most suitable method to achieve a working model?a. Use AutoMLb. Use a pretrained model that you find onlinec. Use an in-house trained model
9. In the context of regex, what does the symbol + mean?a. One or more occurrencesb. Zero or more occurrencesc. Ends withd. Starts with
10. In the context of machine learning, your company wants to identify how many virtual machines it needs to have available at a specific time of day to process transactions. What type of problem is this?a. Regressionb. Classificationc. Clusteringd. Sentiment analysis
9780137506736_web.indb 118 27/09/21 6:32 PM
Index
Symbols* (asterisk), 89{ } (braces), 89^ (caret), 89$ (dollar sign), 89. (period), 89| (pipe character), 89+ (plus sign), 89# (pound sign), 46–47[ ] (square brackets), 89200–204 HTTP status codes, 68400–404 HTTP status codes, 68500 HTTP status code, 68503 HTTP status code, 68
Aabsent state, 180abstracted input, VLANs (virtual
LANs) configuration with, 256abstraction, network service, 237accountability, source control and,
203ACI (Application Centric
Infrastructure), 31, 194action plans, for automation strategies,
268–270addresses (IPv4), identifying, 89
agent keyword, 228agents, 34, 61, 110, 225, 226aggregated metrics, 23aggregation of data, 98–100AI. See artificial intelligence (AI)AIOps (artificial intelligence
operations), 111alarms, 105–107alerts, DNA Center, 23algorithms
supervised, 110unsupervised, 110
Amazon Monitron, 111Amazon Rekognition, 111Amazon Web Services. See AWS
(Amazon Web Services)ambiguity, removing with automation
strategy, 251analysis application, NetFlow, 59Ansible, 31–32
APIs (application programming interfaces), 187–189
architecture, 119–120case studies, 189–195
configuration changes across 100,000 devices, 189–192
disaster recovery at European bank, 194–195
QoS across heterogenous installed base, 193–194
Z02_Ivo_Index_p279-300.indd 279 27/09/21 8:58 PM

280 Ansible
characteristics of, 119–120cloud computing, 183–186
EC2 VM, creating, 184GCP disks, creating, 185resource provisioning, 185–186website content, crawling,
188–189conditionals, 133–136configuration drift, identifying,
107–109configuration playbook, 231containers, 181–183
applications, creating in specific namespaces, 182–183
creating, 181–183files
reading, 155–157writing, 158–160
handlers, 140–143multiple, 142–143playbook execution with,
140–141installing, 120–122inventory, 122–125
with groupings, 123implicit definitions, 124–125with ungrouped hosts, 123with variable assignments, 122verifying, 124
Inventory JSON schema, 56–57loops, 136–139modules, 120, 187
command, 174–176copy, 158docker_container, 181ec2, 207ios_config, 164ios_interface, 164–165lookup plug-in, 156netconf_config, 167–168netconf_get, 165–166netconf_rpc, 168–169restconf_config, 171–173restconf_get, 169–170slurp, 156–157
uri, 188–189vmware_guest, 179–180yum, 174
network devices, interacting with, 160–173NETCONF, 165–169RESTCONF, 169–173SSH (Secure Shell Protocol),
160–165parsing data with, 90–98
device facts, 90–91listing available interfaces, 93parsing and altering interface
names, 91–92recording times of data
collection, 93regular expressions and, 96–98RESTCONF and, 94–96SSH (Secure Shell Protocol)
and, 96–98playbooks. See also specific tasks
example of, 132executing, 143–149overview of, 131–133running for specific group of
hosts, 132–133structure of, 131–132
roles, 149–152default folder structure,
149–150Galaxy, 149–150role directories, 149VLAN creation with, 150–152
servers and virtual machines, 174–181
subnet deployment within cloud, 211–212on legacy network, 212–213
supported operating systems, 121variables, 126–131
Ansible Vaults, 130–131assigning with folder structure,
126–127assigning with variable files, 128defined, 129–130
Z02_Ivo_Index_p279-300.indd 280 27/09/21 8:58 PM
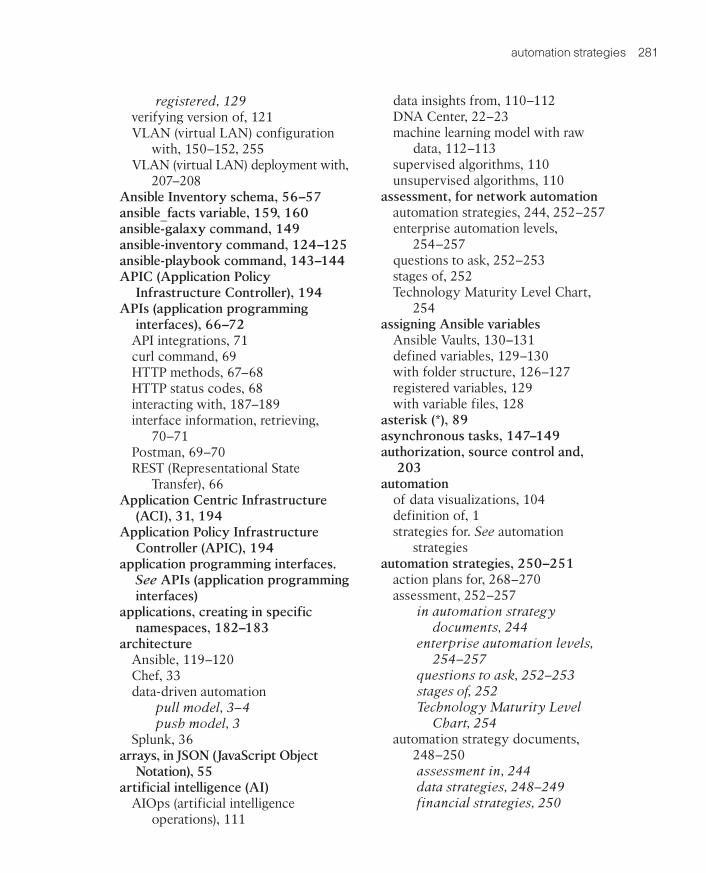
automation strategies 281
registered, 129verifying version of, 121VLAN (virtual LAN) configuration
with, 150–152, 255VLAN (virtual LAN) deployment with,
207–208Ansible Inventory schema, 56–57ansible_facts variable, 159, 160ansible-galaxy command, 149ansible-inventory command, 124–125ansible-playbook command, 143–144APIC (Application Policy
Infrastructure Controller), 194APIs (application programming
interfaces), 66–72API integrations, 71curl command, 69HTTP methods, 67–68HTTP status codes, 68interacting with, 187–189interface information, retrieving,
70–71Postman, 69–70REST (Representational State
Transfer), 66Application Centric Infrastructure
(ACI), 31, 194Application Policy Infrastructure
Controller (APIC), 194application programming interfaces.
See APIs (application programming interfaces)
applications, creating in specific namespaces, 182–183
architectureAnsible, 119–120Chef, 33data-driven automation
pull model, 3–4push model, 3
Splunk, 36arrays, in JSON (JavaScript Object
Notation), 55artificial intelligence (AI)
AIOps (artificial intelligence operations), 111
data insights from, 110–112DNA Center, 22–23machine learning model with raw
data, 112–113supervised algorithms, 110unsupervised algorithms, 110
assessment, for network automationautomation strategies, 244, 252–257enterprise automation levels,
254–257questions to ask, 252–253stages of, 252Technology Maturity Level Chart,
254assigning Ansible variables
Ansible Vaults, 130–131defined variables, 129–130with folder structure, 126–127registered variables, 129with variable files, 128
asterisk (*), 89asynchronous tasks, 147–149authorization, source control and,
203automation
of data visualizations, 104definition of, 1strategies for. See automation
strategiesautomation strategies, 250–251
action plans for, 268–270assessment, 252–257
in automation strategy documents, 244
enterprise automation levels, 254–257
questions to ask, 252–253stages of, 252Technology Maturity Level
Chart, 254automation strategy documents,
248–250assessment in, 244data strategies, 248–249financial strategies, 250
Z02_Ivo_Index_p279-300.indd 281 27/09/21 8:58 PM
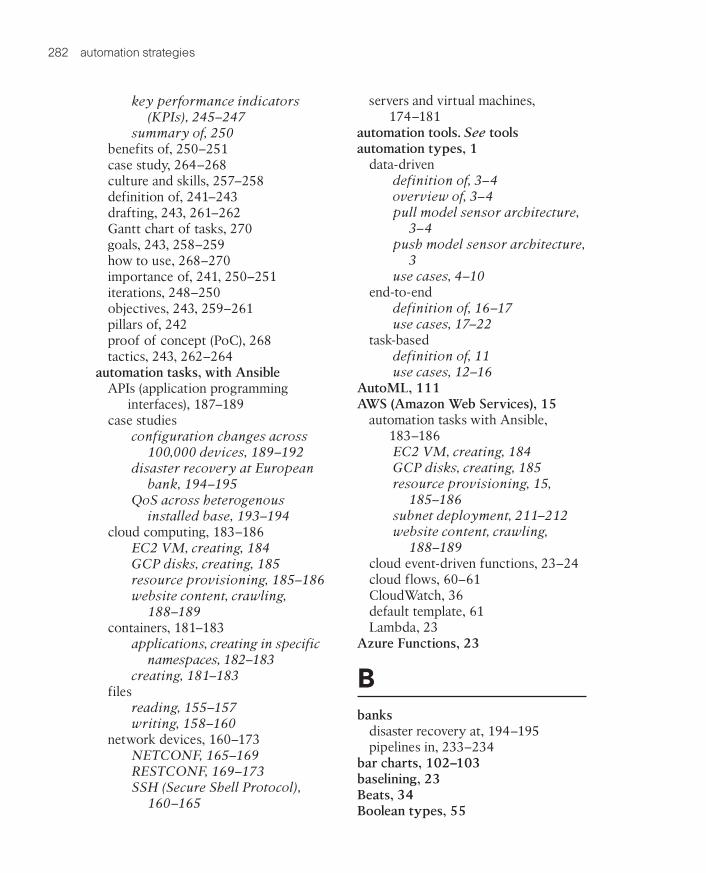
282 automation strategies
key performance indicators (KPIs), 245–247
summary of, 250benefits of, 250–251case study, 264–268culture and skills, 257–258definition of, 241–243drafting, 243, 261–262Gantt chart of tasks, 270goals, 243, 258–259how to use, 268–270importance of, 241, 250–251iterations, 248–250objectives, 243, 259–261pillars of, 242proof of concept (PoC), 268tactics, 243, 262–264
automation tasks, with AnsibleAPIs (application programming
interfaces), 187–189case studies
configuration changes across 100,000 devices, 189–192
disaster recovery at European bank, 194–195
QoS across heterogenous installed base, 193–194
cloud computing, 183–186EC2 VM, creating, 184GCP disks, creating, 185resource provisioning, 185–186website content, crawling,
188–189containers, 181–183
applications, creating in specific namespaces, 182–183
creating, 181–183files
reading, 155–157writing, 158–160
network devices, 160–173NETCONF, 165–169RESTCONF, 169–173SSH (Secure Shell Protocol),
160–165
servers and virtual machines, 174–181
automation tools. See toolsautomation types, 1
data-drivendefinition of, 3–4overview of, 3–4pull model sensor architecture,
3–4push model sensor architecture,
3use cases, 4–10
end-to-enddefinition of, 16–17use cases, 17–22
task-baseddefinition of, 11use cases, 12–16
AutoML, 111AWS (Amazon Web Services), 15
automation tasks with Ansible, 183–186EC2 VM, creating, 184GCP disks, creating, 185resource provisioning, 15,
185–186subnet deployment, 211–212website content, crawling,
188–189cloud event-driven functions, 23–24cloud flows, 60–61CloudWatch, 36default template, 61Lambda, 23
Azure Functions, 23
Bbanks
disaster recovery at, 194–195pipelines in, 233–234
bar charts, 102–103baselining, 23Beats, 34Boolean types, 55
Z02_Ivo_Index_p279-300.indd 282 27/09/21 9:08 PM
code phase (NetDevOps) 283
braces ({ }), 89branches, Git
making changes in, 221–222merging, 222–223
build phase (NetDevOps), 200business alignment, automation
strategies and, 242
Ccandidate datastores, NETCONF,
72–73caret (^), 89case studies
Ansible network automation, 189–195configuration changes across
100,000 devices, 189–192disaster recovery at European
bank, 194–195QoS across heterogenous
installed base, 193–194automation strategies, 264–268data preparation and visualization
machine learning model with raw data, 112–113
mean time to repair (MTTR) reduction, 113–114
network migrations at electricity provider, 115–116
NetDevOps (network DevOps), 233–237new service implementations
in tier 1 service provider, 236–237
new technology trainings at Fortune 500 company, 234–235
pipelines in large bank, 233–234CDP (Cisco Discovery Protocol)
neighbor devices, learning names of, 12–13
centralized source control, 203–204change tracking, source control and,
203
chartsbar, 102–103line, 102–103Technology Maturity Level Chart,
254Chef, 33–34child elements (XML), 49CI/CD (continuous integration/
continuous deployment), 208–210benefits of, 208–210GitLab CI/CD, 224–226pipelines, 214–228
case study, 233–234definition of, 210Git, 215–224GitLab CI/CD, 224–226Jenkins, 226–228, 230–232
Cisco ACI (Application Centric Infrastructure), 31
Cisco APIC (Application Policy Infrastructure Controller), 194
Cisco Discovery Protocol (CDP) neighbor devices, learning names of, 12–13
Cisco DNA Center, 107Cisco FTD module, 187Cisco Intersight, 31Cisco NX-OS, log aggregation on,
98–100Cisco Tetration, 82–83, 100–101close-session operation, NETCONF,
73cloud computing
automation tasks with Ansible, 183–186EC2 VM, creating, 184GCP disks, creating, 185resource provisioning, 15,
185–186subnet deployment, 211–212website content, crawling,
188–189cloud event-driven functions, 23–24cloud flows, 60–61
code phase (NetDevOps), 200
Z02_Ivo_Index_p279-300.indd 283 27/09/21 8:58 PM
284 collecting data
collecting datawith Ansible, 32task-based automation use cases for,
12–13color, in data visualizations, 104command module, 174–176commands. See individual commandscomments, YAML, 46–47commit operation, NETCONF, 73communication, automation strategies
for, 251compliance checking
data-driven automation, 6–7DNA Center, 23
compliance pipelines, 234Compute Engine, 184computing, automation for. See
containers; servers; VMs (virtual machines)
concept, proof of, 268conditionals, 133–136configuration, 107
with cloud event-driven functions, 23–24
configuration drift, 5, 107–109device
Ansible configuration playbook, 231
configuration changes across 100,000 devices, 189–192
with DNA Center, 22–23Git, 215–216
adding files to, 217–218directory structure of, 229remote repositories, 223–224
interfacesIOS, 164–165with NETCONF, 76–77, 167–168retrieving with Ansible,
169–171with Python, 38–39running configuration
retrieving, 166–167saving, 168–169
TACACS+ keys, 31–32, 190–192
task-based automation use cases for, 13–14
VLANs (virtual LANs), 254–256with abstracted input, 256with Ansible, 255Jenkins pipeline for, 255single VLAN on switch with
specific hostname, 133–134two VLANs on switch with
specific hostname, 134–136VMs (virtual machines), with
Terraformapplication of changes, 28–29overview of, 24–25Terraform initialization, 26.tf configuration file, 25verification of applied changes,
29–31verification of changes to be
applied, 26–27configuration drift, 5, 107–109container nodes, in YANG, 63containers, 181–183
applications, creating in specific namespaces, 182–183
creating, 181–183continuous integration/continuous
deployment (CI/CD), 208–210benefits of, 208–210GitLab CI/CD, 224–226pipelines, 214–228
case study, 233–234definition of, 210Git, 215–224GitLab CI/CD, 224–226Jenkins, 226–228, 230–232
conversion, XML-to-JSON, 51–52copy module, 158copy-config operation, NETCONF, 73CPU utilization of routers, data
visualization of, 101–102culture, automation strategies and,
257–258“culture of fear”, 258curl command, 21, 69
Z02_Ivo_Index_p279-300.indd 284 27/09/21 8:58 PM
data gathering 285
D\D characters, 88\d characters, 88dashboards
Cisco Tetration, 82–83Grafana, 35Kibana, 34–35Splunk, 37
data center topology, 19–20data collection, task-based
automation use cases for, 12–13data encoding, YANG, 63–66data enforcement, YAML, 47data formats and models. See also
data gathering; data insights; data preparation; data visualization
cloud flows, 60–61definition of, 44importance of, 43–44IPFIX, 60JSON, 53–57
Ansible Inventory schema, 56–57
data encoding for YANG, 64–66data types, 55XML-to-JSON conversion,
53–55NetFlow, 59–60
architecture, 59components, 59versions of, 59
overview of, 43Syslog, 57–59
message syntax, 57–58severities, 58
XML, 48–53data encoding for YANG, 63–66document example, 48document type definitions
(DTDs), 51–52elements, 49interface attributes, 50name collisions, 50namespaces, 50–51, 168schemas, 51–52
XML-to-JSON conversion, 51–52
XPath, 52–53XQuery, 52–53
YAML, 44–48comments, 46–47data enforcement, 47data types, 46file example, 45flow-style data, 46
YANG, 61–66data encoding for, 63–66modules, 62–63node types, 63
data gathering. See also data insights; data preparation; data visualization
APIs (application programming interfaces), 66–72API integrations, 71curl command, 69HTTP methods, 67–68HTTP status codes, 68interface information,
retrieving, 70–71Postman, 69–70REST (Representational State
Transfer), 66log exporters, 81–83NETCONF, 72–77
candidate datastores, 72–73definition of, 72interaction with, 74–77interface configuration, 76–77interface filter, 75model-driven protocol stack, 80operations, 73RPC reply, 75–76
overview of, 66RESTCONF, 77–80
interface configurations, modifying, 79
interface information, retrieving, 78–79
model-driven protocol stack, 80URI elements, 77–78
telemetry, 80–81
Z02_Ivo_Index_p279-300.indd 285 27/09/21 8:58 PM
286 data insights
data insights, 104–112. See also data visualization
alarms, 105–107artificial intelligence (AI), 110–112configuration drift, 107–109machine learning (ML), 110–112overview of, 104–105
data preparation, 87–100aggregation, 98–100case studies
machine learning model with raw data, 112–113
mean time to repair (MTTR) reduction, 113–114
network migrations at electricity provider, 115–116
labeled data, 110overview of, 87–88parsing, 88–98
with Ansible, 90–98identifying IPv4 addresses
with, 89regular expressions in, 88–89splitting into parts, 88tokenizing, 88type formatting, 88
raw data, 112–113data strategies, 248–249data types
in JSON (JavaScript Object Notation), 55
in YAML, 46data visualization, 100–104
automation of, 104bar charts, 102–103case studies
machine learning model with raw data, 112–113
mean time to repair (MTTR) reduction, 113–114
network migrations at electricity provider, 115–116
color in, 104CPU utilization of routers, 101–102line charts, 102–103
metric scales for, 102stat panels/gauges, 102–104tools for, 100–101
databases, InfluxDB, 106–107data-driven automation
definition of, 3–4overview of, 2pull model sensor architecture, 3–4push model sensor architecture, 3use cases, 4–10
compliance checking, 6–7device monitoring, 5–6optimization, 7–8predictive maintenance, 8–9troubleshooting, 8–10
datastores, NETCONF, 72–73debug keyword, 170declarative approach, 207–208declarative pipelines, 227defaults directory (Ansible), 149defined variables, 129–130defining a threshold, 105delegate_to keyword, 159DELETE method, 67delete-config operation, NETCONF,
73dependencies, resource, 15deploy phase (NetDevOps), 200deployment
continuous, 208–210benefits of, 208–210GitLab CI/CD, 224–226pipelines. See pipelines
subnetsin cloud, 211–212on legacy network, 212–213
VMs (virtual machines)with Ansible, 178–179, 207imperative versus declarative
approach to, 207–208snapshots and VMotion,
180–181with Terraform, 208vmware_guest state choices,
179–180
Z02_Ivo_Index_p279-300.indd 286 27/09/21 8:58 PM

dollar sign ($) 287
description command, 164device facts, parsing with Ansible,
90–91device monitoring, data-driven
automation use cases for, 5–6devices, interacting with, 160–173
getting network devices from DNAC, 187
interfaces, netconf_rpc Ansible module, 168–169
NETCONF, 165–169interface configuration,
167–168netconf_config Ansible module,
167–168netconf_get Ansible module,
165–166netconf_rpc Ansible module,
168–169running configuration,
retrieving, 166–167running configuration, saving,
168–169RESTCONF, 169–173
configuration, retrieving, 169–171
device configuration, 171–173restconf_config module,
171–173restconf_get module, 169–170
SSH (Secure Shell Protocol), 160–165host facts, printing, 160–162IOS interface configuration,
164–165NTP status, printing, 163–164output of show command,
capturing, 162–163DevOps, network. See NetDevOps
(network DevOps)dial-in telemetry, 80dial-out telemetry, 80dictionary data type, 46directories, Ansible role, 149disaster recovery
end-to-end automation use cases for, 20
European bank case study, 194–195testing, 21
disk space, verifying and freeing, 177–178
disks, GCP, 185distributed source control, 204–205DNA Center (DNAC), 9–10, 22–23,
107, 187docker_container module, 181Dockerfile, retrieving, 182document type definitions (DTDs),
51–52documents, automation strategy,
248–250action plans for, 268–270assessment, 244, 252–257
enterprise automation levels, 254–257
questions to ask, 252–253stages of, 252Technology Maturity Level
Chart, 254benefits of, 250–251case study, 264–268culture and skills, 257–258data strategies, 248–249drafting, 243, 261–262financial strategies, 250Gantt chart of tasks, 270goals, 243, 258–259how to use, 268–270importance of, 250–251key performance indicators (KPIs),
245–247common pitfalls with, 245–246creating, 246–247, 260–261definition of, 245high-level, 245low-level, 245objectives-linked, 260–261
objectives, 243, 259–261pillars of, 242proof of concept (PoC), 268summary of, 250tactics, 243, 262–264
dollar sign ($), 89
Z02_Ivo_Index_p279-300.indd 287 27/09/21 8:58 PM
288 drafting automation strategies
drafting automation strategies, 243, 261–262
drift, configuration, 5, 107–109DTDs (document type definitions),
51–52
Eec2 module, 207EC2 VM (virtual machine), creating,
184echo command, 226edit-conf operation, NETCONF, 73Elasticsearch, 34electricity provider, network
migrations at, 115–116elements, XML (Extensible Markup
Language), 49ELK stack, 34end-to-end automation
definition of, 16–17use cases, 17–22
end-to-end pipelines, 234enforcement (data), with YAML, 47enterprise automation levels, 254–257environment, NetDevOps, 226–228/etc/ansible/hosts, 122event-driven functions, 23–24executing Ansible playbooks, 143–149
ad hoc commands, 144ansible-playbook command, 143–144asynchronous tasks, 147–149nonblocking tasks, 147–148run_once task, 146serial execution of tasks, 145–146
explicit namespaces, 51exporters, log, 81–83Extensible Markup Language.
See XML (Extensible Markup Language)
Ffear, culture of, 258features, 9
files, 24adding to Git repositories, 217–218changes to
making in Git branches, 221–222pushing to remote repositories,
223–224rolling back, 219–220verifying, 218–219
creating with Terraform, 25Dockerfile, retrieving, 182reading, 155–157
local files, 156lookup plug-in, 156remote files, 157
writing, 158–160XML document example, 48YAML file example, 45
files directory (Ansible), 149filters, NETCONF, 75financial strategies, 250firewalls
data-driven automation in, 3interacting with. See network
devices, interacting withflow collectors, 59flow exporters, 59flows, cloud, 60–61flow-style data, 46folder structure, assigning Ansible
variables with, 126–127folders, Ansible role, 149–150formats, data. See data formats and
modelsFortune 500, new technology training
in, 234–235forwarders, Splunk, 36–37freeing disk space, 177–178FTD module, 187functional testing, 21functions, cloud event-driven, 23–24
GGalaxy role, 149–150Gantt chart of tasks, 270
Z02_Ivo_Index_p279-300.indd 288 27/09/21 8:58 PM
HTTP (Hypertext Transfer Protocol) 289
gather_facts, 159gathering data. See data gatheringgauges, 102–104GCP (Google Cloud Platform), 15
automation tasks with Ansible, 183–186EC2 VM, creating, 184GCP disks, creating, 185resource provisioning, 15,
185–186subnet deployment, 211–212website content, crawling,
188–189cloud event-driven functions, 23–24cloud flows, 60–61
GCP disks, creating, 185GET method, 67get operation, NETCONF, 73get-conf operation, NETCONF, 73Git, 215–224
branchesmaking changes in, 221–222merging, 222–223
configuration, 215file changes
making in Git branches, 221–222pushing to remote repositories,
223–224rolling back, 219–220verifying, 218–219
repositoriesadding files to, 217–218directory structure of, 229initialization of, 215–216remote, 223–224
git add command, 217, 219, 221git branch command, 221git checkout command, 219–220git clone command, 224git commit command, 217, 218, 219,
221git config command, 215git init command, 215git log command, 217, 218, 219, 221,
222git merge command, 222
git pull command, 223git push command, 223git remote add command, 223git show command, 217GitHub, 189GitLab CI/CD, 224–226goals, automation strategy, 243,
258–259Google Cloud Function, 23Google Cloud Platform. See GCP
(Google Cloud Platform)Google RPC (gRPC), 80Grafana, 35–36, 100–102, 107group_vars, 126groupings, Ansible inventory with,
123gRPC (Google RPC), 80
Hhandlers, Ansible, 140–143
handlers directory, 149multiple, 142–143playbook execution with, 140–141
heavy forwarder, Splunk, 37hello operation, 73heterogenous installed base, QoS
(quality of service) across, 193–194
high availability, 195high-level key performance indicators
(KPIs), 245host_vars, 126hosts
Ansiblegrouped, 123ungrouped, 123
printing facts about, 160–162HTTP (Hypertext Transfer Protocol)
httpd installation, 174–177with command module, 174–176disk space, verifying and
freeing, 177–178independently of operating
system, 176–177
Z02_Ivo_Index_p279-300.indd 289 27/09/21 8:58 PM
290 HTTP (Hypertext Transfer Protocol)
VM deployment with, 178–179VM snapshots and VMotion,
180–181vmware_guest state choices,
179–180with yum module, 174
methods, 67–68, 171status codes, 68
httpapi connection type, 170httpd, installing with Ansible, 174–177
with command module, 174–176disk space verification, 177–178disk space, verifying and freeing,
177–178independently of operating system,
176–177VM deployment with, 178–179VM snapshots and VMotion, 180–181vmware_guest state choices, 179–180with yum module, 174
IIaC (infrastructure as code), 24,
205–208. See also Ansible; Terraform
definition of, 205goals of, 206idempotence, 120, 206immutability, 206–207imperative versus declarative
approach to, 207–208idempotence, 120, 206IETF (Internet Engineering Task
Force), 60ietf-interface, 62
JSON representation of, 64–66XML representation of, 64
immutability, 206–207imperative approach, 207–208implicit definitions, in Ansible
inventory, 124–125implicit namespaces, 51indexer, Splunk, 37
InfluxDB, 36, 106–107infrastructure as code. See IaC
(infrastructure as code)initialization
Git repositories, 215–216Terraform, 26
insights, data, 104–112. See also data gathering; data preparation; data visualization
alarms, 105–107artificial intelligence (AI), 110–112configuration drift, 107–109machine learning (ML), 110–112overview of, 104–105
installationAnsible, 120–122httpd
with command module, 174–176disk space verification, 177–178disk space, verifying and
freeing, 177–178independently of operating
system, 176–177VM deployment with, 178–179VM snapshots and VMotion,
180–181vmware_guest state choices,
179–180with yum module, 174
integration, continuous, 208–210benefits of, 208–210GitLab CI/CD, 224–226pipelines, 214–228
case study, 233–234definition of, 210Git, 215–224GitLab CI/CD, 224–226Jenkins, 226–228, 230–232
integrations, API, 71interaction
with Ansible, 32with cloud event-driven functions,
23–24task-based automation use cases
for, 12
Z02_Ivo_Index_p279-300.indd 290 27/09/21 8:58 PM
languages 291
interface attributes, XML (Extensible Markup Language) document with, 50
interfacesconfiguration
with NETCONF, 76–77, 167–168
with RESTCONF, 79listing available, 93names, parsing with Ansible, 91–92retrieving information about, 70–71,
78–79Ansible with RESTCONF,
94–96Ansible with SSH and regex,
96–98Internet Protocol Flow Information
Export (IPFIX), 60, 113inventory, Ansible, 122–125
with groupings, 123implicit definitions, 124–125with ungrouped hosts, 123with variable assignments, 122verifying, 124
inventory command, 125ios_command module, 162ios_config module, 164ios_interface module, 164–165IPFIX (Internet Protocol Flow
Information Export), 60, 113IPv4 addresses, identifying, 89item keyword, 136iteration. See loops
JJavaScript Object Notation. See JSON
(JavaScript Object Notation)Jenkins, 189, 226–228, 255JSON (JavaScript Object Notation),
53–57Ansible Inventory schema, 56–57data encoding for YANG, 64–66data types, 55XML-to-JSON conversion, 53–55
Kkey performance indicators (KPIs),
245–247common pitfalls with, 245–246creating, 246–247, 260–261definition of, 245high-level, 245low-level, 245objectives-linked, 260–261
keys, TACACS+, 31–32, 190–192Kibana, 34–35, 100–101, 107kill-session operation, NETCONF, 73KPIs. See key performance indicators
(KPIs)Kubernetes, 182, 183
Llabeled data, 110languages
Python, 38–39interface configuration with
NETCONF, 77machine learning (ML) with,
111, 112sklearn, 112
XML (Extensible Markup Language), 48–53data encoding for YANG, 63–66document example, 48document type definitions
(DTDs), 51–52elements, 49interface attributes, 50name collisions, 50namespaces, 50–51, 168schemas, 51–52XML-to-JSON conversion,
51–52XPath, 52–53XQuery, 52–53
YANG, 61–66data encoding for, 63–66
Z02_Ivo_Index_p279-300.indd 291 27/09/21 8:58 PM
292 languages
modules, 62–63node types, 63
LANs (local area networks), virtual. See VLANs (virtual LANs)
Layer 3 VPN topology, 17leaf list nodes, YANG, 63leaf nodes, YANG, 63legacy networks, subnet deployment
with Ansible, 212–213levels, enterprise automation, 254–257line charts, 102–103list data type, YAML, 46list nodes, YANG, 63load prediction, 9local files, reading, 156local source control, 203lock operation, in NETCONF, 73log data processing, 34, 98–100log exporters, 81–83Logstash, 34lookup functions, 188lookup plug-in, 156loop keyword, 136loops, 136–139low-level key performance indicators
(KPIs), 245
Mmachine learning (ML)
data insights from, 110–112DNA Center, 22–23machine learning model with raw data,
112–113macOS, Ansible installation on, 121maintenance, predictive, 7–8mean time to repair (MTTR), 113–114measurement, automation strategies
for, 251merging Git branches, 222–223messages, Syslog, 57–58meta characters, 89meta directory (Ansible), 149methods, 171
DELETE, 67
GET, 67PATCH, 67–68POST, 67PUT, 67–68
metric scales, 102Microsoft Azure, 184migrations
network migrations at electricity provider, 115–116
overview of, 32ML. See machine learning (ML)model-driven data-gathering
techniquesNETCONF, 72–77
candidate datastores, 72–73definition of, 72interaction with, 74–77interface configuration, 76–77interface filter, 75model-driven protocol stack, 80operations, 73RPC reply, 75–76
RESTCONF, 77–80interface configurations,
modifying, 79interface information,
retrieving, 78–79model-driven protocol stack, 80URI elements, 77–78
telemetry, 80–81models, data. See data formats and
modelsmodels, machine learning
data insights from, 110–112machine learning model with raw
data, 112–113modules
Ansible, 120, 174command, 174–176copy, 158docker_container, 181ios_config, 164ios_interface, 164–165lookup plug-in, 156netconf_config, 167–168
Z02_Ivo_Index_p279-300.indd 292 05/10/21 6:15 PM
NetDevOps (network DevOps) 293
netconf_get, 165–166netconf_rpc, 168–169restconf_config, 171–173restconf_get, 169–170slurp, 156–157uri, 187, 188–189vmware_guest, 179–180yum, 174
Cisco FTD, 187ec2, 207YANG, 62–66
monitoringdata-driven automation use cases for,
5–6with DNA Center, 22–23with Grafana, 35–36with Kibana, 34with Splunk, 36–37
Monitron, 111Moogsoft, 111MTTR (mean time to repair),
113–114multiple handlers, 142–143mutable infrastructure, 206–207
Nname collisions, XML (Extensible
Markup Language) document with, 50
namesinterface, parsing with Ansible,
91–92of neighbor devices, 12–13
namespaces, 168creating applications in, 182–183XML (Extensible Markup Language)
document with, 50–51neighbor devices, learning names of,
12–13NETCONF, 72–77, 165–169
candidate datastores, 72–73definition of, 72interaction with, 74–77
interface configuration, 76–77, 167–168
interface filter, 75model-driven protocol stack, 80netconf_config Ansible module,
167–168netconf_get Ansible module,
165–166netconf_rpc Ansible module,
168–169operations, 73RPC reply, 75–76running configuration
retrieving, 166–167saving, 168–169
netconf_config Ansible module, 167–168
netconf_get Ansible module, 165–166netconf_rpc Ansible module, 168–169NetDevOps (network DevOps)
benefits of, 200–202, 210–211case studies, 233–237
new service implementations in tier 1 service provider, 236–237
new technology trainings at Fortune 500 company, 234–235
pipelines in large bank, 233–234
CI/CD (continuous integration/continuous deployment), 208–210benefits of, 208–210GitLab CI/CD, 224–226pipelines, 210, 227–228,
230–232, 233–234tools for, 214–228
definition of, 199–202environment, requirements for,
228–229IaC (infrastructure as code), 205–208
definition of, 205goals of, 206idempotence, 206
Z02_Ivo_Index_p279-300.indd 293 27/09/21 8:58 PM
294 NetDevOps (network DevOps)
immutability, 206–207imperative versus declarative
approach to, 207–208operations, 232–233overview of, 199phases of, 199–202source control, 202–205
centralized, 203–204distributed, 204–205local, 203
stages of, 230–232testing with, 232–233tools, 214–228
Git, 215–224GitLab CI/CD, 224–226Jenkins, 226–228
when to use, 211–214NetFlow, 3, 5, 59–60
architecture, 59components, 59versions of, 59
Netmiko, 38network automation strategies. See
automation strategiesnetwork devices, interacting with,
160–173DNA Center, getting network devices
from, 187NETCONF, 165–169
interface configuration, 167–168netconf_config Ansible module,
167–168netconf_get Ansible module,
165–166netconf_rpc Ansible module,
168–169running configuration,
retrieving, 166–167running configuration, saving,
168–169RESTCONF, 169–173
configuration, retrieving, 169–171
device configuration, 171–173restconf_config module,
171–173
restconf_get module, 169–170SSH (Secure Shell Protocol), 160–165
host facts, printing, 160–162IOS interface configuration,
164–165NTP status, printing, 163–164output of show command,
capturing, 162–163network DevOps. See NetDevOps
(network DevOps)network migrations at electricity
provider, 115–116network service abstraction, 237new service implementations, 236–237Nginx containers, 181–182nodes
Chef, 33YANG, 63
nonblocking tasks, 147–148NTP status, printing, 163–164null types, in JSON (JavaScript Object
Notation), 55number types, in JSON (JavaScript
Object Notation), 55NX-OS, updating TACACS key for,
190–192
Oobject types, in JSON (JavaScript
Object Notation), 55objectives, automation strategy, 243,
259–261Openpyxl, 38OpenStack, 15, 181operating models, automation
strategies and, 242operations
NETCONF, 73NetDevOps, 232–233
optimizationdata-driven automation use cases for,
7–8with DNA Center, 22–23
Z02_Ivo_Index_p279-300.indd 294 27/09/21 8:58 PM
QoS (quality of service) 295
organizational culture, automation strategies and, 258
outliers, DNA Center, 23
PParamiko, 38parent XML elements, 49parsing data, 88–98
with Ansible, 90–98device facts, 90–91listing available interfaces, 93parsing and altering interface
names, 91–92recording times of data
collection, 93regular expressions and, 96–98RESTCONF and, 94–96SSH (Secure Shell Protocol)
and, 96–98identifying IPv4 addresses with, 89regular expressions in, 88–89splitting into parts, 88tokenizing, 88type formatting, 88
PATCH method, 67–68performance testing, 21period (.), 89phases, NetDevOps (network DevOps),
199–202ping command, 21, 236pip, 121pipe character (|), 89pipelines, 233–234
definition of, 210in GitLab CI/CD, 225–226in Jenkins, 227–228, 230–232
plan phase (NetDevOps), 200playbooks, Ansible, 231. See also
Ansibleexample of, 132executing, 143–149
ad hoc commands, 144ansible-playbook command,
143–144
asynchronous tasks, 147–149nonblocking tasks, 147–148run_once task, 146serial execution of tasks,
145–146overview of, 131–133running for specific group of hosts,
132–133structure of, 131–132
plus sign (+), 89PoC (proof of concept), 268POST method, 67PostgreSQL, 36Postman, 69–70pound sign (#), 46–47poweredoff state, 180poweredon state, 180predictive maintenance, data-driven
automation use cases for, 7–8preparing data. See data preparationpresent state, 180proof of concept (PoC), 268providers, 24provisioning
with Ansible, 32, 185–186with cloud event-driven functions,
23–24with DNA Center, 22–23task-based automation use cases for,
14–15with Terraform, 24–31
pull model sensor architecture, 3–4push model sensor architecture, 3PUT method, 67–68Pyautogui, 38Python, 38–39
interface configuration with NETCONF, 77
machine learning (ML) with, 111, 112sklearn, 112
QQoS (quality of service)
Z02_Ivo_Index_p279-300.indd 295 27/09/21 8:58 PM
296 QoS (quality of service)
across heterogenous installed base, 193–194
disaster recovery at European bank, 194–195
queries, XQuery, 52–53questionnaires, assessment, 252–253
Rraw data, machine learning model
with, 112–113reading files, 155–157
local files, 156lookup plug-in, 156remote files, 157
rebootguest state, 180recipes, Chef, 33Red Hat OpenShift, 31Red Hat Virtualization (RHV), 181RedHat Ansible Tower, 106regex. See regular expressions (regex)register keyword, 170registered variables, 129regular expressions (regex)
meta characters, 89parsing data with, 88–89retrieving interface descriptions with,
96–98special characters, 88
Rekognition, 111release phase (NetDevOps), 200remote files, reading, 157remote repositories, Git, 223–224reporting
with Splunk, 37task-based automation use cases for,
15–16repositories, Git
adding files to, 217–218directory structure of, 229initialization of, 215–216remote, 223–224
resourcesdependencies, 15provisioning on AWS, 185–186
REST (Representational State Transfer) APIs, 66
restarted state, 180RESTCONF, 77–80, 169–173
configuration, retrieving, 169–171device configuration, 171–173interface configurations, modifying,
79interface information, retrieving,
78–79, 94–96model-driven protocol stack, 80restconf_config module, 171–173restconf_get module, 169–170URI elements, 77–78
restconf_config module, 171–173restconf_get module, 169–170RFCs (requests for comments)
RFC 3954, 60RFC 5101, 60RFC 5424, 58
RHV (Red Hat Virtualization), 181roadmaps, automation strategies and,
242roles, Ansible, 149–152
default folder structure, 149–150Galaxy, 149–150role directories, 149VLAN creation with, 150–152
rolling back file changes, 219–220root hierarchy (XML), 49rotations per minute (RPMs), for
router fans, 8–9routers
interacting with. See network devices, interacting with
router fans, rotations per minute for, 8–9
RPC reply, 75–76Ruby, 33run_once task, 146running configuration
retrieving, 166–167saving, 168–169
running datastore, NETCONF, 73
Z02_Ivo_Index_p279-300.indd 296 27/09/21 8:58 PM
switches 297
S\S characters, 89\s characters, 89scalar data types, in YAML, 46scales, metric, 102schemas
Ansible Inventory JSON schema, 56–57
XML (Extensible Markup Language) document with, 51–52
YAML, 47scripted pipelines, 227, 230–232SD-WAN (software-defined wide
area networking), data-driven automation in, 7–8
Secure Shell Protocol (SSH), 5, 18Selenium, 38servers, 174–181
automation tasks with Ansible, 174–181
Chef, 33CI/CD, 210
ServiceNow, 189services, new implementations
in tier 1 service provider, 236–237
severities, Syslog, 58show commands, 10
capturing output of, 162–163show cdp neighbors, 12–13show interfaces, 71show ip int brief, 38in typical configuration workflow, 14
shutdownguest state, 180sibling elements (XML), 49Simple Network Management
Protocol (SNMP), 3, 5simplification, automation strategies
for, 251skills, automation strategies and, 242,
257–258sklearn module, 112Slack, 189
slurp module, 156–157snapshots, 180–181SNMP (Simple Network Management
Protocol), 3, 5SolarWinds, 107source control, 202–205
centralized, 203–204distributed, 204–205local, 203
special characters, in regular expressions, 88
speed command, 164splitting data into parts, 88Splunk, 36–37, 100–101, 107, 189square brackets ([ ]), 89SSH (Secure Shell Protocol), 5, 18,
160–165host facts, printing, 160–162IOS interface configuration, 164–165NTP status, printing, 163–164output of show command, capturing,
162–163retrieving interface descriptions with,
96–98startup datastore, NETCONF, 73stat panels, 102–104state choices, vmware_guest, 179–180stateless frameworks, 67status codes, HTTP (Hypertext
Transfer Protocol), 68stdout, 164, 175stdout variable, 163–164steps keyword, 228strategies, automation. See
automation strategiesstring type, in JSON (JavaScript
Object Notation), 55subnet deployment
with Ansiblein cloud, 211–212on legacy network, 212–213
variable files for, 213supervised algorithms, 110suspended state, 180switches
Z02_Ivo_Index_p279-300.indd 297 27/09/21 8:58 PM
298 switches
identifying configuration differences in, 107–109
interacting with. See network devices, interacting with
Syslog, 3, 57–59message syntax, 57–58severities, 58
TTACACS+ keys
configuration with Ansible, 31–32updating, 190–192
tactics, automation strategy, 243, 262–264
task pipelines, 234task-based automation
definition of, 11use cases, 12–16
configuration, 13–14data collection, 12–13interaction, 12provisioning, 14–15reporting, 15–16
tasksasynchronous, 147–149Gantt chart of, 270nonblocking, 147–148run_once, 146serial execution of, 145–146
tasks directory (Ansible), 149technology adoption, automation
strategies and, 242Technology Maturity Level Chart,
254technology training at Fortune 500
company, 234–235Telegraf, 106–107telemetry, 80–81templates directory (Ansible), 149template-ubuntu, 178Terraform, 24–31
application of changes, 28–29overview of, 24–25.tf configuration file, 25, 26
verification of applied changes, 29–31
verification of changes to be applied, 26–27
VM deployment with, 208test phase (NetDevOps), 200testing
disaster recovery, 21functional, 21with NetDevOps (network DevOps),
232–233performance, 21security, 21
tests directory (Ansible), 149Tetration, 82–83, 100–101.tf files, 24, 25threshold, defining, 105tier 1 service providers, new service
implementations in, 236–237tokenizing, 88tools. See individual toolstraceability, source control and, 203traceroute command, 10, 21trainings, new technology, 234–235traps (SNMP), 3tree command, 127troubleshooting
data-driven automation use cases for, 8–10
with DNA Center, 22–23type formatting, 88
Uungrouped hosts, Ansible inventory
with, 123universal forwarder, Splunk, 37unlock operation, NETCONF, 73unsupervised algorithms, 110until keyword, 139updating TACACS+ keys, 190–192URI elements, RESTCONF, 77–78uri module, 187, 188–189use cases
data-driven automation, 4–10
Z02_Ivo_Index_p279-300.indd 298 27/09/21 8:58 PM
VMs (virtual machines) 299
compliance checking, 6–7device monitoring, 5–6optimization, 7–8predictive maintenance, 8–9troubleshooting, 8–10
end-to-end automation, 17–22overview of, 1, 4–10task-based automation, 12–16
configuration, 13–14data collection, 12–13interaction, 12provisioning, 14–15reporting, 15–16
VVagrant, 181validate operation, NETCONF, 73var_files keyword, 128variable assignments, Ansible
inventory with, 122variable files
assigning Ansible variables with, 128for subnets, 213
variables, Ansible, 126–131Ansible Vaults, 130–131assigning with folder structure,
126–127assigning with variable files, 128defined, 129–130registered, 129
vars directory (Ansible), 149Vaults, Ansible, 130–131verifying
Ansible inventory, 124Ansible version, 121disk space, 177–178file changes, 218–219
version history, source control and, 203
virtualization. See containers; VMs (virtual machines)
visualization, data, 100–104automation of, 104bar charts, 102–103
case studiesmachine learning model with
raw data, 112–113mean time to repair (MTTR)
reduction, 113–114network migrations at
electricity provider, 115–116color in, 104CPU utilization of routers, 101–102line charts, 102–103metric scales for, 102stat panels/gauges, 102–104tools for, 100–101
VLANs (virtual LANs)configuring, 254–256
with abstracted input, 256with Ansible, 255Jenkins pipeline for, 255with Python, 38–39single VLAN on switch
with specific hostname, 133–134
two VLANs on switch with specific hostname, 134–136
creating, 150–152VMotion, 180–181VMs (virtual machines), 174–181
automation tasks with Ansible, 174–181
creating with Ansible, 184creating with Terraform
application of changes, 28–29overview of, 24–25Terraform initialization, 26.tf configuration file, 25verification of applied changes,
29–31verification of changes to be
applied, 26–27deployment
with Ansible, 178–179, 207imperative versus declarative
approach to, 207–208snapshots and VMotion,
180–181
Z02_Ivo_Index_p279-300.indd 299 27/09/21 8:58 PM
300 VMs (virtual machines)
with Terraform, 208vmware_guest state choices,
179–180VMware vCloud suite, 15vmware_guest module, 179–180vmware_guest state choices, 179–180VPNs (virtual private networks), 17
W\W characters, 89\w characters, 88webhooks, 106–107website content, crawling, 188–189workstations, Chef, 33writing files, 158–160
XXenServer, 181XML (Extensible Markup Language),
48–53data encoding for YANG, 63–66document example, 48document type definitions (DTDs),
51–52elements, 49
interface attributes, 50name collisions, 50namespaces, 50–51, 168schemas, 51–52XML-to-JSON conversion, 51–52XPath, 52–53, 94XQuery, 52–53, 94
xmlns value, 168XPath, 52–53, 94XQuery, 52–53, 94
Y-ZYamale, 47YAML, 31, 44–48
comments, 46–47data enforcement, 47data types, 46file example, 45flow-style data, 46
YANG, 61–66data encoding for, 63–66modules, 62–66node types, 63
Yet Another Markup Language. See YAML
yum, 121, 174
Z02_Ivo_Index_p279-300.indd 300 27/09/21 8:58 PM


