Embed Size (px)
Citation preview
S-281
Th e lower South Platte River basin of Colorado and Nebraska is an area of intense agriculture supported by surface-water diversions from the river and ground-water pumping from a valley-fi ll alluvial aquifer. Two well networks consisting of 45 wells installed in the South Platte alluvial aquifer were sampled in the early 1990s and again in the early 2000s to examine near-decadal ground-water quality changes in irrigated agricultural areas. Ground-water age generally increases and dissolved-oxygen content decreases with distance along fl ow paths and with depth below the water table, and denitrifi cation is an important natural mitigation mechanism for nitrate in downgradient areas. Ground-water travel time from upland areas to the river ranges from 12 to 31 yr on the basis of apparent ground-water ages. Ground-water nitrate concentrations for agricultural land-use wells increased signifi cantly for oxidized samples over the decade, and nitrogen isotope ratios for oxidized samples indicate synthetic fertilizer as the predominant nitrate source. Ground-water concentrations of atrazine, DEA, and prometon decreased signifi cantly. Th e decrease in pesticide concentrations and a signifi cant increase in the ratio of DEA to atrazine suggest decreases in pesticide concentrations are likely caused by local decreases in application rates and/or degradation processes and that atrazine degradation is promoted by oxidizing conditions. Th e diff erence between results for oxidizing and nitrate-reducing conditions indicates redox state is an important variable to consider when evaluating ground-water quality trends for redox-sensitive constituents such as nitrate and pesticides in the South Platte alluvial aquifer.
Near-Decadal Changes in Nitrate and Pesticide Concentrations in the South Platte River
Alluvial Aquifer, 1993–2004
Suzanne S. Paschke,* Keelin R. Schaff rath, and Shana L. Mashburn USGS
Nitrate and pesticides are frequently detected in ground
water beneath irrigated agricultural areas where chemical
and manure fertilizers and pesticides are applied to promote
crop production. Th e lower South Platte River valley of eastern
Colorado and western Nebraska is an important agricultural
area of the United States encompassing approximately 3640 km2
of irrigated agriculture (Bruce and McMahon, 1998). Water
for irrigated agriculture along the lower South Platte River is
provided by numerous ditches and diversions that route surface
water from the river to agricultural areas and by irrigation wells
pumping from an extensive and productive unconfi ned alluvial
aquifer along the present-day and prehistoric channels of the
South Platte River (Bjorklund and Brown, 1957; Smith et al.,
1964). Th e South Platte alluvial aquifer is vulnerable to the
eff ects of agricultural practices (Rupert, 2003; Caplacha et al.,
2004) because of its general lack of surfi cial confi ning layers,
shallow water table, and high hydraulic conductivity on the
order of 100 m per day in some areas (Andy Moore, Colorado
Water Conservation Board, unpublished data, 2006). Earlier
studies noted the presence of nitrate (nitrite plus nitrate as
nitrogen, NO2+NO
3–N) and pesticides in ground water of the
South Platte alluvial aquifer (Dennehy et al., 1995; McMahon
and Böhlke, 1996; Bruce and McMahon, 1998). No previous
studies, however, examined the long-term temporal trends of
nitrate and pesticides in the South Platte alluvial aquifer. Th is
paper examines changes in nitrate and pesticide concentrations
observed in the South Platte alluvial aquifer from 1993 to 2004.
BackgroundChemical and animal manure fertilizers associated with agri-
culture are the primary sources of nitrogen input to the environ-
ment (Puckett, 1994). Nitrate is a noted chemical contaminant
in aquifers nationwide (Spalding and Exner, 1993), and ground
water in agricultural areas is more likely aff ected by nitrate than
ground water in urban, forest, or rangeland areas (Mueller et al.,
1995). Nitrate concentrations greater than 2 mg L−1 are gener-
ally considered aff ected by an anthropogenic source (Mueller and
Helsel, 1996), and the U.S. Environmental Protection Agency
Abbreviations: USGS, U.S. Geological Survey; NAWQA, National Water-Quality
Assessment Program; DEA, desethylatrazine, also known as 2-chloro-4-
isopropylamino-6-amino-s-triazine or CIAT; δ15N, 15N/14N ratio in nitrate; CFC,
chlorofl uorocarbon, USEPA, U.S. Environmental Protection Agency; MCL, maximum
contaminant level; NASS, National Agricultural Statistics Service.
U.S. Geological Survey, Colorado Water Science Center, Denver Federal Center, P.O. Box
25046 MS 415, Lakewood, CO 80225.
Copyright © 2008 by the American Society of Agronomy, Crop Science
Society of America, and Soil Science Society of America. All rights
reserved. No part of this periodical may be reproduced or transmitted
in any form or by any means, electronic or mechanical, including pho-
tocopying, recording, or any information storage and retrieval system,
without permission in writing from the publisher.
Published in J. Environ. Qual. 37:S-281–S-295 (2008).
doi:10.2134/jeq2007.0656
Received 18 Dec. 2007.
*Corresponding author ([email protected]).
© ASA, CSSA, SSSA
677 S. Segoe Rd., Madison, WI 53711 USA
SPECIAL SUBMISSIONS
S-282 Journal of Environmental Quality • Volume 37 • September–October [Supplement] 2008
(USEPA) has established a Maximum Contaminant Level
(MCL) of 10 mg L−1 for nitrate (USEPA, 1994).
Th e widespread use of pesticides over the past several de-
cades has led to their frequent detection in the environment
including ground water (Barbash and Resek, 1996; Barbash
et al., 1999). Nationwide, the herbicides atrazine and its
degradate desethylatrazine (DEA, also known as 2-chloro-4-
isopropylamino-6-amino-s-triazine or CIAT), metolachlor,
prometon, and simazine were the most frequently detected
pesticides in shallow ground water, and these most frequently
detected herbicides were most often associated with agricul-
tural or urban land use (Gilliom et al., 2006).
Th e occurrence of nitrate and pesticides in ground water of
the South Platte River basin was initially documented by Schuff
(1992) and Dennehy et al. (1995). Schuff (1992) related fertil-
izer application to nitrate concentrations and observed pesticide
detections in Weld County, Colorado. Dennehy et al. (1995)
compiled data from 1980 through 1992 and found nitrate con-
centrations above the 10 mg L−1 MCL for 46 of 107 ground-
water wells and 2 of 54 surface-water sites. Dennehy et al.
(1995) also reported that pesticide detections in ground water
and surface water were associated with agricultural land use.
Th e South Platte River basin was one of the 51 study units
selected for surface-water and ground-water quality studies in
1991 as part of the U.S. Geological Survey National Water-
Quality Assessment (NAWQA) Program (see more detailed
description of the NAWQA program in Rosen et al., 2008).
Two NAWQA ground-water studies were implemented in the
South Platte River Basin to evaluate alluvial-aquifer ground-
water quality– an agricultural land-use study and a fl ow-path
study. A 30-well agricultural land-use network installed in the
South Platte alluvial aquifer between Brighton, CO and North
Platte, NE (Fig. 1) was sampled in 1994 to monitor ground-
water quality in areas dominated by a single crop type (irrigated
corn) and a single hydrogeologic setting (unconfi ned alluvial
aquifer) at a regional scale (Bruce and McMahon, 1998). Ni-
trate was detected in most of the agricultural land-use wells and
concentrations exceeded the 10 mg L−1 MCL in 14 of the 30
wells (Bruce and McMahon, 1998). Pesticides were detected in
29 of the 30 sampled wells, and the most frequently detected
pesticides were atrazine, atrazine degradate DEA, prometon,
metolachlor, and simazine (Bruce and McMahon, 1998). In
1993, samples were collected from a 15-well fl ow-path moni-
toring network near Greeley, CO as part of a localized fl ow-
path study (Fig. 2) (McMahon and Böhlke, 1996). McMahon
and Böhlke (1996) also found elevated nitrate concentrations
in the alluvial aquifer and demonstrated that denitrifi cation was
responsible for a decrease in nitrate ground-water load to the
South Platte River in this area. Pesticides were detected in all of
the 15 fl ow-path wells sampled in 1993.
Th e two initial NAWQA ground-water studies of the South
Platte alluvial aquifer (McMahon and Böhlke, 1996; Bruce and
McMahon, 1998) provided the initial data and impetus to moni-
tor trends of nitrate and pesticide concentrations in the South
Platte alluvial aquifer. Th e agricultural land-use and fl ow-path
monitoring networks were revisited in 2002 and 2004, respectively,
to evaluate temporal trends in ground-water quality over a near-
decadal time span. Th is article presents results from the resampling
eff orts and compares water-quality results from the sampling that
occurred in 2002 to 2004 to results from the 1993 to 1994 studies.
SettingTh e main stem of the South Platte River originates in the
Rocky Mountain Front Range of Colorado, fl ows north-north-
east through the metropolitan area of Denver, and then fl ows
east-northeast across the rural eastern plains of Colorado toward
its confl uence with the North Platte River in western Nebraska
(Fig. 1). Th e climate is semiarid with average annual precipitation
ranging from approximately 30.5 to 48.3 cm per year for the pe-
riod from 1930 to 2003 (National Oceanic and Atmospheric Ad-
ministration, 2003), primarily in the form of spring and summer
rain showers (Bjorklund and Brown, 1957). Surface-water fl ow
in the South Platte River downstream from Denver, Colorado
is a combination of snowmelt runoff from the Rocky Mountain
Front Range, precipitation runoff from tributaries originating on
the eastern plains of Colorado, Wyoming, and Nebraska, irriga-
tion return fl ow, and wastewater-treatment plant discharge from
metropolitan areas. Natural vegetation in the study area is sparse,
with grasslands in the upland terraces away from the river and
phreatophytes such as cottonwoods and willows in the lowland
fl oodplain areas adjacent to the river.
An extensive and productive unconfi ned alluvial aquifer com-
posed of upper Pleistocene to upper Holocene gravel, sand, and
clay deposits is present along the main stem of the South Platte
River and its tributaries (Bjorklund and Brown, 1957; Smith et al.,
1964). In general, ground-water fl ow in the South Platte alluvial
aquifer is toward the river following topography and in the direc-
tion of streamfl ow (Hurr and Schneider, 1972), although pumping
from irrigation wells and leakage from diversion ditches can cause
local fl uctuations in ground-water fl ow directions (James Collins,
U.S. Geological Survey, personal communication, 2007). Recharge
to the alluvial aquifer is from incident precipitation, surface-water
fl ow, agricultural irrigation, leakage from surface-water diversion
ditches, and underlying bedrock aquifers. Ground water discharges
from the alluvial aquifer to surface water, pumping wells, evapo-
transpiration, and underlying bedrock aquifers.
Land use in the study area is primarily agricultural and rural
residential. Agricultural activities include irrigated crops of corn,
alfalfa, and row vegetables; cattle grazing; cattle feed lots; and
non-irrigated winter wheat. Availability of South Platte River
surface water has made agriculture an important industry in the
lower South Platte River valley since the late 19th century (Na-
dler and Schumm, 1981). Crop irrigation from diversion ditches
began in the late 1800s, and by 1897 irrigation had raised the
water table in late summer so that the streamfl ow in the South
Platte River changed from intermittent to perennial (Nadler and
Schumm, 1981). Pumping from the alluvial aquifer developed
during droughts of the 1930s and 1950s (Hurr et al., 1975),
and by 1969, state laws were enacted to regulate pumping so it
would not cause material injury to senior surface-water rights
(MacDonnell, 1988). In response to recent regional drought con-
Paschke et al.: Changes in Nitrate & Pesticide Concentrations in the South Platte River Alluvial Aquifer S-283
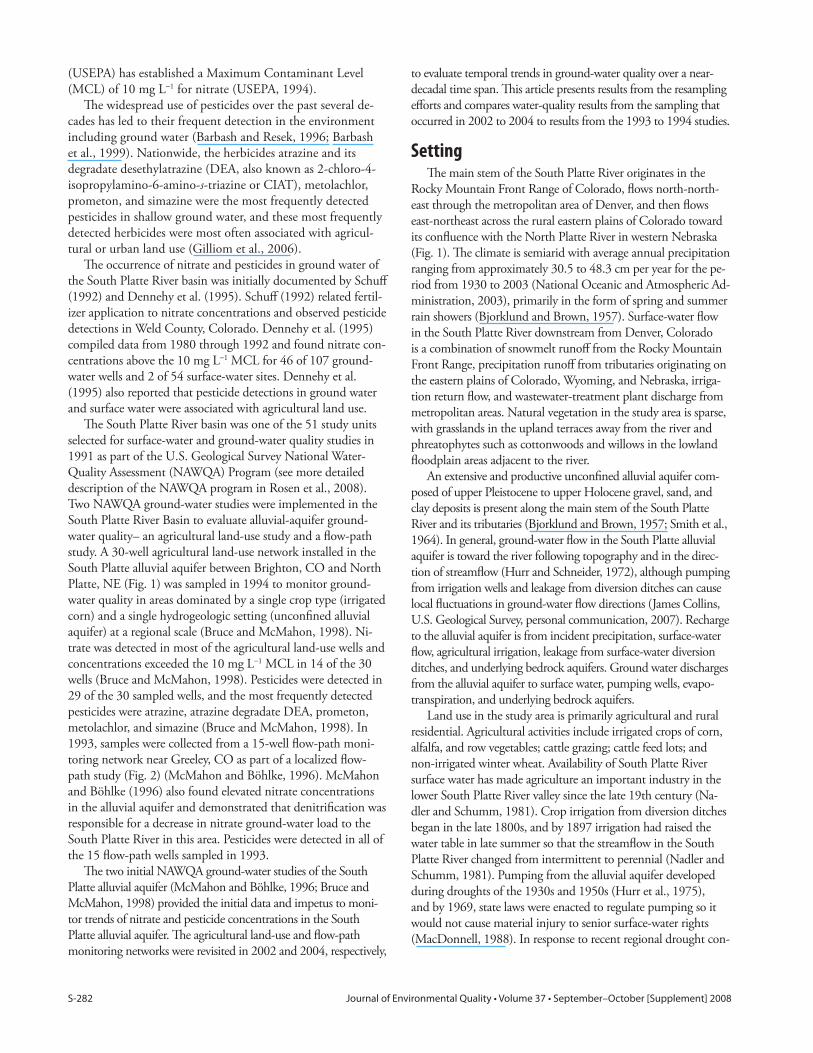
Fig. 1. Location of the South Platte River basin, alluvial aquifer, agricultural land-use wells, and fl ow-path wells.
Fig. 2. Location of the South Platte fl ow-path wells.
S-284 Journal of Environmental Quality • Volume 37 • September–October [Supplement] 2008
ditions that began in 1999 (McCabe et al., 2004), the Colorado
Division of Water Resources curtailed pumping from the South
Platte alluvial aquifer beginning in 2003, again to minimize
adverse aff ects on surface-water rights (Hal Simpson, Colorado
Division of Water Resources, written communication, 2006).
Methods
Well Selection and ConstructionGround-water samples were collected from two NAWQA
ground-water monitoring-well networks installed in the alluvial
aquifer of the lower South Platte River valley. Th e 30-well agri-
cultural land-use network sampled in 1994 was sampled again
in 2002 by this study (Table 1). Monitoring-well locations for
the agricultural land-use study were originally selected using a
computerized technique that generated randomly distributed
potential sampling locations in the land-use areas of interest
(Scott, 1990). Land-owner permission was sought to install
water-quality monitoring wells or sample existing wells as close
as possible to the computer-generated sites (Bruce and McMa-
hon, 1998). All of the agricultural land-use wells are construct-
ed of 5-cm-diam. polyvinyl chloride (PVC) with less than 5-m-
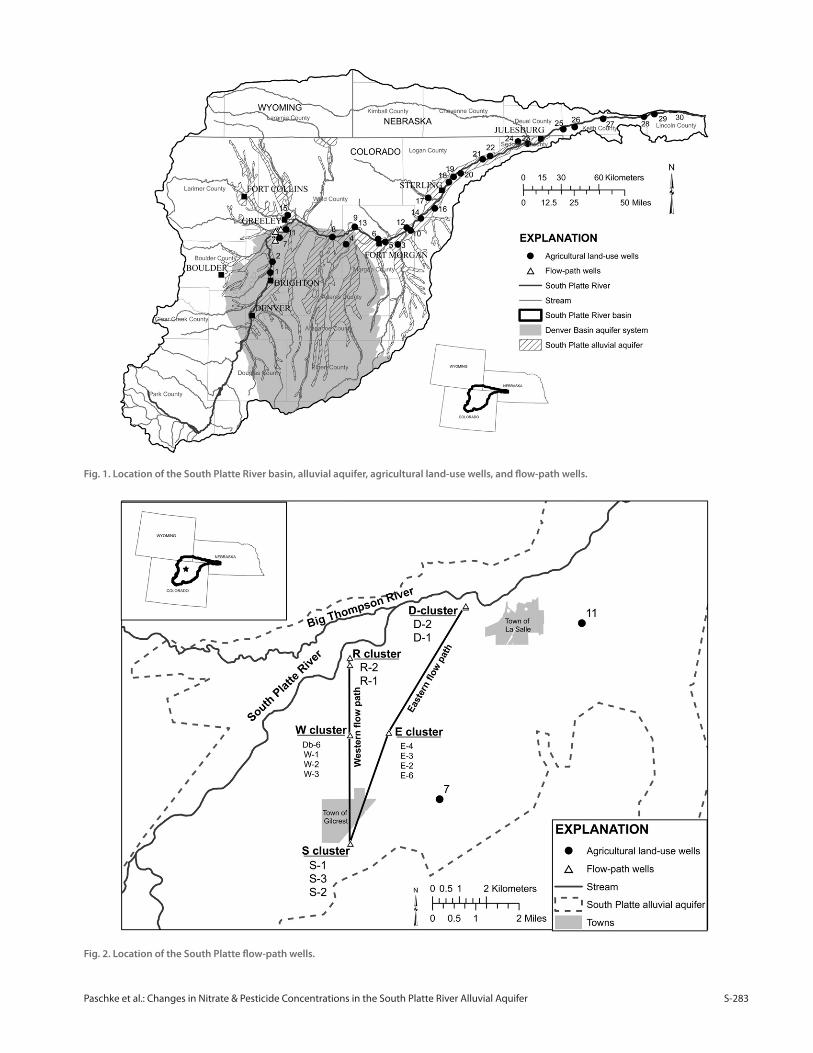
Table 1. Well information for wells sampled in the South Platte agricultural land-use and fl ow-path studies, 1993–2004. [Well no., assigned from original reference–Bruce and McMahon, 1998 for agricultural land-use wells– McMahon and Böhlke, 1996 for fl ow-path wells; Site ID, U.S. Geological Survey site identifi cation number; depths and intervals in meters below land surface; dry, water level below the bottom of well screened interval or insuffi cient water to sample].
Well no. Site IDWell
depthScreened
interval depth1993–1994
Depth to water1993-1994
Sample date2002–2004
Depth to water2002–2004
Sample date
Agricultural land-use wells
1 400237104500301 3.8 2.3–3.8 2.2 06/08/1994 2.4 07/18/2002
2 400711104481801 9.4 6.4–9.4 6.4 06/08/1994 6.3 07/24/2002
3 401440103373201 7.0 4.0–7.0 3.1 07/20/1994 4.0 07/31/2002
4 401449104064801 28.3 25.3–28.3 25.4 07/26/1994 27.0 08/28/2002
5 401544103443101 14.3 11.3–14.3 9.7 07/21/1994 11.2 07/30/2002
6 401702103483901 9.4 6.4–9.4 7.1 07/21/1994 7.2 07/30/2002
7 401726104442201 7.9 4.9–7.9 6.0 06/09/1994 dry 07/25/2002
8 401750104143101 11.6 8.5–11.6 8.3 07/26/1994 9.0 07/25/2002
9 402018103571801 4.0 2.1–3.7 0.4 07/25/1994 0.6 07/29/2002
10 402034103301001 7.0 4.0–7.0 3.3 07/19/1994 6.3 08/01/2002
11 402104104404501 5.8 1.7–5.8 3.4 06/09/1994 3.4 07/25/2002
12 402150103322801 8.2 5.2–8.2 5.7 07/20/1994 6.4 08/01/2002
13 402213104015501 3.7 1.5–3.7 0.7 07/25/1994 0.7 07/29/2002
14 402538103242001 6.1 3.0–6.1 2.4 07/19/1994 2.8 08/06/2002
15 402658104400001 10.1 5.5–10.1 7.7 06/10/1994 8.1 07/24/2002
16 402955103163501 11.0 7.9–11.0 6.3 07/18/1994 6.6 09/11/2002
17 403426103200401 9.4 6.4–9.4 7.4 07/18/1994 5.3 08/07/2002
18 404106103082201 5.5 2.4–5.5 1.3 08/04/1994 1.5 08/07/2002
19 404320103053801 5.2 2.1–5.2 2.0 08/03/1994 2.7 08/08/2002
20 404450103013501 14.3 11.3–14.3 11.8 08/03/1994 12.2 08/08/2002
21 405039102485601 4.6 1.5–4.6 1.7 08/02/1994 2.0 08/12/2002
22 405159102444201 4.6 1.5–4.6 2.8 08/02/1994 2.5 08/13/2002
23 405658102231201 4.9 1.8–4.9 2.1 08/01/1994 1.9 08/15/2002
24 405801102284501 9.1 6.1–9.1 5.5 08/01/1994 6.4 08/13/2002
25 410251102024201 6.7 3.7–6.7 3.4 06/16/1994 5.9 08/14/2002
26 410344101560901 10.1 7.0–10.1 5.2 06/16/1994 8.2 08/14/2002
27 410657101394501 5.2 2.1–5.2 2.9 06/15/1994 4.0 08/20/2002
28 410722101162901 6.7 3.7–6.7 3.3 06/15/1994 3.8 08/21/2002
29 410819101102801 5.2 2.1–5.2 1.6 06/14/1994 2.0 08/21/2002
30 410959100582401 7.0 4.0–7.0 2.1 06/14/1994 1.2 08/22/2002
Flow-path wells
15 (S-1) 401630104462901 9.1 4.6–7.6 4.8 08/31/1993 dry 08/26/2004
16 (S-2) 401630104462902 17.7 16.0–17.5 4.8 08/31/1993 6.8 08/23/2004
17 (S-3) 401630104462903 13.1 10.2–11.7 4.7 08/31/1993 6.8 08/23/2004
9 (Db-6) 401841104464401 11.9 7.3–10.4 8.5 12/09/1992 9.3 08/25/2004
18 (W-1) 401841104464601 18.7 15.8–17.4 9.1 09/02/1993 8.6 09/01/2004
19 (W-2) 401841104464602 13.0 10.7–12.2 9.1 09/02/1993 8.4 09/01/2004
20 (W-3) 401841104464603 9.8 7.5–9.0 9.0 09/02/1993 8.3 09/01/2004
21 (E-4) 401844104450101 10.2 5.5–10.1 7.7 09/01/1993 dry 08/24/2004
22 (E-2) 401844104450102 13.1 11.4–13.0 7.6 09/01/1993 9.8 08/25/2004
23 (E-3) 401844104450103 11.3 9.6–11.1 7.3 09/27/1993 9.9 08/24/2004
24 ((E-6) 401844104450106 21.0 19.2–20.7 7.8 09/01/1993 10.1 08/24/2004
25 (R-1) 402006104465301 11.4 9.1–10.7 1.8 08/30/1993 1.0 08/26/2004
26 (R-2) 402006104465302 3.7 2.3–3.5 1.8 08/30/1993 1.0 08/26/2004
27 (D-1) 402115104432001 11.3 9.9–11.1 2.0 08/25/1993 1.2 08/30/2004
28 (D-2) 402115104432002 5.5 3.8–5.3 1.9 08/25/1993 1.3 08/30/2004
Paschke et al.: Changes in Nitrate & Pesticide Concentrations in the South Platte River Alluvial Aquifer S-285
long screened intervals completed at or just below the water
table (Table 1). Well construction and documentation methods
for wells sampled under the NAWQA program are described
in Lapham et al. (1995), and well construction details for the
South Platte agricultural land-use wells are presented in Bruce
and McMahon (1998). Th e fl ow-path monitoring network
consisting of 15 wells and two surface-water sites was sampled
in 1993 and again in 2004 by this study (Table 1). Flow-path
wells are completed at multiple depths in fi ve clusters along two
ground-water fl ow paths that represent generalized fl ow paths
from upland terraces toward the river (Fig. 2). Flow-path moni-
toring wells are constructed of 5-cm-diam. PVC with short
screened intervals (Table 1).
Sample Collection and AnalysisMonitoring wells were purged and sampled with a Grundfos
submersible pump located near the top of the well screen. Well
purging continued until three or more casing volumes of water
were removed from the well and fi eld parameters of pH, tem-
perature, specifi c conductance, and dissolved oxygen stabilized.
Field parameters were measured with calibrated fi eld meters in
a fl ow-through chamber isolated from the atmosphere. Water
samples were analyzed for a variety of dissolved constituents
including physical properties, major ions, nutrients, trace ele-
ments, dissolved organic carbon, and pesticides. Samples from
the agricultural land-use network additionally were analyzed
for the ratio of 15N/14N in nitrate (δ15N) as an indication of the
nitrate source. Samples from the fl ow-path network addition-
ally were analyzed for major dissolved gases as an indication
of recharge temperature and chlorofl uorocarbons (CFCs) to
estimate apparent ground-water age. To minimize the eff ects
of seasonal variation, samples from a given well were collected
within the same season during both monitoring periods (Table
1). Well purging, sample collection, fi eld measurements, and
equipment cleaning methods followed standard USGS and
NAWQA protocols (U.S. Geological Survey, variously dated;
Koterba et al., 1995; Lapham et al., 1995).
Samples for analysis of major ions, trace elements, nutrients,
dissolved organic carbon, and pesticides were collected and ana-
lyzed at the USGS National Water-Quality Laboratory in Lake-
wood, CO, using standard methods (Brenton and Arnett, 1993;
Faires, 1993; Fishman, 1993; Zaugg et al., 1995; Sandstrom
et al., 2001; Patton and Kryskalla, 2003). Alkalinity was deter-
mined by titration in the fi eld at the time of sample collection
(Rounds and Wilde, 2001). Samples for nitrogen isotope ratios
were analyzed at the USGS Reston Stable Isotope Laboratory
in Reston, VA, using continuous fl ow isotope ratio mass spec-
trometry after bacterial denitrifi cation of the sample into nitrous
oxide (Sigman et al., 2001; Casciotti et al., 2002; Coplen et al.,
2004; http://isotopes.usgs.gov/Quality.htm#samples [verifi ed 30
June 2008]). Samples for major dissolved gases (methane, carbon
dioxide, nitrogen, oxygen, and argon) were collected in 160-mL
serum bottles using butyl rubber stoppers with no headspace
and were analyzed using gas chromatography at the USGS CFC
Laboratory in Reston, VA (http://water.usgs.gov/lab/dissolved-
gas/lab/analytical_procedures/ [verifi ed 30 June 2008]). During
the 1993 fl ow-path sampling, samples for CFC analysis were
collected in 62-mL borosilicate ampoules fl ushed with nitrogen
gas and fused. During the 2004 fl ow-path sampling, samples
for CFC analysis were collected in 150-mL glass bottles with
aluminum-foil lined caps (http://water.usgs.gov/lab/chlorofl uoro-
carbons/sampling/ [verifi ed 30 June 2008]). Purge-and-trap gas
chromatography with an electron capture detector (http://water.
usgs.gov/lab/chlorofl uorocarbons/lab/analytical_procedures/
[verifi ed 30 June 2008]) was used to analyze all CFC samples at
the USGS CFC Laboratory in Reston, VA.
Land Use/Land Cover DataAvailable ancillary data included local land use mapped by
this study and agricultural statistics from the National Agri-
cultural Statistics Service (NASS, http://www.nass.usda.gov/
index.asp [verifi ed 30 June 2008]). Land use and land cover
were mapped within a 500-m-radius buff er for each agri-
cultural well during both sampling cycles to document land
use in direct proximity to the wells at the time of sampling
(Wayne Lapham, U.S. Geological Survey, personal commu-
nication, 2007). County-level crop and livestock production
information for Colorado was compiled from data available
for various years starting in 1950 from the NASS (http://
www.nass.usda.gov/Statistics_by_State/Colorado/index.asp/
[verifi ed 30 June 2008]). County-level estimates of nitrogen
input from atmospheric deposition, synthetic fertilizer, and
manure fertilizer were obtained from Ruddy et al. (2006),
who synthesize previous estimates from Alexander and Smith
(1990) for the period 1945 to 1985 and Battaglin and Gools-
by (1995) for the period 1985 to 1991 with more recent data
for the period 1991 to 2001. Atrazine-use information was
compiled from state-wide pesticide-use data available from
the NASS for selected pesticides beginning in 1990 (http://
www.pestmanagement.info/nass/ [verifi ed 30 June 2008]).
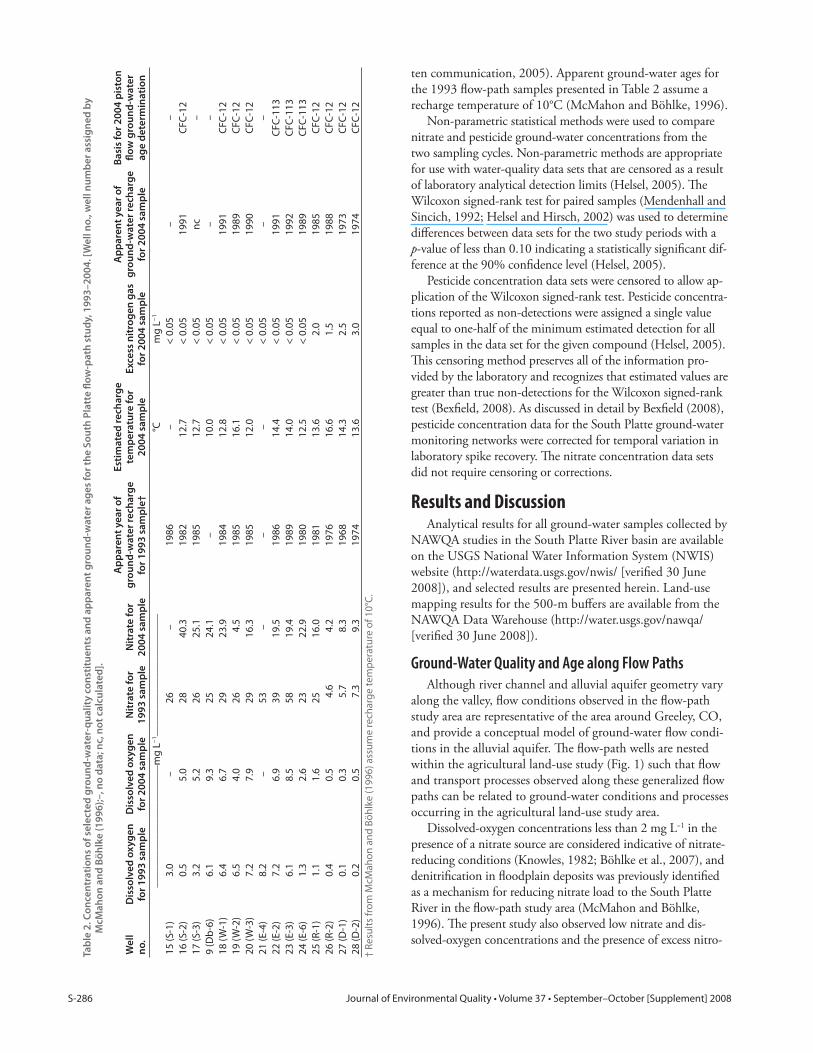
Data AnalysisApparent recharge temperature and ground-water age were
estimated for fl ow-path wells for both sampling cycles using
the concentrations of dissolved gases and CFCs in water sam-
ples. Th e concentrations of dissolved gases argon and nitrogen
were used to estimate water temperature at the time of re-
charge (recharge temperature), excess air, and excess nitrogen
gas concentrations (Ed Busenberg, U.S. Geological Survey,
written communication, 2005). Apparent recharge tempera-
ture was used along with the concentrations of CFC-12 and
CFC-113 to compute apparent ground-water age using the
piston-fl ow model (Busenberg and Plummer, 1992). Concen-
trations of CFC-12 and the piston-fl ow model were used to
estimate apparent age for 8 of the 12 fl ow-path samples from
2004 (Table 2). Concentrations of CFC-113 and the piston-
fl ow model were used to estimate apparent age for three fl ow-
path samples with possible CFC-12 contamination (Table 2)
(Ed Busenberg, U.S. Geological Survey, written communica-
tion, 2004). No apparent age could be determined for the
2004 sample from well S-3 because of excessive nitrogen gas
concentration (Ed Busenberg, U.S. Geological Survey, writ-
S-286 Journal of Environmental Quality • Volume 37 • September–October [Supplement] 2008
ten communication, 2005). Apparent ground-water ages for
the 1993 fl ow-path samples presented in Table 2 assume a
recharge temperature of 10°C (McMahon and Böhlke, 1996).
Non-parametric statistical methods were used to compare
nitrate and pesticide ground-water concentrations from the
two sampling cycles. Non-parametric methods are appropriate
for use with water-quality data sets that are censored as a result
of laboratory analytical detection limits (Helsel, 2005). Th e
Wilcoxon signed-rank test for paired samples (Mendenhall and
Sincich, 1992; Helsel and Hirsch, 2002) was used to determine
diff erences between data sets for the two study periods with a
p-value of less than 0.10 indicating a statistically signifi cant dif-
ference at the 90% confi dence level (Helsel, 2005).
Pesticide concentration data sets were censored to allow ap-
plication of the Wilcoxon signed-rank test. Pesticide concentra-
tions reported as non-detections were assigned a single value
equal to one-half of the minimum estimated detection for all
samples in the data set for the given compound (Helsel, 2005).
Th is censoring method preserves all of the information pro-
vided by the laboratory and recognizes that estimated values are
greater than true non-detections for the Wilcoxon signed-rank
test (Bexfi eld, 2008). As discussed in detail by Bexfi eld (2008),
pesticide concentration data for the South Platte ground-water
monitoring networks were corrected for temporal variation in
laboratory spike recovery. Th e nitrate concentration data sets
did not require censoring or corrections.
Results and DiscussionAnalytical results for all ground-water samples collected by
NAWQA studies in the South Platte River basin are available
on the USGS National Water Information System (NWIS)
website (http://waterdata.usgs.gov/nwis/ [verifi ed 30 June
2008]), and selected results are presented herein. Land-use
mapping results for the 500-m buff ers are available from the
NAWQA Data Warehouse (http://water.usgs.gov/nawqa/
[verifi ed 30 June 2008]).
Ground-Water Quality and Age along Flow PathsAlthough river channel and alluvial aquifer geometry vary
along the valley, fl ow conditions observed in the fl ow-path
study area are representative of the area around Greeley, CO,
and provide a conceptual model of ground-water fl ow condi-
tions in the alluvial aquifer. Th e fl ow-path wells are nested
within the agricultural land-use study (Fig. 1) such that fl ow
and transport processes observed along these generalized fl ow
paths can be related to ground-water conditions and processes
occurring in the agricultural land-use study area.
Dissolved-oxygen concentrations less than 2 mg L−1 in the
presence of a nitrate source are considered indicative of nitrate-
reducing conditions (Knowles, 1982; Böhlke et al., 2007), and
denitrifi cation in fl oodplain deposits was previously identifi ed
as a mechanism for reducing nitrate load to the South Platte
River in the fl ow-path study area (McMahon and Böhlke,
1996). Th e present study also observed low nitrate and dis-
solved-oxygen concentrations and the presence of excess nitro-
Tab
le 2
. Co
nce
ntr
ati
on
s o
f se
lect
ed
gro
un
d-w
ate
r-q
ua
lity
co
nst
itu
en
ts a
nd
ap
pa
ren
t g
rou
nd
-wa
ter
ag
es
for
the
So
uth
Pla
tte
fl o
w-p
ath
stu
dy,
19
93
–2
00
4. [
We
ll n
o.,
we
ll n
um
be
r a
ssig
ne
d b
y
McM
ah
on
an
d B
öh
lke
(1
99
6);
–, n
o d
ata
; nc,
no
t ca
lcu
late
d].
We
lln
o.
Dis
solv
ed
ox
yg
en
fo
r 1
99
3 s
am
ple
Dis
solv
ed
ox
yg
en
fo
r 2
00
4 s
am
ple
Nit
rate
fo
r 1
99
3 s
am
ple
Nit
rate
fo
r 2
00
4 s
am
ple
Ap
pa
ren
t y
ea
r o
f g
rou
nd
-wa
ter
rech
arg
e
for
19
93
sa
mp
le†
Est
ima
ted
re
cha
rge
te
mp
era
ture
fo
r 2
00
4 s
am
ple
Exc
ess
nit
rog
en
ga
s fo
r 2
00
4 s
am
ple
Ap
pa
ren
t y
ea
r o
f g
rou
nd
-wa
ter
rech
arg
e
for
20
04
sa
mp
le
Ba
sis
for
20
04
pis
ton
fl
ow
gro
un
d-w
ate
r a
ge
de
term
ina
tio
n
––––
––––
––––
––––
––––
–––m
g L
−1––
––––
––––
––––
––––
––––
–°C
mg
L−
1
15
(S
-1)
3.0
–2
6
–1
98
6–
< 0
.05
––
16
(S
-2)
0.5
5.0
28
40
.31
98
21
2.7
< 0
.05
19
91
CF
C-1
2
17
(S
-3)
3.2
5.2
26
25
.11
98
51
2.7
< 0
.05
nc
–
9 (
Db
-6)
6.1
9.3
25
24
.1–
10
.0 <
0.0
5–
–
18
(W
-1)
6.4
6.7
29
23
.91
98
41
2.8
< 0
.05
19
91
CF
C-1
2
19
(W
-2)
6.5
4.0
26
4.5
19
85
16
.1 <
0.0
51
98
9C
FC
-12
20
(W
-3)
7.2
7.9
29
16
.31
98
51
2.0
< 0
.05
19
90
CF
C-1
2
21
(E
-4)
8.2
–5
3–
––
< 0
.05
––
22
(E
-2)
7.2
6.9
39
19
.51
98
61
4.4
< 0
.05
19
91
CF
C-1
13
23
(E
-3)
6.1
8.5
58
19
.41
98
91
4.0
< 0
.05
19
92
CF
C-1
13
24
(E
-6)
1.3
2.6
23
22
.91
98
01
2.5
< 0
.05
19
89
CF
C-1
13
25
(R
-1)
1.1
1.6
25
16
.01
98
11
3.6
2.0
19
85
CF
C-1
2
26
(R
-2)
0.4
0.5
4.6
4.2
19
76
16
.61
.51
98
8C
FC
-12
27
(D
-1)
0.1
0.3
5.7
8.3
19
68
14
.32
.51
97
3C
FC
-12
28
(D
-2)
0.2
0.5
7.3
9.3
19
74
13
.63
.01
97
4C
FC
-12
† R
esu
lts
fro
m M
cMa
ho
n a
nd
Bö
hlk
e (
19
96
) a
ssu
me
re
cha
rge
te
mp
era
ture
of
10
°C.
Paschke et al.: Changes in Nitrate & Pesticide Concentrations in the South Platte River Alluvial Aquifer S-287
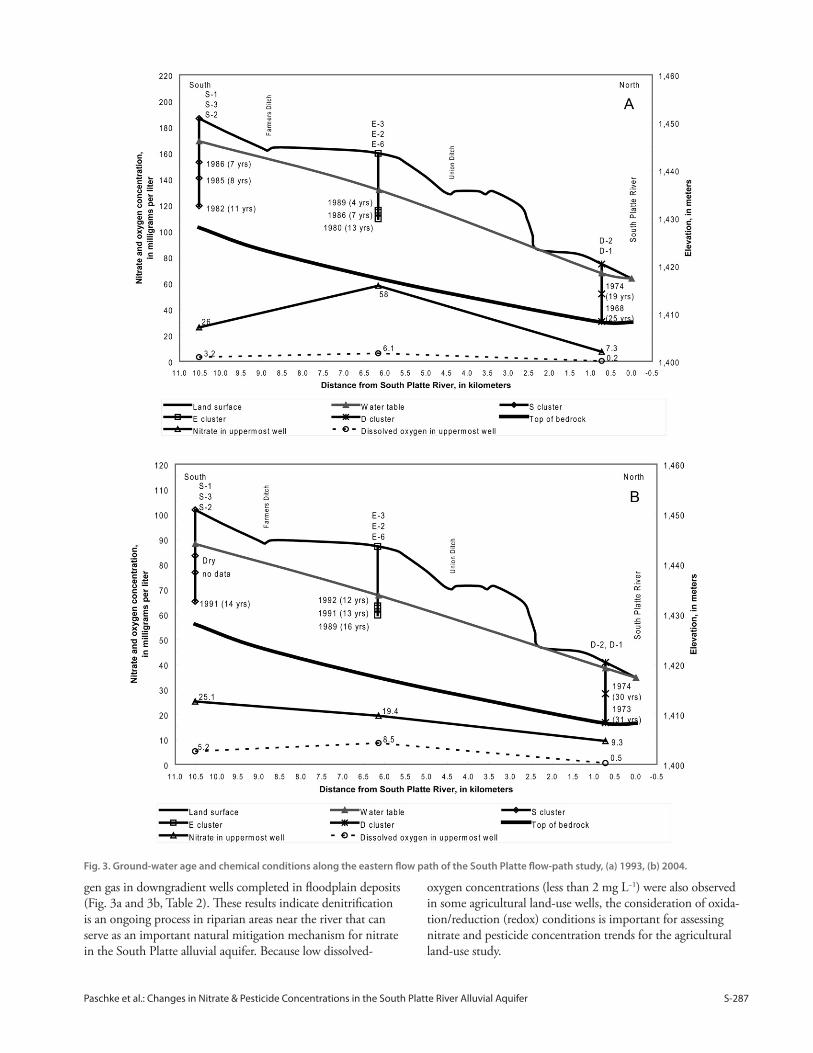
gen gas in downgradient wells completed in fl oodplain deposits
(Fig. 3a and 3b, Table 2). Th ese results indicate denitrifi cation
is an ongoing process in riparian areas near the river that can
serve as an important natural mitigation mechanism for nitrate
in the South Platte alluvial aquifer. Because low dissolved-
oxygen concentrations (less than 2 mg L−1) were also observed
in some agricultural land-use wells, the consideration of oxida-
tion/reduction (redox) conditions is important for assessing
nitrate and pesticide concentration trends for the agricultural
land-use study.
Fig. 3. Ground-water age and chemical conditions along the eastern fl ow path of the South Platte fl ow-path study, (a) 1993, (b) 2004.
S-288 Journal of Environmental Quality • Volume 37 • September–October [Supplement] 2008
Apparent ground-water age (time since recharge) is related
to aquifer fl ow conditions such as distance along a fl ow path
and depth below the water table. Apparent ground-water ages
for 1993 and 2004 consistently show the youngest water in the
upgradient water-table wells and the oldest water at downgradi-
ent wells in the discharge area. In
1993, apparent ground-water ages
ranged from 4 (well E-3) to 8 yr
(well W-3) for upland water-table
wells (Fig. 3A and Table 2) and
apparent ages ranged from 12 (well
R-1) to 25 yr (well D-1) for down-
gradient wells. In 2004, apparent
ground-water ages for the upland
water-table wells ranged from 12
to 14 yr and downgradient appar-
ent ages ranged from 16 (well R-2)
to 31 yr (well D-1). Th ere was also
an increase in apparent ages with
depth below the water table along
the eastern fl ow path (Fig. 3a and
3b). However, at the W cluster of
the western fl ow path, apparent
ages were similar at all sampled
depths during both sampling cycles
indicating the ground water is well
mixed at this location. In general,
apparent ages from the 2004 sam-
ples were older than those from the
1993 samples. Apparent ground-
water ages at the downgradient
discharge areas along the South Platte River indicate total travel
times from upland recharge areas in the range of 12 to 31 yr (Fig.
3a and 3b, Table 2) with the oldest ages occurring at the down-
gradient terminus of the longer (eastern) fl ow path.
Nitrate Results for Agricultural
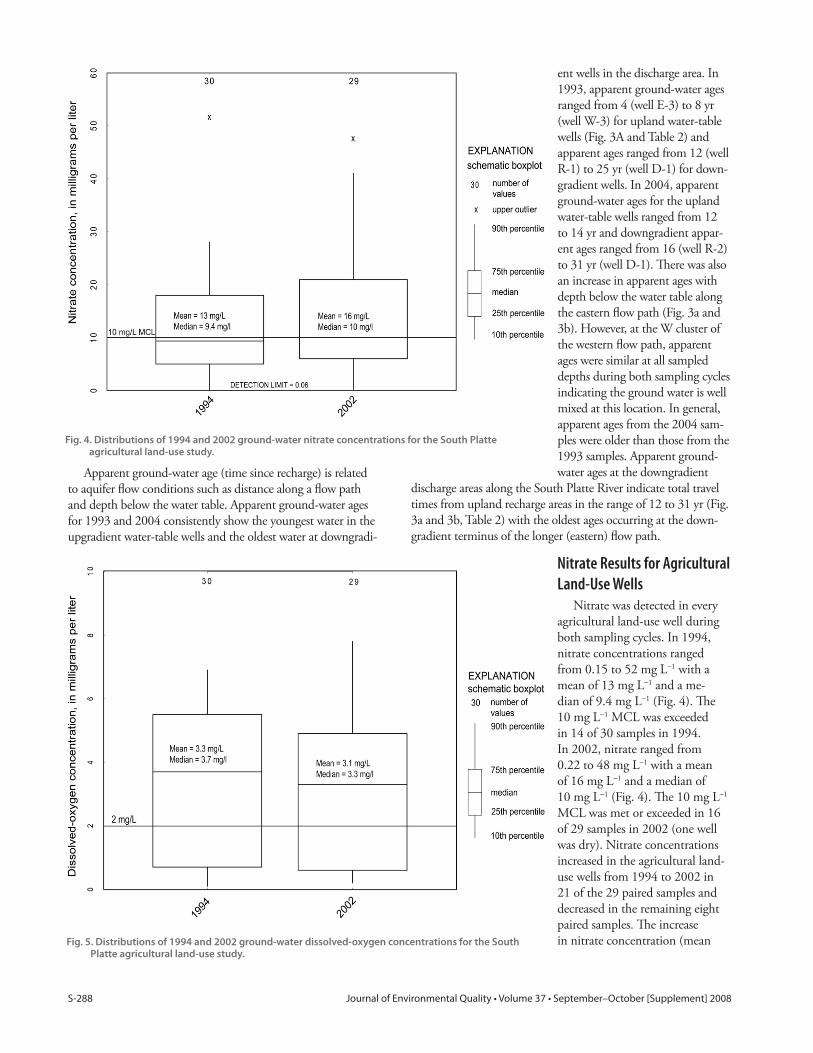
Land-Use WellsNitrate was detected in every
agricultural land-use well during
both sampling cycles. In 1994,
nitrate concentrations ranged
from 0.15 to 52 mg L−1 with a
mean of 13 mg L−1 and a me-
dian of 9.4 mg L−1 (Fig. 4). Th e
10 mg L−1 MCL was exceeded
in 14 of 30 samples in 1994.
In 2002, nitrate ranged from
0.22 to 48 mg L−1 with a mean
of 16 mg L−1 and a median of
10 mg L−1 (Fig. 4). Th e 10 mg L−1
MCL was met or exceeded in 16
of 29 samples in 2002 (one well
was dry). Nitrate concentrations
increased in the agricultural land-
use wells from 1994 to 2002 in
21 of the 29 paired samples and
decreased in the remaining eight
paired samples. Th e increase
in nitrate concentration (mean
Fig. 4. Distributions of 1994 and 2002 ground-water nitrate concentrations for the South Platte agricultural land-use study.
Fig. 5. Distributions of 1994 and 2002 ground-water dissolved-oxygen concentrations for the South Platte agricultural land-use study.
Paschke et al.: Changes in Nitrate & Pesticide Concentrations in the South Platte River Alluvial Aquifer S-289
of 4.1 mg L−1 and median of
2.0 mg L−1) is statistically signifi -
cant (p-value = 0.01 for a one-
sided Wilcoxon signed-rank test).
Because fl ow-path results
indicate redox conditions (rep-
resented by dissolved-oxygen
concentrations) aff ect nitrate
concentrations via denitrifi ca-
tion, the nitrate concentrations
for agricultural land-use wells
are categorized with respect to
dissolved-oxygen concentrations.
In 1994, dissolved-oxygen con-
centrations ranged from 0.1 to
6.9 mg L−1, with a mean of 3.3
and a median of 3.7 mg L−1 (Fig.
5). In 2002, dissolved-oxygen
concentrations ranged from
0.20 to 7.8 mg L−1, with a mean
of 3.1 mg L−1 and a median of
3.3 mg L−1 (Fig. 5). Eleven of 30
dissolved-oxygen values were be-
low 2 mg L−1 in 1994 and 12 of
29 values were below 2 mg L−1 in
2002 indicating denitrifi cation
could be aff ecting nitrate con-
centrations at approximately 40% of the sampling locations.
Th ere was not a signifi cant diff erence in dissolved-oxygen
concentrations between the two sampling cycles.
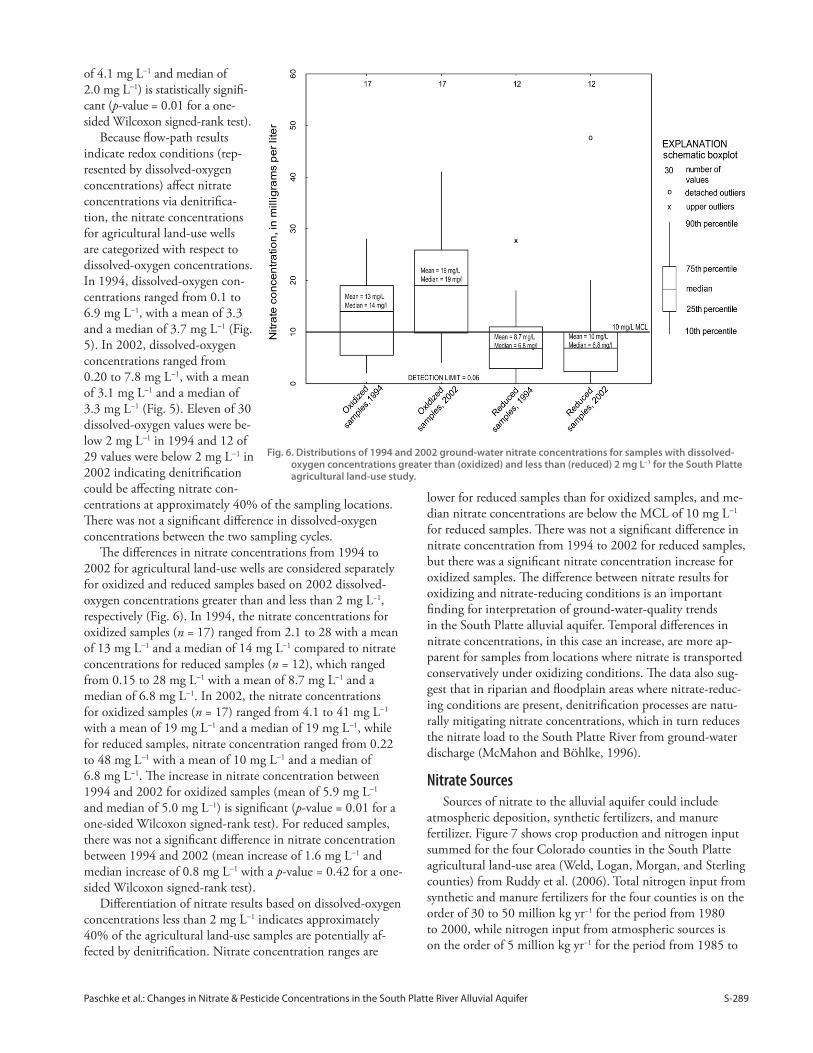
Th e diff erences in nitrate concentrations from 1994 to
2002 for agricultural land-use wells are considered separately
for oxidized and reduced samples based on 2002 dissolved-
oxygen concentrations greater than and less than 2 mg L−1,
respectively (Fig. 6). In 1994, the nitrate concentrations for
oxidized samples (n = 17) ranged from 2.1 to 28 with a mean
of 13 mg L−1 and a median of 14 mg L−1 compared to nitrate
concentrations for reduced samples (n = 12), which ranged
from 0.15 to 28 mg L−1 with a mean of 8.7 mg L−1 and a
median of 6.8 mg L−1. In 2002, the nitrate concentrations
for oxidized samples (n = 17) ranged from 4.1 to 41 mg L−1
with a mean of 19 mg L−1 and a median of 19 mg L−1, while
for reduced samples, nitrate concentration ranged from 0.22
to 48 mg L−1 with a mean of 10 mg L−1 and a median of
6.8 mg L−1. Th e increase in nitrate concentration between
1994 and 2002 for oxidized samples (mean of 5.9 mg L−1
and median of 5.0 mg L−1) is signifi cant (p-value = 0.01 for a
one-sided Wilcoxon signed-rank test). For reduced samples,
there was not a signifi cant diff erence in nitrate concentration
between 1994 and 2002 (mean increase of 1.6 mg L−1 and
median increase of 0.8 mg L−1 with a p-value = 0.42 for a one-
sided Wilcoxon signed-rank test).
Diff erentiation of nitrate results based on dissolved-oxygen
concentrations less than 2 mg L−1 indicates approximately
40% of the agricultural land-use samples are potentially af-
fected by denitrifi cation. Nitrate concentration ranges are
lower for reduced samples than for oxidized samples, and me-
dian nitrate concentrations are below the MCL of 10 mg L−1
for reduced samples. Th ere was not a signifi cant diff erence in
nitrate concentration from 1994 to 2002 for reduced samples,
but there was a signifi cant nitrate concentration increase for
oxidized samples. Th e diff erence between nitrate results for
oxidizing and nitrate-reducing conditions is an important
fi nding for interpretation of ground-water-quality trends
in the South Platte alluvial aquifer. Temporal diff erences in
nitrate concentrations, in this case an increase, are more ap-
parent for samples from locations where nitrate is transported
conservatively under oxidizing conditions. Th e data also sug-
gest that in riparian and fl oodplain areas where nitrate-reduc-
ing conditions are present, denitrifi cation processes are natu-
rally mitigating nitrate concentrations, which in turn reduces
the nitrate load to the South Platte River from ground-water
discharge (McMahon and Böhlke, 1996).
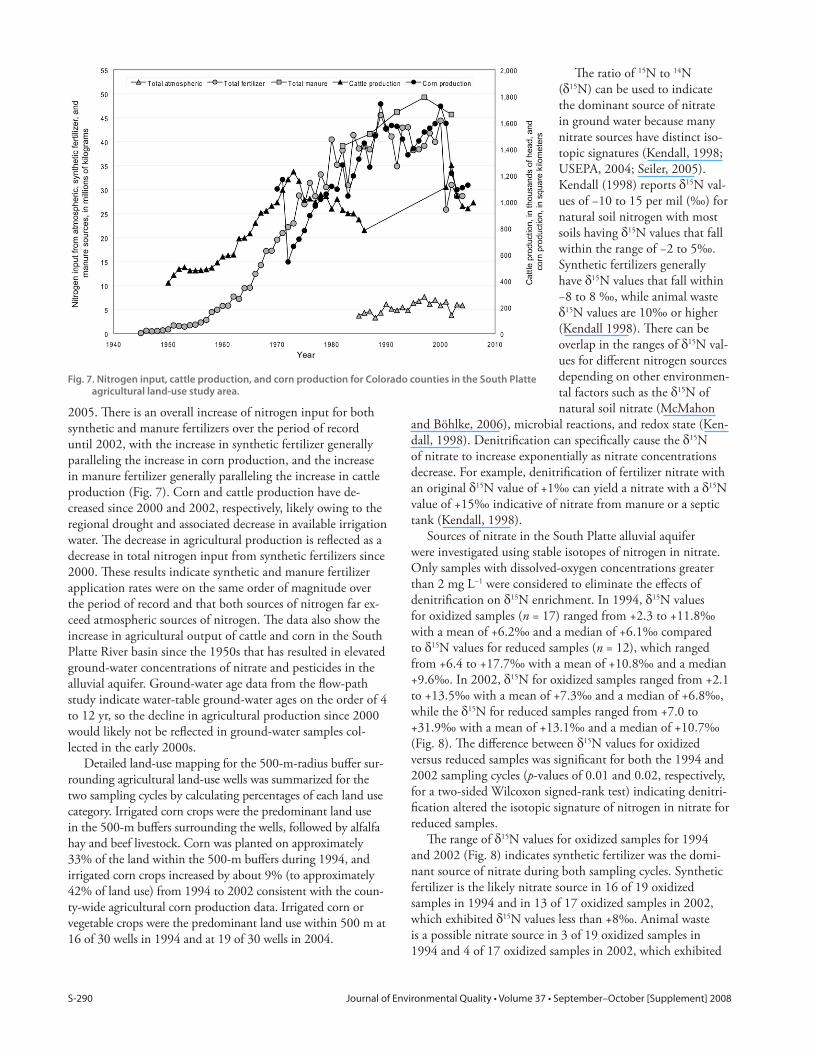
Nitrate SourcesSources of nitrate to the alluvial aquifer could include
atmospheric deposition, synthetic fertilizers, and manure
fertilizer. Figure 7 shows crop production and nitrogen input
summed for the four Colorado counties in the South Platte
agricultural land-use area (Weld, Logan, Morgan, and Sterling
counties) from Ruddy et al. (2006). Total nitrogen input from
synthetic and manure fertilizers for the four counties is on the
order of 30 to 50 million kg yr−1 for the period from 1980
to 2000, while nitrogen input from atmospheric sources is
on the order of 5 million kg yr−1 for the period from 1985 to
Fig. 6. Distributions of 1994 and 2002 ground-water nitrate concentrations for samples with dissolved-oxygen concentrations greater than (oxidized) and less than (reduced) 2 mg L–1 for the South Platte agricultural land-use study.
S-290 Journal of Environmental Quality • Volume 37 • September–October [Supplement] 2008
2005. Th ere is an overall increase of nitrogen input for both
synthetic and manure fertilizers over the period of record
until 2002, with the increase in synthetic fertilizer generally
paralleling the increase in corn production, and the increase
in manure fertilizer generally paralleling the increase in cattle
production (Fig. 7). Corn and cattle production have de-
creased since 2000 and 2002, respectively, likely owing to the
regional drought and associated decrease in available irrigation
water. Th e decrease in agricultural production is refl ected as a
decrease in total nitrogen input from synthetic fertilizers since
2000. Th ese results indicate synthetic and manure fertilizer
application rates were on the same order of magnitude over
the period of record and that both sources of nitrogen far ex-
ceed atmospheric sources of nitrogen. Th e data also show the
increase in agricultural output of cattle and corn in the South
Platte River basin since the 1950s that has resulted in elevated
ground-water concentrations of nitrate and pesticides in the
alluvial aquifer. Ground-water age data from the fl ow-path
study indicate water-table ground-water ages on the order of 4
to 12 yr, so the decline in agricultural production since 2000
would likely not be refl ected in ground-water samples col-
lected in the early 2000s.
Detailed land-use mapping for the 500-m-radius buff er sur-
rounding agricultural land-use wells was summarized for the
two sampling cycles by calculating percentages of each land use
category. Irrigated corn crops were the predominant land use
in the 500-m buff ers surrounding the wells, followed by alfalfa
hay and beef livestock. Corn was planted on approximately
33% of the land within the 500-m buff ers during 1994, and
irrigated corn crops increased by about 9% (to approximately
42% of land use) from 1994 to 2002 consistent with the coun-
ty-wide agricultural corn production data. Irrigated corn or
vegetable crops were the predominant land use within 500 m at
16 of 30 wells in 1994 and at 19 of 30 wells in 2004.
Th e ratio of 15N to 14N
(δ15N) can be used to indicate
the dominant source of nitrate
in ground water because many
nitrate sources have distinct iso-
topic signatures (Kendall, 1998;
USEPA, 2004; Seiler, 2005).
Kendall (1998) reports δ15N val-
ues of −10 to 15 per mil (‰) for
natural soil nitrogen with most
soils having δ15N values that fall
within the range of −2 to 5‰.
Synthetic fertilizers generally
have δ15N values that fall within
−8 to 8 ‰, while animal waste
δ15N values are 10‰ or higher
(Kendall 1998). Th ere can be
overlap in the ranges of δ15N val-
ues for diff erent nitrogen sources
depending on other environmen-
tal factors such as the δ15N of
natural soil nitrate (McMahon
and Böhlke, 2006), microbial reactions, and redox state (Ken-
dall, 1998). Denitrifi cation can specifi cally cause the δ15N
of nitrate to increase exponentially as nitrate concentrations
decrease. For example, denitrifi cation of fertilizer nitrate with
an original δ15N value of +1‰ can yield a nitrate with a δ15N
value of +15‰ indicative of nitrate from manure or a septic
tank (Kendall, 1998).
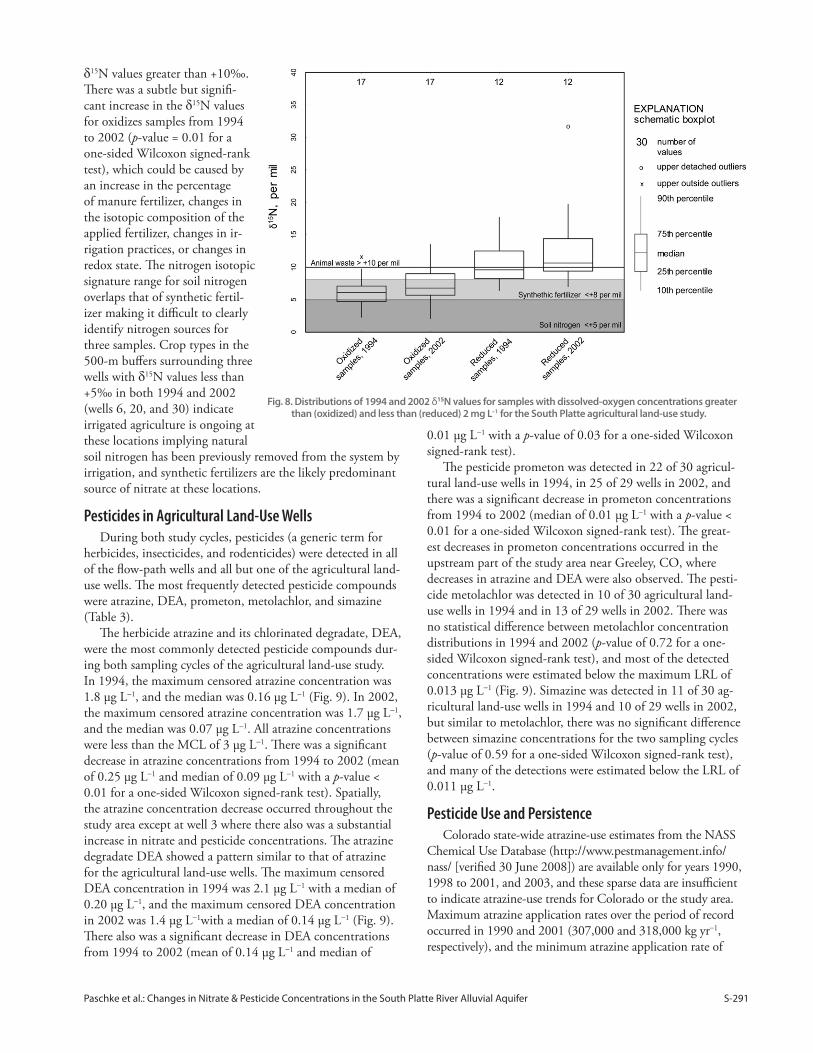
Sources of nitrate in the South Platte alluvial aquifer
were investigated using stable isotopes of nitrogen in nitrate.
Only samples with dissolved-oxygen concentrations greater
than 2 mg L−1 were considered to eliminate the eff ects of
denitrifi cation on δ15N enrichment. In 1994, δ15N values
for oxidized samples (n = 17) ranged from +2.3 to +11.8‰
with a mean of +6.2‰ and a median of +6.1‰ compared
to δ15N values for reduced samples (n = 12), which ranged
from +6.4 to +17.7‰ with a mean of +10.8‰ and a median
+9.6‰. In 2002, δ15N for oxidized samples ranged from +2.1
to +13.5‰ with a mean of +7.3‰ and a median of +6.8‰,
while the δ15N for reduced samples ranged from +7.0 to
+31.9‰ with a mean of +13.1‰ and a median of +10.7‰
(Fig. 8). Th e diff erence between δ15N values for oxidized
versus reduced samples was signifi cant for both the 1994 and
2002 sampling cycles (p-values of 0.01 and 0.02, respectively,
for a two-sided Wilcoxon signed-rank test) indicating denitri-
fi cation altered the isotopic signature of nitrogen in nitrate for
reduced samples.
Th e range of δ15N values for oxidized samples for 1994
and 2002 (Fig. 8) indicates synthetic fertilizer was the domi-
nant source of nitrate during both sampling cycles. Synthetic
fertilizer is the likely nitrate source in 16 of 19 oxidized
samples in 1994 and in 13 of 17 oxidized samples in 2002,
which exhibited δ15N values less than +8‰. Animal waste
is a possible nitrate source in 3 of 19 oxidized samples in
1994 and 4 of 17 oxidized samples in 2002, which exhibited
Fig. 7. Nitrogen input, cattle production, and corn production for Colorado counties in the South Platte agricultural land-use study area.
Paschke et al.: Changes in Nitrate & Pesticide Concentrations in the South Platte River Alluvial Aquifer S-291
δ15N values greater than +10‰.
Th ere was a subtle but signifi -
cant increase in the δ15N values
for oxidizes samples from 1994
to 2002 (p-value = 0.01 for a
one-sided Wilcoxon signed-rank
test), which could be caused by
an increase in the percentage
of manure fertilizer, changes in
the isotopic composition of the
applied fertilizer, changes in ir-
rigation practices, or changes in
redox state. Th e nitrogen isotopic
signature range for soil nitrogen
overlaps that of synthetic fertil-
izer making it diffi cult to clearly
identify nitrogen sources for
three samples. Crop types in the
500-m buff ers surrounding three
wells with δ15N values less than
+5‰ in both 1994 and 2002
(wells 6, 20, and 30) indicate
irrigated agriculture is ongoing at
these locations implying natural
soil nitrogen has been previously removed from the system by
irrigation, and synthetic fertilizers are the likely predominant
source of nitrate at these locations.
Pesticides in Agricultural Land-Use WellsDuring both study cycles, pesticides (a generic term for
herbicides, insecticides, and rodenticides) were detected in all
of the fl ow-path wells and all but one of the agricultural land-
use wells. Th e most frequently detected pesticide compounds
were atrazine, DEA, prometon, metolachlor, and simazine
(Table 3).
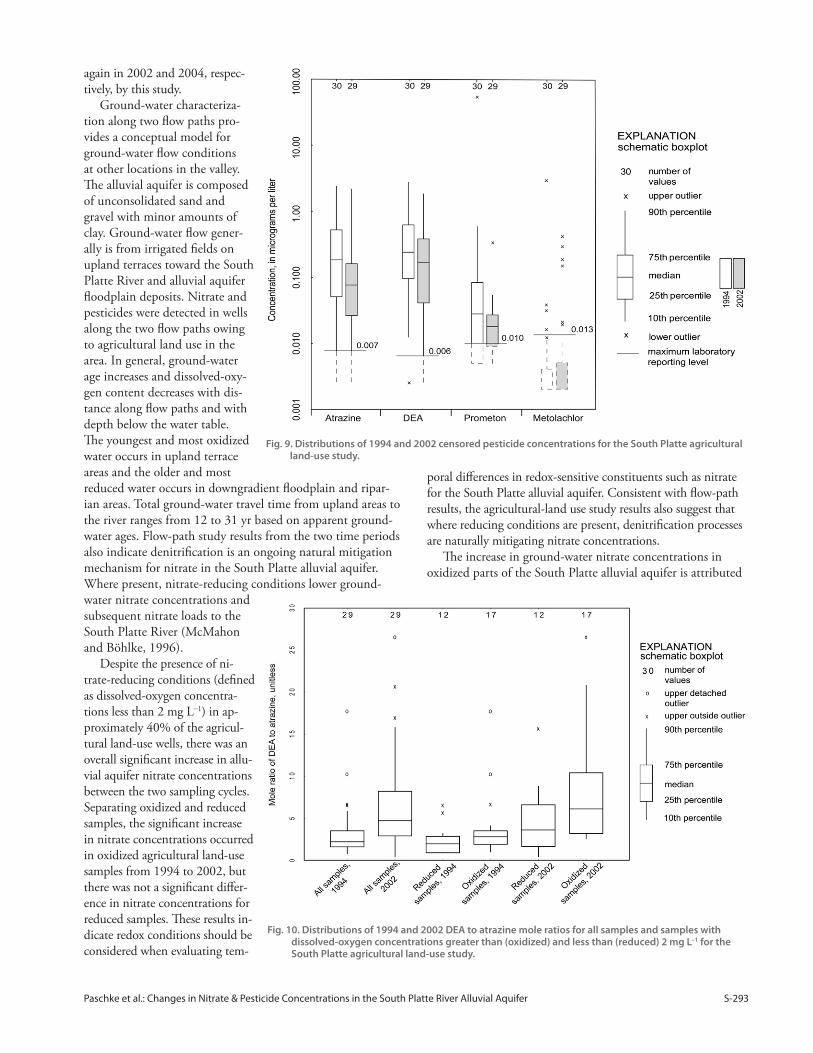
Th e herbicide atrazine and its chlorinated degradate, DEA,
were the most commonly detected pesticide compounds dur-
ing both sampling cycles of the agricultural land-use study.
In 1994, the maximum censored atrazine concentration was
1.8 μg L−1, and the median was 0.16 μg L−1 (Fig. 9). In 2002,
the maximum censored atrazine concentration was 1.7 μg L−1,
and the median was 0.07 μg L−1. All atrazine concentrations
were less than the MCL of 3 μg L−1. Th ere was a signifi cant
decrease in atrazine concentrations from 1994 to 2002 (mean
of 0.25 μg L−1 and median of 0.09 μg L−1 with a p-value <
0.01 for a one-sided Wilcoxon signed-rank test). Spatially,
the atrazine concentration decrease occurred throughout the
study area except at well 3 where there also was a substantial
increase in nitrate and pesticide concentrations. Th e atrazine
degradate DEA showed a pattern similar to that of atrazine
for the agricultural land-use wells. Th e maximum censored
DEA concentration in 1994 was 2.1 μg L−1 with a median of
0.20 μg L−1, and the maximum censored DEA concentration
in 2002 was 1.4 μg L−1with a median of 0.14 μg L−1 (Fig. 9).
Th ere also was a signifi cant decrease in DEA concentrations
from 1994 to 2002 (mean of 0.14 μg L−1 and median of
0.01 μg L−1 with a p-value of 0.03 for a one-sided Wilcoxon
signed-rank test).
Th e pesticide prometon was detected in 22 of 30 agricul-
tural land-use wells in 1994, in 25 of 29 wells in 2002, and
there was a signifi cant decrease in prometon concentrations
from 1994 to 2002 (median of 0.01 μg L−1 with a p-value <
0.01 for a one-sided Wilcoxon signed-rank test). Th e great-
est decreases in prometon concentrations occurred in the
upstream part of the study area near Greeley, CO, where
decreases in atrazine and DEA were also observed. Th e pesti-
cide metolachlor was detected in 10 of 30 agricultural land-
use wells in 1994 and in 13 of 29 wells in 2002. Th ere was
no statistical diff erence between metolachlor concentration
distributions in 1994 and 2002 (p-value of 0.72 for a one-
sided Wilcoxon signed-rank test), and most of the detected
concentrations were estimated below the maximum LRL of
0.013 μg L−1 (Fig. 9). Simazine was detected in 11 of 30 ag-
ricultural land-use wells in 1994 and 10 of 29 wells in 2002,
but similar to metolachlor, there was no signifi cant diff erence
between simazine concentrations for the two sampling cycles
(p-value of 0.59 for a one-sided Wilcoxon signed-rank test),
and many of the detections were estimated below the LRL of
0.011 μg L−1.
Pesticide Use and PersistenceColorado state-wide atrazine-use estimates from the NASS
Chemical Use Database (http://www.pestmanagement.info/
nass/ [verifi ed 30 June 2008]) are available only for years 1990,
1998 to 2001, and 2003, and these sparse data are insuffi cient
to indicate atrazine-use trends for Colorado or the study area.
Maximum atrazine application rates over the period of record
occurred in 1990 and 2001 (307,000 and 318,000 kg yr−1,
respectively), and the minimum atrazine application rate of
Fig. 8. Distributions of 1994 and 2002 δ15N values for samples with dissolved-oxygen concentrations greater than (oxidized) and less than (reduced) 2 mg L–1 for the South Platte agricultural land-use study.
S-292 Journal of Environmental Quality • Volume 37 • September–October [Supplement] 2008
152,000 kg yr−1 occurred in 1999. Th e limited availability of
pesticide-use data precludes relating pesticide use to ground-
water-quality trends in the South Platte River basin. Th ere was
a nationwide reduction in atrazine application rates during the
early 1990s (USEPA, 2003), which could possibly explain the
overall decrease in atrazine and DEA concentrations observed
in the South Platte alluvial aquifer.
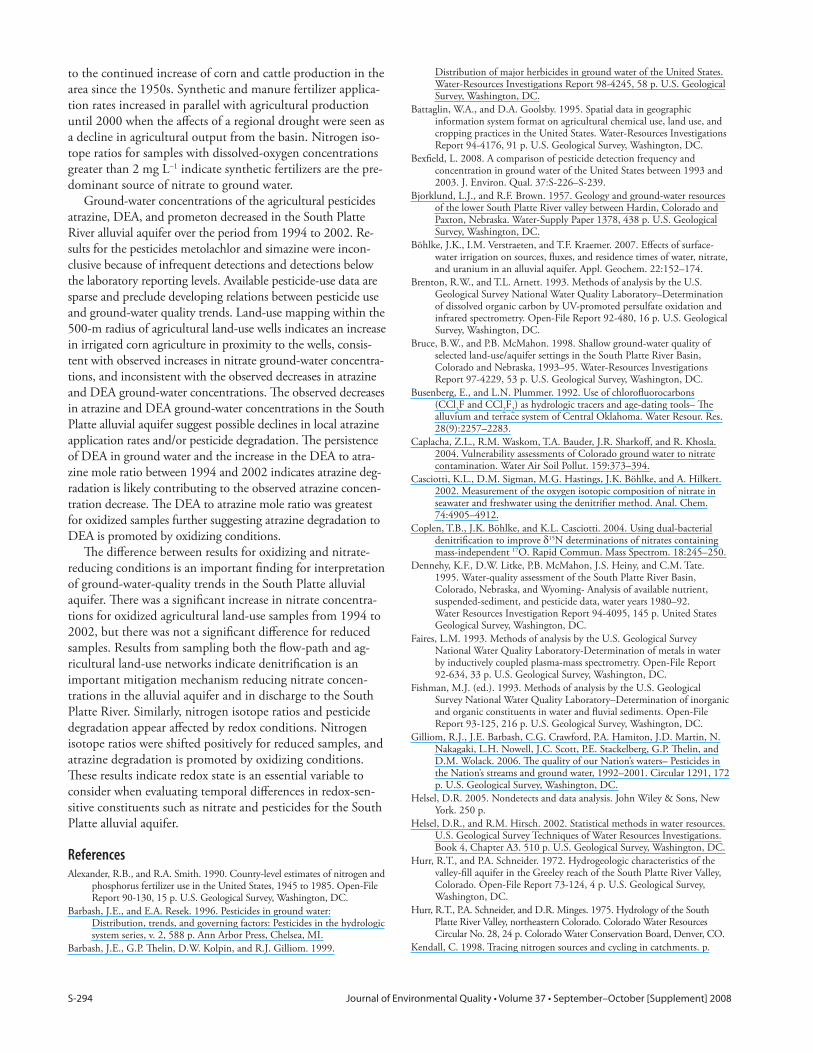
Th e agricultural land-use ground-water concentrations
of atrazine and DEA were examined in more detail to pos-
sibly identify processes controlling their concentrations in the
South Platte alluvial aquifer. Th e continued presence of DEA
in ground water implies atrazine degradation is contributing
to the ground-water atrazine concentration decrease, and the
ratios of DEA to atrazine concentration for 1994 and 2002 are,
in general, greater than 1 for most samples from both sampling
events (Fig. 10). Th ere was a signifi cant increase (p-value < 0.01
for a two-sided Wilcoxon signed-rank test) in the mole ratio of
DEA to atrazine from 1994 (mean of 3.5 and median of 2.4) to
2002 (mean of 6.9 and median of 4.7) implying atrazine degra-
dation increased from 1994 to 2002. Because redox conditions
can aff ect pesticide degradation (Kolpin et al., 1996), and redox
conditions have aff ected nitrate concentrations and nitrogen
isotope ratios in the study area, the distribution of DEA to
atrazine ratios for oxidizing and reduced samples were also con-
sidered separately. Ratios of DEA to atrazine were greater for
oxidized samples than for reduced samples in 1994 and 2002
(Fig. 10) indicating atrazine degradation to DEA is promoted
by oxidizing conditions (Kolpin et al., 1996).
ConclusionsTh e lower South Platte River basin of eastern Colorado and
western Nebraska is an area of intense agriculture supported
by surface-water diversions from the river and ground-water
pumping from a valley-fi ll alluvial aquifer. Th e high hydraulic
conductivity of the alluvial aquifer, the lack of an overlying con-
fi ning layer, and a shallow water table make the South Platte
alluvial aquifer vulnerable to the eff ects of overlying agricultural
land use. Two ground-water monitoring-well networks com-
pleted in the alluvial aquifer in the early 1990s were sampled
again from 2002 to 2004 to evaluate changes in water quality
in the agricultural area over a near-decadal time span. A 30-well
agricultural land-use network sampled in 1994 (Bruce and
McMahon, 1998) and a 15-well fl ow-path monitoring network
sampled in 1993 (McMahon and Böhlke, 1996) were sampled
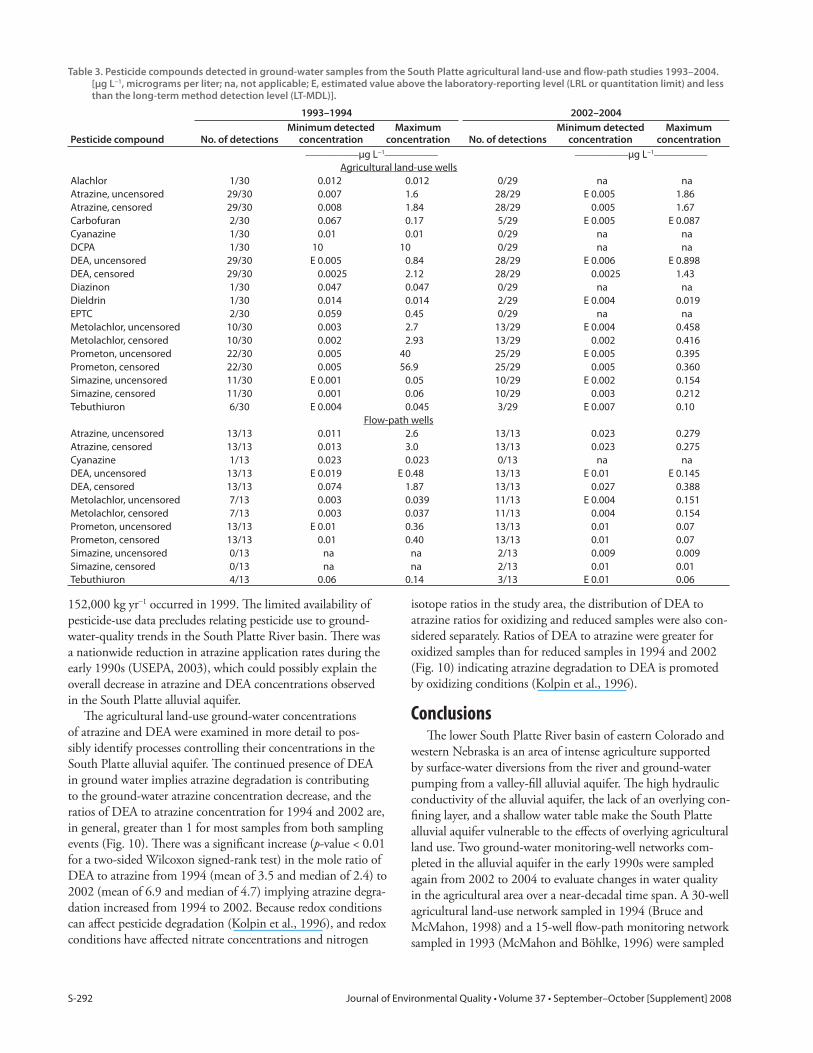
Table 3. Pesticide compounds detected in ground-water samples from the South Platte agricultural land-use and fl ow-path studies 1993–2004. [μg L−1, micrograms per liter; na, not applicable; E, estimated value above the laboratory-reporting level (LRL or quantitation limit) and less than the long-term method detection level (LT-MDL)].
Pesticide compound
1993–1994 2002–2004
No. of detectionsMinimum detected
concentrationMaximum
concentration No. of detectionsMinimum detected
concentrationMaximum
concentration
––––––––––μg L−1–––––––––– ––––––––––μg L−1––––––––––Agricultural land-use wells
Alachlor 1/30 0.012 0.012 0/29 na na
Atrazine, uncensored 29/30 0.007 1.6 28/29 E 0.005 1.86
Atrazine, censored 29/30 0.008 1.84 28/29 0.005 1.67
Carbofuran 2/30 0.067 0.17 5/29 E 0.005 E 0.087
Cyanazine 1/30 0.01 0.01 0/29 na na
DCPA 1/30 10 10 0/29 na na
DEA, uncensored 29/30 E 0.005 0.84 28/29 E 0.006 E 0.898
DEA, censored 29/30 0.0025 2.12 28/29 0.0025 1.43
Diazinon 1/30 0.047 0.047 0/29 na na
Dieldrin 1/30 0.014 0.014 2/29 E 0.004 0.019
EPTC 2/30 0.059 0.45 0/29 na na
Metolachlor, uncensored 10/30 0.003 2.7 13/29 E 0.004 0.458
Metolachlor, censored 10/30 0.002 2.93 13/29 0.002 0.416
Prometon, uncensored 22/30 0.005 40 25/29 E 0.005 0.395
Prometon, censored 22/30 0.005 56.9 25/29 0.005 0.360
Simazine, uncensored 11/30 E 0.001 0.05 10/29 E 0.002 0.154
Simazine, censored 11/30 0.001 0.06 10/29 0.003 0.212
Tebuthiuron 6/30 E 0.004 0.045 3/29 E 0.007 0.10
Flow-path wells
Atrazine, uncensored 13/13 0.011 2.6 13/13 0.023 0.279
Atrazine, censored 13/13 0.013 3.0 13/13 0.023 0.275
Cyanazine 1/13 0.023 0.023 0/13 na na
DEA, uncensored 13/13 E 0.019 E 0.48 13/13 E 0.01 E 0.145
DEA, censored 13/13 0.074 1.87 13/13 0.027 0.388
Metolachlor, uncensored 7/13 0.003 0.039 11/13 E 0.004 0.151
Metolachlor, censored 7/13 0.003 0.037 11/13 0.004 0.154
Prometon, uncensored 13/13 E 0.01 0.36 13/13 0.01 0.07
Prometon, censored 13/13 0.01 0.40 13/13 0.01 0.07
Simazine, uncensored 0/13 na na 2/13 0.009 0.009
Simazine, censored 0/13 na na 2/13 0.01 0.01
Tebuthiuron 4/13 0.06 0.14 3/13 E 0.01 0.06
Paschke et al.: Changes in Nitrate & Pesticide Concentrations in the South Platte River Alluvial Aquifer S-293
again in 2002 and 2004, respec-
tively, by this study.
Ground-water characteriza-
tion along two fl ow paths pro-
vides a conceptual model for
ground-water fl ow conditions
at other locations in the valley.
Th e alluvial aquifer is composed
of unconsolidated sand and
gravel with minor amounts of
clay. Ground-water fl ow gener-
ally is from irrigated fi elds on
upland terraces toward the South
Platte River and alluvial aquifer
fl oodplain deposits. Nitrate and
pesticides were detected in wells
along the two fl ow paths owing
to agricultural land use in the
area. In general, ground-water
age increases and dissolved-oxy-
gen content decreases with dis-
tance along fl ow paths and with
depth below the water table.
Th e youngest and most oxidized
water occurs in upland terrace
areas and the older and most
reduced water occurs in downgradient fl oodplain and ripar-
ian areas. Total ground-water travel time from upland areas to
the river ranges from 12 to 31 yr based on apparent ground-
water ages. Flow-path study results from the two time periods
also indicate denitrifi cation is an ongoing natural mitigation
mechanism for nitrate in the South Platte alluvial aquifer.
Where present, nitrate-reducing conditions lower ground-
water nitrate concentrations and
subsequent nitrate loads to the
South Platte River (McMahon
and Böhlke, 1996).
Despite the presence of ni-
trate-reducing conditions (defi ned
as dissolved-oxygen concentra-
tions less than 2 mg L−1) in ap-
proximately 40% of the agricul-
tural land-use wells, there was an
overall signifi cant increase in allu-
vial aquifer nitrate concentrations
between the two sampling cycles.
Separating oxidized and reduced
samples, the signifi cant increase
in nitrate concentrations occurred
in oxidized agricultural land-use
samples from 1994 to 2002, but
there was not a signifi cant diff er-
ence in nitrate concentrations for
reduced samples. Th ese results in-
dicate redox conditions should be
considered when evaluating tem-
poral diff erences in redox-sensitive constituents such as nitrate
for the South Platte alluvial aquifer. Consistent with fl ow-path
results, the agricultural-land use study results also suggest that
where reducing conditions are present, denitrifi cation processes
are naturally mitigating nitrate concentrations.
Th e increase in ground-water nitrate concentrations in
oxidized parts of the South Platte alluvial aquifer is attributed
Fig. 9. Distributions of 1994 and 2002 censored pesticide concentrations for the South Platte agricultural land-use study.
Fig. 10. Distributions of 1994 and 2002 DEA to atrazine mole ratios for all samples and samples with dissolved-oxygen concentrations greater than (oxidized) and less than (reduced) 2 mg L–1 for the South Platte agricultural land-use study.
S-294 Journal of Environmental Quality • Volume 37 • September–October [Supplement] 2008
to the continued increase of corn and cattle production in the
area since the 1950s. Synthetic and manure fertilizer applica-
tion rates increased in parallel with agricultural production
until 2000 when the aff ects of a regional drought were seen as
a decline in agricultural output from the basin. Nitrogen iso-
tope ratios for samples with dissolved-oxygen concentrations
greater than 2 mg L−1 indicate synthetic fertilizers are the pre-
dominant source of nitrate to ground water.
Ground-water concentrations of the agricultural pesticides
atrazine, DEA, and prometon decreased in the South Platte
River alluvial aquifer over the period from 1994 to 2002. Re-
sults for the pesticides metolachlor and simazine were incon-
clusive because of infrequent detections and detections below
the laboratory reporting levels. Available pesticide-use data are
sparse and preclude developing relations between pesticide use
and ground-water quality trends. Land-use mapping within the
500-m radius of agricultural land-use wells indicates an increase
in irrigated corn agriculture in proximity to the wells, consis-
tent with observed increases in nitrate ground-water concentra-
tions, and inconsistent with the observed decreases in atrazine
and DEA ground-water concentrations. Th e observed decreases
in atrazine and DEA ground-water concentrations in the South
Platte alluvial aquifer suggest possible declines in local atrazine
application rates and/or pesticide degradation. Th e persistence
of DEA in ground water and the increase in the DEA to atra-
zine mole ratio between 1994 and 2002 indicates atrazine deg-
radation is likely contributing to the observed atrazine concen-
tration decrease. Th e DEA to atrazine mole ratio was greatest
for oxidized samples further suggesting atrazine degradation to
DEA is promoted by oxidizing conditions.
Th e diff erence between results for oxidizing and nitrate-
reducing conditions is an important fi nding for interpretation
of ground-water-quality trends in the South Platte alluvial
aquifer. Th ere was a signifi cant increase in nitrate concentra-
tions for oxidized agricultural land-use samples from 1994 to
2002, but there was not a signifi cant diff erence for reduced
samples. Results from sampling both the fl ow-path and ag-
ricultural land-use networks indicate denitrifi cation is an
important mitigation mechanism reducing nitrate concen-
trations in the alluvial aquifer and in discharge to the South
Platte River. Similarly, nitrogen isotope ratios and pesticide
degradation appear aff ected by redox conditions. Nitrogen
isotope ratios were shifted positively for reduced samples, and
atrazine degradation is promoted by oxidizing conditions.
Th ese results indicate redox state is an essential variable to
consider when evaluating temporal diff erences in redox-sen-
sitive constituents such as nitrate and pesticides for the South
Platte alluvial aquifer.
ReferencesAlexander, R.B., and R.A. Smith. 1990. County-level estimates of nitrogen and
phosphorus fertilizer use in the United States, 1945 to 1985. Open-File Report 90-130, 15 p. U.S. Geological Survey, Washington, DC.
Barbash, J.E., and E.A. Resek. 1996. Pesticides in ground water: Distribution, trends, and governing factors: Pesticides in the hydrologic system series, v. 2, 588 p. Ann Arbor Press, Chelsea, MI.
Barbash, J.E., G.P. Th elin, D.W. Kolpin, and R.J. Gilliom. 1999.
Distribution of major herbicides in ground water of the United States. Water-Resources Investigations Report 98-4245, 58 p. U.S. Geological Survey, Washington, DC.
Battaglin, W.A., and D.A. Goolsby. 1995. Spatial data in geographic information system format on agricultural chemical use, land use, and cropping practices in the United States. Water-Resources Investigations Report 94-4176, 91 p. U.S. Geological Survey, Washington, DC.
Bexfi eld, L. 2008. A comparison of pesticide detection frequency and concentration in ground water of the United States between 1993 and 2003. J. Environ. Qual. 37:S-226–S-239.
Bjorklund, L.J., and R.F. Brown. 1957. Geology and ground-water resources of the lower South Platte River valley between Hardin, Colorado and Paxton, Nebraska. Water-Supply Paper 1378, 438 p. U.S. Geological Survey, Washington, DC.
Böhlke, J.K., I.M. Verstraeten, and T.F. Kraemer. 2007. Eff ects of surface-water irrigation on sources, fl uxes, and residence times of water, nitrate, and uranium in an alluvial aquifer. Appl. Geochem. 22:152–174.
Brenton, R.W., and T.L. Arnett. 1993. Methods of analysis by the U.S. Geological Survey National Water Quality Laboratory–Determination of dissolved organic carbon by UV-promoted persulfate oxidation and infrared spectrometry. Open-File Report 92-480, 16 p. U.S. Geological Survey, Washington, DC.
Bruce, B.W., and P.B. McMahon. 1998. Shallow ground-water quality of selected land-use/aquifer settings in the South Platte River Basin, Colorado and Nebraska, 1993–95. Water-Resources Investigations Report 97-4229, 53 p. U.S. Geological Survey, Washington, DC.
Busenberg, E., and L.N. Plummer. 1992. Use of chlorofl uorocarbons (CCl
3F and CCl
2F
2) as hydrologic tracers and age-dating tools– Th e
alluvium and terrace system of Central Oklahoma. Water Resour. Res. 28(9):2257–2283.
Caplacha, Z.L., R.M. Waskom, T.A. Bauder, J.R. Sharkoff , and R. Khosla. 2004. Vulnerability assessments of Colorado ground water to nitrate contamination. Water Air Soil Pollut. 159:373–394.
Casciotti, K.L., D.M. Sigman, M.G. Hastings, J.K. Böhlke, and A. Hilkert. 2002. Measurement of the oxygen isotopic composition of nitrate in seawater and freshwater using the denitrifi er method. Anal. Chem. 74:4905–4912.
Coplen, T.B., J.K. Böhlke, and K.L. Casciotti. 2004. Using dual-bacterial denitrifi cation to improve δ15N determinations of nitrates containing mass-independent 17O. Rapid Commun. Mass Spectrom. 18:245–250.
Dennehy, K.F., D.W. Litke, P.B. McMahon, J.S. Heiny, and C.M. Tate. 1995. Water-quality assessment of the South Platte River Basin, Colorado, Nebraska, and Wyoming- Analysis of available nutrient, suspended-sediment, and pesticide data, water years 1980–92. Water Resources Investigation Report 94-4095, 145 p. United States Geological Survey, Washington, DC.
Faires, L.M. 1993. Methods of analysis by the U.S. Geological Survey National Water Quality Laboratory-Determination of metals in water by inductively coupled plasma-mass spectrometry. Open-File Report 92-634, 33 p. U.S. Geological Survey, Washington, DC.
Fishman, M.J. (ed.). 1993. Methods of analysis by the U.S. Geological Survey National Water Quality Laboratory–Determination of inorganic and organic constituents in water and fl uvial sediments. Open-File Report 93-125, 216 p. U.S. Geological Survey, Washington, DC.
Gilliom, R.J., J.E. Barbash, C.G. Crawford, P.A. Hamiton, J.D. Martin, N. Nakagaki, L.H. Nowell, J.C. Scott, P.E. Stackelberg, G.P. Th elin, and D.M. Wolack. 2006. Th e quality of our Nation’s waters– Pesticides in the Nation’s streams and ground water, 1992–2001. Circular 1291, 172 p. U.S. Geological Survey, Washington, DC.
Helsel, D.R. 2005. Nondetects and data analysis. John Wiley & Sons, New York. 250 p.
Helsel, D.R., and R.M. Hirsch. 2002. Statistical methods in water resources. U.S. Geological Survey Techniques of Water Resources Investigations. Book 4, Chapter A3. 510 p. U.S. Geological Survey, Washington, DC.
Hurr, R.T., and P.A. Schneider. 1972. Hydrogeologic characteristics of the valley-fi ll aquifer in the Greeley reach of the South Platte River Valley, Colorado. Open-File Report 73-124, 4 p. U.S. Geological Survey, Washington, DC.
Hurr, R.T., P.A. Schneider, and D.R. Minges. 1975. Hydrology of the South Platte River Valley, northeastern Colorado. Colorado Water Resources Circular No. 28, 24 p. Colorado Water Conservation Board, Denver, CO.
Kendall, C. 1998. Tracing nitrogen sources and cycling in catchments. p.
Paschke et al.: Changes in Nitrate & Pesticide Concentrations in the South Platte River Alluvial Aquifer S-295
519–576. In C. Kendall and J.J. McDonnell (ed.) Isotope tracers in catchment hydrology. Elsevier, Amsterdam.
Knowles, R. 1982. Denitrifi cation. Microbiol. Rev. 46:43–70.
Kolpin, D.W., E.M. Th urman, and D.A. Goolsby. 1996. Occurrence of selected pesticides and their metabolites in near-surface aquifer of the Midwestern United States. Environ. Sci. Technol. 30:334–340.
Koterba, M.T., F.D. Wilde, and W.W. Lapham. 1995. Ground-water data-collection protocols and procedures– Collection and documentation of water-quality samples and related data. Open-File Report 95-399, 124 p. U.S. Geological Survey, Washington, DC.
Lapham, W.W., F.D. Wilde, and M.T. Koterba. 1995. Ground-water data-collection protocols and procedures for the National Water-Quality Assessment program– Selection, installation, and documentation of wells, and collection of related data. Open-File Report 95-398, 76 p. U.S. Geological Survey, Washington, DC.
MacDonnell, L.J. 1988. Integrating tributary groundwater development into the Prior Appropriation System- the South Platte experience. Completion Report no. 148, 56 p. Colorado State Univ., Colorado Water Resources Research Inst., Fort Collins.
McCabe, G.J., M.A. Palecki, and J.L. Betancourt. 2004. Pacifi c and Atlantic Ocean infl uences on multidecadal drought frequency in the United States. Proc. Natl. Acad. Sci. USA 101(12):4136–4141.
McMahon, P.B., and J.K. Böhlke. 1996. Denitrifi cation and mixing in a stream-aquifer system–Eff ects on nitrate loading to surface water. J. Hydrol. 186:105–128.
McMahon, P.B., and J.K. Böhlke. 2006. Regional patterns in the isotopic composition of natural and anthropogenic nitrate in ground water, High Plains, USA. Environ. Sci. Technol. 40:2965–2970.
Mendenhall, W., and T. Sincich. 1992. Statistics for engineering and the sciences, 3rd ed. Macmillan Publishing, San Francisco. 963 p.
Mueller, D.K., P.A. Hamilton, D.R. Helsel, K.J. Hitt, and B.C. Ruddy. 1995. Nutrients in ground water and surface water of the United States–An analysis of data through 1992. Water Resources Investigation Report 95-4031, 81 p. U.S. Geological Survey, Washington, DC.
Mueller, D.K., and D.R. Helsel. 1996. Nutrients in the Nation’s waters- Too much of a good thing? Circular 1136, 24 p. U.S. Geological Survey, Washington, DC.
Nadler, C.T., and S.A. Schumm. 1981. Metamorphosis of South Platte and Arkansas Rivers, Eastern Colorado. Phys. Geol. 2(2):95–115.
National Oceanic and Atmospheric Administration. 2003. Normal precipitation data for Colorado. Available at http://www.ncdc.noaa.gov/oa/pub/data/coop-precip/colorado.txt (verifi ed 30 June 2008). NOAA, Washington, DC.
Patton, C.J., and J.R. Kryskalla. 2003. Methods of analysis by the U.S. Geological Survey National Water Quality Laboratory- Evaluation of alkaline persulfate digestion as an alternative to Kjeldahl digestion for determination of total and dissolved nitrogen and phosphorus in water. Water-Resources Investigations Report 03-4174, 40 p. U.S. Geological Survey, Washington, DC.
Puckett, L.J. 1994. Nonpoint and point sources of nitrogen in major watersheds in the United States. Water-Resources Investigations Report 94-4001, 12 p. U.S. Geological Survey, Washington, DC.
Rosen, M.R., F.D. Voss, and J.A. Arufe. 2008. Comparison of the ground-water quality trend component of U.S. Geological Survey National Water-Quality Assessment Program to other national designs. J. Environ. Qual. 37:S-199–S-208.
Rounds, S.A., and F.D. Wilde. 2001. Alkalinity and acid neutralizing
capacity. In F.D. Wilde and D.B. Radtke (eds.) National fi eld manual for the collection of water-quality data. U.S. Geological Survey Techniques of Water-Resources Investigations, Book 9, Chapter A6.6, 50 p. U.S. Geological Survey, Washington, DC.
Ruddy, B.C., D.L. Lorenz, and D.K. Mueller. 2006. County-level estimates of nutrient inputs to the land surface of the conterminous United States, 1982–2001. Scientifi c Investigations Report 2006-5012, 23 p. U.S. Geological Survey, Washington, DC.
Rupert, M.G. 2003. Probability of detecting atrazine/desethyl-atrazine and elevated concentrations of nitrate in ground water in Colorado. Water-Resources Investigations Report 02-4269, 40 p. U.S. Geological Survey, Washington, DC.
Sandstrom, M.W., M.E. Stroppel, W.T. Foreman, and M.P. Schroeder. 2001. Methods of analysis by the U.S. Geological Survey National Water Quality Laboratory-Determination of moderate-use pesticides and selected degradates in water by C-18 solid-phase extraction and gas chromatography/mass spectrometry. Water-Resources Investigations Report 01-4098, 78 p. U.S. Geological Survey, Washington, DC.
Schuff , S. 1992. Nitrates can leach but they can’t hide. Colorado Rancher and Farmer, p. 6–14.
Scott, J.C. 1990. Computerized stratifi ed random site-selection approaches for design of a ground-water-quality sampling network. Water-Resources Investigations Report 90-4101, 114 p. U.S. Geological Survey, Washington, DC.
Seiler, R.L. 2005. Combined use of 15N and 18O of nitrate and 11B to evaluate nitrate contamination in ground water. Appl. Geochem. 20:1626–1636.
Sigman, D.M., K.L. Casciotti, M.C. Andreani, C. Barford, M. Galanter, and J.K. Böhlke. 2001. A bacterial method for the nitrogen isotopic analysis of nitrate in seawater and freshwater. Anal. Chem. 73:4145–4153.
Smith, R.O., P.A. Schneider, and L.R. Petri. 1964. Ground-water resources of the South Platte River basin in western Adams and southwestern Weld Counties, Colorado. Water-Supply Paper 1658, 149 p. U.S. Geological Survey, Washington, DC.
Spalding, R.F., and M.E. Exner. 1993. Occurrence of nitrate in ground water- A review. J. Environ. Qual. 22:392–402.
USEPA. 1994. National primary drinking water standards, February 1994. EPA 810-F-94-001A, 8 p. USEPA, Offi ce of Water, Washington, DC.
USEPA. 2003. Interim reregistration eligibility decision for atrazine—Case no. 0062. Available at http://www.epa.gov/oppsrrd1/REDs/atrazine_ired.pdf (verifi ed 30 June 2008). USEPA, Washington, DC.
USEPA. 2004. EPA regional priority AFO science question synthesis document- nitrogen source tracking: Supporting documentation for the EPA Regional Science Workshop on Animal Feeding Operations (AFOS). December 6–9, 2004. College Park, Maryland. Available at http://www.epa.gov/OSP/regions/afo.htm (verifi ed 30 June 2008). USEPA, Washington, DC.
U.S. Geological Survey. variously dated. National fi eld manual for the collection of water-quality data. U.S. Geological Survey Techniques of Water-Resources Investigations, Book 9, Chaps. A1–A9. Available at http://pubs.water.usgs.gov/twri9A (verifi ed 30 June 2008). U.S. Geological Survey, Washington, DC.
Zaugg, S.D., M.W. Sandstrom, S.G. Smith, and K.M. Fehlberg. 1995. Methods of analysis by the U.S. Geological Survey National Water Quality Laboratory-Determination of pesticides in water by C-18 solid-phase extraction and capillary-column gas chromatography/mass spectrometry with selected-ion monitoring. Open-File Report 95-181, 54 p. U.S. Geological Survey, Washington, DC.


