Embed Size (px)
Citation preview
Natural Heat Storage in a Brine-Filled Solar Pond in the Tully Valley of Central New York
IntroductionThe Tully Valley, located in southern Onondaga County,
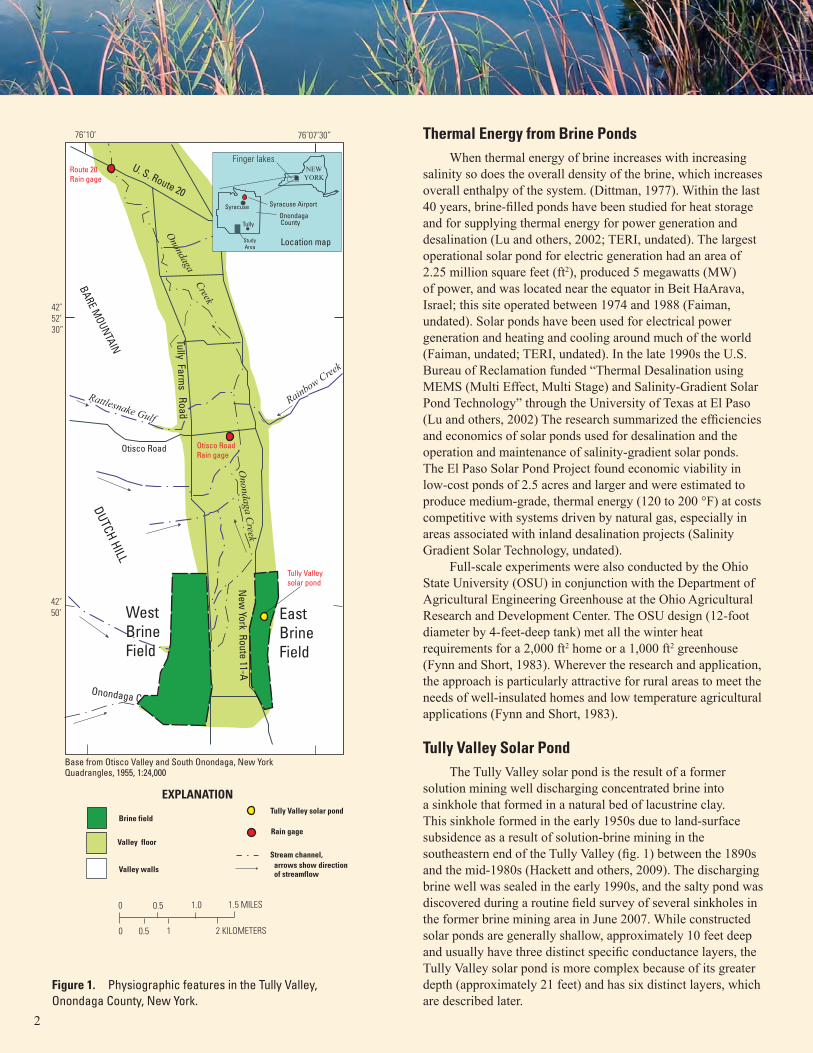
New York, has a long history of unusual natural hydrogeologic phenomena including mudboils (Kappel, 2009), landslides (Tamulonis and others, 2009; Pair and others, 2000), land-surface subsidence (Hackett and others, 2009; Kappel, 2009), and a brine-filled sinkhole or “Solar pond” (fig. 1), which is documented in this report. A solar pond is a pool of salty water (brine) which stores the sun’s energy in the form of heat. The saltwater naturally forms distinct layers with increasing density between transitional zones (haloclines) of rapidly changing specific conductance with depth. In a typical solar pond, the top
layer has a low salt content and is often times referred to as the upper convective zone (Lu and others, 2002). The bottom layer is a concentrated brine that is either convective or temperature stratified dependent on the surrounding environment. Solar insolation is absorbed and stored in the lower, denser brine while the overlying halocline acts as an insulating layer and prevents heat from moving upwards from the lower zone (Lu and others, 2002). In the case of the Tully Valley solar pond, water within the pond can be over 90 degrees Fahrenheit (oF) in late summer and early fall. The purpose of this report is to summarize observations at the Tully Valley brine-filled sinkhole and provide supplemental climate data which might affect the pond salinity gradients insolation (solar energy).
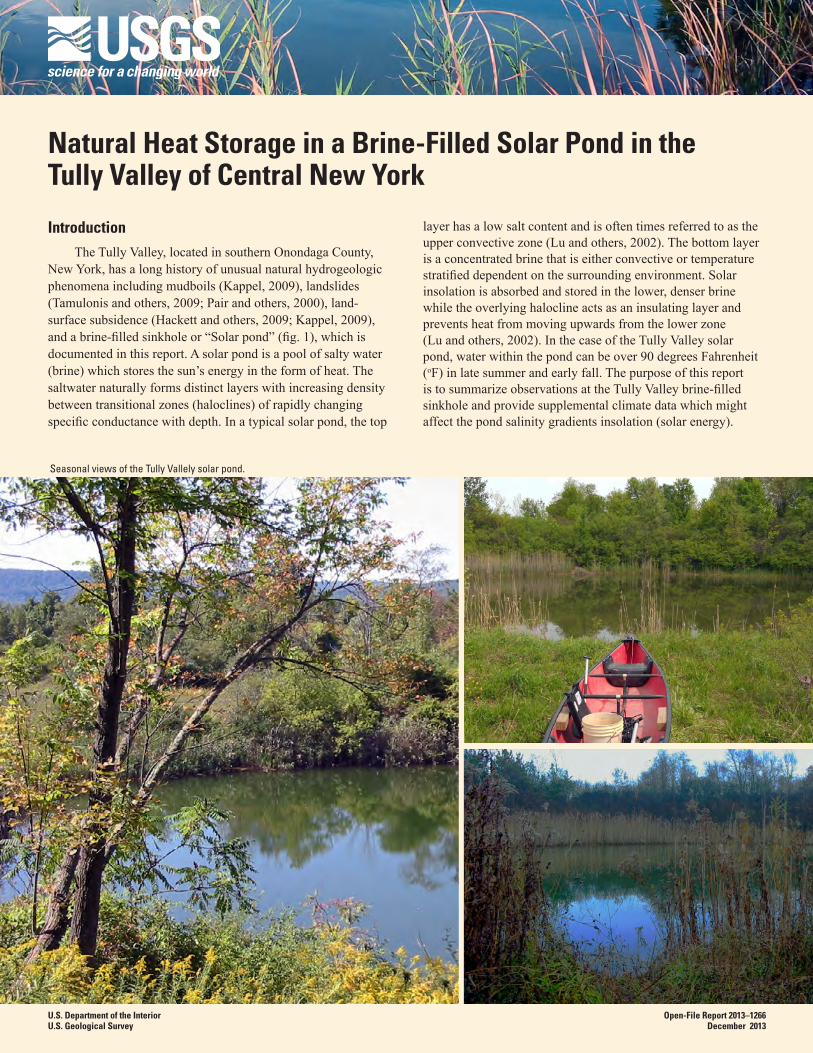
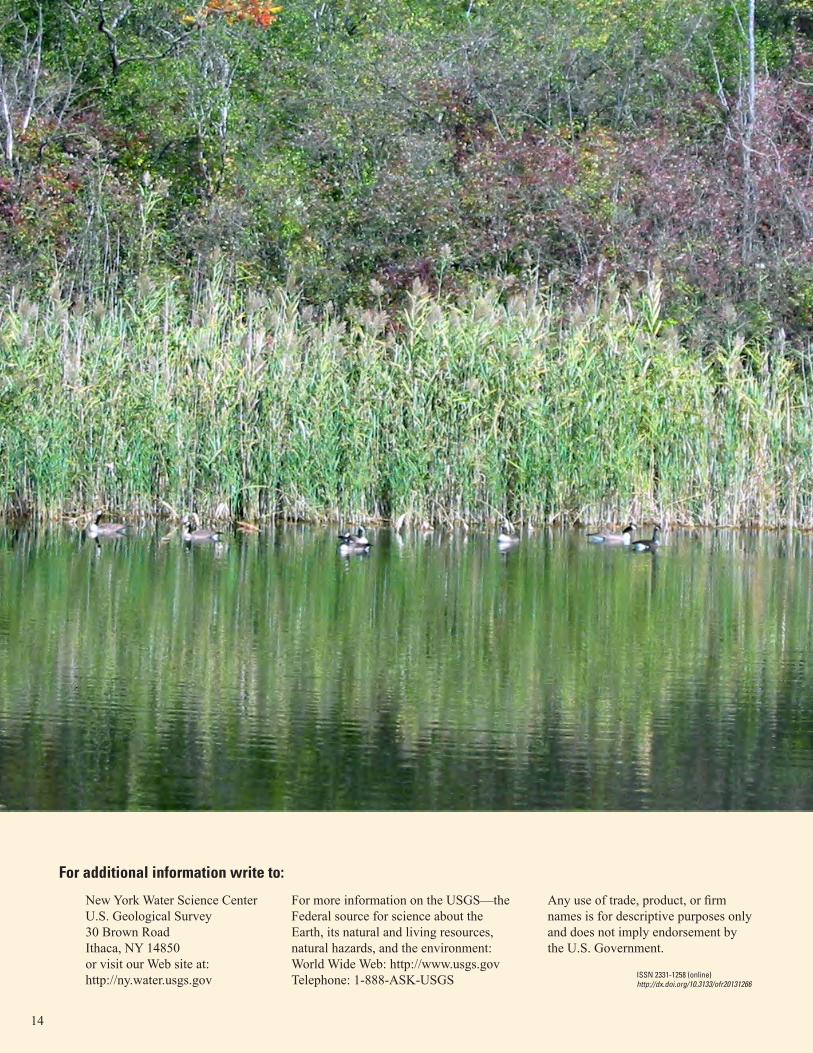
Seasonal views of the Tully Vallely solar pond.
U.S. Department of the InteriorU.S. Geological Survey
Open-File Report 2013–1266December 2013
Otisco Road
Tully Farms Road
Onondaga Creek
New
York Route 11-A
Rattlesnake Gulf
Onondaga Creek
BARE MOUNTAIN
Onondaga Creek
Rainbow Creek
U. S. Route 20Syracuse
Onondaga County
NEWYORK
Study Area
Location map
DUTCH HILL
Otisco RoadRain gage
76˚10’ 76˚07’30”
42˚ 52’ 30”
42˚ 50’
Base from Otisco Valley and South Onondaga, New YorkQuadrangles, 1955, 1:24,000
Rain gage
Tully Valley solar pond
Tully
Route 20Rain gage
EastBrineField
WestBrineField
EXPLANATION
Stream channel, arrows show direction of streamflow
0 0.5 1.0 1.5 MILES
0 0.5 1 2 KILOMETERS
Brine field
Valley walls
Valley floor
Tully Valley solar pond
Finger lakes
Syracuse Airport
2
Figure 1. Physiographic features in the Tully Valley, Onondaga County, New York.
Thermal Energy from Brine PondsWhen thermal energy of brine increases with increasing
salinity so does the overall density of the brine, which increases overall enthalpy of the system. (Dittman, 1977). Within the last 40 years, brine-filled ponds have been studied for heat storage and for supplying thermal energy for power generation and desalination (Lu and others, 2002; TERI, undated). The largest operational solar pond for electric generation had an area of 2.25 million square feet (ft2), produced 5 megawatts (MW) of power, and was located near the equator in Beit HaArava, Israel; this site operated between 1974 and 1988 (Faiman, undated). Solar ponds have been used for electrical power generation and heating and cooling around much of the world (Faiman, undated; TERI, undated). In the late 1990s the U.S. Bureau of Reclamation funded “Thermal Desalination using MEMS (Multi Effect, Multi Stage) and Salinity-Gradient Solar Pond Technology” through the University of Texas at El Paso (Lu and others, 2002) The research summarized the efficiencies and economics of solar ponds used for desalination and the operation and maintenance of salinity-gradient solar ponds. The El Paso Solar Pond Project found economic viability in low-cost ponds of 2.5 acres and larger and were estimated to produce medium-grade, thermal energy (120 to 200 °F) at costs competitive with systems driven by natural gas, especially in areas associated with inland desalination projects (Salinity Gradient Solar Technology, undated).
Full-scale experiments were also conducted by the Ohio State University (OSU) in conjunction with the Department of Agricultural Engineering Greenhouse at the Ohio Agricultural Research and Development Center. The OSU design (12-foot diameter by 4-feet-deep tank) met all the winter heat requirements for a 2,000 ft2 home or a 1,000 ft2 greenhouse (Fynn and Short, 1983). Wherever the research and application, the approach is particularly attractive for rural areas to meet the needs of well-insulated homes and low temperature agricultural applications (Fynn and Short, 1983).
Tully Valley Solar PondThe Tully Valley solar pond is the result of a former
solution mining well discharging concentrated brine into a sinkhole that formed in a natural bed of lacustrine clay. This sinkhole formed in the early 1950s due to land-surface subsidence as a result of solution-brine mining in the southeastern end of the Tully Valley (fig. 1) between the 1890s and the mid-1980s (Hackett and others, 2009). The discharging brine well was sealed in the early 1990s, and the salty pond was discovered during a routine field survey of several sinkholes in the former brine mining area in June 2007. While constructed solar ponds are generally shallow, approximately 10 feet deep and usually have three distinct specific conductance layers, the Tully Valley solar pond is more complex because of its greater depth (approximately 21 feet) and has six distinct layers, which are described later.
3
Profiles of water temperature, specific conductance, and salinity (See appendix 1; available separately at http://pubs.usgs.gov/of/2013/1266/ ) were made over the deepest part (center) of the pond and were initially collected monthly beginning in June 2007. (Note: All specific conductance readings are listed at 25 degrees Celsius (oC) throughout this report.) A Yellow Springs Instrument Model 30 Temperature, Conductivity, Salinity meter 1 was used to collect all profile data. The sonde cable was marked every foot for consistent depth readings, and the instrument was calibrated against known standards several times each year and did not require any recalibration throughout the data collection period. After
1 Use of trade, product, or firm names in this publication is for descriptive purposes only and does not imply endorsement by the U.S. Government.
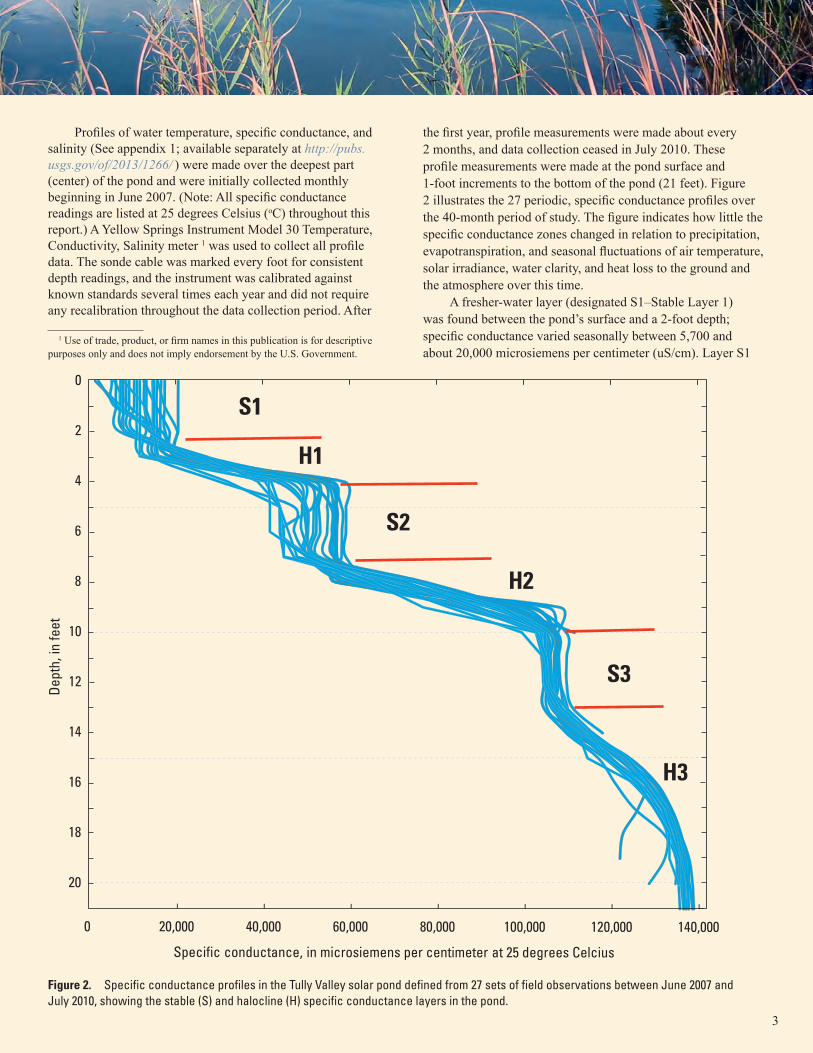
the first year, profile measurements were made about every 2 months, and data collection ceased in July 2010. These profile measurements were made at the pond surface and 1-foot increments to the bottom of the pond (21 feet). Figure 2 illustrates the 27 periodic, specific conductance profiles over the 40-month period of study. The figure indicates how little the specific conductance zones changed in relation to precipitation, evapotranspiration, and seasonal fluctuations of air temperature, solar irradiance, water clarity, and heat loss to the ground and the atmosphere over this time.
A fresher-water layer (designated S1–Stable Layer 1) was found between the pond’s surface and a 2-foot depth; specific conductance varied seasonally between 5,700 and about 20,000 microsiemens per centimeter (uS/cm). Layer S1
0 20,000 40,000 60,000 80,000 100,000 120,000 140,000
0
2
4
6
8
10
12
14
16
18
20
Specific conductance, in microsiemens per centimeter at 25 degrees Celcius
Dept
h, in
feet
S1
S3
S2
H1
H3
H2
Figure 2. Specific conductance profiles in the Tully Valley solar pond defined from 27 sets of field observations between June 2007 and July 2010, showing the stable (S) and halocline (H) specific conductance layers in the pond.
4
is directly affected by evapotranspiration and precipitation at the pond’s surface, which in turn, can change the pond’s surface elevation and thus surface area. The first halocline layer (designated H1–Halocline Layer 1) is a layer of rapidly changing conductivity with depth and is found between 2 and 4.5 feet deep. Layer H1 acts to partly insulate the layers below, and the specific conductance values in H1 transition from about 20,000 to nearly 40,000 µS/cm. The next layer (S2) is between 4.5 and 7 feet and has specific conductance values that seasonally vary from 40,000 to 60,000 µS/cm. The second halocline layer (H2) is between 7 and about 10 feet, with specific conductance values that are relatively constant but vary by depth between 60,000 and just over 105,000 µS/cm, providing insulation for the layers below; the H2 layer has more consistent conductivity than the H1 layer above based upon the compact nature of the 27 profiles collected in this layer. The third stable layer (S3) from 10 to about 13 feet has a rather narrow and consistent range of conductivity from 105,000 to 115,000 µS/cm. The bottom halocline (H3) displays a uniform specific conductance profile from 115,000 to nearly 140,000 µS/cm where the densest brine in the pond is found.
Thermal storage capacity is most prevalent in the deeper layers and is apparently related to the degree of brine saturation, solar irradiance, and water clarity in the S1, H1, and S2 layers. Heat loss occurs at the perimeter of the pond from all layers and back to the atmosphere from only the S1 layer.
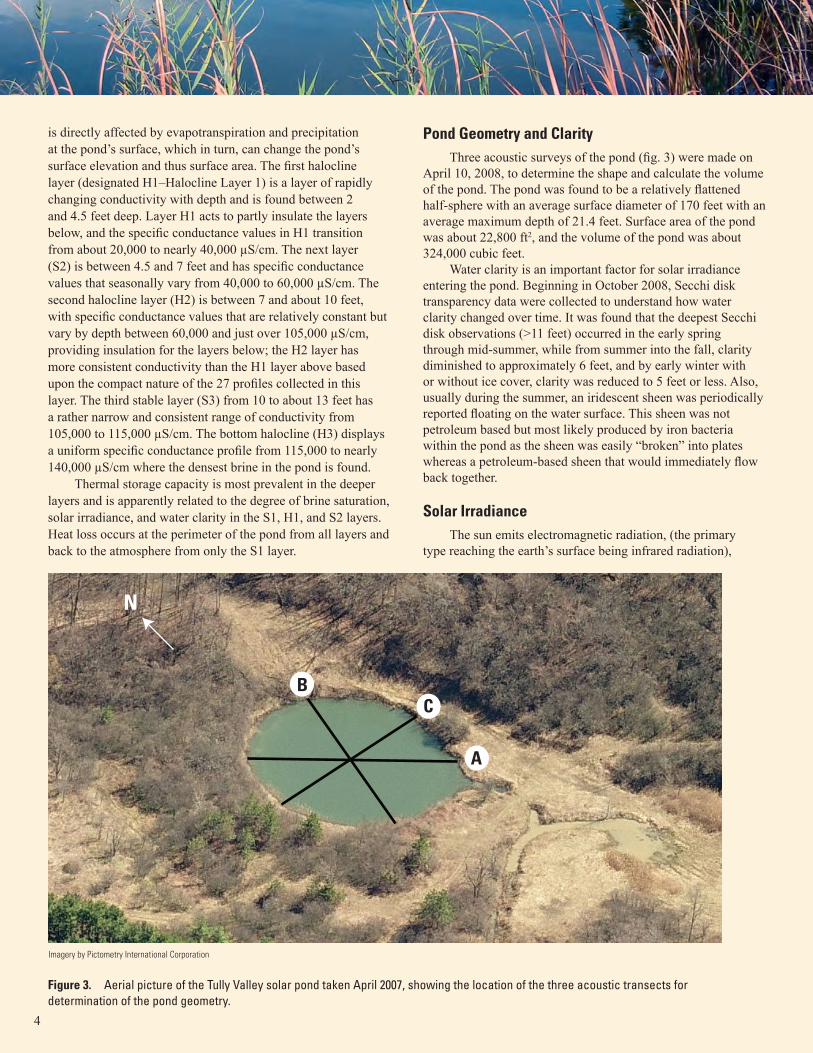
Pond Geometry and Clarity Three acoustic surveys of the pond (fig. 3) were made on
April 10, 2008, to determine the shape and calculate the volume of the pond. The pond was found to be a relatively flattened half-sphere with an average surface diameter of 170 feet with an average maximum depth of 21.4 feet. Surface area of the pond was about 22,800 ft2, and the volume of the pond was about 324,000 cubic feet.
Water clarity is an important factor for solar irradiance entering the pond. Beginning in October 2008, Secchi disk transparency data were collected to understand how water clarity changed over time. It was found that the deepest Secchi disk observations (>11 feet) occurred in the early spring through mid-summer, while from summer into the fall, clarity diminished to approximately 6 feet, and by early winter with or without ice cover, clarity was reduced to 5 feet or less. Also, usually during the summer, an iridescent sheen was periodically reported floating on the water surface. This sheen was not petroleum based but most likely produced by iron bacteria within the pond as the sheen was easily “broken” into plates whereas a petroleum-based sheen that would immediately flow back together.
Solar IrradianceThe sun emits electromagnetic radiation, (the primary
type reaching the earth’s surface being infrared radiation),
BC
A
Imagery by Pictometry International Corporation
N
Figure 3. Aerial picture of the Tully Valley solar pond taken April 2007, showing the location of the three acoustic transects for determination of the pond geometry.
5
which is measured at the earths’ surface in units of watts per square meter (W/m2). The warming of the ground, water, and atmosphere is the direct result of the infrared radiation interacting with the earth’s atmosphere and land/water surfaces. The amount of the heating is variable due to the location on the earth’s surface (latitude), length of the day-night cycle, position of the sun relative to the earth’s surface (seasonality), weather (clouds), and atmospheric pollution.
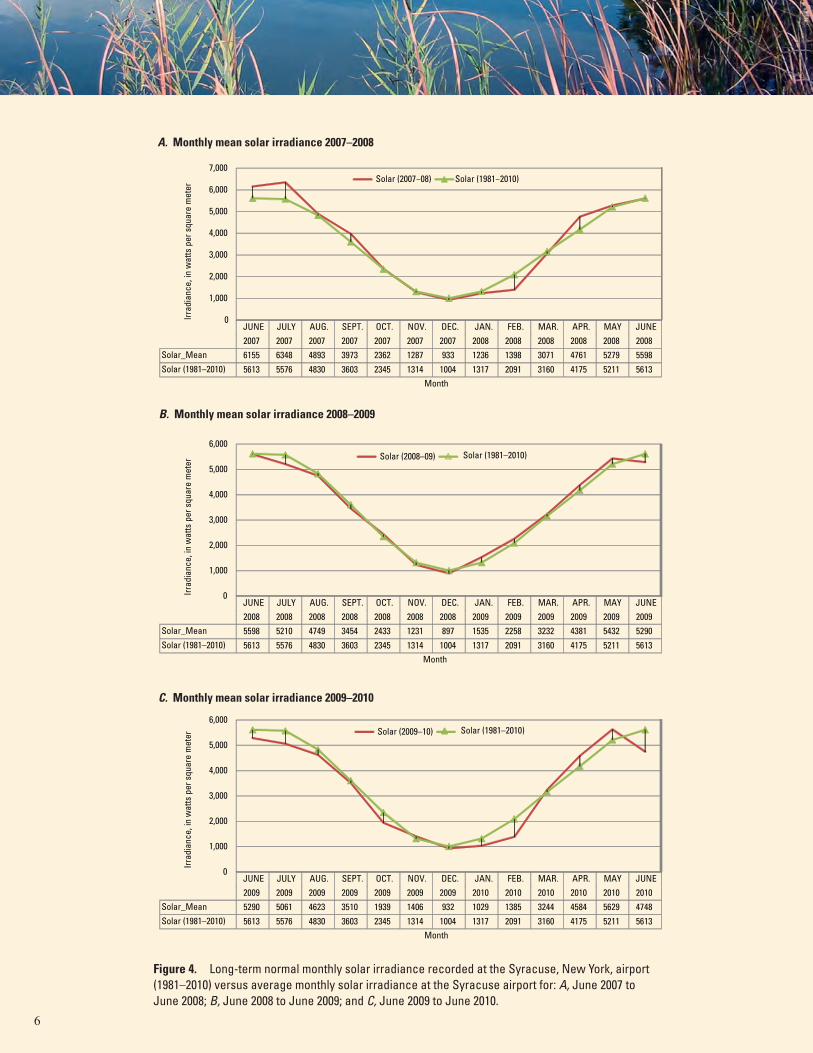
Solar irradiance for the Tully Valley solar pond was estimated from data collected at the Syracuse International Airport (J. Rennells, Northeast Regional Climate Center, written commun., 2012), approximately 15 miles north of the Tully Valley. The 2007–2010 monthly means of solar irradiance are shown in figures 4A–C. In 2007–08 the mean monthly irradiance was slightly above the 30-year (yr) normal for the first half of the period, then moderated on either side of the average for the second half (fig. 4A). In 2008–09 solar irradiance generally followed the 30-yr normal for the period (fig. 4B). In 2009–10 solar irradiance from June 2009 to
February 2010 was below average whereas the rest of the period was generally above normal except for June 2010 (fig. 4C).
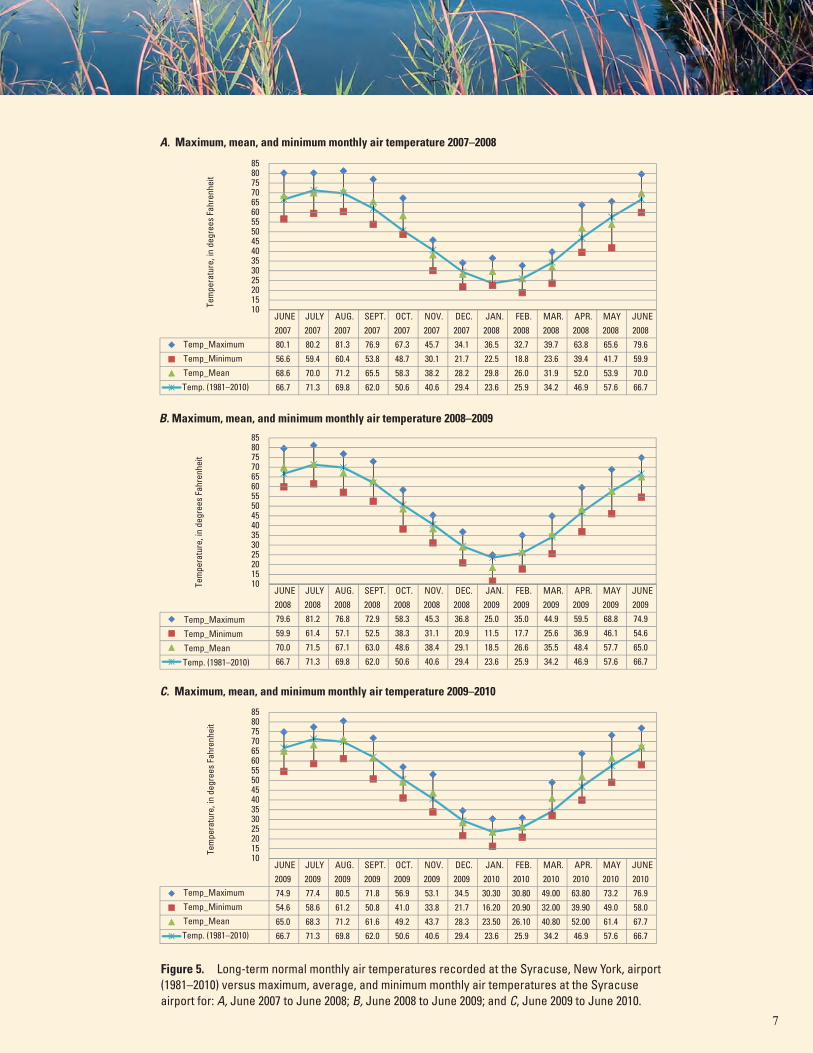
Air TemperatureFor the Tully Valley (greater Syracuse, NY. region) the
average mean temperature is 48.2 °F, and annual average low and high temperatures range from 17 °F to 84 °F (National Climatic Data Center, 2012). Summer daytime temperatures are usually between 70 and 80 °F with occasional 90 °F and above temperatures, whereas winter low temperatures can range between 0 °F and -10 °F. The average central New York freeze-free growing season is between 150 and 180 days long (National Climatic Data Center, 2012).
Air temperature, collected at the Syracuse Hancock International Airport for the period of 2006–2010, is shown in figures 5A–C and provides a means to estimate monthly mean air temperatures for the Tully Valley (maximum, minimum, and mean values). A 30-yr normal temperature for 1981 to 2010 (National Climatic Data Center, 2012) provides a
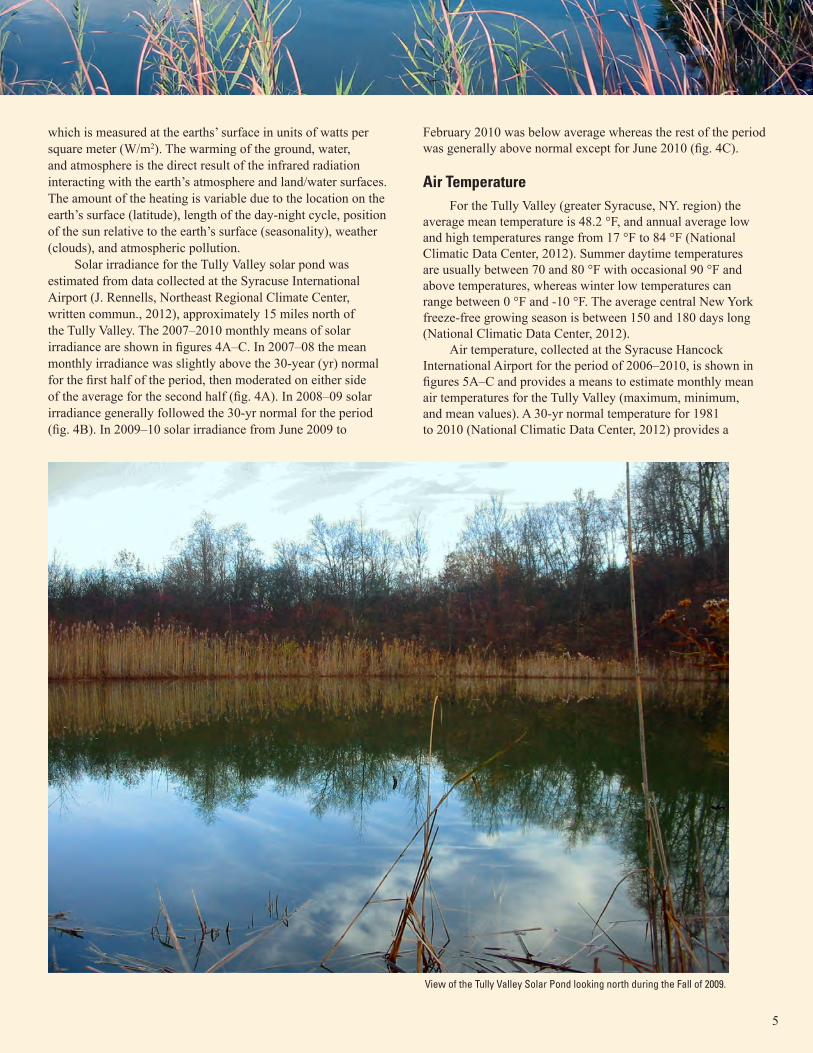
View of the Tully Valley Solar Pond looking north during the Fall of 2009.
JUNE JULY AUG. SEPT. OCT. NOV. DEC. JAN. FEB. MAR. APR. MAY JUNE2007 2007 2007 2007 2007 2007 2007 2008 2008 2008 2008 2008 2008
Solar_Mean 6155 6348 4893 3973 2362 1287 933 1236 1398 3071 4761 5279 5598Solar (1981–2010) 5613 5576 4830 3603 2345 1314 1004 1317 2091 3160 4175 5211 5613
0
1,000
2,000
3,000
4,000
5,000
6,000
7,000
Irrad
ianc
e, in
wat
ts p
er s
quar
e m
eter
Month
Solar (2007−08) Solar (1981−2010)
JUNE JULY AUG. SEPT. OCT. NOV. DEC. JAN. FEB. MAR. APR. MAY JUNE2008 2008 2008 2008 2008 2008 2008 2009 2009 2009 2009 2009 2009
Solar_Mean 5598 5210 4749 3454 2433 1231 897 1535 2258 3232 4381 5432 5290Solar (1981–2010) 5613 5576 4830 3603 2345 1314 1004 1317 2091 3160 4175 5211 5613
0
1,000
2,000
3,000
4,000
5,000
6,000
Irrad
ianc
e, in
wat
ts p
er s
quar
e m
eter
Month
JUNE JULY AUG. SEPT. OCT. NOV. DEC. JAN. FEB. MAR. APR. MAY JUNE2009 2009 2009 2009 2009 2009 2009 2010 2010 2010 2010 2010 2010
Solar_Mean 5290 5061 4623 3510 1939 1406 932 1029 1385 3244 4584 5629 4748Solar (1981–2010) 5613 5576 4830 3603 2345 1314 1004 1317 2091 3160 4175 5211 5613
0
1,000
2,000
3,000
4,000
5,000
6,000
Irrad
ianc
e, in
wat
ts p
er s
quar
e m
eter
Month
Solar (2008–09) Solar (1981–2010)
Solar (2009–10) Solar (1981–2010)
A. Monthly mean solar irradiance 2007–2008
B. Monthly mean solar irradiance 2008–2009
C. Monthly mean solar irradiance 2009–2010
6
Figure 4. Long-term normal monthly solar irradiance recorded at the Syracuse, New York, airport (1981–2010) versus average monthly solar irradiance at the Syracuse airport for: A, June 2007 to June 2008; B, June 2008 to June 2009; and C, June 2009 to June 2010.
JUNE JULY AUG. SEPT. OCT. NOV. DEC. JAN. FEB. MAR. APR. MAY JUNE2007 2007 2007 2007 2007 2007 2007 2008 2008 2008 2008 2008 2008
80.1 80.2 81.3 76.9 67.3 45.7 34.1 36.5 32.7 39.7 63.8 65.6 79.6
56.6 59.4 60.4 53.8 48.7 30.1 21.7 22.5 18.8 23.6 39.4 41.7 59.9
68.6 70.0 71.2 65.5 58.3 38.2 28.2 29.8 26.0 31.9 52.0 53.9 70.0
Temp_Maximum
Temp_Minimum
Temp_Mean
Temp. (1981–2010) 66.7 71.3 69.8 62.0 50.6 40.6 29.4 23.6 25.9 34.2 46.9 57.6 66.7
10152025303540455055606570758085
JUNE JULY AUG. SEPT. OCT. NOV. DEC. JAN. FEB. MAR. APR. MAY JUNE2008 2008 2008 2008 2008 2008 2008 2009 2009 2009 2009 2009 2009
79.6 81.2 76.8 72.9 58.3 45.3 36.8 25.0 35.0 44.9 59.5 68.8 74.9
59.9 61.4 57.1 52.5 38.3 31.1 20.9 11.5 17.7 25.6 36.9 46.1 54.6
70.0 71.5 67.1 63.0 48.6 38.4 29.1 18.5 26.6 35.5 48.4 57.7 65.0
66.7 71.3 69.8 62.0 50.6 40.6 29.4 23.6 25.9 34.2 46.9 57.6 66.7
10152025303540455055606570758085
Tem
pera
ture
, in
degr
ees
Fahr
enhe
it
JUNE JULY AUG. SEPT. OCT. NOV. DEC. JAN. FEB. MAR. APR. MAY JUNE2009 2009 2009 2009 2009 2009 2009 2010 2010 2010 2010 2010 2010
74.9 77.4 80.5 71.8 56.9 53.1 34.5 30.30 30.80 49.00 63.80 73.2 76.9
54.6 58.6 61.2 50.8 41.0 33.8 21.7 16.20 20.90 32.00 39.90 49.0 58.0
65.0 68.3 71.2 61.6 49.2 43.7 28.3 23.50 26.10 40.80 52.00 61.4 67.7
66.7 71.3 69.8 62.0 50.6 40.6 29.4 23.6 25.9 34.2 46.9 57.6 66.7
10152025303540455055606570758085
Temp_Maximum
Temp_Minimum
Temp_Mean
Temp. (1981–2010)
Tem
pera
ture
, in
degr
ees
Fahr
enhe
itTe
mpe
ratu
re, i
n de
gree
s Fa
hren
heit
A. Maximum, mean, and minimum monthly air temperature 2007–2008
B. Maximum, mean, and minimum monthly air temperature 2008–2009
C. Maximum, mean, and minimum monthly air temperature 2009–2010
Temp_Maximum
Temp_Minimum
Temp_Mean
Temp. (1981–2010)
7
Figure 5. Long-term normal monthly air temperatures recorded at the Syracuse, New York, airport (1981–2010) versus maximum, average, and minimum monthly air temperatures at the Syracuse airport for: A, June 2007 to June 2008; B, June 2008 to June 2009; and C, June 2009 to June 2010.
8
comparison to each of the 13-month cycles shown in figure5. Mean temperatures for 2007–08 follow the 30-yr normaltemperature curve with warmer autumn days in September and October 2007, and warmer January and April 2008 temperatures (fig. 5A). Temperatures during 2008–09 follow the 30-yr temperature cycle with the exception of colder days for the month of January 2008 (fig. 5B). The 2009–10 monthly mean temperatures followed the 30-yr normal until spring 2010 with higher than normal average daily temperatures for March through May 2010 (fig. 5C).
PrecipitationMonthly mean precipitation within the Tully Valley was
collected at the U.S Geological Survey (USGS) Otisco Road rain gage (USGS site number 425129076082701) for the three assessment periods. Due to variations in weather patterns across the Tully Valley, data from the rain gage located at the USGS Onondaga Creek near Cardiff, NY (Route 20), streamgage (04237962) were also examined. The 30-yr normal monthly precipitation for the Syracuse area (1981–2010) was obtained from the National Climatic Data Center for comparison to the three, 13-month cycles (National Climatic Data Center, 2012). Figures 6A–C provide monthly precipitation differences as compared to the 30-yr normal. Most notably, average monthly precipitation for all three assessment periods was less than the long-term normal. May, June, and August of 2008 had minor amounts of precipitation (figs. 6A and B), but several monthsalso had much above normal precipitation throughout the three assessment periods—indicative of greater climate and precipitation variability—as comparisons between the Otisco Road and Route 20 raingages confirm lower than expectedprecipitation for most of 2008 in the Tully Valley.
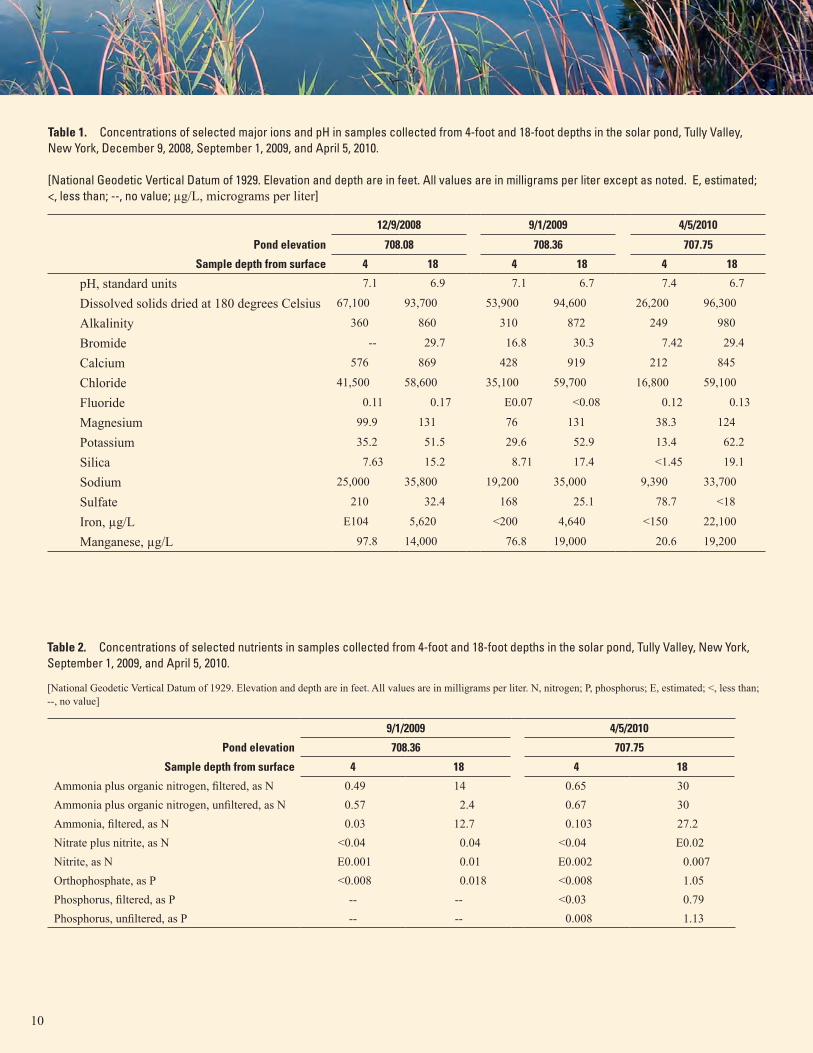
Water QualityWater-quality samples were collected by using a Van
Doren bottle sampler at the center of the solar pond at depths of 4 feet and 18 feet (Zones S2 and H3) on three occasions— December 9, 2008, September 1, 2009, and April 5, 2010. The samples in the upper and lower parts of the pond were collected and processed in a churn splitter in the field using standardUSGS techniques (Wilde and others, 1999a and b) and shipped to the USGS Denver, Colorado, water-quality laboratory for analysis. The samples were analyzed for basic inorganic constituents —chloride, fluoride, bromide, sulfate, and alkalinity, total dissolved solids—calcium, iron, magnesium, manganese, potassium, silica, and sodium (table 1), and nutrients—dissolved ammonia, ammonia plus organic nitrogen, nitrite, nitrite plus nitrate, dissolved phosphorus, and orthophosphate (table 2).
Results of these analyses indicate that most inorganic constituents had greater values at the 18-foot depth with the exception of sulfate which was less concentrated than at the 4-foot depth. pH was lower at the 18-foot depth due to
increased alkalinity and an increased calcium concentration than at the 4-foot depth. The nutrient analyses indicate a reduction of ammonia at the 4-foot depth due to nitrification resulting fromammonia oxidation of decomposing plant and animal matter trapped in the bottom of the pond. In addition, phosphorus was greater at an 18-foot depth as a result of dissolved phosphate run-off and decomposing plant matter at the bottom of the pond.
Water Temperature CyclingWater temperature profiles were also collected along
with the specific conductance and salinity profile data The 27 temperature profiles were then used to create isohyetaltemperature diagrams for the 3 assessment periods —June to June for 2007–2008, 2008–2009, and 2009–2010 (figs. 7A–C).The isohyetal temperature diagrams show areas of similar water temperature in the solar pond over time. All three diagrams have similar characteristics—a 90 °F or higher temperature “bubble” that usually begins to form in June of each year at a depth of about 5 to 6 feet, at the bottom of halocline zone (H1), and slowly grows in size and depth over the next several months into the lower layers (S2, H2, S3, and H3).
By late summer, the bubble becomes smaller and remains in the deeper H3 part of the pond through either November or December of each year. The 80 °F bubble starts slightly higher in the H1 zone and usually lasts through February of the following year in the H3 zone before it too dissipates its heat and the water temperature drops into the 70 °F range until early spring, when increasing solar irradiance begins the next heat-storage cycle. During the winter months the upper water surface cools like a regular pond with ice covering the pond surface. Colder temperatures in the 50–60 °F range persist below the upper halocline (H1) zone, but as springtime approaches, the ice melts and water temperature in the pond quickly responds to increased solar irradiance.
ConclusionsThe development of a solar pond in the Tully Valley
was accidental due to land-surface subsidence adjacent to discharging brine well in a former brine-field area. Although the well was sealed in the early 1990s, the resulting sinkhole was naturally lined with a thick clay deposit which prevented the dense brine from leaking out of the pond since well closure. A series of 27 specific conductance, salinit , and water temperature profiles were made between June 2007 and July2010 to document the range of the specific conductance andtemperature fluctuation that occurred within the pond
Three environmental factors were assessed which were likely to affect the ability of the solar pond to gain energy—solar irradiance, air temperature, and precipitation—all of which were measured remotely and not at the pond itself. Of the three factors, solar irradiance appears to be the primary driver of increasing water temperature change in this pond each summer. Comparing solar irradiance (fig. 4) to measured pond water
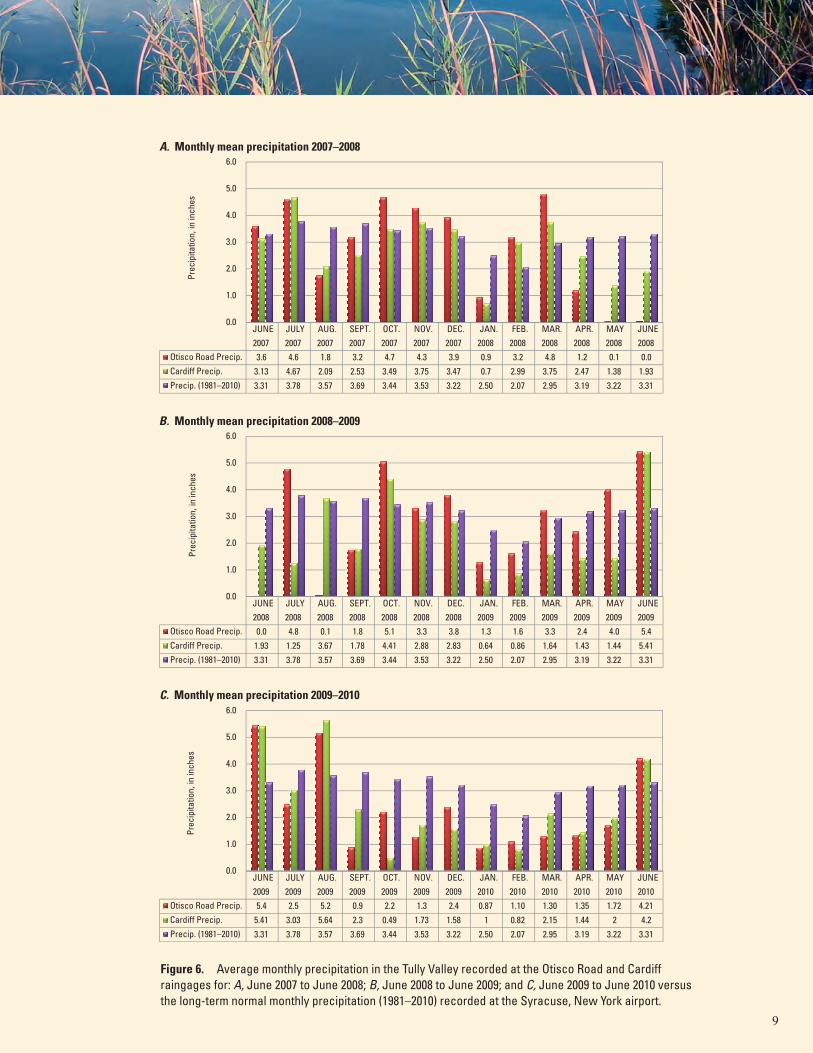
JUNE JULY AUG. SEPT. OCT. NOV. DEC. JAN. FEB. MAR. APR. MAY JUNE2007 2007 2007 2007 2007 2007 2007 2008 2008 2008 2008 2008 2008
Otisco Road Precip. 3.6 4.6 1.8 3.2 4.7 4.3 3.9 0.9 3.2 4.8 1.2 0.1 0.0Cardiff Precip. 3.13 4.67 2.09 2.53 3.49 3.75 3.47 0.7 2.99 3.75 2.47 1.38 1.93Precip. (1981–2010) 3.31 3.78 3.57 3.69 3.44 3.53 3.22 2.50 2.07 2.95 3.19 3.22 3.31
0.0
1.0
2.0
3.0
4.0
5.0
6.0
Prec
ipita
tion,
in in
ches
JUNE JULY AUG. SEPT. OCT. NOV. DEC. JAN. FEB. MAR. APR. MAY JUNE2008 2008 2008 2008 2008 2008 2008 2009 2009 2009 2009 2009 2009
Otisco Road Precip. 0.0 4.8 0.1 1.8 5.1 3.3 3.8 1.3 1.6 3.3 2.4 4.0 5.4Cardiff Precip. 1.93 1.25 3.67 1.78 4.41 2.88 2.83 0.64 0.86 1.64 1.43 1.44 5.41Precip. (1981–2010) 3.31 3.78 3.57 3.69 3.44 3.53 3.22 2.50 2.07 2.95 3.19 3.22 3.31
0.0
1.0
2.0
3.0
4.0
5.0
6.0
Prec
ipita
tion,
in in
ches
JUNE JULY AUG. SEPT. OCT. NOV. DEC. JAN. FEB. MAR. APR. MAY JUNE2009 2009 2009 2009 2009 2009 2009 2010 2010 2010 2010 2010 2010
Otisco Road Precip. 5.4 2.5 5.2 0.9 2.2 1.3 2.4 0.87 1.10 1.30 1.35 1.72 4.21Cardiff Precip. 5.41 3.03 5.64 2.3 0.49 1.73 1.58 1 0.82 2.15 1.44 2 4.2Precip. (1981–2010) 3.31 3.78 3.57 3.69 3.44 3.53 3.22 2.50 2.07 2.95 3.19 3.22 3.31
0.0
1.0
2.0
3.0
4.0
5.0
6.0
Prec
ipita
tion,
in in
ches
A. Monthly mean precipitation 2007–2008
B. Monthly mean precipitation 2008–2009
C. Monthly mean precipitation 2009–2010
9
Figure 6. Average monthly precipitation in the Tully Valley recorded at the Otisco Road and Cardiff raingages for: A, June 2007 to June 2008; B, June 2008 to June 2009; and C, June 2009 to June 2010 versus the long-term normal monthly precipitation (1981–2010) recorded at the Syracuse, New York airport.
10
New York, December 9, 2008, September 1, 2009, and April 5, 2010. [National Geodetic Vertical Datum of 1929. Elevation and depth are in feet. All values are in milligrams per liter except as noted. E, estimated; <, less than; --, no value; µg/L, micrograms per liter]
Table 1. Concentrations of selected major ions and pH in samples collected from 4-foot and 18-foot depths in the solar pond, Tully Valley,
12/9/2008 9/1/2009 4/5/2010
Pond elevation 708.08 708.36 707.75
Sample depth from surface 4 18 4 18 4 18
pH, standard units 7.1 6.9 7.1 6.7 7.4 6.7
Dissolved solids dried at 180 degrees Celsius 67,100 93,700 53,900 94,600 26,200 96,300
Alkalinity 360 860 310 872 249 980
Bromide -- 29.7 16.8 30.3 7.42 29.4
Calcium 576 869 428 919 212 845
Chloride 41,500 58,600 35,100 59,700 16,800 59,100
Fluoride 0.11 0.17 E0.07 <0.08 0.12 0.13
Magnesium 99.9 131 76 131 38.3 124
Potassium 35.2 51.5 29.6 52.9 13.4 62.2
Silica 7.63 15.2 8.71 17.4 <1.45 19.1
Sodium 25,000 35,800 19,200 35,000 9,390 33,700
Sulfate 210 32.4 168 25.1 78.7 <18
Iron, µg/L E104 5,620 <200 4,640 <150 22,100
Manganese, µg/L 97.8 14,000 76.8 19,000 20.6 19,200
Table 2. Concentrations of selected nutrients in samples collected from 4-foot and 18-foot depths in the solar pond, Tully Valley, New York, September 1, 2009, and April 5, 2010.
[National Geodetic Vertical Datum of 1929. Elevation and depth are in feet. All values are in milligrams per liter. N, nitrogen; P, phosphorus; E, estimated; <, less than; --, no value]
9/1/2009 4/5/2010
Pond elevation 708.36 707.75
Sample depth from surface 4 18 4 18
Ammonia plus organic nitrogen, filtered, as N 0.49 14 0.65 30Ammonia plus organic nitrogen, unfiltered, as N 0.57 2.4 0.67 30Ammonia, filtered, as N 0.03 12.7 0.103 27.2Nitrate plus nitrite, as N <0.04 0.04 <0.04 E0.02Nitrite, as N E0.001 0.01 E0.002 0.007Orthophosphate, as P <0.008 0.018 <0.008 1.05Phosphorus, filtered, as P -- -- <0.03 0.79Phosphorus, unfiltered, as P -- -- 0.008 1.13
11
Figure 7. Isohyetal temperature plots for the Tully Valley solar pond during: A ,June 2007 to June 2008; B, June 2008 to June 2009; and C, June 2009 to June 2010, showing the approximate location of stable (S) and halocline (H) specific conductance layers shown in figure 2.
70 oF
2009 2010June July Aug. Sept. Oct. Nov. Dec. Jan. Feb. Mar. Apr. May June
80 oF
90 oF
30 oF
70 oF
70 oF
80 oF 90 oF
50 oF 60 oF60 oF
70 oF
40 oF
70 oF70 oF
70 oF
June July Aug. Sept. Oct. Nov. Dec. Jan. Feb. Mar. Apr. May June
2008 2009
80 oF
90 oF
50 oF
60 oF
100 oF
80 oF
90 oF
60 oF40 oF 30 oF
80 oF
June July Aug. Sept. Oct. Nov. Dec. Jan. Feb. Mar. Apr. May June
2007 2008
100 oF
90 oF
70 oF
60 oF
50 oF
40 oF
80 oF
105 oF
90 oF
80 oF
30 oF70 oF
70 oF
80 oF
90 oF
0
2
4
6
8
10
12
14
16
18
20
Dep
th o
f pon
d, in
feet
0
2
4
6
8
10
12
14
16
18
20
Dep
th o
f pon
d, in
feet
0
2
4
6
8
10
12
14
16
18
20
Dep
th o
f pon
d, in
feet
Spec
ific
cond
ucta
nce
laye
rs (f
igur
e 2)
Spec
ific
cond
ucta
nce
laye
rs (f
igur
e 2)
Spec
ific
cond
ucta
nce
laye
rs (f
igur
e 2)
S1
S2
S3
H1
H2
H3
S1
S2
S3
H1
H2
H3
S1
S2
S3
H1
H2
H3
A
B
C
12
temperatures (fig. 7) indicates that in the summer of 2007 solar irradiance was above the Syracuse long-term monthly average, and the internal pond temperatures were as high as 105 degrees Farenheit (oF), while in the summer of 2008 solar irradiance was near average and internal pond temperatures barely got to 100 oF. During the summer of 2009, solar irradiance was generally below average and internal pond temperatures were just in the 90 oF range and the 90 oF “bubble” was smaller than the preceding 2 years. Average monthly air temperature and precipitation did not appear to have any other effect on the pond temperatures as the amount of solar irradiance (sunshine) is directly related to the amount of clouds, which in turn affects air temperature and precipitation. This is consistent with solar pond research discussed previously, whereby solar ponds are closer to the earths equator, where the sun is higher, air temperatures are greater, and precipitation is much less and leads to much more efficient (higher temperature) solar ponds.
The phenomenon of solar-heated ponds was found to have been heavily researched from the 1980s through the end of the 20th century as to their utility to produce electrical power, desalinate water, and provide heat for multiple purposes. Most of this research generally occurred in areas closer to the equator (Texas, Israel), and most of this research ended by the early 2000s due to high operating costs to maintain these solar ponds, reduced funding, and other energy resources (wind and solar cells), which were apparently more efficient to manage.
The information collected at the Tully Valley solar pond indicates that solar ponds, either natural or man-made, may be useful as a renewable energy source for heating rural buildings and homes if operating costs for such ponds could be proven to be cost effective. Further research on the utility of solar ponds in colder climates is a possibility as the world moves toward renewable-resource technologies. This documentation may provide a basis for further evaluation of this technology in the higher latitudes of North America and elsewhere.
By Brett Hayhurst and William M. Kappel
References Cited
Dittman, G.L., Calculations of Brine Properties, Lawrence Livermore Laboratory, UCID 17406, accessed September 2013, at http://www.osti.gov/bridge/servlets/purl/7111583-l9lvkU/native/7111583.pd.
Faiman, David, undated, Solar energy in Israel: Ben-Gurion National Solar Energy Center, Ben-Gurion University of the Negev, accessed October 2012, at http://cannecy.free.fr/solar/africa/psisrael.php/.
Fynn, R.P., and Short, T.H., 1983, Salt gradient solar ponds–research progress in Ohio and future prospects: Toronto, Canada, Sixth International Symposium on Salt, v. 2, p 431–438.
Hackett, W.R., Gleason, G.C., and Kappel, W.M., 2009, Land-surface subsidence and open bedrock fractures in the Tully Valley, Onondaga County, New York: U.S. Geological Survey Open-File Report 2009–1188, accessed October 2012, 16 p., http://pubs.usgs.gov/of/2009/1188/.
Kappel, W.M, 2009, Remediation of mudboil discharges in the Tully Valley of Central New York: U.S. Geological Survey Open-File Report 2009–1173, 8 p., accessed October 2012, http://pubs.usgs.gov/of/2009/1173/.
Lu, Huanmin, Walton, J.C., and Hein, Herbert, 2002, Thermal desalination using MEMS and salinity-gradient solar pond technology: El Paso, Texas, University of Texas at El Paso, Desalination Research and Development Report No. 80, U.S. Department of the Interior, Bureau of Reclamation Water Treatment Engineering and Research Group, 91 p.
National Climate Data Center, 2012, Syracuse International Airport: National Climate data Center, accessed November 11, 2012, at http://gis.ncdc.noaa.gov/map/viewer/#app=cdo&cfg=cdo&theme=normals&layers=01&node=gis.
Pair, D.L., Kappel, W.M., and Walker, M.S., 2000, History of landslides at the base of Bare Mountain, Tully Valley, Onondaga County, New York: U.S. Geological Survey Fact Sheet FS 0190–99, 6 p., accessed October 2012, http://ny.water.usgs.gov/pubs/fs/fs19099/.
Salinity Gradient Solar Technology, undated, Department of Mechanical Engineering, University of Texas at El Paso, El Paso, Texas, accessed October 2012, at http://wwwold.ece.utep.edu/research/Energy/Pond/pond.html/.
Tamulonis, K.L., Kappel, W.M., and Shaw, S.B., 2009, Causes and movement of landslides at Rainbow Creek and Rattlesnake Gulf in the Tully Valley, Onondaga County, New York: U.S. Geological Survey Scientific Investigations Report 2009–5114, 18 p., accessed October 2012, http://pubs.usgs.gov/sir/2009/5114/.
TERI—The Energy Resources Institute, undated, Salt-gradient solar ponds—Salt of the Earth, accessed October 2012, at http://www.teriin.org/tech_solarponds.php/.
Wilde, F.D., Radtke, D.B., Gibs, J., and Iwatsubo, R.T., eds., 1999a, National field manual for the collection of water-quality data—Collection of water samples: U.S. Geological Survey Techniques of Water-Resources Investigations, book 9, chap. A4, 103 p., plus appendixes.
Wilde, F.D., Radtke, D.B., Gibs, J., and Iwatsubo, R.T., eds., 1999b, National field manual for the collection of water-quality data—Processing of water samples: U.S. Geological Survey Techniques of Water-Resources Investigations, book 9, chap. A5, 128 p., plus appendixes.
13
Photo caption needed here.
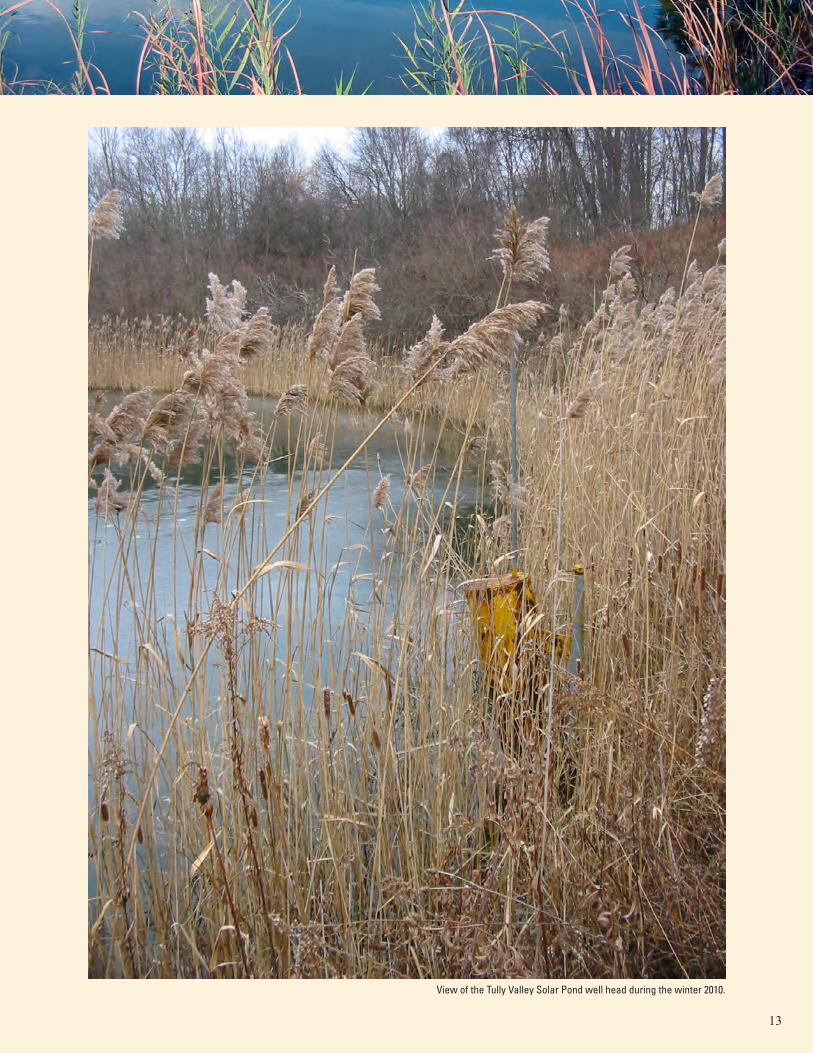
View of the Tully Valley Solar Pond well head during the winter 2010.
14
For additional information write to:
New York Water Science CenterU.S. Geological Survey30 Brown RoadIthaca, NY 14850or visit our Web site at:http://ny.water.usgs.gov
For more information on the USGS —theFederal source for science about theEarth, its natural and living resources,natural hazards, and the environment:World Wide Web: http://www.usgs.govTelephone: 1-888-ASK-USGS
Any use of trade, product, or firm names is for descriptive purposes only and does not imply endorsement by the U.S. Government.
ISSN 2331-1258 (online)http://dx.doi.org/10.3133/ofr20131266


