Embed Size (px)
Citation preview

C r e a t i v e I n d u s t r i e s S e r i e s N o . 4
National Studieson
Assessing the Economic Contributionof the Copyright-Based Industries
The Economic C
ontribution ofC
opyright-Based Industries in A
ustralia
1
Ta b l e o f C o n t e n t s
The Economic Contribution of Copyright-Based Industries in Australia 3
The Economic Contribution of Copyright-Based Industries in Kenya 25
The Economic Contribution of Copyright-Based Industries in Malaysia 107
The Economic Contribution of Copyright-Based Industries in the Netherlands 195
The Economic Contribution of Copyright-Based Industries in Peru 227

The
Econ
omic
Con
trib
utio
n of
Cop
yrig
ht-B
ased
Ind
ustr
ies
in A
ustr
alia
2
The Economic C
ontribution ofC
opyright-Based Industries in A
ustralia
3
The Economic Contribution of Copyright-Based Industries
in Australia
Prepared for the Australian Copyright Council by Price Waterhouse Coopers

The
Econ
omic
Con
trib
utio
n of
Cop
yrig
ht-B
ased
Ind
ustr
ies
in A
ustr
alia
4
C o n t e n t s
Key findings 6
Introduction 81 Value added by copyright industries 132 Employment in copyright industries 163 Trade in copyright products 21
Sources 24
This Report has been prepared by PricewaterhouseCoopers (PwC) at the request of the Australian CopyrightCouncil (ACC) in our capacity as advisors in accordance with the Terms of Reference and the Terms andConditions contained in the Consultant Agreement between ACC and PwC.
The information, statements, statistics and commentary (together the “Information”) contained in this reporthave been prepared by PwC from publicly available material. The Consultants may in their absolute discretion,but without being under any obligation to do so, update, amend or supplement this document. PwC hasbased this report on information received or obtained, on the basis that such information is accurate. The Information contained in this report has not been subject to an Audit.
Comments and queries can be directed to: Jeremy Thorpe Partner – Economics and Strategy PricewaterhouseCoopers 210 Sussex Street Sydney NSW 2000 Phone: (02) 8266 3730 Email: [email protected]
The Economic C
ontribution ofC
opyright-Based Industries in A
ustralia
5
K e y f i n d i n g s
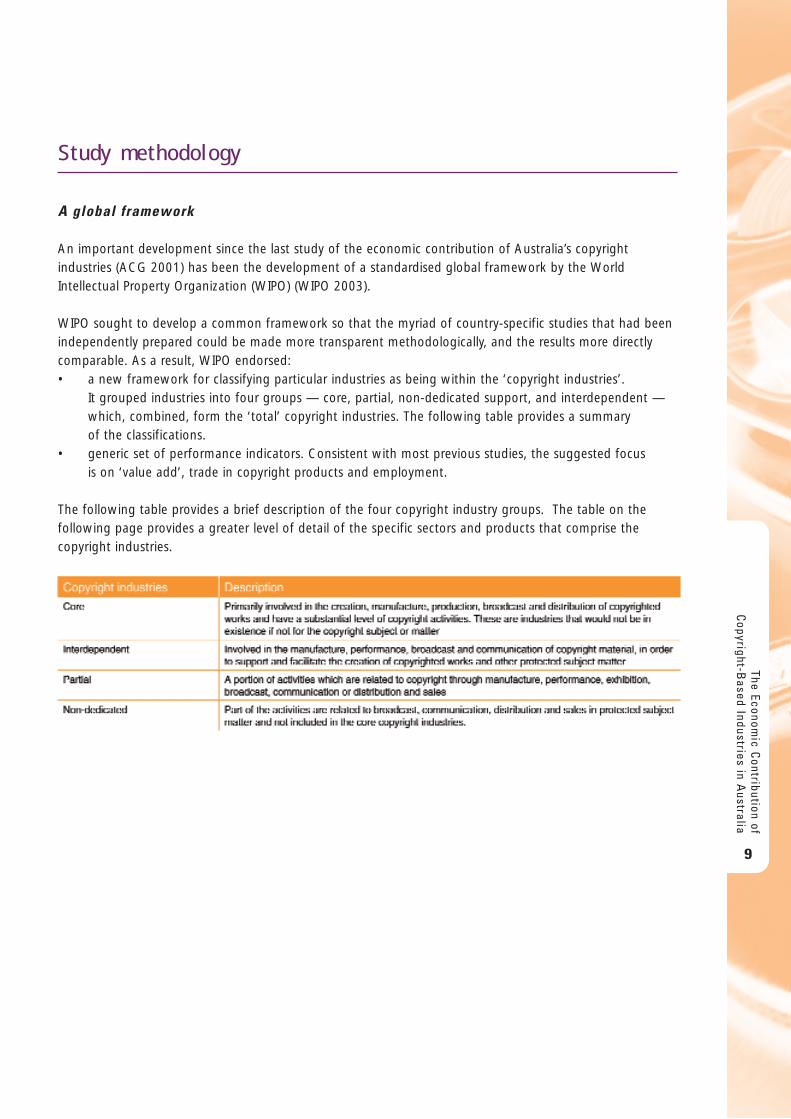
Copyright is a key piece of infrastructure that supports the industries that comprise a modern economyThe World Intellectual Property Organization (WIPO) has identified four classes of copyright industries:• Core – industries that exist only because of copyright and are primarily involved in the creation,
manufacture, production, broadcast and distribution of copyrighted works.• Partial – a portion of the industries’ activities are related to copyright through manufacture,
performance, exhibition, broadcast, communication or distribution and sales.• Interdependent – involved in the manufacture, performance, broadcast and communication in order
to support and facilitate the creation of copyrighted works and other protected subject matter.• Non-dedicated support – duties are included in this group where part of the activities are related to
broadcast, communication, distribution and sales in protected subject matter and they are not includedin the core copyright industries.
Copyright industries comprise a substantial proportion of the Australian economyIn the most recent year for which data is available (2006/07), Australia’s copyright industries:• employed 837,507 people, which constituted 8.0% of the Australian workforce• generated economic value equal to 10.3% of gross domestic product ($97.7 billion)• generated $6.873 billion in exports, equal to 4.1% of total exports.
Australia’s copyright industries have grown considerably over the past 12 yearsOver the period 1995/96 to 2006/07 the real (i.e. inflation adjusted) compound annual growth rate (CAGR)for the copyright industries averaged 4.7%, with the core copyright industries growing 5.1% per year. This compares to a CAGR for gross domestic product (GDP) of 3.6% over the same period.
Productivity growth in Australia’s copyright industries has resulted in significant real wages growthSpurred by digitisation, the value generated in Australia’s copyright industries has increased in real termsover the period 1995/96 to 2006/07 from $85,512 to $116,742 per employee. As a result, the real averagewage for people employed in the copyright industries increased from $51,572 in 1995/96 to $61,355 in2006/07.
Australia remains a significant net importer of copyright goods and servicesWhile exports of copyright products has grown in real terms by 0.6% per year over the period 1995/96 to2006/07, imports have grown at 2.1%. In 2006/07 Australia had a trade deficit of just under $20.8 billionin the copyright industries.
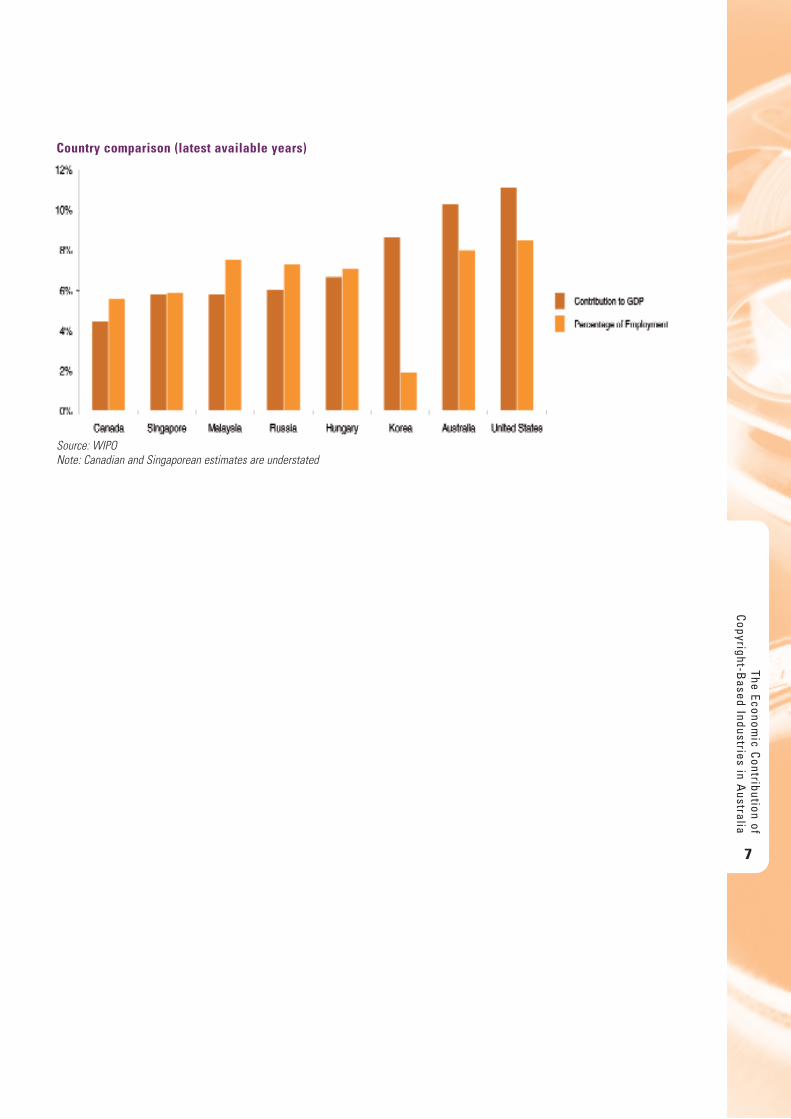
Australia’s economy has a relatively high dependence on copyright industriesIn comparison with other economies that have been analysed using the same WIPO framework as used inthis report, the Australian economy appears to have a greater copyright intensity than average in terms ofboth value added by, and employment in, the copyright industries.
The
Econ
omic
Con
trib
utio
n of
Cop
yrig
ht-B
ased
Ind
ustr
ies
in A
ustr
alia
6
The Economic C
ontribution ofC
opyright-Based Industries in A
ustralia
7
Country comparison (latest available years)
Source: WIPONote: Canadian and Singaporean estimates are understated
I n t r o d u c t i o n
Copyright was once viewed as a specialist branch of law focused primarily on the protection of artisticexpression and hence focused on the protection of artistic creations such as music, literature, paintings, and so on.
Such a narrow conception overlooked the fact that copyright was born as a result of the advent of the first technology for the production of copies of works (i.e. printing with movable type). The subsequentdevelopment of copyright has been shaped by ongoing technological developments and their associatedcommercial exploitation.
In the past decade interest in the economic impact of copyright has been driven by a number of inter-related factors:• The shift to a services economy — while Australia is commonly perceived as being an economy reliant
upon agriculture and resources, in fact it has evolved to one reliant on services. For example, theAustralian Services Roundtable (2008, p. 8) notes that, “In Australia, services account for 78 percent ofGDP and 60 percent of domestic investment. Services employ 8.5 of every 10 Australians, with all netjob growth over the past two decades taking place within the services sector.” Services industries aredisproportionately users and/or producers of copyright material and so the growth in services hasoccurred in conjunction with the growth of copyright industries.
• The mainstream adoption of the Internet, digital production and distribution — Australians haveembraced the use of the Internet, with usage increasing from 33.8% of the population in 2000 to74.3% in December 2007 (Internet World Stats 2008). This is significant, as use of information andcommunications technologies has significantly increased the scope of the subject matter for copyrightprotection, with the ongoing growth of Internet usage and digital delivery of copyright materialsdrawing copyright into the lives of all members of society.
• There is an increasing understanding of the value attached to intangible assets, including copyright —much of the value of the leading companies in the world today resides in their portfolio of intangibleassets. For example, PwC research in the United Kingdom shows that total intangible assets comprise,on average, some 80% of companies’ value (Hadjiloucas 2007). This has caused business to focus itsattention on copyright and intellectual property more greatly.
• Copyright, and intellectual property protection more generally, has been embedded as a mandatoryelement in international trade negotiations — this has resulted in both a standardised set of expectationsand an acknowledgement of the importance of trade in copyright products.
Consistent with this greater interest in better understanding the size and economic contribution of thoseindustries which rely, to varying degrees, on protections afforded by copyright law, this study uses a recentlypublished global framework (WIPO 2003) to better understand the economic contribution of Australia’scopyright industries.
The
Econ
omic
Con
trib
utio
n of
Cop
yrig
ht-B
ased
Ind
ustr
ies
in A
ustr
alia
8
S t u d y m e t h o d o l o g y
A global framework
An important development since the last study of the economic contribution of Australia’s copyrightindustries (ACG 2001) has been the development of a standardised global framework by the WorldIntellectual Property Organization (WIPO) (WIPO 2003).
WIPO sought to develop a common framework so that the myriad of country-specific studies that had beenindependently prepared could be made more transparent methodologically, and the results more directlycomparable. As a result, WIPO endorsed:• a new framework for classifying particular industries as being within the ‘copyright industries’.
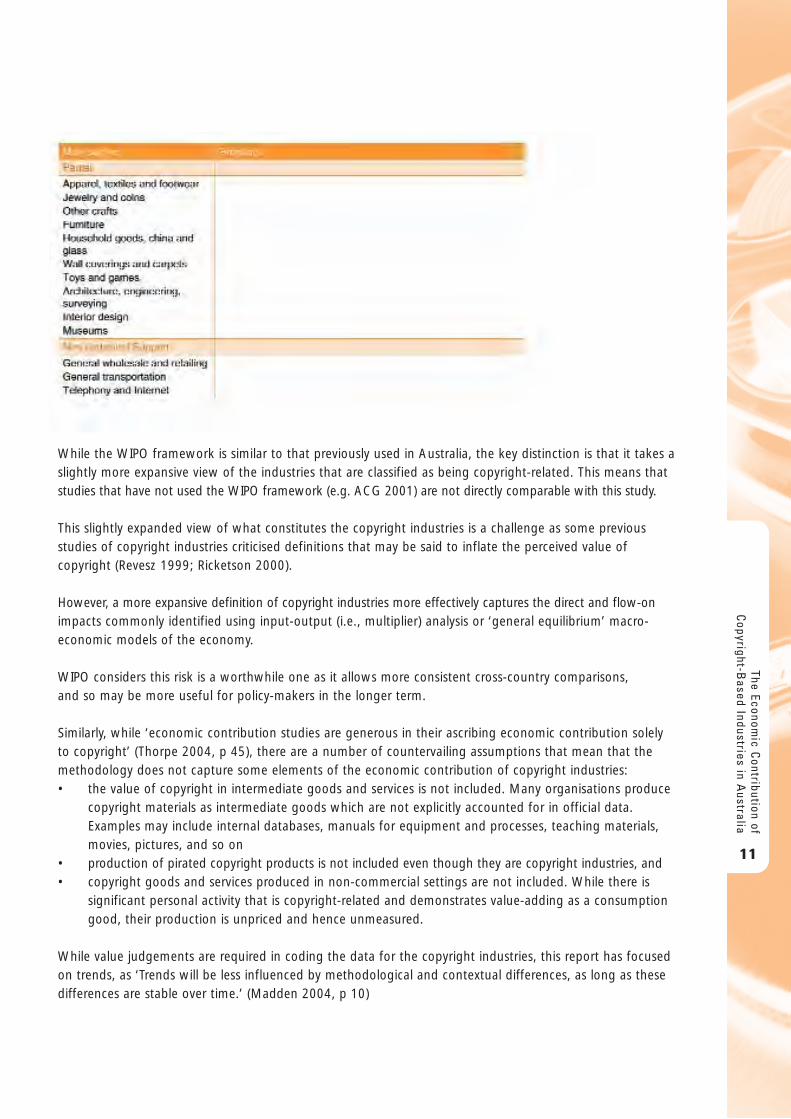
It grouped industries into four groups — core, partial, non-dedicated support, and interdependent —which, combined, form the ‘total’ copyright industries. The following table provides a summary of the classifications.
• generic set of performance indicators. Consistent with most previous studies, the suggested focus is on ‘value add’, trade in copyright products and employment.
The following table provides a brief description of the four copyright industry groups. The table on thefollowing page provides a greater level of detail of the specific sectors and products that comprise thecopyright industries.
The Economic C
ontribution ofC
opyright-Based Industries in A
ustralia
9
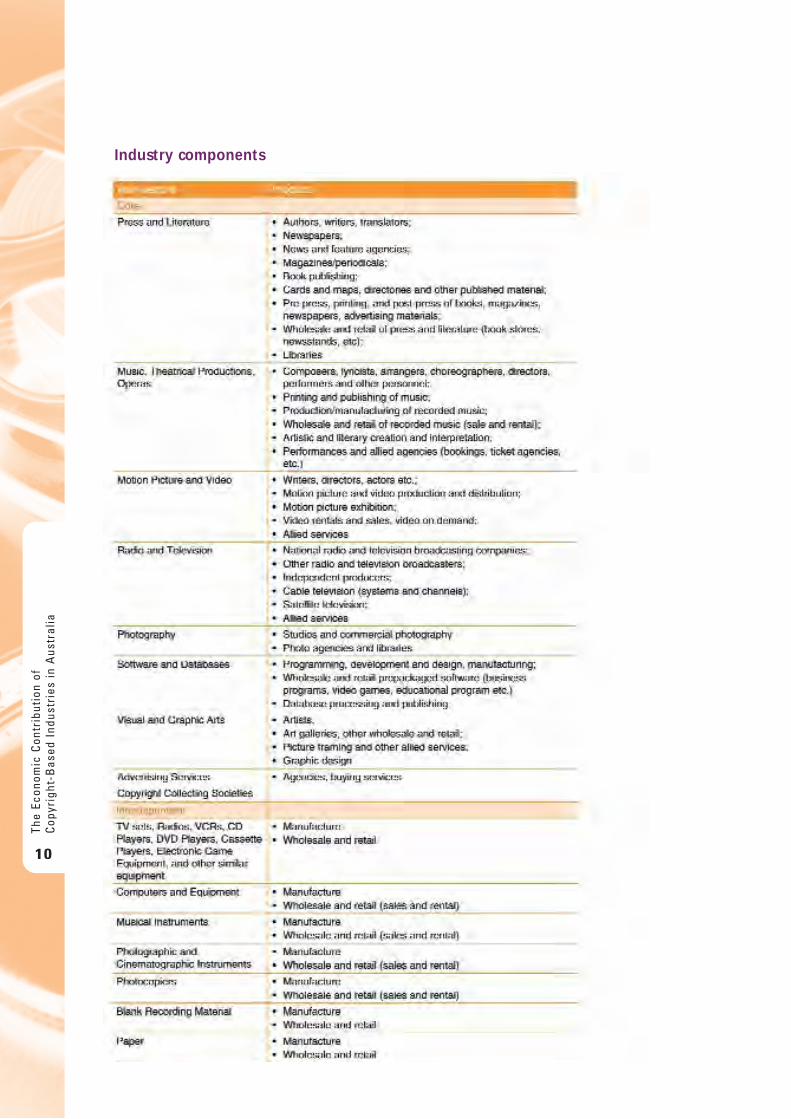
Industry components
The
Econ
omic
Con
trib
utio
n of
Cop
yrig
ht-B
ased
Ind
ustr
ies
in A
ustr
alia
10
While the WIPO framework is similar to that previously used in Australia, the key distinction is that it takes aslightly more expansive view of the industries that are classified as being copyright-related. This means thatstudies that have not used the WIPO framework (e.g. ACG 2001) are not directly comparable with this study.
This slightly expanded view of what constitutes the copyright industries is a challenge as some previousstudies of copyright industries criticised definitions that may be said to inflate the perceived value ofcopyright (Revesz 1999; Ricketson 2000).
However, a more expansive definition of copyright industries more effectively captures the direct and flow-onimpacts commonly identified using input-output (i.e., multiplier) analysis or ‘general equilibrium’ macro-economic models of the economy.
WIPO considers this risk is a worthwhile one as it allows more consistent cross-country comparisons, and so may be more useful for policy-makers in the longer term.
Similarly, while ‘economic contribution studies are generous in their ascribing economic contribution solelyto copyright’ (Thorpe 2004, p 45), there are a number of countervailing assumptions that mean that themethodology does not capture some elements of the economic contribution of copyright industries:• the value of copyright in intermediate goods and services is not included. Many organisations produce
copyright materials as intermediate goods which are not explicitly accounted for in official data.Examples may include internal databases, manuals for equipment and processes, teaching materials,movies, pictures, and so on
• production of pirated copyright products is not included even though they are copyright industries, and• copyright goods and services produced in non-commercial settings are not included. While there is
significant personal activity that is copyright-related and demonstrates value-adding as a consumptiongood, their production is unpriced and hence unmeasured.
While value judgements are required in coding the data for the copyright industries, this report has focusedon trends, as ‘Trends will be less influenced by methodological and contextual differences, as long as thesedifferences are stable over time.’ (Madden 2004, p 10)
The Economic C
ontribution ofC
opyright-Based Industries in A
ustralia
11
It should also be remembered that, even though the focus of this report is upon quantification of thecopyright industries:
The true cultural value of copyright cannot be fully captured by measuring the value-added in thecultural industries however accurate those measures are because there are external benefits that arenot priced through the marketplace; the national culture, a creative environment and freedom ofexpression are examples of non-appropriable benefits. (Towse 2000, p 115)
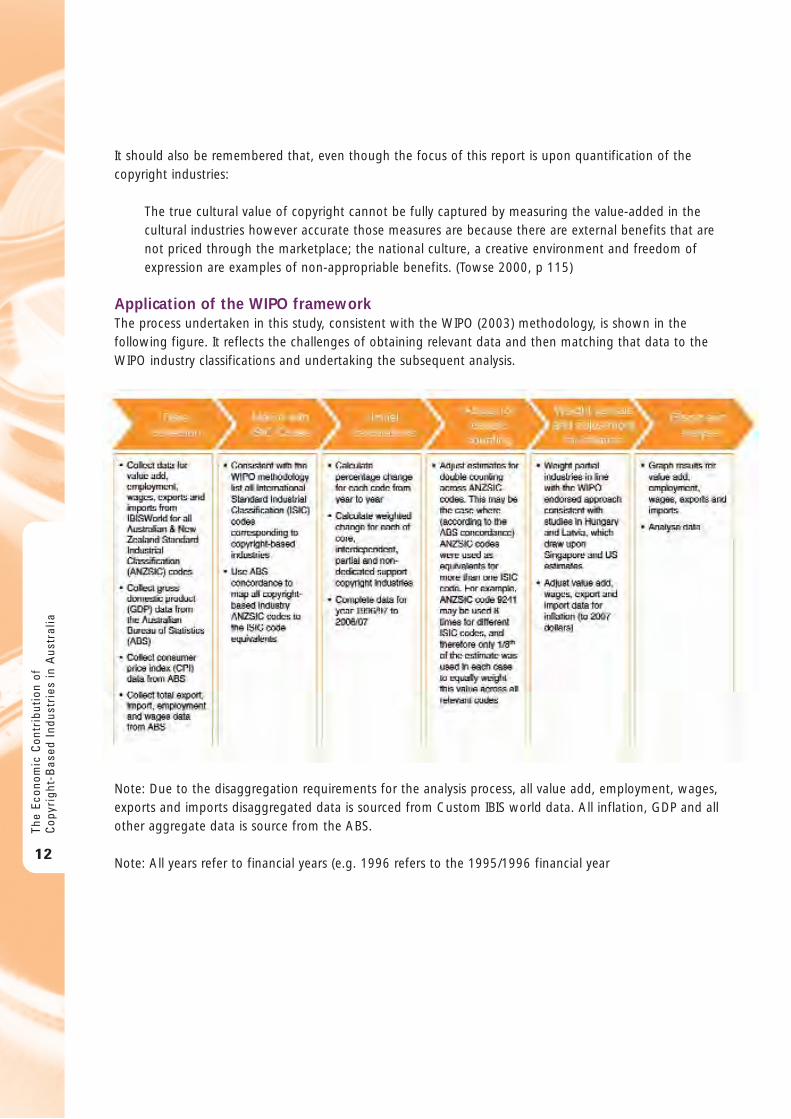
Application of the WIPO frameworkThe process undertaken in this study, consistent with the WIPO (2003) methodology, is shown in thefollowing figure. It reflects the challenges of obtaining relevant data and then matching that data to theWIPO industry classifications and undertaking the subsequent analysis.
Note: Due to the disaggregation requirements for the analysis process, all value add, employment, wages,exports and imports disaggregated data is sourced from Custom IBIS world data. All inflation, GDP and allother aggregate data is source from the ABS.
Note: All years refer to financial years (e.g. 1996 refers to the 1995/1996 financial year
The
Econ
omic
Con
trib
utio
n of
Cop
yrig
ht-B
ased
Ind
ustr
ies
in A
ustr
alia
12
1 . Va l u e a d d e d b y c o p y r i g h t i n d u s t r i e s
The key measure of an industry’s economic contribution is its ‘value add’. Value added is the value of grossoutputs of a particular industry less the value of inputs from other industries. The sum of all industries’ valueadd is the nation’s gross domestic product (GDP). Thus, looking at the value add of Australia’s copyrightindustries provides a measure of the relative importance of the copyright industries.
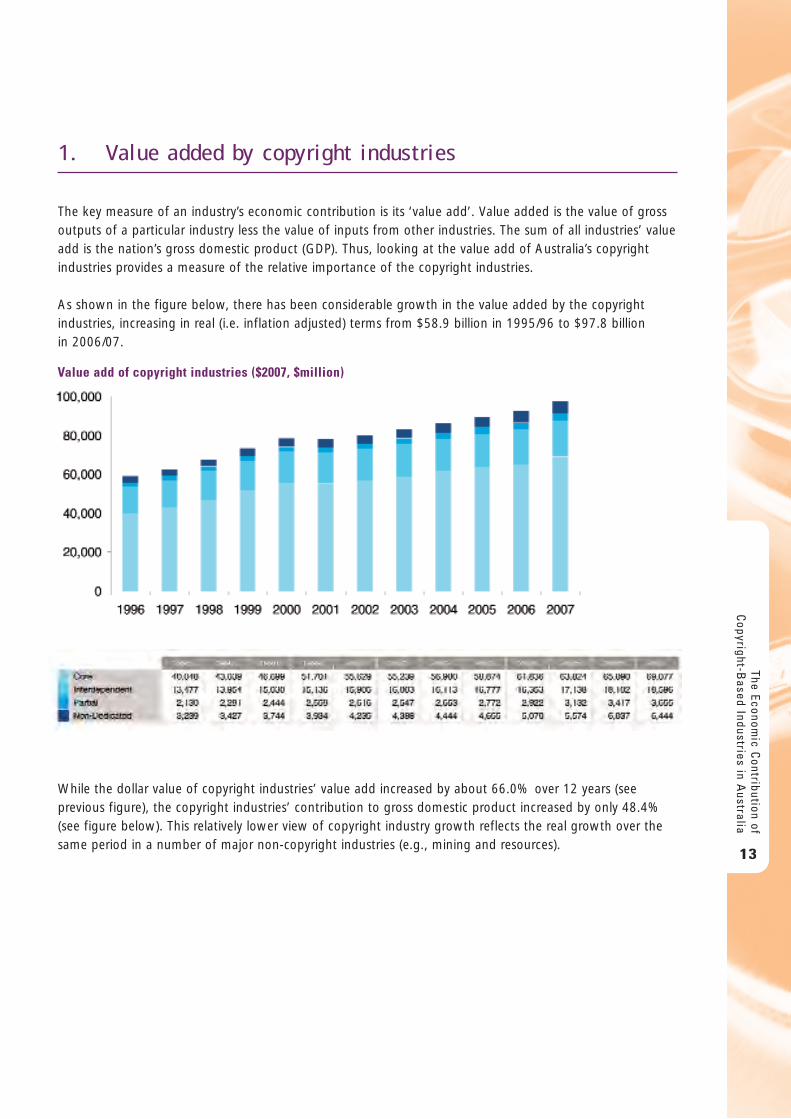
As shown in the figure below, there has been considerable growth in the value added by the copyrightindustries, increasing in real (i.e. inflation adjusted) terms from $58.9 billion in 1995/96 to $97.8 billion in 2006/07.
While the dollar value of copyright industries’ value add increased by about 66.0% over 12 years (seeprevious figure), the copyright industries’ contribution to gross domestic product increased by only 48.4%(see figure below). This relatively lower view of copyright industry growth reflects the real growth over thesame period in a number of major non-copyright industries (e.g., mining and resources).
The Economic C
ontribution ofC
opyright-Based Industries in A
ustralia
13
Value add of copyright industries ($2007, $million)
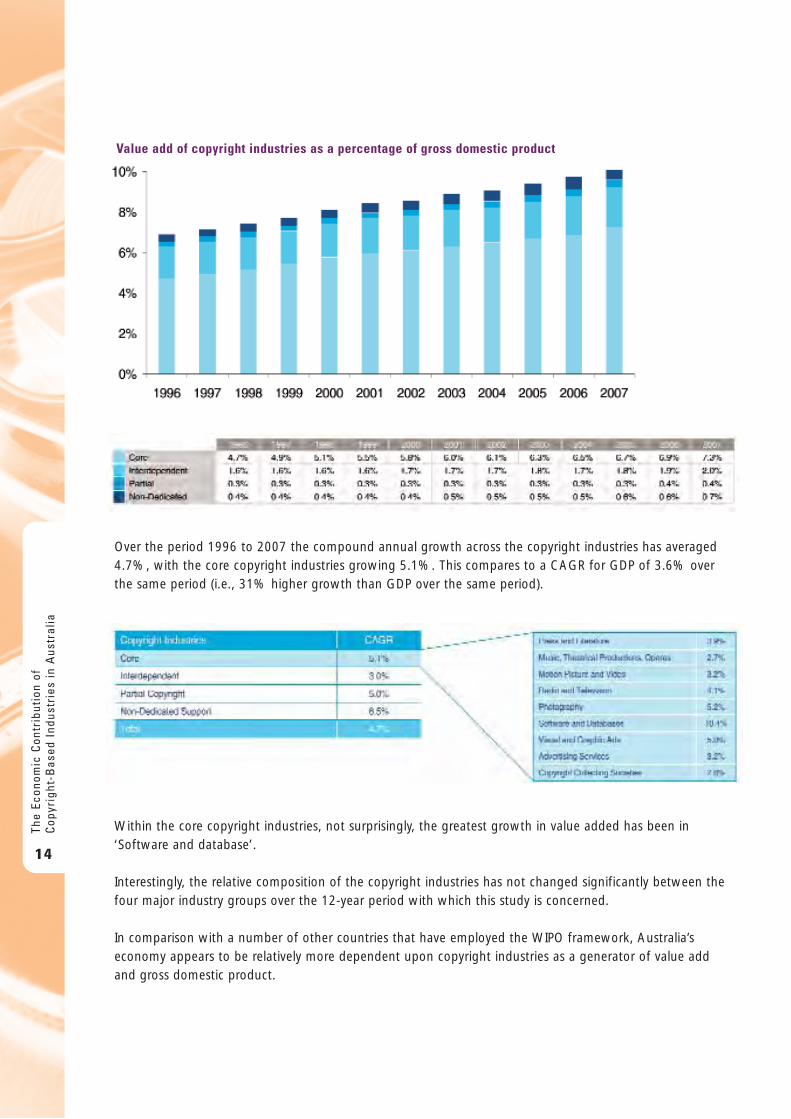
Over the period 1996 to 2007 the compound annual growth across the copyright industries has averaged4.7%, with the core copyright industries growing 5.1%. This compares to a CAGR for GDP of 3.6% overthe same period (i.e., 31% higher growth than GDP over the same period).
Within the core copyright industries, not surprisingly, the greatest growth in value added has been in‘Software and database’.
Interestingly, the relative composition of the copyright industries has not changed significantly between thefour major industry groups over the 12-year period with which this study is concerned.
In comparison with a number of other countries that have employed the WIPO framework, Australia’seconomy appears to be relatively more dependent upon copyright industries as a generator of value addand gross domestic product.
The
Econ
omic
Con
trib
utio
n of
Cop
yrig
ht-B
ased
Ind
ustr
ies
in A
ustr
alia
14
Value add of copyright industries as a percentage of gross domestic product
Real compounding annual growth rate (CAGR) of value add (2002 – 2007)
The Australian copyright industries have experienced moderate growth over the last 5 years compared toother primary Australian industries. The copyright industries experienced 4.0% real compounding annualgrowth over the period 2002 – 2007, in comparison to the CAGR of 4.7% over the period of 1996 – 2007.
The Economic C
ontribution ofC
opyright-Based Industries in A
ustralia
15
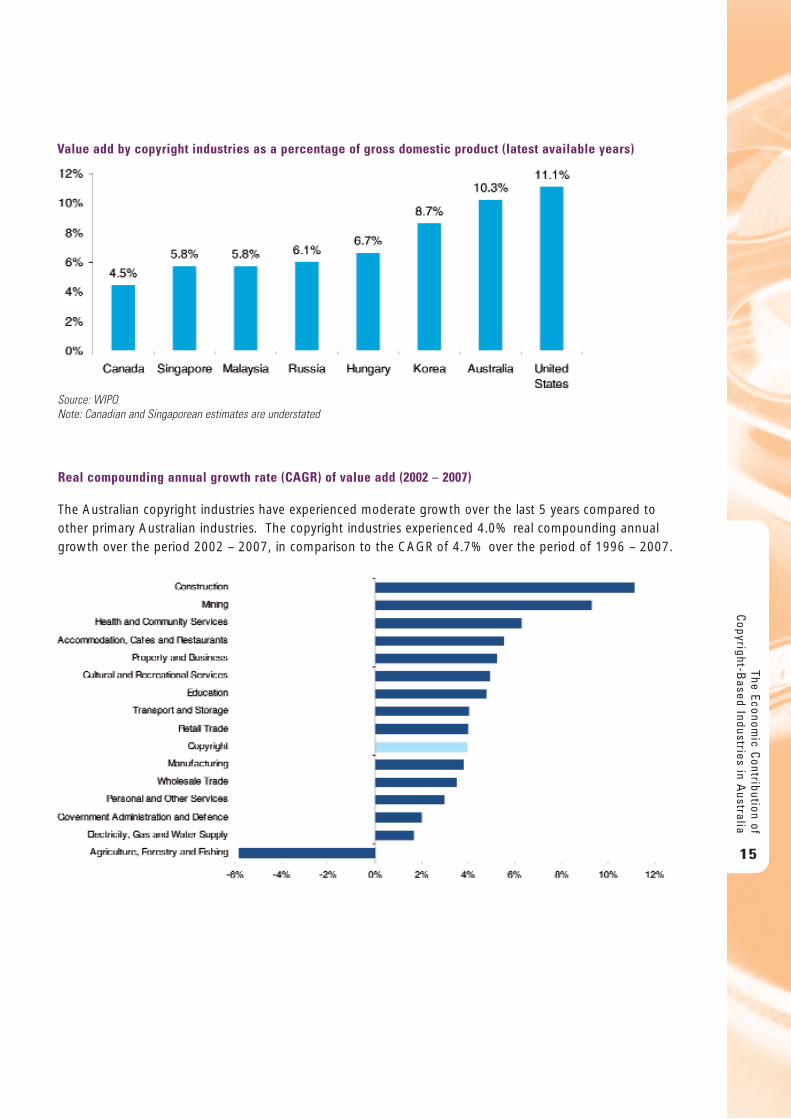
Value add by copyright industries as a percentage of gross domestic product (latest available years)
Source: WIPONote: Canadian and Singaporean estimates are understated
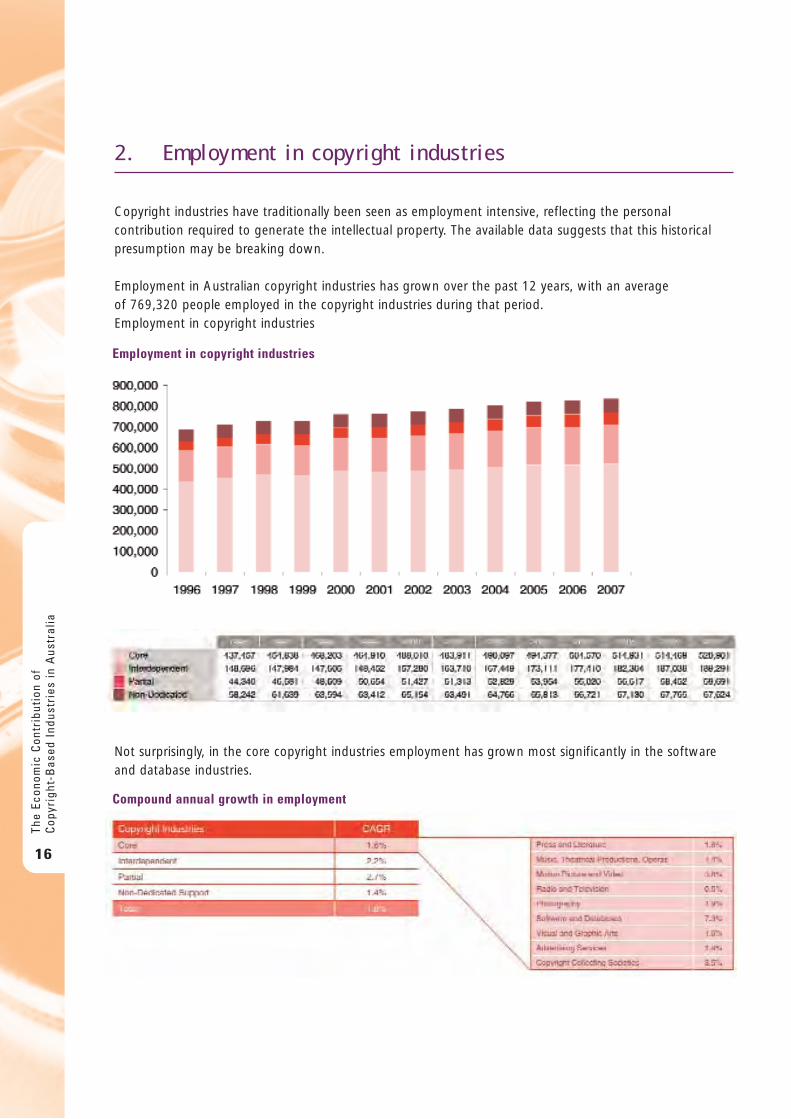
2 . E m p l o y m e n t i n c o p y r i g h t i n d u s t r i e s
Copyright industries have traditionally been seen as employment intensive, reflecting the personalcontribution required to generate the intellectual property. The available data suggests that this historicalpresumption may be breaking down.
Employment in Australian copyright industries has grown over the past 12 years, with an average of 769,320 people employed in the copyright industries during that period.Employment in copyright industries
Not surprisingly, in the core copyright industries employment has grown most significantly in the softwareand database industries.
The
Econ
omic
Con
trib
utio
n of
Cop
yrig
ht-B
ased
Ind
ustr
ies
in A
ustr
alia
16
Employment in copyright industries
Compound annual growth in employment
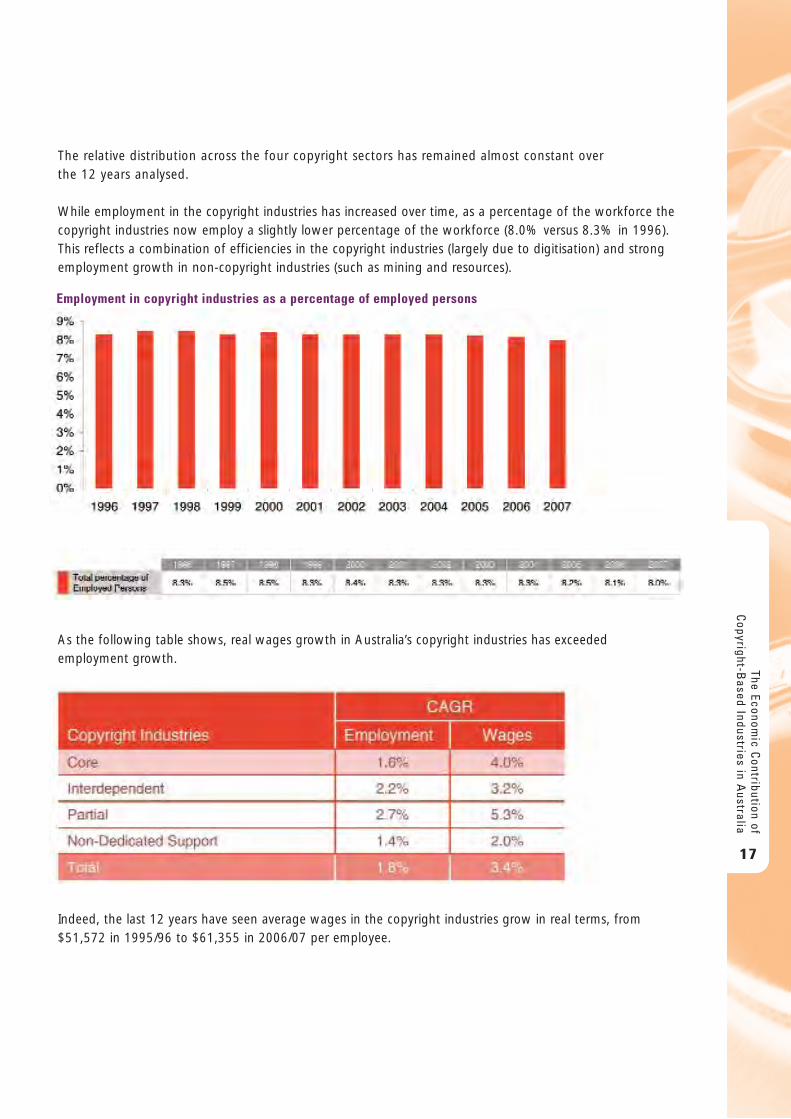
The relative distribution across the four copyright sectors has remained almost constant over the 12 years analysed.
While employment in the copyright industries has increased over time, as a percentage of the workforce thecopyright industries now employ a slightly lower percentage of the workforce (8.0% versus 8.3% in 1996).This reflects a combination of efficiencies in the copyright industries (largely due to digitisation) and strongemployment growth in non-copyright industries (such as mining and resources).
As the following table shows, real wages growth in Australia’s copyright industries has exceededemployment growth.
Indeed, the last 12 years have seen average wages in the copyright industries grow in real terms, from$51,572 in 1995/96 to $61,355 in 2006/07 per employee.
The Economic C
ontribution ofC
opyright-Based Industries in A
ustralia
17
Employment in copyright industries as a percentage of employed persons
This wage growth has not resulted in a major shift to labour (i.e. employees) from other factors ofproduction. Employees in copyright industries are achieving higher real wages, but owners of capital andland in the copyright industries are also receiving higher real returns. As the following diagram shows, realcopyright industry wages as a percentage of value add generated in the copyright industries has decreasedby about 13% over the past 12 years.
Furthermore, although copyright wages have fallen as a percentage of total wages (see figure below),copyright jobs are, on average, better remunerated than the economy as a whole.Th
e Ec
onom
ic C
ontr
ibut
ion
ofC
opyr
ight
-Bas
ed I
ndus
trie
s in
Aus
tral
ia
18
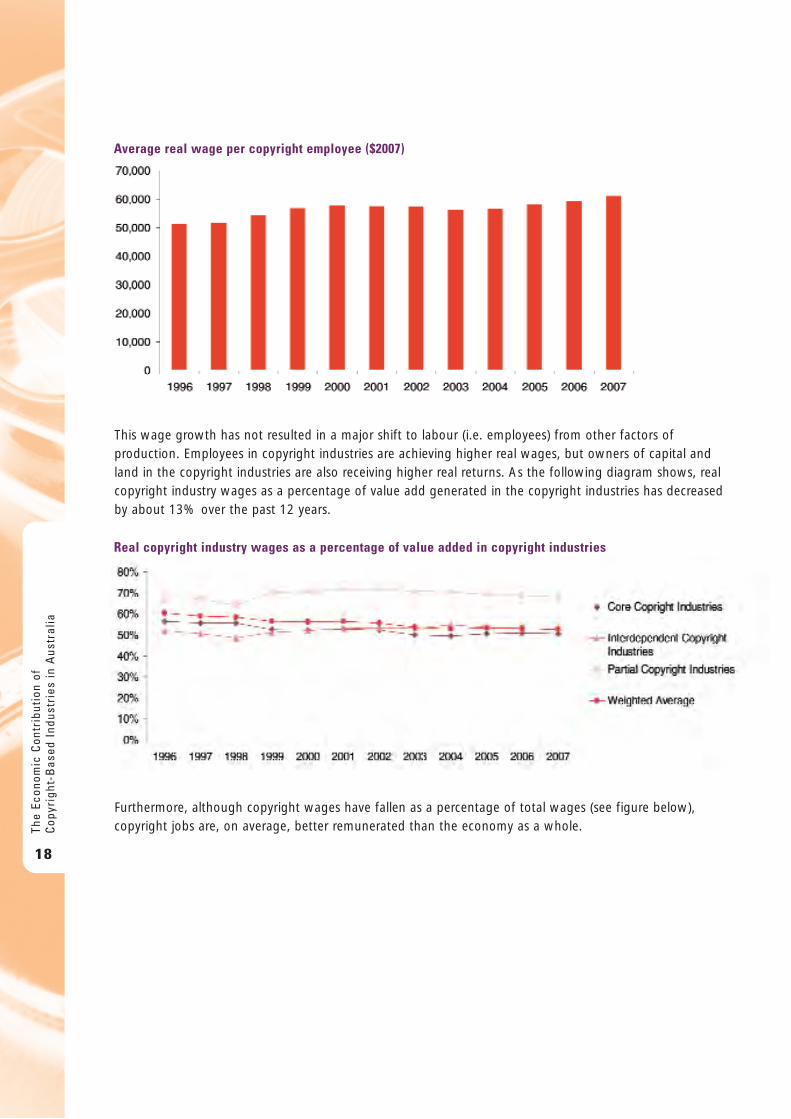
Average real wage per copyright employee ($2007)
Real copyright industry wages as a percentage of value added in copyright industries
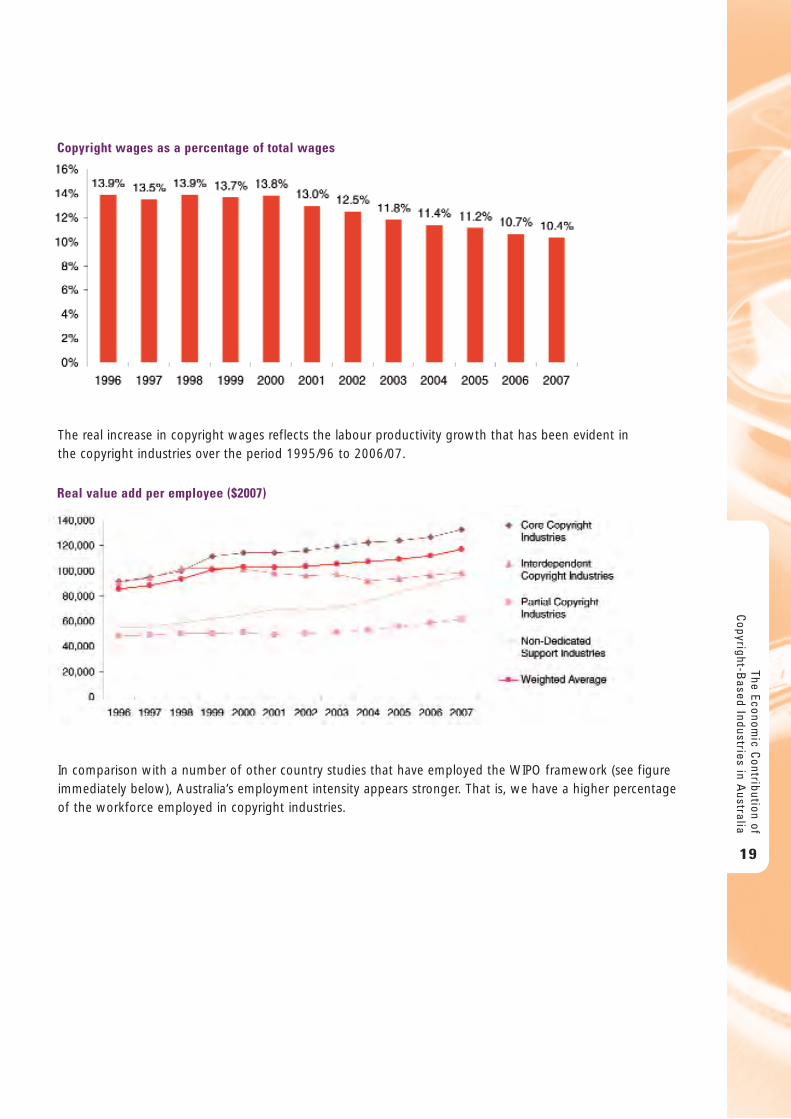
The real increase in copyright wages reflects the labour productivity growth that has been evident in the copyright industries over the period 1995/96 to 2006/07.
In comparison with a number of other country studies that have employed the WIPO framework (see figureimmediately below), Australia’s employment intensity appears stronger. That is, we have a higher percentageof the workforce employed in copyright industries.
The Economic C
ontribution ofC
opyright-Based Industries in A
ustralia
19
Copyright wages as a percentage of total wages
Real value add per employee ($2007)
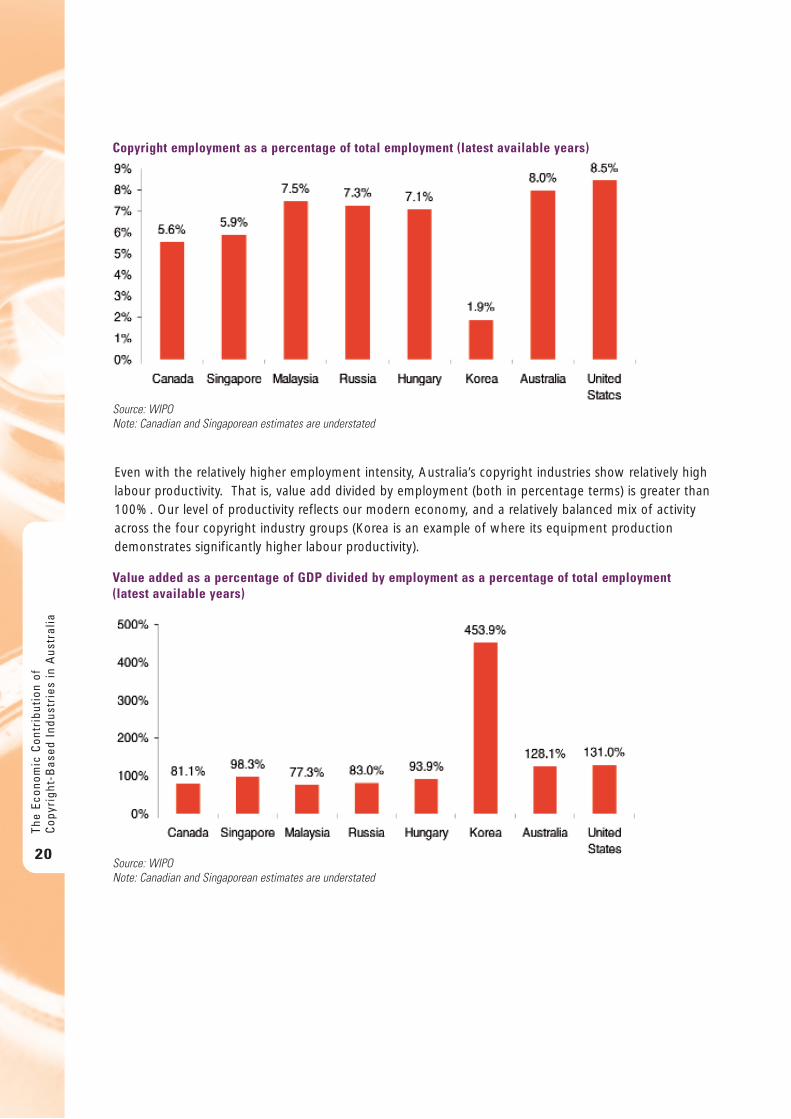
Even with the relatively higher employment intensity, Australia’s copyright industries show relatively highlabour productivity. That is, value add divided by employment (both in percentage terms) is greater than100%. Our level of productivity reflects our modern economy, and a relatively balanced mix of activityacross the four copyright industry groups (Korea is an example of where its equipment productiondemonstrates significantly higher labour productivity).
The
Econ
omic
Con
trib
utio
n of
Cop
yrig
ht-B
ased
Ind
ustr
ies
in A
ustr
alia
20
Copyright employment as a percentage of total employment (latest available years)
Source: WIPONote: Canadian and Singaporean estimates are understated
Value added as a percentage of GDP divided by employment as a percentage of total employment (latest available years)
Source: WIPONote: Canadian and Singaporean estimates are understated
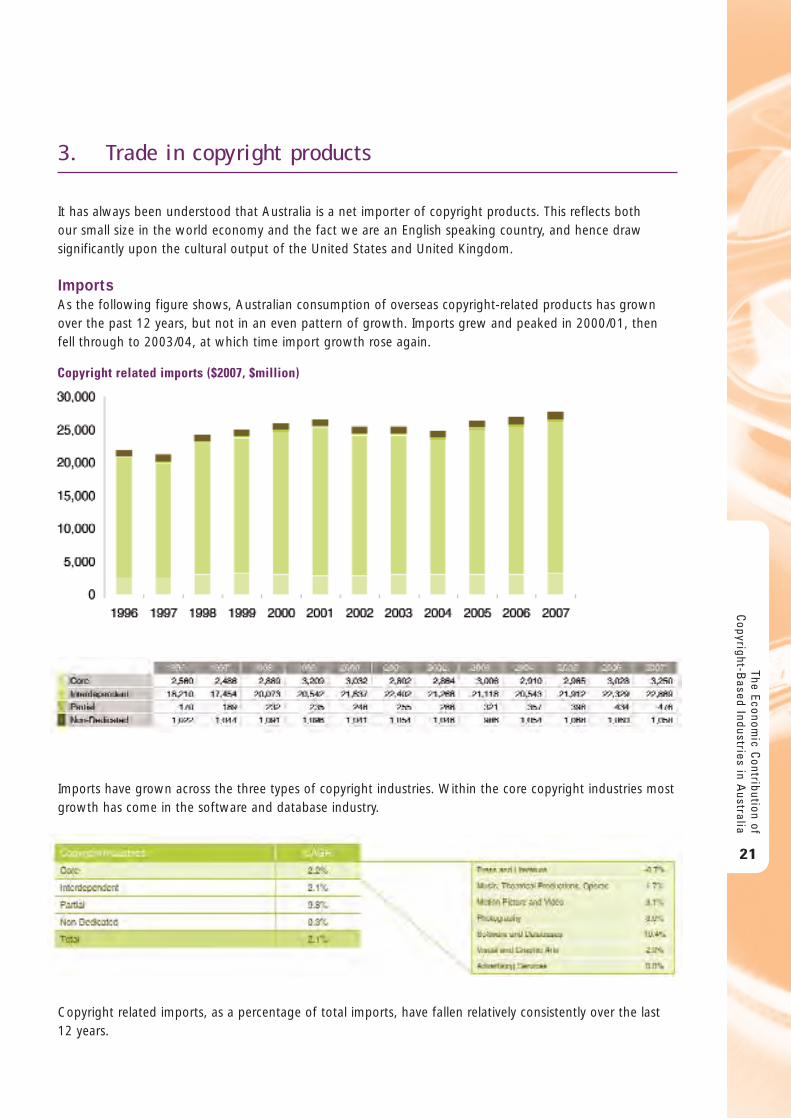
3 . Tr a d e i n c o p y r i g h t p r o d u c t s
It has always been understood that Australia is a net importer of copyright products. This reflects both our small size in the world economy and the fact we are an English speaking country, and hence drawsignificantly upon the cultural output of the United States and United Kingdom.
ImportsAs the following figure shows, Australian consumption of overseas copyright-related products has grownover the past 12 years, but not in an even pattern of growth. Imports grew and peaked in 2000/01, thenfell through to 2003/04, at which time import growth rose again.
Imports have grown across the three types of copyright industries. Within the core copyright industries mostgrowth has come in the software and database industry.
Copyright related imports, as a percentage of total imports, have fallen relatively consistently over the last12 years.
The Economic C
ontribution ofC
opyright-Based Industries in A
ustralia
21
Copyright related imports ($2007, $million)
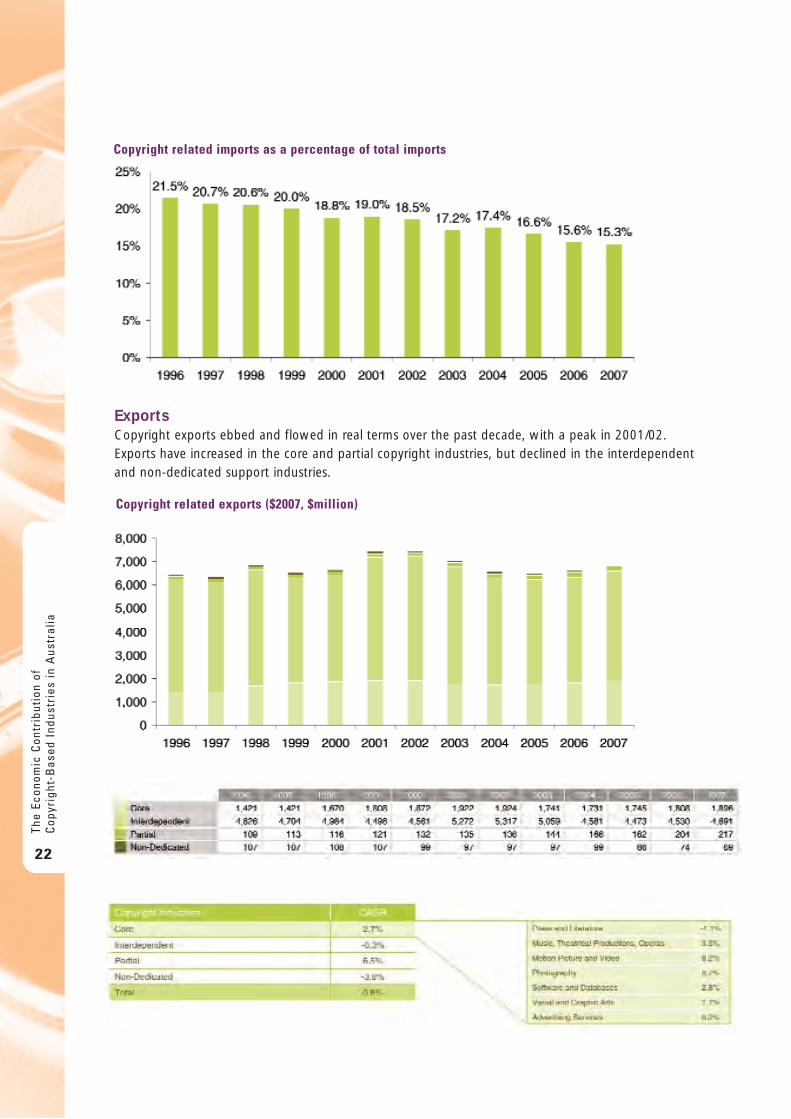
ExportsCopyright exports ebbed and flowed in real terms over the past decade, with a peak in 2001/02.Exports have increased in the core and partial copyright industries, but declined in the interdependent and non-dedicated support industries.
The
Econ
omic
Con
trib
utio
n of
Cop
yrig
ht-B
ased
Ind
ustr
ies
in A
ustr
alia
22
Copyright related imports as a percentage of total imports
Copyright related exports ($2007, $million)
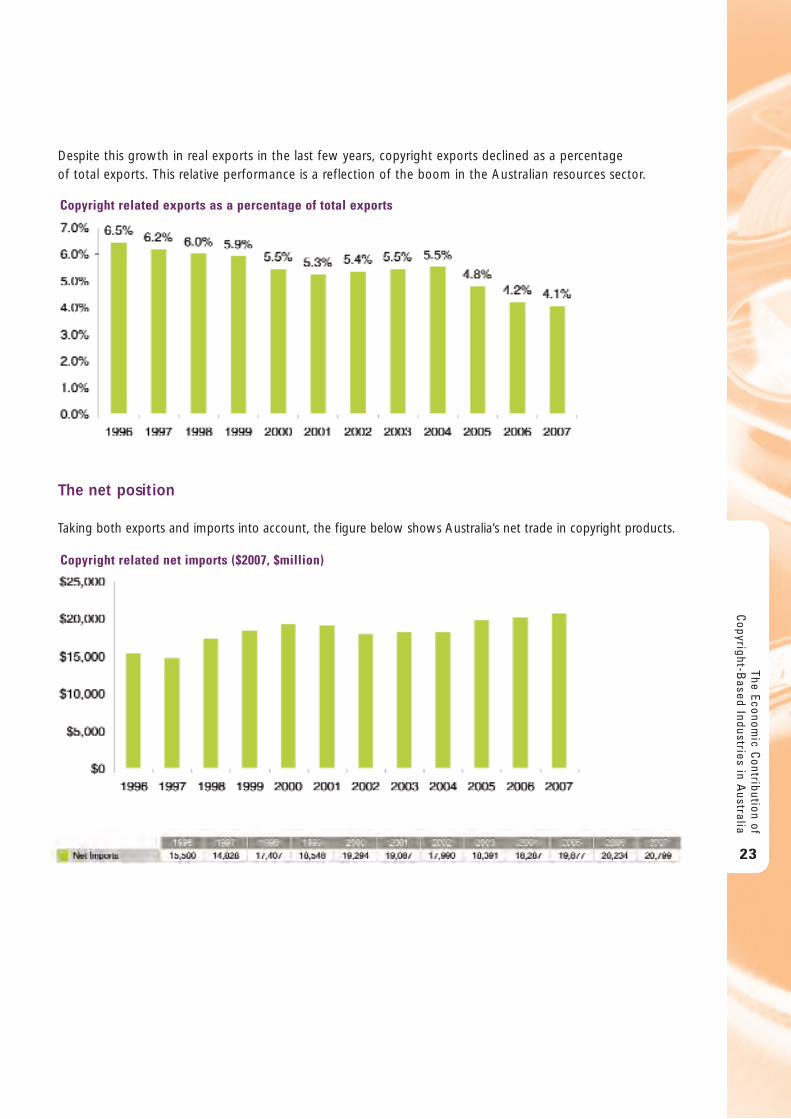
Despite this growth in real exports in the last few years, copyright exports declined as a percentage of total exports. This relative performance is a reflection of the boom in the Australian resources sector.
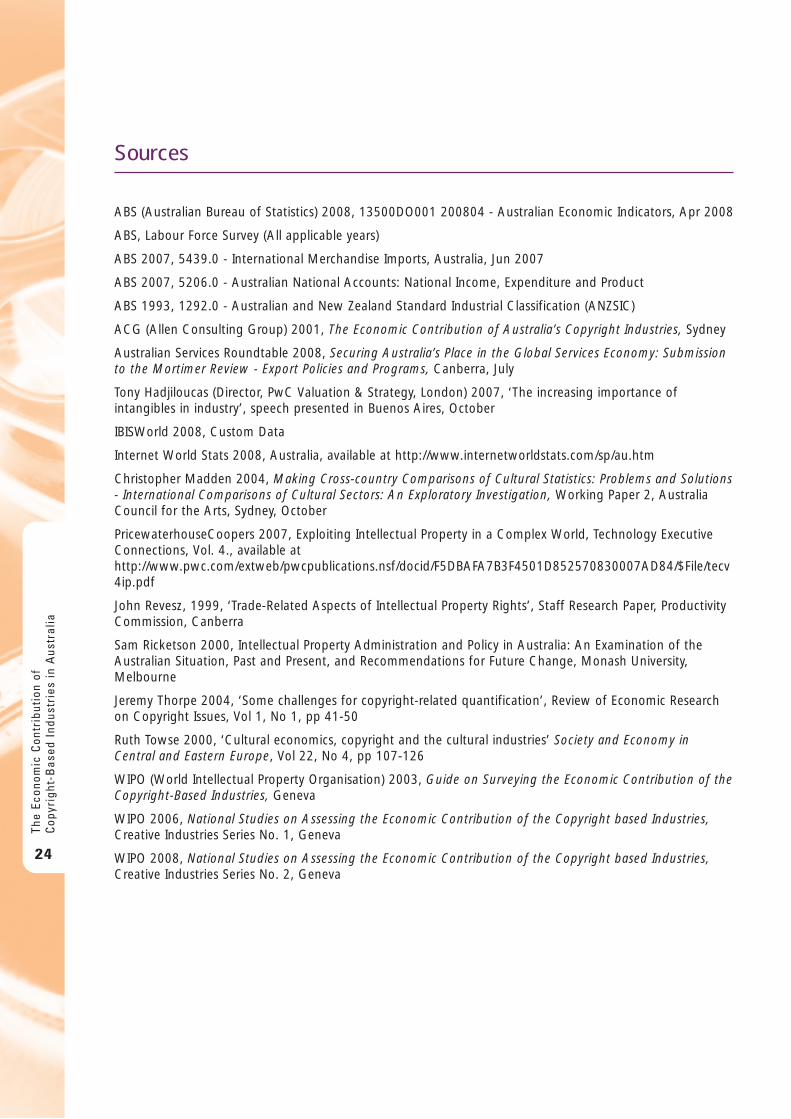
The net position
Taking both exports and imports into account, the figure below shows Australia’s net trade in copyright products.
The Economic C
ontribution ofC
opyright-Based Industries in A
ustralia
23
Copyright related exports as a percentage of total exports
Copyright related net imports ($2007, $million)
S o u r c e s
ABS (Australian Bureau of Statistics) 2008, 13500DO001 200804 - Australian Economic Indicators, Apr 2008
ABS, Labour Force Survey (All applicable years)
ABS 2007, 5439.0 - International Merchandise Imports, Australia, Jun 2007
ABS 2007, 5206.0 - Australian National Accounts: National Income, Expenditure and Product
ABS 1993, 1292.0 - Australian and New Zealand Standard Industrial Classification (ANZSIC)
ACG (Allen Consulting Group) 2001, The Economic Contribution of Australia’s Copyright Industries, Sydney
Australian Services Roundtable 2008, Securing Australia’s Place in the Global Services Economy: Submissionto the Mortimer Review - Export Policies and Programs, Canberra, July
Tony Hadjiloucas (Director, PwC Valuation & Strategy, London) 2007, ‘The increasing importance ofintangibles in industry’, speech presented in Buenos Aires, October
IBISWorld 2008, Custom Data
Internet World Stats 2008, Australia, available at http://www.internetworldstats.com/sp/au.htm
Christopher Madden 2004, Making Cross-country Comparisons of Cultural Statistics: Problems and Solutions- International Comparisons of Cultural Sectors: An Exploratory Investigation, Working Paper 2, AustraliaCouncil for the Arts, Sydney, October
PricewaterhouseCoopers 2007, Exploiting Intellectual Property in a Complex World, Technology ExecutiveConnections, Vol. 4., available athttp://www.pwc.com/extweb/pwcpublications.nsf/docid/F5DBAFA7B3F4501D852570830007AD84/$File/tecv4ip.pdf
John Revesz, 1999, ‘Trade-Related Aspects of Intellectual Property Rights’, Staff Research Paper, ProductivityCommission, Canberra
Sam Ricketson 2000, Intellectual Property Administration and Policy in Australia: An Examination of theAustralian Situation, Past and Present, and Recommendations for Future Change, Monash University,Melbourne
Jeremy Thorpe 2004, ‘Some challenges for copyright-related quantification’, Review of Economic Researchon Copyright Issues, Vol 1, No 1, pp 41-50
Ruth Towse 2000, ‘Cultural economics, copyright and the cultural industries’ Society and Economy inCentral and Eastern Europe, Vol 22, No 4, pp 107-126
WIPO (World Intellectual Property Organisation) 2003, Guide on Surveying the Economic Contribution of theCopyright-Based Industries, Geneva
WIPO 2006, National Studies on Assessing the Economic Contribution of the Copyright based Industries,Creative Industries Series No. 1, Geneva
WIPO 2008, National Studies on Assessing the Economic Contribution of the Copyright based Industries,Creative Industries Series No. 2, Geneva
The
Econ
omic
Con
trib
utio
n of
Cop
yrig
ht-B
ased
Ind
ustr
ies
in A
ustr
alia
24
The Economic C
ontribution ofC
opyright-Based Industries in K
enya
25
The Economic Contribution of Copyright-Based Industries
in Kenya
Dickson Nyariki1
Oliver WasongaCalleb OtienoEric OgadhoCharles IkutwaJulius Kithinji March 20091 The main author is an Associate Professor and teaches economics at the University of Nairobi; P.O. Box 29053-00625, Nairobi; emailaddress [email protected], [email protected]

The
Econ
omic
Con
trib
utio
n of
Cop
yrig
ht-B
ased
Ind
ustr
ies
in K
enya
26
Ta b l e o f C o n t e n t s
Acknowledgements 31
Summary 32
1. INTRODUCTION 351.1 Background and Context 351.2 Objectives and Structure of the Study 361.3 Scope of Study 37
2. COPYRIGHT POLICY AND LAW IN KENYA 382.1 Policies Related to Creative and Copyright Industries 382.2 Copyright Law 38
2.2.1 The Subject Matter and Beneficiaries of Copyright Law 382.2.2 Overview of the Kenyan Copyright Law 392.2.3 Economic Considerations of the Kenyan Copyright Law 40
3. COPYRIGHT-BASED INDUSTRIES IN KENYA 423.1 Composition of Copyright-Based Industries 423.2 Types of Copyright-Based Industries 42
3.2.1 Core Copyright-Based Industries 423.2.2 Interdependent Copyright-Based Industries 433.2.3 Partial Copyright-Based Industries 433.2.4 Non-Dedicated Support Industries 43
3.3 Comparison of Industry Classification for Kenya with the WIPO Guide 443.4 Copyright Factors 453.5 Comparison of Kenya’s Coding and the WIPO Guide (2003) ISIC System 48
4. DATA COLLECTION AND METHODS OF ANALYSIS 504.1 Sources of Information 504.2 Methodology 50
4.2.1 Data Collection 504.2.2 Dealing with Missing Data 504.2.3 Calculation of Indicators of Economic Contribution 51
4.3 Survey Challenges 52
5. ECONOMIC CONTRIBUTION OF COPYRIGHT-BASED INDUSTRIES IN KENYA IN 2007 545.1 Overall Performance of Copyright-Based Industries 545.2 Economic Contribution of Copyright-Based Industries Compared to Other Sectors 585.3 Economic Contribution of Decomposed Core Copyright-Based Industries 615.4 Economic Contribution of Interdependent Copyright-Based Industries 665.5 Economic Contribution of Partial Copyright-Based Industries 705.6 Economic Contribution of Non-Dedicated Support Industries 735.7 Foreign Trade in Copyright-Based Goods and Services 755.8 International Comparisons 78
The Economic C
ontribution ofC
opyright-Based Industries in K
enya
27
6. THE DEVELOPMENT OF SOME CORE COPYRIGHT-BASED INDUSTRIES IN KENYA 816.1 Press and Literature 81
6.1.1 The Press Market 816.1.2 The Book Market 84
6.2 Music, Theatrical Productions and Opera 846.2.1 The Music Industry 84
6.2.2 Theatres 866.3 Film Production and Video 866.4 Radio and Television 876.5 Collective Management Societies 896.6 Institutions set up to safeguard the interests of their members 91
7. CONCLUSIONS AND RECOMMENDATIONS 92
APPENDIX 94
The
Econ
omic
Con
trib
utio
n of
Cop
yrig
ht-B
ased
Ind
ustr
ies
in K
enya
28
Ta b l e s
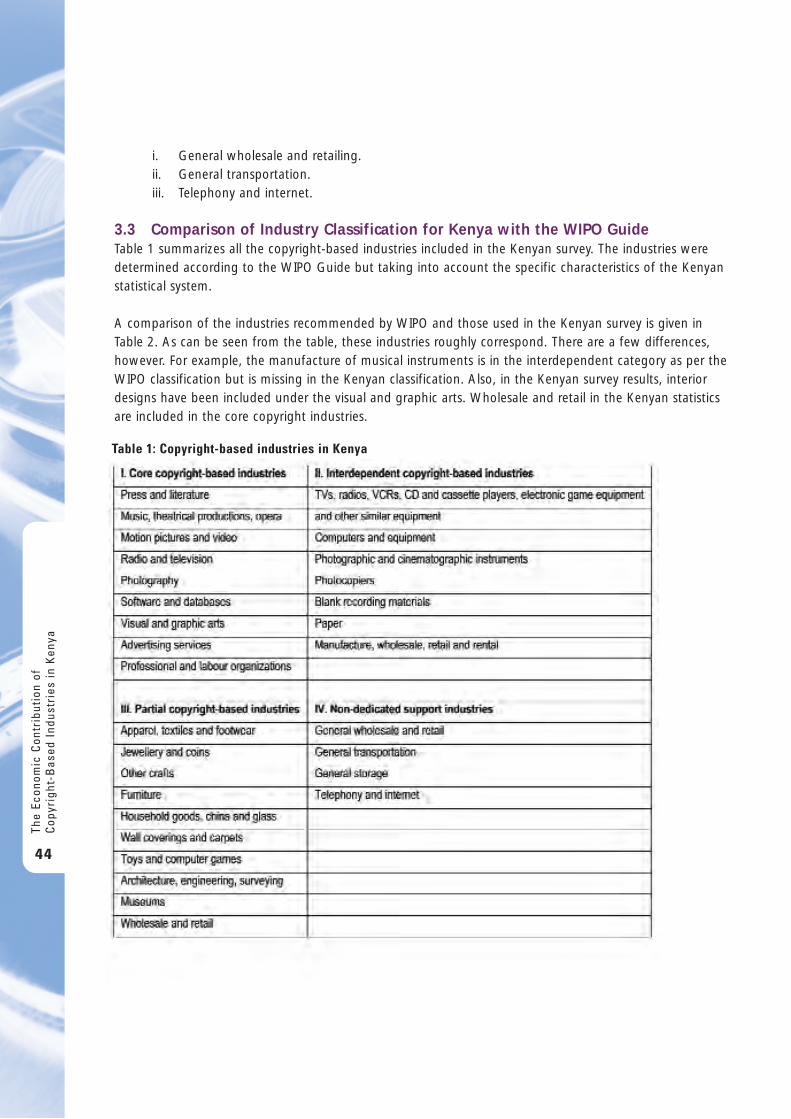
Table 1: Copyright-based industries in Kenya 44
Table 2: Classification of copyright-based industries in Kenya compared to the WIPO Guide classification 45
Table 3: Copyright factors for partial copyright-based industries in Kenya 46
Table 4: Copyright factors adopted for the Kenyan study 47
Table 5: Kenya’s industry coding compared to WIPO (2003) ISIC 48
Table 6: Economic contribution of copyright-based industries in Kenya in 2007 (KSHs, numbers, %) 55
Table 7: Economic contribution of decomposed core copyright-based industries in Kenya in 2007 63
Table 8: Contribution of decomposed core copyright-based industries to employment in Kenya in 2007 64
Table 9: Contribution of decomposed core copyright-based industries to employeeincome in Kenya in 2007 65
Table 10: Contribution of decomposed interdependent copyright-based industriesto value-added in Kenya in 2007 67
Table 11: Contribution of decomposed interdependent copyright-based industriesto employment in Kenya in 2007 68
Table 12: Contribution of decomposed interdependent copyright-based industriesto employee incomes in Kenya in 2007 69
Table 13: Contribution of decomposed partial copyright-based industriesto employment in Kenya in 2007 (numbers, %) 71
Table 14: Contribution of decomposed partial copyright-based industriesto employee incomes in Kenya in 2007 (million KSHs, %) 72
Table 15: Contribution of decomposed non-dedicated support industriesto value-added in Kenya in 2007 (KSHs) 74
Table 16: Contribution of decomposed non-dedicated support industriesto employment and employee income in Kenya in 2007 (numbers, million KSHs) 75
Table 17: Kenya’s exports, imports and trade balance of copyright-based goodsand services in 2007 (‘000 KSHs, %) 76
Table 18: Average daily circulation of leading dailies in Kenya in 2007 (‘000 copies) 83
Table 19: Average circulation of daily and weekly newspapers in Kenya (‘000 copies), 2003-2007 83
Table 20: Readership of a number of newspapers in Kenya in 2005 (%) 84
Table 21: Radio and television frequencies assigned in Kenya, 2003-2007 87
Table 22: Television viewer-ship in Kenya in 2007 (%) 88
Table 23: Radio station listener-ship (% share of audience) in Kenya in 2007 88
Table 24: Fee payable according to different ERP conditions in Kenya in 2007 89
The Economic C
ontribution ofC
opyright-Based Industries in K
enya
29
F i g u r e s
Figure 1: Economic contribution of copyright-based industries in Kenya in 2007 (%) 55
Figure 2: Share contributions within copyright-based industries in Kenyabased on total value-added (GDP) in 2007 56
Figure 3: Share contributions within copyright-based industries in Kenyabased on total gross output in 2007 (%) 56
Figure 4: Productivity within copyright-based industries in Kenya in 2007 (total added value per employee) 57
Figure 5: Productivity of copyright-based industries compared to the national productivityin Kenya in 2007 (total added value per employee) 57
Figure 6: Contribution of copyright-based industries to Kenya’s economy in 2007compared to other sectors on the basis of GDP (%) 58
Figure 7: The contribution of copyright-based industries to Kenya’s economy in 2007compared to other sectors based on employment (‘000) 59
Figure 8: Contribution of copyright-based industries to Kenya’s economy comparedto other sectors on the basis of employee incomes (KSHs millions) 60
Figure 9: Productivity of copyright-based industries in Kenya(total added value in KSHs millions/employee) compared to other sectors in 2007 61
Figure 10: Economic contribution of core copyright-based industries in Kenya in 2007 (%) 62
Figure 11: Structure of core copyright-based industries in Kenya in 2007 based on value-added (%) 63
Figure 12: Structure of core copyright-based industries in Kenya in 2007 according to gross output (%) 64
Figure 13: Structure of core copyright-based industries in Kenya in 2007 based on the number of employees (%) 65
Figure 14: Economic contribution of interdependent copyright-based industries in Kenya in 2007 (%) 66
Figure 15: Contribution of decomposed interdependent copyright-based industriesto value-added in Kenya in 2007 (%) 67
Figure 16: Contribution of decomposed interdependent copyright-based industriesto gross output in Kenya in 2007 (%) 68
Figure 17: Contribution of decomposed interdependent copyright-based industriesto employment in Kenya in 2007 (%) 69
Figure 18: Contribution of decomposed interdependent copyright-based industriesto employee incomes in Kenya in 2007 (%) 70
Figure 19: Economic contribution of partial copyright-based industries in Kenya in 2007 (%) 71
Figure 20: Economic contribution of non-dedicated support industries in Kenya in 2007 (%) 74
Figure 21: Contribution of copyright-based industries to exports and imports in relationto the total national economy in Kenya in 2007 (%) 76
Figure 22: Proportions contributed by copyright-based industries to exports,imports and foreign-trade balance in Kenya in 2007 (%) 77
Figure 23: International comparison of the contribution of core copyright-based industries to GDP (%) 78
Figure 24: International comparison of the contribution of core copyright-based industriesto employment (%) 79
Figure 25: International comparison of the total copyright-based industries to GDP and employment (%) 80
The
Econ
omic
Con
trib
utio
n of
Cop
yrig
ht-B
ased
Ind
ustr
ies
in K
enya
30
A c k n o w l e d g e m e n t s
I acknowledge with thanks the assistance given by many organizations, individuals and government officialsin the course of this study. Special thanks go to Marisella Ouma, Acting Executive Director of Kenya CopyrightBoard (KCB), for granting us her time to answer many queries and for availing useful information oncopyright-based industries in Kenya. In particular, I am immensely appreciative of her effort in spending longhours drafting and signing many introductory letters to potential providers of data, and in being readilyavailable for consultations.
This report may not have been possible without the support of the Kenya Revenue Authority (KRA). TheAuthority provided information on the Kenyan classification of copyright-based industries and data onValue-Added Tax (VAT) and sales, which made it possible to compute value-added and gross output. I amespecially grateful to Jonah Ogaro and his team for working tirelessly on the long list of activities, amidsttheir tight official schedules. I must also acknowledge my former University of Nairobi students, who Iengaged as Research Assistants, for data collection. These were Eunice Nginya, Michael Katete, JosephineWere and Juliana Wanyama. They did not only do an excellent job in collecting data and information inthe face of difficulties but also participated in numerous discussion meetings, and often had the graceand patience to bear with me even when I had shown obvious frustrations. Many thanks too go to allgovernment officials and individuals in the private sector whose names I am not able to mention forfinding time to assist us in obtaining data and information for this study.
The UN World Intellectual Property Organization (WIPO) Office in Geneva facilitated this study in anumber of ways. I greatly appreciate the information provided through publications, reports anddiscussions, and the comments received from the team associated with this study, particularly DimiterGantchev and Christopher Kalanje. Dimiter Gantchev (the current Acting Director, Creative IndustriesDivision) deserves special mention. In addition to his expert contributions, I am deeply obliged to him for his patience and understanding; he encouraged me to soldier on even when the exercise appearedimpossible. I am particularly thankful to him for enabling me to attend the October 2008 Expert Meetingin Singapore. The meeting made many issues clear and demystified apparent obstacles in the study thathitherto seemed insurmountable. I further recognize Stephen Siwek (WIPO’s International Consultant) forhis special role. He went through our drafts with a keen eye for detail, offering worthy criticism andguiding comments, and pointing out errors that would not otherwise have been noticed. The quality ofthis publication owes a lot to him.
This study was conducted with funding from WIPO. We therefore express our gratitude at the challengingbut important opportunity the organization provided us to undertake this study. However, the viewsexpressed in this study are those of the authors and not necessarily those of the WIPO Secretariat or of the Member States of WIPO.
Dickson Nyariki
The Economic C
ontribution ofC
opyright-Based Industries in K
enya
31
S u m m a r y
Copyright-based industries form part of creative industries, which are economic activities based on thecreation, management, use and trade in original creations expressed in tangible form. Creative industries arereferred to as copyright-based industries and products there-from as copyright-based goods when they areprotected under intellectual property rights. There is a growing interest in the copyright-based industriestoday due to the recognition that creativity is the very basis for social, economic and cultural developmentof nations. Based on the World Intellectual Property Organization (WIPO) Guide (2003), studies have beenconducted to quantify the contributions of copyright-based industries in several European, Latin Americanand Asian countries. Currently, there are a number of similar studies going on in Africa.
The overall objective of the Kenyan study was to quantify the economic contribution of copyright andrelated rights-based industries in the country by estimating their value-added to GDP, share of nationalemployment, and revenue generated from foreign trade. The findings of this study are expected to informpolicy formulation processes towards an improved policy framework for the operation of the creative sectorin the country. In accordance with the WIPO Guide, this study categorized the copyright and related rights-based industries into core, interdependent, partial, and non-dedicated support industries.
This study relied mainly on secondary data for 2007 obtained from various government departments andother relevant institutions. The main sources of data included the Kenya Revenue Authority (KRA); KenyaNational Bureau of Statistics (KNBS); Attorney General Chambers; Kenya Institute for Public Policy Researchand Analysis (KIPPRA); Institute of Policy Analysis and Research (IPAR); Kenya Association of Manufacturers(KAM); and the Music Copyright Society of Kenya (MCSK). Other secondary sources of data were past andcurrent research and government reports. In addition, internet searches were employed to access availableinformation on the contribution of creative industries to the national economy.
The results show that the total value-added of copyright-based industries in 2007 amounted to about KSHs85.21 billion, which represented 5.32% of Kenya’s GDP. The contribution to the country’s total value-addedby the core industries was KSHs 36.94 billion (2.3%), by the interdependent industries KSHs 34.78billion (2.17%), the partial industries KSHs 6.56 billion (0.41%), and the non-dedicated supportindustries KSHs 6.92 billion (0.43%). The entire copyright-based industries contributed KSHs 114.23billion out of the national gross output of KSHs 3,041.38 billion, which represented 3.76% of the grossoutput. Out of this total, the core copyright-based industries made a contribution of KSHs 57.2 billion,which formed 1.88%. With respect to the income for employees, the copyright-based industries made atotal of KSHs 19.12 billion, making a proportion of about 1.97% compared to the total national economicvalue of KSHs 749.82 billion. The total employee income for core industries was KSHs 7.61 billion, whichwas 1.02% of the national employee income. Generally, those employed in the non-dedicated supportindustries were the highest paid workers in the copyright-based industries in Kenya.
Copyright-based industries employed 62,131 people. These comprised 3.26% of the total nationalworkforce. Within this number, employee numbers in the core copyright industries were 22,799,constituting 1.2% of the total national workforce.
The core copyright-based industries outperformed the other three categories of copyright-based industries in all the main economic contributions considered in this study—GDP, gross output, employment andemployee incomes. The interdependent copyright-based industries did better than the partial copyright-based and non-dedicated support industries in the contribution to GDP and gross output. The partial
The
Econ
omic
Con
trib
utio
n of
Cop
yrig
ht-B
ased
Ind
ustr
ies
in K
enya
32
copyright-based industries exceeded the interdependent copyright-based and non-dedicated supportindustries in the contribution to employment and employee incomes.
Within the copyright-based industries, the core copyright-based industries made the highest contribution of43% to the total copyright-based GDP, followed by the interdependent copyright-based industries, whichcontributed 41%. With respect to gross output, the core copyright-based industries contributed an evenhigher share of 49% compared to the contribution of interdependent industries of 31% of the totalcopyright-based gross output. The partial copyright-based and non-dedicated support industries madecontributions of 12% and 8% respectively.
Of the copyright-based industries, the most productive, in terms of the total added value per employee, wasthe interdependent industries with a contribution of KSHs 2,446,188, followed by the core copyright-basedindustries with a contribution of KSHs 1,620,426, all the copyright-based industries combined with acontribution of KSHs 1,371,436, and the total national economy with a contribution of KSHs 840,569 peremployee. This shows that the productivity of all the copyright-based industries was more than one-and-a-half times that of the national productivity, while the productivity of the core copyright-based industries andthe interdependent copyright-based industries was twice and three times that of the national productivityrespectively. Also, compared to the other major sectors of the economy, copyright-based industriesperformed impressively in terms of productivity. The core copyright-based industries were second best with a productivity value of KSHs 1.62 million per employee, compared to the best-performing sector—finance,real estate and business services—with a productivity value of KSHs 1.94 million per employee.
The contribution of the copyright-based industries to the national economy on the basis of GDP was higherthan that of the agricultural sector (2.3%), education (2.5%), and healthcare (3.9%), and comparedfavourably with the contributions of the other main sectors of the Kenyan economy, such as fisheries (5.4%)and manufacturing (6.2%). The contribution of copyright-based industries of 62,131 people to the nationalemployment was also higher than that of the electrical-and-water sector (19,000 employees) and themining-and-quarrying sector (6,300 employees). Furthermore, the contribution of copyright-based industriesto the national employee income (KSHs 19.12 billion) was more than that from the mining-and-quarrying(KSHs 1.35 billion) and electrical-and-water (KSHs 8.37 billion) sectors, individually as well as combined.
The core and partial copyright-based industries contributed proportionally more value of exports thanimports compared to the total national exports and imports, which were 1.30% and 0.22% for the coreand 6.54% and 0.99% for the partial, respectively. Similarly, all copyright-based industries combinedproportionally produced higher export value relative to the total national export value (9.35%) than importvalue relative to the total national import value (7.86%). The national economy exhibited a huge foreigntrade deficit compared to the copyright-based industries, implying that the copyright-based industries aredoing better than the overall national economy. However, the copyright-based industries have a relativelyhigh import component, particularly within the interdependent category, that reduces its value-added andgross output.
Most of the statistics and computed economic contributions of copyright-based industries in Kenyacompared reasonably well with those of other countries. In 2007, Kenya’s core copyright-based industriesmade a contribution of over 2.3% to GDP. Compared with the results of similar studies conducted earlier inother countries, this figure was larger than those for Colombia (1.9%), Jamaica (1.7%), Bulgaria (1.6%),Mexico (1.6%) and Ukraine (1.5%). According to the studies so far carried out based on the WIPO Guide,Ukraine core copyright-based industries make the lowest contribution (1.5%) to GDP, while Australia makethe highest (7.3%), followed by the USA (6.5%). These statistics, therefore, indicate that Kenya lies
The Economic C
ontribution ofC
opyright-Based Industries in K
enya
33
somewhere in the middle of the lower half in terms of performance. With respect to employment contributionby the core copyright-based industries, Kenya did not do as well as with GDP contribution. Kenya’scontribution of 1.2% of employees, compared to the national employment, was only better than Ukraine’s(1.16%). However, the core and interdependent copyright-based industries combined accounted for 4.5%of Kenya’s GDP, well above many countries in comparison. A comparison of the contribution of the totalcopyright-based industries to GDP and employment between Kenya and the USA, Singapore, Hungary,Jamaica, and Colombia reveals that Kenya performed favourably. It did better than Jamaica, comparedclosely with Colombia, and did not rank far behind Singapore and Hungary.
In summary, therefore, the contribution of copyright-based industries in Kenya in 2007 was as follows:On the basis of GDP, their contribution within the country was higher than that of the agricultural sector,education, and healthcare, and compared favourably with the fisheries and manufacturing sectors. Withrespect to employment, the industries engaged a higher number of people than the electrical-and-waterand mining-and-quarrying sectors.As far as productivity is concerned, in terms of GDP per employee, theindustries performed one-and-a-half times better than the national economy. Internationally, the industriesperformed averagely in terms of GDP, but did better than a number of countries in Europe, South America,Asia, and the Caribbean.
A few discrepancies were noted in the data used in this study, mainly as a result of databases in Kenyabeing piecemeal and scattered in different government agencies. This presented difficulties in estimating thefull contribution of the copyright-based industries to GDP. The contribution of these industries to the totalvalue-added, therefore, is likely higher than what was shown.
Despite some inadequacies in the policies governing the operations of copyright-based industries in Kenya,their economic contribution is reasonably significant. The economic contribution of copyright-basedindustries in Kenya is higher than a number of important sectors in the country and compares well withthose of several countries in Europe, Asia and the Americas for which similar studies have been conducted.In order to promote the growth and development of already vibrant copyright-based sectors in Kenya,appropriate and operational policy frameworks are imperative.
The
Econ
omic
Con
trib
utio
n of
Cop
yrig
ht-B
ased
Ind
ustr
ies
in K
enya
34
1 . I n t r o d u c t i o n
1.1 Background and ContextCopyright industries form part of creative industries, which are economic activities based on the creation,management, use and trade in original creations expressed in tangible form. When the producedexpressions are protected under intellectual property (IP) rights, then such industries are referred to ascopyright industries and the products there-from as copyright goods. Copyright is a legal term describingrights given to creators for their literary and artistic works. It is a type of property that is founded on aperson’s creative skill and labour. It is designed to prevent the unauthorized use by others of a work, that is,the original form in which an idea or information has been expressed by the creator. According to the WIPOGuide (2003), copyright is not a tangible thing. It is made up of a bundle of exclusive economic rights to docertain acts with an original work or other copyright subject-matter. These rights include the right to copy,publish, communicate (e.g., broadcast, make available online) and publicly perform the copyright material.The copyright creators also have a number of non-economic rights.
The kinds of works covered by copyright include: literary works such as novels, poems and plays; referenceworks; newspapers; computer programs and databases; films, musical compositions and choreography;artistic works such as paintings, drawings, photographs and sculptures; advertisements; architecture; andmaps and technical drawings. Creative industries—most of which are based on copyright and relatedrights—are said to have considerable impact on national economies. National studies in many countrieshave revealed that these industries are major contributors in terms of their relative aggregate value-added to a country’s Gross Domestic Product (GDP) as well as their contribution to employment and foreign trade. For example, as shown in a report by Siwek (2004), one of the highest contributions of the core copyright-based industries to the national economy in terms of gross added value has been in the UK (7.1%). Anotherhas been the USA with a contribution of about 6% in 2002. The contribution of total copyright-basedindustries in the USA in terms of GDP in the same year was an impressive 12%.2
Thus, copyright today is seen as more than a legal system providing a secure and stable environment forcreative activity in different markets. The growing interest is largely due to a number of factors, namely a)the increased recognition of the role of IP in post-industrial society, where more attention is being paid tonon-material production factors; b) the expansion of the scope of copyright protection as a result of digitaltechnology, which has seen the economic gains from different technology-based products rise to verysignificant levels; c) the recognition of copyright-protected material as one of the main components inelectronic commerce and digital transactions courtesy of the digital revolution; and d) the recognition of the fact that creativity is the very basis for the social, economic and cultural development of nations.
The nature of copyright and the scope of its protection, enforcement and infringement have been thesubject of extensive research. Recently, however, the focus has shifted towards the economic characteristicsof copyright. The first studies to quantify the economic contribution and significance of copyright-basedindustries were published in Canada and Sweden in the 1970s. These were followed by further works fromthe USA, New Zealand, the United Kingdom, Holland, Germany and Austria in the 1980s. More studiesbased on an integrated, standardized methodology have since been conducted in the 1990s in Finland,Japan, Argentina, Brazil, Paraguay, Uruguay, and Chile.3 The analysis of the contribution of copyright
The Economic C
ontribution ofC
opyright-Based Industries in K
enya
35
2 Information based on Siwek, S.E. (2004): Report on “The Economic Contribution of Copyright-Based Industries in the US.” Preparedfor the International Intellectual Property Alliance. 3 Penyigey, K. and Munkácsi, P. (2005). “The Economic Contribution of Copyright-Based Industries in Hungary.” In: National Studies onAssessing the Economic Contribution. WIPO, page 287.
industries to national economies in EU countries was published in 2003.4 In 2003, WIPO issued amethodological guide with a view to revealing the economic contribution of copyright-based industriesunder the title: “Guide on Surveying the Economic Contribution of Copyright-Based Industries”.5 TheSingapore, Canada, and USA reports, which were also based on the Guide, were published in 2004,followed by the Latvian report in early 2005.
The motivation behind research on the economic roles of copyright-based industries is to makeeconomic policymakers aware of the economic importance of these industries. This is expected toencourage mainstreaming of copyright-based industries in the development policies of a given country.It is against this background that WIPO and the Government of Kenya commissioned the current studyin light of the increasing importance of copyright-based goods and services to the economy, and as anelement towards introducing an improved policy framework for the operation of the creative sector inthe country. It is expected that the results of this study will serve as an important input in promoting the growth and development of the copyright-based sectors in the country. The Kenyan study is basedon the WIPO Guide (2003).
In this study, copyright covers creative work such as a writer putting words down on paper, a photographertaking a photograph, or a software designer creating a code. Related rights include rights of performingartists, rights of television and radio broadcasters, rights of producers of phonograms, and rights of producers ofmotion pictures. The term ‘copyright’ is used in most cases to cover both copyright and related rights.
1.2 Objectives and Structure of the StudyThe key objectives of this study were to:
a. Quantify the economic contribution of copyright and related rights-based industries in the country by estimating their value-added to GDP, share of national employment, and revenue generated fromforeign trade.
b. Analyze and elaborate on selected copyright and related rights-based industries of importance toKenya, their national market structure, value chain, demand and supply patterns, labour market, policy framework, support from public and civil sectors including the role of collective managementorganizations and other copyright-related organizations, financing mechanisms, and implications of the digital environment, among others.
c. Propose policy, strategy and institutional interventions to encourage the growth and development of copyright-based industries in the country.
The structure of the study is in seven parts:
a. The first part consists of an introduction and a presentation of the objectives and structure of thestudy.
b. The second part presents an overview of the copyright policy and law in Kenya.c. The third part describes the copyright and related rights-based industries in Kenya, presents the
copyright factors used, and provides a comparison of Kenya’s industry coding system and that of theWIPO Guide (2003).
d. Part four provides details of data collection and methods of analysis.
The
Econ
omic
Con
trib
utio
n of
Cop
yrig
ht-B
ased
Ind
ustr
ies
in K
enya
36
4 Picard, R.G., Toivonen, T.E. and Grönlund, M. (2003). “The Contribution of Copyright and Related Rights to the European Economy.”European Commission, Directorate General (Internal Market).5 World Intellectual Property Organization (WIPO) (2003). “Guide on Surveying the Economic Contribution of the Copyright-BasedIndustries.” WIPO, Geneva.
e. The fifth part discusses the results of analysis on the economic contribution of copyright and relatedrights-based industries in Kenya, adapting the general guidelines presented in the Guide to the Kenyansituation, in terms of value-added generated by copyright and related rights-based industries, theircontribution to employment generation, productivity of the various copyright-based sub-sectors, theforeign trade of copyright and related rights-based industries, and a brief comparison of the Kenyanand international studies carried out on the basis of the WIPO Guide.
f. Part six provides a description of the development of some core copyright-based industries in Kenya.g. The final part presents the conclusions of the study and policy recommendations.
1.3 Scope of StudyThe current study attempted to quantify as extensively as possible the economic contribution of copyright-protected goods and services in Kenya in 2007. The study included the following steps:
a. The first step included the identification of the copyright and related rights-based industries to bestudied using as reference Annex I of the WIPO Guide as well as the selected copyright and relatedrights-based industries which were given more detailed analysis. The categorization of the copyrightand related rights-based industries followed the categories presented in the Guide—core,interdependent, partial and non-dedicated copyright industries.
b. Based on the decision on item (a) above, data collection was undertaken. This involved compilingstatistical data by industry classes and collecting additional statistics by preparation and use ofappropriate questionnaires (see Appendix I for a sample questionnaire). The data were then disaggregatedto the required level of detail. Interviews and questionnaires were used to address specific areas.Consultations with the relevant industry sectors, through industry associations, and the relevant public-sector institutions and/or ministries were part of the process.
c. The third step was measurement and calculation of the contribution of the copyright and relatedrights-based industries studied to the national total added value, gross output, employment,employee income and foreign trade, using a selected approach under the WIPO Guide. Theestimation of the relative size of copyright and related rights-based industries covered the size ofthe copyright and related rights-based industries against macro-economic variables such as GDP,gross output and employment.
The Economic C
ontribution ofC
opyright-Based Industries in K
enya
37
2 . C o p y r i g h t Po l i c y a n d L a w i n K e n ya
2.1 Policies Related to Creative and Copyright IndustriesEven though there have been concerted efforts recently by the Government of Kenya to develop policyfocused on creative and copyright-based industries, there has been no national policy on these industries inthe past. The absence of a National IP Policy has meant that Intellectual Property is not well mainstreamedinto the National Development policies and programmes. Its value is thus not adequately recognized bypolicymakers as an important tool for national development that needs to be promoted and protected.Because of inadequacies in the existing policies, most of the creative industries may not be operatingoptimally and therefore a lot of the contribution of these industries is treated as informal and may not becaptured by the government through taxes.
It has been shown through research that strengthening IP protection can stimulate direct foreign investments(DFI), technology transfer and increased funding for research and development. Thus, a number of recentefforts have been made by the Kenya Government that recognize the role creative and/or copyright-basedindustries play in the creation of wealth and therefore reduction of poverty. The government has proposedpolicies that favour the poor and has suggested that poverty alleviation can be achieved by strengtheningthe IP system. The government has therefore established three institutions that administer and promoteintellectual property rights (IPRs). These are the Kenya Industrial Property Institute (KIPI), which administersand promotes industrial property rights that include trademarks and patents; the Kenya Copyright Board(KCB), which is responsible for the administration of copyrights and related rights; and the Kenya PlantHealth Inspectorate Service (KEPHIS), which is responsible for the protection of new plant varieties.
The enactment of the Copyright Act 2001 by the Kenya Government is said to have contributed to arapid growth in the local music industry, and has increased income and employment opportunities. Thestrengthening of registration of industrial designs is also deemed to have had a positive role in increasingconfidence in ownership of products produced by local small and medium enterprises has both strengthenedits IP system and provided opportunities for reducing poverty.6
2.2 Copyright Law
2.2.1 The Subject Matter and Beneficiaries of Copyright LawThe copyright law is based on certain fundamental ideas about creativity and possession. It arises from thenotion that anything we create is an extension of “self” and should be protected from unauthorized use.Copyright law, however, protects only the form of expression of the ideas but not the ideas themselves.It protects the owners of the rights against those who “copy”, or those who take and use the form inwhich the original work has been expressed by the author. It therefore deals with the intellectualcreators in their creation.
Copyright protection includes every production in the literary, scientific and artistic domain whatever themode of expression. For a work to enjoy copyright protection it must be an original creation. This means
The
Econ
omic
Con
trib
utio
n of
Cop
yrig
ht-B
ased
Ind
ustr
ies
in K
enya
38
6 Otieno-Odek, J. (2007). IPRs and Poverty Alleviation. Paper Presented at a Breakfast Meeting on IPRs and Poverty Alleviation, 24 April2007, Norfolk Hotel, Nairobi.
that the work must originate from the author—it must have its origin in the labour of the author. The ideasin the work do not have to be new but the form of expression, be it literary or artistic, must be an originalcreation of the author.
2.2.2 Overview of the Kenyan Copyright LawIn Kenya, the law governing copyright is the Copyright Act 2001 (Act No. 12 of 2001) and the CopyrightRegulations of 2004, published on 18th February 2005. Kenya’s copyright law forms part of civil law, whichis designed to settle property-related and personal matters. Copyright protection law is absolute in itsstructure, establishing a negative obligation which is very similar to an ownership title in character. Thebeneficiaries of copyright protection, as in most countries, are the authors—the creators of individual,original works in literature, science and art—who are entitled to moral and economic rights.
The Copyright Act of 2001 replaced the Copyright Act Cap. 130 of Kenya, which was in force between 1st
April 1966 and 31st January 2003. As in countries like Hungary, the copyright law in Kenya has evolved over the decades in response to new challenges, some of them arising from changes in technology. TheCopyright Act Cap. 130 underwent amendments in 1975, 1982, 1989 and 1995. The Act was amended in order to update it and enhance penalties for infringement of copyright and related rights, and also toexpand the scope of protection. For instance, in 1995, the amendment extended copyright protection tocomputer programs. However, in 2001, it was repealed by Section 52 of the Copyright Act of 2001. Theprovisions of Section 51 of the Act state that “No copyright or right in the nature of copyright shall subsistotherwise than by virtue of this Act or some other enactment in that behalf”. This section expressly providesfor abrogation of common-law rights relating to copyright. The Copyright Act 2001 greatly enhancedpenalties for infringement of copyright and is now in conformity with the Trade-Related Aspects of IntellectualProperty Rights (TRIPs) Agreement, the WIPO Copyright Treaty (WCT) (1996) on the protection of the rightsof authors in literary and artistic works, and the WIPO Performance and Phonograms Treaty (WPPT) (1996).
The Copyright Act 2001 introduced several provisions aimed at making it easier to enforce. Some of theprovisions include:
1) The establishment of the Kenya Copyright Board (KCB). Having recognized the negative impacts ofpiracy in the copyright industry on the economy and on the creativity of the authors, the KCB wascreated as a corporate and autonomous body for administration and enforcement of copyright andrelated rights.
2) The appointment of copyright inspectors and prosecutors trained to enforce the Act under the KCB.3) The establishment of a databank of authors and their works to provide a point of reference for the
public and potential users of copyright works as a way of reducing piracy.4) The enhancement of penalties with imprisonment of up to 10 years and fines up to KSHs 800,000
in order to deter piracy.5) The introduction of authentication devices to distinguish genuine from pirated works.6) Registration and supervision of collective management societies to strengthen the rights holders by
bringing them together.7) The establishment of a competent authority headed by qualified personnel to adjudicate on arising issues.8) Jurisdiction to hear copyright cases, where only experienced magistrates hear and determine court cases.
The Copyright Act 2001 received the Presidential assent on 31st December 2001 and was brought intoforce without the requisite implementing regulations on 1st February 2003. Therefore, as in most
The Economic C
ontribution ofC
opyright-Based Industries in K
enya
39
developing countries, the Kenyan Copyright Act has experienced a number of difficulties related to itsenforcement. Notable obstacles include:
1) Lack of public awareness, which has led to a thriving business in pirated works (thereby reducing legalemployment opportunities), loss of revenue to the government, and death of talent in the copyrightindustry.
2) Lack of training and awareness on the part of most rights holders. Most of the agreements assignedeither for licensing or assignment of copyright do not satisfy the legal requirements to be admissible in court.
3) Lack of training on the part of enforcement officers on copyright laws, implying lack of knowledge on how to gather relevant evidence and lack of awareness of seriousness of copyright infringement.
4) Evidentiary rules requiring detailed and complicated proof of copyright and copyright ownership forcreative works cause unwarranted loss of time, effort and money by the rights holder.
5) Lack of intellectual property expertise is another difficulty faced in enforcing copyright infringements. 6) Lack of intellectual property policy has meant that intellectual property is not mainstreamed into
national development.7) Weak coordination among enforcement agencies.8) It is often difficult to prove the amount of actual damage suffered by the rights holder. 9) High cost of litigation renders rights holders unable to instruct advocates to represent them in court
in case of infringement of their rights.8) Legal procedures to obtain information from or about infringers are missing. The ability to obtain
information necessary to detect and detain all actors in the distribution chain and to identify thesources of supply of illegal goods is important if piracy is to be fought effectively.
9) There are emerging issues in enforcement with the advancement of technology. For example, piracyhas taken a new dimension and has become more sophisticated and lucrative. This has led to the tradein pirated materials becoming a very attractive business.
2.2.3 Economic Considerations of the Kenyan Copyright LawCopyright constitutes an essential element in the economic development process of Kenya. As is always thecase with other countries, some people in Kenya possess the natural gift of intellectual creation more thanothers. Protection under the Kenyan copyright law encourages them to create further works, thus enrichingKenya’s store of literature, music and art, as well as promoting economic development. Certainly, theoverwhelming numbers of authors of creative works are interested in having some control over how theircreations are used and in reaping some economic benefits from that use. This aspect of the Kenyancopyright law as a stimulus for intellectual creativity is of fundamental importance.
In addition, the considerable investments which are sometimes necessary for the creation anddissemination of works of the mind will be more easily obtainable if effective protection exists under the law. In some sectors, for instance book-printing, film-making and record manufacturing, such legalprotection is in fact indispensable—it is simply not possible to engage in these expensive activities if nosatisfactory legal protection exists which gives the possibility to take action against those who use theproducts without permission.
Furthermore, if the copyright protection exists in a work, the author is encouraged not only to create thework but also to make it public and disseminate it widely, because he knows that he will not lose controlover it simply because it is made known to others. Such a wide dissemination of works is generally of greatbenefit for the society as a whole.
An author’s work is generally the personal expression of his thoughts and of his personality and he shouldtherefore be able to claim respect for it—that is, to decide whether, when and how his work may be
The
Econ
omic
Con
trib
utio
n of
Cop
yrig
ht-B
ased
Ind
ustr
ies
in K
enya
40

reproduced and performed in public and also to object to any distortion or mutilation of the work when it is used. Such protection is granted under the law on copyright (moral rights).
Finally, the works of the authors of a country enable the country’s manners, customs and cultural heritageto become better known both inside and outside the country. Consequently, any country wishing tostimulate and inspire its own authors in their creativity must necessarily provide for copyright protection.(For more on Kenya’s copyright law, see Appendix II.)
The Economic C
ontribution ofC
opyright-Based Industries in K
enya
41
3 . C o p y r i g h t - b a s e d I n d u s t r i e s i n K e n ya
3.1 Composition of Copyright-Based IndustriesAs alluded to earlier, copyright-based industries include all the activities and industries that produce works(creations) protected by the copyright law and the industries that consume or utilize such products. Thecopyright law ensures that the rights of those engaged in creations in copyright and related industries areprotected and that the creator of such works benefits both morally and financially from the consumption ofworks they have created.
The creation of works under the protection of copyright law presents a starting point in terms of economicweight and effect of copyright. The creation of copyright-protected works is essentially associated with otheractivities that increase added value. The consumption of literary and artistic creations and works cannot bepossible without interposing certain associated activities (e.g. wrapping, copying, distribution, etc.).
The law covers creative works such as the activities of writers, authors, software designers, etc. Theseactivities are important factors in the economic development of nations worldwide, Kenya included. Apartfrom meeting social and cultural functions, the production of these works is key to enhancing economicvalue through generating added value.
3.2 Types of Copyright-Based IndustriesThe methodological guide published by WIPO (2003) distinguishes four main categories of copyright-basedindustries depending on the type of association to copyright. They are:
I Core copyright-based industries.II Interdependent copyright-based industries.III Partial copyright-based industries.IV Non-dedicated support industries.
Creations and works protected by the copyright law do not carry equal weight in different sectors of theeconomy. There are those that are totally based on copyright-protected creative works. These include,according to the WIPO Guide, core copyright-based industries and interdependent copyright-basedindustries. In other sectors, copyrighted creations are only partly represented or have no role to play at all.These include partial and non-dedicated copyright-based industries.
3.2.1 Core Copyright-Based IndustriesCore copyright-based industries are industries fully engaged in the creation, manufacturing and production,performance, broadcasting and communication, and exhibition or distribution and sale of works and othercreations under the scope of copyright. They are areas in the economy whose activities are based on worksprotected by copyright and related rights. They form the core of copyright-based industries and activities inthem are almost exclusively associated with creations protected by copyright, hence their full activities andperformance are taken into consideration when establishing the economic contribution of copyright-basedindustries. The following industries fall into this category according to the WIPO Guide:
i. Press and literature.ii. Music, theatrical productions and opera.
The
Econ
omic
Con
trib
utio
n of
Cop
yrig
ht-B
ased
Ind
ustr
ies
in K
enya
42
iii. Motion pictures and video.iv. Radio and television.v. Photography.vi. Software and databases.vii. Visual and graphic arts.viii. Advertising.ix. Copyright collecting societies.
3.2.2 Interdependent Copyright-Based IndustriesThe interdependent copyright-based industries are defined by the WIPO Guide (2003) as “industries that are engaged in production, manufacture and sale of equipment whose function is wholly or primarily tofacilitate the creation, production or use of works and other protected subject matter.” These industrieswholly depend on core copyright industries for existence.
This category of industries includes:
i. Manufacture, wholesale and retail of TV sets, radios, VCRs, CD players, DVD players, electronic game equipment and other similar equipment.
ii. Manufacture, wholesale and retail (sales and rental) of computers and equipment.iii. Manufacture, wholesale and retail (sales and rental) of musical instruments.iv. Manufacture, wholesale and retail (sales and rental) of photographic
and cinematographic instruments.v. Manufacture, wholesale and retail (sales and rental) of photocopiers.vi. Manufacture, wholesale and retail of blank recording materials.vii. Manufacture, wholesale and retail of paper.
3.2.3 Partial Copyright-Based IndustriesIndustries in which only a specific proportion of their production is associated with products protected bycopyright and related rights are referred to as partial copyright-based industries. The ratio is indicated by a copyright factor which shows what percentage of the product is under protection of copyright. Thefollowing industries fall under this category, according to the WIPO Guide (2003):
i. Apparel, textiles and footwear.ii. Jewellery and coins.iii. Other crafts.iv. Furniture.v. Household goods, china and glass.vi. Wall coverings and carpets.vii. Toys and games.viii. Architecture, engineering, surveying.ix. Interior design.x. Museums.
3.2.4 Non-Dedicated Support IndustriesThe non-dedicated support industries are those in which a portion of their activities is related to facilitatingbroadcast, communication, distribution and sale of products and works and other protected subject matter.The following industries fall under this category according to the WIPO Guide (2003):
The Economic C
ontribution ofC
opyright-Based Industries in K
enya
43
i. General wholesale and retailing.ii. General transportation.iii. Telephony and internet.
3.3 Comparison of Industry Classification for Kenya with the WIPO GuideTable 1 summarizes all the copyright-based industries included in the Kenyan survey. The industries weredetermined according to the WIPO Guide but taking into account the specific characteristics of the Kenyanstatistical system.
A comparison of the industries recommended by WIPO and those used in the Kenyan survey is given inTable 2. As can be seen from the table, these industries roughly correspond. There are a few differences,however. For example, the manufacture of musical instruments is in the interdependent category as per theWIPO classification but is missing in the Kenyan classification. Also, in the Kenyan survey results, interiordesigns have been included under the visual and graphic arts. Wholesale and retail in the Kenyan statisticsare included in the core copyright industries.
The
Econ
omic
Con
trib
utio
n of
Cop
yrig
ht-B
ased
Ind
ustr
ies
in K
enya
44
Table 1: Copyright-based industries in Kenya
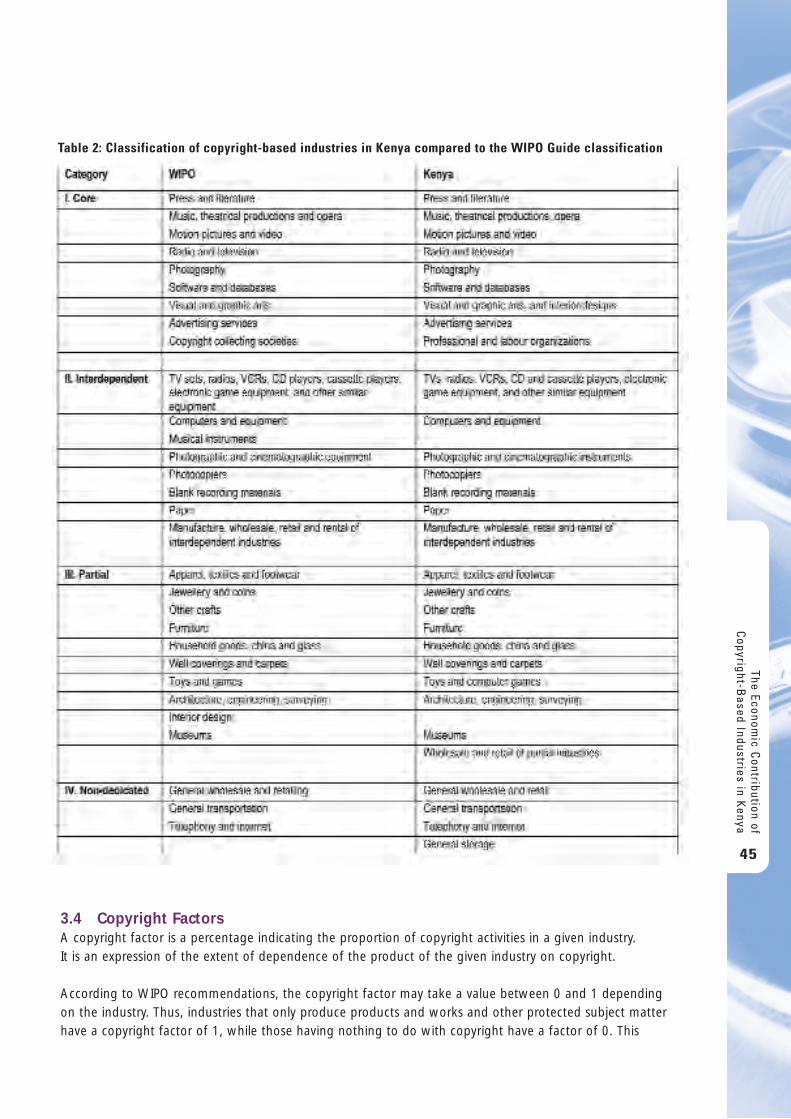
3.4 Copyright FactorsA copyright factor is a percentage indicating the proportion of copyright activities in a given industry. It is an expression of the extent of dependence of the product of the given industry on copyright.
According to WIPO recommendations, the copyright factor may take a value between 0 and 1 dependingon the industry. Thus, industries that only produce products and works and other protected subject matterhave a copyright factor of 1, while those having nothing to do with copyright have a factor of 0. This
The Economic C
ontribution ofC
opyright-Based Industries in K
enya
45
Table 2: Classification of copyright-based industries in Kenya compared to the WIPO Guide classification
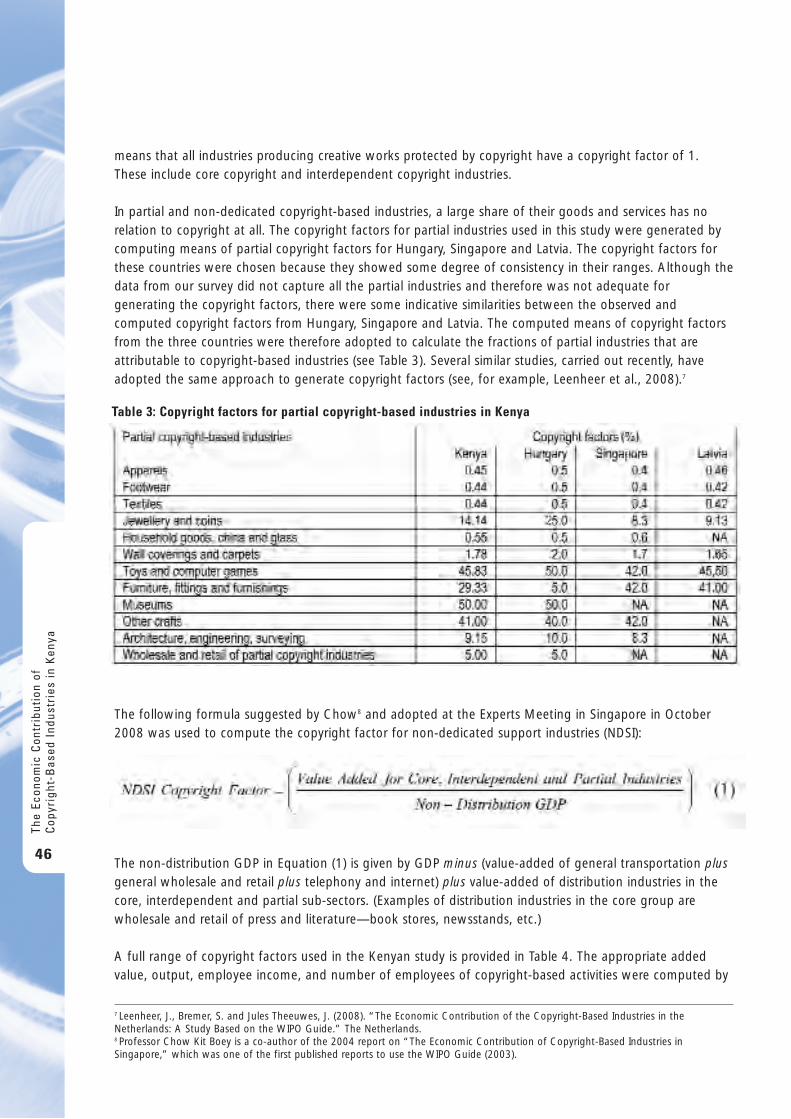
means that all industries producing creative works protected by copyright have a copyright factor of 1.These include core copyright and interdependent copyright industries.
In partial and non-dedicated copyright-based industries, a large share of their goods and services has norelation to copyright at all. The copyright factors for partial industries used in this study were generated bycomputing means of partial copyright factors for Hungary, Singapore and Latvia. The copyright factors forthese countries were chosen because they showed some degree of consistency in their ranges. Although thedata from our survey did not capture all the partial industries and therefore was not adequate forgenerating the copyright factors, there were some indicative similarities between the observed andcomputed copyright factors from Hungary, Singapore and Latvia. The computed means of copyright factorsfrom the three countries were therefore adopted to calculate the fractions of partial industries that areattributable to copyright-based industries (see Table 3). Several similar studies, carried out recently, haveadopted the same approach to generate copyright factors (see, for example, Leenheer et al., 2008).7
The following formula suggested by Chow8 and adopted at the Experts Meeting in Singapore in October2008 was used to compute the copyright factor for non-dedicated support industries (NDSI):
The non-distribution GDP in Equation (1) is given by GDP minus (value-added of general transportation plusgeneral wholesale and retail plus telephony and internet) plus value-added of distribution industries in thecore, interdependent and partial sub-sectors. (Examples of distribution industries in the core group arewholesale and retail of press and literature—book stores, newsstands, etc.)
A full range of copyright factors used in the Kenyan study is provided in Table 4. The appropriate addedvalue, output, employee income, and number of employees of copyright-based activities were computed by
The
Econ
omic
Con
trib
utio
n of
Cop
yrig
ht-B
ased
Ind
ustr
ies
in K
enya
46
Table 3: Copyright factors for partial copyright-based industries in Kenya
7 Leenheer, J., Bremer, S. and Jules Theeuwes, J. (2008). “The Economic Contribution of the Copyright-Based Industries in theNetherlands: A Study Based on the WIPO Guide.” The Netherlands.8 Professor Chow Kit Boey is a co-author of the 2004 report on “The Economic Contribution of Copyright-Based Industries inSingapore,” which was one of the first published reports to use the WIPO Guide (2003).
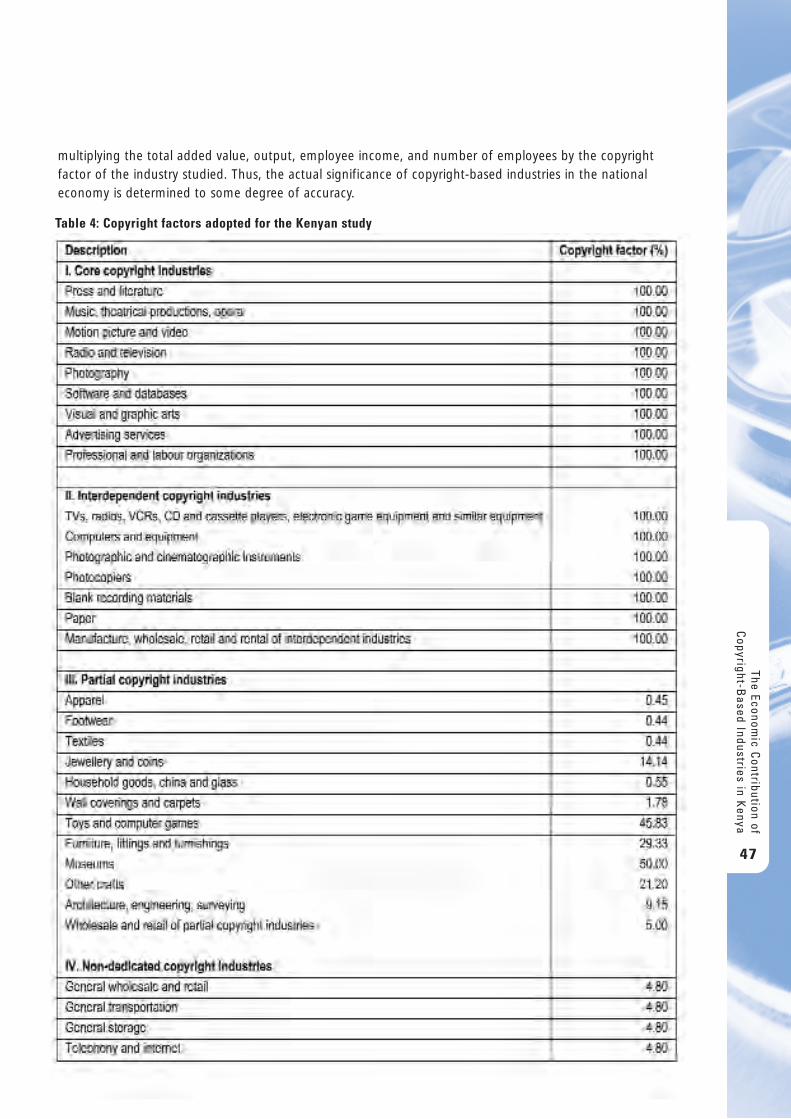
multiplying the total added value, output, employee income, and number of employees by the copyrightfactor of the industry studied. Thus, the actual significance of copyright-based industries in the nationaleconomy is determined to some degree of accuracy.
The Economic C
ontribution ofC
opyright-Based Industries in K
enya
47
Table 4: Copyright factors adopted for the Kenyan study
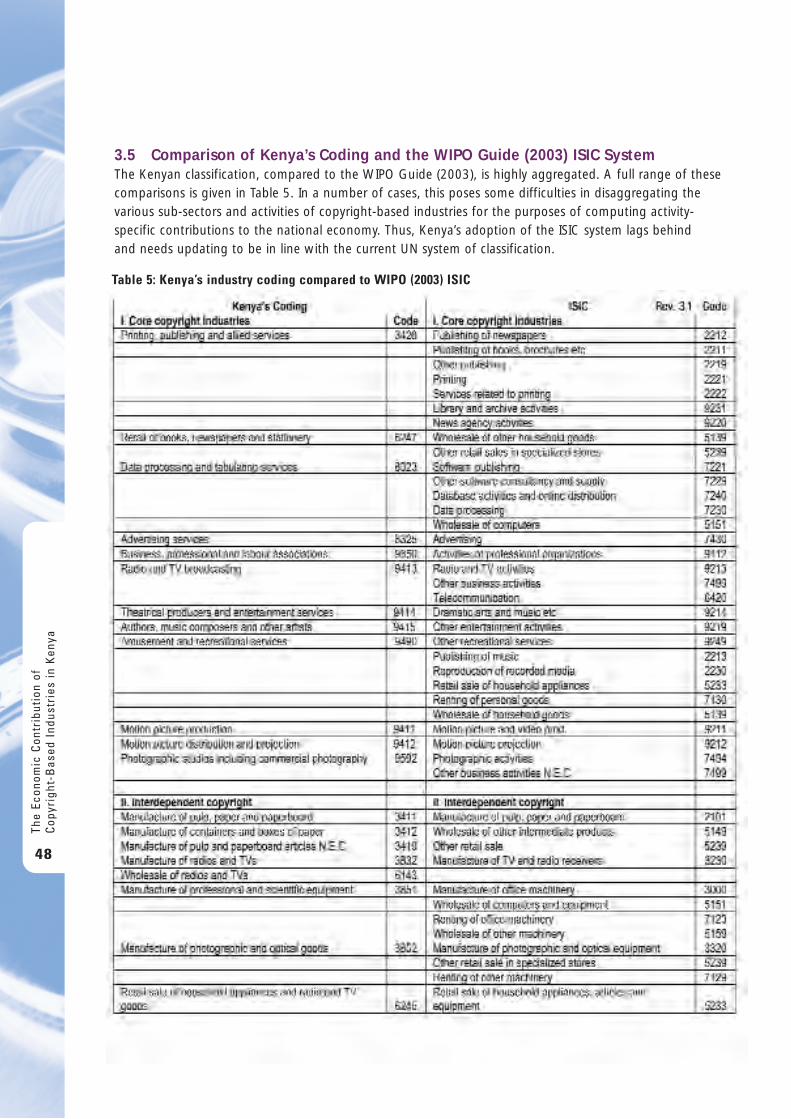
3.5 Comparison of Kenya’s Coding and the WIPO Guide (2003) ISIC SystemThe Kenyan classification, compared to the WIPO Guide (2003), is highly aggregated. A full range of thesecomparisons is given in Table 5. In a number of cases, this poses some difficulties in disaggregating thevarious sub-sectors and activities of copyright-based industries for the purposes of computing activity-specific contributions to the national economy. Thus, Kenya’s adoption of the ISIC system lags behind and needs updating to be in line with the current UN system of classification.
The
Econ
omic
Con
trib
utio
n of
Cop
yrig
ht-B
ased
Ind
ustr
ies
in K
enya
48
Table 5: Kenya’s industry coding compared to WIPO (2003) ISIC
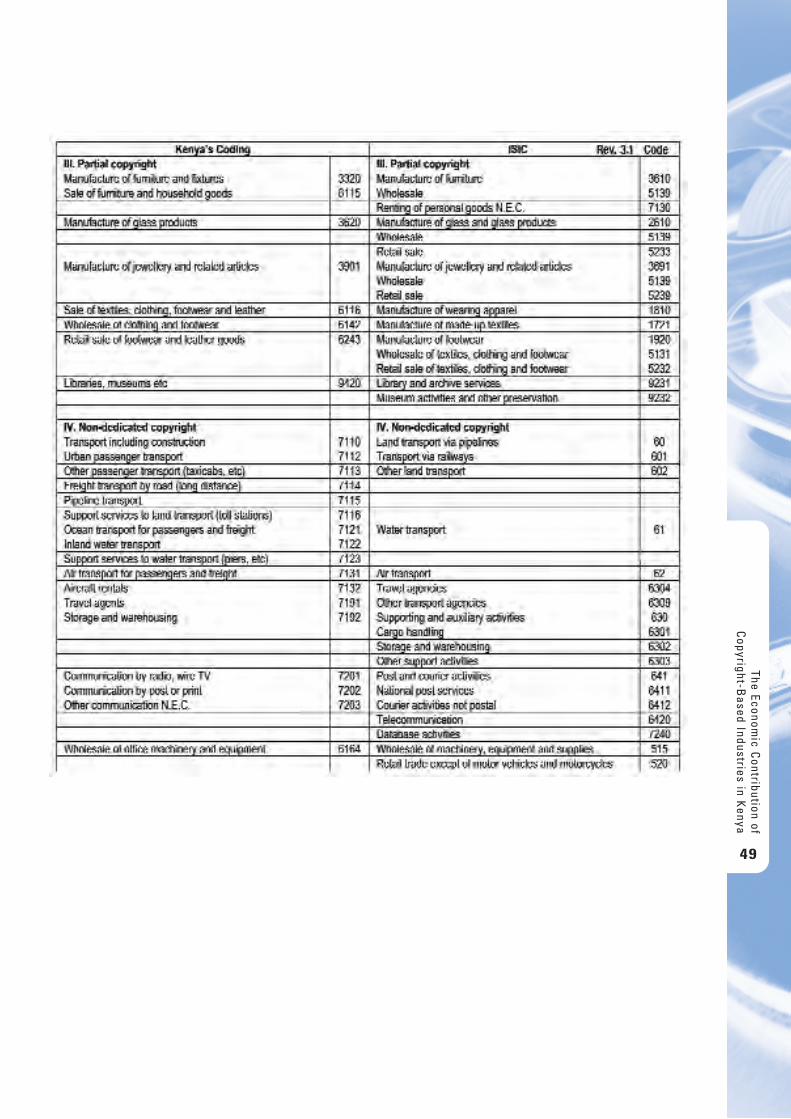
The Economic C
ontribution ofC
opyright-Based Industries in K
enya
49
4 . D a t a C o l l e c t i o n a n d M e t h o d s o f A n a l y s i s
4.1 Sources of InformationThe current study relied mainly on secondary data obtained from various government departments,institutions and NGOs. Sources of data and information included the Kenya Revenue Authority (KRA); Kenya National Bureau of Statistics (KNBS);9 Ministry of Gender, Sports, Culture and Social Services; Ministryof Trade and Industry; Ministry of Tourism and Wildlife; AG Chambers; relevant research institutions andinstitutes such as the Kenya Institute for Public Policy Research and Analysis (KIPPRA), Institute of PolicyAnalysis and Research (IPAR), Kenya Industrial Research and Development Institute (KIRDI), and KenyaIndustrial Estate (KIE); Kenya Association of Manufacturers (KAM); Jua Kali Association; and the MusicCopyright Society of Kenya (MCSK). Other secondary sources of data included past and current research and government reports, and study reports based on the WIPO Guide. In addition, internet searches wereemployed to access available information on the contribution of creative industries to the national economy.
4.2 Methodology
4.2.1 Data CollectionIn this report, the economic contribution of copyright and neighbouring rights is measured according to the guidelines drawn up by WIPO. The study includes core copyright industries, interdependent copyrightindustries, partial copyright industries and non-dedicated support industries. A pilot survey at the initialstages of the study, using a questionnaire, was carried out to identify sources of secondary informationand provide more insights into the nature and organizational structure of the copyright industries inKenya. The primary data collected were later used to fill the gaps identified in the secondary data. Withthese data, there was an attempt to derive the factors used to adjust the contribution of partial copyright-based and non-dedicated support industries to the national economy. While some of the factors generated were found to be close to a few of the already published ones, most of them wereinconsistent with those used in most studies—such as those for the Singaporean, Hungarian and Latvianstudies. This may have been because the data collected were not sufficient to compute reliable factors.
4.2.2 Dealing with Missing DataIn a number of cases, data on one or several industries were missing. In a few cases, recorded data werecontradictory, even from the same source. There were also situations where copyright-based industries’ datawere combined with those that did not fall under copyright-protected industries. Yet again, some data fromdifferent sources were conflicting. For example, data on VAT for particular activities/industries, which wereused to calculate value-added at basic prices, contradicted the sales—in the sense that the value of sales(representing gross output) turned out to be less than the value-added—which should not be the case. In a few cases, data on sales were missing all together.
In cases where sales were missing or were shown to be less than added value, the calculated added valuebased on VAT was used. This meant that there was an undervaluation of the value of sales in that particularactivity. Where data for an activity were available on (for example) employment but missing on VAT or sales(or vice versa), the proportional contribution in one economic indicator (for example, employment) of thatspecific industry was used to estimate another economic indicator (for example, value-added). Also, where a copyright-based industry was combined with that which was not copyright-based and a value for the
The
Econ
omic
Con
trib
utio
n of
Cop
yrig
ht-B
ased
Ind
ustr
ies
in K
enya
50
9 The KNBS provided two publications from which most data on employment, employee incomes and sector contributions wereobtained: Economic Survey (2007), pages 49-262; and Statistical Abstract (2008) on “Annual Production Accounts”, pages 32 and 33.
relevant industry with respect to one of the economic indicators was available, the proportional contributionbased on that indicator was used to obtain its contribution in another indicator. In circumstances wheredata from different sources were contradictory, the researchers had the discretion to select data fromthe source deemed more reliable and representative of the activity in question.10
4.2.3 Calculation of Indicators of Economic ContributionAs in all the previous studies in this field, the indicators of the contribution of Kenyan copyright industries to the national economy are turnover (gross output), value-added, number of persons employed andemployees’ incomes. The value-added is obtained when labour costs (including social-security contributionsand taxes) are added to the operating margin and the income from the sale of fixed assets is deducted fromthis sum. The GDP share of Gross Value-Added (GVA) is calculated to reveal the economic contribution ofthe copyright-based industries to the domestic economy.
GDP can be measured using three approaches—the output or production approach, the expenditureapproach, and the income approach. The production approach views GDP as the sum of value-added (VA)of all industries, i.e., the difference between output and intermediate consumption. In the expenditureapproach, GDP is viewed as the sum of all expenditure categories, including government and householdconsumption, fixed capital formation, changes in inventories, and exports minus imports. The incomeapproach considers GDP to be the sum of the income due to households (compensation of employees, i.e.,wages and salaries, bonuses and other benefits) and corporations (profits or gross operating surpluses) andtaxes on production and imports (indirect taxes). All the three approaches would yield the same estimates ofGDP. However, as different sources of data are used, differences between them inevitably arise. Singapore isone of the few countries that compile GDP estimates using all the three approaches.11
The output or production approach was adopted in the Kenyan case. GDP at basic prices was derived byconverting the Value-Added Tax (VAT) into value-added and then summing it up. Figures on VAT, which isuniformly charged at 16% across items, were obtained from the KRA. In addition to the value-added, theworkforce of the copyright industries was calculated and compared with the total workforce in Kenya.Employee incomes were also treated the same way.
The overall methodological approach consisted of three principal components:
a. Derivation of specific data for the various copyright and related rights-based industries, mainly fromthe Kenya National Bureau of Statistics (KNBS) and the Kenya Revenue Authority (KRA), and otherrelevant government sources. For selected copyright and related rights-based industries (partial andnon-dedicated) for which only a part of the output is copyright-related, relevant copyright factors forpartial industries were calculated using means of similar factors for three countries—Singapore,Hungary and Latvia—considered to be closely comparable. For the non-dedicated support industries,Equation (1) was applied.
b. The total impact, which comprised the direct, indirect and induced impacts. These impacts were foroutput, added value, incomes, employment and foreign trade. The impacts were measured as follows:
i. The direct impact as represented by the operating revenue of copyright and related rights-based activities;
The Economic C
ontribution ofC
opyright-Based Industries in K
enya
51
10 Thus, in a number of cases, gross output was not calculated in conformity with the WIPO Guide.11 Statistics Singapore Newsletter (July 2000). “National Accounts: Measuring Gross Domestic Product (GDP).” Singapore Department ofStatistics, Singapore.
ii. The indirect impact that arises from additional revenue generated from other sectors providing goods and services to copyright and related rights-based sectors; and
iii. The induced impact, limited to the group of non-dedicated support industries.
c. Employment data were compiled for estimation of the employment impact while trade data werecollected for the foreign trade measure.
It was not possible to perform an input-output analysis due to unavailability of adequate data from thestandard data sources. We do recognize, however, the importance of this approach in analyzing theknock-on (multiplier) effects and therefore the comparative advantage in investing in copyright industriesas opposed to other industries. We therefore suggest that follow-up studies seek information fromprofessional and trade organizations, as this was not possible within the framework of the current study.
This study does not include copyright piracy or other illegal uses of copyright-protected works and otherprotected subject matter, because such activities were beyond the scope of the current study.
4.3 Survey ChallengesA number of challenges that deserve mention were faced during the Kenyan survey. Some of these may be unique to Kenya and similar developing countries, while some may be common to all countries.
In Kenya, the rate of growth of creative industries is quite fast, and there is increased awareness of theircontribution to the national economy. However, the high growth rate is making it hard for the governmentto capture the activities and their contribution in its accounts. Also, the inadequacies of existing policieshave made the creative industries operate in an uncoordinated manner, again leading to low focus on theiractivities for the purposes of making them contribute to the national revenue. In addition, the absence of anIP Policy, which has led to inadequate mainstreaming of intellectual property into the national developmentprogrammes, has meant that the value of intellectual property is not appropriately recognized bypolicymakers, and may not necessarily be fully captured in the national accounts.
Another problem, that may be common to all countries, is the unwillingness by those involved in theindustry to disclose information for reasons of avoiding taxation. Particularly common is that most of theartists avoid taxes and even resist exposing themselves, mainly because they want to protect their productsfrom piracy. Also, some retailers of creative works are either operating illegally or stock pirated materials,and would normally avoid disclosure. This would naturally result in poor or no documentation, thereforeleading to no or inadequate database.
In the Kenyan databases, the contribution of creative industries is highly aggregated, e.g. partial and non-dedicated—transport and telecommunication. It is therefore difficult to establish the contribution of specificactivities/industries to the GDP. This would lead to over- or under-estimation or double-accounting of thecontribution of certain industries. Some of the creative industries are traditional and for prestige. Thus, onlycultural value—and no monetary value—is attached to these industries, which include traditional healing,music, dancing and drama. Such industries are found away from cities, where there is little ability andwillingness to pay.
The lack of a concrete databank on the contribution of creative industries in Kenya is a major challenge. Forexample, there is no database of authors and their works. This might be one of the major reasons for therise in piracy, because members of the public or potential users of copyright works do not have a point ofreference to find out who owns what in the copyright industry. Data on software are scanty; what is
The
Econ
omic
Con
trib
utio
n of
Cop
yrig
ht-B
ased
Ind
ustr
ies
in K
enya
52
recorded is the number of internet users and licensed Internet Service Providers (ISPs). Costs of inputs(expenditures) are also scanty, unavailable or highly aggregated, making it difficult to analyze the individualcontributions. Input-output data are not compiled in government records—thus input-output analysis (usingthe Liontief matrix) to estimate multipliers is not possible with limited or inconsistent data.
Another challenge, albeit a minor one, is that Kenya’s industry coding is not in harmony with the UN coding;for example, Kenya’s code for printing is 3420, while the current ISIC coding is 2221. This can causeconfusion. There is also a lack of related studies in similar environments (sub-Saharan Africa) from which to learn lessons for any new survey conducted in those environments.
Because of inadequate data, information and policies, there has been mushrooming of unscrupulous self-imposed industry regulators. These tend to block information flow to artists, so as to control them. Furtherto this, the quantification of exported artistic work is difficult due to a lack of data and also because someof the exportation is not done legally (not on record).
Yet another challenge is that related to piracy. Although not the subject of this survey, as mentioned inprevious paragraphs, piracy has made it difficult to estimate the true contribution of copyright-basedindustries to GDP. For example, most of the music and video products in Kenya are said to be pirated. Withthe advancement of technology, piracy has taken a new dimension and has become sophisticated andlucrative, making trade in pirated material a very attractive business, with even organized gangs beinginvolved; therefore, enforcement has become more challenging and risky.
The Economic C
ontribution ofC
opyright-Based Industries in K
enya
53
5 . E c o n o m i c C o n t r i b u t i o n o f C o p y r i g h t - b a s e d I n d u s t r i e s i n K e n ya i n 2 0 0 7
5.1 Overall Performance of Copyright-Based IndustriesThe economic contribution of the copyright-based industries in Kenya as shown by the values of value-added, employment, and employee incomes is significant. The total value-added (GDP at basic prices) ofcopyright-based industries in 2007 amounted to KSHs 85,208.7 million, which represented 5.32% of thetotal GDP of KSHs 1,603,176 million (at basic prices). Among the copyright-based industries, thecontribution to the country’s total value-added by the core industries was KSHs 36,944.1 million (2.30%),KSHs 34,784.8 million (2.17%) by the interdependent industries, KSHs 6,559.7 million (0.41%) by thepartial industries, and KSHs 6,920.1 million (0.43%) by the non-dedicated industries (see Table 6).
When the core and interdependent copyright-based industries whose activities are 100% copyright-dependentare considered, the two contribute about 4.47%. Thus, even without including the contributions of partialand non-dedicated copyright-based industries whose combined contribution is low (0.84%), assuming thecopyright factors used for apportionment reasonably represent their share contributions, this is a strongindication of the level of contribution of copyright-based industries in Kenya.
In terms of gross output (at basic prices), the entire copyright-based industries contributed KSHs 114,231.6million out of the total national output of KSHs 3,041,382 million, which represented 3.76% of the nationaleconomic output. Out of this total, the core copyright-based industries made a contribution of KSHs57,196.4 million, which formed 1.88% of the total national output. There is, however, a high likelihoodthat sales figures were under-reported.
With respect to the income for employees, the copyright-based industries made a total of KSHs 19,118.9million in 2007, making a proportion of about 1.97% compared to the total national economic value ofKSHs 749,818.5 million. Among the copyright-based industries, the total employee income for coreindustries was KSHs 7,609 million, which was about 1.02% of the national employee income.
In 2007, copyright-based industries employed 62,131 people. This made up about 3.26% of the totalnational workforce (government and private sector employees). Within this number, the core copyrightindustries employed 22,799 people, making up 1.2% of the total national workforce.
Overall, considering that the full contribution of the copyright-based industries may not be captured underthe Kenyan circumstances, these industries may be contributing upwards of 7% to the national economy in terms of GDP, with the core copyright-based industries making a contribution of about 3–4%.Th
e Ec
onom
ic C
ontr
ibut
ion
ofC
opyr
ight
-Bas
ed I
ndus
trie
s in
Ken
ya
54
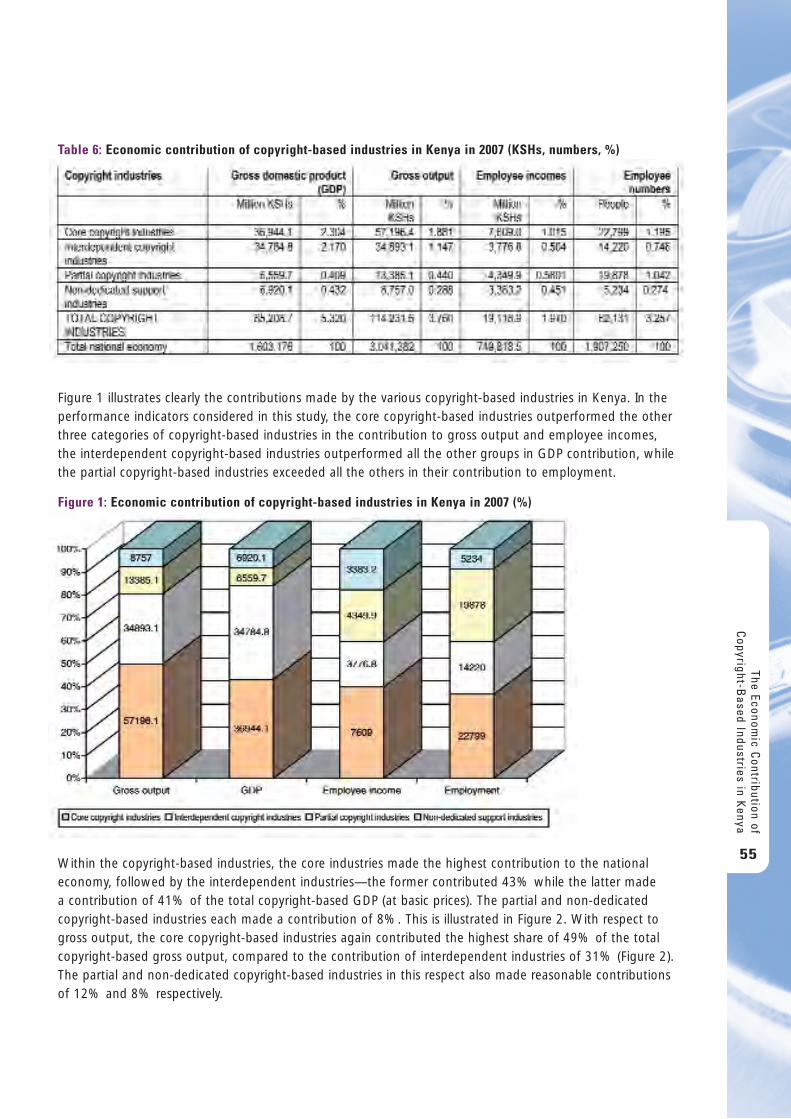
Figure 1 illustrates clearly the contributions made by the various copyright-based industries in Kenya. In theperformance indicators considered in this study, the core copyright-based industries outperformed the otherthree categories of copyright-based industries in the contribution to gross output and employee incomes,the interdependent copyright-based industries outperformed all the other groups in GDP contribution, whilethe partial copyright-based industries exceeded all the others in their contribution to employment.
Within the copyright-based industries, the core industries made the highest contribution to the nationaleconomy, followed by the interdependent industries—the former contributed 43% while the latter made a contribution of 41% of the total copyright-based GDP (at basic prices). The partial and non-dedicatedcopyright-based industries each made a contribution of 8%. This is illustrated in Figure 2. With respect togross output, the core copyright-based industries again contributed the highest share of 49% of the totalcopyright-based gross output, compared to the contribution of interdependent industries of 31% (Figure 2).The partial and non-dedicated copyright-based industries in this respect also made reasonable contributionsof 12% and 8% respectively.
The Economic C
ontribution ofC
opyright-Based Industries in K
enya
55
Table 6: Economic contribution of copyright-based industries in Kenya in 2007 (KSHs, numbers, %)
Figure 1: Economic contribution of copyright-based industries in Kenya in 2007 (%)
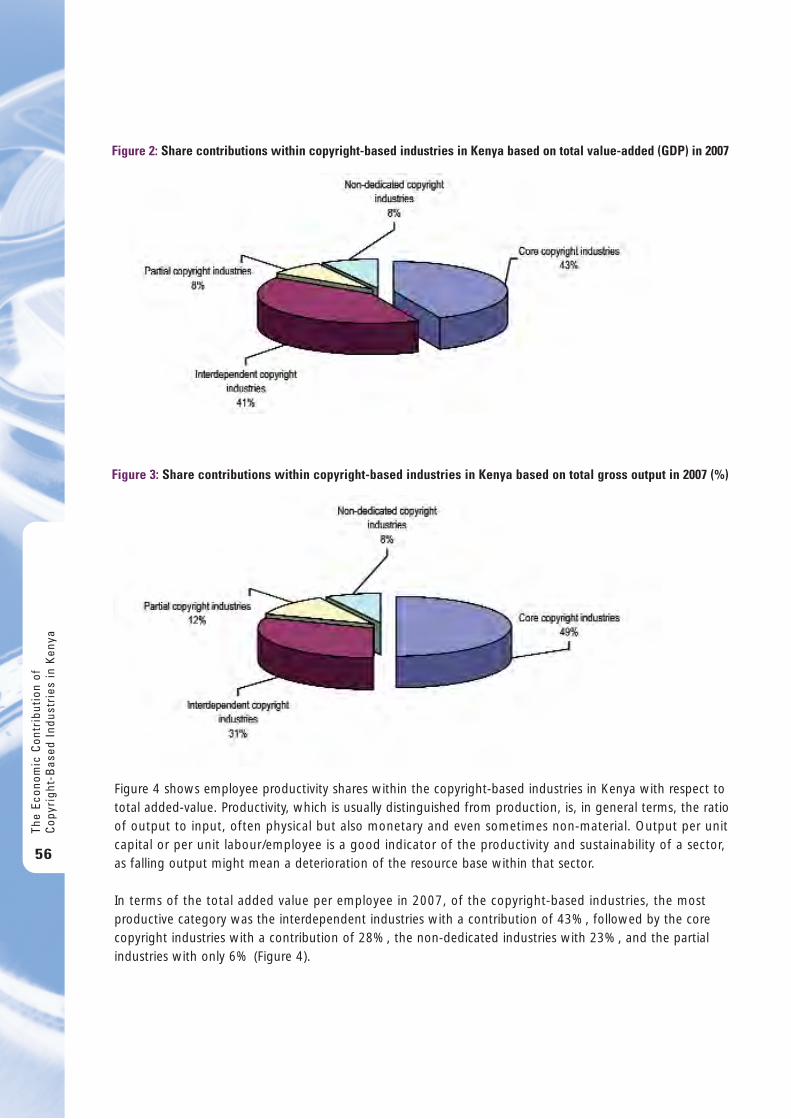
Figure 4 shows employee productivity shares within the copyright-based industries in Kenya with respect tototal added-value. Productivity, which is usually distinguished from production, is, in general terms, the ratioof output to input, often physical but also monetary and even sometimes non-material. Output per unitcapital or per unit labour/employee is a good indicator of the productivity and sustainability of a sector, as falling output might mean a deterioration of the resource base within that sector.
In terms of the total added value per employee in 2007, of the copyright-based industries, the mostproductive category was the interdependent industries with a contribution of 43%, followed by the corecopyright industries with a contribution of 28%, the non-dedicated industries with 23%, and the partialindustries with only 6% (Figure 4).
The
Econ
omic
Con
trib
utio
n of
Cop
yrig
ht-B
ased
Ind
ustr
ies
in K
enya
56
Figure 2: Share contributions within copyright-based industries in Kenya based on total value-added (GDP) in 2007
Figure 3: Share contributions within copyright-based industries in Kenya based on total gross output in 2007 (%)
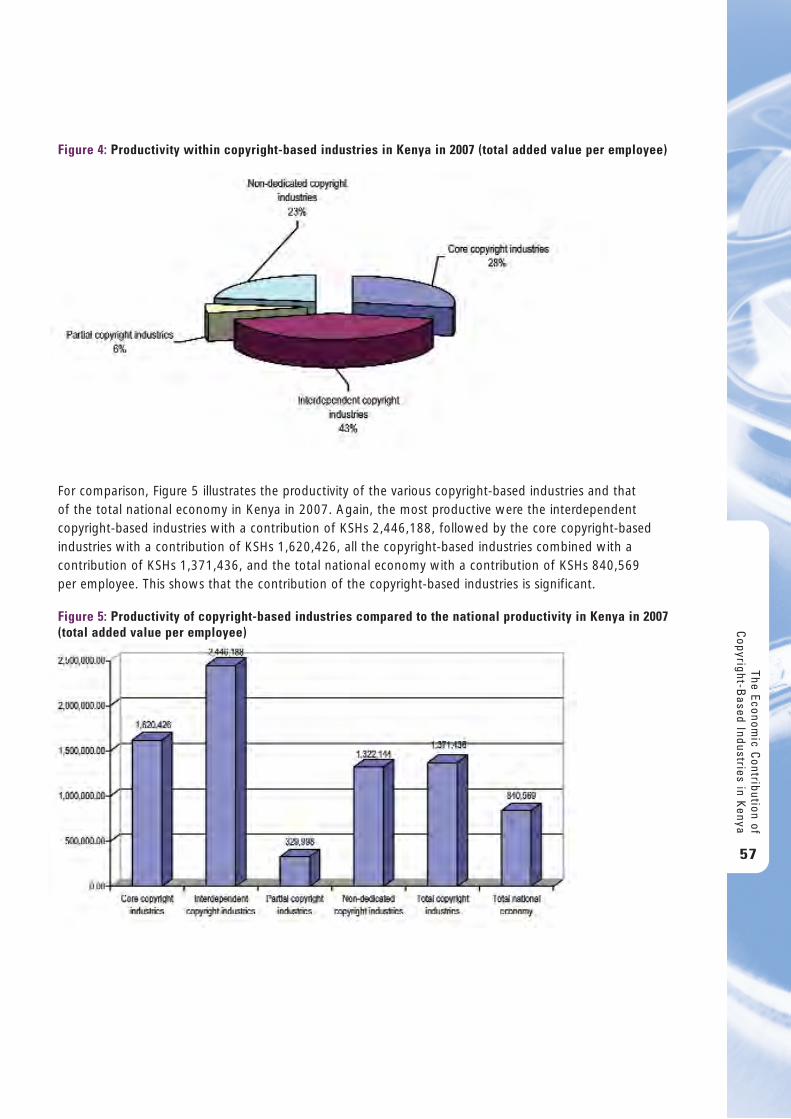
For comparison, Figure 5 illustrates the productivity of the various copyright-based industries and that of the total national economy in Kenya in 2007. Again, the most productive were the interdependentcopyright-based industries with a contribution of KSHs 2,446,188, followed by the core copyright-basedindustries with a contribution of KSHs 1,620,426, all the copyright-based industries combined with acontribution of KSHs 1,371,436, and the total national economy with a contribution of KSHs 840,569 per employee. This shows that the contribution of the copyright-based industries is significant.
The Economic C
ontribution ofC
opyright-Based Industries in K
enya
57
Figure 4: Productivity within copyright-based industries in Kenya in 2007 (total added value per employee)
Figure 5: Productivity of copyright-based industries compared to the national productivity in Kenya in 2007(total added value per employee)
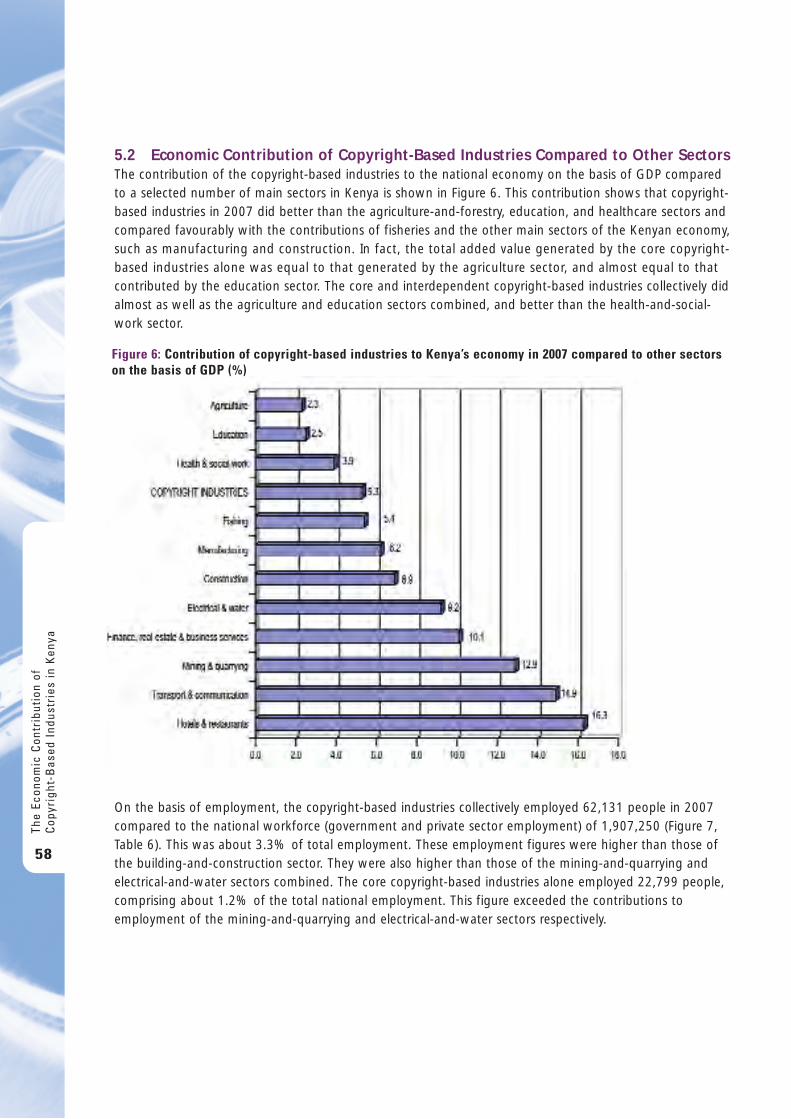
5.2 Economic Contribution of Copyright-Based Industries Compared to Other SectorsThe contribution of the copyright-based industries to the national economy on the basis of GDP comparedto a selected number of main sectors in Kenya is shown in Figure 6. This contribution shows that copyright-based industries in 2007 did better than the agriculture-and-forestry, education, and healthcare sectors andcompared favourably with the contributions of fisheries and the other main sectors of the Kenyan economy,such as manufacturing and construction. In fact, the total added value generated by the core copyright-based industries alone was equal to that generated by the agriculture sector, and almost equal to thatcontributed by the education sector. The core and interdependent copyright-based industries collectively didalmost as well as the agriculture and education sectors combined, and better than the health-and-social-work sector.
On the basis of employment, the copyright-based industries collectively employed 62,131 people in 2007compared to the national workforce (government and private sector employment) of 1,907,250 (Figure 7,Table 6). This was about 3.3% of total employment. These employment figures were higher than those ofthe building-and-construction sector. They were also higher than those of the mining-and-quarrying andelectrical-and-water sectors combined. The core copyright-based industries alone employed 22,799 people,comprising about 1.2% of the total national employment. This figure exceeded the contributions toemployment of the mining-and-quarrying and electrical-and-water sectors respectively.
The
Econ
omic
Con
trib
utio
n of
Cop
yrig
ht-B
ased
Ind
ustr
ies
in K
enya
58
Figure 6: Contribution of copyright-based industries to Kenya’s economy in 2007 compared to other sectorson the basis of GDP (%)
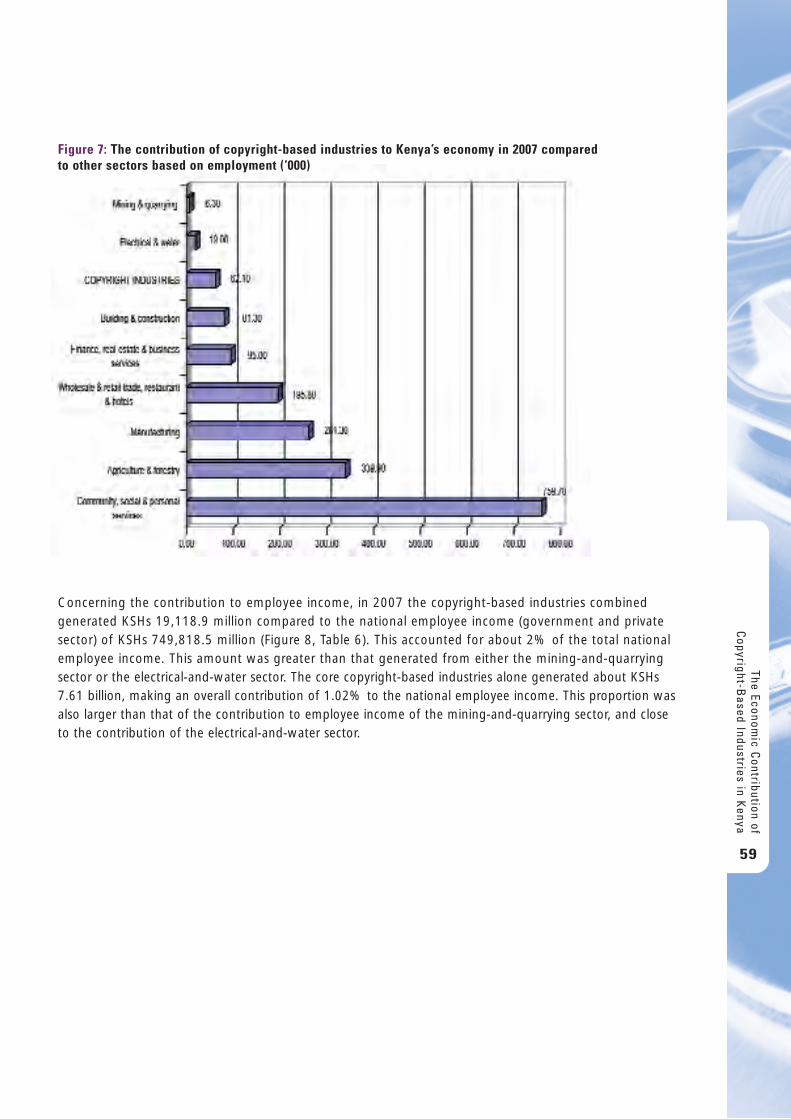
Concerning the contribution to employee income, in 2007 the copyright-based industries combinedgenerated KSHs 19,118.9 million compared to the national employee income (government and privatesector) of KSHs 749,818.5 million (Figure 8, Table 6). This accounted for about 2% of the total nationalemployee income. This amount was greater than that generated from either the mining-and-quarryingsector or the electrical-and-water sector. The core copyright-based industries alone generated about KSHs7.61 billion, making an overall contribution of 1.02% to the national employee income. This proportion wasalso larger than that of the contribution to employee income of the mining-and-quarrying sector, and closeto the contribution of the electrical-and-water sector.
The Economic C
ontribution ofC
opyright-Based Industries in K
enya
59
Figure 7: The contribution of copyright-based industries to Kenya’s economy in 2007 compared to other sectors based on employment (‘000)
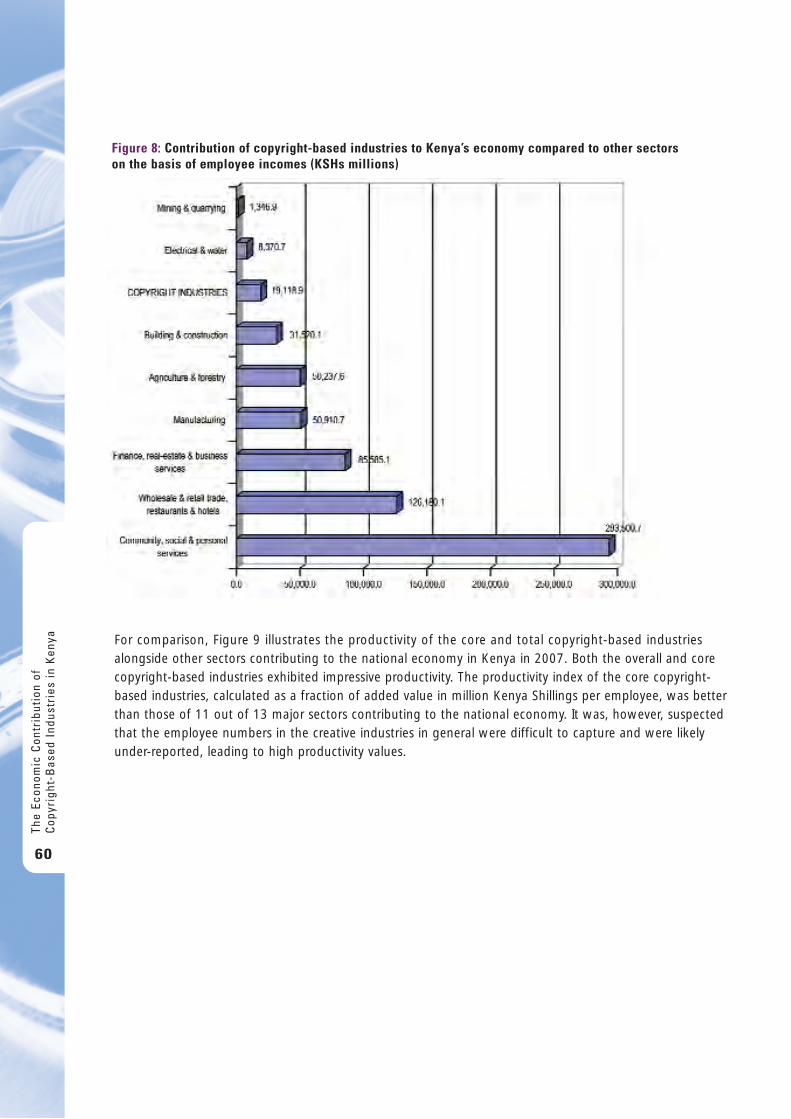
For comparison, Figure 9 illustrates the productivity of the core and total copyright-based industriesalongside other sectors contributing to the national economy in Kenya in 2007. Both the overall and corecopyright-based industries exhibited impressive productivity. The productivity index of the core copyright-based industries, calculated as a fraction of added value in million Kenya Shillings per employee, was betterthan those of 11 out of 13 major sectors contributing to the national economy. It was, however, suspectedthat the employee numbers in the creative industries in general were difficult to capture and were likelyunder-reported, leading to high productivity values.
The
Econ
omic
Con
trib
utio
n of
Cop
yrig
ht-B
ased
Ind
ustr
ies
in K
enya
60
Figure 8: Contribution of copyright-based industries to Kenya’s economy compared to other sectors on the basis of employee incomes (KSHs millions)
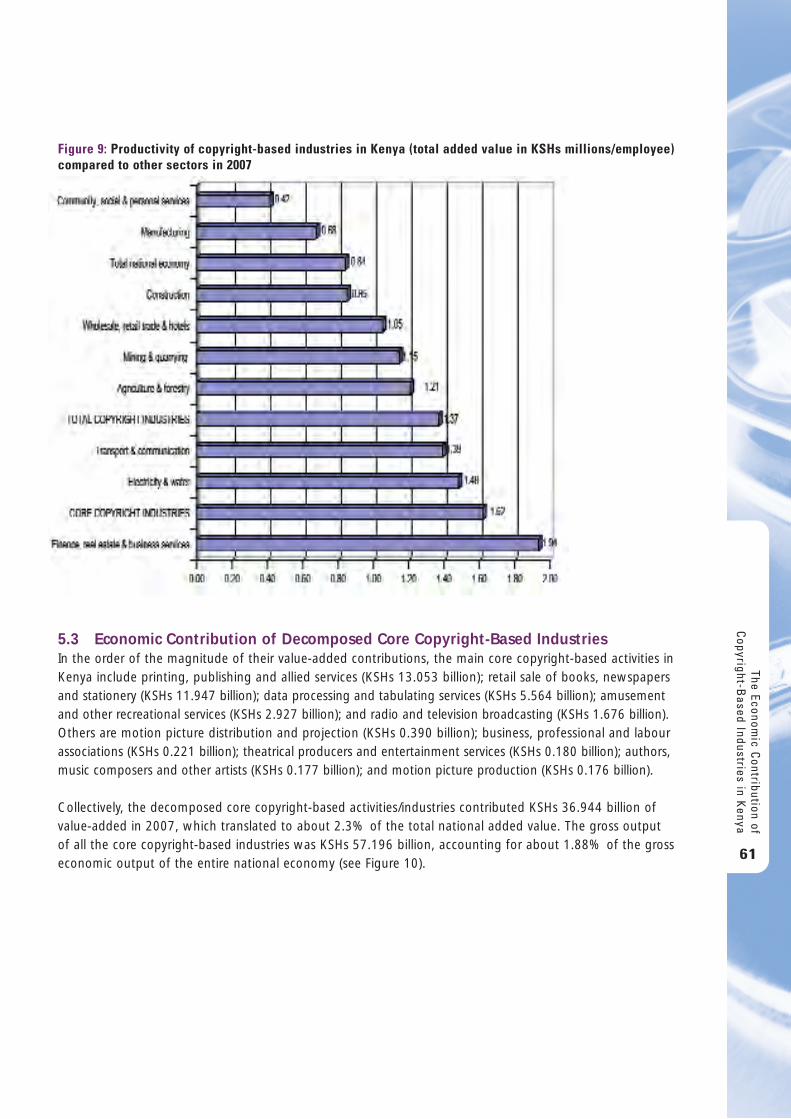
5.3 Economic Contribution of Decomposed Core Copyright-Based Industries In the order of the magnitude of their value-added contributions, the main core copyright-based activities inKenya include printing, publishing and allied services (KSHs 13.053 billion); retail sale of books, newspapersand stationery (KSHs 11.947 billion); data processing and tabulating services (KSHs 5.564 billion); amusementand other recreational services (KSHs 2.927 billion); and radio and television broadcasting (KSHs 1.676 billion).Others are motion picture distribution and projection (KSHs 0.390 billion); business, professional and labourassociations (KSHs 0.221 billion); theatrical producers and entertainment services (KSHs 0.180 billion); authors,music composers and other artists (KSHs 0.177 billion); and motion picture production (KSHs 0.176 billion).
Collectively, the decomposed core copyright-based activities/industries contributed KSHs 36.944 billion ofvalue-added in 2007, which translated to about 2.3% of the total national added value. The gross output of all the core copyright-based industries was KSHs 57.196 billion, accounting for about 1.88% of the grosseconomic output of the entire national economy (see Figure 10).
The Economic C
ontribution ofC
opyright-Based Industries in K
enya
61
Figure 9: Productivity of copyright-based industries in Kenya (total added value in KSHs millions/employee)compared to other sectors in 2007
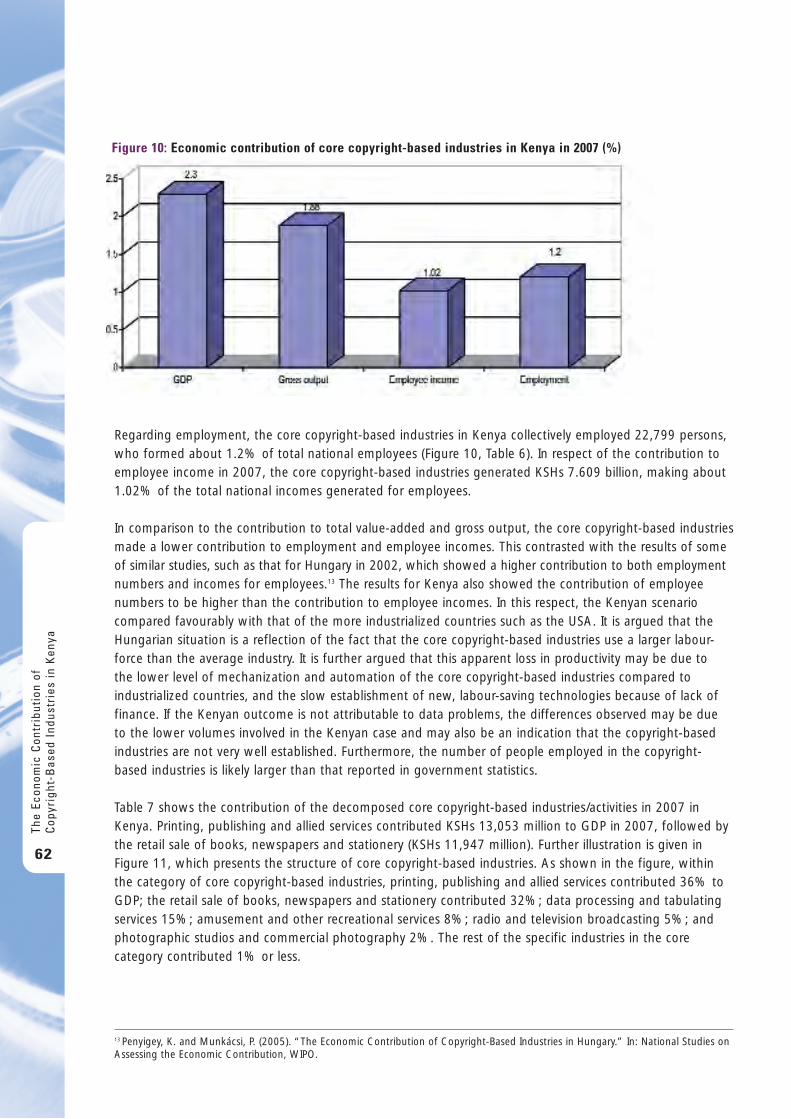
Regarding employment, the core copyright-based industries in Kenya collectively employed 22,799 persons,who formed about 1.2% of total national employees (Figure 10, Table 6). In respect of the contribution toemployee income in 2007, the core copyright-based industries generated KSHs 7.609 billion, making about1.02% of the total national incomes generated for employees.
In comparison to the contribution to total value-added and gross output, the core copyright-based industriesmade a lower contribution to employment and employee incomes. This contrasted with the results of someof similar studies, such as that for Hungary in 2002, which showed a higher contribution to both employmentnumbers and incomes for employees.13 The results for Kenya also showed the contribution of employeenumbers to be higher than the contribution to employee incomes. In this respect, the Kenyan scenariocompared favourably with that of the more industrialized countries such as the USA. It is argued that theHungarian situation is a reflection of the fact that the core copyright-based industries use a larger labour-force than the average industry. It is further argued that this apparent loss in productivity may be due to the lower level of mechanization and automation of the core copyright-based industries compared toindustrialized countries, and the slow establishment of new, labour-saving technologies because of lack offinance. If the Kenyan outcome is not attributable to data problems, the differences observed may be dueto the lower volumes involved in the Kenyan case and may also be an indication that the copyright-basedindustries are not very well established. Furthermore, the number of people employed in the copyright-based industries is likely larger than that reported in government statistics.
Table 7 shows the contribution of the decomposed core copyright-based industries/activities in 2007 inKenya. Printing, publishing and allied services contributed KSHs 13,053 million to GDP in 2007, followed bythe retail sale of books, newspapers and stationery (KSHs 11,947 million). Further illustration is given inFigure 11, which presents the structure of core copyright-based industries. As shown in the figure, withinthe category of core copyright-based industries, printing, publishing and allied services contributed 36% toGDP; the retail sale of books, newspapers and stationery contributed 32%; data processing and tabulatingservices 15%; amusement and other recreational services 8%; radio and television broadcasting 5%; andphotographic studios and commercial photography 2%. The rest of the specific industries in the corecategory contributed 1% or less.
The
Econ
omic
Con
trib
utio
n of
Cop
yrig
ht-B
ased
Ind
ustr
ies
in K
enya
62
Figure 10: Economic contribution of core copyright-based industries in Kenya in 2007 (%)
13 Penyigey, K. and Munkácsi, P. (2005). “The Economic Contribution of Copyright-Based Industries in Hungary.” In: National Studies onAssessing the Economic Contribution, WIPO.
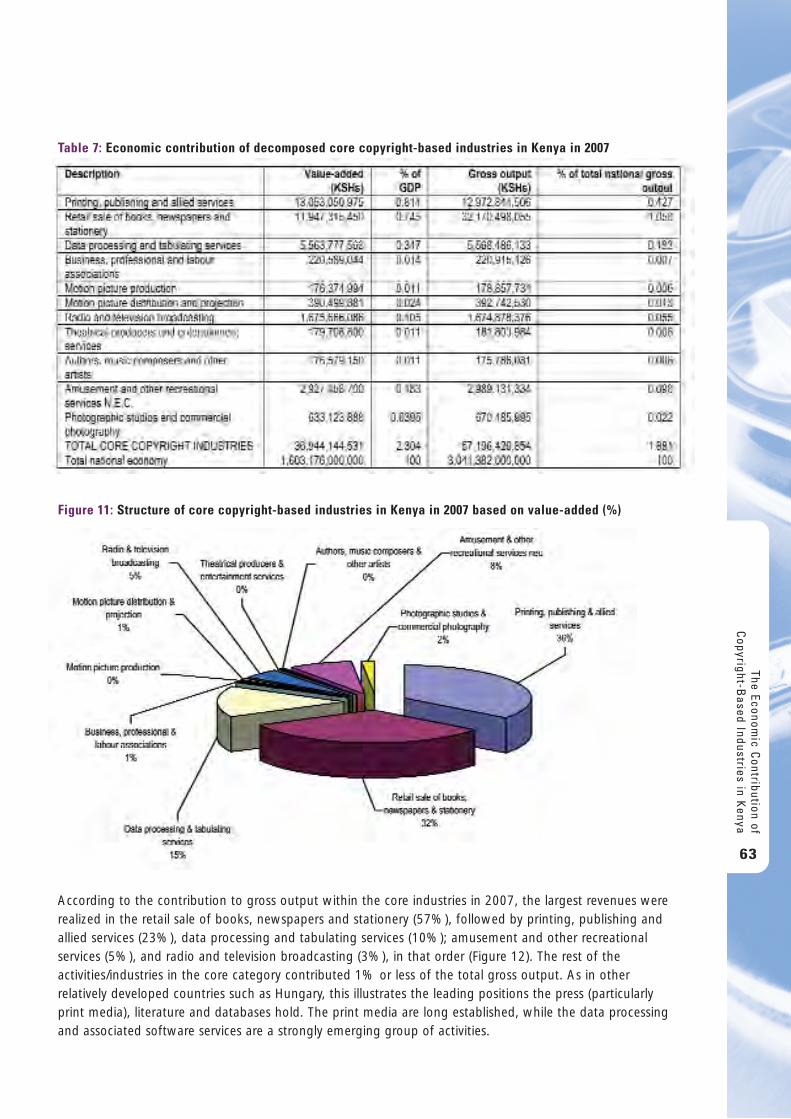
According to the contribution to gross output within the core industries in 2007, the largest revenues wererealized in the retail sale of books, newspapers and stationery (57%), followed by printing, publishing andallied services (23%), data processing and tabulating services (10%); amusement and other recreationalservices (5%), and radio and television broadcasting (3%), in that order (Figure 12). The rest of theactivities/industries in the core category contributed 1% or less of the total gross output. As in otherrelatively developed countries such as Hungary, this illustrates the leading positions the press (particularlyprint media), literature and databases hold. The print media are long established, while the data processingand associated software services are a strongly emerging group of activities.
The Economic C
ontribution ofC
opyright-Based Industries in K
enya
63
Table 7: Economic contribution of decomposed core copyright-based industries in Kenya in 2007
Figure 11: Structure of core copyright-based industries in Kenya in 2007 based on value-added (%)
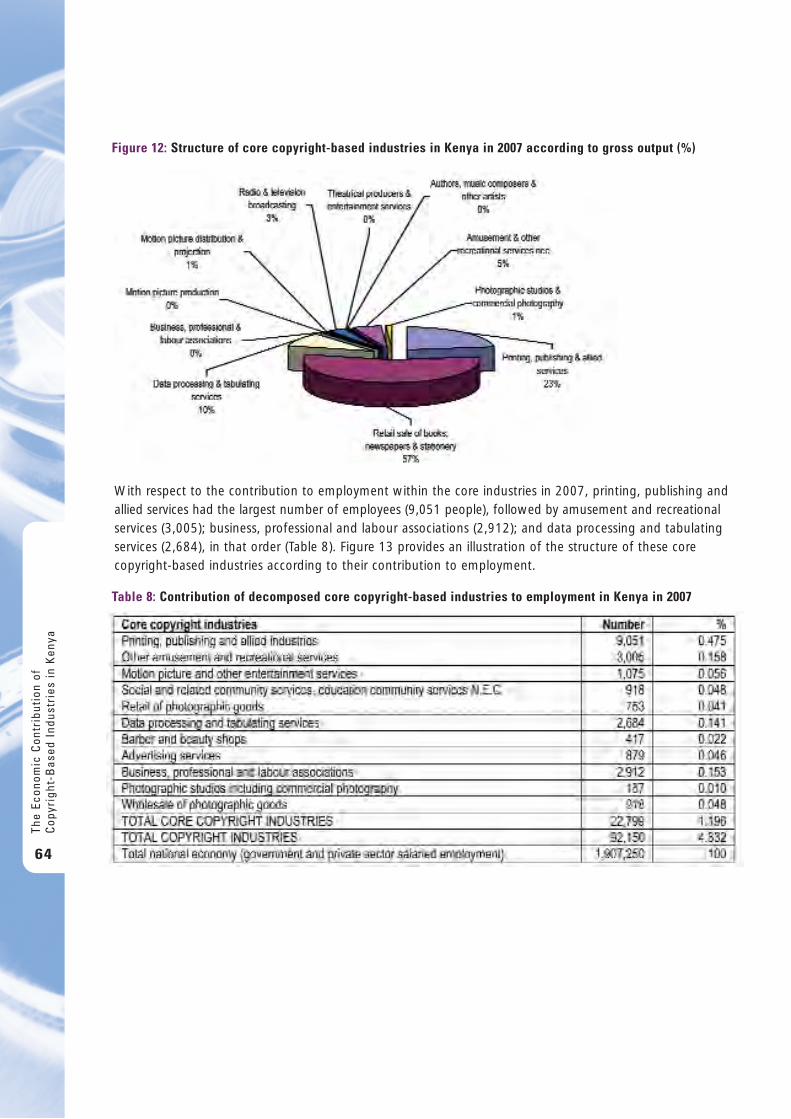
With respect to the contribution to employment within the core industries in 2007, printing, publishing andallied services had the largest number of employees (9,051 people), followed by amusement and recreationalservices (3,005); business, professional and labour associations (2,912); and data processing and tabulatingservices (2,684), in that order (Table 8). Figure 13 provides an illustration of the structure of these corecopyright-based industries according to their contribution to employment.
The
Econ
omic
Con
trib
utio
n of
Cop
yrig
ht-B
ased
Ind
ustr
ies
in K
enya
64
Figure 12: Structure of core copyright-based industries in Kenya in 2007 according to gross output (%)
Table 8: Contribution of decomposed core copyright-based industries to employment in Kenya in 2007
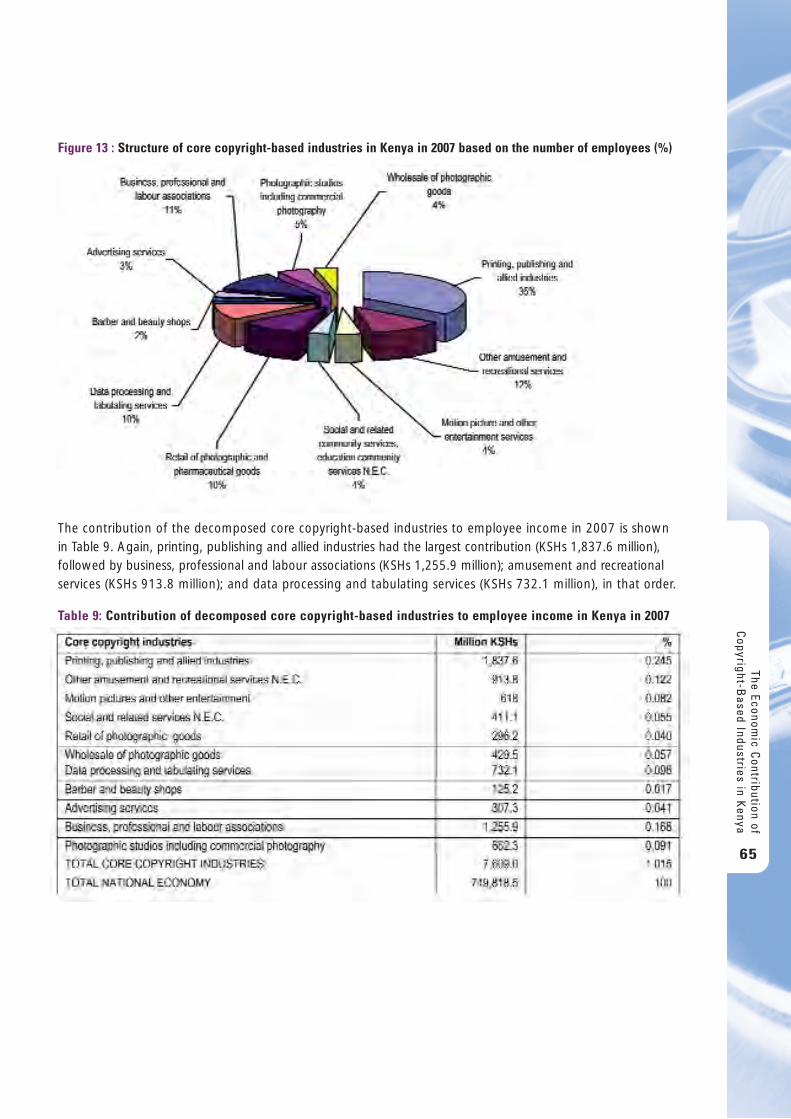
The contribution of the decomposed core copyright-based industries to employee income in 2007 is shownin Table 9. Again, printing, publishing and allied industries had the largest contribution (KSHs 1,837.6 million),followed by business, professional and labour associations (KSHs 1,255.9 million); amusement and recreationalservices (KSHs 913.8 million); and data processing and tabulating services (KSHs 732.1 million), in that order.
The Economic C
ontribution ofC
opyright-Based Industries in K
enya
65
Table 9: Contribution of decomposed core copyright-based industries to employee income in Kenya in 2007
Figure 13 : Structure of core copyright-based industries in Kenya in 2007 based on the number of employees (%)
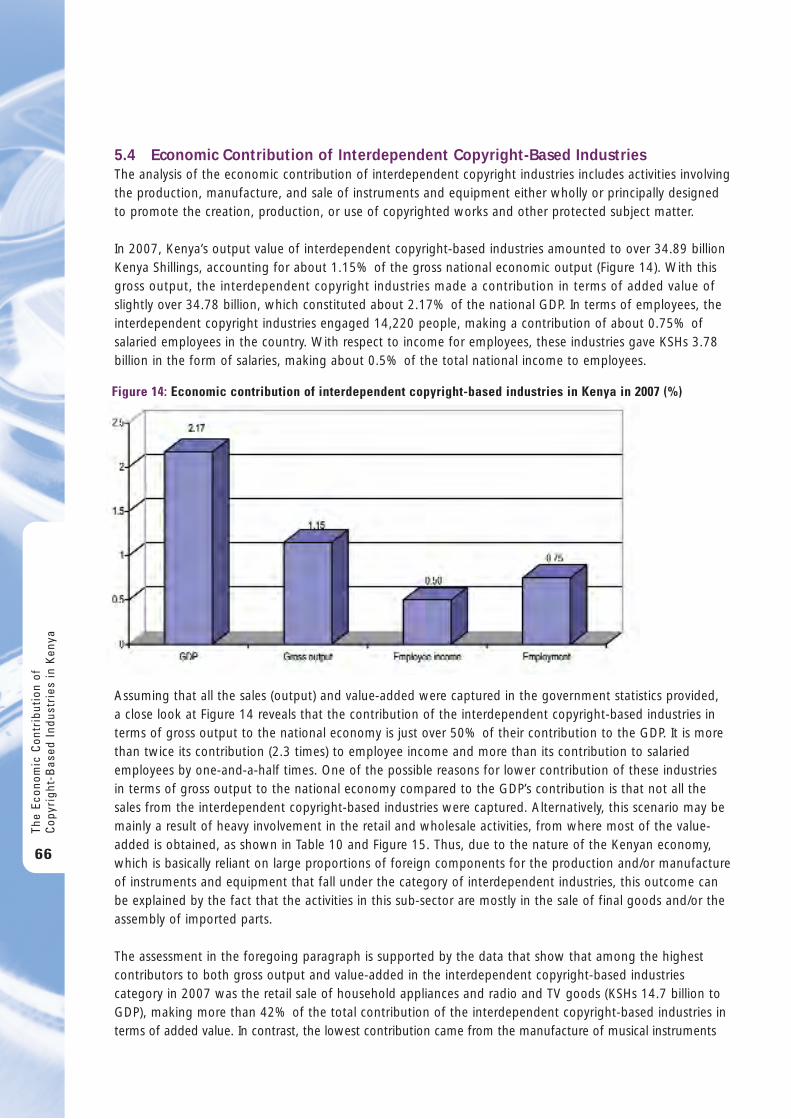
5.4 Economic Contribution of Interdependent Copyright-Based Industries The analysis of the economic contribution of interdependent copyright industries includes activities involvingthe production, manufacture, and sale of instruments and equipment either wholly or principally designedto promote the creation, production, or use of copyrighted works and other protected subject matter.
In 2007, Kenya’s output value of interdependent copyright-based industries amounted to over 34.89 billionKenya Shillings, accounting for about 1.15% of the gross national economic output (Figure 14). With thisgross output, the interdependent copyright industries made a contribution in terms of added value ofslightly over 34.78 billion, which constituted about 2.17% of the national GDP. In terms of employees, theinterdependent copyright industries engaged 14,220 people, making a contribution of about 0.75% ofsalaried employees in the country. With respect to income for employees, these industries gave KSHs 3.78billion in the form of salaries, making about 0.5% of the total national income to employees.
Assuming that all the sales (output) and value-added were captured in the government statistics provided, a close look at Figure 14 reveals that the contribution of the interdependent copyright-based industries interms of gross output to the national economy is just over 50% of their contribution to the GDP. It is morethan twice its contribution (2.3 times) to employee income and more than its contribution to salariedemployees by one-and-a-half times. One of the possible reasons for lower contribution of these industries in terms of gross output to the national economy compared to the GDP’s contribution is that not all thesales from the interdependent copyright-based industries were captured. Alternatively, this scenario may bemainly a result of heavy involvement in the retail and wholesale activities, from where most of the value-added is obtained, as shown in Table 10 and Figure 15. Thus, due to the nature of the Kenyan economy,which is basically reliant on large proportions of foreign components for the production and/or manufactureof instruments and equipment that fall under the category of interdependent industries, this outcome canbe explained by the fact that the activities in this sub-sector are mostly in the sale of final goods and/or theassembly of imported parts.
The assessment in the foregoing paragraph is supported by the data that show that among the highestcontributors to both gross output and value-added in the interdependent copyright-based industriescategory in 2007 was the retail sale of household appliances and radio and TV goods (KSHs 14.7 billion toGDP), making more than 42% of the total contribution of the interdependent copyright-based industries interms of added value. In contrast, the lowest contribution came from the manufacture of musical instruments
The
Econ
omic
Con
trib
utio
n of
Cop
yrig
ht-B
ased
Ind
ustr
ies
in K
enya
66
Figure 14: Economic contribution of interdependent copyright-based industries in Kenya in 2007 (%)
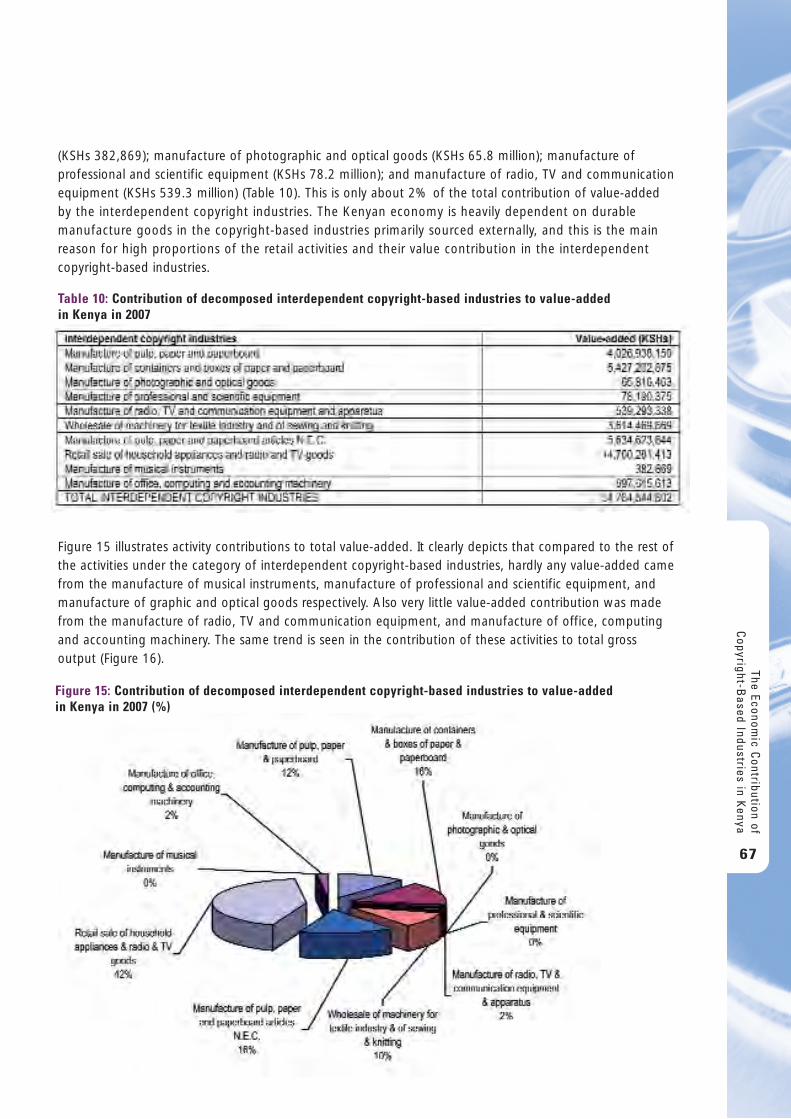
(KSHs 382,869); manufacture of photographic and optical goods (KSHs 65.8 million); manufacture ofprofessional and scientific equipment (KSHs 78.2 million); and manufacture of radio, TV and communicationequipment (KSHs 539.3 million) (Table 10). This is only about 2% of the total contribution of value-addedby the interdependent copyright industries. The Kenyan economy is heavily dependent on durablemanufacture goods in the copyright-based industries primarily sourced externally, and this is the mainreason for high proportions of the retail activities and their value contribution in the interdependentcopyright-based industries.
Figure 15 illustrates activity contributions to total value-added. It clearly depicts that compared to the rest ofthe activities under the category of interdependent copyright-based industries, hardly any value-added camefrom the manufacture of musical instruments, manufacture of professional and scientific equipment, andmanufacture of graphic and optical goods respectively. Also very little value-added contribution was madefrom the manufacture of radio, TV and communication equipment, and manufacture of office, computingand accounting machinery. The same trend is seen in the contribution of these activities to total grossoutput (Figure 16). The Econom
ic Contribution of
Copyright-B
ased Industries in Kenya
67
Table 10: Contribution of decomposed interdependent copyright-based industries to value-added in Kenya in 2007
Figure 15: Contribution of decomposed interdependent copyright-based industries to value-added in Kenya in 2007 (%)
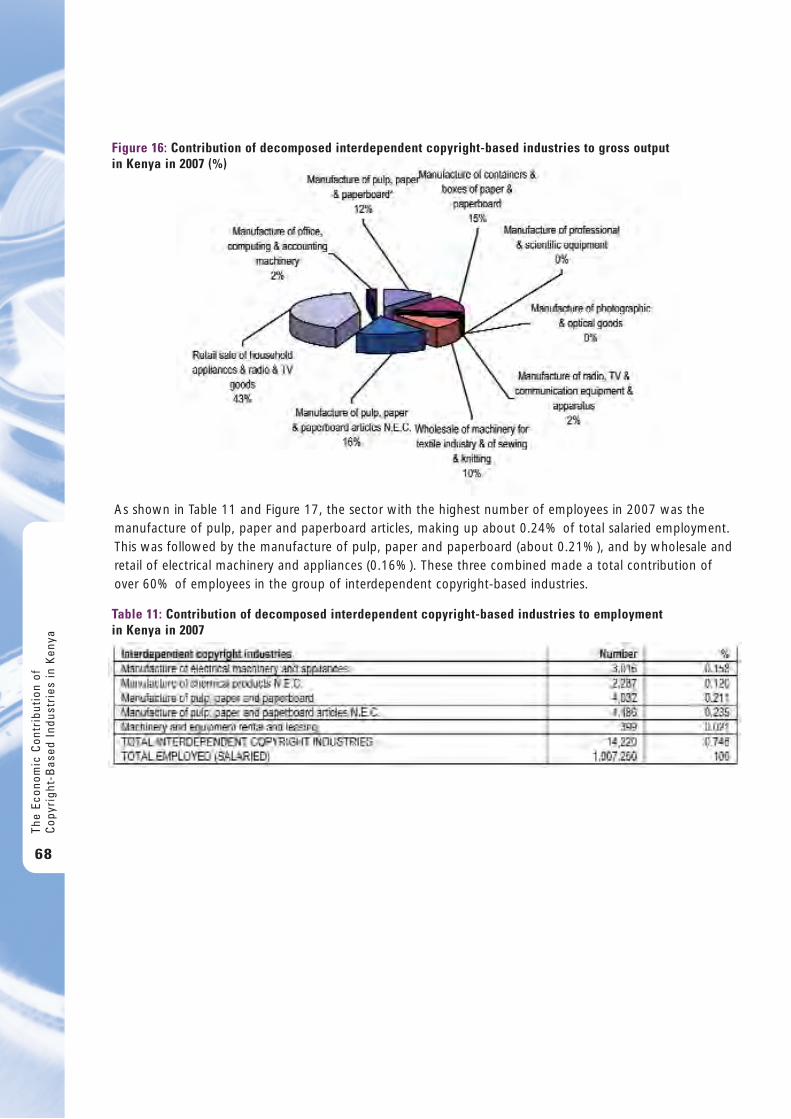
As shown in Table 11 and Figure 17, the sector with the highest number of employees in 2007 was themanufacture of pulp, paper and paperboard articles, making up about 0.24% of total salaried employment.This was followed by the manufacture of pulp, paper and paperboard (about 0.21%), and by wholesale andretail of electrical machinery and appliances (0.16%). These three combined made a total contribution ofover 60% of employees in the group of interdependent copyright-based industries.
The
Econ
omic
Con
trib
utio
n of
Cop
yrig
ht-B
ased
Ind
ustr
ies
in K
enya
68
Figure 16: Contribution of decomposed interdependent copyright-based industries to gross output in Kenya in 2007 (%)
Table 11: Contribution of decomposed interdependent copyright-based industries to employment in Kenya in 2007
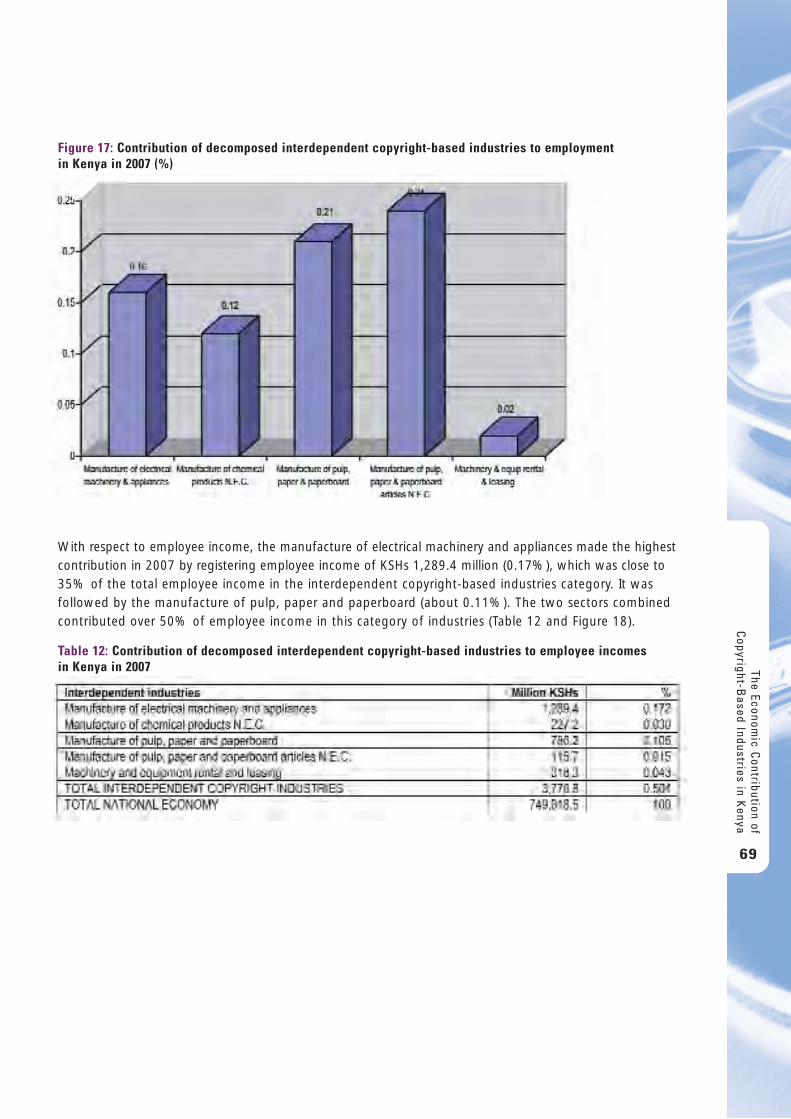
With respect to employee income, the manufacture of electrical machinery and appliances made the highestcontribution in 2007 by registering employee income of KSHs 1,289.4 million (0.17%), which was close to35% of the total employee income in the interdependent copyright-based industries category. It wasfollowed by the manufacture of pulp, paper and paperboard (about 0.11%). The two sectors combinedcontributed over 50% of employee income in this category of industries (Table 12 and Figure 18).
The Economic C
ontribution ofC
opyright-Based Industries in K
enya
69
Figure 17: Contribution of decomposed interdependent copyright-based industries to employment in Kenya in 2007 (%)
Table 12: Contribution of decomposed interdependent copyright-based industries to employee incomes in Kenya in 2007
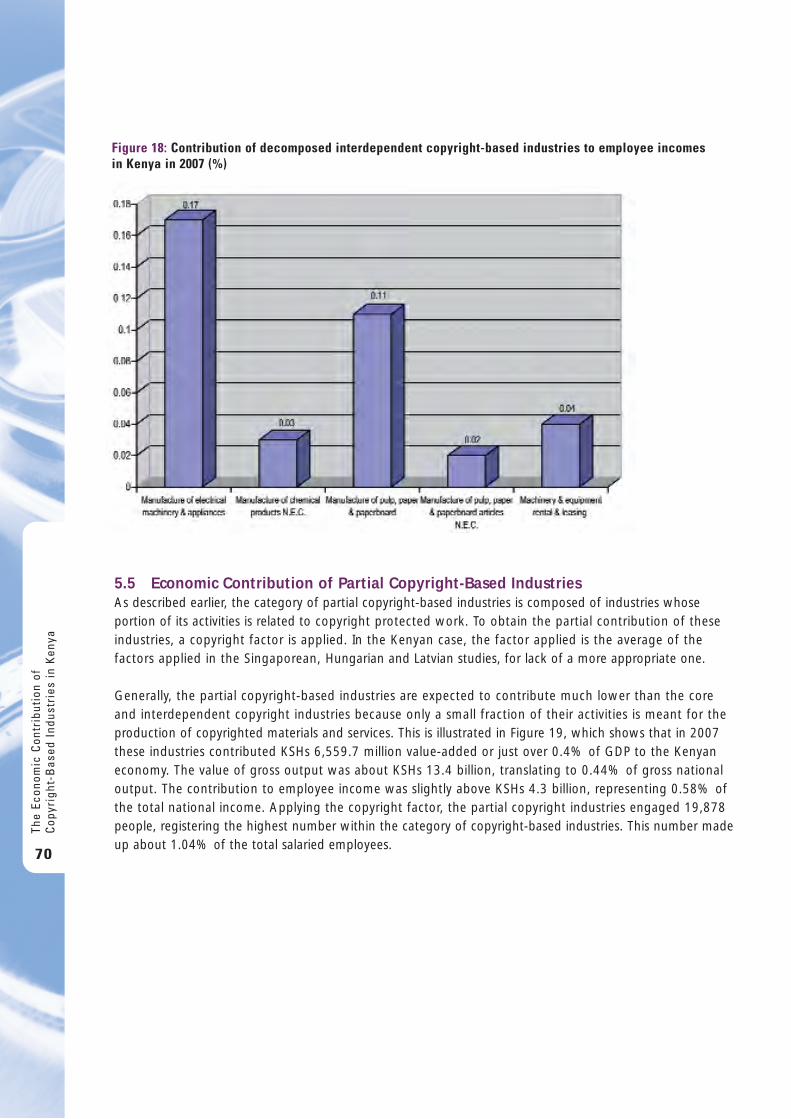
5.5 Economic Contribution of Partial Copyright-Based Industries As described earlier, the category of partial copyright-based industries is composed of industries whoseportion of its activities is related to copyright protected work. To obtain the partial contribution of theseindustries, a copyright factor is applied. In the Kenyan case, the factor applied is the average of thefactors applied in the Singaporean, Hungarian and Latvian studies, for lack of a more appropriate one.
Generally, the partial copyright-based industries are expected to contribute much lower than the core and interdependent copyright industries because only a small fraction of their activities is meant for theproduction of copyrighted materials and services. This is illustrated in Figure 19, which shows that in 2007these industries contributed KSHs 6,559.7 million value-added or just over 0.4% of GDP to the Kenyaneconomy. The value of gross output was about KSHs 13.4 billion, translating to 0.44% of gross nationaloutput. The contribution to employee income was slightly above KSHs 4.3 billion, representing 0.58% ofthe total national income. Applying the copyright factor, the partial copyright industries engaged 19,878people, registering the highest number within the category of copyright-based industries. This number madeup about 1.04% of the total salaried employees.
The
Econ
omic
Con
trib
utio
n of
Cop
yrig
ht-B
ased
Ind
ustr
ies
in K
enya
70
Figure 18: Contribution of decomposed interdependent copyright-based industries to employee incomes in Kenya in 2007 (%)
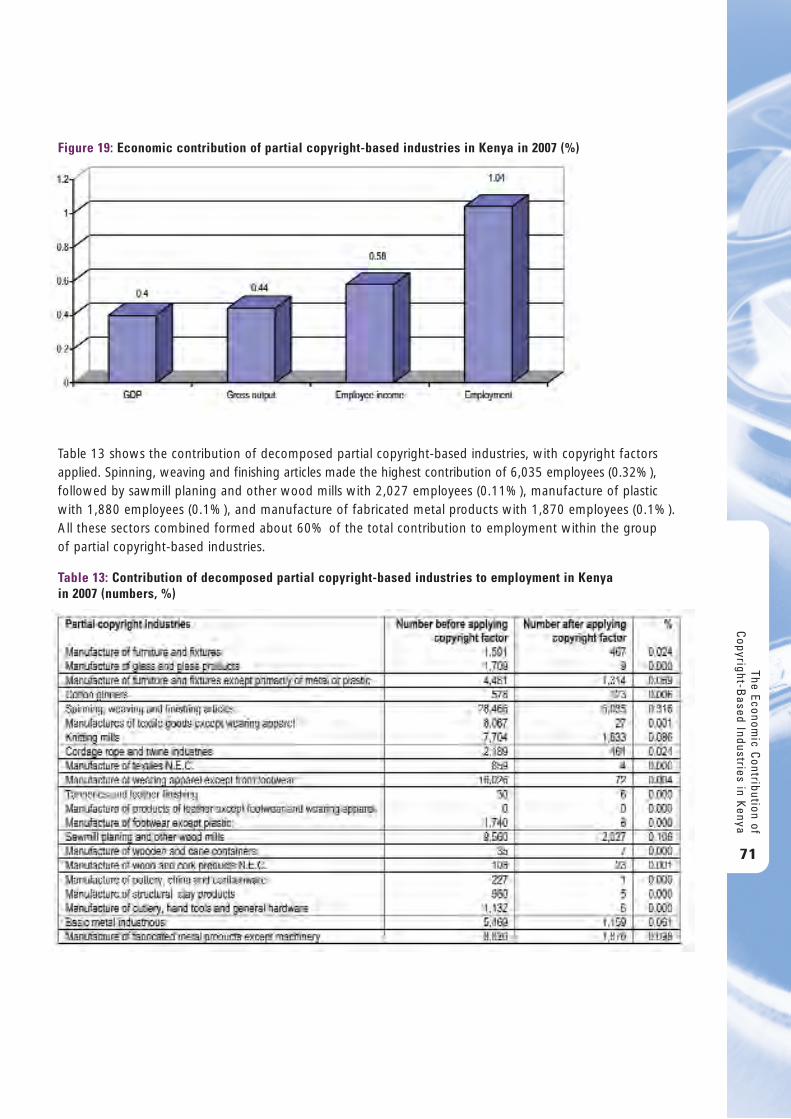
Table 13 shows the contribution of decomposed partial copyright-based industries, with copyright factorsapplied. Spinning, weaving and finishing articles made the highest contribution of 6,035 employees (0.32%),followed by sawmill planing and other wood mills with 2,027 employees (0.11%), manufacture of plasticwith 1,880 employees (0.1%), and manufacture of fabricated metal products with 1,870 employees (0.1%).All these sectors combined formed about 60% of the total contribution to employment within the group of partial copyright-based industries.
The Economic C
ontribution ofC
opyright-Based Industries in K
enya
71
Figure 19: Economic contribution of partial copyright-based industries in Kenya in 2007 (%)
Table 13: Contribution of decomposed partial copyright-based industries to employment in Kenya in 2007 (numbers, %)
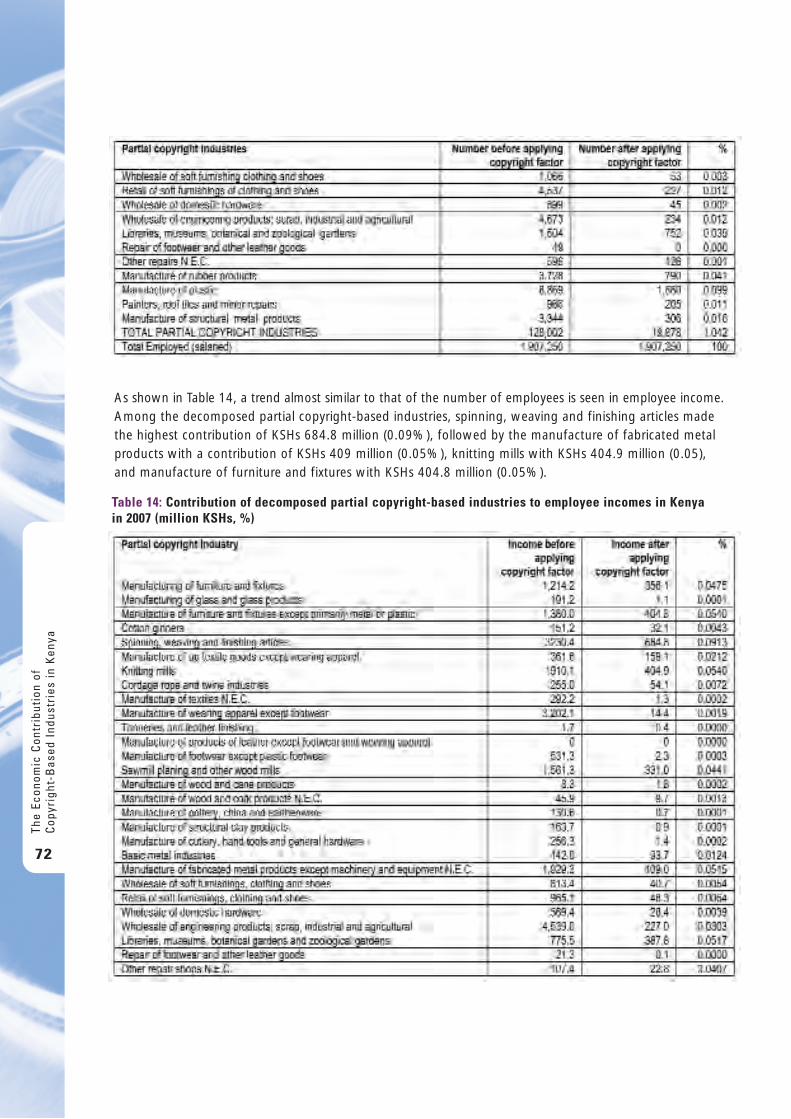
As shown in Table 14, a trend almost similar to that of the number of employees is seen in employee income.Among the decomposed partial copyright-based industries, spinning, weaving and finishing articles madethe highest contribution of KSHs 684.8 million (0.09%), followed by the manufacture of fabricated metalproducts with a contribution of KSHs 409 million (0.05%), knitting mills with KSHs 404.9 million (0.05), and manufacture of furniture and fixtures with KSHs 404.8 million (0.05%).
The
Econ
omic
Con
trib
utio
n of
Cop
yrig
ht-B
ased
Ind
ustr
ies
in K
enya
72
Table 14: Contribution of decomposed partial copyright-based industries to employee incomes in Kenya in 2007 (million KSHs, %)
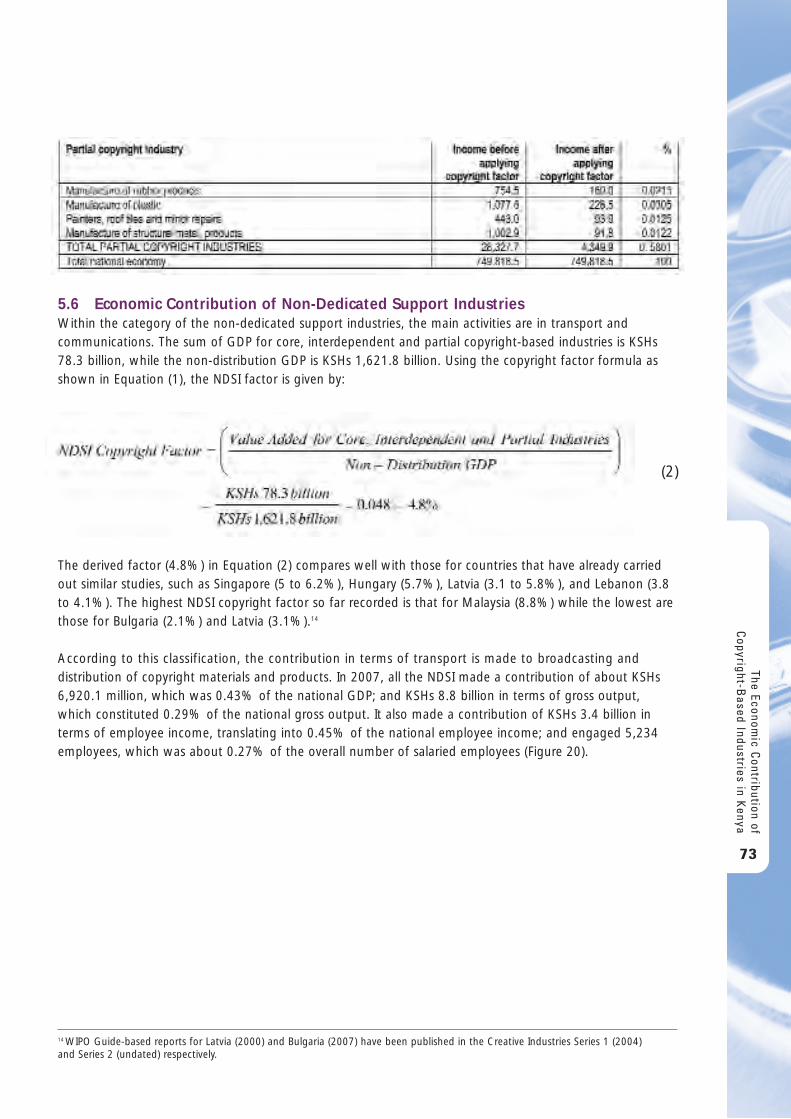
5.6 Economic Contribution of Non-Dedicated Support Industries Within the category of the non-dedicated support industries, the main activities are in transport andcommunications. The sum of GDP for core, interdependent and partial copyright-based industries is KSHs78.3 billion, while the non-distribution GDP is KSHs 1,621.8 billion. Using the copyright factor formula asshown in Equation (1), the NDSI factor is given by:
The derived factor (4.8%) in Equation (2) compares well with those for countries that have already carriedout similar studies, such as Singapore (5 to 6.2%), Hungary (5.7%), Latvia (3.1 to 5.8%), and Lebanon (3.8to 4.1%). The highest NDSI copyright factor so far recorded is that for Malaysia (8.8%) while the lowest arethose for Bulgaria (2.1%) and Latvia (3.1%).14
According to this classification, the contribution in terms of transport is made to broadcasting anddistribution of copyright materials and products. In 2007, all the NDSI made a contribution of about KSHs6,920.1 million, which was 0.43% of the national GDP; and KSHs 8.8 billion in terms of gross output,which constituted 0.29% of the national gross output. It also made a contribution of KSHs 3.4 billion interms of employee income, translating into 0.45% of the national employee income; and engaged 5,234employees, which was about 0.27% of the overall number of salaried employees (Figure 20).
The Economic C
ontribution ofC
opyright-Based Industries in K
enya
73
(2)
14 WIPO Guide-based reports for Latvia (2000) and Bulgaria (2007) have been published in the Creative Industries Series 1 (2004) and Series 2 (undated) respectively.
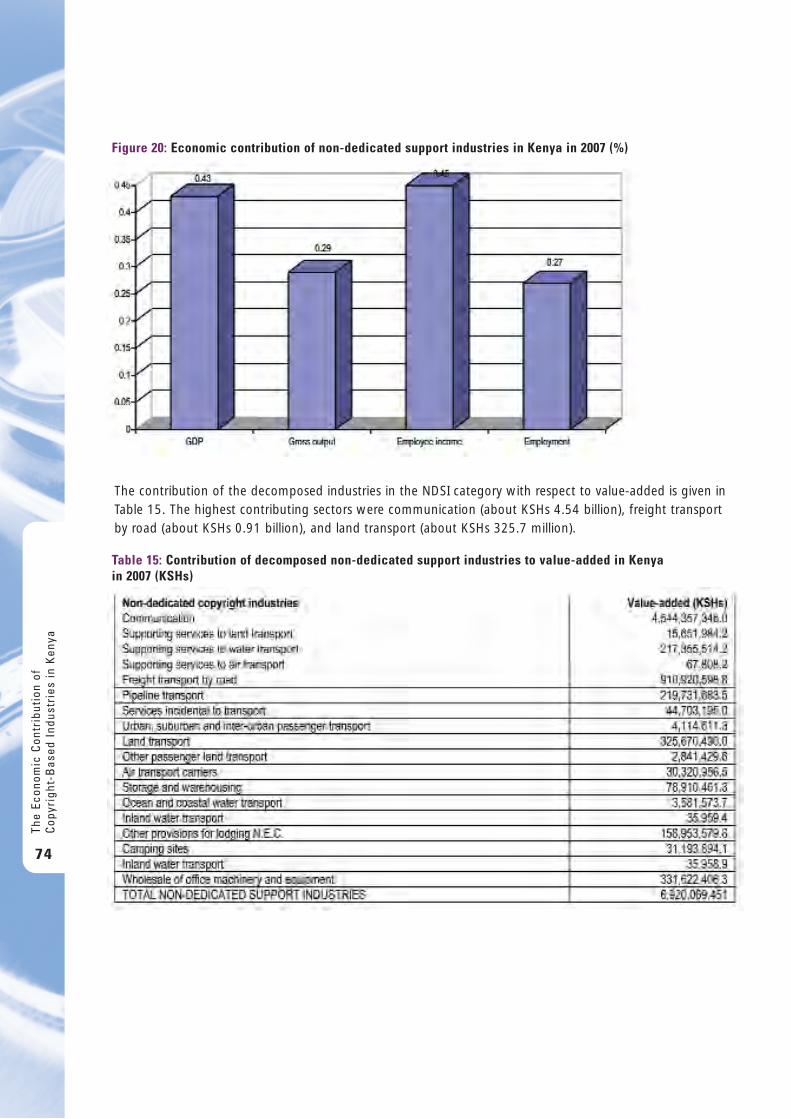
The contribution of the decomposed industries in the NDSI category with respect to value-added is given inTable 15. The highest contributing sectors were communication (about KSHs 4.54 billion), freight transportby road (about KSHs 0.91 billion), and land transport (about KSHs 325.7 million).
The
Econ
omic
Con
trib
utio
n of
Cop
yrig
ht-B
ased
Ind
ustr
ies
in K
enya
74
Figure 20: Economic contribution of non-dedicated support industries in Kenya in 2007 (%)
Table 15: Contribution of decomposed non-dedicated support industries to value-added in Kenya in 2007 (KSHs)
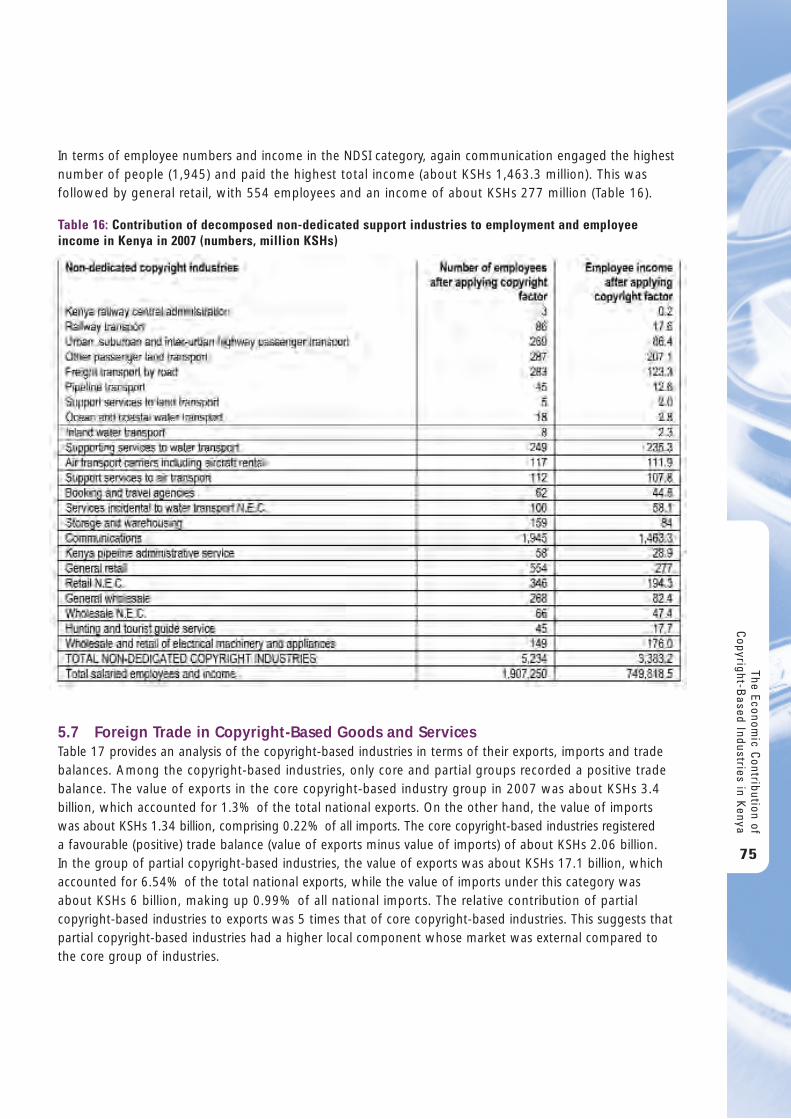
In terms of employee numbers and income in the NDSI category, again communication engaged the highestnumber of people (1,945) and paid the highest total income (about KSHs 1,463.3 million). This wasfollowed by general retail, with 554 employees and an income of about KSHs 277 million (Table 16).
5.7 Foreign Trade in Copyright-Based Goods and ServicesTable 17 provides an analysis of the copyright-based industries in terms of their exports, imports and tradebalances. Among the copyright-based industries, only core and partial groups recorded a positive tradebalance. The value of exports in the core copyright-based industry group in 2007 was about KSHs 3.4billion, which accounted for 1.3% of the total national exports. On the other hand, the value of importswas about KSHs 1.34 billion, comprising 0.22% of all imports. The core copyright-based industries registered a favourable (positive) trade balance (value of exports minus value of imports) of about KSHs 2.06 billion. In the group of partial copyright-based industries, the value of exports was about KSHs 17.1 billion, whichaccounted for 6.54% of the total national exports, while the value of imports under this category wasabout KSHs 6 billion, making up 0.99% of all national imports. The relative contribution of partialcopyright-based industries to exports was 5 times that of core copyright-based industries. This suggests thatpartial copyright-based industries had a higher local component whose market was external compared tothe core group of industries.
The Economic C
ontribution ofC
opyright-Based Industries in K
enya
75
Table 16: Contribution of decomposed non-dedicated support industries to employment and employeeincome in Kenya in 2007 (numbers, million KSHs)
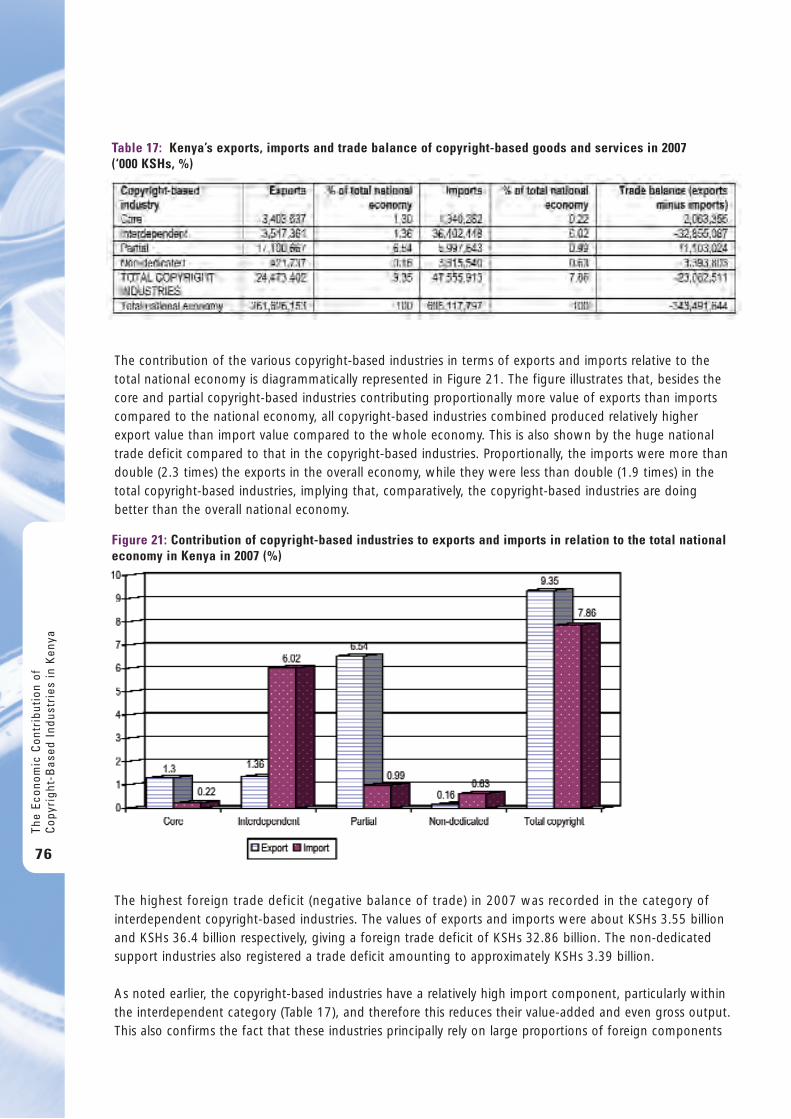
The contribution of the various copyright-based industries in terms of exports and imports relative to thetotal national economy is diagrammatically represented in Figure 21. The figure illustrates that, besides thecore and partial copyright-based industries contributing proportionally more value of exports than importscompared to the national economy, all copyright-based industries combined produced relatively higherexport value than import value compared to the whole economy. This is also shown by the huge nationaltrade deficit compared to that in the copyright-based industries. Proportionally, the imports were more thandouble (2.3 times) the exports in the overall economy, while they were less than double (1.9 times) in thetotal copyright-based industries, implying that, comparatively, the copyright-based industries are doingbetter than the overall national economy.
The highest foreign trade deficit (negative balance of trade) in 2007 was recorded in the category ofinterdependent copyright-based industries. The values of exports and imports were about KSHs 3.55 billionand KSHs 36.4 billion respectively, giving a foreign trade deficit of KSHs 32.86 billion. The non-dedicatedsupport industries also registered a trade deficit amounting to approximately KSHs 3.39 billion.
As noted earlier, the copyright-based industries have a relatively high import component, particularly withinthe interdependent category (Table 17), and therefore this reduces their value-added and even gross output.This also confirms the fact that these industries principally rely on large proportions of foreign components
The
Econ
omic
Con
trib
utio
n of
Cop
yrig
ht-B
ased
Ind
ustr
ies
in K
enya
76
Table 17: Kenya’s exports, imports and trade balance of copyright-based goods and services in 2007 (‘000 KSHs, %)
Figure 21: Contribution of copyright-based industries to exports and imports in relation to the total nationaleconomy in Kenya in 2007 (%)
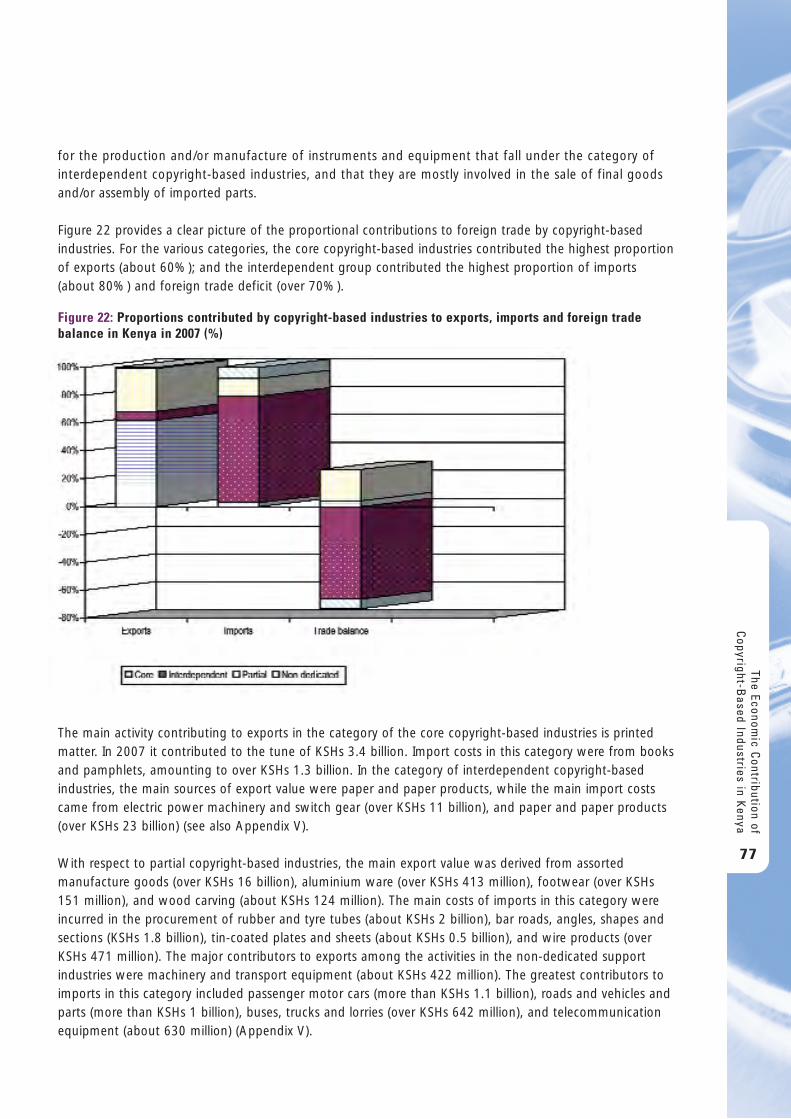
for the production and/or manufacture of instruments and equipment that fall under the category ofinterdependent copyright-based industries, and that they are mostly involved in the sale of final goodsand/or assembly of imported parts.
Figure 22 provides a clear picture of the proportional contributions to foreign trade by copyright-basedindustries. For the various categories, the core copyright-based industries contributed the highest proportionof exports (about 60%); and the interdependent group contributed the highest proportion of imports(about 80%) and foreign trade deficit (over 70%).
The main activity contributing to exports in the category of the core copyright-based industries is printedmatter. In 2007 it contributed to the tune of KSHs 3.4 billion. Import costs in this category were from booksand pamphlets, amounting to over KSHs 1.3 billion. In the category of interdependent copyright-basedindustries, the main sources of export value were paper and paper products, while the main import costscame from electric power machinery and switch gear (over KSHs 11 billion), and paper and paper products(over KSHs 23 billion) (see also Appendix V).
With respect to partial copyright-based industries, the main export value was derived from assortedmanufacture goods (over KSHs 16 billion), aluminium ware (over KSHs 413 million), footwear (over KSHs151 million), and wood carving (about KSHs 124 million). The main costs of imports in this category wereincurred in the procurement of rubber and tyre tubes (about KSHs 2 billion), bar roads, angles, shapes andsections (KSHs 1.8 billion), tin-coated plates and sheets (about KSHs 0.5 billion), and wire products (overKSHs 471 million). The major contributors to exports among the activities in the non-dedicated supportindustries were machinery and transport equipment (about KSHs 422 million). The greatest contributors toimports in this category included passenger motor cars (more than KSHs 1.1 billion), roads and vehicles andparts (more than KSHs 1 billion), buses, trucks and lorries (over KSHs 642 million), and telecommunicationequipment (about 630 million) (Appendix V).
The Economic C
ontribution ofC
opyright-Based Industries in K
enya
77
Figure 22: Proportions contributed by copyright-based industries to exports, imports and foreign tradebalance in Kenya in 2007 (%)
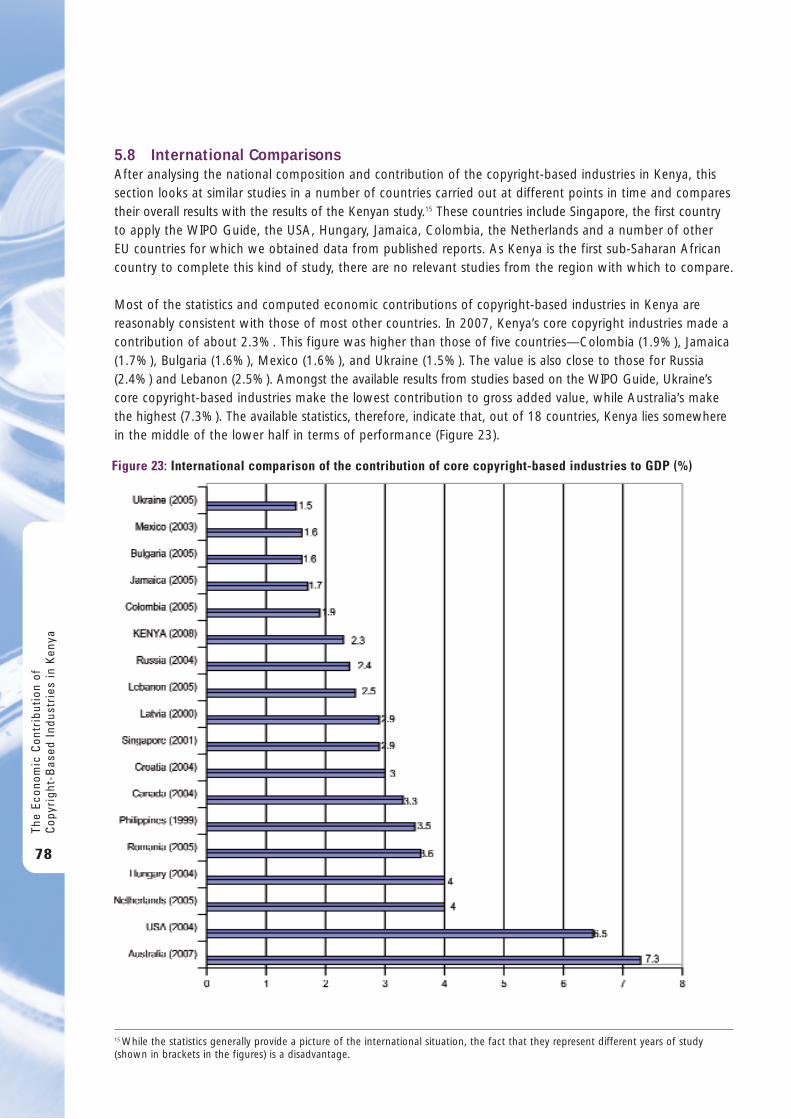
5.8 International ComparisonsAfter analysing the national composition and contribution of the copyright-based industries in Kenya, thissection looks at similar studies in a number of countries carried out at different points in time and comparestheir overall results with the results of the Kenyan study.15 These countries include Singapore, the first countryto apply the WIPO Guide, the USA, Hungary, Jamaica, Colombia, the Netherlands and a number of other EU countries for which we obtained data from published reports. As Kenya is the first sub-Saharan Africancountry to complete this kind of study, there are no relevant studies from the region with which to compare.
Most of the statistics and computed economic contributions of copyright-based industries in Kenya arereasonably consistent with those of most other countries. In 2007, Kenya’s core copyright industries made acontribution of about 2.3%. This figure was higher than those of five countries—Colombia (1.9%), Jamaica(1.7%), Bulgaria (1.6%), Mexico (1.6%), and Ukraine (1.5%). The value is also close to those for Russia(2.4%) and Lebanon (2.5%). Amongst the available results from studies based on the WIPO Guide, Ukraine’score copyright-based industries make the lowest contribution to gross added value, while Australia’s makethe highest (7.3%). The available statistics, therefore, indicate that, out of 18 countries, Kenya lies somewherein the middle of the lower half in terms of performance (Figure 23).
The
Econ
omic
Con
trib
utio
n of
Cop
yrig
ht-B
ased
Ind
ustr
ies
in K
enya
78
Figure 23: International comparison of the contribution of core copyright-based industries to GDP (%)
15 While the statistics generally provide a picture of the international situation, the fact that they represent different years of study(shown in brackets in the figures) is a disadvantage.
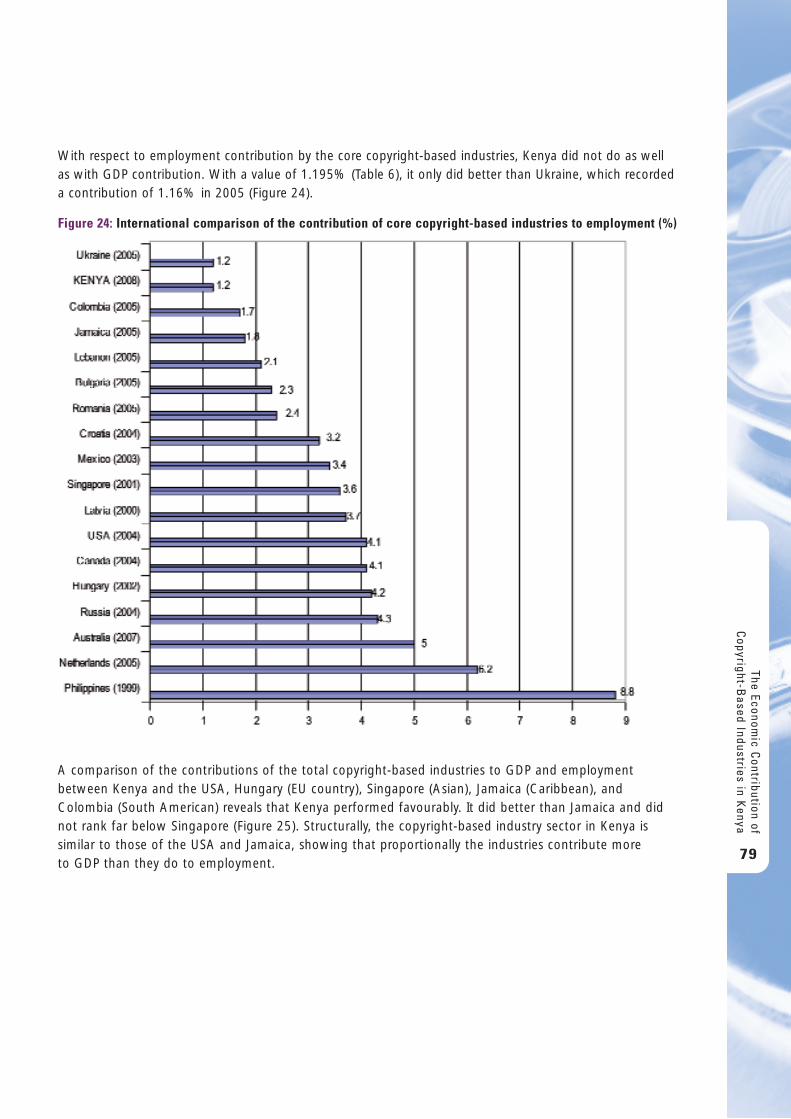
With respect to employment contribution by the core copyright-based industries, Kenya did not do as wellas with GDP contribution. With a value of 1.195% (Table 6), it only did better than Ukraine, which recordeda contribution of 1.16% in 2005 (Figure 24).
A comparison of the contributions of the total copyright-based industries to GDP and employmentbetween Kenya and the USA, Hungary (EU country), Singapore (Asian), Jamaica (Caribbean), andColombia (South American) reveals that Kenya performed favourably. It did better than Jamaica and didnot rank far below Singapore (Figure 25). Structurally, the copyright-based industry sector in Kenya issimilar to those of the USA and Jamaica, showing that proportionally the industries contribute more to GDP than they do to employment.
The Economic C
ontribution ofC
opyright-Based Industries in K
enya
79
Figure 24: International comparison of the contribution of core copyright-based industries to employment (%)
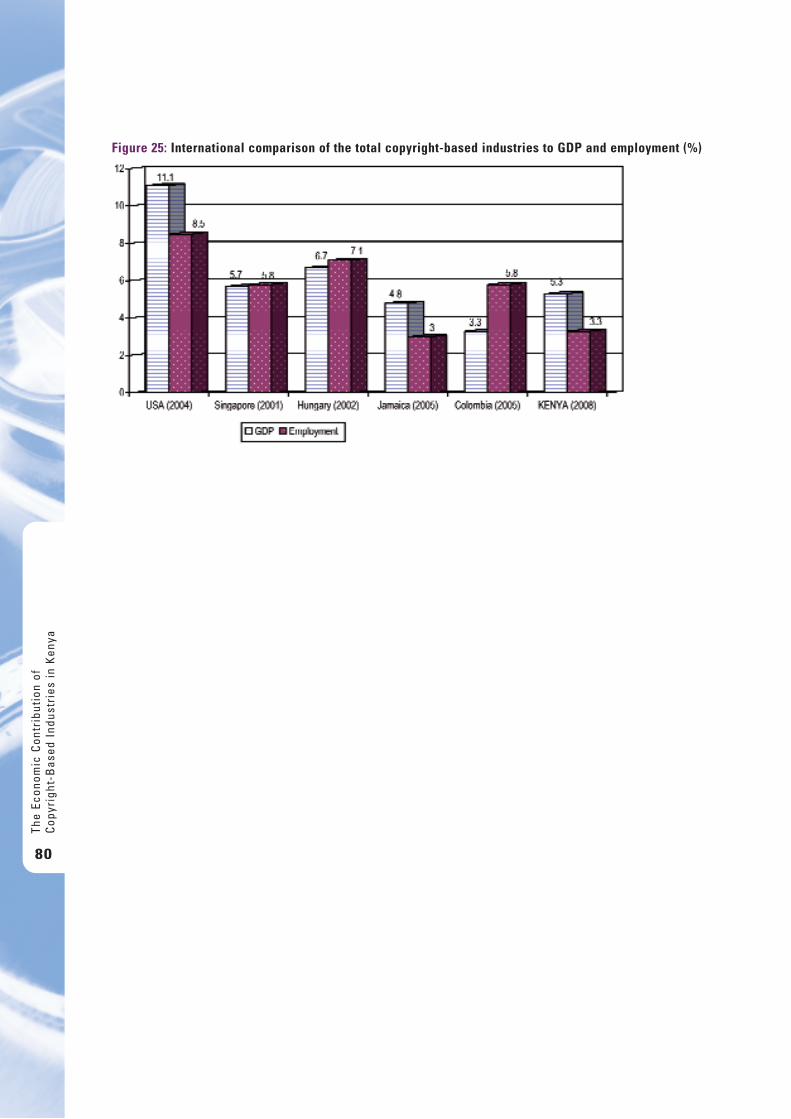
The
Econ
omic
Con
trib
utio
n of
Cop
yrig
ht-B
ased
Ind
ustr
ies
in K
enya
80
Figure 25: International comparison of the total copyright-based industries to GDP and employment (%)
6 . T h e D e v e l o p m e n t o f s o m e C o r e C o p y r i g h t - b a s e d I n d u s t r i e si n K e n ya
This chapter presents a brief picture of the development of some of the main/core copyright-basedindustries in Kenya. The information presented relies mainly on literature and statistics taken fromgovernment reports and industry sources and the results of primary data from questionnaire interviews.Without seeking to be too detailed, this chapter, albeit in a brief form, compiles information on the mostimportant issues regarding press and literature, music, theatrical production, opera, film production andvideos, radio and television, and business and professional associations.
6.1 Press and LiteratureAccording to the records from the Kenya Revenue Authority (KRA), the press and literature group of industries/activities consists of the following major categories:
a. Printing, publishing and allied services.b. Retail sale of books, newspapers and stationery.c. Business, professional and labour associations.
In Kenya, newspaper printing, book publishing, card printing and all other forms of printing and publishingare lumped together under Printing, Publishing and Allied Services. Their sales are lumped together as RetailSale of Books, Newspapers and Stationery. However, efforts are being made to disaggregate these furtherfor the purposes of future industry analysis.
6.1.1 The Press MarketThe history of the press in Kenya is rather recent. It started with the arrival of Pentecostal missionaries nearlya century-and-a-half ago, as the missionaries embarked on teaching new converts how to read and write,primarily so that the new converts could read biblical literature for themselves. The initial publications thencontained religious materials. To date, the church still publishes some religious materials.
Since independence in 1963, the development of the Kenyan press market has been influenced by differentopposing political views. During the single-party era, the ruling party ensured that the press sector wasmonitored and closely controlled so that the single-party ideologies were propagated. During the same timethere were some opposing views from a group of people who were fighting for increased space forreporting. This took place amid strong opposition from the government. The country at this time wasundergoing economic, political and social transformation, which brought about a fresh momentum to theKenyan press market. During this period, the readers developed a specific liking for certain available pressproducts that opposed, or looked like they were opposed to, the status quo. Thus, while a small proportionof the Kenyan population liked the state-sponsored press, a vast majority had started to develop a liking foran alternative press.
Kenya has four major daily national newspapers in English and one in Kiswahili, all published in Nairobiwith a combined daily circulation of almost 400,000.16 The English dailies are the Daily Nation, The Standard,Kenya Times, and People, while Taifa Leo is the Swahili daily. The Daily Nation and Taifa Leo are publishedby the Nation Media Group (NMG), the largest private/independent media company in Kenya. The
The Economic C
ontribution ofC
opyright-Based Industries in K
enya
81
16 Most of the data in this section on the development of the press have been obtained from the Media Council of Kenya Report of2005: “A Baseline Survey of Media in Kenya,” August 2005.
Standard newspaper is published by The Standard Company, which is also an independent company. TheKenya Times, on the other hand, which was associated with the Kenya African National Union (KANU)government, is managed by the former ruling party, KANU. There are also a number of other smallerdaily, weekly and monthly publications.
The Standard is the oldest mass-circulating newspaper in Kenya, founded in 1902 by a Parsee migrant, A.M.Jeevanjee. It catered mainly for civil servants and the business community in Mombasa. The need for anewspaper arose when the British settlers came to Kenya together with Indians to work on the constructionof the railway line from the coast to open up the interior parts of the countryside for settlement. After thecompletion of the railway line, these Indian workers settled in Mombasa and formed the backbone of thecivil service. Two years later, The Standard was sold to the partnership of Mayer and Anderson, whorenamed it The East African Standard, marking the beginning of the European press, concerned withhappenings in Britain and urging subservience to the settlers, a tune that for a long time became the toneof other settler-controlled media, including Mombasa Mail and Nairobi News. The East African Standardbecame the largest and most influential publication in colonial East Africa. In 1967, Lonrho (a company)acquired the newspaper and turned it into a tool to safeguard its interest in the region. In the mid-1990s,following the reorganization at the Lonrho headquarters in London, The Standard was sold again, this timeto a group of Kenyan political businessmen who had then gained control of the Kenya Times Network (KTN)television channel. Today, The Standard, with a daily circulation of 54,000, has outlasted its competitors.Besides The Standard and KTN, this media house also operates the Capital FM radio station, currentlylicensed to broadcast in Nairobi. Capital FM launched its operations in September 1996.
The Daily Nation newspaper, published by the NMG, was first registered in 1959 by Michael Curtis andCharles Hayes. In 1960, it was purchased by the spiritual leader of the Ismaili community, Aga Khan. It wasthe first paper to adopt a policy of Africanization by publishing a Swahili version, Taifa Leo. Today, the DailyNation has a daily circulation of 184,000 copies, while Taifa Leo has a daily circulation of 35,000 copies,making the Nation Kenya’s most widely printed newspaper. The Nation, although targeting the Kenyanmarket, is also circulated throughout the East African region. The NMG also publishes the East African, aconservatively designed weekly focusing on the economic news of East Africa.
The NMG also owns the East African Magazine Ltd, publishers of True Love and Drum magazines. Thecirculation of these magazines increased by 24% and advertising revenue increased by 93% in the first halfof 2007 compared to the same period in 2006. In the first half of 2007 the Daily Nation returned a 26%increase in advertising revenue compared to the same period in 2006. The circulation revenue also increasedby 6%, with NMG’s newly launched Business Daily newspaper showing a promising start.17 Further to this,the NMG owns Nation TV and Nation FM radio called Easy FM, which were licensed in 1998 and went onair a year later. His Highness the Aga Khan is the biggest shareholder in NMG.
The People Daily, owned by Kenneth Matiba, Kenya’s major presidential candidate in 1992, started as aweekly before it turned into a daily newspaper with a Sunday edition in December 1998. It has a dailycirculation of 60,000. Initially founded to serve as the voice of the opposition politics and to report materialsthat the Nation and The Standard feared to touch, the People Daily has since faced lean times. The biggestchallenge facing the paper is its inability to attract sufficient revenue from advertising due to the perceptionthat it is partisan.
The
Econ
omic
Con
trib
utio
n of
Cop
yrig
ht-B
ased
Ind
ustr
ies
in K
enya
82
17 Saturday Nation, July 28, 2007. Music Sector. “Act Tough on Music Piracy,” page 26, by Maurine Ongwae.
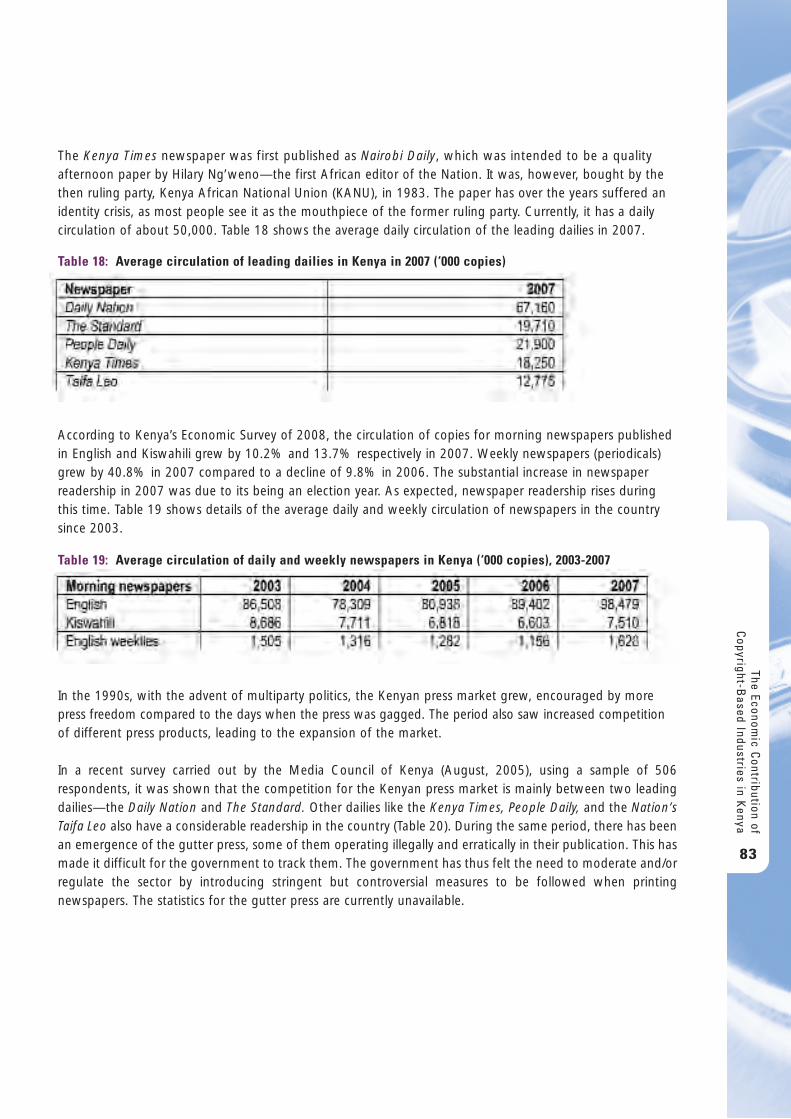
The Economic C
ontribution ofC
opyright-Based Industries in K
enya
83
The Kenya Times newspaper was first published as Nairobi Daily, which was intended to be a qualityafternoon paper by Hilary Ng’weno—the first African editor of the Nation. It was, however, bought by thethen ruling party, Kenya African National Union (KANU), in 1983. The paper has over the years suffered anidentity crisis, as most people see it as the mouthpiece of the former ruling party. Currently, it has a dailycirculation of about 50,000. Table 18 shows the average daily circulation of the leading dailies in 2007.
According to Kenya’s Economic Survey of 2008, the circulation of copies for morning newspapers publishedin English and Kiswahili grew by 10.2% and 13.7% respectively in 2007. Weekly newspapers (periodicals)grew by 40.8% in 2007 compared to a decline of 9.8% in 2006. The substantial increase in newspaperreadership in 2007 was due to its being an election year. As expected, newspaper readership rises duringthis time. Table 19 shows details of the average daily and weekly circulation of newspapers in the countrysince 2003.
In the 1990s, with the advent of multiparty politics, the Kenyan press market grew, encouraged by morepress freedom compared to the days when the press was gagged. The period also saw increased competitionof different press products, leading to the expansion of the market.
In a recent survey carried out by the Media Council of Kenya (August, 2005), using a sample of 506respondents, it was shown that the competition for the Kenyan press market is mainly between two leadingdailies—the Daily Nation and The Standard. Other dailies like the Kenya Times, People Daily, and the Nation’sTaifa Leo also have a considerable readership in the country (Table 20). During the same period, there has beenan emergence of the gutter press, some of them operating illegally and erratically in their publication. This hasmade it difficult for the government to track them. The government has thus felt the need to moderate and/orregulate the sector by introducing stringent but controversial measures to be followed when printingnewspapers. The statistics for the gutter press are currently unavailable.
Table 18: Average circulation of leading dailies in Kenya in 2007 (‘000 copies)
Table 19: Average circulation of daily and weekly newspapers in Kenya (‘000 copies), 2003-2007
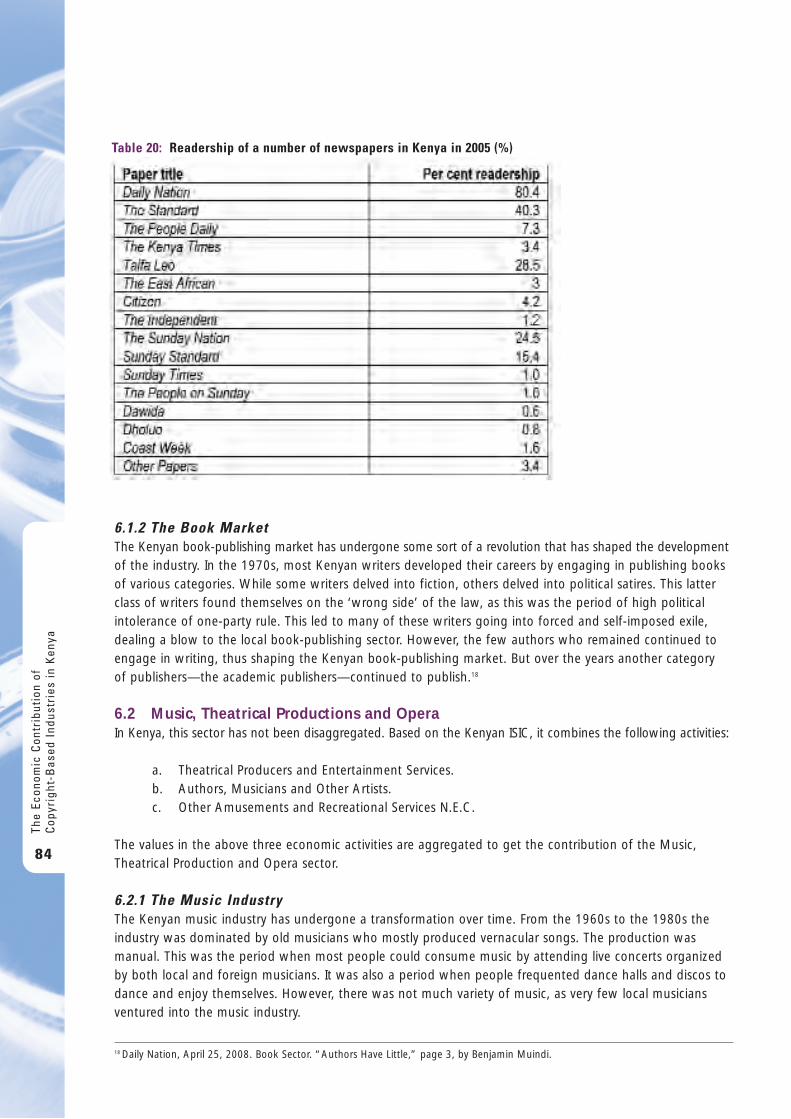
6.1.2 The Book MarketThe Kenyan book-publishing market has undergone some sort of a revolution that has shaped the developmentof the industry. In the 1970s, most Kenyan writers developed their careers by engaging in publishing booksof various categories. While some writers delved into fiction, others delved into political satires. This latterclass of writers found themselves on the ‘wrong side’ of the law, as this was the period of high politicalintolerance of one-party rule. This led to many of these writers going into forced and self-imposed exile,dealing a blow to the local book-publishing sector. However, the few authors who remained continued toengage in writing, thus shaping the Kenyan book-publishing market. But over the years another category of publishers—the academic publishers—continued to publish.18
6.2 Music, Theatrical Productions and OperaIn Kenya, this sector has not been disaggregated. Based on the Kenyan ISIC, it combines the following activities:
a. Theatrical Producers and Entertainment Services.b. Authors, Musicians and Other Artists.c. Other Amusements and Recreational Services N.E.C.
The values in the above three economic activities are aggregated to get the contribution of the Music,Theatrical Production and Opera sector.
6.2.1 The Music IndustryThe Kenyan music industry has undergone a transformation over time. From the 1960s to the 1980s theindustry was dominated by old musicians who mostly produced vernacular songs. The production wasmanual. This was the period when most people could consume music by attending live concerts organizedby both local and foreign musicians. It was also a period when people frequented dance halls and discos todance and enjoy themselves. However, there was not much variety of music, as very few local musiciansventured into the music industry.
The
Econ
omic
Con
trib
utio
n of
Cop
yrig
ht-B
ased
Ind
ustr
ies
in K
enya
84
18 Daily Nation, April 25, 2008. Book Sector. “Authors Have Little,” page 3, by Benjamin Muindi.
Table 20: Readership of a number of newspapers in Kenya in 2005 (%)
The trend of going to dance halls and discos changed drastically in the 1990s due to the liberalization of themusic sector, changes in living standards, and penetration of good-quality sound carriers and quality musicdevices such as CDs which enabled many to consume music in their living rooms. This led to a sharp drop inthe numbers of those who were attending live concerts and discos. It also led to a revolution in the musicindustry as a new crop of young musicians joined the market, with modern music, mostly a blend of localand foreign genres, pushing the older varieties out of the industry or to the vernacular music arena.
Technological advances also made it easier to record music and develop beats; hence there are many moremusicians in the market today than there were in the past. The market of sound-recording media like CDs,VCDs and DVDs has increased drastically in the recent past. The number of families owning CD players hasalso increased, making music consumption easier and faster in these families’ homes. Furthermore, thenumber of privately owned music-producing studios has increased in recent times. Ironically, technologicaladvances have come with undesirable aspects. They have made piracy easier, with musicians losing millionsof Kenya Shillings to this vice yearly. This, coupled with the lack of a clear guiding policy in the sector, hasbecome the single most serious threat to the development of the sector. Currently, the government, throughthe Music Copyright Society of Kenya (MCSK) and the Kenya Association of Music Producers (KAMP), hasinitiated efforts to regulate the sector. The sector is characterized by chaos and poor planning.
The internet has become one of the avenues of pirating music in Kenya, with many people preferring todownload music from the internet, which they consider cheaper than buying the same product from amusician. This has drastically reduced sales and revenues due to the musicians. This form of piracy, commonlyreferred to as cyber crime according to the Kenya Copyright Act 2001, is outlawed. According to this Act,the duration of the copyright lasts through the lifetime of the originator and is valid for up to 50 years after death. The copyright agency estimates the cost of piracy—or, rather, the loss due to piracy—to beapproximately KSHs 30 billion annually.19 The MCSK estimates that pirates earn approximately 98% of the total music revenue, while the musicians get only 2%.20 According to a study done by the World Bank,the economic value of the Kenyan music sector is placed at approximately KSHs 6 billion (US$ 89.6 million)annually. It is noted that the current growth of the entertainment sector draws heavily on the music andhome-grown movies sub-sectors, which have opened up the huge network of nightspots and otherperformance venues around the country. These have created a vibrant new sector that is purely youth-drivenwithout any real government support.21
Most foreigners posing as tourists or researchers coming to study or to buy indigenous music and instrumentsend up studying the designs and probably improving on them and registering them as their own. Targetedareas in Kenya are Nyanza and Coast provinces. In Nyanza, Nyatiti, which forms the main basis of the Luomusic, is highly sought after due to its versatility as a percussion and rhythm instrument, while in the coastthe most targeted instrument is Nzumari, a wind instrument of the Miji Kenda. These traditional musicalinstruments are sought after by developed countries that are looking for new ingredients for their music andinstruments, and could be vital in creating new tonal variation for their music.22 The Kenya Industrial PropertyInstitute (KIPI) has thus acknowledged the urgent need to register the designs of indigenous instruments topreserve their uniqueness as part of the Kenyan heritage and is currently working with the National Museumsof Kenya, which will hold the patents in trust for Kenya.
The Economic C
ontribution ofC
opyright-Based Industries in K
enya
85
19 Sunday Nation April 27, 2008. Music Sector. “Internet Music Piracy,” by John Koigi.20 Saturday Nation July 28, 2007. Music Sector. “Act Tough on Music Piracy,” page 26, by Maurine Ongwae.21 The East African, July 23-29, 2007. Music Sector. “Show Us the Money,” page VI, by John Kariuki.22 Saturday Nation, June 30, 2007. Music Sector. “Trafficking Local Music and Instruments,” page 31 Review, by John Kariuki.
6.2.2 TheatresTheatres have undergone a serious downturn in Kenya compared to the days when the theatre was knownto produce serious theatrical works. In the 1970s, theatrical works gained much momentum. However,during those days of single-party rule, theatrical producers were seen by the political class to represent theopposition. This led to most of the critical theatrical producers being exiled, while those who remained quitthe industry. Today, the Kenyan theatre sector is in disarray, with almost total state neglect. As an exampleof existing apathy towards theatrical works, the 2008 International Theatre Day was not commemorated in Kenya. Also, the Kenya National Theatre is the headquarters of the Kenyan thespians, but this facilityreceives negligible state support, with most of the funds going into paying staff.
At present there are numerous artists in Kenya, most of them not operating on profit. In addition to a lackof support from the government, this is because most Kenyans view the theatre as a social activity to whichmonetary value should not be attached. However, a team of young theatre artists has recently come up,with different groups emerging to engage in theatrical works. Additionally, this sector is now beingsupported by the tourism sector, as most of the consumers of theatrical works are foreigners who arealways keen to sample Kenyan artistic works.
In summary, the drop in the attention given to theatre can be attributed to a number of factors. Theseinclude a crackdown on theatrical producers in the 1970s and 1980s, leading to producers being exiled orquitting art; changing lifestyles, with many Kenyans becoming interested in foreign theatrical works; and the availability of TV sets, making it easy for people to watch the artists in their living rooms. Besides this,the number of people who attend theatre has dropped drastically, for the same reasons. However, changehas been witnessed in the recent past. Apart from tourists, many Kenyans are now starting to attend liveconcerts organized by local thespians and are buying CDs of local thespians. There is expectation that,coupled with the rise of many young talented thespians interested in art, the sector will grow again.
6.3 Film Production and VideoIn Kenya, the film production and video sector is aggregated to include:
a. Motion Picture Production.b. Motion Picture Distribution and Projection.
In the 1970s and 1980s, the Kenyan cinema market was dominated by the existence of cinema halls wherefamilies could go for outings to watch the latest arrivals in terms of the movie market. During this period,there were few or no local productions shown in these cinema halls. The availability of these cinema hallswas skewed. The halls were only found in the cities; hence the rural folk had no access to the movies. This period also saw an upsurge of local comedians whose works could only be broadcast in the thengovernment-sponsored Voice of Kenya (VOK) radio station, now known as the Kenya BroadcastingCorporation (KBC). Unfortunately, those who owned television sets were few; therefore the works of theKenyan comedians had a very limited reach, resulting in low income accruing to them. With the advent ofliberalization of the television sector, however, many Kenyan homesteads acquired television sets, which ledto a decrease in traditional cinema screening and a fall in attendance by the general public to these cinemahalls. This, nevertheless, gave rise to Kenyan comedians whose works could now be screened on thenational television channels. But the full revolution in the Kenyan film industry took place in the late 1990sand early 2000s with the coming of video cameras, recordable tapes and even the sprouting of individualproducers willing to produce works by local comedians, who by now were getting more fame due to theexpansion of the television market.
The
Econ
omic
Con
trib
utio
n of
Cop
yrig
ht-B
ased
Ind
ustr
ies
in K
enya
86
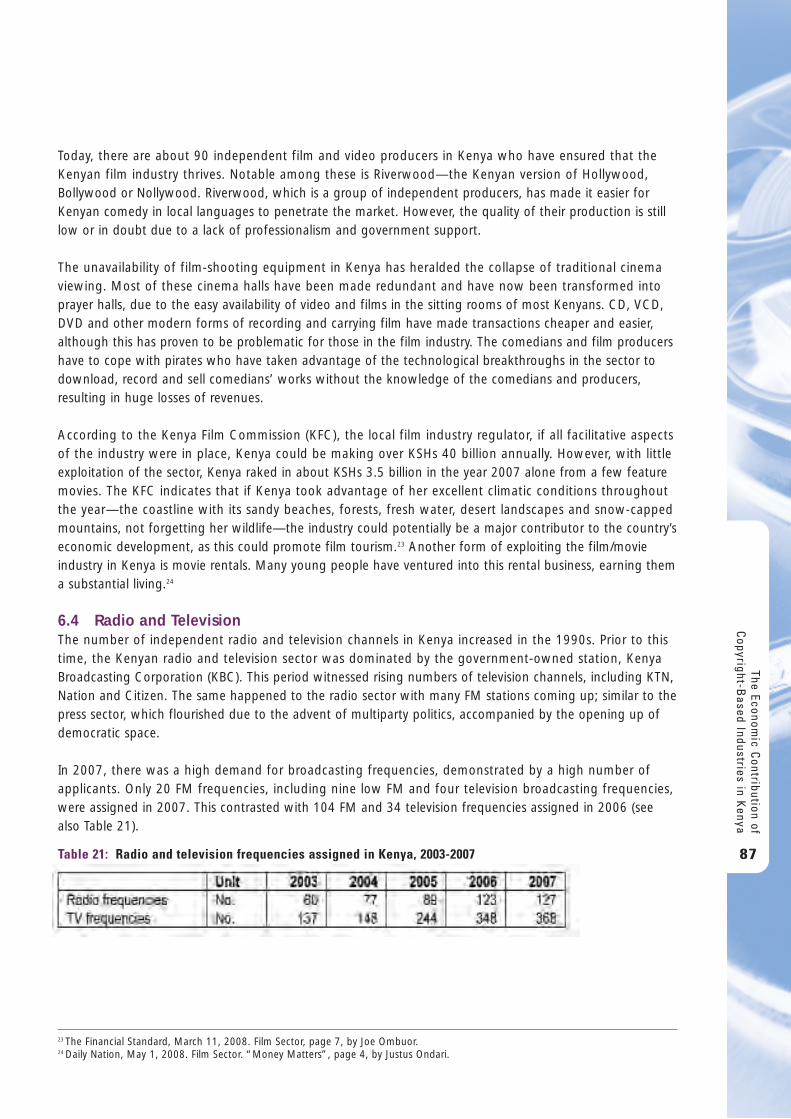
Today, there are about 90 independent film and video producers in Kenya who have ensured that theKenyan film industry thrives. Notable among these is Riverwood—the Kenyan version of Hollywood,Bollywood or Nollywood. Riverwood, which is a group of independent producers, has made it easier forKenyan comedy in local languages to penetrate the market. However, the quality of their production is stilllow or in doubt due to a lack of professionalism and government support.
The unavailability of film-shooting equipment in Kenya has heralded the collapse of traditional cinemaviewing. Most of these cinema halls have been made redundant and have now been transformed intoprayer halls, due to the easy availability of video and films in the sitting rooms of most Kenyans. CD, VCD,DVD and other modern forms of recording and carrying film have made transactions cheaper and easier,although this has proven to be problematic for those in the film industry. The comedians and film producershave to cope with pirates who have taken advantage of the technological breakthroughs in the sector todownload, record and sell comedians’ works without the knowledge of the comedians and producers,resulting in huge losses of revenues.
According to the Kenya Film Commission (KFC), the local film industry regulator, if all facilitative aspects of the industry were in place, Kenya could be making over KSHs 40 billion annually. However, with littleexploitation of the sector, Kenya raked in about KSHs 3.5 billion in the year 2007 alone from a few featuremovies. The KFC indicates that if Kenya took advantage of her excellent climatic conditions throughout the year—the coastline with its sandy beaches, forests, fresh water, desert landscapes and snow-cappedmountains, not forgetting her wildlife—the industry could potentially be a major contributor to the country’seconomic development, as this could promote film tourism.23 Another form of exploiting the film/movieindustry in Kenya is movie rentals. Many young people have ventured into this rental business, earning thema substantial living.24
6.4 Radio and TelevisionThe number of independent radio and television channels in Kenya increased in the 1990s. Prior to thistime, the Kenyan radio and television sector was dominated by the government-owned station, KenyaBroadcasting Corporation (KBC). This period witnessed rising numbers of television channels, including KTN,Nation and Citizen. The same happened to the radio sector with many FM stations coming up; similar to thepress sector, which flourished due to the advent of multiparty politics, accompanied by the opening up ofdemocratic space.
In 2007, there was a high demand for broadcasting frequencies, demonstrated by a high number ofapplicants. Only 20 FM frequencies, including nine low FM and four television broadcasting frequencies,were assigned in 2007. This contrasted with 104 FM and 34 television frequencies assigned in 2006 (seealso Table 21).
The Economic C
ontribution ofC
opyright-Based Industries in K
enya
87
23 The Financial Standard, March 11, 2008. Film Sector, page 7, by Joe Ombuor.24 Daily Nation, May 1, 2008. Film Sector. “Money Matters”, page 4, by Justus Ondari.
Table 21: Radio and television frequencies assigned in Kenya, 2003-2007
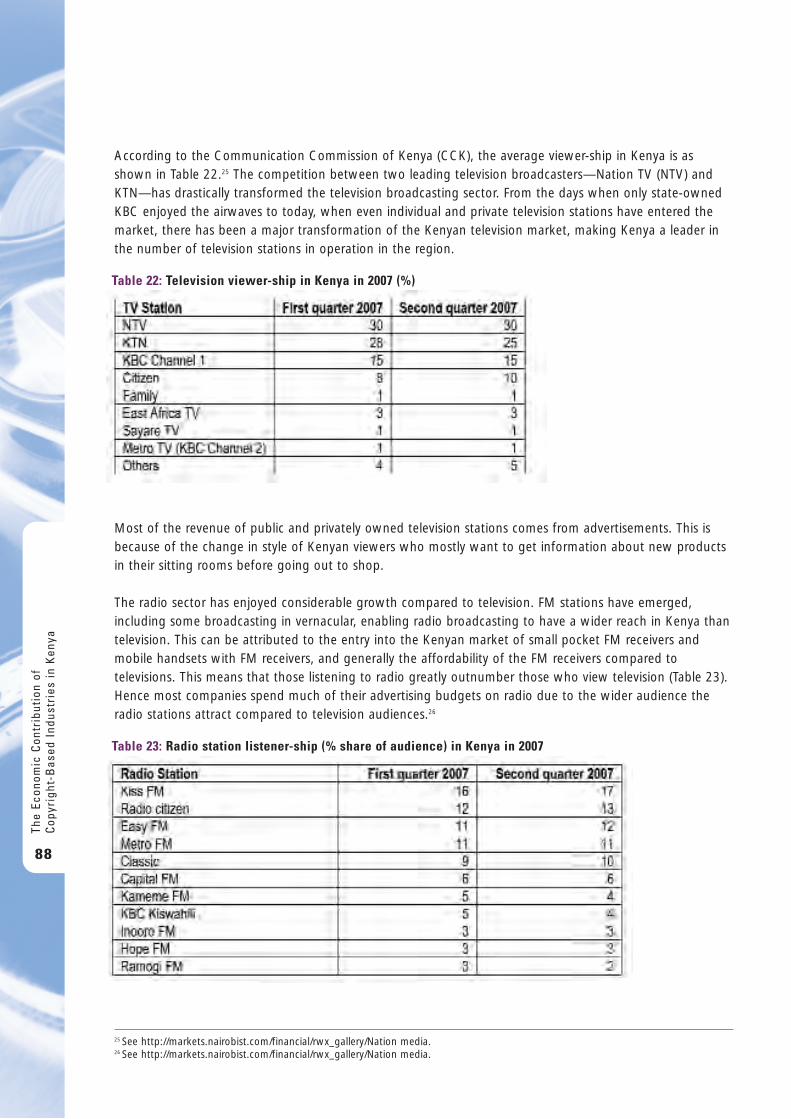
According to the Communication Commission of Kenya (CCK), the average viewer-ship in Kenya is asshown in Table 22.25 The competition between two leading television broadcasters—Nation TV (NTV) andKTN—has drastically transformed the television broadcasting sector. From the days when only state-ownedKBC enjoyed the airwaves to today, when even individual and private television stations have entered themarket, there has been a major transformation of the Kenyan television market, making Kenya a leader inthe number of television stations in operation in the region.
Most of the revenue of public and privately owned television stations comes from advertisements. This isbecause of the change in style of Kenyan viewers who mostly want to get information about new productsin their sitting rooms before going out to shop.
The radio sector has enjoyed considerable growth compared to television. FM stations have emerged,including some broadcasting in vernacular, enabling radio broadcasting to have a wider reach in Kenya thantelevision. This can be attributed to the entry into the Kenyan market of small pocket FM receivers andmobile handsets with FM receivers, and generally the affordability of the FM receivers compared totelevisions. This means that those listening to radio greatly outnumber those who view television (Table 23).Hence most companies spend much of their advertising budgets on radio due to the wider audience theradio stations attract compared to television audiences.26
The
Econ
omic
Con
trib
utio
n of
Cop
yrig
ht-B
ased
Ind
ustr
ies
in K
enya
88
Table 22: Television viewer-ship in Kenya in 2007 (%)
Table 23: Radio station listener-ship (% share of audience) in Kenya in 2007
25 See http://markets.nairobist.com/financial/rwx_gallery/Nation media.26 See http://markets.nairobist.com/financial/rwx_gallery/Nation media.
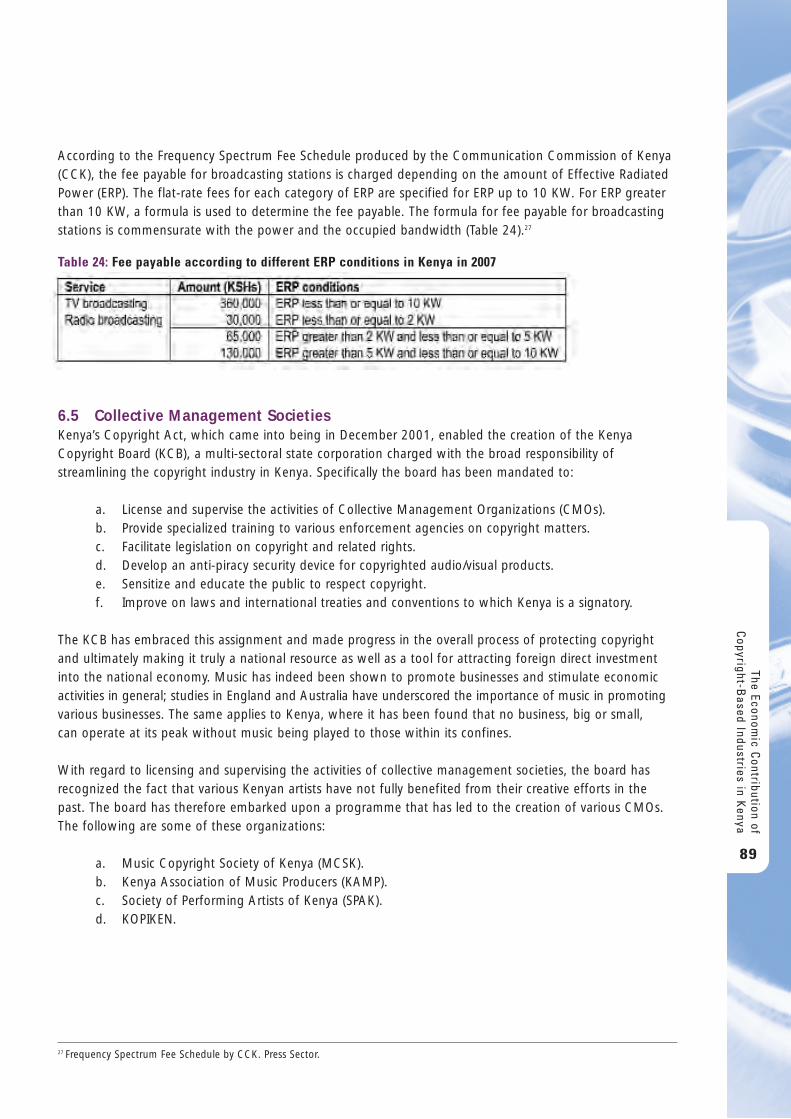
According to the Frequency Spectrum Fee Schedule produced by the Communication Commission of Kenya(CCK), the fee payable for broadcasting stations is charged depending on the amount of Effective RadiatedPower (ERP). The flat-rate fees for each category of ERP are specified for ERP up to 10 KW. For ERP greaterthan 10 KW, a formula is used to determine the fee payable. The formula for fee payable for broadcastingstations is commensurate with the power and the occupied bandwidth (Table 24).27
6.5 Collective Management SocietiesKenya’s Copyright Act, which came into being in December 2001, enabled the creation of the KenyaCopyright Board (KCB), a multi-sectoral state corporation charged with the broad responsibility ofstreamlining the copyright industry in Kenya. Specifically the board has been mandated to:
a. License and supervise the activities of Collective Management Organizations (CMOs).b. Provide specialized training to various enforcement agencies on copyright matters.c. Facilitate legislation on copyright and related rights.d. Develop an anti-piracy security device for copyrighted audio/visual products.e. Sensitize and educate the public to respect copyright.f. Improve on laws and international treaties and conventions to which Kenya is a signatory.
The KCB has embraced this assignment and made progress in the overall process of protecting copyrightand ultimately making it truly a national resource as well as a tool for attracting foreign direct investmentinto the national economy. Music has indeed been shown to promote businesses and stimulate economicactivities in general; studies in England and Australia have underscored the importance of music in promotingvarious businesses. The same applies to Kenya, where it has been found that no business, big or small, can operate at its peak without music being played to those within its confines.
With regard to licensing and supervising the activities of collective management societies, the board hasrecognized the fact that various Kenyan artists have not fully benefited from their creative efforts in thepast. The board has therefore embarked upon a programme that has led to the creation of various CMOs.The following are some of these organizations:
a. Music Copyright Society of Kenya (MCSK).b. Kenya Association of Music Producers (KAMP).c. Society of Performing Artists of Kenya (SPAK).d. KOPIKEN.
The Economic C
ontribution ofC
opyright-Based Industries in K
enya
89
27 Frequency Spectrum Fee Schedule by CCK. Press Sector.
Table 24: Fee payable according to different ERP conditions in Kenya in 2007
a. Kenya Publishers’ Association (KPA).b. Third Force Association.c. Computer Society of Kenya (CSK).d. Kenya Film Commission (KFC).e. Kenya National Library Services (KNLS).
The Music Copyright Society of Kenya (MCSK) is the main body in Kenya representing music performingrights. MCSK’s key function is to collect royalties on behalf of its members. It also administers the ‘non-dramatic’ performing, transmission and broadcasting rights for the musical works of its members and themembers of affiliated societies. The MCSK does this by functioning as a collective administration society thatnegotiates ‘blanket licences’ with music users who then have access to MCSK’s extensive repertoire ofcopyright musical works. Thus, the MCSK administers not only the music of its Kenyan members but alsothe great store of music in the repertoires of all those other societies—in other words, the music of over 1.6 million composers, lyricists and publishers in more than 150 countries. Therefore, no one may give aperformance in public of music without the prior permission of the composer because this would constitutean infringement of the copyright. Apart from the word ‘public,’ meaning any open-air performance, it alsoincludes music played in hotels, supermarkets, discos, factories, banks and inside passenger transportvehicles. In this way, the MCSK offers an essential service to the creators of music the world over andensures that intellectual property rights owners are remunerated for their work.
Charges by the MCSK vary widely. Public transport vehicles, popularly known as Matatus, are charged up to KSHs 2,000 per annum for playing music to their customers.28 Hotels, cyber cafés, hair salons and otherpublic places are charged according to their size, location and sitting capacity. The charges range from KSHs1,500 to KSHs 2,000 per annum. Mobile discos are charged KSHs 10,000, while road-shows are chargedKSHs 10,000 per day. Those playing music in branding companies pay KSHs 3,000 a day.29 The music usersregularly submit returns or lists of musical works performed in their establishment. This enables the MCSKto accurately distribute the royalties which it has collected (from licence fees) to the composers whose workshave actually been performed. In 2008, members of the MCSK received a base amount of KSHs 6,000 each,with the highest receiving KSHs 300,000.30
MCSK’s membership is based on direct membership by composers, authors, translators, arrangers and musicpublishers, as well as members of affiliated societies.31 Currently, the MCSK has 1,300 members. The MCSKis affiliated to composer societies all over the world through a system of reciprocal agreements, eitherthrough bilateral agreements for the protection of intellectual property or through the Berne Convention forthe Protection of Literary and Artistic Works. It authorizes those societies to administer the music of Kenyancomposers, lyricists and publishers in their particular countries.
Formed and registered in 2007, the Kenya Association of Music Producers (KAMP) is charged with collectinggratitude (the equivalent of royalties) on behalf of music producers. The KAMP draws its membership frommusic producers. Just like the MCSK, it is charged with receiving royalties from radio stations, public servicevehicles and all other ‘public’ use of music. The KAMP also charges a fee for the importation of blank CDs,tapes and musical recording media. Because the KAMP has not yet fully established its infrastructure, it iscurrently negotiating with the MCSK to collect royalties on its behalf while it pays the MCSK a commissionfor the services. Similarly, the Society of Performing Artists (SPAK) is a society that brings together various
The
Econ
omic
Con
trib
utio
n of
Cop
yrig
ht-B
ased
Ind
ustr
ies
in K
enya
90
28 See http://www.bellybuttonwindow.com/2008/ kenya/music_copyright_tax_kenya.html.29 See http://www.propertykenya.com/news/517928-toothless-music-society-out-to-regain-former-glory.php.30 See http://timeinmoments.wordpress.com/2008/04/30-the-music-copyright-society-of kenya-celebrating-first-year.31 See http://www.bellybuttonwindow.com/2008/kenya/music_copyright_tax_kenya.html.
performing artists in music. The SPAK is affiliated to the MCSK where it represents the interest of itsmembers, ensuring that they receive royalties that are due to them.
KOPIKEN is a collective management organization that collects royalties for book writers and publishers. Theroyalties emanate mainly from photocopying of books within the country. It also covers external areas, forexample the translation and photocopying of Kenyan books published abroad.32
6.6 Institutions set up to safeguard the interests of their membersThe Kenya Publishers’ Association (KPA) represents the interests of book publishers. It ensures that publishersdo not lose their money to book piracy and illegal sale of other copyright materials. According to the KPA,universities rank high in Kenya among those who photocopy books illegally.33 The KPA works with a specialpolice squad which was formed in 2007 to deal with book piracy and to crack down on illegalphotocopying of original materials.
Members of the KPA include Catholic University, Dhillon Publishers, East African Education Publishers,Evangel Publishing House, Evans Brothers, Express Communication Ltd., Focus Publishers, Gem CounsellingServices, Geoperi Publications, Kwani Trust, Karma Publishing Company, and Kenya Literature Bureau.Others are the Kenya National Library, Law Africa Publishers Ltd., Longhorn Kenya Ltd., Longman KenyaLtd., Macmillan Kenya Publishers, Moi University Publishers, Mountain Top Publishers, Mvule Africa Publishers,Njigua Books, Oxford University Press, Phoenix Publishers, Promarc Media, Queenex Holding Ltd., and StoryMoja Publishers.34
The Third Force Association exists to collect royalties on behalf of film performers and producers. It ensuresthat any illegal use is prevented, and collects royalties from TV stations and cinema halls, among others. Onthe other hand, the Computer Society of Kenya (CSK) exists to protect the rights of software designers andengineers. Apart from ensuring no illegal use of members’ inventions it also does lobbying and advocacy,and helps members to publish their inventions. It also organizes exhibitions, conferences and Training ofTrainers (TOT) workshops, where members can share information.
The Kenya Film Corporation (KFC) was formed to facilitate the screening and filming of Kenyan filmproduction. It exists to support local film producers by providing them with structures necessary for filmproduction. It also organizes educational workshops on production, targeting local film producers to buildtheir capacity in film production.35
The Kenya National Library Services (KNLS) was established by an Act of Parliament, Cap 225 of the Laws ofKenya of April 1965. It commenced activities in1967. Its main mandate is to promote, establish, equip,manage, maintain and develop a chain of libraries in Kenya. The main aim of the KNLS is to make availablefor use by present and future generations national collections at the library and the information centre. Itseeks to provide quality, equitable and accessible library and information services countrywide. Currently, the KNLS has approximately 800,000 volumes of books in stock and about 500,000 registered memberscountrywide. Over 2,000,000 people use the facilities countrywide annually.36
The Economic C
ontribution ofC
opyright-Based Industries in K
enya
91
32 See http://www.kopiken.org/about/organization.html.33 See http://www.kenyapublishers.org/about.html.34 See http://www.kenyapublishers.org/members.html.35 See http://en.wikipedia.org/wiki/kenya_film_commission.36 See http://www.knls.or.ke/index.php?id=2.
7 . C o n c l u s i o n s a n d R e c o m m e n d a t i o n s
The results of this study show that the copyright-based industries in Kenya contribute significantly to thenational economy. The contribution of 5.3% to the total value-added, about 3.8% to the national grossoutput, and 3.3% to the total national workforce by copyright-based industries is an indication of theirsignificance to Kenya’s economy. In terms of employee productivity, copyright-based industries combinedmade a higher contribution per employee than that of the total national economy. Again, this is strongevidence of the contribution of these industries to the national economy. The contribution of the copyright-based industries to the national economy on the basis of GDP was higher than that of the agriculturalsector, healthcare and education, and fisheries, and compared favourably with the contributions of theother main sectors of the Kenyan economy, such as manufacturing, mining-and-quarrying, and construction.
The overall copyright-based industries exhibited impressive productivity. The productivity index of the corecopyright-based industries, calculated as a fraction of added value per employee, was even better, comingsecond best among 13 major sectors contributing to the national economy. The national economy exhibiteda huge foreign trade deficit compared to the copyright industries, implying that, comparatively, the copyrightindustries are doing better than the overall national economy. However, the copyright industries have arelatively high import component, particularly within the interdependent category, which reduces theirvalue-added and gross output. This foreign trade imbalance can be corrected through appropriate andoperational policy frameworks.
Although the copyright-based industries in Kenya contribute significantly to the national economy, theindustry faces a number of challenges that require attention. Some of these may be unique to Kenya andsimilar developing countries, while some may be common to all countries. The copyright-based industrysector is among the fastest growing sectors in Kenya’s economy. However, the value of this sector requiresmore recognition than it is currently receiving from policymakers, since it is an important tool for nationaldevelopment that needs to be promoted and protected. The fast growth rate of the industry also makes it difficult for the government to capture its activities. Most of the creative industries therefore operatehaphazardly and much of their contribution to the national revenue is not captured by the governmentthrough taxes. This implies that the industry’s contribution to the GDP is likely underestimated.
In Kenya, databases on the contribution of creative industries are highly aggregated. This is a potentialsource of inaccuracy in estimation of the contribution of copyright-based industries in the country. In orderto circumvent this problem, the Kenyan classification system of the copyright-based industries must beharmonized with the International System of Industry Classification (ISIC). The ISIC system is moredisaggregated and enables the estimation of the contribution of decomposed sub-sectors to the nationaleconomy. In addition, it is necessary to coordinate and standardize data collection and presentation oncopyright-based industries among major government departments such as the KNBS and KRA.
Given the fast growth rate of the copyright-based industries in Kenya, there is a need to conduct regularstudies to monitor the performance of the industries as a way of keeping track of their activities andcontribution to the national economy. Although not investigated in this study, piracy is a problem in Kenyaand forms part of the unreported contribution of copyright-based industries to the national economy. It is particularly common in developing countries for the artists to avoid taxes and even resist exposingthemselves, mainly because they want to protect their products from piracy. Similarly, some retailers ofcreative works are either operating illegally or stock pirated materials and would normally avoid disclosure.This would naturally result in poor or no documentation, therefore leading to no, or an inadequate,
The
Econ
omic
Con
trib
utio
n of
Cop
yrig
ht-B
ased
Ind
ustr
ies
in K
enya
92
database on the contribution of copyright-based industries to the national economy. This calls for a study to estimate the revenue lost as a result of piracy, as part of the contribution ofcopyright-based industries to Kenya’s economy.
Concerning foreign trade, this study shows that the copyright industries have a relatively high importcomponent, particularly within the interdependent category. This reduces their value-added and even grossoutput. The foreign trade deficits can, however, be addressed through appropriate and favourable policies.
In spite of the apparent inadequacies of policies governing the operations of copyright-based industries inKenya, the economic contribution of these industries, as shown by the values of value-added, employment,and employee incomes, is significant. Their economic contribution in Kenya compares reasonably well with, and in a few cases is higher than, that in a number of countries in Europe, Asia and America forwhich similar studies have been conducted. However, a few discrepancies were noted in this study, partly as a result of databases in Kenya being piecemeal and scattered in different government agencies. Thispresented difficulties in estimating the full contribution of the copyright-based industries to the total GDP.
Existing policies should be strengthened to streamline the operations of copyright-based industries in orderto promote the growth and development of these industries. Adequate policies will enable the government tocapture the contribution of these industries and ultimately lead to deepened recognition of their importance in the national economy. In addition, a proactive approach is necessary to promote the copyright-basedindustries given their significant contribution to the national economy, especially in terms of employment.
This study is a snapshot of what is taking place in the creative sector in Kenya; it has only focused onthe year 2007, and has therefore not captured the copyright-based industry dynamics. The study is alsothe first of its kind to be completed in Africa. There is, however, a need for monitoring and evaluatingthe copyright-based industries. This can only be achieved if similar assessments can be carried outsystematically and consistently. The current study can thus serve as a source of reference material forfuture studies that could cover several years to include dynamic effects within the creative sector. The Econom
ic Contribution of
Copyright-B
ased Industries in Kenya
93
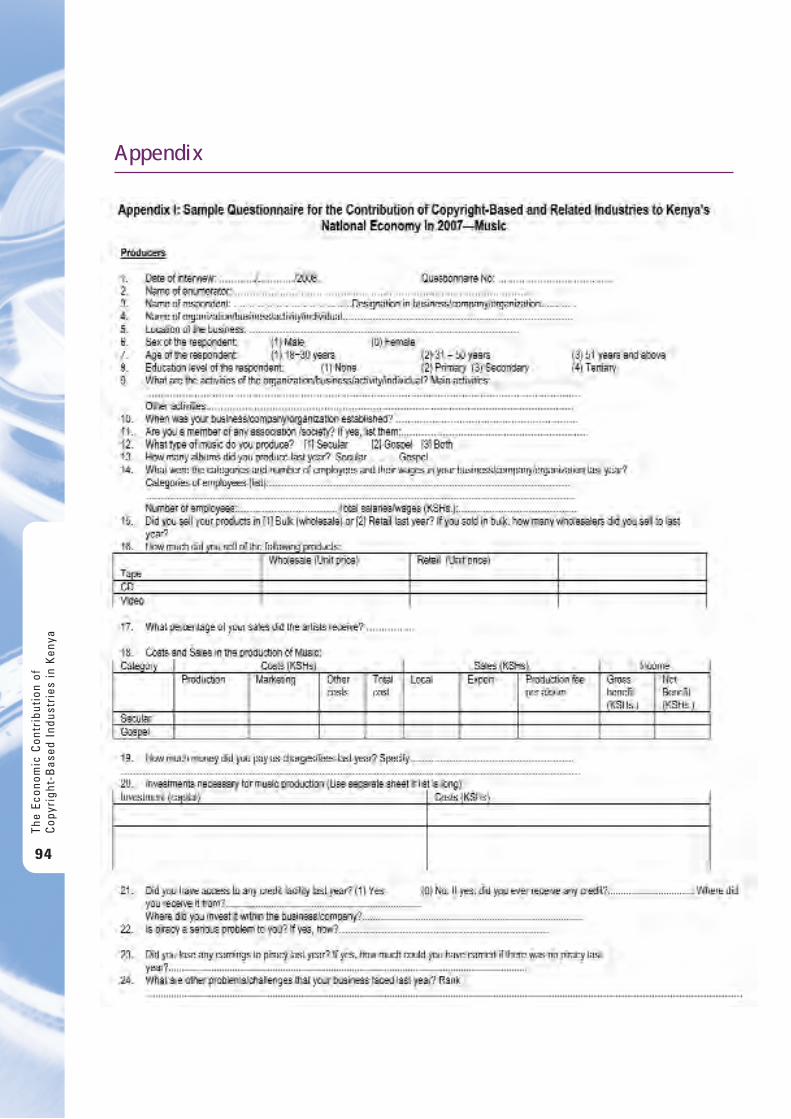
A p p e n d i x
The
Econ
omic
Con
trib
utio
n of
Cop
yrig
ht-B
ased
Ind
ustr
ies
in K
enya
94

The Economic C
ontribution ofC
opyright-Based Industries in K
enya
95

The
Econ
omic
Con
trib
utio
n of
Cop
yrig
ht-B
ased
Ind
ustr
ies
in K
enya
96
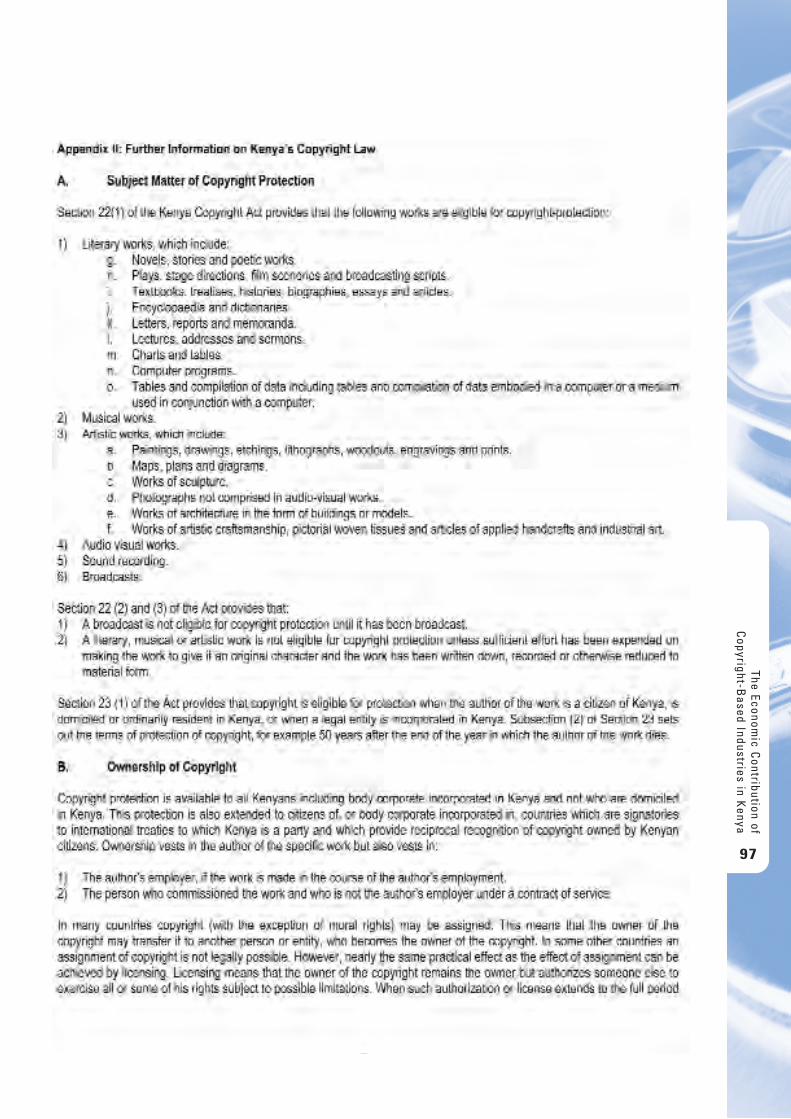
The Economic C
ontribution ofC
opyright-Based Industries in K
enya
97

The
Econ
omic
Con
trib
utio
n of
Cop
yrig
ht-B
ased
Ind
ustr
ies
in K
enya
98
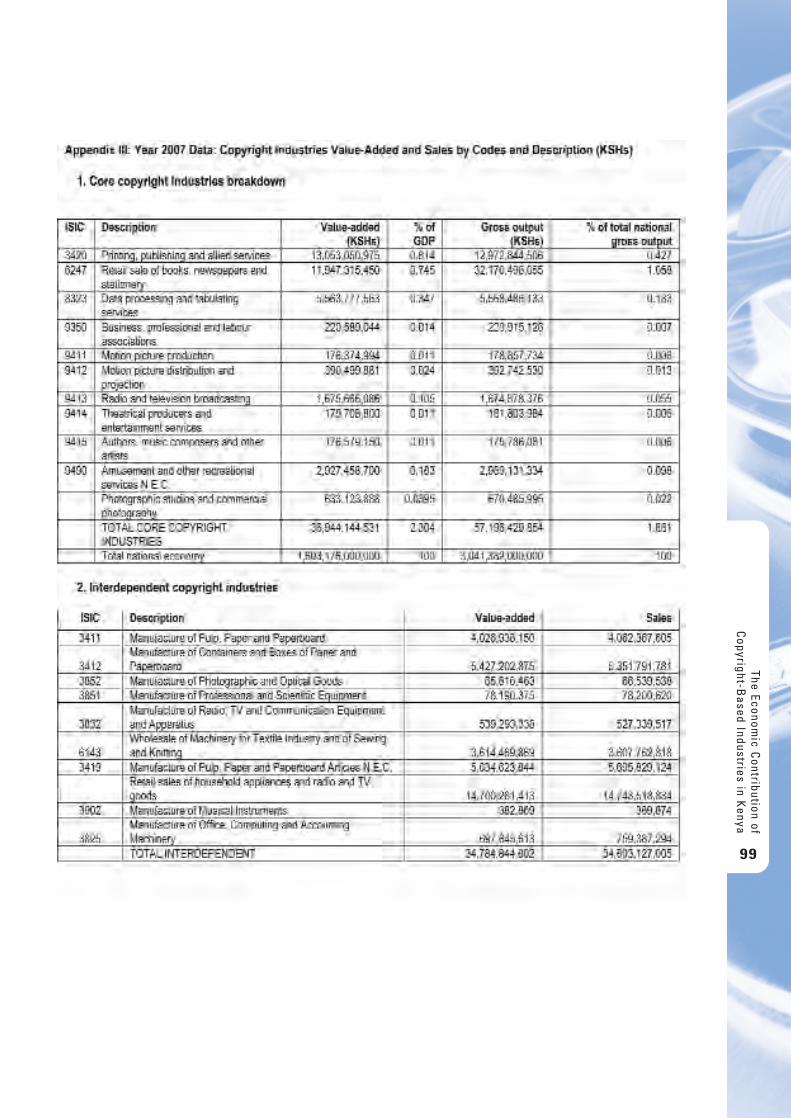
The Economic C
ontribution ofC
opyright-Based Industries in K
enya
99
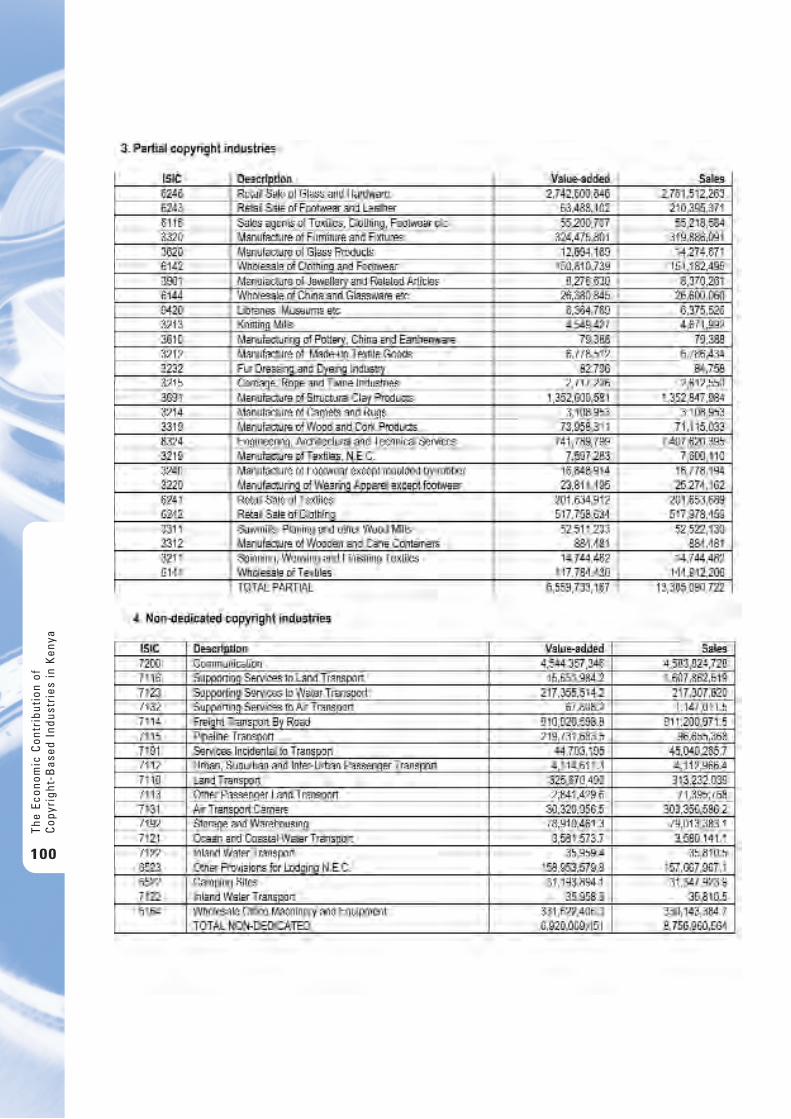
The
Econ
omic
Con
trib
utio
n of
Cop
yrig
ht-B
ased
Ind
ustr
ies
in K
enya
100
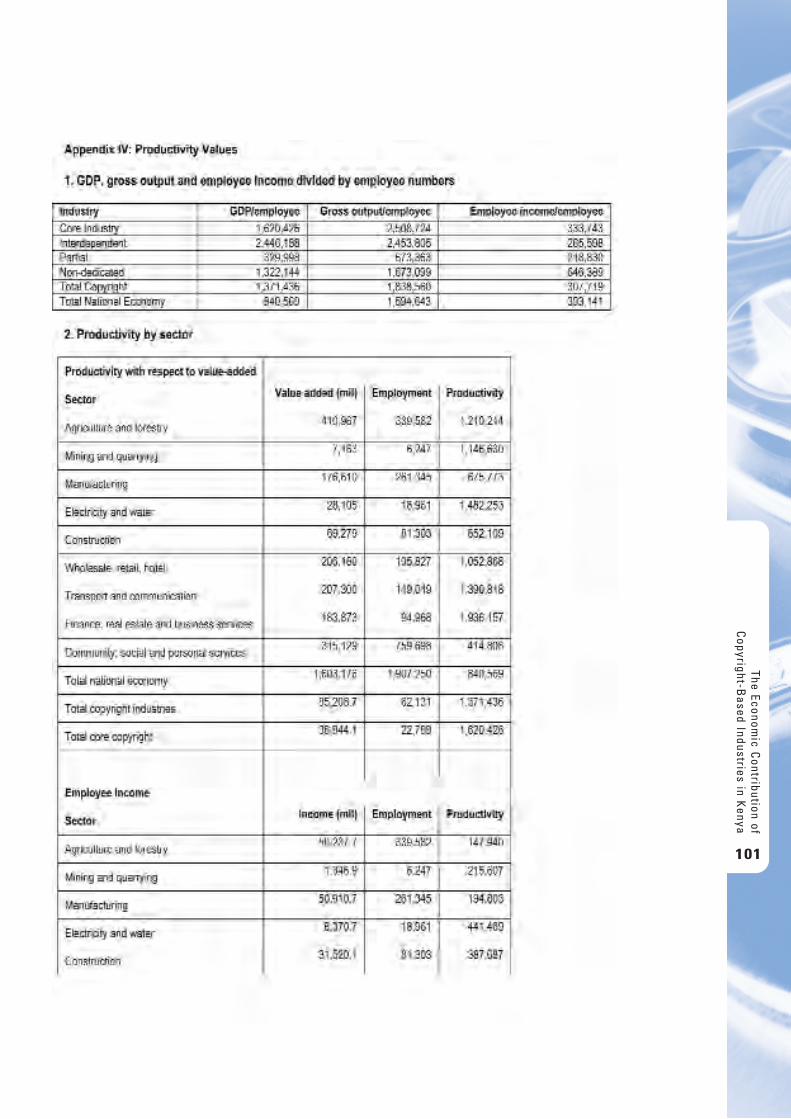
The Economic C
ontribution ofC
opyright-Based Industries in K
enya
101
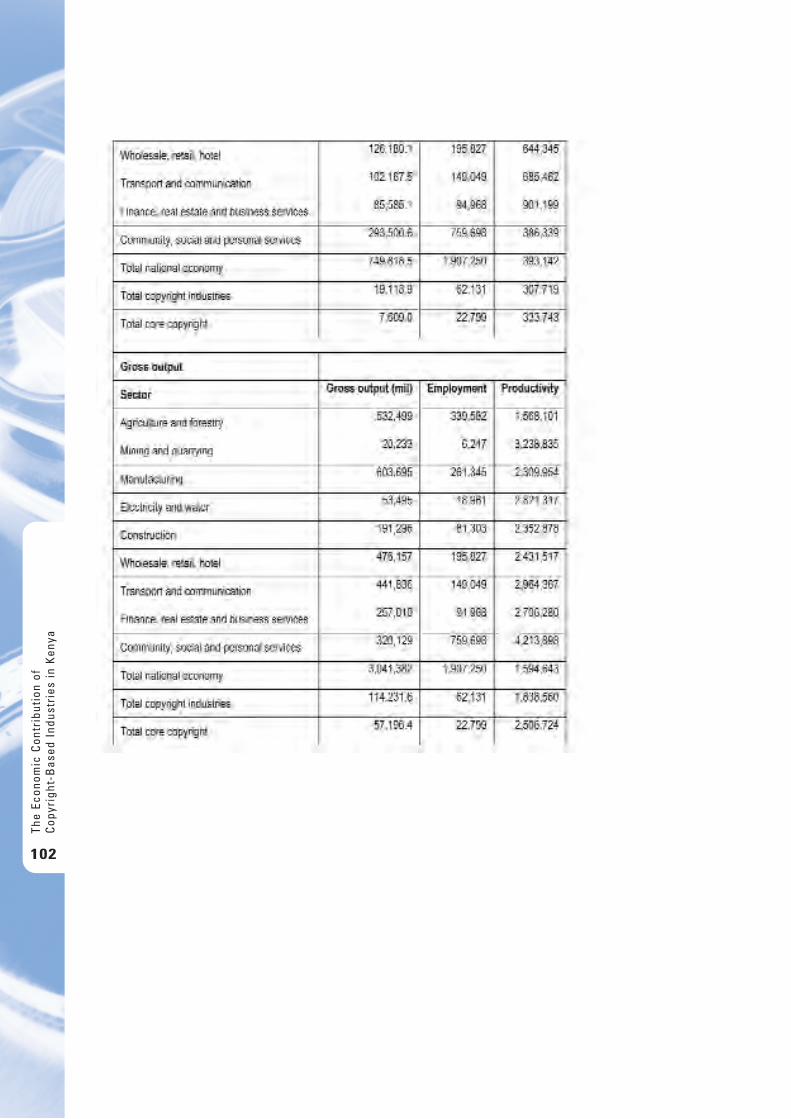
The
Econ
omic
Con
trib
utio
n of
Cop
yrig
ht-B
ased
Ind
ustr
ies
in K
enya
102
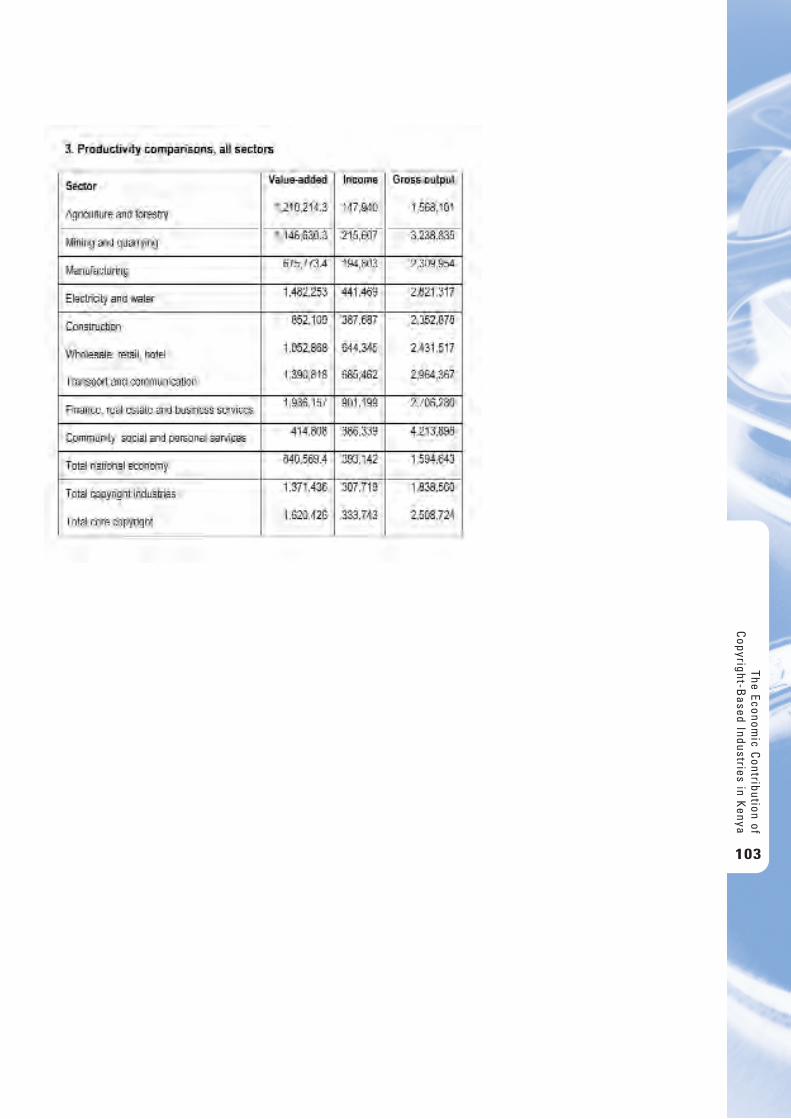
The Economic C
ontribution ofC
opyright-Based Industries in K
enya
103
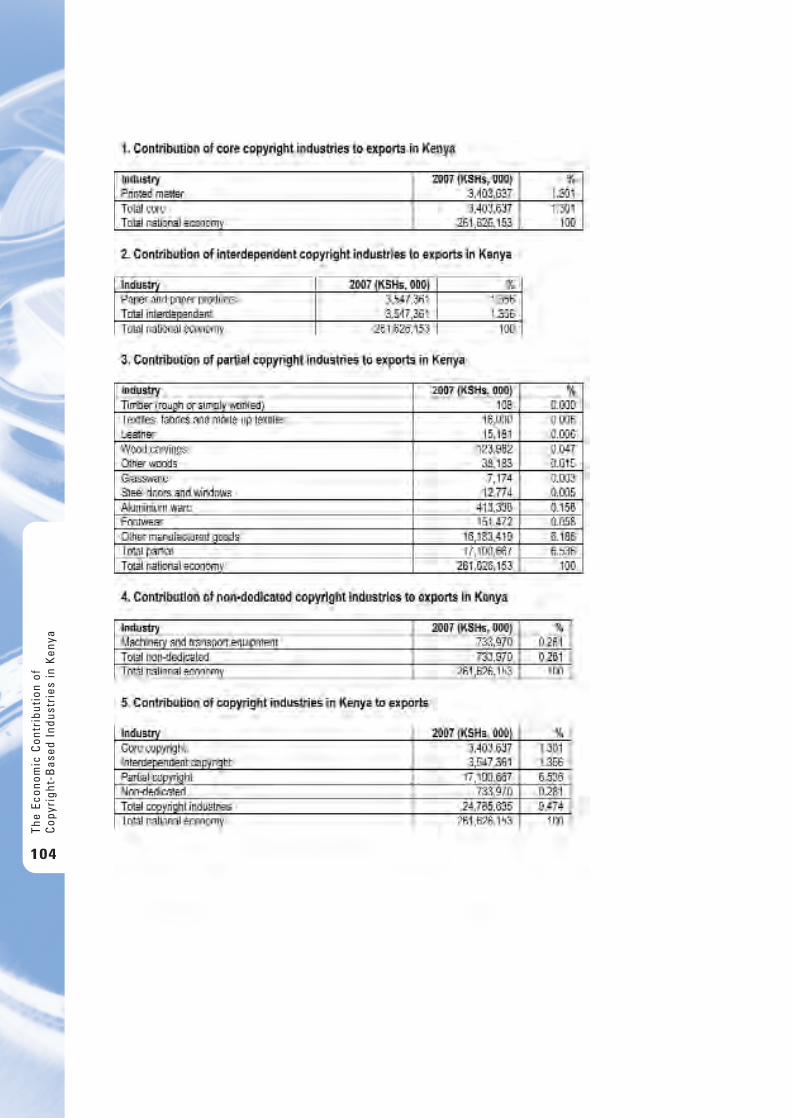
The
Econ
omic
Con
trib
utio
n of
Cop
yrig
ht-B
ased
Ind
ustr
ies
in K
enya
104
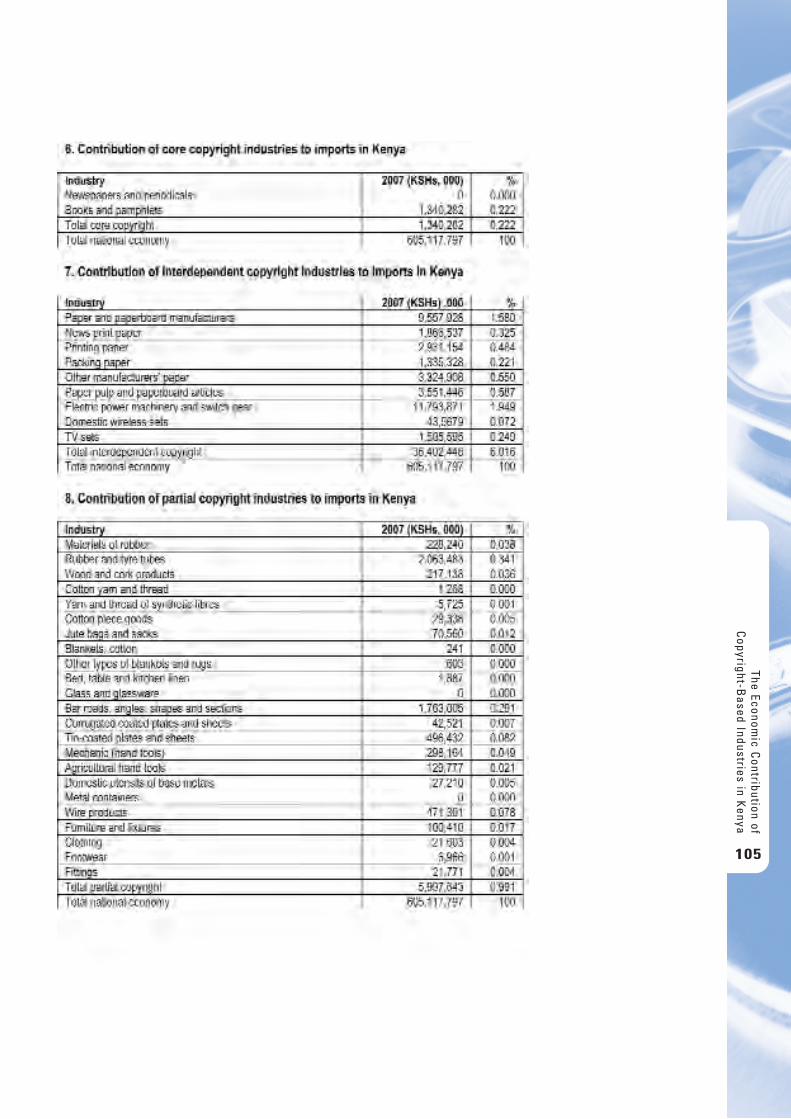
The Economic C
ontribution ofC
opyright-Based Industries in K
enya
105
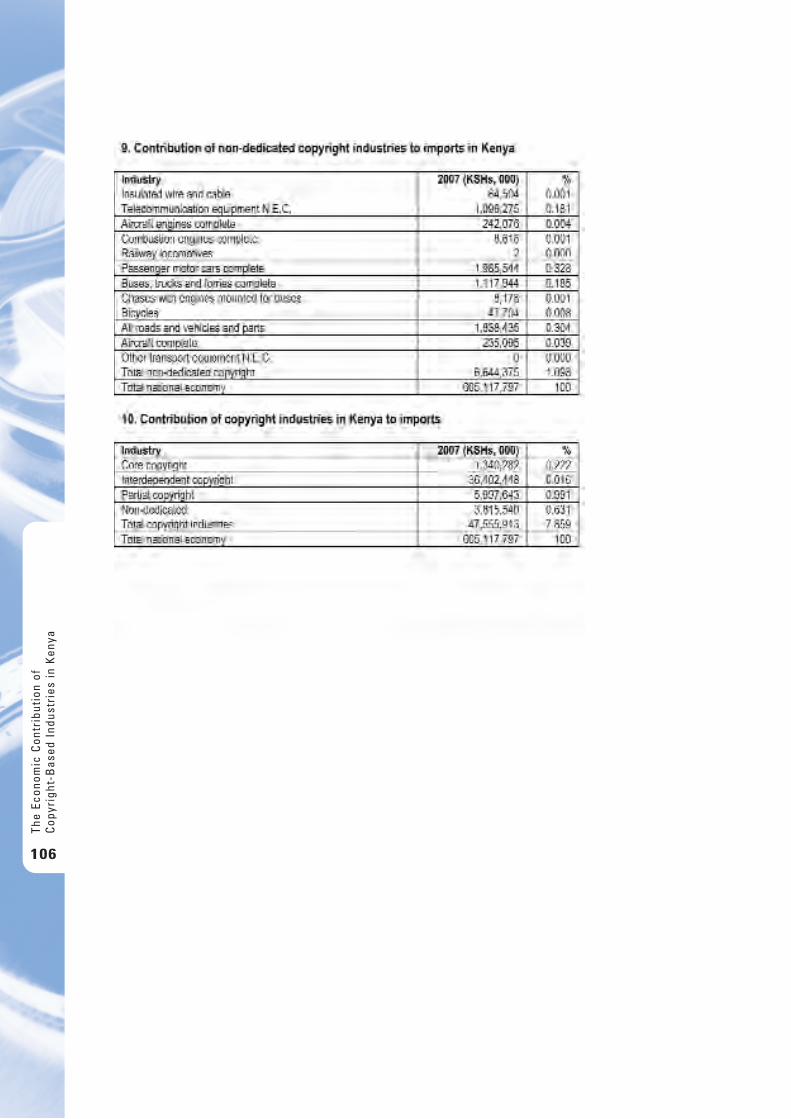
The
Econ
omic
Con
trib
utio
n of
Cop
yrig
ht-B
ased
Ind
ustr
ies
in K
enya
106
The Economic C
ontribution ofC
opyright-Based Industries in M
alaysia
107
The Economic Contribution of Copyright-Based Industries
in Malaysia
Vijayakumari KanapathyProject Coordinator October 23, 2008

The
Econ
omic
Con
trib
utio
n of
Cop
yrig
ht-B
ased
Ind
ustr
ies
in M
alay
sia
108
Ta b l e o f C o n t e n t s
Acknowledgements 114
EXECUTIVE SUMMARY 115
1. INTRODUCTION 1181.1 Background and context 1181.2 Objective of the Study 1191.3 Defining Malaysia’s Copyright-Based Industries 1201.4 Approach and Methodology 121
2 AN OVERVIEW OF COPYRIGHT LAWS AND INSTITUTIONS 1252.1 Introduction 1252.2 Protection of Copyrights 1252.3 Infringement of Copyrights and Remedies 1272.4 Institutional Framework for Copyright Protection 129
3 CONTRIBUTION OF COPYRIGHT-BASED INDUSTRIES TO THE MALAYSIAN ECONOMY 1323.1 Introduction 1323.2 Economic Contribution of Total Copyright-Based Industries 132
4 STRUCTURE AND PERFORMANCE OF COPYRIGHT-BASED INDUSTRY GROUPS 1374.1 Core Copyright Industries 1374.2 Interdependent Copyright Industries 1404.3 Partial Copyright Industries 1424.4 Non-Dedicated Support Industries 145
5. PROFILE OF SELECTED CORE COPYRIGHT INDUSTRIES 1475.1 Press and Literature 1475.2 Music, Theatrical Production and Opera 1515.3 Motion Picture and Video 1555.4 Radio and Television 1585.5 Software and Databases 1615.6 Copyright Collecting Societies 164
6. TRADE IN COPYRIGHT-BASED INDUSTRIES 1666.1 Introduction 1666.2 Trade Contribution 166
The Economic C
ontribution ofC
opyright-Based Industries in M
alaysia
109

7. INTERNATIONAL COMPARISONS 168
8. IMPACT OF COPYRIGHT-BASED INDUSTRIES ON THE ECONOMY 1708.1 Introduction 1708.2 Impact of Copyright Industries on the Economy 170
9. CONCLUSION 172
References 174
The
Econ
omic
Con
trib
utio
n of
Cop
yrig
ht-B
ased
Ind
ustr
ies
in M
alay
sia
110
L i s t o f Ta b l e s
Table 1.1: List of Copyright-Based Industries in Malaysia Based on WIPO Classification 120
Table 2.1 Milestones in the Development of Malaysia’s Copyright Act 1987 125
Table 2.2 Ownership Rights and Duration in Literary and Artistic Works 127
Table 2.3 Remedies for Criminal and Civil Copyright Infringement 128
Table 3.1 Contribution of Copyright-Based Industries to GDP and Employment, 2005 133
Table 3.2 Performance of Copyright-Based Industries, 2000–2005 135
Table 3.3 Number of Professionals in Copyright-Based Industries, 1991 & 2000 135
Table 3.4 Relative Size of the Copyright-Based Industries, 2005 136
Table 3.5 Value Added Per Worker, 2000 & 2005 (Malaysian Ringgit) 136
Table 4.1 Contribution of Core Copyright Industries, 2000–2005 138
Table 4.2 Performance of Core Copyright-Based Industries 139
Table 4.3 Contribution of Interdependent Copyright Industries, 2000–2005 140
Table 4.4 Performance of Interdependent Copyright Industries 142
Table 4.5 Contribution of Partial Copyright Industries, 2000–2005 143
Table 4.6 Performance of Partial Copyright Industries 144
Table 4.7 Contribution of Non-Dedicated Support Industries, 2000–2005 145
Table 4.8 Performance of Non-Dedicated Support Industries 146
Table 5.1 New Books Registered with the National Library, 1997–2007 148
Table 5.2 Newspaper Readership in Malaysia, 2007 149
Table 5.3 Malaysian Film Industry Statistics, 2003–2007 157
Table 5.4 Total Collection by Film Language, 2003–2007 (Percentage) 158
Table 5.5 Revenue from Advertisements, ASTRO (RM million) 160
Table 5.6 ASTRO Penetration Rate (Percentage) 160
Table 5.7 Selected ICT Indicators, 2000 & 2005 162
Table 5.8 Selected MSC Indicators, 2001 & 2005 163
Table 5.9 Total Royalties Collection by Copyright Collecting Societies,2004–2007 (RM million) 164
Table 6.1 Copyright Contribution to Trade, 2000–2005 166
Table 6.2 Trade in Copyrighted Goods, 2000 & 2005 (RM million) 167
Table 7.1 Contribution of Copyright-Based Industries to GDPand Employment in Selected Countries 168
Table 7.2 Contribution of Core Copyright Industry Groups to GDPand Employment in Selected Countries 169
Table 8.1 Input Structure of Core Copyright Industries, 2000 171
Table 8.2 Impact of a 10 Per Cent Increase in Value Added by Sectoron GDP, Employment and Exports (Percentage Change) 171
The Economic C
ontribution ofC
opyright-Based Industries in M
alaysia
111
L i s t o f F i g u r e s
Figure 1.1 Economic Activities Relating to Production, Packaging andDistribution of Materials Protected by Copyright and Related Rights 119
Figure 1.2 Study Approach And Methodology 122
Figure 2.1 Institutional Framework for Copyright Protection 131
L i s t o f C h a r t s
Chart 3.1 Contribution of Copyright Industries to GDP and Employment 132
Chart 3.2 Relative Size of the Copyright Industries by Value Added, 2005 133
Chart 3.3 Relative Size of the Copyright Industries by Employment, 2005 134
Chart 4.1 Value Added of Core Copyright Industries by Sector, 2005 138
Chart 4.2 Employment in Core Copyright Industries by Sector, 2005 139
Chart 4.3 Value Added of Interdependent Copyright Industries by Sector, 2005 141
Chart 4.4 Employment in Interdependent Copyright Industries by Sector, 2005 141
Chart 4.5 Value Added of Partial Copyright Industries by Sector, 2005 143
Chart 4.6 Employment in Partial Copyright Industries by Sector, 2005 144
Chart 4.7 Value Added of Non-Dedicated Support Industries by Sector, 2005 145
Chart 4.8 Employment in Non-Dedicated Support Industries by Sector, 2005 146
Chart 5.1 Total Recorded Music Sold 152
The
Econ
omic
Con
trib
utio
n of
Cop
yrig
ht-B
ased
Ind
ustr
ies
in M
alay
sia
112

L i s t o f A p p e n d i c e s
Appendix 1 Mapping of Copyright-Based Industries 176
Appendix 2 Estimation of Copyright Factors 183
Appendix 3 List of Malaysian Core Copyright Industries at 2-DigitActivity/Commodity Input-Output Classification 190
Appendix 4 Questionnaire 192
The Economic C
ontribution ofC
opyright-Based Industries in M
alaysia
113
A c k n o w l e d g e m e n t s
The study on the economic contribution of copyright-based industries was commissioned by the WorldIntellectual Property Organization (WIPO) at the request of the Intellectual Property Corporation ofMalaysia (MyIPO). It also received financial support from the Government of Japan. My sincere thanks go to Mr Kamel Mohamed, the Director General of MyIPO, for his full support and commitment throughoutthe study. Thanks are also in order for Dr Dimiter Gantchev (Acting Director, Creative Industries Division of WIPO) and Dr Chow Kit Boey (Fellow, Intellectual Property Academy of Singapore) for their insightfulcomments on the initial draft of the study. A debt of gratitude goes to Mr A. Manisekaran (Consultant,Copyright Law Division of WIPO), who facilitated the study in its preparatory stage.
Several organizations and individuals generously shared their data and information that greatly enhancedthe content and quality of the study, and their contributions are gratefully acknowledged. Special mentiongoes to the officers in the Department of Statistics for generating much of the data and for patientlyexplaining and clarifying the data. Finally, thanks go to Ms Siti Salwa Hj. Ghazali and Mr Kuljit Singh fromMyIPO and Mr Qamar Siddique for facilitating the study.
The
Econ
omic
Con
trib
utio
n of
Cop
yrig
ht-B
ased
Ind
ustr
ies
in M
alay
sia
114
1 . E x e c u t i v e S u m m a r y
IntroductionThis study estimates the size of the creative and the information sectors in the Malaysian economy that areprotected by copyright, collectively known as copyright-based industries. There is now a growing body ofevidence on the increasing importance of copyright-based activities in national growth and development.A number of countries have carried out studies to estimate the size of copyright-based industries intheir economies.
This study is a pilot project to comprehensively and systematically define, identify and estimate the economiccontribution of copyright-based industries to the Malaysian economy. It uses the framework and guidelinesrecommended by WIPO to quantify the contribution of copyright-based activities in terms of value added,employment and foreign trade.
WIPO defines copyright-based industries as industries that are engaged in the creation, production,performance, broadcast, communication or distribution and sales of protected materials. This represents the“core” copyright industries. However, in measuring the economic impact, WIPO recognizes the importanceof including the “non-core” activities that support or are related to the “core” activities such as distributionand consumption.
Using WIPO’s framework, Malaysia’s copyright industries are classified into four groups:• The core copyright industries, which create copyright materials as their primary product;• The inter-dependent copyright industries, which support and facilitate the creation of copyright works;• The partial copyright industries, where only a portion of the industry activities are associated with the
creation of copyright works;• The copyright distribution industries, which facilitate the distribution of copyright materials to
businesses and consumers.
Economic Contribution of Copyright-Based IndustriesIn 2005, the estimated total contribution of copyright-based industries to the Malaysian economy was:
• RM30.2 billion of value added (5.8 per cent of GDP)• 817 thousand jobs (7.5 per cent of nationwide employment)• RM3.1 billion worth of exports (1.0 of total exports)
Malaysia’s copyright-based industries have recorded remarkable growth in recent years. Value added in realterms grew at an annual average of 11.1 per cent from 2000 to 2005, surpassing the national growth rateof 6.6 per cent. As a result, their contribution to GDP rose from 4.7 per cent to 5.8 per cent during thisperiod. Likewise, employment grew at 10.7 per cent or three times that at the national level. The strongperformance of these industries has increased their share of the nationwide workforce from 5.3 per cent in 2000 to 7.5 per cent in 2005.
Trade data does not capture the full contribution of copyright industries to the economy, as it generally tendsto underestimate its true value. However, broad trends in the trade of copyrighted products do providesome indication on their performance. Interestingly, the trade balance turned positive in 2005 from a netloss of RM0.5 billion in 2000, due in large part to double-digit growth in the export of copyrighted products.
The Economic C
ontribution ofC
opyright-Based Industries in M
alaysia
115
Copyright-based industries have performed extremely well in comparison to other services and resource-based industries in the economy. They make a larger contribution to GDP and employment comparedto construction, transport and storage, and business services. Their relative growth is much more significant.The total copyright-based industries registered the second highest growth of 11.1 per cent per annum from2000 to 2005, after mining and quarrying (13.1 per cent).
The productivity of the copyright-based industries in 2005 was RM34,848, which was higher than that foragriculture, construction and government services but lower than manufacturing, mining and quarrying, andtransport and storage, and communications. The industries exhibited a productivity growth of 0.4 per centper annum from 2000 to 2005. The characteristic nature of the creative group of industries in generatingemployment explains the slow productivity growth.
Data and information on the copyright-based industries are far from adequate. One of the main reasons isthe higher incidence of microenterprises and individual operators in the creative and information sectors – a characteristic phenomenon of these industries worldwide. There is also an apparent lack of awareness ofthe importance of copyright among consumers as well as producers of copyright works.
Knowledge and content that underpin copyright-based activities have emerged as the main factors ofeconomic growth, and as the nation shifts towards a service-oriented economy, copyright will become moresignificant. Therefore, it is essential that the copyright-based industries be closely monitored, evaluated andprioritized. It is within this context that the following recommendations are made.
• Establish an institutional framework to facilitate systematic and regular data collection and reportingon copyright-based industries. This should be part and parcel of ongoing efforts by the Department ofStatistics to improve the database on the services sector. A Working Committee led by MyIPO and withrepresentation from the Department of Statistics and all agencies related to copyright-based industriessuch as the Ministry of Unity, Culture, Arts and Heritage, Ministry of Communications, Energy and Water,Ministry of Information, the Central Bank, Copyright Collecting Societies and all relevant industryorganizations should be set up to explore the most cost-effective means to generate key economicdata on copyright-based industries. Ongoing establishment and household surveys must be reviewedto evaluate how they can be expanded and improved to generate data on creative industries protectedby copyright. All secondary sources of data on copyright industries must be identified, and theagencies collating such data must be made responsible for producing them on a regular basis.
• The Department of Statistics should team up with the relevant industry organizations and provideprofessional assistance to facilitate the generation of key industry statistics at a more disaggregated levelon a regular basis.
• It would also be timely and useful to generate more detailed trade data on the services sector with the shift towards a service-based economy and the growing importance of trade in services at the bilateral and multilateral negotiations. This would allow more accurate estimates of trade incopyrighted products. Inter-agency collaboration between the relevant agencies in the public andprivate sectors has to be beefed up to initiate data collection and reporting on trade in services.
• More in-depth sector-specific studies of the creative and informative sectors that are protected bycopyright must be carried out. To begin with, a vertical analysis of the nine sub-sectors of the corecopyright industries should be carried out. Such studies can assist in improving the assessment of thecontribution of copyright-based industries to the economy as well as identify the issues and challengesfaced by the industry to prioritize policies.
The
Econ
omic
Con
trib
utio
n of
Cop
yrig
ht-B
ased
Ind
ustr
ies
in M
alay
sia
116

• MyIPO should launch programs such as workshops, seminars and advocacy campaigns in collaborationwith the copyright-based industry organizations to enhance awareness of the importance of copyrightamong both consumers and creators of copyrighted works.
• The study provides strong empirical evidence of the dynamism of the copyright-based industries inMalaysia, demonstrating their key role in the nation’s drive towards a knowledge and information-based economy. The study is at best an exploratory study that contributes to more evidence-basedpolicy-making with respect to the development of copyright-based industries within the context of the overall development of the economy.
The Economic C
ontribution ofC
opyright-Based Industries in M
alaysia
117
1 . I n t r o d u c t i o n
1.1 Background and ContextThere has been a worldwide increase in the contribution of copyright and related rights-based industries(hereafter termed copyright-based industries) to the economy, driven largely by developments in informationand communications technology (ICT). With the advent of ICT, the scope of copyright protection has expandedbeyond the narrower confines of the cultural and social dimensions to include the information economy. As a result, copyright has emerged as an enabling tool for the growth and development of an increasingnumber of industries, especially in the service sector. Without copyright protection, incentives to engage in creative activities are weakened.
WIPO defines copyright-based industries as “industries engaged in creation, production and manufacturing,performance, broadcast, communication and exhibition, or distribution and sales of works and other protectedsubject matter” (WIPO, 2003, p.29). This represents the “core” copyright industries. However, in measuringthe true economic contribution of copyright-based industries to the economy, WIPO acknowledges theimportance of incorporating the multiple effects of copyright on the economy, i.e. the contribution of the“non-core” activities that support or are interrelated to the core copyright industries with regard to suchdistribution and equipment manufacturing (see Figure 1.1).
The growing importance of copyright in changing the economic landscape has been acknowledged by an increasing number of international studies on the economic contribution of copyright-based industries. This study is the first of its kind to comprehensively define, identify and estimate the relative economiccontribution and performance of copyright industries in Malaysia.
The
Econ
omic
Con
trib
utio
n of
Cop
yrig
ht-B
ased
Ind
ustr
ies
in M
alay
sia
118
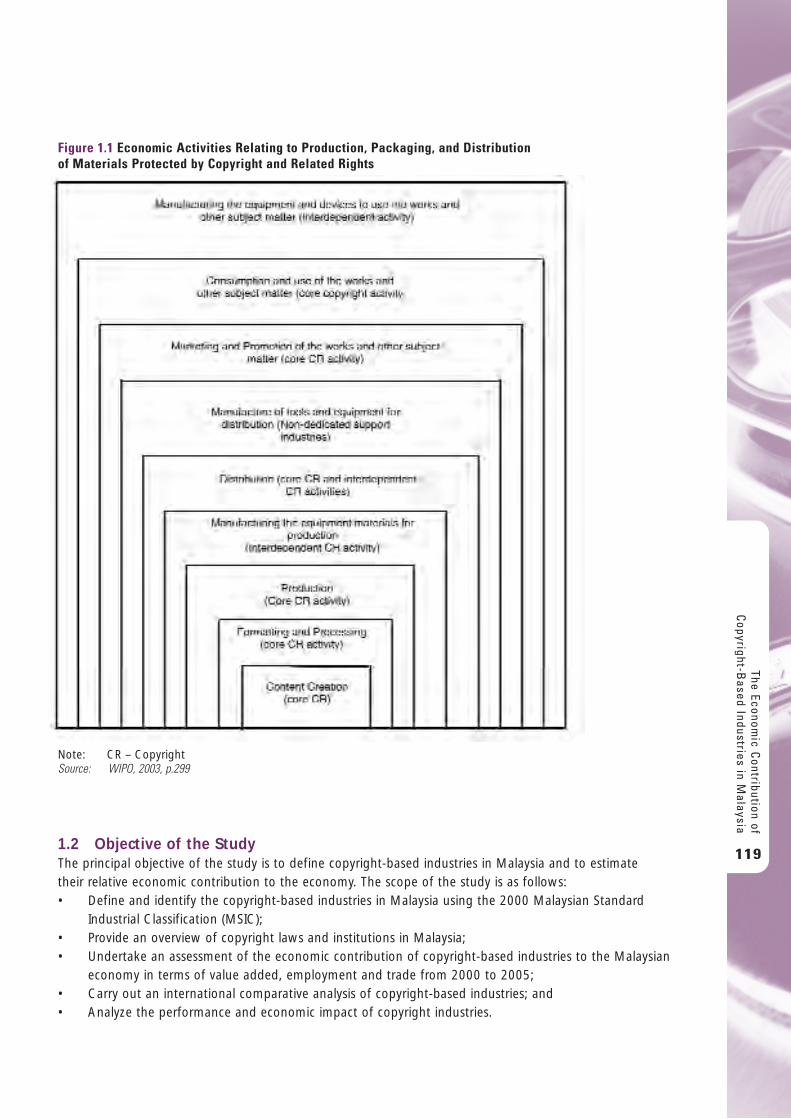
1.2 Objective of the StudyThe principal objective of the study is to define copyright-based industries in Malaysia and to estimate their relative economic contribution to the economy. The scope of the study is as follows:• Define and identify the copyright-based industries in Malaysia using the 2000 Malaysian Standard
Industrial Classification (MSIC);• Provide an overview of copyright laws and institutions in Malaysia;• Undertake an assessment of the economic contribution of copyright-based industries to the Malaysian
economy in terms of value added, employment and trade from 2000 to 2005;• Carry out an international comparative analysis of copyright-based industries; and• Analyze the performance and economic impact of copyright industries.
The Economic C
ontribution ofC
opyright-Based Industries in M
alaysia
119
Figure 1.1 Economic Activities Relating to Production, Packaging, and Distribution of Materials Protected by Copyright and Related Rights
Note: CR – CopyrightSource: WIPO, 2003, p.299
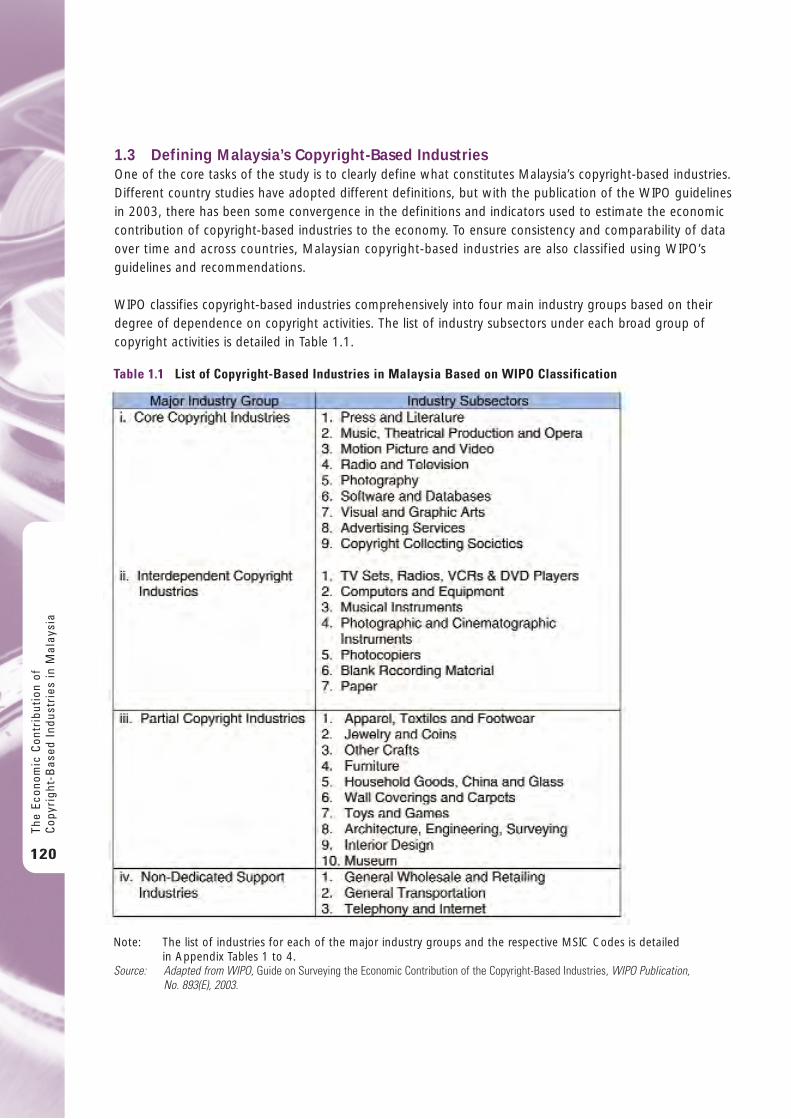
1.3 Defining Malaysia’s Copyright-Based IndustriesOne of the core tasks of the study is to clearly define what constitutes Malaysia’s copyright-based industries.Different country studies have adopted different definitions, but with the publication of the WIPO guidelinesin 2003, there has been some convergence in the definitions and indicators used to estimate the economiccontribution of copyright-based industries to the economy. To ensure consistency and comparability of dataover time and across countries, Malaysian copyright-based industries are also classified using WIPO’sguidelines and recommendations.
WIPO classifies copyright-based industries comprehensively into four main industry groups based on theirdegree of dependence on copyright activities. The list of industry subsectors under each broad group ofcopyright activities is detailed in Table 1.1.
The
Econ
omic
Con
trib
utio
n of
Cop
yrig
ht-B
ased
Ind
ustr
ies
in M
alay
sia
120
Table 1.1 List of Copyright-Based Industries in Malaysia Based on WIPO Classification
Note: The list of industries for each of the major industry groups and the respective MSIC Codes is detailed in Appendix Tables 1 to 4.
Source: Adapted from WIPO, Guide on Surveying the Economic Contribution of the Copyright-Based Industries, WIPO Publication, No. 893(E), 2003.
i. Core Copyright Industries The core copyright industries are industries wholly engaged in the creation, production and manufacturing,performance, broadcast, communication and exhibition or distribution and sales of works and otherprotected subject matter (WIPO, 2003, p.29). There are nine industries that are entirely dependent uponcopyright protection for their activities.
ii. Interdependent Copyright IndustriesThe interdependent copyright industries are industries that are engaged in production, manufacture and saleof equipment whose function is wholly or primarily to support and facilitate the creation, production or useof copyright protected subject matter (WIPO, 2003, p.33).
These are industries that produce products jointly consumed with the core industries. For example, the transmission of entertainment programs requires a television.
iii. Partial Copyright IndustriesThe partial copyright industries are industries in which only a part of the production is linked to copyrightprotected material, such as design, architecture, apparel, jewelry and other crafts. Products by these industriesmay have a registered design as well as copyright protection. Only the element that is protected bycopyright legislation is included.
iv. Non-Dedicated Support IndustriesThe non-dedicated support industries only remotely rely on copyright material and where copyright generatesonly a very small fraction of their business. That portion of activities “related to facilitating broadcast,communication, distribution or sales of works and other protected subjected matter and whose activities are not included in the core copyright industries” are incorporated into this group (WIPO, 2003).
1.4 Approach and MethodologyThe approach and methodology used in the study are based on the guidelines and recommendations byWIPO. The study has also benefited from the experiences reported in a number of country reports on theestimation of the size of the copyright-based industries in their economies (see reference). The major stepsare detailed in Figure 1.2 and discussed in detail below.
i Mapping of Copyright-Based IndustriesA thorough literature review was carried out to determine the scope and definition of copyright-basedindustries in Malaysia, and the methodology and techniques to estimate the economic contribution ofcopyright-based industries to the Malaysian economy. Great caution was exercised to avoid double counting.
WIPO defines copyright-based industries using the International Standard Industrial Classification (ISIC)Codes. This enabled the mapping of the copyright-based industries in Malaysia into the WIPO framework by determining the concordance between the ISIC Codes and the 2000 Malaysian Standard IndustrialClassification (MSIC) Codes. The detailed mapping of Malaysia’s copyright-based industries using WIPOdefinitions and MSIC Codes is given in Appendix 1.
The Economic C
ontribution ofC
opyright-Based Industries in M
alaysia
121
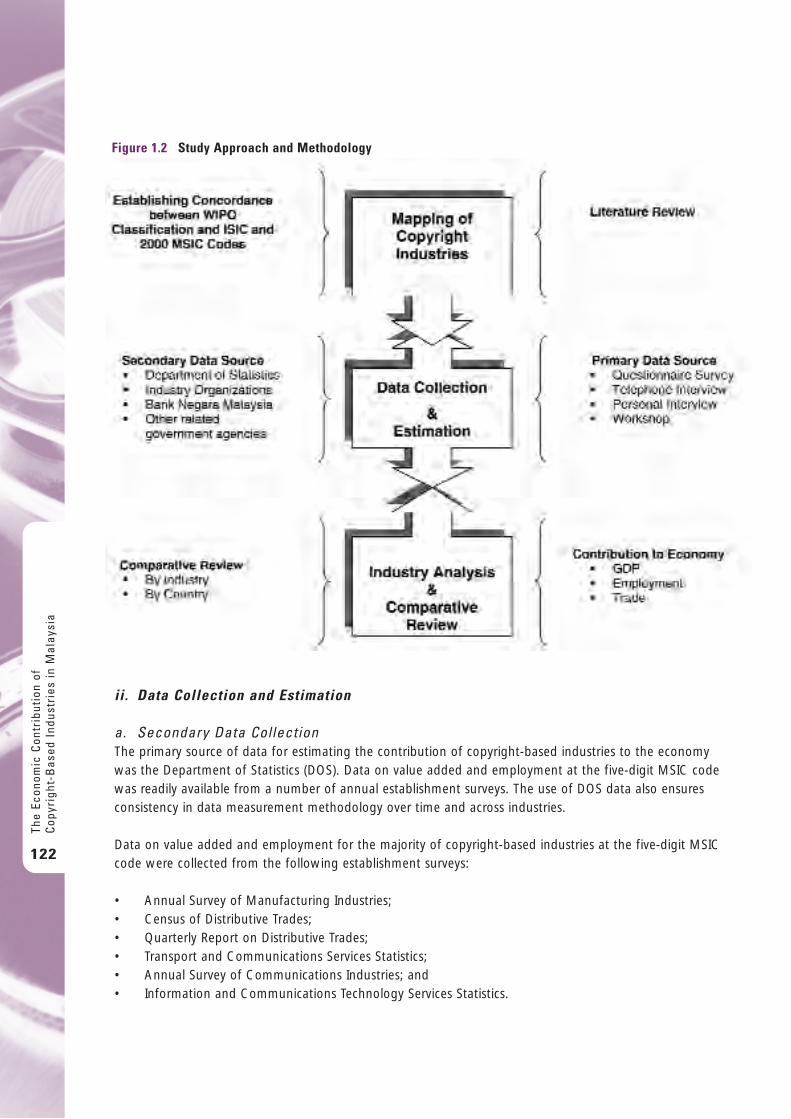
ii. Data Collection and Estimation
a. Secondary Data CollectionThe primary source of data for estimating the contribution of copyright-based industries to the economywas the Department of Statistics (DOS). Data on value added and employment at the five-digit MSIC codewas readily available from a number of annual establishment surveys. The use of DOS data also ensuresconsistency in data measurement methodology over time and across industries.
Data on value added and employment for the majority of copyright-based industries at the five-digit MSICcode were collected from the following establishment surveys:
• Annual Survey of Manufacturing Industries;• Census of Distributive Trades;• Quarterly Report on Distributive Trades;• Transport and Communications Services Statistics; • Annual Survey of Communications Industries; and• Information and Communications Technology Services Statistics.
The
Econ
omic
Con
trib
utio
n of
Cop
yrig
ht-B
ased
Ind
ustr
ies
in M
alay
sia
122
Figure 1.2 Study Approach and Methodology
However, not all of the copyright-based industries were covered by the establishment surveys. For thesmaller industries, data on value added was gathered by DOS on a less regular basis for national accountstabulation. Data for the missing years was extrapolated from the figures available for 2000 and 2003, andverified with estimates on industry growth through personal interviews and secondary data. Similarly, dataon employment was sourced from the 1991 and 2000 Population Census to estimate employment data atthe five-digit MSIC code. Trade data on copyrighted products were identified at the eight-digit SITC codeand sourced from the DOS.
Data on copyright-based industries were collected for the years 2000 to 2005, as 2005 is the latest year for which data are available. The year 2000 was chosen as a base year as it was a census year for mostindustries. It also marked the launching of a number of new establishment surveys to capture thecontribution of non-traditional industries, especially in the services sector, that had altered the Malaysianindustrial landscape.
The overall impact of core copyright industries on the economy was estimated using a computable generalequilibrium model of Malaysia (MGEM). The CGE model was built using the 2000 Input-Output (I-O) table.Hence, Malaysia’s copyright-based industries were redefined using the I-O industry classification and theMSIC/WIPO industry classifications (See Appendix 3).
Nominal data was converted to real terms using the GDP deflator.
b. Primary Data CollectionPrimary data and information were gathered through a nationwide sample survey and personal interviews.A nationwide survey of 1,200 companies located throughout the country was carried out from November2007 to March 2008. The main purpose was to estimate the degree of copyright content in the interdependent,partial and non-dedicated support industries. For the first batch, a detailed questionnaire as shown inAppendix 4 was mailed out. Since most of the data required could be sourced from the Department of Statistics, a shorter version of the questionnaire focusing on the copyright content was used forsubsequent surveys.
Out of the 800 questionnaires mailed to firms in the “non-core” copyright industries, a total of 30responses (3.8 per cent) were received. To increase the response rate and to ensure that all subsectorsare included in the responses, telephone interviews and online survey were also carried out focusing onthe copyright-related questions. A total of 63 companies in the “non-core” copyright industries wereinterviewed, raising the response rate to 11.6 per cent. Telephone interviews were more useful sinceadditional questions could be posed to assess the copyright content of their activities. Of the 400questionnaires mailed to companies in the “core” copyright industries, 16 responded. Their responsesprovided a better understanding of the copyright activities in the country.
c. Data EstimationAs explained earlier, WIPO has identified copyright-based industries into two broad categories, i.e. the“core” and “non-core” copyright industries. The contribution of core copyright industries was simple anddirect as all of the value added and employment of the industries was attributed to copyright activities.There were a total of nine industries in the core copyright group.
As for the non-core copyright industries, not all of their activities can be attributed to copyright protection.For each of these non-core industry groups, the data collected had to be adjusted by using copyright factorsto estimate the value added and employment of the industries attributable to copyright activities. The
The Economic C
ontribution ofC
opyright-Based Industries in M
alaysia
123

copyright factors determine the proportion of value added or employment that is derived from creative and copyright activities. The copyright factor was primarily determined through the nationwide survey of industries in the respective industry group and personal and telephone interviews of key personnel in the companies.
It is apparent that the estimation of copyright activity attributable to the “non-core” group of industries is less precise. Therefore, a great deal of caution was exercised in determining the copyright factors.Adequate feedback from industries and literature review was carried out to ensure the contribution of the “non-core” industries was neither overestimated nor severely underestimated. A detailed explanation of the determination of copyright factors used is given in Appendix 2.
The
Econ
omic
Con
trib
utio
n of
Cop
yrig
ht-B
ased
Ind
ustr
ies
in M
alay
sia
124
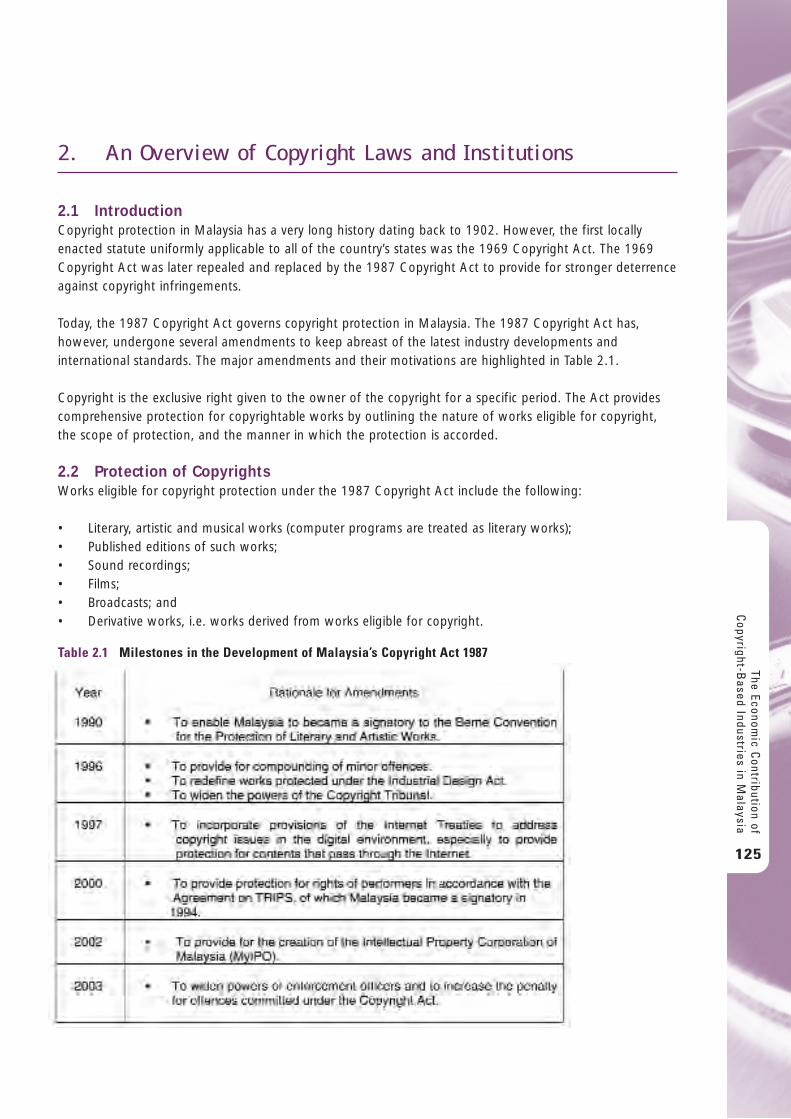
2 . A n O v e r v i e w o f C o p y r i g h t L a w s a n d I n s t i t u t i o n s
2.1 IntroductionCopyright protection in Malaysia has a very long history dating back to 1902. However, the first locallyenacted statute uniformly applicable to all of the country’s states was the 1969 Copyright Act. The 1969Copyright Act was later repealed and replaced by the 1987 Copyright Act to provide for stronger deterrenceagainst copyright infringements.
Today, the 1987 Copyright Act governs copyright protection in Malaysia. The 1987 Copyright Act has,however, undergone several amendments to keep abreast of the latest industry developments andinternational standards. The major amendments and their motivations are highlighted in Table 2.1.
Copyright is the exclusive right given to the owner of the copyright for a specific period. The Act providescomprehensive protection for copyrightable works by outlining the nature of works eligible for copyright,the scope of protection, and the manner in which the protection is accorded.
2.2 Protection of CopyrightsWorks eligible for copyright protection under the 1987 Copyright Act include the following:
• Literary, artistic and musical works (computer programs are treated as literary works); • Published editions of such works;• Sound recordings;• Films;• Broadcasts; and • Derivative works, i.e. works derived from works eligible for copyright.
The Economic C
ontribution ofC
opyright-Based Industries in M
alaysia
125
Table 2.1 Milestones in the Development of Malaysia’s Copyright Act 1987

The scope and duration of copyright for the above are summarized in Table 2.2. There is no registration of copyright material in Malaysia. A work is automatically protected under the following conditions:
• Sufficient effort has been made to make the work original in character; • The work has been written down, recorded or reduced to material form; and• The author is a qualified person, the work is made in Malaysia, or the work is first published in Malaysia.
The copyright holder is initially the author (writer, composer or maker) of the work. However, if an employeedoes the work in the course of his employment, the person who had commissioned the work holds thecopyright, unless otherwise agreed. The author’s right is also transferable.
These rights apply whether the works are copied partially or wholly. Infringement occurs when a workbelonging to the right owner is reproduced, distributed, rented, sold or communicated to the public withoutprior consent from the right owner. In the event of an infringement, the burden of proof lies with theperson claiming that his or her work has been unlawfully copied.
Malaysia is not a member of the International Convention for the Protection of Performers, Producers ofPhonograms and Broadcasting Organizations (the Rome Convention) of 1961. However, in 1994 Malaysiabecame a signatory of the Agreement on the Trade-Related Aspects of Intellectual Property Rights (TRIPSAgreement) that covered substantive portions of the Rome Convention, including protection for performers.
As a developing country, Malaysia was given until the year 2000 to comply fully with the provisions of theTRIPS Agreement. One of the important areas of compliance, that had its roots in the Rome Convention,was the granting of rights to performers. Thus, in 2000 the Copyright Act was amended to providecompliance with the TRIPS obligation and provide protection for performers. Following the amendments,the Copyright Act provides protection for the performer’s rights in a live performance, which subsists for 50years from the beginning of the calendar year following the year in which the live performance was given.
The
Econ
omic
Con
trib
utio
n of
Cop
yrig
ht-B
ased
Ind
ustr
ies
in M
alay
sia
126
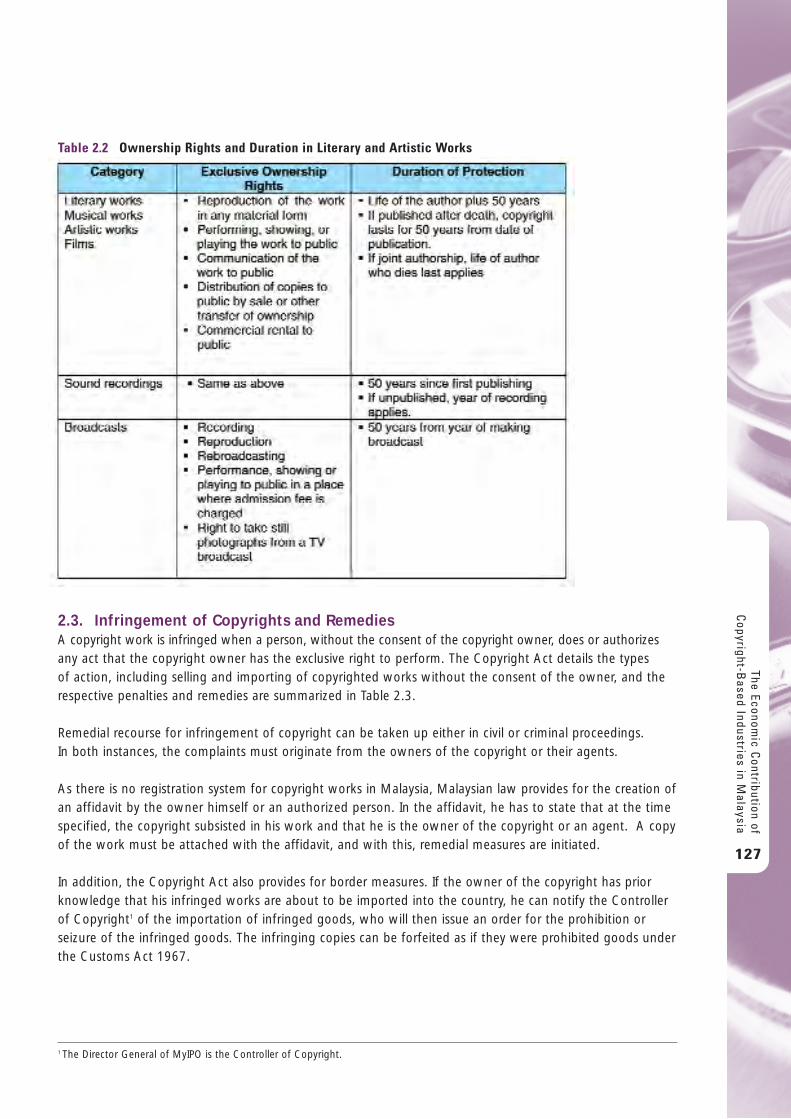
2.3. Infringement of Copyrights and RemediesA copyright work is infringed when a person, without the consent of the copyright owner, does or authorizesany act that the copyright owner has the exclusive right to perform. The Copyright Act details the types of action, including selling and importing of copyrighted works without the consent of the owner, and therespective penalties and remedies are summarized in Table 2.3.
Remedial recourse for infringement of copyright can be taken up either in civil or criminal proceedings. In both instances, the complaints must originate from the owners of the copyright or their agents.
As there is no registration system for copyright works in Malaysia, Malaysian law provides for the creation ofan affidavit by the owner himself or an authorized person. In the affidavit, he has to state that at the timespecified, the copyright subsisted in his work and that he is the owner of the copyright or an agent. A copyof the work must be attached with the affidavit, and with this, remedial measures are initiated.
In addition, the Copyright Act also provides for border measures. If the owner of the copyright has priorknowledge that his infringed works are about to be imported into the country, he can notify the Controllerof Copyright1 of the importation of infringed goods, who will then issue an order for the prohibition orseizure of the infringed goods. The infringing copies can be forfeited as if they were prohibited goods underthe Customs Act 1967.
The Economic C
ontribution ofC
opyright-Based Industries in M
alaysia
127
Table 2.2 Ownership Rights and Duration in Literary and Artistic Works
1 The Director General of MyIPO is the Controller of Copyright.
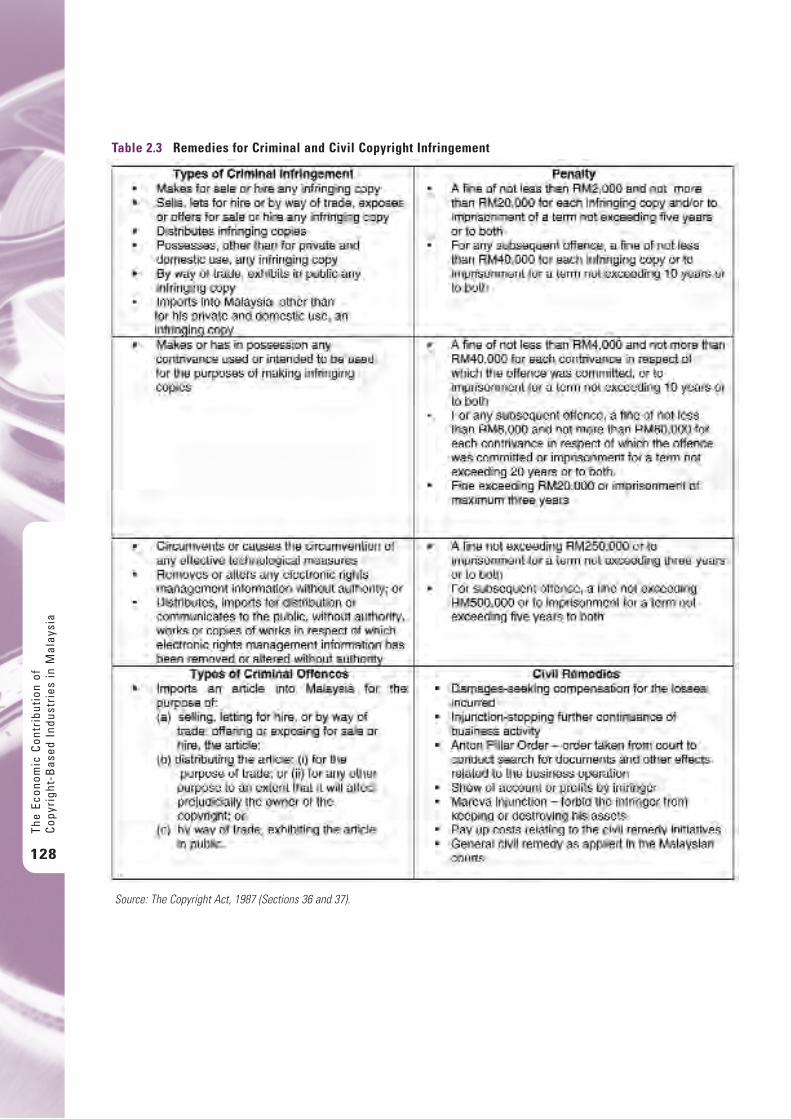
The
Econ
omic
Con
trib
utio
n of
Cop
yrig
ht-B
ased
Ind
ustr
ies
in M
alay
sia
128
Table 2.3 Remedies for Criminal and Civil Copyright Infringement
Source: The Copyright Act, 1987 (Sections 36 and 37).
2.4. Institutional Framework for Copyright ProtectionThere is a fairly well-established institutional framework to ensure adequate protection for copyright worksas shown in Figure 2.1. These include:
(i) Public agencies that are custodians of the policy and regulatory framework covering copyright;(ii) Enforcement agencies that provide surveillance and remedies for copyright infringement; and(iii) Private bodies that serve copyright owners by ensuring their members’ copyright works are
protected and provide feedback to policy-makers to improve the policy and regulatoryenvironment for copyright-based industries to thrive.
i. Policy and Regulatory InstitutionsThe Intellectual Property Corporation of Malaysia (MyIPO), a corporate body under the Ministry of DomesticTrade and Consumer Affairs (MDTCA), acts as the custodian of laws on intellectual property. Accordingly,MyIPO is the lead agency for the regulatory framework for intellectual property (IP) rights. However, thereare other government bodies that independently provide protection to components of copyright works thatfall within their own areas of jurisdiction. These include:
• The Ministry of Home Affairs, which is the custodian of the Film Censorship Act 2002 and the PrintingPress and Publications Act 1984;
• The Ministry of Unity, Culture, Arts and Heritage, which is the custodian of the Film Development Act1984; and
• The Ministry of Communications, Energy and Water, which is the custodian of broadcasting matters.
ii. Enforcement AgenciesThe Copyright law is enforced by the Royal Malaysian Police Department and the Enforcement Division ofthe Ministry of Domestic Trade and Consumer Affairs (MDTCA). At present, the Enforcement Division of theMDTCA has a strong force of some 2,100 officers placed in 72 branches throughout the country to enforcethe law. Copyright owners may lodge an official complaint supported by necessary documents to theEnforcement Division of the Ministry if they suspect infringement. The Division will conduct the necessaryinvestigations with the assistance of the prosecution officers from the Attorney General’s Office. If there issufficient evidence, the case goes to the Court. Civil proceedings, on the other hand, are carried out withthe assistance of lawyers.
The enforcement agencies also carry out anti-piracy measures as provided for in the Copyright Act. Suchmeasures include the establishment of:
• The Anti-Piracy Task Force under the Chairmanship of the Minister of Domestic Trade and ConsumerAffairs. The Task Force is made up of representatives from the government and private sectors engagedin IP affairs.
• The Special Task Force to Combat Counterfeit Products made up of the Royal Malaysian Police Force,Royal Customs Department, the Ministry of Health, the pharmaceutical industries, the Energy Commission,Standards and Industrial Research Institute of Malaysia (SIRIM) Berhad and the cigarette manufacturingcompanies. Other related associations and guilds also actively participate in discussions and incoordination of joint raids and enforcement activities.
• Special Export Unit from the Ministry of Domestic Trade and Consumer Affairs, whose officers arestationed at exit points to foil attempts by pirates trying to export pirated goods.
The Economic C
ontribution ofC
opyright-Based Industries in M
alaysia
129
iii. Special Intellectual Property (IP) CourtsThe Government has approved the establishment of 15 Intellectual Property Sessions Courts to hear cases of a criminal nature, while six Intellectual Property Specialized High Courts have been set up throughout thecountry to hear both civil and criminal cases. These courts have appellate jurisdictions. Currently, there isone specialized IP Sessions Court, i.e. Court 4 in the Federal Capital to hear only first instance criminal cases.
iv. Private Bodies
a. Collective Management OrganizationsThe Copyright Act also provides for the setting-up of licensing bodies commonly termed Collective ManagementOrganizations (CMOs) or Copyright Collecting Societies (CCS) to collect royalties on behalf of copyrightowners for public performance of copyright works.
Sound recordings and musical works are respectively the copyrighted properties of the recording companiesand the songwriters. Any public performance of music must obtain the consent of the sound recordingcompanies and the songwriters via the CMOs that represent them. The CMO issues the public performancelicense for which royalties are imposed. The royalties are then distributed to the sound recording companiesand the songwriters. At present, there are five CMOs licensed in Malaysia, of which three are moreestablished. Details of the CMOs are discussed in Section 5.
b. Industry OrganizationsApart from the CMOs, there are Industry Organizations that represent the interests of their members and their industry. These carry out a variety of activities to develop, promote and protect their respectiveindustry. They hold seminars, dialogues and exhibitions and conduct training programs for their members.They also represent their members in matters affecting policies, laws and regulation, and prepare andforward memoranda to the Government on issues affecting their industry. A list of some of the keycopyright-based industry organizations is given in Appendix 5.
c. Copyright Tribunal The Copyright Act also provides for the establishment of the Copyright Tribunal, an independent body setup by the Minister of Domestic Trade and Consumer Affairs in accordance with Sections 28 to 35 of theCopyright Act 1987.
The Tribunal was originally responsible for approving applications for translation of foreign works into thenational language. Since 1996, however, its mandate has been expanded to include settlement of disputesbetween the CMOs and users of copyright works. Its key functions include:
• Determining types of licensing schemes between the licensing bodies and users of copyrighted works;• Mentioning the instances and the party/parties who may refer or apply with respect to entitlement
of a license;• Providing that the proposed scheme shall be in force and an existing scheme should remain in
operation so long as the order of the Tribunal remains in force;• Providing for the types of licenses that may be granted by licensing bodies;• Specifying instances where terms of the proposed license due to expire may be referred to the Tribunal
by the licensor and licensee respectively;• Providing for the Tribunal to review its orders;
The
Econ
omic
Con
trib
utio
n of
Cop
yrig
ht-B
ased
Ind
ustr
ies
in M
alay
sia
130
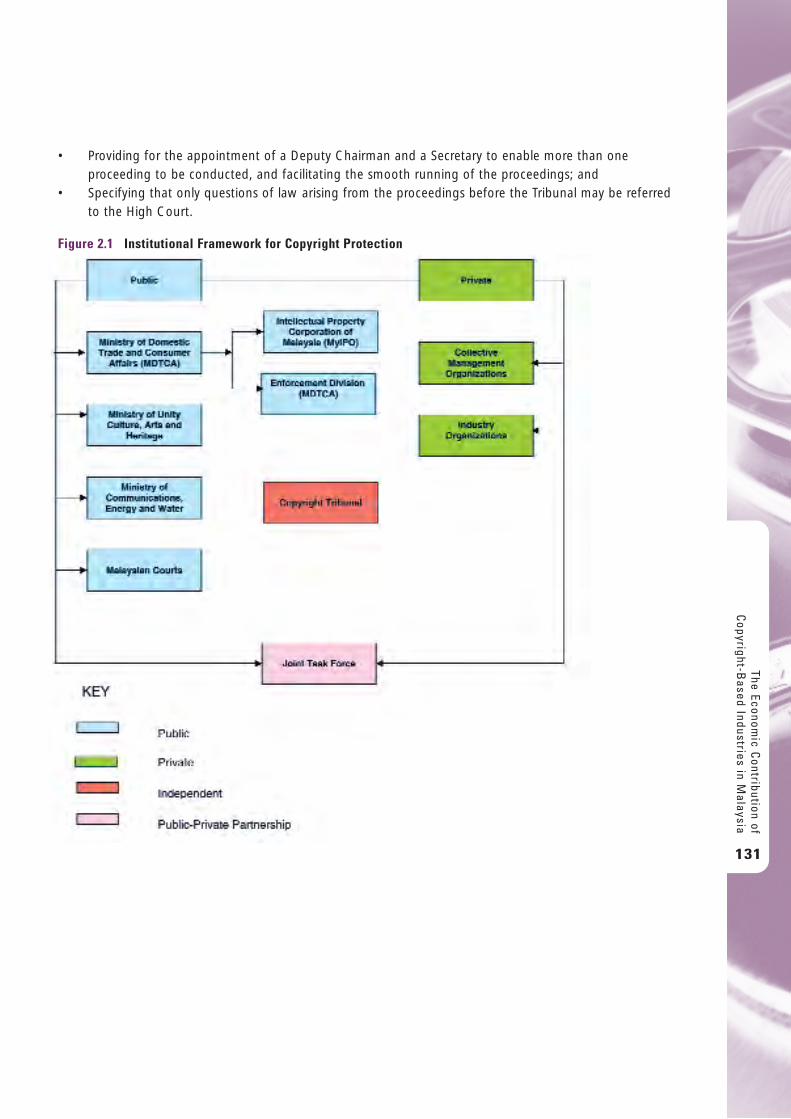
• Providing for the appointment of a Deputy Chairman and a Secretary to enable more than oneproceeding to be conducted, and facilitating the smooth running of the proceedings; and
• Specifying that only questions of law arising from the proceedings before the Tribunal may be referredto the High Court.
The Economic C
ontribution ofC
opyright-Based Industries in M
alaysia
131
Figure 2.1 Institutional Framework for Copyright Protection
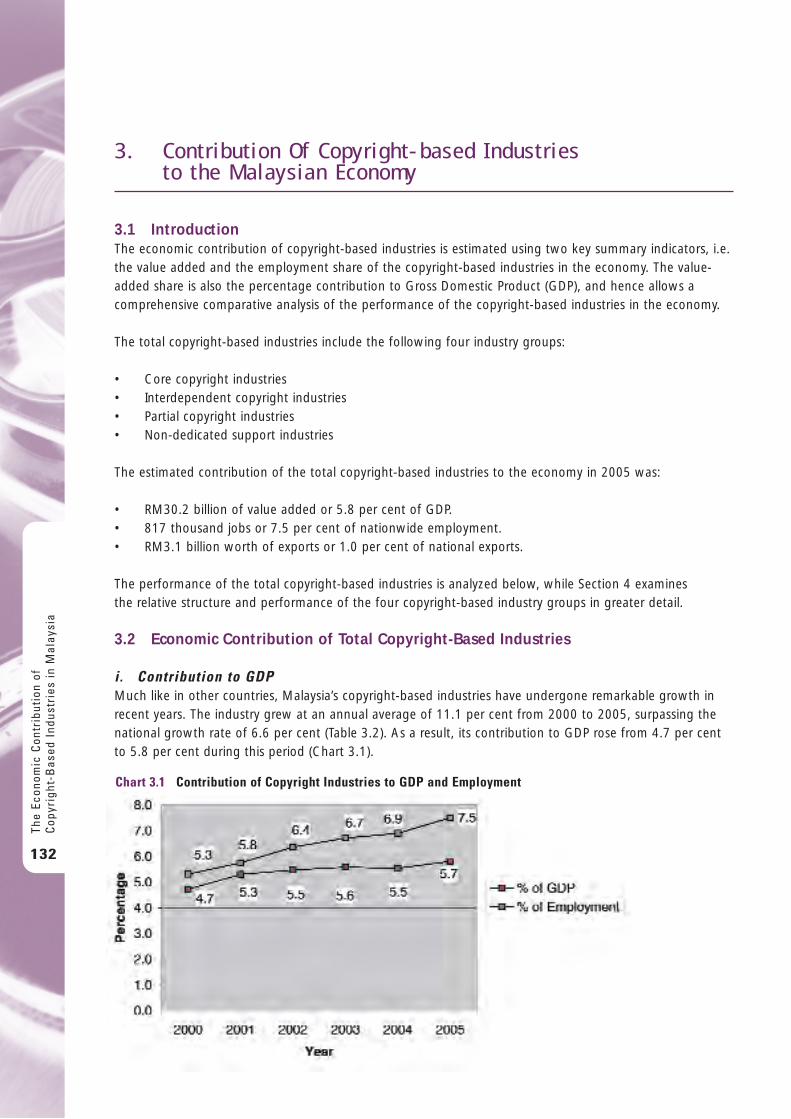
3 . C o n t r i b u t i o n O f C o p y r i g h t - b a s e d I n d u s t r i e st o t h e M a l ay s i a n E c o n o m y
3.1 IntroductionThe economic contribution of copyright-based industries is estimated using two key summary indicators, i.e.the value added and the employment share of the copyright-based industries in the economy. The value-added share is also the percentage contribution to Gross Domestic Product (GDP), and hence allows acomprehensive comparative analysis of the performance of the copyright-based industries in the economy.
The total copyright-based industries include the following four industry groups:
• Core copyright industries• Interdependent copyright industries• Partial copyright industries • Non-dedicated support industries
The estimated contribution of the total copyright-based industries to the economy in 2005 was:
• RM30.2 billion of value added or 5.8 per cent of GDP.• 817 thousand jobs or 7.5 per cent of nationwide employment.• RM3.1 billion worth of exports or 1.0 per cent of national exports.
The performance of the total copyright-based industries is analyzed below, while Section 4 examines the relative structure and performance of the four copyright-based industry groups in greater detail.
3.2 Economic Contribution of Total Copyright-Based Industries
i. Contribution to GDPMuch like in other countries, Malaysia’s copyright-based industries have undergone remarkable growth inrecent years. The industry grew at an annual average of 11.1 per cent from 2000 to 2005, surpassing thenational growth rate of 6.6 per cent (Table 3.2). As a result, its contribution to GDP rose from 4.7 per centto 5.8 per cent during this period (Chart 3.1).
The
Econ
omic
Con
trib
utio
n of
Cop
yrig
ht-B
ased
Ind
ustr
ies
in M
alay
sia
132
Chart 3.1 Contribution of Copyright Industries to GDP and Employment
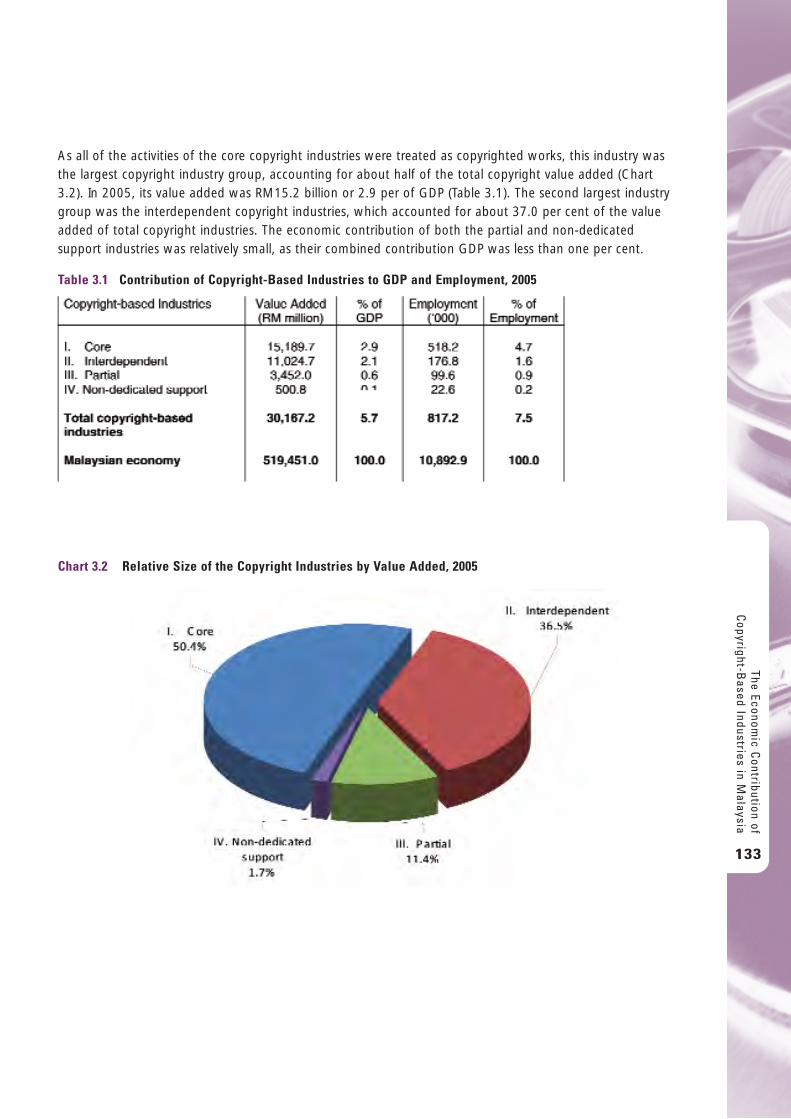
As all of the activities of the core copyright industries were treated as copyrighted works, this industry wasthe largest copyright industry group, accounting for about half of the total copyright value added (Chart3.2). In 2005, its value added was RM15.2 billion or 2.9 per of GDP (Table 3.1). The second largest industrygroup was the interdependent copyright industries, which accounted for about 37.0 per cent of the valueadded of total copyright industries. The economic contribution of both the partial and non-dedicatedsupport industries was relatively small, as their combined contribution GDP was less than one per cent.
The Economic C
ontribution ofC
opyright-Based Industries in M
alaysia
133
Table 3.1 Contribution of Copyright-Based Industries to GDP and Employment, 2005
Chart 3.2 Relative Size of the Copyright Industries by Value Added, 2005
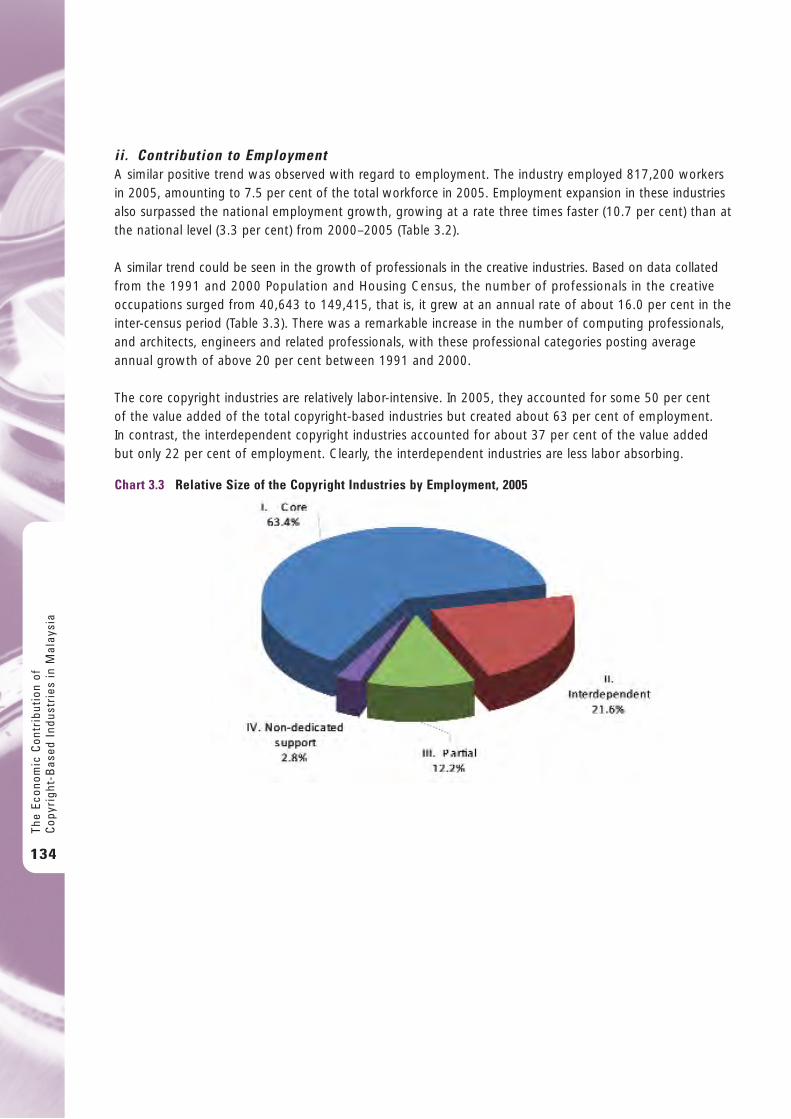
ii. Contribution to EmploymentA similar positive trend was observed with regard to employment. The industry employed 817,200 workersin 2005, amounting to 7.5 per cent of the total workforce in 2005. Employment expansion in these industriesalso surpassed the national employment growth, growing at a rate three times faster (10.7 per cent) than atthe national level (3.3 per cent) from 2000–2005 (Table 3.2).
A similar trend could be seen in the growth of professionals in the creative industries. Based on data collatedfrom the 1991 and 2000 Population and Housing Census, the number of professionals in the creativeoccupations surged from 40,643 to 149,415, that is, it grew at an annual rate of about 16.0 per cent in theinter-census period (Table 3.3). There was a remarkable increase in the number of computing professionals,and architects, engineers and related professionals, with these professional categories posting averageannual growth of above 20 per cent between 1991 and 2000.
The core copyright industries are relatively labor-intensive. In 2005, they accounted for some 50 per cent of the value added of the total copyright-based industries but created about 63 per cent of employment. In contrast, the interdependent copyright industries accounted for about 37 per cent of the value added but only 22 per cent of employment. Clearly, the interdependent industries are less labor absorbing.
The
Econ
omic
Con
trib
utio
n of
Cop
yrig
ht-B
ased
Ind
ustr
ies
in M
alay
sia
134
Chart 3.3 Relative Size of the Copyright Industries by Employment, 2005
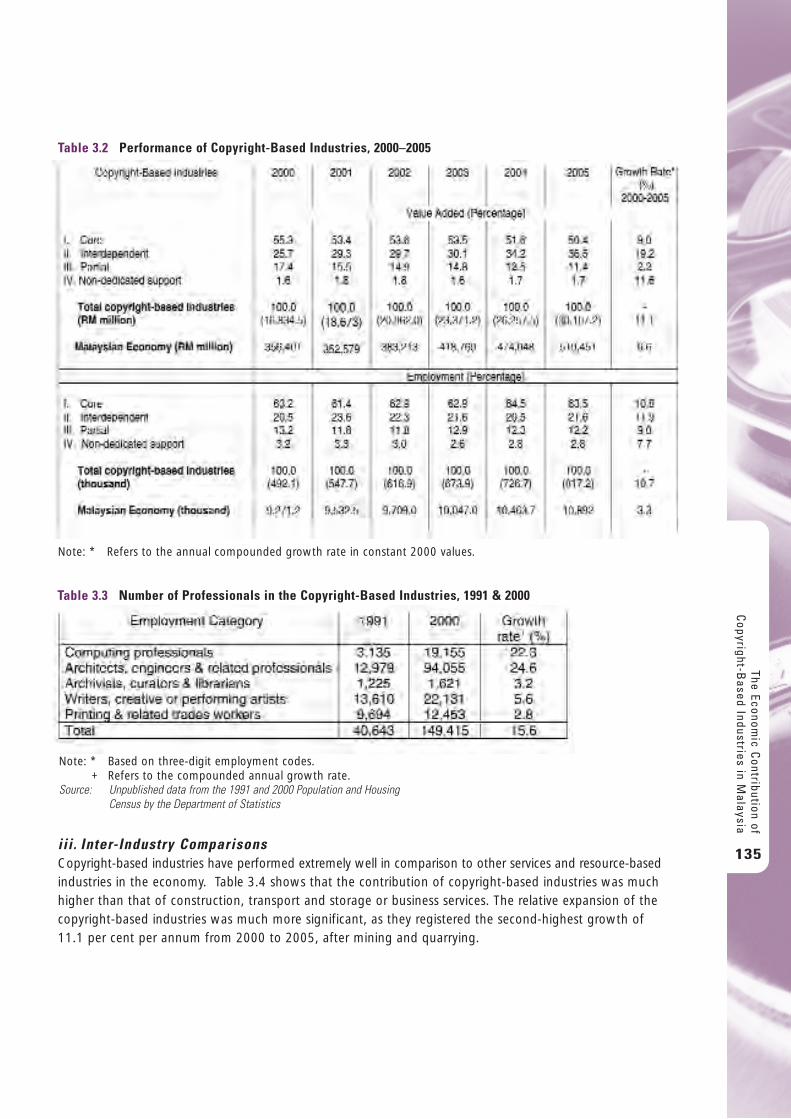
iii. Inter-Industry ComparisonsCopyright-based industries have performed extremely well in comparison to other services and resource-basedindustries in the economy. Table 3.4 shows that the contribution of copyright-based industries was muchhigher than that of construction, transport and storage or business services. The relative expansion of thecopyright-based industries was much more significant, as they registered the second-highest growth of 11.1 per cent per annum from 2000 to 2005, after mining and quarrying.
The Economic C
ontribution ofC
opyright-Based Industries in M
alaysia
135
Table 3.2 Performance of Copyright-Based Industries, 2000–2005
Note: * Refers to the annual compounded growth rate in constant 2000 values.
Table 3.3 Number of Professionals in the Copyright-Based Industries, 1991 & 2000
Note: * Based on three-digit employment codes.+ Refers to the compounded annual growth rate.
Source: Unpublished data from the 1991 and 2000 Population and Housing Census by the Department of Statistics
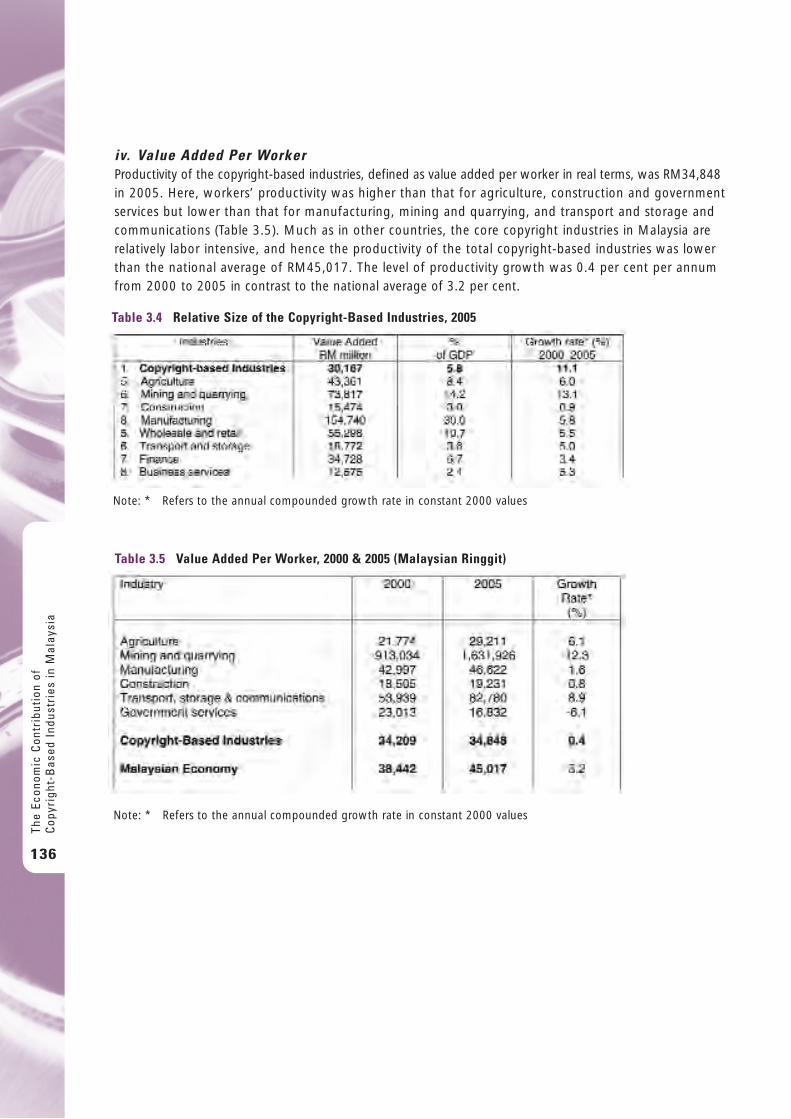
iv. Value Added Per WorkerProductivity of the copyright-based industries, defined as value added per worker in real terms, was RM34,848in 2005. Here, workers’ productivity was higher than that for agriculture, construction and governmentservices but lower than that for manufacturing, mining and quarrying, and transport and storage andcommunications (Table 3.5). Much as in other countries, the core copyright industries in Malaysia arerelatively labor intensive, and hence the productivity of the total copyright-based industries was lowerthan the national average of RM45,017. The level of productivity growth was 0.4 per cent per annumfrom 2000 to 2005 in contrast to the national average of 3.2 per cent.
The
Econ
omic
Con
trib
utio
n of
Cop
yrig
ht-B
ased
Ind
ustr
ies
in M
alay
sia
136
Table 3.4 Relative Size of the Copyright-Based Industries, 2005
Note: * Refers to the annual compounded growth rate in constant 2000 values
Table 3.5 Value Added Per Worker, 2000 & 2005 (Malaysian Ringgit)
Note: * Refers to the annual compounded growth rate in constant 2000 values
4. S t ruc tu re And Pe r fo rmance O f Copy r igh t-based Indus t ry G roups
4.1 Core Copyright IndustriesThe core copyright industries create copyright protected materials as their primary product, and they areclassified into nine industry subsectors:
• Press and literature• Music, theatrical production and opera• Motion picture and video• Radio and television• Photography• Software and databases• Visual and graphic arts• Advertising services• Copyright Collecting Societies
As the copyright content of these industries is relatively high, all of their value added and employment areincluded in the estimation of the economic contribution of copyright-based industries to the Malaysianeconomy. As data for visual arts and graphics have been subsumed under other subsectors2, the relativecontribution of core copyright industries is estimated under eight industry subsectors as shown in Charts 4.1and 4.2.
The core copyright industries accounted for more than half of the contribution of copyright-based industries.However, their relative share has been on the decline, largely due to the rapid growth of the interdependentindustry group. The employment share of the core copyright group is higher at about 63.0 per cent and has remained more or less constant over the years (Table 4.1). The industry grew faster than the economy,registering a growth rate of nine per cent from 2000 to 2005, led by the software and databases and pressand literature subsectors.
Press and literature, software and databases, and motion picture and video have dominated the activities ofcore copyright industries, accounting for an overwhelming 88 per cent of the total value added and 90.8per cent of total employment of the core copyright industries. Press and literature is the largest sub-sectorwithin this group, accounting for some 44 per cent of the total value added and around 55 per cent of totalemployment contribution. However, the software and databases subsector, the next largest sector, was themost dynamic industry and grew at about 12 per cent per annum from 2000 to 2005 (Table 4.2). This ishardly surprising given policy priority and substantial fiscal, financial and infrastructure support from theGovernment for the development of ICT-based industries.
The Economic C
ontribution ofC
opyright-Based Industries in M
alaysia
137
2 See Appendix Table 1.7 for details.
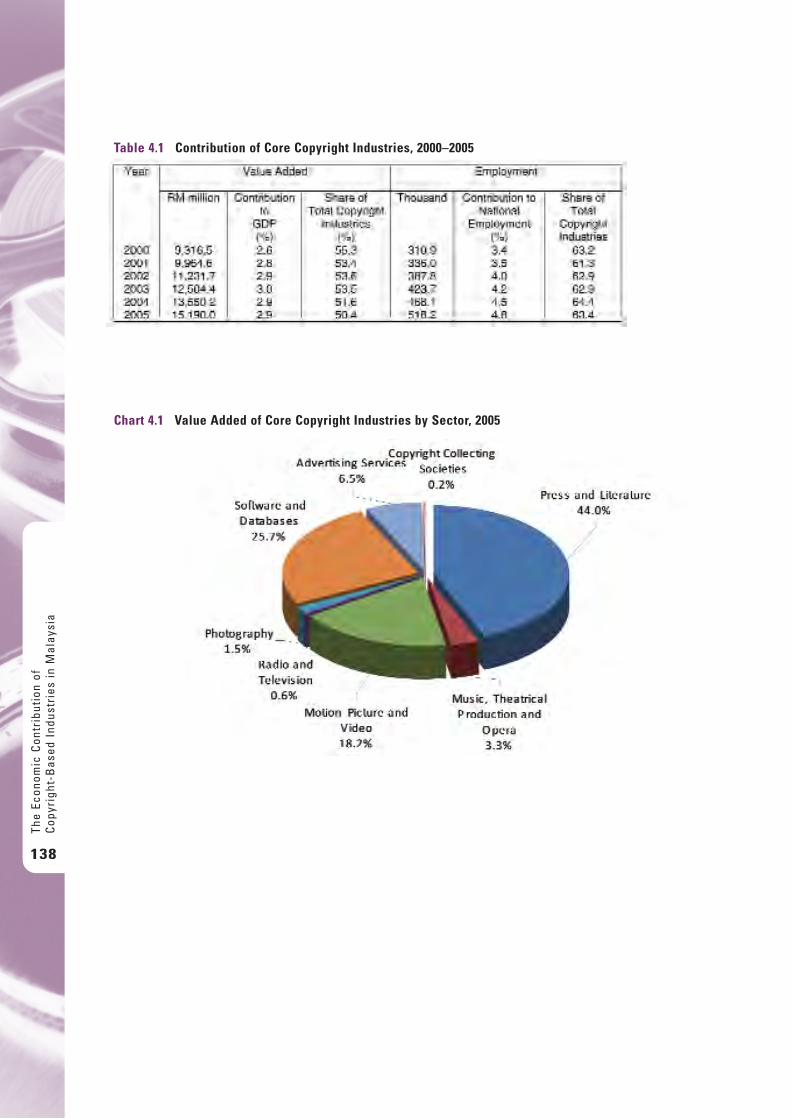
The
Econ
omic
Con
trib
utio
n of
Cop
yrig
ht-B
ased
Ind
ustr
ies
in M
alay
sia
138
Table 4.1 Contribution of Core Copyright Industries, 2000–2005
Chart 4.1 Value Added of Core Copyright Industries by Sector, 2005
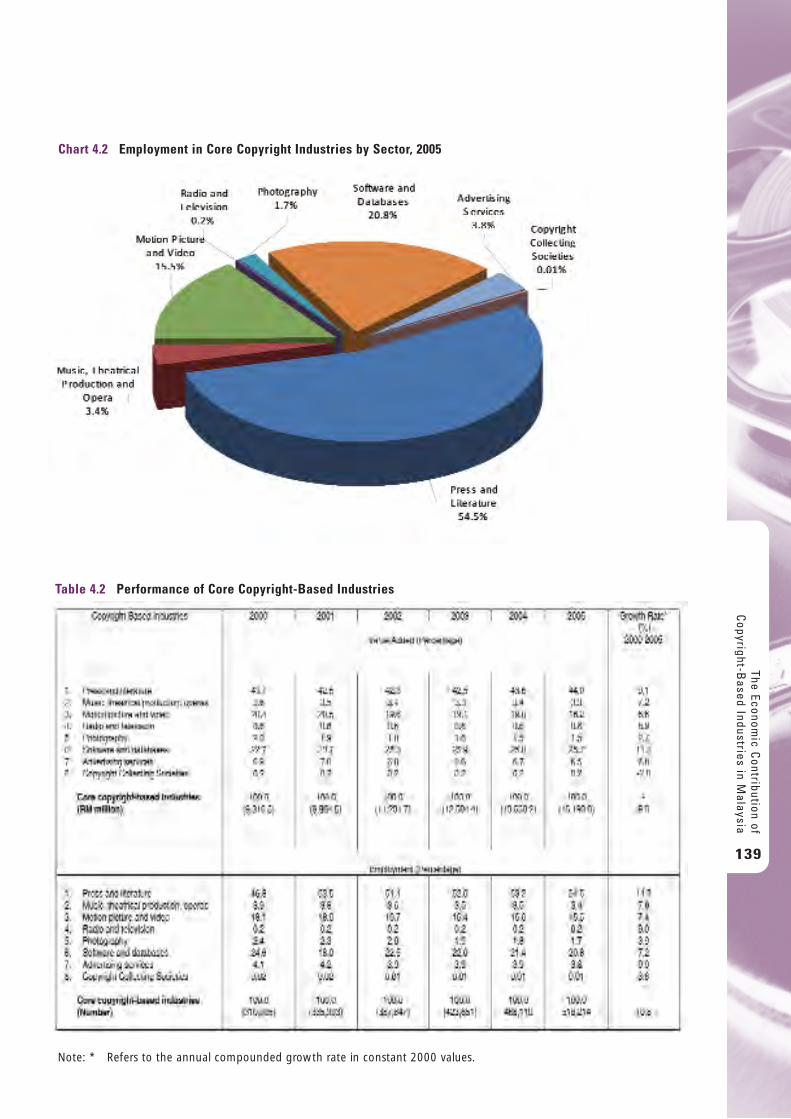
The Economic C
ontribution ofC
opyright-Based Industries in M
alaysia
139
Chart 4.2 Employment in Core Copyright Industries by Sector, 2005
Table 4.2 Performance of Core Copyright-Based Industries
Note: * Refers to the annual compounded growth rate in constant 2000 values.
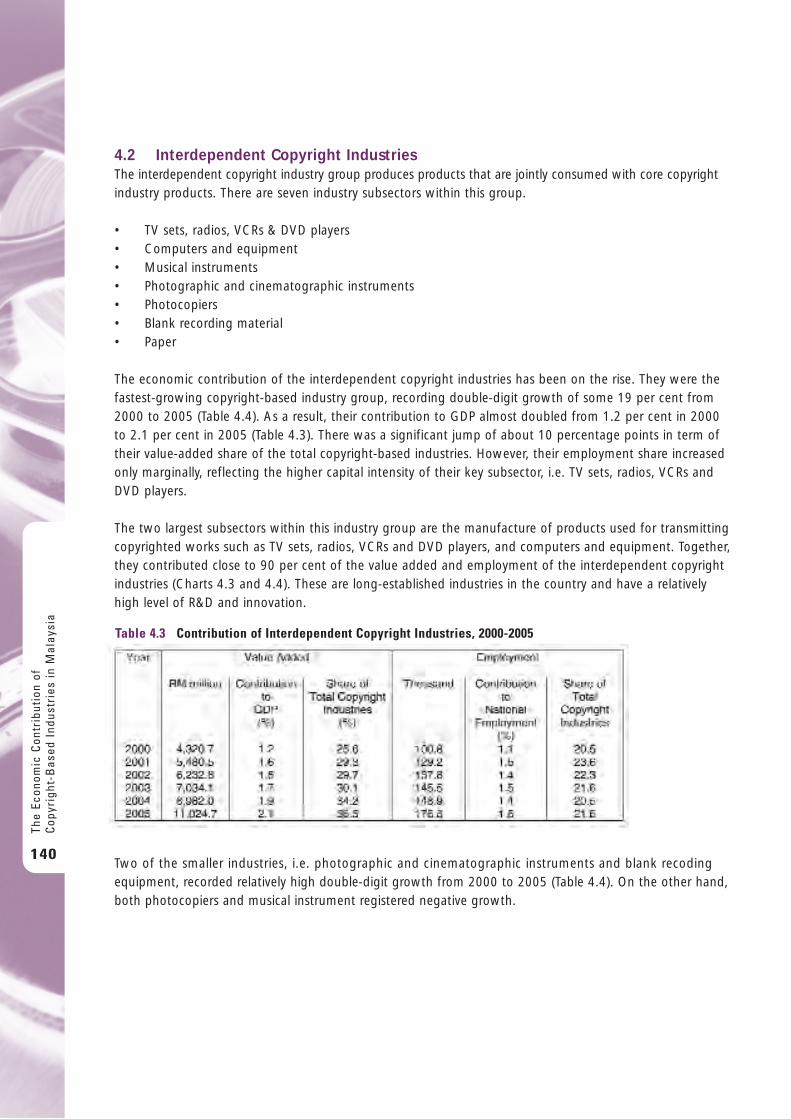
4.2 Interdependent Copyright IndustriesThe interdependent copyright industry group produces products that are jointly consumed with core copyrightindustry products. There are seven industry subsectors within this group.
• TV sets, radios, VCRs & DVD players • Computers and equipment• Musical instruments• Photographic and cinematographic instruments• Photocopiers• Blank recording material• Paper
The economic contribution of the interdependent copyright industries has been on the rise. They were thefastest-growing copyright-based industry group, recording double-digit growth of some 19 per cent from2000 to 2005 (Table 4.4). As a result, their contribution to GDP almost doubled from 1.2 per cent in 2000to 2.1 per cent in 2005 (Table 4.3). There was a significant jump of about 10 percentage points in term oftheir value-added share of the total copyright-based industries. However, their employment share increasedonly marginally, reflecting the higher capital intensity of their key subsector, i.e. TV sets, radios, VCRs andDVD players.
The two largest subsectors within this industry group are the manufacture of products used for transmittingcopyrighted works such as TV sets, radios, VCRs and DVD players, and computers and equipment. Together,they contributed close to 90 per cent of the value added and employment of the interdependent copyrightindustries (Charts 4.3 and 4.4). These are long-established industries in the country and have a relativelyhigh level of R&D and innovation.
Two of the smaller industries, i.e. photographic and cinematographic instruments and blank recodingequipment, recorded relatively high double-digit growth from 2000 to 2005 (Table 4.4). On the other hand,both photocopiers and musical instrument registered negative growth.
The
Econ
omic
Con
trib
utio
n of
Cop
yrig
ht-B
ased
Ind
ustr
ies
in M
alay
sia
140
Table 4.3 Contribution of Interdependent Copyright Industries, 2000-2005
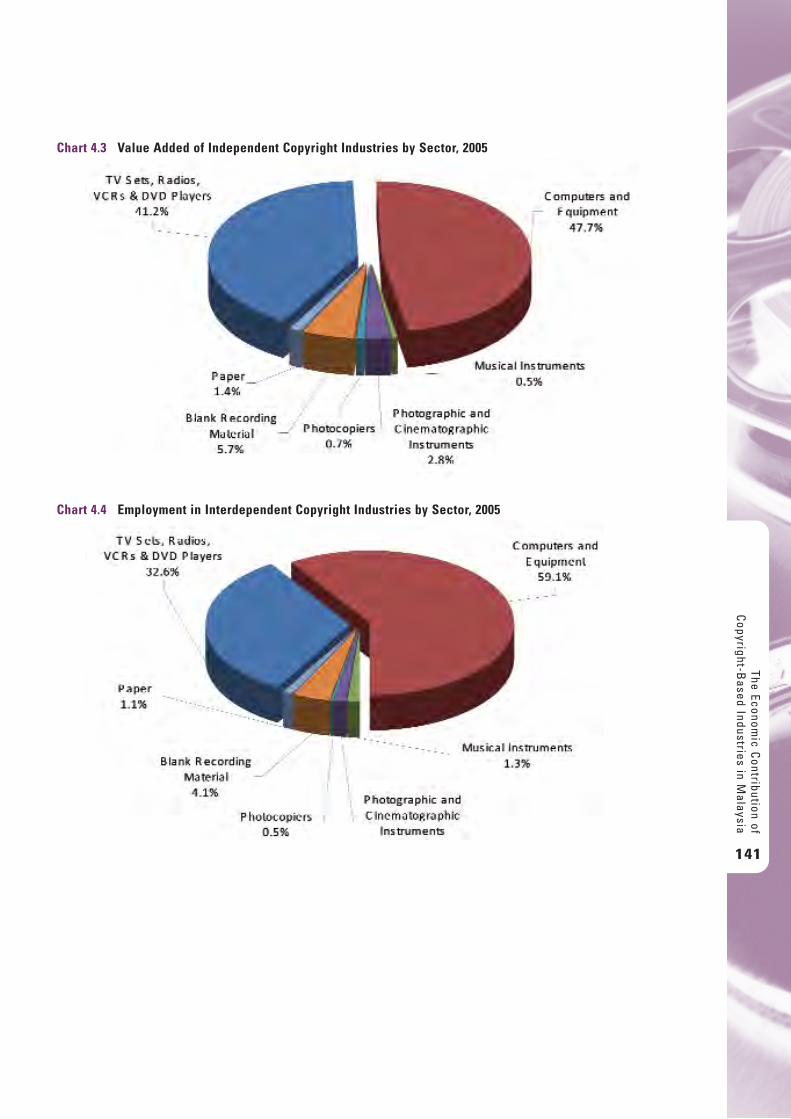
The Economic C
ontribution ofC
opyright-Based Industries in M
alaysia
141
Chart 4.3 Value Added of Independent Copyright Industries by Sector, 2005
Chart 4.4 Employment in Interdependent Copyright Industries by Sector, 2005
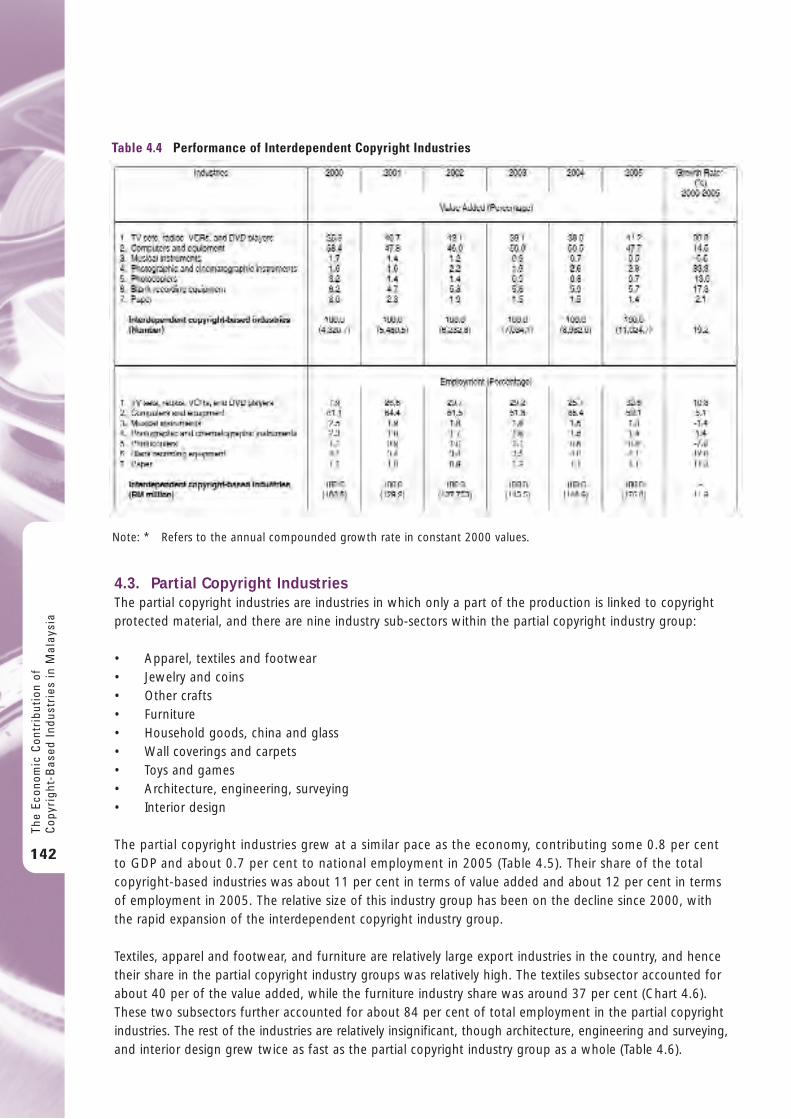
4.3. Partial Copyright IndustriesThe partial copyright industries are industries in which only a part of the production is linked to copyrightprotected material, and there are nine industry sub-sectors within the partial copyright industry group:
• Apparel, textiles and footwear• Jewelry and coins• Other crafts• Furniture• Household goods, china and glass• Wall coverings and carpets• Toys and games• Architecture, engineering, surveying• Interior design
The partial copyright industries grew at a similar pace as the economy, contributing some 0.8 per cent to GDP and about 0.7 per cent to national employment in 2005 (Table 4.5). Their share of the totalcopyright-based industries was about 11 per cent in terms of value added and about 12 per cent in termsof employment in 2005. The relative size of this industry group has been on the decline since 2000, withthe rapid expansion of the interdependent copyright industry group.
Textiles, apparel and footwear, and furniture are relatively large export industries in the country, and hencetheir share in the partial copyright industry groups was relatively high. The textiles subsector accounted forabout 40 per of the value added, while the furniture industry share was around 37 per cent (Chart 4.6).These two subsectors further accounted for about 84 per cent of total employment in the partial copyrightindustries. The rest of the industries are relatively insignificant, though architecture, engineering and surveying,and interior design grew twice as fast as the partial copyright industry group as a whole (Table 4.6).
The
Econ
omic
Con
trib
utio
n of
Cop
yrig
ht-B
ased
Ind
ustr
ies
in M
alay
sia
142
Table 4.4 Performance of Interdependent Copyright Industries
Note: * Refers to the annual compounded growth rate in constant 2000 values.
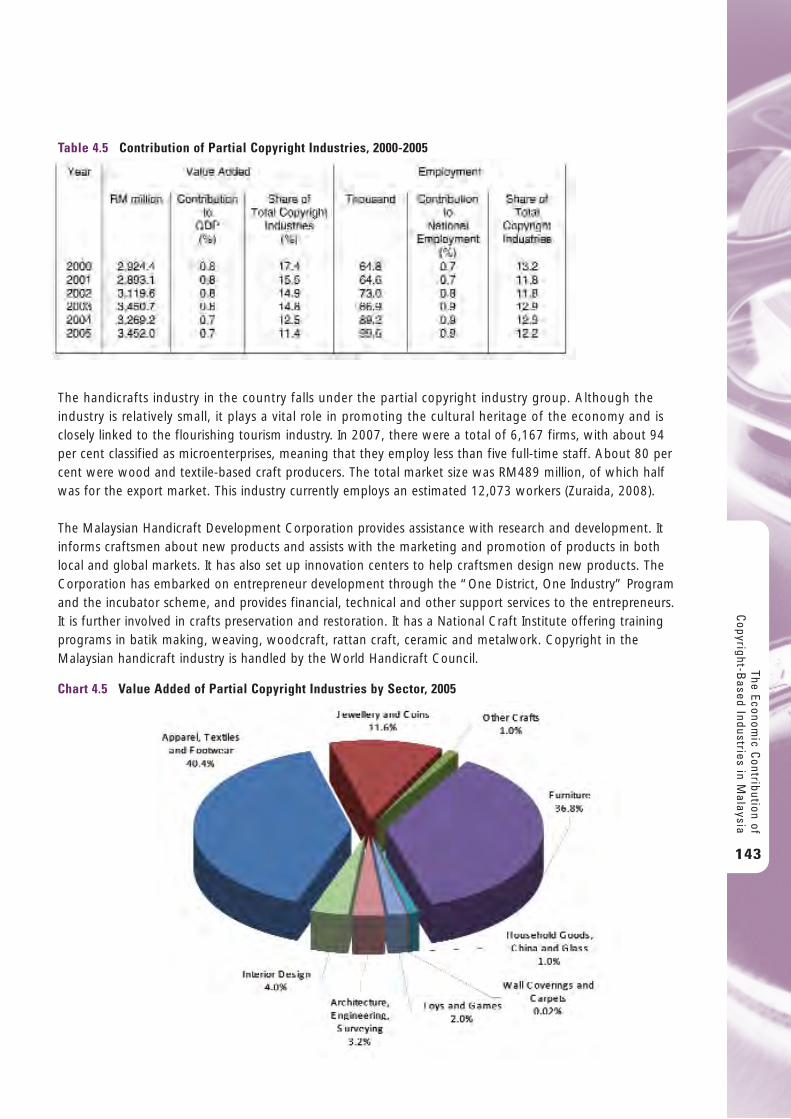
The handicrafts industry in the country falls under the partial copyright industry group. Although theindustry is relatively small, it plays a vital role in promoting the cultural heritage of the economy and isclosely linked to the flourishing tourism industry. In 2007, there were a total of 6,167 firms, with about 94per cent classified as microenterprises, meaning that they employ less than five full-time staff. About 80 percent were wood and textile-based craft producers. The total market size was RM489 million, of which halfwas for the export market. This industry currently employs an estimated 12,073 workers (Zuraida, 2008).
The Malaysian Handicraft Development Corporation provides assistance with research and development. Itinforms craftsmen about new products and assists with the marketing and promotion of products in bothlocal and global markets. It has also set up innovation centers to help craftsmen design new products. TheCorporation has embarked on entrepreneur development through the “One District, One Industry” Programand the incubator scheme, and provides financial, technical and other support services to the entrepreneurs.It is further involved in crafts preservation and restoration. It has a National Craft Institute offering trainingprograms in batik making, weaving, woodcraft, rattan craft, ceramic and metalwork. Copyright in theMalaysian handicraft industry is handled by the World Handicraft Council. The Econom
ic Contribution of
Copyright-B
ased Industries in Malaysia
143
Table 4.5 Contribution of Partial Copyright Industries, 2000-2005
Chart 4.5 Value Added of Partial Copyright Industries by Sector, 2005
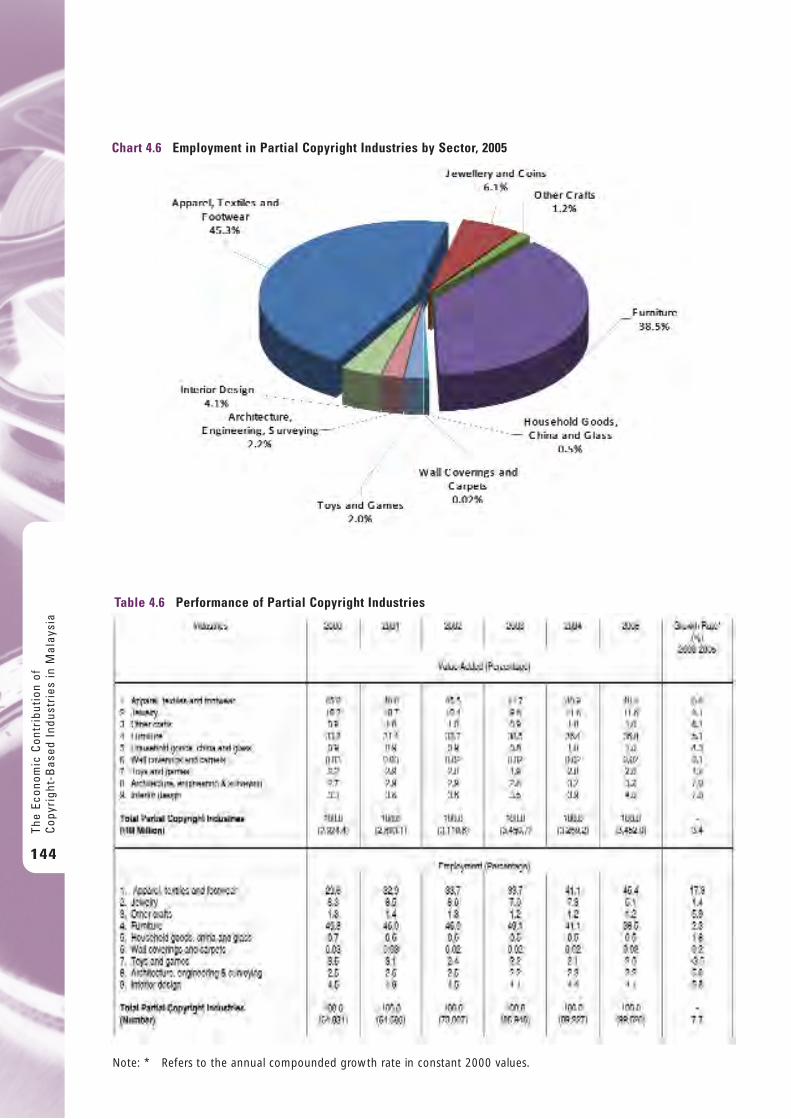
The
Econ
omic
Con
trib
utio
n of
Cop
yrig
ht-B
ased
Ind
ustr
ies
in M
alay
sia
144
Chart 4.6 Employment in Partial Copyright Industries by Sector, 2005
Table 4.6 Performance of Partial Copyright Industries
Note: * Refers to the annual compounded growth rate in constant 2000 values.
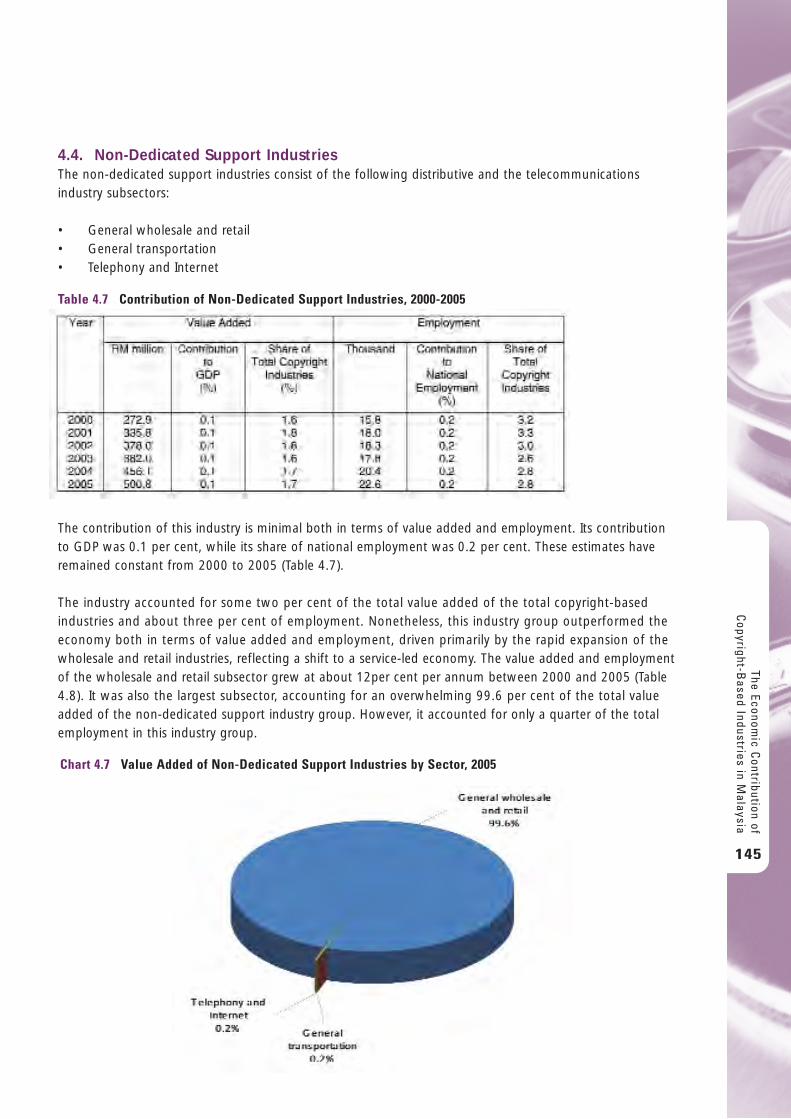
4.4. Non-Dedicated Support IndustriesThe non-dedicated support industries consist of the following distributive and the telecommunicationsindustry subsectors:
• General wholesale and retail• General transportation• Telephony and Internet
The contribution of this industry is minimal both in terms of value added and employment. Its contributionto GDP was 0.1 per cent, while its share of national employment was 0.2 per cent. These estimates haveremained constant from 2000 to 2005 (Table 4.7).
The industry accounted for some two per cent of the total value added of the total copyright-basedindustries and about three per cent of employment. Nonetheless, this industry group outperformed theeconomy both in terms of value added and employment, driven primarily by the rapid expansion of thewholesale and retail industries, reflecting a shift to a service-led economy. The value added and employmentof the wholesale and retail subsector grew at about 12per cent per annum between 2000 and 2005 (Table4.8). It was also the largest subsector, accounting for an overwhelming 99.6 per cent of the total valueadded of the non-dedicated support industry group. However, it accounted for only a quarter of the totalemployment in this industry group.
The Economic C
ontribution ofC
opyright-Based Industries in M
alaysia
145
Table 4.7 Contribution of Non-Dedicated Support Industries, 2000-2005
Chart 4.7 Value Added of Non-Dedicated Support Industries by Sector, 2005
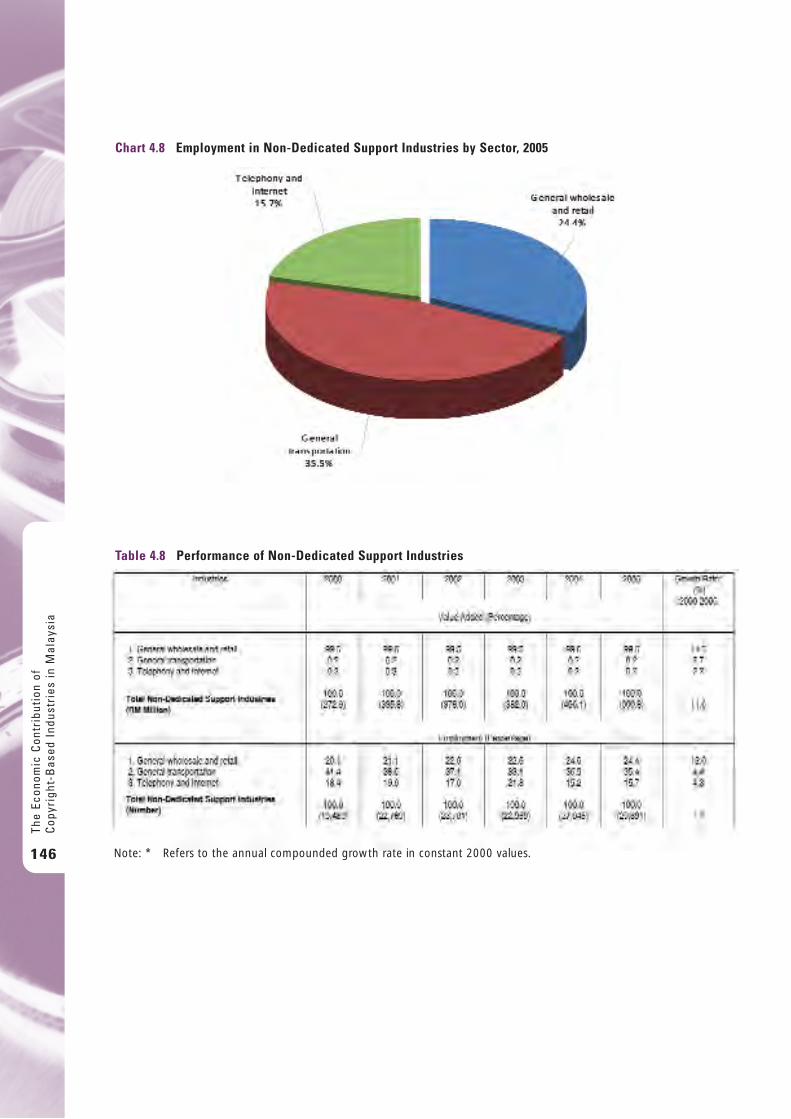
The
Econ
omic
Con
trib
utio
n of
Cop
yrig
ht-B
ased
Ind
ustr
ies
in M
alay
sia
146
Chart 4.8 Employment in Non-Dedicated Support Industries by Sector, 2005
Table 4.8 Performance of Non-Dedicated Support Industries
Note: * Refers to the annual compounded growth rate in constant 2000 values.
5 . P r o f i l e o f S e l e c t e d C o r e C o p y r i g h t I n d u s t r i e s
5.1 Press and LiteratureThe publishing industry is largely driven by the private sector, and caters for a relatively small3 but rapidlyexpanding domestic market. Vastly improved literacy and education levels, higher standards of living andincreased purchasing power have boosted the performance and prospects of the publishing industry.
There has also been renewed public policy support to revitalize the industry to keep abreast of developmentsin the other sectors of the economy. The Government recognizes the integral role of the publishing industryin fostering knowledge-based industries and in its drive to attain developed nation status by 2020.
The National Book Policy formulated in 1985 is being reviewed to transform the industry into a more vibrantand integrated publishing sector. Some key initiatives include strengthening the National Book Council tooversee the implementation of the National Book Policy, reviewing existing laws impinging upon theperformance of the publishing industry, and addressing outstanding issues and problems facing the industry.
The Government has carried out numerous reading campaigns to inculcate the reading habit amongstMalaysians. A Division for the Promotion of Reading was established in 1991 at the National Library. In2003, the Division was restructured into a section called the Information Literacy Movement Division toincorporate new literacy skills into information and communications technology. Since 1995, the month of August, recently changed to July, has been National Reading Month.
Value added in the publishing industry is currently estimated at RM1.8 billion; together with the printingindustry, this subsector accounted for about 44 per cent of core copyright industries. There are around 500publishers, though only an estimated one-third is very active. The majority of publishing companies aresmall privately owned companies with less than 50 employees (Ng, 2005). There are also some fully-ownedor quasi government bodies4, including the university press or publishing departments that carry out in-house publishing.
The activities of the publishing industry include the publication of: (1) serials, i.e. almanacs, annuals andyearbooks, bulletins and newsletters, directories and gazettes, indexes and abstracts, journals andperiodicals, laws and statutes, monograph series, newspapers, patents and standards, proceedings andtransactions published in all the four main languages spoken in the country, i.e. Bahasa Melayu (Malay),English, Chinese and Tamil (Norma Bahri, 1999); (2) books, i.e. school textbooks, including workbooks andreference books, novels, biographies and memoirs, travel books, cookbooks, inspirational and religiousbooks; (3) commercial printing, i.e. cards, envelopes, forms, brochures, posters/ advertising material andcalendars; (4) security printing, i.e. stamps, legal tender, bank forms and passbooks; (5) office supplyprinting, i.e. receipt books, business forms and invoices; (6) packaging materials; and (7) software-relatedprinting services such as typesetting, graphic illustration, imaging and Web design.
Publication of books for children and for the total educational market is currently the most lucrative. Parents are now more conscious of the need for an early start to education and are sending their children to preschools, thus creating increased demand for pre-school literature. There is also support from the
The Economic C
ontribution ofC
opyright-Based Industries in M
alaysia
147
3 The current rate of publication is less than 10,000 titles per year compared to Taiwan (whose population is comparable to Malaysia)which publishes about 30,000 titles annually. 4 The Government Printers, Percetakan Nasional, was corporatized in 1987 and is the main publisher for all government documentssuch as annual reports, laws and statues and brochures.
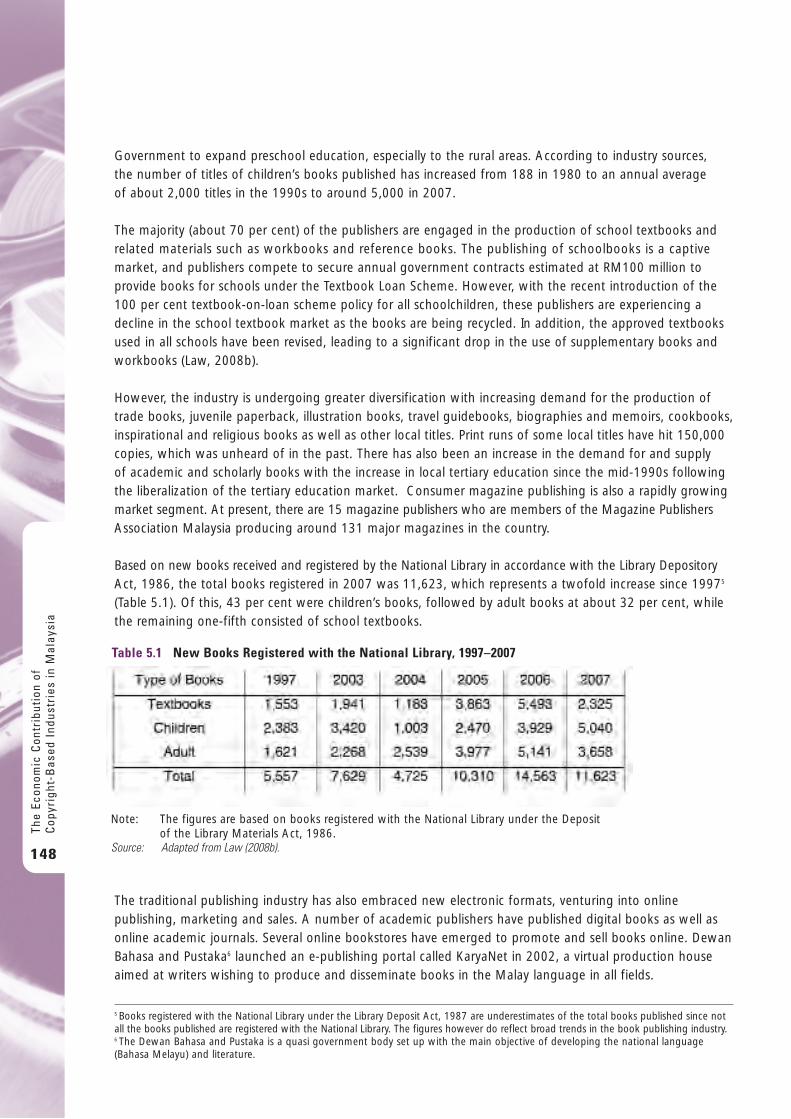
Government to expand preschool education, especially to the rural areas. According to industry sources, the number of titles of children’s books published has increased from 188 in 1980 to an annual average of about 2,000 titles in the 1990s to around 5,000 in 2007.
The majority (about 70 per cent) of the publishers are engaged in the production of school textbooks andrelated materials such as workbooks and reference books. The publishing of schoolbooks is a captivemarket, and publishers compete to secure annual government contracts estimated at RM100 million toprovide books for schools under the Textbook Loan Scheme. However, with the recent introduction of the100 per cent textbook-on-loan scheme policy for all schoolchildren, these publishers are experiencing adecline in the school textbook market as the books are being recycled. In addition, the approved textbooksused in all schools have been revised, leading to a significant drop in the use of supplementary books andworkbooks (Law, 2008b).
However, the industry is undergoing greater diversification with increasing demand for the production oftrade books, juvenile paperback, illustration books, travel guidebooks, biographies and memoirs, cookbooks,inspirational and religious books as well as other local titles. Print runs of some local titles have hit 150,000copies, which was unheard of in the past. There has also been an increase in the demand for and supply of academic and scholarly books with the increase in local tertiary education since the mid-1990s followingthe liberalization of the tertiary education market. Consumer magazine publishing is also a rapidly growingmarket segment. At present, there are 15 magazine publishers who are members of the Magazine PublishersAssociation Malaysia producing around 131 major magazines in the country.
Based on new books received and registered by the National Library in accordance with the Library DepositoryAct, 1986, the total books registered in 2007 was 11,623, which represents a twofold increase since 19975
(Table 5.1). Of this, 43 per cent were children’s books, followed by adult books at about 32 per cent, whilethe remaining one-fifth consisted of school textbooks.
The traditional publishing industry has also embraced new electronic formats, venturing into onlinepublishing, marketing and sales. A number of academic publishers have published digital books as well asonline academic journals. Several online bookstores have emerged to promote and sell books online. DewanBahasa and Pustaka6 launched an e-publishing portal called KaryaNet in 2002, a virtual production houseaimed at writers wishing to produce and disseminate books in the Malay language in all fields.
The
Econ
omic
Con
trib
utio
n of
Cop
yrig
ht-B
ased
Ind
ustr
ies
in M
alay
sia
148
Table 5.1 New Books Registered with the National Library, 1997–2007
Note: The figures are based on books registered with the National Library under the Deposit of the Library Materials Act, 1986.
Source: Adapted from Law (2008b).
5 Books registered with the National Library under the Library Deposit Act, 1987 are underestimates of the total books published since notall the books published are registered with the National Library. The figures however do reflect broad trends in the book publishing industry. 6 The Dewan Bahasa and Pustaka is a quasi government body set up with the main objective of developing the national language(Bahasa Melayu) and literature.
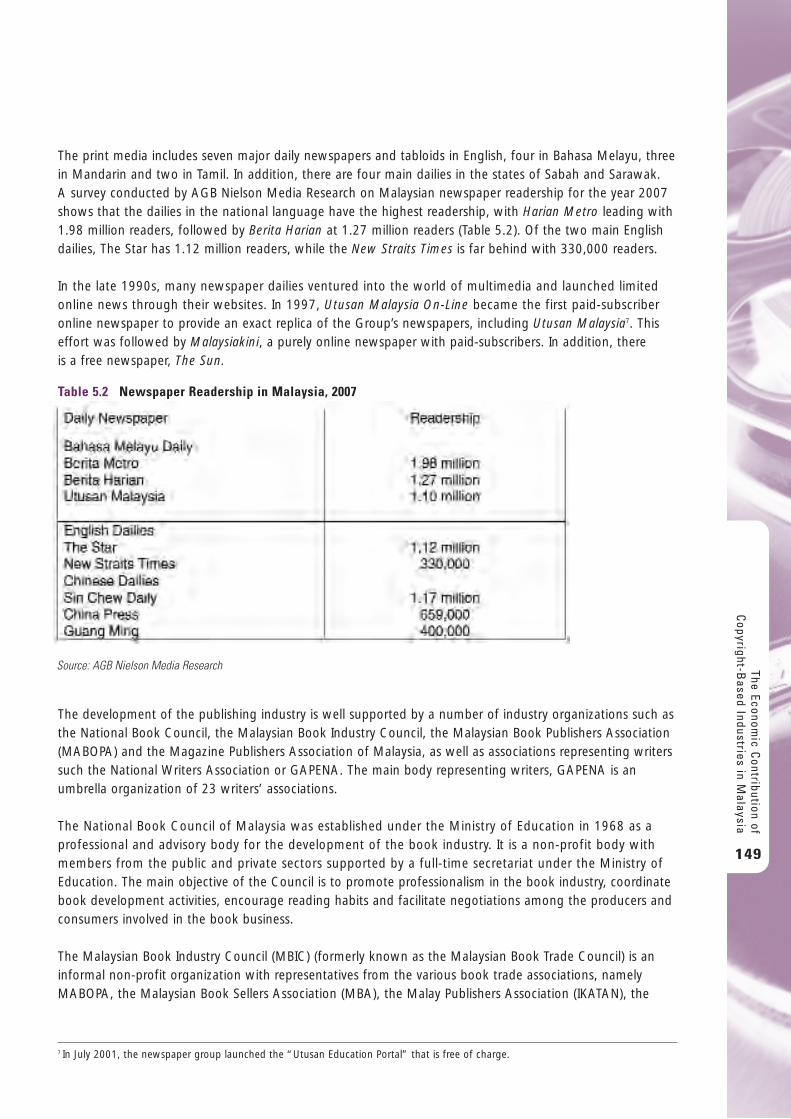
The print media includes seven major daily newspapers and tabloids in English, four in Bahasa Melayu, threein Mandarin and two in Tamil. In addition, there are four main dailies in the states of Sabah and Sarawak. A survey conducted by AGB Nielson Media Research on Malaysian newspaper readership for the year 2007shows that the dailies in the national language have the highest readership, with Harian Metro leading with1.98 million readers, followed by Berita Harian at 1.27 million readers (Table 5.2). Of the two main Englishdailies, The Star has 1.12 million readers, while the New Straits Times is far behind with 330,000 readers.
In the late 1990s, many newspaper dailies ventured into the world of multimedia and launched limitedonline news through their websites. In 1997, Utusan Malaysia On-Line became the first paid-subscriberonline newspaper to provide an exact replica of the Group’s newspapers, including Utusan Malaysia7. Thiseffort was followed by Malaysiakini, a purely online newspaper with paid-subscribers. In addition, there is a free newspaper, The Sun.
The development of the publishing industry is well supported by a number of industry organizations such asthe National Book Council, the Malaysian Book Industry Council, the Malaysian Book Publishers Association(MABOPA) and the Magazine Publishers Association of Malaysia, as well as associations representing writerssuch the National Writers Association or GAPENA. The main body representing writers, GAPENA is anumbrella organization of 23 writers’ associations.
The National Book Council of Malaysia was established under the Ministry of Education in 1968 as aprofessional and advisory body for the development of the book industry. It is a non-profit body withmembers from the public and private sectors supported by a full-time secretariat under the Ministry ofEducation. The main objective of the Council is to promote professionalism in the book industry, coordinatebook development activities, encourage reading habits and facilitate negotiations among the producers andconsumers involved in the book business.
The Malaysian Book Industry Council (MBIC) (formerly known as the Malaysian Book Trade Council) is aninformal non-profit organization with representatives from the various book trade associations, namelyMABOPA, the Malaysian Book Sellers Association (MBA), the Malay Publishers Association (IKATAN), the
The Economic C
ontribution ofC
opyright-Based Industries in M
alaysia
149
7 In July 2001, the newspaper group launched the “Utusan Education Portal” that is free of charge.
Table 5.2 Newspaper Readership in Malaysia, 2007
Source: AGB Nielson Media Research
Malaysian Book Importers Association (MBIA) and the Malaysian Book Contractors Association (MBCA). In1993, MBIC set up a company called the Malaysian Book Promotion Sdn. Bhd. with equal paid-up capital byall members except MBCA. One of the main functions of the MBIC is to help manage and organize theKuala Lumpur International Book Fair. The Malaysian Book Publishers Association (MABOPA) established in1969 represents about 150 publishers. It is the main organization that liaises with the Government onbehalf of the publishing companies to represent and advance the interests of the industry.
The publishing industry faces stiff competition from imported books which are superior in content andquality and offer wider variety for general reading. More than 60 per cent of the academic and universitybooks are currently imported (Ng, 2005). The majority of the local authors view writing as a hobby or asecondary profession and hence pay scant attention to their copyright. The level of copyright awarenessamong authors is low and some authors prefer to sell their publishing rights to the publisher in return for alump sum payment. There is a need for industry organizations to play a greater role in promoting copyrightawareness among writers and authors.
Many of the publishing companies are small and encounter difficulties in accessing funds to modernize their operations. Industry players attribute this to low market demand, short shelf life for Malaysian books in major chain stores, high distribution costs and overheads. Retailers are also known to demand highdiscounts, and many publishers sell on a consignment basis and hence shoulder the risks in the event of poor sales.
The reading culture in the country has improved significantly with the increasing level of education andpurchasing power, but in contrast to many countries in a similar stage of development, Malaysia’s traditionof book authorship, readership and ownership remains relatively weak. Malaysian books have yet to make astrong presence in the global market.
Book piracy and infringement through illegal photocopying, especially by university students, is a perennialproblem. At present, there is no copyright collecting society for the publishing industry. Also known as rightsreproduction organizations (RROs), they play an important role in protecting the copyright of authors andpublishers of educational materials by licensing the copying of such publications (Law, 2008a).
The advent of information technology has altered the landscape of the publishing industry, posing tremendouschallenges and opportunities. The growth of the Internet and portable technology such as e-books orpersonal digital assistants (PDAs) has spurred the growth of electronic publishing or e-publishing. Publishersare now compelled to rise to new challenges of delivering content to consumers in new formats. Authorstoo can take advantage of these new developments by turning into publishers by publishing their ownbooks online at minimal or zero cost.
Though the industry faces enormous challenges, there are a number of positive factors that augur well forthe growth and development of the publishing industry. These include the relatively high level of literacy,strong State support for education at all levels, rapid expansion of private tertiary education, strongemphasis on and commitment to the development of information technology, and an overall positiveinvestment climate.
The
Econ
omic
Con
trib
utio
n of
Cop
yrig
ht-B
ased
Ind
ustr
ies
in M
alay
sia
150
5.2 Music, Theatrical Production and Opera
The Music IndustryMusic, theatrical production and opera as a whole is a relatively small subsector of the core copyrightindustry group, accounting for some three per cent of value added and employment in 2005. The musicindustry is a highly competitive industry and faces tremendous challenges and opportunities following rapidadvancements in ICTs.
The industry has undergone significant transformation worldwide and the Malaysian music industry is noexception. The local industry has evolved from music entertainment via the Radio Malaya stations in the1940s to gramophone records in the 1950s, vinyl records and open-reel tape recorders in the 1960s, and hi-fi systems in the 1970s. Since the 1970s, technological advancements have made music cheaper andmore accessible to a wider audience through the mass production of radios, cassette players and cartridges.The increasing affluence of Malaysians and the international demonstration effects on the local music scenehave contributed to the expansion and diversification of the local music industry. The 1970s witnessed thegrowth of new musical outlets such as dance clubs and discos, while in the latter part of the 1980s karaokeoutlets were set up. By the mid-1990s, compact discs (CDs) were popular and became the main medium for musical videos. The advent of CDs has revolutionized the entire music industry and has heightenedchallenges in addressing piracy.
Currently, there are about 65 active recording companies in Malaysia and the main players include UniversalMusic Malaysia8, Warner Music, EMI and Sony BMG. Together they control some 80 per cent of the musicmarket in Malaysia. These are large global companies with a local presence, and they control the manufacture,marketing, sales and distribution of recorded music through a network of subsidiaries, joint ventures andlicensees. There are also a handful of successful home-based independent recording companies such as LifeRecords (Manisekaran, 2005).
The value chain in the music industry consists of five key areas: artistes and repertoire, recording, production,marketing and sales. Each of these operates as a unique component of the music industry but with multipleclose ties between the various individuals such as artistes, songwriters, composers, musicians and producers,who in turn deal with the record companies, production houses, recording studios and publishers.
One of the foremost challenges facing the industry is piracy. Technology has drastically altered access tomusic products. Previously, customers had to purchase music products from retail outlets, but now they canresort to pirated sources, own devices or the Internet. The incidence of piracy has increased with the adventof optical discs that ensure high-quality reproduction of music. Those peddling pirated music are able to sellat unimaginably low prices and such pirated music is readily available in major stores, let alone open nightmarkets. Producers of genuine music find it exceedingly difficult to compete with these pirated versions astheir average costs are greater due to sales tax, advertisements, royalties and higher overheads. Technologicaladvancements and competitively priced technological gadgets have also enabled customers to create theirown optical discs. The availability of CD burners along with personal computers allows users to burn CDsfor personal consumption as well as for sale using one master CD.
The Economic C
ontribution ofC
opyright-Based Industries in M
alaysia
151
8 Universal Music Malaysia was formed in 1995 as the Malaysian branch of the Universal Music Group (UMG). In 1998 it merged withPolygram Recording Company that was in existence since 1988. UMG leads the music industry accounting for about a quarter of theglobal sales.
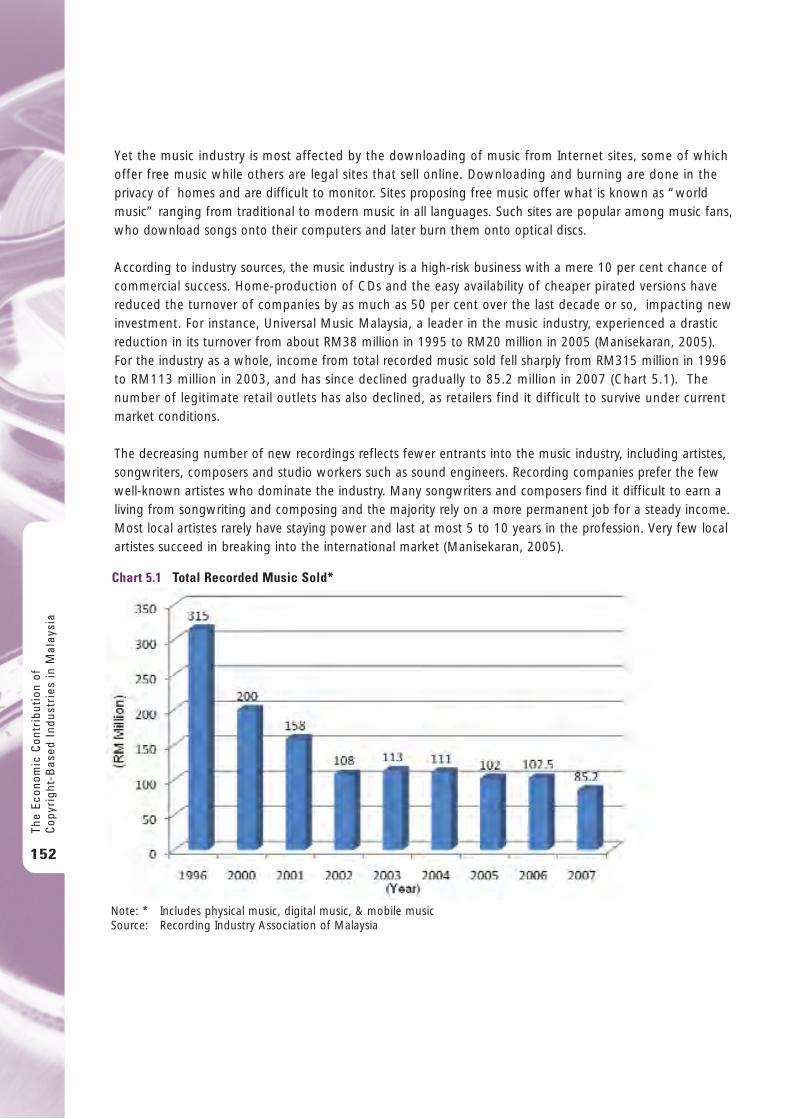
Yet the music industry is most affected by the downloading of music from Internet sites, some of whichoffer free music while others are legal sites that sell online. Downloading and burning are done in theprivacy of homes and are difficult to monitor. Sites proposing free music offer what is known as “worldmusic” ranging from traditional to modern music in all languages. Such sites are popular among music fans,who download songs onto their computers and later burn them onto optical discs.
According to industry sources, the music industry is a high-risk business with a mere 10 per cent chance ofcommercial success. Home-production of CDs and the easy availability of cheaper pirated versions havereduced the turnover of companies by as much as 50 per cent over the last decade or so, impacting newinvestment. For instance, Universal Music Malaysia, a leader in the music industry, experienced a drasticreduction in its turnover from about RM38 million in 1995 to RM20 million in 2005 (Manisekaran, 2005).For the industry as a whole, income from total recorded music sold fell sharply from RM315 million in 1996to RM113 million in 2003, and has since declined gradually to 85.2 million in 2007 (Chart 5.1). Thenumber of legitimate retail outlets has also declined, as retailers find it difficult to survive under currentmarket conditions.
The decreasing number of new recordings reflects fewer entrants into the music industry, including artistes,songwriters, composers and studio workers such as sound engineers. Recording companies prefer the fewwell-known artistes who dominate the industry. Many songwriters and composers find it difficult to earn aliving from songwriting and composing and the majority rely on a more permanent job for a steady income.Most local artistes rarely have staying power and last at most 5 to 10 years in the profession. Very few localartistes succeed in breaking into the international market (Manisekaran, 2005).
The
Econ
omic
Con
trib
utio
n of
Cop
yrig
ht-B
ased
Ind
ustr
ies
in M
alay
sia
152
Chart 5.1 Total Recorded Music Sold*
Note: * Includes physical music, digital music, & mobile musicSource: Recording Industry Association of Malaysia
Apart from piracy that has cut into their margins, the music industry has been battling rising productioncosts. There has been a sharp increase in advertising and marketing costs. Every media platform, such asradio, TV, press and magazine, has raised advertising rates for the music industry by more than 30 per cent.The recent petrol price hike has likewise pushed up distribution and delivery costs.
On a positive note, concerts and performances have become a valuable source of income for artistes. Bygiving live performances, artistes have been able to showcase their skills and talents, improve their stagecraftand help market their albums. In addition, the Annual Music Industry Award (Anugerah Industri Muzik),introduced in 1994 to honor local talents and give due recognition to artistes, musicians, composers, producersand others involved in the production of an album, has been a resounding success. It has been able tocommand an extensive television viewership, capture a regional audience and help promote artistes, bothlocally and regionally.
The interests of the music industry in Malaysia are represented by the Recording Industry Association of Malaysia (RIM). This body currently represents 112 recording companies engaged in the production,manufacturing and distribution of local and international sound, music video and karaoke recordings, whichaccount for some 95 per cent of the legitimate recordings in the music market9. Its main functions includethe protection of intellectual property rights of recording companies and the rights of the artistes, as well asmonitoring and reviewing legislation, regulation and policies affecting the music industry. It works with theGovernment at various levels to fight music piracy.
In 2000, an umbrella body called the Persatuan Karyawan Malaysia or KARYAWAN was formed to look after the welfare of all creative and performing artistes in Malaysia, i.e. all those involved in the music, film,entertainment and broadcasting industries. Its objectives go beyond the protection of copyright to include a wide range of issues facing the local entertainment industry, such as:
• Limited formal representation at the governmental level;• Unemployment of musicians, singers and actors;• Lack of talent sourcing activities; • Lack of long-term financial retirement plan;• Lack of social or welfare services;• Lack of professional training and education;• Lack of management know-how;• Lack of protection for artistes’ rights.
KARYAWAN has successfully initiated a number of programs to assist those in the entertainment industry.With respect to the financial retirement plan, KARYAWAN had created a pension scheme in 2004 forlegendary and veteran artistes who had made an invaluable contribution to the country’s entertainmentindustry. Since the creation of the pension scheme, eight legendary artistes who had contributed immenselyto the arts and entertainment industry have been receiving a total of RM500 per month and will continue todo so for the rest of their lives (Manisekaran, 2005).
In an attempt to revive the spirit of the local artistes and to discover hidden talents, a new program calledAkademi Fantasia was introduced in 2003 with the support of the private pay station ASTRO. This annualevent has been well received by the Malaysian public and has led to the discovery of new talents.
The Economic C
ontribution ofC
opyright-Based Industries in M
alaysia
153
9 Source: Recording Industry of Malaysia: http://www.rim.org.my.
A number of measures have been introduced by the Government to address piracy inherent in the musicindustry. A high-level Task Force was formed in 1999 consisting of relevant government bodies and industrymembers to seek solutions to reduce the incidence of piracy. In 2003, a National Anti-Piracy Campaign waslaunched with the support of local artistes and the recording industries.
The Optical Discs Act was introduced in 2000 to curb piracy at the manufacturing level. The manufacturingof optical discs could not take place without a valid license and a manufacturing code. Manufacturers arealso required to keep records of raw materials, suppliers and customers. Forensic tests have been carried outon seized optical discs in order to trace the source of production. Hologram stickers were introduced in200210 to enable customers to distinguish between counterfeit and original products. The stickers wereplaced on all mediums or devices on which data may be stored in digital form and read by means of laser orany other means such as CD, VCD, CD ROM, DVD, LD, video cassette or audio cassette. The enforcementdivision was beefed up with additional manpower to ensure effective enforcement of the Copyright Act. All of these measures have led to a drop in the incidence of piracy in the country.
Theatrical Production and OperaThe performing arts industry in the country can be divided into traditional vs modern or contemporary theatre.
Traditional theatre in Malaysia long remained a very small industry with the majority of performers workingon a part-time basis. At present, traditional theatre is performed at functions and arts festivals and is closelyassociated with the tourism industry and the promotion of national culture and heritage. Performances arealso put on at the international level as part and parcel of arts festivals and tourism promotions.
Traditional theatre essentially consists of the Malay Opera or Bangsawan, the Mak Yong,11 a traditionaldance-drama, and the Wayang Kulit or shadow puppet performance. The Malay Opera was a popular formof entertainment until the advent of television. The Wayang Kulit is the most well known of the performingarts outside Malaysia and is most popular in the state of Kelantan. Like dance drama, the impact of cinemaand television has resulted in a decline in the art form. Today, there are only a handful of master puppeteersknown as dalangs. The Chinese opera which was popular until the 1960s is now a fading industry.
Modern Malaysian theatre on the other hand first emerged in the capital city of Kuala Lumpur, and todaythere are companies and theatres in major cities around the country. Given the cultural diversity of thecountry, contemporary Malaysian theatre is diverse with productions in Bahasa Melayu, Chinese, Tamil and English. They include art forms ranging from comedy and mime to puppetry and children’s theatre.
Contemporary theatre has made a comeback with the emergence of a number of new production companiessince the late 1980s. These new companies established by some of the leading playwrights, actors anddancers have contributed to the growing professionalism and profitability of the performing arts industry,giving rise to a new breed of artistes who are able to survive solely as artistes.
Some of the leading companies that have taken the performing arts industry to new heights include The ActorsStudio (TAS), The Five Arts Centre12, Instant Café’ Theatre and the Sutra Dance Company. The largest ofthese is TAS, which was set up by a husband-and-wife team in 1989 to stage meaningful theatre, nurtureperforming arts in the young, and provide training in acting, music, dance, creative movement, creativewriting, singing and production.13
The
Econ
omic
Con
trib
utio
n of
Cop
yrig
ht-B
ased
Ind
ustr
ies
in M
alay
sia
154
10 The Trade Description (Original Label) Order 2002 took effect from 15 January 2003.11 Mak Yong is a traditional form of dance-drama from Pattani and Kelantan performed by all female casts. Similar to Mak Yong is thedance-drama of Kedah, known as Mek Mulong.12 The Five Arts Centre was established in 1983.13 Source: TAS: http://www.theactorsstudio.com.my
TAS took the lead in the 1990s to improve the marketing and publicity of theatrical performances by successfullysoliciting corporate sponsorship. Today, corporate support of the performing arts has increased within thecontext of corporate social responsibility.
TAS has actively engaged in the establishment of performance venues to ensure adequate space is availablefor regular performances. In 2005, TAS joined forces with another social and cultural foundation, Penyayang,establishing the Kuala Lumpur Performing Arts Centre (KLPAC) with corporate support. Today, KLPAC hasbecome a national hub for performing arts in the country. KLPAC is well-equipped, with several studios andauditoriums and a performing arts academy. The Centre carries out professional training, workshops andlectures in all forms of performing arts.
State commitment to the performing arts had strengthened with the establishment of a separate new Ministryof Culture, Arts and Heritage14 in 2004 to promote and develop the industry. The new Ministry, now knownas the Ministry of Unity, Culture, Arts and Heritage, has a wide range of programs to “highlight and popularizethe arts and culture” and to “preserve the national heritage in its tangible and intangible form”.
5.3 Motion Picture and VideoThe local film industry essentially consists of the Malay film industry that produces largely for the local Malaymarket. In recent years, however, a more Malaysian outlook has evolved with the emergence of a group ofindependent film makers whose low-budget productions are targeted at a wider international audience.15
Until the 1980s when the National Film Development Corporation (FINAS) was established, the local filmindustry was primarily driven by the private sector. However, the establishment of FINAS in 1981 set thestage for a larger State role in the film industry. The main objectives of FINAS are to promote, maintain andfacilitate the development of the film industry in the country. In line with these objectives, the Corporationprovides training, financial assistance, facilities and amenities, equipment, research and marketing. It alsomaintains a resource centre and grants licenses to members of the film industry.16
FINAS provides financial assistance under various schemes. Financing for the production of quality short films,documentary or animation, including script development, is provided under the Film Art and MultimediaDevelopment Fund, which is managed by a committee comprising film-makers and film activists. Loans are also available under the Feature Film Loan Scheme handled by the Ministry of Unity, Culture, Arts andHeritage, FINAS and the Small and Medium Enterprise Bank. Funds are available for production costs as well as for publicity and promotion. Financing of up to RM1.5 million or not more than 90 per cent ofproduction costs, whichever is lower, is available at an interest rate of four per cent per annum.
FINAS certifies all films produced in Malaysia, and principal photography cannot commence in the absenceof a valid license from FINAS. A valid producer’s license (also issued by FINAS) is a prerequisite for applyingfor a film license. All crew and cast must be registered with FINAS or be members of associations approvedby FINAS.
Although access to exhibitions remains a contentious issue for Malaysian producers, FINAS does requiremandatory screening of all films it certifies as Malaysian filmed in Bahasa Melayu. Syarat Wajib Tayang orthe Compulsory Screening Scheme requires exhibitors to screen certified films for a minimum of sevenconsecutive days, after which the exhibitor can make a commercial determination about whether to extend
The Economic C
ontribution ofC
opyright-Based Industries in M
alaysia
155
14 Previously, arts and culture was combined under the tourism industry and was known as Ministry of Culture, Arts and Tourism. 15 This group is led by producers like Amir Muhammad, James Lee, and Yasmin Ahmad. While their films have won accolades overseas,they continue to face difficulties at home, particularly with regard to censorship.16 Source: FINAS, http//:www.finas.gov.my.
the season. FINAS also determines the release dates for certified films in order to ensure that they are spreadthroughout the year and to avoid too many competing for audiences simultaneously.
A government entertainment tax of 25 per cent applies to cinema tickets. Producers of certified Bahasa Melayulanguage feature films can qualify for the Entertainment Tax Returns. For every Malaysian Ringgit of cinematax raised from the release of certified films, 25 per cent is retained by the Government and the balance issplit equally between the exhibitor and the producer.
With technological advancements such as digital video cameras, animation, graphic and editing software is readily available and affordable and has equipped the younger generation with the tools to make films.This has led to the emergence of a new breed of young independent film-makers with a more multiracialapproach to film-making. Their films are produced in English or in languages commonly used in the countryand hence fail to qualify for State support from FINAS. These films often have to battle with film censorshipas they are deemed contrary to the local Malay culture.
Production of local movies has doubled, rising from 16 movies in 2003 to 30 movies in 2007 (Table 5.3).Likewise, the total number of other types of productions, such as drama, documentary and animation,increased steadily from 375 in 2003 to 527 in 2007 or by some 41 per cent. However, the cost of producingmovies has escalated. The average cost of producing local movies increased by about 15 per cent fromRM1.48 million in 2003 to RM1.7 million in 2007, while for other productions the increase was around 13 per cent over this period. The production of commercials also increased from 1,232 in 2003 to 1,677 in 2007. However, there was a noticeable decline in their average cost of production from RM0.08 millionto RM 0.04 million or by 50 per cent during this period.
Local films face stiff competition from imported films. The total number of all types of films17 importedincreased from 8,723 in 2004 to 9,282 in 2007. The Malaysian film market is multilingual, and the differentmarket segments are served by films from the leading film industry centers around the world. The MalaysianIndian community is served by films from India, the Malaysian Chinese population by films from China,Hong Kong, Singapore and Taiwan and, given the similarity between Bahasa Melayu and Bahasa Indonesia,there is a ready local market for Indonesian films. In addition, local films have to compete with audiovisualmaterial, including music from South Korea and Japan.
The
Econ
omic
Con
trib
utio
n of
Cop
yrig
ht-B
ased
Ind
ustr
ies
in M
alay
sia
156
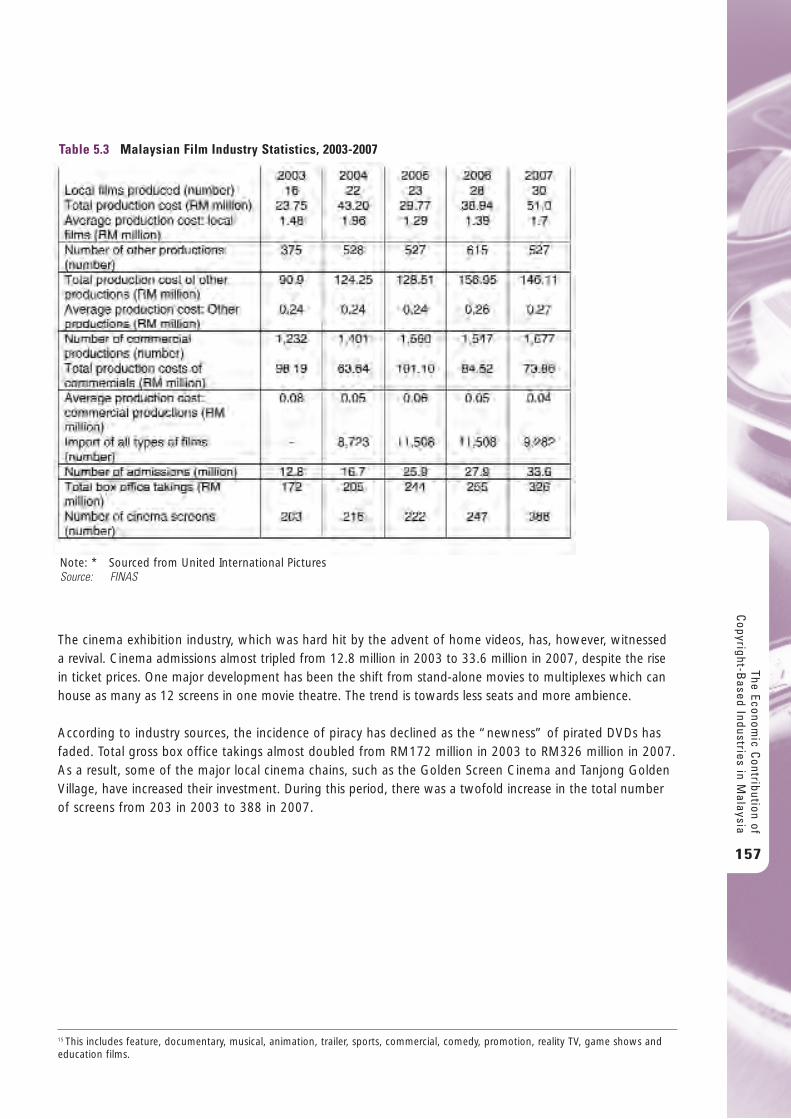
The cinema exhibition industry, which was hard hit by the advent of home videos, has, however, witnesseda revival. Cinema admissions almost tripled from 12.8 million in 2003 to 33.6 million in 2007, despite the risein ticket prices. One major development has been the shift from stand-alone movies to multiplexes which canhouse as many as 12 screens in one movie theatre. The trend is towards less seats and more ambience.
According to industry sources, the incidence of piracy has declined as the “newness” of pirated DVDs hasfaded. Total gross box office takings almost doubled from RM172 million in 2003 to RM326 million in 2007.As a result, some of the major local cinema chains, such as the Golden Screen Cinema and Tanjong GoldenVillage, have increased their investment. During this period, there was a twofold increase in the total numberof screens from 203 in 2003 to 388 in 2007.
The Economic C
ontribution ofC
opyright-Based Industries in M
alaysia
157
Table 5.3 Malaysian Film Industry Statistics, 2003-2007
Note: * Sourced from United International PicturesSource: FINAS
15 This includes feature, documentary, musical, animation, trailer, sports, commercial, comedy, promotion, reality TV, game shows andeducation films.
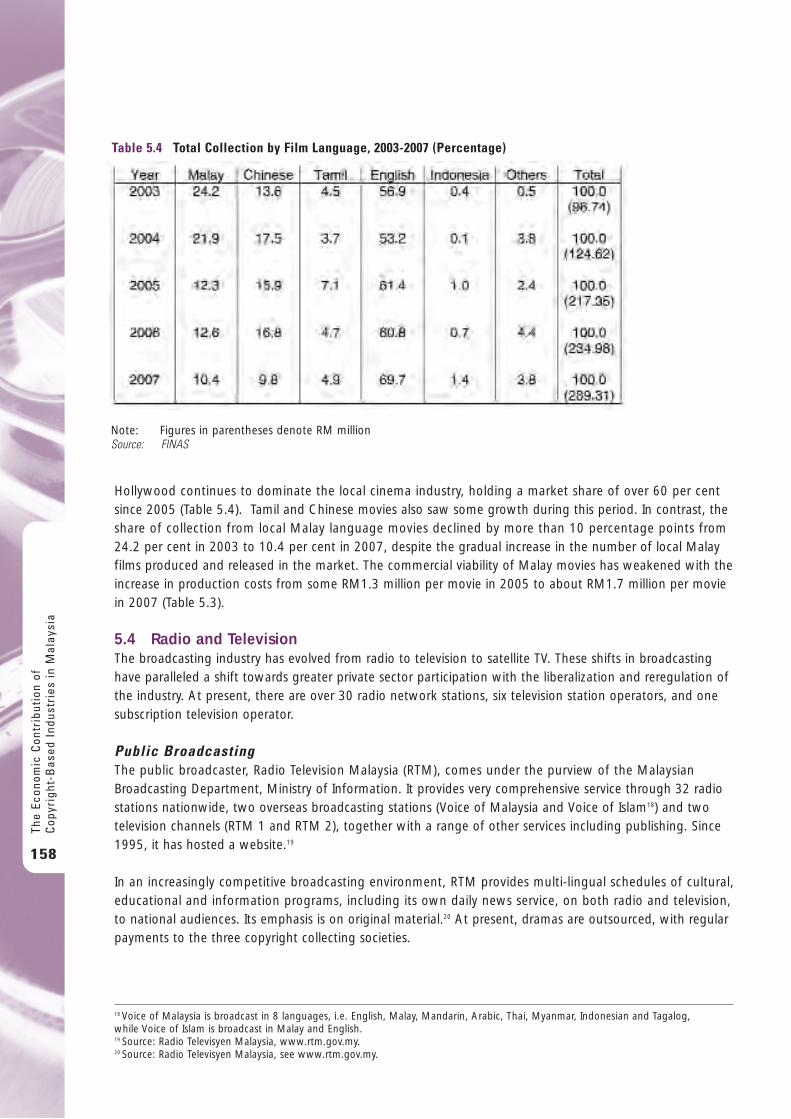
Hollywood continues to dominate the local cinema industry, holding a market share of over 60 per centsince 2005 (Table 5.4). Tamil and Chinese movies also saw some growth during this period. In contrast, theshare of collection from local Malay language movies declined by more than 10 percentage points from24.2 per cent in 2003 to 10.4 per cent in 2007, despite the gradual increase in the number of local Malayfilms produced and released in the market. The commercial viability of Malay movies has weakened with theincrease in production costs from some RM1.3 million per movie in 2005 to about RM1.7 million per moviein 2007 (Table 5.3).
5.4 Radio and TelevisionThe broadcasting industry has evolved from radio to television to satellite TV. These shifts in broadcastinghave paralleled a shift towards greater private sector participation with the liberalization and reregulation ofthe industry. At present, there are over 30 radio network stations, six television station operators, and onesubscription television operator.
Public BroadcastingThe public broadcaster, Radio Television Malaysia (RTM), comes under the purview of the MalaysianBroadcasting Department, Ministry of Information. It provides very comprehensive service through 32 radiostations nationwide, two overseas broadcasting stations (Voice of Malaysia and Voice of Islam18) and twotelevision channels (RTM 1 and RTM 2), together with a range of other services including publishing. Since1995, it has hosted a website.19
In an increasingly competitive broadcasting environment, RTM provides multi-lingual schedules of cultural,educational and information programs, including its own daily news service, on both radio and television, to national audiences. Its emphasis is on original material.20 At present, dramas are outsourced, with regularpayments to the three copyright collecting societies.
The
Econ
omic
Con
trib
utio
n of
Cop
yrig
ht-B
ased
Ind
ustr
ies
in M
alay
sia
158
Table 5.4 Total Collection by Film Language, 2003-2007 (Percentage)
Note: Figures in parentheses denote RM million Source: FINAS
18 Voice of Malaysia is broadcast in 8 languages, i.e. English, Malay, Mandarin, Arabic, Thai, Myanmar, Indonesian and Tagalog, while Voice of Islam is broadcast in Malay and English.19 Source: Radio Televisyen Malaysia, www.rtm.gov.my.20 Source: Radio Televisyen Malaysia, see www.rtm.gov.my.
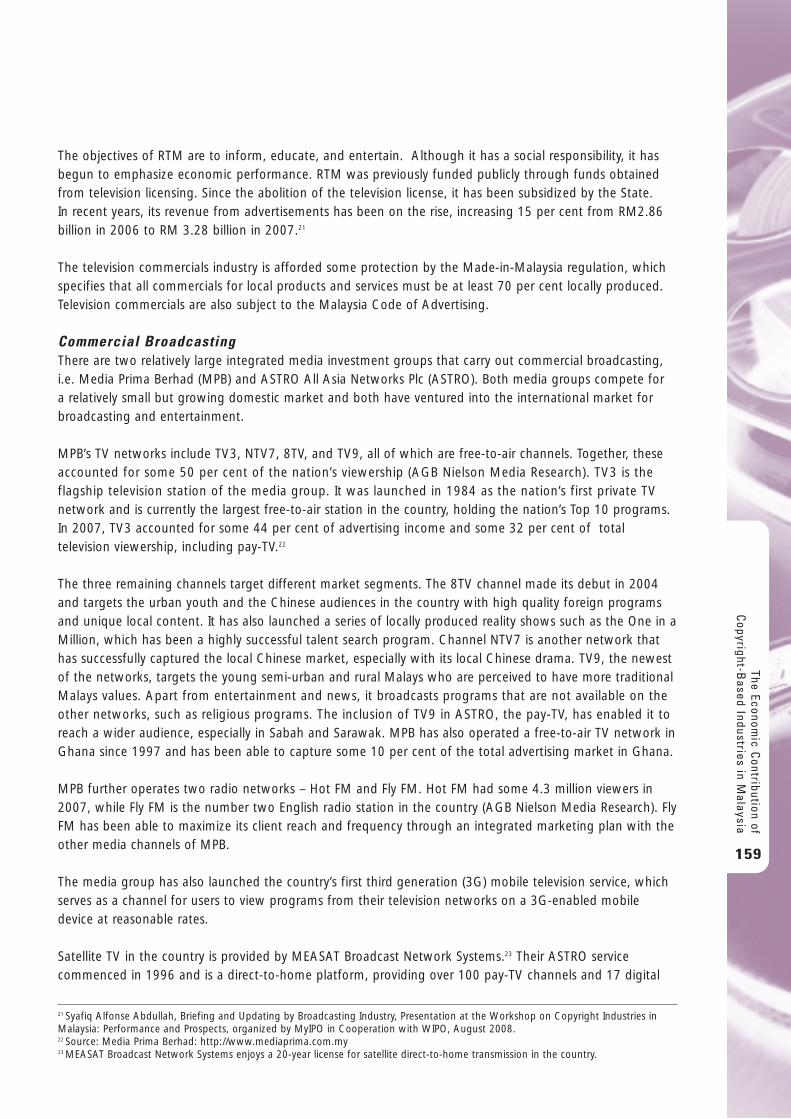
The objectives of RTM are to inform, educate, and entertain. Although it has a social responsibility, it hasbegun to emphasize economic performance. RTM was previously funded publicly through funds obtainedfrom television licensing. Since the abolition of the television license, it has been subsidized by the State. In recent years, its revenue from advertisements has been on the rise, increasing 15 per cent from RM2.86billion in 2006 to RM 3.28 billion in 2007.21
The television commercials industry is afforded some protection by the Made-in-Malaysia regulation, whichspecifies that all commercials for local products and services must be at least 70 per cent locally produced.Television commercials are also subject to the Malaysia Code of Advertising.
Commercial BroadcastingThere are two relatively large integrated media investment groups that carry out commercial broadcasting,i.e. Media Prima Berhad (MPB) and ASTRO All Asia Networks Plc (ASTRO). Both media groups compete for a relatively small but growing domestic market and both have ventured into the international market forbroadcasting and entertainment.
MPB’s TV networks include TV3, NTV7, 8TV, and TV9, all of which are free-to-air channels. Together, theseaccounted for some 50 per cent of the nation’s viewership (AGB Nielson Media Research). TV3 is theflagship television station of the media group. It was launched in 1984 as the nation’s first private TVnetwork and is currently the largest free-to-air station in the country, holding the nation’s Top 10 programs.In 2007, TV3 accounted for some 44 per cent of advertising income and some 32 per cent of totaltelevision viewership, including pay-TV.22
The three remaining channels target different market segments. The 8TV channel made its debut in 2004and targets the urban youth and the Chinese audiences in the country with high quality foreign programsand unique local content. It has also launched a series of locally produced reality shows such as the One in aMillion, which has been a highly successful talent search program. Channel NTV7 is another network thathas successfully captured the local Chinese market, especially with its local Chinese drama. TV9, the newestof the networks, targets the young semi-urban and rural Malays who are perceived to have more traditionalMalays values. Apart from entertainment and news, it broadcasts programs that are not available on theother networks, such as religious programs. The inclusion of TV9 in ASTRO, the pay-TV, has enabled it toreach a wider audience, especially in Sabah and Sarawak. MPB has also operated a free-to-air TV network inGhana since 1997 and has been able to capture some 10 per cent of the total advertising market in Ghana.
MPB further operates two radio networks – Hot FM and Fly FM. Hot FM had some 4.3 million viewers in2007, while Fly FM is the number two English radio station in the country (AGB Nielson Media Research). FlyFM has been able to maximize its client reach and frequency through an integrated marketing plan with theother media channels of MPB.
The media group has also launched the country’s first third generation (3G) mobile television service, whichserves as a channel for users to view programs from their television networks on a 3G-enabled mobiledevice at reasonable rates.
Satellite TV in the country is provided by MEASAT Broadcast Network Systems.23 Their ASTRO servicecommenced in 1996 and is a direct-to-home platform, providing over 100 pay-TV channels and 17 digital
The Economic C
ontribution ofC
opyright-Based Industries in M
alaysia
159
21 Syafiq Alfonse Abdullah, Briefing and Updating by Broadcasting Industry, Presentation at the Workshop on Copyright Industries inMalaysia: Performance and Prospects, organized by MyIPO in Cooperation with WIPO, August 2008. 22 Source: Media Prima Berhad: http://www.mediaprima.com.my23 MEASAT Broadcast Network Systems enjoys a 20-year license for satellite direct-to-home transmission in the country.
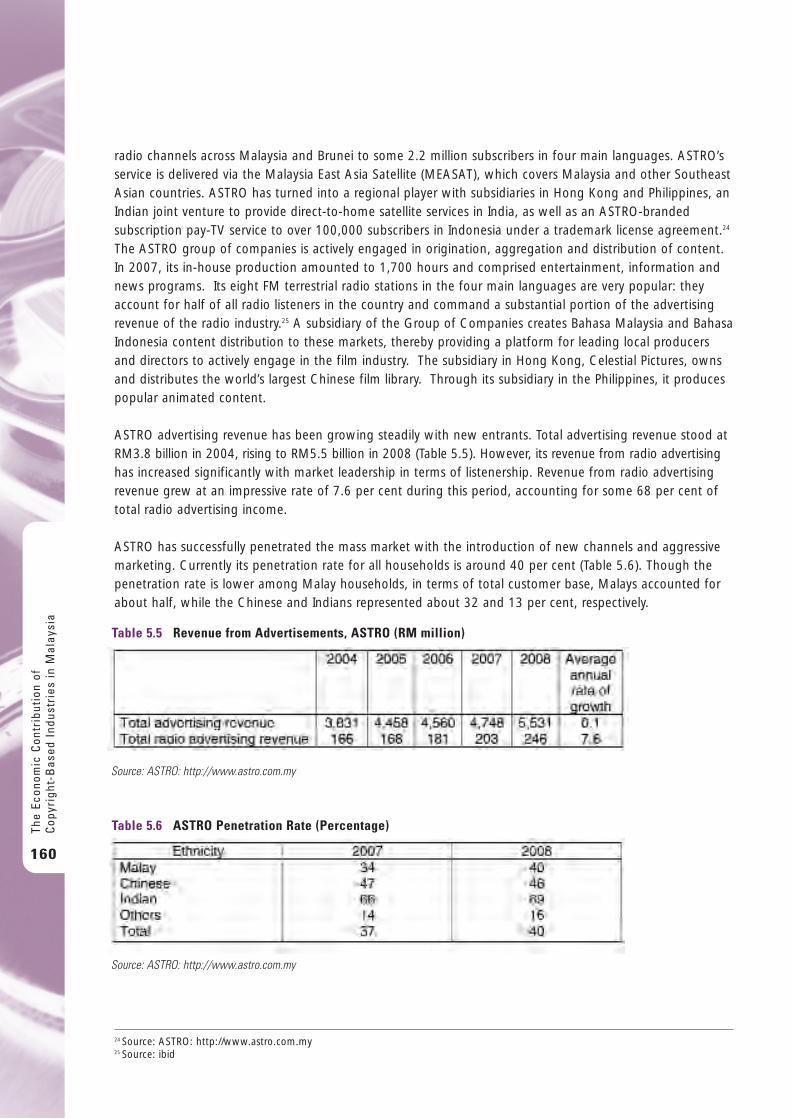
radio channels across Malaysia and Brunei to some 2.2 million subscribers in four main languages. ASTRO’sservice is delivered via the Malaysia East Asia Satellite (MEASAT), which covers Malaysia and other SoutheastAsian countries. ASTRO has turned into a regional player with subsidiaries in Hong Kong and Philippines, anIndian joint venture to provide direct-to-home satellite services in India, as well as an ASTRO-brandedsubscription pay-TV service to over 100,000 subscribers in Indonesia under a trademark license agreement.24
The ASTRO group of companies is actively engaged in origination, aggregation and distribution of content.In 2007, its in-house production amounted to 1,700 hours and comprised entertainment, information andnews programs. Its eight FM terrestrial radio stations in the four main languages are very popular: theyaccount for half of all radio listeners in the country and command a substantial portion of the advertisingrevenue of the radio industry.25 A subsidiary of the Group of Companies creates Bahasa Malaysia and BahasaIndonesia content distribution to these markets, thereby providing a platform for leading local producersand directors to actively engage in the film industry. The subsidiary in Hong Kong, Celestial Pictures, ownsand distributes the world’s largest Chinese film library. Through its subsidiary in the Philippines, it producespopular animated content.
ASTRO advertising revenue has been growing steadily with new entrants. Total advertising revenue stood atRM3.8 billion in 2004, rising to RM5.5 billion in 2008 (Table 5.5). However, its revenue from radio advertisinghas increased significantly with market leadership in terms of listenership. Revenue from radio advertisingrevenue grew at an impressive rate of 7.6 per cent during this period, accounting for some 68 per cent oftotal radio advertising income.
ASTRO has successfully penetrated the mass market with the introduction of new channels and aggressivemarketing. Currently its penetration rate for all households is around 40 per cent (Table 5.6). Though thepenetration rate is lower among Malay households, in terms of total customer base, Malays accounted forabout half, while the Chinese and Indians represented about 32 and 13 per cent, respectively.
The
Econ
omic
Con
trib
utio
n of
Cop
yrig
ht-B
ased
Ind
ustr
ies
in M
alay
sia
160
24 Source: ASTRO: http://www.astro.com.my25 Source: ibid
Table 5.5 Revenue from Advertisements, ASTRO (RM million)
Source: ASTRO: http://www.astro.com.my
Table 5.6 ASTRO Penetration Rate (Percentage)
Source: ASTRO: http://www.astro.com.my
5.5 Software and DatabasesThe software and databases industry is one of the fastest-growing sectors in the economy. Digital technologyhas been adopted to create a wide range of original local content in the area for education, entertainment,commerce and industrial activities for both local and foreign markets. The industry grew at around sevenper cent per annum from 2000 to 2005, exporting some RM5 billion worth of exports per annum26. Asnoted earlier, the industry accounted for more than a quarter of the value added and about one fifth ofemployment in the core copyright industry group in 2005.
The industry has received strong State support in the form of investment in essential ICT infrastructuredevelopment, fiscal and financial incentives and skills training. The Multimedia Super Corridor (MSC), set upin 1996 to build a cluster of local ICT companies and a sustainable ICT industry, continues to providethe platform and enabling environment to develop the ICT industry. Companies set up within the MSChave access to modern physical infrastructure (fiber optic) and a number of fiscal incentives such asincome tax exemption for up to 10 years, 100 per cent investment tax allowance, free import of multimediaequipment and employment of foreign knowledge and IT workers. A number of flagship applicationswere initiated to spearhead the development of the multimedia industry. These included the ElectronicGovernment, Smart School, Government Multipurpose Card and Telehealth as well the R&D Cluster, e-Business, and Technopreneurship programs. These State-driven initiatives have contributed to thedynamism of the software and database industry. MSC has now entered the second phase with theexpansion of the concept to several new cybercities and cybercenters located throughout the country.
Heavy investment in ICT infrastructure has paralleled an increase in ICT adoption in the country. Thepenetration of personal computers (PCs) installed doubled from 9.4 per 100 population to 21.8 in 2005,while Internet dial-up subscription penetration doubled from 7.1 per 100 population in 2000 to 13.9 in2005 (Table 5.7). The number of cellular phone subscription increased fourfold from 5.0 million in 2000 to 19.5 million by 2005. To narrow the digital divide in the country, a program of universal access wasestablished. Telecenters were established in under-served areas, tariffs for telephone and Internet subscriptionwere revised, and PC ownership was promoted. Customized content and online applications weredeveloped to promote the uptake of the ICT facilities and services.
The ICT industry was liberalized and a new regulatory framework was developed. The MalaysianCommunications and Multimedia Commission (MCMC), set up in 1998, is the regulator for thecommunications and multimedia industry. It is charged with implementing and promoting the Government’snational policy objectives for the communications and multimedia sector, in addition to overseeing thedevelopment of the regulatory framework for the converging industries of telecommunications, broadcastingand online activities.27
The Communications and Multimedia Act 1998 provides for the Content Forum to develop the ContentCode and to enforce the Code containing governing standards and practices in the communications andmultimedia industry.28 The Content Code demonstrates a commitment towards self-regulation by theindustry in compliance with the Communications and Multimedia Act 1998. The Communications andMultimedia Content Forum of Malaysia developed the Communications and Multimedia Content Code,officially launched on October 21, 2004, the full text of which is now available online.29
The Economic C
ontribution ofC
opyright-Based Industries in M
alaysia
161
26 Source: MSC Malaysia: http://www.mscmalaysia.my27 Source: Malaysian Communications and Multimedia Commission, www.mcmc.gov.my.28 Communications and Multimedia Content Code, Communications and Multimedia Content Forum of Malaysia, 2004, available onlineat: http://www.mcmc.gov.my/mcmc/facts_figures/codes_gl/guidelines/pdf/ContentCode.pdf.29 Ibid.
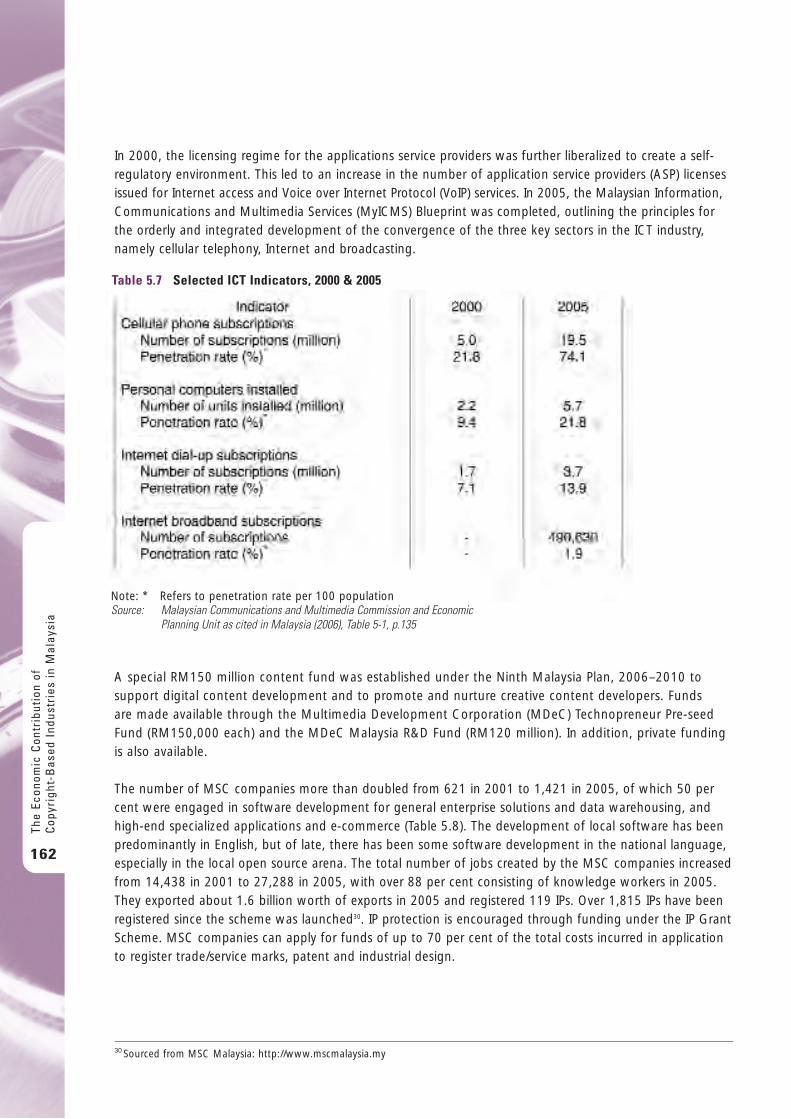
In 2000, the licensing regime for the applications service providers was further liberalized to create a self-regulatory environment. This led to an increase in the number of application service providers (ASP) licensesissued for Internet access and Voice over Internet Protocol (VoIP) services. In 2005, the Malaysian Information,Communications and Multimedia Services (MyICMS) Blueprint was completed, outlining the principles forthe orderly and integrated development of the convergence of the three key sectors in the ICT industry,namely cellular telephony, Internet and broadcasting.
A special RM150 million content fund was established under the Ninth Malaysia Plan, 2006–2010 tosupport digital content development and to promote and nurture creative content developers. Funds are made available through the Multimedia Development Corporation (MDeC) Technopreneur Pre-seedFund (RM150,000 each) and the MDeC Malaysia R&D Fund (RM120 million). In addition, private fundingis also available.
The number of MSC companies more than doubled from 621 in 2001 to 1,421 in 2005, of which 50 percent were engaged in software development for general enterprise solutions and data warehousing, andhigh-end specialized applications and e-commerce (Table 5.8). The development of local software has beenpredominantly in English, but of late, there has been some software development in the national language,especially in the local open source arena. The total number of jobs created by the MSC companies increasedfrom 14,438 in 2001 to 27,288 in 2005, with over 88 per cent consisting of knowledge workers in 2005.They exported about 1.6 billion worth of exports in 2005 and registered 119 IPs. Over 1,815 IPs have beenregistered since the scheme was launched30. IP protection is encouraged through funding under the IP GrantScheme. MSC companies can apply for funds of up to 70 per cent of the total costs incurred in applicationto register trade/service marks, patent and industrial design.
The
Econ
omic
Con
trib
utio
n of
Cop
yrig
ht-B
ased
Ind
ustr
ies
in M
alay
sia
162
Table 5.7 Selected ICT Indicators, 2000 & 2005
Note: * Refers to penetration rate per 100 populationSource: Malaysian Communications and Multimedia Commission and Economic
Planning Unit as cited in Malaysia (2006), Table 5-1, p.135
30 Sourced from MSC Malaysia: http://www.mscmalaysia.my
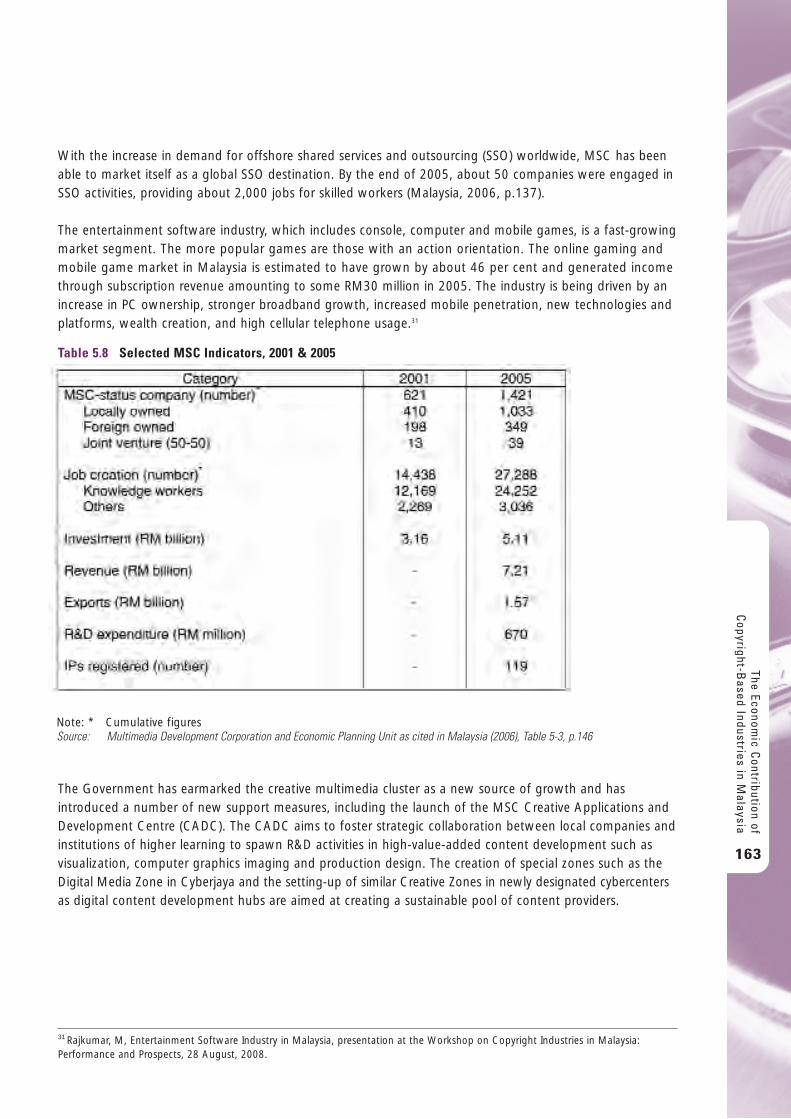
With the increase in demand for offshore shared services and outsourcing (SSO) worldwide, MSC has beenable to market itself as a global SSO destination. By the end of 2005, about 50 companies were engaged inSSO activities, providing about 2,000 jobs for skilled workers (Malaysia, 2006, p.137).
The entertainment software industry, which includes console, computer and mobile games, is a fast-growingmarket segment. The more popular games are those with an action orientation. The online gaming andmobile game market in Malaysia is estimated to have grown by about 46 per cent and generated incomethrough subscription revenue amounting to some RM30 million in 2005. The industry is being driven by anincrease in PC ownership, stronger broadband growth, increased mobile penetration, new technologies andplatforms, wealth creation, and high cellular telephone usage.31
The Government has earmarked the creative multimedia cluster as a new source of growth and hasintroduced a number of new support measures, including the launch of the MSC Creative Applications andDevelopment Centre (CADC). The CADC aims to foster strategic collaboration between local companies andinstitutions of higher learning to spawn R&D activities in high-value-added content development such asvisualization, computer graphics imaging and production design. The creation of special zones such as theDigital Media Zone in Cyberjaya and the setting-up of similar Creative Zones in newly designated cybercentersas digital content development hubs are aimed at creating a sustainable pool of content providers.
The Economic C
ontribution ofC
opyright-Based Industries in M
alaysia
163
31 Rajkumar, M, Entertainment Software Industry in Malaysia, presentation at the Workshop on Copyright Industries in Malaysia:Performance and Prospects, 28 August, 2008.
Table 5.8 Selected MSC Indicators, 2001 & 2005
Note: * Cumulative figuresSource: Multimedia Development Corporation and Economic Planning Unit as cited in Malaysia (2006), Table 5-3, p.146
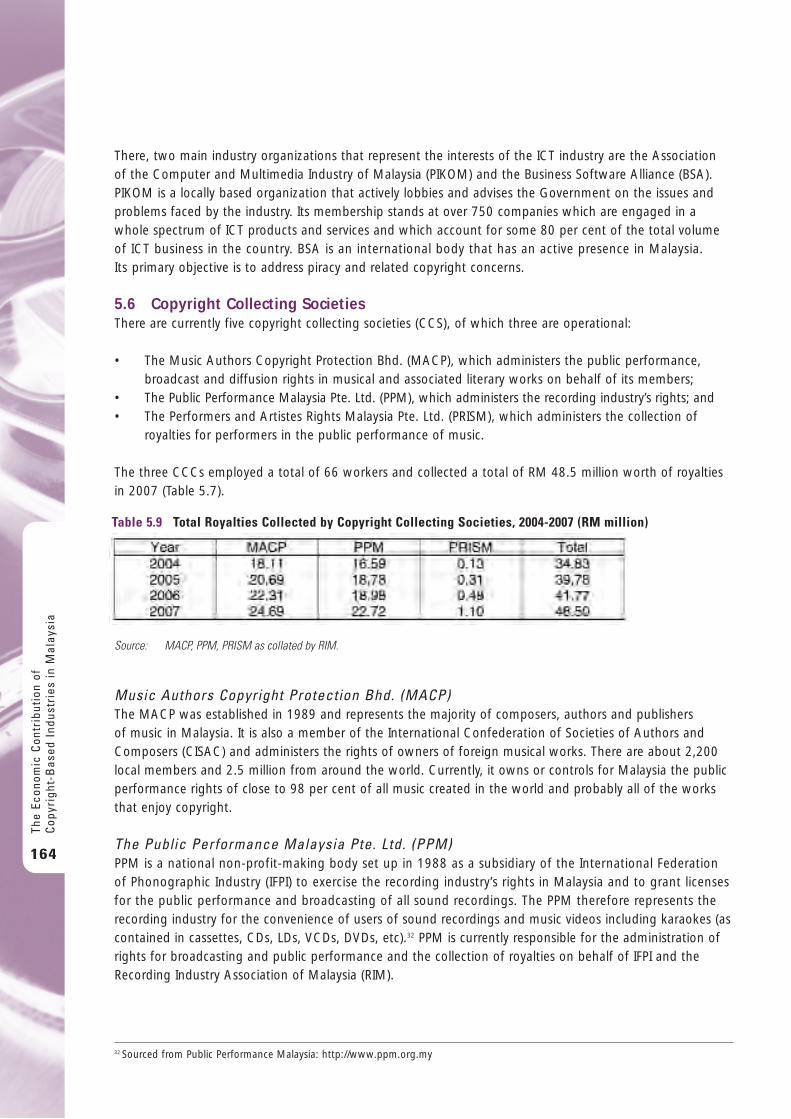
There, two main industry organizations that represent the interests of the ICT industry are the Association of the Computer and Multimedia Industry of Malaysia (PIKOM) and the Business Software Alliance (BSA).PIKOM is a locally based organization that actively lobbies and advises the Government on the issues andproblems faced by the industry. Its membership stands at over 750 companies which are engaged in awhole spectrum of ICT products and services and which account for some 80 per cent of the total volumeof ICT business in the country. BSA is an international body that has an active presence in Malaysia. Its primary objective is to address piracy and related copyright concerns.
5.6 Copyright Collecting SocietiesThere are currently five copyright collecting societies (CCS), of which three are operational:
• The Music Authors Copyright Protection Bhd. (MACP), which administers the public performance,broadcast and diffusion rights in musical and associated literary works on behalf of its members;
• The Public Performance Malaysia Pte. Ltd. (PPM), which administers the recording industry’s rights; and• The Performers and Artistes Rights Malaysia Pte. Ltd. (PRISM), which administers the collection of
royalties for performers in the public performance of music.
The three CCCs employed a total of 66 workers and collected a total of RM 48.5 million worth of royaltiesin 2007 (Table 5.7).
Music Authors Copyright Protection Bhd. (MACP)The MACP was established in 1989 and represents the majority of composers, authors and publishers of music in Malaysia. It is also a member of the International Confederation of Societies of Authors andComposers (CISAC) and administers the rights of owners of foreign musical works. There are about 2,200local members and 2.5 million from around the world. Currently, it owns or controls for Malaysia the publicperformance rights of close to 98 per cent of all music created in the world and probably all of the worksthat enjoy copyright.
The Public Performance Malaysia Pte. Ltd. (PPM)PPM is a national non-profit-making body set up in 1988 as a subsidiary of the International Federation of Phonographic Industry (IFPI) to exercise the recording industry’s rights in Malaysia and to grant licenses for the public performance and broadcasting of all sound recordings. The PPM therefore represents therecording industry for the convenience of users of sound recordings and music videos including karaokes (ascontained in cassettes, CDs, LDs, VCDs, DVDs, etc).32 PPM is currently responsible for the administration ofrights for broadcasting and public performance and the collection of royalties on behalf of IFPI and theRecording Industry Association of Malaysia (RIM).
The
Econ
omic
Con
trib
utio
n of
Cop
yrig
ht-B
ased
Ind
ustr
ies
in M
alay
sia
164
Table 5.9 Total Royalties Collected by Copyright Collecting Societies, 2004-2007 (RM million)
Source: MACP, PPM, PRISM as collated by RIM.
32 Sourced from Public Performance Malaysia: http://www.ppm.org.my
PPM issues licenses for the following usages of the recordings:
i. Public performance (i.e. playing or showing in public);ii. Communication to the public (including broadcast);iii. Copying or reproduction for the purpose of (i) and (ii) above; andiv. Commercial rental.
Examples of establishments and businesses that may require a public performance license include mobilediscos, hotels and hotel ballrooms, night clubs, cinemas, restaurants, jukeboxes, fashions shows andamusement parks.
The Performers and Artistes Rights Malaysia Pte. Ltd. (PRISM)PRISM was formed in 2001 by artistes in the music industry, i.e. by singers, musicians and secessionists. Its main objectives include:
• The protection and enforcement of the rights of performers, i.e. the recording artistes in the musicindustry; and
• The collection and administration of royalties for public performance, broadcasting and communicationon behalf of the performers.
On February 17, 2003, a Memorandum of Understanding was signed by PRISM and PPM to authorize PPMto collect royalties on behalf of PRISM. Some 600 local and 100,000 foreign artistes are members of PRISM.
The Copyright Act does not decide the royalty rate and the mode of payment. PPM and MACP collectroyalties for public performance of music in public places through mechanical means such as tapes, records,CDs videos, radios, TVs, karaoke, juke boxes or even telephone music on hold. MACP, by virtue of its role,collects for the live performance of music, while PPM does not collect for the live performance. Generally,both these CCSs base their rates on the importance of the music to the user. If music is the main feature ofentertainment, such as in dancing halls and karaoke halls, the rates are higher but if the music is not themain feature as in the case of piped music in retail outlets, the rates are lower. This ultimate decision is leftto the CCSs that are familiar with the international trends in determining the rates.
The Economic C
ontribution ofC
opyright-Based Industries in M
alaysia
165
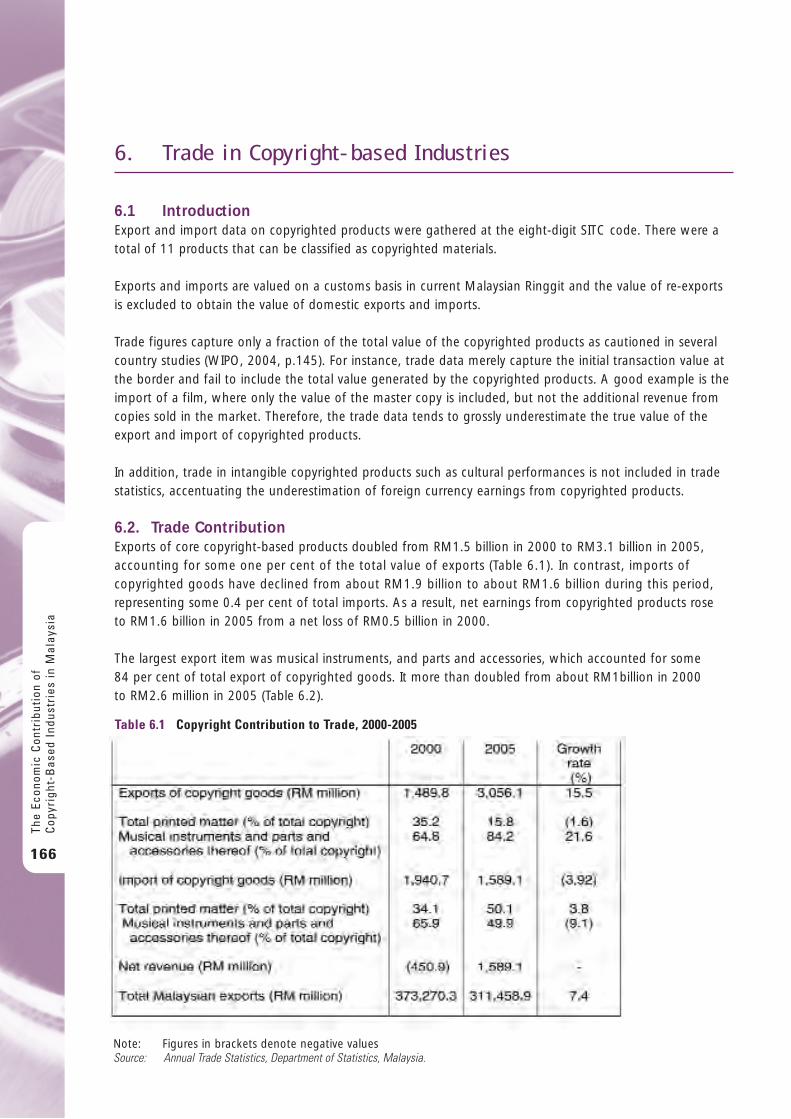
6 . Tr a d e i n C o p y r i g h t - b a s e d I n d u s t r i e s
6.1 IntroductionExport and import data on copyrighted products were gathered at the eight-digit SITC code. There were atotal of 11 products that can be classified as copyrighted materials.
Exports and imports are valued on a customs basis in current Malaysian Ringgit and the value of re-exportsis excluded to obtain the value of domestic exports and imports.
Trade figures capture only a fraction of the total value of the copyrighted products as cautioned in severalcountry studies (WIPO, 2004, p.145). For instance, trade data merely capture the initial transaction value atthe border and fail to include the total value generated by the copyrighted products. A good example is theimport of a film, where only the value of the master copy is included, but not the additional revenue fromcopies sold in the market. Therefore, the trade data tends to grossly underestimate the true value of theexport and import of copyrighted products.
In addition, trade in intangible copyrighted products such as cultural performances is not included in tradestatistics, accentuating the underestimation of foreign currency earnings from copyrighted products.
6.2. Trade ContributionExports of core copyright-based products doubled from RM1.5 billion in 2000 to RM3.1 billion in 2005,accounting for some one per cent of the total value of exports (Table 6.1). In contrast, imports ofcopyrighted goods have declined from about RM1.9 billion to about RM1.6 billion during this period,representing some 0.4 per cent of total imports. As a result, net earnings from copyrighted products rose to RM1.6 billion in 2005 from a net loss of RM0.5 billion in 2000.
The largest export item was musical instruments, and parts and accessories, which accounted for some 84 per cent of total export of copyrighted goods. It more than doubled from about RM1billion in 2000 to RM2.6 million in 2005 (Table 6.2).
The
Econ
omic
Con
trib
utio
n of
Cop
yrig
ht-B
ased
Ind
ustr
ies
in M
alay
sia
166
Table 6.1 Copyright Contribution to Trade, 2000-2005
Note: Figures in brackets denote negative valuesSource: Annual Trade Statistics, Department of Statistics, Malaysia.
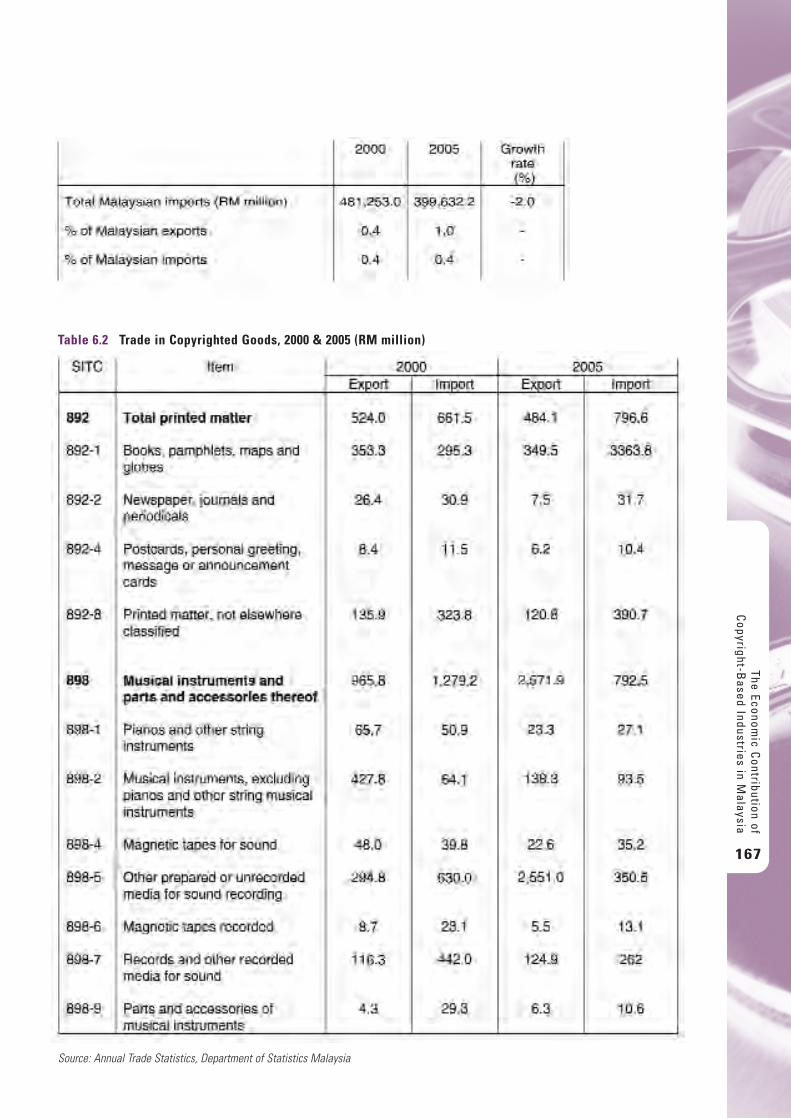
The Economic C
ontribution ofC
opyright-Based Industries in M
alaysia
167
Table 6.2 Trade in Copyrighted Goods, 2000 & 2005 (RM million)
Source: Annual Trade Statistics, Department of Statistics Malaysia
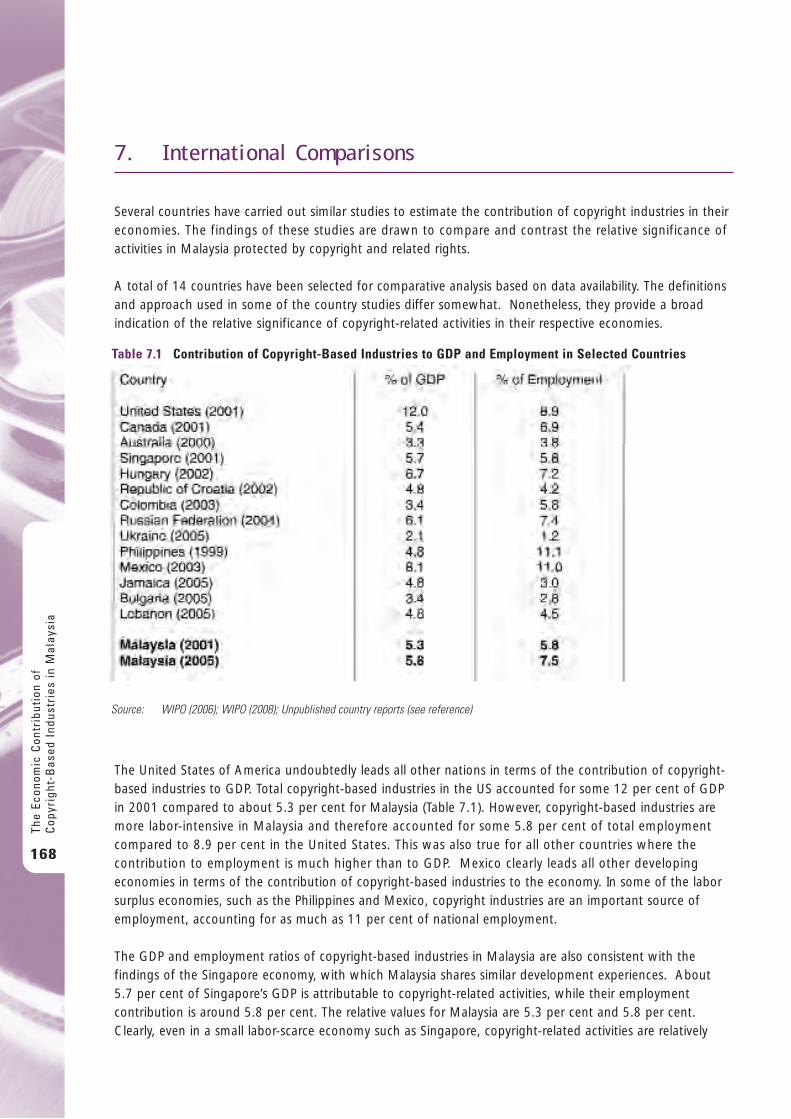
7 . I n t e r n a t i o n a l C o m p a r i s o n s
Several countries have carried out similar studies to estimate the contribution of copyright industries in theireconomies. The findings of these studies are drawn to compare and contrast the relative significance ofactivities in Malaysia protected by copyright and related rights.
A total of 14 countries have been selected for comparative analysis based on data availability. The definitionsand approach used in some of the country studies differ somewhat. Nonetheless, they provide a broadindication of the relative significance of copyright-related activities in their respective economies.
The United States of America undoubtedly leads all other nations in terms of the contribution of copyright-based industries to GDP. Total copyright-based industries in the US accounted for some 12 per cent of GDPin 2001 compared to about 5.3 per cent for Malaysia (Table 7.1). However, copyright-based industries aremore labor-intensive in Malaysia and therefore accounted for some 5.8 per cent of total employmentcompared to 8.9 per cent in the United States. This was also true for all other countries where thecontribution to employment is much higher than to GDP. Mexico clearly leads all other developingeconomies in terms of the contribution of copyright-based industries to the economy. In some of the laborsurplus economies, such as the Philippines and Mexico, copyright industries are an important source ofemployment, accounting for as much as 11 per cent of national employment.
The GDP and employment ratios of copyright-based industries in Malaysia are also consistent with thefindings of the Singapore economy, with which Malaysia shares similar development experiences. About 5.7 per cent of Singapore’s GDP is attributable to copyright-related activities, while their employmentcontribution is around 5.8 per cent. The relative values for Malaysia are 5.3 per cent and 5.8 per cent.Clearly, even in a small labor-scarce economy such as Singapore, copyright-related activities are relatively
The
Econ
omic
Con
trib
utio
n of
Cop
yrig
ht-B
ased
Ind
ustr
ies
in M
alay
sia
168
Table 7.1 Contribution of Copyright-Based Industries to GDP and Employment in Selected Countries
Source: WIPO (2006); WIPO (2008); Unpublished country reports (see reference)
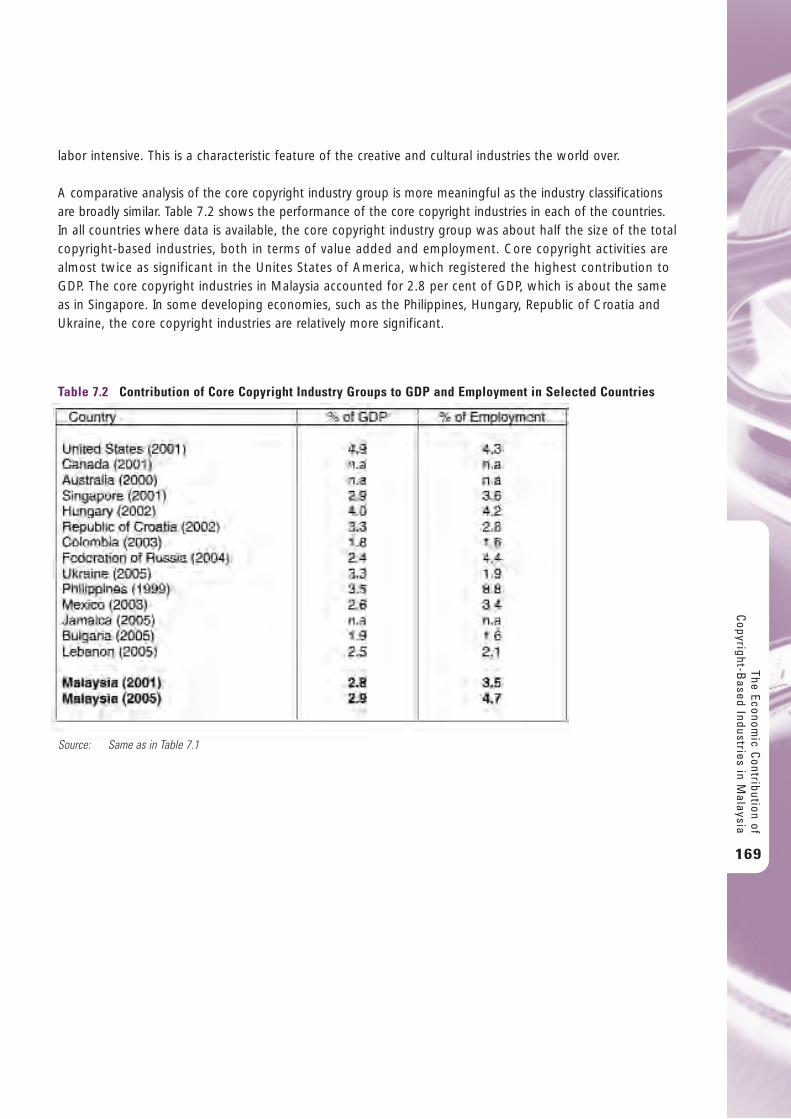
labor intensive. This is a characteristic feature of the creative and cultural industries the world over.
A comparative analysis of the core copyright industry group is more meaningful as the industry classificationsare broadly similar. Table 7.2 shows the performance of the core copyright industries in each of the countries.In all countries where data is available, the core copyright industry group was about half the size of the totalcopyright-based industries, both in terms of value added and employment. Core copyright activities arealmost twice as significant in the Unites States of America, which registered the highest contribution toGDP. The core copyright industries in Malaysia accounted for 2.8 per cent of GDP, which is about the sameas in Singapore. In some developing economies, such as the Philippines, Hungary, Republic of Croatia andUkraine, the core copyright industries are relatively more significant.
The Economic C
ontribution ofC
opyright-Based Industries in M
alaysia
169
Table 7.2 Contribution of Core Copyright Industry Groups to GDP and Employment in Selected Countries
Source: Same as in Table 7.1
8 . I m p a c t o f C o p y r i g h t - b a s e d I n d u s t r i e s o n t h e E c o n o m y
8.1. IntroductionEstablishment surveys provide an estimation of the direct contribution of an industry to the economy.However, the activities of an industry have a direct as well as an indirect impact on the economy, and theinput-output (I-O) table, which records all inter-industry transactions in the economy, can be used toestimate the total impact of any change in industry activity.
The input-output table shows not only the demand for inputs resulting from an increase in output of aparticular industry, but also the long chain of production effects that arise as a result of demand for inputsto produce products demanded by the first industry. The following estimates the impact of the core copyrightindustries on the economy using the 2000 input-output table.
The 2000 I-O table consist of 92 production sectors and of this, the core copyright activities are captured by the following 9 I-O sectors (See Appendix 3):
• I-O code 36 Printed matter• I-O code 69 Wholesale and retail• I-O code 72 Communication• I-O code 78 Business services• I-O code 83 Private non-profit institutions• I-O code 84 Entertainment• I-O code 85 Radio and television broadcasting• I-O code 86 Recreation• I-O code 94 Other public administration
Many of these sectors include output from copyright and non-copyright activities. It is assumed that theinput structure of the I-O sector to which a subsector of the core copyright industry belongs reflects theinput-output structure of the core copyright activities. For instance, the I-O Code 36: Printed matter, maywell represent the input structure of press and literature.
8.2 Impact of Core Copyright Industries on the Economy The I-O table records both the demand and supply responses of an industry’s activities. Hence, when an industry such as “printed matter” increases its production, there is an increase in demand for inputsfrom other industries that supply inputs to “printed matter”. This increase in demand for inputs fromthe other sectors is termed the “backward linkage”. An industry with a higher backward linkageinduces more productive activities throughout the economy. On the other hand, an industry may supplyinputs to one or more industries. This indicates the “forward linkage” of an industry with the industriesto which it supplies inputs. An industry with a higher forward linkage is relatively more sensitive tochanges in other industries’ output.
If a large portion of the total inputs is imported, the impact on the economy of an increase in production ofan industry is reduced by the amount of “leakages” via imported inputs. Table 8.1 shows the input structureof core copyright industries. The core copyright industries purchased about 21 per cent of its inputs fromother domestic industries and imported about 15 per cent of its total inputs from overseas. Total wagesreceived by labor amounted to about 18 per cent while gross profit was about 45 per cent. The corecopyright industry is not very input-intensive and provides relatively high gross returns to capital.
The
Econ
omic
Con
trib
utio
n of
Cop
yrig
ht-B
ased
Ind
ustr
ies
in M
alay
sia
170
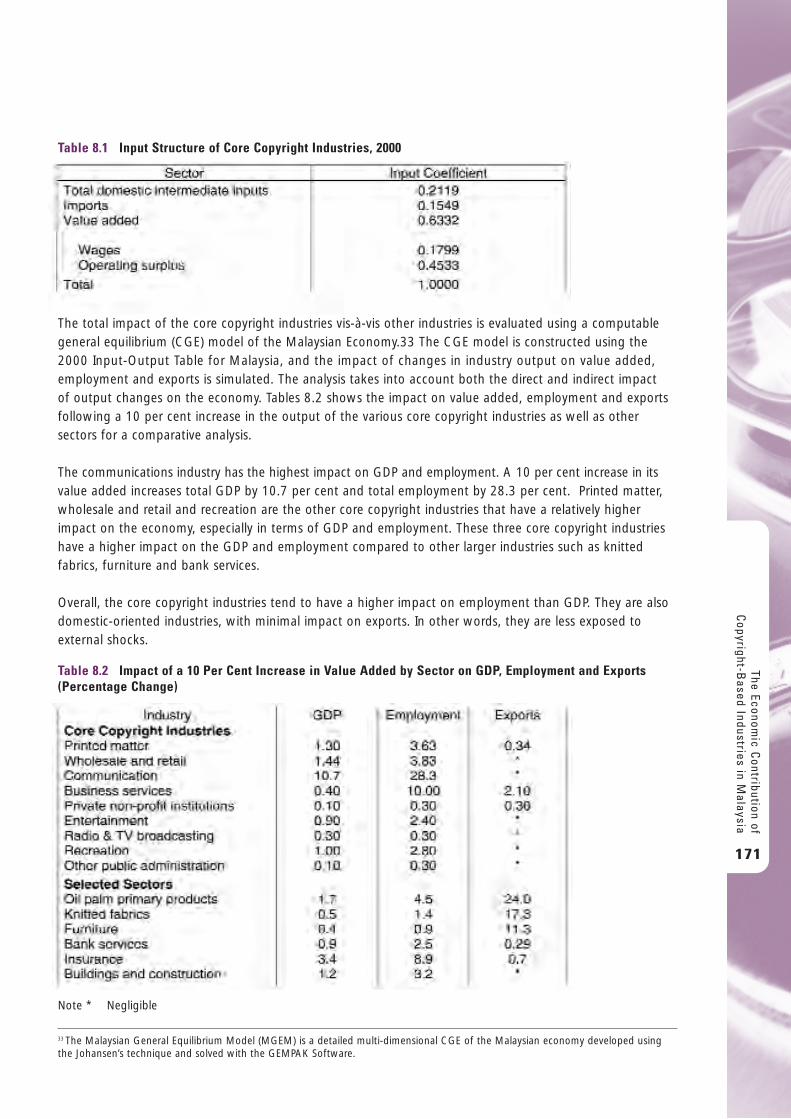
The total impact of the core copyright industries vis-à-vis other industries is evaluated using a computablegeneral equilibrium (CGE) model of the Malaysian Economy.33 The CGE model is constructed using the2000 Input-Output Table for Malaysia, and the impact of changes in industry output on value added,employment and exports is simulated. The analysis takes into account both the direct and indirect impact of output changes on the economy. Tables 8.2 shows the impact on value added, employment and exportsfollowing a 10 per cent increase in the output of the various core copyright industries as well as othersectors for a comparative analysis.
The communications industry has the highest impact on GDP and employment. A 10 per cent increase in itsvalue added increases total GDP by 10.7 per cent and total employment by 28.3 per cent. Printed matter,wholesale and retail and recreation are the other core copyright industries that have a relatively higherimpact on the economy, especially in terms of GDP and employment. These three core copyright industrieshave a higher impact on the GDP and employment compared to other larger industries such as knittedfabrics, furniture and bank services.
Overall, the core copyright industries tend to have a higher impact on employment than GDP. They are alsodomestic-oriented industries, with minimal impact on exports. In other words, they are less exposed toexternal shocks.
The Economic C
ontribution ofC
opyright-Based Industries in M
alaysia
171
Table 8.1 Input Structure of Core Copyright Industries, 2000
33 The Malaysian General Equilibrium Model (MGEM) is a detailed multi-dimensional CGE of the Malaysian economy developed usingthe Johansen’s technique and solved with the GEMPAK Software.
Table 8.2 Impact of a 10 Per Cent Increase in Value Added by Sector on GDP, Employment and Exports(Percentage Change)
Note * Negligible
9 . C o n c l u s i o n
Copyright-based industries in Malaysia have played an increasing role in the growth and development of theMalaysian economy. The estimated contribution of value added in 2005 was RM30.2 billion or 5.8 per centof GDP. The industry also employed about 817,000 workers or 7.5 per cent of the total workforce.
Exports of copyrighted products in 2005 came to RM3.1 billion or one per cent of total export earnings.More importantly, the trade balance turned positive to reach RM1.6 billion in 2005 from a net loss of RM0.5in 2005, largely due to the double-digit growth in exports of copyrighted products.
Of particular significance was the pace at which the industries grew. They recorded annual average growthof 11.1 per cent from 2000 to 2005, surpassing the national growth rate of 6.6 per cent. They alsooutperformed all other services and resource-based industries, with the exception of mining and quarrying,which recorded the highest growth at 13.1 per cent.
Productivity or real value added per worker in the copyright-based industries in 2005 was RM34,848, whichis higher than that for agriculture, construction and government services. The copyright industries of Malaysiaare also relatively more labor intensive and help generate employment.
The industry is not very input intensive and provides relatively high gross returns to capital. The total impactof the core copyright industries on GDP and employment is comparable to many of the larger industriessuch as furniture, knitted fabrics or bank services.
The encouraging performance of the copyright-based industries in Malaysia reflects the importance ofcopyright activities as a potential engine of growth, especially with the shift towards a services-basedeconomy. Creative and information-based activities cut across all aspects of the economy, depending directlyor indirectly on copyright protection. The level of copyright protection is crucial to fostering R&D andattracting new investments, including foreign direct investment.
Yet data and information on the copyright-based industries are far from adequate. Given the higher incidenceof microenterprises and individual operators, characteristic of the creative and information sectors, data andinformation on this group of industries are not well captured by the current statistical system in the country.Data on some copyright-based sub-sectors that fall within the manufacturing sector are very comprehensive,but for the bulk of the copyright-based industries that fall under services, the database is weak.
The pilot project is at best an exploratory study that quantifies the contribution of the copyright-basedindustries to the economy. Given the high level of data aggregation on copyright-based industries generatedby the Department of Statistics, there is reason to believe that the contribution of copyright-based industriesis underestimated.
There is also an apparent lack of awareness of the importance of copyright among consumers as well asproducers of copyright works. Professionals in the creative fields such as authors, composers, lyricists anddesigners pay scant attention to the importance of protecting their creations, as many of them do notdepend on their creativity for a livelihood.
Knowledge and content that underpin copyright-based activities have emerged as the main factors ofeconomic growth, and as the economy shifts towards a service-oriented structure, copyright will become
The
Econ
omic
Con
trib
utio
n of
Cop
yrig
ht-B
ased
Ind
ustr
ies
in M
alay
sia
172

more relevant. Therefore, it is essential that the copyright-based industries be closely monitored, evaluatedand prioritized. It is within this context that the following recommendations are made.
The more immediate response is to establish an institutional framework to facilitate systematic and regulardata collection and reporting on copyright-based industries. This should be part and parcel of the ongoingprocess by the Department of Statistics to improve the database on the service sector. A Working Committeeled by MyIPO and with representation from the Department of Statistics and all related copyright-basedagencies such as the Ministry of Unity, Culture, Arts and Heritage, Ministry of Communications, Energy andWater, Ministry of Information, the Central Bank, Copyright Collecting Societies and the various industryorganizations should be set up to explore the most cost-effective means of generating key economic dataon copyright-based industries.
Many of the ongoing establishment and household surveys must be reviewed to evaluate how they can beexpanded and improved to generate important statistics on the creative and information industries protectedby copyright. All secondary sources of data must be identified, and the agencies collating copyright-baseddata must be made responsible for generating such data on a regular basis.
The Department of Statistics should also link up with the relevant industry organizations and provideprofessional assistance to facilitate the generation of copyright industry data at a more disaggregated levelon a regular basis.
As the nation shifts towards a more service-oriented economy and as trade in services becomes central tobilateral and multilateral negotiations, it would be timely and useful to generate trade data on the servicesector, allowing more accurate estimates of the trade in copyrighted products. Inter-agency cooperationbetween the relevant agencies in the public and private sectors has to be beefed up to initiate datacollection and reporting on trade in services.
There is a need to conduct more in-depth sector-specific studies of the creative and informative sectors thatare protected by copyright. Such studies can assist in improving the assessment of the contribution ofcopyright-based industries to the economy as well as identifying the issues and challenges faced by theindustry in prioritizing policies.
MyIPO should initiate collaborative programs such as workshops, seminars and advocacy campaigns withthe various industry organizations to enhance the level of awareness of the importance of copyright amongconsumers as well as the creators of copyrighted works.
The study provides strong empirical evidence of the dynamism of the copyright-based industries in Malaysia,demonstrating the importance of copyright-based industries in the nation’s drive towards a knowledge andinformation-based economy. The study is at best an exploratory study that contributes to more evidence-based policy-making with respect to the development of copyright-based industries within the context ofthe overall development of the economy.
The study has provided robust empirical evidence to assist policy-makers in designing appropriate strategiesfor the development and protection of copyright-based industries in the country. It has also developed anexplicit and sound framework for updating and improving the database on the creative and information-based sectors that are protected by copyright.
The Economic C
ontribution ofC
opyright-Based Industries in M
alaysia
173
R e f e r e n c e s
Alberto C. Cordy et al, The Economic Contribution of Copyright-Based Industries in Colombia, WorldIntellectual Property Organization (WIPO), March, 2008 (unpublished).
Allen Consulting Group, “The Economic Contribution of Australia’s Copyright Industries”, 2000.
Department of Statistics, Malaysia, “Malaysian Standard Industrial Classification, 2000, March 2003.
Law King Hui, Copyright’s Role in a Nation’s Economy: A Publisher’s Perspective, PowerPoint presentation atthe Workshop on Copyright and Access to Knowledge, organized by the Federation of Malaysia ConsumersAssociation (FONCA), January 31, 2008a.
Law King Hui, A Report on the Malaysian Book Publishing Industry, paper presented at the ASEAN BookPublishers Association Annual Meeting, Singapore, May 30–31, 2008b.
Malaysia, Ninth Malaysia Plan, 2006–2010, Malaysian National Printers Limited, 2006, Kuala Lumpur.
Norma Bahri , “Malaysian Serials: Issues and Problems”, paper presented at the 65th IFLA Council andGeneral Conference, Bangkok, Thailand, August 20–28, 1999, available athttp://www.ifla.org/IV/iflab65/papers/019-149e.htm
Intellectual Property Corporation of Malaysia (MyIPO), National Intellectual Property Policy, (undated)
Manisekaran, A. Success Story of the Music Industry in Malaysia, Intellectual Property Organization ofMalaysia (MyIPO), Paper prepared for the Association of Southeast Asian Nations (ASEAN) and the WorldIntellectual Property Organization (WIPO), 2005
Ng Tieh Chuan, Trends in Malaysian Book Publishing, paper presented at the Roundtable Forum, “ASEAN Publishing Trend”, Bangkok, Thailand, March 26, 2005.
Russian State Institute of Intellectual Property, Study of Economic Significance of Copyright and theProspects of its Use in Some Industries of Russian Economy, 2007 (unpublished).
State Department of Intellectual Property, Ministry of Education, WIPO Study on the Economic Contributionof Copyright-Based Industries in Ukraine, World Intellectual Property Organization (WIPO) 2008(unpublished)
State Intellectual Property Office of the Republic of Croatia, Economic Contribution of Copyright-BasedIndustries to the Economy of the Republic of Croatia, May 2007 World Intellectual Property Organization(WIPO) (unpublished).
Stephen E. Siwek, “Copyright Industries in the U.S. Economy, 2002 Report,”The Economists Incorporated.
World Intellectual Property Organization (WIPO), “National Studies on Assessing the Economic Contributionof the Copyright-Based Industries, Creative Industries Series No.1, WIPO Publication No. 624e, October 2004.
The
Econ
omic
Con
trib
utio
n of
Cop
yrig
ht-B
ased
Ind
ustr
ies
in M
alay
sia
174
World Intellectual Property Organization (WIPO), “National Studies on Assessing the Economic Contributionof the Copyright Based Industries, Creative Industries Series No.2, WIPO Publication No.1009E, October2008.
World Intellectual Property Organization (WIPO), “Guide on Surveying the Economic Contribution of theCopyright-based Industries”, Publication No. 893(E), 2003.
World Intellectual Property Organization (WIPO), “Intellectual Property, Power Tools for Economic Growth”,http://www.wipo.int.
World Intellectual Property Organization (WIPO), Understanding Copyright and Related Rights, PublicationNo. 909(E).
Zuraida Mokhtar, “Craft Industry in Malaysia”, PowerPoint presentation given at the Workshop on CopyrightIndustries in Malaysia: Performance and Prospects, Organized by Intellectual Property Organization ofMalaysia (MyIPO) in cooperation with the World Intellectual Property Organization (WIPO), Kuala Lumpur,September, 2008.
The Economic C
ontribution ofC
opyright-Based Industries in M
alaysia
175
A p p e n d i x 1
Mapping of Copyright-Based Industries The 2000 Malaysian Standard Industrial Classification (MSIC) is almost identical to the International StandardIndustrial Classification (ISIC). As WIPO also classifies copyright industries using the ISIC Codes, the concordancebetween the three classifications was traced to map out Malaysia’s copyright industries. By and large, thethree industry categories merged easily as the MSIC code is very similar to the ISIC. The few differences are highlighted below.
i. Computers and equipment: The “Wholesale of computers, computer peripheral equipmentand software” is classified by ISIC code as 5151, but the equivalent MSIC code is 5153.
ii. Photocopiers: The “Wholesale of other machinery, equipment and supplies” falls under ISICcode 5159, but is 5152 under MSIC.
iii. Blank recording material: The “Wholesale of electronic and telecommunication parts andequipment” falls under ISIC 5152, but is classified under MSIC 5151.
The list of Malaysian copyright industries and their respective MSIC codes are detailed in the AppendixTables 1.1 to 4.
The
Econ
omic
Con
trib
utio
n of
Cop
yrig
ht-B
ased
Ind
ustr
ies
in M
alay
sia
176
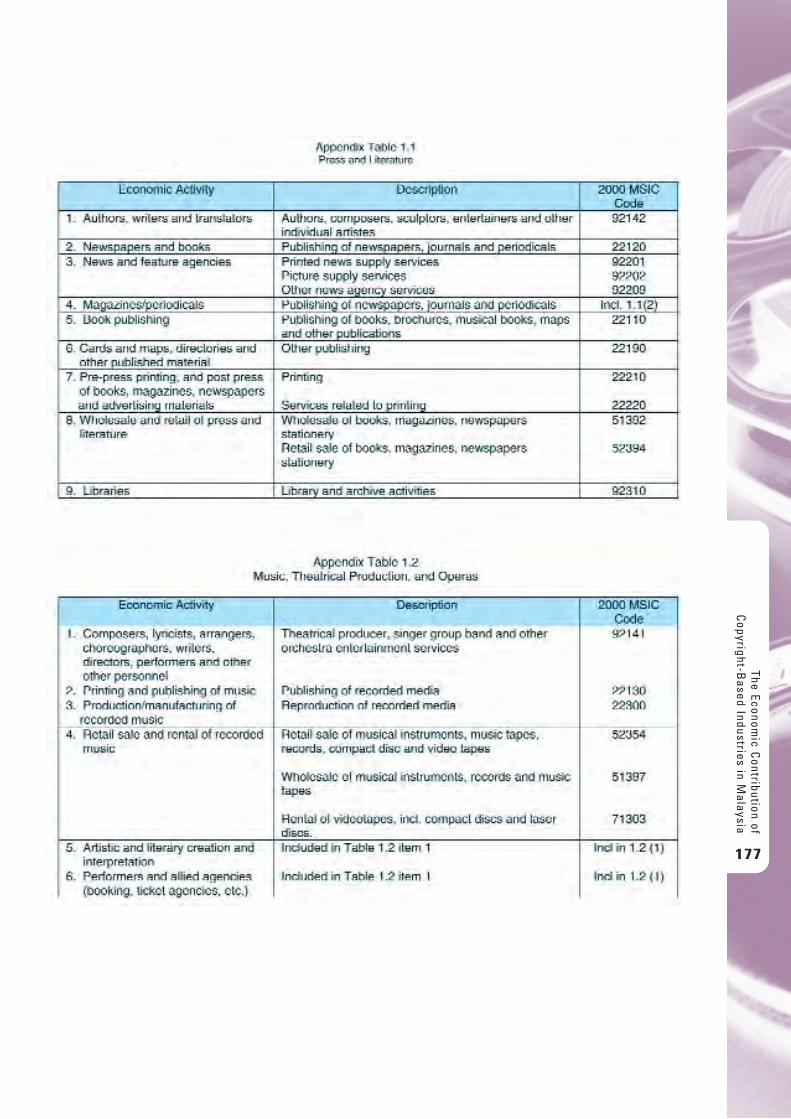
The Economic C
ontribution ofC
opyright-Based Industries in M
alaysia
177
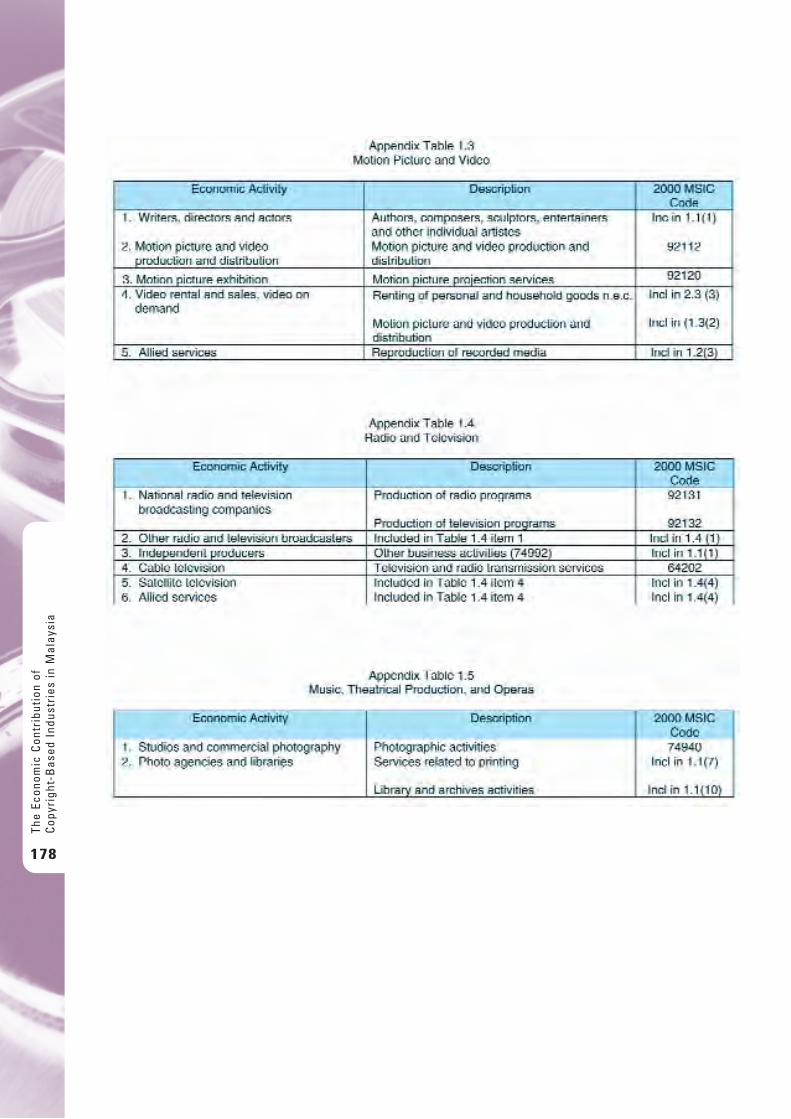
The
Econ
omic
Con
trib
utio
n of
Cop
yrig
ht-B
ased
Ind
ustr
ies
in M
alay
sia
178
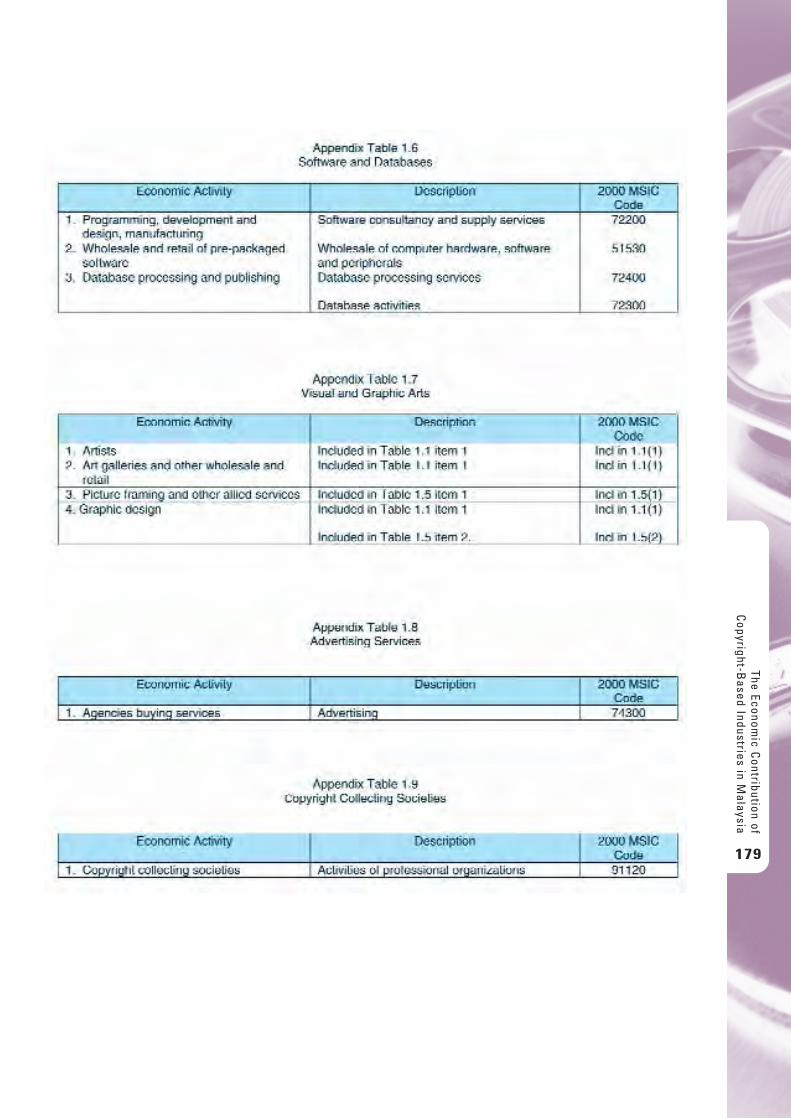
The Economic C
ontribution ofC
opyright-Based Industries in M
alaysia
179
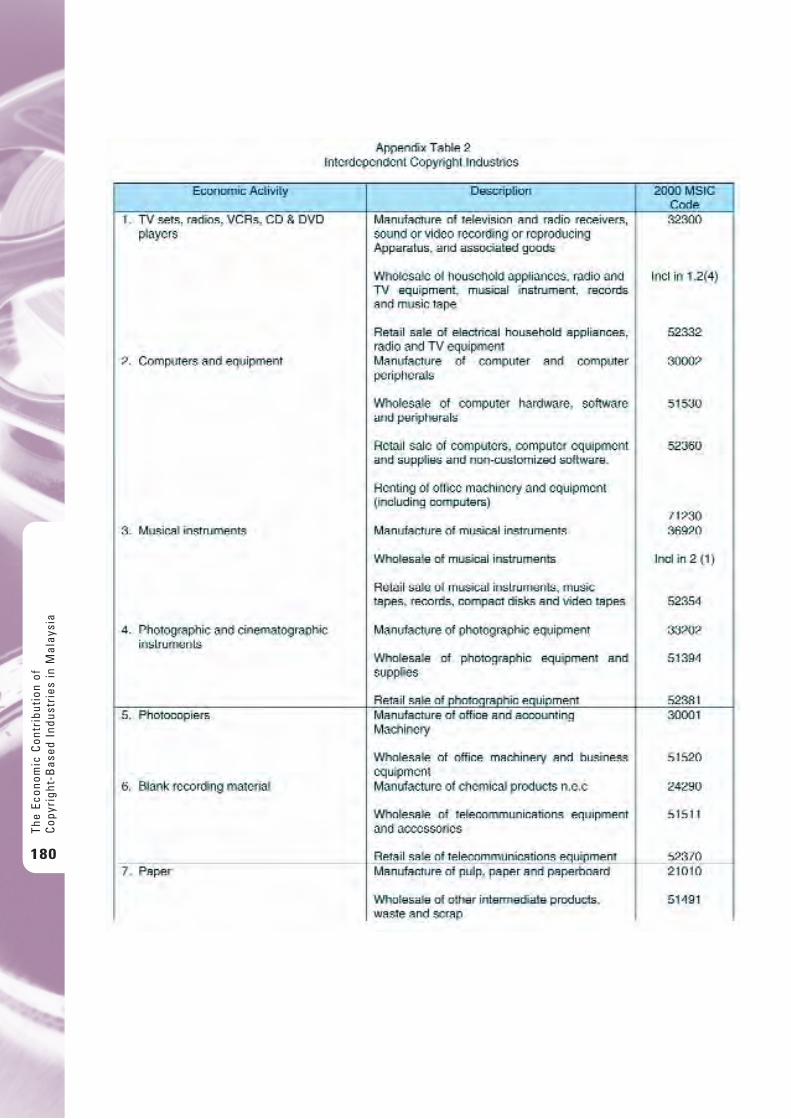
The
Econ
omic
Con
trib
utio
n of
Cop
yrig
ht-B
ased
Ind
ustr
ies
in M
alay
sia
180
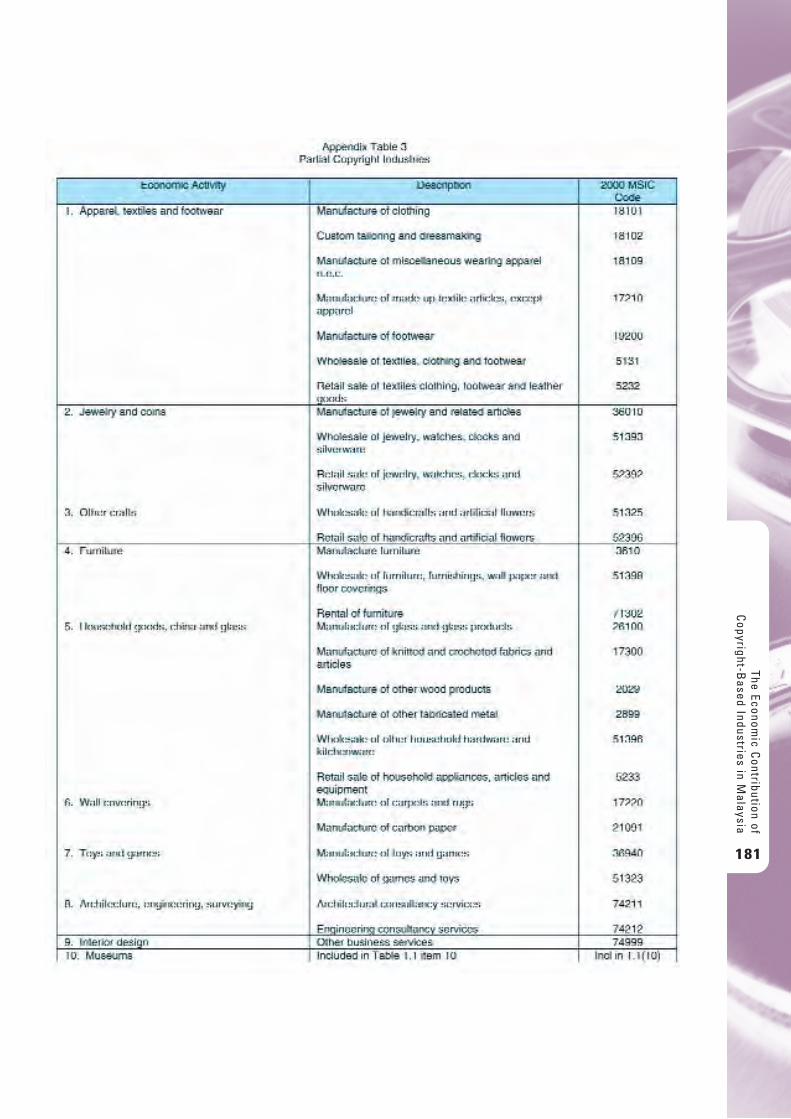
The Economic C
ontribution ofC
opyright-Based Industries in M
alaysia
181
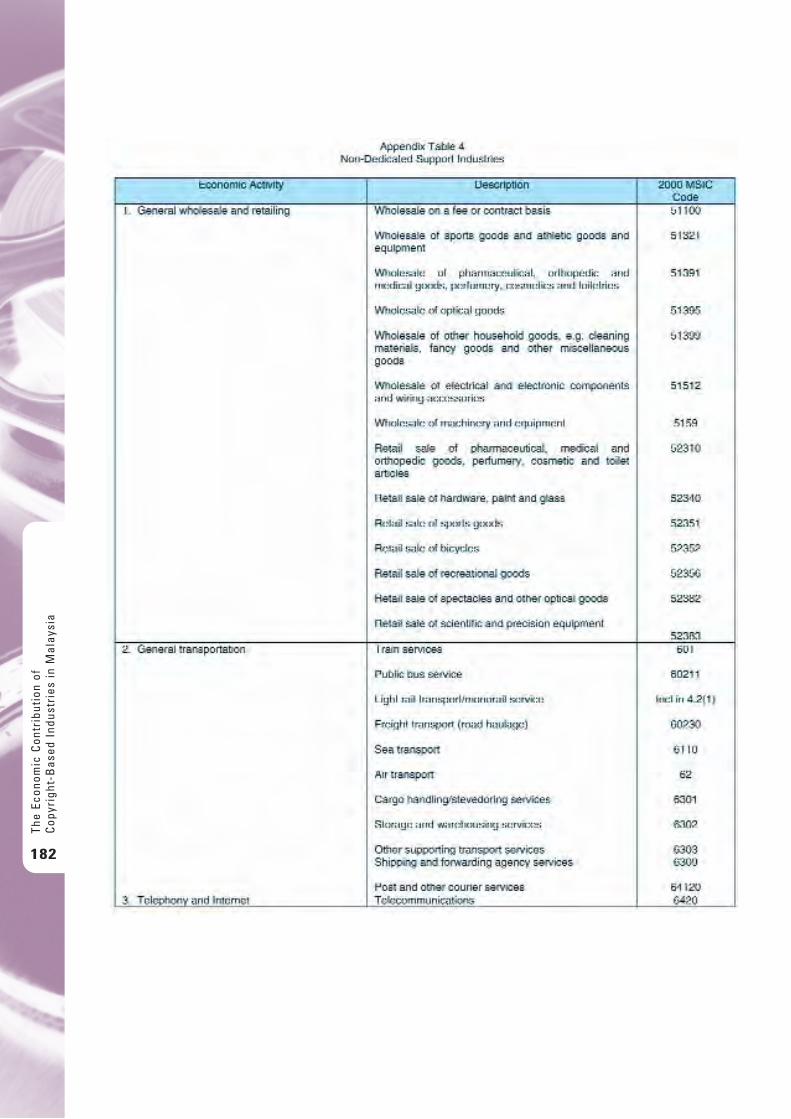
The
Econ
omic
Con
trib
utio
n of
Cop
yrig
ht-B
ased
Ind
ustr
ies
in M
alay
sia
182
A p p e n d i x 2
Estimation of Copyright FactorsIn measuring the economic contribution of copyright industries to the economy, it is important to includethe contribution of both the “core” and “non-core” copyright industries. The “non-core” industries arethose that support or are interrelated to the core copyright industries. These include:
i. Interdependent Copyright Industriesii. Partial Copyright Industries; andiii. Non-Dedicated Support Industries.
For the core copyright industries, all of the industry activities are included in measuring the economiccontribution of copyright industries. For the non-core copyright industries, however, only a fraction of theiractivities is included as reflected by the copyright factor. The copyright factor is a percentage ratio thatexpresses the importance of copyright activities in a given industry. The survey responses, personal interviewand secondary data as well as experiences of other countries were relied upon to estimate the copyrightfactors for Malaysia. The survey responses to three key questions on copyright activities are summarized inAppendix Tables 2.1 to 2.3.
The following explains the estimation of the copyright factors for the three “non-core” copyright industries.
i. Interdependent Copyright IndustriesProducts from interdependent copyright industries are jointly consumed, and hence their activities are generallydependent on the availability of copyright work. In other words, they support the use of the copyright content,and hence they are sometimes referred to as “copyright-related” or “copyright hardware”.
According to WIPO, “statistically, the interdependent copyright industries add a relatively little portion – inaverage between 1.0 per cent to 1.5 per cent to GDP over and above what the core industries contribute.
The Economic C
ontribution ofC
opyright-Based Industries in M
alaysia
183
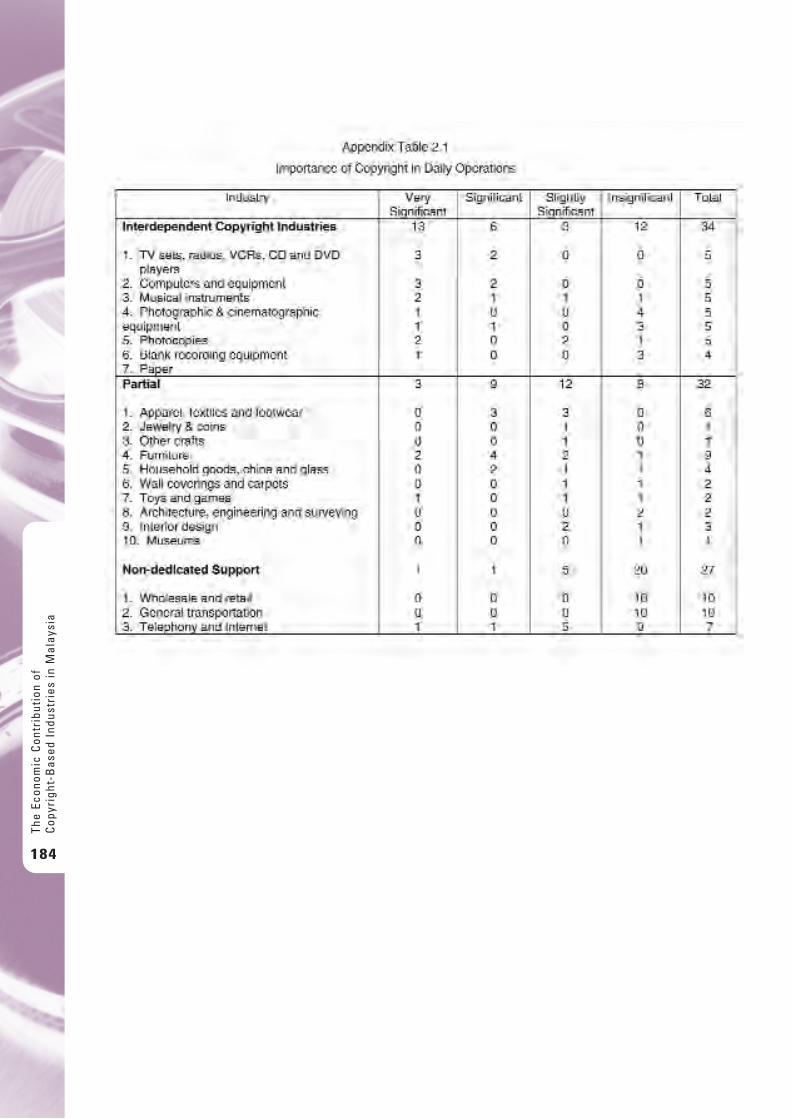
The
Econ
omic
Con
trib
utio
n of
Cop
yrig
ht-B
ased
Ind
ustr
ies
in M
alay
sia
184
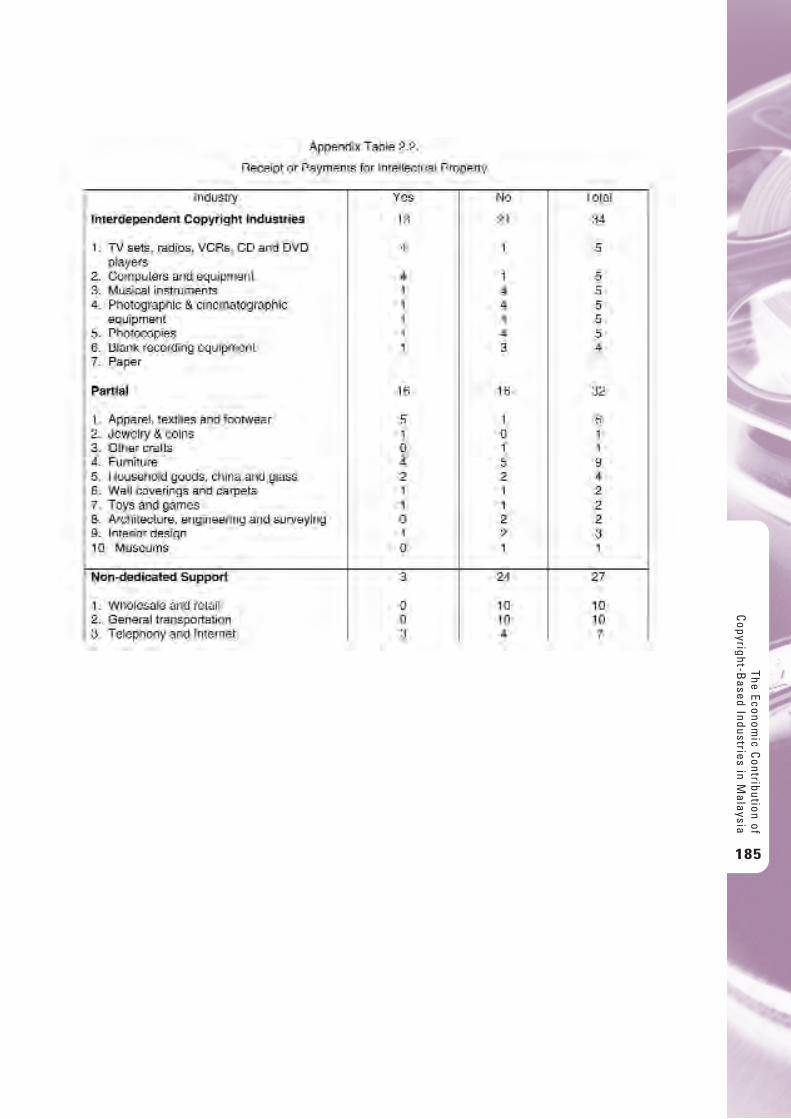
The Economic C
ontribution ofC
opyright-Based Industries in M
alaysia
185
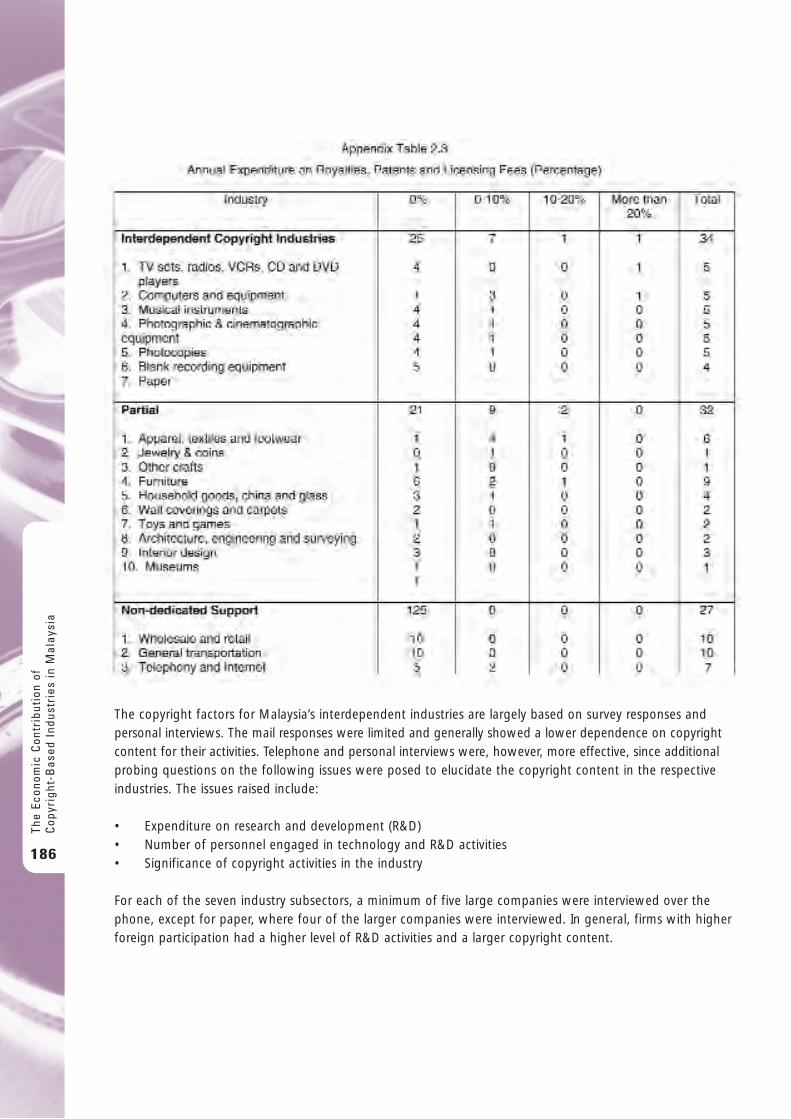
The copyright factors for Malaysia’s interdependent industries are largely based on survey responses andpersonal interviews. The mail responses were limited and generally showed a lower dependence on copyrightcontent for their activities. Telephone and personal interviews were, however, more effective, since additionalprobing questions on the following issues were posed to elucidate the copyright content in the respectiveindustries. The issues raised include:
• Expenditure on research and development (R&D)• Number of personnel engaged in technology and R&D activities• Significance of copyright activities in the industry
For each of the seven industry subsectors, a minimum of five large companies were interviewed over thephone, except for paper, where four of the larger companies were interviewed. In general, firms with higherforeign participation had a higher level of R&D activities and a larger copyright content.
The
Econ
omic
Con
trib
utio
n of
Cop
yrig
ht-B
ased
Ind
ustr
ies
in M
alay
sia
186
ii. Partial Copyright Industries In the case of partial copyright industries, only that portion attributable to works and other protectedsubject matter is included in the estimation of their economic contribution to the economy. There are 10 industries that are classified as partial copyright industries:
• Apparel, textiles and footwear;• Jewelry and coins;• Other crafts;• Furniture;• Household goods, china and glass;• Wall covering and carpets;• Toys and games;• Architecture, engineering and surveying;• Interior design; and• Museums.
The copyright factors for apparel, textiles and footwear, and furniture were estimated through personalinterviews and surveys. These two groups of industries are relatively large and well established in Malaysiaand hence exhibited a higher copyright content than the rest of the industries.
For the remainder of the partial copyright industry groups, the survey response was poor, and telephoneinterviews were more useful in estimating the copyright factors. An average of the results from the surveyand the weighted average of the copyright factors in the Singapore and Hungarian studies were used tocompute the copyright factors for the different industry subsectors. A number of indicators that may wellreflect the copyright content of these industries were used as weights.34
• GDP per capita• Patent and copyright protection• Availability of information and technology personnel• Expenditure on R&D• Basic research; and• Entrepreneurship
iii. Non-Dedicated Copyright IndustriesThe non-dedicated copyright industries are those in which only a portion support and facilitate the distributionof core CB industries and are not already included in the “core” category. These industries include:
• General wholesale and retail;• General transportation; and• Telephony and Internet.
The copyright factors for the distribution industries were estimated using the weighting method that hasbeen adopted in a number of studies, as shown below:
The Economic C
ontribution ofC
opyright-Based Industries in M
alaysia
187
34 The data for 2000 was sourced from The Global Competitiveness Reports and the World Competitiveness Yearbook.
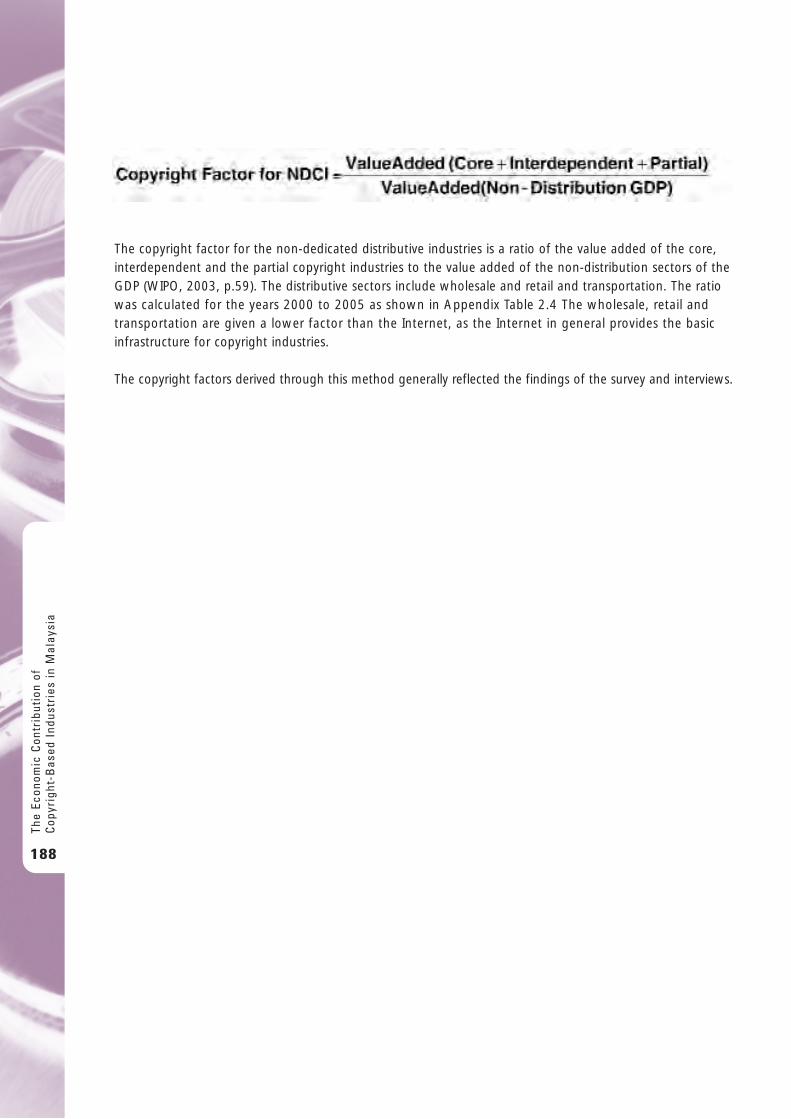
The copyright factor for the non-dedicated distributive industries is a ratio of the value added of the core,interdependent and the partial copyright industries to the value added of the non-distribution sectors of theGDP (WIPO, 2003, p.59). The distributive sectors include wholesale and retail and transportation. The ratiowas calculated for the years 2000 to 2005 as shown in Appendix Table 2.4 The wholesale, retail andtransportation are given a lower factor than the Internet, as the Internet in general provides the basicinfrastructure for copyright industries.
The copyright factors derived through this method generally reflected the findings of the survey and interviews.
The
Econ
omic
Con
trib
utio
n of
Cop
yrig
ht-B
ased
Ind
ustr
ies
in M
alay
sia
188
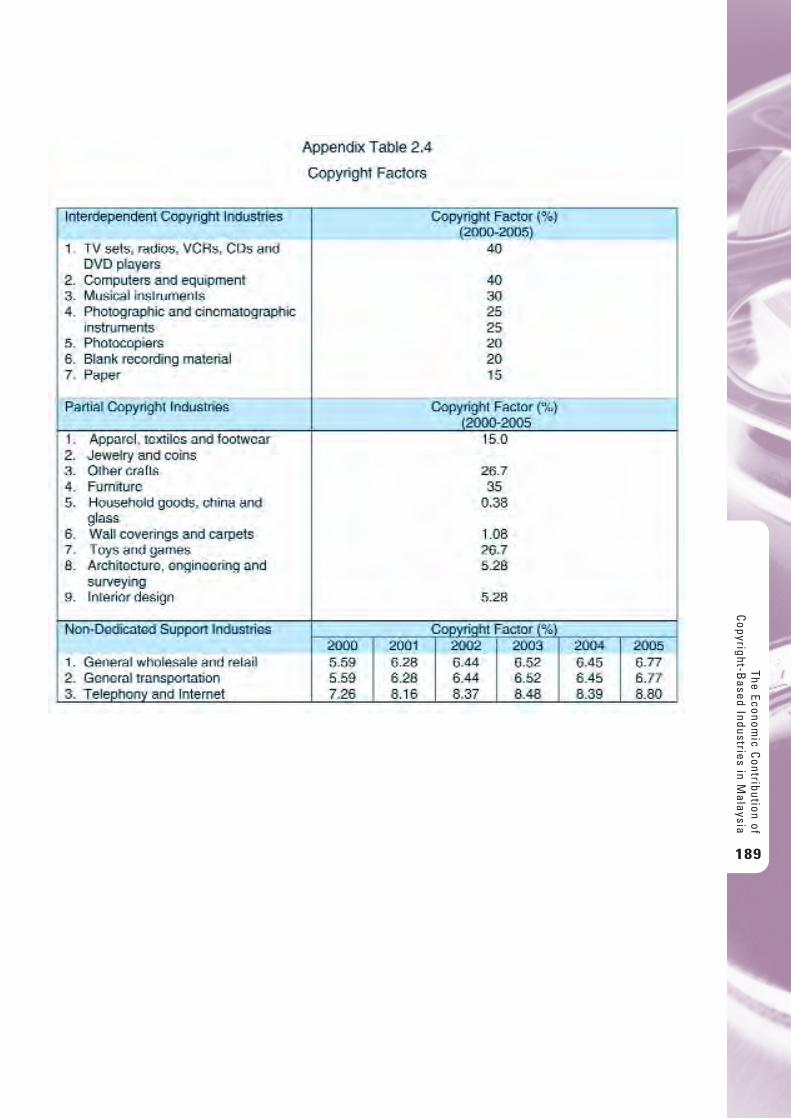
The Economic C
ontribution ofC
opyright-Based Industries in M
alaysia
189
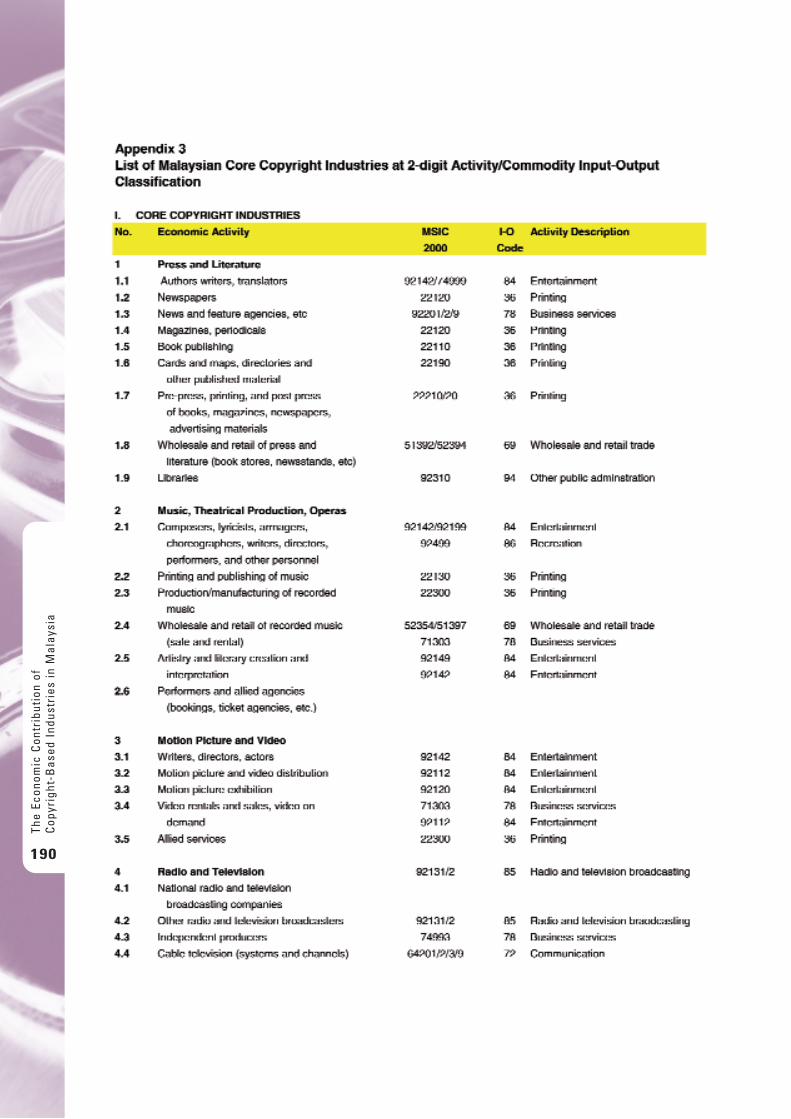
The
Econ
omic
Con
trib
utio
n of
Cop
yrig
ht-B
ased
Ind
ustr
ies
in M
alay
sia
190
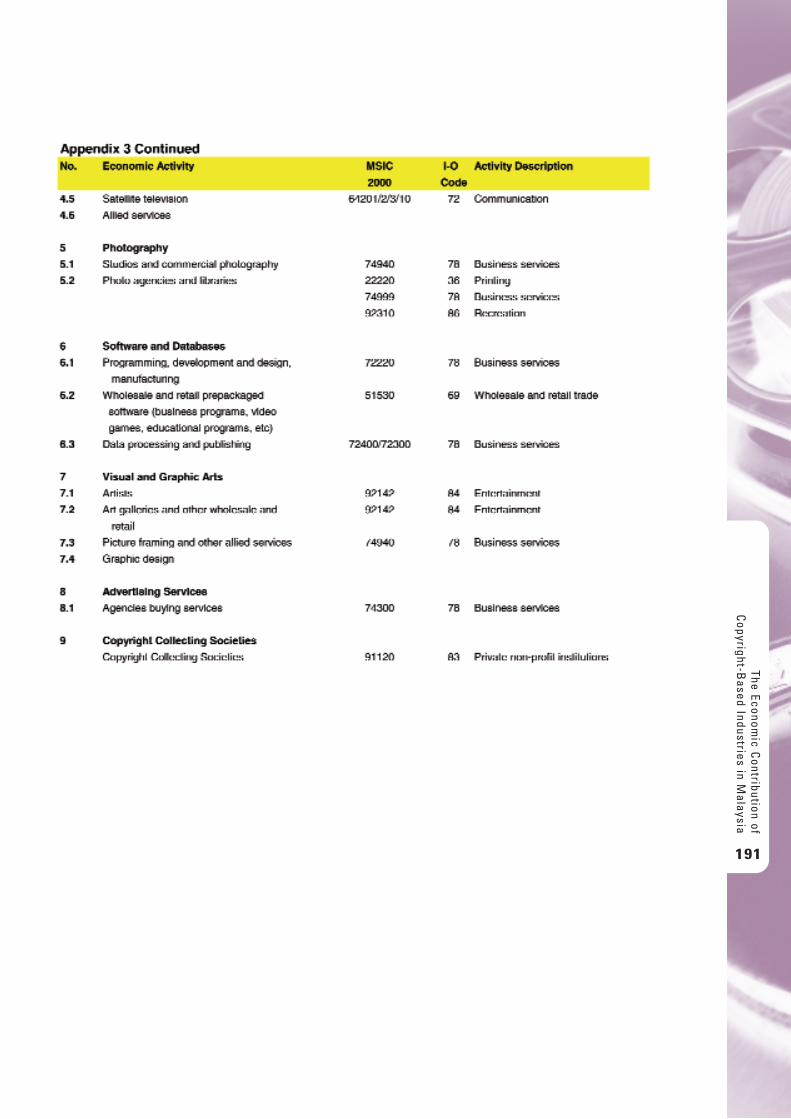
The Economic C
ontribution ofC
opyright-Based Industries in M
alaysia
191

The
Econ
omic
Con
trib
utio
n of
Cop
yrig
ht-B
ased
Ind
ustr
ies
in M
alay
sia
192

The Economic C
ontribution ofC
opyright-Based Industries in M
alaysia
193

The
Econ
omic
Con
trib
utio
n of
Cop
yrig
ht-B
ased
Ind
ustr
ies
in M
alay
sia
194
The Economic C
ontribution ofC
opyright-Based Industries in the N
etherlands
195
The Economic Contribution of Copyright-Based Industries
in the Netherlands
Jorna LeenheerSimon BremerJules Theeuwes

SEO Economic Research carries out independent applied economic research on behalf of the Governmentand the private sector. SEO’s research makes an important contribution to the decision-making processes of itsclients. SEO Economic Research works in conjunction with the Universiteit van Amsterdam, which provides theorganization with invaluable insight into the newest scientific methods. Operating on a not-for-profit basis,SEO invests in the intellectual capital of its staff by encouraging active career planning, publication of scientificwork and participation in scientific networks and international conferences.
The
Econ
omic
Con
trib
utio
n of
Cop
yrig
ht-B
ased
Ind
ustr
ies
in t
he N
ethe
rlan
ds
196
Ta b l e o f C o n t e n t s
Summary 198
1 Introduction 199
1.1 Background 199
1.2 Research according to WIPO Guide 200
1.3 Report structure 201
2 Economic Contribution of the Copyright-Based Industries in 2005 202
2.1 Overview 202
2.2 Core copyright industries broken down into sub-sectors 204
2.3 Partial, interdependent and Non-dedicated copyright industries 207
3 Comparison with Previous Research 209
3.1 International comparison 209
3.2 Comparison with previous Dutch studies 211
List of abbreviations 215
Commission of Accompaniment 215
Appendix A Explanation of the Methodology 216
Data Sources and Industry Codes 216
Available Data and Data Operations 216
Determination of Copyright Factors 218
Appendix B Copyright-Based Industries 221
The Economic C
ontribution ofC
opyright-Based Industries in the N
etherlands
197
S u m m a r y
This report quantifies the economic contribution of the copyright-based industries in the Netherlands. It provides insight into the extent to which economic activities are grounded in copyright-protected products,including goods and services protected by the law on copyright and related rights. The report updates a series of comparable studies which have been conducted approximately every four years since 1986. The present study makes use of data from 2005 and is the first to be conducted in accordance with theguidelines of the World Intellectual Property Organization (WIPO). The WIPO Guide is a recently developedmethodology to determine the economic contribution of the copyright-based industries and aims to makenational studies in this area as internationally comparable as possible.
The WIPO Guide provides guidelines on how to measure added value, employment and the position in thebalance of trade of the copyright-based industries. In 2005 the added value of the Dutch copyright-basedindustries was 30.5 billion euros, equal to 5.9 per cent of Gross Domestic Product (GDP). Employmentin the Dutch copyright-based industries totaled 567,214 full-time equivalents (FTEs), equal to 8.8 percent of total employment in the Netherlands. The balance of trade surplus in these industries was 2.4 billion euros, equal to 6.9 per cent of the total for the Netherlands.
The Guide identifies the copyright-based industries in core sectors, partial industries, interdependentindustries and non-dedicated industries. The most important sub-sectors in the core industries are softwareand databases and press and literature, followed by advertising. The other sub-sectors are music, theatricalproductions and opera, motion pictures and video, radio and television, photography, visual and graphic artsand copyright organizations. Software and databases represents 8.1 billion euros added value and 142,000FTEs. Press and literature has an added value of 6.9 billion euros and 129,000 FTEs. Advertising has anadded value of 1.8 billion euros and 49,000 FTEs.
This is the first study to distinguish between core industries — where copyright plays a primary role — andpartial, interdependent and non-dedicated industries. Partial industries are those in which only a portion of their products are copyright-protected (e.g. furniture, jewelry). Interdependent industries create productsthat facilitate copyright-protected products (e.g. television and paper). The non-dedicated industries play a facilitating role in broadcasting and distribution (e.g. telecommunications, transport). These industries are included only partially because not all their economic activities can be attributed to copyright-protectedproducts. The core industries comprise approximately two-thirds of the total and the other industriesaccount for the remaining one-third.
The economic contribution of the copyright-based industries has now been measured in 17 countries inaccordance with the WIPO Guide, including both developed and developing countries. On average thecopyright-based industries comprise 5.4 per cent of GDP and 5.8 per cent of total employment. The Dutchscore above average on both aspects; in terms of added value the Netherlands comes in fifth, relative to the other 16 countries, and in terms of employment it takes third place.
Because this study is the first to follow the WIPO Guide, quantative comparison with previous research ispossible only to a certain extent. The SEO study conducted in 2000 (using data from 1998) mainlyinvestigated the core industries. Between 1998 and 2005, these core industries grew annually by 4.4 percent on average while employment grew by 7.4 per cent. The SEO study from 2003 and research based onthe Brief Cultuur en Economie (White Paper Culture and Economy) are quantitatively incomparable becausethey study different subjects; the multimedia and creative sectors respectively.
The
Econ
omic
Con
trib
utio
n of
Cop
yrig
ht-B
ased
Ind
ustr
ies
in t
he N
ethe
rlan
ds
198
I n t r o d u c t i o n
1.1 BackgroundThe economic characteristics of copyright are gaining increased attention, both nationally and internationally.There is growing insight into the fact that copyright plays a substantial role in the economy in terms of theproduction, distribution and consumption of copyright-protected products. These products are goods andservices protected by copyright or related rights law. The expanding potential of electronic distribution hasonly further broadened the scope of copyright. The present study aims to quantify the contribution of thecopyright-based industries in the Netherlands; that is, we provide insight into the extent to which economicactivities are grounded in copyright-protected products. This survey of the economic contribution of thecopyright-based industries enhances the likelihood of focusing more attention on the provision of adequatecopyright protection.
The Netherlands has a long tradition of quantifying the economic contribution of the copyright-based industries;the first Dutch study on this subject appeared in 1986, commissioned by Stichting Auteursrechtbelangen(the Foundation for Copyright Interests), with the involvement of the Ministry of Economic Affairs, sincethen, the research has been repeated about every four years. The last SEO report dates from 2003,using data from 2000; it was the first to be commissioned by the Ministry of Economic Affairs.However, this particular study focused differently from the previous studies, namely on the multimediacluster. It consisted of a brief quantitative analysis and case studies that described the market structureand innovativeness of the cluster.
The present study is an update in a series of previous studies on the copyright-based industries and providesinsight into the current situation and developments over time using data from 2005. The challenge hasbeen to conduct the study in accordance with the WIPO Guide.
In 2003, WIPO developed a methodology to determine the economic contribution of the copyright-basedindustries,1 a main goal of the Guide being to make national studies in this area as internationallycomparable as possible. The present research is the first Dutch study to follow the WIPO Guide and atpresent 16 other countries have carried out similar research on the economic contribution of the copyright-based industries in accordance with the Guide, including the United States, Canada, Hungary, and Singapore.
Following the WIPO Guide has meant that this study is not easily comparable with those of previous years.As the 2003 study was focused differently (on the multimedia cluster), this rules out the possibility ofmaking a quantitative comparison with this particular study; this also holds for the research conducted inthe Brief Cultuur en Economie (White Paper on Culture and Economy) that focused on the cultural andcreative sector as its main objective.2 However, with a few minor adaptations, the study from 2000 iscomparable with several portions of the current research, thus enabling an analysis of the developmentof copyright-based industries over time.
The Economic C
ontribution ofC
opyright-Based Industries in the N
etherlands
199
1 A first meeting to update the Guide took place in Singapore in October 2008.2 Based on a report by Marlet, G. and Poort, J., 2005: Omvang en belang van de creatieve productie in Nederland (Scope and Value ofCreative Productions in the Netherlands), in: Cultuur en creativiteit naar waarde geschat (Evaluating Culture and Creativity), Atlas voorGemeenten (Guide for Municipal Authorities)/SEO Economic Research.
1.2 Research according to the WIPO GuideA valid assessment of the economic contribution of copyright entails measuring the following three variablesfor each of the industries that are dependent on or influenced by copyright:
(1) added value; (2) employment; (3) position of trade balance.
Subsequently, the magnitude of the contribution by the copyright-based industries can be related to thetotal Dutch economy. More specifically, this concerns the added value of copyright-based industries as a percentage of Gross Domestic Product and employment in the copyright-based industries as a percentageof total Dutch employment. The trade balance position indicates whether more copyright-protected goodsare imported than exported. This required data on both exports and imports, the position of the tradebalance being the actual difference between the two.
The WIPO Guide recommends taking the following four steps:
1. identification and classification of industries;2. data collection;3. data analysis; 4. analysis and presentation of results.
Identification and Classification of IndustriesThe first step was to determine which industries formed part of the copyright-based industries, and detailscan be found in the Guide; i.e. with reference to the codes assigned by the International Standard IndustrialClassification (ISIC) it identifies the industries belonging to the copyright-based sector.
The WIPO Guide sets out four categories of industries:
• core copyright industries: industries wholly engaged in the creation, production and manufacturing,performance, broadcasting, communication and exhibition of copyright-protected products (e.g. music andmovies);
• partial copyright industries: industries in which certain activities are related to the creation, production,manufacturing, performance, broadcast, communication and exhibition of copyright-protectedproducts.(e.g. jewelry and furniture);
• interdependent copyright industries: industries engaged in production, manufacturing and sales ofequipment and utilities that facilitate the creation, production, manufacturing, performance, broadcast,communication and exhibition of copyright-protected products (e.g. television and paper);
• non-dedicated copyright industries: industries in which certain activities are related to facilitating thebroadcast, communication, distribution or sales of copyright-protected products which do not belong to thecore industries (e.g. telecommunications and transport).
The WIPO Guide indicates which industries come under the various sector headings. Previous Dutch studiesincluded the interdependent and partial industries but to only a limited extent.
Data CollectionIn the Netherlands we have access to very good official statistics and we have based our research on these.
The
Econ
omic
Con
trib
utio
n of
Cop
yrig
ht-B
ased
Ind
ustr
ies
in t
he N
ethe
rlan
ds
200
For added value, we used the production statistics gathered by the Central Dutch Institute of Statistics(CBS). Their statistics on the added value of companies are based on survey material and broken down intoindustry levels. For employment we used the data on jobs and self-employed occupations derived from theSocial Statistics File (SSB) made available by the CBS. Data for the SSB were collected by the tax authoritiesand local governmental administration and cover the entire Dutch population. For the balance of tradefigures, we used external trade data from Eurostat, which contain information on import and export valuesof more than 7,000 product categories. (For an explanation of the data sources and certain necessary dataoperations, see Appendix A.)
The most recent production statistics available were from 2005 and given the necessity of these data for theresearch, we chose to use the statistics for the entire study (even if other more recent data were available).The Guide considers a time-lag of two to three years to be fairly reasonable.
Data Analysis and PresentationData analysis deals with the following challenges:
Ascribing percentages to industries in the partial, interdependent and non-dedicated sectors
Industries that form part of the core sector may be considered as belonging fully to the copyright-basedindustries. For the partial, interdependent and non-dedicated industries, however, not all of their activitiesare either copyright protected or should be considered as part of the copyright-related economy. Therefore, thevarious industries were accorded a percentage (between 0 and 100 per cent). The determination of thesepercentages, also known as copyright factors, is described in the Appendices.
Breakdown of Core Industries into Sub-Sectors
The core industries can be broken down into eight sub-sectors (press and literature, motion pictures andvideo, software and databases, etc.), the WIPO Guide indicating which ISIC code should be ascribed towhich sub-sector. However, a complication arose because the WIPO Guide does not ascribe all codes onlyto one sub-sector. For example, ISIC code 2222 (service activities related to printing) was ascribed to pressand literature and photography. Consequently, we have had to decide how such industries should bedistributed among the different sub-sectors and an explanation of the procedure we followed is set out in the Appendices.
This report presents the results of the analysis based on the collected data and compares them with theresults of previous national and international studies. Our findings have been summarized in illustrativetables and figures to provide a clear overview.
1.3 Report StructureThe report is structured as follows: Chapter 2 presents the most important findings on the economicmagnitude of copyright in terms of value added, employment and balance of trade. We analyzed the core,partial, interdependent and non-dedicated industries and broke the core industries down into sub-sectors.In Chapter 3 we compare our results with findings in other countries and with Dutch studies from previousyears. The Appendices present an overview of the methodology as we have opted to keep methodologicaldiscussion to a minimum in the main text.
The Economic C
ontribution ofC
opyright-Based Industries in the N
etherlands
201
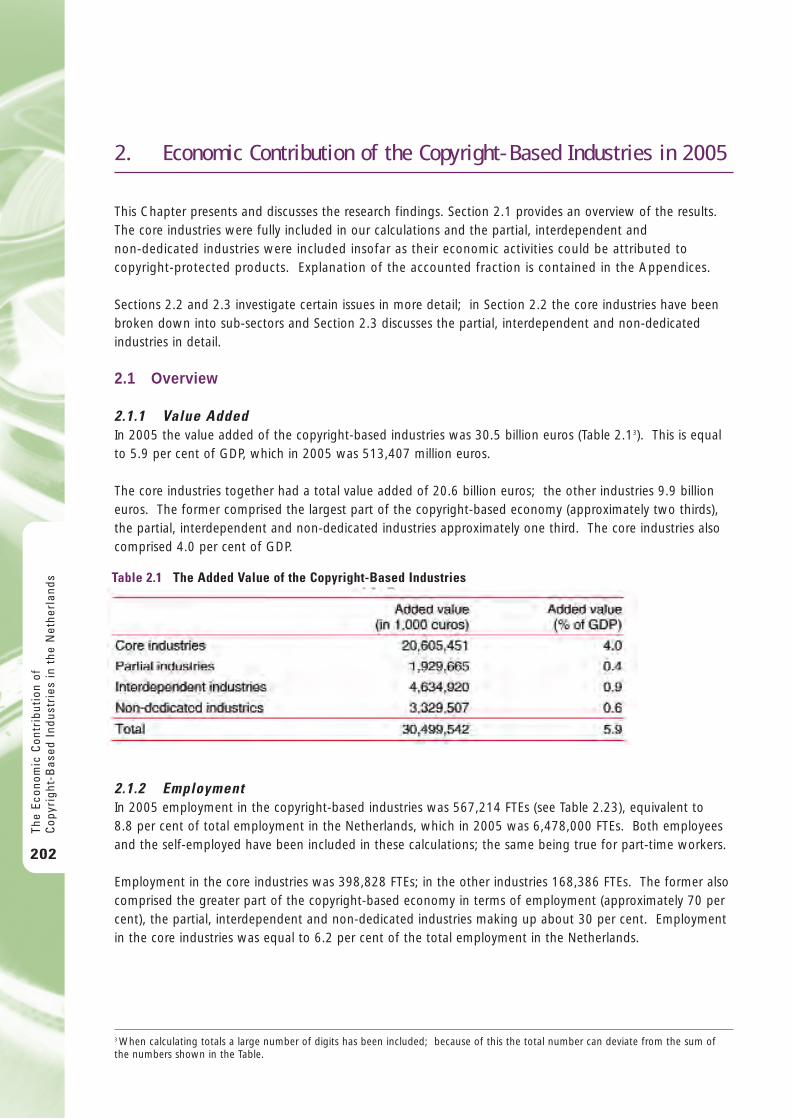
2. Economic Contr ibut ion of the Copyr ight-Based Industr ies in 2005
This Chapter presents and discusses the research findings. Section 2.1 provides an overview of the results.The core industries were fully included in our calculations and the partial, interdependent and non-dedicated industries were included insofar as their economic activities could be attributed tocopyright-protected products. Explanation of the accounted fraction is contained in the Appendices.
Sections 2.2 and 2.3 investigate certain issues in more detail; in Section 2.2 the core industries have beenbroken down into sub-sectors and Section 2.3 discusses the partial, interdependent and non-dedicatedindustries in detail.
2.1 Overview
2.1.1 Value Added In 2005 the value added of the copyright-based industries was 30.5 billion euros (Table 2.13). This is equalto 5.9 per cent of GDP, which in 2005 was 513,407 million euros.
The core industries together had a total value added of 20.6 billion euros; the other industries 9.9 billioneuros. The former comprised the largest part of the copyright-based economy (approximately two thirds),the partial, interdependent and non-dedicated industries approximately one third. The core industries alsocomprised 4.0 per cent of GDP.
2.1.2 EmploymentIn 2005 employment in the copyright-based industries was 567,214 FTEs (see Table 2.23), equivalent to 8.8 per cent of total employment in the Netherlands, which in 2005 was 6,478,000 FTEs. Both employeesand the self-employed have been included in these calculations; the same being true for part-time workers.
Employment in the core industries was 398,828 FTEs; in the other industries 168,386 FTEs. The former alsocomprised the greater part of the copyright-based economy in terms of employment (approximately 70 percent), the partial, interdependent and non-dedicated industries making up about 30 per cent. Employmentin the core industries was equal to 6.2 per cent of the total employment in the Netherlands.
The
Econ
omic
Con
trib
utio
n of
Cop
yrig
ht-B
ased
Ind
ustr
ies
in t
he N
ethe
rlan
ds
202
3 When calculating totals a large number of digits has been included; because of this the total number can deviate from the sum ofthe numbers shown in the Table.
Table 2.1 The Added Value of the Copyright-Based Industries
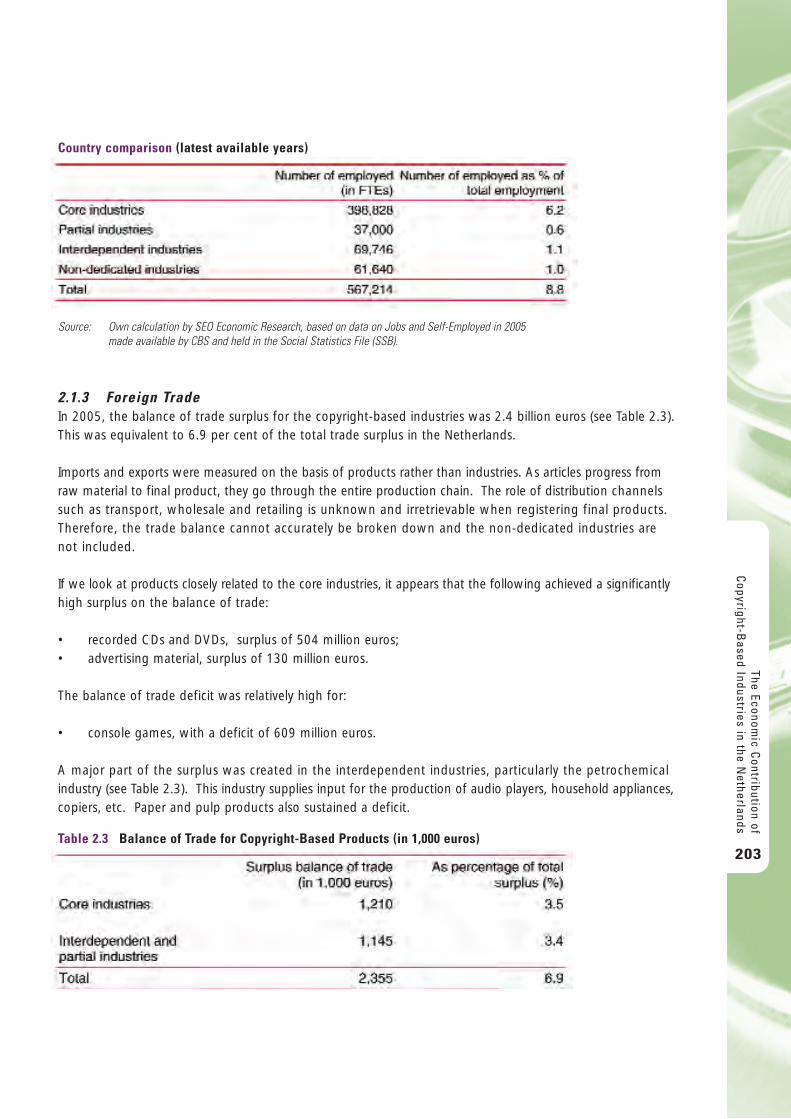
2.1.3 Foreign TradeIn 2005, the balance of trade surplus for the copyright-based industries was 2.4 billion euros (see Table 2.3).This was equivalent to 6.9 per cent of the total trade surplus in the Netherlands.
Imports and exports were measured on the basis of products rather than industries. As articles progress fromraw material to final product, they go through the entire production chain. The role of distribution channelssuch as transport, wholesale and retailing is unknown and irretrievable when registering final products.Therefore, the trade balance cannot accurately be broken down and the non-dedicated industries arenot included.
If we look at products closely related to the core industries, it appears that the following achieved a significantlyhigh surplus on the balance of trade:
• recorded CDs and DVDs, surplus of 504 million euros; • advertising material, surplus of 130 million euros.
The balance of trade deficit was relatively high for:
• console games, with a deficit of 609 million euros.
A major part of the surplus was created in the interdependent industries, particularly the petrochemicalindustry (see Table 2.3). This industry supplies input for the production of audio players, household appliances,copiers, etc. Paper and pulp products also sustained a deficit.
The Economic C
ontribution ofC
opyright-Based Industries in the N
etherlands
203
Country comparison (latest available years)
Table 2.3 Balance of Trade for Copyright-Based Products (in 1,000 euros)
Source: Own calculation by SEO Economic Research, based on data on Jobs and Self-Employed in 2005 made available by CBS and held in the Social Statistics File (SSB).
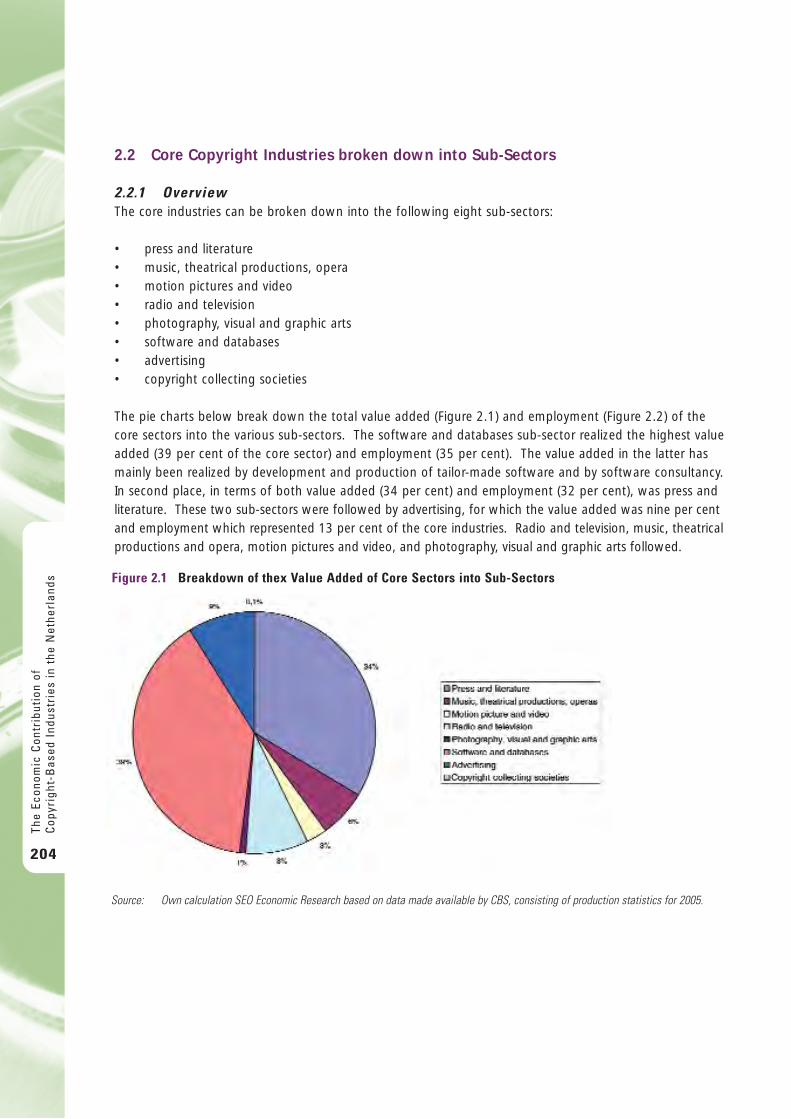
2.2 Core Copyright Industries broken down into Sub-Sectors
2.2.1 OverviewThe core industries can be broken down into the following eight sub-sectors:
• press and literature• music, theatrical productions, opera• motion pictures and video• radio and television• photography, visual and graphic arts• software and databases• advertising • copyright collecting societies
The pie charts below break down the total value added (Figure 2.1) and employment (Figure 2.2) of thecore sectors into the various sub-sectors. The software and databases sub-sector realized the highest valueadded (39 per cent of the core sector) and employment (35 per cent). The value added in the latter hasmainly been realized by development and production of tailor-made software and by software consultancy.In second place, in terms of both value added (34 per cent) and employment (32 per cent), was press andliterature. These two sub-sectors were followed by advertising, for which the value added was nine per centand employment which represented 13 per cent of the core industries. Radio and television, music, theatricalproductions and opera, motion pictures and video, and photography, visual and graphic arts followed.
The
Econ
omic
Con
trib
utio
n of
Cop
yrig
ht-B
ased
Ind
ustr
ies
in t
he N
ethe
rlan
ds
204
Figure 2.1 Breakdown of thex Value Added of Core Sectors into Sub-Sectors
Source: Own calculation SEO Economic Research based on data made available by CBS, consisting of production statistics for 2005.
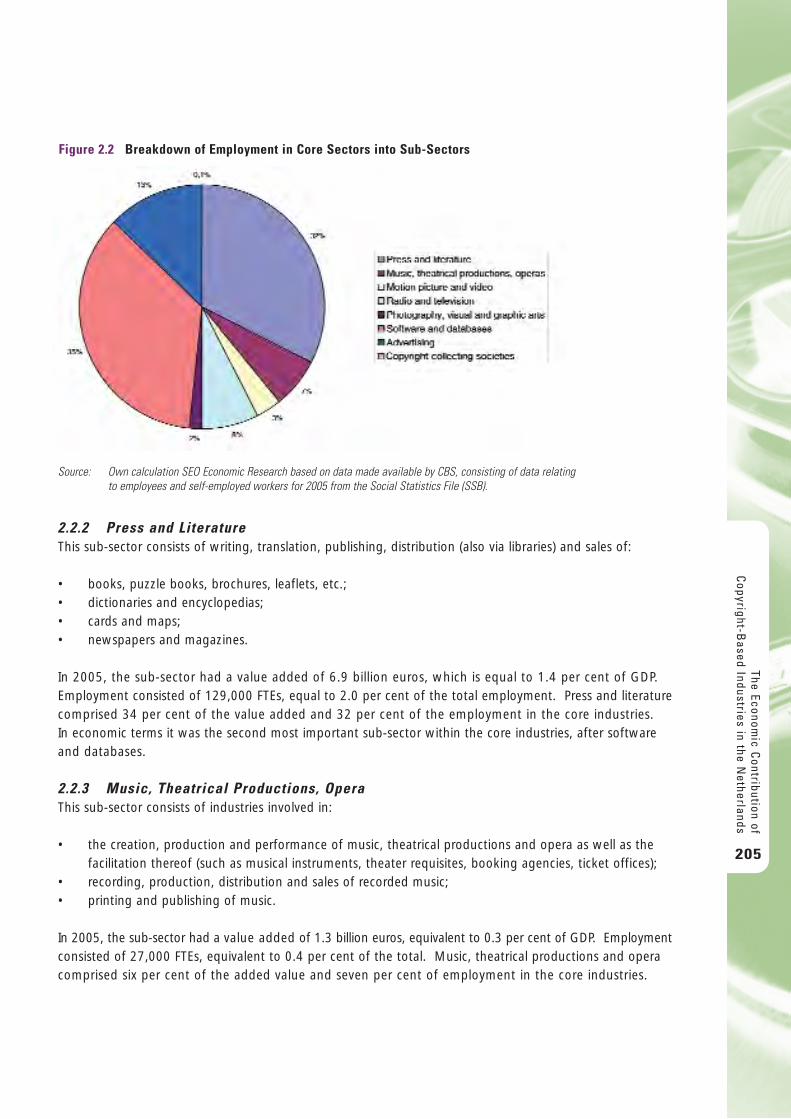
2.2.2 Press and LiteratureThis sub-sector consists of writing, translation, publishing, distribution (also via libraries) and sales of:
• books, puzzle books, brochures, leaflets, etc.;• dictionaries and encyclopedias;• cards and maps;• newspapers and magazines.
In 2005, the sub-sector had a value added of 6.9 billion euros, which is equal to 1.4 per cent of GDP.Employment consisted of 129,000 FTEs, equal to 2.0 per cent of the total employment. Press and literaturecomprised 34 per cent of the value added and 32 per cent of the employment in the core industries. In economic terms it was the second most important sub-sector within the core industries, after softwareand databases.
2.2.3 Music, Theatrical Productions, OperaThis sub-sector consists of industries involved in:
• the creation, production and performance of music, theatrical productions and opera as well as thefacilitation thereof (such as musical instruments, theater requisites, booking agencies, ticket offices);
• recording, production, distribution and sales of recorded music; • printing and publishing of music.
In 2005, the sub-sector had a value added of 1.3 billion euros, equivalent to 0.3 per cent of GDP. Employmentconsisted of 27,000 FTEs, equivalent to 0.4 per cent of the total. Music, theatrical productions and operacomprised six per cent of the added value and seven per cent of employment in the core industries.
The Economic C
ontribution ofC
opyright-Based Industries in the N
etherlands
205
Figure 2.2 Breakdown of Employment in Core Sectors into Sub-Sectors
Source: Own calculation SEO Economic Research based on data made available by CBS, consisting of data relating to employees and self-employed workers for 2005 from the Social Statistics File (SSB).

2.2.4 Motion Pictures and VideoThis sub-sector consists of industries involved in:
• the creation, production, distribution and screening of movies (taking account of the completeproduction chain from scenario writers to screening);
• video rentals and sales (including video-on-demand);• allied services (such as translation and dubbing).
In 2005, this sub-sector had a value added of 567 million euros, equivalent to 0.1 per cent of GDP.Employment consisted of 13,000 FTEs, equivalent to 0.2 per cent of the total. Motion pictures and videocomprised three per cent of the value added and three per cent of employment in the core industries.
2.2.5 Radio and TelevisionThis sub-sector consists of:
• national public and commercial broadcasting companies;• independent radio and television producers;• cable and satellite television (systems and channels) companies.
In 2005, the sub-sector had a value added of 1.7 billion euros, equivalent to 0.3 per cent of GDP.Employment consisted of 30,000 FTEs, equivalent to 0.5 per cent of the total. Radio and televisioncomprised eight per cent of the value added and eight per cent of employment in the core industries.
2.2.6 Photography, Visual and Graphic Arts This sub-sector consists of:
• commercial photography and studios;• photo agencies and libraries;• graphic design;• creation, exhibition (mainly galleries), distribution and sales of the visual arts; • picture framing and other allied services.
In 2005, the sub-sector had a value added of 169 million euros, equivalent to 0.03 per cent of GDP.Employment consisted of 6,000 FTEs, equivalent to 0.10 per cent of the total. Photography, visual and graphicarts comprised one per cent of the value added and two per cent of employment in the core industries.
2.2.7 Software and DatabasesThis sub-sector consists of:
• programming, development and design of software;• manufacturing, wholesale and retail of pre-packaged software (business applications, video games,
educational programs, etc.); • database processing and publishing.
In 2005, the sub-sector produced a value added of 8.1 billion euros, equivalent to 1.57 per cent of GDP.Employment consisted of 142,000 FTEs, equivalent to 2.20 per cent of the total. Software and databasescomprised 39 per cent of the value added and 35 per cent of employment in the core industries. Thismeans that within the core industries, this is by far the most important sub-sector for the Dutch economy.
The
Econ
omic
Con
trib
utio
n of
Cop
yrig
ht-B
ased
Ind
ustr
ies
in t
he N
ethe
rlan
ds
206
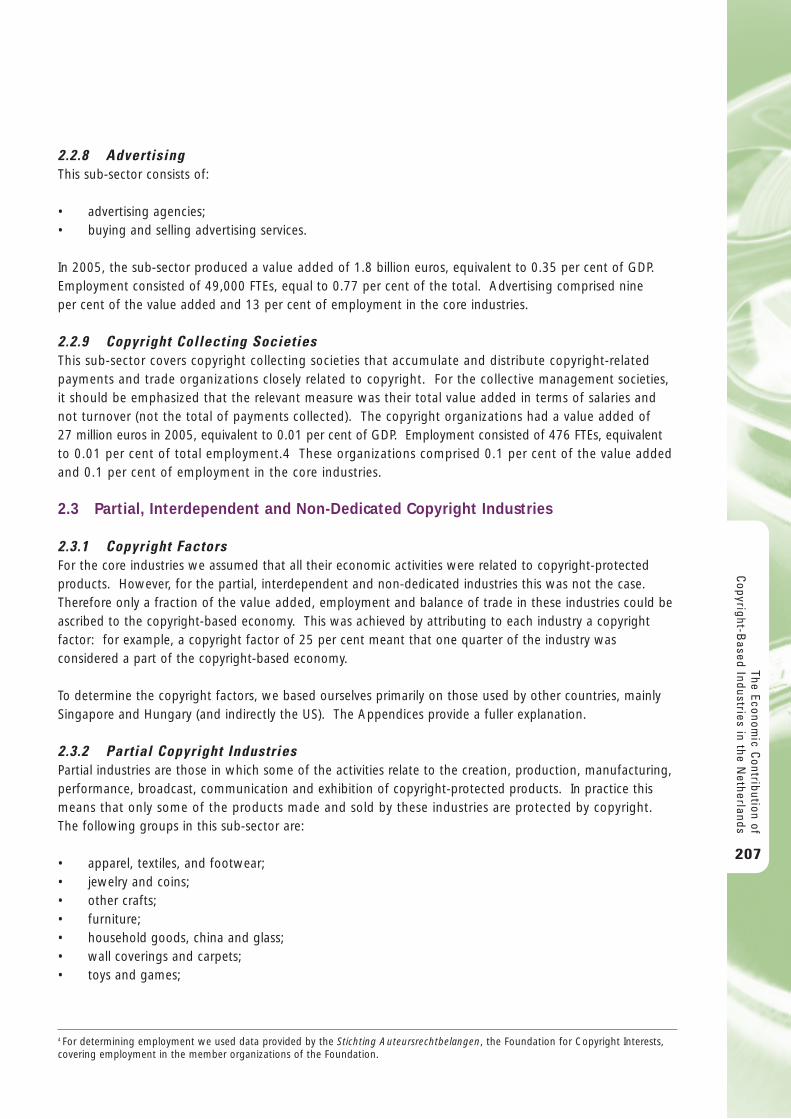
2.2.8 Advertising This sub-sector consists of:
• advertising agencies;• buying and selling advertising services.
In 2005, the sub-sector produced a value added of 1.8 billion euros, equivalent to 0.35 per cent of GDP.Employment consisted of 49,000 FTEs, equal to 0.77 per cent of the total. Advertising comprised nine per cent of the value added and 13 per cent of employment in the core industries.
2.2.9 Copyright Collecting Societies This sub-sector covers copyright collecting societies that accumulate and distribute copyright-relatedpayments and trade organizations closely related to copyright. For the collective management societies,it should be emphasized that the relevant measure was their total value added in terms of salaries andnot turnover (not the total of payments collected). The copyright organizations had a value added of 27 million euros in 2005, equivalent to 0.01 per cent of GDP. Employment consisted of 476 FTEs, equivalentto 0.01 per cent of total employment.4 These organizations comprised 0.1 per cent of the value addedand 0.1 per cent of employment in the core industries.
2.3 Partial, Interdependent and Non-Dedicated Copyright Industries
2.3.1 Copyright FactorsFor the core industries we assumed that all their economic activities were related to copyright-protectedproducts. However, for the partial, interdependent and non-dedicated industries this was not the case.Therefore only a fraction of the value added, employment and balance of trade in these industries could beascribed to the copyright-based economy. This was achieved by attributing to each industry a copyrightfactor: for example, a copyright factor of 25 per cent meant that one quarter of the industry wasconsidered a part of the copyright-based economy.
To determine the copyright factors, we based ourselves primarily on those used by other countries, mainlySingapore and Hungary (and indirectly the US). The Appendices provide a fuller explanation.
2.3.2 Partial Copyright IndustriesPartial industries are those in which some of the activities relate to the creation, production, manufacturing,performance, broadcast, communication and exhibition of copyright-protected products. In practice thismeans that only some of the products made and sold by these industries are protected by copyright.The following groups in this sub-sector are:
• apparel, textiles, and footwear;• jewelry and coins;• other crafts;• furniture;• household goods, china and glass;• wall coverings and carpets;• toys and games;
The Economic C
ontribution ofC
opyright-Based Industries in the N
etherlands
207
4 For determining employment we used data provided by the Stichting Auteursrechtbelangen, the Foundation for Copyright Interests,covering employment in the member organizations of the Foundation.
• architecture, engineering, surveying;• museums.
The copyright factors for the various industries ranged from one to 50 per cent; on average a partial industrywas taken into account with a copyright factor of 10.9 per cent. Using this measurement, we arrived at a value added of 1.9 billion euros for these industries (see Table 2.1). A major segment (26 per cent)consisted of architecture, engineering and surveying. Employment accounted for 37,000 FTEs (see Table2.2), of which 9,000 FTEs could be ascribed to architecture, engineering and surveying.
2.3.3 Interdependent Copyright IndustriesInterdependent industries are those engaged in the production, manufacturing or sale of equipment andutilities that facilitate the creation, production and manufacturing, performance, broadcasting, communicationor exhibition of copyright-protected products. They include, inter alia: television sets, CD and DVD players,computers, musical instruments, paper, photographic instruments and blank recording material.
These industries do not produce copyright-protected products themselves, but without copyright-protectedproducts they would not produce anything or substantially less; therefore they have been partially considered.The copyright factors ranged from 19 per cent to 35 per cent; on average a copyright factor of 24 per centwas taken into account in an interdependent industry.
These industries contributed 4.6 billion euros to the copyright-based economy (see Table 2.1). A major part(48 per cent) came from the manufacture of video and audio recorders and receivers and computers; wholesaleof computers, computer peripheral equipment and software and wholesale in other machines, equipmentand supplies. Employment related to copyright consisted of 69,746 FTEs (Table 2.2).
2.32 Non-Dedicated Copyright IndustriesNon-dedicated industries are those in which some of the activities are related to facilitating the broadcast,communication, distribution and sales of copyright-protected products which do not belong to the coreindustries. These include telecommunications and Internet, general wholesale and retailing and alsoindustries not dedicated to specific trade sectors but which facilitate numerous sectors. The non-dedicatedindustries have been included with a copyright factor of six per cent.
These industries contributed 3.3 billion euros to the copyright-based economy (see Table 2.1); their employment figure amounted to 61,640 FTEs (Table 2.2).
The
Econ
omic
Con
trib
utio
n of
Cop
yrig
ht-B
ased
Ind
ustr
ies
in t
he N
ethe
rlan
ds
208
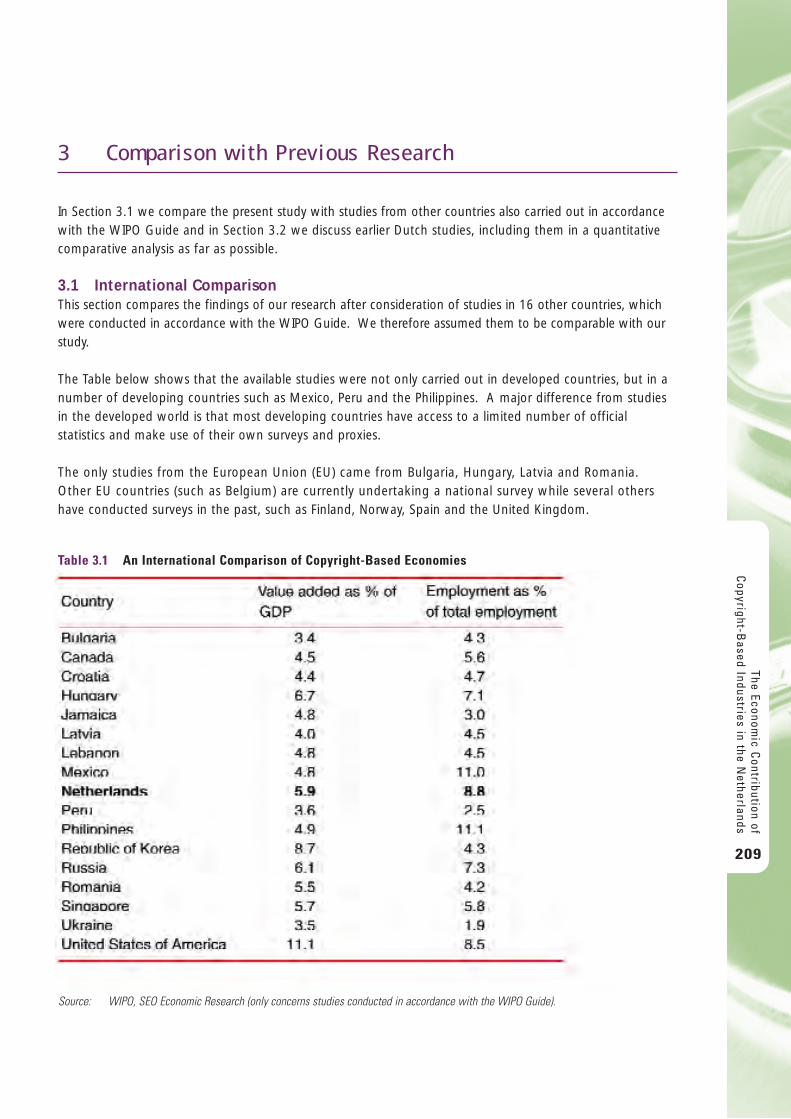
3 C o m p a r i s o n w i t h P r e v i o u s R e s e a r c h
In Section 3.1 we compare the present study with studies from other countries also carried out in accordancewith the WIPO Guide and in Section 3.2 we discuss earlier Dutch studies, including them in a quantitativecomparative analysis as far as possible.
3.1 International ComparisonThis section compares the findings of our research after consideration of studies in 16 other countries, whichwere conducted in accordance with the WIPO Guide. We therefore assumed them to be comparable with ourstudy.
The Table below shows that the available studies were not only carried out in developed countries, but in anumber of developing countries such as Mexico, Peru and the Philippines. A major difference from studiesin the developed world is that most developing countries have access to a limited number of officialstatistics and make use of their own surveys and proxies.
The only studies from the European Union (EU) came from Bulgaria, Hungary, Latvia and Romania.Other EU countries (such as Belgium) are currently undertaking a national survey while several others have conducted surveys in the past, such as Finland, Norway, Spain and the United Kingdom.
The Economic C
ontribution ofC
opyright-Based Industries in the N
etherlands
209
Table 3.1 An International Comparison of Copyright-Based Economies
Source: WIPO, SEO Economic Research (only concerns studies conducted in accordance with the WIPO Guide).
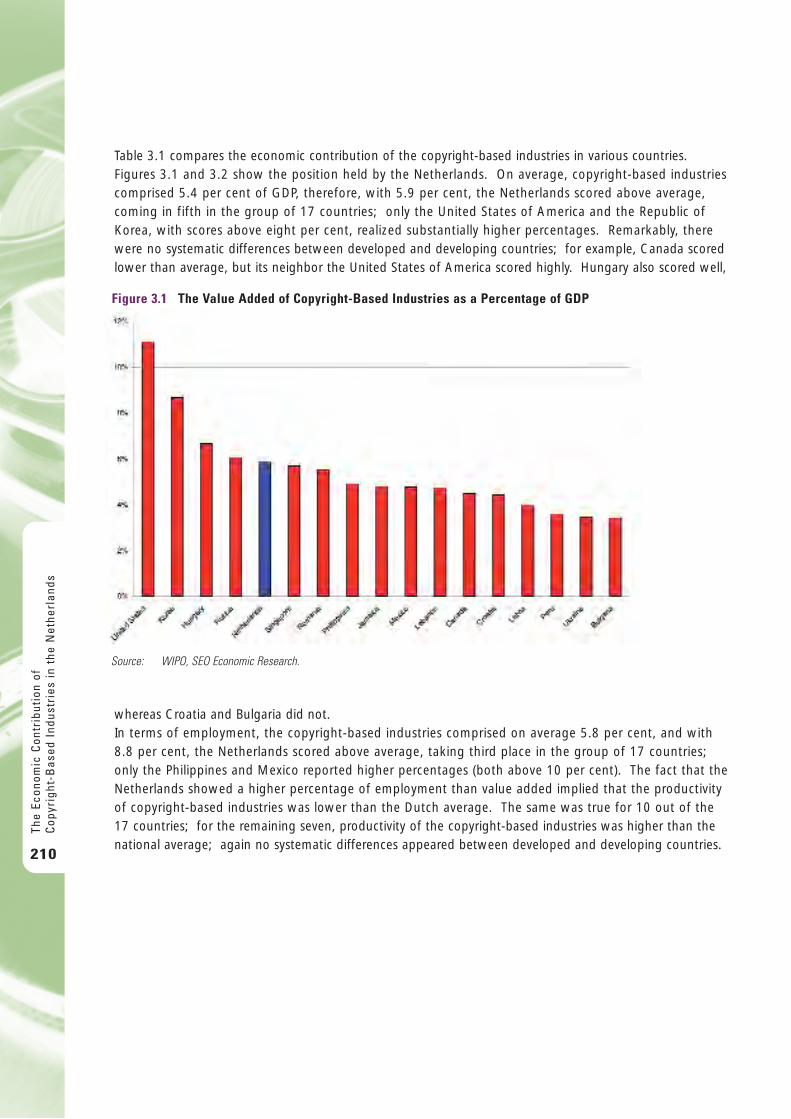
Table 3.1 compares the economic contribution of the copyright-based industries in various countries. Figures 3.1 and 3.2 show the position held by the Netherlands. On average, copyright-based industriescomprised 5.4 per cent of GDP, therefore, with 5.9 per cent, the Netherlands scored above average,coming in fifth in the group of 17 countries; only the United States of America and the Republic ofKorea, with scores above eight per cent, realized substantially higher percentages. Remarkably, therewere no systematic differences between developed and developing countries; for example, Canada scoredlower than average, but its neighbor the United States of America scored highly. Hungary also scored well,
whereas Croatia and Bulgaria did not. In terms of employment, the copyright-based industries comprised on average 5.8 per cent, and with 8.8 per cent, the Netherlands scored above average, taking third place in the group of 17 countries;only the Philippines and Mexico reported higher percentages (both above 10 per cent). The fact that theNetherlands showed a higher percentage of employment than value added implied that the productivity of copyright-based industries was lower than the Dutch average. The same was true for 10 out of the 17 countries; for the remaining seven, productivity of the copyright-based industries was higher than thenational average; again no systematic differences appeared between developed and developing countries.
The
Econ
omic
Con
trib
utio
n of
Cop
yrig
ht-B
ased
Ind
ustr
ies
in t
he N
ethe
rlan
ds
210
Figure 3.1 The Value Added of Copyright-Based Industries as a Percentage of GDP
Source: WIPO, SEO Economic Research.
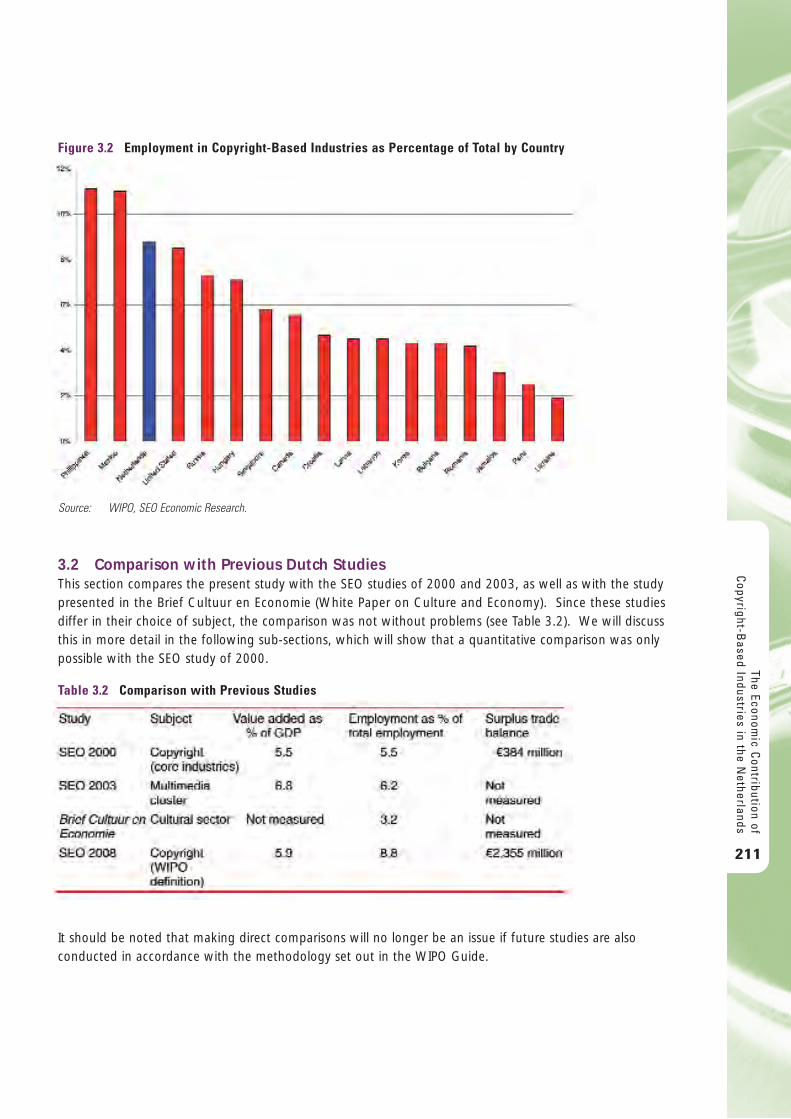
3.2 Comparison with Previous Dutch Studies This section compares the present study with the SEO studies of 2000 and 2003, as well as with the studypresented in the Brief Cultuur en Economie (White Paper on Culture and Economy). Since these studiesdiffer in their choice of subject, the comparison was not without problems (see Table 3.2). We will discussthis in more detail in the following sub-sections, which will show that a quantitative comparison was onlypossible with the SEO study of 2000.
It should be noted that making direct comparisons will no longer be an issue if future studies are alsoconducted in accordance with the methodology set out in the WIPO Guide.
The Economic C
ontribution ofC
opyright-Based Industries in the N
etherlands
211
Figure 3.2 Employment in Copyright-Based Industries as Percentage of Total by Country
Source: WIPO, SEO Economic Research.
Table 3.2 Comparison with Previous Studies
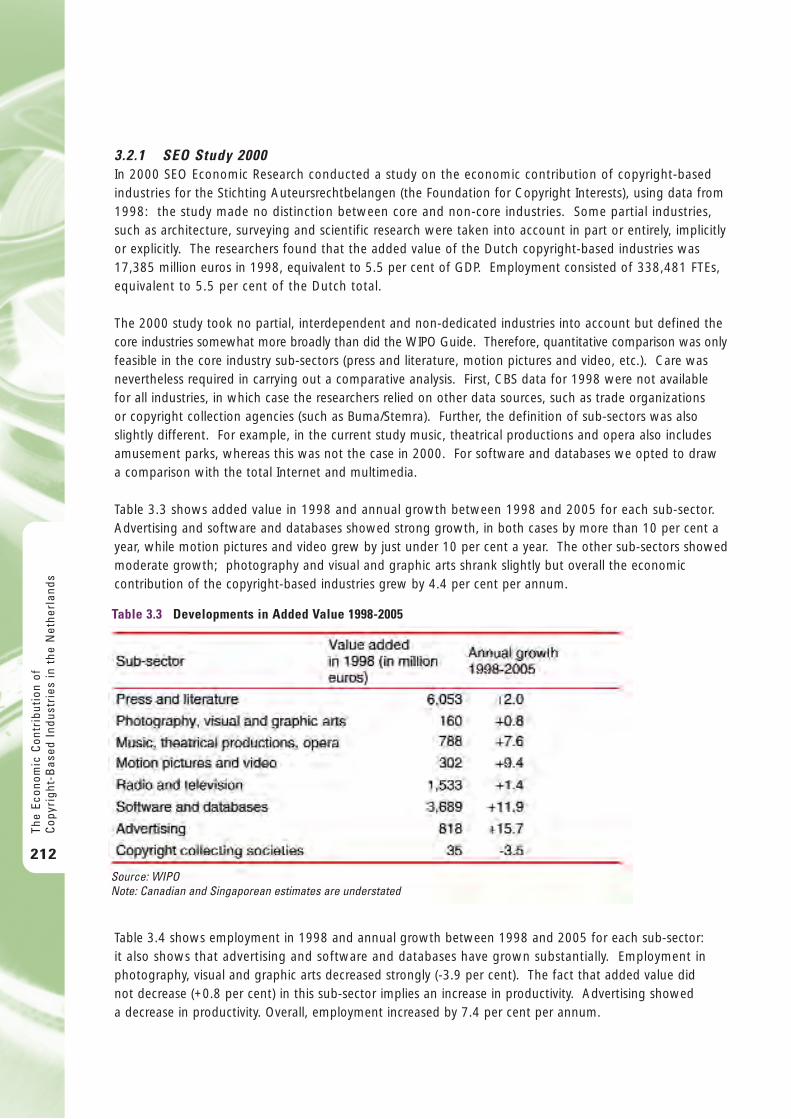
3.2.1 SEO Study 2000In 2000 SEO Economic Research conducted a study on the economic contribution of copyright-basedindustries for the Stichting Auteursrechtbelangen (the Foundation for Copyright Interests), using data from1998: the study made no distinction between core and non-core industries. Some partial industries,such as architecture, surveying and scientific research were taken into account in part or entirely, implicitlyor explicitly. The researchers found that the added value of the Dutch copyright-based industries was17,385 million euros in 1998, equivalent to 5.5 per cent of GDP. Employment consisted of 338,481 FTEs,equivalent to 5.5 per cent of the Dutch total.
The 2000 study took no partial, interdependent and non-dedicated industries into account but defined thecore industries somewhat more broadly than did the WIPO Guide. Therefore, quantitative comparison was onlyfeasible in the core industry sub-sectors (press and literature, motion pictures and video, etc.). Care wasnevertheless required in carrying out a comparative analysis. First, CBS data for 1998 were not available for all industries, in which case the researchers relied on other data sources, such as trade organizations or copyright collection agencies (such as Buma/Stemra). Further, the definition of sub-sectors was alsoslightly different. For example, in the current study music, theatrical productions and opera also includesamusement parks, whereas this was not the case in 2000. For software and databases we opted to draw a comparison with the total Internet and multimedia.
Table 3.3 shows added value in 1998 and annual growth between 1998 and 2005 for each sub-sector.Advertising and software and databases showed strong growth, in both cases by more than 10 per cent ayear, while motion pictures and video grew by just under 10 per cent a year. The other sub-sectors showedmoderate growth; photography and visual and graphic arts shrank slightly but overall the economiccontribution of the copyright-based industries grew by 4.4 per cent per annum.
Table 3.4 shows employment in 1998 and annual growth between 1998 and 2005 for each sub-sector: it also shows that advertising and software and databases have grown substantially. Employment inphotography, visual and graphic arts decreased strongly (-3.9 per cent). The fact that added value did not decrease (+0.8 per cent) in this sub-sector implies an increase in productivity. Advertising showed a decrease in productivity. Overall, employment increased by 7.4 per cent per annum.
The
Econ
omic
Con
trib
utio
n of
Cop
yrig
ht-B
ased
Ind
ustr
ies
in t
he N
ethe
rlan
ds
212
Table 3.3 Developments in Added Value 1998-2005
Source: WIPONote: Canadian and Singaporean estimates are understated
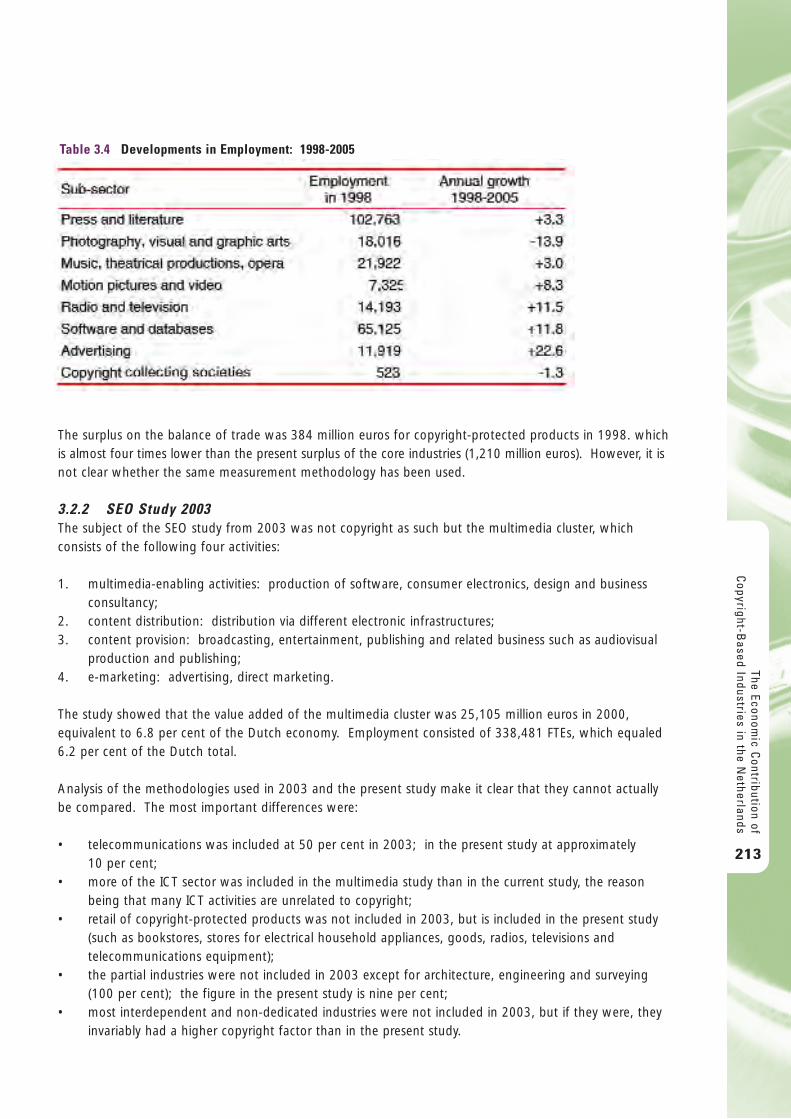
The surplus on the balance of trade was 384 million euros for copyright-protected products in 1998. whichis almost four times lower than the present surplus of the core industries (1,210 million euros). However, it isnot clear whether the same measurement methodology has been used.
3.2.2 SEO Study 2003The subject of the SEO study from 2003 was not copyright as such but the multimedia cluster, whichconsists of the following four activities:
1. multimedia-enabling activities: production of software, consumer electronics, design and businessconsultancy;
2. content distribution: distribution via different electronic infrastructures;3. content provision: broadcasting, entertainment, publishing and related business such as audiovisual
production and publishing;4. e-marketing: advertising, direct marketing.
The study showed that the value added of the multimedia cluster was 25,105 million euros in 2000,equivalent to 6.8 per cent of the Dutch economy. Employment consisted of 338,481 FTEs, which equaled6.2 per cent of the Dutch total.
Analysis of the methodologies used in 2003 and the present study make it clear that they cannot actually be compared. The most important differences were:
• telecommunications was included at 50 per cent in 2003; in the present study at approximately 10 per cent;
• more of the ICT sector was included in the multimedia study than in the current study, the reasonbeing that many ICT activities are unrelated to copyright;
• retail of copyright-protected products was not included in 2003, but is included in the present study(such as bookstores, stores for electrical household appliances, goods, radios, televisions andtelecommunications equipment);
• the partial industries were not included in 2003 except for architecture, engineering and surveying(100 per cent); the figure in the present study is nine per cent;
• most interdependent and non-dedicated industries were not included in 2003, but if they were, theyinvariably had a higher copyright factor than in the present study.
The Economic C
ontribution ofC
opyright-Based Industries in the N
etherlands
213
Table 3.4 Developments in Employment: 1998-2005
Telecommunications and ICT both made a large contribution, accounting for almost 30 per cent of theentire multimedia cluster in 2003, with a value added of approximately 7.5 billion euros (acknowledgingthat these industries were not included for 100 per cent). Also, architecture, engineering and surveyingmade a big contribution (in 2000 four billion euros added value or 16 per cent of the multimedia cluster);this sub-sector was not fully included in the present study, only accounting for nine per cent. Overall, it isnot surprising that the 2003 study found a higher share for the multimedia cluster in Dutch value addedand employment than is currently found for the copyright-based industries. But, as further quantitativecomparison would be non-productive, we have limited ourselves to a comparison with the 2000 report.
3.2.3 White Paper on Culture and EconomyThe study discussed in this White Paper5 gave an overview of the employment, turnover and export of theDutch cultural and creative sector in 2004. The business chain of creative industries consists of three stages:
• initial creation;• material production;• distribution and retail.
The study applied both a limited definition (creation) and a broad definition (creation, production, distribution).The White Paper estimated that the creative industries accounted for 150,000 jobs according to the limiteddefinition and 240,000 jobs according to the broad definition (3.2 per cent of the Dutch total).
The broad definition coincided mostly with the core industries as defined by the Guide, an important exceptionbeing the sub-sector for databases and software, which was barely included (despite its importance). Further,architecture, apparel, interior design, jewelry, design of games and toys and technical design were included,although they are not core industries according to the Guide. Moreover, the research used another datasource (LISA) that did not include part-time jobs and gave no information on part-time factors. On correctingfor these differences, we observed that the findings were in the same order as in our current study.
Furthermore, the study discussed turnover and exports: exports from creative industries equaled 0.14 percent of the total. Creative sector exports were still limited, but growing. There was little information availableon turnover and added value. Creativity in the Netherlands is geographically concentrated in the northernpart of the Dutch conurbation (Randstad), in the Gooi region and along the A2 motorway. The researchersestimated that every euro spent on production in the creative industries created 55 to 90 cents more productionelsewhere in the economy. In stating this, they were underwriting the methodology followed by WIPO, thusleveling out the core industries with parts of the partial, interdependent and non-dedicated industries.
The
Econ
omic
Con
trib
utio
n of
Cop
yrig
ht-B
ased
Ind
ustr
ies
in t
he N
ethe
rlan
ds
214
5 The results are based mainly on a report by Marlet, G. and Poort, J., 2005: Omvang en belang van de creatieve productie in Nederland(Scope and Value of Creative Productions in the Netherlands), in: Cultuur en creativiteit naar waarde geschat (Evaluating the Value ofCulture and Creativity), Atlas voor Gemeenten (Guide for Municipal Authorities)/SEO Economic Research.
List of Abbreviations• GDP: Gross Domestic Product• CBS: Central Dutch Institute of Statistics, Centraal Bureau voor de Statistiek• CPC: Central Product Classification (used by the United Nations)• HS: Harmonized System (used by the European Union)• ISIC: International Standard Industrial Classification• SBI: Standard Business Categorization, Standaard Bedrijfsindeling• SSB: Social Statistics Data File, Sociaal Statistisch Bestand• WIPO: World Intellectual Property Organization
Commission of AccompanimentThe Commission of Accompaniment consisted of:Piet Donselaar – Ministry of Economic AffairsMargreet Groenenboom – Ministry of Economic Affairs (client)Nicole Hagemans – Ministry of JusticeLex Levisson – Ministry of Economic Affairs Roel van de Ven – Ministry of Education, Culture and ScienceWillem Wanrooij – Stichting Auteursrechtbelangen, the Foundation for Copyright Issues
The Economic C
ontribution ofC
opyright-Based Industries in the N
etherlands
215
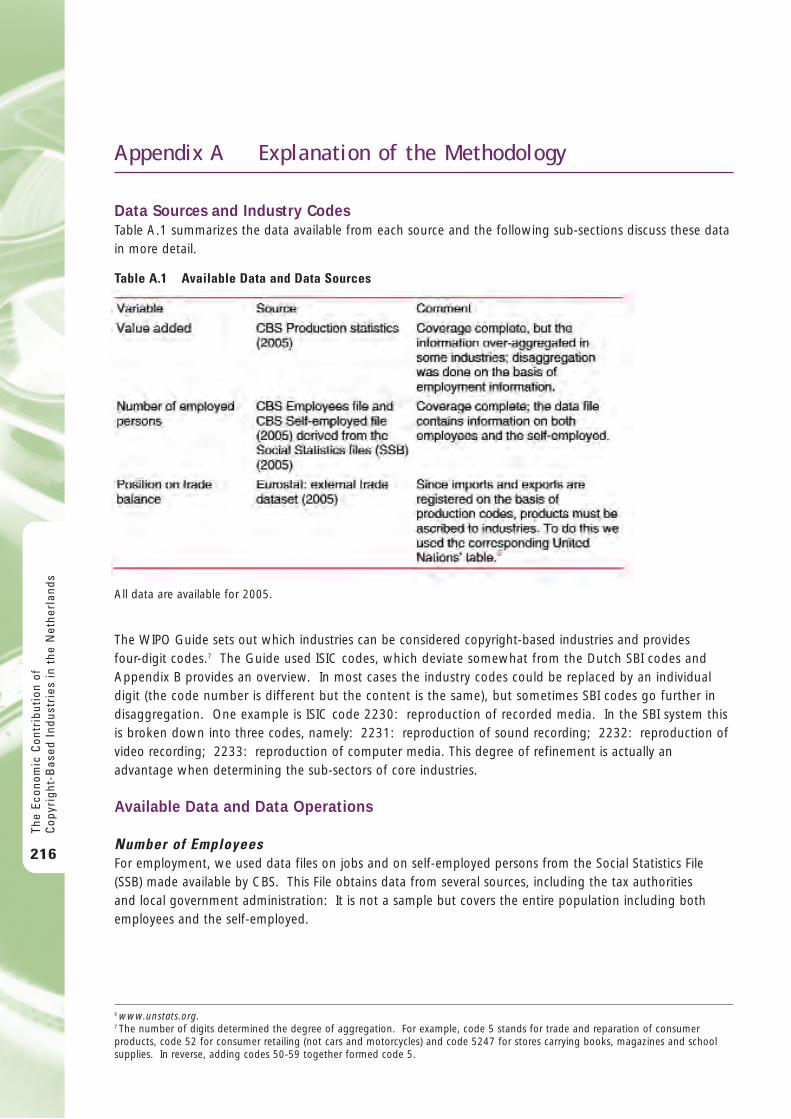
A p p e n d i x A E x p l a n a t i o n o f t h e M e t h o d o l o g y
Data Sources and Industry CodesTable A.1 summarizes the data available from each source and the following sub-sections discuss these datain more detail.
The WIPO Guide sets out which industries can be considered copyright-based industries and provides four-digit codes.7 The Guide used ISIC codes, which deviate somewhat from the Dutch SBI codes andAppendix B provides an overview. In most cases the industry codes could be replaced by an individualdigit (the code number is different but the content is the same), but sometimes SBI codes go further indisaggregation. One example is ISIC code 2230: reproduction of recorded media. In the SBI system thisis broken down into three codes, namely: 2231: reproduction of sound recording; 2232: reproduction ofvideo recording; 2233: reproduction of computer media. This degree of refinement is actually anadvantage when determining the sub-sectors of core industries.
Available Data and Data Operations
Number of EmployeesFor employment, we used data files on jobs and on self-employed persons from the Social Statistics File(SSB) made available by CBS. This File obtains data from several sources, including the tax authorities and local government administration: It is not a sample but covers the entire population including bothemployees and the self-employed.
The
Econ
omic
Con
trib
utio
n of
Cop
yrig
ht-B
ased
Ind
ustr
ies
in t
he N
ethe
rlan
ds
216
Table A.1 Available Data and Data Sources
All data are available for 2005.
6 www.unstats.org.7 The number of digits determined the degree of aggregation. For example, code 5 stands for trade and reparation of consumerproducts, code 52 for consumer retailing (not cars and motorcycles) and code 5247 for stores carrying books, magazines and schoolsupplies. In reverse, adding codes 50-59 together formed code 5.
The Economic C
ontribution ofC
opyright-Based Industries in the N
etherlands
217
The industry in which every Dutch employee and self-employed person is active is documented, as well asthe factor for every part-time job. By summing up the part-time factors we can calculate the full-timeequivalents (FTEs) of employees per industry. For the self-employed we assumed the part-time factor to be0.79, which is equivalent to the average part-time factor in the Netherlands (Source: CBS Statline). Byadding the figures for employees and the self-employed we arrived at a total employment figure for FTEs.
Value Added For the value added we used GDP against market prices. For most industries data on value added wereavailable to the four-digit level, except for industry codes starting with a nine. Relevant to this researchwere codes 91 (employers, employees and trade organizations; religious and political organizations, otheridealistic organizations, etc.) and 92 (culture, sports and recreation).
The question was which part of the aggregate in 91 and 92 should be ascribed to the copyright-basedindustries. Our answer was based on the ratio of employment as employment numbers were fully available.This served as a suitable proxy, given that it concerned labor intensive (and capital extensive) industries andmeant that employment was a good approximation of economic contribution.
Balance of TradeThe aim was to calculate the position of every copyright-based industry. A problem arose in thatinternational trade data are registered per product rather than at industry level.
The most detailed information for measuring the balance of trade came from Eurostat which collects importand export figures for European countries, although these data are gathered on product level, which meansthat they do not register the trading company (belonging to a certain industry), but only the product crossingthe border. Since this report concentrates on industries rather than products, it was important to link thetwo and this we did with the help of a correspondence table (see the process on Figure A.1) that ascribesproducts to industries and was compiled by the UN. However, since the UN table utilizes its own productcodings (CPC codes), it was necessary to use a second correspondence table to link the CPC codes to theharmonized system (HS) coding used in Europe. Fortunately the UN was able to provide the necessarytable and we could therefore ascribe every product group listed in the Eurostat trade data to itscorresponding industry.
However, when ascribing products to industries (i.e. in the correspondence tables) it was not possible todistinguish between, for example, a manufacturer and a wholesaler. If a wholesale company exported achair, this was only registered as “chair” and not as “chair exported by a wholesale company”. This chairmust be ascribed to the wholesale industry, but because chairs cannot be distinguished from chairs exporteddirectly by the manufacturer, a problem arose, and to deal with this we chose to ascribe products to theindustries in which they are finished (in the case of the chair: furniture manufacture).
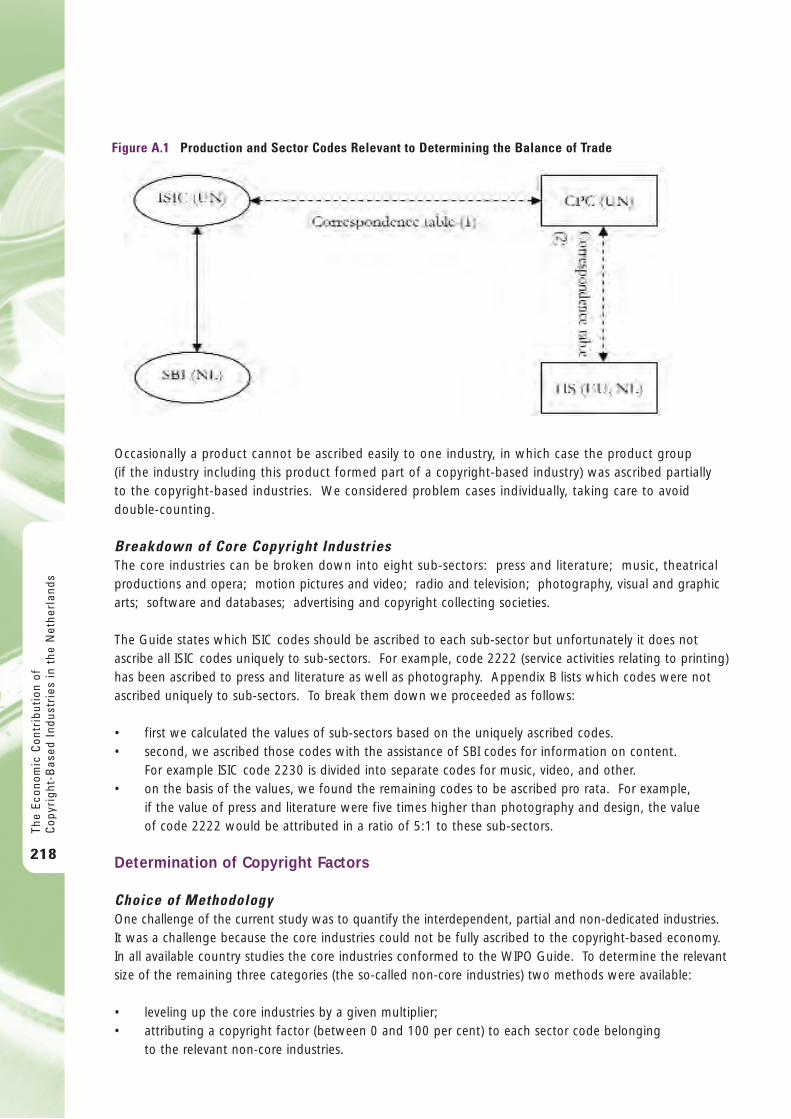
Occasionally a product cannot be ascribed easily to one industry, in which case the product group (if the industry including this product formed part of a copyright-based industry) was ascribed partially to the copyright-based industries. We considered problem cases individually, taking care to avoiddouble-counting.
Breakdown of Core Copyright IndustriesThe core industries can be broken down into eight sub-sectors: press and literature; music, theatricalproductions and opera; motion pictures and video; radio and television; photography, visual and graphicarts; software and databases; advertising and copyright collecting societies.
The Guide states which ISIC codes should be ascribed to each sub-sector but unfortunately it does notascribe all ISIC codes uniquely to sub-sectors. For example, code 2222 (service activities relating to printing)has been ascribed to press and literature as well as photography. Appendix B lists which codes were notascribed uniquely to sub-sectors. To break them down we proceeded as follows:
• first we calculated the values of sub-sectors based on the uniquely ascribed codes. • second, we ascribed those codes with the assistance of SBI codes for information on content.
For example ISIC code 2230 is divided into separate codes for music, video, and other.• on the basis of the values, we found the remaining codes to be ascribed pro rata. For example,
if the value of press and literature were five times higher than photography and design, the value of code 2222 would be attributed in a ratio of 5:1 to these sub-sectors.
Determination of Copyright Factors
Choice of MethodologyOne challenge of the current study was to quantify the interdependent, partial and non-dedicated industries.It was a challenge because the core industries could not be fully ascribed to the copyright-based economy. In all available country studies the core industries conformed to the WIPO Guide. To determine the relevantsize of the remaining three categories (the so-called non-core industries) two methods were available:
• leveling up the core industries by a given multiplier;• attributing a copyright factor (between 0 and 100 per cent) to each sector code belonging
to the relevant non-core industries.
The
Econ
omic
Con
trib
utio
n of
Cop
yrig
ht-B
ased
Ind
ustr
ies
in t
he N
ethe
rlan
ds
218
Figure A.1 Production and Sector Codes Relevant to Determining the Balance of Trade
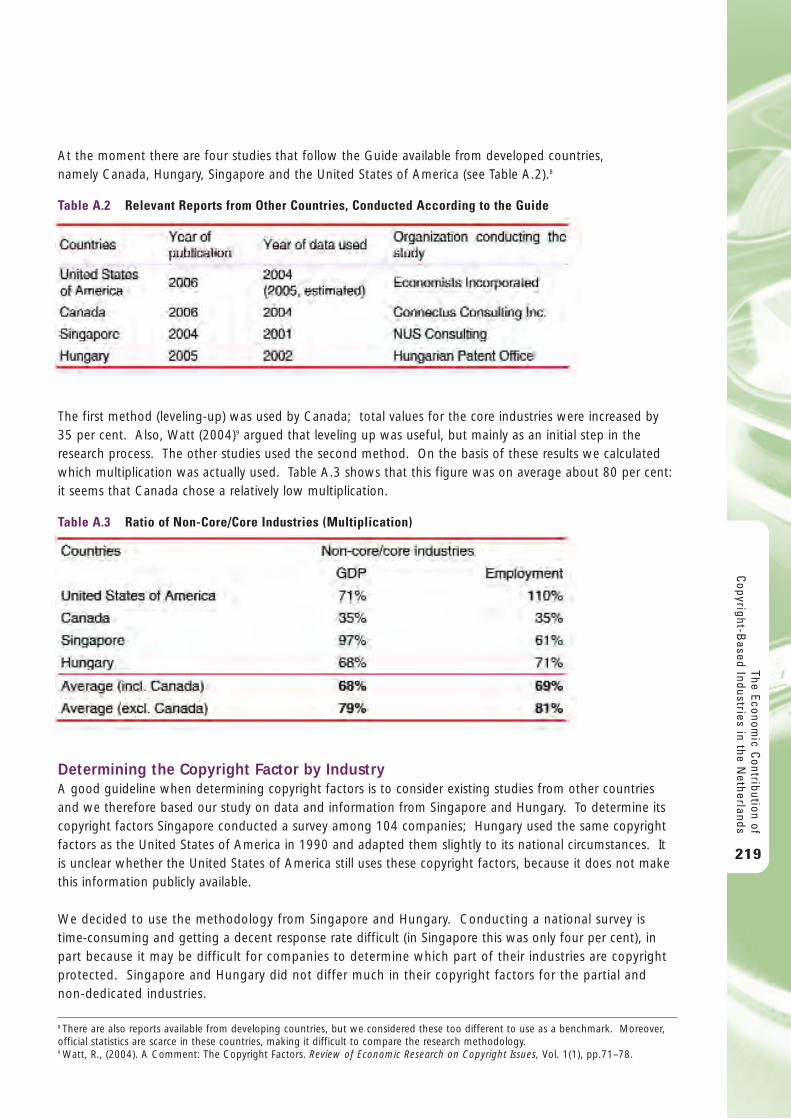
At the moment there are four studies that follow the Guide available from developed countries, namely Canada, Hungary, Singapore and the United States of America (see Table A.2).8
The first method (leveling-up) was used by Canada; total values for the core industries were increased by35 per cent. Also, Watt (2004)9 argued that leveling up was useful, but mainly as an initial step in theresearch process. The other studies used the second method. On the basis of these results we calculatedwhich multiplication was actually used. Table A.3 shows that this figure was on average about 80 per cent:it seems that Canada chose a relatively low multiplication.
Determining the Copyright Factor by IndustryA good guideline when determining copyright factors is to consider existing studies from other countriesand we therefore based our study on data and information from Singapore and Hungary. To determine itscopyright factors Singapore conducted a survey among 104 companies; Hungary used the same copyrightfactors as the United States of America in 1990 and adapted them slightly to its national circumstances. Itis unclear whether the United States of America still uses these copyright factors, because it does not makethis information publicly available.
We decided to use the methodology from Singapore and Hungary. Conducting a national survey istime-consuming and getting a decent response rate difficult (in Singapore this was only four per cent), inpart because it may be difficult for companies to determine which part of their industries are copyrightprotected. Singapore and Hungary did not differ much in their copyright factors for the partial andnon-dedicated industries.
The Economic C
ontribution ofC
opyright-Based Industries in the N
etherlands
219
Table A.2 Relevant Reports from Other Countries, Conducted According to the Guide
Table A.3 Ratio of Non-Core/Core Industries (Multiplication)
8 There are also reports available from developing countries, but we considered these too different to use as a benchmark. Moreover,official statistics are scarce in these countries, making it difficult to compare the research methodology. 9 Watt, R., (2004). A Comment: The Copyright Factors. Review of Economic Research on Copyright Issues, Vol. 1(1), pp.71–78.
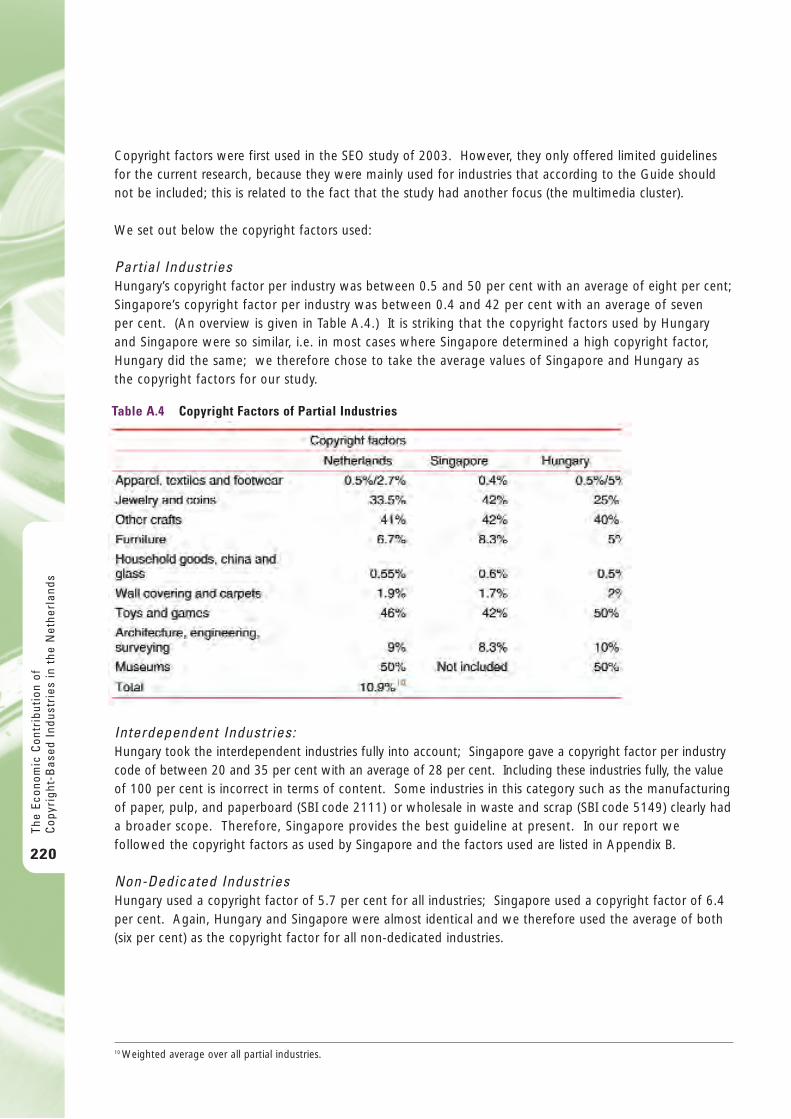
Copyright factors were first used in the SEO study of 2003. However, they only offered limited guidelinesfor the current research, because they were mainly used for industries that according to the Guide shouldnot be included; this is related to the fact that the study had another focus (the multimedia cluster).
We set out below the copyright factors used:
Partial Industries Hungary’s copyright factor per industry was between 0.5 and 50 per cent with an average of eight per cent;Singapore’s copyright factor per industry was between 0.4 and 42 per cent with an average of seven per cent. (An overview is given in Table A.4.) It is striking that the copyright factors used by Hungaryand Singapore were so similar, i.e. in most cases where Singapore determined a high copyright factor,Hungary did the same; we therefore chose to take the average values of Singapore and Hungary as the copyright factors for our study.
Interdependent Industries:Hungary took the interdependent industries fully into account; Singapore gave a copyright factor per industrycode of between 20 and 35 per cent with an average of 28 per cent. Including these industries fully, the valueof 100 per cent is incorrect in terms of content. Some industries in this category such as the manufacturingof paper, pulp, and paperboard (SBI code 2111) or wholesale in waste and scrap (SBI code 5149) clearly hada broader scope. Therefore, Singapore provides the best guideline at present. In our report wefollowed the copyright factors as used by Singapore and the factors used are listed in Appendix B.
Non-Dedicated IndustriesHungary used a copyright factor of 5.7 per cent for all industries; Singapore used a copyright factor of 6.4per cent. Again, Hungary and Singapore were almost identical and we therefore used the average of both(six per cent) as the copyright factor for all non-dedicated industries.
The
Econ
omic
Con
trib
utio
n of
Cop
yrig
ht-B
ased
Ind
ustr
ies
in t
he N
ethe
rlan
ds
220
Table A.4 Copyright Factors of Partial Industries
10 Weighted average over all partial industries.
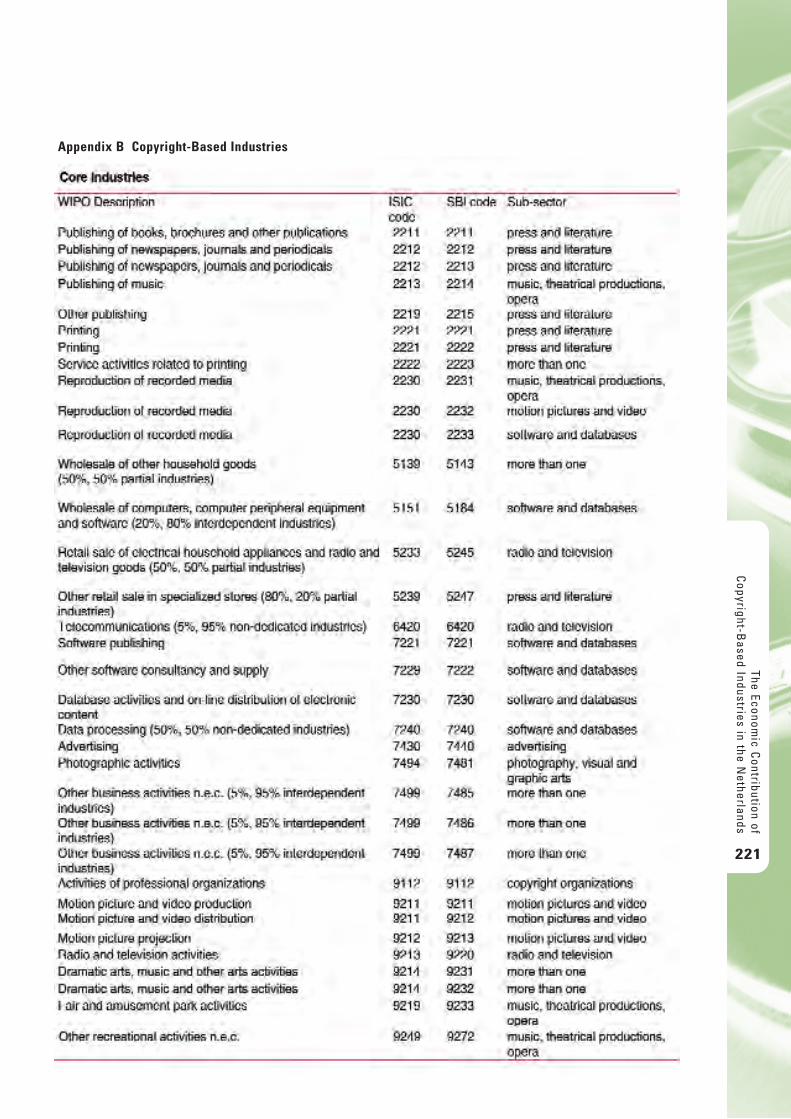
The Economic C
ontribution ofC
opyright-Based Industries in the N
etherlands
221
Appendix B Copyright-Based Industries
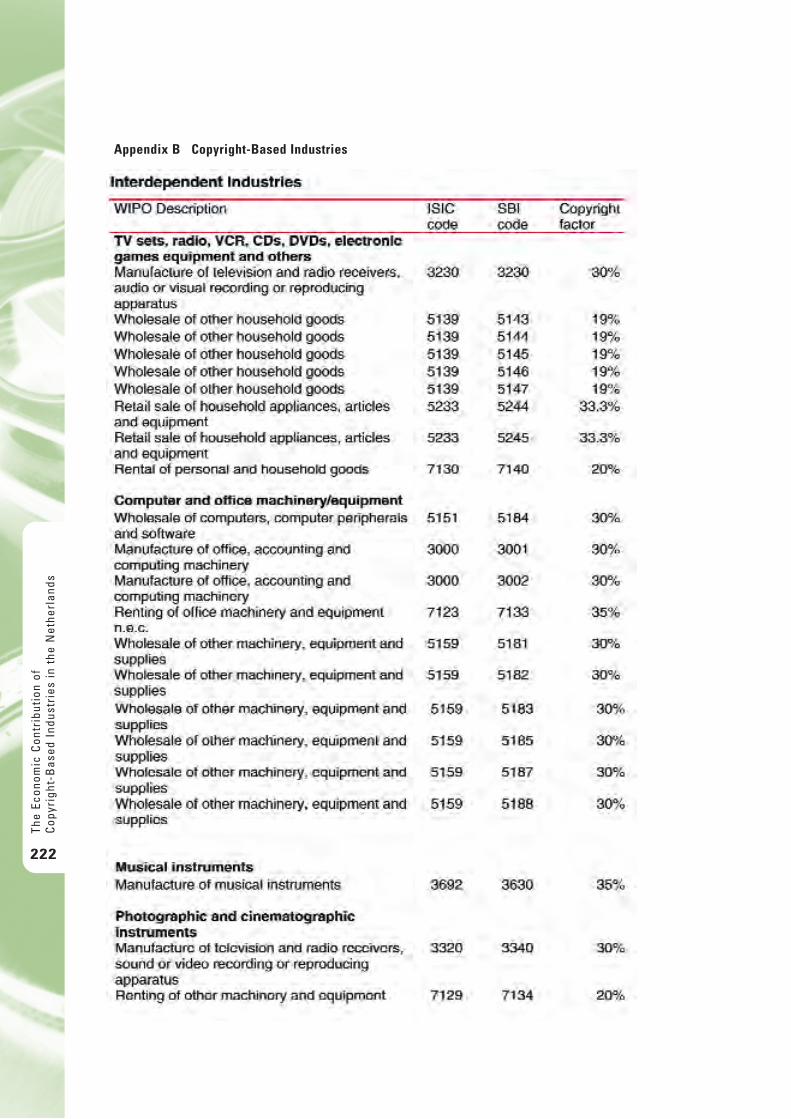
The
Econ
omic
Con
trib
utio
n of
Cop
yrig
ht-B
ased
Ind
ustr
ies
in t
he N
ethe
rlan
ds
222
Appendix B Copyright-Based Industries
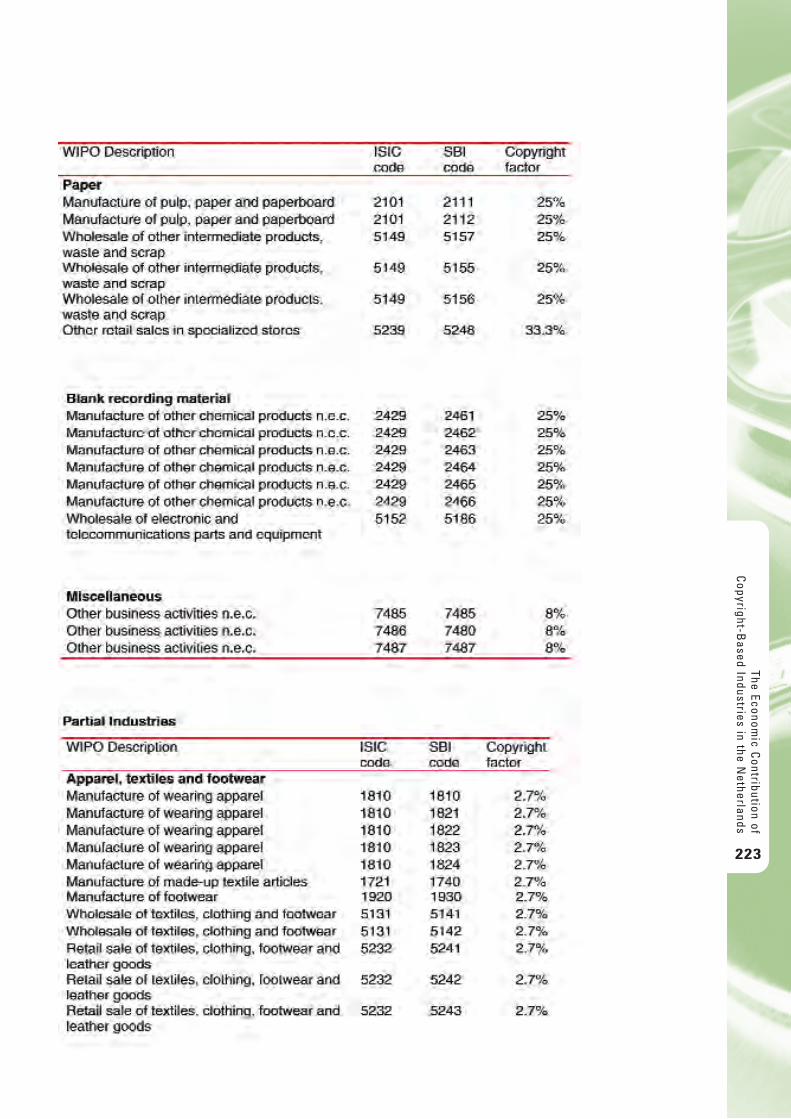
The Economic C
ontribution ofC
opyright-Based Industries in the N
etherlands
223
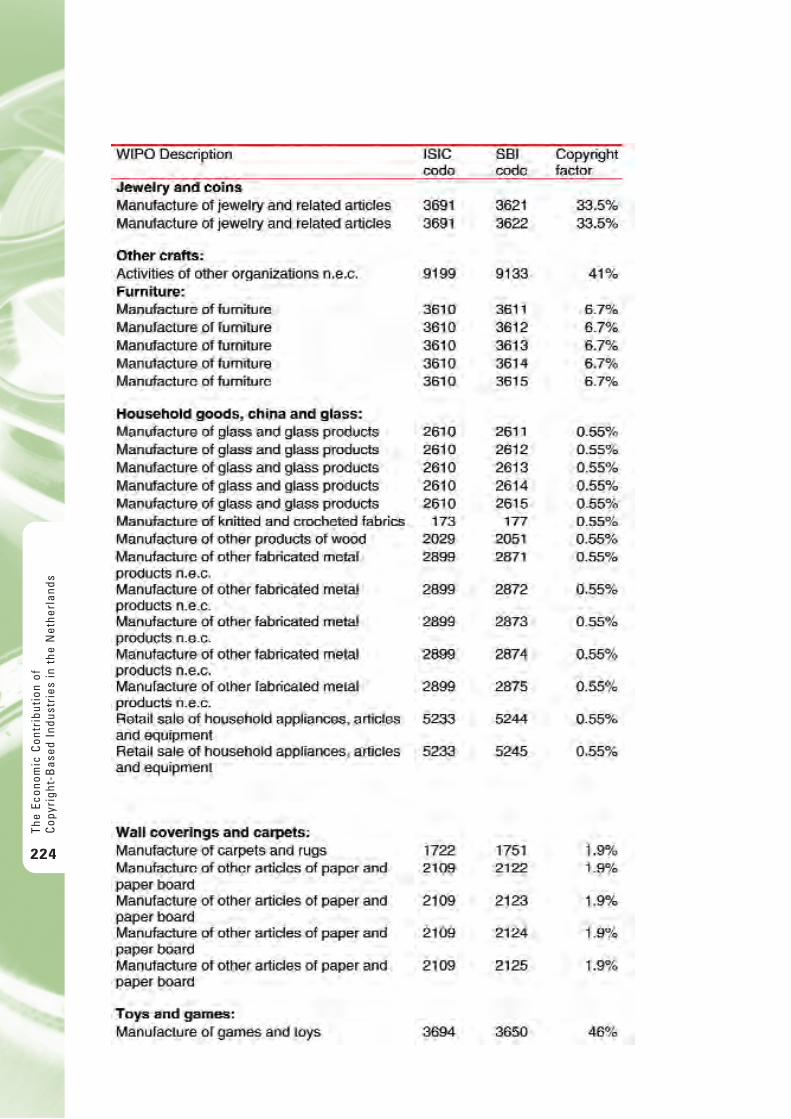
The
Econ
omic
Con
trib
utio
n of
Cop
yrig
ht-B
ased
Ind
ustr
ies
in t
he N
ethe
rlan
ds
224
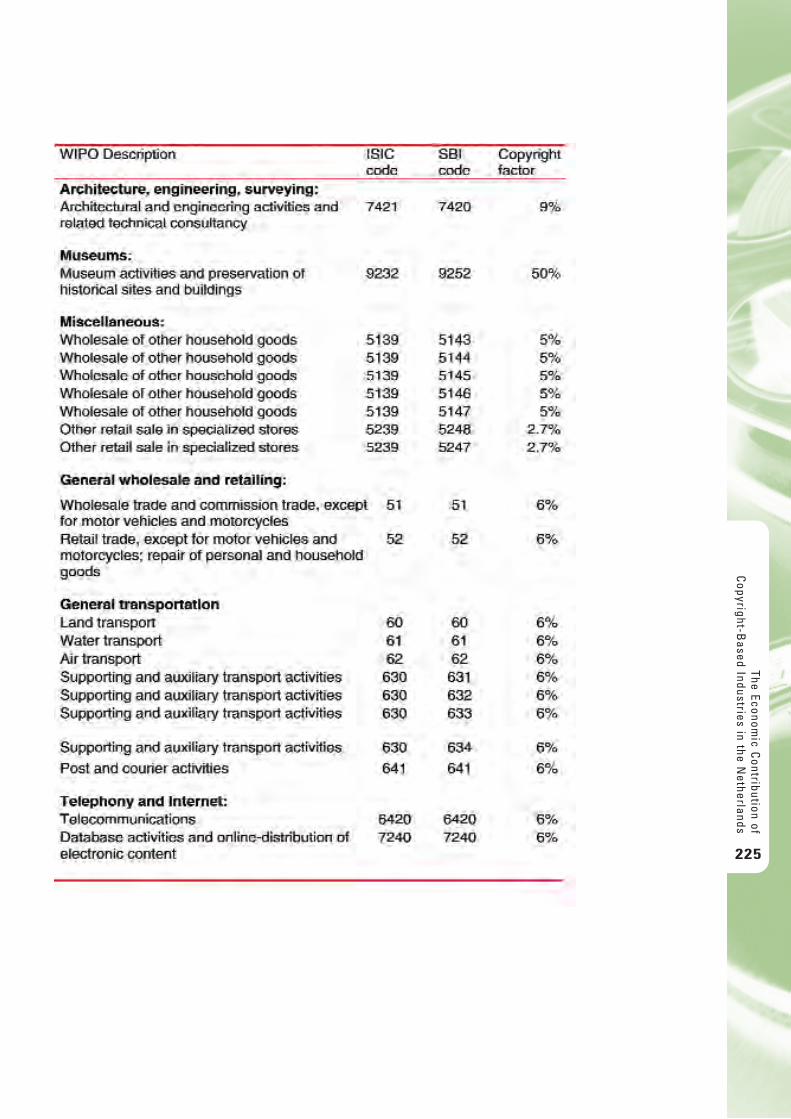
The Economic C
ontribution ofC
opyright-Based Industries in the N
etherlands
225

The
Econ
omic
Con
trib
utio
n of
Cop
yrig
ht-B
ased
Ind
ustr
ies
in t
he N
ethe
rlan
ds
226
The Economic C
ontribution ofC
opyright-Based Industries in P
eru
227
The Economic Contribution of Copyright-Based Industries
in Peru
Rosa Morales SaraviaJosé TávaraRaúl SolórzanoEduardo Villanueva July 2009

The
Econ
omic
Con
trib
utio
n of
Cop
yrig
ht-B
ased
Ind
ustr
ies
in P
eru
228
C o n t e n t s
Executive Summary 234
1. Introduction 239
2. Study Methodology and Sources of Information 2412.1. Value Added Estimation Methodology 2412.2. Employment Estimation Methodology 2442.3. Trade-flows Estimation Methodology 249
3. The Legal Framework on Copyright and Related Rights in Peru 2503.1. Overview 250
4. The Economic Contribution of Copyright-Based Industries in Peru 2614.1. Background and the Basics of CBI Performance 2614.2. Core Copyright Industries 2654.3. Interdependent Copyright Industries 2694.4. Partial Copyright Industries 2734.5. Non-Dedicated Support Industries 2784.6. Services (Trade Balance) 2794.7. Classification of Copyright-Based Industries in Peru 2814.8. International Comparisons 285
5. Description and Estimation of the Economic Contributionof the Main Core Copyright-Based Industries 2885.1. Press and Literature 2885.2. The Music Industry 3005.3. The Motion Picture Industry 3075.4. Television and Radio Industry 3165.5. The Software Industry 3245.6. The Advertising Industry 3285.7. The Copyright Collecting Societies 331
6. Conclusions and Recommendations 334
References 336
Acronyms List 338
Annex A: Conducted Interviews 341
Annex B: Methodological Estimation of Value Added Contributionof Copyright-Based Industries for the Year 2005 Based on Sectoral Dataof the Year 2000 (Ministry of Production) 347
Annex C: Annex to Chapter 3 349
Annex D: Newspapers in Peru, 2005 351
The Economic C
ontribution ofC
opyright-Based Industries in P
eru
229
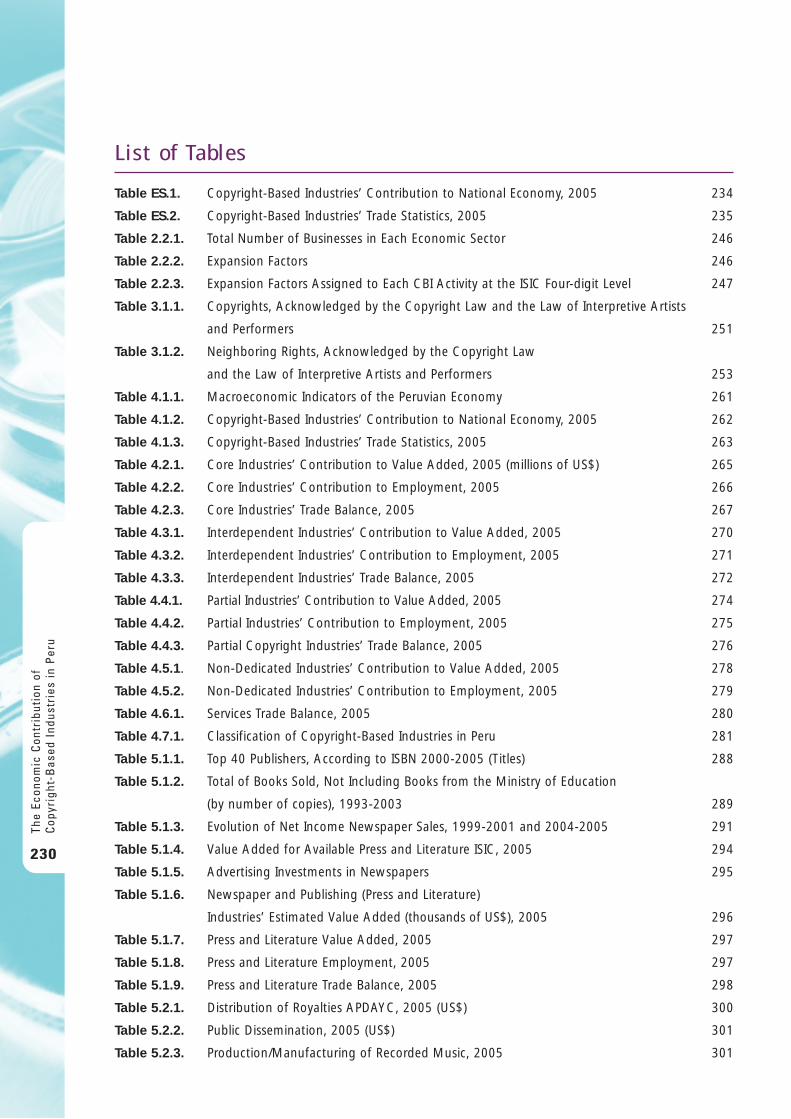
L i s t o f Ta b l e s
Table ES.1. Copyright-Based Industries’ Contribution to National Economy, 2005 234
Table ES.2. Copyright-Based Industries’ Trade Statistics, 2005 235
Table 2.2.1. Total Number of Businesses in Each Economic Sector 246
Table 2.2.2. Expansion Factors 246
Table 2.2.3. Expansion Factors Assigned to Each CBI Activity at the ISIC Four-digit Level 247
Table 3.1.1. Copyrights, Acknowledged by the Copyright Law and the Law of Interpretive Artists
and Performers 251
Table 3.1.2. Neighboring Rights, Acknowledged by the Copyright Law
and the Law of Interpretive Artists and Performers 253
Table 4.1.1. Macroeconomic Indicators of the Peruvian Economy 261
Table 4.1.2. Copyright-Based Industries’ Contribution to National Economy, 2005 262
Table 4.1.3. Copyright-Based Industries’ Trade Statistics, 2005 263
Table 4.2.1. Core Industries’ Contribution to Value Added, 2005 (millions of US$) 265
Table 4.2.2. Core Industries’ Contribution to Employment, 2005 266
Table 4.2.3. Core Industries’ Trade Balance, 2005 267
Table 4.3.1. Interdependent Industries’ Contribution to Value Added, 2005 270
Table 4.3.2. Interdependent Industries’ Contribution to Employment, 2005 271
Table 4.3.3. Interdependent Industries’ Trade Balance, 2005 272
Table 4.4.1. Partial Industries’ Contribution to Value Added, 2005 274
Table 4.4.2. Partial Industries’ Contribution to Employment, 2005 275
Table 4.4.3. Partial Copyright Industries’ Trade Balance, 2005 276
Table 4.5.1. Non-Dedicated Industries’ Contribution to Value Added, 2005 278
Table 4.5.2. Non-Dedicated Industries’ Contribution to Employment, 2005 279
Table 4.6.1. Services Trade Balance, 2005 280
Table 4.7.1. Classification of Copyright-Based Industries in Peru 281
Table 5.1.1. Top 40 Publishers, According to ISBN 2000-2005 (Titles) 288
Table 5.1.2. Total of Books Sold, Not Including Books from the Ministry of Education
(by number of copies), 1993-2003 289
Table 5.1.3. Evolution of Net Income Newspaper Sales, 1999-2001 and 2004-2005 291
Table 5.1.4. Value Added for Available Press and Literature ISIC, 2005 294
Table 5.1.5. Advertising Investments in Newspapers 295
Table 5.1.6. Newspaper and Publishing (Press and Literature)
Industries’ Estimated Value Added (thousands of US$), 2005 296
Table 5.1.7. Press and Literature Value Added, 2005 297
Table 5.1.8. Press and Literature Employment, 2005 297
Table 5.1.9. Press and Literature Trade Balance, 2005 298
Table 5.2.1. Distribution of Royalties APDAYC, 2005 (US$) 300
Table 5.2.2. Public Dissemination, 2005 (US$) 301
Table 5.2.3. Production/Manufacturing of Recorded Music, 2005 301
The
Econ
omic
Con
trib
utio
n of
Cop
yrig
ht-B
ased
Ind
ustr
ies
in P
eru
230
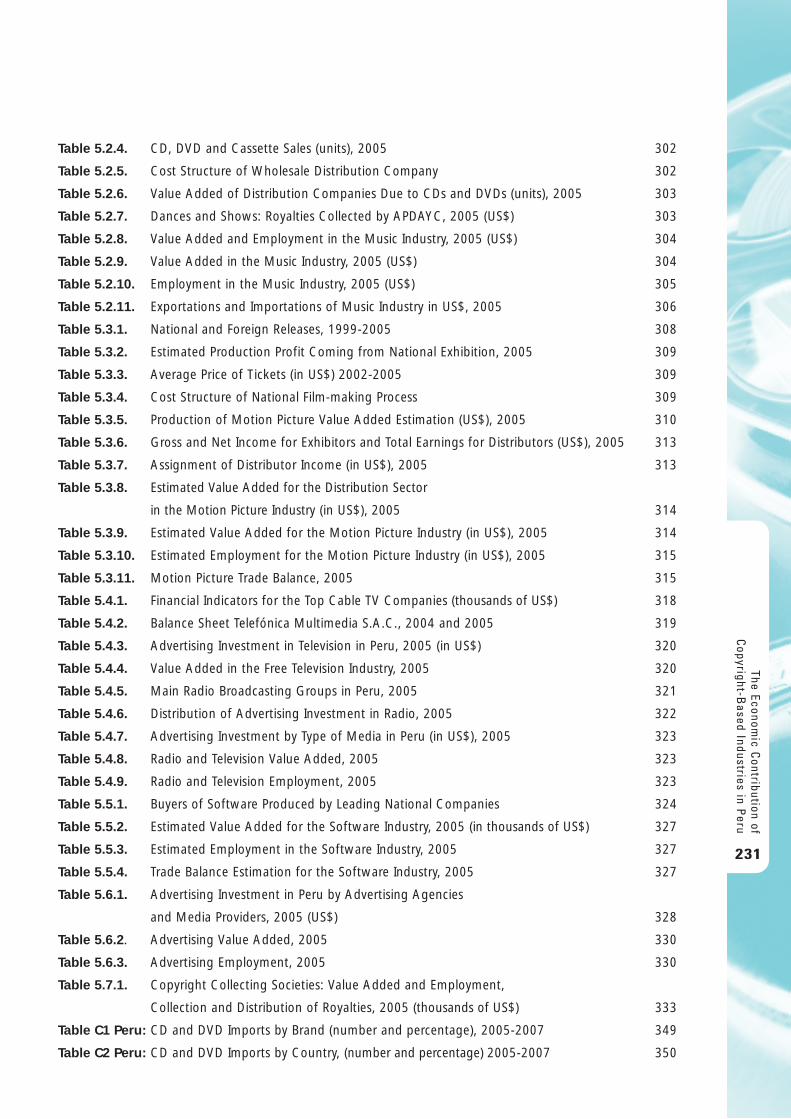
Table 5.2.4. CD, DVD and Cassette Sales (units), 2005 302
Table 5.2.5. Cost Structure of Wholesale Distribution Company 302
Table 5.2.6. Value Added of Distribution Companies Due to CDs and DVDs (units), 2005 303
Table 5.2.7. Dances and Shows: Royalties Collected by APDAYC, 2005 (US$) 303
Table 5.2.8. Value Added and Employment in the Music Industry, 2005 (US$) 304
Table 5.2.9. Value Added in the Music Industry, 2005 (US$) 304
Table 5.2.10. Employment in the Music Industry, 2005 (US$) 305
Table 5.2.11. Exportations and Importations of Music Industry in US$, 2005 306
Table 5.3.1. National and Foreign Releases, 1999-2005 308
Table 5.3.2. Estimated Production Profit Coming from National Exhibition, 2005 309
Table 5.3.3. Average Price of Tickets (in US$) 2002-2005 309
Table 5.3.4. Cost Structure of National Film-making Process 309
Table 5.3.5. Production of Motion Picture Value Added Estimation (US$), 2005 310
Table 5.3.6. Gross and Net Income for Exhibitors and Total Earnings for Distributors (US$), 2005 313
Table 5.3.7. Assignment of Distributor Income (in US$), 2005 313
Table 5.3.8. Estimated Value Added for the Distribution Sector
in the Motion Picture Industry (in US$), 2005 314
Table 5.3.9. Estimated Value Added for the Motion Picture Industry (in US$), 2005 314
Table 5.3.10. Estimated Employment for the Motion Picture Industry (in US$), 2005 315
Table 5.3.11. Motion Picture Trade Balance, 2005 315
Table 5.4.1. Financial Indicators for the Top Cable TV Companies (thousands of US$) 318
Table 5.4.2. Balance Sheet Telefónica Multimedia S.A.C., 2004 and 2005 319
Table 5.4.3. Advertising Investment in Television in Peru, 2005 (in US$) 320
Table 5.4.4. Value Added in the Free Television Industry, 2005 320
Table 5.4.5. Main Radio Broadcasting Groups in Peru, 2005 321
Table 5.4.6. Distribution of Advertising Investment in Radio, 2005 322
Table 5.4.7. Advertising Investment by Type of Media in Peru (in US$), 2005 323
Table 5.4.8. Radio and Television Value Added, 2005 323
Table 5.4.9. Radio and Television Employment, 2005 323
Table 5.5.1. Buyers of Software Produced by Leading National Companies 324
Table 5.5.2. Estimated Value Added for the Software Industry, 2005 (in thousands of US$) 327
Table 5.5.3. Estimated Employment in the Software Industry, 2005 327
Table 5.5.4. Trade Balance Estimation for the Software Industry, 2005 327
Table 5.6.1. Advertising Investment in Peru by Advertising Agencies
and Media Providers, 2005 (US$) 328
Table 5.6.2. Advertising Value Added, 2005 330
Table 5.6.3. Advertising Employment, 2005 330
Table 5.7.1. Copyright Collecting Societies: Value Added and Employment,
Collection and Distribution of Royalties, 2005 (thousands of US$) 333
Table C1 Peru: CD and DVD Imports by Brand (number and percentage), 2005-2007 349
Table C2 Peru: CD and DVD Imports by Country, (number and percentage) 2005-2007 350
The Economic C
ontribution ofC
opyright-Based Industries in P
eru
231
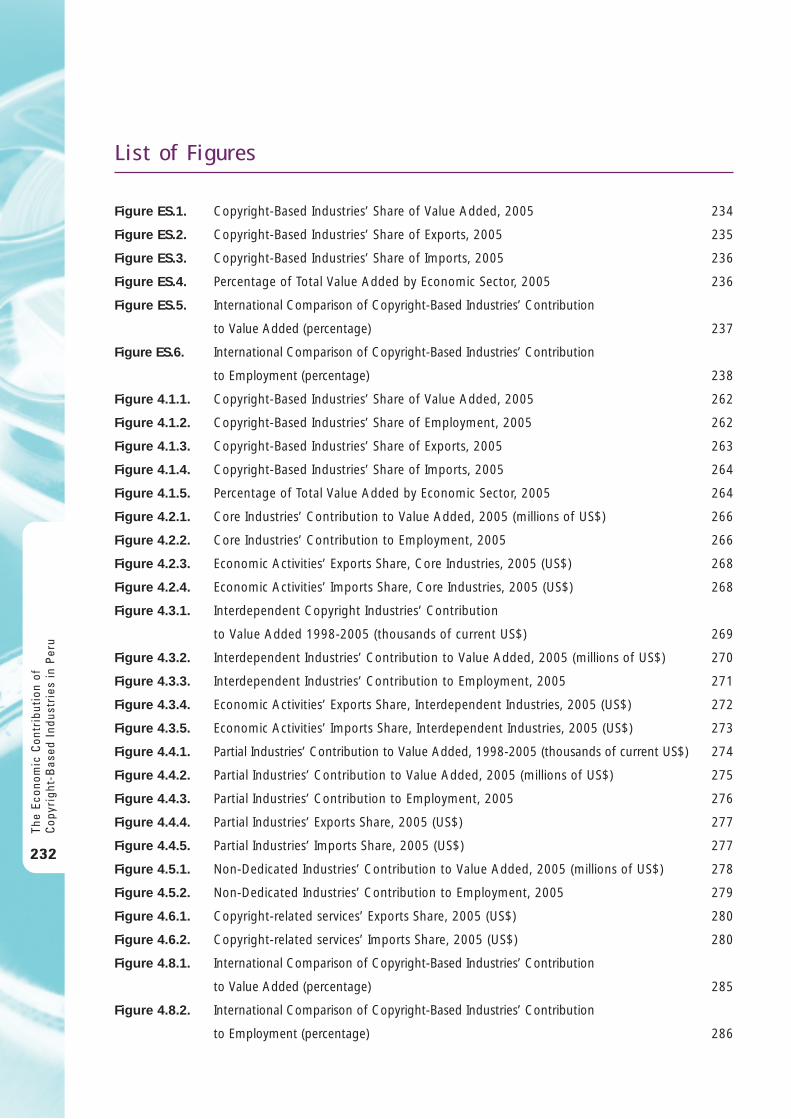
L i s t o f F i g u r e s
Figure ES.1. Copyright-Based Industries’ Share of Value Added, 2005 234
Figure ES.2. Copyright-Based Industries’ Share of Exports, 2005 235
Figure ES.3. Copyright-Based Industries’ Share of Imports, 2005 236
Figure ES.4. Percentage of Total Value Added by Economic Sector, 2005 236
Figure ES.5. International Comparison of Copyright-Based Industries’ Contribution
to Value Added (percentage) 237
Figure ES.6. International Comparison of Copyright-Based Industries’ Contribution
to Employment (percentage) 238
Figure 4.1.1. Copyright-Based Industries’ Share of Value Added, 2005 262
Figure 4.1.2. Copyright-Based Industries’ Share of Employment, 2005 262
Figure 4.1.3. Copyright-Based Industries’ Share of Exports, 2005 263
Figure 4.1.4. Copyright-Based Industries’ Share of Imports, 2005 264
Figure 4.1.5. Percentage of Total Value Added by Economic Sector, 2005 264
Figure 4.2.1. Core Industries’ Contribution to Value Added, 2005 (millions of US$) 266
Figure 4.2.2. Core Industries’ Contribution to Employment, 2005 266
Figure 4.2.3. Economic Activities’ Exports Share, Core Industries, 2005 (US$) 268
Figure 4.2.4. Economic Activities’ Imports Share, Core Industries, 2005 (US$) 268
Figure 4.3.1. Interdependent Copyright Industries’ Contribution
to Value Added 1998-2005 (thousands of current US$) 269
Figure 4.3.2. Interdependent Industries’ Contribution to Value Added, 2005 (millions of US$) 270
Figure 4.3.3. Interdependent Industries’ Contribution to Employment, 2005 271
Figure 4.3.4. Economic Activities’ Exports Share, Interdependent Industries, 2005 (US$) 272
Figure 4.3.5. Economic Activities’ Imports Share, Interdependent Industries, 2005 (US$) 273
Figure 4.4.1. Partial Industries’ Contribution to Value Added, 1998-2005 (thousands of current US$) 274
Figure 4.4.2. Partial Industries’ Contribution to Value Added, 2005 (millions of US$) 275
Figure 4.4.3. Partial Industries’ Contribution to Employment, 2005 276
Figure 4.4.4. Partial Industries’ Exports Share, 2005 (US$) 277
Figure 4.4.5. Partial Industries’ Imports Share, 2005 (US$) 277
Figure 4.5.1. Non-Dedicated Industries’ Contribution to Value Added, 2005 (millions of US$) 278
Figure 4.5.2. Non-Dedicated Industries’ Contribution to Employment, 2005 279
Figure 4.6.1. Copyright-related services’ Exports Share, 2005 (US$) 280
Figure 4.6.2. Copyright-related services’ Imports Share, 2005 (US$) 280
Figure 4.8.1. International Comparison of Copyright-Based Industries’ Contribution
to Value Added (percentage) 285
Figure 4.8.2. International Comparison of Copyright-Based Industries’ Contribution
to Employment (percentage) 286
The
Econ
omic
Con
trib
utio
n of
Cop
yrig
ht-B
ased
Ind
ustr
ies
in P
eru
232
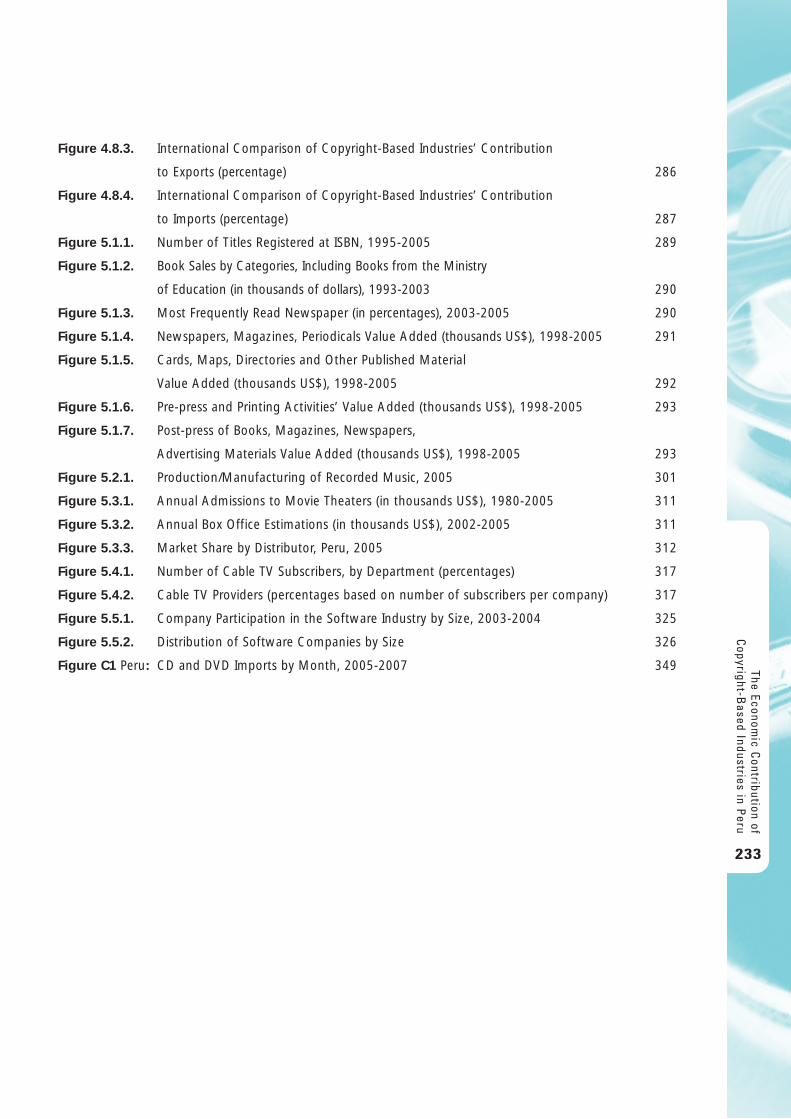
Figure 4.8.3. International Comparison of Copyright-Based Industries’ Contribution
to Exports (percentage) 286
Figure 4.8.4. International Comparison of Copyright-Based Industries’ Contribution
to Imports (percentage) 287
Figure 5.1.1. Number of Titles Registered at ISBN, 1995-2005 289
Figure 5.1.2. Book Sales by Categories, Including Books from the Ministry
of Education (in thousands of dollars), 1993-2003 290
Figure 5.1.3. Most Frequently Read Newspaper (in percentages), 2003-2005 290
Figure 5.1.4. Newspapers, Magazines, Periodicals Value Added (thousands US$), 1998-2005 291
Figure 5.1.5. Cards, Maps, Directories and Other Published Material
Value Added (thousands US$), 1998-2005 292
Figure 5.1.6. Pre-press and Printing Activities’ Value Added (thousands US$), 1998-2005 293
Figure 5.1.7. Post-press of Books, Magazines, Newspapers,
Advertising Materials Value Added (thousands US$), 1998-2005 293
Figure 5.2.1. Production/Manufacturing of Recorded Music, 2005 301
Figure 5.3.1. Annual Admissions to Movie Theaters (in thousands US$), 1980-2005 311
Figure 5.3.2. Annual Box Office Estimations (in thousands US$), 2002-2005 311
Figure 5.3.3. Market Share by Distributor, Peru, 2005 312
Figure 5.4.1. Number of Cable TV Subscribers, by Department (percentages) 317
Figure 5.4.2. Cable TV Providers (percentages based on number of subscribers per company) 317
Figure 5.5.1. Company Participation in the Software Industry by Size, 2003-2004 325
Figure 5.5.2. Distribution of Software Companies by Size 326
Figure C1 Peru: CD and DVD Imports by Month, 2005-2007 349 The Economic C
ontribution ofC
opyright-Based Industries in P
eru
233
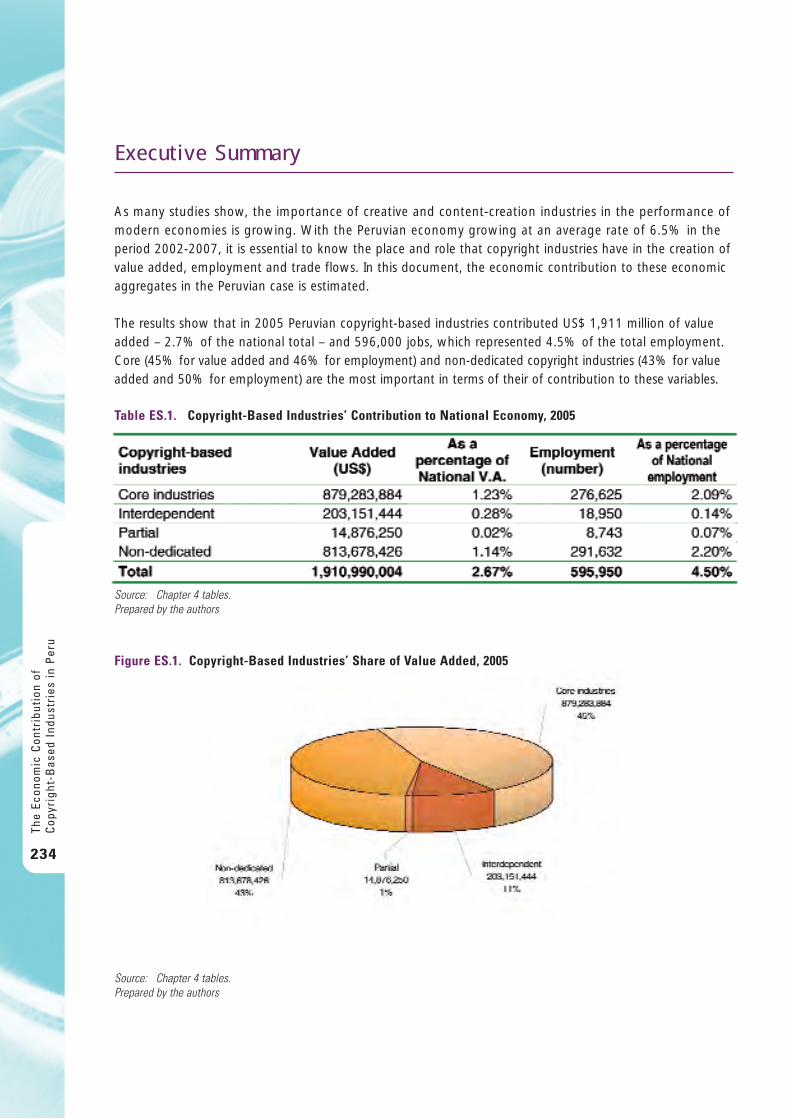
E x e c u t i v e S u m m a r y
As many studies show, the importance of creative and content-creation industries in the performance ofmodern economies is growing. With the Peruvian economy growing at an average rate of 6.5% in theperiod 2002-2007, it is essential to know the place and role that copyright industries have in the creation ofvalue added, employment and trade flows. In this document, the economic contribution to these economicaggregates in the Peruvian case is estimated.
The results show that in 2005 Peruvian copyright-based industries contributed US$ 1,911 million of valueadded – 2.7% of the national total – and 596,000 jobs, which represented 4.5% of the total employment.Core (45% for value added and 46% for employment) and non-dedicated copyright industries (43% for valueadded and 50% for employment) are the most important in terms of their of contribution to these variables.
The
Econ
omic
Con
trib
utio
n of
Cop
yrig
ht-B
ased
Ind
ustr
ies
in P
eru
234
Table ES.1. Copyright-Based Industries’ Contribution to National Economy, 2005
Source: Chapter 4 tables. Prepared by the authors
Figure ES.1. Copyright-Based Industries’ Share of Value Added, 2005
Source: Chapter 4 tables. Prepared by the authors
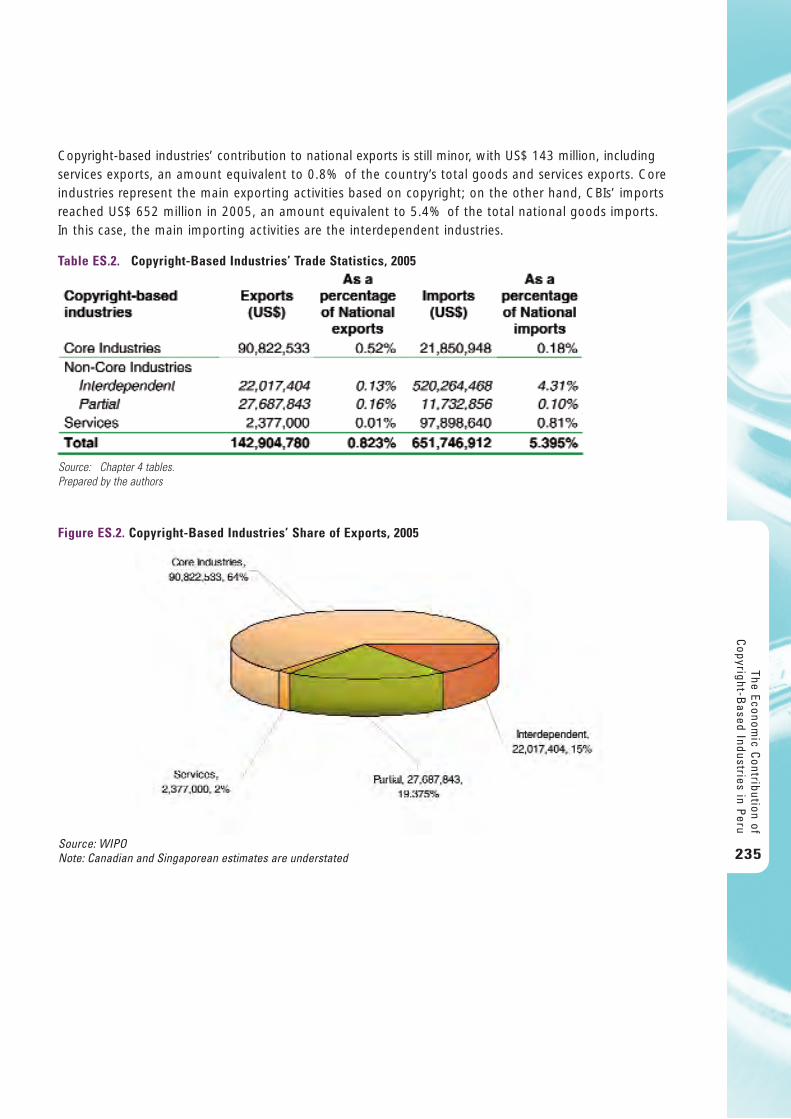
Copyright-based industries’ contribution to national exports is still minor, with US$ 143 million, includingservices exports, an amount equivalent to 0.8% of the country’s total goods and services exports. Coreindustries represent the main exporting activities based on copyright; on the other hand, CBIs’ importsreached US$ 652 million in 2005, an amount equivalent to 5.4% of the total national goods imports. In this case, the main importing activities are the interdependent industries.
The Economic C
ontribution ofC
opyright-Based Industries in P
eru
235
Table ES.2. Copyright-Based Industries’ Trade Statistics, 2005
Source: Chapter 4 tables. Prepared by the authors
Figure ES.2. Copyright-Based Industries’ Share of Exports, 2005
Source: WIPONote: Canadian and Singaporean estimates are understated
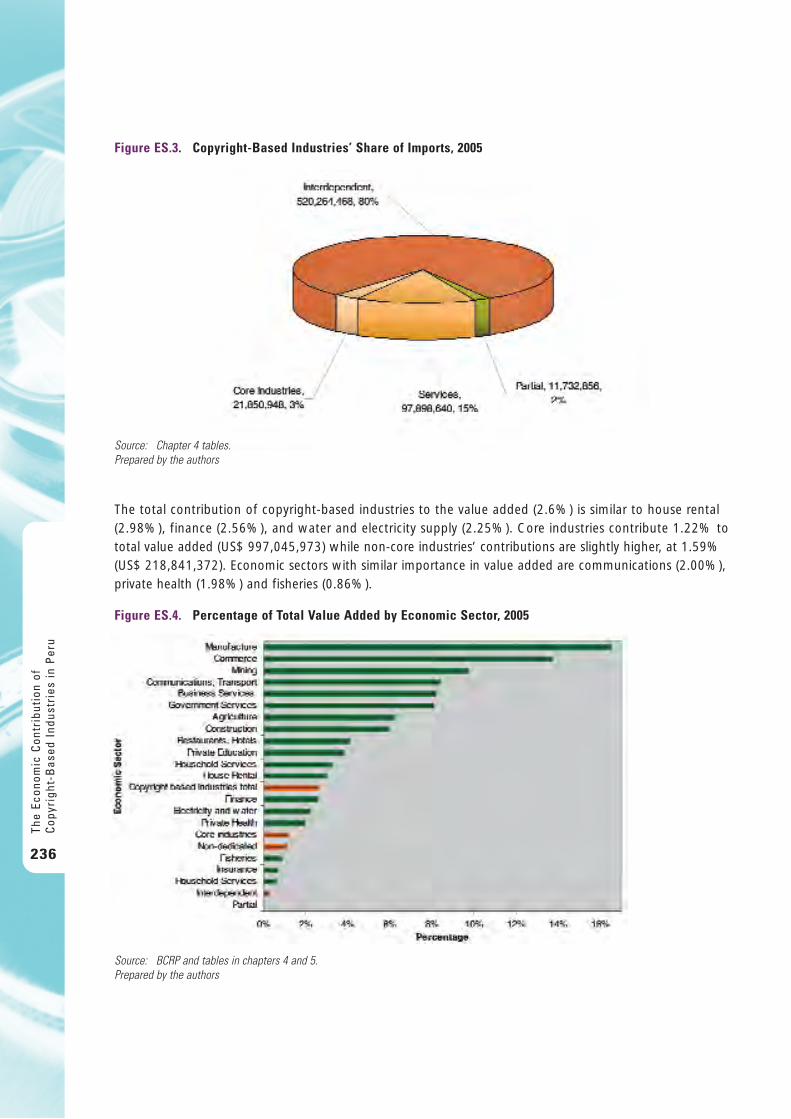
The
Econ
omic
Con
trib
utio
n of
Cop
yrig
ht-B
ased
Ind
ustr
ies
in P
eru
236
The total contribution of copyright-based industries to the value added (2.6%) is similar to house rental(2.98%), finance (2.56%), and water and electricity supply (2.25%). Core industries contribute 1.22% tototal value added (US$ 997,045,973) while non-core industries’ contributions are slightly higher, at 1.59%(US$ 218,841,372). Economic sectors with similar importance in value added are communications (2.00%),private health (1.98%) and fisheries (0.86%).
Figure ES.3. Copyright-Based Industries’ Share of Imports, 2005
Source: Chapter 4 tables. Prepared by the authors
Figure ES.4. Percentage of Total Value Added by Economic Sector, 2005
Source: BCRP and tables in chapters 4 and 5.Prepared by the authors
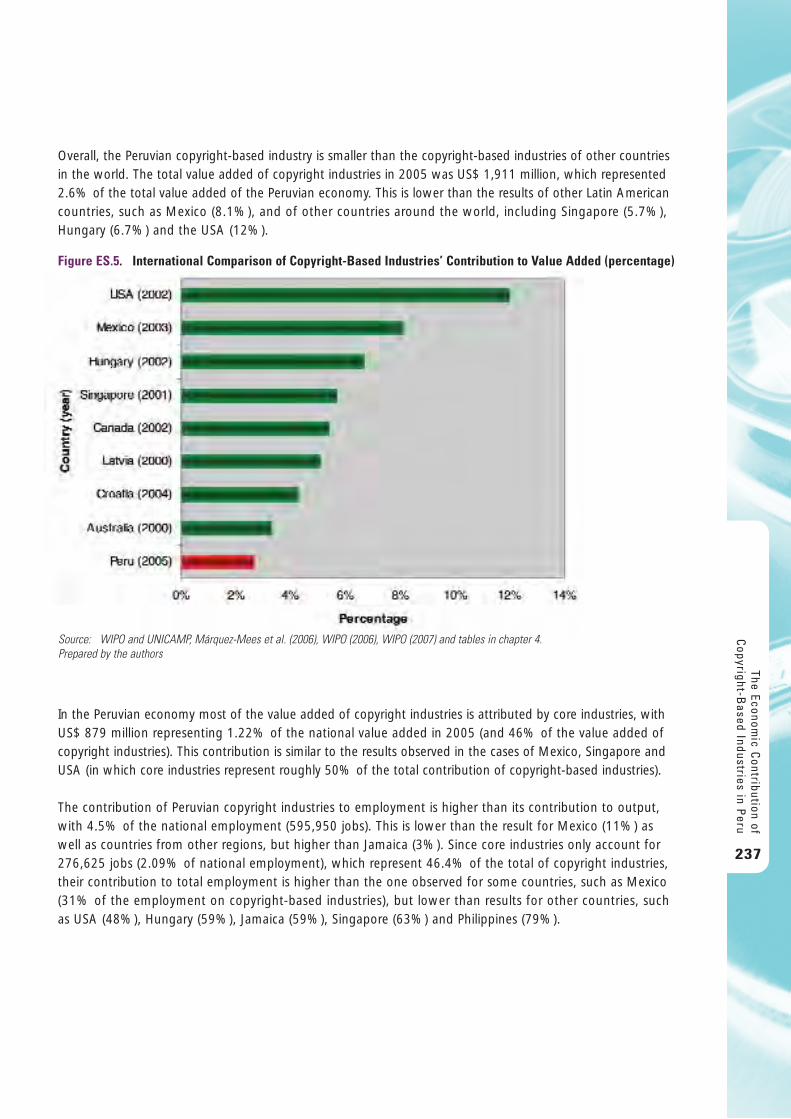
Overall, the Peruvian copyright-based industry is smaller than the copyright-based industries of other countriesin the world. The total value added of copyright industries in 2005 was US$ 1,911 million, which represented2.6% of the total value added of the Peruvian economy. This is lower than the results of other Latin Americancountries, such as Mexico (8.1%), and of other countries around the world, including Singapore (5.7%),Hungary (6.7%) and the USA (12%).
In the Peruvian economy most of the value added of copyright industries is attributed by core industries, withUS$ 879 million representing 1.22% of the national value added in 2005 (and 46% of the value added ofcopyright industries). This contribution is similar to the results observed in the cases of Mexico, Singapore andUSA (in which core industries represent roughly 50% of the total contribution of copyright-based industries).
The contribution of Peruvian copyright industries to employment is higher than its contribution to output,with 4.5% of the national employment (595,950 jobs). This is lower than the result for Mexico (11%) aswell as countries from other regions, but higher than Jamaica (3%). Since core industries only account for276,625 jobs (2.09% of national employment), which represent 46.4% of the total of copyright industries,their contribution to total employment is higher than the one observed for some countries, such as Mexico(31% of the employment on copyright-based industries), but lower than results for other countries, such as USA (48%), Hungary (59%), Jamaica (59%), Singapore (63%) and Philippines (79%).
The Economic C
ontribution ofC
opyright-Based Industries in P
eru
237
Figure ES.5. International Comparison of Copyright-Based Industries’ Contribution to Value Added (percentage)
Source: WIPO and UNICAMP, Márquez-Mees et al. (2006), WIPO (2006), WIPO (2007) and tables in chapter 4. Prepared by the authors
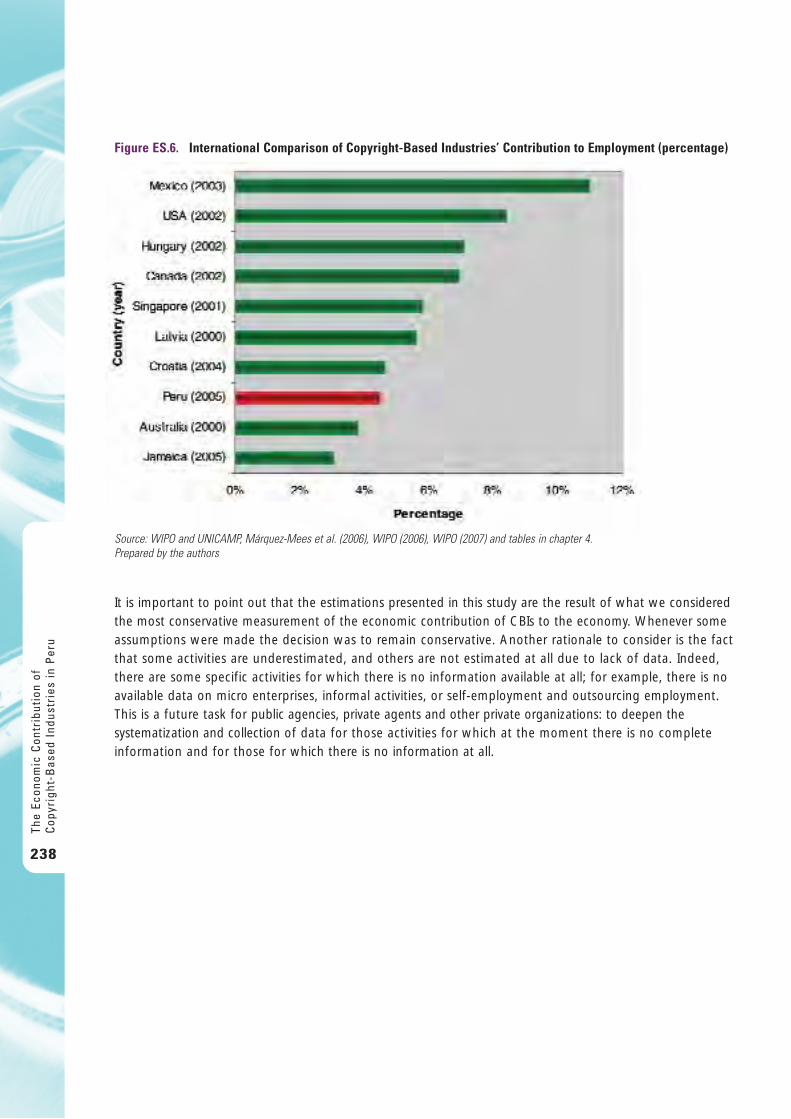
It is important to point out that the estimations presented in this study are the result of what we consideredthe most conservative measurement of the economic contribution of CBIs to the economy. Whenever someassumptions were made the decision was to remain conservative. Another rationale to consider is the factthat some activities are underestimated, and others are not estimated at all due to lack of data. Indeed,there are some specific activities for which there is no information available at all; for example, there is noavailable data on micro enterprises, informal activities, or self-employment and outsourcing employment.This is a future task for public agencies, private agents and other private organizations: to deepen thesystematization and collection of data for those activities for which at the moment there is no completeinformation and for those for which there is no information at all.
The
Econ
omic
Con
trib
utio
n of
Cop
yrig
ht-B
ased
Ind
ustr
ies
in P
eru
238
Figure ES.6. International Comparison of Copyright-Based Industries’ Contribution to Employment (percentage)
Source: WIPO and UNICAMP, Márquez-Mees et al. (2006), WIPO (2006), WIPO (2007) and tables in chapter 4. Prepared by the authors
1 . I n t r o d u c t i o n
The culture, information and content-production industries, i.e. the creative industries, have a growingimportance in countries’ economies. Since the early seventies, many efforts have been made to measure the contribution of these industries to the national economy, mainly in developed countries1.
Peru’s economy has been growing at an average rate of 6.5% in the period 2002-2007; in such anenvironment, it is essential to know what has been the role that specific industries have in the performance of the country. An emerging economy needs the inputs that information and content production provide,making copyright-based industries particularly critical. In a world in which not only physical capital, naturalcapital and labor, but also knowledge and culture are main factors of production, it is not possible to havesustainable growth without the contribution of copyright-based industries.
The objective of the study is to estimate the economic contribution that Copyright-Based Industries (CBIs)make to the national economy, by generating value added, employment and trade flows. Some copyright-based industries, mainly cultural and information industries, are very well known by their economic impacton the economy; nevertheless, some of the copyright components of many activities are not taken intoaccount. This study aims to give a complete assessment by not only including the core copyrightindustries but also the other copyright-related activities (non core).
In 2003, the World Intellectual Property Organization (WIPO) issued a methodological guide with the aim of helping to reveal the place that CBIs have in the economy, entitled “Guide on Surveying the EconomicContribution of the Copyright-Based Industries”. This methodological document has been used in a seriesof countries and their results have been published; other countries have recently finished their studies, andothers are in the process of doing so.
In 2006, the National Institute for the Defense of Competition and the Protection of Intellectual Property(INDECOPI)2 requested support from WIPO to carry out the study in Peru, with the purpose of increasingpublic awareness of the economic contribution of the CBIs. The knowledge generated by the study willprovide policy-makers with useful information that will help design national development strategies.
As mentioned, the methodology used in this study is based on the WIPO Guide, with adaptations due tothe scarcity of available data on public statistics, as well as limited dissemination by private agents oftheir financial information. This adaptation is mainly made for the calculation of value added and isexplained in detail in chapter four. In the case of the core CBIs. The approach followed relies on privatefinancial information available for the main companies in each sector. For the interdependent and partialindustries, the information came from the database provided by the Ministry of Production (PRODUCE),complemented by the copyright factors found in the literature. For the non-dedicated support industries,the aggregate statistics of the Statistics and Informatics National Institute (INEI) in Peru allow these to begrouped into General Wholesale and Retailing, and Transport and Communications, complemented withthe copyright factors.
The Economic C
ontribution ofC
opyright-Based Industries in P
eru
239
1 For a detailed account of the studies and the countries that have developed such studies see the Introduction of the Hungarian Reportin WIPO (2006). 2 Public agency created by Law Decree N° 25868 in November 1992. It is ascribed to the Presidency of the Council of Ministers by orderof Law N° 27789, with technical, economic, budgetary and administrative autonomy.
In the case of employment, the estimations rely mainly on the Annual Economic Survey (EEA) 2005 providedby INEI and the data collected in the interviews. A comprehensive explanation of the methodology can befound in chapter 2. Although almost all the estimations on employment are based on this source ofinformation, for some activities of the interdependent CBIs the source used is the National HouseholdSurvey (ENAHO 2005).
Finally, the estimation of trade flows – that is, exports and imports – has been calculated using the equivalencefor the ISIC code and the Common Nomenclature of the Andean Community Members (NANDINA) obtainedfrom PRODUCE3, which indicates which custom code corresponds to which ISIC code. The informationon exports and imports for the different custom codes has been obtained from the National CustomsAdministration Superintendence Statistical Yearbook (SUNAD, 2005a and 2005b).
We would like to thank all the experts, managers, officers, presidents of unions, presidents of CopyrightCollecting Societies, professionals of the creative industries, and other CBIs-related people we interviewedfor providing us with the information we needed; their wise advice and time are priceless4. Specialacknowledgments to Dimiter Gantchev, Acting Director of the Creative Industries Division in the WorldIntellectual Property Organization, for his patience and invaluable comments on the drafts of the document;to José Luis Zofio, Associate Professor of the Department of Economic Analysis at the Universidad Autónoma deMadrid, for his wise expert advice, always instructive and constructive, on the methodology and all technicalmatters concerning the estimation, as well as for his continuous support as advisor of the study; to MartínMoscoso, Head of the Copyright Office of the National Institute for the Defense of Competition and theProtection of Intellectual Property, for his sustained support in establishing the contacts with the experts,managers, presidents of unions, presidents of the Copyright Collecting Societies, and other people relatedto the CBIs that we interviewed, and to José Tavera, Economic Studies Manager of the National Institute forthe Defense of Competition and the Protection of Intellectual Property, for his timely help and persistence inasking for the information from the public institutions and for from the invaluable assistance provided ingeneral by him and his team.
We would also like to offer our grateful thanks to the research assistants for their participation in the differentsteps of the process to make this report a reality. To Ricardo Álvarez, for his perseverant search ofinformation in the initial stages of the work; to Efraín Rodríguez, for his competent work on the organization of the first sets of information; to Luis Miguel Espinoza and Juan Manuel del Pozo, for their dedicated and efficient assistance on the estimations of the economic variables of the study and search of moreinformation; and to Roberto Piselli, for his efficient management of the databases, and proficient assistancewith the final document. Any errors that this study may have are entirely the responsibility of the authors.
The document has five sections including the introduction. Chapter 2 explains in detail the methodologyfollowed; chapter 3 presents the legal background of copyright protection in Peru, as well as an internationalcomparison; chapter 4 shows the results of the estimation of the economic contribution of CBIs to theeconomy for core, interdependent, partial and non-dedicated copyright-based industries; and in chapter 5the conclusions and recommendations are offered.
The
Econ
omic
Con
trib
utio
n of
Cop
yrig
ht-B
ased
Ind
ustr
ies
in P
eru
240
3 Correlacionador Código CIIU Rev. 3 – Partida arancelaria NANDINA.4 The list of interviews can be found in Annex A.
2 . S t u d y M e t h o d o l o g y a n d S o u r c e s o f I n f o r m a t i o n
The methodology of the study is based on the guidelines presented in the WIPO Guide (2003). Many sourceshave been used and some difficulties regarding the collection of data have been faced. In view of the lackof official and systematic collection of data on the CBIs, some adaptation had to be done for the estimationof the value added; the details are explained in this chapter. For employment, the main source was theAnnual Economic Survey 2005 provided by the Statistics and Informatics National Institute (INEI), for which it was necessary to apply the methodology given by the INEI in order to obtain the nationwide figures. The estimation of exports and imports had as the main source the National Customs AdministrationSuperintendence (SUNAD) Statistical Yearbook; nevertheless, it has been necessary to apply the equivalencefor the ISIC code and the Common Nomenclature of the Andean Community Members (NANDINA), whichindicates which custom code corresponds to which ISIC code.
The selected year for estimation is 2005, based on two considerations. First, the collection of informationstarted at the end of 2006 and finished in May 2008, making 2005 the most recent year for which officialinformation was available. Second, since the adopted methodology is also partially based on the firms’private information, 2005 was not too recent, meaning that the requested information would not be toosensitive from a company perspective.
2.1. Value Added Estimation MethodologyThe first option in terms of estimating the contribution to value added of the CBIs was to use the input-outputtable and apply the output approach. Nonetheless, the last available input-output table made by INEI datesback to 1994, and is thus inappropriate for making a calculation for the year 2005, since the table has been made obsolete by the changes in Peru’s productive structure in the last 14 years, and thus does notrepresent the dynamics and growth of copyright industries today.
The other main option is the income approach; however, information on compensation of employees,operating surplus/mixed income, consumption of fixed capital, other taxes on production, and othersubsidies on production are not available for the CBIs for the year 2005. The Ministry of Production(PRODUCE) has estimates for some ISIC codes’ activities for the press and literature sector, the music sector,and interdependent and partial CBIs; however, the last year available was 2000, thus making it necessary to make predictions for the year 2005. Annex B presents the detailed methodology used. For non-dedicatedCBIs, the information on value added is available in the official statistics for the year 2005.
To complete the estimation of the other activities, we used a supplementary approach mentioned in theWIPO Guide (2003): calculation of value added on the basis of the financial statement reports. One suggestionof the Guide is to conduct a survey on the firms to obtain the information. In our case, it was not possibleto survey a representative sample of sector companies, for two reasons. The first reason was that there areno records or lists of all companies dedicated to either copyright-protected or copyright-related activities todesign the sample. The second reason was that even if it had been possible to draw a sample, to the extentthat companies are not mandated to file data on their economic and financial performance, theresponse rate would have been low. The strategy followed to collect the companies’ data included requestsfor interviews with members of industry associations, collective management societies, and qualifiedmanagement and officials from private companies. There were different levels of success in the collection of data, making it necessary to make educated assumptions to calculate the estimates; these assumptionsare explained in chapters 4 and 5.
The Economic C
ontribution ofC
opyright-Based Industries in P
eru
241
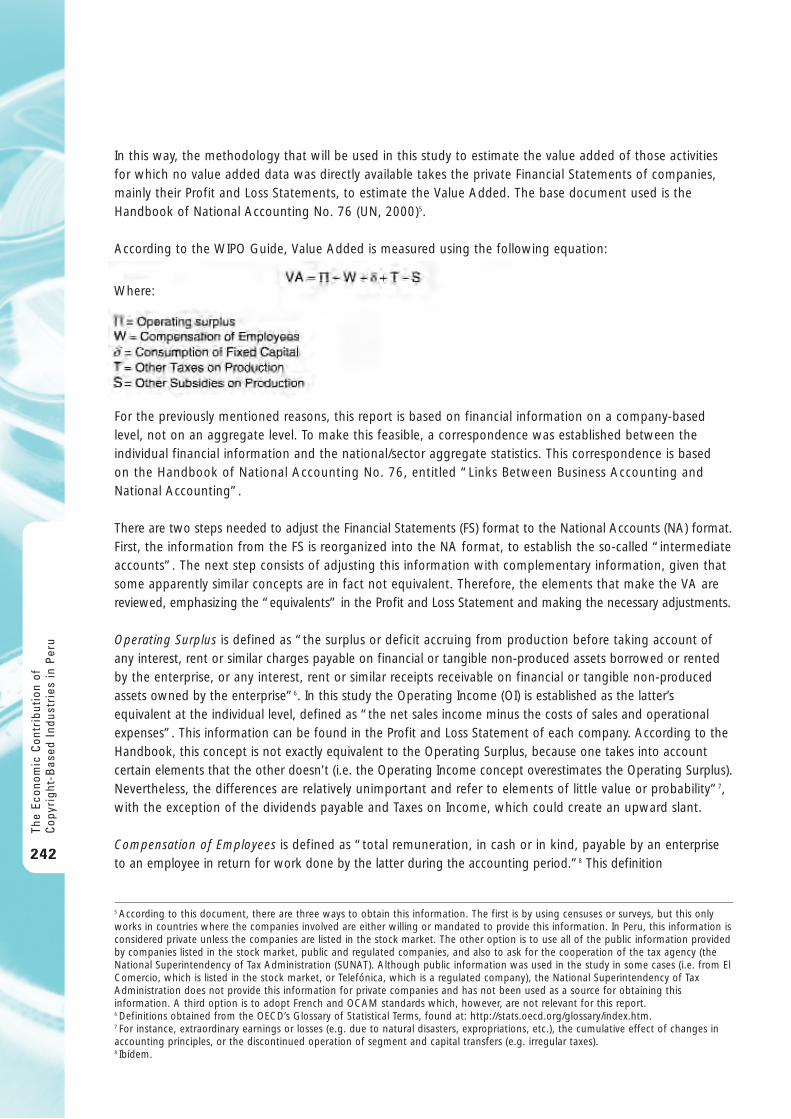
In this way, the methodology that will be used in this study to estimate the value added of those activitiesfor which no value added data was directly available takes the private Financial Statements of companies,mainly their Profit and Loss Statements, to estimate the Value Added. The base document used is theHandbook of National Accounting No. 76 (UN, 2000)5.
According to the WIPO Guide, Value Added is measured using the following equation:
For the previously mentioned reasons, this report is based on financial information on a company-basedlevel, not on an aggregate level. To make this feasible, a correspondence was established between theindividual financial information and the national/sector aggregate statistics. This correspondence is based on the Handbook of National Accounting No. 76, entitled “Links Between Business Accounting andNational Accounting”.
There are two steps needed to adjust the Financial Statements (FS) format to the National Accounts (NA) format.First, the information from the FS is reorganized into the NA format, to establish the so-called “intermediateaccounts”. The next step consists of adjusting this information with complementary information, given thatsome apparently similar concepts are in fact not equivalent. Therefore, the elements that make the VA arereviewed, emphasizing the “equivalents” in the Profit and Loss Statement and making the necessary adjustments.
Operating Surplus is defined as “the surplus or deficit accruing from production before taking account ofany interest, rent or similar charges payable on financial or tangible non-produced assets borrowed or rentedby the enterprise, or any interest, rent or similar receipts receivable on financial or tangible non-producedassets owned by the enterprise”6. In this study the Operating Income (OI) is established as the latter’sequivalent at the individual level, defined as “the net sales income minus the costs of sales and operationalexpenses”. This information can be found in the Profit and Loss Statement of each company. According to theHandbook, this concept is not exactly equivalent to the Operating Surplus, because one takes into accountcertain elements that the other doesn’t (i.e. the Operating Income concept overestimates the Operating Surplus).Nevertheless, the differences are relatively unimportant and refer to elements of little value or probability”7,with the exception of the dividends payable and Taxes on Income, which could create an upward slant.
Compensation of Employees is defined as “total remuneration, in cash or in kind, payable by an enterpriseto an employee in return for work done by the latter during the accounting period.”8 This definition
The
Econ
omic
Con
trib
utio
n of
Cop
yrig
ht-B
ased
Ind
ustr
ies
in P
eru
242
Where:
5 According to this document, there are three ways to obtain this information. The first is by using censuses or surveys, but this onlyworks in countries where the companies involved are either willing or mandated to provide this information. In Peru, this information isconsidered private unless the companies are listed in the stock market. The other option is to use all of the public information providedby companies listed in the stock market, public and regulated companies, and also to ask for the cooperation of the tax agency (theNational Superintendency of Tax Administration (SUNAT). Although public information was used in the study in some cases (i.e. from ElComercio, which is listed in the stock market, or Telefónica, which is a regulated company), the National Superintendency of TaxAdministration does not provide this information for private companies and has not been used as a source for obtaining thisinformation. A third option is to adopt French and OCAM standards which, however, are not relevant for this report.6 Definitions obtained from the OECD’s Glossary of Statistical Terms, found at: http://stats.oecd.org/glossary/index.htm.7 For instance, extraordinary earnings or losses (e.g. due to natural disasters, expropriations, etc.), the cumulative effect of changes inaccounting principles, or the discontinued operation of segment and capital transfers (e.g. irregular taxes).8 Ibídem.
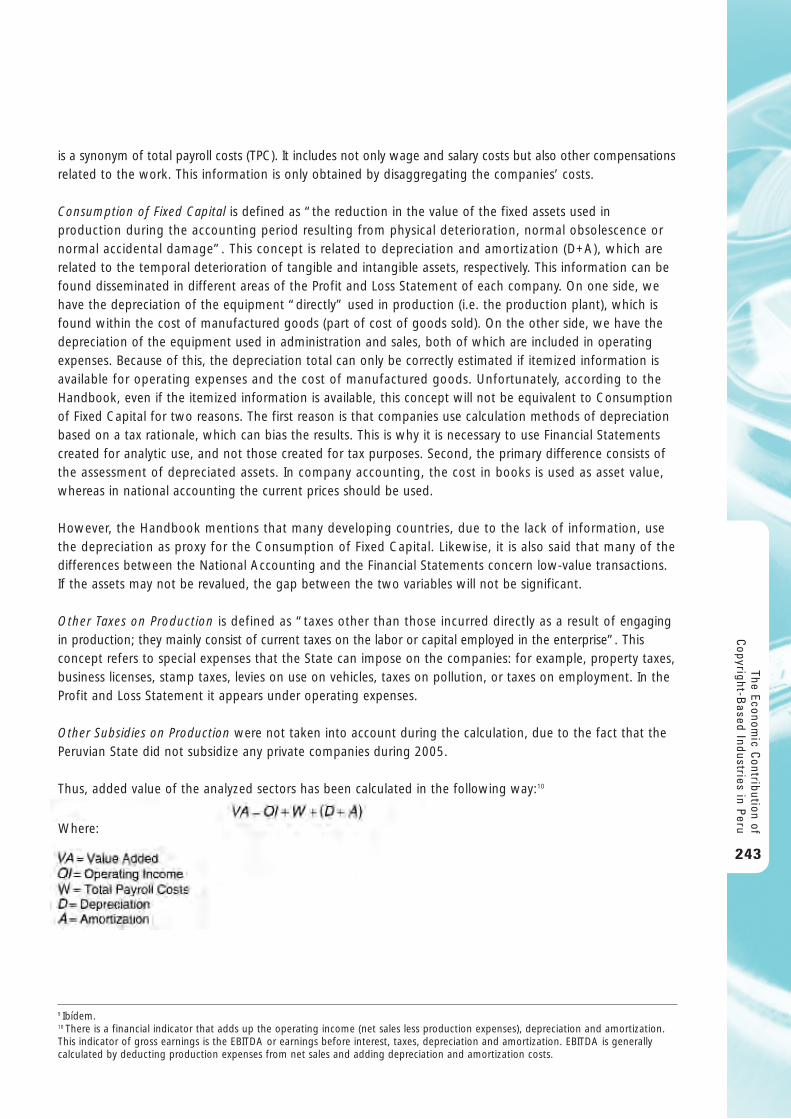
is a synonym of total payroll costs (TPC). It includes not only wage and salary costs but also other compensationsrelated to the work. This information is only obtained by disaggregating the companies’ costs.
Consumption of Fixed Capital is defined as “the reduction in the value of the fixed assets used inproduction during the accounting period resulting from physical deterioration, normal obsolescence ornormal accidental damage”. This concept is related to depreciation and amortization (D+A), which arerelated to the temporal deterioration of tangible and intangible assets, respectively. This information can befound disseminated in different areas of the Profit and Loss Statement of each company. On one side, wehave the depreciation of the equipment “directly” used in production (i.e. the production plant), which isfound within the cost of manufactured goods (part of cost of goods sold). On the other side, we have thedepreciation of the equipment used in administration and sales, both of which are included in operatingexpenses. Because of this, the depreciation total can only be correctly estimated if itemized information isavailable for operating expenses and the cost of manufactured goods. Unfortunately, according to theHandbook, even if the itemized information is available, this concept will not be equivalent to Consumptionof Fixed Capital for two reasons. The first reason is that companies use calculation methods of depreciationbased on a tax rationale, which can bias the results. This is why it is necessary to use Financial Statementscreated for analytic use, and not those created for tax purposes. Second, the primary difference consists ofthe assessment of depreciated assets. In company accounting, the cost in books is used as asset value,whereas in national accounting the current prices should be used.
However, the Handbook mentions that many developing countries, due to the lack of information, use the depreciation as proxy for the Consumption of Fixed Capital. Likewise, it is also said that many of thedifferences between the National Accounting and the Financial Statements concern low-value transactions.If the assets may not be revalued, the gap between the two variables will not be significant.
Other Taxes on Production is defined as “taxes other than those incurred directly as a result of engagingin production; they mainly consist of current taxes on the labor or capital employed in the enterprise”. Thisconcept refers to special expenses that the State can impose on the companies: for example, property taxes,business licenses, stamp taxes, levies on use on vehicles, taxes on pollution, or taxes on employment. In theProfit and Loss Statement it appears under operating expenses.
Other Subsidies on Production were not taken into account during the calculation, due to the fact that thePeruvian State did not subsidize any private companies during 2005.
Thus, added value of the analyzed sectors has been calculated in the following way:10
The Economic C
ontribution ofC
opyright-Based Industries in P
eru
243
9 Ibídem.10 There is a financial indicator that adds up the operating income (net sales less production expenses), depreciation and amortization.This indicator of gross earnings is the EBITDA or earnings before interest, taxes, depreciation and amortization. EBITDA is generallycalculated by deducting production expenses from net sales and adding depreciation and amortization costs.
Where:
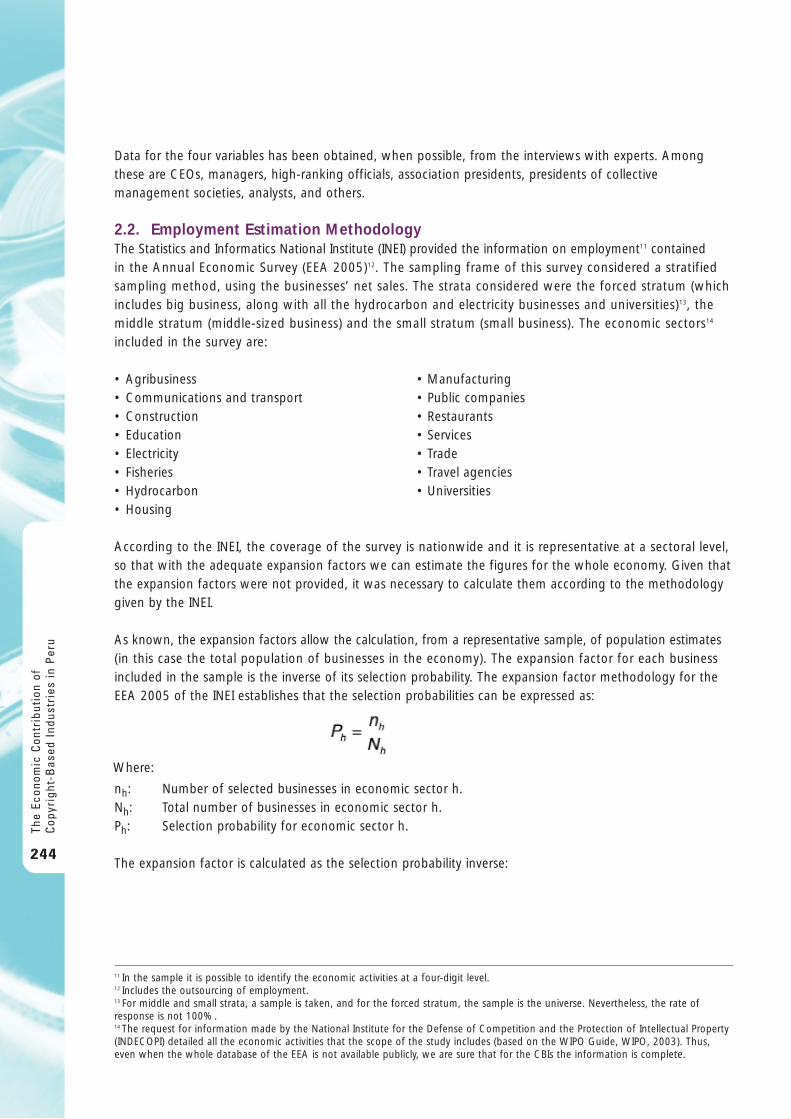
Data for the four variables has been obtained, when possible, from the interviews with experts. Amongthese are CEOs, managers, high-ranking officials, association presidents, presidents of collectivemanagement societies, analysts, and others.
2.2. Employment Estimation MethodologyThe Statistics and Informatics National Institute (INEI) provided the information on employment11 contained in the Annual Economic Survey (EEA 2005)12. The sampling frame of this survey considered a stratifiedsampling method, using the businesses’ net sales. The strata considered were the forced stratum (whichincludes big business, along with all the hydrocarbon and electricity businesses and universities)13, themiddle stratum (middle-sized business) and the small stratum (small business). The economic sectors14
included in the survey are:
• Agribusiness • Manufacturing• Communications and transport • Public companies• Construction • Restaurants• Education • Services• Electricity • Trade• Fisheries • Travel agencies• Hydrocarbon • Universities• Housing
According to the INEI, the coverage of the survey is nationwide and it is representative at a sectoral level, so that with the adequate expansion factors we can estimate the figures for the whole economy. Given thatthe expansion factors were not provided, it was necessary to calculate them according to the methodologygiven by the INEI.
As known, the expansion factors allow the calculation, from a representative sample, of population estimates(in this case the total population of businesses in the economy). The expansion factor for each businessincluded in the sample is the inverse of its selection probability. The expansion factor methodology for theEEA 2005 of the INEI establishes that the selection probabilities can be expressed as:
nh: Number of selected businesses in economic sector h.Nh: Total number of businesses in economic sector h.Ph: Selection probability for economic sector h.
The expansion factor is calculated as the selection probability inverse:
The
Econ
omic
Con
trib
utio
n of
Cop
yrig
ht-B
ased
Ind
ustr
ies
in P
eru
244
11 In the sample it is possible to identify the economic activities at a four-digit level. 12 Includes the outsourcing of employment. 13 For middle and small strata, a sample is taken, and for the forced stratum, the sample is the universe. Nevertheless, the rate ofresponse is not 100%.14 The request for information made by the National Institute for the Defense of Competition and the Protection of Intellectual Property(INDECOPI) detailed all the economic activities that the scope of the study includes (based on the WIPO Guide, WIPO, 2003). Thus,even when the whole database of the EEA is not available publicly, we are sure that for the CBIs the information is complete.
Where:
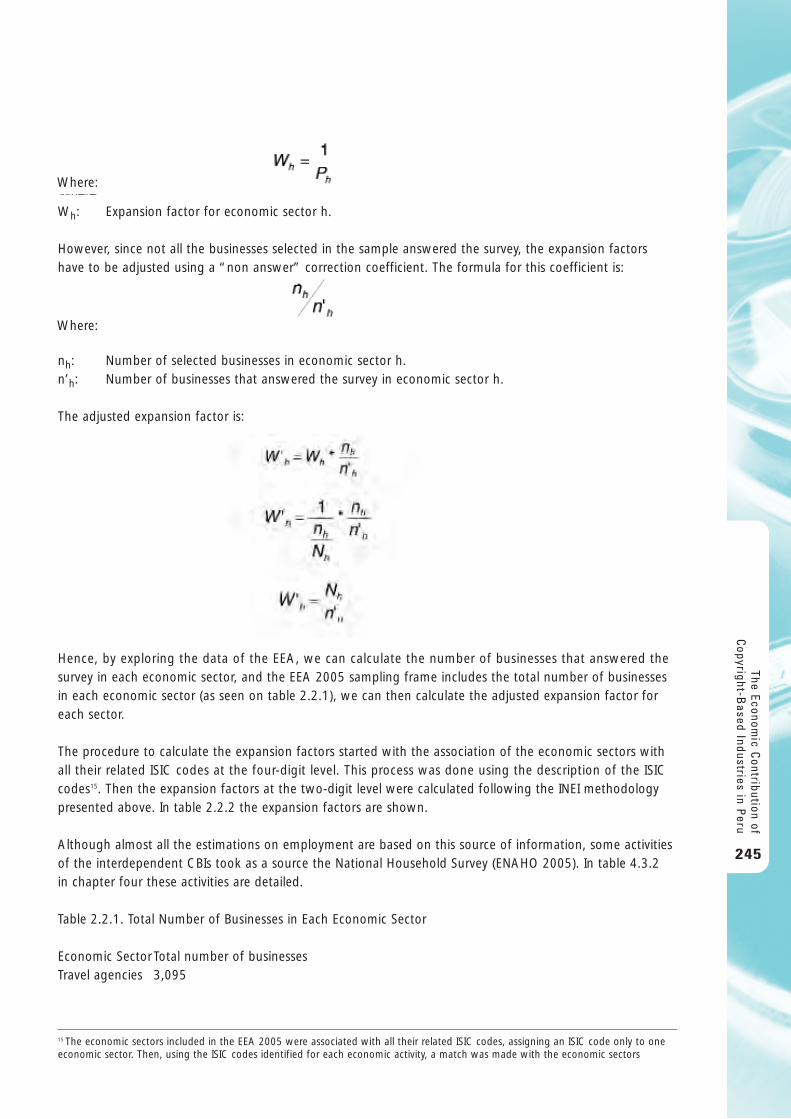
Wh: Expansion factor for economic sector h.
However, since not all the businesses selected in the sample answered the survey, the expansion factorshave to be adjusted using a “non answer” correction coefficient. The formula for this coefficient is:
nh: Number of selected businesses in economic sector h.n’h: Number of businesses that answered the survey in economic sector h.
The adjusted expansion factor is:
Hence, by exploring the data of the EEA, we can calculate the number of businesses that answered thesurvey in each economic sector, and the EEA 2005 sampling frame includes the total number of businessesin each economic sector (as seen on table 2.2.1), we can then calculate the adjusted expansion factor foreach sector.
The procedure to calculate the expansion factors started with the association of the economic sectors withall their related ISIC codes at the four-digit level. This process was done using the description of the ISICcodes15. Then the expansion factors at the two-digit level were calculated following the INEI methodologypresented above. In table 2.2.2 the expansion factors are shown.
Although almost all the estimations on employment are based on this source of information, some activitiesof the interdependent CBIs took as a source the National Household Survey (ENAHO 2005). In table 4.3.2 in chapter four these activities are detailed.
Table 2.2.1. Total Number of Businesses in Each Economic Sector
Economic SectorTotal number of businessesTravel agencies 3,095
The Economic C
ontribution ofC
opyright-Based Industries in P
eru
245
Where:
15 The economic sectors included in the EEA 2005 were associated with all their related ISIC codes, assigning an ISIC code only to oneeconomic sector. Then, using the ISIC codes identified for each economic activity, a match was made with the economic sectors
Where:
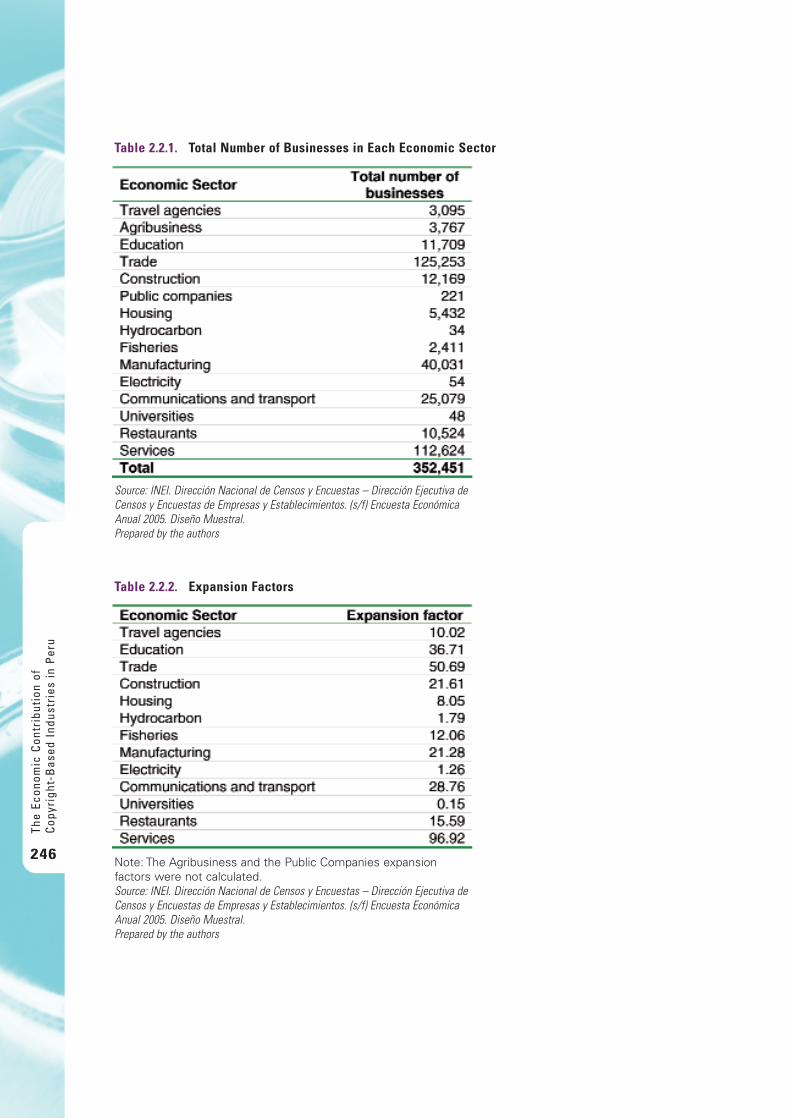
The
Econ
omic
Con
trib
utio
n of
Cop
yrig
ht-B
ased
Ind
ustr
ies
in P
eru
246
Table 2.2.1. Total Number of Businesses in Each Economic Sector
Source: INEI. Dirección Nacional de Censos y Encuestas – Dirección Ejecutiva deCensos y Encuestas de Empresas y Establecimientos. (s/f) Encuesta EconómicaAnual 2005. Diseño Muestral.Prepared by the authors
Table 2.2.2. Expansion Factors
Note: The Agribusiness and the Public Companies expansionfactors were not calculated. Source: INEI. Dirección Nacional de Censos y Encuestas – Dirección Ejecutiva deCensos y Encuestas de Empresas y Establecimientos. (s/f) Encuesta EconómicaAnual 2005. Diseño Muestral.Prepared by the authors
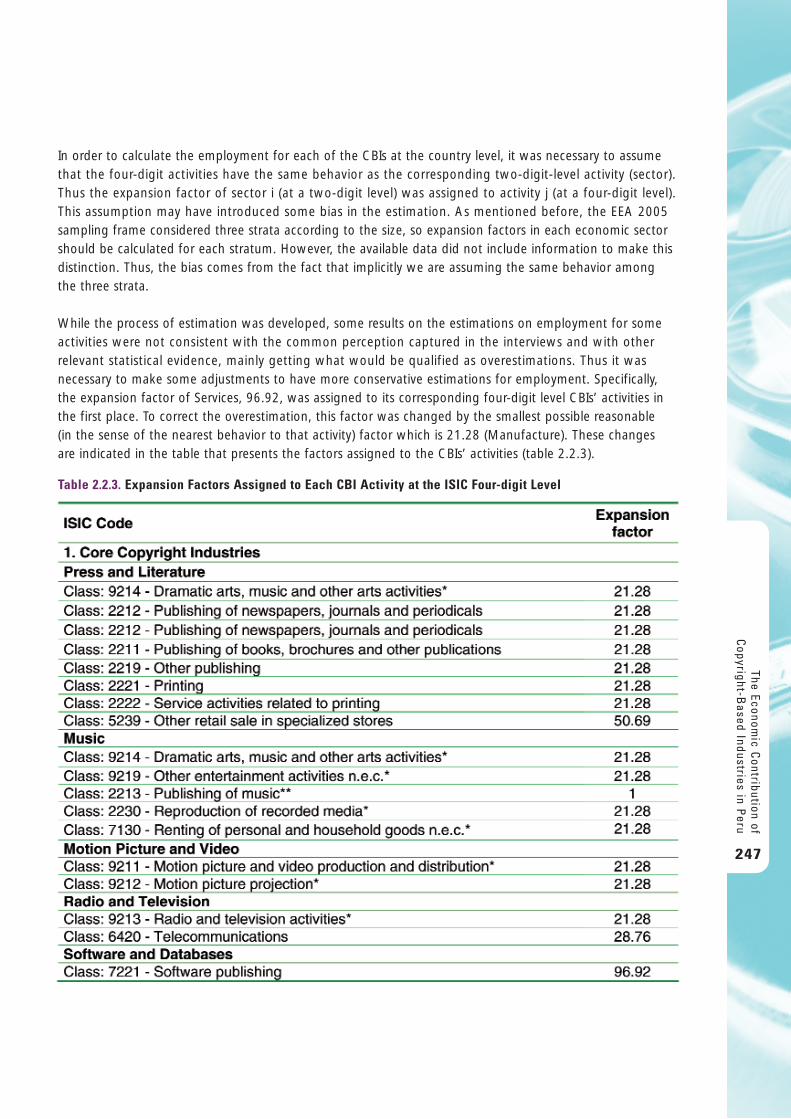
In order to calculate the employment for each of the CBIs at the country level, it was necessary to assumethat the four-digit activities have the same behavior as the corresponding two-digit-level activity (sector).Thus the expansion factor of sector i (at a two-digit level) was assigned to activity j (at a four-digit level).This assumption may have introduced some bias in the estimation. As mentioned before, the EEA 2005sampling frame considered three strata according to the size, so expansion factors in each economic sectorshould be calculated for each stratum. However, the available data did not include information to make thisdistinction. Thus, the bias comes from the fact that implicitly we are assuming the same behavior amongthe three strata.
While the process of estimation was developed, some results on the estimations on employment for someactivities were not consistent with the common perception captured in the interviews and with otherrelevant statistical evidence, mainly getting what would be qualified as overestimations. Thus it wasnecessary to make some adjustments to have more conservative estimations for employment. Specifically,the expansion factor of Services, 96.92, was assigned to its corresponding four-digit level CBIs’ activities inthe first place. To correct the overestimation, this factor was changed by the smallest possible reasonable (in the sense of the nearest behavior to that activity) factor which is 21.28 (Manufacture). These changes are indicated in the table that presents the factors assigned to the CBIs’ activities (table 2.2.3).
The Economic C
ontribution ofC
opyright-Based Industries in P
eru
247
Table 2.2.3. Expansion Factors Assigned to Each CBI Activity at the ISIC Four-digit Level
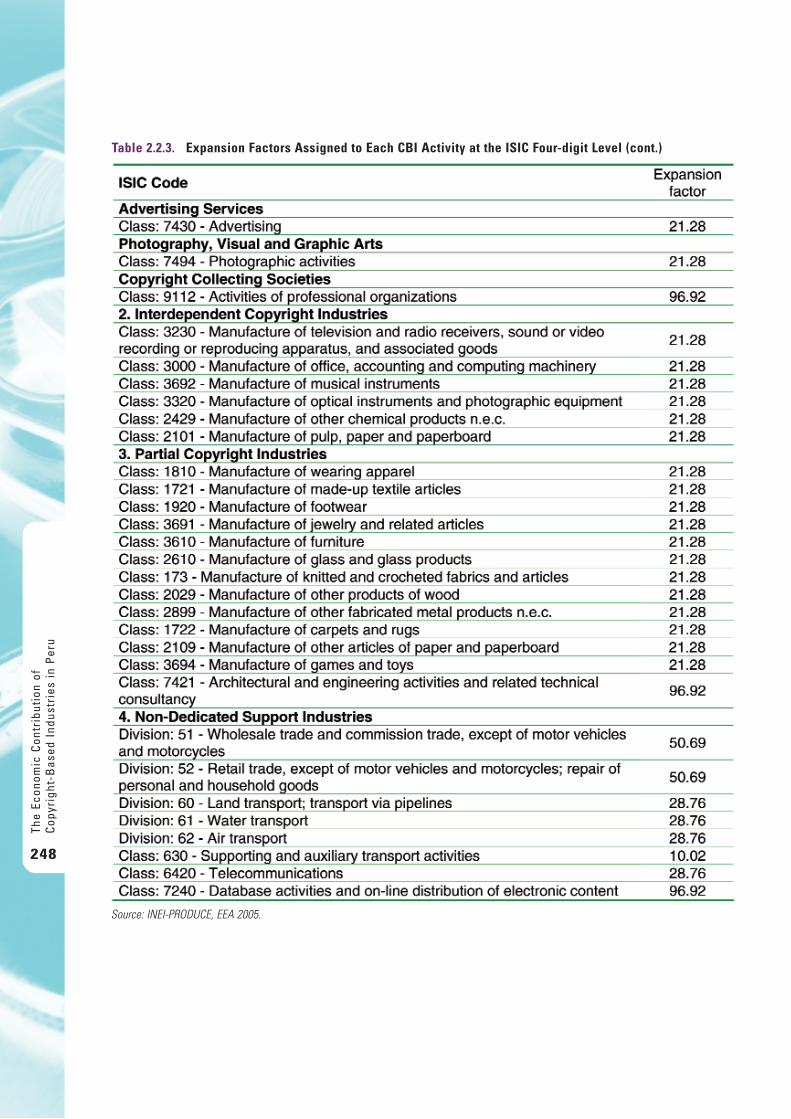
The
Econ
omic
Con
trib
utio
n of
Cop
yrig
ht-B
ased
Ind
ustr
ies
in P
eru
248
Table 2.2.3. Expansion Factors Assigned to Each CBI Activity at the ISIC Four-digit Level (cont.)
Source: INEI-PRODUCE, EEA 2005.
2.3. Trade-flows Estimation MethodologyThe estimation of trade flows – that is, exports and imports – is based on the selection of the custom codescorresponding to the ISIC codes of the CBIs’ activities. The equivalence for the ISIC code and the CommonNomenclature of the Andean Community Members (NANDINA) obtained from PRODUCE16, indicating whichcustom code corresponds to which ISIC code, has been used for this purpose. The information on exportsand imports for the different custom codes has been obtained from the National Customs AdministrationSuperintendence Statistical Yearbook (SUNAD 2005a and 2005b).
The Economic C
ontribution ofC
opyright-Based Industries in P
eru
249
16 Correlacionador Código CIIU Rev. 3 – Partida arancelaria NANDINA.
3 . The Lega l F ramework f o r Copy r i gh t and Re la ted R igh t s i n Pe ru
3.1. OverviewPeru has signed the main international agreements on Copyright and Related Rights. Among these are theBerne Convention for the Protection of Literary and Artistic Works, the Rome Convention for the Protectionof Performers, Producers of Phonograms and Broadcasting Organizations, the Agreement on Trade-Related Aspects of Intellectual Property Rights (TRIPS), the WIPO Copyright Treaty (WCT) and the WIPOPerformances and Phonograms Treaty (WPPT).
Also, as a country member of the Andean Community, in 1993 Peru adopted Decision 351 (CommonRegime on Copyright and Related Rights). Legislative Decree No. 822 (Copyright Law) was subsequentlypromulgated in 1996, followed in 2003 by Law No. 28131 (Law of Interpretive Artists and Performers).
An important Trade Promotion Agreement (TPA) was signed between Peru and the United States of Americaon April 12, 2006. After the corresponding implementation process, which will be further explained, the TPAentered into force on February 1, 2009.
With respect to the Copyright Law, Article 2.17 states that a work is any personal and original intellectualcreation capable of being disclosed or reproduced in any form that is or may yet become known. With regardto the requisite of originality, the Intellectual Property Chamber of the Tribunal of the National Institutefor the Defense of Competition and the Protection of Intellectual Property (INDECOPI) issued Resolution No. 286-1998-TPI-INDECOPI on March 23, 1998, establishing the following as mandatory premises:
"Originality of the work must be understood as a creative and individualized expression (orrepresentative form) of the work, and as a minimum it should be a creation with individuality. The work must express the author’s own work, bearing the stamp of his personality.
Anything forming part of cultural (artistic, scientific or literary) heritage will not be considered asindividual, nor a form of expression that is derived from the nature of things or a mere mechanicalapplication of the provisions in some legal norms, nor a form of expression that is a simple techniqueor simple instructions that require only manual ability for their performance.
Consequently, not all material produced by the efforts of its creator deserves copyright protection.Likewise, even though a creation is certainly devoid of individuality that has been copied verytextually, such circumstance does not convert this into a work."17
With regard to copyright and related rights, the Copyright Law and the Law of Interpretive Artists andPerformers recognize the following moral and economic rights, also indicating the duration of such protection:
The
Econ
omic
Con
trib
utio
n of
Cop
yrig
ht-B
ased
Ind
ustr
ies
in P
eru
250
17 Non-official translation.
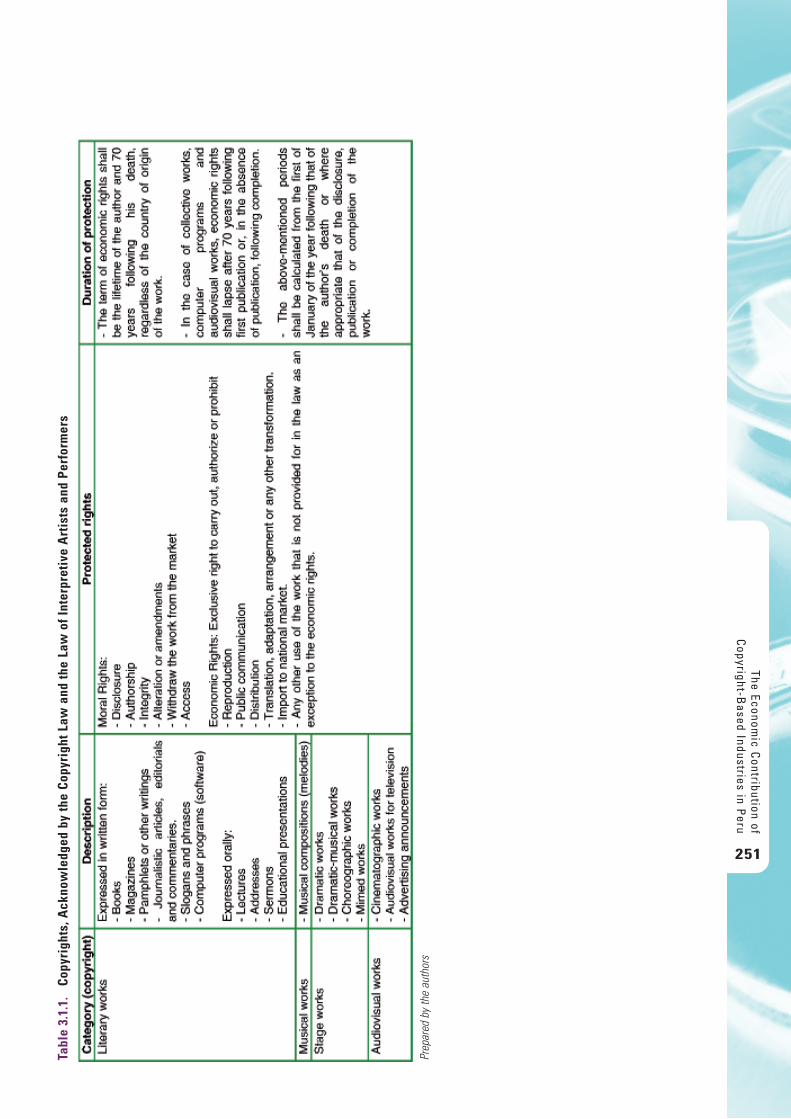
The Economic C
ontribution ofC
opyright-Based Industries in P
eru
251
Tabl
e 3.
1.1.
Co
pyri
ghts
, Ack
now
ledg
ed b
y th
e Co
pyri
ght L
aw a
nd th
e La
w o
f Int
erpr
etiv
e A
rtis
ts a
nd P
erfo
rmer
s
Prep
ared
by
the
auth
ors

The
Econ
omic
Con
trib
utio
n of
Cop
yrig
ht-B
ased
Ind
ustr
ies
in P
eru
252
Tabl
e 3.
1.1.
Co
pyri
ghts
, Ack
now
ledg
ed b
y th
e Co
pyri
ght L
aw a
nd th
e La
w o
f Int
erpr
etiv
e A
rtis
ts a
nd P
erfo
rmer
s (C
ont.)
Prep
ared
by
the
auth
ors
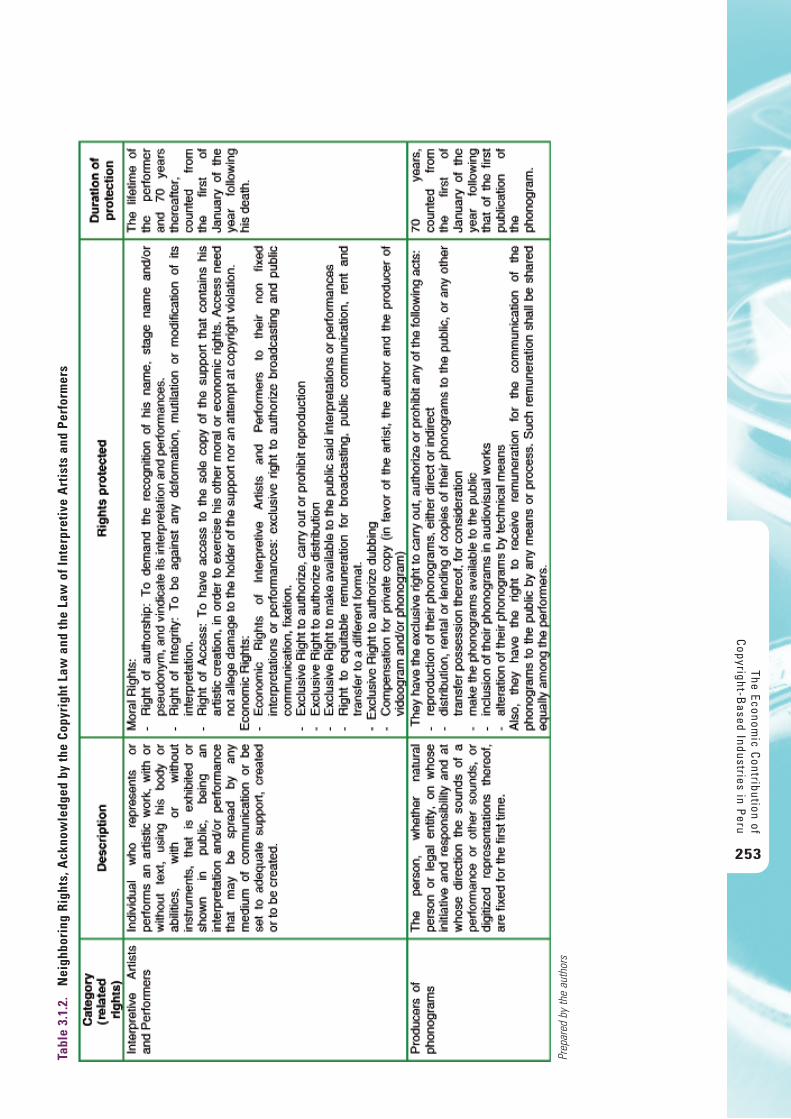
The Economic C
ontribution ofC
opyright-Based Industries in P
eru
253
Tabl
e 3.
1.2.
Nei
ghbo
ring
Rig
hts,
Ack
now
ledg
ed b
y th
e Co
pyri
ght L
aw a
nd th
e La
w o
f Int
erpr
etiv
e A
rtis
ts a
nd P
erfo
rmer
s
Prep
ared
by
the
auth
ors
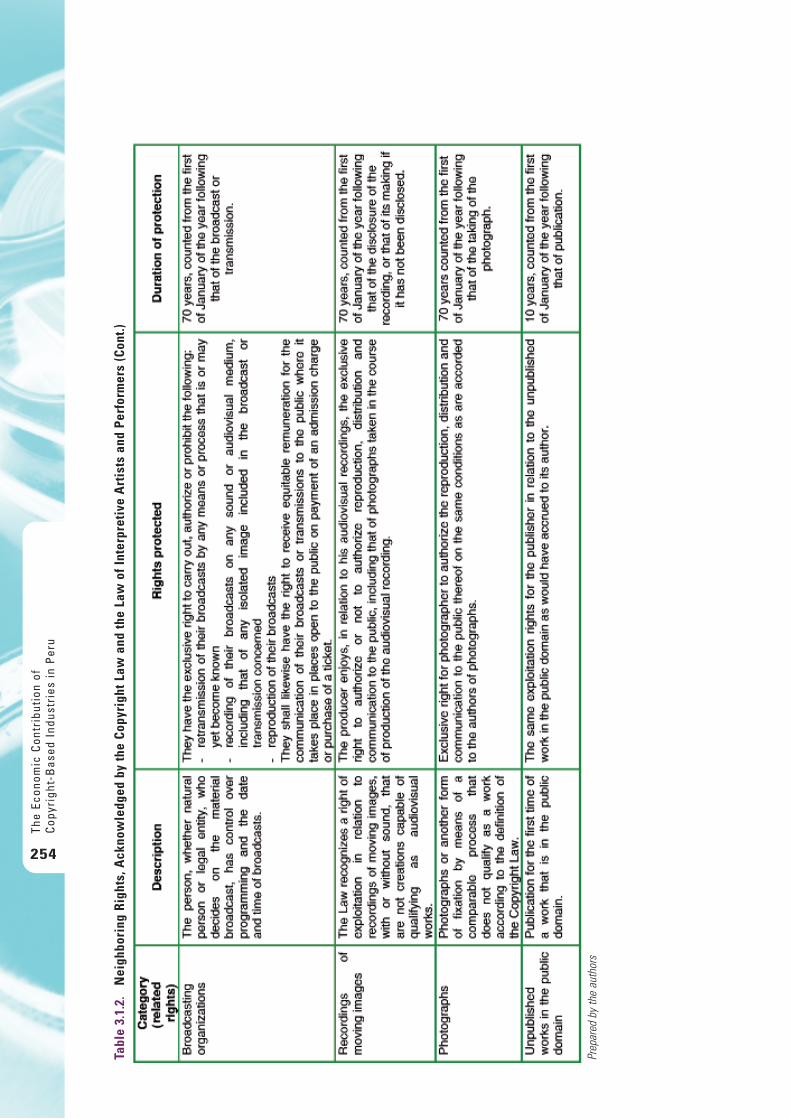
The
Econ
omic
Con
trib
utio
n of
Cop
yrig
ht-B
ased
Ind
ustr
ies
in P
eru
254
Tabl
e 3.
1.2.
N
eigh
bori
ng R
ight
s, A
ckno
wle
dged
by
the
Copy
righ
t Law
and
the
Law
of I
nter
pret
ive
Art
ists
and
Per
form
ers
(Con
t.)
Prep
ared
by
the
auth
ors
INDECOPI’s Copyright Office18, as indicated in the Copyright Law, is the competent national authorityresponsible for administratively assuring and protecting copyright and neighboring rights.
According to the Copyright Law, Collecting Societies are legally constituted, non-profit-making associationsunder civil law devoted to the management, in their own or by delegation of third parties, of copyright orneighboring rights of economic character on behalf and in the interest of a number of authors or owners of such rights. They must obtain authorization for functioning as such from INDECOPI’s Copyright Office, as regulated in the Law. The status of the management society is acquired by virtue of this authorization.Currently there are the following Collective Management Societies in Peru:
1. Peruvian Association of Authors and Composers (APDAYC) 2. Peruvian Association of Visual Artists (APSAV) 3. National Association of Interpretive Artists and Performers (ANAIE) 4. Peruvian Union of Phonographic Producers (UNIMPRO) 5. Audiovisual Producers’ Rights Management Association (EGEDA)
It should also be indicated that Legislative Decree No. 635, the Penal Code in force since April 1991, hasundergone a series of modifications as concerns crimes against intellectual rights. The tendency has been to increase the penalties, thus seeking to continually reduce the violation of the exclusive rights granted for intellectual property.
Law No. 28289, the Law to Fight against Piracy, published in July 2004, modified Law No. 27595 of Decemberof 2001, that had created the Commission to Fight Against Smuggling and Customs Fraud, providing for a change in its name, resulting now in the Commission to Fight against Customs Crimes and Piracy, alsoextending its functional competence to crimes against intellectual property. The Commission is composed of a multi-sectorial group of both State and private-sector entities, and is headed by the Minister ofProduction, exercising its functions through its Technical Secretariat. Law No. 29013 of May of 2007modified the composition of members of the Commission as follows:
a) Minister of Productionb) A representative of the Ministry of Economy and Financec) A representative of the Ministry of Foreign Commerce and Tourismd) A representative of the Ministry of the Interiore) A representative of the Ministry of Defense f) The Chief of the Peruvian Tax and Customs Administration (SUNAT)g) A representative of the Public Ministryh) The President of INDECOPIi) The President of the National Confederation of Private Business Associations (CONFIEP)j) The President of the National Society of Industries k) The President of Lima Chamber of Commercel) A representative of the Micro and Small Enterprises Groupm) A representative of the Regional Government of Tumbesn) A representative of the Regional Government of Loretoo) A representative of the Regional Government of Punop) A representative of the Regional Government of Tacna
The Economic C
ontribution ofC
opyright-Based Industries in P
eru
255
18 In accordance with the amendment introduced by Legislative Decree No. 1033 (published on June 25, 2008; effective 60 days afterits publication), the Copyright Office (ODA) is now named the Copyright Direction.
In 2003, the country’s leading movie and video exhibition and rental companies, in cooperation with INDECOPI,joined efforts to implement what is being called the “Antipiracy Crusade Initiative” and, in this way, alertthe population and the competent authorities to the increasing significance of piracy in Peru, as well as tosuggest means for fighting this problem. The Phonographic Copyright Protecting Association (APDIF Peru)has a similar role for music phonograms.
Another provision in the fight against piracy is Ordinance No. 717, published in October 2004 by the LimaMetropolitan Council. This established a metropolitan policy of contributing to the prevention of tradingproducts violating intellectual property rights, by means of the closing of those establishments that marketor produce these types of products, as well as the seizure of such products. To do so, the municipal boroughswill have to disseminate the scope of this Ordinance and, provided that it is within the jurisdiction of theLima Metropolitan Council, will have to adapt their norms to comply with the provisions of the Ordinance.
Administrative Resolution No. 122-2006-CE-PJ was published in November 2006. This established that theNational Criminal Court and the 1st, 2nd, 3rd and 4th Supra-provincial Courts sitting in Lima also havecompetence for hearing cases involving tax and customs crimes and crimes against intellectual property,thus expanding their powers. It is thus possible to attack the large criminal organizations dedicated tosmuggling, tax evasion and piracy. This mission must be reinforced with intense training for the magistrates.
Administrative Resolution No. 223-2007-CE-PJ of September 2007 specified the scope of AdministrativeResolution No. 122-2006-CE-PJ, indicating that the competence of the National Criminal Court and theSupra-provincial Courts is reserved for massive and complex cases with national repercussions that involvecriminal organizations19.
By Legislative Resolution No. 28766, published on June 29, 2006, the Trade Promotion Agreement betweenPeru and the United States of America was approved. In Chapter XVI of this agreement, provisions to observeand safeguard the Intellectual Property Rights were established, which have been incorporated into ourlegislation as follows, for the entry into force of the Agreement (February 1, 2009):
I. Legislative Decree No. 1033 published on June 25, 2008 It aims to institutionally strengthen INDECOPI and consolidate its autonomy. With regard to theCopyright Office, a four-member Commission has been created inside, which resolves, in the firstadministrative instance, the annulment and cancellation of registration certificates and complaints of copyright infringement.
II. Legislative Decree No. 1076 published on June 28, 2008. It has amended the Copyright Law in thefollowing terms:
II.1. Incorporates two new definitions: rights management information and technological protectionmeasures.
II.2. Establishes that producers of phonograms have the exclusive right to perform, authorize orprohibit: the making available to the public of phonograms in a manner that members of the public may access them from a place and a time that they choose.
II.3. Establishes that the rights holders recognized in the Law, its representatives or the CollectingSocieties and their exclusive licensees or other authorized licensees, without prejudice to otheractions that correspond to them, may require the cessation of the illegal activity of the offenderand demand compensation for material and moral damages caused by the violation and the
The
Econ
omic
Con
trib
utio
n of
Cop
yrig
ht-B
ased
Ind
ustr
ies
in P
eru
256
19 It is important to mention that after the publication date of the Administrative Resolution No. 094-2009-CE-PJ (April 7, 2009),Administrative Resolutions No. 122-2006-CE-PJ and No. 223-2007-CE-PJ are no longer applicable to new cases.
profits obtained by the infringer attributable to the infringement and which were not takeninto account when calculating the amount of damages, or by choice of the right holder, thepre-established compensation, and the payment of costs and expenses.
II.4. Establishes the cases of circumvention of technological protection measures, as well as a listof exceptions.
II.5. Incorporates the cases of infringements related to the removal or alteration of rightsmanagement information.
II.6. Specifies that the court authorities will destroy the infringing goods, at the request of the rightholder, unless there are exceptional circumstances. It has also given these authorities the powerto order the infringers to provide any information they have about those involved in any aspectof the infringement.
III. Legislative Decree No. 1092 published on June 28, 2008 Through this legislative decree the legal framework for the implementation of border measures for the protection of copyright, neighboring rights and trademark rights is established. It mentions thatthe right holder may submit an application to the Customs Administration to suspend the release ofinfringing goods. Similarly, the Customs Administration may initiate ex officio border measures for the suspension of the release of goods for the regime of import, export or transit, when there is reasonable suspicion to believe that they are infringing goods. As complementary provisions, it establishes that the Customs Administration and INDECOPI will implement an electronic system of information exchange of rights holders, and that the Customs Administration can implement a voluntary registration of rights holders and their representatives. Finally, it is noteworthy that the corresponding Implementing Regulation (Supreme Decree No. 003-2009-EF) was published on January 13, 2009.
IV. Law No. 29263, published on October 2, 2008, and Law No. 2931620, published on January 14, 2009 Both laws incorporate significant changes to the Criminal Code of 1991. Consequently, taking intoconsideration the changes that were made in the Criminal Code with Law No. 27729 (2002) and LawNo. 28289 (2004), now the criminal laws have the following wording:
IV.1. Copy or unauthorized reproduction – is punishable with imprisonment for not less than two normore than four years and a ten- to sixty-day fine, when the person that is authorized to publisha work does so in one of the following ways: a) No mention in the copies of the name of the author, translator, adapter, compiler
or arranger. b) Stamping the name with additions or deletions affecting the reputation of the author
as such, or in its case, the translator, adapter, compiler or arranger. c) Publishing the work with abbreviations, additions, deletions, or any other amendment,
without the consent of the right holder. d) Publishing several products separately, when authorization has been given for publication
in whole, or publishing them together, when only has authorization for the publication of them separately.
IV.2. Reproduction, disemination, distribution and circulation of the work without the permission ofthe author – is punishable with imprisonment for not less than two nor more than six years and a thirty- to ninety-day fine, when the person, with respect to a work, an artistic performance, a phonogram or a broadcast or broadcasting transmission, or an audiovisual recording or
The Economic C
ontribution ofC
opyright-Based Industries in P
eru
257
20 It is noteworthy that Law No. 29316 also amends the Copyright Law, ensuring that no hierarchy is established between authors andneighboring rights.
photographic image expressed in any form, does any of the following acts without the priorwritten authorization of the author or right holder: a) It is modified in whole or in part. b) It is distributed by sale, rental or public lending.c) It is publicly communicated or broadcasted, transmitted or retransmitted by any media or
process reserved for the respective right holder. d) It is played, distributed or communicated in greater numbers than authorized in writing. The penalty is not less than four nor more than eight years and a sixty- to one-hundred-and-
twenty-day fine, when the agent reproduces in whole or in part, by any media or process,and if the distribution is made by sale, rental or public lending or other way of transfer thepossession of the medium that contains the work or production that exceeds the two (2) Tax Units21, in a single act or different acts of a lower amount each.
IV.3. Aggravated penalties. The penalty is imprisonment for no less than four nor more than eightyears and a ninety- to one-hundred-and-eighty-day fine when: a) Making available to the public an undisclosed or unpublished work, that was received in
confidence from the copyright holder or someone on his behalf, without the consent of the right holder.
b) The reproduction, distribution or public communication is made for commercial or othereconomic advantage, or by altering or deleting the name or pseudonym of the author,producer or right holder.
c) Knowing the illicit origin of the copy or reproduction, it is distributed to the public, by anymedia, it is stored, hidden, or it is introduced or taken out of the country.
d) Manufacture, assembly, import, export, modify, sell, rent, offer for sale or rent, or make upany other way to put in circulation devices, tangible or intangible systems, schemes orequipment that could transgress another device intended to prevent or restrict the makingof copies of works, or impair the quality of copies, or capable of allowing or encouraging thereceipt of an encrypted program, broadcasted or communicated in other ways to the public,by those who are not authorized to do so.
e) Register in the Copyright Registry the work, interpretation, production or emission of others,or any other intellectual property, as own or as that of a person other than the true right owner.
IV.4. Plagiarism – is punishable with imprisonment for not less than four nor more than eight yearsand a ninety- to one-hundred-and-eighty-day fine, to whom with respect to a work, disseminateit as own, in whole or in part, copying or reproducing it literally, or trying to disguise the copyingby certain alterations, assuming as own or to another, the authorship or ownership of others.
IV.5. Aggravated forms – is punishable with imprisonment for not less than four nor more than eightyears and a ninety- to three-hundred-and-sixty-five-day fine: a) Who assumes falsely the quality of primary or derivative right holder of any rights protected
by the copyright law and neighborly rights, and with that improper assumption, obtains thecompetent authority to suspend the act of communication, reproduction or distribution of thework, interpretation, production, broadcasting or any other protected intellectual property.
b) Who carries out activities of a Collecting Society of copyright law or neighboring rightswithout the due authorization of the competent administrative authority.
c) Who submits false statements in certificates of income; public assistance; used repertoire;identity of authors; allegedly obtained permission; number of copies produced, sold ordistributed free of charge or any other adulteration of data likely to cause injury to any of the copyright or neighboring rights holders.
The
Econ
omic
Con
trib
utio
n of
Cop
yrig
ht-B
ased
Ind
ustr
ies
in P
eru
258
21 In 2009, the Tax Unit is equivalent to S/. 3,550.00 (approximately US$ 1,109.00 at the average exchange rate of February 2009)
d) If the agent that commits the crime integrates an organization intended to perpetrateillegal acts.
e) If the agent that commits any of the mentioned crimes is an official or public servant. IV.6. Circumvention of technological protection measures. A person who, for commercialization or
other economic advantage, without authorization, circumvents any technological protectionmeasure that is utilized by the producers of phonograms, artists or performers and authors ofany work protected by intellectual property rights, shall be punished with imprisonment no morethan two years and a ten- to sixty-day fine.
IV.7. Products intended for the circumvention of technological protection measures. A person who,for commercialization or other economic advantage, manufactures, imports, distributes, offers to the public, provides or otherwise commercializes devices, products or components intendedprimarily for the circumvention of technological protection measures used by producers ofphonograms, artists, performers and authors of any work protected by intellectual propertyrights, shall be punished with imprisonment no more than two years and a ten- to sixty-day fine.
IV.8. Services intended for the circumvention of technological protection measures. A person who, for commercialization or other economic advantage, provides or offers services to the publicprimarily intended for the circumvention of technological protection measures that are utilized by the producers of phonograms, artists, performers and authors of any work protected byintellectual property rights, shall be punished with imprisonment no more than two years and a ten- to sixty-day fine.
IV.9. Crimes against rights management information. Any person who, without authorization and forcommercialization or other economic advantage, removes or alters, either by itself or throughanother, any information about rights management, will be punished with imprisonment nomore than two years and a ten- to sixty-day fine. The same penalty will be imposed on theperson who distributes or imports for distribution rights management information, knowing thatthis has been removed or altered without authorization; or distributes, imports for distribution,broadcasts, communicates or makes available to the public copies of works, interpretations orexecutions or phonograms, knowing that the rights management information has been removedor altered without authorization.
IV.10. Labels, covers or packaging. The person who manufactures, commercializes, distributes, stores,transports, transfers or otherwise arranges for commercial or other economic advantage fakelabels or covers attached or designed to be attached to a phonogram, a copy of computersoftware, documentation or packaging of computer software or a copy of a cinematographic orother audiovisual work, will be punished with imprisonment for no less than three nor more thansix years and a sixty- to one-hundred-and-twenty-day fine.
IV.11. Manuals, licenses or other documentation, or fake packaging related to computer software. The person that develops, commercializes, distributes, stores, transports, transfers or arranges for commercial or other economic advantage manuals, licenses or other documentation, or fakepackaging for computer software, will be punished with imprisonment for no less than four normore than six years and a sixty- to one-hundred-and-twenty-day fine.
IV.12. Preventive seizure and definitive confiscation. In the crimes mentioned above it will proceed thepreventive seizure of the copies and materials, equipment or media used to commit the illegal actand, if so, of the assets and any documentary evidence related to the crime. If necessary, the PublicProsecutor will ask the Judge for permission to read the documentation that is in the place of theintervention, and in the execution of that authorization the documentation related to the field of investigation will be seized. For the seizure is not required to identify individually all thematerials, only if the necessary measures are taken so that during the judicial process all of themare identified. In this event the representative of the Public Ministry participates. Also, the Judge,
The Economic C
ontribution ofC
opyright-Based Industries in P
eru
259
at the request of the Public Ministry, will order to search or to unlock the premises where thecrime is being committed. In case of criminal conviction, the copies, illegal material, equipmentand media used to commit the illegal action will be confiscated and destroyed, unless in exceptionalcases evaluated by the judicial authority. In no case will the illegal copies be returned to the defendant.
IV.13. Devices to assist the decoding of satellite signals carrying programs. A person who manufactures,assembles, modifies, imports, exports, sells, rents or distributes by any media a tangible orintangible device, whose primary function is to assist in decoding an encrypted satellite signalthat carries programs without authorization from the legal distributor of that signal, will bepunished with imprisonment for no less than four nor more than eight years and a ninety- to one-hundred-and-eighty-day fine.
IV.14. Distribution of satellite signals carrying programs. The person who distributes a satellite signalcarrying a program, originally encoded, in the knowledge that it was decoded without theauthorization of the legal distributor of that signal, will be punished with imprisonment for no less than two nor more than six years and a thirty- to ninety-day fine.
IV.15. Protection of encrypted satellite signals. Whoever receives a satellite signal that carries a programoriginally encrypted, knowing that it was decoded without the authorization of the legaldistributor of the signal, will be punished with forty to eighty hours of community service or a ten- to sixty-day fine.
We believe that the recent legislative changes will be useful for advancing the goal of achieving adequatecopyright and related rights protection in our country. Not only have penalties for cases of circumvention oftechnological protection measures and infringements related to the alteration of rights managementinformation been established, but changes to the Criminal Code have been incorporated and provisions for the implementation of border measures have been issued. Similarly, INDECOPI has been institutionallystrengthened and additional faculties have been granted to the judicial authorities.
Finally, to obtain better results in combating piracy, the administrative and judicial authorities should havemore resources and people should be educated about respecting intellectual property.
The
Econ
omic
Con
trib
utio
n of
Cop
yrig
ht-B
ased
Ind
ustr
ies
in P
eru
260
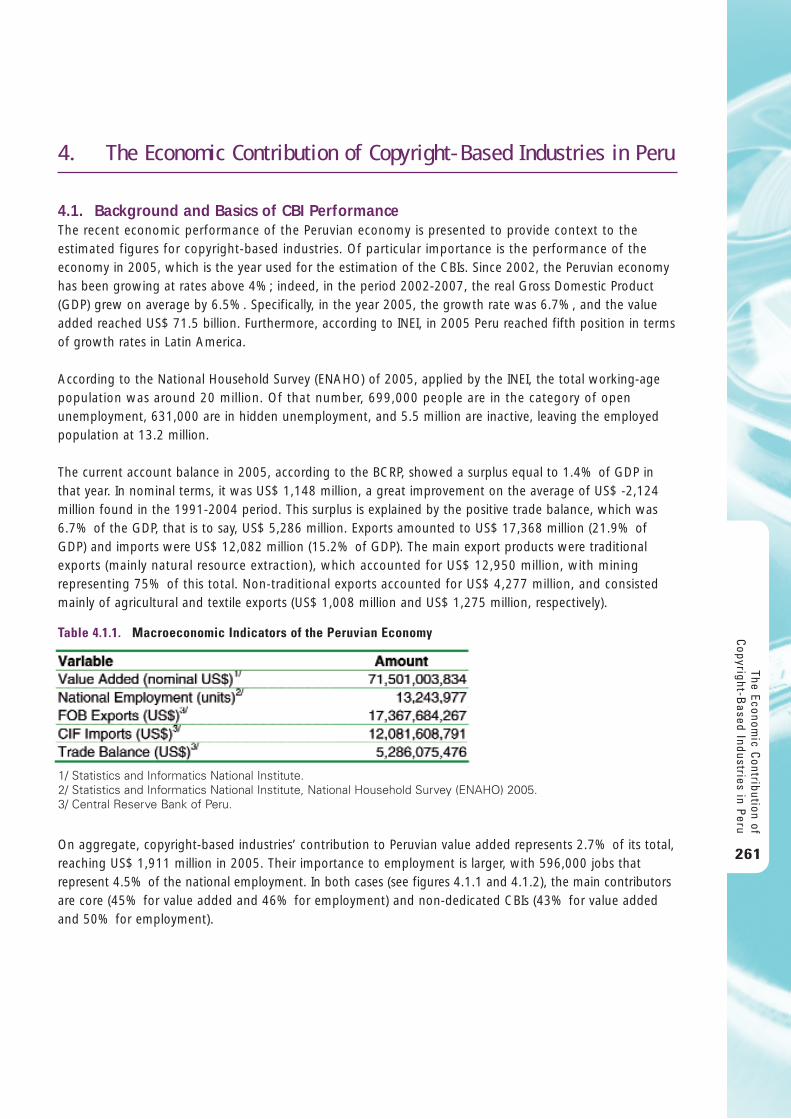
4. The Economic Contr ibut ion of Copyr ight-Based Indust r ies in Peru
4.1. Background and Basics of CBI PerformanceThe recent economic performance of the Peruvian economy is presented to provide context to theestimated figures for copyright-based industries. Of particular importance is the performance of theeconomy in 2005, which is the year used for the estimation of the CBIs. Since 2002, the Peruvian economyhas been growing at rates above 4%; indeed, in the period 2002-2007, the real Gross Domestic Product(GDP) grew on average by 6.5%. Specifically, in the year 2005, the growth rate was 6.7%, and the valueadded reached US$ 71.5 billion. Furthermore, according to INEI, in 2005 Peru reached fifth position in termsof growth rates in Latin America.
According to the National Household Survey (ENAHO) of 2005, applied by the INEI, the total working-agepopulation was around 20 million. Of that number, 699,000 people are in the category of openunemployment, 631,000 are in hidden unemployment, and 5.5 million are inactive, leaving the employedpopulation at 13.2 million.
The current account balance in 2005, according to the BCRP, showed a surplus equal to 1.4% of GDP inthat year. In nominal terms, it was US$ 1,148 million, a great improvement on the average of US$ -2,124million found in the 1991-2004 period. This surplus is explained by the positive trade balance, which was6.7% of the GDP, that is to say, US$ 5,286 million. Exports amounted to US$ 17,368 million (21.9% ofGDP) and imports were US$ 12,082 million (15.2% of GDP). The main export products were traditionalexports (mainly natural resource extraction), which accounted for US$ 12,950 million, with miningrepresenting 75% of this total. Non-traditional exports accounted for US$ 4,277 million, and consistedmainly of agricultural and textile exports (US$ 1,008 million and US$ 1,275 million, respectively).
On aggregate, copyright-based industries’ contribution to Peruvian value added represents 2.7% of its total,reaching US$ 1,911 million in 2005. Their importance to employment is larger, with 596,000 jobs thatrepresent 4.5% of the national employment. In both cases (see figures 4.1.1 and 4.1.2), the main contributorsare core (45% for value added and 46% for employment) and non-dedicated CBIs (43% for value addedand 50% for employment).
The Economic C
ontribution ofC
opyright-Based Industries in P
eru
261
Table 4.1.1. Macroeconomic Indicators of the Peruvian Economy
1/ Statistics and Informatics National Institute.2/ Statistics and Informatics National Institute, National Household Survey (ENAHO) 2005.3/ Central Reserve Bank of Peru.
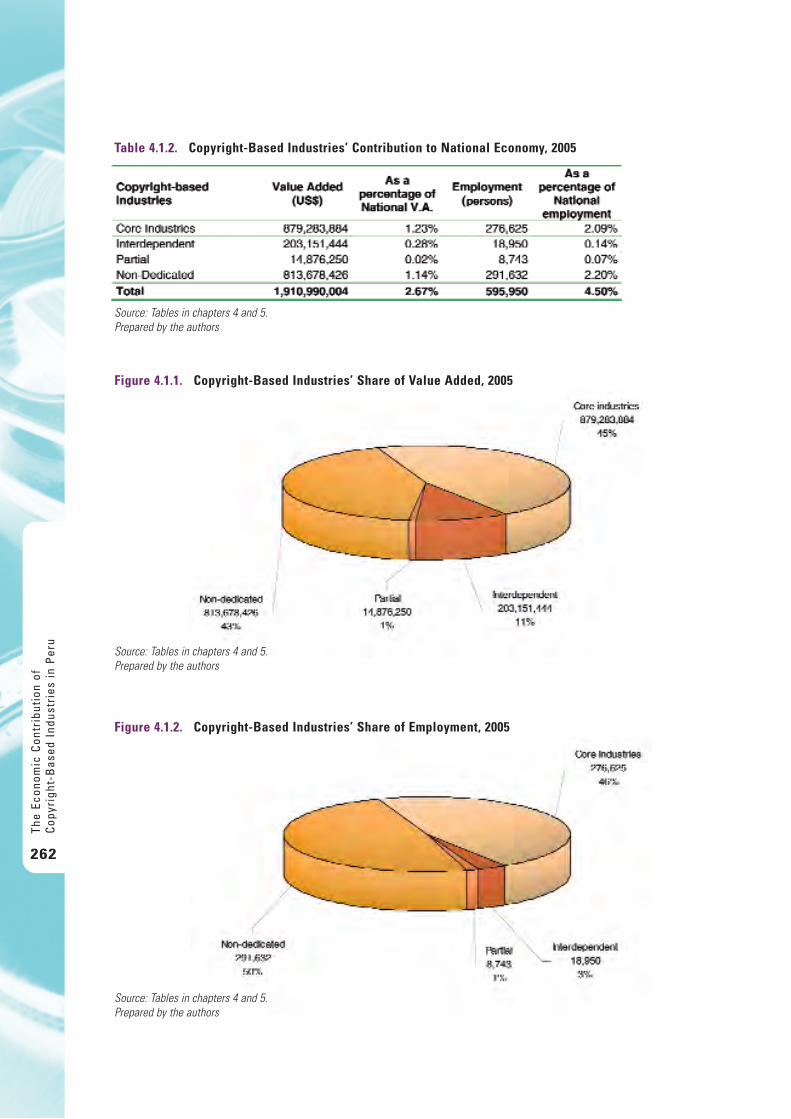
The
Econ
omic
Con
trib
utio
n of
Cop
yrig
ht-B
ased
Ind
ustr
ies
in P
eru
262
Table 4.1.2. Copyright-Based Industries’ Contribution to National Economy, 2005
Source: Tables in chapters 4 and 5.Prepared by the authors
Figure 4.1.1. Copyright-Based Industries’ Share of Value Added, 2005
Source: Tables in chapters 4 and 5.Prepared by the authors
Figure 4.1.2. Copyright-Based Industries’ Share of Employment, 2005
Source: Tables in chapters 4 and 5.Prepared by the authors
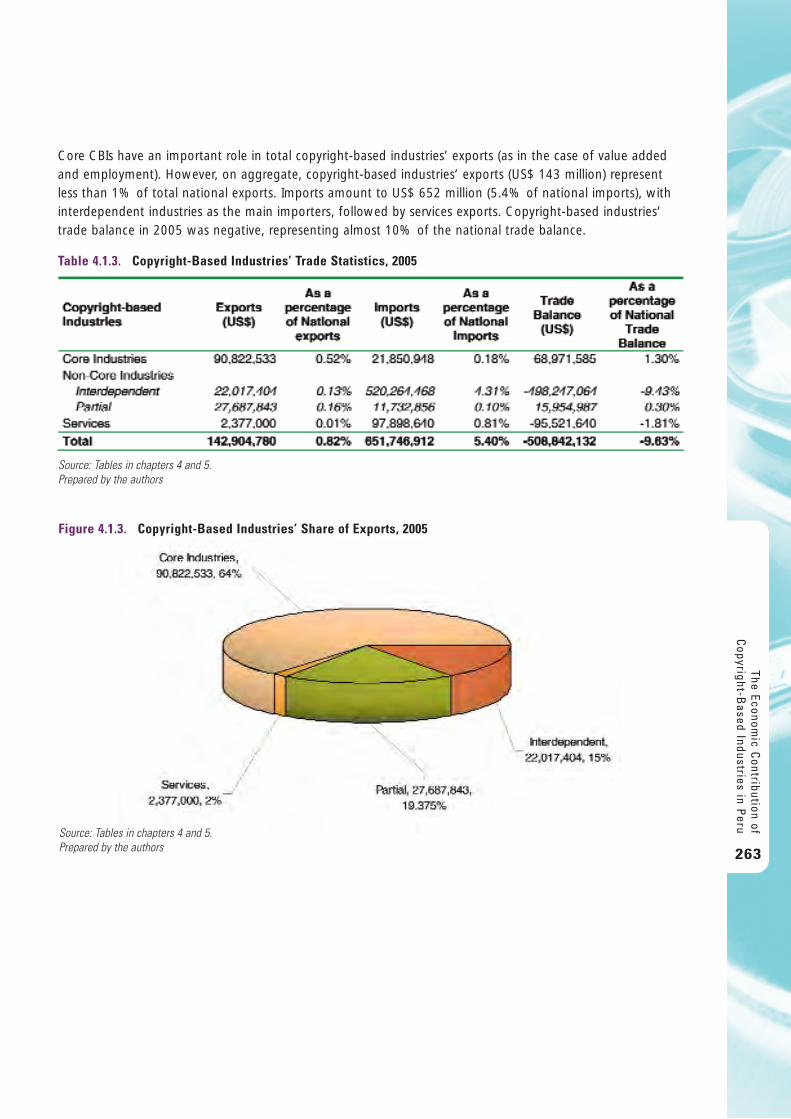
Core CBIs have an important role in total copyright-based industries’ exports (as in the case of value addedand employment). However, on aggregate, copyright-based industries’ exports (US$ 143 million) representless than 1% of total national exports. Imports amount to US$ 652 million (5.4% of national imports), withinterdependent industries as the main importers, followed by services exports. Copyright-based industries’trade balance in 2005 was negative, representing almost 10% of the national trade balance.
The Economic C
ontribution ofC
opyright-Based Industries in P
eru
263
Table 4.1.3. Copyright-Based Industries’ Trade Statistics, 2005
Source: Tables in chapters 4 and 5.Prepared by the authors
Figure 4.1.3. Copyright-Based Industries’ Share of Exports, 2005
Source: Tables in chapters 4 and 5.Prepared by the authors
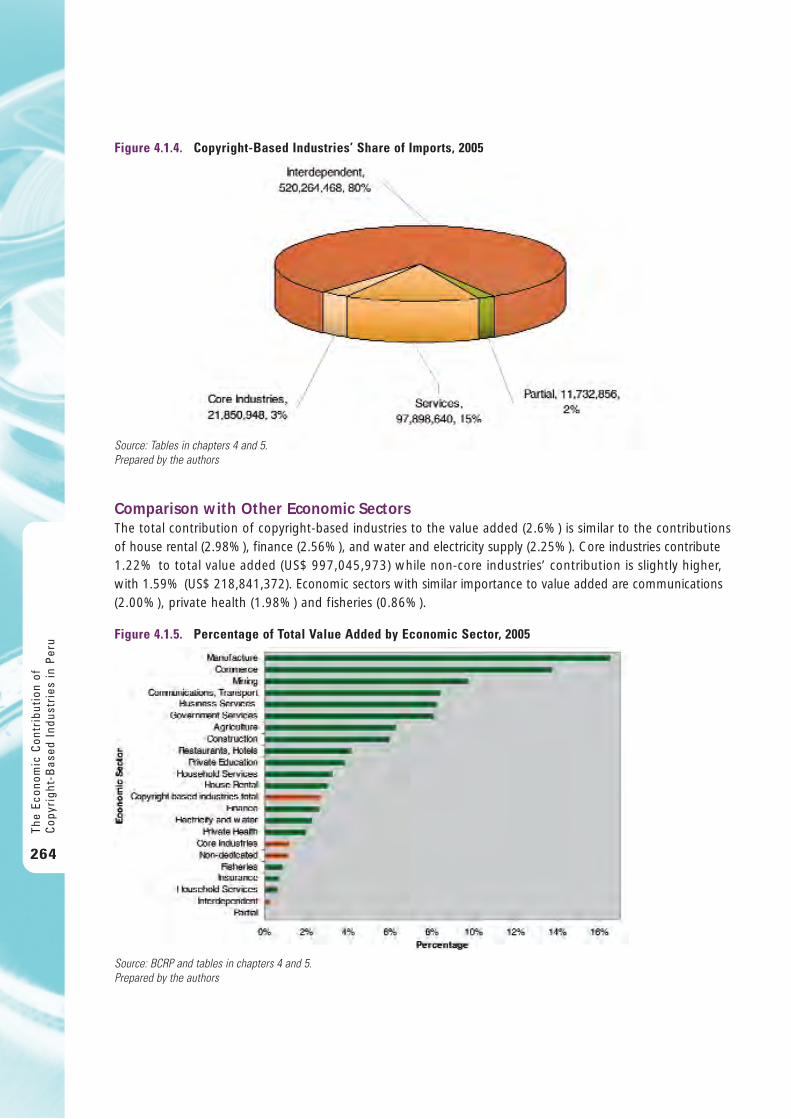
Comparison with Other Economic SectorsThe total contribution of copyright-based industries to the value added (2.6%) is similar to the contributionsof house rental (2.98%), finance (2.56%), and water and electricity supply (2.25%). Core industries contribute1.22% to total value added (US$ 997,045,973) while non-core industries’ contribution is slightly higher,with 1.59% (US$ 218,841,372). Economic sectors with similar importance to value added are communications(2.00%), private health (1.98%) and fisheries (0.86%).
The
Econ
omic
Con
trib
utio
n of
Cop
yrig
ht-B
ased
Ind
ustr
ies
in P
eru
264
Figure 4.1.4. Copyright-Based Industries’ Share of Imports, 2005
Source: Tables in chapters 4 and 5.Prepared by the authors
Figure 4.1.5. Percentage of Total Value Added by Economic Sector, 2005
Source: BCRP and tables in chapters 4 and 5.Prepared by the authors
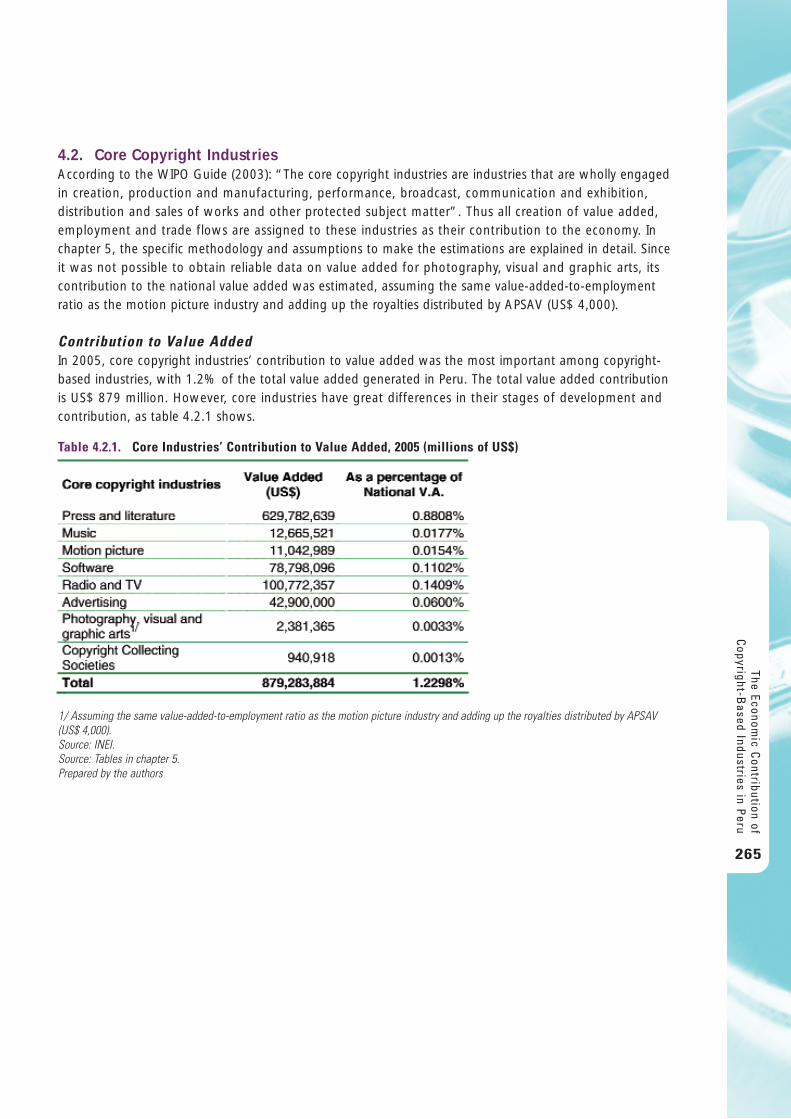
4.2. Core Copyright IndustriesAccording to the WIPO Guide (2003): “The core copyright industries are industries that are wholly engagedin creation, production and manufacturing, performance, broadcast, communication and exhibition,distribution and sales of works and other protected subject matter”. Thus all creation of value added,employment and trade flows are assigned to these industries as their contribution to the economy. Inchapter 5, the specific methodology and assumptions to make the estimations are explained in detail. Sinceit was not possible to obtain reliable data on value added for photography, visual and graphic arts, itscontribution to the national value added was estimated, assuming the same value-added-to-employmentratio as the motion picture industry and adding up the royalties distributed by APSAV (US$ 4,000).
Contribution to Value AddedIn 2005, core copyright industries’ contribution to value added was the most important among copyright-based industries, with 1.2% of the total value added generated in Peru. The total value added contributionis US$ 879 million. However, core industries have great differences in their stages of development andcontribution, as table 4.2.1 shows.
The Economic C
ontribution ofC
opyright-Based Industries in P
eru
265
Table 4.2.1. Core Industries’ Contribution to Value Added, 2005 (millions of US$)
1/ Assuming the same value-added-to-employment ratio as the motion picture industry and adding up the royalties distributed by APSAV(US$ 4,000).Source: INEI.Source: Tables in chapter 5.Prepared by the authors
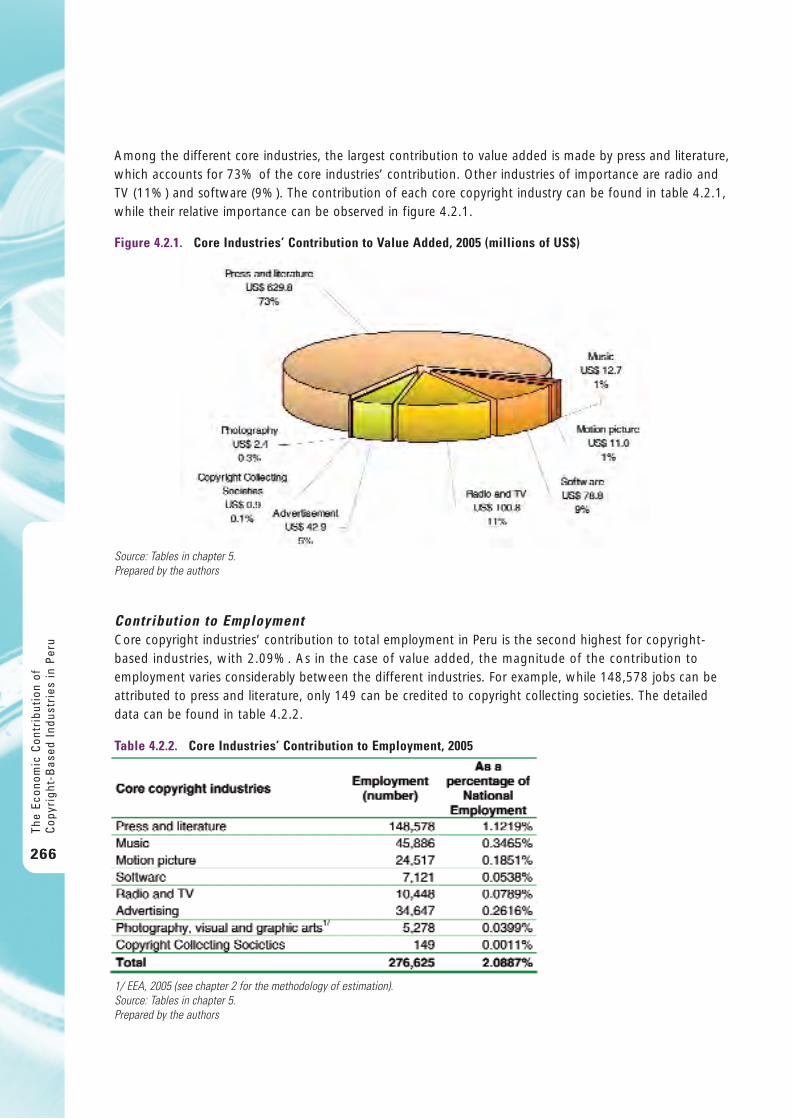
Among the different core industries, the largest contribution to value added is made by press and literature,which accounts for 73% of the core industries’ contribution. Other industries of importance are radio andTV (11%) and software (9%). The contribution of each core copyright industry can be found in table 4.2.1,while their relative importance can be observed in figure 4.2.1.
Contribution to EmploymentCore copyright industries’ contribution to total employment in Peru is the second highest for copyright-based industries, with 2.09%. As in the case of value added, the magnitude of the contribution toemployment varies considerably between the different industries. For example, while 148,578 jobs can beattributed to press and literature, only 149 can be credited to copyright collecting societies. The detaileddata can be found in table 4.2.2.
The
Econ
omic
Con
trib
utio
n of
Cop
yrig
ht-B
ased
Ind
ustr
ies
in P
eru
266
Figure 4.2.1. Core Industries’ Contribution to Value Added, 2005 (millions of US$)
Source: Tables in chapter 5.Prepared by the authors
Table 4.2.2. Core Industries’ Contribution to Employment, 2005
1/ EEA, 2005 (see chapter 2 for the methodology of estimation).Source: Tables in chapter 5.Prepared by the authors
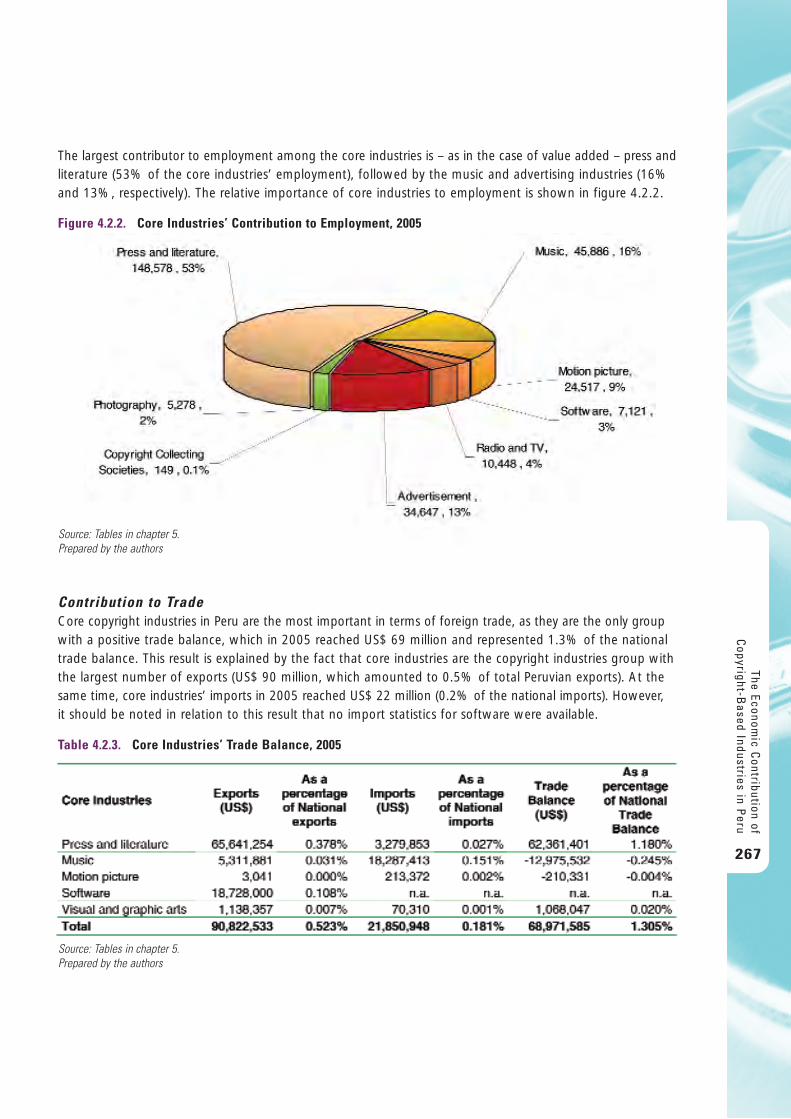
The largest contributor to employment among the core industries is – as in the case of value added – press andliterature (53% of the core industries’ employment), followed by the music and advertising industries (16%and 13%, respectively). The relative importance of core industries to employment is shown in figure 4.2.2.
Contribution to TradeCore copyright industries in Peru are the most important in terms of foreign trade, as they are the only groupwith a positive trade balance, which in 2005 reached US$ 69 million and represented 1.3% of the nationaltrade balance. This result is explained by the fact that core industries are the copyright industries group withthe largest number of exports (US$ 90 million, which amounted to 0.5% of total Peruvian exports). At thesame time, core industries’ imports in 2005 reached US$ 22 million (0.2% of the national imports). However,it should be noted in relation to this result that no import statistics for software were available.
The Economic C
ontribution ofC
opyright-Based Industries in P
eru
267
Figure 4.2.2. Core Industries’ Contribution to Employment, 2005
Source: Tables in chapter 5.Prepared by the authors
Table 4.2.3. Core Industries’ Trade Balance, 2005
Source: Tables in chapter 5.Prepared by the authors
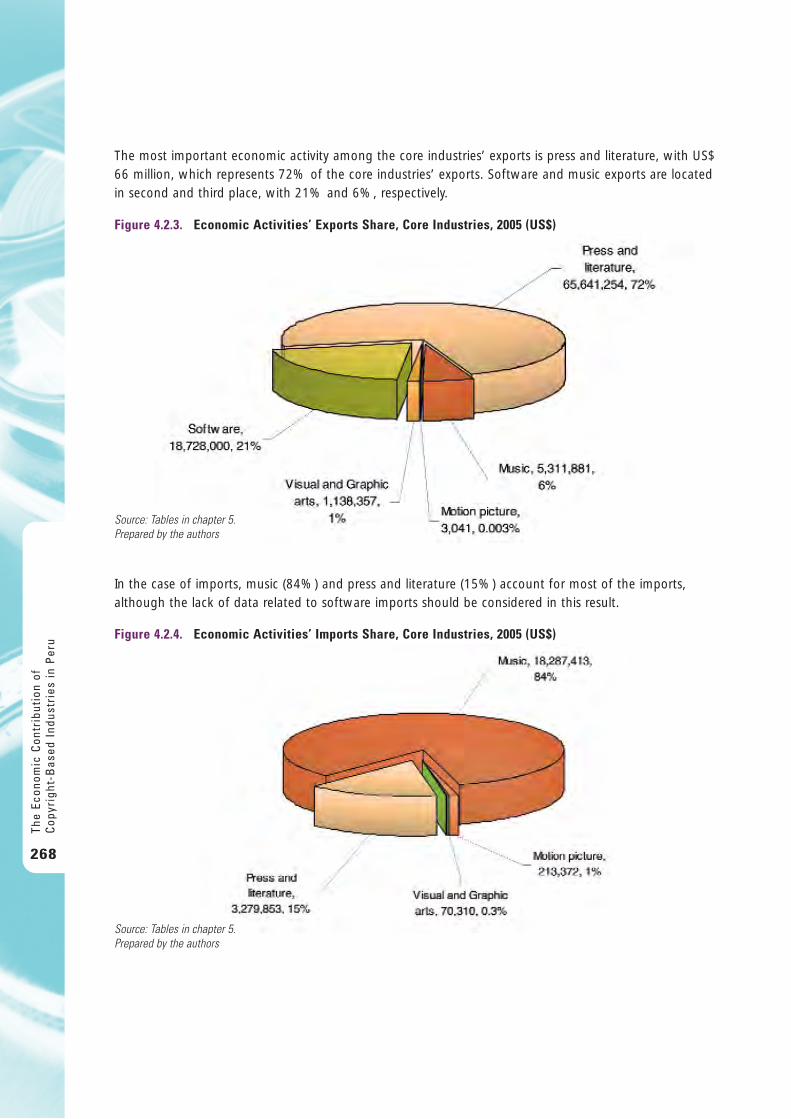
The most important economic activity among the core industries’ exports is press and literature, with US$66 million, which represents 72% of the core industries’ exports. Software and music exports are located in second and third place, with 21% and 6%, respectively.
In the case of imports, music (84%) and press and literature (15%) account for most of the imports,although the lack of data related to software imports should be considered in this result.
The
Econ
omic
Con
trib
utio
n of
Cop
yrig
ht-B
ased
Ind
ustr
ies
in P
eru
268
Figure 4.2.3. Economic Activities’ Exports Share, Core Industries, 2005 (US$)
Source: Tables in chapter 5.Prepared by the authors
Figure 4.2.4. Economic Activities’ Imports Share, Core Industries, 2005 (US$)
Source: Tables in chapter 5.Prepared by the authors
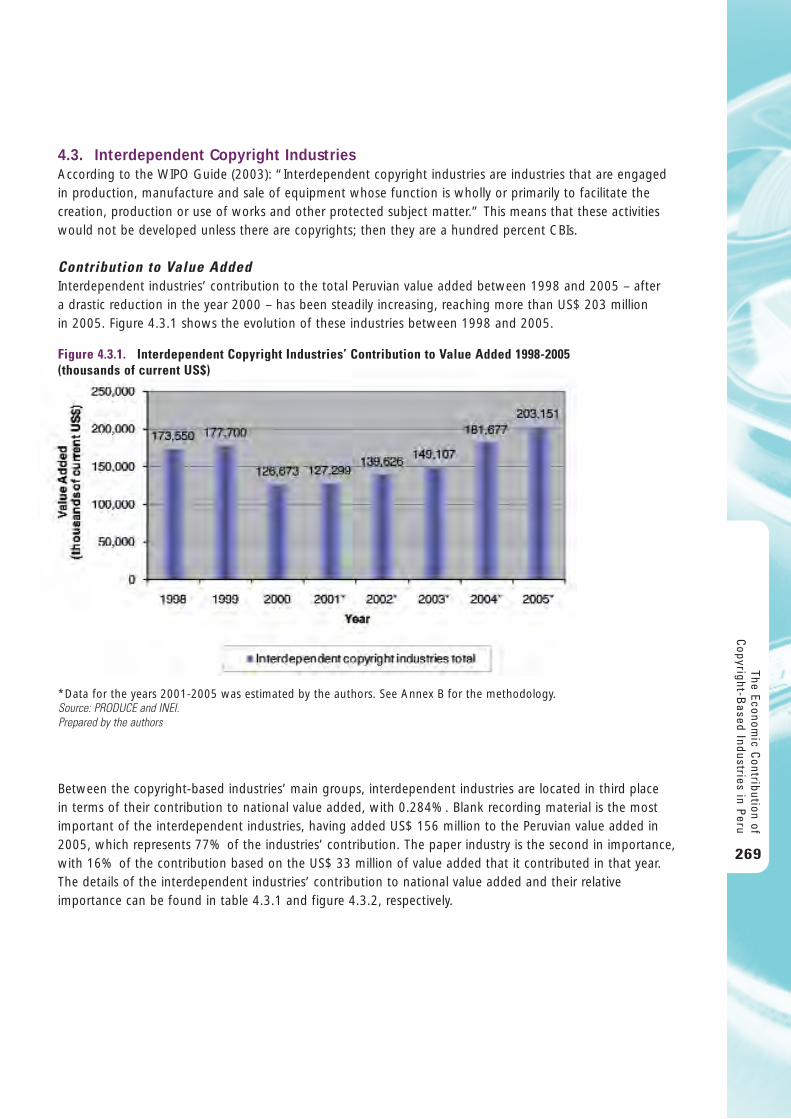
4.3. Interdependent Copyright IndustriesAccording to the WIPO Guide (2003): “Interdependent copyright industries are industries that are engagedin production, manufacture and sale of equipment whose function is wholly or primarily to facilitate thecreation, production or use of works and other protected subject matter.” This means that these activitieswould not be developed unless there are copyrights; then they are a hundred percent CBIs.
Contribution to Value AddedInterdependent industries’ contribution to the total Peruvian value added between 1998 and 2005 – after a drastic reduction in the year 2000 – has been steadily increasing, reaching more than US$ 203 million in 2005. Figure 4.3.1 shows the evolution of these industries between 1998 and 2005.
Between the copyright-based industries’ main groups, interdependent industries are located in third place in terms of their contribution to national value added, with 0.284%. Blank recording material is the mostimportant of the interdependent industries, having added US$ 156 million to the Peruvian value added in2005, which represents 77% of the industries’ contribution. The paper industry is the second in importance,with 16% of the contribution based on the US$ 33 million of value added that it contributed in that year.The details of the interdependent industries’ contribution to national value added and their relativeimportance can be found in table 4.3.1 and figure 4.3.2, respectively.
The Economic C
ontribution ofC
opyright-Based Industries in P
eru
269
Figure 4.3.1. Interdependent Copyright Industries’ Contribution to Value Added 1998-2005 (thousands of current US$)
*Data for the years 2001-2005 was estimated by the authors. See Annex B for the methodology.Source: PRODUCE and INEI.Prepared by the authors
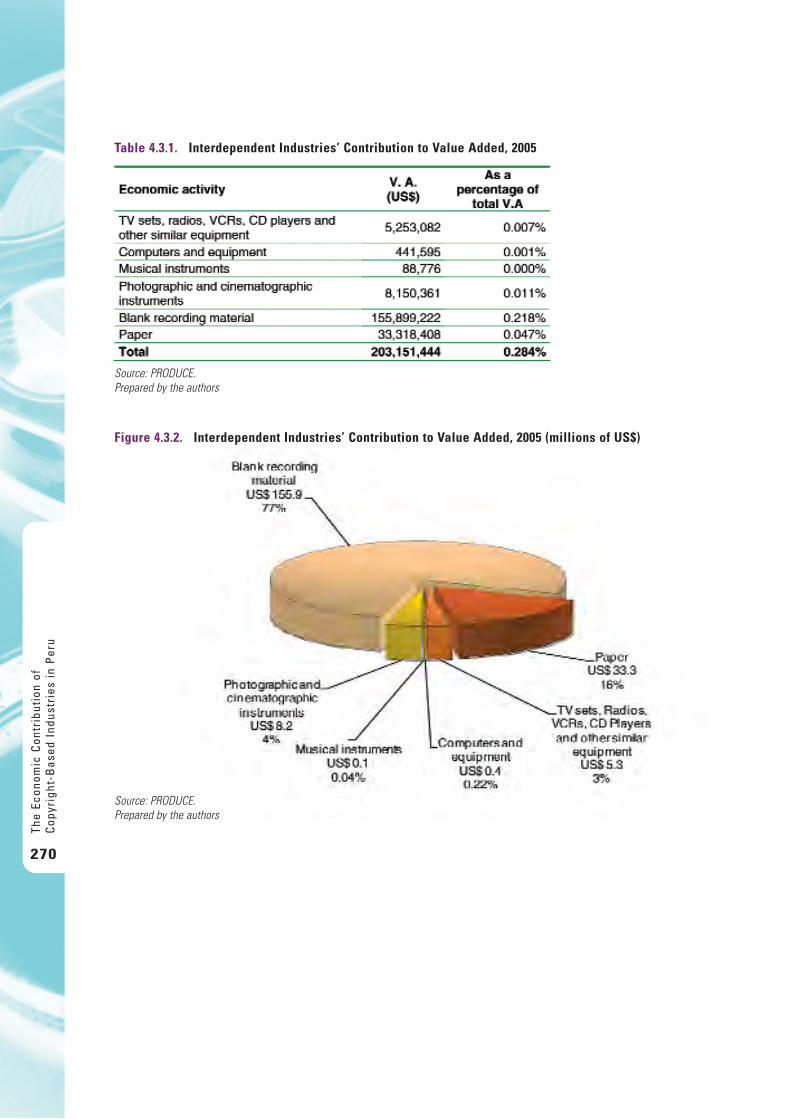
The
Econ
omic
Con
trib
utio
n of
Cop
yrig
ht-B
ased
Ind
ustr
ies
in P
eru
270
Table 4.3.1. Interdependent Industries’ Contribution to Value Added, 2005
Source: PRODUCE.Prepared by the authors
Figure 4.3.2. Interdependent Industries’ Contribution to Value Added, 2005 (millions of US$)
Source: PRODUCE.Prepared by the authors
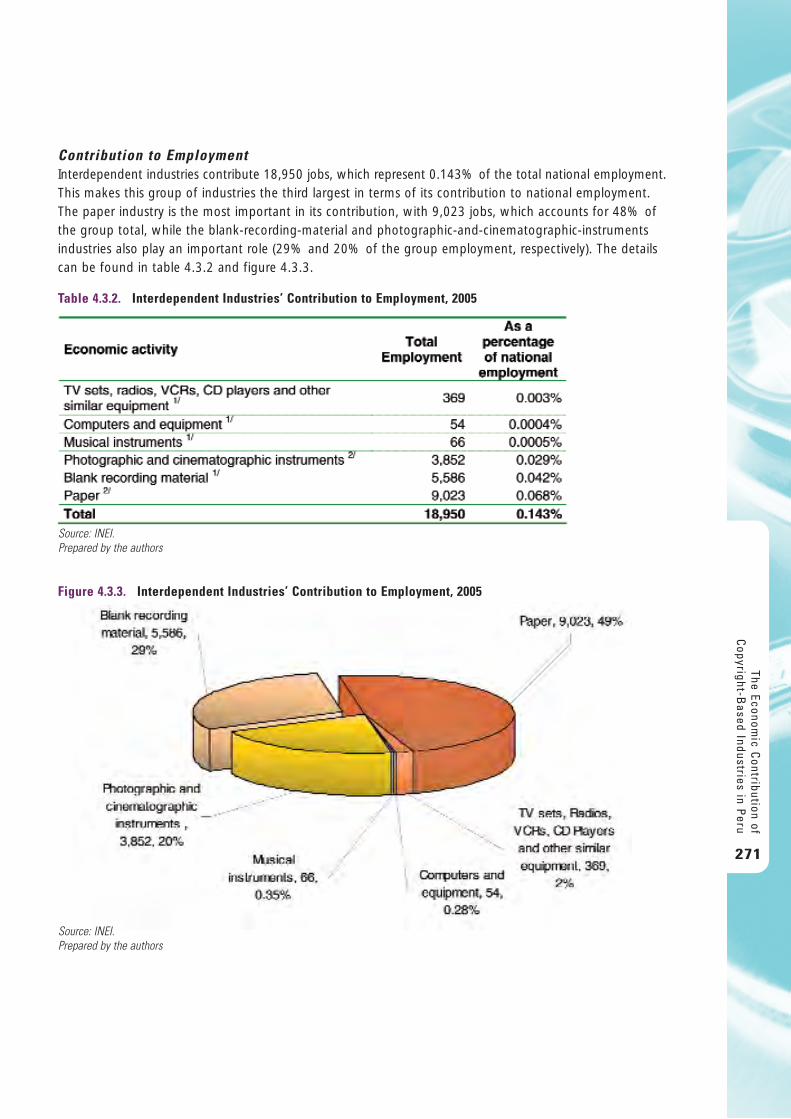
Contribution to EmploymentInterdependent industries contribute 18,950 jobs, which represent 0.143% of the total national employment.This makes this group of industries the third largest in terms of its contribution to national employment. The paper industry is the most important in its contribution, with 9,023 jobs, which accounts for 48% ofthe group total, while the blank-recording-material and photographic-and-cinematographic-instrumentsindustries also play an important role (29% and 20% of the group employment, respectively). The detailscan be found in table 4.3.2 and figure 4.3.3.
The Economic C
ontribution ofC
opyright-Based Industries in P
eru
271
Table 4.3.2. Interdependent Industries’ Contribution to Employment, 2005
Source: INEI. Prepared by the authors
Figure 4.3.3. Interdependent Industries’ Contribution to Employment, 2005
Source: INEI. Prepared by the authors
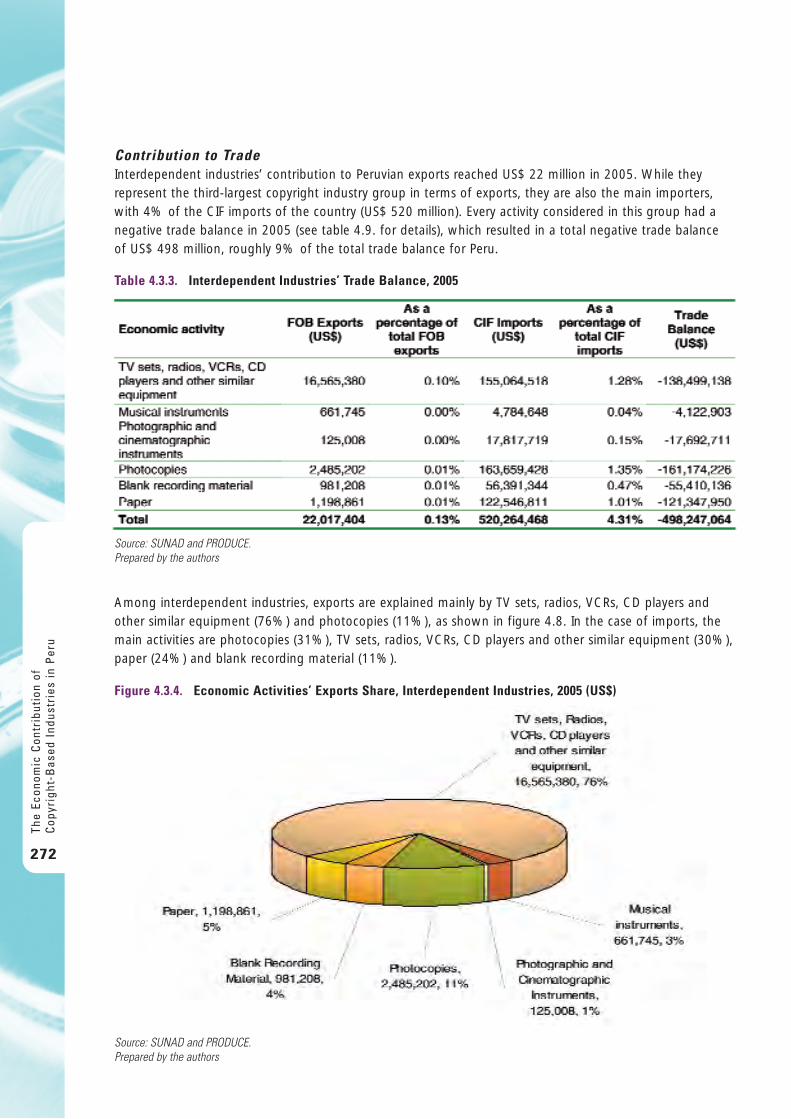
Contribution to TradeInterdependent industries’ contribution to Peruvian exports reached US$ 22 million in 2005. While theyrepresent the third-largest copyright industry group in terms of exports, they are also the main importers,with 4% of the CIF imports of the country (US$ 520 million). Every activity considered in this group had anegative trade balance in 2005 (see table 4.9. for details), which resulted in a total negative trade balanceof US$ 498 million, roughly 9% of the total trade balance for Peru.
Among interdependent industries, exports are explained mainly by TV sets, radios, VCRs, CD players andother similar equipment (76%) and photocopies (11%), as shown in figure 4.8. In the case of imports, themain activities are photocopies (31%), TV sets, radios, VCRs, CD players and other similar equipment (30%),paper (24%) and blank recording material (11%).
The
Econ
omic
Con
trib
utio
n of
Cop
yrig
ht-B
ased
Ind
ustr
ies
in P
eru
272
Table 4.3.3. Interdependent Industries’ Trade Balance, 2005
Source: SUNAD and PRODUCE.Prepared by the authors
Figure 4.3.4. Economic Activities’ Exports Share, Interdependent Industries, 2005 (US$)
Source: SUNAD and PRODUCE.Prepared by the authors
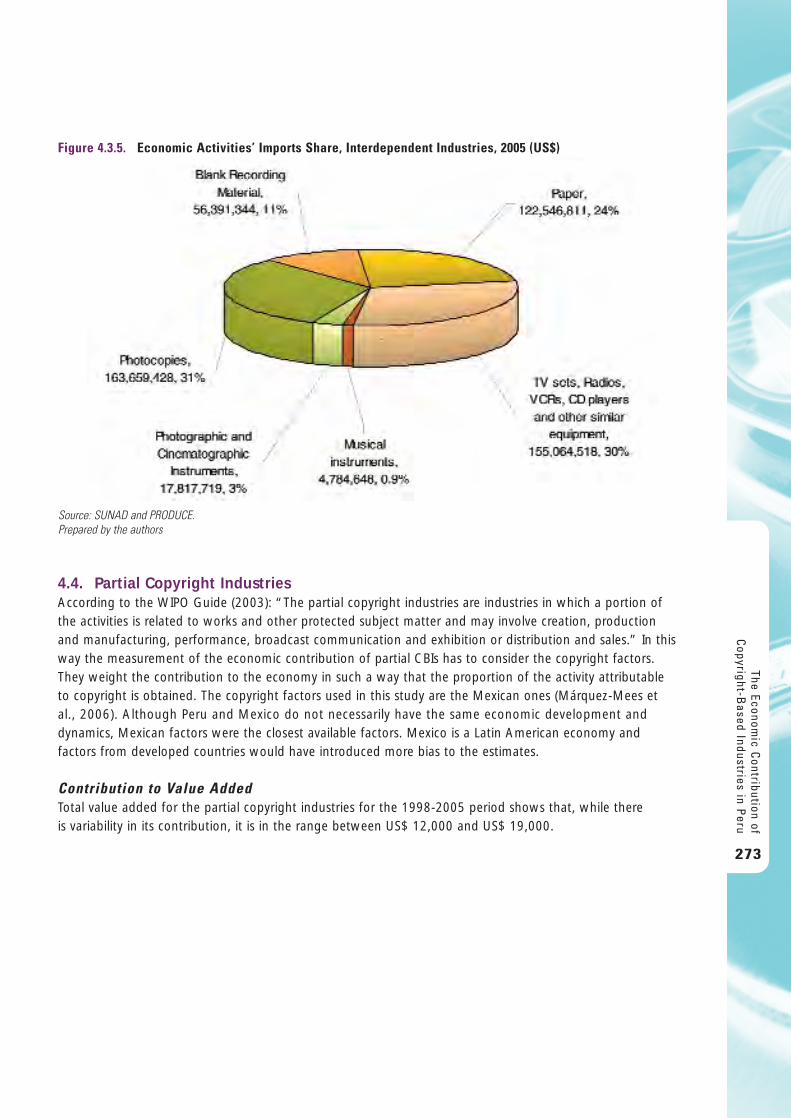
4.4. Partial Copyright IndustriesAccording to the WIPO Guide (2003): “The partial copyright industries are industries in which a portion ofthe activities is related to works and other protected subject matter and may involve creation, productionand manufacturing, performance, broadcast communication and exhibition or distribution and sales.” In thisway the measurement of the economic contribution of partial CBIs has to consider the copyright factors.They weight the contribution to the economy in such a way that the proportion of the activity attributableto copyright is obtained. The copyright factors used in this study are the Mexican ones (Márquez-Mees etal., 2006). Although Peru and Mexico do not necessarily have the same economic development anddynamics, Mexican factors were the closest available factors. Mexico is a Latin American economy andfactors from developed countries would have introduced more bias to the estimates.
Contribution to Value AddedTotal value added for the partial copyright industries for the 1998-2005 period shows that, while there is variability in its contribution, it is in the range between US$ 12,000 and US$ 19,000.
The Economic C
ontribution ofC
opyright-Based Industries in P
eru
273
Figure 4.3.5. Economic Activities’ Imports Share, Interdependent Industries, 2005 (US$)
Source: SUNAD and PRODUCE.Prepared by the authors
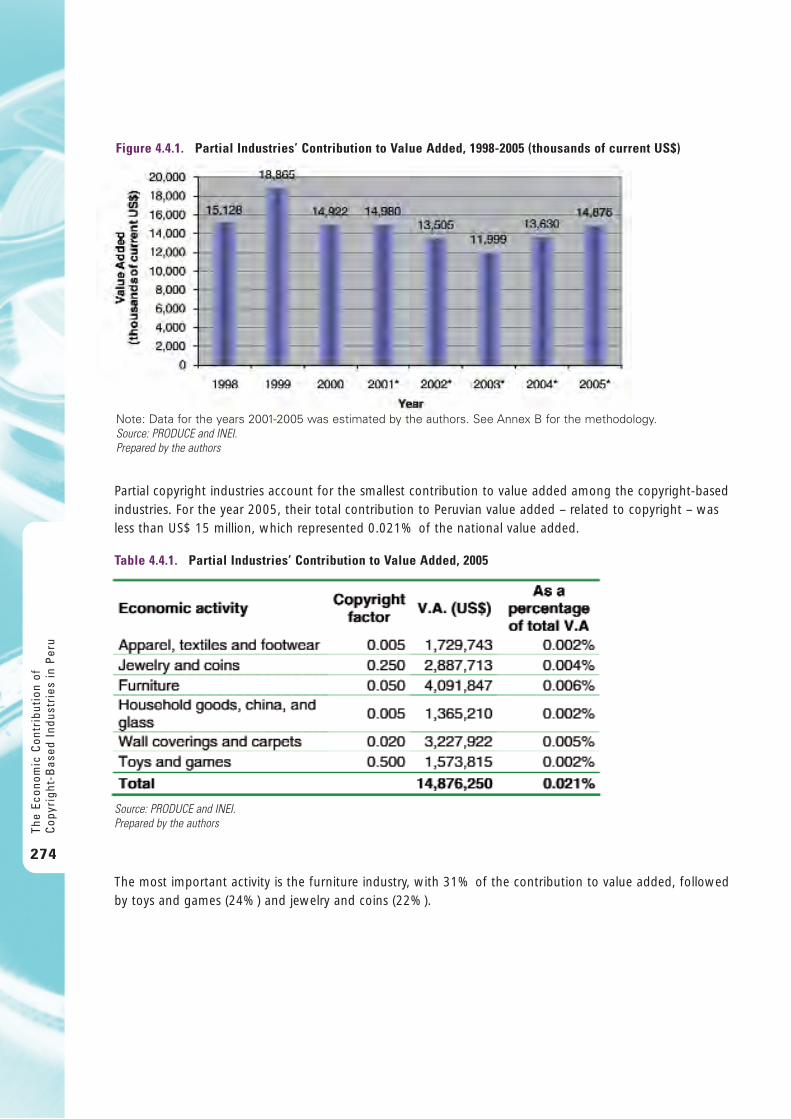
Partial copyright industries account for the smallest contribution to value added among the copyright-basedindustries. For the year 2005, their total contribution to Peruvian value added – related to copyright – wasless than US$ 15 million, which represented 0.021% of the national value added.
The most important activity is the furniture industry, with 31% of the contribution to value added, followedby toys and games (24%) and jewelry and coins (22%).
The
Econ
omic
Con
trib
utio
n of
Cop
yrig
ht-B
ased
Ind
ustr
ies
in P
eru
274
Figure 4.4.1. Partial Industries’ Contribution to Value Added, 1998-2005 (thousands of current US$)
Note: Data for the years 2001-2005 was estimated by the authors. See Annex B for the methodology.Source: PRODUCE and INEI.Prepared by the authors
Table 4.4.1. Partial Industries’ Contribution to Value Added, 2005
Source: PRODUCE and INEI. Prepared by the authors
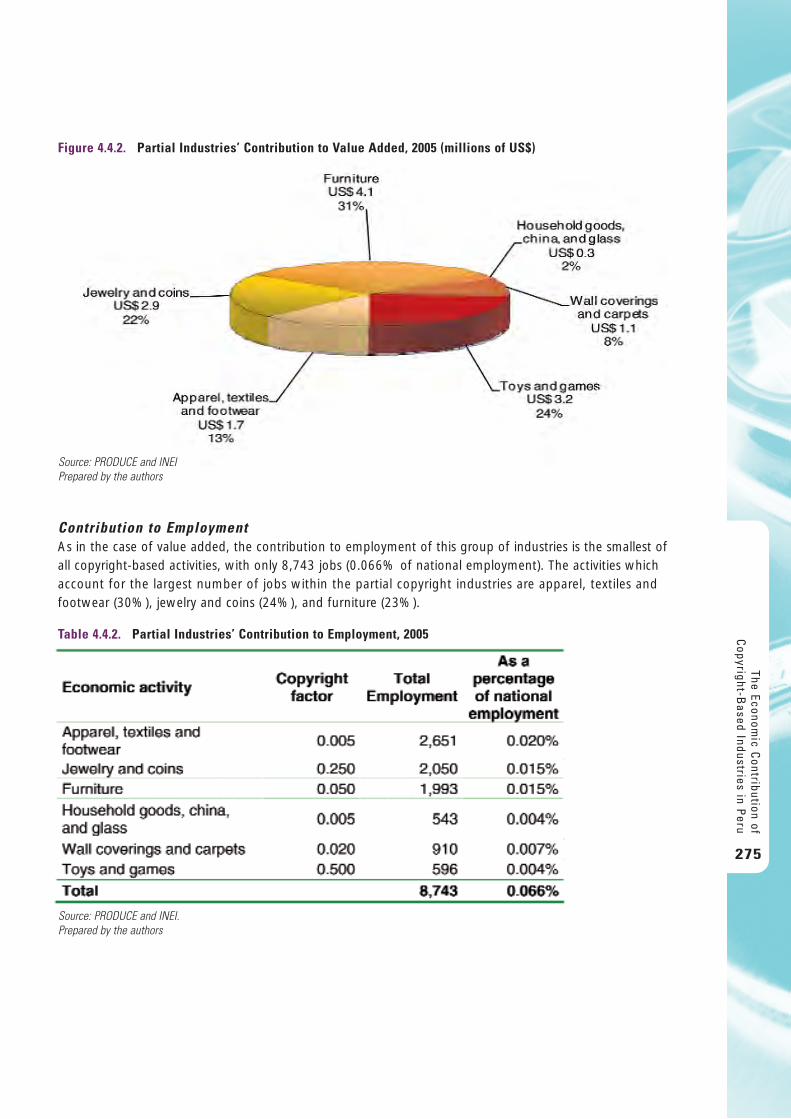
Contribution to EmploymentAs in the case of value added, the contribution to employment of this group of industries is the smallest ofall copyright-based activities, with only 8,743 jobs (0.066% of national employment). The activities whichaccount for the largest number of jobs within the partial copyright industries are apparel, textiles andfootwear (30%), jewelry and coins (24%), and furniture (23%).
The Economic C
ontribution ofC
opyright-Based Industries in P
eru
275
Figure 4.4.2. Partial Industries’ Contribution to Value Added, 2005 (millions of US$)
Source: PRODUCE and INEI Prepared by the authors
Table 4.4.2. Partial Industries’ Contribution to Employment, 2005
Source: PRODUCE and INEI. Prepared by the authors
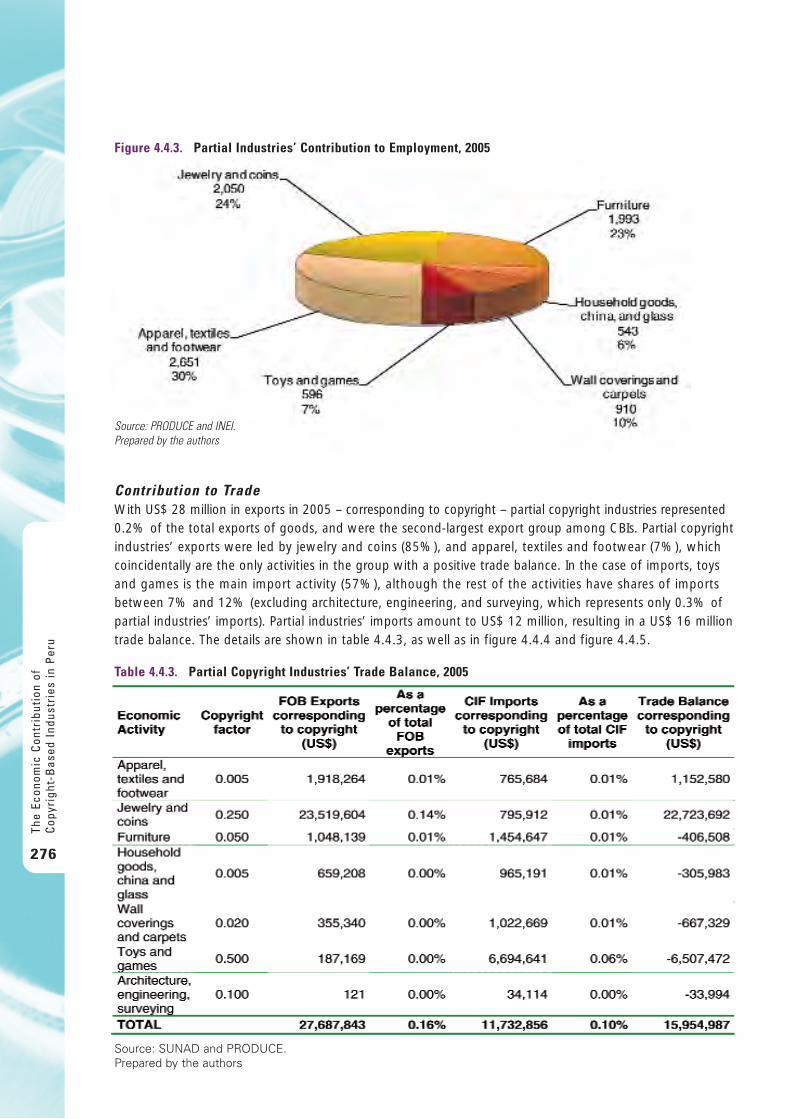
Contribution to TradeWith US$ 28 million in exports in 2005 – corresponding to copyright – partial copyright industries represented0.2% of the total exports of goods, and were the second-largest export group among CBIs. Partial copyrightindustries’ exports were led by jewelry and coins (85%), and apparel, textiles and footwear (7%), whichcoincidentally are the only activities in the group with a positive trade balance. In the case of imports, toysand games is the main import activity (57%), although the rest of the activities have shares of importsbetween 7% and 12% (excluding architecture, engineering, and surveying, which represents only 0.3% ofpartial industries’ imports). Partial industries’ imports amount to US$ 12 million, resulting in a US$ 16 milliontrade balance. The details are shown in table 4.4.3, as well as in figure 4.4.4 and figure 4.4.5.
The
Econ
omic
Con
trib
utio
n of
Cop
yrig
ht-B
ased
Ind
ustr
ies
in P
eru
276
Figure 4.4.3. Partial Industries’ Contribution to Employment, 2005
Source: PRODUCE and INEI. Prepared by the authors
Table 4.4.3. Partial Copyright Industries’ Trade Balance, 2005
Source: SUNAD and PRODUCE.Prepared by the authors
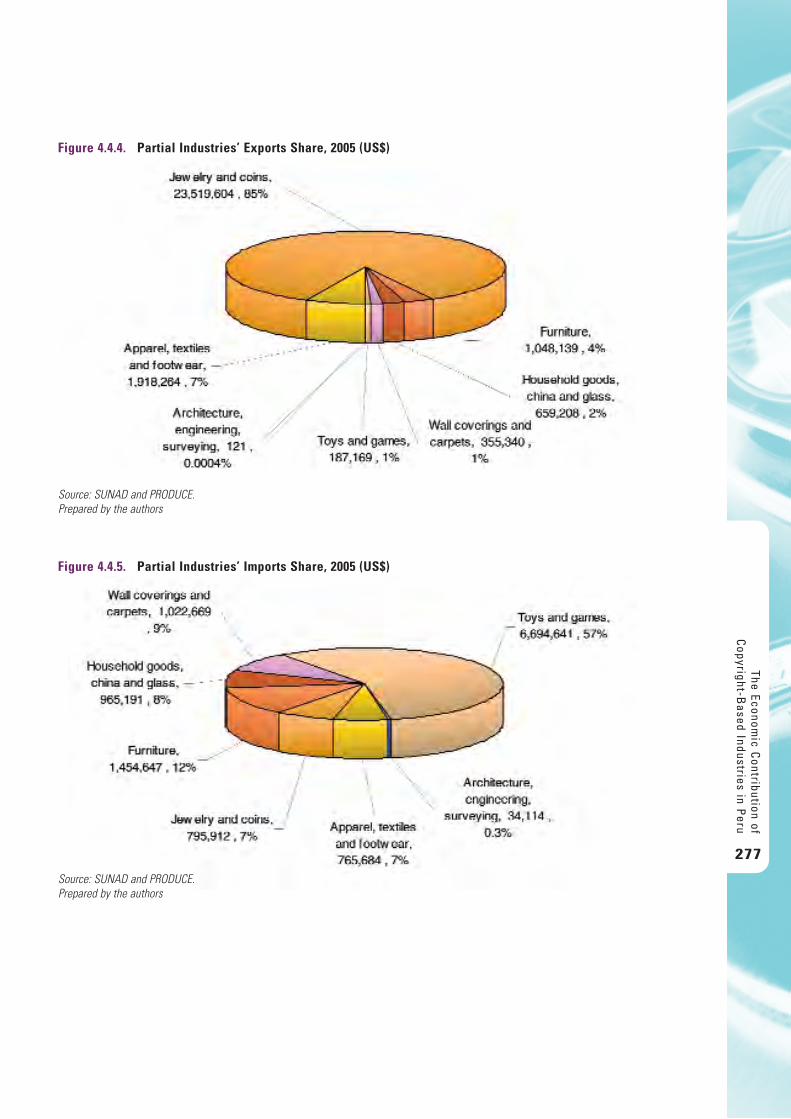
The Economic C
ontribution ofC
opyright-Based Industries in P
eru
277
Figure 4.4.4. Partial Industries’ Exports Share, 2005 (US$)
Source: SUNAD and PRODUCE.Prepared by the authors
Figure 4.4.5. Partial Industries’ Imports Share, 2005 (US$)
Source: SUNAD and PRODUCE.Prepared by the authors
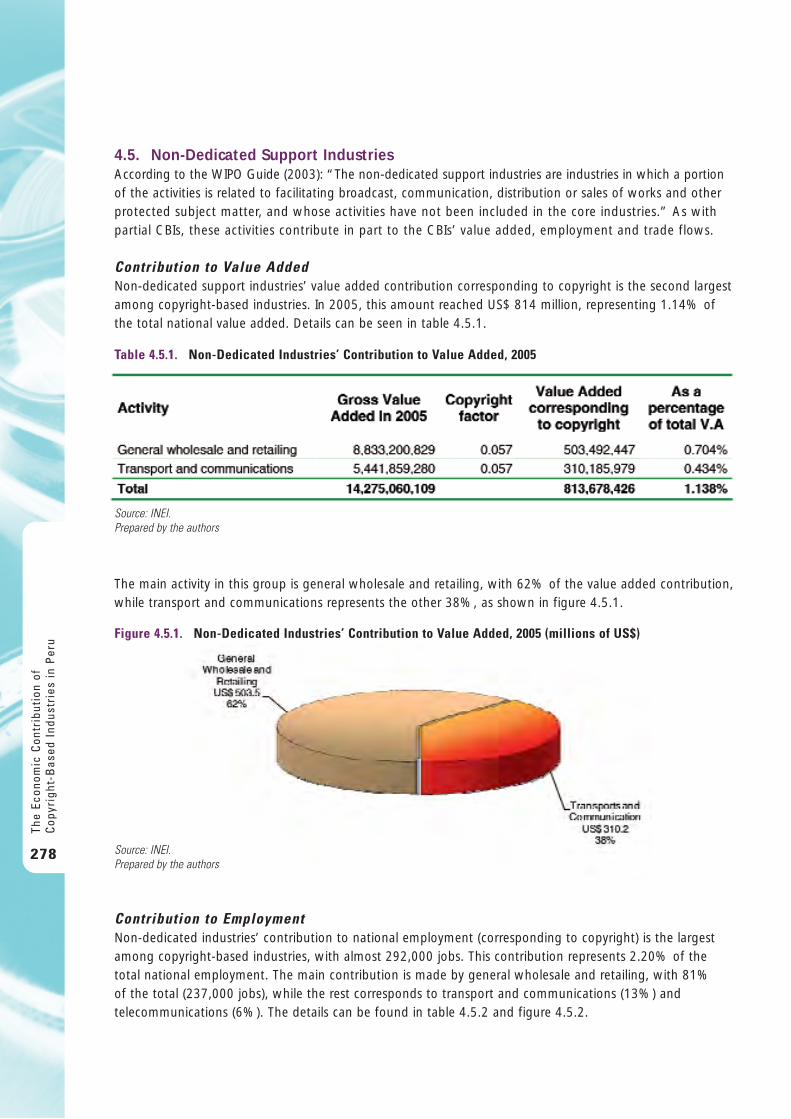
4.5. Non-Dedicated Support IndustriesAccording to the WIPO Guide (2003): “The non-dedicated support industries are industries in which a portionof the activities is related to facilitating broadcast, communication, distribution or sales of works and otherprotected subject matter, and whose activities have not been included in the core industries.” As withpartial CBIs, these activities contribute in part to the CBIs’ value added, employment and trade flows.
Contribution to Value AddedNon-dedicated support industries’ value added contribution corresponding to copyright is the second largestamong copyright-based industries. In 2005, this amount reached US$ 814 million, representing 1.14% ofthe total national value added. Details can be seen in table 4.5.1.
The main activity in this group is general wholesale and retailing, with 62% of the value added contribution,while transport and communications represents the other 38%, as shown in figure 4.5.1.
Contribution to EmploymentNon-dedicated industries’ contribution to national employment (corresponding to copyright) is the largestamong copyright-based industries, with almost 292,000 jobs. This contribution represents 2.20% of thetotal national employment. The main contribution is made by general wholesale and retailing, with 81% of the total (237,000 jobs), while the rest corresponds to transport and communications (13%) andtelecommunications (6%). The details can be found in table 4.5.2 and figure 4.5.2.
The
Econ
omic
Con
trib
utio
n of
Cop
yrig
ht-B
ased
Ind
ustr
ies
in P
eru
278
Table 4.5.1. Non-Dedicated Industries’ Contribution to Value Added, 2005
Source: INEI. Prepared by the authors
Figure 4.5.1. Non-Dedicated Industries’ Contribution to Value Added, 2005 (millions of US$)
Source: INEI. Prepared by the authors
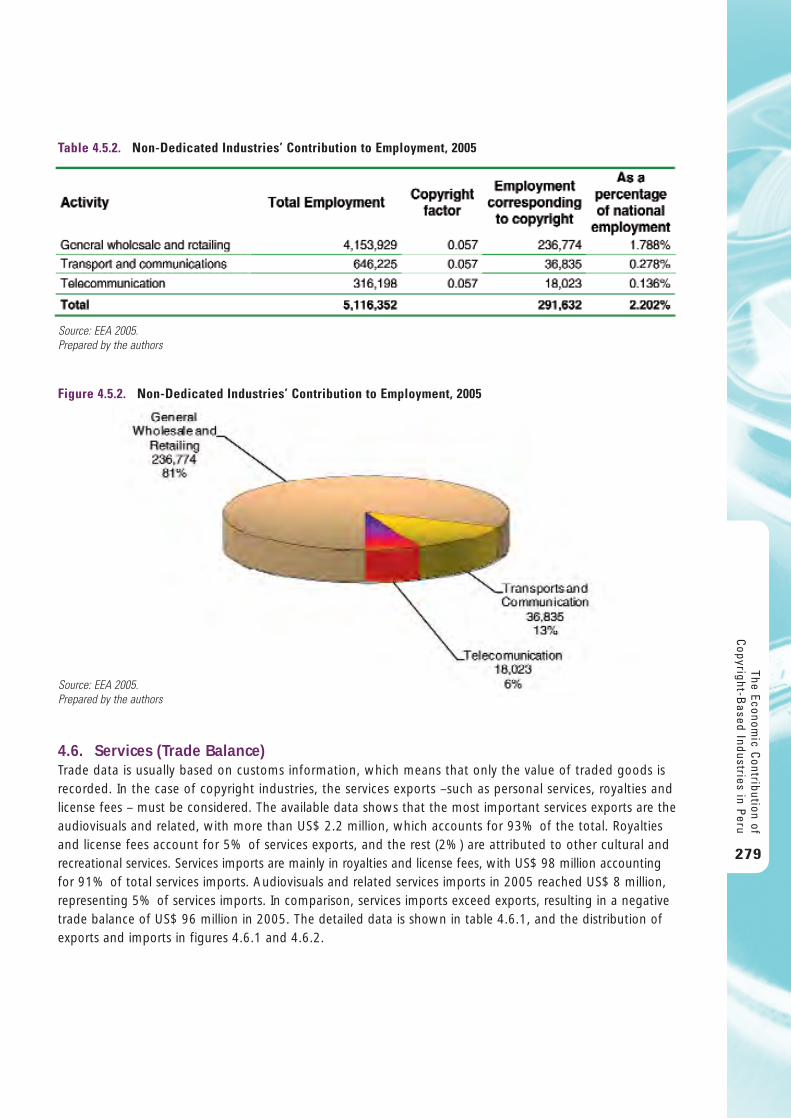
4.6. Services (Trade Balance)Trade data is usually based on customs information, which means that only the value of traded goods isrecorded. In the case of copyright industries, the services exports –such as personal services, royalties andlicense fees – must be considered. The available data shows that the most important services exports are theaudiovisuals and related, with more than US$ 2.2 million, which accounts for 93% of the total. Royaltiesand license fees account for 5% of services exports, and the rest (2%) are attributed to other cultural andrecreational services. Services imports are mainly in royalties and license fees, with US$ 98 million accountingfor 91% of total services imports. Audiovisuals and related services imports in 2005 reached US$ 8 million,representing 5% of services imports. In comparison, services imports exceed exports, resulting in a negativetrade balance of US$ 96 million in 2005. The detailed data is shown in table 4.6.1, and the distribution ofexports and imports in figures 4.6.1 and 4.6.2.
The Economic C
ontribution ofC
opyright-Based Industries in P
eru
279
Table 4.5.2. Non-Dedicated Industries’ Contribution to Employment, 2005
Source: EEA 2005.Prepared by the authors
Figure 4.5.2. Non-Dedicated Industries’ Contribution to Employment, 2005
Source: EEA 2005.Prepared by the authors
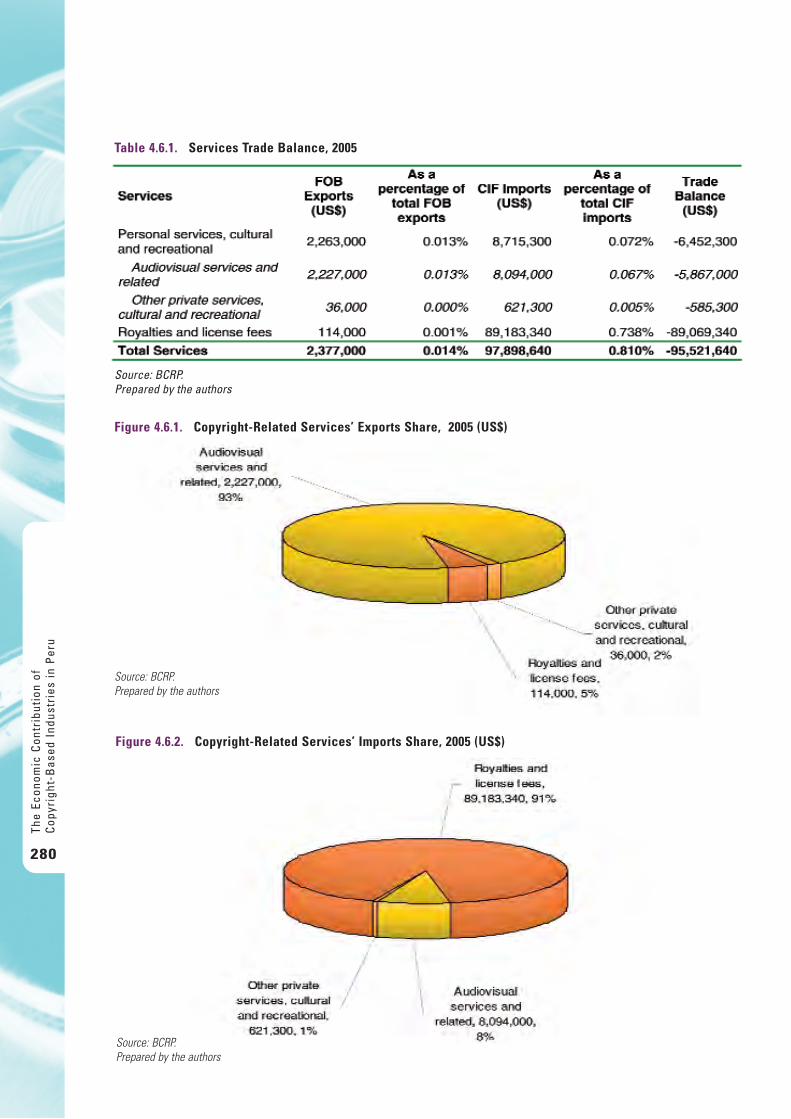
The
Econ
omic
Con
trib
utio
n of
Cop
yrig
ht-B
ased
Ind
ustr
ies
in P
eru
280
Table 4.6.1. Services Trade Balance, 2005
Source: BCRP.Prepared by the authors
Figure 4.6.1. Copyright-Related Services’ Exports Share, 2005 (US$)
Source: BCRP.Prepared by the authors
Figure 4.6.2. Copyright-Related Services’ Imports Share, 2005 (US$)
Source: BCRP.Prepared by the authors
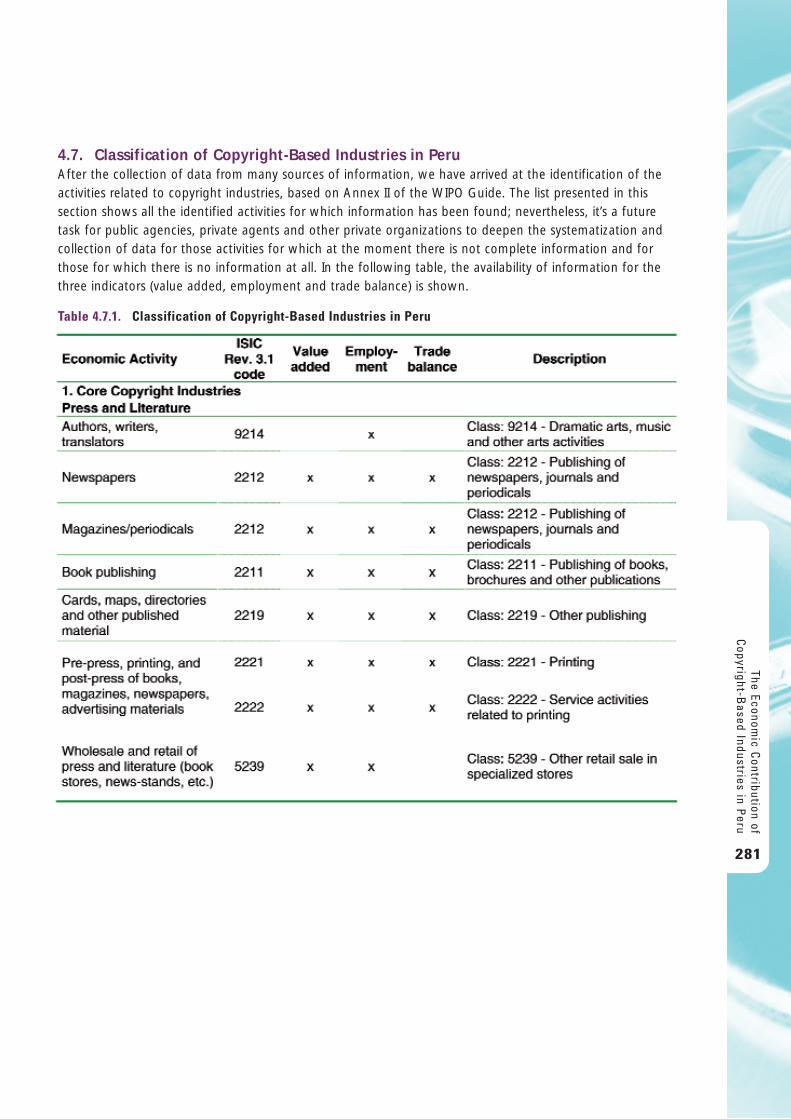
4.7. Classification of Copyright-Based Industries in PeruAfter the collection of data from many sources of information, we have arrived at the identification of theactivities related to copyright industries, based on Annex II of the WIPO Guide. The list presented in thissection shows all the identified activities for which information has been found; nevertheless, it’s a futuretask for public agencies, private agents and other private organizations to deepen the systematization andcollection of data for those activities for which at the moment there is not complete information and forthose for which there is no information at all. In the following table, the availability of information for thethree indicators (value added, employment and trade balance) is shown.
The Economic C
ontribution ofC
opyright-Based Industries in P
eru
281
Table 4.7.1. Classification of Copyright-Based Industries in Peru
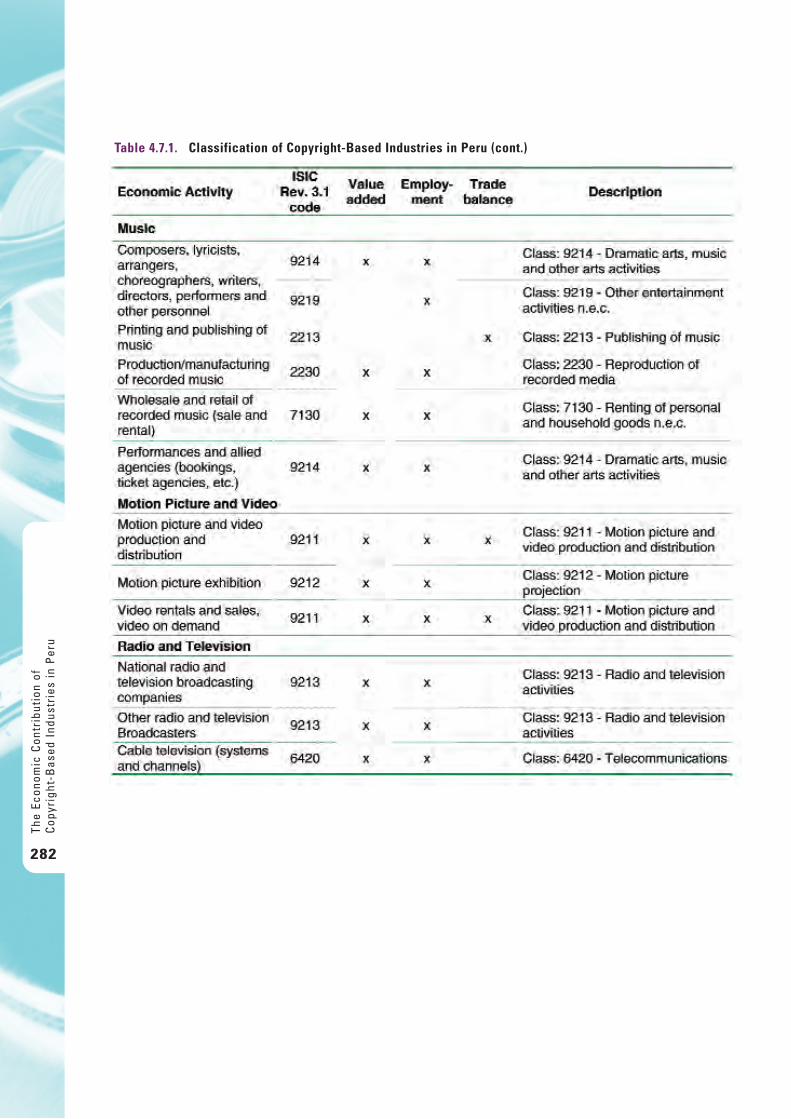
The
Econ
omic
Con
trib
utio
n of
Cop
yrig
ht-B
ased
Ind
ustr
ies
in P
eru
282
Table 4.7.1. Classification of Copyright-Based Industries in Peru (cont.)
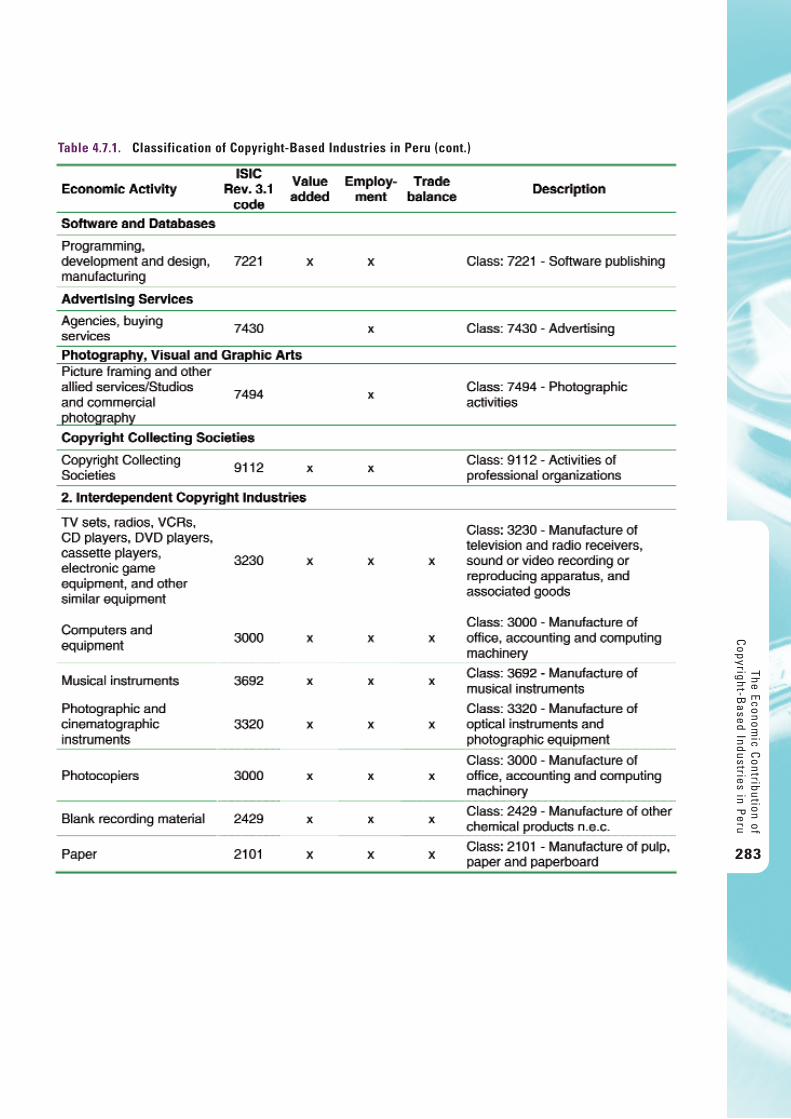
The Economic C
ontribution ofC
opyright-Based Industries in P
eru
283
Table 4.7.1. Classification of Copyright-Based Industries in Peru (cont.)
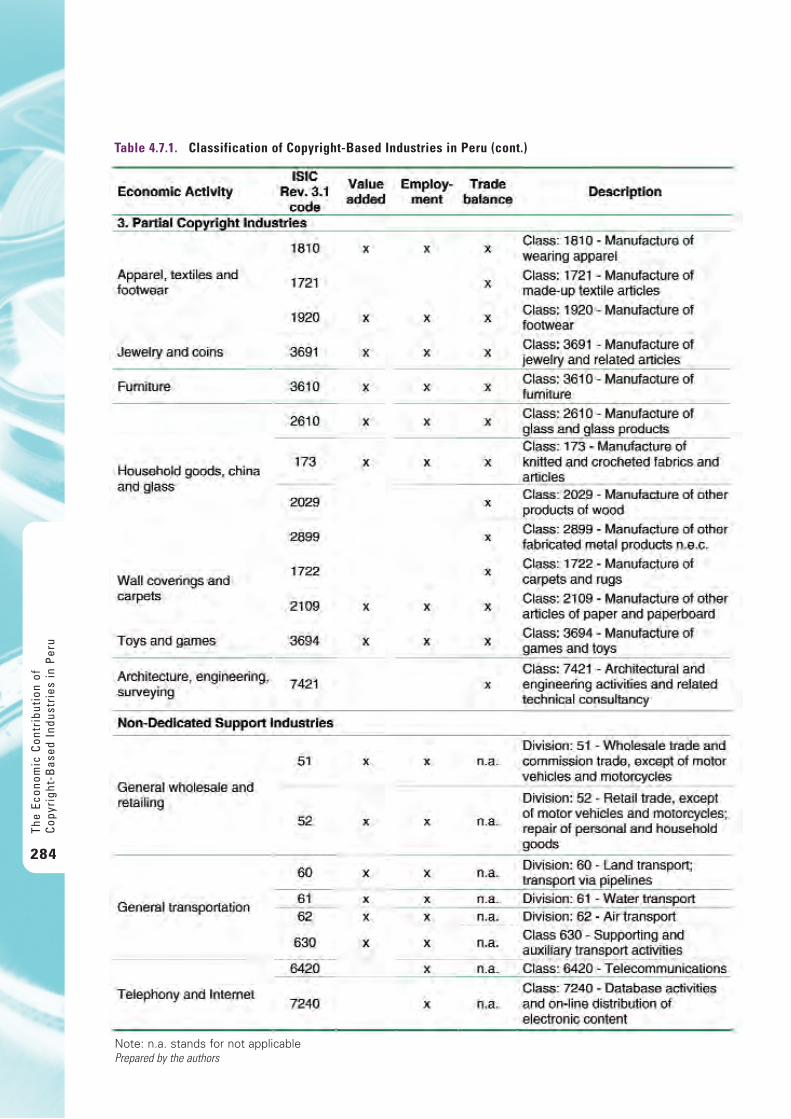
The
Econ
omic
Con
trib
utio
n of
Cop
yrig
ht-B
ased
Ind
ustr
ies
in P
eru
284
Table 4.7.1. Classification of Copyright-Based Industries in Peru (cont.)
Note: n.a. stands for not applicablePrepared by the authors
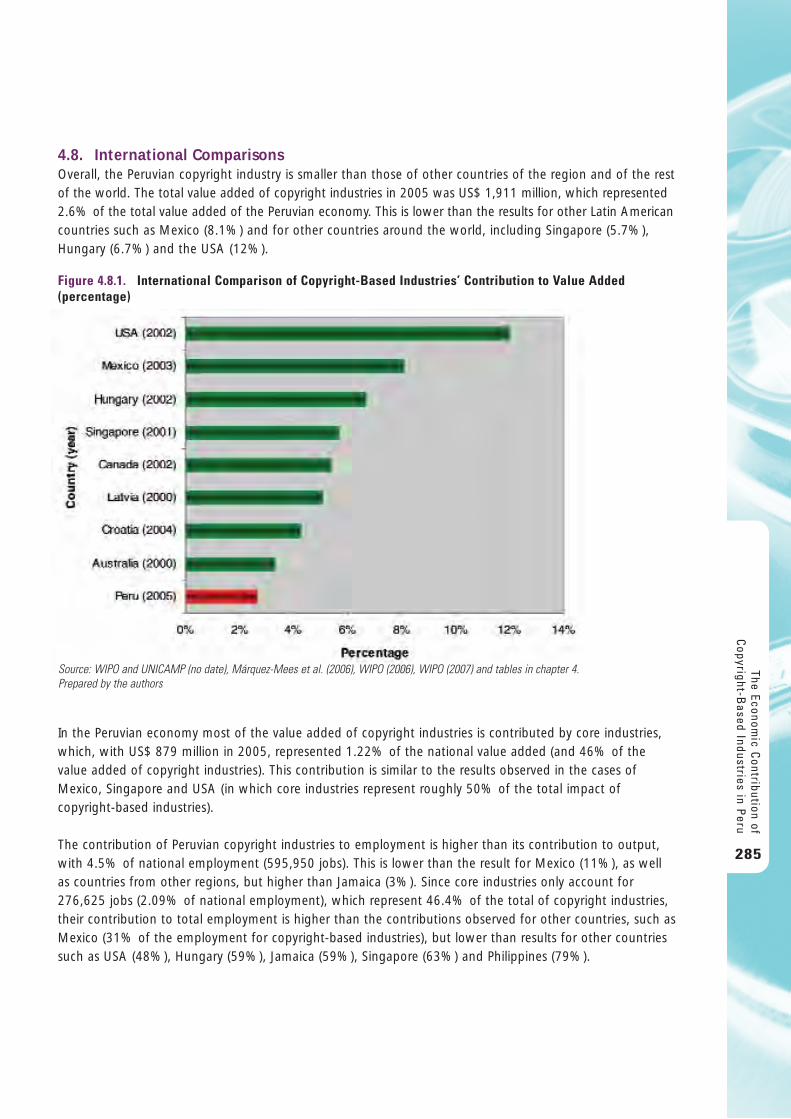
4.8. International ComparisonsOverall, the Peruvian copyright industry is smaller than those of other countries of the region and of the restof the world. The total value added of copyright industries in 2005 was US$ 1,911 million, which represented2.6% of the total value added of the Peruvian economy. This is lower than the results for other Latin Americancountries such as Mexico (8.1%) and for other countries around the world, including Singapore (5.7%),Hungary (6.7%) and the USA (12%).
In the Peruvian economy most of the value added of copyright industries is contributed by core industries,which, with US$ 879 million in 2005, represented 1.22% of the national value added (and 46% of thevalue added of copyright industries). This contribution is similar to the results observed in the cases ofMexico, Singapore and USA (in which core industries represent roughly 50% of the total impact ofcopyright-based industries).
The contribution of Peruvian copyright industries to employment is higher than its contribution to output,with 4.5% of national employment (595,950 jobs). This is lower than the result for Mexico (11%), as wellas countries from other regions, but higher than Jamaica (3%). Since core industries only account for276,625 jobs (2.09% of national employment), which represent 46.4% of the total of copyright industries,their contribution to total employment is higher than the contributions observed for other countries, such asMexico (31% of the employment for copyright-based industries), but lower than results for other countriessuch as USA (48%), Hungary (59%), Jamaica (59%), Singapore (63%) and Philippines (79%).
The Economic C
ontribution ofC
opyright-Based Industries in P
eru
285
Figure 4.8.1. International Comparison of Copyright-Based Industries’ Contribution to Value Added(percentage)
Source: WIPO and UNICAMP (no date), Márquez-Mees et al. (2006), WIPO (2006), WIPO (2007) and tables in chapter 4. Prepared by the authors
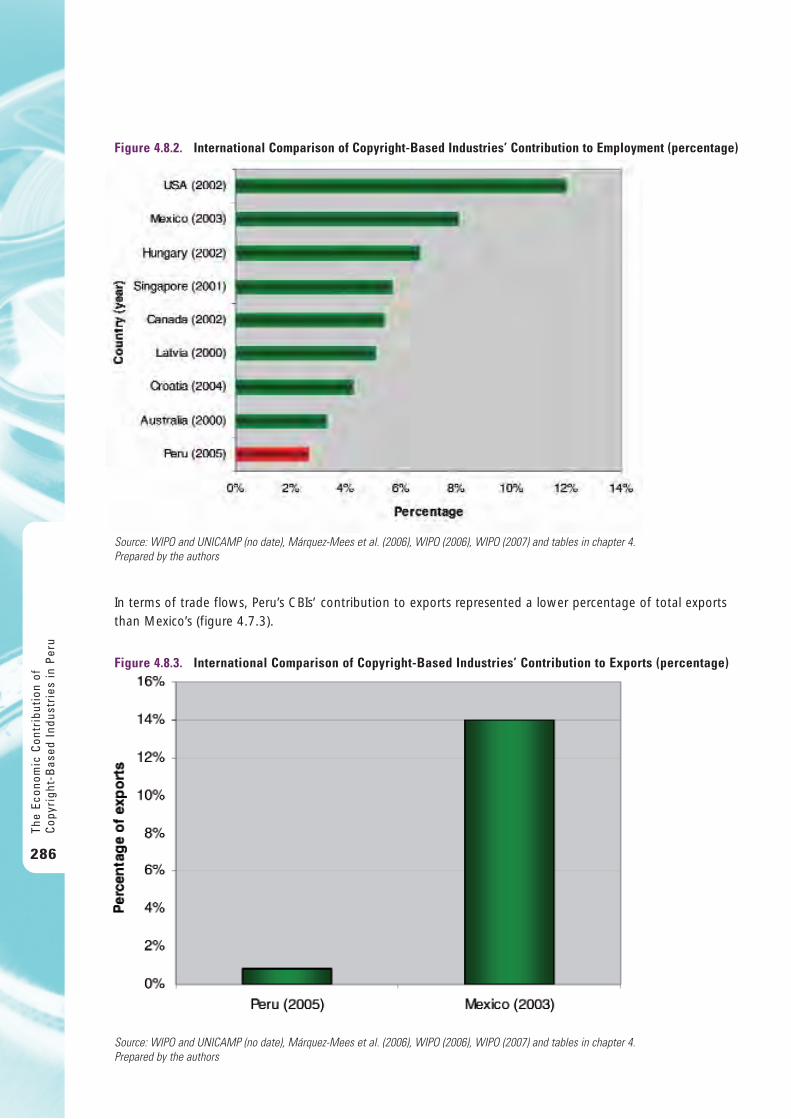
In terms of trade flows, Peru’s CBIs’ contribution to exports represented a lower percentage of total exportsthan Mexico’s (figure 4.7.3).
The
Econ
omic
Con
trib
utio
n of
Cop
yrig
ht-B
ased
Ind
ustr
ies
in P
eru
286
Figure 4.8.2. International Comparison of Copyright-Based Industries’ Contribution to Employment (percentage)
Source: WIPO and UNICAMP (no date), Márquez-Mees et al. (2006), WIPO (2006), WIPO (2007) and tables in chapter 4. Prepared by the authors
Figure 4.8.3. International Comparison of Copyright-Based Industries’ Contribution to Exports (percentage)
Source: WIPO and UNICAMP (no date), Márquez-Mees et al. (2006), WIPO (2006), WIPO (2007) and tables in chapter 4. Prepared by the authors
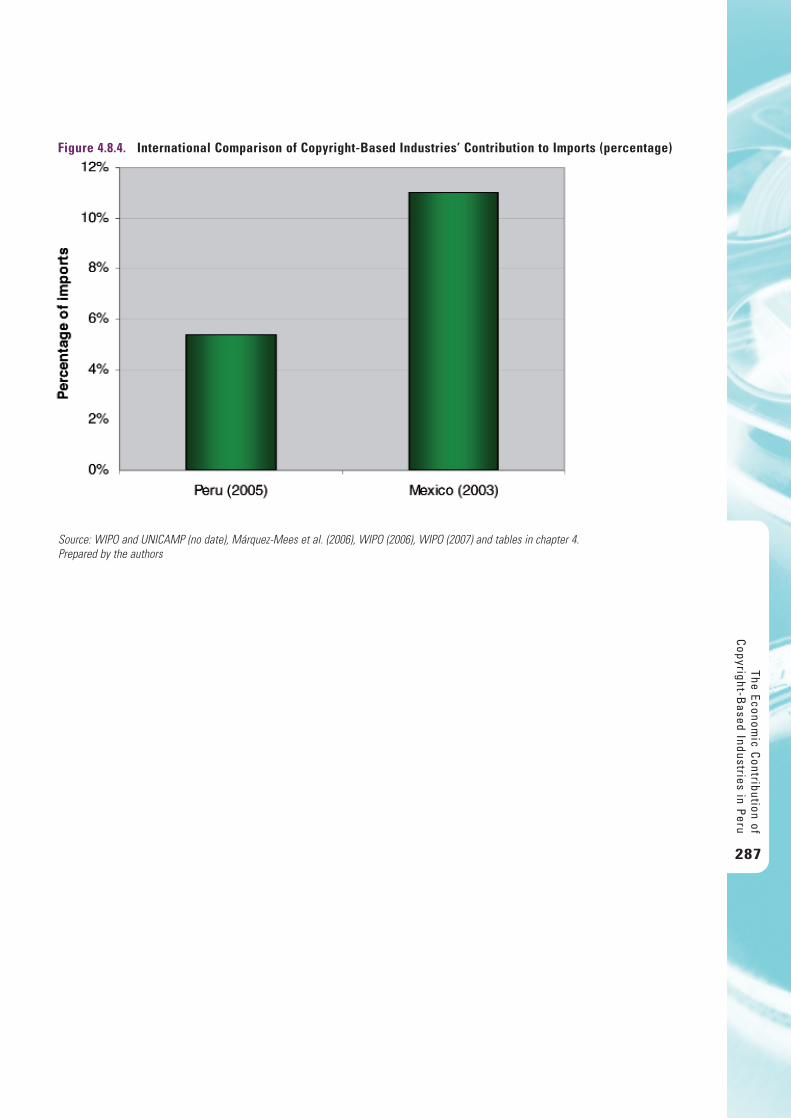
The Economic C
ontribution ofC
opyright-Based Industries in P
eru
287
Figure 4.8.4. International Comparison of Copyright-Based Industries’ Contribution to Imports (percentage)
Source: WIPO and UNICAMP (no date), Márquez-Mees et al. (2006), WIPO (2006), WIPO (2007) and tables in chapter 4. Prepared by the authors
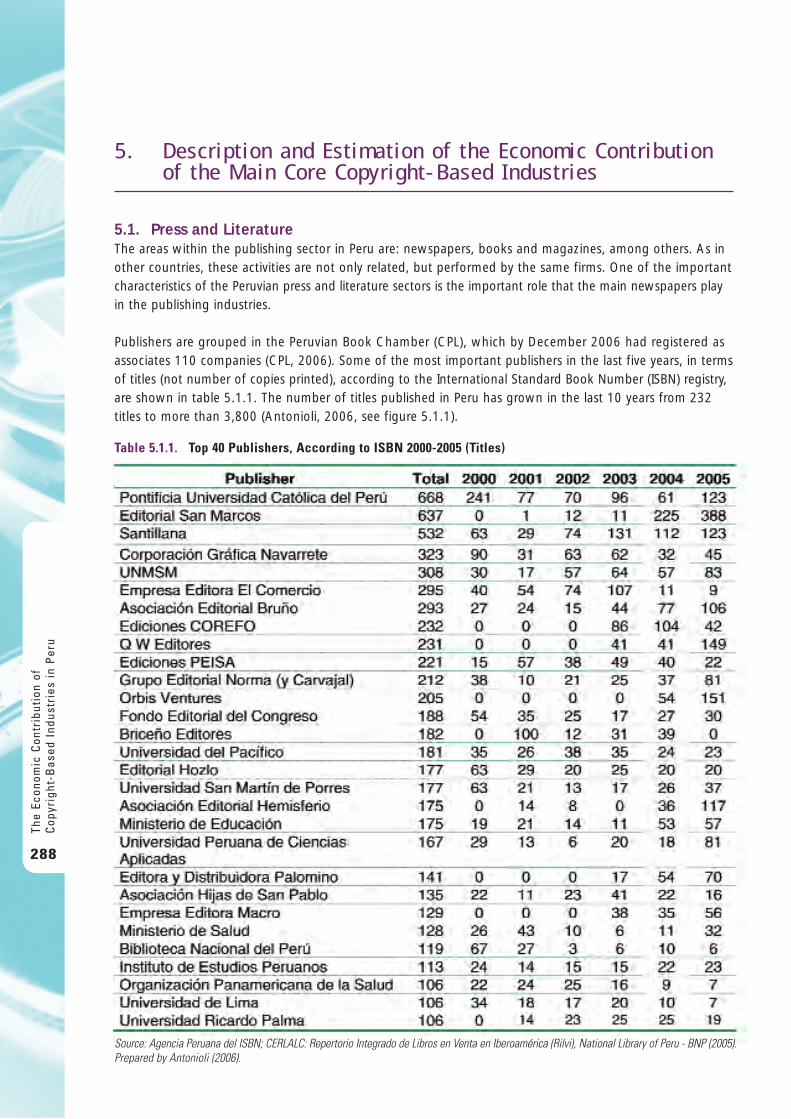
5 . D e s c r i p t i o n a n d E s t i m a t i o n o f t h e E c o n o m i c C o n t r i b u t i o no f t h e M a i n C o r e C o p y r i g h t - B a s e d I n d u s t r i e s
5.1. Press and LiteratureThe areas within the publishing sector in Peru are: newspapers, books and magazines, among others. As inother countries, these activities are not only related, but performed by the same firms. One of the importantcharacteristics of the Peruvian press and literature sectors is the important role that the main newspapers playin the publishing industries.
Publishers are grouped in the Peruvian Book Chamber (CPL), which by December 2006 had registered asassociates 110 companies (CPL, 2006). Some of the most important publishers in the last five years, in termsof titles (not number of copies printed), according to the International Standard Book Number (ISBN) registry,are shown in table 5.1.1. The number of titles published in Peru has grown in the last 10 years from 232titles to more than 3,800 (Antonioli, 2006, see figure 5.1.1).
The
Econ
omic
Con
trib
utio
n of
Cop
yrig
ht-B
ased
Ind
ustr
ies
in P
eru
288
Table 5.1.1. Top 40 Publishers, According to ISBN 2000-2005 (Titles)
Source: Agencia Peruana del ISBN; CERLALC: Repertorio Integrado de Libros en Venta en Iberoamérica (Rilvi), National Library of Peru - BNP (2005).Prepared by Antonioli (2006).
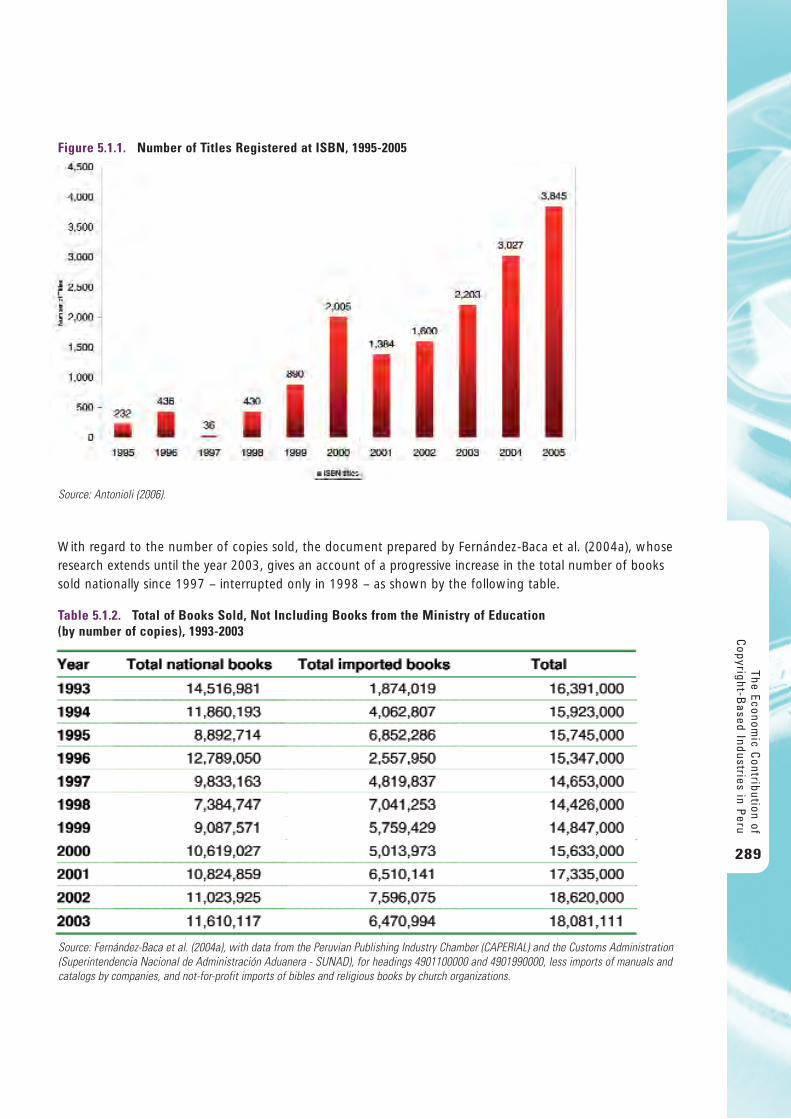
With regard to the number of copies sold, the document prepared by Fernández-Baca et al. (2004a), whoseresearch extends until the year 2003, gives an account of a progressive increase in the total number of bookssold nationally since 1997 – interrupted only in 1998 – as shown by the following table.
The Economic C
ontribution ofC
opyright-Based Industries in P
eru
289
Figure 5.1.1. Number of Titles Registered at ISBN, 1995-2005
Source: Antonioli (2006).
Table 5.1.2. Total of Books Sold, Not Including Books from the Ministry of Education(by number of copies), 1993-2003
Source: Fernández-Baca et al. (2004a), with data from the Peruvian Publishing Industry Chamber (CAPERlAL) and the Customs Administration(Superintendencia Nacional de Administración Aduanera - SUNAD), for headings 4901100000 and 4901990000, less imports of manuals andcatalogs by companies, and not-for-profit imports of bibles and religious books by church organizations.
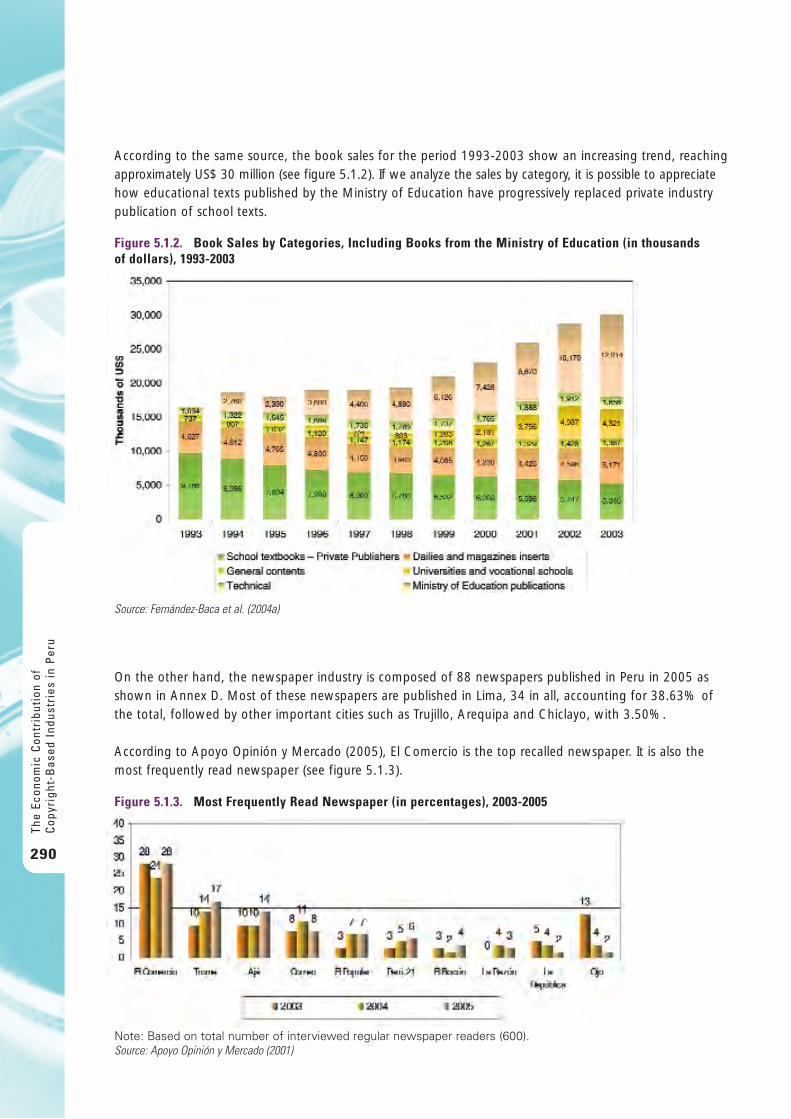
According to the same source, the book sales for the period 1993-2003 show an increasing trend, reachingapproximately US$ 30 million (see figure 5.1.2). If we analyze the sales by category, it is possible to appreciatehow educational texts published by the Ministry of Education have progressively replaced private industrypublication of school texts.
On the other hand, the newspaper industry is composed of 88 newspapers published in Peru in 2005 asshown in Annex D. Most of these newspapers are published in Lima, 34 in all, accounting for 38.63% ofthe total, followed by other important cities such as Trujillo, Arequipa and Chiclayo, with 3.50%.
According to Apoyo Opinión y Mercado (2005), El Comercio is the top recalled newspaper. It is also themost frequently read newspaper (see figure 5.1.3).
The
Econ
omic
Con
trib
utio
n of
Cop
yrig
ht-B
ased
Ind
ustr
ies
in P
eru
290
Figure 5.1.2. Book Sales by Categories, Including Books from the Ministry of Education (in thousands of dollars), 1993-2003
Source: Fernández-Baca et al. (2004a)
Figure 5.1.3. Most Frequently Read Newspaper (in percentages), 2003-2005
Note: Based on total number of interviewed regular newspaper readers (600).Source: Apoyo Opinión y Mercado (2001)
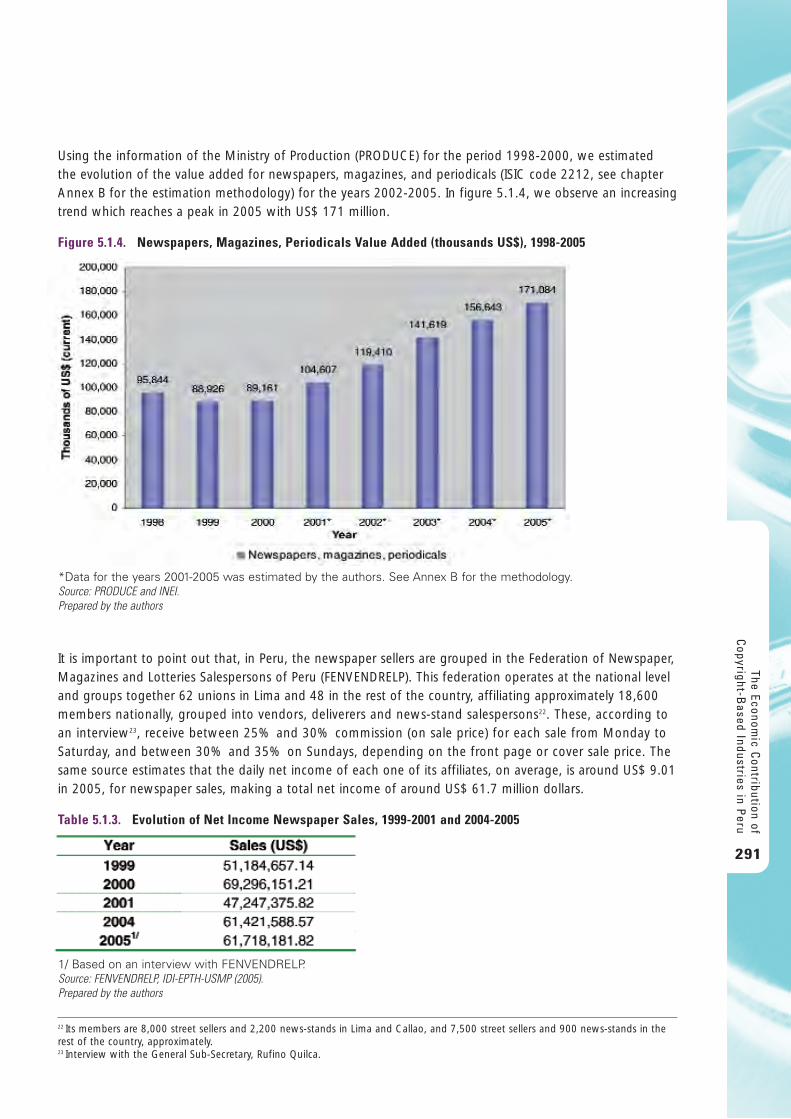
Using the information of the Ministry of Production (PRODUCE) for the period 1998-2000, we estimated the evolution of the value added for newspapers, magazines, and periodicals (ISIC code 2212, see chapterAnnex B for the estimation methodology) for the years 2002-2005. In figure 5.1.4, we observe an increasingtrend which reaches a peak in 2005 with US$ 171 million.
It is important to point out that, in Peru, the newspaper sellers are grouped in the Federation of Newspaper,Magazines and Lotteries Salespersons of Peru (FENVENDRELP). This federation operates at the national leveland groups together 62 unions in Lima and 48 in the rest of the country, affiliating approximately 18,600members nationally, grouped into vendors, deliverers and news-stand salespersons22. These, according to an interview23, receive between 25% and 30% commission (on sale price) for each sale from Monday toSaturday, and between 30% and 35% on Sundays, depending on the front page or cover sale price. Thesame source estimates that the daily net income of each one of its affiliates, on average, is around US$ 9.01in 2005, for newspaper sales, making a total net income of around US$ 61.7 million dollars.
The Economic C
ontribution ofC
opyright-Based Industries in P
eru
291
Figure 5.1.4. Newspapers, Magazines, Periodicals Value Added (thousands US$), 1998-2005
*Data for the years 2001-2005 was estimated by the authors. See Annex B for the methodology.Source: PRODUCE and INEI.Prepared by the authors
Table 5.1.3. Evolution of Net Income Newspaper Sales, 1999-2001 and 2004-2005
1/ Based on an interview with FENVENDRELP.Source: FENVENDRELP, IDI-EPTH-USMP (2005).Prepared by the authors
22 Its members are 8,000 street sellers and 2,200 news-stands in Lima and Callao, and 7,500 street sellers and 900 news-stands in therest of the country, approximately. 23 Interview with the General Sub-Secretary, Rufino Quilca.
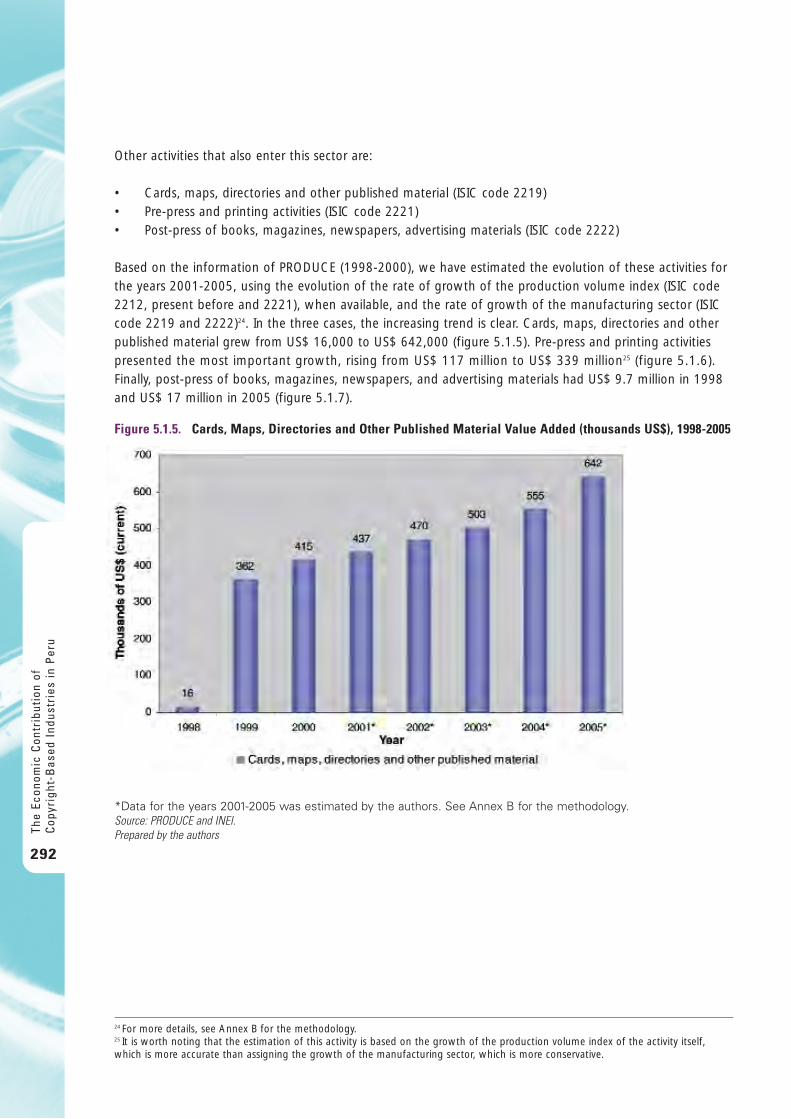
Other activities that also enter this sector are:
• Cards, maps, directories and other published material (ISIC code 2219)• Pre-press and printing activities (ISIC code 2221)• Post-press of books, magazines, newspapers, advertising materials (ISIC code 2222)
Based on the information of PRODUCE (1998-2000), we have estimated the evolution of these activities forthe years 2001-2005, using the evolution of the rate of growth of the production volume index (ISIC code2212, present before and 2221), when available, and the rate of growth of the manufacturing sector (ISICcode 2219 and 2222)24. In the three cases, the increasing trend is clear. Cards, maps, directories and otherpublished material grew from US$ 16,000 to US$ 642,000 (figure 5.1.5). Pre-press and printing activitiespresented the most important growth, rising from US$ 117 million to US$ 339 million25 (figure 5.1.6).Finally, post-press of books, magazines, newspapers, and advertising materials had US$ 9.7 million in 1998and US$ 17 million in 2005 (figure 5.1.7).
The
Econ
omic
Con
trib
utio
n of
Cop
yrig
ht-B
ased
Ind
ustr
ies
in P
eru
292
24 For more details, see Annex B for the methodology.25 It is worth noting that the estimation of this activity is based on the growth of the production volume index of the activity itself,which is more accurate than assigning the growth of the manufacturing sector, which is more conservative.
Figure 5.1.5. Cards, Maps, Directories and Other Published Material Value Added (thousands US$), 1998-2005
*Data for the years 2001-2005 was estimated by the authors. See Annex B for the methodology.Source: PRODUCE and INEI.Prepared by the authors
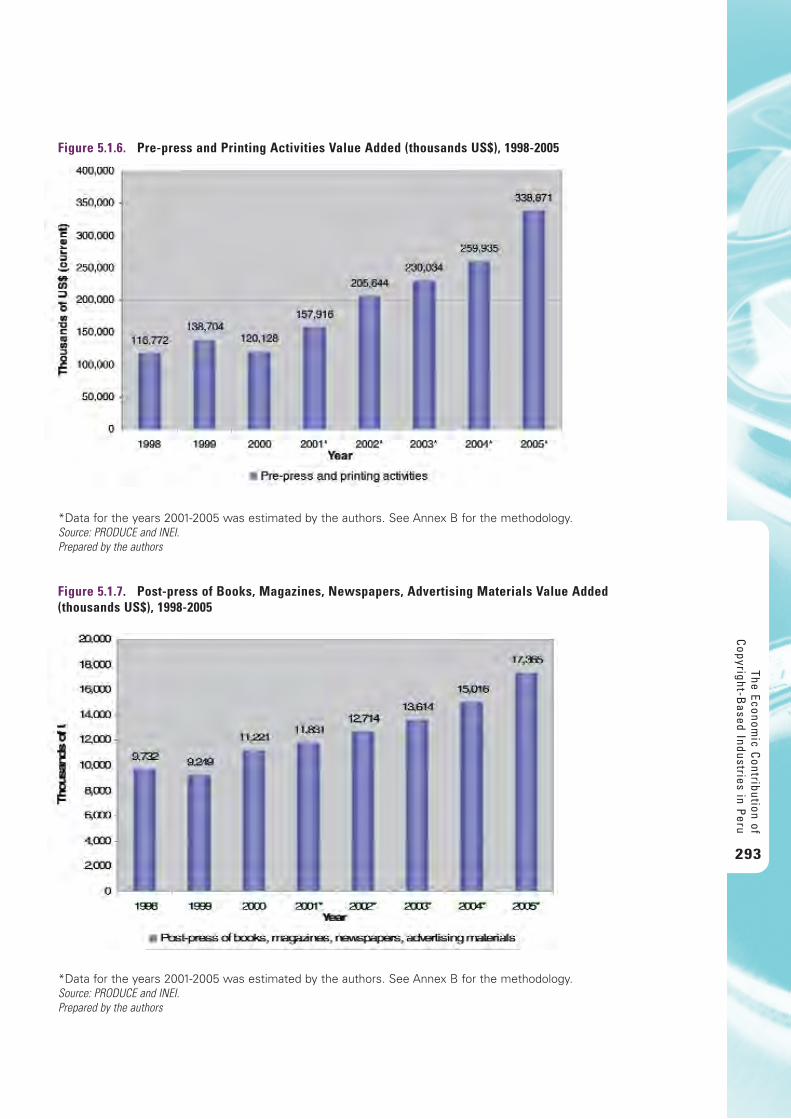
The Economic C
ontribution ofC
opyright-Based Industries in P
eru
293
Figure 5.1.6. Pre-press and Printing Activities Value Added (thousands US$), 1998-2005
*Data for the years 2001-2005 was estimated by the authors. See Annex B for the methodology.Source: PRODUCE and INEI.Prepared by the authors
Figure 5.1.7. Post-press of Books, Magazines, Newspapers, Advertising Materials Value Added (thousands US$), 1998-2005
*Data for the years 2001-2005 was estimated by the authors. See Annex B for the methodology.Source: PRODUCE and INEI.Prepared by the authors
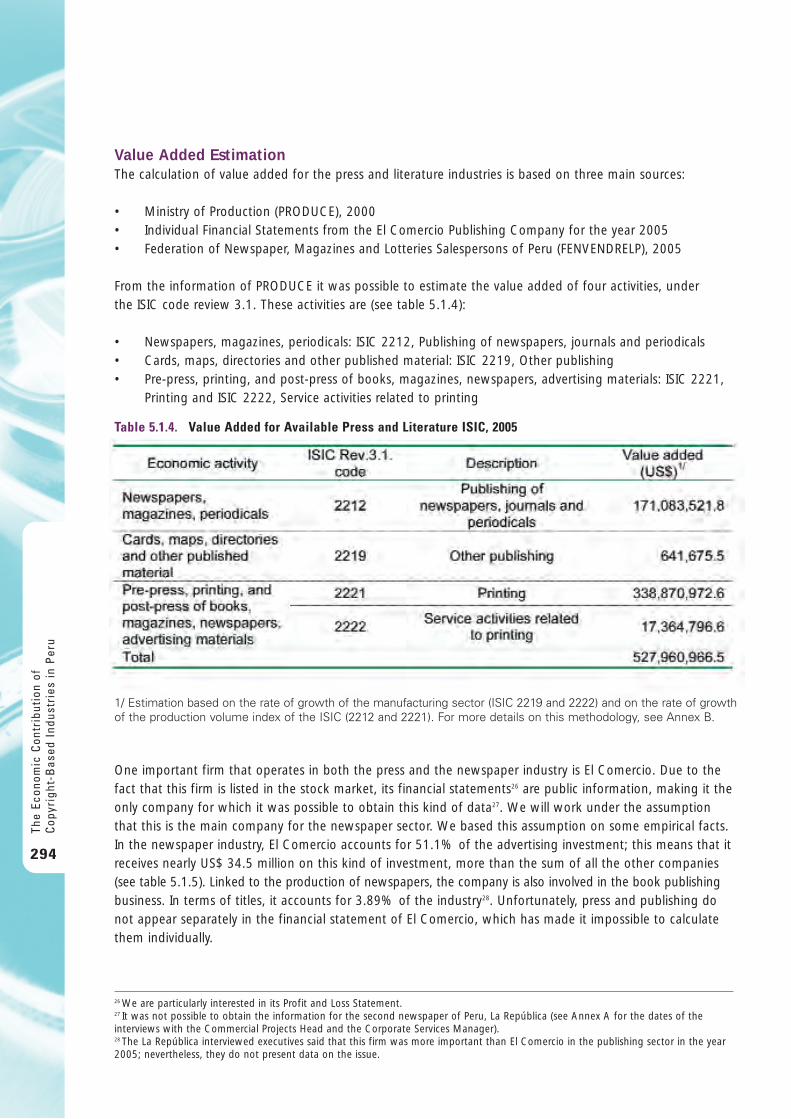
Value Added EstimationThe calculation of value added for the press and literature industries is based on three main sources:
• Ministry of Production (PRODUCE), 2000• Individual Financial Statements from the El Comercio Publishing Company for the year 2005• Federation of Newspaper, Magazines and Lotteries Salespersons of Peru (FENVENDRELP), 2005
From the information of PRODUCE it was possible to estimate the value added of four activities, under the ISIC code review 3.1. These activities are (see table 5.1.4):
• Newspapers, magazines, periodicals: ISIC 2212, Publishing of newspapers, journals and periodicals• Cards, maps, directories and other published material: ISIC 2219, Other publishing• Pre-press, printing, and post-press of books, magazines, newspapers, advertising materials: ISIC 2221,
Printing and ISIC 2222, Service activities related to printing
One important firm that operates in both the press and the newspaper industry is El Comercio. Due to thefact that this firm is listed in the stock market, its financial statements26 are public information, making it theonly company for which it was possible to obtain this kind of data27. We will work under the assumptionthat this is the main company for the newspaper sector. We based this assumption on some empirical facts.In the newspaper industry, El Comercio accounts for 51.1% of the advertising investment; this means that itreceives nearly US$ 34.5 million on this kind of investment, more than the sum of all the other companies(see table 5.1.5). Linked to the production of newspapers, the company is also involved in the book publishingbusiness. In terms of titles, it accounts for 3.89% of the industry28. Unfortunately, press and publishing donot appear separately in the financial statement of El Comercio, which has made it impossible to calculatethem individually.
The
Econ
omic
Con
trib
utio
n of
Cop
yrig
ht-B
ased
Ind
ustr
ies
in P
eru
294
Table 5.1.4. Value Added for Available Press and Literature ISIC, 2005
1/ Estimation based on the rate of growth of the manufacturing sector (ISIC 2219 and 2222) and on the rate of growthof the production volume index of the ISIC (2212 and 2221). For more details on this methodology, see Annex B.
26 We are particularly interested in its Profit and Loss Statement.27 It was not possible to obtain the information for the second newspaper of Peru, La República (see Annex A for the dates of theinterviews with the Commercial Projects Head and the Corporate Services Manager). 28 The La República interviewed executives said that this firm was more important than El Comercio in the publishing sector in the year2005; nevertheless, they do not present data on the issue.
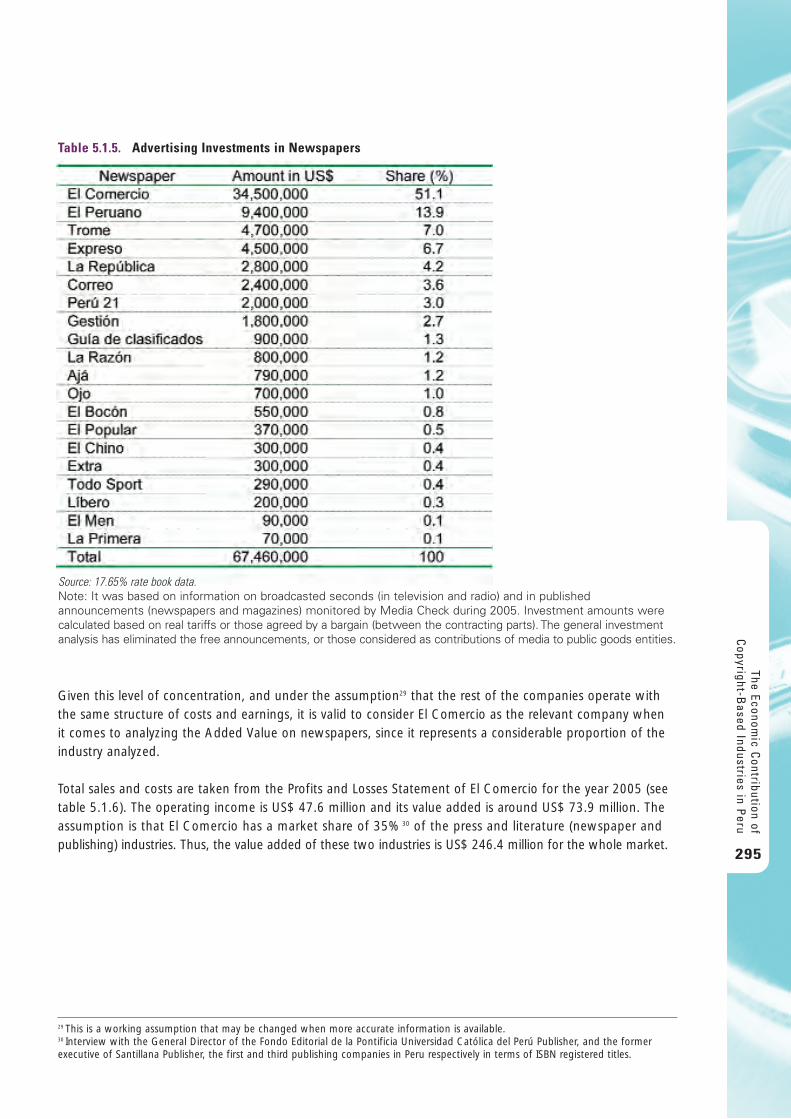
Given this level of concentration, and under the assumption29 that the rest of the companies operate withthe same structure of costs and earnings, it is valid to consider El Comercio as the relevant company when it comes to analyzing the Added Value on newspapers, since it represents a considerable proportion of theindustry analyzed.
Total sales and costs are taken from the Profits and Losses Statement of El Comercio for the year 2005 (seetable 5.1.6). The operating income is US$ 47.6 million and its value added is around US$ 73.9 million. Theassumption is that El Comercio has a market share of 35%30 of the press and literature (newspaper andpublishing) industries. Thus, the value added of these two industries is US$ 246.4 million for the whole market.
The Economic C
ontribution ofC
opyright-Based Industries in P
eru
295
Table 5.1.5. Advertising Investments in Newspapers
Source: 17.65% rate book data. Note: It was based on information on broadcasted seconds (in television and radio) and in publishedannouncements (newspapers and magazines) monitored by Media Check during 2005. Investment amounts werecalculated based on real tariffs or those agreed by a bargain (between the contracting parts). The general investmentanalysis has eliminated the free announcements, or those considered as contributions of media to public goods entities.
29 This is a working assumption that may be changed when more accurate information is available.30 Interview with the General Director of the Fondo Editorial de la Pontificia Universidad Católica del Perú Publisher, and the formerexecutive of Santillana Publisher, the first and third publishing companies in Peru respectively in terms of ISBN registered titles.
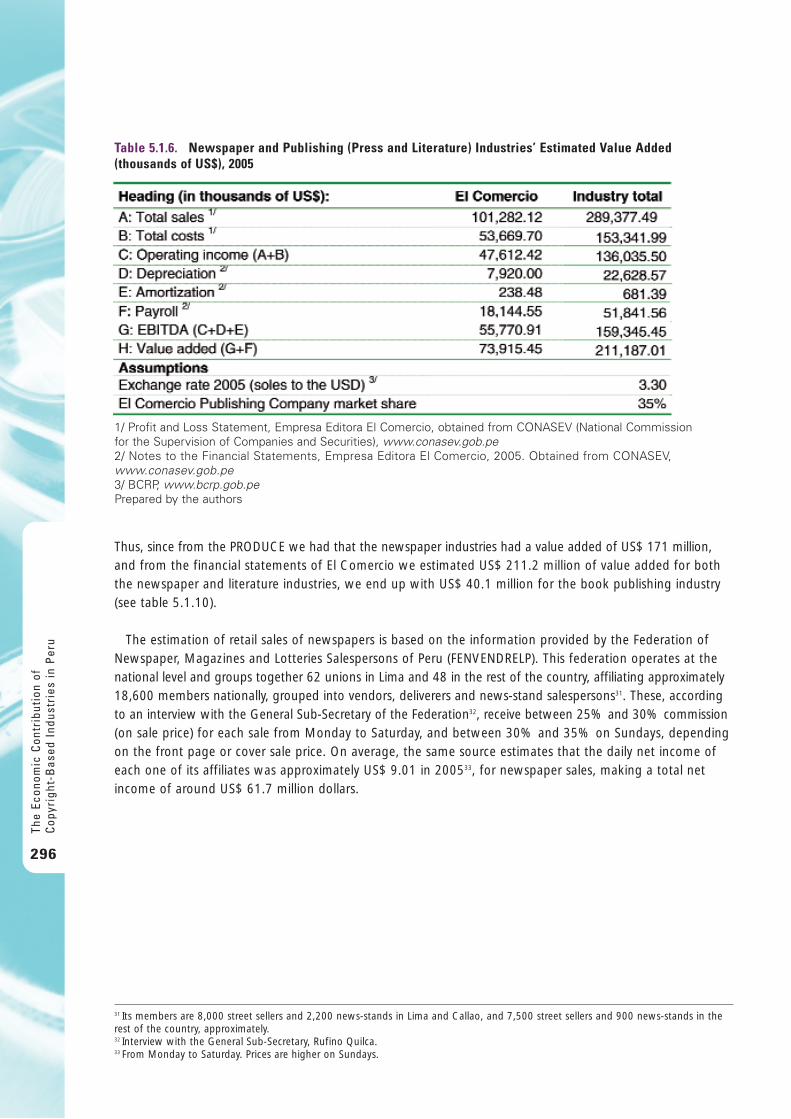
Thus, since from the PRODUCE we had that the newspaper industries had a value added of US$ 171 million,and from the financial statements of El Comercio we estimated US$ 211.2 million of value added for boththe newspaper and literature industries, we end up with US$ 40.1 million for the book publishing industry(see table 5.1.10).
The estimation of retail sales of newspapers is based on the information provided by the Federation ofNewspaper, Magazines and Lotteries Salespersons of Peru (FENVENDRELP). This federation operates at thenational level and groups together 62 unions in Lima and 48 in the rest of the country, affiliating approximately18,600 members nationally, grouped into vendors, deliverers and news-stand salespersons31. These, accordingto an interview with the General Sub-Secretary of the Federation32, receive between 25% and 30% commission(on sale price) for each sale from Monday to Saturday, and between 30% and 35% on Sundays, dependingon the front page or cover sale price. On average, the same source estimates that the daily net income ofeach one of its affiliates was approximately US$ 9.01 in 200533, for newspaper sales, making a total netincome of around US$ 61.7 million dollars.
The
Econ
omic
Con
trib
utio
n of
Cop
yrig
ht-B
ased
Ind
ustr
ies
in P
eru
296
Table 5.1.6. Newspaper and Publishing (Press and Literature) Industries’ Estimated Value Added (thousands of US$), 2005
1/ Profit and Loss Statement, Empresa Editora El Comercio, obtained from CONASEV (National Commission for the Supervision of Companies and Securities), www.conasev.gob.pe2/ Notes to the Financial Statements, Empresa Editora El Comercio, 2005. Obtained from CONASEV,www.conasev.gob.pe3/ BCRP, www.bcrp.gob.pe Prepared by the authors
31 Its members are 8,000 street sellers and 2,200 news-stands in Lima and Callao, and 7,500 street sellers and 900 news-stands in therest of the country, approximately. 32 Interview with the General Sub-Secretary, Rufino Quilca. 33 From Monday to Saturday. Prices are higher on Sundays.
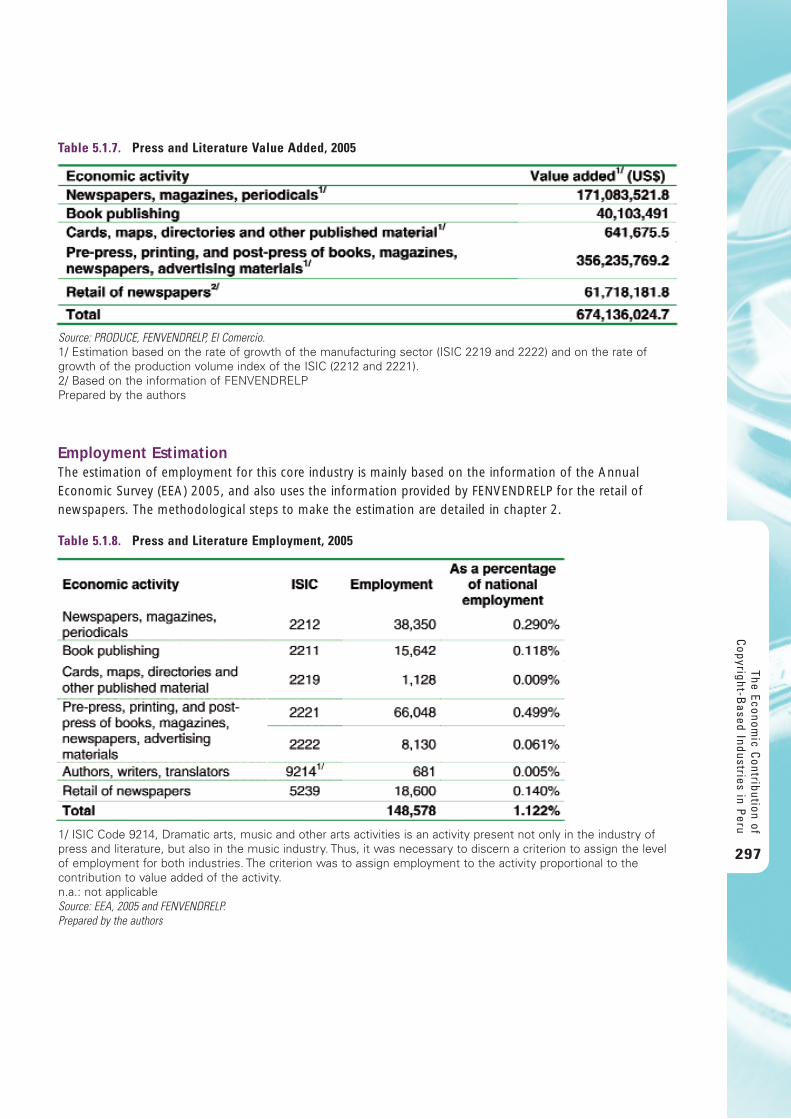
Employment EstimationThe estimation of employment for this core industry is mainly based on the information of the AnnualEconomic Survey (EEA) 2005, and also uses the information provided by FENVENDRELP for the retail ofnewspapers. The methodological steps to make the estimation are detailed in chapter 2.
The Economic C
ontribution ofC
opyright-Based Industries in P
eru
297
Table 5.1.7. Press and Literature Value Added, 2005
Source: PRODUCE, FENVENDRELP, El Comercio.1/ Estimation based on the rate of growth of the manufacturing sector (ISIC 2219 and 2222) and on the rate ofgrowth of the production volume index of the ISIC (2212 and 2221). 2/ Based on the information of FENVENDRELPPrepared by the authors
Table 5.1.8. Press and Literature Employment, 2005
1/ ISIC Code 9214, Dramatic arts, music and other arts activities is an activity present not only in the industry ofpress and literature, but also in the music industry. Thus, it was necessary to discern a criterion to assign the levelof employment for both industries. The criterion was to assign employment to the activity proportional to thecontribution to value added of the activity. n.a.: not applicableSource: EEA, 2005 and FENVENDRELP.Prepared by the authors
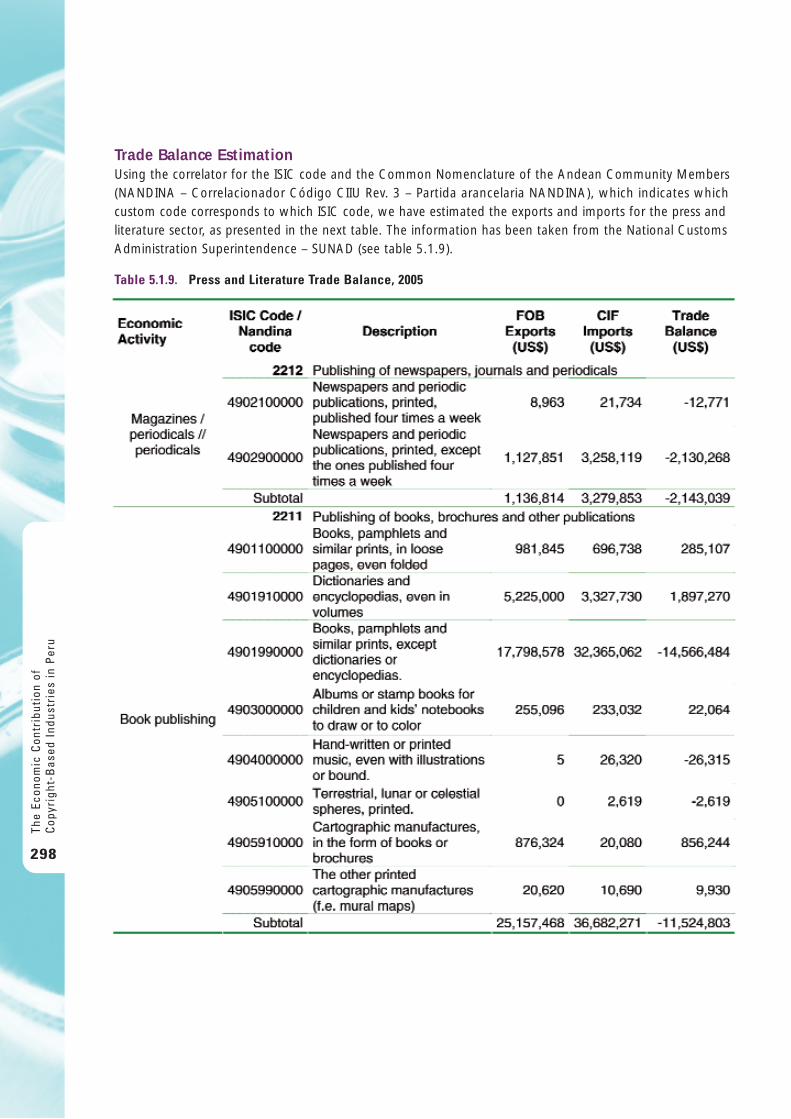
Trade Balance EstimationUsing the correlator for the ISIC code and the Common Nomenclature of the Andean Community Members(NANDINA – Correlacionador Código CIIU Rev. 3 – Partida arancelaria NANDINA), which indicates whichcustom code corresponds to which ISIC code, we have estimated the exports and imports for the press andliterature sector, as presented in the next table. The information has been taken from the National CustomsAdministration Superintendence – SUNAD (see table 5.1.9).
The
Econ
omic
Con
trib
utio
n of
Cop
yrig
ht-B
ased
Ind
ustr
ies
in P
eru
298
Table 5.1.9. Press and Literature Trade Balance, 2005
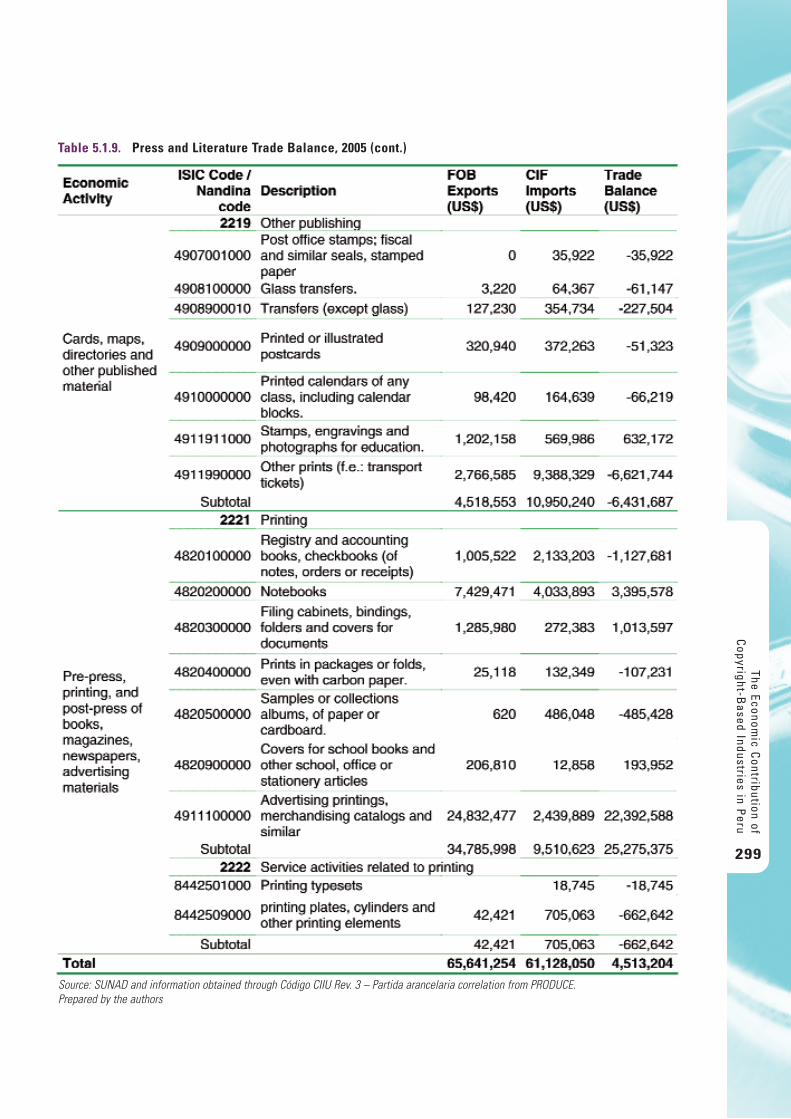
The Economic C
ontribution ofC
opyright-Based Industries in P
eru
299
Table 5.1.9. Press and Literature Trade Balance, 2005 (cont.)
Source: SUNAD and information obtained through Código CIIU Rev. 3 – Partida arancelaria correlation from PRODUCE. Prepared by the authors
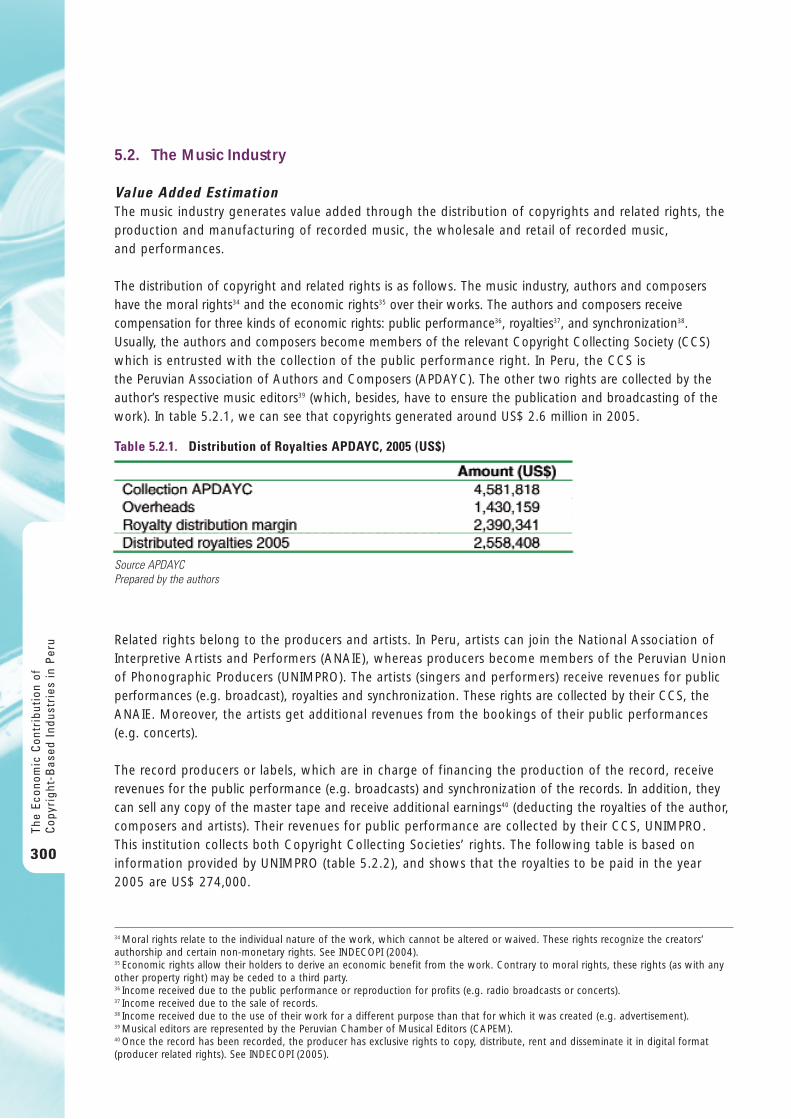
5.2. The Music Industry
Value Added EstimationThe music industry generates value added through the distribution of copyrights and related rights, theproduction and manufacturing of recorded music, the wholesale and retail of recorded music, and performances.
The distribution of copyright and related rights is as follows. The music industry, authors and composershave the moral rights34 and the economic rights35 over their works. The authors and composers receivecompensation for three kinds of economic rights: public performance36, royalties37, and synchronization38.Usually, the authors and composers become members of the relevant Copyright Collecting Society (CCS)which is entrusted with the collection of the public performance right. In Peru, the CCS is the Peruvian Association of Authors and Composers (APDAYC). The other two rights are collected by theauthor’s respective music editors39 (which, besides, have to ensure the publication and broadcasting of thework). In table 5.2.1, we can see that copyrights generated around US$ 2.6 million in 2005.
Related rights belong to the producers and artists. In Peru, artists can join the National Association ofInterpretive Artists and Performers (ANAIE), whereas producers become members of the Peruvian Union of Phonographic Producers (UNIMPRO). The artists (singers and performers) receive revenues for publicperformances (e.g. broadcast), royalties and synchronization. These rights are collected by their CCS, theANAIE. Moreover, the artists get additional revenues from the bookings of their public performances(e.g. concerts).
The record producers or labels, which are in charge of financing the production of the record, receiverevenues for the public performance (e.g. broadcasts) and synchronization of the records. In addition, theycan sell any copy of the master tape and receive additional earnings40 (deducting the royalties of the author,composers and artists). Their revenues for public performance are collected by their CCS, UNIMPRO. This institution collects both Copyright Collecting Societies’ rights. The following table is based oninformation provided by UNIMPRO (table 5.2.2), and shows that the royalties to be paid in the year2005 are US$ 274,000.
The
Econ
omic
Con
trib
utio
n of
Cop
yrig
ht-B
ased
Ind
ustr
ies
in P
eru
300
Table 5.2.1. Distribution of Royalties APDAYC, 2005 (US$)
Source APDAYCPrepared by the authors
34 Moral rights relate to the individual nature of the work, which cannot be altered or waived. These rights recognize the creators’authorship and certain non-monetary rights. See INDECOPI (2004).35 Economic rights allow their holders to derive an economic benefit from the work. Contrary to moral rights, these rights (as with anyother property right) may be ceded to a third party. 36 Income received due to the public performance or reproduction for profits (e.g. radio broadcasts or concerts).37 Income received due to the sale of records.38 Income received due to the use of their work for a different purpose than that for which it was created (e.g. advertisement).39 Musical editors are represented by the Peruvian Chamber of Musical Editors (CAPEM).40 Once the record has been recorded, the producer has exclusive rights to copy, distribute, rent and disseminate it in digital format(producer related rights). See INDECOPI (2005).
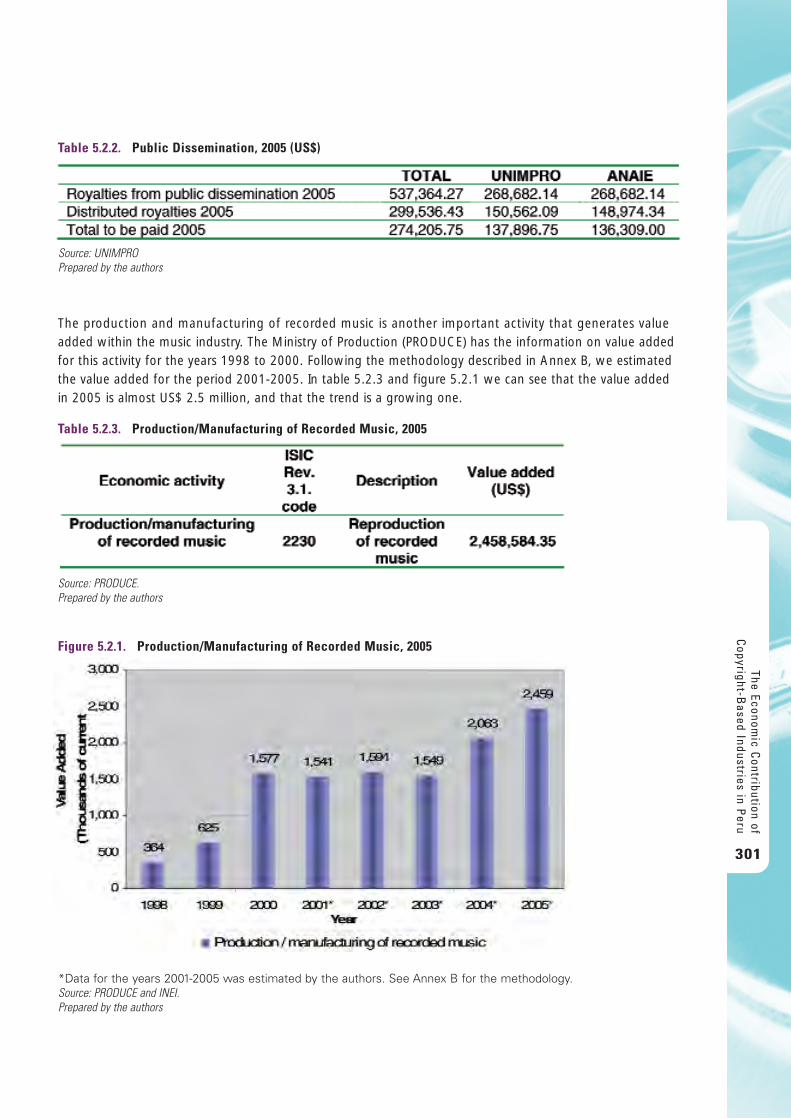
The production and manufacturing of recorded music is another important activity that generates valueadded within the music industry. The Ministry of Production (PRODUCE) has the information on value addedfor this activity for the years 1998 to 2000. Following the methodology described in Annex B, we estimatedthe value added for the period 2001-2005. In table 5.2.3 and figure 5.2.1 we can see that the value addedin 2005 is almost US$ 2.5 million, and that the trend is a growing one.
The Economic C
ontribution ofC
opyright-Based Industries in P
eru
301
Table 5.2.2. Public Dissemination, 2005 (US$)
Source: UNIMPROPrepared by the authors
Table 5.2.3. Production/Manufacturing of Recorded Music, 2005
Source: PRODUCE.Prepared by the authors
Figure 5.2.1. Production/Manufacturing of Recorded Music, 2005
*Data for the years 2001-2005 was estimated by the authors. See Annex B for the methodology.Source: PRODUCE and INEI.Prepared by the authors
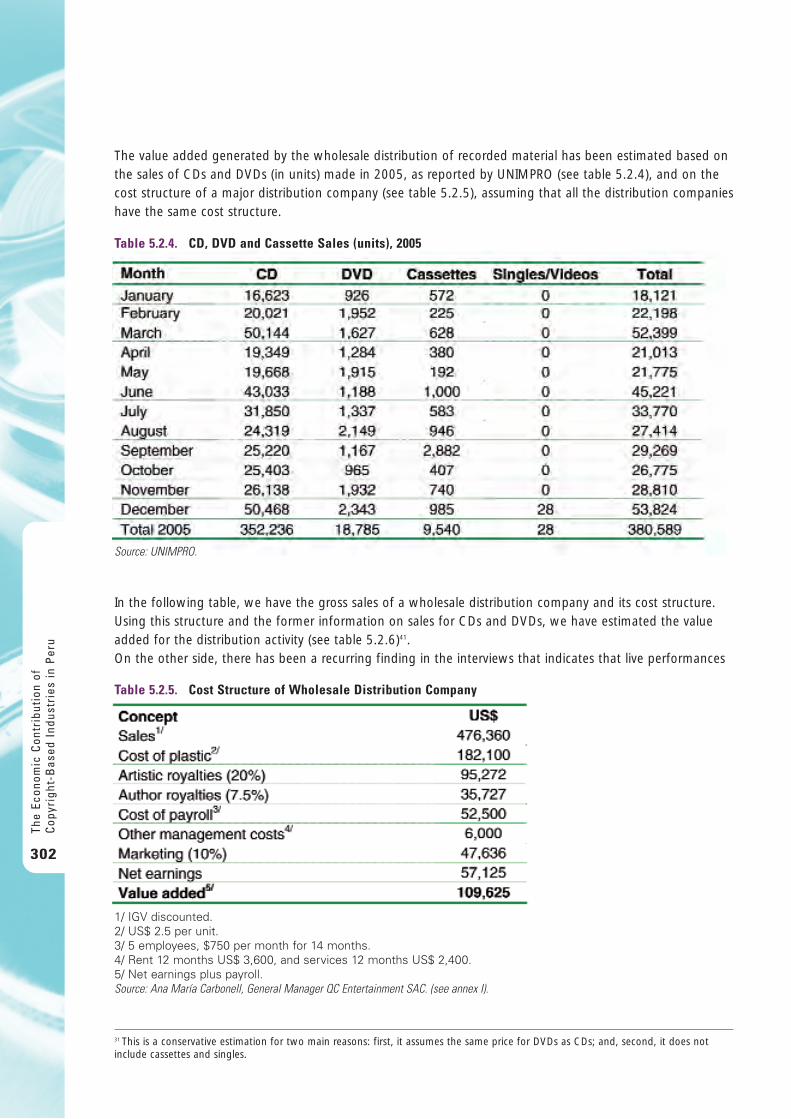
The value added generated by the wholesale distribution of recorded material has been estimated based onthe sales of CDs and DVDs (in units) made in 2005, as reported by UNIMPRO (see table 5.2.4), and on thecost structure of a major distribution company (see table 5.2.5), assuming that all the distribution companieshave the same cost structure.
In the following table, we have the gross sales of a wholesale distribution company and its cost structure.Using this structure and the former information on sales for CDs and DVDs, we have estimated the valueadded for the distribution activity (see table 5.2.6)41. On the other side, there has been a recurring finding in the interviews that indicates that live performances
The
Econ
omic
Con
trib
utio
n of
Cop
yrig
ht-B
ased
Ind
ustr
ies
in P
eru
302
Table 5.2.4. CD, DVD and Cassette Sales (units), 2005
Source: UNIMPRO.
31 This is a conservative estimation for two main reasons: first, it assumes the same price for DVDs as CDs; and, second, it does notinclude cassettes and singles.
Table 5.2.5. Cost Structure of Wholesale Distribution Company
1/ IGV discounted.2/ US$ 2.5 per unit.3/ 5 employees, $750 per month for 14 months.4/ Rent 12 months US$ 3,600, and services 12 months US$ 2,400.5/ Net earnings plus payroll.Source: Ana María Carbonell, General Manager QC Entertainment SAC. (see annex I).
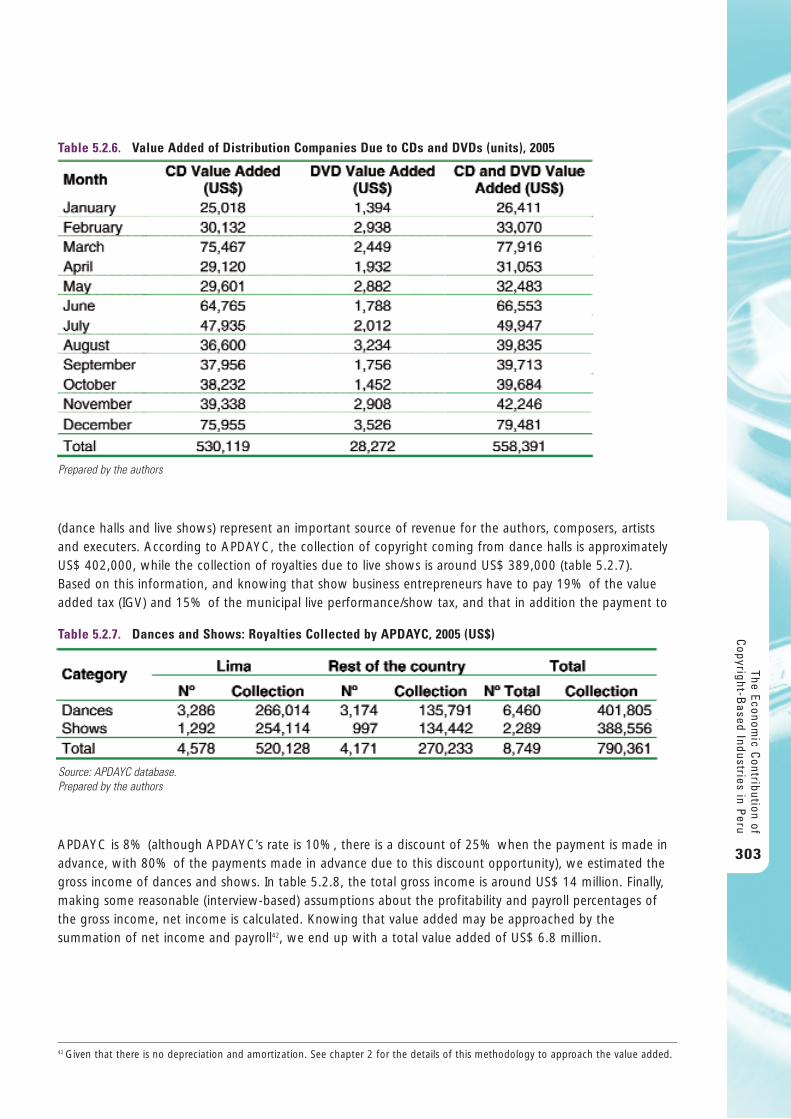
(dance halls and live shows) represent an important source of revenue for the authors, composers, artistsand executers. According to APDAYC, the collection of copyright coming from dance halls is approximatelyUS$ 402,000, while the collection of royalties due to live shows is around US$ 389,000 (table 5.2.7). Based on this information, and knowing that show business entrepreneurs have to pay 19% of the valueadded tax (IGV) and 15% of the municipal live performance/show tax, and that in addition the payment to
APDAYC is 8% (although APDAYC’s rate is 10%, there is a discount of 25% when the payment is made inadvance, with 80% of the payments made in advance due to this discount opportunity), we estimated thegross income of dances and shows. In table 5.2.8, the total gross income is around US$ 14 million. Finally,making some reasonable (interview-based) assumptions about the profitability and payroll percentages ofthe gross income, net income is calculated. Knowing that value added may be approached by thesummation of net income and payroll42, we end up with a total value added of US$ 6.8 million.
The Economic C
ontribution ofC
opyright-Based Industries in P
eru
303
Table 5.2.6. Value Added of Distribution Companies Due to CDs and DVDs (units), 2005
Prepared by the authors
Table 5.2.7. Dances and Shows: Royalties Collected by APDAYC, 2005 (US$)
Source: APDAYC database.Prepared by the authors
42 Given that there is no depreciation and amortization. See chapter 2 for the details of this methodology to approach the value added.
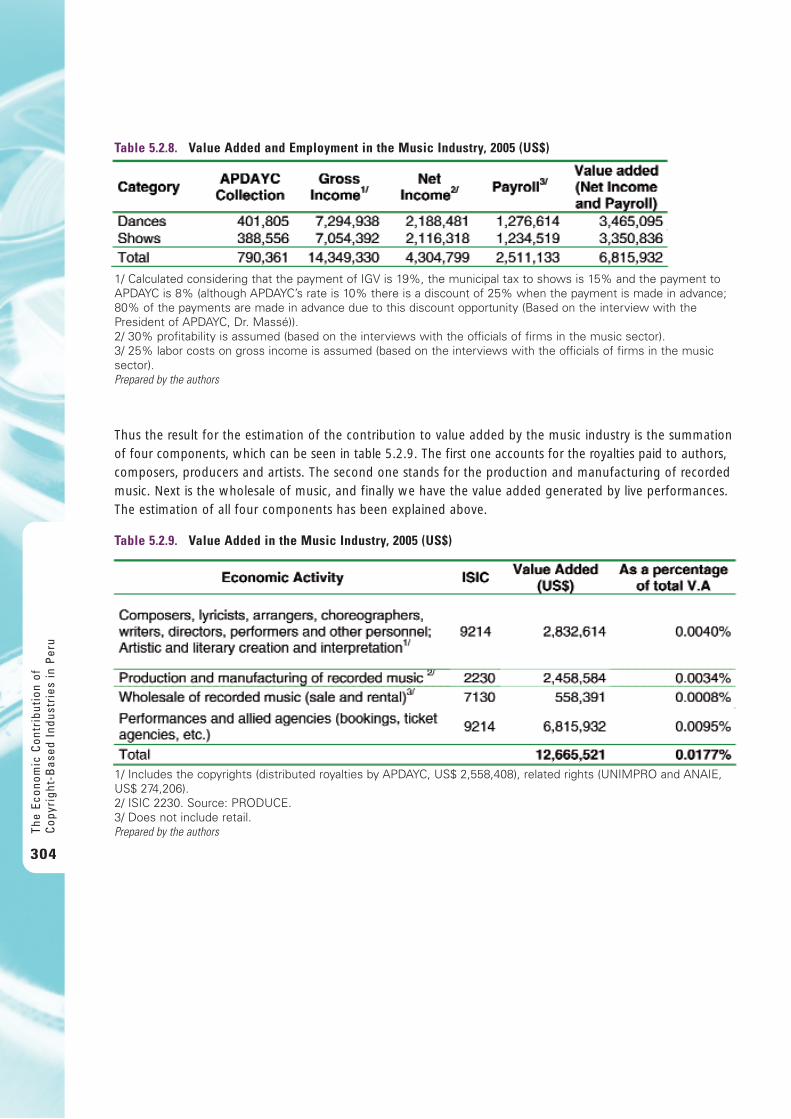
Thus the result for the estimation of the contribution to value added by the music industry is the summationof four components, which can be seen in table 5.2.9. The first one accounts for the royalties paid to authors,composers, producers and artists. The second one stands for the production and manufacturing of recordedmusic. Next is the wholesale of music, and finally we have the value added generated by live performances.The estimation of all four components has been explained above.
The
Econ
omic
Con
trib
utio
n of
Cop
yrig
ht-B
ased
Ind
ustr
ies
in P
eru
304
Table 5.2.8. Value Added and Employment in the Music Industry, 2005 (US$)
1/ Calculated considering that the payment of IGV is 19%, the municipal tax to shows is 15% and the payment toAPDAYC is 8% (although APDAYC’s rate is 10% there is a discount of 25% when the payment is made in advance;80% of the payments are made in advance due to this discount opportunity (Based on the interview with thePresident of APDAYC, Dr. Massé)). 2/ 30% profitability is assumed (based on the interviews with the officials of firms in the music sector).3/ 25% labor costs on gross income is assumed (based on the interviews with the officials of firms in the musicsector).Prepared by the authors
Table 5.2.9. Value Added in the Music Industry, 2005 (US$)
1/ Includes the copyrights (distributed royalties by APDAYC, US$ 2,558,408), related rights (UNIMPRO and ANAIE,US$ 274,206).2/ ISIC 2230. Source: PRODUCE.3/ Does not include retail.Prepared by the authors
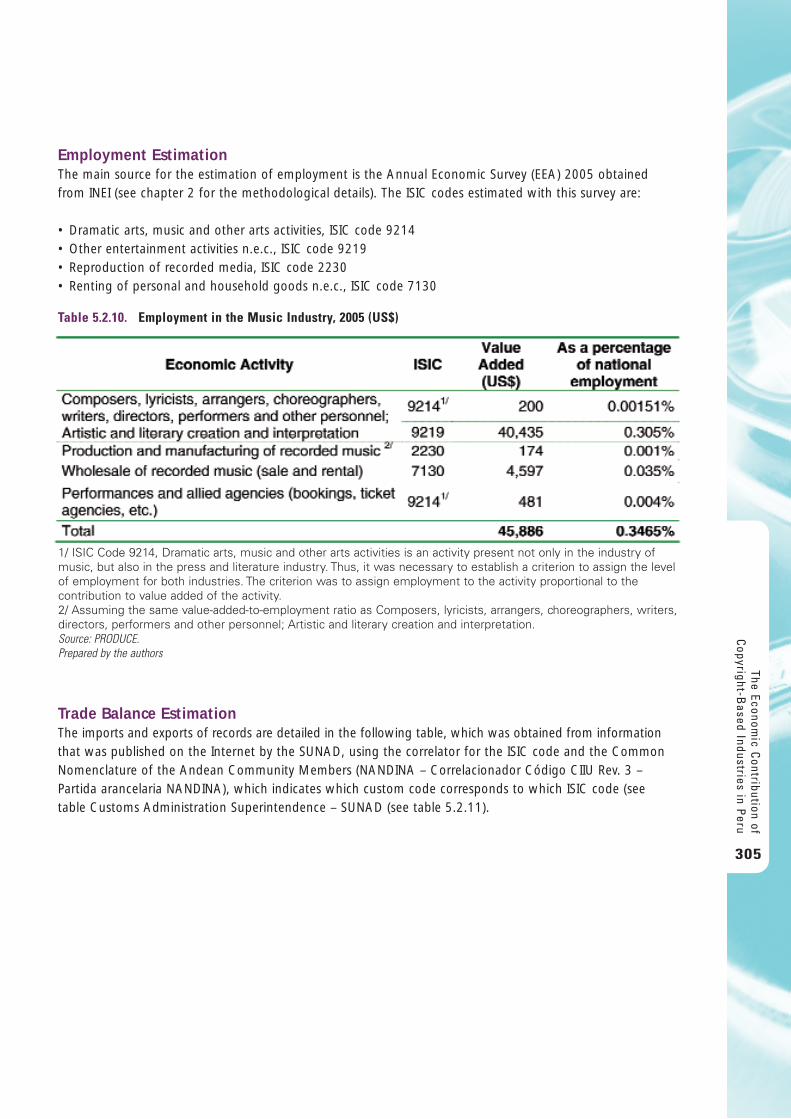
Employment EstimationThe main source for the estimation of employment is the Annual Economic Survey (EEA) 2005 obtainedfrom INEI (see chapter 2 for the methodological details). The ISIC codes estimated with this survey are:
• Dramatic arts, music and other arts activities, ISIC code 9214• Other entertainment activities n.e.c., ISIC code 9219• Reproduction of recorded media, ISIC code 2230• Renting of personal and household goods n.e.c., ISIC code 7130
Trade Balance EstimationThe imports and exports of records are detailed in the following table, which was obtained from informationthat was published on the Internet by the SUNAD, using the correlator for the ISIC code and the CommonNomenclature of the Andean Community Members (NANDINA – Correlacionador Código CIIU Rev. 3 –Partida arancelaria NANDINA), which indicates which custom code corresponds to which ISIC code (seetable Customs Administration Superintendence – SUNAD (see table 5.2.11).
The Economic C
ontribution ofC
opyright-Based Industries in P
eru
305
Table 5.2.10. Employment in the Music Industry, 2005 (US$)
1/ ISIC Code 9214, Dramatic arts, music and other arts activities is an activity present not only in the industry ofmusic, but also in the press and literature industry. Thus, it was necessary to establish a criterion to assign the levelof employment for both industries. The criterion was to assign employment to the activity proportional to thecontribution to value added of the activity. 2/ Assuming the same value-added-to-employment ratio as Composers, lyricists, arrangers, choreographers, writers,directors, performers and other personnel; Artistic and literary creation and interpretation.Source: PRODUCE.Prepared by the authors
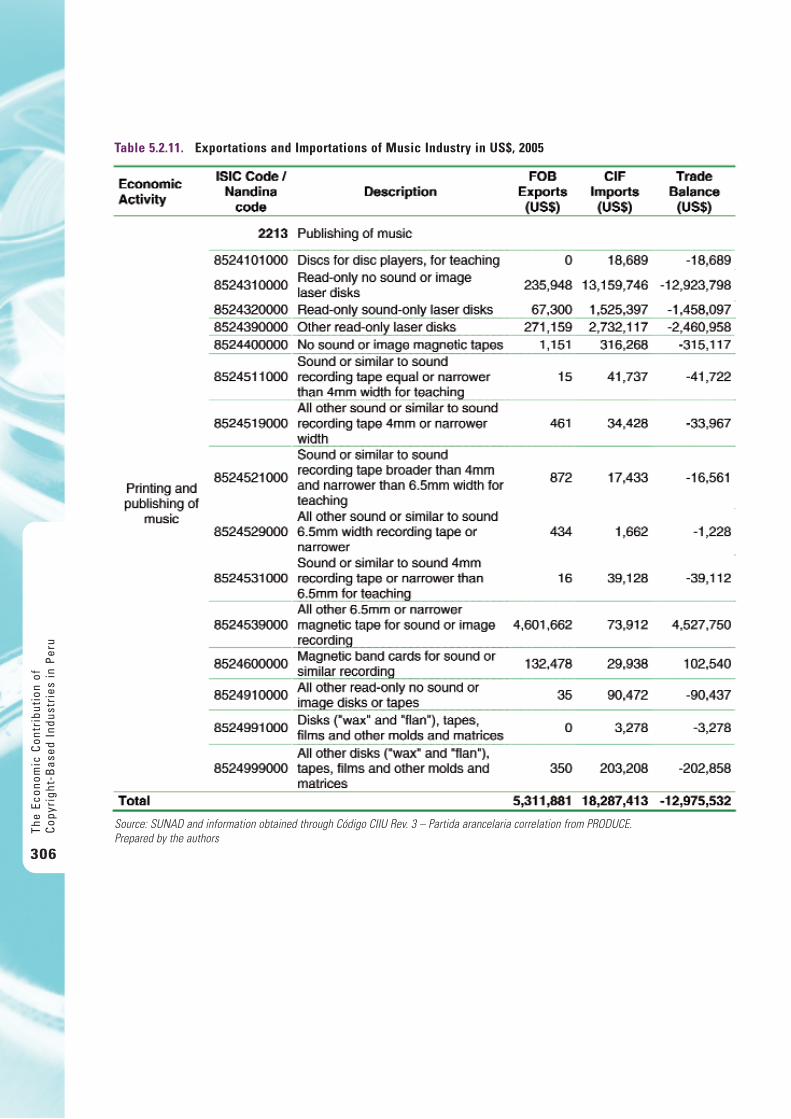
The
Econ
omic
Con
trib
utio
n of
Cop
yrig
ht-B
ased
Ind
ustr
ies
in P
eru
306
Table 5.2.11. Exportations and Importations of Music Industry in US$, 2005
Source: SUNAD and information obtained through Código CIIU Rev. 3 – Partida arancelaria correlation from PRODUCE. Prepared by the authors
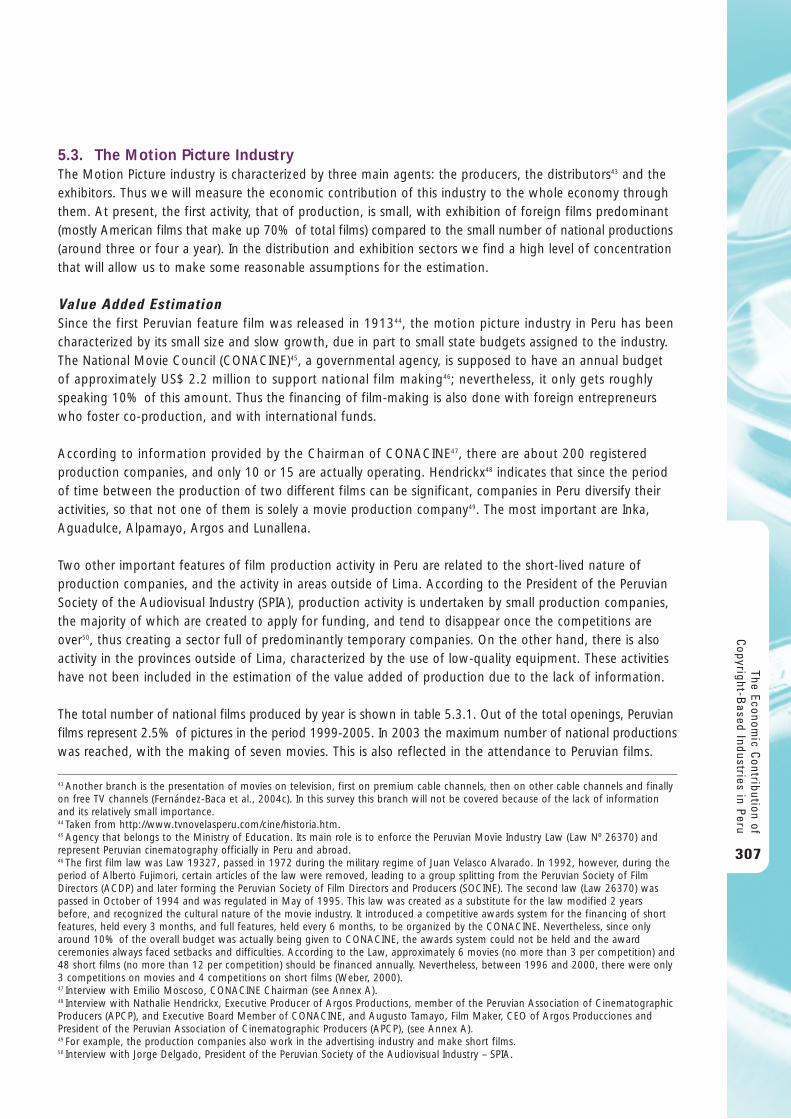
5.3. The Motion Picture IndustryThe Motion Picture industry is characterized by three main agents: the producers, the distributors43 and theexhibitors. Thus we will measure the economic contribution of this industry to the whole economy throughthem. At present, the first activity, that of production, is small, with exhibition of foreign films predominant(mostly American films that make up 70% of total films) compared to the small number of national productions(around three or four a year). In the distribution and exhibition sectors we find a high level of concentrationthat will allow us to make some reasonable assumptions for the estimation.
Value Added EstimationSince the first Peruvian feature film was released in 191344, the motion picture industry in Peru has beencharacterized by its small size and slow growth, due in part to small state budgets assigned to the industry.The National Movie Council (CONACINE)45, a governmental agency, is supposed to have an annual budgetof approximately US$ 2.2 million to support national film making46; nevertheless, it only gets roughlyspeaking 10% of this amount. Thus the financing of film-making is also done with foreign entrepreneurswho foster co-production, and with international funds.
According to information provided by the Chairman of CONACINE47, there are about 200 registeredproduction companies, and only 10 or 15 are actually operating. Hendrickx48 indicates that since the periodof time between the production of two different films can be significant, companies in Peru diversify theiractivities, so that not one of them is solely a movie production company49. The most important are Inka,Aguadulce, Alpamayo, Argos and Lunallena.
Two other important features of film production activity in Peru are related to the short-lived nature ofproduction companies, and the activity in areas outside of Lima. According to the President of the PeruvianSociety of the Audiovisual Industry (SPIA), production activity is undertaken by small production companies,the majority of which are created to apply for funding, and tend to disappear once the competitions areover50, thus creating a sector full of predominantly temporary companies. On the other hand, there is alsoactivity in the provinces outside of Lima, characterized by the use of low-quality equipment. These activitieshave not been included in the estimation of the value added of production due to the lack of information.
The total number of national films produced by year is shown in table 5.3.1. Out of the total openings, Peruvianfilms represent 2.5% of pictures in the period 1999-2005. In 2003 the maximum number of national productionswas reached, with the making of seven movies. This is also reflected in the attendance to Peruvian films.
The Economic C
ontribution ofC
opyright-Based Industries in P
eru
307
43 Another branch is the presentation of movies on television, first on premium cable channels, then on other cable channels and finallyon free TV channels (Fernández-Baca et al., 2004c). In this survey this branch will not be covered because of the lack of informationand its relatively small importance.44 Taken from http://www.tvnovelasperu.com/cine/historia.htm.45 Agency that belongs to the Ministry of Education. Its main role is to enforce the Peruvian Movie Industry Law (Law Nº 26370) andrepresent Peruvian cinematography officially in Peru and abroad.46 The first film law was Law 19327, passed in 1972 during the military regime of Juan Velasco Alvarado. In 1992, however, during theperiod of Alberto Fujimori, certain articles of the law were removed, leading to a group splitting from the Peruvian Society of FilmDirectors (ACDP) and later forming the Peruvian Society of Film Directors and Producers (SOCINE). The second law (Law 26370) waspassed in October of 1994 and was regulated in May of 1995. This law was created as a substitute for the law modified 2 yearsbefore, and recognized the cultural nature of the movie industry. It introduced a competitive awards system for the financing of shortfeatures, held every 3 months, and full features, held every 6 months, to be organized by the CONACINE. Nevertheless, since onlyaround 10% of the overall budget was actually being given to CONACINE, the awards system could not be held and the awardceremonies always faced setbacks and difficulties. According to the Law, approximately 6 movies (no more than 3 per competition) and48 short films (no more than 12 per competition) should be financed annually. Nevertheless, between 1996 and 2000, there were only3 competitions on movies and 4 competitions on short films (Weber, 2000).47 Interview with Emilio Moscoso, CONACINE Chairman (see Annex A).48 Interview with Nathalie Hendrickx, Executive Producer of Argos Productions, member of the Peruvian Association of CinematographicProducers (APCP), and Executive Board Member of CONACINE, and Augusto Tamayo, Film Maker, CEO of Argos Producciones andPresident of the Peruvian Association of Cinematographic Producers (APCP), (see Annex A). 49 For example, the production companies also work in the advertising industry and make short films.50 Interview with Jorge Delgado, President of the Peruvian Society of the Audiovisual Industry – SPIA.
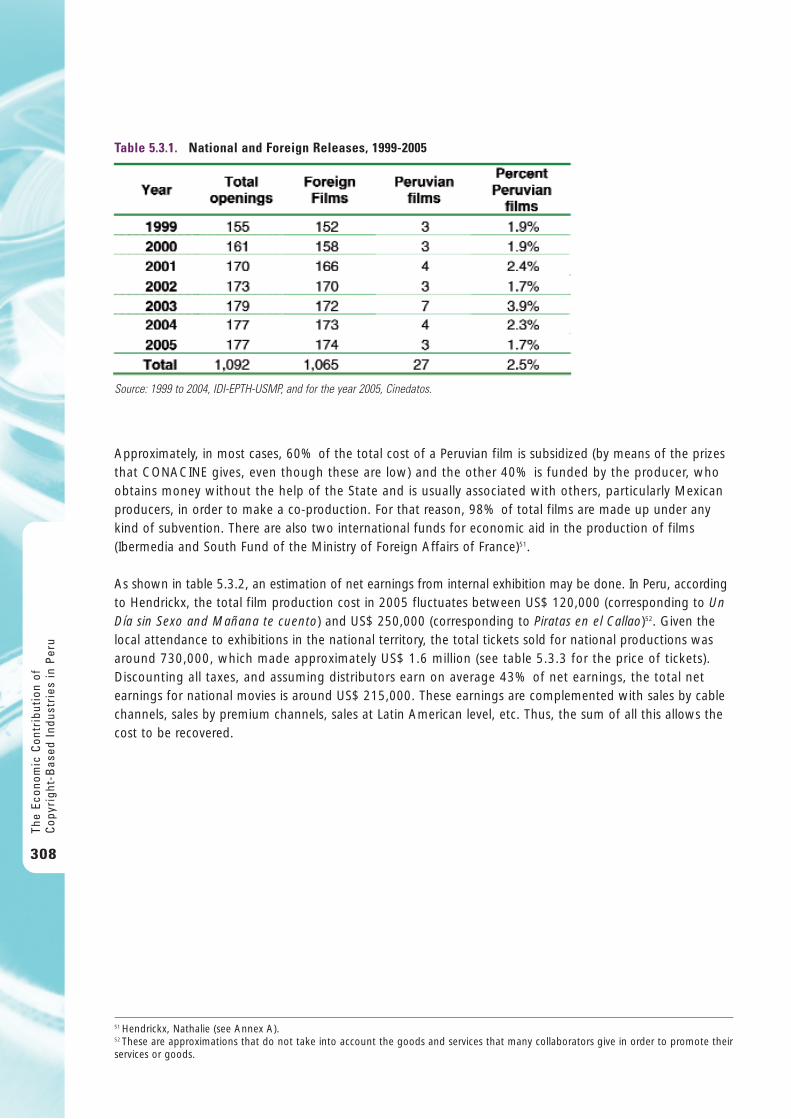
Approximately, in most cases, 60% of the total cost of a Peruvian film is subsidized (by means of the prizesthat CONACINE gives, even though these are low) and the other 40% is funded by the producer, whoobtains money without the help of the State and is usually associated with others, particularly Mexicanproducers, in order to make a co-production. For that reason, 98% of total films are made up under anykind of subvention. There are also two international funds for economic aid in the production of films(Ibermedia and South Fund of the Ministry of Foreign Affairs of France)51.
As shown in table 5.3.2, an estimation of net earnings from internal exhibition may be done. In Peru, accordingto Hendrickx, the total film production cost in 2005 fluctuates between US$ 120,000 (corresponding to UnDía sin Sexo and Mañana te cuento) and US$ 250,000 (corresponding to Piratas en el Callao)52. Given thelocal attendance to exhibitions in the national territory, the total tickets sold for national productions wasaround 730,000, which made approximately US$ 1.6 million (see table 5.3.3 for the price of tickets).Discounting all taxes, and assuming distributors earn on average 43% of net earnings, the total netearnings for national movies is around US$ 215,000. These earnings are complemented with sales by cablechannels, sales by premium channels, sales at Latin American level, etc. Thus, the sum of all this allows thecost to be recovered.
The
Econ
omic
Con
trib
utio
n of
Cop
yrig
ht-B
ased
Ind
ustr
ies
in P
eru
308
Table 5.3.1. National and Foreign Releases, 1999-2005
Source: 1999 to 2004, IDI-EPTH-USMP, and for the year 2005, Cinedatos.
51 Hendrickx, Nathalie (see Annex A).52 These are approximations that do not take into account the goods and services that many collaborators give in order to promote theirservices or goods.
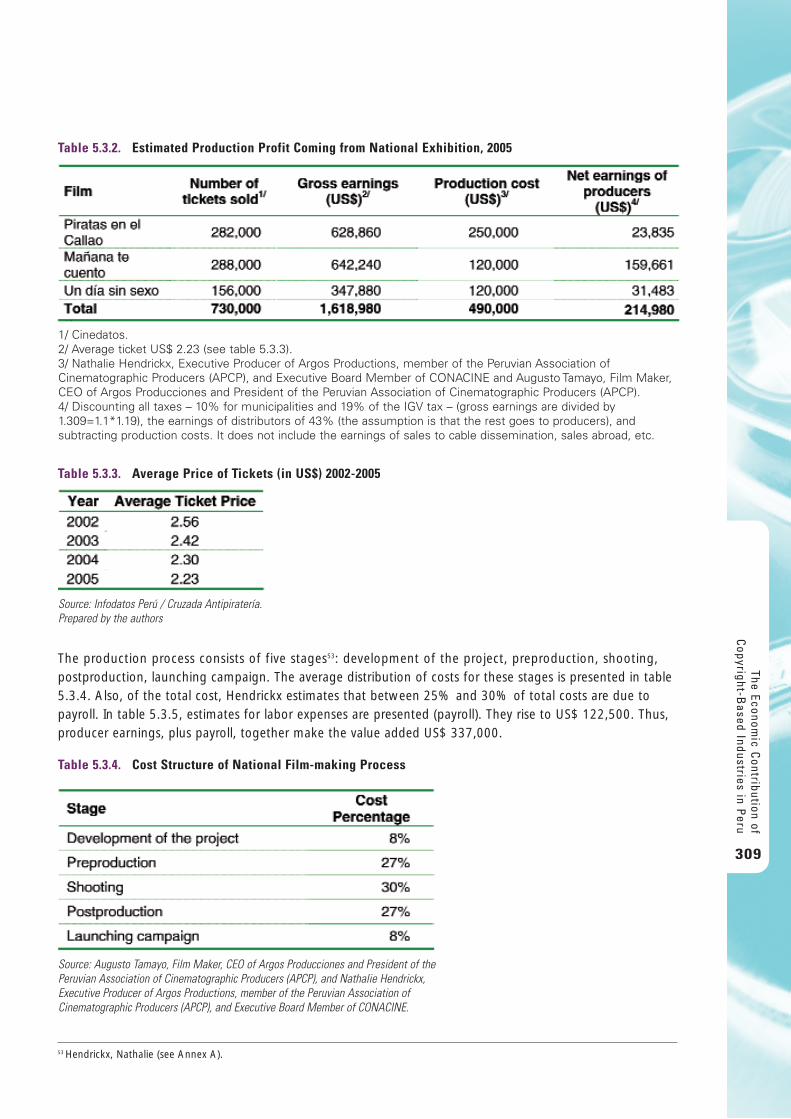
The production process consists of five stages53: development of the project, preproduction, shooting,postproduction, launching campaign. The average distribution of costs for these stages is presented in table5.3.4. Also, of the total cost, Hendrickx estimates that between 25% and 30% of total costs are due topayroll. In table 5.3.5, estimates for labor expenses are presented (payroll). They rise to US$ 122,500. Thus,producer earnings, plus payroll, together make the value added US$ 337,000.
The Economic C
ontribution ofC
opyright-Based Industries in P
eru
309
Table 5.3.2. Estimated Production Profit Coming from National Exhibition, 2005
1/ Cinedatos.2/ Average ticket US$ 2.23 (see table 5.3.3).3/ Nathalie Hendrickx, Executive Producer of Argos Productions, member of the Peruvian Association ofCinematographic Producers (APCP), and Executive Board Member of CONACINE and Augusto Tamayo, Film Maker,CEO of Argos Producciones and President of the Peruvian Association of Cinematographic Producers (APCP). 4/ Discounting all taxes – 10% for municipalities and 19% of the IGV tax – (gross earnings are divided by1.309=1.1*1.19), the earnings of distributors of 43% (the assumption is that the rest goes to producers), andsubtracting production costs. It does not include the earnings of sales to cable dissemination, sales abroad, etc.
Table 5.3.3. Average Price of Tickets (in US$) 2002-2005
Source: Infodatos Perú / Cruzada Antipiratería.Prepared by the authors
53 Hendrickx, Nathalie (see Annex A).
Table 5.3.4. Cost Structure of National Film-making Process
Source: Augusto Tamayo, Film Maker, CEO of Argos Producciones and President of thePeruvian Association of Cinematographic Producers (APCP), and Nathalie Hendrickx,Executive Producer of Argos Productions, member of the Peruvian Association ofCinematographic Producers (APCP), and Executive Board Member of CONACINE.
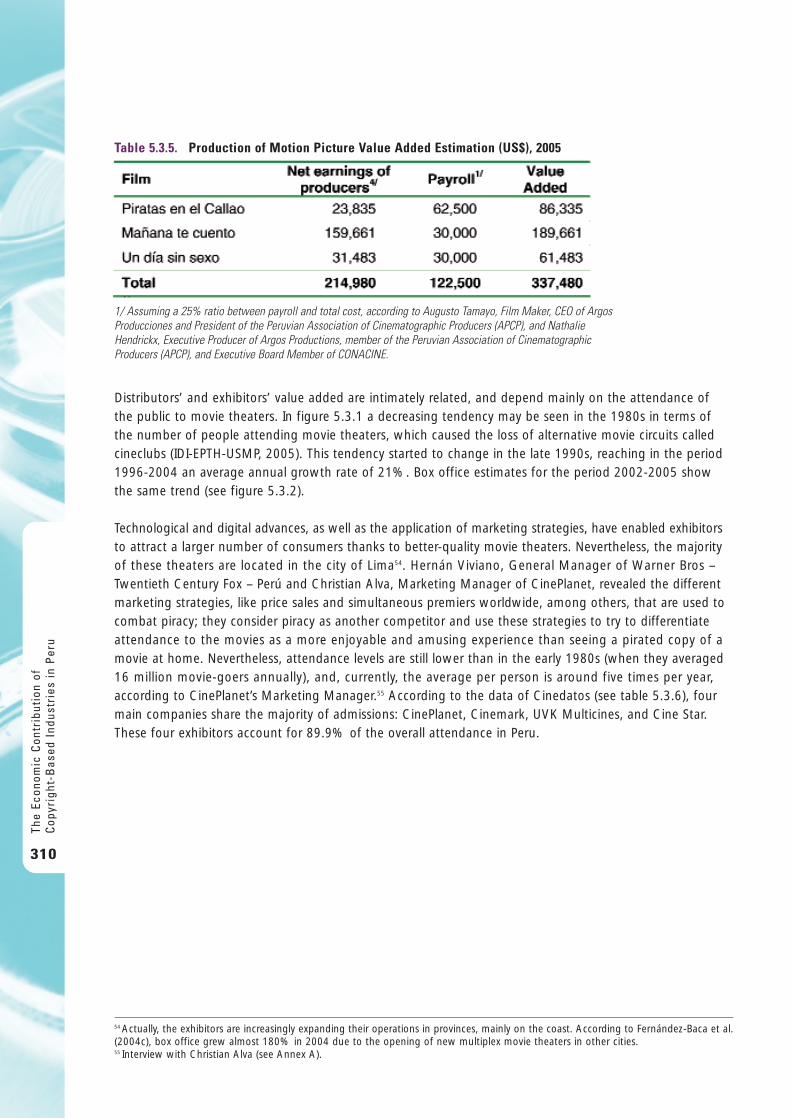
Distributors’ and exhibitors’ value added are intimately related, and depend mainly on the attendance of the public to movie theaters. In figure 5.3.1 a decreasing tendency may be seen in the 1980s in terms of the number of people attending movie theaters, which caused the loss of alternative movie circuits calledcineclubs (IDI-EPTH-USMP, 2005). This tendency started to change in the late 1990s, reaching in the period1996-2004 an average annual growth rate of 21%. Box office estimates for the period 2002-2005 showthe same trend (see figure 5.3.2).
Technological and digital advances, as well as the application of marketing strategies, have enabled exhibitorsto attract a larger number of consumers thanks to better-quality movie theaters. Nevertheless, the majorityof these theaters are located in the city of Lima54. Hernán Viviano, General Manager of Warner Bros –Twentieth Century Fox – Perú and Christian Alva, Marketing Manager of CinePlanet, revealed the differentmarketing strategies, like price sales and simultaneous premiers worldwide, among others, that are used tocombat piracy; they consider piracy as another competitor and use these strategies to try to differentiateattendance to the movies as a more enjoyable and amusing experience than seeing a pirated copy of amovie at home. Nevertheless, attendance levels are still lower than in the early 1980s (when they averaged16 million movie-goers annually), and, currently, the average per person is around five times per year,according to CinePlanet’s Marketing Manager.55 According to the data of Cinedatos (see table 5.3.6), fourmain companies share the majority of admissions: CinePlanet, Cinemark, UVK Multicines, and Cine Star.These four exhibitors account for 89.9% of the overall attendance in Peru.
The
Econ
omic
Con
trib
utio
n of
Cop
yrig
ht-B
ased
Ind
ustr
ies
in P
eru
310
Table 5.3.5. Production of Motion Picture Value Added Estimation (US$), 2005
1/ Assuming a 25% ratio between payroll and total cost, according to Augusto Tamayo, Film Maker, CEO of ArgosProducciones and President of the Peruvian Association of Cinematographic Producers (APCP), and NathalieHendrickx, Executive Producer of Argos Productions, member of the Peruvian Association of CinematographicProducers (APCP), and Executive Board Member of CONACINE.
54 Actually, the exhibitors are increasingly expanding their operations in provinces, mainly on the coast. According to Fernández-Baca et al.(2004c), box office grew almost 180% in 2004 due to the opening of new multiplex movie theaters in other cities. 55 Interview with Christian Alva (see Annex A).
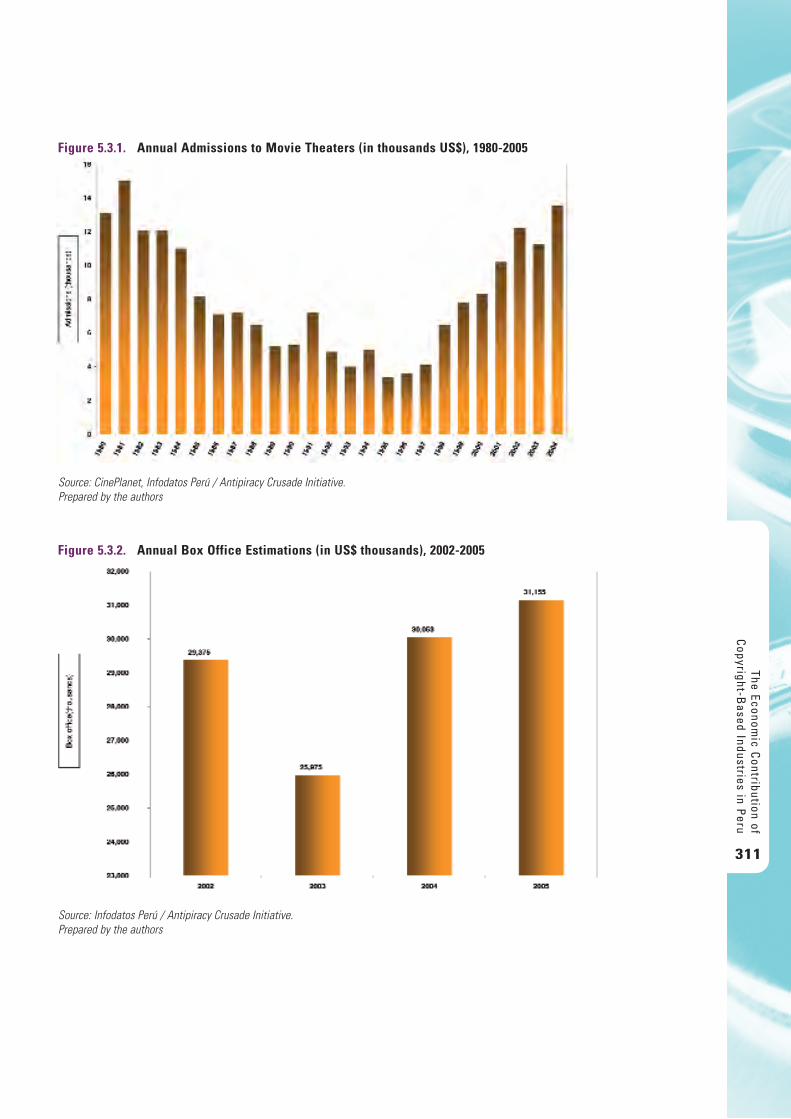
The Economic C
ontribution ofC
opyright-Based Industries in P
eru
311
Figure 5.3.1. Annual Admissions to Movie Theaters (in thousands US$), 1980-2005
Source: CinePlanet, Infodatos Perú / Antipiracy Crusade Initiative. Prepared by the authors
Figure 5.3.2. Annual Box Office Estimations (in US$ thousands), 2002-2005
Source: Infodatos Perú / Antipiracy Crusade Initiative. Prepared by the authors
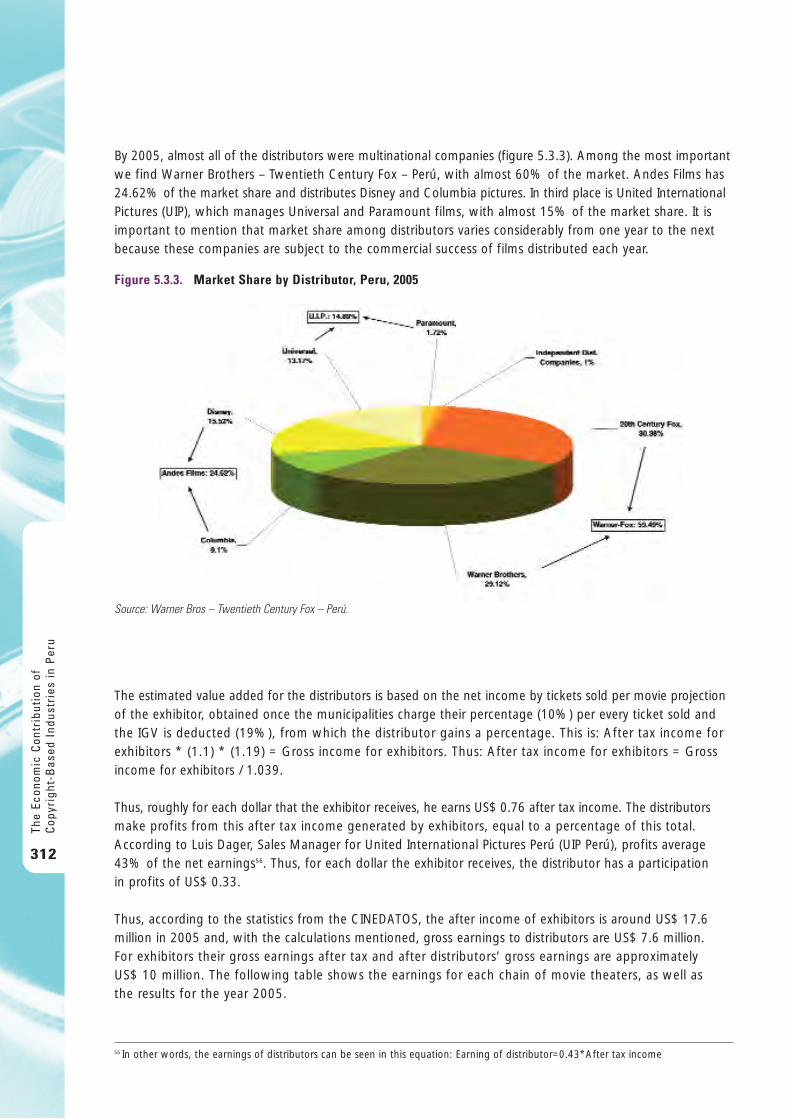
By 2005, almost all of the distributors were multinational companies (figure 5.3.3). Among the most importantwe find Warner Brothers – Twentieth Century Fox – Perú, with almost 60% of the market. Andes Films has24.62% of the market share and distributes Disney and Columbia pictures. In third place is United InternationalPictures (UIP), which manages Universal and Paramount films, with almost 15% of the market share. It isimportant to mention that market share among distributors varies considerably from one year to the nextbecause these companies are subject to the commercial success of films distributed each year.
The estimated value added for the distributors is based on the net income by tickets sold per movie projectionof the exhibitor, obtained once the municipalities charge their percentage (10%) per every ticket sold andthe IGV is deducted (19%), from which the distributor gains a percentage. This is: After tax income forexhibitors * (1.1) * (1.19) = Gross income for exhibitors. Thus: After tax income for exhibitors = Grossincome for exhibitors / 1.039.
Thus, roughly for each dollar that the exhibitor receives, he earns US$ 0.76 after tax income. The distributorsmake profits from this after tax income generated by exhibitors, equal to a percentage of this total.According to Luis Dager, Sales Manager for United International Pictures Perú (UIP Perú), profits average43% of the net earnings56. Thus, for each dollar the exhibitor receives, the distributor has a participation in profits of US$ 0.33.
Thus, according to the statistics from the CINEDATOS, the after income of exhibitors is around US$ 17.6million in 2005 and, with the calculations mentioned, gross earnings to distributors are US$ 7.6 million. For exhibitors their gross earnings after tax and after distributors’ gross earnings are approximately US$ 10 million. The following table shows the earnings for each chain of movie theaters, as well as the results for the year 2005.
The
Econ
omic
Con
trib
utio
n of
Cop
yrig
ht-B
ased
Ind
ustr
ies
in P
eru
312
Figure 5.3.3. Market Share by Distributor, Peru, 2005
Source: Warner Bros – Twentieth Century Fox – Perú.
56 In other words, the earnings of distributors can be seen in this equation: Earning of distributor=0.43*After tax income
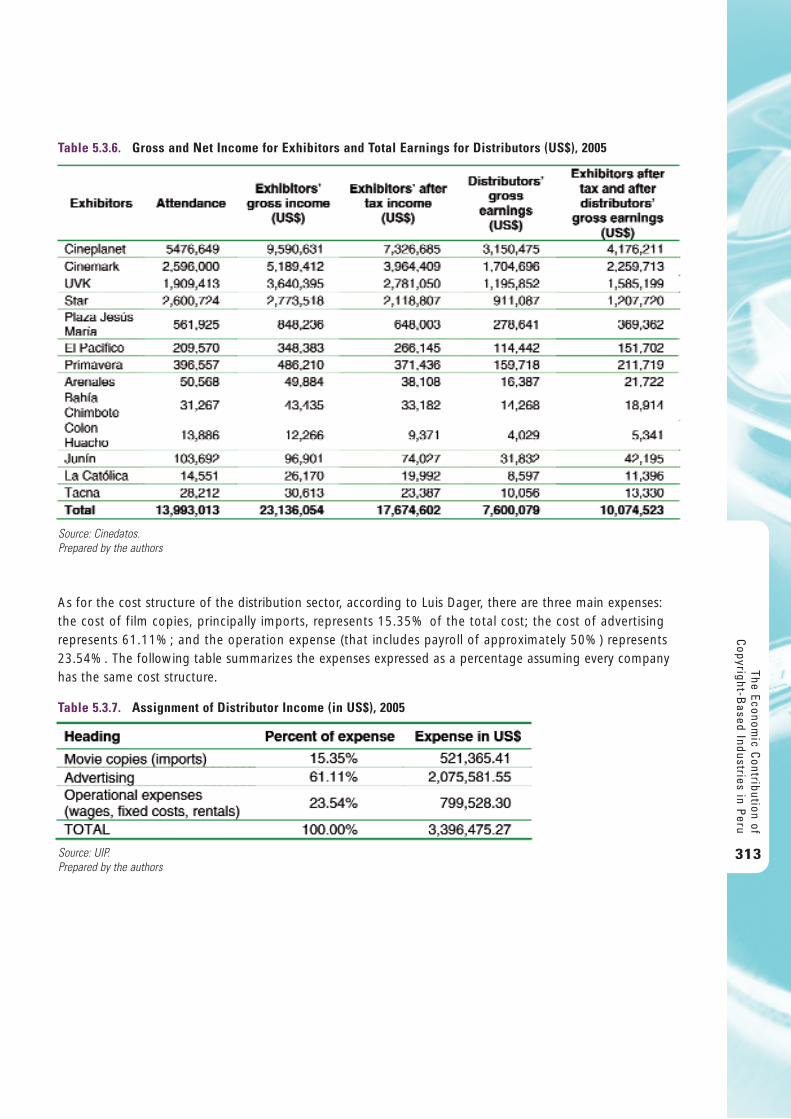
As for the cost structure of the distribution sector, according to Luis Dager, there are three main expenses:the cost of film copies, principally imports, represents 15.35% of the total cost; the cost of advertisingrepresents 61.11%; and the operation expense (that includes payroll of approximately 50%) represents23.54%. The following table summarizes the expenses expressed as a percentage assuming every companyhas the same cost structure.
The Economic C
ontribution ofC
opyright-Based Industries in P
eru
313
Table 5.3.6. Gross and Net Income for Exhibitors and Total Earnings for Distributors (US$), 2005
Source: Cinedatos. Prepared by the authors
Table 5.3.7. Assignment of Distributor Income (in US$), 2005
Source: UIP. Prepared by the authors
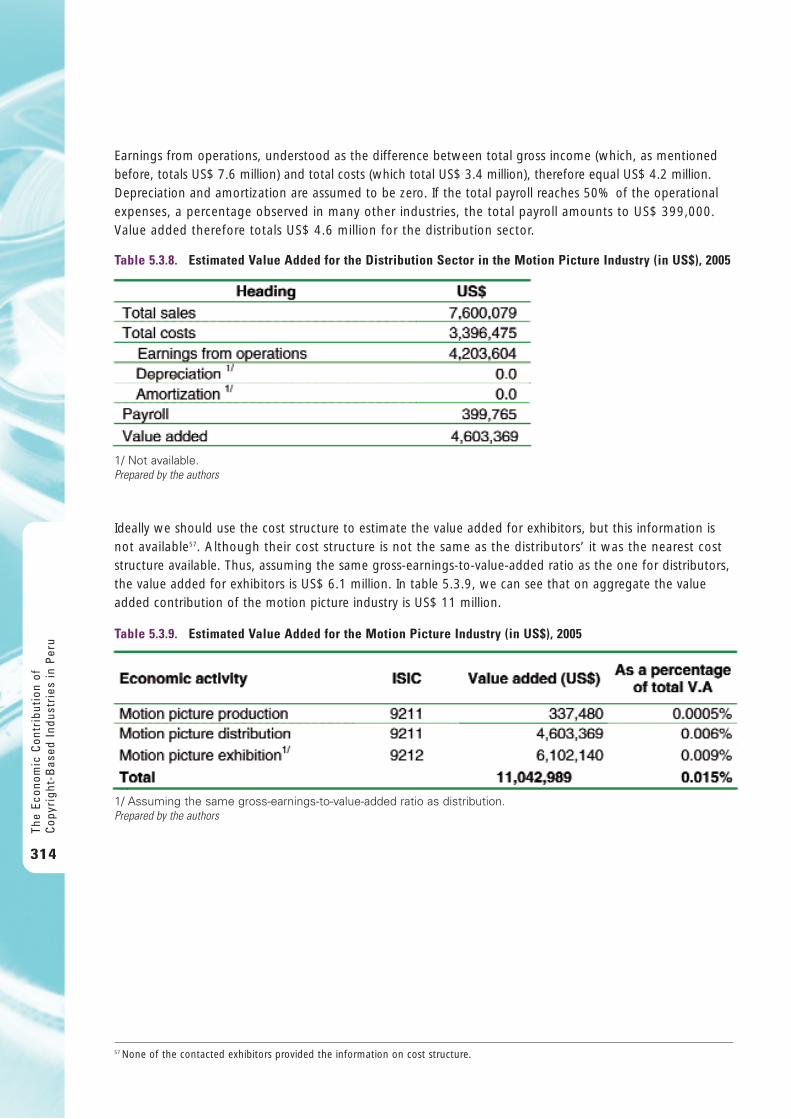
Earnings from operations, understood as the difference between total gross income (which, as mentionedbefore, totals US$ 7.6 million) and total costs (which total US$ 3.4 million), therefore equal US$ 4.2 million.Depreciation and amortization are assumed to be zero. If the total payroll reaches 50% of the operationalexpenses, a percentage observed in many other industries, the total payroll amounts to US$ 399,000.Value added therefore totals US$ 4.6 million for the distribution sector.
Ideally we should use the cost structure to estimate the value added for exhibitors, but this information isnot available57. Although their cost structure is not the same as the distributors’ it was the nearest coststructure available. Thus, assuming the same gross-earnings-to-value-added ratio as the one for distributors,the value added for exhibitors is US$ 6.1 million. In table 5.3.9, we can see that on aggregate the valueadded contribution of the motion picture industry is US$ 11 million.
The
Econ
omic
Con
trib
utio
n of
Cop
yrig
ht-B
ased
Ind
ustr
ies
in P
eru
314
Table 5.3.8. Estimated Value Added for the Distribution Sector in the Motion Picture Industry (in US$), 2005
1/ Not available.Prepared by the authors
Table 5.3.9. Estimated Value Added for the Motion Picture Industry (in US$), 2005
1/ Assuming the same gross-earnings-to-value-added ratio as distribution.Prepared by the authors
57 None of the contacted exhibitors provided the information on cost structure.
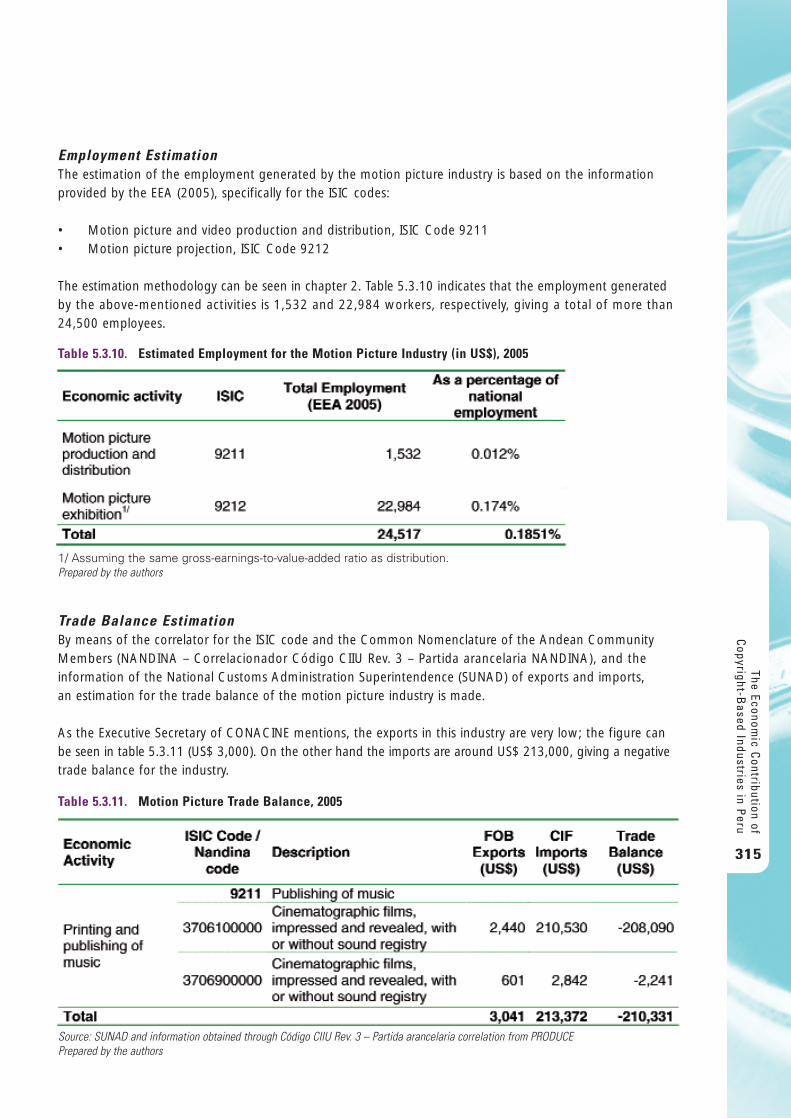
Employment EstimationThe estimation of the employment generated by the motion picture industry is based on the informationprovided by the EEA (2005), specifically for the ISIC codes:
• Motion picture and video production and distribution, ISIC Code 9211• Motion picture projection, ISIC Code 9212
The estimation methodology can be seen in chapter 2. Table 5.3.10 indicates that the employment generatedby the above-mentioned activities is 1,532 and 22,984 workers, respectively, giving a total of more than24,500 employees.
Trade Balance EstimationBy means of the correlator for the ISIC code and the Common Nomenclature of the Andean CommunityMembers (NANDINA – Correlacionador Código CIIU Rev. 3 – Partida arancelaria NANDINA), and theinformation of the National Customs Administration Superintendence (SUNAD) of exports and imports, an estimation for the trade balance of the motion picture industry is made.
As the Executive Secretary of CONACINE mentions, the exports in this industry are very low; the figure canbe seen in table 5.3.11 (US$ 3,000). On the other hand the imports are around US$ 213,000, giving a negativetrade balance for the industry.
The Economic C
ontribution ofC
opyright-Based Industries in P
eru
315
Table 5.3.10. Estimated Employment for the Motion Picture Industry (in US$), 2005
1/ Assuming the same gross-earnings-to-value-added ratio as distribution.Prepared by the authors
Table 5.3.11. Motion Picture Trade Balance, 2005
Source: SUNAD and information obtained through Código CIIU Rev. 3 – Partida arancelaria correlation from PRODUCE Prepared by the authors
5.4. Television and Radio Industry
Value Added EstimationWith the purpose of measuring the economic contribution of this industry, we will focus on public cablebroadcasting services (cable TV) and private public interest broadcasting services (free-to-air radio and TV) .Cable TV services are defined as “those that distribute multichannel and multipoint broadcasting signalsthrough cables and radio waves, from one or more stations belonging to the same distribution system,inside of a concession area” (article 90 of Regulations). In Anglo-Saxon literature this service is known bythe acronym CATV (Community Antenna Television). In these systems, the signals are transported usingcables instead of an individual antenna receiver.
Subscribers of TV cable pay a pre-determined amount to receive the signals. Also, the companies that offerthese services are subject to State regulation and supervision. For this reason, there is more informationavailable for this industry as opposed to open air radio and TV, for which very little information is available.It is important to distinguish between the different types of signals that can be transmitted and received bycable television:
• From open channels: Signals that can be received by any conventional receiving device, in UHF and VHF frequencies.
• Via satellite: Transmissions from a satellite, using a reception satellite dish59.• Company-owned channels: Signals transmitted independently by each cable television company.• Other services: Internet (OSIPTEL, 2002).
The
Econ
omic
Con
trib
utio
n of
Cop
yrig
ht-B
ased
Ind
ustr
ies
in P
eru
316
15 In this industry, the General Regulations of the Telecommunications Law establish a classification for the services oftelecommunications services based on two basic criteria. The first is a technological criterion, while the second relates to the nature anduse of these services.
Based on technical criteria, services are classified as:• Carriers• Teleservices, also called final services• Broadcasting • Value added servicesDepending on their nature they are classified as follows: • Public Services• Private Services• Private Services of Public InterestTitle IV of the regulation combines both criteria to establish the following classification of broadcasting services: A. Public Broadcasting Services
a. Distribution of radio broadcasting by cable, in the following ways:i. Wire or optic cableii. Multichannel multipoint distribution system (MMDS)iii. Direct satellite broadcasting
b. Distribution of piped-in musicc. Any other classified by the Ministry as such
B. Private broadcasting services (set up by an individual or company to satisfy his or her broadcasting needs within a determinedarea, such as closed circuit TV)
C. Public-interest private radio or television broadcasting services targeting the general public. Regulations also distinguish betweencommercial and education radio broadcasting, and according to its operational confines, local and rural radio broadcasting.
This classification embraces different criteria that take account of diverse considerations and policies, and is not consistent with theobjective of distinguishing and measuring the contribution of copyright activities or industries to generating employment and creatingvalue.59 For satellite TV, “the signals are received directly from an orbiting satellite through small satellite dishes positioned in the subscribers’homes” (OSIPTEL 2002). In contrast, the free signal from radio and TV transmissions comes from a transmission tower placed on theground, which the users receive directly through an antenna. Another significant difference in relation to this study is derived naturallyfrom the fact that cable TV and satellite TV users must pay for the services provided, generally a fee (for example a monthly fee, basedon the number of channels provided). In contrast “open” radio and TV users receive the signal for free. In this case, the source ofincome for these broadcasting companies is limited mostly to advertising.
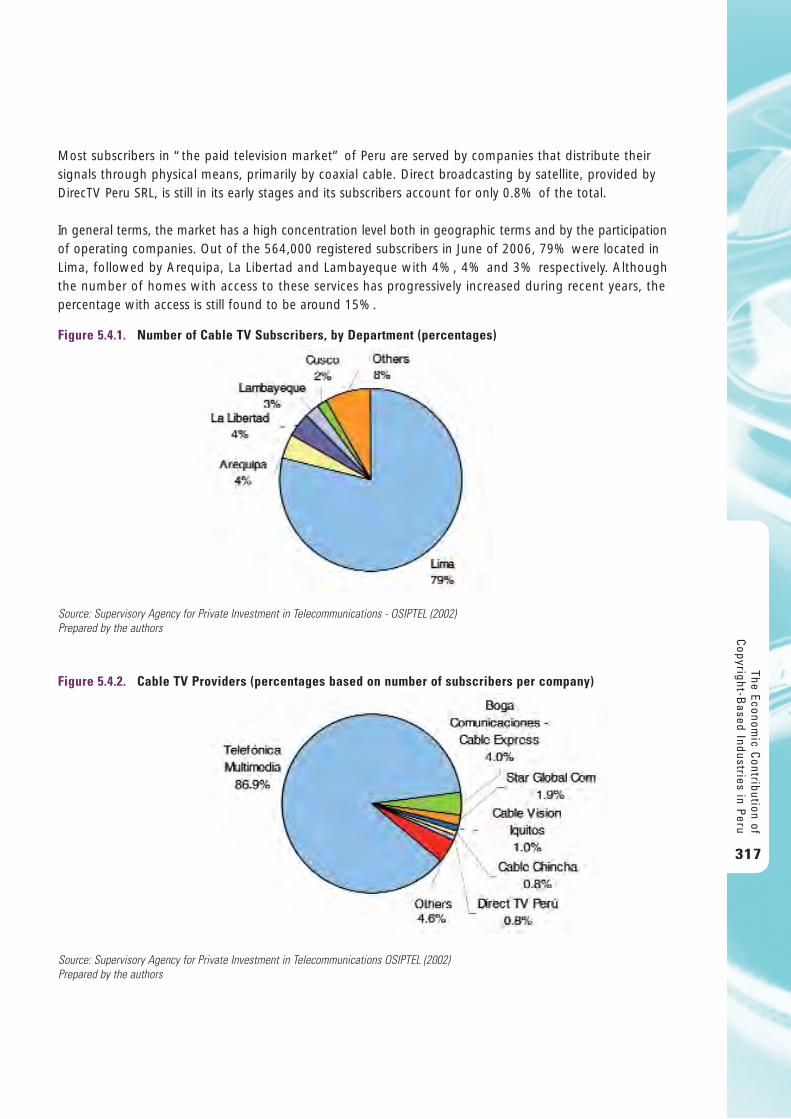
Most subscribers in “the paid television market” of Peru are served by companies that distribute theirsignals through physical means, primarily by coaxial cable. Direct broadcasting by satellite, provided byDirecTV Peru SRL, is still in its early stages and its subscribers account for only 0.8% of the total.
In general terms, the market has a high concentration level both in geographic terms and by the participationof operating companies. Out of the 564,000 registered subscribers in June of 2006, 79% were located inLima, followed by Arequipa, La Libertad and Lambayeque with 4%, 4% and 3% respectively. Although the number of homes with access to these services has progressively increased during recent years, thepercentage with access is still found to be around 15%.
The Economic C
ontribution ofC
opyright-Based Industries in P
eru
317
Figure 5.4.1. Number of Cable TV Subscribers, by Department (percentages)
Source: Supervisory Agency for Private Investment in Telecommunications - OSIPTEL (2002)Prepared by the authors
Figure 5.4.2. Cable TV Providers (percentages based on number of subscribers per company)
Source: Supervisory Agency for Private Investment in Telecommunications OSIPTEL (2002)Prepared by the authors
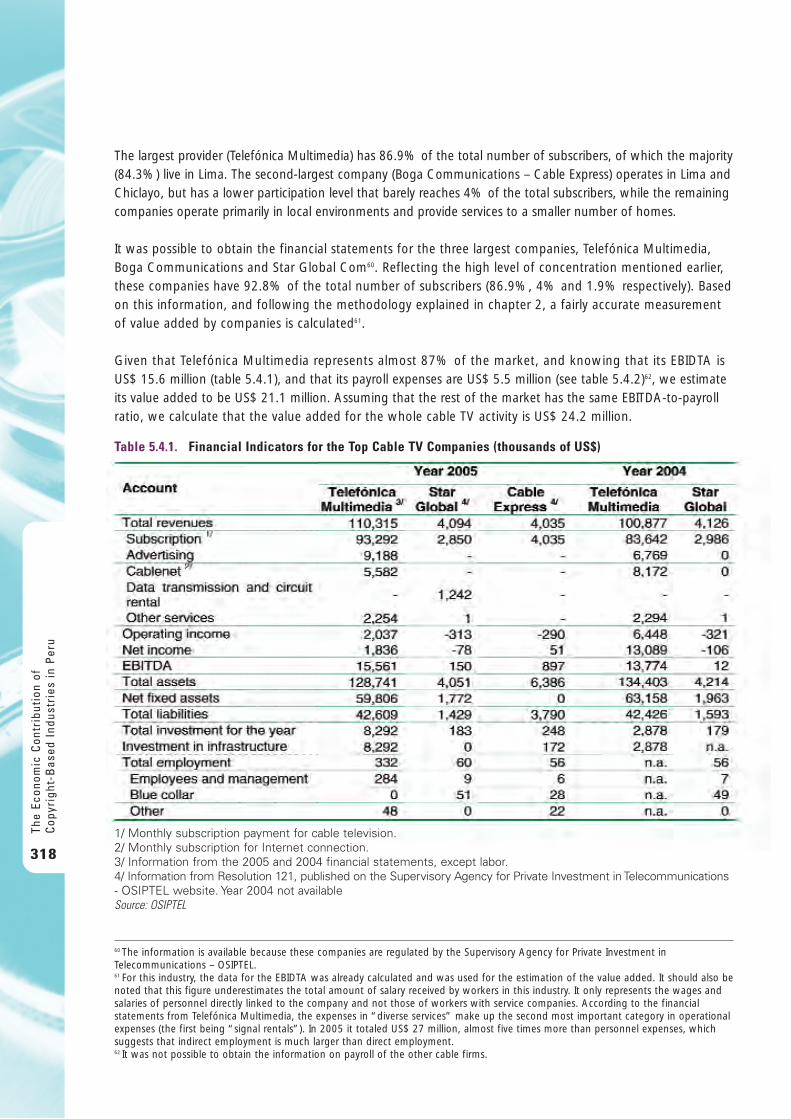
The largest provider (Telefónica Multimedia) has 86.9% of the total number of subscribers, of which the majority(84.3%) live in Lima. The second-largest company (Boga Communications – Cable Express) operates in Lima andChiclayo, but has a lower participation level that barely reaches 4% of the total subscribers, while the remainingcompanies operate primarily in local environments and provide services to a smaller number of homes.
It was possible to obtain the financial statements for the three largest companies, Telefónica Multimedia,Boga Communications and Star Global Com60. Reflecting the high level of concentration mentioned earlier,these companies have 92.8% of the total number of subscribers (86.9%, 4% and 1.9% respectively). Basedon this information, and following the methodology explained in chapter 2, a fairly accurate measurementof value added by companies is calculated61.
Given that Telefónica Multimedia represents almost 87% of the market, and knowing that its EBIDTA isUS$ 15.6 million (table 5.4.1), and that its payroll expenses are US$ 5.5 million (see table 5.4.2)62, we estimateits value added to be US$ 21.1 million. Assuming that the rest of the market has the same EBITDA-to-payrollratio, we calculate that the value added for the whole cable TV activity is US$ 24.2 million.
The
Econ
omic
Con
trib
utio
n of
Cop
yrig
ht-B
ased
Ind
ustr
ies
in P
eru
318
60 The information is available because these companies are regulated by the Supervisory Agency for Private Investment inTelecommunications – OSIPTEL.61 For this industry, the data for the EBIDTA was already calculated and was used for the estimation of the value added. It should also benoted that this figure underestimates the total amount of salary received by workers in this industry. It only represents the wages andsalaries of personnel directly linked to the company and not those of workers with service companies. According to the financialstatements from Telefónica Multimedia, the expenses in “diverse services” make up the second most important category in operationalexpenses (the first being “signal rentals”). In 2005 it totaled US$ 27 million, almost five times more than personnel expenses, whichsuggests that indirect employment is much larger than direct employment.62 It was not possible to obtain the information on payroll of the other cable firms.
Table 5.4.1. Financial Indicators for the Top Cable TV Companies (thousands of US$)
1/ Monthly subscription payment for cable television.2/ Monthly subscription for Internet connection.3/ Information from the 2005 and 2004 financial statements, except labor.4/ Information from Resolution 121, published on the Supervisory Agency for Private Investment in Telecommunications- OSIPTEL website. Year 2004 not availableSource: OSIPTEL
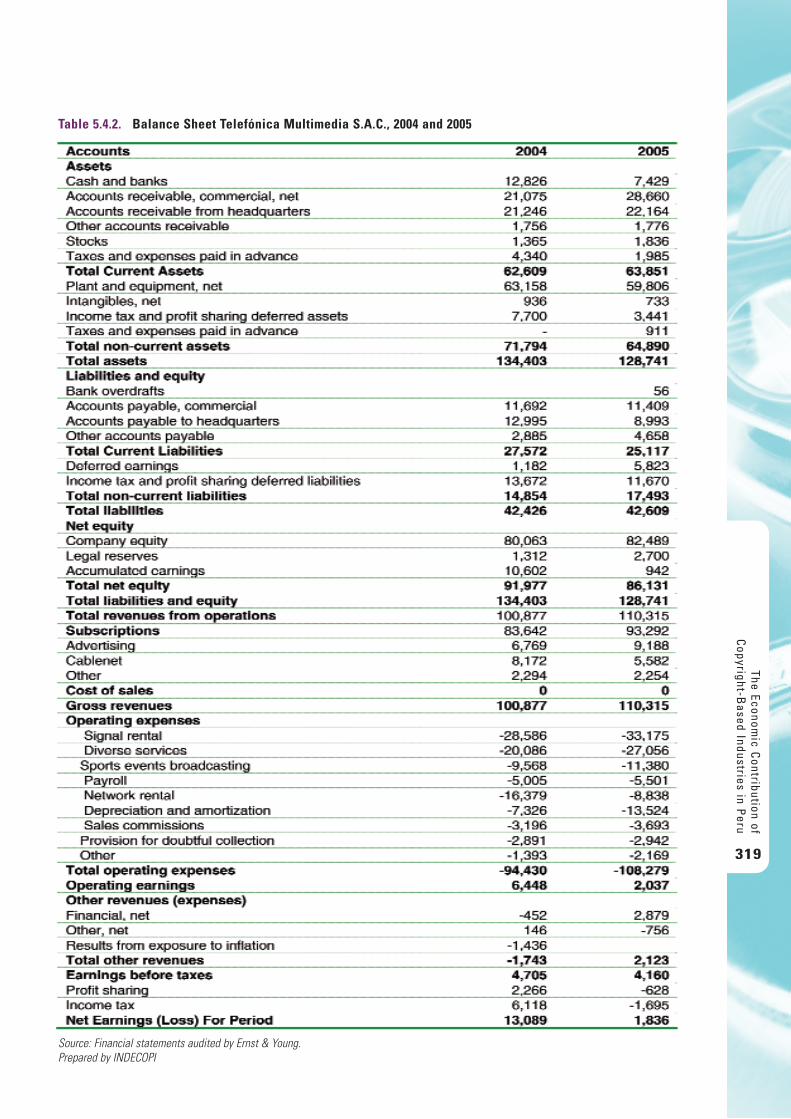
The Economic C
ontribution ofC
opyright-Based Industries in P
eru
319
Table 5.4.2. Balance Sheet Telefónica Multimedia S.A.C., 2004 and 2005
Source: Financial statements audited by Ernst & Young.Prepared by INDECOPI
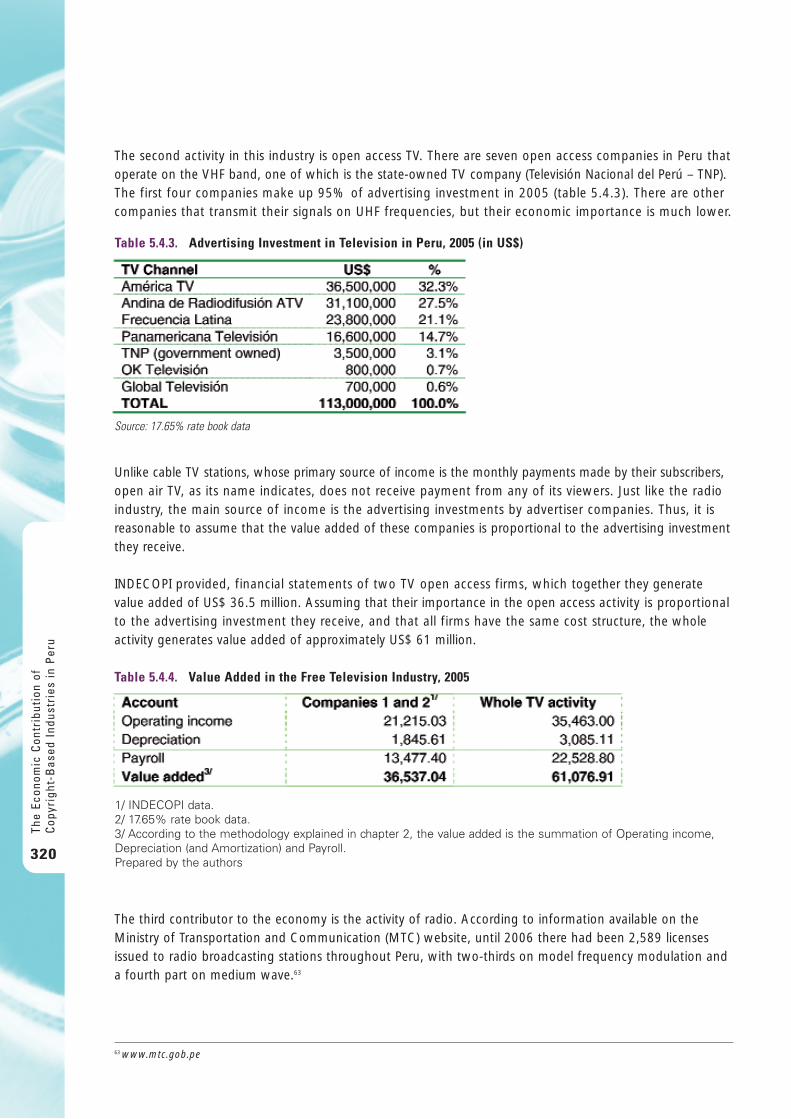
The second activity in this industry is open access TV. There are seven open access companies in Peru thatoperate on the VHF band, one of which is the state-owned TV company (Televisión Nacional del Perú – TNP).The first four companies make up 95% of advertising investment in 2005 (table 5.4.3). There are othercompanies that transmit their signals on UHF frequencies, but their economic importance is much lower.
Unlike cable TV stations, whose primary source of income is the monthly payments made by their subscribers,open air TV, as its name indicates, does not receive payment from any of its viewers. Just like the radioindustry, the main source of income is the advertising investments by advertiser companies. Thus, it isreasonable to assume that the value added of these companies is proportional to the advertising investmentthey receive.
INDECOPI provided, financial statements of two TV open access firms, which together they generatevalue added of US$ 36.5 million. Assuming that their importance in the open access activity is proportionalto the advertising investment they receive, and that all firms have the same cost structure, the wholeactivity generates value added of approximately US$ 61 million.
The third contributor to the economy is the activity of radio. According to information available on theMinistry of Transportation and Communication (MTC) website, until 2006 there had been 2,589 licensesissued to radio broadcasting stations throughout Peru, with two-thirds on model frequency modulation anda fourth part on medium wave.63
The
Econ
omic
Con
trib
utio
n of
Cop
yrig
ht-B
ased
Ind
ustr
ies
in P
eru
320
Table 5.4.3. Advertising Investment in Television in Peru, 2005 (in US$)
Source: 17.65% rate book data
Table 5.4.4. Value Added in the Free Television Industry, 2005
1/ INDECOPI data.2/ 17.65% rate book data.3/ According to the methodology explained in chapter 2, the value added is the summation of Operating income,Depreciation (and Amortization) and Payroll.Prepared by the authors
63 www.mtc.gob.pe
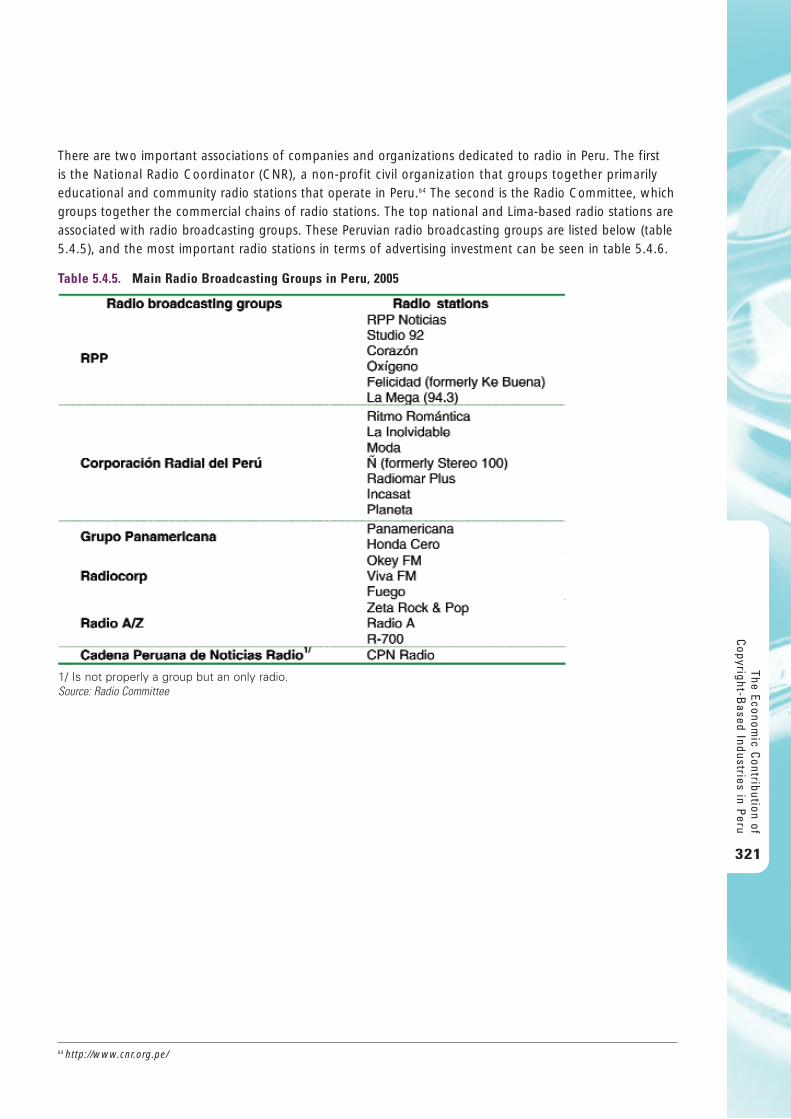
There are two important associations of companies and organizations dedicated to radio in Peru. The first is the National Radio Coordinator (CNR), a non-profit civil organization that groups together primarilyeducational and community radio stations that operate in Peru.64 The second is the Radio Committee, whichgroups together the commercial chains of radio stations. The top national and Lima-based radio stations areassociated with radio broadcasting groups. These Peruvian radio broadcasting groups are listed below (table5.4.5), and the most important radio stations in terms of advertising investment can be seen in table 5.4.6.
The Economic C
ontribution ofC
opyright-Based Industries in P
eru
321
64 http://www.cnr.org.pe/
Table 5.4.5. Main Radio Broadcasting Groups in Peru, 2005
1/ Is not properly a group but an only radio. Source: Radio Committee
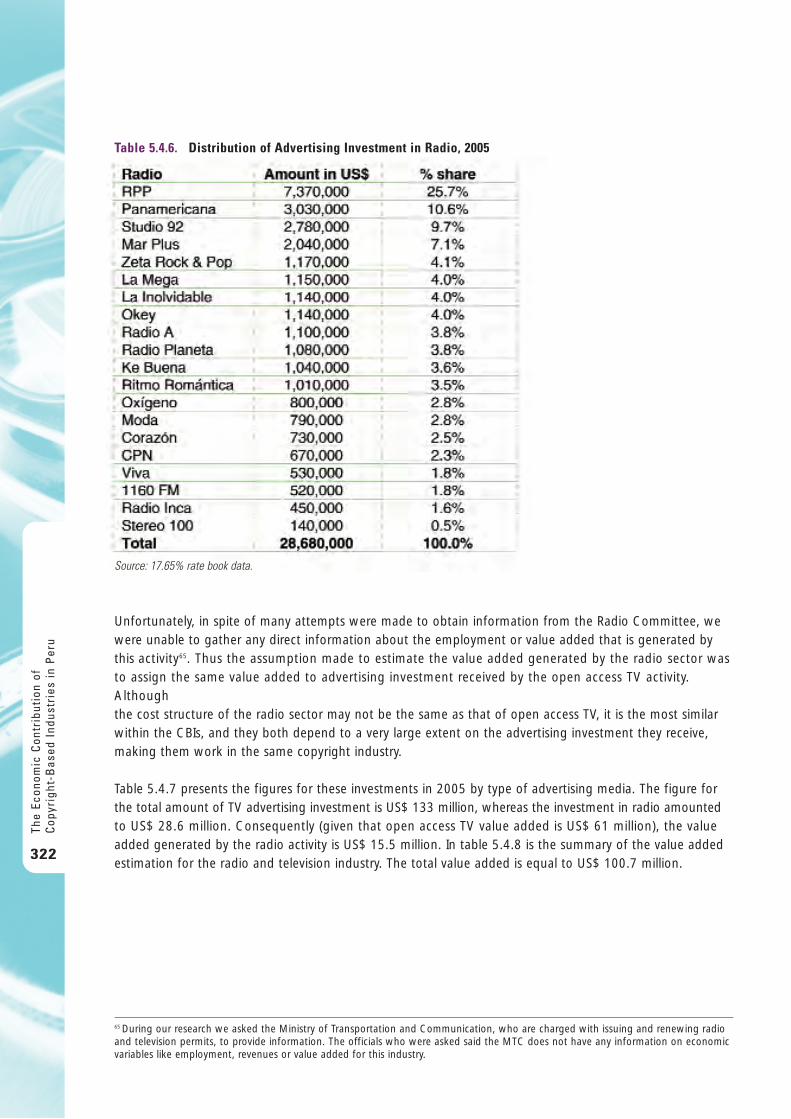
Unfortunately, in spite of many attempts were made to obtain information from the Radio Committee, wewere unable to gather any direct information about the employment or value added that is generated bythis activity65. Thus the assumption made to estimate the value added generated by the radio sector wasto assign the same value added to advertising investment received by the open access TV activity.Although the cost structure of the radio sector may not be the same as that of open access TV, it is the most similarwithin the CBIs, and they both depend to a very large extent on the advertising investment they receive,making them work in the same copyright industry.
Table 5.4.7 presents the figures for these investments in 2005 by type of advertising media. The figure forthe total amount of TV advertising investment is US$ 133 million, whereas the investment in radio amountedto US$ 28.6 million. Consequently (given that open access TV value added is US$ 61 million), the valueadded generated by the radio activity is US$ 15.5 million. In table 5.4.8 is the summary of the value addedestimation for the radio and television industry. The total value added is equal to US$ 100.7 million.
The
Econ
omic
Con
trib
utio
n of
Cop
yrig
ht-B
ased
Ind
ustr
ies
in P
eru
322
Table 5.4.6. Distribution of Advertising Investment in Radio, 2005
Source: 17.65% rate book data.
65 During our research we asked the Ministry of Transportation and Communication, who are charged with issuing and renewing radioand television permits, to provide information. The officials who were asked said the MTC does not have any information on economicvariables like employment, revenues or value added for this industry.
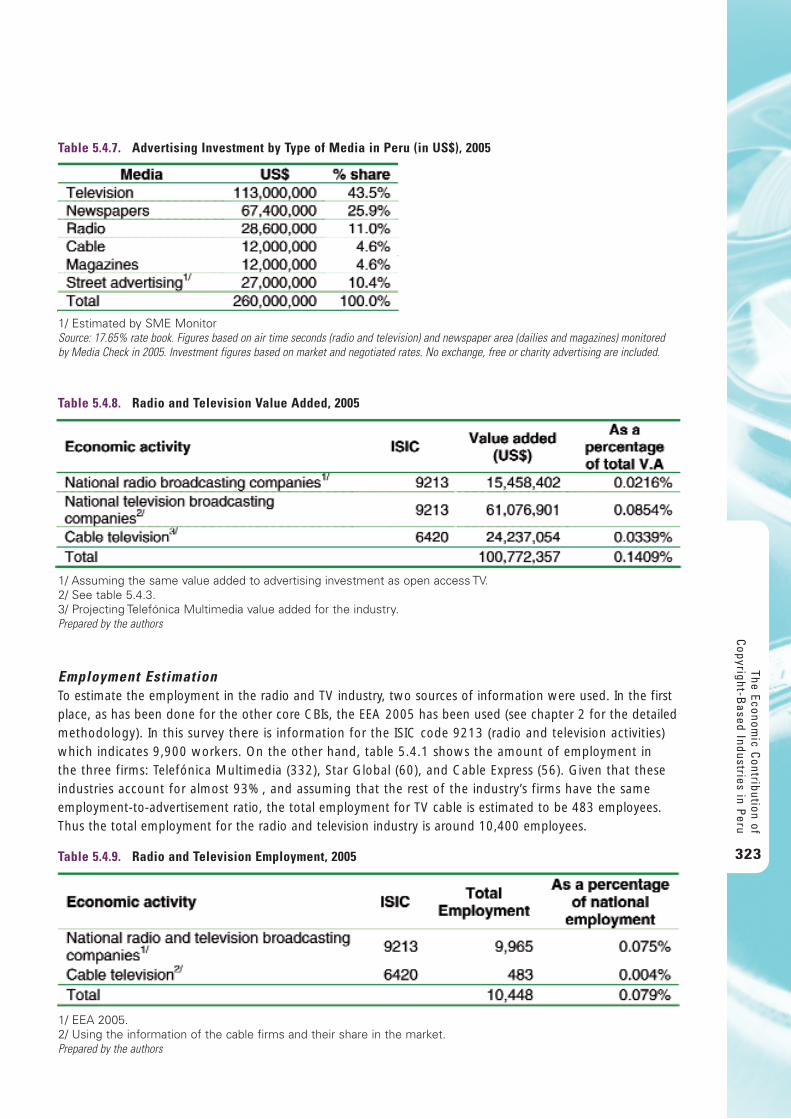
Employment EstimationTo estimate the employment in the radio and TV industry, two sources of information were used. In the firstplace, as has been done for the other core CBIs, the EEA 2005 has been used (see chapter 2 for the detailedmethodology). In this survey there is information for the ISIC code 9213 (radio and television activities)which indicates 9,900 workers. On the other hand, table 5.4.1 shows the amount of employment in the three firms: Telefónica Multimedia (332), Star Global (60), and Cable Express (56). Given that theseindustries account for almost 93%, and assuming that the rest of the industry’s firms have the sameemployment-to-advertisement ratio, the total employment for TV cable is estimated to be 483 employees.Thus the total employment for the radio and television industry is around 10,400 employees.
The Economic C
ontribution ofC
opyright-Based Industries in P
eru
323
Table 5.4.7. Advertising Investment by Type of Media in Peru (in US$), 2005
1/ Estimated by SME MonitorSource: 17.65% rate book. Figures based on air time seconds (radio and television) and newspaper area (dailies and magazines) monitoredby Media Check in 2005. Investment figures based on market and negotiated rates. No exchange, free or charity advertising are included.
Table 5.4.8. Radio and Television Value Added, 2005
1/ Assuming the same value added to advertising investment as open access TV.2/ See table 5.4.3.3/ Projecting Telefónica Multimedia value added for the industry.Prepared by the authors
Table 5.4.9. Radio and Television Employment, 2005
1/ EEA 2005.2/ Using the information of the cable firms and their share in the market.Prepared by the authors
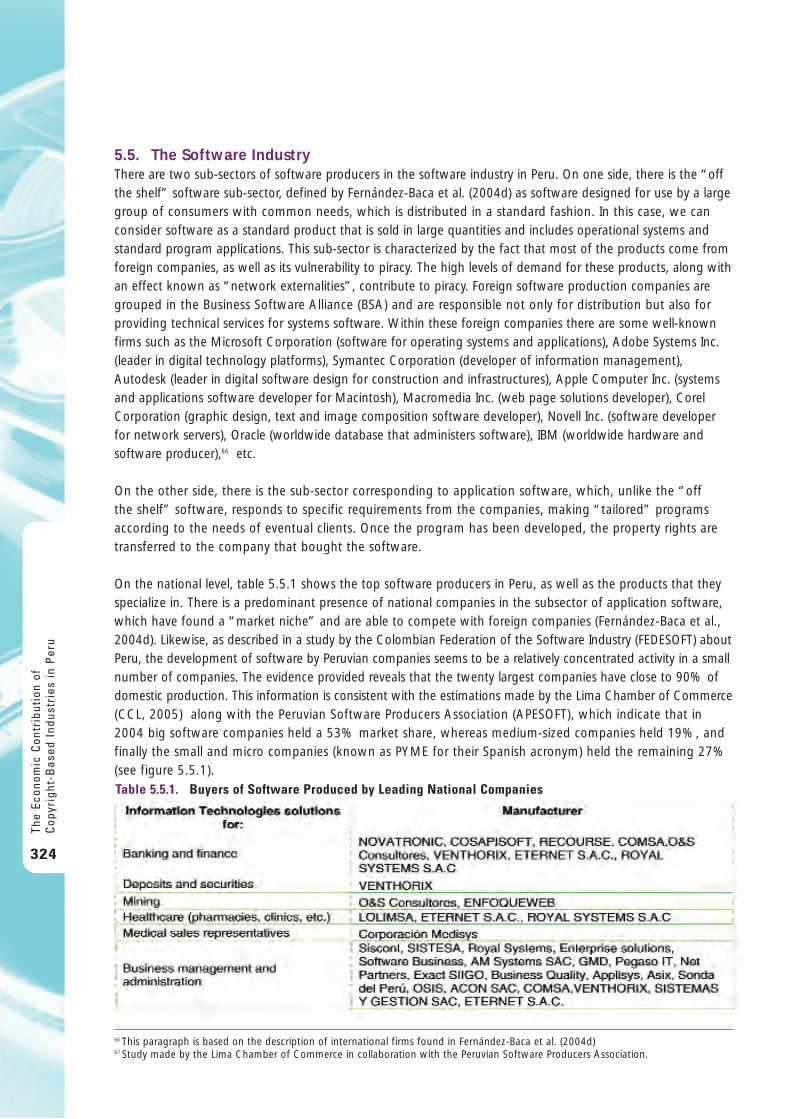
5.5. The Software IndustryThere are two sub-sectors of software producers in the software industry in Peru. On one side, there is the “offthe shelf” software sub-sector, defined by Fernández-Baca et al. (2004d) as software designed for use by a largegroup of consumers with common needs, which is distributed in a standard fashion. In this case, we canconsider software as a standard product that is sold in large quantities and includes operational systems andstandard program applications. This sub-sector is characterized by the fact that most of the products come fromforeign companies, as well as its vulnerability to piracy. The high levels of demand for these products, along withan effect known as “network externalities”, contribute to piracy. Foreign software production companies aregrouped in the Business Software Alliance (BSA) and are responsible not only for distribution but also forproviding technical services for systems software. Within these foreign companies there are some well-knownfirms such as the Microsoft Corporation (software for operating systems and applications), Adobe Systems Inc.(leader in digital technology platforms), Symantec Corporation (developer of information management),Autodesk (leader in digital software design for construction and infrastructures), Apple Computer Inc. (systemsand applications software developer for Macintosh), Macromedia Inc. (web page solutions developer), CorelCorporation (graphic design, text and image composition software developer), Novell Inc. (software developerfor network servers), Oracle (worldwide database that administers software), IBM (worldwide hardware andsoftware producer),66 etc.
On the other side, there is the sub-sector corresponding to application software, which, unlike the “off the shelf” software, responds to specific requirements from the companies, making “tailored” programsaccording to the needs of eventual clients. Once the program has been developed, the property rights aretransferred to the company that bought the software.
On the national level, table 5.5.1 shows the top software producers in Peru, as well as the products that theyspecialize in. There is a predominant presence of national companies in the subsector of application software,which have found a “market niche” and are able to compete with foreign companies (Fernández-Baca et al.,2004d). Likewise, as described in a study by the Colombian Federation of the Software Industry (FEDESOFT) aboutPeru, the development of software by Peruvian companies seems to be a relatively concentrated activity in a smallnumber of companies. The evidence provided reveals that the twenty largest companies have close to 90% ofdomestic production. This information is consistent with the estimations made by the Lima Chamber of Commerce(CCL, 2005) along with the Peruvian Software Producers Association (APESOFT), which indicate that in2004 big software companies held a 53% market share, whereas medium-sized companies held 19%, andfinally the small and micro companies (known as PYME for their Spanish acronym) held the remaining 27%(see figure 5.5.1).
The
Econ
omic
Con
trib
utio
n of
Cop
yrig
ht-B
ased
Ind
ustr
ies
in P
eru
324
66 This paragraph is based on the description of international firms found in Fernández-Baca et al. (2004d)67 Study made by the Lima Chamber of Commerce in collaboration with the Peruvian Software Producers Association.
Table 5.5.1. Buyers of Software Produced by Leading National Companies
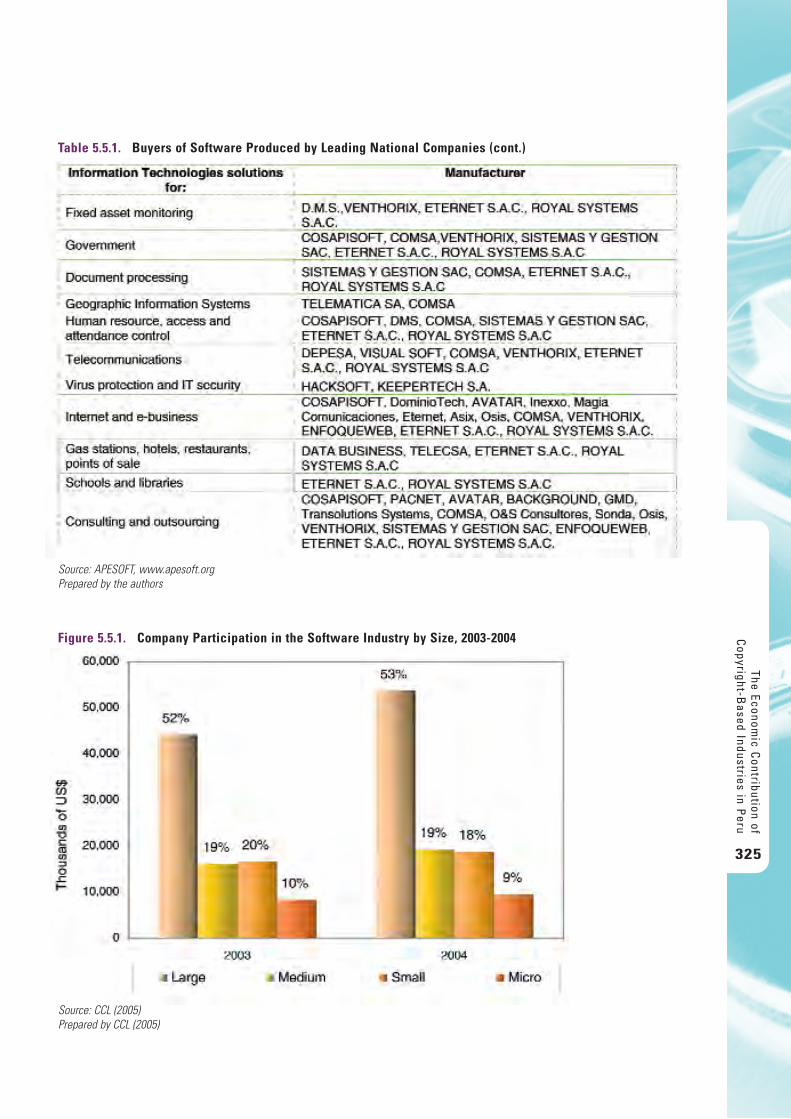
The Economic C
ontribution ofC
opyright-Based Industries in P
eru
325
Table 5.5.1. Buyers of Software Produced by Leading National Companies (cont.)
Source: APESOFT, www.apesoft.orgPrepared by the authors
Figure 5.5.1. Company Participation in the Software Industry by Size, 2003-2004
Source: CCL (2005)Prepared by CCL (2005)
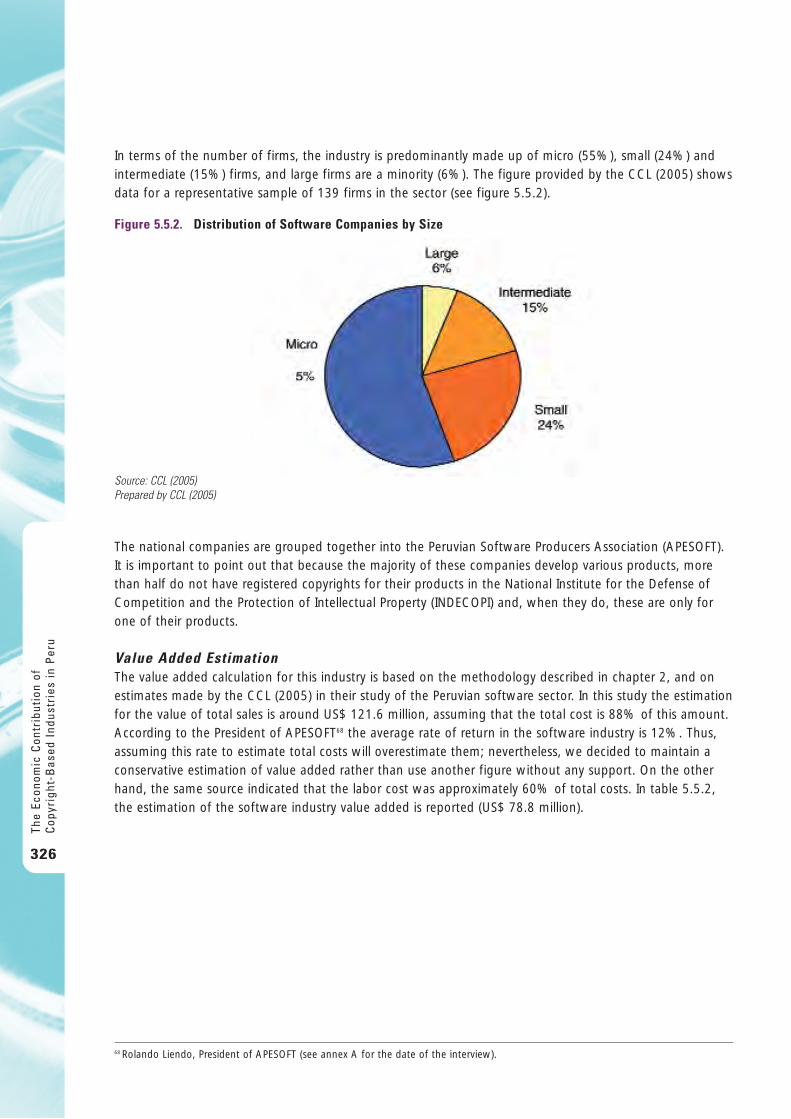
In terms of the number of firms, the industry is predominantly made up of micro (55%), small (24%) andintermediate (15%) firms, and large firms are a minority (6%). The figure provided by the CCL (2005) showsdata for a representative sample of 139 firms in the sector (see figure 5.5.2).
The national companies are grouped together into the Peruvian Software Producers Association (APESOFT).It is important to point out that because the majority of these companies develop various products, morethan half do not have registered copyrights for their products in the National Institute for the Defense ofCompetition and the Protection of Intellectual Property (INDECOPI) and, when they do, these are only forone of their products.
Value Added EstimationThe value added calculation for this industry is based on the methodology described in chapter 2, and onestimates made by the CCL (2005) in their study of the Peruvian software sector. In this study the estimationfor the value of total sales is around US$ 121.6 million, assuming that the total cost is 88% of this amount.According to the President of APESOFT68 the average rate of return in the software industry is 12%. Thus,assuming this rate to estimate total costs will overestimate them; nevertheless, we decided to maintain aconservative estimation of value added rather than use another figure without any support. On the otherhand, the same source indicated that the labor cost was approximately 60% of total costs. In table 5.5.2,the estimation of the software industry value added is reported (US$ 78.8 million).
The
Econ
omic
Con
trib
utio
n of
Cop
yrig
ht-B
ased
Ind
ustr
ies
in P
eru
326
Figure 5.5.2. Distribution of Software Companies by Size
Source: CCL (2005)Prepared by CCL (2005)
68 Rolando Liendo, President of APESOFT (see annex A for the date of the interview).
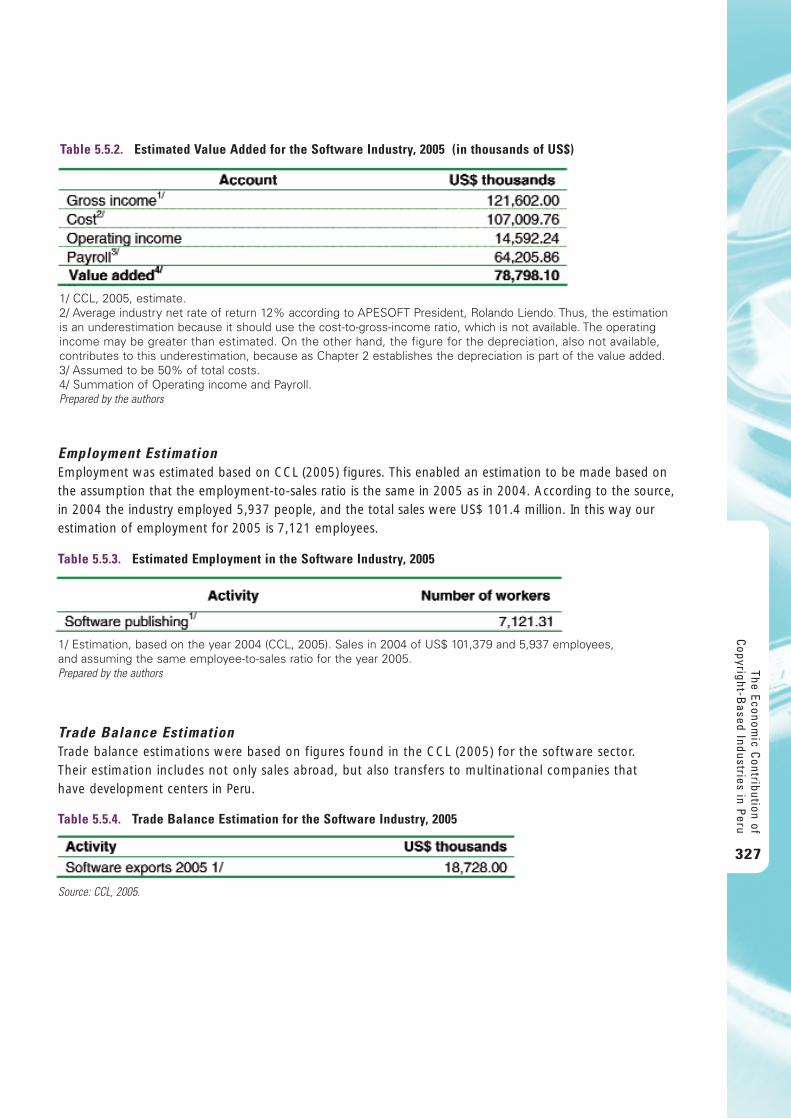
Employment EstimationEmployment was estimated based on CCL (2005) figures. This enabled an estimation to be made based onthe assumption that the employment-to-sales ratio is the same in 2005 as in 2004. According to the source,in 2004 the industry employed 5,937 people, and the total sales were US$ 101.4 million. In this way ourestimation of employment for 2005 is 7,121 employees.
Trade Balance EstimationTrade balance estimations were based on figures found in the CCL (2005) for the software sector. Their estimation includes not only sales abroad, but also transfers to multinational companies that have development centers in Peru.
The Economic C
ontribution ofC
opyright-Based Industries in P
eru
327
Table 5.5.2. Estimated Value Added for the Software Industry, 2005 (in thousands of US$)
1/ CCL, 2005, estimate.2/ Average industry net rate of return 12% according to APESOFT President, Rolando Liendo. Thus, the estimation is an underestimation because it should use the cost-to-gross-income ratio, which is not available. The operatingincome may be greater than estimated. On the other hand, the figure for the depreciation, also not available,contributes to this underestimation, because as Chapter 2 establishes the depreciation is part of the value added.3/ Assumed to be 50% of total costs. 4/ Summation of Operating income and Payroll. Prepared by the authors
Table 5.5.3. Estimated Employment in the Software Industry, 2005
1/ Estimation, based on the year 2004 (CCL, 2005). Sales in 2004 of US$ 101,379 and 5,937 employees, and assuming the same employee-to-sales ratio for the year 2005. Prepared by the authors
Table 5.5.4. Trade Balance Estimation for the Software Industry, 2005
Source: CCL, 2005.
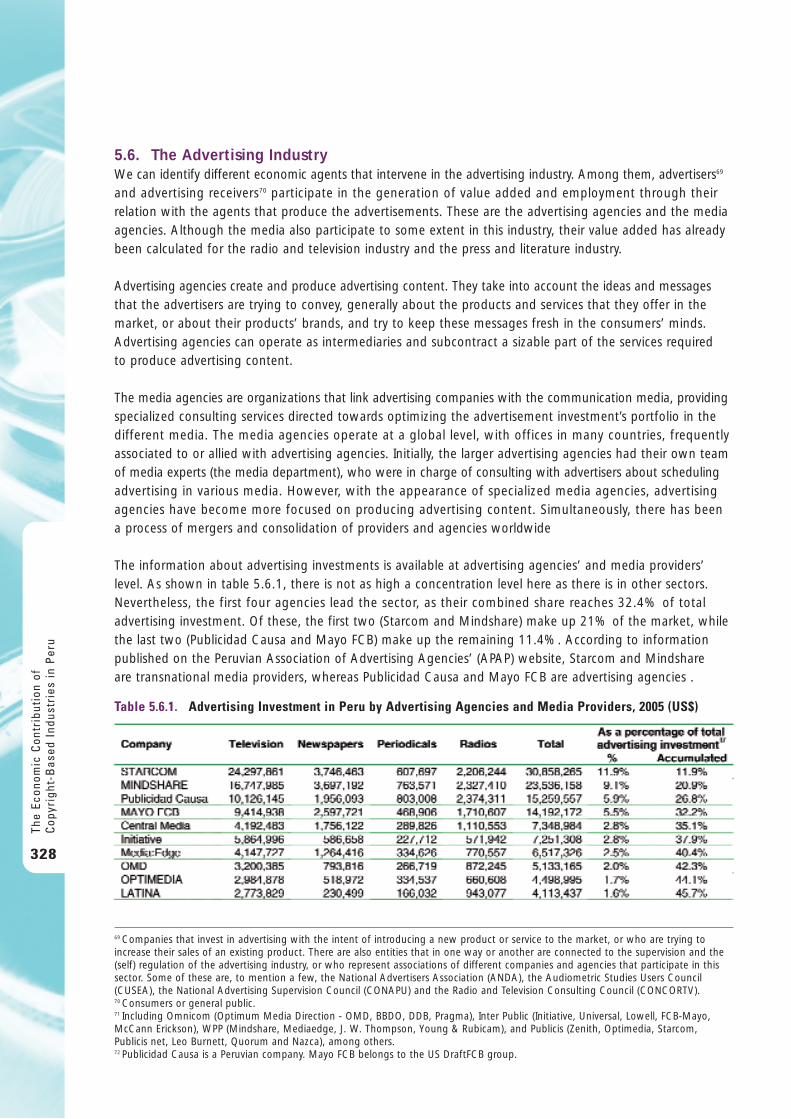
5.6. The Advertising IndustryWe can identify different economic agents that intervene in the advertising industry. Among them, advertisers69
and advertising receivers70 participate in the generation of value added and employment through theirrelation with the agents that produce the advertisements. These are the advertising agencies and the mediaagencies. Although the media also participate to some extent in this industry, their value added has alreadybeen calculated for the radio and television industry and the press and literature industry.
Advertising agencies create and produce advertising content. They take into account the ideas and messagesthat the advertisers are trying to convey, generally about the products and services that they offer in themarket, or about their products’ brands, and try to keep these messages fresh in the consumers’ minds.Advertising agencies can operate as intermediaries and subcontract a sizable part of the services required to produce advertising content.
The media agencies are organizations that link advertising companies with the communication media, providingspecialized consulting services directed towards optimizing the advertisement investment’s portfolio in thedifferent media. The media agencies operate at a global level, with offices in many countries, frequentlyassociated to or allied with advertising agencies. Initially, the larger advertising agencies had their own teamof media experts (the media department), who were in charge of consulting with advertisers about schedulingadvertising in various media. However, with the appearance of specialized media agencies, advertisingagencies have become more focused on producing advertising content. Simultaneously, there has beena process of mergers and consolidation of providers and agencies worldwide
The information about advertising investments is available at advertising agencies’ and media providers’level. As shown in table 5.6.1, there is not as high a concentration level here as there is in other sectors.Nevertheless, the first four agencies lead the sector, as their combined share reaches 32.4% of totaladvertising investment. Of these, the first two (Starcom and Mindshare) make up 21% of the market, whilethe last two (Publicidad Causa and Mayo FCB) make up the remaining 11.4%. According to informationpublished on the Peruvian Association of Advertising Agencies’ (APAP) website, Starcom and Mindshare are transnational media providers, whereas Publicidad Causa and Mayo FCB are advertising agencies .
The
Econ
omic
Con
trib
utio
n of
Cop
yrig
ht-B
ased
Ind
ustr
ies
in P
eru
328
69 Companies that invest in advertising with the intent of introducing a new product or service to the market, or who are trying toincrease their sales of an existing product. There are also entities that in one way or another are connected to the supervision and the(self) regulation of the advertising industry, or who represent associations of different companies and agencies that participate in thissector. Some of these are, to mention a few, the National Advertisers Association (ANDA), the Audiometric Studies Users Council(CUSEA), the National Advertising Supervision Council (CONAPU) and the Radio and Television Consulting Council (CONCORTV). 70 Consumers or general public.71 Including Omnicom (Optimum Media Direction - OMD, BBDO, DDB, Pragma), Inter Public (Initiative, Universal, Lowell, FCB-Mayo,McCann Erickson), WPP (Mindshare, Mediaedge, J. W. Thompson, Young & Rubicam), and Publicis (Zenith, Optimedia, Starcom,Publicis net, Leo Burnett, Quorum and Nazca), among others.72 Publicidad Causa is a Peruvian company. Mayo FCB belongs to the US DraftFCB group.
Table 5.6.1. Advertising Investment in Peru by Advertising Agencies and Media Providers, 2005 (US$)
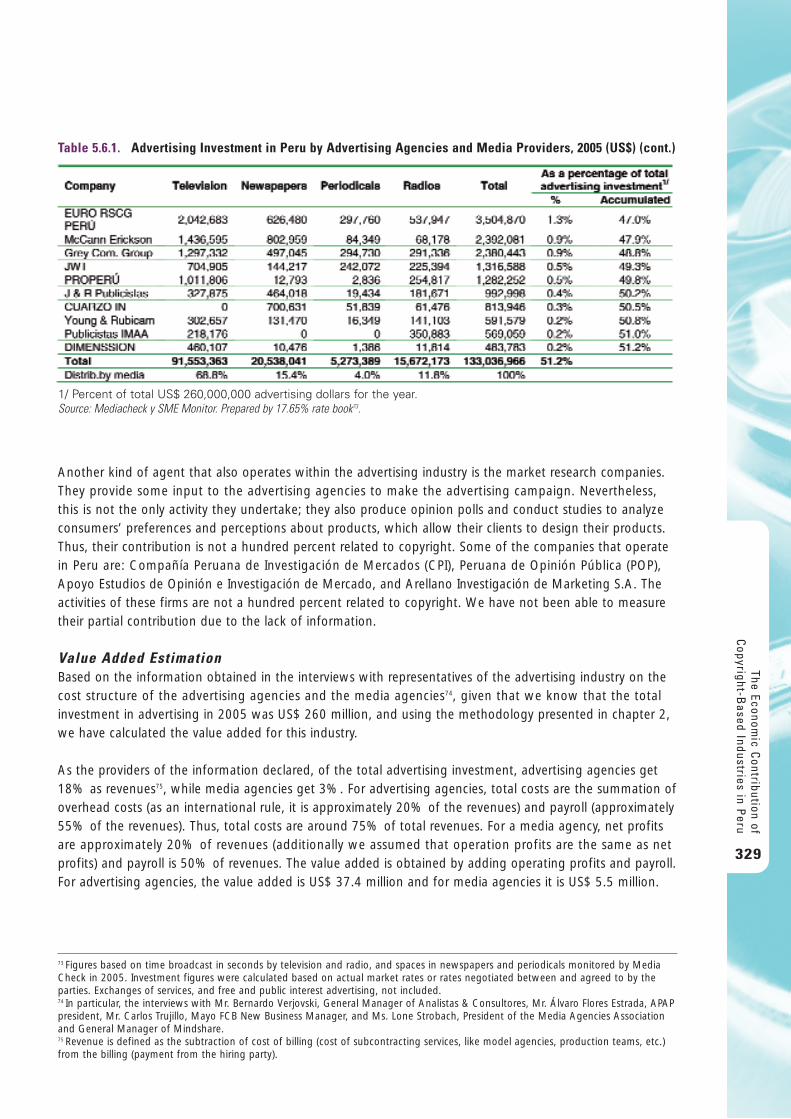
Another kind of agent that also operates within the advertising industry is the market research companies.They provide some input to the advertising agencies to make the advertising campaign. Nevertheless,this is not the only activity they undertake; they also produce opinion polls and conduct studies to analyzeconsumers’ preferences and perceptions about products, which allow their clients to design their products.Thus, their contribution is not a hundred percent related to copyright. Some of the companies that operatein Peru are: Compañía Peruana de Investigación de Mercados (CPI), Peruana de Opinión Pública (POP),Apoyo Estudios de Opinión e Investigación de Mercado, and Arellano Investigación de Marketing S.A. Theactivities of these firms are not a hundred percent related to copyright. We have not been able to measuretheir partial contribution due to the lack of information.
Value Added EstimationBased on the information obtained in the interviews with representatives of the advertising industry on thecost structure of the advertising agencies and the media agencies74, given that we know that the totalinvestment in advertising in 2005 was US$ 260 million, and using the methodology presented in chapter 2,we have calculated the value added for this industry.
As the providers of the information declared, of the total advertising investment, advertising agencies get18% as revenues75, while media agencies get 3%. For advertising agencies, total costs are the summation ofoverhead costs (as an international rule, it is approximately 20% of the revenues) and payroll (approximately55% of the revenues). Thus, total costs are around 75% of total revenues. For a media agency, net profitsare approximately 20% of revenues (additionally we assumed that operation profits are the same as netprofits) and payroll is 50% of revenues. The value added is obtained by adding operating profits and payroll.For advertising agencies, the value added is US$ 37.4 million and for media agencies it is US$ 5.5 million.
The Economic C
ontribution ofC
opyright-Based Industries in P
eru
329
Table 5.6.1. Advertising Investment in Peru by Advertising Agencies and Media Providers, 2005 (US$) (cont.)
1/ Percent of total US$ 260,000,000 advertising dollars for the year.Source: Mediacheck y SME Monitor. Prepared by 17.65% rate book73.
73 Figures based on time broadcast in seconds by television and radio, and spaces in newspapers and periodicals monitored by MediaCheck in 2005. Investment figures were calculated based on actual market rates or rates negotiated between and agreed to by theparties. Exchanges of services, and free and public interest advertising, not included. 74 In particular, the interviews with Mr. Bernardo Verjovski, General Manager of Analistas & Consultores, Mr. Álvaro Flores Estrada, APAPpresident, Mr. Carlos Trujillo, Mayo FCB New Business Manager, and Ms. Lone Strobach, President of the Media Agencies Associationand General Manager of Mindshare.75 Revenue is defined as the subtraction of cost of billing (cost of subcontracting services, like model agencies, production teams, etc.)from the billing (payment from the hiring party).
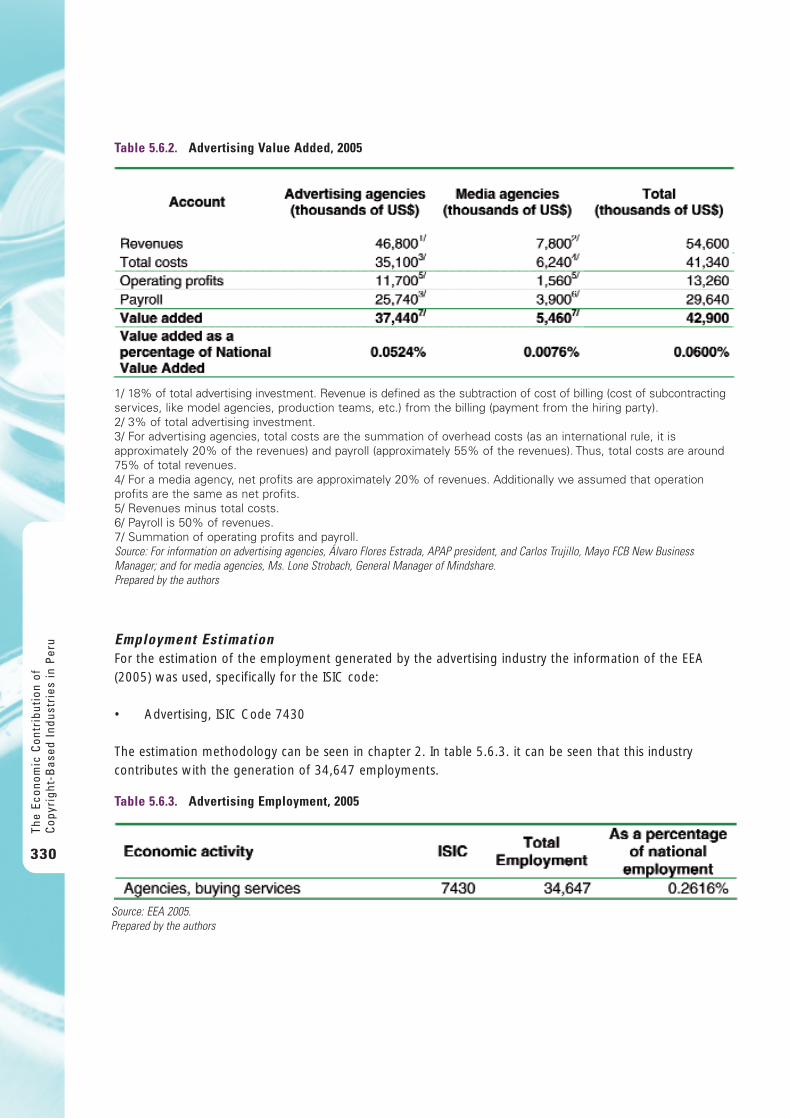
Employment EstimationFor the estimation of the employment generated by the advertising industry the information of the EEA(2005) was used, specifically for the ISIC code:
• Advertising, ISIC Code 7430
The estimation methodology can be seen in chapter 2. In table 5.6.3. it can be seen that this industrycontributes with the generation of 34,647 employments.
The
Econ
omic
Con
trib
utio
n of
Cop
yrig
ht-B
ased
Ind
ustr
ies
in P
eru
330
Table 5.6.2. Advertising Value Added, 2005
1/ 18% of total advertising investment. Revenue is defined as the subtraction of cost of billing (cost of subcontractingservices, like model agencies, production teams, etc.) from the billing (payment from the hiring party).2/ 3% of total advertising investment. 3/ For advertising agencies, total costs are the summation of overhead costs (as an international rule, it isapproximately 20% of the revenues) and payroll (approximately 55% of the revenues). Thus, total costs are around75% of total revenues.4/ For a media agency, net profits are approximately 20% of revenues. Additionally we assumed that operationprofits are the same as net profits. 5/ Revenues minus total costs. 6/ Payroll is 50% of revenues. 7/ Summation of operating profits and payroll. Source: For information on advertising agencies, Álvaro Flores Estrada, APAP president, and Carlos Trujillo, Mayo FCB New BusinessManager; and for media agencies, Ms. Lone Strobach, General Manager of Mindshare. Prepared by the authors
Table 5.6.3. Advertising Employment, 2005
Source: EEA 2005.Prepared by the authors
5.7. The Copyright Collecting SocietiesCopyright Collecting Societies are an essential part of the core copyright-based industries because theycontribute substantially to the process that sustains the functioning of the system; they are the link betweenthe copyright owners (the creators)76 and the users (Tavera and Oré, 2006). The Copyright Collecting Societiesare non-profit institutions dedicated to collecting, administrating and distributing funds to their associates.
The five administration societies that operate in the country are:
• ANAIE: National Association of Interpretive Artists and PerformersAsociación Nacional de Artistas, Intérpretes y Ejecutantes
• APDAYC: Peruvian Association of Authors and ComposersAsociación Peruana de Autores y Compositores
• APSAV: Peruvian Association of Visual Artists Asociación Peruana de Artistas Visuales
• EGEDA: Audio-visual Producers’ Rights Management Association Entidad de Gestión de Derechos de los Productores
• UNIMPRO: Peruvian Union of Phonographic Producers Unión Peruana de Productores Fonográficos
National Association of Interpretive Artists and Performers (ANAIE)77
The National Association of Interpretive Artists and Performers, ANAIE, primarily operates in relation to theaudiovisual and recording industries. Created in 1993, it administrates the patrimonial and moral rights ofperforming artists that belong to the association, and collects the royalties for the public use of their audiovisualor recorded works in relation to the secondary uses of recordings (i.e. for commercials, whether they be forpublic or private use) both within the country and abroad. This international reach was achieved throughrepresentation contracts with its counterpart associations abroad (including Colombia, Venezuela, Chile,Bolivia, Ecuador, Brazil, Uruguay, Mexico, France, and Italy). It also authorizes public broadcasting, copying,direct or indirect reproduction of audiovisual products of its members, and collects royalties correspondingto events such as those performed in dance halls and shows, movie theaters, and on free, cable or satellitetelevision broadcasts, and for the use of recordings in karaoke and other clubs, bars, hotels, hospitals,shopping centers and other public locations. Members associated with the ANAIE include a wide spectrumof artists, among them musicians, singers, actors, dancers, choreographers, orchestra conductors, andtheater, television and film directors.
The relationship between the ANAIE and UNIMPRO establishes that the secondary royalty payments forrecords are shared by artists and record producers. Copyright Office – INDECOPI (ODA) has established thatUNIMPRO shall assume its royalty collection and administration responsibilities. In 2005, a total of 1,198artists collected royalties.
Peruvian Association of Authors and Composers (APDAYC)The Peruvian Association of Authors and Composers (APDAYC) is a collective management society dedicated to collecting copyright royalties for authors and composers of music in Peru. The APDAYC has 16 offices inLima and 23 offices in the provinces, and is the only society authorized by the Peruvian State to collect anddistribute the royalties to authors and composers whenever their works are used and divulged78.
The Economic C
ontribution ofC
opyright-Based Industries in P
eru
331
76 They group together copyright owners, i.e. holders of rights pertaining to creators of artistic or literary works, and owners ofconnected rights, i.e. moral rights.77 Registered under Card 16260 in the Lima and Callao Company Registry, and authorized as a Collective Management Society byResolution No. 0047-2001/ODA-INDECOPI of INDECOPI’s Copyright Bureau, and registered in that Bureau’s registry as well.78 http://www.apsav.org.pe/principal.htm
Founded in 1952, it works on behalf of more than 4,000 authors and composers in Peru and represents allauthors of the world through the International Confederation of Societies of Authors and Composers (CISAC),which, along with other similar institutions, administrates 98% of worldwide repertoires through 36 mutualinternational signed agreements.
Peruvian Association of Visual Artists (APSAV)79
The Peruvian Association of Visual Artists (APSAV) is a collecting society that, since 2004 (four years after itscreation), has been in charge of monitoring the usage of its members’ works, as well as collecting anddistributing royalties. Also, it is in charge of granting licenses for reproduction, distribution and publicbroadcasting of works, as well as the collection and distribution of royalties for copyright and related rightsfrom its audiovisual associates in the industry, on both a national and international level. Likewise, it oversees the percentage of re-sales for original works. The number of its associates in 2005 totaled 127.
The Association also oversees the creative field (which ranges from drawings, collages, comics, andelectronic art to sculpture, photography, carved installations, interventions, paintings and videoart)developed by artists of still and moving visual works independently of the works’ material support. It administrates in a collective form the rights of 40,000 visual artists in the world using agreements with Spain, France, Germany, Mexico, Belgium, USA, Chile, and Venezuela, among others80.
Audio-visual Producers’ Rights Management Association (EGEDA)81
The Audio-visual Producers’ Rights Management Association (EGEDA), through its Latin America branchEGEDA Peru, is the collective administration entity that, since its creation in 2002, has represented anddefined the intellectual property rights for audiovisual producers and recorders, as well as rights-holders.These rights are described in the Copyright Law through Legislative Decree 822. EGEDA represents morethan 8,000 producers at a worldwide level .
EGEDA objective is to ensure the protection of these rights and fight piracy and fraud in the audiovisualsector, as well as to promote the audiovisual sector of Peru. Also, it is responsible for the rights pertaining toadministrators, such as retransmitted versions, public broadcasting of works and audiovisual recordings, andcompensation for private copies, as well as the administration and protection of all other rights correspondingto the audiovisual producers described in the Copyright Law.
Peruvian Union of Phonographic Producers (UNIMPRO)83
The Peruvian Record Producers’ Union (UNIMPRO) groups together natural or incorporated record producers(producers of musical recordings) and performing artists for the administration of their rights. The administrationof authors’ and producers’ rights is one of the union’s responsibilities . Among its members are: Sony MusicEntertainment Perú S.A., Distribuidora y Ventas S.A., Universal Music Perú S.A., Producciones IEMPSA S.A.,Wika Discos S.A., Rosita MusicaL Service & Production E.I.R.L., Mega Entertainment E.I.R.L., and BMG Ariolade Colombia Sucursal Peruana S.A.
The
Econ
omic
Con
trib
utio
n of
Cop
yrig
ht-B
ased
Ind
ustr
ies
in P
eru
332
79 It is registered as a civil non-profit organization in the Public Registry’s Docket No. 11008511 and authorized as a collectivemanagement society by Resolution No. 00070-1999-ODA/INDECOPI, issued by the Copyright Bureau at INDECOPI.80 http://www.apsav.org.pe/principal.htm81 It was authorized by Resolution No. 072-2002-ODA-INDECOPI dated June 11, 2002, published in the Regulations Booklet of ElPeruano official gazette that year.82 http://www.egeda.com.pe/ 83 Established by Resolution. No. 172-2001/ODA-INDECOPI dated 19.06.2001, published August 1, 2001, in "El Peruano" official gazette.84 http://www.unimpro.org/index2.htm
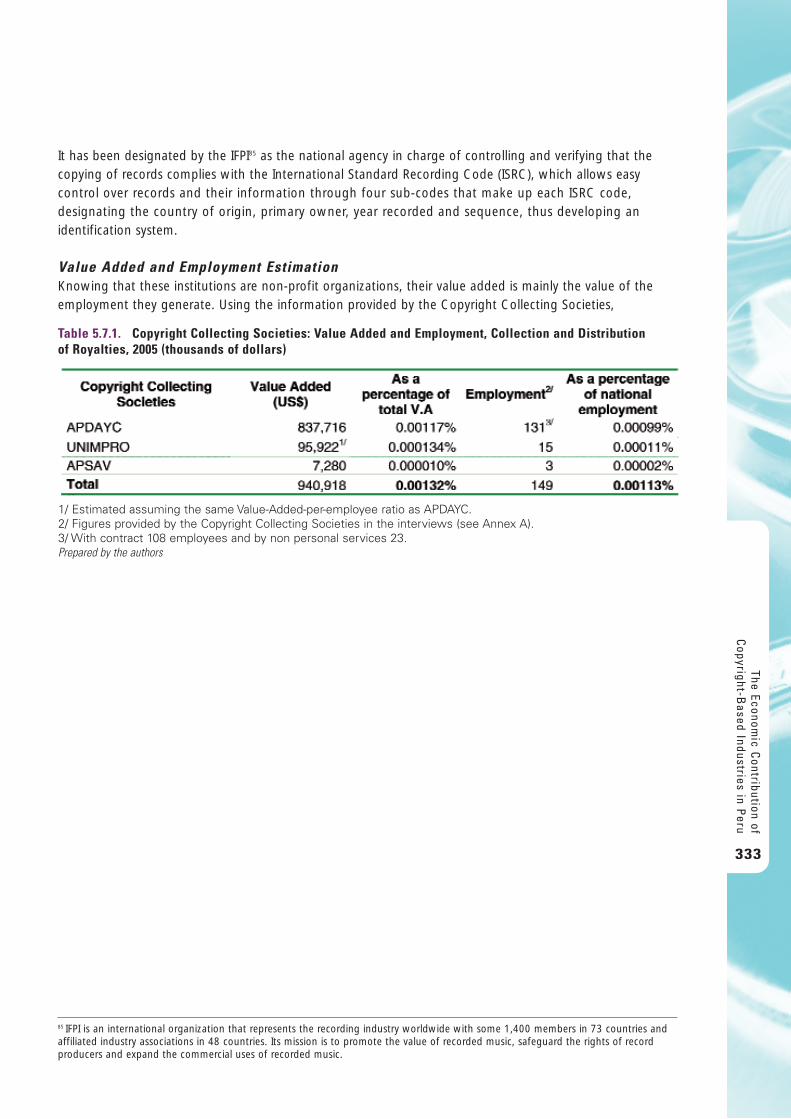
It has been designated by the IFPI85 as the national agency in charge of controlling and verifying that thecopying of records complies with the International Standard Recording Code (ISRC), which allows easycontrol over records and their information through four sub-codes that make up each ISRC code,designating the country of origin, primary owner, year recorded and sequence, thus developing anidentification system.
Value Added and Employment EstimationKnowing that these institutions are non-profit organizations, their value added is mainly the value of theemployment they generate. Using the information provided by the Copyright Collecting Societies,
The Economic C
ontribution ofC
opyright-Based Industries in P
eru
333
85 IFPI is an international organization that represents the recording industry worldwide with some 1,400 members in 73 countries andaffiliated industry associations in 48 countries. Its mission is to promote the value of recorded music, safeguard the rights of recordproducers and expand the commercial uses of recorded music.
Table 5.7.1. Copyright Collecting Societies: Value Added and Employment, Collection and Distribution of Royalties, 2005 (thousands of dollars)
1/ Estimated assuming the same Value-Added-per-employee ratio as APDAYC. 2/ Figures provided by the Copyright Collecting Societies in the interviews (see Annex A). 3/ With contract 108 employees and by non personal services 23.Prepared by the authors
6 . C o n c l u s i o n s a n d R e c o m m e n d a t i o n s
The copyright-based industries are an important component of Peru’s economy. Their contribution to valueadded has been calculated at 2.6%, which represents a bigger percentage than finance and electricity-and-water. Considering its status as a developing nation, Peru’s CBI contribution to value added may look small,but taking into account the context it is still significant.
The contribution to employment is 4.5% of total employment. While almost duplicating the contribution tovalue added, the employment share has a large component of dependent or non-dedicated CBIs. PeruvianCBIs account for a larger share of employment than Australian or Jamaican CBIs, with figures similar toEastern European nations like Latvia and Croatia.
Regarding foreign trade, CBIs represent 0.8% of Peru’s exports and 5.4% of its imports, making this countrya net importer of intellectual property works, services and related goods and services. While the coreindustries are the most significant source of exports, with over 50% of the total, the predominance ofinterdependent industries’ imports indicates a reliance on foreign-made finished goods and supplies.
We consider that the results of the estimation are a lower bound of the contribution of CBIs to Peru'seconomy. The rationale for this conclusion lies in the fact that some activities are underestimated and othersare not estimated at all due to the lack of information. Indeed, there are some specific activities for whichthere is no information available, including data on micro enterprises, self-employment and outsourcingemployment. From this perspective, it is possible to conclude that these estimations underrate theperformance of CBIs with regard to value added, employment and foreign trade.
The study only provides a limited estimate of CBIs’ contribution to Peru’s economy as it based on availabledata on the concentration and distribution of the CBIs: while, as with most of Peru's economy, there is aheavy concentration of economic agents in Lima, the capital city, there are important activities and thussignificant economic contributions that players outside of Lima manage to make; nevertheless, theinformation about them is scarce and unreliable.
While we are confident on the pertinence and strength of the methodology used for this report, there isinsufficient information regarding the cost and earnings structures of the core industries, including press and literature, music, cinema and television. This is another reason why we consider that our measurementshould be refined with better data collection and fine-tuning of the model used in Peru.
The recent legislative changes will be useful in obtaining adequate copyright and neighboring rights protectionin Peru. Not only have penalties for cases of circumvention of technological protection measures andinfringements related to the alteration of rights management information been established, but changes tothe Criminal Code have been incorporated and provisions for the implementation of border measures havebeen issued. Similarly, INDECOPI has been institutionally strengthened and additional faculties have beengranted to the judicial authorities. However, to obtain better results in combating piracy, the administrativeand judicial authorities should have more resources and people should be educated about respectingintellectual property.
The
Econ
omic
Con
trib
utio
n of
Cop
yrig
ht-B
ased
Ind
ustr
ies
in P
eru
334
RecommendationsIn this study we have not been able to present the evolution and trends of the contribution of CBI toPeru's economy, but just a picture of their size in a given year. Therefor, it is recommend as a first step toconstruct input-output tables whereby CBIs are specifically included. Also, to improve data collection, it isrecommended that surveys of CBIs’ micro enterprises are carried out, due to their significance to thePeruvian economy, with a focus on employment generation given that a number of CBI activities tend tobe labor intensive.
All data collection efforts should pay particular attention to CBI economic activities which are locatedoutside Lima. It is necessary to conduct studies on emerging regional economic agents, particularly in themedia and printing activities, to ascertain whether the models based on Lima firms are reliable and relevant.
We consider that it is crucial to estimate the economic contribution of CBIs for the years to come, in orderto have a clearer picture of the development of these activities. International evidence suggests that theaverage trend is increasing. What is the expected evolution of the economic contribution of the CBIs indeveloping countries, specifically in Peru, in terms of value added, employment, exports and imports? Ashas been mentioned, Peru is a growing, emerging economy, with a growth rate of 9% for 2007. In thiscontext it is logical to suggest that CBIs will have an increasing importance in the generation of value addedfor the economy, given their role not only in producing final goods and services but also in being a criticalfactor of production, namely knowledge. With this information we may be able to establish the effects ofpublic policies like enforcement of IPRs on the economic contribution of CBIs.
Along these lines, it may be necessary to estimate the copyright factors for the Peruvian economy in orderto obtain more accurate estimations of the contribution of partial and non-dedicated CBIs. In order toachieve these results, direct cooperation, coordination and the exploitation of synergies among the differentstakeholders and official institutions in charge of promotion and protection of CBIs and intellectual propertyis crucial importance. Also, the role of an international institution such as the World Intellectual PropertyOrganization (WIPO) of the United Nations, which has the expertise in working out these kinds of processes,is a key issue.
Notwithstanding its limitations, the dissemination of this report, especially among stakeholders, opinionleaders, officials and policymakers, will stimulate discussion and help foster the understanding of therole that copyright-based industries are playing in the economic development. It would be advisable todesign dissemination events for specific industries, to discuss sector-specific conclusions and policy recommendations.
Further research is required on the contribution of emerging markets, including independent music production,performance and recording of Andean music, tropical-Andean and tropical music, and "youth rock", aswell as independent publishing, short-form movies, documentaries and similar productions in digitalformats, the garment industry, photography and illustration, theatrical productions, cartoonists and otherless-well-known activities.
Finally, it is important to underscore the promotion and protection of intellectual rights as a key avenue fordeveloping each specific industry and stimulating the investments by the many agents involved in these activities.
The Economic C
ontribution ofC
opyright-Based Industries in P
eru
335
R e f e r e n c e s
Antonioli, Dante (2006). "El libro en el Perú: evolución y diagnóstico, 1995-2005". PROMOLIBRO. Lima. 135 pp.
Asociación Peruana de Autores y Compositores – APDAYC (2005) Memoria 2005. Lima: APDAYC.
Asociación Peruana de Productores de Software - APESOFT (2006) Industria del Software en el Perú y la Propiedad Intelectual: Situación Actual y Perspectivas. PowerPoint version.
Apoyo Opinión y Mercado (2005), IGM Actitudes hacia la prensa escrita, Lima: Apoyo.
Biblioteca Nacional del Perú - BNP (2005), Bibliografía Peruana, Lima: BNP.
Cámara de Comercio de Lima – CCL, Programa de Apoyo a la Competitividad de la Industria del Software;APESOFT (2005) Perfil de la Industria Peruana De Software 2005. Lima. 45pp.
Cámara Peruana del Libro – CPL (no date) Estadísticas del Libro en el Perú. Available in:www.cpl.org.pe/estadistica/bajar3.php?id_leyestadistica=25D17Z37Z
Cámara Peruana del Libro – CPL (2005a) La piratería editorial y los determinantes de su demanda. Informe. CPL.
Cámara Peruana del Libro – CPL (2005b) Una aproximación al mercado informal de la industria pirataeditorial. Informe. CPL.
Cámara Peruana del Libro – CPL (2006) Padrón de Asociados Diciembre 2006.
FEDESOFT (no date) La Industria del Software en Perú: Análisis de Mercado y Estratégico Sectorial. Availablein: http://www.proexport.com.co/VBeContent/servicios/NewsDetail.asp?ID=1457&IDCompany=12
Fernández-Baca, Jorge, Gustavo León y León, Janice Seinfeld and Ylva Villavicencio (2004a). Informe FinalSobre La Piratería en la Industria del Libro en el Perú. Proyecto Crecer. Lima: Proyecto CRECER.
Fernández-Baca, Jorge, Gustavo León y León, Janice Seinfeld and Ylva Villavicencio (2004b), Informe finalsobre la piratería en la industria de fonogramas en el Perú, Lima: Proyecto CRECER.
Fernández-Baca, Jorge, Gustavo León y León, Janice Seinfeld and Ylva Villavicencio (2004c), Informe finalsobre la piratería en la industria de películas y videos en el Perú, Lima: Proyecto CRECER.
Fernández-Baca, Jorge, Gustavo León y León, Janice Seinfeld and Ylva Villavicencio (2004d), Informe finalsobre la piratería en la industria de software en el Perú, Lima: Proyecto CRECER.
International Intellectual Property Alliance - IIPA (2006) Special 301 Report Peru. Available athttp://www.iipa.com/rbc/2006/2006SPEC301PERU.pdf
International Intellectual Property Alliance - IIPA (2007) Special 301 Report Peru. Available athttp://www.iipa.com/rbc/2007/2007SPEC301PERU.pdf
The
Econ
omic
Con
trib
utio
n of
Cop
yrig
ht-B
ased
Ind
ustr
ies
in P
eru
336
INDECOPI (2004), La Industria Fonográfica y la Piratería en el Mercado Peruano 1999-2003, Documento de Discusión No 03-2004/GEE. Lima: Gerencia de Estudios Económicos-INDECOPI.
Instituto de Investigación de la Escuela Profesional de Turismo y Hotelería de la Universidad San Martín de Porres – IDI-EPTH-USMP (2005), El impacto económico de la cultura en Perú, Bogotá: Convenio Andrés Bello.
Márquez-Mees, Victoria, Mariano Ruiz Funes and Berenice Yaber (2006) The economic contribution of copyright-based industries in Mexico. Manuscript. Prepared for WIPO.
Organismo Supervisor de Inversión Privada en Telecomunicaciones – OSIPTEL (2002). “Situación del Mercadode Televisión por cable”. Lima: OSIPTEL.
Superintendencia Nacional de Aduanas - SUNAD (2005a) Anuario Estadístico, Importaciones. Lima: SUNAD.
Superintendencia Nacional de Aduanas - SUNAD (2005b) Anuario Estadístico, Exportaciones. Lima: SUNAD.
Tavera, Jose and Tilsa Oré (2006). Las Sociedades de Gestión Colectiva de los Derechos de Autor: UnaRevisión al Caso Peruano. Documento de Impacto Nº 002 – 2006/GEE. Lima: INDECOPI.
United Nations – UN (2000) Handbook of National Accounting – Links between Business Accounting andNational Accounting. Department of Economic and Social Affairs Statistics Division Studies in Methods.Series F, No. 76. New York: UN.
Weber, René (2000) Hacia una nueva Ley de Cine en el Perú. En: Butaca Sanmarquina, año 2, No 7, September.
World Intellectual Property Organization – WIPO and Universidade Estadual de Campinas – UNICAMP (nodate) Estudio sobre la importancia económica de las industrias y actividades protegidas por el derecho deautor y los derechos conexos en los países de MERCOSUR y Chile. Manuscript.
World Intellectual Property Organization – WIPO (2003) Guide on Surveying the Economic Contribution of the Copyright-Based Industries. Geneva: WIPO.
World Intellectual Property Organization – WIPO (2006) National Studies on Assessing the EconomicContribution of the Copyright-Based Industries. Creative Industries Series No. 1. Geneva: WIPO.
World Intellectual Property Organization – WIPO and State Intellectual Property Office of the Republic of Croatia (2007) Economic Contribution of Copyright-Based Industries to the economy of the Republic of Croatia. Manuscript.
The Economic C
ontribution ofC
opyright-Based Industries in P
eru
337
A c r o n y m s L i s t
AAP: Association of American Publishers ACDP: Asociación de Cineastas del Perú, Peruvian Society of Film DirectorsANAIE: Asociación Nacional de Artistas, Intérpretes y Ejecutantes, National Association
of Interpretive Artists and PerformersANDA: Asociación Nacional de Anunciantes, National Advertisers AssociationANR: Comité Nacional de Radio, National Radio Committee APAP: Asociación Peruana de Agencias de Publicidad, Peruvian Association
of Advertising AgenciesAPCP: Asociación de Productores Cinematrográficos del Perú, Association
of Cinematographic ProducersAPDAYC: Asociación Peruana de Autores y Compositores, Peruvian Association
of Authors and ComposersAPDIF: Asociación Protectora de los Derechos Intelectuales Fonográficos,
Phonographic Copyright Protecting AssociationAPSAV: Asociación Peruana de Artistas Visuales, Peruvian Association
of Visual Artists APESOFT: Asociación Peruana de Productores de Software,
Peruvian Software Producers AssociationBCRP: Banco Central de Reserva del Perú, Peruvian Central Bank of ReservesBNP: Biblioteca Nacional del Perú, National Library of PeruBSA: Business Software AllianceCAPEM: Cámara Peruana de Editores de Música, Peruvian Chamber of Musical EditorsCAPERIAL: Cámara Peruana de la Industria de la Industria Editorial,
Peruvian Publishing Industry ChamberCAPEX: Capital ExpenditureCATV: Community Antenna TelevisionCBIs: Copyright-Based IndustriesCCL: Cámara de Comercio de Lima, Lima Chamber of CommerceCCS: Copyright Collecting SocietiesCD: Compact DiscCEO: Chief Executive Officer CERLALC: Centro Regional para el Fomento del Libro en América Latina y el Caribe,
Regional Center for Book Encouragement in Latin America and the CaribbeanCIF: Cost, insurance and freightCISAC: Confederación Internacional de Sociedades de Autores y Compositores,
International Confederation of Societies of Authors and ComposersCNR: Coordinadora Nacional de Radio, National Radio Coordinator CONACINE: Consejo Nacional de Cine, National Movie CommissionCONAPU: Consejo Nacional de Supervisión de la Publicidad, National Advertising Supervision Council CONASEV: Comisión Nacional Supervisora de Empresas y Valores, National Commission for the
Supervision of Companies and Securities CONCORTV: Consejo Consultivo de Radio y Televisión, Radio and Television Consulting CouncilCONFIEP: Confederación National de Instituciones Empresariales Privadas, National Confederation
of Private Business AssociationsCOPERF: Comité de Productores de Fonogramas y Videogramas, Peruvian Committee
of Phonogram and Videogram Producers
The
Econ
omic
Con
trib
utio
n of
Cop
yrig
ht-B
ased
Ind
ustr
ies
in P
eru
338
CPI: Compañía Peruana de Investigación de MercadosCPL: Cámara Peruana del Libro, Peruvian Book ChamberCUSEA: Consejo de Usuarios de estudios de Audiometría, Audiometric Studies Users CouncilDVD: Digital Versatile Disc or Digital Video Disc86
EBITDA: Earnings before interest, taxes, depreciation and amortizationEEA: Encuesta Económica Anual, Annual Economic SurveyEGEDA: Entidad de Gestión de Derechos de los Productores, Audio-visual Producers’ Rights
Management Association ENAHO: Encuesta Nacional de Hogares, National Household SurveyESA: Entertainment Software Association FEDESOFT: Federación Colombiana de la Industria del Software, Colombian Federation
of the Software IndustryFENVENDRELP: Federación Nacional de Vendedores de Diarios, Revistas y Loterías del Perú, Federation
of Newspaper, Magazines and Lotteries Salespersons of PeruFOB: Free on BoardGDP: Gross Domestic ProductGRADE: Grupo de Análisis para el Desarrollo, Group for the Analysis of DevelopmentICACS: Confederation of Authors and Composers SocietiesIDI-EPTH-USMP: Instituto de Investigación de la Escuela Profesional de Turismo y Hotelería de la Facultad
de Ciencias de la Comunicación, Turismo y Psicología de la Universidad de San Martínde Porres; Tourism and Hospitality School of the Communications Science, Tourism and Psychology Department at San Martin de Porres University
IFTA: Independent Film & Television AllianceIGV: Impuesto General a las Ventas, Value Added Tax IIPA: International Intellectual Property AllianceIMPI: Instituto Mexicano de la Propiedad Intelectual, Mexican Institute of Industrial PropertyINDAUTOR: Instituto National del Derecho de Autor, National Copyright InstituteINEI: Instituto Nacional de Estadística e Informática, Statistics and Informatics National Institute INDECOPI: Instituto Nacional de la Competencia y Propiedad Intelectual, National Institute
for the Defense of Competition and the Protection of Intellectual PropertyISBN: International Standard Book Number ISIC: International Standard Industry CodeISRC: International Standard Recording CodeIT: Information TechnologyMMDS: Multichannel Multipoint Distribution System MPAA: Motion Picture Association of America MTC: Ministerio de Transportes y Comunicaciones, Ministry of Transportation
and CommunicationNANDINA: Nomenclatura Común de los Países Miembros del Acuerdo de Cartagena,
Common Nomenclature of the Andean Community Membersn.a.: Not Applicablen.e.c.: Not Elsewhere ClassifiedNMPA: National Music Publishers' AssociationOCDE: Organización para la Cooperación y Desarrollo Económico; Organization
for Cooperation of Economic DevelopmentODA: Oficina de Derechos de Autor – INDECOPI, Copyright Office – INDECOPI
The Economic C
ontribution ofC
opyright-Based Industries in P
eru
339
86 The press realize announcing the specification finalization only refers to the technology as DVD, making no mention of what theletters stand for www.toshiva.co.jp/about/press/1995_12/pr0802.htm
OMD: Optimum Media Direction OSIPTEL: Organismo Supervisor de Inversión Privada en Telecomunicaciones, Supervisory Agency
for Private Investment in TelecommunicationsPOP: Peruana de Opinión Pública PRODUCE: Ministerio de Producción, Ministry of ProductionPUCP: Pontificia Universidad Católica del Perú, Pontifical Catholic University of PeruPYME: Pequeña y Micro empresa, Small and micro enterprisesRIAA: Recording Industry Association of AmericaSIN: Sociedad Nacional de Industrias, Industrial National Association SOCINE: Sociedad Peruana de Directores y Productores Cinematográficos, Peruvian Society
of Film Directors and ProducersSPIA: Sociedad Peruana de la Industria Audiovisual, Peruvian Society of the Audiovisual
IndustrySUNAD: Superintendencia Nacional de Aduanas, National Customs Administration
Superintendence SUNAT: Superintendencia Nacional de Administración Tributaria, National Superintendency
of Tax AdministrationTPA: Trade Promotion AgreementTDV: Tecnología Digital VictoriaTRIPS: Aspectos relacionados con el comercio de los Derechos de Propiedad Intelectual,
Trade Related Aspects of Intellectual Property RightsUIP: United International Pictures UIT: Unidad Impositiva Tributaria, Tax Unit UN: United Nations UNIMPRO: Unión Peruana de Productores Fonográficos, Peruvian Union of Phonographic ProducersUSMP: Universidad San Martín de Porres, San Martín de Porres UniversityVHS: Video Home SystemWCT: Tratado de la OMPI sobre Derecho de Autor, WIPO Copyright Treaty WIPO: World Intellectual Property OrganizationWPPT: Tratado de la OMPI sobre Interpretación o Ejecución y Fonogramas, WIPO Performance
and Phonograms Treaty
The
Econ
omic
Con
trib
utio
n of
Cop
yrig
ht-B
ased
Ind
ustr
ies
in P
eru
340
A n n e x A : C o n d u c t e d I n t e r v i e w s
Press and Literature Industry1) Date: December 13th, 2006
Institution: Cámara peruana del libro (CPL)Name: Liliana Minaya CácedaPosition: Manager
2) Date: February 16th, 2007Institution: Fondo Editorial de la Pontificia Universidad Católica del Perú (PUCP)Name: Patricia ArévaloPosition: General Director
3) Date: June 28th, 2007Institution: Diario La RepúblicaName: Daniela BiboliniPosition: Commercial Projects Boss
4) Date: June 28th, 2007Institution: Diario La RepúblicaName: Maria Eugenia MohmePosition: Corporate Services Manager
5) Date: July 9th, 2007Institution: Federación Nacional de Vendedores de Diarios, Revistas y Loterías
del Perú (FENVENDRELP)Name: Rufino QuilcaPosition: General Subsecretary
Music Industry6) Date: February 16th, 2007
Institution: Productora Rock en el ParqueName: Julio César VásquezPosition: General Producer
7) Date: April 2nd, 2007Institution: Tecnología Digital Victoria (TDV)Name: Francisco SamillánPosition: Sales Manager
8) Date: April 2nd, 2007Institution: Tecnología Digital Victoria (TDV)Name: Fernando PeñaPosition: Marketing Manager
The Economic C
ontribution ofC
opyright-Based Industries in P
eru
341

9) Date: August 3rd, 2007Institution: Phantom Music Name: Eduardo PoncePosition: Marketing Manager
10) Date: November 23rd, 2007Institution: QC Entertainment S.A.C. Name: Ana María Carbonell Position: General Manager
Motion Picture Industry11) Date: January 26th, 2007
Institution: Consejo Nacional de Cinematografía (CONACINE)Name: Emilio Moscoso ManriquePosition: Executive Secretary
12) Date: March 23rd, 2007Institution: Sociedad Peruana de la Industria Audiovisual (SPIA)Name: Jorge DelgadoPosition: President
13) Date: March 26th, 2007Institution: Cinedatos del Perú Name: Percy Valladares Position: Owner
14) Date: March 29th, 2007Institution: United International Pictures (UIP)Name: Luis Dager AlvaPosition: Sales Manager
15) Date: July 20th, 2007Institution: Argos Productions, CONACINE, Peruvian Association of CinematographicProducers (APCP) Name: Nathalie HendrickxPosition: Executive Producer, Executive Board Member, Member
16) Date: August 7th, 2007Institution: CineplanetName: Christian AlvaPosition: Marketing Manager
17) Date: August 7th, 2007Institution: CineplanetName: Alicia CruzatePosition: General Accountant
The
Econ
omic
Con
trib
utio
n of
Cop
yrig
ht-B
ased
Ind
ustr
ies
in P
eru
342
18) Date: August 28th, 2007Institution: Warner Bros – Twentieth Century Fox – PerúName: Hernán VivianoPosition: General Manager
Radio and Television Industry19) Date: January 17th, 2007; July 12th, 2007
Institution: Comité Nacional de Radio (ANR)Name: Daniel ChapellPosition: Executive Director
20) Date: January 17th, 2007Institution: Comité Nacional de Radio (ANR)Name: Natalia CalderónPosition: Functionary
21) Date: February 27th, 2007Institution: Asociación Protectora de los Derechos Intelectuales Fonográficos (APDIF)Name: José Anderson Tuesta López Position: Legal advisor
22) Date: November 28th, 2007Institution: Consejo Consultivo de Radio y Televisión (CONCORTV)Name: Carlos RivadeneyraPosition: Member of the Board
Software Industry 23) Date: November 30th, 2006
Institution: Asociación Peruana de Productores de Software (APESOFT)Name: Rafael Romero Mina Position: General Manager
24) Date: January 24th, 2007Institution: LolimsaName: Rolando Liendo ChicataPosition: Manager of Lolimsa, Directive Committee President of Asociación
Peruana de Productores de Software (APESOFT)
Advertising Services Industry 25) Date: November 30th, 2006
Institution: Asociación Nacional de Anunciantes (ANDA)Name: Martha De Weck Position: Administrator
26) Date: February 12th, 2007Institution: DixitName: Manuel EchegarayPosition: General Manager
The Economic C
ontribution ofC
opyright-Based Industries in P
eru
343
27) Date: March 27th, 2007I Institution: Asociación Peruana de Agencias de Publicidad (APAP)
Name: Alvaro Florez EstradaPosition: President of APAP, President of Publicis
28) Date: April 2nd, 2007Institution1: Mindshare, and Media Agencies Association.Institution2: Media Agencies Association.Name: Lone StrobachPosition1: General Manager, HeadPosition2: President
29) Date: June 27th, 2007Institution: Mayo FCBName: Carlos TrujilloPosition: New Business Director
Copyright Collecting Societies30) Date: November 21st, 2006
Institution: Entidad de Gestión de Derechos de los Productores Audiovisuales (EGEDA)Name: Juan Pablo Grau QuinterosPosition: General Director
31) Date: November 27th, 2006; November 14th, 2007 Institution: Asociación Peruana de Autores y Compositores (APDAYC)Name: Armando Masse FernándezPosition: President of Executive Board
32) Date: January 11th, 2007; April 2nd, 2007Institution: Unión Peruana de Productores Fonográficos (UNIMPRO)Name: Guillermo Bracamonte OrtizPosition: General Director
33) Date: February 18th, 2007; December 5th, 2007 Institution: Asociación Peruana de Artistas Visuales (APSAV)Name: Ylva VillavicencioPosition: General Director
34) Date: April 2nd, 2007; April 11th, 2007Institution: Unión Peruana de Productores Fonográficos (UNIMPRO)Name: Miriam AstudilloPosition: General Accountant
35) Date: April 16th, 2007Institution: Asociación Nacional de Artistas Intérpretes y Ejecutantes (ANAIE)Position: Administrative worker
The
Econ
omic
Con
trib
utio
n of
Cop
yrig
ht-B
ased
Ind
ustr
ies
in P
eru
344
36) Date: November 14th, 2007 Institution: Asociación Peruana de Autores y Compositores (APDAYC)Name: Tatiana QuintanaPosition: Director of Broadcasting and Cable
37) Date: November 14th, 2007 Institution: Asociación Peruana de Autores y Compositores (APDAYC)Name: José RamírezPosition: Operations Manager
Methodology 38) Date: February 9th, 2007
Institution: Pontificia Universidad Católica del Perú (PUCP), Grossman Capital MarketsName: Carlos Palomino SelemPosition: PUCP Financial Analysis Professor, International Broker
39) Date: January 15th, 2007Institution: Pontificia Universidad Católica del Perú (PUCP),
Banco de Crédito del Perú (BCP)Name: Marco AiquipaPosition: PUCP Financial Analysis Professor, Functionary of BCP
Other Institutions 40) Date: November 27th, 2006; January 9th, 2007
Institution: Instituto Nacional de Estadística e Informática (INEI)Name: Teresa GasparPosition: Technical Diffusion Office Assistant
41) Date: November 7th, 2006; January 9th, 2007; January 10th, 2007; August 7th, 2007Institution: Instituto Nacional de Defensa de la Competencia y de la PropiedadIntelectual (INDECOPI)Name: Martín Moscoso Position: Copyright Office Boss (ODA)
42) Date: January 9th, 2007Institution: Instituto Nacional de Defensa de la Competencia y de la PropiedadIntelectual (INDECOPI)Name: Carlos Baldoceda Position: Intellectual Property Hall Archive Assistant
43) Date: January 15th, 2007Institution: Pontificia Universidad Católica del Perú (PUCP)Name: Carla ColonaPosition: Institutional Communication Direction
The Economic C
ontribution ofC
opyright-Based Industries in P
eru
345
44) Date: February 28th, 2007Institution: Analistas y Consultores Name: Bernando VerjovskiPosition: General Manager
45) Date: March 9th, 2007 Institution: Cruzada Antipiratería – Hugo Bravo de Rueda Law FirmName: Hugo Bravo de RuedaPosition: Head
46) Date: March 15th, 2007 Institution: Comisión de Lucha contra los Delitos Aduaneros y la PirateríaName: Paul Vera RegaladoPosition: Secretario Técnico
47) Date: March 30th, 2007 Institution: Sociedad Nacional de Industrias (SNI)Name: Raúl SaldíasPosition: SNI Voting Member
The
Econ
omic
Con
trib
utio
n of
Cop
yrig
ht-B
ased
Ind
ustr
ies
in P
eru
346
A n n e x B :
Methodological Estimation of Value Added Contribution of Copyright-Based Industries for the Year 2005 Based on Sectoral Data of the Year 2000 (Ministry of Production)This Annex presents the methodology used to calculate the data for the different copyright-based industries,mainly for interdependent and partial87. The methodology is based on many sources, such as on theTechnology of Information and Statistics General Office of the Ministry of Production (PRODUCE), theNational Institute for Statistics and Informatics (INEI) and the Peruvian Central Bank of Reserves (BCRP)88. Inall cases, in order to get the most precise estimates possible, a number of assumptions were made and willbe explained below.
As mentioned in chapter 2, data on manufacturing activities is available for the period 1998-2000 inPRODUCE. The database has information on value added, wages, salaries, remunerations paid to eventualpersonnel, other expenses of eventual and permanent personnel, depreciation value realized at the end ofthe year, tributes, net amount of taxes to goods and services, amount of specific taxes and exploitationsurplus.
The information in this database, ordered by the different level of involvement with copyright, and with afour-digit ISIC code, is:
• Core industries:o 2212: Publishing of newspapers, journals and periodicals, o 2219: Other publishing, o 2221: Printing, o 2222: Service activities related to printing,o 2230: Reproduction of recorded media.
• Interdependent industries:o 2101: Manufacture of pulp, paper and paperboard,o 2429: Manufacture of other chemical products n.e.c.,o 3000: Manufacture of office, accounting and computing machinery, o 3230: Manufacture of television and radio receivers, sound or video recording or reproducingapparatus, and associate goods,o 3320: Manufacture of optical instruments and photographic equipment,o 3692: Manufacture of musical instruments.
• Partial industries:o 1730: Manufacture of knitted and crocheted fabrics and articles,o 1810: Manufacture of wearing apparel,o 1920: Manufacture of footwear,o 2109: Manufacture of other articles of paper and paperboard,o 2610: Manufacture of glass and glass products,o 3610: Manufacture of furniture,o 3691: Manufacture of jewelry and related articles, o 3694: Manufacture of games and toys.
The Economic C
ontribution ofC
opyright-Based Industries in P
eru
347
87 For a few activities of core copyright industries the methodology has been applied. 88 For the exchange rate.
In order to obtain the estimations for the year 2005, some assumptions had to be made and somecomplementary information had to be used. First, we assumed that in real terms the value added of theseactivities follows the rate of growth of the real GDP of the same activities. Nevertheless, this data was notavailable at this level of disaggregation. It was therefore necessary to use another variable. The only realvariable available for the period 2000-2005 with a four-digit ISIC code was the production volume index,although it is only available for some ISIC activities . Thus, the assumption is that the real value added forthis set of activities follows the rate of growth of the production volume index. For the rest of the ISIC codesthe assumption is that the activities follow the rate of growth of the manufacturing GDP.
The
Econ
omic
Con
trib
utio
n of
Cop
yrig
ht-B
ased
Ind
ustr
ies
in P
eru
348
89 The activities, at a four-digit level, for which this index is available, are: 2101, 2212, 2221, 2429, 1730, 1810, 1920, 2109, 2610,3610, and 3691.
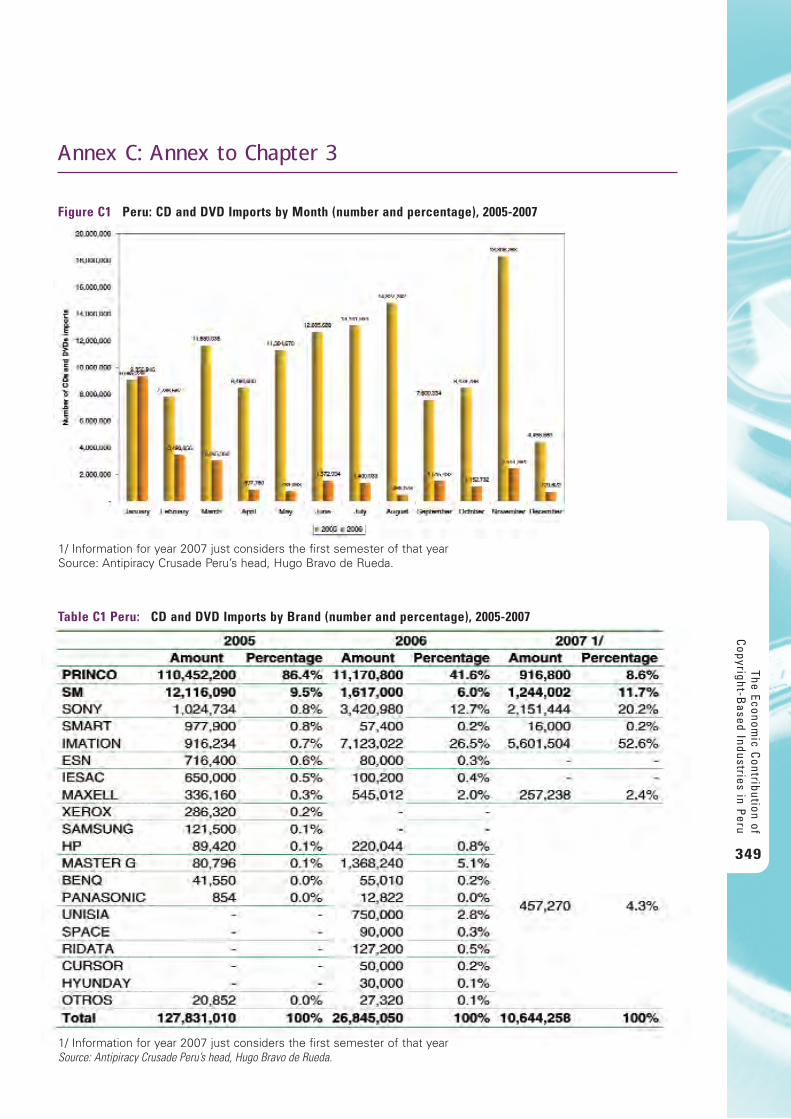
A n n e x C : A n n e x t o C h a p t e r 3
The Economic C
ontribution ofC
opyright-Based Industries in P
eru
349
Figure C1 Peru: CD and DVD Imports by Month (number and percentage), 2005-2007
1/ Information for year 2007 just considers the first semester of that yearSource: Antipiracy Crusade Peru’s head, Hugo Bravo de Rueda.
Table C1 Peru: CD and DVD Imports by Brand (number and percentage), 2005-2007
1/ Information for year 2007 just considers the first semester of that yearSource: Antipiracy Crusade Peru’s head, Hugo Bravo de Rueda.
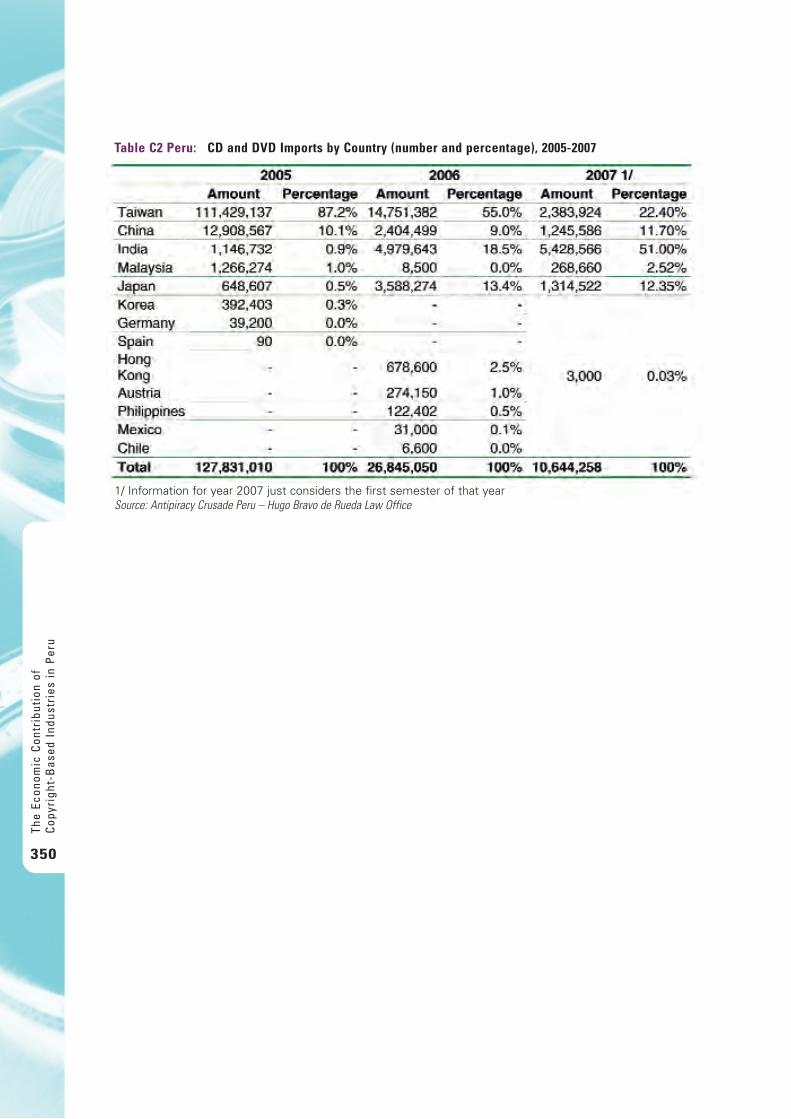
The
Econ
omic
Con
trib
utio
n of
Cop
yrig
ht-B
ased
Ind
ustr
ies
in P
eru
350
Table C2 Peru: CD and DVD Imports by Country (number and percentage), 2005-2007
1/ Information for year 2007 just considers the first semester of that yearSource: Antipiracy Crusade Peru – Hugo Bravo de Rueda Law Office
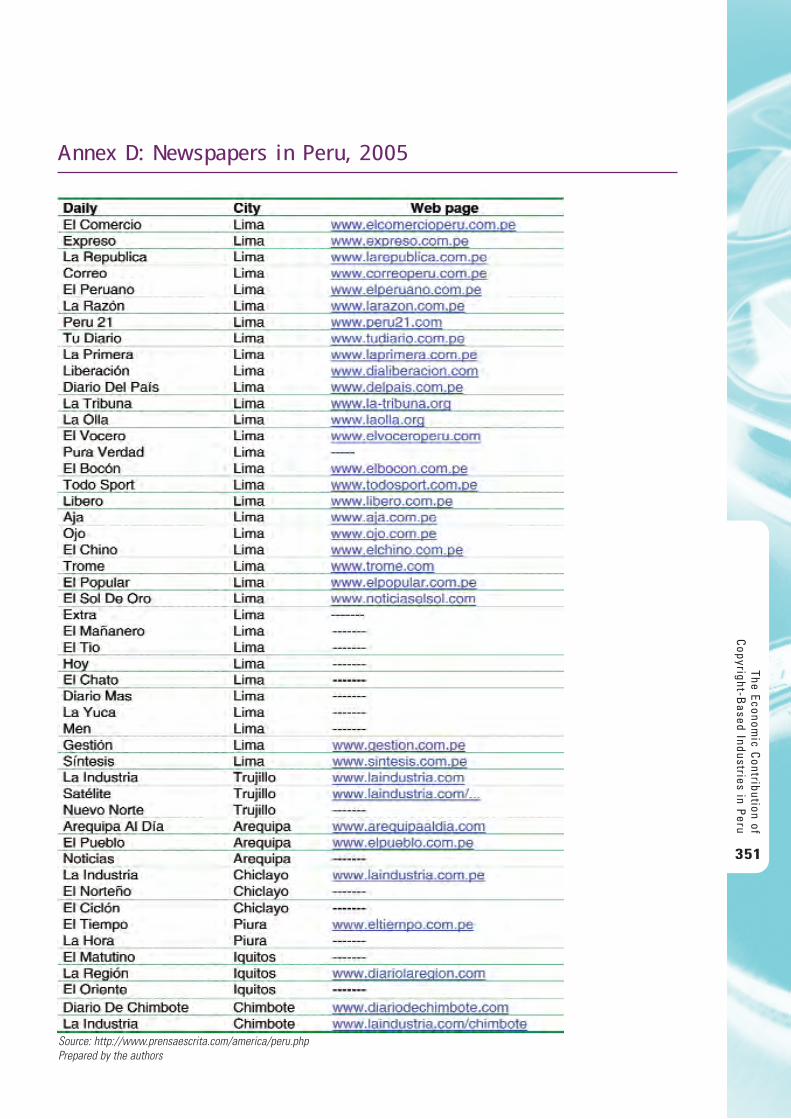
A n n e x D : N e w s p a p e r s i n Pe r u , 2 0 0 5
The Economic C
ontribution ofC
opyright-Based Industries in P
eru
351
Source: http://www.prensaescrita.com/america/peru.phpPrepared by the authors
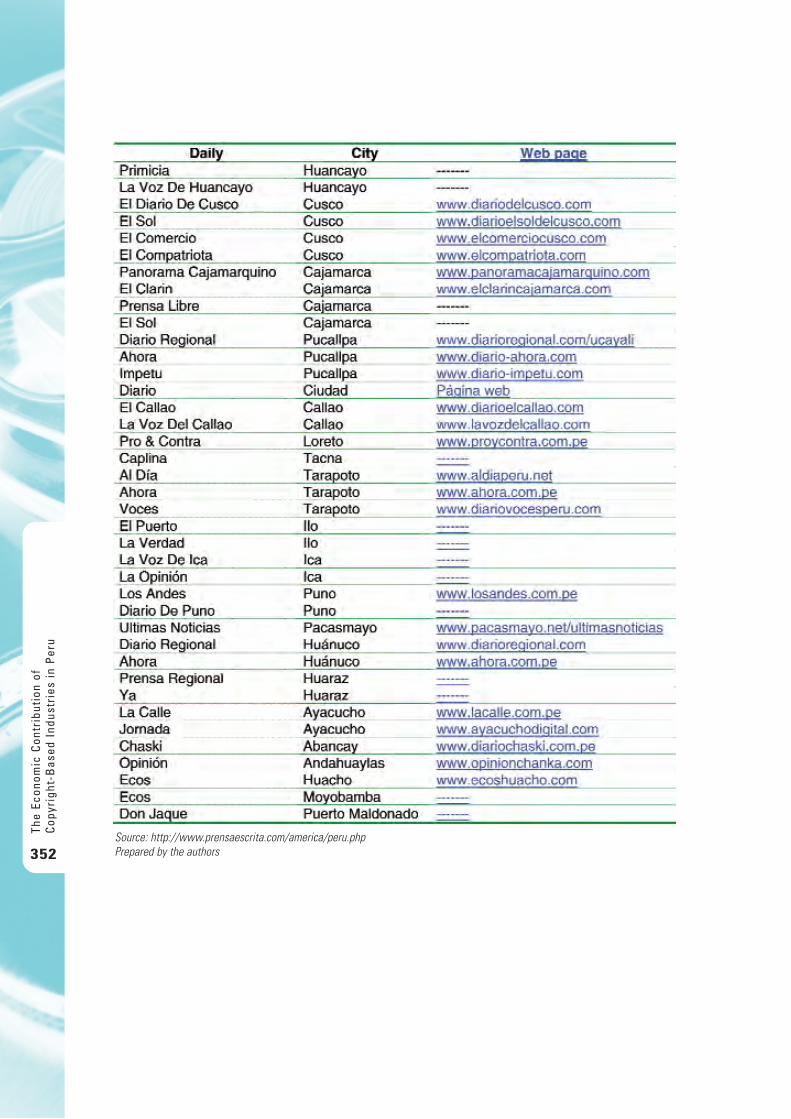
The
Econ
omic
Con
trib
utio
n of
Cop
yrig
ht-B
ased
Ind
ustr
ies
in P
eru
352Source: http://www.prensaescrita.com/america/peru.phpPrepared by the authors

WIPO Publication No. 1024e ISBN 978-92-805-2022-4 January 2011
For more information contact WIPO at www.wipo.int
World Intellectual Property Organization (WIPO)34, chemin des ColombettesP.O. Box 18CH-1211 Geneva 20Switzerland
Telephone:+41 22 338 91 11
Fax:+41 22 740 54 28


![WIPO Jadi-UM patent[1]](https://img.dokumen.tips/doc/110x75/631339eeb22baff5c40f06ac/wipo-jadi-um-patent1.jpg)
