Embed Size (px)
Citation preview

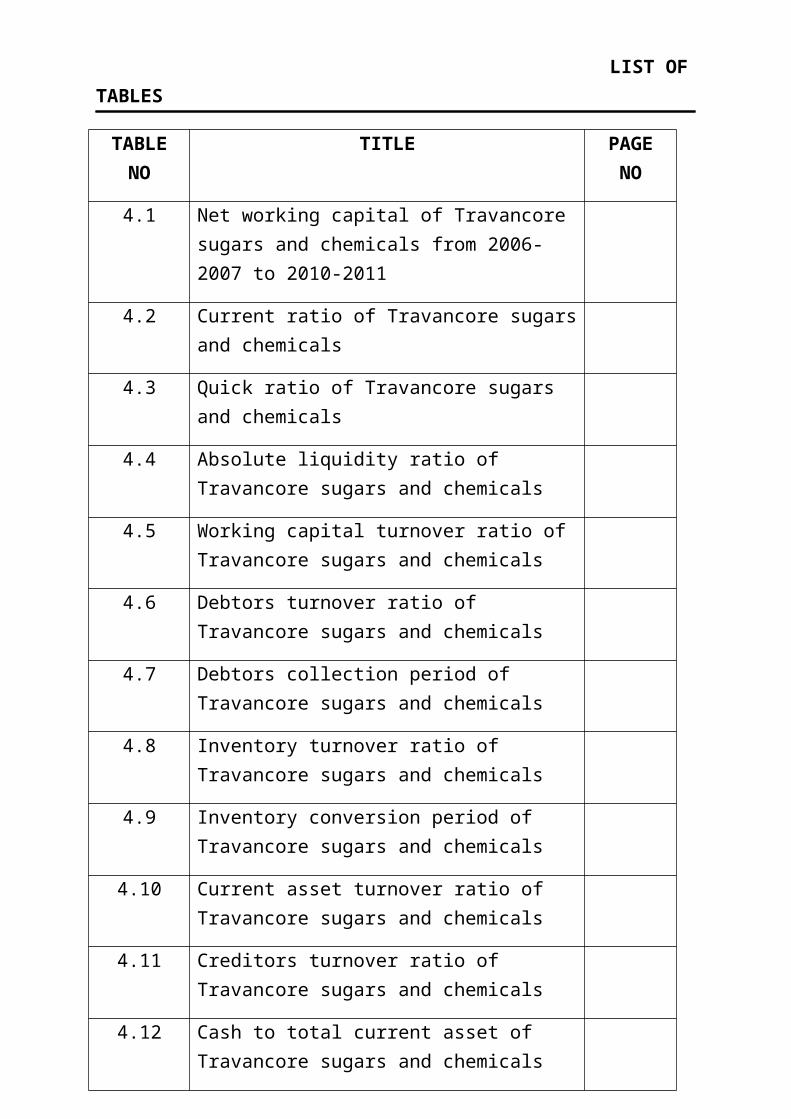
LIST OFTABLES
TABLENO
TITLE PAGENO
4.1 Net working capital of Travancore sugars and chemicals from 2006-2007 to 2010-2011
4.2 Current ratio of Travancore sugarsand chemicals
4.3 Quick ratio of Travancore sugars and chemicals
4.4 Absolute liquidity ratio of Travancore sugars and chemicals
4.5 Working capital turnover ratio of Travancore sugars and chemicals
4.6 Debtors turnover ratio of Travancore sugars and chemicals
4.7 Debtors collection period of Travancore sugars and chemicals
4.8 Inventory turnover ratio of Travancore sugars and chemicals
4.9 Inventory conversion period of Travancore sugars and chemicals
4.10 Current asset turnover ratio of Travancore sugars and chemicals
4.11 Creditors turnover ratio of Travancore sugars and chemicals
4.12 Cash to total current asset of Travancore sugars and chemicals
4.13 Gross profit ratio of Travancore sugars and chemicals
4.14 Net profit ratio of Travancore sugars and chemicals
4.15 Statement of change in working capital for the year 2006-2007
4.16
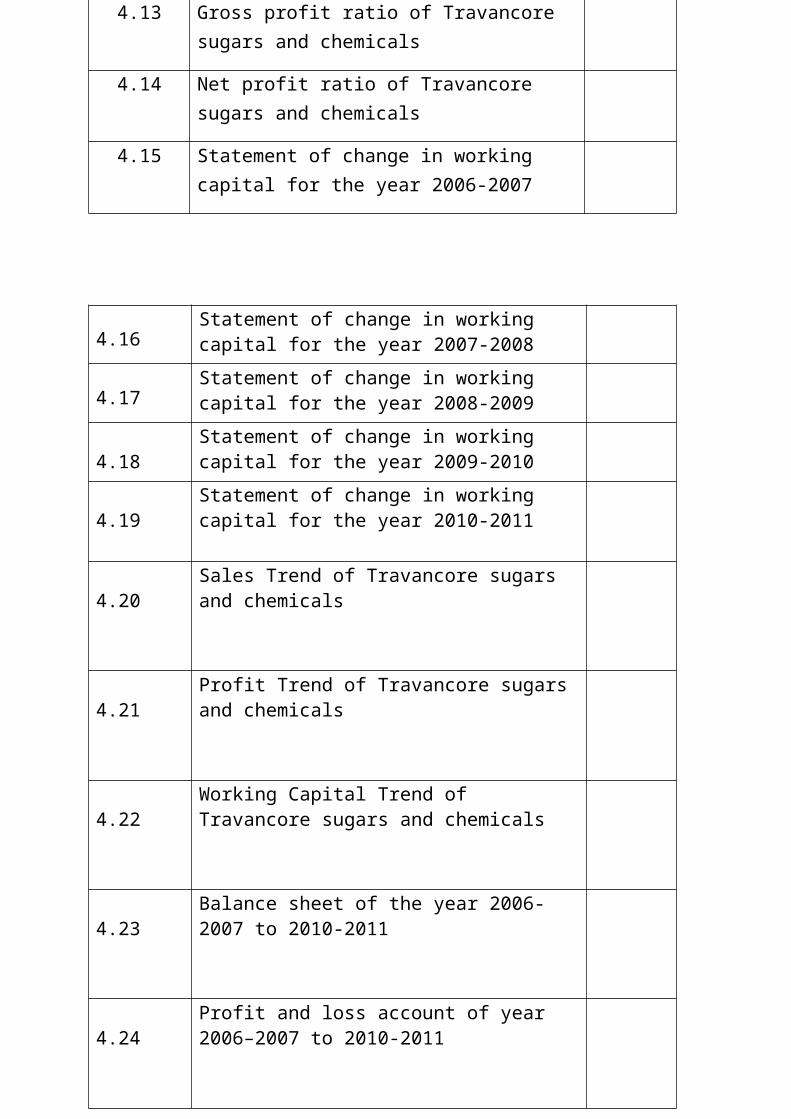
Statement of change in working capital for the year 2007-2008
4.17
Statement of change in working capital for the year 2008-2009
4.18
Statement of change in working capital for the year 2009-2010
4.19
Statement of change in working capital for the year 2010-2011
4.20
Sales Trend of Travancore sugars and chemicals
4.21
Profit Trend of Travancore sugars and chemicals
4.22
Working Capital Trend of Travancore sugars and chemicals
4.23
Balance sheet of the year 2006-2007 to 2010-2011
4.24
Profit and loss account of year 2006–2007 to 2010-2011
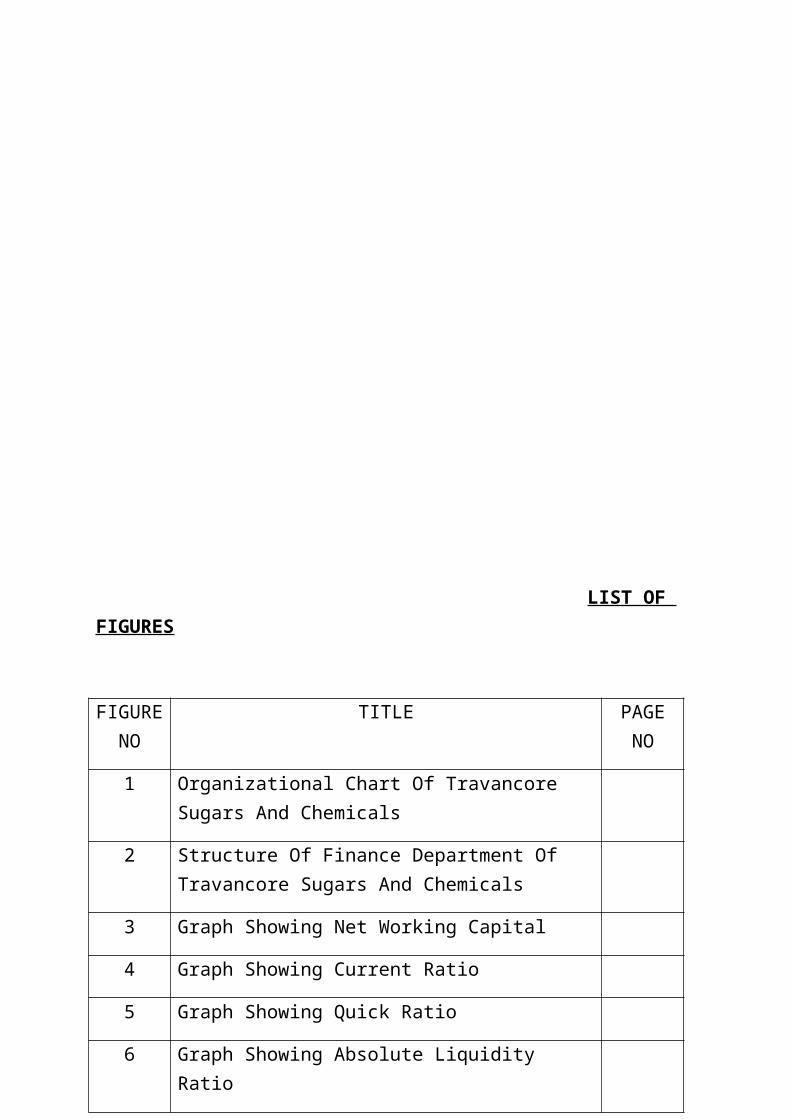
LIST OF FIGURES
FIGURENO
TITLE PAGENO
1 Organizational Chart Of Travancore Sugars And Chemicals
2 Structure Of Finance Department Of Travancore Sugars And Chemicals
3 Graph Showing Net Working Capital
4 Graph Showing Current Ratio
5 Graph Showing Quick Ratio
6 Graph Showing Absolute Liquidity Ratio
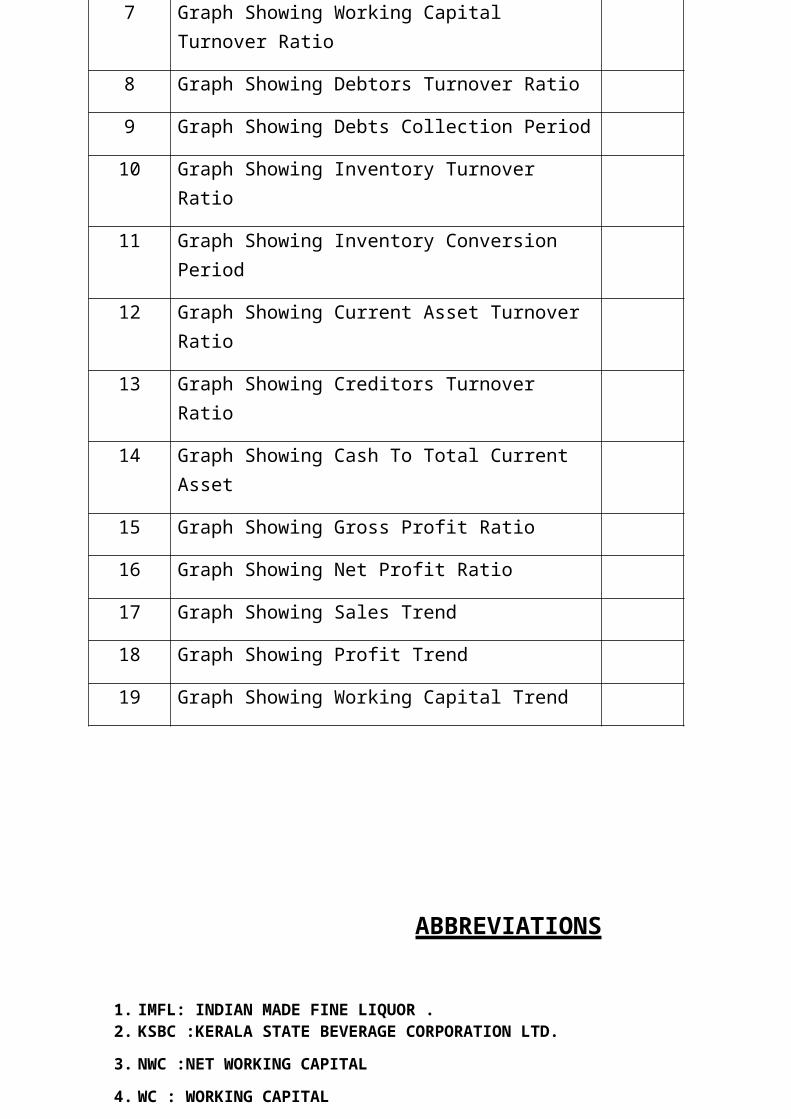
7 Graph Showing Working Capital Turnover Ratio
8 Graph Showing Debtors Turnover Ratio
9 Graph Showing Debts Collection Period
10 Graph Showing Inventory Turnover Ratio
11 Graph Showing Inventory Conversion Period
12 Graph Showing Current Asset Turnover Ratio
13 Graph Showing Creditors Turnover Ratio
14 Graph Showing Cash To Total Current Asset
15 Graph Showing Gross Profit Ratio
16 Graph Showing Net Profit Ratio
17 Graph Showing Sales Trend
18 Graph Showing Profit Trend
19 Graph Showing Working Capital Trend
ABBREVIATIONS
1. IMFL: INDIAN MADE FINE LIQUOR .2. KSBC :KERALA STATE BEVERAGE CORPORATION LTD.
3. NWC :NET WORKING CAPITAL
4. WC : WORKING CAPITAL

5. RMCP : RAW MATERIAL CONVERSION PERIOD
6. WIPCP : WORK IN PROGRESS CONVERSION PERIOD
7. FGCP : FINISHED GOODS CONVERSION PERIOD
8. ICP : INVENTORY CONVERSION PERIOD
9. RCP : RECEIVABLES CONVERSION PERIOD
10.PAYABLES (PDP) : PAYABLES DEFERRAL PERIOD
11.NOC : NET OPERATING CYCLE
12.GOC : GROSS OPERATING CYCLE
13.K.R.S : KERALA ROADWAYS TRANSPORT LTD
14.TSC :TRAVANCORE SUGARS AND CHEMICALS

CHAPTER 1
INTRODUCTION TO THE STUDY
CHAPTER 1
INTRODUCTION
1.1 INTRODUCTION
A business undertaking requires funds for two
purposes: -
To create productive capacities through purchase of fixed
assets, etc.
To finance current assets required for day to day running
of the business.
Working capital refers to the funds invested in current
assets i.e., investment in stock, sundry debtors, cash
and current assets. Current assets are essential to use
fixed assets profitably. For example a machine cannot be
used without providing necessary raw materials. It is
obvious that a certain amount of funds is always tied up
in raw material inventories working progress, finished
goods, consumable stores, sundry debtors and day-to-day
cash requirements. However, the business also enjoys
credit facilities from his suppliers who may give the raw
materials on credit. Similarly a businessman may not pay
immediately for various expenses. But labours are paid
periodically. Therefore certain amount of funds is
automatically available to finance the current assets
requirements. However, the requirements for current
assets are usually greater than the amount of funds
available through current liabilities. In other words,
the current assets are to be kept at higher level than
the current liabilities. This difference is known as
working capital.
Working Capital Management is significant in financial
management due to the fact that it plays a vital role in
keeping the wheel of the business running. Every business
requires capital, without which it cannot be promoted. It
holds exceptional importance in the case of a
manufacturing company. It also covers various concepts
like inventory management, cash management, credit policy
etc. Working capital is the heart of the business. If it
is weak, business cannot prosper and survive. It is
therefore said the fate of large scale investment in
fixed assets is often determined by a relatively small
amount of current assets. As the working capital is
important to the company is important to keep adequate
working capital with the company. Cash is the lifeline of
company. If this lifeline deteriorates so the company’s
ability to fund operation, reinvest do meet capital
requirements and payment. Understanding company’s cash
flow prospects is to look at its working capital
management. This study is undertaken to find out
efficiency of working capital management of Travancore
Sugars And Chemicals Ltd., Valanjavattom.
1.2 OBJECTIVES OF THE STUDY
To identify the financial strength and weakness of
Travancore Sugars And Chemicals Ltd.
To study the performance of beverage industry in general and
Travancore Sugars And Chemicals Ltd. in particular
To study the liquidity and solvency position of Travancore
Sugars And Chemicals Ltd.
To study the cash management practices of Travancore Sugars
And Chemicals Ltd.
To study the receivable management practices of Travancore
Sugars And Chemicals Ltd.
To examine the inventory management of Travancore Sugars And
Chemicals Ltd.
1.3 SCOPE OF THE STUDY
The study of working capital is of major
importance to the internal and external analysis because of
its close relationship with the current day to day operations
of a business. To meet the current requirements of a business
enterprise such as the purchases of services, raw materials
etc. working capital is essential. It is also pointed out that
working capital is nothing but one segment of the capital
structure of a business.
In this study, the working capital management of
the company is analyzed and conclusions and suggestions are
drawn from it in order for the betterment of the company.
1.4 RESEARCH METHODOLOGY
Research methodology is a way to
systematically solve the research problem. It may be
understood as a science of studying how research is done
scientifically. In it we study the various steps that are
generally adopted by a researcher in studying his research
problem along with the logic behind them. It is necessary for
the researcher to know not only the research
methods/techniques but also the methodology. Researchers not
only need to know how to develop certain indices or tests, how
to calculate the mean, the mode, the median or the standard
deviation or chi-square, how to apply particular research
techniques, but they also need to know which of these methods
or techniques, are relevant and which are not, and what would
they mean and indicate and why. Researchers also need to
understand the assumptions underlying various techniques and
they need to know the criteria by which they can decide that
certain techniques and procedures will be applicable to
certain problems and others will not. All this means that it
is necessary for the researcher to design his methodology for
his problem as the same may differ from problem to problem.
1.4.1 METHODS FOR DATA COLLECTION
The collection is the process of enumeration together with the proper recording of results. The
success of an enquiry is based up on the proper collection of
data. The data may be classified as primary and secondary.
PRIMARY DATA
Primary data are those data, which are
collected at the first time, and they are original in
character. This study covers the enquiry regarding the
inventory data. Under this research the data collected
personally.
SECONDARY DATA
Secondary data are those data
that are already collected by someone for some purposes
and are available for the present study. Various sources of
secondary data including Annual reports, Official website of
Travancore Sugars And Chemicals Ltd., research abstracts
published in various books and research articles published in
business journals.
1.4.2 PERIOD OF THE STUDY
The study covers a period of fiveyears performance of Travancore Sugars And Chemicals Ltd. The
years taken for the study are from 2006-11.
1.4.3 AREA OF THE STUDY
The area selected for the study isTravancore Sugars And Chemicals Ltd. Valanjavattom.
1.4.4 TOOLS FOR DATA ANALYSIS
The data collected where grouped and
analyzed by using appropriate accounting ratios. The trend
analysis where also used for this study. Statement of change
in working capital is also prepared with a way to ascertain
the effect of changes of various components in the working
capital of company.
1.5 LIMITATIONS OF THE STUDY
Some of the data was not given by the company due to
the maintenance of financial secrecy. So the study
cannot be covered to all the areas of working
capital.
The qualitative aspects where also used only in a
limited contexts.
The limitation in the compilation of secondary data
might have affected the findings of the study.
1.6 CHAPTERISATION
This study report contains five chapters.
Chapter 1- This chapter contains the Introduction,
Objectives of the study, Scope of the study, Research
Methodology, Period of the study, Tools for data analysis,
and Limitations of the study.
Chapter 2- deals with profiles of the study.
Chapter 3- gives a theoretical framework for undertaking the
study and deals with growth and development of beverage
industry and the performance of Travancore Sugars And
Chemicals Ltd.
Chapter 4- explains the results of analysis of working
capital management of Travancore Sugars And Chemicals Ltd.
Chapter 5- consists of findings, suggestions and conclusion.

CHAPTER 2
PROFILES
2.1 INDUSTRY PROFILE
I n d i a h a s a p o p u l a t i o n o f m o r e
t h a n 1 . 1 5 0 B i l l i o n s w h i c h i s j u s t b e h i n d C h i n a .
According to the national sample survey; by 2030 India
population will be around 1.450 Billion and will surpass
China to become the World largest in terms of
population. Beverage Industry which is directly
related to the population is expected to maintain a
robust growth rate. The price stability throughout the year
has contributed to the increase in domestic liquor sales. The
Indian beverage market offers hot options. In India, various
positive factors drive the beverage markets. One is the
rising number of people in the middle class with extra money
to spend on new beverages like wine new brands of imported
whiskey, or the fancy energy drinks, some of which are really
good to enable people to work longer, to listen longer
during conferences, and even to party longer and have
fun.
MAJOR MARKET UNDER INDIAN BEVERAGE INDUSTRY
1. Indian Non-Alcoholic Beverage Market
2. Indian Soft Drink Market
3. Indian Tea Market
4. Indian Alcoholic Beverage Market
5. Indian Beer Market
6. Indian Wine Market
Liquor production is one of the
profitable businesses in today’s world. In India several
private, public and government companies are producing liquor
and making huge profits. But this liquor consumption is
injurious to human body. It will spoil the life of young
generations of a country. The government cannot stop the
production and distribution of liquor because it accelerates
the revenue in the form tax. The turnover tax of liquor
(IMFL) sales is 96%.
KSBC (Kerala State Beverages
Corporation) has the monopoly right to distribute the liquor
throughout the state and any other selling activities within
the state are illegal and are subject to serve punishment
including imprisonment.
The Kerala State Beverages (M&M)
Corporation handles potable liquor made out of Extra Neutral
Alcohol. Potable liquor is a consumable item containing
potable Alcohol and other chemicals. The role the KSBC is
channelizing all kinds of liquor/beer/wine from manufactures
throughout the country for the consumers in Kerala. As such
KSBC is not restricting purchase of liquor from any
manufacturer who is prepared to enter into a valid contract.
KSBC performs the role of procuring liquor and take adequate
steps to ensure the quality standards of liquor and place them
to the consumer through the various channels of distribution
enabling the consumer to take his preference. The liquor
brought through KSBC contains the holographic stickers pasted
on the bottle caps. The
activity of KSBC confines to contracts for procurement and
distribution. Consumer has to know hid health condition while
deciding to drink. Alcohol is not a freely marketable item
like any other consumable but can be sold only through
license. In this point of view there is a message that
consumer has to check his health while consuming liquor.
The judicial commission of inquiry appointed by the Government
to streamline the liquor trade in the state recommended-
To provide genuine liquor at reasonable price, through
Government agencies
Exploitation through increased taxation and
exploitation by middleman should be stopped and
consumer protection must be the guiding policy.
For achieving the above, nationalization of entire liquor
trade was suggested.
In line with the suggestion the
Government decided to set up a Public Sector Corporation to
procure spirit and arrange blending, bottling, sealing and
distribution of arrack and also for dealing with the sale of
IMFL. An amendment was made in the Abkari Act in 1984 to give
effect to the same.
KSBC was formed on 23.2.1984 to take over the wholesale
distribution of liquor in a phased manner and to eventually
set up distilleries and blending units to produce spirit,
arrack and IMFL. Since then the distribution of liquor has
been brought under the control of the Corporation. By a
decision in 2001 the majority of the retail outlets also have
been entrusted to the Corporation. As at present the whole
activity of IMFL from procurement to distribution and sale to
the consumer is controlled by the Corporation except for loose
vending of liquor by Bars/Clubs and a small portion of the
retails by Consumer Federation.
Objectives
1. To provide genuine quality liquor to consumers at
reasonable prices
2. To make available supplies of liquor commensurate to demand
3. To evolve a proper system to prevent misuse, distribution
of spurious liquor through unauthorized sources and evasion of
duties and taxes by middlemen
4. Consumer protection and satisfaction
Corporate Objectives of the Company
To build lasting relationships with customers based on
trust and mutual benefit
To uphold highest ethical standards in conduct of our
business
To create and nurture a culture that supports flexibility,
learning and is proactive to change
To chart a challenging career for employees with
opportunities for advancement and rewards
To value the opportunity and responsibility to make a
meaningful difference in people’s lives
To maintain the Quality of the product
2.2 COMPANY PROFILE
A PROFILE OF TRAVANCORE SUGARS AND CHEMICALS LTD.
COMPANY NAME: Travancore Sugars & Chemicals Ltd.
OWNER: Government of Kerala
LOCATION: Valanjavattom
FULL ADDRESS: Travancore Sugars & Chemicals Ltd.
Valanjavattom,
Thiruvalla -689 104
Tel: 0471-2332632
E-
mail: [email protected]
The Travancore Sugars and Chemicals Ltd (TSC Ltd) was
incorporated in June 1937 with an authorized share capital of
Rs.60, 00,000 with an objective to acquire carryon and
transact the traders and business of planets, general
merchants and importers, manufactures of dealers in sugar,
wine and spirits. Now the Company is concentrating on Indian
made fine liquor (IMFL) production. There is no marketing
department in the company because the sales of IMFL products
are only done through the Kerala State Beverage Corporation
(KSBC) Ltd. This government company registered under the joint
stock Companies Act 1956 and its share capital as at 2008 is
Rs.1, 31, 56,890
Manpower of the Company is 218 employees at present and
turnover approximately for the year ended 2007-2008 is 83
lakhs. The operations of the company are highly sophisticated
over the years and the company has developed very high
reputation for the quality of its products. The products are
resilient, inexpensive and hygienic. The Company follows
strict quality control measures.
LOCATION
Selection of proper location for a new plant is
essential for the smooth functioning of the company.
Travancore sugars and chemicals Ltd is situated at the place
called Valanjavattom near Thiruvalla.
Major reason for the selection of this location is
availability of transportation facilities, banking facilities
and well skilled labour forces etc.
LOGISTICS:
Internal Movement
Trolley and vehicles are used to move semi-finished goods from
one process station to another process station.
External Environment
In the case of road Transport TSC has made contract with
various transport companies like K.R.S (Kerala Roadways
Transport Ltd ) and A.C cargo management. Other mode of
transportation is rail.
Mission of the Company
“To provide full employment to its employees & to keep financial stability of the
concern”
Vision of the Company
“To increase its production as double and to attract more customers”
BOARD OF DIRECTORS
CHAIRMAN:
Mr. C.K. VISWANATHAN IAS.
DIRECTORS:
Mr. T.K. MANOJ KUMAR
Mr. N.SHANKAR REDDY IPS
Mr. MANAPANDIYAN IAS
MANAGING DIRECTOR: Mr.
N VIJYAANAND
SENIOR MANAGER (FINANCE) & SECRETORY IN CHARGE:
Mr. ALEX P. ABRAHAM, FCA.
AUDITORS:
M/S SRIDHAR & Co.
Chartered Accounts,
Thiruvananthapuram.
BANKERS:
State Bank of Travancore
State Bank of India
Indian Overseas Bank
Government Treasury
Pathanamthitta District
Co-operative Bank
LEGAL ADVISERS:
M/S MENON AND PAI
Ernakulum
2.3 PRODUCT PROFILE
Travancore Sugars Chemicals Ltd produces variety of products
which are given below.
INDIAN MADE FINE LIQUOR (IMFL)
During the financial year 2008-2009 the company sold 2774528
bulk litres of IMFL valued Rs.87031902 but during the
financial year 2007-2008 the company sold 2782000 bulk litres
of IMFL valued Rs.858814668. So we can find out that there is
a minute change in sales of IMFL. But even if there is change
in sales the value rate is increased now the company produces
so many brands of liquor which are given below.
(a) MAJOR PREMIUM BRAND
This brand is specially produced for high class segment.
Normally this brand is costlier than other products. It is
one of the brands which has a great move in the market. This
product is an advancement of its earliest product named
Commander VSOP Brandy.
(b) FESTIVAL XXX RUM
Festival xxx rum is a leading brand in middle class segment.
During the year 2007-2008 as per sales report this brand makes
good sales.
(c) JAWAN XXX RUM
During the year 2007-2008 as per the sales report this is the
most profit making brand of the company. These brand targets
mainly on middle class segment. Price of this product is
around 180rs for 750 ml bottle. The main ingredients are
caromic colour, essence and extra 96% neutral alcohol and food
flavor.
(d) CHEERS XXX RUM
This is a special brand for low class segment, these brands
also keep god sales report, but low compared to others.
DENATURED AND METYLATED SPIRIT
During the year 2007-2008 the company sold 17944 bulk liters
of methylated spirit valuated 792775 Rs. and 3259 liters of
Denatured spirit costing Rs.143746. The earnings from these
were much high compared to its earning in previous years. In
the year 2006-2007 total earnings from both was around 6.5
lakh only.
RECTIFIED SPIRIT
During the year 2008-2009 the company sold 149462 liters of
rectified spirit valued at Rs.5380643. When compared to the
previous year there is much more decrease in the sales of
rectified spirit. It contains 94% alcohol.
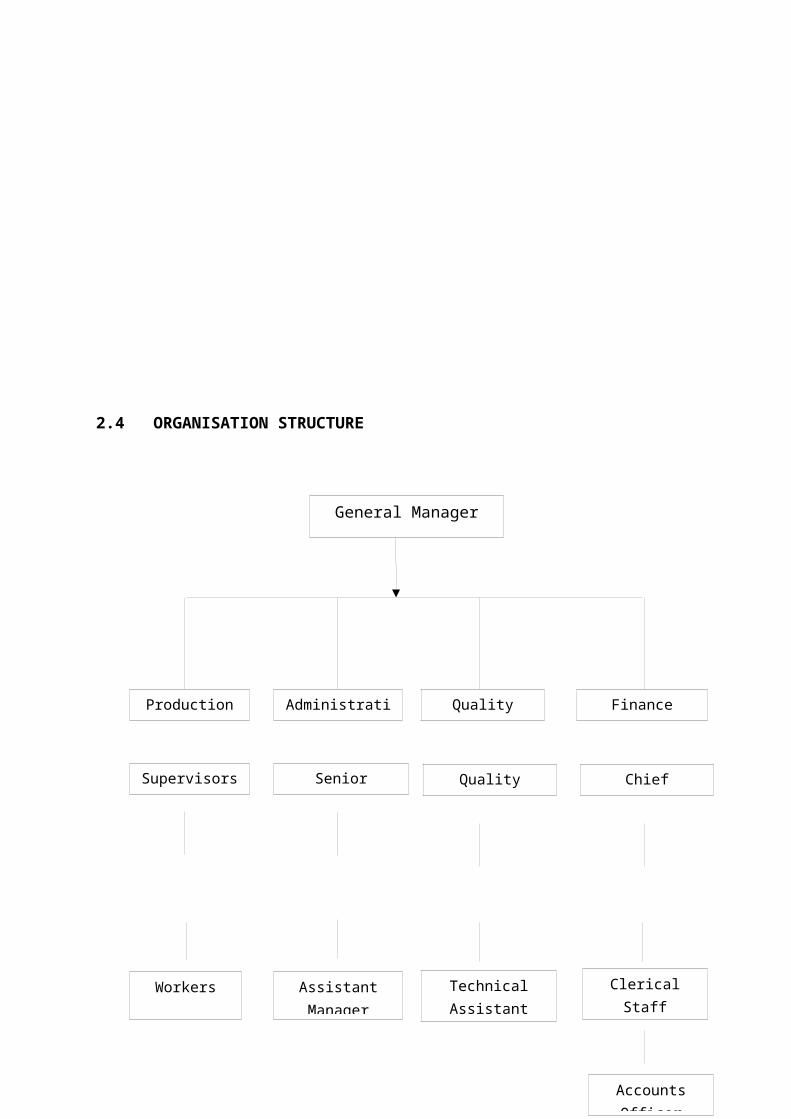
2.4 ORGANISATION STRUCTURE
General Manager
Finance
ChiefAccountant
QualityManager
Supervisors SeniorManager
QualityControl
Administration
Production
ClericalStaff
Workers AssistantManager
TechnicalAssistant
AccountsOfficer
Fig: 1
FUNCTIONAL DEPARTMENTS OF TSC
In TSC the work activities that are similar and logically
connected are grouped to form departments. At present there
are seven departments in the organization. They are as
follows.
1. Production Department
2. Quality Control Department
3. Production Planning Department
4. Material Department
5. Finance Department
6. Human Resource Management
7. Personnel and Administrative Department
FINANCE AND ACCOUNTS DEPARTMENT :
This department is headed by an eminent Finance Manager, who
can make the finance details of the organization up to date.
Every year an audit will be conducted for checking the
financial position of the organization and to check the
correctness of the accounts.
FINANCIAL MANAGEMENT IN TSC LTD.
Senior finance Manager manages the finance department and he
reports to the M.D directly, about the functions of the
department.
BASIC FUNCTIONS OF ACCOUNTS DEPARTMENT
1. Planning and allocating works to accounts staff.
2. Salary and wage administration.
3. Incentives and overtime payment etc.
4. Retirement, gratuity and other personal matters.
5. Verifying cash books.
6. Verifying debtor’s statement.
7. Verifying stock statement.
8. Attending legal and departmental proceedings.
9. Verifying bank reconciliation statement.
10. Scrutinizing of purchase bill, expense bill etc.
11. Submitting periodicals to PF, ESI sales Tax.
12. Legal Security.
13. Monthly closing accounts.
14. Debit and credit note preparation.
15. Renewal of various licenses.
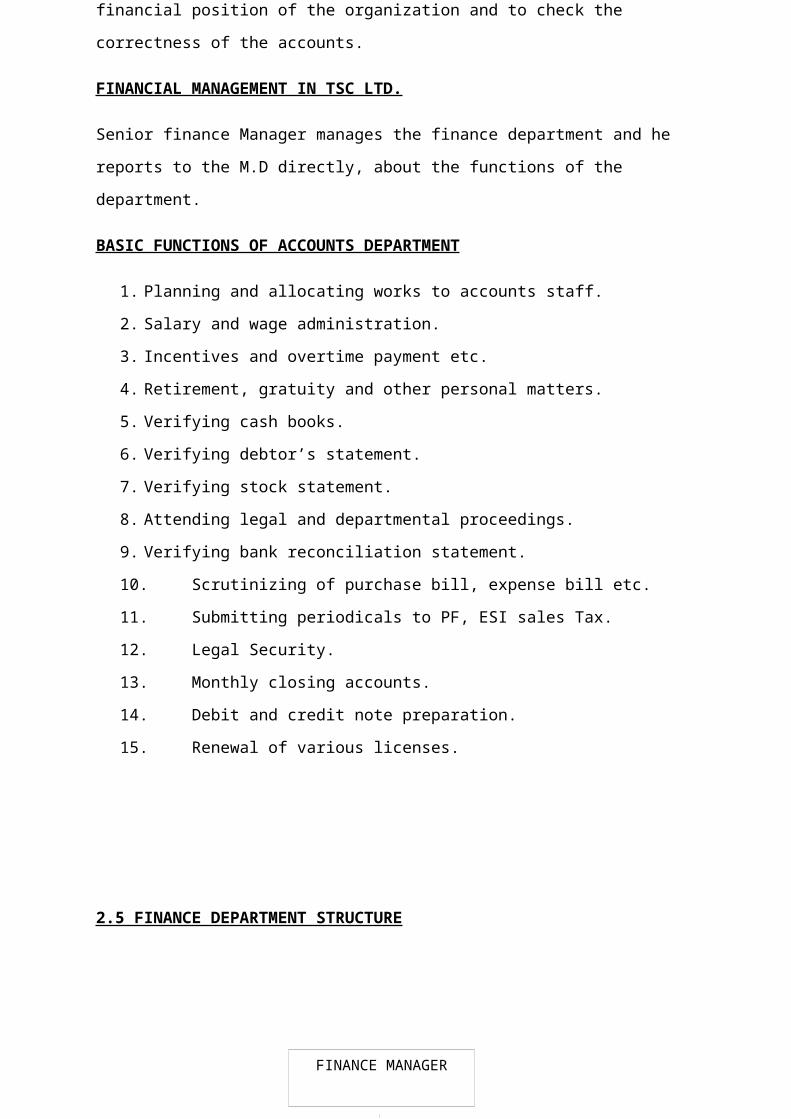
2.5 FINANCE DEPARTMENT STRUCTURE
FINANCE MANAGER
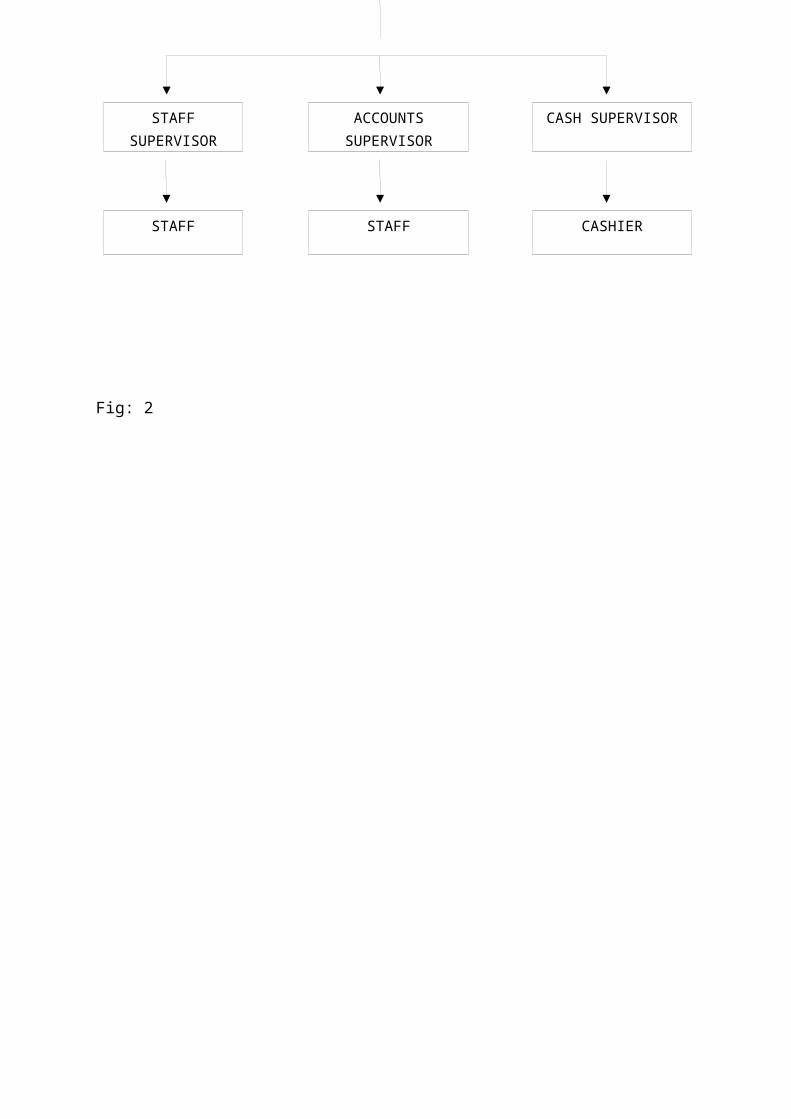
Fig: 2
STAFFSUPERVISOR
ACCOUNTSSUPERVISOR
CASH SUPERVISOR
STAFF STAFF CASHIER

CHAPTER 3
THEORETICAL FRAMEWORK
3.1 INTRODUCTION
Financial management decisions are divided into the management
of assets (investments) and liabilities (sources of
financing), in the long-term and the short-term. It is common
knowledge that a firm’s value cannot be maximized in the long
run unless it survives the short run. Firms fail most often
because they are unable to meet their working capital needs;
consequently, sound working capital management is a requisite
for firm survival.
About 60 percent of a financial manager’s time is devoted to
working capital management, and many of the potential
employees in finance-related fields will find out that their
first assignment on the job will involve working capital. For
these reasons, working capital policy and management is an
essential topic of study. In many text books working capital
refers to current assets, and net working capital is defined
as current assets minus current liabilities. Working capital
policy refers to decisions relating to the level of current
assets and the way they are financed, while working capital
management refers to all those decisions and activities a firm
undertakes in order to manage efficiently the elements of
current assets.
The term working capital originated with the old Yankee
peddler, who would load up his wagon with goods and then go
off on his route to peddle his wares. The merchandise was
called working capital because it was what he actually sold,
or “turned over”, to produce his profits. The wagon and horse
were his fixed assets. He generally owned the horse and wagon,
so they were financed with “equity” capital, but he borrowed
the funds to buy the merchandise. These borrowings were called
working capital loans, and they had to be repaid after each
trip to demonstrate to the bank that the credit was sound. If
the peddler was able to repay the loan, then the bank would
issue another loan, and these were sound banking practices.
The days of the Yankee peddler have long since pasted, but the
importance of working capital remains. Current asset
management and short-term financing are still the two basic
elements of working capital and a daily headache for the
financial managers.
3.2 MEANING OF WORKING CAPITAL
A firm may exist without making profits but cannot survive
without liquidity. The function of working capital
management organization is similar that of heart in a human
body. Also it is an important function of financial
management. The financial manager must determine the
satisfactory level of working capital funds and also the
optimum mix of current assets and current liabilities. He
must ensure that the appropriate sources of funds are used
to finance working capital and should also see that short
term obligation of the business are met well in time.
Working Capital consists of that portion of the assets of a
business, which are used, in current operations. It includes
receivables, inventories or raw materials, stores, work-in-
progress and finished goods, merchandise, bill receivable
and cash. These types of assets are normally temporary in
nature. In accounting concept of working capital it is the
difference between inflow and outflow of funds i.e. sources
and uses of funds, (i.e. net cash inflow). In other words,
working capital is the excess of current assets over current
liabilities. Working capital management is concerned with
problem that arises in attempting to manage the current
liabilities and the interrelationship exists between them.
Management of short-term asset and short term financing is
referring to working capital management and current asset
management. The goal of working capital management is to
manage a current asset in such a manner so that the
satisfactory level should be maintained.
Working capital as represented by excess of current assets
over current liabilities and identifying the relatively
liquid portion of the total enterprise capital which
constitutes a margin for meeting obligation within the
ordinary operating cycle of the business.
"The sum of the current asset is the working capital." J.S
Mill defines the gross concept. "Whenever working capital is
mentioned it brings to mind current assets and current
liabilities with general understanding that working capital
is the difference between the two."
CONCEPTS OF WORKING CAPITAL
There are two concepts of working capital, Gross concept
(GWC) and Net Concept (NWC).
Gross working capital refers to a firm's investment in
current assets. Current assets are the assets, which can be
converted into cash within an accounting year and includes
cash, short-term securities, debtor, bills receivables and
inventories. In other way, it defines as "total of current
assets i.e. circulating capital." This concept is also known
as quantitative concept.
The net concept i.e. net working capital concept refers to
the difference between current assets and current
liabilities. Current liabilities are those claims of
outsiders, which are expected to mature for payment within
an accounting year and include creditors, bills payable,
bank overdraft and outstanding expenses. This concept gives
idea regarding sources of financing capital i.e. amount of
current assets which would remain surplus if all current
liabilities are paid. It can be positive or negative
(positive is net working capital and negative is deficit
working capital)
3.3 TYPES OF WORKING CAPITAL
Classification on the basis of concept:
Gross working capital: This concept is also known as
quantitative concept It takes current assets i.e. cash,
accounts receivables, merchandize, debtors etc. into
account When die organization considers long-term
funds, this concept is significant.
Net working capital: This concept is also known as
qualitative concept. According to this concept, working
capital is the excess of current assets over current
liabilities. This concept shows how much amount is left
for operating activities. For determining the financial
position (i.e. liquidity) this concept is significant
Deficit Working Capital: Excess of current liabilities
over current assets is deficit working capital. Such a
situation is not absolutely theoretical and occurs when
a firm is nearly a crisis of some magnitude.
Classification on the basis of financial statement:
This classification has been done on the basis of financial
statement because the information regarding the working
capital is collected from the profit and loss account or
balance sheet.
(I) Balance sheet:
When the information regarding the working capital is
collected from the balance sheet (i.e. the items appearing in
balance sheet), then this type of working capital is known as
balance sheet working capital.
The basis can now again classified as;
• Gross Working Capital
• Net Working Capital
• Deficit Working Capital
(II) Profit & Loss Account:
Cash working capital: Cash working capital arises when the
items regarding the working capital is collected from the
profit and loss account i.e. the items appearing in P&L A/c.
It shows the real flow of money and values at a particular
time and is considered to be then more realistic approach
and having great significance to working capital management
in recent years as it shows the adequacy of cash flow in
business. It is based on operating cycle concept.
The duration of time required to complete the different
events like conversion of cash into raw materials, raw
material into work-in-progress, work-in-progress into
finished goods, finished goods to debtors and bill receivable
through sales and conversion of bill receivable to cash etc.
in case of manufacturing firm.
Classification on the basis of variability:
Permanent working capital:
The working capital which is permanent in nature is
permanent working capital. They cannot be varied due to
variation in sales. It is the minimum level of current
assets kept by the organization required always for business
operation even if there is fluctuation in sales. Normally it
consists of low level of inventory cash, bill receivable,
and material in process, finished goods. These can be
obtained any day of the year because it is permanent in
nature. Amount of such investment is called as Permanent
Working Capital. Permanent Working Capital is also known as
fixed or regulating Working Capital. This amount varies
year-to-year depending upon the growth and stage of business
cycle in which it operates.
Variable working capital:
It is required during the most active seasons of the year.
It is most suited to the business, which is seasonal and
cyclical in nature. It represents as additional asset
required for normal functioning of business in favorable
seasons. It changes according to variation in sales.
Temporary Working Capital:
Total Current Assets - Permanent Current Assets. It changes
according to change in operational activity. This is also
known as Temporary, Seasonal or Special Working Capital. The
Permanent is constant and temporary is fluctuating according
to seasonal demand.
3.4 FACTORS AFFECTING WORKING CAPITAL REQUIREMENTS
A firm should plan its operations in such a way that it
should have neither the lack of working capital nor it
should have excess of working capital. There is no set of
rules or formula to determine the working capital
requirement but there are so many factors that affect in
determining the requirement of working capital. The factors
mainly affect the size and nature of industry and firm.
These factors are also changing from time to time. In
general, following factors are affecting the requirement of
working capital.
1. Nature of Industry: The main factor which affects the
requirement is the nature of the industry i.e. if the
industry is of small type there may be less need of cash,
investment. On the other hand, if the industry is of large
type, the block cash etc. are kept on large basis. Even
the goods and raw materials are purchased and supplied on
credit basis.
Investing huge amount in fixed assets, have the lowest
needs for current assets, partly because of the cash
nature of their business and partly because of selling
services instead of products. Thus, no funds will be tied
up in accounts receivables and inventories. On the other
hand, trading and financial firms have a very low
investment in fixed assets but huge amount to be invested
in working capital.
2. Demand of creditors: Creditors are the liability of any
organization. They have interested in the assets of a
company and security of loans. They want their advances
should be sufficiently covered. This can only be possible
when the assets are greater than its liabilities so that
they may easily get money as and when needed and at the
time of maturity.
3. Cash Requirements: Cash is a part of current assets. The
company should maintain the minimum cash level. It helps
in the smoother functioning of business operation. It
should be adequate and properly utilized. It is both the
means and end of enterprise. Just as blood, gives life to
the human body, in the same way cash gives profit and
solvency to the working capital structure of an
enterprise.
4. General nature of business: The general nature of business
is also as important determinant of working capital.
Working capital requirements are depend upon general
nature and its activity to work. In public utility
services, the working capital requirement is relatively
slow as the inventories and goods rapidly change into
cash. The large concerns that are engaged in production
maintenance, a big part of investment consists of working
capital. They have to maintain cash, inventory at very
large level. Manufacturing organization, however face
problems of slow turnover of inventories and receivable
and invest large amount in working capital. The industrial
concern should have a fairly large amount of working
capital though it varies from industry to industry
depending on their assets structure.
5. Time: This is also an important factor that affects the
requirement of working capital. If the time required in
manufacturing goods is more (large), the investment in
working capital is also greater and if the time is less
than the amount invested in working capital is also less.
Moreover, the amount of working capital depends upon
inventory turnover and the unit cost of goods that are
sold. The greater the cost the larger is amount of working
capital.
6. Volume of sales: This is the most important factor
affecting the requirement of working capital. A firm
maintains current assets because they are needed to
support the operational activation, which result in sales.
The volume of sale and the size of the working capital are
directly related to each other. As the volume of sale
increases the working capital investment increases and
vices versa.
7. Terms of purchase and sale: If the credit terms of
purchases are more favorable and those of sales less
liberal, less cash is invested in inventory. With more
favorable credit terms, working capital requirements can
be reduced as the firms do get more time for payment to
creditors or suppliers. The credit granting policy of a
firm affects the working capital requirement by
influencing the size of account receivables.
8. Inventory Turnover: If it is high, the working capital
requirement will be low. If it is low, working capital
requirement reduces. Managing working capital is
synonymous with controlling inventories. Good inventory
management is helpful for the structure of working
capital.
9. Receivable Turnover: It is necessary to have an effective
control over receivables. Prompt collection of receivables
and good facilities for setting payables result into low
working capital requirements obtain maximum sales; keep
bad debt losses to minimum. Minimize the cost of
investment etc. are the objectives of receivables
management.
10.Business cycle: More working capital is required in the
prosperity of business expansion and less working capital
required at the time of depression. In the period of
prosperity, additional funds are required to invest in
plant and machinery to meet the increased demand. The
depression phase lead to fall in the level of inventories
and book debts and so less working capital is required.
Business fluctuation influences the size of working
capital mainly through the effect of inventories.
11.Variation in Sales: A seasonal business requires the
maximum amount of working capital for a relatively short
period of time.
12.Production Cycle: The time to convert raw material into
finished goods is referred to as the production cycle or
operating cycle. The longer the duration, more working
capital is required and lesser the duration less working
capital is required. So it is an important factor, which
affects the working capital requirement more working
capital is required to finance the production cycle.
13.Liquidity and Profitability: If firm is interested in
maintaining the liquidity and wants to improve the
liquidity, more working capital is required. If a firm
desires to take a greater risk for bigger gains and
losses, it reduces the size of its working capital in
relation to its sales. A firm therefore should choose
between liquidity and profitability and decides about its
working capital requirement accordingly.
14.Profit planning and control: Adequate profit assists in
generation of cash. It makes it possible for management
to plough back a part of earning into the business and
substantially build up internal financial resources.
15.Activities of the firms: A firm' policy regarding the
sale also depends upon the requirement of working
capital. If a firm's sells its goods to customer on
credit basis, it requires more working capital as
compared to cash sales.
16.Production Policy: There are two options open to the
enterprise, either they confine their production only to
periods when goods are purchased or they follow a steady
production policy throughout the year. In former case,
there will be serious production problems. During the
slack season, the firm will have to maintain the working
force and physical facilities without adequate production
or sale. The programmed accumulation of stock will
naturally require an increasing amount of working
capital, which will remain tied up for some months.
17.Turnover of circulating capital: Conversion of cash to
inventory, inventory to finished goods, finished good to
book debts of account receivables, book debt to cash
account play an important role in judging the working
capital requirement.
18.Inherent hazards and contingencies: An enterprise
operating an industry subject to wide fluctuation in
demand and prices for its products, periodic operating
losses or rapidly changing technology, requires
additional working capital.
19.Repayment ability: Enterprise repayment ability
determines the level of its working capital.
20.Availability of credit: An enterprise which can get
credit from bank and suppliers easily on favorable
conditions will operate with less working capital than an
enterprise with such a facility.
21.Operational and Financial efficiency: Working capital
turnover can only be improved with a better operational
and financial efficiency of a firm.
22.Dividend Policy: A shortage of working capital often acts
as powerful reason for reducing or shipping a cash
dividend.
23.Value of current assets: A decrease in the real value of
current assets compared to their book value reduces the
size of the working capital. If real value of current
assets increases, there will be an increase in working
capital.
24.Price level changes: The rise price level will require an
enterprise to maintain a higher amount of working capital.
The companies, which can immediately reverse their product
prices with rising price level, will not face a severe
working capital problem.
25.Gestation Period: Certain industries have a long
gestation period with a result that a considerable number
of years must elapse before production; operation can be
carried on profitably. During this period income is
insufficient and working capital is greater.
3.5 FINANCING OF WORKING CAPITAL
The working capital requirements of a concern can be
classified as:
a) Permanent or fixed working capital requirements.
b) Temporary or variable working capital requirements.
In any concern, a part of the working capital investments are
as permanent investments in fixed assets. This is so because
there is always a minimum level of current assets which are
continuously required by the enterprise to carry out its day
to day business operations and this minimum cannot be expected
to reduce at any time. This minimum level of current assets
gives rise to permanent working capital.
Similarly, some amount of working capital may be required to
meet the seasonal demands and some special exigencies such as
rise in prices, strikes etc. This proportion of working
capital gives rise to temporary or variable working capital
which cannot be permanently employed gainfully in business.
FINANCING OF PERMANENT WORKING CAPITAL
Permanent working capital should be financed in such a manner
that the enterprise may have its uninterrupted use for a
sufficiently long period. There are five important sources of
permanent working capital. They are;
1) Shares: Issue of shares is the most important source for
raising the permanent capital. A company can issue various
types of shares as equity shares, preference shares and
deferred shares.
2) Debentures: A debenture is an instrument issued by the
company acknowledging its debt to its holder. It is also an
important method of raising long term capital. The
debenture holders are the creditors of the company. A fixed
rate of interest is paid on debentures. The interest on
debentures is a charge against profit and loss account. The
firm issuing debentures also enjoys a number of benefits
such as trading on equity, retention of control, tax
benefits, etc.
3) Public Deposits: Public deposits are the fixed deposits
accepted by a business enterprise directly from the public.
This source of raising short term and medium term finance
was very popular in the absence of banking facilities.
Public deposits as a source of finance have a large number
of advantages such as simple and convenient source of
finance, taxation benefits, trading on equity, etc.
4) Ploughing back of profits: It means the reinvestments by
concern of its surplus earnings in its business. It is an
internal source of finance and is not suitable for
established firm for its expansion, modernization and
replacement etc. this method of finance has a number of
advantages as it is the cheapest rather cost free source of
finance; there is no need to keep securities; there is no
dilution of control; it ensures stable dividend policy and
gains confidence of public.
5) Loans from financial institutions: Financial institutions
such as Commercial Banks, Life Insurance Corporation,
Industrial Finance Corporation of India etc. also provide
short term, medium term and long term loans. This source of
finance is more suitable to meet the medium term demands of
working capital.
FINANCING OF TEMPORARY WORKING CAPITAL
The main sources of short term working capital are as
follows:
1) Indigenous bankers: Private money-lenders and other
country bankers used to be the only source of finance
prior to the establishment of commercial banks. They used
to charge very high rates of interest and exploited the
customers to the largest extent possible. Now-a-days with
the development of commercial banks they have lost their
monopoly. But even today some business houses have to
depend upon indigenous bankers for obtaining loans to meet
their working capital requirements.
2) Trade credit: Trade credit refers to the credit extended
by the suppliers of goods in the normal course of
business. As present day commerce is built upon credit,
the trade credit arrangement of a firm with its suppliers
is an important source of short term finance. The credit-
worthiness of a firm and the confidence of its suppliers
are the main basis of securing trade credit. It is mostly
granted on an open account basis whereby supplier sends
goods to the buyer for the payment to be received in
future as per terms of the sales invoice. It may also take
the form of bills payable whereby the buyer signs a bill
of exchange payable on a specified future date.
3) Installment credit: This is another method by which the
assets are purchased and the possession of goods is taken
immediately but the payment is made in installments over a
pre-determined period of time. Generally, interest is
charged on the unpaid price or it may be adjusted in the
price. But in any case, it provides funds for some time
and is used as a source of short term working capital by
many business houses which have difficult fund position.
4) Advances: Some business houses get advances from their
customers and agents against orders and this source is a
short term source of finance for them. It is a cheap
source of finance and in order to minimize their
investment in working capital, some firms having long
production cycle, especially the firms manufacturing
industrial products prefer to take advances from their
customers.
5) Factoring: Another method of raising short term finance is
through accounts receivable credit offered by commercial
banks and factors. A commercial bank may provide finance
by discounting the bills or invoices of its customers.
Thus, a firm gets immediate payment for sales made on
credit. A factor is a financial institution which offers
services relating to management and financing of debts
arising out of credit sales. Factors render services
varying from bill discounting facilities offered by
commercial banks to a total takeover of administration of
credit sales including maintenance of sales ledger,
collection of accounts receivables, credit control and
protection from bad debts, provision of finance and
rendering advisory services to their clients.
6) Accrued expenses: Accrued expenses are the expenses which
have been incurred but not yet due and hence not yet paid
also. These simply represent a liability that a firm has
to pay for the services already received by it. The most
important items of accruals are wages and salaries,
interest, and taxes. The amount of accruals varies with
the change in the level of activity of a firm. When the
activity level expands, accruals also increase and hence
they provide spontaneous source finance. Further as no
interest is payable on accrued expenses, they represent a
free source of finance.
7) Deferred incomes: They are incomes received in advance
before supplying goods or services. They represent funds
received by a firm for which it has to supply goods or
services in future. These funds increase the liquidity of
a firm and constitute an important source of short term
finance. However, firms having great demand for its
products and services, and those having good reputation in
the market can demand deferred incomes.
8) Commercial paper: It represents unsecured promissory
notes issued by firms to raise short term funds. It is an
important money market instrument. Only a company which is
listed on the stock exchange has a net worth of at least
Rs. 10 crores and a maximum permissible bank finance of
Rs. 25 crores can issue commercial paper not exceeding 30
per cent of its working capital. The maturity period of
commercial paper, in India, mostly ranges from 91 to 180
days. Commercial paper is a cheaper source of raising
short term finance as compared to the bank credit and
proves to be effective even during period of tight bank
credit.
9) Working capital finance by commercial banks: Commercial
banks are the most important source of short term capital.
The major portion of working capital loans are provided by
commercial banks. They provide a wide variety of loans
tailored to meet the specific requirements of a concern.
The different forms in which the banks normally provide
loans and advances are loans, cash credits, overdrafts,
purchasing and discounting of bills.
3.6 TECHNIQUES FOR ANALYSING WORKING CAPITAL
There are four important techniques for analyzing the
working capital position of an enterprise.
Ratio Analysis
Fund Flow Analysis
Cash Flow Analysis
Trend Analysis
Ratio Analysis: It is commonly used technique for
analyzing working capital management. Management can use
ratio analysis of working capital as a means of checking
upon the efficiency with which working capital is being
used in a concern. It can be used with profit to measure
the pulse of the working capital. It can help us to
diagnose the working capital position of the
enterprise.This technique is most commonly used because
it practically deals with each and every aspect of
working capital analysis. In this technique for each
aspect of analysis, certain ratios are computed and then
results are drawn based on trends shown by then against
those fixed as guideposts. Various ratios are used in
analyzing the various aspects of the working capital
position of an enterprise. Ratio analysis is not only a
technique to find out or point out the relationship
between two figures but also points out the devices to
measure the fundamental strengths or weakness of a
concern.
Following are some of the important ratios used to analyze
the liquidity, efficiency and profitability position of the
firm.
LIQUIDITY RATIOS
Liquidity is the ability of the firm to meet its current
liability as they fall due. Since liquidity is basic to
continuous operations of the firm it is necessary to
determining the degree of liquidity of the firm. It is also
known as working capital ratio. The most important liquidity
ratios are;
CURRENT RATIO
Current Ratio is the most commonly used ratio to measure
liquidity of a concern. It represents the ratio of current
assets to current liabilities. In a sound business a Current
Ratio of 2:1 is considered as an ideal one.
QUICK RATIO
This ratio is also known as “Acid Test Ratio”. It is the
relation between quick assets to current liabilities. It is
determined by dividing “quick assets” by current
liabilities. An Acid Test Ratio of 1:1 is considered
satisfactory as a firm can easily meet all its current
liabilities.
ABSOLUTE LIQUIDITY RATIO
This ratio is obtained by dividing cash (of course cash in
hand and cash at bank) and marketable securities by current
liabilities. It is also known as Cash Position Ratio. A
ratio of 0.5:1 is recommended to ensure liquidity. This test
is more vigorous measure of a firm’s liquidity position.
TURNOVER RATIO OR EFFICENCY RATIO
The ratios computed under this group indicate the efficiency
of the organization to use various kinds of assets by
converting them in the form of sale. These ratios are also
called activity ratios or asset management ratios. The asset
basically categorized as fixed assets and current assets and
the current assets further classified according to individual
components of current assets viz. investment and receivables
or debtors or as net current asset. The important efficiency
ratios are the following.
WORKING CAPITAL TURNOVER RATIO
This ratio reflects the turnover of the firm’s net working
capital in the course of the year. It is a good measure of
over- trading and under- trading. It helps in simple
assessment of liquidity, profitability, solvency and
efficiency of the firm.
DEBTORS TURNOVER RATIO
The purpose of this ratio is to know the credit collection
power and policy of the firm. For this a relationship is
established between accounts receivables and net credit
sales of the period. A shorter collection period implies
prompt payment by debtors.
AVERAGE DEBT COLLECTION PERIOD:
The average collection period measures the quality of
debtors since it indicate the speed of their collection. The
shorter the average collection period, the better the
quality of the debtors since a short collection period
implies the prompt payment by debtors. The average
collection period should be compared against the firm’s
credit terms and policy judges its credit and collection
efficiency.
INVENTORY TURNOVER RATIO
This ratio indicates whether investment is efficiently used
or not. It, therefore, explains whether investment in
inventories is within proper limits or not. It also measures
the effectives of the firm’s sales efforts.
INVENTORY CONVERSION PERIOD
This indicates how quickly a company is turning over its
inventory. When deciding the appropriate level of inventory, a
company should strike a balance between the cost of tying up
capital and the demands from the customer. Generally, a high
inventory turnover (short inventory holding period) is
Preferred. An unreasonably long inventory holding period may
indicate an economic recession, obsolete inventory, poor sales
and marketing, a change of customer taste or bad inventory
management.
CURRENT ASSET TURNOVER RATIO
Current assets turnover ratio is calculate to know the firms
efficiency of utilizing the current assets .current assets
includes the assets like inventories, sundry debtors, bills
receivable, cash in hand or bank, marketable securities,
prepaid expenses and short term loans and advances. This ratio
includes the efficiency with which current assets turn into
sales. A higher ratio implies a more efficient use of funds
thus high turnover ratio indicate to reduced the lock up of
funds in current assets. An analysis of this ratio over a
period of time reflects working capital management of a firm.
CREDITORS TURNOVER RATIO
It indicates the number of times the accounts payable rotate
in a year. It signifies the credit period enjoyed by the firm
in paying its creditors. This ratio shows the relationship
between net credit purchases for the whole year and average
creditors. The ratio signifies that the creditors are being
paid promptly, thus enhancing the credit worthiness of the
company.
PROFITABILITY RATIOS
GROSS PROFIT RATIO
This ratio expresses the relationship between gross
profit and sales. This ratio helps in ascertaining
whether the average percentage of mark up on the goods
in maintained or not. It also indicates the degree to
which selling price per unit may decline without
resulting in losses from operations to the firm.
NET PROFIT RATIO
This ratio is also called as the net profit to sales or
net profit margin ratio. It is determined by dividing
the net income after tax to the net sales for the period
and the measures the profit per rupee of sales.
Fund Flow Analysis: Fund flow analysis shows how funds
have been procured for a business and how they have been
employed. This technique helps to analyze changes in
working capital components between two dates. The
comparison of current assets and current liabilities as
shown in the balance sheet at beginning and at the end
of a specific period, shows changes in such types of
current assets as well as the sources from which working
capital has been obtained. It shows how funds have been
procured for a business and how they have been employed.
It is a useful tool for internal management in its
control of working capital.
"The statement of sources and applications of funds gives a
clear answer to the questions of what has become of the net
profit in such situations. And also what has become of the
funds obtained from all other sources”. However, with the
help of this technique we cannot know whether the working
capital is being used most efficiently. It does not throw
light on the significance of movements in the working
capital structure.
One objective of efficient working capital management is to
minimize the amount of cash in hand. Minimizing the funds
required means knowing when funds will be available and when
funds will be needed. The funds flow can be managed so that
the inflows and outflows nearly match. It is not sufficient
that the final accounts shows a profit and the balance sheet
points a rosy picture of financial health of an enterprises.
All mis will look meaningless unless the funds inflows and
outflows are so regulated that at all times there is enough
cash available to meet obligation as and when they mature.
Cash Flow Analysis: It is an important component of
working capital because it is a form of liquid capital.
It is very necessary for day-to-day operation. It is the
important current asset, which affects business
activities. Cash flow analysis is an important tool for
cash flow planning. Cash is the focal point of working
capital flows.
A statement showing the variation in cash has to be
prepared and is known as cash flow statement. It highlights
the causes, which changes the cash position between two
balance sheet dates. It depicts a penetrating review of cash
movement and an operating cycle. It shows the flow of cash for
a period. Hence, an analysis dealing with inflow and outflow
of cash referred to as cash flow analysis. It shows the
movement of cash in and out of the business by listing the
source of cash receipts and the uses of cash. Sound working
capital management requires maintenance of an adequate amount
of cash. Controlling the investment in working capital begins
with cash management.
Trend Analysis: Working capital trend analysis in an
important technique of working capital management. Trend
percentage constitutes an important tool of
interpretative analysis of financial position of a
company.
It indicates die changes, which have been taking, place from
time to time in individual items of current assets, current
liabilities and net working based on some standard year and
its effect on working capital position. It enables us to
evaluate the upward and downward trend of current asset and
current liabilities. These are usually measured from review of
comparative balance sheets of a concern at the end of two
accounting years and results are drawn based on trend shown by
them. Trend analysis involves the calculation of percentage
relationship that each statement item bears to the same items
in the base year. Trend percentage discloses change in the
financial and operating data between specific periods and
makes it possible for the analyst to form an opinion as to
whether favorable or unfavorable tendencies are reflected by
data.
The goal of working capital management is to manage the firm's
current assets and current liabilities is such a way that a
satisfactory level of working capital is maintained. This is
so because if the firm cannot maintain a satisfactory level of
working capital, it is likely to become insolvent and may even
be forced into bankruptcy. The current assets should be large
enough to cover its current liabilities in order to ensure a
reasonable margin of safety. Each of current assets must be
managed efficiently in order to maintain the liquidity of the
firm while not keeping too high level of any one of them.
3.7 INADEQUATE WORKING CAPITAL
Every business concern must have adequate working capital to
run its business operations. It should have neither redundant
or excess working capital nor inadequate nor shortage of
working capital. Both excess and short working capital
positions are bad for any business. Out of the two, inadequacy
of working capital is more dangerous from the point of view of
the firm.
DISADVANTAGES OF INADEQUATE WORKING CAPITAL
1. A concern with inadequate working capital cannot pay its
short-term liabilities in time. Thus, it will lose its
reputation and shall not be able to get good credit
facilities.
2. It cannot buy its requirements in bulk and avail
discounts etc.
3. It becomes difficult for the firms to exploit favorable
market conditions and undertake profitable projects due
to lack of working capital.
4. The firm cannot pay its day-to-day expenses of its
operations and creates inefficiency, increases costs and
reduces the profits of the business.
5. It becomes impossible to utilize efficiently the fixed
assets due to non availability of liquid funds.
6. The rate of return on investments also falls with the
shortage of working capital.
3.8 COMPONENTS OF WORKING CAPITAL
The three major component of working capital management
include:
Inventory management
Receivables management
Cash management
A detailed discussion of these components is given below:
INVENTORY MANAGEMENT:
Inventory is defined as the sum of the
value of raw material and supplies, including spares, semi-
processed material or work in progress and finished goods. The
nature of inventory is largely depending upon the type of
operation carried on. It is possible to reduce the inventory
to a certain level without affecting production and sales, by
using simple inventory planning and controlling technique. The
reduction in “excessive” inventories carries a favorable
impact on the company’s profitability.
Maintaining inventories involves tying up
of the company’s funds and incurrence of storage and handling
cost. There are three components: Raw material, Work in
progress; and finished goods involved in inventory management.
RECEIVABLES MANAGEMENT:
Receivables or debtors are the one
of the most important parts of the current assets which is
created if the company sells the finished goods to the
customer but not receive the cash for the same immediately.
Trade credit arises when firm sells its products and services
on credit and does not receive cash immediately. It is
essential marketing tool, acting as bridge for the movement of
goods through production and distribution stages to customers.
The receivables include three characteristics:
1) It involve element of risk which should be carefully
analysis.
2) It is based on economic value.
3) It implies futurity. The cash payment for goods or serves
received by the buyer will be made by him in a future period.
CASH MANAGEMENT:
Cash is common purchasing power or medium of exchange. As
such, it forms the most important component of working
capital. The term cash with reference to cash management is
used in two senses, in narrow sense it is used broadly to
cover cash and generally accepted equivalent of cash such as
cheques, draft and demand deposits in banks. The broader view
of cash includes near cash items, such as marketable
securities or bank time deposits. The basic characteristic of
near-cash assets is that they can readily be converted into
cash. They also provide short term investment outlet for
excess and are also useful for meeting planned outflow of
funds.
Cash management is concerned with the managing of:
(i)Cash flows into and out of the firm
(ii)Cash flows within the firm and
(iii)Cash balances held by the firm at a point of the time by
financing deficit or investing surplus cash.
OBJECTIVES OF CASH MANAGEMENT
There are two basic objectives of cash management:
To meet the cash disbursement needs as per the payment
schedule;
To minimize the amount locked up as cash balances.
CHAPTER 4
DATA ANALYSIS
AND
INTERPRETATION
WORKING CAPITAL MANAGEMENT OF TRAVANCORE SUGARS & CHEMICALS
LTD: AN ANALYSIS
The present chapter is an attempt to evaluate the working
capital management of TSC. For the purpose of analysis data
were collected from financial statements of TSC for the period
from 2006 – 07 to 2010 – 11. Appropriate accounting ratios,
schedule of working capital and trend analysis were used.
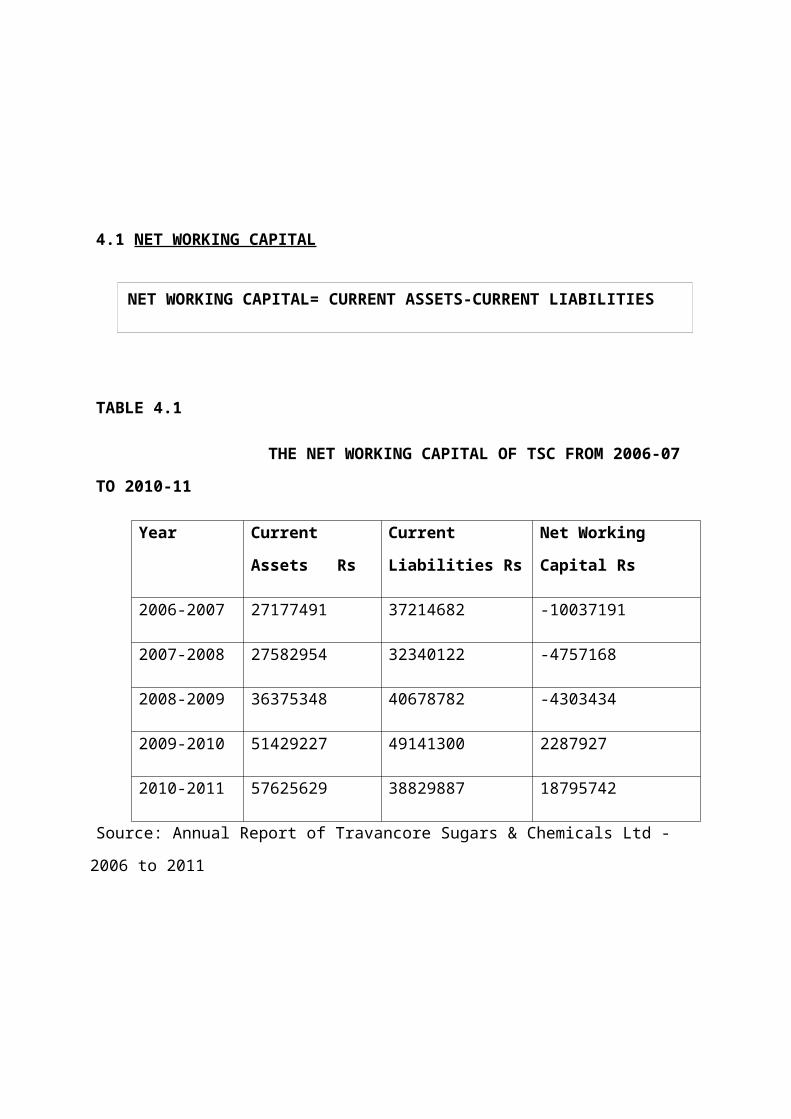
4.1 NET WORKING CAPITAL
TABLE 4.1
THE NET WORKING CAPITAL OF TSC FROM 2006-07
TO 2010-11
Year Current
Assets Rs
Current
Liabilities Rs
Net Working
Capital Rs
2006-2007 27177491 37214682 -10037191
2007-2008 27582954 32340122 -4757168
2008-2009 36375348 40678782 -4303434
2009-2010 51429227 49141300 2287927
2010-2011 57625629 38829887 18795742
Source: Annual Report of Travancore Sugars & Chemicals Ltd -
2006 to 2011
NET WORKING CAPITAL= CURRENT ASSETS-CURRENT LIABILITIES
2006-2007
2007-2008
2008-2009
2009-2010
2010-2011
-20000000
-10000000
0
10000000
20000000
30000000
40000000
50000000
60000000
70000000
Current Assets RsCurrent Liabilities RsNet Working Capital Rs
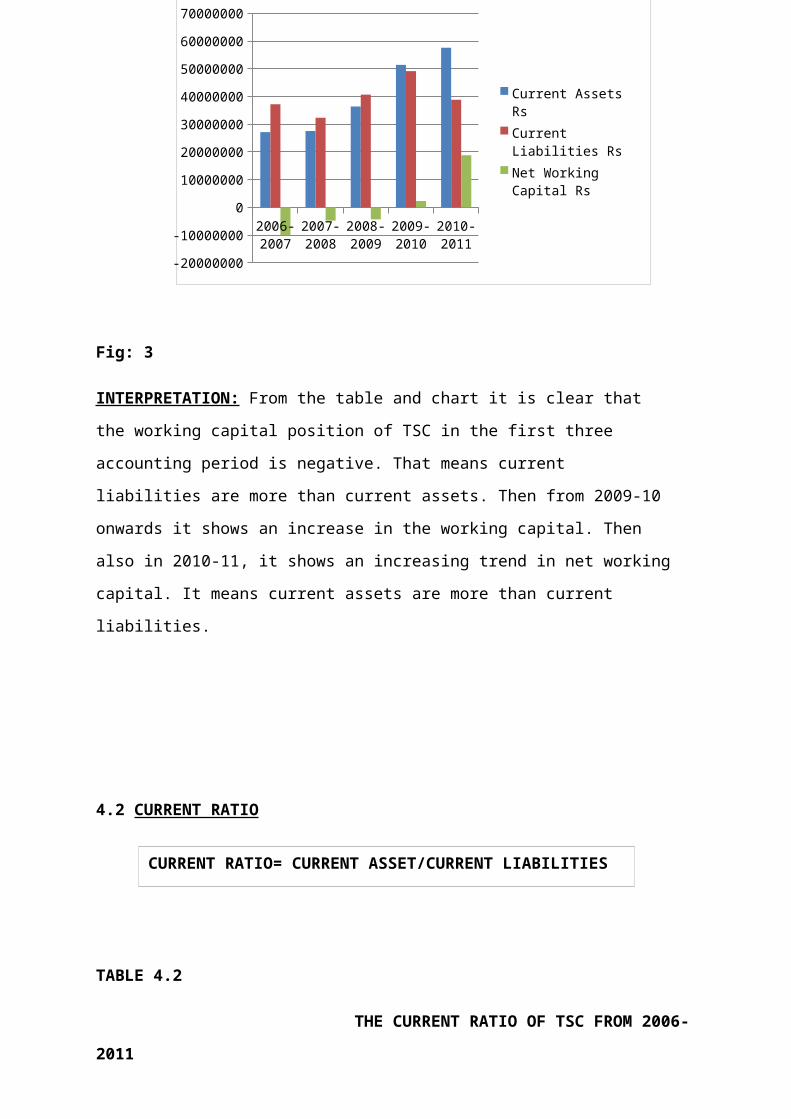
Fig: 3
INTERPRETATION: From the table and chart it is clear that
the working capital position of TSC in the first three
accounting period is negative. That means current
liabilities are more than current assets. Then from 2009-10
onwards it shows an increase in the working capital. Then
also in 2010-11, it shows an increasing trend in net working
capital. It means current assets are more than current
liabilities.
4.2 CURRENT RATIO
TABLE 4.2
THE CURRENT RATIO OF TSC FROM 2006-
2011
CURRENT RATIO= CURRENT ASSET/CURRENT LIABILITIES
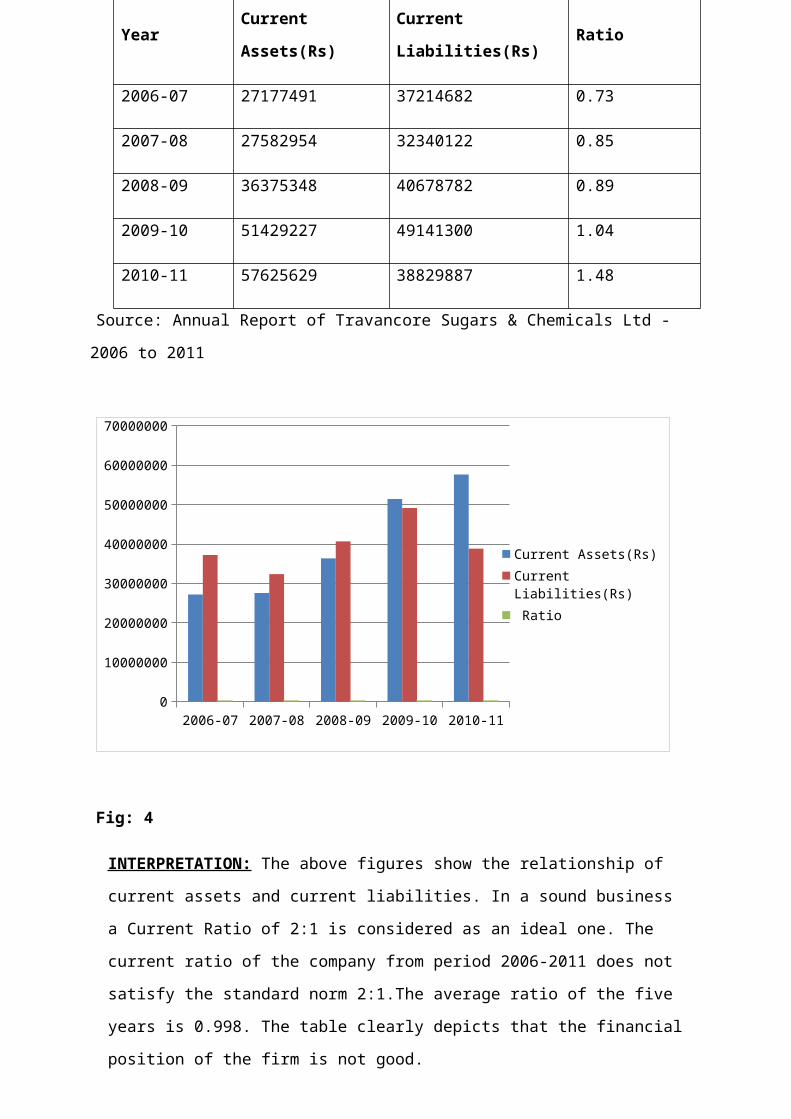
YearCurrent
Assets(Rs)
Current
Liabilities(Rs)Ratio
2006-07 27177491 37214682 0.73
2007-08 27582954 32340122 0.85
2008-09 36375348 40678782 0.89
2009-10 51429227 49141300 1.04
2010-11 57625629 38829887 1.48
Source: Annual Report of Travancore Sugars & Chemicals Ltd -
2006 to 2011
2006-07 2007-08 2008-09 2009-10 2010-110
10000000
20000000
30000000
40000000
50000000
60000000
70000000
Current Assets(Rs)Current Liabilities(Rs) Ratio
Fig: 4
INTERPRETATION: The above figures show the relationship of
current assets and current liabilities. In a sound business
a Current Ratio of 2:1 is considered as an ideal one. The
current ratio of the company from period 2006-2011 does not
satisfy the standard norm 2:1.The average ratio of the five
years is 0.998. The table clearly depicts that the financial
position of the firm is not good.
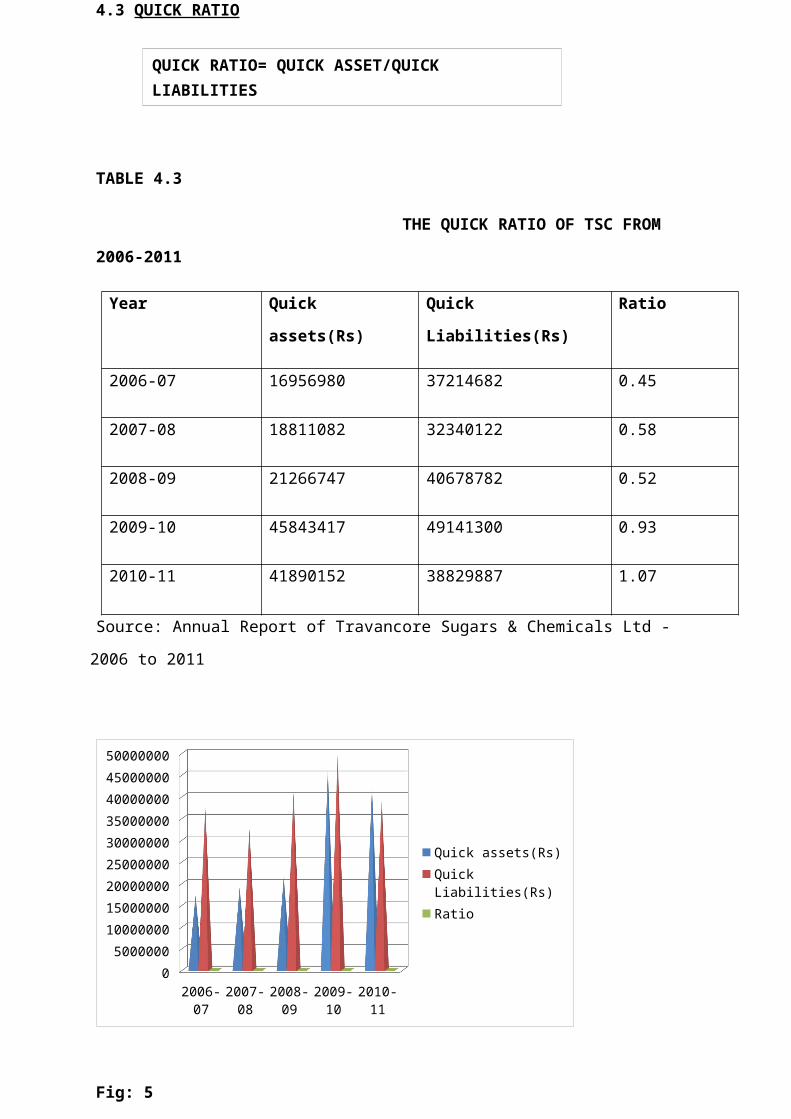
4.3 QUICK RATIO
TABLE 4.3
THE QUICK RATIO OF TSC FROM
2006-2011
Year Quick
assets(Rs)
Quick
Liabilities(Rs)
Ratio
2006-07 16956980 37214682 0.45
2007-08 18811082 32340122 0.58
2008-09 21266747 40678782 0.52
2009-10 45843417 49141300 0.93
2010-11 41890152 38829887 1.07
Source: Annual Report of Travancore Sugars & Chemicals Ltd -
2006 to 2011
2006-07
2007-08
2008-09
2009-10
2010-11
05000000100000001500000020000000250000003000000035000000400000004500000050000000
Quick assets(Rs)Quick Liabilities(Rs)Ratio
Fig: 5
QUICK RATIO= QUICK ASSET/QUICK LIABILITIES
INTERPRETATION: The above table shows the relationship between
quick assets and current liabilities. The standard norm for
quick ratio is 1:1. An examination of the above table shows
that the quick ratio of the company for the period 2010-11 is
only satisfactory and the other period’s does not satisfies
the standard norm 1:1. The average ratio of the five years is
0.71. The table clearly depicts that the financial position of
the firm is not good.
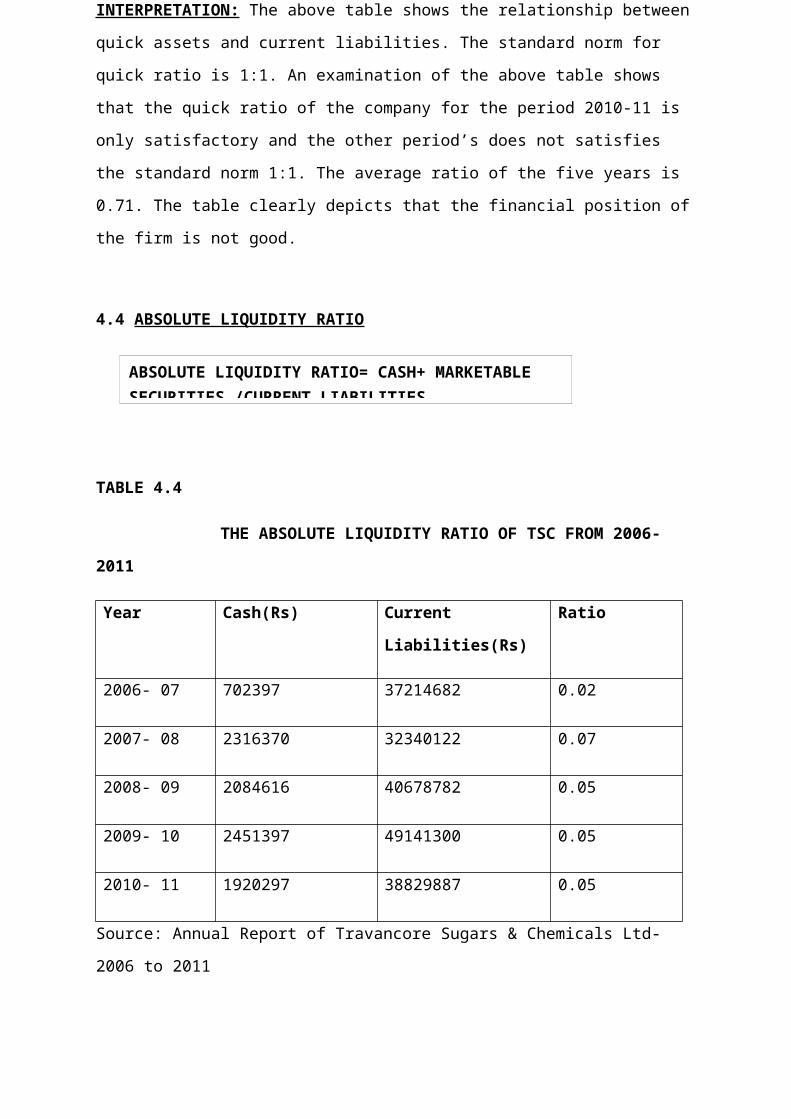
4.4 ABSOLUTE LIQUIDITY RATIO
TABLE 4.4
THE ABSOLUTE LIQUIDITY RATIO OF TSC FROM 2006-
2011
Year Cash(Rs) Current
Liabilities(Rs)
Ratio
2006- 07 702397 37214682 0.02
2007- 08 2316370 32340122 0.07
2008- 09 2084616 40678782 0.05
2009- 10 2451397 49141300 0.05
2010- 11 1920297 38829887 0.05
Source: Annual Report of Travancore Sugars & Chemicals Ltd-
2006 to 2011
ABSOLUTE LIQUIDITY RATIO= CASH+ MARKETABLE SECURITIES /CURRENT LIABILITIES
2006-07
2007-08
2008-09
2009-2010
2010-11
00.010.020.030.040.050.060.070.08
0.0188000000000004
0.0716
0.05120.0498000000000004
0.0494000000000004
Absolute Liquidity Ratio
Fig: 6
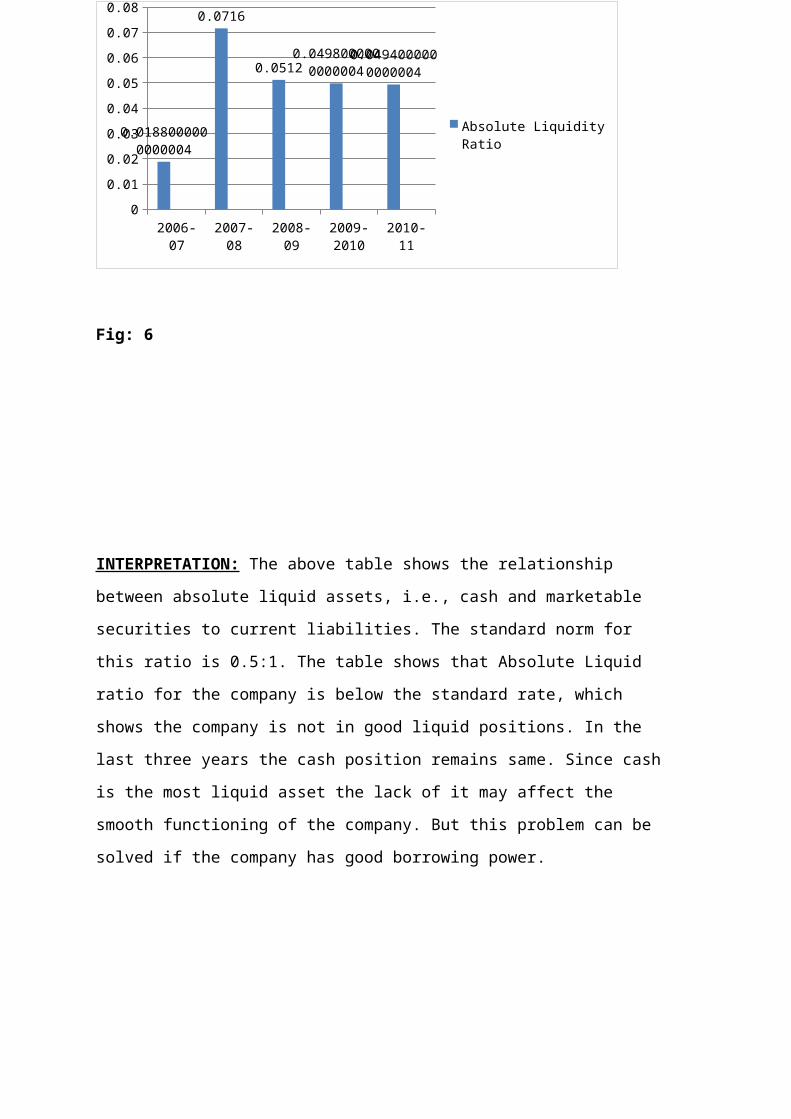
INTERPRETATION: The above table shows the relationship
between absolute liquid assets, i.e., cash and marketable
securities to current liabilities. The standard norm for
this ratio is 0.5:1. The table shows that Absolute Liquid
ratio for the company is below the standard rate, which
shows the company is not in good liquid positions. In the
last three years the cash position remains same. Since cash
is the most liquid asset the lack of it may affect the
smooth functioning of the company. But this problem can be
solved if the company has good borrowing power.
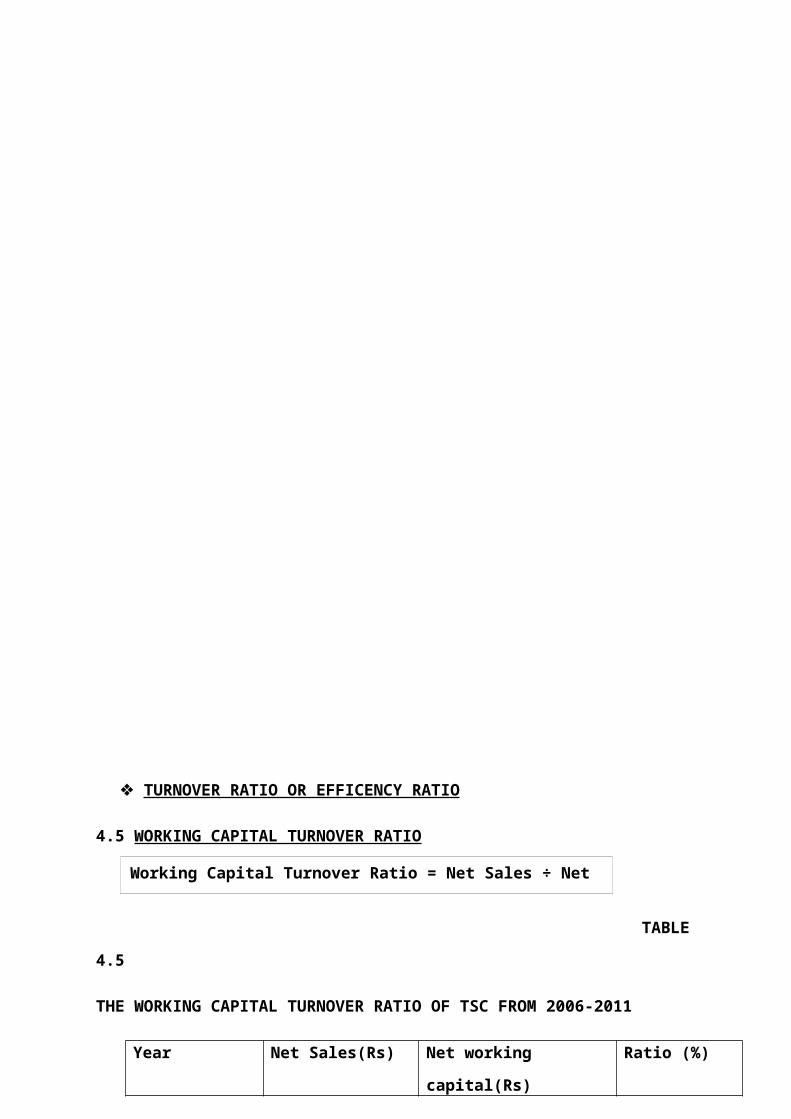
TURNOVER RATIO OR EFFICENCY RATIO
4.5 WORKING CAPITAL TURNOVER RATIO
TABLE
4.5
THE WORKING CAPITAL TURNOVER RATIO OF TSC FROM 2006-2011
Year Net Sales(Rs) Net working
capital(Rs)
Ratio (%)
Working Capital Turnover Ratio = Net Sales ÷ Net
Working Capital
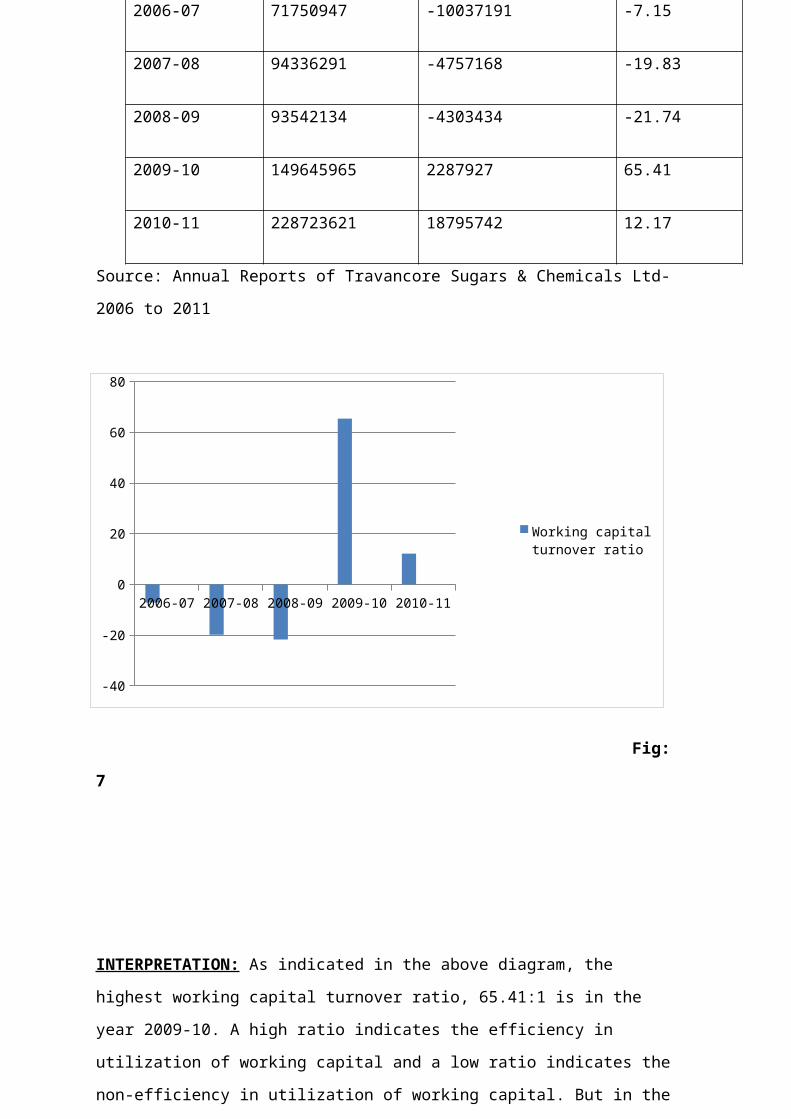
2006-07 71750947 -10037191 -7.15
2007-08 94336291 -4757168 -19.83
2008-09 93542134 -4303434 -21.74
2009-10 149645965 2287927 65.41
2010-11 228723621 18795742 12.17
Source: Annual Reports of Travancore Sugars & Chemicals Ltd-
2006 to 2011
2006-07 2007-08 2008-09 2009-10 2010-11
-40
-20
0
20
40
60
80
Working capital turnover ratio
Fig:
7
INTERPRETATION: As indicated in the above diagram, the
highest working capital turnover ratio, 65.41:1 is in the
year 2009-10. A high ratio indicates the efficiency in
utilization of working capital and a low ratio indicates the
non-efficiency in utilization of working capital. But in the

first three years the ratio is negative which means the
firm’s working capital is not good.
4.6 DEBTORS TURNOVER RATIO
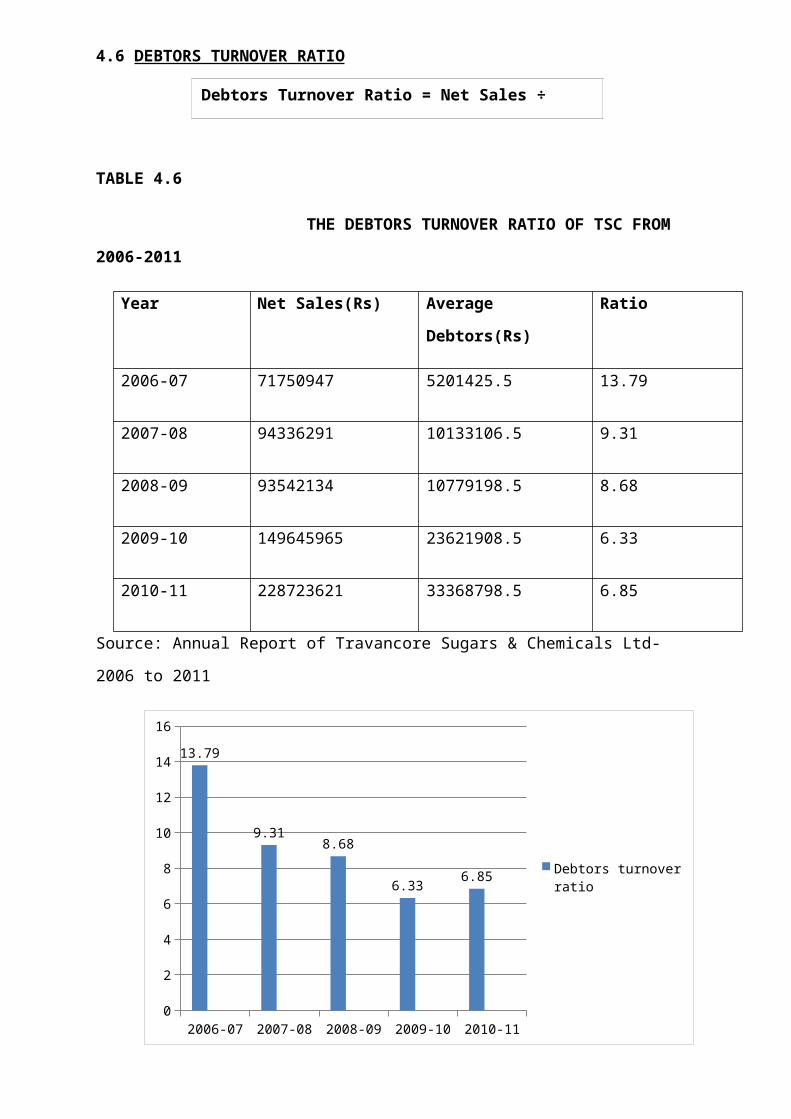
TABLE 4.6
THE DEBTORS TURNOVER RATIO OF TSC FROM
2006-2011
Year Net Sales(Rs) Average
Debtors(Rs)
Ratio
2006-07 71750947 5201425.5 13.79
2007-08 94336291 10133106.5 9.31
2008-09 93542134 10779198.5 8.68
2009-10 149645965 23621908.5 6.33
2010-11 228723621 33368798.5 6.85
Source: Annual Report of Travancore Sugars & Chemicals Ltd-
2006 to 2011
2006-07 2007-08 2008-09 2009-10 2010-110
2
4
6
8
10
12
14
1613.79
9.318.68
6.33 6.85 Debtors turnover ratio
Debtors Turnover Ratio = Net Sales ÷ Average Debtors
Fig:
8
INTERPRETATION: Debtors Turnover ratio indicates the no of
times debtors turnover each year. Higher the value of debtors
turnover, the more efficient is the management of credit
because the collection period of the debtors will low. highest
debtors turnover ratio is recorded in 2006-07 with 13.57. .
Then it decreases from 2006-07 to 2009-10. Then in 2010-11,
there is a little increase in the ratio. The increased Debtors
Turnover Ratio shows the better management in debtors
collection.
4.7 AVERAGE DEBT COLLECTION PERIOD:
TABLE 4.7
THE DEBTORS COLLECTION PERIOD OF TSC FROM
2006-2011
Year Days Debtors Turnover
Ratio
Debtors
Collection
Period(Days)
2006-07 365 13.79 26
2007-08 365 9.31 39
2008-09 365 8.68 42
2009-10 365 6.33 58
2010-11 365 6.85 53
Debtors Collection Period (Days) = 365 ÷ Debtors Turnover Ratio
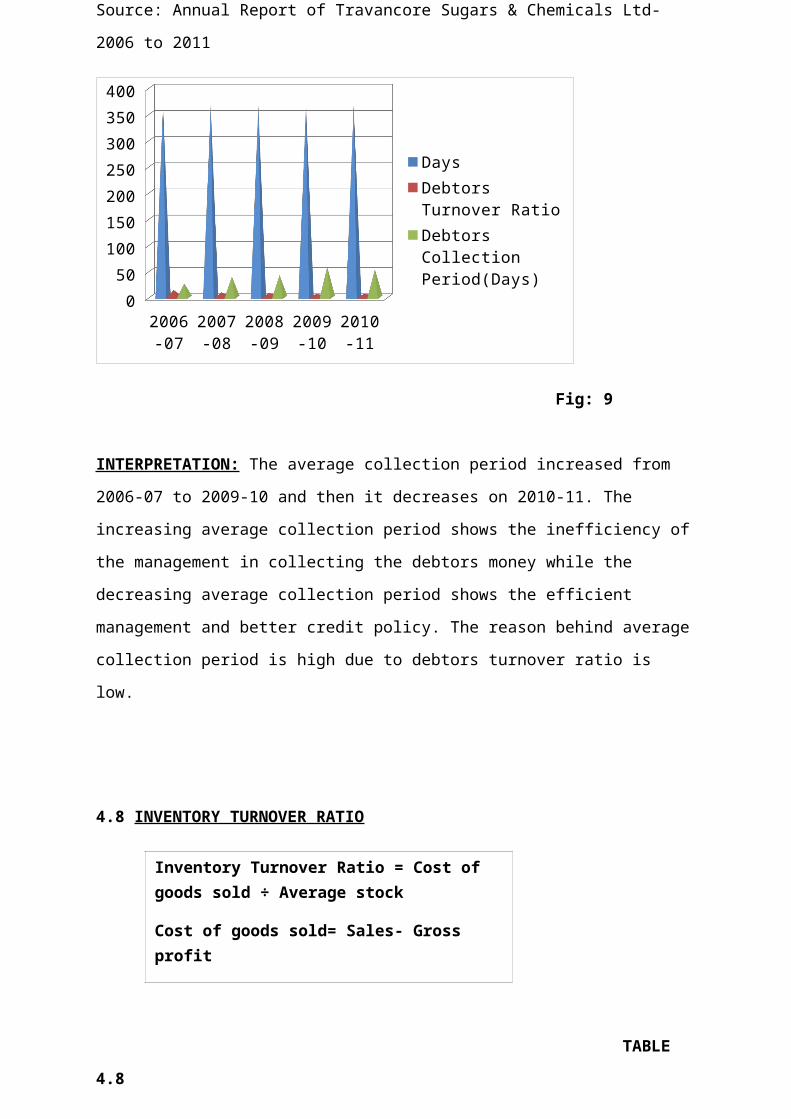
Source: Annual Report of Travancore Sugars & Chemicals Ltd-
2006 to 2011
2006-07
2007-08
2008-09
2009-10
2010-11
050
100150200250300350400
DaysDebtors Turnover RatioDebtors Collection Period(Days)
Fig: 9
INTERPRETATION: The average collection period increased from
2006-07 to 2009-10 and then it decreases on 2010-11. The
increasing average collection period shows the inefficiency of
the management in collecting the debtors money while the
decreasing average collection period shows the efficient
management and better credit policy. The reason behind average
collection period is high due to debtors turnover ratio is
low.
4.8 INVENTORY TURNOVER RATIO
TABLE
4.8
Inventory Turnover Ratio = Cost of goods sold ÷ Average stock
Cost of goods sold= Sales- Gross profit
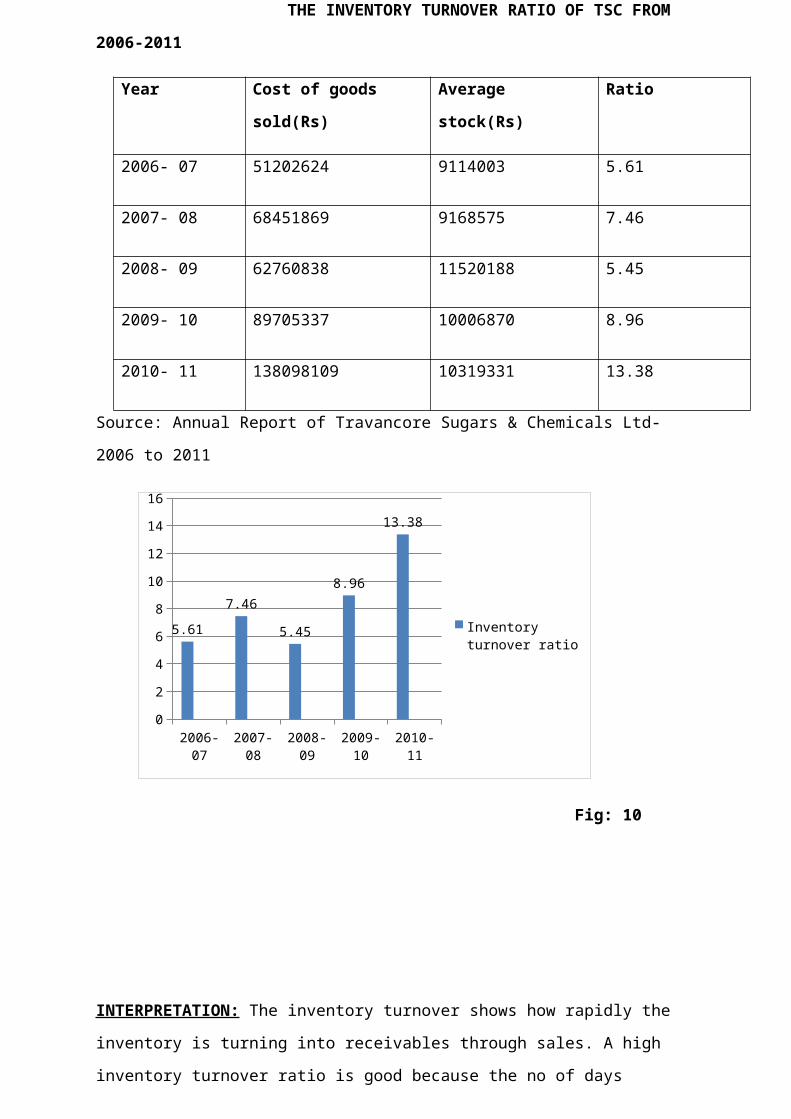
THE INVENTORY TURNOVER RATIO OF TSC FROM
2006-2011
Year Cost of goods
sold(Rs)
Average
stock(Rs)
Ratio
2006- 07 51202624 9114003 5.61
2007- 08 68451869 9168575 7.46
2008- 09 62760838 11520188 5.45
2009- 10 89705337 10006870 8.96
2010- 11 138098109 10319331 13.38
Source: Annual Report of Travancore Sugars & Chemicals Ltd-
2006 to 2011
2006-07
2007-08
2008-09
2009-10
2010-11
0
2
4
6
8
10
12
14
16
5.617.46
5.45
8.96
13.38
Inventory turnover ratio
Fig: 10
INTERPRETATION: The inventory turnover shows how rapidly the
inventory is turning into receivables through sales. A high
inventory turnover ratio is good because the no of days
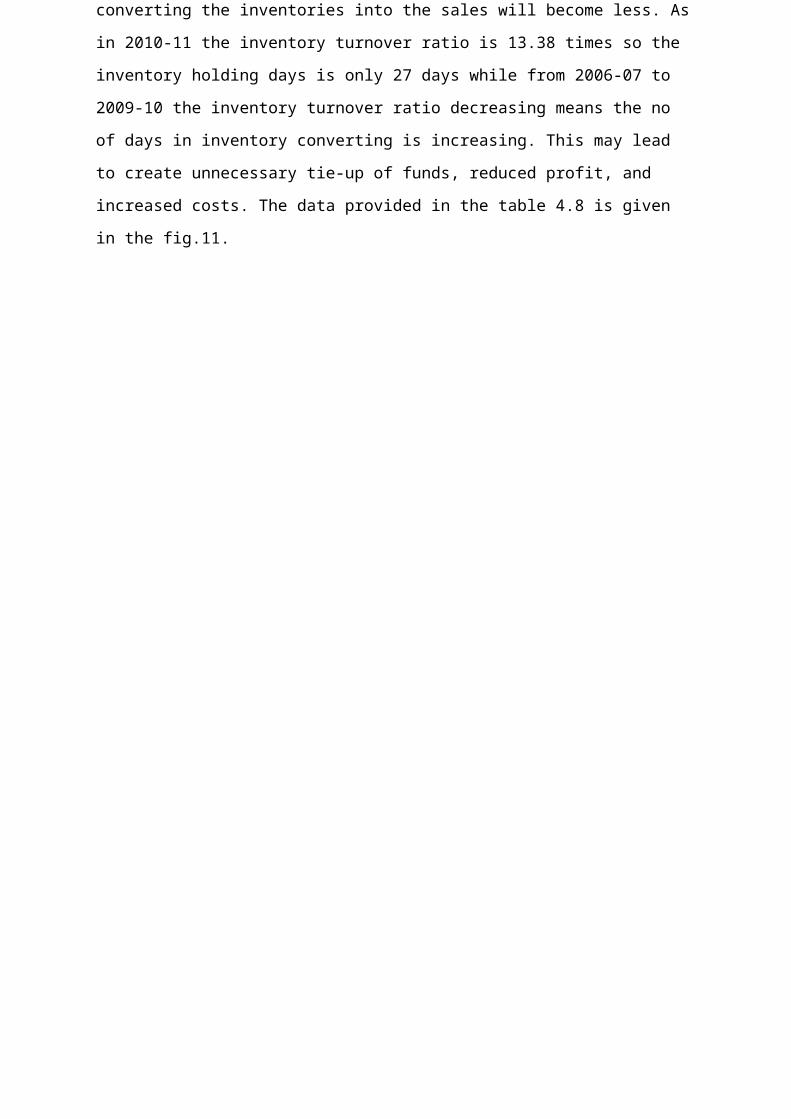
converting the inventories into the sales will become less. As
in 2010-11 the inventory turnover ratio is 13.38 times so the
inventory holding days is only 27 days while from 2006-07 to
2009-10 the inventory turnover ratio decreasing means the no
of days in inventory converting is increasing. This may lead
to create unnecessary tie-up of funds, reduced profit, and
increased costs. The data provided in the table 4.8 is given
in the fig.11.
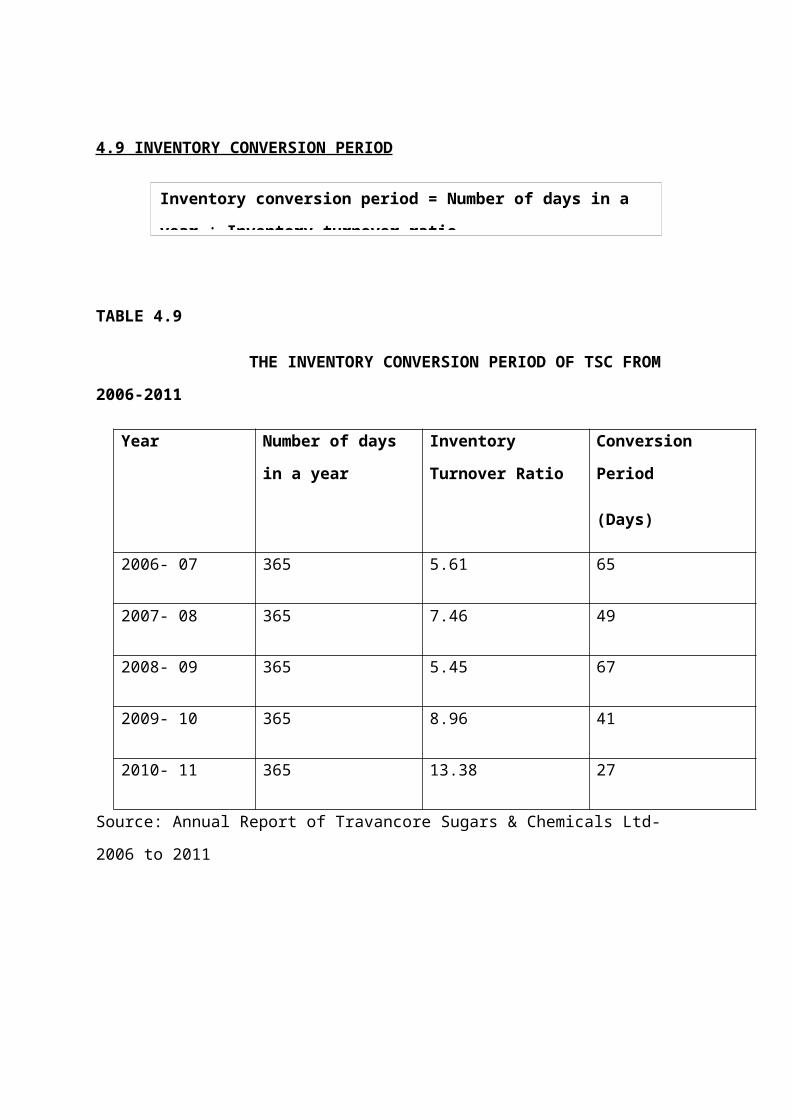
4.9 INVENTORY CONVERSION PERIOD
TABLE 4.9
THE INVENTORY CONVERSION PERIOD OF TSC FROM
2006-2011
Year Number of days
in a year
Inventory
Turnover Ratio
Conversion
Period
(Days)
2006- 07 365 5.61 65
2007- 08 365 7.46 49
2008- 09 365 5.45 67
2009- 10 365 8.96 41
2010- 11 365 13.38 27
Source: Annual Report of Travancore Sugars & Chemicals Ltd-
2006 to 2011
Inventory conversion period = Number of days in a
year ÷ Inventory turnover ratio
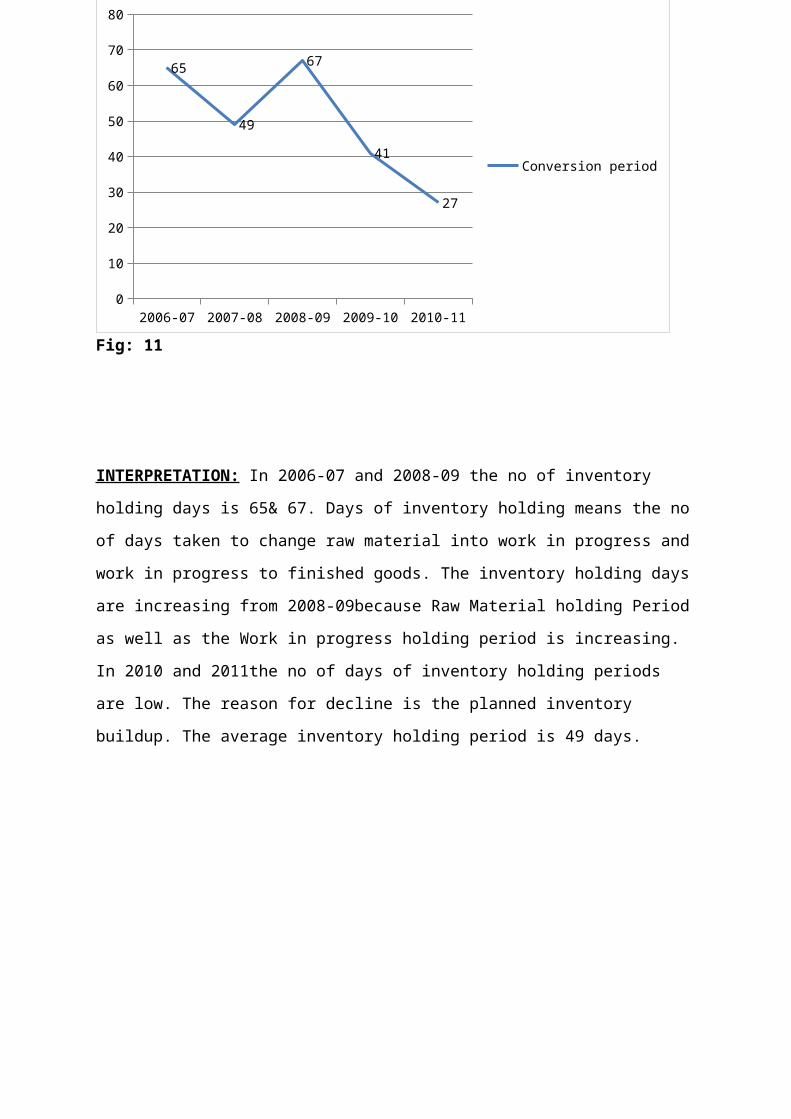
Fig: 11
INTERPRETATION: In 2006-07 and 2008-09 the no of inventory
holding days is 65& 67. Days of inventory holding means the no
of days taken to change raw material into work in progress and
work in progress to finished goods. The inventory holding days
are increasing from 2008-09because Raw Material holding Period
as well as the Work in progress holding period is increasing.
In 2010 and 2011the no of days of inventory holding periods
are low. The reason for decline is the planned inventory
buildup. The average inventory holding period is 49 days.
2006-07 2007-08 2008-09 2009-10 2010-110
10
20
30
40
50
60
70
80
65
49
67
41
27
Conversion period
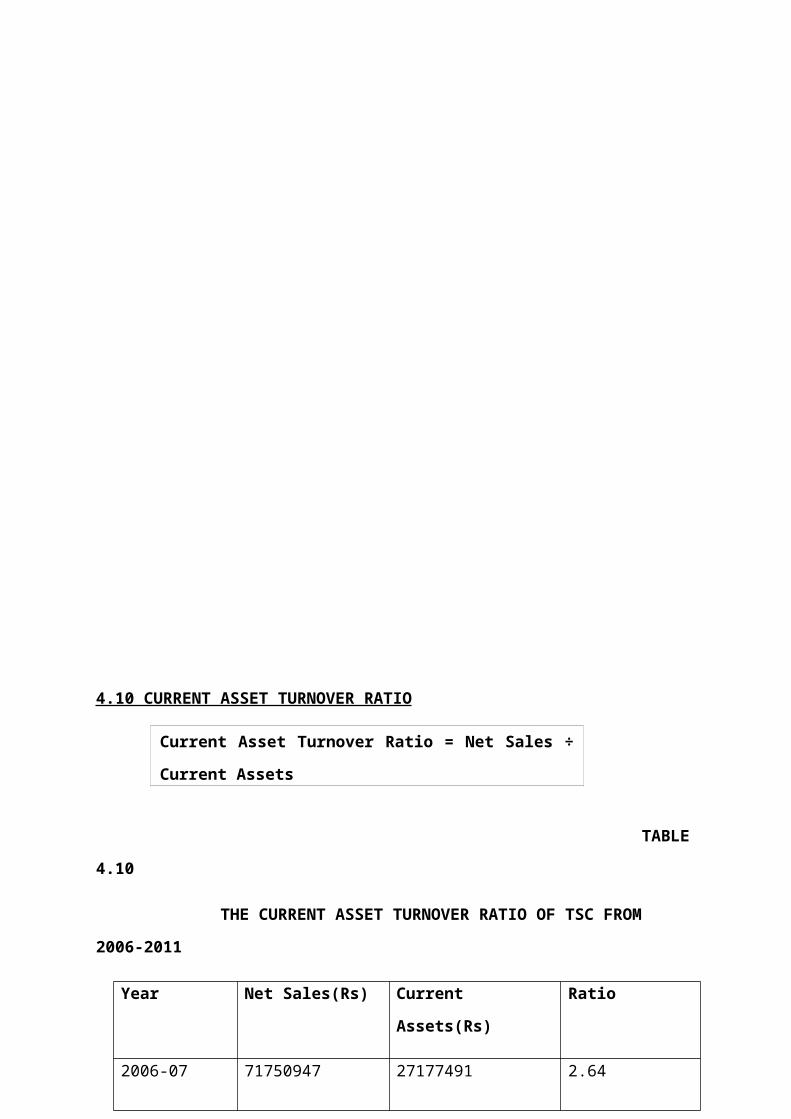
4.10 CURRENT ASSET TURNOVER RATIO
TABLE
4.10
THE CURRENT ASSET TURNOVER RATIO OF TSC FROM
2006-2011
Year Net Sales(Rs) Current
Assets(Rs)
Ratio
2006-07 71750947 27177491 2.64
Current Asset Turnover Ratio = Net Sales ÷
Current Assets
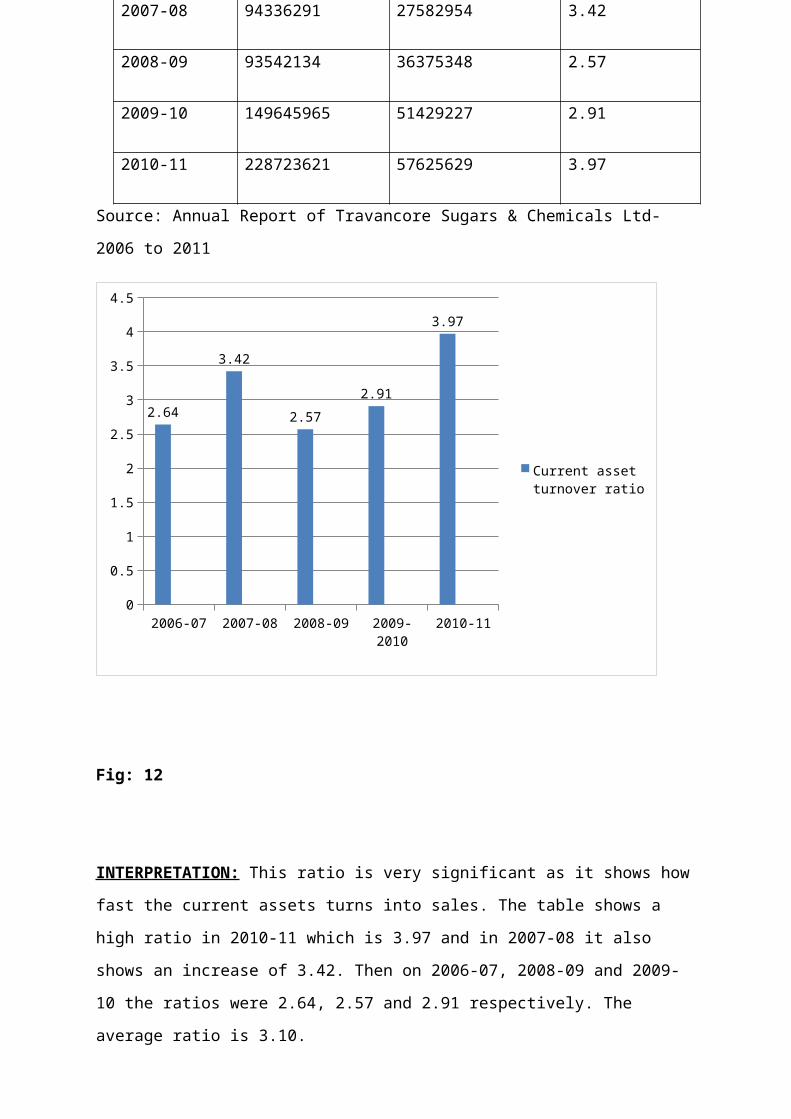
2007-08 94336291 27582954 3.42
2008-09 93542134 36375348 2.57
2009-10 149645965 51429227 2.91
2010-11 228723621 57625629 3.97
Source: Annual Report of Travancore Sugars & Chemicals Ltd-
2006 to 2011
2006-07 2007-08 2008-09 2009-2010
2010-110
0.5
1
1.5
2
2.5
3
3.5
4
4.5
2.64
3.42
2.572.91
3.97
Current asset turnover ratio
Fig: 12
INTERPRETATION: This ratio is very significant as it shows how
fast the current assets turns into sales. The table shows a
high ratio in 2010-11 which is 3.97 and in 2007-08 it also
shows an increase of 3.42. Then on 2006-07, 2008-09 and 2009-
10 the ratios were 2.64, 2.57 and 2.91 respectively. The
average ratio is 3.10.

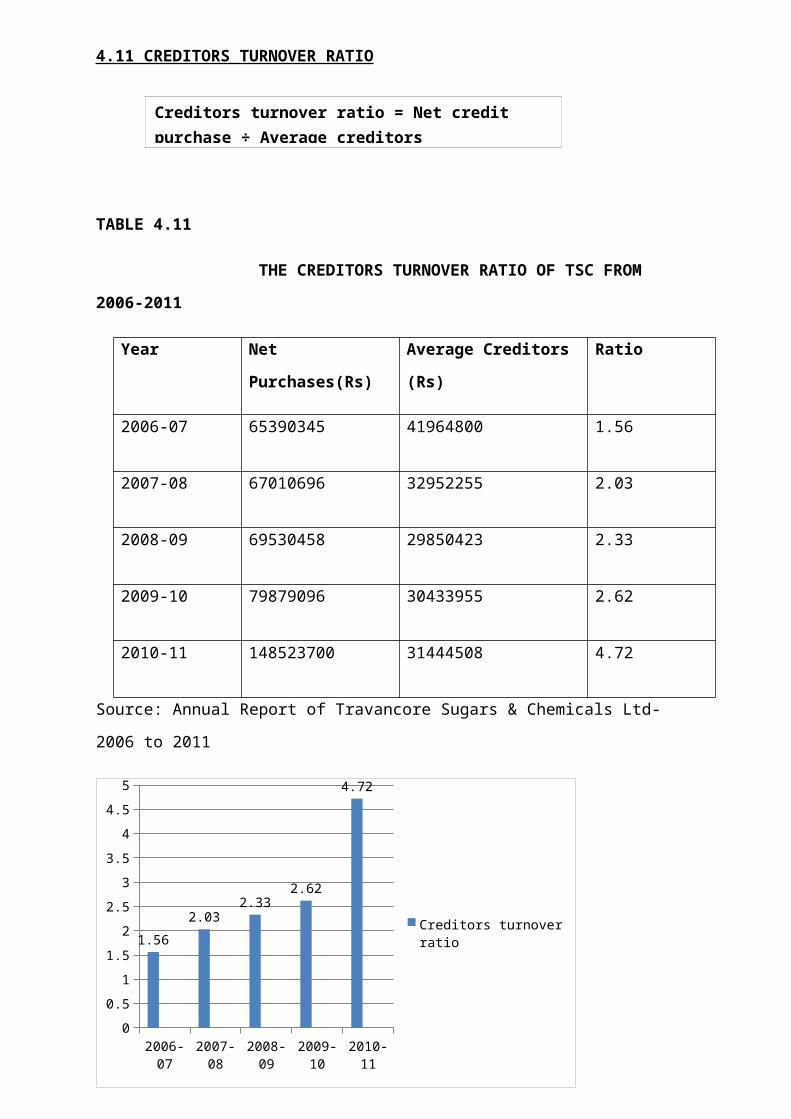
4.11 CREDITORS TURNOVER RATIO
TABLE 4.11
THE CREDITORS TURNOVER RATIO OF TSC FROM
2006-2011
Year Net
Purchases(Rs)
Average Creditors
(Rs)
Ratio
2006-07 65390345 41964800 1.56
2007-08 67010696 32952255 2.03
2008-09 69530458 29850423 2.33
2009-10 79879096 30433955 2.62
2010-11 148523700 31444508 4.72
Source: Annual Report of Travancore Sugars & Chemicals Ltd-
2006 to 2011
2006-07
2007-08
2008-09
2009-10
2010-11
00.51
1.52
2.53
3.54
4.55
1.562.03
2.332.62
4.72
Creditors turnover ratio
Creditors turnover ratio = Net credit purchase ÷ Average creditors
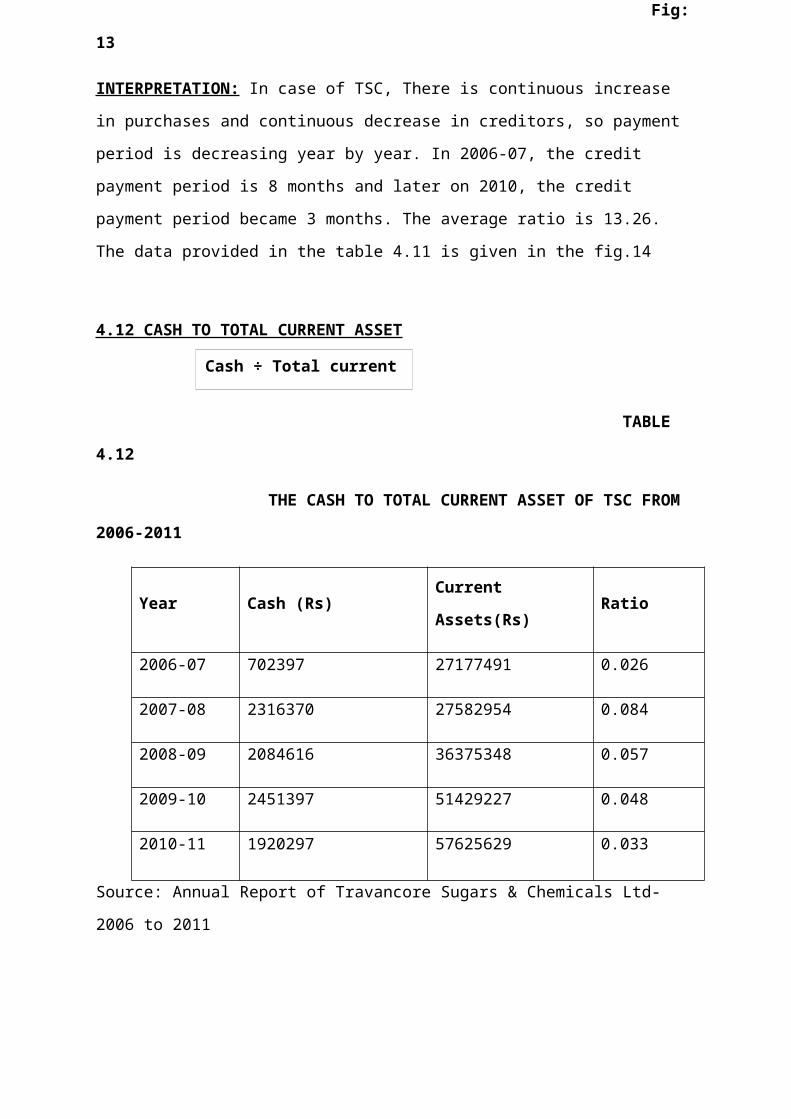
Fig:
13
INTERPRETATION: In case of TSC, There is continuous increase
in purchases and continuous decrease in creditors, so payment
period is decreasing year by year. In 2006-07, the credit
payment period is 8 months and later on 2010, the credit
payment period became 3 months. The average ratio is 13.26.
The data provided in the table 4.11 is given in the fig.14
4.12 CASH TO TOTAL CURRENT ASSET
TABLE
4.12
THE CASH TO TOTAL CURRENT ASSET OF TSC FROM
2006-2011
Year Cash (Rs)Current
Assets(Rs)Ratio
2006-07 702397 27177491 0.026
2007-08 2316370 27582954 0.084
2008-09 2084616 36375348 0.057
2009-10 2451397 51429227 0.048
2010-11 1920297 57625629 0.033
Source: Annual Report of Travancore Sugars & Chemicals Ltd-
2006 to 2011
Cash ÷ Total currentasset
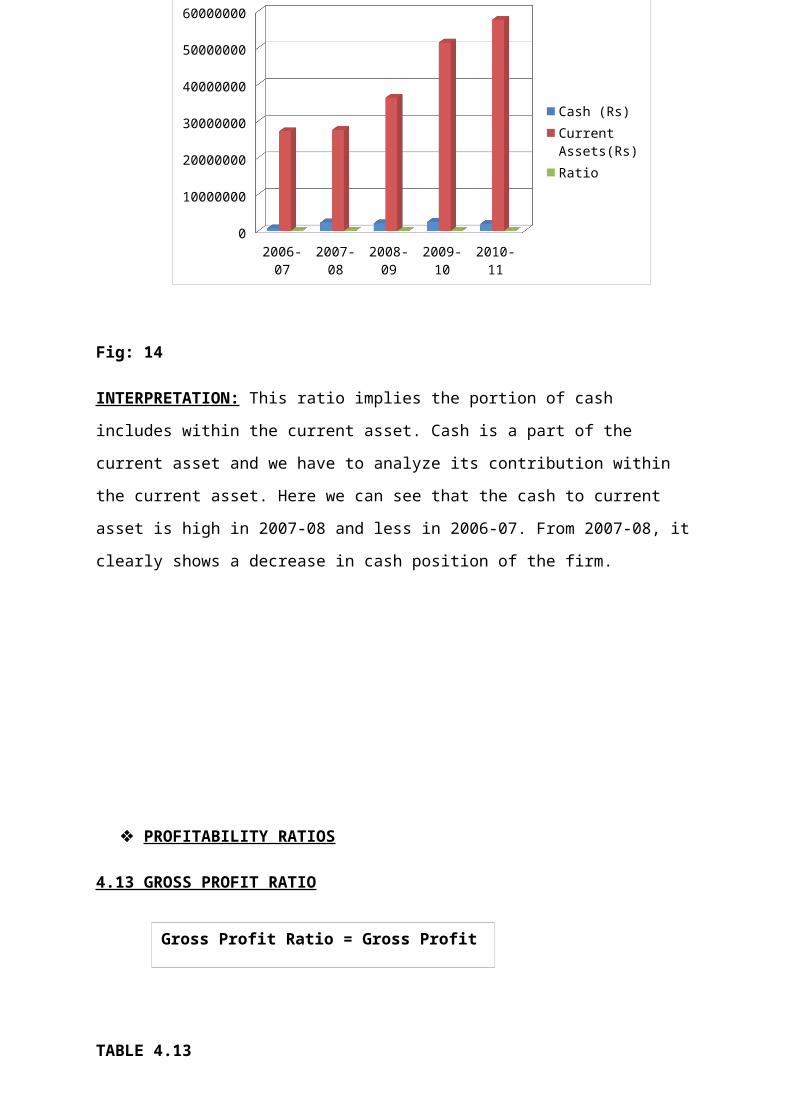
2006-07
2007-08
2008-09
2009-10
2010-11
0
10000000
20000000
30000000
40000000
50000000
60000000
Cash (Rs)Current Assets(Rs)Ratio
Fig: 14
INTERPRETATION: This ratio implies the portion of cash
includes within the current asset. Cash is a part of the
current asset and we have to analyze its contribution within
the current asset. Here we can see that the cash to current
asset is high in 2007-08 and less in 2006-07. From 2007-08, it
clearly shows a decrease in cash position of the firm.
PROFITABILITY RATIOS
4.13 GROSS PROFIT RATIO
TABLE 4.13
Gross Profit Ratio = Gross Profit
÷ Sales × 100
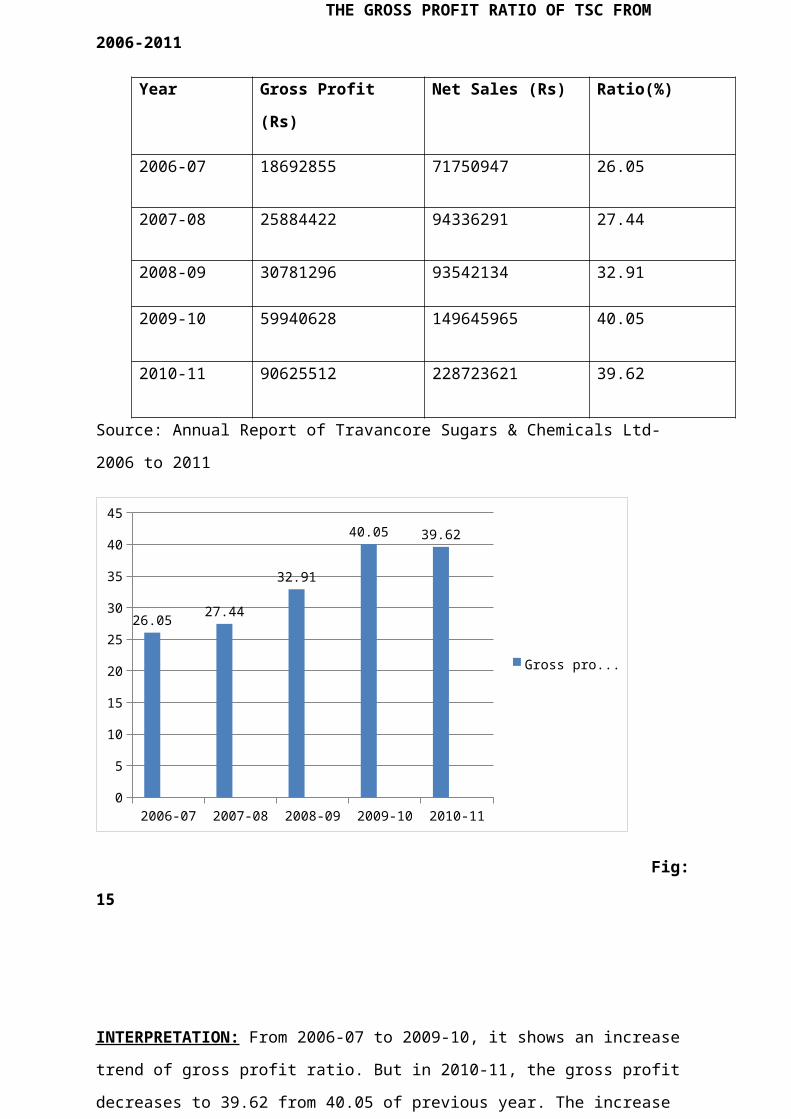
THE GROSS PROFIT RATIO OF TSC FROM
2006-2011
Year Gross Profit
(Rs)
Net Sales (Rs) Ratio(%)
2006-07 18692855 71750947 26.05
2007-08 25884422 94336291 27.44
2008-09 30781296 93542134 32.91
2009-10 59940628 149645965 40.05
2010-11 90625512 228723621 39.62
Source: Annual Report of Travancore Sugars & Chemicals Ltd-
2006 to 2011
2006-07 2007-08 2008-09 2009-10 2010-110
5
10
15
20
25
30
35
40
45
26.05 27.44
32.91
40.05 39.62
Gross pro...
Fig:
15
INTERPRETATION: From 2006-07 to 2009-10, it shows an increase
trend of gross profit ratio. But in 2010-11, the gross profit
decreases to 39.62 from 40.05 of previous year. The increase

in gross profit ratio of first 4 years may be due to a
decrease in the selling price without a corresponding increase
in the cost of goods sold.
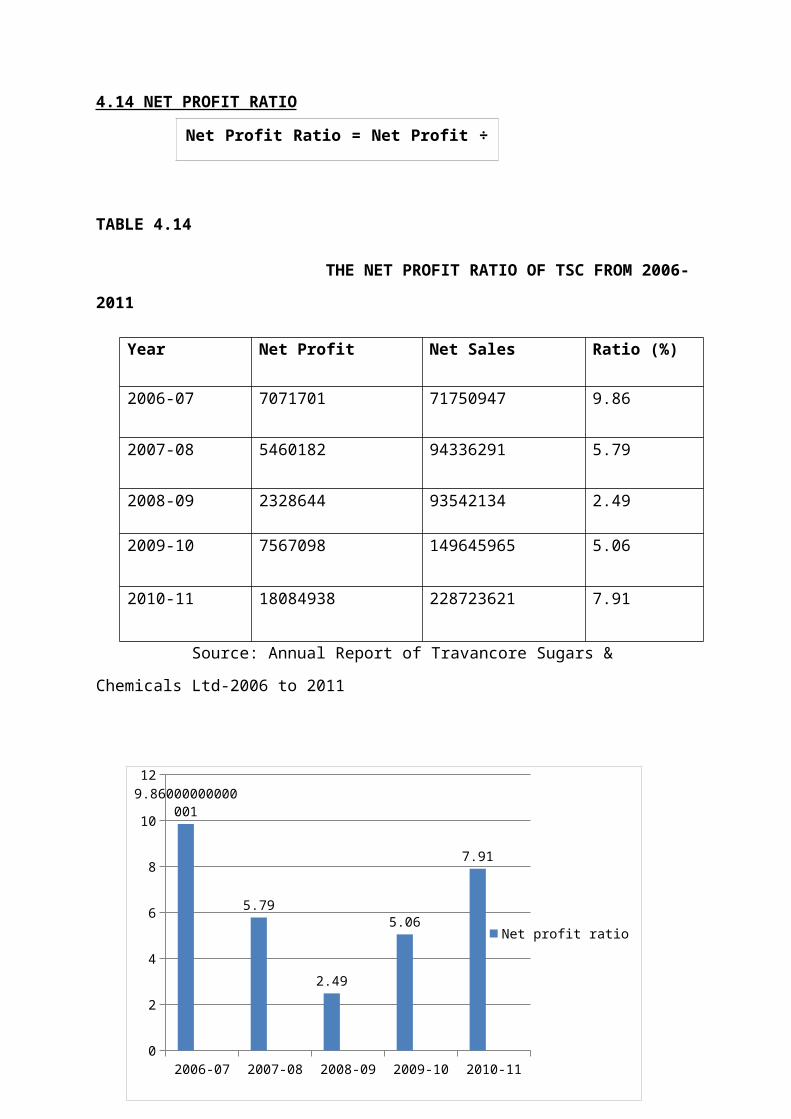
4.14 NET PROFIT RATIO
TABLE 4.14
THE NET PROFIT RATIO OF TSC FROM 2006-
2011
Year Net Profit Net Sales Ratio (%)
2006-07 7071701 71750947 9.86
2007-08 5460182 94336291 5.79
2008-09 2328644 93542134 2.49
2009-10 7567098 149645965 5.06
2010-11 18084938 228723621 7.91
Source: Annual Report of Travancore Sugars &
Chemicals Ltd-2006 to 2011
Net Profit Ratio = Net Profit ÷
Sales × 100
2006-07 2007-08 2008-09 2009-10 2010-110
2
4
6
8
10
129.86000000000
001
5.79
2.49
5.06
7.91
Net profit ratio
Fig: 16
INTERPRETATION: The table shows a high net profit ratio in
2006-07 which is 9.86. It shows that the firm has a good
operational efficiency and a good profitability position. But
later on the next years the ratio decreases to 5.79 and 2.49
which show the company has not a good profitable position.
Then on the next year the ratio increases to 5.06 to 7.91.
SCHEDULE OF CHANGES IN WORKING CAPITAL
In order to ascertain the increase or decrease in working
capital between two dates of the Balance Sheet, a statement
is prepared containing current assets and current
liabilities. This statement is called ‘statement of changes
in working capital’. This helps to analyze working capital
components between two dates and also compare current assets
and current liabilities.
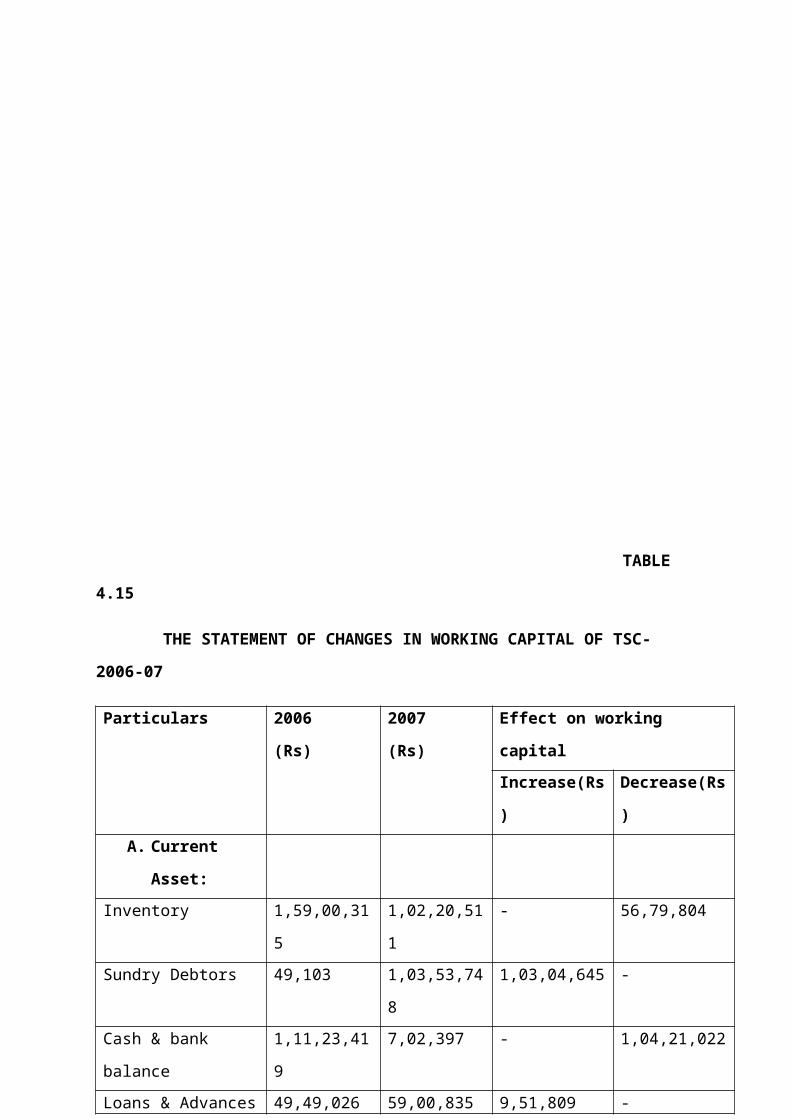
TABLE
4.15
THE STATEMENT OF CHANGES IN WORKING CAPITAL OF TSC-
2006-07
Particulars 2006
(Rs)
2007
(Rs)
Effect on working
capitalIncrease(Rs
)
Decrease(Rs
)A. Current
Asset:Inventory 1,59,00,31
5
1,02,20,51
1
- 56,79,804
Sundry Debtors 49,103 1,03,53,74
8
1,03,04,645 -
Cash & bank
balance
1,11,23,41
9
7,02,397 - 1,04,21,022
Loans & Advances 49,49,026 59,00,835 9,51,809 -
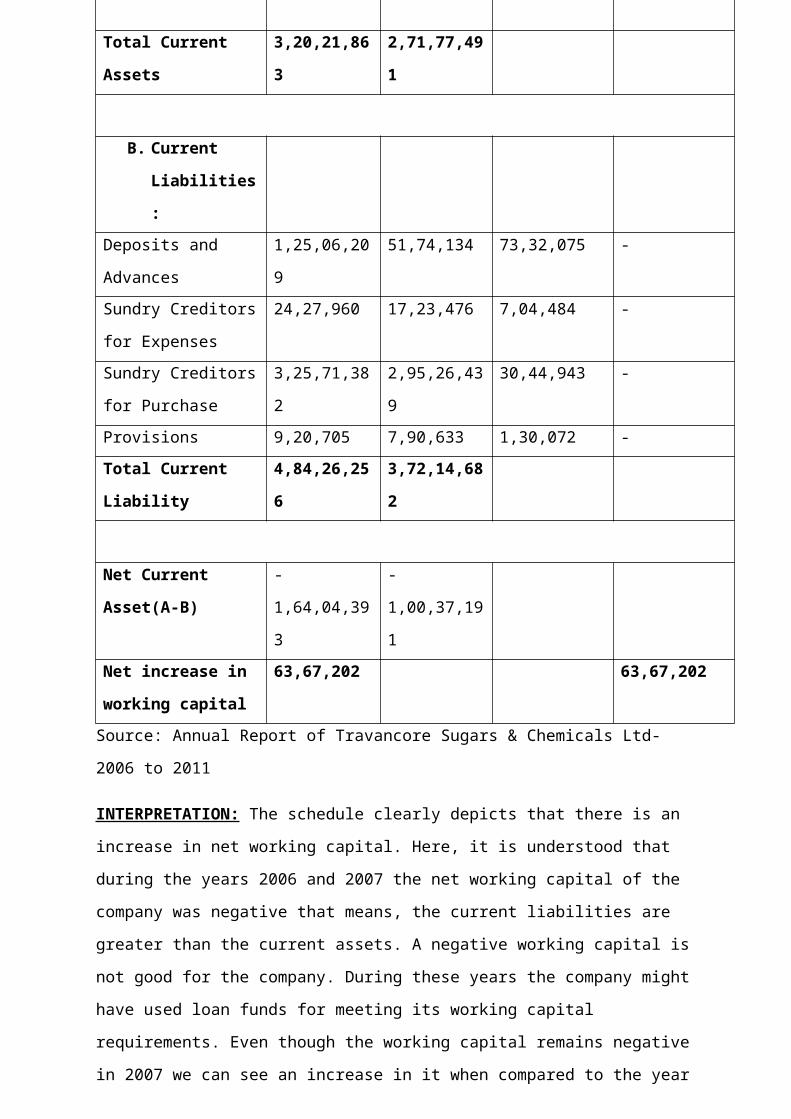
Total Current
Assets
3,20,21,86
3
2,71,77,49
1
B. Current
Liabilities
:Deposits and
Advances
1,25,06,20
9
51,74,134 73,32,075 -
Sundry Creditors
for Expenses
24,27,960 17,23,476 7,04,484 -
Sundry Creditors
for Purchase
3,25,71,38
2
2,95,26,43
9
30,44,943 -
Provisions 9,20,705 7,90,633 1,30,072 -Total Current
Liability
4,84,26,25
6
3,72,14,68
2
Net Current
Asset(A-B)
-
1,64,04,39
3
-
1,00,37,19
1Net increase in
working capital
63,67,202 63,67,202
Source: Annual Report of Travancore Sugars & Chemicals Ltd-
2006 to 2011
INTERPRETATION: The schedule clearly depicts that there is an
increase in net working capital. Here, it is understood that
during the years 2006 and 2007 the net working capital of the
company was negative that means, the current liabilities are
greater than the current assets. A negative working capital is
not good for the company. During these years the company might
have used loan funds for meeting its working capital
requirements. Even though the working capital remains negative
in 2007 we can see an increase in it when compared to the year
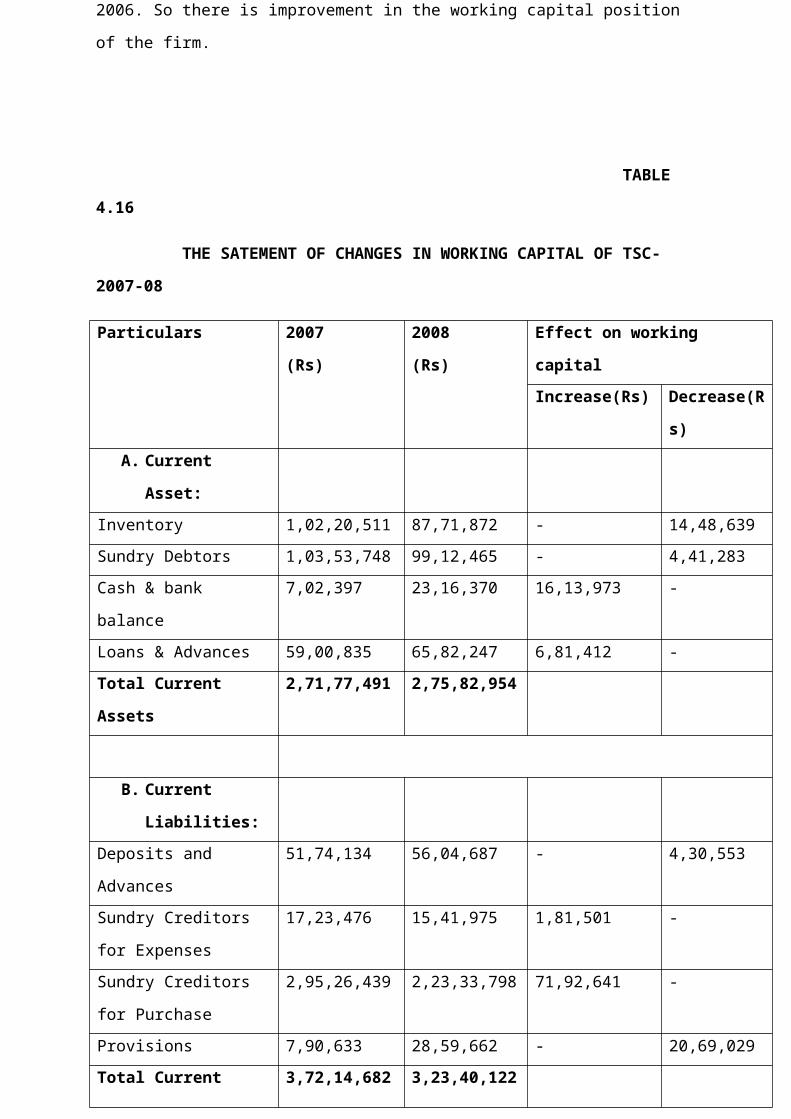
2006. So there is improvement in the working capital position
of the firm.
TABLE
4.16
THE SATEMENT OF CHANGES IN WORKING CAPITAL OF TSC-
2007-08
Particulars 2007
(Rs)
2008
(Rs)
Effect on working
capitalIncrease(Rs) Decrease(R
s)A. Current
Asset:Inventory 1,02,20,511 87,71,872 - 14,48,639Sundry Debtors 1,03,53,748 99,12,465 - 4,41,283Cash & bank
balance
7,02,397 23,16,370 16,13,973 -
Loans & Advances 59,00,835 65,82,247 6,81,412 -Total Current
Assets
2,71,77,491 2,75,82,954
B. Current
Liabilities:Deposits and
Advances
51,74,134 56,04,687 - 4,30,553
Sundry Creditors
for Expenses
17,23,476 15,41,975 1,81,501 -
Sundry Creditors
for Purchase
2,95,26,439 2,23,33,798 71,92,641 -
Provisions 7,90,633 28,59,662 - 20,69,029Total Current 3,72,14,682 3,23,40,122
Liability
Net Current
Asset(A-B)
-
1,00,37,191
-47,57,168
Net increase in
working capital
52,80,023 52,80,023
Source: Annual Report of Travancore Sugars & Chemicals Ltd-
2006 to 2011
INTERPRETATION: The schedule shows an increase in the net
working capital. From the schedule of working capital, it is
understood that during the years 2007 and 2008 the net working
capital of the company was negative that means, the current
liabilities are greater than the current assets. The net
current assets of 2007 and 2008 are Rs -10037191 and Rs -
4757168. Here the current liability is more than that of
current asset which shows a decrease in working capital. But
when compared to 2007, the net current asset of 2008 is Rs -
4757168.
TABLE
4.17
THE STATEMENT OF CHANGES IN WORKING CAPITAL OF
TSC-2008-09
Particulars 2008
(Rs)
2009
(Rs)
Effect on working capitalIncrease(Rs) Decrease(Rs)
A.Current Asset:
Inventory 87,71,872 1,51,08,601 63,36,729 -Sundry Debtors 99,12,465 1,16,45,932 17,33,467 -
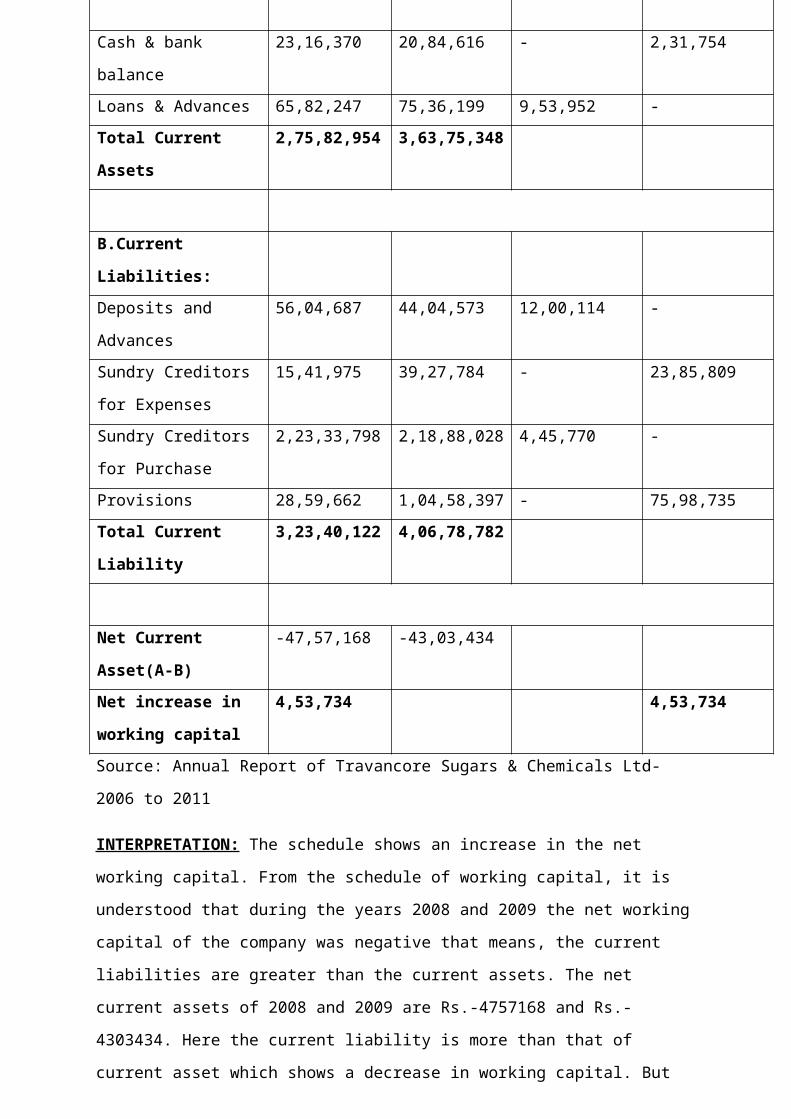
Cash & bank
balance
23,16,370 20,84,616 - 2,31,754
Loans & Advances 65,82,247 75,36,199 9,53,952 -Total Current
Assets
2,75,82,954 3,63,75,348
B.Current
Liabilities:Deposits and
Advances
56,04,687 44,04,573 12,00,114 -
Sundry Creditors
for Expenses
15,41,975 39,27,784 - 23,85,809
Sundry Creditors
for Purchase
2,23,33,798 2,18,88,028 4,45,770 -
Provisions 28,59,662 1,04,58,397 - 75,98,735Total Current
Liability
3,23,40,122 4,06,78,782
Net Current
Asset(A-B)
-47,57,168 -43,03,434
Net increase in
working capital
4,53,734 4,53,734
Source: Annual Report of Travancore Sugars & Chemicals Ltd-
2006 to 2011
INTERPRETATION: The schedule shows an increase in the net
working capital. From the schedule of working capital, it is
understood that during the years 2008 and 2009 the net working
capital of the company was negative that means, the current
liabilities are greater than the current assets. The net
current assets of 2008 and 2009 are Rs.-4757168 and Rs.-
4303434. Here the current liability is more than that of
current asset which shows a decrease in working capital. But
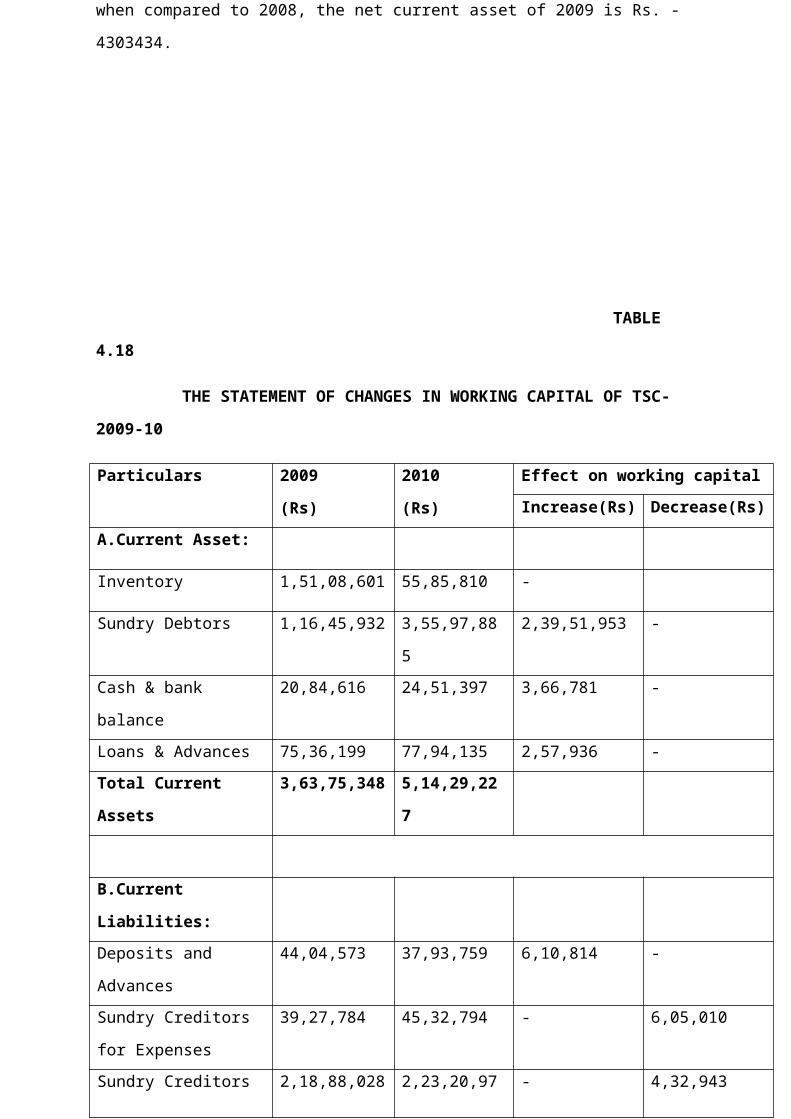
when compared to 2008, the net current asset of 2009 is Rs. -
4303434.
TABLE
4.18
THE STATEMENT OF CHANGES IN WORKING CAPITAL OF TSC-
2009-10
Particulars 2009
(Rs)
2010
(Rs)
Effect on working capitalIncrease(Rs) Decrease(Rs)
A.Current Asset:
Inventory 1,51,08,601 55,85,810 -
Sundry Debtors 1,16,45,932 3,55,97,88
5
2,39,51,953 -
Cash & bank
balance
20,84,616 24,51,397 3,66,781 -
Loans & Advances 75,36,199 77,94,135 2,57,936 -Total Current
Assets
3,63,75,348 5,14,29,22
7
B.Current
Liabilities:Deposits and
Advances
44,04,573 37,93,759 6,10,814 -
Sundry Creditors
for Expenses
39,27,784 45,32,794 - 6,05,010
Sundry Creditors 2,18,88,028 2,23,20,97 - 4,32,943
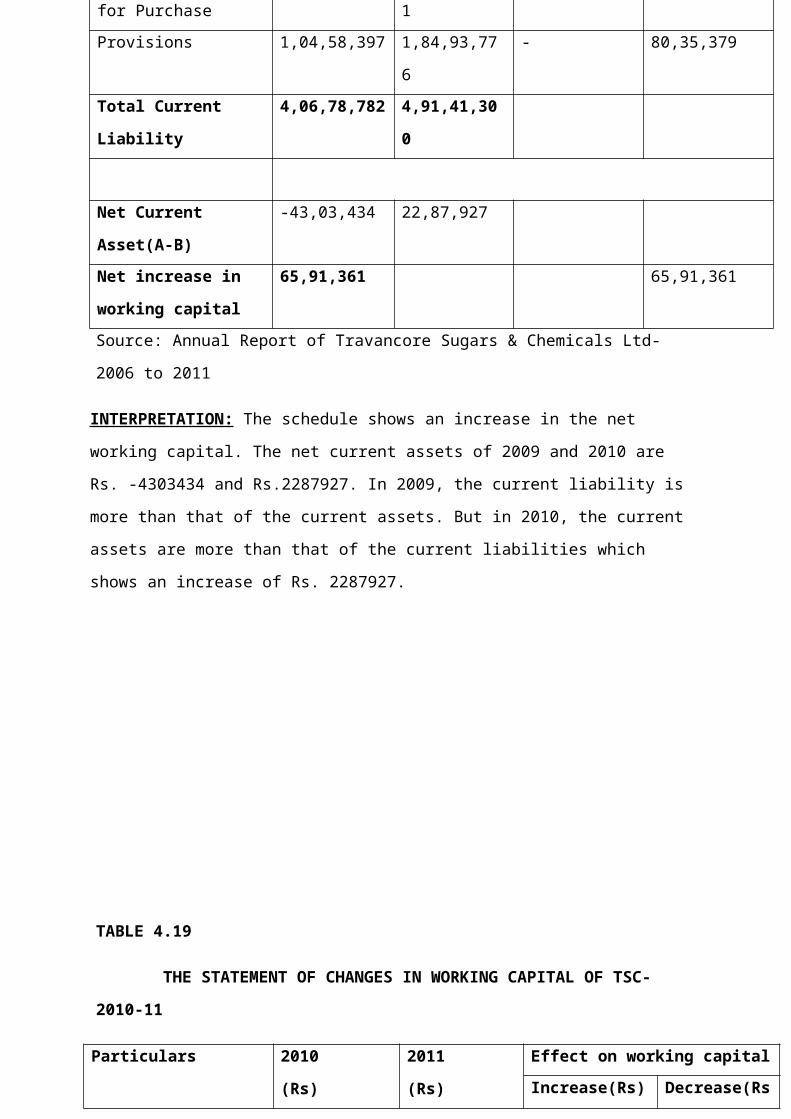
for Purchase 1Provisions 1,04,58,397 1,84,93,77
6
- 80,35,379
Total Current
Liability
4,06,78,782 4,91,41,30
0
Net Current
Asset(A-B)
-43,03,434 22,87,927
Net increase in
working capital
65,91,361 65,91,361
Source: Annual Report of Travancore Sugars & Chemicals Ltd-
2006 to 2011
INTERPRETATION: The schedule shows an increase in the net
working capital. The net current assets of 2009 and 2010 are
Rs. -4303434 and Rs.2287927. In 2009, the current liability is
more than that of the current assets. But in 2010, the current
assets are more than that of the current liabilities which
shows an increase of Rs. 2287927.
TABLE 4.19
THE STATEMENT OF CHANGES IN WORKING CAPITAL OF TSC-
2010-11
Particulars 2010
(Rs)
2011
(Rs)
Effect on working capitalIncrease(Rs) Decrease(Rs
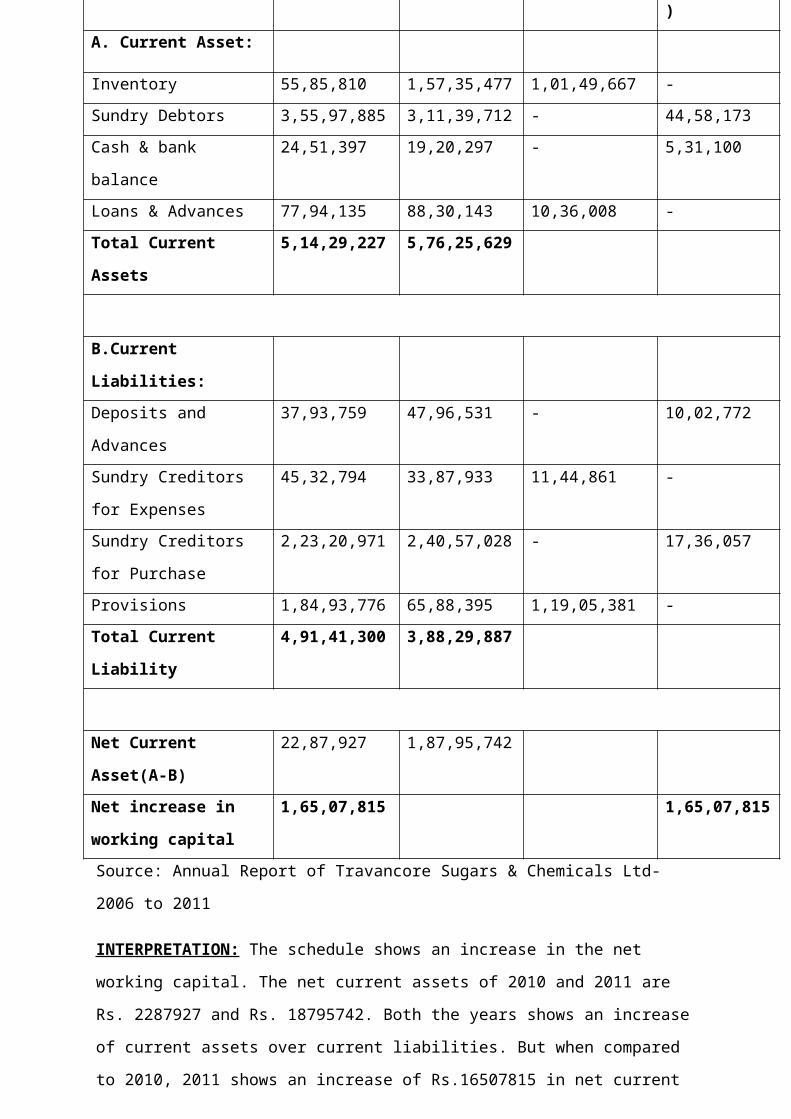
)A. Current Asset:
Inventory 55,85,810 1,57,35,477 1,01,49,667 -Sundry Debtors 3,55,97,885 3,11,39,712 - 44,58,173Cash & bank
balance
24,51,397 19,20,297 - 5,31,100
Loans & Advances 77,94,135 88,30,143 10,36,008 -Total Current
Assets
5,14,29,227 5,76,25,629
B.Current
Liabilities:Deposits and
Advances
37,93,759 47,96,531 - 10,02,772
Sundry Creditors
for Expenses
45,32,794 33,87,933 11,44,861 -
Sundry Creditors
for Purchase
2,23,20,971 2,40,57,028 - 17,36,057
Provisions 1,84,93,776 65,88,395 1,19,05,381 -Total Current
Liability
4,91,41,300 3,88,29,887
Net Current
Asset(A-B)
22,87,927 1,87,95,742
Net increase in
working capital
1,65,07,815 1,65,07,815
Source: Annual Report of Travancore Sugars & Chemicals Ltd-
2006 to 2011
INTERPRETATION: The schedule shows an increase in the net
working capital. The net current assets of 2010 and 2011 are
Rs. 2287927 and Rs. 18795742. Both the years shows an increase
of current assets over current liabilities. But when compared
to 2010, 2011 shows an increase of Rs.16507815 in net current
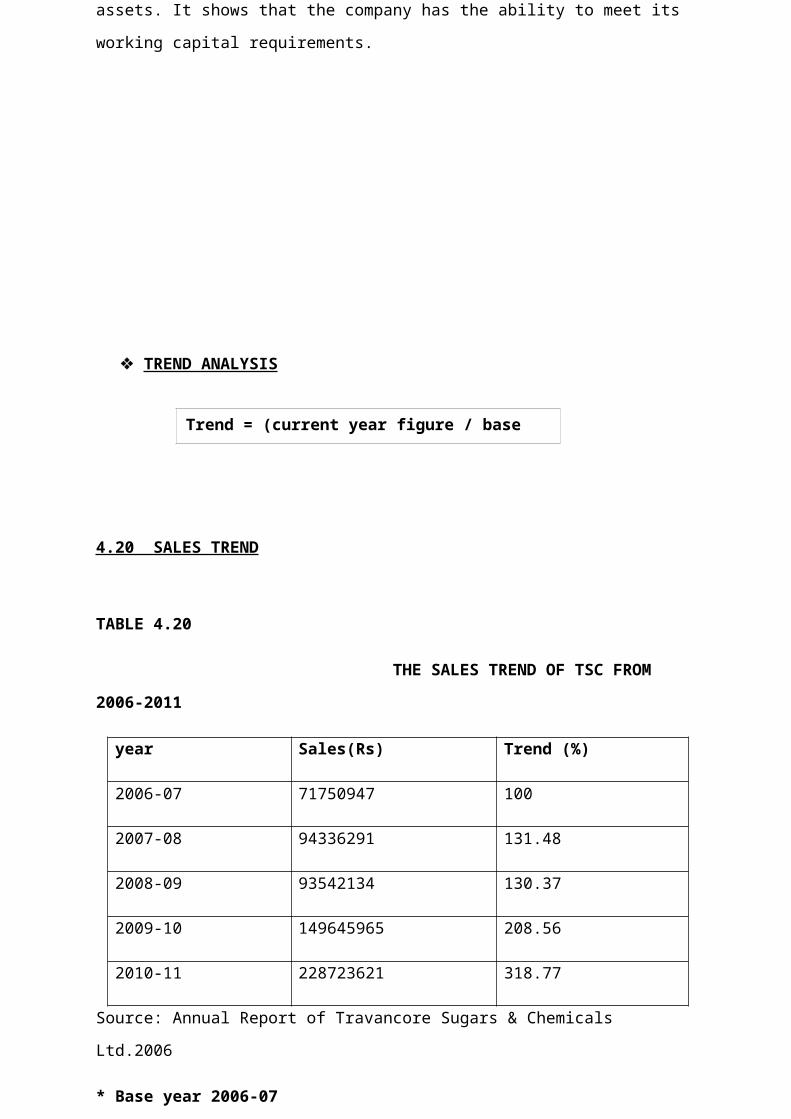
assets. It shows that the company has the ability to meet its
working capital requirements.
TREND ANALYSIS
4.20 SALES TREND
TABLE 4.20
THE SALES TREND OF TSC FROM
2006-2011
year Sales(Rs) Trend (%)
2006-07 71750947 100
2007-08 94336291 131.48
2008-09 93542134 130.37
2009-10 149645965 208.56
2010-11 228723621 318.77
Source: Annual Report of Travancore Sugars & Chemicals
Ltd.2006
* Base year 2006-07
Trend = (current year figure / base
year figure) * 100
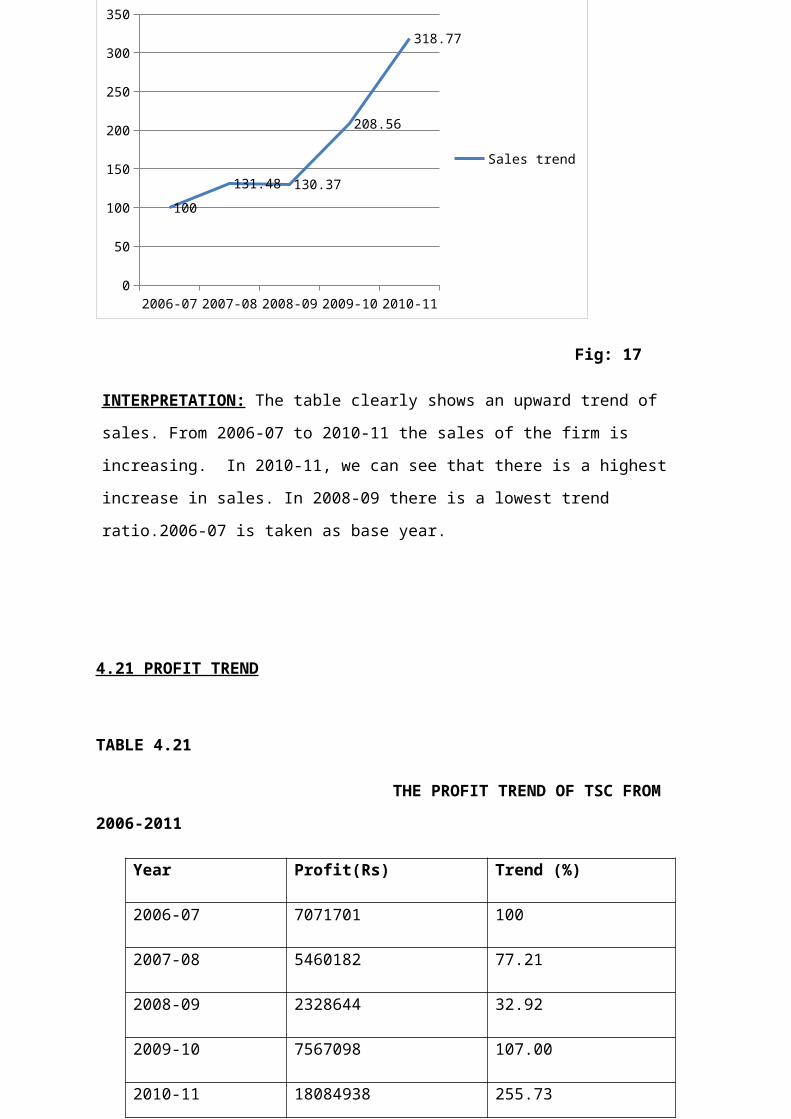
2006-07 2007-08 2008-09 2009-10 2010-110
50
100
150
200
250
300
350
100131.48 130.37
208.56
318.77
Sales trend
Fig: 17
INTERPRETATION: The table clearly shows an upward trend of
sales. From 2006-07 to 2010-11 the sales of the firm is
increasing. In 2010-11, we can see that there is a highest
increase in sales. In 2008-09 there is a lowest trend
ratio.2006-07 is taken as base year.
4.21 PROFIT TREND
TABLE 4.21
THE PROFIT TREND OF TSC FROM
2006-2011
Year Profit(Rs) Trend (%)
2006-07 7071701 100
2007-08 5460182 77.21
2008-09 2328644 32.92
2009-10 7567098 107.00
2010-11 18084938 255.73
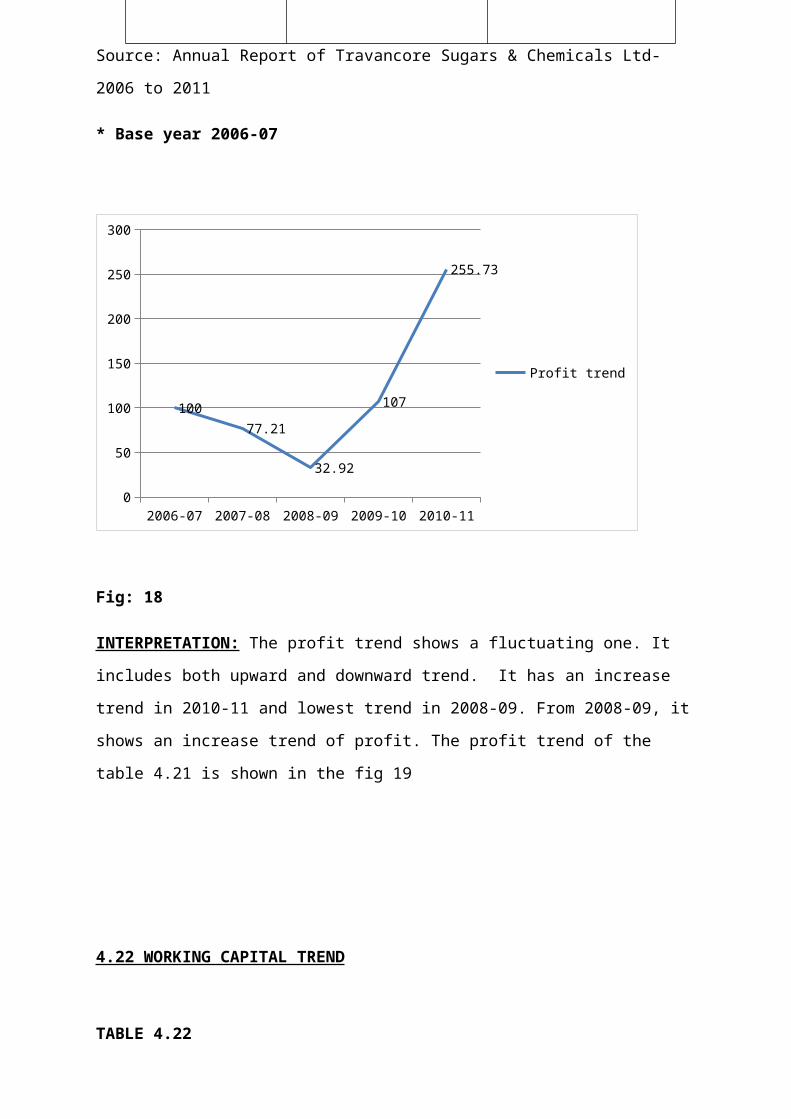
Source: Annual Report of Travancore Sugars & Chemicals Ltd-
2006 to 2011
* Base year 2006-07
2006-07 2007-08 2008-09 2009-10 2010-110
50
100
150
200
250
300
10077.21
32.92
107
255.73
Profit trend
Fig: 18
INTERPRETATION: The profit trend shows a fluctuating one. It
includes both upward and downward trend. It has an increase
trend in 2010-11 and lowest trend in 2008-09. From 2008-09, it
shows an increase trend of profit. The profit trend of the
table 4.21 is shown in the fig 19
4.22 WORKING CAPITAL TREND
TABLE 4.22
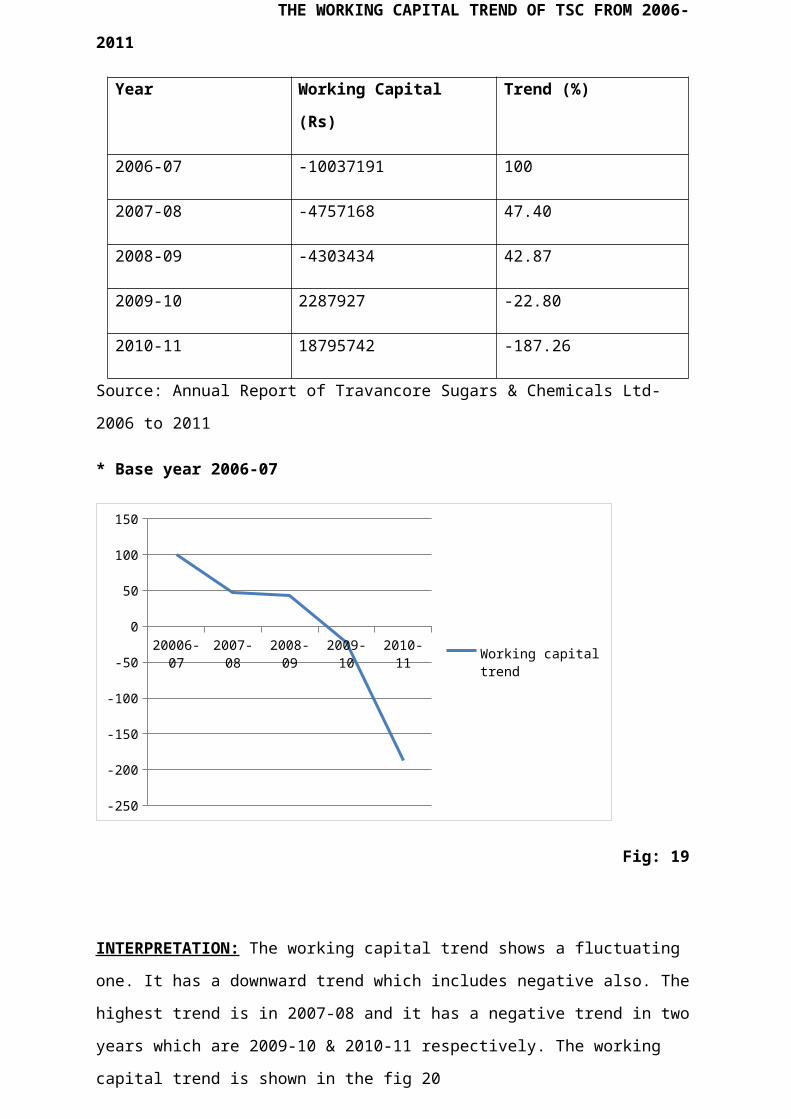
THE WORKING CAPITAL TREND OF TSC FROM 2006-
2011
Year Working Capital
(Rs)
Trend (%)
2006-07 -10037191 100
2007-08 -4757168 47.40
2008-09 -4303434 42.87
2009-10 2287927 -22.80
2010-11 18795742 -187.26
Source: Annual Report of Travancore Sugars & Chemicals Ltd-
2006 to 2011
* Base year 2006-07
20006-07
2007-08
2008-09
2009-10
2010-11
-250
-200
-150
-100
-50
0
50
100
150
Working capital trend
Fig: 19
INTERPRETATION: The working capital trend shows a fluctuating
one. It has a downward trend which includes negative also. The
highest trend is in 2007-08 and it has a negative trend in two
years which are 2009-10 & 2010-11 respectively. The working
capital trend is shown in the fig 20

CHAPTER 5
FINDINGS, SUGGESTIONS,
AND
CONCLUSIONS
The present chapter is indented to list out the major findings of the study, the conclusions arrived at and to give suitable suggestions for improving the financial performance of Travancore sugars and chemicals ltd.
FINDINGS
The major findings are listed below1. It is found that the firm is not maintaining the standard
norm of current ratio in standard level (2:1) any of the
five years covered under the study. Hence the liquidity
position of the firm is not sound.
2. The quick ratio and the absolute ratio also supported the
finding that the liquidity position of firm is not good.
3. The working capital turnover ratio position shows a
tremendous progress from negative increase to positive
increase.
4. The current assets turnover ratio shows the stability
over these years except 2007-08 and 2010-11 where the
ratios are 3.42 and 3.97respectivly.
5. The collection period has increased from 26 to 58 days
during the five years covered under the study. It shows
that the receivable management is not efficient.
6. The period of converting raw materials to finished goods
has decreased from 65 to 27 days. It indicates the
efficiency of inventory management system.
The schedule of changes in the working capital reveals
that the working capital position is improving year after
year.
7. Gross profit ratio of the firm shows slight increase
every year, the gross profit ratio keeps fluctuating.
8. Net profit ratio shows a decline up to 2008-09 and it
increases there after due to the efforts taken by the
company for reducing the administration expenses.
9. The authorized share capital of TSC ltd. is Rs.6 lakhs.
10. KSBC has the monopoly right to distribute liquor
throughout the state.
SUGGESTIONS
The following suggestions are made,
Policy decisions may be taken by the management to maintain
the working capital at the optimum level.
Policy initiative may take by management to improve
liquidity position of company for investing maximum amount
in current asset.
The debt collection policy of company may be reframed by
taking in to consideration by credit period enjoyed by
company.
CONCLUSIONS
The study focus on the practice of the management of working
capital of TSC attempted to analyses the key aspects which
govern the finance management practice of company. The study
examines such areas as the liquidity position of firm and
different components and different constraints of working
capital management such as cash management, receivable
management and inventory management. The study came to the
conclusion that the practice of cash management and
receivable management is not up to the mark and inventory
management shows an improvement during the period covered
under the study. It is concluded that overall working capital
management of company is average.
BIBLIOGRAPHY
Books
Jain S.P, Narang.K.L;”Cost Accounting”, Twelfth revised
edition, Kalyani publishers, New Delhi; 1990
Dr. Maheswari S.N, Financial Management Principles and Practice,
Sultan Chand & sons publishers New Deihi 2008
Gupta Shashi. K and Sharma R K, Financial Management Theory
and Practice, Kalyani Publishers, Ludhiana 2009
Pandey I.M; “financial management”; Vikas publishing house
ptv.ltd. 2010.
Vittal P.R, Business Mathematics and Statistics, Margham
Publications, Chennai
Reports
Annual report of Travancore Sugars and Chemicals Ltd -
2006-2007.
Annual report of Travancore Sugars and Chemicals Ltd -
2007-2008.
Annual report of Travancore Sugars and Chemicals Ltd -
2008-2009.
Annual report of Travancore Sugars and Chemicals Ltd -
2009-2010.
Annual report of Travancore Sugars and Chemicals Ltd -
2010-2011.
Websites
www.scribd.com/doc/36964993/ Indian - Beverage - Industry -
Report
travancoresugars.blogspot.com.
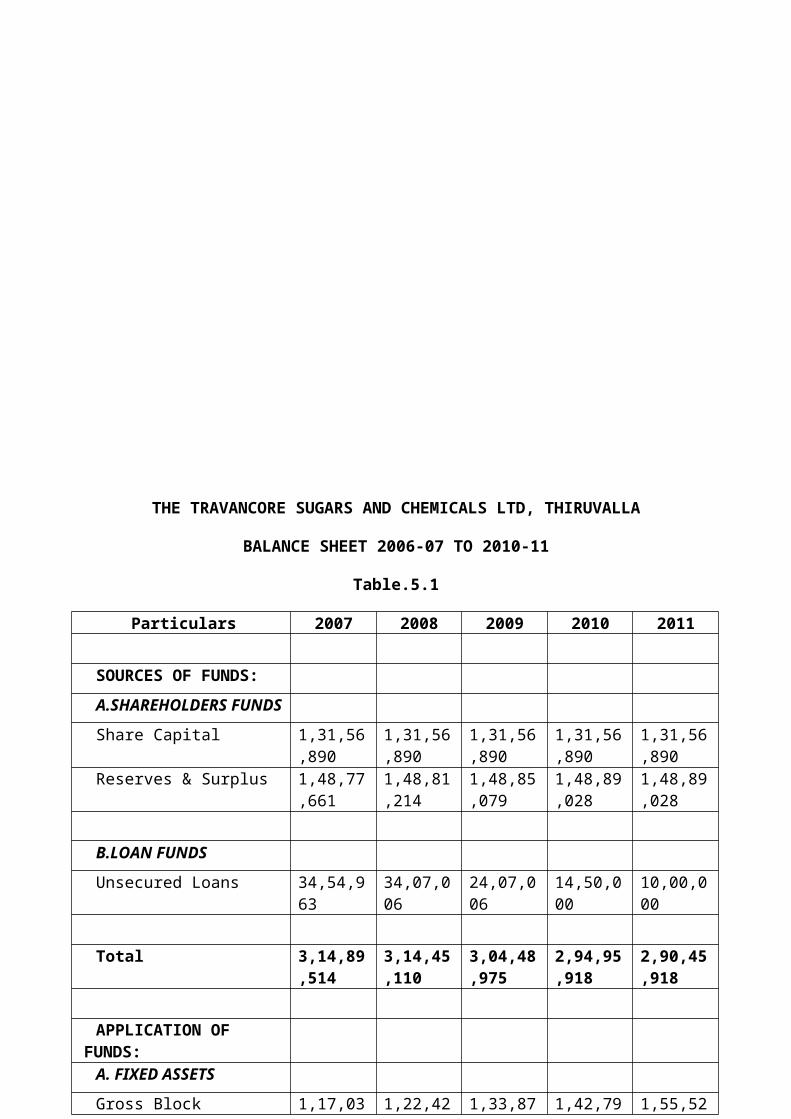
THE TRAVANCORE SUGARS AND CHEMICALS LTD, THIRUVALLA
BALANCE SHEET 2006-07 TO 2010-11
Table.5.1
Particulars 2007 2008 2009 2010 2011
SOURCES OF FUNDS:A.SHAREHOLDERS FUNDS
Share Capital 1,31,56,890
1,31,56,890
1,31,56,890
1,31,56,890
1,31,56,890
Reserves & Surplus 1,48,77,661
1,48,81,214
1,48,85,079
1,48,89,028
1,48,89,028
B.LOAN FUNDS
Unsecured Loans 34,54,963
34,07,006
24,07,006
14,50,000
10,00,000
Total 3,14,89,514
3,14,45,110
3,04,48,975
2,94,95,918
2,90,45,918
APPLICATION OF FUNDS:
A. FIXED ASSETS
Gross Block 1,17,03 1,22,42 1,33,87 1,42,79 1,55,52
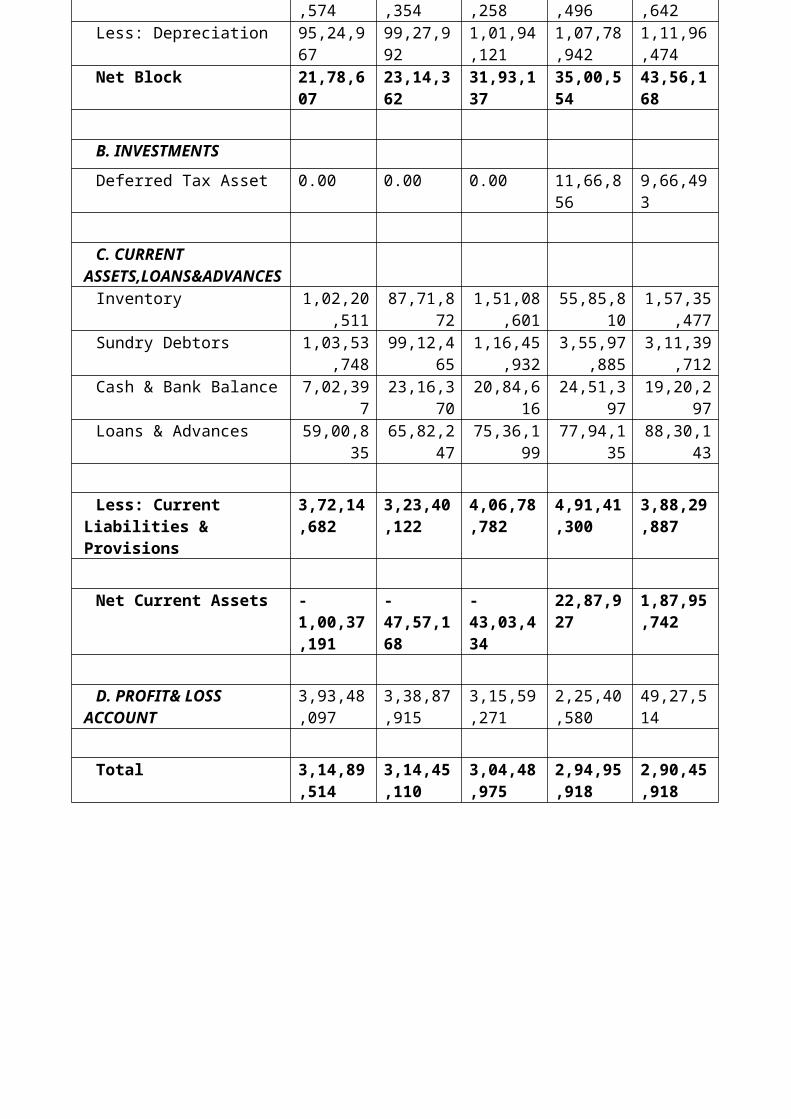
,574 ,354 ,258 ,496 ,642Less: Depreciation 95,24,9
6799,27,992
1,01,94,121
1,07,78,942
1,11,96,474
Net Block 21,78,607
23,14,362
31,93,137
35,00,554
43,56,168
B. INVESTMENTS
Deferred Tax Asset 0.00 0.00 0.00 11,66,856
9,66,493
C. CURRENT ASSETS,LOANS&ADVANCESInventory 1,02,20
,51187,71,8
721,51,08
,60155,85,8
101,57,35
,477Sundry Debtors 1,03,53
,74899,12,4
651,16,45
,9323,55,97
,8853,11,39
,712Cash & Bank Balance 7,02,39
723,16,3
7020,84,6
1624,51,3
9719,20,2
97Loans & Advances 59,00,8
3565,82,2
4775,36,1
9977,94,1
3588,30,1
43
Less: Current Liabilities & Provisions
3,72,14,682
3,23,40,122
4,06,78,782
4,91,41,300
3,88,29,887
Net Current Assets -1,00,37,191
-47,57,168
-43,03,434
22,87,927
1,87,95,742
D. PROFIT& LOSS ACCOUNT
3,93,48,097
3,38,87,915
3,15,59,271
2,25,40,580
49,27,514
Total 3,14,89,514
3,14,45,110
3,04,48,975
2,94,95,918
2,90,45,918
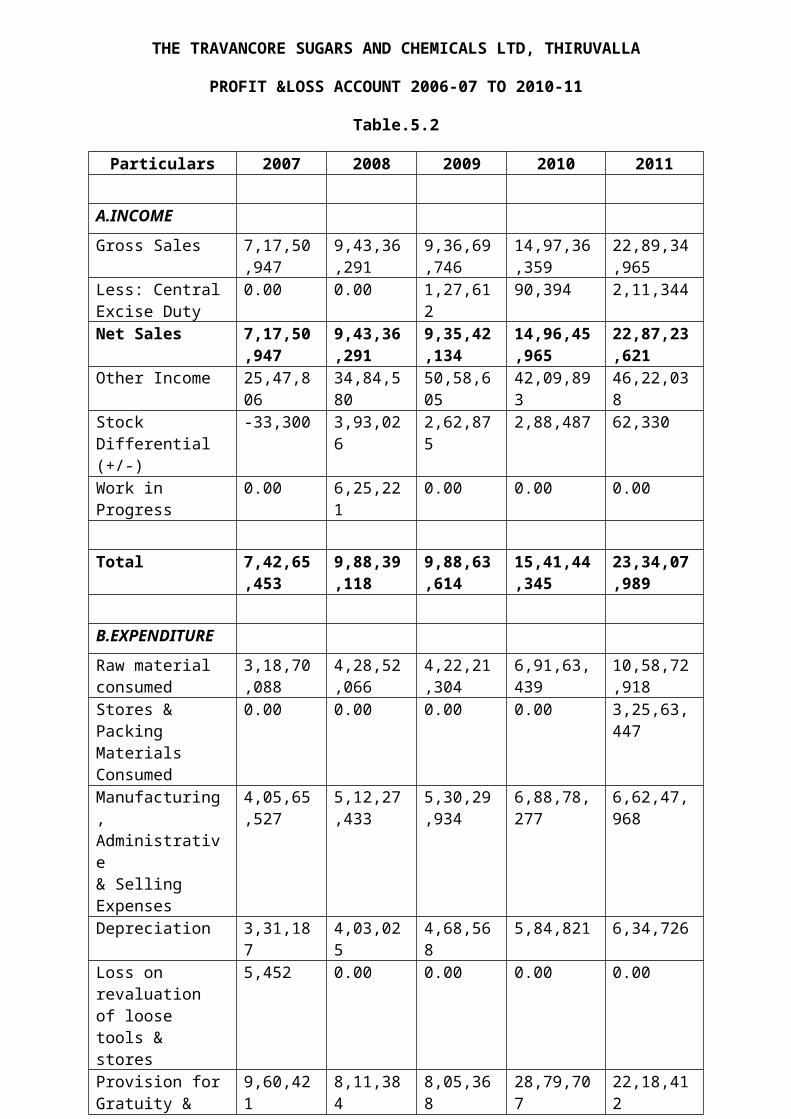
THE TRAVANCORE SUGARS AND CHEMICALS LTD, THIRUVALLA
PROFIT &LOSS ACCOUNT 2006-07 TO 2010-11
Table.5.2
Particulars 2007 2008 2009 2010 2011
A.INCOME
Gross Sales 7,17,50,947
9,43,36,291
9,36,69,746
14,97,36,359
22,89,34,965
Less: CentralExcise Duty
0.00 0.00 1,27,612
90,394 2,11,344
Net Sales 7,17,50,947
9,43,36,291
9,35,42,134
14,96,45,965
22,87,23,621
Other Income 25,47,806
34,84,580
50,58,605
42,09,893
46,22,038
Stock Differential (+/-)
-33,300 3,93,026
2,62,875
2,88,487 62,330
Work in Progress
0.00 6,25,221
0.00 0.00 0.00
Total 7,42,65,453
9,88,39,118
9,88,63,614
15,41,44,345
23,34,07,989
B.EXPENDITURE
Raw material consumed
3,18,70,088
4,28,52,066
4,22,21,304
6,91,63,439
10,58,72,918
Stores & Packing MaterialsConsumed
0.00 0.00 0.00 0.00 3,25,63,447
Manufacturing, Administrative& Selling Expenses
4,05,65,527
5,12,27,433
5,30,29,934
6,88,78,277
6,62,47,968
Depreciation 3,31,187
4,03,025
4,68,568
5,84,821 6,34,726
Loss on revaluation of loose tools & stores
5,452 0.00 0.00 0.00 0.00
Provision forGratuity &
9,60,421
8,11,384
8,05,368
28,79,707
22,18,412
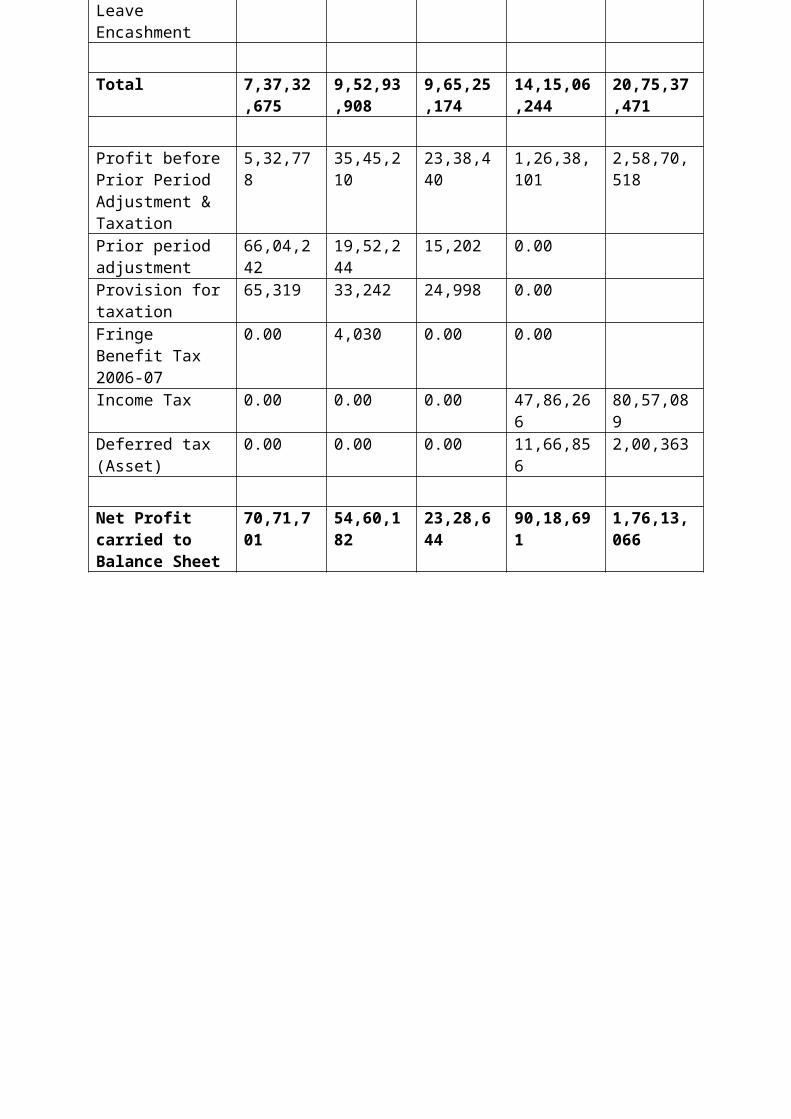
Leave Encashment
Total 7,37,32,675
9,52,93,908
9,65,25,174
14,15,06,244
20,75,37,471
Profit beforePrior PeriodAdjustment & Taxation
5,32,778
35,45,210
23,38,440
1,26,38,101
2,58,70,518
Prior period adjustment
66,04,242
19,52,244
15,202 0.00
Provision fortaxation
65,319 33,242 24,998 0.00
Fringe Benefit Tax 2006-07
0.00 4,030 0.00 0.00
Income Tax 0.00 0.00 0.00 47,86,266
80,57,089
Deferred tax (Asset)
0.00 0.00 0.00 11,66,856
2,00,363
Net Profit carried to Balance Sheet
70,71,701
54,60,182
23,28,644
90,18,691
1,76,13,066