Embed Size (px)
Citation preview

The Science of the Total Environment, 77 (1988) 189-202 189 Elsevier Science Publishers B.V., Amsterdam - - Printed in The Netherlands
MULTIVARIATE ANALYSIS OF HEAVY METAL CONCENTRATIONS IN SEDIMENTS OF THE LAGOON OF VENICE
B. PAVONI, A. MARCOMINI, A. SFRISO and A.A. ORIO
Dipartimento di Scienze Ambientali, Facolt~t di Chimica Industriale, Calle Larga S. Marta 2137, 30123 Venezia (Italy)
(Received March 8th, 1988; accepted April 5th, 1988)
ABSTRACT
Concentrations of Hg, Pb, Cd, Ni, Co, Zn, Cr, Cu and Fe in surface sediments sampled in the Lagoon of Venice were processed using two mathematical statistical methods. "Principal Component" analysis and "Cluster" analysis were combined in order to assess the degree of contamination in different areas of the lagoon, to determine the sources, and to trace the diffusion paths. Data were normalized to the "natural" concentrations of metals determined from the deepest sections of the sediment cores.
The eigenvalues of the first three Principal Components (PC) accounted for 97% of the total variance. The composition of the first eigenvector is related to the overall metal contamination. The second PC separates two main types of contamination: one due to Hg, the second to Zn and related metals (Cd, Pb, Co, Cu and Ni). A third PC isolates Pb from the zinc association.
The relationships among metals highlighted by the cluster analysis and synthesized in the dendrogram helped identify the sources of pollution.
The lagoon area facing the Porto Marghera industrial zone has suffered the worst contamina- tion and contaminated sediments have spread from there to peripheral zones. For metals, such as Zn, Cd or Pb, the contamination contributed by fresh water from inland was also considerable.
INTRODUCTION
The Lagoon of Venice is a natural ecosystem that originated about 6000 years ago from an embayment created by the action of marine currents on the sediments transported by three of the most important Venetian rivers: the Piave, Brenta and Bacchiglione. Its present shape is the result of the natural course of geological events and the superimposition of human interventions.
The lagoon is a brackish pond connected with the sea by three entrance c h a n n e l s ( the po r t s of Lido, M a l a m o c c o a n d Chioggia) . I t r e ce ive s f resh w a t e r f rom the a g r i c u l t u r a l a r ea s i n l a n d t h r o u g h a t l ea s t 24 c h a n n e l s a n d sma l l r i ve r s ( B e r n a r d i et al., 1986) a n d sa l t w a t e r f rom the sea. The l a g o o n is t he s i n k for u r b a n a n d i n d u s t r i a l w a s t e w a t e r f rom the i n d u s t r i a l zone of P o r t o M a r g h e r a , f rom the t o w n s of M e s t r e a n d Ven ice , a n d f rom the v i l l ages of the h i n t e r l a n d . F o r t he l a s t few yea r s i t h a s d i s p l a y e d the s y m p t o m s of a p o l l u t e d a n d hyper - t r o p h i c e n v i r o n m e n t , w i t h a b n o r m a l a l gae g rowth , h i g h fish m o r t a l i t i e s a n d i n v a s i o n s of c h i r o n o m i d s d u r i n g t he l a t e s p r i n g a n d s u m m e r (Sfriso e t al., 1987).
0048-9697/88/$03.50 © 1988 Elsevier Science Publishers B.V.

190
In addition, in autumn and winter the combination of meteorological and lunar events causes the '~acqua al ta" phenomenon: the low-lying parts of the center of Venice are submerged, severely hindering city activities. In the last decade, a number of papers have been published dealing with many aspects of the hydrodynamics, pollution and eutrophication of the lagoon. Pellizzato and Scattolin published a collection of the available literature in 1982.
The available experimental data were processed and reported with the aim of discussing the various facets in an integrated review (Cossu e de Fraja Frangipane, 1985). The geochemistry of recent sediments in the central part of the lagoon was also investigated by Menegazzo Vitturi et al. (1987).
In the present paper, data obtained in our laboratory that deal with the concentrations of Hg, Pb, Cd, Ni, Co, Cu, Zn, Cr and Fe determined in 163 surface sediment samples from all over the lagoon area, are treated statistic- ally. The complete table of analytical results is reported in Donazzolo et al. (1984).
The hypotheses on the degree and type of pollution, worked out previously on the basis of identifying equal-concentration areas, are looked at again and validated by means of recently obtained information and statistical support (Pavoni et al., 1987). The data have been processed using two complementary mathematical-statistical methods: "Principal component" and "Cluster" analyses (Davis, 1986, and references therein).
METHODS
Sediments were collected from 1976 to 1978 at the stations shown in Fig. 1. The 5-10 cm surface sediments were collected with a modified stainless-steel van Veen grab sampler. The sediment concentrations of metals (Hg, Pb, Cd, Cu, Zn, Cr, Fe, Ni and Co) were determined according to the methods described by Donazzolo et al. (1984). Analyses were performed by atomic absorption spectro- photometry in flameless mode for Hg and in flame mode for the other metals. For Hg, sediments were digested for 2 h with hot concentrated sulfuric, nitric and hydrochloric acids. Then solutions of 5% potassium permanganate and potassium persulfate were added. Other metals were extracted with hot 8 N nitric acid for 2 h.
Data were processed using routines taken from the SPSSPC and SPSSX statistical packages and from Davis (1986). An approach similar to that described in Mantovan et al. (1985) was used.
As a starting point for the interpretation of the results, the lagoon was divided into three areas, separated by the dashed lines in Fig. 1. The southern area extends from Chioggia to the boundary of the watershed zone located between the third industrial zone and Lido Island; it communicates with the Adriatic Sea through the Ports of Chioggia and Malamocco.
The second area includes the samples taken from the watershed and ends at a line drawn between the airport and the island of S. Erasmo. This line crosses a very shallow area populated by high macroalgal biomass that prevents water
1 9 1
_ n ~
l..- . .i \ Z
iA 0
= 7
= ~e 0 I-
+__x+..<~:~---- • +.. ..,? I -
! : o • ,= , . ~ ... 0
"=, o:
l.,l.i "~ +0 +
++*°.° :o,.. ,.. - -
. . . . , ~ o - <~ • :'.'.'; " ~ | ° o ~ / \ ~ :Ez :::'.,-. ~ \ . . , ~ < , , ,
\ ~ . ~] '7 . + . - - " -+ t \ - . e ,,r..+% < +..
+ ii'X • ++ + : . + . - o.- +
. . . " • o. ~ +~
. - ," < <
+ +
"~ + • ~ , . g
m
192
c i rcula t ion . This a r ea rece ives wa t e r f rom the indus t r ia l cen te r of Por to M a r g h e r a and f rom the c i ty of Venice and c o m m u n i c a t e s wi th the sea t h r o u g h the Lido en t r anc e channe l
Final ly , the re is a n o r t h e a s t e r n area , f rom where the w a t e r also runs to the Por t of Lido. The w a t e r masses coming f rom the las t two a reas mix poor ly wi th each other . Dur ing ebb tide they exit in two di f ferent layers , the one coming f rom the n o r t h e a s t mov ing u n d e r n e a t h the o the r and su r fac ing fu r the r offshore (Alberotanza , 1973).
RESULTS AND DISCUSSION
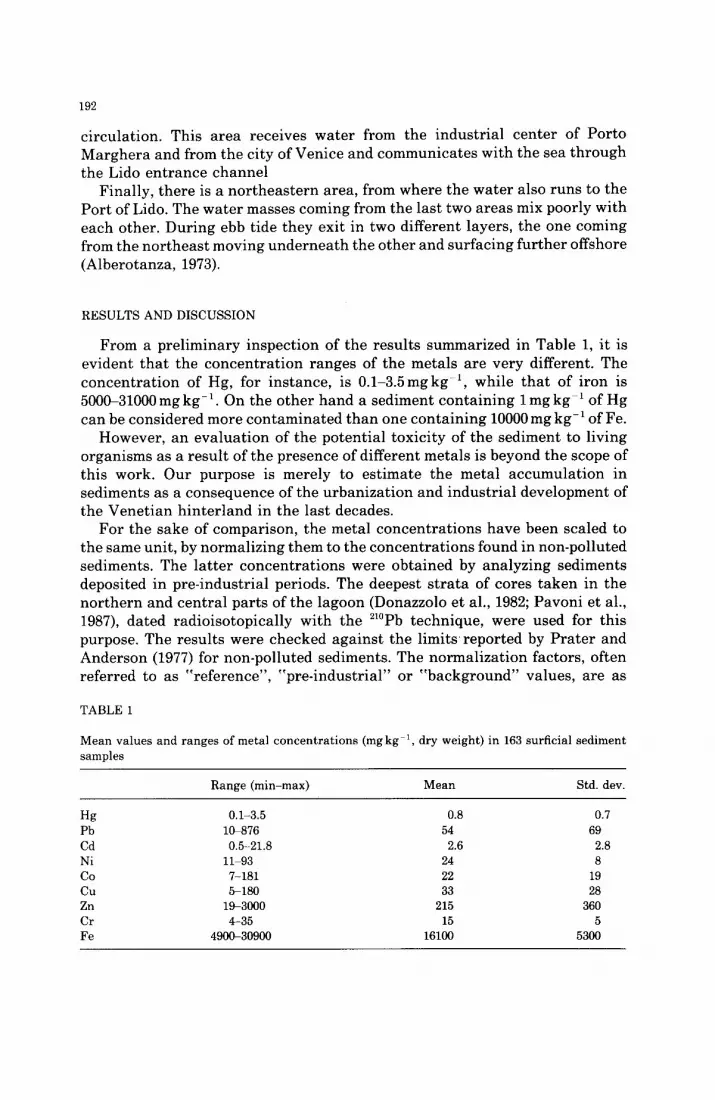
From a p re l imina ry inspec t ion of the resu l t s summar ized in Tab le 1, i t is ev ident t h a t the c o n c e n t r a t i o n r anges of the meta l s a re ve ry different . The c o n c e n t r a t i o n of Hg, for ins tance , is 0 . 1 - 3 . 5 m g k g -1, whi le t h a t of i ron is 5000-31000 mg kg -1. On the o the r hand a sed iment con ta in ing 1 mg kg -1 of Hg can be cons idered more c o n t a m i n a t e d t h a n one con t a in ing 10000 mg kg-~ of Fe.
However , an e v a l u a t i o n of the po ten t i a l tox ic i ty of the sed iment to l iving o rgan i sms as a resu l t of the p resence of di f ferent me ta l s is beyond the scope of this work. Our purpose is mere ly to e s t ima te the me ta l a c c u m u l a t i o n in sed iments as a consequence of the u rban i za t i on and indus t r ia l deve lopmen t of the Vene t i an h in t e r l and in the las t decades.
For the sake of compar i son , the me ta l co ncen t r a t i ons have been scaled to the same unit , by normal i z ing them to the concen t r a t i ons found in non-pol lu ted sediments . The l a t t e r c o n c e n t r a t i o n s were ob ta ined by ana lyz ing sed iments deposi ted in pre- indus t r ia l periods. The deepes t s t r a t a of cores t a k e n in the n o r t h e r n and cen t ra l pa r t s of the l agoon (Donazzolo et al., 1982; Pavon i et al., 1987), da ted rad io i so top ica l ly wi th the 21°pb technique , were used for this purpose. The resu l t s were checked aga ins t the l im i t s r epor ted by P r a t e r and Ander son (1977) for non-pol lu ted sediments . The no rma l i za t i on factors , of ten re fe r red to as " re fe rence" , "p re - indus t r i a l " or " b a c k g r o u n d " values , are as
TABLE 1
Mean values and ranges of metal concentrations (mg kg 1, dry weight) in 163 surficial sediment samples
Range (min-max) Mean Std. dev.
Hg 0.1-3.5 0.8 0.7 Pb 1(~876 54 69 Cd 0.5-21.8 2.6 2.8 Ni 11 93 24 8 Co 7-181 22 19 Cu 5-180 33 28 Zn 19-3000 215 360 Cr 4-35 15 5 Fe 4900-30900 16100 5300

193
follows ( m g k g 1, d.w.): Hg, 0.1; Pb, 25; Cd, 1; Ni, 20; Co, 15; Zn, 70; Cr, 20; Cu, 20; Fe, 20000.
The me ta l c o n c e n t r a t i o n s of sed iment samples were divided by the re ference va lues and these resu l t s r ep re sen t the degree of a c c u m u l a t i o n of me ta l s in any sample , in r e l a t ion to the n a t u r a l level. The da ta r eca l cu l a t ed in this way were used for the m a t h e m a t i c a l process ing.
A m o n g the ava i l ab le m a t h e m a t i c a l - s t a t i s t i c a l t echn iques t ha t a l low mul- t i v a r i a t e ana lys i s of a set of da ta s t r uc tu r ed as a ma t r i x wi th co lumns rep- r e sen t ing va r i ab le s and rows observa t ions , two were of p a r t i c u l a r in te res t for our purposes: " P r i n c i p a l c o m p o n e n t ana lys i s " (PCA) and " F a c t o r ana lys i s" . The first is bas ica l ly a m a t h e m a t i c a l r e a r r a n g e m e n t of data , whi le the second has been developed as a s ta t i s t i ca l tool. The ph i losophy behind the two a p p r o a c h e s is different: the first seeks the l inear combina t i on of var iables , cal led " P r i n c i p a l C o m p o n e n t s " or somet imes " F a c t o r s " , ca l cu la t ed as eigeno vec to rs of the v a r i a n c e - c o v a r i a n c e (va-co) mat r ix . The sum of the assoc ia ted e igen va lues is equal to the t r ace of the v a - c o mat r ix . When the cumula t i ve v a r i a n c e expla ined by the e igenva lues of the first two or th ree PCs is above 90%, the combina t ions of the or ig ina l va r i ab l e s can be used ins tead of the va r i ab l e s themselves , s ince the m u l t i v a r i a t e sys tem can be descr ibed m u c h more concisely, whi le losing on ly a mino r a m o u n t of in format ion . " F a c t o r
a n a l y s i s " assumes t ha t the va r i ab i l i t y of the da ta set is gene ra t ed by the p resence of a l imi ted n u m b e r of under ly ing factors . A model is then des igned a pr ior i and the resu l t s a re m a n i p u l a t e d wi th va r ious t echn iques of axis r o t a t i o n in order to opt imize the f i t t ing to the model. Since no model was ava i l ab l e for the l agoon and s ince our a im was to ob ta in the mos t synthet ic , q u a n t i t a t i v e and exhaus t ive i n t e r p r e t a t i o n of the da ta possible, we per fo rmed the p r inc ipa l c o m p o n e n t analys is .
No da t a s t anda rd i za t i on was car r ied out, i.e. the normal ized da t a were not r educed to s t anda rd scores wi th m e a n = 0 and s t anda rd dev ia t ion = 1. Stan-
TABLE 2
Eigenvalues of the nine eigenvectors, total variance and cumulative total variance accounted for by the eigenvalues. Only the first three eigenvectors have been retained
Vector Eigenvalue Total variance (%) Total variance (cumulative, %)
I 67.47 73.40 73.4 II 14.49 15.80 89.2 III 7.08 7.70 96.9 IV 1.15 1.30 98.1 V 0.91 1.00 99.1 VI 0.70 0.80 99.9 VII 0.08 0.08 99.9 VIII 0.02 0.02 100 IX 1 x 10 6 1 x 10 -6 100

194
TABLE 3
M a t r i x of vec to r composi t ions . Rows, var iab les ; columns, vec tors
Var i ab le s E ige nve c to r s
I II III
Hg 0.775 - 0.626 0.004
Pb 0.089 0.117 0.989 Cd 0.289 0.289 - 0.067
Ni 0.013 0.002 - 0.021
Co 0.100 0.080 - 0.022 Cu 0.123 0.051 0.000
Zn 0.532 0.708 - 0.130
Cr 0.014 0.014 - 0.003 Fe 0.009 0.009 - 0.009
dardization is the most common way of transforming variables into the same unit, but in our case it was not necessary, since the normalization procedure adopted was much more meaningful to us from an environmental point of view. From the va-co matrix, nine eigenvectors accompanied by nine eigenvalues were extracted. The first three eigenvalues contributed 97% of the total variance and were the only ones retained (Table 2).
The composition of the first three PCs, referred to as PC "loadings", is reported in Table 3 and plotted in Fig. 2. The first PC includes the positive contribution of all metals, in particular Hg and Zn, and then, in order of decreasing importance, Cd, Cu, Co, Pb, Cr, Ni and Fe. Therefore, it measures the global extent of metal accumulation.
If we plot the scores (obtained by multiplying the normalized concentration data by the PC loadings) on the axis of the first PC, we can classify sediments according to their actual metal contamination.
CONPOSIIION OF EIGEHUECTO~S
• ! st UE~OR ~ J [] 2 nd U~OR
i
[ ] 3 1'4 U[CTOR
- i Hg Pb Cd Ni Co Cu 7,, C~ )'e UiRIA~I~
Fig. 2. Compos i t ion of e igenvec tors : l oad ings for the f irst t h r ee p r inc ipa l components .

HIST~RAH of l 5t PRIIglPAL C~PP~EHI SCOP,~
• SOUItlgP~ ~RLq
CEHI'RAL AREA
[] NO~HERN AR~
10 14 18 22 26 38 34 38 42 48
195
Fig. 3. Frequency histogram of sample scores onto the first principal component grouped according to the three lagoon areas.
/ ' / / / ~ T , ~r p.c.
-Vr ,;j.:,, / / .,,,, . / / / .o
N o r t h e r n A,o I / / / 1' ' I' l " " " / / ' 1 , ,~ I H / / " 1 ° .+H
'-''1' t Ip'+''I'" .+r I"1
~,
Fig. 4. Scores of samples, according to thei r geographical position, plotted in the space defined by the axes of the first three principal components.

196
SEDIMENT SAMPLES 2nd and 3rd COMPONENT SCORES
b O
X <
F- Z Ld Z 0 {3_
0 0
2 , 8 - -
2 .6 -
2 . 4 -
2 . 2 -
2 -
1 . 8 -
1 . 6 -
1 . 4 -
+
1.2
. p $ 0 % + + +
++ + ++ e+, ~, +% * +
,+ . * ~ + ~ g ~* , + + ~ ' * + ' , ,
+ , ~5" . . . . . . . . . . . . . . . . . . . . . . . . . . . L _ _ . . ~ - . . . .
0
0 0
0
+
0
t,% o + + 0 5 O
0 0 0 0
O~o ° ~o o ~° 0 o o °~°°°%o ° +
0
¢ o I I I I
0 2
C O M P O N E N T AXIS
0 . 8 - -
0 . 6 -
0 . 4 -
0 . 2 -
0 I I I
- 4 - 2
2nd
Fig. 5. Scores of samples, according to their geographical position, plotted in the plane defined by the axes of the second and third principal components. (o) southern area; ( + ) central area; (*) northern area.
The second PC is made up of the negative contribution of rig and the positive contribution of Zn, Cd, Pb, Co and Cu, neglecting other metals. The second PC score plot enables us to distinguish those sediments characterized by prevailing Hg contamination from those characterized by contamination with Zn and other metals. The second PC is five times less efficient than the first in accounting for the total variance.
The third PC which is ten times less effective than the first, allows a further sample distinction to be made within the metals grouped with Zn; the Pb contribution is found to be positive, while the contribution of Zn, Cd, Ni and Co is negative.
Figure 3 shows frequency histograms of the sample scores plotted on the first PC axis and separated according to their geographical position, which allow us to evaluate the contamination levels of the three areas into which the lagoon has been divided. The samples from the southern area are all grouped at low values of the axis, indicating very low contamination, while those from the

197
northern area have slightly higher values; the samples from the central area span the whole axis, showing a considerable degree of contamination. From the plot of scores on the plane defined by the second and third PCs, different contamination characteristics can be highlighted. If we plot the samples of the three areas, all the samples, apart from a few belonging to the central area, are clustered near the origin of the axes. To show the distribution in greater detail, we plotted all the samples with scores in the interval mean + standard deviation on an expanded scale. Figure 4 shows the plot of these scores in the space defined by the axes of the three PCs. Figure 5 shows the projection on the X, Y plane.
Figure 4 shows, in addition to the above-mentioned overall contamination levels of samples from the three areas (represented by the heights of the bars), a quite neat separation on the third PC axis illustrating the contamination by Pb as compared to that by other metals grouped with Zn; it is represented by a line parallel to the second PC axis of equation y = 1.1.
The separation along the second PC, which distinguishes the prevailing contamination by Hg from that by Zn and related metals, is less evident; it could be shown by drawing a line of equation x = - 1 (not drawn here, however).
The separation along the third axis has a correspondence in the geographic location of samples, since all samples plotted in the plane section with y > 1.1 are located north-east of the line between the industrial zone and the island of Lido (see Fig. 1). In Fig. 5, three plane sections are delimited: that with y < 1.1 contains samples of the southern area; that with x < -1 .7 and y > 1.1 contains the samples of the central and the northern zone; and the third, with y > 1.1 and x > - 1.7, is a mixed zone and collects scattered samples from all zones.
These observations confirm that the highest metal accumulation, and therefore the highest contamination, is observed in the central part of the lagoon, close to the city of Venice and the industrial center of Porto Marghera. As the contamination reaches the fringe zones, it becomes less intense and takes a different form, that is, the prevailing contaminant metals change. To the south, the contamination declines considerably, consisting mainly of Zn and the metals grouped with it. The decrease in Pb contamination is particular- ly noticeable. To the northeast, on the other hand, the contamination does not decrease to such a great extent, and it is almost of the same type as in the central part.
Let us now consider the possible sources of lagoon sediment contamination. Waters and particulate matter from the towns of Venice, Mestre and Chioggia, from the industrial site of Porto Marghera, and from the agricultural and industrial inland territory enter the lagoon through at least 24 main input points distributed along the lagoon border. Some of them are river-sized, like the Naviglio del Brenta and the Sile, others are channels, like the Osellino, and others are only pumping stations. A thorough description is given in the article by Bernardi et al. (1986), in which seasonal trends of flows are also reported.

198
TABLE 4
Correlation matrix of variables (normalized metal concentrations)
Hg Pb Cd Ni Co Cu Zn Cr Fe
Hg 1.000 0.190 0.660 0.230 0.520 0.620 0.610 0.660 0.200 Pb 1.000 0.230 0.060 0.170 0.210 0.240 0.230 - 0.004 Cd 1.000 0.220 0.700 0.640 0.910 1.000 0.160 Ni 1.000 0.690 0.300 0.220 0.220 0.430 Co 1.000 0.480 0.660 0.700 0.150 Cu 1.000 0.680 0.640 0.450 Zn 1.000 0.920 0.320 Cr 1.000 0.160 Fe 1.000
The water mass therefore conta ins u rban and agr icu l tu ra l run-off, effluents from plants t rea t ing domestic and industr ial waste, non- t rea ted sewage from houses and small factories, and erosion and dissolut ion waters from spoil heaps or dredged materials .
Even t hough the number of industr ies in Marghe ra has decreased consider- ably in the last decade, it is still one of the largest industr ia l centers in Italy. In 1978, when the last census of industr ies was completed, the fol lowing factories were present: a large chlor-alkal i plant, a p lant for producing Zn and Cd from sphalerites, a large coal-, oil- and gas-fired electric power plant, a fac tory where a luminum and related alloys are produced by an electrolyt ic process, basic steel works and foundries, a large shipyard, an oil refinery, chemical plants for inorganic products such as sulphur ic acid and ammonia , and for organic chemicals such as plastic fibers, a ferti l izer plant processing phosphori tes , a glass and coke manufac ture r , and a series of minor factories producing such things as paint, de tergent and fire bricks. In addition, in the inland te r r i to ry there are a number of small factories, including tanner ies and
| 5 10 15 20 25 [ l I I I !
Cd
Zn Ha Cu Co Hi re i Pb
Uariables
P[HDROGflflN [RON CLUSTEfl HLgSIS l~ig. 6. Dendrogram from cluster analysis.

199
paint and electroplating factories, whose activities have not yet been adequately evaluated to judge their impact on the environment.
Since the relationships between the accumulations of the various metals in the sediment could help identify the contamination sources, the linear correla- tion matrix was calculated for variables (Table 4). This matrix was then used to perform the cluster analysis; finally, a similarity dendrogram among variables was obtained (Fig. 6). The dendrogram shows a sequence in the associations, displaying the same information as the correlation matrix, but in a more easily interpretable form. At the most significant level, there is an association between the accumulations of Zn, Cd and Cr. This could be related to their similar transport mechanisms throughout the water body; this would be quite plausible for Zn and Cd, which belong to the same chemical group and display similar geochemical characteristics. However this argument would only hold true if we accepted a common contamination source; the most likely source of these elements would be the sphalerite (ZnS) processing plant in Marghera. This plant came into operation in 1936 and in the first period of activity not only was no care taken to prevent the leakage of contaminated waters and materials from the factory, but also tailings from it were used to fill part of the lagoon for future industrial installations, including the sites of the second industrial zone, which has been partly occupied, and a third one, which was never completed. Contaminated materials were therefore dispersed from the surroundings of the factory and from the sites where tailings were dumped. Contamination by these metals has reached the fringe southern areas of the lagoon. The Zn-Cd association, however, can be traced back to another conta- mination source, namely the electroplating industries inland. This would help to explain the presence of contamination in the northeastern areas where the rivers Dese and Sile flow into the lagoon carrying their contamination load. Chromium contamination is low and its weight in the principal component composition is negligible.
From a look at the dendrogram plot, other associations at a lower signifi- cance level can be detected between mercury and copper, and between these two and Zn, Cd and Cr. This association is probably due to the common geographic origin of these metals, which come mainly from the Marghera area. The electrolytic production of chlorine and sodium hydroxide from brine solutions using Hg electrodes (De Nora technology) is located in this area, along with other industries. Less significant associations relate iron and nickel, which may come from the foundries or from other activities that use steel, such as ship building or housing construction. These activities are concentrated in the industrial area, but can also be found elsewhere around the lagoon, for instance in Venice, Chioggia or some of the islands. Lead is present in sphalerites up to ~2% and is profitably recovered in the sphalerite processing. Our data show an extremely poor association between sediment accumulation of lead and that of other metals: in the dendrogram plot, Pb is associated with other metals at the least significant step. The presence of lead in sediments must be due to particular industrial activities, such as sulfuric

200
acid production, and/or to a completely different source, such as petrol combustion. Lead may have been conveyed to the lagoon sediments through the inflow of inland fresh waters containing urban run-off, or it may have fallen directly from the atmosphere. The latter source presents a serious problem in terms of global heavy metal pollution (FSrstner and Wittmann, 1983), especially in the case of lead. The distribution of PC scores of sediments along the axis of the third PC shows quite a neat separation of samples located north or south of a line drawn between the island of Lido and the third industrial zone. This indicates that in the central and northern part of the lagoon the combined contribution of the above-mentioned sources is considerably larger than in the southern area. The industries most likely responsible for lead leakage are located mainly in Marghera. In addition, the urbanized areas and those with the densest traffic are mostly close to the central part of the lagoon. As far as the indirect atmospheric fallout is concerned, i.e. the lead carried to the lagoon by fresh waters from the hinterland, we may refer to the paper of Bernardi et al. (1986), despite the fact that their samples were taken a few years later (1982-1983). They estimated the annual mean contributions of metals carried to the lagoon through freshwater inflows. The average amounts were calculated from the water concentrations and from the flows of the streams considered. According to them, the contribution of lead from inland fresh waters decreases from north to southwest, as also observed in the trend of our results.
CONCLUSIONS
Prior to mathematical-statist ical processing, the analytical results concerning metals concentrations in the sediments were normalized to background levels and the new variables calculated are therefore proportional to the metal accumulations in the sediments resulting from the urbanization and industrialization of the Venetian inland territory.
The combination of principal component and cluster analyses has some interesting advantages when compared with data interpretation based on the horizontal distribution of sediment concentrations: results were reported in a more concise and equally quantitative form, with very little loss of informa- tion. The degree of contamination of the different parts of the lagoon was highlighted in the plot of the scores along a single function: the first PC. A second function (second PC) allowed us to distinguish the two main forms of contamination: that associated with Hg, and that associated with Zn and related metals (Cd, Pb, Cu, Ni and Co). A third function isolated Pb from this association. The relationships among metal accumulations obtained through cluster analysis and synthesized by the dendrogram plots gave some useful hints as to the sources of pollution. The part of the lagoon close to Porto Marghera was the one that suffered the worst contamination. From this area, the contamination spread to the peripheral areas.
The contribution of fresh water inflow to contamination was also evaluated,

201
especially in relation to Zn, Cd and Pb. It was found that this source is important in explaining the contamination present in the northeastern area.
In previous work, Pavoni et al. (1987) studied the development of metal contamination over the last 100 years. The sections of three sediment cores, sampled in the area of the lagoon between the city of Venice and Marghera, were radioisotopically 21°pb dated and analyzed. Data were processed following the same approach used in this work, two PCs being sufficient to account for the total variance: one detailed the mercury contamination, and the second highlighted the contamination by Zn, Cd, Co, Cu and Pb. The results were similar to those described in the present article, if we compare the two PCs evaluated in the previous work with the second PC in this paper. The greater amount of data available for the present analysis allowed us to draw a more comprehensive picture of sediment contamination in the Venetian lagoon. The first PC was related to the global metal contamination, and the finer details were shown by means of a third PC, which distinguished Pb contamination from that of Zn. However, there is general agreement between the two results: one relative to 41 samples, the sections of cores taken in the most critical area of the lagoon, and the second using samples from the entire lagoon. This further supports the hypothesis that the original nucleus of contamination is the lagoon area close to the industrial zone, from where the contamination spreads to fringe areas.
ACKNOWLEDGEMENTS
The authors are grateful to Prof. Piero Mantovan for critically reviewing the manuscript.
REFERENCES
Alberotanza, L., 1973. Studio aerografico del flusso e riflusso della Bocca di Porto di Lido. Lab. Studio Dinamica Grandi Masse, CNR, Venezia, Tecn. Rep. No. 73.
Bernardi, S., R. Cecchi, F. Costa, G. Ghermandi and S. Vazzoler, 1986. Trasferimento di acqua dolce e di inquinant i nella laguna di Venezia. Inquinamento, 1/2: 4644.
Cossu, R. and E. De Fraja Frangipane, 1985. Stato delle conoscenze sul l ' inquinamento della laguna di Venezia. Progetto Venezia, Ministero dei Lavori Pubblici ,Magistrato alle Acque, Consorzio Venezia Nuova, Vol. 4.
Davis, J.C., 1986. Statistics and Data Analysis in Geology. John Wiley & Sons, New York 2nd edn, 645 pp.
Donazzolo, R., A.A. Orio and B. Pavoni, 1982. Radiometric dating and pol lutant profiles in a sediment core from the lagoon of Venice. Oceanol. Acta, 101-107.
Donazzolo, R., A.A. Orio, B. Pavoni and G. Perin, 1984. Heavy metals in sediments of the Venice lagoon. Oceanol. Acta, 7: 25-32.
FSrstner, U. and G. Wit tmann, 1983. Metal Pollut ion in the Aquatic Environment. Springer- Verlag, Berlin, 2nd edn, 486 pp.
Mantovan, P., L. Menegazzo Vitturi, B. Pavoni and S. Rabitti , 1985. Sediments and pollution in the Nor thern Adriatic Sea: a statist ical analysis. Cont. Shelf Res., 4:321 340.
Menegazzo Vitturi, L., E. Molinaroli, M. Pistolato and G. Rampazzo, 1987. Geochemistry of recent sediments in the lagoon of Venice. Rend. Soc. Ital. Mineral. Petrol., 42: 59-72.

202
Pavoni, B., R. Donazzolo, A. Marcomini, D. Degobbis and A.A. Orio, 1987. Historical development of the Venice lagoon contamination as recorded in radiodated sediment cores. Mar. Pollut. Bull., 18: 18-24.
Pellizzato, M. and M. Scattolin, 1982. Materiali per una bibliografia sulla laguna e sul golfo di Venezia. Consorzio per lo sviluppo della pesca e dell 'acquacultura nel Veneto, 1-74 pp.
Prater, B.L. and M.A. Anderson, 1977. A 96-hour bioassay of Otter Creek, Ohio. J. Water Pollut. Control Fed., 49: 209~2106.
Sfriso, A., A. Marcomini and B. Pavoni, 1987. Relationships between macroalgal biomass and nutrient concentrations in a hyperthrophic area of the Venice lagoon. Mar. Environ. Res., 22: 297-312.