Embed Size (px)
Citation preview
Journal of Intelligent Manufacturinghttps://doi.org/10.1007/s10845-020-01714-7
Multi-robot multi-operator collaborative assembly systems: aperformance evaluation model
Giovanni Boschetti1 ·Matteo Bottin2 ·Maurizio Faccio1 · Riccardo Minto1
Received: 21 June 2020 / Accepted: 10 November 2020© The Author(s) 2020
AbstractIn the last decade, collaborative assembly systems (CAS) are becoming increasingly common due to their ability to merge theflexibility of a manual assembly system with the performance of traditional robotics. Technical constraints, e.g., dedicatedtools or resources, or performance requirements, e.g., throughput, could encourage the use of a CAS built around a multi-robot and multi-operator layout, i.e., with a number of resources greater than 2. Starting from the development of a prototypemulti-robot multi-operator collaborative workcell, a simulation environment was developed to evaluate the makespan andthe degree of collaboration in multi-robot multi-operator CAS. From the simulation environment, a mathematical model wasconceptualized. The presented model allows estimating, with a certain degree of accuracy, the performances of the system.The results have investigated how several process characteristics, i.e. the number and type of resources, the resources layout,the task allocation method, and the number of feeding devices, influence the degree of collaboration between the resources.Lastly, the authors propose a compact analytic formulation, based on an exponential function, and define the methods and theinfluence factors to determine its parameters.
Keywords Collaborative robots · Assembly systems · Makespan evaluation · CAS
Introduction
The mass customization requested by the current market ispushing companies to offer a wide range of different prod-ucts.Assembly, due to its position at the end of the productionprocess, is the production technology most affected by thistrend (Kimet al. 2020). It is therefore fundamental to use flex-ible assembly systems that couldmanage changes in volumesand products (Azzi et al. 2012a, b). For a flexible assembly
B Maurizio [email protected]
Giovanni [email protected]
Matteo [email protected]
Riccardo [email protected]
1 Department of Management and Engineering, University ofPadova, Stradella S. Nicola, 3, Vicenza, Italy
2 Department of Industrial Engineering, University of Padova,Via Venezia, 1, Padova, Italy
system to be successful it requires the optimization of Bar-bazza et al. (2017):
– Unit direct production cost (e/part), i.e. the ratio of thehourly costs of the workcell and the average throughput;
– Mix flexibility, i.e. the ability to handle a wide variety ofparts, and manage a wide variety of parts and products;
– Volume flexibility, i.e. the ability to change the produc-tivity of the system without reducing its efficiency.
A possible solution could be the adoption of a traditionalManual Assembly System (MAS), toward which companiesare directed due to the requested flexibility and number ofproduct variants (Heilala and Voho 2001). These systemsgrant the maximum degree of flexibility in comparison toothers, but they present several drawbacks. The accuracy ofthe task and the activity repeatability need improvements;ergonomics problems could also occur (Battini et al. 2011).
To lower the costs of labor, Western countries haveadopted automatic systems. Since Boothroyd et al. (1982)described the automatic assembly systems, they are increas-ing their importance thanks to their high production rates,reduced costs and better quality of the final product. The
123

Journal of Intelligent Manufacturing
optimization of the assembly process is required for acost-effective and competitive paradigm shift from massproduction to mass customization, while also ensuring therequested product variety (Hu et al. 2011).
Several developments of the flexible assembly systems(FAS) have been proposed in the literature (Rosati et al.2013, 2015). Among those, Collaborative Assembly Sys-tems (CAS) (Faccio et al. 2019) improve the flexibility andlower the cycle time by using collaborative robots, or cobots(Colgate et al. 1996). Indeed, the market request for cus-tomized products could be too expensive to be performedwith traditional automatic systems, whereas a manual pro-duction has the drawbacks mentioned above. Therefore,cobots could lead, under proper conditions, to improved pro-ductivity (Gil-Vilda et al. 2017), thanks to reduced setuptimes and by sharing the tasks between the human opera-tor and the robotic device. Moreover, task-sharing not onlyreduces the cycle times since the robot operates in parallelwith the operator but also because it avoids additional anduseless movements of the operator.
A model was previously proposed to allow small- andmedium-sized enterprises (SMEs) to evaluate the benefits ofCAS, in particular identifying the influence of the productcharacteristics (Faccio et al. 2020) on the interferences inthe shared workspace, and therefore on the cycle time andeconomic advantage of cobots.
However, the previous simulated model is somewhatrestricting towards the possible application of CAS, in partic-ular on the hypothesis of multi-robot and/or multi-operatorscenarios. The optimal number of resources in a CAS isnot bound to be limited to two, and a multi-resources sce-nario could improve the throughput. Though, two key factor(Faccio et al. 2020) should be considered to observe a posi-tive change: the spatial interferences between the resourcesshould be kept at a minimum in order to collaborate, and suit-able process characteristics, i.e. the resources should have theability to perform the tasks in a shared workspace. There-fore, multiple resources should be considered for adoptionwhenever: the needed assembly time of the product is greatlysuperior to the desired cycle time; in the case of several dif-ferent tasks that require dedicated tools and resources, e.g.screwing processes; only if the layout size allows for theusage of multiple resources. Several studies were proposedfor collaboration of multiple robot systems and the collabo-ration in CAS systems, however, systems for the analysis anddesign of multi-robot multi-operator CAS have not been suf-ficiently studied. For these reasons our works aims to providea model that allows to estimate the performance of CAS sys-tems in a multi-resource context. Moreover, the model helpsto identify a set of variables that should be introduced to takeinto account the influence of the workplace characteristics.
A fundamental constraint for multi-resource systems isthe workspace of the resources. Indeed, not only the size
of the workplace needs to be sufficient for the adoption ofmultiple resources, but it is also a critical key factor thatinfluences the performance of the system. If each workspaceoverlaps, the resources could interfere with each other; if allthe workspaces are completely separated, a CAS does nothave any meaning to be used, both from the economic andperformance point of view. Thus, to achieve the required per-formance, the design of the layout, i.e. the resource positionin the assembly cell and respective assembly task alloca-tion, and the design of the workspace of each resource areneeded. This study is therefore driven by the need to studysystems able to carry out complex assembly tasks in multi-resources scenario, guaranteeing a high level of collaborationwith proper workspace-sharing.
The main contribution to the field provided by thisresearch is:
– The identification of the characteristics that influencesthe performance of a multi-resources CAS;
– To provide a model that allows to estimate the cycle timegiven the product characteristics, the number of feedingdevices and resources and the degree of collaborationwithout the need of a simulation environment.
This study provides to the SMEs amodel useful to evaluatewith a reasonable error the cycle time obtainablewith amulti-resourcesCAS, therefore allowing to identify if these systemsmay be a viable solution and evaluating the possible benefits.Starting from the results of a simulation environment usedto determine in a preliminary phase the achievable degreeof collaboration for a particular application, we propose amathematical model to estimate the performance of multi-resources systems consideringdifferent scenarios. Therefore,we believe that after the preliminary phase the proposedmodel is of practical interest, since it allows to estimate theperformance, and thus the costs and benefits, of collaborativerobots even in complex assembly systems without the needof time-consuming simulations.
The mathematical model investigates the influence of thesystemworkplace on its performance. Indeed, previousmod-els take into account only the task distribution or productcharacteristics. However, other process characteristics suchas the resources position have to be taken into account whenstudying complex assembly systems such as multi-resourcesCAS, since their influence is relevant. Therefore, our worknot only presents a model for the perfomance estimation butalso states how to take into account these process character-istics. In this way, we think that we can provide practitionersa model that allows them to estimate if a CAS is suitable fortheir application and how to optimize the workplace and thetask distribution to maximize economic convenience.
The paper is organized as follows: section “Related work”presents the state of the art, which shows the novelty and
123
Journal of Intelligent Manufacturing
the importance of the presented study; section “Performanceevaluation model for multi-robot multi-operator CAS” intro-duces the variables and hypotheses defined and presents thecycle time evaluation model. section “Simulation environ-ment” introduces the assumptions adopted in the simulationenvironment from which the model has been conceptual-ized and its experimental validation. Section “Results anddiscussion” presents the results and, section “Conclusion”concludes the presented work.
Related work
Traditional robotic workcells composed by multiple coop-erating robots are nowadays more frequent. Indeed, despitethey are a more complex solution to maintain and to recoverin case of faults, they present several advantages, i.e. fewerfixtures and reduced cycle time (Ranky 2003). It is thereforeunderstandable that, as soon as robots and human operatorscould work alongside, multi-robot multi-operator systemswere studied. Moreover, since the difference in skill betweenthe human operator and the cobot leads to greater complex-ity, the use of simulation environments allows to considerthe interaction between the resources and the workplace(Bänziger et al. 2020).
Ding et al. (2013) defined a finite state automata to designa human robot application. The algorithm, focused on guar-anteeing the worker safety without any production loss, wastested on an CAS workcell composed by two human oper-ators and a ABB Dual-Arm Concept Robot, also referredas FRIDA, cobot. Two intersecting interaction zones weredefined, where direct contact between the cobot and theoperator might occur; inside these, different thresholds wereestablished, adapting the cobot speed. A similar scenariois studied in Sadik et al. (2017), which is focused on theoptimization of the task scheduling through the Johnson’smethod. As observed by the authors, the two operators mighthave different assembly speeds, further complicating the taskoptimization; however it should be noted that the tasks arecarried out in a sequential order between the cobot and thehuman team. In a similar way, Tsarouchi et al. (2017) pro-posed amethod for the allocation of sequential tasks assignedto multiple human and robotic resources that constitute aCAS. The framework was tested in a scenario different fromthe previous ones, constituted by two industrial robots and ahuman operator, which interact through a depth sensor anda gesture handler software. A similar scenario is inspectedin Tan et al. (2009), who developed a prototype CAS systemcomposed by a human operator assisted by two traditionalrobots on a mobile platform. The interaction between thehuman and the robot team is analysed considering the oper-ator safety and mental workload and the performance of thesystem.
Three different case studies are also presented inMichaloset al. (2015), with one scenario presenting four collaborat-ing resources. The type of resources and the layout to beused in each case are affected by several variables, such asthe type of robot, its payload, product characteristics, i.e.,geometry and weight, and the process characteristics. How-ever, it should be noted that the work is focused on the safetyrelated aspects that need to be considered during the design ofhuman–robot collaborative applications. The layout designproblem is also analysed by Tsarouchi et al. (2017), consid-ering at the same time the task planning problem. The authorspropose a model for automatic generation of layout genera-tion and task planning, since the workplace design and taskallocation is a critical issue for the throughput increase andthe cycle time reduction. When a process changes, the layoutis designed with the objective of the cycle time improve-ment and the time reduction for re-design and reconfiguration(Tsarouchi et al. 2016). Differently, Ore et al. (2016) use adeveloped simulation software that evaluates the CAS appli-cation, minimizing the operation time, both for the robot andfor the operator, and the biomechanical load on the oper-ator, observed from the basis of the adopted posture. Themethod was used to optimize a CAS, considering not onlythe three-dimensional layout, but also the spatial positionof the human–robot handover. Lastly, Fechter et al. (2018)presents a practical approach for workplace design.
The studies presented so far not only highlight the neces-sity of considering the workplace design when developing aCAS application, but also the increasing presence of multi-resource CAS. However, it is clear examining the literaturethat the contributions available onmulti-resources CAS seemto be focused on proposing technical solutions to increasesafety, productivity and reduce costs. On the contrary, tothe authors’ knowledge, a model which allows to estimatethe cycle time obtainable in a particular application, withoutthe need of a simulation environment, is not present. Thisis probably due to the difficulties encountered when mod-elling the human–robot interaction, since it is affected bythe unpredictability of the human behaviour; this is furthercomplicated when considering multi-resource scenario.
Performance evaluationmodel formulti-robot multi-operator CAS
The objective of this work is to evaluate the achievablemakespan when considering a multi-resource layout. Ingreater detail, the addressed problem is:
– To obtain a suitable collaboration between the resources;– To estimate the achievable makespan Ttot with the con-
sidered task allocation.
123
Journal of Intelligent Manufacturing
Therefore, this work aims to define a function that estimatesTnorm , i.e. Ttot normalized by unit of space and number ofparts, for the considered scenario (P,W ):
Tnorm = F(P,W ) (1)
where P are the product characteristics (number of parts andproduct size) andW represents the workplace characteristics(e.g. number of resources, distance between the resourcesand task allocation method).
To exemplify the main idea of our approach and alsoits effectiveness, we will present a numerical example. Weconsider a collaborative assembly system composed by fourresources, 2 collaborative robots and 2 operators, placed ina certain disposition and with 4 feeders; these parametersbelongs to theW variables. The considered CAS is tasked toassembly a square product of size equal to 400 mm and com-posed by 22 parts, which results from previous works to apossible collaboration value of about 45%; these parametersbelongs to the P variables. Ourmodel estimates a normalizedcycle time Tnorm equal to: 6.73 · 10−4
[ hmm
]
Nomenclature
Input variables and parameters
Np Number of parts to be assembledL Side of the square workspace (mm)Nr Number of resourcesN f Number of feeding devicesc% Total collaboration parameter (%)
For each resource i considered, both human operator(s)and cobot(s), the following parameters were defined:
ta,i Assembly time [h/part]
tpp,i Unit pick time [h/part]
si Hand/end-effector
movement speed [mm/h]
wi Resource weight on collaboration
Output variables
Ttot Achievable cycle time [h]
Tnorm Cycle time normalized byL
and Np [h/mm]
Variables used in the simulation environment
Several other variables are defined in the simulation envi-ronment used to test the model:
Lmin Minimum arm length of
resource i [mm]
Lmax Maximum arm length of
resource i [mm]
R Radius i of the 2D sphere-swept
line [mm]Ericson (2004)
c%i, j Collaboration parameter for
resources i, j[%]Ttot,a Total assembly time [h]
Tcoll,i, j Resources i, j
collaboration time [h]
Variables used to define the model
Ttask Time spent on task completion [h]
Tmotion Time spent on motion [h]
Ttask,c0 Time spent on task completion
without collaboration [h]
Tmotion,c0 Time spent on motion
without collaboration [h]
Tc0 Cycle time normalized by L
and Np without collaboration [h/mm]
f Factor of collaboration
Other variables used in this work
P Product characteristics
W Workplace characteristics
Ttot,a,i, j Total assembly time
for resources i, j [h]
Tk Time required for task k [h]
Tc Desired cycle time [h]
ri Ratio between the process time
of resource i and a reference
tri Total time for resource i [h]
r f Ratio between N f andNr
Hypotheses
The hypotheses that characterize the model are:
123

Journal of Intelligent Manufacturing
– The considered assembly system does not distinguishbetween different feeding typologies, since this worksupposes that all the devices can provide each part whenrequired.
– Between each change in assembly tasks the payload dif-ference is minimal, therefore retooling is not needed andeach resource can move every parts.
– The considered assembly process does not take intoaccount any precedence constraint.
– The number of resource Nr is defined as:
Nr =∑Np
k TkTc
(2)
where Tk is the time needed to carry out task k and Tc isthe desired cycle time. In this work we will focus onlyon the scenarios with Nr > 2.
Model description
First of all, to describe the model it is important to definethe three main tasks considered to represent the assemblyprocess:
– picking, i.e. when a resource moves from the feedingpoint to an assembly point and returns to the feeder orfrom a point to the following one in the case of a pureassembly process;
– placing, i.e. when a resource places the picked part in theproper position;
– fastening, i.e. when a resource attaches the part to anotheror to the product base.
Two main groups were defined from these three tasks, calledpicking and assembly, where the latter groups the placingand fastening tasks. The total process time for each resourcewill be therefore composed by the total picking and assemblytime for said resource.
Considering the assembly for large pieces, or in the caseof large workspaces, it is possible for each resources to worksimultaneously. Therefore, when evaluating the total assem-bly time Ttot,a,i, j for two resources i, j as Faccio et al.(2019):
Ttot,a,i, j = (ta,i − Tcoll,i, j ) + (ta, j − Tcoll,i, j ) + Tcoll,i, j
= ta,i + ta, j − Tcoll,i, j(3)
a certain shared time Tcoll,i, j between the two resourcesshould be considered. This shared time is dependent by inter-ferences that can happen between cobots and human oper-ators during the assembly process; interferences which arerepresented by the degree of collaboration c% ∈ [0,100][%]
Faccio et al. (2019). Extending the definition presented inFaccio et al. (2020), the total c% is evaluated as the weightedarithmetic mean of the degree of collaboration between tworesources i, j c%,i, j , therefore:
c% =∑Nr
i, j (wi + w j )Tcoll,i, j
(Nr − 1)Ttot,a∑Nr
i wi
[%] (4)
where wi and w j are the weight of the resources i and jrespectively and Tcoll,i, j the collaboration time evaluatedfor each couple i, j of resources, Nr the total number ofresources considered in the layout and Ttot,a is the totalassembly time of the CAS.
The simulation environment used in Faccio et al. (2020)showed that there is a relation between c% and the cycle time.To avoid considering the effects of Np and L on the cycletime, i.e. the increase in the cycle time due to the increasein Np and the increase in the motion time due to increase inthe product size, it is suggested to evaluate the effects of thecollaboration on the normalized cycle time Tnorm , defined as
Tnorm = TtaskNp
+ Tmotion
Np · L[
h
mm · points]
(5)
where Ttask is the time spent on task completion and Tmotion
the remaining time, thus motion time. Due to its nature, evenif Ttask is not divided by L , it can be considered appliedto unit of L . The evaluated time is related to the assemblyprocess speed, since it represents the speed to assembly onepart on one millimetre-sized product, thus the lower is Tnormthe higher the assembly speed and therefore the throughput.
The results obtained from the adopted simulation envi-ronment were fitted with different models, e.g. polynomials,power and hyperbolic, and considering the sum of squaresdue to error (SSE), the model which fitted in the most signif-icant and correct way was the one-term exponential model,with an SSE ranging around a 10−7 order of magnitude.Therefore, the relation between c% and Tnorm can be rep-resented by the following one-term exponential model:
Tnorm = Tc0e− f c% (6)
with Tc0 and f constants. Thismodel allows therefore to esti-mate Tnorm of a particular application with different degreeof collaboration; given the product characteristics L and Np
it it then possible to estimate the cycle time.
123

Journal of Intelligent Manufacturing
Definition of Tc0
Due to the exponential nature of the model, Tc0 is equal tothe measured Tnorm in a zero-collaboration scenario, i.e.
Tc0 = Ttask,c0Np
+ Tmotion,c0
Np · L[
h
mm · points]
(7)
with Ttask,c0 the time required to carry out the tasks withoutany collaboration and Tmotion,c0 the time required for theresource to move towards the feeding device and towards theplacing point with null c%. In a similar scenario, it is easierto determine this two values: indeed, since the resources arenot collaborating, the tasks are carried out in sequence, whichcould imply that it is the sum of the time required for eachprocess tasks, meant as picking and assembly. However, theresources presents different picking and assembly times dueto their different nature; therefore, Ttask,c0 is between thesum of the task times of the fastest resource and the sum ofthe task times of the slowest one, i.e.
ta, f + tpp, f ≤ Ttask,c0 ≤ ta,s + tpp,s (8)
with ta, f and tpp, f the assembly and picking time of thefastest resource respectively and ta,s and tpp,s the assem-bly and picking time of the slowest resource respectively.To evaluate Ttask,c0, the distribution of the tasks betweenthe resources should be considered. Without consideringany technological limitation, i.e. every resource can performevery task, and without considering any precedence betweenthe tasks, the task allocation for the resource i is based onthe weight ri , i.e. the ratio between the process time betweenthe resources:
ri = tr1tri
= ta,r1 + tpp,r1ta,ri + tpp,ri
(9)
with tr1 is the total time of the reference resource, i.e. the sumof the picking time tpp,r1 and the assembly time ta,r1, and triis the total time of the resource i , i.e. the sum of the pickingtime tpp,ri and the assembly time ta,ri . Ttask,c0 is thereforeevaluated as:
Ttask, c0 = Np
∑i ri tri∑i ri
(10)
Moreover, the time required for the resource tomove towardsthe feeding device and towards the placing point, hereaftercalledmotion-time, should be considered. Considering a uni-form distribution of the placing points, the motion-time foreach resources can be evaluated as the sum of the timeneeded to move from one placing point and another, and thetime needed to move from the feeding device nearest to theresource i and the center of the workspace. These two values
can be obtained by considering a weighted mean speed, withthe weight ri evaluated as before, since the task allocation isbased on the time needed to carry out the assembly process.Moreover, the distance between the feeding devices and thecenter is also the weighted mean distance. The motion-timeTmotion,c0 is therefore evaluated as:
Tmotion,c0 = FCw + P1P2sw
(11)
with FCw the weighted mean distance between the feedingdevice and the center, P1P2 the average distance between theplacing points and sw the weighted average speed.
It should be noted that the proposed definition of Tnorm ,and therefore of Tc0, reduces the influence of Tmotion,c0 onits value, thus it is possible to evaluate Tc0 by consideringonly Ttask,c0 with a fair approximation.
Definition of f
In regards to the exponent constant f , called factor of col-laboration, our study shows that it represents the level ofcriticality of the layout, i.e. how much it is important that theresources collaborate on the shared workspace. Indeed, f ishigher in scenarios where the probability of interference ishigher and thus a higher value of c% is needed. As presentedin Faccio et al. (2020), the risk of interferences, representedindirectly by c%, depends on the product characteristics, butalso on certain process characteristics, e.g. the layout config-uration and/or the assembly process time.
The simulation tests show that f depends on several pro-cess characteristics, which can be grouped as related to theresources and the feeding devices.
– Resources
– Resource type and number, i.e. the distribution of humanoperators and cobots composing the CAS. Since theresources present greatly different task times (ta and tpp)between each other, an asymmetrical resource distribu-tion, e.g. n cobots and m operators, results in a morecritical layout, increasing f . Moreover, considering ntype 1 resources and m type 2 resources, with m < n,the considered layout will be more critical if the type 1resources have higher task times since they will occupythe shared workspace for a longer time, thus increasingthe risk of spatial interferences.
– Resource task time, i.e. the difference between ta and tppof the resources. As shown previously, different timesbetween the resources increase f , since higher differ-ences reduce the possibility of synchronization betweenthe resources, i.e. they cannot enter and leave the sharedworkspace at the same time. Moreover, in the hypothe-
123
Journal of Intelligent Manufacturing
sis of an assembly process without any precedence, theresources time and distribution influence the task distri-bution r which in turn further influences f .
– Feeding devices– The ratio r f between the number of feeding device N f
and Nr . Under the hypothesis that each bulk can provideevery part required for the process assembly, each bulkcan serve every resource, thus lowering r f to values infe-rior to 1 increases the chances of interferences, and as aconsequence f . It should be noted that due to the hypoth-esis set on the feeding devices, values of r f greater than 1does not imply a further reductionof f since the resourceswill reach the nearest unoccupied feeding device.
– Feeding device position, since an increase of the mini-mum distance of each resource from the feeding devices,decreases the possibility of interferences, and thereforef .
Differently from Tc0, the great number of variables con-siderably makes it difficult to provide a significant formulafor f ; however, as presented in section “Results and discus-sion”, several observations can be inferred from the proposedtests.
Simulation environment
The simulation environment has allowed to evaluate themakespan and c% for several layouts in a multi-resourcesCAS scenario given the product and process characteristics.This section introduces the assumptions adopted in the sim-ulation environment and description of the model.
Model application: assumptions and input values
The simulation environment is based on the followingassumptions:
– The pick-and-place time is evaluated as the time neededto move from the completed point to the feeder and thento the placing point, considering also the time requiredfor grasping the object. Regarding the cobot(s), we con-sidered a gripper with a closing/opening time of 0.7 s.
– The human operator(s) is allowed to move his/her base,representing the shoulder, around the workspace in ordertoo reach bulks/placing points too far from the base. Thismotion is outside the workspace in order to reduce therisk of interferences, but it is simulated to better computethe expended time.
– Besides the motion time component, the assembly andpicking time of each task are equal.
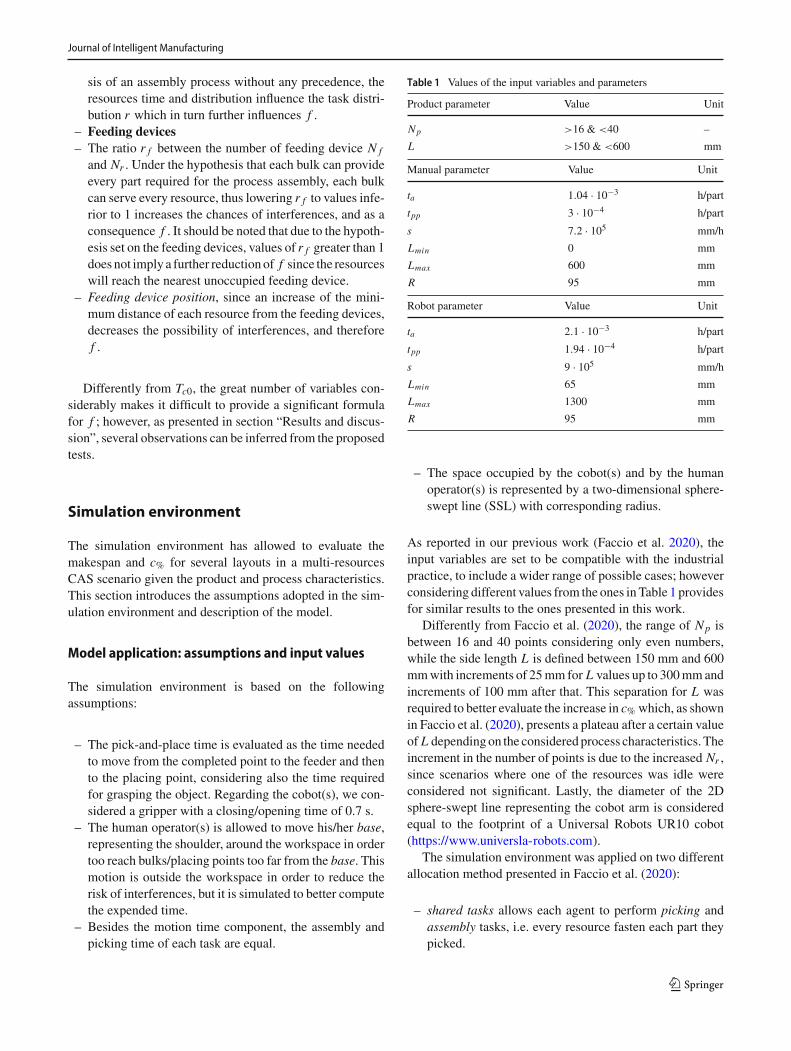
Table 1 Values of the input variables and parameters
Product parameter Value Unit
Np >16 & <40 –
L >150 & <600 mm
Manual parameter Value Unit
ta 1.04 · 10−3 h/part
tpp 3 · 10−4 h/part
s 7.2 · 105 mm/h
Lmin 0 mm
Lmax 600 mm
R 95 mm
Robot parameter Value Unit
ta 2.1 · 10−3 h/part
tpp 1.94 · 10−4 h/part
s 9 · 105 mm/h
Lmin 65 mm
Lmax 1300 mm
R 95 mm
– The space occupied by the cobot(s) and by the humanoperator(s) is represented by a two-dimensional sphere-swept line (SSL) with corresponding radius.
As reported in our previous work (Faccio et al. 2020), theinput variables are set to be compatible with the industrialpractice, to include a wider range of possible cases; howeverconsidering different values from the ones inTable 1 providesfor similar results to the ones presented in this work.
Differently from Faccio et al. (2020), the range of Np isbetween 16 and 40 points considering only even numbers,while the side length L is defined between 150 mm and 600mmwith increments of 25mm for L values up to 300mmandincrements of 100 mm after that. This separation for L wasrequired to better evaluate the increase in c% which, as shownin Faccio et al. (2020), presents a plateau after a certain valueof L dependingon the consideredprocess characteristics. Theincrement in the number of points is due to the increased Nr ,since scenarios where one of the resources was idle wereconsidered not significant. Lastly, the diameter of the 2Dsphere-swept line representing the cobot arm is consideredequal to the footprint of a Universal Robots UR10 cobot(https://www.universla-robots.com).
The simulation environment was applied on two differentallocation method presented in Faccio et al. (2020):
– shared tasks allows each agent to perform picking andassembly tasks, i.e. every resource fasten each part theypicked.
123
Journal of Intelligent Manufacturing
Table 2 Comparison between the estimated and mean values: examplefor a 2-cobots-2-operators layout
Std. deviation σ Estimated Tc0 Mean Tc0 Unit
0.1μ 1.7 · 10−3 1.62 · 10−3 h/mm
0.3μ 1.7 · 10−3 1.61 · 10−3 h/mm
Std. deviation σ Estimated f Mean f Unit
0.1μ 1.95 1.97 –
0.3μ 1.95 2.00 –
– human p/p separates the placing from the assembly tasks,thus the human operators pick and place every part sothat the robots can fasten it; this choice was driven by theassembly considered, which showed a manual pickingfaster than the robotic one.
with different Nr , resource position, and number of bulks.
Validation test
We analysed the robustness of the model to uncertainties,which could lead to performance deterioration (Boudjelida2019). The operator(s) task times are considered as the mainsources of uncertainty, which is reasonable since the robot(s)task times are more repeatable. We assumed that the opera-tor(s) task times are normally distributed, which is realistic inmost cases of manual work (Moodie 1965; Buzacott 1990):for each scenario we set the mean μ equal to the value inTable 1 and the standard deviation σ equal to 10% and 30%of μ, respectively. For each scenario the mean values of Tc0and f have been evaluated using 100 samples of the opera-tor(s) task times, as seen in Table 2. The results show that theestimation of Tc0 and f is compatible with the mean value.
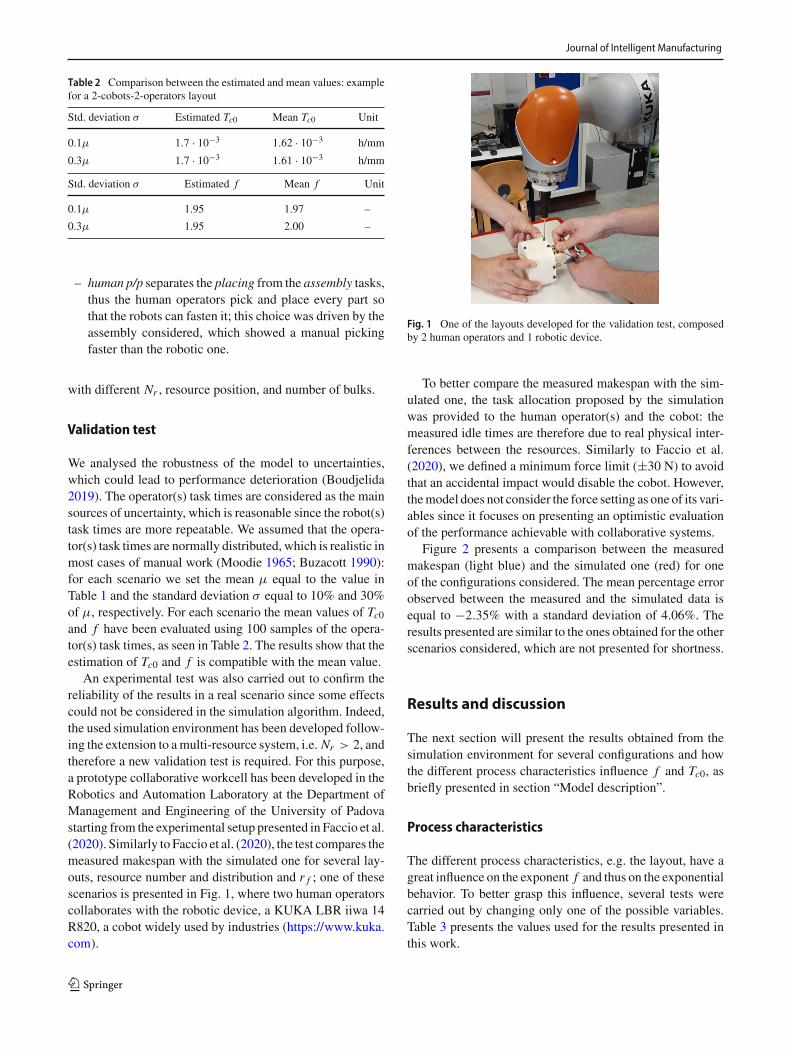
An experimental test was also carried out to confirm thereliability of the results in a real scenario since some effectscould not be considered in the simulation algorithm. Indeed,the used simulation environment has been developed follow-ing the extension to amulti-resource system, i.e. Nr > 2, andtherefore a new validation test is required. For this purpose,a prototype collaborative workcell has been developed in theRobotics and Automation Laboratory at the Department ofManagement and Engineering of the University of Padovastarting from the experimental setup presented in Faccio et al.(2020). Similarly to Faccio et al. (2020), the test compares themeasured makespan with the simulated one for several lay-outs, resource number and distribution and r f ; one of thesescenarios is presented in Fig. 1, where two human operatorscollaborates with the robotic device, a KUKA LBR iiwa 14R820, a cobot widely used by industries (https://www.kuka.com).
Fig. 1 One of the layouts developed for the validation test, composedby 2 human operators and 1 robotic device.
To better compare the measured makespan with the sim-ulated one, the task allocation proposed by the simulationwas provided to the human operator(s) and the cobot: themeasured idle times are therefore due to real physical inter-ferences between the resources. Similarly to Faccio et al.(2020), we defined a minimum force limit (±30 N) to avoidthat an accidental impact would disable the cobot. However,themodel does not consider the force setting as one of its vari-ables since it focuses on presenting an optimistic evaluationof the performance achievable with collaborative systems.
Figure 2 presents a comparison between the measuredmakespan (light blue) and the simulated one (red) for oneof the configurations considered. The mean percentage errorobserved between the measured and the simulated data isequal to −2.35% with a standard deviation of 4.06%. Theresults presented are similar to the ones obtained for the otherscenarios considered, which are not presented for shortness.
Results and discussion
The next section will present the results obtained from thesimulation environment for several configurations and howthe different process characteristics influence f and Tc0, asbriefly presented in section “Model description”.
Process characteristics
The different process characteristics, e.g. the layout, have agreat influence on the exponent f and thus on the exponentialbehavior. To better grasp this influence, several tests werecarried out by changing only one of the possible variables.Table 3 presents the values used for the results presented inthis work.
123

Journal of Intelligent Manufacturing
Fig. 2 Comparison between the simulated (red) and measured (lightblue)makespan for one of the configurations. Themeanpercentage erroris −2.35% with a standard deviation of 4.06% (Color figure online)
Table 3 Tested process characteristics influencing f
Process characteristic Scenarios
Nr 3,4
Resource distribution 2 cobots 1 operator
1 cobot 3 operators
2 cobots 2 operators
3 cobots 1 operator
r f 1/2
2/2
3/4
4/4
2/3
3/3
Layouts for Nr = 3 a,b,c
Task allocation method Shared tasks
Human p/p
Firstly, a number of resources Nr greater than 2 was con-sidered to show how an increased number of resources canlead to greater f . Since the given resources are classified byonly two different types in the model, i.e. human operatoror cobot, scenarios composed by an uneven or equal num-ber of cobots and human operators are possible. The effectsof an asymmetrical resource distribution on f in compari-son to symmetrical one is therefore studied for both the Nr
considered.Moreover, the resources position has also a great effect on
f and different layouts were examined: e.g. Fig. 3 presentsthe layouts used for a scenario composedof 2 cobots, 1 humanoperator, 3 feeding devices and product size of 150 mm, i.e.the minimum L . The circles represents the base point andthe hand/end-effector, where the cobots are represented bythe green and black cirlces and the human operator by the
red ones. Three feeding points are represented as three smallcyan circles, and the black square represents the product.Layouts studied for different resource distribution and Nr ,while presenting similar results, are omitted for shortness.
Reducing the number of feeding devices, and thereforetesting values of r f less than 1, increases the probability ofinterferences, as the resources could interfere both near thecommon feeding device, but also in the shared workspace.Indeed, under the hypothesis of an assembly process withoutany precedence, the tasks carried out by each resource willbe the nearest to the resource bases, but also to the commonfeeding device, therefore increasing the risk of interferences.This effect could be considered even in the case that the feed-ing devices provide only specific parts, by placing a sufficientnumber of feeding devices to satisfy each resource simulta-neously; however, a compromisewith the cost of this solutionshould be considered. As stated above, values of r f greaterthan 1 are not considered relevant due to the hypotheses.Furthermore, for the Human p/p task allocation method thefeeding devices concern only the human operators, thereforer f is evaluated as 2/2 or 1/2 even if Nr is greater than 2.Again, several ratios were examined but this work presentsonly a limited number for shortness.
The following paragraphwill present some of the obtainedresults for each task allocationmethod considered and focus-ing on the effect of one parameter at a time.
Shared tasks method
Resources distribution
Considering Nr equal to 4, three scenarios for different dis-tributions of resources are possible:
– 1 cobot and 3 human operators;– 2 cobots and 2 human operators;– 3 cobots and 1 human operator.
whereas scenarios composed of only cobots or human oper-ators are not considered significant for the purpose of theresearch. For r f equal to 1 and the same resources position,we can observe the behaviour represented in Fig. 4, wherethe equation of the one-term exponential model representedis obtained through least square fitting.
Consideringoneof the scenarios for reference, e.g. thefirstscenario with 3 human operators and 1 cobot, the coefficientTc0 can be roughly estimated considering only Eq. (10) as
Tc0 = 3 · (tpp + ta)op + rc · (tpp + ta)rc3 + rc
= 1.5 · 10−3 [h/part](12)
123

Journal of Intelligent Manufacturing
-400 -300 -200 -100 0 100 200 300 400 500 600
-500
-400
-300
-200
-100
0
100
200
300
Oper.CobotCobotBulkProd.
-600 -400 -200 0 200 400 600
-400
-300
-200
-100
0
100
200
300
400
500
600
Oper.CobotCobotBulkProd.
-600 -400 -200 0 200 400 600 800
-400
-200
0
200
400
600
Oper.CobotCobotBulkProd.
(a) (b) (c)
Fig. 3 Resource and bulk position tested. For each one of them, the mean distance between the resources is presented
0.1 0.15 0.2 0.25 0.3 0.35 0.4 0.45
C% [ ]
0.6
0.7
0.8
0.9
1
1.1
1.2
1.3
1.4
Tno
rm [h
/mm
]
10-3 T normalized - point/size, 4 feeders
y = 1.56e-03 e-2.20e+00 x
0.1 0.15 0.2 0.25 0.3 0.35 0.4 0.45 0.5 0.55 0.6
C% [ ]
0.5
0.6
0.7
0.8
0.9
1
1.1
1.2
1.3
1.4
1.5T
norm
[h/m
m]
10-3 T normalized - point/size, 4 feeders
y = 1.62e-03 e-1.95e+00 x
0.1 0.2 0.3 0.4 0.5 0.6 0.7 0.8
C% [ ]
0.4
0.6
0.8
1
1.2
1.4
1.6
1.8
Tno
rm [h
/mm
]
10-3 T normalized - point/size, 4 feeders
y = 1.92e-03 e-1.96e+00 x
(a) (b) (c)
Fig. 4 Effect of the resources type and distribution on the exponential model considering four resources with r f equal to 1 and the same resourcesposition
with the weight rc evaluated as presented in (9), consideringthe human operator as the reference resource r1 and equal to0.5841. The resulting percentage error between the estimatedvalue and the one resulting from the simulation environment(1.56 · 10−3[h/part]) is therefore −4.13%, which can beconsidered acceptable in a rough design phase. Analogously,the value of Tc0 for the other two scenarios, i.e. 2-cobots-2-operators and 3-cobots-1-operator, can be estimated equalto 1.7 · 10−3[h/part] and 1.9 · 10−3[h/part] respectively,thus the estimation differs from the simulated values by apercentage error of 4.93%and−1.04%,which can be consid-ered acceptable. Regarding the exponent f , despite it cannotbe estimated similarly to Tc0, two important considerationcan be made, especially observing the layout composed by 3operators and 1 cobot. The higher value of f (−2.20) for thisscenario is due to two different effects: first of all, the oddresource distribution, differently from the scenario with tworesources per type (−1.95). As previously stated, the differ-ent task time between the two type of resources increases theprobability of spatial interferences, which is related to f .
However, the other layout with odd resource distribution(3 cobots-1 operator) has a lower f (−1.96), which is dueto the characteristics of the single resource: in the layout
composed by 3 cobots, the human operator is faster than thecobots in terms of task time, therefore they will occupy theshared workspace for a lower amount of time, and thereforeit presents a decrease in the probability of spatial interfer-ence, given a certain task distribution. On the contrary, thescenario presenting only 1 cobots has a higher f since thesingle resource is slower than the others in terms of tasktime. Moreover, despite the higher speed of the cobot, themotion time is much lower than the task time due to the sizeof the workspace, thus, with the data considered, the humanoperators occupy the shared workspace for less time than thecobots.
Number of resources
The number of resources can indeed influence f since it isstrictly related to the number of interferences in the sharedworkspace. Figure 5 represent the scenario of 2 cobots and 1human operator, r f equal to 1, with the resources and feed-ing devices defined to keep the same distance between theresources as the previous scenarios, thus removing the effectof the layout.
123

Journal of Intelligent Manufacturing
0.1 0.15 0.2 0.25 0.3 0.35 0.4 0.45 0.5 0.55 0.6
C% [ ]
0.8
0.9
1
1.1
1.2
1.3
1.4
1.5
1.6
1.7
1.8
Tno
rm [h
/mm
]10-3 T normalized - point/size, 3 feeders
y = 1.96e-03 e-1.47e+00 x
Fig. 5 Effect of the number of resources on the exponential modelconsidering 2 cobots and 1 operator with r f equal to 1 and the sameresources position. (Tnorm = 1.96 · 10−3e−1.47c% h
mm )
The value of f is lower for 3 resources (2 cobots and1 human operator, −1.47) than for four (3 cobots and 1human operator, −1.95): indeed, the influence of Nr shouldbe considered, since fewer resources are used in the CAS,and therefore that occupy in the shared workspace, loweringthe possibility of spatial interferences.
Furthermore, the value of Tc0 is different from the ones ofthe previous layouts due to the different resource distribution.The value of Tc0 can be estimated considering (10) as
Tc0 = (tpp + ta)op + 2 · rc · (tpp + ta)rc1 + 2 · rc
= 1.86 · 10−3 [h/part](13)
with the weight rc again evaluated as 0.5841. The result-ing percentage error between the estimated value and theone resulting from the simulation environment (1.96 ·10−3[h/part]) is therefore −5.37%, which can be consid-ered acceptable in a rough design phase. Lastly, the influenceof the resource distribution is also noticeable for differentnumber of resources, with results similar to the ones pre-sented above.
Layout
The influence of the resources and feeding devices positionon f is studied by considering three scenarios composed by2 cobots and 1 human operator, with r f equal to 1, placed atdifferent distances between each other, i.e. Layout a,b, c inFig. 3.
While the Layout a corresponds to the one presented inFig. 5, and therefore is omitted here for shortness, the simu-lation results for the other two layouts are presented in Fig. 6.
As shown,Layoutb, characterizedby the furthest resources,with a mean distance between their base position equal to1024.8mm, presents theminimum absolute value of f , equalto −1.34. Indeed, considering that without any precedencethe current task for each resource will be the nearest one, asthe distance between the resources increase, the risk of spa-tial interferences decreases. This effect could be consideredeven in the case of precedence between the tasks, by keepingthe maximum possible distance between the simultaneoustasks of the resources.
As the mean distance decreases (Layout a, 765.9 mm) thevalue of f increases, and the maximum value of f for thethree scenarios is measured in Layout c, which presents theminimummeandistance, equal to 731.9mm, and an exponentf equal to−1.48. Interestingly, the difference between thesetwo values of f is smaller thanwith the one of Layout b, sincethe difference between the mean distance is also smaller.
Number of feeding devices
The last variable that was observed influencing f is the num-ber of feeding devices, as seen in Fig. 7, where we consideredtwo layouts composed by 2 cobots and 2 human operators,placed at the same distance in the two scenario.
For the considered task allocation method, this effect isthe one that most influences f , with an increase of over 70%by only reducing r f from 1 to 0.75. Further reduction ofthe number of feeding devices greatly increases the factor ofcollaboration, since the possibility of interferences greatlyincreases also near the common feeding device. Similarresults are obtained for different r f , Nr , resource distribu-tion and position.
Human p/pmethod
Resource distribution
The results of the tests for the resource distribution consid-ering the Human p/p task allocation method are presentedin Fig. 8. Differently from the previous one, this methodrequires less feeding devices, as only the human operatorsare carrying out the picking tasks. However, this method alsoleads to greater makespan and lower c%, as shown in Faccioet al. (2020). Moreover, this scenario differs in the evaluationof Tc0: indeed, rc will be equal to 1 since every placing taskscarried out by the operators correspond to an equal numberof fastening tasks by the cobots. Therefore the value of Tc0for a layout composed of 2 operators and 2 cobots can beevaluated as:
123

Journal of Intelligent Manufacturing
0.1 0.2 0.3 0.4 0.5 0.6 0.7 0.8
C% [ ]
0.7
0.8
0.9
1
1.1
1.2
1.3
1.4
1.5
1.6
1.7T
norm
[h/m
m]
10-3 T normalized - point/size, 3 feeders
y = 1.86e-03 e-1.34e+00 x
0.1 0.15 0.2 0.25 0.3 0.35 0.4 0.45 0.5 0.55
C% [ ]
0.8
0.9
1
1.1
1.2
1.3
1.4
1.5
1.6
1.7
1.8
Tno
rm [h
/mm
]
10-3 T normalized - point/size, 3 feeders
y = 1.97e-03 e-1.48e+00 x
(a) (b)
Fig. 6 Effect of resource position on the factor of collaboration f for Layout b and c
0 0.05 0.1 0.15 0.2 0.25 0.3 0.35 0.4 0.45
C% [ ]
0.6
0.8
1
1.2
1.4
1.6
1.8
Tno
rm [h
/mm
]
10-3 T normalized - point/size, 4 feeders
y = 1.66e-03 e-2.30e+00 x
0 0.05 0.1 0.15
C% [ ]
0.9
1
1.1
1.2
1.3
1.4
1.5
1.6
1.7
1.8
Tno
rm [h
/mm
]
10-3 T normalized - point/size, 3 feeders
y = 1.72e-03 e-3.92e+00 x
(a) (b)
Fig. 7 Effect of the number of feeding devices on the factor f in a layout composed of 4 resources, 2 cobots and 2 human operators
Tc0 = (tpp + ta)op + rc · (ta)rc1
= 2.7 · 10−3 [h/part](14)
This equation can be better explained by considering thateach tasks time is composed by the picking (tpp) and placing(ta) time of the human operators and the fastening (ta) timeof the cobots.
Two different scenarios were considered, with Nr equalto 4, r f equal to 1 and same resources position:
– 2 cobots and 2 human operators;– 3 cobots and 1 human operator.
123
Journal of Intelligent Manufacturing
0.04 0.06 0.08 0.1 0.12 0.14 0.16 0.18 0.2 0.22 0.24
C% [ ]
1.4
1.6
1.8
2
2.2
2.4
2.6
2.8T
norm
[h/m
m]
10-3 T normalized - point/size, 2 feeders
y = 2.78e-03 e-2.47e+00 x
0.01 0.02 0.03 0.04 0.05 0.06 0.07 0.08
C% [ ]
1.9
2
2.1
2.2
2.3
2.4
2.5
2.6
2.7
2.8
Tno
rm [h
/mm
]
10-3 T normalized - point/size, 2 feeders
y = 2.87e-03 e-4.90e+00 x
(a) (b)
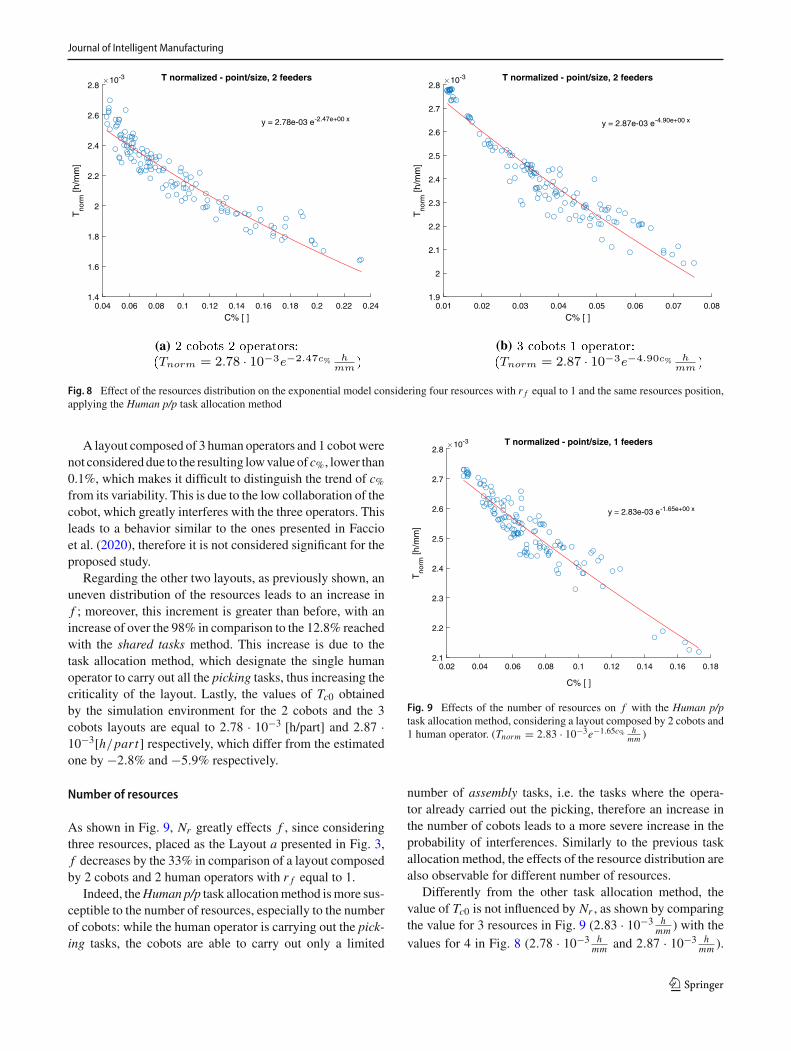
Fig. 8 Effect of the resources distribution on the exponential model considering four resources with r f equal to 1 and the same resources position,applying the Human p/p task allocation method
A layout composed of 3 human operators and 1 cobotwerenot considereddue to the resulting lowvalueof c%, lower than0.1%, which makes it difficult to distinguish the trend of c%from its variability. This is due to the low collaboration of thecobot, which greatly interferes with the three operators. Thisleads to a behavior similar to the ones presented in Faccioet al. (2020), therefore it is not considered significant for theproposed study.
Regarding the other two layouts, as previously shown, anuneven distribution of the resources leads to an increase inf ; moreover, this increment is greater than before, with anincrease of over the 98% in comparison to the 12.8% reachedwith the shared tasks method. This increase is due to thetask allocation method, which designate the single humanoperator to carry out all the picking tasks, thus increasing thecriticality of the layout. Lastly, the values of Tc0 obtainedby the simulation environment for the 2 cobots and the 3cobots layouts are equal to 2.78 · 10−3 [h/part] and 2.87 ·10−3[h/part] respectively, which differ from the estimatedone by −2.8% and −5.9% respectively.
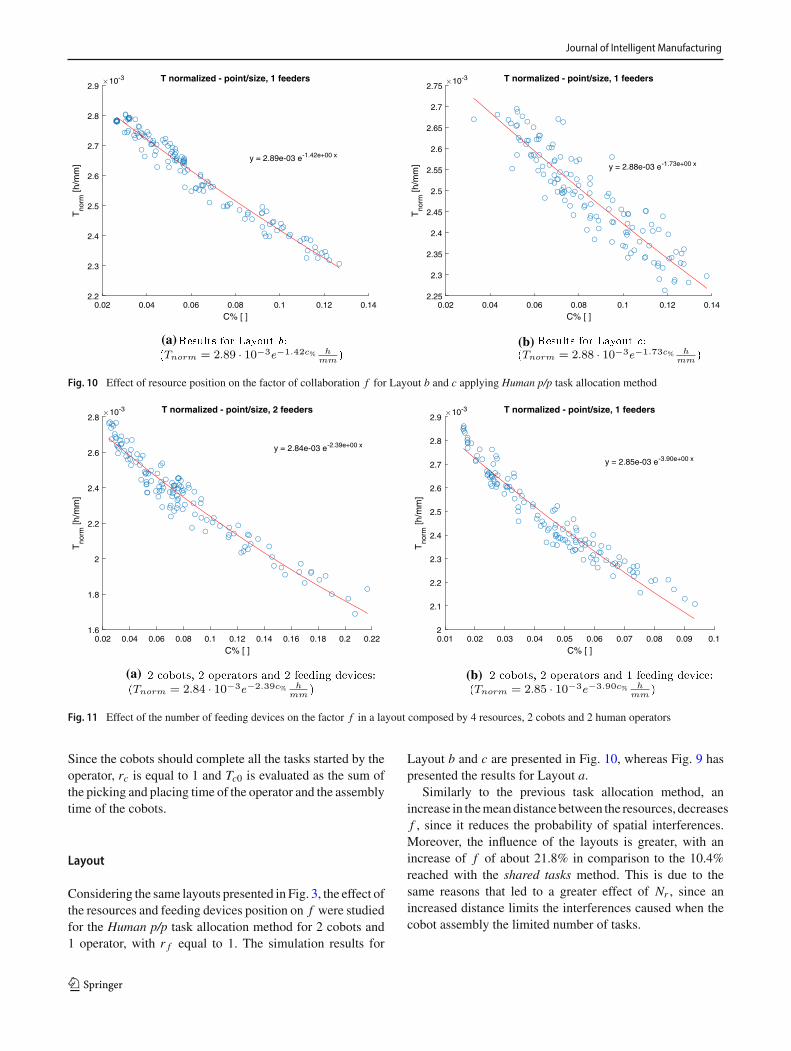
Number of resources
As shown in Fig. 9, Nr greatly effects f , since consideringthree resources, placed as the Layout a presented in Fig. 3,f decreases by the 33% in comparison of a layout composedby 2 cobots and 2 human operators with r f equal to 1.
Indeed, theHuman p/p task allocationmethod ismore sus-ceptible to the number of resources, especially to the numberof cobots: while the human operator is carrying out the pick-ing tasks, the cobots are able to carry out only a limited
0.02 0.04 0.06 0.08 0.1 0.12 0.14 0.16 0.18
C% [ ]
2.1
2.2
2.3
2.4
2.5
2.6
2.7
2.8
Tno
rm [h
/mm
]
10-3 T normalized - point/size, 1 feeders
y = 2.83e-03 e-1.65e+00 x
Fig. 9 Effects of the number of resources on f with the Human p/ptask allocation method, considering a layout composed by 2 cobots and1 human operator. (Tnorm = 2.83 · 10−3e−1.65c% h
mm )
number of assembly tasks, i.e. the tasks where the opera-tor already carried out the picking, therefore an increase inthe number of cobots leads to a more severe increase in theprobability of interferences. Similarly to the previous taskallocation method, the effects of the resource distribution arealso observable for different number of resources.
Differently from the other task allocation method, thevalue of Tc0 is not influenced by Nr , as shown by comparingthe value for 3 resources in Fig. 9 (2.83 · 10−3 h
mm ) with thevalues for 4 in Fig. 8 (2.78 · 10−3 h
mm and 2.87 · 10−3 hmm ).
123
Journal of Intelligent Manufacturing
0.02 0.04 0.06 0.08 0.1 0.12 0.14
C% [ ]
2.2
2.3
2.4
2.5
2.6
2.7
2.8
2.9T
norm
[h/m
m]
10-3 T normalized - point/size, 1 feeders
y = 2.89e-03 e-1.42e+00 x
0.02 0.04 0.06 0.08 0.1 0.12 0.14
C% [ ]
2.25
2.3
2.35
2.4
2.45
2.5
2.55
2.6
2.65
2.7
2.75
Tno
rm [h
/mm
]
10-3 T normalized - point/size, 1 feeders
y = 2.88e-03 e-1.73e+00 x
(a) (b)
Fig. 10 Effect of resource position on the factor of collaboration f for Layout b and c applying Human p/p task allocation method
0.02 0.04 0.06 0.08 0.1 0.12 0.14 0.16 0.18 0.2 0.22
C% [ ]
1.6
1.8
2
2.2
2.4
2.6
2.8
Tno
rm [h
/mm
]
10-3 T normalized - point/size, 2 feeders
y = 2.84e-03 e-2.39e+00 x
0.01 0.02 0.03 0.04 0.05 0.06 0.07 0.08 0.09 0.1
C% [ ]
2
2.1
2.2
2.3
2.4
2.5
2.6
2.7
2.8
2.9T
norm
[h/m
m]
10-3 T normalized - point/size, 1 feeders
y = 2.85e-03 e-3.90e+00 x
(a) (b)
Fig. 11 Effect of the number of feeding devices on the factor f in a layout composed by 4 resources, 2 cobots and 2 human operators
Since the cobots should complete all the tasks started by theoperator, rc is equal to 1 and Tc0 is evaluated as the sum ofthe picking and placing time of the operator and the assemblytime of the cobots.
Layout
Considering the same layouts presented in Fig. 3, the effect ofthe resources and feeding devices position on f were studiedfor the Human p/p task allocation method for 2 cobots and1 operator, with r f equal to 1. The simulation results for
Layout b and c are presented in Fig. 10, whereas Fig. 9 haspresented the results for Layout a.
Similarly to the previous task allocation method, anincrease in themeandistancebetween the resources, decreasesf , since it reduces the probability of spatial interferences.Moreover, the influence of the layouts is greater, with anincrease of f of about 21.8% in comparison to the 10.4%reached with the shared tasks method. This is due to thesame reasons that led to a greater effect of Nr , since anincreased distance limits the interferences caused when thecobot assembly the limited number of tasks.
123
Journal of Intelligent Manufacturing
Number of feeding devices
Lastly, the influence of r f on f was observed using theHuman p/p method in Fig. 11. Differently from the previ-ous task allocation method, r f is related only to the numberof human operators, since the picking tasks are not carriedout by the cobots. Therefore, considering a layout composedby 2 human operators and 2 cobots, the possible value of r fwill be 1, i.e. 2 feeding devices, and 0.5, i.e. 1 feeding device;for the same reasons presented above, values of r f greaterthan 1 were not considered in this study.
Figure 11 presents the results for two scenarios:
– 2 cobots and 2 operators, r f equal to 1;– 2 cobots and 2 operators, r f equal to 0.5;
with the same resource position. The results show, similarlyto the previous method, that the reduction of r f leads to anincrease of f above the 60%, therefore the great impact ofthe number of feeding devices on the criticality of the layoutis confirmed also with the Human p/p method. It should benoted that, due to the nature of the proposed method, theresource distribution has a greater influence on f , leading toeven lower collaboration values.
Conclusion
This paper presents a model developed starting from a pro-totype workcell which aims to estimate the cycle time of aCAS given the product characteristics, the number of feedingdevices and resources, and the degree of collaboration. Theexponential model shows how different process characteris-tics, such as the number and type of resources, the layout andthe number of feeding devices, affect the exponent f . Theseeffects were presented and discussed for two different taskallocation using a tested simulation environment. The resultsdemonstrate that:
– An exponential model for determining the Tnorm of aCAS is provided;
– A method for evaluating Tc0, the coefficient of theexponential model, is provided; moreover the differencebetween the estimation and the simulated result is up to5%.
– The influence of different process characteristics, e.g. thelayout, on the exponent f is presented along with theireffect.
The proposed model will be useful for practitioners that aimsto evaluate the feasibility of a multi-resource CAS, and alsothe most appropriate design, in a rough design phase.
Future research will examine the effects of the introduc-tion of task precedence on the exponential model, whichlimits the collaboration between the resources; moreover,wewill analyze if other characteristics, such as technologicalconstraints, will be considered. The effect of the uncertaintieson themodel will be studied inmore detail, considering otherprobability density functions, such as the gamma model.Lastly, studying several case studies will allow defining aguide for the evaluation of the exponent.
Funding Open access funding provided by Universitá degli Studi diPadova within the CRUI-CARE Agreement.
Open Access This article is licensed under a Creative CommonsAttribution 4.0 International License, which permits use, sharing, adap-tation, distribution and reproduction in any medium or format, aslong as you give appropriate credit to the original author(s) and thesource, provide a link to the Creative Commons licence, and indi-cate if changes were made. The images or other third party materialin this article are included in the article’s Creative Commons licence,unless indicated otherwise in a credit line to the material. If materialis not included in the article’s Creative Commons licence and yourintended use is not permitted by statutory regulation or exceeds thepermitted use, youwill need to obtain permission directly from the copy-right holder. To view a copy of this licence, visit http://creativecommons.org/licenses/by/4.0/.
References
Azzi, A., Battini, D., Faccio, M., & Persona, A. (2012). Sequenc-ing procedure for balancing the workloads variations in case ofmixed model assembly system with multiple secondary feederlines. International Journal ofProductionResearch,50(21), 6081–6098.
Azzi, A., Faccio, M., Persona, A., & Sgarbossa, F. (2012a). Lot split-ting scheduling procedure for makespan reduction and machinecapacity increase in a hybrid flow shop with batch production.International Journal of Advanced Manufacturing Technology,59(5–8), 775–786.
Bänziger, T., Kunz, A., & Wegener, K. (2020). Optimizing human–robot task allocation using a simulation tool based on standardizedworkdescriptions. Journal of IntelligentManufacturing,31, 1635–1648.
Barbazza, L., Faccio, M., Oscari, F., & Rosati, G. (2017). Agility inassembly systems: A comparison model. Assembly Automation,37(4), 411–421.
Battini, D., Faccio, M., Persona, A., & Sgarbossa, F. (2011).New methodological framework to improve productivity andergonomics in assembly system design. International Journal ofIndustrial Ergonomics, 41(1), 30–42.
Boothroyd, G., Poli, C., & Murch, L. E. (1982). Automatic Assembly.New York: Marcel Dekker.
Boudjelida, A. (2019). On the robustness of joint production andmaintenance scheduling in presence of uncertainties. Journal ofIntelligent Manufacturing, 30, 1515–1530.
Buzacott, J. A. (1990). Abandoning the moving assembly line: Modelsof human operators and job sequencing. The International Journalof Production Research, 28(5), 821–839.
Colgate, J. E.,Wannasuphoprasit,W., & Peshkin,M.A. (1996). Cobots:Robots for Collaboration with Human Operators. In Proceedings
123
Journal of Intelligent Manufacturing
of the ASME Dynamic Systems and Control Division DSC (Vol.58, pp. 433–440).
Ding, H., Schipper, M., & Matthias, B. (2013, October). Collabora-tive behavior design of industrial robots for multiple human–robotcollaboration. In IEEE ISR 2013 (pp. 1-6). IEEE.
Ericson, C. (2004). Real-time collision detection. Boca Raton: CRCPress.
Faccio, M., Bottin, M., & Rosati, G. (2019). Collaborative and tradi-tional robotic assembly: a comparison model, in The InternationalJournal of Advanced Manufacturing Technology, 1-18.
Faccio, M., Minto, R., Rosati, G., & Bottin, M. (2020). The influence ofthe product characteristics on human-robot collaboration: Amodelfor the performance of collaborative robotic assembly. The Inter-national Journal of Advanced Manufacturing Technology, 106(5),2317–2331.
Fechter, M., Seeber, C., & Chen, S. (2018). Integrated process planningand resource allocation for collaborative robot workplace design.Procedia CIRP, 72, 39–44.
Gil-Vilda, F., Sune, A., Yagüe-Fabra, J. A., Crespo, C., & Serrano, H.(2017). Integration of a collaborative robot in a U-shaped produc-tion line: A real case study.ProcediaManufacturing, 13, 109–115.
Heilala, J., & Voho, P. (2001). Modular reconfigurable flexible finalassembly systems. Assembly Automation, 21(1), 20–28.
https://www.kuka.com/it-it/prodotti-servizi/sistemi-robot/robot-industriali/lbr-iiwa .
https://www.universal-robots.com/products/ur10-robot/ .Hu, S. J., Ko, J., Weyand, L., ElMaraghy, H. A., Lien, T. K., Koren, Y.,
et al. (2011). Assembly system design and operations for productvariety. CIRP Annals, 60(2), 715–733.
Kim, D., Park, J., Baek, S., et al. (2020). A modular factory testbedfor the rapid reconfiguration of manufacturing systems. Journal ofIntelligent Manufacturing, 31, 661–680.
Michalos, G., Makris, S., Tsarouchi, P., Guasch, T., Kontovrakis, D., &Chryssolouris, G. (2015). Design considerations for safe human–robot collaborative workplaces. Procedia CIRP, 37, 248–253.
Moodie, C. L. (1965). A heuristic method of assembly line balancingfor assumptions of constant or variable work element times. TheJournal of Industrial Engineering, 16(6), 23–29
Ore, F., Vemula, B. R., Hanson, L., & Wiktorsson, M. (2016). Human-industrial robot collaboration: Application of simulation softwarefor workstation optimisation. Procedia CIRP, 44, 181–186.
Ranky, P. G. (2003). Collaborative, synchronous robots servingmachines and cells. Industrial Robot, 30(3), 213–217.
Rosati, G. et al. (2013). Fully flexible assembly systems (F-FAS): Anew concept in flexible automation in Assembly Automation, 33(1), art. no. 17077306, pp. 8–21.
Rosati G. et al. (2015). Hybrid fexible assembly systems (H FAS):bridging the gap between traditional and fully flexible assemblysystems., in The International Journal of AdvancedManufacturingTechnology 81.5-8, 1289-1301.
Sadik, A. R., Taramov, A., & Urban, B. (2017). Optimization of tasksscheduling in cooperative robotics manufacturing via Johnson’salgorithm case-study: One collaborative robot in cooperation withtwo workers. In 2017 IEEE conference on systems, process andcontrol (ICSPC) (pp. 36–41).
Tan, J. T. C., Duan, F., Zhang, Y., Watanabe, K., Kato, R., & Arai, T.(2009, October). Human-robot collaboration in cellular manufac-turing: Design and development. In 2009 IEEE/RSJ internationalconference on intelligent robots and systems (pp. 29–34). IEEE.
Tsarouchi, P., Matthaiakis, A. S., Makris, S., & Chryssolouris, G.(2017). On a human–robot collaboration in an assembly cell. Inter-national Journal of Computer Integrated Manufacturing, 30(6),580–589.
Tsarouchi, P., Michalos, G., Makris, S., Athanasatos, T., Dimoulas,K., & Chryssolouris, G. (2017). On a human–robot workplacedesign and task allocation system. International Journal of Com-puter Integrated Manufacturing, 30(12), 1272–1279.
Tsarouchi, P., Spiliotopoulos, J.,Michalos, G., Koukas, S., Athanasatos,A., Makris, S., et al. (2016). A decision making framework forhuman robot collaborative workplace generation. Procedia CIRP,44, 228–232.
Publisher’s Note Springer Nature remains neutral with regard to juris-dictional claims in published maps and institutional affiliations.
123


