Embed Size (px)
Citation preview

Computational Materials Science 45 (2009) 881–888
Contents lists available at ScienceDirect
Computational Materials Science
journal homepage: www.elsevier .com/locate/commatsci
Multi-phase-field simulations for dynamic recrystallization
T. Takaki a,*, Y. Hisakuni b, T. Hirouchi b, A. Yamanaka c, Y. Tomita b
a Graduate School of Science and Technology, Kyoto Institute of Technology, Matsugasaki, Sakyo, Kyoto 606-8585, Japanb Graduate School of Engineering, Kobe University, Rokkodai, Nada, Kobe 657-8501, Japanc Graduate School of Engineering, Tokyo Institute of Technology, O-Okayama, Meguro, Tokyo 152-8552, Japan
a r t i c l e i n f o a b s t r a c t
Article history:Received 17 October 2008Received in revised form 30 November 2008Accepted 12 December 2008Available online 21 January 2009
PACS:81.40.Gh81.40.Ef47.11.St
Keywords:Dynamic recrystallizationMulti-phase-field methodGrain deformationDRX cycleMultiscale simulation
0927-0256/$ - see front matter � 2008 Elsevier B.V. Adoi:10.1016/j.commatsci.2008.12.009
* Corresponding author. Tel./fax: +81 75 724 7317.E-mail address: [email protected] (T. Takaki).
A dynamic recrystallization multi-phase-field (MPF-DRX) model that can approximately take intoaccount grain deformation during dynamic recrystallization (DRX) has been developed, where the graindeformation was introduced by changing the size of a finite difference grid so as to keep the volume con-stant. The accuracy of the developed model was confirmed by simulating a single DRX grain growth. As aresult of MPF-DRX simulations with grain deformation, it was clarified that, from microstructure evolu-tions, the appropriate deformation during DRX can be reproduced by the developed model. However, itwas also concluded that the macroscopic stress–strain relationship and variations in grain size are notaffected by the grain deformation introduced here. Furthermore, the DRX cycle was defined and the rela-tionship between the DRX cycle fraction and the stress–strain curve was discussed. As a result, it wasconcluded that the stress–strain curve with multiple peaks is observed when the strain at the first valleyof the stress–strain curve is smaller than that corresponding to the maximum first DRX cycle fraction.
� 2008 Elsevier B.V. All rights reserved.
1. Introduction Recently, Xiao et al. [11,12] and Yazdipour et al. [13] have
When metallic materials with low-to-medium stacking faultenergies are worked under high temperatures, dynamic recrystal-lization (DRX) arises, where hardening caused by the accumulationof dislocation and softening due to the nucleation and growth ofDRX grains occur simultaneously [1–3]. It is well-known that mac-roscopic mechanical behavior during hot working accompanyingDRX is largely affected by microstructure evolutions. Therefore,for more understanding of the DRX mechanism and microstructuredesign during hot working, it is important to construct a multiscalemodel that enables systematic investigations of macroscopicmechanical behavior caused by a microstructure change.
Ding and Guo [4] developed a cellular automaton DRX (CA-DRX)simulation model, where the evolution of dislocation density ismodeled by the Kocks–Mecking (KM) model [5] and DRX graingrowth is simulated by a cellular automaton (CA) method. Themacroscopic stress–strain property is related to the microstructureby Bailey–Hirsch equation [6] using the average dislocationdensity. The model successfully simulated the macroscopicstress–strain relationship caused by microstructure evolutionsand variations in grain size. This model is widely applied to theother materials and phenomena [7–10].
ll rights reserved.
developed a CA-DRX simulation model, where the topologicaldeformation of grains can be approximately taken into consider-ation. Xiao et al. [11] concluded that the DRX kinetics simulatedby their CA model with the topological deformation of grains is fas-ter than that obtained by conventional CA-DRX simulation withoutdeformation.
Takaki et al. have developed a multi-phase-field DRX (MPF-DRX)model [14], where the grain growth driven by stored energy is sim-ulated by the MPF method [15] using an efficient computationalalgorithm [16] and the dislocation density evolution due to plasticdeformation and dynamic recovery (DRV) is expressed by the KMmodel. It is confirmed that the model can simulate DRX grain growthwith high accuracy by comparing theoretically and numerically ob-tained grain boundary migration rates. Furthermore, they comparedthe numerical results obtained by the MPF-DRX and CA-DRX models[9] and emphasized that the MPF-DRX model can simulate DRX graingrowth more precisely than the CA-DRX model.
In this study, the MPF-DRX model that can approximately takeinto account grain deformation during DRX is developed. Here, thegrain deformation is introduced by changing the size of a finite dif-ference grid so as to keep the volume constant. The effects of thegrain deformation introduced in this study on microstructure evo-lutions and the macroscopic stress–strain relationship are dis-cussed in detail. Furthermore, the DRX cycle concept is
882 T. Takaki et al. / Computational Materials Science 45 (2009) 881–888
introduced and its effects on the transition from a multiple-peakstress–strain curve to a single-peak stress–strain curve arediscussed.
2. MPF-DRX model with grain deformation
We have developed a MPF-DRX model [14], in which the graingrowth driven by stored energy is simulated by the MPF method[15] using an efficient computational algorithm [16] and the dislo-cation density evolution due to plastic deformation and DRV is ex-pressed by the KM model [5]. A macroscopic stress–strain curve isobtained from the Bailey–Hirsch equation [6] using the averagedislocation density.
In this section, the MPF-DRX model is explained and the graindeformation model is introduced into the MPF-DRX model.
2.1. Multi-phase-field model
Let us consider a polycrystalline system including N grains. Theath grain is indicated by the phase field /a, where /a takes a valueof 1 inside the ath grain, 0 inside the other grains and 0 < /a < 1 atthe grain boundary. The /a are not independent and must satisfy
XN
a¼1
/a ¼ 1: ð1Þ
Here, we use the free energy functional
F ¼Z
V
XN
a¼1
XN
b¼aþ1
�a2
ab
2r/a � r/b þWab/a/b
!þ fe
" #dV ; ð2Þ
where aab is the gradient coefficient, Wab is the height of the energybarrier and fe is the free energy density in the grains. Here, the num-ber of grains, N, in Eqs. (1) and (2) can be replaced with n ¼
PNa¼1ra,
where ra = 1 when 0 < /a 6 1 and 0 otherwise.The evolution equation of the phase field /i is derived as [15]
_/i ¼ �Xn
j¼1
2M/ij
ndFd/i� dF
d/j
!; ð3Þ
where M/ij is the phase field mobility. The functional derivative
dF/d/i is calculated as
dFd/i¼Xn
k¼1
Wik/k þa2
ik
2r2/k
� �þ ofe
o/i: ð4Þ
Here, by selecting the driving term as ofe=o/i � ofe=o/j ¼� 8
p
ffiffiffiffiffiffiffiffiffi/i/j
pDEij, where DEij is the difference in stored energy
between grains i and j and 8/p is obtained fromR 1
0
ffiffiffiffiffiffiffiffiffiffiffi/1/2
pd/ ¼R 1
0
ffiffiffiffiffiffiffiffiffiffiffiffiffiffiffiffiffiffiffi/ð1� /Þ
pd/ ¼ p
8, the evolution equation of the phase field /i
reduces to
_/i ¼ �Xn
j¼1
2M/ij
n
Xn
k¼1
Wik �Wjk
� �/k þ
12
a2ik � a2
jk
� �r2/k
"
� 8p
ffiffiffiffiffiffiffiffiffi/i/j
qDEij
�: ð5Þ
Since the coefficients in Eq. (5), aij, Wij and M/ij , are respectively
related to the grain boundary thickness dij, grain boundary energycij and grain boundary mobility Mij by
aij ¼2p
ffiffiffiffiffiffiffiffiffiffi2dcij
q;Wij ¼
4cij
d;M/
ij ¼p2
8dMij; ð6Þ
where the diagonal components are zero, the grain growth processcan be reproduced quantitatively. For simplicity, it is assumed thatall grain boundaries are high–angle grain boundaries with cij = cand Mij = M. Furthermore, the dislocation density is assumed to beconstant in a grain. To calculate the driving force DEij, we introducean additional variable qi that takes a constant dislocation density
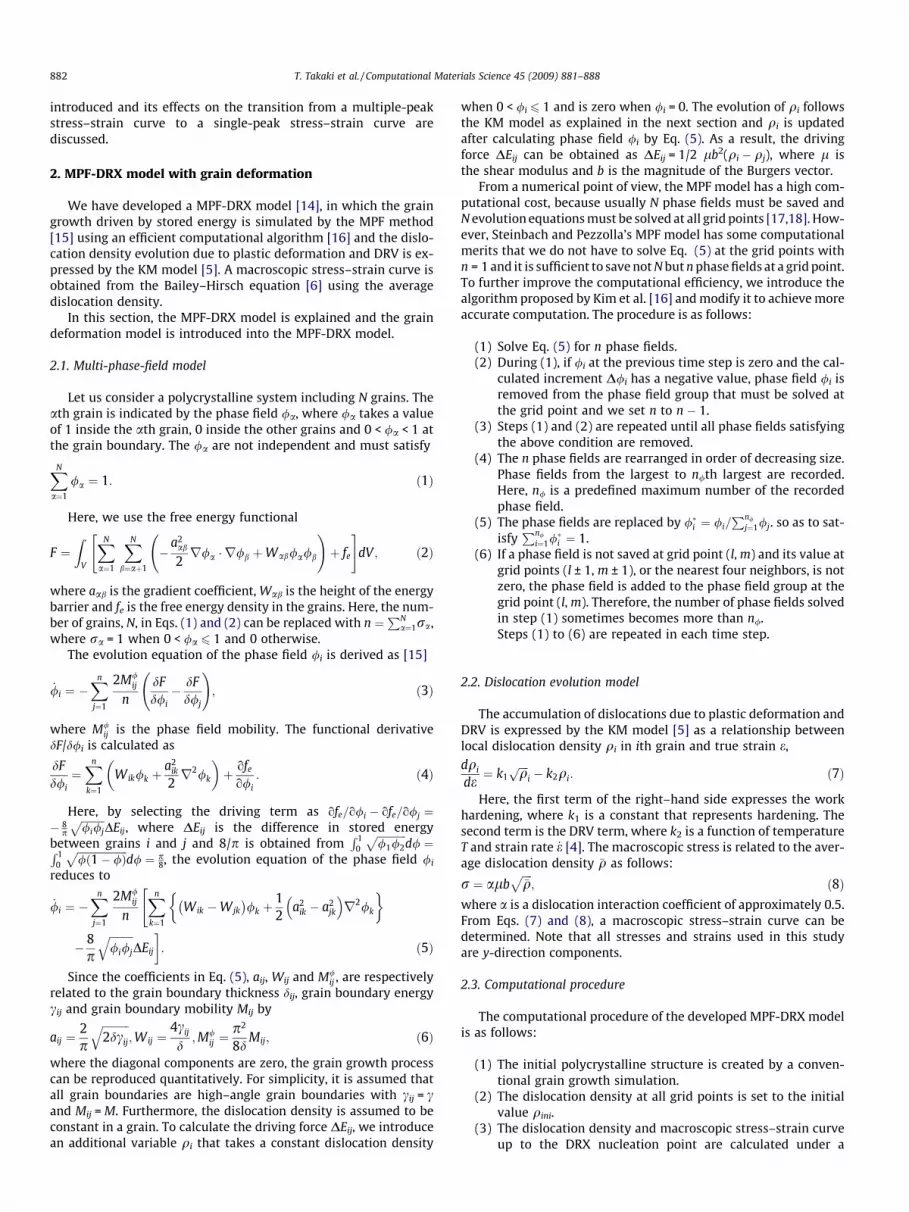
when 0 < /i 6 1 and is zero when /i = 0. The evolution of qi followsthe KM model as explained in the next section and qi is updatedafter calculating phase field /i by Eq. (5). As a result, the drivingforce DEij can be obtained as DEij = 1/2 lb2(qi � qj), where l isthe shear modulus and b is the magnitude of the Burgers vector.
From a numerical point of view, the MPF model has a high com-putational cost, because usually N phase fields must be saved andN evolution equations must be solved at all grid points [17,18]. How-ever, Steinbach and Pezzolla’s MPF model has some computationalmerits that we do not have to solve Eq. (5) at the grid points withn = 1 and it is sufficient to save not N but n phase fields at a grid point.To further improve the computational efficiency, we introduce thealgorithm proposed by Kim et al. [16] and modify it to achieve moreaccurate computation. The procedure is as follows:
(1) Solve Eq. (5) for n phase fields.(2) During (1), if /i at the previous time step is zero and the cal-
culated increment D/i has a negative value, phase field /i isremoved from the phase field group that must be solved atthe grid point and we set n to n � 1.
(3) Steps (1) and (2) are repeated until all phase fields satisfyingthe above condition are removed.
(4) The n phase fields are rearranged in order of decreasing size.Phase fields from the largest to n/th largest are recorded.Here, n/ is a predefined maximum number of the recordedphase field.
(5) The phase fields are replaced by /�i ¼ /i=Pn/
j¼1/j. so as to sat-isfy
Pn/
i¼1/�i ¼ 1.
(6) If a phase field is not saved at grid point (l, m) and its value atgrid points (l ± 1, m ± 1), or the nearest four neighbors, is notzero, the phase field is added to the phase field group at thegrid point (l, m). Therefore, the number of phase fields solvedin step (1) sometimes becomes more than n/.Steps (1) to (6) are repeated in each time step.
2.2. Dislocation evolution model
The accumulation of dislocations due to plastic deformation andDRV is expressed by the KM model [5] as a relationship betweenlocal dislocation density qi in ith grain and true strain e,
dqi
de¼ k1
ffiffiffiffiqp
i � k2qi: ð7Þ
Here, the first term of the right–hand side expresses the workhardening, where k1 is a constant that represents hardening. Thesecond term is the DRV term, where k2 is a function of temperatureT and strain rate _e [4]. The macroscopic stress is related to the aver-age dislocation density �q as follows:
r ¼ albffiffiffiffi�q
p; ð8Þ
where a is a dislocation interaction coefficient of approximately 0.5.From Eqs. (7) and (8), a macroscopic stress–strain curve can bedetermined. Note that all stresses and strains used in this studyare y-direction components.
2.3. Computational procedure
The computational procedure of the developed MPF-DRX modelis as follows:
(1) The initial polycrystalline structure is created by a conven-tional grain growth simulation.
(2) The dislocation density at all grid points is set to the initialvalue qini.
(3) The dislocation density and macroscopic stress–strain curveup to the DRX nucleation point are calculated under a

Fig. 1. Shape changes of finite difference grid for expressing deformation.
T. Takaki et al. / Computational Materials Science 45 (2009) 881–888 883
constant strain increment De ¼ _eDt by Eqs. (7) and (8),where Dt is the time increment.
(4) If the dislocation density of a finite difference grid pointlocated on a grain boundary exceeds the critical value qc
required to create a nucleus, the grid point is counted as anucleation potential site. And, when the present time stepis a time step to put one nucleus calculated from a nucle-ation rate _n and area of nucleation potential site, one circularnucleus with dislocation density qini is placed on the grainboundary selected randomly.
(5) The DRX grain growth is simulated by solving Eq. (5).(6) The dislocation density variables at all grid points and the
macroscopic stress are calculated by Eqs. (7) and (8).Steps (4) to (6) are repeated.
2.4. Grain deformation model
The grain deformation during DRX is approximately modeled bychanging the size of a finite difference grid. From the relation be-tween nominal strain en and true strain e, or e = ln(1 + en), the gridsize in the y-direction is changed by following Dy = eeDyini, whereDyini is the initial grid size in the y-direction. At the same time, thegrid size in the x-direction Dx is changed following Dx = Dyini/Dy � Dxini so as to keep the grid area constant to express plasticdeformation.
3. Numerical conditions
Almost all numerical conditions are set to be identical to theprevious ones [14] as follows: For Eqs. (5) and (6), grain boundaryenergy c = 0.208 J/m2, grain boundary thickness d = 7Dyini andgrain boundary mobility M = M0/Texp( � Qb/RT), where M0 =0.139 m4K/Js, the activation energy Qb = 110 KJ/mol and R is thegas constant. For Eqs. (7) and (8), k1 = 4.00 � 108/m and k2 = albk1/rst, where a = 0.5, shear modulus l = 42.1 GPa, the magnitudeof the Burgers vector b = 2.56 � 10�10 m and the steady-state stressrst ¼ fA1 _e expðQa=RTÞg1=A2 , where A1 = 2.0 � 1044, A2 = 7.6 and acti-vation energy Qa = 275 KJ/mol. For DRX nucleation, we set the crit-ical stress rc to 40 MPa, which corresponds to the criticaldislocation density qc = (rc/alb)2 = 5.51 � 1013/m2, and we employthe nucleation rate per unit area of the grain boundary expressedby _n ¼ c _ed expð�Q a=RTÞ [4], where c = 5.0 � 1025 and d = 1. Theintroduction of the nucleation rate _n means that the nucleationrate is proportional to the total area of grain boundary. Here, onenucleus is created every ð _nDtngbDxDy=dÞ�1 steps, where ngb is thenumber of grid points located in the grain boundary or satisfying0 < /i < 1. The initial dislocation density is set to qini = 109/m2, thetime increment Dt = 0.0075 s and the predefined maximum num-ber of the recorded phase field n/ = 5.
Fig. 2. Evolutions of grain boundary migration rate with time.
4. Numerical results and discussion
4.1. Single DRX grain growth
In the deformation model developed in this study, the aspect ra-tio of a finite difference grid changes with the progress of deforma-tion. The shape changes of the grid during deformation are shownin Fig. 1. To reduce the maximum aspect ratio, the initial grid withthe maximum aspect ratio is used. The maximum aspect ratio ofthe finite difference grid used in simulations described in next sub-section is set to be 1.69 (Dxini:Dyini = 1/1.3:1.3).
Here, the accuracy of the model is confirmed by performing asingle DRX grain growth simulation. The finite difference gridswith Dx:Dy = 1/1.3:1.3 = 0.358 lm: 0.65 lm are fixed in the com-
putational domain with 130 � 77 grids (DX � DY = 50.05 lm �50 lm) and the grain boundary velocities along the x- and y-axesare compared. All regions except for one DRX nucleus on the originare set to the deformed grain.
Fig. 2 shows variations in grain boundary velocities on the x-and y-axes. As shown in Fig. 2 of Ref. [14], although, at the begin-ning of growth, the migration rate of the grain boundary acceler-ates owing to the reduction in the level of the curvature effect ofthe DRX grain and the increase in driving force, after some periods,the migration rate begins to decrease, and finally, the DRX graingrowth stops because of zero driving force. Comparing the grainboundary migration rates on the x- and y-axes, it is confirmed thatthey exhibit identical variations. Therefore, we can conclude thatthe DRX grain growth is not affected by the aspect ratio of the finitedifference grid. Furthermore, numerical results perfectly agreewith the theoretical values expressed by V = M(DE � c/r), where ris the radius of the DRX grain. It should be noted that the multi-phase-field method employed in the MPF-DRX model can simulateDRX grain growth with high accuracy.
4.2. DRX simulations with deformation
The DRX simulations are performed for polycrystalline metalswith initial grain diameters of 30, 80 and 250 lm. The followingcomputational domains are prepared for each grain size.
D0 = 30 lm, 1332 � 834 grids (508.5 lm � 542.1 lm), 396 ini-tial grainsD0 = 80 lm, 1386 � 811 grids (533.1 lm � 527.2 lm), 56 initialgrainsD0 = 250 lm, 1238 � 634 grids (476.2 lm � 412.1 lm), 4 initialgrains.
Here, the grains are set to be regular hexagons. The initial gridsize is set to be Dxini:Dyini = 1/1.3:1.3 = 0.358 lm: 0.65 lm. Peri-odic boundary conditions are applied to all boundaries. To empha-size the effects of grain deformation, DRX simulations are also
884 T. Takaki et al. / Computational Materials Science 45 (2009) 881–888
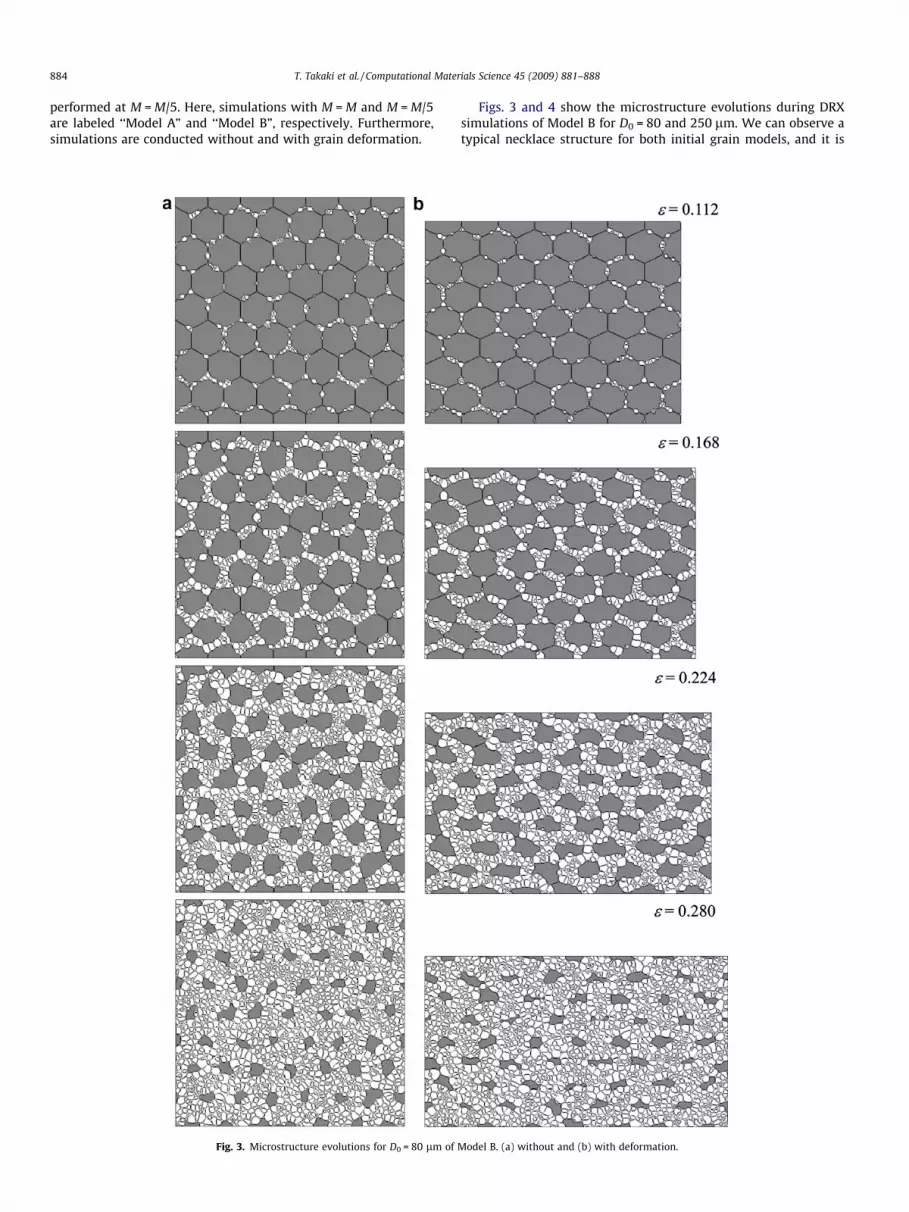
performed at M = M/5. Here, simulations with M = M and M = M/5are labeled ‘‘Model A” and ‘‘Model B”, respectively. Furthermore,simulations are conducted without and with grain deformation.
Fig. 3. Microstructure evolutions for D0 = 80 lm of
Figs. 3 and 4 show the microstructure evolutions during DRXsimulations of Model B for D0 = 80 and 250 lm. We can observe atypical necklace structure for both initial grain models, and it is
Model B. (a) without and (b) with deformation.

Fig. 4. Microstructure evolutions for D0 = 250 lm of Model B. (a) without and (b) with deformation.
Fig. 5. Stress–strain curves for Models A and B and for with and without deformation. Initial grain sizes are D0 = 30, 80 and 250 lm.
T. Takaki et al. / Computational Materials Science 45 (2009) 881–888 885
clearer for D0 = 250 lm. In the case of taking deformation into ac-count, it is clearly observed that the initial grains elongate into thex-direction owing to the compression deformation. Therefore, it is
confirmed that the grain deformation model developed in this studyhas the potential to estimate the deformed microstructures. On theother hand, the DRX grains remain almost equiaxed grain structures.

Fig. 6. Variations in average grain size for Models A and B and for with and without deformation. Initial grain sizes are D0 = 30, 80 and 250 lm
Fig. 7. Variations in DRX cycle fraction for Model A without deformation.
886 T. Takaki et al. / Computational Materials Science 45 (2009) 881–888
Fig. 5 shows stress–strain curves. As for Model A, curves withmultiple peaks are observed for D0 = 30 lm and single-peak curvesare observed for D0 = 80 and 250 lm. These transitions from multi-ple-peak curves to single-peak curves depending on the initialgrain size are similar to the results of experiments and simulationsreported thus far [4,9,19,20]. In Model B with a grain boundarymobility that is one-fifth that of Model A, a single-peak curve is ob-served for all D0 values, because softening due to DRX grain growthis relatively delayed compared with hardening due to the evolutionof dislocation density. Therefore, it is expected that effects of graindeformation introduced here are more marked for Model B than forModel A. However, from Fig. 5, stress–strain curves with and with-out deformation are almost identical for both model A and modelB, although we can observe the difference in microstructure, asshown in Figs. 3 and 4. Xiao et al. [11] concluded that the DRXkinetics simulated by their CA model with the topological defor-mation of grains is faster than that obtained by conventional CA-DRX simulation. The reason for this is concluded to be the plasticdeformation that elongates the grain boundaries that are nucle-ation sites. However, because, in their [11] and our models, thedeformation is approximated and not solved perfectly, for exam-ple, circle and square respectively change to ellipse and rectangu-lar with boundary lengths identical to those of the original shapes,it is thought that the length of the grain boundary must not changein our models. In the previous subsection, it is demonstrated thatour model can simulate DRX growth independent of the shape ofthe finite difference grid and with high accuracy. Therefore, wecan conclude that the conventional DRX model without deforma-tion is sufficient for investigating macroscopic stress–strain curvesand variations in grain size (explained later), although the defor-mation model established here is a powerful tool for simulatingthe microstructure evolutions with deformation, as shown in Figs.3 and 4.
Fig. 6 shows variations in average grain diameter. No differ-ences can be observed between the results with and without defor-mation, as observed in stress–strain curves. The grain sizeconverges to 19.8 lm and 9.5 lm for Model A and Model B, respec-tively. The grains are refined for a smaller interface mobility, be-cause new DRX grains are nucleated at the grain boundariesbefore the DRX grain grows larger.
4.3. DRX cycle
Different from static recrystallization (SRX), the dislocationdensity inside the recrystallized grain increases with the progressof DRX. Therefore, it is difficult to distinguish the recrystallizedgrain from the deformed material during DRX. Here, we introducea DRX cycle concept and discuss the relationships of variations inDRX cycle fraction and stress–strain curves. Although the DRX cy-cle concept has already been used to explain the transition from asingle-peak curve to a multiple-peak stress–strain curve [2,21], asfar as we know, quantitative investigations using the DRX cycleconcept have not been reported thus far.
The DRX cycle number of initial grains is set to zero. The DRXcycle number of newly nucleated DRX grains is set to the numberthat one is added to the minimum DRX cycle number among somephase field variables of a grid point, which is the center of the nu-cleus. Fig. 7 shows variations in DRX cycle fraction together withstress–strain curves for D0 = 30, 80 and 250 lm. The numbers from1 to 12 in Fig. 7 indicate the DRX cycle numbers. Here, thecomputational domains used in Ref. [14] are employed and the

T. Takaki et al. / Computational Materials Science 45 (2009) 881–888 887
deformation model discussed in the previous subsection is notused here. Therefore, the finite difference grid size isDx = Dy = 0.5 lm constant. In the case of D0 = 30 lm, the maxi-mum first DRX cycle fraction reaches almost 1.0. This indicates thatthe initial grains are all replaced by first DRX cycle grains. As DRXproceeds, the maximum DRX cycle fractions decrease and thewaves of the DRX fraction are superimposed. The wave heightsof multiple peaks of stress–strain curves gradually decrease, and fi-nally, the stress converges to a constant value. For D0 = 80 lm, wecan observe the stress–strain curve with a single-peak, althoughDRX cycle fractions exhibit changes similar to D0 = 30 lm. As forD0 = 250 lm, it is observed that the maximum DRX cycle fractionsare almost constant and three or four DRX cycles overlap.
Next, let us discuss the transition from a multiple-peak stress–strain curve to a single-peak stress–strain curve. To form a multi-
Fig. 8. (a) Close-up view of stress–strain curves upto e = 0.25 for D0
ple-peak stress–strain curve, rehardening after the first softeningdue to the growth of DRX grains included in the first DRX cycleis necessary.Fig. 8 shows DRX cycle distributions for points (b),(c), (d) and (e) shown in (a) close-up stress–strain curves. For D0
= 250 lm that shows single-peak stress–strain curve, the secondDRX cycle occurs already at point (d) and first, second and thirdDRX cycle grains and initial grains are mixed in point (e). In suchcase, new DRX grains occur before hardening and it results in con-tinuous softening or single-peak curve. On the other hand, inD0 = 30 lm, there are no second DRX grains even at point (c) afterrehardening. For this, it is considered that rehardening must occurbefore the start of the second DRX cycle or before the peak of thefirst DRX cycle. Fig. 9 shows the effects of initial grain diameterD0 on the relationship between two strains: the strain at the firstvalley of the stress–strain curve (filled circles) and the strain for
= 30 and 250 lm and (b–e) distributions of DRX cycle number.
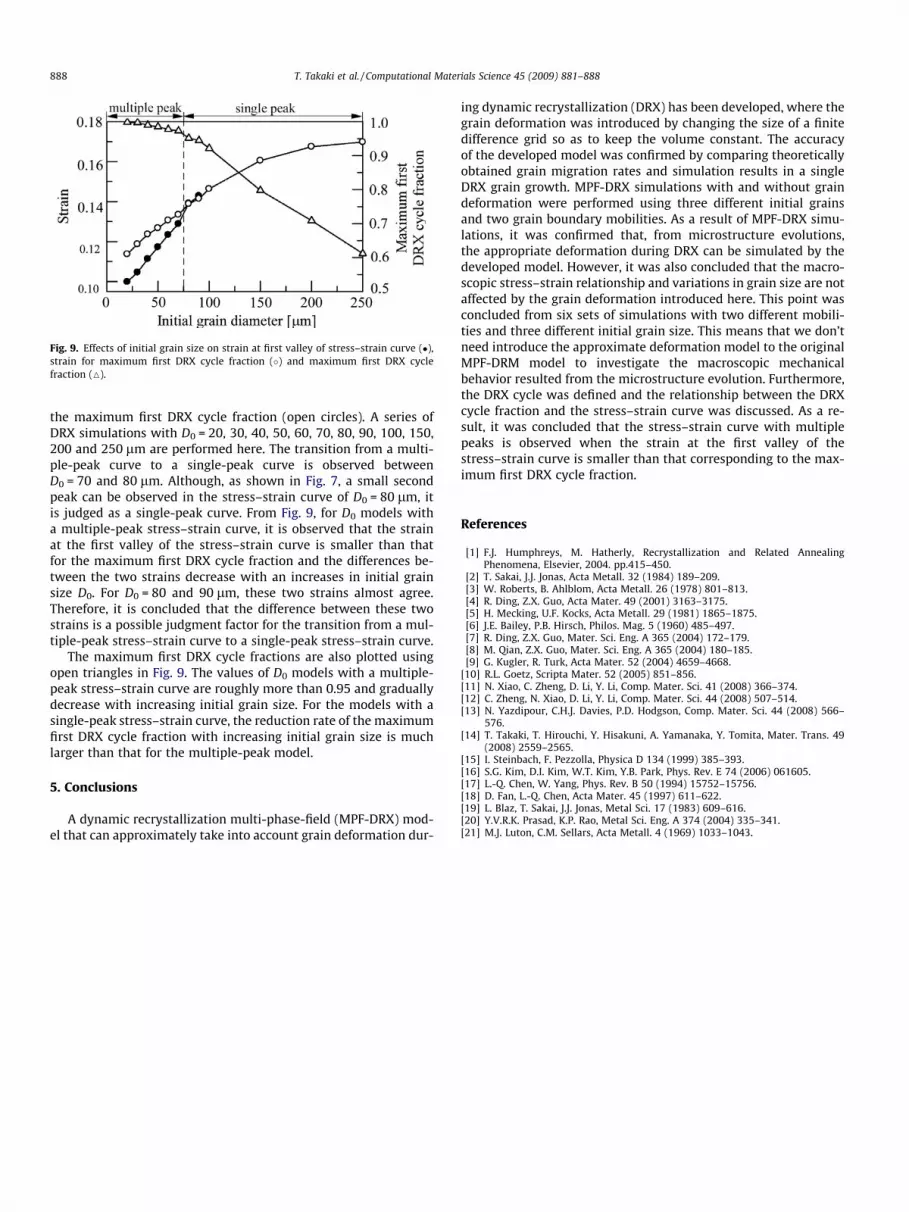
Fig. 9. Effects of initial grain size on strain at first valley of stress–strain curve (�),strain for maximum first DRX cycle fraction (�) and maximum first DRX cyclefraction (M).
888 T. Takaki et al. / Computational Materials Science 45 (2009) 881–888
the maximum first DRX cycle fraction (open circles). A series ofDRX simulations with D0 = 20, 30, 40, 50, 60, 70, 80, 90, 100, 150,200 and 250 lm are performed here. The transition from a multi-ple-peak curve to a single-peak curve is observed betweenD0 = 70 and 80 lm. Although, as shown in Fig. 7, a small secondpeak can be observed in the stress–strain curve of D0 = 80 lm, itis judged as a single-peak curve. From Fig. 9, for D0 models witha multiple-peak stress–strain curve, it is observed that the strainat the first valley of the stress–strain curve is smaller than thatfor the maximum first DRX cycle fraction and the differences be-tween the two strains decrease with an increases in initial grainsize D0. For D0 = 80 and 90 lm, these two strains almost agree.Therefore, it is concluded that the difference between these twostrains is a possible judgment factor for the transition from a mul-tiple-peak stress–strain curve to a single-peak stress–strain curve.
The maximum first DRX cycle fractions are also plotted usingopen triangles in Fig. 9. The values of D0 models with a multiple-peak stress–strain curve are roughly more than 0.95 and graduallydecrease with increasing initial grain size. For the models with asingle-peak stress–strain curve, the reduction rate of the maximumfirst DRX cycle fraction with increasing initial grain size is muchlarger than that for the multiple-peak model.
5. Conclusions
A dynamic recrystallization multi-phase-field (MPF-DRX) mod-el that can approximately take into account grain deformation dur-
ing dynamic recrystallization (DRX) has been developed, where thegrain deformation was introduced by changing the size of a finitedifference grid so as to keep the volume constant. The accuracyof the developed model was confirmed by comparing theoreticallyobtained grain migration rates and simulation results in a singleDRX grain growth. MPF-DRX simulations with and without graindeformation were performed using three different initial grainsand two grain boundary mobilities. As a result of MPF-DRX simu-lations, it was confirmed that, from microstructure evolutions,the appropriate deformation during DRX can be simulated by thedeveloped model. However, it was also concluded that the macro-scopic stress–strain relationship and variations in grain size are notaffected by the grain deformation introduced here. This point wasconcluded from six sets of simulations with two different mobili-ties and three different initial grain size. This means that we don’tneed introduce the approximate deformation model to the originalMPF-DRM model to investigate the macroscopic mechanicalbehavior resulted from the microstructure evolution. Furthermore,the DRX cycle was defined and the relationship between the DRXcycle fraction and the stress–strain curve was discussed. As a re-sult, it was concluded that the stress–strain curve with multiplepeaks is observed when the strain at the first valley of thestress–strain curve is smaller than that corresponding to the max-imum first DRX cycle fraction.
References
[1] F.J. Humphreys, M. Hatherly, Recrystallization and Related AnnealingPhenomena, Elsevier, 2004. pp.415–450.
[2] T. Sakai, J.J. Jonas, Acta Metall. 32 (1984) 189–209.[3] W. Roberts, B. Ahlblom, Acta Metall. 26 (1978) 801–813.[4] R. Ding, Z.X. Guo, Acta Mater. 49 (2001) 3163–3175.[5] H. Mecking, U.F. Kocks, Acta Metall. 29 (1981) 1865–1875.[6] J.E. Bailey, P.B. Hirsch, Philos. Mag. 5 (1960) 485–497.[7] R. Ding, Z.X. Guo, Mater. Sci. Eng. A 365 (2004) 172–179.[8] M. Qian, Z.X. Guo, Mater. Sci. Eng. A 365 (2004) 180–185.[9] G. Kugler, R. Turk, Acta Mater. 52 (2004) 4659–4668.
[10] R.L. Goetz, Scripta Mater. 52 (2005) 851–856.[11] N. Xiao, C. Zheng, D. Li, Y. Li, Comp. Mater. Sci. 41 (2008) 366–374.[12] C. Zheng, N. Xiao, D. Li, Y. Li, Comp. Mater. Sci. 44 (2008) 507–514.[13] N. Yazdipour, C.H.J. Davies, P.D. Hodgson, Comp. Mater. Sci. 44 (2008) 566–
576.[14] T. Takaki, T. Hirouchi, Y. Hisakuni, A. Yamanaka, Y. Tomita, Mater. Trans. 49
(2008) 2559–2565.[15] I. Steinbach, F. Pezzolla, Physica D 134 (1999) 385–393.[16] S.G. Kim, D.I. Kim, W.T. Kim, Y.B. Park, Phys. Rev. E 74 (2006) 061605.[17] L.-Q. Chen, W. Yang, Phys. Rev. B 50 (1994) 15752–15756.[18] D. Fan, L.-Q. Chen, Acta Mater. 45 (1997) 611–622.[19] L. Blaz, T. Sakai, J.J. Jonas, Metal Sci. 17 (1983) 609–616.[20] Y.V.R.K. Prasad, K.P. Rao, Metal Sci. Eng. A 374 (2004) 335–341.[21] M.J. Luton, C.M. Sellars, Acta Metall. 4 (1969) 1033–1043.


