Embed Size (px)
Citation preview
BioMed CentralBMC Neurology
ss
Open AcceResearch article'MRI-negative PET-positive' temporal lobe epilepsy (TLE) and mesial TLE differ with quantitative MRI and PET: a case control studyRoss P Carne*1,3,4,7,9,10, Terence J O'Brien4,6,10, Christine J Kilpatrick4,6,10, Lachlan R MacGregor4,8, Lucas Litewka1, Rodney J Hicks2,10 and Mark J Cook1,3,5,10Address: 1Victorian Epilepsy Centre, St Vincent's Hospital, Melbourne, Australia, 2PET Centre, The Peter MacCallum Cancer Institute, Melbourne, Australia, 3Department of Neurology, St. Vincent's Hospital, Melbourne, Australia, 4Department of Neurology, The Royal Melbourne Hospital, Melbourne, Australia, 5Department of Medicine, St. Vincent's Hospital, Melbourne, Australia, 6Department of Medicine, The Royal Melbourne Hospital, Melbourne, Australia, 7Department of Neuroscience, The Geelong Hospital, Barwon Health, Geelong, Australia, 8Department of Clinical Epidemiology and Biostatistics, The Royal Melbourne Hospital, Melbourne, Australia, 9School of Medicine, Deakin University, Geelong, Australia and 10Faculty of Medicine, The University of Melbourne, Melbourne, Australia
Email: Ross P Carne* - [email protected]; Terence J O'Brien - [email protected]; Christine J Kilpatrick - [email protected]; Lachlan R MacGregor - [email protected]; Lucas Litewka - [email protected]; Rodney J Hicks - [email protected]; Mark J Cook - [email protected]
* Corresponding author
AbstractBackground: 'MRI negative PET positive temporal lobe epilepsy' represents a substantial minority of temporallobe epilepsy (TLE). Clinicopathological and qualitative imaging differences from mesial temporal lobe epilepsy arereported. We aimed to compare TLE with hippocampal sclerosis (HS+ve) and non lesional TLE without HS (HS-ve) on MRI, with respect to quantitative FDG-PET and MRI measures.
Methods: 30 consecutive HS-ve patients with well-lateralised EEG were compared with 30 age- and sex-matchedHS+ve patients with well-lateralised EEG. Cerebral, cortical lobar and hippocampal volumetric and co-registeredFDG-PET metabolic analyses were performed.
Results: There was no difference in whole brain, cerebral or cerebral cortical volumes. Both groups showedmarginally smaller cerebral volumes ipsilateral to epileptogenic side (HS-ve 0.99, p = 0.02, HS+ve 0.98, p < 0.001).In HS+ve, the ratio of epileptogenic cerebrum to whole brain volume was less (p = 0.02); the ratio of epileptogeniccerebral cortex to whole brain in the HS+ve group approached significance (p = 0.06). Relative volume deficitswere seen in HS+ve in insular and temporal lobes. Both groups showed marked ipsilateral hypometabolism (p <0.001), most marked in temporal cortex. Mean hypointensity was more marked in epileptogenic-to-contralateralhippocampus in HS+ve (ratio: 0.86 vs 0.95, p < 0.001). The mean FDG-PET ratio of ipsilateral to contralateralcerebral cortex however was low in both groups (ratio: HS-ve 0.97, p < 0.0001; HS+ve 0.98, p = 0.003), and moremarked in HS-ve across all lobes except insula.
Conclusion: Overall, HS+ve patients showed more hippocampal, but also marginally more ipsilateral cerebraland cerebrocortical atrophy, greater ipsilateral hippocampal hypometabolism but similar ipsilateral cerebralcortical hypometabolism, confirming structural and functional differences between these groups.
Published: 24 June 2007
BMC Neurology 2007, 7:16 doi:10.1186/1471-2377-7-16
Received: 19 December 2006Accepted: 24 June 2007
This article is available from: http://www.biomedcentral.com/1471-2377/7/16
© 2007 Carne et al; licensee BioMed Central Ltd. This is an Open Access article distributed under the terms of the Creative Commons Attribution License (http://creativecommons.org/licenses/by/2.0), which permits unrestricted use, distribution, and reproduction in any medium, provided the original work is properly cited.
Page 1 of 13(page number not for citation purposes)
BMC Neurology 2007, 7:16 http://www.biomedcentral.com/1471-2377/7/16
BackgroundTemporal lobe epilepsy is the commonest form of refrac-tory focal epilepsy in adults. About 30% of temporal lobeepilepsy is due to foreign tissue lesions, whilst 60–70% isdesignated "non lesional" (NLTLE). The most commonpathological substrate in this "non-lesional" group is hip-pocampal sclerosis (HS), present in a majority of medi-cally refractory cases. Whilst it is difficult to give exactproportions, given that only patients with intractable sei-zures undergo full characterisation, around 70% of thesepatients with NLTLE are thought to have HS [1]. It is esti-mated that at least 30% of patients with NLTLE have nei-ther a foreign tissue temporal lobe lesion nor MRIevidence of HS (HS-ve).
A previous study by our group demonstrated significantclinicopathological and qualitative structural and func-tional imaging differences between TLE associated withhippocampal sclerosis (HS+ve) and TLE with no evidenceof hippocampal sclerosis on MRI (HS-ve) [2]. Apart fromthe lack of evidence of the defining hippocampal sclerosis(HS) on MRI, HS-ve patients in general showed lateralisedbut more widespread temporal hypometabolism on FDG-PET with blinded visual assessment. This group weretherefore dubbed "MRI negative PET positive TLE". Otherfindings in the HS-ve group included a less frequent his-tory of febrile convulsions; slower rhythms at ictal EEGonset; less frequent histopathological hippocampal scle-rosis, and a similarly good post surgical outcome even inthe subgroup of HS-ve patients who had undergone a hip-pocampal sparing procedure. Further study with Statisti-cal Parametric Mapping (SPM) has suggested the maindifference between the groups lies in greater hippocampalhypometabolism in the HS+ve group [3].
Brain volume deficits have been reported in epilepsiescovering a range of syndromes and aetiologies, and tosome extent can be used to differentiate these syndromes[4-6]. Temporal lobe epilepsy in particular has been asso-ciated with regional and more widespread areas ofatrophic change, sometimes only evident with detailedvolumetric study [7]. The most obvious structural differ-ence between HS+ve and HS-ve temporal lobe epilepsyinvolves the presence or absence of hippocampal atrophy.However, an appreciation of more widespread differencesin degree and distribution of volume deficits betweenthese two groups, if present, may shed light on any possi-ble pathophysiological differences.
The functional imaging characteristics of these groups arealso of great interest. Many HS-ve patients, as with HS+vepatients, have prominent focal hypometabolism on FDG-PET scans [8], with rare false lateralisation. The underlyingpathophysiological basis for the hypometabolism seen inpatients with TLE is still unresolved. While FDG-PET has
shown a high correlation with MRI-identified HS for thelateralisation of the epileptogenic zone, many studieshave found that the magnitude of the hypometabolismcorrelates weakly or not at all with either direct [9] or indi-rect [10,11](MRI hippocampal volumetry) measures ofhippocampal neuronal loss, even in patients with HS. Inboth HS-ve and HS+ve TLE, decreased metabolism mayinvolve lateral as well as mesial temporal structures. Ourprevious study suggested more extensive hypometabolismin HS-ve patients compared to HS+ve on blinded visualassessment, extending to more commonly involve tempo-ral structures beyond anterior or mesial regions [2]. How-ever, the extent of differential involvement of temporalsub-regions and remote cortex on FDG-PET is difficult toquantitate visually.
Given the differences obvious on visual analysis, we wereinterested to investigate whether further differing patternsof structural or functional changes were present betweenthese TLE subgroups using quantitative and semiquantita-tive methods. The primary hypothesis was that the epilep-togenic focus in HS-ve patients involves primarily lateralrather than mesial temporal structures, and that the quan-titative structural and functional changes would reflectthis. The current study aimed to investigate this hypothe-sis by comparing volumetric MRI and coregistered FDG-PET metabolic measures on scans from HS+ve and HS-veTLE patients.
MethodsThis study involved the same patient cohort as that froma previously reported case-control study [2], but on thisoccasion consisted of a detailed quantitative assessmentof the patients' MRI and PET scans.
Case SelectionCases comprised 30 consecutive patients with clinicallyand video-EEG defined non-lesional temporal lobe epi-lepsy (NLTLE) and well-lateralised ictal EEG changes, butwithout evidence of HS on MRI, including MR volumetry(HS-ve). All patients had been admitted for a comprehen-sive inpatient assessment including video-EEG monitor-ing between 1996 and 2002 at one of three tertiary referralhospitals. Controls were 30 age- and sex-matched patientswith well-lateralised unilateral ictal and/or interictal epi-leptiform EEG discharges and concordant unequivocalevidence of hippocampal sclerosis on MRI, confirmed byMR volumetry (HS+ve). The controls were selected bystarting with the most recent HS+ve patient and movingconsecutively retrospectively through the epilepsy moni-toring database, matching as appropriate for age and sex.HS-ve patients represented close to 20% of medicallyrefractory partial epilepsy patients assessed at these insti-tutions. The study was approved by the institutional ethicscommittees of The Royal Melbourne Hospital, St. Vin-
Page 2 of 13(page number not for citation purposes)
BMC Neurology 2007, 7:16 http://www.biomedcentral.com/1471-2377/7/16
cent's Hospital and The Peter MacCallum Cancer Insti-tute. All patients consented to MRI and PET scans as partof the study.
Historical features in these groups have been previouslydescribed [2]. Significantly there was no differencebetween the groups in duration of epilepsy, presence ortype of auras, or pre-operative seizure frequency scoresclassified according to a 12-point seizure frequency score(SFS).
MRI methodsAll imaging was performed on a 1.5 Tesla GE Signa (GESystems Milwaukee). In addition to standard axial andsagittal sequences, approximately 124 contiguous T1-weighted MPRAGE images were acquired, with FOV 24cm, and a 256*256 matrix, providing in-plane resolutionof 0.98 mm2. Resolution in the Z-plane was 1.5 mm.Images were obtained using a three-dimensional volumeacquisition sequence in addition to standard sequences.Data was segmented, using a semi automated, three-dimensional morphometric protocol to define the struc-tures of interest. The methods of MRI segmentation andquantitation have been previously described [12].
Cerebral cortex was extracted by an interactive threshold-ing method, performed by a single blinded observer, asdescribed in a previous paper [12]. Hippocampi weremeasured according to a well defined protocol [13].
The groups were compared for MRI volumetric measuresof: hippocampus; whole brain; total cerebral cortex; hem-ispheric volumes ipsilateral and contralateral to seizureonset; extracted hemispheric cortical volumes ipsi- andcontralateral to seizure onset; and segmented lobar vol-umes of ipsi- and contralateral frontal, temporal, parietal,occipital and insular cortices.
FDG-PET MethodsPatients were imaged in the interictal state on a PENN PET300H Tomograph scanner with sodium iodide crystals,using a 25.6 cm diameter reconstruction field of view and3D whole-head acquisition, according to a previouslydefined protocol [8]. For the 2 mm slice thickness used forwhole-body imaging, the measured resolution was 4.2mm at full width at half maximum transaxially and 5.4mm at full width at half maximum out of plane. The doseof FDG administered was 37–111 MBq (1–3 mCi). Onebed position was used. All scans were commenced 45minutes after injection of FDG with the patient lying com-fortably in a darkened room during the uptake period.The scan acquisition time was 30–40 minutes to achievecomparable statistical quality between scans. The dura-tion of acquisition was based on count rates measured atthe commencement of imaging, achieving total counts of
>40 million. Measured, segmented attenuation correctionwas derived from a rotating 'single photon' Cs-137 source.The data were processed using a Wiener prefilter (scalingvalue = 0.5) and ordered-subsets expectation maximiza-tion (OSEM) iterative reconstruction performed with 4iterations and 8 subsets. OSEM significantly reduces thedegree of statistical noise in the reconstructed imagescompared to previous filtered back projection techniqueson this system. The Wiener pre-filter improved resolutionby enhancing the frequencies that define the resolvingpower of the system modulation transfer function (MTF).The images were reconstructed into a 256 × 250 mm cylin-dric volume with a 2 mm slice thickness. The reconstruc-tion process created a standard series of contiguousimages oriented in the transaxial, coronal, sagittal, andtranstemporal planes.
[18F] FDG-PET scans were available for analysis in 30 HS-ve patients and 27 HS+ve patients. Three of the 27 FDGPET scans in the HS+ve group were technically subopti-mal, and did not allow accurate coregistration to be per-formed. These three HS+ve FDG PET scans all showedlateralised ipsilateral temporal hypometabolism, and hadbeen included in the previously published study reportingvisual analyses (Carne et al. 2004). Coregistered FDG-PETanalyses of these HS+ve controls and of the FDG PETscans of their matched MRI negative PET positive counter-part cases were not included in this analysis, allowing 27HS-ve and 24 HS+ve patients to be analysed.
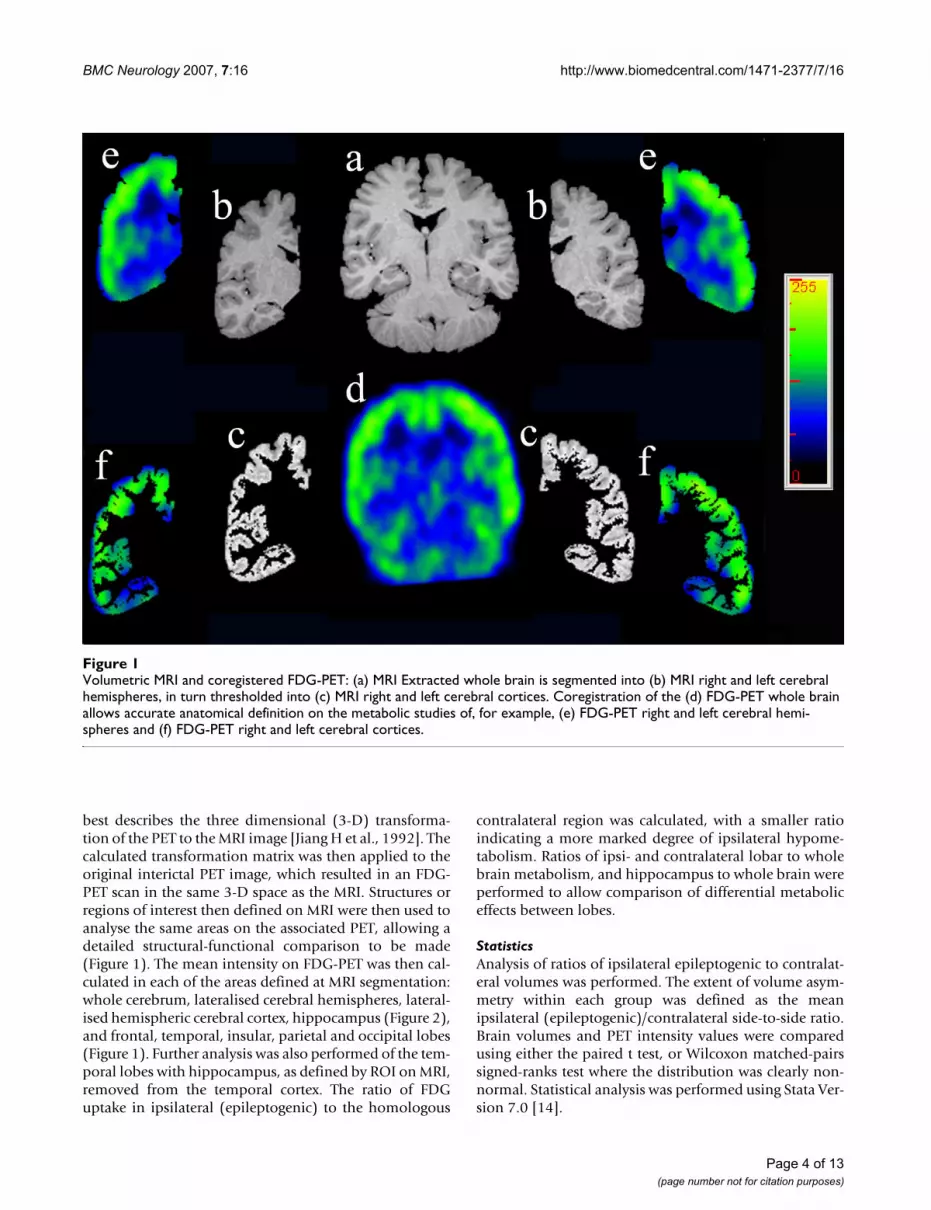
Image Processing for MRI/FDG-PET coregistrationOne of the difficulties with quantitation of regionalchanges on FDG-PET scans is the relatively lesser anatom-ical resolution obtained compared to MRI. To overcomethis, the FDG-PET scan was coregistered with the patientsvolumetric MRI, and the detailed anatomical structuresdefined on the MRI used to accurately quantitate the asso-ciated metabolic change on the PET (Figure 1).
Coregistration was performed using a surface matchingtechnique, involving conversion of MRI and FDG-PET tobinary volumes and subsequent matching of surfacepoints, using the AnalyzeAVW software package (MayoClinic). Binary images representing the cerebral surfacefor each scan were obtained by extracting the brain fromextracerebral structures on MRI, as described previously[12], and thresholding out the extracerebral uptake onFDG-PET. Interior "holes" were then deleted, to give twobinary single objects representing brain surface as meas-ured using each modality.
One thousand points on the surface of the first cerebralbinary image (PET) were sampled and the points thenmatched to the corresponding surface of the other cere-bral binary image (MRI) resulting in a 4 × 4 matrix that
Page 3 of 13(page number not for citation purposes)
BMC Neurology 2007, 7:16 http://www.biomedcentral.com/1471-2377/7/16
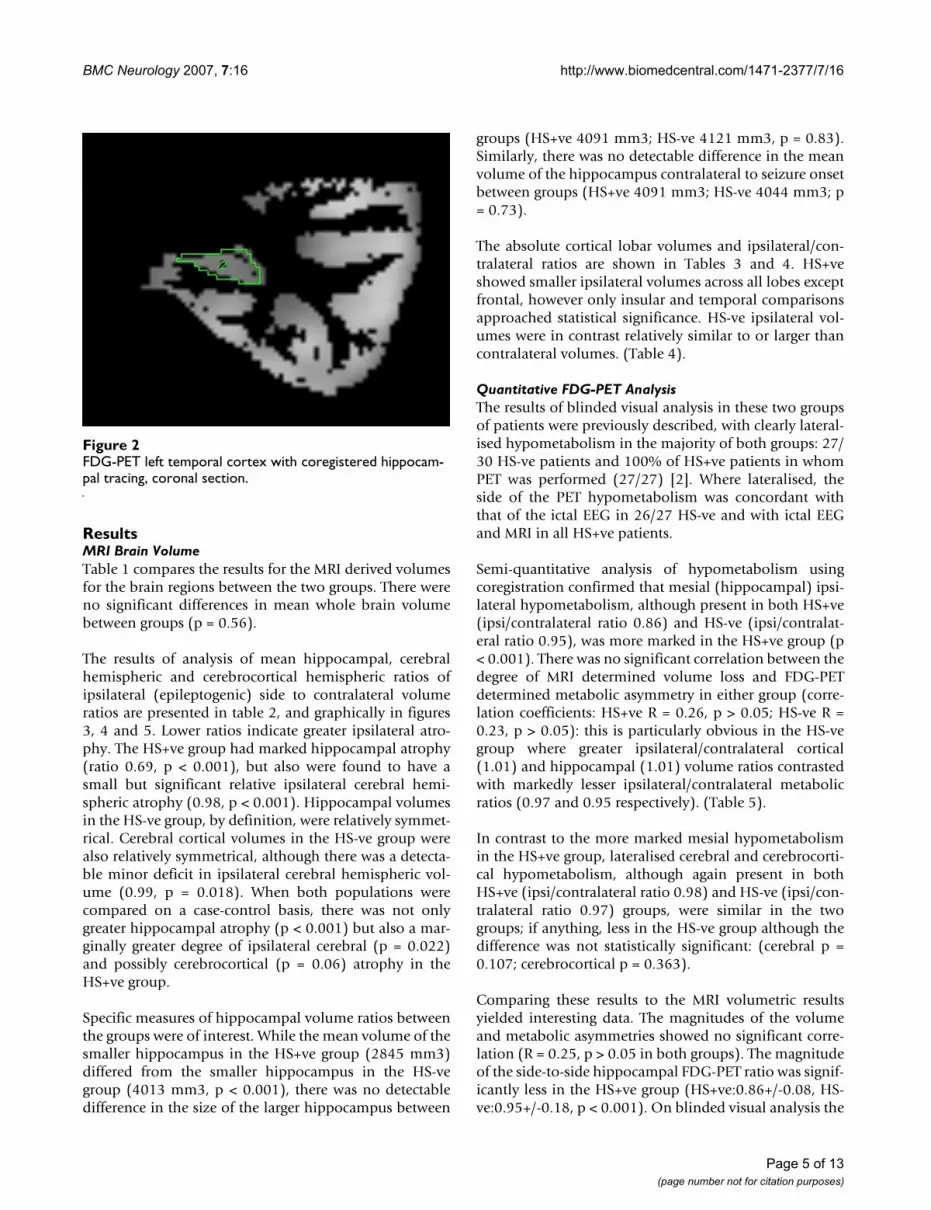
best describes the three dimensional (3-D) transforma-tion of the PET to the MRI image [Jiang H et al., 1992]. Thecalculated transformation matrix was then applied to theoriginal interictal PET image, which resulted in an FDG-PET scan in the same 3-D space as the MRI. Structures orregions of interest then defined on MRI were then used toanalyse the same areas on the associated PET, allowing adetailed structural-functional comparison to be made(Figure 1). The mean intensity on FDG-PET was then cal-culated in each of the areas defined at MRI segmentation:whole cerebrum, lateralised cerebral hemispheres, lateral-ised hemispheric cerebral cortex, hippocampus (Figure 2),and frontal, temporal, insular, parietal and occipital lobes(Figure 1). Further analysis was also performed of the tem-poral lobes with hippocampus, as defined by ROI on MRI,removed from the temporal cortex. The ratio of FDGuptake in ipsilateral (epileptogenic) to the homologous
contralateral region was calculated, with a smaller ratioindicating a more marked degree of ipsilateral hypome-tabolism. Ratios of ipsi- and contralateral lobar to wholebrain metabolism, and hippocampus to whole brain wereperformed to allow comparison of differential metaboliceffects between lobes.
StatisticsAnalysis of ratios of ipsilateral epileptogenic to contralat-eral volumes was performed. The extent of volume asym-metry within each group was defined as the meanipsilateral (epileptogenic)/contralateral side-to-side ratio.Brain volumes and PET intensity values were comparedusing either the paired t test, or Wilcoxon matched-pairssigned-ranks test where the distribution was clearly non-normal. Statistical analysis was performed using Stata Ver-sion 7.0 [14].
Volumetric MRI and coregistered FDG-PET: (a) MRI Extracted whole brain is segmented into (b) MRI right and left cerebral hemispheres, in turn thresholded into (c) MRI right and left cerebral corticesFigure 1Volumetric MRI and coregistered FDG-PET: (a) MRI Extracted whole brain is segmented into (b) MRI right and left cerebral hemispheres, in turn thresholded into (c) MRI right and left cerebral cortices. Coregistration of the (d) FDG-PET whole brain allows accurate anatomical definition on the metabolic studies of, for example, (e) FDG-PET right and left cerebral hemi-spheres and (f) FDG-PET right and left cerebral cortices.
Page 4 of 13(page number not for citation purposes)
BMC Neurology 2007, 7:16 http://www.biomedcentral.com/1471-2377/7/16
ResultsMRI Brain VolumeTable 1 compares the results for the MRI derived volumesfor the brain regions between the two groups. There wereno significant differences in mean whole brain volumebetween groups (p = 0.56).
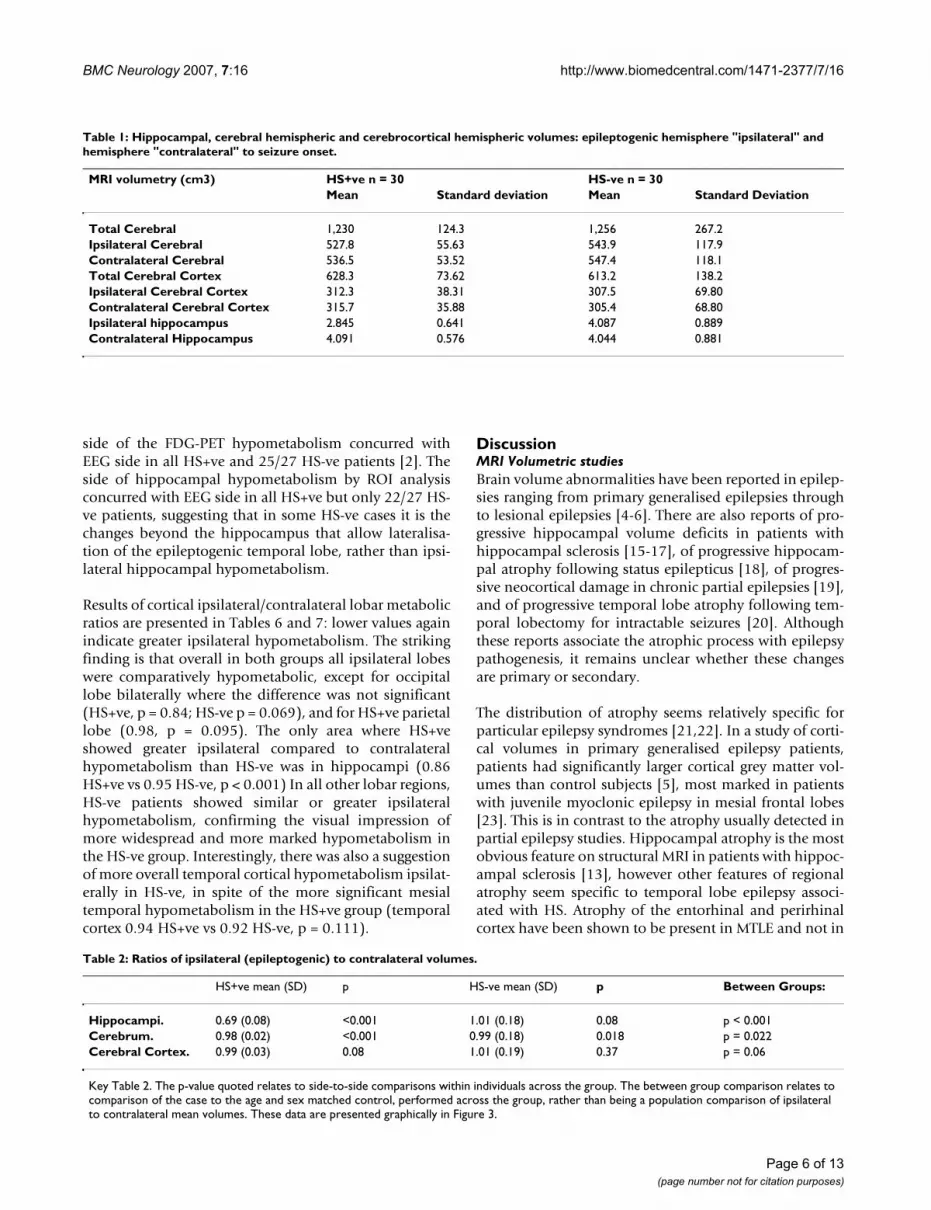
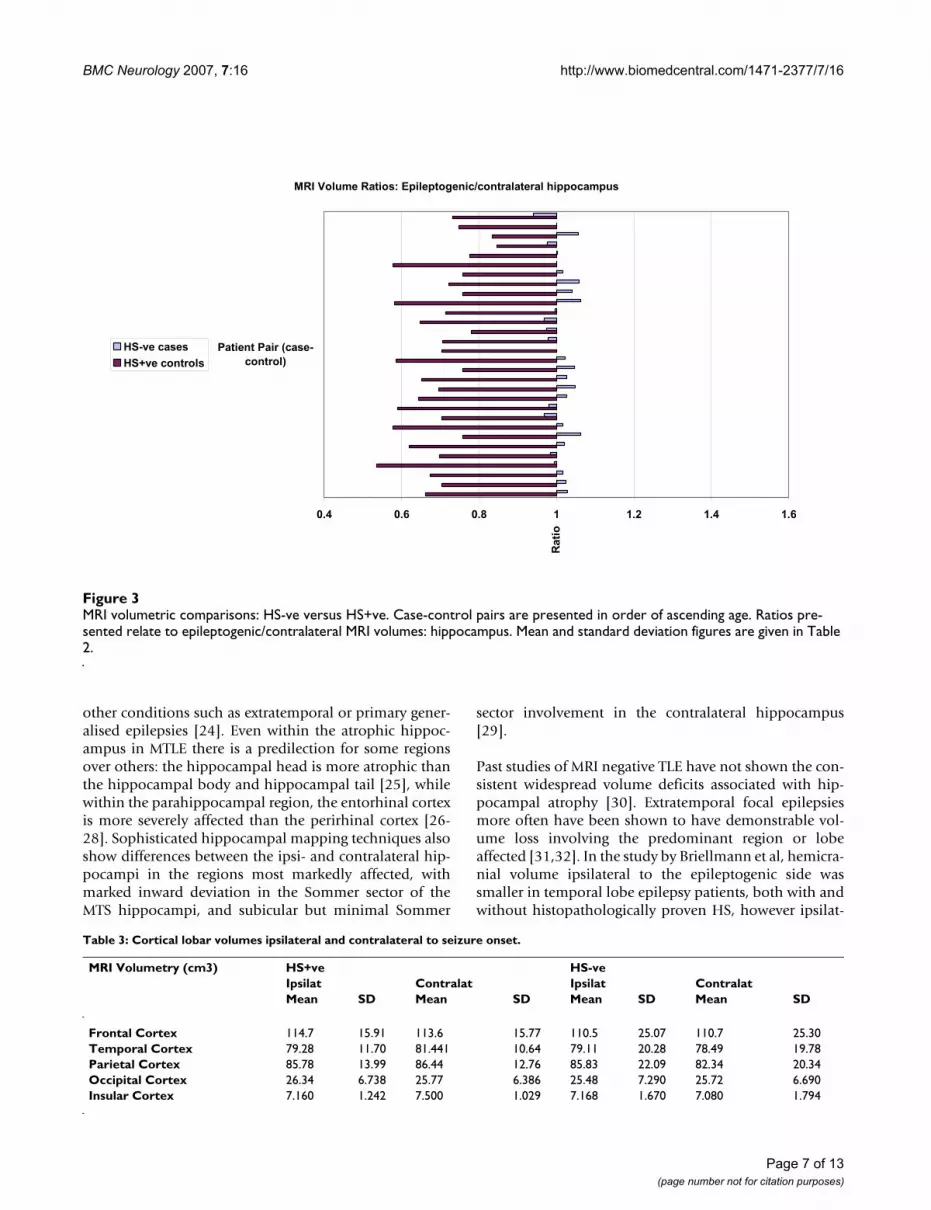
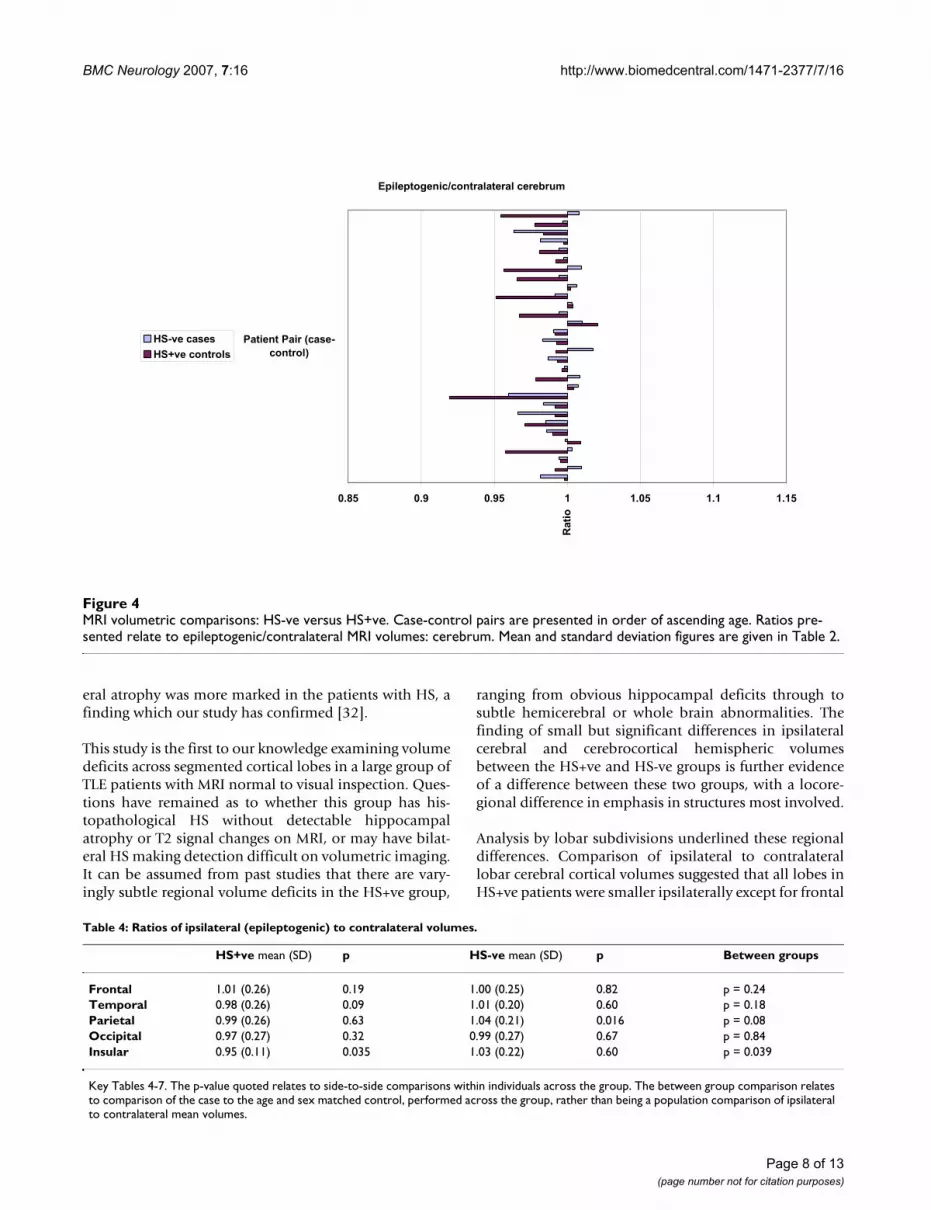
The results of analysis of mean hippocampal, cerebralhemispheric and cerebrocortical hemispheric ratios ofipsilateral (epileptogenic) side to contralateral volumeratios are presented in table 2, and graphically in figures3, 4 and 5. Lower ratios indicate greater ipsilateral atro-phy. The HS+ve group had marked hippocampal atrophy(ratio 0.69, p < 0.001), but also were found to have asmall but significant relative ipsilateral cerebral hemi-spheric atrophy (0.98, p < 0.001). Hippocampal volumesin the HS-ve group, by definition, were relatively symmet-rical. Cerebral cortical volumes in the HS-ve group werealso relatively symmetrical, although there was a detecta-ble minor deficit in ipsilateral cerebral hemispheric vol-ume (0.99, p = 0.018). When both populations werecompared on a case-control basis, there was not onlygreater hippocampal atrophy (p < 0.001) but also a mar-ginally greater degree of ipsilateral cerebral (p = 0.022)and possibly cerebrocortical (p = 0.06) atrophy in theHS+ve group.
Specific measures of hippocampal volume ratios betweenthe groups were of interest. While the mean volume of thesmaller hippocampus in the HS+ve group (2845 mm3)differed from the smaller hippocampus in the HS-vegroup (4013 mm3, p < 0.001), there was no detectabledifference in the size of the larger hippocampus between
groups (HS+ve 4091 mm3; HS-ve 4121 mm3, p = 0.83).Similarly, there was no detectable difference in the meanvolume of the hippocampus contralateral to seizure onsetbetween groups (HS+ve 4091 mm3; HS-ve 4044 mm3; p= 0.73).
The absolute cortical lobar volumes and ipsilateral/con-tralateral ratios are shown in Tables 3 and 4. HS+veshowed smaller ipsilateral volumes across all lobes exceptfrontal, however only insular and temporal comparisonsapproached statistical significance. HS-ve ipsilateral vol-umes were in contrast relatively similar to or larger thancontralateral volumes. (Table 4).
Quantitative FDG-PET AnalysisThe results of blinded visual analysis in these two groupsof patients were previously described, with clearly lateral-ised hypometabolism in the majority of both groups: 27/30 HS-ve patients and 100% of HS+ve patients in whomPET was performed (27/27) [2]. Where lateralised, theside of the PET hypometabolism was concordant withthat of the ictal EEG in 26/27 HS-ve and with ictal EEGand MRI in all HS+ve patients.
Semi-quantitative analysis of hypometabolism usingcoregistration confirmed that mesial (hippocampal) ipsi-lateral hypometabolism, although present in both HS+ve(ipsi/contralateral ratio 0.86) and HS-ve (ipsi/contralat-eral ratio 0.95), was more marked in the HS+ve group (p< 0.001). There was no significant correlation between thedegree of MRI determined volume loss and FDG-PETdetermined metabolic asymmetry in either group (corre-lation coefficients: HS+ve R = 0.26, p > 0.05; HS-ve R =0.23, p > 0.05): this is particularly obvious in the HS-vegroup where greater ipsilateral/contralateral cortical(1.01) and hippocampal (1.01) volume ratios contrastedwith markedly lesser ipsilateral/contralateral metabolicratios (0.97 and 0.95 respectively). (Table 5).
In contrast to the more marked mesial hypometabolismin the HS+ve group, lateralised cerebral and cerebrocorti-cal hypometabolism, although again present in bothHS+ve (ipsi/contralateral ratio 0.98) and HS-ve (ipsi/con-tralateral ratio 0.97) groups, were similar in the twogroups; if anything, less in the HS-ve group although thedifference was not statistically significant: (cerebral p =0.107; cerebrocortical p = 0.363).
Comparing these results to the MRI volumetric resultsyielded interesting data. The magnitudes of the volumeand metabolic asymmetries showed no significant corre-lation (R = 0.25, p > 0.05 in both groups). The magnitudeof the side-to-side hippocampal FDG-PET ratio was signif-icantly less in the HS+ve group (HS+ve:0.86+/-0.08, HS-ve:0.95+/-0.18, p < 0.001). On blinded visual analysis the
FDG-PET left temporal cortex with coregistered hippocam-pal tracing, coronal sectionFigure 2FDG-PET left temporal cortex with coregistered hippocam-pal tracing, coronal section.
Page 5 of 13(page number not for citation purposes)
BMC Neurology 2007, 7:16 http://www.biomedcentral.com/1471-2377/7/16
side of the FDG-PET hypometabolism concurred withEEG side in all HS+ve and 25/27 HS-ve patients [2]. Theside of hippocampal hypometabolism by ROI analysisconcurred with EEG side in all HS+ve but only 22/27 HS-ve patients, suggesting that in some HS-ve cases it is thechanges beyond the hippocampus that allow lateralisa-tion of the epileptogenic temporal lobe, rather than ipsi-lateral hippocampal hypometabolism.
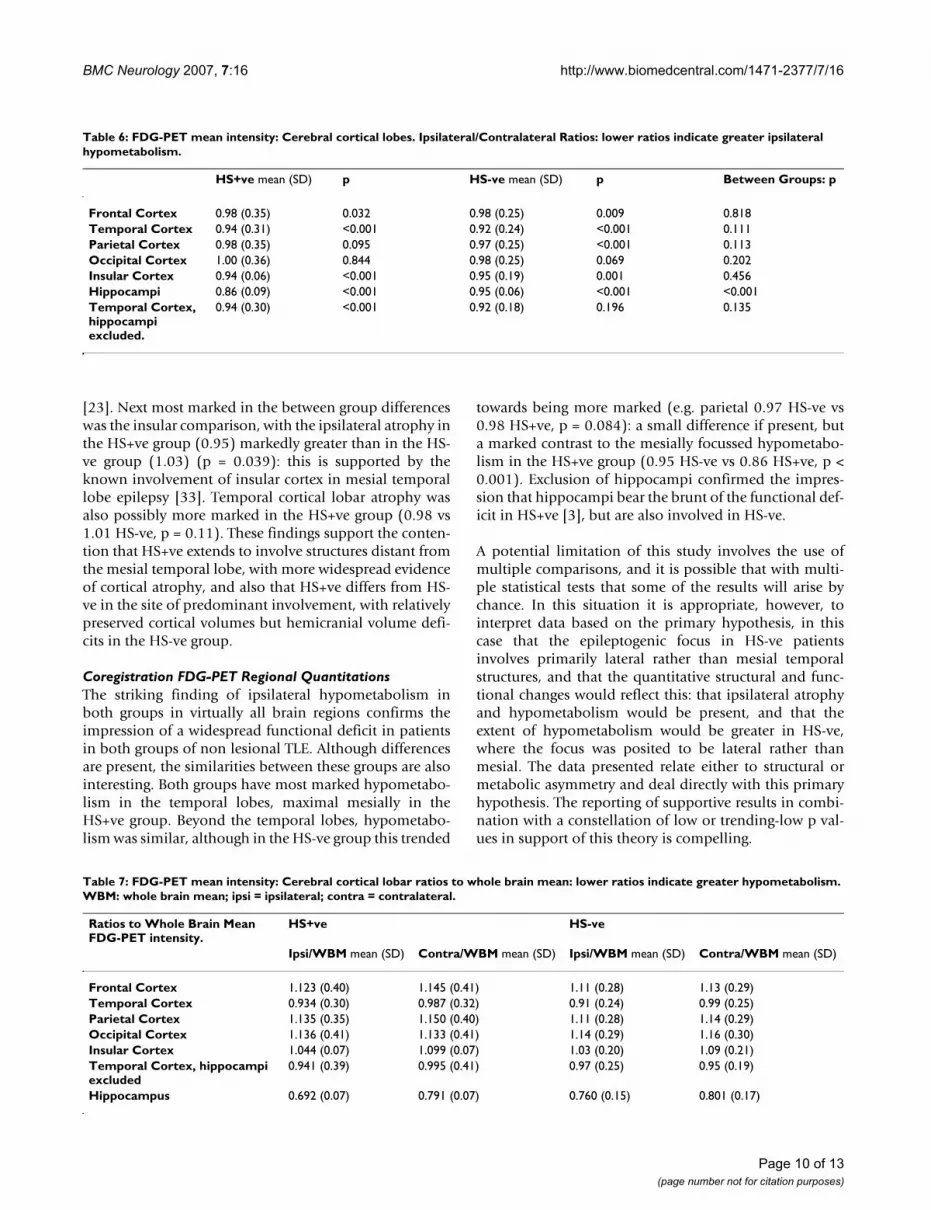
Results of cortical ipsilateral/contralateral lobar metabolicratios are presented in Tables 6 and 7: lower values againindicate greater ipsilateral hypometabolism. The strikingfinding is that overall in both groups all ipsilateral lobeswere comparatively hypometabolic, except for occipitallobe bilaterally where the difference was not significant(HS+ve, p = 0.84; HS-ve p = 0.069), and for HS+ve parietallobe (0.98, p = 0.095). The only area where HS+veshowed greater ipsilateral compared to contralateralhypometabolism than HS-ve was in hippocampi (0.86HS+ve vs 0.95 HS-ve, p < 0.001) In all other lobar regions,HS-ve patients showed similar or greater ipsilateralhypometabolism, confirming the visual impression ofmore widespread and more marked hypometabolism inthe HS-ve group. Interestingly, there was also a suggestionof more overall temporal cortical hypometabolism ipsilat-erally in HS-ve, in spite of the more significant mesialtemporal hypometabolism in the HS+ve group (temporalcortex 0.94 HS+ve vs 0.92 HS-ve, p = 0.111).
DiscussionMRI Volumetric studiesBrain volume abnormalities have been reported in epilep-sies ranging from primary generalised epilepsies throughto lesional epilepsies [4-6]. There are also reports of pro-gressive hippocampal volume deficits in patients withhippocampal sclerosis [15-17], of progressive hippocam-pal atrophy following status epilepticus [18], of progres-sive neocortical damage in chronic partial epilepsies [19],and of progressive temporal lobe atrophy following tem-poral lobectomy for intractable seizures [20]. Althoughthese reports associate the atrophic process with epilepsypathogenesis, it remains unclear whether these changesare primary or secondary.
The distribution of atrophy seems relatively specific forparticular epilepsy syndromes [21,22]. In a study of corti-cal volumes in primary generalised epilepsy patients,patients had significantly larger cortical grey matter vol-umes than control subjects [5], most marked in patientswith juvenile myoclonic epilepsy in mesial frontal lobes[23]. This is in contrast to the atrophy usually detected inpartial epilepsy studies. Hippocampal atrophy is the mostobvious feature on structural MRI in patients with hippoc-ampal sclerosis [13], however other features of regionalatrophy seem specific to temporal lobe epilepsy associ-ated with HS. Atrophy of the entorhinal and perirhinalcortex have been shown to be present in MTLE and not in
Table 1: Hippocampal, cerebral hemispheric and cerebrocortical hemispheric volumes: epileptogenic hemisphere "ipsilateral" and hemisphere "contralateral" to seizure onset.
MRI volumetry (cm3) HS+ve n = 30 HS-ve n = 30Mean Standard deviation Mean Standard Deviation
Total Cerebral 1,230 124.3 1,256 267.2Ipsilateral Cerebral 527.8 55.63 543.9 117.9Contralateral Cerebral 536.5 53.52 547.4 118.1Total Cerebral Cortex 628.3 73.62 613.2 138.2Ipsilateral Cerebral Cortex 312.3 38.31 307.5 69.80Contralateral Cerebral Cortex 315.7 35.88 305.4 68.80Ipsilateral hippocampus 2.845 0.641 4.087 0.889Contralateral Hippocampus 4.091 0.576 4.044 0.881
Table 2: Ratios of ipsilateral (epileptogenic) to contralateral volumes.
HS+ve mean (SD) p HS-ve mean (SD) p Between Groups:
Hippocampi. 0.69 (0.08) <0.001 1.01 (0.18) 0.08 p < 0.001Cerebrum. 0.98 (0.02) <0.001 0.99 (0.18) 0.018 p = 0.022Cerebral Cortex. 0.99 (0.03) 0.08 1.01 (0.19) 0.37 p = 0.06
Key Table 2. The p-value quoted relates to side-to-side comparisons within individuals across the group. The between group comparison relates to comparison of the case to the age and sex matched control, performed across the group, rather than being a population comparison of ipsilateral to contralateral mean volumes. These data are presented graphically in Figure 3.
Page 6 of 13(page number not for citation purposes)
BMC Neurology 2007, 7:16 http://www.biomedcentral.com/1471-2377/7/16
other conditions such as extratemporal or primary gener-alised epilepsies [24]. Even within the atrophic hippoc-ampus in MTLE there is a predilection for some regionsover others: the hippocampal head is more atrophic thanthe hippocampal body and hippocampal tail [25], whilewithin the parahippocampal region, the entorhinal cortexis more severely affected than the perirhinal cortex [26-28]. Sophisticated hippocampal mapping techniques alsoshow differences between the ipsi- and contralateral hip-pocampi in the regions most markedly affected, withmarked inward deviation in the Sommer sector of theMTS hippocampi, and subicular but minimal Sommer
sector involvement in the contralateral hippocampus[29].
Past studies of MRI negative TLE have not shown the con-sistent widespread volume deficits associated with hip-pocampal atrophy [30]. Extratemporal focal epilepsiesmore often have been shown to have demonstrable vol-ume loss involving the predominant region or lobeaffected [31,32]. In the study by Briellmann et al, hemicra-nial volume ipsilateral to the epileptogenic side wassmaller in temporal lobe epilepsy patients, both with andwithout histopathologically proven HS, however ipsilat-
Table 3: Cortical lobar volumes ipsilateral and contralateral to seizure onset.
MRI Volumetry (cm3) HS+ve HS-veIpsilat Contralat Ipsilat ContralatMean SD Mean SD Mean SD Mean SD
Frontal Cortex 114.7 15.91 113.6 15.77 110.5 25.07 110.7 25.30Temporal Cortex 79.28 11.70 81.441 10.64 79.11 20.28 78.49 19.78Parietal Cortex 85.78 13.99 86.44 12.76 85.83 22.09 82.34 20.34Occipital Cortex 26.34 6.738 25.77 6.386 25.48 7.290 25.72 6.690Insular Cortex 7.160 1.242 7.500 1.029 7.168 1.670 7.080 1.794
MRI volumetric comparisons: HS-ve versus HS+veFigure 3MRI volumetric comparisons: HS-ve versus HS+ve. Case-control pairs are presented in order of ascending age. Ratios pre-sented relate to epileptogenic/contralateral MRI volumes: hippocampus. Mean and standard deviation figures are given in Table 2.
MRI Volume Ratios: Epileptogenic/contralateral hippocampus
0.4 0.6 0.8 1 1.2 1.4 1.6
Patient Pair (case-
control)
Rati
o
HS-ve cases
HS+ve controls
Page 7 of 13(page number not for citation purposes)
BMC Neurology 2007, 7:16 http://www.biomedcentral.com/1471-2377/7/16
eral atrophy was more marked in the patients with HS, afinding which our study has confirmed [32].
This study is the first to our knowledge examining volumedeficits across segmented cortical lobes in a large group ofTLE patients with MRI normal to visual inspection. Ques-tions have remained as to whether this group has his-topathological HS without detectable hippocampalatrophy or T2 signal changes on MRI, or may have bilat-eral HS making detection difficult on volumetric imaging.It can be assumed from past studies that there are vary-ingly subtle regional volume deficits in the HS+ve group,
ranging from obvious hippocampal deficits through tosubtle hemicerebral or whole brain abnormalities. Thefinding of small but significant differences in ipsilateralcerebral and cerebrocortical hemispheric volumesbetween the HS+ve and HS-ve groups is further evidenceof a difference between these two groups, with a locore-gional difference in emphasis in structures most involved.
Analysis by lobar subdivisions underlined these regionaldifferences. Comparison of ipsilateral to contralaterallobar cerebral cortical volumes suggested that all lobes inHS+ve patients were smaller ipsilaterally except for frontal
MRI volumetric comparisons: HS-ve versus HS+veFigure 4MRI volumetric comparisons: HS-ve versus HS+ve. Case-control pairs are presented in order of ascending age. Ratios pre-sented relate to epileptogenic/contralateral MRI volumes: cerebrum. Mean and standard deviation figures are given in Table 2.
Epileptogenic/contralateral cerebrum
0.85 0.9 0.95 1 1.05 1.1 1.15
Patient Pair (case-
control)
Rati
o
HS-ve cases
HS+ve controls
Table 4: Ratios of ipsilateral (epileptogenic) to contralateral volumes.
HS+ve mean (SD) p HS-ve mean (SD) p Between groups
Frontal 1.01 (0.26) 0.19 1.00 (0.25) 0.82 p = 0.24Temporal 0.98 (0.26) 0.09 1.01 (0.20) 0.60 p = 0.18Parietal 0.99 (0.26) 0.63 1.04 (0.21) 0.016 p = 0.08Occipital 0.97 (0.27) 0.32 0.99 (0.27) 0.67 p = 0.84Insular 0.95 (0.11) 0.035 1.03 (0.22) 0.60 p = 0.039
Key Tables 4-7. The p-value quoted relates to side-to-side comparisons within individuals across the group. The between group comparison relates to comparison of the case to the age and sex matched control, performed across the group, rather than being a population comparison of ipsilateral to contralateral mean volumes.
Page 8 of 13(page number not for citation purposes)
BMC Neurology 2007, 7:16 http://www.biomedcentral.com/1471-2377/7/16
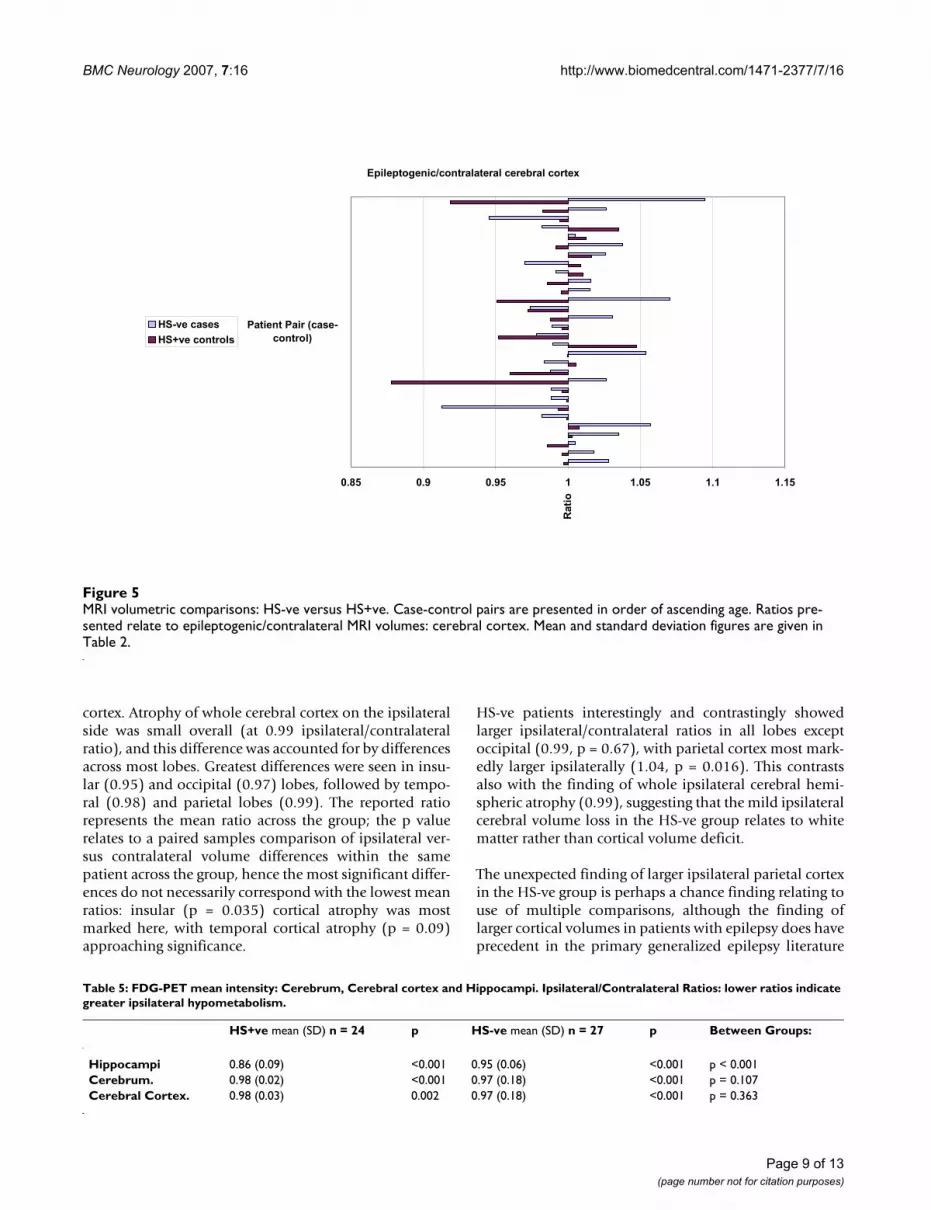
cortex. Atrophy of whole cerebral cortex on the ipsilateralside was small overall (at 0.99 ipsilateral/contralateralratio), and this difference was accounted for by differencesacross most lobes. Greatest differences were seen in insu-lar (0.95) and occipital (0.97) lobes, followed by tempo-ral (0.98) and parietal lobes (0.99). The reported ratiorepresents the mean ratio across the group; the p valuerelates to a paired samples comparison of ipsilateral ver-sus contralateral volume differences within the samepatient across the group, hence the most significant differ-ences do not necessarily correspond with the lowest meanratios: insular (p = 0.035) cortical atrophy was mostmarked here, with temporal cortical atrophy (p = 0.09)approaching significance.
HS-ve patients interestingly and contrastingly showedlarger ipsilateral/contralateral ratios in all lobes exceptoccipital (0.99, p = 0.67), with parietal cortex most mark-edly larger ipsilaterally (1.04, p = 0.016). This contrastsalso with the finding of whole ipsilateral cerebral hemi-spheric atrophy (0.99), suggesting that the mild ipsilateralcerebral volume loss in the HS-ve group relates to whitematter rather than cortical volume deficit.
The unexpected finding of larger ipsilateral parietal cortexin the HS-ve group is perhaps a chance finding relating touse of multiple comparisons, although the finding oflarger cortical volumes in patients with epilepsy does haveprecedent in the primary generalized epilepsy literature
Table 5: FDG-PET mean intensity: Cerebrum, Cerebral cortex and Hippocampi. Ipsilateral/Contralateral Ratios: lower ratios indicate greater ipsilateral hypometabolism.
HS+ve mean (SD) n = 24 p HS-ve mean (SD) n = 27 p Between Groups:
Hippocampi 0.86 (0.09) <0.001 0.95 (0.06) <0.001 p < 0.001Cerebrum. 0.98 (0.02) <0.001 0.97 (0.18) <0.001 p = 0.107Cerebral Cortex. 0.98 (0.03) 0.002 0.97 (0.18) <0.001 p = 0.363
MRI volumetric comparisons: HS-ve versus HS+veFigure 5MRI volumetric comparisons: HS-ve versus HS+ve. Case-control pairs are presented in order of ascending age. Ratios pre-sented relate to epileptogenic/contralateral MRI volumes: cerebral cortex. Mean and standard deviation figures are given in Table 2.
Epileptogenic/contralateral cerebral cortex
0.85 0.9 0.95 1 1.05 1.1 1.15
Patient Pair (case-
control)
Rati
o
HS-ve cases
HS+ve controls
Page 9 of 13(page number not for citation purposes)
BMC Neurology 2007, 7:16 http://www.biomedcentral.com/1471-2377/7/16
[23]. Next most marked in the between group differenceswas the insular comparison, with the ipsilateral atrophy inthe HS+ve group (0.95) markedly greater than in the HS-ve group (1.03) (p = 0.039): this is supported by theknown involvement of insular cortex in mesial temporallobe epilepsy [33]. Temporal cortical lobar atrophy wasalso possibly more marked in the HS+ve group (0.98 vs1.01 HS-ve, p = 0.11). These findings support the conten-tion that HS+ve extends to involve structures distant fromthe mesial temporal lobe, with more widespread evidenceof cortical atrophy, and also that HS+ve differs from HS-ve in the site of predominant involvement, with relativelypreserved cortical volumes but hemicranial volume defi-cits in the HS-ve group.
Coregistration FDG-PET Regional QuantitationsThe striking finding of ipsilateral hypometabolism inboth groups in virtually all brain regions confirms theimpression of a widespread functional deficit in patientsin both groups of non lesional TLE. Although differencesare present, the similarities between these groups are alsointeresting. Both groups have most marked hypometabo-lism in the temporal lobes, maximal mesially in theHS+ve group. Beyond the temporal lobes, hypometabo-lism was similar, although in the HS-ve group this trended
towards being more marked (e.g. parietal 0.97 HS-ve vs0.98 HS+ve, p = 0.084): a small difference if present, buta marked contrast to the mesially focussed hypometabo-lism in the HS+ve group (0.95 HS-ve vs 0.86 HS+ve, p <0.001). Exclusion of hippocampi confirmed the impres-sion that hippocampi bear the brunt of the functional def-icit in HS+ve [3], but are also involved in HS-ve.
A potential limitation of this study involves the use ofmultiple comparisons, and it is possible that with multi-ple statistical tests that some of the results will arise bychance. In this situation it is appropriate, however, tointerpret data based on the primary hypothesis, in thiscase that the epileptogenic focus in HS-ve patientsinvolves primarily lateral rather than mesial temporalstructures, and that the quantitative structural and func-tional changes would reflect this: that ipsilateral atrophyand hypometabolism would be present, and that theextent of hypometabolism would be greater in HS-ve,where the focus was posited to be lateral rather thanmesial. The data presented relate either to structural ormetabolic asymmetry and deal directly with this primaryhypothesis. The reporting of supportive results in combi-nation with a constellation of low or trending-low p val-ues in support of this theory is compelling.
Table 7: FDG-PET mean intensity: Cerebral cortical lobar ratios to whole brain mean: lower ratios indicate greater hypometabolism. WBM: whole brain mean; ipsi = ipsilateral; contra = contralateral.
Ratios to Whole Brain Mean FDG-PET intensity.
HS+ve HS-ve
Ipsi/WBM mean (SD) Contra/WBM mean (SD) Ipsi/WBM mean (SD) Contra/WBM mean (SD)
Frontal Cortex 1.123 (0.40) 1.145 (0.41) 1.11 (0.28) 1.13 (0.29)Temporal Cortex 0.934 (0.30) 0.987 (0.32) 0.91 (0.24) 0.99 (0.25)Parietal Cortex 1.135 (0.35) 1.150 (0.40) 1.11 (0.28) 1.14 (0.29)Occipital Cortex 1.136 (0.41) 1.133 (0.41) 1.14 (0.29) 1.16 (0.30)Insular Cortex 1.044 (0.07) 1.099 (0.07) 1.03 (0.20) 1.09 (0.21)Temporal Cortex, hippocampi excluded
0.941 (0.39) 0.995 (0.41) 0.97 (0.25) 0.95 (0.19)
Hippocampus 0.692 (0.07) 0.791 (0.07) 0.760 (0.15) 0.801 (0.17)
Table 6: FDG-PET mean intensity: Cerebral cortical lobes. Ipsilateral/Contralateral Ratios: lower ratios indicate greater ipsilateral hypometabolism.
HS+ve mean (SD) p HS-ve mean (SD) p Between Groups: p
Frontal Cortex 0.98 (0.35) 0.032 0.98 (0.25) 0.009 0.818Temporal Cortex 0.94 (0.31) <0.001 0.92 (0.24) <0.001 0.111Parietal Cortex 0.98 (0.35) 0.095 0.97 (0.25) <0.001 0.113Occipital Cortex 1.00 (0.36) 0.844 0.98 (0.25) 0.069 0.202Insular Cortex 0.94 (0.06) <0.001 0.95 (0.19) 0.001 0.456Hippocampi 0.86 (0.09) <0.001 0.95 (0.06) <0.001 <0.001Temporal Cortex, hippocampi excluded.
0.94 (0.30) <0.001 0.92 (0.18) 0.196 0.135
Page 10 of 13(page number not for citation purposes)
BMC Neurology 2007, 7:16 http://www.biomedcentral.com/1471-2377/7/16
In both HS-ve and HS+ve groups the percentage ofpatients with lateralised concordant hypometabolism onFDG PET scanning was high, both by visual and semiquantitative analyses. In a previous study, the extent ofhypometabolism on PET was found to extend more fre-quently beyond anterior and or mesial temporal regionsalone to involve other temporal or extratemporal regionsin the HS-ve group [2]. Other features of the HS-ve groupsuggested that the focus in the group of patients does notlie mesially, but is more likely to involve the lateral tem-poral neocortex.
Other groups have noted the difference in the FDG PETfindings between temporal lobe epilepsy patients withprimarily mesial and lateral foci. One study [34] foundsignificant differences between mesial and lateral TLE insimilar pattern: that study included 35 patients with lat-eral TLE, only 11 of whom were non lesional, the remain-der of whom had CD, vascular malformations ortumours. They found that hypometabolism was moreprominent in the lateral structures than mesial in bothgroups, which differs from our finding in the mesial groupwith proven hippocampal sclerosis who had moremarked mesial hypometabolism, a finding also reportedby other groups [35]. It is interesting though to comparethe findings in the lateral group in that study, where themajority had observed structural lesions – the best 'goldstandard' for seizure onset localization – with our studywhere structural lesions were not evident. This similar pat-tern of hypometabolic involvement in our non lesionalgroup suggests a lateral temporal onset in the HS-vepatients.
This striking mesial/hippocampal emphasis in the HS+vegroup suggests that this group may be relatively homoge-nous in its involvement of mesial structures/hippocam-pus, whereas there is no corresponding single structure orarea that is consistently involved in the HS-ve group. Thisraises the question as to whether the non lesional group isa disease, a syndrome, or a collection of unrelated entitiesthat have in common no clear epileptogenic lesion on theMRI. The temptation to define this group as temporal lobeepilepsy that is not "HS" can to some extent be counteredby the findings on FDG-PET, a positive feature for defini-tion that clearly differentiates the group from extratempo-ral epilepsies, and the MRI, which differentiates the groupfrom MTLE. Beyond this it is possible that HS-ve temporallobe epilepsy represents a group with diverse aetiologies,but on balance highly unlikely given the overall similari-ties otherwise on structural, functional and histopatho-logical comparisons.
The pathophysiology underlying the hypometabolismseen on FDG PET in temporal lobe epilepsy remainsuncertain, and although predictably observed and well
described is not well explained by observed macro ormicrostructural alterations. The area of hypometabolismon FDG PET is generally thought much larger than thearea of presumed pathological involvement [36], thoughthe widespread extent of both hypometabolism and corti-cal atrophy in both groups is confirmed by our study.Electroclinical studies suggest that the pattern of hypome-tabolism may relate to both the onset of the ictal dis-charge and to the patterns of preferential spread [37]. Arelationship between interictal slow wave activity andFDG PET hypometabolism may indicate that thehypometabolic area represents a region of increased neu-ronal inhibition which can receive interictal and ictalpropagation [38]. Quantitative FDG-PET uptake studieshave shown the most marked deficits when comparingHS+ve TLE patients to controls bilaterally in frontal andparietal lobes, in comparison to the more marked abnor-malities detected in temporal lobes with asymmetry indi-ces [39]. There is conflicting evidence as to whether theextent or severity of hypometabolism relates to neuronalloss [40,9,11], duration of prior habitual seizures [41,42]or severity of seizures [43]. In our study, the finding of sig-nificant mesial hypometabolism in the MRI negative (HS-ve) group, despite volumetrically normal hippocampi, isevidence against the contention that volume loss andhypometabolism are significantly correlated. This alsoargues against partial volume effect being a major contri-bution to the results at the hippocampal level. Neverthe-less, this contribution cannot be excluded, and is apotential limitation of the study. Further analysis withpartial volume correction, or alternatively with voxelbased morphometric methods to more closely delineatesites of structural or metabolic heterogeneity may help toclarify this further. Even in our HS+ve group, there wasnot a significant correlation between degrees of MRI volu-metric and FDG-PET metabolic asymmetry (correlationcoefficient 0.26). The fact that hypometabolism is inde-pendent of neuronal loss perhaps accounts for it being anindependent predictor of surgical outcome [44-46].
Another potential limitation of the study is that we didnot assess for changes in smaller subregions of the brain.The large structures assessed (i.e. hemispheres) are heter-ogeneous and therefore focal changes at lobar and sublo-bar levels could easily have been missed. However, thelimited number of subjects that were available for inclu-sion in this study did not allow the statistical power toassess multiple regions of interest. Future studies, involv-ing larger numbers of patients, should extend from ourresults by investigating for regional changes particularly inthe cortex.
The smaller hemicranial volumes and varying but almostubiquitous hypometabolism on the side of the epilep-togenic focus occurring irrespective of the presence or
Page 11 of 13(page number not for citation purposes)
BMC Neurology 2007, 7:16 http://www.biomedcentral.com/1471-2377/7/16
absence of HS are of great interest. Does this represent adiffering pathological process in the hemisphere to that inthe hippocampus, or is this the same process with a differ-ence in regional emphasis? There is little or no structuralhistopathological evidence to suggest that the associatedfindings in the lateral neocortex and hemispheric struc-tures differ significantly between the groups; given this,perhaps the latter hypothesis seems the most valid. Suchdifferences in location of primary involvement may derivefrom differential timing of an initial insult: for instancegiven differential embryological timing of hippocampaland adjacent neocortical development, it is conceivablethat a precisely timed embryological insult could affectone region with relative sparing of the other; with the sub-sequent response of surviving cortex determining thedegree of the eventual predilection towards epileptogene-sis, an interesting hypothesis that will require furtherstudy.
ConclusionOverall, HS+ve patients showed more hippocampal, butalso marginally more ipsilateral cerebral and cerebrocorti-cal atrophy, greater ipsilateral hippocampal hypometabo-lism but similar ipsilateral cerebral corticalhypometabolism, confirming structural and functionaldifferences between these groups, in support of the clini-cal findings which suggest that these two groups representdiffering syndromes.
Competing interestsThe author(s) declare that they have no competing inter-ests.
Authors' contributionsAll authors were involved in manuscript revision. Allauthors read and approved the final manuscript.
RC participated in study design, coordinated the study,collated the data, participated in image manipulation andanalysis and drafted the manuscript.
TOB participated in study conception, coordination andediting of the manuscript.
CK participated in study conception, coordination andediting of the manuscript
LM participated in study design and performed the statis-tical analysis.
LL helped substantially with the image manipulation, seg-mentation and analysis.
RH helped with PET data acquisition and data analysis.
MC participated in study conception, coordination andediting of the manuscript.
AcknowledgementsWe wish to thank Mr David Binns for his assistance in preparation of the FDG-PET scans and for his expert technical advice.
RC was supported by an Epilepsy Fellowship funded by an unrestricted research grant from Sanofi-Synthelabo Australia.
References1. Cascino GD, Jack CR Jr, Parisi JE, Sharbrough FW, Hirschorn KA,
Meyer FB, Marsh WR, O'Brien PC: Magnetic resonance imaging-based volume studies in temporal lobe epilepsy: pathologicalcorrelations. Ann Neurol 1991, 30:31-36.
2. Carne RP, O'Brien TJ, Kilpatrick CJ, MacGregor LR, Hicks RJ, MurphyMA, Bowden SC, Kaye AH, Cook MJ: MRI-negative PET-positivetemporal lobe epilepsy: a distinct surgically remediable syn-drome. Brain 2004, 127:2276-2285.
3. Carne RP, Cook MJ, MacGregor LR, Kilpatrick CJ, Hicks RJ, O'BrienTJ: 'MRI negative PET positive' Temporal Lobe Epilepsy(TLE): FDG-PET pattern differs from mesial TLE. Mol Imagingand Biol 2006, 9(1):32-42.
4. Sisodiya SM, Free SL, Stevens JM, Fish DR, Shorvon SD: Widespreadcerebral structural changes in two patients with gelastic sei-zures and hypothalamic hamartomata. Epilepsia 1997,38:1008-1010.
5. Woermann FG, Sisodiya SM, Free SL, Duncan JS: Quantitative MRIin patients with idiopathic generalized epilepsy. Evidence ofwidespread cerebral structural changes. Brain 1998, 121(Pt9):1661-1667.
6. Marsh L, Morrell MJ, Shear PK, Sullivan EV, Freeman H, Marie A, LimKO, Pfefferbaum A: Cortical and hippocampal volume deficitsin temporal lobe epilepsy. Epilepsia 1997, 38:576-587.
7. Bonilha L, Rorden C, Halford JJ, Eckert M, Appenzeller S, Cendes F,Li LM: Asymmetrical extra-hippocampal gray matter lossrelated to hippocampal atrophy in patients with medial tem-poral lobe epilepsy. J Neurol Neurosurg Psychiatry 2006.
8. O'Brien TJ, Hicks RJ, Ware R, Binns DS, Murphy M, Cook MJ: Theutility of a 3-dimensional, large-field-of-view, sodium iodidecrystal – based PET scanner in the presurgical evaluation ofpartial epilepsy. J Nucl Med 2001, 42:1158-1165.
9. Henry TR, Babb TL, Engel J Jr, Mazziotta JC, Phelps ME, Crandall PH:Hippocampal neuronal loss and regional hypometabolism intemporal lobe epilepsy. Ann Neurol 1994, 36:925-927.
10. Semah F, Baulac M, Hasboun D, Frouin V, Mangin JF, Papageorgiou S,Leroy-Willig A, Philippon J, Laplane D, Samson Y: Is interictal tem-poral hypometabolism related to mesial temporal sclerosis?A positron emission tomography/magnetic resonance imag-ing confrontation. Epilepsia 1995, 36:447-456.
11. O'Brien TJ, Newton MR, Cook MJ, Berlangieri SU, Kilpatrick C, Mor-ris K, Berkovic SF: Hippocampal atrophy is not a major deter-minant of regional hypometabolism in temporal lobeepilepsy. Epilepsia 1997, 38:74-80.
12. Carne RP, Vogrin S, Litewka L, Cook MJ: Cerebral cortex: an MRIbased study of volume and variance with age and sex. J ClinNeurosci 2006, 13:60-72.
13. Cook MJ, Fish DR, Shorvon SD, Straughan K, Stevens JM: Hippoc-ampal volumetric and morphometric studies in frontal andtemporal lobe epilepsy. Brain 1992, 115(Pt 4):1001-1015.
14. College Station TSC: Stata Statistical Software. 2001.15. Briellmann RS, Berkovic SF, Syngeniotis A, King MA, Jackson GD: Sei-
zure-associated hippocampal volume loss: a longitudinalmagnetic resonance study of temporal lobe epilepsy. AnnNeurol 2002, 51:641-644.
16. Liu RS, Lemieux L, Bell GS, Bartlett PA, Sander JW, Sisodiya SM, Shor-von SD, Duncan JS: A longitudinal quantitative MRI study ofcommunity-based patients with chronic epilepsy and newlydiagnosed seizures: methodology and preliminary findings.Neuroimage 2001, 14:231-243.
17. O'Brien TJ, So EL, Meyer FB, Parisi JE, Jack CR: Progressive hippoc-ampal atrophy in chronic intractable temporal lobe epilepsy.Ann Neurol 1999, 45:526-529.
Page 12 of 13(page number not for citation purposes)
BMC Neurology 2007, 7:16 http://www.biomedcentral.com/1471-2377/7/16
Publish with BioMed Central and every scientist can read your work free of charge
"BioMed Central will be the most significant development for disseminating the results of biomedical research in our lifetime."
Sir Paul Nurse, Cancer Research UK
Your research papers will be:
available free of charge to the entire biomedical community
peer reviewed and published immediately upon acceptance
cited in PubMed and archived on PubMed Central
yours — you keep the copyright
Submit your manuscript here:http://www.biomedcentral.com/info/publishing_adv.asp
BioMedcentral
18. Wieshmann UC, Woermann FG, Lemieux L, Free SL, Bartlett PA,Smith SJ, Duncan JS, Stevens JM, Shorvon SD: Development of hip-pocampal atrophy: a serial magnetic resonance imagingstudy in a patient who developed epilepsy after generalizedstatus epilepticus. Epilepsia 1997, 38:1238-1241.
19. Liu RS, Lemieux L, Bell GS, Hammers A, Sisodiya SM, Bartlett PA,Shorvon SD, Sander JW, Duncan JS: Progressive neocorticaldamage in epilepsy. Ann Neurol 2003, 53:312-324.
20. Ellamushi H, Moran NF, Kitchen ND, Stevens JM, Kendall BE, LemieuxL: Generalised cerebral atrophy following temporal lobec-tomy for intractable epilepsy associated with mesial tempo-ral sclerosis. Magn Reson Imaging 2000, 18:269-274.
21. Gartner B, Seeck M, Michel CM, Delavelle J, Lazeyras F: Patientswith extratemporal lobe epilepsy do not differ from healthysubjects with respect to subcortical volumes. J Neurol Neuro-surg Psychiatry 2004, 75:588-592.
22. Natsume J, Bernasconi N, Andermann F, Bernasconi A: MRI volum-etry of the thalamus in temporal, extratemporal, and idio-pathic generalized epilepsy. Neurology 2003, 60:1296-1300.
23. Woermann FG, Free SL, Koepp MJ, Sisodiya SM, Duncan JS: Abnor-mal cerebral structure in juvenile myoclonic epilepsy dem-onstrated with voxel-based analysis of MRI. Brain 1999, 122(Pt11):2101-2108.
24. Bernasconi N, Andermann F, Arnold DL, Bernasconi A: Entorhinalcortex MRI assessment in temporal, extratemporal, and idi-opathic generalized epilepsy. Epilepsia 2003, 44:1070-1074.
25. Hogan RE, Bucholz RD, Choudhuri I, Mark KE, Butler CS, Joshi S:Shape analysis of hippocampal surface structure in patientswith unilateral mesial temporal sclerosis. J Digit Imaging 2000,13:39-42.
26. Bernasconi N, Bernasconi A, Caramanos Z, Antel SB, Andermann F,Arnold DL: Mesial temporal damage in temporal lobe epi-lepsy: a volumetric MRI study of the hippocampus, amygdalaand parahippocampal region. Brain 2003, 126:462-469.
27. Bonilha L, Kobayashi E, Rorden C, Cendes F, Li LM: Medial tempo-ral lobe atrophy in patients with refractory temporal lobeepilepsy. J Neurol Neurosurg Psychiatry 2003, 74:1627-1630.
28. Jutila L, Ylinen A, Partanen K, Alafuzoff I, Mervaala E, Partanen J, Vapal-ahti M, Vainio P, Pitkanen A: MR volumetry of the entorhinal,perirhinal, and temporopolar cortices in drug-refractorytemporal lobe epilepsy. AJNR Am J Neuroradiol 2001,22:1490-1501.
29. Hogan RE, Wang L, Bertrand ME, Willmore LJ, Bucholz RD, Nassif AS,Csernansky JG: MRI-based high-dimensional hippocampalmapping in mesial temporal lobe epilepsy. Brain 2004,127:1731-1740.
30. Woermann FG, Free SL, Koepp MJ, Ashburner J, Duncan JS: Voxel-by-voxel comparison of automatically segmented cerebralgray matter – A rater-independent comparison of structuralMRI in patients with epilepsy. Neuroimage 1999, 10:373-384.
31. Lawson JA, Cook MJ, Vogrin S, Litewka L, Strong D, Bleasel AF, ByeAM: Clinical, EEG, and quantitative MRI differences in pedi-atric frontal and temporal lobe epilepsy. Neurology 2002,58:723-729.
32. Briellmann RS, Jackson GD, Kalnins R, Berkovic SF: Hemicranialvolume deficits in patients with temporal lobe epilepsy withand without hippocampal sclerosis. Epilepsia 1998,39:1174-1181.
33. Bouilleret V, Dupont S, Spelle L, Baulac M, Samson Y, Semah F: Insu-lar cortex involvement in mesiotemporal lobe epilepsy: apositron emission tomography study. Ann Neurol 2002,51:202-208.
34. Kim YK, Lee DS, Lee SK, Kim SK, Chung CK, Chang KH, Choi KY,Chung JK, Lee MC: Differential features of metabolic abnor-malities between medial and lateral temporal lobe epilepsy:quantitative analysis of (18)F-FDG PET using SPM. J Nucl Med2003, 44:1006-1012.
35. Arnold S, Schlaug G, Niemann H, Ebner A, Luders H, Witte OW,Seitz RJ: Topography of interictal glucose hypometabolism inunilateral mesiotemporal epilepsy. Neurology 1996,46:1422-1430.
36. Engel J Jr, Brown WJ, Kuhl DE, Phelps ME, Mazziotta JC, Crandall PH:Pathological findings underlying focal temporal lobehypometabolism in partial epilepsy. Ann Neurol 1982,12:518-528.
37. Chassoux F, Semah F, Bouilleret V, Landre E, Devaux B, Turak B,Nataf F, Roux FX: Metabolic changes and electro-clinical pat-terns in mesio-temporal lobe epilepsy: a correlative study.Brain 2004, 127:164-174.
38. Koutroumanidis M, Binnie CD, Elwes RD, Polkey CE, Seed P, AlarconG, Cox T, Barrington S, Marsden P, Maisey MN, Panayiotopoulos CP:Interictal regional slow activity in temporal lobe epilepsycorrelates with lateral temporal hypometabolism as imagedwith 18FDG PET: neurophysiological and metabolic implica-tions. J Neurol Neurosurg Psychiatry 1998, 65:170-176.
39. Nelissen N, van Paesschen W, Baete K, Van Laere K, Palmini A, VanBilloen H, Dupont P: Correlations of interictal FDG-PETmetabolism and ictal SPECT perfusion changes in humantemporal lobe epilepsy with hippocampal sclerosis. Neuroim-age 2006, 32:684-695.
40. Foldvary N, Lee N, Hanson MW, Coleman RE, Hulette CM, FriedmanAH, Bej MD, Radtke RA: Correlation of hippocampal neuronaldensity and FDG-PET in mesial temporal lobe epilepsy. Epi-lepsia 1999, 40:26-29.
41. Matheja P, Kuwert T, Ludemann P, Weckesser M, Kellinghaus C,Schuierer G, Diehl B, Ringelstein EB, Schober O: Temporalhypometabolism at the onset of cryptogenic temporal lobeepilepsy. Eur J Nucl Med 2001, 28:625-632.
42. Theodore WH, Kelley K, Toczek MT, Gaillard WD: Epilepsy dura-tion, febrile seizures, and cerebral glucose metabolism. Epi-lepsia 2004, 45:276-279.
43. Spanaki MV, Kopylev L, Liow K, DeCarli C, Fazilat S, Gaillard WD,Theodore WH: Relationship of seizure frequency to hippoc-ampus volume and metabolism in temporal lobe epilepsy.Epilepsia 2000, 41:1227-1229.
44. Dlugos DJ, Jaggi J, O'Connor WM, Ding XS, Reivich M, O'Connor MJ,Sperling MR: Hippocampal cell density and subcortical metab-olism in temporal lobe epilepsy. Epilepsia 1999, 40:408-413.
45. Theodore WH, Gaillard WD, De Carli C, Bhatia S, Hatta J: Hippoc-ampal volume and glucose metabolism in temporal lobe epi-leptic foci. Epilepsia 2001, 42:130-132.
46. Vinton AB, Carne R, Hicks RJ, Desmond PM, Kilpatrick C, Kaye AH,O'Brien TJ: The extent of resection of FDG-PET hypometab-olism relates to outcome of temporal lobectomy. Brain 2007,130(Pt 2):548-60.
Pre-publication historyThe pre-publication history for this paper can be accessedhere:
http://www.biomedcentral.com/1471-2377/7/16/prepub
Page 13 of 13(page number not for citation purposes)


