Embed Size (px)
Citation preview
23nd INTERNATIONAL SCIENTIFIC AND TECHNICALCONFERENCE ON TRANSPORT, ROAD-BUILDING,
AGRICULTURAL, HOISTING & HAULING ANDMILITARY TECHNICS AND TECHNOLOGIES
ORGANIZERSCIENTIFIC-TECHNICALUNION OF MECHANICALENGINEERINGInternal combustion engineAutomobiles, tractors and motor trucks, Material handling,Equipment, Logistics
24-27.06.2015 VARNA, BULGARIA
PROCEEDINGS VOL 3
MOTAUTO ‘15trans &
SCIENTIFIC TECHNICAL UNION OF MECHANICAL ENGINEERING
YEAR XXIII ISSUE 14 (177) JUNE 2015.
XXIII INTERNATIONAL SCIENTIFIC-TECHNICAL CONFERENCE
ttrraannss && MMOOTTAAUUTTOO ’’1155
PROCEEDINGS
SECTION III TRANSPORT. SAFETY AND ECOLOGY.
LOGISTICS AND MANAGEMENT. EDUCATION THEORY
24-27.06.2015 Varna Bulgaria
Publisher: Scientific-technical union of mechanical engineering ISSN: 1310 – 3946
CONTENTS METHODOLOGY OF TICKET MACHINE DESIGNING IN PASSENGERRAILWAYS VEHICLES Ing. Ponický J. , Ing. Zitrický V. PhD., doc. Ing. Kendra M. PhD. ..................................................................................................................... 4 ELECTRIC MOBILITY IN THE BALTICS Prof. Berjoza D. Dr. sc. ing., Asoc. prof. Jurgena I. Dr. oec. ............................................................................................................................... 8 AN ONLINE MEASUREMENT SYSTEM OF TRANSPORTATION SAFETY AND COMFORT Prof. M.Sc. Dogruel M. PhD. ............................................................................................................................................................................. 11 PARAMETRIC ANALYSIS OF THE SHIP CAPSIZE PROBLEM Assoc. Prof. Dr. Deleanu D. ............................................................................................................................................................................... 15 ON APPROXIMATING THE PERIODIC SOLUTIONS OF CAPSIZE EQUATION Assoc. Prof. Dr. Deleanu D. ............................................................................................................................................................................... 18 THERMAL COMFORT ASSESSMENT USING HUMAN SUBJECTS PhD Student Danca P., Lecturer PhD Vartires A. .............................................................................................................................................. 22 TRANSIT ROUTES FOR TRANSPORTATION OF DANGEROUS GOODS IN THE CITY OF BRATISLAVA Ing. Vrabel, J., PhD., doc. Ing. Jagelcak, J.,PhD., Ing. Sarkan, B., PhD., Ing. Skrucany, T., PaedDr. Seliga, A.,PhD. .................................... 26 EVALUATION OF AIRCRAFT PASSENGER CABIN FIRE SAFETY AND MEASURES FOR IMPROVEMENT Leonid Vinogradov Master Sc. Eng., Yuri Sologubov, Master Sc. Eng ............................................................................................................ 30 TECHNOLOGICAL STRUCTURE OF OPERATIONAL FILES IN REGIONAL BUS TRANSPORT FOR THE NEEDS OF THE TENDER FOR CARRIERS Ing. Vít Janoš, Ph.D., Ing. Karel Baudyš, Ph.D. ................................................................................................................................................ 33 EKOMPAKT, A NEW TECHNOLOGY FOR OBTAINING ENERGY FROM BIOMASS Prof. DSc. PhD. Lech J. Sitnik, PhD. Anna Janicka, PhD. WojciechWalkowiak, PhD. RadoslawWrobel, PhD. MSc. Monika Andrych ....... 37 ACTUAL ACCELERATION, VELOCITY AND TRAVELED DISTANCE PROFILES OF VEHICLES IN URBAN ENVIRONMENT AS DOMINANT MICROSCOPIC TRAFFIC FLOW PARAMETERS Ass. Prof. Aleksandar Kostikj, PhD, Prof. Milan Kjosevski, PhD, Prof. Ljupcho Kocarev, PhD ..................................................................... 40 IMPROVING THE EFFICIENCY off-line HEAT PUMP SYSTEM FOR HEATING RURAL HOUSE IN THE COLD DAYS Ass.Prof. Sydykov Sh., Ass.Prof. Umbetkulov E., Dr.PhD Аlibek N. .............................................................................................................. 45 ИЗМЕРВАНЕ И ЕКОЛОГИЧЕН КОНТРОЛ НА ЗАМЪРСЯВАНЕТО НА АТМОСФЕРАТА С ТОКСИЧНИ АЗОТНИ ОКИСИ TOXIC NITROGEN OXIDES. Инж. – физик Ташев В., Гл. асистент Манев А. ............................................................................................................................................ 49 PROSPECTS FOR THE DEVELOPMENT OF IMPORTED FOREST MACHINES MAINTENANCE IN THE RUSSIAN FEDERATION Prof. Dr. Eng. Shilovsky V., Prof. Dr. Eng. Pitukhin A., Ass. prof. Dr. Eng. Kostyukevich V. ....................................................................... 53 IMPORTANCE OF TRAFFIC SAFETY AND ENVIRONMENTAL PROTECTION IN SERBIA Associate prof. Dr Tomić-Petrović N. ................................................................................................................................................................ 56 USAGE OF FESTO SIMULATOR FOR MARINE SYSTEMS eng.M.Vasilev, phd ............................................................................................................................................................................................. 59 CHALLENGES OF BLENDED LEARNING Prof. M.Sc. Marunić G. PhD., M.Sc. Glažar V. PhD. ........................................................................................................................................ 61 INNOVATIVE APPROACH TO THE SERVICE QUALITY IN RAILWAY FREIGHT TRANSPORT doc. Ing. Eva Nedeliaková, PhD.1, Ing. Jana Sekulová 1, Ing. Ivan Nedeliak, PhD. ........................................................................................ 65 EVALUATION OF THE EFFECTIVENESS OF LIBERALIZATION OF THE RAIL FREIGHT MARKET IN SLOVAKIA assoc. prof. Ing. Anna Dolinayová, PhD. Ing. Juraj Kanis. ................................................................................................................................ 67 DETERMINE THE OPTIMAL ROUTE OF THE ROUTING OF THE SINGLE WAGONS METHOD CPM ON THE NETWORK ŽSR doc. Ing. Dolinayová A. PhD.1, Ing. Ľoch M. ................................................................................................................................................... 71 MODERN METHODS FOR THE TEACHING OF VEHICLES CONTROL AND DIAGNOSTICS SYSTEMS M.Sc. Dižo J. PhD., M.Sc. Galliková J. PhD., M.Sc. Blatnický M. PhD., Assoc. prof. M.Sc. Dalibor Barta, PhD. ........................................ 75 INTERNET AND SEO METHODS BY ROAD TRANSPORT BUSINESS

RNDr. Knutelská M. PhD., RNDr. Šusteková D. PhD. ..................................................................................................................................... 79 CARPOOLING AS A MEASURE FOR ACHIEVING SUSTAINABLE URBAN MOBILITY: EUROPEAN GOOD PRACTICE EXAMPLES MSc.Eng. Parezanović T., Petrović M. PhD., Bojković N. PhD., Prof. Pejčić Tarle S. PhD. ........................................................................... 82 DETERMINATION OF OIL SPILL PARAMETERS IN THE PROCESS OF OIL AND OIL PRODUCTS SPREADING ON THE WATER SURFACE Dr. eng.Tsetskhladze R., Assoc.Prof. Chogovadze J., Assoc.Prof. Lomidze A., Assoc.Prof. Mardaleishvili N. .............................................. 86 A MOBILE APPLIKATION OF REGIONAL TOURIST ROUTES Prof. Dr.Tsiramua S.,Prof. Dr. Kochadze T.,Assoc.Prof. Dr. Chogovadze D.,Assoc.Prof. Dr.Dangadze I. ..................................................... 89 HOW IS THE ARTIFICIAL INTELLIGENCE USED IN APPLICATIONS FOR TRAFFIC MANAGEMENT RNDr. Šusteková D. PhD., RNDr. Knutelská M. PhD. ..................................................................................................................................... 91 ANALYZING AND MODELING THE IMPACT OF TRANSPORT SERVICE RELIABILITY ON PASSENGERS BEHAVIOR Silviya Krasteva .................................................................................................................................................................................................. 95 БЕЗОПАСНОСТ НА ЕЛЕКТРОМОБИЛИТЕ Assoс. Prof. Eng. Dragneva N. PhD, .................................................................................................................................................................. 99 EQUIPMENT OPTIMIZATION IN REGIONAL AGRICULTURAL LOGISTICS CENTERS Prof.Dr. Botsvadze L., Doctoral candidate Sharabidze D. ............................................................................................................................... 102 THE ROLE OF BATUMI STATE MARITIME ACADEMY IN TRAINING OF THE FUTURE SEAFARERS IN ACCORDANCE WITH THE MODERN REQUIREMENTS Dr. Eng. Tsetskhladze M., Prof. Dr. Kochadze T. ............................................................................................................................................ 104 IMPORTANSE OF MERCHANT FLIIT IN COUNTRY TRANSPORT INFRASTRUCTURE IMPROVEMENT Prof. Dr. Gogiashvili F., Doctoral candidate Dolidze I., .................................................................................................................................. 106 ВЪЗМОЖНОСТИ ЗА ПРИЛОЖЕНИЕ НА ИЗКУСТВЕНИ НЕВРОННИ МРЕЖИ (ИНМ) ПРИ ТРАНСПОРТНОТО ПЛАНИРАНЕ ас.маг.инж. Беров Т. ....................................................................................................................................................................................... 108 STUDYING OF SOIL SURFACE SUBSIDENCE UPON LONG LENGTH UNDERGROUND PIPELINES PENETRATION Prof. Dr. Eng. Janat Musayev, PhD. Algazy.Zhauyt ........................................................................................................................................ 112 THE PROVIDING OF THE POWER SAVING CONTROL OF ONE OUTPUT VALUE WITH TWO CONTROLLING CHANNELS HAVING DIFFERENTEFFECTIVENESS AND COST OF THE CONTROLLING RESOURCE Prof. Zhmud V., PhD., Prof. Dimitrov L., PhD. ............................................................................................................................................... 118 АНАЛИЗ НА ТЕХНОЛОГИЧНИТЕ РИСКОВЕ ПРИ ИЗГРАЖДАНЕ НА СИЛОЗ С ПЪЛЗЯЩ КОФРАЖ д-р инж. Владкова Бл., д-р инж. Крилчев Ал. , д-р инж. Хутов Ил., доц. Лилов Ил., инж. Пенков Сп. ................................................ 123 BLAST LOADING ON STRUCTURES FROM THE EXPLOSIONS NEAR THE GROUND SURFACE M.Sc. Hutov I. PhD., Assoc. Prof. M.Sc. Ganev R. PhD., M.Sc. Petkov Y. ................................................................................................... 127 STUDY OF THE DEVELOPMENT OF THE STRUCTURE OF THE NETWORK OF SOFIA SUBWAY Assoc. Prof. PhD Stoilova S., MSc. eng. Stoev V. ........................................................................................................................................... 131 QUALITY MANAGEMENT SYSTEM IN PUBLIC TRANSPORT OF PERSONS ACCORDING TO ISO 9001:2008 economist eng. doctorand Bratu V., Ph.D. Prof. Boroiu A., eng. doctorand A. A. Boroiu ............................................................................. 139 ENVIRONMENTAL MANAGEMENT SYSTEM REQUIREMENTS IN PUBLIC PASSENGER TRANSPORT ISO 14001 : 2004 economist eng. doctorand Bratu V., associate professor Mitran G. ................................................................................................................. 141 SYSTEM REQUIREMENTS FOR SAFETY AND HEALTH MANAGEMENT AT WORK IN THE PUBLIC PASSENGER TRANSPORT UNDER OHSAS 18001 :2007 economist eng. doctorand Bratu V., associate professor Neagu E., Ph.D. Prof. Nicolae V. E. ....................................................................... 143 INTERNATIONAL TRANSPORT PROJECTS AND ECOSYSTEM OF BLACK SEA Prof. Dr. Gogiashvili F., Prof. Dr. Mamuladze R., Doctoral candidate Baramidze M. ................................................................................... 146 RESEARCH RESULTS OF ENERGY EFFICIENT VENTILATION SYSTEM OF SHEEPFOLD M. ISSAKHANOV, N. ALIBEK, T. DYUSENBAYEV, M. ISSAKHANOV, Candidate of Technical Sciences, Professor, N. ALIBEK, PhD, T. DYUSENBAYEV, engineer ........................................................................................................................................................................ 148 STUDY OF THE EFFECT OF TRIM ON SHIP POWERING PERFORMANCE VASILEVA Alexandrina ................................................................................................................................................................................. 151
METHODOLOGY OF TICKET MACHINE DESIGNING IN PASSENGER RAILWAYS VEHICLES
Ing. Ponický J. 1, Ing. Zitrický V. PhD. 1, doc. Ing. Kendra M. PhD. 1
University of Žilina, The Faculty of Operation and Economics of Transport and Communications, Department of Railway Transport, Univerzitná 1, 010 26 Žilina, Slovakia1
[email protected], [email protected], [email protected]
Abstract: The task of integrated transport system in passenger transport is connection between their other modes. One part of implementation of integrated transport system is set up the ticketing system for validation. This problem can solving by the ticket machines and their location. When ticket machines are located in vehicle, we create conditions for Self-Service System in public transport.
The paper is focused on the description of factors, which influences number of ticket markers in railway passenger vehicles. For example these factors is circulation time of vehicles, transport distance, travel speed and etc. One part of paper includes the methodology of calculation the ticket markers for rail passenger vehicles.
KEYWORDS: INTEGRATED TRANSPORT SYSTEM, MARKING MACHINE, THE SELF-SERVICE SYSTEM, TRANSPORT TICKET VALIDATION
1. Introduction Integrated transport system (ITS) allows passengers to use one
ticket by travelling with all transport modes in integrated area. The important question by the ITS is to solve problems with service system of passengers. Service system of passenger can be in several forms. One of the ways to ensure passenger expedition is located the ticket machines to vehicles. When ticket machines are located in vehicle, we create conditions for Self-Service System in public transport. Carrier has not ensured a conductor that will be validating the travel ticket. When carrier is using Self-Service system, passenger must validate the travel ticket in ticket machines after entry into the vehicle. The advantage for carrier, which is using of Self-Service system, is low economic burden (personal costs).
2. Self-Service system One form of Self-Service system is based on the location of
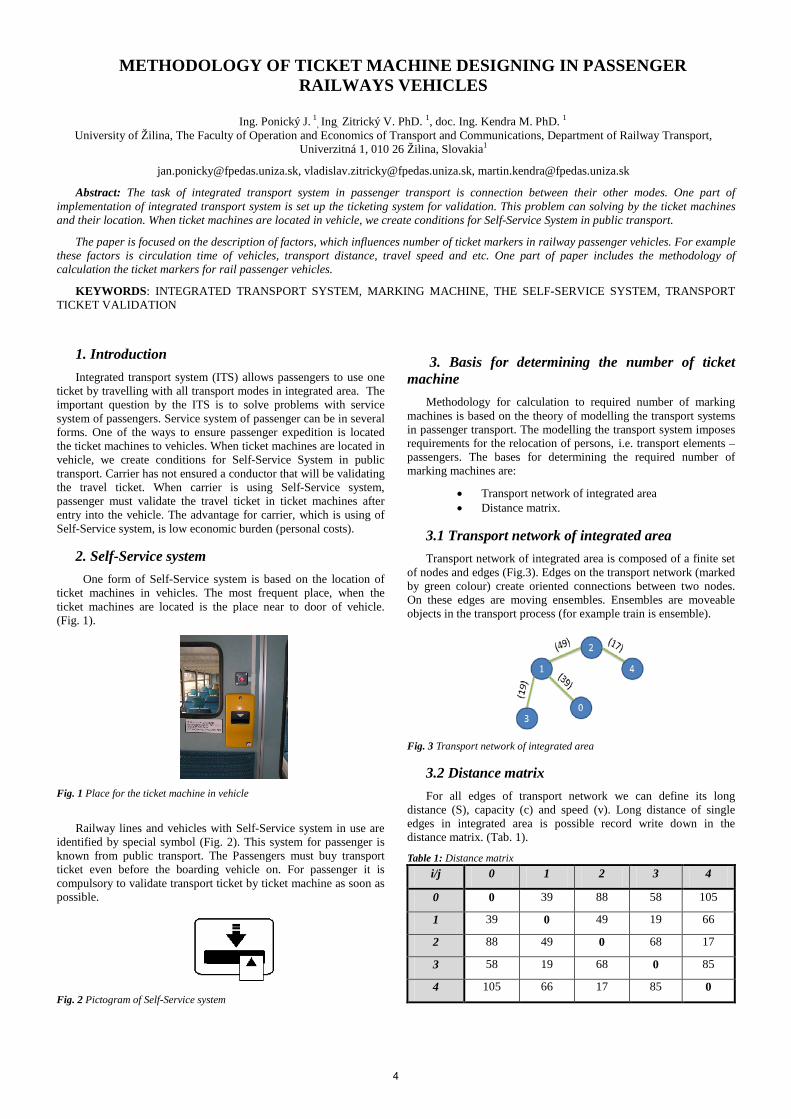
ticket machines in vehicles. The most frequent place, when the ticket machines are located is the place near to door of vehicle. (Fig. 1).
Fig. 1 Place for the ticket machine in vehicle
Railway lines and vehicles with Self-Service system in use are identified by special symbol (Fig. 2). This system for passenger is known from public transport. The Passengers must buy transport ticket even before the boarding vehicle on. For passenger it is compulsory to validate transport ticket by ticket machine as soon as possible.
Fig. 2 Pictogram of Self-Service system
3. Basis for determining the number of ticket machine
Methodology for calculation to required number of marking machines is based on the theory of modelling the transport systems in passenger transport. The modelling the transport system imposes requirements for the relocation of persons, i.e. transport elements – passengers. The bases for determining the required number of marking machines are:
• Transport network of integrated area • Distance matrix.
3.1 Transport network of integrated area Transport network of integrated area is composed of a finite set
of nodes and edges (Fig.3). Edges on the transport network (marked by green colour) create oriented connections between two nodes. On these edges are moving ensembles. Ensembles are moveable objects in the transport process (for example train is ensemble).
Fig. 3 Transport network of integrated area
3.2 Distance matrix For all edges of transport network we can define its long
distance (S), capacity (c) and speed (v). Long distance of single edges in integrated area is possible record write down in the distance matrix. (Tab. 1).
Table 1: Distance matrix i/j 0 1 2 3 4
0 0 39 88 58 105
1 39 0 49 19 66
2 88 49 0 68 17
3 58 19 68 0 85
4 105 66 17 85 0
4
4. The calculation the required number of marking machines
The exact number of marking machines, which will be equipped ensembles in the integrated area, depends on the following factors:
• the design of the door on the set, • composition sets (train composition), • the number of sets.
4.1 The design of the door on the set Set is a dose (rail vehicle) that is creating by the defining
rules. When replenish a dose with appointed objects, we are create the ensemble.
The technical design of the door on the set affects the number of marking machines, which are located near the door. Also type of transport influences the technical solution of door on the vehicle.
Technical solution of used doors can be divided:
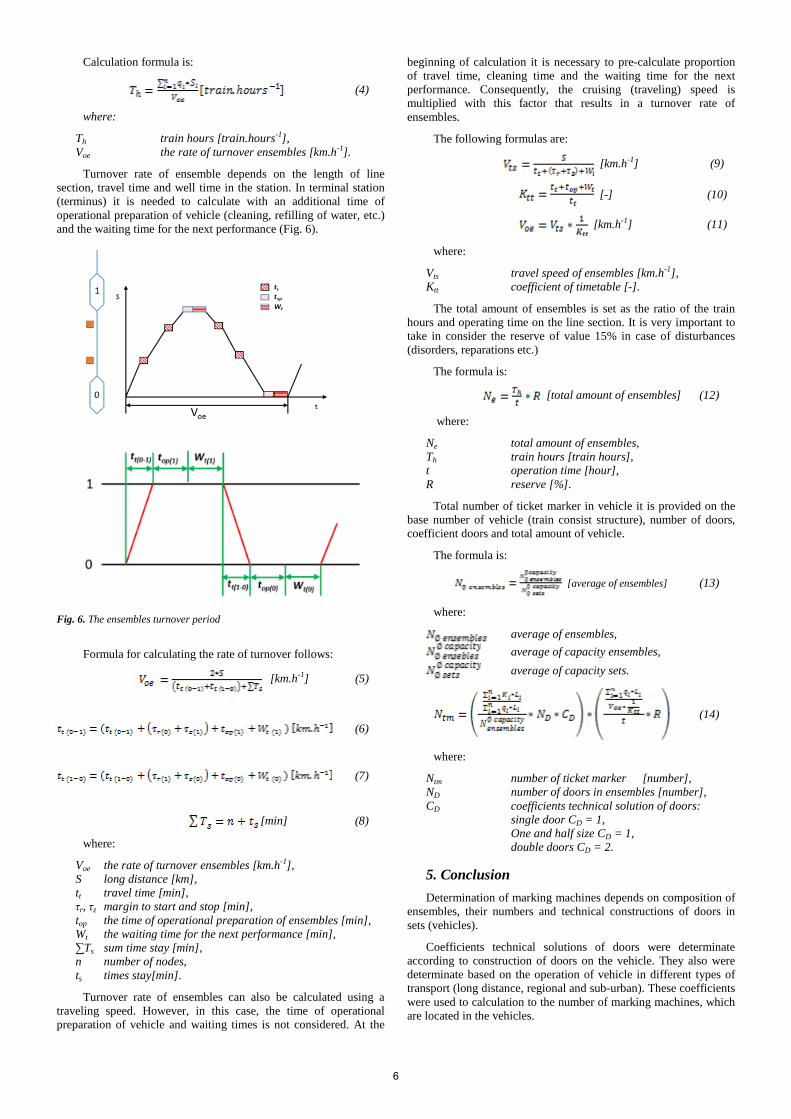
• single door (Fig. 4) – simple wing with basic (standard) width,
• one and half size – simple wing (wider single doors),
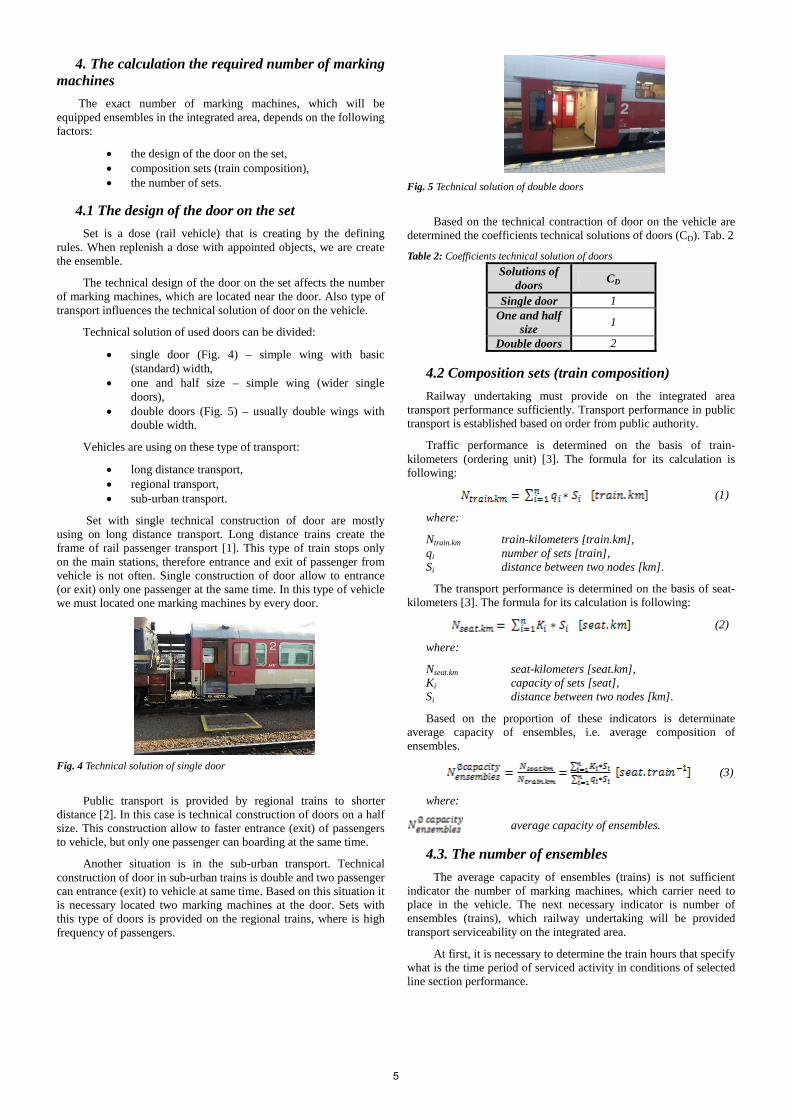
• double doors (Fig. 5) – usually double wings with double width.
Vehicles are using on these type of transport:
• long distance transport, • regional transport, • sub-urban transport.
Set with single technical construction of door are mostly using on long distance transport. Long distance trains create the frame of rail passenger transport [1]. This type of train stops only on the main stations, therefore entrance and exit of passenger from vehicle is not often. Single construction of door allow to entrance (or exit) only one passenger at the same time. In this type of vehicle we must located one marking machines by every door.
Fig. 4 Technical solution of single door
Public transport is provided by regional trains to shorter distance [2]. In this case is technical construction of doors on a half size. This construction allow to faster entrance (exit) of passengers to vehicle, but only one passenger can boarding at the same time.
Another situation is in the sub-urban transport. Technical construction of door in sub-urban trains is double and two passenger can entrance (exit) to vehicle at same time. Based on this situation it is necessary located two marking machines at the door. Sets with this type of doors is provided on the regional trains, where is high frequency of passengers.
Fig. 5 Technical solution of double doors
Based on the technical contraction of door on the vehicle are determined the coefficients technical solutions of doors (CD). Tab. 2
Table 2: Coefficients technical solution of doors Solutions of
doors CD
Single door 1 One and half
size 1
Double doors 2
4.2 Composition sets (train composition) Railway undertaking must provide on the integrated area
transport performance sufficiently. Transport performance in public transport is established based on order from public authority.
Traffic performance is determined on the basis of train-kilometers (ordering unit) [3]. The formula for its calculation is following:
(1)
where:
Ntrain.km train-kilometers [train.km], qi number of sets [train], Si distance between two nodes [km].
The transport performance is determined on the basis of seat-kilometers [3]. The formula for its calculation is following:
(2)
where:
Nseat.km seat-kilometers [seat.km], Ki capacity of sets [seat], Si distance between two nodes [km].
Based on the proportion of these indicators is determinate average capacity of ensembles, i.e. average composition of ensembles.
(3)
where:
average capacity of ensembles.
4.3. The number of ensembles The average capacity of ensembles (trains) is not sufficient
indicator the number of marking machines, which carrier need to place in the vehicle. The next necessary indicator is number of ensembles (trains), which railway undertaking will be provided transport serviceability on the integrated area.
At first, it is necessary to determine the train hours that specify what is the time period of serviced activity in conditions of selected line section performance.
5
Calculation formula is:
(4)
where:
Th train hours [train.hours-1], Voe the rate of turnover ensembles [km.h-1].
Turnover rate of ensemble depends on the length of line section, travel time and well time in the station. In terminal station (terminus) it is needed to calculate with an additional time of operational preparation of vehicle (cleaning, refilling of water, etc.) and the waiting time for the next performance (Fig. 6).
Fig. 6. The ensembles turnover period
Formula for calculating the rate of turnover follows:
[km.h-1] (5)
(6)
(7)
[min] (8)
where:
Voe the rate of turnover ensembles [km.h-1], S long distance [km], tt travel time [min], τr, τz margin to start and stop [min], top the time of operational preparation of ensembles [min], Wt the waiting time for the next performance [min], ∑Ts sum time stay [min], n number of nodes, ts times stay[min].
Turnover rate of ensembles can also be calculated using a traveling speed. However, in this case, the time of operational preparation of vehicle and waiting times is not considered. At the
beginning of calculation it is necessary to pre-calculate proportion of travel time, cleaning time and the waiting time for the next performance. Consequently, the cruising (traveling) speed is multiplied with this factor that results in a turnover rate of ensembles.
The following formulas are:
[km.h-1] (9)
[-] (10)
[km.h-1] (11)
where:
Vts travel speed of ensembles [km.h-1], Ktt coefficient of timetable [-].
The total amount of ensembles is set as the ratio of the train hours and operating time on the line section. It is very important to take in consider the reserve of value 15% in case of disturbances (disorders, reparations etc.)
The formula is:
[total amount of ensembles] (12)
where:
Ne total amount of ensembles, Th train hours [train hours], t operation time [hour], R reserve [%].
Total number of ticket marker in vehicle it is provided on the base number of vehicle (train consist structure), number of doors, coefficient doors and total amount of vehicle.
The formula is:
[average of ensembles] (13)
where:
average of ensembles, average of capacity ensembles, average of capacity sets.
(14)
where:
Ntm number of ticket marker [number], ND number of doors in ensembles [number], CD coefficients technical solution of doors: single door CD = 1, One and half size CD = 1, double doors CD = 2.
5. Conclusion Determination of marking machines depends on composition of
ensembles, their numbers and technical constructions of doors in sets (vehicles).
Coefficients technical solutions of doors were determinate according to construction of doors on the vehicle. They also were determinate based on the operation of vehicle in different types of transport (long distance, regional and sub-urban). These coefficients were used to calculation to the number of marking machines, which are located in the vehicles.
6

Carrier is obliged to provide transport performance based on the order by public authority, with own ensembles (vehicles), on the whole integrated area. Proportion of these values (based on train and seat kilometres) gives the average capacity of the ensembles (trains).
The number of ensembles (trains) is based on the train hours and return speed of set. These values determines of time period transport serviceability of the territory. Faster transport serviceability of the integrated area we achieve with increasing of return speed of sets.
Acknowledgement The paper is supported by the KEGA č. 026ŽU-4/2015
Innovative approaches in system of teaching management in the study program Railway transport with a focus on application the dynamic quality models in the railway transport.
References [1]Knižka, J. a kol.: Základy železničnej dopravnej prevádzky,
page 63, ISBN 978 – 80 – 554 – 0120 – 1
[2] Knižka, J. a kol.: Základy železničnej dopravnej prevádzky, page 64, ISBN 978 – 80 – 554 – 0120 - 1
7
ELECTRIC MOBILITY IN THE BALTICS
Prof. Berjoza D. Dr. sc. ing.1, Asoc. prof. Jurgena I. Dr. oec.2
Faculty of Engineering - Latvia University of Agriculture [email protected]
Faculty of Economics and Social Development - Latvia University of Agriculture [email protected]
Abstract: The Baltic States have no fuel resources needed for internal combustion engines. Oil products are imported. Internal combustion automobiles make a negative effect on the surrounding environment, as they produce toxic emissions and noises. One of the ways how to use electric energy – a resource produced in the Baltic States – is the exploitation of electric vehicles. The use of electric vehicles in the Baltic States began in 2010. Since this year, the best infrastructures for electric vehicles and their charging have been created in Estonia. The paper analyses the quantitative and qualitative specifics of electric vehicles and their infrastructures in the Baltic States as well as reviews the development prospects.
Keywords: ELECTRIC VEHICLES, CHARGING POINTS, ALGORITHM OF CALCULATION, NUMBER OF CHARGING STATIONS, NUMBER OF ELECTRIC VEHICLES
1. Introduction At present, electric vehicles of several kinds are exploited in the
Baltic States. Electric bicycles were among the first electric vehicles to appear in the market. Initially, electric bicycles used lead-gel batteries. Over the past three years, lithium-ion batteries were also used, yet, such a structure raises the cost of a bicycle by 30-35%. Compared with other electric vehicles, electric bicycles have significant advantages, for example, comparatively low prices and exploitation costs as well as a possibility to continue riding by pedalling if their batteries are discharged. Bicycles belong to the group of electric vehicles that can be relatively easily and cheaply converted into electric vehicles, using a standard electric bicycle conversion kit.
The firm Impresso which sells low-speed electric vehicles operates in Latvia since 2007 [1]. The speed of low-speed electric vehicles is within a range of 25-45 km/h, and a few modifications of them may participate in road traffic. Low-speed electric vehicles are used on golf courses and in other closed territories, for example, in sea ports and in the territory of Latvia’s Children’s Hospital. Such vehicles are mainly used for tourist tours in the towns of Sigulda and Jurmala.
The year 2010 may be regarded as the year when the use of electric vehicles was begun in the Baltic States; the exploitation of converted electric vehicles was started in Lithuania and Estonia. In 2011, two Fiat Fiorino electric vehicles were begun to be used in Latvia [2]. These vehicles were the first mass-production electric automobiles that were registered for road traffic in Latvia. In 2011, a charging infrastructure began developing in the Baltic States as well. Due to the fact that serious electric mobility involves the introduction of passenger electric vehicles, the paper will analyse in detail particularly this kind of electric mobility.
2. Aspects of electric mobility In order to provide electric mobility, first of all, electric vehicles
are necessary. Charging stations or other kinds of charging devices, sales of electric vehicles and their spare parts, technical support and repairs contribute to a wider use of electric vehicles. With electric vehicles developing, such vehicles are used for passenger transport, in agriculture and for water and air transport.
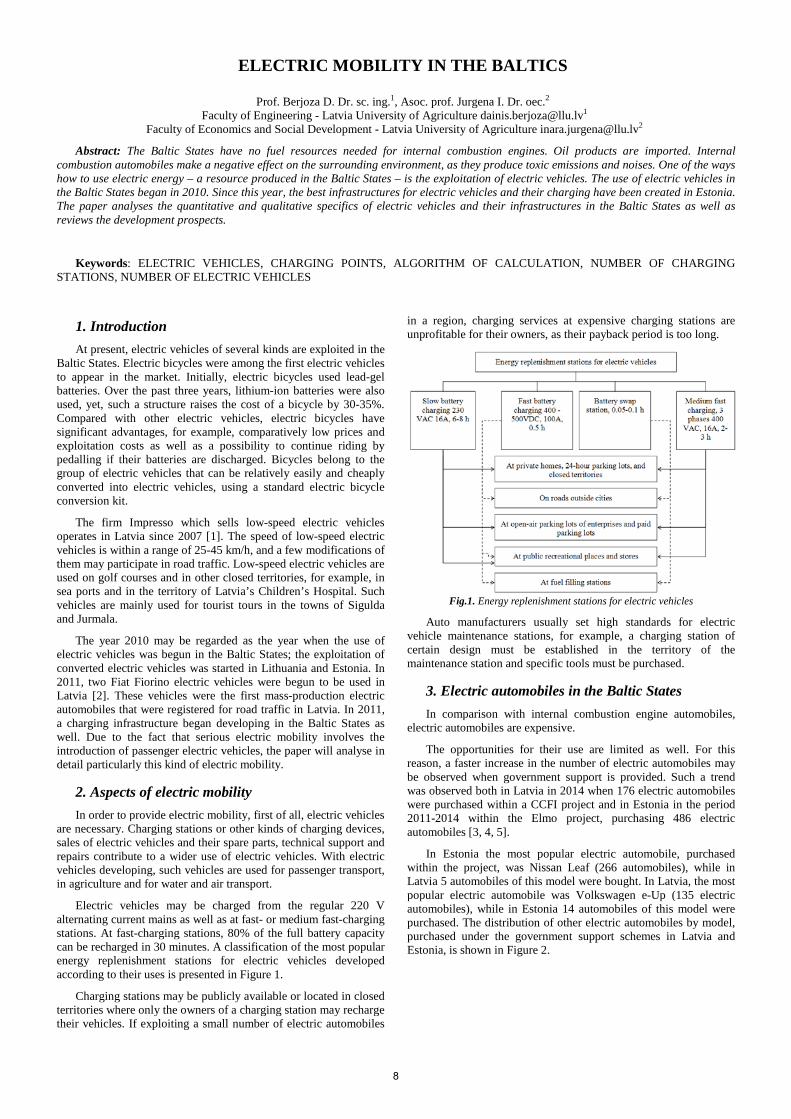
Electric vehicles may be charged from the regular 220 V alternating current mains as well as at fast- or medium fast-charging stations. At fast-charging stations, 80% of the full battery capacity can be recharged in 30 minutes. A classification of the most popular energy replenishment stations for electric vehicles developed according to their uses is presented in Figure 1.
Charging stations may be publicly available or located in closed territories where only the owners of a charging station may recharge their vehicles. If exploiting a small number of electric automobiles
in a region, charging services at expensive charging stations are unprofitable for their owners, as their payback period is too long.
Fig.1. Energy replenishment stations for electric vehicles
Auto manufacturers usually set high standards for electric vehicle maintenance stations, for example, a charging station of certain design must be established in the territory of the maintenance station and specific tools must be purchased.
3. Electric automobiles in the Baltic States In comparison with internal combustion engine automobiles,
electric automobiles are expensive.
The opportunities for their use are limited as well. For this reason, a faster increase in the number of electric automobiles may be observed when government support is provided. Such a trend was observed both in Latvia in 2014 when 176 electric automobiles were purchased within a CCFI project and in Estonia in the period 2011-2014 within the Elmo project, purchasing 486 electric automobiles [3, 4, 5].
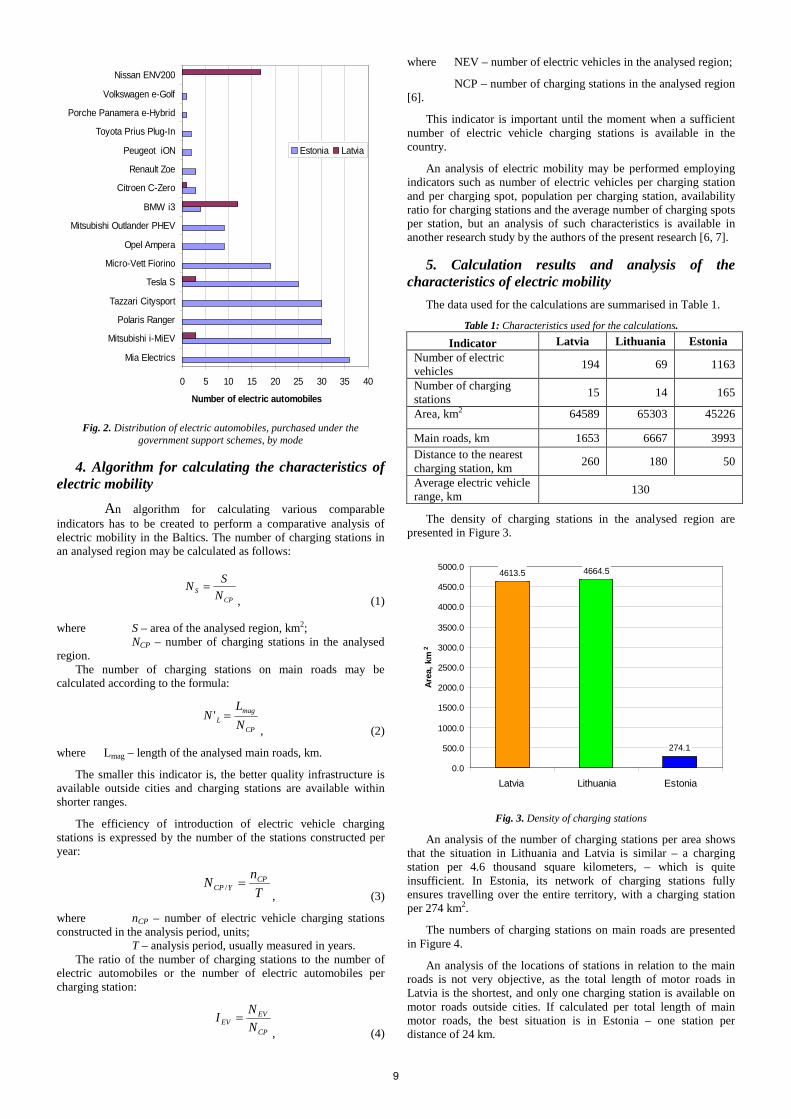
In Estonia the most popular electric automobile, purchased within the project, was Nissan Leaf (266 automobiles), while in Latvia 5 automobiles of this model were bought. In Latvia, the most popular electric automobile was Volkswagen e-Up (135 electric automobiles), while in Estonia 14 automobiles of this model were purchased. The distribution of other electric automobiles by model, purchased under the government support schemes in Latvia and Estonia, is shown in Figure 2.
8
0 5 10 15 20 25 30 35 40
Mia Electrics
Mitsubishi i-MiEV
Polaris Ranger
Tazzari Citysport
Tesla S
Micro-Vett Fiorino
Opel Ampera
Mitsubishi Outlander PHEV
BMW i3
Citroen C-Zero
Renault Zoe
Peugeot iON
Toyota Prius Plug-In
Porche Panamera e-Hybrid
Volkswagen e-Golf
Nissan ENV200
Number of electric automobiles
Estonia Latvia
Fig. 2. Distribution of electric automobiles, purchased under the
government support schemes, by mode
4. Algorithm for calculating the characteristics of electric mobility
An algorithm for calculating various comparable indicators has to be created to perform a comparative analysis of electric mobility in the Baltics. The number of charging stations in an analysed region may be calculated as follows:
CPS N
SN =, (1)
where S – area of the analysed region, km2; NCP – number of charging stations in the analysed
region. The number of charging stations on main roads may be
calculated according to the formula:
CP
magL N
LN ='
, (2)
where Lmag – length of the analysed main roads, km.
The smaller this indicator is, the better quality infrastructure is available outside cities and charging stations are available within shorter ranges.
The efficiency of introduction of electric vehicle charging stations is expressed by the number of the stations constructed per year:
TnN CP
YCP =/, (3)
where nCP – number of electric vehicle charging stations constructed in the analysis period, units;
T – analysis period, usually measured in years. The ratio of the number of charging stations to the number of
electric automobiles or the number of electric automobiles per charging station:
CP
EVEV N
NI =, (4)
where NEV – number of electric vehicles in the analysed region;
NCP – number of charging stations in the analysed region [6].
This indicator is important until the moment when a sufficient number of electric vehicle charging stations is available in the country.
An analysis of electric mobility may be performed employing indicators such as number of electric vehicles per charging station and per charging spot, population per charging station, availability ratio for charging stations and the average number of charging spots per station, but an analysis of such characteristics is available in another research study by the authors of the present research [6, 7].
5. Calculation results and analysis of the characteristics of electric mobility
The data used for the calculations are summarised in Table 1.
Table 1: Characteristics used for the calculations.
Indicator Latvia Lithuania Estonia Number of electric vehicles 194 69 1163
Number of charging stations 15 14 165
Area, km2 64589 65303 45226
Main roads, km 1653 6667 3993 Distance to the nearest charging station, km 260 180 50
Average electric vehicle range, km 130
The density of charging stations in the analysed region are presented in Figure 3.
4613.5 4664.5
274.1
0.0
500.0
1000.0
1500.0
2000.0
2500.0
3000.0
3500.0
4000.0
4500.0
5000.0
Latvia Lithuania Estonia
Area
, km
2
Fig. 3. Density of charging stations
An analysis of the number of charging stations per area shows that the situation in Lithuania and Latvia is similar – a charging station per 4.6 thousand square kilometers, – which is quite insufficient. In Estonia, its network of charging stations fully ensures travelling over the entire territory, with a charging station per 274 km2.
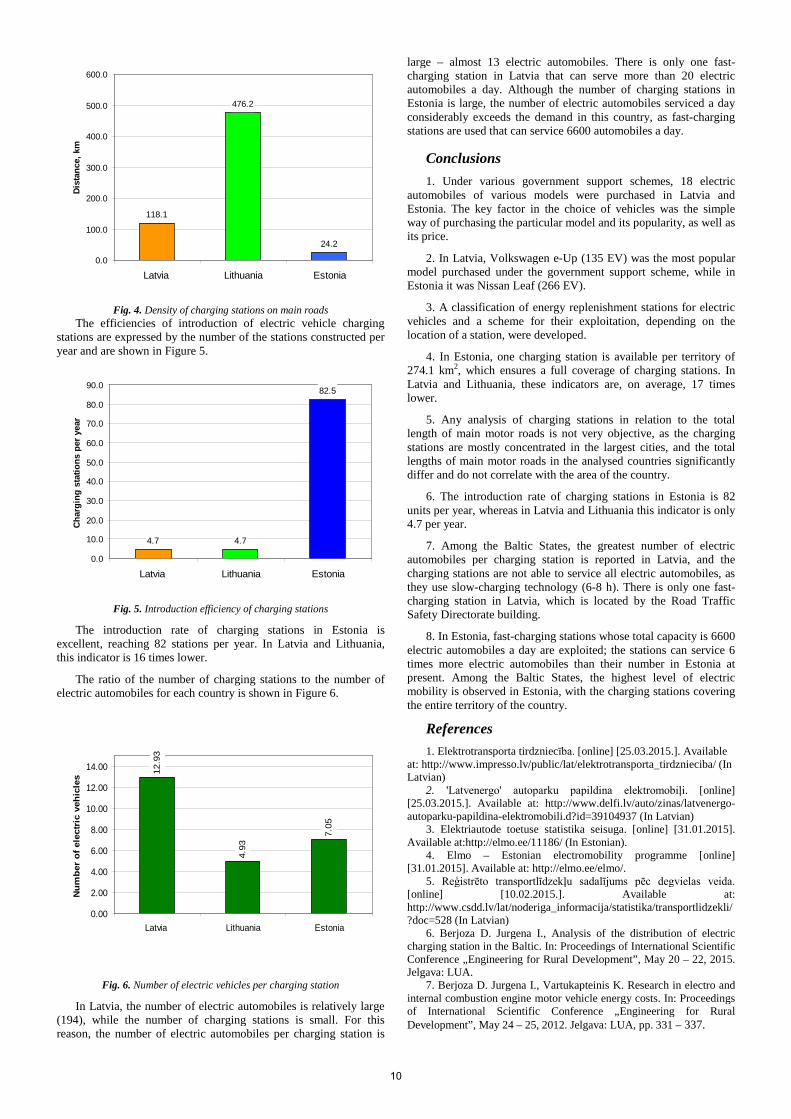
The numbers of charging stations on main roads are presented in Figure 4.
An analysis of the locations of stations in relation to the main roads is not very objective, as the total length of motor roads in Latvia is the shortest, and only one charging station is available on motor roads outside cities. If calculated per total length of main motor roads, the best situation is in Estonia – one station per distance of 24 km.
9
118.1
476.2
24.2
0.0
100.0
200.0
300.0
400.0
500.0
600.0
Latvia Lithuania Estonia
Dist
ance
, km
Fig. 4. Density of charging stations on main roads
The efficiencies of introduction of electric vehicle charging stations are expressed by the number of the stations constructed per year and are shown in Figure 5.
4.7 4.7
82.5
0.0
10.0
20.0
30.0
40.0
50.0
60.0
70.0
80.0
90.0
Latvia Lithuania Estonia
Char
ging
sta
tions
per
yea
r
Fig. 5. Introduction efficiency of charging stations
The introduction rate of charging stations in Estonia is excellent, reaching 82 stations per year. In Latvia and Lithuania, this indicator is 16 times lower.
The ratio of the number of charging stations to the number of electric automobiles for each country is shown in Figure 6.
12.9
3
4.93
7.05
0.00
2.00
4.00
6.00
8.00
10.00
12.00
14.00
Latvia Lithuania Estonia
Num
ber
of e
lect
ric
vehi
cles
Fig. 6. Number of electric vehicles per charging station
In Latvia, the number of electric automobiles is relatively large (194), while the number of charging stations is small. For this reason, the number of electric automobiles per charging station is
large – almost 13 electric automobiles. There is only one fast-charging station in Latvia that can serve more than 20 electric automobiles a day. Although the number of charging stations in Estonia is large, the number of electric automobiles serviced a day considerably exceeds the demand in this country, as fast-charging stations are used that can service 6600 automobiles a day.
Conclusions 1. Under various government support schemes, 18 electric
automobiles of various models were purchased in Latvia and Estonia. The key factor in the choice of vehicles was the simple way of purchasing the particular model and its popularity, as well as its price.
2. In Latvia, Volkswagen e-Up (135 EV) was the most popular model purchased under the government support scheme, while in Estonia it was Nissan Leaf (266 EV).
3. A classification of energy replenishment stations for electric vehicles and a scheme for their exploitation, depending on the location of a station, were developed.
4. In Estonia, one charging station is available per territory of 274.1 km2, which ensures a full coverage of charging stations. In Latvia and Lithuania, these indicators are, on average, 17 times lower.
5. Any analysis of charging stations in relation to the total length of main motor roads is not very objective, as the charging stations are mostly concentrated in the largest cities, and the total lengths of main motor roads in the analysed countries significantly differ and do not correlate with the area of the country.
6. The introduction rate of charging stations in Estonia is 82 units per year, whereas in Latvia and Lithuania this indicator is only 4.7 per year.
7. Among the Baltic States, the greatest number of electric automobiles per charging station is reported in Latvia, and the charging stations are not able to service all electric automobiles, as they use slow-charging technology (6-8 h). There is only one fast-charging station in Latvia, which is located by the Road Traffic Safety Directorate building.
8. In Estonia, fast-charging stations whose total capacity is 6600 electric automobiles a day are exploited; the stations can service 6 times more electric automobiles than their number in Estonia at present. Among the Baltic States, the highest level of electric mobility is observed in Estonia, with the charging stations covering the entire territory of the country.
References 1. Elektrotransporta tirdzniecība. [online] [25.03.2015.]. Available
at: http://www.impresso.lv/public/lat/elektrotransporta_tirdznieciba/ (In Latvian)
2. 'Latvenergo' autoparku papildina elektromobiļi. [online] [25.03.2015.]. Available at: http://www.delfi.lv/auto/zinas/latvenergo-autoparku-papildina-elektromobili.d?id=39104937 (In Latvian)
3. Elektriautode toetuse statistika seisuga. [online] [31.01.2015]. Available at:http://elmo.ee/11186/ (In Estonian).
4. Elmo – Estonian electromobility programme [online] [31.01.2015]. Available at: http://elmo.ee/elmo/.
5. Reģistrēto transportlīdzekļu sadalījums pēc degvielas veida. [online] [10.02.2015.]. Available at: http://www.csdd.lv/lat/noderiga_informacija/statistika/transportlidzekli/?doc=528 (In Latvian)
6. Berjoza D. Jurgena I., Analysis of the distribution of electric charging station in the Baltic. In: Proceedings of International Scientific Conference „Engineering for Rural Development”, May 20 – 22, 2015. Jelgava: LUA.
7. Berjoza D. Jurgena I., Vartukapteinis K. Research in electro and internal combustion engine motor vehicle energy costs. In: Proceedings of International Scientific Conference „Engineering for Rural Development”, May 24 – 25, 2012. Jelgava: LUA, pp. 331 – 337.
10
AN ONLINE MEASUREMENT SYSTEM OF TRANSPORTATION SAFETY AND COMFORT
Prof. M.Sc. Dogruel M. PhD.
Department of Electrical and Electronics Engineering, Faculty of Engineering, Marmara University, Istanbul, Turkey [email protected]
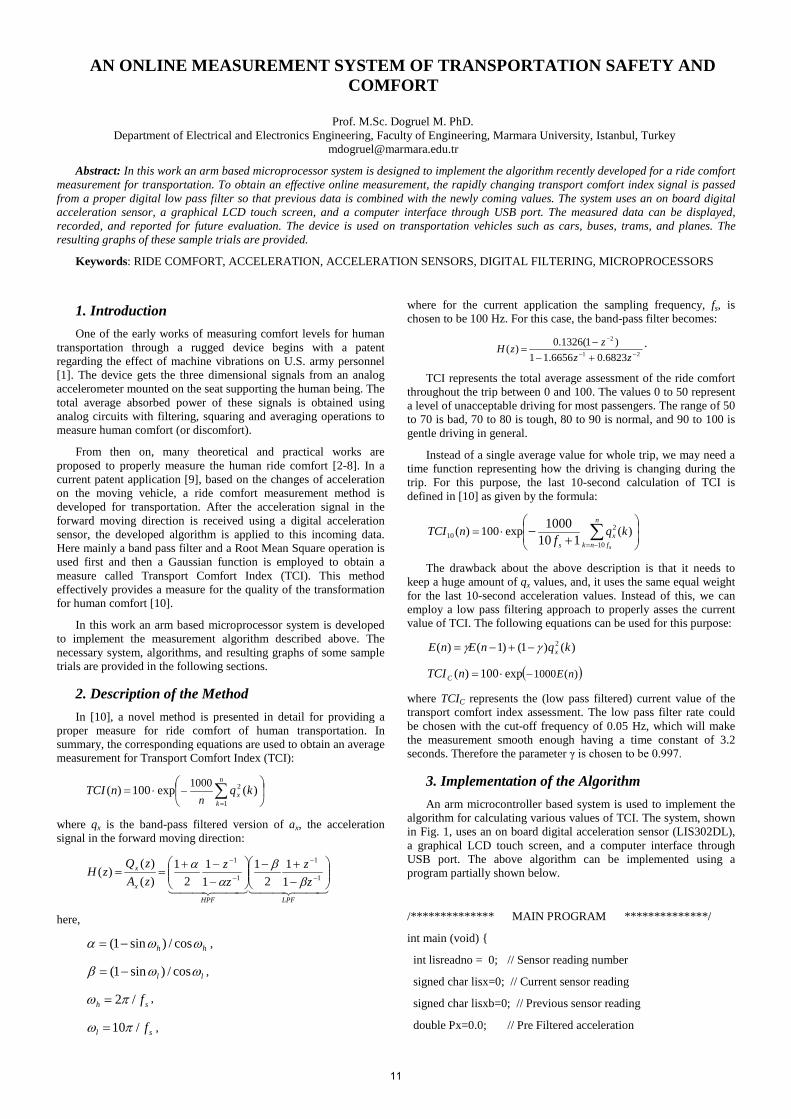
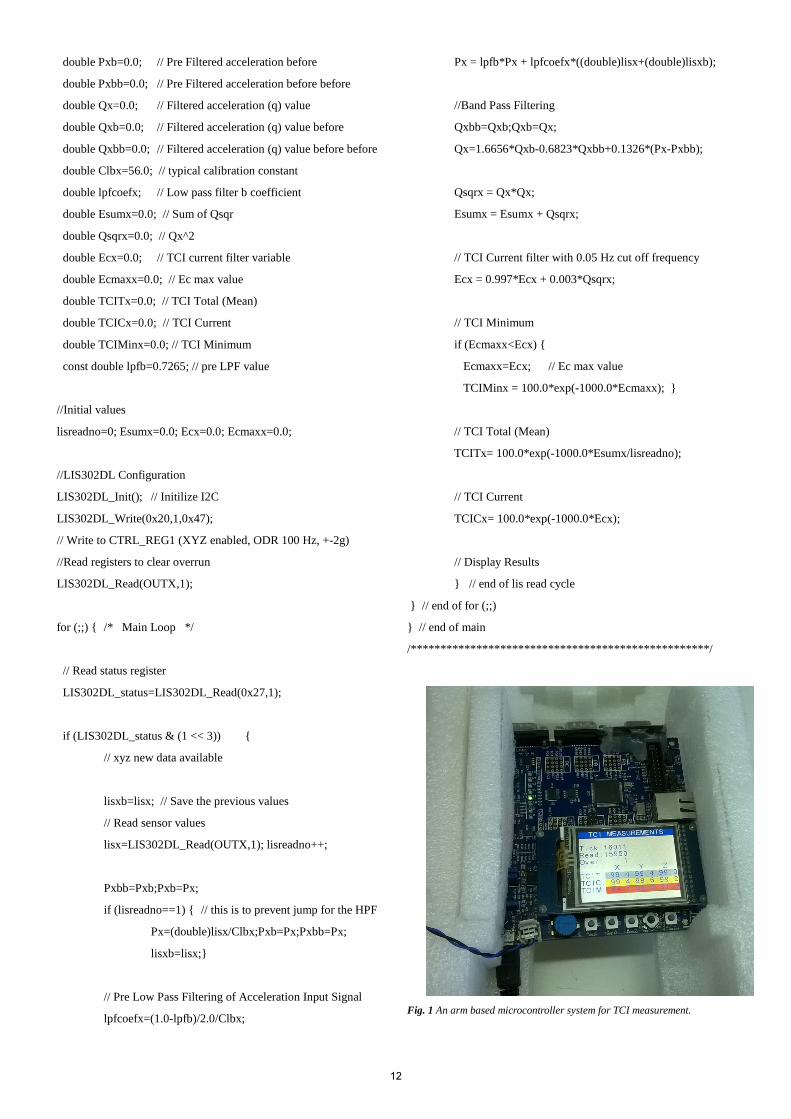
Abstract: In this work an arm based microprocessor system is designed to implement the algorithm recently developed for a ride comfort measurement for transportation. To obtain an effective online measurement, the rapidly changing transport comfort index signal is passed from a proper digital low pass filter so that previous data is combined with the newly coming values. The system uses an on board digital acceleration sensor, a graphical LCD touch screen, and a computer interface through USB port. The measured data can be displayed, recorded, and reported for future evaluation. The device is used on transportation vehicles such as cars, buses, trams, and planes. The resulting graphs of these sample trials are provided.
Keywords: RIDE COMFORT, ACCELERATION, ACCELERATION SENSORS, DIGITAL FILTERING, MICROPROCESSORS
1. Introduction One of the early works of measuring comfort levels for human
transportation through a rugged device begins with a patent regarding the effect of machine vibrations on U.S. army personnel [1]. The device gets the three dimensional signals from an analog accelerometer mounted on the seat supporting the human being. The total average absorbed power of these signals is obtained using analog circuits with filtering, squaring and averaging operations to measure human comfort (or discomfort).
From then on, many theoretical and practical works are proposed to properly measure the human ride comfort [2-8]. In a current patent application [9], based on the changes of acceleration on the moving vehicle, a ride comfort measurement method is developed for transportation. After the acceleration signal in the forward moving direction is received using a digital acceleration sensor, the developed algorithm is applied to this incoming data. Here mainly a band pass filter and a Root Mean Square operation is used first and then a Gaussian function is employed to obtain a measure called Transport Comfort Index (TCI). This method effectively provides a measure for the quality of the transformation for human comfort [10].
In this work an arm based microprocessor system is developed to implement the measurement algorithm described above. The necessary system, algorithms, and resulting graphs of some sample trials are provided in the following sections.
2. Description of the Method In [10], a novel method is presented in detail for providing a
proper measure for ride comfort of human transportation. In summary, the corresponding equations are used to obtain an average measurement for Transport Comfort Index (TCI):
⋅= ∑
=
−n
kx kqnTCI
n 1
2 )(exp100)( 1000
where qx is the band-pass filtered version of ax, the acceleration signal in the forward moving direction:
LPFHPF
x
x
zz
zz
zAzQ
zH
−+−
−−+
==−
−
−
−
1
1
1
1
11
21
11
21
)()(
)(β
βα
α
here,
hh ωωα cos/)sin1( −= ,
ll ωωβ cos/)sin1( −= ,
sh f/2πω = ,
sl f/10πω = ,
where for the current application the sampling frequency, fs, is chosen to be 100 Hz. For this case, the band-pass filter becomes:
21
2
6823.06656.11)1(1326.0)(
−−
−
+−−
=zz
zzH .
TCI represents the total average assessment of the ride comfort throughout the trip between 0 and 100. The values 0 to 50 represent a level of unacceptable driving for most passengers. The range of 50 to 70 is bad, 70 to 80 is tough, 80 to 90 is normal, and 90 to 100 is gentle driving in general.
Instead of a single average value for whole trip, we may need a time function representing how the driving is changing during the trip. For this purpose, the last 10-second calculation of TCI is defined in [10] as given by the formula:
⋅= ∑
−=+−
n
fnkx
s s
kqnTCIf 10
210 )(exp100)(
1101000
The drawback about the above description is that it needs to keep a huge amount of qx values, and, it uses the same equal weight for the last 10-second acceleration values. Instead of this, we can employ a low pass filtering approach to properly asses the current value of TCI. The following equations can be used for this purpose:
)()1()1()( 2 kqnEnE xγγ −+−=
( ))(1000exp100)( nEnTCIC −⋅=
where TCIC represents the (low pass filtered) current value of the transport comfort index assessment. The low pass filter rate could be chosen with the cut-off frequency of 0.05 Hz, which will make the measurement smooth enough having a time constant of 3.2 seconds. Therefore the parameter γ is chosen to be 0.997.
3. Implementation of the Algorithm An arm microcontroller based system is used to implement the
algorithm for calculating various values of TCI. The system, shown in Fig. 1, uses an on board digital acceleration sensor (LIS302DL), a graphical LCD touch screen, and a computer interface through USB port. The above algorithm can be implemented using a program partially shown below.
/************** MAIN PROGRAM **************/
int main (void)
int lisreadno = 0; // Sensor reading number
signed char lisx=0; // Current sensor reading
signed char lisxb=0; // Previous sensor reading
double Px=0.0; // Pre Filtered acceleration
11
double Pxb=0.0; // Pre Filtered acceleration before
double Pxbb=0.0; // Pre Filtered acceleration before before
double Qx=0.0; // Filtered acceleration (q) value
double Qxb=0.0; // Filtered acceleration (q) value before
double Qxbb=0.0; // Filtered acceleration (q) value before before
double Clbx=56.0; // typical calibration constant
double lpfcoefx; // Low pass filter b coefficient
double Esumx=0.0; // Sum of Qsqr
double Qsqrx=0.0; // Qx^2
double Ecx=0.0; // TCI current filter variable
double Ecmaxx=0.0; // Ec max value
double TCITx=0.0; // TCI Total (Mean)
double TCICx=0.0; // TCI Current
double TCIMinx=0.0; // TCI Minimum
const double lpfb=0.7265; // pre LPF value
//Initial values
lisreadno=0; Esumx=0.0; Ecx=0.0; Ecmaxx=0.0;
//LIS302DL Configuration
LIS302DL_Init(); // Initilize I2C
LIS302DL_Write(0x20,1,0x47);
// Write to CTRL_REG1 (XYZ enabled, ODR 100 Hz, +-2g)
//Read registers to clear overrun
LIS302DL_Read(OUTX,1);
for (;;) /* Main Loop */
// Read status register
LIS302DL_status=LIS302DL_Read(0x27,1);
if (LIS302DL_status & (1 << 3))
// xyz new data available
lisxb=lisx; // Save the previous values
// Read sensor values
lisx=LIS302DL_Read(OUTX,1); lisreadno++;
Pxbb=Pxb;Pxb=Px;
if (lisreadno==1) // this is to prevent jump for the HPF
Px=(double)lisx/Clbx;Pxb=Px;Pxbb=Px;
lisxb=lisx;
// Pre Low Pass Filtering of Acceleration Input Signal
lpfcoefx=(1.0-lpfb)/2.0/Clbx;
Px = lpfb*Px + lpfcoefx*((double)lisx+(double)lisxb);
//Band Pass Filtering
Qxbb=Qxb;Qxb=Qx;
Qx=1.6656*Qxb-0.6823*Qxbb+0.1326*(Px-Pxbb);
Qsqrx = Qx*Qx;
Esumx = Esumx + Qsqrx;
// TCI Current filter with 0.05 Hz cut off frequency
Ecx = 0.997*Ecx + 0.003*Qsqrx;
// TCI Minimum
if (Ecmaxx<Ecx)
Ecmaxx=Ecx; // Ec max value
TCIMinx = 100.0*exp(-1000.0*Ecmaxx);
// TCI Total (Mean)
TCITx= 100.0*exp(-1000.0*Esumx/lisreadno);
// TCI Current
TCICx= 100.0*exp(-1000.0*Ecx);
// Display Results
// end of lis read cycle
// end of for (;;)
// end of main
/**************************************************/
Fig. 1 An arm based microcontroller system for TCI measurement.
12
a)
b)
c)
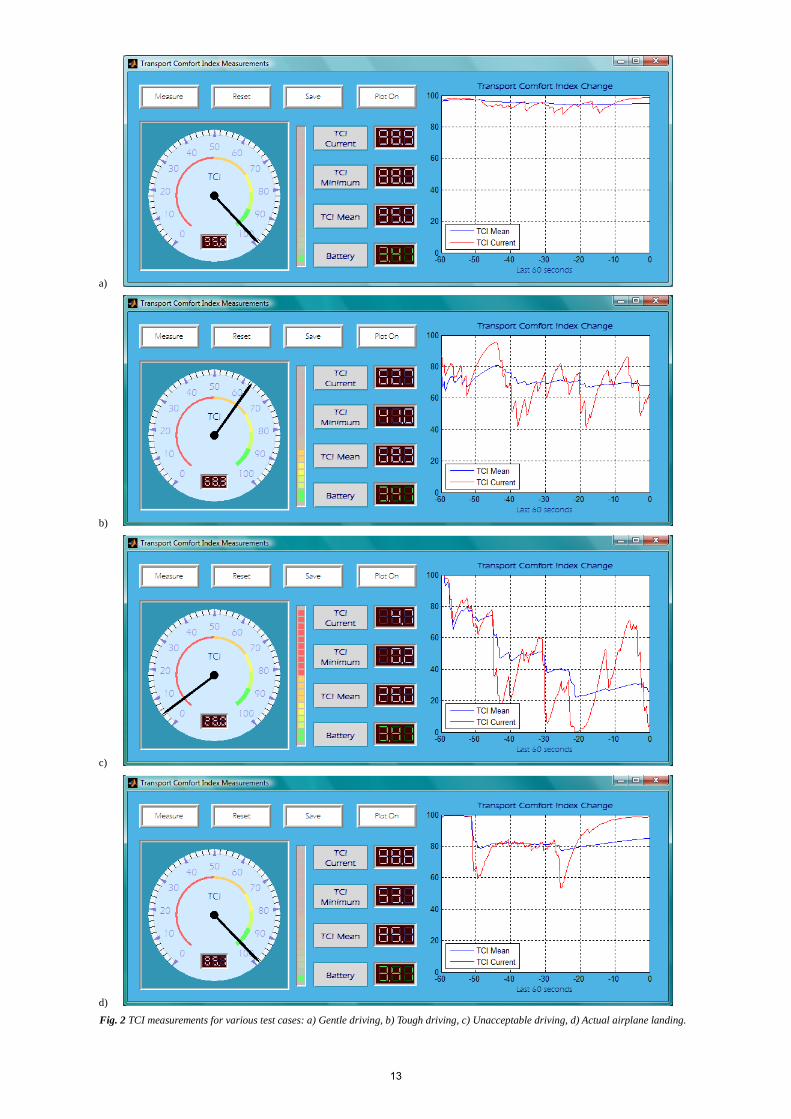
d) Fig. 2 TCI measurements for various test cases: a) Gentle driving, b) Tough driving, c) Unacceptable driving, d) Actual airplane landing.
13
4. Measurement Results 60-second driving tests are carried out using different styles as
shown in Fig. 2. Figures (a) to (c) are corresponding to gentle, tough and unacceptable driving. As seen from the plots, the algorithm stably and quickly tends to the correct levels as expected. Fig. 2(d) shows a sample of an actual airplane landing. As seen from the graph, the landing is at normal comfort level.
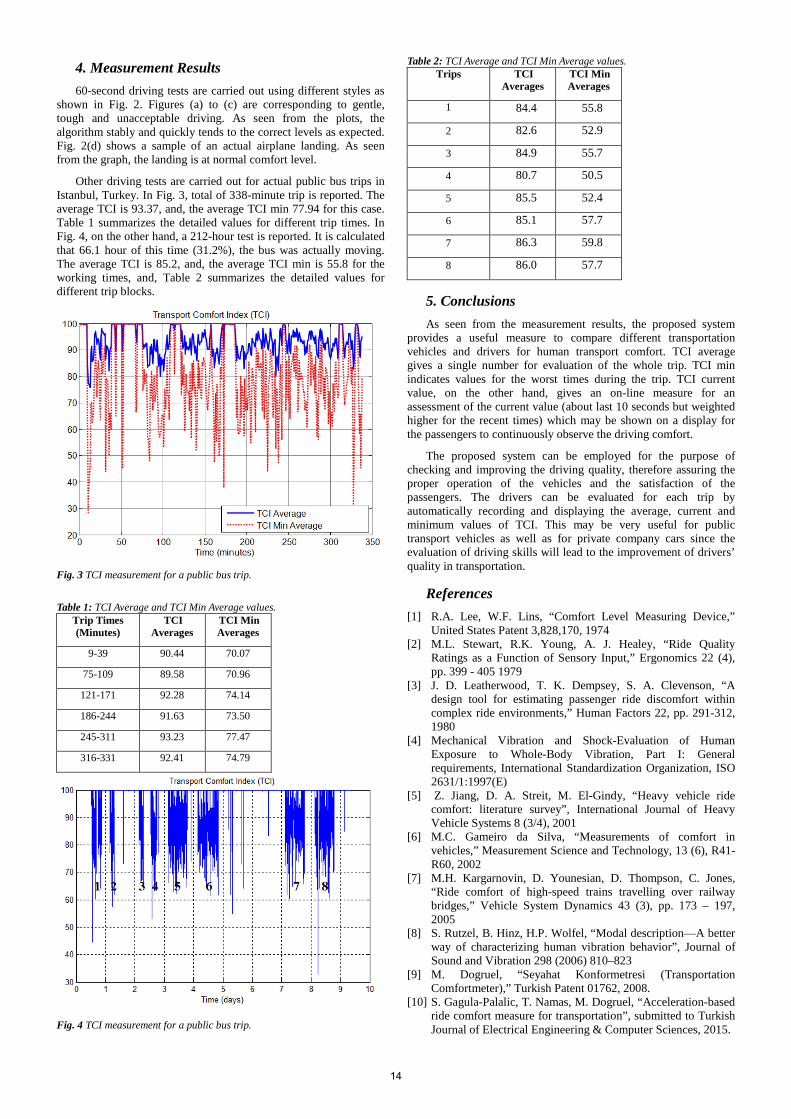
Other driving tests are carried out for actual public bus trips in Istanbul, Turkey. In Fig. 3, total of 338-minute trip is reported. The average TCI is 93.37, and, the average TCI min 77.94 for this case. Table 1 summarizes the detailed values for different trip times. In Fig. 4, on the other hand, a 212-hour test is reported. It is calculated that 66.1 hour of this time (31.2%), the bus was actually moving. The average TCI is 85.2, and, the average TCI min is 55.8 for the working times, and, Table 2 summarizes the detailed values for different trip blocks.
Fig. 3 TCI measurement for a public bus trip.
Table 1: TCI Average and TCI Min Average values. Trip Times (Minutes)
TCI Averages
TCI Min Averages
9-39 90.44 70.07
75-109 89.58 70.96
121-171 92.28 74.14
186-244 91.63 73.50
245-311 93.23 77.47
316-331 92.41 74.79
Fig. 4 TCI measurement for a public bus trip.
Table 2: TCI Average and TCI Min Average values. Trips TCI
Averages TCI Min Averages
1 84.4 55.8
2 82.6 52.9
3 84.9 55.7
4 80.7 50.5
5 85.5 52.4
6 85.1 57.7
7 86.3 59.8
8 86.0 57.7
5. Conclusions As seen from the measurement results, the proposed system
provides a useful measure to compare different transportation vehicles and drivers for human transport comfort. TCI average gives a single number for evaluation of the whole trip. TCI min indicates values for the worst times during the trip. TCI current value, on the other hand, gives an on-line measure for an assessment of the current value (about last 10 seconds but weighted higher for the recent times) which may be shown on a display for the passengers to continuously observe the driving comfort.
The proposed system can be employed for the purpose of checking and improving the driving quality, therefore assuring the proper operation of the vehicles and the satisfaction of the passengers. The drivers can be evaluated for each trip by automatically recording and displaying the average, current and minimum values of TCI. This may be very useful for public transport vehicles as well as for private company cars since the evaluation of driving skills will lead to the improvement of drivers’ quality in transportation.
References [1] R.A. Lee, W.F. Lins, “Comfort Level Measuring Device,”
United States Patent 3,828,170, 1974 [2] M.L. Stewart, R.K. Young, A. J. Healey, “Ride Quality
Ratings as a Function of Sensory Input,” Ergonomics 22 (4), pp. 399 - 405 1979
[3] J. D. Leatherwood, T. K. Dempsey, S. A. Clevenson, “A design tool for estimating passenger ride discomfort within complex ride environments,” Human Factors 22, pp. 291-312, 1980
[4] Mechanical Vibration and Shock-Evaluation of Human Exposure to Whole-Body Vibration, Part I: General requirements, International Standardization Organization, ISO 2631/1:1997(E)
[5] Z. Jiang, D. A. Streit, M. El-Gindy, “Heavy vehicle ride comfort: literature survey”, International Journal of Heavy Vehicle Systems 8 (3/4), 2001
[6] M.C. Gameiro da Silva, “Measurements of comfort in vehicles,” Measurement Science and Technology, 13 (6), R41-R60, 2002
[7] M.H. Kargarnovin, D. Younesian, D. Thompson, C. Jones, “Ride comfort of high-speed trains travelling over railway bridges,” Vehicle System Dynamics 43 (3), pp. 173 – 197, 2005
[8] S. Rutzel, B. Hinz, H.P. Wolfel, “Modal description—A better way of characterizing human vibration behavior”, Journal of Sound and Vibration 298 (2006) 810–823
[9] M. Dogruel, “Seyahat Konformetresi (Transportation Comfortmeter),” Turkish Patent 01762, 2008.
[10] S. Gagula-Palalic, T. Namas, M. Dogruel, “Acceleration-based ride comfort measure for transportation”, submitted to Turkish Journal of Electrical Engineering & Computer Sciences, 2015.
14
PARAMETRIC ANALYSIS OF THE SHIP CAPSIZE PROBLEM
Assoc. Prof. Dr. Deleanu D. Faculty of Naval Electro mechanics - Maritime University of Constanta, Romania
Abstract: The non-linear ship capsize equation derived by Thompson et al., that incorporates both direct and parametric excitation, is examined numerically in an attempt to deepen our understanding on the influence of the parameters involved in the final ship’s response. Because our interest is focused on the binary outcome of capsize-non-capsize, no remark of the steady-state onto which a non-capsize motion may settle is made. The four-dimensional phase-control space includes the non-dimensional damping coefficient, the ratio between wave frequency and ship’s natural frequency, and the direct and parametric forcing amplitudes. All the computed boundaries between capsizing and non-capsizing regions in bi-dimensional projections of control parameter space show fractal features.
Keywords: TRANSIENT SHIP CAPSIZE, BEAM SEA, FRACTAL BOUNDARY, PARAMETRIC STUDY
1. Introduction Capsizing or keeling over is that catastrophic situation in which
a ship is turned on its side. It is responsible every year for a lot of material damages and losses of human lives. To prevent such events, a better understanding of ship stability is necessary.
The nonlinear behavior of ship motion leading to capsize has been extensively studied in the last three decades by many researchers using mathematical models in conjunction with theoretical developments in the dynamics of nonlinear systems. Thus, Thompson thought ship capsizing as an escape from a potential well and introduced innovative concepts like transient capsize diagram and index of capsizability [1]. Other authors, including Sanchez and Nayfeh [2], Kan and Taguchi [3] etc., focused on understanding fundamental mechanisms of capsizing with rather simplified mathematical modelling [4, 5]. Multi-degree-of-freedom models have been proposed by Spyrou [6], Vassalos et al. [7], and Oh et al. [8]. Experimental investigations were made by Bird and Odibasi [9], Umeda et al. [10], Hamamoto et al. [11], and others. .
Both theoretical and experimental studies have identified several physical mechanisms of ship capsize, including pure resonant rolling, parametric excitation, broaching, and loss of stability at a wave crest. It was emphasized the fact that more attention should be pay to capsize under transient, rather than steady-state conditions. This situation corresponds to a short train of regular waves impinging upon the ship in otherwise relatively calm weather conditions. Dangerous large-amplitude motions and, finally, capsizing can appear when the ship is hit by no more than 8 – 10 sufficiently steep waves [12].
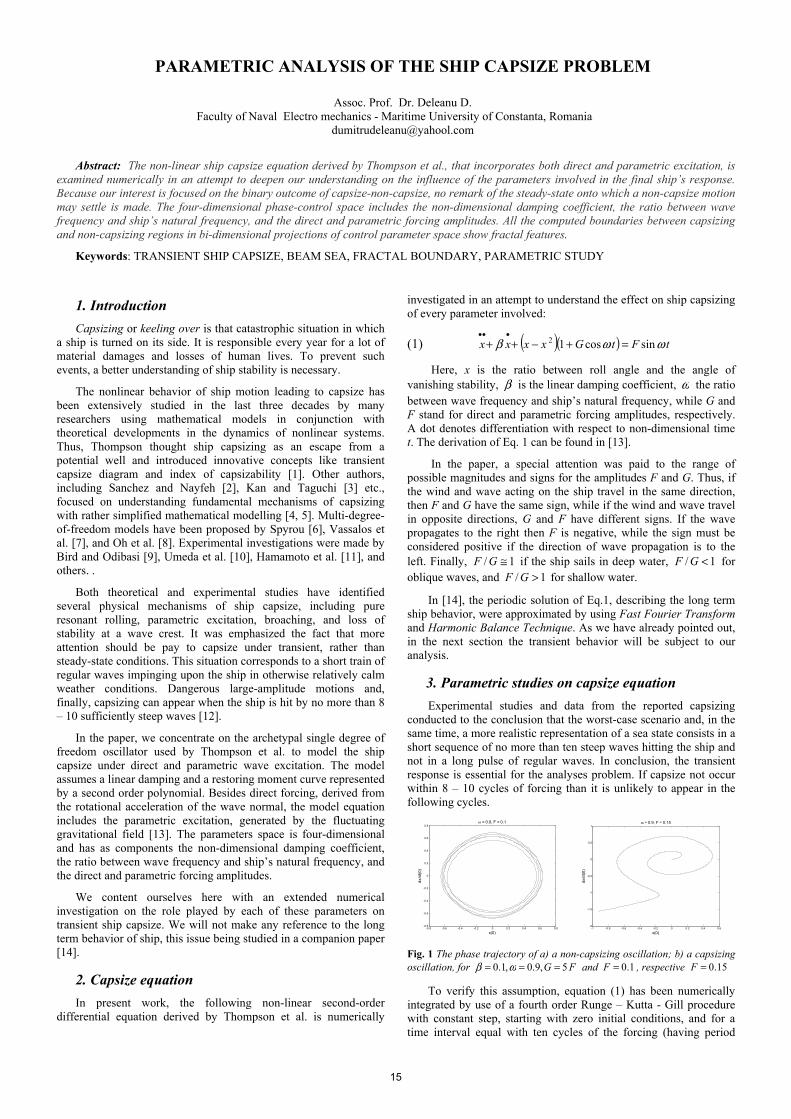
In the paper, we concentrate on the archetypal single degree of freedom oscillator used by Thompson et al. to model the ship capsize under direct and parametric wave excitation. The model assumes a linear damping and a restoring moment curve represented by a second order polynomial. Besides direct forcing, derived from the rotational acceleration of the wave normal, the model equation includes the parametric excitation, generated by the fluctuating gravitational field [13]. The parameters space is four-dimensional and has as components the non-dimensional damping coefficient, the ratio between wave frequency and ship’s natural frequency, and the direct and parametric forcing amplitudes.
We content ourselves here with an extended numerical investigation on the role played by each of these parameters on transient ship capsize. We will not make any reference to the long term behavior of ship, this issue being studied in a companion paper [14].
2. Capsize equation In present work, the following non-linear second-order
differential equation derived by Thompson et al. is numerically
investigated in an attempt to understand the effect on ship capsizing of every parameter involved:
(1) ( )( ) tFtGxxxx ωωβ sincos12 =+−++•••
Here, x is the ratio between roll angle and the angle of vanishing stability, β is the linear damping coefficient, ω the ratio between wave frequency and ship’s natural frequency, while G and F stand for direct and parametric forcing amplitudes, respectively. A dot denotes differentiation with respect to non-dimensional time t. The derivation of Eq. 1 can be found in [13].
In the paper, a special attention was paid to the range of possible magnitudes and signs for the amplitudes F and G. Thus, if the wind and wave acting on the ship travel in the same direction, then F and G have the same sign, while if the wind and wave travel in opposite directions, G and F have different signs. If the wave propagates to the right then F is negative, while the sign must be considered positive if the direction of wave propagation is to the left. Finally, 1/ ≅GF if the ship sails in deep water, 1/ <GF for oblique waves, and 1/ >GF for shallow water.
In [14], the periodic solution of Eq.1, describing the long term ship behavior, were approximated by using Fast Fourier Transform and Harmonic Balance Technique. As we have already pointed out, in the next section the transient behavior will be subject to our analysis.
3. Parametric studies on capsize equation Experimental studies and data from the reported capsizing conducted to the conclusion that the worst-case scenario and, in the same time, a more realistic representation of a sea state consists in a short sequence of no more than ten steep waves hitting the ship and not in a long pulse of regular waves. In conclusion, the transient response is essential for the analyses problem. If capsize not occur within 8 – 10 cycles of forcing than it is unlikely to appear in the following cycles.
-0.8 -0.6 -0.4 -0.2 0 0.2 0.4 0.6 0.8-0.8
-0.6
-0.4
-0.2
0
0.2
0.4
0.6
0.8
x(0)
dx/d
t(0)
ω = 0.9, F = 0.1
-1 -0.8 -0.6 -0.4 -0.2 0 0.2 0.4 0.6-2
-1.5
-1
-0.5
0
0.5
1
x(0)
dx/d
t(0)
ω = 0.9, F = 0.15
Fig. 1 The phase trajectory of a) a non-capsizing oscillation; b) a capsizing oscillation, for FG 5,9.0,1.0 === ωβ and 1.0=F , respective 15.0=F
To verify this assumption, equation (1) has been numerically integrated by use of a fourth order Runge – Kutta - Gill procedure with constant step, starting with zero initial conditions, and for a time interval equal with ten cycles of the forcing (having period
15
ωπ /2=T ). For a specified set of parameters G,, ωβ , and
variable F, the system (1) evolves to a limit cycle for small forcing amplitude F or goes out in the phase plane, like a spiral with extending amplitude, for sufficiently large values of F. The second case corresponds to capsize (see Fig. 1).
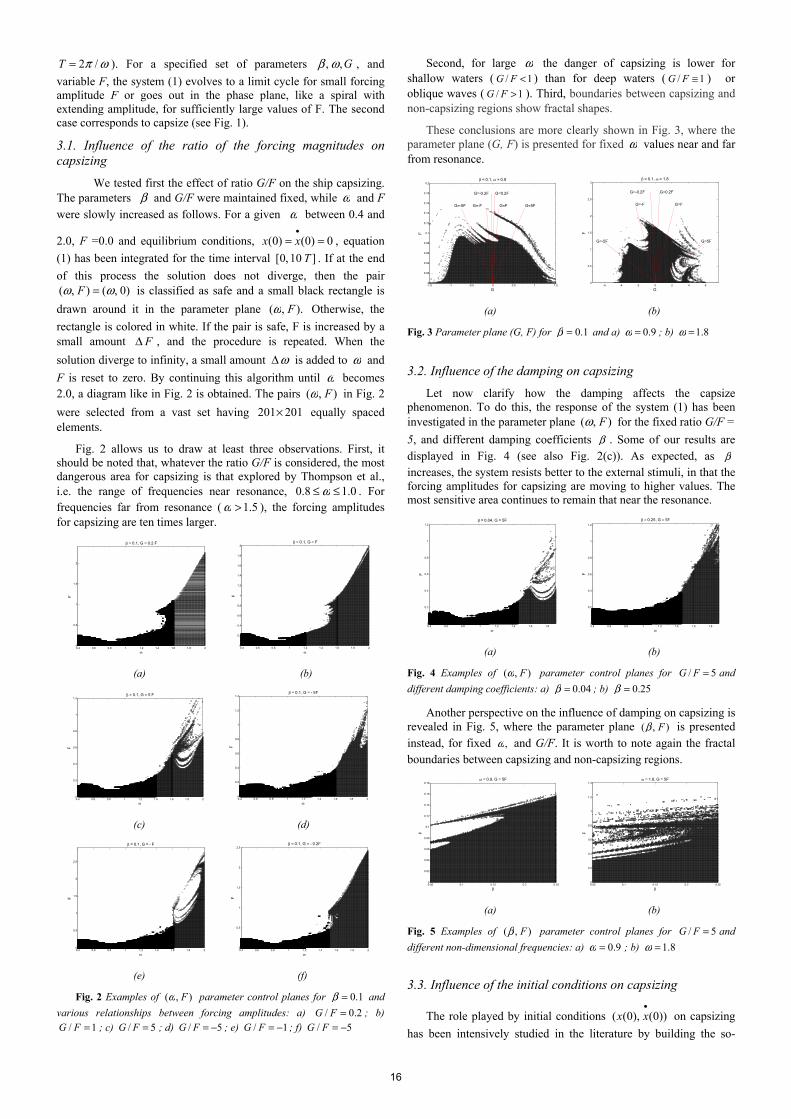
3.1. Influence of the ratio of the forcing magnitudes on capsizing
We tested first the effect of ratio G/F on the ship capsizing. The parameters β and G/F were maintained fixed, while ω and F were slowly increased as follows. For a given ω between 0.4 and
2.0, F =0.0 and equilibrium conditions, 0)0()0( ==•xx , equation
(1) has been integrated for the time interval ]10,0[ T . If at the end
of this process the solution does not diverge, then the pair )0,(),( ωω =F is classified as safe and a small black rectangle is
drawn around it in the parameter plane ).,( Fω Otherwise, the
rectangle is colored in white. If the pair is safe, F is increased by a small amount FΔ , and the procedure is repeated. When the
solution diverge to infinity, a small amount ωΔ is added to ω and
F is reset to zero. By continuing this algorithm until ω becomes 2.0, a diagram like in Fig. 2 is obtained. The pairs ),( Fω in Fig. 2
were selected from a vast set having 201201× equally spaced elements.
Fig. 2 allows us to draw at least three observations. First, it should be noted that, whatever the ratio G/F is considered, the most dangerous area for capsizing is that explored by Thompson et al., i.e. the range of frequencies near resonance, 0.18.0 ≤≤ ω . For frequencies far from resonance ( 5.1>ω ), the forcing amplitudes for capsizing are ten times larger.
0.4 0.6 0.8 1 1.2 1.4 1.6 1.8 20
0.5
1
1.5
2
ω
F
β = 0.1, G = 0.2 F
0.4 0.6 0.8 1 1.2 1.4 1.6 1.8 20
0.2
0.4
0.6
0.8
1
1.2
1.4
1.6
1.8
2
ω
F
β = 0.1, G = F
(a) (b)
0.4 0.6 0.8 1 1.2 1.4 1.6 1.8 20
0.2
0.4
0.6
0.8
1
1.2
ω
F
β = 0.1, G = 5 F
0.4 0.6 0.8 1 1.2 1.4 1.6 1.8 20
0.2
0.4
0.6
0.8
1
1.2
1.4
ω
F
β = 0.1, G = - 5F
(c) (d)
0.4 0.6 0.8 1 1.2 1.4 1.6 1.8 20
0.5
1
1.5
2
2.5
ω
F
β = 0.1, G = - F
0.4 0.6 0.8 1 1.2 1.4 1.6 1.8 20
0.5
1
1.5
2
2.5
ω
F
β = 0.1, G = - 0.2F
(e) (f)
Fig. 2 Examples of ),( Fω parameter control planes for 1.0=β and
various relationships between forcing amplitudes: a) 2.0/ =FG ; b) 1/ =FG ; c) 5/ =FG ; d) 5/ −=FG ; e) 1/ −=FG ; f) 5/ −=FG
Second, for large ω the danger of capsizing is lower for shallow waters ( 1/ <FG ) than for deep waters ( 1/ ≅FG ) or oblique waves ( 1/ >FG ). Third, boundaries between capsizing and non-capsizing regions show fractal shapes.
These conclusions are more clearly shown in Fig. 3, where the parameter plane (G, F) is presented for fixed ω values near and far from resonance.
-1.5 -1 -0.5 0 0.5 1 1.50
0.02
0.04
0.06
0.08
0.1
0.12
0.14
0.16
0.18
0.2
G=5FG=-5F G=FG=-F
G=0.2FG=-0.2F
G
F
β = 0.1, ω = 0.9
-6 -4 -2 0 2 4 60
0.5
1
1.5
2
2.5
3
G=FG=-F
G=5FG=-5F
G=0.2FG=-0.2F
G
F
β = 0.1, ω = 1.8
(a) (b)
Fig. 3 Parameter plane (G, F) for 1.0=β and a) 9.0=ω ; b) 8.1=ω
3.2. Influence of the damping on capsizing
Let now clarify how the damping affects the capsize phenomenon. To do this, the response of the system (1) has been investigated in the parameter plane ),( Fω for the fixed ratio G/F =
5, and different damping coefficients β . Some of our results are displayed in Fig. 4 (see also Fig. 2(c)). As expected, as β increases, the system resists better to the external stimuli, in that the forcing amplitudes for capsizing are moving to higher values. The most sensitive area continues to remain that near the resonance.
0.4 0.6 0.8 1 1.2 1.4 1.6 1.80
0.2
0.4
0.6
0.8
1
1.2
ω
F
β = 0.04, G = 5F
0.4 0.6 0.8 1 1.2 1.4 1.6 1.80
0.2
0.4
0.6
0.8
1
1.2
ω
F
β = 0.25, G = 5F
(a) (b)
Fig. 4 Examples of ),( Fω parameter control planes for 5/ =FG and
different damping coefficients: a) 04.0=β ; b) 25.0=β
Another perspective on the influence of damping on capsizing is revealed in Fig. 5, where the parameter plane ),( Fβ is presented instead, for fixed ,ω and G/F. It is worth to note again the fractal boundaries between capsizing and non-capsizing regions.
0.05 0.1 0.15 0.2 0.250
0.02
0.04
0.06
0.08
0.1
0.12
0.14
0.16
0.18
β
F
ω = 0.9, G = 5F
0.05 0.1 0.15 0.2 0.250
0.2
0.4
0.6
0.8
1
1.2
1.4
β
F
ω = 1.8, G = 5F
(a) (b)
Fig. 5 Examples of ),( Fβ parameter control planes for 5/ =FG and
different non-dimensional frequencies: a) 9.0=ω ; b) 8.1=ω
3.3. Influence of the initial conditions on capsizing
The role played by initial conditions ))0(),0((•xx on capsizing
has been intensively studied in the literature by building the so-
16
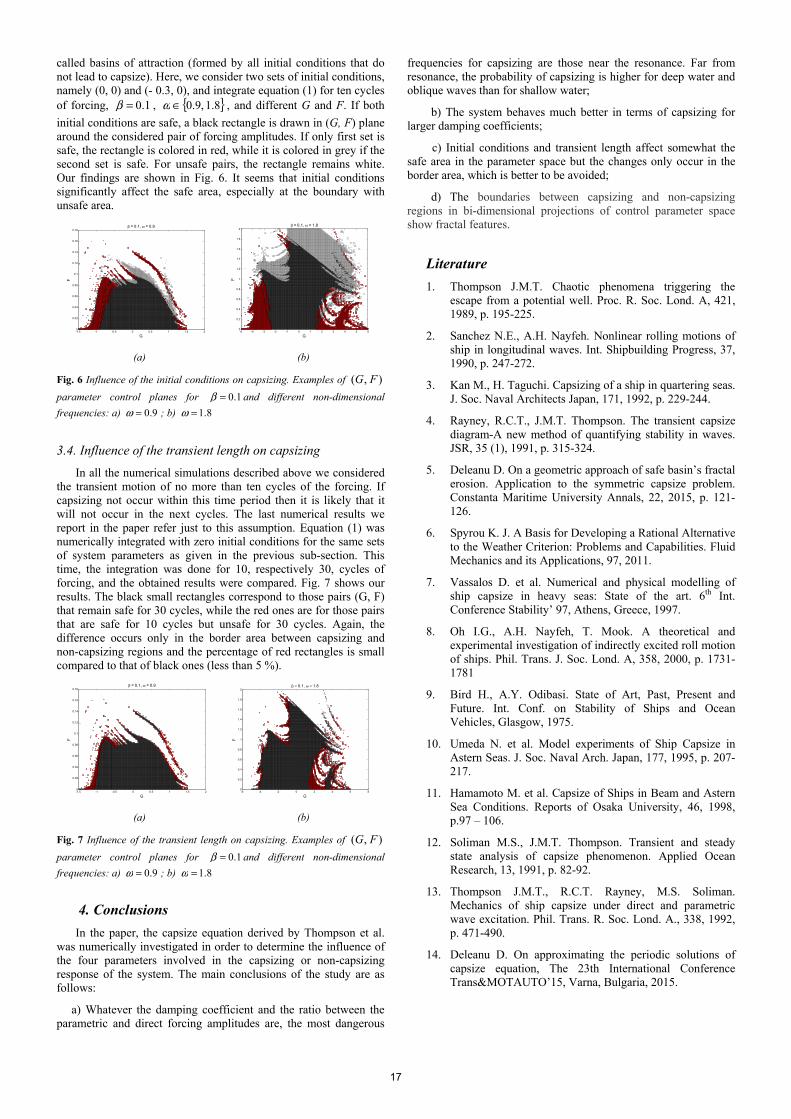
called basins of attraction (formed by all initial conditions that do not lead to capsize). Here, we consider two sets of initial conditions, namely (0, 0) and (- 0.3, 0), and integrate equation (1) for ten cycles of forcing, 1.0=β , 8.1,9.0∈ω , and different G and F. If both
initial conditions are safe, a black rectangle is drawn in (G, F) plane around the considered pair of forcing amplitudes. If only first set is safe, the rectangle is colored in red, while it is colored in grey if the second set is safe. For unsafe pairs, the rectangle remains white. Our findings are shown in Fig. 6. It seems that initial conditions significantly affect the safe area, especially at the boundary with unsafe area.
-1.5 -1 -0.5 0 0.5 1 1.5 20
0.02
0.04
0.06
0.08
0.1
0.12
0.14
0.16
0.18
G
F
β = 0.1, ω = 0.9
-5 -4 -3 -2 -1 0 1 2 3 4 5 60
0.2
0.4
0.6
0.8
1
1.2
1.4
1.6
1.8
2
G
Fβ = 0.1, ω = 1.8
(a) (b)
Fig. 6 Influence of the initial conditions on capsizing. Examples of ),( FG
parameter control planes for 1.0=β and different non-dimensional
frequencies: a) 9.0=ω ; b) 8.1=ω
3.4. Influence of the transient length on capsizing
In all the numerical simulations described above we considered the transient motion of no more than ten cycles of the forcing. If capsizing not occur within this time period then it is likely that it will not occur in the next cycles. The last numerical results we report in the paper refer just to this assumption. Equation (1) was numerically integrated with zero initial conditions for the same sets of system parameters as given in the previous sub-section. This time, the integration was done for 10, respectively 30, cycles of forcing, and the obtained results were compared. Fig. 7 shows our results. The black small rectangles correspond to those pairs (G, F) that remain safe for 30 cycles, while the red ones are for those pairs that are safe for 10 cycles but unsafe for 30 cycles. Again, the difference occurs only in the border area between capsizing and non-capsizing regions and the percentage of red rectangles is small compared to that of black ones (less than 5 %).
-1.5 -1 -0.5 0 0.5 1 1.5 20
0.02
0.04
0.06
0.08
0.1
0.12
0.14
0.16
0.18
G
F
β = 0.1, ω = 0.9
-6 -4 -2 0 2 4 6 80
0.2
0.4
0.6
0.8
1
1.2
1.4
1.6
1.8
2
G
F
β = 0.1, ω = 1.8
(a) (b)
Fig. 7 Influence of the transient length on capsizing. Examples of ),( FG
parameter control planes for 1.0=β and different non-dimensional
frequencies: a) 9.0=ω ; b) 8.1=ω
4. Conclusions
In the paper, the capsize equation derived by Thompson et al. was numerically investigated in order to determine the influence of the four parameters involved in the capsizing or non-capsizing response of the system. The main conclusions of the study are as follows:
a) Whatever the damping coefficient and the ratio between the parametric and direct forcing amplitudes are, the most dangerous
frequencies for capsizing are those near the resonance. Far from resonance, the probability of capsizing is higher for deep water and oblique waves than for shallow water;
b) The system behaves much better in terms of capsizing for larger damping coefficients;
c) Initial conditions and transient length affect somewhat the safe area in the parameter space but the changes only occur in the border area, which is better to be avoided;
d) The boundaries between capsizing and non-capsizing regions in bi-dimensional projections of control parameter space show fractal features.
Literature 1. Thompson J.M.T. Chaotic phenomena triggering the
escape from a potential well. Proc. R. Soc. Lond. A, 421, 1989, p. 195-225.
2. Sanchez N.E., A.H. Nayfeh. Nonlinear rolling motions of ship in longitudinal waves. Int. Shipbuilding Progress, 37, 1990, p. 247-272.
3. Kan M., H. Taguchi. Capsizing of a ship in quartering seas. J. Soc. Naval Architects Japan, 171, 1992, p. 229-244.
4. Rayney, R.C.T., J.M.T. Thompson. The transient capsize diagram-A new method of quantifying stability in waves. JSR, 35 (1), 1991, p. 315-324.
5. Deleanu D. On a geometric approach of safe basin’s fractal erosion. Application to the symmetric capsize problem. Constanta Maritime University Annals, 22, 2015, p. 121-126.
6. Spyrou K. J. A Basis for Developing a Rational Alternative to the Weather Criterion: Problems and Capabilities. Fluid Mechanics and its Applications, 97, 2011.
7. Vassalos D. et al. Numerical and physical modelling of ship capsize in heavy seas: State of the art. 6th Int. Conference Stability’ 97, Athens, Greece, 1997.
8. Oh I.G., A.H. Nayfeh, T. Mook. A theoretical and experimental investigation of indirectly excited roll motion of ships. Phil. Trans. J. Soc. Lond. A, 358, 2000, p. 1731-1781
9. Bird H., A.Y. Odibasi. State of Art, Past, Present and Future. Int. Conf. on Stability of Ships and Ocean Vehicles, Glasgow, 1975.
10. Umeda N. et al. Model experiments of Ship Capsize in Astern Seas. J. Soc. Naval Arch. Japan, 177, 1995, p. 207-217.
11. Hamamoto M. et al. Capsize of Ships in Beam and Astern Sea Conditions. Reports of Osaka University, 46, 1998, p.97 – 106.
12. Soliman M.S., J.M.T. Thompson. Transient and steady state analysis of capsize phenomenon. Applied Ocean Research, 13, 1991, p. 82-92.
13. Thompson J.M.T., R.C.T. Rayney, M.S. Soliman. Mechanics of ship capsize under direct and parametric wave excitation. Phil. Trans. R. Soc. Lond. A., 338, 1992, p. 471-490.
14. Deleanu D. On approximating the periodic solutions of capsize equation, The 23th International Conference Trans&MOTAUTO’15, Varna, Bulgaria, 2015.
17
ON APPROXIMATING THE PERIODIC SOLUTIONS OF CAPSIZE EQUATION
Assoc. Prof. Dr. Deleanu D. Faculty of Naval Electro mechanics - Maritime University of Constanta, Romania
Abstract: The motion of a ship in long beam seas could be described by a second-order non-linear differential equation, having the roll angle as variable and depending on four parameters. With the direct forcing amplitude as bifurcation parameter, the dynamical system exhibits either periodic or chaotic behaviour, the route to chaos being realized by a period doubling sequence of periodic motions. Some accepted indicators, like bifurcation diagrams, phase planes and Poincare sections have been computed and they confirm the transition from order to chaos. In the main part of the paper, the harmonic balance method is used to obtain approximate solutions for the periodic motions and to predict the period doubling bifurcations by a stability analysis.
Keywords: SHIP CAPSIZE, DIRECT AND PARAMETRIC EXCITATION, ORDER AND CHAOS, PERIODIC SOLUTIONS
1. Introduction Capsizing is the most disastrous situation in which can find a
sailing ship, since it leads to heavy losses of human lives and ship. It primarily affects the fishing boats and small vessels, but in certain circumstances large ships may suffer too, although they satisfy all the existing rules concerning the risk of capsizing [1]. This is why the stability against capsizing is a fundamental requirement when designing a ship. Unfortunately, despite an extensive experimental and theoretical research during the last decades, this undesirable complex phenomenon is not fully understood yet.
The efforts of researchers have been focused on several directions. First, it was found that the majority of capsizing events occur in astern seas, as a result of pure loss of stability, parametric resonance, broaching, cargo shift, water on deck and wind [2]. Second, mathematical models, following an increasing sophistication and capable of predicting well enough the ship dynamics for some given environment conditions, have been proposed. Most of these approaches consider only the ship’s rolling motion, but models with two, three and even six degrees-of-freedom have been developed. A generally accepted model has not yet been established [3, 4]. Finally, some innovative concepts as transient safe basins, transient capsize diagram, index of capsized resistance, and the recent theoretical developments in the dynamical non-linear systems seem to lead to an improved understanding of the ship capsize process [5, 6].
According to Cardo et al [7], it has become habitual to study the capsize dynamics using a one degree-of-freedom nonlinear
oscillator taking the form ( ) )(, tftGZg =+
+
•••θθθ , with θ the
roll angle,
•θg the damping function, ),( tGZ θ a non-linear
function which encapsulates the restoring moment, and )(tf the external forcing function depending on time.
In the present work we shall restrict our attention to the particular case of Thompson’s equation, which models in a simplified fashion the uncoupled roll motion of a ship in periodic beam seas, with both direct and parametric excitation, the latter multiplying the conventional restoring function [8]. The remainder of our paper proceeds as follows. In Section 2 the archetypal model equation of Thompson et al. is presented in the simplest setting possible. In the following two sections, the approximate solutions for the periodic orbits, given by fast Fourier transform and harmonic balance method, are obtained. We close with a short summary and conclusions in Section 5.
2. Capsize equation In the paper, the following equation, derived by Thompson et
al., is further investigated numerically and analytically with a view to prove the period doubling sequence of periodic motions leading to chaos, and finally to capsize:
(1) ( )( ) tFtGxxxx ωωβ sincos12 =+−++•••
where
(2) kAGkAFxVn
f
V−=−=== ,,,
2
θω
ωω
ωθθ
Here, θ represents the roll angle, Vθ the angle of vanishing stability, β the non-dimensional damping coefficient, fω the
wave frequency, nω the natural frequency of the boat, A the wave height, and k the wave number. The forcing amplitudes F and G stand for direct and parametric excitation, respectively. Finally, a dot denotes differentiation with respect to time. The details about Eq. 1 can be found in [8], where some preliminary numerical studies for 85.0=ω and 1.0=β are presented.
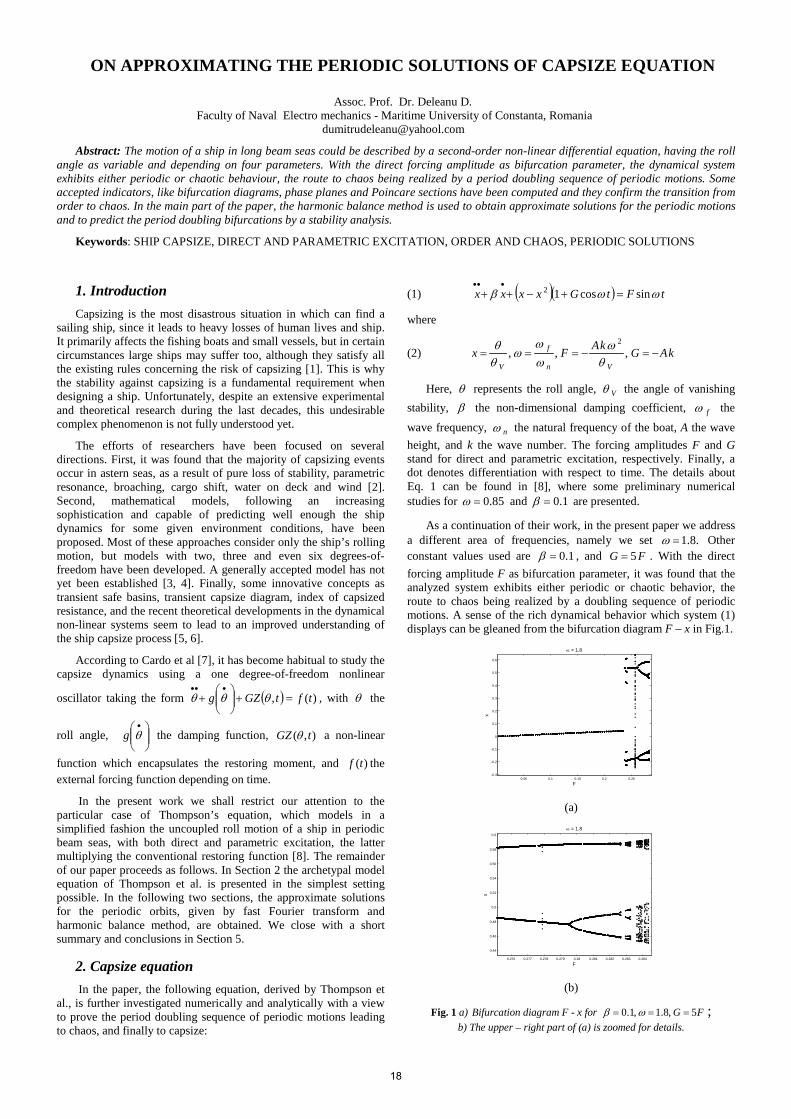
As a continuation of their work, in the present paper we address a different area of frequencies, namely we set .8.1=ω Other constant values used are 1.0=β , and FG 5= . With the direct forcing amplitude F as bifurcation parameter, it was found that the analyzed system exhibits either periodic or chaotic behavior, the route to chaos being realized by a doubling sequence of periodic motions. A sense of the rich dynamical behavior which system (1) displays can be gleaned from the bifurcation diagram F – x in Fig.1.
0.05 0.1 0.15 0.2 0.25-0.3
-0.2
-0.1
0
0.1
0.2
0.3
0.4
0.5
0.6
F
x
ω = 1.8
(a)
0.276 0.277 0.278 0.279 0.28 0.281 0.282 0.283 0.284
0.44
0.46
0.48
0.5
0.52
0.54
0.56
0.58
0.6
F
x
ω = 1.8
(b)
Fig. 1 a) Bifurcation diagram F - x for FG 5,8.1,1.0 === ωβ ; b) The upper – right part of (a) is zoomed for details.
18
To construct this diagram, we started from equilibrium
conditions ( 0)0()0( ==•xx ) and plotted x at every one forcing
cycle with the same phase angle. The first 200 cycles were discarded to avoid transients.
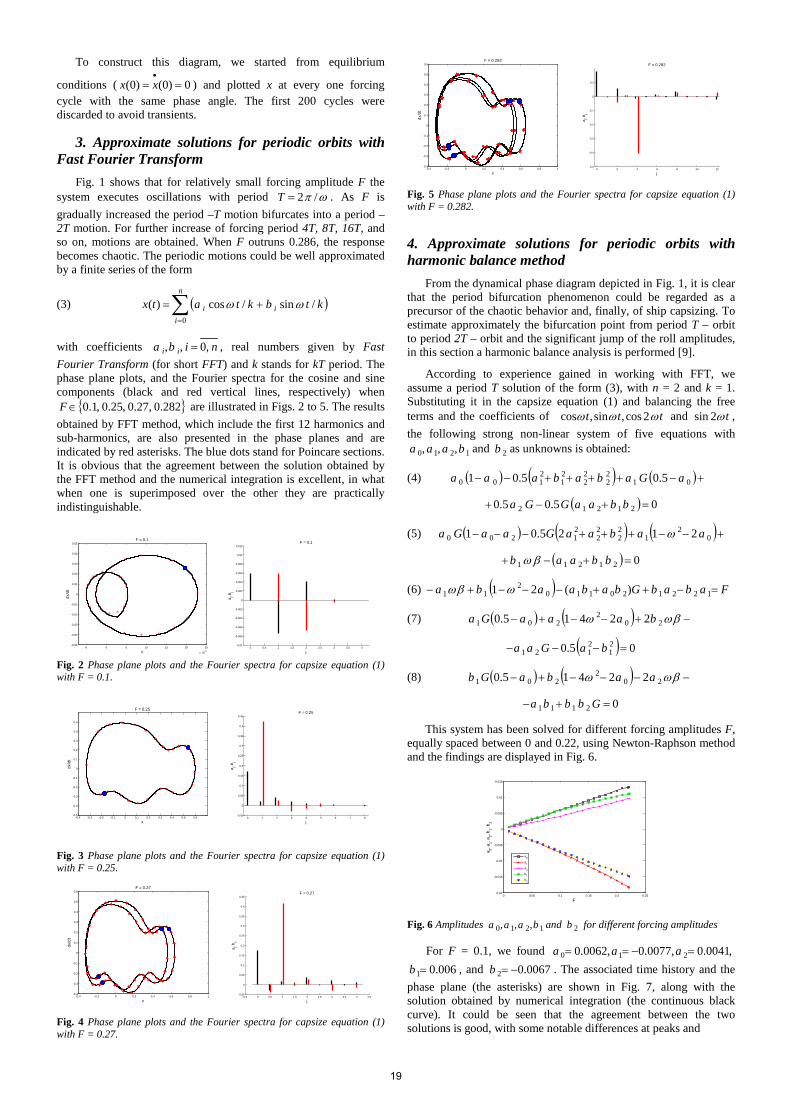
3. Approximate solutions for periodic orbits with Fast Fourier Transform
Fig. 1 shows that for relatively small forcing amplitude F the system executes oscillations with period ωπ /2=T . As F is gradually increased the period –T motion bifurcates into a period – 2T motion. For further increase of forcing period 4T, 8T, 16T, and so on, motions are obtained. When F outruns 0.286, the response becomes chaotic. The periodic motions could be well approximated by a finite series of the form
(3) ( )∑=
+=n
iii ktbktatx
0
/sin/cos)( ωω
with coefficients niba ii ,0,, = , real numbers given by Fast Fourier Transform (for short FFT) and k stands for kT period. The phase plane plots, and the Fourier spectra for the cosine and sine components (black and red vertical lines, respectively) when
282.0,27.0,25.0,1.0∈F are illustrated in Figs. 2 to 5. The results obtained by FFT method, which include the first 12 harmonics and sub-harmonics, are also presented in the phase planes and are indicated by red asterisks. The blue dots stand for Poincare sections. It is obvious that the agreement between the solution obtained by the FFT method and the numerical integration is excellent, in what when one is superimposed over the other they are practically indistinguishable.
-5 0 5 10 15 20 25
x 10-3
-0.05
-0.04
-0.03
-0.02
-0.01
0
0.01
0.02
0.03
0.04
0.05
x
dx/d
t
F = 0.1
0 0.5 1 1.5 2 2.5 3 3.5 4-0.01
-0.008
-0.006
-0.004
-0.002
0
0.002
0.004
0.006
0.008
0.01
0.012
j
a j, bj
F = 0.1
Fig. 2 Phase plane plots and the Fourier spectra for capsize equation (1) with F = 0.1.
-0.4 -0.3 -0.2 -0.1 0 0.1 0.2 0.3 0.4 0.5 0.6-0.5
-0.4
-0.3
-0.2
-0.1
0
0.1
0.2
0.3
0.4
0.5
x
dx/d
t
F = 0.25
0 1 2 3 4 5 6 7 8-0.05
0
0.05
0.1
0.15
0.2
0.25
0.3
0.35
0.4
0.45
j
a j, bj
F = 0.25
Fig. 3 Phase plane plots and the Fourier spectra for capsize equation (1) with F = 0.25.
-0.4 -0.2 0 0.2 0.4 0.6 0.8 1-0.4
-0.3
-0.2
-0.1
0
0.1
0.2
0.3
0.4
0.5
0.6
x
dx/d
t
F = 0.27
-0.5 0 0.5 1 1.5 2 2.5 3 3.5 4 4.5-0.05
0
0.05
0.1
0.15
0.2
0.25
0.3
0.35
0.4
0.45
j
a j, bj
F = 0.27
Fig. 4 Phase plane plots and the Fourier spectra for capsize equation (1) with F = 0.27.
-0.4 -0.2 0 0.2 0.4 0.6 0.8 1-0.4
-0.3
-0.2
-0.1
0
0.1
0.2
0.3
0.4
0.5
0.6
x
dx/d
t
F = 0.282
0 2 4 6 8 10 12-0.5
-0.4
-0.3
-0.2
-0.1
0
0.1
j
a j, bj
F = 0.282
Fig. 5 Phase plane plots and the Fourier spectra for capsize equation (1) with F = 0.282.
4. Approximate solutions for periodic orbits with harmonic balance method From the dynamical phase diagram depicted in Fig. 1, it is clear that the period bifurcation phenomenon could be regarded as a precursor of the chaotic behavior and, finally, of ship capsizing. To estimate approximately the bifurcation point from period T – orbit to period 2T – orbit and the significant jump of the roll amplitudes, in this section a harmonic balance analysis is performed [9].
According to experience gained in working with FFT, we assume a period T solution of the form (3), with n = 2 and k = 1. Substituting it in the capsize equation (1) and balancing the free terms and the coefficients of ttt ωωω 2cos,sin,cos and tω2sin , the following strong non-linear system of five equations with
1210 ,,, baaa and 2b as unknowns is obtained:
(4) ( ) ( ) ( )+−++++−− 0122
22
21
2100 5.05.01 aGababaaa
( ) 05.05.0 21212 =+−+ bbaaGGa
(5) ( ) ( ) ( )+−−+++−−− 02
122
22
21200 2125.01 aabaaGaaGa ω
( ) 021211 =+−+ bbaab βω
(6) ( ) FababGbabaaba =−++−−−+− 1221201102
11 )(21 ωβω
(7) ( ) ( ) −+−−+− βωω 202
201 22415.0 baaaGa
( ) 05.0 21
2121 =−−− baGaa
(8) ( ) ( ) −−−−+− βωω 202
201 22415.0 aabaGb
02111 =+− Gbbba
This system has been solved for different forcing amplitudes F, equally spaced between 0 and 0.22, using Newton-Raphson method and the findings are displayed in Fig. 6.
0 0.05 0.1 0.15 0.2 0.25-0.02
-0.015
-0.01
-0.005
0
0.005
0.01
0.015
F
a 0, a1, a
2, b1, b
2
a0
a1
a2b1
b2
Fig. 6 Amplitudes 1210 ,,, baaa and 2b for different forcing amplitudes
For F = 0.1, we found ,0041.0,0077.0,0062.0 210 =−== aaa 006.01=b , and 0067.02 −=b . The associated time history and the
phase plane (the asterisks) are shown in Fig. 7, along with the solution obtained by numerical integration (the continuous black curve). It could be seen that the agreement between the two solutions is good, with some notable differences at peaks and
19
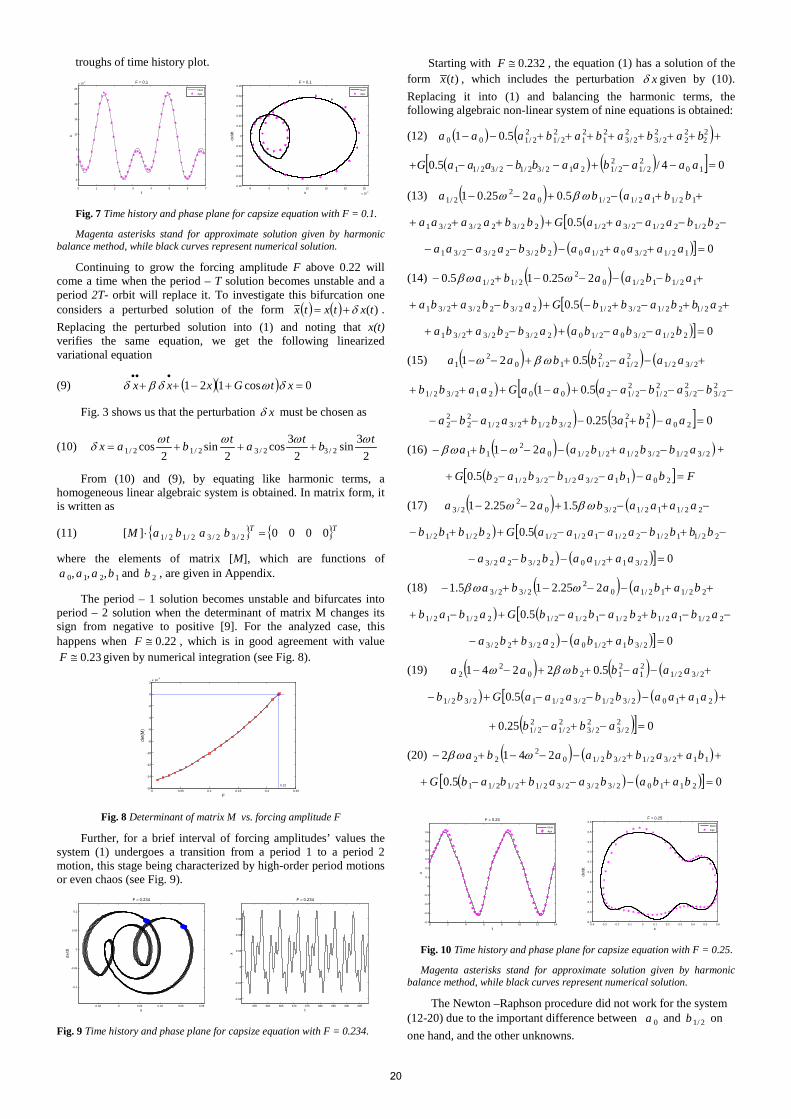
troughs of time history plot.
0 1 2 3 4 5 6 7
-5
0
5
10
15
20
25
x 10-3
t
x
F = 0.1
NumApx
-5 0 5 10 15 20 25
x 10-3
-0.05
-0.04
-0.03
-0.02
-0.01
0
0.01
0.02
0.03
0.04
0.05
x
dx/d
t
F = 0.1
NumApx
Fig. 7 Time history and phase plane for capsize equation with F = 0.1.
Magenta asterisks stand for approximate solution given by harmonic balance method, while black curves represent numerical solution.
Continuing to grow the forcing amplitude F above 0.22 will come a time when the period – T solution becomes unstable and a period 2T- orbit will replace it. To investigate this bifurcation one considers a perturbed solution of the form ( ) ( ) )(txtxtx δ+= . Replacing the perturbed solution into (1) and noting that x(t) verifies the same equation, we get the following linearized variational equation
(9) ( )( ) 0cos121 =+−++•••
xtGxxx δωδβδ
Fig. 3 shows us that the perturbation xδ must be chosen as
(10) 2
3sin2
3cos2
sin2
cos 2/32/32/12/1tbtatbtax ωωωω
δ +++=
From (10) and (9), by equating like harmonic terms, a homogeneous linear algebraic system is obtained. In matrix form, it is written as
(11) TTbabaM 0000][ 2/32/32/12/1 =⋅
where the elements of matrix [M], which are functions of 1210 ,,, baaa and 2b , are given in Appendix.
The period – 1 solution becomes unstable and bifurcates into period – 2 solution when the determinant of matrix M changes its sign from negative to positive [9]. For the analyzed case, this happens when 22.0≅F , which is in good agreement with value
23.0≅F given by numerical integration (see Fig. 8).
0 0.05 0.1 0.15 0.2 0.25-16
-14
-12
-10
-8
-6
-4
-2
0
2x 10
-3
F
det(M
)
0.22
Fig. 8 Determinant of matrix M vs. forcing amplitude F
Further, for a brief interval of forcing amplitudes’ values the system (1) undergoes a transition from a period 1 to a period 2 motion, this stage being characterized by high-order period motions or even chaos (see Fig. 9).
-0.02 0 0.02 0.04 0.06 0.08
-0.1
-0.05
0
0.05
0.1
x
dx/d
t
F = 0.234
655 660 665 670 675 680 685 690 695
-0.04
-0.02
0
0.02
0.04
0.06
t
x
F = 0.234
Fig. 9 Time history and phase plane for capsize equation with F = 0.234.
Starting with 232.0≅F , the equation (1) has a solution of the form )(tx , which includes the perturbation xδ given by (10). Replacing it into (1) and balancing the harmonic terms, the following algebraic non-linear system of nine equations is obtained:
(12) ( ) ( )++++++++−− 22
22
22/3
22/3
21
21
22/1
22/100 5.01 babababaaa
( ) ( )[ ] 04/5.0 102
2/12
2/1212/32/12/32/11 =−−+−−−+ aaabaabbaaaG
(13) ( ) ( ++−+−− 12/112/12/102
2/1 5.0225.01 bbaabaa ωβω
) ([ −−−+++++ 22/122/12/32/122/322/32/31 5.0 bbaaaaGbbaaaa
) ( )] 012/12/302/1022/322/32/31 =++−−−− aaaaaabbaaaa
(14) ( ) ( +−−−−+− 12/112/102
2/12/1 225.015.0 abbaaba ωωβ
) ([ ++−+−+−++ 22/122/12/32/122/322/32/31 5.0 abbabbGabbaba
) ( )] 022/12/302/1022/322/32/31 =−−+−++ bababaabbaba
(15) ( ) ( ) ( +−−++−− 2/32/12
2/12
2/1102
1 5.021 aaabbaa ωβω
) ( ) ([ −−−−−+−+++ 22/3
22/3
22/1
22/1200212/32/1 5.01 babaaaaGaabb
) ( ) ] 0325.0 2021
212/32/12/32/1
22
22 =−+−+−−− aababbaaba
(16) ( ) ( )2/32/12/32/12/12/102
11 21 abbabaaba −+−−−+− ωωβ +
( )[ ] FbabaabbabG =−−−−+ 20112/32/12/32/125.0
(17) ( ) ( −+−+−− 22/112/12/302
2/3 5.1225.21 aaaabaa ωβω
) ([ −+−−−++− 22/112/122/112/12/122/112/1 5.0 bbbbaaaaaGbbbb
) ( )] 02/312/1022/322/3 =+−−− aaaabbaa
(18) ( ) ( ++−−−+− 22/112/102
2/32/3 225.215.1 babaaba ωωβ
) ([ −−+−−+−+ 22/112/122/112/12/122/112/1 5.0 ababbababGabab
) ( )] 02/312/1022/322/3 =+−+− babaabba
(19) ( ) ( ) ( +−−++−− 2/32/121
2120
22 5.02241 aaabbaa ωβω
) ( ) ( )[ ++−−−+− 21102/32/12/32/112/32/1 5.0 aaaabbaaaGbb
( )] 025.0 22/3
22/3
22/1
22/1 =−+−+ abab
(20) ( ) ( )+++−−−+− 112/32/12/32/102
22 2412 baabbaaba ωωβ
( ) ( )[ ] 05.0 21102/32/32/32/12/12/11 =+−−+−+ bababaabbabG
0 2 4 6 8 10 12 14-0.4
-0.3
-0.2
-0.1
0
0.1
0.2
0.3
0.4
0.5
0.6
t
x
F = 0.25
NumApx
-0.4 -0.3 -0.2 -0.1 0 0.1 0.2 0.3 0.4 0.5 0.6-0.4
-0.3
-0.2
-0.1
0
0.1
0.2
0.3
0.4
0.5
0.6
x
dx/d
t
F = 0.25
NumApx
Fig. 10 Time history and phase plane for capsize equation with F = 0.25.
Magenta asterisks stand for approximate solution given by harmonic balance method, while black curves represent numerical solution.
The Newton –Raphson procedure did not work for the system (12-20) due to the important difference between 0a and 2/1b on one hand, and the other unknowns.
20

However, neglecting the small terms like 22/1 aa , we were able to estimate the solution of system (12 – 20). The results for
25.0=F are shown in Fig. 10. Again, the agreement between the harmonic balance solution and the numerical one is good enough, the notable differences being associated to the first derivative,
dtdx / . The period – 2T motion loses quickly its stability (around 26.0≅F ) and, after a new transition stage, turn into a period – 4T
motion. The mathematics involved by harmonic balance method becomes from now on quite cumbersome.
5. Conclusions
In the paper, the ship capsize equation provided by Thompson and co-workers was analytically and numerically investigated for a range of frequencies far from resonance conditions. Excepting the fact that capsizing is moving into an area of higher values of forcing amplitudes, the system’s behaviour remains unchanged, i.e. the chaos is shown to occur through a cascade of period doubling bifurcations as the forcing amplitude is increased.
The Fast Fourier Transform has been used to obtain approximate solutions for period – T, 2T, 4T and 8T motions, and the results proved to be excellent when compared with the numerical ones.
The Harmonic Balance Technique, with appropriate harmonic terms in the assumed solution, allowed us to approximate period T and 2T motions and to estimate the bifurcation between them. Because of the mathematics involved in approximating the higher-order period motions, the above-mentioned method is inadequate to study the next period-doubling bifurcations leading to chaos.
Literature 1. … The specialist Committee on Stability: Final report and
Recommendations to the 22th ITTC. In Proceedings of the 22th ITTC Conference, Seoul and Shangai, 1999.
2. Hinz T. Mathematical models in description of capsizing scenarios. Archives of Civil and Mechanical Engineering, 7, 2007, p. 125-134.
3. Kan M., H. Taguchi. Capsizing of a ship in quartering seas. J. Soc. Naval Architects Japan, 171, 1992, p. 229-244.
4. Oh I.G., A.H. Nayfeh, T. Mook. A theoretical and experimental investigation of indirectly excited roll motion of ships. Phil. Trans. J. Soc. Lond. A, 358, 2000, p. 1731-1781.
5. Rayney, R.C.T., J.M.T. Thompson. The transient capsize diagram-A new method of quantifying stability in waves. JSR, 35 (1), 1991, p. 315-324.
6. Deleanu D. On a geometric approach of safe basin’s fractal erosion. Application to the symmetric capsize problem. Constanta Maritime University Annals, 22, 2015, p. 121-126.
7. Cardo A. A. Francescutto, R. Nabugoj. Nonlinear rolling response in a regular sea. International Shipbuilding Progress, 28, 1991, p. 204-209.
8. Thompson J.M.T., R.C.T. Rayney, M.S. Soliman. Mechanics of ship capsize under direct and parametric wave excitation. Phil. Trans. R. Soc. Lond. A., 338, 1992, p. 471-490.
9. Szemplinska-Stupnicka W., J. Bajkovski. The ½ sub-harmonic resonance and its transition to chaotic motion in a non-linear oscillator. Int. J. of Nonlinear Mechanics, 25 (5), 1986, p. 401-419.
APPENDIX
The elements 4,1, ≤≤ jim ji of matrix M in (11) are defined as follows:
( ) ,215.0,25.021 12022
101 aGaaPGaaP −−−=−−−= ω
,5.0,5.0,5.0 1254213 GaaPPGbbP +==−−= ωβ
,5.0,25.221,5.0 182
107126 GaPGaaPGbbP =−−−=−−= ω
,,,5.0,5.1 431221112109 PPmPPmGbPP +=+=−== ωβ
,,,, 2122432136145213 PPmPPmPPmPPm −=−=+=−=
,,,, 3632523152243623 PPmPPmPPmPPm −=−=+=−=
,,,, 25426341109348733 PPmPPmPPmPPm +=+=+=−=
., 874491043 PPmPPm +=−=
21
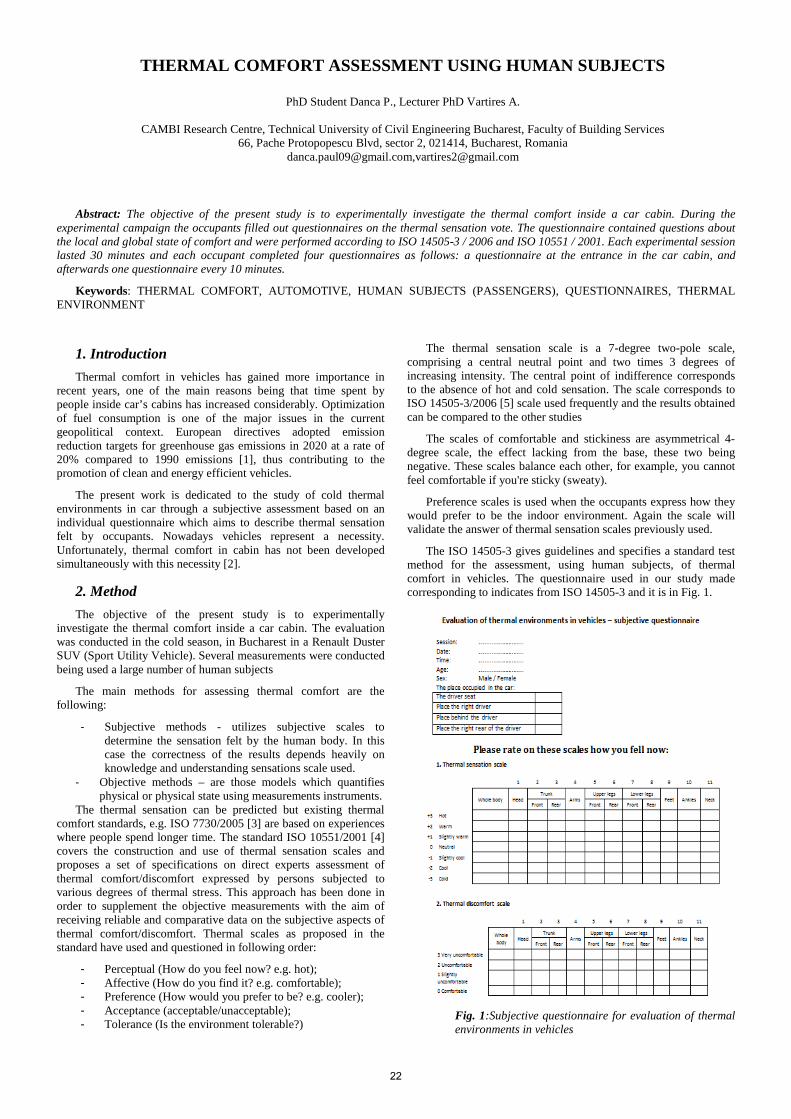
THERMAL COMFORT ASSESSMENT USING HUMAN SUBJECTS
PhD Student Danca P., Lecturer PhD Vartires A.
CAMBI Research Centre, Technical University of Civil Engineering Bucharest, Faculty of Building Services 66, Pache Protopopescu Blvd, sector 2, 021414, Bucharest, Romania
[email protected],[email protected]
Abstract: The objective of the present study is to experimentally investigate the thermal comfort inside a car cabin. During the experimental campaign the occupants filled out questionnaires on the thermal sensation vote. The questionnaire contained questions about the local and global state of comfort and were performed according to ISO 14505-3 / 2006 and ISO 10551 / 2001. Each experimental session lasted 30 minutes and each occupant completed four questionnaires as follows: a questionnaire at the entrance in the car cabin, and afterwards one questionnaire every 10 minutes.
Keywords: THERMAL COMFORT, AUTOMOTIVE, HUMAN SUBJECTS (PASSENGERS), QUESTIONNAIRES, THERMAL ENVIRONMENT
1. Introduction Thermal comfort in vehicles has gained more importance in
recent years, one of the main reasons being that time spent by people inside car’s cabins has increased considerably. Optimization of fuel consumption is one of the major issues in the current geopolitical context. European directives adopted emission reduction targets for greenhouse gas emissions in 2020 at a rate of 20% compared to 1990 emissions [1], thus contributing to the promotion of clean and energy efficient vehicles.
The present work is dedicated to the study of cold thermal environments in car through a subjective assessment based on an individual questionnaire which aims to describe thermal sensation felt by occupants. Nowadays vehicles represent a necessity. Unfortunately, thermal comfort in cabin has not been developed simultaneously with this necessity [2].
2. Method The objective of the present study is to experimentally
investigate the thermal comfort inside a car cabin. The evaluation was conducted in the cold season, in Bucharest in a Renault Duster SUV (Sport Utility Vehicle). Several measurements were conducted being used a large number of human subjects
The main methods for assessing thermal comfort are the following:
- Subjective methods - utilizes subjective scales to determine the sensation felt by the human body. In this case the correctness of the results depends heavily on knowledge and understanding sensations scale used.
- Objective methods – are those models which quantifies physical or physical state using measurements instruments.
The thermal sensation can be predicted but existing thermal comfort standards, e.g. ISO 7730/2005 [3] are based on experiences where people spend longer time. The standard ISO 10551/2001 [4] covers the construction and use of thermal sensation scales and proposes a set of specifications on direct experts assessment of thermal comfort/discomfort expressed by persons subjected to various degrees of thermal stress. This approach has been done in order to supplement the objective measurements with the aim of receiving reliable and comparative data on the subjective aspects of thermal comfort/discomfort. Thermal scales as proposed in the standard have used and questioned in following order:
- Perceptual (How do you feel now? e.g. hot); - Affective (How do you find it? e.g. comfortable); - Preference (How would you prefer to be? e.g. cooler); - Acceptance (acceptable/unacceptable); - Tolerance (Is the environment tolerable?)
The thermal sensation scale is a 7-degree two-pole scale, comprising a central neutral point and two times 3 degrees of increasing intensity. The central point of indifference corresponds to the absence of hot and cold sensation. The scale corresponds to ISO 14505-3/2006 [5] scale used frequently and the results obtained can be compared to the other studies
The scales of comfortable and stickiness are asymmetrical 4-degree scale, the effect lacking from the base, these two being negative. These scales balance each other, for example, you cannot feel comfortable if you're sticky (sweaty).
Preference scales is used when the occupants express how they would prefer to be the indoor environment. Again the scale will validate the answer of thermal sensation scales previously used.
The ISO 14505-3 gives guidelines and specifies a standard test method for the assessment, using human subjects, of thermal comfort in vehicles. The questionnaire used in our study made corresponding to indicates from ISO 14505-3 and it is in Fig. 1.
Fig. 1:Subjective questionnaire for evaluation of thermal environments in vehicles
22
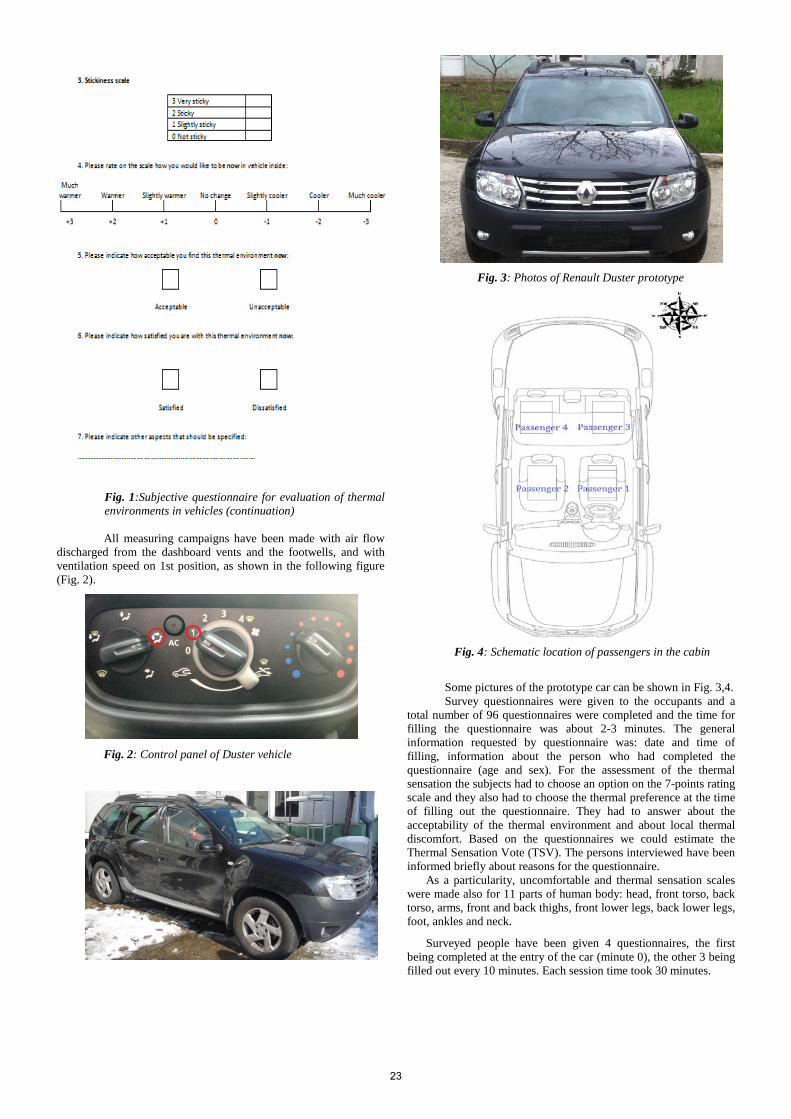
Fig. 1:Subjective questionnaire for evaluation of thermal environments in vehicles (continuation) All measuring campaigns have been made with air flow
discharged from the dashboard vents and the footwells, and with ventilation speed on 1st position, as shown in the following figure (Fig. 2).
Fig. 2: Control panel of Duster vehicle
Fig. 3: Photos of Renault Duster prototype
Fig. 4: Schematic location of passengers in the cabin
Some pictures of the prototype car can be shown in Fig. 3,4. Survey questionnaires were given to the occupants and a
total number of 96 questionnaires were completed and the time for filling the questionnaire was about 2-3 minutes. The general information requested by questionnaire was: date and time of filling, information about the person who had completed the questionnaire (age and sex). For the assessment of the thermal sensation the subjects had to choose an option on the 7-points rating scale and they also had to choose the thermal preference at the time of filling out the questionnaire. They had to answer about the acceptability of the thermal environment and about local thermal discomfort. Based on the questionnaires we could estimate the Thermal Sensation Vote (TSV). The persons interviewed have been informed briefly about reasons for the questionnaire.
As a particularity, uncomfortable and thermal sensation scales were made also for 11 parts of human body: head, front torso, back torso, arms, front and back thighs, front lower legs, back lower legs, foot, ankles and neck.
Surveyed people have been given 4 questionnaires, the first being completed at the entry of the car (minute 0), the other 3 being filled out every 10 minutes. Each session time took 30 minutes.
23
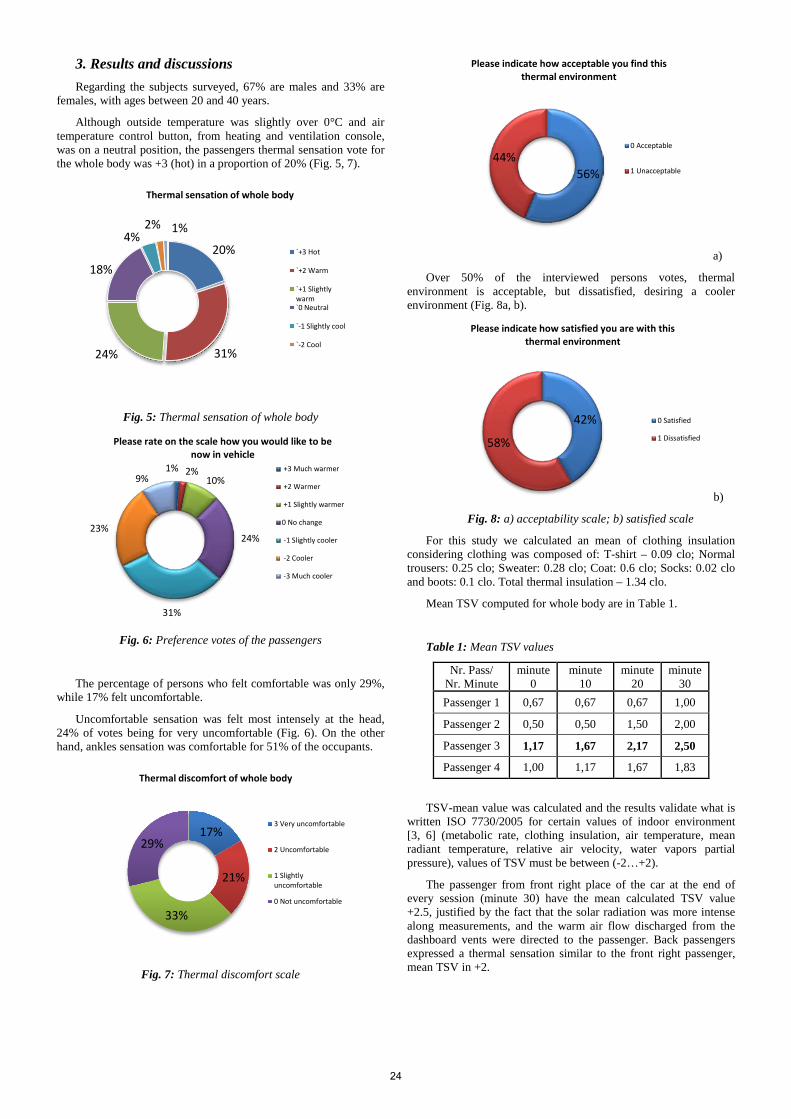
3. Results and discussions Regarding the subjects surveyed, 67% are males and 33% are
females, with ages between 20 and 40 years.
Although outside temperature was slightly over 0°C and air temperature control button, from heating and ventilation console, was on a neutral position, the passengers thermal sensation vote for the whole body was +3 (hot) in a proportion of 20% (Fig. 5, 7).
Fig. 5: Thermal sensation of whole body
Fig. 6: Preference votes of the passengers
The percentage of persons who felt comfortable was only 29%, while 17% felt uncomfortable.
Uncomfortable sensation was felt most intensely at the head, 24% of votes being for very uncomfortable (Fig. 6). On the other hand, ankles sensation was comfortable for 51% of the occupants.
Fig. 7: Thermal discomfort scale
a)
Over 50% of the interviewed persons votes, thermal environment is acceptable, but dissatisfied, desiring a cooler environment (Fig. 8a, b).
b)
Fig. 8: a) acceptability scale; b) satisfied scale
For this study we calculated an mean of clothing insulation considering clothing was composed of: T-shirt – 0.09 clo; Normal trousers: 0.25 clo; Sweater: 0.28 clo; Coat: 0.6 clo; Socks: 0.02 clo and boots: 0.1 clo. Total thermal insulation – 1.34 clo.
Mean TSV computed for whole body are in Table 1.
Table 1: Mean TSV values
Nr. Pass/ Nr. Minute
minute 0
minute 10
minute 20
minute 30
Passenger 1 0,67 0,67 0,67 1,00
Passenger 2 0,50 0,50 1,50 2,00
Passenger 3 1,17 1,67 2,17 2,50
Passenger 4 1,00 1,17 1,67 1,83
TSV-mean value was calculated and the results validate what is written ISO 7730/2005 for certain values of indoor environment [3, 6] (metabolic rate, clothing insulation, air temperature, mean radiant temperature, relative air velocity, water vapors partial pressure), values of TSV must be between (-2…+2).
The passenger from front right place of the car at the end of every session (minute 30) have the mean calculated TSV value +2.5, justified by the fact that the solar radiation was more intense along measurements, and the warm air flow discharged from the dashboard vents were directed to the passenger. Back passengers expressed a thermal sensation similar to the front right passenger, mean TSV in +2.
20%
31% 24%
18%
4% 2% 1%
Thermal sensation of whole body
`+3 Hot
`+2 Warm
`+1 Slightlywarm`0 Neutral
`-1 Slightly cool
`-2 Cool
1% 2% 10%
24%
31%
23%
9%
Please rate on the scale how you would like to be now in vehicle
+3 Much warmer
+2 Warmer
+1 Slightly warmer
0 No change
-1 Slightly cooler
-2 Cooler
-3 Much cooler
17%
21%
33%
29%
Thermal discomfort of whole body
3 Very uncomfortable
2 Uncomfortable
1 Slightlyuncomfortable
0 Not uncomfortable
56% 44%
Please indicate how acceptable you find this thermal environment
0 Acceptable
1 Unacceptable
42%
58%
Please indicate how satisfied you are with this thermal environment
0 Satisfied
1 Dissatisfied
24
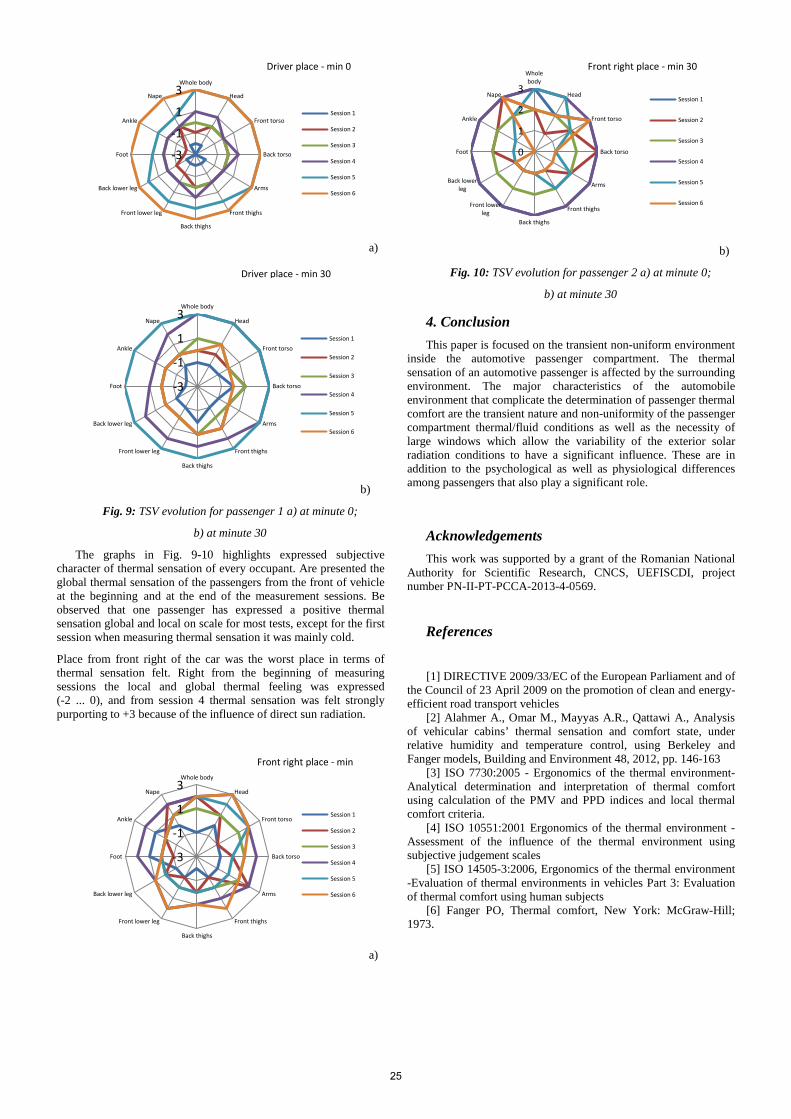
a)
b)
Fig. 9: TSV evolution for passenger 1 a) at minute 0;
b) at minute 30
The graphs in Fig. 9-10 highlights expressed subjective character of thermal sensation of every occupant. Are presented the global thermal sensation of the passengers from the front of vehicle at the beginning and at the end of the measurement sessions. Be observed that one passenger has expressed a positive thermal sensation global and local on scale for most tests, except for the first session when measuring thermal sensation it was mainly cold. Place from front right of the car was the worst place in terms of thermal sensation felt. Right from the beginning of measuring sessions the local and global thermal feeling was expressed (-2 ... 0), and from session 4 thermal sensation was felt strongly purporting to +3 because of the influence of direct sun radiation.
a)
b)
Fig. 10: TSV evolution for passenger 2 a) at minute 0;
b) at minute 30
4. Conclusion This paper is focused on the transient non-uniform environment
inside the automotive passenger compartment. The thermal sensation of an automotive passenger is affected by the surrounding environment. The major characteristics of the automobile environment that complicate the determination of passenger thermal comfort are the transient nature and non-uniformity of the passenger compartment thermal/fluid conditions as well as the necessity of large windows which allow the variability of the exterior solar radiation conditions to have a significant influence. These are in addition to the psychological as well as physiological differences among passengers that also play a significant role.
Acknowledgements This work was supported by a grant of the Romanian National
Authority for Scientific Research, CNCS, UEFISCDI, project number PN-II-PT-PCCA-2013-4-0569.
References
[1] DIRECTIVE 2009/33/EC of the European Parliament and of the Council of 23 April 2009 on the promotion of clean and energy-efficient road transport vehicles
[2] Alahmer A., Omar M., Mayyas A.R., Qattawi A., Analysis of vehicular cabins’ thermal sensation and comfort state, under relative humidity and temperature control, using Berkeley and Fanger models, Building and Environment 48, 2012, pp. 146-163
[3] ISO 7730:2005 - Ergonomics of the thermal environment- Analytical determination and interpretation of thermal comfort using calculation of the PMV and PPD indices and local thermal comfort criteria.
[4] ISO 10551:2001 Ergonomics of the thermal environment - Assessment of the influence of the thermal environment using subjective judgement scales
[5] ISO 14505-3:2006, Ergonomics of the thermal environment -Evaluation of thermal environments in vehicles Part 3: Evaluation of thermal comfort using human subjects
[6] Fanger PO, Thermal comfort, New York: McGraw-Hill; 1973.
-3
-1
1
3Whole body
Head
Front torso
Back torso
Arms
Front thighs
Back thighs
Front lower leg
Back lower leg
Foot
Ankle
Nape
Session 1
Session 2
Session 3
Session 4
Session 5
Session 6
Driver place - min 0
-3
-1
1
3Whole body
Head
Front torso
Back torso
Arms
Front thighs
Back thighs
Front lower leg
Back lower leg
Foot
Ankle
Nape
Session 1
Session 2
Session 3
Session 4
Session 5
Session 6
Driver place - min 30
-3
-1
1
3Whole body
Head
Front torso
Back torso
Arms
Front thighs
Back thighs
Front lower leg
Back lower leg
Foot
Ankle
Nape
Session 1
Session 2
Session 3
Session 4
Session 5
Session 6
Front right place - min
0
1
2
3Wholebody
Head
Front torso
Back torso
Arms
Front thighs
Back thighs
Front lowerleg
Back lowerleg
Foot
Ankle
NapeSession 1
Session 2
Session 3
Session 4
Session 5
Session 6
Front right place - min 30
25
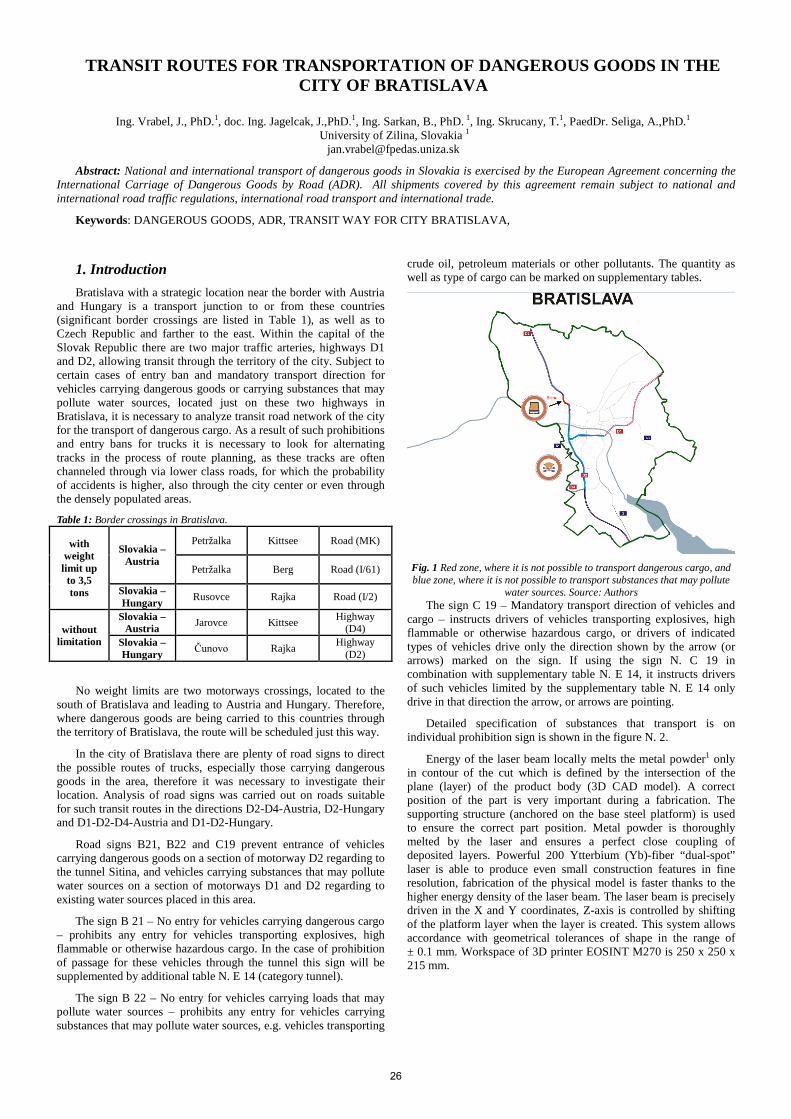
TRANSIT ROUTES FOR TRANSPORTATION OF DANGEROUS GOODS IN THE CITY OF BRATISLAVA
Ing. Vrabel, J., PhD.1, doc. Ing. Jagelcak, J.,PhD.1, Ing. Sarkan, B., PhD. 1, Ing. Skrucany, T.1, PaedDr. Seliga, A.,PhD.1
University of Zilina, Slovakia 1
Abstract: National and international transport of dangerous goods in Slovakia is exercised by the European Agreement concerning the International Carriage of Dangerous Goods by Road (ADR). All shipments covered by this agreement remain subject to national and international road traffic regulations, international road transport and international trade.
Keywords: DANGEROUS GOODS, ADR, TRANSIT WAY FOR CITY BRATISLAVA,
1. Introduction Bratislava with a strategic location near the border with Austria
and Hungary is a transport junction to or from these countries (significant border crossings are listed in Table 1), as well as to Czech Republic and farther to the east. Within the capital of the Slovak Republic there are two major traffic arteries, highways D1 and D2, allowing transit through the territory of the city. Subject to certain cases of entry ban and mandatory transport direction for vehicles carrying dangerous goods or carrying substances that may pollute water sources, located just on these two highways in Bratislava, it is necessary to analyze transit road network of the city for the transport of dangerous cargo. As a result of such prohibitions and entry bans for trucks it is necessary to look for alternating tracks in the process of route planning, as these tracks are often channeled through via lower class roads, for which the probability of accidents is higher, also through the city center or even through the densely populated areas.
Table 1: Border crossings in Bratislava.
with weight
limit up to 3,5 tons
Slovakia – Austria
Petržalka Kittsee Road (MK)
Petržalka Berg Road (I/61)
Slovakia – Hungary Rusovce Rajka Road (I/2)
without limitation
Slovakia – Austria Jarovce Kittsee Highway
(D4) Slovakia – Hungary Čunovo Rajka Highway
(D2)
No weight limits are two motorways crossings, located to the south of Bratislava and leading to Austria and Hungary. Therefore, where dangerous goods are being carried to this countries through the territory of Bratislava, the route will be scheduled just this way.
In the city of Bratislava there are plenty of road signs to direct the possible routes of trucks, especially those carrying dangerous goods in the area, therefore it was necessary to investigate their location. Analysis of road signs was carried out on roads suitable for such transit routes in the directions D2-D4-Austria, D2-Hungary and D1-D2-D4-Austria and D1-D2-Hungary.
Road signs B21, B22 and C19 prevent entrance of vehicles carrying dangerous goods on a section of motorway D2 regarding to the tunnel Sitina, and vehicles carrying substances that may pollute water sources on a section of motorways D1 and D2 regarding to existing water sources placed in this area.
The sign B 21 – No entry for vehicles carrying dangerous cargo – prohibits any entry for vehicles transporting explosives, high flammable or otherwise hazardous cargo. In the case of prohibition of passage for these vehicles through the tunnel this sign will be supplemented by additional table N. E 14 (category tunnel).
The sign B 22 – No entry for vehicles carrying loads that may pollute water sources – prohibits any entry for vehicles carrying substances that may pollute water sources, e.g. vehicles transporting
crude oil, petroleum materials or other pollutants. The quantity as well as type of cargo can be marked on supplementary tables.
Fig. 1 Red zone, where it is not possible to transport dangerous cargo, and blue zone, where it is not possible to transport substances that may pollute
water sources. Source: Authors The sign C 19 – Mandatory transport direction of vehicles and
cargo – instructs drivers of vehicles transporting explosives, high flammable or otherwise hazardous cargo, or drivers of indicated types of vehicles drive only the direction shown by the arrow (or arrows) marked on the sign. If using the sign N. C 19 in combination with supplementary table N. E 14, it instructs drivers of such vehicles limited by the supplementary table N. E 14 only drive in that direction the arrow, or arrows are pointing.
Detailed specification of substances that transport is on individual prohibition sign is shown in the figure N. 2.
Energy of the laser beam locally melts the metal powder1 only in contour of the cut which is defined by the intersection of the plane (layer) of the product body (3D CAD model). A correct position of the part is very important during a fabrication. The supporting structure (anchored on the base steel platform) is used to ensure the correct part position. Metal powder is thoroughly melted by the laser and ensures a perfect close coupling of deposited layers. Powerful 200 Ytterbium (Yb)-fiber “dual-spot” laser is able to produce even small construction features in fine resolution, fabrication of the physical model is faster thanks to the higher energy density of the laser beam. The laser beam is precisely driven in the X and Y coordinates, Z-axis is controlled by shifting of the platform layer when the layer is created. This system allows accordance with geometrical tolerances of shape in the range of ± 0.1 mm. Workspace of 3D printer EOSINT M270 is 250 x 250 x 215 mm.
26
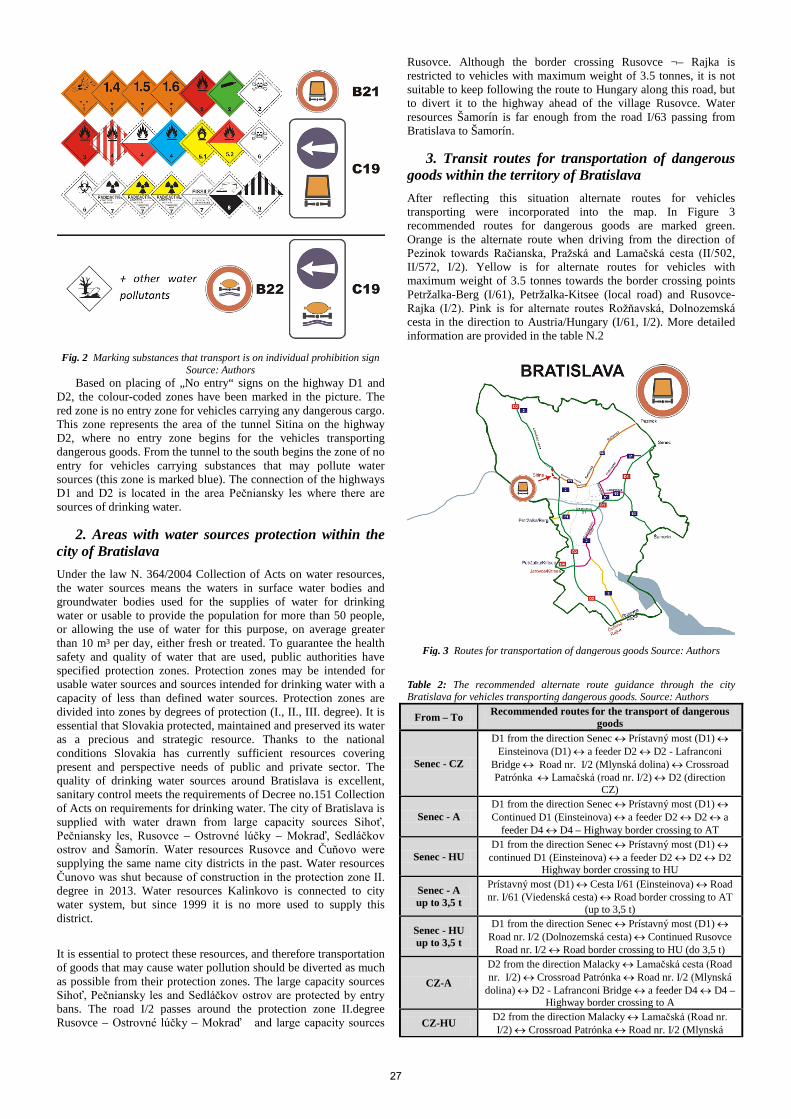
Fig. 2 Marking substances that transport is on individual prohibition sign
Source: Authors Based on placing of „No entry“ signs on the highway D1 and
D2, the colour-coded zones have been marked in the picture. The red zone is no entry zone for vehicles carrying any dangerous cargo. This zone represents the area of the tunnel Sitina on the highway D2, where no entry zone begins for the vehicles transporting dangerous goods. From the tunnel to the south begins the zone of no entry for vehicles carrying substances that may pollute water sources (this zone is marked blue). The connection of the highways D1 and D2 is located in the area Pečniansky les where there are sources of drinking water.
2. Areas with water sources protection within the city of Bratislava Under the law N. 364/2004 Collection of Acts on water resources, the water sources means the waters in surface water bodies and groundwater bodies used for the supplies of water for drinking water or usable to provide the population for more than 50 people, or allowing the use of water for this purpose, on average greater than 10 m³ per day, either fresh or treated. To guarantee the health safety and quality of water that are used, public authorities have specified protection zones. Protection zones may be intended for usable water sources and sources intended for drinking water with a capacity of less than defined water sources. Protection zones are divided into zones by degrees of protection (I., II., III. degree). It is essential that Slovakia protected, maintained and preserved its water as a precious and strategic resource. Thanks to the national conditions Slovakia has currently sufficient resources covering present and perspective needs of public and private sector. The quality of drinking water sources around Bratislava is excellent, sanitary control meets the requirements of Decree no.151 Collection of Acts on requirements for drinking water. The city of Bratislava is supplied with water drawn from large capacity sources Sihoť, Pečniansky les, Rusovce – Ostrovné lúčky – Mokraď, Sedláčkov ostrov and Šamorín. Water resources Rusovce and Čuňovo were supplying the same name city districts in the past. Water resources Čunovo was shut because of construction in the protection zone II. degree in 2013. Water resources Kalinkovo is connected to city water system, but since 1999 it is no more used to supply this district.
It is essential to protect these resources, and therefore transportation of goods that may cause water pollution should be diverted as much as possible from their protection zones. The large capacity sources Sihoť, Pečniansky les and Sedláčkov ostrov are protected by entry bans. The road I/2 passes around the protection zone II.degree Rusovce – Ostrovné lúčky – Mokraď and large capacity sources
Rusovce. Although the border crossing Rusovce ¬– Rajka is restricted to vehicles with maximum weight of 3.5 tonnes, it is not suitable to keep following the route to Hungary along this road, but to divert it to the highway ahead of the village Rusovce. Water resources Šamorín is far enough from the road I/63 passing from Bratislava to Šamorín.
3. Transit routes for transportation of dangerous goods within the territory of Bratislava After reflecting this situation alternate routes for vehicles transporting were incorporated into the map. In Figure 3 recommended routes for dangerous goods are marked green. Orange is the alternate route when driving from the direction of Pezinok towards Račianska, Pražská and Lamačská cesta (II/502, II/572, I/2). Yellow is for alternate routes for vehicles with maximum weight of 3.5 tonnes towards the border crossing points Petržalka-Berg (I/61), Petržalka-Kitsee (local road) and Rusovce-Rajka (I/2). Pink is for alternate routes Rožňavská, Dolnozemská cesta in the direction to Austria/Hungary (I/61, I/2). More detailed information are provided in the table N.2
Fig. 3 Routes for transportation of dangerous goods Source: Authors
Table 2: The recommended alternate route guidance through the city Bratislava for vehicles transporting dangerous goods. Source: Authors
From – To Recommended routes for the transport of dangerous goods
Senec - CZ
D1 from the direction Senec ↔ Prístavný most (D1) ↔ Einsteinova (D1) ↔ a feeder D2 ↔ D2 - Lafranconi
Bridge ↔ Road nr. I/2 (Mlynská dolina) ↔ Crossroad Patrónka ↔ Lamačská (road nr. I/2) ↔ D2 (direction
CZ)
Senec - A D1 from the direction Senec ↔ Prístavný most (D1) ↔ Continued D1 (Einsteinova) ↔ a feeder D2 ↔ D2 ↔ a
feeder D4 ↔ D4 – Highway border crossing to AT
Senec - HU D1 from the direction Senec ↔ Prístavný most (D1) ↔
continued D1 (Einsteinova) ↔ a feeder D2 ↔ D2 ↔ D2 Highway border crossing to HU
Senec - A up to 3,5 t
Prístavný most (D1) ↔ Cesta I/61 (Einsteinova) ↔ Road nr. I/61 (Viedenská cesta) ↔ Road border crossing to AT
(up to 3,5 t)
Senec - HU up to 3,5 t
D1 from the direction Senec ↔ Prístavný most (D1) ↔ Road nr. I/2 (Dolnozemská cesta) ↔ Continued Rusovce
Road nr. I/2 ↔ Road border crossing to HU (do 3,5 t)
CZ-A
D2 from the direction Malacky ↔ Lamačská cesta (Road nr. I/2) ↔ Crossroad Patrónka ↔ Road nr. I/2 (Mlynská
dolina) ↔ D2 - Lafranconi Bridge ↔ a feeder D4 ↔ D4 – Highway border crossing to A
CZ-HU D2 from the direction Malacky ↔ Lamačská (Road nr. I/2) ↔ Crossroad Patrónka ↔ Road nr. I/2 (Mlynská
27
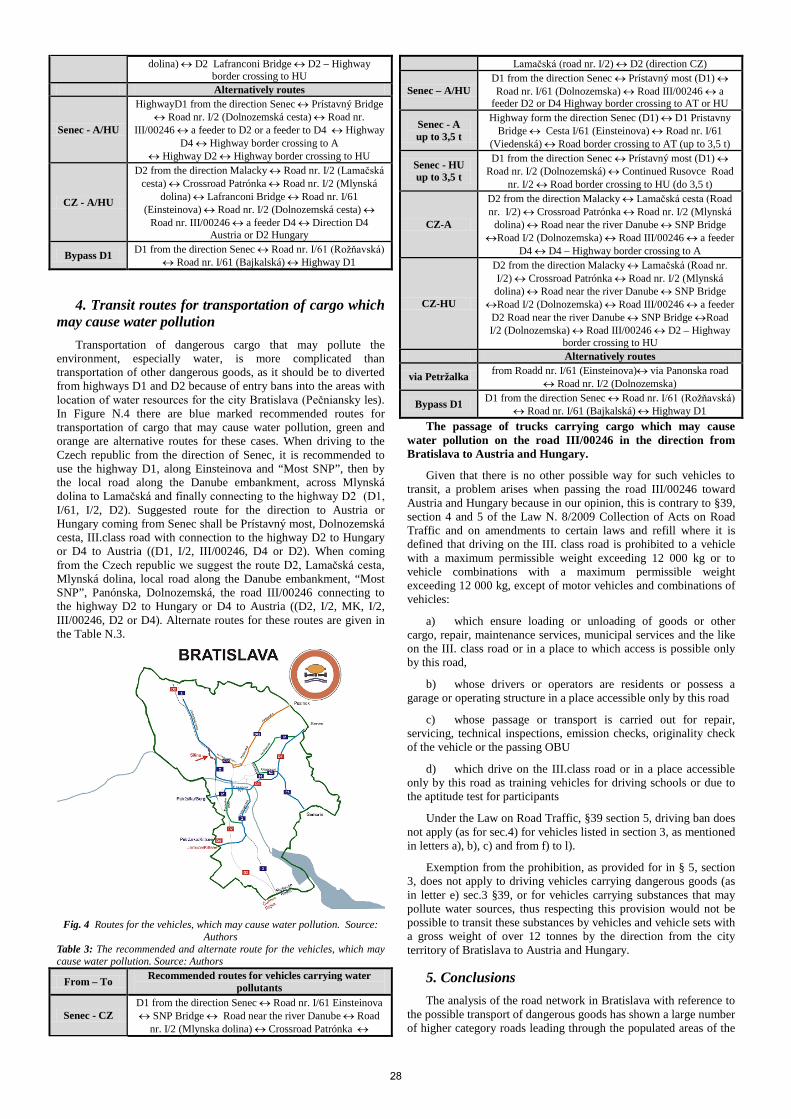
dolina) ↔ D2 Lafranconi Bridge ↔ D2 – Highway border crossing to HU
Alternatively routes
Senec - A/HU
HighwayD1 from the direction Senec ↔ Prístavný Bridge ↔ Road nr. I/2 (Dolnozemská cesta) ↔ Road nr.
III/00246 ↔ a feeder to D2 or a feeder to D4 ↔ Highway D4 ↔ Highway border crossing to A
↔ Highway D2 ↔ Highway border crossing to HU
CZ - A/HU
D2 from the direction Malacky ↔ Road nr. I/2 (Lamačská cesta) ↔ Crossroad Patrónka ↔ Road nr. I/2 (Mlynská
dolina) ↔ Lafranconi Bridge ↔ Road nr. I/61 (Einsteinova) ↔ Road nr. I/2 (Dolnozemská cesta) ↔
Road nr. III/00246 ↔ a feeder D4 ↔ Direction D4 Austria or D2 Hungary
Bypass D1 D1 from the direction Senec ↔ Road nr. I/61 (Rožňavská) ↔ Road nr. I/61 (Bajkalská) ↔ Highway D1
4. Transit routes for transportation of cargo which may cause water pollution
Transportation of dangerous cargo that may pollute the environment, especially water, is more complicated than transportation of other dangerous goods, as it should be to diverted from highways D1 and D2 because of entry bans into the areas with location of water resources for the city Bratislava (Pečniansky les). In Figure N.4 there are blue marked recommended routes for transportation of cargo that may cause water pollution, green and orange are alternative routes for these cases. When driving to the Czech republic from the direction of Senec, it is recommended to use the highway D1, along Einsteinova and “Most SNP”, then by the local road along the Danube embankment, across Mlynská dolina to Lamačská and finally connecting to the highway D2 (D1, I/61, I/2, D2). Suggested route for the direction to Austria or Hungary coming from Senec shall be Prístavný most, Dolnozemská cesta, III.class road with connection to the highway D2 to Hungary or D4 to Austria ((D1, I/2, III/00246, D4 or D2). When coming from the Czech republic we suggest the route D2, Lamačská cesta, Mlynská dolina, local road along the Danube embankment, “Most SNP”, Panónska, Dolnozemská, the road III/00246 connecting to the highway D2 to Hungary or D4 to Austria ((D2, I/2, MK, I/2, III/00246, D2 or D4). Alternate routes for these routes are given in the Table N.3.
Fig. 4 Routes for the vehicles, which may cause water pollution. Source:
Authors Table 3: The recommended and alternate route for the vehicles, which may cause water pollution. Source: Authors
From – To Recommended routes for vehicles carrying water pollutants
Senec - CZ D1 from the direction Senec ↔ Road nr. I/61 Einsteinova ↔ SNP Bridge ↔ Road near the river Danube ↔ Road
nr. I/2 (Mlynska dolina) ↔ Crossroad Patrónka ↔
Lamačská (road nr. I/2) ↔ D2 (direction CZ)
Senec – A/HU D1 from the direction Senec ↔ Prístavný most (D1) ↔ Road nr. I/61 (Dolnozemska) ↔ Road III/00246 ↔ a
feeder D2 or D4 Highway border crossing to AT or HU
Senec - A up to 3,5 t
Highway form the direction Senec (D1) ↔ D1 Pristavny Bridge ↔ Cesta I/61 (Einsteinova) ↔ Road nr. I/61
(Viedenská) ↔ Road border crossing to AT (up to 3,5 t)
Senec - HU up to 3,5 t
D1 from the direction Senec ↔ Prístavný most (D1) ↔ Road nr. I/2 (Dolnozemská) ↔ Continued Rusovce Road
nr. I/2 ↔ Road border crossing to HU (do 3,5 t)
CZ-A
D2 from the direction Malacky ↔ Lamačská cesta (Road nr. I/2) ↔ Crossroad Patrónka ↔ Road nr. I/2 (Mlynská
dolina) ↔ Road near the river Danube ↔ SNP Bridge ↔Road I/2 (Dolnozemska) ↔ Road III/00246 ↔ a feeder
D4 ↔ D4 – Highway border crossing to A
CZ-HU
D2 from the direction Malacky ↔ Lamačská (Road nr. I/2) ↔ Crossroad Patrónka ↔ Road nr. I/2 (Mlynská dolina) ↔ Road near the river Danube ↔ SNP Bridge
↔Road I/2 (Dolnozemska) ↔ Road III/00246 ↔ a feeder D2 Road near the river Danube ↔ SNP Bridge ↔Road I/2 (Dolnozemska) ↔ Road III/00246 ↔ D2 – Highway
border crossing to HU Alternatively routes
via Petržalka from Roadd nr. I/61 (Einsteinova)↔ via Panonska road ↔ Road nr. I/2 (Dolnozemska)
Bypass D1 D1 from the direction Senec ↔ Road nr. I/61 (Rožňavská) ↔ Road nr. I/61 (Bajkalská) ↔ Highway D1
The passage of trucks carrying cargo which may cause water pollution on the road III/00246 in the direction from Bratislava to Austria and Hungary.
Given that there is no other possible way for such vehicles to transit, a problem arises when passing the road III/00246 toward Austria and Hungary because in our opinion, this is contrary to §39, section 4 and 5 of the Law N. 8/2009 Collection of Acts on Road Traffic and on amendments to certain laws and refill where it is defined that driving on the III. class road is prohibited to a vehicle with a maximum permissible weight exceeding 12 000 kg or to vehicle combinations with a maximum permissible weight exceeding 12 000 kg, except of motor vehicles and combinations of vehicles:
a) which ensure loading or unloading of goods or other cargo, repair, maintenance services, municipal services and the like on the III. class road or in a place to which access is possible only by this road,
b) whose drivers or operators are residents or possess a garage or operating structure in a place accessible only by this road
c) whose passage or transport is carried out for repair, servicing, technical inspections, emission checks, originality check of the vehicle or the passing OBU
d) which drive on the III.class road or in a place accessible only by this road as training vehicles for driving schools or due to the aptitude test for participants
Under the Law on Road Traffic, §39 section 5, driving ban does not apply (as for sec.4) for vehicles listed in section 3, as mentioned in letters a), b), c) and from f) to l).
Exemption from the prohibition, as provided for in § 5, section 3, does not apply to driving vehicles carrying dangerous goods (as in letter e) sec.3 §39, or for vehicles carrying substances that may pollute water sources, thus respecting this provision would not be possible to transit these substances by vehicles and vehicle sets with a gross weight of over 12 tonnes by the direction from the city territory of Bratislava to Austria and Hungary.
5. Conclusions The analysis of the road network in Bratislava with reference to
the possible transport of dangerous goods has shown a large number of higher category roads leading through the populated areas of the
28

city with a lot of intersections and a high frequency of bus stops. The main transit route is made of highways D1 and D2, which in most cases are optimal for transporting all kinds of goods. In the city of Bratislava, however, both highways are crossing water sources Pečniansky les and therefore can not be used to its full length in the city goods transport that may pollute water. In addition, the D2 highway passes through the tunnel Sitina, which is categorized as E, and therefore is excluded from the transportation of dangerous goods. Trucks should avoid the tunnel on the road I /2. Another factor that complicates planning the transport routes of these cargoes is the fact that in Bratislava is a large number of no entry signs for trucks (especially in the city). Suggested routes are then kept as much as possible on first class roads and motorways. As this was no longer possible for alternate routes, it is appropriate to use these routes in such cases where a shipment can not be carried out on the recommended route.
_______________________________________
REFERENCES
[1] ADR European Agreement concerning the International Carriage of Dangerous Goods by Road
[2] Tranzitné trasy ADR v Bratislave / Ján Vrábel, Juraj Jagelčák. In: Truck & business - ISSN 1337-897X. - Roč. 7, č. 2 (2014), s. 28-31.
[3] http://www.minv.sk/swift_data/source/policia/ dopravna_policia/zakony/UZ%209_2009%20k%201.1.2014.pdf
[4] http://www.cdb.sk/files/documents/cestna-databanka/vystupy-cdb/2014/prehlad_udajov_ck_kraj-okres_01-01-2014.pdf
[5] http://www.minv.sk/swift_data/source/ policia/dopravna_policia/zakony/UZ%209_2009%20k%201.1.2014.pdf
[6] http://www.vuvh.sk/download/dok/Seminar_Problemy_oc hrany_vod/Trancikova_Ohrozenie_vodarenskych_zdrojov.pdf
_______________________________________
This contribution/publication is the result of the project implementation:
Centre of excellence for systems and services of intelligent transport, ITMS 26220120028 supported by the Research & Development Operational Programme funded by the ERDF.
"Podporujeme výskumné aktivity na Slovensku/Projekt je
spolufinancovaný zo zdrojov EÚ"
29
EVALUATION OF AIRCRAFT PASSENGER CABIN FIRE SAFETY AND MEASURES FOR IMPROVEMENT
Leonid Vinogradov Master Sc. Eng.
Education: Riga Technical University Institute of Civil Aviation 1 Lomonosova street, LV 1019, Riga, Latvija
phone (+371) 29462835. E-mail: [email protected] Yuri Sologubov, Master Sc. Eng
Education: Riga Aviation Engineering Higher Military College Phone (+371) 29810200. Email: [email protected]
ABSTRACT: This research has been carried out on aircraft passenger cabin fire safety problem. The pathways of decreasing the fire danger are considered. The algorithm of fire safety implementation was presented. Risk management would decrease the state of danger in the cabin as the subject of the research, therefore, increase the safety to the maximum level available today. KEYWORDS: Aviation incident and/or accident, fireproof structural and decoration materials, fire safety, fire risk, fire dangerous stress/load, passenger cabin fire danger decrease.
1. General Ensuring safety of any object requires ability to employ methods and practices of protection against dangers in force. Hence why analysing fire safety problems it is necessary to evaluate two terms: Danger and Safety. Both of them are interconnected by the term of Risk. Thus a linkage between interconnected events Danger - Risk - Safety is established, where the most questionable term is the Risk. Here is the most popular definition: Risk – a probable danger of any failure caused by actions undertaken, also, the actions as they are if leading to failure of the results anticipated. From the middle of the XX century one of the risks on air transport had become the fire risk. It is often possible to make forced landing after fire is emerged on board yet the conditions for passengers in the cabin remain sustained at safe levels. However such cases have collateral victims who lose their lives after landing because of flame and smoke penetrated into cabin. The fires in cabins and under their floors generate extreme stress factors and along the delay of the crew actions may lead to a catastrophe. Forecasted by ICAO yearly world increase of pax transportation volume by 4-7% meanwhile the safety remaining at the same level will lead to yearly 4% increase of deaths caused by fires.[1] According to statistics around 75% of air accidents happen at take-off, landing and approach stages of flight, i.e. within airport vicinity and one of the major causes of human deaths is emergency aftermath fires.
2. Aircraft passenger cabin fire risk levels The epicentres of fire in an aircraft might be:
• Aero engine • Fuel system • Electric power network • Passenger cabin • Crew cockpit • Service compartments - cargo/baggage, technical/crew
Fires inside cabins are related to fires in confined spaces. They feature high density smokes, small burning spots, great gradient of temperatures along the cabin height, low temperature of fire (comparing with external fires), also, great concentration of highly toxic substances in burning products. Burning may start as a result of reckless care to fires, short cuts in electrical wiring of an aircraft, carrying flammable substances and materials by passengers and other causes.
In the table below are shares of fires on aircraft structural elements. [2]
Nr Types of fires on aircrafts Share of totals
1 Fires on fuel spills/leaks located on one and both sides of a/c
55%
2 Fires and burnings on power plants 25% 3 Fires and burnings inside passenger cabins 12% 4 Fires and burnings on landing gears 5-6% 5 Other fires and burnings 2-3% The results of a series of fire tests prove that one of the major causes of heavy injuries made to human beings in passenger cabin fires of aircrafts [3] are intoxications with fully or partially burned fire products. The results of analysis made on air samples taken during fire tests indicated that after 2-3 minutes from the start of a flamed burning lethal concentration levels reached:
• Carbon oxide • Hydrocyanic/Prussic Acid • Acronitryl • other toxic substances.
By the 3rd minute of burning the oxygen concentration decreased to 6%, and the carbon concentration rose up to 12% per volume. Concentration like that is lethal to human beings. Up to 40% of passengers’ deaths happen due to their intoxication by toxic products of burning decoration materials in cabins, thermal traumas and evacuation procedure problems. The heavy consequences concerned (including those with losses of humans) determine the problem actuality and therefore require effective measures to enhance fire safety of passengers on air transport. The major fac5-tors of danger during fires inside passenger cabins are:
• great speed of fire propagation and high temperature of flame;
• quick accumulation of burning toxic products and loss of visibility;
• situational panic. At fires inside cabins the temperature along height rises rapidly. The tests showed the temperature at floor level may remain at 50°C while can reach 250°C at 1.30..1.50 metres above the floor. The burning occurs on the surfaces of walls, ceiling, passenger armchairs, however may also take place in the cabins’ volume due to burning drops of molten plastics flowing down from passenger cabin and cockpit decorations and structures. When fire gets through the cabin walls to the core structures (stringers, bulkheads and the skin) the temperature in the cabin top rapidly increases (up to 900°C) and open flames spread. Very high temperature can melt and start burning of some types of passenger armchairs made with magnesium alloys. That would hinder and compromise killing the fire.
30
As soon as at fires inside passenger cabins the factors of danger increase rapidly and the conditions become ultimately fatal it is utterly vital to evacuate human beings in a fast and safe manner. Taking into account the safety of evacuation process as the major condition the evaluation of fire risk is verified. The factors of fire danger inside the passenger cabins are the following:
• presence of fire sources; • massive fire load; • limitations of evacuation feasibility; • absence of smoke removal system; • high concentration of human bodies across the volume.
At present various polymer materials are widely used in decoration of cockpits, passenger cabins and cargo compartments of modern aircraft designs. At start of a fire all of them burn easily and produce great amount of heat and noxious fumes. These are the main reasons of deaths there. The amount of fire load in structural and decorative polymer materials in passenger cabins may comprise about 2 to 3.5 metric tons, which in case of a fire would become not only a source of air contamination, but also the carriers of toxic volatile compounds.[4] Great volumes of fire prone polymer materials used for decoration and trim in modern aircraft designs are determining to the fire risks, thus creating the requirement to apply thermally stabile compounds.[5-6] Introduction of fire safe materials to aircraft interiors should extend the time period of the so called “safe” evacuation of humans from 2…4 minutes at present till 10 minutes.
3 Aircraft passenger cabin fire safety improvement directions.
Evaluation of aircraft passenger cabin fire safety level greatly depends on calculation of the fire risk. This is a process of complex calculation which is based on accounting of the evacuation time, floorplan, dangers and fire risks, protective equipment available. The risk determinating methodical approaches are the following:
• direct assessment based on data processing; • model analysis, setting various events’ probabilities’
interconnection; • technical analysis.
In order to perform the fire risk analysis the collection of aircraft specification data is required. It would encompass:
• specific design features; • thermo-physical characteristics of the materials used for
furnishes, structures, equipment mountings; • types, quantities and disposition of fire prone substances
and materials; • number and probable locations of humans; • fire protection, aural warning systems and evacuation
control. At the same time into account are being taken the below mentioned factors:
• possible fire progression dynamics; • composition and characteristics of the fire protection
system; • possible effect of the fire on human beings and structures.
The frequency of actual fire situations equals the number of fires happened on the protected facility during a yearly period. The evaluation of frequency parameters of possible fire events could be performed upon statistical data.[8] A risk of a fire is deemed as acceptable when: Q QB B
H≤ , where QB
H – is a normalised value of a fire risk, which is set as one of a million per calendar year, i.e. QВ
Н=10-6 year -1; and where QВ – calculated value of a fire risk.
A fire risk calculated value could be found as a maximum value of the fire scenarios considered: QВ=maxQВ,1,...QВ,i... QВ,N, where QВ,i – calculated value of a fire risk for the i-th scenario, N – number of fire scenarios considered. The fire scenario is deemed as a variant of a fire progression taking into account the place of it’s start and character of it’s development, when the worst conditions for human beings take place.[10] A fire risk calculated value for the i-th scenario is found in accordance with the formula: QВ,i= Qn,i *(1-Kan,i)*Pnp,i * (1-PЭ,i) *(1-Kn,э,i), where Qn,i– a fire events’ frequency per year period is found using statistical data. When statistics are not available it is allowed to use as Qп = 4⋅10-2; Kan,i – a coefficient for automatic fire extinguishing equipment. It is allowed as Kan,i=0,9 because in this particular case it is not necessary; Рпр,i – a probability of human presence in the aircraft, found from the proportion Рпр,i = tфункц,i /24, where tфункц,i – a time period of human presence in the aircraft, in minutes; Рэ,i – a probability of evacuation for passengers; Kп.з,i – a coefficient for automatic fire protection equipment which is used for safe evacuation of humans at fire is in accordance with legal requirements. The probability of evacuation is calculated as per following formula [9]:
>≥
≤≤+
≤+<<−
=
;мин 6 скtилиблt8,0рtесли0,000,
мин; 6 ск tи блt8,0нэtрtесли0,999,
мин; 6 ск tи нэtрtблt8,0рtесли,нэt
рtбл0,8t
эР
where tр – calculated time for evacuation, in minutes; tнэ - time period of evacuation since the beginning of the fire, in minutes; tбл - time period since the beginning of the fire till the exits become blocked due to fire dangerous factors with the ultimate tolerable values come into force, in minutes; tск – time period when humans are blocking the evacuation paths (human flow density in the evacuation paths is above 0.5 value), in minutes; Blocked exits time period tбл is found by calculating the time till fire dangerous factors reach the ultimate tolerable values in the paths of evacuation at different moments of time. The coefficient for automatic fire protection equipment which is used for safe evacuation of humans at fire is in accordance with legal requirements Kп.з. can be found by the following formula: Kп.з = 1-(1- Kобн* KСОУЭ) *(1- Kобн* KПДЗ), where Kобн - a coefficient for automatic fire protection equipment which is used for safe evacuation of humans at fire is in accordance with legal requirements; KСОУЭ - a coefficient for fire warning and evacuation control systems are in accordance with legal requirements; KПДЗ - a coefficient for smoke expelling system is in accordance with legal requirements. [9] Conclusions The analysis accomplished here has shown that the average value of a fire risk could be calculated if based on the fire scenario modelling. The risk of a fire is calculated for the specific aircraft design, either existing or proposed, and also for the specific conditions of the accident followed by a fire. The risk of a fire is as required and is not higher than one of a million per year period even while a human being is located as far as possible from the cabin exit point.
31

Reference literature list: 1. ICAO Assembly – 38th Session 24 September to 4 October
2013 A38-WP/2201, TE/90_ 3/9/13, Revised 12/9/13 2. Рогачёв А.А. (Rogachev A.A.) Эффективность тушения
пожаров воздушных судов на земле / А.А.Рогачёв // Проблемы безопасности полётов.-1987.-8. Flight safety problematics.
3. Center for Chemical Process Safety Guidelines for Hazard Evaluation Procedures, with Worked Examples (2nd Edition ed.). Wiley-American Institute Of Chemical Engineers.1992 ISBN 0-8169-0491-X
4. Decadal Survey of Civil Aeronautics: Foundation for the Future/ Steering Committee for the Decadal Survey of Civil Aeronautics, National Research Council. – 2006. -212
5. Барботько С.Л., Воробьёв В.Н. (Barbotjko, Vorobyev) Пожаробезопасность авиационных материалов и элементов конструкций: справочник –ред.Е.Н.Кабалова.-ВИАМ,2007.-543 с.
6. Асеева Р.М., Заиков Г.Е. Горение полимерных материалов.-М.: Наука, 1981.-280 с.
7. Full-Scale Test Evaluation of Aircraft Fuel Fire Burn through Resistance Improvements // DOT/FAA/AR-98/52.-41
8. Брушлинский Н. Н. (Brushlinsky N.N.) Основы теории пожарных рисков и ее приложения / Н. Н. Брушлинский, С. В. Соколов, Е. А. Кленко и др. — М. : Академия ГПС МЧС России, 2012. — 192 с.
9. Методика определения расчетных величин пожарного риска в зданиях, сооружениях и строениях различных классов функциональной пожарной опасности: приложение к Приказу МЧС России от 30.06.2009 г. 382; зарегистр. в Минюсте РФ 06.08.2009 г., per. 14486 [Электронный ресурс]. — Режим доступа: http://www.mchs.gov.ru.
10. Брушлинский Н.Н (Brushlinsky N.N.). Основы теории пожарных рисков и её приложения / Н.Н.Брушлинский, С.В.Соколов.
32
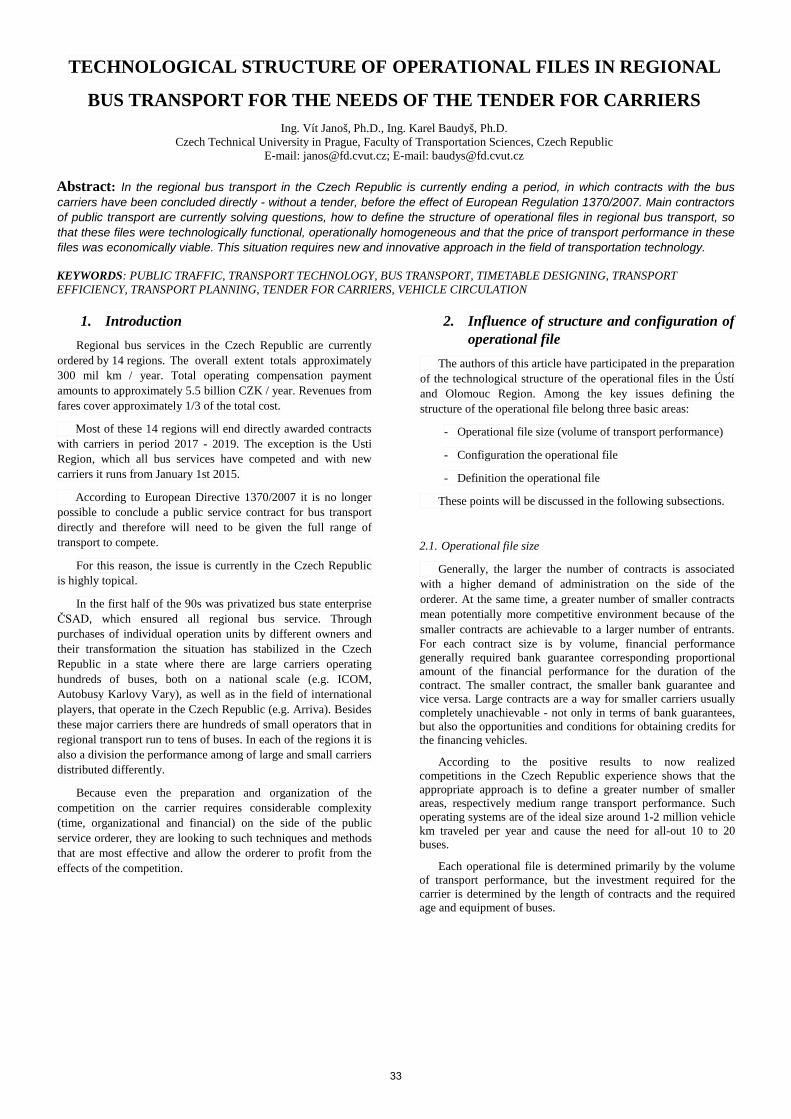
TECHNOLOGICAL STRUCTURE OF OPERATIONAL FILES IN REGIONAL
BUS TRANSPORT FOR THE NEEDS OF THE TENDER FOR CARRIERS
Ing. Vít Janoš, Ph.D., Ing. Karel Baudyš, Ph.D. Czech Technical University in Prague, Faculty of Transportation Sciences, Czech Republic
E-mail: [email protected]; E-mail: [email protected] Abstract: In the regional bus transport in the Czech Republic is currently ending a period, in which contracts with the bus carriers have been concluded directly - without a tender, before the effect of European Regulation 1370/2007. Main contractors of public transport are currently solving questions, how to define the structure of operational files in regional bus transport, so that these files were technologically functional, operationally homogeneous and that the price of transport performance in these files was economically viable. This situation requires new and innovative approach in the field of transportation technology. KEYWORDS: PUBLIC TRAFFIC, TRANSPORT TECHNOLOGY, BUS TRANSPORT, TIMETABLE DESIGNING, TRANSPORT EFFICIENCY, TRANSPORT PLANNING, TENDER FOR CARRIERS, VEHICLE CIRCULATION
1. Introduction Regional bus services in the Czech Republic are currently
ordered by 14 regions. The overall extent totals approximately 300 mil km / year. Total operating compensation payment amounts to approximately 5.5 billion CZK / year. Revenues from fares cover approximately 1/3 of the total cost.
Most of these 14 regions will end directly awarded contracts with carriers in period 2017 - 2019. The exception is the Usti Region, which all bus services have competed and with new carriers it runs from January 1st 2015.
According to European Directive 1370/2007 it is no longer possible to conclude a public service contract for bus transport directly and therefore will need to be given the full range of transport to compete.
For this reason, the issue is currently in the Czech Republic is highly topical.
In the first half of the 90s was privatized bus state enterprise ČSAD, which ensured all regional bus service. Through purchases of individual operation units by different owners and their transformation the situation has stabilized in the Czech Republic in a state where there are large carriers operating hundreds of buses, both on a national scale (e.g. ICOM, Autobusy Karlovy Vary), as well as in the field of international players, that operate in the Czech Republic (e.g. Arriva). Besides these major carriers there are hundreds of small operators that in regional transport run to tens of buses. In each of the regions it is also a division the performance among of large and small carriers distributed differently.
Because even the preparation and organization of the competition on the carrier requires considerable complexity (time, organizational and financial) on the side of the public service orderer, they are looking to such techniques and methods that are most effective and allow the orderer to profit from the effects of the competition.
2. Influence of structure and configuration of operational file
The authors of this article have participated in the preparation of the technological structure of the operational files in the Ústí and Olomouc Region. Among the key issues defining the structure of the operational file belong three basic areas:
- Operational file size (volume of transport performance)
- Configuration the operational file
- Definition the operational file
These points will be discussed in the following subsections.
2.1. Operational file size
Generally, the larger the number of contracts is associated with a higher demand of administration on the side of the orderer. At the same time, a greater number of smaller contracts mean potentially more competitive environment because of the smaller contracts are achievable to a larger number of entrants. For each contract size is by volume, financial performance generally required bank guarantee corresponding proportional amount of the financial performance for the duration of the contract. The smaller contract, the smaller bank guarantee and vice versa. Large contracts are a way for smaller carriers usually completely unachievable - not only in terms of bank guarantees, but also the opportunities and conditions for obtaining credits for the financing vehicles.
According to the positive results to now realized competitions in the Czech Republic experience shows that the appropriate approach is to define a greater number of smaller areas, respectively medium range transport performance. Such operating systems are of the ideal size around 1-2 million vehicle km traveled per year and cause the need for all-out 10 to 20 buses.
Each operational file is determined primarily by the volume of transport performance, but the investment required for the carrier is determined by the length of contracts and the required age and equipment of buses.
33
2.2. Configuration the operational file
In the particular regions there is very heterogeneous structure of transport performance. On one hand, the connection can be found, their peak occupancy amounts typically up to 100 passengers, on the other hand can be found connections whose peak occupation does not exceed the of 20 passengers. These extremes are going in principle across the whole territory of the Czech Republic. In terms of the size of buses required we move from the minimum size of a bus for regional traffic with a length of 8.5 meters to 3-axle 15 m buses or articulated buses.
It is obvious that a larger number of operational files (i.e. the areas defined by one contract) must be each operational file in a certain way homogeneous, graspable, coherent and compact. This homogeneity can be in principle regarded geographically or operationally.
Typical geographical clustering to the operational files would be necessary to copy administrative boundaries, eg. former districts, or there may be cases where the territory is geographically isolated by a natural barrier.
The advantage of the geographical clustering of the territory on operational files is high operational ability of the carrier (on all lines in this area operates just one carrier, any advances and operational vehicles can be concentrated in one "central" point etc.). Geographical clustering would have been 100% successful but only in such theoretical case, that the territorial boundaries were "impenetrable" by the regular public transport, ie. there would be no lines connecting neighboring regions. This principle was applied in many cases at a time, when organization of regular public transport fell under the district offices (very small regions) - in many places in the Czech Republic can be still on line planes seen, that the lines do not go behind the former district border and "ignore" aims on "other side". In many ways it is so apparent lack of connection quality between medium sized regional centers.
However, because often there are strong linkages between regional centers, is perfect geographic clustering not reachable. There will always interregional connection lines, which must be allocated in one or in the other operational file, and so there will be possible, that more carriers will operate in single areas.
Conversely, operationally perfect clustering of the territory would not be after lines, but after individual links, respectively groups of circulation plans of single vehicle types. Each operational file would have been formed by numerous circulation plans on the same type of vehicle. These circuits would be designed for maximum operating efficiency and maximum operating use of buses and personnel. Clustering into such operational files would be based on the assumption of a single bus-fleet, uniform technical background, identical vehicles and identical traffic backups. The maximum operating efficiency in many cases would be leading to a large spatial overlap between operational files, which would run at maximum driving time for drivers and limits on buses refueling. Strictly operatinal clustering would have the major advantage, that the vast majority of links would be ensured by such bus, its capacity meets real demand and would minimize excess of offered capacity.
2.3. Definition the operational file
Principle definition of the operational file was at the orderers, who have in bus transport already tendered, or are only preparing the tenders, primarily such, that they were primarily based on the geographical clustering. By the geographic clustering is generally easier to comply with local catchment area, transport links and axes of regular commuting.
When defining the operating files themselves, were in the proposals removed the obvious disadvantages of geographical clustering - i.e. primarily too high demand on the variability of sizes and types of buses. This clustering principle was so extended by two additional factors:
- the maximum allowable size of operation file
- limiting allowable number of vehicle types
In smaller operational files for lower number of vehicles is limitong of allowable number of vehicle types essential, because it reduces the real cost of uptime, maintenance of the fleet of buses and reduces the diversity of necessary technical background. Limiting the number of vehicle types can be solved either by lump sum (strict determination of the type of vehicle, which is required at the busiest link by passanger frequency on strongest line in the operating file), or by using the properties of the elements of operational clustering. The very strict definition of just one type of vehicle would lead to excessive overhangs of offered capacity on most of the connections in the area. The authors of this article recommended to the orderers of public bus services, to balance factors of geographical and operational clustering, by using of two types, as permissible limit of the number and types of buses operating in the file.
The result is a geographical clustering with the very high emphasis on operational efficiencies and with limited spatial overlaps.
3. Technological structure of traffic performance in operational file
The specific content of each operating file are concrete lines, their timetables and the resulting number of vehicles, which is necessary to ensure the required transport performance .
Before assigning single lines to single operational files it is usually appropriate to revise leading of lines, not only for transportation reasons, but also for operational reasons. In the current conditions of Czech Republic, there´s line management in many cases "historic" and in many cases was in regional bus transport not changed eg. 30 years, regardless of economic, socio-economic and demographic trends.
Based on the review of known facts of the various transport relations should be applied methods of line-planning leading to maximizing of the number of direct-travelling passengers, with the following modifications:
• unification lines given to a balanced use of vehicle capacity (some lines were rearranged into another operational areas and vice versa), all busses in the area have newly the same passenger capacity
• with regard to the balanced use of vehicles was necessary to determine the permissibility of carriyng of standing passengers; taking into account the sharpness of the morning peak hour is usually not possible to avoid deterioration of transport (regular standing
34
passengers) in school connections - account the vehicle capacity on the school board would lead to excess capacity for the rest of the day;
• increasing the number of diametric lines, diametrical line without mutual strengths transport relations between the endpoints are operatively mutually rerouting so, that the time-length of the line, including half turnover times in both endpoints, approaching an integer multiple of half of the period (interval)
After creating the line leading follows usually next step - forming a timetable. Within the framework of changes and modifications in operational concepts in regional bus services, there´s slowly more and more enforcing principle of periodic (or integrated perioc) timetable (IPT). They are defined IPT-nodes, transfer / changing nodes and intended length intervals for the peak- and off-peak hours.
The standard follow-up step after creating a timetable would be to create cycles of vehicles and personnel. In this case, it is then also possible to use well-known optimization methods to minimize the number of deployed vehicles.
The author´s team new approach is, that already when the timetable proposal is created, combines the operational concept with cycles of vehicles, in mutual repeating iteration steps.
After designing of the line-network and basic structure of the periodic timetable and IPT-junctions were made minor changes in the raster of periodic timetable. In the morning peak hours were separately taken into account the requirements of the local time (starting times by significant employers, beginning of school hours) and the structure of IPT was often partially deflected. At the same time, during the morning peak hours was usually a structure of IPT preserved primarily in the main transport directions and main change linkages, while in the opposite direction (contrary to a major transport streams) were used differing routes, atypical crossings between the lines, as well as pragmatic time positions, which led to the minimization of the number of vehicles in the morning peak hour of the workday. It is just a morning peak hour of the working day, which determines the number of vehicles.
Approach to the timetable creatimg is as follows:
1) defining IPT nodes and intervals, calculate the number of vehicles for "basic periodical operation"
2) defining a specific operation in the morning peak hours and minimizing the number of vehicles in this period; ideally for the number required in previous point 1
3) after the arrival of school busses, as soon as possible "timetable transition" to defined structure of periodical timetable
4) operational optimization and ensuring operational efficiency (breaks for drivers, refueling buses...)
5) adaptation of timetables in the evening hours (to minimize the number of vehicles, reduction of total working time of drivers)
The aim is to ensure maximum operational efficiency within a defined operational file.
The following figure expresses the fixed costs of the bus relative to the average daily performance.
Fig. 1: Bus fix costs (depreciation) by average daily mileage
Currently, the regional bus services in the Czech Republic has held daily vehicle mileage normally about 60-130 km. From the above figure it is apparent, that the cost curve is broken in the space daily performance of 200-300 km, which corresponds to an annual mileage of a vehicle about 70 000 to 100 000 km.
In no operational file are these limit values reached in the beginning. It is natural, since the beginning sort of performance into operational files is usually made by current timetables, which has been usually no optimized before. It is certainly not without interest, that for example in Region Ústí nad Labem, where they are generally the most experience with tenders in regular public bus transport, there are always in all operational files reached values from 70 to 100 thousand vehicle-km annual mileage. The main subject of rationalization it is usually the maximum reduction of the number of vehicles necessary to ensure the demanded transport performance, and only after this step, at the optimized number of vehicles can be considered a possible rise in transport performance.
Currently, in conditions in the Czech Republic in the field of bus prices, fuel prices and the drivers' cost, we can very simply state, that if an operational optimization saves 1 bus in operational file, it is a cost equivalent of 60-70 kilometers daily transport performance, of which we can improve transport services.
In relation to how the orderers are increasingly understand the relationship between structure and scope of the transport performance in relation to its cost, there are requirements for structuring the prices of transport performance into fixed and variable components. By changing the traffic performance during the execution of the contract remains fixed component fixed and variable component reflects truly realized extent of the traffic performance
Application of these principles is fully reflected in the operation costs. For example, in the Region Ústí nad Labem, in the operational file "Dolní Poohří", have the authors of this article achieved continuously optimizing condition, that the number of vehicles has been reduced from 30 to 25 and the annual mileage of one bus currently amounts 90 000 km yearly mileage.
35
4. Conclusion The necessity of holding tenders for the bus carrier in a
regular public transport in the Czech environment, fundamentally changes the relationship between the orderer and the carrier in public transport.
The first major change is, that in the regional bus services the public orderer can not conclude a contract with a carrier directly, although this orderer is satisfied with carriers´s services and pays the normal und usual price of transport performance, and under normal circumstances there would be not any reason to change the carrier.
The second, more fundamental change is the fact, that the public orderer by preparing a tender for the carrier, has to ensure a wide range of activities, previously carried out by the carrier. While the direct award of traffic performance rises in the interaction orderer - carrier, and the carrier himself watches operational productivity of the negotiated services, so at the competition is the situation different. The orderer of public services defines the operational concept and all requirements. Any technological error concerning in the tender documentation can not be removed in consultation with any carrier who wants to participate in the tender. Such error or hidden unproductivity increases the cost of transport performance, and orderer will it subsequently pay. Full operational optimization - timetables, cycles of vehicles, personnel demands etc. must be well thought out by the orderer already in the formulation of the operational file and operating requirements in the tender. In the Czech Republic, this situation ordering parties generally chew very slowly, and often have a tendency to underestimate the situation.
The situation is in many ways even for new by bus operators participating in the tenders too, because the demands on the operational concept and quality are predetermined from the orderer. The carrier has already no possibility to optimize (or partially) operational concepts according to its operational needs. The role of carriers in this regard is already seemingly passive - however numerous carriers orient already in the new circumstances and focus their activities on the rationalization measures that allow them to cope with the prescribed requirements at the lowest cost. After the carriers have no opportunity to enter timetable preparation and requirements during the tender, they are focusing on typical operating area (suitable dislocation vehicles and personnel for contract performance, minimizing of empty rides, placement of technical and technological background, optimal mode of refueling buses, reduction of personnel time losses etc.)
This current situation is a great challenge for us - academics - too, as we are by the orderers increasingly asked to perform a variety of operational and technological optimization of operational concepts in preparation of the structure of operational files, in order to achieve the lowest cost of transport performance by fixed transportation requirements
On the example of the Region Ústí nad Labem shows, that a good and thorough preparation of a tender in public regional bus transport can reduce the unit cost of transport performance by up to 20%, with a further price reduction due to a competitive environment. From the original average price of the transport performance of about 35, - CZK / km came the orderer after tender to an average value of about 28, - CZK / km transport performance. The Region Ústí nad Labem, as the orderer of public services, so could significantly extend the range of connections and improve the quality of public transport services -
while preservating and no increasing of the original level of operating compensation from public money.
REFERENCES
1. Janoš, V.: Using Gravity Model in Regional Rail Transport Planning. In Advances in Applied and Pure Mathematics. Athens: WSEAS Press, 2014, p. 436-441. ISSN 2227-4588. ISBN 978-960-474-380-3
2. Janoš, V. - Baudyš, K.: TRANSPORT PLANNING ON THE LIBERALIZED MARKET OF PUBLIC SERVICES. In trans&MOTAUTO´14 XXII INTERNATIONAL CONFERENCE PROCEEDINGS. Sofia: Scientific-technical union of mechanical engineering, 2014, ISSN 1310-3946.
3. Janoš, V. - Baudyš, K. - Sitora, D. - Coufal, L.: Segregation of the Olomouc region for operational files for the needs of the tender for carriers in bus transport. 2014
4. Janoš, V. - Baudyš, K.: Transport Planning of Public Services. In Proceedings of the 11th European Transport Congress. Praha: České vysoké učení technické v Praze, Fakulta dopravní, 2013, . ISBN 978-80-01-05321-8
5. Janoš, V. - Baudyš, K.: Development of Periodic Timetable in the Czech Republic. In Road and Rail infrastructure II. Zagreb: University of Zagreb, 2012, p. 869-873. ISBN 978-953-6272-49-5
6. Janoš, V. - Baudyš, K. - Vichta, F.: Financing the Public Transport in the Sphere of Regulated Competition. In Sborník konference Euro Traffic 2006. Praha: ABF a.s., 2006, s. 7. ISBN 80-86905-15-2.
36
EKOMPAKT, A NEW TECHNOLOGY FOR OBTAINING ENERGY FROM BIOMASS
Prof. DSc. PhD. Lech J. Sitnik, PhD. Anna Janicka, PhD. WojciechWalkowiak, PhD. RadoslawWrobel, PhD. MSc. Monika Andrych.
The Division of Vehicle Engineering, Faculty of Mechanical Engineering, Wroclaw University of Technology, Poland [email protected], [email protected], [email protected], radosław.wró[email protected],
Abstract: In the Division of Vehicle Engineering ,Wroclaw University of Technology, there is realized the grant which aim is to work out the innovative compact EKOMPACT module- the installation of electric energy generation from biomass renewable resources by new technolo-gy. Research results (primarily simulation) provide necessary data for any modification of the installation in a way that the implementation of a new solution will be possible in diverse locations which are characterized by different working conditions. KEYWORDS: BIOMASS, MODYFICATION, ENERGY
1. Introduction
Dynamic, global economy development implicates huge market demand for installations generating electric energy from renewable resources in a way that does not have any negative effects on the environment. Both in Poland and in the world, numerous scientific researches are carried out, which effect is visible in the knowledge concerning gasification processes of solid fuels of natural origins and solids of synthetic origins. Knowable are: standard gasification technologies ( among them chemism of the process, the impact of particular parameters on its progress), combustion technologies of gas received from substrates transformation, catalysts of medium and high caloric combustion of gasified gas product, technologies of heat recovering from techno-logic processes ( e.g. ORC systems), methods of combustion gases purifying, technologies of purifying and stabilizing solid products of gasification process, methods: measurement supporting chemical processes, remote control and archiving of installation working parameters. In the currently knowable technologies, total energy extraction from the acquired fuel is not fulfilled, which is reasoned by technical-economical considerations. Scientific- technological progress is not sufficient in this case. As an effect of project fulfilling, the new product will be imple-mented, which fully inscribes into existing technological gap. In the world, there is missing the technology that allows the conditioning of acquired gas and fumes in a way which safety enables their heat energy use. Carrying out of the present project, enables to work out a new, compact module for obtaining electric energy from biomass. The novelty of this module will result from the making use of innovative technological solutions which are not currently applied in the branch. 2. Assumptions regarding biomass transformation process. Standard gasification of solid fuels of natural origins and solids of synthetic origins is the issue known and well described in scientific literature. Workings over congregation systems connected with biomass gasification are pursued in the whole world, mainly in the USA and UE countries. Experimental installation of biomass gasification for obtaining electric energy are launched by such companies as: • Institut fur Warmetechnik w Graz (Austria) – demonstrative
installation, gasification in solid bed, gas engine Jenbacher company 38 kWe power (electric energy) [1],
• Blackwater Valley Energy (UK) - demonstrative installation, downdraft gasification of 200kWe power [2],
• Xylowatt (Switzerland) – downdraft gasification, heat inter-changer, filter, mud of 55kWe power[3],
• HKV Hogild (Dannemark) – two-sided gasification, heat interchanger , filter of120kWe power, [4],
• KHD Koln (Germany) - two zonal gasification, mud of 38kWe power, [5],
• Hermogenics Albuquerque (USA) - downdraft gasification of 300kWelectric energy power. [6],
• A.H.T. PyrogasVertriebs GmbH (Germany) - multi zonal gasification modules 50-500 kWe, [7].
EKOMPACT is technology of new pro energy process of biomass energy extraction together with the elimination of wastes. Project fulfilling enables to work out a new installation module for the process fulfilling. The novelty of process results from making use of innovative tech-nological solutions which are the issue of the project. The innova-tion results from carrying out of the process in a way that, there will be fulfilled its subsequent functions: • Biomass conditioning • Double phase gasification ( the first- pyrolysis where the heat
is provided to biomass by radiation, the second- gasification of fluid and solid products by overheated steam)
• Conditioning of gas as fuel ( the quality of gas is researched on-line, gas purification and mixing it with other gases in or-der to obtain the particular mixture parameters),
• Conditioning of fumes ( the quality of fumes is researched on-line, for utilization the catalytic systems will be used, among them the DENOSOX system of catalytic denitrifying, desul-phurization of fumes)
• Utilization of process solid holdovers to the environmentally harmless form.
• Management of heat energy stream, • Piloting ( individual piloting of each system; integrated pilot-
ing of installation system based on mathematical models; working monitoring piloting of particular piloting systems, which when necessary takes its role with the use of artificial intelligence and fuzzy logic when it is ended; piloting in actu-al time through the use of signal processes).
What is more, electric energy will be obtained in both generator powered by engine and by the multisided use of holdovers heat. Currently working installation for renewable resources gasification does not have such advanced solutions which enable the high elec-tric energy yield with low harmless in the environment. 3. General project conception description The aim of the project is development of an innovative, on the world scale, compact module for obtaining electric energy mainly from biomass. The effect of project fulfilling will be the activation of demonstra-tive installation and testing of compact module EKOPMACT in
37

which all system elements will be integrated in one standard con-tainer. The results of demonstrative installation researches will provide necessary data for any process installation modification in order to make the implementation of a new solution in various locations, characterized by different working conditions, possible. Expected economic effects result from introducing the new product into the market and they are supposed to enable the multiple turn of outlays borne for B+R workings in five years from the project beginning. After finishing the project, the demonstrative installation will be used for pursuing further B+R working which aim will be, among others, obtaining synthetic fuels from biomass. 4. Research tasks expected for fulfilling in the project The key research tasks includes the verification of: • Installation working on the basis of biomass wastes, which
will produce electric energy for sale ( positive energy balance) and selling solid product ( installation will work without wastes),
• Construction of the reactor for biomass from wastes gasifica-tion, which produces medium caloric gas and fluid that after conditioning will be suitable for feeding engine of unit gener-ating electric current ,
• Internal combustion engine modification in a way allowing it to work efficiently and stably while powering it by condi-tioned gas regardless the type of biomass that empowers the gasifying reactor,
• Unit of biomass dosing and unit of purifying exhaust gases in a way allowing them to be efficient during working of instal-lation empowered by different types of biomass,
• Unit of separating and packaging of wastes from products, to make them obtain solid form which will be possible for trans-ferring it to the natural environment,
• Piloting-measurement system to make possible the semiauto-matic, optimal installation working with remote control of its exploitation.
5. Description of researching methods and techniques applied in the project. Within the frames of fulfilling the project, the following researching methods have been applied: • Chemical analyses ( among them chromatographic ones):
chromatographic (GC-FID, GC-MS), spectrometric, useful-ness of biogas as engine fuel, waste after gasification process. The analyses will be performed with the use of devices from Pracowni Badań Emisji PWR equipment o Quality and quantity parameters evaluation: biogas,
fumes, process wastes o Toxicological analyses concerning cytotoxicity of
fumes emitted from EKOMPACT device (according to PN-EN ISO10993-5). For the researches the line of cell from human lungs lining ((ATCC CCL185).
• Evaluation of fumes toxicity by the use of equivalent toxicity quotient methods, o Toxicity evaluation of fumes emitted form installation
(actual toxicity) o Evaluation of systems for fumes purification efficien-
cy. • Researches over engine roller performance tester: Engine
studies on unique, complexly equipped roller performance tester location dedicated to studies of engines empowered by gas fuel with the system of analyzers based on reference methodology. o Methodology of matching engine to EKOMPACT de-
vice. o Authorial methodology of internal catalyst of combus-
tion process implementation according to method pa-
tented by project authors relying on catalytically ac-tive substance introduction into the inside of engine combustion chamber ( on a special, optimized mover) what enables
Shortening of ignition delay of biogas and air mixture in engine, r
Carcinogenic emission reduction. • Thermal characteristics of devices studies: Researches with
the use of thermo vision cameras and apparatus for heat in-spection which are among the equipment belonging to The Division of Vehicle Engineering, Wroclaw University of Technology. o Evaluation of process pursuing parameters and ther-
mal characteristics of devices in the container. • Numerical simulations: MES- computer calculating programs
which use the MES method in static, dynamic, modal analysis issue. o Durability calculations of device and units elements
and their numerical optimization o Numerical CFD simulations, calculations of: turbulent
flow, stationary and non stationery, multi phase: flows with cavitations
o Heat flow modeling o Combustion processes calculations,
• Proliferation of pollution indicating- flow with constant phase. o Calculations of gas ang heat flow inside device and its
units with numerical optimization of these processes. o Numerical simulations CHEM-CAD: numerical mod-
eling of chemical reactions which take place during gasification phase and engine combustion.
Process optimization according to chem-ical reaction process in gasification and combustion process of mixture of known quality and quantity composi-tion, in order to develop device working mode.
o Numerical simulations MBS (Multibody Symula-tions): numerical kinematic-dynamic modeling.
Optimal packaging of devices and units in container.
• Vibrant acoustic analyses: o Acoustic object researches: assignment of pressure
level and acoustic power, location of sound sources with the use of probe and acoustic holography.
o Object vibration research: spectral analysis, modal analysis. In the researches there is planned making use of application for non stationary acoustic holography, impulse hummer of strength detectors, accelerometers 3-axial PCB-ICP, multichannel dynamic signal ana-lyzer, low frequency microphones, sound level meter with G filter.
o Optimizing of device according to minimizing noise and vibrations emission.
6. Conclusions Module EKOMPACT will be a total novelty in the world market. This module, currently, does not have any equivalent which would enable the high yield of electric energy together with providing, at the same time, huge possibility of installation modification for each of users, in order to its optimal adaptability for requirements of localization and charge. There will be implemented the series of totally innovative conceptions and solutions, which will cause the creation of new market for new product. In development workings it is also predicted the use of gathered experiences for creating future installation generating synthetic, hydrocarbon fluid fuels from biomass gasification ( according to new synthesis processes).
38

Predicted economic effects, connected with introduction of a new product in the marker, enable the multiple turn of outlays borne for B+R workings in five years from the project beginning. The implementation of new technology confirms the inception of new, stable work places for high qualified people in the European Union. 7. Literature: [1]http://www.energetische-biomasse-nutzung.de/fileadmin/user_upload/Optmierung_Achental/Dokumente/SNG-Stand_der_Technik.pdf [2]http://www.ieatask33.org/app/webroot/files/file/country_reports/IEA_Task33_UK_CReport_June_2006.pdf [3]http://www.xylowatt.com/ [4]http://hogild.dk/ [5]http://www.aht-pyrogas.de/de/component/content/category/86-a-h-t-auf-deutsch/ [6]http://www.thermogenics.com/ [7]http://www.thermogenics.com/
39
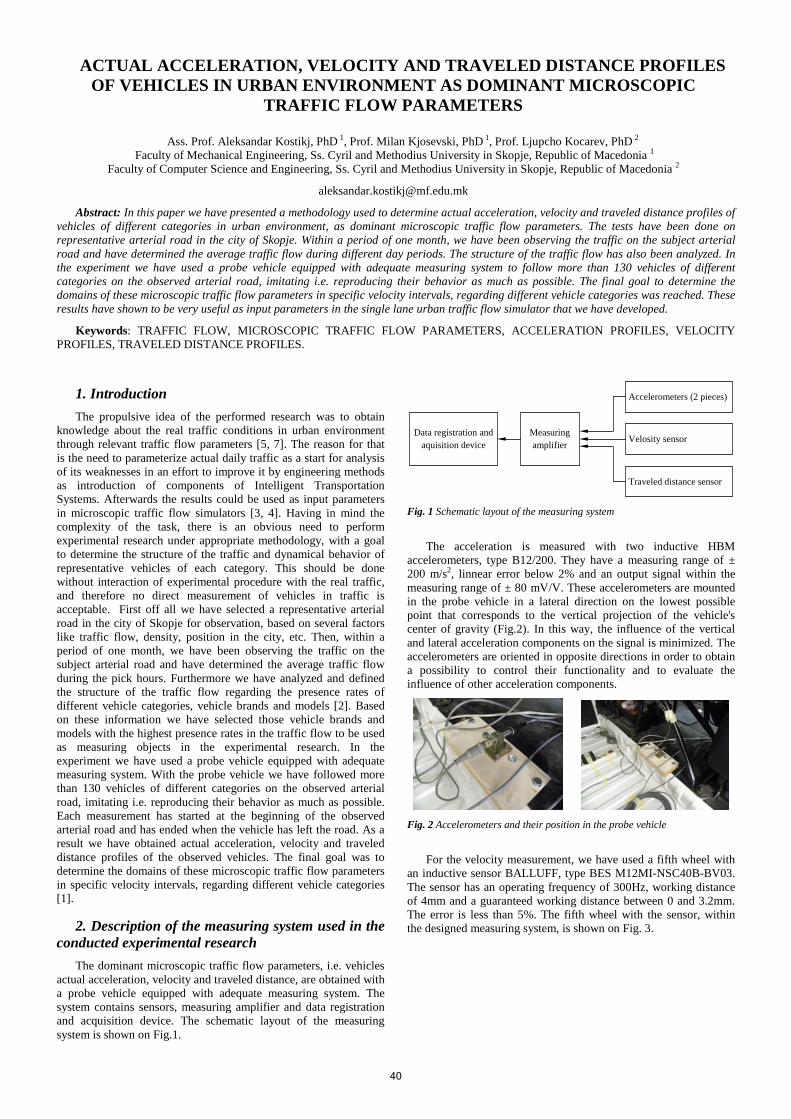
ACTUAL ACCELERATION, VELOCITY AND TRAVELED DISTANCE PROFILES OF VEHICLES IN URBAN ENVIRONMENT AS DOMINANT MICROSCOPIC
TRAFFIC FLOW PARAMETERS
Ass. Prof. Aleksandar Kostikj, PhD 1, Prof. Milan Kjosevski, PhD 1, Prof. Ljupcho Kocarev, PhD 2 Faculty of Mechanical Engineering, Ss. Cyril and Methodius University in Skopje, Republic of Macedonia 1
Faculty of Computer Science and Engineering, Ss. Cyril and Methodius University in Skopje, Republic of Macedonia 2
Abstract: In this paper we have presented a methodology used to determine actual acceleration, velocity and traveled distance profiles of vehicles of different categories in urban environment, as dominant microscopic traffic flow parameters. The tests have been done on representative arterial road in the city of Skopje. Within a period of one month, we have been observing the traffic on the subject arterial road and have determined the average traffic flow during different day periods. The structure of the traffic flow has also been analyzed. In the experiment we have used a probe vehicle equipped with adequate measuring system to follow more than 130 vehicles of different categories on the observed arterial road, imitating i.e. reproducing their behavior as much as possible. The final goal to determine the domains of these microscopic traffic flow parameters in specific velocity intervals, regarding different vehicle categories was reached. These results have shown to be very useful as input parameters in the single lane urban traffic flow simulator that we have developed.
Keywords: TRAFFIC FLOW, MICROSCOPIC TRAFFIC FLOW PARAMETERS, ACCELERATION PROFILES, VELOCITY PROFILES, TRAVELED DISTANCE PROFILES.
1. Introduction The propulsive idea of the performed research was to obtain
knowledge about the real traffic conditions in urban environment through relevant traffic flow parameters [5, 7]. The reason for that is the need to parameterize actual daily traffic as a start for analysis of its weaknesses in an effort to improve it by engineering methods as introduction of components of Intelligent Transportation Systems. Afterwards the results could be used as input parameters in microscopic traffic flow simulators [3, 4]. Having in mind the complexity of the task, there is an obvious need to perform experimental research under appropriate methodology, with a goal to determine the structure of the traffic and dynamical behavior of representative vehicles of each category. This should be done without interaction of experimental procedure with the real traffic, and therefore no direct measurement of vehicles in traffic is acceptable. First off all we have selected a representative arterial road in the city of Skopje for observation, based on several factors like traffic flow, density, position in the city, etc. Then, within a period of one month, we have been observing the traffic on the subject arterial road and have determined the average traffic flow during the pick hours. Furthermore we have analyzed and defined the structure of the traffic flow regarding the presence rates of different vehicle categories, vehicle brands and models [2]. Based on these information we have selected those vehicle brands and models with the highest presence rates in the traffic flow to be used as measuring objects in the experimental research. In the experiment we have used a probe vehicle equipped with adequate measuring system. With the probe vehicle we have followed more than 130 vehicles of different categories on the observed arterial road, imitating i.e. reproducing their behavior as much as possible. Each measurement has started at the beginning of the observed arterial road and has ended when the vehicle has left the road. As a result we have obtained actual acceleration, velocity and traveled distance profiles of the observed vehicles. The final goal was to determine the domains of these microscopic traffic flow parameters in specific velocity intervals, regarding different vehicle categories [1].
2. Description of the measuring system used in the conducted experimental research
The dominant microscopic traffic flow parameters, i.e. vehicles actual acceleration, velocity and traveled distance, are obtained with a probe vehicle equipped with adequate measuring system. The system contains sensors, measuring amplifier and data registration and acquisition device. The schematic layout of the measuring system is shown on Fig.1.
Data registration and aquisition device
Measuring amplifier
Accelerometers (2 pieces)
Velosity sensor
Traveled distance sensor
Fig. 1 Schematic layout of the measuring system
The acceleration is measured with two inductive HBM accelerometers, type B12/200. They have a measuring range of ± 200 m/s2, linnear error below 2% and an output signal within the measuring range of ± 80 mV/V. These accelerometers are mounted in the probe vehicle in a lateral direction on the lowest possible point that corresponds to the vertical projection of the vehicle's center of gravity (Fig.2). In this way, the influence of the vertical and lateral acceleration components on the signal is minimized. The accelerometers are oriented in opposite directions in order to obtain a possibility to control their functionality and to evaluate the influence of other acceleration components.
Fig. 2 Accelerometers and their position in the probe vehicle
For the velocity measurement, we have used a fifth wheel with an inductive sensor BALLUFF, type BES M12MI-NSC40B-BV03. The sensor has an operating frequency of 300Hz, working distance of 4mm and a guaranteed working distance between 0 and 3.2mm. The error is less than 5%. The fifth wheel with the sensor, within the designed measuring system, is shown on Fig. 3.
40
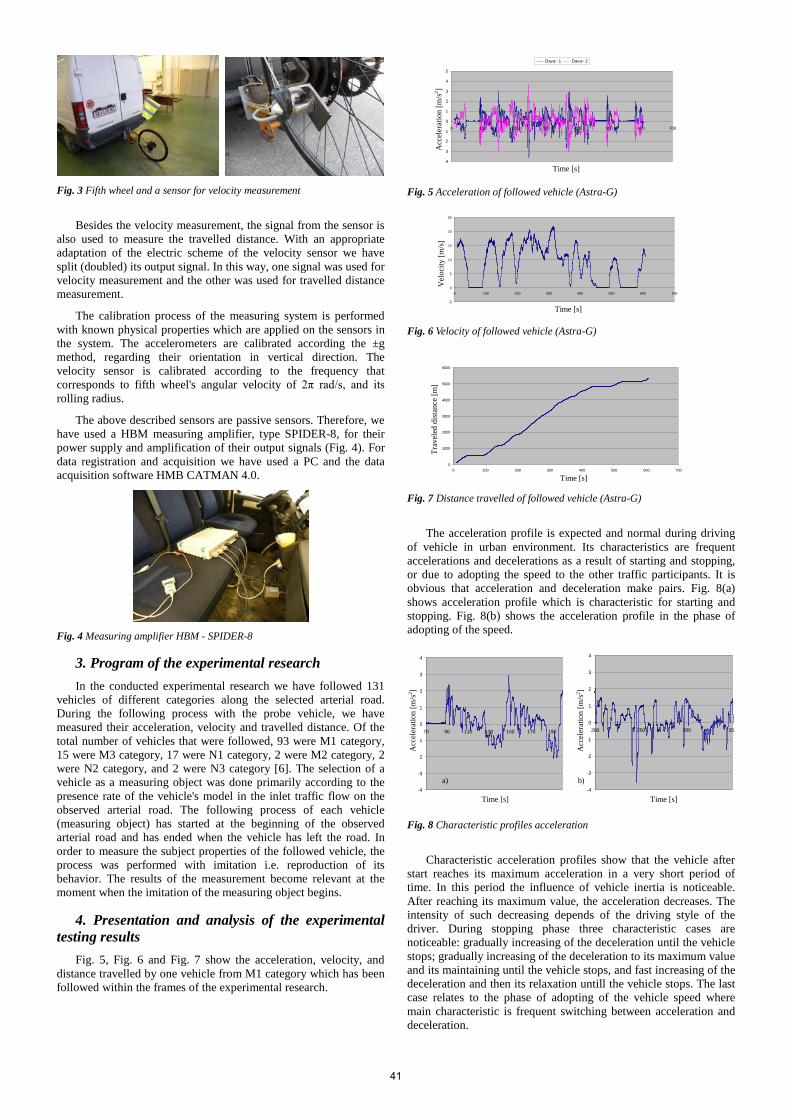
Fig. 3 Fifth wheel and a sensor for velocity measurement
Besides the velocity measurement, the signal from the sensor is also used to measure the travelled distance. With an appropriate adaptation of the electric scheme of the velocity sensor we have split (doubled) its output signal. In this way, one signal was used for velocity measurement and the other was used for travelled distance measurement.
The calibration process of the measuring system is performed with known physical properties which are applied on the sensors in the system. The accelerometers are calibrated according the ±g method, regarding their orientation in vertical direction. The velocity sensor is calibrated according to the frequency that corresponds to fifth wheel's angular velocity of 2π rad/s, and its rolling radius.
The above described sensors are passive sensors. Therefore, we have used a HBM measuring amplifier, type SPIDER-8, for their power supply and amplification of their output signals (Fig. 4). For data registration and acquisition we have used a PC and the data acquisition software HMB CATMAN 4.0.
Fig. 4 Measuring amplifier HBM - SPIDER-8
3. Program of the experimental research In the conducted experimental research we have followed 131
vehicles of different categories along the selected arterial road. During the following process with the probe vehicle, we have measured their acceleration, velocity and travelled distance. Of the total number of vehicles that were followed, 93 were M1 category, 15 were M3 category, 17 were N1 category, 2 were M2 category, 2 were N2 category, and 2 were N3 category [6]. The selection of a vehicle as a measuring object was done primarily according to the presence rate of the vehicle's model in the inlet traffic flow on the observed arterial road. The following process of each vehicle (measuring object) has started at the beginning of the observed arterial road and has ended when the vehicle has left the road. In order to measure the subject properties of the followed vehicle, the process was performed with imitation i.e. reproduction of its behavior. The results of the measurement become relevant at the moment when the imitation of the measuring object begins.
4. Presentation and analysis of the experimental testing results
Fig. 5, Fig. 6 and Fig. 7 show the acceleration, velocity, and distance travelled by one vehicle from M1 category which has been followed within the frames of the experimental research.
-4
-3
-2
-1
0
1
2
3
4
5
0 100 200 300 400 500 600 700
Vr eme [s]
Zab
rzuv
anje
[m/s2
]
Dava~ 1 Dava~ 2
Fig. 5 Acceleration of followed vehicle (Astra-G)
-5
0
5
10
15
20
25
0 100 200 300 400 500 600 700
Vr eme [s]
Brz
ina
[m/s]
Fig. 6 Velocity of followed vehicle (Astra-G)
0
1000
2000
3000
4000
5000
6000
0 100 200 300 400 500 600 700
Vr eme [s]
Pom
inat
pat
[m]
Fig. 7 Distance travelled of followed vehicle (Astra-G)
The acceleration profile is expected and normal during driving of vehicle in urban environment. Its characteristics are frequent accelerations and decelerations as a result of starting and stopping, or due to adopting the speed to the other traffic participants. It is obvious that acceleration and deceleration make pairs. Fig. 8(a) shows acceleration profile which is characteristic for starting and stopping. Fig. 8(b) shows the acceleration profile in the phase of adopting of the speed.
-4
-3
-2
-1
0
1
2
3
4
70 90 110 130 150 170 190
Vr eme [s]
Zab
rzuv
awe
[m/s2 ]
-4
-3
-2
-1
0
1
2
3
4
200 250 300 35
Vr eme [s]
Zab
rzuv
awe
[m/s2 ]
Fig. 8 Characteristic profiles acceleration
Characteristic acceleration profiles show that the vehicle after start reaches its maximum acceleration in a very short period of time. In this period the influence of vehicle inertia is noticeable. After reaching its maximum value, the acceleration decreases. The intensity of such decreasing depends of the driving style of the driver. During stopping phase three characteristic cases are noticeable: gradually increasing of the deceleration until the vehicle stops; gradually increasing of the deceleration to its maximum value and its maintaining until the vehicle stops, and fast increasing of the deceleration and then its relaxation untill the vehicle stops. The last case relates to the phase of adopting of the vehicle speed where main characteristic is frequent switching between acceleration and deceleration.
a) b)
Time [s]
Acc
eler
atio
n [m
/s2 ]
Time [s]
Time [s]
Time [s]
Time [s]
Acc
eler
atio
n [m
/s2 ]
Acc
eler
atio
n [m
/s2 ]
Trav
eled
dis
tanc
e [m
] V
eloc
ity [m
/s]
41
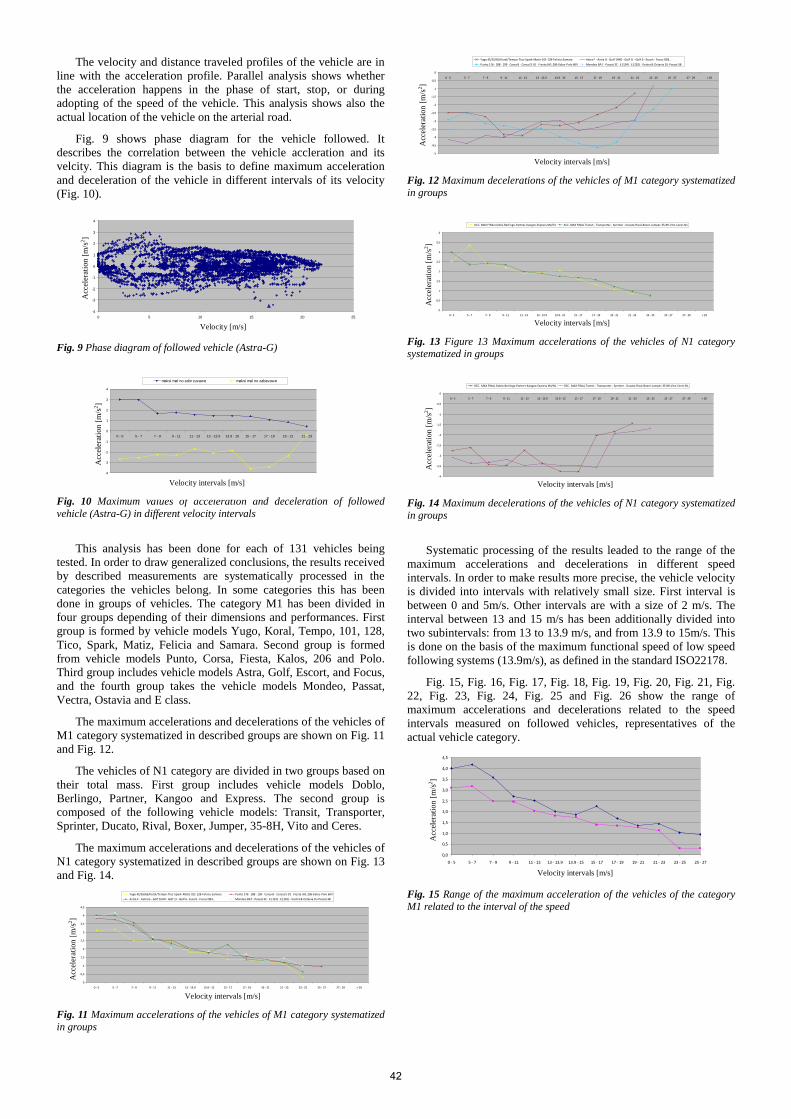
The velocity and distance traveled profiles of the vehicle are in line with the acceleration profile. Parallel analysis shows whether the acceleration happens in the phase of start, stop, or during adopting of the speed of the vehicle. This analysis shows also the actual location of the vehicle on the arterial road.
Fig. 9 shows phase diagram for the vehicle followed. It describes the correlation between the vehicle accleration and its velcity. This diagram is the basis to define maximum acceleration and deceleration of the vehicle in different intervals of its velocity (Fig. 10).
-4
-3
-2
-1
0
1
2
3
4
0 5 10 15 20 25
Br zi na [m/s]
Zab
rzuv
anje
[m/s2 ]
Fig. 9 Phase diagram of followed vehicle (Astra-G)
-4
-3
-2
-1
0
1
2
3
4
0 - 5 5 - 7 7 - 9 9 - 11 11 - 13 13 - 13.9 13.9 - 15 15 - 17 17 - 19 19 - 21 21 - 23
I nt er val i na br zi na [m/s]
Zab
rzuv
awe
[m/s2 ]
maksi mal no zabr zuvawe maksi mal no zabavawe
Fig. 10 Maximum values of acceleration and deceleration of followed vehicle (Astra-G) in different velocity intervals
This analysis has been done for each of 131 vehicles being tested. In order to draw generalized conclusions, the results received by described measurements are systematically processed in the categories the vehicles belong. In some categories this has been done in groups of vehicles. The category M1 has been divided in four groups depending of their dimensions and performances. First group is formed by vehicle models Yugo, Koral, Tempo, 101, 128, Tico, Spark, Matiz, Felicia and Samara. Second group is formed from vehicle models Punto, Corsa, Fiesta, Kalos, 206 and Polo. Third group includes vehicle models Astra, Golf, Escort, and Focus, and the fourth group takes the vehicle models Mondeo, Passat, Vectra, Ostavia and E class.
The maximum accelerations and decelerations of the vehicles of M1 category systematized in described groups are shown on Fig. 11 and Fig. 12.
The vehicles of N1 category are divided in two groups based on their total mass. First group includes vehicle models Doblo, Berlingo, Partner, Kangoo and Express. The second group is composed of the following vehicle models: Transit, Transporter, Sprinter, Ducato, Rival, Boxer, Jumper, 35-8H, Vito and Ceres.
The maximum accelerations and decelerations of the vehicles of N1 category systematized in described groups are shown on Fig. 13 and Fig. 14.
0
0,5
1
1,5
2
2,5
3
3,5
4
4,5
0 - 5 5 - 7 7 - 9 9 - 11 11 - 13 13 - 13.9 13.9 - 15 15 - 17 17 - 19 19 - 21 21 - 23 23 - 25 25 - 27 27 - 29 > 29
I nt er val i na br zi na [m/s]
Zab
rzuv
awe
[m/s2 ]
Yugo 45/55/65/Koral/Tempo-Tico-Spark-Matiz-101-128-Felicia-Samara Punto 176 - 188 - 199 - Corsa B - Corsa (S-D) - Fiesta JH1-206-Kalos-Polo 6KVAstra F - Astra G - Golf 1HX0 - Golf 1J - Golf 6 - Escort - Focus DB3… Mondeo BA7 - Passat 3C - E (124) - E (210) - Vectra B-Octavia 1U-Passat 3B
Fig. 11 Maximum accelerations of the vehicles of M1 category systematized in groups
-5
-4,5
-4
-3,5
-3
-2,5
-2
-1,5
-1
-0,5
0
0 - 5 5 - 7 7 - 9 9 - 11 11 - 13 13 - 13.9 13.9 - 15 15 - 17 17 - 19 19 - 21 21 - 23 23 - 25 25 - 27 27 - 29 > 29
I nt er val i na br zi na [m/s]
Zab
rzuv
awe
[m/s2 ]
Yugo 45/55/65/Koral/Tempo-Tico-Spark-Matiz-101-128-Felicia-Samara Astra F - Astra G - Golf 1HX0 - Golf 1J - Golf 6 - Escort - Focus DB3…Punto 176 - 188 - 199 - Corsa B - Corsa (S-D) - Fiesta JH1-206-Kalos-Polo 6KV Mondeo BA7 - Passat 3C - E (124) - E (210) - Vectra B-Octavia 1U-Passat 3B
Fig. 12 Maximum decelerations of the vehicles of M1 category systematized in groups
0
0,5
1
1,5
2
2,5
3
3,5
4
0 - 5 5 - 7 7 - 9 9 - 11 11 - 13 13 - 13.9 13.9 - 15 15 - 17 17 - 19 19 - 21 21 - 23 23 - 25 25 - 27 27 - 29 > 29
I nt er val i na br zi na [m/s]
Zab
rzuv
awe
[m/s2 ]
ACC. MAX FINAL Doblo-Berlingo-Partner-Kangoo-Express M1/N1 ACC. MAX FINAL Transit - Transporter - Sprinter - Ducato-Rival-Boxer-Jumper-35-8H-Vito-Ceres N1
Fig. 13 Figure 13 Maximum accelerations of the vehicles of N1 category systematized in groups
-4
-3,5
-3
-2,5
-2
-1,5
-1
-0,5
0
0 - 5 5 - 7 7 - 9 9 - 11 11 - 13 13 - 13.9 13.9 - 15 15 - 17 17 - 19 19 - 21 21 - 23 23 - 25 25 - 27 27 - 29 > 29
I nt er val i na br zi na [m/s]
Zab
rzuv
awe
[m/s2 ]
DEC. MAX FINAL Doblo-Berlingo-Partner-Kangoo-Express M1/N1 DEC. MAX FINAL Transit - Transporter - Sprinter - Ducato-Rival-Boxer-Jumper-35-8H-Vito-Ceres N1
Fig. 14 Maximum decelerations of the vehicles of N1 category systematized in groups
Systematic processing of the results leaded to the range of the maximum accelerations and decelerations in different speed intervals. In order to make results more precise, the vehicle velocity is divided into intervals with relatively small size. First interval is between 0 and 5m/s. Other intervals are with a size of 2 m/s. The interval between 13 and 15 m/s has been additionally divided into two subintervals: from 13 to 13.9 m/s, and from 13.9 to 15m/s. This is done on the basis of the maximum functional speed of low speed following systems (13.9m/s), as defined in the standard ISO22178.
Fig. 15, Fig. 16, Fig. 17, Fig. 18, Fig. 19, Fig. 20, Fig. 21, Fig. 22, Fig. 23, Fig. 24, Fig. 25 and Fig. 26 show the range of maximum accelerations and decelerations related to the speed intervals measured on followed vehicles, representatives of the actual vehicle category.
0,0
0,5
1,0
1,5
2,0
2,5
3,0
3,5
4,0
4,5
0 - 5 5 - 7 7 - 9 9 - 11 11 - 13 13 - 13.9 13.9 - 15 15 - 17 17 - 19 19 - 21 21 - 23 23 - 25 25 - 27
I nt er val na br zi na [m/s]
Zab
rzuv
awe
[m/s2 ]
Fig. 15 Range of the maximum acceleration of the vehicles of the category M1 related to the interval of the speed
Acc
eler
atio
n [m
/s2 ]
Acc
eler
atio
n [m
/s2 ]
Acc
eler
atio
n [m
/s2 ]
Acc
eler
atio
n [m
/s2 ]
Acc
eler
atio
n [m
/s2 ]
Acc
eler
atio
n [m
/s2 ]
Velocity [m/s]
Velocity intervals [m/s]
Velocity intervals [m/s]
Velocity intervals [m/s]
Velocity intervals [m/s]
Velocity intervals [m/s]
Velocity intervals [m/s]
Acc
eler
atio
n [m
/s2 ]
42
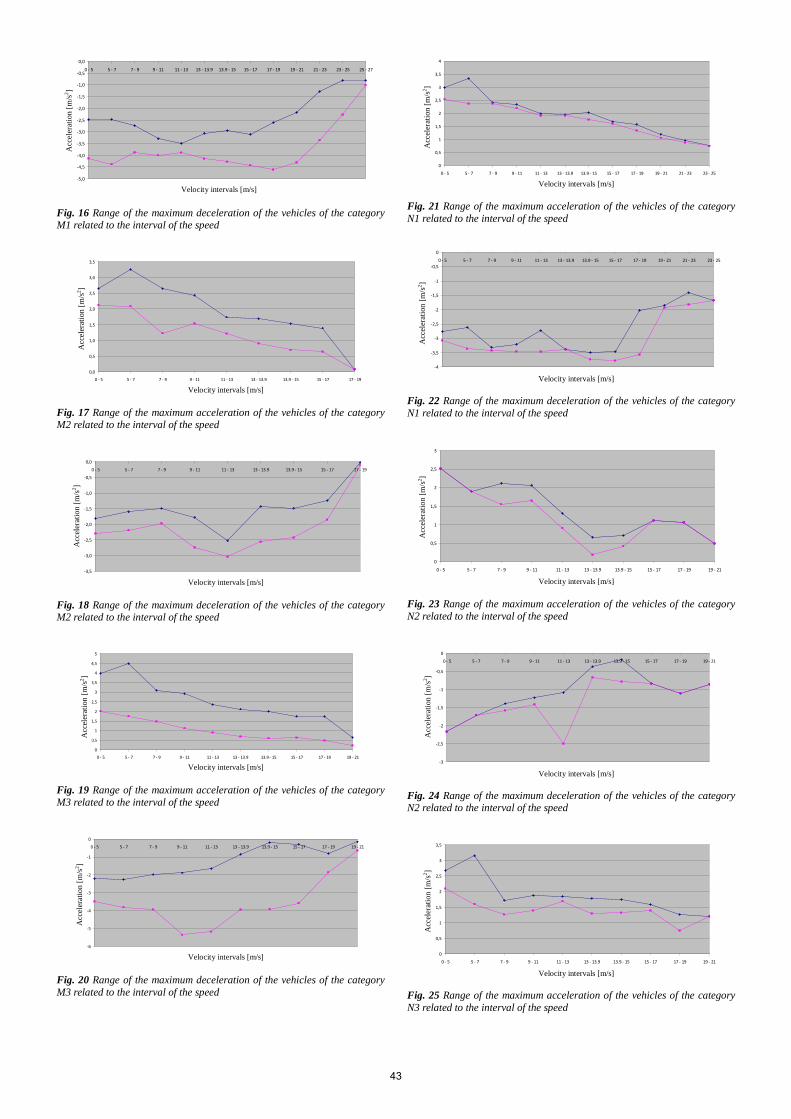
-5,0
-4,5
-4,0
-3,5
-3,0
-2,5
-2,0
-1,5
-1,0
-0,5
0,0
0 - 5 5 - 7 7 - 9 9 - 11 11 - 13 13 - 13.9 13.9 - 15 15 - 17 17 - 19 19 - 21 21 - 23 23 - 25 25 - 27
I nt er val na br zi na [m/s]
Zab
rzuv
awe
[m/s2 ]
Fig. 16 Range of the maximum deceleration of the vehicles of the category M1 related to the interval of the speed
0,0
0,5
1,0
1,5
2,0
2,5
3,0
3,5
0 - 5 5 - 7 7 - 9 9 - 11 11 - 13 13 - 13.9 13.9 - 15 15 - 17 17 - 19
I nt er val na br zi na [m/s]
Zab
rzuv
anje
[m/s2 ]
Fig. 17 Range of the maximum acceleration of the vehicles of the category M2 related to the interval of the speed
-3,5
-3,0
-2,5
-2,0
-1,5
-1,0
-0,5
0,0
0 - 5 5 - 7 7 - 9 9 - 11 11 - 13 13 - 13.9 13.9 - 15 15 - 17 17 - 19
I nt er val na br zi na [m/s]
Zab
rzuv
awe
[m/s2 ]
Fig. 18 Range of the maximum deceleration of the vehicles of the category M2 related to the interval of the speed
0
0,5
1
1,5
2
2,5
3
3,5
4
4,5
5
0 - 5 5 - 7 7 - 9 9 - 11 11 - 13 13 - 13.9 13.9 - 15 15 - 17 17 - 19 19 - 21
I nt er val na br zi na [m/s]
Zab
rzuv
awe
[m/s2 ]
Fig. 19 Range of the maximum acceleration of the vehicles of the category M3 related to the interval of the speed
-6
-5
-4
-3
-2
-1
0
0 - 5 5 - 7 7 - 9 9 - 11 11 - 13 13 - 13.9 13.9 - 15 15 - 17 17 - 19 19 - 21
I nt er val na br zi na [m/s]
Zab
rzuv
awe
[m/s2 ]
Fig. 20 Range of the maximum deceleration of the vehicles of the category M3 related to the interval of the speed
0
0,5
1
1,5
2
2,5
3
3,5
4
0 - 5 5 - 7 7 - 9 9 - 11 11 - 13 13 - 13.9 13.9 - 15 15 - 17 17 - 19 19 - 21 21 - 23 23 - 25
I nt er val na br zi na [m/s]
Zab
rzuv
awe
[m/s2 ]
Fig. 21 Range of the maximum acceleration of the vehicles of the category N1 related to the interval of the speed
-4
-3,5
-3
-2,5
-2
-1,5
-1
-0,5
0
0 - 5 5 - 7 7 - 9 9 - 11 11 - 13 13 - 13.9 13.9 - 15 15 - 17 17 - 19 19 - 21 21 - 23 23 - 25
I nt er val na br zi na [m/s]
Zab
rzuv
awe
[m/s2 ]
Fig. 22 Range of the maximum deceleration of the vehicles of the category N1 related to the interval of the speed
0
0,5
1
1,5
2
2,5
3
0 - 5 5 - 7 7 - 9 9 - 11 11 - 13 13 - 13.9 13.9 - 15 15 - 17 17 - 19 19 - 21
I nt er val na br zi na [m/s]
Zab
rzuv
awe
[m/s2 ]
Fig. 23 Range of the maximum acceleration of the vehicles of the category N2 related to the interval of the speed
-3
-2,5
-2
-1,5
-1
-0,5
0
0 - 5 5 - 7 7 - 9 9 - 11 11 - 13 13 - 13.9 13.9 - 15 15 - 17 17 - 19 19 - 21
I nt er val na br zi na [m/s]
Zab
rzuv
awe
[m/s2 ]
Fig. 24 Range of the maximum deceleration of the vehicles of the category N2 related to the interval of the speed
0
0,5
1
1,5
2
2,5
3
3,5
0 - 5 5 - 7 7 - 9 9 - 11 11 - 13 13 - 13.9 13.9 - 15 15 - 17 17 - 19 19 - 21
I nt er val na br zi na [m/s]
Zab
rzuv
awe
[m/s2 ]
Fig. 25 Range of the maximum acceleration of the vehicles of the category N3 related to the interval of the speed
Acc
eler
atio
n [m
/s2 ]
Acc
eler
atio
n [m
/s2 ]
Acc
eler
atio
n [m
/s2 ]
Acc
eler
atio
n [m
/s2 ]
Acc
eler
atio
n [m
/s2 ]
Acc
eler
atio
n [m
/s2 ]
Acc
eler
atio
n [m
/s2 ]
Acc
eler
atio
n [m
/s2 ]
Acc
eler
atio
n [m
/s2 ]
Acc
eler
atio
n [m
/s2 ]
Velocity intervals [m/s]
Velocity intervals [m/s]
Velocity intervals [m/s]
Velocity intervals [m/s]
Velocity intervals [m/s]
Velocity intervals [m/s]
Velocity intervals [m/s]
Velocity intervals [m/s]
Velocity intervals [m/s]
Velocity intervals [m/s]
43
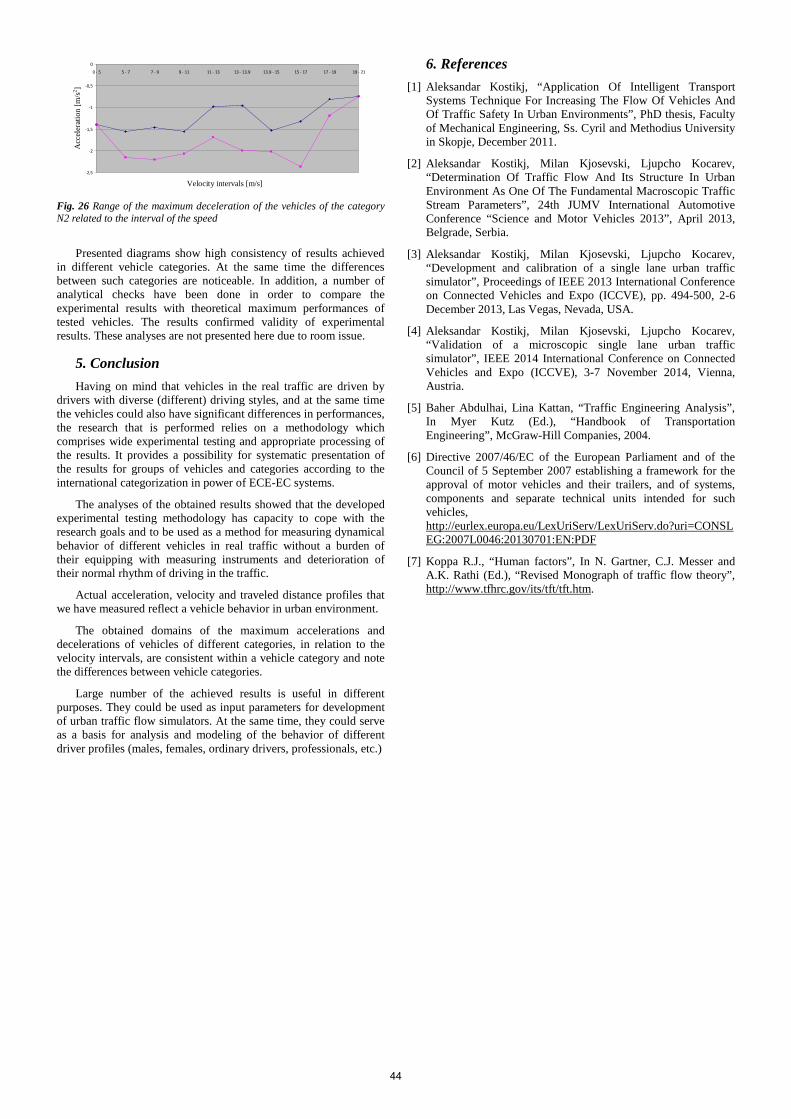
-2,5
-2
-1,5
-1
-0,5
0
0 - 5 5 - 7 7 - 9 9 - 11 11 - 13 13 - 13.9 13.9 - 15 15 - 17 17 - 19 19 - 21
I nt er val na br zi na [m/s]
Zab
rzuv
awe
[m/s2 ]
Fig. 26 Range of the maximum deceleration of the vehicles of the category N2 related to the interval of the speed
Presented diagrams show high consistency of results achieved in different vehicle categories. At the same time the differences between such categories are noticeable. In addition, a number of analytical checks have been done in order to compare the experimental results with theoretical maximum performances of tested vehicles. The results confirmed validity of experimental results. These analyses are not presented here due to room issue.
5. Conclusion Having on mind that vehicles in the real traffic are driven by
drivers with diverse (different) driving styles, and at the same time the vehicles could also have significant differences in performances, the research that is performed relies on a methodology which comprises wide experimental testing and appropriate processing of the results. It provides a possibility for systematic presentation of the results for groups of vehicles and categories according to the international categorization in power of ECE-EC systems.
The analyses of the obtained results showed that the developed experimental testing methodology has capacity to cope with the research goals and to be used as a method for measuring dynamical behavior of different vehicles in real traffic without a burden of their equipping with measuring instruments and deterioration of their normal rhythm of driving in the traffic.
Actual acceleration, velocity and traveled distance profiles that we have measured reflect a vehicle behavior in urban environment.
The obtained domains of the maximum accelerations and decelerations of vehicles of different categories, in relation to the velocity intervals, are consistent within a vehicle category and note the differences between vehicle categories.
Large number of the achieved results is useful in different purposes. They could be used as input parameters for development of urban traffic flow simulators. At the same time, they could serve as a basis for analysis and modeling of the behavior of different driver profiles (males, females, ordinary drivers, professionals, etc.)
6. References [1] Aleksandar Kostikj, “Application Of Intelligent Transport
Systems Technique For Increasing The Flow Of Vehicles And Of Traffic Safety In Urban Environments”, PhD thesis, Faculty of Mechanical Engineering, Ss. Cyril and Methodius University in Skopje, December 2011.
[2] Aleksandar Kostikj, Milan Kjosevski, Ljupcho Kocarev, “Determination Of Traffic Flow And Its Structure In Urban Environment As One Of The Fundamental Macroscopic Traffic Stream Parameters”, 24th JUMV International Automotive Conference “Science and Motor Vehicles 2013”, April 2013, Belgrade, Serbia.
[3] Aleksandar Kostikj, Milan Kjosevski, Ljupcho Kocarev, “Development and calibration of a single lane urban traffic simulator”, Proceedings of IEEE 2013 International Conference on Connected Vehicles and Expo (ICCVE), pp. 494-500, 2-6 December 2013, Las Vegas, Nevada, USA.
[4] Aleksandar Kostikj, Milan Kjosevski, Ljupcho Kocarev, “Validation of a microscopic single lane urban traffic simulator”, IEEE 2014 International Conference on Connected Vehicles and Expo (ICCVE), 3-7 November 2014, Vienna, Austria.
[5] Baher Abdulhai, Lina Kattan, “Traffic Engineering Analysis”, In Myer Kutz (Ed.), “Handbook of Transportation Engineering”, McGraw-Hill Companies, 2004.
[6] Directive 2007/46/EC of the European Parliament and of the Council of 5 September 2007 establishing a framework for the approval of motor vehicles and their trailers, and of systems, components and separate technical units intended for such vehicles, http://eurlex.europa.eu/LexUriServ/LexUriServ.do?uri=CONSLEG:2007L0046:20130701:EN:PDF
[7] Koppa R.J., “Human factors”, In N. Gartner, C.J. Messer and A.K. Rathi (Ed.), “Revised Monograph of traffic flow theory”, http://www.tfhrc.gov/its/tft/tft.htm.
Acc
eler
atio
n [m
/s2 ]
Velocity intervals [m/s]
44
IMPROVING THE EFFICIENCY off-line HEAT PUMP SYSTEM FOR HEATING RURAL HOUSE IN THE COLD DAYS
Ass.Prof. Sydykov Sh., Ass.Prof. Umbetkulov E., Dr.PhD Аlibek N.
Kazakh National Agrarian University, Department of Energy Saving and Automation, Almaty, Kazakhstan
e-mail: [email protected]
Summary: This article presents methods and means of increasing an efficiency of heat pump system and hot water supply for residential houses on the base of using of the heat pumps «air-water», solar collector of energy and ground heat exchangers. The technological scheme of energy saving heat pump system of the rural house taking into account local climatic conditions is described. The study determines typical temperature parameters hybrid heat pump system’s elements at cold days in heating season. The expediency of use of solar energy and heat of ground for preliminary heating of the cold external air arriving to the thermal pump «air-water» is proved.
KEYWORDS: HEATING, THERMAL PUMP, AIR SOLAR COLLECTOR, SOIL HEAT EXCHANGER, WARMTH
ACCUMULATION. 1. Introduction Distinctive feature of agricultural objects of Republic of
Kazakhstans is their rather small individual capacity and significant dispersion on extensive territory that creates the certain difficulties in construction of the effective centralized systems of heating and hot water supply (HHWS). At the same time local climatic conditions of this country favour to development of independent hybrid systems HHWS with use of renewed energy sources (RES), in particular, to energy of the Sun, a wind and heat of a ground. The last provides use of popular thermal pumps (TP) or their combination with other types of power sources. The choice of updating of TP depends on climatic conditions of the district and technical and economic indicators of the equipment. The solution of questions of a choice of TP type, scales and areas of their rational use in the different countries is far not equivalent. As a rule, geothermal TP «water-water» were extended in the northern countries, and in southern - TP «air-water». The price of the last for 30-40 % is cheaper than geothermal TP at comparability of capacity and quality of the equipment. This difference essentially increases at carrying out difficult earthwork, drilling of wells (by depth of 60-100 m) and a laying of geothermal probes [1].
In the majority of regions of Kazakhstan it is more preferable to use low-potential warmth of atmospheric air, that is to apply to HHWS of rural houses the thermal pumps «air-water» (TPAW). Wide circulation of TPAW is connected with relative simplicity of installation and low cost concerning other types of thermal pumps. Weakness of TPAW is reduction of thermal capacity at decrease in temperature of external air lower – 15 °С [2].
Considering that decrease in temperature of external air (below – 15 °С) in the majority of regions of Kazakhstan is observed rather short time (10-15 days of the winter period), arises practical interest to search of possibility of increase of overall performance of heat pump system of a heat supply (HPHS) of rural houses during this period of time taking into account use of local resources.
In this article it is offered some ways of increase of overall performance of HPHS of rural houses in cold days at the expense of preliminary heating of the external air arriving in TPAW, by means of the thermal blocks accumulating warmth of solar energy (in the afternoon) and soil air lines (at night).
2. Materials and research methods 2.1 Preconditions of use of solar energy and warmth of soil
for HHWS of the rural house. The main indicator of overall performance of TP is the factor of transformation of the thermal pumps COP (coefficient of preformance) which is defined by the relation of capacity of received useful heat to the capacity spent for a drive of the compressor [1,2].
For calculation of COP the formula [1] is used:
,
where Qн – received useful heat, J; W - power consumption, J.
TPAW, as a rule, have optimum values СОР = 3,5 … 4,0 at
temperature of external air t=2 °C [1]. With increase in temperature of a source of low-potential heat and reduction of temperature of heating factor СОР increases and can reach 4, 5 and more values. Fall of temperature of air during winter time considerably reduces СОР and leads to an inefficiency of use TPAW.
Key question on which efficiency of application of TP substantially depends, the question of temperature increase of a source of low-potential heat, that is the air arriving in TPAW is. Considering short duration of the coldest days in the southern and western regions of Kazakhstan (10-15 days) for achievement of the specified purpose in rural areas it is possible to find separate ways and means. For example, previously to pass cold external air through the adapted economic constructions, cellars, etc.
At a complete set of hybrid HPHS for rural houses of Kazakhstan, first of all, it is necessary to consider use of solar energy (especially in the afternoon). It gives essential reduction of consumption of electric energy TPAW with 25 to 15 % from the general development [3,4].
Irrespective of a geographical arrangement of the republic, resources of solar energy in the country are stable and accepted, thanks to favourable dry climatic conditions. The quantity of a sundial makes 2200-3000 hours in a year, and energy of sunlight of 1300-1800 kW on metre a year. Total day radiation under various conditions on the republic makes 3,8-5,2 kWh/sq.m. Average monthly temperature of external air, for example, in Almaty area during winter time does not decrease below – 11 °C. In some cases this temperature can decrease to – 25 °С (in a current of 3-5 days).
In rural areas of the majority of regions of Kazakhstan and attractive use of warmth of soil as its temperature, on depth of 1,3-1,5 metres, practically do not change and keeps in limits 7-10 °C heat is available. When laying soil air lines on this depth and the admission through them cold external air from the subsequent giving in TPAW it is possible to increase in addition efficiency of its work in cold days.
Considering stated in this article one of ways of increase of efficiency of TPS of the rural house at the expense of preliminary heating of the external cold air arriving in TPAW, in the heat exchangers accumulating solar heat and warmth of soil is offered.
2.2 Block diagramme of the HHWS hybrid system. Widespread devices for transformation
solar energy in thermal are concentrating and directly absorbing a solar stream - solar collectors and absorbers or panels. As solar
WQСОР н=
45
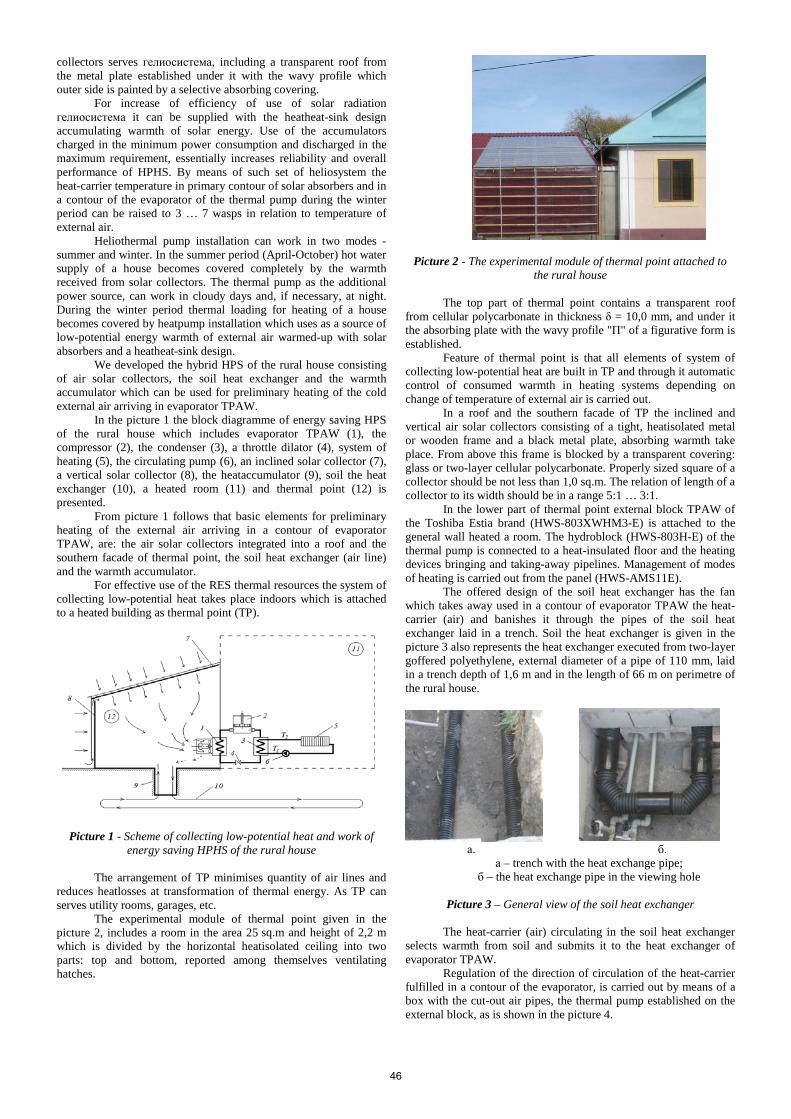
collectors serves гелиосистема, including a transparent roof from the metal plate established under it with the wavy profile which outer side is painted by a selective absorbing covering.
For increase of efficiency of use of solar radiation гелиосистема it can be supplied with the heatheat-sink design accumulating warmth of solar energy. Use of the accumulators charged in the minimum power consumption and discharged in the maximum requirement, essentially increases reliability and overall performance of HPHS. By means of such set of heliosystem the heat-carrier temperature in primary contour of solar absorbers and in a contour of the evaporator of the thermal pump during the winter period can be raised to 3 … 7 wasps in relation to temperature of external air.
Heliothermal pump installation can work in two modes - summer and winter. In the summer period (April-October) hot water supply of a house becomes covered completely by the warmth received from solar collectors. The thermal pump as the additional power source, can work in cloudy days and, if necessary, at night. During the winter period thermal loading for heating of a house becomes covered by heatpump installation which uses as a source of low-potential energy warmth of external air warmed-up with solar absorbers and a heatheat-sink design.
We developed the hybrid HPS of the rural house consisting of air solar collectors, the soil heat exchanger and the warmth accumulator which can be used for preliminary heating of the cold external air arriving in evaporator TPAW.
In the picture 1 the block diagramme of energy saving HPS of the rural house which includes evaporator TPAW (1), the compressor (2), the condenser (3), a throttle dilator (4), system of heating (5), the circulating pump (6), an inclined solar collector (7), a vertical solar collector (8), the heataccumulator (9), soil the heat exchanger (10), a heated room (11) and thermal point (12) is presented.
From picture 1 follows that basic elements for preliminary heating of the external air arriving in a contour of evaporator TPAW, are: the air solar collectors integrated into a roof and the southern facade of thermal point, the soil heat exchanger (air line) and the warmth accumulator.
For effective use of the RES thermal resources the system of collecting low-potential heat takes place indoors which is attached to a heated building as thermal point (TP).
Picture 1 - Scheme of collecting low-potential heat and work of energy saving HPHS of the rural house
The arrangement of TP minimises quantity of air lines and
reduces heatlosses at transformation of thermal energy. As TP can serves utility rooms, garages, etc.
The experimental module of thermal point given in the picture 2, includes a room in the area 25 sq.m and height of 2,2 m which is divided by the horizontal heatisolated ceiling into two parts: top and bottom, reported among themselves ventilating hatches.
Picture 2 - The experimental module of thermal point attached to the rural house
The top part of thermal point contains a transparent roof
from cellular polycarbonate in thickness δ = 10,0 mm, and under it the absorbing plate with the wavy profile "П" of a figurative form is established.
Feature of thermal point is that all elements of system of collecting low-potential heat are built in TP and through it automatic control of consumed warmth in heating systems depending on change of temperature of external air is carried out.
In a roof and the southern facade of TP the inclined and vertical air solar collectors consisting of a tight, heatisolated metal or wooden frame and a black metal plate, absorbing warmth take place. From above this frame is blocked by a transparent covering: glass or two-layer cellular polycarbonate. Properly sized square of a collector should be not less than 1,0 sq.m. The relation of length of a collector to its width should be in a range 5:1 … 3:1.
In the lower part of thermal point external block TPAW of the Toshiba Estia brand (HWS-803XWHM3-E) is attached to the general wall heated a room. The hydroblock (HWS-803H-E) of the thermal pump is connected to a heat-insulated floor and the heating devices bringing and taking-away pipelines. Management of modes of heating is carried out from the panel (HWS-AMS11E).
The offered design of the soil heat exchanger has the fan which takes away used in a contour of evaporator TPAW the heat-carrier (air) and banishes it through the pipes of the soil heat exchanger laid in a trench. Soil the heat exchanger is given in the picture 3 also represents the heat exchanger executed from two-layer goffered polyethylene, external diameter of a pipe of 110 mm, laid in a trench depth of 1,6 m and in the length of 66 m on perimetre of the rural house.
а. б.
а – trench with the heat exchange pipe; б – the heat exchange pipe in the viewing hole
Picture 3 – General view of the soil heat exchanger
The heat-carrier (air) circulating in the soil heat exchanger
selects warmth from soil and submits it to the heat exchanger of evaporator TPAW.
Regulation of the direction of circulation of the heat-carrier fulfilled in a contour of the evaporator, is carried out by means of a box with the cut-out air pipes, the thermal pump established on the external block, as is shown in the picture 4.
46
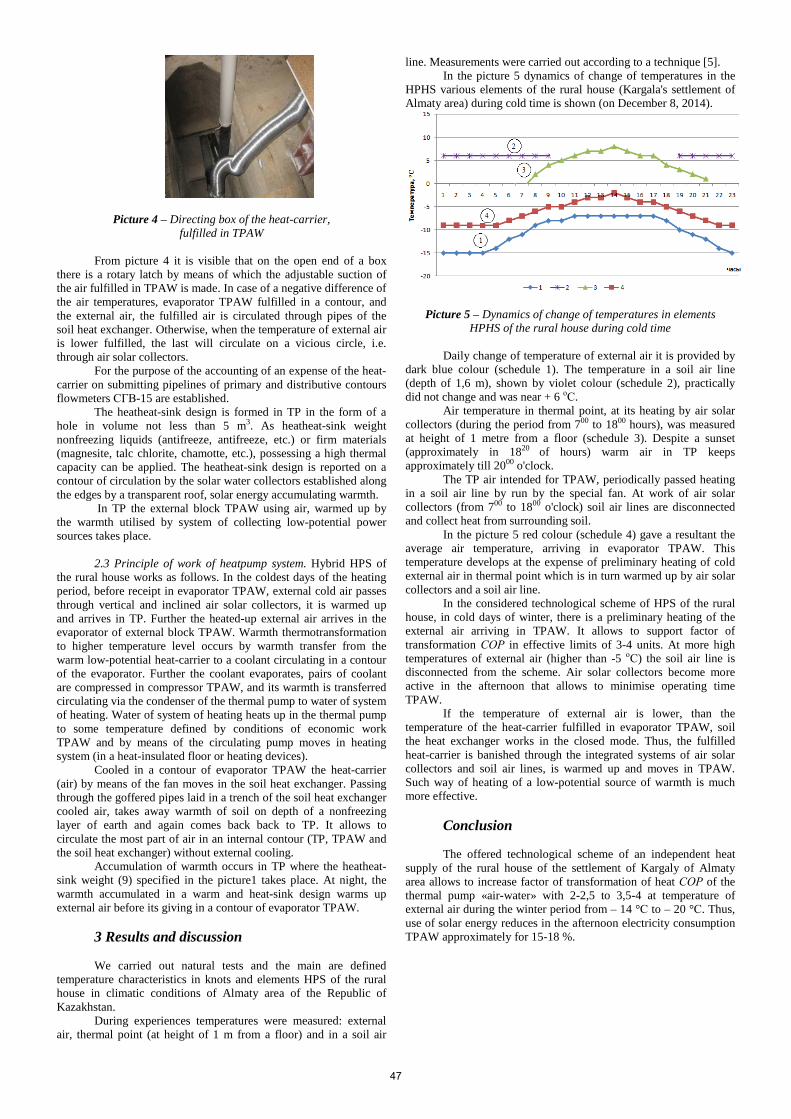
Picture 4 – Directing box of the heat-carrier, fulfilled in TPAW
From picture 4 it is visible that on the open end of a box
there is a rotary latch by means of which the adjustable suction of the air fulfilled in TPAW is made. In case of a negative difference of the air temperatures, evaporator TPAW fulfilled in a contour, and the external air, the fulfilled air is circulated through pipes of the soil heat exchanger. Otherwise, when the temperature of external air is lower fulfilled, the last will circulate on a vicious circle, i.e. through air solar collectors.
For the purpose of the accounting of an expense of the heat-carrier on submitting pipelines of primary and distributive contours flowmeters СГВ-15 are established.
The heatheat-sink design is formed in TP in the form of a hole in volume not less than 5 m3. As heatheat-sink weight nonfreezing liquids (antifreeze, antifreeze, etc.) or firm materials (magnesite, talc chlorite, chamotte, etc.), possessing a high thermal capacity can be applied. The heatheat-sink design is reported on a contour of circulation by the solar water collectors established along the edges by a transparent roof, solar energy accumulating warmth.
In TP the external block TPAW using air, warmed up by the warmth utilised by system of collecting low-potential power sources takes place.
2.3 Principle of work of heatpump system. Hybrid HPS of
the rural house works as follows. In the coldest days of the heating period, before receipt in evaporator TPAW, external cold air passes through vertical and inclined air solar collectors, it is warmed up and arrives in TP. Further the heated-up external air arrives in the evaporator of external block TPAW. Warmth thermotransformation to higher temperature level occurs by warmth transfer from the warm low-potential heat-carrier to a coolant circulating in a contour of the evaporator. Further the coolant evaporates, pairs of coolant are compressed in compressor TPAW, and its warmth is transferred circulating via the condenser of the thermal pump to water of system of heating. Water of system of heating heats up in the thermal pump to some temperature defined by conditions of economic work TPAW and by means of the circulating pump moves in heating system (in a heat-insulated floor or heating devices).
Cooled in a contour of evaporator TPAW the heat-carrier (air) by means of the fan moves in the soil heat exchanger. Passing through the goffered pipes laid in a trench of the soil heat exchanger cooled air, takes away warmth of soil on depth of a nonfreezing layer of earth and again comes back back to TP. It allows to circulate the most part of air in an internal contour (TP, TPAW and the soil heat exchanger) without external cooling.
Accumulation of warmth occurs in TP where the heatheat-sink weight (9) specified in the picture1 takes place. At night, the warmth accumulated in a warm and heat-sink design warms up external air before its giving in a contour of evaporator TPAW.
3 Results and discussion We carried out natural tests and the main are defined
temperature characteristics in knots and elements HPS of the rural house in climatic conditions of Almaty area of the Republic of Kazakhstan.
During experiences temperatures were measured: external air, thermal point (at height of 1 m from a floor) and in a soil air
line. Measurements were carried out according to a technique [5]. In the picture 5 dynamics of change of temperatures in the
HPHS various elements of the rural house (Kargala's settlement of Almaty area) during cold time is shown (on December 8, 2014).
Picture 5 – Dynamics of change of temperatures in elements HPHS of the rural house during cold time
Daily change of temperature of external air it is provided by
dark blue colour (schedule 1). The temperature in a soil air line (depth of 1,6 m), shown by violet colour (schedule 2), practically did not change and was near + 6 оС.
Air temperature in thermal point, at its heating by air solar collectors (during the period from 700 to 1800 hours), was measured at height of 1 metre from a floor (schedule 3). Despite a sunset (approximately in 1820 of hours) warm air in TP keeps approximately till 2000 o'clock.
The TP air intended for TPAW, periodically passed heating in a soil air line by run by the special fan. At work of air solar collectors (from 700 to 1800 o'clock) soil air lines are disconnected and collect heat from surrounding soil.
In the picture 5 red colour (schedule 4) gave a resultant the average air temperature, arriving in evaporator TPAW. This temperature develops at the expense of preliminary heating of cold external air in thermal point which is in turn warmed up by air solar collectors and a soil air line.
In the considered technological scheme of HPS of the rural house, in cold days of winter, there is a preliminary heating of the external air arriving in TPAW. It allows to support factor of transformation СОР in effective limits of 3-4 units. At more high temperatures of external air (higher than -5 оС) the soil air line is disconnected from the scheme. Air solar collectors become more active in the afternoon that allows to minimise operating time TPAW.
If the temperature of external air is lower, than the temperature of the heat-carrier fulfilled in evaporator TPAW, soil the heat exchanger works in the closed mode. Thus, the fulfilled heat-carrier is banished through the integrated systems of air solar collectors and soil air lines, is warmed up and moves in TPAW. Such way of heating of a low-potential source of warmth is much more effective.
Conclusion The offered technological scheme of an independent heat
supply of the rural house of the settlement of Kargaly of Almaty area allows to increase factor of transformation of heat СОР of the thermal pump «air-water» with 2-2,5 to 3,5-4 at temperature of external air during the winter period from – 14 °С to – 20 °С. Thus, use of solar energy reduces in the afternoon electricity consumption TPAW approximately for 15-18 %.
47

Literature 1 Горшков Г.В. Тепловые насосы, аналитический обзор
// Справочник промышленного оборудования.-2004.-2. С.47-80
2 Попов А.В. Анализ эффективности различных типов тепловых насосов //Проблемы энергосбережение.-2005.- 2. С.17-22.
3 Митина И.В. Сравнительный анализ воздушных систем отопления с тепловым насосом и солнечным подогревом хладагента //Возобновляемые источники энергии: материалы пятой всероссийской научной молодежной школы. – М. - 2006 г. – С.75-78.
4 Петросян Л.А. Использование солнечной энергии и тепловых насосов для теплоснабжения жилых зданий // Сб. научн. трудов Ереванского государственного университета архитектуры и строительства. Ереван, 2003.- Т. 2. - С.122-124.
5 ГОСТ Р 54856-2011. Теплоснабжение зданий. Методика расчета энергопотребления и эффективности системы теплогенерации с солнечными установками. М.: Стандартинформ, 2012.- 38 с.
48
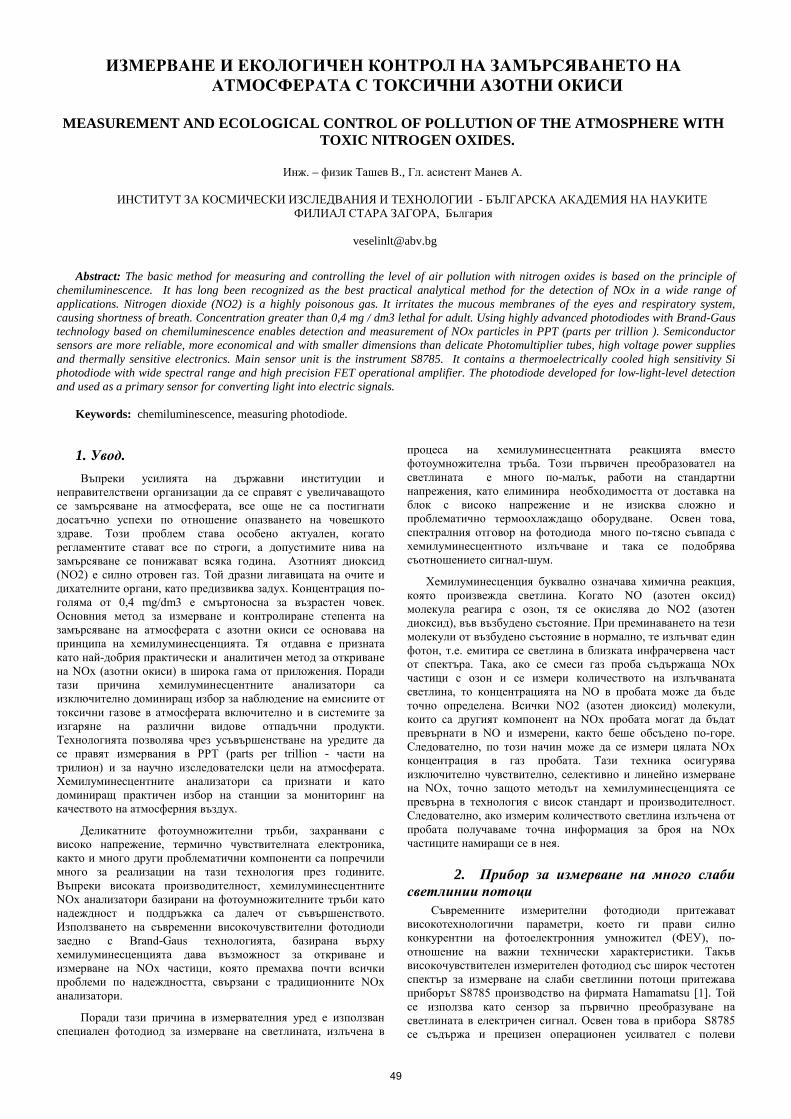
ИЗМЕРВАНЕ И ЕКОЛОГИЧЕН КОНТРОЛ НА ЗАМЪРСЯВАНЕТО НА АТМОСФЕРАТА С ТОКСИЧНИ АЗОТНИ ОКИСИ
MEASUREMENT AND ECOLOGICAL CONTROL OF POLLUTION OF THE ATMOSPHERE WITH
TOXIC NITROGEN OXIDES.
Инж. – физик Ташев В., Гл. асистент Манев А.
ИНСТИТУТ ЗА КОСМИЧЕСКИ ИЗСЛЕДВАНИЯ И ТЕХНОЛОГИИ - БЪЛГАРСКА АКАДЕМИЯ НА НАУКИТЕ ФИЛИАЛ СТАРА ЗАГОРА, България
Abstract: The basic method for measuring and controlling the level of air pollution with nitrogen oxides is based on the principle of
chemiluminescence. It has long been recognized as the best practical analytical method for the detection of NOx in a wide range of applications. Nitrogen dioxide (NO2) is a highly poisonous gas. It irritates the mucous membranes of the eyes and respiratory system, causing shortness of breath. Concentration greater than 0,4 mg / dm3 lethal for adult. Using highly advanced photodiodes with Brand-Gaus technology based on chemiluminescence enables detection and measurement of NOx particles in PPT (parts per trillion ). Semiconductor sensors are more reliable, more economical and with smaller dimensions than delicate Photomultiplier tubes, high voltage power supplies and thermally sensitive electronics. Main sensor unit is the instrument S8785. It contains a thermoelectrically cooled high sensitivity Si photodiode with wide spectral range and high precision FET operational amplifier. The photodiode developed for low-light-level detection and used as a primary sensor for converting light into electric signals.
Keywords: chemiluminescence, measuring photodiode.
1. Увод. Въпреки усилията на държавни институции и
неправителствени организации да се справят с увеличаващото се замърсяване на атмосферата, все още не са постигнати досатъчно успехи по отношение опазването на човешкото здраве. Този проблем става особено актуален, когато регламентите стават все по строги, а допустимите нива на замърсяване се понижават всяка година. Азотният диоксид (NO2) е силно отровен газ. Той дразни лигавицата на очите и дихателните органи, като предизвиква задух. Концентрация по-голяма от 0,4 mg/dm3 е смъртоносна за възрастен човек. Основния метод за измерване и контролиране степента на замърсяване на атмосферата с азотни окиси се основава на принципа на хемилуминесценцията. Тя отдавна е призната като най-добрия практически и аналитичен метод за откриване на NOx (азотни окиси) в широка гама от приложения. Поради тази причина хемилуминесцентните анализатори са изключително доминиращ избор за наблюдение на емисиите от токсични газове в атмосферата включително и в системите за изгаряне на различни видове отпадъчни продукти. Технологията позволява чрез усъвършенстване на уредите да се правят измервания в PPT (parts per trillion - части на трилион) и за научно изследователски цели на атмосферата. Хемилуминесцентните анализатори са признати и като доминиращ практичен избор на станции за мониторинг на качеството на атмосферния въздух.
Деликатните фотоумножителни тръби, захранвани с високо напрежение, термично чувствителната електроника, както и много други проблематични компоненти са попречили много за реализации на тази технология през годините. Въпреки високата производителност, хемилуминесцентните NOx анализатори базирани на фотоумножителните тръби като надеждност и поддръжка са далеч от съвършенството. Използването на съвременни високочувствителни фотодиоди заедно с Brand-Gaus технологията, базирана върху хемилуминесценцията дава възможност за откриване и измерване на NOx частици, която премахва почти всички проблеми по надеждността, свързани с традиционните NOx анализатори.
Поради тази причина в измервателния уред е използван специален фотодиод за измерване на светлината, излъчена в
процеса на хемилуминесцентната реакцията вместо фотоумножителна тръба. Този първичен преобразовател на светлината е много по-малък, работи на стандартни напрежения, като елиминира необходимостта от доставка на блок с високо напрежение и не изисква сложно и проблематично термоохлаждащо оборудване. Освен това, спектралния отговор на фотодиода много по-тясно съвпада с хемилуминесцентното излъчване и така се подобрява съотношението сигнал-шум.
Хемилуминесценция буквално означава химична реакция, която произвежда светлина. Когато NO (азотен оксид) молекула реагира с озон, тя се окислява до NO2 (азотен диоксид), във възбудено състояние. При преминаването на тези молекули от възбудено състояние в нормално, те излъчват един фотон, т.е. емитира се светлина в близката инфрачервена част от спектъра. Така, ако се смеси газ проба съдържаща NOx частици с озон и се измери количеството на излъчваната светлина, то концентрацията на NO в пробата може да бъде точно определена. Всички NO2 (азотен диоксид) молекули, които са другият компонент на NOx пробата могат да бъдат превърнати в NO и измерени, както беше обсъдено по-горе. Следователно, по този начин може да се измери цялата NOx концентрация в газ пробата. Тази техника осигурява изключително чувствително, селективно и линейно измерване на NOx, точно защото методът на хемилуминесценцията се превърна в технология с висок стандарт и производителност. Следователно, ако измерим количеството светлина излъчена от пробата получаваме точна информация за броя на NOx частиците намиращи се в нея.
2. Прибор за измерване на много слаби светлинии потоци
Съвременните измерителни фотодиоди притежават високотехнологични параметри, което ги прави силно конкурентни на фотоелектронния умножител (ФЕУ), по-отношение на важни технически характеристики. Такъв високочувствителен измерителен фотодиод със широк честотен спектър за измерване на слаби светлинни потоци притежава приборът S8785 производство на фирмата Hamamatsu [1]. Той се използва като сензор за първично преобразуване на светлината в електричен сигнал. Освен това в прибора S8785 се съдържа и прецизен операционен усилвател с полеви
49
транзистори на входа за неговото усилване. Схемата е показана на фиг. 1.
Фиг.1. Блокова схема на фотодиода с усилвател S8785 на един
чип.
Освен фотодиод и усилвател приборът съдържа и резистор Rf = 10 GΩ, термистор за измерване на температурата и електронен охладител за поддържане на температура от -25 °C. Всичко това е изградено върху един чип със сапфирена подложка, която е с много голямо съпротивление и за това токовете на утечка са практически равни на нула.
Приборът S8785 има следните по-важни параметри:
- Голяма активна площ във вид на прозорче с размери 10 х 10 мм.
- Силициев фотодиод, който е оптимизиран за прецизна фотометрия от ултравиолетовия до близкия инфрачервен диапазон и по-точно от 200 до 1200 nm.
- Компактен херметизиран корпус със сапфирен прозорец.
- Вграден прецизен операционен усилвател с много голямо входно съпротивление и FET транзистори на входа.
- Много високо усилване обезпечено от вградения високоомен резистор Rf = 10 GΩ, включен в обратната връзка на операционния усилвател.
- Ниско ниво на шум. - Високоефективно охлаждане вградено на самия чип с
температурна разлика от 50°C. - Вграден термистор с висока стабилност.
3. Сравнение между ФЕУ и прибора S8785. Основното предназначение на прибора е измерване на
светлинни потоци с много ниска амплитуда. Това се постига благодарение на високата му чувствителност, която е -5.1 V/nW.
Нека да направим едно сравнение между чувствителността на измерване с фотоелектронен умножител и фотодиод. В публикацията “Методи за измерване на ултравиолетови светлинни потоци с много нисък интензитет “ [2], бе пресметнато, какво е изходното напрежение при предположение, че на фотокатода на ФЕУ попадне един фотон. В режим на броене на фотони единичния фотоелектрон, който се емитира от фотокатода има заряд q= 1.6x10⁻¹⁹ [C]. Ако типичното усилването на електронния фотоумножител е μ = 5x10⁶ , тогава анодния изходен заряд се дава от:
(1) ][108105][106.1 13619 CCqQ −− ×=×××=×= µ Ако типичната широчината на изходния импулс на изхода
на фотоелектронния умножител е t=10 ns тогава за пика на изходния ток IP се получава:
(2) ][80][1010][108
9
13
As
Ct
qIp µµ=
××
=×
= −
−
Ако товарното съпротивление или входния импеданс Z на прилежащия усилвател е 50 Ω , то изходния импулс има пиково напрежение :
(3) ][4][50][80][][ mvAZAIpVo =Ω×=Ω×= µµ
Импулсния усилвател след изхода на ФЕУ има усилване от 36 dB или 63 пъти.
(4) VmVmVVout 252.0][25263][4 ==×= От характеристиките на фотодиода виждаме, че той има
чувствителност от 5.1 V / nW, включително вградения операционен усилвател и вградения високоомен резистор.
От друга страна енергията, която пренася един фотон е :
(5) [ ] [ ][ ] eVnm
smJshcE 22.2555
)/10998.2()10626.6( 834
=×××
==−
λ
Или в джаули получаваме:
(6) ][1056.3][10602.122.2 1919 JJeVE −− ×=××=
Ако предположим теоретично, че времето на действие на фотона е същото както на ФЕУ, т.е. 10 nS, то за мощността и изходното напрежение получаваме съответно:
(7) ][0356.0][1056.3][1010
][1056.3 119
19
nWWsJ
tEP =×=
××
== −−
−
А за изходното напрежение:
(8) ][182.0][
][1.5][0356.0 VnWVnWVout =×=
Където 5.1 V/nW e чувствителноста на фотодиода.
Тези изчисления показват, че доколкото стойностите 0.252V, формула (5) и 0.182V, формула (8) кореспондират една с друга, то по отношение на регистрация и усилване на слабите светлинни сигнали специализираните измерителни фотодиоди все повече настигат характеристиките на ФЕУ. Фотодиодите обаче, работят само в аналогов режим и все още не могат да регистрират светлинни потоци в далечния ултравиолетов диапазон, което в случая не е от значение.
Фотодиодите са прибори, които преобразуват директно попадналата светлина в техния p-n преход в електрическа енергия под формата на електрически ток. Много е важно да се знае, че генерирания ток е правопропорционален на количеството светлина попаднала на фотокатода.
Генерирания от фотодиода ток показан на фиг. 1, минава през резистора Rf , преобразува се в напрежение и се усилва от операционния усилвател. Той е с много високо входно съпротивление, гарантирано от полевите транзистори на входа, така че консумацията на ток практически е равна на нула. В самия чип има вграден термоохладител, който ефективно може да намали температурата с 50 ºC и тя да достигне до - 25 ºC При тези ниски температури на охлаждане токът на тъмно силно намалява. Наличието на термистор върху самия чип, дава възможност да се измери температурата на фотодиода. Ако има разлика между текущата температура на фотодиода и зададената, автоматично се включва терморегулатора, който охлажда чипа до необходимата температура. Това на практика означава, че ако се зададе работна температура от -25 ºC тя може да се поддържа автоматично до +25 ºC на околната среда.
4. По-важни електрически и оптически характеристики на прибора S8785.
4.1 Максимални характеристики. Те са показани в табл. 1.
50
Табл. 1 Максимални характеристики.
4.2 Типични характеристики.
Те са измерени при Vcc=±15V, Rl = 1MΩ и са показани в табл. 2.
Табл. 2 Типични характеристики.
4.3 Спектрална характеристика.
Спектралната характеристика на прибора е показана на фиг. 2. Тя показва, че чувствителността на фотодиода е в диапазона от 200 до 1200 nm.
Фиг. 2 Спектрална характеристика на прибора
.
4.4 Механична конструкция на прибора. Механичната конструкция е показана на фиг. 3
Фиг. 3 Външен изглед на приборите S8785.
5. Електрическа схема на фотометъра за измерване на светлина по метода на хемилуминесценцията.
Електрическата схема на уреда е показана на фиг. 4. Освен прибора S8785 той съдържа още няколко усилвателя.
Изходния сигнал от прибора се усилва допълнително от инвертиращ операционен усилвател ИОУ, показан на фиг. 4. Този усилвател трябва да бъде с високо входно съпротивление, което се явява товар за полезния сигнал. Според техническите изисквания неговата стойност трябва да е по-голяма от 1 MΩ.
Термисторът Term е включен в мостова схема, където се изработва сигнал на грешката между зададената и текущата температура. Този сигнал се усилва от диференциален усилвател ДОУ и се подава към нискочестотен драйвер НЧД. Мощния НЧД подава достатъчно силен ток от порядъка на 0.8[А] за да работи термо охладителя в режим на охлаждане или затопляне в зависимост от околната температура и най-вече от температурата на чипа S8785. Най-често тази температура се поддържа на стойност - 25º C, за да се получи максимално ниска величина на тока на тъмно. При тези ниски стойности на температурата тока на тъмно е от порядъка на няколко пикоампера, а полезния сигнал е от порядъка на стотици пикоампери, което осигурява много добро съотношение между сигнал и шум.
Фиг.4 Електрическа схема на уреда
51

6. Заключение. Основно качество на уреда е, че в неговата конструкция е
използван съвременен фотодиод специализиран за измервателни приложения. Тези фотодиоди притежават висока чувствителност, широка спектрална характеристика, много добра линейност, нисък ток на тъмно, висока квантова ефективност и непретенциозно захранване. По този начин уреда става компактен, с малки размери здрав корпус и годен за мобилни приложения.
Литература: 1. H A M A M A T S U “Measuring silicon photodiodes with
preamplifier and TE-cooler” http://www.hamamatsu.com/resources/pdf/ssd/s9295_series_ks
pd1064e02.pdf 2. T a s h e v V., M a n e v A. Методи за измерване на
ултравиолетови светлинни потоци с много нисък интензитет “
52
PROSPECTS FOR THE DEVELOPMENT OF IMPORTED FOREST MACHINES MAINTENANCE IN THE RUSSIAN FEDERATION
ПЕРСПЕКТИВЫ РАЗВИТИЯ ТЕХНИЧЕСКОГО СЕРВИСА ЗАРУБЕЖНОЙ ЛЕСОЗАГОТОВИТЕЛЬНОЙ
ТЕХНИКИ В РОССИИ
Prof. Dr. Eng. Shilovsky V.1, Prof. Dr. Eng. Pitukhin A.1, Ass. prof. Dr. Eng. Kostyukevich V.1 Institute of Forestry, Engineering and Building Sciences 1, – Petrozavodsk State University, Russia
Abstract: The article considers the issues of imported forest machines maintenance technology and knowledge management in the North-West of the Russian Federation. The paper proposes a structure of technological instruction to restore parts by welding and building up. Basic requirements for the work-site arrangement are formulated. Theoretical statements are accompanied by calculated reliability assessment of forest machines. The assessment is based on the research of details durability of forest machinery John Deere 1010 and 1410. The research was carried out for four years and included 16 forest machines. The main objects of the research were details of processing equipment (manipulator), hydraulic system, and engine fuel system of forwarder John Deere 1010 D. The efficiency criteria of multicomponent reserve delivery of spare parts and consumables are formulated.
KEYWORDS: MAINTENANCE PERFORMANCE, REPAIR INSTRUCTIONS, SPARE PARTS SUPPLY
1. Introduction
Development of maintenance management of imported forest machines (FM) operating in Russia, can be considered at the general management level and at the unit level of a maintenance enterprise (Shilovsky, 2001, 2005, 2012).
Maintenance performance policy of forest machines manufacturers is one of the effective tools for expanding the market, because every consumer is interested in cost-effective operation of the purchased equipment. Manufacturers expand the market of their machinery sales and also receive additional income from organizing corporate maintenance. Sometimes this income exceeds the income from the sale of machinery. Corporate maintenance of machinery, i.e. on-site maintenance and repair of equipment, organized by the manufacturer, has an advantage over the organization of repair and maintenance of machines by independent dealer services and requires development and perfection. Corporate maintenance and repair can establish a direct link between the consumer and the manufacturer; help to get information about the machines reliability, the causes of failures as the fault of the manufacturer and the consumer, and to take quick measures to eliminate them. Therefore the main issue is to develop and implement technological instructions to eliminate the failures occurred. The most valuable part of these instructions should be the technology of the failed FM parts, units and aggregates repair, which can be competently developed only by the manufacturer.
The need for such technical documents certainly exists. Consumers and organizations involved in machines and equipment repairing are extremely interested in their speedy development. There are cases when for the elimination of cracks which appeared in the processing FM equipment, the consumer is forced to turn to specialized services to perform chemical analysis of the failed metal construction material to conduct effective welding of cracks with the right electrodes and in the right mode [1, 5].
Indeed, the manufacturer gets more profit selling a greater number of spare parts, even if they can be effectively repaired by the consumer or by specialized repair enterprises. But on the competitive market it is the manufacturer who provides more cost-effective technical operation of the equipment purchased by the consumer who wins eventually.
It is believed that the overhaul of machinery and components is not beneficial for the consumer. This depends on the remanufactured components life time and repair costs. The calculations applied to agricultural machinery show that if the cost of repair is not more than 80% of the cost of the new object, with the full recovery of the component, the repair is beneficial to the consumer.
Repair cost depends on the amount of repair production, if it grows then the price decreases. General strategic maintenance management team has to make preliminary estimates of the repair production volume and the cost of a repaired equipment unit and to suggest an optimal variant of repair volume and the cost of repaired equipment.
One of the examples of the strategic management team’s efforts can be a standard technological instruction of parts’ operable state restoration, which can serve as the basis for an operating technological instruction of specific details restoration. A standard instruction presents a list of regulations which are specified in operating instructions. For example, a technological instruction of parts restoration by welding and welding with flux-cored wires includes:
I. General regulations and a description of the process; II. The materials used; III. The influence of welding parameters on the configuration
of the weld; IV. Preparation of welded joints; V. Choice of welding and surfacing; VI. Features of a semi-automatic welding; VII. The equipment for welding and surfacing; VIII. The organization of the workplace; IX. Defects and quality control of welded joints; X. Safety; XI. Fire-prevention measures.
Section "Workplace" plays a special role in technological instructions. Workplace organization is carried out in accordance with the working draft of a workplace, developed on the basis of the provisions of standard project workplace requirements for all types of jobs. The working draft specifies general positions of a standard project for a specific workplace. A standard project of a workplace includes:
I. General. Main rules of the workplace; II. Methods and techniques; III. Maintenance organization; IV. Means for communication between a workplace and
maintenance services; V. Working conditions (lighting, sanitary requirements,
aesthetic requirements, work and rest schedule); VI. Combining of professions, team form of labor
organization.
For example, a working draft of a welder’s workplace (manual arc welding) defines: • The purpose and plan of the workplace; • The layout of workspace;
53
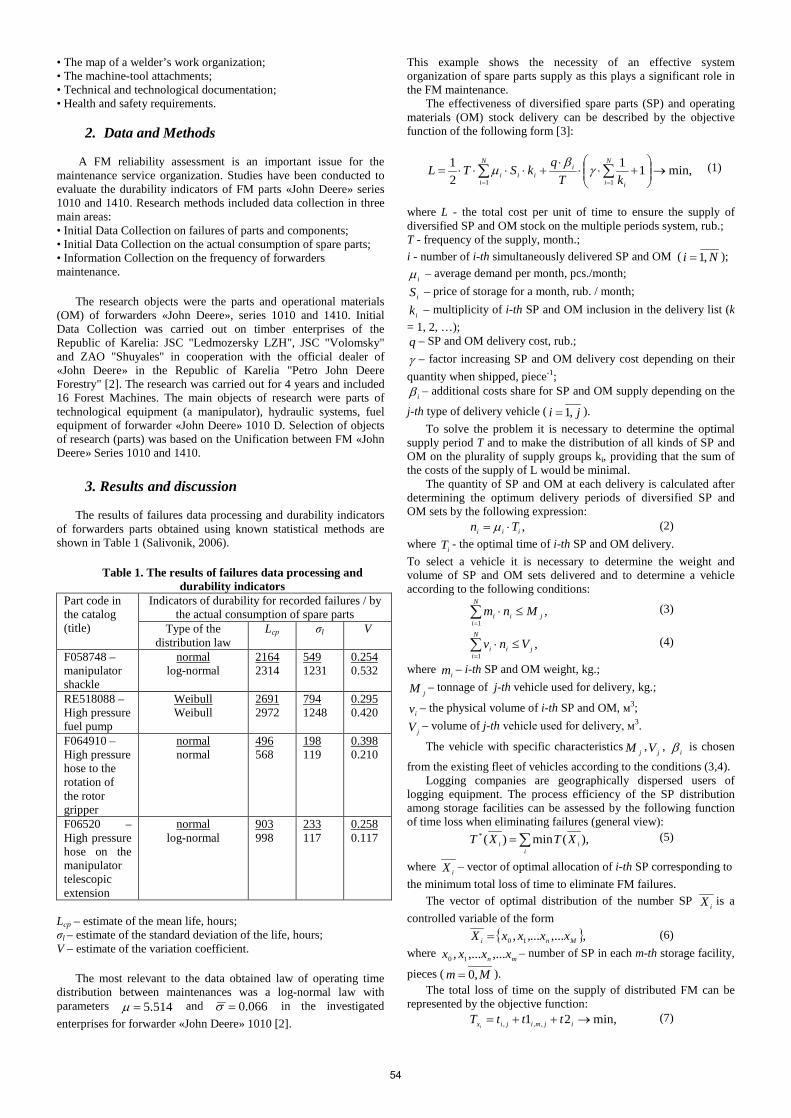
• The map of a welder’s work organization; • The machine-tool attachments; • Technical and technological documentation; • Health and safety requirements.
2. Data and Methods
A FM reliability assessment is an important issue for the
maintenance service organization. Studies have been conducted to evaluate the durability indicators of FM parts «John Deere» series 1010 and 1410. Research methods included data collection in three main areas: • Initial Data Collection on failures of parts and components; • Initial Data Collection on the actual consumption of spare parts; • Information Collection on the frequency of forwarders maintenance.
The research objects were the parts and operational materials (OM) of forwarders «John Deere», series 1010 and 1410. Initial Data Collection was carried out on timber enterprises of the Republic of Karelia: JSC "Ledmozersky LZH", JSC "Volomsky" and ZAO "Shuyales" in cooperation with the official dealer of «John Deere» in the Republic of Karelia "Petro John Deere Forestry" [2]. The research was carried out for 4 years and included 16 Forest Machines. The main objects of research were parts of technological equipment (a manipulator), hydraulic systems, fuel equipment of forwarder «John Deere» 1010 D. Selection of objects of research (parts) was based on the Unification between FM «John Deere» Series 1010 and 1410.
3. Results and discussion
The results of failures data processing and durability indicators of forwarders parts obtained using known statistical methods are shown in Table 1 (Salivonik, 2006).
Table 1. The results of failures data processing and durability indicators
Part code in the catalog (title)
Indicators of durability for recorded failures / by the actual consumption of spare parts
Type of the distribution law
Lср σl V
F058748 – manipulator shackle
normal log-normal
2164 2314
549 1231
0.254 0.532
RE518088 – High pressure fuel pump
Weibull Weibull
2691 2972
794 1248
0.295 0.420
F064910 – High pressure hose to the rotation of the rotor gripper
normal normal
496 568
198 119
0.398 0.210
F06520 – High pressure hose on the manipulator telescopic extension
normal log-normal
903 998
233 117
0.258 0.117
Lср – estimate of the mean life, hours; σl – estimate of the standard deviation of the life, hours; V – estimate of the variation coefficient.
The most relevant to the data obtained law of operating time distribution between maintenances was a log-normal law with parameters 514.5=µ and 066.0=σ in the investigated enterprises for forwarder «John Deere» 1010 [2].
This example shows the necessity of an effective system organization of spare parts supply as this plays a significant role in the FM maintenance.
The effectiveness of diversified spare parts (SP) and operating materials (OM) stock delivery can be described by the objective function of the following form [3]:
min,1121
11→
+⋅⋅
⋅+⋅⋅⋅⋅= ∑∑
==
N
i i
iii
N
ii kT
qkSTL γβ
µ (1)
where L - the total cost per unit of time to ensure the supply of diversified SP and OM stock on the multiple periods system, rub.; T - frequency of the supply, month.; i - number of i-th simultaneously delivered SP and OM ( Ni ,1= );
iµ – average demand per month, pcs./month;
iS – price of storage for a month, rub. / month;
ik – multiplicity of i-th SP and OM inclusion in the delivery list (k = 1, 2, …); q – SP and OM delivery cost, rub.; γ – factor increasing SP and OM delivery cost depending on their quantity when shipped, piece-1;
iβ – additional costs share for SP and OM supply depending on the
j-th type of delivery vehicle ( ji ,1= ). To solve the problem it is necessary to determine the optimal
supply period T and to make the distribution of all kinds of SP and OM on the plurality of supply groups ki, providing that the sum of the costs of the supply of L would be minimal.
The quantity of SP and OM at each delivery is calculated after determining the optimum delivery periods of diversified SP and OM sets by the following expression:
,iii Tn ⋅= µ (2) where iT - the optimal time of i-th SP and OM delivery. To select a vehicle it is necessary to determine the weight and volume of SP and OM sets delivered and to determine a vehicle according to the following conditions:
,1
j
N
iii Mnm ≤⋅∑
=
(3)
,1
j
N
iii Vnv ≤⋅∑
=
(4)
where im – i-th SP and OM weight, kg.;
jM – tonnage of j-th vehicle used for delivery, kg.;
iv – the physical volume of i-th SP and OM, м3;
jV – volume of j-th vehicle used for delivery, м3.
The vehicle with specific characteristicsjM , jV , iβ is chosen
from the existing fleet of vehicles according to the conditions (3,4). Logging companies are geographically dispersed users of
logging equipment. The process efficiency of the SP distribution among storage facilities can be assessed by the following function of time loss when eliminating failures (general view):
),(min)(*i
ii XTXT ∑= (5)
where iX – vector of optimal allocation of i-th SP corresponding to the minimum total loss of time to eliminate FM failures.
The vector of optimal distribution of the number SP iX is a controlled variable of the form
,,......,, 10 Mni xxxxX = (6) where mn xxxx ,...,..., 10 – number of SP in each m-th storage facility,
pieces ( Mm ,0= ). The total loss of time on the supply of distributed FM can be
represented by the objective function: min,21 ,,, →++= ijmijix tttT
i (7)
54

where jit ,– amount of time required for delivery of i-th SP, located
directly on j-th FM operating site, h.; jmit ,,1 - the time required to deliver the necessary i-th SP, located at
the nearest storage facility «m» from the j-th failed FM, h.; it2 - amount of time required for delivery of the i-th SP from an
external source, h. The mathematical model for determining the number of
reserved spare parts in each storage facility “m” is based on discrete-event simulation modeling representing system model development with time and implementing the approach of “time advance from event to event” [5].
4. Conclusions
1. Development of imported FM maintenance in Russia is possible through expansion of corporate maintenance and repair in specialized enterprises, developing and implementing the technology of repair and restoration of FM parts and components.
2. Implementation of a cost-effective operation maintenance system and SP and OM supply chain will expand markets for FM, generate more profit for manufacturers of forest machines and reduce service, maintenance and repair costs for consumers.
3. Organization and development of maintenance marketing and management will improve the competitiveness of FM by satisfying growing demands of consumers.
4. One of the effective tools to improve the competitiveness of FM is to improve their maintainability, that is their constructive adaptability and high-quality maintenance and repair in regular operation conditions.
5. References
1. Pitukhin, A. V., Shilovsky, V.N., Skobtsov, I.G., Kyalvilyaynen, V.A., (2012) ‘Improvement of Forest Machines Maintainability’, Petrozavodsk: PSU, PetroPress, 240 p.
2. Salivonik, A.V. (2006) ‘Improving of forest machines operating efficiency through optimal reservation of spare parts and materials (with specific reference to «John Deere» Forest Machines)’, Abstract of PhD Thesis. Petrozavodsk: PSU, 19 p.
3. Shilovsky, V.N. (2006) ‘Theoretical bases and strategies of marketing and management organization of geographically distributed machines and equipment maintenance’. Monograph. Petrozavodsk: PSU, 2001. 324 p.
4. Shilovsky, V.N., Pitukhin, A.V., Serebryanskiy, N.I., Egipti, A.E. (2005) ‘Technology management of machinery and equipment maintenance’, Textbook. Petrozavodsk: PSU, 2005. 232 p.
5. Shilovsky, V.N. (2012) ‘Marketing and management development of forest machines maintenance’, Textbook. Petrozavodsk: PSU, 2012. 268 p.
55
IMPORTANCE OF TRAFFIC SAFETY AND ENVIRONMENTAL PROTECTION IN SERBIA
Associate prof. Dr Tomić-Petrović N.
Faculty of Transport and Traffic Engineering, University of Belgrade, Serbia
e-mail address: [email protected]
Abstract: This paper is devoted to traffic safety and environmental protection in Serbia. Unfortunately the level of air pollution i.e. the level of emission of carbon dioxide in the world is still raising. Additional actions are needed in order to limit the effect of climate changes in the following years. People ask why electric vehicles aren’t main-stream? It seems that price has a lot to do with it. The Road Traffic Safety Agency with its systematic and responsible activities set clear guidelines for the monitoring and improvement of road safety in Serbia. In the Republic of Serbia from 1981 till 2013 in the traffic accidents 41.718 persons were killed. In the same period 632.936 persons were seriously injured. Republic of Serbia on the 16th of November 2011 began to commemorate the World’s Day of memory on victims in the traffic accidents. Law on road traffic safety came into effect in the Republic of Serbia in 2009. and brought many changes in our legal order. Majority of those changes meant harmonization with European Union regulation in the area of traffic safety. Changes made by the new Law on infractions (“Officaial Gazette of the Republic of Serbia“, no. 65/13) in application from March the 1st 2014. show the increase of penalties for unscrupulous drivers, but drivers complain on to many regulations and difficulties to get documents for motor vehicle use. In this paper there are mentioned the most efficient hybrids we can buy today. In Serbia “FIAT automobiles of Serbia” is still the leading exporter on the list of 15 biggest Serbian exporters, according to the data of the Serbian Ministry of Finances. In April 2015 at New York Auto Show will be possible to see all new accomplishments in auto-moto industry all over the world.
Key words: SAFETY, HYBRID CARS, PROTECTION, ENVIRONMENT, SERBIA.
1. Introduction
Yet in the mid-17 th century appeared the first buses1 that were drawn by horses. The first automobile in Belgrade, capital of Serbia, appeared in year 1901. Today in 21-st century, in 2015 the record sales of the new automobiles in the world, almost 85 million of vehicles is expected. (“Observer”). While “Chevrolet Corvette”, “America’s Sports Car”, build in Kentucky moved into its seventh generation in 20142. A 2015 “Chevrolet Colorado” named the best and it is truck of the year. Nowdays director of Google’s self-driving car project announced that Google plans to test the cars on Northern California roads, first with temporary controls, then without controls, after California law changes to allow it. Nowdays too, we are introducing all new 2015 Mustang. Also all new and updated SUVs coming in 2015, while “Mercedes GLB“: the baby G-wagen is coming in 2019.
There are global expectations that there will be 100 million of vehicles by the year 2019.3 However in the world Jet Taxi also solves the urban transport crush. The French solution for a small city car is “Renault Twingo TCE 90”4. This small city car does not have too much in common with its predecessors and the most recognizable is with the model “Renault 5”. It is significant that the emission of carbon dioxide in this car is 99 gr/per
1 Double-decker, today the symbol of the British capital, appeared for the first time on the streets of Paris two and a half centuries ago. It is interesting that the early sixties of the last century travelers in Belgrade, our capital city, were transported by London buses "lejlend".
2 While the seven-speed manual gearbox is made in Mexico, the new eight-speed automatic is GM design made in Toledo, in Ohio.
3 World car market will grow 3.5% per year, while the highest growth during 2014 is expected in China to 8.8%, while in Europe it will reach 6.4%. Otherwise, in China by 2020, average annual growth in car sales will amount to 5% and 6% in Brazil. (According to a Reuters report, reports Tanjug).
4 French “Renault” with “Daymler” on the platform of “Smart” has made “Twingo” of third generation. The car is functional, nimble, real urban hit with the driving characteristics suitable for the city and will be a great rival to popular models of this class. Also announcements from the "Renault" on racing versions of the car, "Sport" and "Gordini" seems to have not just a publicity stunt.
kilometer, so we can ask the question whether the “Renault EOLAB” is the super-mini for the future? This paper is devoted to traffic safety and environmental protection in Serbia.
2. Traffic Safety in the Republic of Serbia
In the Republic of Serbia from 1981 till 2013 in the traffic accidents 41.718 persons were killed. In the same period 632.936 persons were seriously injured.
Disastrous are the facts that from 2001 to 2012. in Serbia were killed 2.813 pedestrians (there were more than 13.000 seriously injured, while 28.000 pedestrians were slightly injured). Only during the year 2013, 165 pedestrians were killed, and in 2012 there were only 10 dead persons less. Unfortunately, today, pedestrians crossings are very fateful for pedestrians in Serbia.
The Road Traffic Safety Agency of the Republic of Serbia works intensively on the protection of citizens and the results of research conducted so far are the basis for further activities. A great number, 21.914 of examinees were included in the Road Traffic Safety Agency research that brought conclusions that the most risky locations for pedestrians were badly illuminated and marked pedestrian crossings and many streets.
The leading cause of death in children aged 1 to 14 years in Serbia are the injuries to the passengers as the most common, and 43% of children injured in traffic suffers a traumatic brain injury. Unfortunately, 80% of collisions with the victims on the roads happens in inhabited places.
Data show that 59% of people on the front, and only 3% of people in the back seat of the vehicle use safety belts.
In the last 10 years 290 children were killed in the traffic in Republic of Serbia, while as many as 18.000 were injured. The authorities quote that nine children died in traffic accidents the year 2013 .
56

With the aim that no child is killed in Serbia in year 2020, pupils in our schools will learn more on the traffic safety.5 Unfortunatelly, the secondary school pupils receive no tuition on the topic of traffic. Therefore, the newly formed governmental body for coordination of road traffic safety gave the initiative for the introduction of new classes in schools and now the final decision on that will be made by the Ministry of Education, because there is a need for change in teaching program, as well as the preparation of the textbooks and polygons for education of pupils. We believe that the new contents will be available in the Serbian schools from September 2015.
The results of the research conducted by the Ministry of Sport and Youth show that most pupils in secondary schools have up to 5 hours of leisure time daily. All of them would like to go to driving-schools, but mastering driving skills is as expensive as learning a foreign language.
The Road Traffic Safety Agency with its systematic and responsible activities set clear guidelines for the monitoring and improvement of road safety in Serbia.
Republic of Serbia on the 16th of November 2011 began to commemorate the World’s Day of memory on victims in the traffic accidents.6
Law on road traffic safety (“Official Gazette RS“, no. 41/09, 53/10, 101/11) came into effect in the Republic of Serbia in 2009. and brought many changes in our legal order. Majority of those changes meant harmonization with European Union regulation in the area of traffic safety. Changes made by the new Law on infractions (“Officaial Gazette of the Republic of Serbia“, no. 65/13) in application from March the 1st 2014. show the increase of penalties for unscrupulous drivers, but drivers complain on to many regulations and difficulties to get documents for motor vehicle use.
3. Actual eco-trends in Serbia and in the world
During 2014 “FIAT automobiles of Serbia”7 was still the leading exporter on the list of 15 biggest Serbian exporters, according to the data of the Serbian Ministry of Finances. In the first eight months of this year it exported cars for 947, 2 million euros. "Big Fića"8 is not giving up, and in 2013 in Kragujevac it was produced 117.000 of "Big Fića" and almost the entire that contingent went to Europe (80%) and United States (20%). However, the production of a more robust model "500-X" is not realized, as the responsible of the group "Fiat-Craysler" decided that this model will be produced in another country, and not in Serbia.
A toll payment per kilometer in Serbia could for about half a year be replaced by vignette, that is labels that allow unlimited use of roads in a given time period (usually seven days, month or year).
For the new, fourth generation "Toyota Yaris"9 it was spent about 85 million euros to redesign more than 1,000 positions
5 See:“Politika“, Society, page 08, 9-th September 2014.
6 Charitable Society “Road Peace“ from Great Britain in 1993. started to commemorate the Day of memory on victims in traffic accidents.
7 “Fiat“ produces 160.000 to 170.000 automobiles per year.
8 Price of car model "500-L "is now about 15,000 euros with the duty of 25%.
9 The maximum speed of this car is 175 kilometers per hour, and carbon dioxide emissions of 123 g / per kilometer.
for this small city car, which is known since its appearance in 1998, as a reliable, high quality and agile and small consumer. We should also mention the car "Toyota Corolla", as well as several versions of small cars "Kia Rio", "Kia Soul" and "Kia Forte", then the car "Mazda 3" (it gets great fuel economy) that isn’t a hybrid or a diesel, then “Hyundai Elantra” and despite these also auto “Subara Impreza”, good car for us and for those who live where the snow often falls.
In April 2015. at New York Auto Show will be possible to see all new accomplishments in auto-moto industry all over the world. Great deals, going fast. So, we have to be in trend. For example, Dodge was iconic car of the last century. But “Dodge Grand Caravan“ and “Ford SVT Raptor“ won’t be around for 2015, either, they’re likely to come back for the 2016 model year. “Chevrolet“ mild hybrids will be a thing of past after 2015 too. “Toyota FJ cruiser“ was going to be a one generation vehicle and in Toyota wanting to focus on fuel cell technology.
It is already 21 years of the “Vauxhall Corsa”-e and of “Ford10 Mondeo”, a “Honda Civic type R Concept” is seen (and new “Honda” HR-V SUV) at the 2014 Paris Motor Show too, while “Mazda M-X 5“ of the fourth generation 11 was real hit at Paris Motor Show. We have to write down about the remarkable history of the 91 year of “Volvo” too.
At the 2015 Detroit Auto Show there were different models, from eco cars of the future to bonkers pick-up trucks. In the meantime the 2015 New York Auto Show was held in April and 2015 Chicago Auto Show too.
People ask why electric vehicles aren’t main-stream? I think that price has a lot to do with it.
Although at the Paris Motor Show in 2014 were presented 83 mpg “Porsche Cayenne S E Hybrid“ set /especially prepared for Paris 2014/, and “Mercedes AMG GT“ edition first leaked ahead of Paris, Lamborghini’s new 200 mph hybrid, new Volkswagen Passat and roofless “Ferrari 458 Speciale A“ unleashed too, always being sought “Alfa Romeo Giullieta“ right now "dragon" in the Italian style “1,4 tb 170 ks –potenca“, this is the type of Eu 5, with a six-speed manual transmission, reservoir with a maximum of 60 liters and developing maximum speed of 218 kilometers / per hour.
In Germany still in 2012, a conference was held with representatives of the "Platform for Electric Mobility" in charge to evaluate and coordinate the German strategy for electric vehicles. Will the planned target of one million electric cars on the roads of Germany until the 2020s be achieved? This is a complex task that requires the cooperation of the automobile constructors, battery manufacturers, subcontractors and other actors in the production chain. Previously, we could not imagine "BMW" with the three-cylinder engine, and with front-wheel drive, but now when the future began, now, "BMW and 8", with three-cylinder engine under the hood, if necessary, will have the help of an electric motor.
The most efficient hybrids you can buy today are:
- “BMW i 3“ city car is an all electric vehicle; - “Volkswagen Jetta Hybrid“ – 45 MPGE. The Jetta
Diesel has made significant fuel economy improvements for the 2015. model year;
10 In “Ford” says “working very hard” on F-150 Hybrid.
11 Officially, according to the Guinness Book of Records it is the best-selling sports two-seater of all times. It is scheduled for market only for 2015, and it has been announced, so far unthinkable, installation of diesel generators.
57
- “Toyota Prius“ plug in - 95 MPGE, “Toyota Prius C“ – 50 MPGE, Toyota’s baby hybrid. The Prius has come a long way since its US introduction in 2000;
- “Ford Fusion Energi / C“ – Max Energi – 88 MPGE; - “Chevrolet Volt“ – 98 MPGE; - “Honda Accord Hybrid“- 47 MPG, “Honda Accord
plug in -115 MPGE achieves the highest fuel economy, drivers are able to travel a total of 570 miles before filling or charging up. “Honda Civic Hybrid“- 45 MPG, still remains one of the more efficient hybrids on the market, besting the “Ford Fusion Hybrid“, “Toyota Carmy Hybrid“, “Kia Optima Hybrid“, and even „Lincoln MKZ Hybrid“. Also we can mentioned “Toyota Avalon“ the hybrid’s 2,5-liter four cylinder with an electric motor. And at least the “Tesla Model S“ that is a great four-door luxury sporty car that happens to be electric, with its optional 85 kWh battery, that can travel between 180 and 225 miles per charge.
Among green cars we can mention too Bradley GT II Electric, Nissan leaf, Toyota RAV4 EV and a Fisker Karma too.
At the 2015 Detroit Motor Show i.e. North American International Auto Show are shown in eco cars of the future. For example, “Acura NSX“ uses a new twin-turbocharged hybrid powertrain and also “Volkswagen Cross Coupe GTE Concept“ with the four-wheel drive plug-in hybrid. Really they were eco-warriors, beacuse Detroit has everything. Although, “Chevrolet-s mild hybrids“ will be a thing of past after 2015. So, .....putting an end to all “Chevrolet mild hybrids.“
4. Conclusion
We should remind on duties and constant care for the environment we live in. Unfortunately the level of air pollution i.e. the level of emission of carbon dioxide in the world is still raising. Additional actions are needed in order to limit the effect of climate changes in the following years. Earth Day is an annual global event that occurs every April 22-nd, and this year 2015 it passed in the sign of the struggle against pollution and climate changes. In this paper there are mentioned the most efficient hybrids we can buy today, eco-conscious cars and in that way show support for the environment.
“Volkswagen Golf“ is 2015 North American Car of the year and in April 2015, at New York Auto Show it was possible to see all new trends in auto-motor industry all over the world.
In the Constitution of the Republic of Serbia from year 2006 it is predicted that Republic of Serbia regulates and provides for sustainable development12 and Council for sutainable development was established by Decision on establishing of Council for sutainable development as expert and advisory body of the Government of Republic of Serbia.
The fifth part of the National Strategy of sustainable development13 is dedicated to the issues of environmental protection and preservation of natural resources in the Republic of Serbia, as well as to the impacts of economic development on the environment. In that part the aims, measures and priorities connected with protection of natural resources (air, water, land,
12 See: article 97. of the Constitution of the Republic of Serbia, “Official Gazette RS“, no. 98/2006.
13 Official Gazette of RS", no. 57/2008.
biodiversity, forests, mineral resources and renewable energy sources), protection from different factors of risk effects for the environment (climate changes and damage of ozone layer, waste, chemicals, accidents, ionizing and non- ionizing radiation, noise and natural disasters), protection from factors of risk for the environment effect in different economic sectors (industry, mining, energetic, agriculture, forestry, hunting and fishing, transportation and tourism), are given as well as introduction of cleaner production.
It is neccessary to stress in media and inform wider public on the importance of environmental aspects of traffic taking into consideration the well known fact how much cars reduce air quality by emission of harmful gases.
During 2011. the Ministry of Environment, Mining and Space Planning allowed the subvention for purchasing hybrid cars in our country. As the final result all cars with emission of carbon dioxide less than 100 g per kilometer ran will have certain privileges i.e. there will be additional benefits for all those who drive “green“ cars. Owners of the ecologically “suitable“ cars get ECO Friendly licence in the form of certificate on the occasion of vechicle purchasing. In Serbia all owners of cars with CO2 emission less than 100 g per kilometer ran will enjoy certain privileges, like more favorable insurance package, provision of free parking, more favorable conditions of financing. However, they are not exempted from customs duties, as it was announced.
Increase of vehicles using natural gas happened because of economic benefit for consumers, but they were certainly urged also by ecological interests. It is very important that the number of “green“ vehicles constantly increases.
5. References
1. Autosjedalica uvijek i bez iznimke, Roda, Roditelji u akciji, Nacionalni program sigurnosti cestovnog prometa, 5. dopunjeno i prošireno izdanje, Zagreb, 2014.
2. Law on infractions, “Officaial Gazette of the Republic of Serbia“, no. 65/13.
3. Law on Road Traffic Safety, “Official Gazette RS“, no. 41/09, 53/10, 101/11.
4. National Strategy of sustainable development, "Official Gazette of RS", no. 57/2008.
5. Overview of project methods for monitoring of the traffic safety indicators and their importance for the strategic traffic safety management, Republic of Serbia, Road Traffic Safety Agency, February 2014.
6. N.Tomić-Petrović, ”New trends in environmental safety in Serbia“, “trans&MOTOAUTO ’13“, “International virtual journal for science, technics and innovations for the industry, MTM – Machines, technologies, materials“, year VII, Issue 4/2013, ISSN 1313-0226, published by Scientific Technical Union of Mechanical Engineering, page 21-23.
58
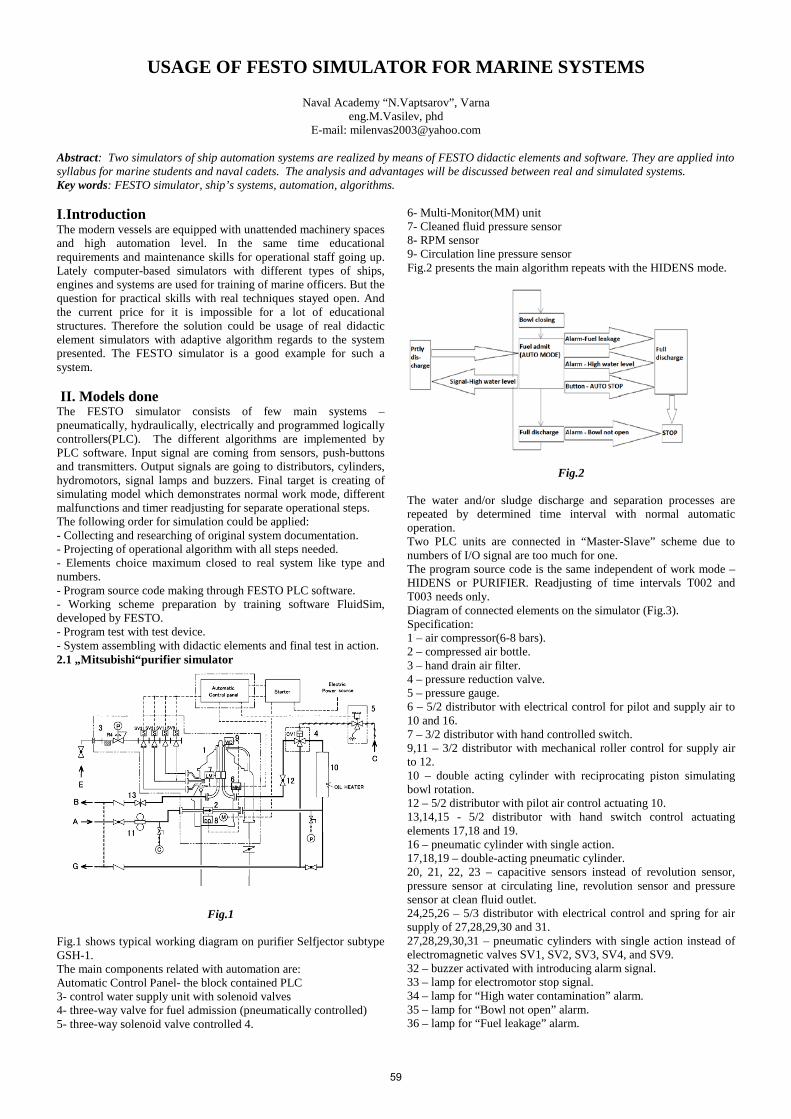
USAGE OF FESTO SIMULATOR FOR MARINE SYSTEMS
Naval Academy “N.Vaptsarov”, Varna eng.M.Vasilev, phd
Е-mail: [email protected]
Abstract: Two simulators of ship automation systems are realized by means of FESTO didactic elements and software. They are applied into syllabus for marine students and naval cadets. The analysis and advantages will be discussed between real and simulated systems. Key words: FESTO simulator, ship’s systems, automation, algorithms. I.Introduction The modern vessels are equipped with unattended machinery spaces and high automation level. In the same time educational requirements and maintenance skills for operational staff going up. Lately computer-based simulators with different types of ships, engines and systems are used for training of marine officers. But the question for practical skills with real techniques stayed open. And the current price for it is impossible for a lot of educational structures. Therefore the solution could be usage of real didactic element simulators with adaptive algorithm regards to the system presented. The FESTO simulator is a good example for such a system. II. Models done The FESTO simulator consists of few main systems – pneumatically, hydraulically, electrically and programmed logically controllers(PLC). The different algorithms are implemented by PLC software. Input signal are coming from sensors, push-buttons and transmitters. Output signals are going to distributors, cylinders, hydromotors, signal lamps and buzzers. Final target is creating of simulating model which demonstrates normal work mode, different malfunctions and timer readjusting for separate operational steps. The following order for simulation could be applied: - Collecting and researching of original system documentation. - Projecting of operational algorithm with all steps needed. - Elements choice maximum closed to real system like type and numbers. - Program source code making through FESTO PLC software. - Working scheme preparation by training software FluidSim, developed by FESTO. - Program test with test device. - System assembling with didactic elements and final test in action. 2.1 „Mitsubishi“purifier simulator
Fig.1
Fig.1 shows typical working diagram on purifier Selfjector subtype GSH-1. The main components related with automation are: Automatic Control Panel- the block contained PLC 3- control water supply unit with solenoid valves 4- three-way valve for fuel admission (pneumatically controlled) 5- three-way solenoid valve controlled 4.
6- Multi-Monitor(ММ) unit 7- Cleaned fluid pressure sensor 8- RPM sensor 9- Circulation line pressure sensor Fig.2 presents the main algorithm repeats with the HIDENS mode.
Fig.2 The water and/or sludge discharge and separation processes are repeated by determined time interval with normal automatic operation. Two PLC units are connected in “Master-Slave” scheme due to numbers of I/O signal are too much for one. The program source code is the same independent of work mode – HIDENS or PURIFIER. Readjusting of time intervals Т002 and Т003 needs only. Diagram of connected elements on the simulator (Fig.3). Specification: 1 – air compressor(6-8 bars). 2 – compressed air bottle. 3 – hand drain air filter. 4 – pressure reduction valve. 5 – pressure gauge. 6 – 5/2 distributor with electrical control for pilot and supply air to 10 and 16. 7 – 3/2 distributor with hand controlled switch. 9,11 – 3/2 distributor with mechanical roller control for supply air to 12. 10 – double acting cylinder with reciprocating piston simulating bowl rotation. 12 – 5/2 distributor with pilot air control actuating 10. 13,14,15 - 5/2 distributor with hand switch control actuating elements 17,18 and 19. 16 – pneumatic cylinder with single action. 17,18,19 – double-acting pneumatic cylinder. 20, 21, 22, 23 – capacitive sensors instead of revolution sensor, pressure sensor at circulating line, revolution sensor and pressure sensor at clean fluid outlet. 24,25,26 – 5/3 distributor with electrical control and spring for air supply of 27,28,29,30 and 31. 27,28,29,30,31 – pneumatic cylinders with single action instead of electromagnetic valves SV1, SV2, SV3, SV4, and SV9. 32 – buzzer activated with introducing alarm signal. 33 – lamp for electromotor stop signal. 34 – lamp for “High water contamination” alarm. 35 – lamp for “Bowl not open” alarm. 36 – lamp for “Fuel leakage” alarm.
59
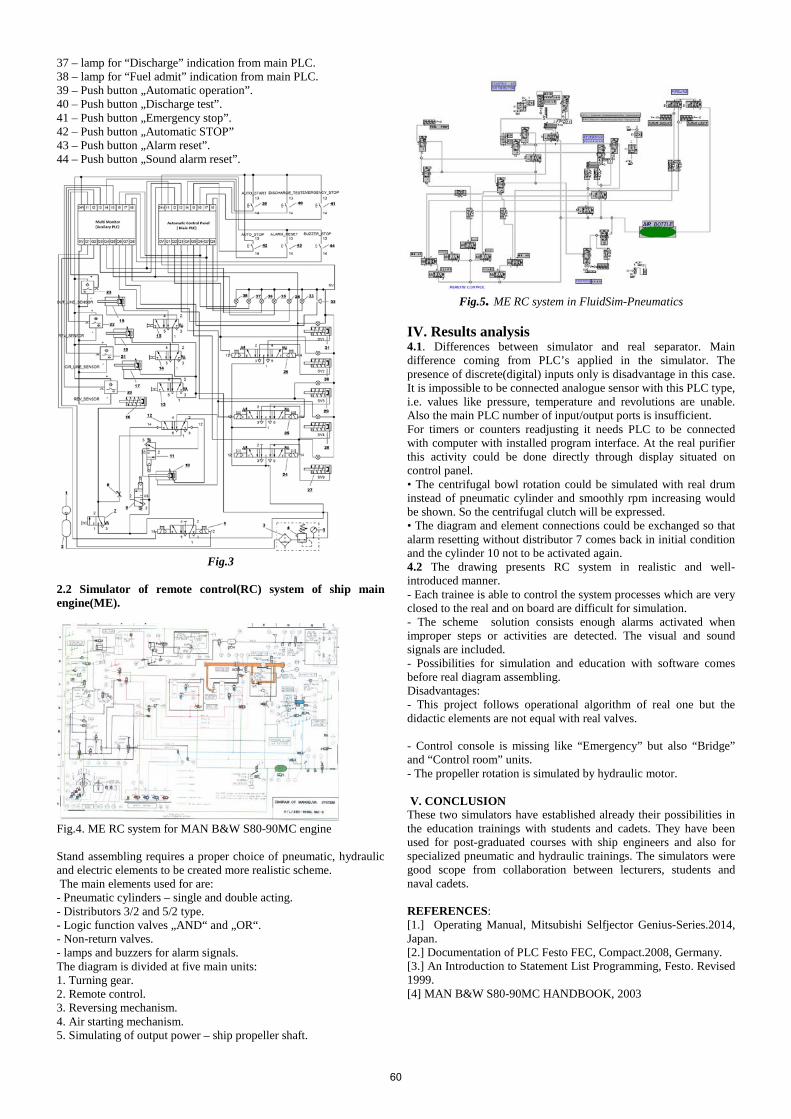
37 – lamp for “Discharge” indication from main PLC. 38 – lamp for “Fuel admit” indication from main PLC. 39 – Push button „Automatic operation”. 40 – Push button „Discharge test”. 41 – Push button „Emergency stop”. 42 – Push button „Automatic STOP” 43 – Push button „Alarm reset”. 44 – Push button „Sound alarm reset”.
Fig.3
2.2 Simulator of remote control(RC) system of ship main engine(ME).
Fig.4. ME RC system for MAN B&W S80-90MC engine Stand assembling requires a proper choice of pneumatic, hydraulic and electric elements to be created more realistic scheme. The main elements used for are: - Pneumatic cylinders – single and double acting. - Distributors 3/2 and 5/2 type. - Logic function valves „AND“ and „OR“. - Non-return valves. - lamps and buzzers for alarm signals. The diagram is divided at five main units: 1. Turning gear. 2. Remote control. 3. Reversing mechanism. 4. Air starting mechanism. 5. Simulating of output power – ship propeller shaft.
Fig.5. ME RC system in FluidSim-Pneumatics
IV. Results analysis 4.1. Differences between simulator and real separator. Main difference coming from PLC’s applied in the simulator. The presence of discrete(digital) inputs only is disadvantage in this case. It is impossible to be connected analogue sensor with this PLC type, i.e. values like pressure, temperature and revolutions are unable. Also the main PLC number of input/output ports is insufficient. For timers or counters readjusting it needs PLC to be connected with computer with installed program interface. At the real purifier this activity could be done directly through display situated on control panel. • The centrifugal bowl rotation could be simulated with real drum instead of pneumatic cylinder and smoothly rpm increasing would be shown. So the centrifugal clutch will be expressed. • The diagram and element connections could be exchanged so that alarm resetting without distributor 7 comes back in initial condition and the cylinder 10 not to be activated again. 4.2 The drawing presents RC system in realistic and well-introduced manner. - Each trainee is able to control the system processes which are very closed to the real and on board are difficult for simulation. - The scheme solution consists enough alarms activated when improper steps or activities are detected. The visual and sound signals are included. - Possibilities for simulation and education with software comes before real diagram assembling. Disadvantages: - This project follows operational algorithm of real one but the didactic elements are not equal with real valves. - Control console is missing like “Emergency” but also “Bridge” and “Control room” units. - The propeller rotation is simulated by hydraulic motor. V. CONCLUSION These two simulators have established already their possibilities in the education trainings with students and cadets. They have been used for post-graduated courses with ship engineers and also for specialized pneumatic and hydraulic trainings. The simulators were good scope from collaboration between lecturers, students and naval cadets. REFERENCES: [1.] Operating Manual, Mitsubishi Selfjector Genius-Series.2014, Japan. [2.] Documentation of PLC Festo FEC, Compact.2008, Germany. [3.] An Introduction to Statement List Programming, Festo. Revised 1999. [4] MAN B&W S80-90MC HANDBOOK, 2003
60
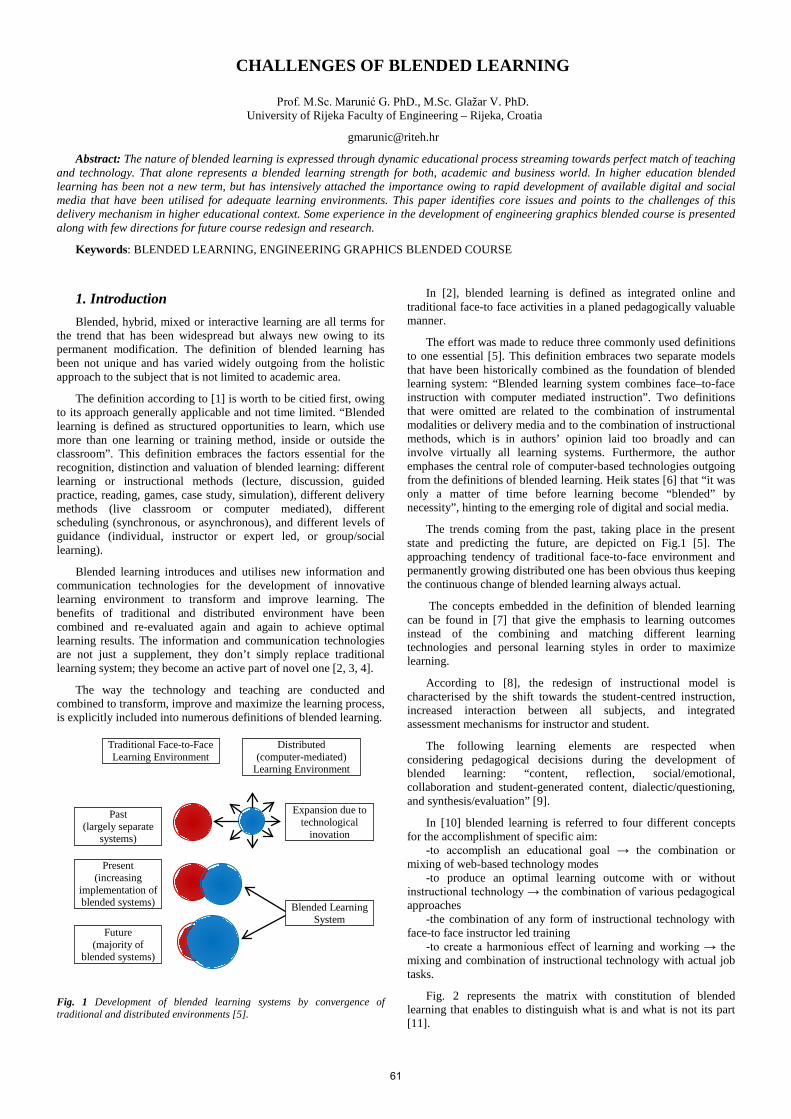
CHALLENGES OF BLENDED LEARNING
Prof. M.Sc. Marunić G. PhD., M.Sc. Glažar V. PhD. University of Rijeka Faculty of Engineering – Rijeka, Croatia
Abstract: The nature of blended learning is expressed through dynamic educational process streaming towards perfect match of teaching and technology. That alone represents a blended learning strength for both, academic and business world. In higher education blended learning has been not a new term, but has intensively attached the importance owing to rapid development of available digital and social media that have been utilised for adequate learning environments. This paper identifies core issues and points to the challenges of this delivery mechanism in higher educational context. Some experience in the development of engineering graphics blended course is presented along with few directions for future course redesign and research.
Keywords: BLENDED LEARNING, ENGINEERING GRAPHICS BLENDED COURSE
1. Introduction Blended, hybrid, mixed or interactive learning are all terms for
the trend that has been widespread but always new owing to its permanent modification. The definition of blended learning has been not unique and has varied widely outgoing from the holistic approach to the subject that is not limited to academic area.
The definition according to [1] is worth to be citied first, owing to its approach generally applicable and not time limited. “Blended learning is defined as structured opportunities to learn, which use more than one learning or training method, inside or outside the classroom”. This definition embraces the factors essential for the recognition, distinction and valuation of blended learning: different learning or instructional methods (lecture, discussion, guided practice, reading, games, case study, simulation), different delivery methods (live classroom or computer mediated), different scheduling (synchronous, or asynchronous), and different levels of guidance (individual, instructor or expert led, or group/social learning).
Blended learning introduces and utilises new information and communication technologies for the development of innovative learning environment to transform and improve learning. The benefits of traditional and distributed environment have been combined and re-evaluated again and again to achieve optimal learning results. The information and communication technologies are not just a supplement, they don’t simply replace traditional learning system; they become an active part of novel one [2, 3, 4].
The way the technology and teaching are conducted and combined to transform, improve and maximize the learning process, is explicitly included into numerous definitions of blended learning.
Fig. 1 Development of blended learning systems by convergence of traditional and distributed environments [5].
In [2], blended learning is defined as integrated online and traditional face-to face activities in a planed pedagogically valuable manner.
The effort was made to reduce three commonly used definitions to one essential [5]. This definition embraces two separate models that have been historically combined as the foundation of blended learning system: “Blended learning system combines face–to-face instruction with computer mediated instruction”. Two definitions that were omitted are related to the combination of instrumental modalities or delivery media and to the combination of instructional methods, which is in authors’ opinion laid too broadly and can involve virtually all learning systems. Furthermore, the author emphases the central role of computer-based technologies outgoing from the definitions of blended learning. Heik states [6] that “it was only a matter of time before learning become “blended” by necessity”, hinting to the emerging role of digital and social media.
The trends coming from the past, taking place in the present state and predicting the future, are depicted on Fig.1 [5]. The approaching tendency of traditional face-to-face environment and permanently growing distributed one has been obvious thus keeping the continuous change of blended learning always actual.
The concepts embedded in the definition of blended learning can be found in [7] that give the emphasis to learning outcomes instead of the combining and matching different learning technologies and personal learning styles in order to maximize learning.
According to [8], the redesign of instructional model is characterised by the shift towards the student-centred instruction, increased interaction between all subjects, and integrated assessment mechanisms for instructor and student.
The following learning elements are respected when considering pedagogical decisions during the development of blended learning: “content, reflection, social/emotional, collaboration and student-generated content, dialectic/questioning, and synthesis/evaluation” [9].
In [10] blended learning is referred to four different concepts for the accomplishment of specific aim:
-to accomplish an educational goal → the combination or mixing of web-based technology modes
-to produce an optimal learning outcome with or without instructional technology → the combination of various pedagogical approaches
-the combination of any form of instructional technology with face-to face instructor led training
-to create a harmonious effect of learning and working → the mixing and combination of instructional technology with actual job tasks.
Fig. 2 represents the matrix with constitution of blended learning that enables to distinguish what is and what is not its part [11].
Traditional Face-to-Face Learning Environment
Distributed (computer-mediated)
Learning Environment
Blended Learning System
Expansion due to technological
inovation
Past (largely separate
systems)
Present (increasing
implementation of blended systems)
Future (majority of
blended systems)
61
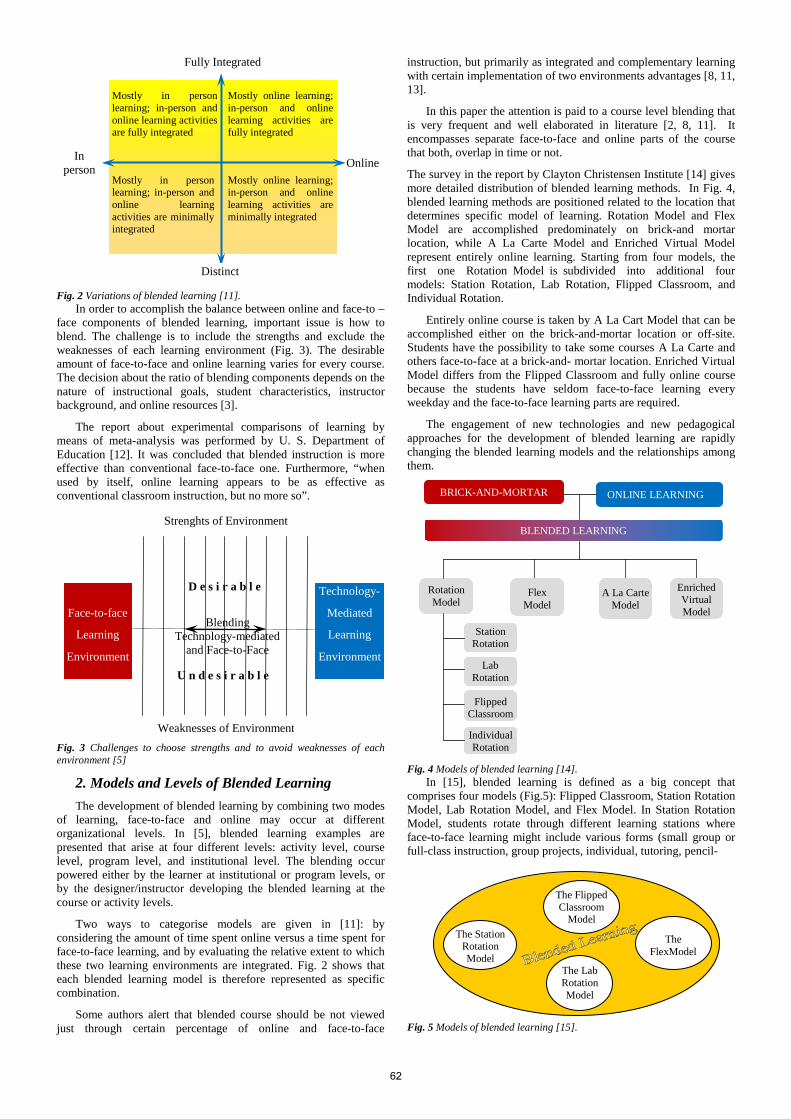
Fig. 2 Variations of blended learning [11]. In order to accomplish the balance between online and face-to –
face components of blended learning, important issue is how to blend. The challenge is to include the strengths and exclude the weaknesses of each learning environment (Fig. 3). The desirable amount of face-to-face and online learning varies for every course. The decision about the ratio of blending components depends on the nature of instructional goals, student characteristics, instructor background, and online resources [3].
The report about experimental comparisons of learning by means of meta-analysis was performed by U. S. Department of Education [12]. It was concluded that blended instruction is more effective than conventional face-to-face one. Furthermore, “when used by itself, online learning appears to be as effective as conventional classroom instruction, but no more so”.
Fig. 3 Challenges to choose strengths and to avoid weaknesses of each environment [5]
2. Models and Levels of Blended Learning
The development of blended learning by combining two modes of learning, face-to-face and online may occur at different organizational levels. In [5], blended learning examples are presented that arise at four different levels: activity level, course level, program level, and institutional level. The blending occur powered either by the learner at institutional or program levels, or by the designer/instructor developing the blended learning at the course or activity levels.
Two ways to categorise models are given in [11]: by considering the amount of time spent online versus a time spent for face-to-face learning, and by evaluating the relative extent to which these two learning environments are integrated. Fig. 2 shows that each blended learning model is therefore represented as specific combination.
Some authors alert that blended course should be not viewed just through certain percentage of online and face-to-face
instruction, but primarily as integrated and complementary learning with certain implementation of two environments advantages [8, 11, 13].
In this paper the attention is paid to a course level blending that is very frequent and well elaborated in literature [2, 8, 11]. It encompasses separate face-to-face and online parts of the course that both, overlap in time or not.
The survey in the report by Clayton Christensen Institute [14] gives more detailed distribution of blended learning methods. In Fig. 4, blended learning methods are positioned related to the location that determines specific model of learning. Rotation Model and Flex Model are accomplished predominately on brick-and mortar location, while A La Carte Model and Enriched Virtual Model represent entirely online learning. Starting from four models, the first one Rotation Model is subdivided into additional four models: Station Rotation, Lab Rotation, Flipped Classroom, and Individual Rotation.
Entirely online course is taken by A La Cart Model that can be accomplished either on the brick-and-mortar location or off-site. Students have the possibility to take some courses A La Carte and others face-to-face at a brick-and- mortar location. Enriched Virtual Model differs from the Flipped Classroom and fully online course because the students have seldom face-to-face learning every weekday and the face-to-face learning parts are required.
The engagement of new technologies and new pedagogical approaches for the development of blended learning are rapidly changing the blended learning models and the relationships among them.
Fig. 4 Models of blended learning [14]. In [15], blended learning is defined as a big concept that
comprises four models (Fig.5): Flipped Classroom, Station Rotation Model, Lab Rotation Model, and Flex Model. In Station Rotation Model, students rotate through different learning stations where face-to-face learning might include various forms (small group or full-class instruction, group projects, individual, tutoring, pencil-
Fig. 5 Models of blended learning [15].
Blending Technology-mediated
and Face-to-Face
U n d e s i r a b l e
D e s i r a b l e
BRICK-AND-MORTAR ONLINE LEARNING
BLENDED LEARNING
Rotation Model
Flex Model
A La Carte Model
Enriched Virtual Model
Station Rotation
Lab Rotation
Flipped Classroom
Individual Rotation
The Station Rotation Model
The Flipped Classroom
Model
The Lab Rotation Model
The FlexModel
Face-to-face
Learning
Environment
Technology-
Mediated
Learning
Environment
Strenghts of Environment
Weaknesses of Environment
Mostly in person learning; in-person and online learning activities are fully integrated
Mostly online learning; in-person and online learning activities are fully integrated
Mostly online learning; in-person and online learning activities are minimally integrated
Mostly in person learning; in-person and online learning activities are minimally integrated
Fully Integrated
Distinct
In person Online
62
and - paper assignments). The definition of Lab Rotation model differs from the previous Online Lab model as students rotate between the classroom and computer lab. The meaning of Flex Model is the same for the citied authors regardless of temporal distance. One of the most implemented and recent blended learning Online Driver model, is widely known as Flipped Classroom Model and the learning method as “flipping” [2, 14]. The students learn online delivered course material at their own pace, and in the classroom the emphasis is given to learning that provides individual help and improves student-lecturer interaction.
3. Blended Learning in Higher Education The challenges of blended learning in higher education are
numerous and their emergence is encouraged permanently based upon the innovative technological developments and interaction through traditional learning environments, which emphasises blended learning transformational force.
For higher education courses blended learning has become the reality characterized by continuous investigation and debates of the benefits, potential and effectiveness to transform and improve the learning process. New, highly interactive, meaningful and student-centred blended learning environments have been developed fostered by the current and advanced technologies. The convergence of traditional face-to-face and distributed learning environment that were sharply separated in the past has been in progress by developing blended learning environment. Different media/method combinations and the needs of different audiences have enabled the approach of face-to-face practiced in a lecturer-centred environment and person-to-person classroom activities, and distance learning system based on self-paced learning.
Numerical indicators cited by the authors, support the fact that blended learning has been embedded through higher education. In 2005 [16], was found that 93% of doctoral programs and 89% of master´s programs, but only 50% of baccalaureate programs offered blended learning classes. In [6], a short section is given considering online course frequency and going from 2003 when roughly 10% students in higher education took an online course, to 2014, when was projected that 50% of all post-secondary students would take at least one class online.
Christensen et al. [17] predicted that by 2019, 50% of all high school courses would be delivered online.
Dzuiban et al. [8] believe that “the transformational nature of blended courses creates complicated interactions among many components of the university similar to those found in the literature regarding complex and social system theories.” The primary changes in the roles and expectations of faculty, students, and administrators are presumed. As regards the student population, the learning environment drastically differs from face-to-face one. The student is forced to approach with more responsibility towards blended courses with continuous and active involvement.
The presented results of research into blended learning in undergraduate studies have considered different methods of teaching and the applied recent technology. In the authors’ opinion [4], the use of new information and communication technologies along with face-to-face learning and the developed new learning environment, demand serious and intensive examination of the effect upon student´s learning. The research was performed in two steps. First step dealt with the effect of involved blended learning on the obtained outcomes that was examined based on the dropout rate and the proportion of exam passes in the considered classes. Secondly, the students´ experience of the process was analysed through three aspects of their perception: the gained benefits, the effect on their learning experience and the derived satisfaction degree. Therefore, two outcome measures were combined, an objective measure regarding the final exam, and a subjective measure expressing perception of the applied blending learning. The conclusion was that the implementation of blended learning
positively effects on both, students’ final course success and positive attitude towards learning.
4. Blended Learning Model of Engineering Graphics Course
At the University of Rijeka Faculty of Engineering, Croatia (afterwards Faculty of Engineering) considerable progress has been obvious in the first decade of this century as regards the acquisition and utilization of recent hardware and software. These intentions and possibilities have been crucial for the development of up-to-date engineering curriculum, as this necessity was recognised earlier but the realisation was limited by the circumstances. The favourable environment coincided with the transformation of studies through the Bologna process and the development of new curricula.
The studies of Mechanical Engineering and Naval Architecture as well as newer study of Computer Engineering at the Faculty of Engineering, all included the course dealing with engineering graphics, although not covered with equal course hours. Until the year 2008 when the curricula according to the Bologna process were implemented, engineering graphics course involved traditional teaching form where the classroom face-to-face teaching was combined with exercises based upon the use of computer and adequate commercial engineering software. The efforts were made primarily to keep this basic hardware and software always up to date, and to include new contents too, in spite of the inability to accordingly redesign the course.
Along with available resources progress, engineering graphics course redesign has occurred going towards student-centred environment. The changes embraced the method and media for delivery followed by adequate modification of course content and starting from the course goals/objectives consistent with Blooom´s taxonomy.
The course management system MudRI [18] was adopted at the University level that allows certain course designer to choose the range of possibilities offered by the system that best corresponds to the course nature and objectives.
The students approach the system by the allotted electronic identity [19] and the corresponding course password. A blended learning sequence consists of face-to-face lectures and laboratory exercises complemented by available on line resources that are not limited to the course management system.
Through the course management system students can access to general information about the course, the course content, and the additional text guides and examples related to the assignments and all forms of assessment (home works, projects, final exam). The created environment with the course content on-line gives the opportunity to make insight into the content that will be the coming one through face-to-face learning, and enables the self-paced learning. A certain content regarding the development of engineering graphics documentation is completely delivered on line and removed from the classroom.
The final student’s scores cover the results of different assessment forms that are performed during the semester (attendance and activities at lecture and laboratory classes, homework, projects) and the exam at the end of semester.
The course management system has considerably improved the communication and the interaction velocity relating both, lecturer-student(s) and student(s)-student(s), by means of forum and/or e-mail.
As engineering graphics courses run through the first year of study that is characterised by high student numbers, a blended course facilitates the delivery of course material and improves the communication. In the same time huge student population requires an extra effort to adopt proper ratio of face-to-face and on line instruction through the course management system in order to develop balanced and effective blended course.
The intended future efforts would be small steps in the course redesign firstly towards more effective communication and interaction based upon the increase of on line instruction and
63
possibility for more face-to-face activities, and secondly the implementation of emerging technology possibilities. In [5] some of complementary strengths and weaknesses are separated that impact class discussions as mostly used instructional method. As the strengths of computer mediated environment, the flexibility regarding the time and place, the possibility of 100% participation and depth of reflection are mentioned, versus human connection and spontaneity of class discussions. The absence of spontaneity and human connection are in the same time disadvantages of computer mediated environment, and for face-to-face environment these are the decreased participation and the lack of flexibility.
Some factors of influence are to be more weighted than others that are set without the possibility of intervention and regulation. First of all it is the number of students that are engaged at the courses under consideration and the corresponding number of classes needed. As the courses belong to the first year of study, the question of student’s motivation and the achieved final success is crucial for both, the courses reputation and studies credibility.
Today’s environment is promising for the acquisition and engagement of new technologies that are essential driver for the course redesign which can certainly redraw students attention and improve their motivation. In order to benefit from, the required resources have to be provided.
Another issue that is not less important concerns the reconsidering of course management system possibilities in relation to additional or other ways of student’s assessment.
The intention is to evaluate possible expected improvement of learning efficiency obtained through redesigned blended course by collecting data that concern variety of aspects.
5. Conclusion The strength of blended learning built in its basic and mostly
used definitions comes out of the combined face-to-face and online teaching methods into one integrated instructional approach.
Numerous benefits of blended learning have been reported based on its possibility to take advantage of certain environment strength and to avoid less effective elements.
Osguthorpe and Graham [3] listed and described six goals that might be expected when developing blended environments: pedagogical richness, access to knowledge, social interaction, personal agency, cost effectiveness and ease of revision.
In [5] three reasons are extracted and elaborated that foster the attractiveness of blended learning spreading: improved pedagogy, increased access/flexibility and increased cost effectiveness.
Many works explicitly indicate the benefits of blended learning, such as: class goals that can be easily met, redesigned courses with easily measured educational outcomes, students can collaborate on their own time, enhanced computer literacy of students and lecturers, temporal independence of student, improved communication, the reduced rates of drop, fail and withdraw.
The achieved benefits of blended learning model and its impact on the learning effectiveness improvement, depend on how are face-to-face and computer mediated instructions blended, i.e. how successfully the peculiarities of actual environment through which blended learning is developed are taken into consideration.
5. Literature [1] Pankin, J., Roberts, J., Savio, M. Blended Learning at MIT,
Blended Learning White Paper sponsored by the MIT Training Alignment Team (TAT), 2012, pp 1-3.
[2] The Definition of Blended Learning, 2013, Available from: http://www.teachthought.com/blended-learning-2/the-definition-of-blended-learning/, Accessed on: 2015-20-03.
[3] Osguthorpe, R.T. & Graham, C.R. Blended Learning Environments Definitions and Directions - The Quarterly Review of Distance Education, Vol. 4(3), 2003, pp 227-233.
[4] Lopez-Perez, M.V., Lopez-Perez, M.C., Rodrigez-Ariza, L. Blended Learning in Higher Education: Students´ Perceptions and Their Relation to Outcomes – Computers & Education, Vol. 56, 2011, pp 818-826.
[5] Bonk, C. J., Graham, C. R., Cross, J., Moore, M. G., in: Handbook of Blended Learning: Global Perspectives, Local Designs, San Francisco, Wiley & Sons, 2005.
[6] Heik, T. 6 Types of Blended Learning, 2012, Available from: http://www.teachthought.com/learning/6-types-of-blended-learning/, Accessed on: 2015-03-20.
[7] Hijazi, S., Crowely, M., Smith, M. L., Shafer, C., in: Proceedings of the 2006 ASCUE Conference, June 11-15, 2006, pp 67-73.
[8] Dzubian, C. D., Hartman, J. L., Moskal, P. D. Blended Learning - EDUCAUSE Review, Vol. 7, 2004, pp 1-12.
[9] Buckley, D. P. In Pursuit of the Learning Paradigm: Coupling Faculty Transformation and Institutional Change - EDUCAUSE Review, Vol.37(1), 2002, pp 29-38.
[10] Driscoll, M. Blended Learning: Let´s Get Beyond the Hype, IBM Global Services, Available from: https://www-07.ibm.com/services/pdf/blended_learning.pdf,
Accessed on: 2015-03-20. [11] Millichap, N. & Vogt, K. 2012, Building Blocks for College
Completition: Blended Learning, Available from: http://net.educause.edu/ir/library/pdf/ng1235.pdf, Accessed on: 2015-03-20.
[12] U.S. Department of Education, Evaluation of Evidence–Based Practices in Online Learning: A Meta-Analysis and Review of Online Learning Studies, 2010, Available from: https://www2.ed.gov/rschstat/eval/tech/evidence-based-practices/finalreport.pdf, Accessed on: 2015-03-20.
[13] Cross, J., in: Handbook of Blended Learning: Global Perspectives, Local Designs, San Francisco, Pfeiffer Publishing, 2006.
[14] Clayton Christensen Institute, Blended Learning Definitions and Models, Available from: http://www.christenseninstitute.org/blended-learning-definitions-and-models/, Accessed on: 2015-03-20.
[15] The Four Important Models of Blended Learning Teachers Should Know about, 2014, Available from: http://www.educatorstechnology.com/2014/04/the-four-important-models-of-blended.html , Accessed on: 2015-03-20.
[16] Arabasz,P.&Baker,M.B. Evolving Campus Support Models for e-Learning Course, Educause Center for Applied Research, 2003, Available from: https://net.educause.edu/ir/library/pdf/EKF/ekf0303.pdf, Accessed on: 2015-03-20.
[17] Christensen, C., Curtis, W. J., Horn, M. B. Disrupting Class, Expanded Edition: How Disruptive Innovation Will Change the Way the World Learns, Mc Graw-Hill, 2010.
[18] University of Rijeka, IT Academy, e-Learning Internet and a Learning Management System (LMS) MudRi (based on free source e-learning software Moodle), 2013, Available from: https://mudri.uniri.hr, Accessed on: 2015-03-20.
[19] Infrastructure of Ministry of Science, Education and Sports of the Republic of Croatia, Available from: http://www.aaiedu.hr/stanje.html, Accessed on:2015-03-20.
64
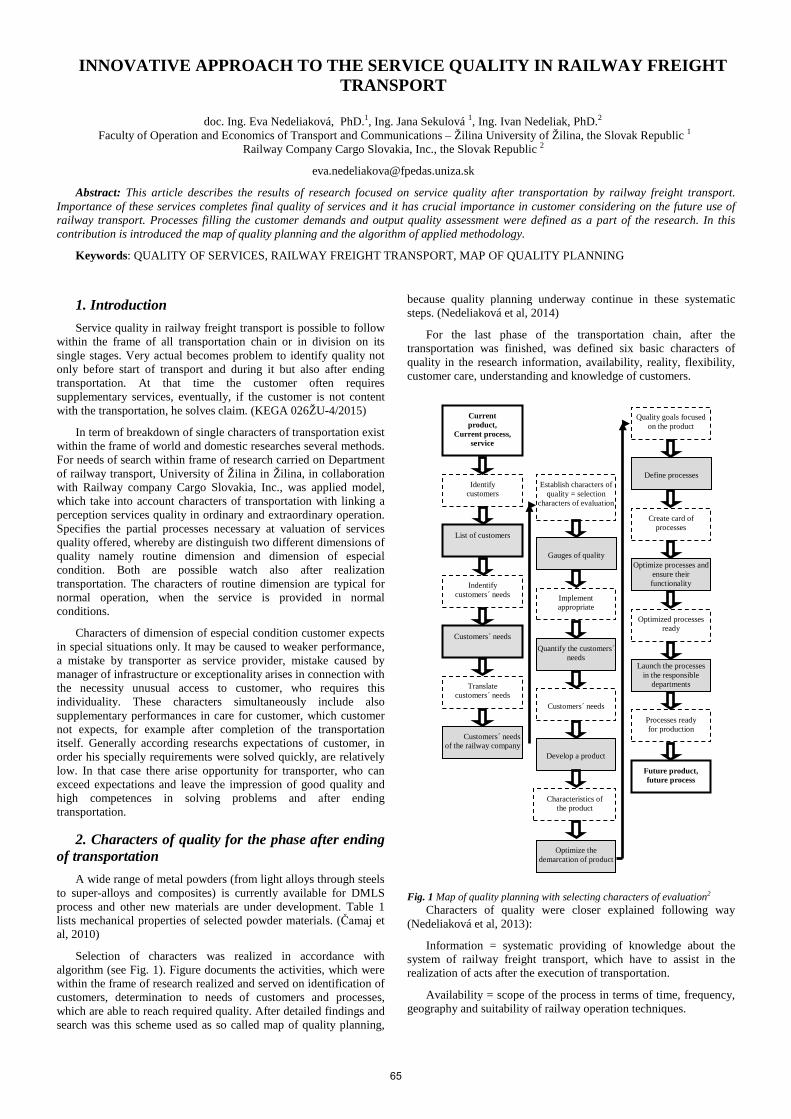
INNOVATIVE APPROACH TO THE SERVICE QUALITY IN RAILWAY FREIGHT TRANSPORT
doc. Ing. Eva Nedeliaková, PhD.1, Ing. Jana Sekulová 1, Ing. Ivan Nedeliak, PhD.2
Faculty of Operation and Economics of Transport and Communications – Žilina University of Žilina, the Slovak Republic 1
Railway Company Cargo Slovakia, Inc., the Slovak Republic 2
Abstract: This article describes the results of research focused on service quality after transportation by railway freight transport. Importance of these services completes final quality of services and it has crucial importance in customer considering on the future use of railway transport. Processes filling the customer demands and output quality assessment were defined as a part of the research. In this contribution is introduced the map of quality planning and the algorithm of applied methodology.
Keywords: QUALITY OF SERVICES, RAILWAY FREIGHT TRANSPORT, MAP OF QUALITY PLANNING
1. Introduction Service quality in railway freight transport is possible to follow
within the frame of all transportation chain or in division on its single stages. Very actual becomes problem to identify quality not only before start of transport and during it but also after ending transportation. At that time the customer often requires supplementary services, eventually, if the customer is not content with the transportation, he solves claim. (KEGA 026ŽU-4/2015)
In term of breakdown of single characters of transportation exist within the frame of world and domestic researches several methods. For needs of search within frame of research carried on Department of railway transport, University of Žilina in Žilina, in collaboration with Railway company Cargo Slovakia, Inc., was applied model, which take into account characters of transportation with linking a perception services quality in ordinary and extraordinary operation. Specifies the partial processes necessary at valuation of services quality offered, whereby are distinguish two different dimensions of quality namely routine dimension and dimension of especial condition. Both are possible watch also after realization transportation. The characters of routine dimension are typical for normal operation, when the service is provided in normal conditions.
Characters of dimension of especial condition customer expects in special situations only. It may be caused to weaker performance, a mistake by transporter as service provider, mistake caused by manager of infrastructure or exceptionality arises in connection with the necessity unusual access to customer, who requires this individuality. These characters simultaneously include also supplementary performances in care for customer, which customer not expects, for example after completion of the transportation itself. Generally according researchs expectations of customer, in order his specially requirements were solved quickly, are relatively low. In that case there arise opportunity for transporter, who can exceed expectations and leave the impression of good quality and high competences in solving problems and after ending transportation.
2. Characters of quality for the phase after ending of transportation
A wide range of metal powders (from light alloys through steels to super-alloys and composites) is currently available for DMLS process and other new materials are under development. Table 1 lists mechanical properties of selected powder materials. (Čamaj et al, 2010)
Selection of characters was realized in accordance with algorithm (see Fig. 1). Figure documents the activities, which were within the frame of research realized and served on identification of customers, determination to needs of customers and processes, which are able to reach required quality. After detailed findings and search was this scheme used as so called map of quality planning,
because quality planning underway continue in these systematic steps. (Nedeliaková et al, 2014)
For the last phase of the transportation chain, after the transportation was finished, was defined six basic characters of quality in the research information, availability, reality, flexibility, customer care, understanding and knowledge of customers.
Fig. 1 Map of quality planning with selecting characters of evaluation2 Characters of quality were closer explained following way
(Nedeliaková et al, 2013):
Information = systematic providing of knowledge about the system of railway freight transport, which have to assist in the realization of acts after the execution of transportation.
Availability = scope of the process in terms of time, frequency, geography and suitability of railway operation techniques.
Quality goals focused on the product
Define processes
Create card of processes
Optimize processes and ensure their functionality
Optimized processes ready
Launch the processes in the responsible
departments
Processes ready for production
Future product, future process
Develop a product
Establish characters of quality = selection
characters of evaluation
Gauges of quality
Implement appropriate
t
Customers´ needs
Quantify the customers´ needs
Characteristics of the product
Optimize the demarcation of product
Current product,
Current process, service
Identify customers
List of customers
Indentify customers´ needs
t
Customers´ needs
Translate customers´ needs
Customers´ needs of the railway company
65
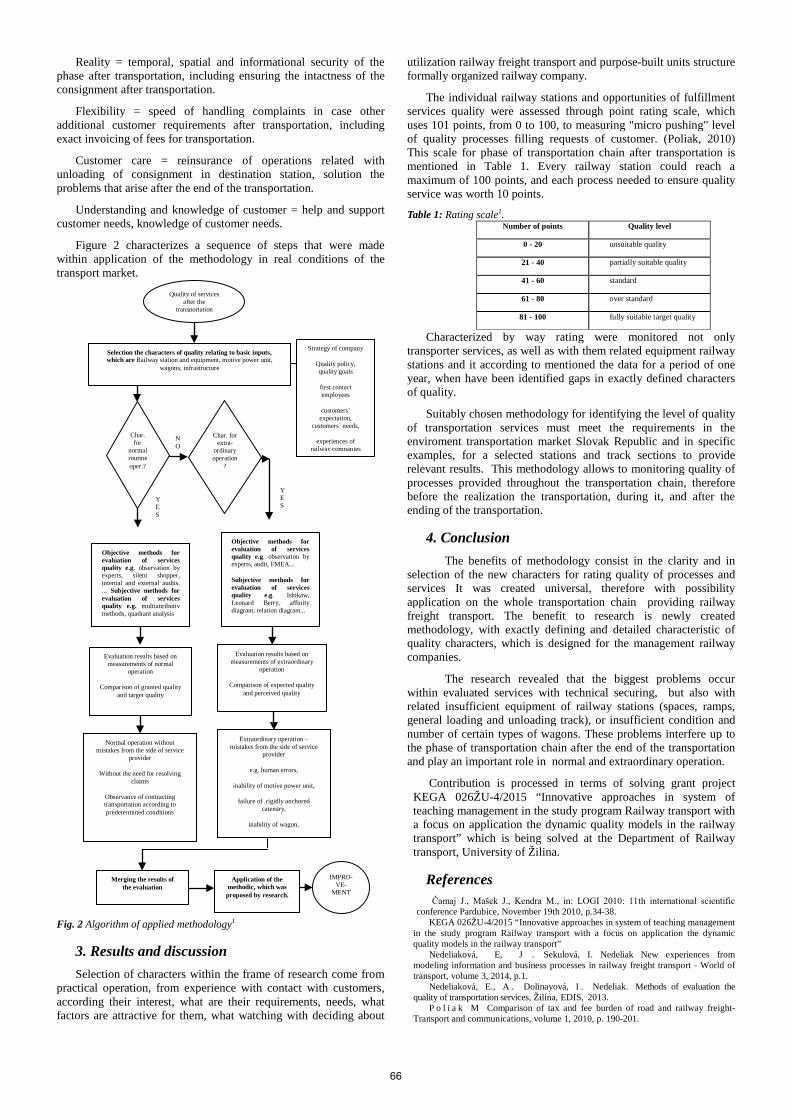
Reality = temporal, spatial and informational security of the phase after transportation, including ensuring the intactness of the consignment after transportation.
Flexibility = speed of handling complaints in case other additional customer requirements after transportation, including exact invoicing of fees for transportation.
Customer care = reinsurance of operations related with unloading of consignment in destination station, solution the problems that arise after the end of the transportation.
Understanding and knowledge of customer = help and support customer needs, knowledge of customer needs.
Figure 2 characterizes a sequence of steps that were made within application of the methodology in real conditions of the transport market.
Fig. 2 Algorithm of applied methodology1
3. Results and discussion Selection of characters within the frame of research come from
practical operation, from experience with contact with customers, according their interest, what are their requirements, needs, what factors are attractive for them, what watching with deciding about
utilization railway freight transport and purpose-built units structure formally organized railway company.
The individual railway stations and opportunities of fulfillment services quality were assessed through point rating scale, which uses 101 points, from 0 to 100, to measuring "micro pushing" level of quality processes filling requests of customer. (Poliak, 2010) This scale for phase of transportation chain after transportation is mentioned in Table 1. Every railway station could reach a maximum of 100 points, and each process needed to ensure quality service was worth 10 points.
Table 1: Rating scale1. Number of points Quality level
0 - 20 unsuitable quality
21 - 40 partially suitable quality
41 - 60 standard
61 - 80 over standard
81 - 100 fully suitable target quality
Characterized by way rating were monitored not only transporter services, as well as with them related equipment railway stations and it according to mentioned the data for a period of one year, when have been identified gaps in exactly defined characters of quality.
Suitably chosen methodology for identifying the level of quality of transportation services must meet the requirements in the enviroment transportation market Slovak Republic and in specific examples, for a selected stations and track sections to provide relevant results. This methodology allows to monitoring quality of processes provided throughout the transportation chain, therefore before the realization the transportation, during it, and after the ending of the transportation.
4. Conclusion The benefits of methodology consist in the clarity and in
selection of the new characters for rating quality of processes and services It was created universal, therefore with possibility application on the whole transportation chain providing railway freight transport. The benefit to research is newly created methodology, with exactly defining and detailed characteristic of quality characters, which is designed for the management railway companies.
The research revealed that the biggest problems occur within evaluated services with technical securing, but also with related insufficient equipment of railway stations (spaces, ramps, general loading and unloading track), or insufficient condition and number of certain types of wagons. These problems interfere up to the phase of transportation chain after the end of the transportation and play an important role in normal and extraordinary operation.
Contribution is processed in terms of solving grant project KEGA 026ŽU-4/2015 “Innovative approaches in system of teaching management in the study program Railway transport with a focus on application the dynamic quality models in the railway transport” which is being solved at the Department of Railway transport, University of Žilina.
References Čamaj J., Mašek J., Kendra M., in: LOGI 2010: 11th international scientific
conference Pardubice, November 19th 2010, p.34-38. KEGA 026ŽU-4/2015 “Innovative approaches in system of teaching management
in the study program Railway transport with a focus on application the dynamic quality models in the railway transport”
Nedeliaková, E, J . Sekulová, I. Nedeliak New experiences from modeling information and business processes in railway freight transport - World of transport, volume 3, 2014, p.1.
Nedeliaková, E., A . Dolinayová, I . Nedeliak. Methods of evaluation the quality of transportation services, Žilina, EDIS, 2013.
P o l i a k M Comparison of tax and fee burden of road and railway freight-Transport and communications, volume 1, 2010, p. 190-201.
Objective methods for evaluation of services quality e.g. observation by experts, silent shopper, internal and external audits, ... Subjective methods for evaluation of services quality e.g. multiattributiv methods, quadrant analysis
Objective methods for evaluation of services quality e.g. observation by experts, audit, FMEA...
Subjective methods for evaluation of services quality e.g. Ishikaw, Leonard Berry, affinity diagram, relation diagram...
Evaluation results based on measurements of normal
operation
Comparison of granted quality and target quality
Evaluation results based on measurements of extraordinary
operation
Comparison of expected quality and perceived quality
Extraordinary operation – mistakes from the side of service
provider
e.g. human errors,
inability of motive power unit,
failure of rigidly anchored catenary,
inability of wagon,
Merging the results of the evaluation
Application of the methodic, which was
proposed by research.
IMPRO-VE-
MENT
Normal operation without mistakes from the side of service
provider
Without the need for resolving claims
Observance of contracting transportation according to predetermined conditions
NO
YES
YES
Quality of services after the
transportation
Char. for
normal routine oper.?
Char. for extra-
ordinary operation
?
Selection the characters of quality relating to basic inputs, which are Railway station and equipment, motive power unit,
wagons, infrastructure
Strategy of company
Quality policy, quality goals
first contact employees
customers´ expectation,
customers´ needs,
experiences of railway companies
66
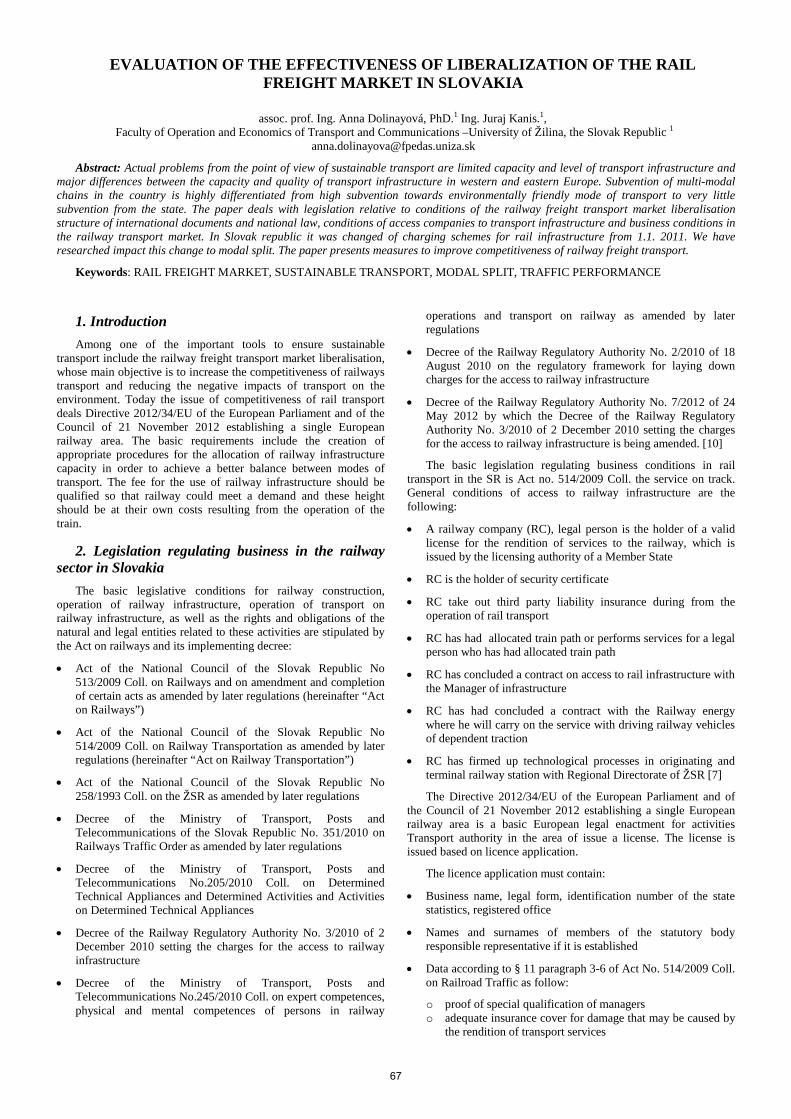
EVALUATION OF THE EFFECTIVENESS OF LIBERALIZATION OF THE RAIL FREIGHT MARKET IN SLOVAKIA
assoc. prof. Ing. Anna Dolinayová, PhD.1 Ing. Juraj Kanis.1,
Faculty of Operation and Economics of Transport and Communications –University of Žilina, the Slovak Republic 1
Abstract: Actual problems from the point of view of sustainable transport are limited capacity and level of transport infrastructure and major differences between the capacity and quality of transport infrastructure in western and eastern Europe. Subvention of multi-modal chains in the country is highly differentiated from high subvention towards environmentally friendly mode of transport to very little subvention from the state. The paper deals with legislation relative to conditions of the railway freight transport market liberalisation structure of international documents and national law, conditions of access companies to transport infrastructure and business conditions in the railway transport market. In Slovak republic it was changed of charging schemes for rail infrastructure from 1.1. 2011. We have researched impact this change to modal split. The paper presents measures to improve competitiveness of railway freight transport.
Keywords: RAIL FREIGHT MARKET, SUSTAINABLE TRANSPORT, MODAL SPLIT, TRAFFIC PERFORMANCE
1. Introduction Among one of the important tools to ensure sustainable
transport include the railway freight transport market liberalisation, whose main objective is to increase the competitiveness of railways transport and reducing the negative impacts of transport on the environment. Today the issue of competitiveness of rail transport deals Directive 2012/34/EU of the European Parliament and of the Council of 21 November 2012 establishing a single European railway area. The basic requirements include the creation of appropriate procedures for the allocation of railway infrastructure capacity in order to achieve a better balance between modes of transport. The fee for the use of railway infrastructure should be qualified so that railway could meet a demand and these height should be at their own costs resulting from the operation of the train.
2. Legislation regulating business in the railway sector in Slovakia
The basic legislative conditions for railway construction, operation of railway infrastructure, operation of transport on railway infrastructure, as well as the rights and obligations of the natural and legal entities related to these activities are stipulated by the Act on railways and its implementing decree:
• Act of the National Council of the Slovak Republic No 513/2009 Coll. on Railways and on amendment and completion of certain acts as amended by later regulations (hereinafter “Act on Railways”)
• Act of the National Council of the Slovak Republic No 514/2009 Coll. on Railway Transportation as amended by later regulations (hereinafter “Act on Railway Transportation”)
• Act of the National Council of the Slovak Republic No 258/1993 Coll. on the ŽSR as amended by later regulations
• Decree of the Ministry of Transport, Posts and Telecommunications of the Slovak Republic No. 351/2010 on Railways Traffic Order as amended by later regulations
• Decree of the Ministry of Transport, Posts and Telecommunications No.205/2010 Coll. on Determined Technical Appliances and Determined Activities and Activities on Determined Technical Appliances
• Decree of the Railway Regulatory Authority No. 3/2010 of 2 December 2010 setting the charges for the access to railway infrastructure
• Decree of the Ministry of Transport, Posts and Telecommunications No.245/2010 Coll. on expert competences, physical and mental competences of persons in railway
operations and transport on railway as amended by later regulations
• Decree of the Railway Regulatory Authority No. 2/2010 of 18 August 2010 on the regulatory framework for laying down charges for the access to railway infrastructure
• Decree of the Railway Regulatory Authority No. 7/2012 of 24 May 2012 by which the Decree of the Railway Regulatory Authority No. 3/2010 of 2 December 2010 setting the charges for the access to railway infrastructure is being amended. [10]
The basic legislation regulating business conditions in rail transport in the SR is Act no. 514/2009 Coll. the service on track. General conditions of access to railway infrastructure are the following:
• A railway company (RC), legal person is the holder of a valid license for the rendition of services to the railway, which is issued by the licensing authority of a Member State
• RC is the holder of security certificate
• RC take out third party liability insurance during from the operation of rail transport
• RC has had allocated train path or performs services for a legal person who has had allocated train path
• RC has concluded a contract on access to rail infrastructure with the Manager of infrastructure
• RC has had concluded a contract with the Railway energy where he will carry on the service with driving railway vehicles of dependent traction
• RC has firmed up technological processes in originating and terminal railway station with Regional Directorate of ŽSR [7]
The Directive 2012/34/EU of the European Parliament and of the Council of 21 November 2012 establishing a single European railway area is a basic European legal enactment for activities Transport authority in the area of issue a license. The license is issued based on licence application.
The licence application must contain:
• Business name, legal form, identification number of the state statistics, registered office
• Names and surnames of members of the statutory body responsible representative if it is established
• Data according to § 11 paragraph 3-6 of Act No. 514/2009 Coll. on Railroad Traffic as follow:
o proof of special qualification of managers o adequate insurance cover for damage that may be caused by
the rendition of transport services
67
o solvability for the rendition of transport services o solvability is checked out annual accounts
• Indication of network or lines where the applicant wishes to provide transport services
• Type and volume of traffic at what applicant ask for licence
• Data on the number and type of operating rail vehicles
• Description transport line and time table [8]
An applicant who meets the requirements of § 11 of the Act on Railroad Traffic has the right to issue licenses. A license to provide rail services granted by the licensing authorities of other EU Member State is valid in the Slovak Republic as well as the license granted by the licensing authority under this Act.
The following table shows number of valid license for freight transport in selected European countries.
Table 1: The number of valid license per country
Country Number of licenses New Amended Suspended Revoked
Germany 58 40 0 19 Poland 57 33 2 30 Czech Republic 46 4 0 1 Hungary 29 6 0 15 Slovak Republic 27 1 0 1 Italy 22 5 0 5 Lithuania 13 1 16 1 Spain 13 6 0 0 Sweden 13 7 0 9 Austria 12 0 0 0
Source: ERADIS
Railway companies have to conclude Contract on the access to the railway infrastructure of ŽSR after obtaining the license. This contract contains the terms and conditions for providing transport services on the railway network.
A railway undertaking, as a legal entity, may operate transport provided the following conditions:
• is a holder of a valid license for transport services on the railway infrastructure, issued by a licensing Member State’s authority,
• path capacity has been allocated to the train operator, or the train operator is providing the transport services for a person, to whom the path capacity was allocated,
• is a holder of a valid safety certificate,
• has concluded a track access agreement with the infrastructure manager,
• for the whole period of transport operation has an insurance for damage liability resulting from transport operation on railway infrastructure,
• has concluded an Agreement with the Railway Power Engineering Centre, if the railway undertaking intends to provide transport operation by vehicles of dependant traction,
• has approved the technological procedures at railway stations, which are the departing and/or terminus station of the train operator’s trains,
• has concluded an Agreement with the infrastructure manager on providing of activities regarding pumping of fuels into railway undertakings’ motive power units in case, that the railway undertaking will operate the transport by motive power units of independent traction. [10]
On the day of launching of providing transport services on railway infrastructure operated on the base of the licence, the
railway undertaking must have a safety certificate. Safety certificate is issued by Transport Authority on the base of railway undertaking request.
3. Comparison of the development of traffic performance on the railway network ZSR
The aim of the liberalization of the rail transport market is to increase the competitiveness of rail transport to road transport. This aim should be to help on change of railway infrastructure charging system, which significantly reduced the charges for the use of railway infrastructure, mainly for through trains. The following figures show a comparison of transport performance in passenger and freight transport on the railway network ZSR. [1-4]
0
5000
10000
15000
20000
25000
30000
35000
40000
2001 2002 2003 2004 2005 2006 2007 2008 2009 2010 2011 2012 2013 2014th
ousa
nd tr
ain.
kmpassenger traffic goods traffic
Fig. 1 Development of traffic performance in train-km
0
5000
10000
15000
20000
25000
30000
2001 2002 2003 2004 2005 2006 2007 2008 2009 2010 2011 2012 2013 2014
gros
s ton
ne-k
m
passenger traffic goods traffic
Fig. 2 Development of traffic performance in gross tone-km
Development of traffic performance of passenger transport in train-km has a steady character since 2003 and varies from 31 to 32 mph. train-km per year. Traffic performance in gross tonne-km also develop equally, a slight decrease in last years is due to the use of electric motor train set eventually diesel motor train set whose net weight is considerably lower than a classic train set.
In goods traffic, there was a continual decrease in traffic performance from 2001 to 2009. We can see in Fig. 1 and Fig. 2 that the traffic performance increased slightly in 2014 compare to 2010.
The main railway freight operator is ZSSK Cargo Slovakia in the Slovak Republic. Its share of transport performance is approximately 80%. The following figures show a comparison of the share of transport operators on the traffic performance. [1-4]
68
0102030405060708090
100
2009 2010 2011 2012 2013 2014
ZSSK Cargo Slovakia other railways companies
Fig. 3 Share of the transport operators on the traffic performance - number of train
0102030405060708090
100
2009 2010 2011 2012 2013 2014
ZSSK Cargo Slovakia other railways companies
Fig. 4 Share of the transport operators on the traffic performance - train-km
Share of state railway operator ZSSK Cargo Slovakia is decreased continually in the rail transport market. While in 2009 the share of ZSSK Cargo was nearly 95% in 2014 was only 80%. At the same time traffic performances of private railway operators increase. The best share of all private railway operators had METRANS Danubia, their share was 4.0 % of the train km and 3.9% of gross tonnes km in 2014. The following table shows comparison the share of train km of top ten railway freight operators.
Table 2: The share of train km of railway freight operators Carrier 2013 2014 ZSSK Cargo Slovakia, a. s. 82.5 % 80.6 % METRANS /DANUBIA/, a. s. 3.6 % 4.0 % CENTRAL RAILWAYS, a. s. 1.9 % 3.0 % Express Group, a. s. 2.0 % 2.6 % Prvá Slovenská železničná, a. s. 2.5 % 2.2 % Railtrans International, s. r. o. 0.4 % 1.5 % PKP CARGO, S. A. 0.3 % 0.3 % LOKORAIL, a. s. 1.9 % 0.7 % LTE Logistik a Transport,, Slovakia, s. r. o. 0.9 % 0.9 % SŽDC, BA 0.7 % 0.9 %
Source: ZSR Increasing the share of private companies in the train
kilometres as well as in the gross tonne kilometres is most often caused by an alteration in percentage distribution (due to a decrease in the share of transport activities ZSSK CARGO Slovakia) and not increasing the volume of goods transported. Nowadays the valid license has 49 railway companies but actually 20 private companies realize traffic in the network of ŽSR.
4. Modal split The main actors in the transport market include freight carriers,
haulers, state and forwarding organizations. Each of the entities located in this market follows its interests. Hauler requires the transport with high quality at a reasonable price, carriers and forwarders organizations require a reasonable profit, the state role of the state is the tendency of sustainable mobility. [9]
The following figures shows the modal split in the Slovak republic. Figure 5 shows the modal split before the full liberalization of the rail freight market. [5, 12]
35%
62%
3%
Railway transport
Road transport
Inland waterwaytransport
Fig. 5 Modal split in freight transport 2001 – 2006
Figure 6 shows the modal split from full liberalization to change of charging system of railway infrastructure. [5, 12]
20%
75%
5%
Railway transport
Road transport
Inland waterwaytransport
Fig. 6 Modal split in freight transport 2007 – 2010
Figure 7 shows the modal split after change of charging system of railway infrastructure. [5, 12]
20%
78%
2%Railway transport
Road transport
Inland waterwaytransport
Fig. 7 Modal split in freight transport 2011 – 2014
Modal split in freight transport is somewhat simplified by some transport may take place only certain types of traffic due to the characteristics of goods and operational and technical characteristics of the department of transport. However, currently dominate the production of such products whose specific characteristics allow transport of various modes of transport and the carrier has a choice by comparing the price and quality. [6]
Modal split in the Slovak Republic is comparable to modal split in the EU. It is characterized by a high proportion of road freight transport and the ever decreasing share of rail freight transport.
69
5. Result and discussion Comparative analysis showed that the liberalization of the
railway market as well as the change of the charging scheme of railway infrastructure in Slovakia has not yet produced the desired effect. Performance of goods rail traffic is volatile downward trend, whereas the average annual decrease since 2001 is more than 3%. In contrast, the performance of road freight transport recorded after a slight dip in 2009, in 2011 increase again and move to the level of 2008 and it increase continually since.
The main reason of this decrease can defined as follows:
• Change of productions in the national economy • Low flexibility of providing transport services • Low portfolio of additional transport services • Problems with interoperability railway vehicles as soon as
train crews and drivers • Dependence on manager of infrastructure • High capital and running costs • Challenging maintenance of rail vehicles • Closing of line to traffic of manager of infrastructure • Norms of weight or length train in the regional line is not
enough • Longer term of delivery compare to road transport • High cost during transport small number of wagons in the
train • High costs of operation, maintenance and managements of
railway siding • Need for professional employees with specific skills etc.
We are realized the pilot research in the some selected industrial companies with a view to find out what influence costumers when choosing a mode of transport. The research was realized through personal questioning in the largest companies in two region with different economic level. Choice of regions was done designedly with a view to find out differences between economically developed and economically weaker regions.
The majority of addressed companies carries their product to medium and longer distances. Half of these companies used the services of road haulage operator, 33% of rail freight traffic and 17% of companies have own vehicles.
We determined these factors based on previous research:
• Price • Speed of transport • Meeting delivery terms • Safety • Environmental aspect • Providing additional services
The companies considered the price as the most important factor when choosing a mode of transport for transportation of their products and the least important factor was environmental aspect in the both regions. Different results were only at two factors – speed of transport and meeting delivery terms. The companies in the regions with higher economic level considered speed of transport more important than meeting delivery terms and in the companies in the region with lower economic level it was other way round.
6. Conclusion One of the aims of European transport policy and Slovak
transport policy too is improving competitiveness of railway transport in the transport market. In the Slovak republic has been realized a number of measures from full liberalization of freight railway transport to change charging schemes of railway infrastructure since 2001. Despite these measures the share of the railway transport in the transport market didn’t increase.
In the market economy freight transport it is part of the logistics management, which plays an important role in safeguarding corporate activities and affects the quality of processes. The role of the carrier is to know customer needs and respond on them to supply of needed transport services. Nowadays, the companies in Slovak republic consider the price as a major factor which influence choose of transport mode.
This paper is supported by the VEGA Agency by the Project 1/0701/14 “The impact of the railway freight transport market
liberalisation on the social transport costs”
References
[1] Annual Repoort ZSR, 2003. Available from: http:// www.zsr.sk/buxus/docs/vyrSpravy/VyrocnaSprava2003.pdf
[2] Annual Repoort ZSR, 2008. Available from: http:// www.zsr.sk/buxus/docs/vyrSpravy/VyrocnaSprava2008.pdf
[3] Annual Repoort ZSR, 2010. Available from: http:// www.zsr.sk/buxus/docs/vyrSpravy/VyrocnaSprava2010.pdf
[4] Annual Repoort ZSR, 2014. Available from: http:// www.zsr.sk/buxus/docs/vyrSpravy/VyrocnaSprava2003.pdf
[5] Current data on transport. SU SR, 2013. Available from: https://slovak.statistics.sk/wps/portal
[6] Dolinayová, A., Ľoch M.: Comparative analysis of charging schemes for rail infrastructure and performance of railway undertaking in SR. In: EURO - ŽEL 2014. 22nd international symposium "Recent challenges for European railways" 3rd-4th June 2014, Žilina, Slovak Republic. Symposium proceedings. Brno: Tribun EU 2014. ISBN 978-80-263-0700-6.
[7] Guide for candidates before entering the network ZSR. Available from: http://www.zsr.sk/slovensky/zeleznicna-dopravna-cesta/marketing/informacie-pre-dopravcov/prirucky.html?page_id=3125
[8] Licensing Practices, Regulatory Authority, 2014 Available from:http://drahy.nsat.sk/povolenia-a-licencie-na-zeleznicnych-drahach/licencie-na-prevadzkovanie-dopravy-na-zeleznicnych-drahach/postup-pri-udelovani-licencie/
[9] Nedeliaková, E., Nedeliak, I., Halás M.: Sustainability of european system in the context of transport policy measures impact In: EURO - ŽEL 2014. 22nd international symposium "Recent challenges for European railways" 3rd-4th June 2014, Žilina, Slovak Republic. Symposium proceedings. Brno: Tribun EU, 2014. ISBN 978-80-263-0700-6.
[10] Network Statement 2015, ZSR Available from: http://www.zsr.sk/anglicky/railwaysinfrastructure/marketing/network-statement.html?page_id=1047
[11] Report from ERADIS database, 2015. Available from: https://eradis.era.europa.eu/safety_docs/licences/statistics_ru.aspx
[12] Statistical Yearbook 2012.VEDA, SAV Bratislava 2012. ISBN 978-80-224-1266-7
70
DETERMINE THE OPTIMAL ROUTE OF THE ROUTING OF THE SINGLE WAGONS METHOD CPM ON THE NETWORK ŽSR
doc. Ing. Dolinayová A. PhD.1, Ing. Ľoch M.1,
Faculty of Operation and Economics of Transport and Communications – University of Žilina, the Slovak Republic 1
[email protected], [email protected]
Abstract: In the sector of railway freight transport is considerable part of performance carried out through the transportation of single wagons from the departure station to the destination station which show decreasing trend in the last period. Currently, the transportation of the single wagons is realized according to long term established procedures, which do not take into account its direction on the basis of the optimal costs for the individual carriers on the network of ŽSR. Transportation of single wagons is realized based on train formation, which is regularly analyzed and adjusted on the basis of strength of wagons lane and requirements of the Business Department. By the application of different optimization methods it is possible to achieve reengineering of these procedures and optimize costs. The paper deals with the reengineering of the single wagons routing by application Critical Path Method (CPM) on the selected particular traffic relation on the network of ŽSR. Through application of CPM method and by reengineering of technological processes it is possible to achieve cost savings for the customer as well as for the carrier for the carriage of goods and truncation the delivery time of shipment to the customer as well as to increase the competitiveness of the railway company.
Keywords: SINGLE WAGON, CPM METHOD, NETWORK OF ŽSR, FREIGHT TRANSPORT,
1. Introduction The railway transport is integral part of the transport sector of
the European Union, and simultaneously, it is one of the ecological means of transport. The decreasing trend of the freight rail transport has coerced European community to strengthen its position and to adopt necessary legislative measures. The directive of the European parliament and the Council 2012/34 of the European Union through which regulates the unified European railway area emphasizes that the member states should adopt such measures which will support rail transport competitiveness and they will take into account individual characteristic features of the railways. [3]
Rail transport market in the Slovakia has constantly changed since 1993. There was only one company in the Slovakia until 2002 – Železnice Slovenskej republiky (ŽSR). This company had been divided into two companies since January 1st 2002 – ŽSR as an administrator and operator, and Železničná spoločnosť a.s. which provided operation of the transport and marketing activities (passenger and freight transport). Finally, three companies started to operate on the transport market after the transformation in 2005 – Železnice Slovenskej republiky, as a manager of the infrastructure, Železničná spoločnosť Slovensko a.s., for passenger transport, and Železničná spoločnosť Cargo Slovakia a.s., for freight transport. The transformation of the rail transport in the Slovak republic is depicted in Figure 1. [2,3]
Fig. 1 Transformation of the rail transport in the Slovak Republic
Strong competition for customers currently takes place on the transport market among the carriers providing the transport services. The most important thing in the competition game is to best fulfill demands of the customers, which mostly are the delivery
in time, at the required place, in the required quality and amount, and mainly for the optimal price.
The considerable part of the performances in the freight rail transport sector is carried out by transport of the single wagon consignments from the station of departure to the station of destination. This kind of transport has recently shown a downward trend. If the companies want this transport to be competitive, it is necessary, not only to adjust the legislation, but also to search the technological possibilities of the transport and shipping process optimization which will lead to better prices and quality of the provided services.
2. Current routing status of the wagon transportation
The contemporary model of the organization of the wagon currents on the Slovak railway network is not based on any freight train composition concept. It has been carried out on the basis of the long term established practices since 1995. The single wagon transport on the Slovak railway network is provided only by national carrier – ZSSK CARGO a.s. The private carriers operating on the Slovak railway market implement solely transport of the direct integrated trains.
The routing of the wagon currents on the Slovak railway network is carried out among the train formation stations. There were 31 formation stations in the network of ŽSR for the period of operating schedule 2014/2015. They are depicted in the figure 2. Some of the stations are enlisted among the main marshaling yards where the direct freight trains are composed; for example Bratislava východ, Zvolen freight station, Žilina – Teplička and Štúrovo. [2,5]
Fig. 2 Current status of the train formation stations on the network of ŽSR
The routing for each pair of the train formation stations and between the formation station and station in its yard area is arranged by service aid of ŽSR Routing data for the wagon loads, which
71
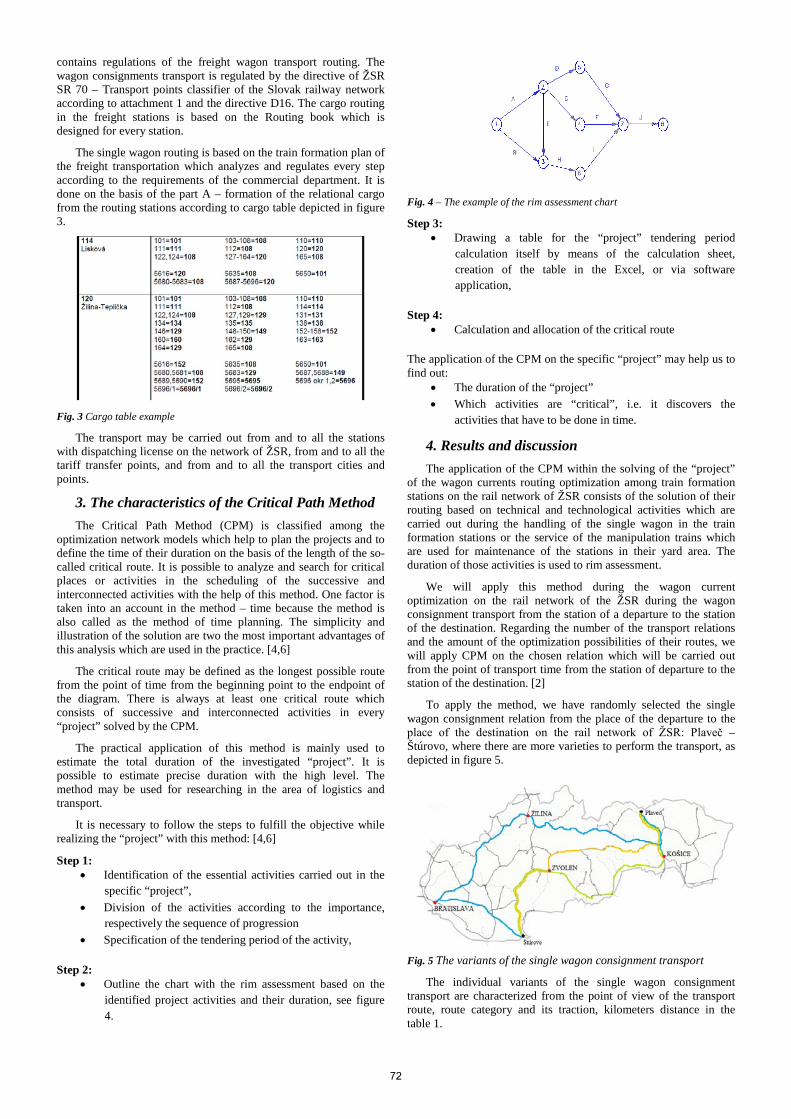
contains regulations of the freight wagon transport routing. The wagon consignments transport is regulated by the directive of ŽSR SR 70 – Transport points classifier of the Slovak railway network according to attachment 1 and the directive D16. The cargo routing in the freight stations is based on the Routing book which is designed for every station.
The single wagon routing is based on the train formation plan of the freight transportation which analyzes and regulates every step according to the requirements of the commercial department. It is done on the basis of the part A – formation of the relational cargo from the routing stations according to cargo table depicted in figure 3.
Fig. 3 Cargo table example
The transport may be carried out from and to all the stations with dispatching license on the network of ŽSR, from and to all the tariff transfer points, and from and to all the transport cities and points.
3. The characteristics of the Critical Path Method The Critical Path Method (CPM) is classified among the
optimization network models which help to plan the projects and to define the time of their duration on the basis of the length of the so-called critical route. It is possible to analyze and search for critical places or activities in the scheduling of the successive and interconnected activities with the help of this method. One factor is taken into an account in the method – time because the method is also called as the method of time planning. The simplicity and illustration of the solution are two the most important advantages of this analysis which are used in the practice. [4,6]
The critical route may be defined as the longest possible route from the point of time from the beginning point to the endpoint of the diagram. There is always at least one critical route which consists of successive and interconnected activities in every “project” solved by the CPM.
The practical application of this method is mainly used to estimate the total duration of the investigated “project”. It is possible to estimate precise duration with the high level. The method may be used for researching in the area of logistics and transport.
It is necessary to follow the steps to fulfill the objective while realizing the “project” with this method: [4,6]
Step 1: • Identification of the essential activities carried out in the
specific “project”, • Division of the activities according to the importance,
respectively the sequence of progression • Specification of the tendering period of the activity,
Step 2:
• Outline the chart with the rim assessment based on the identified project activities and their duration, see figure 4.
Fig. 4 – The example of the rim assessment chart
Step 3: • Drawing a table for the “project” tendering period
calculation itself by means of the calculation sheet, creation of the table in the Excel, or via software application,
Step 4:
• Calculation and allocation of the critical route
The application of the CPM on the specific “project” may help us to find out:
• The duration of the “project” • Which activities are “critical”, i.e. it discovers the
activities that have to be done in time.
4. Results and discussion The application of the CPM within the solving of the “project”
of the wagon currents routing optimization among train formation stations on the rail network of ŽSR consists of the solution of their routing based on technical and technological activities which are carried out during the handling of the single wagon in the train formation stations or the service of the manipulation trains which are used for maintenance of the stations in their yard area. The duration of those activities is used to rim assessment.
We will apply this method during the wagon current optimization on the rail network of the ŽSR during the wagon consignment transport from the station of a departure to the station of the destination. Regarding the number of the transport relations and the amount of the optimization possibilities of their routes, we will apply CPM on the chosen relation which will be carried out from the point of transport time from the station of departure to the station of the destination. [2]
To apply the method, we have randomly selected the single wagon consignment relation from the place of the departure to the place of the destination on the rail network of ŽSR: Plaveč – Štúrovo, where there are more varieties to perform the transport, as depicted in figure 5.
Fig. 5 The variants of the single wagon consignment transport
The individual variants of the single wagon consignment transport are characterized from the point of view of the transport route, route category and its traction, kilometers distance in the table 1.
72
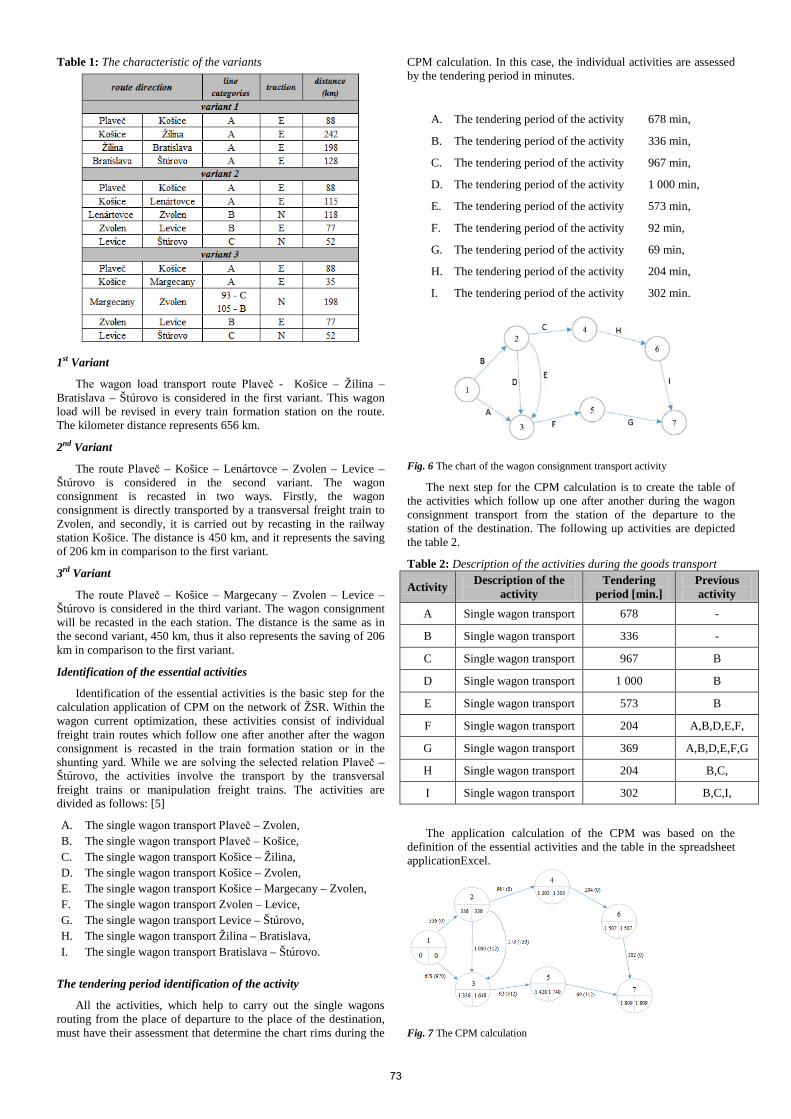
Table 1: The characteristic of the variants
1st Variant
The wagon load transport route Plaveč - Košice – Žilina – Bratislava – Štúrovo is considered in the first variant. This wagon load will be revised in every train formation station on the route. The kilometer distance represents 656 km.
2nd Variant
The route Plaveč – Košice – Lenártovce – Zvolen – Levice – Štúrovo is considered in the second variant. The wagon consignment is recasted in two ways. Firstly, the wagon consignment is directly transported by a transversal freight train to Zvolen, and secondly, it is carried out by recasting in the railway station Košice. The distance is 450 km, and it represents the saving of 206 km in comparison to the first variant.
3rd Variant
The route Plaveč – Košice – Margecany – Zvolen – Levice – Štúrovo is considered in the third variant. The wagon consignment will be recasted in the each station. The distance is the same as in the second variant, 450 km, thus it also represents the saving of 206 km in comparison to the first variant.
Identification of the essential activities
Identification of the essential activities is the basic step for the calculation application of CPM on the network of ŽSR. Within the wagon current optimization, these activities consist of individual freight train routes which follow one after another after the wagon consignment is recasted in the train formation station or in the shunting yard. While we are solving the selected relation Plaveč – Štúrovo, the activities involve the transport by the transversal freight trains or manipulation freight trains. The activities are divided as follows: [5]
A. The single wagon transport Plaveč – Zvolen, B. The single wagon transport Plaveč – Košice, C. The single wagon transport Košice – Žilina, D. The single wagon transport Košice – Zvolen, E. The single wagon transport Košice – Margecany – Zvolen, F. The single wagon transport Zvolen – Levice, G. The single wagon transport Levice – Štúrovo, H. The single wagon transport Žilina – Bratislava, I. The single wagon transport Bratislava – Štúrovo.
The tendering period identification of the activity
All the activities, which help to carry out the single wagons routing from the place of departure to the place of the destination, must have their assessment that determine the chart rims during the
CPM calculation. In this case, the individual activities are assessed by the tendering period in minutes.
A. The tendering period of the activity 678 min,
B. The tendering period of the activity 336 min,
C. The tendering period of the activity 967 min,
D. The tendering period of the activity 1 000 min,
E. The tendering period of the activity 573 min,
F. The tendering period of the activity 92 min,
G. The tendering period of the activity 69 min,
H. The tendering period of the activity 204 min,
I. The tendering period of the activity 302 min.
Fig. 6 The chart of the wagon consignment transport activity
The next step for the CPM calculation is to create the table of the activities which follow up one after another during the wagon consignment transport from the station of the departure to the station of the destination. The following up activities are depicted the table 2.
Table 2: Description of the activities during the goods transport
Activity Description of the activity
Tendering period [min.]
Previous activity
A Single wagon transport 678 -
B Single wagon transport 336 -
C Single wagon transport 967 B
D Single wagon transport 1 000 B
E Single wagon transport 573 B
F Single wagon transport 204 A,B,D,E,F,
G Single wagon transport 369 A,B,D,E,F,G
H Single wagon transport 204 B,C,
I Single wagon transport 302 B,C,I,
The application calculation of the CPM was based on the definition of the essential activities and the table in the spreadsheet applicationExcel.
Fig. 7 The CPM calculation
73
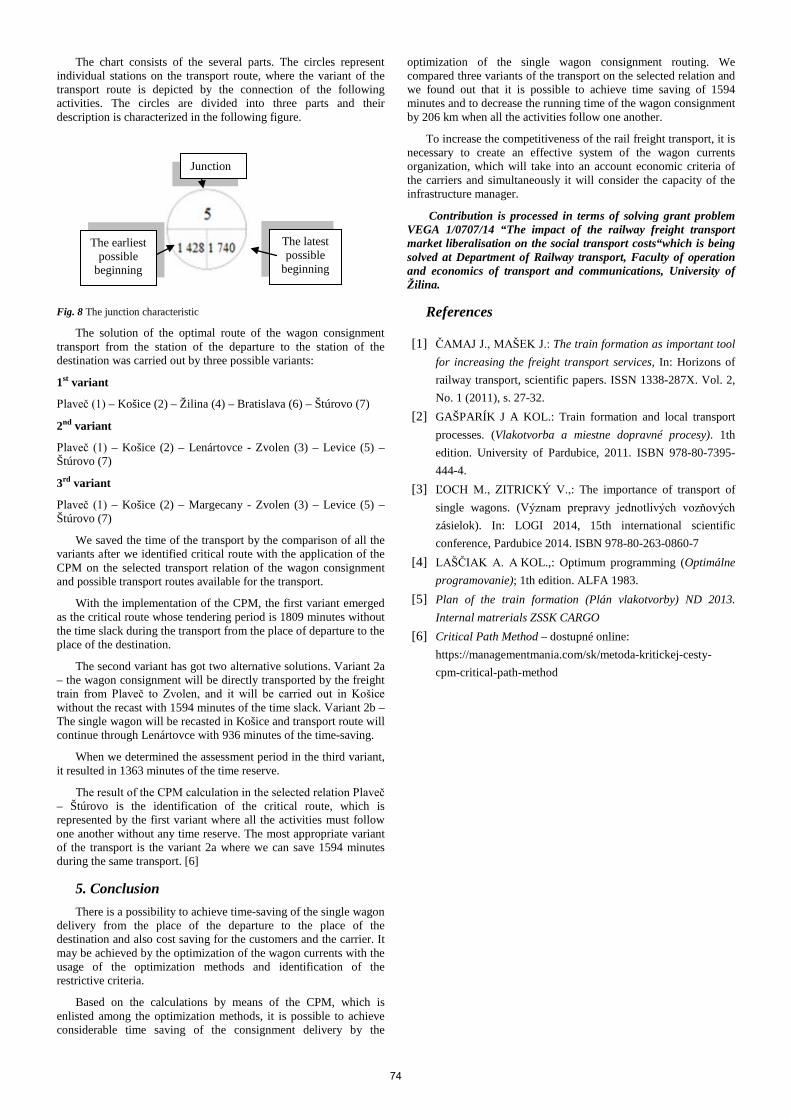
The chart consists of the several parts. The circles represent individual stations on the transport route, where the variant of the transport route is depicted by the connection of the following activities. The circles are divided into three parts and their description is characterized in the following figure.
Fig. 8 The junction characteristic
The solution of the optimal route of the wagon consignment transport from the station of the departure to the station of the destination was carried out by three possible variants:
1st variant
Plaveč (1) – Košice (2) – Žilina (4) – Bratislava (6) – Štúrovo (7)
2nd variant
Plaveč (1) – Košice (2) – Lenártovce - Zvolen (3) – Levice (5) – Štúrovo (7)
3rd variant
Plaveč (1) – Košice (2) – Margecany - Zvolen (3) – Levice (5) – Štúrovo (7)
We saved the time of the transport by the comparison of all the variants after we identified critical route with the application of the CPM on the selected transport relation of the wagon consignment and possible transport routes available for the transport.
With the implementation of the CPM, the first variant emerged as the critical route whose tendering period is 1809 minutes without the time slack during the transport from the place of departure to the place of the destination.
The second variant has got two alternative solutions. Variant 2a – the wagon consignment will be directly transported by the freight train from Plaveč to Zvolen, and it will be carried out in Košice without the recast with 1594 minutes of the time slack. Variant 2b – The single wagon will be recasted in Košice and transport route will continue through Lenártovce with 936 minutes of the time-saving.
When we determined the assessment period in the third variant, it resulted in 1363 minutes of the time reserve.
The result of the CPM calculation in the selected relation Plaveč – Štúrovo is the identification of the critical route, which is represented by the first variant where all the activities must follow one another without any time reserve. The most appropriate variant of the transport is the variant 2a where we can save 1594 minutes during the same transport. [6]
5. Conclusion There is a possibility to achieve time-saving of the single wagon
delivery from the place of the departure to the place of the destination and also cost saving for the customers and the carrier. It may be achieved by the optimization of the wagon currents with the usage of the optimization methods and identification of the restrictive criteria.
Based on the calculations by means of the CPM, which is enlisted among the optimization methods, it is possible to achieve considerable time saving of the consignment delivery by the
optimization of the single wagon consignment routing. We compared three variants of the transport on the selected relation and we found out that it is possible to achieve time saving of 1594 minutes and to decrease the running time of the wagon consignment by 206 km when all the activities follow one another.
To increase the competitiveness of the rail freight transport, it is necessary to create an effective system of the wagon currents organization, which will take into an account economic criteria of the carriers and simultaneously it will consider the capacity of the infrastructure manager.
Contribution is processed in terms of solving grant problem VEGA 1/0707/14 “The impact of the railway freight transport market liberalisation on the social transport costs“which is being solved at Department of Railway transport, Faculty of operation and economics of transport and communications, University of Žilina.
References
[1] ČAMAJ J., MAŠEK J.: The train formation as important tool for increasing the freight transport services, In: Horizons of railway transport, scientific papers. ISSN 1338-287X. Vol. 2, No. 1 (2011), s. 27-32.
[2] GAŠPARÍK J A KOL.: Train formation and local transport processes. (Vlakotvorba a miestne dopravné procesy). 1th edition. University of Pardubice, 2011. ISBN 978-80-7395-444-4.
[3] ĽOCH M., ZITRICKÝ V.,: The importance of transport of single wagons. (Význam prepravy jednotlivých vozňových zásielok). In: LOGI 2014, 15th international scientific conference, Pardubice 2014. ISBN 978-80-263-0860-7
[4] LAŠČIAK A. A KOL.,: Optimum programming (Optimálne programovanie); 1th edition. ALFA 1983.
[5] Plan of the train formation (Plán vlakotvorby) ND 2013. Internal matrerials ZSSK CARGO
[6] Critical Path Method – dostupné online: https://managementmania.com/sk/metoda-kritickej-cesty-cpm-critical-path-method
Junction
The latest possible
beginning
The earliest possible
beginning
74
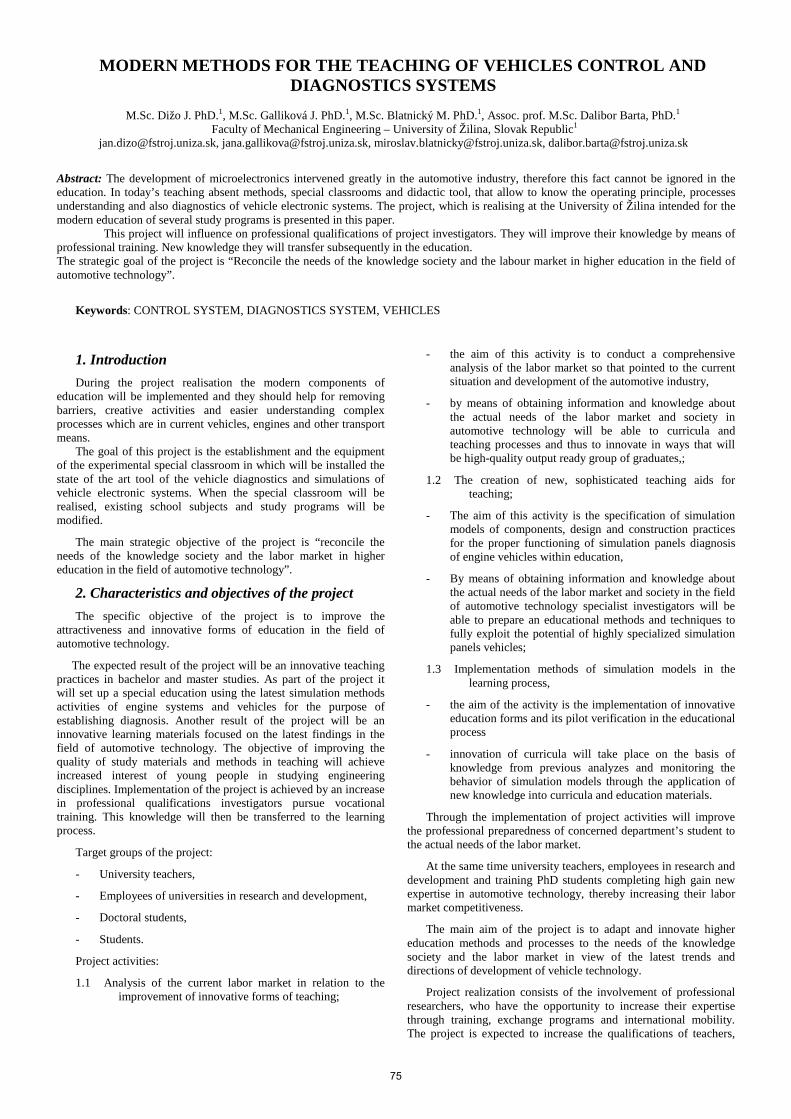
MODERN METHODS FOR THE TEACHING OF VEHICLES CONTROL AND DIAGNOSTICS SYSTEMS
M.Sc. Dižo J. PhD.1, M.Sc. Galliková J. PhD.1, M.Sc. Blatnický M. PhD.1, Assoc. prof. M.Sc. Dalibor Barta, PhD.1
Faculty of Mechanical Engineering – University of Žilina, Slovak Republic1
[email protected], [email protected], [email protected], [email protected]
Abstract: The development of microelectronics intervened greatly in the automotive industry, therefore this fact cannot be ignored in the education. In today’s teaching absent methods, special classrooms and didactic tool, that allow to know the operating principle, processes understanding and also diagnostics of vehicle electronic systems. The project, which is realising at the University of Žilina intended for the modern education of several study programs is presented in this paper.
This project will influence on professional qualifications of project investigators. They will improve their knowledge by means of professional training. New knowledge they will transfer subsequently in the education. The strategic goal of the project is “Reconcile the needs of the knowledge society and the labour market in higher education in the field of automotive technology”.
Keywords: CONTROL SYSTEM, DIAGNOSTICS SYSTEM, VEHICLES
1. Introduction During the project realisation the modern components of
education will be implemented and they should help for removing barriers, creative activities and easier understanding complex processes which are in current vehicles, engines and other transport means.
The goal of this project is the establishment and the equipment of the experimental special classroom in which will be installed the state of the art tool of the vehicle diagnostics and simulations of vehicle electronic systems. When the special classroom will be realised, existing school subjects and study programs will be modified.
The main strategic objective of the project is “reconcile the needs of the knowledge society and the labor market in higher education in the field of automotive technology”.
2. Characteristics and objectives of the project The specific objective of the project is to improve the
attractiveness and innovative forms of education in the field of automotive technology.
The expected result of the project will be an innovative teaching practices in bachelor and master studies. As part of the project it will set up a special education using the latest simulation methods activities of engine systems and vehicles for the purpose of establishing diagnosis. Another result of the project will be an innovative learning materials focused on the latest findings in the field of automotive technology. The objective of improving the quality of study materials and methods in teaching will achieve increased interest of young people in studying engineering disciplines. Implementation of the project is achieved by an increase in professional qualifications investigators pursue vocational training. This knowledge will then be transferred to the learning process.
Target groups of the project:
- University teachers,
- Employees of universities in research and development,
- Doctoral students,
- Students.
Project activities:
1.1 Analysis of the current labor market in relation to the improvement of innovative forms of teaching;
- the aim of this activity is to conduct a comprehensive analysis of the labor market so that pointed to the current situation and development of the automotive industry,
- by means of obtaining information and knowledge about the actual needs of the labor market and society in automotive technology will be able to curricula and teaching processes and thus to innovate in ways that will be high-quality output ready group of graduates,;
1.2 The creation of new, sophisticated teaching aids for teaching;
- The aim of this activity is the specification of simulation models of components, design and construction practices for the proper functioning of simulation panels diagnosis of engine vehicles within education,
- By means of obtaining information and knowledge about the actual needs of the labor market and society in the field of automotive technology specialist investigators will be able to prepare an educational methods and techniques to fully exploit the potential of highly specialized simulation panels vehicles;
1.3 Implementation methods of simulation models in the learning process,
- the aim of the activity is the implementation of innovative education forms and its pilot verification in the educational process
- innovation of curricula will take place on the basis of knowledge from previous analyzes and monitoring the behavior of simulation models through the application of new knowledge into curricula and education materials.
Through the implementation of project activities will improve the professional preparedness of concerned department’s student to the actual needs of the labor market.
At the same time university teachers, employees in research and development and training PhD students completing high gain new expertise in automotive technology, thereby increasing their labor market competitiveness.
The main aim of the project is to adapt and innovate higher education methods and processes to the needs of the knowledge society and the labor market in view of the latest trends and directions of development of vehicle technology.
Project realization consists of the involvement of professional researchers, who have the opportunity to increase their expertise through training, exchange programs and international mobility. The project is expected to increase the qualifications of teachers,
75
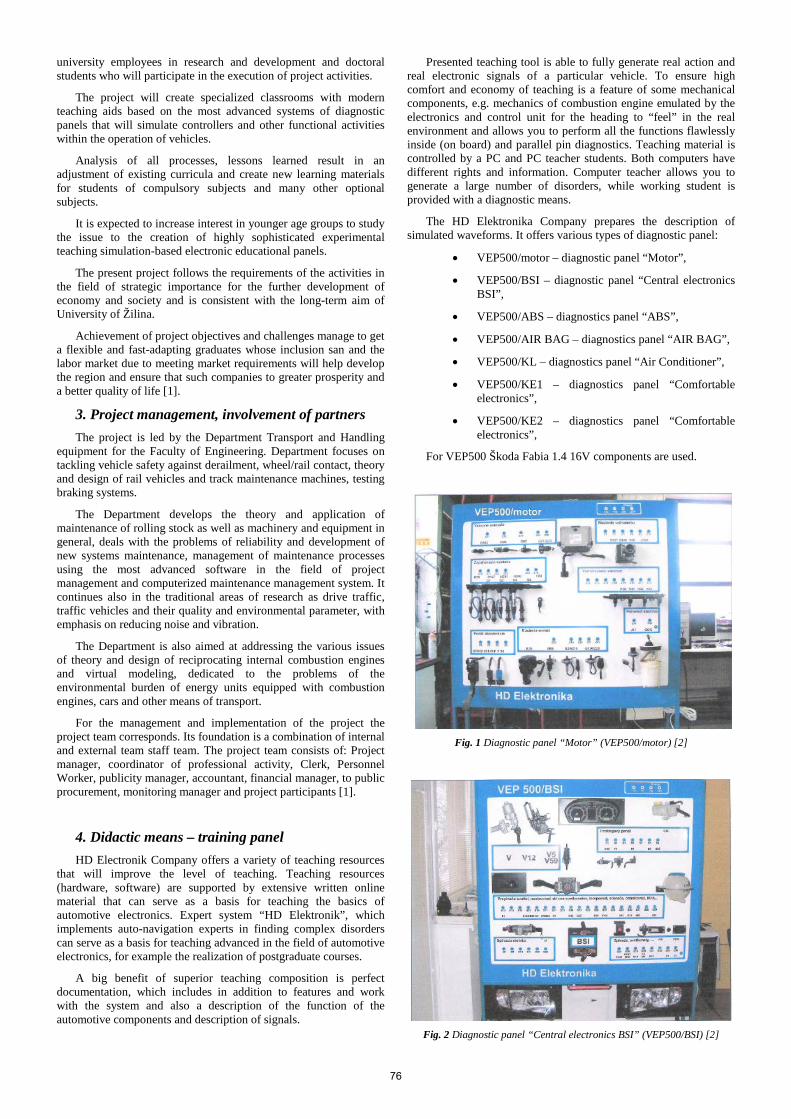
university employees in research and development and doctoral students who will participate in the execution of project activities.
The project will create specialized classrooms with modern teaching aids based on the most advanced systems of diagnostic panels that will simulate controllers and other functional activities within the operation of vehicles.
Analysis of all processes, lessons learned result in an adjustment of existing curricula and create new learning materials for students of compulsory subjects and many other optional subjects.
It is expected to increase interest in younger age groups to study the issue to the creation of highly sophisticated experimental teaching simulation-based electronic educational panels.
The present project follows the requirements of the activities in the field of strategic importance for the further development of economy and society and is consistent with the long-term aim of University of Žilina.
Achievement of project objectives and challenges manage to get a flexible and fast-adapting graduates whose inclusion san and the labor market due to meeting market requirements will help develop the region and ensure that such companies to greater prosperity and a better quality of life [1].
3. Project management, involvement of partners The project is led by the Department Transport and Handling
equipment for the Faculty of Engineering. Department focuses on tackling vehicle safety against derailment, wheel/rail contact, theory and design of rail vehicles and track maintenance machines, testing braking systems.
The Department develops the theory and application of maintenance of rolling stock as well as machinery and equipment in general, deals with the problems of reliability and development of new systems maintenance, management of maintenance processes using the most advanced software in the field of project management and computerized maintenance management system. It continues also in the traditional areas of research as drive traffic, traffic vehicles and their quality and environmental parameter, with emphasis on reducing noise and vibration.
The Department is also aimed at addressing the various issues of theory and design of reciprocating internal combustion engines and virtual modeling, dedicated to the problems of the environmental burden of energy units equipped with combustion engines, cars and other means of transport.
For the management and implementation of the project the project team corresponds. Its foundation is a combination of internal and external team staff team. The project team consists of: Project manager, coordinator of professional activity, Clerk, Personnel Worker, publicity manager, accountant, financial manager, to public procurement, monitoring manager and project participants [1].
4. Didactic means – training panel HD Electronik Company offers a variety of teaching resources
that will improve the level of teaching. Teaching resources (hardware, software) are supported by extensive written online material that can serve as a basis for teaching the basics of automotive electronics. Expert system “HD Elektronik”, which implements auto-navigation experts in finding complex disorders can serve as a basis for teaching advanced in the field of automotive electronics, for example the realization of postgraduate courses.
A big benefit of superior teaching composition is perfect documentation, which includes in addition to features and work with the system and also a description of the function of the automotive components and description of signals.
Presented teaching tool is able to fully generate real action and real electronic signals of a particular vehicle. To ensure high comfort and economy of teaching is a feature of some mechanical components, e.g. mechanics of combustion engine emulated by the electronics and control unit for the heading to “feel” in the real environment and allows you to perform all the functions flawlessly inside (on board) and parallel pin diagnostics. Teaching material is controlled by a PC and PC teacher students. Both computers have different rights and information. Computer teacher allows you to generate a large number of disorders, while working student is provided with a diagnostic means.
The HD Elektronika Company prepares the description of simulated waveforms. It offers various types of diagnostic panel:
• VEP500/motor – diagnostic panel “Motor”,
• VEP500/BSI – diagnostic panel “Central electronics BSI”,
• VEP500/ABS – diagnostics panel “ABS”,
• VEP500/AIR BAG – diagnostics panel “AIR BAG”,
• VEP500/KL – diagnostics panel “Air Conditioner”,
• VEP500/KE1 – diagnostics panel “Comfortable electronics”,
• VEP500/KE2 – diagnostics panel “Comfortable electronics”,
For VEP500 Škoda Fabia 1.4 16V components are used.
Fig. 1 Diagnostic panel “Motor” (VEP500/motor) [2]
Fig. 2 Diagnostic panel “Central electronics BSI” (VEP500/BSI) [2]
76
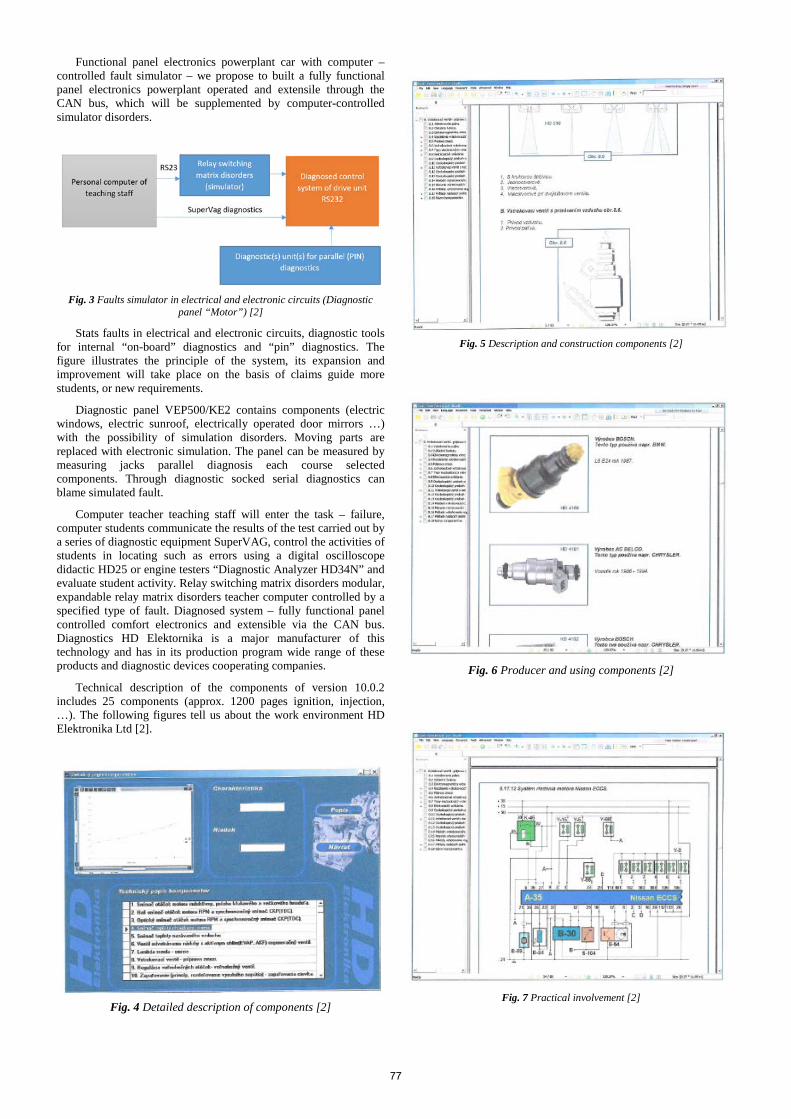
Functional panel electronics powerplant car with computer – controlled fault simulator – we propose to built a fully functional panel electronics powerplant operated and extensile through the CAN bus, which will be supplemented by computer-controlled simulator disorders.
Fig. 3 Faults simulator in electrical and electronic circuits (Diagnostic
panel “Motor”) [2]
Stats faults in electrical and electronic circuits, diagnostic tools for internal “on-board” diagnostics and “pin” diagnostics. The figure illustrates the principle of the system, its expansion and improvement will take place on the basis of claims guide more students, or new requirements.
Diagnostic panel VEP500/KE2 contains components (electric windows, electric sunroof, electrically operated door mirrors …) with the possibility of simulation disorders. Moving parts are replaced with electronic simulation. The panel can be measured by measuring jacks parallel diagnosis each course selected components. Through diagnostic socked serial diagnostics can blame simulated fault.
Computer teacher teaching staff will enter the task – failure, computer students communicate the results of the test carried out by a series of diagnostic equipment SuperVAG, control the activities of students in locating such as errors using a digital oscilloscope didactic HD25 or engine testers “Diagnostic Analyzer HD34N” and evaluate student activity. Relay switching matrix disorders modular, expandable relay matrix disorders teacher computer controlled by a specified type of fault. Diagnosed system – fully functional panel controlled comfort electronics and extensible via the CAN bus. Diagnostics HD Elektornika is a major manufacturer of this technology and has in its production program wide range of these products and diagnostic devices cooperating companies.
Technical description of the components of version 10.0.2 includes 25 components (approx. 1200 pages ignition, injection, …). The following figures tell us about the work environment HD Elektronika Ltd [2].
Fig. 4 Detailed description of components [2]
Fig. 5 Description and construction components [2]
Fig. 6 Producer and using components [2]
Fig. 7 Practical involvement [2]
77
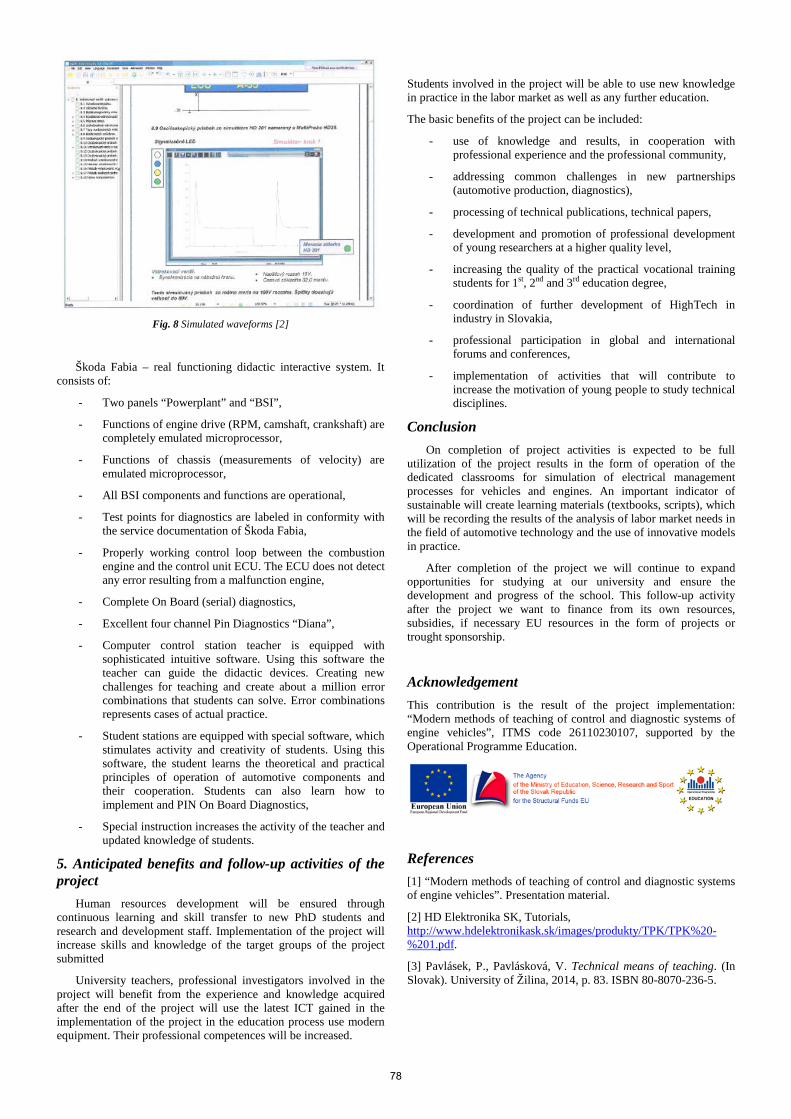
Fig. 8 Simulated waveforms [2]
Škoda Fabia – real functioning didactic interactive system. It consists of:
- Two panels “Powerplant” and “BSI”,
- Functions of engine drive (RPM, camshaft, crankshaft) are completely emulated microprocessor,
- Functions of chassis (measurements of velocity) are emulated microprocessor,
- All BSI components and functions are operational,
- Test points for diagnostics are labeled in conformity with the service documentation of Škoda Fabia,
- Properly working control loop between the combustion engine and the control unit ECU. The ECU does not detect any error resulting from a malfunction engine,
- Complete On Board (serial) diagnostics,
- Excellent four channel Pin Diagnostics “Diana”,
- Computer control station teacher is equipped with sophisticated intuitive software. Using this software the teacher can guide the didactic devices. Creating new challenges for teaching and create about a million error combinations that students can solve. Error combinations represents cases of actual practice.
- Student stations are equipped with special software, which stimulates activity and creativity of students. Using this software, the student learns the theoretical and practical principles of operation of automotive components and their cooperation. Students can also learn how to implement and PIN On Board Diagnostics,
- Special instruction increases the activity of the teacher and updated knowledge of students.
5. Anticipated benefits and follow-up activities of the project
Human resources development will be ensured through continuous learning and skill transfer to new PhD students and research and development staff. Implementation of the project will increase skills and knowledge of the target groups of the project submitted
University teachers, professional investigators involved in the project will benefit from the experience and knowledge acquired after the end of the project will use the latest ICT gained in the implementation of the project in the education process use modern equipment. Their professional competences will be increased.
Students involved in the project will be able to use new knowledge in practice in the labor market as well as any further education.
The basic benefits of the project can be included:
- use of knowledge and results, in cooperation with professional experience and the professional community,
- addressing common challenges in new partnerships (automotive production, diagnostics),
- processing of technical publications, technical papers,
- development and promotion of professional development of young researchers at a higher quality level,
- increasing the quality of the practical vocational training students for 1st, 2nd and 3rd education degree,
- coordination of further development of HighTech in industry in Slovakia,
- professional participation in global and international forums and conferences,
- implementation of activities that will contribute to increase the motivation of young people to study technical disciplines.
Conclusion On completion of project activities is expected to be full
utilization of the project results in the form of operation of the dedicated classrooms for simulation of electrical management processes for vehicles and engines. An important indicator of sustainable will create learning materials (textbooks, scripts), which will be recording the results of the analysis of labor market needs in the field of automotive technology and the use of innovative models in practice.
After completion of the project we will continue to expand opportunities for studying at our university and ensure the development and progress of the school. This follow-up activity after the project we want to finance from its own resources, subsidies, if necessary EU resources in the form of projects or trought sponsorship.
Acknowledgement This contribution is the result of the project implementation: “Modern methods of teaching of control and diagnostic systems of engine vehicles”, ITMS code 26110230107, supported by the Operational Programme Education.
References [1] “Modern methods of teaching of control and diagnostic systems of engine vehicles”. Presentation material.
[2] HD Elektronika SK, Tutorials, http://www.hdelektronikask.sk/images/produkty/TPK/TPK%20-%201.pdf.
[3] Pavlásek, P., Pavlásková, V. Technical means of teaching. (In Slovak). University of Žilina, 2014, p. 83. ISBN 80-8070-236-5.
78
INTERNET AND SEO METHODS BY ROAD TRANSPORT BUSINESS
RNDr. Knutelská M. PhD., RNDr. Šusteková D. PhD. Faculty of Operation and Economics of Transport and Communications, Department of Quantitative Methods and Economic Informatics,
University of Žilina, Žilina, Slovak Republic
Abstract: This paper deals with the use of Internet by the road transport business, especially with the marketing web services. The aim is to show the importance of the Search engine optimisation (SEO) methods for the creation of webpages, as their consistent implementation is relevant for improving marketing communication and improving the search-engine rankings. The results of a survey among small and medium enterprises in the road transport business show that proper attention given to the creation of a company website brings clear economic effects.
Keywords: INTERNET SERVICES, MARKETING COMMUNICATION, SEARCH ENGINE OPTIMIZATION, SEO
Príspevok vznikol v nadväznosti na riešený projekt spolufinancovaný zo zdrojov EÚ s názvom „Kalita vzdelávania a rozvoj ľudských zdrojov ako piliere vedomostnej spoločnosti na Fakulte PEDAS Žilinskej univerzity v Žiline“, ITMS kód projektu 26110230083“, riešeného na Žilinskej univerzite v Žiline.
This paper is prepared with the support of the project "Education quality and human resources development as the pillars of a knowledge society at the Faculty PEDAS, University of Žilina in Žilina.“, ITMS project code 26110230083, University of Žilina.
Moderné vzdelávanie pre vedomostnú spoločnosť/Projekt je spolufinancovaný zo zdrojov EÚ
Modern kowledge society education /
Project is co-financed by the EC funds
Communication over Internet The use of modern information and communication
technologies and Internet services is nowadays an inherent part of the management and decision-making process and in-house communication. Knowledge-based economy can be characterised by greater dependence on knowledge, information and highly-qualified skills and by increased need of both private and public sector to access them. Important changes occurred also in the area of marketing communication. Traditional forms of communication are insufficient; market situation requires targeted use of the Internet services. This naturally concerns also companies in the transportation sector.
Communication over the Internet is a natural requirement of today's national and international transportation. E-mail and online voice and video communication are commonly used. These means of communication in the area of transportation and logistics are used not only for marketing communication, but, considering the nature of the enterprise and workers' goods' and vehicles' mobility, also for the communication between drivers and dispatch, which leads to decrease in administration work, communication costs and to more efficient use of working time. The Internet access is also important, and it is, because of the necessary mobility, ensured through wireless access.
E-mail is one of the oldest Internet services. This service, especially after the implementation of the Act on electronic signature, has a tendency to fully replace the older way of communication by ordinary mail. Other tools of internet
communication are newsletters, discussion fora, chat and messengers. Newsletters are electronic news outlets sent to registered users by e-mail. They contain articles related to the company's area of operations, including news in its field, invitation to events as well as advertisement. [1].
Discussion fora are to be found relatively often. This communication tool enables participants to discuss the given topic using short text messages. Unlike the previous ways of communication that do not require real-time Internet connectivity, chat is an on-line way of communication, or, in another way, electronic group discussion, just as tradition phone-call, where all the participants are connected to the Internet in the real time. Messengers are software tools of internet communication, e.g. Windows Messenger. The applications used are usually free of charge or are a part of the operation system.
One of today's progressive technologies is Voice over IP (VoIP). It is a methodology and group of technologies for the delivery of voice communications and multimedia sessions over Internet Protocol (IP) networks, such as the Internet. [1].
The particularity of the use of Internet in the transportation is transportation databases. These network application offer online interface for use of other companies' capacities of transportation (trucks and other cargo vehicles) and for offer of one's own transportation capacities. Freighters and other prospective clients can find out about the most efficient use of their vehicle and possibilities of transportation of their goods. These services are
79
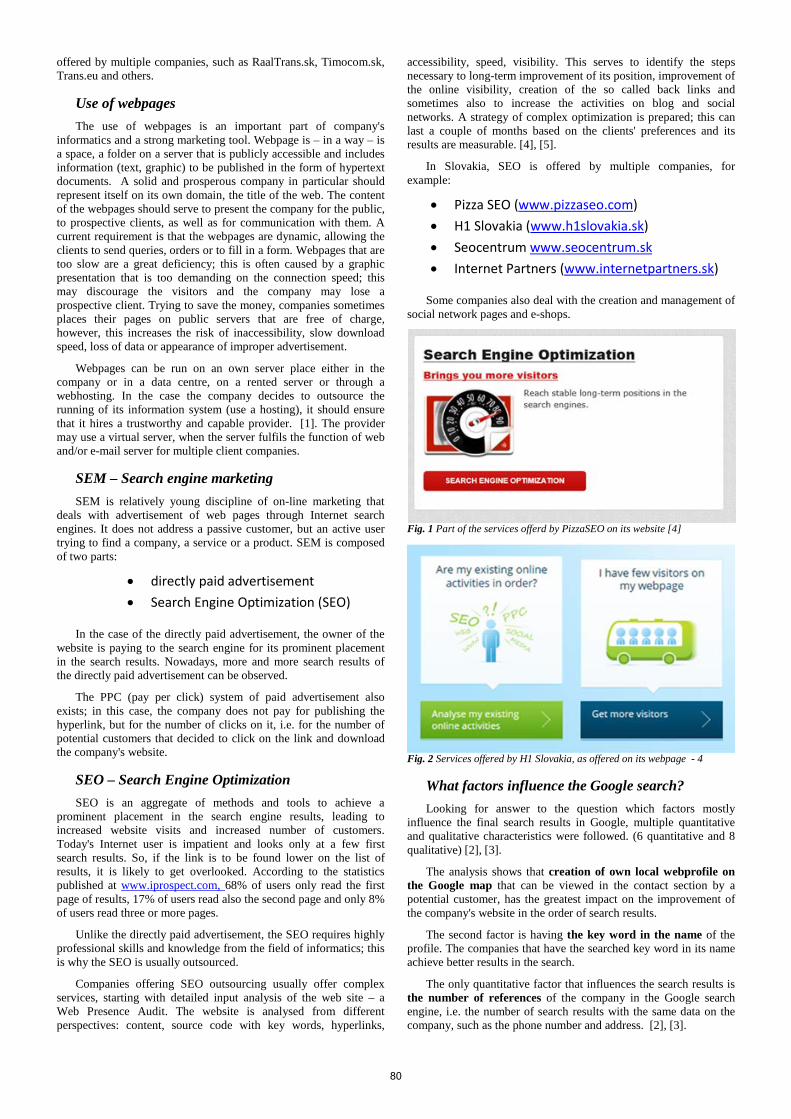
offered by multiple companies, such as RaalTrans.sk, Timocom.sk, Trans.eu and others.
Use of webpages The use of webpages is an important part of company's
informatics and a strong marketing tool. Webpage is – in a way – is a space, a folder on a server that is publicly accessible and includes information (text, graphic) to be published in the form of hypertext documents. A solid and prosperous company in particular should represent itself on its own domain, the title of the web. The content of the webpages should serve to present the company for the public, to prospective clients, as well as for communication with them. A current requirement is that the webpages are dynamic, allowing the clients to send queries, orders or to fill in a form. Webpages that are too slow are a great deficiency; this is often caused by a graphic presentation that is too demanding on the connection speed; this may discourage the visitors and the company may lose a prospective client. Trying to save the money, companies sometimes places their pages on public servers that are free of charge, however, this increases the risk of inaccessibility, slow download speed, loss of data or appearance of improper advertisement.
Webpages can be run on an own server place either in the company or in a data centre, on a rented server or through a webhosting. In the case the company decides to outsource the running of its information system (use a hosting), it should ensure that it hires a trustworthy and capable provider. [1]. The provider may use a virtual server, when the server fulfils the function of web and/or e-mail server for multiple client companies.
SEM – Search engine marketing SEM is relatively young discipline of on-line marketing that
deals with advertisement of web pages through Internet search engines. It does not address a passive customer, but an active user trying to find a company, a service or a product. SEM is composed of two parts:
• directly paid advertisement • Search Engine Optimization (SEO)
In the case of the directly paid advertisement, the owner of the website is paying to the search engine for its prominent placement in the search results. Nowadays, more and more search results of the directly paid advertisement can be observed.
The PPC (pay per click) system of paid advertisement also exists; in this case, the company does not pay for publishing the hyperlink, but for the number of clicks on it, i.e. for the number of potential customers that decided to click on the link and download the company's website.
SEO – Search Engine Optimization SEO is an aggregate of methods and tools to achieve a
prominent placement in the search engine results, leading to increased website visits and increased number of customers. Today's Internet user is impatient and looks only at a few first search results. So, if the link is to be found lower on the list of results, it is likely to get overlooked. According to the statistics published at www.iprospect.com, 68% of users only read the first page of results, 17% of users read also the second page and only 8% of users read three or more pages.
Unlike the directly paid advertisement, the SEO requires highly professional skills and knowledge from the field of informatics; this is why the SEO is usually outsourced.
Companies offering SEO outsourcing usually offer complex services, starting with detailed input analysis of the web site – a Web Presence Audit. The website is analysed from different perspectives: content, source code with key words, hyperlinks,
accessibility, speed, visibility. This serves to identify the steps necessary to long-term improvement of its position, improvement of the online visibility, creation of the so called back links and sometimes also to increase the activities on blog and social networks. A strategy of complex optimization is prepared; this can last a couple of months based on the clients' preferences and its results are measurable. [4], [5].
In Slovakia, SEO is offered by multiple companies, for example:
• Pizza SEO (www.pizzaseo.com) • H1 Slovakia (www.h1slovakia.sk) • Seocentrum www.seocentrum.sk • Internet Partners (www.internetpartners.sk)
Some companies also deal with the creation and management of social network pages and e-shops.
Fig. 1 Part of the services offerd by PizzaSEO on its website [4]
Fig. 2 Services offered by H1 Slovakia, as offered on its webpage - 4
What factors influence the Google search? Looking for answer to the question which factors mostly
influence the final search results in Google, multiple quantitative and qualitative characteristics were followed. (6 quantitative and 8 qualitative) [2], [3].
The analysis shows that creation of own local webprofile on the Google map that can be viewed in the contact section by a potential customer, has the greatest impact on the improvement of the company's website in the order of search results.
The second factor is having the key word in the name of the profile. The companies that have the searched key word in its name achieve better results in the search.
The only quantitative factor that influences the search results is the number of references of the company in the Google search engine, i.e. the number of search results with the same data on the company, such as the phone number and address. [2], [3].
80
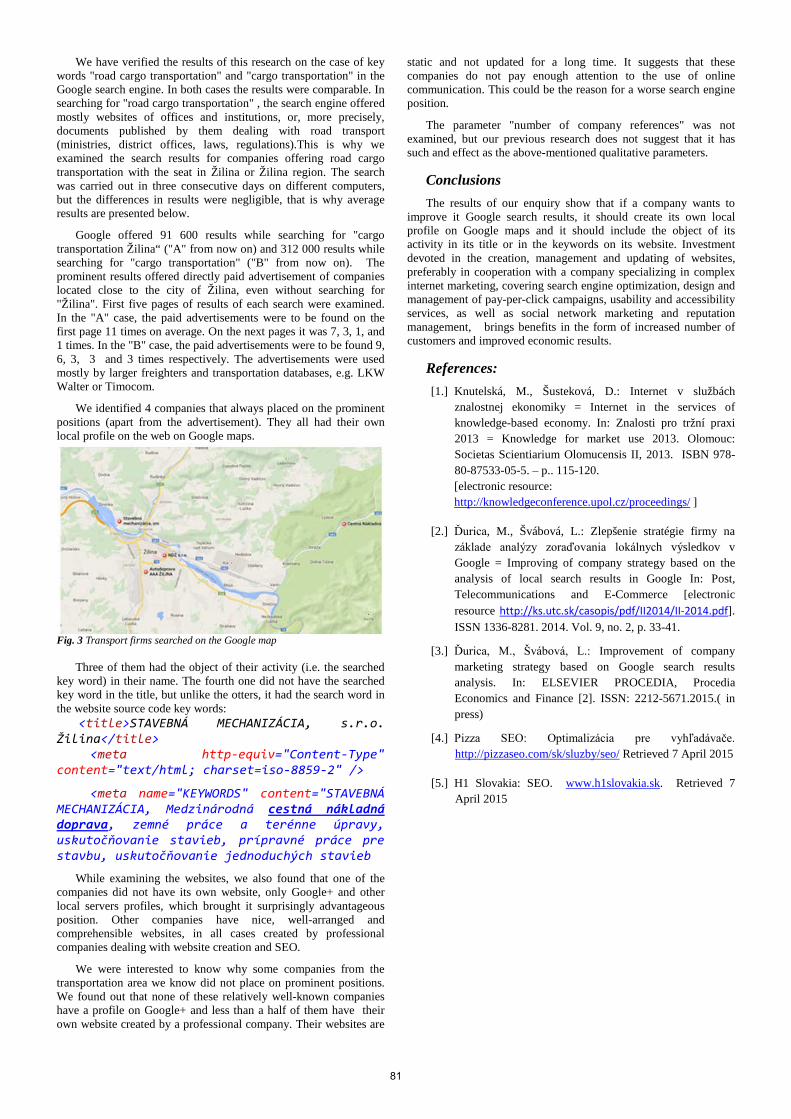
We have verified the results of this research on the case of key words "road cargo transportation" and "cargo transportation" in the Google search engine. In both cases the results were comparable. In searching for "road cargo transportation" , the search engine offered mostly websites of offices and institutions, or, more precisely, documents published by them dealing with road transport (ministries, district offices, laws, regulations).This is why we examined the search results for companies offering road cargo transportation with the seat in Žilina or Žilina region. The search was carried out in three consecutive days on different computers, but the differences in results were negligible, that is why average results are presented below.
Google offered 91 600 results while searching for "cargo transportation Žilina“ ("A" from now on) and 312 000 results while searching for "cargo transportation" ("B" from now on). The prominent results offered directly paid advertisement of companies located close to the city of Žilina, even without searching for "Žilina". First five pages of results of each search were examined. In the "A" case, the paid advertisements were to be found on the first page 11 times on average. On the next pages it was 7, 3, 1, and 1 times. In the "B" case, the paid advertisements were to be found 9, 6, 3, 3 and 3 times respectively. The advertisements were used mostly by larger freighters and transportation databases, e.g. LKW Walter or Timocom.
We identified 4 companies that always placed on the prominent positions (apart from the advertisement). They all had their own local profile on the web on Google maps.
Fig. 3 Transport firms searched on the Google map
Three of them had the object of their activity (i.e. the searched
key word) in their name. The fourth one did not have the searched key word in the title, but unlike the otters, it had the search word in the website source code key words:
<title>STAVEBNÁ MECHANIZÁCIA, s.r.o. Žilina</title>
<meta http-equiv="Content-Type" content="text/html; charset=iso-8859-2" />
<meta name="KEYWORDS" content="STAVEBNÁ MECHANIZÁCIA, Medzinárodná cestná nákladná doprava, zemné práce a terénne úpravy, uskutočňovanie stavieb, prípravné práce pre stavbu, uskutočňovanie jednoduchých stavieb
While examining the websites, we also found that one of the companies did not have its own website, only Google+ and other local servers profiles, which brought it surprisingly advantageous position. Other companies have nice, well-arranged and comprehensible websites, in all cases created by professional companies dealing with website creation and SEO.
We were interested to know why some companies from the transportation area we know did not place on prominent positions. We found out that none of these relatively well-known companies have a profile on Google+ and less than a half of them have their own website created by a professional company. Their websites are
static and not updated for a long time. It suggests that these companies do not pay enough attention to the use of online communication. This could be the reason for a worse search engine position.
The parameter "number of company references" was not examined, but our previous research does not suggest that it has such and effect as the above-mentioned qualitative parameters.
Conclusions The results of our enquiry show that if a company wants to
improve it Google search results, it should create its own local profile on Google maps and it should include the object of its activity in its title or in the keywords on its website. Investment devoted in the creation, management and updating of websites, preferably in cooperation with a company specializing in complex internet marketing, covering search engine optimization, design and management of pay-per-click campaigns, usability and accessibility services, as well as social network marketing and reputation management, brings benefits in the form of increased number of customers and improved economic results.
References: [1.] Knutelská, M., Šusteková, D.: Internet v službách
znalostnej ekonomiky = Internet in the services of knowledge-based economy. In: Znalosti pro tržní praxi 2013 = Knowledge for market use 2013. Olomouc: Societas Scientiarium Olomucensis II, 2013. ISBN 978-80-87533-05-5. – p.. 115-120. [electronic resource: http://knowledgeconference.upol.cz/proceedings/ ]
[2.] Ďurica, M., Švábová, L.: Zlepšenie stratégie firmy na základe analýzy zoraďovania lokálnych výsledkov v Google = Improving of company strategy based on the analysis of local search results in Google In: Post, Telecommunications and E-Commerce [electronic resource http://ks.utc.sk/casopis/pdf/II2014/II-2014.pdf]. ISSN 1336-8281. 2014. Vol. 9, no. 2, p. 33-41.
[3.] Ďurica, M., Švábová, L.: Improvement of company marketing strategy based on Google search results analysis. In: ELSEVIER PROCEDIA, Procedia Economics and Finance [2]. ISSN: 2212-5671.2015.( in press)
[4.] Pizza SEO: Optimalizácia pre vyhľadávače. http://pizzaseo.com/sk/sluzby/seo/ Retrieved 7 April 2015
[5.] H1 Slovakia: SEO. www.h1slovakia.sk. Retrieved 7 April 2015
81
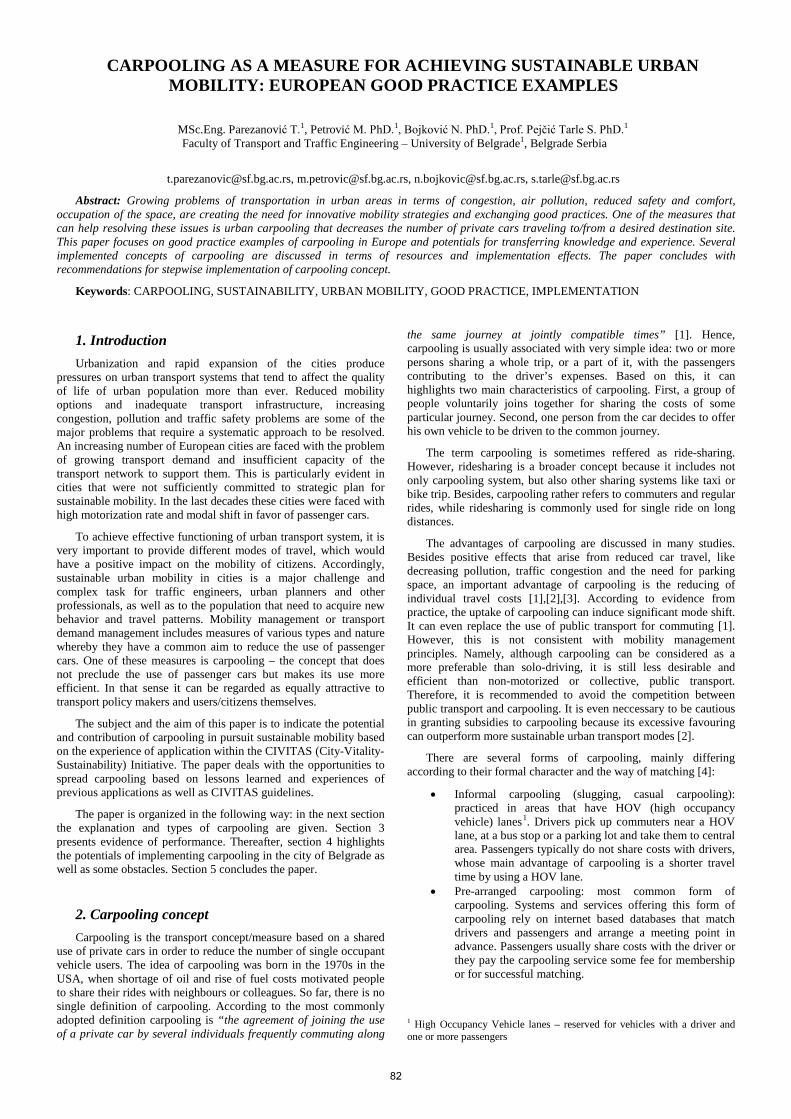
CARPOOLING AS A MEASURE FOR ACHIEVING SUSTAINABLE URBAN MOBILITY: EUROPEAN GOOD PRACTICE EXAMPLES
MSc.Eng. Parezanović T.1, Petrović M. PhD.1, Bojković N. PhD.1, Prof. Pejčić Tarle S. PhD.1
Faculty of Transport and Traffic Engineering – University of Belgrade1, Belgrade Serbia
[email protected], [email protected], [email protected], [email protected]
Abstract: Growing problems of transportation in urban areas in terms of congestion, air pollution, reduced safety and comfort, occupation of the space, are creating the need for innovative mobility strategies and exchanging good practices. One of the measures that can help resolving these issues is urban carpooling that decreases the number of private cars traveling to/from a desired destination site. This paper focuses on good practice examples of carpooling in Europe and potentials for transferring knowledge and experience. Several implemented concepts of carpooling are discussed in terms of resources and implementation effects. The paper concludes with recommendations for stepwise implementation of carpooling concept.
Keywords: CARPOOLING, SUSTAINABILITY, URBAN MOBILITY, GOOD PRACTICE, IMPLEMENTATION
1. Introduction Urbanization and rapid expansion of the cities produce
pressures on urban transport systems that tend to affect the quality of life of urban population more than ever. Reduced mobility options and inadequate transport infrastructure, increasing congestion, pollution and traffic safety problems are some of the major problems that require a systematic approach to be resolved. An increasing number of European cities are faced with the problem of growing transport demand and insufficient capacity of the transport network to support them. This is particularly evident in cities that were not sufficiently committed to strategic plan for sustainable mobility. In the last decades these cities were faced with high motorization rate and modal shift in favor of passenger cars.
To achieve effective functioning of urban transport system, it is very important to provide different modes of travel, which would have a positive impact on the mobility of citizens. Accordingly, sustainable urban mobility in cities is a major challenge and complex task for traffic engineers, urban planners and other professionals, as well as to the population that need to acquire new behavior and travel patterns. Mobility management or transport demand management includes measures of various types and nature whereby they have a common aim to reduce the use of passenger cars. One of these measures is carpooling – the concept that does not preclude the use of passenger cars but makes its use more efficient. In that sense it can be regarded as equally attractive to transport policy makers and users/citizens themselves.
The subject and the aim of this paper is to indicate the potential and contribution of carpooling in pursuit sustainable mobility based on the experience of application within the CIVITAS (City-Vitality-Sustainability) Initiative. The paper deals with the opportunities to spread carpooling based on lessons learned and experiences of previous applications as well as CIVITAS guidelines.
The paper is organized in the following way: in the next section the explanation and types of carpooling are given. Section 3 presents evidence of performance. Thereafter, section 4 highlights the potentials of implementing carpooling in the city of Belgrade as well as some obstacles. Section 5 concludes the paper.
2. Carpooling concept Carpooling is the transport concept/measure based on a shared
use of private cars in order to reduce the number of single occupant vehicle users. The idea of carpooling was born in the 1970s in the USA, when shortage of oil and rise of fuel costs motivated people to share their rides with neighbours or colleagues. So far, there is no single definition of carpooling. According to the most commonly adopted definition carpooling is “the agreement of joining the use of a private car by several individuals frequently commuting along
the same journey at jointly compatible times” [1]. Hence, carpooling is usually associated with very simple idea: two or more persons sharing a whole trip, or a part of it, with the passengers contributing to the driver’s expenses. Based on this, it can highlights two main characteristics of carpooling. First, a group of people voluntarily joins together for sharing the costs of some particular journey. Second, one person from the car decides to offer his own vehicle to be driven to the common journey.
The term carpooling is sometimes reffered as ride-sharing. However, ridesharing is a broader concept because it includes not only carpooling system, but also other sharing systems like taxi or bike trip. Besides, carpooling rather refers to commuters and regular rides, while ridesharing is commonly used for single ride on long distances.
The advantages of carpooling are discussed in many studies. Besides positive effects that arise from reduced car travel, like decreasing pollution, traffic congestion and the need for parking space, an important advantage of carpooling is the reducing of individual travel costs [1],[2],[3]. According to evidence from practice, the uptake of carpooling can induce significant mode shift. It can even replace the use of public transport for commuting [1]. However, this is not consistent with mobility management principles. Namely, although carpooling can be considered as a more preferable than solo-driving, it is still less desirable and efficient than non-motorized or collective, public transport. Therefore, it is recommended to avoid the competition between public transport and carpooling. It is even neccessary to be cautious in granting subsidies to carpooling because its excessive favouring can outperform more sustainable urban transport modes [2].
There are several forms of carpooling, mainly differing according to their formal character and the way of matching [4]:
• Informal carpooling (slugging, casual carpooling): practiced in areas that have HOV (high occupancy vehicle) lanes1. Drivers pick up commuters near a HOV lane, at a bus stop or a parking lot and take them to central area. Passengers typically do not share costs with drivers, whose main advantage of carpooling is a shorter travel time by using a HOV lane.
• Pre-arranged carpooling: most common form of carpooling. Systems and services offering this form of carpooling rely on internet based databases that match drivers and passengers and arrange a meeting point in advance. Passengers usually share costs with the driver or they pay the carpooling service some fee for membership or for successful matching.
1 High Occupancy Vehicle lanes – reserved for vehicles with a driver and one or more passengers
82
• Real time carpooling (instant, ad-hoc or dynamic carpooling): emerged from the flexibilisation of working times. Service providers offer real-time matching: commuter’s demand is instantly matched with a compatible offer in order to keep waiting times as short as possible.
Generally, carpooling can happen in a spontaneous way, as is the case with common household members trips or friends and colleagues travelling together. Accordingly, carpooling can be differentiate as internal or external [2], whereby the internal one appears in the above described situations. It is characterized by a high degree of confidence between carpoolers. On the other hand, the external carpooling happens when there are no specific relation or previous communication between carpooling members. This kind of carpooling is therefore more demanding in terms of organization. This is not only because of possible resistance and mistrust, but also because of the need to determine the location of the carpooling checkpoints. Additionaly, the origins and destinations of driver and carpoolers or carpoolers themselves may be different, which implies the need for complex organization from external sources.
Table 1 summarizes some forms of travel arrangements within a carpooling concept.
Table 1: Some characteristics of carpooling
Degree of connection
High household memebrs
Medium friends, colleagues, neighbours, etc.
Low unrelated people
Origin/destination (O/D)
O matching
non-matching
D matching
non-matching
Travel organising
spontanious
pre-arranged
dynamic
Financial aspects household budget savings
individual travel costs savings
3. Carpooling in Europe – good practice examples A number of studies and initiatives promote the concept of
sustainable mobility. One of them is the CIVITAS initiative whose aim is to support financing sustainable mobility projects and provide the platform for knowledge exchange. The CIVITAS initiative put emphasize on measures that favour efficient and environmentally less harmful transport.
Together with other initiatives that promote sustainable mobility like EPOMM2 (European Platform on Mobility Management) or KonSult3 (Knowledgebase on Sustainable Urban Land use and Transport), CIVITAS project eventually became important knowledge database in this area. Based on practical application, the policy makers have gained valuable insight and evidence on performance for many soft policy measures whose potentials are often questionable. By now, more than 200 cities across Europe joined CIVITAS. They are committed to test innovative urban mobility measures and exchange good practice. Since 2002, CIVITAS initiative has realized a number of carpooling measures in many different cities. A brief overview of some of them is presented below [5].
2 www.epomm.eu 3 http://www.konsult.leeds.ac.uk/
In Debrecen (Hungary), one of the largest university towns in Hungary, carpooling was an innovative solution. With the participation of university student organizations and the use of their intranet, a service for pairing driving was created. The service was promoted by local television and radio stations, leaflets and the university intranet. After completion of the implementation of this system in 2008, there were 100 registered users and 204 ads placed - information about sharing rides. Given that it was a completely new project, the efficacy is obvious.
As well as in Debrecen, the city of Krakow in Poland, began with the implementation of this system primarily for the needs of universities and students, but the ultimate goal was the inclusion of all residents of Krakow. During the first year of implementation, the project under the name Let's ride together attracted 700 users, while the number of registered monthly trip varied from 30 to 50. However, two key barriers in the application of carpooling were detected - the fear for personal safety and the unwillingness of sharing rides with strangers.
In the city of Rome, the primary objective of carpooling system was reducing congestion in the central city area, as well as promoting more efficient ways of using the car. In order to determine the characteristics of travel in the project area, the extensive research with about 100 000 questionnaires was conducted. A simulation model designed to manage carpooling services was developed and installed. The results of the application of these measures were encouriging: a total of 1 180 carpooling users were registered, while the occupancy vehicles raised to 75%.
The concept of carpooling in Perugia (Italy), was primarily intended for students and staff at the University of Perugia. During the implementation the specific prototype-gate was developed. It was able to verify the number of people in the vehicle before entering the parking space designed for carpoolers, by reading occupant's smart cards (prepaid cards for carpooling). Vehicles with three or more passengers were allowed to access the parking lot. Thus, car owners were enforced toincrease the occupancy of their vehicles.
In Toulouse (France) carpooling Association Covoituval operated within the existing mobility center established by the operators of public transport Tisséo who granted it official status. Within two years (2005-2007), the number of registered users increased from 194 to 1 866, where as many as 17% of users shared drive on a daily basis. For this period, about 1 600 000 kilometers were avoided, with a saving of 340 000 kg of carbon dioxide equivalents.
Within CIVITAS II project in the German city of Stuttgart, carpooling application is tested for the purpose of major sporting and other events in the city, or in cases where there is a high demand for transport to the same place at the same time. Existing system-portal for registration and booking driving Pendlernetz Stuttgart was adapted to travel for the purpose of attending sport events, concert, etc. The promotion of this system in particular has contributed to the football club Stuttgart and VfB Stuttgart, for example through the club newsletter and stadium display screens. Also, more than 45 major companies in Stuttgart participated in the organization of promotional campaigns, creating presentations, posters and flyers to their employees presented this new system. As a result of the measure, the demand for carpooling system increased: the number of hits rides on the carpooling portal increased from around 200 000 in 2005 to more than 800 000 in 2008. The fact that more than 120 companies and about 40 municipalities in the region promote the link Stuttgart Pendlernetz Portal confirms the growth of public awareness.
In many other cities across Europe the idea of avoiding solo driving is appearing. For example, the carpooling system in Belgrade still does not exists in the way it is intended to be - for commuters and regular daily rides. Instead, there are recently introduced systems of sharing rides mainly across country and for one-time purpose, which can accordingly be rather considered as
83
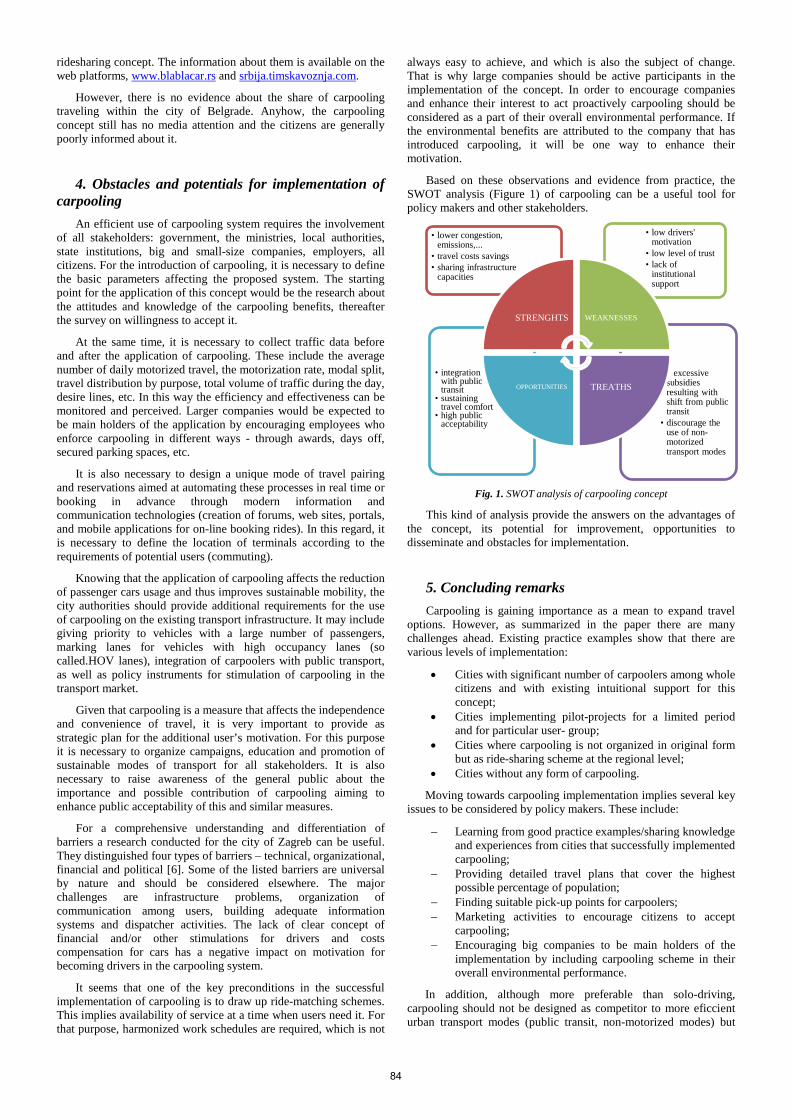
ridesharing concept. The information about them is available on the web platforms, www.blablacar.rs and srbija.timskavoznja.com.
However, there is no evidence about the share of carpooling traveling within the city of Belgrade. Anyhow, the carpooling concept still has no media attention and the citizens are generally poorly informed about it.
4. Obstacles and potentials for implementation of carpooling
An efficient use of carpooling system requires the involvement of all stakeholders: government, the ministries, local authorities, state institutions, big and small-size companies, employers, all citizens. For the introduction of carpooling, it is necessary to define the basic parameters affecting the proposed system. The starting point for the application of this concept would be the research about the attitudes and knowledge of the carpooling benefits, thereafter the survey on willingness to accept it.
At the same time, it is necessary to collect traffic data before and after the application of carpooling. These include the average number of daily motorized travel, the motorization rate, modal split, travel distribution by purpose, total volume of traffic during the day, desire lines, etc. In this way the efficiency and effectiveness can be monitored and perceived. Larger companies would be expected to be main holders of the application by encouraging employees who enforce carpooling in different ways - through awards, days off, secured parking spaces, etc.
It is also necessary to design a unique mode of travel pairing and reservations aimed at automating these processes in real time or booking in advance through modern information and communication technologies (creation of forums, web sites, portals, and mobile applications for on-line booking rides). In this regard, it is necessary to define the location of terminals according to the requirements of potential users (commuting).
Knowing that the application of carpooling affects the reduction of passenger cars usage and thus improves sustainable mobility, the city authorities should provide additional requirements for the use of carpooling on the existing transport infrastructure. It may include giving priority to vehicles with a large number of passengers, marking lanes for vehicles with high occupancy lanes (so called.HOV lanes), integration of carpoolers with public transport, as well as policy instruments for stimulation of carpooling in the transport market.
Given that carpooling is a measure that affects the independence and convenience of travel, it is very important to provide as strategic plan for the additional user’s motivation. For this purpose it is necessary to organize campaigns, education and promotion of sustainable modes of transport for all stakeholders. It is also necessary to raise awareness of the general public about the importance and possible contribution of carpooling aiming to enhance public acceptability of this and similar measures.
For a comprehensive understanding and differentiation of barriers a research conducted for the city of Zagreb can be useful. They distinguished four types of barriers – technical, organizational, financial and political [6]. Some of the listed barriers are universal by nature and should be considered elsewhere. The major challenges are infrastructure problems, organization of communication among users, building adequate information systems and dispatcher activities. The lack of clear concept of financial and/or other stimulations for drivers and costs compensation for cars has a negative impact on motivation for becoming drivers in the carpooling system.
It seems that one of the key preconditions in the successful implementation of carpooling is to draw up ride-matching schemes. This implies availability of service at a time when users need it. For that purpose, harmonized work schedules are required, which is not
always easy to achieve, and which is also the subject of change. That is why large companies should be active participants in the implementation of the concept. In order to encourage companies and enhance their interest to act proactively carpooling should be considered as a part of their overall environmental performance. If the environmental benefits are attributed to the company that has introduced carpooling, it will be one way to enhance their motivation.
Based on these observations and evidence from practice, the SWOT analysis (Figure 1) of carpooling can be a useful tool for policy makers and other stakeholders.
Fig. 1. SWOT analysis of carpooling concept
This kind of analysis provide the answers on the advantages of the concept, its potential for improvement, opportunities to disseminate and obstacles for implementation.
5. Concluding remarks Carpooling is gaining importance as a mean to expand travel
options. However, as summarized in the paper there are many challenges ahead. Existing practice examples show that there are various levels of implementation:
• Cities with significant number of carpoolers among whole citizens and with existing intuitional support for this concept;
• Cities implementing pilot-projects for a limited period and for particular user- group;
• Cities where carpooling is not organized in original form but as ride-sharing scheme at the regional level;
• Cities without any form of carpooling.
Moving towards carpooling implementation implies several key issues to be considered by policy makers. These include:
− Learning from good practice examples/sharing knowledge and experiences from cities that successfully implemented carpooling;
− Providing detailed travel plans that cover the highest possible percentage of population;
− Finding suitable pick-up points for carpoolers; − Marketing activities to encourage citizens to accept
carpooling; − Encouraging big companies to be main holders of the
implementation by including carpooling scheme in their overall environmental performance.
In addition, although more preferable than solo-driving, carpooling should not be designed as competitor to more eficcient urban transport modes (public transit, non-motorized modes) but
• excessive subsidies resulting with shift from public transit
• discourage the use of non-motorized transport modes
• integration with public transit
• sustaining travel comfort
• high public acceptability
• low drivers' motivation
• low level of trust • lack of
institutional support
• lower congestion, emissions,...
• travel costs savings • sharing infrastructure
capacities
STRENGHTS WEAKNESSES
TREATHS OPPORTUNITIES
84

rather to be planned as a part of joint effort to achieve sustainable urban mobility.
6. References
[1] Galizzi, M., 2004. The economics of carpooling: a survey for Europe. Workshop, University of Bergamo, Italy.
[2] Vanoutrive, T., Vijver, E.V.D., Malderen, L.V., Jourquin, B., Thomas, I., Verhetsel, A., Witlox, F., What determines carpooling to workplaces in Belgium: location, organisation or promotion?. Journal of Transport Geography 22, 2012, 77-86.
[3] Abrahamse, W., Keall, M., Effectiveness of a web-based intervention to encourage carpooling to work: A case study of Wellington, New Zealand. Transport Policy 21, 2012, 45-51.
[4] Handke, V., Jonuschat, H., Flexible ridesharing - new opportunities and service concepts for sustainable mobility. Springer, Berlin, 2013.
[5] Civitas Initiative – Clean and Better Transport in Cities, Sustainable mobility highlights 2002-2012, Available from: http://www.civitas.eu/sites/default/files/documents/file/2013_car-independent_car-pooling.pdf
[6] Slavulj, M., Grgurević, I., Golubić, J., Analysis of possible risk in introducing congestion charging and carpooling measures in Zagreb. In: Longhurts, J.W.S., Brebbia, C.A., editors. Urban Transport XVIII: Urban transport and the environment in the 21st century, WIT Press, 2012, 433-445.
Acknowledgements
This paper is a part of the project “Critical infrastructure management for sustainable development in postal, communication and railway sector of Republic of Serbia”, funded by the Ministry of Education and Science of the Republic of Serbia, Project number: TR36022.
85
DETERMINATION OF OIL SPILL PARAMETERS IN THE PROCESS OF OIL AND OIL PRODUCTS SPREADING ON THE WATER SURFACE
ОПРЕДЕЛЕНИЕ ПАРАМЕТРОВ НЕФТЯНОГО ПЯТНА В ПРОЦЕССЕ РАСТЕКАНИЯ НЕФТИ И
НЕФТЕПРОДУКТОВ ПО ВОДНОЙ ПОВЕРХНОСТИ
Dr. eng.Tsetskhladze R., Assoc.Prof. Chogovadze J., Assoc.Prof. Lomidze A., Assoc.Prof. Mardaleishvili N. Akaki Tsereteli State University, Kutaisi, Georgia
Abstract: The growing marine pollution by oil strengthens the interest not only in the methods of combating their causes, but in methods of their forecasting as well on the basis of modeling and calculation of spreading oil spreading on the sea for some reason or other.
The paper dwells on a mathematical model of calculating the area of oil spill spreading. The developed methodology for calculating change in the radius and area of oil spill is represented by function of three arguments: oil product density ρo, spillover volume V and spreading time t.
The proposed model allows forecasting the initial stages of oil spreading. The given methodology enables to determine transit time of the process of oil spill spreading from the first phase to the second one, and from the second to the third one, and the radius and area of oil spill spreading. KEY WORDS: MATHEMATICAL MODELING, POLLUTION, WATER AREAS, OIL. OIL PRODUCT; SEA. 1. Introduction
In recent years, the interest in studies of mechanism of oil spreading in the marine environment has grown significantly. Total ingress of oil products into the sea at a first approximation is proportional to the volume of the world oil production that conditions the growing marine pollution hazard. Marine pollutions caused by tanker and other ship accidents are the most hazardous because they are not predictable and besides they are of the local nature at their high power. Despite permanent tightening of safety standards, the accidents during transportation of oil products still remain pernicious for the environment.
While planning and carrying out works on combating accidental spills on the sea, there will usually be a need to forecast oil spreading on the sea. These forecasts allow, in particular, warning of possibility of coastal zone pollution by oil, crossing the areas of intensive economic activities by oil spill, vessels’ courses and so on.
2. Prerequisites and means for solving the problem
As is well-known, Black Sea is a landlocked water object, which is of considerable transport importance, based on rapidly developing port infrastructure, which is oriented on the export of oil and oil products. At the same time, this water object has a huge recreation potential, whose development and even its existence can be endangered.
In the near future, the annual volume of oil transportations over Black Sea may be increased to 220-250 tons. Herewith, through the port terminals of: Ukraine there is anticipated to transport up to 50 mln tons per year, Russia – up to 60 mln tons, Georgia – up to 30 mln tons, Bulgaria – up to 25 mln tons and Turkey – about 35 mln tons per year.
Despite permanent tightening of safety standards, transportation of oil products still remain pernicious for the environment. The main problem in sealift transportation of oil and oil products is safeguarding the operation of tankers in part of preventing oil spills, explosions and fires.
Studies of processes associated with oil and oil products spreading on the water surface were performed by many famous scientists. The papers [1,2,3] dwell on spreading of oil slick, which is formed at oil spill on the sea and dynamics of oil pollution in the sea coastal zone. There is proposed a mathematical model of this process.
3. Mathematical model The modern scientific and technical literature on studies of
physical processes of oil spreading on the water surface [4], [5] mostly dwells on three methodologies of calculating the time variations of the radius of oil spill. In these methodologies, the radius of oil spill is represented by function of three arguments: oil product density ρo, spillover volume V and spreading time t.
There is conducted the analysis of the developments in the field of estimating parameters of oil spill during its spreading on the water surface. As a basic one, there has been chosen the Fay methodology, which envisages the phase changes of physical processes during the spreading of oil spill.
In Fay’s theory, oil spreading occurs under gravity and surface tension at different stages by forces of inertia and viscosity [6].
According to Fay methodology [5], oil spreading on the surface usually has three phases: inertial, gravitational-viscose and surface tension phase.
At an initial stage, of high importance are gravity and inertia forces.
(1) .)(41
2
⋅
−⋅⋅⋅= tVgktR
w
owi ρ
ρρD
In the gravitational-viscose phase (second one) of oil pollution spill spreading, there are taken into account viscose friction forces in the slick. In this case calculations are made in accordance with formula
(2) .1)(61
21
23
2
⋅⋅
−⋅⋅⋅=
вw
owv tVgktR
νρρρ
D
During the third phase of oil pollution spill spreading, most prevailed are surface tension forces (surface tension phase). In this case calculations are made by
(3) .1)(41
232
⋅
⋅⋅⋅=ww
t tktRνρ
σD
In these expressions, the methodologies for assessing the radius R(t) of oil spill spreading, there are used the following designations: νw – coefficient of kinematic viscosity of water, m2/sec; ki = 1,14; kv =1,45; kt = 2,3. σ – resulting surface tension, which according to [6] equals 0,02...0,03 N/m;
86
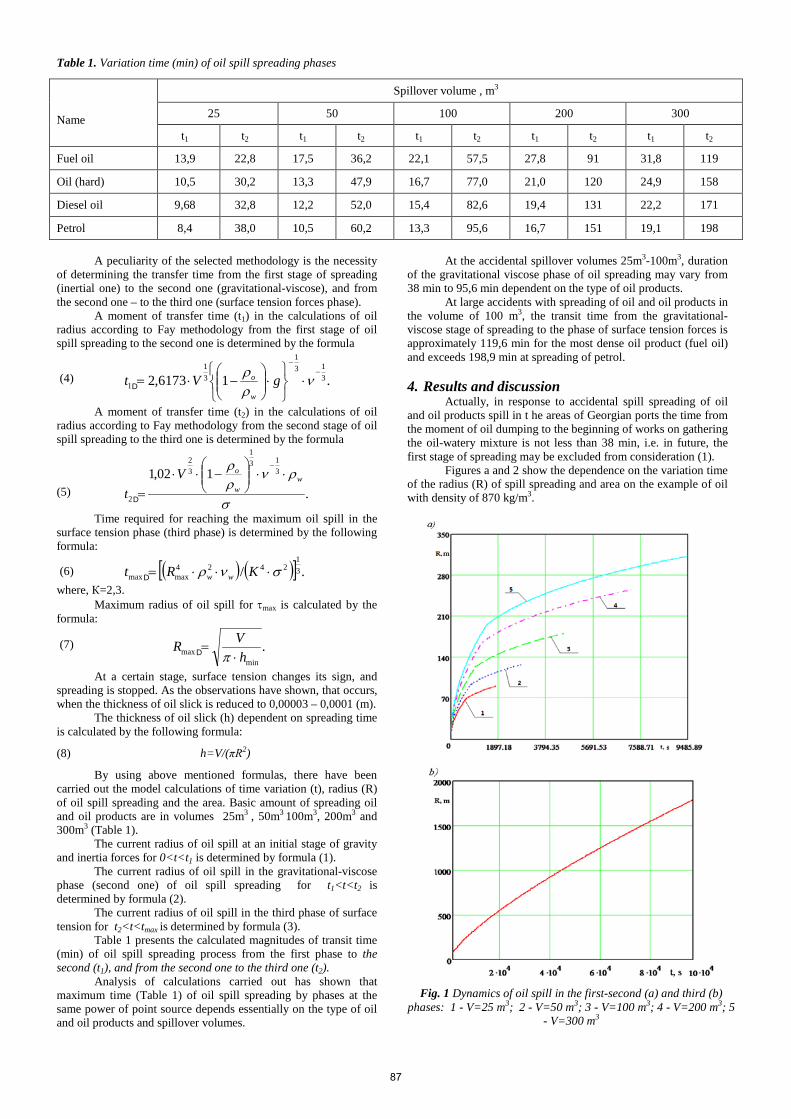
Table 1. Variation time (min) of oil spill spreading phases
Name
Spillover volume , m3
25 50 100 200 300
t1 t2 t1 t2 t1 t2 t1 t2 t1 t2
Fuel oil 13,9 22,8 17,5 36,2 22,1 57,5 27,8 91 31,8 119
Oil (hard) 10,5 30,2 13,3 47,9 16,7 77,0 21,0 120 24,9 158
Diesel oil 9,68 32,8 12,2 52,0 15,4 82,6 19,4 131 22,2 171
Petrol 8,4 38,0 10,5 60,2 13,3 95,6 16,7 151 19,1 198
A peculiarity of the selected methodology is the necessity of determining the transfer time from the first stage of spreading (inertial one) to the second one (gravitational-viscose), and from the second one – to the third one (surface tension forces phase).
A moment of transfer time (t1) in the calculations of oil radius according to Fay methodology from the first stage of oil spill spreading to the second one is determined by the formula
(4) .16173,2 313
1
31
1
−−
⋅
⋅
−⋅= νρρ gVt
w
oD
A moment of transfer time (t2) in the calculations of oil radius according to Fay methodology from the second stage of oil spill spreading to the third one is determined by the formula
(5) .102,1 3
131
32
2 σ
ρνρρ
ww
oVt
⋅⋅
−⋅⋅
=
−
D
Time required for reaching the maximum oil spill in the surface tension phase (third phase) is determined by the following formula:
(6) ( ) ( )[ ] ./ 31
2424maxmax σνρ ⋅⋅⋅= KRt wwD
where, К=2,3. Maximum radius of oil spill for τmax is calculated by the
formula:
(7) .min
max hVR⋅
=πD
At a certain stage, surface tension changes its sign, and spreading is stopped. As the observations have shown, that occurs, when the thickness of oil slick is reduced to 0,00003 – 0,0001 (m).
The thickness of oil slick (h) dependent on spreading time is calculated by the following formula:
(8) h=V/(πR2)
By using above mentioned formulas, there have been carried out the model calculations of time variation (t), radius (R) of oil spill spreading and the area. Basic amount of spreading oil and oil products are in volumes 25m3 , 50m3 100m3, 200m3 and 300m3 (Table 1).
The current radius of oil spill at an initial stage of gravity and inertia forces for 0<t<t1 is determined by formula (1).
The current radius of oil spill in the gravitational-viscose phase (second one) of oil spill spreading for t1<t<t2 is determined by formula (2).
The current radius of oil spill in the third phase of surface tension for t2<t<tmax is determined by formula (3).
Table 1 presents the calculated magnitudes of transit time (min) of oil spill spreading process from the first phase to the second (t1), and from the second one to the third one (t2).
Analysis of calculations carried out has shown that maximum time (Table 1) of oil spill spreading by phases at the same power of point source depends essentially on the type of oil and oil products and spillover volumes.
At the accidental spillover volumes 25m3-100m3, duration of the gravitational viscose phase of oil spreading may vary from 38 min to 95,6 min dependent on the type of oil products.
At large accidents with spreading of oil and oil products in the volume of 100 m3, the transit time from the gravitational-viscose stage of spreading to the phase of surface tension forces is approximately 119,6 min for the most dense oil product (fuel oil) and exceeds 198,9 min at spreading of petrol.
4. Results and discussion
Actually, in response to accidental spill spreading of oil and oil products spill in t he areas of Georgian ports the time from the moment of oil dumping to the beginning of works on gathering the oil-watery mixture is not less than 38 min, i.e. in future, the first stage of spreading may be excluded from consideration (1).
Figures a and 2 show the dependence on the variation time of the radius (R) of spill spreading and area on the example of oil with density of 870 kg/m3.
Fig. 1 Dynamics of oil spill in the first-second (a) and third (b)
phases: 1 - V=25 m3; 2 - V=50 m3; 3 - V=100 m3; 4 - V=200 m3; 5 - V=300 m3
87
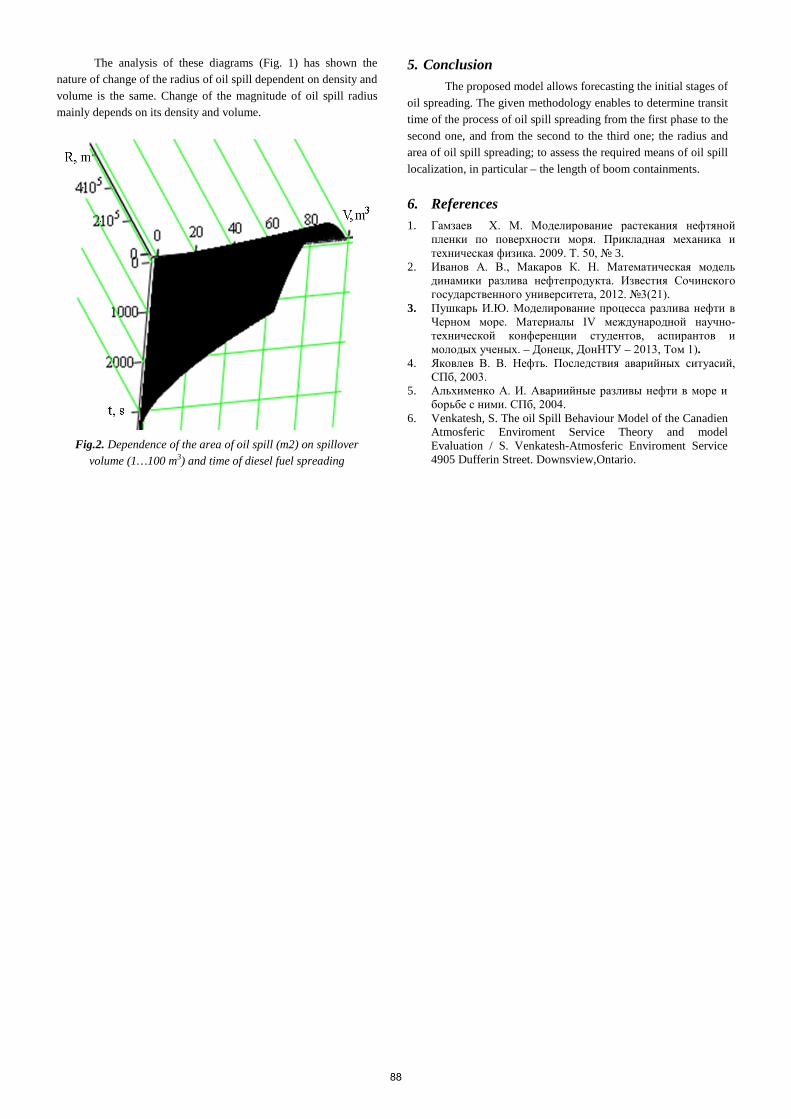
The analysis of these diagrams (Fig. 1) has shown the nature of change of the radius of oil spill dependent on density and volume is the same. Change of the magnitude of oil spill radius mainly depends on its density and volume.
Fig.2. Dependence of the area of oil spill (m2) on spillover
volume (1…100 m3) and time of diesel fuel spreading
5. Conclusion The proposed model allows forecasting the initial stages of
oil spreading. The given methodology enables to determine transit time of the process of oil spill spreading from the first phase to the second one, and from the second to the third one; the radius and area of oil spill spreading; to assess the required means of oil spill localization, in particular – the length of boom containments.
6. References 1. Гамзаев Х. М. Моделирование растекания нефтяной
пленки по поверхности моря. Прикладная механика и техническая физика. 2009. Т. 50, 3.
2. Иванов А. В., Макаров К. Н. Математическая модель динамики разлива нефтепродукта. Известия Сочинского государственного университета, 2012. 3(21).
3. Пушкарь И.Ю. Моделирование процесса разлива нефти в Черном море. Материалы IV международной научно-технической конференции студентов, аспирантов и молодых ученых. – Донецк, ДонНТУ – 2013, Том 1).
4. Яковлев В. В. Нефть. Последствия аварийных ситуасий, СПб, 2003.
5. Альхименко А. И. Авариийные разливы нефти в море и борьбе с ними. СПб, 2004.
6. Venkatesh, S. The oil Spill Behaviour Model of the Canadien Atmosferic Enviroment Service Theory and model Evaluation / S. Venkatesh-Atmosferic Enviroment Service 4905 Dufferin Street. Downsview,Ontario.
88
A MOBILE APPLIKATION OF REGIONAL TOURIST ROUTES
МОБИЛЬНАЯ АПЛИКАЦИЯ РЕГИОНАЛЬНЫХ ТУРИСТИЧЕСКИХ МАРШРУТОВ
Prof. Dr.Tsiramua S 1.,Prof. Dr. Kochadze T2.,Assoc.Prof. Dr. Chogovadze D 2., Assoc.Prof. Dr.Dangadze I 2.
University of Georgia 1 – Tbilisi, Georgia AkakiTsereteli state University2- Kutaisi, Georgia
[email protected],[email protected], [email protected], [email protected]
Abstract: It is impossible even imagine tourism development without using modern innovative technologies. The modern WEBGIS and Mobile systems allow putting in an absolutely new light the country’s tourist potential.
The tourist routes, tourist facilities and infrastructures indicated on the digital interactive geo-information map (GIS) with textual and visual (photo, video) information, which are integrated on the tourist web-portal and in the touch-screen devices (cell phones, graphics pads, smart-phones) make the mentioned information available in any country of the world.
The Center of Geographic Information of Georgia has developed a mobile application “TravelGIS” for the mobile devices operating on the platform of Android and IOS, which have no analog in the world. The mentioned application is designed in three languages (Georgian, English, Russian) and represents the information-communicative means for tourist organizations (companies and tour operators), tourist destinations and for promoting the whole country’s tourist potential. Any interested person can find and select on his own cell phone the information by any desired criteria – country, region, Tourist Company, infrastructure unit, type of tourist services, duration and complexity).
KEY WORDS: MOBILE APPLIKATION; TOURIST TOURE; CENTER OF GEOGRAPHIC INFORMATION 1. Introduction
Development of the world tourist market fosters search of ways foe effective development of tourism. At present stage, the information technology and software tools become far more widespread in tourist industry. The activities on forming, promoting and marketing of tourist product become impossible without the adequate information management.
GIS – is a modern computer technology for mapping and analysis of real-world objects, as well as developments that took place on this planet. This technology allows combining the work with a database, for example, the query and statistical analysis with the opportunity of a full-fledged visualization and geographical analysis provided by the maps. These opportunities set GIS apart from other information systems and present unique opportunities for its use in tourism.
The GISs vary in data domain of information modeling, for instance, urban GIS, environmental GIS and so on; among them the land information systems are widely used. The problem orientation of GIS depends on those problems (scientific and applied) which are solving within it, including inventory of resources (including cadastre), analysis, assessment, monitoring, management and planning, and support for decision-making. The integrated GISs combine the functional capabilities of GISs and the digital image processing systems (remote sensing data) in a uniform integrated environment [2].
2. Preconditions and means for resolving the problem The GIS technologies are used in various fields of man’s
activity: geodesy, land resources management, urban management, assessment inventory, planning of forest resources, landscape ecology, and fire probability.
GIS helps to improve the quality of life through the use of desktop mapping application of the GGP Systems Company. The Project enables to estimate a quantity and availability of the existing recreation areas in the open air.
At the present stage, the GIS technologies are actively used in touristic designing and when organizing exploitation of tourist resources and tourist industry venues. The Google Earth service allows traveling by interactive map of the planet, which is created from the ideally “sewn” to each other satellite imageries with a detailed three-dimensional visualization. On the interactive world map it is possible to study any section and find any point (including by searching), look more closely at the area around it, and, if
necessary, even to map an optimal route. When necessary, it is possible to fly over the territory at a specified height and speed, measure the distance, work with GPS and create our own map by laying the own objects on the original map ofGoogle Earth.
There are available on the Internet the interactive maps of some cities, and we shall note that some of them are prepared at a very high level, but most of them still leave much to be desired. The GISs play a special role when developing the projects of long-term planning of tourism development in the region. A peculiarity of geo-informational approach in working out the programs for regional tourism development is creation of a uniform intellectual system, which keeps together: geo-data base, actual non-uniformly scaled digital mapping bases and satellite imageries of the average and high solution, as well as materials of video-observations; methods and technologies of the automatic spatial-temporal analysis of monitoring and modeling; modern geo-portal solutions ensuring the publication and internal use of spatial information through the WEB-technologies [3].
Combination of rich cultural and historical heritage of the Imereti region of Georgia with its natural-resource potential promotes the development of various types of tourism in the region: mental-patriotic; rural; agrarian-ethnographical; children’s and youth; business and scientific; eventful; winter tourism; spa and health tourism and so on.
The development of tourism in the Imereti region is largely dependent upon the effectiveness of government regulation and support of travel industry. For the use of tourism as one of the directions of structural economic conversion, it is necessary to increase the effectiveness of regional policy in the field of tourism, strategic planning of tourism development on the basis of systems approach, use of the program-target, design methods of management, and mechanisms of the state-private partnership. We believe that, at present tourism did not reach the required level of development for influencing the economy of the regions.
One of the topical issues of tourist activities in the regions is an organizationof recreational spaces in the suburban zone for urban residents during weekends and public holidays. In this context, it is necessary to offer the scientifically justified programs for distribution of visitors on the territory of suburban zone. Geographical Information System, which contains information on capabilities and peculiarities of a particular territory, should allow creating the project of exploitation of suburban recreation zones. Information provided by Geographical Information System should be divided into the layers dependent on lines of its application:
89
natural-landscape, historical-cultural, transport, lodging facilities services and so on [2].
The conducted analysis of GISs developed in various regions of the country enables us to conclude that at present in Georgia, the scientific-practical activities on introduction and application of geo-information systems in the field of tourism for planning and monitoring of activities is not developed yet. With creation of prospective development programs in Georgia’s regions, the technologies should become the essential foundation of a uniform tourist-recreation system of Georgia.
There is established in Georgia a non-governmental organization Geo-Information Center of Georgia (TravelGIS), which is aimed at promoting the development of tourism infrastructure [3, 4]. The main direction of the activities include as follows: creation of the National Geo-Information System of Tourism; the continuous safety monitoring system of the group and individual tourist routes across Georgia by using the GIS and GPS technologies; organization of virtual trips on the country’s tourist routes for domestic and foreign travelers.
The modern GIS technologies allow creating the geo-tourist GISs, in other words, the mass integrated data of tourism for organizing the tourist activities. Each traveler by using the materials of such GIS will be able to quickly accept any information in the form of maps, digital models, graphs, diagrams and other modes of visualization. The specialized tourism GIS optimally has four databases: tourist resources, service characteristics, tourist statistics, and geographical information. The development of the project of a particular GIS is carried out, as a rule, by the group of various-profile specialists engaging in work the additional executives at different stages. These stages comprise: formulation of goals and specification, determining the organizational resources and restrictions, generation and assessment of alternative projects, integral estimation of costs and profit.
Threemaindevelopmentstages: – evaluation of the goal and resources (description of the
goal and consumer needs, description and assessment of required data and methods of gridding, inventory of sources and specification of data files, evaluation of the system’s specification);
– generationandassessmentofalternativeprojects (descriptionoftherequirementsofequipmentandmathematicalsupport,feasibilityandcostsevaluation, descriptionandassessmentoflegalandpoliticalaspects);
– integral estimation of the systems’ specification (final assessment of profit, costs and impact).
Aggregate of control means (a command menu, toolbars, pictograms, buttons, dialog boxes, etc.), which are used for interaction of user with the geo-information system, forms the user interface of GIS. By using these control means, the user carries out certain functions, runs applications, adjusts the required mode of operation (for example, selects the unit of measurement) and so on.
With the purpose of promoting the tourist resources of the country’s regions, the Geo-Information Center of Tourism has developed an application of tourist routes TravelGIS for the Android and IOS mobile phones. The mentioned application is designed in three languages (Georgian, English, Russian) and it can be used for choosing the required tour by some parameters – visited country, Tourist Company, type of tour and others. The tour chosen in such a way “opens’ on the electronic map on the display of your smart-phone in the form of linear object. The tourist resources (the monuments of cultural heritage, natures, museums, etc.) as well as the objects of tourist infrastructure (hotels, food-service objects, camping and picnic sites, etc.) are designated on the electronic map in the form of point objects. After pressing any of them on the smart-phone display, there will “open’” the photo of this particular object and displays textual information. Here, on the electronic map, by using the GIS technology, you will be able to detect precisely your location and thereby to exclude the possibility of deviation from the route, and to ensure tour safety.
At present, the market of geo-information services is actively developing. It is necessary to create the national geo-information system on the basis of regional GIS systems, and to
integrate it in the world geo-information system of tourism. The regional GIS system should contain the actual objects of tourism shown on the tourist geo-information map with the appropriate geo-information data, as well as with visual and textual information.
In accordance with the regional economic policy and on the basis of integrated territorial planning, the investment projects of tourism development in the regions should be accompanied by implementing complex measures, and first of all, by the creation of the effective geo-information map containing the map material, the objects of the world’s cultural heritage, conservation areas, national parks, road conditions, lodging objects, internal transport and so on.
The wide application of geo-information technologies should significantly foster the expansion to the required level of territorial planning, and therefore to foster the increasing validity of made management decisions, including related to the tourism development [1].
3. Conclusion
In this context, it would be advisable to develop the program of the recreation tourism development in the Imereti region on the basis of using the geo-information technologies, which should envisage:
- study of natural monuments and other tourist attractions in the region;
- designing of new tourist routes with use of geo-information systems of tourism;
- the establishment of the continuous monitoring system throughout the territory of the Imereti region with the use of modern information technologies;
- optimizing the process of choosing the tourist routes; - issuance of information materials on tourism; - organization of trainings, seminars, exhibitions, contests
and conferences; - participation in creating and improving the legal
framework on tourism. The development of the program of the recreation tourism
development in the Imereti region on the basis of using the geo-information technologies should enable us to carry out the analysis, define the territories suitable for organizing a particular type of tourism, and identify the relationships between various parameters.
The establishment of tourism-oriented GIS of the Imereti region of Georgia will enable us to make spatial requests and carry out the analysis, define the territories suitable for the required activities, and identify the relationships between various parameters. Information placed on the map of resorts, their disposition plans, quality of service, photos of rooms, beaches, names of local cuisine dishes and other information will provide the tourism companies having access to this GIS with the considerable advantages.
4. Literature
1. A.V. Vasilyev. The design problems of tourist clusters
and modern technologies for their modeling. // problems of modern economy. – 2012. - 3 (43). – pp. 329–332.
2. E.V. Vishnevskaya. Actual problems of using GIS in the development of regional tourism in the Belgorod region // E.V. Vishnevskaya, M.I. Litvinova, I.V. Bogomazova // Basic researches. – М., 2012. – 3. – pp. 177–180
3. S. Tsiramua, G. Tsiramua. Geo-information technologies in tourism II International Scientific-Practical Conference “Tourism: economy and business” Batumi, 2011
4. K. Abuladze, S. Tsiramua, G. Tsiramua. A mobile application of tourism “TravelGIS”. V International Scientific-Practical Conference “Tourism: economy and business” Batumi, 2014.
The publication is made under support of Shota Rustaveli National Science Foundation.
90

HOW IS THE ARTIFICIAL INTELLIGENCE USED IN APPLICATIONS FOR TRAFFIC MANAGEMENT
RNDr. Šusteková D. PhD., RNDr. Knutelská M. PhD Faculty of Operation and Economics of Transport and Communications, Department of Quantitative Methods and Economic Informatics,
University of Žilina, Žilina, Slovak Republic
Abstract: There are described in the article current applications with the artificial intelligence and value of using it for the road transport efficiency. This paper deals with concept of artificial intelligence, main reasons for successful growing of AI at present and main areas of AI using in transportation. One part of the article aims to define the artificial neural networks and basic elements of them. The article describes the reason of use them in transportation problems solving, the possibility of using neural networks in the road transport, examples of tasks solvable by neural nets, the advantages and disadvantages of using neural networks.
Keywords: PERCEPTRON, ARTIFICIAL INTELLIGENCE, NEURAL NETS, FEED FORWARD NEURAL NET, UNMANNED
Príspevok vznikol v nadväznosti na riešený projekt spolufinancovaný zo zdrojov EÚ s názvom „Kalita vzdelávania a rozvoj ľudských zdrojov ako piliere vedomostnej spoločnosti na Fakulte PEDAS Žilinskej univerzity v Žiline“, ITMS kód projektu 26110230083“, riešeného na Žilinskej univerzite v Žiline.
This paper is prepared with the support of the project "Education quality and human resources development as the pillars of a knowledge society at the Faculty PEDAS, University of Žilina in Žilina.“, ITMS project code 26110230083, University of Žilina.
Moderné vzdelávanie pre vedomostnú spoločnosť/Projekt je spolufinancovaný zo zdrojov EÚ
Modern kowledge society education /
Project is co-financed by the EC funds
1. Introduction
Intelligent technologies which are penetrating to different parts of human life don't ignore transportation. As an example we can take intelligent transport systems and automated transport systems which use information, transportation and communication technologies implemented to vehicles or to infrastructure. These systems aim to increase people or goods mobility along with increasing road safety and transportation comfort, reduction of transport collisions and impacts on environment.
Information technologies usage became inherent component of “human“ development. Ability to effectively process and use information and knowledge became one of the most important parts of economic growth and prosperity. In transportation, the still changing environment of many participants, special attention should be paid to artificial intelligence – progressive information technology.
2. What Artificial intelligence is and main areas of its utilization in transportation
There are a lot of definitions of Artificial intelligence (AI), for better imagination what AI is I choose following two from Marvin Minsky and John L. Gordon:
Marvin Minsky : Artificial intelligence is the science of making machines or systems do things that would require intelligence if done by men:
John L. Gordon: The aim of Artificial Intelligence is to create intelligent machines and through this, to understand the principles of intelligence. At the moment, we can settle for creating less stupid machines.
According to these definitions we can say that AI systems are characterized by:
They think like people
They act like people
They think reasonably (rational)
91
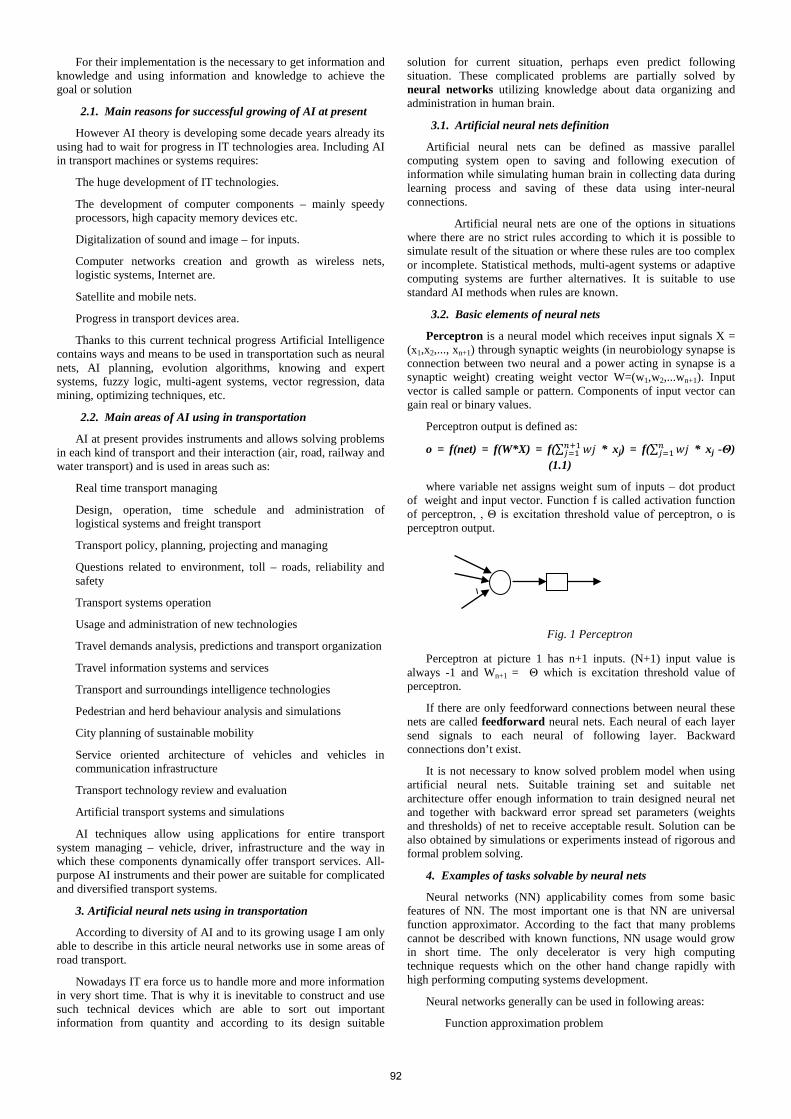
For their implementation is the necessary to get information and knowledge and using information and knowledge to achieve the goal or solution
2.1. Main reasons for successful growing of AI at present
However AI theory is developing some decade years already its using had to wait for progress in IT technologies area. Including AI in transport machines or systems requires:
The huge development of IT technologies.
The development of computer components – mainly speedy processors, high capacity memory devices etc.
Digitalization of sound and image – for inputs.
Computer networks creation and growth as wireless nets, logistic systems, Internet are.
Satellite and mobile nets.
Progress in transport devices area.
Thanks to this current technical progress Artificial Intelligence contains ways and means to be used in transportation such as neural nets, AI planning, evolution algorithms, knowing and expert systems, fuzzy logic, multi-agent systems, vector regression, data mining, optimizing techniques, etc.
2.2. Main areas of AI using in transportation
AI at present provides instruments and allows solving problems in each kind of transport and their interaction (air, road, railway and water transport) and is used in areas such as:
Real time transport managing
Design, operation, time schedule and administration of logistical systems and freight transport
Transport policy, planning, projecting and managing
Questions related to environment, toll – roads, reliability and safety
Transport systems operation
Usage and administration of new technologies
Travel demands analysis, predictions and transport organization
Travel information systems and services
Transport and surroundings intelligence technologies
Pedestrian and herd behaviour analysis and simulations
City planning of sustainable mobility
Service oriented architecture of vehicles and vehicles in communication infrastructure
Transport technology review and evaluation
Artificial transport systems and simulations
AI techniques allow using applications for entire transport system managing – vehicle, driver, infrastructure and the way in which these components dynamically offer transport services. All-purpose AI instruments and their power are suitable for complicated and diversified transport systems.
3. Artificial neural nets using in transportation
According to diversity of AI and to its growing usage I am only able to describe in this article neural networks use in some areas of road transport.
Nowadays IT era force us to handle more and more information in very short time. That is why it is inevitable to construct and use such technical devices which are able to sort out important information from quantity and according to its design suitable
solution for current situation, perhaps even predict following situation. These complicated problems are partially solved by neural networks utilizing knowledge about data organizing and administration in human brain.
3.1. Artificial neural nets definition
Artificial neural nets can be defined as massive parallel computing system open to saving and following execution of information while simulating human brain in collecting data during learning process and saving of these data using inter-neural connections.
Artificial neural nets are one of the options in situations where there are no strict rules according to which it is possible to simulate result of the situation or where these rules are too complex or incomplete. Statistical methods, multi-agent systems or adaptive computing systems are further alternatives. It is suitable to use standard AI methods when rules are known.
3.2. Basic elements of neural nets
Perceptron is a neural model which receives input signals X = (x1,x2,..., xn+1) through synaptic weights (in neurobiology synapse is connection between two neural and a power acting in synapse is a synaptic weight) creating weight vector W=(w1,w2,...wn+1). Input vector is called sample or pattern. Components of input vector can gain real or binary values.
Perceptron output is defined as:
o = f(net) = f(W*X) = f(∑ 𝑤𝑗𝑛+1𝑗=1 * xj) = f(∑ 𝑤𝑗𝑛
𝑗=1 * xj -Θ) (1.1)
where variable net assigns weight sum of inputs – dot product of weight and input vector. Function f is called activation function of perceptron, , Θ is excitation threshold value of perceptron, o is perceptron output.
Fig. 1 Perceptron
Perceptron at picture 1 has n+1 inputs. (N+1) input value is always -1 and Wn+1 = Θ which is excitation threshold value of perceptron.
If there are only feedforward connections between neural these nets are called feedforward neural nets. Each neural of each layer send signals to each neural of following layer. Backward connections don’t exist.
It is not necessary to know solved problem model when using artificial neural nets. Suitable training set and suitable net architecture offer enough information to train designed neural net and together with backward error spread set parameters (weights and thresholds) of net to receive acceptable result. Solution can be also obtained by simulations or experiments instead of rigorous and formal problem solving.
4. Examples of tasks solvable by neural nets
Neural networks (NN) applicability comes from some basic features of NN. The most important one is that NN are universal function approximator. According to the fact that many problems cannot be described with known functions, NN usage would grow in short time. The only decelerator is very high computing technique requests which on the other hand change rapidly with high performing computing systems development.
Neural networks generally can be used in following areas:
Function approximation problem
w
92
Category classification, situation classification
Prediction problem solving
Signal transformation
Association problems, memory simulation
4.1. Advantages of using neural nets in transportation
Following advantages and disadvantages of using neural nets applies broadly as well as in road transport. For this reason I am mentioning them in this article:
Neural nets allow parallel data processing and by using appropriate hardware it is possible to allocate calculations on more parallel processors.
This capability of NN is essential for example to construct unmanned vehicle due to a processing a huge number of inputs from surroundings during driving the vehicle.
Neural net doesn’t need any information about process structure to which it is implicated, it learns and does not to be reprogrammed.
Instead of it is possible use just suitably chosen training set and appropriate network architecture. Train with back propagation of errors set the parameters (weights and thresholds) of network so that we get acceptable solution. The solution can be finalized by simulations and experimentation rather than rigorous and formal approach to the problem.
If neural net is used with learning algorithm it can be adapted to changes in parameters.
Neural nets are suitable for identification, classification and sorting of models – using in recognition of road signs, registration plates, driving licenses, people faces and others.
If neural nets are implemented without learning algorithm they are quite fast.
Learning algorithm is a huge programme process that can significantly slow the NN.
NN allows abstracting managing rules for different regulators (such as human being or regulator with long computing time) and replace them.
Very important in unmanned vehicles – human solutions in the cars are relatively so slow that cause most of road accidents. A decisions of NN system is disproportionately faster.
NN allows data reduction to smaller dimension.
NN are universal approximator – they allow approximation of any function with any accuracy.
4.2. Disadvantages of using neural nets in transportation
Artificial intelligence and NN also need a huge hardware support.
There is no methodology for neural net architecture and functions for neural description. Implementation is done by experiments and mistakes what increase time demand on solution.
The architecture of a neural network is different from the architecture of microprocessors therefore needs to be emulated.
Learning process can take very long time.
During the learning process can became the situation when neurons reach the state of saturation consequently their outputs lead to extreme values for example sensible error signals.
5. Some neural nets application description in road transport
The following section describes some important and interesting applications of neural networks in a road transport and explains NN using in these solutions.
5.1. Driving of unmanned vehicles or computer controlled cars
One of the most valid successes at present is using artificial neural nets in the road transport. When appeared vehicles on the road without steering wheels of a man for the first time they aroused a wave of interest. Simply because it is amazing to see how the car passes several thousand kilometres without a driver and no crash.
Currently is their development in full drift and they have already driven more than a half million kilometres. In one US state there is a law allowing unmanned vehicles on the roads. Unmanned vehicles controlled by computer covered many different transport situations without an incident.
Unmanned vehicles development is related to development of Automatic Transport Systems ATS. These systems use only electric vehicles and different transport organization as usual. Main feature is using only unmanned vehicles and eliminating other drivers from limited ATS area what will bring more discipline and less accidents in the transport. Only electric vehicles are planned in this project to clear away exhaust fumes and to enrich environment. Such projects are currently realized in some countries, in others is its development financed.
5.2. Driver behaviour modelling
Sometimes using GPS or other navigation doesn’t have to be the best solution. Driver has to decide about by-pass road or using highroad etc. There are models allowing designing such transport systems which consider safety and effectiveness of human mobility. Feed forward neural nets are used in analysing desirable road from interactive simulators.
Such system was created as following:
Neural net was designed with volunteers providing trial journeys. During the journey they were deciding about the most effective and the most suitable way from many different criterions. According to the actions of volunteers neural net training set was created. This neural net learned same decisions as volunteering drivers and was able to choose journey from unknown data.
5.3. Creation of models which can forecast following of traffic signs by driver
There are algorithms created to solve this problem. Current models use fuzzy logic and neural nets combination to overcome limitations of existing algorithms. Using neural nets to solve such problems is preferable due to their ability to solve nonlinear relations and because they are immune against mistakes obtained from imperfect inputs. NN are suitable for reactive behaviour modelling which is often described as rules connecting perceived situation with attributable measures.
Models which can forecast following of traffic signs by driver can be used as a part in Intelligent transport system (ITS) or ATS.
5.4. Systems for advising maintenance and repair of paths and roads can foresee problems on the roads caused by weather or abrasion
ITS and ATS need to have such parts which offer overall view of roads and paths state for either road participants or transport companies which are in charge of road conditions.
Systems for advising maintenance and repair of paths and roads can be divided to two subsystems – diagnostic and prognostic.
Diagnostic subsystem can be classified as pattern detecting problem. Neural nets are used here to process road surface snapshots and assigning them to different defect categories.
93

Diagnostic subsystem also automatically detects by-pass roads or damaged roads.
Prognostic subsystem is complex according to its conformity – road repair actions are not only dependant on actual road condition but also on traffic intensity and on financial needs required for road repair. Data collection for all potential situations is extremely difficult. Suitable solution might be connecting more neural nets to one system.
5.5. Systems for classification and registering of passing vehicles
NN are in this case used to process input data from signallers built beside the roads (video cam with high performing snapshot processing, sensors, etc.) Their main contribution is noticeable during bad external conditions. These systems were successfully run in licensed trademark reading.
5.6. Traffic net analysis and Journey planning and optimizing
These systems use neural nets to diagnose traffic jams and analyse season changes in the traffic and can plan the most effective route what can shorten journeys, lower accidents and finally save environment. The most difficult part is setting parameters for the problem which is nonlinear.
5.7. Traffic streaming forecast
Very important parts of ATS or ITS are systems to recognize and predict congestions to inform all road users about actual situation.
The benefit of a neural network to solve this problem is that it absorbs patterns in data and so can learn to generalize. The main features of a neural network approach are trials of its application to a congestion recognition problem to short term and long term forecasting of flows Models to recognize and predict congestions include:
Short term forecast – forecasting few minutes, can be part of transport managing system
Long term forecast – forecasting months or years, important in planning and building roads
5.8. Transport economics
Neural nets can also be used in solving problems in the area no one would expect – impact of noise on real estate price close to transport arteries. Used neural net consisted of instrument which could analyse many variables – real estate condition, age, largeness and of course noise factor of vehicles.
5.9. Traffic sign recognition
There are devices that can detect, recognise and follow traffic signs from moving vehicle. Recognition is done by colour segmentation and neural nets classification. Existing systems can not only recognise traffic signs but also locate and gather them. Locating is realised by approximating location from GPS device and location of traffic sign acquired from video cam or video file. Traffic signs gathering help to build traffic sign database which in the same time composes training data set.
Traffic signs are characterized by features from which the most important for detecting and recognising are colour and shape. Detection is done by classical methods based on tresholding and colour segmentation using different colour models or shape models (in black and white images) or their combination. 3D modelling is also often used.
There are more methods which use machine learning algorithms for classification and detection.
6. Conclusion
Artificial Intelligence and Neural nets included in there have broad utilization in every area of transport. Their applications can be found in all systems involving road transport management, such as
Automatic transport systems using electric computer managed vehicles
Intelligent road systems
Intelligent highway systems
Traffic road logistics and many other.
Nowadays all rich developed countries involve in development of these systems which costs high financial means.
References
[1] Akiyama, T., Sasaki,T.: A neural network approach to the identification of real time origin-destination flows from traffic counts. In: Proc. Int. Conf. on Artificial Intelligence Applications in Transportation Engineering (1992). [2] Collins and Evans, 1994. A. Collins and A. Evans, Aircraft noise and residential property values, an artificial neural network approach. J. Transp. Econ. Policy 28 2 (1994), pp. 175–197. [3] Dougherty ,M.S., Joint,M.: A behavioural model of driver route choice using neural networks. In: Proc. Int. Conf. on Artificial Intelligence Applications in Transportation Engineering (1992). [4] Hajek, J.. Hurdal, B.: Comparison of rule-based and neural network solutions for a structured selection problem. Transportation Research Record (1993),View Record in Scopus | Cited By in Scopus (1) [5] Panwai, S : Evaluation of discrete choice and neural network approaches for modelling driver compliance with traffic information, Transportmetrica, Journal of the Hong Kong Society for Transportation Studies, 2009 [6] http://www.akri.org/ai/defs.htm [7] http://www.dacs.dtic.mil/techs/neural/neural_ToC.html [8] Velkoborský, J.: Moderní informační systémy pro plánování a řízení výroby, JT System 9/2003. [9] http://dal.hnonline.sk/c1-24927730-perspektivy-senzorovych-sieti-v-logistike [10] Collins and Evans, 1994. A. Collins and A. Evans, Aircraft noise and residential property values, an artificial neural network approach. J. Transp. Econ. Policy 28 2 (1994), pp. 175–197.
94
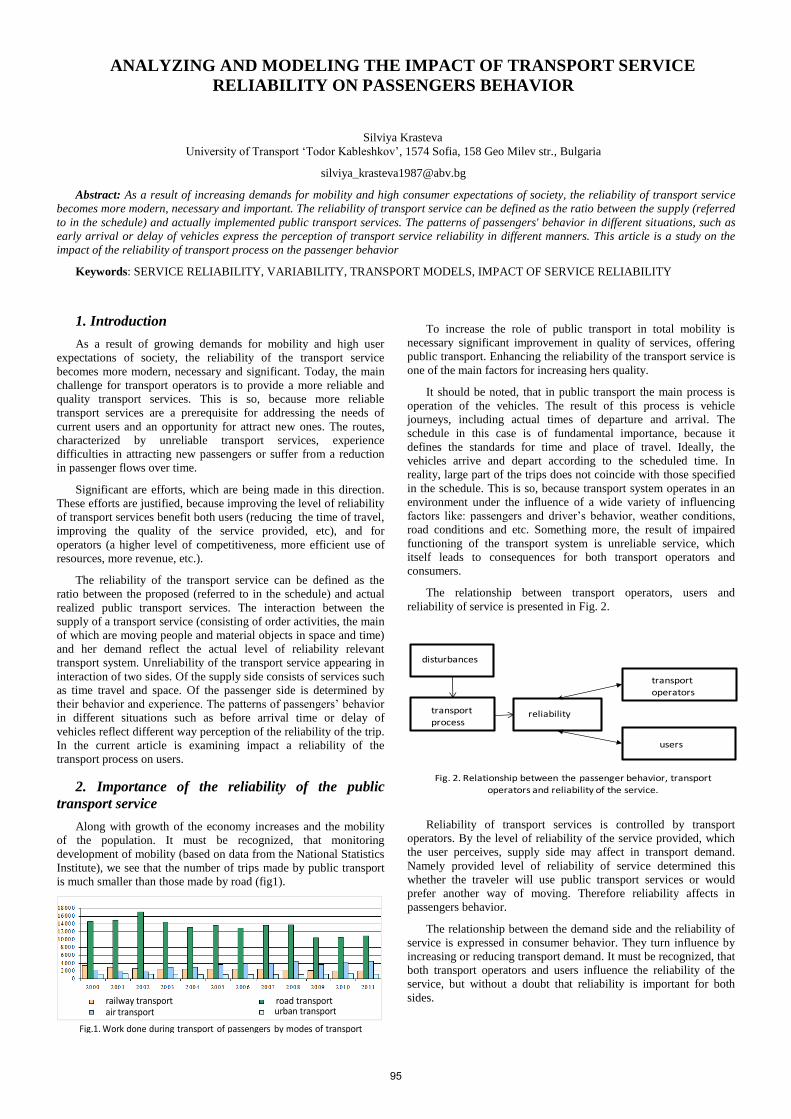
ANALYZING AND MODELING THE IMPACT OF TRANSPORT SERVICE
RELIABILITY ON PASSENGERS BEHAVIOR
Silviya Krasteva
University of Transport ‘Todor Kableshkov’, 1574 Sofia, 158 Geo Milev str., Bulgaria
Abstract: As a result of increasing demands for mobility and high consumer expectations of society, the reliability of transport service
becomes more modern, necessary and important. The reliability of transport service can be defined as the ratio between the supply (referred
to in the schedule) and actually implemented public transport services. The patterns of passengers' behavior in different situations, such as
early arrival or delay of vehicles express the perception of transport service reliability in different manners. This article is a study on the
impact of the reliability of transport process on the passenger behavior
Keywords: SERVICE RELIABILITY, VARIABILITY, TRANSPORT MODELS, IMPACT OF SERVICE RELIABILITY
1. Introduction
As a result of growing demands for mobility and high user
expectations of society, the reliability of the transport service
becomes more modern, necessary and significant. Today, the main
challenge for transport operators is to provide a more reliable and
quality transport services. This is so, because more reliable
transport services are a prerequisite for addressing the needs of
current users and an opportunity for attract new ones. The routes,
characterized by unreliable transport services, experience
difficulties in attracting new passengers or suffer from a reduction
in passenger flows over time.
Significant are efforts, which are being made in this direction.
These efforts are justified, because improving the level of reliability
of transport services benefit both users (reducing the time of travel,
improving the quality of the service provided, etc), and for
operators (a higher level of competitiveness, more efficient use of
resources, more revenue, etc.).
The reliability of the transport service can be defined as the
ratio between the proposed (referred to in the schedule) and actual
realized public transport services. The interaction between the
supply of a transport service (consisting of order activities, the main
of which are moving people and material objects in space and time)
and her demand reflect the actual level of reliability relevant
transport system. Unreliability of the transport service appearing in
interaction of two sides. Of the supply side consists of services such
as time travel and space. Of the passenger side is determined by
their behavior and experience. The patterns of passengers’ behavior
in different situations such as before arrival time or delay of
vehicles reflect different way perception of the reliability of the trip.
In the current article is examining impact a reliability of the
transport process on users.
2. Importance of the reliability of the public
transport service
Along with growth of the economy increases and the mobility
of the population. It must be recognized, that monitoring
development of mobility (based on data from the National Statistics
Institute), we see that the number of trips made by public transport
is much smaller than those made by road (fig1).
To increase the role of public transport in total mobility is
necessary significant improvement in quality of services, offering
public transport. Enhancing the reliability of the transport service is
one of the main factors for increasing hers quality.
It should be noted, that in public transport the main process is
operation of the vehicles. The result of this process is vehicle
journeys, including actual times of departure and arrival. The
schedule in this case is of fundamental importance, because it
defines the standards for time and place of travel. Ideally, the
vehicles arrive and depart according to the scheduled time. In
reality, large part of the trips does not coincide with those specified
in the schedule. This is so, because transport system operates in an
environment under the influence of a wide variety of influencing
factors like: passengers and driver’s behavior, weather conditions,
road conditions and etc. Something more, the result of impaired
functioning of the transport system is unreliable service, which
itself leads to consequences for both transport operators and
consumers.
The relationship between transport operators, users and
reliability of service is presented in Fig. 2.
Reliability of transport services is controlled by transport
operators. By the level of reliability of the service provided, which
the user perceives, supply side may affect in transport demand.
Namely provided level of reliability of service determined this
whether the traveler will use public transport services or would
prefer another way of moving. Therefore reliability affects in
passengers behavior.
The relationship between the demand side and the reliability of
service is expressed in consumer behavior. They turn influence by
increasing or reducing transport demand. It must be recognized, that
both transport operators and users influence the reliability of the
service, but without a doubt that reliability is important for both
sides.
disturbances
transport process
reliability
transport
operators
users
Fig. 2. Relationship between the passenger behavior, transport operators and reliability of the service.
railway transportair transport
road transporturban transport
Fig.1. Work done during transport of passengers by modes of transport
95
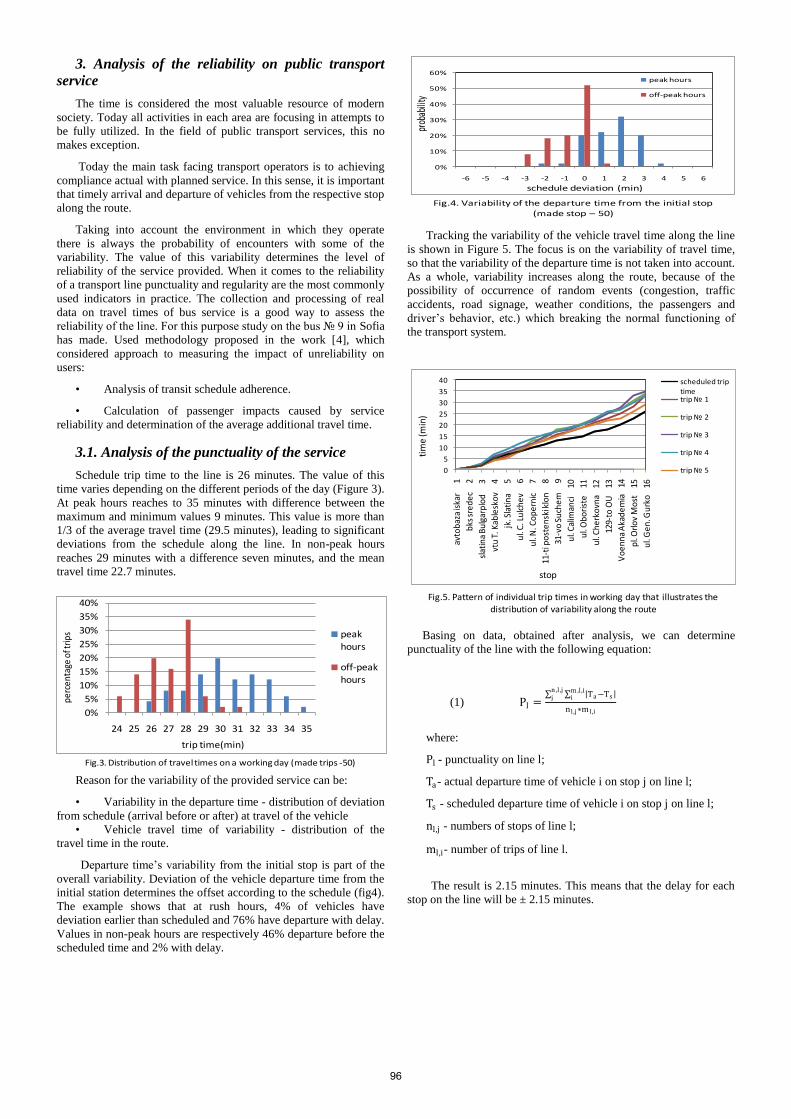
3. Analysis of the reliability on public transport
service
The time is considered the most valuable resource of modern
society. Today all activities in each area are focusing in attempts to
be fully utilized. In the field of public transport services, this no
makes exception.
Today the main task facing transport operators is to achieving
compliance actual with planned service. In this sense, it is important
that timely arrival and departure of vehicles from the respective stop
along the route.
Taking into account the environment in which they operate
there is always the probability of encounters with some of the
variability. The value of this variability determines the level of
reliability of the service provided. When it comes to the reliability
of a transport line punctuality and regularity are the most commonly
used indicators in practice. The collection and processing of real
data on travel times of bus service is a good way to assess the
reliability of the line. For this purpose study on the bus 9 in Sofia
has made. Used methodology proposed in the work [4], which
considered approach to measuring the impact of unreliability on
users:
• Analysis of transit schedule adherence.
• Calculation of passenger impacts caused by service
reliability and determination of the average additional travel time.
3.1. Analysis of the punctuality of the service
Schedule trip time to the line is 26 minutes. The value of this
time varies depending on the different periods of the day (Figure 3).
At peak hours reaches to 35 minutes with difference between the
maximum and minimum values 9 minutes. This value is more than
1/3 of the average travel time (29.5 minutes), leading to significant
deviations from the schedule along the line. In non-peak hours
reaches 29 minutes with a difference seven minutes, and the mean
travel time 22.7 minutes.
Reason for the variability of the provided service can be:
• Variability in the departure time - distribution of deviation
from schedule (arrival before or after) at travel of the vehicle
• Vehicle travel time of variability - distribution of the
travel time in the route.
Departure time’s variability from the initial stop is part of the
overall variability. Deviation of the vehicle departure time from the
initial station determines the offset according to the schedule (fig4).
The example shows that at rush hours, 4% of vehicles have
deviation earlier than scheduled and 76% have departure with delay.
Values in non-peak hours are respectively 46% departure before the
scheduled time and 2% with delay.
Tracking the variability of the vehicle travel time along the line
is shown in Figure 5. The focus is on the variability of travel time,
so that the variability of the departure time is not taken into account.
As a whole, variability increases along the route, because of the
possibility of occurrence of random events (congestion, traffic
accidents, road signage, weather conditions, the passengers and
driver’s behavior, etc.) which breaking the normal functioning of
the transport system.
Basing on data, obtained after analysis, we can determine
punctuality of the line with the following equation:
(1) Pl = Ta −Ts m ,l,i
in ,l ,jj
n l ,j∗m l ,i
where:
Pl - punctuality on line l;
Ta- actual departure time of vehicle i on stop j on line l;
Ts - scheduled departure time of vehicle i on stop j on line l;
nl,j - numbers of stops of line l;
ml,i- number of trips of line l.
The result is 2.15 minutes. This means that the delay for each
stop on the line will be ± 2.15 minutes.
Fig.4. Variability of the departure time from the initial stop
(made stop – 50)
0%
10%
20%
30%
40%
50%
60%
-6 -5 -4 -3 -2 -1 0 1 2 3 4 5 6
peak hours
off-peak hours
prob
abili
ty
schedule deviation (min)
0
5
10
15
20
25
30
35
40
avto
baz
a is
kar
1
bks
sre
de
c
2
slat
ina
Bu
lgar
plo
d
3
vtu
T. K
able
sko
v
4
jk. S
lati
na
5
ul.
C. L
ulc
he
v
6
ul.
N. C
op
ern
ic
7
11-t
i po
ste
nsk
i klo
n
8
31-v
o S
uch
em
9
ul.
Cal
iman
ci
10
ul.
Ob
ori
ste
1
1
ul.
Ch
erk
ovn
a
12
129-
to O
U
13
Vo
en
na
Aka
de
mia
14
pl.
Orl
ov
Mo
st
15
ul.
Ge
n. G
urk
o
16
scheduled trip timetrip 1
trip 2
trip 3
trip 4
trip 5
stop
tim
e (m
in)
Fig.5. Pattern of individual trip times in working day that illustrates the distribution of variability along the route
0%
5%
10%
15%
20%
25%
30%
35%
40%
24 25 26 27 28 29 30 31 32 33 34 35
peak hours
off-peak
hours
trip time(min)
perc
enta
ge o
f trip
s
Fig.3. Distribution of travel times on a working day (made trips -50)
96
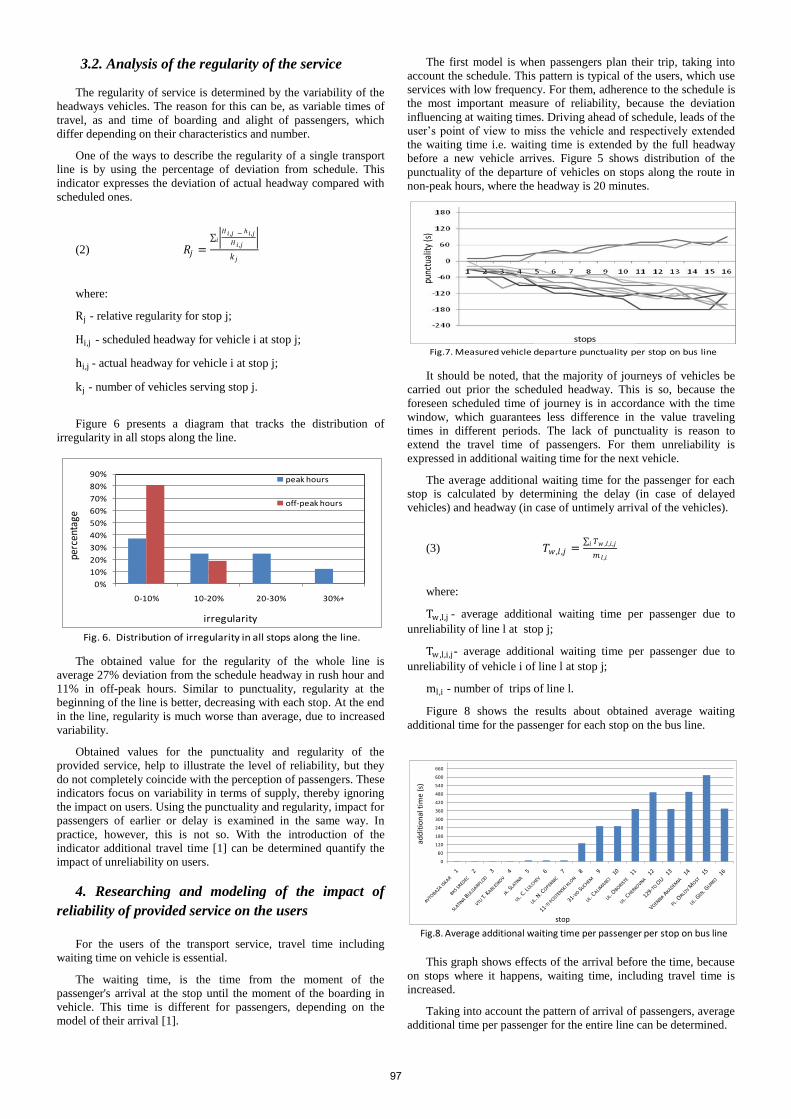
3.2. Analysis of the regularity of the service
The regularity of service is determined by the variability of the
headways vehicles. The reason for this can be, as variable times of
travel, as and time of boarding and alight of passengers, which
differ depending on their characteristics and number.
One of the ways to describe the regularity of a single transport
line is by using the percentage of deviation from schedule. This
indicator expresses the deviation of actual headway compared with
scheduled ones.
(2) 𝑅𝑗 =
𝐻𝑖 ,𝑗 − ℎ𝑖 ,𝑗
𝐻𝑖 ,𝑗 𝑖
𝑘𝑗
where:
Rj - relative regularity for stop j;
Hi,j - scheduled headway for vehicle i at stop j;
hi,j - actual headway for vehicle i at stop j;
kj - number of vehicles serving stop j.
Figure 6 presents a diagram that tracks the distribution of
irregularity in all stops along the line.
The obtained value for the regularity of the whole line is
average 27% deviation from the schedule headway in rush hour and
11% in off-peak hours. Similar to punctuality, regularity at the
beginning of the line is better, decreasing with each stop. At the end
in the line, regularity is much worse than average, due to increased
variability.
Obtained values for the punctuality and regularity of the
provided service, help to illustrate the level of reliability, but they
do not completely coincide with the perception of passengers. These
indicators focus on variability in terms of supply, thereby ignoring
the impact on users. Using the punctuality and regularity, impact for
passengers of earlier or delay is examined in the same way. In
practice, however, this is not so. With the introduction of the
indicator additional travel time [1] can be determined quantify the
impact of unreliability on users.
4. Researching and modeling of the impact of
reliability of provided service on the users
For the users of the transport service, travel time including
waiting time on vehicle is essential.
The waiting time, is the time from the moment of the
passenger's arrival at the stop until the moment of the boarding in
vehicle. This time is different for passengers, depending on the
model of their arrival [1].
The first model is when passengers plan their trip, taking into
account the schedule. This pattern is typical of the users, which use
services with low frequency. For them, adherence to the schedule is
the most important measure of reliability, because the deviation
influencing at waiting times. Driving ahead of schedule, leads of the
user’s point of view to miss the vehicle and respectively extended
the waiting time i.e. waiting time is extended by the full headway
before a new vehicle arrives. Figure 5 shows distribution of the
punctuality of the departure of vehicles on stops along the route in
non-peak hours, where the headway is 20 minutes.
It should be noted, that the majority of journeys of vehicles be
carried out prior the scheduled headway. This is so, because the
foreseen scheduled time of journey is in accordance with the time
window, which guarantees less difference in the value traveling
times in different periods. The lack of punctuality is reason to
extend the travel time of passengers. For them unreliability is
expressed in additional waiting time for the next vehicle.
The average additional waiting time for the passenger for each
stop is calculated by determining the delay (in case of delayed
vehicles) and headway (in case of untimely arrival of the vehicles).
(3) 𝑇𝑤 ,𝑙 ,𝑗 = 𝑇𝑤 ,𝑙 ,𝑖,𝑗𝑖
𝑚 𝑙 ,𝑖
where:
Tw ,l,j - average additional waiting time per passenger due to
unreliability of line l at stop j;
Tw ,l,i,j- average additional waiting time per passenger due to
unreliability of vehicle i of line l at stop j;
ml,i - number of trips of line l.
Figure 8 shows the results about obtained average waiting
additional time for the passenger for each stop on the bus line.
This graph shows effects of the arrival before the time, because
on stops where it happens, waiting time, including travel time is
increased.
Taking into account the pattern of arrival of passengers, average
additional time per passenger for the entire line can be determined.
0%
10%
20%
30%
40%
50%
60%
70%
80%
90%
0-10% 10-20% 20-30% 30%+
peak hours
off-peak hours
irregularity
perc
enta
ge
Fig. 6. Distribution of irregularity in all stops along the line.
punc
tual
ity (s
)
stops
Fig.7. Measured vehicle departure punctuality per stop on bus line
0
60
120
180
240
300
360
420
480
540
600
660
stop
add
itio
nal
tim
e (s
)
Fig.8. Average additional waiting time per passenger per stop on bus line
97
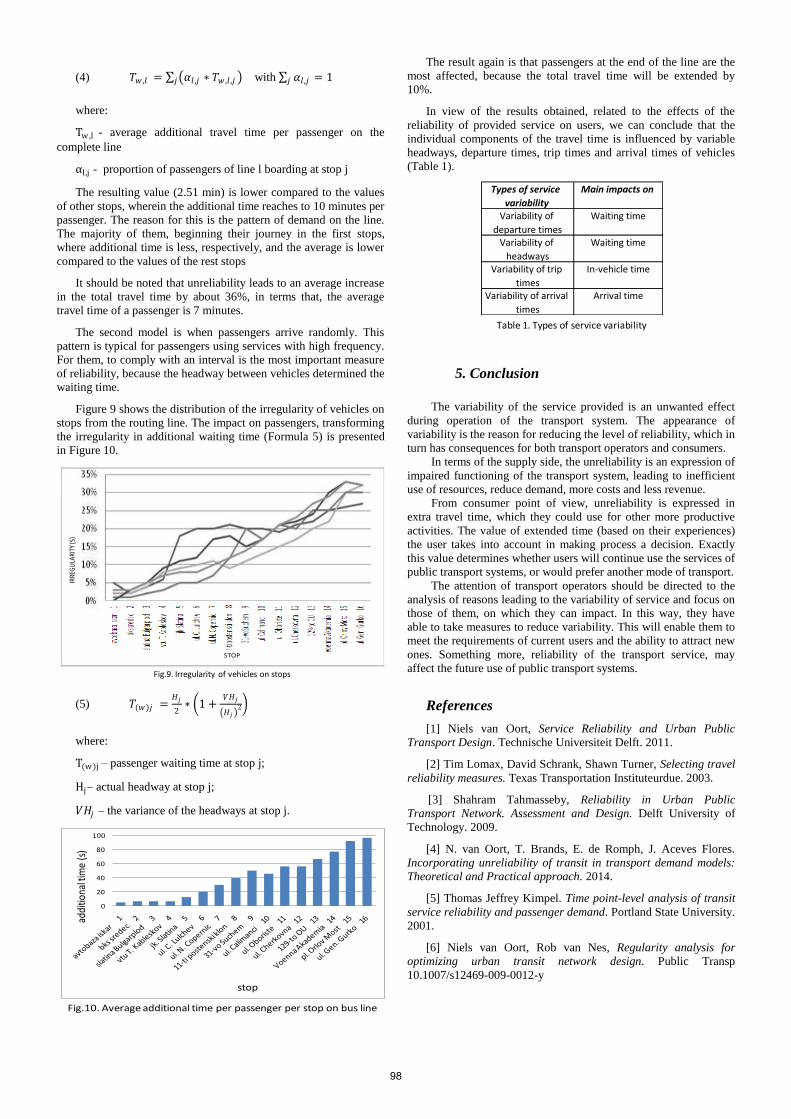
(4) 𝑇𝑤 ,𝑙 = 𝛼𝑙 ,𝑗 ∗ 𝑇𝑤 ,𝑙 ,𝑗 𝑗 with 𝛼𝑙 ,𝑗 = 1𝑗
where:
Tw ,l - average additional travel time per passenger on the
complete line
αl,j - proportion of passengers of line l boarding at stop j
The resulting value (2.51 min) is lower compared to the values
of other stops, wherein the additional time reaches to 10 minutes per
passenger. The reason for this is the pattern of demand on the line.
The majority of them, beginning their journey in the first stops,
where additional time is less, respectively, and the average is lower
compared to the values of the rest stops
It should be noted that unreliability leads to an average increase
in the total travel time by about 36%, in terms that, the average
travel time of a passenger is 7 minutes.
The second model is when passengers arrive randomly. This
pattern is typical for passengers using services with high frequency.
For them, to comply with an interval is the most important measure
of reliability, because the headway between vehicles determined the
waiting time.
Figure 9 shows the distribution of the irregularity of vehicles on
stops from the routing line. The impact on passengers, transforming
the irregularity in additional waiting time (Formula 5) is presented
in Figure 10.
(5) 𝑇(𝑤)𝑗 =𝐻𝑗
2∗ 1 +
𝑉𝐻𝑗
𝐻𝑗 2
where:
T(w)j – passenger waiting time at stop j;
Hj– actual headway at stop j;
𝑉𝐻𝑗 – the variance of the headways at stop j.
The result again is that passengers at the end of the line are the
most affected, because the total travel time will be extended by
10%.
In view of the results obtained, related to the effects of the
reliability of provided service on users, we can conclude that the
individual components of the travel time is influenced by variable
headways, departure times, trip times and arrival times of vehicles
(Table 1).
5. Conclusion
The variability of the service provided is an unwanted effect
during operation of the transport system. The appearance of
variability is the reason for reducing the level of reliability, which in
turn has consequences for both transport operators and consumers.
In terms of the supply side, the unreliability is an expression of
impaired functioning of the transport system, leading to inefficient
use of resources, reduce demand, more costs and less revenue.
From consumer point of view, unreliability is expressed in
extra travel time, which they could use for other more productive
activities. The value of extended time (based on their experiences)
the user takes into account in making process a decision. Exactly
this value determines whether users will continue use the services of
public transport systems, or would prefer another mode of transport.
The attention of transport operators should be directed to the
analysis of reasons leading to the variability of service and focus on
those of them, on which they can impact. In this way, they have
able to take measures to reduce variability. This will enable them to
meet the requirements of current users and the ability to attract new
ones. Something more, reliability of the transport service, may
affect the future use of public transport systems.
References
[1] Niels van Oort, Service Reliability and Urban Public
Transport Design. Technische Universiteit Delft. 2011.
[2] Tim Lomax, David Schrank, Shawn Turner, Selecting travel
reliability measures. Texas Transportation Instituteurdue. 2003.
[3] Shahram Tahmasseby, Reliability in Urban Public
Transport Network. Assessment and Design. Delft University of
Technology. 2009.
[4] N. van Oort, T. Brands, E. de Romph, J. Aceves Flores.
Incorporating unreliability of transit in transport demand models:
Theoretical and Practical approach. 2014.
[5] Thomas Jeffrey Kimpel. Time point-level analysis of transit
service reliability and passenger demand. Portland State University.
2001.
[6] Niels van Oort, Rob van Nes, Regularity analysis for
optimizing urban transit network design. Public Transp
10.1007/s12469-009-0012-y
STOP
IRRE
GU
LARI
TY (S
)
Fig.9. Irregularity of vehicles on stops
0
20
40
60
80
100
addi
tiona
l tim
e(s
)
stop
Fig.10. Average additional time per passenger per stop on bus line
Table 1. Types of service variability
Types of service
variability
Main impacts on
Variability of
departure times
Waiting time
Variability of
headways
Waiting time
Variability of trip
times
In-vehicle time
Variability of arrival
times
Arrival time
Table 1. Types of service variability
98
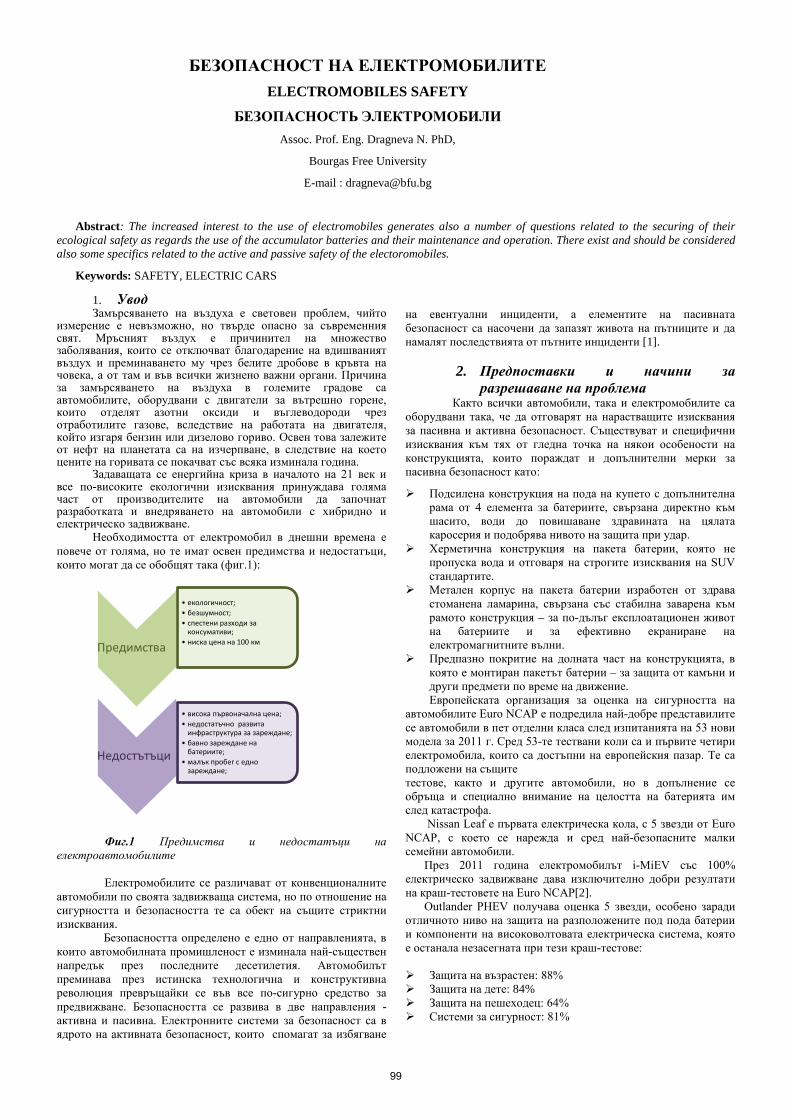
БЕЗОПАСНОСТ НА ЕЛЕКТРОМОБИЛИТЕ ELECTROMOBILES SAFETY
БЕЗОПАСНОСТЬ ЭЛЕКТРОМОБИЛИ Assoс. Prof. Eng. Dragneva N. PhD,
Bourgas Free University
E-mail : [email protected]
Abstract: The increased interest to the use of electromobiles generates also a number of questions related to the securing of their ecological safety as regards the use of the accumulator batteries and their maintenance and operation. There exist and should be considered also some specifics related to the active and passive safety of the electoromobiles.
Keywords: SAFETY, ELECTRIC CARS
1. Увод Замърсяването на въздуха е световен проблем, чийто
измерение е невъзможно, но твърде опасно за съвременния свят. Мръсният въздух е причинител на множество заболявания, които се отключват благодарение на вдишваният въздух и преминаването му чрез белите дробове в кръвта на човека, а от там и във всички жизнено важни органи. Причина за замърсяването на въздуха в големите градове са автомобилите, оборудвани с двигатели за вътрешно горене, които отделят азотни оксиди и въглеводороди чрез отработилите газове, вследствие на работата на двигателя, който изгаря бензин или дизелово гориво. Освен това залежите от нефт на планетата са на изчерпване, в следствие на което цените на горивата се покачват със всяка изминала година.
Задаващата се енергийна криза в началото на 21 век и все по-високите екологични изисквания принуждава голяма част от производителите на автомобили да започнат разработката и внедряването на автомобили с хибридно и електрическо задвижване.
Необходимостта от електромобил в днешни времена е повече от голяма, но те имат освен предимства и недостатъци, които могат да се обобщят така (фиг.1):
Фиг.1 Предимства и недостатъци на електроавтомобилите
Електромобилите се различават от конвенционалните
автомобили по своята задвижваща система, но по отношение на сигурността и безопасността те са обект на същите стриктни изисквания.
Безопасността определено е едно от направленията, в които автомобилната промишленост е изминала най-съществен напредък през последните десетилетия. Автомобилът преминава през истинска технологична и конструктивна революция превръщайки се във все по-сигурно средство за предвижване. Безопасността се развива в две направления - активна и пасивна. Електронните системи за безопасност са в ядрото на активната безопасност, които спомагат за избягване
на евентуални инциденти, а елементите на пасивната безопасност са насочени да запазят живота на пътниците и да намалят последствията от пътните инциденти [1].
2. Предпоставки и начини за разрешаване на проблема
Както всички автомобили, така и електромобилите са оборудвани така, че да отговарят на нарастващите изисквания за пасивна и активна безопасност. Съществуват и специфични изисквания към тях от гледна точка на някои особености на конструкцията, които пораждат и допълнителни мерки за пасивна безопасност като:
Подсилена конструкция на пода на купето с допълнителна рама от 4 елемента за батериите, свързана директно към шасито, води до повишаване здравината на цялата каросерия и подобрява нивото на защита при удар.
Херметична конструкция на пакета батерии, която не пропуска вода и отговаря на строгите изисквания на SUV стандартите.
Метален корпус на пакета батерии изработен от здрава стоманена ламарина, свързана със стабилна заварена към рамото конструкция – за по-дълъг експлоатационен живот на батериите и за ефективно екраниране на електромагнитните вълни.
Предпазно покритие на долната част на конструкцията, в която е монтиран пакетът батерии – за защита от камъни и други предмети по време на движение. Европейската организация за оценка на сигурността на
автомобилите Euro NCAP е подредила най-добре представилите се автомобили в пет отделни класа след изпитанията на 53 нови модела за 2011 г. Сред 53-те тествани коли са и първите четири електромобила, които са достъпни на европейския пазар. Те са подложени на същите тестове, както и другите автомобили, но в допълнение се обръща и специално внимание на целостта на батерията им след катастрофа.
Nissan Leaf е първата електрическа кола, с 5 звезди от Euro NCAP, с което се нарежда и сред най-безопасните малки семейни автомобили.
През 2011 година електромобилът i-MiEV със 100% електрическо задвижване дава изключително добри резултати на краш-тестовете на Euro NCAP[2].
Outlander PHEV получава оценка 5 звезди, особено заради отличното ниво на защита на разположените под пода батерии и компоненти на високоволтовата електрическа система, която е останала незасегната при тези краш-тестове:
Защита на възрастен: 88% Защита на дете: 84% Защита на пешеходец: 64% Системи за сигурност: 81%
Предимства
• екологичност; • безшумност; • спестени разходи за
консумативи; • ниска цена на 100 км
Недостътъци
• висока първоначална цена; • недостатъчно развита
инфраструктура за зареждане; • бавно зареждане на
батериите; • малък пробег с едно
зареждане;
99
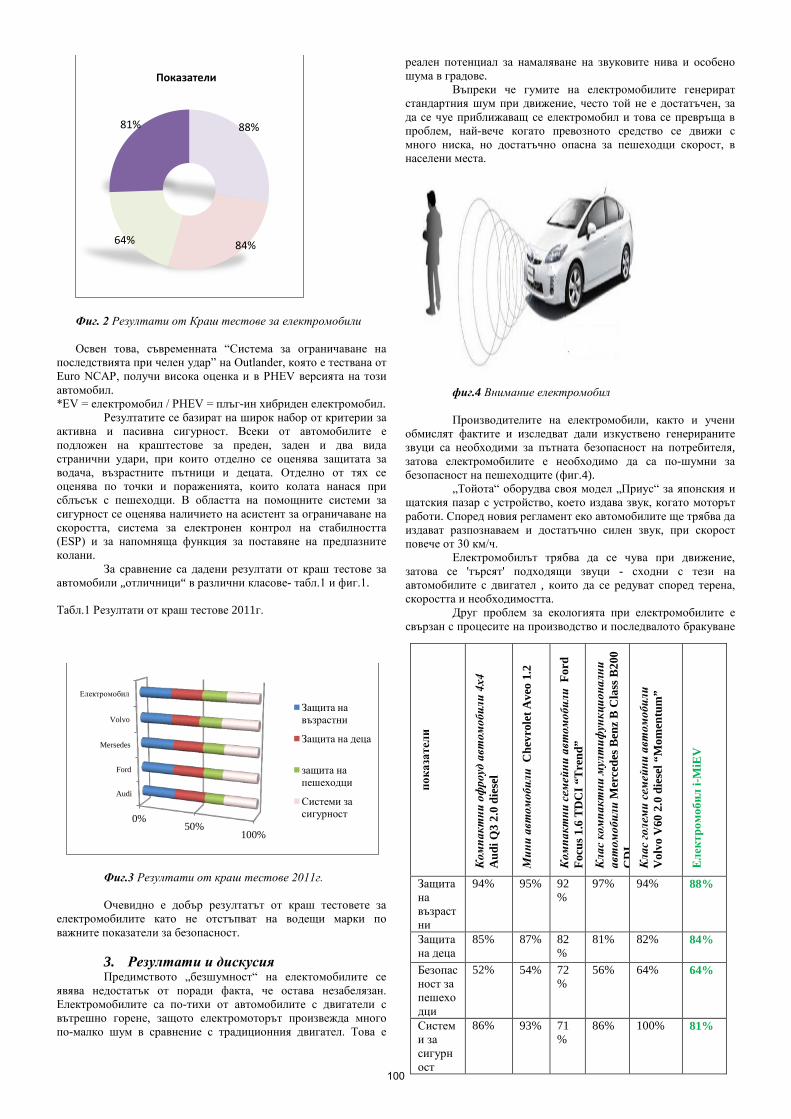
Фиг. 2 Резултати от Краш тестове за електромобили Освен това, съвременната “Система за ограничаване на
последствията при челен удар” на Outlander, която е тествана от Euro NCAP, получи висока оценка и в PHEV версията на този автомобил. *EV = електромобил / PHEV = плъг-ин хибриден електромобил.
Резултатите се базират на широк набор от критерии за активна и пасивна сигурност. Всеки от автомобилите е подложен на краштестове за преден, заден и два вида странични удари, при които отделно се оценява защитата за водача, възрастните пътници и децата. Отделно от тях се оценява по точки и пораженията, които колата нанася при сблъсък с пешеходци. В областта на помощните системи за сигурност се оценява наличието на асистент за ограничаване на скоростта, система за електронен контрол на стабилността (ESP) и за напомняща функция за поставяне на предпазните колани.
За сравнение са дадени резултати от краш тестове за автомобили „отличници“ в различни класове- табл.1 и фиг.1.
Табл.1 Резултати от краш тестове 2011г.
Фиг.3 Резултати от краш тестове 2011г. Очевидно е добър резултатът от краш тестовете за
електромобилите като не отстъпват на водещи марки по важните показатели за безопасност.
3. Резултати и дискусия Предимството „безшумност“ на електомобилите се
явява недостатък от поради факта, че остава незабелязан. Електромобилите са по-тихи от автомобилите с двигатели с вътрешно горене, защото електромоторът произвежда много по-малко шум в сравнение с традиционния двигател. Това е
реален потенциал за намаляване на звуковите нива и особено шума в градове.
Въпреки че гумите на електромобилите генерират стандартния шум при движение, често той не е достатъчен, за да се чуе приближаващ се електромобил и това се превръща в проблем, най-вече когато превозното средство се движи с много ниска, но достатъчно опасна за пешеходци скорост, в населени места.
фиг.4 Внимание електромобил Производителите на електромобили, както и учени
обмислят фактите и изследват дали изкуствено генерираните звуци са необходими за пътната безопасност на потребителя, затова електромобилите е необходимо да са по-шумни за безопасност на пешеходците (фиг.4).
„Тойота“ оборудва своя модел „Приус“ за японския и щатския пазар с устройство, което издава звук, когато моторът работи. Според новия регламент еко автомобилите ще трябва да издават разпознаваем и достатъчно силен звук, при скорост повече от 30 км/ч.
Електромобилът трябва да се чува при движение, затова се 'търсят' подходящи звуци - сходни с тези на автомобилите с двигател , които да се редуват според терена, скоростта и необходимостта.
Друг проблем за екологията при електромобилите е свързан с процесите на производство и последвалото бракуване
88%
84% 64%
81%
Показатели
0%50%
100%
Audi
Ford
Mersedes
Volvo
Електромобил
Защита на възрастни
Защита на деца
защита на пешеходци
Системи за сигурност
пока
зате
ли
Ком
пакт
ни о
фро
уд а
втом
обил
и 4х
4
Aud
i Q3
2.0
dies
el
Мин
и ав
том
обил
и C
hevr
olet
Ave
o 1.
2
Ком
пакт
ни с
емей
ни а
втом
обил
и F
ord
Focu
s 1.6
TD
CI “
Tre
nd”
Кла
с ко
мпа
ктни
мул
тиф
ункц
иона
лни
авт
омоб
или
Mer
cede
s Ben
z B
Cla
ss B
200
CD
I
Кла
с го
лем
и се
мей
ни а
втом
обил
и
Vol
vo V
60 2
.0 d
iese
l “M
omen
tum
”
Еле
ктро
моб
ил i-
MiE
V
Защита на възрастни
94% 95% 92%
97% 94% 88%
Защита на деца
85% 87% 82%
81% 82% 84%
Безопасност за пешеходци
52%
54% 72%
56% 64% 64%
Системи за сигурност
86%
93% 71%
86% 100% 81%
100

на батериите. По правило при тях се срещат много токсични химични елементи. Докато електромобилите са все още екзотика, проблемът не е голям, но с нарастване на тяхната популярност, човечеството ще трябва да търси нови начини, както за производство, така и за бракуване на акумулаторите и батериите.
Отсъствието на нагряване при бързо разреждане също влияе положително за подобряване на безопасността при използването на батериите. Компанията Power Japan Plus е представила така наречената технология Ryden или Dual Carbon, която предполага използването в батерията на въглероден анод и катод, като по този начин се увеличава скоростта на зареждане на съществуващите литиево-йонни акумулатори 20 пъти. За недопускане на прегряване на клетките на акумулаторите производителите на електроавтомобили предвиждат система за охлаждане. Известно е, че повредена батерия вследствие на прегряване може да бъде причина за взрив или пожар.[3]
Друг проблем е, че капацитетът на акумулаторите намалява при понижаване на температурите. Факт е също така, че през зимата разстоянието, което един автомобил може да измине без презареждане намалява два пъти.[4]
Електрическите автомобили е необходимо да отговарят на строги изисквания за електрическа безопасност, за да се гарантира, че потребителите в автомобила не могат да пострадат от токов удар от части от превозното средство или двигателния отсек.
4. Заключение Електромобилите въпреки някои свои недостатъци са
безспорен фаворит в натоварения град. Безопасни, икономични и екологични са показателите с които може да се отличат идеалните автомобили за градска среда, а именно тези захранвани с електричество. Предимствата им са безспорни:
1. При специфичните транспортни условия в градска среда (задръствания и голям брой светофарни уредби) електромобилите имат експлоатационното предимство, че електродвигателят не консумира енергия.
2. Липсата на вредни емисии е другата важна експлоатационна характеристика на електромобилитетака се осигурява по-здрав и комфортен микроклимат в големия град, което има голяма обществена полза.
3. Намалението на градиента на уличния шум при движението на електромобилите в сравнение с автомобилите с бензинови двигатели има важно значение за живота на хората .
Референции: 1. http://www.autoreview.bg 2. http://cars.prosport.bg 3. http://hi-news.ru/technology 4. http://www.dnes.bg/cars
101
EQUIPMENT OPTIMIZATION IN REGIONAL AGRICULTURAL LOGISTICS CENTERS
ОПТИМИЗАЦИЯ ОБОРУДОВАНИЯ РЕГИОНАЛЬНЫХ АГРАРНЫХ ЛОГИСТИЧЕСКИХ ЦЕНТРОВ
Prof.Dr. Botsvadze L., Doctoral candidate Sharabidze D.
Akaki Tsereteli State University, Kutaisi, Georgia [email protected] [email protected]
Abstract : A regional agricultural center is a key link in the system of supplying Georgian standard citrus cultures to the goods markets of European countries. The elements of such logistics centers are united into three groups which comprise three large logistics divisions – supply, production and distribution.
Optimization of the production subdivisions and technical equipment is carried out on the basis of optimizing the whole center by developing a simulation model based on statistical modeling of random streams. At first, a structural-parametrical (qualitative) model of agricultural center was developed. For optimizing the center’s technical equipment and operating standards, the combined optimization parameters have been developed. Based on the objective function formalization, there has been developed a system model of planning and optimizing of agricultural center by developing the system constraints. Optimization and algorithmization of subdivisions and the whole system are carried out by decomposition of model on separate blocks, which correspond to separate subsystems of the center. KEY WORDS: REGIONAL LOGISTICS CENTER, LOGISTICAL SYSTEM, SIMULATION MODEL, STRUCHTURAL-PARAMETRICAL MODEL, DECOMPOSITION, ALGORITHMIZATION.
1. Introduction Export delivery chain of citrus cultures is a complex macro-logistical international transport-logistical system, whose central core is a regional agricultural logistics center. In the center, there are carried out production and processing of products. It has the possible sustainable communications with suppliers and customers.
On the basis of the management principles of delivery chains, in the conditions of unlimted impact of environmental factors, there has been selected the type of a model of system optimization.
2. Preconditions and means for resolving the problem
For modeling of logistics processes that take place in agricultural center we introduce the following designations: KK – index of the citrus production farming enterprise )( Kk ∈ ; i –
index of peripheral pick-up and production sections, )( mi∈ ; j-
index of a regional logistics agricultural center, )( nj∈ ;
−1j index of citrus pick-up and processing technological shop,
)( 11 Gj ∈ ; −2j index of temporary storage of sorted citrus
cultures in refrigerating store, )( 22 Gj ∈ ; j3 – index of package
and material resources store, )( 33 Gj ∈ ; −4j index of
preservation technological shop, )( 44 Gj ∈ ; j5 - index of packing
and consolidation store, )( 55 Gj ∈ ; −6j index of temporary
storage of finished products, )( 77 Gj ∈ ; −8j index of
products delivery section, )( 88 Gj ∈ ; −µ index of motor
transport motive power types, )( ξµ ∈ ; −1µ index of rolling
equipment types, )( 1 ξµ ∈ ; −1i index of picked citrus types,
)( 11 θ∈i ; −2i index of sorted citrus types, )( 22 Ii ∈ ; −3i
index of preserved citrus finished product types; −4i index of
cintrus fruits transportation mode, )( 44 Ii ∈ ; −5i index of citrus
temporary storage mode in refrigerating store, )( 55 Ii ∈ ; P –
index of the equipment for roots and packaging means )( Pp∈ ;
−δ index of the used transport package types )( ∆∈δ . When implementing various projects in the field transport
and logistics, there is envisaged the combined optimality criterion.
It represents: determininf the effects by comparing the obtained integral results tP and costs tЗ ; doscounting the requsted rates on capital and results at the initial stage, and taking into account the inflation bonus τ of discount rate i. These indicators are as follows: net present value maximum maxSDS and profitability index (SI), internal rate of return MSN. For the optimal version, the following conditions should be satisfied 0≥SDS ; 1≥SI ;
inIMSN ≥ . The formulas for calculating the combined criteria are as follows (1)
t
T
ttt
T
tttt i
Ki
ЗPSDS)]1)(1[(
1)]1)(1[(
1)(max0 ττ ++
=++
−= ∑∑== 0
. The profitability index is the ratio of the sum of the reduced
effects to the value of capital investments
(2) t
t
tttt iЗP
KSI
)]1)(1[(1)(1
1 τ++−= ∑
=
+ .
If 0≥SDS and SI>1 – the project is effective and it can be implemented.
An internal rate of return MN is that rate of discount, with which the value of the reduced effects equals the amount of the reduced capital investments (3)
inSnE
iP
iЗPMSN
t
tt
t
tt
tt ≥++
=++
−= ∑∑
== 00 )]1)(1[()]1)(1[( ττ.
When determining effectiveness and modelling of the logistics objects, there should be examined the system “input-process-output”.
The designing and management model of agricultural center is developed on the basis of its structural-parametrical model. Each group in the structural-parametrical model is represented by vector.
The model is presented in the following form: tX – is a vector of
the input control (uncontrolled) parameters; −)(tϕ
a vector of the
intermediate parameters; −)(tξ
a vector of the perturbation
parameters; −)(tZ
a vector of the technological parameters;
−)(tY
a vector of the output controllable (state) parameters;
−)(tg a constraint vector.
102
The output parameters of mathematical model of the center, which represent its functioning are divided into: 1. General
parameters of functioning of the center: 1jiQ
; 1jiP ; 1jiK ; 1jiC ;
1jiR ; 1jiSDS ; jMSN ; 1jiSI ; 2. Economic indicators of
operation of each sub-system of the center: 1jiKµ ; 1jiCµ ;
11ijQ ;
12ijQ ; 13ijQ ;
13ijK ; 15ijQ ; 3. Design parameters: jLµ ;
1jiS ;
1jiP ; jNdamx. ; 1jiP ; d
1jir ; pmmjS ; pmmjr ; xad
jr ; gkjr ; .cv.t ;
1jiN ;
4. Laboor resources and specific indicators assessing parameters:
.optP ; .meqP ; .umpP ; .xfC ; .mtvЗ ; 5. Specific indicators.
Comparison of different versions of the investment projects of the agricultural center and selecting the best one from them is recommended to be carried out on the basis of: net present value maximum (maxSDSi); profitability index (SIj); internal rate of return (MSNj), and recoupment period (GV). This problem can be presented in the vectorial form as follows: (4)
=Π
mlibrACACACACACALC SDSRЗPQY max;max;min;max;max
. The methodology for different ways of solving multi-
criterion problems is described in the professional literature [3,4]. In order to construct a mathematical model of the center it
is necessary to formulate the set of all constraints of the system and general intersubsystem constraints, select the objective function for each of them and for the system as a whole. The objective function, in the general form and with account for auxiliary criteria, is represented in the form of the equations (1-4).
For developing a mathematical model there are used the following designations [1].
In general, the optimal equioment of the regional agricultural center and the problem of defining its operation can be formulated as follows: it is necessary to find such plan (structure) and parameters of operating the regional agricultural center (5)
;;;;;;;;522522522131431441111
0tiijtiijtiijjtiijtjjtiijjtijjtik XXXXXXXX
j ′=Π ηµ
tipijtpijjtpi XXX
j 25626525;; .
that the objective function of macro-logistical effectiveness
would reach its maximum value under the following conditions and constraints: 1. The condition of a balnce between production of citrus cultures and demand for them (6) ∑ ∑∑∑∑∑∑
∈ = = ∈∈ ∈ ∈
′⋅=Kk nj i Tt
tjiIi Ti
tik AXθξµ
µ β1
121
2 1 .
2. The condition of meeting the demanf for finished products (7) ∑ ∑ ∑ ∑ ∑ ∑∑∑ ∑
∈ ∈ = ∈ ∈ ∈′ ∈ ∈′ ==
11 4 1 11 2211
1 3314
Gj Jj Gj Ij Ii Tt
ttjji Tt Ii
tijj XX
∑ ∑ ∑∑ ∑∑ ∑ ∑∑∈ ∈ ∈ ∈∈ ′∈′ ∈ ∈
′ +=22 6 55 22
256244 11 33
314
Gj j Ii Pp Iitiijj
Gj Ii Ii Yttiij DD .
3. The condition of using of roots and packaging (8)
≤
⋅
⋅+
⋅
⋅++∑ ∑∑ ∑∑∑
∈ ∈ ∈ ∈ ∈Pp Tt Ii Pp i Tt ti
jjtpijj
ti
pjjtpijj
TGtX
TGtX
KK i
33 2 2
12
3
131
][][)(1
brbr
remrez
tjpitjpi NN32
+≤ .
4. The condition of using of labor resources (9)∑∑ ∑ ∑ ∑
∈ ∈ ∈ ∈ ∈≤⋅
Tt njrmjj
nj Rrrmjj
Mmjjrm SRЦQ
1211
1 ,
where, −r labor resources multiplicity index; −rmjjЦ
1 labor resources norms when performing the
operations; −rmjjSR
1the condition of the existence of labor resources
multiplicity during the time of market sub-systems ტ; 5. The condition of variables integrality and positivity property: (10) 0
1≥tikjX µ ; 0
11≥tijjX ; 0
1441≥tiijjX ; ;
311 tiijX ′
05521≥tiijjX ; 00
522≥tiijX ;
0252≥tiijX ; 0
25≥tipjX ; 0
265≥tpijjX ;
0255≥tipijX .
Pp∈ ; ξµ ∈ ; Tt ≤ ; ∆∈δ ; θ∈1i . A mathematical model (5-10) is solved through its
decomposition on the separate blocks, which correspond to the sub-systems and components of agricultural center.
3. Conclusion 1. A regional agricultural center is a multi-purpose
complex, production logistical system. It pertains to the category of integrated production-distributing logistical systems, which operates under conditions of ambient probability-infinity factors;
2. Studies of optimizing technical equipment and operation of agricultural center should be carried out on the basis of methodology for analysis and synthesis of the complex systems, which envisages its structural-imitating modeling based on statistical simulation. The use of these models allows taking account for real working conditions in designing that increases efficiency of designing.
3. With the purpose of extension of operation life of agricultural center, we belive that it is expedient to raise the issue of icreasing operation durability of such-type objects by changing their specialization that will ensure its operation throughout the year. 4. Literature
1. L.V. Botsvadze. Transport-logistical and integrated distribution systems / L. Botsvadze, K. Eradze, V. Botsvadze. Monograph, Volume II, III. Volume II – Logistics of integrated distribution systems. Volume III – Warehousing and port logistics. Business Academy of Georgia. Tbilsi – The publishing house “Universali”, 2014, - 630, 480 p.
2. L. Botsvadze and others. Management and strategies of delivery chains. Manual // L. Botsvadze, K. Eradze, O. Gelashvili, V. Botsvadze // Business Academy of Georgia. Tbilsi – The publishing house “Dinain pretekspresi’, 2012. – 885 p.
3. D.J. Bowersox, D.J. Closs. Logistics. Supply Chain Management. – 2nd edition, translated from English. – M.: Olimp_Business, 2005. – 640 p.
4. O. B. Malikov. Маликов О.Б. warehouses and cargo terminals. Reference book. SBR. The publishing house “Business-press”. – 2005. – 560 p.
5. J. Shapiro. Supply Chain Modeling / Translated from English. Moscow: Nauka publishers, - 416 p.
103
THE ROLE OF BATUMI STATE MARITIME ACADEMY IN TRAINING OF THE FUTURE SEAFARERS IN ACCORDANCE WITH THE MODERN REQUIREMENTS
РОЛЬ БАТУМСКОЙ ГОСУДАРСТВЕННОЙ АКАДЕМИИ В ПОДГОТОВКЕ БУДУЩИХ МОРЯКОВ В
СООТВЕТСТВИИ С СОВРЕМЕННЫМИ ТРЕБОВАНИЯМИ
Dr. Eng. Tsetskhladze M., Prof. Dr. Kochadze T.,, AkakiTsereteli state University, Kutaisi, Georgia [email protected]@mail.ru ;
Abstract:The present paper deals with a brief history of Georgian Maritime traditions and development of Georgian seafarers. It
also describes the collapse of Georgian fleet and hard condition of Georgian seafarers. A negative dynamics of the last 20 years which damaged popularization of the seafarer profession and caused letting down of the high class specialists from the fleet and their degradation.
A positive dynamics of the last years - the state interest towards Maritime Education sphere is resulted in update of Maritime Academy infrastructure, material technical resources are also improved. The laboratories provided with the modern equipment and updated educational programmes tuned to the IMO requirements promote education and training of highly competitive seafarers in accordance with the international requirements.
KEY WORDS: SEAFARER, GEORGIAN FLEET, SHIPPING, MODERN REQUIREMENTS OF MARITIME FIELD.
1. Introduction
Nowadays, merchant fleet is a main factor of the world economy. It is the cheapest means of the cargo transportation which positively developing average share in the total turnover is 70%.
Taking into account the ports and the nearest’s past fleet, Georgia is considered as a country with good maritime traditions. Georgian seafarers successfully serve in the best world maritime companies. Nowadays Georgian seafarers are considered as one of the best and well paid specialists. Such position, taken in the conditions of a high competitevness also underlines a high level of our seafarers’ training, education and competence.
Development of Georgian fleet and recognition of Georgian seafarers started in the first half of the XXth century. Establishing of the Maritime College in 1929 in Batumi promoted this process. Increasing number of competent maritime personnel, as well as the existence of the Port of Batumi promoted creation of Georgian Shipping Company. As the result, Georgian seafarers, because of their diligence and high competence served a high appreciation among the leading maritime and crewing companies. Georgian captains, chief engineers were considered as the best and required specialists. The photos and histories of the Geogian seafarers are widely kept at the maritime museums on the whole Post-Soviet space.
2. Preconditions and means for resolving the
problem The Soviet collapse and the process of the new states
establishingaggravated conditions of the Georgian seafarers.Russia, as the Soviet Union heir made everything to disconnect the links between Post-Soviet shipping companies. As the result of Russian policy, the sums accumulated on the common account were not shared between the shipping companies and accordingly the shipping companies were bankrupted, at the same time, the cargoes became under Russian control which left newly created shipping companies without chances of their development. The newly created states had no proper business plans of the shipping companies development, different teams fought for political impact which caused chaos in Georgia, as well as in other post Soviet republics. Weakstatecontrol, disconnection of the business relations caused an improper management of the fleet, causing improper usage of the ships and working on the demping prices.As the result, Georgian Shipping Company, having 56 ships was completely destroyed. The same problem was related to the Fihsery Department with the tens of the trawlers, Batumi and Poti Shipyards and 10 000 t. dock.Georgian ports, despite their military-strategic importance ports were long term leased. The same problems touched maritime
education - Batumi Maritime College – furtherly Batumi State Maritime Academy, #1 Vocational College and Maritime Training Centres. All above said resulted in the fact of Georgian diplomas invalidation.
Collapse of Georgian fleet put Georgian seafarers in the hardest condition. Employment of Georgian seafarers became very difficult. There were only several crewing companies which had limited employment resourse. Level of Georgian seafarers did not meet the international requirements, especially regarding the English language competence. Many experienced seafarers left maritime activity, young specialist could not get onboard training and it became difficult to link with potential employer. Only two or three crewing companies monopolized employment stating low salaries and difficult conditions. Maritime specialty gradually became nonpopular. Unfortunately there was no government support of the seafarers.
But the people having old maritime traditions and world famous maritime specialists did their best to managesuch hard problems. The experienced seafarers with their love of the profession and their young energetic colleagues made their best and got serious results in the shortest terms. Georgian maritime legislation, Batumi State Maritime Academy and the training centre were tuned to the International Maritime Organization requirements. It also should be noted that as the result of the documents invalidation, Georgian maritime sphere became under the special control. It was a hard task to manage these problems. This taks was successfully decided, which was appropriately stated in EMSA 2013 September report. It also should be noted that the members of commission were not only satisfied by the Maritime Agency and Maritime Academy conditions but also expressed appreciation by them. The members of commission were especially satisfied with the Maritime Training Centre and declared that the Centre is one of the best among the centres existed in the Balck Sea basin. Comparison with Turkish, Bulgarian, Romanian, Ukrainian and Russian centres was very important for our centre because the stated countries budgets considerable exceed Georgian one [3].
The main role in this success belongs to the Government of Georgia and the Ministry of Economy which during the last years despite the other critical problems put millions investment into Maritime Academy development. The great role played by Geogrian Maritime Agency in this success should also be especially noted. The Agency controlled and supported Academy, especially in the process of curriculum tuning to the standards of the International Maritime Organization. The Government of Autonomous Republic also greatly supports Maritime Academy. Municipality of Batumi also supported Academy when provided BSMA with one of the most important building in which a newly constructed and equipped Training Centre was placed.
104
After the Soviet collapse, onboard training became the most important problem for the Academy graduates. The training is is the integral part of Maritime Education. Many rectors together with the government tried to manage the problem, but unfortunately it was fruitless. It is necessary to coordinate activities of several structures and the government’s will in order to manage this problem [1]. The shipowners’ choice of personnel employment is based on their real education and training level. It is caused by a number of seafarers, exceeding the number of vacancies.At the same time, it is not a secret that many ship masters promote and provide their own countries-oriented employment policy and often unfairly block employemnt of Georgian seafarers. Taking above said into account education and training of our seafarers should fully correspond the international standards and protect them from possible problems. Batumi State Maritime Academy provides all conditions, necessary to educate andtrain such personnel.
It is a very important fact, that some neighbouring countries which have no approach to the sea expressed their wish to send their students at Batumi State Maritime Academy. A successful implementation of this project will be the best advertisement for Academy. The choice of Batumi State Maritime Academy is caused by some logical reasons. Nowadays there are several popular higher maritime institutions in the Black Sea basin and the choice of Batumi State Maritime Academy has a set of fundamental reasons. The academic level of the students who, in the frames of academic mobility were enlisted at Batumi State Maritime Academy from the similar institutions differs from the level of BSMA students. During the last decade I worked with the gradutes of different maritime institutions and can’t say that their level exceeds the laevel of BSMA students. It is caused by some objective and subjective reasons and the positive difference of our maritime education and training should be appropriately promoted among the structures related to the employment of the seafarers [2].
It should be noted that the countries which express their
desire to provide their citizens with Maritime Education in Georgia are expected take active part in transcontinental projects and it is not excluded that were going to participate by their own fleet and personnel. It will be a patriotic activity which also should provide a great profit from the namedprojects.
It would be better if Georgian Government discusses Georgian fleet and seafarers participation in the process of economic development of our country’s economy. One of the main problems - manning of the fleet will be decided by the local personnel inclusion.
3. Conclusion
The role of Academy administration and the Rector should be especially noted, whose great love of the maritime sphere resulted in the Academy rapid and fruitfull development process, which was appropriately appreciated by the International Maritime Organization and the crewing companies.
Such attention increased motivation and moral obligation sense of Academy personnel and created appropriate working conditions. 4. Literature
1 Solomon Pavlishvili.tspetsifika of development of a transport corridor of Georgia. Tbilisi. 2014. 2. Solomon Pavlishvili features of development of a transport corridor of Georgia. Tbilisi. 2014. 3. Ana Kurtanidze information technology in transport. Transport and Machine.Tbilisi 2012 88-93 pg.
105
IMPORTANSE OF MERCHANT FLIIT IN COUNTRY TRANSPORT INFRASTRUCTURE IMPROVEMENT
ЗНАЧЕНИЕ МОРСКОГО ТОРГОВОГО ФЛОТА В СОВЕРШЕНСТВОВАНИЕ ТРАНСПОРТНОЙ
ИНФРАСТРУКТУРЫ СТРАНЫ
Prof. Dr. Gogiashvili F., Doctoral candidate Dolidze I., Akaki Tsereteli state University, Kutaisi, Georgia
[email protected]; [email protected]
Abstract : The present paper deals with Georgian State transitive importance, its transport infrastructure effectiveness improvement. It also deals with importance of maritime infrastructure in the transport artery development and the prospects of turnover increase based on the positive calculations of the experts who consider Georgia as the shortest link between Asia and Georgia. The paper also presents the prospects of Georgian transport infrastructure and Merchant fleet inclusion into the intercontinental projects implementation.
KEY WORDS: ECOSYSTEM OF THE BLACK SEA,“NABUCCO”PROJECT,ECOLOGICAL CONDITION OF THE BLACK SEA 1. Introduction
Nowadays, when Georgia tries to hold a position of regional centre in Caucasus it is very important to use its geopolitical and economic potential. It is well known that Western developed and rapidly developing Asian countries are interested in Georgia as in the transit country. If some of serious corporaions or the groups of businessmen tries to invest into Georgia, they will be first of all interested in the hydroresourses or the transport artery of Georgia. During the last years, the process of the hydro resources development is actively being implemented, but the transport sphere is not so actively developed. The choice of the hydro resources development is chosen because of a rapid feedback from the investments put, money invested into the transport infrastructure are not so fast returned. It is absolutely acceptable from the business approach, but Georgian party should act differently. Their attempt should make transport infrastructure presentation as attractive as it is possible, they should do their best to attract investments and provide a basis for a long term profit oriented sphere development which is critically important for our country. Georgian transport infrastructure capacity should be studied in case of its full resource use, it also is important to provide an appropriate legislative background, the tariff policy should alos be revised, especially on the railway. The international experience, especially of developed Western countries, should be taken into consideration on all stages of presented chain development.
2. Preconditions and means for resolving the problem
The location of Georgia and the fact that it is a maritime gate of the South Caucasus, preset its geopolitical priority, the use of which should be appropriately implemented. Georgia, having such geopolitical location, may become transport-logistical centre of Caucasus, partly function of wich is performed nowdays. But, taking into account intensified interest of different European countries and the international corporations towards the countries of the region and wish of Georgia to integrate into European Union, it becomes obvious, that Georgian conomic resource will be fully put into operation an our state will join EU. Accordingly, Georgia should develop well planned schedule of its economy development paying special attention to maritime infrastructure improvement.
Importance of Georgian ports for Caucasian the Middle East countries significantly increases because of rapid development of scientific-technical progress and especially because of increasing need of carbonaceous raw. These countries have considerable reserves of oil and gas, at the same time, the countries produce cotton – one of the best raw for industry, the countries are distinguished by a stable indicators of profits and the routes passing through Georgia are the best ones for these countries. All this
promotes the process of making the country as the key transit region. Iran, which kept posiibility of transit even after the Russian Empire invasion into Caucasus, actively used Georgian maritime corridor in the XVII-XIXth centuries.
Accordingly it is possible to turn back Iran interest to such possibility, giving Georgian ports a chance of their attractiveness and importance increase.
Russia implements the main cargo turnover of the Middle East countries, the fact of which is caused by many artificial factors, such as: pipeline and well developed railway network between Russia and the Middle East countries; well developed and equipped Black Sea ports existed in Russian management. Port operations costs are low and loading discharging operations are well organized; distance of Russian railway is longer than passing via Georgia, but it is compensated by low railway tariffs.
A sector shortening transit routes which pass Caucasus as well as its natural location present the main priority for the Middle Asia transport corridor and it needs appropriate usage in connection with other types of transport to determine the proper development of Gerogian ports. The world economy is interested in the transit routes diversification to provide a free competition. Thus, changes in political climate will not significantly impact upon the economic stability. The stated reason has a high importance for Georgian ports sustainable development.
Caucasus, because of its geopolitical location and natural resources is a unique world region. That is why this region is so important for the Central and Eastern Eurpoe and for economic relations development of the South Caucasian countries. During the last decade, Caucasian factor became increasingly important and the region became in the focus of the interest of world largest countries, the international organizations and the largest transnational corporations. Accordingly, Georgia became the centre linking two parts of the Earth – Europe and Asia.
European Union supported “TRACECA” project will link the countries of the Central Asia and the river Danube basin. This Europe-Asia transport-communication corridor having many branches will pass our country, providing facors of stability and economic development.
“TRACECA” project is considered as a factor of Georgian economic relations development which should define the strategic directions of country’s development.
The project deals Georgian branch of modernized variant of historical “Silk Road” branch. Shipping of strategically important cargoes, such as oil, cotton, gaz, mineral raw materials will be provided by this route.
Initiative of Georgia and Azerbaijan on a “New Silk Road” which is also supported by European Union will be a new stage of Eurasia corridor development. Eurasian route will create
106
completely new transcontinental link from the Pacific to the Atlantic ocean. Solution of the stated problems is closely related with Georgian economic development, gaining the approppriate political importance, accordingly, the projects are critically important for Georgia.
It is impossible to imagine Georgian transport infrastructure without development of Georgian ports, especially of Batumi and Pot ports because of their maijor role in cargo handling. At the same time, the other transport sectors should bee proportionally developed. Intensive works of capacity increase are held on construction of the East-West highway and Georgian railway. Accordingly, it is necessary to provide scientific research of Georgian transport infrastrucre development.
Georgian economy is on development stage. There is a low domestic product level for per capita population, but natural resources of Georgia, education promotion, professionalism and inclusion of the country into the world economic processes will cause its rapid economic development. Naturally, in this case demands on the transportation, especially on shipping will significantly increase. This also is one of the most important factors of the actuality of the stated issue.
Unfortunately nowadays Georgia does not have its own fleet, but in future, development of economy will put creation of the fleet into the agenda of Georgian ports sustainbale development.
Issues of the ports development and organization are less studied by the world economic science, especially in the cases of Georgian ports. That is why the modern scientific methods of planning and management are not actively used in Georgian ports, accordingly, shiphandling is not of the planned rhythmic character with growing of the cargo handling costs. Resolving of the stated issues presents a vital importance for the ports effective development. In order to implement innovations in maritime industry, as well as in all other ones, it is necessary to study local and global markets. Demands determine the prospects of the directions development. It is necessary to create state agency for resources studies, with representation of the air, marine and railway departments, involving appropriate specialists to identify and resolve existed problems. Scientific research works in the transport sphere are very limited in Georgia. The Ministry of Transport was disaffirmed as the result of reform. There is no person in the parliament or in the government to speak about transport problems, innovations or ideas. During the last 10-15 years it was a good idea about the ports and fleet development, but unfortunately, it was not implemented. It was the result of the policy which was implemented in the country transport system when non specialist made decisions or decision were made only one person only because of his discretion. Neither national interests nor long term prospects were taken into consideration. The absence of conduction of the special scientific researches and the control of maritime infrasturcure development caused falling behind of Georgia from the world economy rhythm. There is no a list of attractive projects in Georgia. The investors interested in Georgia have no access to the potential projects and the companies interested in the projects development should conduct all preparatory works, during conduction of which they consider firstly their own profits and accordigly, Georgia should follow their
conditions or refuse their projects implementation. All this creates a negative investment background and damages the country’s image. In 2012 the International Maritime Organization and the United Nations Organization in the frames of RIO+20 Conference worked out the strategy of sustainable maritime transport sphere development. The states, interested in the strategy development jointed for its implmentation. Large tonnage container ships effectiveness and the principles of their fuel supply were in focus of their interest. Capital Ship Management Corporation announced Joint Development Project, developed by Lloyd’s Register, Daewoo Shipbuilding and Marine Engineering at the “Poseidon” conference held in the Athens in August, 2014. The project is aimed at research of alternative fuel, liquefied gas use on large container carriers of 14000 TEU and more. If we take into consideration, that TRASECA member states, Azerbaijan and Kazakhstan have lots of liquefied gaz reserves, we’ll have effective decision of Georgian fleet supply by the fuel. Ship-owner companies, actively diiscuss liquefied gaz usage in shipping. As it is said in Regional Register Manager, Apostle Pulovassili’s report, by 2030 11% of the world fleet will use liquefied gas as the fuel. By the opinion of Capital Ship Management’s leaders, ultra large container ships working on liquified present ideal ship model. The company analyzes the costs and effectiveness calculation and risks related to such ships operation.
3. Conclusion
The main aim of these calculations to make liquified gaz the main source of ships bunkering, innovations of the maritime sphere should be appropriately studied to improve the “general corporate effectiveness” which means effectiveness of fuel use, crew comfort and nature environment protection. Lloyd Register provides the project analysis and the risks assessment. Despite Georgia does not have its own gaz resource, it is necessary for the government of Georgia to take into consideration the fact and to put ship bunkering into long term perspective. It should be noted that issue of the bunkering provision is not appropriately managed in Georgian ports despite its signifcant logistical imp ortance. 4. Literature
1. Tkeshelashvili G. Tkeshelashvili V. Georgian Transport review. Tbilisi. 2010 pg 65.
2. WWW. Potisporti ge. 3. WWW batumiporti. com
107
ВЪЗМОЖНОСТИ ЗА ПРИЛОЖЕНИЕ НА ИЗКУСТВЕНИ НЕВРОННИ МРЕЖИ (ИНМ) ПРИ ТРАНСПОРТНОТО ПЛАНИРАНЕ
POSSIBILITIES FOR APPLICATION OF ARTIFICIAL NEURAL NETWORKS (ANN) IN
TRANSPORTATION PLANNING
ас.маг.инж. Беров Т.1, ВТУ”Т.Каблешков” - София1
E-mail: [email protected]; Abstract: The object of this paper is the implementation of the ANN model for modeling of both trip generation and trip distribution, and mode choice - steps of the classic four-step transport model. The ANN model is implemented on MS Excel spreadsheet and Solver add-in. Algorithm on how to build neural network model with Excel is explained step by step. The factors for the relevant steps and architecture of the respective neural networks are defined. The model is focused on the two competing public passenger transport services – rail services and bus services. KEYWORDS: PUBLIC TRANSPORTATION; TRIP GENERATION, ARTIFICIAL NEURAL NETWORKS, EXCEL
1.Въведение През 1943 г. Маккулок и Питс предлагат модел на неврон
като двоичен прагов елемент. С това се слага началото на моделирането на изкуствени невронни мрежи (ИНМ), намиращи приложение в производственото планиране и управление на процеси, система за идентификация, проверка и прогнозиране и др.
Невронните мрежи са единият от основните методи за обучение в компютърната интелигентност. Полученото знание в невронните мрежи се представя с числените стойности на теглата в структурните връзки. Характерно приложение на ИНМ е за апроксимация на нелинейна функция като не се нуждаят от предположение за зависими и независими променливи. Тази им способност дава възможност за приложение при моделиране на транспортни процеси.
Транспортните инженери често се сблъскват с въпроса как да се извлече достатъчна информация от оскъдни отчетни или от изследването данни. Общият подход е да се създаде модел, който описва поведението на наблюдаваното явление, при което данните се използват за калибриране / валидиране.
При транспортното планиране изключително прилаган е класически четиристъпков транспортен модел: Генериране на пътуванията (trip generation); Разпределяне на пътуванията (trip distribution); Избор на вид превоз (mode choice) и Полагане на движението (route flow assignment). Получените крайни резултати са строго зависими от качеството на използваните данни. При отделните стъпки на този модел обикновено се използват класическите подходи: методът на линейната регресия при моделиране на генерираните пътувания; най-често използваните методи за моделиране на дистрибуцията на пътуванията са така наречените гравитационни модели; изборът между железопътния и автобусния транспорт се моделира чрез двучленен логит модел.
Предмет на настоящия материал е начина на приложение на модела ИНМ при две от стъпките на четиристъпковия модел за търсенето на транспортни услуги за превоз на пътници с обществен транспорт в Република България, за конкуриращите се два вида обществени превози, а именно железопътните и автобусните. Предложени са съответните структури ИНМ модели, които са реализирани чрез използване на Excel -> Solver като съответен инструментариум.
2.Описание на проблема Използвани методи Както бе посочено по-горе, широко използвани методи за
генериране на произведени и привлечени пътувания е Метод на линейната регресия. (1) Yi = a0 + a1x1+..+anxn където Yi е броя произведени (или привлечени) пътувания в зона i; x1, ., xn са влияещите социално-
икономически и демографски фактори, характерни за зона i; ai са коефициенти, получени от регресионния анализ. Най-често използваните методи за моделиране на дистрибуцията на пътуванията са така наречените гравитационни модели. Типична форма на модел за определяне на брой пътувания между двойка транспортни райони: (2) Tij = Ai.Bj.Oi.Dj.f (cij)
където A и B са множества от балансиращи коефициенти аналогични на тези от метода на Фурнес; O и D със съответните им индекси са броят породени и броят привлечени пътувания за дадените зони, f(cij) е функцията на възпиране. Тя има за цел да обясни неизгодите от едно пътуване между дадените зони, като най-често се използват експоненциални, показателни или смесени функции на „обобщените разходи“ за пътуване (парични разходи за гориво, билети, паркинг, разходи на време за пътуване, чакане, прекачване превърнати във величини с една и съща мерна единица).
Широко използван подход за Избор на вид превоз (също така и за Разпределяне на пътуванията) са логит модели. Те са модели за избор на една алтернатива измежду две и повече (discrete choice, mode choice). Изборът се основава на „полезността“, т.е. предполага се, че се избира тази алтернатива, която предлага най-висока полезност Ui:
(3) Uin = U (Sn, Xin, ε) където Sn е набор от характеристики, които описват взимащия решение n, Xin е група економетрични данни, описващи алтернативите и ε е случаен елемент. Приема се, че полезността е линейна функция на няколко наблюдаеми фактора, като всеки фактор k има и коефициент βk, отразяващ тежестта, т.е. значението му в общата полезност: (4) Ui = ∑ βk . Xik
След определяне на полезността на всички Z конкурентни алтернативи, може да се пристъпи към търсене на вероятността всяка една от тях да бъде предпочетена от пътника:
(5) P(1|Z)=𝑒𝑒𝜇.𝑈1
∑ 𝑒𝑒𝜇.𝑈𝑧𝑍𝑧=1
Мащабния параметър обикновено е равен на единица, но
неговото използване повишава точността на прогнозата, т.е. той служи за нормализация. При бинарен модел с две алтернативи:
(6) P(1)=1
1 + 𝑒𝑒−(𝑢1−𝑢2)
108
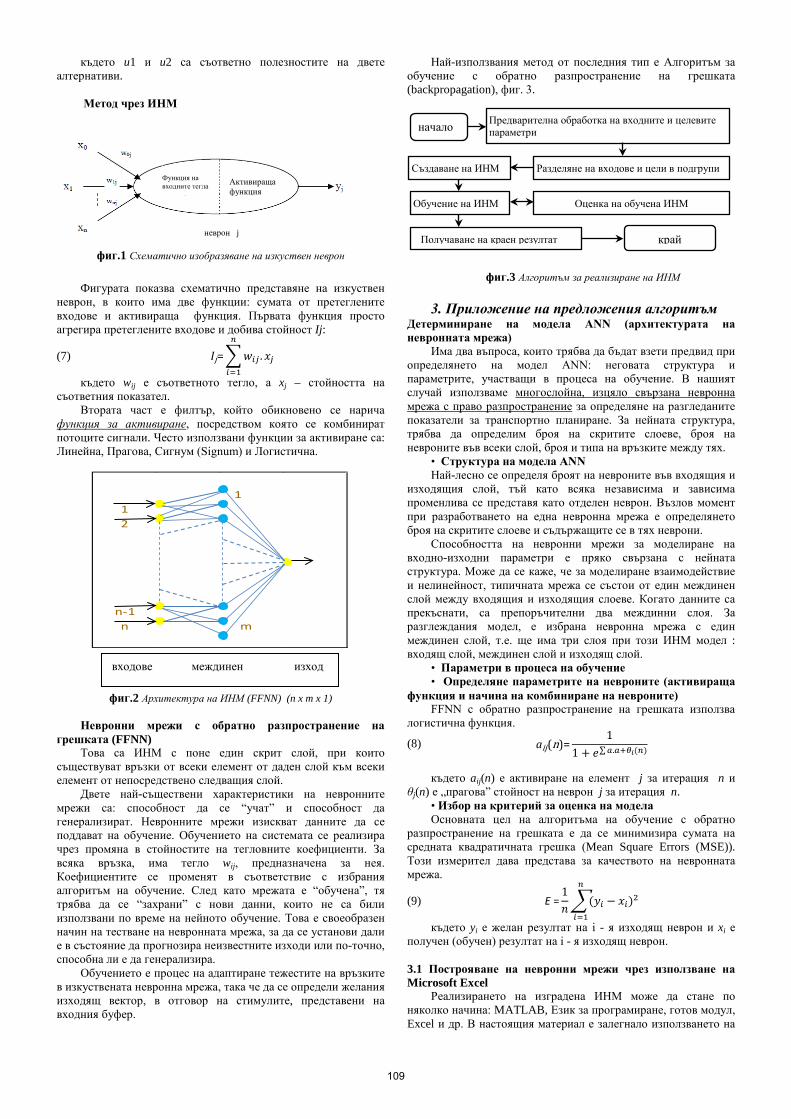
където u1 и u2 са съответно полезностите на двете алтернативи.
Метод чрез ИНМ
фиг.1 Схематично изобразяване на изкуствен неврон
Фигурата показва схематично представяне на изкуствен
неврон, в които има две функции: сумата от претеглените входове и активираща функция. Първата функция просто агрегира претеглените входове и добива стойност Ij:
(7) Ij=𝑤𝑤𝑖𝑗 .𝑥𝑥𝑗
𝑛
𝑖=1
където wij е съответното тегло, а xj – стойността на съответния показател.
Втората част е филтър, който обикновено се нарича функция за активиране, посредством която се комбинират потоците сигнали. Често използвани функции за активиране са: Линейна, Прагова, Сигнум (Signum) и Логистична.
фиг.2 Архитектура на ИНМ (FFNN) (n x m x 1) Невронни мрежи с обратно разпространение на
грешката (FFNN) Това са ИНМ с поне един скрит слой, при които
съществуват връзки от всеки елемент от даден слой към всеки елемент от непосредствено следващия слой.
Двете най-съществени характеристики на невронните мрежи са: способност да се “учат” и способност да генерализират. Невронните мрежи изискват данните да се поддават на обучение. Обучението на системата се реализира чрез промяна в стойностите на тегловните коефициенти. За всяка връзка, има тегло wij, предназначена за нея. Коефициентите се променят в съответствие с избрания алгоритъм на обучение. След като мрежата е “обучена”, тя трябва да се “захрани” с нови данни, които не са били използвани по време на нейното обучение. Това е своеобразен начин на тестване на невронната мрежа, за да се установи дали е в състояние да прогнозира неизвестните изходи или по-точно, способна ли е да генерализира.
Обучението е процес на адаптиране тежестите на връзките в изкуствената невронна мрежа, така че да се определи желания изходящ вектор, в отговор на стимулите, представени на входния буфер.
Най-използвания метод от последния тип е Алгоритъм за обучение с обратно разпространение на грешката (backpropagation), фиг. 3.
фиг.3 Алгоритъм за реализиране на ИНМ
3. Приложение на предложения алгоритъм Детерминиране на модела ANN (архитектурата на невронната мрежа)
Има два въпроса, които трябва да бъдат взети предвид при определянето на модел ANN: неговата структура и параметрите, участващи в процеса на обучение. В нашият случай използваме многослойна, изцяло свързана невронна мрежа с право разпространение за определяне на разгледаните показатели за транспортно планиране. За нейната структура, трябва да определим броя на скритите слоеве, броя на невроните във всеки слой, броя и типа на връзките между тях.
• Структура на модела ANN Най-лесно се определя броят на невроните във входящия и
изходящия слой, тъй като всяка независима и зависима променлива се представя като отделен неврон. Възлов момент при разработването на една невронна мрежа е определянето броя на скритите слоеве и съдържащите се в тях неврони.
Способността на невронни мрежи за моделиране на входно-изходни параметри е пряко свързана с нейната структура. Може да се каже, че за моделиране взаимодействие и нелинейност, типичната мрежа се състои от един междинен слой между входящия и изходящия слоеве. Когато данните са прекъснати, са препоръчителни два междинни слоя. За разглеждания модел, е избрана невронна мрежа с един междинен слой, т.е. ще има три слоя при този ИНМ модел : входящ слой, междинен слой и изходящ слой.
• Параметри в процеса на обучение • Определяне параметрите на невроните (активираща
функция и начина на комбиниране на невроните) FFNN с обратно разпространение на грешката използва
логистична функция.
(8) аij(n)=1
1 + 𝑒𝑒∑𝑎.𝑎+𝜃𝑖(𝑛) където aij(n) е активиране на елемент j за итерация n и
θj(n) е „прагова” стойност на неврон j за итерация n. • Избор на критерий за оценка на модела Основната цел на алгоритъма на обучение с обратно
разпространение на грешката е да се минимизира сумата на средната квадратичната грешка (Mean Square Errors (MSE)). Този измерител дава представа за качеството на невронната мрежа.
(9) E =1𝑛𝑛 (𝑦𝑦𝑖 − 𝑥𝑥𝑖)2
𝑛
𝑖=1
където yi е желан резултат на i - я изходящ неврон и xi е получен (обучен) резултат на i - я изходящ неврон. 3.1 Построяване на невронни мрежи чрез използване на Microsoft Excel Реализирането на изградена ИНМ може да стане по няколко начина: MATLAB, Език за програмиране, готов модул, Excel и др. В настоящия материал е залегнало използването на
неврон j
Активираща функция
Функция на входните тегла
112
n-1n m
входове междинен изход
Предварителна обработка на входните и целевите параметри
Разделяне на входове и цели в подгрупи Създаване на ИНМ
Обучение на ИНМ Оценка на обучена ИНМ
Получаване на краен резултат
начало
край
109

Excel и инструмента Solver (фиг.4). Използваните стъпки са както следва: 1. Подготвяне на данни за обучение на ИНМ
- определяне на входните и изходни параметри; - определяне на броя входове и изходи на ИНМ; - разпределяне на данните в групи (обучение, контрол,
проверка); - скалиране на данните [0,1];
2. Определяне на архитектурата на ИНМ - определяне слоевете и невроните за всеки слой; - определяне на трансферната функция; - инициализиране стойностите на теглата и отклоненията; - въвеждане на формули за всички скрити неврони; - въвеждане на формули за изходящия неврон; - въвеждане на формули за error^2 и MSE.
3. Стартиране на Solver add‐in - целева функция - min MSE; - извършване на минимизирането.
4. Обработка на получения резултат. - зареждане графика за изход и прогнозен резултат;
- скалиране на прогнозирания изход; - записване на окончателните стойности на теглата и
отместванията.
Определяне на параметри при транспортно планиране чрез ИНМ Две от стъпките на традиционния четиристъпков транспортен модел са генериране на пътуванията и избор на вид превоз. Разгледано е използването на ИНМ модела за търсенето на транспортни услуги за превоз на пътници с обществен транспорт в Република България, за конкуриращите се два вида обществени превози, а именно железопътните и автобусните.
Генериране на пътуванията Използвани фактори (както за изходящи, така и за
входящи пътувания) са: - числеността на населението, X1 - БВП на глава от населението, X2 - средна годишна работна заплата, X3 - цена на жилища, X4 - изход – съответните пътувания X5
Таблица 1: Параметри на модел ИНМ за Генериране на пътуванията Брой на слоевете 3 Брой на невроните във входящия слой 4 Брой на невроните в междинния слой 6 Брой на невроните в изходящия слой 1 Активираща функция за междинния слой Логистична
функция Активираща функция за изходящия слой Логистична
функция Избор на вид превоз В стъпката „модален сплит“ трябва да се разработи модел,
отчитащ точно факторите определящи личния избор на вид транспорт за дадено пътуване. Тези фактори могат да се класифицират в три групи – такива, характеризиращи пътуващия (доходи, притежание на автомобил, семейно положение и др.), такива, характеризиращи пътуването (цел на пътуване, време от денонощието) и такива, характеризиращи условията на пътуването (парични и времеви разходи, честота на услугата, комфорт).
Приложен е модела ИНМ за два вида транспорт – железопътен (ЖТ) и автобусен (АТ). Входни параметри са съответно времепътуване, цена за билет, честота на услугата и комфорт за всеки от двата вида транспорт. Изходен параметър е 𝑝𝑝𝑖𝑗влак.
(10) 𝑇𝑇𝑖𝑗влак=𝑝𝑝𝑖𝑗влак.𝑇𝑇𝑖𝑗
където 𝑇𝑇𝑖𝑗 е общия поток, съответстващ на дъгата (ij); 𝑇𝑇𝑖𝑗влак е съответно общия влакопоток, а 𝑝𝑝𝑖𝑗влак е дела на влакопотока.
Използвани фактори за Избор на вид превоз са: - времепътуване - АТ, X1 - времепътуване - ЖТ, X2 - цена за билет - АТ, X3 - цена за билет - ЖТ, X4 - честота на услугата - АТ, X5 - честота на услугата - ЖТ, X6 - комфорт - АТ, X7 - комфорт - ЖТ, X8 - изход – пътувания ЖТ X9
Таблица 2: Параметри на модел ИНМ за Избор на вид превоз Брой на слоевете 3 Брой на невроните във входящия слой 8 Брой на невроните в междинния слой 12 Брой на невроните в изходящия слой 1 Активираща функция за междинния слой
Логистична функция
Активираща функция за изходящия слой Логистична функция
4.Резултати На фиг. 4 е показан екрана на Excel за ИНМ за табл.1.
Използвани са данни [1],[7] за прогнозиране на пътувания за сухоземен транспорт.
Използвани означения при реализация чрез Excel: Слой 1 - Входове: X1, X2, X3, X4 Слой 2 -изчисления: Стойности за тегла: w(1,1), w(1,2), w(1,3), w(1,4) за скрит неврон (1,1) w(2,1), w(2,2), w(2,3), w(2,4) за скрит неврон (1,2) …………………….. w(6,1), w(6,2), w(6,3), w(6,4) за скрит неврон (1,6) Отклонения: b(1,1) за скрит неврон (1,1) b(1,2) за скрит неврон (1,2) …………………. b(1,6) за скрит неврон (1,6) Формули в Excel: Скрит Неврон (1,1) = 1/(1+(EXP(‐(X1*w(1,1) + X2*w(1,2) +
X3*w(1,3)+X4*w(1,4)+b(1,1) ) Скрит Неврон (1,2) = 1/(1+(EXP(‐(X1*w(2,1) + X2*w(2,2) +
X3*w(2,3)+X4*w(2,4)+b(1,2) ) ………………. Скрит Неврон (1,6) = 1/(1+(EXP(‐(X1*w(6,1) + X2*w(6,2) +
X3*w(6,3)+X4*w(6,4)+b(1,6) ) Слой 3: Изчисления за Стойности на тегла: w(22,1), w(22,2), .. , w(22,6) Отместване: b(2,1) Формули в Excel: Изходен неврон = 1/(1+(EXP(‐(h(1,1)*w(22,1) +
h(1,2)*w(22,2)+h(1,3)*w(22,3)+ .. + h(1,6)*w(22,6)+b(2,1) ) Калкулираме грешка^2, MSE Формули в Excel: Error^2 = (X5 – ИЗХ())^2 MSE= Average(Error^2) Run Solver add‐in Целева клетка: MSE (W24) Регулируеми клетки: всички данни за теглото и
отклонение (O6:O23;Q6:Q24); Критерии: Минимизиране MSE Показване на прогнозна диаграма и желания изход. На фиг.5 е показана графиката на разликата между
входните пътувания за обучение на ИНМ и съответните им получени в следствие на обучението резултантни пътувания.
110
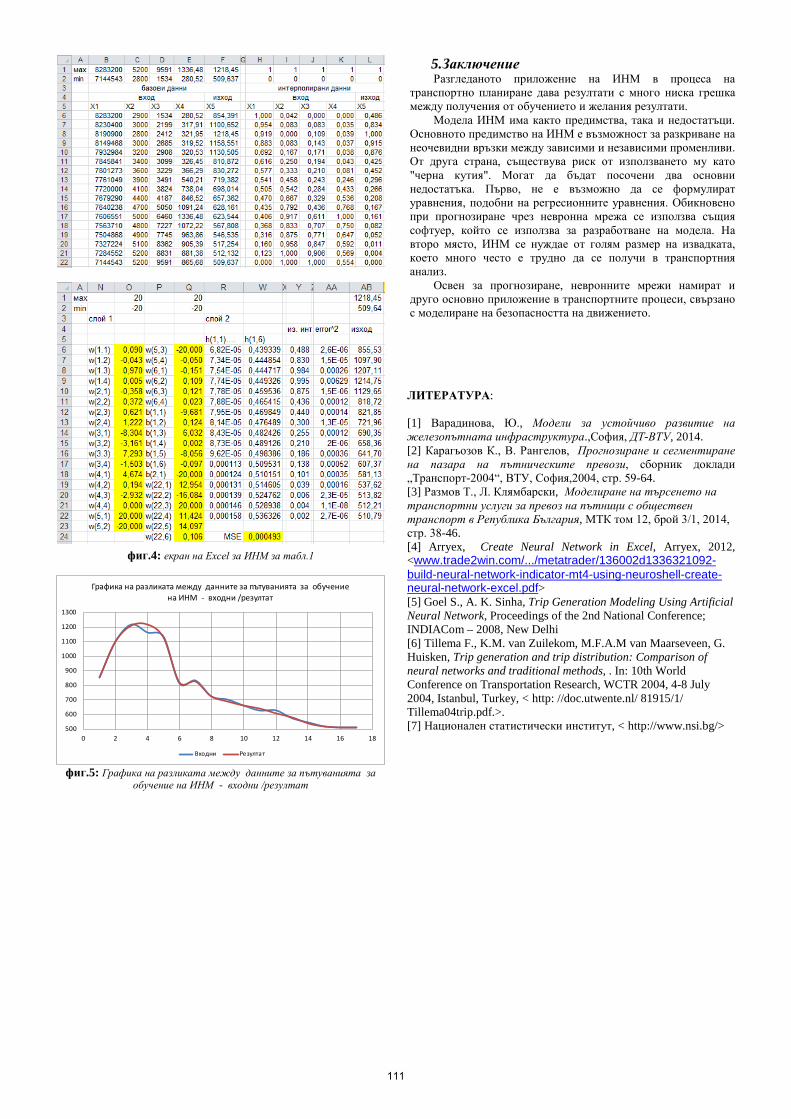
фиг.4: екран на Excel за ИНМ за табл.1
фиг.5: Графика на разликата между данните за пътуванията за
обучение на ИНМ - входни /резултат
5.Заключение Разгледаното приложение на ИНМ в процеса на
транспортно планиране дава резултати с много ниска грешка между получения от обучението и желания резултати.
Модела ИНМ има както предимства, така и недостатъци. Основното предимство на ИНМ е възможност за разкриване на неочевидни връзки между зависими и независими променливи. От друга страна, съществува риск от използването му като "черна кутия". Могат да бъдат посочени два основни недостатъка. Първо, не е възможно да се формулират уравнения, подобни на регресионните уравнения. Обикновено при прогнозиране чрез невронна мрежа се използва същия софтуер, който се използва за разработване на модела. На второ място, ИНМ се нуждае от голям размер на извадката, което много често е трудно да се получи в транспортния анализ.
Освен за прогнозиране, невронните мрежи намират и друго основно приложение в транспортните процеси, свързано с моделиране на безопасността на движението.
ЛИТЕРАТУРА: [1] Варадинова, Ю., Модели за устойчиво развитие на железопътната инфраструктура.,София, ДТ-ВТУ, 2014. [2] Карагьозов К., В. Рангелов, Прогнозиране и сегментиране на пазара на пътническите превози, сборник доклади „Транспорт-2004“, ВТУ, София,2004, стр. 59-64. [3] Размов Т., Л. Клямбарски, Моделиране на търсенето на транспортни услуги за превоз на пътници с обществен транспорт в Република България, МТК том 12, брой 3/1, 2014, стр. 38-46. [4] Arryex, Create Neural Network in Excel, Arryex, 2012, <www.trade2win.com/.../metatrader/136002d1336321092-build-neural-network-indicator-mt4-using-neuroshell-create-neural-network-excel.pdf> [5] Goel S., A. K. Sinha, Trip Generation Modeling Using Artificial Neural Network, Proceedings of the 2nd National Conference; INDIACom – 2008, New Delhi [6] Tillema F., K.M. van Zuilekom, M.F.A.M van Maarseveen, G. Huisken, Trip generation and trip distribution: Comparison of neural networks and traditional methods, . In: 10th World Conference on Transportation Research, WCTR 2004, 4-8 July 2004, Istanbul, Turkey, < http: //doc.utwente.nl/ 81915/1/ Tillema04trip.pdf.>. [7] Национален статистически институт, < http://www.nsi.bg/>
500
600
700
800
900
1000
1100
1200
1300
0 2 4 6 8 10 12 14 16 18
Графика на разликата между данните за пътуванията за обучение на ИНМ - входни /резултат
Входни Резултат
111
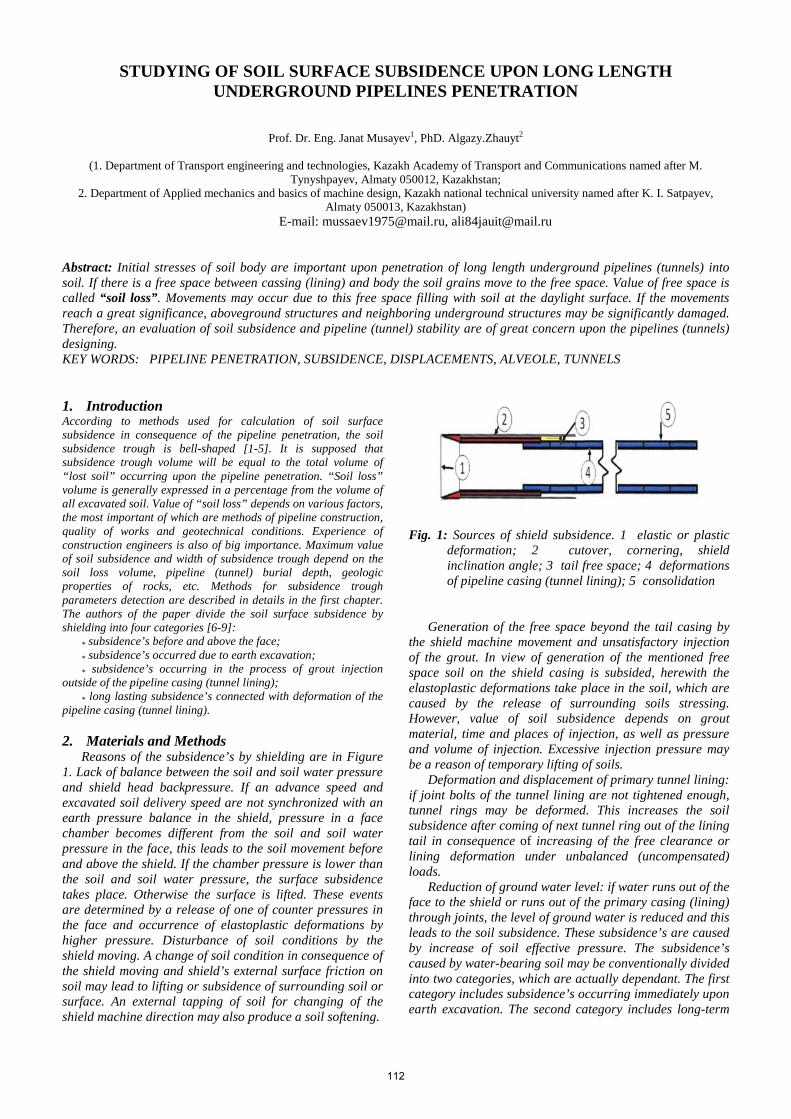
STUDYING OF SOIL SURFACE SUBSIDENCE UPON LONG LENGTH UNDERGROUND PIPELINES PENETRATION
Prof. Dr. Eng. Janat Musayev1, PhD. Algazy.Zhauyt2
(1. Department of Transport engineering and technologies, Kazakh Academy of Transport and Communications named after M.
Tynyshpayev, Almaty 050012, Kazakhstan; 2. Department of Applied mechanics and basics of machine design, Kazakh national technical university named after K. I. Satpayev,
Almaty 050013, Kazakhstan) E-mail: [email protected], [email protected]
Abstract: Initial stresses of soil body are important upon penetration of long length underground pipelines (tunnels) into soil. If there is a free space between cassing (lining) and body the soil grains move to the free space. Value of free space is called “soil loss”. Movements may occur due to this free space filling with soil at the daylight surface. If the movements reach a great significance, aboveground structures and neighboring underground structures may be significantly damaged. Therefore, an evaluation of soil subsidence and pipeline (tunnel) stability are of great concern upon the pipelines (tunnels) designing. KEY WORDS: PIPELINE PENETRATION, SUBSIDENCE, DISPLACEMENTS, ALVEOLE, TUNNELS 1. Introduction According to methods used for calculation of soil surface subsidence in consequence of the pipeline penetration, the soil subsidence trough is bell-shaped [1-5]. It is supposed that subsidence trough volume will be equal to the total volume of “lost soil” occurring upon the pipeline penetration. “Soil loss” volume is generally expressed in a percentage from the volume of all excavated soil. Value of “soil loss” depends on various factors, the most important of which are methods of pipeline construction, quality of works and geotechnical conditions. Experience of construction engineers is also of big importance. Maximum value of soil subsidence and width of subsidence trough depend on the soil loss volume, pipeline (tunnel) burial depth, geologic properties of rocks, etc. Methods for subsidence trough parameters detection are described in details in the first chapter. The authors of the paper divide the soil surface subsidence by shielding into four categories [6-9]:
* subsidence’s before and above the face; * subsidence’s occurred due to earth excavation; * subsidence’s occurring in the process of grout injection
outside of the pipeline casing (tunnel lining); * long lasting subsidence’s connected with deformation of the
pipeline casing (tunnel lining).
2. Materials and Methods Reasons of the subsidence’s by shielding are in Figure
1. Lack of balance between the soil and soil water pressure and shield head backpressure. If an advance speed and excavated soil delivery speed are not synchronized with an earth pressure balance in the shield, pressure in a face chamber becomes different from the soil and soil water pressure in the face, this leads to the soil movement before and above the shield. If the chamber pressure is lower than the soil and soil water pressure, the surface subsidence takes place. Otherwise the surface is lifted. These events are determined by a release of one of counter pressures in the face and occurrence of elastoplastic deformations by higher pressure. Disturbance of soil conditions by the shield moving. A change of soil condition in consequence of the shield moving and shield’s external surface friction on soil may lead to lifting or subsidence of surrounding soil or surface. An external tapping of soil for changing of the shield machine direction may also produce a soil softening.
Fig. 1: Sources of shield subsidence. 1 elastic or plastic deformation; 2 cutover, cornering, shield inclination angle; 3 tail free space; 4 deformations of pipeline casing (tunnel lining); 5 consolidation
Generation of the free space beyond the tail casing by the shield machine movement and unsatisfactory injection of the grout. In view of generation of the mentioned free space soil on the shield casing is subsided, herewith the elastoplastic deformations take place in the soil, which are caused by the release of surrounding soils stressing. However, value of soil subsidence depends on grout material, time and places of injection, as well as pressure and volume of injection. Excessive injection pressure may be a reason of temporary lifting of soils.
Deformation and displacement of primary tunnel lining: if joint bolts of the tunnel lining are not tightened enough, tunnel rings may be deformed. This increases the soil subsidence after coming of next tunnel ring out of the lining tail in consequence of increasing of the free clearance or lining deformation under unbalanced (uncompensated) loads.
Reduction of ground water level: if water runs out of the face to the shield or runs out of the primary casing (lining) through joints, the level of ground water is reduced and this leads to the soil subsidence. These subsidence’s are caused by increase of soil effective pressure. The subsidence’s caused by water-bearing soil may be conventionally divided into two categories, which are actually dependant. The first category includes subsidence’s occurring immediately upon earth excavation. The second category includes long-term
112
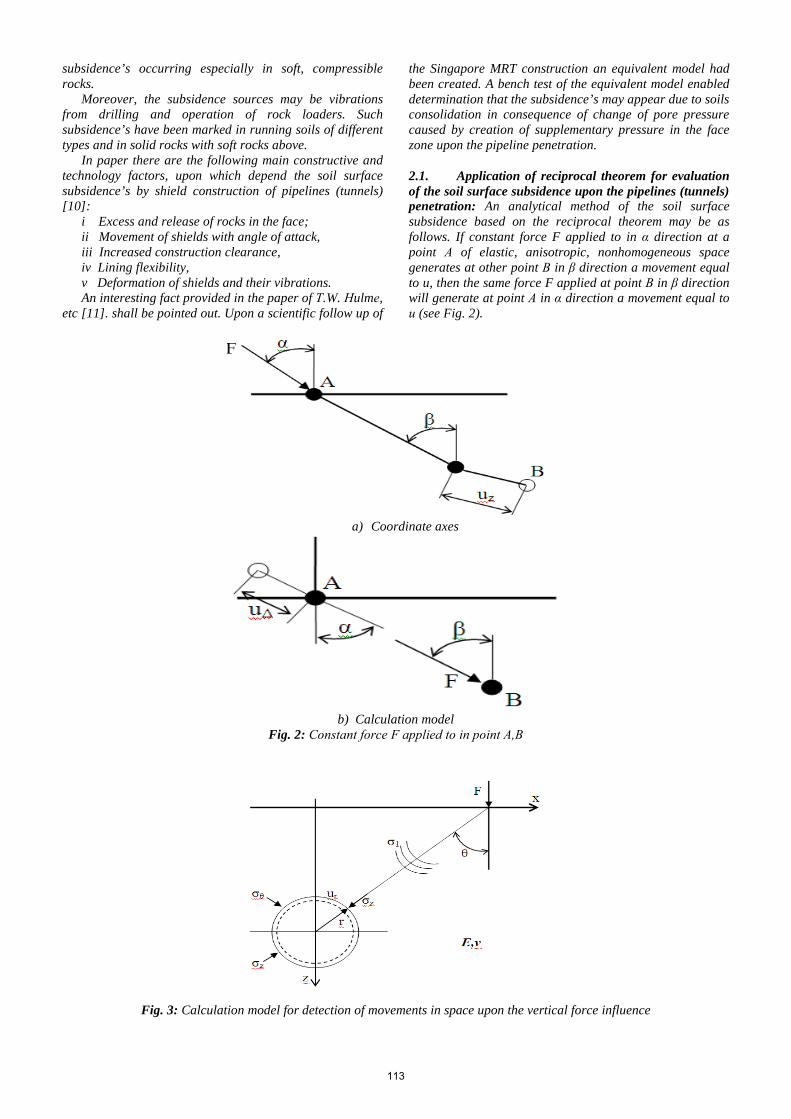
subsidence’s occurring especially in soft, compressible rocks.
Moreover, the subsidence sources may be vibrations from drilling and operation of rock loaders. Such subsidence’s have been marked in running soils of different types and in solid rocks with soft rocks above.
In paper there are the following main constructive and technology factors, upon which depend the soil surface subsidence’s by shield construction of pipelines (tunnels) [10]:
i Excess and release of rocks in the face; ii Movement of shields with angle of attack, iii Increased construction clearance, iv Lining flexibility, v Deformation of shields and their vibrations. An interesting fact provided in the paper of Т.W. Нulmе,
etc [11]. shall be pointed out. Upon a scientific follow up of
the Singapore MRT construction an equivalent model had been created. A bench test of the equivalent model enabled determination that the subsidence’s may appear due to soils consolidation in consequence of change of pore pressure caused by creation of supplementary pressure in the face zone upon the pipeline penetration.
2.1. Application of reciprocal theorem for evaluation of the soil surface subsidence upon the pipelines (tunnels) penetration: An analytical method of the soil surface subsidence based on the reciprocal theorem may be as follows. If constant force F applied to in α direction at a point А of elastic, anisotropic, nonhomogeneous space generates at other point В in β direction a movement equal to u, then the same force F applied at point В in β direction will generate at point А in α direction a movement equal to и (see Fig. 2).
a) Coordinate axes
b) Calculation model
Fig. 2: Constant force F applied to in point А,B
Fig. 3: Calculation model for detection of movements in space upon the vertical force influence
113
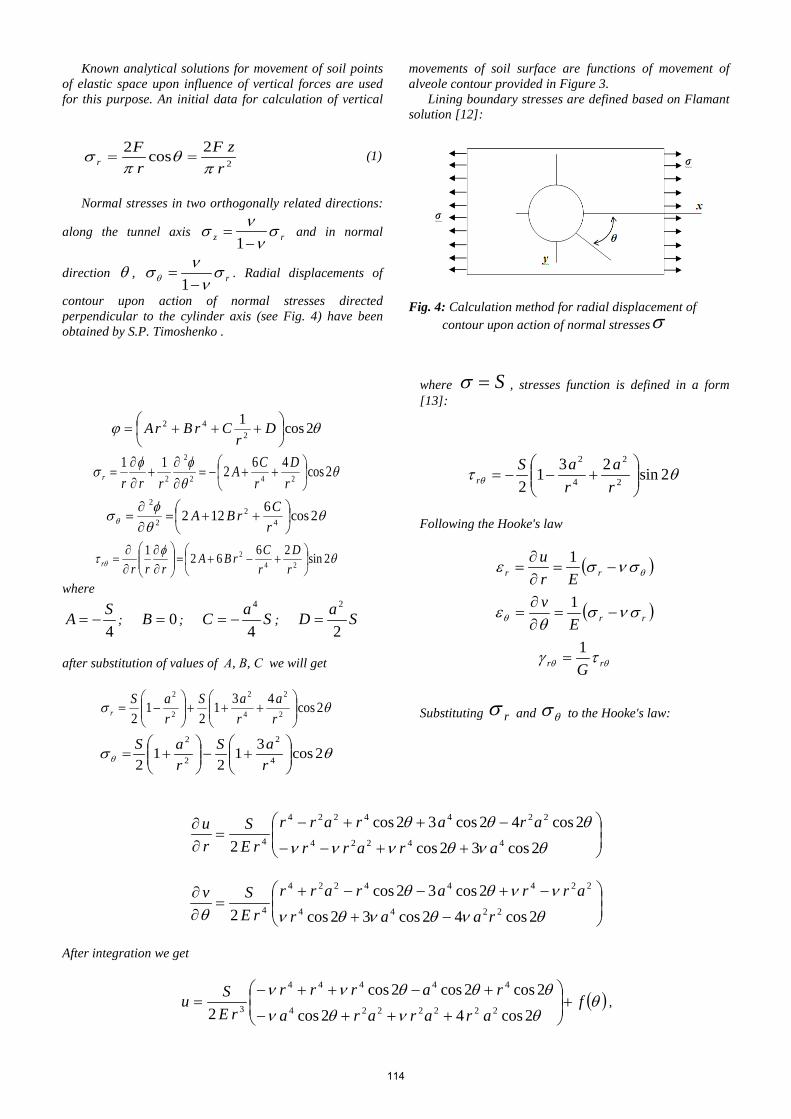
Known analytical solutions for movement of soil points of elastic space upon influence of vertical forces are used for this purpose. An initial data for calculation of vertical
movements of soil surface are functions of movement of alveole contour provided in Figure 3.
Lining boundary stresses are defined based on Flamant solution [12]:
2
2cos2r
zFrF
r πθ
πσ == (1)
Normal stresses in two orthogonally related directions:
along the tunnel axis rz σν
νσ−
=1
and in normal
direction θ , rσν
νσθ −=
1. Radial displacements of
contour upon action of normal stresses directed perpendicular to the cylinder axis (see Fig. 4) have been obtained by S.P. Timoshenko .
Fig. 4: Calculation method for radial displacement of contour upon action of normal stressesσ
where S=σ , stresses function is defined in a form [13]:
θϕ 2cos12
42
+++= D
rCrBrA
θθφφ
σ 2cos46211242
2
2
++−=
∂∂
+∂∂
=rD
rCA
rrrr
θθφσθ 2cos6122 4
22
2
++=
∂∂
=rCrBA
θφ
τ θ 2sin2662124
2
+−+=
∂∂
∂∂
=rD
rCrBA
rrrr
where
4SA −= ; 0=B ; SaC
4
4
−= ; SaD2
2
=
after substitution of values of А, В, С we will get
θσ 2cos4312
12 2
2
4
2
2
2
+++
−=
ra
raS
raS
r
θσθ 2cos312
12 4
2
2
2
+−
+=
raS
raS
θτ θ 2sin2312 2
2
4
2
+−−=
ra
raS
r
Following the Hooke's law
( )θσνσε −=∂∂
= rr Eru 1
( )rrEv σνσθ
εθ −=∂∂
=1
θθ τγ rr G1
=
Substituting rσ and θσ to the Hooke's law:
++−−
−++−=
∂∂
θνθννν
θθθ
2cos32cos2cos42cos32cos
2 44224
2244224
4 ararrarararr
rES
ru
−+
−+−−+=
∂∂
θνθνθν
ννθθθ 2cos42cos32cos
2cos32cos2 2244
22444224
4 raararrararr
rESv
After integration we get
( )θθνθν
θθθννf
arararararrr
rESu +
+++−
+−++−=
2cos42cos2cos2cos2cos
2 2222224
44444
3 ,
114
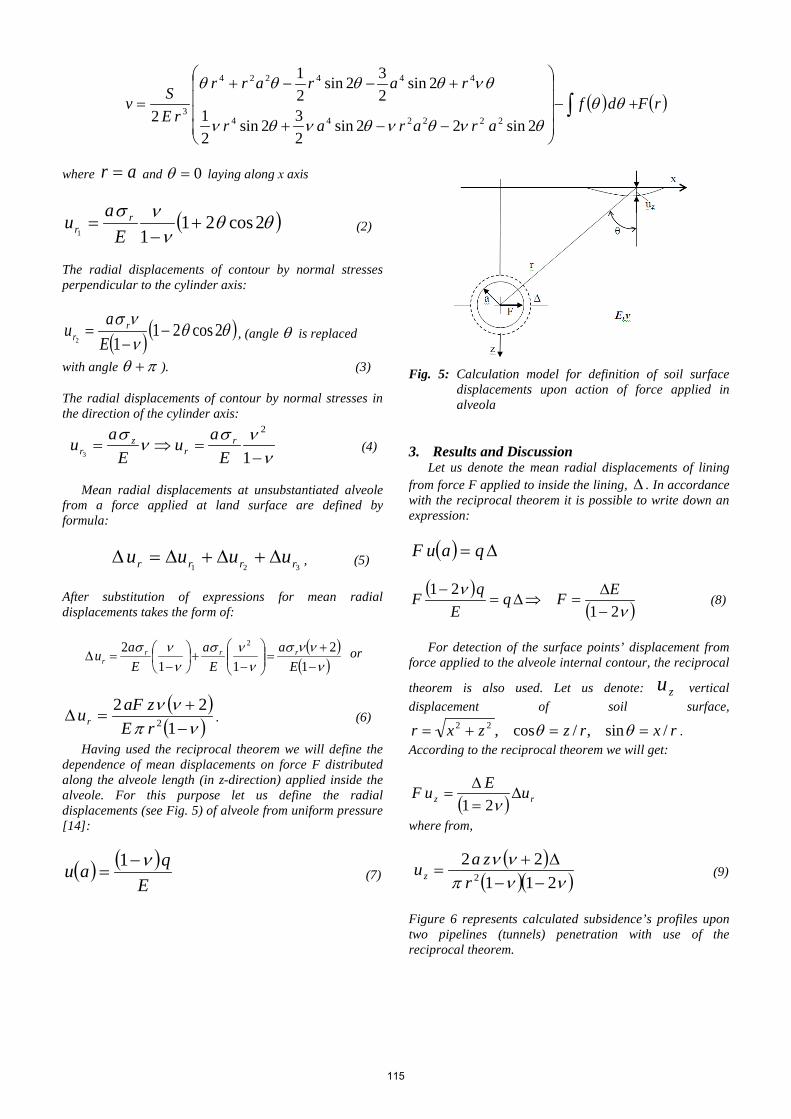
( ) ( )rFdfararar
rararr
rESv ∫ +−
−−+
+−−+= θθ
θνθνθνθν
θνθθθθ
2sin22sin232sin
21
2sin232sin
21
2 222244
444224
3
where ar = and 0=θ laying along х axis
( )θθν
νσ 2cos2111
+−
=E
au rr (2)
The radial displacements of contour by normal stresses perpendicular to the cylinder axis:
( ) ( )θθννσ 2cos21
12−
−=
Eau r
r , (angle θ is replaced
with angle πθ + ). (3)
The radial displacements of contour by normal stresses in the direction of the cylinder axis:
ννσ
νσ
−=⇒=
1
2
3 Eau
Eau r
rz
r (4)
Mean radial displacements at unsubstantiated alveole
from a force applied at land surface are defined by formula:
321 rrrr uuuu ∆+∆+∆=∆ , (5)
After substitution of expressions for mean radial displacements takes the form of:
( )( )νννσ
ννσ
ννσ
−+
=
−
+
−
=∆1
211
2 2
Ea
Ea
Eau rrr
r or
( )( )νπνν−+
=∆1
222rE
zaFur . (6)
Having used the reciprocal theorem we will define the dependence of mean displacements on force F distributed along the alveole length (in z-direction) applied inside the alveole. For this purpose let us define the radial displacements (see Fig. 5) of alveole from uniform pressure [14]:
( ) ( )E
qau ν−=
1 (7)
Fig. 5: Calculation model for definition of soil surface
displacements upon action of force applied in alveola
3. Results and Discussion Let us denote the mean radial displacements of lining
from force F applied to inside the lining, ∆ . In accordance with the reciprocal theorem it is possible to write down an expression:
( ) ∆= qauF
( )
( )νν
2121
−∆
=⇒∆=− EFq
EqF (8)
For detection of the surface points’ displacement from
force applied to the alveole internal contour, the reciprocal
theorem is also used. Let us denote: zu vertical displacement of soil surface,
rxrzzxr /sin,/cos,22 ==+= θθ . According to the reciprocal theorem we will get:
( ) rz uEuF ∆=∆
=ν21
where from,
( )( )( )ννπ
νν211
222 −−
∆+=
rzauz (9)
Figure 6 represents calculated subsidence’s profiles upon two pipelines (tunnels) penetration with use of the reciprocal theorem.
115
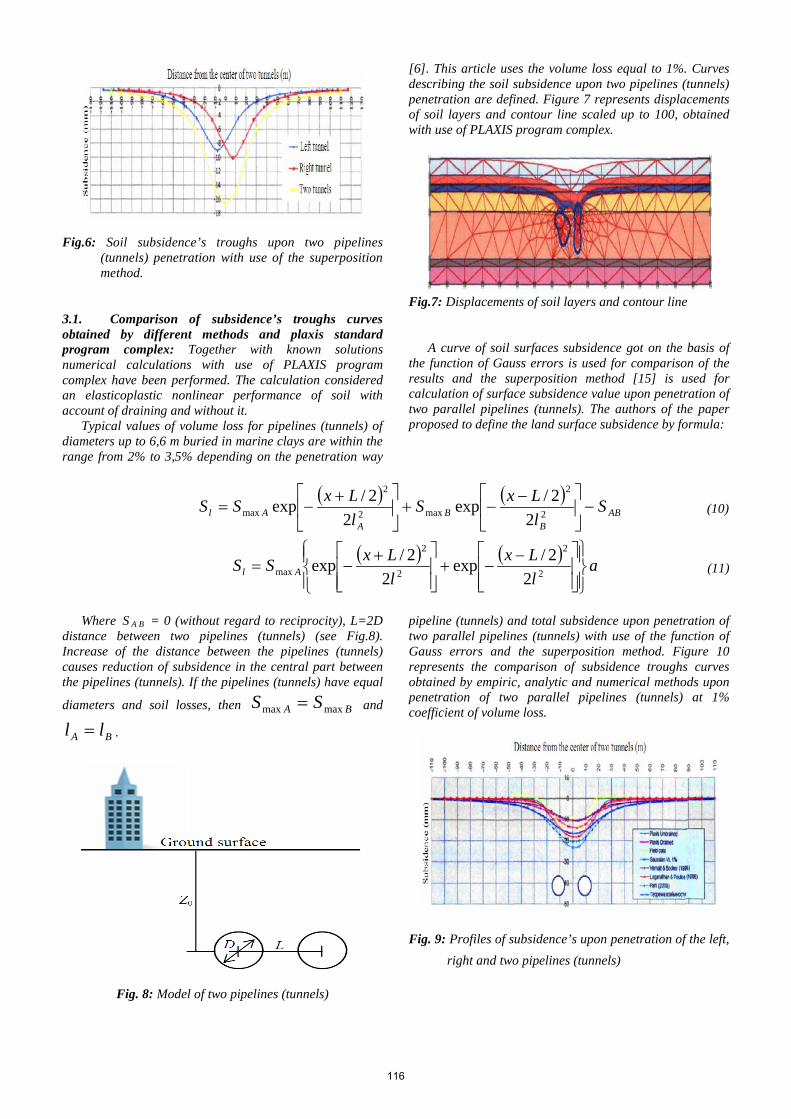
Fig.6: Soil subsidence’s troughs upon two pipelines (tunnels) penetration with use of the superposition method.
3.1. Comparison of subsidence’s troughs curves obtained by different methods and plaxis standard program complex: Together with known solutions numerical calculations with use of PLAXIS program complex have been performed. The calculation considered an elasticoplastic nonlinear performance of soil with account of draining and without it.
Typical values of volume loss for pipelines (tunnels) of diameters up to 6,6 m buried in marine clays are within the range from 2% to 3,5% depending on the penetration way
[6]. This article uses the volume loss equal to 1%. Curves describing the soil subsidence upon two pipelines (tunnels) penetration are defined. Figure 7 represents displacements of soil layers and contour line scaled up to 100, obtained with use of PLAXIS program complex.
Fig.7: Displacements of soil layers and contour line
A curve of soil surfaces subsidence got on the basis of
the function of Gauss errors is used for comparison of the results and the superposition method [15] is used for calculation of surface subsidence value upon penetration of two parallel pipelines (tunnels). The authors of the paper proposed to define the land surface subsidence by formula:
( ) ( )AB
BB
AAl S
lLxS
lLxSS −
−−+
+−= 2
2
max2
2
max 22/exp
22/exp (10)
( ) ( ) alLx
lLxSS Al
−−+
+−= 2
2
2
2
max 22/exp
22/exp (11)
Where S A B = 0 (without regard to reciprocity), L=2D
distance between two pipelines (tunnels) (see Fig.8). Increase of the distance between the pipelines (tunnels) causes reduction of subsidence in the central part between the pipelines (tunnels). If the pipelines (tunnels) have equal
diameters and soil losses, then BA SS maxmax = and
BA ll = .
Fig. 8: Model of two pipelines (tunnels)
pipeline (tunnels) and total subsidence upon penetration of two parallel pipelines (tunnels) with use of the function of Gauss errors and the superposition method. Figure 10 represents the comparison of subsidence troughs curves obtained by empiric, analytic and numerical methods upon penetration of two parallel pipelines (tunnels) at 1% coefficient of volume loss.
Fig. 9: Profiles of subsidence’s upon penetration of the left, right and two pipelines (tunnels)
116
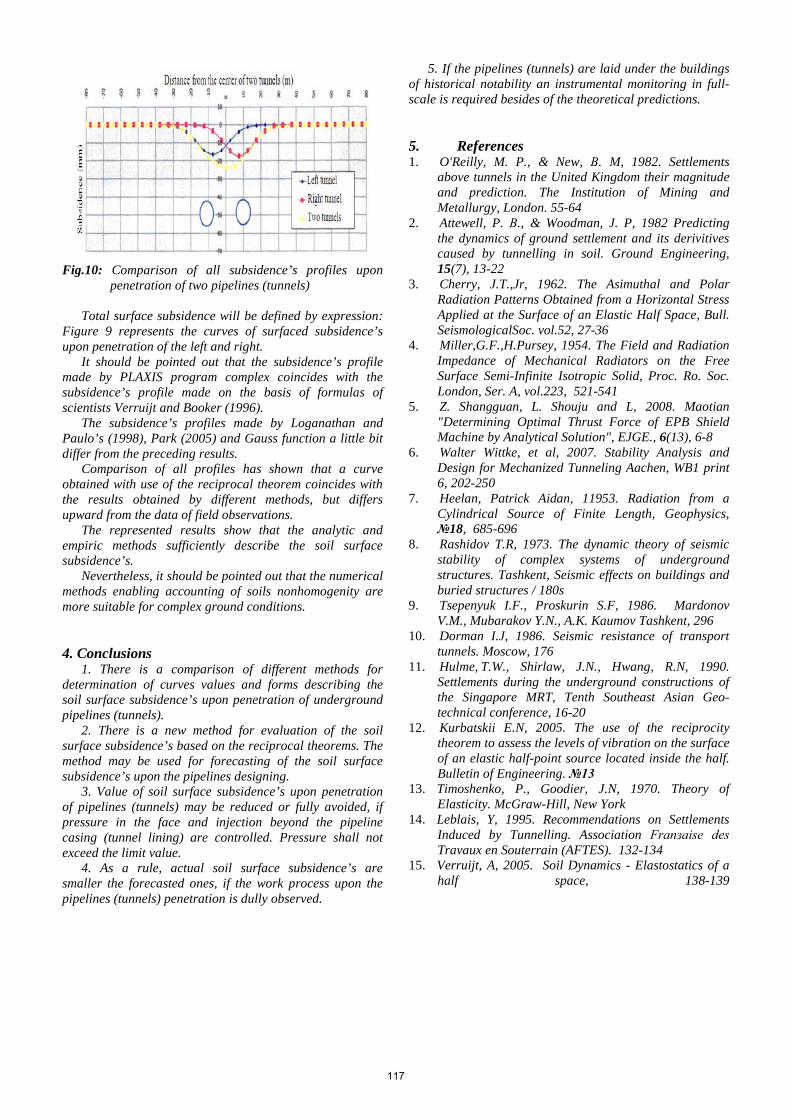
Fig.10: Comparison of all subsidence’s profiles upon
penetration of two pipelines (tunnels)
Total surface subsidence will be defined by expression: Figure 9 represents the curves of surfaced subsidence’s upon penetration of the left and right.
It should be pointed out that the subsidence’s profile made by PLAXIS program complex coincides with the subsidence’s profile made on the basis of formulas of scientists Verruijt and Booker (1996).
The subsidence’s profiles made by Loganathan and Paulo’s (1998), Park (2005) and Gauss function a little bit differ from the preceding results.
Comparison of all profiles has shown that a curve obtained with use of the reciprocal theorem coincides with the results obtained by different methods, but differs upward from the data of field observations.
The represented results show that the analytic and empiric methods sufficiently describe the soil surface subsidence’s.
Nevertheless, it should be pointed out that the numerical methods enabling accounting of soils nonhomogenity are more suitable for complex ground conditions.
4. Conclusions
1. There is a comparison of different methods for determination of curves values and forms describing the soil surface subsidence’s upon penetration of underground pipelines (tunnels).
2. There is a new method for evaluation of the soil surface subsidence’s based on the reciprocal theorems. The method may be used for forecasting of the soil surface subsidence’s upon the pipelines designing.
3. Value of soil surface subsidence’s upon penetration of pipelines (tunnels) may be reduced or fully avoided, if pressure in the face and injection beyond the pipeline casing (tunnel lining) are controlled. Pressure shall not exceed the limit value.
4. As a rule, actual soil surface subsidence’s are smaller the forecasted ones, if the work process upon the pipelines (tunnels) penetration is dully observed.
5. If the pipelines (tunnels) are laid under the buildings of historical notability an instrumental monitoring in full-scale is required besides of the theoretical predictions.
5. References 1. O'Reilly, M. P., & New, В. M, 1982. Settlements
above tunnels in the United Kingdom their magnitude and prediction. The Institution of Mining and Metallurgy, London. 55-64
2. Attewell, P. В., & Woodman, J. P, 1982 Predicting the dynamics of ground settlement and its derivitives caused by tunnelling in soil. Ground Engineering, 15(7), 13-22
3. Cherry, J.T.,Jr, 1962. The Asimuthal and Polar Radiation Patterns Obtained from a Horizontal Stress Applied at the Surface of an Elastic Half Space, Bull. SeismologicalSoc. vol.52, 27-36
4. Miller,G.F.,H.Pursey, 1954. The Field and Radiation Impedance of Mechanical Radiators on the Free Surface Semi-Infinite Isotropic Solid, Proc. Ro. Soc. London, Ser. A, vol.223, 521-541
5. Z. Shangguan, L. Shouju and L, 2008. Maotian "Determining Optimal Thrust Force of EPB Shield Machine by Analytical Solution", EJGE., 6(13), 6-8
6. Walter Wittke, et al, 2007. Stability Analysis and Design for Mechanized Tunneling Aachen, WB1 print 6, 202-250
7. Heelan, Patrick Aidan, 11953. Radiation from a Cylindrical Source of Finite Length, Geophysics, 18, 685-696
8. Rashidov T.R, 1973. The dynamic theory of seismic stability of complex systems of underground structures. Tashkent, Seismic effects on buildings and buried structures / 180s
9. Tsepenyuk I.F., Proskurin S.F, 1986. Mardonov V.M., Mubarakov Y.N., A.K. Kaumov Tashkent, 296
10. Dorman I.J, 1986. Seismic resistance of transport tunnels. Moscow, 176
11. Hulme, T.W., Shirlaw, J.N., Hwang, R.N, 1990. Settlements during the underground constructions of the Singapore MRT, Tenth Southeast Asian Geo-technical conference, 16-20
12. Kurbatskii E.N, 2005. The use of the reciprocity theorem to assess the levels of vibration on the surface of an elastic half-point source located inside the half. Bulletin of Engineering. 13
13. Timoshenko, P., Goodier, J.N, 1970. Theory of Elasticity. McGraw-Hill, New York
14. Leblais, Y, 1995. Recommendations on Settlements Induced by Tunnelling. Association Franзaise des Travaux en Souterrain (AFTES). 132-134
15. Verruijt, A, 2005. Soil Dynamics - Elastostatics of a half space, 138-139
117
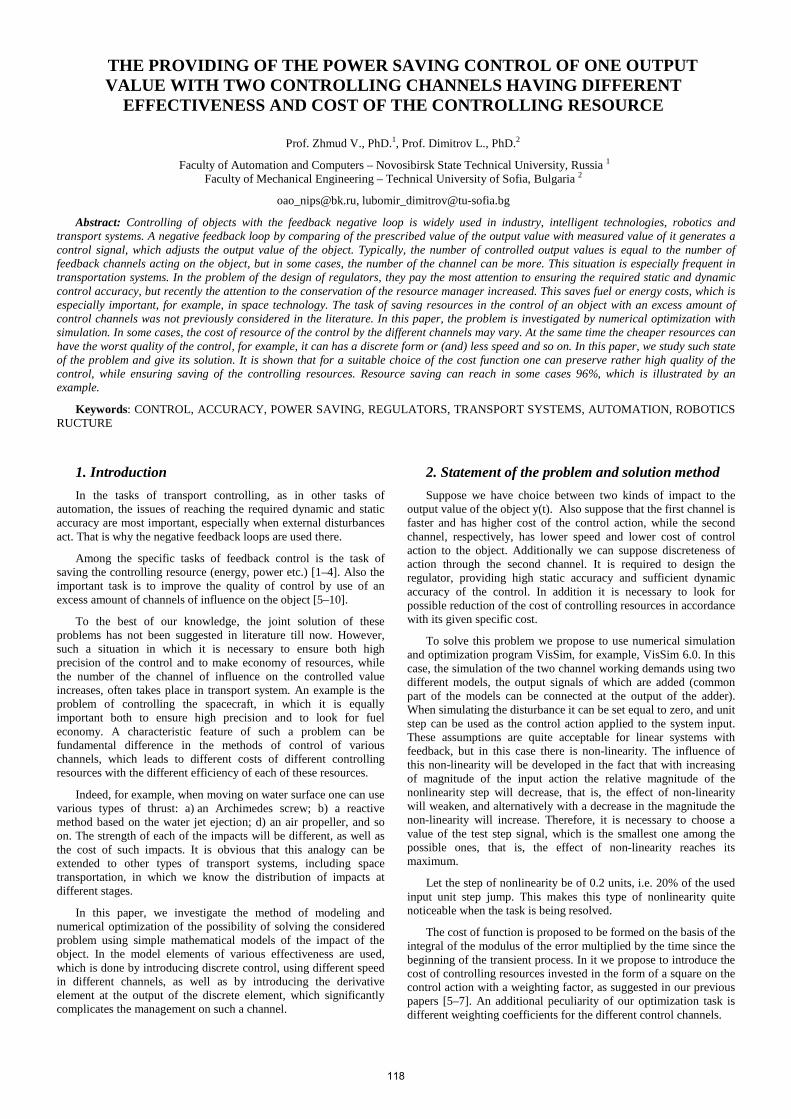
THE PROVIDING OF THE POWER SAVING CONTROL OF ONE OUTPUT VALUE WITH TWO CONTROLLING CHANNELS HAVING DIFFERENT
EFFECTIVENESS AND COST OF THE CONTROLLING RESOURCE
Prof. Zhmud V., PhD.1, Prof. Dimitrov L., PhD.2
Faculty of Automation and Computers – Novosibirsk State Technical University, Russia 1
Faculty of Mechanical Engineering – Technical University of Sofia, Bulgaria 2
[email protected], [email protected]
Abstract: Controlling of objects with the feedback negative loop is widely used in industry, intelligent technologies, robotics and transport systems. A negative feedback loop by comparing of the prescribed value of the output value with measured value of it generates a control signal, which adjusts the output value of the object. Typically, the number of controlled output values is equal to the number of feedback channels acting on the object, but in some cases, the number of the channel can be more. This situation is especially frequent in transportation systems. In the problem of the design of regulators, they pay the most attention to ensuring the required static and dynamic control accuracy, but recently the attention to the conservation of the resource manager increased. This saves fuel or energy costs, which is especially important, for example, in space technology. The task of saving resources in the control of an object with an excess amount of control channels was not previously considered in the literature. In this paper, the problem is investigated by numerical optimization with simulation. In some cases, the cost of resource of the control by the different channels may vary. At the same time the cheaper resources can have the worst quality of the control, for example, it can has a discrete form or (and) less speed and so on. In this paper, we study such state of the problem and give its solution. It is shown that for a suitable choice of the cost function one can preserve rather high quality of the control, while ensuring saving of the controlling resources. Resource saving can reach in some cases 96%, which is illustrated by an example.
Keywords: CONTROL, ACCURACY, POWER SAVING, REGULATORS, TRANSPORT SYSTEMS, AUTOMATION, ROBOTICS RUCTURE
1. Introduction In the tasks of transport controlling, as in other tasks of
automation, the issues of reaching the required dynamic and static accuracy are most important, especially when external disturbances act. That is why the negative feedback loops are used there.
Among the specific tasks of feedback control is the task of saving the controlling resource (energy, power etc.) [1–4]. Also the important task is to improve the quality of control by use of an excess amount of channels of influence on the object [5–10].
To the best of our knowledge, the joint solution of these problems has not been suggested in literature till now. However, such a situation in which it is necessary to ensure both high precision of the control and to make economy of resources, while the number of the channel of influence on the controlled value increases, often takes place in transport system. An example is the problem of controlling the spacecraft, in which it is equally important both to ensure high precision and to look for fuel economy. A characteristic feature of such a problem can be fundamental difference in the methods of control of various channels, which leads to different costs of different controlling resources with the different efficiency of each of these resources.
Indeed, for example, when moving on water surface one can use various types of thrust: a) an Archimedes screw; b) a reactive method based on the water jet ejection; d) an air propeller, and so on. The strength of each of the impacts will be different, as well as the cost of such impacts. It is obvious that this analogy can be extended to other types of transport systems, including space transportation, in which we know the distribution of impacts at different stages.
In this paper, we investigate the method of modeling and numerical optimization of the possibility of solving the considered problem using simple mathematical models of the impact of the object. In the model elements of various effectiveness are used, which is done by introducing discrete control, using different speed in different channels, as well as by introducing the derivative element at the output of the discrete element, which significantly complicates the management on such a channel.
2. Statement of the problem and solution method Suppose we have choice between two kinds of impact to the
output value of the object y(t). Also suppose that the first channel is faster and has higher cost of the control action, while the second channel, respectively, has lower speed and lower cost of control action to the object. Additionally we can suppose discreteness of action through the second channel. It is required to design the regulator, providing high static accuracy and sufficient dynamic accuracy of the control. In addition it is necessary to look for possible reduction of the cost of controlling resources in accordance with its given specific cost.
To solve this problem we propose to use numerical simulation and optimization program VisSim, for example, VisSim 6.0. In this case, the simulation of the two channel working demands using two different models, the output signals of which are added (common part of the models can be connected at the output of the adder). When simulating the disturbance it can be set equal to zero, and unit step can be used as the control action applied to the system input. These assumptions are quite acceptable for linear systems with feedback, but in this case there is non-linearity. The influence of this non-linearity will be developed in the fact that with increasing of magnitude of the input action the relative magnitude of the nonlinearity step will decrease, that is, the effect of non-linearity will weaken, and alternatively with a decrease in the magnitude the non-linearity will increase. Therefore, it is necessary to choose a value of the test step signal, which is the smallest one among the possible ones, that is, the effect of non-linearity reaches its maximum.
Let the step of nonlinearity be of 0.2 units, i.e. 20% of the used input unit step jump. This makes this type of nonlinearity quite noticeable when the task is being resolved.
The cost of function is proposed to be formed on the basis of the integral of the modulus of the error multiplied by the time since the beginning of the transient process. In it we propose to introduce the cost of controlling resources invested in the form of a square on the control action with a weighting factor, as suggested in our previous papers [5–7]. An additional peculiarity of our optimization task is different weighting coefficients for the different control channels.
118
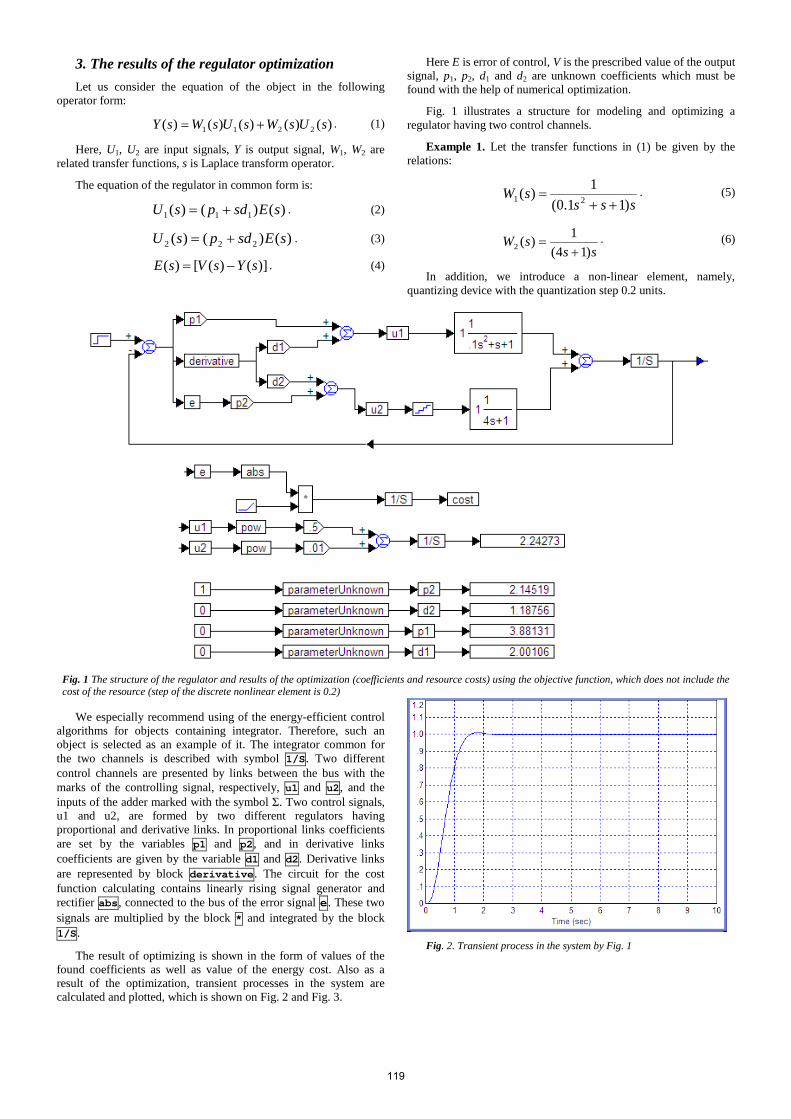
3. The results of the regulator optimization Let us consider the equation of the object in the following
operator form:
)()()()()( 2211 sUsWsUsWsY += . (1)
Here, U1, U2 are input signals, Y is output signal, W1, W2 are related transfer functions, s is Laplace transform operator.
The equation of the regulator in common form is:
)()()( 111 sEsdpsU += . (2)
)()()( 222 sEsdpsU += . (3)
)]()([)( sYsVsE −= . (4)
Here E is error of control, V is the prescribed value of the output signal, p1, p2, d1 and d2 are unknown coefficients which must be found with the help of numerical optimization.
Fig. 1 illustrates a structure for modeling and optimizing a regulator having two control channels.
Example 1. Let the transfer functions in (1) be given by the relations:
ssssW
)11.0(1)( 21 ++
= . (5)
sssW
)14(1)(2 +
= . (6)
In addition, we introduce a non-linear element, namely, quantizing device with the quantization step 0.2 units.
Fig. 1 The structure of the regulator and results of the optimization (coefficients and resource costs) using the objective function, which does not include the cost of the resource (step of the discrete nonlinear element is 0.2)
We especially recommend using of the energy-efficient control
algorithms for objects containing integrator. Therefore, such an object is selected as an example of it. The integrator common for the two channels is described with symbol 1/S. Two different control channels are presented by links between the bus with the marks of the controlling signal, respectively, u1 and u2, and the inputs of the adder marked with the symbol Σ. Two control signals, u1 and u2, are formed by two different regulators having proportional and derivative links. In proportional links coefficients are set by the variables p1 and p2, and in derivative links coefficients are given by the variable d1 and d2. Derivative links are represented by block derivative. The circuit for the cost function calculating contains linearly rising signal generator and rectifier abs, connected to the bus of the error signal e. These two signals are multiplied by the block * and integrated by the block 1/S.
The result of optimizing is shown in the form of values of the found coefficients as well as value of the energy cost. Also as a result of the optimization, transient processes in the system are calculated and plotted, which is shown on Fig. 2 and Fig. 3.
Fig. 2. Transient process in the system by Fig. 1
119
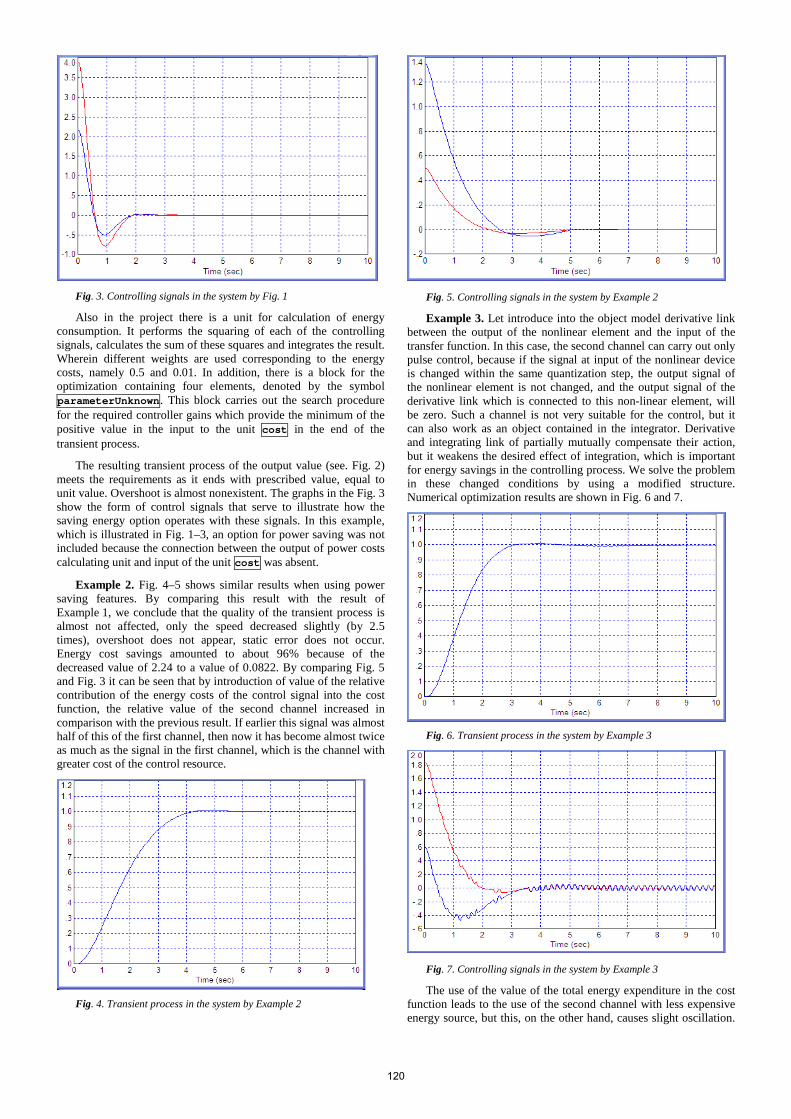
Fig. 3. Controlling signals in the system by Fig. 1
Also in the project there is a unit for calculation of energy consumption. It performs the squaring of each of the controlling signals, calculates the sum of these squares and integrates the result. Wherein different weights are used corresponding to the energy costs, namely 0.5 and 0.01. In addition, there is a block for the optimization containing four elements, denoted by the symbol parameterUnknown. This block carries out the search procedure for the required controller gains which provide the minimum of the positive value in the input to the unit cost in the end of the transient process.
The resulting transient process of the output value (see. Fig. 2) meets the requirements as it ends with prescribed value, equal to unit value. Overshoot is almost nonexistent. The graphs in the Fig. 3 show the form of control signals that serve to illustrate how the saving energy option operates with these signals. In this example, which is illustrated in Fig. 1–3, an option for power saving was not included because the connection between the output of power costs calculating unit and input of the unit cost was absent.
Example 2. Fig. 4–5 shows similar results when using power saving features. By comparing this result with the result of Example 1, we conclude that the quality of the transient process is almost not affected, only the speed decreased slightly (by 2.5 times), overshoot does not appear, static error does not occur. Energy cost savings amounted to about 96% because of the decreased value of 2.24 to a value of 0.0822. By comparing Fig. 5 and Fig. 3 it can be seen that by introduction of value of the relative contribution of the energy costs of the control signal into the cost function, the relative value of the second channel increased in comparison with the previous result. If earlier this signal was almost half of this of the first channel, then now it has become almost twice as much as the signal in the first channel, which is the channel with greater cost of the control resource.
Fig. 4. Transient process in the system by Example 2
Fig. 5. Controlling signals in the system by Example 2
Example 3. Let introduce into the object model derivative link between the output of the nonlinear element and the input of the transfer function. In this case, the second channel can carry out only pulse control, because if the signal at input of the nonlinear device is changed within the same quantization step, the output signal of the nonlinear element is not changed, and the output signal of the derivative link which is connected to this non-linear element, will be zero. Such a channel is not very suitable for the control, but it can also work as an object contained in the integrator. Derivative and integrating link of partially mutually compensate their action, but it weakens the desired effect of integration, which is important for energy savings in the controlling process. We solve the problem in these changed conditions by using a modified structure. Numerical optimization results are shown in Fig. 6 and 7.
Fig. 6. Transient process in the system by Example 3
Fig. 7. Controlling signals in the system by Example 3
The use of the value of the total energy expenditure in the cost function leads to the use of the second channel with less expensive energy source, but this, on the other hand, causes slight oscillation.
120
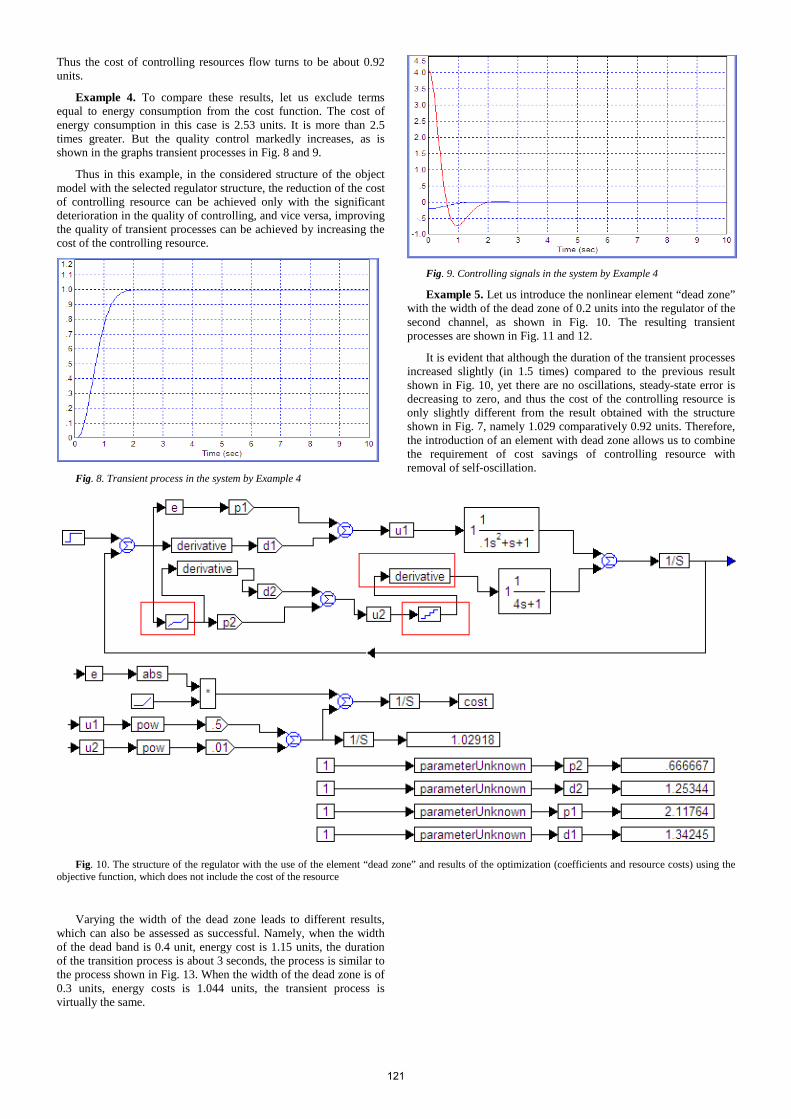
Thus the cost of controlling resources flow turns to be about 0.92 units.
Example 4. To compare these results, let us exclude terms equal to energy consumption from the cost function. The cost of energy consumption in this case is 2.53 units. It is more than 2.5 times greater. But the quality control markedly increases, as is shown in the graphs transient processes in Fig. 8 and 9.
Thus in this example, in the considered structure of the object model with the selected regulator structure, the reduction of the cost of controlling resource can be achieved only with the significant deterioration in the quality of controlling, and vice versa, improving the quality of transient processes can be achieved by increasing the cost of the controlling resource.
Fig. 8. Transient process in the system by Example 4
Fig. 9. Controlling signals in the system by Example 4
Example 5. Let us introduce the nonlinear element “dead zone” with the width of the dead zone of 0.2 units into the regulator of the second channel, as shown in Fig. 10. The resulting transient processes are shown in Fig. 11 and 12.
It is evident that although the duration of the transient processes increased slightly (in 1.5 times) compared to the previous result shown in Fig. 10, yet there are no oscillations, steady-state error is decreasing to zero, and thus the cost of the controlling resource is only slightly different from the result obtained with the structure shown in Fig. 7, namely 1.029 comparatively 0.92 units. Therefore, the introduction of an element with dead zone allows us to combine the requirement of cost savings of controlling resource with removal of self-oscillation.
Fig. 10. The structure of the regulator with the use of the element “dead zone” and results of the optimization (coefficients and resource costs) using the
objective function, which does not include the cost of the resource
Varying the width of the dead zone leads to different results, which can also be assessed as successful. Namely, when the width of the dead band is 0.4 unit, energy cost is 1.15 units, the duration of the transition process is about 3 seconds, the process is similar to the process shown in Fig. 13. When the width of the dead zone is of 0.3 units, energy costs is 1.044 units, the transient process is virtually the same.
121
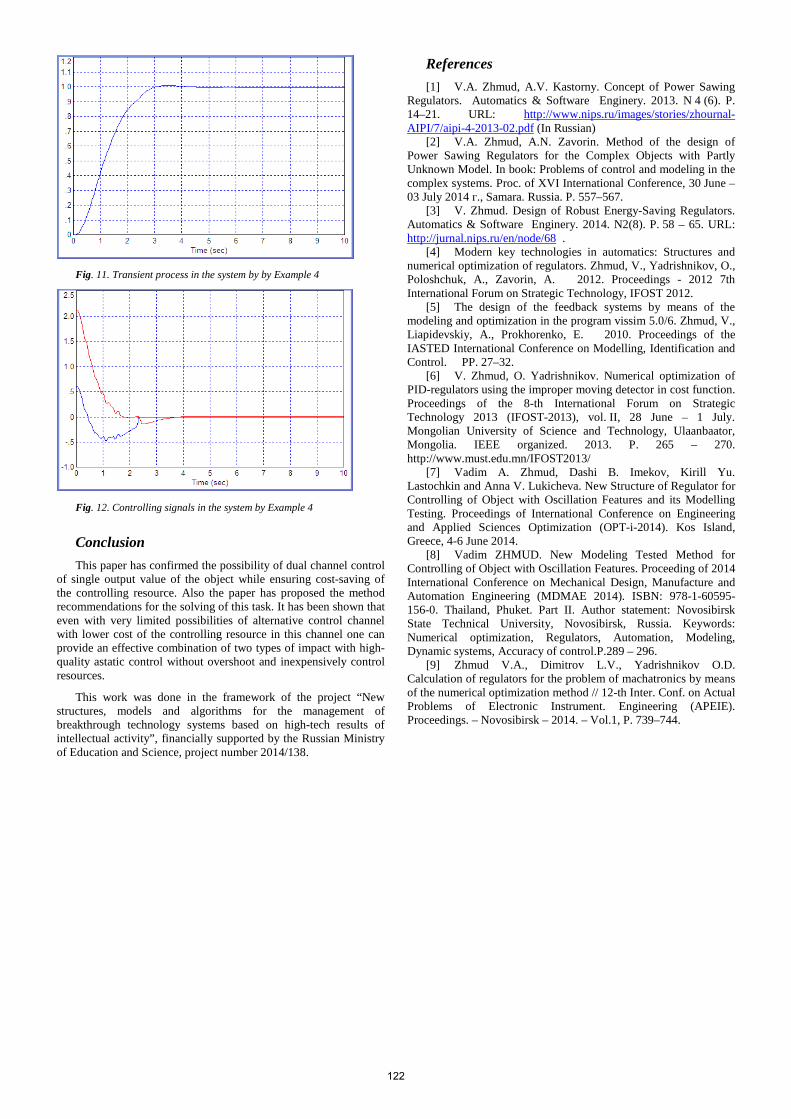
Fig. 11. Transient process in the system by by Example 4
Fig. 12. Controlling signals in the system by Example 4
Conclusion This paper has confirmed the possibility of dual channel control
of single output value of the object while ensuring cost-saving of the controlling resource. Also the paper has proposed the method recommendations for the solving of this task. It has been shown that even with very limited possibilities of alternative control channel with lower cost of the controlling resource in this channel one can provide an effective combination of two types of impact with high-quality astatic control without overshoot and inexpensively control resources.
This work was done in the framework of the project “New structures, models and algorithms for the management of breakthrough technology systems based on high-tech results of intellectual activity”, financially supported by the Russian Ministry of Education and Science, project number 2014/138.
References [1] V.A. Zhmud, A.V. Kastorny. Concept of Power Sawing
Regulators. Automatics & Software Enginery. 2013. N 4 (6). P. 14–21. URL: http://www.nips.ru/images/stories/zhournal-AIPI/7/aipi-4-2013-02.pdf (In Russian)
[2] V.A. Zhmud, A.N. Zavorin. Method of the design of Power Sawing Regulators for the Complex Objects with Partly Unknown Model. In book: Problems of control and modeling in the complex systems. Proc. of XVI International Conference, 30 June – 03 July 2014 г., Samara. Russia. P. 557–567.
[3] V. Zhmud. Design of Robust Energy-Saving Regulators. Automatics & Software Enginery. 2014. N2(8). P. 58 – 65. URL: http://jurnal.nips.ru/en/node/68 .
[4] Modern key technologies in automatics: Structures and numerical optimization of regulators. Zhmud, V., Yadrishnikov, O., Poloshchuk, A., Zavorin, A. 2012. Proceedings - 2012 7th International Forum on Strategic Technology, IFOST 2012.
[5] The design of the feedback systems by means of the modeling and optimization in the program vissim 5.0/6. Zhmud, V., Liapidevskiy, A., Prokhorenko, E. 2010. Proceedings of the IASTED International Conference on Modelling, Identification and Control. PP. 27–32.
[6] V. Zhmud, O. Yadrishnikov. Numerical optimization of PID-regulators using the improper moving detector in cost function. Proceedings of the 8-th International Forum on Strategic Technology 2013 (IFOST-2013), vol. II, 28 June – 1 July. Mongolian University of Science and Technology, Ulaanbaator, Mongolia. IEEE organized. 2013. P. 265 – 270. http://www.must.edu.mn/IFOST2013/
[7] Vadim A. Zhmud, Dashi B. Imekov, Kirill Yu. Lastochkin and Anna V. Lukicheva. New Structure of Regulator for Controlling of Object with Oscillation Features and its Modelling Testing. Proceedings of International Conference on Engineering and Applied Sciences Optimization (OPT-i-2014). Kos Island, Greece, 4-6 June 2014.
[8] Vadim ZHMUD. New Modeling Tested Method for Controlling of Object with Oscillation Features. Proceeding of 2014 International Conference on Mechanical Design, Manufacture and Automation Engineering (MDMAE 2014). ISBN: 978-1-60595-156-0. Thailand, Phuket. Part II. Author statement: Novosibirsk State Technical University, Novosibirsk, Russia. Keywords: Numerical optimization, Regulators, Automation, Modeling, Dynamic systems, Accuracy of control.P.289 – 296.
[9] Zhmud V.A., Dimitrov L.V., Yadrishnikov O.D. Calculation of regulators for the problem of machatronics by means of the numerical optimization method // 12-th Inter. Conf. on Actual Problems of Electronic Instrument. Engineering (APEIE). Proceedings. – Novosibirsk – 2014. – Vol.1, P. 739–744.
122
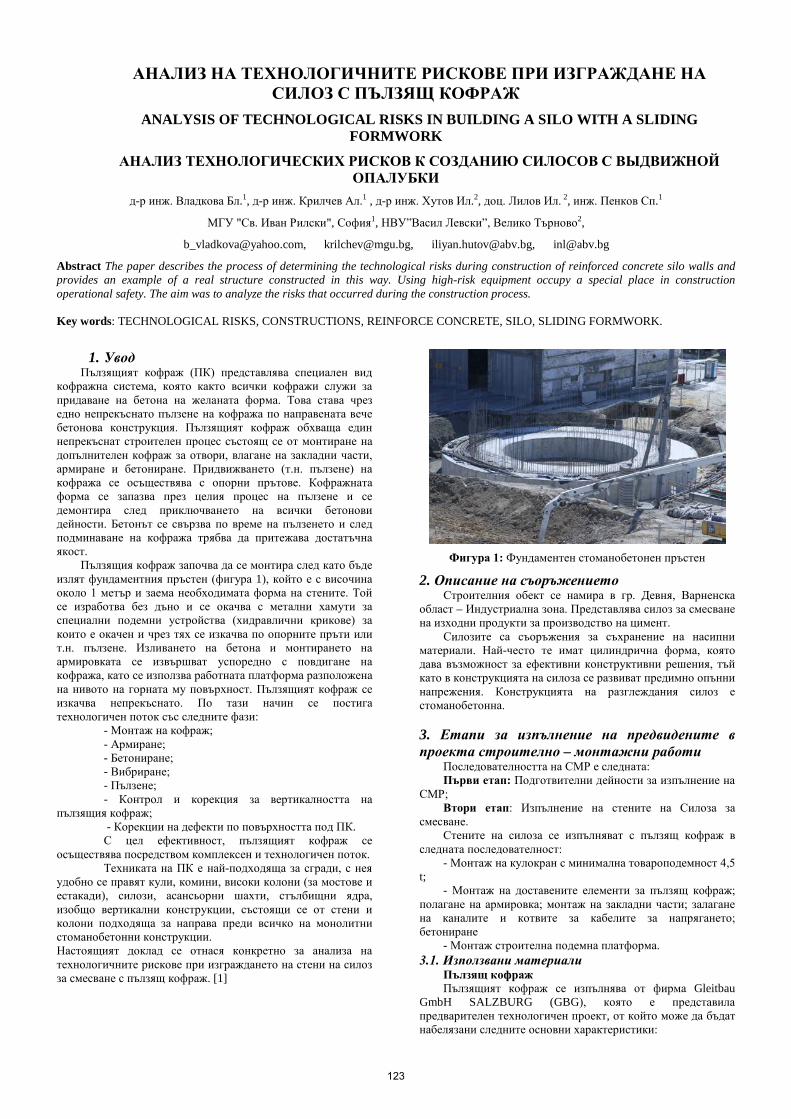
АНАЛИЗ НА ТЕХНОЛОГИЧНИТЕ РИСКОВЕ ПРИ ИЗГРАЖДАНЕ НА СИЛОЗ С ПЪЛЗЯЩ КОФРАЖ
ANALYSIS OF TECHNOLOGICAL RISKS IN BUILDING A SILO WITH A SLIDING FORMWORK
АНАЛИЗ ТЕХНОЛОГИЧЕСКИХ РИСКОВ К СОЗДАНИЮ СИЛОСОВ С ВЫДВИЖНОЙ ОПАЛУБКИ
д-р инж. Владкова Бл.1, д-р инж. Крилчев Ал.1 , д-р инж. Хутов Ил.2, доц. Лилов Ил. 2, инж. Пенков Сп.1
МГУ "Св. Иван Рилски", София1, НВУ”Васил Левски”, Велико Търново2,
[email protected], [email protected], [email protected], [email protected]
Abstract The paper describes the process of determining the technological risks during construction of reinforced concrete silo walls and provides an example of a real structure constructed in this way. Using high-risk equipment occupy a special place in construction operational safety. The aim was to analyze the risks that occurred during the construction process. Key words: TECHNOLOGICAL RISKS, CONSTRUCTIONS, REINFORCE CONCRETE, SILO, SLIDING FORMWORK.
1. Увод Пълзящият кофраж (ПК) представлява специален вид
кофражна система, която както всички кофражи служи за придаване на бетона на желаната форма. Това става чрез едно непрекъснато пълзене на кофража по направената вече бетонова конструкция. Пълзящият кофраж обхваща един непрекъснат строителен процес състоящ се от монтиране на допълнителен кофраж за отвори, влагане на закладни части, армиране и бетониране. Придвижването (т.н. пълзене) на кофража се осъществява с опорни прътове. Кофражната форма се запазва през целия процес на пълзене и се демонтира след приключването на всички бетонови дейности. Бетонът се свързва по време на пълзенето и след подминаване на кофража трябва да притежава достатъчна якост.
Пълзящия кофраж започва да се монтира след като бъде излят фундаментния пръстен (фигура 1), който е с височина около 1 метър и заема необходимата форма на стените. Той се изработва без дъно и се окачва с метални хамути за специални подемни устройства (хидравлични крикове) за които е окачен и чрез тях се изкачва по опорните пръти или т.н. пълзене. Изливането на бетона и монтирането на армировката се извършват успоредно с повдигане на кофража, като се използва работната платформа разположена на нивото на горната му повърхност. Пълзящият кофраж се изкачва непрекъснато. По тази начин се постига технологичен поток със следните фази:
- Монтаж на кофраж; - Армиране; - Бетониране; - Вибриране; - Пълзене; - Контрол и корекция за вертикалността на
пълзящия кофраж; - Корекции на дефекти по повърхността под ПК. С цел ефективност, пълзящият кофраж се
осъществява посредством комплексен и технологичен поток. Техниката на ПК е най-подходяща за сгради, с нея
удобно се правят кули, комини, високи колони (за мостове и естакади), силози, асансьорни шахти, стълбищни ядра, изобщо вертикални конструкции, състоящи се от стени и колони подходяща за направа преди всичко на монолитни стоманобетонни конструкции. Настоящият доклад се отнася конкретно за анализа на технологичните рискове при изграждането на стени на силоз за смесване с пълзящ кофраж. [1]
Фигура 1: Фундаментен стоманобетонен пръстен
2. Описание на съоръжението Строителния обект се намира в гр. Девня, Варненска
област – Индустриална зона. Представлява силоз за смесване на изходни продукти за производство на цимент.
Силозите са съоръжения за съхранение на насипни материали. Най-често те имат цилиндрична форма, която дава възможност за ефективни конструктивни решения, тъй като в конструкцията на силоза се развиват предимно опънни напрежения. Конструкцията на разглеждания силоз е стоманобетонна.
3. Етапи за изпълнение на предвидените в проекта строително – монтажни работи
Последователността на СМР е следната: Първи етап: Подготвителни дейности за изпълнение на
СМР; Втори етап: Изпълнение на стените на Силоза за
смесване. Стените на силоза се изпълняват с пълзящ кофраж в
следната последователност: - Монтаж на кулокран с минимална товароподемност 4,5
t; - Монтаж на доставените елементи за пълзящ кофраж;
полагане на армировка; монтаж на закладни части; залагане на каналите и котвите за кабелите за напрягането; бетониране
- Монтаж строителна подемна платформа. 3.1. Използвани материали
Пълзящ кофраж Пълзящият кофраж се изпълнява от фирма Gleitbau
GmbH SALZBURG (GBG), която е представила предварителен технологичен проект, от който може да бъдат набелязани следните основни характеристики:
123
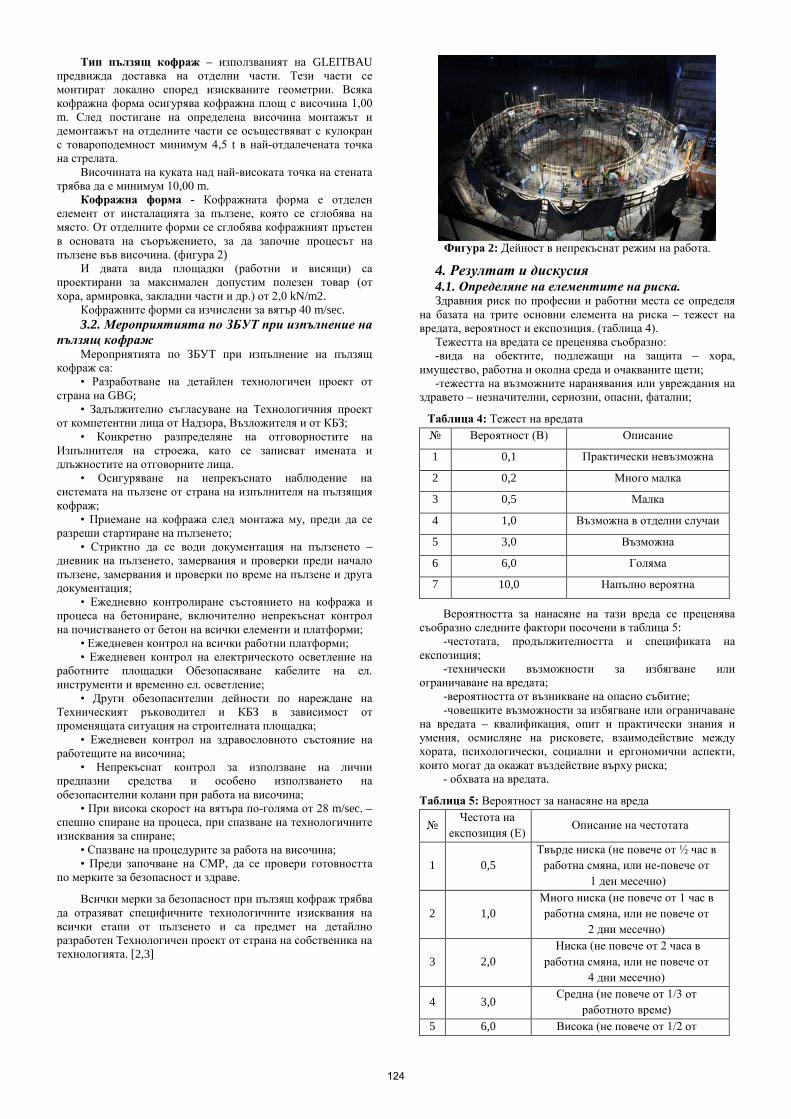
Тип пълзящ кофраж – използваният на GLEITBAU предвижда доставка на отделни части. Тези части се монтират локално според изискваните геометрии. Всяка кофражна форма осигурява кофражна площ с височина 1,00 m. След постигане на определена височина монтажът и демонтажът на отделните части се осъществяват с кулокран с товароподемност минимум 4,5 t в най-отдалечената точка на стрелата.
Височината на куката над най-високата точка на стената трябва да е минимум 10,00 m.
Кофражна форма - Кофражната форма е отделен елемент от инсталацията за пълзене, която се сглобява на място. От отделните форми се сглобява кофражният пръстен в основата на съоръжението, за да започне процесът на пълзене във височина. (фигура 2)
И двата вида площадки (работни и висящи) са проектирани за максимален допустим полезен товар (от хора, армировка, закладни части и др.) от 2,0 kN/m2.
Кофражните форми са изчислени за вятър 40 m/sec. 3.2. Мероприятията по ЗБУТ при изпълнение на
пълзящ кофраж Мероприятията по ЗБУТ при изпълнение на пълзящ
кофраж са: • Разработване на детайлен технологичен проект от
страна на GBG; • Задължително съгласуване на Технологичния проект
от компетентни лица от Надзора, Възложителя и от КБЗ; • Конкретно разпределяне на отговорностите на
Изпълнителя на строежа, като се записват имената и длъжностите на отговорните лица.
• Осигуряване на непрекъснато наблюдение на системата на пълзене от страна на изпълнителя на пълзящия кофраж;
• Приемане на кофража след монтажа му, преди да се разреши стартиране на пълзенето;
• Стриктно да се води документация на пълзенето – дневник на пълзенето, замервания и проверки преди начало пълзене, замервания и проверки по време на пълзене и друга документация;
• Ежедневно контролиране състоянието на кофража и процеса на бетониране, включително непрекъснат контрол на почистването от бетон на всички елементи и платформи;
• Ежедневен контрол на всички работни платформи; • Ежедневен контрол на електрическото осветление на
работните площадки Обезопасяване кабелите на ел. инструменти и временно ел. осветление;
• Други обезопасителни дейности по нареждане на Техническият ръководител и КБЗ в зависимост от променящата ситуация на строителната площадка;
• Ежедневен контрол на здравословното състояние на работещите на височина;
• Непрекъснат контрол за използване на лични предпазни средства и особено използването на обезопасителни колани при работа на височина;
• При висока скорост на вятъра по-голяма от 28 m/sec. – спешно спиране на процеса, при спазване на технологичните изисквания за спиране;
• Спазване на процедурите за работа на височина; • Преди започване на СМР, да се провери готовността
по мерките за безопасност и здраве.
Всички мерки за безопасност при пълзящ кофраж трябва да отразяват специфичните технологичните изисквания на всички етапи от пълзенето и са предмет на детайлно разработен Технологичен проект от страна на собственика на технологията. [2,3]
Фигура 2: Дейност в непрекъснат режим на работа.
4. Резултат и дискусия 4.1. Определяне на елементите на риска. Здравния риск по професии и работни места се определя
на базата на трите основни елемента на риска – тежест на вредата, вероятност и експозиция. (таблица 4).
Тежестта на вредата се преценява съобразно: -вида на обектите, подлежащи на защита – хора,
имущество, работна и околна среда и очакваните щети; -тежестта на възможните наранявания или увреждания на
здравето – незначителни, сериозни, опасни, фатални;
Таблица 4: Тежест на вредата Вероятност (В) Описание
1 0,1 Практически невъзможна
2 0,2 Много малка
3 0,5 Малка
4 1,0 Възможна в отделни случаи
5 3,0 Възможна
6 6,0 Голяма
7 10,0 Напълно вероятна
Вероятността за нанасяне на тази вреда се преценява съобразно следните фактори посочени в таблица 5:
-честотата, продължителността и спецификата на експозиция;
-технически възможности за избягване или ограничаване на вредата;
-вероятността от възникване на опасно събитие; -човешките възможности за избягване или ограничаване
на вредата – квалификация, опит и практически знания и умения, осмисляне на рисковете, взаимодействие между хората, психологически, социални и ергономични аспекти, които могат да окажат въздействие върху риска;
- обхвата на вредата.
Таблица 5: Вероятност за нанасяне на вреда
Честота на експозиция (Е)
Описание на честотата
1 0,5 Твърде ниска (не повече от ½ час в
работна смяна, или не-повече от 1 ден месечно)
2 1,0 Много ниска (не повече от 1 час в работна смяна, или не повече от
2 дни месечно)
3 2,0 Ниска (не повече от 2 часа в
работна смяна, или не повече от 4 дни месечно)
4 3,0 Средна (не повече от 1/3 от
работното време) 5 6,0 Висока (не повече от 1/2 от
124
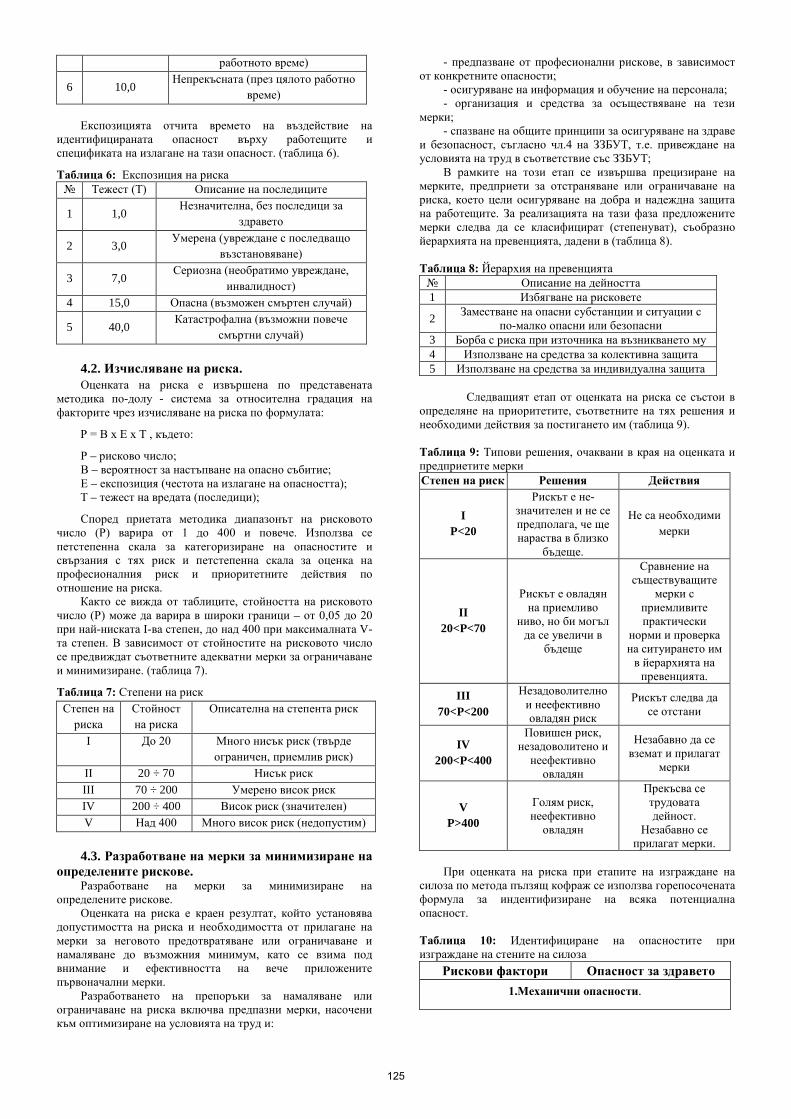
работното време)
6 10,0 Непрекъсната (през цялото работно
време) Експозицията отчита времето на въздействие на
идентифицираната опасност върху работещите и спецификата на излагане на тази опасност. (таблица 6).
Таблица 6: Експозиция на риска Тежест (Т) Описание на последиците
1 1,0 Незначителна, без последици за
здравето
2 3,0 Умерена (увреждане с последващо възстановяване)
3 7,0 Сериозна (необратимо увреждане,
инвалидност) 4 15,0 Опасна (възможен смъртен случай)
5 40,0 Катастрофална (възможни повече
смъртни случай) 4.2. Изчисляване на риска. Оценката на риска е извършена по представената
методика по-долу - система за относителна градация на факторите чрез изчисляване на риска по формулата:
Р = В х Е х Т , където:
Р – рисково число; В – вероятност за настъпване на опасно събитие; Е – експозиция (честота на излагане на опасността); Т – тежест на вредата (последици);
Според приетата методика диапазонът на рисковото число (Р) варира от 1 до 400 и повече. Използва се петстепенна скала за категоризиране на опасностите и свързания с тях риск и петстепенна скала за оценка на професионалния риск и приоритетните действия по отношение на риска.
Както се вижда от таблиците, стойността на рисковото число (Р) може да варира в широки граници – от 0,05 до 20 при най-ниската I-ва степен, до над 400 при максималната V-та степен. В зависимост от стойностите на рисковото число се предвиждат съответните адекватни мерки за ограничаване и минимизиране. (таблица 7).
Таблица 7: Степени на риск Степен на
риска Стойност на риска
Описателна на степента риск
I До 20 Много нисък риск (твърде ограничен, приемлив риск)
II 20 ÷ 70 Нисък риск III 70 ÷ 200 Умерено висок риск IV 200 ÷ 400 Висок риск (значителен) V Над 400 Много висок риск (недопустим)
4.3. Разработване на мерки за минимизиране на
определените рискове. Разработване на мерки за минимизиране на
определените рискове. Оценката на риска е краен резултат, който установява
допустимостта на риска и необходимостта от прилагане на мерки за неговото предотвратяване или ограничаване и намаляване до възможния минимум, като се взима под внимание и ефективността на вече приложените първоначални мерки.
Разработването на препоръки за намаляване или ограничаване на риска включва предпазни мерки, насочени към оптимизиране на условията на труд и:
- предпазване от професионални рискове, в зависимост от конкретните опасности;
- осигуряване на информация и обучение на персонала; - организация и средства за осъществяване на тези
мерки; - спазване на общите принципи за осигуряване на здраве
и безопасност, съгласно чл.4 на ЗЗБУТ, т.е. привеждане на условията на труд в съответствие със ЗЗБУТ;
В рамките на този етап се извършва прецизиране на мерките, предприети за отстраняване или ограничаване на риска, което цели осигуряване на добра и надеждна защита на работещите. За реализацията на тази фаза предложените мерки следва да се класифицират (степенуват), съобразно йерархията на превенцията, дадени в (таблица 8).
Таблица 8: Йерархия на превенцията
Описание на дейността 1 Избягване на рисковете
2 Заместване на опасни субстанции и ситуации с по-малко опасни или безопасни
3 Борба с риска при източника на възникването му 4 Използване на средства за колективна защита 5 Използване на средства за индивидуална защита
Следващият етап от оценката на риска се състои в
определяне на приоритетите, съответните на тях решения и необходими действия за постигането им (таблица 9).
Таблица 9: Типови решения, очаквани в края на оценката и предприетите мерки Степен на риск Решения Действия
I P<20
Рискът е не- значителен и не се предполага, че ще нараства в близко
бъдеще.
Не са необходими мерки
II 20<P<70
Рискът е овладян на приемливо
ниво, но би могъл да се увеличи в
бъдеще
Сравнение на съществуващите
мерки с приемливите практически
норми и проверка на ситуирането им
в йерархията на превенцията.
III 70<P<200
Незадоволително и неефективно овладян риск
Рискът следва да се отстани
IV 200<P<400
Повишен риск, незадоволитено и
неефективно овладян
Незабавно да се вземат и прилагат
мерки
V P>400
Голям риск, неефективно
овладян
Прекъсва се трудовата дейност.
Незабавно се прилагат мерки.
При оценката на риска при етапите на изграждане на
силоза по метода пълзящ кофраж се използва горепосочената формула за индентифизиране на всяка потенциална опасност. Таблица 10: Идентифициране на опасностите при изграждане на стените на силоза
Рискови фактори Опасност за здравето 1.Механични опасности.
125
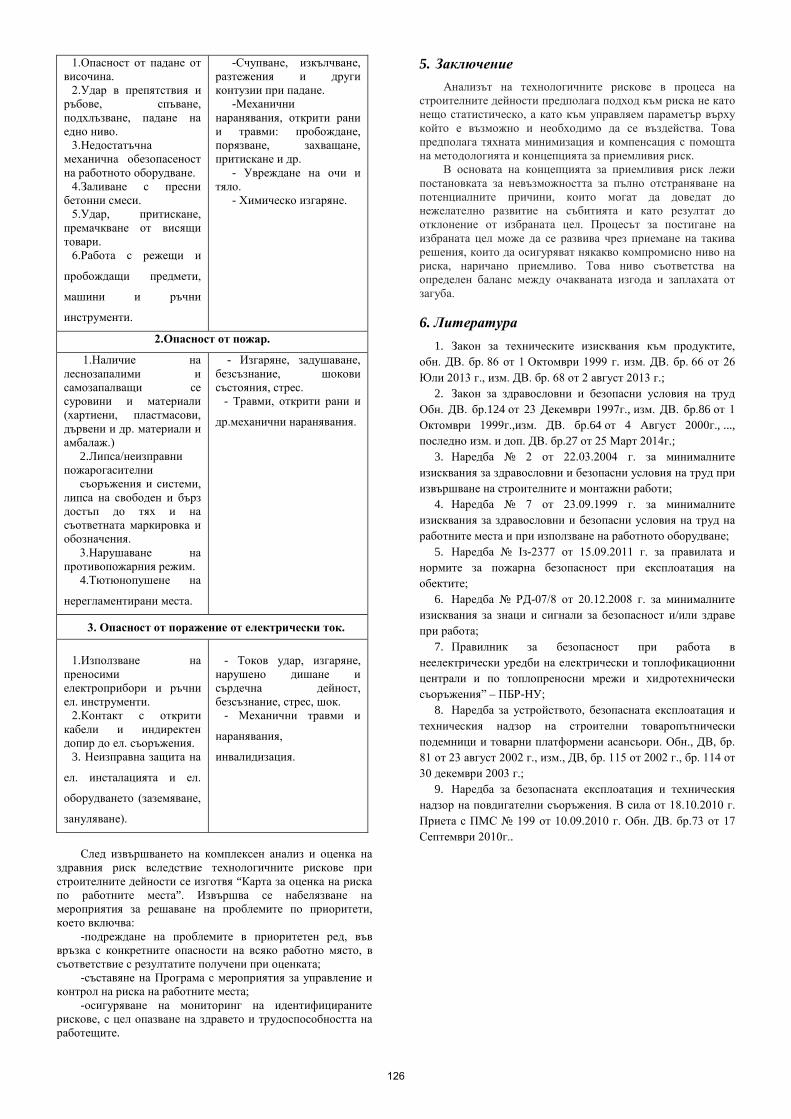
1.Опасност от падане от височина.
2.Удар в препятствия и ръбове, спъване, подхлъзване, падане на едно ниво.
3.Недостатъчна механична обезопасеност на работното оборудване.
4.Заливане с пресни бетонни смеси.
5.Удар, притискане, премачкване от висящи товари.
6.Работа с режещи и
пробождащи предмети,
машини и ръчни
инструменти.
-Счупване, изкълчване, разтежения и други контузии при падане.
-Механични наранявания, открити рани и травми: пробождане, порязване, захващане, притискане и др.
- Увреждане на очи и тяло.
- Химическо изгаряне.
2.Опасност от пожар.
1.Наличие на леснозапалими и самозапалващи се суровини и материали (хартиени, пластмасови, дървени и др. материали и амбалаж.)
2.Липса/неизправни пожарогасителни
съоръжения и системи, липса на свободен и бърз достъп до тях и на съответната маркировка и обозначения.
3.Нарушаване на противопожарния режим.
4.Тютюнопушене на
нерегламентирани места.
- Изгаряне, задушаване, безсъзнание, шокови състояния, стрес.
- Травми, открити рани и
др.механични наранявания.
3. Опасност от поражение от електрически ток. 1.Използване на
преносими електроприбори и ръчни ел. инструменти.
2.Контакт с открити кабели и индиректен допир до ел. съоръжения.
3. Неизправна защита на
ел. инсталацията и ел.
оборудването (заземяване,
зануляване).
- Токов удар, изгаряне,
нарушено дишане и сърдечна дейност, безсъзнание, стрес, шок.
- Механични травми и
наранявания,
инвалидизация.
След извършването на комплексен анализ и оценка на
здравния риск вследствие технологичните рискове при строителните дейности се изготвя “Карта за оценка на риска по работните места”. Извършва се набелязване на мероприятия за решаване на проблемите по приоритети, което включва:
-подреждане на проблемите в приоритетен ред, във връзка с конкретните опасности на всяко работно място, в съответствие с резултатите получени при оценката;
-съставяне на Програма с мероприятия за управление и контрол на риска на работните места;
-осигуряване на мониторинг на идентифицираните рискове, с цел опазване на здравето и трудоспособността на работещите.
5. Заключение Анализът на технологичните рискове в процеса на
строителните дейности предполага подход към риска не като нещо статистическо, а като към управляем параметър върху който е възможно и необходимо да се въздейства. Това предполага тяхната минимизация и компенсация с помощта на методологията и концепцията за приемливия риск.
В основата на концепцията за приемливия риск лежи постановката за невъзможността за пълно отстраняване на потенциалните причини, които могат да доведат до нежелателно развитие на събитията и като резултат до отклонение от избраната цел. Процесът за постигане на избраната цел може да се развива чрез приемане на такива решения, които да осигуряват някакво компромисно ниво на риска, наричано приемливо. Това ниво съответства на определен баланс между очакваната изгода и заплахата от загуба.
6. Литература
1. Закон за техническите изисквания към продуктите, обн. ДВ. бр. 86 от 1 Октомври 1999 г. изм. ДВ. бр. 66 от 26 Юли 2013 г., изм. ДВ. бр. 68 от 2 август 2013 г.;
2. Закон за здравословни и безопасни условия на труд Обн. ДВ. бр.124 от 23 Декември 1997г., изм. ДВ. бр.86 от 1 Октомври 1999г.,изм. ДВ. бр.64 от 4 Август 2000г., ..., последно изм. и доп. ДВ. бр.27 от 25 Март 2014г.;
3. Наредба 2 от 22.03.2004 г. за минималните изисквания за здравословни и безопасни условия на труд при извършване на строителните и монтажни работи;
4. Наредба 7 от 23.09.1999 г. за минималните изисквания за здравословни и безопасни условия на труд на работните места и при използване на работното оборудване;
5. Наредба Iз-2377 от 15.09.2011 г. за правилата и нормите за пожарна безопасност при експлоатация на обектите;
6. Наредба РД-07/8 от 20.12.2008 г. за минималните изисквания за знаци и сигнали за безопасност и/или здраве при работа;
7. Правилник за безопасност при работа в неелектрически уредби на електрически и топлофикационни централи и по топлопреносни мрежи и хидротехнически съоръжения” – ПБР-НУ;
8. Наредба за устройството, безопасната експлоатация и техническия надзор на строителни товаропътнически подемници и товарни платформени асансьори. Обн., ДВ, бр. 81 от 23 август 2002 г., изм., ДВ, бр. 115 от 2002 г., бр. 114 от 30 декември 2003 г.;
9. Наредба за безопасната експлоатация и техническия надзор на повдигателни съоръжения. В сила от 18.10.2010 г. Приета с ПМС 199 от 10.09.2010 г. Обн. ДВ. бр.73 от 17 Септември 2010г..
126
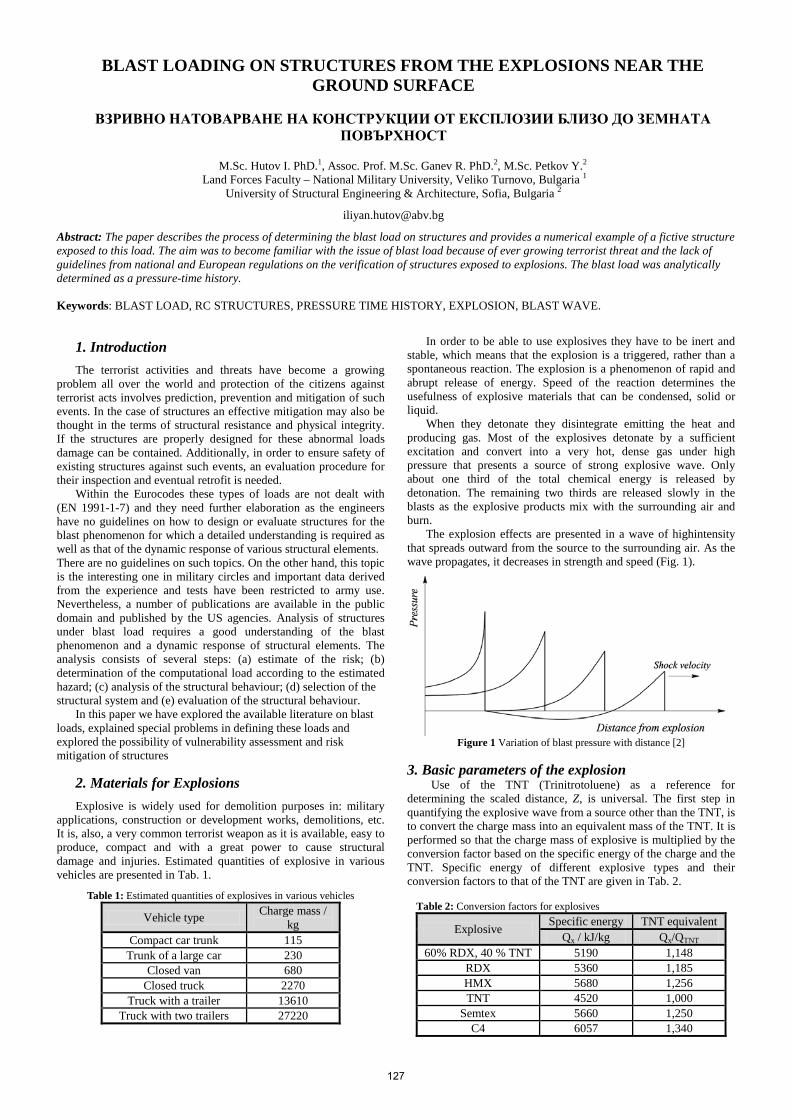
BLAST LOADING ON STRUCTURES FROM THE EXPLOSIONS NEAR THE GROUND SURFACE
ВЗРИВНО НАТОВАРВАНЕ НА КОНСТРУКЦИИ ОТ ЕКСПЛОЗИИ БЛИЗО ДО ЗЕМНАТА
ПОВЪРХНОСТ
M.Sc. Hutov I. PhD.1, Assoc. Prof. M.Sc. Ganev R. PhD.2, M.Sc. Petkov Y.2
Land Forces Faculty – National Military University, Veliko Turnovo, Bulgaria 1
University of Structural Engineering & Architecture, Sofia, Bulgaria 2
Abstract: The paper describes the process of determining the blast load on structures and provides a numerical example of a fictive structure exposed to this load. The aim was to become familiar with the issue of blast load because of ever growing terrorist threat and the lack of guidelines from national and European regulations on the verification of structures exposed to explosions. The blast load was analytically determined as a pressure-time history. Keywords: BLAST LOAD, RC STRUCTURES, PRESSURE TIME HISTORY, EXPLOSION, BLAST WAVE.
1. Introduction The terrorist activities and threats have become a growing
problem all over the world and protection of the citizens against terrorist acts involves prediction, prevention and mitigation of such events. In the case of structures an effective mitigation may also be thought in the terms of structural resistance and physical integrity. If the structures are properly designed for these abnormal loads damage can be contained. Additionally, in order to ensure safety of existing structures against such events, an evaluation procedure for their inspection and eventual retrofit is needed.
Within the Eurocodes these types of loads are not dealt with (EN 1991-1-7) and they need further elaboration as the engineers have no guidelines on how to design or evaluate structures for the blast phenomenon for which a detailed understanding is required as well as that of the dynamic response of various structural elements. There are no guidelines on such topics. On the other hand, this topic is the interesting one in military circles and important data derived from the experience and tests have been restricted to army use. Nevertheless, a number of publications are available in the public domain and published by the US agencies. Analysis of structures under blast load requires a good understanding of the blast phenomenon and a dynamic response of structural elements. The analysis consists of several steps: (a) estimate of the risk; (b) determination of the computational load according to the estimated hazard; (c) analysis of the structural behaviour; (d) selection of the structural system and (e) evaluation of the structural behaviour.
In this paper we have explored the available literature on blast loads, explained special problems in defining these loads and explored the possibility of vulnerability assessment and risk mitigation of structures
2. Materials for Explosions Explosive is widely used for demolition purposes in: military
applications, construction or development works, demolitions, etc. It is, also, a very common terrorist weapon as it is available, easy to produce, compact and with a great power to cause structural damage and injuries. Estimated quantities of explosive in various vehicles are presented in Tab. 1.
Table 1: Estimated quantities of explosives in various vehicles
Vehicle type Charge mass / kg
Compact car trunk 115 Trunk of a large car 230
Closed van 680 Closed truck 2270
Truck with a trailer 13610 Truck with two trailers 27220
In order to be able to use explosives they have to be inert and stable, which means that the explosion is a triggered, rather than a spontaneous reaction. The explosion is a phenomenon of rapid and abrupt release of energy. Speed of the reaction determines the usefulness of explosive materials that can be condensed, solid or liquid.
When they detonate they disintegrate emitting the heat and producing gas. Most of the explosives detonate by a sufficient excitation and convert into a very hot, dense gas under high pressure that presents a source of strong explosive wave. Only about one third of the total chemical energy is released by detonation. The remaining two thirds are released slowly in the blasts as the explosive products mix with the surrounding air and burn.
The explosion effects are presented in a wave of highintensity that spreads outward from the source to the surrounding air. As the wave propagates, it decreases in strength and speed (Fig. 1).
Figure 1 Variation of blast pressure with distance [2]
3. Basic parameters of the explosion
Use of the TNT (Trinitrotoluene) as a reference for determining the scaled distance, Z, is universal. The first step in quantifying the explosive wave from a source other than the TNT, is to convert the charge mass into an equivalent mass of the TNT. It is performed so that the charge mass of explosive is multiplied by the conversion factor based on the specific energy of the charge and the TNT. Specific energy of different explosive types and their conversion factors to that of the TNT are given in Tab. 2. Table 2: Conversion factors for explosives
Explosive Specific energy TNT equivalent Qx / kJ/kg Qx/QTNT
60% RDX, 40 % TNT 5190 1,148 RDX 5360 1,185 HMX 5680 1,256 TNT 4520 1,000
Semtex 5660 1,250 C4 6057 1,340
127
Explosion wave front speed equation, Us, and the maximum dynamic pressure, qs, are defined as [1]:
(1) o
osos p
ppaU7
76. +=
(2) ( )os
ss pp
pq7.2
5 2
+=
where: ps – peak static wave front overpressure, bar p0 – ambient air pressure (atmospheric pressure), bar a0 – speed of sound in the air, m/s.
There are various proposals for the calculation of the main explosion parameters.
Brode [6] gives the following values for the peak static overpressure for near (when the ps is greater than 10 bar) and for medium to far away (when the ps is between 0,1 and 10 bar):
(3) ,17,63 +=
Zps
ps > 10 bar
(4) ,019,085,5455,1975,0
32 −++=ZZZ
ps 0,1 <ps< 10 bar
where
Z – scaled distance,
(5) 3 W
RZ = ,
R – distance from the centre of a spherical charge, m W – charge mass expressed in kilograms of TNT. Newmark and Hansen [7] proposed the use of the following values:
(6) 33 .93.6784
RW
RWps += ,
Mills [8] proposed the following: (7) kPa
ZZZps ,019,01081141772
23 −++=
Other important parameters include: tо = duration of the positive phase during which the pressure is greater than the pressure of the surrounding air and is = the specific wave impulse that is equal to the area under the pressure-time curve from the moment of arrival, tA, to the end of the positive phase and is given by expression:
(8) ( )∫+
=oA
A
tt
tss dttpi
The typical pressure profile of the explosion wave in time for
the explosion in the air is given in Fig. 2.
Figure 2 Pressure-time profile of the explosion wave
4. Results and discussions In most instances simplifications lead to conservative
constructions. However, unknown factors may lead to the overestimation of the structural capacity to blast loadings.
Unexpected shock wave refraction, design methods, quality of construction and materials, interaction with ground, are different for each particular structure. In order to overcome these uncertainties it is recommended that the mass of TNT equivalent is increased by 20 %. This increased value of the charge weight is called the "effective charge weight". 4.1. Loading categories Explosion loadings can be divided into two main groups according to the confinement of an explosive charge: confined and unconfined. Tab. 3 shows an overview of possible loading categories. Table 3: Explosion load categories
Charge confinement Categories
Unconfined The explosion in the free air The explosion in the air The explosion near the ground
Confined Full ventilation Partially confined Fully confined
4.2. Structure – explosion interaction
As the wave propagates through the air, the wave front encircles the structure and all its surfaces so that the whole structure is exposed to the blast pressure. The magnitude and distribution of the structural loading depends on the following factors: a) the characteristics of explosives that depend on the type of explosive material, released energy (size of detonation) and weight of explosive, b) the detonation location relative to the structure, c) intensity and magnification of pressure in the interaction with the ground or the structure itself.
Time record of the explosion pressure wave is usually described as an exponential function in the form of Friendlander's equation [1], in which the b is the parameter of the waveform:
(9)
−
−=
00
exp1.)(tb
ttptp t
s
For the various purposes approximations are satisfactory. This
change in pressure over time is shown in Fig. 2. Rankine and Huguenot [1] derived an equation for refracted
overpressure pr: (10) pr = 2 ps + (γ+1).qs Substituting (2) into the equation (10):
(11)
++
=00
00
747.2pppppp sr
If the rectangular structure is exposed to an explosion, it will
be exposed to pressures on all its surfaces. Each surface suffers two concurrent components of the load. Diffraction of explosion around the structure will enclose a target and cause a normal force to any exposed surfaces (Fig. 3). Structure is pushed to the right if the left side is loaded while simultaneously pushed slightly to the left as the diffraction ends. Drag force pushes the structure from the left side and that is followed by the suction force on the right when the dynamic pressure crosses (blast wind) over and around the structure.
128
As the shock front expands in surrounding volume of the air, the peak initial pressure is reduced and the duration of the pressure increases.
Figure 3 Behaviour of the wave during its pass around the structure
Wave front comes to a particular location at the time tA, and after the increase to a maximum value of ps0, the peak pressure decreases to the value of atmospheric pressure at the time t0 what represents a positive phase.
This is followed by a negative phase with duration t0 which is usually much longer than the positive phase and it is characterized by a negative pressure (below atmospheric) with a maximum value of ps0 and reverse flow of particles. Impulse associated with the shock wave is the surface below pressure-time curve and is indicated with is for the positive phase and is for a negative phase (Fig. 2). 4.3. The explosion near the ground If the charge is located very close to the ground or on the ground the explosion is termed near the ground. Refracted wave arises as the initial blast wave is refracted and increased by reflection of the ground. Unlike an explosion in the air, the refracted wave is merged with the initial wave in the detonation point, and they form a single wave (Fig. 4).
Figure 4 Refracted wave of the explosion near the ground
Figure 5 Parameters of the positive phase blast wave near the ground [5]
Figure 6 Parameters of the negative phase blast wave near the ground [5]
For an explosion near the ground, the load acting on the structure is calculated as for the explosion in the air, except that the initial pressure and other parameters for the positive phase are determined as explained in Fig. 5 and the theoretical parameters of the negative phase as in Fig. 6.
4.4. Pressures on the structural surfaces
In order to analyze the blast loadings it is necessary to determine the initial reduction of the dynamic pressure in the time as the effects on the structure depend on the pressure-time history as well as on the peak value. The explosion wave form (Fig. 7) is characterized by a sudden increase in pressure to peak, decrease to an atmospheric pressure (positive phase) and the period in which the pressure falls below the atmospheric pressure (negative phase).
129
Figure 7 Pressure time history
The reduction speed of the initial and dynamic pressure, after
the passing of the wave front, is a function of the peak pressure and the magnitude of detonation. For the analysis purposes, the actual reduction of the initial pressure can be assumed as a triangular pressure impulse.
The actual duration of the positive phase is replaced by a fictitious duration and is expressed as a function of the total positive impulse and the peak pressure:
This expression can be used for the initial and for the refracted pressure by taking the values of refracted impulse pressure and peak refracted pressure, respectively.
As the fictitious duration of the positive phase is shorter than the actual duration, a difference between the fictitious phase and the beginning of the negative phase is created. This difference, shown in Fig. 7, should be retained in the analysis because of the retention order of the different stages of loading. 4.5. The average pressure on the front facade The variation of the pressure on the front structural facade, for a rectangular structure with sides parallel to the wave front above the ground, in the area of low pressure is shown in Fig. 8.
Figure 8 The load on the front surface of the structure
The peak pressure on the front structural facade in time of the
explosion's arrival, tA, will be the peak refracted overpressure pr, which is a function of the initial pressure (Fig. 5). This pressure then decreases in time interval [t', tA] due to the passage of waves above and around the structure, which is less than pr (peak overpressure over and around the structure will be ps).
The overpressure on the front surface of the structure continues to decrease until the pressure is equalized with the pressure of the surrounding air. Clearing time (passing time), tc, needed that the refracted pressure drops to the level of the initial pressure can be expressed as:
(12) r
c CRSt).1(
4+
=
S – length of the "clearing", is equal to the height of the structure, H or a half-width of the structure, W/2, whichever is less (Fig. 8), R – ratio S/G, where G is the height of the structure, H or half-width of the structure, W/2, whichever is less, Cr – speed of sound in refracted area (Figs. 2 ÷ 192, [5]).
Pressure that acts on the front surface after the time tc is the algebraic sum of the initial pressure ps and drag dependent pressure, CD·q:
(13) p = ps+CD.q,
Drag coefficient CD connects the dynamic pressure and total translational pressure in the direction of the wind-induced dynamic pressure and varies with Mach number (or Reynolds number in the area of low pressure), and depends on the geometry of the structure. It can be taken as ≥ 1,0 for the front facade, while for the side, rear and roof surfaces it can be taken < 1,0 (Tab. 4).
The fictitious length of the refracted wave front, trf, is calculated according to the formula:
(14) r
rrf p
ii 2= ,
where pr is the refracted peak pressure.
Table 4: Drag coefficients Loaded surface CD
Front 0,8 ÷ 1,6 Rear 0,25 ÷ 0,5
Side and roof 0 ÷ 172 - 0,4
172 ÷ 345 - 0,3 345 ÷ 896 - 0,2
5. Conclusion
The explosion in or near the structure can cause catastrophic damage to the structure, formation of fragments, destruction of life-support systems (air conditioning, sprinklers). Injuries and deaths can be caused by exposure to explosion wave front, collapse of the structure, impact of parts, fire and smoke. Secondary effects of the explosion can hinder or even prevent the evacuation of people from the structure causing additional injuries and deaths.
The Bulgarian national legislation and also Euronorms have no guidelines for design of buildings to blast loads.
It is shown that the effects of blast loading can be taken into account for structural design by the use of available literature. Available commercial software for structural analysis can be used for design purposes, while further analysis should be directed towards familiarizing the phenomenon of the internal explosion. Thus a complete picture of the explosion effects on the structure can be obtained. 6. Literature [1] Mays, G. C.; Smith, P. D; Blast Effects on Buildings – Design of Buildings to Optimize Resistance to Blast Loading, Tomas Telford, 2001. [2] Ngo, T.; Mendis, P.; Gupta, A.; Ramsay, J. Blast Loading and Effects on Structures – An Overview EJSE Special Issue: Loading on Structures, 2007. [3] Moon, Nitesh N. Prediction of Blast Loading and its Impact on Buildings, Department of Civil Engineering, National Institute of Technology, Rourkela, 2009. [4] Remennikov, A. M. A Review of Methods for Predicting Bomb Blast Effects on Buildings. // Journal of Battlefield Technology, Aragon Press Pty Ltd., 6, 3(2003), pp. 5-10. [5] Unified Facilities Criteria (UFC), Structures to Resist the Effects of Accidental Explosions, U. S. Army Corps of Engineers, Naval Facilities Engineering Command, Air Force Civil Engineer Support Agency, UFC 3-340-02, 5 December 2008. [6] Brode, H. L. Numerical solution of spherical blast waves. // Journal of Applied Physics, American Institute of Physics, Ney York, 1955. [7] Newmark, N. M.; Hansen, R. J. Design of blast resistant structures. // Shock and Vibration Handbook, Vol. 3, Eds. Harris and Crede. McGraw-Hill, New York, USA. 1961. [8] Mills, C. A. The design of concrete structure to resist explosions and weapon effects. // Proceedings of the 1st Int. Conference on concrete for hazard protections, Edinburgh, UK, pp. 61-73, 1987.
130
STUDY OF THE DEVELOPMENT OF THE STRUCTURE OF THE NETWORK OF SOFIA SUBWAY
ИЗСЛЕДВАНЕ НА РАЗВИТИЕТО НА СТРУКТУРАТА НА МЕТРОМРЕЖАТА НА СОФИЙСКИЯ
МЕТОПОЛИТЕН
Assoc. Prof. PhD Stoilova S., MSc. eng. Stoev V., Faculty of Transport, Technical University – Sofia, Bulgaria
E mail: [email protected]; [email protected] Abstract: The main issues are considered in this topic: study of the structure of metro system by using the Graph Theory. New indicators have been defined in the research such as a degree of routing, a connectivity of the route, average length per link (which takes into account the number of routes), intensity of the route, density of the route. The study includes network of Sofia subway and the plans for its future development. The methodology could be used to evaluate other existing metro networks as well as for preliminary analysis in the design of subway systems. KEYWORDS: GRAPH THEORY, METRO NETWORK, SUBWAY, PASSENGERS, VERTEX, EDGES, CONNECTIVITY, STATION
1. Introduction Metro systems are the main type of public transport in many
cities around the world. The structure of the different metro lines depends on the size of the city, the location of the different regions, the density of the development and others. The structure of the metro network, the number of subway lines and subway routes are important for the volume of passenger flows and the overall organization of urban passenger transport. An analysis of metro networks features can be of substantial help for planners.
The object of the research is the network of Sofia’s subway. The operation of the Sofia‘s subway started from 1998, the expansion continues to our own day. As of May 2015, the Sofia Metro consists of two interconnected lines, serving 34 stations, with a total route length of 38.6 km. In this context it is necessary to examine factors related to the structure of the metro network to assess the schemes of development and organization of transport.
The aim of the study is: • To apply the Graph Theory for studying metro network; • To examine the state and the structure of metro network
with indicators defined by the Graph theory; • Apply the model to the network study of the Sofia’s
metro system and the future plans of development. 2. Methodological approach The Graph Theory is inherently linked to transportation. A lot
of researchers have used the Graph Theory to study the characteristics of transport networks. In [11] is explained the main Graph Theory concepts as well as various indicators have been introduced, such as traffic flow, network diameter, and other dimensionless ratios. The first introducing of three of the Graph Theory’s indicators directly linked to network design (circuits, degree of connectivity, and complexity) is made in [9]. In [12] is established a comprehensive series of new indicators, the line overlapping index, the circle availability, and network complexity. The main indices that represent the structural properties of a graph as such are beta index (a level of connectivity), alpha index (a measure of connectivity which evaluates the number of cycles in a graph), gamma index (connectivity), eta index (average length per link) and others, [12].
Some authors have used the Graph Theory to study metro networks. In [5] and [6] are used three indicators such as coverage, directness, and connectivity to assess the overall properties of networks. There are introduced new indicators such as tau (directness) and rho (connectivity). Authors have analysed 19 subway networks located around the world, [5, 8]. They are compared by using the annual numbers of boarding per capita as a
performance indicator. In [6] has been adapted various concepts of the Graph Theory to describe characteristics of the State, Form and Structure of 33 metro systems. The complexity of metro systems and the impact of network size have been analysed and the implications on robustness have been discussed, [7]. It uses three indicators relevant to ridership: coverage, directness, and connectivity. This study used the Graph Theory as a mathematical method to transform networks into graphs, from which relevant properties (e.g., links, nodes) were collected. The authors analysed 19 subway–metro networks and developed three indicators to assess the overall properties of transit networks, linking them to ridership.
The Graph Theory and the Complex Network Theory are adopted to examine the connectivity, robustness and reliability of the Shanghai subway network of China, [16]. The subway network systems of four cities, i.e., Seoul, Tokyo, Boston and Beijing, are studied by using global and local efficiencies and the Graph Theory, [3]. The Complex Network Theory and the Graph Theory are adopted to analyse and calculate the vulnerability of metro network, [4].
All these studies indicate that the Graph Theory may be successfully used for examining the metro networks. In the papers, it has not been studied the effect of the number of routes in metro systems on their structure and the satisfaction of passengers.
2.1. A representation a metro network in a graph
In this research is used the methodology elaborated by authors
in [13]. The model was applied to study and classify the 22 European metro systems.
The goal of a graph is to represent the structure of a network, [2, 15]. A graph is a symbolic representation of a network and of its connectivity. It implies an abstraction of the reality so it can be simplified as a set of linked nodes. The conversion of a real network into a planar graph is based on the following principles: every terminal and intersection point becomes a node; each connected node is then linked to a straight segment.
The metro network is presented in a graph. It is a set of vertexes (nodes) (V) connected by edges (links) (E). The vertex is a terminal or an intersection point of a graph. It is the abstraction of a location. The edges are a links between two stations. A link is the abstraction of a transport infrastructure which supports movements between nodes. Two types of vertices (nodes) have been defined: transfer and end-vertices. Transfer-vertices are transfer stations, where it is possible to switch lines without exiting the system regardless of the nature of the transfer which could be a simple cross platform interchange or a longer walk. End-vertices are the line terminals, where it is not possible to switch to another metro line. If a terminal actually hosts two lines, it is considered as a transfer-vertex. The ability to transfer is the determining factor to define the transfer-vertices.
131
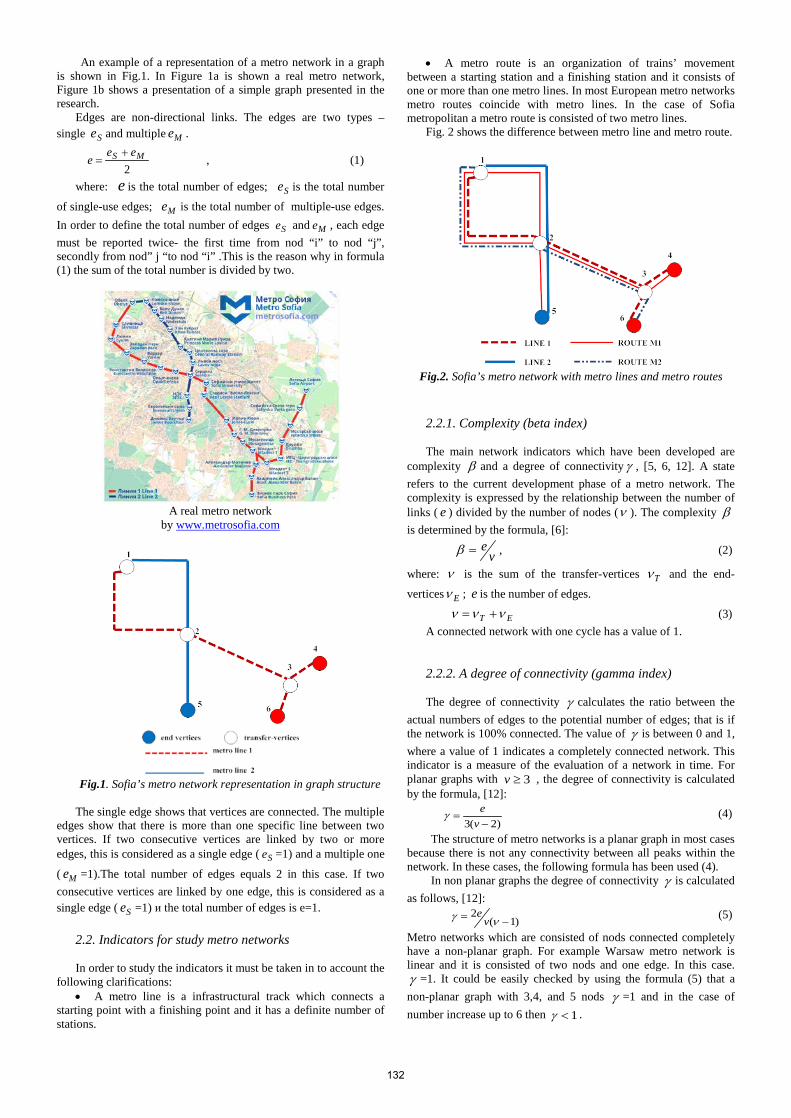
An example of a representation of a metro network in a graph is shown in Fig.1. In Figure 1a is shown a real metro network, Figure 1b shows a presentation of a simple graph presented in the research.
Edges are non-directional links. The edges are two types – single Se and multiple Me .
2MS ee
e+
= , (1)
where: e is the total number of edges; Se is the total number
of single-use edges; Me is the total number of multiple-use edges. In order to define the total number of edges Se and Me , each edge must be reported twice- the first time from nod “i” to nod “j”, secondly from nod” j “to nod “i” .This is the reason why in formula (1) the sum of the total number is divided by two.
A real metro network
by www.metrosofia.com
Fig.1. Sofia’s metro network representation in graph structure
The single edge shows that vertices are connected. The multiple
edges show that there is more than one specific line between two vertices. If two consecutive vertices are linked by two or more edges, this is considered as a single edge ( Se =1) and a multiple one
( Me =1).The total number of edges equals 2 in this case. If two consecutive vertices are linked by one edge, this is considered as a single edge ( Se =1) и the total number of edges is e=1.
2.2. Indicators for study metro networks
In order to study the indicators it must be taken in to account the following clarifications:
• A metro line is a infrastructural track which connects a starting point with a finishing point and it has a definite number of stations.
• A metro route is an organization of trains’ movement between a starting station and a finishing station and it consists of one or more than one metro lines. In most European metro networks metro routes coincide with metro lines. In the case of Sofia metropolitan a metro route is consisted of two metro lines. Fig. 2 shows the difference between metro line and metro route.
Fig.2. Sofia’s metro network with metro lines and metro routes
2.2.1. Complexity (beta index)
The main network indicators which have been developed are complexity β and a degree of connectivity γ , [5, 6, 12]. A state refers to the current development phase of a metro network. The complexity is expressed by the relationship between the number of links ( e ) divided by the number of nodes (ν ). The complexity β is determined by the formula, [6]:
ve=β , (2)
where: ν is the sum of the transfer-vertices Tν and the end-
vertices Eν ; e is the number of edges.
ET ννν += (3) A connected network with one cycle has a value of 1. 2.2.2. A degree of connectivity (gamma index)
The degree of connectivity γ calculates the ratio between the
actual numbers of edges to the potential number of edges; that is if the network is 100% connected. The value of γ is between 0 and 1, where a value of 1 indicates a completely connected network. This indicator is a measure of the evaluation of a network in time. For planar graphs with 3≥v , the degree of connectivity is calculated by the formula, [12]:
)2(3 −
=veγ (4)
The structure of metro networks is a planar graph in most cases because there is not any connectivity between all peaks within the network. In these cases, the following formula has been used (4).
In non planar graphs the degree of connectivity γ is calculated as follows, [12]:
)1(2
−= νγ ve (5)
Metro networks which are consisted of nods connected completely have a non-planar graph. For example Warsaw metro network is linear and it is consisted of two nods and one edge. In this case. γ =1. It could be easily checked by using the formula (5) that a non-planar graph with 3,4, and 5 nods γ =1 and in the case of number increase up to 6 then 1<γ .
132
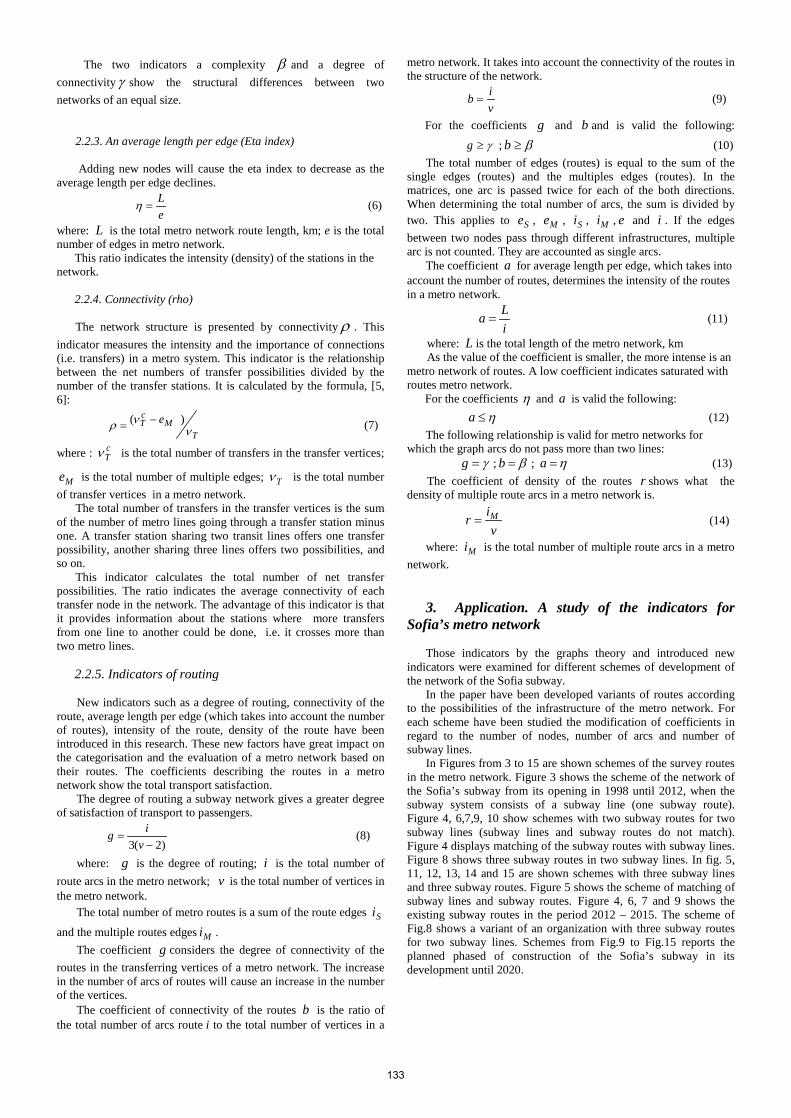
The two indicators a complexity β and a degree of connectivityγ show the structural differences between two networks of an equal size.
2.2.3. An average length per edge (Eta index)
Adding new nodes will cause the eta index to decrease as the
average length per edge declines.
eL
=η (6)
where: L is the total metro network route length, km; e is the total number of edges in metro network.
This ratio indicates the intensity (density) of the stations in the network.
2.2.4. Connectivity (rho)
The network structure is presented by connectivity ρ . This indicator measures the intensity and the importance of connections (i.e. transfers) in a metro system. This indicator is the relationship between the net numbers of transfer possibilities divided by the number of the transfer stations. It is calculated by the formula, [5, 6]:
T
McT e
ννρ )( −= (7)
where : cTν is the total number of transfers in the transfer vertices;
Me is the total number of multiple edges; Tν is the total number of transfer vertices in a metro network.
The total number of transfers in the transfer vertices is the sum of the number of metro lines going through a transfer station minus one. A transfer station sharing two transit lines offers one transfer possibility, another sharing three lines offers two possibilities, and so on.
This indicator calculates the total number of net transfer possibilities. The ratio indicates the average connectivity of each transfer node in the network. The advantage of this indicator is that it provides information about the stations where more transfers from one line to another could be done, i.e. it crosses more than two metro lines.
2.2.5. Indicators of routing
New indicators such as a degree of routing, connectivity of the route, average length per edge (which takes into account the number of routes), intensity of the route, density of the route have been introduced in this research. These new factors have great impact on the categorisation and the evaluation of a metro network based on their routes. The coefficients describing the routes in a metro network show the total transport satisfaction.
The degree of routing a subway network gives a greater degree of satisfaction of transport to passengers.
)2(3 −
=v
ig (8)
where: g is the degree of routing; i is the total number of route arcs in the metro network; v is the total number of vertices in the metro network.
The total number of metro routes is a sum of the route edges Si
and the multiple routes edges Mi . The coefficient g considers the degree of connectivity of the
routes in the transferring vertices of a metro network. The increase in the number of arcs of routes will cause an increase in the number of the vertices.
The coefficient of connectivity of the routes b is the ratio of the total number of arcs route i to the total number of vertices in a
metro network. It takes into account the connectivity of the routes in the structure of the network.
vib = (9)
For the coefficients g and b and is valid the following:
γ≥g ; β≥b (10) The total number of edges (routes) is equal to the sum of the
single edges (routes) and the multiples edges (routes). In the matrices, one arc is passed twice for each of the both directions. When determining the total number of arcs, the sum is divided by two. This applies to Se , Me , Si , Mi , e and i . If the edges between two nodes pass through different infrastructures, multiple arc is not counted. They are accounted as single arcs.
The coefficient a for average length per edge, which takes into account the number of routes, determines the intensity of the routes in a metro network.
iLa = (11)
where: L is the total length of the metro network, km As the value of the coefficient is smaller, the more intense is an
metro network of routes. A low coefficient indicates saturated with routes metro network.
For the coefficients η and a is valid the following: η≤a (12)
The following relationship is valid for metro networks for which the graph arcs do not pass more than two lines:
γ=g ; β=b ; η=a (13) The coefficient of density of the routes r shows what the
density of multiple route arcs in a metro network is.
v
ir M= (14)
where: Mi is the total number of multiple route arcs in a metro network.
3. Application. A study of the indicators for
Sofia’s metro network Those indicators by the graphs theory and introduced new
indicators were examined for different schemes of development of the network of the Sofia subway.
In the paper have been developed variants of routes according to the possibilities of the infrastructure of the metro network. For each scheme have been studied the modification of coefficients in regard to the number of nodes, number of arcs and number of subway lines.
In Figures from 3 to 15 are shown schemes of the survey routes in the metro network. Figure 3 shows the scheme of the network of the Sofia’s subway from its opening in 1998 until 2012, when the subway system consists of a subway line (one subway route). Figure 4, 6,7,9, 10 show schemes with two subway routes for two subway lines (subway lines and subway routes do not match). Figure 4 displays matching of the subway routes with subway lines. Figure 8 shows three subway routes in two subway lines. In fig. 5, 11, 12, 13, 14 and 15 are shown schemes with three subway lines and three subway routes. Figure 5 shows the scheme of matching of subway lines and subway routes. Figure 4, 6, 7 and 9 shows the existing subway routes in the period 2012 – 2015. The scheme of Fig.8 shows a variant of an organization with three subway routes for two subway lines. Schemes from Fig.9 to Fig.15 reports the planned phased of construction of the Sofia’s subway in its development until 2020.
133
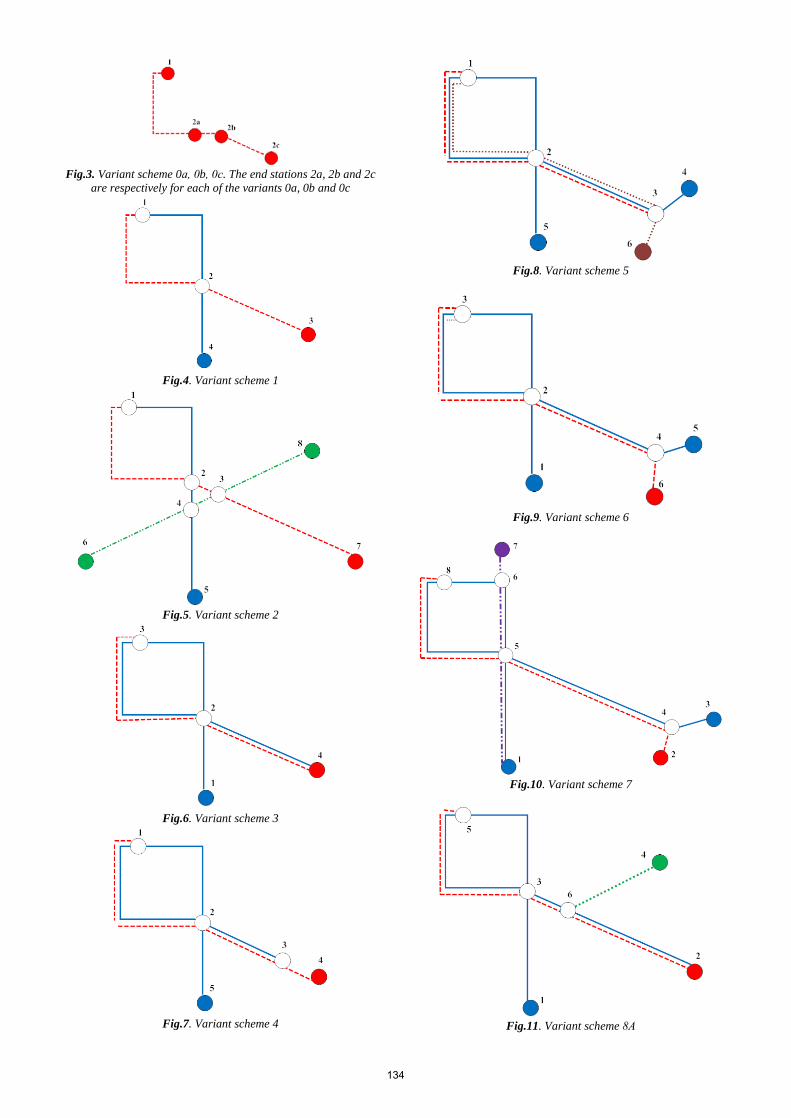
Fig.3. Variant scheme 0а, 0b, 0с. The end stations 2a, 2b and 2c
are respectively for each of the variants 0a, 0b and 0c
Fig.4. Variant scheme 1
Fig.5. Variant scheme 2
Fig.6. Variant scheme 3
Fig.7. Variant scheme 4
Fig.8. Variant scheme 5
Fig.9. Variant scheme 6
Fig.10. Variant scheme 7
Fig.11. Variant scheme 8А
134
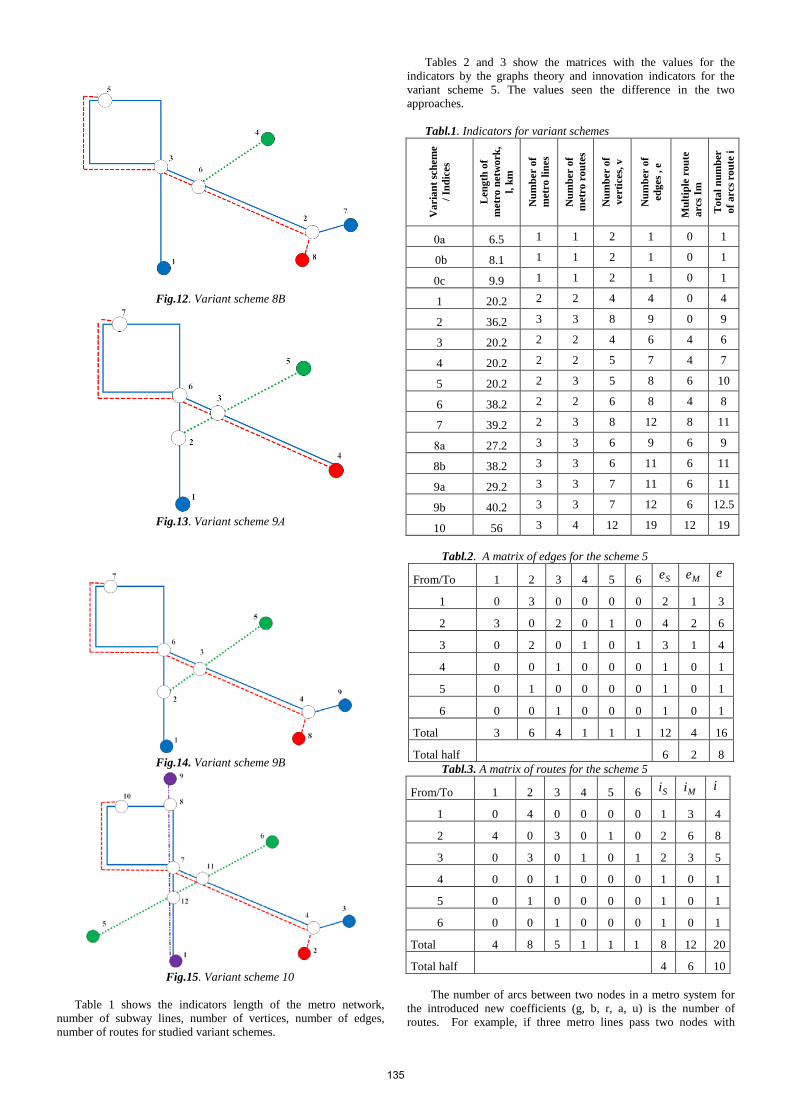
Fig.12. Variant scheme 8B
Fig.13. Variant scheme 9А
Fig.14. Variant scheme 9B
Fig.15. Variant scheme 10
Table 1 shows the indicators length of the metro network,
number of subway lines, number of vertices, number of edges, number of routes for studied variant schemes.
Tables 2 and 3 show the matrices with the values for the indicators by the graphs theory and innovation indicators for the variant scheme 5. The values seen the difference in the two approaches.
Tabl.1. Indicators for variant schemes
Var
iant
sche
me
/ Ind
ices
Len
gth
of
met
ro n
etw
ork,
l,
km
Num
ber
of
met
ro li
nes
Num
ber
of
met
ro r
oute
s
Num
ber
of
vert
ices
, v
Num
ber
of
edge
s , e
Mul
tiple
rou
te
arcs
Im
Tot
al n
umbe
r of
arc
s rou
te i
0а 6.5 1 1 2 1 0 1
0b 8.1 1 1 2 1 0 1
0c 9.9 1 1 2 1 0 1
1 20.2 2 2 4 4 0 4
2 36.2 3 3 8 9 0 9
3 20.2 2 2 4 6 4 6
4 20.2 2 2 5 7 4 7
5 20.2 2 3 5 8 6 10
6 38.2 2 2 6 8 4 8
7 39.2 2 3 8 12 8 11
8а 27.2 3 3 6 9 6 9
8b 38.2 3 3 6 11 6 11
9a 29.2 3 3 7 11 6 11
9b 40.2 3 3 7 12 6 12.5
10 56 3 4 12 19 12 19
Tabl.2. A matrix of edges for the scheme 5
From/To 1 2 3 4 5 6 Se Me e
1 0 3 0 0 0 0 2 1 3
2 3 0 2 0 1 0 4 2 6
3 0 2 0 1 0 1 3 1 4
4 0 0 1 0 0 0 1 0 1
5 0 1 0 0 0 0 1 0 1
6 0 0 1 0 0 0 1 0 1
Total 3 6 4 1 1 1 12 4 16
Total half 6 2 8 Tabl.3. A matrix of routes for the scheme 5
From/To 1 2 3 4 5 6 Si Mi i
1 0 4 0 0 0 0 1 3 4
2 4 0 3 0 1 0 2 6 8
3 0 3 0 1 0 1 2 3 5
4 0 0 1 0 0 0 1 0 1
5 0 1 0 0 0 0 1 0 1
6 0 0 1 0 0 0 1 0 1
Total 4 8 5 1 1 1 8 12 20
Total half 4 6 10
The number of arcs between two nodes in a metro system for the introduced new coefficients (g, b, r, a, u) is the number of routes. For example, if three metro lines pass two nodes with
135
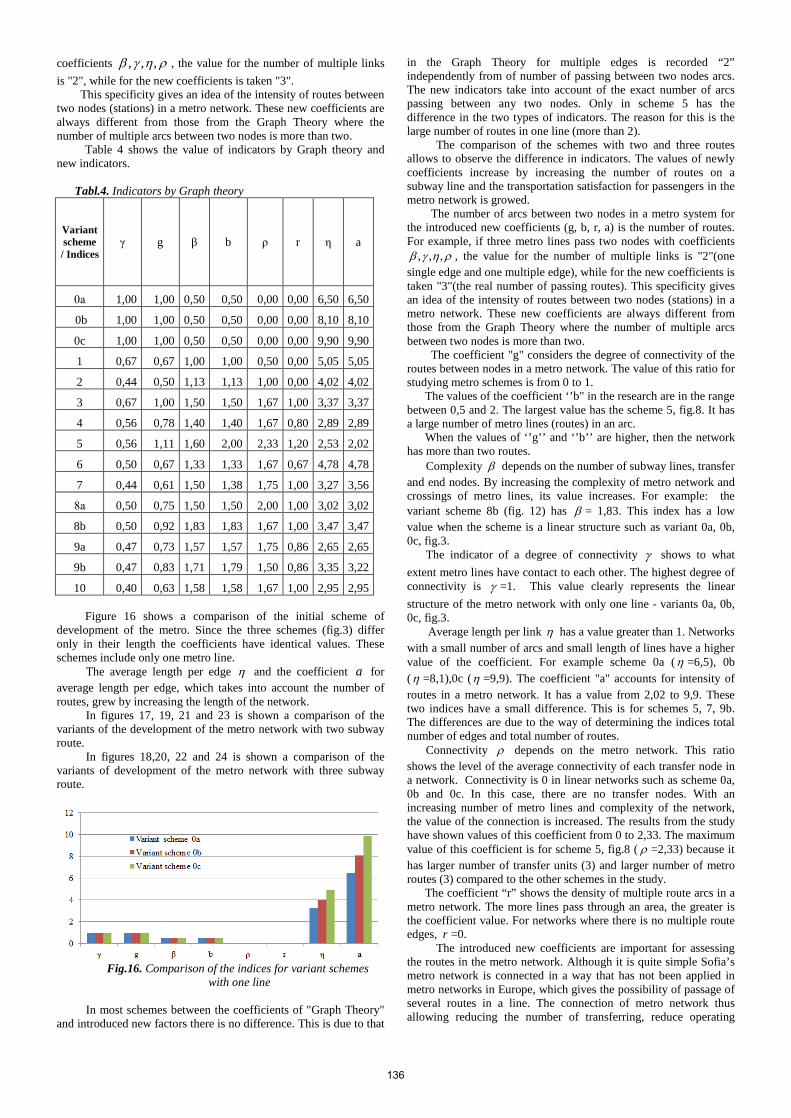
coefficients ρηγβ ,,, , the value for the number of multiple links is "2", while for the new coefficients is taken "3".
This specificity gives an idea of the intensity of routes between two nodes (stations) in a metro network. These new coefficients are always different from those from the Graph Theory where the number of multiple arcs between two nodes is more than two.
Table 4 shows the value of indicators by Graph theory and new indicators.
Tabl.4. Indicators by Graph theory
Variant scheme / Indices
γ g β b ρ r η a
0а 1,00 1,00 0,50 0,50 0,00 0,00 6,50 6,50
0b 1,00 1,00 0,50 0,50 0,00 0,00 8,10 8,10
0c 1,00 1,00 0,50 0,50 0,00 0,00 9,90 9,90
1 0,67 0,67 1,00 1,00 0,50 0,00 5,05 5,05
2 0,44 0,50 1,13 1,13 1,00 0,00 4,02 4,02
3 0,67 1,00 1,50 1,50 1,67 1,00 3,37 3,37
4 0,56 0,78 1,40 1,40 1,67 0,80 2,89 2,89
5 0,56 1,11 1,60 2,00 2,33 1,20 2,53 2,02
6 0,50 0,67 1,33 1,33 1,67 0,67 4,78 4,78
7 0,44 0,61 1,50 1,38 1,75 1,00 3,27 3,56
8а 0,50 0,75 1,50 1,50 2,00 1,00 3,02 3,02
8b 0,50 0,92 1,83 1,83 1,67 1,00 3,47 3,47
9a 0,47 0,73 1,57 1,57 1,75 0,86 2,65 2,65
9b 0,47 0,83 1,71 1,79 1,50 0,86 3,35 3,22
10 0,40 0,63 1,58 1,58 1,67 1,00 2,95 2,95 Figure 16 shows a comparison of the initial scheme of
development of the metro. Since the three schemes (fig.3) differ only in their length the coefficients have identical values. These schemes include only one metro line.
The average length per edge η and the coefficient a for average length per edge, which takes into account the number of routes, grew by increasing the length of the network.
In figures 17, 19, 21 and 23 is shown a comparison of the variants of the development of the metro network with two subway route.
In figures 18,20, 22 and 24 is shown a comparison of the variants of development of the metro network with three subway route.
Fig.16. Comparison of the indices for variant schemes
with one line
In most schemes between the coefficients of "Graph Theory" and introduced new factors there is no difference. This is due to that
in the Graph Theory for multiple edges is recorded “2” independently from of number of passing between two nodes arcs. The new indicators take into account of the exact number of arcs passing between any two nodes. Only in scheme 5 has the difference in the two types of indicators. The reason for this is the large number of routes in one line (more than 2).
The comparison of the schemes with two and three routes allows to observe the difference in indicators. The values of newly coefficients increase by increasing the number of routes on a subway line and the transportation satisfaction for passengers in the metro network is growed.
The number of arcs between two nodes in a metro system for the introduced new coefficients (g, b, r, a) is the number of routes. For example, if three metro lines pass two nodes with coefficients
ρηγβ ,,, , the value for the number of multiple links is "2"(one single edge and one multiple edge), while for the new coefficients is taken "3"(the real number of passing routes). This specificity gives an idea of the intensity of routes between two nodes (stations) in a metro network. These new coefficients are always different from those from the Graph Theory where the number of multiple arcs between two nodes is more than two.
The coefficient "g" considers the degree of connectivity of the routes between nodes in a metro network. The value of this ratio for studying metro schemes is from 0 to 1.
The values of the coefficient ‘’b" in the research are in the range between 0,5 and 2. The largest value has the scheme 5, fig.8. It has a large number of metro lines (routes) in an arc.
When the values of ‘’g’’ and ‘’b’’ are higher, then the network has more than two routes.
Complexity β depends on the number of subway lines, transfer and end nodes. By increasing the complexity of metro network and crossings of metro lines, its value increases. For example: the variant scheme 8b (fig. 12) has β = 1,83. This index has a low value when the scheme is a linear structure such as variant 0a, 0b, 0c, fig.3.
The indicator of a degree of connectivity γ shows to what extent metro lines have contact to each other. The highest degree of connectivity is γ =1. This value clearly represents the linear structure of the metro network with only one line - variants 0a, 0b, 0c, fig.3.
Average length per link η has a value greater than 1. Networks with a small number of arcs and small length of lines have a higher value of the coefficient. For example scheme 0a (η =6,5), 0b (η =8,1),0c (η =9,9). The coefficient "a" accounts for intensity of routes in a metro network. It has a value from 2,02 to 9,9. These two indices have a small difference. This is for schemes 5, 7, 9b. The differences are due to the way of determining the indices total number of edges and total number of routes.
Connectivity ρ depends on the metro network. This ratio shows the level of the average connectivity of each transfer node in a network. Connectivity is 0 in linear networks such as scheme 0a, 0b and 0c. In this case, there are no transfer nodes. With an increasing number of metro lines and complexity of the network, the value of the connection is increased. The results from the study have shown values of this coefficient from 0 to 2,33. The maximum value of this coefficient is for scheme 5, fig.8 ( ρ =2,33) because it has larger number of transfer units (3) and larger number of metro routes (3) compared to the other schemes in the study.
The coefficient “r” shows the density of multiple route arcs in a metro network. The more lines pass through an area, the greater is the coefficient value. For networks where there is no multiple route edges, r =0.
The introduced new coefficients are important for assessing the routes in the metro network. Although it is quite simple Sofia’s metro network is connected in a way that has not been applied in metro networks in Europe, which gives the possibility of passage of several routes in a line. The connection of metro network thus allowing reducing the number of transferring, reduce operating
136
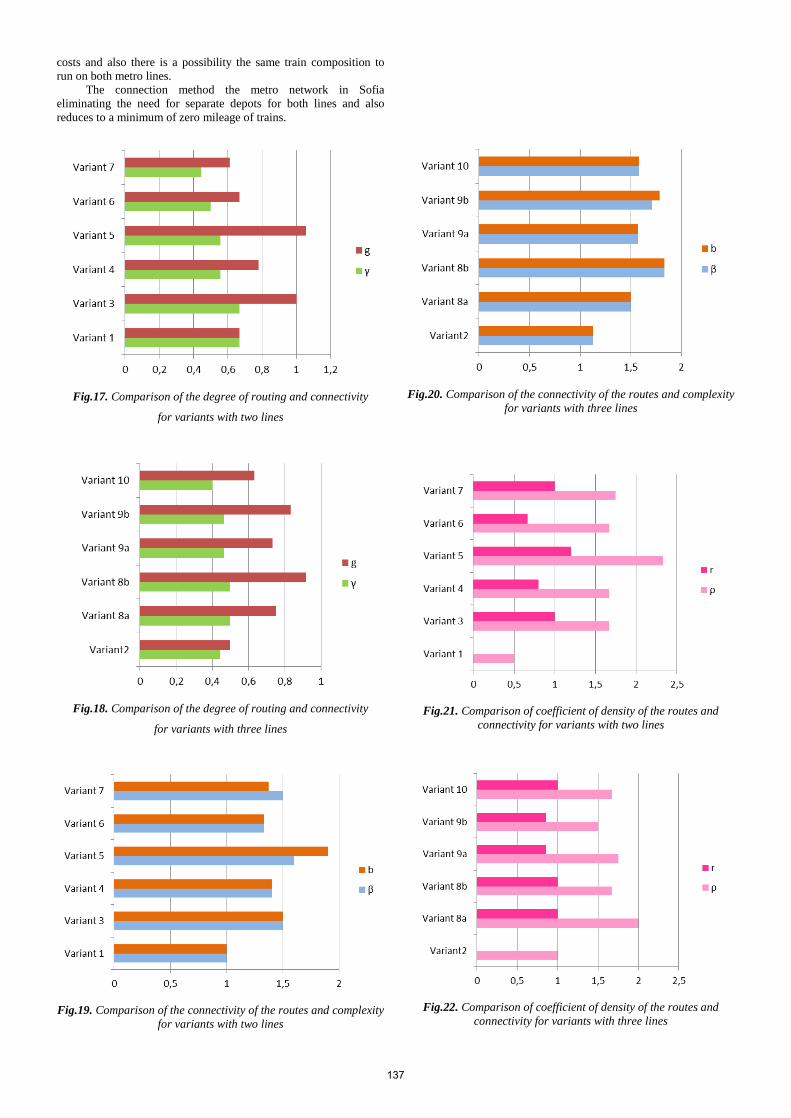
costs and also there is a possibility the same train composition to run on both metro lines.
The connection method the metro network in Sofia eliminating the need for separate depots for both lines and also reduces to a minimum of zero mileage of trains.
Fig.17. Comparison of the degree of routing and connectivity
for variants with two lines
Fig.18. Comparison of the degree of routing and connectivity
for variants with three lines
Fig.19. Comparison of the connectivity of the routes and complexity
for variants with two lines
Fig.20. Comparison of the connectivity of the routes and complexity
for variants with three lines
Fig.21. Comparison of coefficient of density of the routes and
connectivity for variants with two lines
Fig.22. Comparison of coefficient of density of the routes and
connectivity for variants with three lines
137
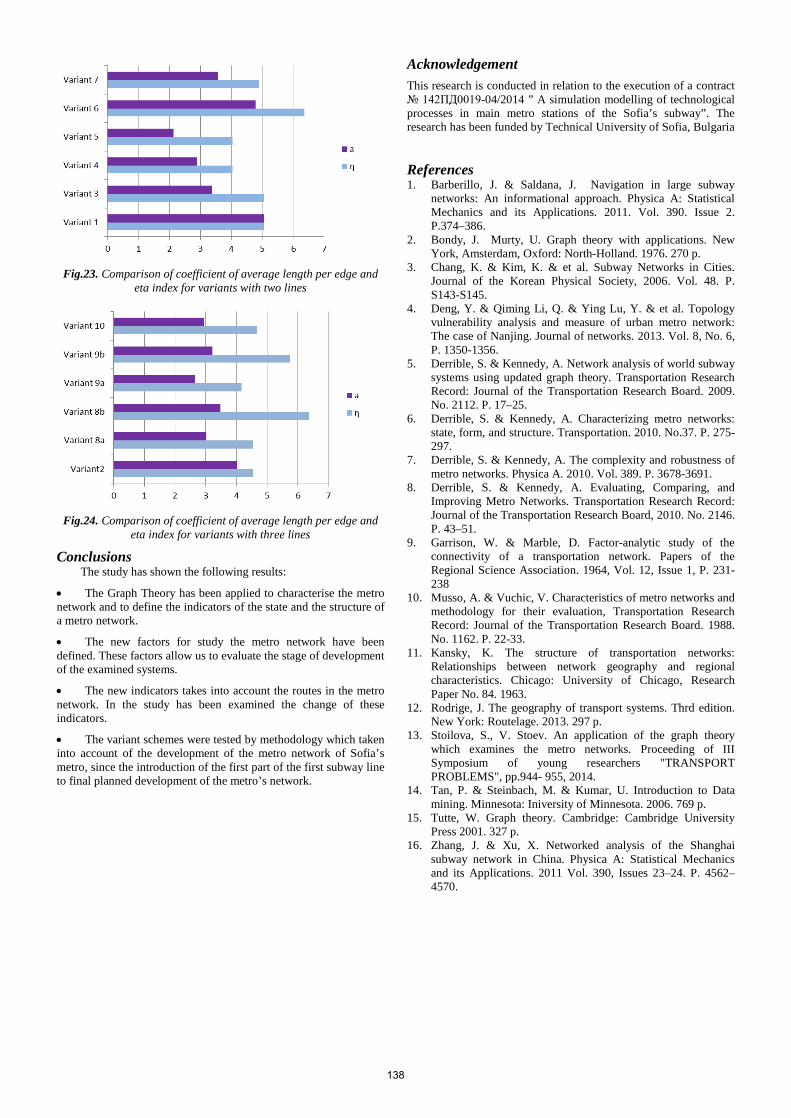
Fig.23. Comparison of coefficient of average length per edge and
eta index for variants with two lines
Fig.24. Comparison of coefficient of average length per edge and
eta index for variants with three lines
Conclusions The study has shown the following results:
• The Graph Theory has been applied to characterise the metro network and to define the indicators of the state and the structure of a metro network.
• The new factors for study the metro network have been defined. These factors allow us to evaluate the stage of development of the examined systems.
• The new indicators takes into account the routes in the metro network. In the study has been examined the change of these indicators.
• The variant schemes were tested by methodology which taken into account of the development of the metro network of Sofia’s metro, since the introduction of the first part of the first subway line to final planned development of the metro’s network.
Acknowledgement This research is conducted in relation to the execution of a contract 142ПД0019-04/2014 ” A simulation modelling of technological processes in main metro stations of the Sofia’s subway”. The research has been funded by Technical University of Sofia, Bulgaria
References 1. Barberillo, J. & Saldana, J. Navigation in large subway
networks: An informational approach. Physica A: Statistical Mechanics and its Applications. 2011. Vol. 390. Issue 2. P.374–386.
2. Bondy, J. Murty, U. Graph theory with applications. New York, Amsterdam, Oxford: North-Holland. 1976. 270 p.
3. Chang, K. & Kim, K. & et al. Subway Networks in Cities. Journal of the Korean Physical Society, 2006. Vol. 48. P. S143-S145.
4. Deng, Y. & Qiming Li, Q. & Ying Lu, Y. & et al. Topology vulnerability analysis and measure of urban metro network: The case of Nanjing. Journal of networks. 2013. Vol. 8, No. 6, P. 1350-1356.
5. Derrible, S. & Kennedy, A. Network analysis of world subway systems using updated graph theory. Transportation Research Record: Journal of the Transportation Research Board. 2009. No. 2112. P. 17–25.
6. Derrible, S. & Kennedy, A. Characterizing metro networks: state, form, and structure. Transportation. 2010. No.37. P. 275-297.
7. Derrible, S. & Kennedy, A. The complexity and robustness of metro networks. Physica A. 2010. Vol. 389. P. 3678-3691.
8. Derrible, S. & Kennedy, A. Evaluating, Comparing, and Improving Metro Networks. Transportation Research Record: Journal of the Transportation Research Board, 2010. No. 2146. P. 43–51.
9. Garrison, W. & Marble, D. Factor-analytic study of the connectivity of a transportation network. Papers of the Regional Science Association. 1964, Vol. 12, Issue 1, P. 231-238
10. Musso, A. & Vuchic, V. Characteristics of metro networks and methodology for their evaluation, Transportation Research Record: Journal of the Transportation Research Board. 1988. No. 1162. P. 22-33.
11. Kansky, K. The structure of transportation networks: Relationships between network geography and regional characteristics. Chicago: University of Chicago, Research Paper No. 84. 1963.
12. Rodrige, J. The geography of transport systems. Thrd edition. New York: Routelage. 2013. 297 p.
13. Stoilova, S., V. Stoev. An application of the graph theory which examines the metro networks. Proceeding of III Symposium of young researchers "TRANSPORT PROBLEMS", pp.944- 955, 2014.
14. Tan, P. & Steinbach, M. & Kumar, U. Introduction to Data mining. Minnesota: Iniversity of Minnesota. 2006. 769 p.
15. Tutte, W. Graph theory. Cambridge: Cambridge University Press 2001. 327 p.
16. Zhang, J. & Xu, X. Networked analysis of the Shanghai subway network in China. Physica A: Statistical Mechanics and its Applications. 2011 Vol. 390, Issues 23–24. P. 4562–4570.
138
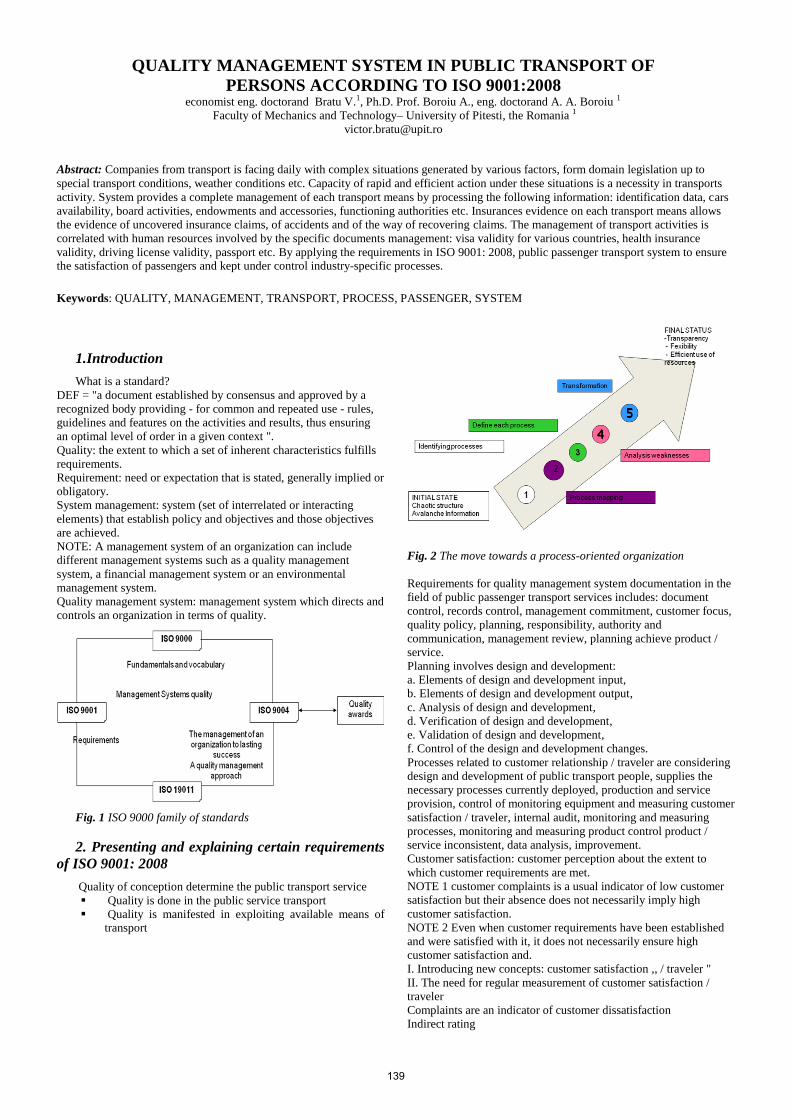
QUALITY MANAGEMENT SYSTEM IN PUBLIC TRANSPORT OF
PERSONS ACCORDING TO ISO 9001:2008 economist eng. doctorand Bratu V.1, Ph.D. Prof. Boroiu A., eng. doctorand A. A. Boroiu 1
Faculty of Mechanics and Technology– University of Pitesti, the Romania 1
Abstract: Companies from transport is facing daily with complex situations generated by various factors, form domain legislation up to
special transport conditions, weather conditions etc. Capacity of rapid and efficient action under these situations is a necessity in transports
activity. System provides a complete management of each transport means by processing the following information: identification data, cars
availability, board activities, endowments and accessories, functioning authorities etc. Insurances evidence on each transport means allows
the evidence of uncovered insurance claims, of accidents and of the way of recovering claims. The management of transport activities is
correlated with human resources involved by the specific documents management: visa validity for various countries, health insurance
validity, driving license validity, passport etc. By applying the requirements in ISO 9001: 2008, public passenger transport system to ensure the satisfaction of passengers and kept under control industry-specific processes.
Keywords: QUALITY, MANAGEMENT, TRANSPORT, PROCESS, PASSENGER, SYSTEM
1.Introduction
What is a standard?
DEF = "a document established by consensus and approved by a
recognized body providing - for common and repeated use - rules,
guidelines and features on the activities and results, thus ensuring
an optimal level of order in a given context ".
Quality: the extent to which a set of inherent characteristics fulfills
requirements.
Requirement: need or expectation that is stated, generally implied or
obligatory.
System management: system (set of interrelated or interacting
elements) that establish policy and objectives and those objectives
are achieved.
NOTE: A management system of an organization can include
different management systems such as a quality management
system, a financial management system or an environmental
management system.
Quality management system: management system which directs and
controls an organization in terms of quality.
Fig. 1 ISO 9000 family of standards
2. Presenting and explaining certain requirements
of ISO 9001: 2008
Quality of conception determine the public transport service
Quality is done in the public service transport
Quality is manifested in exploiting available means of transport
Fig. 2 The move towards a process-oriented organization
Requirements for quality management system documentation in the
field of public passenger transport services includes: document
control, records control, management commitment, customer focus,
quality policy, planning, responsibility, authority and
communication, management review, planning achieve product /
service.
Planning involves design and development:
a. Elements of design and development input,
b. Elements of design and development output,
c. Analysis of design and development,
d. Verification of design and development,
e. Validation of design and development,
f. Control of the design and development changes.
Processes related to customer relationship / traveler are considering
design and development of public transport people, supplies the
necessary processes currently deployed, production and service
provision, control of monitoring equipment and measuring customer
satisfaction / traveler, internal audit, monitoring and measuring
processes, monitoring and measuring product control product /
service inconsistent, data analysis, improvement.
Customer satisfaction: customer perception about the extent to
which customer requirements are met.
NOTE 1 customer complaints is a usual indicator of low customer
satisfaction but their absence does not necessarily imply high
customer satisfaction.
NOTE 2 Even when customer requirements have been established
and were satisfied with it, it does not necessarily ensure high
customer satisfaction and.
I. Introducing new concepts: customer satisfaction ,, / traveler "
II. The need for regular measurement of customer satisfaction /
traveler
Complaints are an indicator of customer dissatisfaction
Indirect rating
139

a. Turnover
b. Frequency Controls / racing
c. The proportion of customers set
d. The duration of the client relationship
e. ratio of recommendations given by clients
f. The rate of positive responses
g. Number of complaints
h. Market Segment
i. The rate of loss of customers / passengers
Direct assessment
A survey method (eg by post, fax, e-mail)
B. Contact Phone
C. Direct contacts
3. Conclusions
Possible obstacles in the development of quality management in
public transport services:
Human Barriers:
a) failure to action hiring of the Director General and management
team;
b) managers do not have clear goals and quality objectives;
c) do not give managers instance, does not demonstrate that they
truly believe or intend what I say;
d) insufficient trained staff;
e) Good communication is encouraged, not paying attention to
attitudes, ability and employee participation not clear what is
expected of them.
Cultural barriers:
a) improve the quality of power is perceived as quality assurance
departments and quality control;
b) improve the quality of power is perceived as the service sector;
c) inappropriate behaviors and attitudes;
d) barriers between departments;
e) only interested in lowering costs and increasing productivity
usually at the expense of quality;
f) insufficient resources.
Human barriers:
a) failure to action hiring of the Director General and management
team;
b) managers do not have clear goals and quality objectives;
c) do not give managers instance, does not demonstrate that they
truly believe or intend what I say;
d) insufficient trained staff;
e) good communication is encouraged, not paying attention to
attitudes, ability and employee participation not clear what is
expected of them.
Fig. 3.1 Model of process control
References
*** ISO 9000: 2006 Quality management systems. Fundamentals
and vocabulary.
*** ISO 9001 : 2008 Quality management systems. Requirements
*** ISO 9004:2009 (replaces ISO 9004:2000) Guidance Document
Managing for the sustained success of an organization. A quality
management approach
*** ISO 19011:2011 Guidelines for auditing management systems
140
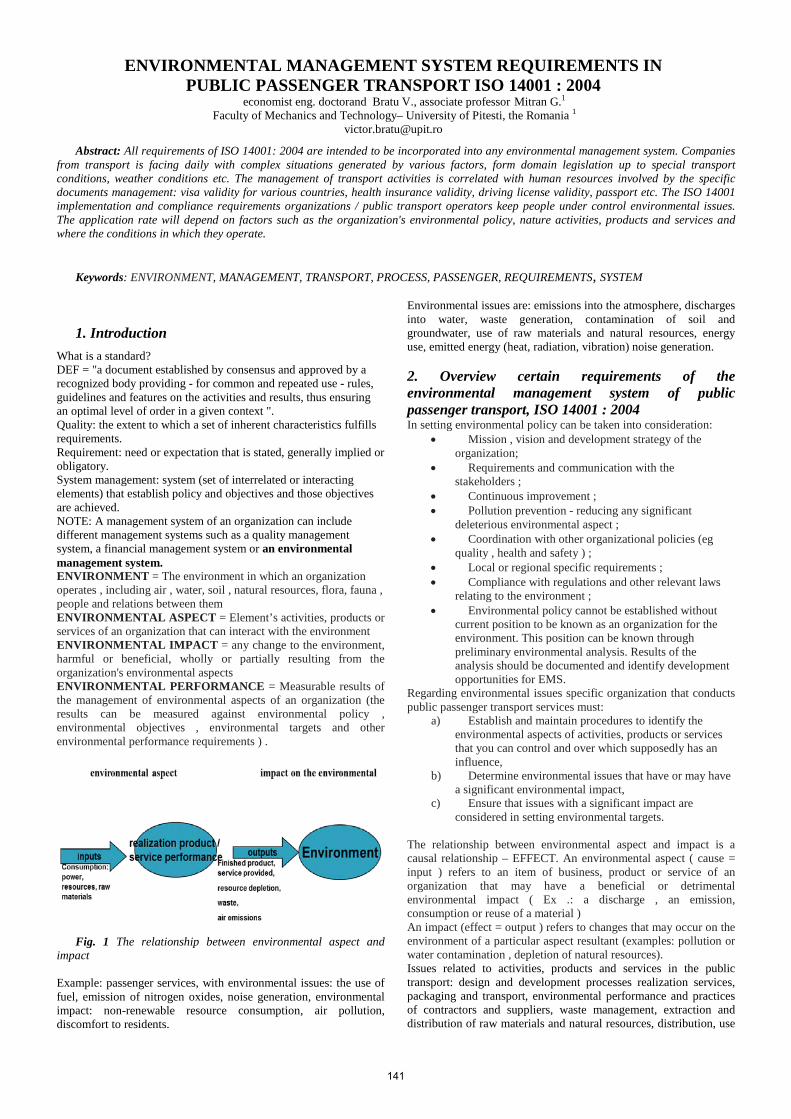
ENVIRONMENTAL MANAGEMENT SYSTEM REQUIREMENTS IN PUBLIC PASSENGER TRANSPORT ISO 14001 : 2004
economist eng. doctorand Bratu V., associate professor Mitran G.1 Faculty of Mechanics and Technology– University of Pitesti, the Romania 1
Abstract: All requirements of ISO 14001: 2004 are intended to be incorporated into any environmental management system. Companies from transport is facing daily with complex situations generated by various factors, form domain legislation up to special transport conditions, weather conditions etc. The management of transport activities is correlated with human resources involved by the specific documents management: visa validity for various countries, health insurance validity, driving license validity, passport etc. The ISO 14001 implementation and compliance requirements organizations / public transport operators keep people under control environmental issues. The application rate will depend on factors such as the organization's environmental policy, nature activities, products and services and where the conditions in which they operate.
Keywords: ENVIRONMENT, MANAGEMENT, TRANSPORT, PROCESS, PASSENGER, REQUIREMENTS, SYSTEM
1. Introduction What is a standard? DEF = "a document established by consensus and approved by a recognized body providing - for common and repeated use - rules, guidelines and features on the activities and results, thus ensuring an optimal level of order in a given context ". Quality: the extent to which a set of inherent characteristics fulfills requirements. Requirement: need or expectation that is stated, generally implied or obligatory. System management: system (set of interrelated or interacting elements) that establish policy and objectives and those objectives are achieved. NOTE: A management system of an organization can include different management systems such as a quality management system, a financial management system or an environmental management system. ENVIRONMENT = The environment in which an organization operates , including air , water, soil , natural resources, flora, fauna , people and relations between them ENVIRONMENTAL ASPECT = Element’s activities, products or services of an organization that can interact with the environment ENVIRONMENTAL IMPACT = any change to the environment, harmful or beneficial, wholly or partially resulting from the organization's environmental aspects ENVIRONMENTAL PERFORMANCE = Measurable results of the management of environmental aspects of an organization (the results can be measured against environmental policy , environmental objectives , environmental targets and other environmental performance requirements ) .
Fig. 1 The relationship between environmental aspect and
impact
Example: passenger services, with environmental issues: the use of fuel, emission of nitrogen oxides, noise generation, environmental impact: non-renewable resource consumption, air pollution, discomfort to residents.
Environmental issues are: emissions into the atmosphere, discharges into water, waste generation, contamination of soil and groundwater, use of raw materials and natural resources, energy use, emitted energy (heat, radiation, vibration) noise generation.
2. Overview certain requirements of the environmental management system of public passenger transport, ISO 14001 : 2004 In setting environmental policy can be taken into consideration:
• Mission , vision and development strategy of the organization;
• Requirements and communication with the stakeholders ;
• Continuous improvement ; • Pollution prevention - reducing any significant
deleterious environmental aspect ; • Coordination with other organizational policies (eg
quality , health and safety ) ; • Local or regional specific requirements ; • Compliance with regulations and other relevant laws
relating to the environment ; • Environmental policy cannot be established without
current position to be known as an organization for the environment. This position can be known through preliminary environmental analysis. Results of the analysis should be documented and identify development opportunities for EMS.
Regarding environmental issues specific organization that conducts public passenger transport services must:
a) Establish and maintain procedures to identify the environmental aspects of activities, products or services that you can control and over which supposedly has an influence,
b) Determine environmental issues that have or may have a significant environmental impact,
c) Ensure that issues with a significant impact are considered in setting environmental targets.
The relationship between environmental aspect and impact is a causal relationship – EFFECT. An environmental aspect ( cause = input ) refers to an item of business, product or service of an organization that may have a beneficial or detrimental environmental impact ( Ex .: a discharge , an emission, consumption or reuse of a material ) An impact (effect = output ) refers to changes that may occur on the environment of a particular aspect resultant (examples: pollution or water contamination , depletion of natural resources). Issues related to activities, products and services in the public transport: design and development processes realization services, packaging and transport, environmental performance and practices of contractors and suppliers, waste management, extraction and distribution of raw materials and natural resources, distribution, use
141
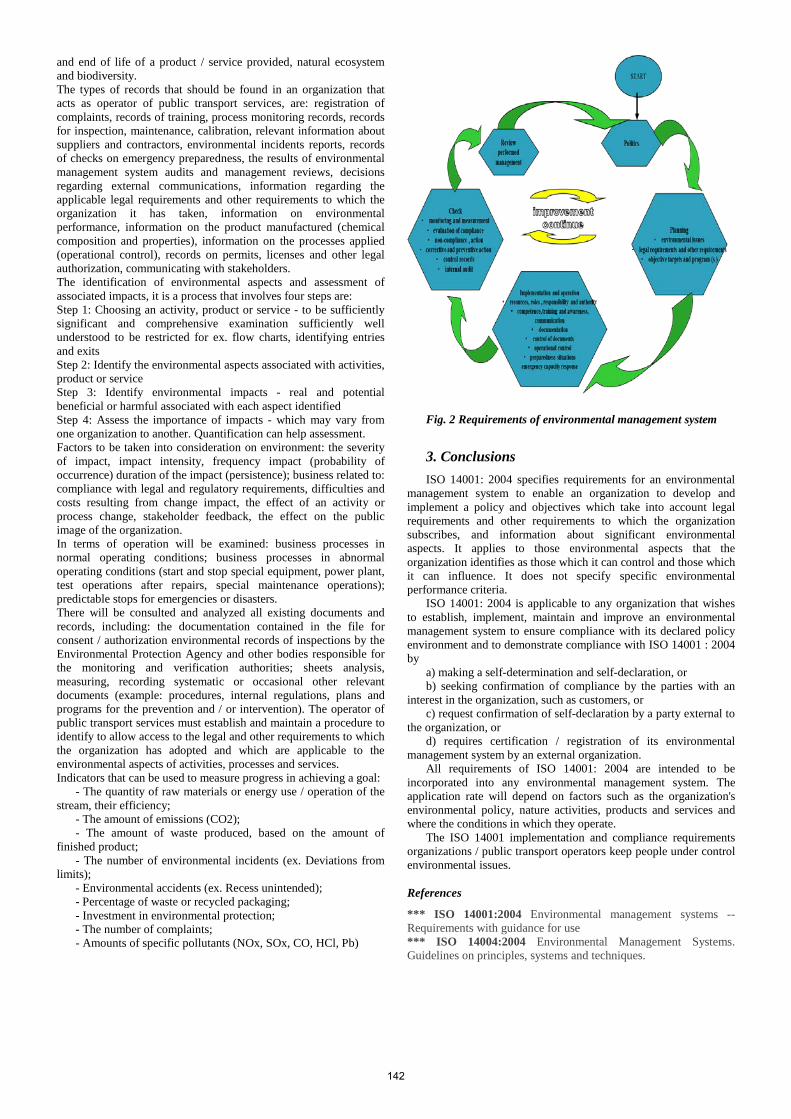
and end of life of a product / service provided, natural ecosystem and biodiversity. The types of records that should be found in an organization that acts as operator of public transport services, are: registration of complaints, records of training, process monitoring records, records for inspection, maintenance, calibration, relevant information about suppliers and contractors, environmental incidents reports, records of checks on emergency preparedness, the results of environmental management system audits and management reviews, decisions regarding external communications, information regarding the applicable legal requirements and other requirements to which the organization it has taken, information on environmental performance, information on the product manufactured (chemical composition and properties), information on the processes applied (operational control), records on permits, licenses and other legal authorization, communicating with stakeholders. The identification of environmental aspects and assessment of associated impacts, it is a process that involves four steps are: Step 1: Choosing an activity, product or service - to be sufficiently significant and comprehensive examination sufficiently well understood to be restricted for ex. flow charts, identifying entries and exits Step 2: Identify the environmental aspects associated with activities, product or service Step 3: Identify environmental impacts - real and potential beneficial or harmful associated with each aspect identified Step 4: Assess the importance of impacts - which may vary from one organization to another. Quantification can help assessment. Factors to be taken into consideration on environment: the severity of impact, impact intensity, frequency impact (probability of occurrence) duration of the impact (persistence); business related to: compliance with legal and regulatory requirements, difficulties and costs resulting from change impact, the effect of an activity or process change, stakeholder feedback, the effect on the public image of the organization. In terms of operation will be examined: business processes in normal operating conditions; business processes in abnormal operating conditions (start and stop special equipment, power plant, test operations after repairs, special maintenance operations); predictable stops for emergencies or disasters. There will be consulted and analyzed all existing documents and records, including: the documentation contained in the file for consent / authorization environmental records of inspections by the Environmental Protection Agency and other bodies responsible for the monitoring and verification authorities; sheets analysis, measuring, recording systematic or occasional other relevant documents (example: procedures, internal regulations, plans and programs for the prevention and / or intervention). The operator of public transport services must establish and maintain a procedure to identify to allow access to the legal and other requirements to which the organization has adopted and which are applicable to the environmental aspects of activities, processes and services. Indicators that can be used to measure progress in achieving a goal:
- The quantity of raw materials or energy use / operation of the stream, their efficiency;
- The amount of emissions (CO2); - The amount of waste produced, based on the amount of
finished product; - The number of environmental incidents (ex. Deviations from
limits); - Environmental accidents (ex. Recess unintended); - Percentage of waste or recycled packaging; - Investment in environmental protection; - The number of complaints; - Amounts of specific pollutants (NOx, SOx, CO, HCl, Pb)
Fig. 2 Requirements of environmental management system
3. Conclusions ISO 14001: 2004 specifies requirements for an environmental
management system to enable an organization to develop and implement a policy and objectives which take into account legal requirements and other requirements to which the organization subscribes, and information about significant environmental aspects. It applies to those environmental aspects that the organization identifies as those which it can control and those which it can influence. It does not specify specific environmental performance criteria.
ISO 14001: 2004 is applicable to any organization that wishes to establish, implement, maintain and improve an environmental management system to ensure compliance with its declared policy environment and to demonstrate compliance with ISO 14001 : 2004 by
a) making a self-determination and self-declaration, or b) seeking confirmation of compliance by the parties with an
interest in the organization, such as customers, or c) request confirmation of self-declaration by a party external to
the organization, or d) requires certification / registration of its environmental
management system by an external organization. All requirements of ISO 14001: 2004 are intended to be
incorporated into any environmental management system. The application rate will depend on factors such as the organization's environmental policy, nature activities, products and services and where the conditions in which they operate.
The ISO 14001 implementation and compliance requirements organizations / public transport operators keep people under control environmental issues.
References
*** ISO 14001:2004 Environmental management systems -- Requirements with guidance for use *** ISO 14004:2004 Environmental Management Systems. Guidelines on principles, systems and techniques.
142
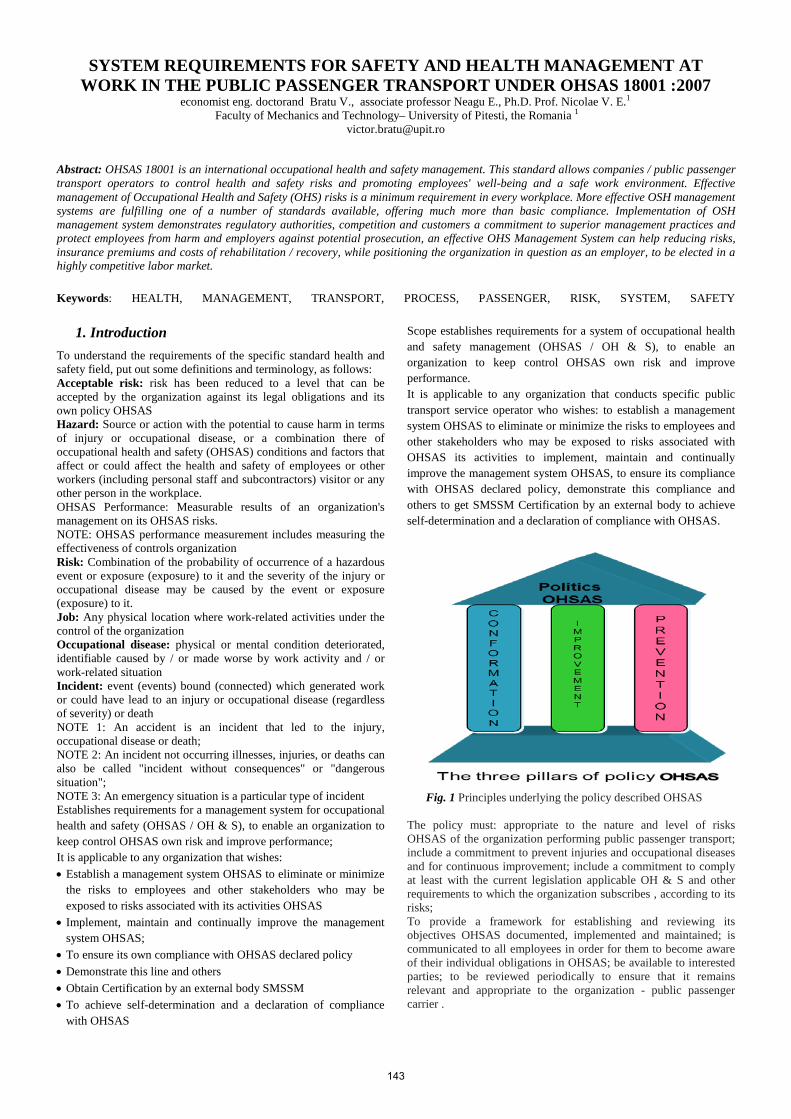
SYSTEM REQUIREMENTS FOR SAFETY AND HEALTH MANAGEMENT AT WORK IN THE PUBLIC PASSENGER TRANSPORT UNDER OHSAS 18001 :2007
economist eng. doctorand Bratu V., associate professor Neagu E., Ph.D. Prof. Nicolae V. E.1 Faculty of Mechanics and Technology– University of Pitesti, the Romania 1
Abstract: OHSAS 18001 is an international occupational health and safety management. This standard allows companies / public passenger transport operators to control health and safety risks and promoting employees' well-being and a safe work environment. Effective management of Occupational Health and Safety (OHS) risks is a minimum requirement in every workplace. More effective OSH management systems are fulfilling one of a number of standards available, offering much more than basic compliance. Implementation of OSH management system demonstrates regulatory authorities, competition and customers a commitment to superior management practices and protect employees from harm and employers against potential prosecution, an effective OHS Management System can help reducing risks, insurance premiums and costs of rehabilitation / recovery, while positioning the organization in question as an employer, to be elected in a highly competitive labor market.
Keywords: HEALTH, MANAGEMENT, TRANSPORT, PROCESS, PASSENGER, RISK, SYSTEM, SAFETY
1. Introduction To understand the requirements of the specific standard health and safety field, put out some definitions and terminology, as follows: Acceptable risk: risk has been reduced to a level that can be accepted by the organization against its legal obligations and its own policy OHSAS Hazard: Source or action with the potential to cause harm in terms of injury or occupational disease, or a combination there of occupational health and safety (OHSAS) conditions and factors that affect or could affect the health and safety of employees or other workers (including personal staff and subcontractors) visitor or any other person in the workplace. OHSAS Performance: Measurable results of an organization's management on its OHSAS risks. NOTE: OHSAS performance measurement includes measuring the effectiveness of controls organization Risk: Combination of the probability of occurrence of a hazardous event or exposure (exposure) to it and the severity of the injury or occupational disease may be caused by the event or exposure (exposure) to it. Job: Any physical location where work-related activities under the control of the organization Occupational disease: physical or mental condition deteriorated, identifiable caused by / or made worse by work activity and / or work-related situation Incident: event (events) bound (connected) which generated work or could have lead to an injury or occupational disease (regardless of severity) or death NOTE 1: An accident is an incident that led to the injury, occupational disease or death; NOTE 2: An incident not occurring illnesses, injuries, or deaths can also be called "incident without consequences" or "dangerous situation"; NOTE 3: An emergency situation is a particular type of incident Establishes requirements for a management system for occupational health and safety (OHSAS / OH & S), to enable an organization to keep control OHSAS own risk and improve performance; It is applicable to any organization that wishes: • Establish a management system OHSAS to eliminate or minimize
the risks to employees and other stakeholders who may be exposed to risks associated with its activities OHSAS
• Implement, maintain and continually improve the management system OHSAS;
• To ensure its own compliance with OHSAS declared policy • Demonstrate this line and others • Obtain Certification by an external body SMSSM • To achieve self-determination and a declaration of compliance
with OHSAS
Scope establishes requirements for a system of occupational health and safety management (OHSAS / OH & S), to enable an organization to keep control OHSAS own risk and improve performance. It is applicable to any organization that conducts specific public transport service operator who wishes: to establish a management system OHSAS to eliminate or minimize the risks to employees and other stakeholders who may be exposed to risks associated with OHSAS its activities to implement, maintain and continually improve the management system OHSAS, to ensure its compliance with OHSAS declared policy, demonstrate this compliance and others to get SMSSM Certification by an external body to achieve self-determination and a declaration of compliance with OHSAS.
Fig. 1 Principles underlying the policy described OHSAS
The policy must: appropriate to the nature and level of risks OHSAS of the organization performing public passenger transport; include a commitment to prevent injuries and occupational diseases and for continuous improvement; include a commitment to comply at least with the current legislation applicable OH & S and other requirements to which the organization subscribes , according to its risks; To provide a framework for establishing and reviewing its objectives OHSAS documented, implemented and maintained; is communicated to all employees in order for them to become aware of their individual obligations in OHSAS; be available to interested parties; to be reviewed periodically to ensure that it remains relevant and appropriate to the organization - public passenger carrier .
143
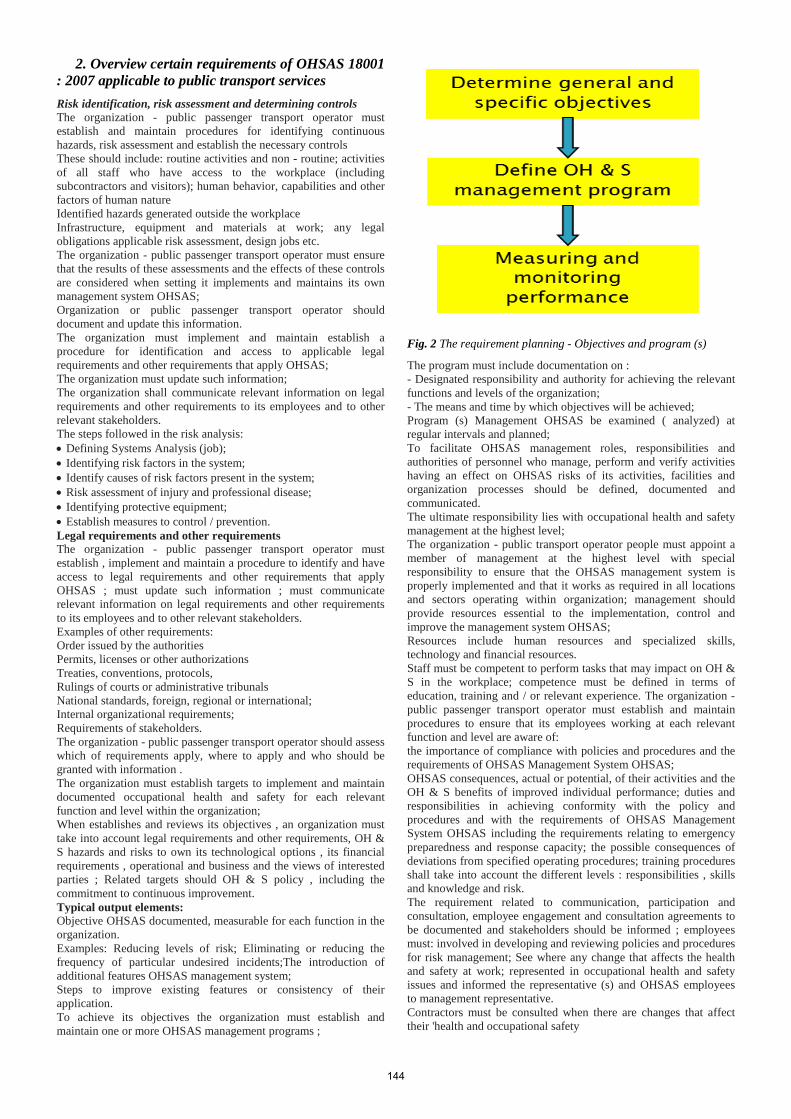
2. Overview certain requirements of OHSAS 18001 : 2007 applicable to public transport services Risk identification, risk assessment and determining controls The organization - public passenger transport operator must establish and maintain procedures for identifying continuous hazards, risk assessment and establish the necessary controls These should include: routine activities and non - routine; activities of all staff who have access to the workplace (including subcontractors and visitors); human behavior, capabilities and other factors of human nature Identified hazards generated outside the workplace Infrastructure, equipment and materials at work; any legal obligations applicable risk assessment, design jobs etc. The organization - public passenger transport operator must ensure that the results of these assessments and the effects of these controls are considered when setting it implements and maintains its own management system OHSAS; Organization or public passenger transport operator should document and update this information. The organization must implement and maintain establish a procedure for identification and access to applicable legal requirements and other requirements that apply OHSAS; The organization must update such information; The organization shall communicate relevant information on legal requirements and other requirements to its employees and to other relevant stakeholders. The steps followed in the risk analysis: • Defining Systems Analysis (job); • Identifying risk factors in the system; • Identify causes of risk factors present in the system; • Risk assessment of injury and professional disease; • Identifying protective equipment; • Establish measures to control / prevention. Legal requirements and other requirements The organization - public passenger transport operator must establish , implement and maintain a procedure to identify and have access to legal requirements and other requirements that apply OHSAS ; must update such information ; must communicate relevant information on legal requirements and other requirements to its employees and to other relevant stakeholders. Examples of other requirements: Order issued by the authorities Permits, licenses or other authorizations Treaties, conventions, protocols, Rulings of courts or administrative tribunals National standards, foreign, regional or international; Internal organizational requirements; Requirements of stakeholders. The organization - public passenger transport operator should assess which of requirements apply, where to apply and who should be granted with information . The organization must establish targets to implement and maintain documented occupational health and safety for each relevant function and level within the organization; When establishes and reviews its objectives , an organization must take into account legal requirements and other requirements, OH & S hazards and risks to own its technological options , its financial requirements , operational and business and the views of interested parties ; Related targets should OH & S policy , including the commitment to continuous improvement. Typical output elements: Objective OHSAS documented, measurable for each function in the organization. Examples: Reducing levels of risk; Eliminating or reducing the frequency of particular undesired incidents;The introduction of additional features OHSAS management system; Steps to improve existing features or consistency of their application. To achieve its objectives the organization must establish and maintain one or more OHSAS management programs ;
Fig. 2 The requirement planning - Objectives and program (s)
The program must include documentation on : - Designated responsibility and authority for achieving the relevant functions and levels of the organization; - The means and time by which objectives will be achieved; Program (s) Management OHSAS be examined ( analyzed) at regular intervals and planned; To facilitate OHSAS management roles, responsibilities and authorities of personnel who manage, perform and verify activities having an effect on OHSAS risks of its activities, facilities and organization processes should be defined, documented and communicated. The ultimate responsibility lies with occupational health and safety management at the highest level; The organization - public transport operator people must appoint a member of management at the highest level with special responsibility to ensure that the OHSAS management system is properly implemented and that it works as required in all locations and sectors operating within organization; management should provide resources essential to the implementation, control and improve the management system OHSAS; Resources include human resources and specialized skills, technology and financial resources. Staff must be competent to perform tasks that may impact on OH & S in the workplace; competence must be defined in terms of education, training and / or relevant experience. The organization - public passenger transport operator must establish and maintain procedures to ensure that its employees working at each relevant function and level are aware of: the importance of compliance with policies and procedures and the requirements of OHSAS Management System OHSAS; OHSAS consequences, actual or potential, of their activities and the OH & S benefits of improved individual performance; duties and responsibilities in achieving conformity with the policy and procedures and with the requirements of OHSAS Management System OHSAS including the requirements relating to emergency preparedness and response capacity; the possible consequences of deviations from specified operating procedures; training procedures shall take into account the different levels : responsibilities , skills and knowledge and risk. The requirement related to communication, participation and consultation, employee engagement and consultation agreements to be documented and stakeholders should be informed ; employees must: involved in developing and reviewing policies and procedures for risk management; See where any change that affects the health and safety at work; represented in occupational health and safety issues and informed the representative (s) and OHSAS employees to management representative. Contractors must be consulted when there are changes that affect their 'health and occupational safety
144
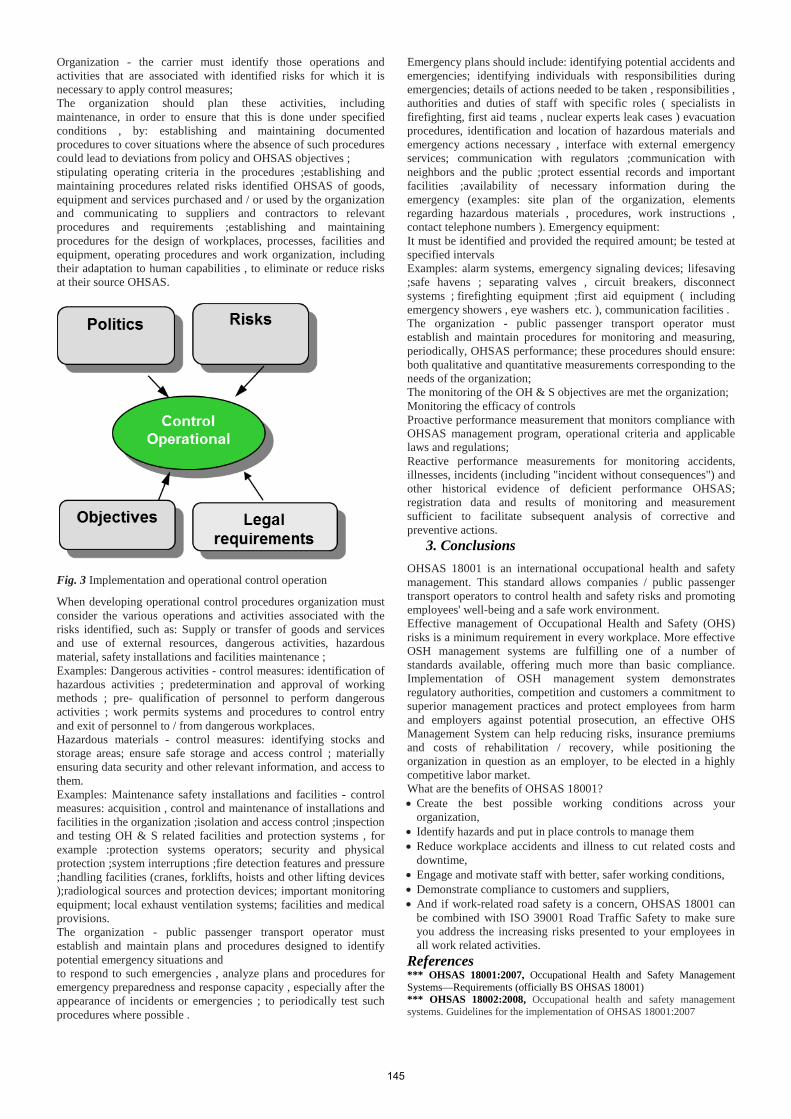
Organization - the carrier must identify those operations and activities that are associated with identified risks for which it is necessary to apply control measures; The organization should plan these activities, including maintenance, in order to ensure that this is done under specified conditions , by: establishing and maintaining documented procedures to cover situations where the absence of such procedures could lead to deviations from policy and OHSAS objectives ; stipulating operating criteria in the procedures ;establishing and maintaining procedures related risks identified OHSAS of goods, equipment and services purchased and / or used by the organization and communicating to suppliers and contractors to relevant procedures and requirements ;establishing and maintaining procedures for the design of workplaces, processes, facilities and equipment, operating procedures and work organization, including their adaptation to human capabilities , to eliminate or reduce risks at their source OHSAS.
Fig. 3 Implementation and operational control operation
When developing operational control procedures organization must consider the various operations and activities associated with the risks identified, such as: Supply or transfer of goods and services and use of external resources, dangerous activities, hazardous material, safety installations and facilities maintenance ; Examples: Dangerous activities - control measures: identification of hazardous activities ; predetermination and approval of working methods ; pre- qualification of personnel to perform dangerous activities ; work permits systems and procedures to control entry and exit of personnel to / from dangerous workplaces. Hazardous materials - control measures: identifying stocks and storage areas; ensure safe storage and access control ; materially ensuring data security and other relevant information, and access to them. Examples: Maintenance safety installations and facilities - control measures: acquisition , control and maintenance of installations and facilities in the organization ;isolation and access control ;inspection and testing OH & S related facilities and protection systems , for example :protection systems operators; security and physical protection ;system interruptions ;fire detection features and pressure ;handling facilities (cranes, forklifts, hoists and other lifting devices );radiological sources and protection devices; important monitoring equipment; local exhaust ventilation systems; facilities and medical provisions. The organization - public passenger transport operator must establish and maintain plans and procedures designed to identify potential emergency situations and to respond to such emergencies , analyze plans and procedures for emergency preparedness and response capacity , especially after the appearance of incidents or emergencies ; to periodically test such procedures where possible .
Emergency plans should include: identifying potential accidents and emergencies; identifying individuals with responsibilities during emergencies; details of actions needed to be taken , responsibilities , authorities and duties of staff with specific roles ( specialists in firefighting, first aid teams , nuclear experts leak cases ) evacuation procedures, identification and location of hazardous materials and emergency actions necessary , interface with external emergency services; communication with regulators ;communication with neighbors and the public ;protect essential records and important facilities ;availability of necessary information during the emergency (examples: site plan of the organization, elements regarding hazardous materials , procedures, work instructions , contact telephone numbers ). Emergency equipment: It must be identified and provided the required amount; be tested at specified intervals Examples: alarm systems, emergency signaling devices; lifesaving ;safe havens ; separating valves , circuit breakers, disconnect systems ; firefighting equipment ;first aid equipment ( including emergency showers , eye washers etc. ), communication facilities . The organization - public passenger transport operator must establish and maintain procedures for monitoring and measuring, periodically, OHSAS performance; these procedures should ensure: both qualitative and quantitative measurements corresponding to the needs of the organization; The monitoring of the OH & S objectives are met the organization; Monitoring the efficacy of controls Proactive performance measurement that monitors compliance with OHSAS management program, operational criteria and applicable laws and regulations; Reactive performance measurements for monitoring accidents, illnesses, incidents (including "incident without consequences") and other historical evidence of deficient performance OHSAS; registration data and results of monitoring and measurement sufficient to facilitate subsequent analysis of corrective and preventive actions.
3. Conclusions OHSAS 18001 is an international occupational health and safety management. This standard allows companies / public passenger transport operators to control health and safety risks and promoting employees' well-being and a safe work environment. Effective management of Occupational Health and Safety (OHS) risks is a minimum requirement in every workplace. More effective OSH management systems are fulfilling one of a number of standards available, offering much more than basic compliance. Implementation of OSH management system demonstrates regulatory authorities, competition and customers a commitment to superior management practices and protect employees from harm and employers against potential prosecution, an effective OHS Management System can help reducing risks, insurance premiums and costs of rehabilitation / recovery, while positioning the organization in question as an employer, to be elected in a highly competitive labor market. What are the benefits of OHSAS 18001? • Create the best possible working conditions across your
organization, • Identify hazards and put in place controls to manage them • Reduce workplace accidents and illness to cut related costs and
downtime, • Engage and motivate staff with better, safer working conditions, • Demonstrate compliance to customers and suppliers, • And if work-related road safety is a concern, OHSAS 18001 can
be combined with ISO 39001 Road Traffic Safety to make sure you address the increasing risks presented to your employees in all work related activities.
References *** OHSAS 18001:2007, Occupational Health and Safety Management Systems—Requirements (officially BS OHSAS 18001) *** OHSAS 18002:2008, Occupational health and safety management systems. Guidelines for the implementation of OHSAS 18001:2007
145
INTERNATIONAL TRANSPORT PROJECTS AND ECOSYSTEM OF BLACK SEA
МЕЖДУНАРОДНЫЕ ТРАНСПОРТНЫЕ ПРОЕКТЫ И ЭКОСИСТЕМА ЧЕРНОГО МОРЯ
Prof. Dr. Gogiashvili F.1, Prof. Dr. Mamuladze R.2, Doctoral candidate Baramidze M.2
1.Akaki Tsereteli State University, Kutaisi, Georgia 2. Batumi state Maritime Akademy, Batumi, Georgia
[email protected]; [email protected]
Abstrac: The importance of the Black Sea for modern Georgia is invaluable. It represents one of the important natural formations for the common geographical location of the country, resource potential, the main artery of recreational zone and foreign relations. Therefore, the security, economic welfare and future in general depend on effective use of economic potential of the Black Sea and its ecological condition.
The article deals with the ecological condition of the main problems of the Black Sea. Special attention is paid to international transport and energy projects. It is proved that the projects that have been implemented and planned the "Blue Stream" and "South Stream" (so called "Turkish Stream") represent potential threats to the Black Sea in terms of environmental deterioration. Modest conclusions are made in the article concerning the joint efforts of the Black Sea countries directed to support transport and energy projects, realization of which will impact ecological condition of the Black Sea. In the opinion of the authors, the "Nabucco" project represents the very transport-energetic project. KEY WORDS: ECOSYSTEM OF THE BLACK SEA, “NABUCCO” PROJECT, ECOLOGICAL CONDITION OF THE BLACK SEA
1. Introduction
The importance of the Black Sea for modern Georgia is invaluable. It represents one of the important natural formations for the common geographical location of the country, resource potential, the main artery of recreational zone and foreign relations. Therefore, the security, economic welfare and future in general depend on effective use of economic potential of the Black Sea and its ecological condition.
The Black Sea has an area of 422,000 km2, the longest east-west extent is about 1,167 km (Burgas-Kobuleti), a maximum width - 580 km, a maximum depth – 2211 m, the coastline is approximately 4000 km, 320 km of which belongs to Georgia (Russian Federation – 395 km, the Ukraine – 1340 km, Romania – 215 km, Bulgaria – 317 km, Turkey – 1365 km).
A net outflow of water reaches 200 km3 per year through the Bosporus. Inflow of freshwater from the surrounding areas reaches 320 km³ per year, the majority of which comes from central and central-eastern Europe [1].
So called oxygen rich “organized” layer of the Black Sea extends to the depth of 175-200 m, from 200 m up to the bottom it is almost without oxygen and there is no organic life there. Outstanding features of the Black Sea, distinguishing it from the rest hydra shell of the earth, represent original layering character. Surface layer which is 175-200 m thick stands out with its density (it is lighter) from water body. This difference is so clear that confusion between layers of water is almost impossible. That’s why deep water is accumulated with huge quantity of H2S.
The Black Sea is one of the biggest locked water massive that does not stand out from the complex features and is convenient for navigation. Therefore, the Black Sea is the most important transport corridor [2].
2. Preconditions and means for resolving
theproblem In 1960-ies of XX century intensive involvement of
humanity in ecosystem of the Black Sea, in particular excessive use of the Black Sea resources, unplanned urbanization in the coastal zones, invasion of series of exotic and pathogenic organisms ballast water through the ballast waters, building of dams on many rivers, huge number of constructions to protect the coastlines, unduly cleaned wastewater spill (ships, industry and coastal areas of the settlements and their improper caring), the growth of illegal fishing and many other reasons have led to the degradation of the Black Sea ecosystem. Natural features of the Black Sea make this process
even more difficult. Exchange of the Black Sea water to the Mediterranean Sea water is extremely slow. Its salinity is less than 20 per mile. There are no revolutions and reversing in the Black Sea, in the contrary to other seas (the Baltic Sea). As a result, there is very little oxygen in it and contaminants are collected in abundance. Water is actually stopped; as a result oxygen is only in upper layers. Healthy seas need the oxygen not only for living organisms, but also for putrefaction and decomposition of dead plants and dead animals. Black Sea and its resources are in greatest danger. It is almost completely locked and probably the most polluted seas in the world due to the fact that the pool is much beyond the scope of the six countries bordering the sea, and 17 countries are involved in the contamination. The only linking of the sea to the world ocean is Bosporus Strait. At the same time it receives waste water and other pollutants from such large rivers as the Danube, Dnepr, and elevation, as well as from many other smaller rivers. Hence, it is understandable that protection of the Black Sea is possible only with the joint efforts and international assistance.
Currently, the Black Sea is facing the following main problems: • Nitrogen and phosphorus compounds; • Sewage Water; • Toxicants; • Radioactive materials; • Invasive species of living organisms • Raw refuse and oil pollution; • International transport and energy projects.
One of the important problems mentioned above is international transport and energy projects. A highly favorable coastal location of the Black Sea has always been a certain advantage for development of transport industry, especially in recent period, when there have been many economic changes in the region. The location means many advantages and disadvantages for the region located on the crossroad of Europe and Asia: on the one hand it is it’s a favorable condition for the development of trade, but its’ necessary to establish a certain balance firstly between the current favorable economic profit and on the other hand increasing, long term development of the native population and environment. Transportation of the oil in the Black Sea region in a part of this kind of danger, especially if the social and environmental issues are left by the wayside, and the geopolitical importance of the arguments prevail importance of future decisions. In recent period the issue of international importance is energy supply of Europe. Many projects are being developed, which provide energy to improve the energy supply through diversification of routes and
146
sources. This kind of route crosses the Black Sea and poses serious threats for the Black Sea from the ecological point of view. If the Black Sea performed only the navigational function in the past, in recent years it gained the new function – one pipeline has already been built and some more pipelines are planned to be built on the grounds of the Black Sea. Particularly [3,4]: The Blue Stream. Mentioned project is considered as the deepest pipeline in the world, the total length of the pipeline is 1240 km, which started operations in 2006. The land section consists of the Stavropolskaya and Krasnodarskaya compressor stations. The offshore section is 396 kilometers long laying from the Beregovaya compressor station in Arkhipo-Osipovka to the Durusu terminal locating 60 kilometers from Samsun (Turkey).
”South Stream” and “Turkish Stream”. ”South Stream” is an abandoned project running into 10 milliards to transport natural gas of the Russian Federation through the Black Sea to Bulgaria and through Serbia, Hungary and Slovenia further to Austria. According to the project 2000 km long pipeline was to to start from Varna and run to Pleven. From there, the original southwestern route was to continue through Greece and Ionian Sea to southern Italy. The newer northwestern route would have continued from Pleven to Serbia. In Serbia, then running through Zaječar and Paraćin to Čenta. From Čenta the main pipeline would have continued in direction of Gospođinci while branch-off line would run to Republika Srpska in Bosnia and Herzegovina. Construction of the Russian onshore facilities for the pipeline started on December 7, 2012 by “GAZPROM” [5,6]. The last developments in the Ukraine lead the project in danger. That is why, at the end of 2014, Russia decided to suspend the "South Stream" and instead of it started so called "Turkish Stream" pipeline. The Turkish Stream is a working name of the proposed natural gas pipeline from Russia to Turkey across the Black Sea. The proposal was announced by Russian president Vladimir Putin on 1 December 2014, during his state visit to Turkey. The pipeline would start at Russkaya compressor station near Anapa. The landing point in Turkey is not negotiated yet. According to Gazprom, pipe-laying works will start immediately when the landing point in Turkey is decided. The mentioned projects constitute potential threats to the pollution of the Black Sea, hydrogen sulfide gas, which is considered as corrosive substances is poisonous and causes rapid corrosions of metal. Therefore, on the one hand, the efforts of the Black Sea countries should be implemented to the strict monitoring of the proper operations of the pipeline, on the other hand, active support of the alternative projects linking to the Black Sea. To our opinion The Nabucco Pipeline is this kind of alternative project.
”The Nabucco Project” aims to run the gas obtained in Caspian region and Central Asia to Europe through Georgia and Turkey. Preparations started in 2002, the building of the pipeline was planned to start in 2011 and finish in 2014, but because of the problems with gas supplier countries the realization of the project was postponed several times. In 2011 it was announced that enforcement of the project was postponed until 2018. However, on 28 June 2013 Shah Deniz consortium announced that it had chosen the Trans Adriatic Pipeline over Nabucco for its gas exports,
Nabucco, is the idea born on the interests of the European Union and US, while South Stream project was created and supported by political leadership of Russia, hence Russia has done everything to ensure that this project is not implemented and partially succeeded in it.
Judging from the economic and technical parameters,”Nabucco” is more interesting project then "South Stream”. Implementation of "South Stream" (including the "Turkish Stream") and blocking ”Nabucco” allows Russia to influence the prices of natural gas supply not only in Europe, but also supply of Europe with gas from the Caspian Sea countries (Turkmenistan, Azerbaijan, Kazakhstan, Uzbekistan) as well. Moreover, unlike the Persian Gulf countries (which deliver natural gas in tankers to European terminals), but the pipeline, they don’t have no other means of supply of natural gas.
The main advantages of the "Nabucco" in comparison to "South Stream is as follows: • Reduces dependence of Eastern European countries on Russia; • The project is open to several transit suppliers, ensuring competition and, therefore, protects consumers from monopolistic pricing; • Eencourages the utilization of new deposits, as Europe is the most expensive natural gas market in the world. • Encourages trans-Caspian pipeline, which will break the path for a large natural gas resources of Turkmenistan, Uzbekistan and Kazakhstan to European markets, bypassing Russia and contribute to the growth of their political independence; • Technically easier to implement, its operation will be relatively cheap and economic parameters are better; • The most important issue is to reduce the risks and threats that are associated with the deterioration of the ecological conditions of the Black Sea [7]. Another problem in terms of the ecological state of the oil extraction works. Such work is already being planned. Another problem in terms of the ecological condition is commencement of crude-oil production. These kinds of works are already planned and do not bode well for the Black Sea. If the industrial production of oil starts, it will have a very large impact on the Black Sea, because the biggest problem is not the "big discharge", but also the so-called "daily discharge". "The Black Sea Convention" can be considered as a step forward in terms of protection of the Black Sea. The convention was signed in Bucharest in April 1992, and ratified by all six legislative assemblies of the Black Sea countries as of Bulgaria, Georgia, Romania, Russia, Turkey and the Ukraine. The countries acknowledge the increasing deterioration of the environment in their joint resources in the Black Sea which caused signing of Convention on the Protection of the Black Sea against Pollution (also so called the Black Convention or the Bucharest Convention). On 31st October 1996, Bulgaria, Romania, Russia, Georgia and Ukraine's Ministers of Environment met in Istanbul, where they signed the Strategic Action Plan for the Protection of the Black Sea, the most comprehensive program, which is to save the world’s one of the most polluted seas.
3. Conclusion
It can be said that currently there are plenty of other economic projects in the Black Sea countries, which are a potential threat from the ecological point of view. As for the ecological projects enhancing reduction of the pollution of the Black Sea, are very small. Besides, there are no states safe from the adverse effects of pollution on human health effects or country's economy. Therefore, the joint efforts of the Black Sea countries should be directed to such projects, including support of transport and energy projects, realization of which will have minor impact on the ecological situation in the Black Sea.
3. Literature
1. R. Mamuladze, "Black Sea Cruise Potential, Problems and Prospects", Batumi State Maritime Academy, I Regional Symposium: „Cruise Tourism – World Experience and Perspectives of the Development in Black Sea Region”, Batumi, April 30, 2014 2. http://reportiori.ge/?menuid=2&id=48123 3. http://www.rec-caucasus.org/files/publications/pub_1400668450.pdf 4. http://www.radiotavisupleba.ge/content/article/1555073.html 5. http://www.internet.ge/v3-0/index.php?action=news&category=4&news=60692 6. http://www.gazprom.com/about/production/projects/pipelines/blue-stream/ 7. http://news.ge/ge/news/story/115024-putinma-samkhretis-nakadi-dakhurulad-gamoatskhada
147
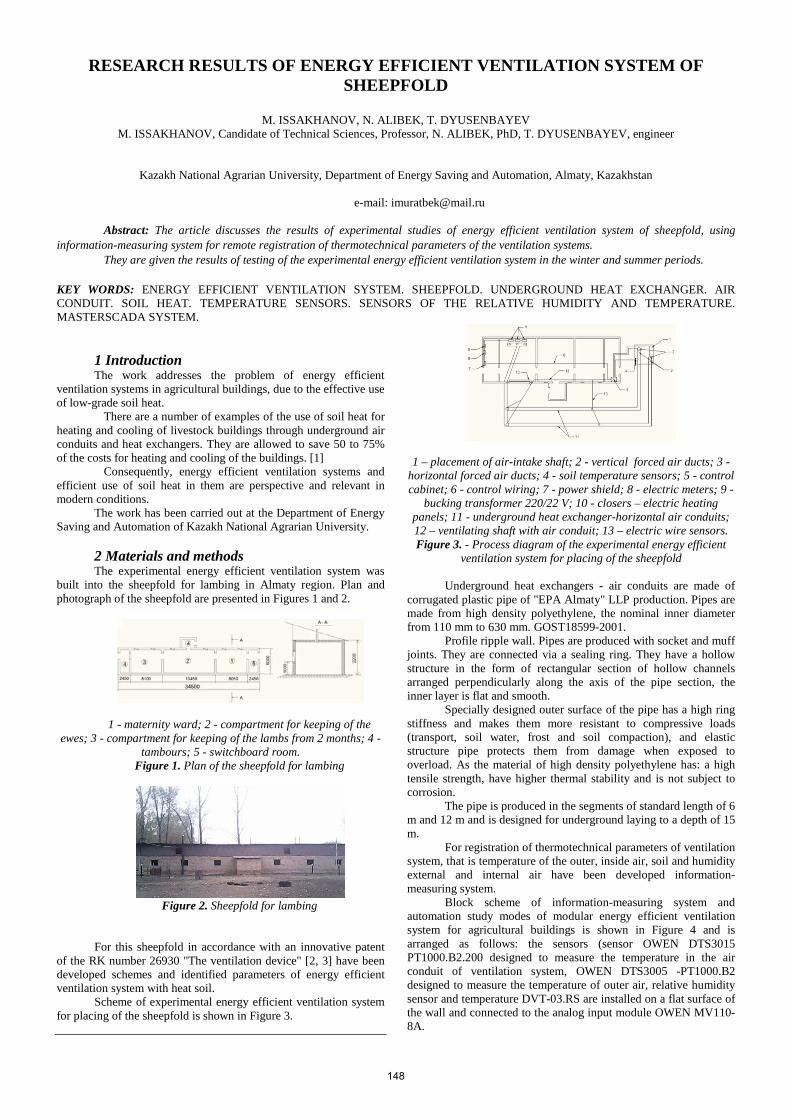
RESEARCH RESULTS OF ENERGY EFFICIENT VENTILATION SYSTEM OF SHEEPFOLD
M. ISSAKHANOV, N. ALIBEK, T. DYUSENBAYEV
M. ISSAKHANOV, Candidate of Technical Sciences, Professor, N. ALIBEK, PhD, T. DYUSENBAYEV, engineer
Kazakh National Agrarian University, Department of Energy Saving and Automation, Almaty, Kazakhstan
e-mail: [email protected]
Abstract: The article discusses the results of experimental studies of energy efficient ventilation system of sheepfold, using
information-measuring system for remote registration of thermotechnical parameters of the ventilation systems. They are given the results of testing of the experimental energy efficient ventilation system in the winter and summer periods.
KEY WORDS: ENERGY EFFICIENT VENTILATION SYSTEM. SHEEPFOLD. UNDERGROUND HEAT EXCHANGER. AIR CONDUIT. SOIL HEAT. TEMPERATURE SENSORS. SENSORS OF THE RELATIVE HUMIDITY AND TEMPERATURE. MASTERSCADA SYSTEM.
1 Introduction The work addresses the problem of energy efficient
ventilation systems in agricultural buildings, due to the effective use of low-grade soil heat.
There are a number of examples of the use of soil heat for heating and cooling of livestock buildings through underground air conduits and heat exchangers. They are allowed to save 50 to 75% of the costs for heating and cooling of the buildings. [1]
Consequently, energy efficient ventilation systems and efficient use of soil heat in them are perspective and relevant in modern conditions.
The work has been carried out at the Department of Energy Saving and Automation of Kazakh National Agrarian University.
2 Materials and methods The experimental energy efficient ventilation system was
built into the sheepfold for lambing in Almaty region. Plan and photograph of the sheepfold are presented in Figures 1 and 2.
1 - maternity ward; 2 - compartment for keeping of the ewes; 3 - compartment for keeping of the lambs from 2 months; 4 -
tambours; 5 - switchboard room. Figure 1. Plan of the sheepfold for lambing
Figure 2. Sheepfold for lambing
For this sheepfold in accordance with an innovative patent of the RK number 26930 "The ventilation device" [2, 3] have been developed schemes and identified parameters of energy efficient ventilation system with heat soil.
Scheme of experimental energy efficient ventilation system for placing of the sheepfold is shown in Figure 3.
1 – placement of air-intake shaft; 2 - vertical forced air ducts; 3 - horizontal forced air ducts; 4 - soil temperature sensors; 5 - control cabinet; 6 - control wiring; 7 - power shield; 8 - electric meters; 9 -
bucking transformer 220/22 V; 10 - closers – electric heating panels; 11 - underground heat exchanger-horizontal air conduits; 12 – ventilating shaft with air conduit; 13 – electric wire sensors. Figure 3. - Process diagram of the experimental energy efficient
ventilation system for placing of the sheepfold
Underground heat exchangers - air conduits are made of corrugated plastic pipe of "EPA Almaty" LLP production. Pipes are made from high density polyethylene, the nominal inner diameter from 110 mm to 630 mm. GOST18599-2001.
Profile ripple wall. Pipes are produced with socket and muff joints. They are connected via a sealing ring. They have a hollow structure in the form of rectangular section of hollow channels arranged perpendicularly along the axis of the pipe section, the inner layer is flat and smooth.
Specially designed outer surface of the pipe has a high ring stiffness and makes them more resistant to compressive loads (transport, soil water, frost and soil compaction), and elastic structure pipe protects them from damage when exposed to overload. As the material of high density polyethylene has: a high tensile strength, have higher thermal stability and is not subject to corrosion.
The pipe is produced in the segments of standard length of 6 m and 12 m and is designed for underground laying to a depth of 15 m.
For registration of thermotechnical parameters of ventilation system, that is temperature of the outer, inside air, soil and humidity external and internal air have been developed information-measuring system.
Block scheme of information-measuring system and automation study modes of modular energy efficient ventilation system for agricultural buildings is shown in Figure 4 and is arranged as follows: the sensors (sensor OWEN DTS3015 PT1000.B2.200 designed to measure the temperature in the air conduit of ventilation system, OWEN DTS3005 -PT1000.B2 designed to measure the temperature of outer air, relative humidity sensor and temperature DVT-03.RS are installed on a flat surface of the wall and connected to the analog input module OWEN MV110-8A.
148
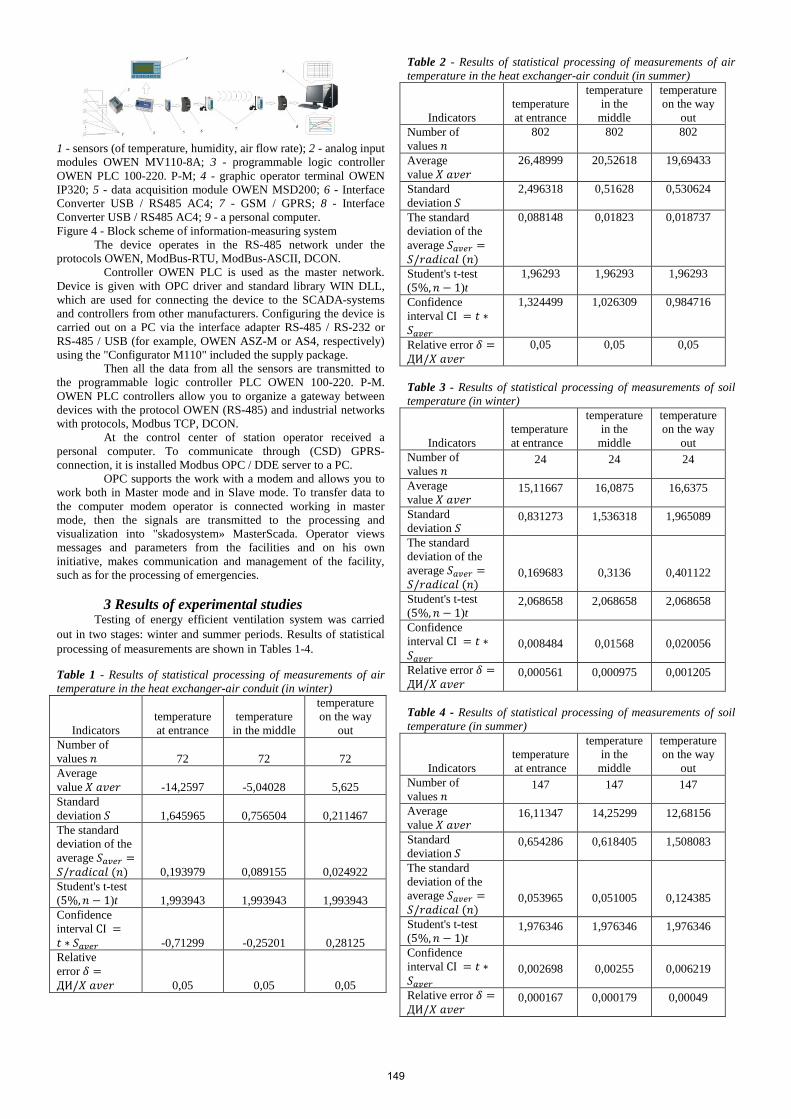
1 - sensors (of temperature, humidity, air flow rate); 2 - analog input modules OWEN MV110-8A; 3 - programmable logic controller OWEN PLC 100-220. P-M; 4 - graphic operator terminal OWEN IP320; 5 - data acquisition module OWEN MSD200; 6 - Interface Converter USB / RS485 AC4; 7 - GSM / GPRS; 8 - Interface Converter USB / RS485 AC4; 9 - a personal computer. Figure 4 - Block scheme of information-measuring system
The device operates in the RS-485 network under the protocols OWEN, ModBus-RTU, ModBus-ASCII, DCON.
Controller OWEN PLC is used as the master network. Device is given with OPC driver and standard library WIN DLL, which are used for connecting the device to the SCADA-systems and controllers from other manufacturers. Configuring the device is carried out on a PC via the interface adapter RS-485 / RS-232 or RS-485 / USB (for example, OWEN ASZ-M or AS4, respectively) using the "Configurator M110" included the supply package.
Then all the data from all the sensors are transmitted to the programmable logic controller PLC OWEN 100-220. P-M. OWEN PLC controllers allow you to organize a gateway between devices with the protocol OWEN (RS-485) and industrial networks with protocols, Modbus TCP, DCON.
At the control center of station operator received a personal computer. To communicate through (CSD) GPRS-connection, it is installed Modbus OPC / DDE server to a PC.
OPC supports the work with a modem and allows you to work both in Master mode and in Slave mode. To transfer data to the computer modem operator is connected working in master mode, then the signals are transmitted to the processing and visualization into "skadosystem» MasterScada. Operator views messages and parameters from the facilities and on his own initiative, makes communication and management of the facility, such as for the processing of emergencies.
3 Results of experimental studies Testing of energy efficient ventilation system was carried
out in two stages: winter and summer periods. Results of statistical processing of measurements are shown in Tables 1-4.
Table 1 - Results of statistical processing of measurements of air temperature in the heat exchanger-air conduit (in winter)
Indicators temperature at entrance
temperature in the middle
temperature on the way
out Number of values 𝑛 72 72 72 Average value 𝑋 𝑎𝑣𝑒𝑟 -14,2597 -5,04028 5,625 Standard deviation 𝑆 1,645965 0,756504 0,211467 The standard deviation of the average 𝑆𝑎𝑣𝑒𝑟 =𝑆/𝑟𝑎𝑑𝑖𝑐𝑎𝑙 (𝑛) 0,193979 0,089155 0,024922 Student's t-test (5%,𝑛 − 1)t 1,993943 1,993943 1,993943 Confidence interval CI =𝑡 ∗ 𝑆𝑎𝑣𝑒𝑟 -0,71299 -0,25201 0,28125 Relative error 𝛿 =ДИ/𝑋 𝑎𝑣𝑒𝑟 0,05 0,05 0,05
Table 2 - Results of statistical processing of measurements of air temperature in the heat exchanger-air conduit (in summer)
Indicators temperature at entrance
temperature in the
middle
temperature on the way
out Number of values 𝑛
802 802 802
Average value 𝑋 𝑎𝑣𝑒𝑟
26,48999 20,52618 19,69433
Standard deviation 𝑆
2,496318 0,51628 0,530624
The standard deviation of the average 𝑆𝑎𝑣𝑒𝑟 =𝑆/𝑟𝑎𝑑𝑖𝑐𝑎𝑙 (𝑛)
0,088148 0,01823 0,018737
Student's t-test (5%,𝑛 − 1)t
1,96293 1,96293 1,96293
Confidence interval CI = 𝑡 ∗𝑆𝑎𝑣𝑒𝑟
1,324499 1,026309 0,984716
Relative error 𝛿 =ДИ/𝑋 𝑎𝑣𝑒𝑟
0,05 0,05 0,05
Table 3 - Results of statistical processing of measurements of soil temperature (in winter)
Indicators temperature at entrance
temperature in the
middle
temperature on the way
out Number of values 𝑛
24 24 24
Average value 𝑋 𝑎𝑣𝑒𝑟
15,11667 16,0875 16,6375
Standard deviation 𝑆
0,831273 1,536318 1,965089
The standard deviation of the average 𝑆𝑎𝑣𝑒𝑟 =𝑆/𝑟𝑎𝑑𝑖𝑐𝑎𝑙 (𝑛)
0,169683 0,3136 0,401122
Student's t-test (5%,𝑛 − 1)t
2,068658 2,068658 2,068658
Confidence interval CI = 𝑡 ∗𝑆𝑎𝑣𝑒𝑟
0,008484 0,01568 0,020056
Relative error 𝛿 =ДИ/𝑋 𝑎𝑣𝑒𝑟
0,000561 0,000975 0,001205
Table 4 - Results of statistical processing of measurements of soil temperature (in summer)
Indicators temperature at entrance
temperature in the
middle
temperature on the way
out Number of values 𝑛
147 147 147
Average value 𝑋 𝑎𝑣𝑒𝑟
16,11347 14,25299 12,68156
Standard deviation 𝑆
0,654286 0,618405 1,508083
The standard deviation of the average 𝑆𝑎𝑣𝑒𝑟 =𝑆/𝑟𝑎𝑑𝑖𝑐𝑎𝑙 (𝑛)
0,053965 0,051005 0,124385
Student's t-test (5%,𝑛 − 1)t
1,976346 1,976346 1,976346
Confidence interval CI = 𝑡 ∗𝑆𝑎𝑣𝑒𝑟
0,002698 0,00255 0,006219
Relative error 𝛿 =ДИ/𝑋 𝑎𝑣𝑒𝑟
0,000167 0,000179 0,00049
149

During tests energy efficient ventilation system during the winter period found that the room temperature of the sheepfold ranged from +5,4 ° C to +6,0 ° C, on average + 5,6 ° C, with the number of measurements n = 72.
The relative humidity of the room of the sheepfold was in average 79.2% (for n = 72). The maximum and minimum value of relative humidity were respectively 93.4% and 64.1%. At the lowest outdoor temperature -18 ° C (04.02.2014) supply air temperature reached 6 ° C. Supply flow rate fluctuate depending on the outdoor temperature within 70-140 m3 / h. The maximum heat output of installation was 2.2 kW.
During tests energy efficient ventilation system in summer found that the room temperature of sheepfold ranged from +16,6 °C to + 27,29 °C on average + 22,3 °C, with the number of measurements n = 820.
The relative humidity of the room of sheepfold averaged 30.5% (for n = 820). Maximum and minimum value of relative humidity was respectively 58.88% and 10.37%. At the highest temperature of the outside air + 33,4°C supply air temperature reached + 19,6°C and humidity increased from 12% to 23%. Air flow rate was 140 m3/h. The cooling capacity of the installation was 2.6 kW.
Conclusion In times of testing energy efficient ventilation system
provided the required power saving mode and zootechnical parameters of the microclimate in the maternity ward of the sheepfold.
Energy efficient ventilation system has been adopted for economic use and recommended for implementation in the sheep farms.
1. Stepanova V.E. Renewable energy at the agricultural enterprises. – Мoscow: Agropromizdat, 1989. –p. 112
2. Innovative patent. 26930 from 25.04.2013 «Ventilation device», Issakhanov М.Zh., Alibek N.B., Doldayev О.Z., Dyusenbauev Т.S. et al.
3. M. Issakhanov, N. Alibek, T. Dyusenbayev.Energy saving ventilation systems for sheep premises. International journal International scientific, scientific applied and informational journal mechanization in agriculture. 7/2014, Sofia, Bulgaria «Energy saving ventilation systems for sheep premises».
150

STUDY OF THE EFFECT OF TRIM ON SHIP POWERING PERFORMANCE
ИЗСЛЕДВАНЕ НА ВЛИЯНИЕТО НА ДИФЕРЕНТА ВЪРХУ ХОДОВИТЕ КАЧЕСТВА НА КОРАБА
VASILEVA Alexandrina Technical University - Varna, Bulgaria
E-mail: [email protected]
Abstract: The recently issued IMO requirements for reduction of GHG emissions for shipping reinforced the attempts to increase the energy efficiency of ships. One of the measures prescribed by IMO is Ship Energy Efficiency Management Plan (SEEMP). This, among other things, involves trim optimization. Trim i.e. difference between the draft at the bow and the stern is controlled parameter worthy of attention with respect of fuel usage and GHG emissions while the ship is cruising. It is shown in this paper that the powering performance of vessels varies with different trim conditions. The main objective function of the trim optimization is the powering performance (resistance and propulsion). The objective of this paper is to analyze the physics behind the effect of varied trim on ship resistance and propulsion, to detect the origin of this effect. In particular are examined the change of total resistance depending on the change of some parameters such as length of waterline (hence frictional resistance), submerged surface , change of the residual resistance, wave making/breaking at the bow and analyzed in terms of and viscous - pressure resistance (form-factor). Also examined are parameters influencing the powering performance as: thrust deduction, wake fraction, relative rotative efficiency, and propeller efficiency when the ship is trimmed. This analysis has been based on experimental data of particular ships. KEYWORDS: ENERGY EFFICIENCY, SEEMP, TRIM OPTIMIZATION 1. Introduction Energy efficiency of ships has ever been an important issue for ship-owners and ship operators due to entirely economic reasons.
Lately, however, this interest has been revived and reinforced by the environmental concerns of mankind in all fields of our life.
The recently issued IMO Marine Environment Protection Committee (MEPC) requirement for reduction of GHG emissions from shipping reinforced the attempts to increase the energy efficiency of ships.
One of the measures the IMO introduced regarding reduction of GHG emitted by shipping [4] is SEEMP (Ship Energy Efficiency Management Plan). SEEMP is mandatory to exist onboard every ship but voluntary in contents. Table 1.1 shows SEEMP related measures.
Table 1.1 SEEMP related measures No. Energy Efficiency Measure 1 Engine tuning and monitoring 2 Hull condition 3 Propeller condition 4 Reduced auxiliary power 5 Speed reduction (operation) 6 Trim/draft monitoring and optimisation 7 Voyage execution 8 Weather routing 9 Advanced hull coating
10 Propeller upgrade and aft body flow devices
The topic of this paper is trim/draft optimization and more specifically analysis of the physics behind its effect on ship powering performance, effect of flow and resistance when draft and trim vary.
2. Physics behind the effect of varied trim on ship
powering performance FORCE Technology, Denmark [3] investigated what causes the change in propulsive power when a vessel is trimmed. The possible explanations may relate to changes in the following parameters:
wetted surface area; water line length; form-factor; residual resistance coefficient; thrust deduction; wake fraction; propeller efficiency and relative rotative efficiency.
The objective of this section is to try decompose the effects of trim on the above parameters. All discussions are based on the results of powering model tests of 320 000 DWT VLCC at one speed (The trim optimization test matrix included four practicable ballast conditions- 1 m, 2 m, 2.4 m and 3 m trim aft, without systematic variation of mean draught).
Trim is defined as the difference between the draft at aft perpendicular (TA) and the draft at fore perpendicular (TF):
FA TTTRIM −= (2.1)
The physical effects that reduce delivered power when the ship is trimmed can relate to ship resistance and propulsive efficiency, as shown in the formula to determine the delivered power (2.2):
D
TD
VRPη
.= (2.2)
i.e. the scope to reduce the power are reducing the ship resistance (RT) and/or increasing the propulsive efficiency ( ηD).
2.1. Resistance
The total resistance coefficient, according to ITTC [1] is:
AFRT CCkCC +++= ).1( (2.3)
The correlation allowance CA usually is assumed constant for all trim conditions, except in case of major changes in draft
Change in the friction resistance coefficient CF, according to ITTC-57 is:
210 )2(Re)(log
075,0−
=FC (2.4)
Where Re is Reynolds number defined by:
νWLLV .Re = (2.5)
151
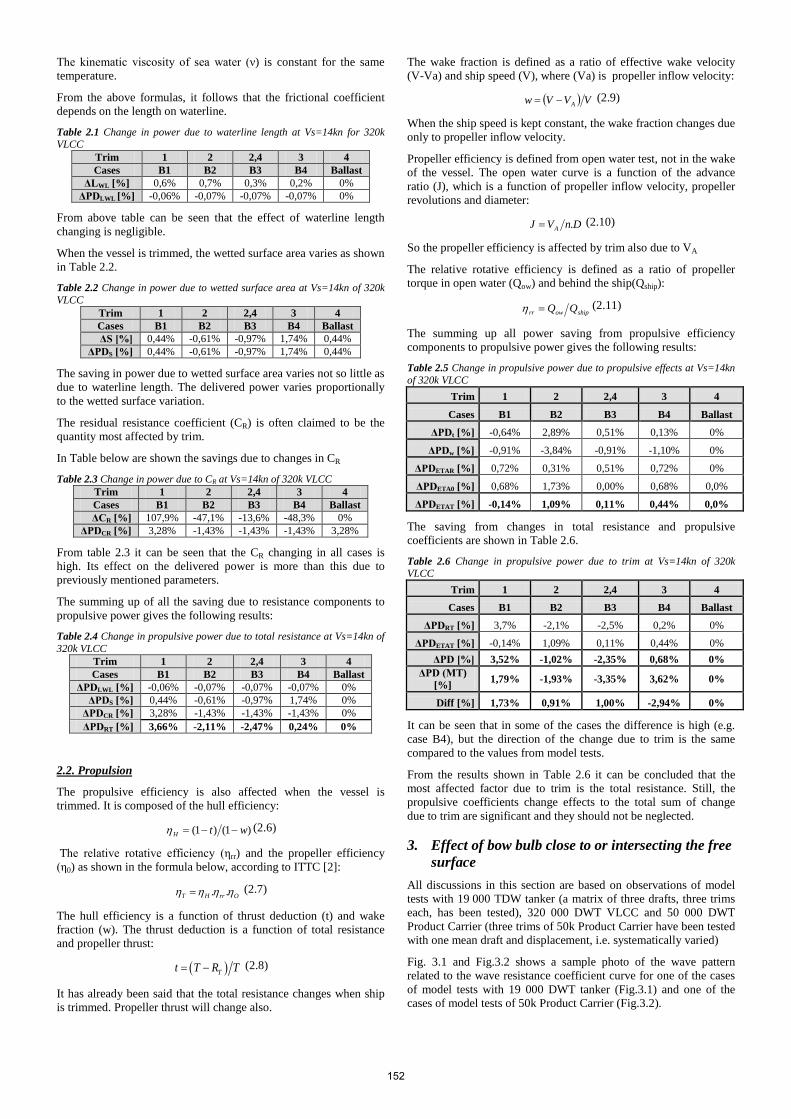
The kinematic viscosity of sea water (ν) is constant for the same temperature.
From the above formulas, it follows that the frictional coefficient depends on the length on waterline.
Table 2.1 Change in power due to waterline length at Vs=14kn for 320k VLCC
Trim 1 2 2,4 3 4 Cases B1 B2 B3 B4 Ballast
ΔLWL [%] 0,6% 0,7% 0,3% 0,2% 0% ΔPDLWL [%] -0,06% -0,07% -0,07% -0,07% 0%
From above table can be seen that the effect of waterline length changing is negligible.
When the vessel is trimmed, the wetted surface area varies as shown in Table 2.2.
Table 2.2 Change in power due to wetted surface area at Vs=14kn of 320k VLCC
Trim 1 2 2,4 3 4 Cases B1 B2 B3 B4 Ballast ΔS [%] 0,44% -0,61% -0,97% 1,74% 0,44%
ΔPDS [%] 0,44% -0,61% -0,97% 1,74% 0,44%
The saving in power due to wetted surface area varies not so little as due to waterline length. The delivered power varies proportionally to the wetted surface variation.
The residual resistance coefficient (CR) is often claimed to be the quantity most affected by trim.
In Table below are shown the savings due to changes in CR
Table 2.3 Change in power due to CR at Vs=14kn of 320k VLCC Trim 1 2 2,4 3 4 Cases B1 B2 B3 B4 Ballast ΔCR [%] 107,9% -47,1% -13,6% -48,3% 0%
ΔPDCR [%] 3,28% -1,43% -1,43% -1,43% 3,28%
From table 2.3 it can be seen that the CR changing in all cases is high. Its effect on the delivered power is more than this due to previously mentioned parameters.
The summing up of all the saving due to resistance components to propulsive power gives the following results:
Table 2.4 Change in propulsive power due to total resistance at Vs=14kn of 320k VLCC
Trim 1 2 2,4 3 4 Cases B1 B2 B3 B4 Ballast
ΔPDLWL [%] -0,06% -0,07% -0,07% -0,07% 0% ΔPDS [%] 0,44% -0,61% -0,97% 1,74% 0%
ΔPDCR [%] 3,28% -1,43% -1,43% -1,43% 0% ΔPDRT [%] 3,66% -2,11% -2,47% 0,24% 0%
2.2. Propulsion
The propulsive efficiency is also affected when the vessel is trimmed. It is composed of the hull efficiency:
)1()1( wtH −−=η (2.6)
The relative rotative efficiency (ηrr) and the propeller efficiency (η0) as shown in the formula below, according to ITTC [2]:
OrrHT ηηηη ..= (2.7)
The hull efficiency is a function of thrust deduction (t) and wake fraction (w). The thrust deduction is a function of total resistance and propeller thrust:
( )Tt T R T= − (2.8)
It has already been said that the total resistance changes when ship is trimmed. Propeller thrust will change also.
The wake fraction is defined as a ratio of effective wake velocity (V-Va) and ship speed (V), where (Va) is propeller inflow velocity:
( ) VVVw A−= (2.9)
When the ship speed is kept constant, the wake fraction changes due only to propeller inflow velocity.
Propeller efficiency is defined from open water test, not in the wake of the vessel. The open water curve is a function of the advance ratio (J), which is a function of propeller inflow velocity, propeller revolutions and diameter:
DnVJ A .= (2.10)
So the propeller efficiency is affected by trim also due to VA
The relative rotative efficiency is defined as a ratio of propeller torque in open water (Qow) and behind the ship(Qship):
shipowrr QQ=η (2.11)
The summing up all power saving from propulsive efficiency components to propulsive power gives the following results:
Table 2.5 Change in propulsive power due to propulsive effects at Vs=14kn of 320k VLCC
Trim 1 2 2,4 3 4
Cases B1 B2 B3 B4 Ballast
ΔPDt [%] -0,64% 2,89% 0,51% 0,13% 0%
ΔPDw [%] -0,91% -3,84% -0,91% -1,10% 0%
ΔPDETAR [%] 0,72% 0,31% 0,51% 0,72% 0%
ΔPDETA0 [%] 0,68% 1,73% 0,00% 0,68% 0,0%
ΔPDETAT [%] -0,14% 1,09% 0,11% 0,44% 0,0%
The saving from changes in total resistance and propulsive coefficients are shown in Table 2.6.
Table 2.6 Change in propulsive power due to trim at Vs=14kn of 320k VLCC
Trim 1 2 2,4 3 4
Cases B1 B2 B3 B4 Ballast
ΔPDRT [%] 3,7% -2,1% -2,5% 0,2% 0%
ΔPDETAT [%] -0,14% 1,09% 0,11% 0,44% 0% ΔPD [%] 3,52% -1,02% -2,35% 0,68% 0%
ΔPD (MT) [%] 1,79% -1,93% -3,35% 3,62% 0%
Diff [%] 1,73% 0,91% 1,00% -2,94% 0%
It can be seen that in some of the cases the difference is high (e.g. case B4), but the direction of the change due to trim is the same compared to the values from model tests.
From the results shown in Table 2.6 it can be concluded that the most affected factor due to trim is the total resistance. Still, the propulsive coefficients change effects to the total sum of change due to trim are significant and they should not be neglected. 3. Effect of bow bulb close to or intersecting the free
surface All discussions in this section are based on observations of model tests with 19 000 TDW tanker (a matrix of three drafts, three trims each, has been tested), 320 000 DWT VLCC and 50 000 DWT Product Carrier (three trims of 50k Product Carrier have been tested with one mean draft and displacement, i.e. systematically varied)
Fig. 3.1 and Fig.3.2 shows a sample photo of the wave pattern related to the wave resistance coefficient curve for one of the cases of model tests with 19 000 DWT tanker (Fig.3.1) and one of the cases of model tests of 50k Product Carrier (Fig.3.2).
152
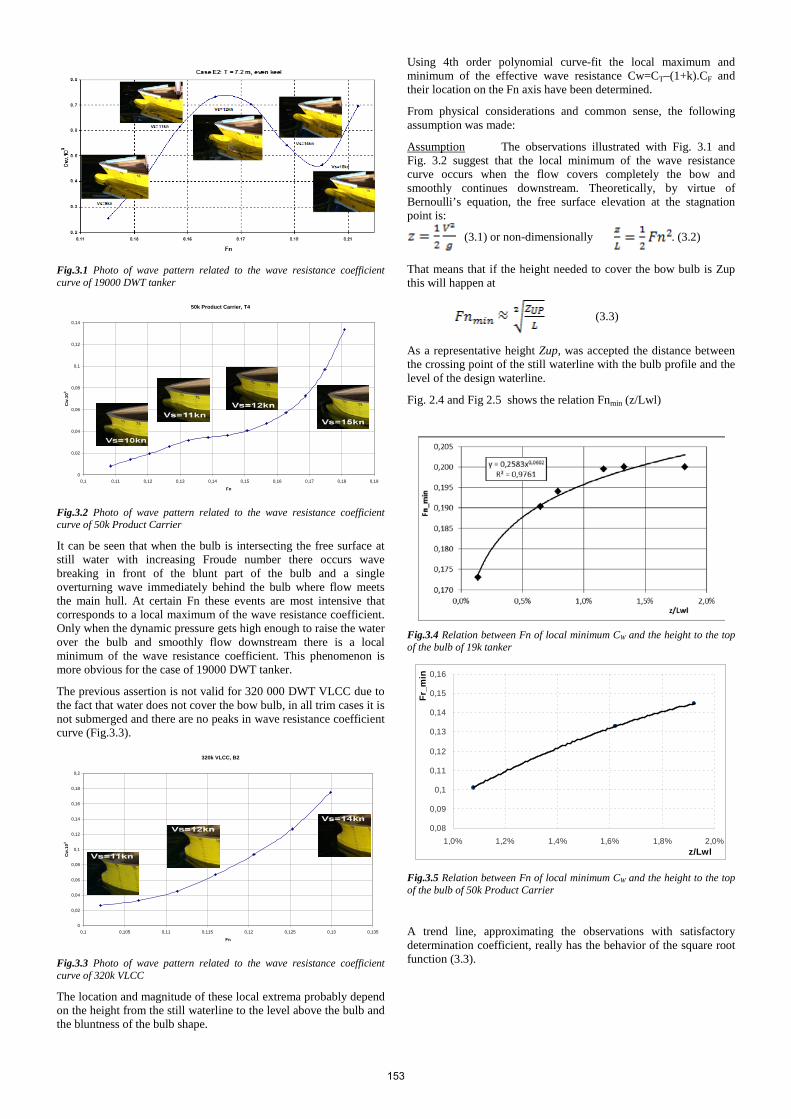
Fig.3.1 Photo of wave pattern related to the wave resistance coefficient curve of 19000 DWT tanker
50k Product Carrier, T4
0
0,02
0,04
0,06
0,08
0,1
0,12
0,14
0,1 0,11 0,12 0,13 0,14 0,15 0,16 0,17 0,18 0,19
Fn
Cw
.103
Fig.3.2 Photo of wave pattern related to the wave resistance coefficient curve of 50k Product Carrier
It can be seen that when the bulb is intersecting the free surface at still water with increasing Froude number there occurs wave breaking in front of the blunt part of the bulb and a single overturning wave immediately behind the bulb where flow meets the main hull. At certain Fn these events are most intensive that corresponds to a local maximum of the wave resistance coefficient. Only when the dynamic pressure gets high enough to raise the water over the bulb and smoothly flow downstream there is a local minimum of the wave resistance coefficient. This phenomenon is more obvious for the case of 19000 DWT tanker.
The previous assertion is not valid for 320 000 DWT VLCC due to the fact that water does not cover the bow bulb, in all trim cases it is not submerged and there are no peaks in wave resistance coefficient curve (Fig.3.3).
320k VLCC, B2
0
0,02
0,04
0,06
0,08
0,1
0,12
0,14
0,16
0,18
0,2
0,1 0,105 0,11 0,115 0,12 0,125 0,13 0,135
Fn
Cw
.103
Fig.3.3 Photo of wave pattern related to the wave resistance coefficient curve of 320k VLCC
The location and magnitude of these local extrema probably depend on the height from the still waterline to the level above the bulb and the bluntness of the bulb shape.
Using 4th order polynomial curve-fit the local maximum and minimum of the effective wave resistance Cw=CT–(1+k).CF and their location on the Fn axis have been determined.
From physical considerations and common sense, the following assumption was made:
Assumption The observations illustrated with Fig. 3.1 and Fig. 3.2 suggest that the local minimum of the wave resistance curve occurs when the flow covers completely the bow and smoothly continues downstream. Theoretically, by virtue of Bernoulli’s equation, the free surface elevation at the stagnation point is:
(3.1) or non-dimensionally . (3.2)
That means that if the height needed to cover the bow bulb is Zup this will happen at
(3.3)
As a representative height Zup, was accepted the distance between the crossing point of the still waterline with the bulb profile and the level of the design waterline.
Fig. 2.4 and Fig 2.5 shows the relation Fnmin (z/Lwl)
Fig.3.4 Relation between Fn of local minimum CW and the height to the top of the bulb of 19k tanker
0,08
0,09
0,1
0,11
0,12
0,13
0,14
0,15
0,16
1,0% 1,2% 1,4% 1,6% 1,8% 2,0%z/Lwl
Fr_m
in
Fig.3.5 Relation between Fn of local minimum CW and the height to the top of the bulb of 50k Product Carrier
A trend line, approximating the observations with satisfactory determination coefficient, really has the behavior of the square root function (3.3).
153
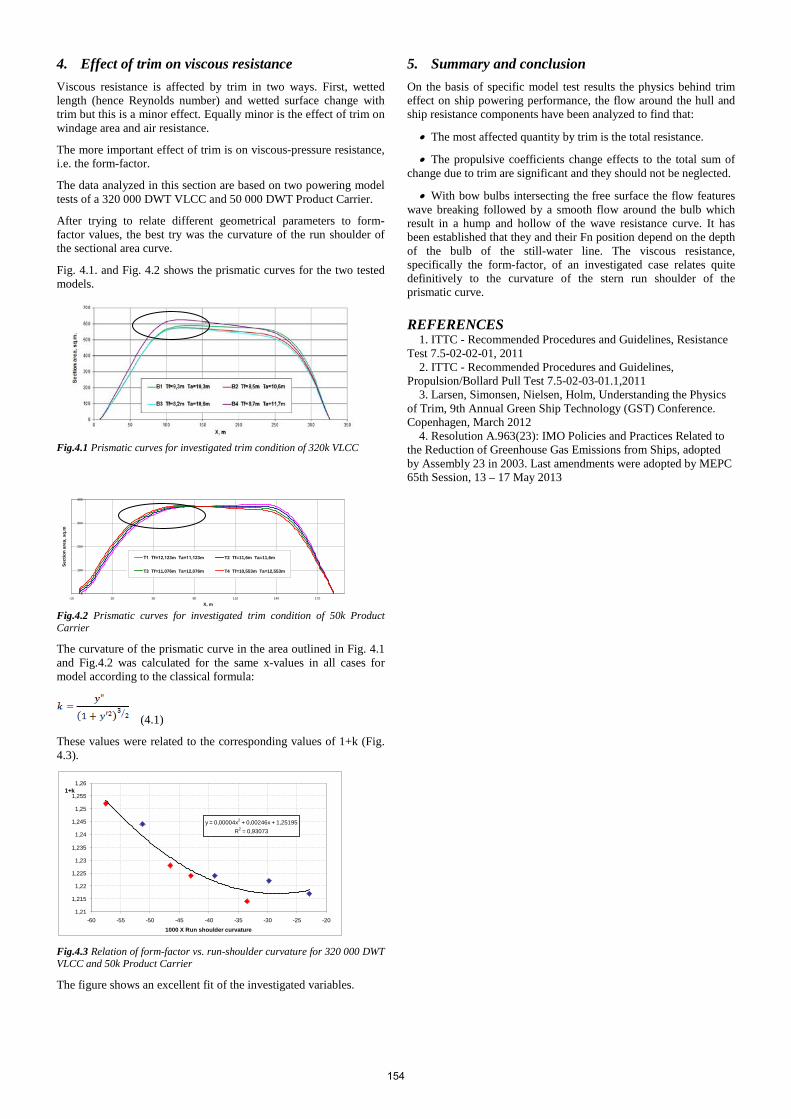
4. Effect of trim on viscous resistance Viscous resistance is affected by trim in two ways. First, wetted length (hence Reynolds number) and wetted surface change with trim but this is a minor effect. Equally minor is the effect of trim on windage area and air resistance.
The more important effect of trim is on viscous-pressure resistance, i.e. the form-factor.
The data analyzed in this section are based on two powering model tests of a 320 000 DWT VLCC and 50 000 DWT Product Carrier.
After trying to relate different geometrical parameters to form-factor values, the best try was the curvature of the run shoulder of the sectional area curve.
Fig. 4.1. and Fig. 4.2 shows the prismatic curves for the two tested models.
Fig.4.1 Prismatic curves for investigated trim condition of 320k VLCC
Fig.4.2 Prismatic curves for investigated trim condition of 50k Product Carrier
The curvature of the prismatic curve in the area outlined in Fig. 4.1 and Fig.4.2 was calculated for the same x-values in all cases for model according to the classical formula:
(4.1)
These values were related to the corresponding values of 1+k (Fig. 4.3).
y = 0,00004x2 + 0,00246x + 1,25195R2 = 0,93073
1,21
1,215
1,22
1,225
1,23
1,235
1,24
1,245
1,25
1,255
1,26
-60 -55 -50 -45 -40 -35 -30 -25 -201000 X Run shoulder curvature
1+k
Fig.4.3 Relation of form-factor vs. run-shoulder curvature for 320 000 DWT VLCC and 50k Product Carrier
The figure shows an excellent fit of the investigated variables.
5. Summary and conclusion On the basis of specific model test results the physics behind trim effect on ship powering performance, the flow around the hull and ship resistance components have been analyzed to find that:
• The most affected quantity by trim is the total resistance.
• The propulsive coefficients change effects to the total sum of change due to trim are significant and they should not be neglected.
• With bow bulbs intersecting the free surface the flow features wave breaking followed by a smooth flow around the bulb which result in a hump and hollow of the wave resistance curve. It has been established that they and their Fn position depend on the depth of the bulb of the still-water line. The viscous resistance, specifically the form-factor, of an investigated case relates quite definitively to the curvature of the stern run shoulder of the prismatic curve. REFERENCES
1. ITTC - Recommended Procedures and Guidelines, Resistance Test 7.5-02-02-01, 2011
2. ITTC - Recommended Procedures and Guidelines, Propulsion/Bollard Pull Test 7.5-02-03-01.1,2011
3. Larsen, Simonsen, Nielsen, Holm, Understanding the Physics of Trim, 9th Annual Green Ship Technology (GST) Conference. Copenhagen, March 2012
4. Resolution A.963(23): IMO Policies and Practices Related to the Reduction of Greenhouse Gas Emissions from Ships, adopted by Assembly 23 in 2003. Last amendments were adopted by MEPC 65th Session, 13 – 17 May 2013
0
100
200
300
400
-10 20 50 80 110 140 170
X, m
Sect
ion
area
, sq.
m
Т1 Tf=12,123m Ta=11,123m T2 Tf=11,6m Ta=11,6m
T3 Tf=11,076m Ta=12,076m T4 Tf=10,553m Ta=12,553m
154


