Embed Size (px)
Citation preview
Molecular Phylogeny of the Major Hylobatid Divisions
Molecular Phylogenetics and EvolutionVol. 19, No. 3, June, pp. 486–494, 2001doi:10.1006/mpev.2001.0939, available online at http://www.idealibrary.com on
Christian Roos* and Thomas Geissmann†
*AG Primatengenetik, Deutsches Primatenzentrum, Kellnerweg 4, 37077 Gottingen, Germany; and †Institut fur Zoologie,Tierarztliche Hochschule Hannover, Bunteweg 17, 30559 Hannover, Germany
Received October 17, 2000; revised January 8, 2001
based mainly on mitochondrial DNA sequences was
We describe DNA sequences for the mitochondrialcontrol region and phenylalanine-tRNA from the fourextant gibbon subgenera. In contrast to earlier studieson gibbon phylogeny that used other parts of themtDNA, the control region depicts the crested gibbons(Nomascus) as the most basal group of the Hylobati-dae, followed by Symphalangus, with Bunopithecusand Hylobates as the last to diverge. Our data showthat the molecular distances among the four gibbonsubgenera are in the same range as those betweenHomo and Pan, or even higher. As a consequence ofthese findings, we propose to raise all four gibbonsubgenera to genus rank. © 2001 Academic Press
Key Words: evolution; Hylobates; Bunopithecus;Symphalangus; Nomascus; genetics; DNA; mitochon-drial control region.
INTRODUCTION
Although the monophyly of the gibbons (family Hy-lobatidae) is widely accepted, this is not the case for thetaxonomy adopted within the family. In early studieson gibbon systematics, the Hylobatidae were groupedinto two distinct genera, including the siamang(Symphalangus) on the one hand and all the remaininggibbons (Hylobates) on the other (e.g., Napier andNapier, 1967; Schultz, 1933; Simonetta, 1957). Whengibbons were studied in more detail, however, it be-came clear that four, not two, major hylobatid divisionsneeded to be recognized. These groups are generallyaccepted now as four distinct subgenera (i.e., Sympha-langus, Nomascus, Bunopithecus, and Hylobates)(Geissmann, 1994, 1995; Marshall and Sugardjito,1986; Nowak, 1999; Prouty et al., 1983; Rowe, 1996).
The phylogenetic relationships among these fourmajor groups are still unknown. Most previous studieshave been based on morphology, vocalization, electro-phoretic protein evidence, and karotyping and havediffered in their conclusions (Bruce and Ayala, 1979;Creel and Preuschoft, 1984; Geissmann, 1993, 2001;Groves, 1972; Haimoff et al., 1982; Liu et al., 1987;Shafer, 1986). Even the use of molecular techniques
1055-7903/01 $35.00Copyright © 2001 by Academic PressAll rights of reproduction in any form reserved.
486
not able to resolve the evolutionary relationshipsamong the gibbon subgenera (Garza and Woodruff,1992; Hall et al., 1998; Hayashi et al., 1995; Zehr, 1999;Zhang, 1997). Furthermore, most molecular studiesdid not include the subgenus Bunopithecus and there-fore presented an incomplete view on gibbon evolution(Garza and Woodruff, 1992; Hayashi et al., 1995).
The mitochondrial control region is known to evolvefaster than other parts of mtDNA and may therefore bemore suited to resolve a radiation which evolved over ashort time span than sequences used in previous stud-ies (Garza and Woodruff, 1992; Hall et al., 1998; Ha-yashi et al., 1995; Zehr, 1999; Zhang, 1997). We havetherefore determined the DNA sequence of the com-plete mitochondrial control region and adjacent phe-nylalanine-tRNA (Phe-tRNA) of the four gibbon sub-genera with the intention of (1) resolving theevolutionary relationships between the subgenera and(2) comparing the distances between them with thosebetween the great ape genera Homo and Pan.
MATERIALS AND METHODS
Five gibbon species representing the four majorgroups within the Hylobatidae clade, Hylobates,Bunopithecus, Symphalangus, and Nomascus, werestudied. All study animals or their parents were iden-tified by us using fur coloration and vocal characteris-tics as described in Geissmann (1995).
Sequence Determination
DNA was extracted from periphereal blood lympho-cytes and hair samples (H. hoolock) by the standardmethods outlined in Sambrook et al. (1989) and Walshet al. (1991), respectively. The complete mitochondrialcontrol region and adjacent Phe-tRNA from one indi-vidual each of H. (Bunopithecus) hoolock, H. (Nomas-cus) leucogenys leucogenys, H. (Nomascus) gabriellae,and H. (Symphalangus) syndactylus and two individu-als of H. (Hylobates) lar were PCR-amplified (Saiki etal., 1988) with the oligonucleotide primers L16007 (59-CCCAAAGCTAAAATTCTAA-39) and H00651 (59-TA-ACTGCAGAAGGCTAGGACCAAACCT-39) according

to Kocher et al. (1989), with H and L designating the
(qtdqqN(cs
tained with the PUZZLE software (Strimmer and von
487MOLECULAR PHYLOGENY OF THE GIBBONS
heavy- and light-strand sequences of the mitochondrialgenome and the numbers indicating the 39 end of theprimers according to the human reference sequence(Anderson et al., 1981). The amplifications were carriedout for 35 cycles. Each cycle consisted of a 40-s dena-turation at 92°C, 40 s at 50°C for annealing, and 90 s at72°C for extension.
The resulting PCR products were separated on 1%agarose gels and visualized by ethidium bromide stain-ing.
The fragments of a size of about 1.2 kb were excisedfrom the gel and the DNA was extracted with theQiagen Gel Extraction Kit.
Direct sequencing reactions were performed with thesame primers as indicated above with the Big DyeTerminator Cycle Sequencing Kit (Perkin–Elmer) fol-lowing the manufacturer’s recommendations. All se-quencing reactions were run on an automated ABI377sequencer (Perkin–Elmer). The sequences determinedand details of the individuals in the study presentedherein are available in GenBank under the AccessionNos. AF193804 and AF311721–AF311725.
Sequence Comparisons
Considering the fast pace of sequence evolution per-taining to the mitochondrial control region, only greatape sequences were taken into account for the se-quence comparisons and phylogenetic analyses. Thegorilla (Gorilla gorilla, NC001645) and orang-utanPongo pygmaeus, NC001646) (Horai et al., 1995) se-uences were excluded from the analyses since both ofhe sequences exhibit a major deletion in the mitochon-rial control region. Thus, the herein determined se-uences were compared with the homologous se-uences obtained from human (Homo sapiens,C001807) (Anderson et al., 1981), pygmy chimpanzee
Pan paniscus, NC001644) (Horai et al., 1995), andommon chimpanzee (Pan troglodytes, X93335) (Arna-on et al., 1996).The sequences were aligned with the Clustal W pro-
gram, version 1.7 (Thompson et al., 1994), with a gap-opening penalty of 10.00 and a gap-extension penaltyof 0.05. The alignments obtained in this way wereafterward optimized manually. To remove poorlyaligned positions and regions with a too-high diver-gence we applied the Gblocks software (Castresana,2000) on the Clustal W-generated alignment. There-fore, default settings for both protein and rDNA align-ments were applied.
Distance Calculations
Distances between taxa were estimated by two mea-sures of sequence divergence in the Gblocks alignment.First, the observed proportion of base differences be-tween taxa was calculated by SeqPup (version 0.7).Second, a maximum-likelihood (ML) estimate was ob-
Haeseler, 1996) with estimated base frequencies andtransition:transversion ratios.
Phylogenetic Analyses
A priori tests of the data for the presence of a phy-logenetic signal were carried out with the likelihood-mapping option included in PUZZLE. Phylogenetictrees were constructed based on three algorithms:maximum-parsimony (MP) (Fitch, 1971) and neighbor-joining (NJ) (Saitou and Nei, 1987), included inPHYLIP, version 3.5c (Felsenstein, 1993) and maxi-mum-likelihood as implemented in PUZZLE, version4.0.2 (Strimmer and von Haeseler, 1996).
Distance corrections for the NJ analysis were carriedout with the ML distance correction and transition:transversion ratios as estimated in PUZZLE. For MLreconstructions the HKY (Hasegawa et al., 1985) andthe TN (Tamura and Nei, 1993) models both assuminguniform rate of sequence evolution and rate heterogen-ity across sites, were used.
Support of internal branch length was either deter-mined by bootstrap analyses (MP and NJ) performedwith 1000 replications or indicated by the ML quartetpuzzling support values (1000 puzzling steps). The50%-majority rule consensus trees were calculatedwith CONSENSE of the PHYLIP package. To checkthe significance of the differences between the log like-lihoods of alternative trees we used the Kishino–Hase-gawa test in PUZZLE giving alternative intrees andmanually calculated the significance level of each tree.
RESULTS
The lengths of the mitochondrial control regions are1028 bp (H. lar 1 and H. tar 2), 1059 bp (H. hoolock),1064 bp (H. syndactylus), 1011 bp (H. gabriellae), and1031 bp (H. leucogenys).
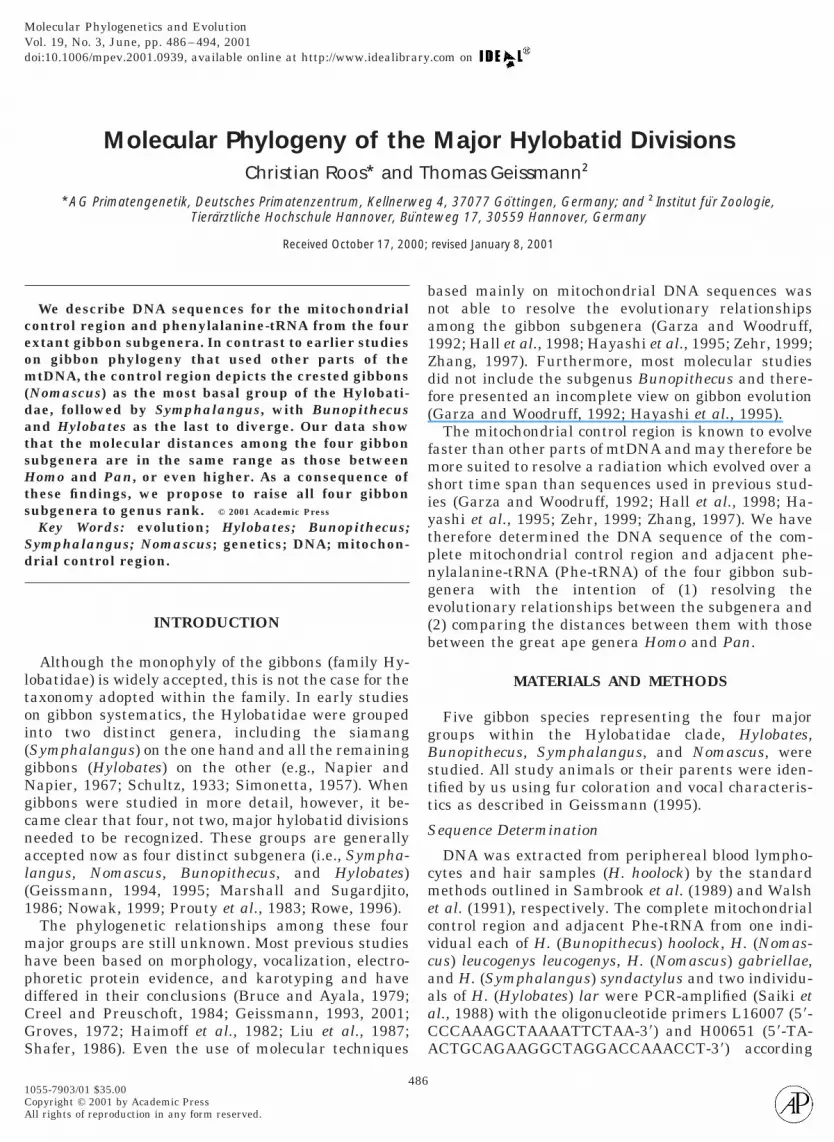
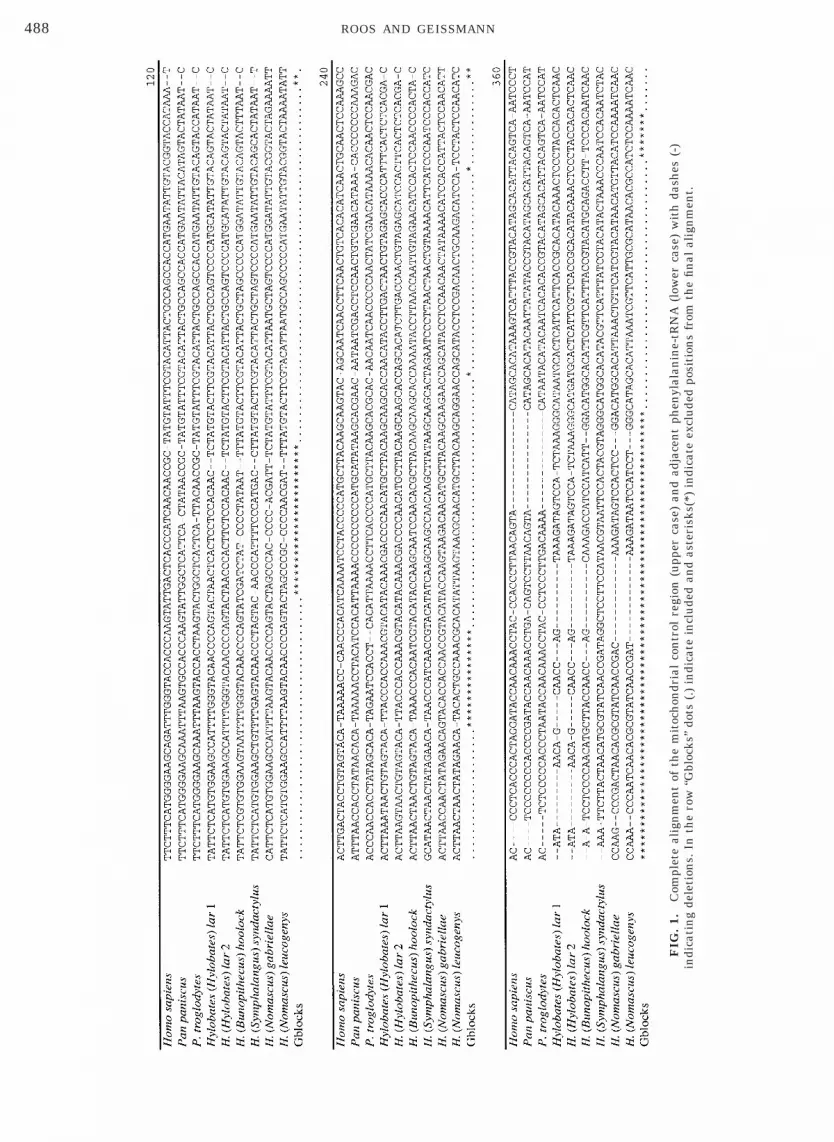
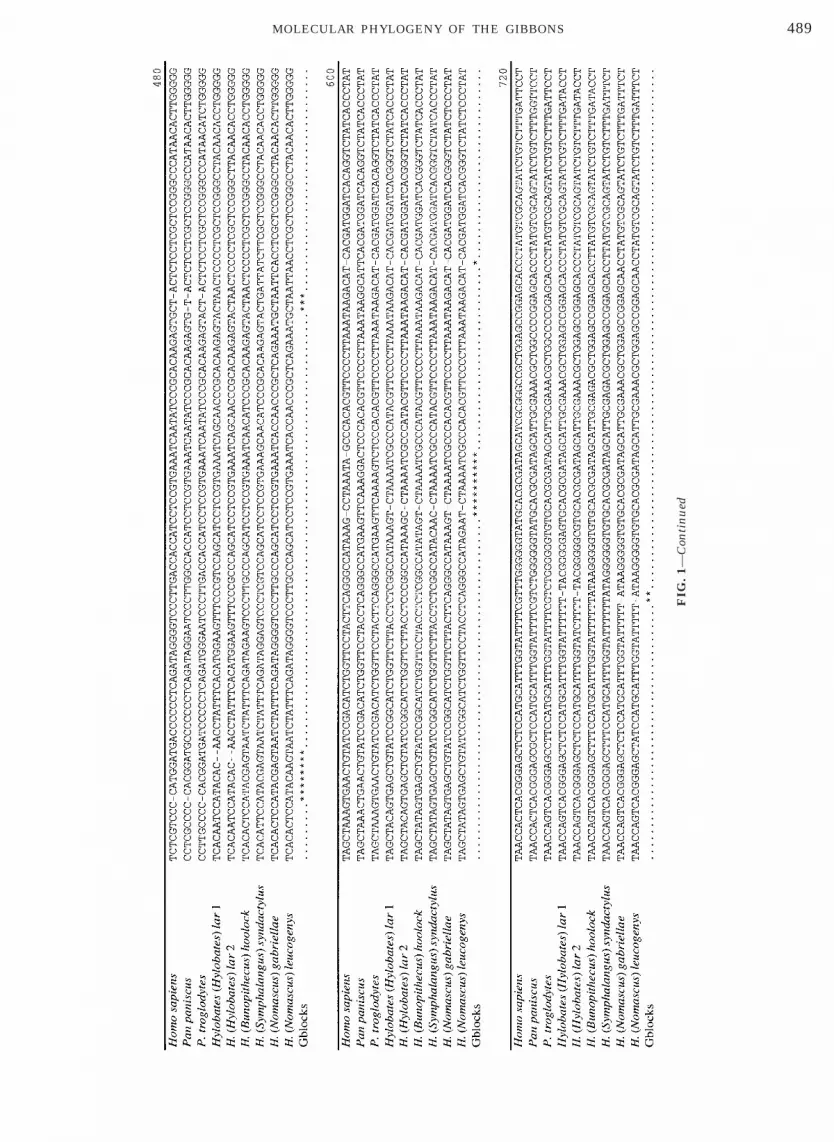
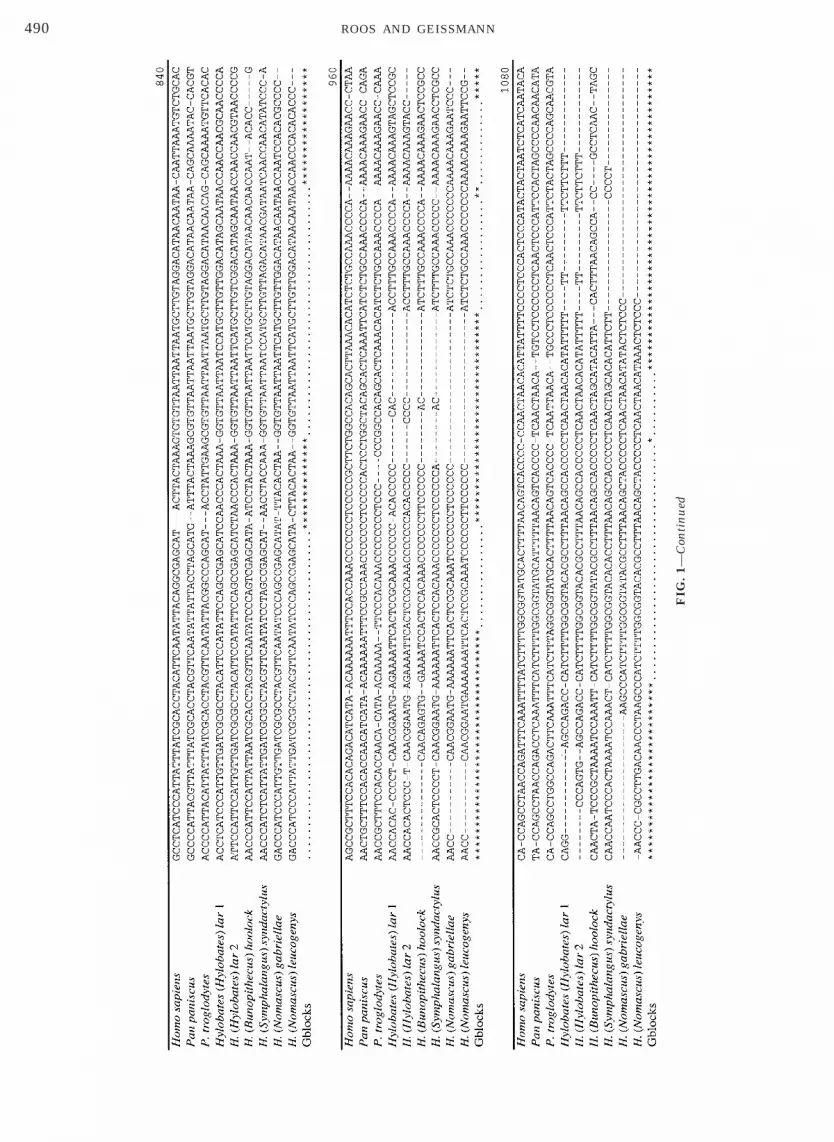
To determine the phylogenetic affiliations among thegibbon subgenera and the hominids, sequences of allthe gibbons, human, and common and pygmy chimpan-zees were aligned. The complete alignment of the con-trol region and adjacent Phe-tRNA generated byClustal W is 1238 bp in length. After the exclusion ofgaps and poorly aligned positions by Gblocks with themore stringent defaults for proteins aligments, the fi-nal alignment was 857 bp in length with 574 (67%)constant sites (Fig. 1).
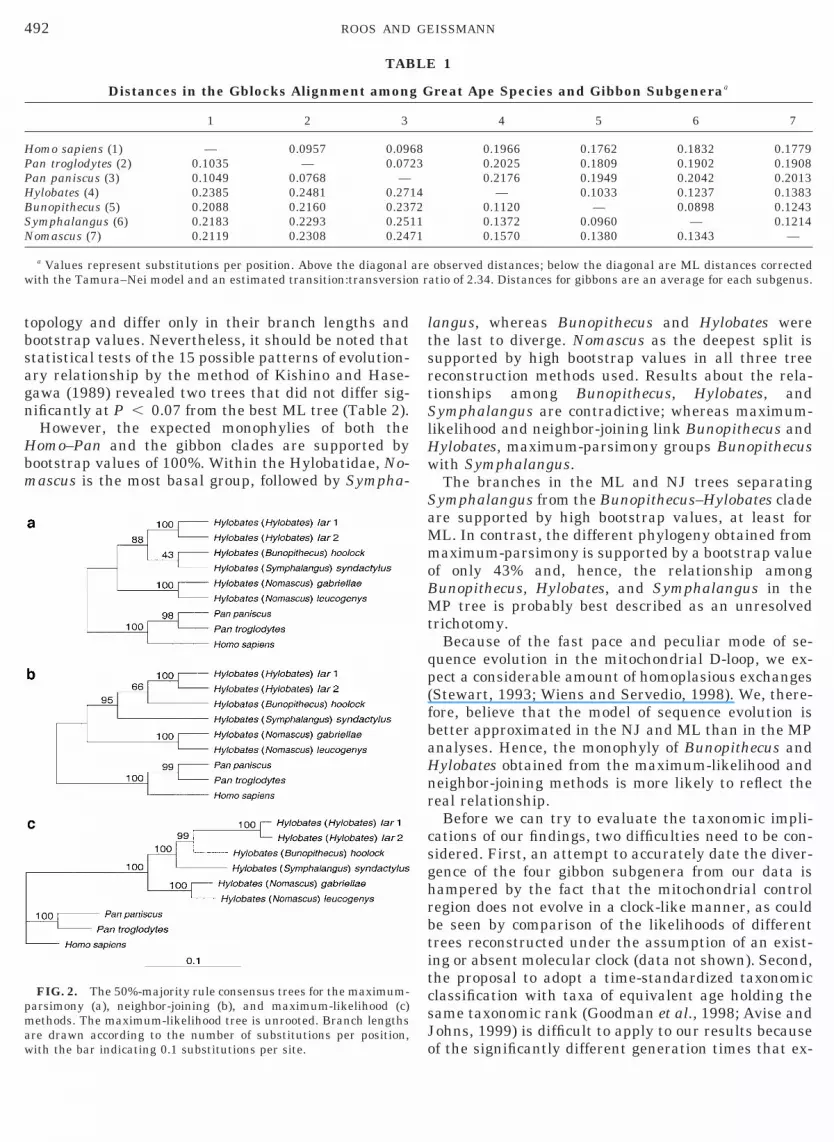
The observed base differences between the four gib-bon subgenera in the Gblocks alignment range from8.98 to 13.83% and from 9.57 to 9.68% between Panand Homo (Table 1).
Initially we checked for the presence of a phyloge-netic signal by conducting a likelihood-mapping anal-ysis as implemented in PUZZLE. A starlike evolutionwas excluded by a strong phylogenetic signal indicat-
FIG
.1.
Com
plet
eal
ign
men
tof
the
mit
och
ondr
ial
con
trol
regi
on(u
pper
case
)an
dad
jace
nt
phen
ylal
anin
e-tR
NA
(low
erca
se)
wit
hda
shes
(-)
indi
cati
ng
dele
tion
s.In
the
row
“Gbl
ocks
”do
ts(.
)in
dica
tein
clu
ded
and
aste
risk
s(*)
indi
cate
excl
ude
dpo
siti
ons
from
the
fin
alal
ign
men
t.
488 ROOS AND GEISSMANN
FIG
.1—
Con
tin
ued
489MOLECULAR PHYLOGENY OF THE GIBBONS
FIG
.1—
Con
tin
ued
490 ROOS AND GEISSMANN

ing the suitability of the data for phylogenetic recon-
bNiMrsrawwwaBtl6lp
asar
atTssaIhmqtd
ltapgEGr
FIG
.1—
Con
tin
ued
491MOLECULAR PHYLOGENY OF THE GIBBONS
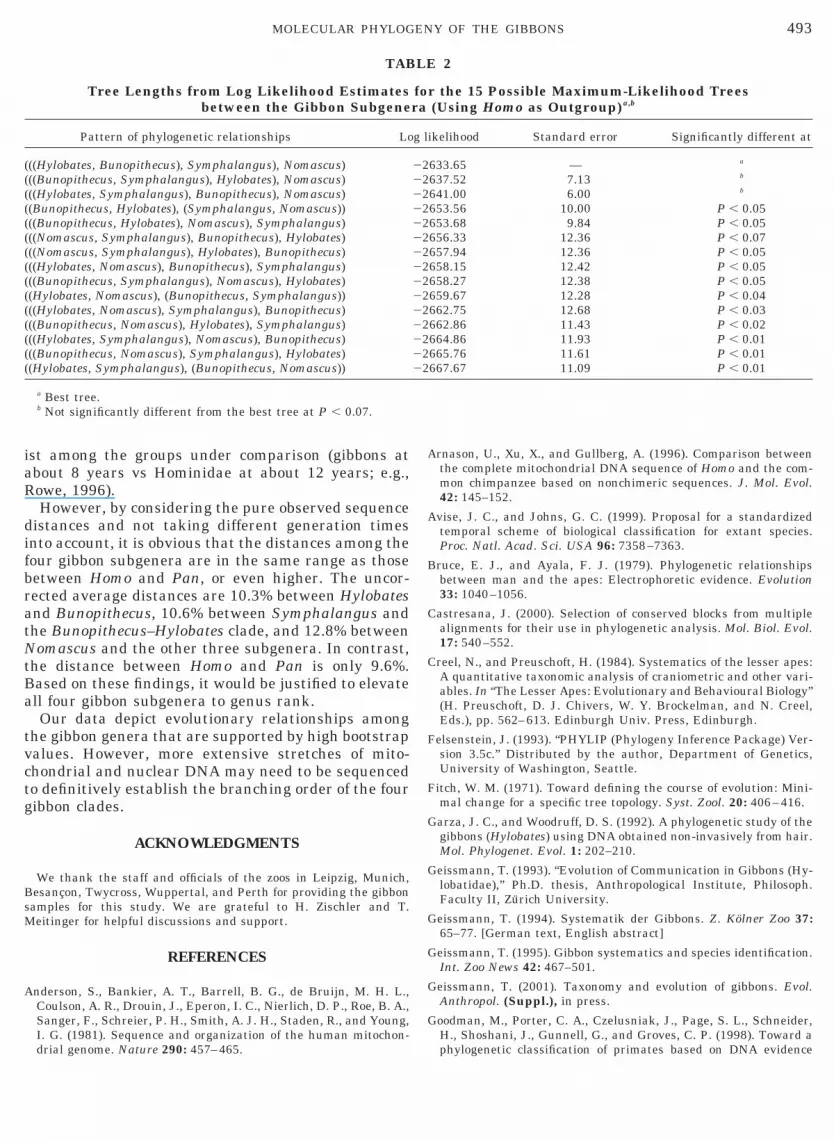
structions.Tree reconstructions were carried out by the maxi-
mum-parsimony, neighbor-joining, and maximum-likelihood methods (Fig. 2). All three algorithms sepa-rate the Homo–Pan clade from the Hylobatidae with abootstrap value of 100%. Within each of the subgeneraHylobates and Nomascus, two representatives were an-alyzed. H. lar 1 and H. lar 2, which represent Hylo-ates, form a sister clade, as do the representatives ofomascus, H. gabriellae and H. leucogenys. Each clade
s supported by bootstrap values of 100% (for the ML,P, and NJ methods). Furthermore, all three algo-
ithms display Nomascus as the deepest split, with aupport of 100, 95, and 88% for ML, NJ, and MP trees,espectively. Discordant phylogenetic relationshipsmong Hylobates, Bunopithecus, and Symphalangusere obtained by the three applied algorithms:hereas maximum-parsimony links Bunopithecusith Symphalangus as sister taxa, neighbor-joiningnd maximum-likelihood result in a monophyly ofunopithecus and Hylobates. Bootstrap values for
hese relationships obtained from the maximum-like-ihood and neighbor-joining algorithms are 99 and6%, respectively, whereas the Bunopithecus–Sympha-angus clade displayed by maximum-parsimony is sup-orted by a bootstrap value of only 43%.To determine the log likelihood differences between
lternative ML trees with one representative of eachubgenus, the 15 possible patterns of relationshipmong the subgenera were tested. The log likelihoodanged from 22633.65 to 22667.67 (Table 2).The above-described trees are based on the Gblocks
lignment with defaults for protein alignments, and inhe case of maximum-likelihood they are based on theN model, with the assumption of uniform rate ofequence evolution. Furthermore, trees were recon-tructed with all three algorithms with a Gblockslignment generated with less stringent parameters.n addition to the described ML tree, maximum-likeli-ood reconstructions were carried out with the HKYodel with the assumptions of uniform rate of se-
uence evolution and rate heterogenity across sites. Allhese alternative trees revealed the same topology andiffered only by branch lengths and bootstrap values.
DISCUSSION
Previous molecular studies failed to resolve the re-ationships among the four gibbon subgenera. In con-rast, sequences of the mitochondrial control regionnd adjacent Phe-tRNA represented in our study de-ict evolutionary relationships among the gibbon sub-enera that are supported by high bootstrap values.ven if trees are reconstructed with other models or ablocks alignment obtained from less stringent pa-
ameters, the resulting trees always show the same
Hw
SaMmoBMt
qp(fbaHnr
csghrbtitcsJo
TABLE 1
w
492 ROOS AND GEISSMANN
topology and differ only in their branch lengths andbootstrap values. Nevertheless, it should be noted thatstatistical tests of the 15 possible patterns of evolution-ary relationship by the method of Kishino and Hase-gawa (1989) revealed two trees that did not differ sig-nificantly at P , 0.07 from the best ML tree (Table 2).
However, the expected monophylies of both theHomo–Pan and the gibbon clades are supported bybootstrap values of 100%. Within the Hylobatidae, No-mascus is the most basal group, followed by Sympha-
Distances in the Gblocks Alignment amon
1 2 3
Homo sapiens (1) — 0.0957 0.09Pan troglodytes (2) 0.1035 — 0.07Pan paniscus (3) 0.1049 0.0768 —Hylobates (4) 0.2385 0.2481 0.27Bunopithecus (5) 0.2088 0.2160 0.23Symphalangus (6) 0.2183 0.2293 0.25Nomascus (7) 0.2119 0.2308 0.24
a Values represent substitutions per position. Above the diagonalith the Tamura–Nei model and an estimated transition:transversio
FIG. 2. The 50%-majority rule consensus trees for the maximum-parsimony (a), neighbor-joining (b), and maximum-likelihood (c)methods. The maximum-likelihood tree is unrooted. Branch lengthsare drawn according to the number of substitutions per position,with the bar indicating 0.1 substitutions per site.
langus, whereas Bunopithecus and Hylobates werethe last to diverge. Nomascus as the deepest split issupported by high bootstrap values in all three treereconstruction methods used. Results about the rela-tionships among Bunopithecus, Hylobates, andSymphalangus are contradictive; whereas maximum-likelihood and neighbor-joining link Bunopithecus and
ylobates, maximum-parsimony groups Bunopithecusith Symphalangus.The branches in the ML and NJ trees separating
ymphalangus from the Bunopithecus–Hylobates cladere supported by high bootstrap values, at least forL. In contrast, the different phylogeny obtained fromaximum-parsimony is supported by a bootstrap value
f only 43% and, hence, the relationship amongunopithecus, Hylobates, and Symphalangus in theP tree is probably best described as an unresolved
richotomy.Because of the fast pace and peculiar mode of se-
uence evolution in the mitochondrial D-loop, we ex-ect a considerable amount of homoplasious exchangesStewart, 1993; Wiens and Servedio, 1998). We, there-ore, believe that the model of sequence evolution isetter approximated in the NJ and ML than in the MPnalyses. Hence, the monophyly of Bunopithecus andylobates obtained from the maximum-likelihood andeighbor-joining methods is more likely to reflect theeal relationship.Before we can try to evaluate the taxonomic impli-
ations of our findings, two difficulties need to be con-idered. First, an attempt to accurately date the diver-ence of the four gibbon subgenera from our data isampered by the fact that the mitochondrial controlegion does not evolve in a clock-like manner, as coulde seen by comparison of the likelihoods of differentrees reconstructed under the assumption of an exist-ng or absent molecular clock (data not shown). Second,he proposal to adopt a time-standardized taxonomiclassification with taxa of equivalent age holding theame taxonomic rank (Goodman et al., 1998; Avise andohns, 1999) is difficult to apply to our results becausef the significantly different generation times that ex-
reat Ape Species and Gibbon Subgeneraa
4 5 6 7
0.1966 0.1762 0.1832 0.17790.2025 0.1809 0.1902 0.19080.2176 0.1949 0.2042 0.2013
— 0.1033 0.1237 0.13830.1120 — 0.0898 0.12430.1372 0.0960 — 0.12140.1570 0.1380 0.1343 —
observed distances; below the diagonal are ML distances correctedatio of 2.34. Distances for gibbons are an average for each subgenus.
g G
6823
14721171
aren r
ratNtBa
tvctg
B
C
C
F
F
G
G
G
G
G
G
TABLE 2
493MOLECULAR PHYLOGENY OF THE GIBBONS
ist among the groups under comparison (gibbons atabout 8 years vs Hominidae at about 12 years; e.g.,Rowe, 1996).
However, by considering the pure observed sequencedistances and not taking different generation timesinto account, it is obvious that the distances among thefour gibbon subgenera are in the same range as thosebetween Homo and Pan, or even higher. The uncor-ected average distances are 10.3% between Hylobatesnd Bunopithecus, 10.6% between Symphalangus andhe Bunopithecus–Hylobates clade, and 12.8% betweenomascus and the other three subgenera. In contrast,
he distance between Homo and Pan is only 9.6%.ased on these findings, it would be justified to elevatell four gibbon subgenera to genus rank.Our data depict evolutionary relationships among
he gibbon genera that are supported by high bootstrapalues. However, more extensive stretches of mito-hondrial and nuclear DNA may need to be sequencedo definitively establish the branching order of the fouribbon clades.
ACKNOWLEDGMENTS
We thank the staff and officials of the zoos in Leipzig, Munich,Besancon, Twycross, Wuppertal, and Perth for providing the gibbonsamples for this study. We are grateful to H. Zischler and T.Meitinger for helpful discussions and support.
REFERENCES
Anderson, S., Bankier, A. T., Barrell, B. G., de Bruijn, M. H. L.,Coulson, A. R., Drouin, J., Eperon, I. C., Nierlich, D. P., Roe, B. A.,Sanger, F., Schreier, P. H., Smith, A. J. H., Staden, R., and Young,I. G. (1981). Sequence and organization of the human mitochon-drial genome. Nature 290: 457–465.
Tree Lengths from Log Likelihood Estimatesbetween the Gibbon Subgene
Pattern of phylogenetic relationships Lo
(((Hylobates, Bunopithecus), Symphalangus), Nomascus)(((Bunopithecus, Symphalangus), Hylobates), Nomascus)(((Hylobates, Symphalangus), Bunopithecus), Nomascus)((Bunopithecus, Hylobates), (Symphalangus, Nomascus))(((Bunopithecus, Hylobates), Nomascus), Symphalangus)(((Nomascus, Symphalangus), Bunopithecus), Hylobates)(((Nomascus, Symphalangus), Hylobates), Bunopithecus)(((Hylobates, Nomascus), Bunopithecus), Symphalangus)(((Bunopithecus, Symphalangus), Nomascus), Hylobates)((Hylobates, Nomascus), (Bunopithecus, Symphalangus))(((Hylobates, Nomascus), Symphalangus), Bunopithecus)(((Bunopithecus, Nomascus), Hylobates), Symphalangus)(((Hylobates, Symphalangus), Nomascus), Bunopithecus)(((Bunopithecus, Nomascus), Symphalangus), Hylobates)((Hylobates, Symphalangus), (Bunopithecus, Nomascus))
a Best tree.b Not significantly different from the best tree at P , 0.07.
Arnason, U., Xu, X., and Gullberg, A. (1996). Comparison betweenthe complete mitochondrial DNA sequence of Homo and the com-mon chimpanzee based on nonchimeric sequences. J. Mol. Evol.42: 145–152.
Avise, J. C., and Johns, G. C. (1999). Proposal for a standardizedtemporal scheme of biological classification for extant species.Proc. Natl. Acad. Sci. USA 96: 7358–7363.
ruce, E. J., and Ayala, F. J. (1979). Phylogenetic relationshipsbetween man and the apes: Electrophoretic evidence. Evolution33: 1040–1056.
astresana, J. (2000). Selection of conserved blocks from multiplealignments for their use in phylogenetic analysis. Mol. Biol. Evol.17: 540–552.
reel, N., and Preuschoft, H. (1984). Systematics of the lesser apes:A quantitative taxonomic analysis of craniometric and other vari-ables. In “The Lesser Apes: Evolutionary and Behavioural Biology”(H. Preuschoft, D. J. Chivers, W. Y. Brockelman, and N. Creel,Eds.), pp. 562–613. Edinburgh Univ. Press, Edinburgh.
elsenstein, J. (1993). “PHYLIP (Phylogeny Inference Package) Ver-sion 3.5c.” Distributed by the author, Department of Genetics,University of Washington, Seattle.
itch, W. M. (1971). Toward defining the course of evolution: Mini-mal change for a specific tree topology. Syst. Zool. 20: 406–416.
arza, J. C., and Woodruff, D. S. (1992). A phylogenetic study of thegibbons (Hylobates) using DNA obtained non-invasively from hair.Mol. Phylogenet. Evol. 1: 202–210.
eissmann, T. (1993). “Evolution of Communication in Gibbons (Hy-lobatidae),” Ph.D. thesis, Anthropological Institute, Philosoph.Faculty II, Zurich University.
eissmann, T. (1994). Systematik der Gibbons. Z. Kolner Zoo 37:65–77. [German text, English abstract]
eissmann, T. (1995). Gibbon systematics and species identification.Int. Zoo News 42: 467–501.
eissmann, T. (2001). Taxonomy and evolution of gibbons. Evol.Anthropol. (Suppl.), in press.
oodman, M., Porter, C. A., Czelusniak, J., Page, S. L., Schneider,H., Shoshani, J., Gunnell, G., and Groves, C. P. (1998). Toward aphylogenetic classification of primates based on DNA evidence
r the 15 Possible Maximum-Likelihood Trees(Using Homo as Outgroup)a,b
ikelihood Standard error Significantly different at
633.65 — a
637.52 7.13 b
641.00 6.00 b
653.56 10.00 P , 0.05653.68 9.84 P , 0.05656.33 12.36 P , 0.07657.94 12.36 P , 0.05658.15 12.42 P , 0.05658.27 12.38 P , 0.05659.67 12.28 P , 0.04662.75 12.68 P , 0.03662.86 11.43 P , 0.02664.86 11.93 P , 0.01665.76 11.61 P , 0.01667.67 11.09 P , 0.01
fora
g l
222222222222222222222222222222

complemented by fossil evidence. Mol. Phylogenet. Evol. 9: 585–598.
H
K
K
L
M
N
N
P
Rowe, N. (1996). “The Pictorial Guide to the Living Primates,” Pogo-nias Press, East Hampton, NY.
S
S
S
S
S
S
S
S
T
T
W
W
Z
Z
494 ROOS AND GEISSMANN
Groves, C. P. (1972). Systematics and phylogeny of gibbons. In “Gib-bon and Siamang” (D. M. Rumbaugh, Ed.), Vol. 1, pp. 1–89.Karger, Basel.
Haimoff, E. H., Chivers, D. J., Gittins, S. P., and Whitten, A. J.(1982). A phylogeny of gibbons (Hylobates spp.) based on morpho-logical and behavioural characters. Folia Primatol. 39: 213–237.
Hall, L. M., Jones, D. S., and Wood, B. A. (1998). Evolution of thegibbon subgenera inferred from cytochrome b DNA sequence data.Mol. Phylogenet. Evol. 10: 281–286.
Hasegawa, M., Kishino, H., and Yano, T. (1985). Dating of the hu-man–ape splitting by a molecular clock of mitochondrial DNA. J.Mol. Evol. 22: 160–174.
Hayashi, S., Hayasaka, K., Takenaka, O., and Horai, S. (1995).Molecular phylogeny of gibbons inferred from mitochondrial DNAsequences: Preliminary report. J. Mol. Evol. 41: 359–365.
orai, S., Hayasaka, K., Kondo, R., Tsugane, K., and Takahata, N.(1995). Recent African origin of modern humans revealed by com-plete sequences of hominoid mitochondrial DNAs. Proc. Natl.Acad. Sci. USA 92: 532–536.
ishino, H., and Hasegawa, M. (1989). Evaluation of the maximumlikelihood estimate of the evolutionary tree topologies from DNAsequence data, and the branching order of Hominoidea. J. Mol.Evol. 29: 170–179.
ocher, T. D., Thomas, W. K., Meyer, A., Edwards, S. V., Paabo, S.,Villablanca, F. X., and Wilson, A. C. (1989). Dynamics of mitochon-drial DNA evolution in animals: Amplification and sequencingwith conserved primers. Proc. Natl. Acad. Sci. USA 86: 6196–6200.
iu, R., Shi, L., and Chen, Y. (1987). [A study on the chromosomes ofwhite-browed gibbon (Hylobates hoolock leuconedys)]. Acta The-riol. Sinica 7: 1–7. [Chinese text, English summary]
arshall, J. T., and Sugardjito, J. (1986). Gibbon systematics. In“Comparative Primate Biology,” Vol. 1: “Systematics, Evolution,and Anatomy” (D. R. Swindler and J. Erwin, Eds.), pp. 137–185. R.Liss, New York.
apier, J. R., and Napier, P. H. (1967). “A Handbook of LivingPrimates,” Academic Press, London.
ovak, M. (1999). “Walker’s Primates of the World,” Johns HopkinsPress, Baltimore.
routy, L. A., Buchanan, P. D., Pollitzer, W. S., and Mootnick, A. R.(1983). Bunopithecus: A genus-level taxon for the hoolock gibbon(Hylobates hoolock). Am. J. Primatol. 5: 83–87.
aiki, R. K., Gelfand, D. H., Stoffel, S., Scharf, S. J., Higuchi, R.,Horn, G. T., Mullis, K. B., and Erlich, H. A. (1988). Primer-directedenzymatic amplification of DNA with a thermostable DNA poly-merase. Science 239: 487–491.
aitou, N., and Nei, M. (1987). The neighbor-joining method: A newmethod of reconstructing phylogenetic trees. Mol. Biol. Evol. 4:406–425.
ambrook, J., Fritch, E. F., and Maniatis, T. (1989). “MolecularCloning: A Laboratory Manual” Cold Spring Harbor LaboratoryPress, Cold Spring Harbor, NY.
chultz, A. H. (1933). Observations on the growth, classification andevolutionary specialization of gibbons and siamangs. Human Biol.5: 212–255 and 385–428.
hafer, D. A. (1986). Evolutionary cytogenetics of the siabon (gibbon-siamang) hybrid apes. In “Current Perspectives in Primate Biol-ogy” (D. M. Taub and F. A. King, Eds.), pp. 226–239. Reinhold,New York.
imonetta, A. (1957). Catalogo e sinonimia annotata degli ominoidifossili ed attuali (1758–1955). Atti Soc. Toscana Sci. Nat. Pisa Ser.B 64: 53–113.
tewart, C. B. (1993). The powers and pitfalls of parsimony. Nature361: 603–607.
trimmer, K., and von Haeseler, A. (1996). Quartet puzzling: Amaximum likelihood method for reconstructing tree topologies.Mol. Biol. Evol. 13: 964–969.
amura, K., and Nei, M. (1993). Estimation of the number of nucle-otide substitutions in the control region of mitochondrial DNA inhumans and chimpanzees. J. Mol. Evol. 10: 512–526.
hompson, J. D., Higgins, D. G., and Gibson, T. J. (1994). Clustal W:Improving the sensitivity of progressive multiple sequence align-ment through sequence weighting, position-specific gap penaltiesand weight matrix choice. Nucleic Acids Res. 22: 4673–4680.alsh, P. S., Metzger, D. A., and Higuchi, R. (1991). Chelex 100 as amedium for simple extraction of DNA for PCR-based typing fromforensic material. BioTechniques 10: 506–513.iens, J. J., and Servedio, M. R. (1998). Phylogenetic analysis andintraspecific variation: Performance of parsimony, likelihood anddistance methods. Syst. Biol. 47: 228–253.
ehr, S. (1999). “A Nuclear and Mitochondrial Phylogeny of theLesser Apes (Primates, Genus Hylobates),” Ph.D. thesis, HarvardUniversity, Cambridge.
hang, Y. (1997). [Mitochondrial DNA sequence evolution and phy-logenetic relationships of gibbons]. Acta Genet. Sinica 24: 231–237.[Chinese text, English summary]