Embed Size (px)
Citation preview
† Submitted to International Journal of Fatigue
Modified Kitagawa Diagram and Transition from Crack Nucleation to Crack Propagation†
K. Sadananda and S. Sarkar
Technical Data Analysis 3190 Fairview Park Drive, Suite 650, Falls Church, VA 22042
Abstract
Kitagawa-Takahashi diagram combines the endurance limit of a smooth specimen and the crack propagation threshold in a fracture mechanics specimen into single diagram thus providing the connection between the stress or strain-life and damage tolerance approaches. The diagram is modified by considering a) fatigue requires two independent load-parameters for unambiguous description, b) long crack growth behavior defines the material resistance under constant stress amplitudes along with the associated R-ratio effects, c) remote applied stresses and localized plasticity-effects can be combined to provide the total mechanical force opposing the material resistance leading to crack initiation, growth and failure describable in the diagram, 4) localized plasticity contributes to internal stresses that either augment or retard the remote stresses, and finally 5) the magnitude and gradient of these internal stresses determine the condition for propagation and/or non-propagation of the incipient cracks that form either at pre-existing stress concentrations or in-situ formed stress concentrations due to localized plasticity. Analysis of incipient short cracks growing under the elastic-plastic notch tip stress fields are analyzed systematically for various elastic stress concentrations, Kt, and notch-tip radii. A general formulation is developed based on the calculations that can be incorporated into the unified life predication model that is being developed.
------------------------------- 1. Introduction: Extensive work has been done to characterize fatigue life based on either stress- or strain-life criterion, or crack growth life using the damage-tolerance criterion by utilizing fracture mechanics methodology(1-3). In the stress- or stain-life, the nucleation of a crack is considered as a major event of fatigue life; and correspondingly the design methodology is centered on preventing such formation in critical components under service-loads. In the damage tolerance approach, crack is assumed to be present in a structure and its propagation resulting in the failure of a component under service-loads is considered. While the two approaches, the stress or stain-life and the damage-tolerance, diverge from philosophical perspective, there is a need to combine these two approaches in terms of life prediction of a component in service, since in many cases total life includes both crack nucleation and propagation. This can be done, in principle, by using the modified Kitagawa-Takahashi diagram(4). Our efforts(5-8) during the past decade were centered on establishing that fatigue involves two-independent load parameters, the peak or the mean stress, and the stress-amplitude. The two parameters manifest for stress-life in terms of maximum stress, σmax and stress amplitude ∆σe. The roles of these two parameters on stress-life have been considered in the past, starting from Goodman(9), as the mean-stress or strain effects(10). For crack growth, the two-load-parameter requirement manifests in terms of peak stress intensity factor, Kmax and the stress intensity range, ∆K. The role of Kmax on crack growth has been recognized in the past, but mostly at the high end of crack growth rates, when monotonic modes of failure get superimposed on fatigue crack growth(11). For major part of the crack-growth life, the stress intensity factor range, ∆K, is
† Submitted to International Journal of Fatigue
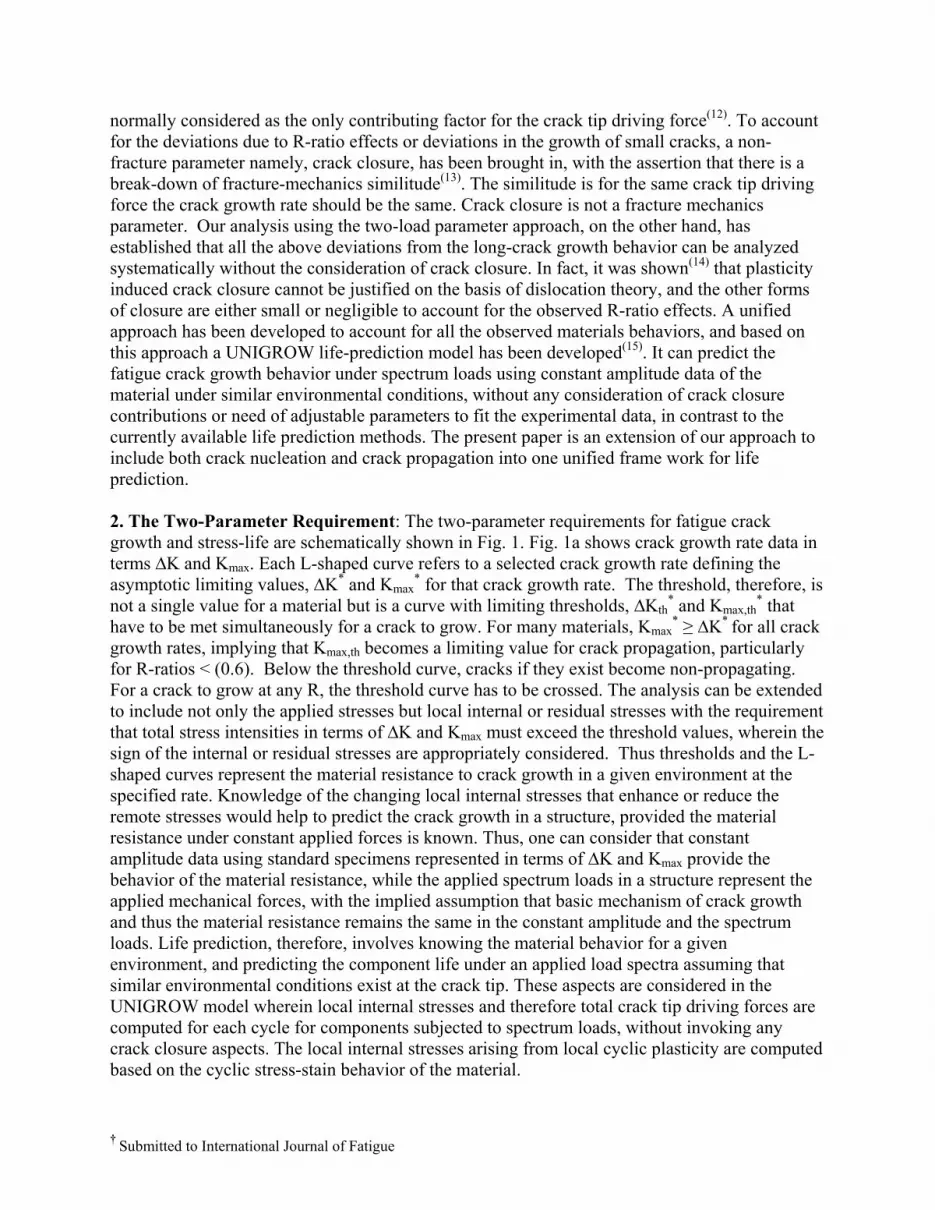
normally considered as the only contributing factor for the crack tip driving force(12). To account for the deviations due to R-ratio effects or deviations in the growth of small cracks, a non-fracture parameter namely, crack closure, has been brought in, with the assertion that there is a break-down of fracture-mechanics similitude(13). The similitude is for the same crack tip driving force the crack growth rate should be the same. Crack closure is not a fracture mechanics parameter. Our analysis using the two-load parameter approach, on the other hand, has established that all the above deviations from the long-crack growth behavior can be analyzed systematically without the consideration of crack closure. In fact, it was shown(14) that plasticity induced crack closure cannot be justified on the basis of dislocation theory, and the other forms of closure are either small or negligible to account for the observed R-ratio effects. A unified approach has been developed to account for all the observed materials behaviors, and based on this approach a UNIGROW life-prediction model has been developed(15). It can predict the fatigue crack growth behavior under spectrum loads using constant amplitude data of the material under similar environmental conditions, without any consideration of crack closure contributions or need of adjustable parameters to fit the experimental data, in contrast to the currently available life prediction methods. The present paper is an extension of our approach to include both crack nucleation and crack propagation into one unified frame work for life prediction. 2. The Two-Parameter Requirement: The two-parameter requirements for fatigue crack growth and stress-life are schematically shown in Fig. 1. Fig. 1a shows crack growth rate data in terms ∆K and Kmax. Each L-shaped curve refers to a selected crack growth rate defining the asymptotic limiting values, ∆K* and Kmax
* for that crack growth rate. The threshold, therefore, is not a single value for a material but is a curve with limiting thresholds, ∆Kth
* and Kmax,th* that
have to be met simultaneously for a crack to grow. For many materials, Kmax* ≥ ∆K* for all crack
growth rates, implying that Kmax,th becomes a limiting value for crack propagation, particularly for R-ratios < (0.6). Below the threshold curve, cracks if they exist become non-propagating. For a crack to grow at any R, the threshold curve has to be crossed. The analysis can be extended to include not only the applied stresses but local internal or residual stresses with the requirement that total stress intensities in terms of ∆K and Kmax must exceed the threshold values, wherein the sign of the internal or residual stresses are appropriately considered. Thus thresholds and the L-shaped curves represent the material resistance to crack growth in a given environment at the specified rate. Knowledge of the changing local internal stresses that enhance or reduce the remote stresses would help to predict the crack growth in a structure, provided the material resistance under constant applied forces is known. Thus, one can consider that constant amplitude data using standard specimens represented in terms of ∆K and Kmax provide the behavior of the material resistance, while the applied spectrum loads in a structure represent the applied mechanical forces, with the implied assumption that basic mechanism of crack growth and thus the material resistance remains the same in the constant amplitude and the spectrum loads. Life prediction, therefore, involves knowing the material behavior for a given environment, and predicting the component life under an applied load spectra assuming that similar environmental conditions exist at the crack tip. These aspects are considered in the UNIGROW model wherein local internal stresses and therefore total crack tip driving forces are computed for each cycle for components subjected to spectrum loads, without invoking any crack closure aspects. The local internal stresses arising from local cyclic plasticity are computed based on the cyclic stress-stain behavior of the material.
† Submitted to International Journal of Fatigue
From the point of materials behavior, the limiting values in terms of ∆K* and Kmax
* as a function of crack growth rate provide a trajectory path defining material resistance path for a given environment. For a perfectly inert environment when a crack grows purely under cyclic plasticity, the two parameters are equal, defining a trajectory map in terms of ∆K* and Kmax
* as a 45o-line. The trajectories that deviate from this line for different materials and environments are attributed to the superimposed monotonic modes of crack growth with the environmental contributions dominating. The trajectory paths provide the material resistance to applied forces, and therefore embedded in them is the in-situ changes in the governing mechanisms of crack growth. Most importantly, the trajectory path takes into consideration the crack-path history which describes material path that fallows the Principle of Least Action(16). Its importance become more evident in defining the superimposed chemical driving forces during corrosion fatigue discussed in a separate paper. The changes in the trajectory paths during crack growth thus reflect the changing mechanisms of crack growth reflecting the material (chemistry and microstructure), environment (chemistry) and stress (external and internal) interactions. Fig. 1b shows a parallel behavior in terms of stress-life where for a given number of cycles to failure, say 107 cycles, the endurance is expressed in terms of two parameters, amplitude and peak stress as, ∆σe and σmax,e, respectively. Thus similar to crack growth thresholds, stress-life endurance is not a single value but a curve defining the two limiting values in terms of amplitude and peak stress(17). In the past, most of the effects of σmax have been described as mean stress effects(10). Similar to the crack growth case, endurance limit in terms of peak stress is greater than that of amplitude (i.e., σmax,e ≥ ∆σe). This similarity in behavior both during crack growth and stress-life affirms that effects of stress ratio, R, or effects of means stresses in both are intrinsic to fatigue damage rather than arising from some extraneous factors behind the crack tip. Extraneous factors, such as crack closure, need to be considered only if they become overwhelming and the material behavior otherwise cannot be accounted by the two-parameters; but they should not be universally adopted for all fatigue life predication cases, as is being done in the current accepted methodologies. The discussion is to emphasize the fact that fatigue life predictive methodology must consider the two-load parameters that are intrinsic to fatigue as they reflect both in stress-life and damage tolerance approaches, and any predictive models that ignore these facts would end up with many adjustable parameters (or a single adjustable parameter that is to be adjusted continuously for each loading system) reducing them to be empirical than predictive in nature. 3. Non-Propagating Cracks: Cracks that form during cyclic loads general grow and cause failure. There are, however, some specific cases, such as in the case of cracks emanating from sharp notches, a crack can get initiated due to high notch-tip internal stresses, but the remote stresses may not be sufficient to propagate that crack as it grows out of the localized internal stress fields. Because of this difference in the initiation and propagating conditions, situation exists wherein the stress concentration factor, KF defined under fatigue(10) differs from that given by the elastic stress concentration factor, Kt. Normally the elastic stress concentration factor, Kt, can defined as the ratio of peak stress at the notch tip to the nominal stress. On the other hand KF relays on the failure criteria as the ratio of the endurance limit of a notched specimen to that of un-notched
† Submitted to International Journal of Fatigue
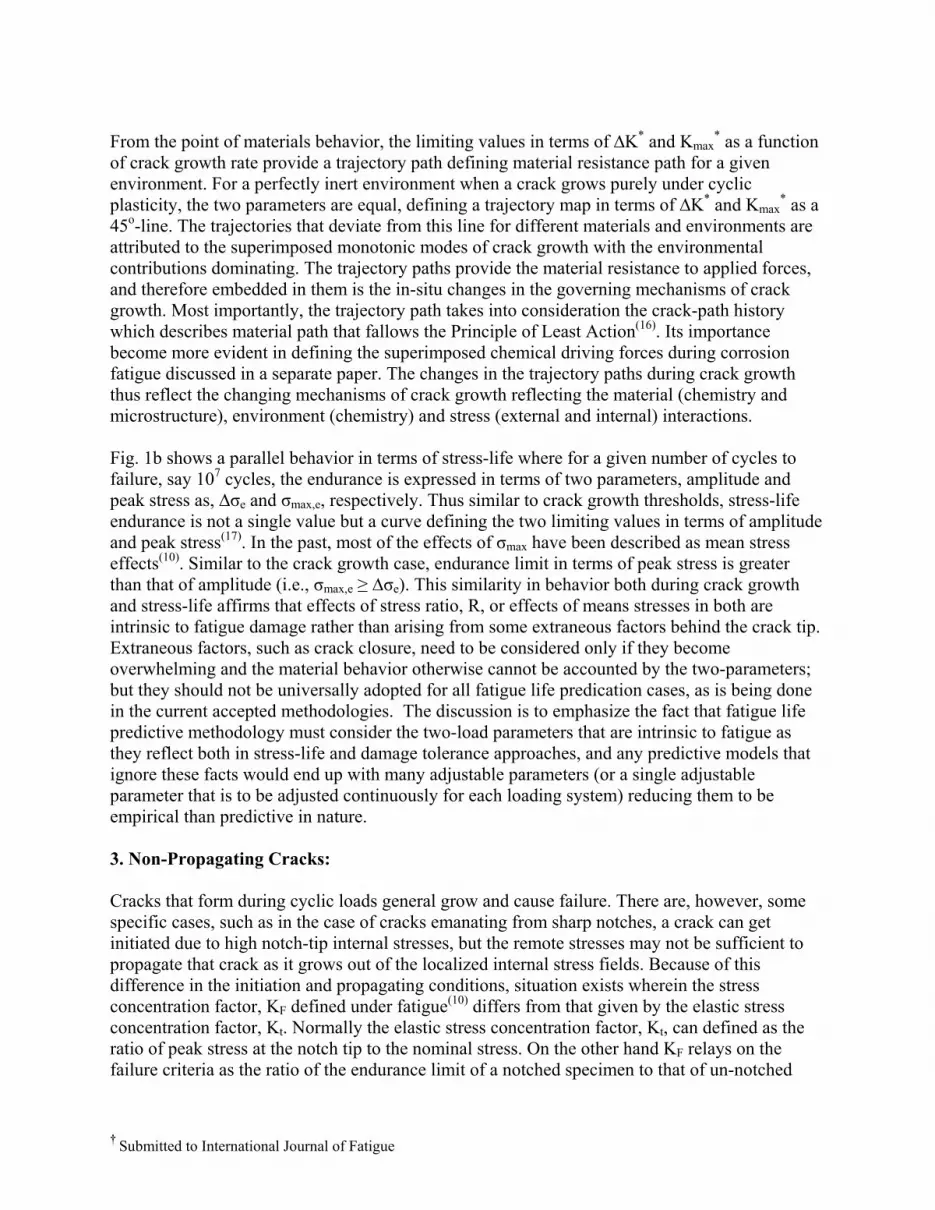
specimen, wherein failure involves not only crack nucleation but its propagation until specimen fails. KF therefore excludes the non-propagating conditions where Kt can be high enough to nucleate a crack but the crack-tip stresses are not sufficient to sustain its growth leading to its arrest. This important difference between propagating and non-propagating conditions, differentiating the nucleation versus propagation, forms the important consideration in connecting the two criteria; stress-life and damage tolerance, as well design methodology with consideration to non-propagating cracks. In addition, in Fig. 1b, a series of curves for different number of cycles to failure, NF, can be defined parallel to the endurance curve. Similarly one can also define the curve for a giga-cycle fatigue(18), wherein the mechanism for crack initiation is different. The limiting values in terms of σmax
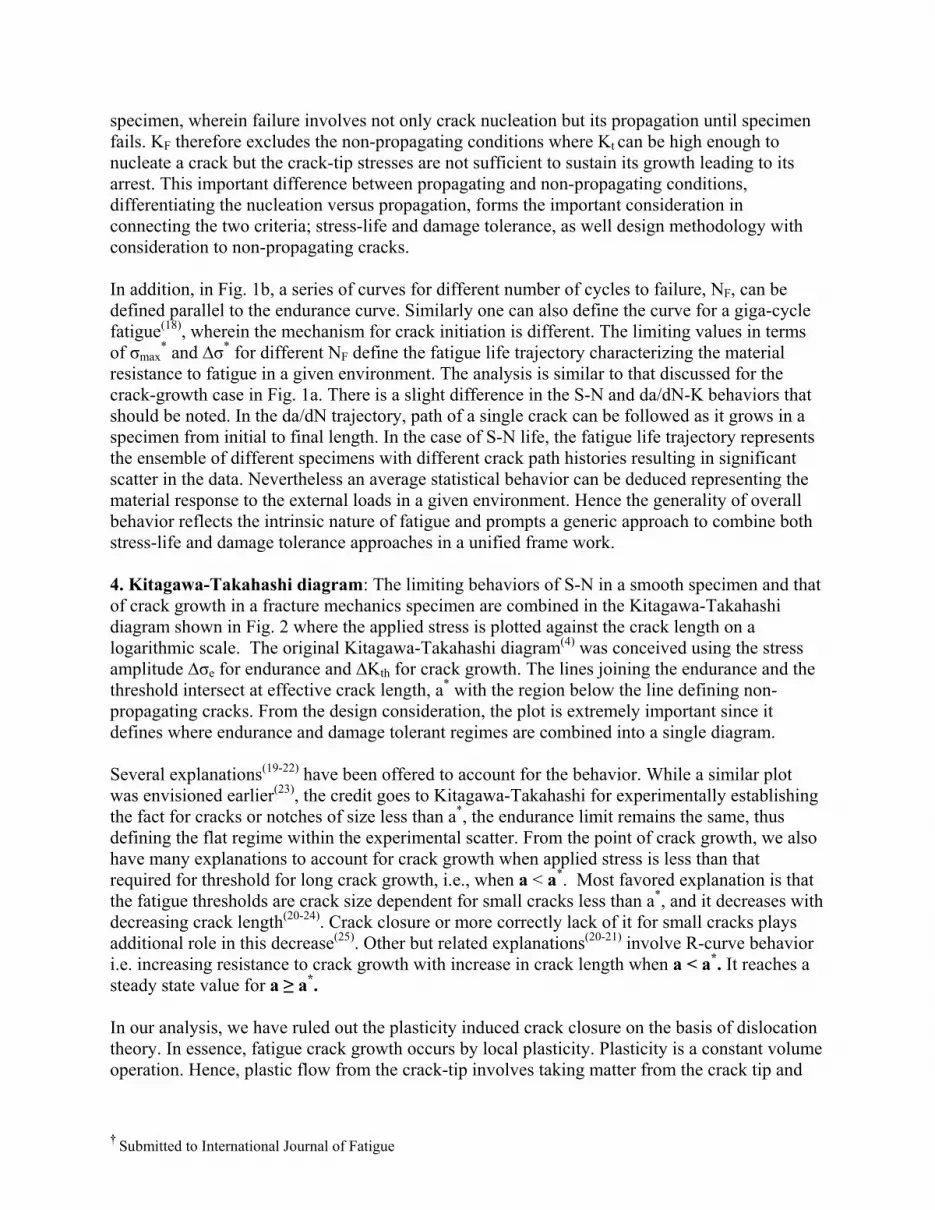
* and ∆σ* for different NF define the fatigue life trajectory characterizing the material resistance to fatigue in a given environment. The analysis is similar to that discussed for the crack-growth case in Fig. 1a. There is a slight difference in the S-N and da/dN-K behaviors that should be noted. In the da/dN trajectory, path of a single crack can be followed as it grows in a specimen from initial to final length. In the case of S-N life, the fatigue life trajectory represents the ensemble of different specimens with different crack path histories resulting in significant scatter in the data. Nevertheless an average statistical behavior can be deduced representing the material response to the external loads in a given environment. Hence the generality of overall behavior reflects the intrinsic nature of fatigue and prompts a generic approach to combine both stress-life and damage tolerance approaches in a unified frame work. 4. Kitagawa-Takahashi diagram: The limiting behaviors of S-N in a smooth specimen and that of crack growth in a fracture mechanics specimen are combined in the Kitagawa-Takahashi diagram shown in Fig. 2 where the applied stress is plotted against the crack length on a logarithmic scale. The original Kitagawa-Takahashi diagram(4) was conceived using the stress amplitude ∆σe for endurance and ∆Kth for crack growth. The lines joining the endurance and the threshold intersect at effective crack length, a* with the region below the line defining non-propagating cracks. From the design consideration, the plot is extremely important since it defines where endurance and damage tolerant regimes are combined into a single diagram. Several explanations(19-22) have been offered to account for the behavior. While a similar plot was envisioned earlier(23), the credit goes to Kitagawa-Takahashi for experimentally establishing the fact for cracks or notches of size less than a*, the endurance limit remains the same, thus defining the flat regime within the experimental scatter. From the point of crack growth, we also have many explanations to account for crack growth when applied stress is less than that required for threshold for long crack growth, i.e., when a < a*. Most favored explanation is that the fatigue thresholds are crack size dependent for small cracks less than a*, and it decreases with decreasing crack length(20-24). Crack closure or more correctly lack of it for small cracks plays additional role in this decrease(25). Other but related explanations(20-21) involve R-curve behavior i.e. increasing resistance to crack growth with increase in crack length when a < a*. It reaches a steady state value for a ≥ a*. In our analysis, we have ruled out the plasticity induced crack closure on the basis of dislocation theory. In essence, fatigue crack growth occurs by local plasticity. Plasticity is a constant volume operation. Hence, plastic flow from the crack-tip involves taking matter from the crack tip and
† Submitted to International Journal of Fatigue
redistributing to the region around as dislocations (involving extra planes). Thus from the conservation principle, the dislocation stress fields in the plastic zone, although induces compressive stress fields at the crack tip, the resulting compressive displacements cannot close the crack-tip unless the blunting resulting from their emission is fully eliminated. This can occur only when all the dislocations that were emitted go back into the crack eliminating all the ledges that formed during their emission. Cyclic plasticity that differs from monotonic plasticity implies that there are residual dislocations left in each cycle which keep the crack tip open. This is true whether the dislocation source is at the crack tip or just away from the crack tip, as long as the crack-tip stress fields forms the basis for the localized plasticity. This, in fact, forms a basis for the UNIGROW model for fatigue life prediction, in that unloading during fatigue leaves at least a hole of radius ρ due to crack-tip blunting. Compressive stresses due to plasticity will be acting on the hole during unloading and are predictable, as the problem now reduces similar to any notch or a hole under a remote compression. No plasticity induced crack closure is involved in this physically realistic process. The explanation is valid even if the plastic zone moves behind the crack tip and fresh new plastic zone forms ahead of the crack tip since every dislocation emitted from the crack has its counterpart ledge that keeps the crack open. Far field unloading will still keep the crack tip open due to blunting at the crack tip. In our approach, we start with a postulate that long crack growth behavior is intrinsic material behavior (no extrinsic crack closure is involved) as elucidated in Fig. 1a. Implication is the limiting thresholds or the threshold curve represents material behavior for a given environment as material resistance. Hence thresholds are independent of crack length. Given this premise, how do we account the Kitagawa-Takahashi diagram and also use it for life prediction, going from smooth specimen to fracture mechanics specimen? This is discussed next. 5. Modified Kitagawa-Takahashi Diagram: Some preliminary aspects of these were discussed before(17), but here we present extensive experimental support for validity of the concepts. Fig. 3 shows a modified-Kitagawa-Takahashi diagram. The modifications from the original (compare with Fig. 2) involves first, a) consideration of two load-parameter requirement for fatigue and b) recognition that Kmax,th and σmax,e are greater than or equal to the corresponding amplitude threshold and endurance. Hence the plot is represented taking Kmax,th and σmax,e, which are dominating particularly for R less than 0.6 or 0.7. Next, the Kmax,th line is extrapolated to the crack length less than a* joining the crack initiation point, σIN, for a smooth specimen in a monotonic test. The σIN can be thought off as the stress necessary to initiate a crack in a smooth specimen subjected to ½ cycle i.e. only rising part of the first cycle. Similarly, another line parallel to the threshold line is drawn corresponding to KIC (or overload fracture K in fatigue) joining on the Y-axis at the fracture stress, σf, or tensile strength of a smooth specimen. Thus we have an endurance limit, σmax,e, crack initiation σIN, fracture stress, σf, forming three limiting values on the stress axis that connects to the fatigue behavior involving cyclic loads. The regime defined by ABCD is called internal stress triangle. Increasing applied stress from A to B decreases the number of cycles required for crack initiation from the endurance limit (say, 107 cycles) to 0.5 cycle. The line joining B to E provides the increasing stress required for growth of an initiated crack until failure occurs at the point E which for a smooth specimen is defined as ultimate tensile strength. The length BE depends on the tearing
† Submitted to International Journal of Fatigue
modulus of the material as defined by Paris or depends on the local work hardening characteristics of the material or local resistance to the growth of an initiated crack. Movement from the threshold Kmax,th-line to the KIC-line, therefore, involves crack growth which can be accomplished either under constant stress or variable stress test as in spectrum loads. Number of cycles required for crack growth therefore depends on the stress and crack length, the history of damage that being accumulated with cycling. This diagram does not depict the kinetics of crack growth, or how fast the crack grows either at constant remote stress or increasing or fluctuating stress. The diagram is a schematic representation of a general behavior while specifics of the lines Kmax,th and KIC lines and how they join the limiting values on the y-axis depends on the material flow behavior and environmental interactions, the later part being discussed in a separate paper. 6. Internal Stress Triangle Most important aspect of fatigue involves unraveling the internal stress triangle. Since Kmax,th-line represents the minimum K (or crack tip driving force) required for the crack growth resulting ultimately the failure. Point A in Fig. 3, on the other hand, representing the endurance limit indicates that at that stress the smooth specimen eventually will fail, albeit it takes very large number of cycles. Implication of that is an incipient crack that forms eventually will grow contributing to specimen failure. Figure 3 shows that applied stress should be at lease of the order of B where the threshold K can be satisfied for the incipient crack to grow. The stress at least locally near the crack tip has to be increased from A to B. This is accomplished by cyclic plasticity. Here, the crack growth is accomplished by building the necessary internal stresses which can augment the remote applied stress, σmax,e so that locally Kmax,th condition is met for the crack to grow. Cyclic strain contributes a cumulative damage that enhances the local internal stress cycle by cycle eventually meeting the minimum threshold criteria for its growth. From the microstructural considerations, we know that with cycling dislocation channels and intrusions and extrusions form with associated build up dislocation pile-ups leading to crack initiation and growth. Tanaka and Mura(26) have developed a model based on dislocation dipole accumulation. In essence, the inhomogeneity in deformation leads to the build up the local internal stresses necessary for the initiation. The number of cycles required for the initiation depends on the material flow properties, slip irreversibility, and any surface related microstructural inhomogeneities, if present. If there are surface compressive residual stresses present which retard the build up of the necessary tensile internal stresses for crack initiation and growth, fatigue endurance is enhanced. Surface compressive residual stresses, for example, can be induced by shot peening. In addition, since the cyclic damage is concentrated more near the specimen surface, it has been found that frequent removal of the damaged area by electro polishing extends the fatigue life, the since internal stresses that are being formed are being removed by the polishing(27). Likewise, if the deformation can occur homogeneously in a specimen, crack nucleation is also prevented. (Such conditions can be created by making grain size very fine inducing super-plastic conditions). However for engineering alloys with inhomogeneous distribution of grain sizes and their orientations, localized surface deformation is inevitable, leading to the creation of internal stress fields. While from the continuum considerations, the internal stresses have to be self-equilibrating at local level of the order of few
† Submitted to International Journal of Fatigue
grain sizes, they remain heterogeneous due to the build up of deformation bands or dislocation walls, intrusions and extrusions, and thus paving the way for their accumulation. The rate of accumulation of these internal stresses are material specific and depends on the crystal structure, slip character (planar or wavy) which in turn depends on the stacking fault energy of the material or its precipitate structure, reversibility of slip, etc. Source for internal stresses from the point of fatigue is mainly plasticity, which at micro scale level depends on a) dislocation generation and their movement and b) their distribution. Evaluation of the internal stress generation using dislocation modeling becomes a formidable task due to very large number of dislocations involved and the solution that one arrives depends not only on their number density but also on their spatial distribution which in turn depend on the imposed initial and boundary conditions and strain history. Hence because of these complexities, the experimental data alone form the guiding light for the life-prediction models. The modified Kitagawa-Takahashi diagram, Fig. 3, further shows that for the specimen cycled at the endurance limit, A, not only the local internal stresses have to be increased to the point indicated by B for the crack initiation, they have to sustain its growth along the path BCD there by meeting continuously the minimum crack growth criteria. At the point D, when the crack has now grown to the size a*, the remote applied stress is sufficient to drive the crack further to failure. Thus in essence, the internal stress triangle provides two essential minima criteria for sustained crack growth; the internal stress magnitude and its gradient. Somewhat similar concept is implied, although not explicitly stated in terms of internal stresses, in the critical distance approach of Taylor(28). The residual plasticity (cyclic strain) in each cycle helps to slowly build up the necessary internal stresses required to augment the applied stresses for crack initiation and its sustained growth. The number of cycles required for fatigue crack initiation and for its continuous growth therefore ultimately depends on the internal stress generation by cyclic plasticity. The internal stresses should affect both Kmax and ∆K, since they respectively correspond to monotonic and cyclic plastic strains associated with fatigue. Since Kmax is more dominant along with the associated monotonic plastic zone, internal stress contribution to Kmax is also more significant. These aspects are considered in the UNIGROW model for spectrum loads. The modified Kitagawa-Takahashi diagram thus combines crack nucleation in a smooth specimen and sustained crack growth in the fracture mechanics specimen that combining the stress-life and damage tolerance criteria into one. In the region below the endurance and threshold curves, crack remains dormant. Implication is the cycling in this regime will not produce the required magnitude of internal stresses and/or their gradients for the crack to grow. The applied stress or crack length have to cross the limiting values bounded by the endurance and the Kmax,th
. It is possible, in some cases, existence of another endurance limit, as in the giga cycle range where the mechanism shift from surface crack to internal crack initiation at some inclusions or porosity. This affects the initiation but not propagation threshold which follows steady state continuum mechanics consideration. Therefore, in the giga cycle fatigue regime too even though endurance is reduced, the Kmax,th for crack growth has to be met by generation of sufficient internal stresses by localized plasticity(18). Crack growth kinetics also becomes slower since larger number of cycles is required to generate the needed internal stresses. Similarly crack meandering or getting temporarily arrested at hard grains by a growing physically short cracks
† Submitted to International Journal of Fatigue
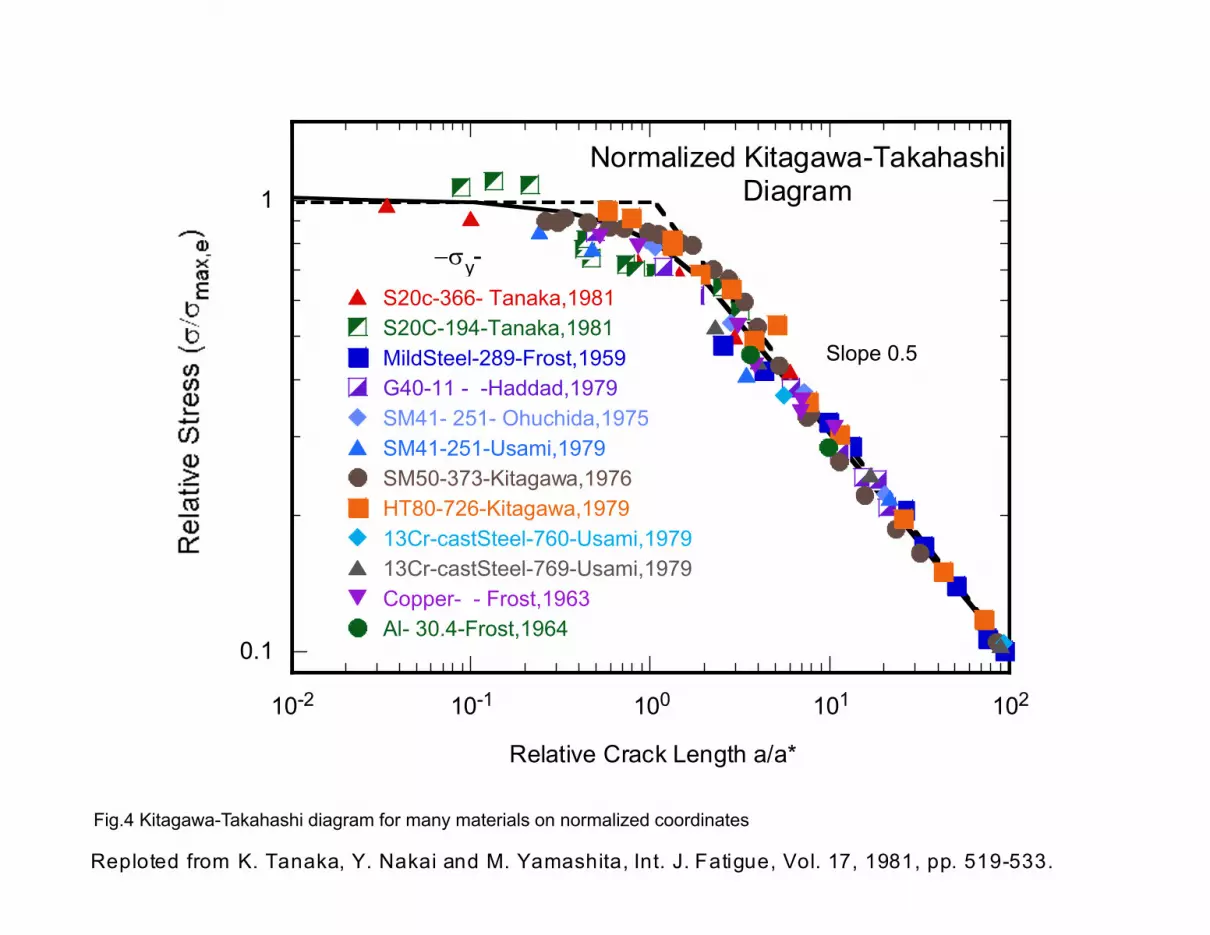
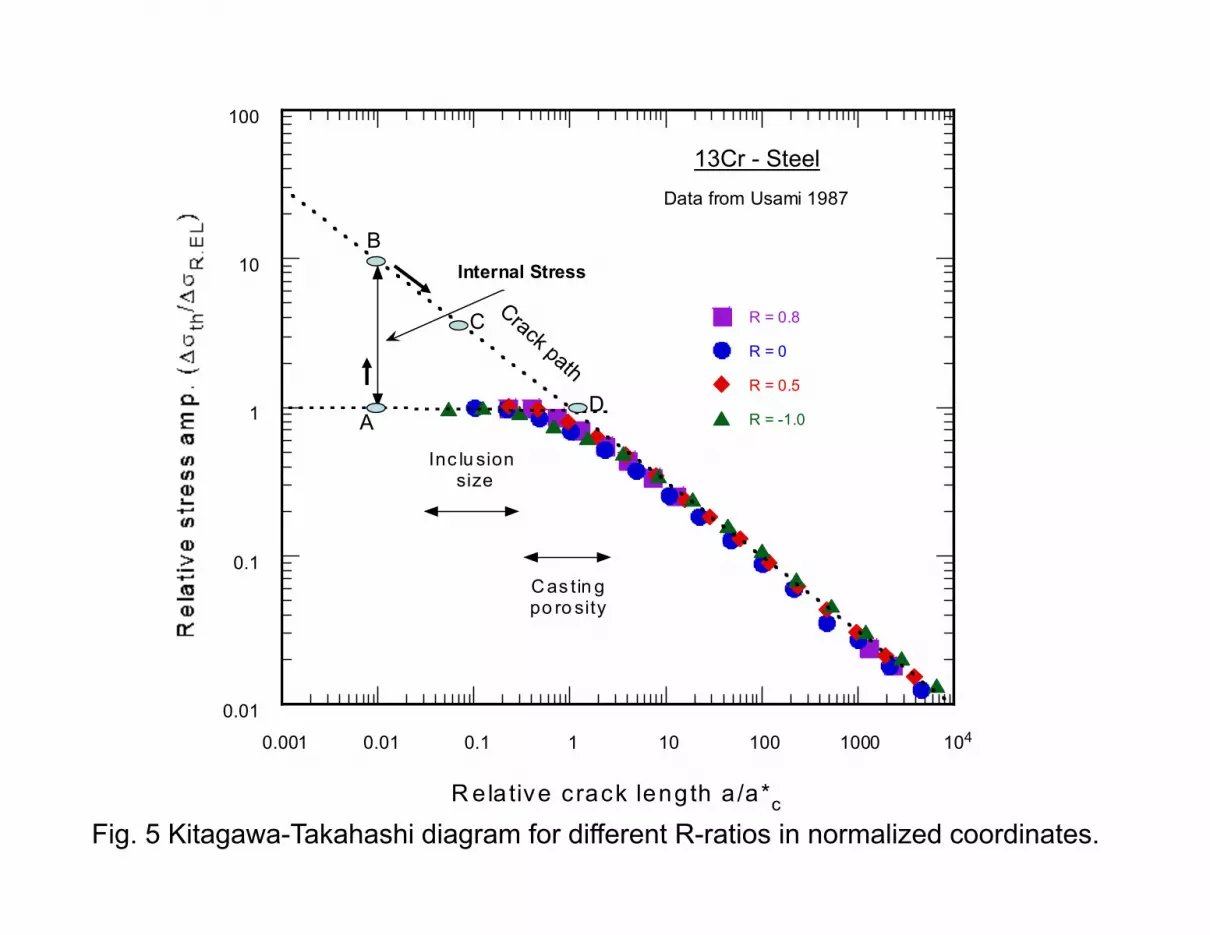
can be considered at a continuum level as building up of the necessary internal stresses required to reach the steady state condition. Here steady state condition defined by Kmax,th represents the property of a crack in material that statistically samples average grain orientations or microstructural distribution. It is similar to any engineering property such as yield stress or even the endurance limit for a material; thus justifying the long crack growth behavior being taken as representative material behavior. 7. Generality of the behavior: Figs. 4 and 5 show the generalization of the behavior which are taken from Tanaka et al(20) and Usami et al(29), respectively. In these figures, for different materials or conditions, the stress axis is normalized by their respective endurance limits and crack length is normalized by their respective critical crack lengths, a*. Hence the endurance line and the threshold line meet at the point (1,1) and all the data for various materials fall on a single curve in Fig. 4. In Fig. 5 the data for steel for various R-ratios fall on a single curve. Several implications can be drawn from these figures. First, for the crack lengths greater than the critical size, all data fell on their Kmax,th line with the slope 0.5, implying that linear elastic crack growth behavior is essentially valid for all the materials. In addition, role of stress that includes the contributions from internal stresses due to localized plasticity can be separated from the material resistance to crack growth, since different materials with different plastic flow properties behave similarly. Extension of Griffith’s criterion for crack growth by Orawan(30) and Irwin(31) and others involved rewriting the crack tip driving force, G, to be grater than surface energy γ plus the plastic work term P. Since P is of several orders of magnitude greater than surface energy γ, the later is normally neglected. Thus the equation is represented as
G ≥ γ + P ~ ≥ P ----- (1),
where P is the contribution from the plastic work term.
Rice(32) has pointed out earlier that it is better to bring P to the left hand side and rewrite the above equation as
G - P ≥ γ ------- (2)
This representation has profound implication as Rice discussed in his paper. Most important is we cannot neglect γ anymore since it is involved in the creation of two new surfaces. In addition it can be altered by aggressive environments, the implication of which we will discuss in the corrosion paper. In the above representation, plasticity contributes to the driving force than energy dissipation per sec. As Rice stated earlier that this is true if the plasticity is localized near the crack tip. The remote (or long range) plasticity that does not play any direct role in the crack initiation and growth and is mostly dissipative and its contribution to crack tip driving force is negligible. In terms of crack tip driving forces, we can generalize the above equation in the spirit of Irwin strain energy criteria representing the strain energy release rate in terms of linear elastic stress intensity factor K, as
Kapl ± KInt ≥ Kmax,th ……..(3)

† Submitted to International Journal of Fatigue
where it is recognized that crack tip plasticity due to remote stress can either augment or reduce the crack tip driving force. In Eq. 3, Kapl and Kint are contribution from remote applied stress and local internal stress, respectively. Crack growth under compression-compression fatigue has been observed and is used as a method of generating a fatigue pre-crack(33-35). From the above equation, the crack arrest occurs in this case when Kint ≤ Kapl + Kmax,th. Here we have a case where material resistance given by Kmax,th and remote compressive stress, Kapl are opposing the crack growth against the crack tip driving force due to internal stress. Implication is that at the arrest condition, it is not that internal stresses (or residual stresses) are zero, as some assumed(36), but only Kint ≤ Kapl + Kmax,th, i.e., the tensile stress contribution from the plasticity became lower than force needed to drive the crack to overcome the opposing surface energy and remote compressive stress contributions. Since plasticity always exists in front a crack under a stress, we have no case when the internal stress contribution to crack growth is zero; it is either positive or negative depending on the nature of plasticity. The above equation also has bearing in terms of fatigue behavior under overloads and under-loads, where the role and the sign of Kint can be changing. This aspect is considered in the UNIGROW model. Hence, when we have assumed that long crack growth behavior is fundamental, we have essentially assumed that the steady state conditions exists ahead of the crack tip and contribution of the plasticity under the steady state are incorporated in the threshold value. The above conditions are valid with in the assumption of localized plasticity or small-scale yielding conditions. Returning back to Fig. 3, the implication of equation 3 in relation to internal stress triangle is evident. The internal stress arising from localized plasticity contributes as the additional driving force in equation 3 to overcome the material resistance to crack initiation and growth. In addition that the minimum gradient path BCD has to be met for crack growth implies that steady state conditions for long crack growth has to be met since threshold line Kmax,th takes into consideration steady state plasticity associated with long crack growth. The experimental validation for this assumption will be provided shortly. The generality of the behavior shown in Fig. 4 and 5 demonstrates the steady state conditions for long crack growth threshold are valid for all materials and there is an additional contribution from internal stress from the localized crack-tip plasticity providing as the additional driving force for the growth of a short crack. Fig 5 brings in additional considerations since both endurance and the thresholds are collapsing into one curve for all R-ratios. In the endurance limit for smooth specimens, there are mean stress effects. In the threshold for crack growth regime, we consider that threshold is a curve and not a single value without involving any similitude break down, Fig.1a. On the other hand if one considers plasticity induced crack closure where there is no similitude, the normalization need not bring the data into one for all R-ratios, since mean stress effects in a smooth specimen are different from the crack closure effects in a fracture mechanics specimen. Thus, both Figs. 4 and 5 show that intrinsic material behavior is reflected in the general uniqueness of the curves. Additionally, based on the generalized curves, material behavior can be formulated for both crack initiation and propagation. The material response depends purely on the crack tip driving forces and the material resistance provided by the long crack growth behavior. Perturbations due to overloads, under-loads and mean stress effects or spectrum loads reduce the problem to determining accurately the local crack tip driving forces due to applied and internal stresses. The experimental data under constant amplitudes should provide the material response under steady
† Submitted to International Journal of Fatigue
state conditions, while judicious selection of analytical tools provides a methodology for the determination of internal or residual stresses so that reasonably accurate life prediction under fatigue can be made. We note that residual stresses in terms generated during cold working, welding, shot peening, forging, etc that fracture mechanics community routinely considers are only a subset of generalized internal stresses that are being considered here. 8. Short crack growth: Fig 6 shows schematically the long crack growth behavior and the perturbations due to overloads and under-loads and short cracks. Short cracks have been classified in terms physically short, mechanically short and microstructurally short(37). However, from the point of deviations from the long crack growth behavior in Fig. 6, these distinctions are unrecognizable. Since long crack growth behavior is taken as basic or represents steady-state behavior under a constant nominal stress, the deviations represent perturbations due to changes in the local crack-tip driving forces. This aspect is readily accepted when it comes to the effect of overloads and under-loads as they are due to change in the plastic zone which alters the local crack tip driving force. Fig.6 shows that the deviations are also similar for short cracks. From the point of generality, we therefore define the deviations are due to change in the crack tip driving force due to local plasticity. Assuming that a given crack increment per cycle, da/dN, occurs at the same crack tip driving force represented by K as given by the long crack growth curve, the contributing Kint can be determined by the difference in K for long crack minus that for a short crack, since the plot in Fig. 6 is based on the remote applied K. In essence the figure shows due to positive contribution from the internal stress, the required applied stress to enforce a particular crack growth rate, da/dN, is lower than that of steady-state long crack. Similarly the effects of overloads and under-loads on long crack growth can be accounted by negative or positive contributions from the internal stresses, respectively. Thus the material behavior is self-consistent and is in tune with Eq.3. In Fig. 6 crack growth rate for short cracks decelerate and accelerate due to changing internal stresses, while the applied stress contribution increases monotonically with increase in crack length. Short cracks normally initiate at some stress concentrations. These stress concentrations can be pre-existing as in the case of notches, holes, or inclusions, or can be in-situ generated due to heterogeneous slip and the formation intrusions and extrusions as in the case of smooth specimens. The crack arrest and its deflections at the grain boundaries are due to changing material resistance from grain to grain which forms an additional factor for consideration of small cracks. From the point of generality, the acceleration and deceleration are noticed even for through thickness-cracks encompassing many grains but still short in the growth direction. Just based experimental da/dN-∆K curves, the growth behaviors are indistinguishable whether they are physically short, mechanically short or microstructurally short, whether they are from a smooth specimen or from a notched specimen. Hence all deviations can be considered as due to fluctuating internal stress contributions as the incipient cracks grow from their stress concentrations. Under elastic-plastic conditions, the stresses may peak slightly ahead of the notch and then decrease to the level of nominal stress value. Fig. 7 depicts the stress intensity factor K for a short crack due to applied and internal stresses at a notch tip under elastic-plastic conditions computed using the procedure outlined recently by Kujawski(38). At a smaller nominal stress σ1, beyond the process zone the stress intensity decreases and then increases reaching at crack

† Submitted to International Journal of Fatigue
lengths greater than a* the value that corresponds to purely remote stress. If the decrease falls below the level of Kmax,th for that material, then a growing crack gets arrested resulting in a non-propagating crack. On the other hand, if the nominal stress is σ2 which is greater than σ1, then the minimum in K of the short crack may still be higher than the threshold value. In that case, the crack growth rate initially decreases but then increases slowly merging with the constant amplitude data, as shown schematically in fig. 6. Thus both crack arrest at lower stress and continuous crack growth with deceleration and acceleration merging with long crack growth rates can be accounted due to gradient in the internal stresses, without any need of crack closure concept. From the modified Kitagwa-Takahashi diagram in Fig 3, the crack arrest occurs whenever the K-total at the crack tip falls below the Kmax,th curve. For very sharp notches, the internal stress fields are quite high near the notch tip thus facilitating ready nucleation of short cracks. However the internal stresses can decrease rapidly such that K for the growing incipient crack can fall below the threshold line causing the crack growth arrest. Thus in a specimen with pre-existing sharp notches, even though elastic stress concentration factor Kt is large, an incipient crack can get arrested with the result that the fatigue failure does not occur unless the applied stress is increased. Thus normally for Kt greater than 4, there is a disparity in the nominal stresses required for crack nucleation vs. continuous crack propagation resulting in specimen failure. Hence fatigue stress concentration factor KF defined on the basis of fatigue failure differs from that of Kt, where Kt is defined as the ratio maximum stress to nominal stress. It is evident that for continuous crack growth not only the maximum stress but its gradient is also important to sustain the continuity in growth. Crack arrests can occur even for a growing long crack if the overload ratios are very high and the back ground amplitudes are low. Interplay of material resistance and the changing contributions to the crack tip driving forces in terms of Eq. 3 is evident in all cases. 9. Experimental Verification: The above analysis of short crack problem with the requirement that long crack growth behavior provides the fundamental material resistance can be verified to some extent, using the available short crack growth data in the literature provided the information given is complete in terms of initial crack lengths and stresses applied. We give several examples to illustrate the generality of the behavior discussed above in terms of the modified Kitagawa-Takahashi diagram. Fig. 8 shows the experimental data for short and long cracks in an Al-alloy collected by Newman(39) where applied stresses are provided and initial crack lengths can be computed using a standard expression for the stress intensity factor, K = Yσ √(πa), where for simplicity the geometric factor Y is taken as ≈ 1. The plot represents only the positive ∆K which is same as Kmax for this case since R = -1. The internal stress contribution Kint is taken for each selected crack growth rate as the difference in K value from that of long crack curve. This Kint represents equivalent stress intensity parameter due to the internal stress. The internal stress is not a single value but with a gradient decreasing with distance away from the stress concentration. The true K contribution due to varying internal stress can only be calculated if we know the internal stress profile using weight-function methods(40) . For simplicity, we assume that Kint that is given by the difference between the short crack and long crack represents net internal stress effect for that crack length expressed in terms of the field parameter K. Hence the effective internal stress experienced by that growing crack can be computed using the expression above as
† Submitted to International Journal of Fatigue
σint= Kint/{Y√(πa)} ------ (4)
where Y for simplicity is taken as ≈ 1. The changing value of Kint with changing crack length deduced as function of crack growth rates from the figure provides, using the above expression, the changing value of average internal stress, σint, as a function of crack length. Within the linear elastic approximation the total stress is given by
σT = σapl + σint ---- (5) The Eq. 5 is the expression of left hand side of Eq. 3 in terms of stresses which affect the crack tip driving forces and Kmax,th stands for material resistance for separation. Fig. 8 shows that at stress 60 MPa, growth of a short crack is decelerated continuously until complete crack arrest occurs. On the other hand for stresses 70 MPa and above, there is deceleration and acceleration but no crack arrest. With increasing crack length the growth rates of short crack merge with those of long crack. If the tests continue, the specimens eventually fail when the overload fracture occurs. Note that there is a small initial acceleration of short cracks before deceleration occurs in tune with the initial increase in internal stress contribution, but shown in Fig. 7 as part of process zone. Fig. 9 shows the computed values of the total stress at the crack tip for the two cases when applied stress is below and above crack arrest condition. The total stress is clearly greater than the threshold Kmax,th curve for a growing crack. The threshold line is also deduced based on the long crack growth data provided by Newman(39) for the material. In the regime of observations, Fig.8, the crack growth rates are sensitive to changing ∆K. This transforms to small changes in the total stresses hence these changes are not noticeable in Fig. 8. As the internal stress contribution decrease the total stress will reduce to that of applied stress. For the case of 60MPa, as the crack decelerates the total stress drops quickly at the arrest point to the level of nominal stress. If the endurance limit is at or below 60 MPa, the crack should eventually grow to cause failure. In that case prolonged cycling is needed to generate additional internal stresses to jack up the total stress enough to move the crack to ac beyond which the crack growth can occur under the applied load. For the case of 70 MPa there is a decrease of internal stress until it merges with the long crack growth can occur under applied load alone.
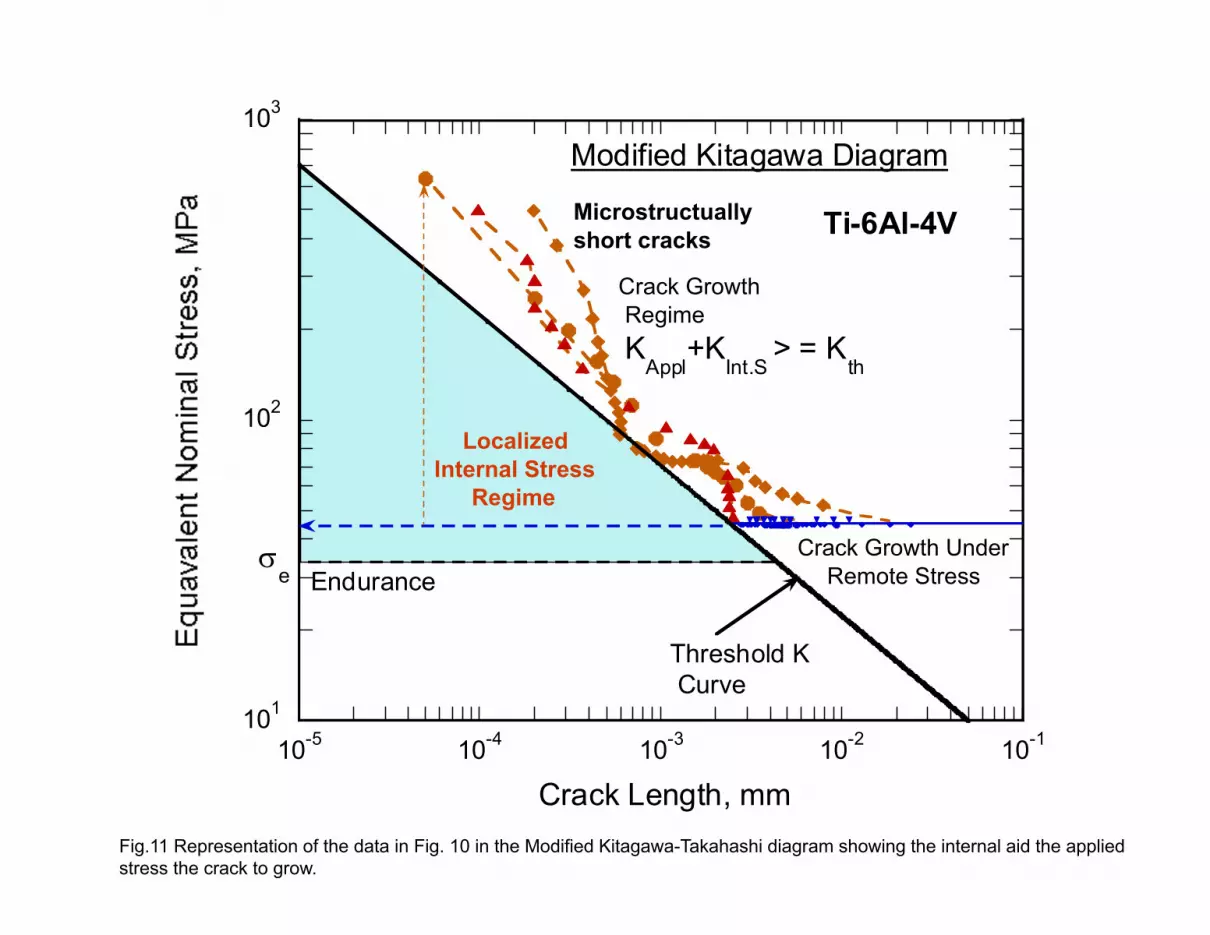
Fig. 10 shows another example where the data was collected by a team of scientists under Air force contract(41). These cracks are termed microstructurally short cracks. The cracks may not be through thickness cracks. Nevertheless, we apply the same procedure adopted for the through thickness cracks in order to check the generality as well as the limitations of the approach. Ultimately this becomes relevant to determine the applicability of general principles to cases that are of interest in service, such as corner cracks or thumb nail cracks, etc. Hence even though the cracks in reality may be three dimensional, in computing the applied and internal stresses, we approximate them as through thickness cracks and consider only one dimensional change in crack length. Thus using Eqs. 4 and 5, we compute the total equivalent stress acting on the crack at any given position. Fig. 11 shows the computed stresses and crack lengths represented in terms of the modified Kitagawa-Takahashi diagram. In this case the starting crack lengths are slightly different and the
† Submitted to International Journal of Fatigue
crack growth rates also change drastically. The long crack growth threshold is also shown along with the endurance stress for this material. The total stress that drives the crack growth is always above the threshold line and during the deceleration regime the stresses come close to the threshold line. Since acceleration again occurs, the data move away from the threshold limit as the crack growth rate increases during acceleration. The curves ultimately merge with constant applied load limit as the crack growth rate merge with the long crack growth behavior. By these results several concepts are validated. This includes a) the internal stress concept, b) consideration that long crack growth threshold represents the limiting behavior; c) perturbations are due to the superimposed internal stresses, and d) the generality of the modified Kitagawa-Takahashi diagram in combining endurance limit of smooth specimen on one side, the short crack growth behavior, and long crack growth behavior on the other. A similar behavior was found for all the materials that were analyzed in the literature where short crack growth information available includes the applied stresses and crack lengths in each test. Unfortunately most of the short crack growth data in the literature do not contain all the required information to compute the applied stresses and crack lengths to plot in the modified Kitagawa-Takahashi diagram. The analysis shows that crack initiation, short cracks and long crack growth behavior can all be combined for life prediction. The intrinsic material behavior in terms of how many cycles are required in order to build the necessary internal stress to aid the applied to initiate and propagate a crack can only be extracted from the experimental data at constant amplitudes in a representative environment. Using that data one can predict the behavior under complex loads.. All cracks originate from stress concentrations, either pre-existing or in-situ generated by heterogeneous slip. Growth of incipient cracks can be examined using fracture mechanics methodology by combining the endurance with the crack growth using the modified Kitagawa-Takahashi diagram. Fig. 7 shows schematically that there is a minimum K that occurs as an incipient crack grows from its stress concentration source and for it to grow continuously the minimum must exceed the Kmax,th threshold value. The minimum in K occurs at distance from the notch tip and can be physically related to the critical crack size a* below which plasticity effects are become more important to drive the crack tip. Therefore, for crack lengths less than the critical size, the computation of internal stresses contributing to crack growth are necessary, particularly under elastic-plastic conditions to arrive at some generic formulation that can used in life prediction. Analysis shows that stress intensity factor for an incipient crack emanating from a stress concentration fluctuates contributing to deceleration and accelerations in crack growth rates. Fluctuations arise due to varying internal stresses which depend on the elastic-plastic conditions at the stress concentration which can be represented by a notch or a hole. This is also the short crack growth regime where lot of work is done in trying to predict the crack growth rates and thus life of a component. By separating the mechanical response form the material response as in Eq.3, we can separately examine the internal stresses and their role, while retaining the long crack growth behavior as representative of the material response. Hence in the following we examine more closely the growth of short cracks in the elastic-plastic notch-tip stress fields. 10. Evaluation of the crack tip driving forces at Stress concentrations:
† Submitted to International Journal of Fatigue
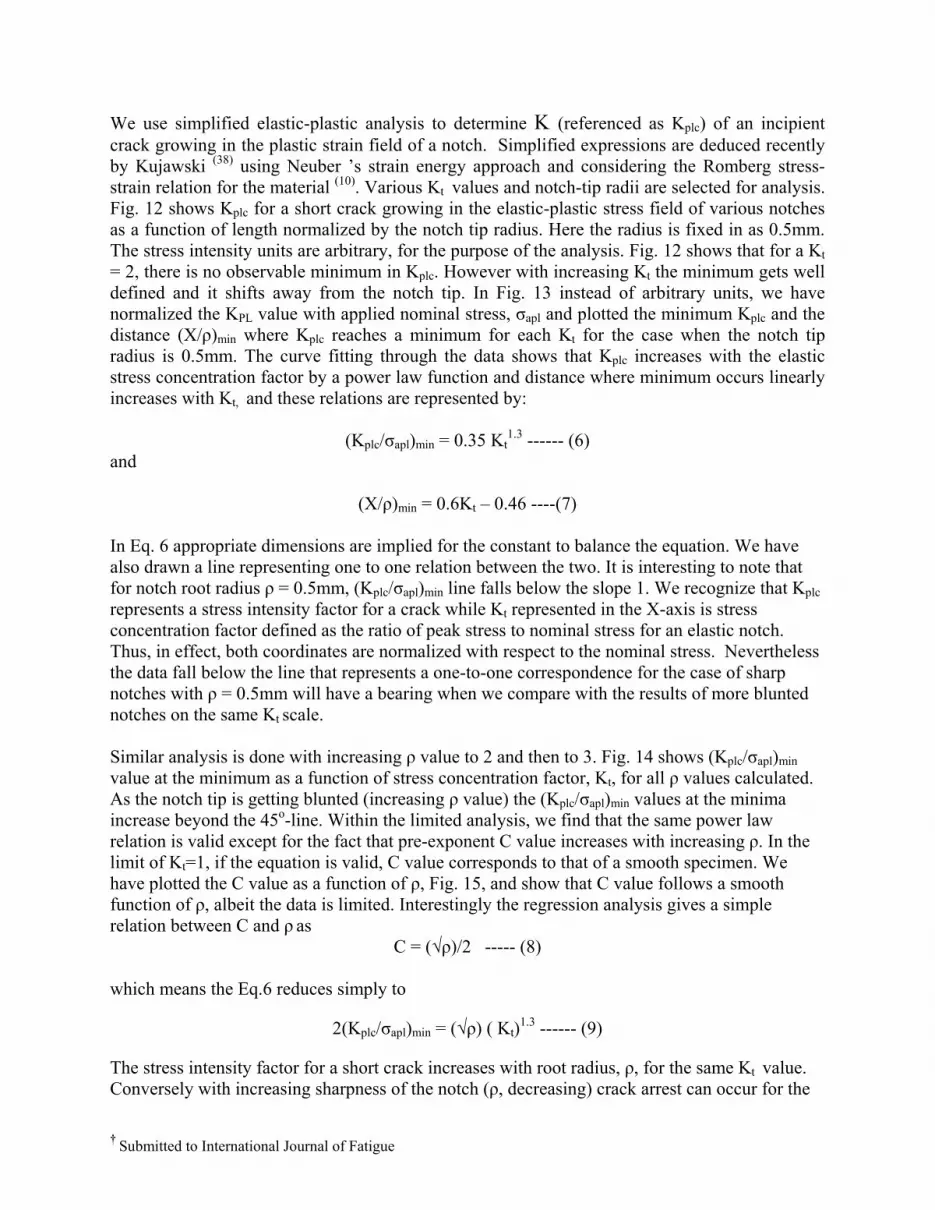
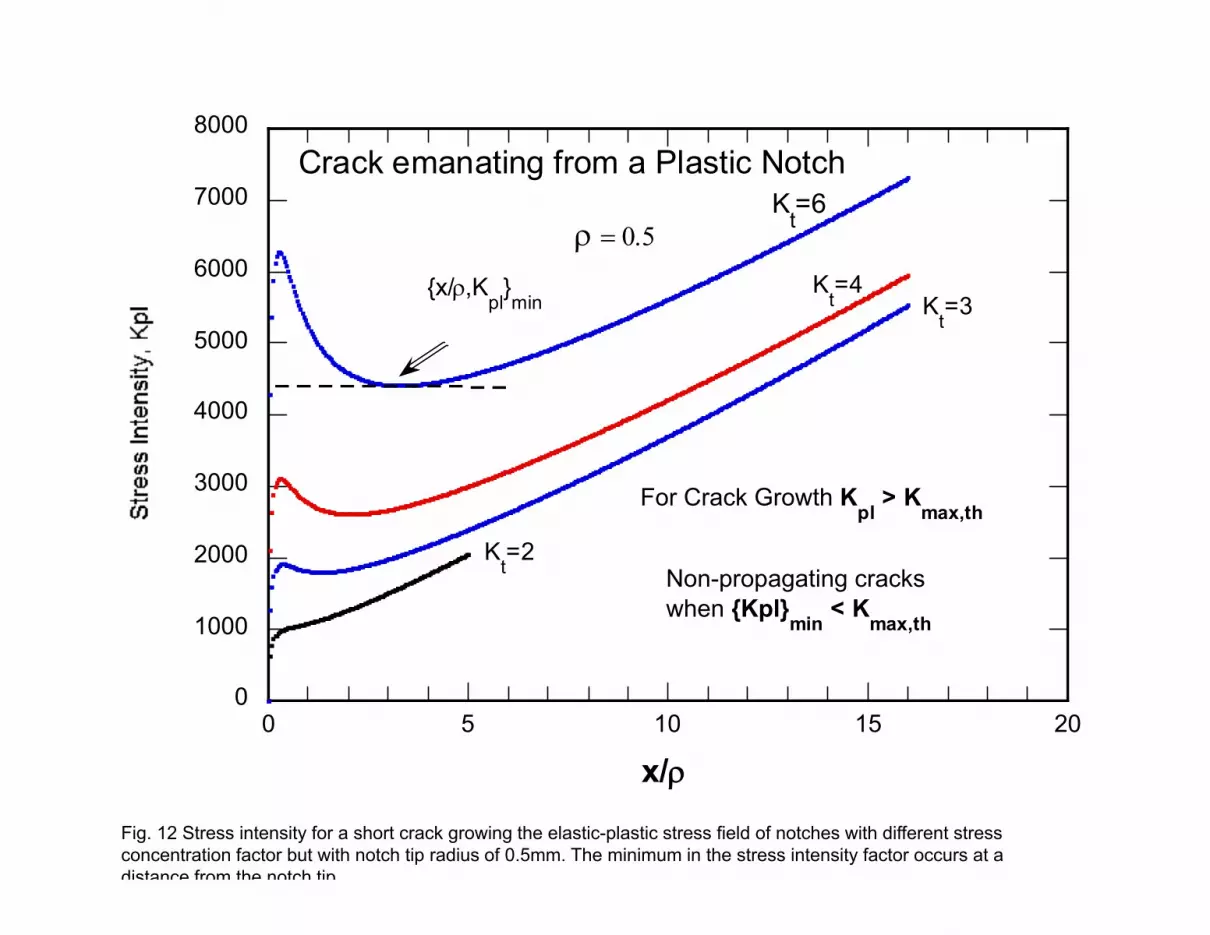
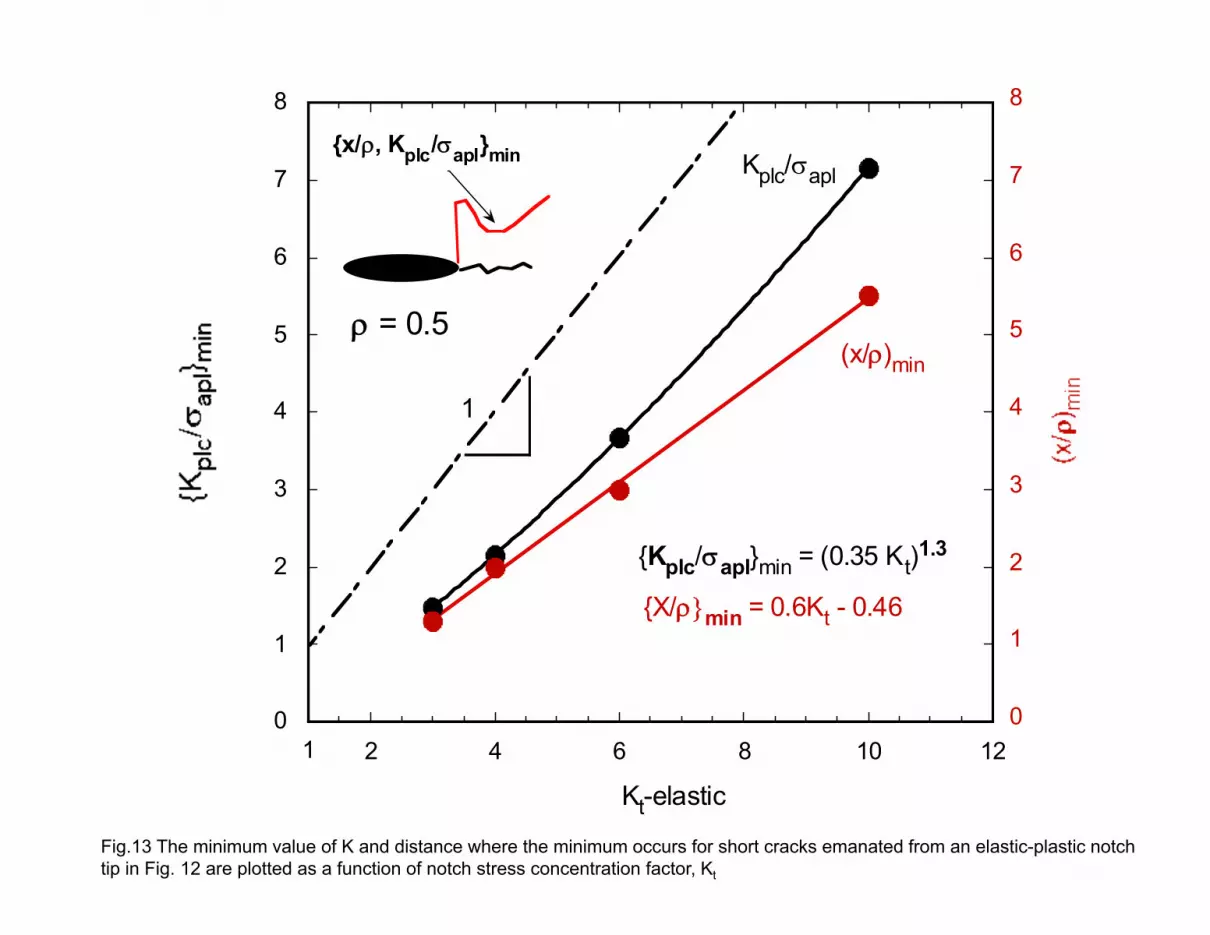
We use simplified elastic-plastic analysis to determine K (referenced as Kplc) of an incipient crack growing in the plastic strain field of a notch. Simplified expressions are deduced recently by Kujawski (38) using Neuber ’s strain energy approach and considering the Romberg stress-strain relation for the material (10). Various Kt values and notch-tip radii are selected for analysis. Fig. 12 shows Kplc for a short crack growing in the elastic-plastic stress field of various notches as a function of length normalized by the notch tip radius. Here the radius is fixed in as 0.5mm. The stress intensity units are arbitrary, for the purpose of the analysis. Fig. 12 shows that for a Kt = 2, there is no observable minimum in Kplc. However with increasing Kt the minimum gets well defined and it shifts away from the notch tip. In Fig. 13 instead of arbitrary units, we have normalized the KPL value with applied nominal stress, σapl and plotted the minimum Kplc and the distance (X/ρ)min where Kplc reaches a minimum for each Kt for the case when the notch tip radius is 0.5mm. The curve fitting through the data shows that Kplc increases with the elastic stress concentration factor by a power law function and distance where minimum occurs linearly increases with Kt, and these relations are represented by:
(Kplc/σapl)min = 0.35 Kt1.3 ------ (6)
and
(X/ρ)min = 0.6Kt – 0.46 ----(7)
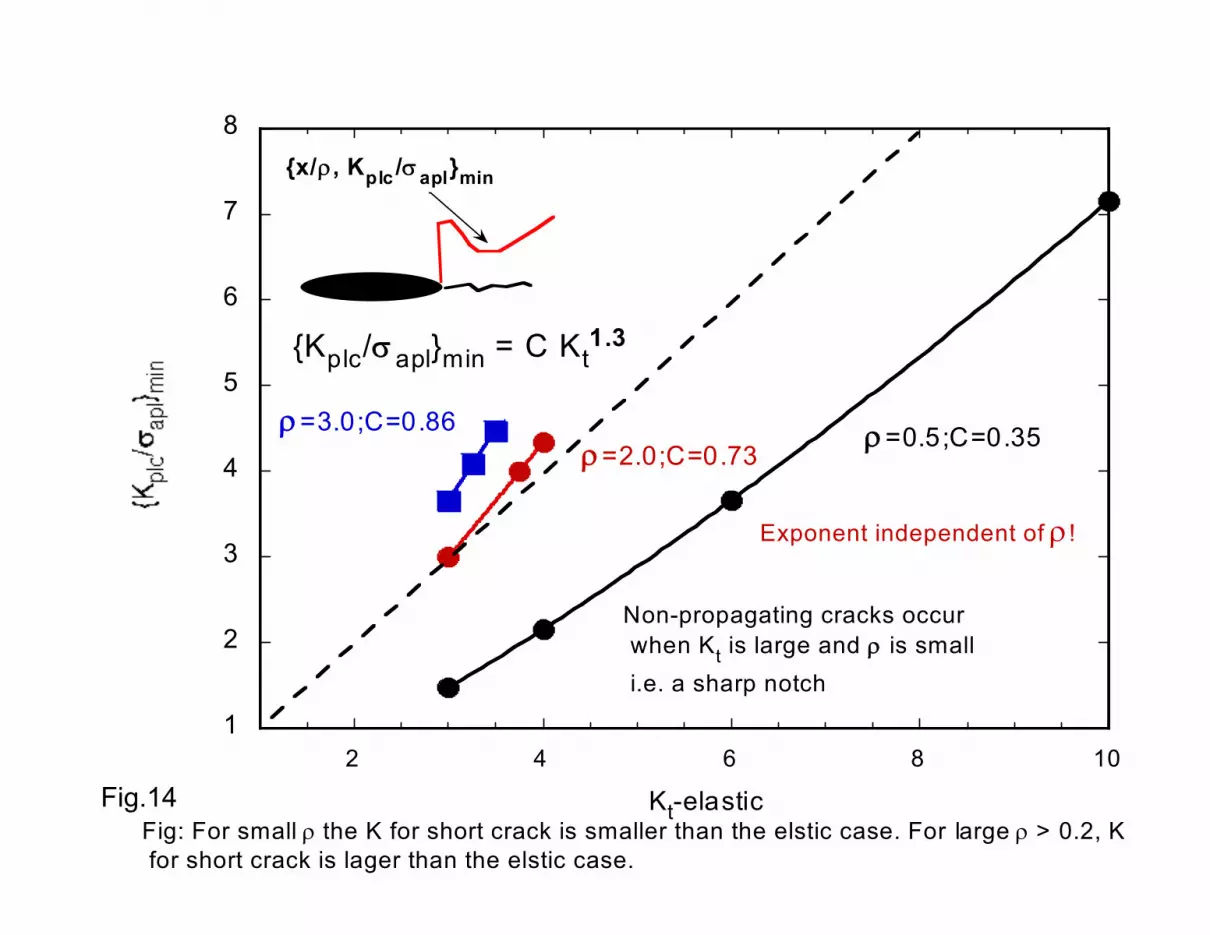
In Eq. 6 appropriate dimensions are implied for the constant to balance the equation. We have also drawn a line representing one to one relation between the two. It is interesting to note that for notch root radius ρ = 0.5mm, (Kplc/σapl)min line falls below the slope 1. We recognize that Kplc represents a stress intensity factor for a crack while Kt represented in the X-axis is stress concentration factor defined as the ratio of peak stress to nominal stress for an elastic notch. Thus, in effect, both coordinates are normalized with respect to the nominal stress. Nevertheless the data fall below the line that represents a one-to-one correspondence for the case of sharp notches with ρ = 0.5mm will have a bearing when we compare with the results of more blunted notches on the same Kt scale. Similar analysis is done with increasing ρ value to 2 and then to 3. Fig. 14 shows (Kplc/σapl)min value at the minimum as a function of stress concentration factor, Kt, for all ρ values calculated. As the notch tip is getting blunted (increasing ρ value) the (Kplc/σapl)min values at the minima increase beyond the 45o-line. Within the limited analysis, we find that the same power law relation is valid except for the fact that pre-exponent C value increases with increasing ρ. In the limit of Kt=1, if the equation is valid, C value corresponds to that of a smooth specimen. We have plotted the C value as a function of ρ, Fig. 15, and show that C value follows a smooth function of ρ, albeit the data is limited. Interestingly the regression analysis gives a simple relation between C and ρ as
C = (√ρ)/2 ----- (8)
which means the Eq.6 reduces simply to
2(Kplc/σapl)min = (√ρ) ( Kt)1.3 ------ (9)
The stress intensity factor for a short crack increases with root radius, ρ, for the same Kt value. Conversely with increasing sharpness of the notch (ρ, decreasing) crack arrest can occur for the
† Submitted to International Journal of Fatigue
same Kt value if the stress intensity factor at the minimum falls below the threshold for crack growth. Thus, both the stress concentration factor Kt and root radius of the notch, ρ, are important in determining the value of K for the short crack. With increasing ρ, the gradient of the stress field of the notch changes thus affecting the growth of the incipient crack initiated at the notch tip. With increasing remote applied stress, σapl, the K for the short crack also increases linearly, as is to be expected. Since crack arrest occurs when the Kplc falls below the threshold value for continuous fatigue crack growth, crack growth is ensured and thus failure occurs only when
2(Kplc/σapl)min = (√ρ) ( Kt)1.3 ≥ (Kmax,th/σapl) ------(10)
and using the modified Kitagawa-Takahashi diagram we can express Kmax,th as
Kmax,th = Y σmax,e √(πa*), ------(11)
where σmax,e is the endurance limit in a smooth specimen and the geometric component Y is taken approximately as 1. Hence from Eq. 10 and 11, the minimum condition for continuous crack propagation can be expressed for any applied stress, σapl as
2(Kplc/σapl)min = (√ρ) ( Kt)1.3 ≥ Y (√πa*) σmax,e/σapl ------ (12)
The Eq. 12 states that for any notched specimen of Kt the minimum applied stress is required for it to propagate. If crack can initiate at stress σmax,e/Kt the initiated crack will propagate only if Eq. 12 is satisfied. Hence minimum stress values for crack initiation and propagation conditions for a notched specimen of Kt are defined, respectively, as
σapl,in = σmax,e/Kt -------- (13), and
σapl,pr = Y ({(πa*)/ρ}0.5 σmax,e/( Kt)1.3} = Kmax,th/{(√ρ) ( Kt)
1.3} ---- (14)
Thus crack initiation and propagation differ since the maximum stress at the notch tip governs the initiation while propagation is insured only when the internal stress gradient meets the Kmax,th condition for long cracks as established by the modified Kitagawa-Takahashi diagram and validated by the observed experimental results. Thus by way of Eq. 14, the growth of incipient crack at an elastic-plastic notch tip is now expressed in simpler linear elastic formulation in terms of Kmax,th for a long crack and elastic stress concentration factor, Kt, and notch-tip radius, ρ. Incidentally, the ρ dependence on the stress for crack initiation in eq. 10 follows closely the ρ dependence envisioned by Barsom and McNicole(42) based on the experimental results on fatigue crack nucleation in notched specimens in high strength steels, as well as that of the stress filed of a blunted crack of root radius ρ deduced by Crager and Paris(43). The above equations can form the basis for incorporation into the life prediction methodology as the kinetics of short crack growth are now reduced to the same as those of long crack growth, except for the changing crack tip driving forces due to elastic-plastic internal stress field of the notch. Needless to say, Eq. 3 forms the basis for this analysis.
11. Analysis of the Holes of various radii:
† Submitted to International Journal of Fatigue
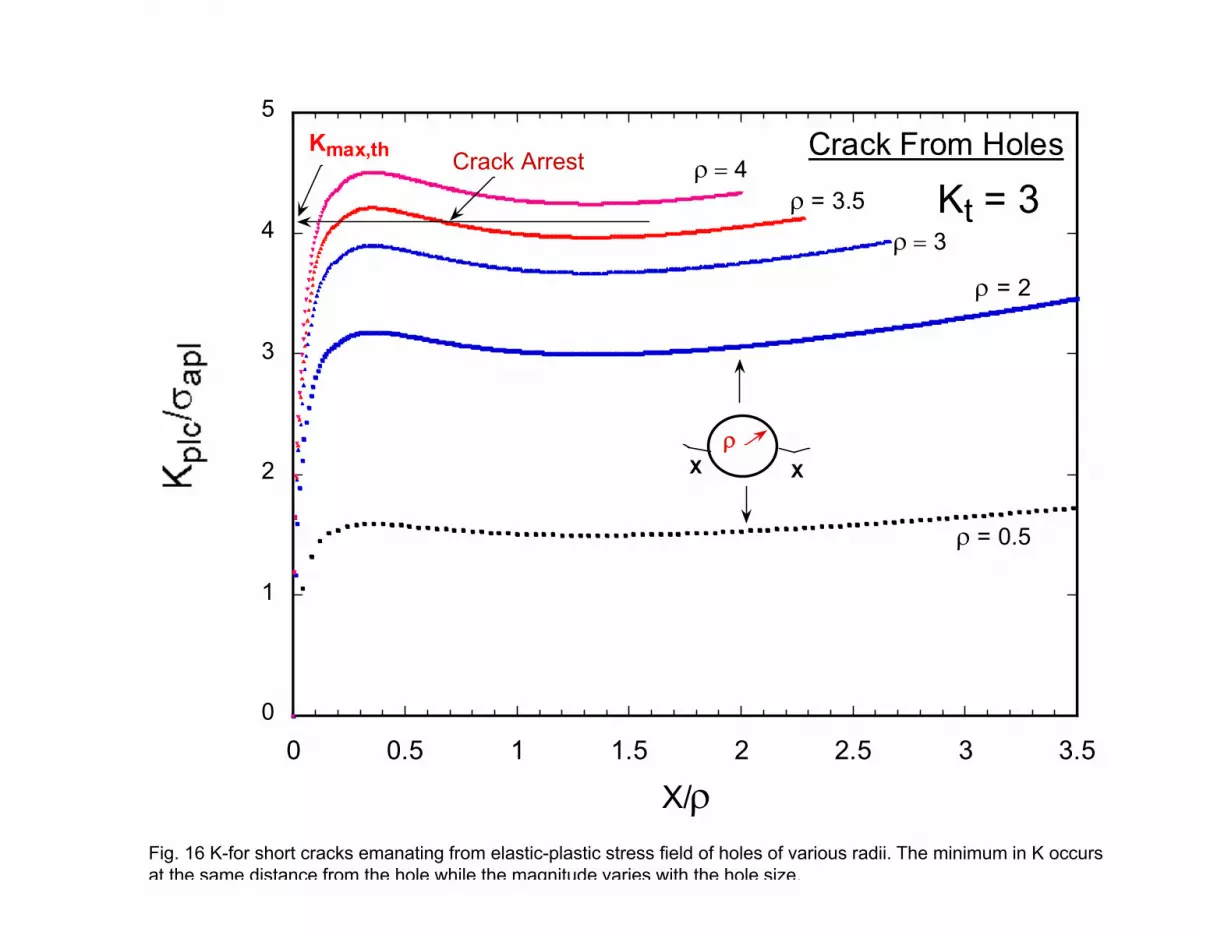
To check the consistency of the present analysis, it is now extended for holes of different radius, where Kt = 3, thus Kt is kept constant while the radius of the hole, ρ, is changed. Fig. 16 shows the stress intensity factor, Kplc, normalized with respect to the nominal applied stress, σapl, of a growing short crack under elastic-plastic holes of various radii. There are distinct minima in the Kplc value that occurs at a distant from the notch root radius. The results are similar to the more general notches reported in fig. 12. The only difference is the minima occurs at the same distance when normalized by the root radius, ρ. The minimum value observed is plotted as function of root radius and is shown in Fig. 17. The results show a power law relation which can be expressed using the regression analysis as
(Kplc/σplc)min = 2.1 √(ρ) --------(15)
which is close to that which can be deduced from Eq. 9, by substituting Kt = 3. Thus with increasing hole radius, the magnitude of the minimum increases for the same nominal stress value. Conversely with reducing hole radius, for the same nominal stress, non-propagating crack conditions can be encountered, in agreement with experimental results of Endo et al(43). Thus analysis and the results are self-consistent and provide the basis for the modified Kitagawa-Takahashi diagram in combining the crack nucleation, short crack growth and crack propagation in one framework that can be used as a basis for the life prediction of components subjected to spectrum loads.
12 Application to Life-Prediction: Finally we provide a way of adopting these concepts in the development of life prediction. First, as emphasized before the analysis only provides the nature of the internal stresses and the crack growth conditions as well as when non-propagation or non-failure conditions are encountered under fatigue cycling and not the kinetics of crack growth, per sec. The fundamental results of this analysis is two fold – from the point of crack nucleation, the smooth specimen data (including the mean-stress effects) provides the basic data for analysis and prediction. For any other pre-existing stress concentrations, the stress for nucleation is given by σmax,e /Kt, although experimental support for this is needed not only at endurance stress but for stresses higher than the endurance. Similarly for crack propagating conditions, the threshold curve for a long crack forms the basis for life-prediction. For prediction of the kinetics of crack growth, the crack growth behavior of long crack forms the basis. UNIGROW modeling takes into consideration the R-ratio effects of the long crack growth and also considers the internal stresses that perturb the long crack growth kinetics during overloading and under-loading during spectrum loads. In the same fashion, the internal stress effects at the notches and the growing incipient cracks can be taken into consideration the formulae presented in Eq. 10-14. The notch stress intensity factor and notch tip radius (or hole radius) are required input for the computation of the internal stresses to determine the requirement for continuous crack growth and failure. A systematic analysis of crack initiation and crack propagation using notches for various Kt and notch tip radii will help to establish on firm ground some of the concepts presented in this analysis.
13. Summary: We have presented a modified Kitagawa-Takahashi failure diagram by combining the crack nucleation of smooth specimen at one extreme and crack propagation of a fracture mechanics specimen on the other, and by bringing the magnitude and gradients in the internal stresses required for continuous crack growth under fatigue. Localized plasticity forms the basis for the additional crack tip driving forces in either accelerating or decelerating crack

† Submitted to International Journal of Fatigue
growth kinetics there by providing conditions for either crack arrest or resulting non-propagating cracks and for continuous uninterrupted crack growth. The methodology is based on separating the mechanically introduced crack tip driving forces vs. the material resistance; the later can be extracted from long-crack growth data under constant amplitudes. Such a separation is based on the original Rice analysis which is extended to fatigue. In a separate paper these concepts are extended to corrosion and corrosion-fatigue thus unifying the life prediction under subcritical crack growth under one basic formulation.
Acknowledgements: The present research effort is supported by ONR …
References: 1. SAE Fatigue design approach, 3rd Edition, 1997, Pub. SAE Intenational, Warrendal, Pa. 2. Damage Tolerant design DTD handbook, the DOD Joint Service Specification Guide - JSSG-2006 - Aircraft Structures. 3. Fatigue, Fail-Safe, And Damage Tolerance Evaluation Of Metallic Structure For Normal, Utility, Acrobatic, And Commuter Category Airplanes, AC 23-13A, FAA, US dept of Transportation, September 29, 2005. 4. H. Kitagawa, and S. Takahashi, “Applicability of fracture mechanics to very small 953 cracks or the cracks in the early stage”. In: Proceedings of the second 954 international conference on mechanical behavior of materials. Metals Park 955 (OH): ASM; 1976. p. 627–31. 956. 5. A.K. Vasudevan and K. Sadananda, Mater. Sci Engng. 1994, vol. A188, pp. 1-22 6. A.K. Vasudevan and K. Sadananda, Metall. Trans. 1995, vol. 26A, pp. 1221-34. 7. K. Sadananda, A.K. Vasudevan, Int. J. Fatigue, 1997, vol. 19, S99-109. 8. K. Sadananda and A.K. Vasudevan, Int. J. Fatigue, 2003, Vol. 25, pp. 899-914. 9. J. Goodman, Mechanics Applied to Engineering. London: Longmans Green; 1899, 934. 10. N.E. Dowling, Mechanical Behavior of Materials: Engineering Methods for Deformation, Fracture and Fatigue. 2nd ed. Upper Saddle River (NJ): Prentice Hall; 1999.
11. Forman RG, Kearney VE, Engle RM. J Basic Eng 1987;89:459–64. 944 12 P. C. Paris and F. Erdogan, “A Critical Analysis of Crack Propagation Laws,” Transaction ASME, Journal of Basic Engineering, 1963, Vol. 85, pp. 528-534 13. Suresh S, Ritchie R. Propagation of Short Fatigue Cracks. Int. Met. Review, 1984, vol.29, pp. 445–76. 14. N. Lout, K. Sadananda, M. Duesbery, and A.K. Vasudevan, A Theoretical Analysis of crack Closure”, Metall Mater Trans. A, 1993, Vol. 24A, 2225-2232. 15. A.K.Vasudevan, Unified Fatigue Damage Analysis:The UniGrow Model, ONR- Briefing for the Condition-Based Maintenance Plus Action Group, March 2, 2011 16. J. Lagrange, Méchanique Analytique. 1788, p. 226 17. K. Sadananda, S. Sarkar, D. Kujawski, A. K. Vasudevan, “A two-parameter analysis of S-N fatigue life using ∆σ and σmax”, Int. J. Fatigue, 2009, Vol. 31, pp. 1648-1659. 18. K. Sadananda, A.K. Vasudevan and N. Phan, “Analysis of endurance limits under very high cycle fatigue using a unified damage approach, Int. J. fatigue, 2007, vol. 29, pp. 2060-2071. 19. El-Haddad MH, Topper TH, Smith KN. Eng Fract Mech 1979;11:573–84. 957
20. K. Tanaka, Y. Nakai, M. Yamashita, ‘Fatigue crack growth threshold of small cracks’, Int. J. Fatigue, 1981, vol. 17, pp. 519-33. 21. R. Pippan, M. Berger M, H.P. Stu¨we, Metall Trans 1987 vol.18A, p. 429.

† Submitted to International Journal of Fatigue
22. Pineau A. ‘Short fatigue crack behavior in relation to three-dimensional aspects and crack closure effect’. In: Ritchie RO, Lankford J, editors. Proceedings: Small Fatigue Cracks. AIME; 1986. p. 191–212.
23. Alcoa report? 24. A. Navarro and E.R. de los Rios, “Short and long fatigue crack growth: A unified model”, Phil. Mag. 1988, vol. 57, pp.15-36. 25. M.S. Bruzzi, P.E. McHugh, “Methodology for modeling the small crack fatigue behavior of aluminum alloys”, Int. J. Fatigue, 2002, vol. 24, pp. 1071–1078 26. K. Tanaka and T. Mura, Fatigue Crack Growth along Planar Slip Bands”, Acta Metallurgica, 1984, Vol. 32, pp. 1731-1740. 27. I. R. Kramer, A mechanism of Fatigue Failure, Met. Trans. 1974, Vol. 5. p. 1735. 28. D. Taylor – A mechanistic approach to critical-distance methods in notch fatigue, Fatigue Fract Engng Mater Struct 24, 215-224, 2001. 29 S. Usami, “Engineering applications of small crack fatigue properties”, in Small Fatigue Cracks’, Ed. R.O. Ritchie and J. Lankford, AIME, Warrendale, Pa. 1986, pp. 559-586. 30. E. Orowan, 1948. Fracture and strength of solids. Reports on Progress in Physics XII, 185–232. 31. G.R. Irwin “Analysis of stresses and strains near the end of a crack traversing a plate”, Journal of Applied Mechanics 1957, vol. 24, pp.361–364. 32. J.R. Rice, ‘An Examination of the Fracture Mechanics Energy Balance from the point of view of continuum Mechanics”, in Proc. 1st Inter. Con. Fracture, Sendai, 1965, Eds. T. Yokobori et al, Vol. 1, Japan Soc. For Strength and Fracture of Materials, Tokyo, 1966- pp. 309-340. 33. N.E. Fleck, C.S. Shin, R.A. Smith, ‘Fatigue Crack Growth under compressive loading’, Engrg.Frac. Mech., 1985, vol. 21, pp. 173-185. 34. S.Suresh, “Crack initiation under cyclic compression and its application’,Engrg. Frac. Mech., 1985, vol 21, 452-463. 35. R. Pippan, Growth of Short cracks under cyclic compression’ Fat. Engrg. Mat. Struc. 1987, Vol. 9, pp. 319-328. 36. J.C. Newman, Jr. Y. Yamada, ‘compression precracking methods to generate near threshold fatigue crack growth rate data’, Int. J. Fatigue., 2010, vol. 32, pp. 879-885. 37. S. Suresh, Fatigue of materials, 2nd Edition, 1998, University Press, Cambridge, 38. D. Kujawski, “Estimations of stress intensity factor for a short crack in an elastic-plastic notch”, Engrg Frac. Mech., 2008, vol. 75, pp. 5246-47.
39. J. C. Newman, Jr. Private communication, 2009 40. G.Shen and Glinka G., “Weight Functions for a Surface Semi-Elliptical Crack in a Finite Thickness Plate,“ Theor. Appl. Fract. Mech., 1991, Vol. 15, pp. 247-255 41. Air Force Report – ref: 42. J.B. Barson and R.C. McNicol, “Effect of Stress concentration on Fatigue-Crack Initiation in HY-130 Steel”, ASTM-STP 559, 1973, pp. 183-204. 43. M. Creager and P.C. Paris, “Elastic Field Equations for Blunt Cracks with reference to stress corrosion cracking”, Engrg. Frac. Mech., 1967, Vol. 3, pp. 247-252. 43 K. Endo, K. Komai and I. Yamamoto, Bull. MSME, 1981, Vol. 24, pp. 1326-32
† Submitted to International Journal of Fatigue
Figure Captions
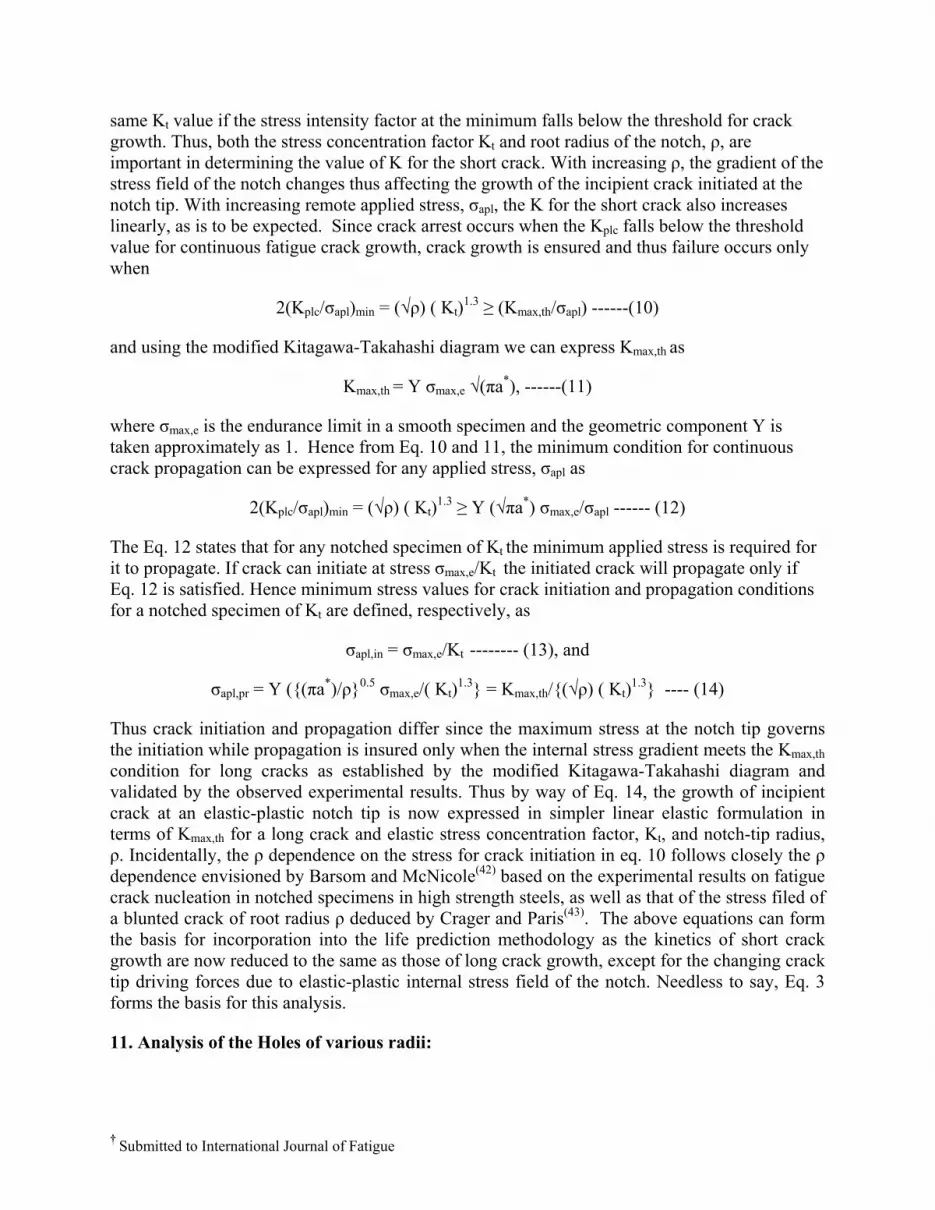
Fig. 1 Two load-parameter requirement for Fatigue. a) Kmax and ∆K for crack growth and b) σmax and ∆σ for fatigue life. Non-propagating or no-failure regimes exist below the thresholds for both. Increasing crack growth rate or reducing life, increases the two respective parameters along the trajectory paths representing material resistance. Fig 2 Original Kitagawa-Takahashi diagram combining Endurance limit and Fatigue thresholds. Fig. 3 Modified Kitagawa-Takahashi diagram for Fatigue failure. σIN and σf are crack initiation and failure stress under tensile load and σmax,e is endurance limit for smooth specimen. Kmax,th and KIC are fatigue threshold and fracture toughness of the material. ABCD defines the internal stress trangle with BCD defining the minimum stress and gradient required for a crack to grow. Fig.4 Kitagawa-Takahashi diagram for many materials on normalized coordinates, replotted from Tanaka et al. Fig. 5 Kitagawa-Takahashi diagram for different R-ratios in normalized coordinates. Fig.6 Behavior of long crack growth represents material response to an applied force. Deviations from it arise due to local stresses. Similitude that for a given da/dN (material response) the needed mechanical forces remain the same. No similitude break down occurs or is needed to justify the deviations from long crack growth behavior. Deviations occur due to fluctuating internal stresses. Fig.7 Crack tip driving force fluctuates due to changing combined internal and applied stresses resulting in deceleration, acceleration and growth, and even arrest of a growing crack when the force falls below the required threshold force. Fig.8 Crack growth behavior of short cracks in relation to that of long cracks for an Aluminum alloy. Fig.9 Modified Kitagawa diagram for the data in Fig. 8 showing that internal stresses and applied stresses exceed the minimum required for crack growth based on the threshold for long crack. Fig.10. Fatigue crack growth behavior of microstructurally short cracks in relation to that of long crack in Ti-6Al-4V. Fig.11. Representation of the data in Fig. 10 in the Modified Kitagawa-Takahashi diagram showing the internal aid the applied stress the crack to grow. Fig. 12 Stress intensity for a short crack growing the elastic-plastic stress field of notches with different stress concentration factor but with notch tip radius of 0.5mm. The minimum in the stress intensity factor occurs at a distance from the notch tip.

† Submitted to International Journal of Fatigue
Fig.13 The minima of K-values and distances where the minima occur for short cracks emanated from an elastic-plastic notch-tips in Fig. 12 are plotted as a function of notch stress concentration factor, Kt. Fig. 14 The minima K-values for short cracks emanated from elastic-plastic notch-tips are plotted as function of Kt for different notch tip radii. Fig.15. The constant value, C in Fig.14 varies with square-root dependence on notch-tip radius, ρ. Fig. 16 K-for short cracks emanating from elastic-plastic stress field of holes of various radii. The minimum in K occurs at the same distance from the hole while the magnitude varies with the hole size. Fig.17 K for short cracks emanating in the presence of elastic-plastic stress fields of holes as a function of hole radius. .
Crack Growth
∆Kth
Kmax,th
Non-Propagatingcracks
Kmax
∆K
Kmax,th ≥ ∆Kth
Increasingda/dN
Crack growthTrajectory
a)
Fig. 1 Two load-parameter requirement for Fatigue. a) Kmax and ∆K for crack growth and b) σmax and ∆σ for fatigue life. Non-propagating or no-failure regimes exist below the thresholds for both. Increasing crack growth rate or reducing life, increasesthe two respective parameters along the trajectory paths representing material resistance.
∆σ
Endurance
∆σe
σmax,e
σmax
No-Failure
σmax,e ≥ ∆σe,
Fatigue lifetrajectory
DecreasingFatigue life
b)
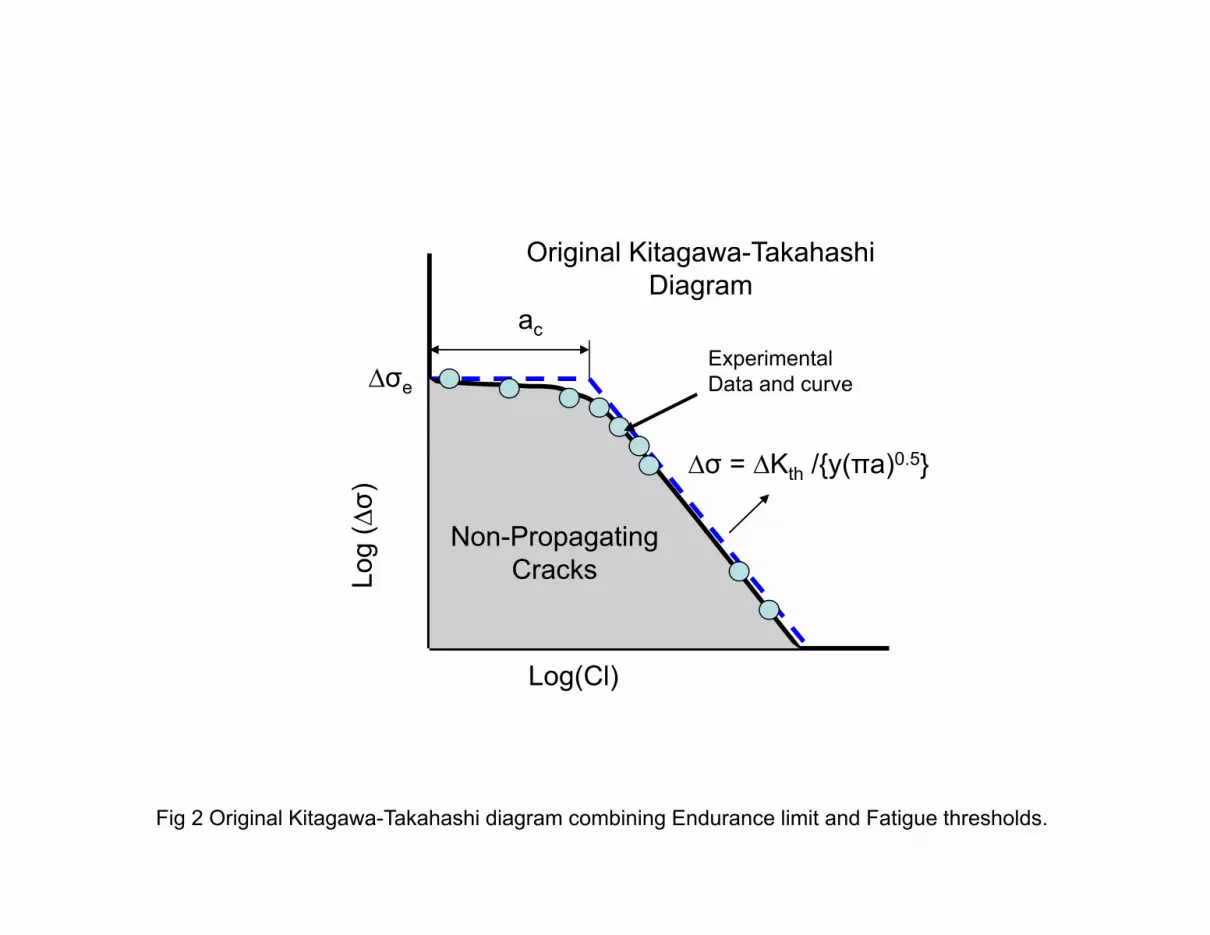
Fig 2 Original Kitagawa-Takahashi diagram combining Endurance limit and Fatigue thresholds.
ac
∆σ = ∆Kth /{y(πa)0.5}
Log
(∆σ)
Log(Cl)
∆σe
Non-PropagatingCracks
Original Kitagawa-TakahashiDiagram
Experimental Data and curve
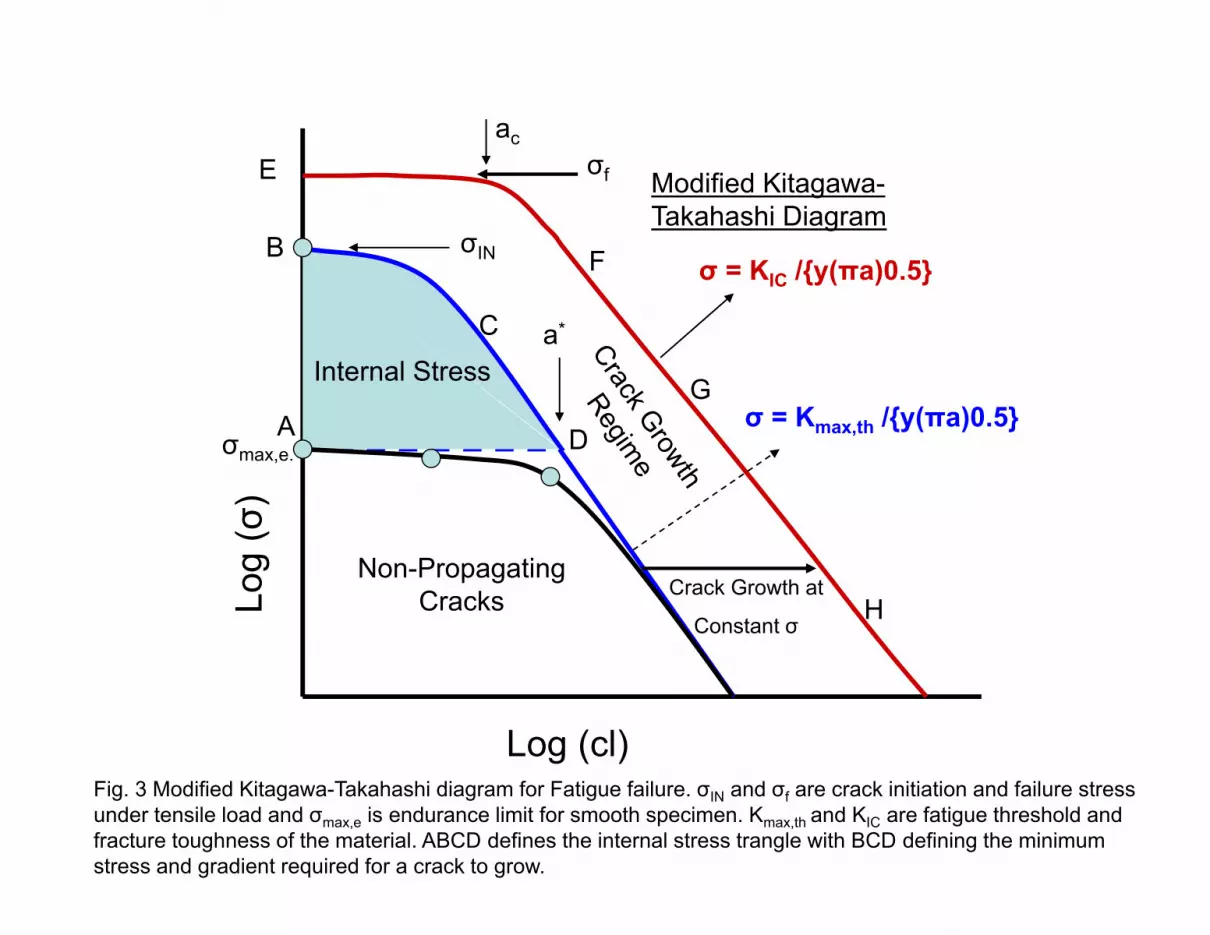
Fig. 3 Modified Kitagawa-Takahashi diagram for Fatigue failure. σIN and σf are crack initiation and failure stress under tensile load and σmax,e is endurance limit for smooth specimen. Kmax,th and KIC are fatigue threshold and fracture toughness of the material. ABCD defines the internal stress trangle with BCD defining the minimum stress and gradient required for a crack to grow.
Internal Stress
σIN
σmax,e.
Log (cl)
Log
(σ)
A
B
C
D
a*
E σf
σ = Kmax,th /{y(πa)0.5}
σ = KIC /{y(πa)0.5}
G
H
F
Non-PropagatingCracks
Modified Kitagawa-Takahashi Diagram
Crack Growth at
Constant σ
ac
y-
Normalized Kitagawa-TakahashiDiagram
0.1
1
10-2 10-1 100 101 102
S20c-366- Tanaka,1981S20C-194-Tanaka,1981MildSteel-289-Frost,1959G40-11 - -Haddad,1979SM41- 251- Ohuchida,1975SM41-251-Usami,1979SM50-373-Kitagawa,1976HT80-726-Kitagawa,197913Cr-castSteel-760-Usami,197913Cr-castSteel-769-Usami,1979Copper- - Frost,1963Al- 30.4-Frost,1964
Relative Crack Length a/a*
Slope 0.5
Reploted from K. Tanaka, Y. Nakai and M. Yamashita, Int. J. Fatigue, Vol. 17, 1981, pp. 519-533.
Fig.4 Kitagawa-Takahashi diagram for many materials on normalized coordinates
0.01
0.1
1
10
100
0.001 0.01 0.1 1 10 100 1000 104
R = 0.8
R = 0
R = 0.5
R = -1.0
R ela tive crack length a /a*c
13Cr - SteelData from Usami 1987
Inc lu sion size
Cas tin gpo ro sity
Internal Stress
A
B
C
D
Fig. 5 Kitagawa-Takahashi diagram for different R-ratios in normalized coordinates.

Overload
Underload
Short cracks
Long Crack
K
da/d
N
Kint
crackarrest
dl
Perturbations from Long Crack Growth
da/dN1
Fig.6 Behavior of long crack growth represents material response to an applied force. Deviations from it arise due to local stresses. Similitude that for a given da/dN (material response) the needed mechanical forces remains the same. No similitude break down occurs or is needed to justify the deviations from long crack growth behavior. Deviations occur due to fluctuating internal stresses.
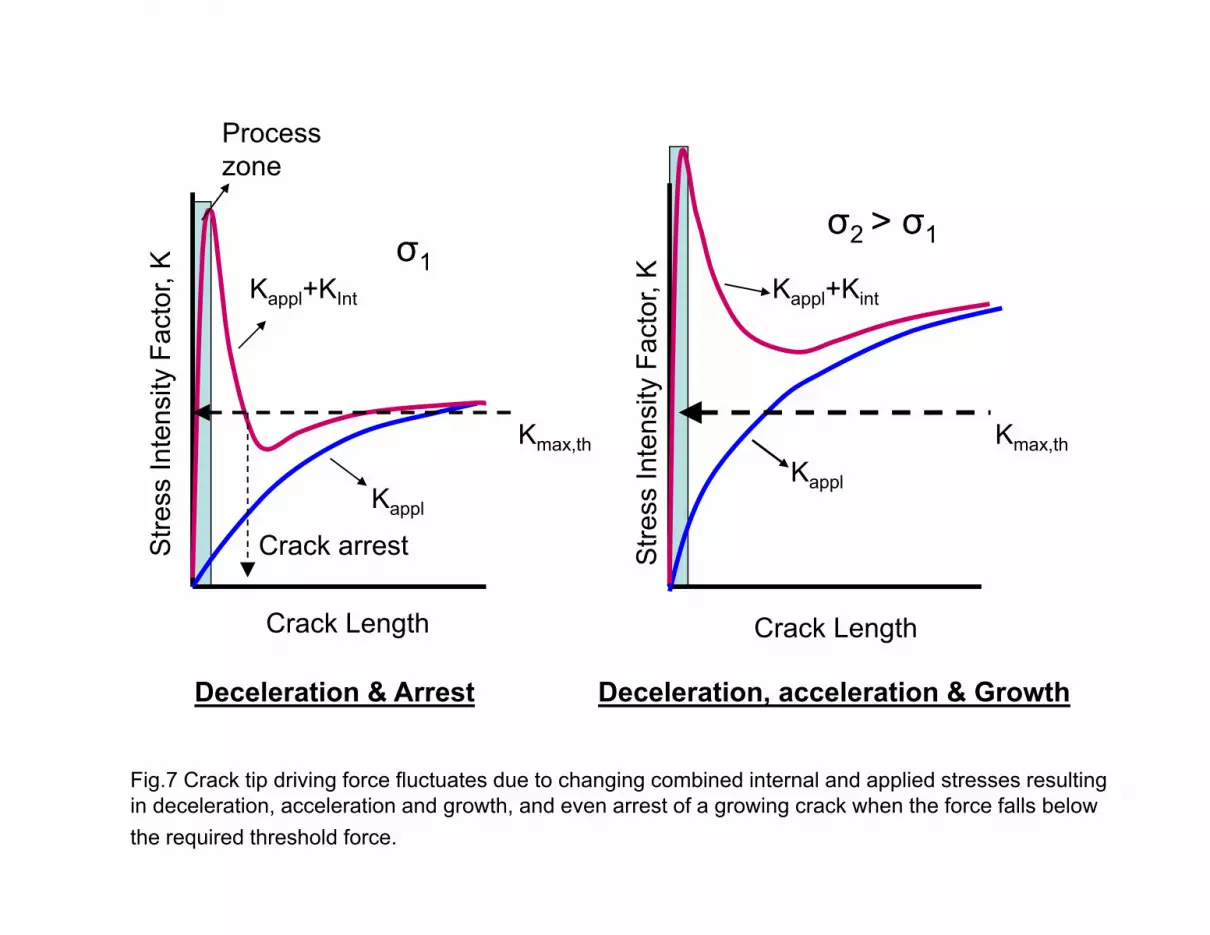
Fig.7 Crack tip driving force fluctuates due to changing combined internal and applied stresses resulting in deceleration, acceleration and growth, and even arrest of a growing crack when the force falls below the required threshold force.
Crack Length
Stre
ss In
tens
ity F
acto
r, K
Crack arrest
Kmax,th
Kappl
Kappl+KInt
Processzone
Deceleration & Arrest
Kmax,th
Kappl
Kappl+Kint
Deceleration, acceleration & Growth
Crack LengthS
tress
Inte
nsity
Fac
tor,
Kσ1σ2 > σ1

10-12
10-11
10-10
10-9
10-8
10-7
10-6
10-5
10-4
1 10 100
da/
dN, m
/cyc
le
MPa(m)0.5
Al-2024 T3Long and Short Crack Data
Smax
= 105 MPa
R = -1
80 MPa
70 MPa
60 MPa
Long Crack
Data Collected by Newman
Fig.8 Crack growth behavior of short cracks in relation to that of long cracks for an Aluminum alloy

101
102
0.0001 0.001 0.01
Short Crack to Long Crack
Crack Length, m
e,max
70 MPa
60 MPa
Short Crack Growth
Long Crack Growth
Internal Stress Regime
Long Crack Threshold
Merging with Long Crack
ac
Al 2024-T3R = -1
CrackArrest
Fig. 9. Modified Kitagawa diagram for the data in Fig. 8 showing that internal stresses and applied stresses exceed the minimum required for crack growth based on threshold for long crack..

10-9
10-8
10-7
10-6
10-5
1 10
Ti-6Al-4V
MPa(m)0.5
Long Crack
Data collected by AirforceMicrostructurally
Short Cracks
1
2
3
4
5
Fig.10 Fatigue crack growth behavior of microstructurally short cracks in relation to that of long crack in Ti-6Al-4V.
101
102
103
10-5 10-4 10-3 10-2 10-1
Ti-6Al-4V
Crack Length, mm
Threshold K Curve
Modified Kitagawa Diagram
Crack Growth Regime
Microstructuallyshort cracks
LocalizedInternal Stress
Regime
e Endurance
Crack Growth UnderRemote Stress
KAppl
+KInt.S
> = Kth
Fig.11 Representation of the data in Fig. 10 in the Modified Kitagawa-Takahashi diagram showing the internal aid the applied stress the crack to grow.
0
1000
2000
3000
4000
5000
6000
7000
8000
0 5 10 15 20
x/
Kt=6
Kt=4
Kt=3
Kt=2
{x/,Kpl
}min
For Crack Growth Kpl
> Kmax,th
Non-propagating cracks when {Kpl}
min < K
max,th
Crack emanating from a Plastic Notch
Fig. 12 Stress intensity for a short crack growing the elastic-plastic stress field of notches with different stress concentration factor but with notch tip radius of 0.5mm. The minimum in the stress intensity factor occurs at a distance from the notch tip
0
1
2
3
4
5
6
7
8
2 4 6 8 10 120
1
2
3
4
5
6
7
8
Kt-elastic
1
(x/)min
Kplc/apl
{Kplc/apl}min = (0.35 Kt)1.3
{X/min = 0.6Kt - 0.46
1
{x/, Kplc/apl}min
= 0.5
Fig.13 The minimum value of K and distance where the minimum occurs for short cracks emanated from an elastic-plastic notch tip in Fig. 12 are plotted as a function of notch stress concentration factor, Kt
1
2
3
4
5
6
7
8
1
2
3
4
5
6
7
8
2 4 6 8 10
Kt-elastic
=0.5;C=0.35=2.0;C=0.73=3.0;C=0.86
{Kplc/apl}min = C Kt1.3
{x/, Kplc /apl}min
Fig: For small the K for short crack is smaller than the elstic case. For large > 0.2, K for short crack is lager than the elstic case.
Non-propagating cracks occur when Kt is large and is small i.e. a sharp notch
Exponent independent of!
Fig.14

0.3
0.4
0.5
0.6
0.7
0.8
0.9
0 0.5 1 1.5 2 2.5 3 3.5
C = 0.5 ( )0.5
Fig.15. The constant value, C in Fig.14 varies with square-root dependence on notch-tip radius, ρ.
0
1
2
3
4
5
0 0.5 1 1.5 2 2.5 3 3.5
X/
XX
= 0.5
= 2
3
= 3.54Crack Arrest Crack From Holes
Kt = 3Kmax,th
Fig. 16 K-for short cracks emanating from elastic-plastic stress field of holes of various radii. The minimum in K occurs at the same distance from the hole while the magnitude varies with the hole size.

1
1.5
2
2.5
3
3.5
4
4.5
0 1 2 3 4 5
mm
Holes - Kt=3
2.1(
Fig. 17 K for short cracks emanating from in the presence of elastic-plastic stress fields of holes as a function of hole radius.


