Embed Size (px)
Citation preview
REVIEWS OF
MODERN PHYSICS VoLUME 29, NuMBER 4 OcroBER, 1957
Synthesis of the Elements in Stars* E. MARGARET BURBIDGE, G. R. BURBIDGE, WILLIAM: A. FOWLER, AND F. HOYLE
Kellogg Radiation1Laboratory, California Institute of Technology, and M aunt Wilson and Palomar Observatories, Carnegie Institution of Washington,
California Institute of Technology, Pasadena, California
"It is the stars, The stars above us, govern our conditions"; (King Lear, Act IV, Scene 3)
but perhaps
"The fault, dear Brutus, is not in our stars, But in ourselves," (Julius Caesar, Act I, Scene 2)
TABLE OF CONTENTS Page
I. Introduction ............................................................... · ............... 548 A. Element Abundances and Nuclear Structure. . . . . . . . . . . . . . . . . . . . . . . . . . . . . . . . . . . . . . . . . . . . . . . 548 B. Four Theories of the Origin of the Elements ............................................... 550 C. General Features of Stellar Synthesis ..................................................... 550
II. Physical Processes Involved in Stellar Synthesis, Their Place of Occurrence, and the Time-Scales Associated with Them ............... · ..................... · ................................. 551 A. Modes of Element Synthesis ............................................................. 551 B. Method of Assignment of Isotopes among Processes (i) to (viii) .............................. 553 C. Abundances and Synthesis Assignments Given in the Appendix. . . . . . . . . . . . . . . . . . . . . . . . . . . . . . 555 D. Time-Scales for Different Modes of Synthesis .............................................. 556
III. Hydrogen Burning, Helium Burning, the a Process, and Neutron Production ..................... 559 A. Cross-Section Factor and Reaction Rates .................................................. 559 B. Pure Hydrogen Burning ................... ; ............................................... 562 C. Pure Helium Burning ................................................................... 565 D. a Process ................................... :· ........................................... 567 E. Succession of Nuclear Fuels in an Evolving Star ....... , ................................... 568 F. Burning of Hydrogen and Helium with Mixtures of Other Elements; Stellar Neutron Sources .... 569
IV. e Process. . . . . . . . . . . . . . . . . . . . . . . . . . . . . . . . . . . . . . . . . . . . . . . . . . . . . . . . . . . . . . . . . . . . . . . . . . . . . . . . . 577
V. s and r Processes: General Considerations. . . . . . . . . . . . . . . . . . . . . . . . . . . . . . . . . . . . . . . . . . . . . . . . . . . . 580 A. "Shielded" and "Shielding" Isobars and the s, r, p Processes ................................. 580 B. Neutron-Capture Cross Sections ........... , .............................................. 581 C. General Dynamics of the s and r Processes . . . . . . . . . . . . . . . . . . . . . . . . . . . . . . . . . . . . . . . . . . . . . . . . 583
VI. Details of the s Process . . . . . . . . . . . . . . . . . . . . . . . . . . . . . . . . . . . . . . . . . . . . . . . . . . . . . . . . . . . . . . . . . . . . 583
*Supported in part by the joint program of the Office of Naval Research and the U. S. Atomic Energy Commission.
547 'Cqpyrlght © 1957 by the American Physical Society
548 BURBIDGE, BURBIDGE, FOWLER, AND HOYLE
VII. Details of the r Process . . . . . . . . . . . . . . . . . . . . . . . . . . . . . . . . . . . . . . . . . . . . . . . . . . . . . . . . . . . . . . . . . . . . 587 A. Path of the r Process ................................................................... 588 B. Calculation of the r-Process Abundances .................................................. 593 C. Time for the r Process: Steady Flow and Cycling. . . . . . . . . . . . . . . . . . . . . . . . . . . . . . . . . . . . . . . . . . 596 D. Freezing of the r-Process Abundances ........................................... · .......... 597
VIII. Extension and Termination of the r Process and s Process ..................................... . 598 598 598 605 608
A. Synthesis of the Naturally Radioactive Elements .......................................... . B. Extension and Termination of the r Process .............................................. . C. Age of the Elements and of the Galaxy .................................................. . D. Termination of the s Process; the Abundances of Lead, Bismuth, Thorium, and Uranium ...... .
IX. p Process ................................................................................ . 615
618 X. x Process ................................................................................ . A. Observational Evidence for Presence of Deuterium, Lithium, Beryllium, and Boron in our Galaxy 618 B. Nuclear Reactions which Destroy Deuterium, Lithium, Beryllium, and Boron ................. 618 C. Synthesis of Deuterium, Lithium, Beryllium, and Boron . . . . . . . . . . . . . . . . . . . . . . . . . . . . . . . . . . . . 618 D. Preservation of Lithium in Stars ......................................................... 620
XI. Variations in Chemical Composition among Stars, and Their Bearing on the Various Synthesizing Processes. . . . . . . . . . . . . . . . . . . . . . . . . . . . . . . . . . . . . . . . . . . . . . . . . . . . . . . . . . . . . . . . . . . . . . . . . . . . . . . . . 620 A. Hydrogen Burning and Helium Burning ................................................... 621 B. a Process .............................................................................. 626 C. Synthesis of Elements in the Iron Peak of the Abundance Curve, and the Aging Effect as It Is
Related to This and Other Types of Element Synthesis . . . . . . . . . . . . . . . . . . . . . . . . . . . . . . . . . . . . . 626 D. s Process .............................................................................. 627 E. r Process ....................................................... ~ ...................... 629 F. p Process .............................................................................. 629 G. x Process .............................................................................. 629 H. Nuclear Reactions and Element Synthesis in Surfaces of Stars. . . . . . . . . . . . . . . . . . . . . . . . . . . . . . . 629
XU. General Astrophysics . . . . . . . . . . . . . . . . . . . . . . . . . . . . . . . . . . . . . . . . . . . . . . . . . . . . . . . . . . . . . . . . 630 A. Ejection of Material from Stars and the Enrichment of the Galaxy in Heavy Elements ......... 63Q B. Supernova Outbursts. . . . . . . . . . . . . . . . . . . . . . . . . . . . . . . . . . . . . . . . . . . . . . . . . . . . . . . . . . . . . . . . . . . 633 C. Supernova Light Curves. . . . . . . . . . . . . . . . . . . . . . . . . . . . . . . . . . . . . . . . . . . . . . . . . . . . . . . . . . . . . . . . 635 D. Origin of the r-Process Isotopes in the Solar System ....................................... 639
XIII. Conclusion . . . . . . . . . . . . . . . . . . . . . . . . . . . . . . . . . . . . . . . . . . . . . . . . . . . . . . . . . . . . . . . . . . . . . . . . . . . . . . . 639 Acknowledgments. . . . . . . . . . . . . . . . . . . . . . . . . . . . . . . . . . . . . . . . . . . . . . . . . . . . . . . . . . . . . . . . . . . . 641 Appendix. . . . . . . . . . . . . . . . . . . . . . . . . . . . . . . . . . . . . . . . . . . . . . . . . . . . . . . . . . . . . . . . . . . . . . . . . . . . . . . . . 641 Bibliography. . . . . . . . . . . . . . . . . . . . . . . . . . . . . . . . . . . . . . . . . . . . . . . . . . . . . . . . . . . . . . . . . . . . . . . . . . . . . . 647
I. INTRODUCTION
A. Element Abundances and Nuclear Structure
M AN inhabits a universe composed of a great variety of elements and their isotopes. In Table
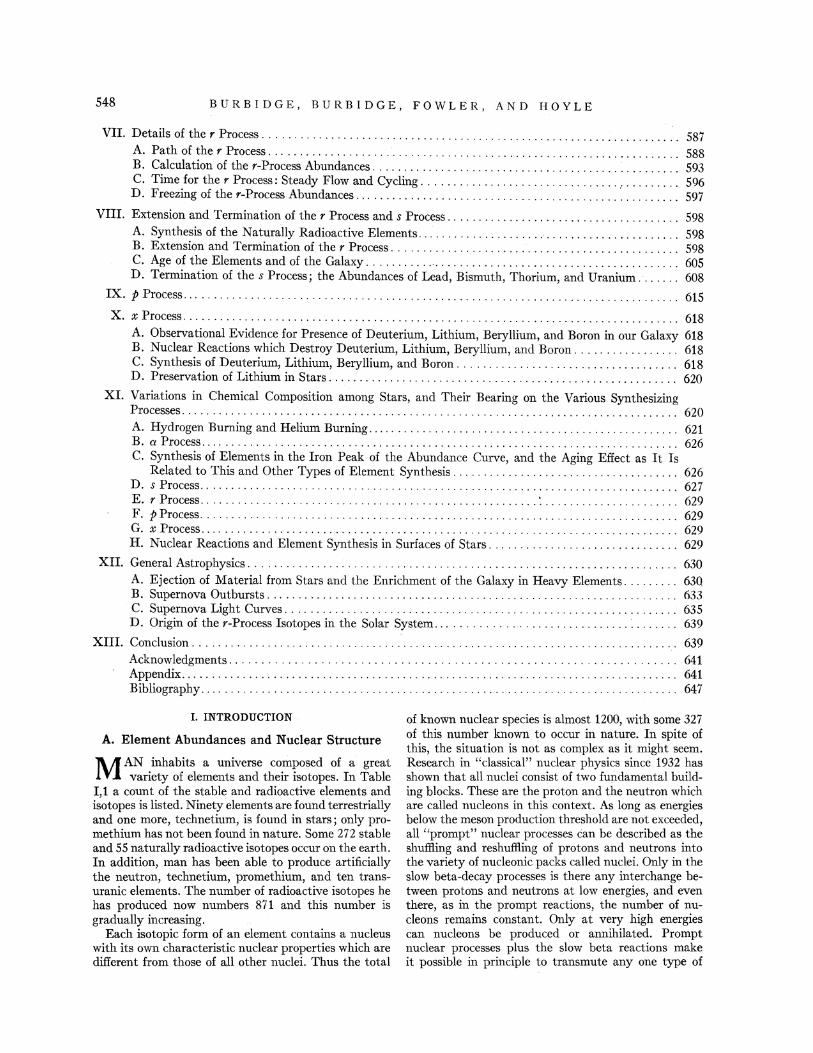
I,1 a count of the stable and radioactive elements and isotopes is listed. Ninety elements are found terrestrially and one more, technetium, is found in stars; only promethium has not been found in nature. Some 272 stable and 55 naturally radioactive isotopes occur on the earth. In addition, man has been able to produce artificially the neutron, technetium, promethium, and ten transmanic elements. The number of radioactive isotopes he has produced now numbers 871 and this number is gradually increasing.
Each isotopic form of an element contains a nucleus with its own characteristic nuclear properties which are different from those of all other nuclei. Thus the total
of known nuclear species is almost 1200, with some 327 of this number known to occur in nature. In spite of this, the situation is not as complex as it might seem. Research in "classical" nuclear physics since 1932 has shown that all nuclei consist of two fundamental building blocks. These are the proton and the neutron which are called nucleons in this context. As long as energies below the meson production threshold are not exceeded, all "prompt" nuclear processes can be described as the shuffling and reshuffling of protons and neutrons into the variety of nucleonic packs called nuclei. Only in the slow beta-decay processes is there any interchange between protons and neutrons at low energies, and even there, as in the prompt reactions, the number of nucleons remains constant. Only at very high energies can nucleons be produced or annihilated. Prompt nuclear processes plus the slow beta reactions make it possible in principle to transmute any one type of
SYNTHESIS OF ELEMENTS IN STARS 549
TABLE 1,1. Table of elements and isotopes [compiled from Chart of the Nuclides (Knolls Atomic Power Laboratory, April, 1956)].
Elements Isotopes
Stable 81 Stable 272 Radioactive: Radioactive:
Natural (Z~83) 1• Natural (A <206) 11d (Z>83) 9b . (A~206) 44
Natural: Natural: Stable and Radioactive 91 Stable and Radioactive 327
Radioactive: Radioactive: Artificial (Z ~ 83) 1• Artificial (A <206) 702
(Z>83) 10 (A~206) 169
Total 102 Total 1198 Neutron 1 Neutron 1
103 1199
• Tc, observed in S-type stars. . b Including At and Fr produced in weak side links of natural radioactivity e Pm, not observed in nature. d Including H•, Cl•, and Tc••.
nuclear material into any other even at low energies of interaction.
With this relatively simple picture of the structure and interactions of the nuclei of the elements in mind, it is natural to attempt to explain their origin by a synthesis or buildup starting with one or the other or both of the fundamental building blocks. The following question can be asked: What has been the history of the matter, on which we can make observations, which produced the elements and isotopes of that matter in the abundance distribution which observation yields? This history is hidden in the abundance distribution of the elements. To attempt to understand the sequence of events leading to the formation of the elements it is necessary to study the so-called universal or cosmic abundance curve.
Whether or not this abundance curve is universal is not the point here under discussion. It is the distribution for the matter on which we have been able to make observations. We can ask for the history of that particular matter. We can also seek the history of the peculiar and abnormal abundances, observed in some stars. We can finally approach the problem of the universal or cosmic abundances. To avoid any implication that the abundance curve is universal, when such an implication is irrelevant, we commonly refer to the number distribution of the atomic species as a function of atomic weight simplyas the atomic abundance distribution. In graphical form, we call it the atomic abundance curve.
The first attempt to construct such an abundance curve was made by Goldschmidt (Go37}.t An improved curve was given by Brown (Br49) and more recently Suess and Urey (Su56) have used the latest available data to give the most comprehensive curve so far available. These curves are derived mainly from terrestrial, meteoritic, and solar data, and in some cases from other astronomical sources. Abundance determinations for
t Refer to Bibliography at end of paper.
H
10 He
N•82 N=l26
-2
100 .150
ATOMIC WEIGHT
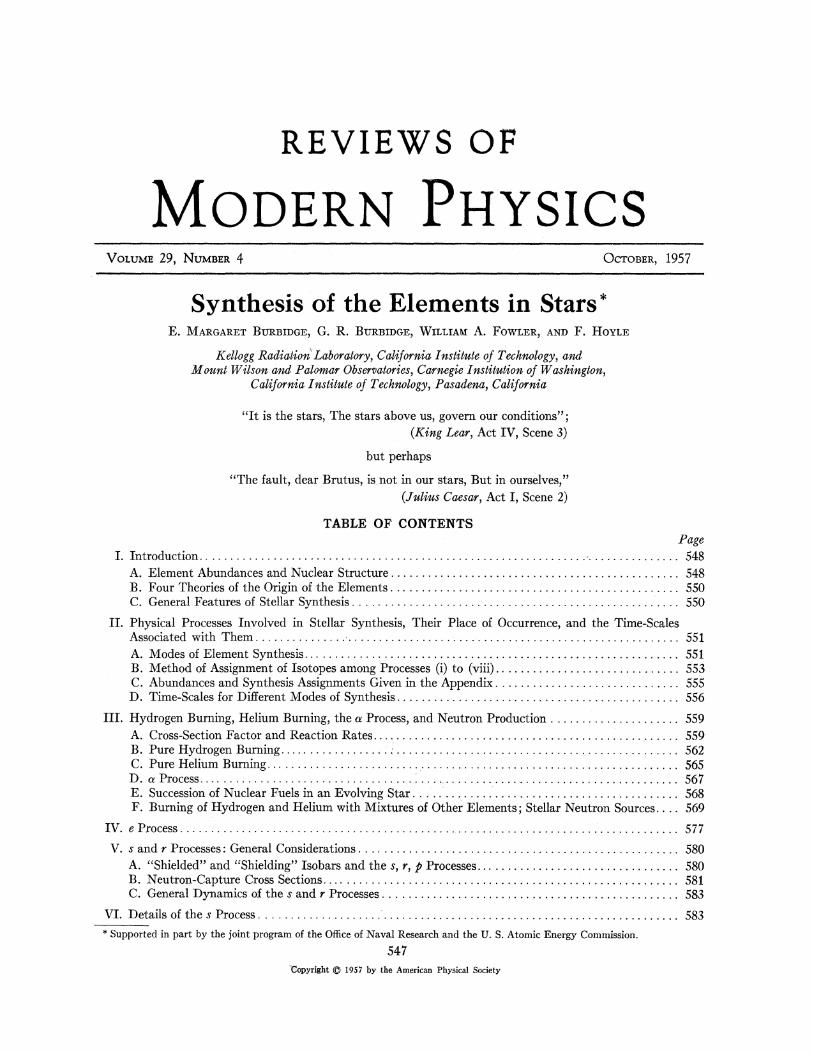
FIG. 1,1. Schematic curve of atomic abundances as a function of atomic weight based on the data of Suess and Urey (Su56). Suess and· Urey have employed relative isotopic abundances to determine the slope and general trend of the curve. There is still considerable spread of the individual abundances about the curve illustrated, but the general features shown are now fairly well established. These features are outlined in Table 1,2. Note the overabundances relative to their neighbors of the alpha-particle nuclei A= 16, 20, · · ·40, the peak at the iron group nuclei, and the twin peaks at A= 80 and 90, at 130 and 138, and at 194 and 208.
the sun were :first derived by Russell (Ru29) and the most recent work is due to Goldberg, Aller, and Miiller (Go57). Accurate relative isotopic abundances are available from mass spectroscopic data, and powerful use was made of these by Suess and Urey in compiling their abundance table. This table, together with some solar values given by Goldberg et al., forms the basic data for this paper.
It seems probable that the elements all evolved from hydrogen, since the proton is stable while the neutron is not. Moreover, hydrogen is the most abundant element, and helium, which is the immediate product of hydrogen burning by the pp chain and the CN cycle, is the next most abundant element. The packing-fraction curve shows tht the greatest stability is reached at iron and nickel. However, it seems probable that iron and nickel comprise less than 1% of the total mass of the galaxy. It is clear that although nuclei are tending to evolve to the configurations of greatest stability, they are still a long way from reaching this situation.
It has been generally stated that the atomic abundance curve has an exponential decline to A,....,100 and is approximately constant thereafter. Although this is very roughly true it ignores many details which are important dues to our understanding of element synthesis. These details are shown schematically in Fig. I,1
550 BURBIDGE, BURBIDGE, FOWLER, AND HOYLE
TABLE !,2. Features of the abundance curve.
Feature
Exponential decrease from hydrogen to A"-'100
Cause
Increasing rarity of synthesis for increasing A, reflecting that stellar evolution to advanced stages necessary to build high A is not common.
Fairly abrupt change to small Constant u(n,'Y) in s process. slope for A > 100 Cycling in r process.
Rarity of D, Li, Be, B as com- Inefficient production, also con-pared with their neighbors H, sumed in stellar interiors even He, C, N, 0 atrelativelylowtemperatures.
High abundances of alpha-particle nuclei such as 0 16,
Ne20· • · Ca40 Ti48 relative to their neighb~rs
Strongly-marked peak in abundance curve centered on Fe~6
{A= 80, 130, 196
Double peaks
A=90, 138,208
He burning and a process more productive than H burning and s process in this region.
e process; stellar evolution to advanced stage where maximum energy is released (Fe66
lies near minimum of packingfraction curve).
Neutron capture in r process (magic N =50, 82, 126 for progenitors).
Neutron capture in s process (magic N=SO, 82, 126 for stable nuclei).
Rarity of proton-rich heavy Not produced in main line of r nuclei or s process; produced in rare
p process. ·
and are outlined in the left-hand column of Table I,2. The explanation of the right-hand column will be given in Sec. II.
It is also necessary to provide an explanation of the origin of the naturally radioactive elements. Further, the existence of the shielded isobars presents a special problem.
B. Four.Theories of the Origin of the Elements
Any completely satisfactory theory of element formation must explain in quantitative detail all of the features of the atomic abundance curve. Of the theories so far developed, three assume that the elements were built in a primordial state of the universe. These are the nonequilibrium theory of Gamow, Alpher, and Herman [see (AlSO)], together with the recent modifications by Hayashi and Nishida (Ha56), the polyneutron theory of Mayer and Teller (Ma49), and the equilibrium theory developed by Klein, Beskow, and Treffenberg (Kl47). A detailed review of the history and development of these theories was given by Alpher and Herman (Al53).
Each of these theories possesses some attractive features, but none succeeds in meeting all of the requirements. It is our view that these are mainly satisfied by the fourth theory in which it is proposed that the stars are the seat of origin of the elements. In contrast with the other theories which demand matter in a particular
primordial state for which we have no evidence, this latter theory is intimately related to the known fact that nuclear transformations are currently taking place inside stars. This is a strong argument, since the primordial theories depend on very special initial conditions for the universe. Another general argument in favor of the stellar theory is as follows.
It is required that the elements, however they were formed, are distributed on a cosmic scale. Stars do this by ejecting material, the most efficient mechanisms being probably the explosive ejection of material in supernovae, the less energetic but more frequent novae, and the less rapid and less violent ejection from stars in the giant stages of evolution and from planetary nebulae. Primordial theories certainly distribute material on a cosmic scale but a difficulty is that the distribution ought to have been spatially uniform and independent of time once the initial phases of the universe were past. This disagrees with observation. There are certainly differences in composition between stars of different ages, and also stars at particular evolutionary stages have abnormalities such as the presence of technetium in the S-type stars and Cf264 in supernovae. A detailed discussion of these and other features is given in Sees. XI and XII.
It is not known for certain at the present time whether all of the atomic species heavier than hydrogen have been produced in stars without the necessity of element synthesis in a primordial explosive stage of the universe. Without attempting to give a definite answer to this problem we intend in this paper to restrict ourselves to element synthesis in stars and to lay the groundwork for future experimental, observational, and theoretical work which may ultimately provide conclusive evidence for the origin of the elements in stars. However, from the standpoint of the nuclear physics alone it is clear that our conclusions will be equally valid for a primordial synthesis in which the initial and later evolving conditions of temperature and density are similar to those found in the interiors of stars.
C. General Features of Stellar Synthesis
Except at catastrophic phases a star possesses a selfgoverning mechanism in which the temperature is adjusted so that the outflow of energy through the star is balanced by nuclear energy generation. The temperature required to give this adjustment depends on the particular nuclear fuel available. Hydrogen requires a lower temperature than helium; helium requires a lower temperature than carbon, and so on, the increasing temperature sequence ending at iron since energy generation by fusion processes ends here. If hydrogen is present the temperature is adjusted to hydrogen as a fuel, and is comparatively low. But if hydrogen becomes exhausted as stellar evolution proceeds, the temperature rises until helium becomes effective as a fuel. When helium becomes exhausted the temperature rises still
SYNTHESIS OF ELEMENTS IN STARS 551
further until the next nuclear fuel comes into operation, and so on. The automatic temperature rise is brought about in each case by the conversion of gravitational energy into thermal energy.
In this way, one set of reactions after another is brought into operation, the sequence always being accompanied by rising temperature. Since penetrations of Coulomb barriers occur more readily as the temperature rises it can be anticipated that the sequence will be one in ·which reactions take place between nuclei with greater and greater nuclear charges. As it becomes possible to penetrate larger and larger barriers the nuclei will evolve towards configurations of greater and greater stability, so that heavier and heavier nuclei will be synthesized until iron is reached. Thus there must be a progressive conversion of light nuclei into heavier ones as the temperature rises.
There are a number of complicating factors which are superposed on these general trends. These include the following.
The details of the rising temperature and the barrier effects of nuclear reactions at low temperatures must be considered.
The temperature is not everywhere the same inside a star, so that the nuclear evolution is most advanced in the central regions and least or not at all advanced near the surface. Thus the composition of the star cannot be expected to be uniform throughout. A stellar explosion does not accordingly lead to the ejection of material of one definite composition, but instead a whole range of compositions may be expected.
Mixing within a star, whereby the central material is mixed outward, or the outer material inward, produces special effects.
Material ejected from one star may subsequently become condensed in another star. This again produces special nuclear effects.
All of these complications show that the stellar theory cannot be simple, and this may be a point in favor of the theory, since the abundance curve which we are trying to explain is also not simple. Our view is that the elements have evolved, and are evolving, by a whole series of processes. These are marked in the schema tic abundance curve, Fig. 1,1, asH burning, He burning, a, e, r, s, and p processes. The nature of these processes is shown in detail in Fig. I,2; details of this diagram are explained in the following sections.
II. PHYSICAL PROCESSES INVOLVED IN STELLAR SYNTHESIS, THEIR PLACE OF OCCURRENCE,
AND THE TIME-SCALES ASSOCIATED WITH THEM
A. Modes of Element Synthesis
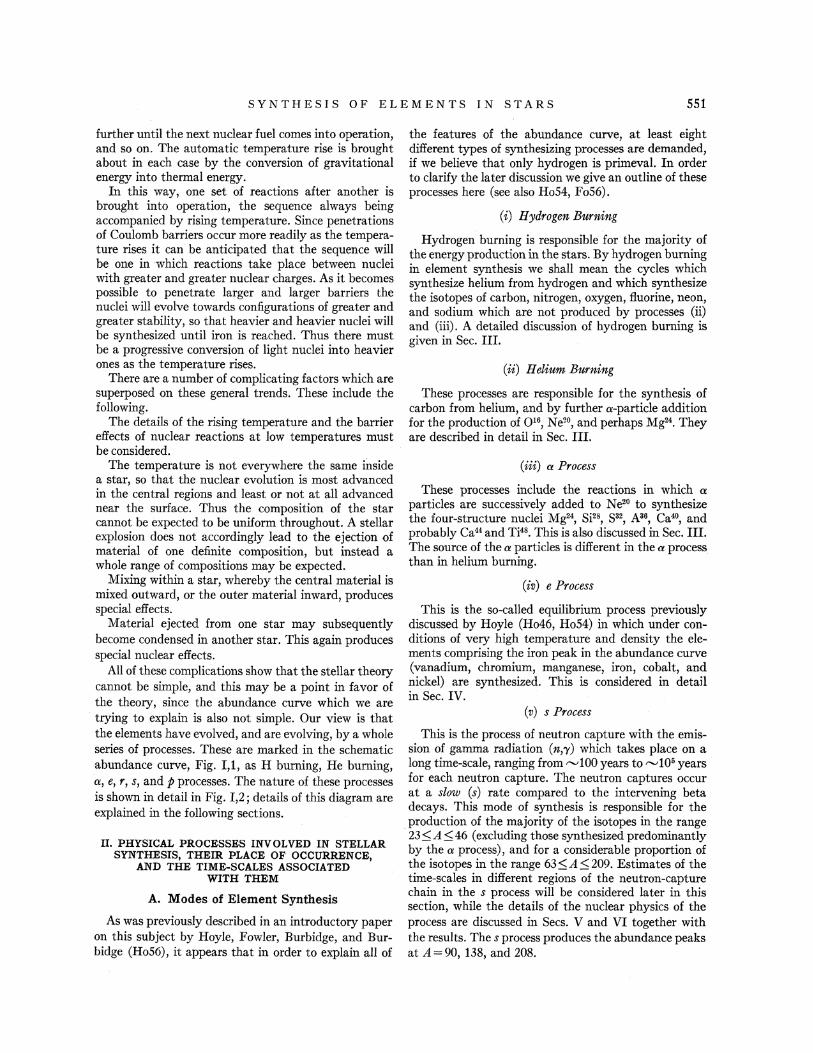
As was previously described in an introductory paper on this subject by Hoyle, Fowler, Burbidge, and Burbidge (Ho56), it appears that in order to explain all of
the features of the abundance curve, at least eight different types of synthesizing processes are demanded, if we believe that only hydrogen is primeval. In order to clarify the later discussion we give an outline of these processes here (see also Ho54, Fo56).
(i) Hydrogen Burning
Hydrogen burning is responsible for the majority of the energy production in the stars. By hydrogen burning in element synthesis we shall mean the cycles which synthesize helium from hydrogen and which synthesize the isotopes of carbon, nitrogen, oxygen, :fluorine, neon, and sodium which are not produced by processes (ii) and (iii). A detailed discussion of hydrogen burning is given in Sec. III.
(ii) Helium Burning
These processes are responsible for the synthesis of carbon from helium, and by further a-particle addition for the production of 0 16, Ne20, and perhaps Mg24• They are described in detail in Sec. III.
(iii) a Process
These processes include the reactions in which a particles are successively added to Ne20 to synthesize the four-structure nuclei Mg24, Si28, S32, A36, Ca4°, and probably Ca44 and Ti48• This is also discussed in Sec. III. The source of the a particles is different in the a process than in helium burning.
(iv) e Process
This is the so-called equilibrium process previously discussed by Hoyle (Ho46, Ho54) in which under conditions of very high temperature and density the elements comprising the iron peak in the abundance curve (vanadium, chromium, manganese, iron, cobalt, and nickel) are synthesized. This is considered in detail in Sec. IV.
( v) s Process
This is the process of neutron capture with the emission of gamma radiation (n,-y) which takes place on a long time-scale, ranging from '""100 years to '""105 years for each neutron capture. The neutron captures occur at a slow (s) rate compared to the intervening beta decays. This mode of synthesis is responsible for the production of the majority of the isotopes in the range 23~A~46 (excluding those synthesized predominantly by the a process), and for a considerable proportion of the isotopes in the range 63=::;A=::;209. Estimates of the time-scales in different regions of the neutron-capture chain in the s process will be considered later in this section, while the details of the nuclear physics of the process are discussed in Sees. V and VI together with the results. The s process produces the abundance peaks at A= 90, 138, and 208.
552 BURBIDGE, BURBIDGE, FOWLER, AND HOYLE'
HYDROGEN BURNING---
HI j)p• He4 CN ' -
~~ • ~ ' 2 z C1 -...- C13--.. N14-..- N15- ...... C12
: '/nC-?'J/~ iil o'6 t o'7 · o'8 F19
% '24 21 ,22 !23 ,20 0 Jn n a-process i=::E , t ~~ Mg24 p31 g32
~m 1 ~..Jo~ le-process f Neutron Rich ol&J Isotopes T'ISO' 48 ~~......_Iron Ti : Group Slow capture(s-process) ~ 11 TC 99" on Fe56
~'-----Heavy P jt_' R'' hEiements
ro on JC 4 Isotopes . a·decay
(~-~rocess} ! fission
Rapid capture (r-process) "cf2~4· on Fe56
y-process 1 ' Transbismuth ( U Th t )
Elements , 'e c
..._. M · L' H·burning om me: He-burning -- Less Frequent Processes .- s-process ~ Neutron Capture: r- process
-~Catalytic Process: CN, Ne Na cycles
- Equilibrium: e-process
~Alpha Capture: a-process
----Modifying Process: j)-j)rocess y-process
---- AI pha decay or Fission
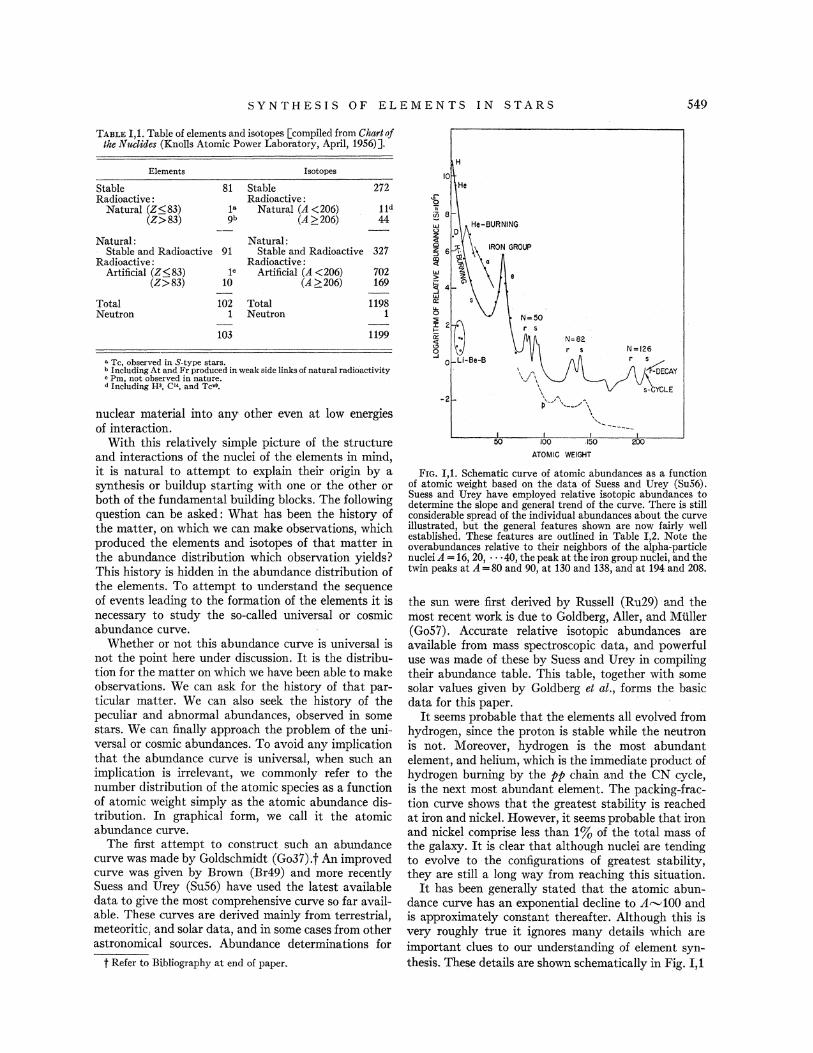
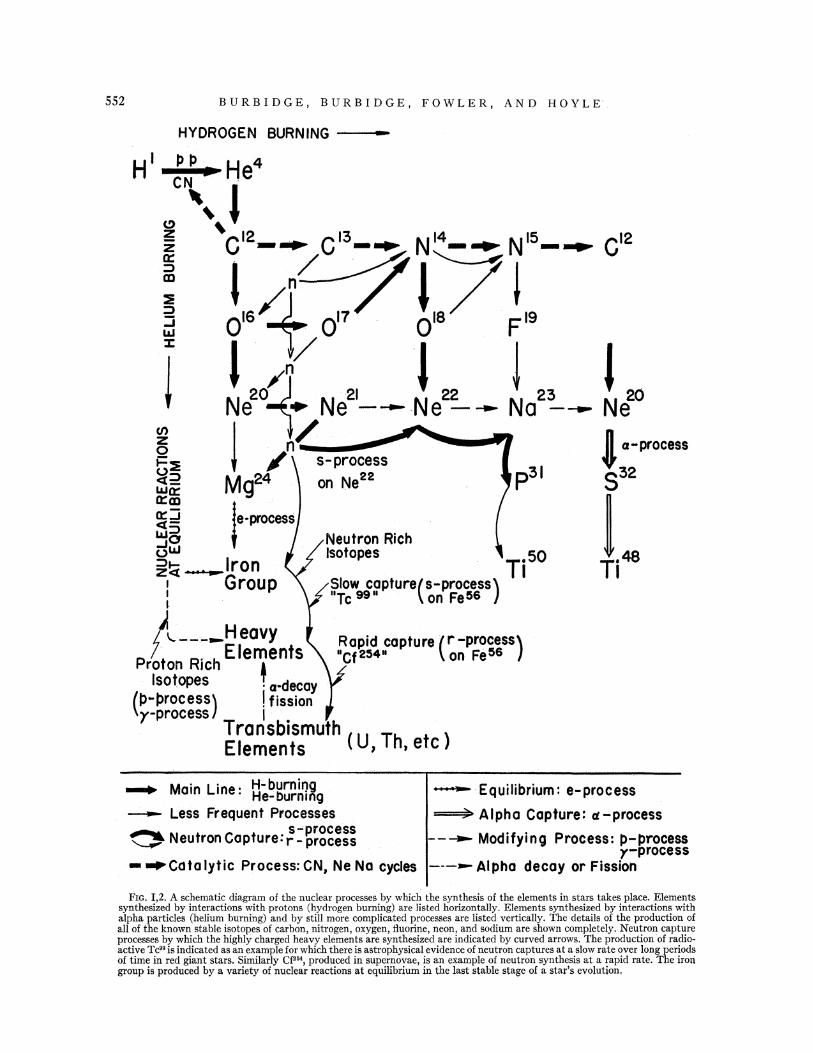
FIG. 1,2. A schematic diagram of the nuclear processes by which the synthesis of the elements in stars takes place. Elements synthesized by interactions with protons (hydrogen burning) are listed horizontally. Elements synthesized by interactions with alpha particles (helium burning) and by still more complicated processes are listed vertically. The details of the production of all of the known stable isotopes of carbon, nitrogen, oxygen, fluorine, neon, and sodium are shown completely. Neutron capture processes by which the highly charged heavy elements are synthesized are indicated by curved arrows. The production of radioactive Tc99 is indicated as an example for which there is astrophysical evidence of neutron captures at a slow rate over long periods of time in red giant stars. Similarly C:£264, produced in supernovae, is an example of neutron synthesis at a rapid rate. The iron group is produced by a variety of nuclear reactions at equilibrium in the last stable stage of a star's evolution,
SYNTHESIS OF ELEMENTS IN STARS SS3
(vi) r Process
This is the process of neutron capture on a very short time-scale, ,-....,0.01-10 sec for the beta-decay processes interspersed between the neutron captures. The neutron captures occur at a rapid (r) rate compared to the beta decays. This mode of synthesis is responsible for production of a large number of isotopes in the range 70~A~209, and also for synthesis of uranium and thorium. This process may also be responsible for some light element synthesis, e.g., S36, Ca46, Ca48, and perhaps Ti47, Ti49, and Ti50• Details of this process and the results of the calculations are discussed in Sees. VII and VIII. The r process produces the abundance peaks at A = 80, 130, and 194.
(vii) p Process
This is the process of proton capture with the emission of gamma radiation (p,r), or the emission of a neutron following gamma-ray absorption ('Y,n), which is responsible for the synthesis of a number of proton-rich isotopes having low abundances as compared with the nearby normal and neutron-rich isotopes. It is discussed in Sec. IX.
(viii) x Process
This process is responsible for the synthesis of deuterium, lithium, beryllium, and boron. More than one type of process may be demanded here (described collectively as the x process), but the characteristic of all of these elements is that they are very unstable at the temperatures of stellar interiors, so that it appears probable that they have been produced in regions of low density and temperature. There is, however, some observational evidence against this which is discussed in Sec. X together with the details of the possible synthesizing processes.
In the upper half of Table II,l the abundances of different natural groups of elements, taken from the
atomic abundance table of Suess and Urey (SuS6), have been summed and listed, firstly by number and by fraction of the total, and secondly by weight and by mass fraction of the total. In the lower half of Table II,l, a similar listing has been made, but in this case the isotopes have been grouped according to which mode of synthesis has been responsible for their production. Our method of assignment to these different processes is described in subsection B. In some cases a natural group comprises just the elements built by one process; e.g., the iron group of elements are also the e-process isotopes in the lower half of the table, and consequently the same entry appears in both halves. In one case, that of the r-process isotopes of intermediate atomic weight, the estimate given is one that has been calculated in Sec. VII.
An auxiliary but indispensable process which is also demanded in our description of element synthesis is a nuclear process which will provide a source of free neutrons for both the s process and the r process. The first suggestion in this direction was made by Cameron (CaS4, CaSS) and Greenstein (Gr54), who proposed that the C13(a,n)016 reaction would provide such a source. In addition to this the reaction Ne21 (a,n)Mg24
has also been proposed by Fowler, Burbidge, and Burbidge (FoSS). More detailed work on the rates of these reactions by Marion and Fowler is now available (Ma57) and some discussion is included in Sec. III.
B. Method of Assignment of Isotopes among Processes (i) to (viii)
Of the eight processes which are demanded to synthesize all of the stable isotopes, assignments among hydrogen burning, helium burning, the a process, the e process, and the x process are comparatively straightforward, and are implicit in previous work and in the discussions in Sees. III, IV, and X. Thus pure hydrogen
TABLE II,l. Atomic abundances of various groups of the elements from Suess and Urey (Su56).
Group By number Fraction of total By weight Fraction of total
H 4.00X10¹⁰ 0.928 4.03X10¹⁰ 0.755 He 3.08X10⁹ 0.071 1.23X 10¹⁰ 0.231
Li, Be, B 1.44X10² 3.3x10-• 1.30X 10³ 2.4xw-s Carbon group: C, N, 0, Ne 4.01X10⁷ 9.3x10-• 6.5 X10⁸ 1.2X 10-z Silicon group : N a- Sc 2.65X10⁶ 6.1X10⁻⁵ 7.3 X10⁷ uxw-a Iron group : 50:::; A :::; 62 6.4 X10⁶ 1.5X 10⁻⁶ 3.6 X10⁷ 6.7xw-• Middleweight: 63:s;A <100 1.1 X10³ 2.6X1o-s 7.7 X10⁴ 1.4X 10⁻⁶
Heavyweight: A;::: 100 28 6.Sx10-10 4.6 X10' 8.6x10-s
H+He burning: 12:s;A:s;22 4.01X10⁷ 9.3X10-• 6.5 X10⁸ 1.2X10⁻²
a process: 24, 28, · · · 48 2.2 X10⁶ s.1x10-• 6.1 X10⁷ 1.1X10⁻³
s process : 23:::; A :::; 46 4.7 Xl05 1.1X 10⁻⁵ 1.3 X 10⁷ 2.4Xl0-4
e process: SO:s;A:::; 62 6.4 X10⁵ 1.5X10⁻⁶ 3.6 X10⁷ 6.7xw-• s process: 63:s;A:s;75 8.8 X10² z.oxw-s 5.7 XlO' 1.1X10-• s process: A> 75 1.1 X 10² 2.6Xl0-9 1.1 X 10⁴ 2.1X 10⁻⁷
r process: intermediate A ~1.5 X10³ ~3.5X1o-s ~s XlO' ~LSXl0-6
(calculated) r process: A> 75 1.5 X 10² 3.5X10⁻⁹ 1.4 X 10⁴ 2.6X10⁻⁷
p process: 3.1 7,2x to-n 2.0 X10² 3.8X10⁻⁹
Summary:X(H)=0.755, Y(He)=0.231, Z(A>4)=0.014
554 BURBIDGE, BURBIDGE, FOWLER, AND HOYLE
~ s-process (n,y-slowl ~ r-process (n,y-ropidl - p- process !P,y or y,n 1
... , 0
%
"' .2
~----------~~~o~--------~,4~0--------~,ai A-
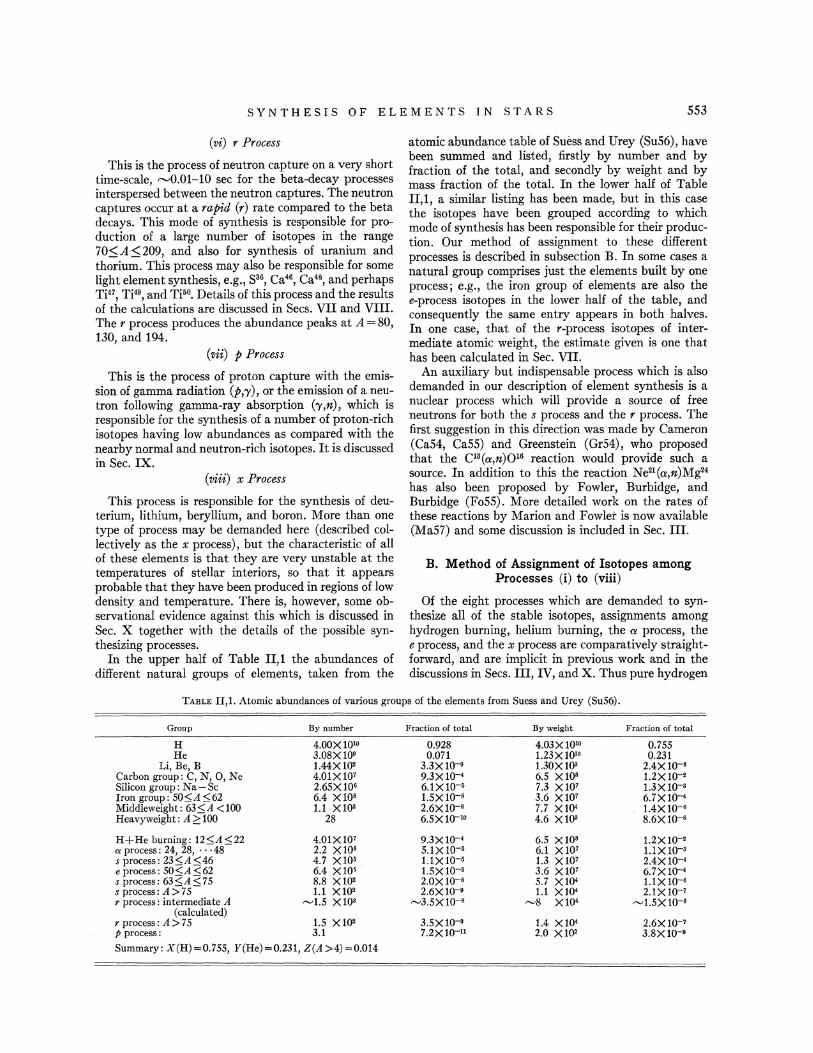
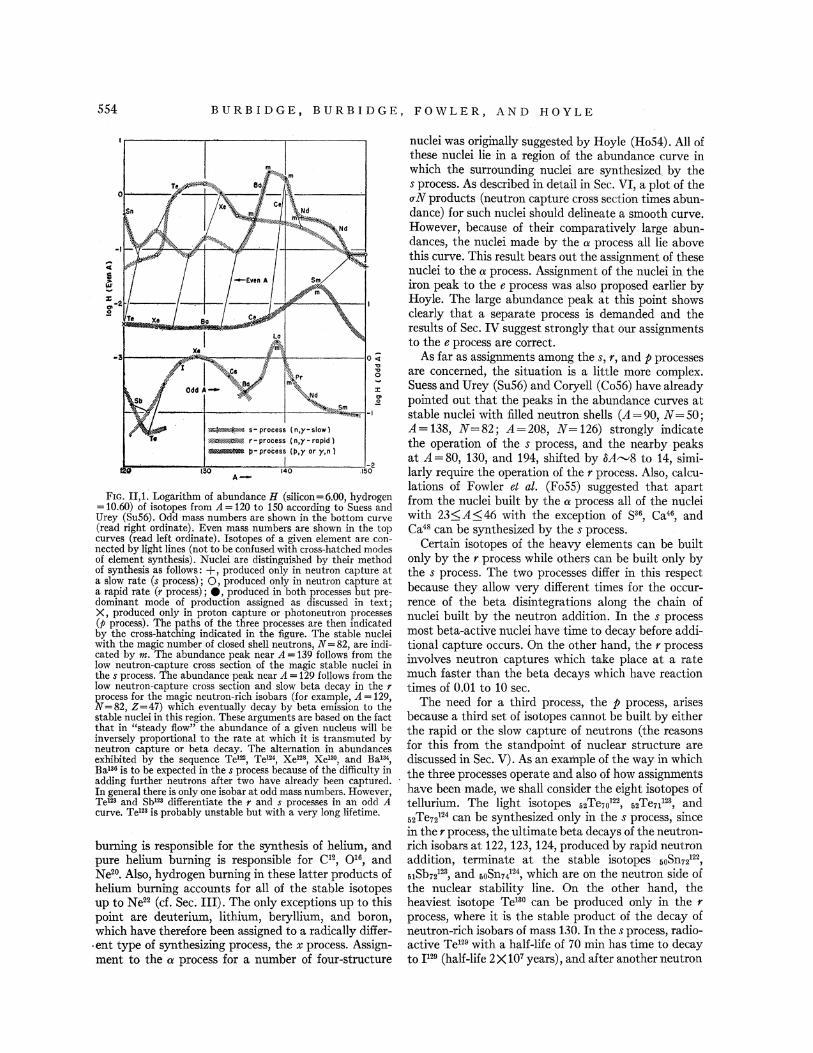
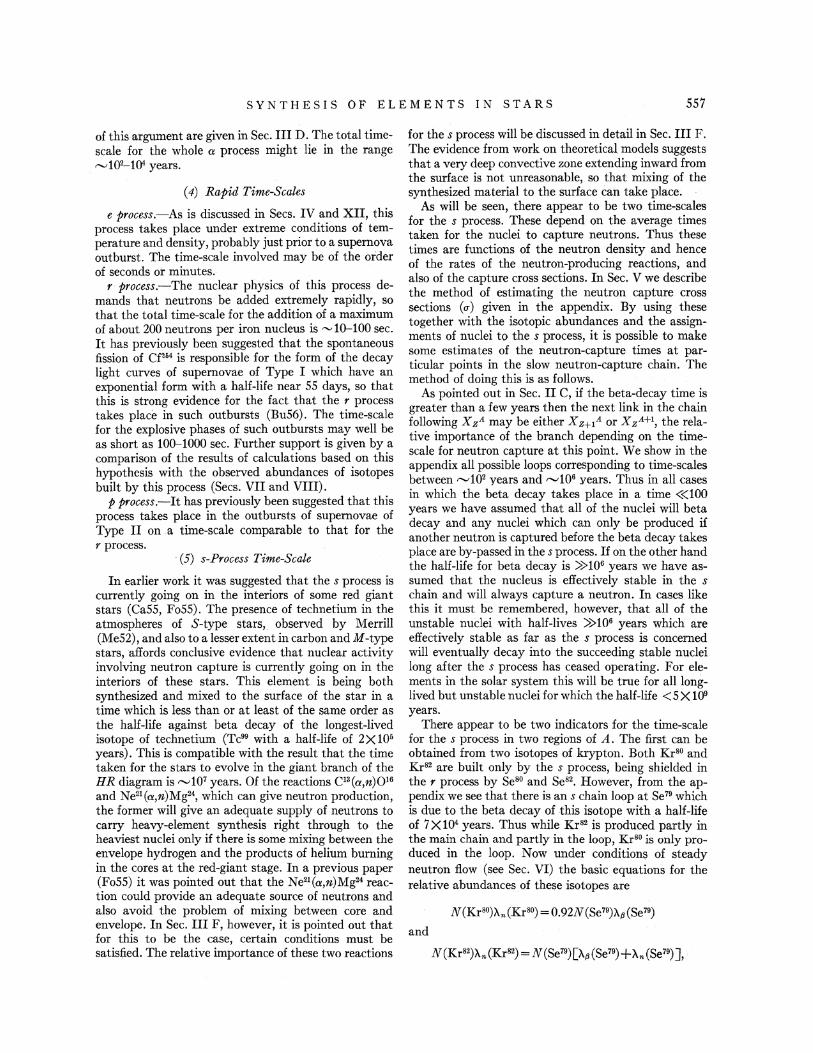
FIG. II,l. Logarithm of abundance H (silicon=6.00, hydrogen = 10.60) of isotopes from A= 120 to 150 according to Suess and Urey (Su56). Odd mass numbers are shown in the bottom curve (read right ordinate). Even mass numbers are shown in the top curves (read left ordinate). Isotopes of a given element are connected by light lines (not to be confused with cross-hatched modes of element synthesis). Nuclei are distinguished by their method of synthesis as follows: +,produced only in neutron capture at a slow rate (s process); 0, produced only in neutron capture at a rapid rate (r process) ; e, produced in both processes but predominant mode of production assigned as discussed in text; X, produced only in proton capture or photoneutron processes (p process). The paths of the three processes are then indicated by the cross-hatching indicated in the figure. The stable nuclei with the magic number of closed shell neutrons, N = 82, are indicated by m. The abundance peak near A = 139 follows from the low neutron-capture cross section of the magic stable nuclei in the s process. The abundance peak near A= 129 follows from the low neutron-capture cross section and slow beta decay in the r process for the magic neutron-rich isobars (for example, A= 129, N = 82, Z = 47) which eventually decay by beta emission to the stable nuclei in this region. These arguments are based on the fact that in "steady flow" the abundance of a given nucleus will be inversely proportional to the rate at which it is transmuted by neutron capture or beta decay. The alternation in abundances exhibited by the sequence TeJ!ll, Tel24, Xe128, Xel30, and Ba134, Ba136 is to be expected in the s process because of the difficulty in adding further neutrons after two have already been captured. In general there is only one isobar at odd mass numbers. However, Tel28 and SJ>U3 differentiate the r and s processes in an odd A curve. Te1" is probably unstable but with a very long lifetime.
burning is responsible for the synthesis of helium, and pure helium burning is responsible for C12, 016, and Ne2°. Also, hydrogen burning in these latter products of helium burning accounts for all of the stable isotopes up to Ne22 (d. Sec. III). The only exceptions up to this point are deuterium, lithium, beryllium, and boron, which have therefore been assigned to a radically differ
·ent type of synthesizing process, the x process. Assign-ment to the a process ~or a number of four-structure
nuclei was originally suggested by Hoyle (Ho54). All of these nuclei lie in a region of the abundance curve in which the surrounding nuclei are synthesized by the s process. As described in detail in Sec. VI, a plot of the rr N products (neutron capture cross section times abundance) for such nuclei should delineate a smooth curve. However, because of their comparatively large abundances, the nuclei made by the u process all lie above this curve. This result bears out the assignment of these nuclei to the a process. Assignment of the nuclei in the iron peak to the e process was also proposed earlier by Hoyle. The large abundancepeak at this point shows clearly that a separate process is demanded and the results of Sec. IV suggest strongly that our assignments to the e process are correct.
As far as assignments among the s, r, and p processes are concerned, the situation is a little more complex. Suess and Urey (Su56) and Coryell (Co56) have already pointed out that the peaks in the abundance curves at stable nuclei with :filled neutron shells (A= 90, N =50; A= 138, N = 82; A= 208, N = 126) strongly indicate the operation of the s process, and the nearby peaks at A=80, 130, and 194, shifted by OA,....,8 to 14, similarly require the operation of the r process. Also, calculations of Fowler et al. (FoSS) suggested that apart from the nuclei built by the a process all of the nuclei with 23:::;A:::;46 with the exception of S36, Ca46, and Ca48 can be synthesized by the s process.
Certain isotopes of the heavy elements can be built only by the r process while others can be built only by the s process. The two processes differ in this respect because they allow very different times for the occurrence of the beta disintegrations along the chain of nuclei built by the neutron addition. In the s process most beta-active nuclei have time to decay before additional capture occurs. On the other hand, the r process involves neutron captures which take place at a rate much faster than the beta decays which have reaction times of 0.01 to 10 sec.
The need for a third process, the p process, arises because a third set of isotopes cannot be built by either the rapid or the slow capture of neutrons (the reasons for this from the standpoint of nuclear structure are discussed in Sec. V). As an example of the way in which the three processes operate and also of how assignments have been made, we shall consider the eight isotopes of tellurium. The light isotopes 52Te1o122, 52Te71123, and 52Te12124 can be synthesized only in the s process, since in the r process, the ultimate beta decays of the neutronrich isobars at 122, 123, 124, produced by rapid neutron addition, terminate at the stable isotopes 5oSn12122,
51Sb12123, and 50Sn1i24, which are on the neutron side of the nuclear stability line. On the other hand, the heaviest isotope Te130 can be produced only in the r process, where it is the stable product of the decay of neutron-rich isobars of mass 130. In the s process, radioactive Te129 with a half-life of 70 min has time to decay to 1129 (half-life 2X10⁷ years), and after another neutron
SYNTHESIS OF ELEMENTS IN STARS 555
capture, the resultant P 30 decays in 12.6 hr to Xe130
which is thus produced in the s chain instead of Te130•
The isotopes Te126, Te126, and Te128 can be produced in either the s or the r process, although Te128 is produced in the slow capture of neutrons only in a weak side link of the chain resulting from the fact that I128 decays 5% of the time by positron emission or electron capture. Thus we believe that it is synthesized predominantly by the,, process. The rarest and lightest isotope Te120
cannot be built by either process and it is for this isotope that the p process is demanded. Te120 is about 1% as abundant, and Te122, Te123, and Te124 are about 10% as abundant, as Te128 and Te130• This suggests that we assign Te126, which has an abundance comparable to Te128 and Te180, to the r process. Te126 is an intermediate case, but it follows the trend of the r process and to this we assign its production. Assignments between the s, r, and p processes have been made in this way. In Figs. II,1; II,2; and II,3, the separation of the isotopes in the region 120 <A< 150 is shown. In Fig. II,1 the abundances are plotted logarithmically after the manner of Suess and Urey (Su56). Nuclear species produced in the same process are connected by shaded curves and the general trend of the production becomes clear. In order to show more clearly the great increase in abundance in the peaks, linear plots of the abundances of the odd and even isotopes, respectively, are shown in Figs. II,2 and II,3. The magic-number peaks stand out clearly in both odd-A and even-A nuclei.
C. Abundances and Synthesis Assignments Given in the Appendix
The Appendix contains all of the information we have been able to collect which is relevant to the synthesis
m • MAGI!:; SHELL NUMBER
ABJNOANCE PEAKS FOR N•82
La '"?
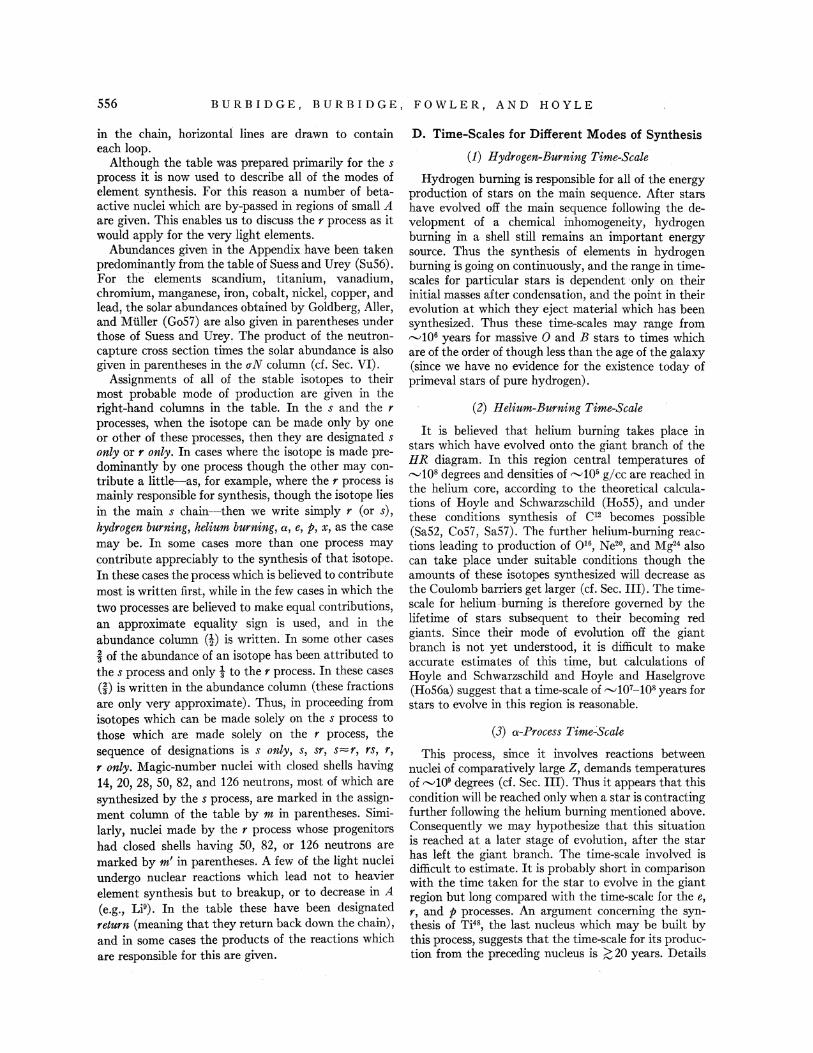
FIG. II,2. The odd A abundance peaks near A = 129 and 139 shown on a linear scale. See Fig. II,l for comments.
ABUNDANCE PEAKS FOR N=B2 AND Z •50
I
Ba m
ATOMIC WEIGHT (EVEN!
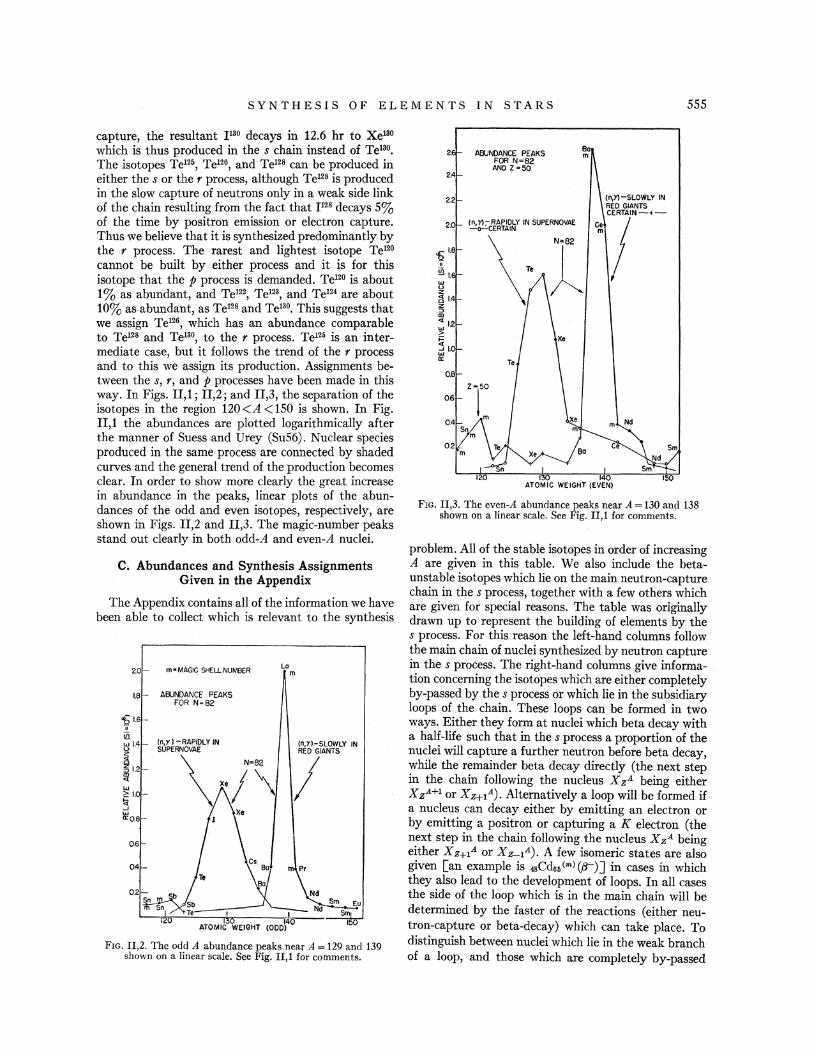
FrG. II,3. The even-A abundance peaks near A= 130 and 138 shown on a linear scale. See Fig. II,1 for comments.
problem. All of the stable isotopes in order of increasing A are given in this table. We also include the betaunstable isotopes which lie on the main neutron-capture chain in the s process, together with a few others which are given for special reasons. The table was originally drawn up to represent the building of elements by the s process. For this reason the left-hand columns follow the main chain of nuclei synthesized by neutron capture in the s process. The right-hand columns give information concerning the isotopes which are either completely by-passed by the s process or which lie in the subsidiary loops of the chain. These loops can be formed in two ways. Either they form at nuclei which beta decay with a half-life such that in the s process a proportion of the nuclei will capture a further neutron before beta decay, while the remainder beta decay directly (the next step in the chain following the nucleus X zA being either XzA+I or XzHA). Alternatively a loop will be formed if a nucleus can decay either by emitting an electron or by emitting a positron or capturing a K electron (the next step in the chain following the nucleus X zA being either Xz+IA or Xz_lA). A few isomeric states are also given [an example is 48Cc46<"'l(.B-)] in cases in which they also lead to the development of loops. In all cases the side of the loop which is in the main chain will be determined by the faster of the reactions (either neutron-capture or beta-decay) which can take place. To distinguish between nuclei which lie in the weak branch of a loop, and those which are completely by-passed
556 BURBIDGE, BURBIDGE, FOWLER, AND HOYLE
in the chain, horizontal lines are drawn to contain each loop.
Although the table was prepared primarily for the s process it is now used to describe all of the modes of element. synthesis. For this reason a number of betaactive nuclei which are by-passed in regions of small A are given. This enables us to discuss the r process as it would apply for the very light elements.
Abundances given in the Appendix have been taken predominantly from the table of Suess and Urey (SuS6). For the elements scandium, titanium, vanadium, chromium, manganese, iron, cobalt, nickel, copper, and lead, the solar abundances obtained by Goldberg, Aller, and Muller {Go57) are also given in parentheses under those of Suess and Urey. The product of the neutroncapture cross section times the solar abundance is also given in parentheses in the uN column (d. Sec. VI).
Assignments of all of the stable isotopes to their most probable mode of production are given in the right~hand columns in the table. In the s and the r processes, when the isotope can be made only by one or other of these processes, then they are designated s only or r only. In cases where the isotope is made predominantly by one process though the other may contribute a little----as, for example, where the r process is mainly responsible for synthesis, though the isotope lies in the main s chain-then we write simply r {or s), hydrogen burning, helium burning, a, e, p, x, as the case may be. In some cases more than one process may contribute appreciably to the synthesis of that isotope. In these cases the process which is believed to contribute most is written first, while in the few cases in which the two processes are believed to make equal contributions, an approximate equality sign is used, and in the abundance column (!) is written. In some other cases i of the abundance of an isotope has been attributed to the s process and only t to the r process. In these cases (i) is written in the abundance column (these fractions are only very approximate). Thus, in proceeding from isotopes which can be made solely on the s process to those which · are made solely on the r process, the sequence of designations is s only, s, sr, s=r, rs, r, r only. Magic-number nuclei with closed shells having 14, 20, 28, SO, 82, and 126 neutrons, most of which are synthesized by the s process, are marked in the assignment column of the table by m in parentheses. Similarly, nuclei made by the r process whose progenitors had closed shells having SO, 82, or 126 neutrons are marked by m' in parentheses. A few of the light nuclei undergo nuclear reactions which lead not to heavier element synthesis but to breakup, or to decrease in A (e.g., LiD). In the table these have been designated return (meaning that they return back down the chain), and in some cases the products of the reactions which are responsible for this are given.
D. Time-Scales for Different Modes of Synthesis
(1) Hydrogen-Burning Time-Scale
Hydrogen burning is responsible for all of the energy production of stars on the main sequence. After stars have evolved off the main sequence following the development of a chemical inhomogeneity, hydrogen burning in a shell still remains an important energy source. Thus the synthesis of elements in hydrogen burning is going on continuously, and the range in timescales for particular stars is dependent only on their initial masses after condensation, and the point in their evolution at which they eject material which has been synthesized. Thus these time-scales may range from rv106 years for massive 0 and B stars to times which are of the order of though less than the age of the galaxy (since we have no evidence for the existence today of primeval stars of pure hydrogen).
(2) Helium-Burning Time-Scale
It is believed that helium burning takes place in stars which have evolved onto the giant branch of the HR diagram. In this region central temperatures of ,....,108 degrees and densities of ,....,105 g/cc are reached in the helium core, according to the theoretical calculations of Hoyle and Schwarzschild (HoSS), and under these conditions synthesis of C12 becomes possible (SaS2, CoS7, SaS7). The further helium-burning reactions leading to production of 0 16, Ne20, and Mg24 also can take place under suitable conditions though the amounts of these isotopes synthesized will decrease as the Coulomb barriers get larger (d. Sec. III). The timescale for helium· burning is therefore governed by the lifetime of stars subsequent to their becoming red giants. Since their mode of evolution off the giant branch is not yet understood, it is difficult to make accurate estimates of this ti!ne, but calculations of Hoyle and Schwarzschild and Hoyle and Haselgrove (HoS6a) suggest that a time-scale of ,....,107-108 years for stars to evolve in this region is reasonable.
(3) a-Process Time~Scale
This process, since it involves reactions between nuclei of comparatively large Z, demands temperatures of ,....,109 degrees (d. Sec. III). Thus it appears that this condition will be reached only when a star is contracting further following the helium burning mentioned above. Consequently we may hypothesize that this situation is reached at a later stage of evolution, after the star has left the giant branch. The time-scale involved is difficult to estimate. It is probably short in comparison with the time taken for the star to evolve in the giant region but long compared with the time-scale for the e, r, and p processes. An argument concerning the synthesis of Ti48, the last nucleus which may be built by this process, suggests that the time-scale for its production from the preceding nucleus is ~ 20 years. Details
SYN.TH ESI S OF ELEMENTS IN STARS 557
of this argument are given in Sec. III D. The total timescale for the whole a process might lie in the range ""1()2-1()4 years.
( 4) Rapid Time-Scales
e process.-As is discussed in Sees. IV and XII, this process takes place under extreme conditions of temperature and density, probably just prior to a supernova outburst. The time-scale involved may be of the order of seconds or minutes.
r process.-The nuclear physics of this process demands that neutrons be added extremely rapidly, so that the total time-scale for the addition of a maximum of about 200 neutrons per iron nucleus is "'10--100 sec. It has previously been suggested that the spontaneous fission of C:fl64 is responsible for the form of the decay light curves of supernovae of Type I which have an exponential form with a half-life near 55 days, so that this is strong evidence for the fact that the r process takes place in such outbursts (Bu56). The time-scale for the explosive phases of such outbursts may well be as short as 100--1000 sec. Further support is given by a comparison of the results of calculations based on this hypothesis with the observed abundances of isotopes built by this process (Sees. VII and VIII).
p process.-It has previously been suggested that this process takes place in the outbursts of supernovae of Type II on .a time-scale comparable to that for the r process.
· (5) s-Process Time-Scale
In earlier work it was suggested that the s process is currently going on in the interiors of some red giant stars (CaSS, FoSS). The presence of technetium in the atmospheres of S-type stars, observed by Merrill (Me52), and also to a lesser extent in carbon and M -type stars, affords conclusive evidence that nuclear activity involving neutron capture is currently going on in the interiors of these stars. This element is being both synthesized and mixed to the surface of the star in a time which is less than or at least of the same order as the half~life against beta decay of the longest-lived isotope of technetium (Tc99 with a half-life of 2X10⁵
years). This is compatible with the result that the time taken for the stars to evolve in the giant branch of the HR diagram is "-'107 years. Of the reactions C13 (a,n)016
and Ne21 (a,n)Mg2\ which can give neutron production, the former will give an adequate supply of neutrons to carry heavy-element synthesis right through to the heaviest nuclei only if there is some mixing between the envelope hydrogen and the products of helium burning in the cores at the red-giant stage. In a previous paper (FoSS) it was pointed out that the Ne21 (a,n)Mg24 reaction could provide an adequate source of neutrons and also avoid the problem of mixing between core and envelope. In Sec. III F, however, it is pointed out that for this to be the case, certain conditions must be satis:(ied. The relative importance of these two reactions
for the s process will be discussed in detail in Sec. III F. The evidence from work on theoretical models.suggests that a very deep convective zone extending inward from the surface is not unreasonable, so that mixing of the synthesized material to the surface can take place~
As will be seen, there appear to be two time-scales for the s process. These depend on the average times taken for the nuclei to capture neutrons. Thus these times are functions of the neutron density and hence of the rates of the neutron-producing reactions, and also of the capture cross sections. In Sec. V we describe the method of estimating the neutron capture cross sections (u) given in the appendix. By using these together with the isotopic abundances and the assignments of nuclei to the s process, it is possible to make some estimates of the neutron-capture times at particular points in the slow neutron-capture chain. The method of doing this is as follows.
As pointed out in Sec. II C, if the beta-decay time is greater than a few years then the next link in the chain following XzA may be either Xz+IA or XzA+I, the relative importance of the branch depending on the timescale for neutron capture at this point. We show in the appendix all possible loops corresponding to time-scales between "-'102 years and "-'106 years. Thus in all cases in which the beta decay takes place in a time «100 years we have assumed that all of the nuclei will beta decay and any nuclei which can only be produced if another neutron is captured before the beta decay takes place are by-passed in the s process. If on the other hand the half-life for beta decay is »106 years we have assumed that the nucleus is effectively stable in the s chain and will always capture a neutron. In cases like this it must be remembered, however, that all of the unstable nuclei with half-lives »106 years which are effectively stable as far as the s process is concerned will eventually decay into the succeeding stable nuclei long after the s process has ceased operating. For elements in the solar system this will be true for all longlived but unstable nuclei for which the half-life <SX 109
years. There appear to be two indicators for the time-scale
for the s process in two regions of A. The first can be obtained from two isotopes of krypton. Both Kr80 and Kr82 are built only by the s process, being shielded in the r process by Se80 and Se82 • However, from the appendix we see that there is an s chain loop at Se79 which is due to the beta decay of this isotope with a half-life of 7X1()4 years. Thus while Kr82 is produced partly in the main chain and partly in the loop, Kr80 is only produced in the loop. Now under condition:;; of steady neutron flow (see Sec. VI) the basic equations for the relative abundances. of these isotopes are
and
558 BURBIDGE, BURBIDGE, FOWLER, AND HOYLE
where X., and AIJ are the neutron-capture and beta-decay rates respectively. The coefficient 0.92 appears because in the loop the nuclei have to pass through Br80 which beta decays only 92% of the time. On dividing these two equations and substituting in terms of the halflives t., and t/J instead of the rates, we find that
t,.(Se79)+t/J(Se79) t,.(Kr80) N(Kr82)
0.92------t,.(Se79) t,.(Kr82) N(KrSO)
Now u(Kr80)~2u(Kr82) so that X,.(Kr80)"-'2X .. (Kr82) and t.,(Kr82)~2t,.(Kr80). [In the appendix we put u(Kr80)
=u(Kr82) and do not in general take into account the factor of ......... 2 which is a result of the fact that the light neutron-poorer isotopes capture neutrons more readily than the heavier ones.] The abundance ratio N(Kr82)/
N (Kr80) is given in the appendix. Thus substituting these values on the right-hand side of the equation we find for Se79 that
t,./t{j= 1/1.37,
and, since t/J=7X1()4 years, t .. =5.1X1()4 years. Now this half-life for neutron capture is determined in a region where u,.=360 mb, so that in the region near iron where this neutron chain begins and where u= 30 mb the effective half-life is 5.1 X 104X360/3~6X 105 years. The total time demanded to build up the isotopes from iron if this were characteristic of the whole curve would be 10L 107 years since there are many captures involved, but most of these take place on nuclei with larger u values than that for iron. We show later that this long time-scale for the s process is probably the result of a paucity of neutrons-probably only about five neutrons per iron nucleus are made available. This is reflected in the tendency for the u N product to decrease rather rapidly as A increases.
The second indicator for an s process time-scale comes from consideration of the isotopes of gadolinium at A= 152 and 154. Of these isotopes Gd164 can only be
lei"
EXPLOSION r-PROCESS
~~-PROCESS
TIME SCALE ------- e-PROCESS
r~ JL?L~~--~ ;i lrf' ARS s - PROCESS ~ He-BURNING COOLING ~ td0YEARS ... CORE CONTRACTION
lrl H-BURNING
TIME !YEARS) 0
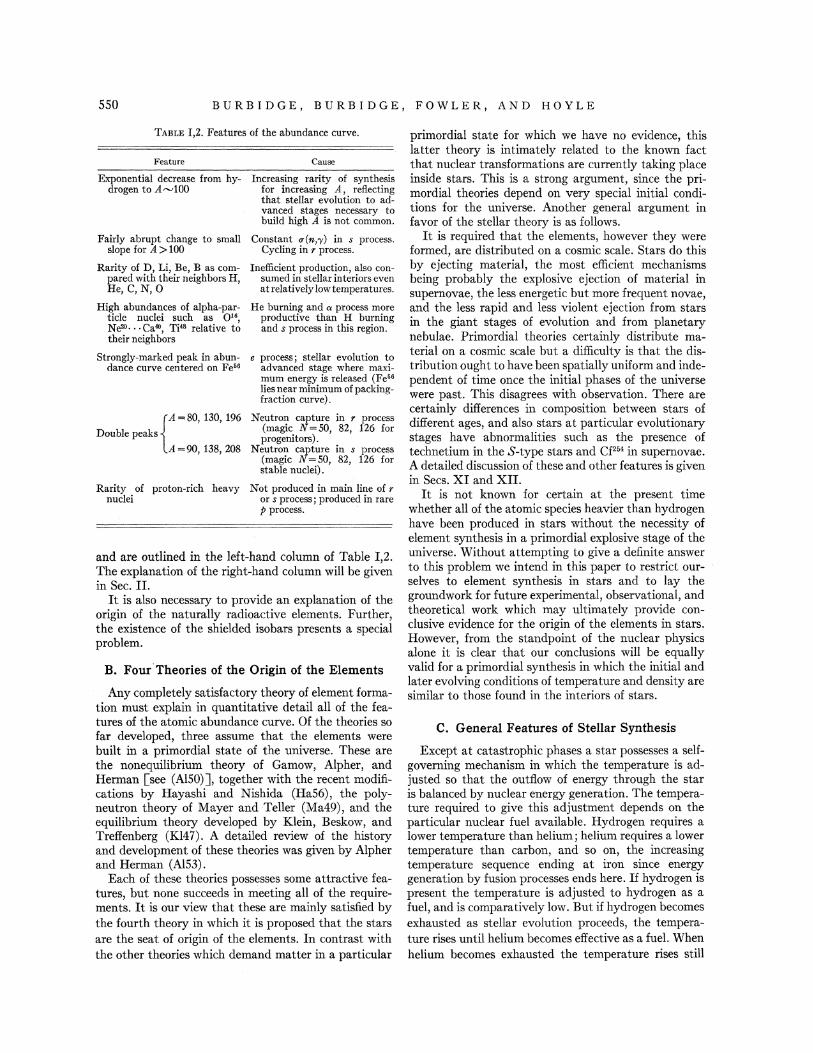
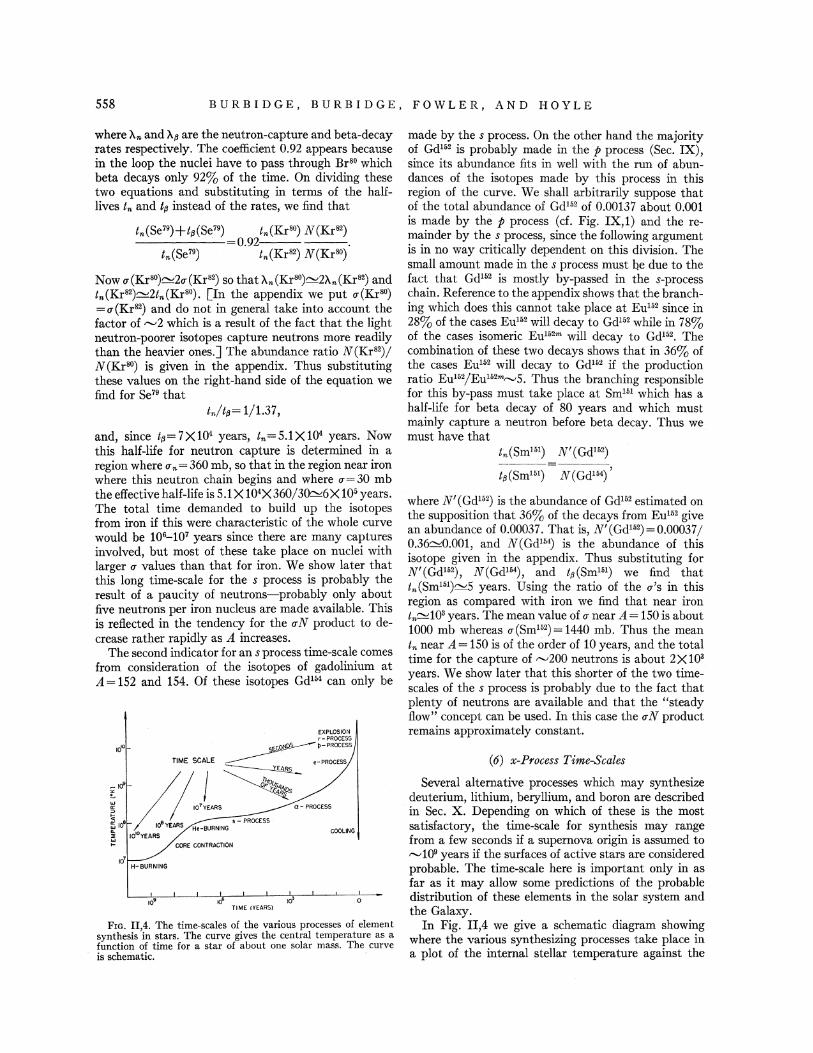
FIG. II,4. The time-scales of the various processes of element synthesis in stars. The curve gives the central temperature as a function of time for a star of about one solar mass. The curve is schematic.
made by the s process. On the other hand the majority of Gd162 is probably made in the p process (Sec. IX), since its abundance fits in well with the run of abundances of the isotopes made by this process in this region of the curve. We shall arbitrarily suppose that of the total abundance of Gd152 of 0.00137 about 0.001 is made by the p process (d. Fig. IX,1) and the remainder by the s process, since the following argument is in no way critically dependent on this division. The small amount made in the s process must be due to the fact that Gd162 is mostly by-passed in the s-process chain. Reference to the appendix shows that the branching which does this cannot take place at Eu152 since in 28% of the cases Eu162 will decay to Gd152 while in 78% of the cases isomeric Eu162m will decay to Gd152• The combination of these two decays shows that in 36% of the cases Eu152 will decay to Gd162 if the production ratio Eu162/Eu162m,.....,S. Thus the branching responsible for this by-pass must take place at Sm161 which has a half-life for beta decay of 80 years and which must mainly capture a neutron before beta decay. Thus we must have that
t,.(Smr•r) N'(Gdr•z)
tll(Sm151) N(Gd164)'
where N'(Gd162) is the abundance of Gd152 estimated on the supposition that 36% of the decays from Eu1"2 give an abundance of 0.00037. That is, N'(Gd162)=0.00037/ 0.36~0.001, and N(Gd164) is the abundance of this isotope given in the appendix. Thus substituting for N'(Gd152), N(Gd154), and ttl(Sm151) we find that t,.(Sm151)"-'5 years. Using the ratio of the u's in this region as compared with iron we find that near iron t,.~103 years. The mean value of u near A= 150 is about 1000mb whereas u(Sm162)=1440 mb. Thus the mean t,. near A= 150 is of the order of 10 years, and the total time for the capture of ......... 200 neutrons is about 2X10³
years. We show later that this shorter of the two timescales of the s process is probably due to the fact that plenty of neutrons are available and that the "steady flow" concept can be used. In this case the uN product remains approximately constant.
(6) x-Process Time-Scales
Several alternative processes which may synthesize deuterium, lithium, beryllium, and boron are described
· in Sec. X. Depending on which of these is the most satisfactory, the time-scale for synthesis may range from a few seconds if a supernova origin is assumed to .......,109 years if the surfaces of active stars are considered probable. The time-scale here is important only in as far as it may allow some predictions of the probable distribution of these elements in the solar system and the Galaxy.
In Fig. II,4 we give a schematic diagram showing where the various synthesizing processes take place in a plot of the internal stellar temperature against the
SYNTHESIS OF ELEMENTS IN STARS SS9
time that the star lives in each temperature range. The estimated time-scales associated with each of these processes are also given very approximately.
III. HYDROGEN BURNING, HELIUM BURNING, THE a PROCESS, AND NEUTRON PRODUCTION
This section and the sections to follow are devoted to detailed elaboration and discussion of the different physical processes introduced in Sec. II. These sections treat quantitatively experimental and theoretical evaluations of the cross sections and reaction rates of the nuclear processes involved in energy generation and element synthesis in stars. The material supplements and extends that published in a series of articles in 19S4 (FoS4, BoS4, HoS4), in 19SS (FoSS, FoSSa), and in 19S6 (BuS6). In the first part of this section we give a discussion of the relations between nuclear cross sections and nuclear reaction rates in stellar interiors and of the notation used in this and the following sections.
A. Cross-Section Factor and Reaction Rates
The experimental results to be discussed will be used to derive the numerical value of the nuclear cross-section factor for a charged particle reaction defined by
S=u(E)E exp(31.28ZIZoA!.E-i) kev barns
where u(E) is the cross section in barns (1<r24 cm2)
measured at the center-of-mass energy E in kev. The charges of the interacting particles are Z1 and Zo in units of the proton charge and A=A1Aoj(A1+Ao) is their reduced mass in atomic mass units. S is measured in the center-of-mass system. From measurements made in the laboratory system with incident particle energy E1 and with target nuclei at rest, the quantity S is given by
Ao S=u(E1)E1 exp(31.28ZIZoAllEI-l) kev barns.
A1+Ao
For a nonresonant or off-resonant reaction S is a slowly varying function of the energy E. Methods for extrapolating to the effective thermal energy E. in stellar interiors have been given by numerous authors (SaS2a, FoS4, SaSS, MaS7). The effective thermal energy at temperature Tis
E.= 1.220(Z12Zo2ATs2)i kev barns,
where T6 is the temperature measured in units of 106 °K. The width of the effective range of thermal energy is
till.=0.7S(Z12Zo2ATo6) 1' 6 kev.
The mean reaction rate of a thermonuclear process may be expressed as
X1X0 P=pr=n1rto(uv)Av=3.63X1Q47p2-. -(uv)Av
A1Ao
reactions cm-3 sec-1,
where n1 and no are the number densities of the interacting particles per cm3 and (uv)Av is the average of the cross section multiplied by the velocity in cm8 sec-1. The quantity r is the reaction rate per gram per second. The quantities X1 and xo are the amounts of the interacting nuclei expressed as fractions by weight. In terms of S.=S(E.) kev barns, it is found for a nonresonant process that
reactions em-s sec-1
reactions cm-3 sec-1,
where s. isin kev barns and
(this r is not to be confused with the mean lifetime of the interacting particles which will always be accompanied by appropriate subscripts, etc.). The term j. is the electron screening or shielding factor discussed by Salpeter (SaS4), evaluated at E •. The cross-section factor s. as customarily calculated does not include allowance for electron screening.
The mean lifetime of the nuclei of type 0 for the interaction with nuclei of type 1 is given by
1 --=PI(O)=voP/no TI(Q)
where vo is the number of nuclei of type 0 consumed in each reaction. The quantity P1 (0) is the mean reaction rate per nucleus of type 0. If nuclei of type 0 are regenerated in a cycle of reactions then r1 (0) becomes the mean cycle time for nuclei of type 0.
The most satisfactory procedure for determining s. is to make experimental observations on cross sections over a range of energies not too large compared to E •. The cross-section factor, S, can then be plotted as a function of E and an appropriate extrapolation to find s. can be made. This is not always possible and computational procedures for several frequently occurring cases will now be given.
(i) For the case in which So is to be calculated from the experimentally determined parameters of a reso-
560 BURB(DGE, BURBIDGE, FOWLER, AND HOYLE
nance at E. which falls outside the range Eo±2~Eo, then For large x (high Coulomb barrier):
and
r1r2 o-=1!"JI.2w,------
(E-Er)2+r2/4'
The corrections for level shift effects are given by Marion and Fowler (Ma57). The various quantities which enter into these expressions are:
ll.= reduced De Broglie wavelength of interacting particles 0 and 1
= (h2/2ME)!= 144(AE)-l fermis (lQ-13 em) R/ll.= (E/ER)l
R=interaction radius = 1.44(Al *+ Aoi) fermis
812=dimensionless reduced width for the interaction of particle 1 with particle 0, derivable from the observed width, r1
rl=width for re-emission of particle 1 with particle 0
= 688h2/2M R2) (R/li.)P I = 6812(EER)lPz = [31r/2K2t.t12(x)](l-azE)812ER
Xexp( -31.28Z1ZoA tE-l) Pz= barrier penetration factor for orbital angular
momentumlh = [1r(ER/ E)ij4K2t.tl2(x)](1-azE)
Xexp( -31.28Z1Z0AlE-l) r2= experimental width for emission of reaction
product 2 with 3; approximately independent of E.
r=total width of resonance=r1+r2+ · · · w=statisticalfactor= (21+1)/ (211+1) (2Jo+l) ]=angular momentum of resonant state
J1=angular momentum of particle 1 J o= angular momentum of particle 0 x= 2 (Ea/ ER)b 0.525 (AZ1ZoR)i
ER=[1/l(l+1)]Xcentrifugal barrier height =h2/2MR2=20.9/AR2X103 kev
Ea=Coulomb barrier height=Z1Zoe2/R = (1.44Z1Zo/R)X10S kev.
K21+1(x)=modi:fied Bessel function of order 21+1. Convenient tables forK are given in (Br37, 52).
1 [ 1 {K2t.ts(x)( (2)2) } az=-- . 1-21(1+1) - -1 3ER l+1 K21+1(x) x
a1-o=_1_. {Ka(x) _ 1 }· 3ER K1(x)
[ 2(l+W] K2t.tl(x)"'=' (1rj2x)i exp -x+-;-
Pz""'[ : 0r(1-azE) expf -31.28Z1Z0AtE-i
+4(~:) '-z(t+W( ::) t] Pz/Po""exp[ -2l(l+1)(ER/Ec)l]
=exp[ -7.62l(l+1)/(AZ1ZoR)t]
In principle the cross sections and cross-section factors given above must be summed over all values of the orbital angular momentum, lh. The expressions given apply to any one specified l-wave interaction. Because of the low energies involved in nuclear collisions in stellar interiors, s-wave (1=0) interactions and in some cases p-wave (l= 1) interactions are usually the only ones which need to be taken into account. However, whenever selection rules or destructive interference effectsreduce the low 1-value interactions to zero then higher l values must be considered. In addition, ~henever any particular l-wave interaction is resonant, see (iv), then it must be taken into account. Resonant cross sections can be quite large even for high l values.
(ii) For the case in which the cross section is an average over resonances of the same spin and parity with mean width r spaced by an average energy interval equal to D, then averaging over the expression for ogiven in (i) yields
In general, each l wave can form several compound systems of different spins but the same parity. In employing the above approximate relation with the simple statistical factor (2l+ 1) we assume that these different systems have the same mean widths, r, and the same mean level separations, D.
With the foregoing expression for ii, one finds, neglecting a1Eo,
812 2l+ 1 rzBR So"" 1.94X 10⁴__ . -- kev barns.
A K2t.t12(x) rD
This will prove to be useful for order of magnitude estimates for interactions of charged particles with heavy nuclei (z;c 10). Blatt and Weisskopf (Bl52) have given a general relation between the particle decay widths, r1 ex: 812, for a given system of resonances and
SYNTHESIS OF ELEMENTS IN STARS 561
their mean energy separation. This can be written
Xo D 612 =--{J(Ao).
37rR ER
The function {J(A 0) varies between I"V0.3 and 3 for all except a few light and intermediate weight nuclei (Fe54, We57a) and we will set it equal to unity for order of magnitude estimates in what follows. The quantity Xo= 0. 7 X Hr13 em is the characteristic reduced De Broglie wavelength of low-energy nucleons once inside nuclei.
We now have, for R in fermis,
2l+1 rz So"'1.4X10³------kev barns.
ARKu+I2(x) r
For l=O and large x we then have
So(l=0)"'1.8X 10a_1_ rz(Ec)t AR r ER
Xexp[ +4( ;:) t] kev barns.
In general for (p,'Y) reactions on the light nuclei (Z=6 to 12) one finds So"' 1 to 100 kev barns. For the (p,a) reactions, So"' 103 to 106 kev barns. On substitution into the expression for the mean lifetime, and setting vo= 1, fo= 1, l=O, it is found that
1 PXI (Z1Zo) 516 rz --"'3.8X 10¹¹-----
rl(O) AI R!A SIGT6i r
xexp[ +4(;:r-r] sec-1•
In cases where this expression is applicable, e.g., (p,'Y) or (a,n) reactions on heavy nuclei (Z~ 10) one will in general have r= r2>>rl.
(iii) In the case of light nuclei, the interaction energy may fall in the flat minimum in between resonances. For this nonresonant case, order of magnitude estimates may be made by summing the contributions of all resonances of a given type with width r spaced by an average energy interval equal to D. The nonresonant cross section for a given l-wave interaction is
This expression assumes that all except the two nearest resonances have random phases, that is, that their contributions to the cross section can be simply added without compounding amplitudes. The factor (r+8) is to be used if the two nearest resonances interfere constructively; the factor (1r2 - 8) if the two nearest resonances interfere destructively. In fact, it is possible for the cross section for a given l wave to go to zero if all
of the contributing states interfere to give zero reaction amplitude. In this case the next highest l wave must be considered. On the average, for order of magnitude estimates, we can assume that all resonances, including the two nearest ones, are randomly phased in which case the factor 7r2±8 becomes r. The expression for Unr
is then the same as if in (ii) with r replaced by 2Dj1r. With this substitution, expressions for So and 1/r1 (0) given in (ii) can be employed. It will be noted, however, that in general r 2 <D so that an approximation similar to rz,..._,r is not valid in this case. For the light nuclei D,..._,1 to 10 Mev, whereas for radiative processes rz=r')',..._,O.l to 100 ev so that 10-7<r')'/D<1Q-4• For particle emission r 2/ D may be as high as 0.1.
(iv) When a resonance E, falls within the range I"VE0 ±2t:.Eo the resonant cross section factor S,, derivable from the resonant cross section u ,, must be employed. When resonant, even fairly large l-wave interactions must be considered. We have
u ,= 47rX2wrlrz/r2•
We will consider two limiting cases,
u,---47!"X2rl/rz for r=rz>>ri,
CT,~47rX2r2/ri for r=rl»rz.
The cross-section factor is
612 1-alEr wr2ER Sr= 1.24X 10⁴_ ---
A K2l+I2(x) r 2
The two limiting cases become
fh2 1-alEr wER Sr~1.24X1Q4_---
A Ku+I2(x) rz
wrz s,~2.63X10³-
Arl
Xexp(+31.28ZlZoAtE,-t) for r""'r1»r2•
The resonant reaction rate is for r in kev and S, in kev barns:
f, P=3.08X1Q-16nino--S,re-rr reactions cm~3 sec-1
A!T6!
X1Xo fr = 1.12X 1033p2 __ ---Srre-rr
A1Ao A!T6!
X1Xo wERf ,812 1-alEr ~1.39X1037p2-- , e-r,
A1Ao (AT6)~ Kz1+12(x)
for r""'rz»rl X1X0 wrzfr
~2.94X 1036p2----- exp( -11.61E,/T6)
A1Ao (AT6)i for r""'rl»rz.
562 BURBIDGE, BURBIDGE, FOWLER, AND HOYLE
In the preceding expressions
Tr= 31.28ZtZoA lE,-l+ 11.61E,jT6
and f, is the electron shielding factor evaluated atE,. The mean reaction time of nuclei of type 0 is
1 PXt vofr --= Pt (0) = 1.86X 10⁹- --Sri' e-rr sec-1
rt(O) At AlT6l
PXt VoWERj/Jr2 1-azEr ~2.31X10¹³- e-rr
A (AT6)l K21-1-t2(x)
, for r""'r2»I't PX1 VoWI'dr
~.49X 1013---- exp( -11.61Er/T6) At (AT6)!
for r""'r1»r2.
B. Pure Hydrogen Burning
The point of view that element synthesis begins with pure hydrogen (primordial or continuously produced) condensed in stars is based on the existence of the socalled direct pp chain of reactions by which hydrogen is converted into helium. This chain is initiated by the direct pp reaction
p+~d+.a++v+ +0.421 Mev,
which has good theoretical foundations but which has not yet been observed experimentally in the laboratory because of its extremely low cross section even at relatively high interaction energies. In the above equation and in what follows we use "+ for neutrinos emitted with positrons, ,a+, and "- for antineutrinos emitted with electrons, fJ-. We use nuclear rather than atomic mass differences in expressing the Q values of all reactions. There is of course practically no difference in atomic and nuclear Q values when positrons or electrons are not involved.
The calculated cross section for the pp reaction is 1Q-47 cm2= 1Q-23 bam at 1-Mev laboratory energy. This is much too small for detection with currently available techniques. The yield whena thick hydrogen target is employed can be estimated to be sxto-28
reaction per incident proton or approximately one reaction per 3X10⁸ amp sec corresponding at 106 volts to 3 X 10¹⁴ w sec. Thus only one reaction per 10M egawatt years of bombardment can be expected. In an earlier paper (Fo54) it was indicated that the cross section would reach a maximum value at 100 kev. This is not the case if account is taken of the rapid increase in betadecay probability with increasing beta-decay energy and hence with increasing incident proton energy. At the present time, however, it is not possible to obtain within many orders of magnitude, the necessary amounts of bombardment even at 1 Mev or above. At 100 Mev the cross section becomes 3X1G-16 bam but very pure hydrogen targets would be necessary to avoid positron production in heavy nuclei as contaminants.
At still higher energy, meson production becomes a complication.
(1) Rate of pp Reaction
Definitive theoretical calculations on the rate of the pp processes were given by Salpeter (Sa52a). These calculations accurately took into account the welldetermined phenomenological parameters of the neutron-proton and proton-proton interactions and showed that the main uncertainty in the cross section lay at that time in the uncertainty of the Gamow-Teller betadecay constant for which the following value was given:
g= 7 .5± 1.5 X 1Q-4 sec1 (Sa52a).
This value was adopted by Fowler (Fo54). The 20% uncertainty in the value of the Gamow-Teller coupling constant did not imply any uncertainty in the validity of the Gamow-Teller selection rules for beta-decay transitions. Then, as now, the super-allowed nature of the beta decay, He6 (o+)~Li6 (1+)+,a-+v-, which is permitted only by the Gamow-Teller selection rules, serves as a solid empirical foundation for this type of transition. The recent discovery of the nonconservation of parityt in allowed beta decay transitions (Wu57, Le56, Al57) is further substantiation of the existence of Gamow-Teller selection rules. The fore-and-aft asymmetry in the decay of aligned Co60 nuclei observed by Wu et al. is not possible for allowed Fermi transitions even with nonconservation of parity.
Experimental data on jt values for super-allowed mirror transitions and ~0 transitions in beta decay available in 1956 were employed by Kofoed-Hansen and Winther (Ko56) to evaluate the coupling constants in beta decay with improved accuracy. A recent measurement of the energy of the 014(o+)~N14*(0+) transition by Bromley et al. (Br57) leads to only a minor change in Kofoed-Hansen and Winther's results. Bromley et at. find 1809.7±7.8 kev for the transition energy and thus an jt value equal to 3088±56, which brings 0 14 into agreement with the Al26, CP\ and K38 o+~o+ transitions used by Kofoed-Hansen and Winther.
The quantity g which appears in Salpeter's expression for the rate of the pp reaction is related to the quantities Band x defined by Kofoed-Hansen and Winther (Ko56) through the relation
g=4ln2(x/ B)= 2.77 (xj B).
They find that the best fit to the experimental data yields B=2787±70 sec, x=O.S60±0.012, so that B/x=4980±150sec. With the new 0 14 data we estimate B=2818, x=0.544 so that B/x=5180 and
g= 5.35±0.15X 1Q-4 sec1 (new value, 1957),
t The reader is admonished that parity is still conserved to a high degree of experimental accuracy in reactions involving the strong interactions among nucleons (Ta57) as contrasted with the weak interactions leading to beta decay. The importance of parity conservation in nuclear reactions is illustrated in the discussion of the 3a reaction in Sec. IC(l).
SYNTHESIS OF ELEMENTS IN STARS 563
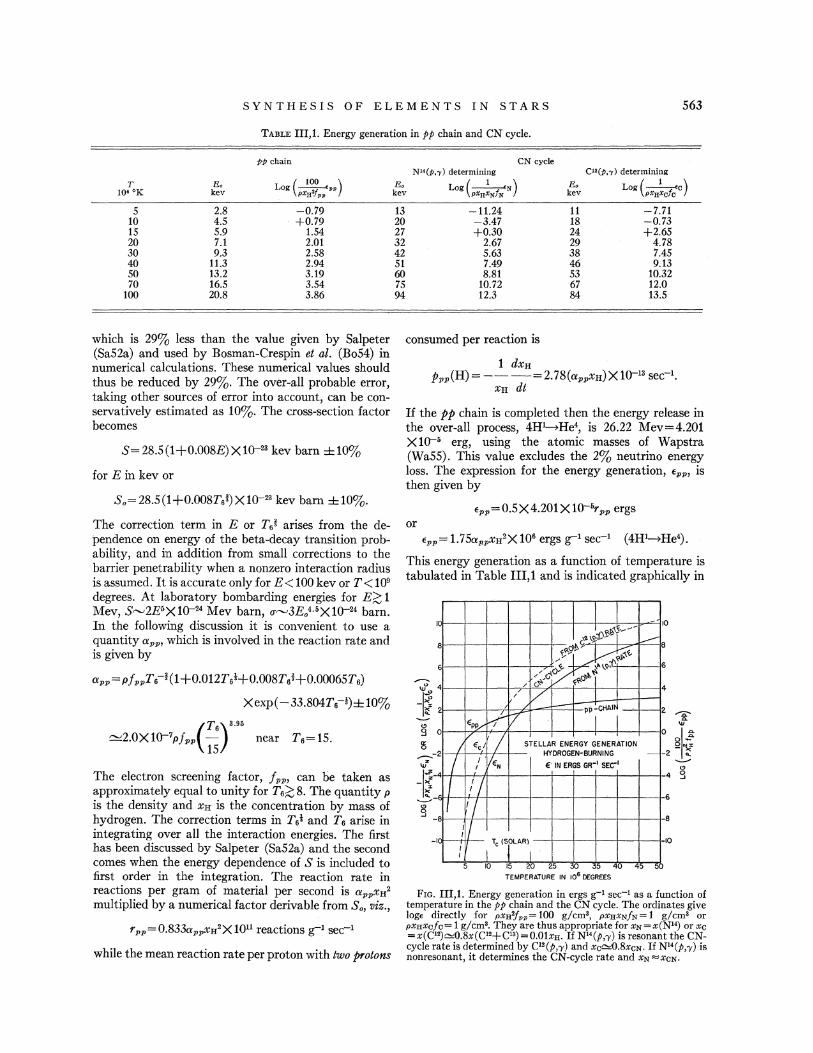
TABLE III,1. Energy generation in pp chain and CN cycle.
pp chain
T Eo Log ( 1~ ••) 10' °K kev pXg PP
5 2.8 -0.79 10 4.5 +0.79 15 5.9 1.54 20 7.1 2.01 30 9.3 2.58 40 11.3 2.94 50 13.2 3.19 70 16.5 3.54
100 20.8 3.86
which is 29% less than the value given by Salpeter (Sa52a) and used by Bosman-Crespin et at. (Bo54) in numerical calculations. These numerical values should thus be reduced by 29%. The over-all probable error, taking other sources of error into account, can be conservatively estimated as 10%. The cross-section factor becomes
S=28.5(1+0.008E)X1Q-23 kev barn ±10%
for E in kev or
S.=28.S(l+0.008T6i)X1Q-23 kev barn ±10%.
The correction term in E or T6i arises from the dependence on energy of the beta-decay transition probability, and in addition from small corrections to the barrier penetrability when a nonzero interaction radius is assumed. It is accurate only forE< 100 kev or T<109
degrees. At laboratory bombarding energies for E?::, 1 Mev, St'.J2E5X 1Q-24 Mev barn, ut'.J3E.uX 1Q-24 barn. In the following discussion it is convenient to use a quantity aPP> which is involved in the reaction rate and is given by
app = p fppT6-i( 1 +0.012Tsl+0.008T 6i+0.00065T 6)
Xexp( -33.804T6-l)±10%
(T6)s:95
~2.0X1Q-7pfpp 15 near T6=15.
The electron screening factor, fpp, can be taken as approximately equal to unity for Ts?::, 8. The quantity p is the density and XH is the concentration by mass of hydrogen. The correction terms in T61 and Ts arise in integrating over all the interaction energies. The first has been discussed by Salpeter (Sa52a) and the second comes when the energy dependence of S is included to first order in the integration. The reaction rate in reactions per gram of material per second is appXH2
multiplied by a numerical factor derivable from S., viz.,
while the mean reaction rate per proton with two protons
CN cycle Nl'(P."Y) determining C"(P,-y) determining
Eo Eo kev
Log ( __!__.N) PXnXNfN kev Log (___!__.c)
PXnXcfo
13 20 27 32 42 51 60 75 94
-11.24 11 -7.71 -3.47 18 -0.73 +0.30 24 +2.65
2.67 29 4.78 5.63 38 7.45 7.49 46 9.13 8.81 53 10.32
10.72 67 12.0 12.3 84 13.5
consumed per reaction is
1 dxH PPP(H) = ---= 2. 78(appXH) X 1Q-13 sec-1•
XH dt
If the pp chain is completed then the energy release in the over-all process, 4H4He4, is 26.22 Mev=4.201 X1Q-5 erg, using the atomic masses of Wapstra (WaSS). This value excludes the 2% neutrino energy loss. The expression for the energy generation, Epp, is then given by
Epp=O.SX4.201X1Q-5rpp ergs or
Epp= 1.7Sa11pXH2X 106 ergs g-1 sec-1 (4H4He4).
This energy generation as a function of temperature is tabulated in Table III,l and is indicated graphically in
I - I
I:D~f---8
~' 1---a
:\
6 . / ,;:
4 /-~~v .I
/ / /
0
6
4
2 / - pp-CHAII·~ f--
EPJY ~ tl I I 0
I 2 I E0 / STELLAR ENERGY GENERATION HYDROGEN-BURNING -
4 I ,''liEN f:· IN ERGS GR-1 SEC"1
I !/ -I 'I 8
:II I
'Tc (SrAR)I I I
2 ......-.:-
0 ~~~ -2 ...
-.:....-'
-4 g 6
-8
-10
5 10 15 20 25 :30 35 0 45 50 TEMPERATURE IN 106 DEGREES
FIG. III,l. Energy generation in ergs g-1 sec-1 as a function of temperature in the pp chain and the CN cycle. The ordinates give loge directly for pXH2f •• = 100 g/cm3, pXHXN/N= 1 g/cm3 or pXHXc/c= 1 g/cm3. They are thus appropriate for XN=x(NI4) or xc = x(C12)=0.8x(C'2+Cl3) =0.01xH. If Nl'(P,'Y) is resonant the CNcycle rate is determined by C12 (p,1') and xc=0.8xcN· If N"(P,'Y) is nonresonant, it determines the CN-cycle rate and "N""XcN.
564 BURBIDGE, BURBIDGE, FOWLER, AND HOYLE
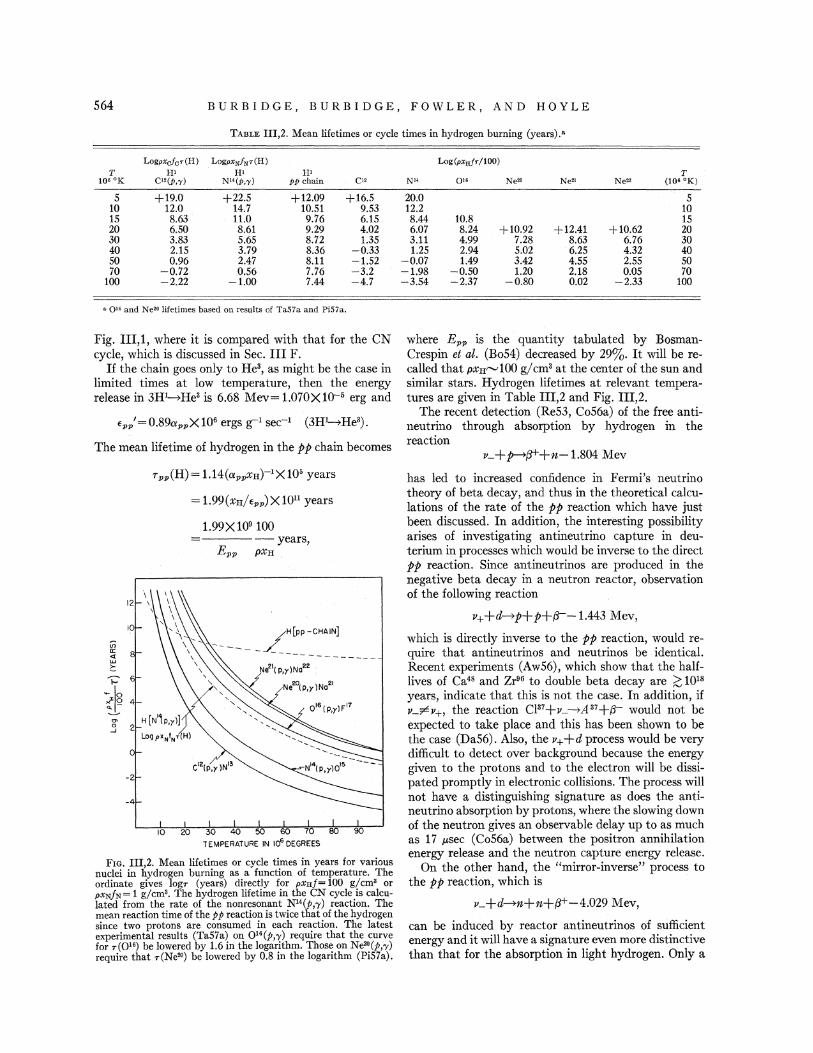
TABLE III,2. Mean lifetimes or cycle times in hydrogen burning (years).•
Logpxcf0T(H) LogpxNfNT(H)
T Hl HI HI 10' °K C12(p,y) N 14 (P,y) pp chain C"
5 +19.0 +22.5 +12.09 +16.5 10 12.0 14.7 10.51 9.53 15 8.63 11.0 9.76 6.15 20 6.50 8.61 9.29 4.02 30 3.83 5.65 8.72 1.35 40 2.15 3.79 8.36 -0.33 50 0.96 2.47 8.11 -1.52 70 -0.72 0.56 7.76 -3.2
100 -2.22 -1.00 7.44 -4.7
• 0" and Ne" lifetimes based on results of Ta57a and Pi57a.
Fig. III,l, where it is compared with that for the CN cycle, which is discussed in Sec. III F.
If the chain goes only to He3, as might be the case in limited times at low temperature, then the energy release in 3H4He3 is 6.68 Mev= 1.070X to-5 erg and
Epp'=0.89appX106 ergs g-1 sec-1 (3H4He3).
The mean lifetime of hydrogen in the pp chain becomes
r pp(H) = 1.14(appXH)-1 X 10⁶ years
=1.99(xH/Epp)X1011 years
v; 0:: <t lU t. t:' _,0 ,;<o ... -
"' 0 ..J
4
2
0
-2
-4
1.99X 10⁹ 100 years,
PXH
------ /H(pp -CHAIN)
--------------
Fro. III,2. Mean lifetimes or cycle times in years for various nuclei in hydrogen burning as a function of temperature. The ordinate gives logr (years) directly for pXHf= 100 g/cm3 or pXN/N= 1 g/cma. The hydrogen lifetime in tile CN cycle is calculated from tile rate of the nonresonant N14(p,-y) reaction. The mean reaction time of the pp reaction is twice that of tile hydrogen since two protons are consumed in each reaction. The latest experimental results (Ta57a) on 0 16 (p,-y) require tllat tile curve for r(OI') be lowered by 1.6 in tile logarithm. Those on Ne'JJJ(p,-y) require that r(Ne'JJJ) be lowered by 0.8 in the logarithm (Pi57a).
Log(px11jT/100)
T N" Q16 Ne" Ne" Ne" (10'°K)
20.0 5 12.2 10 8.44 10.8 15 6.07 8.24 +10.92 +12.41 +10.62 20 3.11 4.99 7.28 8.63 6.76 30 1.25 2.94 5.02 6.25 4.32 40
-O.o7 1.49 3.42 4.55 2.55 50 -1.98 -0.50 1.20 2.18 0.05 70 -3.54 -2.37 -0.80 0.02 -2.33 100
where Epp is the quantity tabulated by BosmanCrespin et al. (Bo54) decreased by 29%. It will be recalled that pXH"-'100 g/cm3 at the center of the sun and similar stars. Hydrogen lifetimes at relevant temperatures are given in Table III,2 and Fig. III,2.
The recent detection (Re53, Co56a) of the free antineutrino through absorption by hydrogen in the reaction
v-+~.a++n-1.804 Mev
has led to increased confidence in Fermi's neutrino theory of beta decay, and thus in the theoretical calculations of the rate of the pp reaction which have just been discussed. In addition, the interesting possibility arises of investigating antineutrino capture in deuterium in processes which would be inverse to the direct pp reaction. Since antineutrinos are produced in the negative beta decay in a neutron reactor, observation of the following reaction
v++d~p+p+fj--1.443 Mev,
which is directly inverse to the pp reaction, would require that antineutrinos and neutrinos be identical. Recent experiments (Aw56), which show that the halflives of Ca48 and Zr96 to double beta decay are ~ 1018
years, indicate that this is not the case. In addition, if v_;o6v+, the reaction Cl37+v-~A 37+{j- would not be expected to take place and this has been shown to be the case (Da56). Also, the v+ +d process would be very difficult to detect over background because the energy given to the protons and to the electron will be dissipated promptly in electronic collisions. The process will not have a distinguishing signature as does the antineutrino absorption by protons, where the slowing down of the neutron gives an observable delay up to as much as 17 J.!SCC (Co56a) between the positron annihilation energy release and the neutron capture energy release.
On the other hand, the "mirror-inverse" process to the pp reaction, which is
p_ +d~n+n+.a+-4.029 Mev,
can be induced by reactor antineutrinos of sufficient energy and it will have a signature even more distinctive than that for the absorption in light hydrogen. Only a
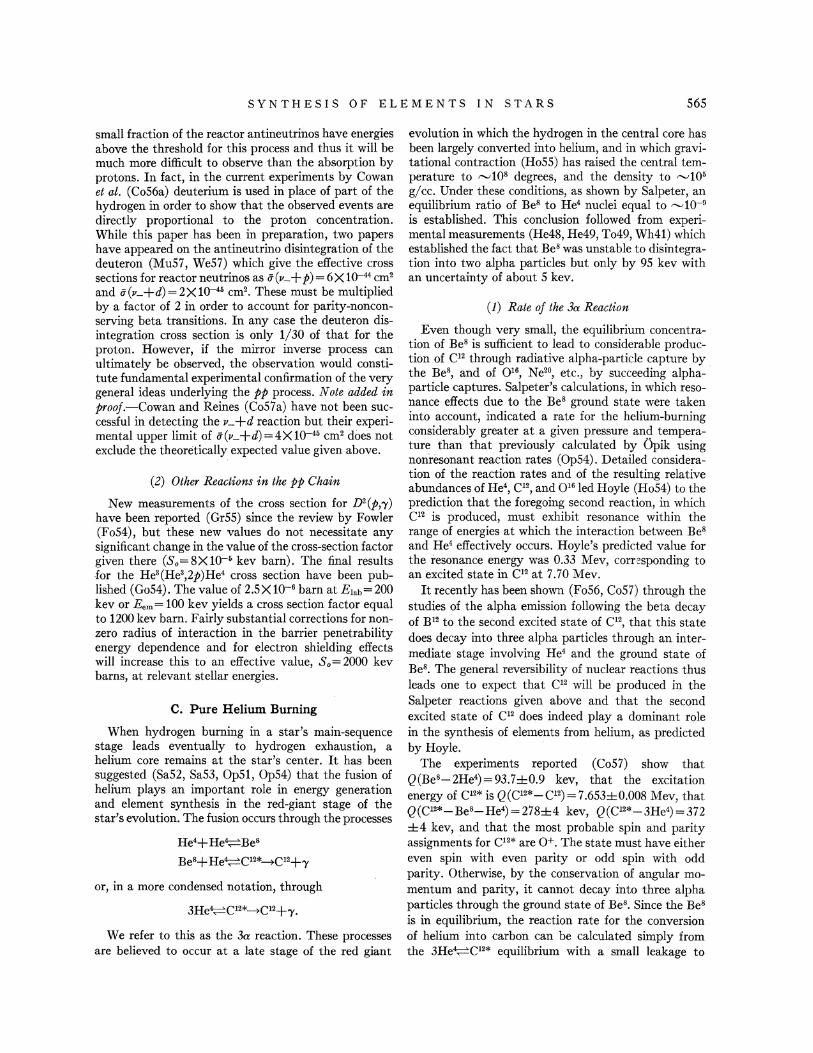
SYNTHESIS OF ELEMENTS IN STARS 565
small fraction of the reactor antineutrinos have energies above the threshold for this process and thus it will be much more difficult to observe than the absorption by protons. In fact, in the current experiments by Cowan et al. (Co56a) deuterium is used in place of part of the hydrogen in order to show that the observed events are directly proportional to the proton concentration. While this paper has been in preparation, two papers have appeared on the antineutrino disintegration of the deuteron (Mu57, WeS7) which give the effective cross sections for reactor neutrinos as if (v_ + p) = 6 X 10-44 cm2
and ii(v-+d)=2X1o-45 cm2. These must be multiplied by a factor of 2 in order to account for parity-nonconserving beta transitions. In any case the deuteron disintegration cross section is only 1/30 of that for the proton. However, if the mirror inverse process can ultimately be observed, the observation would constitute fundamental experimental confirmation of the very general ideas underlying the pp process. Note added in prooj.-Cowan and Reines (CoS7a) have not been successful in detecting the v_ +d reaction but their experimental upper limit of ii(v_+d)=4X1o-46 cm2 does not exclude the theoretically expected value given above.
(2) Other Reactions in the pp Chain
New measurements of the cross section for D2 (p,'Y) have been reported (Gr55) since the review by Fowler (Fo54), but these new values do not necessitate any significant change in the value of the cross-section factor given there (So=8X10-~> kev barn). The final results .for the He3 (He3,2p)He4 cross section have been published (GoS4). The value of 2.SX10-6 barn at E 1ab= 200 kev or Eem= 100 kev yields a cross section factor equal to 1200 kev barn. Fairly substantial corrections for nonzero radius of interaction in the barrier penetrability energy dependence and for electron shielding effects will increase this to an effective value, So= 2000 kev barns, at relevant stellar energies.
C. Pure Helium Burning
When hydrogen burning in a star's main-sequence stage leads eventually to hydrogen exhaustion, a helium core remains at the star's center. It has been suggested (SaS2, SaS3, OpS1, OpS4) that the fusion of helium plays an important role in energy generation and element synthesis in the red-giant stage of the star's evolution. The fusion occurs through the processes
He4+He~Be8
Bes+ He~C12*~C12+'Y
or, in a more condensed notation, through
3He~C12*~C12+"f.
We refer to this as the 3a: reaction. These processes are believed to occur at a late stage of the red giant
evolution in which the hydrogen in the central core has been largely converted into helium, and in which gravitational contraction (RoSS) has raised the central temperature to "-'108 degrees, and the density to "-'105
gjcc. Underthese conditions, as shown by Salpeter, an equilibrium ratio of Be8 to He4 nuclei equal to "-'10-9
is established. This conclusion followed from experimental measurements (He48, He49, To49, Wh41) which established the fact that Be8 was unstable to disintegration into two alpha particles but only by 9S kev with an uncertainty of about S kev.
(1) Rate of the 3a Reaction
Even though very small, the equilibrium concentration of Be8 is sufficient to lead to considerable production of C12 through radiative alpha-particle capture by the Be8, and of 0 16, Ne20, etc., by succeeding alphaparticle captures. Salpeter's calculations, in which resonance effects due to the Be8 ground state were taken into account, indicated a rate for the helium-burning considerably greater at a given pressure and temperature than that previously calculated by Opik using nonresonant reaction rates (OpS4). Detailed consideration of the reaction rates and of the resulting relative abundances of He4, C12, and 0 16 led Hoyle (Ho54) to the prediction that the foregoing second reaction, in which C12 is produced, must exhibit resonance within the range of energies at which the interaction between Be8
and He4 effectively occurs. Hoyle's predicted value for the resonance energy was 0.33 Mev, corr~sponding to an excited state in C12 at 7.70 Mev .
It recently has been shown (Fo56, CoS7) through the studies of the alpha emission following the beta decay of B12 to the second excited state of Cl2, that this state does decay into three alpha particles through an intermediate stage involving He4 and the ground state of Be8• The general reversibility of nuclear reactions thus leads one to expect that C12 will be produced in the Salpeter reactions given above and that the second excited state of C12 does indeed play a dominant role in the synthesis of elements from helium, as predicted by Hoyle.
The experiments reported (Co57) show that Q(Bes_2He4)=93.7±0.9 kev, that the excitation energy of C12* is Q(Cl2*-C12)=7.6S3±0.008 Mev, that Q(C12*-Be8-He4)=278±4 kev, Q(Cl2*-3He4)=372 ±4 kev, and that the most probable spin and parity assignments for C12* are o+. The state must have either even spin with even parity or odd spin with odd parity. Otherwise, by the conservation of angular momentum and parity, it cannot decay into three alpha particles through the ground state of Be8• Since the Be8
is in equilibrium, the reaction rate for the conversion of helium into carbon can be calculated simply from the 3He~C12* equilibrium with a small leakage to
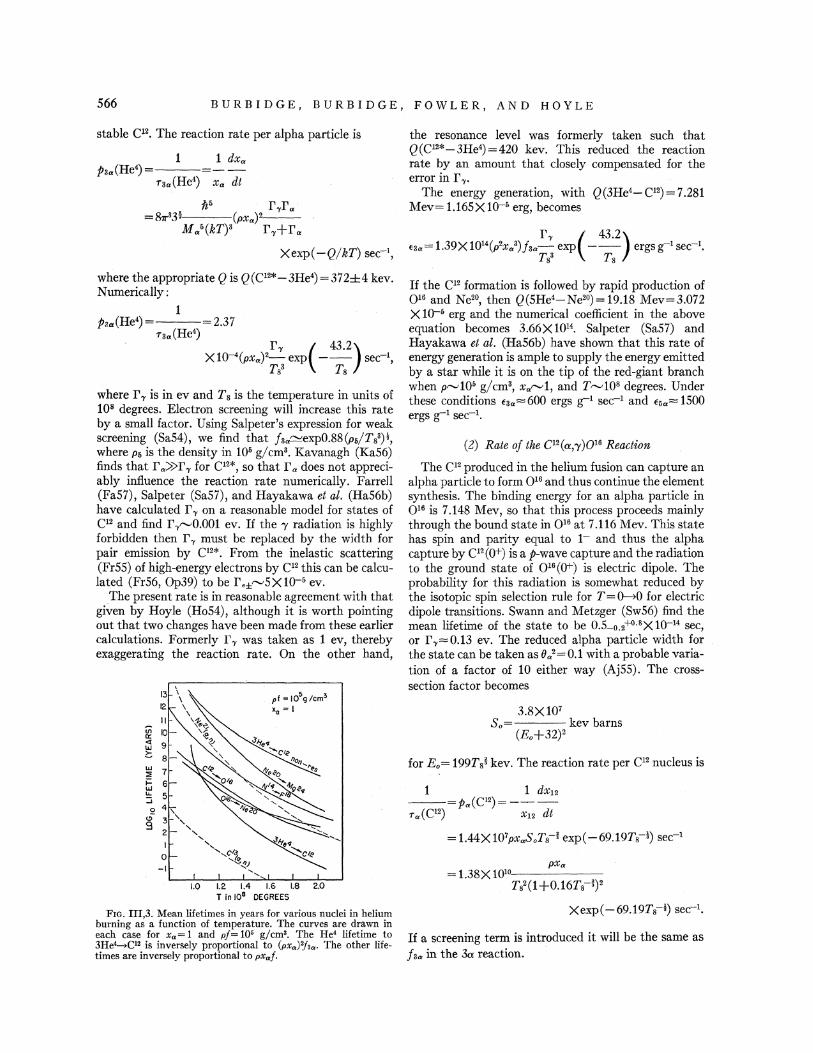
566 BURBIDGE, BURBIDGE, FOWLER, AND HOYLE
stable C12• The reaction rate per alpha particle is
1 1 dxa
Taa (He4) X a dt
h" r'Yr" =87T33i (pxa)2 __ _
Ma6(kT) 3 r'Y+r"
Xexp( -Q/kT) sec!,
where the appropriate Q is Q(C12*-3He4)=372±4 kev. Numerically:
where r 'Y is in ev and T8 is the temperature in units of 108 degrees. Electron screening will increase this rate by a small factor. Using Salpeter's expression for weak screening (Sa54), we find that fsa""'exp0.88(p6/T83)!, where p6 is the density in 105 g/cm3• Kavanagh (Ka56) finds that r ,»r 'Y for C12*, so that r" does not appreciably influence the reaction rate numerically. Farrell (Fa57), Salpeter (Sa57), and Hayakawa et al. (Ha56b) have calculated r 'Y on a reasonable model for states of C12 and find r 'Y"-'0.001 ev. If the 'Y radiation is highly forbidden then r r must be replaced by the width for pair emission by C12*. From the inelastic scattering (FrSS) of high-energy electrons by CI2 this can be calculated (Fr56, Op39) to be L±'""SX 10-5 ev.
The present rate is in reasonable agreement with that given by Hoyle (Ho54), although it is worth pointing out that two changes have been made from these earlier calculations. Formerly r 'Y was taken as 1 ev, thereby exaggerating the reaction rate. On the other hand,
pf = J05g /cm3
•a =I
1.0 1.2 1.4 1.6 1.8 2.0 T in 108 DEGREES
FIG. III,3. Mean lifetimes in years for various nuclei in helium burning as a function of temperature. The curves are drawn in each case for xa= 1 and pf= 106 g/cm3• The He4 lifetime to 3He4-+C12 is inversely proportional to (pX0.)'1j 301 • The other lifetimes are inversely proportional to pxaf·
the resonance level was formerly taken such that Q(C12*-3He4)=420 kev. This reduced the reaction rate by an amount that closely compensated for the error in r 'Y·
The energy generation, with Q (3He4_ C12) = 7.281 Mev= 1.165X 10⁻⁵ erg, becomes
If the C12 formation is followed by rapid production of 0 16 and Ne20, then Q(SHe4-Ne20)=19.18 Mev=3.072 X 10-• erg and the numerical coefficient in the above equation becomes 3.66X10¹⁴• Salpeter (Sa57) and Hayakawa et al. (Ha56b) have shown that this rate of energy generation is ample to supply the energy emitted by a star while it is on the tip of the red-giant branch when p,...._,105 g/cm3, Xa,...._,1, and T"-'108 degrees. Under these conditions e3,.=600 ergs g-1 sec-1 and e5,= 1500 ergs g-1 sec-1.
(2) Rate of the 0 2(a,'Y)016 Reaction
The C12 produced in the helium fusion can capture an alpha particle to form 0 16 and thus continue the element synthesis. The binding energy for an alpha particle in 0 16 is 7.148 Mev, so that this process proceeds mainly through the bound state in 0 16 at 7.116 Mev. This state has spin and parity equal to 1- and thus the alpha capture by C12 (0+) is a p-wave capture and the radiation to the ground state of 0 16 (0+) is electric dipole. The probability for this radiation is somewhat reduced by the isotopic spin selection rule for T=~O for electric dipole transitions. Swann and Metzger (Sw56) find the mean lifetime of the state to be O.S-o.z+0 ·8X 10-14 sec, or r r=0.13 ev. The reduced alpha particle width for the state can be taken as 8}= 0.1 with a probable variation of a factor of 10 either way (AjSS). The crosssection factor becomes
3.8X10⁷
Sa=----· kev barns (Ea+32) 2
for Eo= 199T8i kev. The reaction rate per C12 nucleus is
1 1 dx12 --=Pa(Clz)= ---r a(C12) X12 dt
= 1.44X10⁷pxaSaTs-i exp( -69.19Ts-l) sec-1
PXa = 1.38X 10¹⁰-----
T82(1 +O.l6Ts-I)2
Xexp( -69.19T8-l) sec-1•
If a screening term is introduced it will be the same as faa in the 3a reaction.
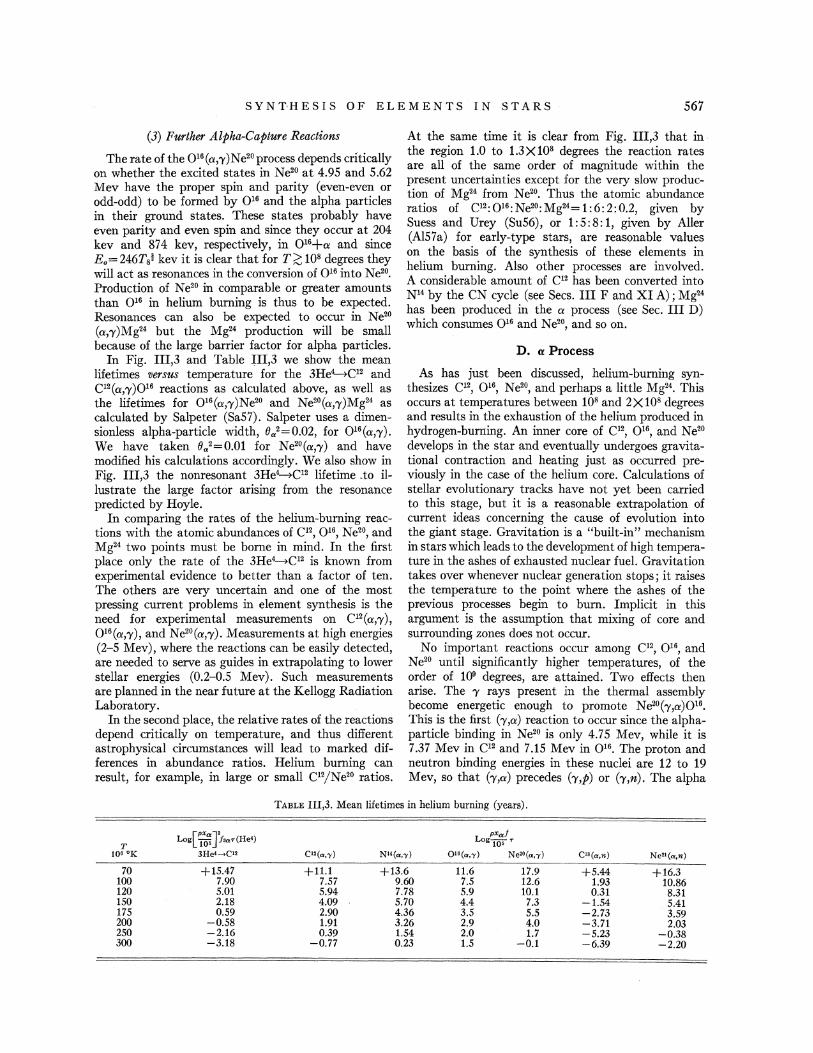
SYNT-HESIS OF ELEMENTS IN STARS 567
(3) Further Alpha-Capture Reactions
The rate of the 0 16 (a;y)Ne20 process depends critically on whether the excited states in Ne2° at 4.95 and 5.62 Mev have the proper spin and parity (even-even or odd-odd) to be formed by 0 16 and the alpha particles in their ground states. These states probably have even parity and even spin and since they occur at 204 kev and 874 kev, respectively, in 0 16+a and since Eo= 246T8i kev it is clear that for T ;(; 108 degrees they will act as resonances in the conversion of 0 16 into Ne20•
Production of Ne20 in comparable or greater amounts than 0 16 in helium burning is thus to be expected. Resonances can also be expected to occur in Ne20
(a,')')Mg24 but the Mg24 production will be small because of the large barrier factor for alpha particles.
In Fig. III,3 and Table ~II,3 we show the mean lifetimes versus temperature for the 3He4C12 and CI2 (a,')')016 reactions as calculated above, as well as the lifetimes for 0 16 (a,'Y)Ne20 and Ne20(a,')')Mg24 as calculated by Salpeter (Sa57). Salpeter uses a dimensionless alpha-particle width, Ba2=0.02, for 0 16(a,')'). We have taken 8 .. 2 =0.01 for Ne20 (a,'Y) and have modified his calculations accordingly. We also show in Fig. III,3 the nonresonant 3He4C12 lifetime .to illustrate the large factor arising from the resonance predicted by Hoyle.
In comparing the rates of the helium-burning reactions with the atomic abundances of C12, 0 16, Ne20, and Mg24 two points must be borne in mind. In the first place only the rate of the 3He4C12 is known from experimental evidence to better than a factor of ten. The others are very uncertain and one of the most pressing current problems in element synthesis is the need for experimental measurements on C12 (a,')'), Q16(a,')'), and Ne20 (a,')'). Measurements at high energies (2-5 Mev), where the reactions can be easily detected, are needed to serve as guides in extrapolating to lower stellar energies (0.2-0.5 Mev). Such measurements are planned in the near future at the Kellogg Radiation Laboratory.
In the second place, the relative rates of the reactions depend critically on temperature, and thus different astrophysical circumstances will lead to marked differences in abundance ratios. Helium burning can result, for example, in large or small C12/Ne20 ratios.
At the same time it is clear from Fig. III,3 that in the region 1.0 to 1.3X10⁸ degrees the reaction rates are all of the same order of magnitude within the present uncertainties except for the very slow production of Mg24 from Ne20• Thus the atomic abundance ratios of C12:016 :Ne20:Mg24 =1:6:2:0.2, given by Suess and Urey (Su56), or 1:5:8: 1, given by Aller (Al57a) for early-type stars, are reasonable values on the basis of the synthesis of these elements in helium burning. Also other processes are involved. A considerable amount of C12 has been converted into Nl4 by the CN cycle (see Sees. III F and XI A) ; Mg24
has been produced in the a process (see Sec. III D) which consumes 0 16 and Ne20, and so on.
D. a Process
As has just been discussed, helium-burning synthesizes C12, 0 16, Ne2°, and perhaps a little Mg24• This occurs at temperatures between 108 and 2X10⁸ degrees and results in the exhaustion of the helium produced in hydrogen-burning. An inner core of C12, 0 16, and Ne2o develops in the star and eventually undergoes gravitational contraction and heating just as occurred previously in the case of the helium core. Calculations of stellar evolutionary tracks have not yet been carried to this stage, but it is a reasonable extrapolation of current ideas concerning the cause of evolution into the giant stage. Gravitation is a "built-in" mechanism in stars which leadsto the development of high temperature in the ashes of exhausted nuclear fuel. Gravitation takes over whenever nuclear generation stops; it raises the temperature to the point where the ashes of the previous processes begin to burn. Implicit in this argument is the assumption that mixing of core and surrounding zones does not occur.
No important reactions occur among CI2, 0 16, and Ne20 until significantly higher temperatures, of the order of 1()9 degrees, are attained. Two effects then arise. The 'Y rays present in the thermal assembly become energetic enough to promote Ne20 (')',a)016,
This is the first ('Y,a) reaction to occur since the alphaparticle binding in Ne20 is only 4.75 Mev, while it is 7.37 Mev in C12 and 7.15 Mev in 0 16• The proton and neutron binding energies in these nuclei are 12 to 19 Mev, so that ('Y,a) precedes ('Y,p) or ('Y,n). The alpha
TABLE III,3. Mean lifetimes in helium burning (years).
[PXa]' PXaf T
Log 10, /aaT(He•) Log106 T
106 °K 3He<-->Cl2 C12(a,'y) N14(a,-y) Q16(a,'y) Ne20(a,-y) C"(a,n) Ne"(a,n)
70 +15.47 +11.1 +13.6 11.6 17.9 +5.44 +16.3 100 7.90 7.57 9.60 7.5 12.6 1.93 10.86 120 5.01 5.94 7.78 5.9 10.1 0.31 8.31 150 2.18 4.09 5.70 4.4 7.3 -1.54 5.41 175 0.59 2.90 4.36 3.5 5.5 -2.73 3.59 200 -0.58 1.91 3.26 2.9 4.0 -3.71 2.03 250 -2.16 0.39 1.54 2.0 1.7 -5.23 -0.38 300 -3.18 -0.77 0.23 1.5 -0.1 -6.39 -2.20
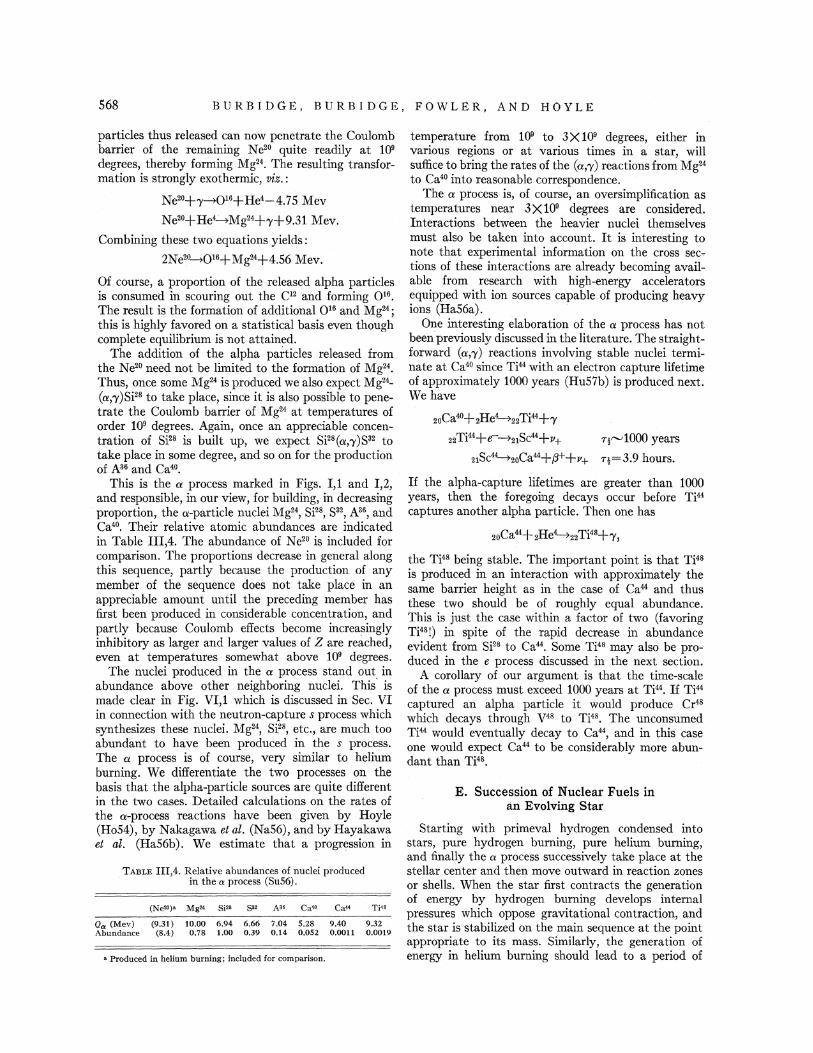
568 BURBIDGE, BURBIDGE, FOWLER, AND HOYLE
particles thus released can now penetrate the Coulomb barrier of the remaining Ne20 quite readily at 1()9 degrees, thereby forming Mg24. The resulting transformation is strongly exothermic, viz.:
Ne2o+y~016+ He4_4. 75 Mev
Ne20+He4Mg24+'y+9.31 Mev.
Combining these two equations yields:
2Ne24016+ Mg24+4.56 Mev.
Of course, a proportion of the released alpha particles is consumed in scouring out the C12 and forming 0 16. The result is the formation of additional 0 16 and Mg24 ;
this is highly favored on a statistical basis even though complete equilibrium is not attained.
The addition of the alpha particles released from the Ne20 need not be limited to the formation of Mg24. Thus, once some Mg24 is produced we also expect Mg24-(a;y )Si28 to take place, since it is also possible to penetrate the Coulomb barrier of Mg24 at temperatures of order 109 degrees. Again, once an appreciable concentration of Si28 is built up, we expect Si28 (a;y)S32 to take place in some degree, and so on for the production of N 6 and Ca40.
This is the a process marked in Figs. I,1 and I,2, and responsible, in our view, for building, in decreasing proportion, the a-particle nuclei Mg24, Si28, 832, N 6, and Ca40. Their relative atomic abundances are indicated in Table III,4. The abundance of Ne20 is included for comparison. The proportions decrease in general along this sequence, partly because the production. of any member of the sequence does not take place in an appreciable amount until the preceding member has first been produced in considerable concentration, and partly because Coulomb effects become increa~ingly inhibitory as larger and larger values of Z are reached, even at temperatures somewhat above 1()9 degrees.
The nuclei produced in the a process stand out in abundance above other neighboring nuclei. This is made clear in Fig. VI,1 which is discussed in Sec. VI in connection with the neutron-capture s process which synthesizes these nuclei. Mg24, Si~8, etc., are much too abundant to have been produced in the s process. The. a process is of course, very similar to helium burning. We differentiate the two processes on the basis that the alpha-particle sources are quite different in the two cases. Detailed calculations on the rates of the a-process reactions have been given by Hoyle (Ho54), by Nakagawa et al. (Na56), and by Hayakawa et al. (Ha56b). We estimate that a progression in
TABLE III,4. Relative abundances of nuclei produced in the a process (Su56).
(Neto)a MgM Si.ts sn A36 Ca-to Ca« Ti4&
Oa (Mev) (9.31) 10.00 6.94 6.66 7.04 5.28 9.40 9.32 Abundance (8.4) 0.78 1.00 0.39 0.14 0.052 0.0011 0.0019
a Produced in helium burning; included for comparison.
temperature from 1()9 to 3X10⁹ degrees, either in various regions or at various times in a star, will suffice to bring the rates of the (a,')') reactions from Mg24
to Ca40 into reasonable correspondence. The a process is, of course, an oversimplification as
temperatures near 3X10⁹ . degrees are considered. Interactions between the heavier nuclei themselves must also be taken into account. It is interesting to note that experimental information on the cross sections of these interactions are already becoming available from research with high-energy accelerators equipped with ion sources capable of producing heavy ions (Ha56a). ·
One interesting elaboration of the a process has not been previously discussed in the literature. The straightforward (a,')') reactions involving stable nuclei terminate at Ca40 since Ti44 with an electron capture lifetime of approximately 1000 years (Hu57b) is produced next. We have
2oCa40+ 2He422 Ti44+'Y
22Ti44+e~21Sc44+v+ Tf'-'1000 years
21Sc~2oCa44+.a++v+ Tt=3.9 hours.
If the alpha-capture lifetimes are greater than 1000 years, then the foregoing decays occur before Ti44 captures another alpha particle. Then one has
2oCa44+ 2He422 Ti48+'Y,
the Ti48 being stable. The important point is that Ti48 is produced in an interaction with approximately the same barrier height as in the case of Ca44 and thus these two should be of roughly equal abundance. This is just the case within a factor of two (favoring Ti48 !) in spite of the rapid decrease in abundance evident from Si28 to Ca44• Some Ti48 may also be produced in the e process discussed in the next section.
A corollary of our argument is that the time-scale of the a process must exceed 1000 years at Ti44• If Ti44
captured an alpha particle it would produce Cr'8
which decays through V48 to Ti48• The unconsumed Ti44 would eventually decay to Ca44, and in this case one would expect Ca44 to be considerably more abundant than Ti48.
E. Succession of Nuclear Fuels in an Evolving Star
Starting with primeval hydrogen condensed into stars, pure hydrogen burning, pure helium burning, and finally the a process successively take place at the stellar center and then move outward in reaction zones or shells. When the star first contracts the generation of energy by hydrogen burning develops internal pressures which oppose gravitational contraction, and the star is stabilized on the main sequence at the point appropriate to its mass. Similarly, the generation of energy in helium burning should lead to a period of
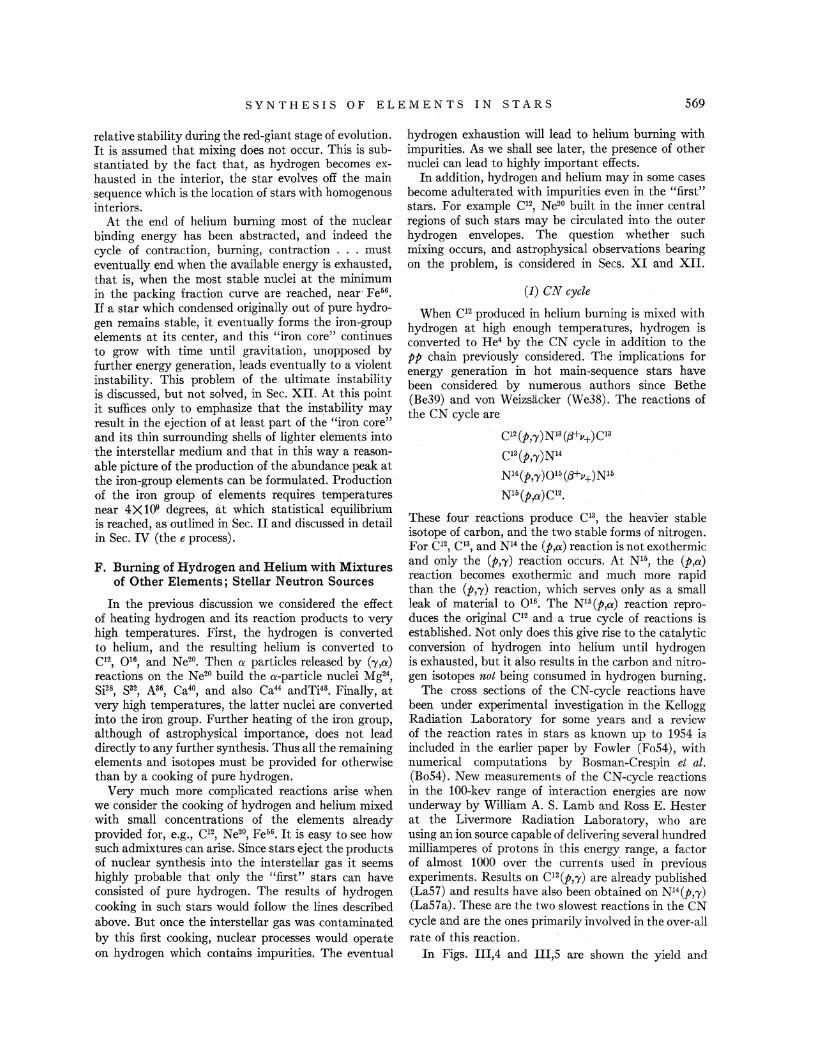
SYNTHESIS OF ELEMENTS IN STARS 569
relative stability during the red-giant stage of evolution. It is assumed that mixing does not occur. This is substantiated by the fact that, as hydrogen becomes exhausted in the interior, the star evolves off the main sequence which is the location of stars with homogenous interiors.
At the end of helium burning most of the nuclear binding energy has been abstracted, and indeed the cycle of contraction, burning, contraction . . . must eventually end when the available energy is exhausted, that is, when the most stable nuclei at the minimum in the packing fraction curve are reached, near· Fe66. If a star which condensed originally out of pure hydrogen remains stable, it eventually forms the iron-group elements at its center, and this "iron core" continues to grow with time until gravitation, unopposed by further energy generation, leads eventually to a violent instability. This problem of the ultimate instability is discussed, but not solved, in Sec. XII. At this point it suffices only to emphasize that the instability may result in the ejection of at least part of the "iron core" and its thin surrounding shells of lighter elements· into the interstellar medium and that in this way a reasonable picture of the production of the abundance peak at the iron-group elements can be formulated. Production of the iron group of elements requires temperatures near 4X1()9 degrees, at which statistical equilibrium is reached, as outlined in Sec. II and discussed in detail in Sec. IV (thee process).
F. Burning of Hydrogen and Helium with Mixtures of Other Elements; Stellar Neutron Sources
In the previous discussion we considered the effect of heating hydrogen and its reaction products to very high temperatures. First, the hydrogen is converted to helium, and the resulting helium is converted to C12, 0 16, and Ne20. Then a particles released by ('y,a) reactions on the Ne20 build the a-particle nuclei Mg24, Si28, S32, N 6, Ca40, and also Ca44 andTi48. Finally, at very high temperatures, the latter nuclei are converted into the iron group. Further heating of the iron group, although of astrophysical importance, does not lead directly to any further synthesis. Thus all the remaining elements and isotopes must be provided for otherwise than by a cooking of pure hydrogen.
Very much more complicated reactions arise when we consider the cooking of hydrogen and helium mixed with small concentrations of the elements already provided for, e.g., C12, Ne20, Fe66. It is easy to see how such admixtures can arise. Since stars eject the products of nuclear synthesis into the interstellar gas it seems highly probable that only the "first ... stars can have consisted of pure hydrogen. The results of hydrogen cooking in such stars would follow the lines described above. But once the interstellar gas was contaminated by this first cooking, nuclear processes would operate on hydrogen which contains impurities. The eventual
hydrogen exhaustion will lead to helium burning with impurities. As we shall see later, the presence of other nuclei can lead to highly important effects.
In addition, hydrogen and helium may in some cases become adulterated with impurities even in the ":first" stars. For example C12, Ne20 built in the inner central regions of such stars may be circulated into the outer hydrogen envelopes. The question whether such mixing occurs, and astrophysical observations bearing on the problem, is considered in Sees. XI and XII.
(1) CN cycle
When C12 produced in helium burning is mixed with hydrogen at high enough temperatures, hydrogen is converted to He4 by the CN cycle in addition to the pp chain previously considered. The implications for energy generation in hot main-sequence stars have been considered by numerous authors since Bethe (Be39) and von Weizsacker (We38). The reactions of the CN cycle are
Cl2(p,-y)N13([j+v+)Cla
Cl3(p,-y)N14
Nl4(p,-y)Q15(fj+v+)Nl5
NI6(p,a)Ct2.
These four reactions produce C13, the heavier stable isotope of carbon, and the two stable forms of nitrogen. For C12, C13, and N14 the (p,a) reaction is not exothermic and only the (p,-y) reaction occurs. At N16, the (p,a) reaction becomes exothermic and much m:ore rapid than the (p,-y) reaction, which serves only as a small leak of material to 0 16. The N16 (p,a) reaction reproduces the original C12 and a true cycle of reactions is established. Not only does this give rise to the catalytic conversion of hydrogen into helium until hydrogen is exhausted, but it also results in the carbon and nitrogen isotopes not being consumed in hydrogen burning.
The cross sections of the CN-cycle reactions have been under experimental investigation in the Kellogg Radiation Laboratory for some years and a review of the reaction rates in ~tars as known up to 1954 is included in the earlier paper by Fowler (Fo54), with numerical computations by Bosman-Crespin et at. (Bo54). New measurements of the CN-cycle reactions in the 100-kev range of interaction energies are now underway by William A. S. Lamb and Ross E. Hester at the Livermore Radiation Laboratory, who are using an ion source capable of delivering several hundred milliamperes of protons in this energy range, a factor of almost 1000 over the currents used in previous experiments. Results on C12(p,-y) are already published (La57) and results have also been obtained on Nl4 (p,-y) (La57a). These are the two slowest reactions in the CN cycle and are the ones primarily involved in the over-all rate of this reaction.
In Figs. III,4 and III,5 are shown the yield and
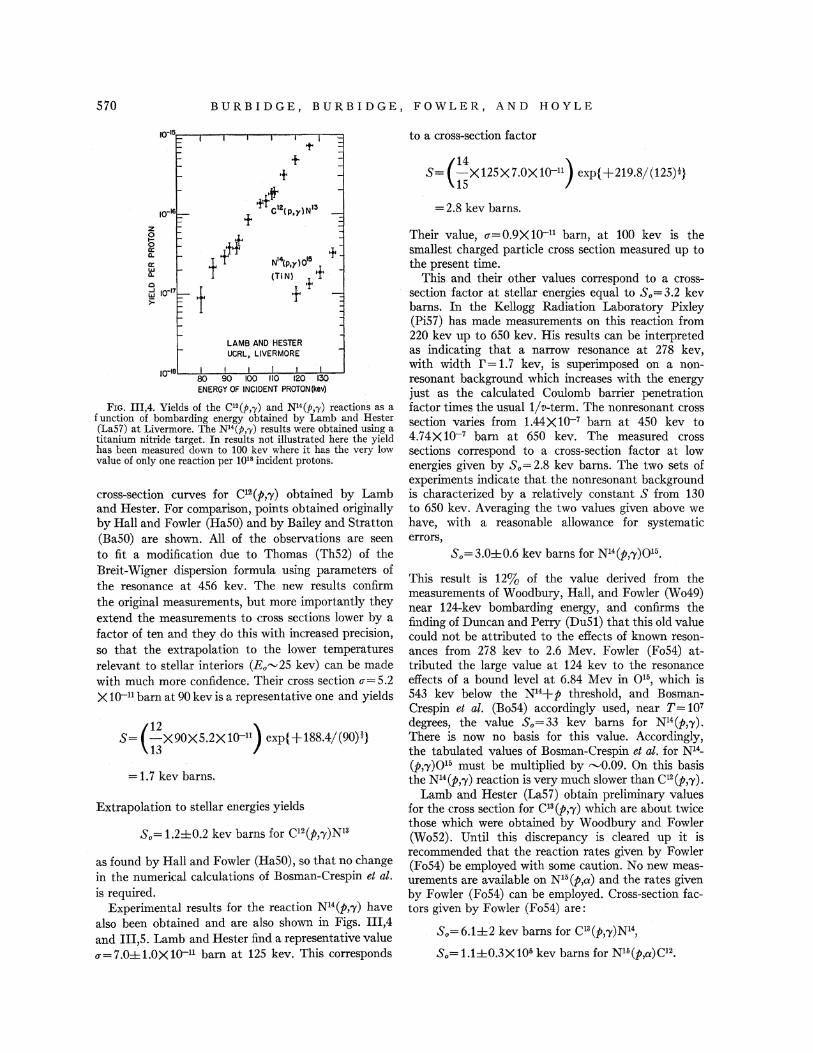
570 BURBIDGE, BURBIDGE, FOWLER, AND HOYLE
LAMB AND HESTER UCRL, LIVERMORE
FIG. III,4. Yields of the Cl2(p,'Y) and Nl4(P,'Y) reactions as a function of bombarding energy obtained by Lamb and Hester (La57) at Livermore. The N14(P,'Y) results were obtained using a titanium nitride target. In results not illustrated here the yield has been measured down to 100 kev where it has the very low value of only one reaction per 1018 incident protons.
cross-section curves for Cl2 (p,'Y) obtained by Lamb and Hester. For comparison, points obtained originally by Hall and Fowler (Ha50) and by Bailey and Stratton (Ba50) are shown. All of the observations are seen to fit a modification due to Thomas (Th52) of the Breit-Wigner dispersion formula using parameters of the resonance at 456 kev. The new results confirm the original measurements, but more importantly they extend the measurements to cross sections lower by a factor of ten and they do this with increased precision, so that the extrapolation to the lower temperatures relevant to stellar interiors (Eo"-'25 kev) can be made with much more confidence. Their cross section u= 5.2 X to-n barn at 90 kev is a representative one and yields
S= c; X90X5.2X to-11) exp{ + t88.4/ (90)!}
= 1. 7 kev barns.
Extrapolation to stellar energies yields
So= 1.2±0.2 kev barns for C12(p,'Y)N13
as found by Hall and Fowler (Ha50), so that no change in the numerical calculations of Bosman-Crespin et at. is required.
Experimental results for the reaction N14(p,'Y) have also been obtained and are also shown in Figs. III,4 and III,5. Lamb and Hester find a representative value u=7.0±1.0X1Q-11 barn at 125 kev. This corresponds
to a cross-section factor
S= c:X125X7.0X1o-11 ) exp{ +219.8/(125)*}
= 2.8 kev barns.
Their value, u=0.9X1Q-11 barn, at 100 kev is the smallest charged particle cross section measured up to the present time.
This and their other values correspond to a crosssection factor at stellar energies equal to So=3.2 kev barns. In the Kellogg Radiation Laboratory Pixley (Pi57) has made measurements on this reaction from 220 kev up to 650 kev. His results can be interpreted as indicating that a narrow resonance at 278 kev, with width r= 1.7 kev, is superimposed on a nonresonant background which increases with the energy just as the calculated Coulomb barrier penetration factor times the usual 1/v-term. The nonresonant cross section varies from 1.44X1o-7 barn at 450 kev to 4.74X1Q-7 barn at 650 kev. The measured cross sections correspond to a cross-section factor at low energies given by So=2.8 kev barns. The two sets of experiments indicate that the nonresonant background is characterized by a relatively constant S from 130 to 650 kev. Averaging the two values given above we have, with a reasonable allowance for systematic errors,
So=3.0±0.6 kev barns for N14 (p,'Y)Q16,
This result is 12% of the value derived from the measurements of Woodbury, Hall, and Fowler (Wo49) near 124-kev bombarding energy, and confirms the finding of Duncan and Perry (Du51) that this old value could not be attributed to the effects of known resonances from 278 kev to 2.6 Mev. Fowler (Fo54) attributed the large value at 124 kev to the resonance effects of a bound level at · 6.84 Mev in 0 15, which is 543 kev below the N14+ p threshold, and BosmanCrespin et al. (Bo54) accordingly used, near T= 107
degrees, the value So=33 kev barns for N14(p,'Y). There is now no basis for this value. Accordingly, the tabulated values of Bosman-Crespin et at. for N14-
(p,'Y)015 must be multiplied by "'0.09. On this basis the N14(p,'Y) reaction is very much slower than C12(p,'Y).
Lamb and Hester (La57) obtain preliminary values for the cross section for C13 (p,'Y) which are about twice those which were obtained by Woodbury and Fowler (Wo52). Until this discrepancy is cleared up it is recommended that the reaction rates given by Fowler (Fo54) be employed with some caution. No new measurements are available on N16(p,o:) and the rates given by Fowler (Fo54) can be employed. Cross-section factors given by Fowler (Fo54) are:
So=6.1±2 kev barns for Cl3(p,'Y)N14,
So= 1.1±0.3X 10⁵ kev barns for N10(p,a)C12.
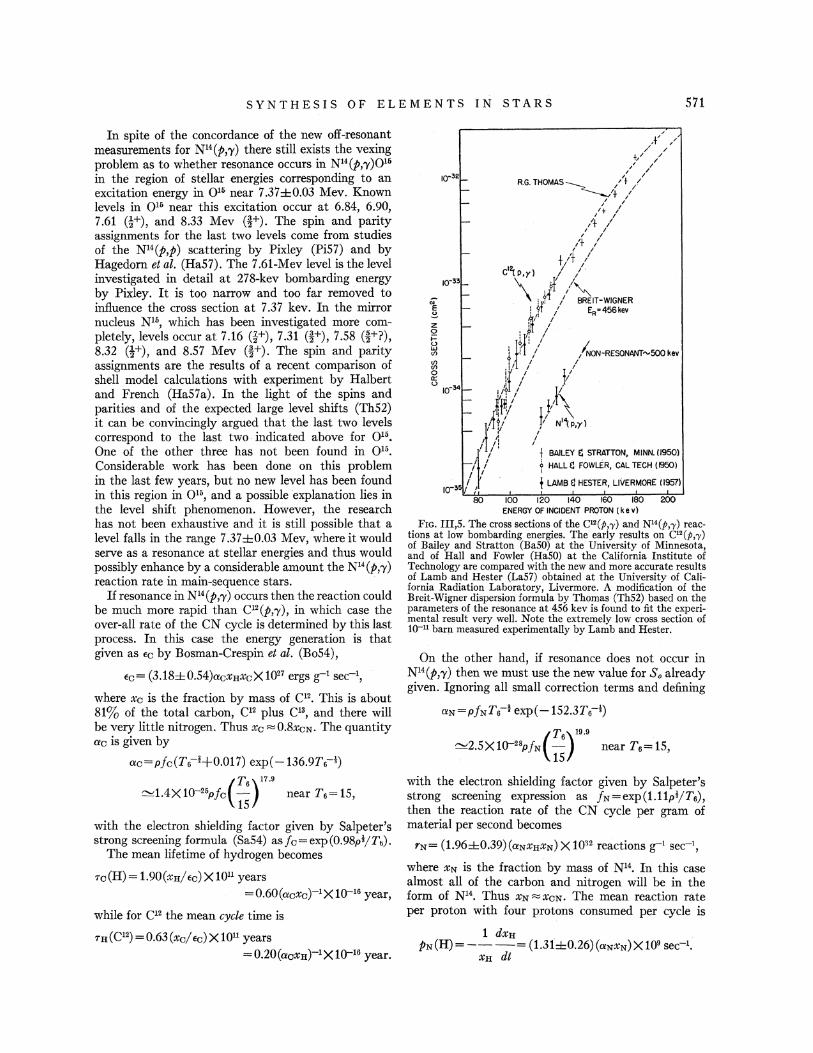
SYNTHESIS OF ELEMENTS IN STARS 571
In spite of the concordance of the new off-resonant measurements for N14{p,'Y) there still exists the vexing problem as to whether resonance occurs in N14(p,'Y)015
in the ·region of stellar energies corresponding to an excitation energy in 0 10 near 7.37±0.03 Mev. Known levels in 0 10 near this excitation occur at 6.84, 6.90, 7.61 (j+), and 8.33 Mev (!+). The spin and parity assignments for the last two levels come from studies of the N14(p,p) scattering by Pixley (Pi57) and by Hagedorn et al. (Ha57). The 7.61-Mev level is the level investigated in detail at 278-kev bombarding energy by Pixley. It is too narrow and too far removed to influence the cross section at 7.37 kev. In the mirror nucleus N10, which has been investigated more completely, levels occur at 7.16 (}+), 7.31 (!+), 7.58 (J+?), 8.32 (!+), and 8.57 Mev (!+). The spin and parity assignments are the results of a recent comparison of shell model calculations with experiment by Halbert and French (Ha57a). In the light of the spins and parities and of the expected large level shifts (Th52) it can be convincingly argued that the last two levels correspond to the last two· indicated above for 0 16•
One of the other three has not been found in 0 15•
Considerable work has been done on this problem in the last few years, but no new level has been found in this region in 0 16, and a possible explanation lies in the level shift phenomenon. However, the research has not been exhaustive and it is still possible that a level falls in the range 7.37±0.03 Mev, where it would serve as a resonance at stellar energies and thus would possibly enhance by a considerable amount the N14(p,'Y) reaction rate in main-sequence stars.
If resonance in N14(p,'Y) occurs then the reaction could be much more rapid than CI2(p,'Y), in which case the over-all rate of the CN cycle is determined by this last process. In this case the energy generation is that given as Ec by Bosman-Crespin et al. (Bo54),
Ec= (3.18±0.54)acxaxcX1027 ergs g-1 sect,
where xc is the fraction by mass of Cl2• This is about 81% of the total carbon, C12 plus CI8, and there will be very little nitrogen. Thus Xc ~ 0.8xcN. The quantity ac is given by
ac=pfc(T6-i+0.017) exp( -136.9T6-t)
~1.4X1o-25pfc(~;)17 •9 near T&=15,
with the electron shielding factor given by Salpeter's strong screening formula (Sa54) asfc=exp(0.98pijT6).
The mean lifetime of hydrogen becomes
Tc(H) = 1.90(xa/ Ec) X 1011 years = 0.60(acXc)-1 X 1o-16 year,
while for C12 the mean cycle time is
Ta(Cl2)=0.63(xc/Ec)X1011 years =0.20(acxa)-1X1Q-16 year.
.. + .... "' .... " / ;
+/ / / //
/ // R.G. THOMAS---,_ /t 1 .
~'+ /
-
-
I I
/+ /' /+ I
I I I I
/i- / I I
+/+ / c'2cP,yl / /.
ro-33 ,_ \ ~f /""" ;;E f- ;r~.f / BREIT-WIGNER
f- i 9 11 ER=456kev ; ~'' I
~ r- . r:~ / 1/) l ,f I (f) r- 'I I
~ if' I 5 lo-34- ). I II? I
- mffi / - 1~1/ ~ y tl
,1,1 I I
I I .
f BAILEY El STRATTON, MINN. 11950) f HALL El FOWLER, CAL TECH (1950) r-/1 r
(rJ35i/ I
~oo~--~,oo~-.,2~o---rd40n--.,ro~--~~a~o--~200~ f LAMB fJ HESTER, LIVERMORE (1957)
ENERGY OF INCIDENT PROTON ( k e v)
FIG. III,S. The cross sections of the ca(p,'Y) and Nl4(p,'Y) reactions at low bombarding energies. The early results on C12(P,'Y) of Bailey and Stratton (Ba50) at the University of Minnesota, and of Hall and Fowler (Ha50) at the California Institute of Technology are compared with the new and more accurate results of Lamb and Hester (La57) obtained at the University of California Radiation Laboratory, Livermore. A modification of the Breit-Wigner dispersion formula by Thomas (Th52) based on the parameters of the resonance at 456 kev is found to fit the experimental result very well. Note the extremely low cross section of 10-u barn measured experimentally by Lamb and Hester.
On the other hand, if resonance does not occur in N14(p,'Y) then we must use the new value for s. already given. Ignoring all small correction terms and defining
aN= p !NT 6-f exp( -152.3T 6-i)
~2.5XlQ-28P!N(~;) 19.9
near T6=15,
with the electron shielding factor given by Salpeter's strong screening expression as fN=exp(1.11pijT6),
then the reaction rate of the CN cycle per gram of material per second becomes
rN= (1.96±0.39) (aNXHXN) X 1032 reactions g-1 sec-1,
where XN is the fraction by mass of N14• In this case almost all of the carbon and nitrogen will be in the form of N14• Thus XN~XCN· The mean reaction rate per proton with four protons consumed per cycle is
1 dxa PN(H) = ---= (1.31±0.26)(aNXN)X 109 sec-1•
XH dt
572 BURBIDGE, BURBIDGE, FOWLER, AND HOYLE
The energy release per cycle, excluding the 6% neutrino energy loss, is 25.04 Mev=4.011X10⁻⁵ erg using Wapstra's masses (WaSS), so that the rate of energy generation can be written
EN= (0. 786±0.16) (aNXHXN) X 1028 ergs g-1 sec-1•
The mean lifetime of hydrogen becomes
TN(H) = 1.90(xH/ EN) Xl011 years = (2.42±0.48) (aNXN)-1X 1Q-17 year,
while for N14 the mean cycle time is
TH(N) = 0.55 (xN/ EN) X 1011 years = (0.70±0.14) (aNXH)-1X1Q-17 year.
At the present time the rate of energy generation by the CN cycle can be· taken as lying between the wide limits given by EN and Ec. Since resonance has not been established in N14 (p;y), the best guess is EN. Values for Ec and EN and the various lifetimes and cycle times are given in Figs. III,1 and III,2 and in Tables III,l and III,2.
Because of the uncertainty in the resonance problem in N14 (p,'Y) it is reasonable to employ astrophysical arguments in search of a more definite answer concerning the rate of the CN cycle. Let it be assumed that the observed cosmic abundances of N14 and C13 have been produced at equilibrium at temperature T from C12 in the CN cycle. Then if S.=33 kev barns (Fo54) for N14 (p,'Y) and S.=6.1 kev barns (Fo54) for CI3(p,'Y) it can be calculated that the relative numbers of nuclei are given by
N14/C13 = [133/Ts]2•
The relative abundance given by Suess and Urey (Su56) is
Nl4/C13= 168.
The temperature giving this ratio is approximately 107
degrees. At this temperature the C12 cycle time is 3X1()9 years for pxH= 100 g/cm3, so conversion of CI2
to CI3 or N14 will occur only in old stars. With the lower limit of S.=3.0 kev barns for N14
(p,'Y) it is found that
N14/C13 = [440/Ts]2•
The temperature corresponding to the observed relative abundance is "-'T= 3.4 X 10⁷ degrees. This value is close to the temperature believed to hold in the hydrogenburning shells surrounding the helium cores of red giant stars (HoSS). It is perhaps reasonable astrophysically to argue that this constitutes the last situation in which C13 and N14 are in equilibrium under hydrogen-burning. The C13 and N14· from these shells will be ejected into space when instability arises in the stellar interior. C13
and N14 which remain in the helium region after the exhaustion of hydrogen are consumed in helium burning by CI3(a,n) and N14(a,')'). On the basis, then, of this
argument, the lower limit for So would seem to be the preferred value.
With the new value for s. for N14 (p,'Y) it is found that the CN cycle rate will exceed that for the pp chain only in stars with central temperatures over 18X106 degrees. The existence of nitrogen-rich peculiar stars, as discussed in Sec. XI, is to be expected on this basis since at equilibrium in the CN cycle we now have
Nl4/C12 = [200/T6]2
so that N14»C12 at all reasonable temperatures (T6 < 40) for hydrogen burning. Stars in which carbon from the helium-burning cores has been passed slowly enough through hydrogen-burning zones and then mixed into the outer atmosphere will show a much greater overabundance of nitrogen than of carbon. The C12/C13
ratio by number should be 4.6 for the carbon in such stars. On the other hand, stars in which C12, 0 16, and Ne20 from helium-burning zones were mixed quickly without hydrogen-burning into the envelope would show anomalous abundances of these isotopes and not necessarily of N14 or C13• The ratio of CI2/C13 might be quite large in such stars. These points have been emphasized by Greenstein (Gr54a); see also Sec. XI A.
Finally, with the new nonresonant value for N14-
(p,'Y) the CN cycle is very slow in the sun. The recent inhomogeneous model calculations of Schwarzchild, Howard, and Harm (Sc57) which use only the pp chain need not be modified to include CN cycle processing of hydrogen except for the cases involving rather low values of the initial hydrogen content. D. E. Osterbrack (private communication) has kindly made differential corrections to the calculations of Schwarzschild et al. using the pp reaction and N14 (p,'Y) reaction rates given in this paper. He finds Tc=15.4X10⁶ degrees and Pc= 147 g/cm3 for an original hydrogen content of 80% by mass. These values replace Tc= 14.8 X 10⁶ degrees and p0 = 132 g/cm3• For the present values XH=0.30 and XcN=0.003 at the solar center he finds Epp=S.25 ergs g-1 sec-1 and EcN=0.20 erg g-1
sec-1• Thus the CN-cycle energy generation is only about 4% of that of the pp chain at the center and is less than this value on the average.
(2) Other Hydrogen-Burning Reactions
The reactions of protons and other light nuclei have been discussed by Fowler (Fo54) and by Salpeter (SaSS) and most recently by Marion and Fowler (Ma57). The rapid destruction of the lithium, beryllium, and boron isotopes in hydrogen burning, the end result being the production of helium, is well known and will not be discussed here, though some of the problems which this raises for synthesis of these elements are discussed in Sec. X.
At the temperatures occurring in the hydrogenburning shells of red giant stars 0 16 is converted to
SYNTHESIS OF ELEMENTS IN STARS 573
Ql6(p,"( )F17 (,B+P+)Q17
QI7(p,a)N14+1.20 Mev (exothermic).
The N14 is then processed by the CN cycle. When the small leakage due to N15(p,'Y)016 from the CN cycle is taken into account with the above reactions one has a generalized CNO cycle.
For 0 16 (p,'Y) Tanner and Pixley (Ta57a) give the preliminary value
So=4±2 kev barns for Q16(p,'Y)
so that the lifetime for 0 16 in hydrogen burning becomes
TH (016) = 0.5 (aoxH)-1 X 10-17 year, where
ao=pT6-i exp( -166.7T6-l).
Here we have neglected the weak electron shielding expected to hold in high-temperature, low-density shells. Since Q16(p,'Y) is followed rapidly by Q17(p,a) and by hydrogen processing in the CN cycle, the hydrogen lifetime will be the same as that for 0 16. Whenever 0 16 burning is not complete, a small amount of 0 17 ( "'1Q-3X016) remains in equilibrium with 0 16• This may· be sufficient to account for the small concentration of 0 17=4X1Q-4X016 observed in the oxygen isotope ratios. Apparently, not all of the Qt6 and .011 have been destroyed in the hydrogen-burning shells of the giant stars during the relatively short life of this evolutionary stage. On the other hand, 0 18= 2 X 1Q-3X 0 16 is not produced in sufficient abundance by Q17(p,'Y)F18(,8+p+)018 since the (p,a) reaction is much faster than the (p,'Y) for 011.
The burning of Ne20 in hydrogen is followed by the NeNa cycle which is somewhat similar to the CN cycle,
Ne2 (p,'Y )Na21 ((tl-P+)Ne21
Ne2t(p,'Y)Na22(,8+P+)Ne22
Ne22(p,'Y)Na2s
Na23(p,a)Ne2o,
New calculations based on recent experimental information have been made for the rates of the NeNa-cycle reactions by Marion and Fowler (Ma57). It is found that Na23 (p,a) is considerably faster than Na23 (p,'Y), so that little leakage from the cycle occurs to Mg24•
A method of obtaining the reduced nucleon emission widths for the corresponding levels of mirror nuclei is presented and is used in particular in the calculation of theNe20 (p,'Y) reaction rate. It is found that a bound level in Na21 at Ne20+p-26 kev markedly enhances the rate of this reaction and that So~ 12 kev barns at the temperatures of hydrogen-burning shells. Results of preliminary measurements by Pixley, Hester, and Lamb (PiS7a) increase this to
S,p=.75 kev barns for Ne20(p,'Y)Na2t.
Substantial quantities of Ne21 are produced at the elevated temperatures occurring just before the hydrogen is exhausted in such shells. This will be true only if the carbon, nitrogen, and oxygen isotopes are relatively rare so that hydrogen is not processed too rapidly before the Ne20 can be burned. The Ne21 thus formed becomes important in the subsequent helium burning when the reaction Ne21 (a,n)Mg24 may serve as a source of neutrons for heavy element synthesis.
The mean lifetimes or cycle times of the light nuclei in hydrogen-burning are summarized in Table III,2 and Fig. III,2.
(3) Helium Burning with Reaction Products; Ste,lar Neutron Sources
The primary products of pure helium burning are C12, 0 16, and Ne20. When these are subjected to further hydrogen burning, production of all of the stable isotopes from C12 to Na23, with the exception of N15, 0 18, and Fl9, is accounted for. Production of these three exceptions is treated at the end of this section. In hydrogen burning, cyclic processes are established which transform the hydrogen into helium without consuming the cycling, catalytic nuclei. Exceptions are 0 16 and 0 17 ; these nuclei are consumed in hydrogen burning so it is clear that a proportion of these isotopes originally produced has not been subjected to terminal hydrogen burning.
Exhaustion of the hydrogen by the cyclic processes eventually means that the unconsumed isotopes of carbon, nitrogen, neon, sodium, and perhaps oxygen, will be mixed with helium. Upon contraction the mixture comes to a temperature at which helium begins to interact with these nuclei. Numerous reactions occur but by far the most significant .are the exothermic (a,n) reactions which provide a source of neutrons for the sand r processes by which the heavy elements can be synthesized.
The first stellar neutron source was proposed by Greenstein (Gr54) and by Cameron (CaS4, CaSS), namely the exothermic reaction :
C13 (a,n)016+2.20 Mev.
To this, Fowler et al. (FoSS) added the exothermic (a,n) reactions involving the A= 4n+ 1 nuclei, viz.,
Q11(a1n)Ne20+0.60 Mev
Ne21 (a,n)Mg24+2.S8 Mev
Mg25(a,n)Si28+2.67 Mev
and the special case,
Mg26 (a,n)Si29+0.04 Mev.
The next A =4n+ 1 reaction, Si29(a,n)S32, is endothermic by 1.S3 Mev, and S33 (a,n)A36 is endothermic by 2.0 Mev.
Insofar as neutron sources for the. s process in red giants are concerned, we must confine our attention to C13 and Ne21. Very little 0 17 remains for helium burning
574 BURBIDGE, BURBIDGE, FOWLER, AND HOYLE
because it is destroyed by 0 17 (p,a) in hydrogen burning. Mg25 and Mg26 are not produced in hydrogen burning because the hydrogen is consumed in other processes before Mg24 (p,'Y) becomes operative.
Marion and Fowler (Ma57) have recently discussed the rates of the C13(a,n) and Ne21 (a,n) reactions. For the Cl3(a,n) reaction they find S.=2.1X10¹¹T6-t kev bam so that the C13 lifetime is ·
Ta2
Tan(C13)=4.9X1Q-28- exp(323T6-t) years. PXa .
For the Ne21 (a,n) reaction they find S.= 1.6X 10¹³ kev barns so that the N e21 lifetime is
Tat Tan(Ne21)=5.6X1Q-30- exp(468Ta-t) years.
PXa
A reaction rate of importance in the following discussion is that of N14 (a,'Y), for which it was found that S.= 1.2X 10⁷T6-t kev bam and
T62
r ay(N4) = 8.2X lQ-24__ exp(360T6-t) years. PXa
The above lifetimes are indicated graphically in Fig. III,3 and are tabulated in Table III,3.
Neither C13(a,n) nor Ne21 (a,n) are wholly free from objection as stellar neutron sources. Cameron (Ca55) and Fowler et al. (Fo55) have discussed the problems which arise if the CI3(a,n)016 reaction is taken as the principal source of neutrons for heavy element synthesis in helium burning during the giant stage of a star's evolution. The essential difficulty lies in the fact that only a small amount of C13 is produced at equilibrium in the carbon-nitrogen cycle; C13/C12= 1/4.6 by number at equilibrium. As a result too few neutrons are produced when C13 begins to interact with the helium. The cosmic abundance ratio C12/Fe06 =6.4 implies that 6.4/4.6= 1.4 neutrons will become available per iron nucleus and these will only be sufficient to build nuclei slightly heavier than Fe66• Another difficulty is the fact that N14 is the most abundant of the isotopes at equilibrium in the CN cycle; N14/ C13 = 168 even at the high temperature of 3.4X10⁷ degrees for a hydrogen-burning shell. The reaction N14(n,p)C14 consumes a large fraction of the neutrons produced in the C13 (a,n)016 reaction. These difficulties can be avoided, as emphasized by Cameron, with the C13-(a,n)016 reaction as the neutron source, if it is postulated that considerable mixing between core and envelope takes place during the giant stage. In this case hydrogen from the envelope interacts with C12 produced by 3He4CI2 in the_ core and constantly replenishes the C13 supply but at such a rate that little N14 is produced by the Cl3(p,'Y)Nl4 reaction. In addition if C1a, produced in the hot center of a core, is mixed into the cooler
outer regions of the core where C13 is burning, then the C12 captures the protons from N14(n,p) and replenishes the C13, thus permitting the full quota of neutrons to be made available for heavy element synthesis just beyond FeM.
Fowler et al. proposed the Ne21 (a,n)Mg24 ·reaction as an alternative source of neutrons which would avoid the foregoing difficulties without calling upon core-envelope mixing with its attendant stability problems. In this proposal it is assumed that Ne20, previously produced during helium burning at an earlier stage of galactic evolution, is converted into Ne21 in the hydrogen-burning shells at 3Q-50X 106
degrees surrounding the helium-burning cores of redgiant stars. When the shell hydrogen is converted into what then becomes core helium, the Ne21 interacts with helium to produce neutrons. The neutrons are captured by iron-group nuclei, also previously synthesized, to produce heavy elements. The atomic abundance ratio Ne20/Fe66 = 14 is taken as indicating that "-'14 neutrons will become available per iron nucleus, a sufficient number for considerable heavy element synthesis. This suggestion thus requires that:
(i) The reactions Ne20(p,'Y)Na21 (j3+v+)Ne21 produce Ne21 faster than it is destroyed by the Ne21 (p,'Y)Na22 reaction.
(ii) The Ne21 is produced before the hydrogen mixed with the Ne20 is exhausted by the pp chain . or the CN-cycle reactions.
(iii) The N14 is depleted by the N14(a,'Y)F18 reaction before the Ne21 (a,n)Mg24 reaction supplies the neutrons.
(iv) The Ne21 is consumed by Ne21 (a,n)Mg24 before helium is depleted in the core.
Because of the uncertainty in the reaction-rate calculations presented here, it is not possible to give unequivocal answers as to whether these conditions are satisfied; however, the following qualified statements can be made. With regard to (i) the results incorporated in Table III,2 and Fig. III,2 indicate that Ne21 is indeed produced from Ne20 faster than it is destroyed. If the NeNa cycle reaches equilibrium, then about 90% of the Ne20 could have been converted into Ne21 along with small amounts of Ne22 and Na23•
With regard to (ii), it is clear that the conversion of Ne20 into Ne21 will not occur before the hydrogen is exhausted by the CN cycle or oxygen reactions unless there is only a small concentration of carbon, nitrogen, and oxygen, perhaps 0.1% that of hydrogen by weight. This is "-'8% the normal abundance but could occur in some stars. With regard to (iii) it may be seen from Table III,3 and Fig. III,3 that N14 will be fairly well scoured out at low temperatures before Ne21 begins to interact, although there is again considerable uncertainty in this conclusion.
With regard to (iv), Table III,3 and Fig. III,3 show that Ne21 (a,n) will compete with other helium reactions only at elevated temperatures near 2X10⁸
SYNTHESIS OF ELEMENTS IN STARS 575
degrees in the core. Even then it is about a hundred times slower than the consumption of He4 by 3He4 c12 as long as helium is abundant. However, there is a factor of x.,2 in the rate of 3He4C12 relative to Ne21-(a,n), where Xa is the concentration by weight of the helium. Thus when xa<0.1, the Ne21 will be consumed. Indeed, we can expect that as Xa decreases the core temperature will rise to maintain the energy generation and eventually the last He4 nuclei will rapidly scour out the Ne21 at high temperature. In any case, even if the N e21 remains impervious to helium burning it will lose its loosely-bound neutron in the subsequent interactions of the medium-weight nuclei.
With the above considerations in mind a tentative picture of the generation of neutrons in red giant cores is as follows. We assume that the core will spend some 107 to 10s years at low temperature (20-40X106
degrees) while the star slowly progresses into the giant stage, som~ 10° years at 50 to 100X 106 degrees, and then only a brief period, say lOS years, at 200X 106 degrees as it rapidly exhausts helium and burns the middle weight elements. The C13 lifetime to the (a,n) reaction is about 106 years at 75X106 degrees, so that era will be consumed at this stage. Thus a few neutrons per Fe66 become available on a time-scale of about 10° years. We have seen in Sec. II that a time-scale $106 years per neutron capture is demanded to produce the early part of the abundance distribution built by the s process; this is discussed further.. in Sec. VI. With the consumption of the era in its central regions, the core now heats to greater temperatures and rapidly processes He4 by 3He4er2, etc. Toward the end of the helium burning, instability may well set in and mixing may occur throughout the core and with the envelope hydrogen. New C13 is produced, Ne21 burns, and a great flux of neutrons is produced in the final period of about 103 years. In Sec.II we showed that a shorter time-scale was necessary to account for the s-process abundance distribution for elements with A~ 100, where the atomic abundance curve becomes relatively flat. This is discussed further in Sec. VI, and in Sec. XI in connection with the observed overabundances of heavy elements in stars believed to have recently undergone s-process synthesis in their interiors.
Finally, we turn to neutron sources on a very short time-scale, "'10 seconds, as in supernovae. A mechanism by which neutrons could arise in the hot envelope of a supernova following core collapse was proposed by Burbidge, Hoyle, Burbidge, Christy, and Fowler (Bu56). This mechanism is thought to occur in four stages:
(i) A collapse of the inner regions of a highly evolved star occurs leading to the conversion of gravitational energy into other forms of energy, particularly in the envelope of the star where it is converted into thermal energy. A possible cause of such a collapse is discussed in detail in Sec. XII. The imploding envelope reaches
2X10⁸ degrees as a result of the conversion of gravitational energy into thermal energy. The density rises to "'106 g/cm3.
(ii) The onset of reactions of the type C12 (p,'Y)N13, Ql6(p,'Y)P7, Ne2°(p,'Y)Na2\ Mg24 (p,'Y)Al26 take place in the outer parts of the star. These occur very rapidly at 2X 10⁸ degrees. The mean energy production from these reactions may be taken as approximately 2 Mev per proton. With a composition characteristic of a highly evolved star, consisting of approximately equal abundances (by number) of hydrogen, helium, and light nuclei, the energy released in these reactions is sufficient to raise the temperature of the material to a value "'109 degrees as the hydrogen is consumed. If all of the nuclear energy were converted into particle energy, a temperature of 6Xl09 degrees would be attained. This maximum temperature will not be reached, however, because of the conversion of energy into radiation, turbulence, growing magnetic fields and the general expansion of the eventually exploding envelope. However, 109 degrees will probably be reached during the initial implosion of the envelope into the region vacated by the collapsing core. A radiation temperature of "'109 degrees will result from the hydrogen consumption if p= tOo g/cm3.
(iii) At this high temperature, alpha-particle reactions become important, and the crucial neutronproducing reaction is Ne21 (a,n)Mg24, which follows very rapidly on the 23-second beta decay of Na21. The mean reaction time for Ne21 is of the order of to-o sec if T"-'109 degrees and ~106 g/cm3. The. (a,n) reactions on C13 and 0 17 are not operative under these conditions since N18 requires 14 min in the mean to decay to C13 and P 7 requires 100 sec to decay to 0 17•
A series of neutron-producing reactions from combined hydrogen and helium burning on Ne20 and heavier nuclei are shown in Fig. III,6. All of the beta decays shown in this diagram are reasonably short. In general (p,'Y) reactions compete with positron emission until proton addition is no longer possible and positron emission must occur.
(iv) The neutrons produced in hydrogen and helium burning are rapidly thermalized (kT"-'100 kev) and then they are captured primarily by the abundant nuclei of the. iron group which were initially present in the envelope. We have supposed that their abundances at this stage total about 1% by mass. If the envelope was very underabundant in these elements the neutrons would be captured by the light elements. This rapid neutron capture process, the r process, will be discussed in detail in Sees. VII and VIII. For this discussion we require to know the neutron density. This will now be estimated.
The neutrons become available in the mean lifetime of Na21 (33 sec), or Mg22 (7 sec) and Al26 (10 sec). Thus a reasonable mean time for the neutron production during the imploding high-density stage is about 10
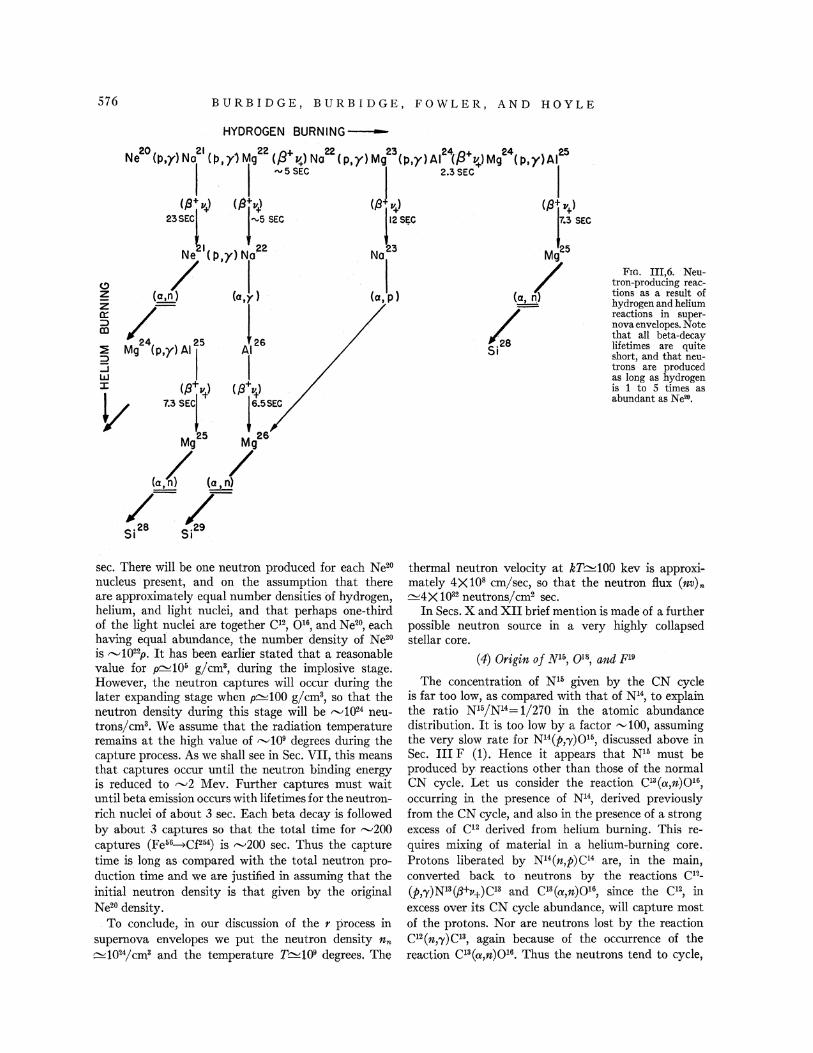
576 BURBIDGE, BURBIDGE, FOWLER, AND HOYLE
HYDROGEN BURNING--
20 . 21 22 (.)+ 22 23 24 (.)+ 24 25 Ne (p,y)Nol (fl,y1Mg (~ ~)No (p,y)Mg (fl,y)AI (~ ~)Mg (p,y)AI . I ""5 SEC 1 2.3 SEC I
(fa• vJ c f3+ 11) C/3 "+> <f3+ "+> 23 sECl · I ""5 sEc I ;2 s~c 17.3 SEC
I 22 t3 25 l (~.y)T Nol l (a,n) (a,y) (a, p) (a, n)
FIG. III,6. Neutron-producing reactions as a result of hydrogen and helium reactions in supernovaenvelopes. Note that all beta-decay lifetimes are quite short, and that neutrons are produced as long as hydrogen is 1 to 5 times as abundant as Ne20.
/- t L-Mr( •• y, A'i' i"o 5128
(fa+") <.B\> 7.3 SEC! !6.5SEC
Mg2s Mg26
/ / (a,n) (a,n)
/-L-Si28 Si29
sec. There will be one neutron produced for each Ne20
nucleus present, and on the assumption that there are approximately equal number densities of hydrogen, helium, and light nuclei, and that perhaps one-third of the light nuclei are together C12, 0 16, and Ne20, each having equal abundance, the number density of Ne20 is ,....._,1022p. It has been earlier stated that a reasonable value for JC:::105 g/cm3, during the implosive stage; However, the neutron captures will occur during the later expanding stage when JC:::100 g/cm3, so that the neutron density during this stage will be ,....._,1024 neutrons/cm3. We assume that the radiation temperature remains at the high value of ,....._,109 degrees during the capture process. As we shall see in Sec. VII, this means that captures occur until the neutron binding energy is reduced to ,....._,z Mev. Further captures must wait until beta emission occurs with lifetimes for the neutronrich nuclei of about 3 sec. Each beta decay is followed by about 3 captures so that the total time for ,..._,zoo captures (Fe64Cf264) is ,..._,zoo sec. Thus the capture time is long as compared with the total neutron production time and we are justified in assuming that the initial neutron density is that given by the original Ne20 density.
To conclude, in our discussion of the r process in supernova envelopes we put the neutron density n,. ~10~4/cm3 and the temperature T"-'109 degrees. The
thermal neutron velocity at kT"-'100 kev is approximately 4X 10⁸ em/sec, so that the neutron flux (nv),. ~4X1Q92 neutrons/cm2 sec.
In Sees. X and XII brief mention is made of a further possible neutron source in a very highly collapsed stellar core.
(4) Origin of N 1", QIB, and p19
The concentration of N15 given by the CN cycle is far too low, as compared with that of N14, to explain the ratio Nl6/Nl4=1/270 in the atomic abundance distribution. It is too low by a factor "'100, assuming the very slow rate for N14(p,'Y)016, discussed above in Sec. III F (1). Hence it appears that N15 must be produced by reactions other than those of the normal CN cycle. Let us consider the reaction CI3 (a,n)016,
occurring in the presence of N14, derived previously from the CN cycle, and also in the presence of a strong excess of Cl2 derived from helium burning. This requires mixing of material in a helium-burning core. Protons liberated by N14(n,p)C14 are, in the main, converted back to neutrons by the reactions cn(p,'Y)N13{13+v+)C13 and C13(a,n)016, since the CI2, in excess over its CN cycle abundance, will capture most of the protons. Nor are neutrons lost by the reaction C12(n,'Y)C1s, again because of the occurrence of the reaction C13(a,n)016• Thus the neutrons tend to cycle,
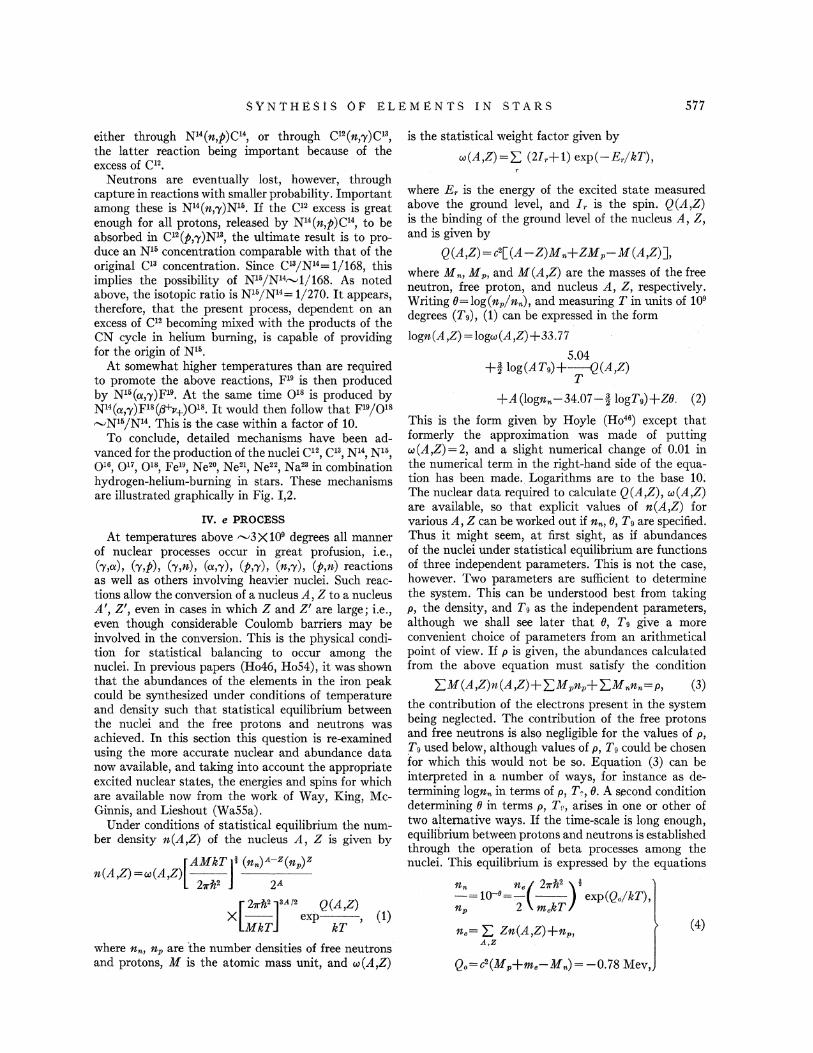
SYNTHESIS OF ELEMENTS IN STARS 577
either through N14(n,p)C14, or through CI2(n,'Y)CJ3, the latter reaction being important because of the excess of C12.
Neutrons are eventually lost, however, through capture in reactions with smaller probability. Important among these is N14(n,'Y)N16. If the C12 excess is great enough for all protons, released by N14 (n,p)C14, to be absorbed in C12(p,'Y)N13, the ultimate result is to produce an N16 concentration comparable with that of the original C13 concentration. Since C13/N14= 1/168, this implies the possibility of N16/Nl4,_,1/168. As noted above, the isotopic ratio is N16/N14= 1/270. It appears, therefore, that the present process, dependent on an excess of C12 becoming mixed with the products of the CN cycle in helium burning, is capable of providing for the origin of Nl6.
At somewhat higher temperatures than are required to promote the above reactions, F19 is then produced by Nl6(a,'Y)Fl9• At the same time 0 18 is produced by N14(a,'Y)Fl8(,8+v+)018. It would then follow that Fl9/018 ,_,N16/N14. This is the case within a factor of 10.
To conclude, detailed mechanisms have been advanced for the production of the nuclei C12, Cl3, N14, Nl6, 0 16, 0 17, 0 18, Fe19, Ne20, Ne2I, Ne22, Na23 in combination hydrogen-helium-burning in stars. These mechanisms are illustrated graphically in Fig. I,2.
IV. e PROCESS
At temperatures above ,_,3X109 degrees all manner of nuclear processes occur in great profusion, i.e., ('Y,a), ('Y,p), ('Y,n), (a,'Y), (p,'Y), (n,'Y), (p,n) reactions as well as others involving heavier nuclei. Such reactions allow the conversion of a nucleus A, Z to a nucleus A', Z', even in cases in which Z and Z' are large; i.e., even though considerable Coulomb barriers may be involved in the conversion. This is the physical condition for statistical balancing to occur among the nuclei. In previous papers (Ho46, Ho54), it was shown that the abundances of the elements in the iron peak could be synthesized under conditions of temperature and density such that statistical equilibrium between the nuclei and the free protons and neutrons was achieved. In this section this question is re-examined using the more accurate nuclear and abundance data now available, and taking into account the appropriate excited nuclear states, the energies and spins for which are available now from the work of Way, King, McGinnis, and Lieshout (WaSSa).
Under conditions of statistical equilibrium the number density n(A,Z) of the nucleus A, Z is given by
[AMkTJi (n,..)A-Z(np)Z
n(A,Z)=w(A,Z) --27rlt2 2A
[27rft2]3A/2 .. Q(A,Z)
X -- exp-- (1) MkT kT '
where n,.., np are the number densities of free neutrons and protons, M is the atomic mass unit, and w(A,Z)
is the statistical weight factor given by
w(A,Z)=L; (21.+1) exp(-Er/kT),
where E, is the energy of the excited state measured above the ground level, and Ir is the spin. Q(A,Z) is the binding of the ground level of the nucleus A, Z, and is given by
Q(A,Z)=c2[(A-Z)M,..+ZMp-M(A,Z)],
where M,.., Mp, and M(A,Z) are the masses of the free neutron, free proton, and nucleus A, Z, respectively. Writing O=log(npjn,.), and measuring Tin units of 109
degrees (Tg), (1) can be expressed in the form
logn(A,Z)=logw(A,Z)+33.77
5.04 +! log(ATg)+--=--~J(A,Z)
T
+A(logn,..-34.07-! logT9)+Z8. (2)
This is the form given by Hoyle (Ho46) except that formerly the approximation was made of putting w(A,Z)=2, and a slight numerical change of 0.01 in the numerical term in the right-hand side of the equation has been made. Logarithms are to the base 10; The nuclear data required to calculate Q(A,Z), w(A,Z) are available, so that explicit values of n(A,Z) for various A, Z can be worked out if n,.., 8, Tg are specified. Thus it might seem, at first sight, as if abundances of the nuclei under statistical equilibrium are functions of three independent parameters. This is not the case, however. Two parameters are sufficient to determ-ine the system. This can be understood best from taking p, the density, and T9 as the independent parameters, although we shall see later that 0, Tg give a more convenient choice of parameters from an arithmetical point of view. If p is given, the abundances calculated from the above equation must satisfy the condition
L;M(A,Z)n(A,Z)+ L;Mpnp+ L;M ,..n,..=p, (3)
the contribution of the electrons present in the system being neglected. The contribution of the free protons and free neutrons is also negligible for the values of p, T9 used below, although values of p, T9 could be chosen for which this would not be so. Equation (3) can be interpreted in a number of ways, for instance as determining logn,. in terms of p, T~, 8. A s,econd condition determining 0 in terms p, T11, arises in one or other of two altemative ways. If the time-scale is long enough, equilibrium between protons and neutrons is established through the operation of beta processes among the nuclei. This equilibrium is expressed by the equations
n,.. n.( 27r'h2 )! -=1o-8=:- -- exp(Q./kT), np 2 m.kT
n.= L Zn(A,Z)+np, (4) A,Z
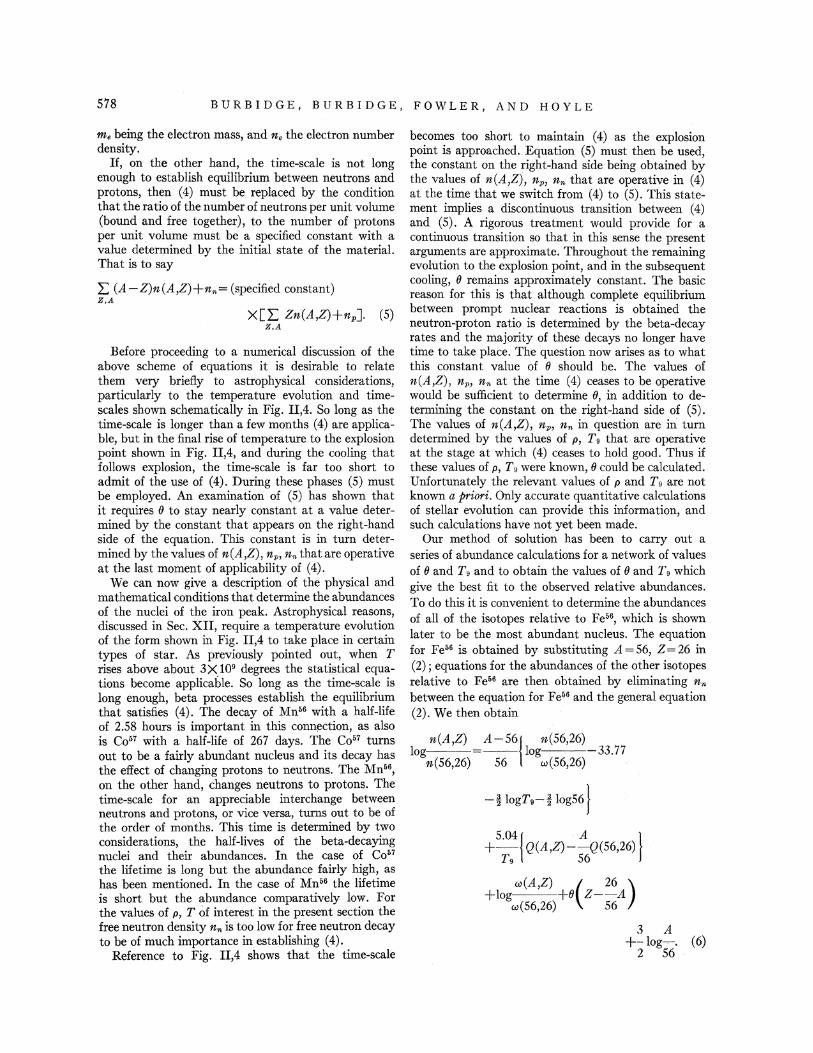
578 BURBIDGE, BURBIDGE, FOWLER, AND HOYLE
m. being the electron .mass, and n. the electron number density.
If, on the other hand, the time-scale is not long enough to establish equilibrium between neutrons and protons, then (4) must be replaced by the condition that the ratio of the number of neutrons per unit volume (bound and free together), to the number of protons per unit. volume must be a specified constant with a value determined by the initial state of the material. That is to say
L (A- Z)n(A,Z)+n,.= (specified constant) Z,A
X[L Zn(A,z)+np]. (5) Z,A
Before proceeding to a numerical discussion of the above scheme of equations it is desirable to relate them very briefly to astrophysical considerations, particularly to the temperature evolution and timescales shown schematically in Fig. !1,4. So long as the time-scale is longer than a few months (4) are applicable, but in the final rise of temperature to the explosion point shown in Fig. II,4, and during the cooling that follows explosion, the time-scale is far too short to admit of the use of (4). During these phases (5) must be employed. An examination of (5) has shown that it requires (} to stay nearly constant at a value determined by the constant that appears on the right-hand side of the equation. This constant is in turn determined by the values of n(A,Z), np, n,. that are operative at the last moment of applicability of (4).
We can now give a description of the physical and mathematical conditions that determine the abundances of the nuclei of the iron peak. Astrophysical reasons, discussed in Sec. XII, require a temperature evolution of the form shown in Fig. II,4 to take place in certain types of star. As previously pointed out, when T rises above about 3X 10⁹ degrees the statistical equations become applicable. So long as the time-scale is long enough, beta processes establish the equilibrium that satisfies (4). The decay of Mn116 with a half-life of 2.58 hours is important in this connection, as also is Co67 with a half-life of 267 days. The Co67 turns out to be a fairly abundant nucleus and its decay has the effect of changing protons to neutrons. The Mn66,
on the other hand, changes neutrons to protons. The time-scale for an appreciable interchange between neutrons and protons, or vice versa, turns out to be of the order of months. This time is determined by two considerations, the half-lives of the beta-decaying nuclei and their abundances. In the case of Co67
the lifetime is long but the abundance fairly high, as has been mentioned. In the case of Mn56 the lifetime is short but the abundance comparatively low. For the values of p, T of interest in the present section the free neutron density n,. is too low for free neutron decay to be of much importance in establishing (4).
Reference to Fig. II,4 shows that the time-scale
becomes too short to maintain ( 4) as the explosion point is approached. Equation (5) must then be used, the constant on the right-hand side being obtained by the values of n(A,Z), np, n,. that are operative in (4) at the time that we switch from (4) to (5). This statement implies a discontinuous transition between (4) and (5). A rigorous treatment would provide for a continuous transition so that in this sense the present arguments are approximate. Throughout the remaining evolution to the explosion point,.and in the subsequent cooling, (} remains approximately constant. The basic reason for this is that although complete equilibrium between prompt nuclear reactions is obtained the neutron-proton ratio is determined by the beta-decay rates and the majority of these decays no longer have time to take place. The question now arises as to what this constant value of (} should be. The values of n(A,Z), np, n .. at the time (4) ceases to be operative would be sufficient to determine (}, in addition to determining the constant on the right-hand side of (5). The values of n(A,Z), np, n,. in question are in turn determined by the values of p, T9 that are operative at the stage at which (4) ceases to hold good. Thus if these values of p, Tg were known,(} could be calculated. Unfortunately the relevant values of p and T9 are not known a priori. Only accurate quantitative calculations of stellar evolution can provide this information, and such calculations have not yet been made.
Our method of solution has been to carry out a series of abundance calculations for a network of values of(} and Tg and to obtain the values of(} and Tg which give the best fit to the observed relative abundances. To do this it is convenient to determine the abundances of all of the isotopes relative to Fe56, which is shown later to be the most abundant nucleus. The equation for Fe56 is obtained by substituting A= 56, Z = 26 in (2); equations for the abundances of the other isotopes relative to Fe66 are then obtained by eliminating nn between the equation for Fe56 and the general equation (2). We then obtain
n(A,Z) A -56{ n(56,26) log log . 33.77
n(56,26) 56 w(56,26)
-! logT9-! log56}
5.04{ A } +- Q(A,Z)-~(56,26) Tg 56
w(A,Z) ( 26 ) +log +e z--A
w(56,26) 56
3 A +-log-. (6)
2 56
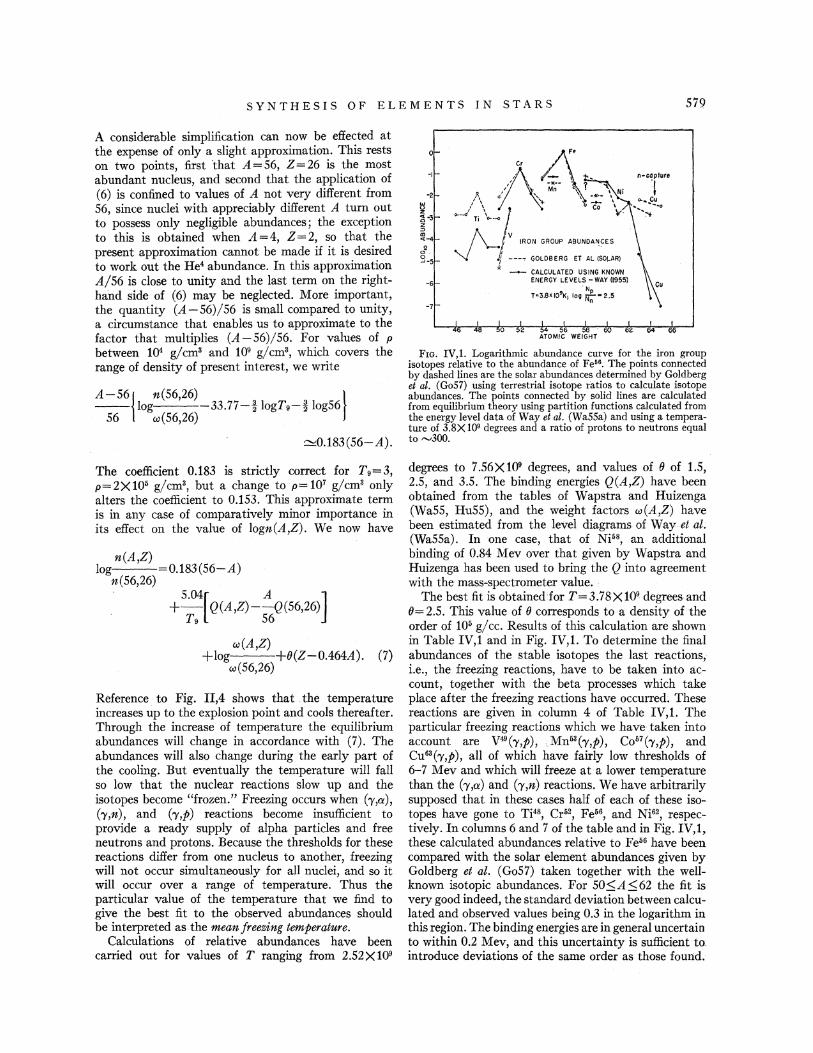
SYNTHESIS OF ELEMENTS IN STARS 579
A considerable simplification can now be effected at the expense of only a slight approximation. This rests on two points, :first ·that A= 56, Z = 26 is the most abundant nucleus, and second that the application of (6) is confined to values of A not very different from 56, since nuclei with appreciably different A turn out to possess only negligible abundances; the exception to this is obtained when A=4, Z=2, so that the present approximation cannot be made if it is desired to work out the He4 abundance. In this approximation A/56 is close to unity and the last term on the righthand side of (6) may be neglected. More important, the quantity (A-56)/56 is small compared to unity, a circumstance that enables us to approximate to the factor that multiplies (A -56)/56. For values of p between 1()4 g/cm3 and 109 g/cm3, which covers the range of density of present interest, we write
A -56{ n(56,26) } -- log 33.77-J logTg-J log56
56 w(56,26)
~0.183(56-A).
The coefficient 0.183 is strictly correct for Tg= 3, p=2X10⁶ g/cm3, but a change to p=107 g/cm3 only alters the coefficient to 0.153. This approximate term is in any case of comparatively minor importance in its effect on the value of logn(A,Z). We now have
n(A,Z) log 0.183(56-A)
n(56,26)
+ 5 '04[Q(A,Z)-~(56,26)] Tg 56
w(A,Z) +log +8(Z-0.464A). (7)
w(56,26)
Reference to Fig. II,4 shows that . the temperature increases up to the explosion point and cools thereafter. Through the increase of temperature the equilibrium abundances will change in accordance with (7). The abundances will also change during the early part of the cooling. But eventually the temperature will fall so low that the nuclear reactions slow up and the isotopes become "frozen." Freezing occurs when ('Y,a), ('y,n), and (-y,p) reactions become insufficient to provide a ready supply of alpha particles and free neutrons and protons. Because the thresholds for these reactions differ from one nucleus to another, freezing will not occur simultaneously for all nuclei, and so it will occur over a range of temperature. Thus the particular value of the temperature that we find to give the best fit to the observed abundances should be interpreted as the mean freezing temperature.
Calculations of relative abundances have been carried out for values of T ranging from 2.52X10⁹
·J
-7
_._ CALCULATED USING KNOWN ENERGY LEVELS- WAY (1955)
.N T•3.8XI09t<; lo9 N: •2.5-
Fro. IV,l. Logarithmic abundance curve for the iron group isotopes relative to the abundance of Fe16• The points connected by dashed lines· are the solar abundances determined by Goldberg et al. ( Go57) using terrestrial isotope ratios to calculate isotope abundances. The points connected by solid lines are calculated from equilibrium theory using partition functions calculated from the energy level data of Way et al. (WaSSa) and using a temperature of 3.8X 10⁹ degrees and a ratio of protons to neutrons equal to .-v300.
degrees to 7.56X10⁹ degrees, and values of 8 of 1.5, 2.5, and 3.5. The binding energies Q(A,Z) have been obtained from the tables of Wapstra and Huizenga (Wa55, HuSS), and the weight factors w(A,Z) have been estimated from the level diagrams of Way et al. (WaSSa). In one case, that of Ni68, an additional binding of 0.84 Mev over that given by Wapstra and Huizenga has been used to bring the Q into agreement with the mass-spectrometer value.
The best fit is obtained for T=3.78X10~ degrees and 8= 2.5. This value of 8 corresponds to a density of the order of 106 g/ cc. Results of this calculation are shown in Table IV,1 and in Fig. IV,l. To determine the final abundances of the stable isotopes the last reactions, i.e., the freezing reactions, have to be taken into account, together with the beta processes which take place after the freezing reactions have occurred. These reactions are given in column 4 of Table IV,l. The particular freezing reactions which we have taken into account are V49 (-y,p), ,Mn63 ('Y,p), Co67 (-y,p), and Cu63 (-y,p), all of which have fairly low thresholds of 6-7 Mev and which will freeze at a lower temperature than the (-y,a) and (-y,n) reactions. We have arbitrarily supposed that in these cases half of each of these isotopes have gone to Ti48, Cr62, Fe56, and Ni62, respectively. In columns 6 and 7 of the table and in Fig. IV,1, these calculated abundances relative to Fe66 have been compared with the solar element abundances given by Goldberg et al. (Go57) taken together with the wellknown isotopic abundances. For SO:::;A:::;62 the fit is very good indeed, the standard deviation between calculated and observed values being 0.3 in the logarithm in this region. The binding energies are in general uncertain to within 0.2 Mev, and this uncertainty is sufficient to. introduce deviations of the same order as those found.
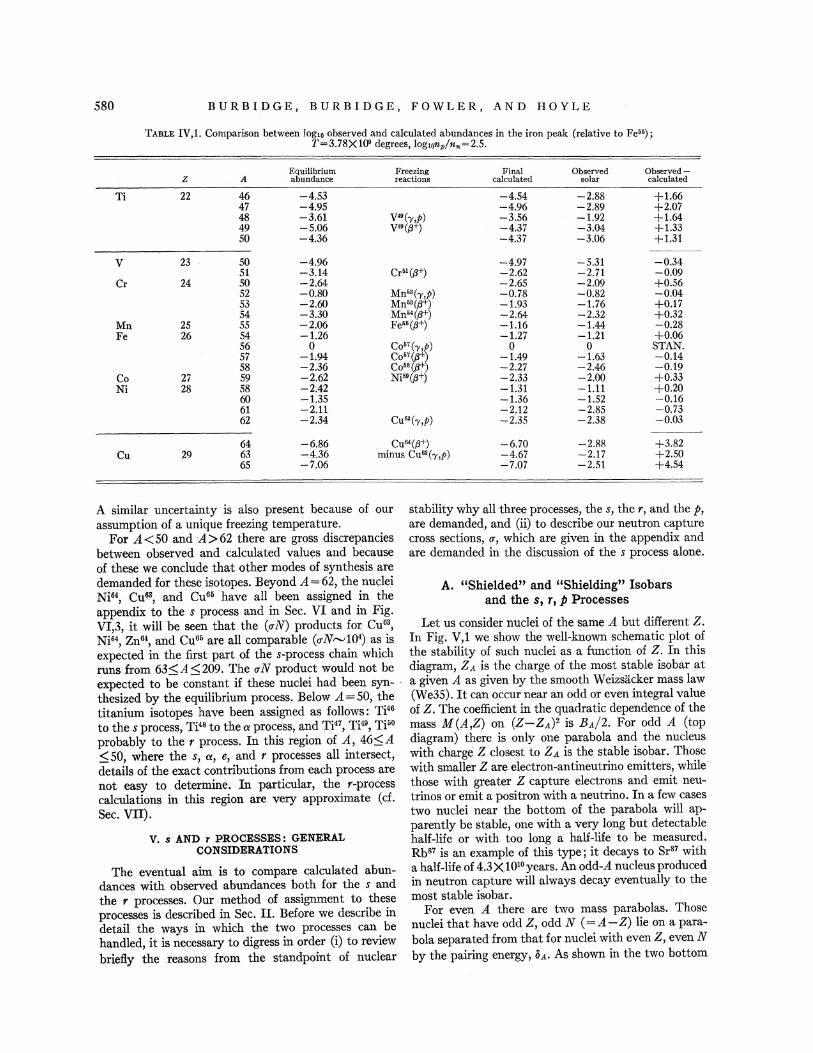
580 BURBIDGE, BURBIDGE, FOWLER, AND HOYLE
TABLE IV,1. Comparison between log,o observed and calculated abundances in the iron peak (relative to Feti6); T=3.78X10⁹ degrees, log,0np/nn=2.5.
Equilibrium Freezing Final Observed Observed-z A abundance reactions calculated solar calculated
Ti 22 46 -4.53 -4.54 -2.88 +1.66 47 -4.95 -4.96 -2.89 +2.07 48 -3.61 V'9(y,p) -3.56 -1.92 +1.64 49 -5.06 V'9(!3+) -4.37 -3.Q4 +1.33 50 -4.36 -4.37 -3.06 +1.31
------
v 23 50 -4.96 -4.97 -5.31 -0.34 51 -3.14 Cr01 (!3+) -2.62 -2.71 -0.09
Cr 24 50 -2.64 -2.65 -2.Q9 +0.56 52 -0.80 Mn53 (-y,p) -0.78 -0.82 -0.04 53 -2.60 Mn53 (!3+) -1.93 -1.76 +0.17 54 -3.30 Mn54 (!3+) -2.64 -2.32 +0.32
Mn 25 55 -2.06 Fe55 (!3+) -1.16 -1.44 -0.28 Fe 26 54 -1.26 -1.27 -1.21 +0.06
56 0 Co57 (-y,p) 0 0 STAN. 57 -1.94 Co57 (!3+) -1.49 -1.63 -0.14 58 -2.36 Co"s(!3+) -2.27 -2.46 -0.19
Co 27 59 -2.62 Ni'9(!3+) -2.33 -2.00 +0.33 Ni 28 58 -2.42 -1.31 -1.11 +0.20
60 -1.35 -1.36 -1.52 -0.16 61 -2.11 -2.12 -2.85 -0.73 62 -2.34 Cu63 (-y,p) -2.35 -2.38 -0.03
64 -6.86 Cu64 (!3+) -6.70 -2.88 +3.82 Cu 29 63 -4.36 minus Cu63 (-y,p) -4.67 -2.17 +2.50
65 -7.06
A similar uncertainty is also present because of our assumption of a unique freezing temperature.
For A< 50 and A> 62 there are gross discrepancies between observed and calculated values and because of these we conclude that other modes of synthesis are demanded for these isotopes. Beyond A= 62, the nuclei Ni64, Cu63, and Cu66 have all been assigned in the appendix to the s process and in Sec. VI and in Fig. VI,3, it will be seen that the (aN) products for Cu63,
Ni64, Zn64, and Cu66 are all comparable (aN"-'104) as is expected in the first part of the s-process chain which runs from 63=s;A=s;209. The aN product would not be expected to be constant if these nuclei had been syn- -thesized by the equilibrium process. Below A= 50, the titanium isotopes have been assigned as follows: Ti46
to the s process, Ti48 to the a process, and Ti47, Ti49, Ti60
probably to the r process. In this region of A, 46=s;A ::;so, where the s, a, e, and r processes all intersect, details of the exact contributions from each process are not easy to determine. In particular, the r~process calculations in this region are very approximate (cf. Sec. VII).
V. s AND r PROCESSES: GENERAL CONSIDERATIONS
The eventual aim is to compare calculated abundances with observed abundances both for the s and the r processes. Our method of assignment to these processes is described in Sec. II. Before we describe in detail the ways in which the two processes can be handled, it is necessary to digress in order (i) to review briefly the reasons from the standpoint of nuclear
-7.07 -2.51 +4.54
stability why all three processes, the s, the r, and the p, are demanded, and (ii) to describe our neutron capture cross sections, IJ", which are given in the appendix and are demanded in the discussion of the s process alone.
A. "Shielded" and "Shielding" Isobars and the s, r, p Processes
Let us consider nuclei of the same A but different Z. In Fig. V,l we show the well-known schematic plot of the stability of such nuclei as a function of Z. In this diagram, ZA is the charge of the most stable isobar at a given A as given by the smooth Weizsacker mass law (We35). It can occur near an odd or even integral value of Z. The coefficient in the quadratic dependence of the mass M(A,Z) on (Z-ZA) 2 is BA/2. For odd A (top diagram) there is only one parabola and the nucleus with charge Z closest to ZA is the stable isobar. Those with smaller Z are electron-antineutrino emitters, while those with greater Z capture electrons and emit neutrinos or emit a positron with a neutrino. In a few cases two nuclei near the bottom of the parabola will apparently be stable, one with a very long but detectable half-life or with too long a half-life to be measured. Rb87 is an example of this type; it decays to Sr87 with a half-life of 4.3X10¹⁰ years. An odd-A nucleus produced in neutron capture will always decay eventually to the most stable isobar.
For even A. there are two mass parabolas. Those nuclei that have odd Z, odd N (=A- Z) lie on a parabola separated from that for nuclei with even Z, even N by the pairing energy, OA. As shown in the two bottom
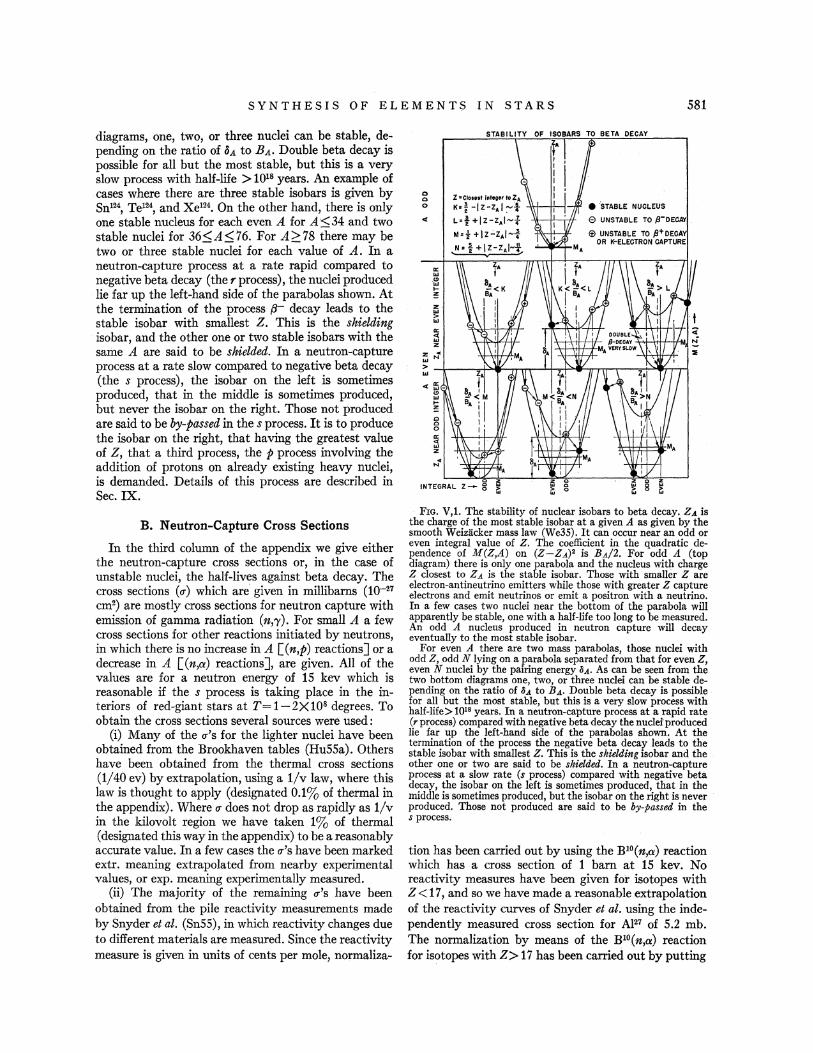
SYNTHESIS OF ELEMENT~ IN STARS 581
diagrams, one, two, or three nuclei can be stable, depending on the ratio of 8.a to B.a. Double beta decay is possible for all but the most stable, but this is a very slow process with half-life > 1018 years. An example of cases where there are three stable isobars is given by Sn124, Te124, and Xe124• On the other hand, there is only one stable nucleus for each even A for A·:::;34 and two stable nuclei for 36~A~76. For A~78 there may be two or three stable nuclei for each value of A. In a neutron-capture process at a rate rapid co1npared to negative beta decay (the r process), the nuclei produced lie far up the left-hand side of the parabolas shown. At the termination of the process p- decay leads to the stable isobar with sinallest Z. This is the shielding isobar, and the other one or two stable isobars with the same A are said to be shielded. In a neutron-capture process at a rate slow compared to negative beta decay (the s process), the isobar on the left is soinetimes produced, that in the middle is so1netimes produced, but never the isobar on the right. Those not produced are said to be by-passed in the s process. It is to produce the isobar on the right, that having the greatest value of Z, that a third process, the p process involving the addition of protons on already existing heavy nuclei, is demanded. Details of this process are described in Sec. IX.
B. Neutron-Capture Cross Sections
In the third column of the appendix we give either the neutron-capture cross sections or, in the case of unstable nuclei, the half-lives against beta decay. The cross sections (o-) which are given in Inillibarns (1Q-27
Cin2) are mostly cross sections for neutron capture with emission of ga1llllla radiation (n,-y). For small A a few cross sections for other reactions initiated by neutrons, in which there is no increase in A [(n,p) reactions] or a decrease in A [(n,a) reactions], are given. All of the values are for a neutron energy of 15 kev which is reasonable if the s process is taking place in the interiors of red-giant stars at T=l-2X10⁸ degrees. To obtain the cross sections several sources were used :
(i) Many of the o-'s for the lighter nuclei have been obtained from the Brookhaven tables (Hu55a). Others have been obtained from the therinal cross sections (1/40 ev) by extrapolation, using a 1/v law, where this law is thought to apply (designated 0.1% of thermal in the appendix). Where o- does not drop as rapidly as 1/v in the kilovolt region we have taken 1% of thermal (designated this way in the appendix) to be a reasonably accurate value. In a few cases the o-'s have been Inarked extr. Ineaning extrapolated froin nearby experimental values, or exp. meaning experimentally Ineasured.
(ii) The Inajority of the remaining u's have been obtained frolll the pile reactivity measurements made by Snyder et al. (Sn55), in which reactivity changes due to different materials are measured. Since the reactivity Ineasure is given in units of cents per mole, riormaliza-
0 0 0
a: "' ·r;l ,_ !': z. \\! "' a: ... "' z
:r: ~ -+----~~~on~Yh~~~n-.-~~.rrr;
4 ffi-"' "' ... !': 0 0 0
~ z Nc
FIG. V,l. The stability of nuclear isobars to beta decay. ZA is the charge of the most stable isobar at a given A as given by the smooth Weizacker mass law (We35). It can occur near an odd or even integral value of Z. The coefficient in the quadratic dependence of M(Z,A) on (Z-ZA) 2 is BA/2. For odd A (top diagram) there is only one parabola and the nucleus with charge Z closest to ZA is the stable isobar. Those with smaller Z are electron-antineutrino emitters while those with greater Z capture electrons and emit neutrinos or emit a positron with a neutrino. In a few cases two nuclei near the bottom of the parabola will apparently be stable, one with a half-life too long to be measured. An odd A nucleus produced in neutron capture will decay eventually to the most stable isobar.
For even A there are two mass parabolas, those nuclei with odd Z, odd N lying on a parabola separated from that for even Z, even N nuclei by the pairing energy a A. As can be seen from the two bottom diagrams one, two, or three nuclei can be stable depending on the ratio of aA to BA. Double beta decay is possible for all but the most stable, but this is a very slow process with half-life> 1018 years. In a neutron-capture process at a rapid rate (r process) compared with negative beta decay the nucletproduced lie far up the left-hand side of the parabolas shown. At the termination of the process the negative beta decay leads to the stable isobar with smallest Z. This is the shielding isobar and the other one or two are said to be shielded. In a neutron-capture process at a slow rate (s process) compared with negative beta decay, the isobar on the left is sometimes produced, that in the middle is sometimes produced, but the isobar on the right is never produced. Those not produced are said to be by-passed in the s process.
tion has been carried out by using the B10(n,a) reaction which has a cross section of 1 bam at 15 kev. No reactivity measures have been given for isotopes with Z < 17, and so we have made a reasonable extrapolation of the reactivity curves of Snyder et al. using the independently measured cross section for Al27 of 5.2 Inb. The normalization by means of the B10(n,a) reaction for isotopes with Z> 17 has been carried out by putting
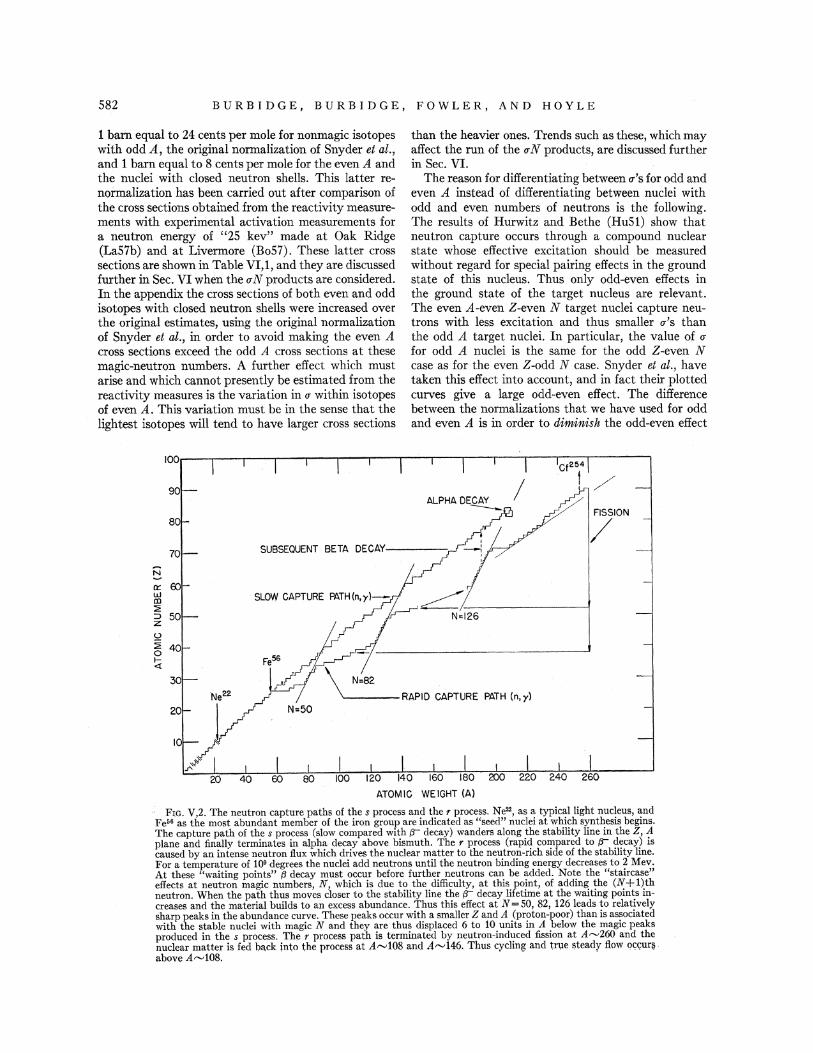
582 BURBIDGE, BURBIDGE, FOWLER, AND HOYLE
1 barn equal to 24 cents per mole for nonmagic isotopes with odd A, the original normalization of Snyder et al., and 1 bam equal to 8 cents per mole for the even A and the nuclei with closed neutron shells. This latter renormalization has been carried out after comparison of the cross sections obtained from the reactivity measurements with experimental activation measurements for a neutron energy of "25 kev" made at Oak Ridge (La57b) and at Livermore (Bo57). These latter cross sections are shown in Table VI,1, and they are discussed further in Sec. VI when the uN products are considered. In the appendix the cross sections of both even and odd isotopes with closed neutron shells were increased over the original estimates, using the original normalization of Snyder et al., in order to avoid making the even A cross sections exceed the odd A cross sections at these magic-neutron numbers. A further effect which must arise and which cannot presently be estimated from the reactivity measures is the variation in u within isotopes of even A. This variation must be in the sense that the lightest isotopes will tend to have larger cross sections
than the heavier ones. Trends such as these, which may affect the run of the u N products, are discussed further in Sec. VI.
The reason for differentiating between u's for odd and even A instead of differentiating between nuclei with odd and even numbers of neutrons is the following. The results of Hurwitz and Bethe (Hu51) show that neutron capture occurs through a compound nuclear state whose effective excitation should be measured without regard for special pairing effects in the ground state of this nucleus. Thus only odd-even effects in the ground state of the target nucleus are relevant. The even A -even Z-even N target nuclei capture neutrons with less excitation and thus smaller u's than the odd A target nuclei. In particular, the value of u for odd A nuclei is the same for the odd Z-even N case as for the even Z-odd N case. Snyder et al., have taken this effect into account, and in fact their plotted curves give a large odd-even effect. The difference between the normalizations that we have used for odd and even A is in order to diminish the odd-even effect
/ FISSION
/
· FIG. V,2. The neutron capture paths of the s process and the r process. Ne'll, as a typical light nucleus, and Fe56 as the most abundant member of the iron group are indicated as "seed" nuclei at which synthesis begins. The capture path of the s process (slow compared with {r decay) wanders along the stability line in the Z, A plane and finally terminates in alpha decay above bismuth. The r process (rapid compared to {r decay) is caused by an intense neutron flux which drives the nuclear matter to the neutron-rich side of the stability line. For a temperature of 109 degrees the nuclei add neutrons until the neutron binding energy decreases to 2 Mev. At these "waiting points" {J decay must occur before further neutrons can be added. Note the "staircase" effects at neutron magic numbers, N, which is due to the difficulty, at this point, of adding the (N + 1)th neutron. When the path thus moves closer to the stability line the rr decay lifetime at the waiting points increases and the material builds to an excess abundance. Thus this effect at N =50, 82, 126 leads to relatively sharp peaks in the abundance curve. These peaks occur with a smaller Z and A (proton-poor) than is associated with the stable nuclei with magic N and they are thus displaced 6 to 10 units in A below the magic peaks produced in the s process. The r process path is terminated by neutron-induced fission at A~260 and the nuclear matter is fed back into the process at A"-'108 and A"-'146. Thus cycling and true steady flow o<;c;ur!} above A,....,108.
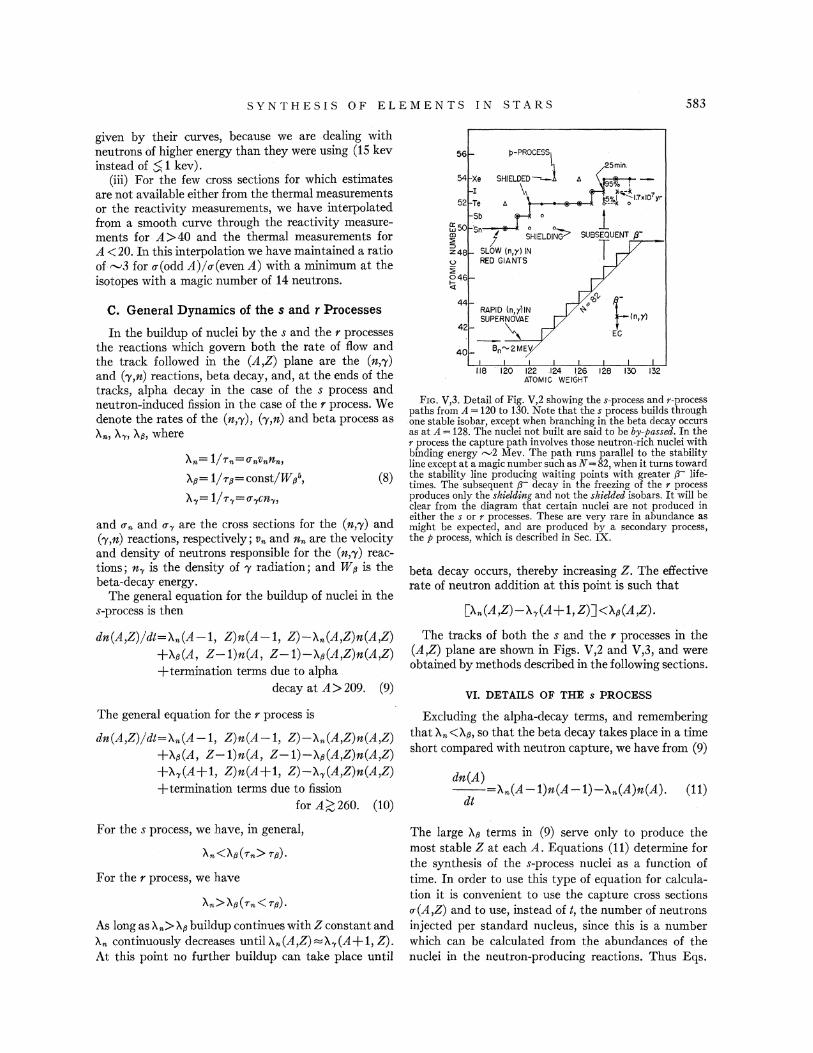
SYNTHESIS OF ELEMENTS IN STARS 583
given by their curves, because we are dealing with neutrons of higher energy than they were using (15 kev instead of $ 1 kev).
(iii) For the few cross sections for which estimates are not available either from the thermal measurements or the reactivity measurements, we have interpolated from a smooth curve through the reactivity measurements for A>40 and the thermal measurements for A <20. In this interpolation we have maintained a ratio of "'3 for u(odd A)/u(even A) with a minimum at the isotopes with a magic number of 14 neutrons.
C. General Dynamics of the s and r Processes
In the buildup of nuclei by the s and the r processes the reactions which govern both the rate of flow and the track followed in the (A,Z) plane are the (n,'Y) and ('Y,n) reactions, beta decay, and, at the ends of the tracks, alpha decay in the case of the s process and neutron-induced fission in the case of the r process. We denote the rates of the (n,"(), ('Y,n) and beta process as X,., A·n AfJ, where
An= 1/Tn=O"nVnnn,
AfJ= 1/T,a=const/W!i".
'A,= 1/T,=u,cn,,
(8)
and O"n and u, are the cross sections for the (n,'Y) and ('Y,n) reactions, respectively; Vn and nn are the velocity and density of neutrons responsible for the (n,'Y) reactions; n, is the density of 'Y radiation; and W ,a is the beta-decay energy.
The general equation for the buildup of nuclei in the s-process is then
dn(A,Z)/dt=Xn(A-1, Z)n(A-1, Z)-'An(A,Z)n(A,Z) +'A11 (A, Z-1)n(A, Z-1)-'Afl(A,Z)n(A,Z) +termination terms due to alpha
decay at A> 209. (9)
The general equation for the r process is
dn(A,Z)/dt=f-n(A-1, Z)n(A-1, Z)-'An(A,Z)n(A,Z) +'Af!(A, Z-1)n(A, Z-1)-X!l(A,Z)n(A,Z) +t-,(A+l, Z)n(A+l, Z)-'A,(A,Z)n(A,Z) +termination terms due to fission
for A~260. (10)
For the s process, we have, in general,
An<AfJ(Tn>Tfl).
For the r process, we have
As long as Xn> Af3 buildup continues with Z constant and An continuously decreases until An(A,Z)~t.,(A+1, Z). At this point no further buildup can take place until
56
54 Xe
52 Te
Sb 8:;50 ·sn o o
~ j SHIELDING>
~48 SLOW {n,y) IN v RED GIANTS ~ 046 '<i
44 RAPID (n,y)IN SUPERNOVAE
42 ~ 40 Bn~2MEV
25min.
~ln,rl EC
118 120 122 .124 126 128 130 132 ATOMIC WEIGHT
Fw. V,3. Detail of Fig. V,2 showing the s-process and r-process paths from A= 120 to 130. Note that the s process builds through one stable isobar, except when branching in the beta decay occurs as at A= 128. The nuclei not built are said to be by-passed. In the r process the capture path involves those neutron-rich nuclei with binding energy "'2 Mev. The path runs parallel to the stability line except at a magic number such as N = 82, when it turns toward the stability line producing waiting points with greater fJ lifetimes. The subsequent fJ decay in the freezing of the r process produces only the shielding and not the shielded isobars. It will be clear from the diagram that certain nuclei are not produced in either the s or r processes. These are very rare in abundance as might be expected, and are produced by a secondary process, the p process, which is described in Sec. IX.
beta decay occurs, thereby increasing Z. The effective rate of neutron addition at this point is such that
[Xn (A ,Z)- 'A,(A + 1, Z)] <'A13(A ,Z).
The tracks of both the s and the r processes in the (A,Z) plane are shown in Figs. V,2 and V,3, and were obtained by methods described in the following sections.
VI. DETAILS OF THE s PROCESS
Excluding the alpha-decay terms, and remembering that An <'Afl, so that the beta decay takes place in a time short compared with neutron capture, we have from (9)
dn(A) --=Xn(A -1)n(A -1)-'A,.(A)n(A). (11)
dt
The large Afl terms in (9) serve only to produce the most stable Z at each A. Equations (11) determine for the synthesis of the s-process nuclei as a function of time. In order to use this type of equation for calculation it is convenient to use the capture cross sections u(A,Z) and to use, instead oft, the number of neutrons injected per standard nucleus, since this is a number which can be calculated from the abundances of the nuclei in the neutron-producing reactions. Thus Eqs.
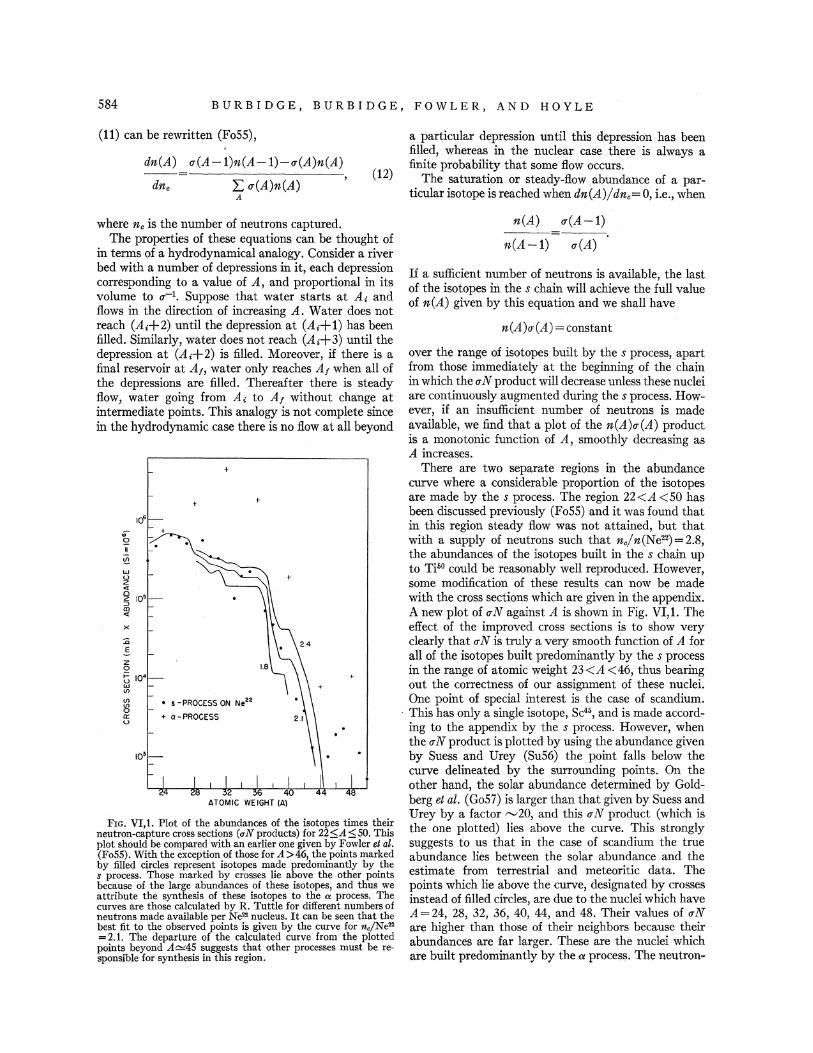
584 BURBIDGE, BURBIDGE, FOWLER, AND HOYLE
(11) can be rewritten (FoSS),
dn(A) <r(A -1)n(A -1)-<r(A)n(A)
dnc I: <r(A)n(A) (12)
A
where nc is the number of neutrons captured. The properties of these equations can be thought of
in terms of a hydrodynamical analogy. Consider a river bed with a number of depressions in it, each depression corresponding to a value of A, and proportional in its volume to <r-1• Suppose that water starts at A; and flows in the direction of increasing A. Water does not reach (A;+2) until the depression at (A;+ 1) has been filled. Similarly, water does not reach (A;+3) until the depression at (A;+2) is filled. Moreover, if there is a final reservoir at Ah water only reaches A1 when all of the depressions are filled. Thereafter there is steady flow, water going from A; to A1 without change at intermediate points. This analogy is not complete since in the hydrodynamic case there is no flow at all beyond
+
r
.. Q II
~ UJ u r z <t 0 z => ro <t
X
:;;
.5 z 0
:::; 104
w (f)
(f) . s -PROCESS ON Ne22
~ 0:: u
FIG. VI,l. Plot of the abundances of the isotopes times their neutron-capture cross sections (uN products) for 22~A ~50. This plot should be compared with an earlier one given by Fowler et al. (FoSS). With the exception of those for A >46, the points marked by filled circles represent isotopes made predominantly by the s process. Those marked by crosses lie above tlle oilier points because of the large abundances of these isotopes, and thus we attribute the synthesis of these isotopes to the a process. The curves are those calculated by R. Tuttle for different numbers of neutrons made available per Ne22 nucleus. It can be seen that the best fit to the observed points is given by the curve for nc/N e22
= 2.1. The departure of the calculated curve from the plotted points beyond A~45 suggests that other processes must be responsible for synthesis in this region.
a particular depression until this depression has been filled, whereas in the nuclear case there is always a finite probability that some flow occurs.
The saturation or steady-flow abundance of a particular isotope is reached when dn(A)/ dnc= 0, i.e., when
n(A) <r(A -1)
n(A -1) <r(A)
If a sufficient number of neutrons is available, the last of the isotopes in the s chain will achieve the full value of n(A) given by this equation and we shall have
n(A)<T(A) =constant
over the range of isotopes built by the s process, apart from those immediately at the beginning of the chain in which the <rN product will decrease unless these nuclei are continuously augmented during the s process. However, if an insufficient number of neutrons is made available, we find that a plot of the n(A)<r(A) product is a monotonic function of A, smoothly decreasing as A increases.
There are two separate regions in the abundance curve where a considerable proportion of the isotopes are made by the s process. The region 22<A <50 has been discussed previously (FoSS) and it was found that in this region steady flow was not attained, but that with a supply of neutrons such that nc/n(Ne22) = 2.8, the abundances of the isotopes built in the s chain up to Ti"0 could be reasonably well reproduced. However, some modification of these results can now be made with the cross sections which are given in the appendix. A new plot of <rN against A is shown in Fig. VI,l. The effect of the improved cross sections is to show very clearly that <rN is truly a very smooth function of A for all of the isotopes built predominantly by the s process in the range of atomic weight 23 <A< 46, thus bearing out the correctness of our assignment of these nuclei. One point of special interest is the case of scandium.
· This has only a single isotope, Sc46, andis made according to the appendix by the s process. However, when the <r N product is plotted by using the abundance given by Suess and Urey (Su56) the point falls below the curve delineated by the surrounding points. On the other hand, the solar abundance determined by Goldberg et al. (Go57) is larger than that given by Suess and Urey by a factor ,--...,20, and this <TN product (which is the one plotted) lies above the curve. This strongly suggests to us that in the case of scandium the true abundance lies between the solar abundance and the estimate from terrestrial and meteoritic data. The points which lie above the curve, designated by crosses instead of filled circles, are due to the nuclei which have A= 24, 28, 32, 36, 40, 44, and 48. Their values of <r N are higher than those of their neighbors because their abundances are far larger. These are the nuclei which are built predominantly by the a process. The neutron-
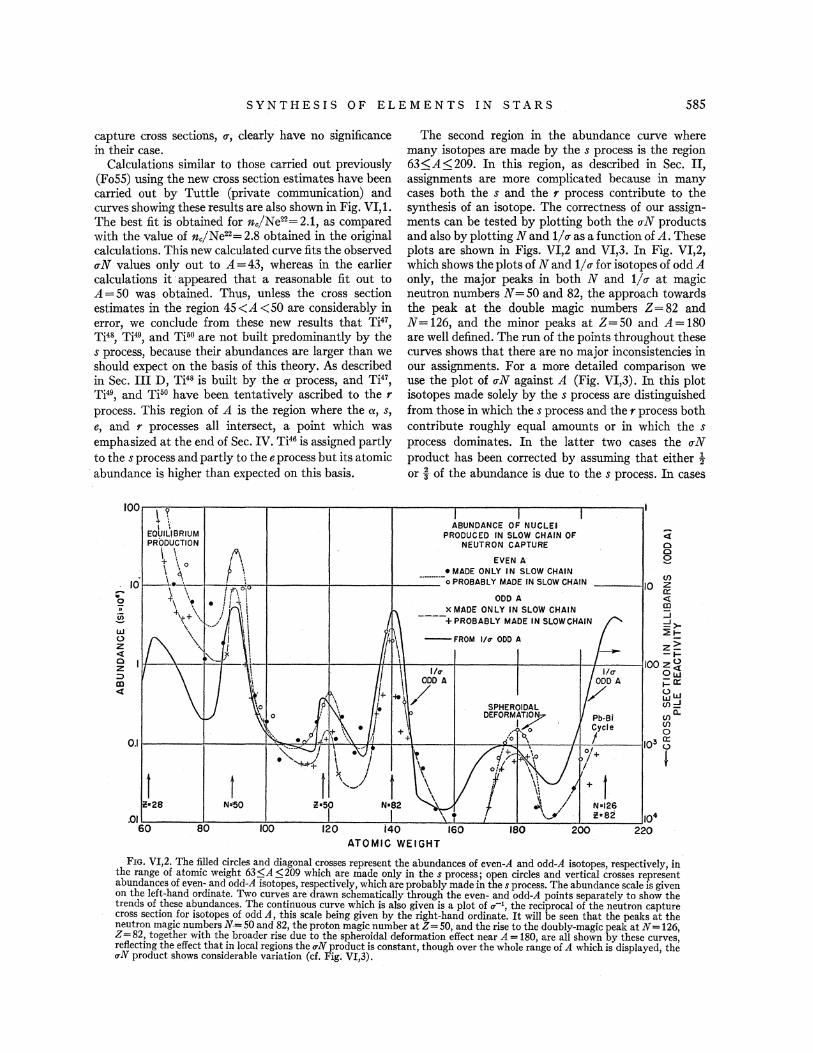
SYNTHESIS OF ELEMENTS IN STARS 585
capture cross sections, u, clearly have no significance in their case.
Calculations similar to those carried out previously (FoSS) using the new cross section estimates have been carried out by Tuttle (private communication) and curves showing these results are also shown in Fig. VI,L The best fit is obtained for nc/Ne22 = 2.1, as compared with the value of nc/Ne22= 2.8 obtained in the original calculations. This new calculated curve fits the observed uN values only out to A=43, whereas in the earlier calculations it appeared that a reasonable fit out to A= 50 was obtained. Thus, unless the cross section estimates in the region 45 <A <50 are considerably in error, we conclude from these new results that Ti47,
Ti4s, Ti49, and Ti50 are not built predominantly by the s process, because their abundances are larger than we should expect on the basis of this theory. As described in Sec. III D, Ti48 is built by the a process, and Ti47,
Ti49, and Ti50 have been tentatively ascribed to the r process. This region of A is the region where the a, s, e, and r processes all intersect, a point which was emphasized at the end of Sec. IV. Ti46 is assigned partly to the s process and partly to thee process but its atomic abundance is higher than expected on this basis.
10 ~ .. 2 .. .§ 1./J u z <(
The second region in the abundance curve where many isotopes are made by the s process is the region 63::;A::; 209. In this region, as described in Sec. II, assignments are more complicated because in many cases both the s and the r process contribute to the synthesis of an isotope. The correctness of our assignments can be tested by plotting both the uN products and also by plotting Nand 1/ rT as a function of A. These plots are shown in Figs. VI,2 and VI,3. In Fig. VI,2, which shows the plots of Nand 1/ u for isotopes of odd A only, the major peaks in both N and 1/u at magic neutron numbers N =50 and 82, the approach towards the peak at the double magic numbers Z = 82 and N = 126, and the minor peaks at Z =50 and A= 180 are well defined. The run of the points throughout these curves shows that there are no major inconsistencies in our assignments. For a more detailed comparison we use the plot of uN against A (Fig. VI,3). In this plot isotopes made solely by the s process are distinguished from those in which the s process and the r process both contribute roughly equal amounts or in which the s process dominates. In the latter two cases the rTN product has been corrected by assuming that either ! or j of the abundance is due to the s process. In cases
--FROM 1/v ODD A
<l 0
§ (/)
----110 ~ <l co ::i :!>::2:1-
z2: -l-
0 z ~--~--~~-·~t_, _______ 1---~r+4+-~~+--------+--------+-~~-~IOOz~
01./J j::O:
:::> co <( ULIJ
~::! (/)a.. (/)
0 0.11------t-----+~~,>Z---f '-t'r-""=:::fi--1---+---t---:;;,...fl.-d-+---+-l--!----li03 :3
t
FIG. VI,2. The ~lied ~ircles and diagonal <;rosses represent th~ abundances of even-A and odd-A isotopes, respectively, in the range of atomiC weight 63 SA S 209 which are made only m the s process; open circles and vertical crosses represent abundances of even- .and odd-A isotopes, respectively, whi<:h are probably made in the s process. The abundance scale is given on the left-hand ordmate. Two curves are drawn schematically through the even- and odd-A points separately to show the trends of ~hese al;mndances. The conti?uous cur~e w~ich is also given is a plot of u-1, the reciprocal of the neutron capture cross sectwn. for Isotopes of odd A, thiS scale bemg given by the right-hand ordinate. It will be seen that the peaks at the neutron magic nur~bers N= 50 and _82, the proton magic .number at Z ~50, and the rise to the doubly-magic peak at N = 126, Z=82: together With th~ broader r~se due to the sphe~Idal deformatwn effect near A= 180, are all shown by these curves, refiectmg the effect that m local regwns the uN product IS constant, though over the whole range of A which is displayed the uN product shows considerable variation (cf. Fig. VI,3). '
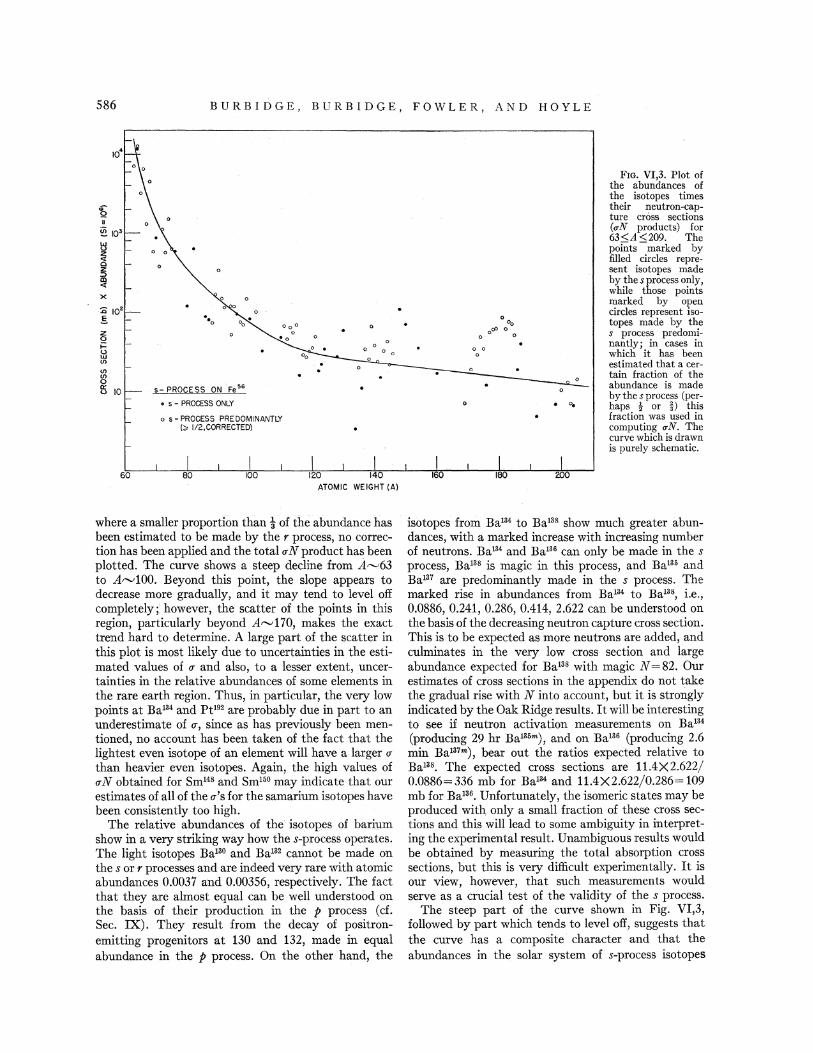
586 BURBIDGE, BURBIDGE, FOWLER, AND HOYLE
~
lj z <I 0 z
i X
:ii 10" .s z 0 ;::: ~ tn
tn tn 0 5 10
60
s- PROCESS ON 'Fe 56
• 5 - PROCESS ONLY
o 5 - PROCESS PRE DOMINANTLY (;. I/2,CORRECTEDl
0
0 0
ATOMIC WEIGHT (A)
where a smaller proportion than l of the abundance has been estimated to be made by the r process, no correction has been applied and the total u N product has been plotted. The curve shows a steep decline from .A"-'63 to A"-'100. Beyond this point, the slope appears to decrease more gradually, and it may tend to level off completely; however, the scatter of the points in this region, particularly beyond A"-'170, makes the exact trend hard to determine. A large part of the scatter in this plot is most likely due to uncertainties in the estimated values of u and also, to a lesser extent, uncertainties in the relative abundances of some elements in the rare earth region. Thus, in particular, the very low points at Ba134 and Pt192 are probably due in part to an underestimate of u, since as has previously been mentioned, no account has been taken of the fact that the lightest even isotope of an element will have a larger u than heavier even isotopes. Again, the high values of uN obtained for Sm148 and Sm150 may indicate that our estimates of all of the u's for the samarium isotopes have been consistently too high.
The relative abundances of the isotopes of barium show in a very striking way how the s-process operates. The light isotopes Ba130 and Ba132 cannot be made on the s orr processes and are indeed very rare with atomic abundances 0.0037 and 0.00356, respectively. The fact that they are almost equal can be well understood on the basis of their production in the p process (cf. Sec. IX). They result from the decay of positronemitting progenitors at 130 and 132, made in equal abundance in the p process. On the other hand, the
0
0 0 0
. ""
Fro. VI,3. Plot of the abundances of the isotopes times their neutron-capture cross sections (oN products) for 63::::;A::::;209. The points marked by filled circles represent isotopes made by the s process only, while those points marked by open circles represent isotopes made by the s process predominantly; in cases in which it has been estimated that a certain fraction of the abundance is made by the s process (perhaps ! or j) this fraction was used in computing oN. The curve which is drawn is purely schematic.
isotopes from Ba134 to Ba138 show much greater abundances, with a marked increase with increasing number of neutrons. Ba134 and Ba136 can only be made in the s process, Ba138 is magic in this process, and Ba135 and Ba137 are predominantly made in the s process. The marked rise in abundances from Ba134 to Ba138, i.e., 0.0886, 0.241, 0.286, 0.414, 2.622 can be understood on the basis of the decreasing neutron capture cross section. This is to be expected as more neutrons are added, and culminates in the very low cross section and large abundance expected for Ba138 with magic N=82. Our estimates of cross sections in the appendix do not take the gradual rise with N into account, but it is strongly indicated by the Oak Ridge results. It will be interesting to see if neutron activation measurements on Ba134 (producing 29 hr Ba136m), and on Ba136 (producing 2.6 min Ba137m), bear out the ratios expected relative to Ba138• The expected cross sections are 11.4X2.622/ 0.0886= 336 mb for Ba134 and 11.4X2.622/0.286= 109 mb for Ba136• Unfortunately, the isomeric states may be produced with only a small fraction of these cross sections and this will lead to some ambiguity in interpreting the experimental result. Unambiguous results would be obtained by measuring the total absorption cross sections, but this is very difficult experimentally. It is our view, however, that such measurements would serve as a crucial test of the validity of the s process.
The steep part of the curve shown in Fig. VI,3, followed by part which tends to level off, suggests that the curve has a composite character and that the abundances in the solar system of s-process isotopes
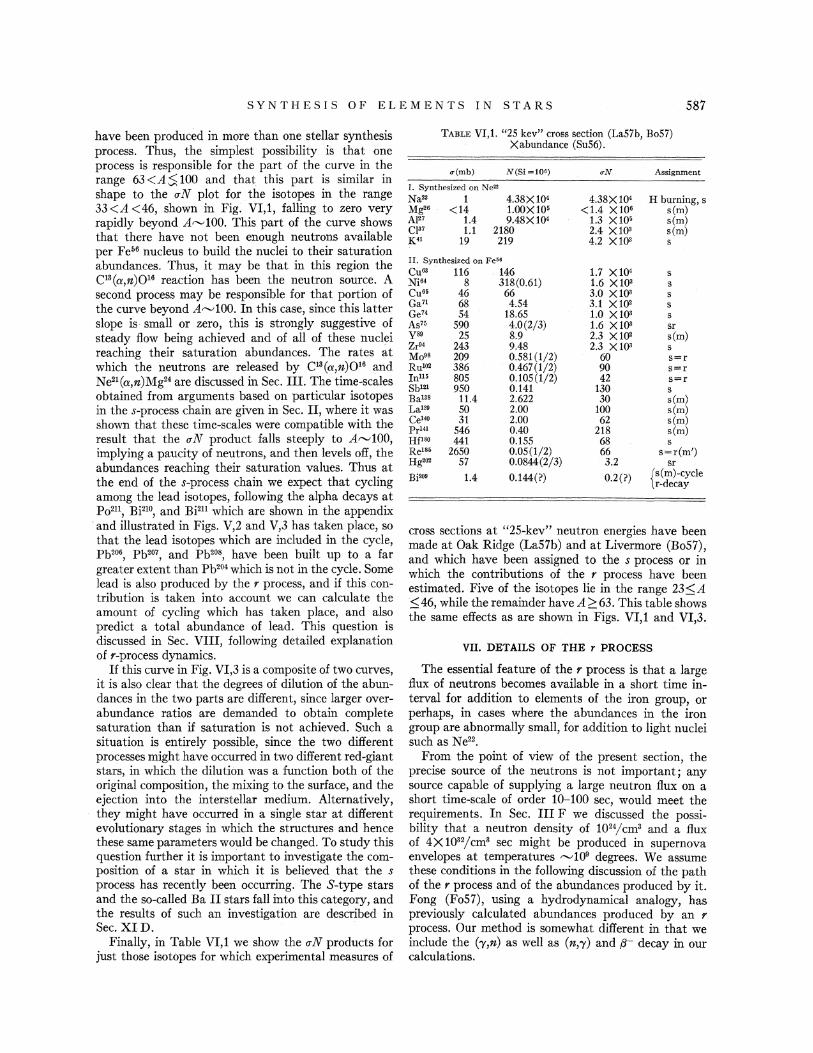
SYNTHESIS OF ELEMENTS IN STARS 587
have been produced in more than one stellar synthesis process. Thus, the simplest possibility is that one process is responsible for the part of the curve in the range 63<A:$100 and that this part is similar in shape to the aN plot for the isotopes in the range 33<A<46, shown in Fig. VI,1, falling to zero very rapidly beyond A"-'100. This part of the curve shows that there have not been enough neutrons available per Fe56 nucleus to build the nuclei to their saturation abundances. Thus, it may be that in this region the C13 (a,n)016 reaction has been the neutron source. A second process may be responsible for that portion of the curve beyond A"-'100. In this case, since this latter slope is small or zero, this is strongly suggestive of steady flow being achieved and of all of these nuclei reaching their saturation abundances. The rates at which the neutrons are released by CI8(a,n)016 and Ne21 (a,n)Mg24 are discussed in Sec. III. The time-scales obtained from arguments based on particular isotopes in the s-process chain are given in Sec. II, where it was shown that these time-scales were compatible with the result that the aN product falls steeply to A,..,.,100, implying a paucity of neutrons, and then levels off, the abundances reaching their saturation values. Thus at the end of the s-process chain we expect that cycling among the lead isotopes, following the alpha decays at Po211, Bi210, and Bi211 which are shown in the appendix
·and illustrated in Figs. V,2 and V,3 has taken place, so that the lead isotopes which are included in the cycle, Pb206, Pb207, and Pb208, have been built up to a far greater extent than Pb204 which is not in the cycle. Some lead is also produced by the r process, and if this contribution is taken into account we can calculate the amount of cycling which has taken place, and also predict a total abundance of lead. This question is discussed in Sec. VIII, following detailed explanation of r-process dynamics.
If this curve in Fig. VI,3 is a composite of two curves, it is also clear that the degrees of dilution of the abundances in the two parts are different, since larger overabundance ratios are demanded to obtain complete saturation than if saturation is not achieved. Such a situation is entirely possible, since the two different processes might have occurred in two different red-giant stars, in which the dilution was a function both of the original composition, the mixing to the surface, and the ejection into the interstellar medium. Alternatively, they might have occurred in a single star at different evolutionary stages in which the structures and hence these same parameters would be changed. To study this question further it is important to investigate the composition of a star in which it is believed that the s process has recently been occurring. The S-type stars and the so-called Ba II stars fall into this category, and the results of such an investigation are described in Sec. XID.
Finally, in Table VI,1 we show the aN products for just those isotopes for which experimental measures of
TABLE VI,l. "25 kev" cross section (La57b, Bo57) Xabundance (Su56).
u(mb) N(Si=lO•) uN Assignment
I. Synthesized on N e" Na23 1 4.38X10⁴ 4.38X1Q4 Hburning, s Mg•s <14 1.00X10⁵ <1.4 X10⁶ s(m) AJ27 1.4 9.48X10⁴ 1.3 X 10⁵ s(m) cJa7 1.1 2180 2.4 X10S s(m) Ku 19 219 4.2 X10S
II. Synthesized on Fe"
cu•' 116 146 1.7 X 10⁴ s Nia• 8 318(0.61) 1.6 X10³ s cuss 46 66 3.0 X10S s Ga71 68 4.54 3.1 X10' s Ge7< 54 18.65 1.0 X10³ s As75 590 4.0(2/3) 1.6 X 10³ sr ys9 25 8.9 2.3 X10' s(m) Zr9< 243 9.48 2.3 X10' Mo9s 209 0.581(1/2) 60 s=r Rul02 386 0.467(1/2) 90 s=r Jn115 805 0.105(1/2) 42 s=r Sbln 950 0.141 130 s Balas 11.4 2.622 30 s(m) La139 50 2.00 100 s(m) Cet<o 31 2.00 62 s(m) Prl<l 546 0.40 218 s(m) H£180 441 0.155 68 s Reiss 2650 0.05(1/2) 66 s=r(m') Hg202 57 0.0844(2/3) 3.2 sr BiB09 1.4 0.144(?) 0.2(?) { s(m)-cycle
r-decay
cross sections at "25-kev" neutron energies have been made at Oak Ridge (La57b) and at Livermore (Bo57), and which have been assigned to the s process or in which the contributions of the r process have been estimated. Five of the isotopes lie in the range 23:s;;A :::;; 46, while the remainder have A;::: 63. This table shows the same effects as are shown in Figs. VI,l and VI,3.
VII. DETAILS OF THE r PROCESS
The essential feature of the r process is that a large flux of neutrons becomes available in a short time interval for addition to elements of the iron group, or perhaps, in cases where the abundances in the iron group are abnormally small, for addition to light nuclei such as Ne22•
From the point of view of the present section, the precise source of the neutrons is not important; any source capable of supplying a large neutron flux on a short time-scale of order 10-100 sec, would meet the requirements. In Sec. III F we discussed the possibility that a neutron density of 1024/cm3 and a flux of 4X1032/cm3 sec might be produced in supernova envelopes at temperatures ,.....,109 degrees. We assume these conditions in the following discussion of the path of the r process and of the abundances produced by it. Fong (Fo57), using a hydrodynamical analogy, has previously calculated abundances produced by an r process. Our method is somewhat different in that we include the ('y,n) as well as (n;y) and 13- decay in our calculations.
588 BURBIDGE, BURBIDGE, FOWLER, AND HOYLE
A. Path of the r Process A nucleus of fixed Z cannot add neutrons indefinitely
even in the presence of an intense neutron flux. The energy of binding of each successive neutron becomes progressively weaker as more and more neutrons are added, until ultimately the binding falls to zero. This sets an upper limit to neutron addition at fixed Z. Moreover, not even this limit will be attained because of the incidence of ('y,n) reactions at the temperature necessary to produce the neutrons by charged particle interactions. The effect of ('Y,n) reactions can readily be understood from statistical considerations. Write n(A,Z) and n,. for the number densities of nuclei A, Z and of neutrons respectively, and let Q,.(A,Z) be the neutron binding to the nucleus X(A,Z) in the reaction,
X(A,Z)+~X(A+1, Z)+'Y+Q,.(A,Z),
such that
Q,.(A,Z)=B,.(A+1, Z)
=c2[M(A,Z)+M,.-M(A+1,Z)]. (13)
Note that Q,. for nucleus A, Z is equal to the neutron binding energy B,. (taken positive) in nucleus A+ 1, Z. With T in units of 109 degrees, Q,. in Mev, and neglecting weight factors of order unity, the statistical balance in this reaction is expressed by
n(A+1,Z) 5.04 log logn,.-34.07-! logTg+---=--<?.. (14)
n(A,Z) T 9
with all logarithms to the base 10.l"or neutron addition to be highly effective we require n (A+ 1, Z) In (A ,Z) » 1. When n(A+1, Z)jn(A,Z)rv1, neutron addition is less effective. When n(A+1, Z)/n(A,Z)«1, neutrons are scarcely added at all. As an approximation, adequate for the present discussion, we may consider that neutrons are added or not added according to whether n(A + 1, Z) I n(A ,Z);:::: 1 is satisfied or not, i.e., according to whether
T9 Q,.;::::-(34.07+! logTg-logn,.) (15)
5.04
is satisfied or not. With Tgrv1 and n,.rv1024 as found in Sec. III F, we have
Q .. ~2 Mev.
Larger Q,. values would be required at higher temperatures or at lower neutron densities. n(A+1, Z)ln(A,Z) is very sensitive to small changes in Q,. or T9• Under the conditions discussed above 5.04Q,./T9:::::: 10. Hence a ten percent change in Q,., namely by 0.2 Mev, or a ten percent change in T9, namely by 108 degrees, will change n(A+1,Z)/N(A,Z), by a factor of ten. Conversely, for given Q,., T9, and Z the distribution in abundance will exhibit a sharp peak where n(A+1, Z) =n(A,Z). This peak will be at most two or three units in A in width.
We have said that Q,. decreases as more and more neutrons are added at fixed Z. This statement ignored neutron pairing effects. Thus Q,. is higher for odd N=A-Z by 1.5 to 3 Mev (depending on A) than it is for even N =A-Z. This means that instead of a simple monotonic decrease of Q,. with increasing A (Z fixed) we have two decreasing sequences, one for N odd, the other for N even, the two sequences being separated by about 2 Mev in the range of A of interest in this discussion.
Consider the effect of these two sequences on the criterion for neutron addition. Evidently the pairing effect makes it substantially more difficult for Q,. to satisfy the criterion when N is even, and hence neutron addition must always be expected to cease when N is even. Thus if a neutron can be added at N even, then a further neutron will always be added, since an additional energy approximately equal to 2 Mev is then available for binding the second neutron. On the other hand, when a neutron is added at odd N, the situation is reversed-a second neutron would in that case be less strongly bound by rv2 Mev-so that, although the first neutron might satisfy our criterion, the second is a good deal less likely to do so, and eventually, when N becomes large enough, will not in fact do so. Thus we expect that neutron addition will always cease with N at an even value, so that if A is odd Z must be odd, and if A is even Z must be even.
These remarks all refer to a fixed value of Z. Now Z must increase by unity from time to time, since the neutron-rich nuclei at present under consideration are all unstable against negative beta decay, the lifetimes being rv0.01-10 sec. When Z thus increases, the energy of binding of the next neutron increases quite substantially, so that one or more neutrons can again be added. Once again, however, neutron addition will cease at some even N. Neutron addition cannot then proceed until Z increases by a further unit-and so on. We therefore obtain a clear picture of how the nuclei evolve, by repeated neutron addition interspersed with /Jprocesses, the nuclei always being obliged to "wait" for a {J- process when neutron addition decreases Q,. to the limit allowed by our criterion. The process is shown schematically in Fig. V,2. A detail of this figure for 118<A < 132 is shown in Fig. V,3.
The sand r processes differ in a very crucial way. In the s process, neutrons are made available very slowly so that the neutron density is always low. In such circumstances the addition of neutrons to the nuclei is controlled by their (n,'Y) cross sections. That is to say, the various nuclei compete among themselves for the capture of a slow trickle of neutrons, the abundances of the nuclei being governed by the flow equation (11)
dn(A)jdt= -X,.(A)n(A)+X,.(A-l)n(A-1),
where n(A) is the abundance of that beta-stable isobar at A which occurs in the s-process capture path. In the
· r process, on the other hand, we are concerned with a
SYNTHESIS OF ELEMENTS IN STARS 589
situation in which there is no neutron shortage, and neutron addition is limited not by (n,'Y) cross sections but by ('Y,n) competition and by "waiting" for rr processes to take place. Essentially, we assume that equilibrium is reached between the rapid (n,'Y) and ('Y,n) processes, viz., n, ~'Y, n, and that the slow betadecay processes constitute a slow leakage from this equilibrium. The corresponding flow equation in the ,. process, derived from the general equation (10), takes the form
dn(Z)jdt= ->.p(Z)n(Z)+>.p(Z-1)n(Z-1), (16)
where n(Z) is the density of that isotope of element Z at which waiting for negative beta decay occurs, i.e., the isotope for which Q,."-'2 Mev. The quantity Xp(Z) is related to the beta-decay mean lifetime, rp, and halflife, tp, by X11 = 1/ r 11 = 0.693/tfJ. The condition for steady flow in the ,. process is
>.11 (Z)n(Z)=X.s(Z-1)n(Z-1)=const or
n(Z) cc x11- 1(Z) = r11 (Z).
This is the analog of the steady-flow condition in the s process, namely,
X,.(A)n(A) =>.,.(A -1)n(A -1) = const or
n(A) cc X,.-1(A).
Just as the abundances of the s nuclei suggest that steady flow has occurred in the s process, so the abundances of the ,. nuclei suggest that steady flow has occurred in the r process.
The n(Z) given by the flow equations cannot immediately be interpreted as atomic abundances. At first sight it might seem as if only certain values of A are concerned in the ,. process, namely the values of A at which the nuclei "wait." In Figs. V,2 or V,3, if nuclei of charge Z wait at A, nuclei of charge Z+1 wait at A+.llA, where ~A equals the number of neutron captures. at Z+1 after beta decay at Z. Thus it might appear that only atomic weights A, A+~A, etc., are likely to be produced in any appreciable. abundances by the ,. process. This would be the case if there were a unique track of the kind shown in Figs. V,2 and V,3. But this is scarcely likely to be the case, since there will certainly be a spread in A, Z values about this path, simply due to the statistical nature of Eq. (14). Thus a small scatter in the values of atomic weights at which waiting for beta decay occurs is only to be expected. This suggests that we convert the nz abundances to nA abundances by
n(A) = n(Z) (~A)-1= n(Z) (dZ/ dA), (17)
where ~A is the number of unit steps in A for a single step in Z along the typical track of the form shown in Fig. V,2, and dZ/dA is the slope of the track in the Z, A plane. That is to say, we "spread" the abundances accumulated at the "waiting points" over the intervals
of A that occur between the waiting points. This treatment is of course approximate, but it is thought adequate for the present purpose, since the present analysis contains other simplifications that are explained at a later stage. We arbitrarily take the spread from a given waiting point at A to the next higher waiting point at A+~A rather than in the reverse direction. Physically, this corresponds to the assumption that, in freezing, the material accumulated at a waiting point with given A, Z is spread out, as 'Y radiation dies out, by final neutron captures over an interval in A up to the waiting A for Z+1. The equation for the equilibrium between (n,'Y) and ('Y,n) reactio~s is much more sensitive toT, (linear dependence), than to n,., (logarithmic dependence). Thus, as T and n,. decrease, the equilibrium is displaced toward slightly greater A values, representing the capture of the last neutrons.
The solution of the dynamical problem in the r process falls into two parts. The first part consists in a determination of the track shown schematically in Fig. V,2, the second consists in estimating the betadecay waiting time. The relative abundances given by steady flow then follow immediately from
Tp(A,Z) dZ n(A) ex: r11(A,Z)-,
.1A dA
where r.s(A,Z) is now the mean beta-decay lifetime at the waiting point, A, for a given Z. A determination of the track demands a precise specification of the criterion for neutron addition. This criterion can be written as Q,.~Q., where Q. is to be a specified quantity, of order 2 Mev, which depends on n,., T in accordance with the inequality (15).
The problem of the determination of the track is that of obtaining Q,. as a function of A, Z from nuclear data. Assuming for the moment this to be done, we then have Q,.(A,Z)~Q. as the condition for neutron addition. We now wish to determine the waiting values of A for various Z by using the following criteria.
With Z specified, N=A-Z must be even, and
Q,.(A,Z)~Q.,
Q,.(A+2,Z)<Q •.
In this way the waiting points A, A+~A, · · · corresponding to Z, Z+ 1, · · · can be found. A further necessary condition is that the waiting points increase monotonically with Z.
We have not found it possible to determine the waiting points solely from the current empirical nuclear data on neutron binding energies. This is to be expected, if it is recalled that one must know the binding energy of the very neutron-rich nuclei along the neutron capture path with considerable precision ("-'0.2 Mev) in order to specify the path precisely. Even the binding energies of the stable nuclei on which careful mass measurements have been made are rarely known to this
590 BURBIDGE, BURBIDGE, FOWLER, AND HOYLE
precision. Furthermore, the extrapolation to the neutron-rich nuclei involves considerable uncertainty. For these reasons we have been forced to resort to a method of calculating r-process abundances which establishes a few parameters semiempirically on the basis of certain salient features of the abundance curve itself. We now outline a method of calculation which may eventually be capable of yielding a theoretical abundance curve on the basis of nuclear data alone.
First, we consider the determination of Q(A,Z) on the basis of the smooth Weizsacker atomic mass formula (We35), neglecting shell, pairing and quadrupole deformation effects:
1 [ (A-2Z) 2
M(A,Z)= (A-Z)M,.+ZMH-- aA-{3r---c2 A
Z(Z-1)] --yA*----Al '
(18)
where M,. and M H are the masses of the neutron and of the hydrogen atom and a, {J, -y, and ~are constants in energy units, to be determined empirically. They represent, respectively, volume, isotopic, surface, and Coulomb energy parameters. In the following discussion we use a= 15.3, {3=22.6, -y= 16.7, and ~=0.69, all in Mev, as determined by Fowler, Hornyak, and Cohen (Fo47). Equation (18) can be alternatively written as
1 M(A,Z)=MA+-BA(Z-ZA)2, (18a)
2c2
where
(19)
is the value of Z at a given mass number, A, for which M(A,Z) has the minimum value, MA. ZA is not necessarily integral, and both MA and ZA can be determined in terms of the empirical constants by setting oM/oZ=O, keeping A constant. The coefficient BA appears in the well-known parabolic dependence of M(A,Z) on Z and can be evaluated from
(20)
Alternatively, MA, ZA, and BA can be taken as quantities to be determined as empirical functions of A.
Returning to Eq. (18), we can determine Q,.(A,Z) as follows
Q,.(A,Z)=c2[M,.+M(A,Z)-M(A+1,Z)]
( P) ~ Z(Z-1) =a-fJ 1-4- -hA-l+----
A2 3 At
~-fJ-~-yA-l+4fJP[1 +-~-A*]· 3 A 2 12fJ
(21)
The terms in the second line in Eq. (21) can be identified successively as due to volume, isotopic, surface, and Coulomb effects in atomic masses. Equating Q,. to a specified Q. in Eq. (21) gives A as a smooth function of Z. The plot of Z against A runs approximately parallel to the stability line, but it is depressed below this line by an amount that depends on the value of Q •. For Q.= 2 Mev the depression amounts to about 7 units in Z at A"-'100 and about 11 units in Z at A"-'200. If the nuclear masses were really given by the Weizsacker formula the nuclei would evolve along this line, not completely in a smooth fashion because of the discrete nature of A, but smoothly within one unit of A. There would be no gross deflections of the line, such as are implied in Figs. V,2 and V,3. In addition, the values of r~ and dZ/dA would also be a smooth function of A, so that the theory would be incapable of explaining the peaks and troughs of the abundance curve for the r nuclei. Evidently an improved expression must be used for M(A,Z) if the theory is to provide this degree of detail. We have not attempted a complete treatment but have been content to approximate in a degree that does not seem to have too serious an impact on the calculated results. A fuller treatment of the form of M(A,Z) is at present being investigated by Dr. Forrest Mozer at the California Institute of Technology, and improved results should be forthcoming from its use.
Our treatment is based on modifying the above expression for M(A,Z) so that we have
1 M(A,Z)=Mw(A,Z)--[j(N)+g(Z)], (22)
c2
where Mw(A,Z) represents the Weizsacker expressions given in Eq. (18). That is to say, we subtract a sum of two functions, one of the neutron number and the other of the proton number. Insofar as they are functions of Nand Z separately, this procedure takes into account the important effects on nuclear masses of (i) neutron or proton shell structure, (ii) spheroidal quadrupole deformation of partially filled shells, and (iii) pairing of neutrons and pairing of protons. Products of two such functions are not included. The quantities f(N) and g(Z) will be discontinuous functions at magic closed shell numbers for Nor Z respectively. The sign is taken negative so that f(N) and g(Z), as positive quantities, decrease the mass and add to the stability of a nucleus.
We now obtain
Q,.(A,Z)=a-fJ-hA-1
+4fJP[1+-~ Ai]+f'(A-Z), (23) A2 12{3
where dj(N)
f'(A-Z)= f'(N)=--= j(A+1-Z)- f(A-Z). dN
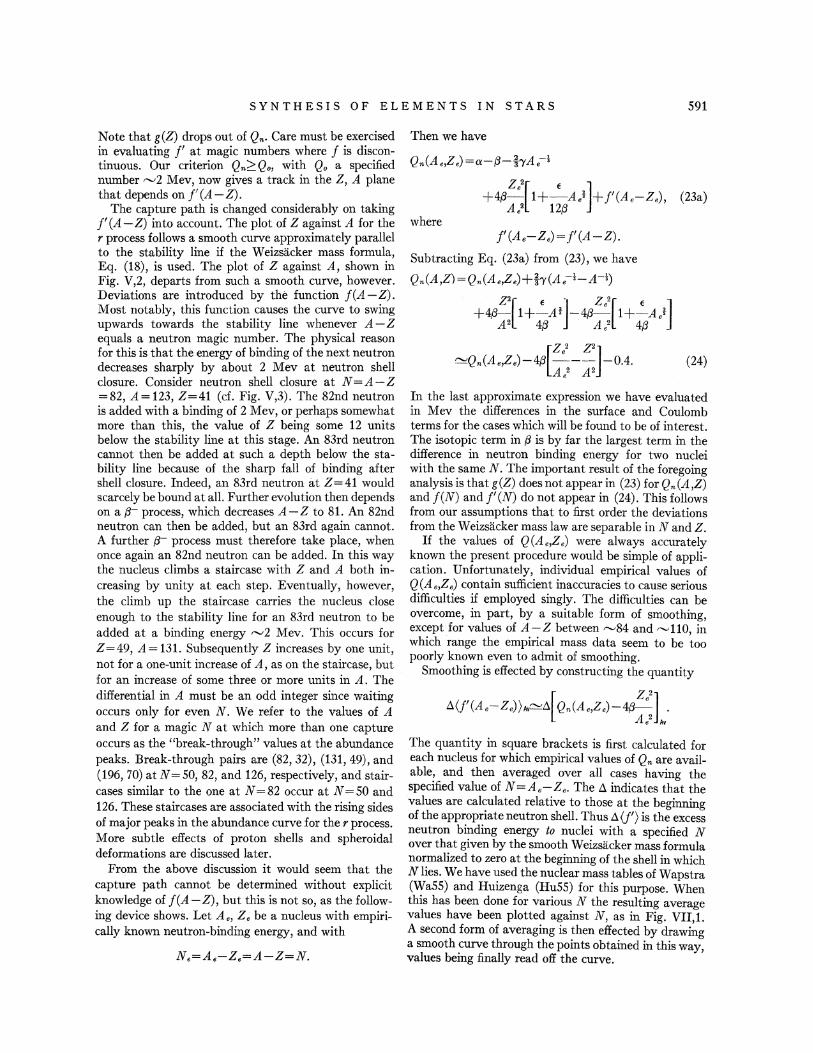
S Y NTH E S I S 0 F E L E M EN T S IN STARS 591
Note that g(Z) drops out of Q,.. Care must be exercised in evaluating f' at magic numbers where f is discontinuous. Our criterion Q,.~Q., with Q. a specified number '"'-'2 Mev, now gives a track in the Z, A plane that depends on f'(A-Z).
The capture path is changed considerably on taking f'(A-Z) into account. The plot of Z against A for the r process follows a smooth curve approximately parallel to the stability line if the Weizsacker mass formula, Eq. (18), is used. The plot of Z against A, shown in Fig. V,2, departs from such a smooth curve, however. Deviations are introduced by the function f(A-Z). Most notably, this function causes the curve to swing upwards towards the stability line whenever A-Z equals a neutron magic number. The physical reason for this is that the energy of binding of the next neutron decreases sharply by about 2 Mev at neutron shell closure. Consider neutron shell closure at N=A-Z =82, A=123, Z=41 (d. Fig. V,3). The 82nd neutron is added with a binding of 2 Mev, or perhaps somewhat more than this, the value of Z being some 12 units below the stability line at this stage. An 83rd neutron cannot then be added at such a depth below the stability line because of the sharp fall of binding ·after shell closure. Indeed, an 83rd neutron at Z=41 would scarcely be bound at all. Further evolution then depends on a p- process, which decreases A-Z to 81. An 82nd neutron can then be added, but an 83rd again cannot. A further p- process must therefore take place, when once again an 82nd neutron can be added. In this way the nucleus climbs a staircase with Z and A both increasing by unity at each step. Eventually, however, the climb up the staircase carries the nucleus close enough to the stability line for an 83rd neutron to be added at a binding energy "'2 Mev. This occurs for Z=49, A=131. Subsequently Z increases by one unit, not for a one-unit increase of A, as on the staircase, but for an increase of some three or more units in A. The differential in A must be an odd integer since waiting occurs only for even N. We refer to the values of A and Z for a magic Nat which more than one capture occurs as the "break-through" values at the abundance peaks. Break-through pairs are (82, 32), (131, 49), and (196, 70) at N =50, 82, and 126, respectively, and staircases similar to the one at N = 82 occur at N =50 and 126. These staircases are associated with the rising sides of major peaks in the abundance curve for the r process. More subtle effects of proton shells and spheroidal deformations are discussed later.
From the above discussion it would seem that the capture path cannot be determined without explicit knowledge of f(A -Z), but this is not so, as the following device shows. Let A., Z~ be a nucleus with empirically known neutron-binding energy, and with
N.=A.-Z.=A-Z=N.
Then we have
Q,.(A.,Z.)=a-fJ-f'yA.-1
+4fJZ•2[1+-E A.i]+J'(A.-Z.) (23a)
A.2 12fJ ' where
f'(A.-Z.)= f'(A-Z).
Subtracting Eq. (23a) from (23), we have
Q,.(A,Z)=Q,.(A.,Z.)+f-y(A.-1-A-t)
+4fJ z2[1+~A~J· -4{3 z.2[1+~A.t] A2 4fJ Al 4fJ
[Z.2 p]
~Q,.(A.,Z.)-4{3 --- -0.4. A,2 A2
(24)
In the last approximate expression we have evaluated in Mev the differences in the surface and Coulomb terms for the cases which will be found to be of interest. The isotopic term in fJ is by far the largest term in the difference in neutron binding energy for two nuclei with the same N. The important result of the foregoing analysis is that g(Z) does not appear in (23) for Q .. (A ,Z) and f(N) and f' (N) do not appear in (24). This follows from our assumptions that to first order the deviations from the Weizsacker mass law are separable inN and Z.
If the values of Q(A.,Z.) were always accurately known the present procedure would be simple of application. Unfortunately, individual empirical values of Q(A.,Z.) contain sufficient inaccuracies to cause serious difficulties if employed singly. The difficulties can be overcome, in part, by a suitable form of smoothing, exceptfor values of A-Z between '"'-'84 and "-'110, in which range the empirical mass data seem to be too poorly known even to admit of smoothing.
Smoothing is effected by constructing the quantity
t:.(j'(A.-Z.))Av~t:.[Q,.(A.,Z.)-4{3 z.:] . A. Av
The quantity in square brackets is first calculated for each nucleus for which empirical values of Q,. are available, and then averaged over all cases having the specified value of N=A.-Z •. The t:. indicates that the values are calculated relative to those at the beginning of the appropriate neutron shell. Thus t:. (f') is the excess neutron binding energy to nuclei with a specified N over that given by the smooth Weizsacker mass formula normalized to zero at the beginning of the shell in which N lies. We have used the nuclear mass tables of Wapstra (WaSS) and Huizenga (RuSS) for this purpose. When this has been done for various N the resulting average values have been plotted against N, as in Fig. VII,L A second form of averaging is then effected by drawing a smooth curve through the points obtained in this way values being finally read off the curve. '
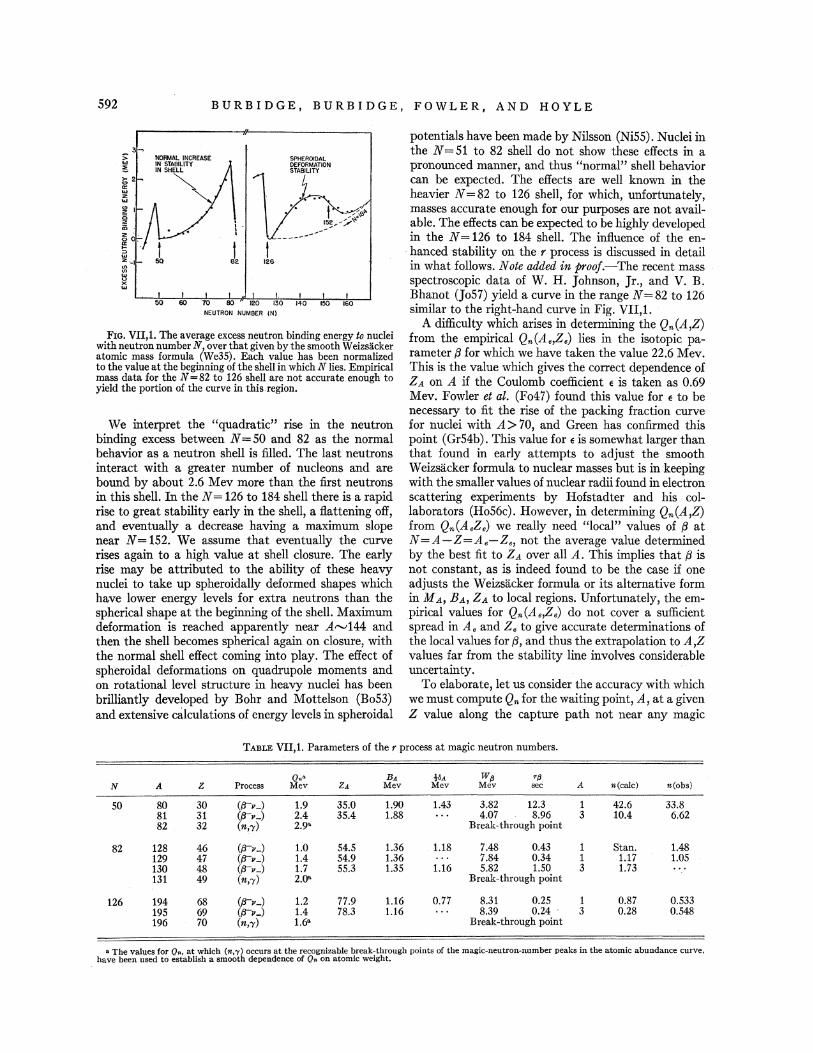
592 BURBIDGE, BURBIDGE, FOW·LER, AND HOYLE
50 EO 10 eo NEUTRON NUMBER !Nl
FIG. VII,l. The average excess neutron binding energy to nuclei with neutron number N;, over that given by the smooth W eizsacker atomic mass formula \We35). Each value has been normalized to the value at the. beginning of the shell in which N lies. Empirical mass data for the N = 82 to 126 shell are not accurate enough to yield the portion of the curve in this.region.
We interpret the "quadratic" rise in the neutron binding excess between N =50 and 82 as the normal behavior as a neutron shell is filled. The last neutrons interact with a greater number of nucleons and are bound by about 2.6 Mev more than the first neutrons in this shell. In the N = 126 to 184 shell there is a rapid rise to great stability early in the shell, a :flattening off, and eventually a decrease having a maximum slope near N = 152. We assume that eventually the curve rises again to a high value at shell closure. The early rise may be attributed to the ability of these heavy nuclei to take up spheroidally deformed shapes which have lower energy levels for extra neutrons than the spherical shape at the beginning of the shell. Maximum deformation is reached apparently near A,...,_,144 and then the shell becomes spherical again on closure, with the normal shell effect coming into play. The effect of spheroidal deformations on quadrupole moments and on rotational level structure in heavy nuclei has been brilliantly developed by Bohr and Mottelson (Bo53) and extensive calculations of energy levels in spheroidal
potentials have been made by Nilsson (NiSS). Nuclei in the N =51 to 82 shell do not show these effects in a pronounced manner, and thus "normal" shell behavior can be expected. The effects are well known in the heavier N = 82 to 126 shell, for which, unfortunately, masses accurate enough for our purposes are not available. The effects can be expected to be highly developed in the N = 126 to 184 shell. The influence of the enhanced stability on the r process is discussed in detail in what follows. Note added in proof.-The recent mass spectroscopic data of W. H. Johnson, Jr., and V. B. Bhanot (Jo57) yield a curve in the range N = 82 to 126 similar to the right-hand curve in Fig. VII,l.
A difficulty which arises in determining the Q,.(A,Z) from the empirical Q,.(A.,Z.) lies in the isotopic parameter {3 for which we have taken the value 22.6 Mev. This is the value which gives the correct dependence of ZA on A if the Coulomb coefficient E is taken as 0.69 Mev. Fowler et at. (Fo47) found this value for E to be necessary to fit the rise of the packing fraction curve for nuclei with A> 70, and Green has confirmed this point (Gr54b). This value forE is somewhat larger than that found in early attempts to adjust the smooth Weizsacker formula to nuclear masses but is in keeping with the smaller values of nuclear radii found in electron scattering experiments by Hofstadter and his collaborators (Ho56c). However, in determining Q,.(A,Z) from Q.,(A.Z.) we really need "local" values of {3 at N=A-Z=A.-Z., not the average value determined by the best fit to ZA over all A. This implies that {3 is not constant, as is indeed found to be the case if one adjusts the Weizsacker formula or its alternative form in M A, BA, ZA to local regions. Unfortunately, the empirical values for Q.,(A.,Z.) do not cover a sufficient spread in A. and z. to give accurate determinations of the local values for {3, and thus the extrapolation to A,Z values far from the stability line involves considerable uncertainty.
To elaborate, let us consider the accuracy with which we must compute Q., for the waiting point, A, at a given Z value along the capture path not near any magic
TABLE VII,l. Parameters of the r process at magic neutron numbers.
Q.• BA t8A w/3 T{J
N A z Process Mev ZA Mev Mev Mev sec A n(calc) n(obs)
50 80 30 (flv_) 1.9 35.0 1.90 1.43 3.82 12.3 1 42.6 33.8 81 31 (f]v_) 2.4 35.4 1.88 4.07 8.96 3 10.4 6.62 82 32 (n,'Y) 2.9• Break-through point
82 128 46 (IJv_) 1.0 54.5 1.36 1.18 7.48 0.43 1 Stan. 1.48 129 47 (f'J-.,_) 1.4 54.9 1.36 7.84 0.34 1 1.17 1.05 130 48 (trv_) 1.7 55.3 1.35 1.16 5.82 1.50 3 1.73 131 49 (n,'Y) 2.0' Break-through point
126 194 68 (IJ,_) 1.2 77.9 1.16 0.77 8.31 0.25 1 0.87 0.533 195 69 ({rv_) 1.4 78.3 1.16 8.39 0.24 3 0.28 0.548 196 70 (n,'Y) 1.6" Break-through point
a The values for Qn, at which (n,y) occurs at the recognizable break-through points of the magic-neutron-number peaks in the atomic abundance curve, have been used to establish a smooth dependence of Q. on atomic weight.
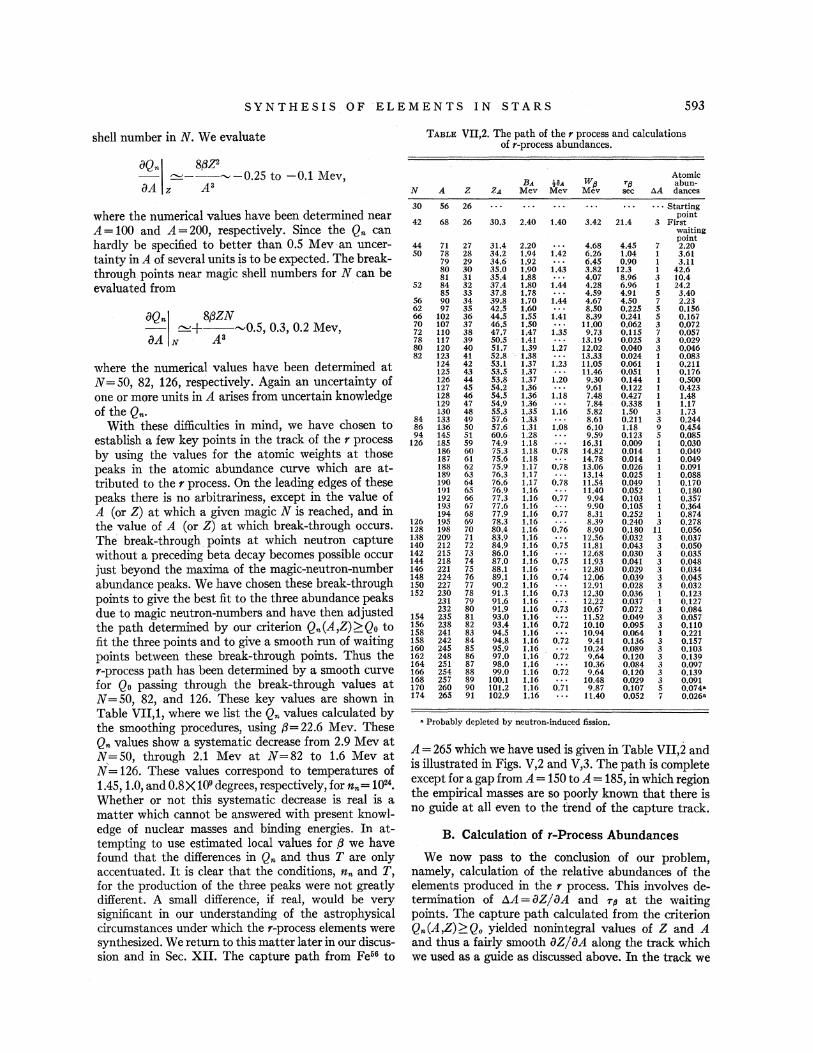
SYNTHESIS OF ELEMENTS IN STARS S93
shell number inN. We evaluate
iJQ,, 8(3V - ~---"-'-0.2S to -0.1 Mev, aA z A 3
where the numerical values have been determined near A= 100 and A= 200, respectively. Since the Qn can hardly be specified to better than O.S Mev an uncertainty in A of several units is to be expected. The breakthrough points near magic shell numbers for N can be evaluated from
iJQ,, 8(3ZN - ~+--"-'O.S, 0.3, 0.2 Mev, aA N A3
where the numerical values have been determined at N =SO, 82, 126, respectively. Again an uncertainty of one or more units in A arises from uncertain knowledge of the Q,.
With these difficulties in mind, we have chosen to establish a few key points in the track of the r process by using the values for the atomic weights at those peaks in the atomic abundance curve which are attributed to the r process. On the leading edges of these peaks there is no arbitrariness, except in the value of A (or Z) at which a given magic N is reached, and in the value of A (or Z) at which break-through occurs. The break-through points at which neutron capture without a preceding beta decay becomes possible occur just beyond the maxima of the magic-neutron-number abundance peaks. We have chosen these break-through points to give the best fit to the three abundance peaks due to magic neutron-numbers and have then adjusted the path determined by our criterion Q,(A,Z);2:Qo to fit the three points and to give a smooth run of waiting points between these break-through points. Thus the r-process path has been determined by a smooth curve for Q0 passing through the break-through values at N =SO, 82, and 126. These key values are shown in Table VII,1, where we list the Q, values calculated by the smoothing procedures, using (3= 22.6 Mev. These Q, values show a systematic decrease from 2.9 Mev at N=SO, through 2.1 Mev at N=82 to 1.6 Mev at !l= 126. These values correspond to temperatures of 1.4S, 1.0, and 0.8X10⁹ degrees, respectively, for nn= 1024•
Whether or not this systematic decrease is real is a matter which cannot be answered with present knowledge of nuclear masses and binding energies. In attempting to use estimated local values for (3 we have found that the differences in Q, and thus T are only accentuated. It is clear that the conditions, n, and T, for the production of the three peaks were not greatly different. A small difference, if real, would be very significant in our understanding of the astrophysical circumstances under which the r-process elements were synthesized. We return to this matter later in our discussion and in Sec. XII. The capture path from Fe66 to
N
30
42
44 so
52
56 62 66 70 72 78 80 82
84 86 94
126
126 128 1.38 140 142 144 146 148 150 152
154 156 158 158 160 162 164 166 168 170 174
TABLE VII,2. The path of the r process and calculations of r-process abundances.
A z 56 26
68 26
71 27 78 28 79 29 80 30 81 31 84 32 85 33 90 34 97 35
102 36 107 37 110 38 117 39 120 40 123 41 124 42 125 43 126 44 127 45 128 46 129 47 130 48 133 49 136 50 145 51 185 59 186 60 187 61 188 62 189 63 190 64 191 65 192 66 193 67 194 68 195 69 198 70 209 71 212 72 215 73 218 74 221 75 224 76 227 77 230 78 231 79 232 80 235 81 238 82 241 83 242 84 245 85 248 86 251 87 254 88 257 89 260 90 265 91
BA tBA Wtl Mev Mev Mev
30.3 2.40
31.4 2.20 34.2 1.94 34.6 1.92 35.0 1.90 35.4 1.88 37.4 1.80 37.8 1.78 39.8 1.70 42.5 1.60 44.5 1.55 46.5 1.50 47.7 1.47 50.5 1.41 51.7 1.39 52.8 1.38 53.1 1.37 53.5 1.37 53.8 1.37 54.2 1.36 54.5 1.36 54.9 1.36 55.3 1.35 57.6 1.33 57.6 1.31 60.6 1.28 74.9 1.18 75.3 1.18 75,6 1.18 75.9 1.17 76.3 1.17 76.6 1.17 76.9 1.16 77.3 1.16 77.6 1.16 77.9 1.16 78.3 1.16 80.4 1.16 83.9 1.16 84.9 1.16 86.0 1.16 87.0 1.16 88.1 1.16 89.1 1.16 90.2 1.16 91.3 1.16 91.6 1.16 91.9 1.16 93.0 1.16 93.4 1.16 94.5 1.16 94.8 1.16 95.9 1.16 97.0 1.16 98.0 1.16 99.0 1.16
100.1 1.16 101.2 1.16 102.9 1.16
1.40
1.42
1.43
1.44
1.44
1.41
1.35
1.27
1.23
1.20
1.18
1.16
1.08
0.78
0.78
0.78
0.77
0.77
0.76
0.75
0.75
0.74
0.73
0.73
0.72
0.72
0.72
0.72
0.71
3.42
4.68 6.26 6.45 3.82 4.07 4.28 4.59 4.67 8.50 8.39
11.00 9.73
13.19 12.02 13.33 11.05 11.46
9.30 9.61 7.48 7.84 5.82 8.61 6.10 9.59
16.31 14,82 14.78 13.06 13,14 11.54 11.40
9.94 9.90 8.31 8.39 8.90
12.56 11.81 12.68 11.93 12.80 12.06 12.91 12.30 12.22 10.67 11.52 10.10 10.94 9.41
10.24 9,64
10.36 9.64
10.48 9.87
11.40
Atomic Ttl abun-sec t.A dances
···Starting point
21.4 3 First
4.4S 7 1.04 1 0.90 1
12.3 1 8.96 3 6.96 1 4.91 5 4,50 7 0,225 5 0.241 5 0.062 3 0.115 7 0,025 3 0.040 3 0.024 1 0.061 1 0.051 1 0.144 1 0.122 1 0.427 1 0.338 1 1.50 3 0.211 3 1.18 9 0.123 5 0.009 1 0.014 1 0.014 1 0.026 1 0.025 1 0.049 1 0.052 1 0.103 1 0.105 1 0.252 1 0.240 3 0.180 11 0.032 3 0,043 3 0.030 3 0.041 3 0.029 3 0.039 3 0,028 3 0.036 1 0.037 1 0.072 3 0.049 3 0.095 3 0.064 1 0.136 3 0.089 3 0.120 3 0.084 3 0.120 3 0.029 3 0,107 5 0,052 7
waiting point 2.20 3.61 3.11
42.6 10.4 24.2
3.40 2.23 0.156 0.167 0.072 0.057 0.029 0.046 0.083 0.211 0,176 0.500 0.423 1,48 1.17 1.73 0.244 0.454 0.085 0.030 0.049 0,049 0.091 0.088 0.170 0.180 0.357 0.364 0.874 0.278 0.056 0.037 0.050 0,035 0.048 0.034 0.045 0.032 0.123 0.127 0.084 0.057 0.110 0.221 0.157 0.103 0,139 0.097 0.139 0.091 0.074• 0.026•
• Probably depleted by neutron-induced fission,
A= 26S which we have used is given in Table VII,2 and is illustrated in Figs. V,2 and V,3. The path is complete except for a gap from A= 150 to A= 18S, in which region the empirical masses are so poorly known that there is no guide at all even to the trend of the capture track.
B. Calculation of r-Process Abundances
We now pass to the conclusion of our problem, namely, calculation of the relative abundances of the elements produced in the r process. This involves determination of AA=ilZ/ilA and Ttl at the waiting points. The capture path calculated from the criterion Q,(A,Z);=::Q. yielded nonintegral values of Z and A and thus a fairly smooth ilZ/ilA along the track which we used as a guide as discussed above. In the track we
594 BURBIDGE, BURBIDGE, FOWLER, AND HOYLE
have finally chosen in Table VII,2, and in the "actual" track, Z and A change by integral values, and so we have chosen to use the integral ~A listed in Table VII,2, jn calculating n(A). In Table VII,2 the various parameters needed in the abundance calculations are also listed.
The mean beta-decay lifetimes at the waiting points have been calculated from the Fermi expression
1 1()4 TfJ=-=--- sec,
xfJ Wi where W {J, measured in Mev, is the effective beta-decay energy at the waiting point. It includes the kinetic energy of the electron and neutrino and the rest-mass equivalent energy (O~S Mev) of the electron. The numerical constant has been determined by using an allowed transition log1oft value of 3.8S, where
if W fJ is measured in Mev, and t= 0.693Tp is the betadecay half-life. The method described below for evaluating W fJ leads in general to an underestimate, so that our values of Tp could be too large by a factor of as much as 10. However, the relative values and thus the relative abundances should not be uncertain by such a large factor.
The determination of WfJ as a function of the waiting point charge, Z, and mass, A, is a matter of some complexity. The total kinetic energy, QfJ, available in the beta transition to the ground state of the daughter nucleus is calculable from the atomic mass expression given in Eq. (22) and becomes
QfJ=c2[M(A,Z,N)-M(A, Z+1, N.,...-1)].
Since the masses are atomic rather than nuclear, no allowance need be made for the beta-electron mass. We thus have,
dg df QfJ=BA(ZA-Z-O.S)+---. (2S)
dZ dN
In this expression dgjdZ and df/dN explicitly appear. However, since they appear as a difference their influence on Q11 cannot be. too great. Except at shell numbers, g and f increase with Z and N, respectively. If g and f were linear in Z and N with the same coefficient, then dg/dZ-djjdN would be zero. Actually, g and fare approximately quadratiC in: the nuclear excess over magic-number values. Since there is a neutron excess in negative beta decay, in general djjdN>dgjdZ and ZA and BA are usually smaller than the values calculated from the smooth formula. ZA changes discontinuously at magic numbers, increasing after N magic and decreasing at Z magic. Actually, the residual effect of these terms can be taken into account by using just the
first term of Eq. (2S) for Q11 with local values for BA and ZA, particularly for ZA. Local values for ZA have been given by Coryell (CoS3) and we have used these values as tabulated in Table VII,2. ZA is not only a function of A but also of the shell in which Z and N fall. Coryell chose the smooth Weizsacker relation between local values of BA and ZA, namely BAZA~4fJ, but we have not found this to be sufficiently accurate for our purpose. Accordingly, we made an independent analysis in order to obtain the values of BA listed in Table VII,2. To do this we used Coryell's ZA at a given A and determined BA from the empirical QfJ differences calculable at a given A from the masses of Wapstra (WaSS) and Huizenga (RuSS). These values of BA are shown as a function of A in Fig. VII,2.
We thus have
QfJ= BA (ZA- Z-0.5),
where BA and ZA are now the "local" values for these quantities taking into account all deviations from the Weizsacker mass law except odd:..even effects, which must be treated separately, as discussed below, for nuclei with odd A and even A. It is emphasized that z A must be chosen to correspond to the shells in which Z and N lie.
The beta-ray transition to the ground state of the daughter nucleus will rarely be allowed. Allowed transitions occur to excited states of the daughter nucleus having spins differing by zero or unity from those of the parent ground state and having the same parity. Of these allowed transitions perhaps one is favored by a large matrix element indicating considerable similarity in the initial and final states as to spin, isobaric spin, and orbital characteristics. The excitation of this favored state will in general be lower at larger A, since the level density increases with A. It can be argued that the amount of excitation ought to be proportional to, and of the order of magnitude of, the isobaric parameter BA. We have arbitrarily chosen 2BA as the excitation energy of the excited state to which the beta transition effectively occurs. With this choice, the relative heights of the abundance peaks at N =SO, 82, and 126 are approximately reproduced as indicated by a comparison of the columns giving n(obs) and n(calc) in Table VII,l. The choice of 2BA probably errs on the high side, so that our estimates for W 13 may be somewhat low.
We can now write down W fJ as soon as pairing energy or odd-even terms are clarified. If 5A is used to designate the pairing energy term, and if odd A nuclei are taken as arbitrary standards for which no pairing correction is made, then for the mass of the ground states of even A, even Z, even N nuclei we must subtract oA/2, and for even A, odd Z, odd N nuclei we must add OA/2. Our waiting nuclei all have even N, so that for odd A no correction is necessary and for even A we must subtract oA/2. On the other hand, the special symmetry properties of the ground states of nuclei insofar as pairing
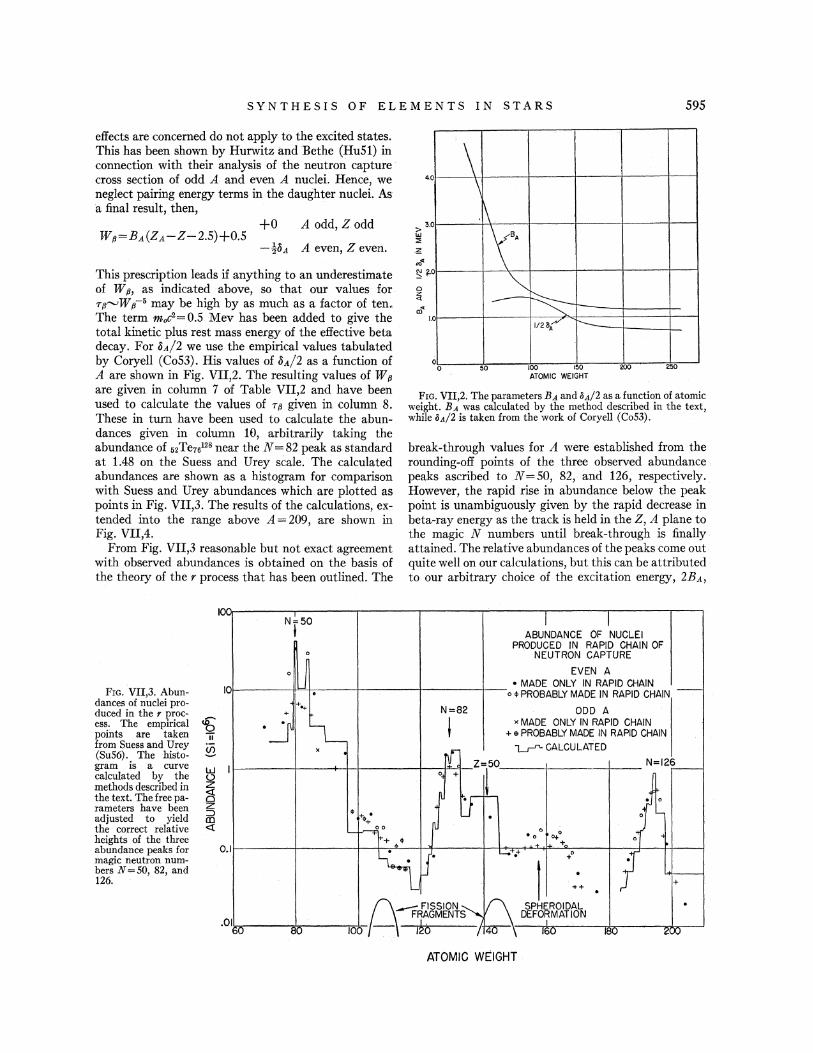
SYNTHESIS OF ELEMENTS IN STARS 595
effects are concerned do not apply to the excited states. This has been shown by Hurwitz and Bethe (Hu51) in connection with their analysis of the neutron capture cross section of odd A and even A nuclei. Hence, we 4.o
\ \ neglect pairing energy terms in the daughter nuclei. As
a final result, then,
Wfl=BA(ZA-Z-2.5)+0.5 +O A odd, Z odd
-!<5A A even, Z even.
This prescription leads if anything to an underestimate of W fl• as indicated above, so that our values for Tfl,....._,wfl-• may be high by as much as a factor of ten. The term mo&= 0.5 Mev has been added to give the total kinetic plus rest mass energy of the effective beta decay. For !5A/2 we use the empirical values tabulated by Coryell (Co53). His values of !5A/2 as a function of A are shown in Fig. VII,2. The resulting values of W fJ
are given in column 7 of Table VII,2 and have been used to calculate the values of Tfl given in column 8. These in turn have been used to calculate the abundances given in column 10, arbitrarily taking the abundance of 62 Te16128 near the N = 82 peak as standard at 1.48 on the Suess and Urey scale. The calculated abundances are shown as a histogram for comparison with Suess and Urey abundances which are plotted as points in Fig. VII,3. The results of the calculations, extended into the range above A= 209, are shown in Fig. VII,4.
From Fig. VII,3 reasonable but not exact agreement with observed abundances is obtained on the basis of the theory of the r process that has been outlined. The
"·
> 3.
~ 0
.\
y· .0
"" ~ --.0
1/28_./ r--
.;;:;
0 0 50 100 150 200 250
ATOMIC WEIGHT
FIG. VII,2. The parameters BA and oA/2 as a function of atomic weight. B A was calculated by the method described in the text, while oA/2 is taken from the work of Coryell (Co53). ·
break-through values for A were established from the rounding-off points of the three observed abundance peaks ascribed to N=SO, 82, and 126, respectively. However, the rapid rise in abundance below the peak point is unambiguously given by the rapid decrease in beta-ray energy as the track is held in the Z, A plane to the magic N numbers until break-through is finally attained. The relative abundances of the peaks come out quite well on our calculations, but this can be attributed to our arbitrary choice of the excitation energy, 2BA,
I I ABUNDANCE OF NUCLEI
PRODUCED IN RAPID CHAIN OF o NEUTRON CAPTURE
o J EVEN A • MADE ONLY IN RAPID CHAIN
FrG. VII,3. Abun- 101------11-'="-+-=-.-----t--~--t-----+--o ~PROBABLY MADE IN RAPID CHAIN -dances of nuclei pro- ..... duced in the r proc- + N=82 ODD A ess. The empirical ~ •• _] I x MADE ONLY IN RAPID CHAIN points are taken 11 t + e PROBABLY MADE IN RAPID CHAIN from Suess and Urey rf: 1....r-"" CALCULATED (Su56). The histo... ~ x
gram is a curve li------+---+-+-t-----t--t"-:'I-Z=50 ___ +-----+-- N=l2~ calculated by the t;l 0 + I methods described in 2~0 t the text. The free pa- J U ...__,• rameters have been adjusted to yield ffi • ~ .. • the correct relative <! ~rl.o+ . heights of the three I r· T
• 0 0 0+0
+ abundance peaks for 0.1 ~lt ~.-:. .. ,+ magic neutron num- • • • I +
0 .. ·.. • hers N <=50, 82, and
126.
A-r:t,;&~k~~s---... (\ oWF~~~~PJfrb~ '016J..,5o..-----.~-;ao~--~=oo:~«- 1~0 1 40 \ 16u tao
ATOMIC WEIGHT
l I +
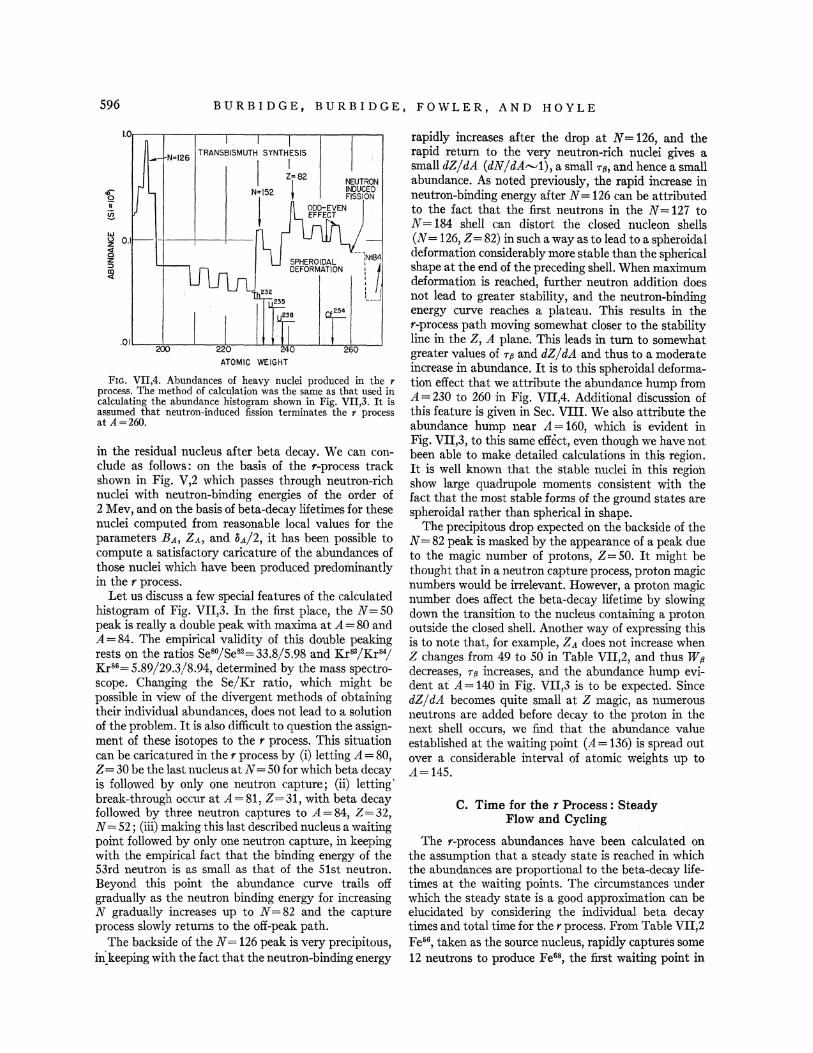
596 BURBIDGE, BURBIDGE, FOWLER, AND HOYLE
~ II
!e
w 0 0.1 z <t 0 z ::> ID <
TRANSBISMUTH SYNTHESIS
1 ~=82 N=l52 l t
ATOMIC WEIGHT
NEUTRON INDUCED FISSION
FIG. VII,4. Abundances of heavy nuclei produced in the 1· process. The method of calculation was the same as that used in calculating the abundance histogram shown in Fig. VII,3. It is assumed that neutron-induced fission terminates the r process at A =260.
in the residual nucleus after beta decay. We can conclude as follows: on the basis of the r-process track shown in Fig. V,2 which passes through neutron-rich nuclei with neutron-binding energies of the order of 2 Mev, and on the basis of beta-decay lifetimes for these nuclei computed from reasonable local values for the parameters BA, ZA, and oA/2, it has been possible to compute a satisfactory caricature of the abundances of those nuclei which have been produced predominantly in the r process.
Let us discuss a few special features of the calculated histogram of Fig. VII,3. In the first place, the N =50 peak is really a double peak with maxima at A= 80 and A= 84. The empirical validity of this double peaking rests on the ratios Se80/Se82= 33.8/5.98 and Kr83/Kr84/
Kr86 = 5.89/29.3/8.94, determined by the mass spectroscope. Changing the Se/Kr ratio, which might be possible in view of the divergent methods of obtaining their individual abundances, does not lead to a solution of the problem. It is also difficult to question the assignment of these isotopes to the r process. This situation can be caricatured in the r process by (i) letting A= 80, Z = 30 be the last nucleus at N =50 for which beta decay is followed by only one neutron capture; (ii) letting' break-through occur at A=81, Z=31, with beta decay followed by three neutron captures to A= 84, Z = 32, N =52; (iii) making this last described nucleus a waiting point followed by only one neutron capture, in keeping with the empirical fact that the binding energy of the 53rd neutron is as small as that of the 51st neutron. Beyond this point the abundance curve trails off gradually as the neutron binding energy for increasing N gradually increases up to N = 82 and the capture process slowly returns to the off-peak path.
The backside of the N = 126 peak is very precipitous, in)eeping with the fact that the neutron-binding energy
rapidly increases after the drop at N = 126, and the rapid return to the very neutron-rich nuclei gives a small dZ/dA (dN/dA'"'-'1), a small Tff, and hence a small abundance. As noted previously, the rapid increase in neutron-binding energy after N = 126 can be attributed to the fact that the first neutrons in the N = 127 to N = 184 shell can distort the closed nucleon shells (N = 126, Z = 82) in such a way as to lead to a spheroidal deformation considerably more stable than the spherical shape at the end of the preceding shell. When maximum deformation is reached, further neutron addition does not lead to greater stability, and the neutron-binding energy curve reaches a plateau. This results in the r-process path moving somewhat closer to the stability line in the Z, A plane. This leads in turn to somewhat greater values of Tff and dZ/dA and thus to a moderate increase in abundance. It is to this spheroidal deformation effect that we attribute the abundance hump from A= 230 to 260 in Fig. VII,4. Additional discussion of this feature is given in Sec. VIII. We also attribute the abundance hump near A= 160, which is evident in Fig. VII,3, to this same effect, even though we have not been able to make detailed calculations in this region. It is well known that the stable nuclei in this region show large quadrupole moments consistent with the fact that the most stable forms of the ground states are spheroidal rather than spherical in shape.
The precipitous drop expected on the backside of the N = 82 peak is masked by the appearance of a peak due to the magic number of protons, Z=50. It might be thought that in a neutron capture process, proton magic numbers would be irrelevant. However, a proton magic number does affect the beta-decay lifetime by slowing down the transition to the nucleus containing a proton outside the closed shell. Another way of expressing this is to note that, for example, ZA does not increase when Z changes from 49 to 50 in Table VII,2, and thus W ff decreases, Tff increases, and the abundance hump evident at A= 140 in Fig. VII,3 is to be expected. Since dZjdA becomes quite small at Z magic, as numerous neutrons are added before decay to the proton in the next shell occurs, we find that the abundance value established at the waiting point (A= 136) is spread out over a considerable interval of atomic weights up to A= 145.
C. Time for the r Process : Steady Flow and Cycling
The r-process abundances have been calculated on the assumption that a steady state is reached in which the abundances are proportional to the beta-decay lifetimes at the waiting points. The circumstances under which the steady state is a good approximation can be elucidated by considering the individual beta decay times and total time for the r process. From Table VII,2 Fe56, taken as the source nucleus, rapidly captures some 12 neutrons to produce Fe68, the first waiting point in
SYNTHESIS OF ELEMENTS IN STARS 597
the "typical" capture path. Here Q,. is less than Q0
("-'3 Mev in this region) for the first time and beta decay occurs with a lifetime of ,...._,21 sec. This is longer than all the succeeding lifetimes and is in fact ,...._,25% of the total time for the r process. This latter quantity is just the sum of all the Tfl in Table VII,2, plus a rough estimate of 3 sec for the region A= 150 to 185, and is therefore ,...._,go sec. Mter passing Fe68, the material spends "-'40 sec in the N =50 (and 52) peak. Thus the long-lived "source" and first "sink" control the flow for a considerable period during which the heavier, shorter-lived products come into, and remain in equilibrium with, these h:>ng-lived predecessors. It is significant that the Fe68 lifetime plus the N =50 peak lifetime is long as compared with the 5 to 23 sec lifetimes of Mg22, Na21, etc., which control the production of the neutrons. It is also significant that the total time for the r process is comparable to the "'100-sec expansion and cooling time for the supernova envelope.
From the correspondence of the calculated abundances with those in the atomic abundance distribution, it would seem that this distribution was produced under conditions in which steady flow was just reached and maintained. Other conditions can pertain in different circumstances. The establishment of steady flow requires about 38 neutrons per capturing Fe56, since the average atomic weight in the distribution given in Fig. VII,3 is ~94. For fewer than 38 neutrons per Fe56,
the upper end of the abundance curve will not reach its full value. For a greater number of neutrons, as will certainly be the case in some supernovae, the abundances of high atomic weight will be enhanced over those illustrated in Fig. VII,3. This enhancement occurs over the entire region above A"-'110 because of cycling resulting from the neutron-induced fission process near A,...._,260.- For asymmetric fission, one-half of the flow is returned near A,...._,110 and the full flow is maintained above A"-'150. Thus the abundances above A,..._.110 grow relative to those below ,...._,110, with a factor of two marking the growth above A,...._,150 relative to that for A"-'110 to 150. For a neutron to iron-group abundance ratio ~ 100, practically all of the original "seed" nuclei will be cycling in the region A,...._,UO to 260 and increasing in abundance with average atomic weight A~174. Under these circumstances the peaks at N = 82 and N = 126 have about the same abundances, since only one half of the material is returned to the N = 82 peak in the cycling. In Sec. XII we consider the case of enhanced production above Arv110 to be typical for certain supernovae.
D. Freezing of the r-Process Abundances
Implicit in our comparison of calculated abundances with those observed is the assumption that the unstable nuclei produced at mass number A in the r process subsequently decay only by beta decay to their stable isobars with the same mass number. This is indeed the
predominant final step in the synthesis of a stable nucleus by the r process as the temperature and neutron flux decrease and the r process abundances are "frozen in." In some cases beta decay can occur to a state of the residual nucleus in the final chain of beta decays which is so highly excited that it is unstable to neutron emission. This is similar to the delayed emission of neutrons following fission. Since this mode of decay is not the main one, we have neglected it in our calculations. We note here, however, that delayed neutron emission occurs for even-even nuclei, since the depression of their ground states results in the availability of higher excited states when they are produced. Thus, this process favors odd A production over even A, since some even A mass chains switch to odd by delayed neutron emission. This point tends to compensate for the fact that even A abm:i.dances are somewhat greater than odd A abundances before the freezing occurs.
Smart (Sm48, Sm49) suggested, in connection with primordial synthesis of the elements, that ('Y,n) reactions compete with negative beta decay in the freezing after a rapid neutron capture process. In this way the shielded isobars could be produced. In stellar synthesis the shielded isobars are produced separately in a second process which we have labeled the s process and which we suggest has occurred during the giant stage of stellar evolution. It is our belief that ('Y,n) reactions subsequent to the r process, primordially or in supernovae, cannot have produced the shielded isobar abundances found in the atomic abundance curve.
It has been noted in Sec. VI that the barium isotope ratios and absolute abundances are consistent with pand s-process production. Let us now consider the difficulties arising in an attempt to explain the observed barium abundances, for example, on the basis of ('Y,n) reactions in the freezing of the r process. In the first place the possibility can be considered that the neutron flux suddenly ceases while the temperature is still high and that ('Y,n) reactions rather than negative beta decays return the material to the stability line. This would require the ejection of some 10 to 30 neutrons per product nucleus and would obviously be selfdefeating in that it would almost restore the original neutron flux. Furthermore it would invalidate the explanation for the r-process peak abundances given in this section and would require double abundance humps to have been produced in the r-process path near Arv100, 140, and 200, for which there are no known reasons.
A more reasonable possibility is that suggested by Smart; after the original very fast beta decays bring the nuclei close to the stability ~ine, the beta lifetimes become long and the ('Y,n) process competes in the final adjustments. Thus in the case of barium, material produced at A just greater than 138 might stop, after fast beta decay, in the long-lived unstable barium isotopes 5oBae3139 (85 min), 56Bae4140 (12.8 days), and 56Bae5141
(18 min). Then ('Y,n) processes would scour out the
598 BURBIDGE, BURBIDGE, FOWLER, AND HOYLE
loosely bound 85th, 84th, and 83rd neutrons and pile up the material in 66Ba82138 with its tightly bound 82nd neutron. Some leakage to the lighter isotopes could occur and a general tailing off in abundance from 66Bas2138 to 66Ba1i30 would be expected. This is indeed found with the important exception that o&Ba74130 is even slightly more abundant than 6aBa1a132, which is not to be expected at all. Furthermore, if the ('Y,n) process does occur at barium, why does it not occur for xenon? On the basis of this process one would expect magic 5~e82136 to be the most abundant of the xenon isotopes, with a tailing off to 6~e7o124• This is not found to be the case. 6~e78132 is the most abundant isotope of xenon and · is 2 to 3 times as abundant as o4Xeso134 and 6~e82136 . On the other hand, this is just what is to be expected if it is supposed that the s and r processes are operating separately. 5~e78132 is the heaviest stable isotope of xenon which can be produced in the s process, and presumably it has the smallest (n,'Y) cross section. 64Xe8o134 and 5~e82136 are made only in the r process, and they are low in abundance in keeping with the general ratio of the r-process abundances to the s-process abundances in this region.
Returning to the case of barium, we must finally emphasize that in the Suess and Urey distribution Ba138 is very abundant compared to its neighbors. If it were made by ('Y,n) reactions following the r process, this would require an abundance peak in the primary path at A just greater than 138, for which no explanation can be given in terms of known "magic" properties. On the other hand its great production in the s process is understood in terms of its own magic properties.
VIII. EXTENSION AND TERMINATION OF THE r PROCESS AND s PROCESS
A. Synthesis of the Naturally Radioactive Elements
Because of its long time-scale and because it builds through the beta-stable nuclei, the s process is incapable of producing the naturally radioactive elements beyond bismuth. Bismuth (Z = 83) is the heaviest of the elements with an isotope which does not decay by electron emission, alpha-particle emission, or fission. As is discussed in detail later, the short-lived alpha-emitting isotopes of polonium, which are produced after bismuth, terminate the s process by cycling its products back to lead.
On the other hand, just because of its short time-scale and because it builds through charge-poor, neutron-rich nuclei, the r process can produce transbismuth elements. These proton-poor nuclei are relatively more stable to alpha emission and fission than their stable isobars at a given A.
A convincing experimental demonstration of this was givenby the production of Cf254 and other nuclei in the November, 1952, thermonuclear hydrogen bomb test at Bikini, as reported by Fields et al. (Fi56). These
nuclei were synthesized by the instantaneous irradiation of U238 by an intense neutron flux. The successive addition of neutrons to U238 built U264 and other neutronrich uranium isotopes. Mter the explosion, the U264
decayed rapidly to beta-stable C£264• The C£254 was detected in the test debris through its spontaneous decay by the fission process. The energy release in the spontaneous fission is 220 Mev per decay, which is very large compared to the energy emitted in alpha decay (,...._,5 Mev) or beta decay (,...._,1 Mev). Fields et al. reported the half-life of C£254 as 55 days. More recent measurements by Thompson and Ghiorso (Th57) yield a preliminary value of 61 days while Huizenga and Diamond (Hu57) have recently obtained a value of 56.2±0.7 days.§ The Cf254 is unique in that it is the only betastable nucleus which decays predominantly by spontaneous fission with a half-life between a few days and 1Q4 years.
The authors and their collaborators (Bu56, Ba56) have associated the r process astrophysically with the explosion of supernovae of Type I. A characteristic feature of supernovae of Type I is that after an initial period of 5o-100 days the light curve exhibits an exponential decline corresponding to about 0.0137 magnitudes daily or a half-life of 55 days. The uncertainties in this half-life are discussed in Sec. XII. The close correspondence between this value and that for Cf254 suggested that Cf254 was produced in the supernova explosion along with the other products of the r process. Because of its large energy' release per decay it was supposed in this earlier work that the C£264 would dominate the radioactive energy input into the supernova debris for the order of a year after the original outburst. In the following part of this section we discuss the radioactive decay of the r-process products which give the radioactive energy input for Type I supernovae. The connection between the energy input and the light curve for Type I supernovae is discussed in Sec. XII. The source of the great flux of neutrons required in supernovae has been discussed in Sec. III.
B. Extension and Termination of the r Process
(1) Radioactive Energy Input in Type I Supernovae
Certain of the calculations necessary for computing the radioactive energy release by r-process products have been made by Schuman (Sc57a). He has analyzed the mode of decay and calculated the total decay energy for the longest-lived neutron-rich nuclei produced in each mass chain where the r process extends beyond the stable nuclei (A>209). His results, modified by new data, are incorporated in Table VIII.l. The total decay
§The calculations which are described in this section have all been made using a half-life of C:£264 of 61 days, since the authors were not aware of the work of Huizenga and Diamond when they were made. Clearly, the value obtained by them is in better agreement with the original result of Baade for the half-life of the light curve of the supernova in IC 4182.
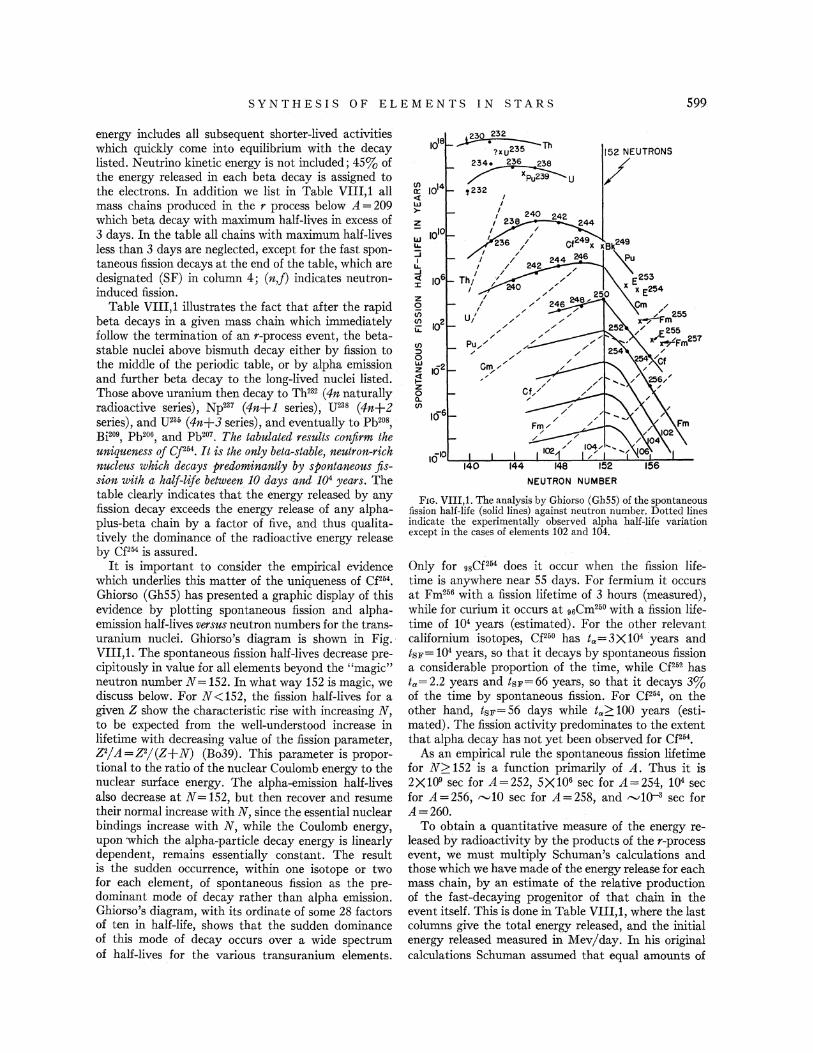
SYNTHESIS OF ELEMENTS IN STARS 599
energy includes all subsequent shorter-lived activities which quickly come into equilibrium with the decay listed. Neutrino kinetic energy is not included; 45% of the energy released in each beta decay is assigned to the electrons. In addition we list in Table VIII,1 all mass chains produced in the r process below A = 209 which beta decay with maximum half-lives in excess of 3 days. In the table all chains with maximum half-lives less than 3 days are neglected, except for the fast spontaneous fission decays at the end of the table, which are designated (SF) in column 4; (n,f) indicates neutroninduced fission.
Table VIII,1 illustrates the fact that after the rapid beta decays in a given mass chain which immediately follow the termination of an r-process event, the betastable nuclei above bismuth decay either by fission to the middle of the periodic table, or by alpha emission and further beta decay to the long-lived nuclei listed. Those above uranium then decay to Th232 (4n naturally radioactive series), Np237 (4n+l series), U238 (4n+Z series), and U236 (4n+3 series), and eventually to Pb208,
Bi209, Pb206, and Pb207• The tabUlated results confirm the uniqueness of Cf264• It is the only beta-stable, neutron-rich nucleus which decays predominantly by spontaneous fission with a half-life between 10 days and 104 years. The table clearly indicates that the energy released by any fission decay exceeds the energy release of any alphaplus-beta chain by a factor of five, and thus qualitatively the dominance of the radioactive energy release by Cf264 is assured.
It is important to consider the empirical evidence which underlies this matter of the uniqueness of Cf264•
Ghiorso (GhSS) has presented a graphic display of this evidence by plotting spontaneous fission and alphaemission half-lives versus neutron numbers for the transuranium nuclei. Ghiorso's diagram is shown in Fig. · VIII,LThe spontaneous fission half-lives decrease precipitously in value for all elements beyond the "magic" neutron number N = 152. In what way 152 is magic, we discuss below. For N < 152, the fission half-lives for a given Z show the characteristic rise with increasing N, to be expected from the well-understood increase in lifetime with decreasing value of the fission parameter, Z2/A=Z2/(Z+N) (Bo39). This parameter is proportional to the ratio of the nuclear Coulomb energy to the nuclear surface energy. The alpha-emission half-lives also decrease at N = 152, but then recover and resume their normal increase with N, since the essential nuclear bindings increase with N, while the Coulomb energy, upon which the alpha-particle decay energy is linearly dependent, remains essentially constant. The result is the sudden occurrence, within one isotope or two for each element, of spontaneous fission as the predominant mode of decay rather than alpha emission. Ghiorso's diagram, with its ordinate of some 28 factors of ten in half-life, shows that the sudden dominance of this mode of decay occurs over a wide spectrum of half-lives for the various transuranium elements.
(/) 0: <( IIJ >-
~ 1&.1 II. ::J I
II.
<l J::
z Q (/) (/)
ii:
(/)
g z ~ z 0 IL (/)
~Th ?xu235 152 NEUTRONS
234• 236 238
~u / t232
NEUTRON NUMBER
FIG. VIII,L The analysis by Ghiorso (Gh55) of the spontaneous fission half-life (solid lines) against neutron number. Dotted lines indicate the experimentally observed alpha half-life variation except in the cases of elements 102 and 104.
Only for g8Cf264 does it occur when the fission lifetime is anywhere near 55 days. For fermium it occurs at Fm256 with a fission lifetime of 3 hours (measured), while for curium it occurs at 9sCm260 with a fission lifetime of 1Q4 years (estimated). For the other relevant californium isotopes, Cf2°0 has ta=3X1Q4 years and tsF= 104 years, so that it decays by spontaneous fission a considerable proportion of the time, while Cf262 has ta=2.2 years and tsF=66 years, so that it decays 3% of the time by spontaneous fission. For Cf264, on the other hand, tsF= 56 days while ta'?:.100 years (estimated). The fission activity predominates to the extent that alpha decay has not yet been observed for C£264•
As an empirical rule the spontaneous fission lifetime for N'?:.152 is a function primarily of A. Thus it is 2X1Q9 sec for A=252, 5X10⁶ sec for A=254, 104 sec for A=256, "'10 sec for A=258, and rvlQ--'J sec for A=260.
To obtain a quantitative measure of the energy released by radioactivity by the products of the r-process event, we must multiply Schuman's calculations and those which we have made of the energy release for each mass chain, by an estimate of the relative production of the fast-decaying progenitor of that chain in the event itself. This is done in Table VIII,1, where the last columns give the total energy released, and the initial energy released measured in Mev/day. In his original calculations Schuman assumed that equal amounts of
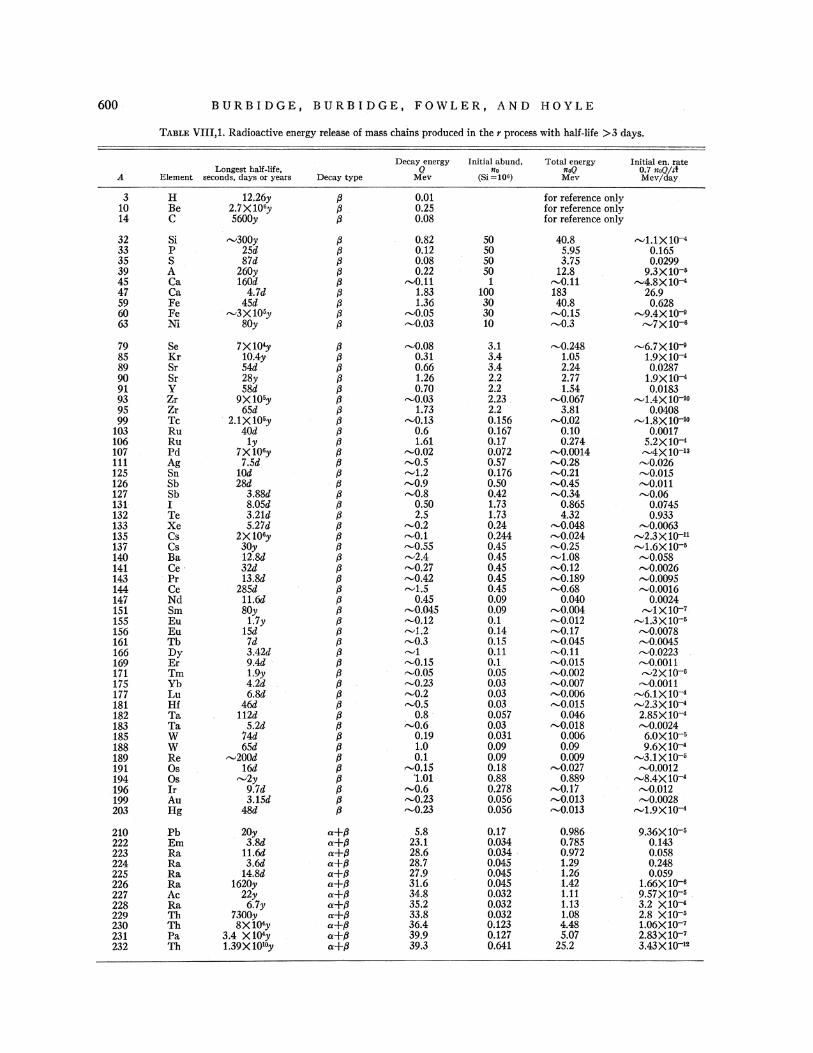
600 BURBIDGE, BURBIDGE, FOWLER, AND HOYLE
TABLE VIII,l. Radioactive energy release of mass chains produced in the r process with half-life >3 days.
Decay energy Initial abund. Total energy Initial en. rate Longest half-life, Q no noQ 0.7 noo/att
A Element seconds, days or years Decay type Mev (Si=10') Mev Mev/ ay
3 H 12.26y fJ O.Ql for reference only 10 Be 2.7X10⁶y fJ. 0.25 for reference only 14 c 5600y {J o.os for reference only
32 Si "'300y fJ O.S2 so 40.S "'1.1X 10⁻⁴ 33 p 2Sd fJ 0.12 so 5.95 0.165 35 s S7d {J 0.08 so 3.75 0.0299 39 A 260y fJ 0.22 so 12.8 9.3X10-~~ 45 Ca 160d {J rv0.11 1 "'0.11 "'4.SX10""4
47 Ca 4.7d {J 1.83 100 183 26.9 59 Fe 45d fJ 1.36 30 40.8 0.62S 60 Fe "-'3X10⁶y {J ......,0.05 30 ......,0.15 "-'9.4X 1Q-9 63 Ni SOy {J ......,0.03 10 ......,0.3 rv7X1o--6
79 Se 7X10⁴y fJ ......,0.08 3.1 rv0.248 "-'6. 7 X 1Q-9 85 Kr 10.4y fJ 0.31 3.4 1.05 1.9X10⁻⁴ S9 Sr 54d fJ 0.66 3.4 2.24 0.02S7 90 Sr 2Sy fJ 1.26 2.2 2.77 1.9X10⁻⁴ 91 y 58d fJ 0.70 2.2 1.54 0.0183 93 Zr 9X10⁵y {J "'0.03 2.23 ......,0.067 "'1.4X to--lo 95 Zr 6Sd {J 1.73 2.2 3.S1 0.0408 99 Tc · 2.1X105y fJ "'0.13 0.156 "'0.02 "'l.SX to--lo
103 Ru 40d {J 0.6 0.167 0.10 0.0017 106 Ru 1y fJ 1.61 0.17 0.274 5.2X10⁻⁴ 107 Pd 7X10⁶y {J ......,0.02 0.072 ......,0.0014 "-'4X to--la 111 Ag 7.5d fJ "'0.5 0.57 ....... 0.28 "-'0.026 125 Sn 10d fJ "-'1.2 0.176 ....... 0.21 ......,0.015 126 Sb 2Sd fJ ......,0.9 0.50 "'0.45 "-'0.011 127 Sb 3.S8d fJ ......,O.S 0.42 ....... 0.34 ......,0.06 131 I S.05d {J 0.50 1.73 O.S65 0.0745 132 Te 3.21d {J 2.5 1.73 4.32 0.933 133 Xe 5.27d fJ ......,0.2 0.24 ......,0.048 ......,0.0063 135 Cs 2X10⁶y fJ ......,0,1 0.244 rv0,024 rv2,3 X 1o--11 137 Cs 30y {J ......,0.55 0.45 ......,0.25 rv1.6X lo--5 140 Ba l2.8d fJ "'2.4 0.45 "-'1.08 ......,0.05S 141 Ce· 32d {J ,...;0.27 0.45 ......,0.12 ......,0.0026 143 Pr 13.8d {J ......,0.42 0.45 ....... 0.189 rv0.0095 144 Ce 285d {J "-'1.5 0.45 ......,0.68 "'0.0016 147 Nd 11.6d {J 0.45 0.09 0.040 0.0024 151 Sm SOy {J ......,0.045 0.09 ......,0.004 ......,lXto--7 155 Eu 1.7y {J "'0.12 0.1 rv0.012 "'1.3X to--6
156 Eu 1Sd fJ "-'1.2 0.14 ......,0.17 ......,0,0078 161 Tb 7d fJ ......,0,3 0.15 ......,0.045 ......,0.0045 166 Dy 3.42d fJ "-'1 0.11 ......,0,11 "-'0.0223 169 Er 9.4d fJ "-'0.15 0.1 ....... 0.015 ....... o.oou 171 Tm 1.9y fJ ......,0.05 0.05 ......,0.002 "'2Xto--6 175 Yb 4.2d {J "-'0,23 0.03 ......,0.007 ......,0,0011 177 Lu 6.8d fJ ....... o.2 0.03 ....... 0.006 "-'6.1X 10⁻⁴ 181 Hf 46d {J ......,0,5 0.03 ......,0.015 "'2.3X10⁻⁴ 182 Ta 112d {J 0.8 0.057 0.046 2.S5X10-4 183 Ta 5.2d {J "-'0.6 0.03 "-'0.01S ......,0.0024 185 w 74d {J 0.19 0.031 0.006 6.0X1o--5
1SS w 6Sd {J 1.0 0.09 0.09 9.6X10⁻⁴ 189 Re "-'200d {J 0.1 0.09 0.009 "-'3.1X1o--11
191 Os 16d {J ......,0.15 0.18 "-'0.027 ....... 0.0012 194 Os "-'2y {J '1.01 O.S8 0.889 "'S.4X 10-4 196 lr 9.7d {J ......,0,6 0.278 "-'0.17 "-'0.012 199 Au 3.1Sd {J ......,0,23 0.056 ......,0,013 ......,0.002S 203 Hg 48d {J "-'0,23 0.056 "-'0.013 rv1.9X lQ-4
210 Pb 20y a+fJ 5.8 0.17 0.9S6 9.36X1o--6
222 Em . 3.8d a+fJ 23.1 0.034 0.7S5 0.143 223 Ra 11.6d a+fJ 28.6 0.034 0.972 0.05S 224 Ra 3.6d a+fJ 2S.7 0.045 1.29 0.248 225 Ra 14.8d a+fJ 27.9 0.045 1.26 0.059 226 Ra 1620y a+fJ 31.6 0.045 1.42 1.66X1Q-6 227 Ac 22y a+fJ 34.8 0.032 1.11 9.57Xto--6
22S Ra 6.7y a+fJ 35.2 0.032 1.13 3.2 X10⁻⁴ 229 Th 7300y a+fJ 33.S 0.032 LOS 2.s xto--• 230 Th SX1Q4y a+fJ 36.4 0.123 4.48 1.06Xto--7
231 Pa 3.4 Xl04y a+fJ 39.9 0.127 5.07 2.83X1o--7 232 Th 1.39X10¹⁰y a+fJ 39.3 0.641 25.2 3.43 X to--12
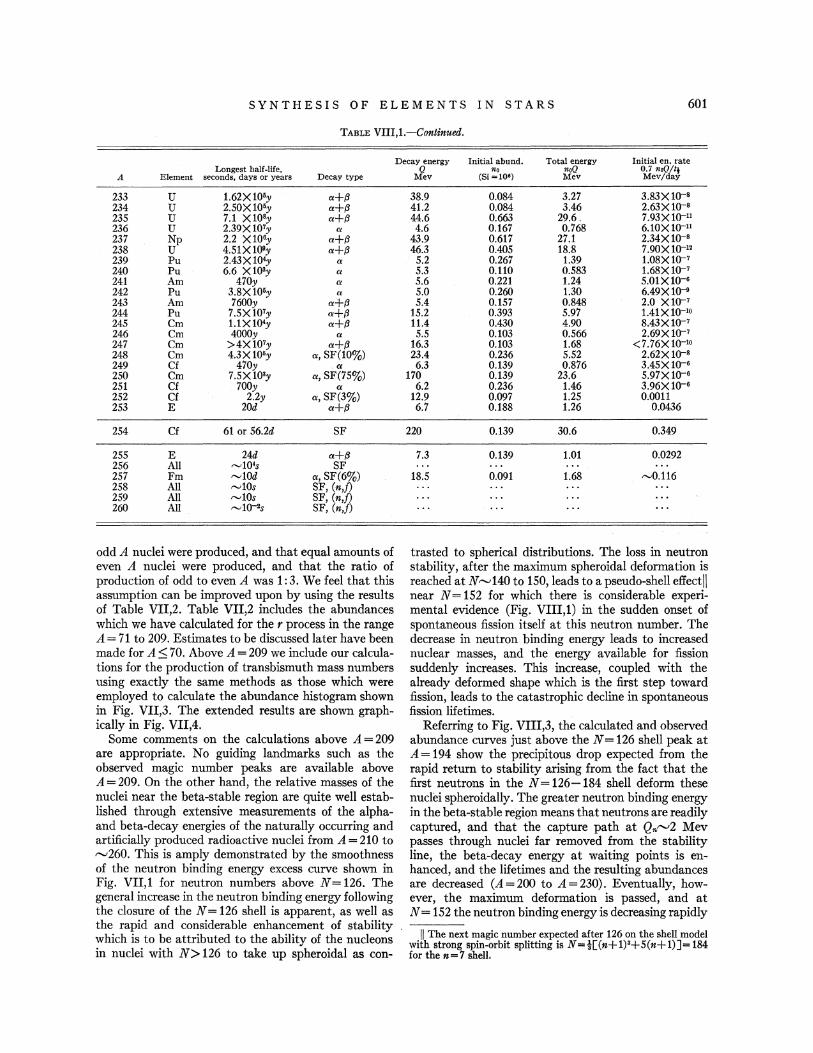
SYNTHESIS OF ELEMENTS IN STARS 601
TABLE VIII,l.-Continued.
Longest half-life, A Element seconds, days or years Decay type
233 u 1.62X10⁶y a+J3 234 u 2.50X10•y a+i3 235 u 7.1 X10⁸y a+i3 236 u 2.39X10⁷y a 237 Np 2.2 X10⁶y a+# 238 u 4.51X10⁹y a+# 239 Pu 2.43X 10⁴y a 240 Pu 6.6 X10³y a 241 Am 470y a 242 Pu 3.8X10⁵y a 243 Am 7600y a+i3 244 Pu 7.5X 10⁷y a+# 245 Cm 1.1X 1Q4y a+# 246 Cm 4000y a 247 Cm >4X10⁷y a+P 248 Cm 4.3X10⁶y a, SF(10%) 249 Cf 470y a 250 Cm 7.5X10³y a, SF(75%) 251 Cf 700y a 252 Cf 2.2y a, SF(3%) 253 E 20d a+J3
254 Cf 61 or 56.2d SF
255 E 24d a+i3 256 All ~104s SF 257 Fm ~10d a, SF(6%) 258 All ~10s SF, (n,f) 259 All ~tos SF, (n,j) 260 All ~10--2s SF, (n,f)
odd A nuclei were produced, and that equal amounts of even A nuclei were produced, and that the ratio of production of odd to even A was 1:3. We feel that this assumption can be improved upon by using the results of Table VII,2. Table VII,2 includes the abundances which we have calculated for the r process in the range A= 71 to 209. Estimates to be discussed later have been made for A.::; 70. Above A= 209 we include our calculations for the production of transbismuth mass numbers using exactly the same methods as those which were employed to calculate the abundance histogram shown in Fig. VII,3. The extended results are shown graphically in Fig. VII,4.
Some comments on the calculations above A= 209 are appropriate. No guiding landmarks such as the observed magic number peaks are available above A= 209. On the other hand, the relative masses of the nuclei near the beta-stable region are quite well established through extensive measurements of the alphaand beta-decay energies of the naturally occurring and artificially produced radioactive nuclei from A= 210 to "-'260. This is amply demonstrated by the smoothness of the neutron binding energy excess curve shown in Fig. VII,1 for neutron numbers above N = 126. The general increase in the neutron binding energy following the closure of the N = 126 shell is apparent, as well as the rapid and considerable enhancement of stability which is to be attributed to the ability of the nucleons in nuclei with N> 126 to take up spheroidal as con-
Decay energy Initial abund. Total energy Initial en. rate Q no noQ 0.7 noQ/ti
Mev (Si=lO') Mev Mev/day
38.9 0.084 3.27 3.83X 10--s 41.2 0.084 3.46 2.63X1Q--8
44.6 0.663 29.6. 7.93X 1Q--11
4.6 0.167 0.768 6.10 X 10--11
43.9 0.617 27.1 2.34X10--s 46.3 0.405 18.8 7.90X 1Q--12
5.2 0.267 1.39 1.08X10--7
5.3 0.110 0.583 1.68X10--7
5.6 0.221 1.24 5.o1X10--6
5.0 0.260 1.30 6.49X10--9
5.4 0.157 0.848 2.0 X 1Q--7
15.2 0.393 5.97 1.41X 10--10
11.4 0.430 4.90 8.43X 1Q--7
5.5 0.103 0.566 2.69X 10--7
16.3 0.103 1.68 <7.76X10--10
23.4 0.236 5.52 2.62X 10--s 6.3 0.139 0.876 3.45X 10--s
170 0.139 23.6 5.97X10--6
6.2 0.236 1.46 3.96X 10--s 12.9 0.097 1.25 0.0011 6.7 0.188 1.26 0.0436
220 0.139 30.6 0.349
7.3 0.139 1.01 0.0292
18.5 0.091 1.68 ~0.116
trasted to spherical distributions. The loss in neutron stability, after the maximum spheroidal deformation is reached at N"-'140 to 150, leads to a pseudo-shell effect II near N = 152 for which there is considerable experimental evidence (Fig. VIII,l) in the sudden onset of spontaneous fission itself at this neutron number. The decrease in neutron binding energy leads to increased nuclear masses, and the energy available for fission suddenly increases. This increase, coupled with the already deformed shape which is the first step toward fission, leads to the catastrophic decline in spontaneous fission lifetimes.
Referring to Fig. VIII,3, the calculated and observed abundance curves just above the N = 126 shell peak at A= 194 show the precipitous drop expected from the rapid return to stability arising from the fact that the first neutrons in the N = 126-184 shell deform these nuclei spheroidally. The greater neutron binding energy in the beta-stable region means that neutrons are readily captured, and that the capture path at Qn"-'2 Mev passes through nuclei far removed from the stability line, the beta-decay energy at waiting points is enhanced, and the lifetimes and the resulting abundances are decreased (A= 200 to A= 230). Eventually, however, the maximum deformation is passed, and at N = 152 the neutron binding energy is decreasing rapidly
II The next magic number expected after 126 on the shell model with strong spin-orbit splitting is N=i[(n+1)3+5(n+1)]=184 for the n=7 shell.
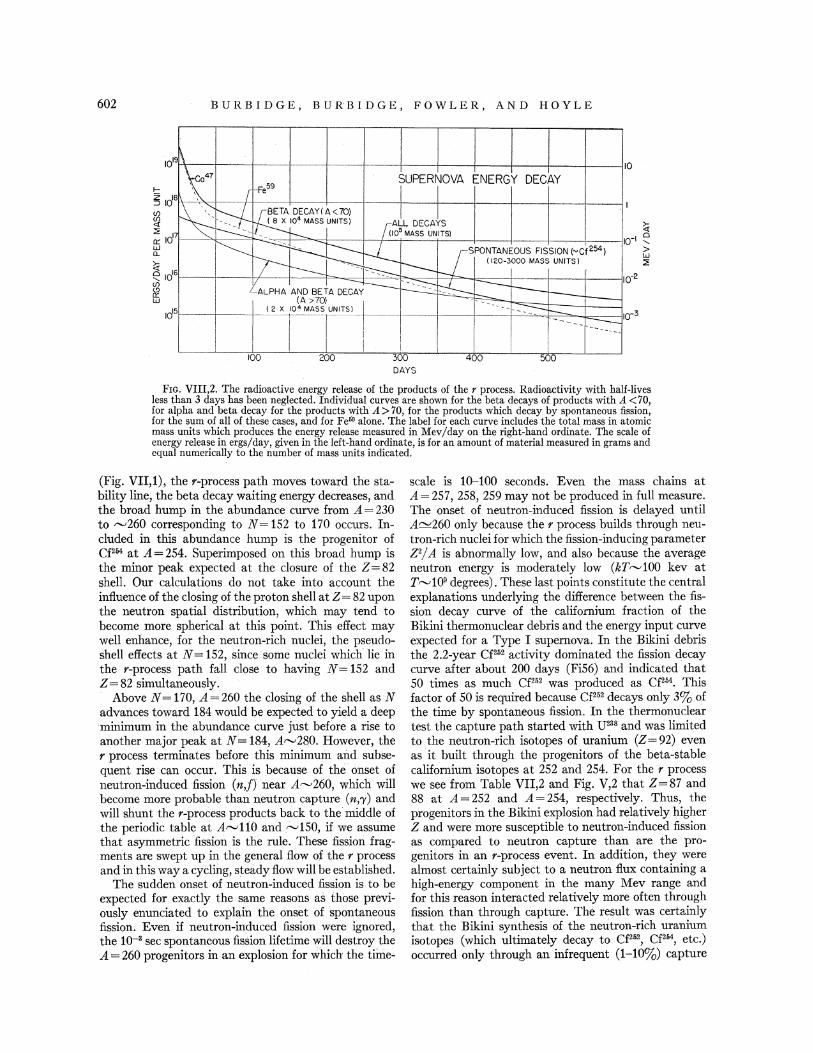
602 BURBIDGE, BURBIDGE, FOWLER, AND HOYLE
10 191\ I 0
'\47 IUPERIOVA ENERGY DECAY 18
rf-Fe59
I~ ~ ~ DECAY(A<70) {<~~1. DECJS 104 MASS UNITS)
-- t-- 05 MASS UNITS) I
~ ~~-----t-1-- u-SPONTANEOUS FISSION (~ct254)
11-t---~~ r-- ( 120-3000 MASS UNITS)
16 - -~ ~=..:::::::::::r--t--
I '-ALPHA AND BETA DECAY~----....____
(A >70) I -------- --:-:--::1--- -15 ( 2 X 10 4 MASS UNITS)
I I
----- -I --- ---
I I I
10
100 200 300 400 500 DAYS
FIG. VIII,2. The radioactive energy release of the products of the r process. Radioactivity with half-lives less than 3 days has been neglected. Individual curves are shown for the beta decays of products with A <70, for alpha and beta decay for the products with A> 70, for the products which decay by spontaneous fission, for the sum of all of these cases, and for Fe59 alone. The label for each curve includes the total mass in atomic mass units which produces the energy release measured in Mev/day on the right-hand ordinate. The scale of energy release in ergs/day, given in the left-hand ordinate, is for an amount of material measured in grams and equal numerically to the number of mass units indicated.
(Fig. VII,1), the r-process path moves toward the stability line, the beta decay waiting energy decreases, and the broad hump in the abundance curve from A= 230 to rv260 corresponding to N = 1S2 to 170 occurs. Included in this abundance hump is the progenitor of Cf254 at A= 2S4. Superimposed on this broad hump is the minor peak expected at the closure of the Z = 82 shell. Our calculations do not take into account the influence of the closing of the proton shell at Z= 82 upon the neutron spatial distribution, which may tend to become more spherical at this point. This effect may well enhance, for the neutron-rich nuclei, the pseudoshell effects at N = 1S2, since some nuclei which lie in the r-process path fall close to having N = 1S2 and Z=82 simultaneously. ·
Above N = 170, A= 260 the closing of the shell as N advances. toward 184 would be expected to yi«M a deep minimum in the abundance curve just before a rise to another major peak at N = 184, Arv280. However, the r process terminates before this minimum and subsequent rise can occur. This is because of the onset of neutron-induced fission (n,J) near Arv260, which will become more probable than neutron capture (n,-y) and will shunt the r-process products back to the middle of the periodic table at ArvllO and rv1SO, if we assume that f!,symmetric fission is the rule. These fission fragments are swept up in the general flow of the r process and in this way a cyclmg, steady flow will be established.
The sudden onset of neutron-induced fission is to be expected for exactly the same reasons as those previously enunciated to explain the onset of spontaneous fission. Even if neutron-induced fission were ignored, the lQ-3 sec spontaneous fission lifetime will destroy the A = 260 progenitors in an explosion for whieh the time-
scale is 1Q-100 seconds. Even the mass chains at A= 2S7, 2S8, 2S9 may not be produced in full measure. The onset of neutron-induced fission is delayed until A~260 only because the r process builds through neutron-rich nuclei for which the fission-inducing parameter Z2/ A is abnormally low, and also because the average neutron energy is moderately low (kTrv100 kev at Trv109 degrees). These last points constitute the central expla:p.ations underlying the difference between the fission decay curve of the californium fraction of the Bikini thermonuclear debris and the energy input curve expected for a Type I supernova. In the Bikini debris the 2.2-year C£252 activity dominated the fission decay curve after about 200 days (FiS6) and indicated that SO times as much Cf262 was produced as Cf254• This factor of SO is required because Cf262 decays only 3% of the time by spontaneous fission. In the thermonuclear test the capture path started with U238 and was limited to the neutron-rich isotopes of uranium (Z = 92) even as it built through the progenitors of the beta-stable californium isotopes at 2S2 and 2S4. For the r process we see from Table VII,2 and Fig. V,2 that Z=87 and 88 at A=2S2 and A=254, respectively. Thus, the progenitors in the Bikini explosion had relatively higher Z and were more susceptible to neutron-induced fission as compared to neutron capture than are the progenitors in an r-process event. In addition, they were almost certainly subject to a neutron flux containing a high-energy component in the many Mev range and for this reason interacted relatively more often through fission than through capture. The result was certainly that the Bikini synthesis of the neutron-rich uranium isotopes (which ultimately decay to C£262, Cf264, etc.) occurred only through an infrequent (1-10%) capture
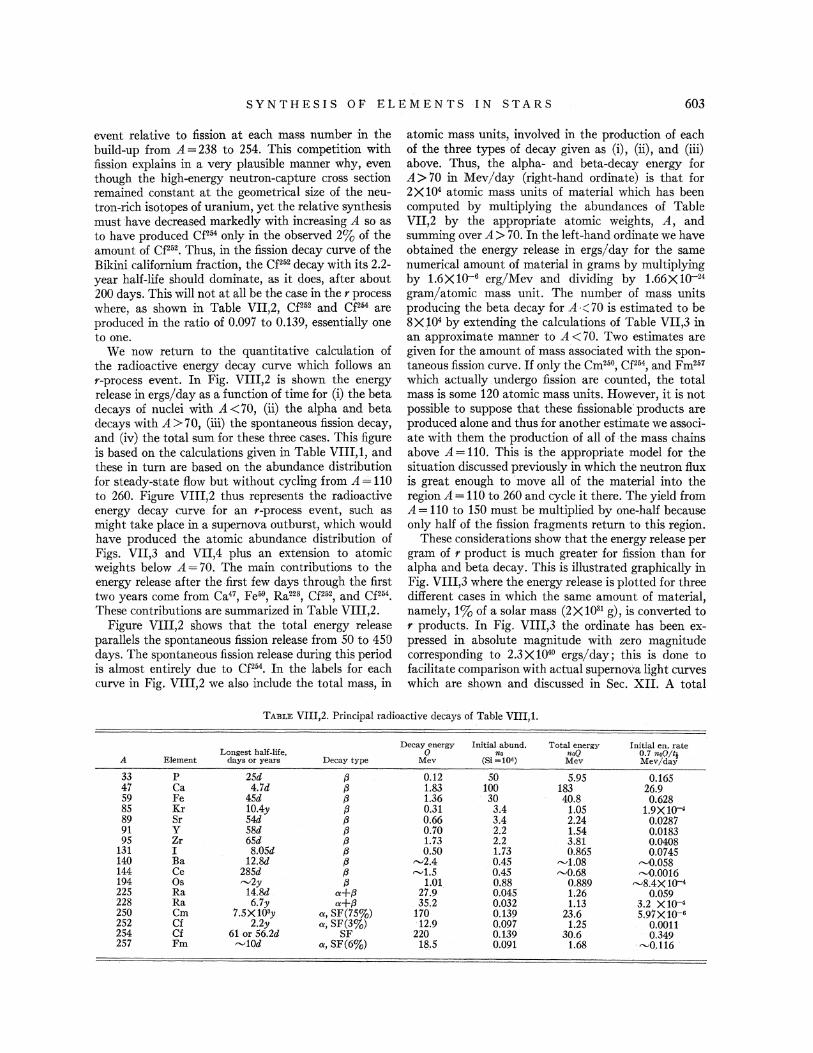
SYNTHESIS OF ELEMENTS IN STARS 603
event relative to fission at each mass number in the build-up from A= 238 to 254. This competition with fission explains in a very plausible manner why, even though the high-energy neutron-capture cross section remained constant at the geometrical size of the neutron-rich isotopes of uranium, yet the relative synthesis must have decreased markedly with increasing A so as to have produced Cf254 only in the observed 2% of the amount of C£252• Thus, in the fission decay curve of the Bikini californium fraction, the Cf2• 2 decay with its 2.2-year half-life should dominate, as it does, after about 200 days. This will not at all be the case in the r process where, as shown in Table VII,2, C£252 and Cf254 are produced in the ratio of 0.097 to 0.139, essentially one to one.
We now return to the quantitative calculation of the radioactive energy decay curve which follows an r-process event. In Fig. VIII,2 is shown the energy release in ergs/day as a function of time for (i) the beta decays of nuclei with A < 70, (ii) the alpha and beta decays with A> 70, (iii) the spontaneous fission decay, and (iv) the total sum for these three cases. This figure is based on the calculations given in Table VIII,l, and these in turn are based on the abundance distribution for steady-state flow but without cycling from A= 110 to 260. Figure VIII,2 thus represents the radioactive energy decay curve for an r-process event, such as might take place in a supernova outburst, which would have produced the atomic abundance distribution of Figs. VII,3 and VII,4 plus an extension to atomic weights below A= 70. The main contributions to the energy release after the first few days through the first two years come from Ca47, Fe59, Ra228, Cf252, and Cf254 •
These contributions are summarized in Table VIII,2. Figure VIII,2 shows that the total energy release
parallels the spontaneous fission release from SO to 450 days. The spontaneous fission release during this period is almost entirely due to C£254• In the labels for each curve in Fig. VIII,2 we also include the total mass, in
atomic mass units, involved in the production of each of the three types of decay given as (i), (ii), and (iii) above. Thus, the alpha- and beta-decay energy for A>70 in Mev/day (right-hand ordinate) is that for 2X10⁴ atomic mass units of material which has been computed by multiplying the abundances of Table VII,2 by the appropriate atomic weights, A, and summing over A> 70. In the left-hand ordinate we have obtained the energy release in ergs/ day for the same numerical amount of material in grams by multiplying by 1.6 X 1 Q--6 erg/Mev and dividing by 1.66 X 10⁻²⁴
gram/atomic mass unit. The number of mass units producing the beta decay for A< 70 is estimated to be 8 X 10⁴ by extending the calculations of Table VII,3 in an approximate manner to A <70. Two estimates are given for the amount of mass associated with the spontaneous fission curve. If only the Cm250, Cf254, and Fm257
which actually undergo fission are counted, the total mass is some 120 atomic mass units. However, it is not possible to suppose that these fissionable' products are produced alone and thus for another estimate we associate with them the production of all ofthe mass chains above A= 110. This is the appropriate model for the situation discussed previously in which the neutron flux is great enough to move all of the material into the region A= 110 to 260 and cycle it there. The yield from A= 110 to 150 must be multiplied by one-half because only half of the fission fragments return to this region.
These considerations show that the energy release per gram of r product is much greater for fission than for alpha and beta decay. This is illustrated graphically in Fig. VIII,3 where the energy release is plotted for three different cases in which the same amount of material, namely, 1% of a solar mass (2 X 1031 g), is converted to r products. In Fig. VIII,3 the ordinate has been expressed in absolute magnitude with zero magnitude corresponding to 2.3 X 10⁴° ergs/ day; this is done to facilitate comparison with actual supernova light curves which are shown and discussed in Sec. XII. A total
TABLE VIII,2. Principal radioactive decays of Table VIII,1.
Decay energy Initial abund. Total energy Initial en. rate Longest half-life. Q no noQ 0.7 noO!tt
A Element days or years Decay type Mev (Si =10') Mev Mev/day
33 p 25d (3 0.12 50 5.95 0.165 47 Ca 4.7d (3 1.83 100 183 26.9 59 Fe 45d {3 1.36 30 40.8 0.628 85 Kr 10.4y {3 0.31 3.4 1.05 1.9X10⁻⁴
89 Sr 54d {3 0.66 3.4 2.24 0.0287 91 y 58d {3 0.70 2.2 1.54 0.0183 95 Zr 65d {3 1.73 2.2 3.81 0.0408
131 I 8.05d {3 0.50 1.73 0.865 0.0745 140 Ba 12.8d (3 "-'2.4 0.45 "-'1.08 "-'0.058 144 Ce 285d {3 "-'1.5 0.45 "-'0.68 "-'0.0016 194 Os "-'2y {3 1.01 0.88 0.889 ""'8.4X 1Q-4
225 Ra 14.8d a+f3 27.9 0.045 1.26 0.059 228 Ra 6.7y a+f3 35.2 0.032 1.13 3.2 X1Q-4
250 Cm 7.5X10³y a, SF(75%) 170 0.139 23.6 5.97X1o-s 252 Cf 2.2y a, SF(3%) 12.9 0.097 1.25 0.0011 254 Cf 61 or 56.2d SF 220 0.139 30.6 0.349 257 Fm "-'lOd a, SF(6%) 18.5 0.091 1.68 ~0.116
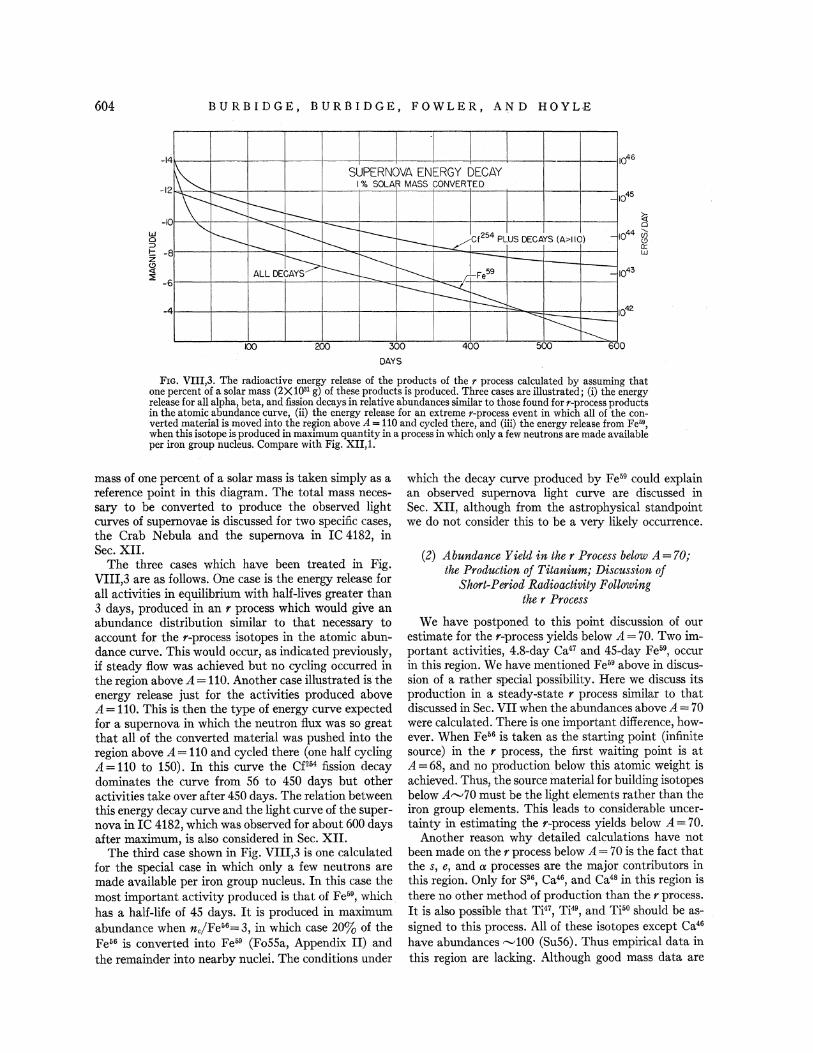
604 BURBIDGE, BURBIDGE, FOWLER, AND HOYL.£
-I 4 I
2~ SUPERNOVA ENERGY DECAY
w 0 :::> !::: z §
-I
-I
8
-6
-4
\--::::: -----"-... .....____ .......... .....____
---ALL DEC~
1% SOLA MASS CONVERTED
-I 045
-----......_ -----.L'!Ct254 PLUS DECAYS (A>IIO) -I
.....____ ------ .....____ Fe 59 -I --~ ~ ::::,. I
-........::::: .............__
042
tOO 2.00 300
DAYS
400 500 600
FIG. VIII,3. The r.adioactive energy release of the products of the r process calculated by assuming that one percent of a solar mass (2X 1()31 g) of these products is produced. Three cases are illustrated· (i) the energy :elease for a.ll alpha, beta, and :fiss~?n decays in relative abundances similar to those found for r-p:ocess products m the atom1c abundance curve, (n) the energy release for an extreme r-process event in which all of the converted material is moved into the region above A= 110 and cycled there, and (iii) the energy release from Fe69 when this isotope is produced in maximum quantity in a process in which only a few neutrons are made availabl~ per iron group nucleus. Compare with Fig. XII,1.
mass of one percent of a solar mass is taken simply as a reference point in this diagram. The total mass necessary to be converted to produce the observed light curves of supernovae is discussed for two specific cases, the Crab Nebula and the supernova in IC 4182, in Sec. XII.
The three cases which have been treated in Fig. VIII,3 are as follows. One case is the energy release for all activities in equilibrium with half-lives greater than 3 days, produced in an r process which would give an abundance distribution similar to that necessary to account for the r-process isotopes in the atomic abundance curve. This would occur, as indicated previously, if steady flow was achieved but no cycling occurred in the region above A= 110. Another case illustrated is the energy release just for the activities produced above A= 110. This is ~hen the type of energy curve expected for a supernova in which the neutron flux was so great that all of the converted material was pushed into the region above A= 110 and cycled there (one half cycling A= 110 to 150). In this curve the C:£264 fission decay dominates the curve from 56 to 450 days but other activities take over after 450 days. The relation between this energy decay curve and the light curve of the supernova in IC 4182, which was observed for about 600 days after maximum, is also considered in Sec. XII.
The third case shown in Fig. VIII,3 is one calculated for the special case in which only a few neutrons are made available per iron group nucleus. In this case the most important activity produced is that of Fe69, which has a half-life of 45 days. It is produced in maximum abundance when nc/Fe56 =3, in which case 20% of the Fe66 is converted into Fe69 (FoSSa, Appendix II) and the remainder into nearby nuclei. The conditions under
which the decay curve produced by Fe59 could explain an observed supernova light curve are discussed in Sec. XII, although from the astrophysical standpoint we do not consider this to be a very likely occurrence.
(2) Abundance Yield in the r Process below A=70; the Production of Titanium; Discussion of
Short-Period Radioactivity Following the r Process
We have postponed to this point discussion of our estimate for the r-process yields below A= 70. Two important activities, 4.8-day Ca47 and 45-day Fe59, occur in this region. We have mentioned Fe69 above in discussion of a rather special possibility. Here we discuss its production in a steady-state r process similar to that discussed in Sec. VII when the abundances above A= 70 were calculated. There is one important difference, however. When Fe56 is taken as the starting point (infinite source) in the r process, the first waiting point is at A= 68, and no production below this atomic weight is achieved. Thus, the source material for building isotopes below A"-'70 must be the light elements rather than the iron group elements. This leads to considerable uncertainty in estimating the r-process yields below A= 70.
Another reason why detailed calculations have not been made on the r process below A= 70 is the fact that the s, e, and a processes are the major contributors in this region. Only for S36, Ca46, and Ca48 in this region is there no other method of production than the r process. It is also possible that Ti47, Ti49, and Ti50 should be assigned to this process. All of these isotopes except Ca46
have abundances "'-'100 (SuS6). Thus empirical data in this region are lacking. Although good mass data are
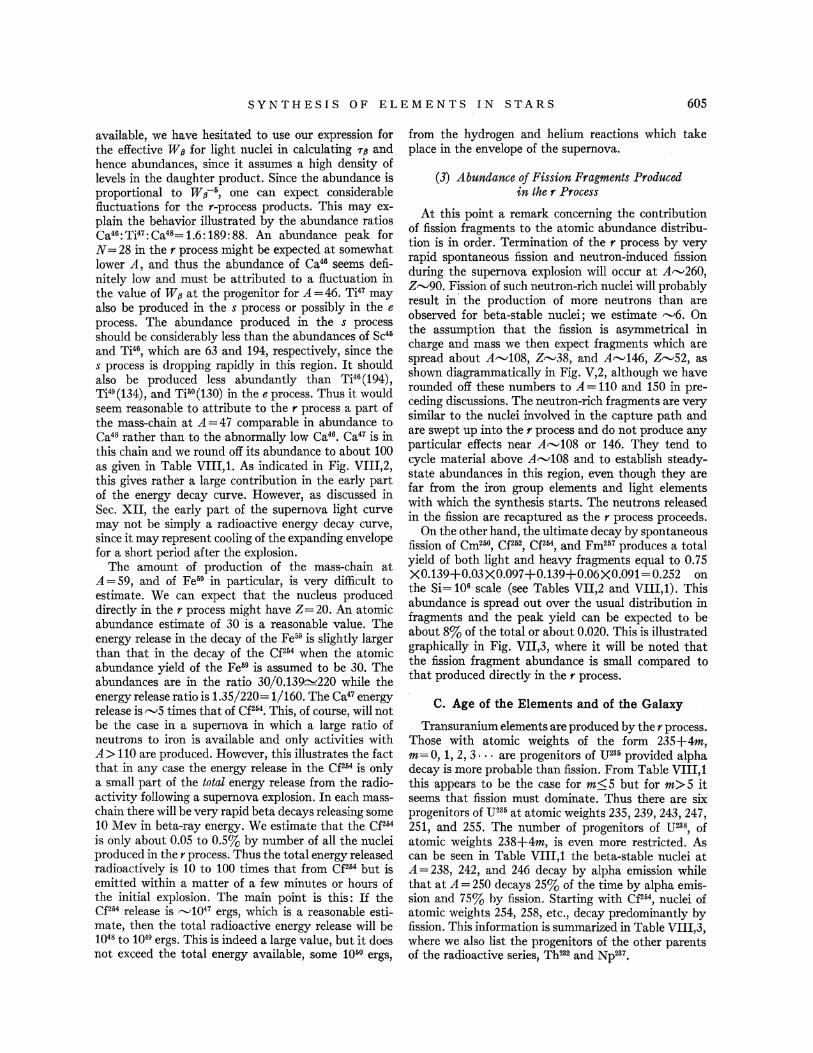
SYNTHESIS OF ELEMENTS IN STARS 605
available, we have hesitated to use our expression for the effective W p for light nuclei in calculating rp and hence abundances, since it assumes a high density of levels in the daughter product. Since the abundance is proportional to Wp-5, one can expect considerable fluctuations for the r-process products. This may explain the behavior illustrated by the abundance ratios Ca46:Ti41:Ca48=1.6:189:88. An abundance peak for N = 28 in the r process might be expected at somewhat lower A, and thus the abundance of Ca46 seems definitely low and must be attributed to a fluctuation in the value of Wp at the progenitor for A=46. Ti47 may also be produced in the s process or possibly in the e process. The abundance produced in the s process should be considerably less than the abundances of Sc45 and Ti46, which are 63 and 194, respectively, since the s process is dropping rapidly in this region. It should also be produced less abundantly than Ti46 (194), Ti49 (134), and Ti50 (130) in thee process. Thus it would seem reasonable to attribute to the r process a part of the mass-chain at A= 4 7 comparable in abundance to Ca48 rather than to the abnormally low Ca46. Ca47 is in this chain and we round off its abundance to about 100 as given in Table VIII,l. As indicated in Fig. VIII,2, this gives rather a large contribution in the early part of the energy decay curve. However, as discussed in Sec. XII, the early part of the supernova light curve may not be simply a radioactive energy decay curve, since it may represent cooling of the expanding envelope for a short period after the explosion.
The amount of production of the mass-chain at A= 59, and of Fe59 in particular, is very difficult to estimate. We can expect that the nucleus produced directly in the r process might have Z= 20. An atomic abundance estimate of 30 is a reasonable value. The energy release in the decay of the Fe59 is slightly larger than that in the decay of the Cf254 when the atomic abundance yield of the Fe59 is assumed to be 30. The abundances are in the ratio 30/0.139~220 while the energy release ratio is 1.35/220= 1/160. The Ca47 energy release is ""'5 times that of Cf254. This, of course, will not be the case in a supernova in which a large ratio of neutrons to iron is available and only activities with A> 110 are produced. However, this illustrates the fact that in any case the ene:t:gy release in the Cf254 is only a small part of the total energy release from the radioactivity following a supernova explosion. In each masschain there will be very rapid beta decays releasing some 10 Mev in beta-ray energy. We estimate that the Cf264
is only about 0.05 to 0.5% by number of all the nuclei produced in the r process. Thus the total energy released radioactively is 10 to 100 times that from Cf254 but is emitted within a matter of a few minutes or hours of the initial explosion. The main point is this: If the Cf254 release is "-'1047 ergs, which is a reasonable estimate, then the total radioactive energy release will be 1048 to 1049 ergs. This is indeed a large value, but it does not exceed the total energy available, some 1050 ergs,
from the hydrogen and helium reactions which take place in the envelope of the supernova.
(3) Abundance of Fission Fragments Produced in the r Process
At this point a remark concerning the contribution of fission fragments to the atomic abundance distribution is in order. Termination of the r process by very rapid spontaneous fission and neutron-induced fission during the supernova explosion will occur at A"-'260, Z"-'90. Fission of such neutron-rich nuclei will probably result in' the production of more neutrons than are observed for beta-stable nuclei; we estimate "-'6. On the assumption that the fission is asymmetrical in charge and mass we then expect fragments which are spread about A"-'108, Z"-'38, and A"-'146, Z"-'52, as shown diagrammatically in Fig. V,2, although we have rounded off these numbers to A= 110 and 150 in preceding discussions. The neutron-rich fragments are very similar to the nuclei involved in the capture path and are swept up into the r process and do not produce any particular effects near A"-'108 or 146. They tend to cycle material above A"-'108 and to establish steadystate abundances in this region, even though they are far from the iron group elements and light elements with which the synthesis starts. The neutrons released in the fission are recaptured as the r process proceeds.
On the other hand, the ultimate decay by spontaneous fission of Cm250, Cf252, Cf254, and Fm257 produces a total yield of both light and heavy fragments equal to 0.75 X0.139+0.03 X0.097+0.139+0.06X0.091= 0.252 on the Si= 106 scale (see Tables VII,2 and VIII,1). This abundance is spread out over the usual distribution in fragments and the peak yield can be expected to be about 8% of the total or about 0.020. This is illustrated graphically in Fig. VII,3, where it will be noted that the fission fragment abundance is small compared to that produced directly in the r process.
C. Age of the Elements and of the Galaxy
Transuranium elements are produced by the r process. Those with atomic weights of the form 235+4m, m= 0, 1, 2, 3 · . · are progenitors of U235 provided alpha decay is more probable than fission. From Table VIII,1 this appears to be the case for m:::;5 but for m>S it seems that fission must dominate. Thus there are six progenitors of U235 at atomic weights 235,239,243, 247, 251, and 255. The number of progenitors of U238, of atomic weights 238+4m, is even more restricted. As can be seen in Table VIII,l the beta-stable nuclei at A= 238, 242, and 246 decay by alpha emission while that at A=250 decays 25% of the time by alpha emission and 75% by fission. Starting with C£254, nuclei of atomic weights 254, 258, etc., decay predominantly by fission. This information is summarized in Table VIII,3, where we also list the progenitors of the other parents of the radioactive series, Th232 and Np237,
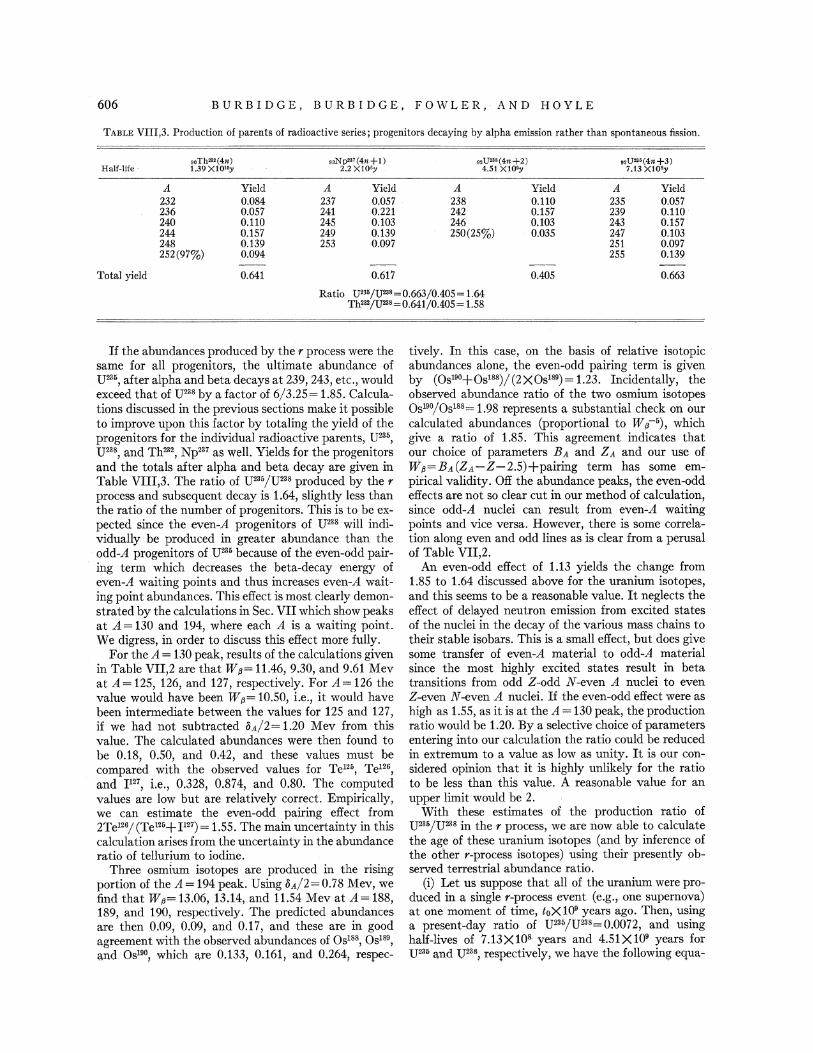
606 BURBIDGE, BURBIDGE, FOWLER, AND HOYLE
TABLE VIII,3. Production of parents of radioactive series; progenitors decaying by alpha emission rather than spontaneous fission.
ooTh"'(4n) ,.N P"' ( 4n + 1) .,U"8 (4n+2) ,u•"(4n+3) Half-life 1.39 XlOIOy 2.2 XlO'y 4.51 XlO'Y 7.13 X10'y
A Yield A Yield A Yield A Yield 232 0.084 237 0.057 238 0.110 235 0.057 236 0.057 241 0.221 242 0.157 239 0.110 240 0.110 245 0.103 246 0.103 243 0.157 244 0.157 249 0.139 250(25%) 0.035 247 0.103 248 0.139 253 0.097 251 0.097 252(97%) 0.094 255 0.139
Total yield 0.641 0.617 0.405 0.663
Ratio U235/TJ238=0.663/0.405= 1.64 Th232/U"38=0.641/0.405= 1.58
If the abundances produced by the r process were the same for all progenitors, the ultimate abundance of U236, after alpha and beta decays at 239, 243, etc., would exceed that of U238 by a factor of 6/3.25= 1.85. Calculations discussed in the previous sections make it possible to improve upon this factor by totaling the yield of the progenitors for the individual radioactive parents, U236,
U238, and Th232, Np237 as well. Yields for the progenitors and the totals after alpha and beta decay are given in Table VIII,3. The ratio of U235/U238 produced by the r process and subsequent decay is 1.64, slightly less than the ratio of the number of progenitors. This is to be expected since the even-A progenitors of U238 will individually be produced in greater abundance than the odd-A progenitors of U285 because of the even-odd pairing term which decreases the beta-decay energy of even-A waiting points and thus increases even-A waiting point abundances. This effect is most clearly demonstrated by the calculations in Sec. VII which show peaks at A= 130 and 194, where each A is a waiting point. We digress, in order to discuss this effect more fully.
For the A= 130 peak, results of the calculations given in Table VII,2 are that Wp= 11.46, 9.30, and 9.61 Mev at A= 125, 126, and 127, respectively. For A= 126 the value would have been W11= 10.50, i.e., it would have been intermediate between the values for 125 and 127, if we had not subtracted fiA/2= 1.20 Mev from this value. The calculated abundances were then found to be 0.18, 0.50, and 0.42, and these values must be compared with the observed values for Te126, Te126,
and 1127, i.e., 0.328, 0.874, and 0.80. The computed values are low but are relatively correct. Empirically, we can estimate the even-odd pairing effect from 2Tel26j (Tet25+ Jl27) = 1.55. The main uncertainty in this calculation arises from the uncertainty in the abundance ratio of tellurium to iodine.
Three osmium isotopes are produced in the rising portion of the A= 194 peak. Using fiA/2=0.78 Mev, we find that W 11= 13.06, 13.14, and 11.54 Mev at A= 188, 189, and 190, respectively. The predicted abundances are then 0.09, 0.09, and 0.17, and these are in good agreement with the observed abundances of Os188, Os1S9,
a.nd Qsl901 which a,re 0,1331 0.1611 a,nd 0.2641 respec-
tively. In this case, on the basis of relative isotopic abundances alone, the even-odd pairing term is given by (Os190+0s188)/(2X0s189)= 1.23. Incidentally, the observed abundance ratio of the two osmium isotopes Os190/0s188= 1.98 represents a substantial check on our calculated abundances (proportional to wll-5), which give a ratio of 1.85. This agreement indicates that our choice of parameters B A and Z A and our use of. Wp=BA(ZA-Z-2.5)+pairing term has some empirical validity. Off the abundance peaks, the even-odd effects are not so clear cut in our method of calculation, since odd-A nuclei can result from even-A waiting points and vice versa. However, there is some correlation along even and odd lines as is clear from a perusal of Table VII,2.
An even-odd effect of 1.13 yields the change from 1.85 to 1.64 discussed above for the uranium isotopes, and this seems to be a reasonable value. It neglects the effect of delayed neutron emission from excited states of the nuclei in the decay of the various mass chains to their stable isobars. This is a small effect, but does give some transfer of even-A material to odd-A material since the most highly excited states result in beta transitions from odd Z-odd N"even A nuclei to even Z-even N-even A nuclei. If the even-odd effect were as high as 1.55, as it is at the A= 130 peak, the production ratio would be 1.20. By a selective choice of parameters entering into our calculation the ratio could be reduced in extremum to a value as low as unity. It is our considered opinion that it is highly unlikely for the ratio to be less than this value. A reasonable value for an upper limit would be 2.
With these estimates of the production ratio of U235/U288 in the r process, we are now able to calculate the age of these uranium isotopes (and by inference of the other r-process isotopes) using their presently observed terrestrial abundance ratio.
(i) Let us suppose that all of the uranium were produced in a single r-process event (e.g., one supernova) at one moment of time, t0Xl09 years ago. Then, using a present-day ratio of U235/U288 =0.0072, and using half-lives of 7.13X10⁸ years and 4.51X10⁹ years for U236 a,nd U2881 respectively, we ha,ve the following equa,-
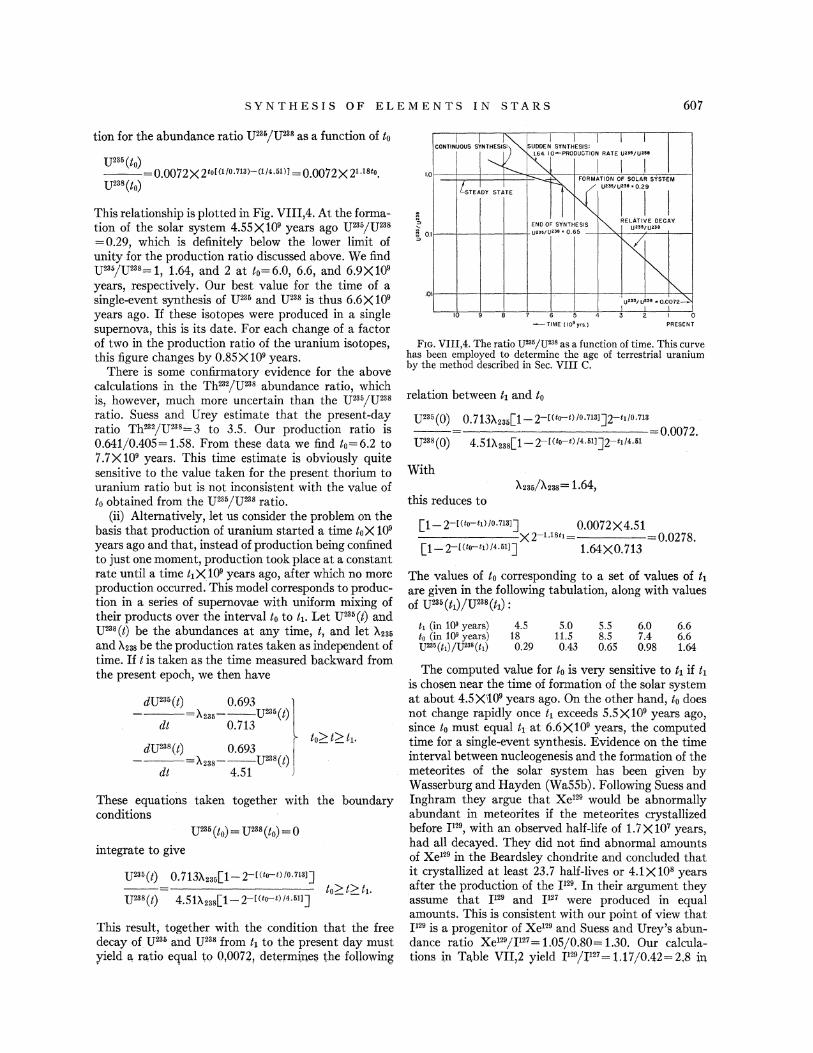
SYNTHESIS OF ELEMENTS IN STARS 607
tion for the abundance ratio U235/U238 as a function of to
U236(to) ---=0.0072X2to[(l/0.7l3)-(l/4.6l)J=0.0072X21.18to. U23B(to)
This relationship is plotted in Fig. VIII,4. At the formation of the solar system 4.55X10⁹ years ago U286/U238 =0.29, which is definitely below the lower limit of unity for the production ratio discussed above. We find U236/U288= 1, 1.64, arid 2 at t0= 6.0, 6.6, and 6.9X 10⁹
years, respectively. Our best value for the time of a single-event synthesis of U236 and U238 is thus 6.6X10⁹
years ago. If these isotopes were produced in a single supernova, this is its date. For each change of a factor of two in the production ratio of the uranium isotopes, this figure changes by 0.85X 10⁹ years.
There is some confirmatory evidence for the above calculations in the Th232/U238 abundance ratio, which is, however, much more uncertain than the U23"/U238 ratio. Suess and Urey estimate that the present-day ratio Th232/U238=3 to 3.5. Our production ratio is 0.641/0.405 = 1.58. From these data we find to= 6.2 to 7.7X10⁹ years. This time estimate is obviously quite sensitive to the value taken for the present thorium to uranium ratio but is not inconsistent with the value of to obtained from the U236/U23S ratio.
(ii) Alternatively, let us consider the problem on the basis that production of uranium started a time to X 109
years ago and that, instead of production being confined to just one moment, production took place at a constant rate until a time ltX109 years ago, after which no more production occurred. This model corresponds to production in a series of supernovae with uniform mixing of their products over the interval to to h. Let U236 (t) and U238 (t) be the abundances at any time, t, and let >.236 and A238 be the production rates taken as independent of time. If t is taken as the time measured backward from the present epoch, we then have
dU236 (t) 0.693 } ----=X2a•---U236 (t)
dt 0.713
dU238(t) 0.693 ----=A2as---U238 (t)
dt 4.51 J
These equations taken together with the boundary conditions
integrate to give
This result, together with the condition that the free decay of U236 and U238 from t1 to the present day must yield a ratio equal to 0,00721 determ~nes the following
CONTIN~OUS t~ SUOOE~ SYNTJESIS: I I I K.o-PRODUCTIOi RATE I"''U'i'
I LSTE~OY ST~TE ll'ki~T~I·~i' END OF SYNTHESIS ""' RELATIVE DECAY
1.0
" ' l! 0 .I "
unatuue umt um • o. 65 "<
""' ~ .0 I I uaas, utae • 0.01072~
10 8 6 5 4 2 0 --TIME (109 yr$.} PRESENT
FrG. VIII,4. The ratio lJ236 /U238 as a function of time. This curve has been employed to determine the age of terrestrial uranium by the method described in Sec. VIII C.
relation between t1 and to
U235(0) 0. 713>.236[1- 2-l<to-c-t)/0.7l3l]2-tt/0.7la 0.0072.
U23S(O) 4.51A2ss[1- 2-l(to-c-tl/4.511]2-tt/4.61
With
this reduces to
[1- 2-l<to-c-ttJto.naJ] 0.0072X4.51 -------X 2-1.1811 0.0278. [1- 2-l<to-c-ttl /4.511] 1.64XO. 713
The values of to corresponding to a set of values of t1
are given in the following tabulation, along with values of U236 (tt)/U238 (tl):
t1 (in 109 years) to (in 109 years) U23•(tt) /U238(tt)
4.5 18 0.29
5.0 11.5 0.43
5.5 8.5 0.65
6.0 7.4 0.98
6.6 6.6 1.64
The computed value for to is very sensitive to t1 if t1 is chosen near the time of formation of the solar system at about 4.5X';109 years ago. On the other hand, to does not change rapidly once t1 exceeds 5.5X10⁹ years ago, since to must equal hat 6.6X10⁹ years, the computed time for a single-event synthesis. Evidence on the time interval between nucleogenesis and the formation of the meteorites of the solar system has been given by Wasserburg and Hayden (Wa55b). Following Suess and Inghram they argue that Xe129 would be abnormally abundant in meteorites if the meteorites crystallized before P 29, with an observed half-life of 1.7X10⁷ years, had all decayed. They did not find abnormal amounts of Xe129 in the Beardsley chondrite and concluded that it crystallized at least 23.7 half-lives or 4.1 X 10⁸ years after the production of the P29. In their argument they assume that I129 and I127 were produced in equal amounts. This is consistent with our point of view that I 129 is a progenitor of Xe129 and Suess and Urey's abimdance ratio Xe129/P27 = 1.05/0.80= 1.30. Our calculations in Ta,ble VII,2 yield F 29/F27 =1.17j0.42=2,8 in
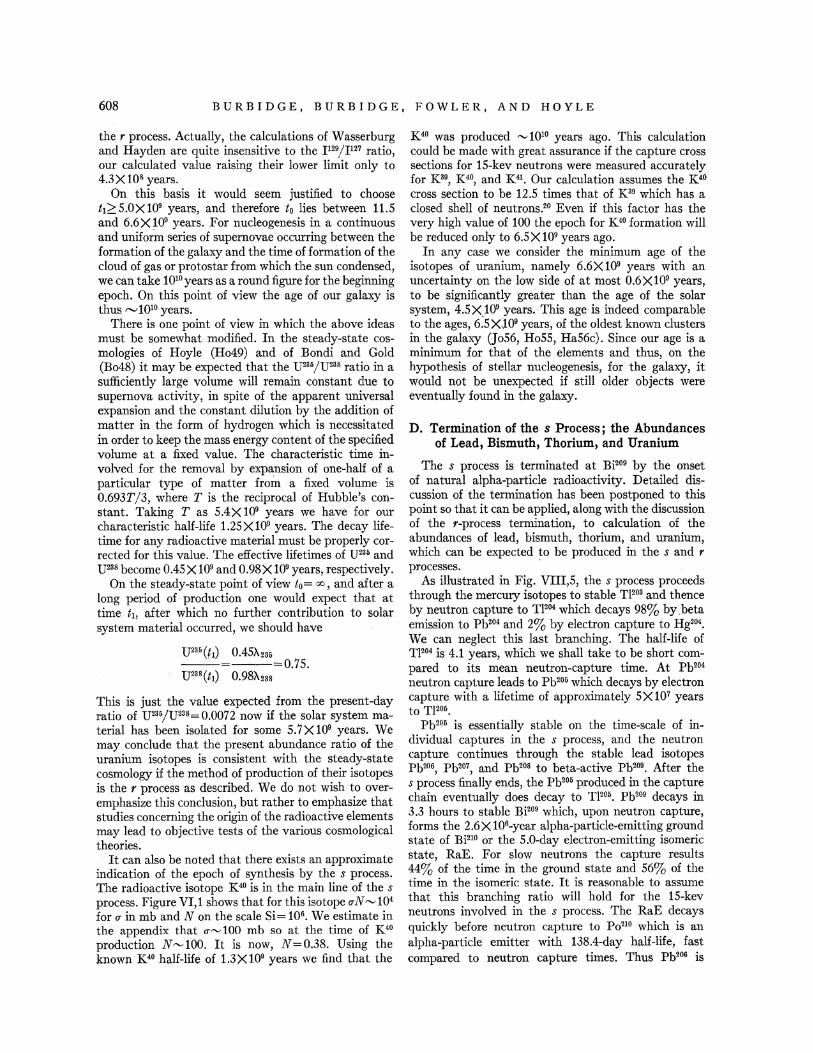
608 BURBIDGE, BURBIDGE, FOWLER, AND HOYLE
the r process. Actually, the calculations of Wasserburg and Hayden are quite insensitive to the F 29/Jl27 ratio, our calculated value raising their lower limit only to 4.3X10⁸ years. ·
On this basis it would seem justified to choose t1~S:OX109 years, and therefore to lies between 11.5 and 6.6X 10⁹ years. For nucleogenesis in a continuous and uniform series of supernovae occurring between the formation of the galaxy and the time of formation of the cloud of gas or protostar from which the sun condensed, we can take 1010 years as a round figure for the beginning epoch. On this point of view the age of our galaxy is thus "'1010 years.
There is one point of view in which the above ideas must be somewhat modified. In the steady-state cosmologies of Hoyle (Ho49) and of Bondi and Gold (Bo48) it may be expected that the U236/U238 ratio in a sufficiently large volume will remain constant due to supernova activity, in spite of the apparent universal expansion and the constant dilution by the addition of matter in the form of hydrogen which is necessitated in order to keep the mass energy content of the specified volume at a fixed value. The characteristic time involved for the removal by expansion of one-half of a particular type of matter from a fixed volume is 0.693T/3, where T is the reciprocal of Hubble's constant. Taking T as 5.4X 10⁹ years we have for our characteristic half-life 1.2SX109 years. The decay lifetime for any radioactive material must be properly corrected for this value. The effective lifetimes of U236 and U238 become 0.4SX109 and 0.98X1Q9 years, respectively.
On the steady-state point of view t0= oo, and after a long period of production one would expect that at time t1, after which no further contribution to solar system material occurred, we should have
U236 (tl) 0.45Xm --·-=--=0.75. U238(tl) 0.98>.238
This is just the value expected from the present-day ratio of U236/U238 =0.0072 now if the solar system material has been isolated for some 5.7X 10⁹ years. We may conclude that the present abundance ratio of the uranium isotopes is consistent with the steady-state cosmology if the method of production of their isotopes is the r process as described. We do not wish to overemphasize this conclusion, but rather to emphasize that studies concerning the origin of the radioactive elements may lead to objective tests of the various cosmological theories. · It can also be noted that there exists an approximate
indication of the epoch of synthesis by the s process. The radioactive isotope K40 is in the main line of the s process. Figure VI,1 shows that for this isotope oN"-'104 for u in mb and Non the scale Si= 106• We estimate in the appendix that CT"' 100 mb so at the time of K40 production N"-'100. It is now, N=0.38. Using the known K40 half-life of 1.3X10⁹ years we find that the
K40 was produced "-'1010 years ago. This calculation could be made with great assurance if the capture cross sections for 15-kev neutrons were measured accurately for K39, K40, and K41• Our calculation assumes the K40 cross section to be 12.5 times that of K39 which has a closed shell of neutrons.20 Even if this factor has the very high value of 100 the epoch for K40 formation will be reduced only to 6.SX109 years ago.
In any case we consider the minimum age of the isotopes of uranium, namely 6.6X10⁹ years with an uncertainty on the low side of at most 0.6X10⁹ years, to be significantly greater than the age of the solar system, 4.5 X_1Q9 years. This age is indeed comparable to the ages, 6.5 Xl09 years, of the oldest known clusters in the galaxy (Jo56, RoSS, Ha56c). Since our age is a minimum for that of th.e elements and thus, on the hypothesis of stellar nucleogenesis, for the galaxy, it would not be unexpected if still older objects were eventually found in the galaxy.
D. Termination of the s Process; the Abundances of Lead, Bismuth, Thorium, and Uranium
The s process is terminated at Bi209 by the onset of natural alpha-particle radioactivity. Detailed discussion of the termination has been postponed to this point so that it can be applied, along with the discussion of the r-process termination, to calculation of the abundances of lead, bismuth, thorium, and uranium, which can be expected ~o be produced in the s and r processes.
As illustrated in Fig. VIII,S, the s process proceeds through the mercury isotopes to stable Tl203 and thence by neutron capture to Tl204 which decays 98% by .beta emission to Pb204 and 2% by electron capture to Hg204. We can neglect this last branching. The half-life of Tl204 is 4.1 years, which we shall take to be short compared to its mean neutron-capture time. At Pb204 neutron capture leads to Pb206 which decays by electron capture with a lifetime of approximately SX107 years to Tl2o&.
Pb206 is essentially stable on the time-scale of individual captures in the s process, and the neutron capture continues through the stable lead isotopes Pb206, Pb207, and Pb208 to beta-active Pb209. After the s process finally ends, the Pb206 produced in the capture chain eventually does decay to Tl206. Pb209 decays in 3.3 hours to stable ~i209 which, upon neutron capture, forms the 2.6 X 10⁶-year alpha-particle-emitting ground state of Bi210 or the 5.0-day electron-emitting isomeric state, RaE. For slow neutrons the capture results 44% of the time in the ground state and 56% of the time in the isome:r;ic state. It is reasonable to assume that this branching ratio will hold for the 15-kev neutrons involved in the s process. The RaE decays quickly before neutron capture to Po210 which is an alpha-particle emitter with 138.4-day half-life, fast compared to neutron capture times. Thus Pb206 is
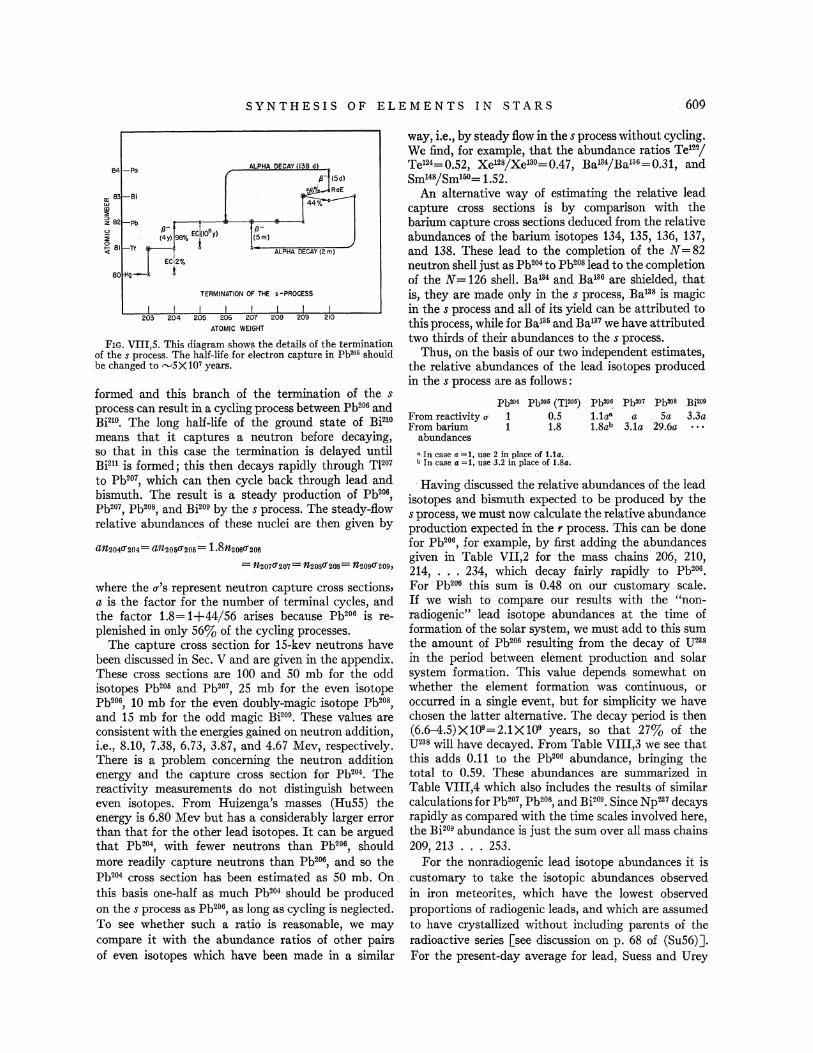
SYNTHESIS OF ELEMENTS IN STARS 609
TERMINATION OF THE s -PROCESS
FIG. VIII,S. This diagram shows the details of the termination of the s process. The half-life for electron capture in Pb~5 should be changed to rvSX 107 years.
formed and this branch of the termination of the s process can result in a cycling process between Pb206 and Bi210. The long half-life of the ground state of Bi.210 means that it captures a neutron before decaying, so that in this case the termination is delayed until Bi211 is formed; this then decays rapidly through Tl207 to Pb207, which can then cycle back through lead and bismuth. The result is a steady production of Pb206, Pb207, Pb20B, and Bi.2°9 by the s process. The steady-flow relative abundances of these nuclei are then given by
an2o4cr2o4= an2o5cr2o5= l.8n2o6cr2o6 = n2o1CT2o1= n2oscr2os= n2o9cr2o91
where the cr's represent neutron capture cross sections, a is the factor for the number of terminal cycles, and the factor 1.8= 1+44/56 arises because Pb206 is replenished in only 56% of the cycling processes.
The capture cross section for 15-kev neutrons have been discussed in Sec. V and are given in the appendix. These cross sections are 100 and 50 mb for the odd isotopes Pb206 and Pb207, 25 mb for the even isotope Pb206, 10 mb for the even doubly-magic isotope Pb208, and 15 mb for the odd magic Bi209. These values are consistent with the energies gained on neutron addition, i.e., 8.10, 7.38, 6.73, 3.87, and 4.67 Mev, respectively. There is a problem concerning the neutron addition energy and the capture cross section for Pb204. The reactivity measurements do not distinguish between even isotopes. From Huizenga's masses (Hu55) the energy is 6.80 Mev but has a considerably larger error than that for the other lead isotopes. It can be argued that Pb204, with fewer neutrons than Pb206, should more readily capture neutrons than Pb2°6, and so the Pb204 cross section has been estimated as SO mb. On, this basis one-half as much Pb204 should be produced on the s process as Pb206, as long as cycling is neglected. To see whether such a ratio is reasonable, we may compare it with the abundance ratios of other pairs of even isotopes which have been made in a similar
way, i.e., by steady flow in the s process without cycling. We find, for example, that the abundance ratios Te122/ Te124=0.52, Xel2BjXe180=0.47, Ba134/Ba136=0.31, and Smt4B/Smt60= 1.52.
An alternative way of estimating the relative lead capture cross sections is by comparison with the barium capture cross sections deduced from the relative abundances of the barium isotopes 134, 135, 136, 137, and 138. These lead to the completion of the N = 82 neutron shell just as Pb204 to Pb208 lead to the completion of the N=126 shell. Ba134 and Ba136 are shielded, that is, they are made only in the s process, Ba138 is magic in the s process and all of its yield can be attributed to this process, while for Ba136 and Ba137 we have attributed two thirds of their abundances to the s process.
Thus, on the basis of our two independent estimates, the relative abundances of the lead isotopes produced in the s process are as follows :
From reactivity u From barium
abundances
Pb204 Pb~6 (TJ~•) Ph~~ PJ>207 pJ>20s Bi209 1 0.5 l.laa a Sa 3.3a 1 1.8 1.8ab 3.1a 29.6a
• In case a =1, use 2 in place of 1.1a. h In case a. =1, use 3.2 in place of 1.8a..
· Having discussed the relative abundances of the lead isotopes and bismuth expected to be produced by the s process, we must now calculate the relative abundance production expected in the r process. This can be done for Pb206, for example, by first adding the abundances given in Table VII,2 for the mass chains 206, 210, 214, ... 234, which decay fairly rapidly to Pb206. For Pb206 this sum is 0.48 on our customary scale. If we wish to compare our results with the "nonradiogenic" lead isotope abundances at the time of formation of the solar system, we must add to this sum the amount of Pb206 resulting from the decay of lJ238 in the period between element production and solar system formation. This value depends somewhat on whether the element formation was continuous, or occurred in a single event, but for simplicity we have chosen the latter alternative. The decay period is then (6.6-4.5)X109=2.1X10⁹ years, so that 27% of the U238 will have decayed. From Table VIII,3 we see that this adds 0.11 to the Pb206 abundance, bringing the total to 0.59. These abundances are summarized in Table VIII,4 which also includes the results of similar calculations for Pb207, Pb208, and Bi209. Since Np237 decays rapidly as compared with the time scales involved here, the Bi209 abundance is just the sum over all mass chains 209, 213 . . . 253.
For the nonradiogenic lead isotope abundances it is customary to take the isotopic abundances observed in iron meteorites, which have the lowest observed proportions of radiogenic leads, and which are assumed to have crystallized without including parents of the radioactive series [see discussion on p. 68 of (Su56)]. For the present-day average for lead, Suess and Urey
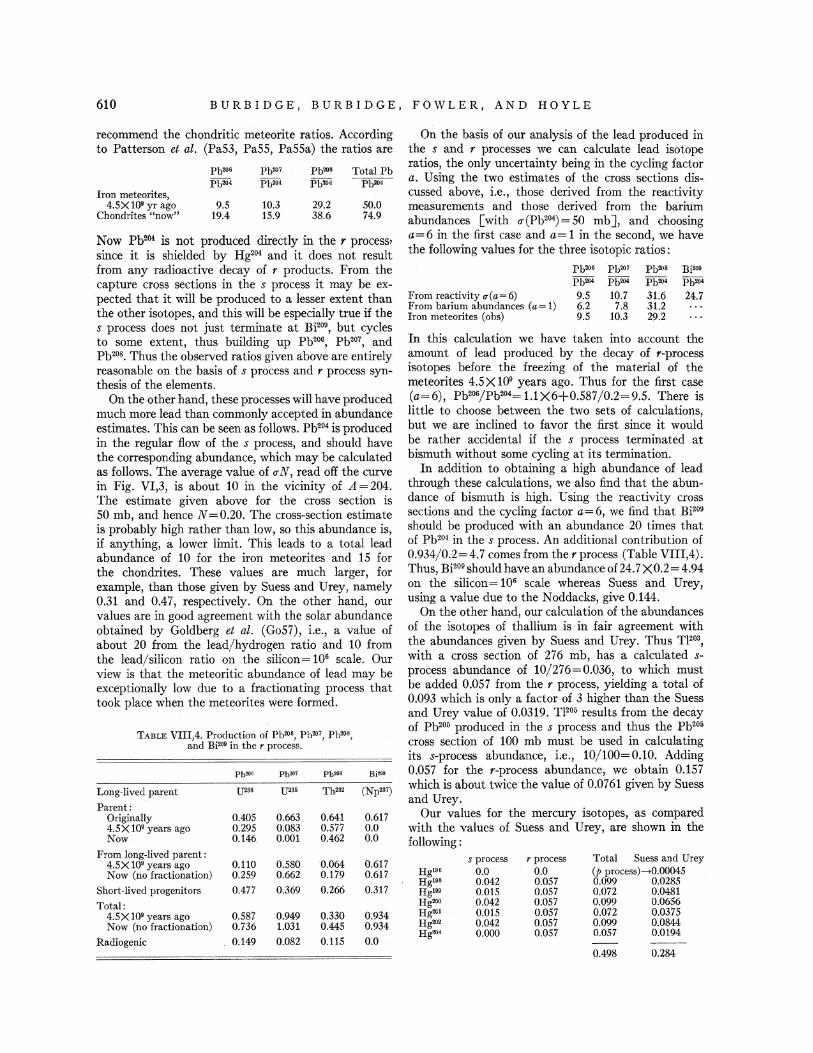
610 BURBIDGE, BURBIDGE, FOWLER, AND HOYLE
recommend the chondritic meteorite ratios. According to Patterson et al. (Pa53, PaSS, PaSSa) the ratios are
Pb'O• Pb207 Pb20s Total Pb Pb20< Pb20< Pb20< PlJ20<
Iron meteorites, 4.5X 1()11 yr ago 9.5 10.3 29.2 50.0
Chondrites "now" 19.4 15.9 38.6 74.9
Now Pb204 is not produced directly in the r process• since it is shielded by Hg204 and it does not result from any radioactive decay of r products. From the capture cross sections in the s process it may be expected that it will be produced to a lesser extent than the other isotopes, and this will be especially true if the s process does not just terminate at Bi209, but cycles to some extent, thus building up Pb206, Pb207, and Pb208. Thus the observed ratios given above are entirely reasonable on the basis of s process and r process synthesis of the elements.
On the other hand, these processes will have produced much more lead than commonly accepted in abundance estimates. This can be seen as follows. Pb204 is produced in the regular flow of the s process, and should have the corresponding abundance, which may be calculated as follows. The average value of oN, read off the curve in Fig. VI,3, is about 10 in the vicinity of A= 204. The estimate given above for the cross section is SO mb, and hence N = 0.20. The cross-section estimate is probably high rather than low, so this abundance is, if anything, a lower limit. This leads to a total lead abundance of 10 for the iron meteorites and 15 for the chondrites. These values are much larger, for example, than those given by Suess and Urey, namely 0.31 and 0.47, respectively. On the other hand, our values are in good agreement with the solar abundance obtained by Goldberg et al. (Go57), i.e., a value of about 20 from the lead/hydrogen ratio and 10 from the lead/silicon ratio on the silicon= 106 scale. Our view is that the meteoritic abundance of lead may be exceptionally low due to a fractionating process that took place when the meteorites were formed.
TABLE VIII,4. Production of Pb206, Pb207, Pb•os, and Bi209 in the r process.
Ph"' Ph"'' Ph"' Bi2D9
Long-lived parent {]238 u•a6 Th'32 (Np•a')
Parent: Originally 0.405 0.663 0.641 0.617 4.5X 10⁹ years ago 0.295 0.083 0.577 0.0 Now 0.146 0.00.1 0.462 0.0
From long-lived parent: 4.5X 10⁹ years ago 0.110 0.580 0.064 0.617 Now (no fractionation) 0.259 0.662 0.179 0.617
Short-lived progenitors 0.477 0.369 0.266 0.317
Total: 4.5X1()9 years ago 0.587 0.949 0.330 0.934 Now (no fractionation) 0.736 1.031 0.445 0.934
Radiogenic 0.149 0.082 0.115 0.0
On the basis of our analysis of the lead produced in the s and r processes we can calculate lead isotope ratios, the only uncertainty being in the cycling factor a. Using the two estimates of the cross sections discussed above, i.e., those derived from the reactivity measurements and those derived from the barium abundances [with u (Pb204) =SO mb ], and choosing a= 6 in the first case and a= 1 in the second, we have the following values for the three isotopic ratios:
Pb206 Pb207 Pb20s Bi20• Pb204 Pb20< Pb20< Pb'O•
From reactivity u(a=6) 9.5 10.7 31.6 24.7 From barium abundances (a= 1) 6.2 7.8 31.2 Iron meteorites (obs) 9.5 10.3 29.2
In this calculation we have taken into account the amount of lead produced by the decay of r-process isotopes before the freezing of the material of the meteorites 4.5 X 10⁹ years ago. Thus for the first case (a=6), Pb206/Pb204= 1.1X6+0.587/0.2=9.S. There is little to choose between the two sets of calculations, but we are inclined to favor the first since it would be rather accidental if the s process terminated at bismuth without some cycling at its termination.
In addition to obtaining a high abundance of lead through these calculations, we also find that the abundance of bismuth is high. Using the reactivity cross sections and the cycling factor a= 6, we find that Bi2o9 should be produced with an abundance 20 times that of Pb204 in the s process. An additional contribution of 0.934/0.2=4.7 comes from the r process (Table VIII,4). Thus, Bi209 should have an abundance of24. 7 X0.2 = 4.94 on the silicon= 106 scale whereas Suess and Urey, using a value due to the Noddacks, give 0.144.
On the other hand, our calculation of the abundances of the isotopes of thallium is in fair agreement with the abundances given by Suess and Urey. Thus TJ2oa, with a cross section of 276 mb, has a calculated sprocess abundance of 10/276=0.036, to which must· be added 0.057 from the r process, yielding a total of 0.093 which is only a factor of 3 higher than the Suess and Urey value of 0.0319. Tl205 results from t.he decay of Pb205 produced in the s process and thus the Pb205 cross section of 100 mb must be used in calculating its s-process abundance, i.e., 10/100=0.10. Adding O.OS7 for the r-process abundance, we obtain 0.1S7 which is about twice the value of 0.0761 given by Suess and Urey.
Our values for the mercury isotopes, as compared with the values of Suess and Urey, are shown in the following:
s process r process Total Suess and Urey Hgtos 0.0 0.0 (p process)->0.00045 Hgtos 0.042 0.057 0.099 0.0285 Hgloo 0.015 0.057 0.072 0.0481 Hg200 0.042 0.057 0.099 0.0656 Hg201 0.015 0.057 0.072 0.0375 Hg202 0.042 0.057 0.099 0.0844 Hg20• 0.000 0.057 0.057 0.0194
0.498 0.284
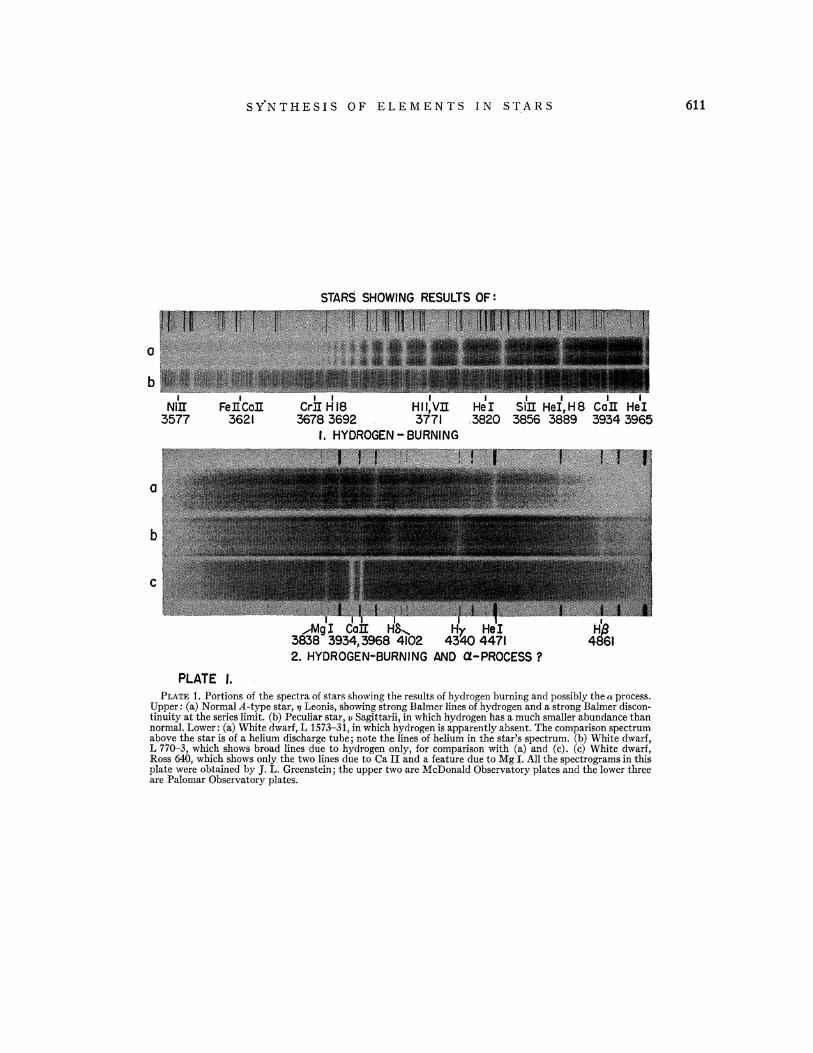
0
b
0
b
c
PLATE f.
SY.NTHESIS OF ELEMENTS IN STARS
STARS SHOWING RESULTS OF:
I Hll, vn
3678 3692 3771 I. HYDROGEN- BURNING
..,...Mgl 3838 3934,3968 4471 2. HYDROGEN-BURNING AND a-PROCESS?
PLATE 1. Portions of the spectra of stars showing the results of hydrogen burning and possibly the a process. Upper: (a) Normal A-type star, 1J Leonis, showing strong Balmer lines of hydrogen and a strong Balmer discontinuity at the series limit. (b) Peculiar star, v Sagittarii, in which hydrogen has a much smaller abundance than normal. Lower: (a) White dwarf, L 1573-31, in which hydrogen is apparently absent. The comparison spectrum above the star is of a helium discharge tube; note the lines of helium in the star's spectrum. (b) White dwarf, L 770-3, which shows broad lines due to hydrogen only, for comparison with (a) and (c). (c) White dwarf, Ross 640, which shows only the two lines due to Ca II and a feature due to Mg I. All the spectrograms in this plate were obtained by J. L. Greenstein; the upper two are McDonald Observatory plates and the lower three are Palomar Observatory plates.
611
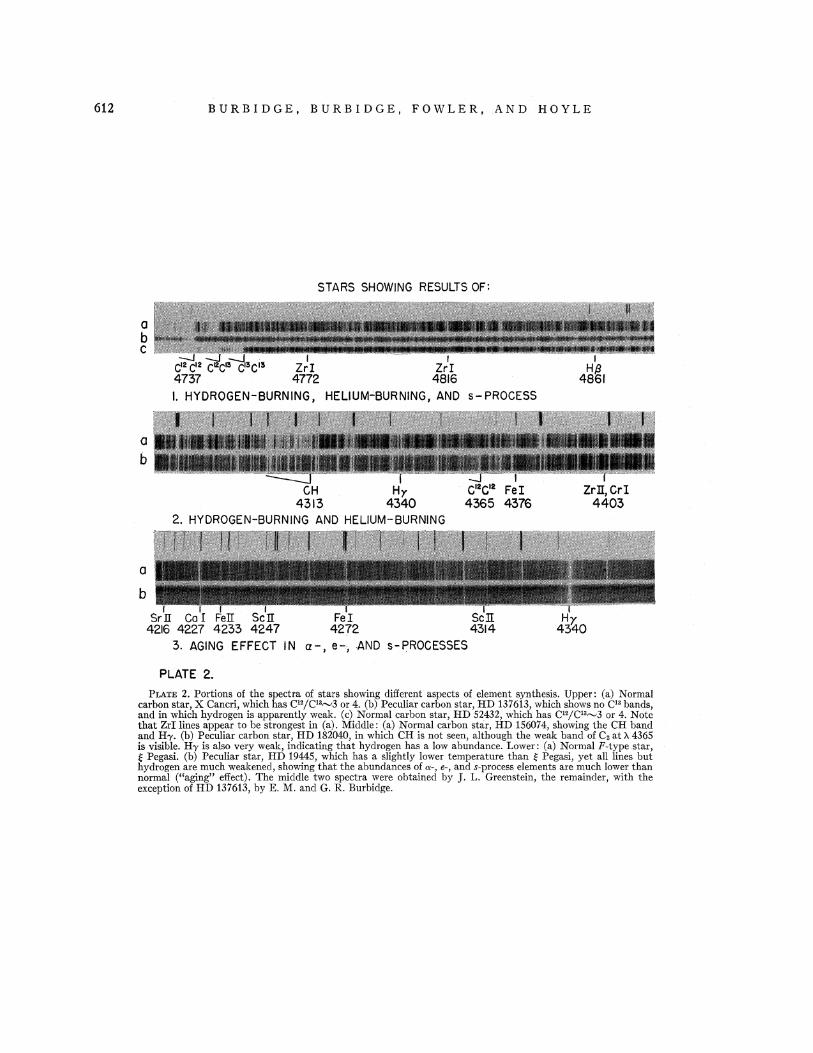
612
a b c
a b
a
b
BURBIDGE, BURBIDGE, FOWLER, AND HOYLE
STARS SHOWING RESULTS OF:
I. HYDROGEN-BURNING, HELIUM-'BURNING, AND s-PROCESS
2. HYDROGEN-BURNING AND HELIUM-BURNING
Sr Co I 4216 4227 4233
3. AGING EFFECT IN a-, e-, AND s-PROCESSES
PLATE 2. PLATE 2. Portions of the spectra of stars showing different aspects of element synthesis. Upper: (a) Normal
carbon star, X Cancri, which has C12/C1•"'3 or 4. (b) Peculiar carbon star, HD 137613, which shows no C13 bands, and in which hydrogen is apparently weak. (c) Normal carbon star, HD 52432, which has Cl2/Cl3"'3 or 4. Note that Zri lines appear to be strongest in (a). Middle: (a) Normal carbon star, HD 156074, showing the CH band and H7. (b) Peculiar carbon star, HD 182040, in which CHis not seen, although the weak band of C2 at:>- 4365 is visible. H'Y is also very weak, indicating that hydrogen has a low abundance. Lower: (a) Normal F-type star, ~ Pegasi. (b) Peculiar star, HD 19445, which has a slightly lower temperature than !; Pegasi, yet all lines but hydrogen are much weakened, showing that the abundances of a-, e-, and s-process elements are much lower than normal ("aging" effect). The middle two spectra were obtained by J. L. Greenstein, the remainder, with the exception of HD 137613, by E. M. and G. R. Burbidge.
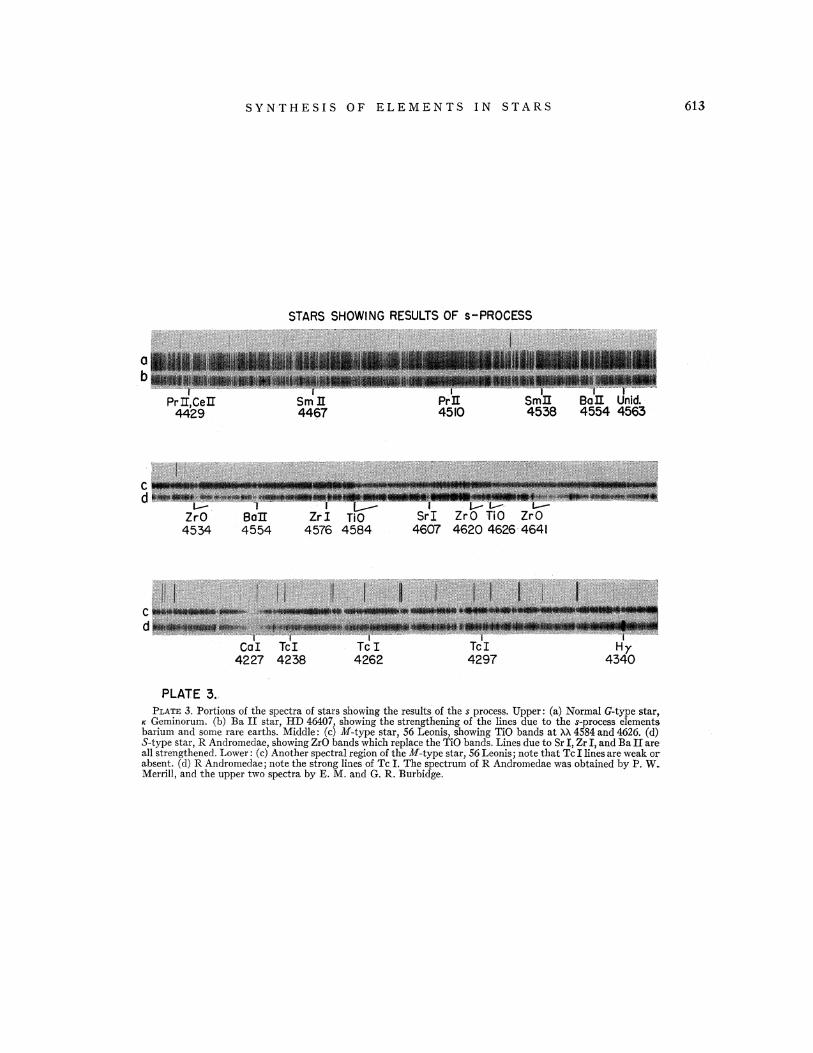
a b
c d
c d
SYNTHESIS OF ELEMENTS IN STARS
STARS SHOWING RESULTS OF s-PROCESS
PLATE 3. PLATE 3. Portions of the spectra of stars showing the results of the s process. Upper: (a) Normal G-type star,
K Geminorum. (b) Ba II star, HD 46407, showing the strengthening of the lines due to the s-process elements barium and some rare earths. Middle: (c) M-type star, 56 Leonis, showing TiO bands at 'A.A. 4584 and 4626. (d) S-type star, R Andromedae, showing ZrO bands which replace the TiO bands. Lines due to SrI, ZrT, and Ba II are all strengthened. Lower: (c) Another spectral region of theM-type star, 56 Leonis; note that Tci lines are weak or absent. (d) R Andromedae; note the strong lines of Tc I. The spectrum of R Andromedae was obtained by P. W. Merrill, and the upper two spectra by E. M. and G. R. Burbidge.
613
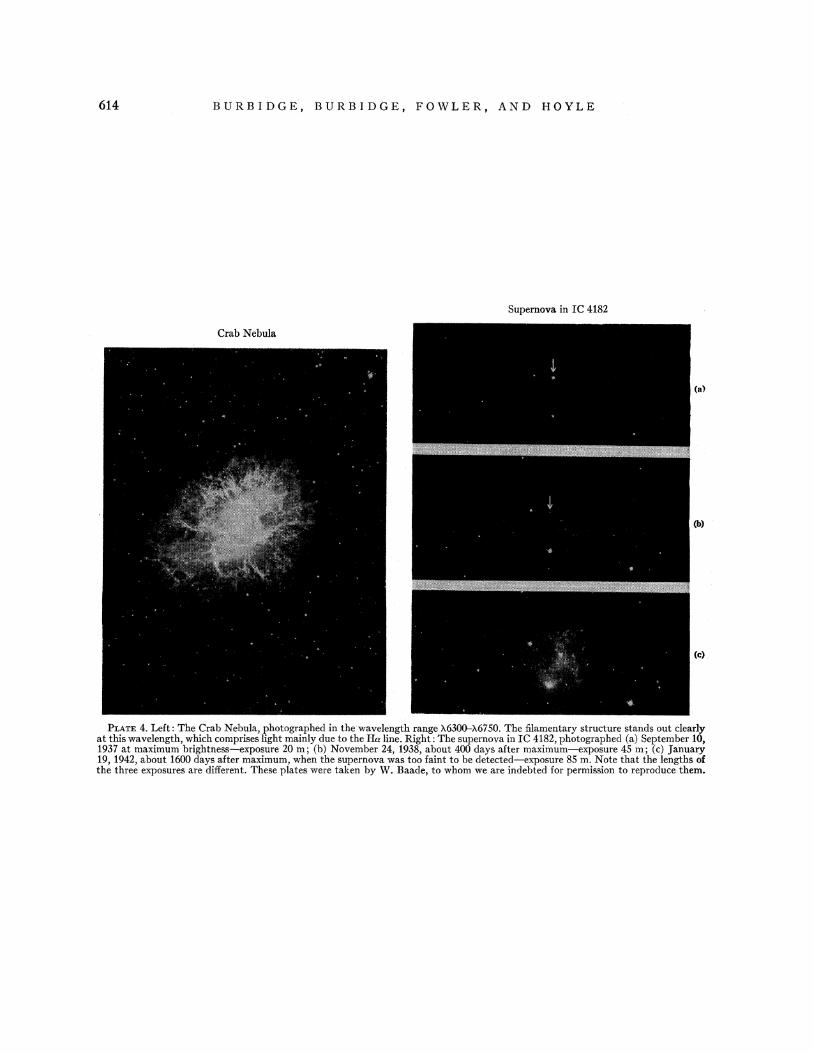
614 BURBIDGE, BURBIDGE, FOWLER, AND HOYLE
Supernova in IC 4182
Crab Nebula
(a)
(c)
PLATE 4. Left: The Crab Nebula, photographed in the wavelength range X6300-A6750. The filamentary structure stands out clearly at this wavelength, which comprises light mainly due to the Ha line. Right: The supernova in IC 4182, photographed (a) September 10, 1937 at maximum brightness-exposure 20m; (b) November 24, 1938, about 400 days after maximum-exposure 45 m; (c) January 19, 1942, about 1600 days after maximum, when the supernova was too faint to be detected-exposure 85 m. Note that the lengths of the three exposures are different. These plates were taken by W. Baade, to whom we are indebted for permission to reproduce them.
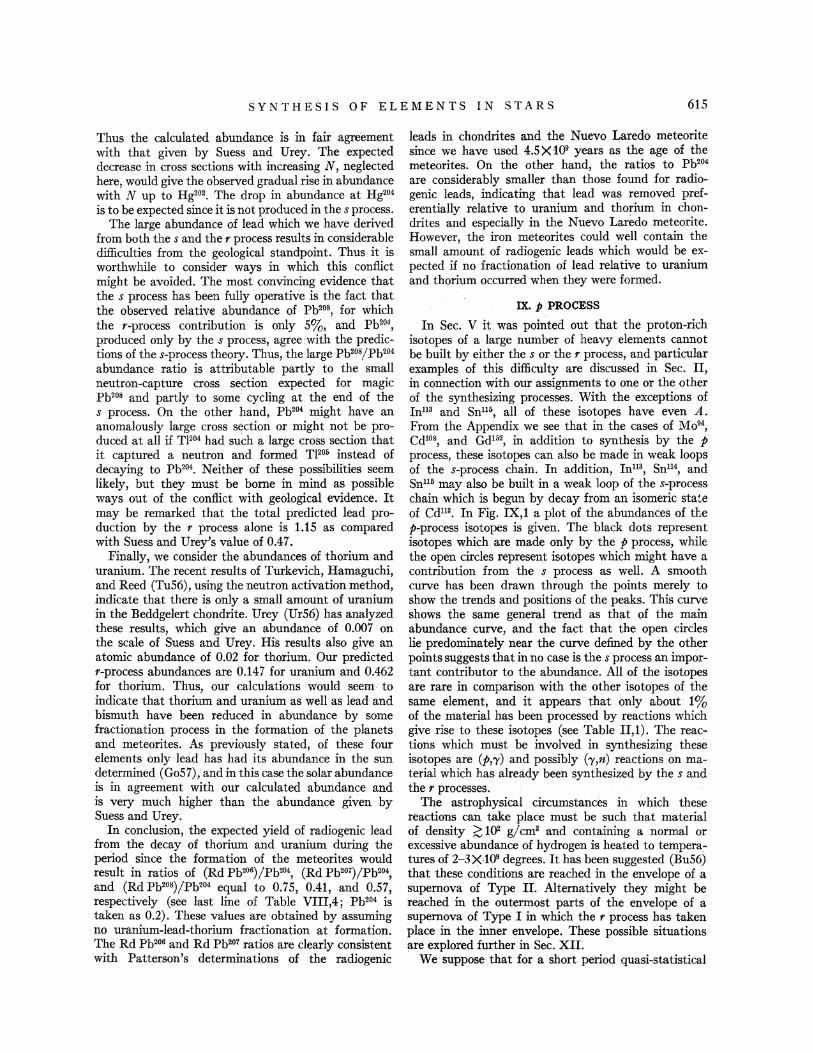
S Y NTH E S I S 0 F E L E M EN T S I N STARS 615
Thus the calculated abundance is in fair agreement with that given by Suess and Urey. The expected decrease in cross sections with increasing N, neglected here, would give the observed gradual rise in abundance with N up to Hg202. The drop in abundance at Hg204
is to be expected since it is not produced in the s process. The large abundance of lead which we have derived
from both the s and the r process results in considerable difficulties from the ·geological standpoint. Thus. it is worthwhile to consider ways in which this conflict might be avoided. The most convincing evidence that the s process has been fully operative is the fact that the observed relative abundance of Pb208, for which the r-process contribution is only S%, and Pb204,
produced only by the s process, agree:with the predictions of the s-process theory. Thus, the large Pb208/Pb204 abundance ratio is attributable partly to the small neutron-capture cross section expected for magic Pb208 and partly to some cycling at. the end of the s process. On the other hand, Pb204 might have an anomalously large cross section or might not be produced at all if Tl204 had suCh a large cross section that it captured a neutron and fornied Tl206 instead of decaying to Pb204. Neither of these possibilities seem likely, but they must be borne. in mind as possible ways out of the conflict with geological evidence. It may be remarked that the total predicted lead production by the r process alone is 1.15 as compared with Suess and Urey's value of 0.47.
Finally, we consider the abundances of thorium and uranium. The recent results of Turkevich, Hamaguchi, and Reed (Tu56), using the neutron activation method, indicate that there is only a smallamount of uranium in the Beddgelert chondrite. Urey. (Ur56) has analyzed these results, which give an abundance of 0.007 on the scale of Suess and Urey. His results also give an atomic abundance of 0.02 for thorium. Our predicted r-process abundances are 0.147 for uranium and 0.462 for thorium. Thus, our calculations would seem to indicate that thorium and uranium as well as lead and bismuth have been· reduced in abundance by some fractionation process in the formation of the planets and meteorites. As previously stated, of these four elements only lead has had its abundance in the sun determined ( Go57), and in this case the solar abundance is in agreement with our calculated abundance and is very much·. higher than the abundance given by Suess and Urey.
In conclusion, the expected yield of radiogenic lead from the decay of thorium and uranium during the penod since· the formation of the meteorites would result in ratios of (Rd Pb206)/Pb204, (Rd Pb207)/Pb204, and (Rd Pb208)/Pb204 equal to 0.75, 0.41, and 0.57, respectively (see last line . of Table VIII,4; Pb204 is taken as 0.2). These values are obtained by assuming no uranium-.lead-thorium fractionation at formation. The Rd Pb206 and Rd Pb207 ratios are clearly consistent with Patterson's determinations of the radiogenic
leads hi chondrites and the Nuevo Laredo meteorite since we have used 4.5X·1()9 years as the age of the meteorites. On the other hand, the ratios to Pb204 are considerably smaller than those found for radiogenic leads, indicating that lead was removed preferentially relative to uranium and thorium in chondrites and especially in the Nuevo Laredo meteorite. However, the iron meteorites could well contain the small amount of radiogenic leads which would be expected ifno fractionation of lead relative to uranium and thorium occurred when they were iformed.
IX. p PROCESS
In Sec. V it was pointed out that the proton-rich isotopes of a large number of heavy elements cannot be built by either the s or the r process, and particular examples of this difficulty are discussed in Sec. II, in connection with our assignments to one or the other of the synthesizing processes. With the exceptions of Inll3 and Sn116, all of these isotopes have even A. From the Appendix we see that in the cases of Mo94,
Cd108, and Gd162, in addition to synthesis by the p process, these isotopes can also be made in weak loops of the s-process chain. In addition, full3, Sn114, and snm may also be built in a weak loop of the s-process. chain which is begun· by decay from an isomeric state of cam. In Fig. IX,l a plot of the abundances of the p-process isotopes is given. The . black dots represent isotopes which are made only by the p process, while the open circles represent isotopes which might have a contribution from the s process as well. A smooth curve has been drawn through the points merely to Show the trends and positions of the peaks. This curve shows the same general trend as that of the main abundance curve, and the fact that the open circles lie predominately near the curve defined by the other points suggests that in no case is the s process an impor.tant contributor to the abundance. All of the isotopes are rare in comparison with the other isotopes of the same element, and it appears that only about. 1% of the material has been processed by reactions which give rise to these isotopes (see Table II,1). The reactions which must be involved in synthesizing these isotopes are (p,-y) and possibly ('Y,n) reactions on material which has already been synthesized by the s and the r processes.
The astrophysical circumstances in which these reactions can take place must be such that material of density ~ 102 g/cm3 and containing a normal or excessive abundance of hydrogen is heated to tempera:tures of 2-3:><·1()9 degrees. It has been suggested (Bu56) that these conditions are reached in the envelope of a supernova of Type II. Alternatively they might be reached in the outermost parts of the envelope of a supernova of Type I in which the r process has taken place in the inner envelope. These possible situations ~re explored further in See. XII.
We suppose that for a Short period quasi-statistical
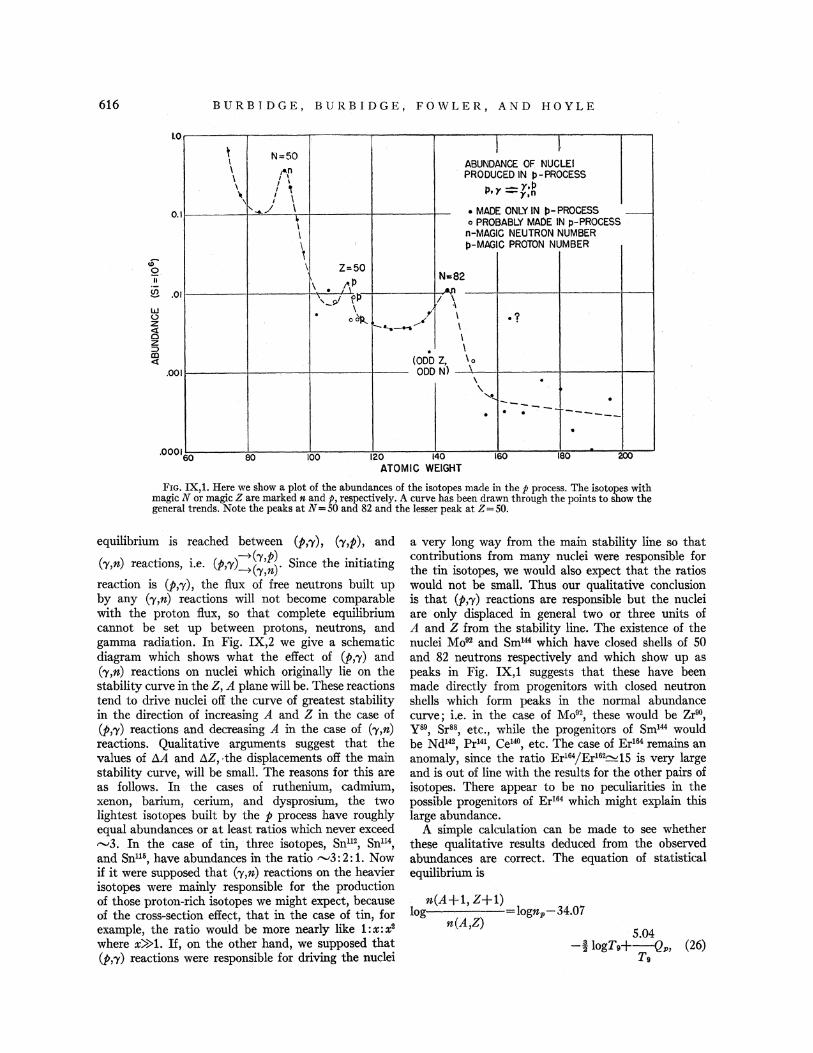
616 BURBIDGE, BURBIDGE, FOWLER, AND HOYLE
t.o..----t --.---N-... -50--,--------,-----..-----rl-----.,.--~,---,
I ABUNDANCE OF NUCLEI \ f'f . PRODUCED IN j)-PROCESS \ I \ p y _y,P -.., / \ ' -y,n
!'....,/ \ 0. I
.D Q
\ \
\ \ Z=50
• MADE ONLY IN j)- PROCESS _ o PROBABLY MAOE IN p-PROCESS n-MAGIC NEUTRON NUMBER !I-MAGIC PROlON NUMBER
N .. 82 \ • ~,P .an --+-----f----,.------l----1
r------+-------r~,~--~~\p I \
II
§ .0 I
• odp,_ / I •? -._,_ .... ...- I
I.LI (.) z g z ::> co <l
\ . \ (ODD Z, \o
~----~~--,--4-------+---- ODDNl --'~-+-------r------~--~ .00 I \ . ' .... -----. . ------
• ·0001ebo,_----!ao-::------:,koo::-----t.l2""o,.....----;,!..40...---~,60;;::------:,;kao,_-__...--i.200~--~
ATOMIC WEIGHT
FIG. IX,1. Here we show a plot of the abundances of the isotopes made in the p process. The isotopes with magic N or magic Z are marked n and p, respectively. A curve has been drawn through the points to show the general trends. Note the peaks at N =50 and 82 and the lesser peak at Z =50.
equilibrium is reached between (p,-y), (-y,p), and
( ) · · (p )~<-r,p) s· th · · · ·· -y,n. reactions, I.e. ,-y ( . )' mce e rmtiatmg ~ -y,n
reaction is (p,-y), the flux of free neutrons built up by any (-y,n) reactions will not become comparable with the proton flux, so that complete equilibrium cannot be set up between protons, neutrons, and gamma radiation. In Fig. IX,2 we give a schematic diagram which shows what the effect of (p,-y) and (-y,n) reactions on nuclei which originally lie on the stability curve in the Z, A plane will be. These reactions tend to drive nuclei off the curve of greatest stability in the direction of increasing A and Z in the case of (p,-y) reactions and decreasing A in the case of ('Y,n) reactions. Qualitative arguments suggest that the values of l\A and .tlZ, -the displacements off the main stability curve, will be small. The reasons for this are as follows. In the cases of ruthenium, cadmium, xenon, barium, cerium, and dysprosium, the two lightest isotopes built by the p process have roughly equal abundances or at least ratios which never exceed ,.....,3, In the case of tin, three isotopes, Sn112, Sn114, and Sn115, have abundances in the ratio ,.....,3:2:1. Now if it were supposed that (-y,n) reactions on the heavier isotopes were mainly responsible for the production of those proton-rich isotopes we might expect, because of the cross-section effect, that in the case of tin, for example, the ratio would be more nearly like l:x:x2 where x»1. If, on the other hand, we supposed that (p,-y) reactions were responsible for driving the nuclei
a very long way from the main stability line so that contributions from many nuclei were responsible for the tin isotopes, we would also expect that the ratios would not be small. Thus our qualitative conclusion is that (p,'Y) reactions are responsible but the nuclei are only displaced in general two or three units of A and Z from the stability line. The existence of the nuclei Mo92 and Sm144 which have closed shells of 50 and 82 neutrons respectively and which show up as peaks in Fig. IX,l suggests that these have been made directly from progenitors with closed neutron shells which form peaks in the normal abundance curve; i.e. in the case of Mo92, these would be Zr90,
Y89, Sr88, etc., while the progenitors of Sm144 would be Nd142, Pr14\ Ce140, etc. The case of Erl64 remains an anomaly, since the ratio Er164/ful6h.-15 is very large and is out of line with the results for the other pairs of isotopes. There appear to be no peculiarities in the possible progenitors of Er164 which might explain this large abundance.
A simple calculation can be made to see whether these qualitative results deduced from the observed abundances are correct. The equation of statistical equilibrium is
n(A+l,Z+l) log logn11-34.07
n(A,Z)
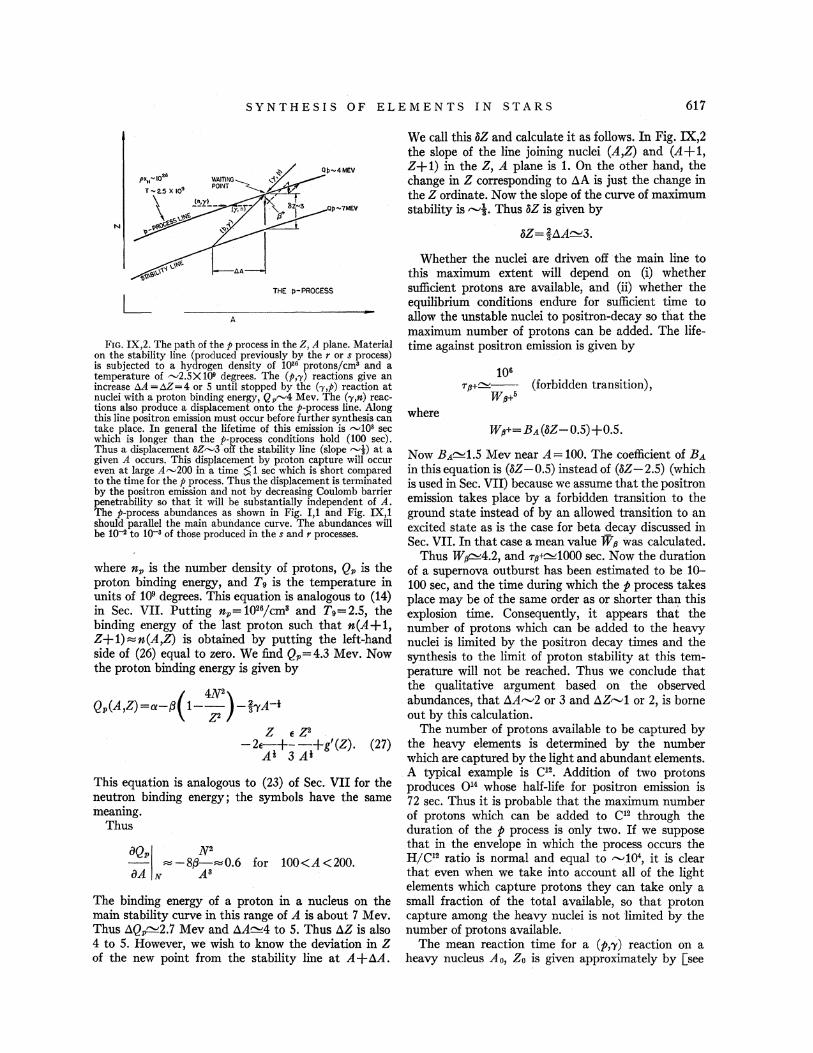
SYNTHESIS OF ELEMENTS IN STARS 617
N
L THE p-PROCESS
A
FrG. IX,2. The path of the p process in the Z, A plane. Material on the stability line (produced previously by the r or s process) is subjected to a hydrogen density of 1()26 protons/cm3 and a temperature of "'2.5X 1()9 degrees. The (p,-y J reactions give an increase M=AZ=4 or 5 until stopped by the (-y,p) reaction at nuclei with a proton binding energy, Qp"-'4 Mev. The (-y,n) reactions also produce a displacement onto the p-process line. Along this line positron emission must occur before further synthesis can take place. In general the lifetime of this emission is "-'103 sec which is longer than the p-process conditions hold (100 sec). Thus a displacement liZ""-'3 off the stability line (slope "-'i) at a given A occurs. This displacement by proton capture will occur even at large A"-'200 in a time ;); 1 sec which is short compared to the time for the p process. Thus the displacement is terminated by the positron emission and not by decreasing Coulomb barrier penetrability so that it will be substantially independent of A. The p-process abundances as shown in Fig. 1,1 and Fig. IX,1 should parallel the main abundance curve. The abundances will be lQ-2 to w-a of those produced in the s and r processes.
where np is the number density of protons, Qp is the proton binding energy, and T 9 is the temperature in units of 1()9 degrees. This equation is analogous to (14) in Sec. VII. Putting np= 1026/cm8 and T9= 2.5, the binding energy of the last proton such that n(A + 1, Z+1):::.n(A,Z) is obtained by putting the left-hand side of (26) equal to zero. We find Qp=4.3 Mev. Now the proton binding energy is given by
Qp(A,Z)=a-{j( 1-:)-tyA-l Z E Z2
-2e-+--+g'(Z). (27) Ai 3 Al
This equation is analogous to (23) of Sec. VII for the neutron binding energy; the symbols have the same meaning.
Thus
iJQp' N2 - :::::-8j3-:::::0.6 for 100<A<200. iJA N A8
The binding energy of a proton in a nucleus on the main stability curve in this range of A is about 7 Mev. Thus AQ~2.7 Mev and AA~4 to 5. Thus AZ is also 4 to 5. However, we wish to know the deviation in Z of the new point from the stability line at A+AA.
We call this 8Z and calculate it as follows. In Fig. IX,2 the slope of the line joining nuclei (A,Z) and (A+1, Z+ 1) in the Z, A plane is 1. On the other hand, the change in Z corresponding to AA is just the change in the Z ordinate. Now the slope of the curve of maximum stability is "'i· Thus az is given by
8Z=fAA~3.
Whether the nuclei are driven off the main line to this· maximum extent will depend on (i) whether sufficient protons are available, and (ii) whether the equilibrium conditions endure for sufficient time to allow the unstable nuclei to positron-decay so that the maximum number of protons can be added. The lifetime against positron emission is given by
where
106
rp+~-- (forbidden transition), Wfi+5
W/i+=BA(8Z-0.5)+0.5.
Now BA"'1.5 Mev near A= 100. The coefficient of BA in this equation is (8Z -0.5) instead of (8Z- 2.5) (which is used in Sec. VII) because we assume that the positron emission takes place by a forbidden transition to the ground state instead of by an allowed transition to an excited state as is the case for beta decay discussed in Sec. VII. In that case a mean value "W11 was calculated.
Thus W ~4.2, and Tfi-I'"Y1000 sec. Now the duration of a supernova outburst has been estimated to be 10-100 sec, and the time during which the p process takes place may be of the same order as or shorter than this explosion time. Consequently, it appears that the number of protons which can be added to the heavy nuclei is limited by the positron decay times and the synthesis to the limit of proton stability at this temperature will not be reached. Thus we conclude that the qualitative argument based on the observed abundances, that AA"'2 or 3 and AZ"'1 or 2, is borne out by this calculation.
The number of protons available to be captured by the heavy elements is determined by the number which are captured by the light and abundant elements. A typical example is C12• Addition of two protons produces 0 14 whose half-life for positron emission is 72 sec. Thus it is probable that the maximum number of protons which can be added to C12 through the duration of the p process is only two. If we suppose that in the envelope in which the process occurs the H/Cl2 ratio is normal and equal to ,..._,lQ4, it is clear that even when we take into account all of the light elements which capture protons they can take only a small fraction of the total available, so that proton capture among the heavy nuclei is not iimited by the number of protons available.
The mean reaction time for a (p;y) reaction on a heavy nucleus Ao, Zo is given approximately by [see
618 BURBIDGE, BURBIDGE, FOWLER, AND HOYLE
Sec. IliA, ca.se (ii)]
1 Zo6/6
-=3.1X10⁹tr--r A 01i 6T9i
Xexp[ 1.26{AZo(A 0t+t)}l-4.2S(z~:) 1] sec!,
where A=Ao/(Ao+l). For example, for 8oHg200, we have
1 p -=3.0X 1028- exp( -78.8T9-t) sec-1•
T T~ .
Thus for T9= 2.S and p= 102 g/cm8, 1/ r= 10 sec-1,
so that the capture rate is rapid and is not a limiting factor in the proton addition.
X. x PROCESS
We have given the name x process collectively to mechanisms which may synthesize deuterium, lithium, beryllium, and boron. Some discussion of the problems involved in the x process are discussed in this section.
A. Observational Evidence for the·Presence·of Deuterium, Lithium, Beryllium, and
Boron. in our Galaxy
From the appendix the number ratios of deuterium, Li8, LF, Be9, B10, and B11 relative to hydrogen are 1.4X1Q-4, 1.8X10⁻¹⁰, 2.3X1Q-9, SX1Q-10, 1.1X1Q-10,
and 4.9X1Q-10, respectively. Thus deuterium is rare as compared with its neighbors hydrogen and helium in the atomic abundance table, but as far as the remainder of the elements are concerned is very abundant and comparable with iron. Lithium, beryllium, and boron are all extremely rare as compared with their neighbors helium, carbon, nitrogen, and oxygen, and are only about 100 .times as abundant as the majority of the heavy elements (see Fig. I,l). It should be emphasized for these elements particularly that all of these values have been obtained from terrestrial and meteoritic data and thus they may not be at all representative of the cosmic abundances of these elements.
A number of attempts have been made to detect deuterium in the sun. The latest, by Kinman (KiS6), shows that the abundance ratio of deuterium to hydrogen in the atmosphere is less than 4X lQ-6• Attempts have also been made to detect the radio spectral line at 327 Me/sec due to neutral deuterium in interstellar gas, and the most recent results by Stanley and Price (StS6) and Adgie and Hey (AdS7) lead to the conclusion that the deuterium to hydrogen ratio does not exceed SX lQ-4.
The abundances of lithium and beryllium in the solar atmosphere have been investigated by Greenstein and Richardson (GrS1) and Greenstein and TandbergHanssen (GrS4c). They found that while the isotope ratio Li6/LF could well be normal, the lithium to. hy-
drogen ratio lies in the range 1.6X1Q-1L7X1Q-12
or about 100 times smaller than the meteoritic value. The beryllium to hydrogen ratio= 1Q-10, a value which is reasonably well in agreement with that of Suess and Urey. An upper limit to the beryllium to hydrogen ratio of 1Q-10 has been obtained for a magnetic star by Fowler, Burbidge, and Burbidge (FoSSa).· Estimates of the upper limits to the interstellar abundances of lithium and beryllium have been made by Spitzer (Sp49, SpSS). He hasestimated that the upper limit to the lithium to sodium ratio is about 0.1, so that if sodium has normal abundance the lithium to hydrogen ratio is less than lQ-7• The beryllium to hydrogen ratio is found to be~ to-n. This is an order of magnitude lower than that found in meteorites, and Spitzer has concluded that ))ome beryllium may be locked up in interstellar grains.
Lithium, probably in variable amounts, has been detected through the presence of the Li I resonance doublet at A 6707.8 in a wide variety of late-type stars~ Certain carbon stars show this feature very stronglyin their spectra (Mc40, Mc41, Mc44, Sa44, FuS6), while it is also present inS-stars (KeS6, TeS6), and in M-type dwarfs and giants (GrS7). No relative abundances are yet available.
Boron is spectroscopically unobservable. In the primary cosmic radiation the abundances of
lithium, beryllium, and boron are comparable with those of carbon, nitrogen, and oxygen (GoS4a, KaS4, NoSS, NoS7).
B. Nuclear Reactions Which Destroy Deuterium, · Lithium, Beryllium, and Boron
First· we outline the reactions which destroy these light elements in a hydrogen-burning zone. At temperatures commonly found in the interiors of main-sequence stars the reactions which destroy deuterium are D2(d,p)H3 (.8-)He3, D2(p,'Y)He3, and D2(d,n)He3• In the same way the reactions which destroy lithium are Li6(p,a)He3 and LF(p,a)He4. Beryllium is destroyed by Be9 (p,d)Be42He4 and D2 (p,'Y)He8, or Be9(p,a) Li6 (p,a)He3• Boron is destroyed by B10(p,a)Be7 (EC)LF(p,a)He4 and B11(p,a)Be42He4. Thus the net result is always· to corivert these elements into helium through proton bombardment, and the rates of the reactions are such that in all conditions before a star evolves off the main sequence all of the deuterium; lithium, beryllium, and boron in the volume which contains the vast majority of the mass will be destroyed (SaSS).
C. Synthesis of Deuterium, Lithium, Beryllium, and Boron
The foregoing considerations make it appear probable that· these . elements have been synthesized in a lowtemperature, low·density environment in the universe, or conceivably in. a region in which hydrogen was
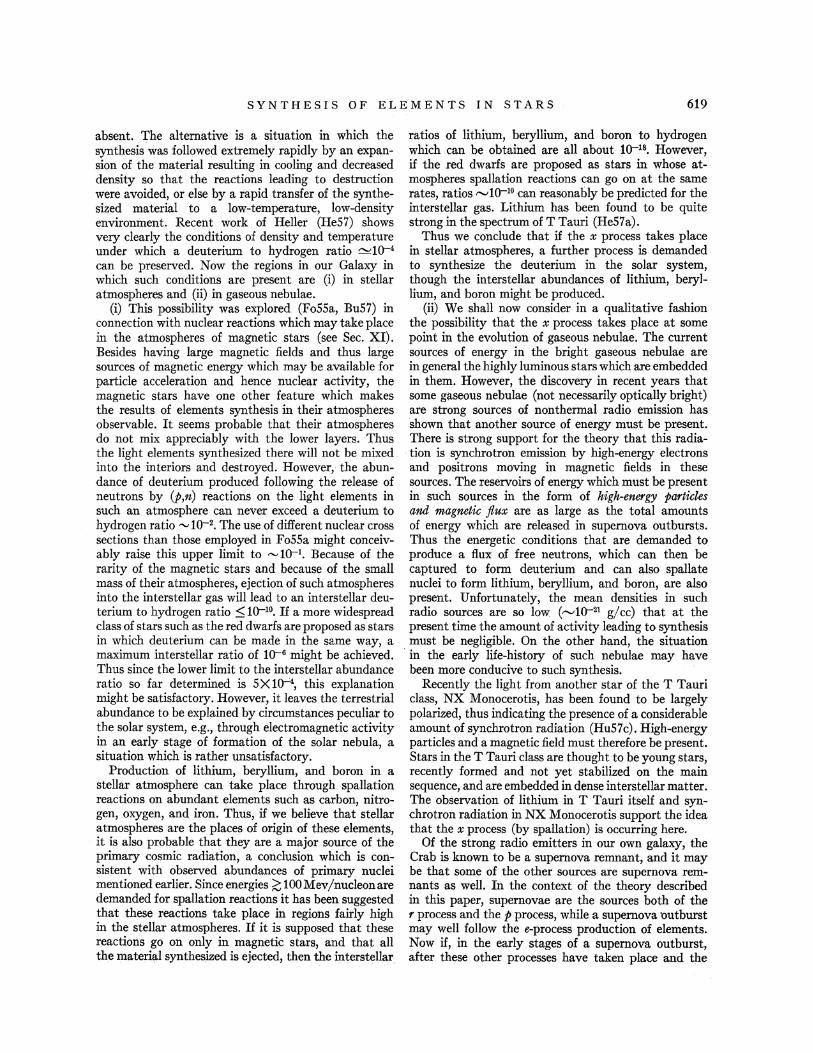
S Y NTH E S I S 0 F E L EM EN T S I N S T A R S 619
absent. The alternative is a situation in which the synthesis was followed extremely rapidly by an expansion of the material resulting in cooling and decreased density so that the reactions leading to destruction were avoided, or else by a rapid transfer of the synthesized material to a low-temperature, low-density environment. Recent work of Heller (HeS7) shows very clearly the conditions of density and temperature under which a deuterium to hydrogen ratio ~10--4 can be preserved .. Now the regions in our Galaxy in which such conditions are present are (i) in stellar atmospheres and (ii) in gaseous nebulae.
(i) This possibility was explored (FoSSa, BuS7) in connection with nuclear reactions which may take place in the atmospheres of magnetic stars (see Sec. XI). Besides having large magnetic fields and thus large sources of magnetic energy which may be available for particle acceleration and hence nuclear activity, the magnetic stars have one other feature which makes the results of elements synthesis in their atmospheres observable. It seems probable that their atmospheres do not mix appreciably with the lower layers. Thus the light elements synthesized there will not be mixed into the interiors and destroyed. However; the abundance of deuterium produced following the release of neutrons by (p,n) reactions on the light elements in such an atmosphere can never exceed a deuterium to hydrogen ratio·"' 1Q-2• The use of difierent nuclear cross sections than those employed in FoSSa might conceivably raise this upper limit to "-'lQ-1• Because of the rarity of the magnetic stars and because of the small mass of their atmospheres, ejection of such atmospheres into the interstellar gas will lead to an interstellar deuterium to hydrogen ratio s; 1Q-10• H a more widespread class of stars such as the red dwarfs are proposed as stars in which deuterium can be made in the same way, a maximum interstellar ratio of 1Q-6 might be achieved. Thus since the lower limit to the interstellar abundance ratio so far determined is SX1o-'4, this explanation might be satisfactory. However, it leaves the terrestrial abundance to be explained by circumstances peculiar to the solar system, e.g., through electromagnetic activity in an early stage of formation of the solar nebula, a situation which is rather unsatisfactory.
Production of lithium, beryllium, and boron in a stellar atmosphere can take place through spallation reactions on abundant elements such as carbon, nitrogen, oxygen, and iron. Thus, if we believe that stellar atmospheres are the places of origin of these elements, it is also probable that they are a major source of the primary cosmic radiation, a conclusion which is consistent with observed abundances of primary nuclei mentioned earlier. Since energies;(; 100Mev/nucleonare demanded for spallation reactions it has been suggested that these reactions take place in regions fairly high in the stellar atmospheres. H it is supposed that these reactions go on only in magnetic stars, and that all the material synthe!\ized is ejected, then the interstellar
ratios of lithium, beryllium, and boron to hydrogen which can be obtained are all about 1Q-18• However, if the red dwarfs are proposed as stars in whose atmospheres spallation reactions can go on at the same rates, ratios ,....,lQ-10 can reasonably be predicted for the interstellar gas. Lithium has been found to be quite strong in the spectrum ofT Tauri (HeS7a).
Thus we conclude that if the x process takes place in stellar atmospheres, a further process is demanded to synthesize the deuterium in the solar system, though the interstellar abundances of lithium, beryllium, and boron might be produced.
(ii) We shall now consider in a qualitative fashion the possibility that the x process takes place at some point in the evolution of gaseous nebulae. The current sources of energy in the bright gaseous nebulae are in general the highly luminous stars which are embedded in them. However, the discovery in recent years that some gaseous nebulae (not necessarily optically bright) are strong sources of nonthermal radio emission has shown that another source of energy must be present. There is strong support for the theory that this radiation is synchrotron emission by high-energy electrons and positrons moving in magnetic fields in these sources. The reservoirs of energy which must be present in such sources in the form of high-energy particles and magnetic flux are as large as the total amounts of energy which are released in supernova outbursts. Thus the energetic conditions that are demanded to produce a :flux of free neutrons, which can then be captured to form deuterium and can also spallate nuclei to form lithium, beryllium, and. boron, are also present. Unfortunately, the mean densities in such radio sources are so low ("'lQ-21 g/cc) that at the present time the amount of activity leading to !\ynthesis must be negligible. On the other hand, the situation
· in the early life-history of such nebulae may have been more conducive to such !\ynthesis.
Recently the light from another star of the T Tauri class, NX Monocerotis, has been found to be largely polarized, thus indicating the presence of a considerable amount of synchrotron radiation (HuS7c). High-energy particles and a magnetic field must therefore be present. Stars in the T Tauri class are thought to be young stars, recently formed and not yet stabilized on the main sequence, and are embedded in dense interstellar matter. The observation of lithium in T Tauri itself and synchrotron radiation in NX Monocerotis support the idea that the x process (by spallation) is occurring here.
Of the strong radio emitters in our own galaxy, the Crab is known to be a supernova remnant, and it may be that some of the other sources are supernova remnants as well. In the context of the theory described in this paper, supernovae are the sources both of the ,. process and the p process, while a supernova 'Outburst may well follow the e-process production of elements. · Now if, in the early stages of a supernova outburst, after these other processes have taken place and the
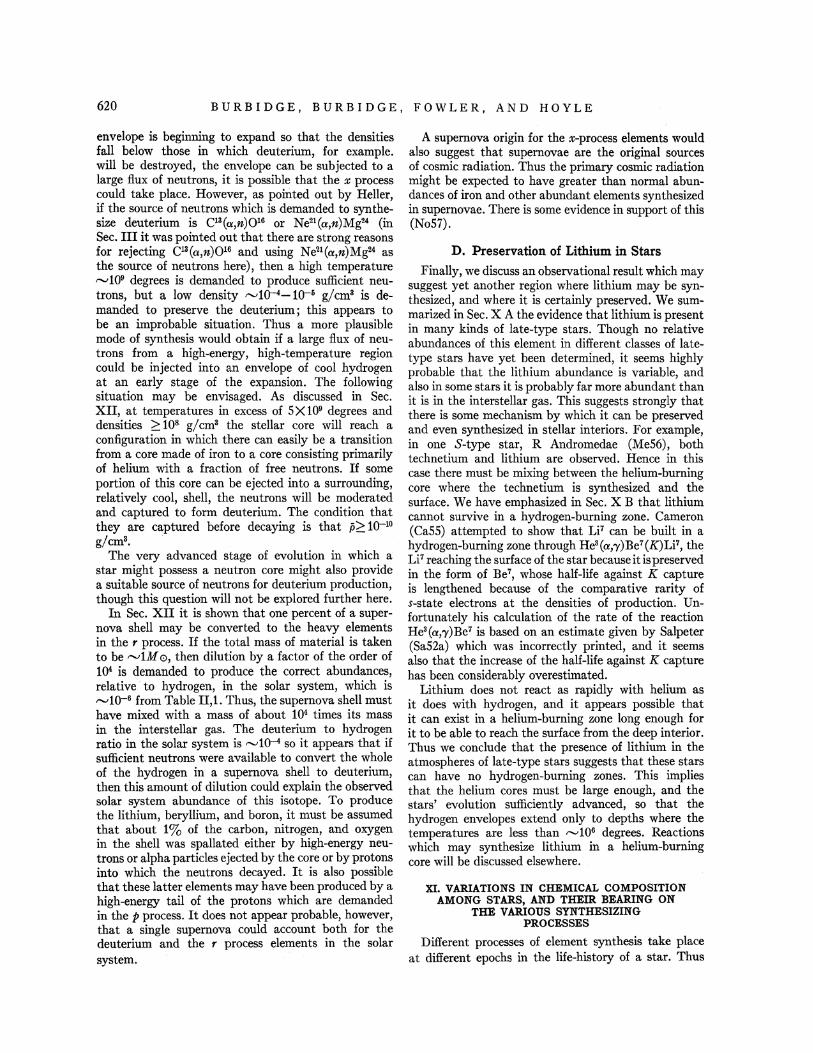
620 BURBIDGE, BURBIDGE, FOWLER, AND HOYLE
envelope is beginning to expand so that the densities fall below those in which deuterium, for example. will be destroyed, the envelope can be subjected to a large flux of neutrons, it is possible that the x process could take place. However, as pointed out by Heller, if the source of neutrons which is demanded to synthesize deuterium is C13(a,n)016 or Ne21 (a,n)Mg24 (in Sec. III it was pointed out that there are strong reasons for rejecting C13 (a,n)016 and using Ne21 (a,n)Mg24 as the source of neutrons here), then a high temperature "-'109 degrees is demanded to produce sufficient neutrons, but a low density "'10-4-lQ-6 g/cm3 is demanded to preserve the deuterium; this appears to be an improbable situation. Thus a more plausible mode of synthesis would obtain if a large flux of neutrons from a high-energy, high-temperature region could be injected into an envelope of cool hydrogen at an early stage of the expansion. The following situation may be envisaged. As discussed in Sec. XII, at temperatures in excess of SX 109 degrees and densities ;::::: 108 g/cm3 the stellar core will reach a configuration in which there can easily be a transition from a core made of iron to a core consisting primarily of helium with a fraction of free neutrons. If some portion of this core can be ejected into a surrounding, relatively cool, shell, the neutrons will be moderated and captured to form deuterium. The condition that they are captured before decaying is that p;:::: 1Q-10
g/cma. . The very advanced stage of evolution in which a
star might possess a neutron core might also provide a suitable source of neutrons for deuterium production, though this question will not be explored further here.
In Sec. XII it is shown that one percent of a supernova shell may be converted to the heavy elements in the r process. If the total mass of material is taken to be "'1M 0, then dilution by a factor of the order of 104 is demanded to produce the correct abundances, relative · to hydrogen, in the solar system, which is ""'lo-6 from Table II,l. Thus, the supernova shell must have mixed with a mass of about 104 times its mass in the interstellar gas. The deuterium to hydrogen ratio in the solar system is "'lQ-4 so it appears that if sufficient neutrons were available to convert the whole of the hydrogen in a supernova shell to deuterium, then this amount of dilution could explain the observed solar system abundance of this isotope. To produce the lithium, beryllium, and boron, it must be assumed that about 1% of the carbon, nitrogen, and oxygen in the shell was spallated either by high-energy neutrons or alpha particles ejected by the core or by protons into which the neutrons decayed. It is also possible that these latter elements may have been produced by a high-energy tail of the protons which are demanded in the p process. It does not appear probable, however, that a single supernova could account both for the deuterium and the r process elements in the solar system.
A supernova origin for the x-process elements would also suggest that supernovae are the original sources of cosmic radiation. Thus the primary cosmic radiation might be expected to have greater than normal abundances of iron and other abundant elements synthesized in supernovae. There is some evidence in support of this (No57).
D. Preservation of Lithium in Stars Finally, we discuss an observational result which may
suggest yet another region where lithium may be synthesized, and where it is certainly preserved. We summarized in Sec. X A the evidence that lithium is present in many kinds of late-type stars. Though no relative abundances of this element in different classes of latetype stars have yet been determfned, it seems highly probable that the lithium abundance is variable, and also in some stars it is probably far more abundant than it is in the interstellar gas. This suggests strongly that there is some mechanism by which it can be preserved and even synthesized in stellar interiors. For example, in one S-type star, R Andromedae (Me56), both technetium and lithium are observed. Hence in this case there must be mixing between the helium-burning core where the technetium is synthesized and the surface. We have emphasized in Sec. X B that lithium cannot survive in a hydrogen-burning zone. Cameron (CaSS) attempted to show that LF can be built in a hydrogen-burning zone through He3(a;y)Be7(K)LF, the Li7 reaching the surface of the star because it is preserved in the form of Be7, whose half-life against K capture is lengthened because of the comparative rarity of s-state electrons at the densities of production. Unfortunately his calculation of the rate of the reaction He3(a;y)Be7 is based on an estimate given by Salpeter (Sa52a) which was incorrectly printed, and it seems also that the increase of the half-life against K capture has been considerably overestimated.
Lithium does not react as rapidly with helium as it does with hydrogen, and it appears possible that it can exist in a helium-burning zone long enough for it to be able to reach the surface from the deep interior. Thus we conclude that the presence of lithium in the atmospheres of late-type stars suggests that these stars can have no hydrogen-burning zones. This implies that the helium cores must be large enough, and the stars' evolution sufficiently advanced, so that the hydrogen envelopes extend only to depths where the temperatures are less than "-'106 degrees. Reactions which may synthesize lithium in a helium-burning core will be discussed elsewhere.
XI. VARIATIONS IN CHEMICAL COMPOSITION AMONG STARS, AND THEIR BEARING ON
THE VARIOUS SYNTHESIZING PROCESSES
Different processes of element synthesis take place at different epochs in the life-history of a star. Thus
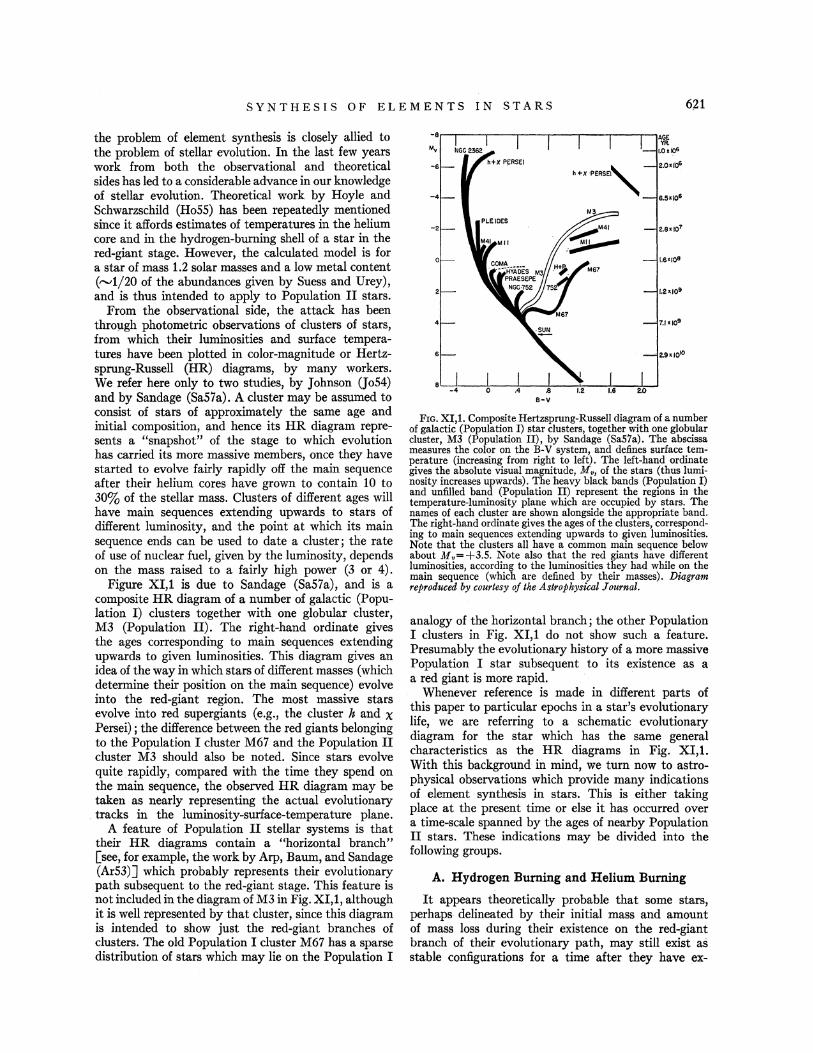
SYNTHESIS OF ELEMENTS IN STARS 6,21
the problem of element synthesis is closely allied to the problem of stellar evolution. In the last few years work from both the observational and theoretical sides has led to a considerable advance in our knowledge of stellar evolution. Theoretical work by Hoyle and Schwarzschild (Ho55) has been repeatedly mentioned since it affords estimates of temperatures in the helium core and in the hydrogen-burning shell of a star in the red-giant stage. However, the calculated model is for a star of mass 1.2 solar masses and a low metal content ("-'1/20 of the abundances given by Suess and Urey), and is thus intended to apply to Population II stars.
From the observational side, the attack has been throJl,gh photometric observations of clusters of stars, from which their luminosities and surface temperatures have been plotted in color-magnitude or Hertzsprung-Russell (HR) diagrams, by many workers. We refer here only to two studies, by Johnson Go54) and by Sandage (Sa57a). A cluster may be assumed to consist of stars of approximately the same age and initial composition, and hence its HR diagram represents a "snapshot" of the stage to which evolution has carried its more massive members, once they have started to evolve fairly rapidly off the main sequence after their helium cores have grown to contain 10 to 30% of the stellar mass. Clusters of different ages will have main sequences extending upwards to stars of different luminosity, and the point at which its main sequence ends can be used to date a cluster; the rate of use of nuclear fuel, given by the luminosity, depends on the mass raised to a fairly high power (3 or 4).
Figure XI,1 is due to Sandage (Sa57a), and is a composite HR diagram of a number of galactic (Population I) clusters together with one globular cluster, M3 (Population II). The right-hand ordinate gives the ages corresponding to main sequences extending upwards to given luminosities. This diagram gives an idea of the way in which stars of different masses (which determine their position on the main sequence) evolve into the red-giant region. The most massive stars evolve into red supergiants (e.g., the cluster h and x Persei) ; the difference between the red giants belonging to the Population I cluster M67 and the Population II cluster M3 should also be noted. Since stars evolve quite rapidly, compared with the time they spend on the main sequence, the observed HR diagram may be taken as nearly representing the actual evolutionary
. tracks in the luminosity-surface-temperature plane. A feature of Population II stellar systems is that
their HR diagrams contain a "horizontal branch" [see, for example, the work by Arp, Baum, and Sandage (Ar53)] which probably represents their evolutionary path subsequent to the red-giant stage. This feature is not included in the diagram of M3 in Fig. XI,1, although it is well represented by that cluster, since this diagram is intended to show just the red-giant branches of clusters. The old Population I cluster M67 has a sparse distribution of stars which may lie on the Population I
B-V
FIG. XI,l. Composite Hertzsprung-Russell diagram of a number of galactic (Population I) star clusters, together with one globular cluster, M3 (Population II)., by Sandage (Sa57a). The abscissa measures the color on the B-V system, and defines surface temperature (increasing from right to left). The left-hand ordinate gives the absolute visual magnitude, M., of the stars (thus luminosity increases upwards). The heavy black bands (Population I) and unfilled band (Population II) represent the reg~.ons in the temperature-luminosity plane which are occupied by stars. The names of each cluster are shown alongside the appropriate band. The right-hand ordinate gives the ages of the clusters, corresponding to main sequences extending upwards to given luminosities. Note that the clusters all have a common main sequence below about M.=+3.5. Note also that the red giants have different luminosities, according to the luminosities they had while on the main sequence (which are defined by their masses). DWgram reproduced by courtesy of the Astrophysical Journal.
analogy of the horizontal branch; the other Population I clusters in Fig. XI,1 do not show such a feature. Presumably the evolutionary history of a more massive Population I star subsequent to its existence as a a red giant is more rapid.
Whenever reference is made in different parts of this paper to particular epochs in a star's evolutionary life, we are referring to a schematic evolutionary diagram for the star which has the same general characteristics as the HR diagrams in Fig. XI,1. With this background in mind, we turn now to astrophysical observations which provide many indications of element synthesis in stars. This is either taking place at the present time or else it has occurred over a time-scale spanned by the ages of nearby Population II stars. These indications may be divided into the following groups.
A. Hydrogen Burning and Helium. Burning
It appears theoretically probable that some stars, perhaps delineated by their initial mass and amount of mass loss during their existence on the red-giant branch of their evolutionary path, may still exist as stable configurations for a time after they ha.ve ex-
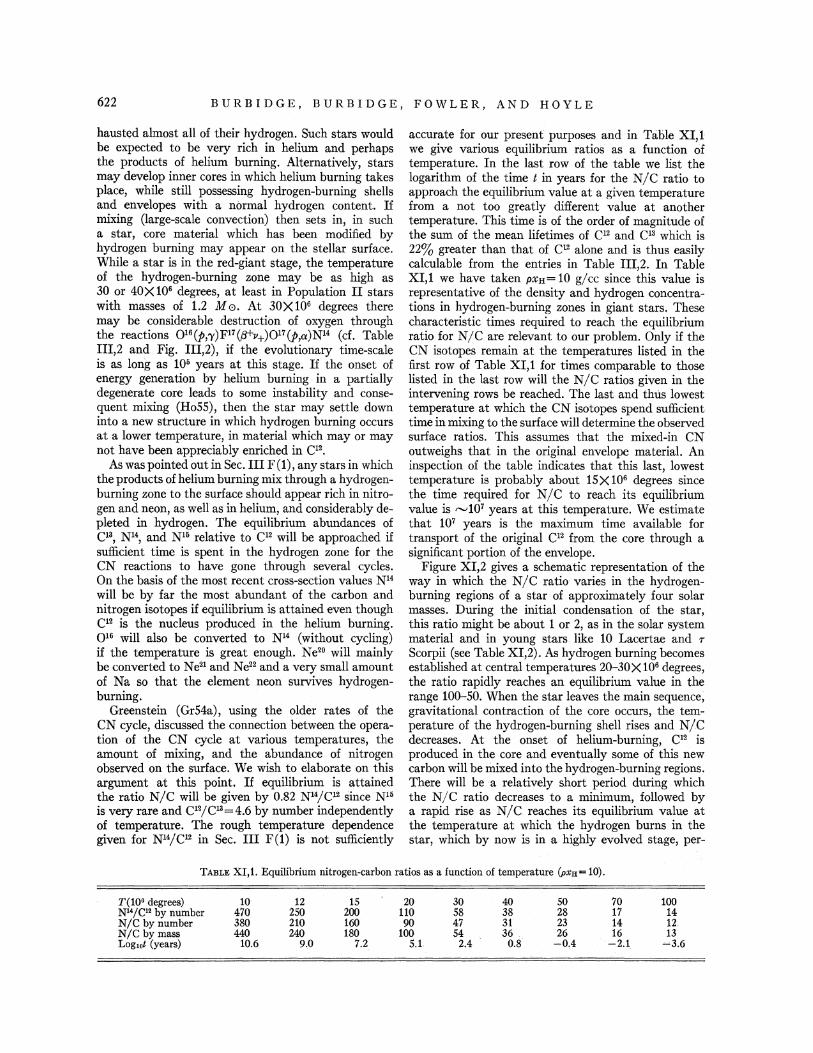
622 BURBIDGE, BURBIDGE, FOWLER, AND HOYLE
haust~d almost all of their hydrogen. Such stars would be expected to be very rich in helium and perhaps the products of helium burning. Alternatively, stars may develop inner cores in which helium burning takes place, while still possessing hydrogen-burning shells and envelopes with a normal hydrogen content. If mixing (large-scale convection) then sets in, in such a star, core material which has been modified by hydrogen burning may appear on the stellar surface. While a star is in the red-giant stage, the temperature of the hydrogen-burning zone may be as high as 30 or 40X 106 degrees, at least in Population II stars with masses of 1.2 M 0. At 30X 106 degrees there may be considerable destruction of oxygen through the reactions 0 16 (p,'Y)F17 (.8+v+)017 (p,a)N14 (cf. Table III,2 and Fig. III,2), if the evolutionary time-scale is as long as 105 years at this stage. If the onset of energy generation by helium burning in a partially degenerate core leads to some instability and consequent mixing (Ho55), then the star may settle down into a new structure in which hydrogen burning occurs at a lower temperature, in material which may or may not have been appreciably enriched in 0 2•
As was pointed out in Sec. III F(1), any stars in which the products of helium burning mix through a hydrogenburning zone to the surface should appear rich in nitrogen and neon, as well as in helium, and considerably depleted in hydrogen. The equilibrium abundances of Cl3, N14, and N16 relative to 0 2 will be approached if sufficient time is spent in the hydrogen zone for the CN reactions to have gone through several cycles. On the basis of the most recent cross-section values Nl4
will be by far the most abundant of the carbon and nitrogen isotopes if equilibrium is attained even though C12 is the nucleus produced in the helium burning. 0 16 will also be converted to N14 (without cycling) if the temperature is great enough. Ne20 will mainly be converted to Ne21 and Ne22 and a very small amount of Na so that the element neon survives hydrogenburning.
Greenstein (Gr54a), using the older rates of the CN cycle, discussed the connection between the operation of the CN cycle at various temperatures, the amount of mixing, and the abundance of nitrogen observed on the surface. We wish to elaborate on this argument at this point. If equilibrium is attained the ratio N/C will be given by 0.82 N14/Cl2 since N15
is very rare and 0 2/C13=4.6 by number independently of temperature. The rough temperature dependence given for N14/C12 in Sec. III F(1) is not sufficiently
accurate for our present purposes and in Table XI,l we give various equilibrium ratios as a function of temperature. In the last row of the table we list the logarithm of the time t in years for the N/C ratio to approach the equilibrium value at a given temperature from a not too greatly different value at another temperature. This time is of the order of magnitude of the sum of the mean lifetimes of C12 and C13 which is 22% greater than that of C12 alone and is thus easily calculable from the entries in Table III,2. In Table XI,l we have taken PXH= 10 g/cc since this value is representative of the density and hydrogen concentrations in hydrogen-burning zones in giant stars. These characteristic times required to reach the equilibrium ratio for NjC are relevant to our problem. Only if the CN isotopes remain at the temperatures listed in the first row of Table XI,l for times comparable to those listed in the last row will the N/C ratios given in the intervening rows be reached. The last and thus lowest temperature at which the CN isotopes spend sufficient time in mixing to the surface will determine the observed surface ratios. This assumes that the mixed-in CN outweighs that in the original envelope material. An inspection of the table indicates that this last, lowest temperature is probably about 15X106 degrees since the time required for N/C to reach its equilibrium value is "'107 years at this temperature. We estimate that 107 years is the maximum tiine available for transport of the original C12 from the core through a significant portion of the envelope.
Figure XI,2 gives a schematic representation of the way in which the N/C ratio varies in the hydrogenburning regions of a star of approximately four solar masses. During the initial condensation of the star, this ratio might be about 1 or 2, as in the solar system material and in young stars like 10 Lacertae and r Scorpii (see Table XI,2). As hydrogen burning becomes established at central temperatures 20-30X 106 degrees, the ratio rapidly reaches an equilibrium value in the range 100-50. When the star leaves the main sequence; gravitational contraction of the core occurs, the temperature of the hydrogen-burning shell rises and N/C decreases. At the onset of helium-burning, C12 is produced in the core and eventually some of this new carbon will be mixed into the hydrogen-burning regions. There will be a relatively short period during which the N/C ratio decreases to a minimum, followed by a rapid rise as N/C reaches its equilibrium value at the temperature at which the hydrogen burns in the star, which by now is in a highly evolved stage, per-
TABLE XI,l. Equilibrium nitrogen-carbon ratios as a function of temperature (pxH= 10).
T(108 degrees) 10 12 15 20 30 40 50 70 100 Nl4/C12 by number 470 250 200 110 58 38 28 17 14 N/C by number 380 210 160 90 47 31 23 14 12 N/C by mass 440 240 180 100 54 36 26 16 13 Log10t (years) 10.6 9.0 7.2 5.1 2.4 0.8 -0 .. 4 -2.1 ~3.6
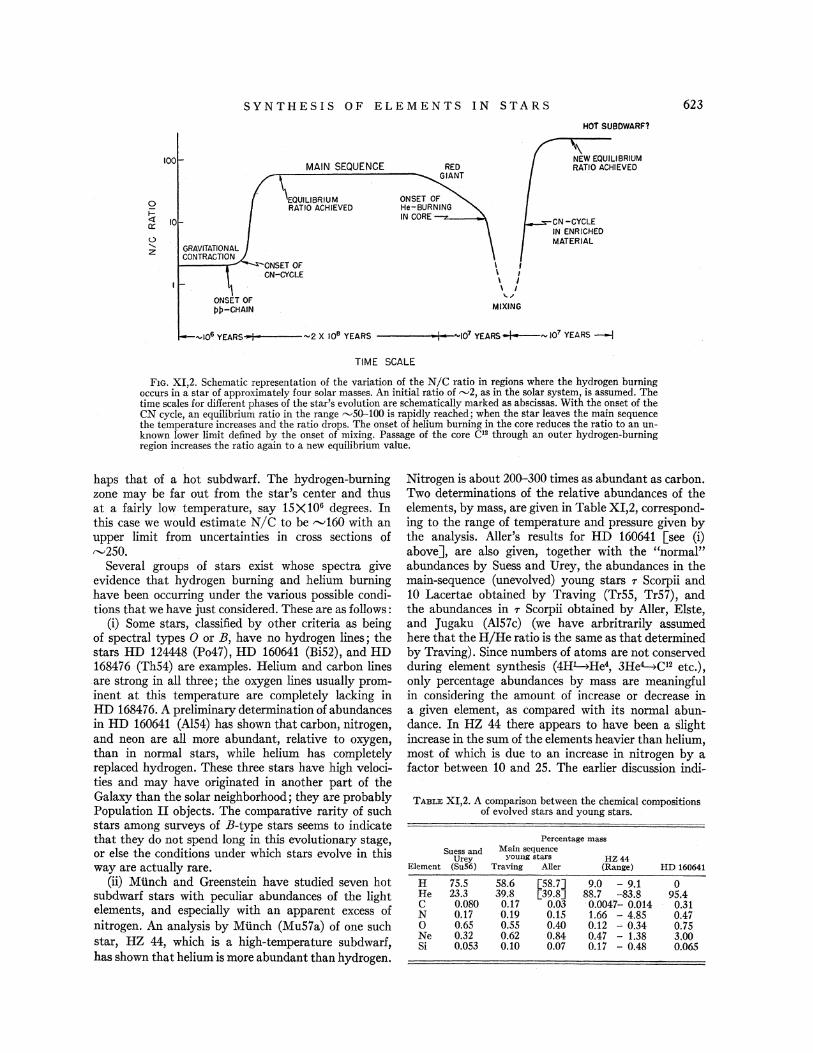
SYNTHESIS OF ELEMENTS IN STARS 623
0
~ a:: (.)
' z
100
10
MAIN SEQUENCE
EQUILIBRIUM RATIO ACHIEVED
I I \ I I I I I
MIXING
HOT SUBOWARF?
TIME SCALE
FIG. XI,2. Schematic representation of the variation of the N/C ratio in regions where the hydrogen burning occurs in a star of approximately four solar masses. An initial ratio of "-'2, as in the solar system, is assumed. The time scales for different phases of the star's evolution are schematically marked as abscissas. With the onset of the CN cycle, an equilibrium ratio in the range "'5Q--100 is rapidly reached; when the star leaves the main sequence the temperature increases and the ratio drops. The onset of helium burning in the core reduces the ratio to an unknown lower limit defined by the onset of mixing. Passage of the core Cl2 through an outer hydrogen-burning region increases the ratio again to a new equilibrium value.
haps that of a hot subdwarf. The hydrogen-burning zone may be far out from the star's center and thus at a fairly low temperature, say 15X106 degrees. In this case we would estimate N/C to be ,.,..,160 with an upper limit from uncertainties in cross sections of "'250.
Several groups of stars exist whose spectra give evidence that hydrogen burning and helium burning have been occurring under the various possible conditions that we have just considered. These are as follows:
(i) Some stars, classified by other criteria as being of spectral types 0 or B, have no hydrogen lines; the stars HD 124448 (Po47), HD 160641 (Bi52), and HD 168476 (Th54) are examples. Helium and carbon lines are strong in all three; the oxygen lines usually prominent at this temperature are completely lacking in HD 168476. A preliminary determination of abundances in HD 160641 (Al54) has shown that carbon, nitrogen, and neon are all more abundant, relative to oxygen, than in normal stars, while helium has completely replaced hydrogen. These three stars have high velocities and may have originated in another part of the Galaxy than the solar neighborhood; they are probably Population II objects. The comparative rarity of such stars among surveys of B-type stars seems to indicate that they do not spend long in this evolutionary stage, or else the conditions under which stars evolve in this way are actually rare.
(ii) Munch and Greenstein have studied seven hot subdwarf stars with peculiar abundances of the light elements, and especially with an apparent excess of nitrogen. An analysis by Miinch (Mu57a) of one such star, HZ 44, which is a high-temperature subdwarf, has shown that helium is more abundant than hydrogen.
Nitrogen is about 200-300 times as abundant as carbon. Two determinations of the relative abundances of the elements, by mass, are given in Table XI,2, corresponding to the range of temperature and pressure given by the analysis. Aller's results for HD 160641 [see (i) above], are also given, together with the "normal" abundances by Suess and Urey, the abundances in the main-sequence (unevolved) young stars T Scorpii and 10 Lacertae obtained by Traving (Tr55, Tr57), and the abundances in T Scorpii obtained by Aller, Elste, and Jugaku (Al57c) (we have arbritrarily assumed here that the H/He ratio is the same as that determined by Traving). Since numbers of atoms are not conserved during element synthesis (4H4He4, 3He4C12 etc.), only percentage abundances by mass are meaningful in considering the amount of increase or decrease in a given element, as compared with its normal abundance. In HZ 44 there appears to have been a slight increase in the sum of the elements heavier than helium, most of which is due to an increase in nitrogen by a factor between 10 and 25. The earlier discussion indi-
TABLE XI,2. A comparison between the chemical compositions of evolved stars and young stars.
Percentage mass
Suess and Main sequence Urey young stars HZ44
Element (Su56) Traving Aller (Range) HD 160641
H 75.5 58.6 p8.7~ 9.0 - 9.1 0 He 23.3 39.8 39.8 88.7 -83.8 95.4 c 0.080 0.17 0.03 0.0047- 0.014 0.31 N 0.17 0.19 0.15 1.66 - 4.85 0.47 0 0.65 0.55 0.40 0.12 - 0.34 0.75 Ne 0.32 0.62 0.84 0,47 - 1.38 3.00 Si 0.053 0.10 O.o7 0.17 - 0.48 0.065
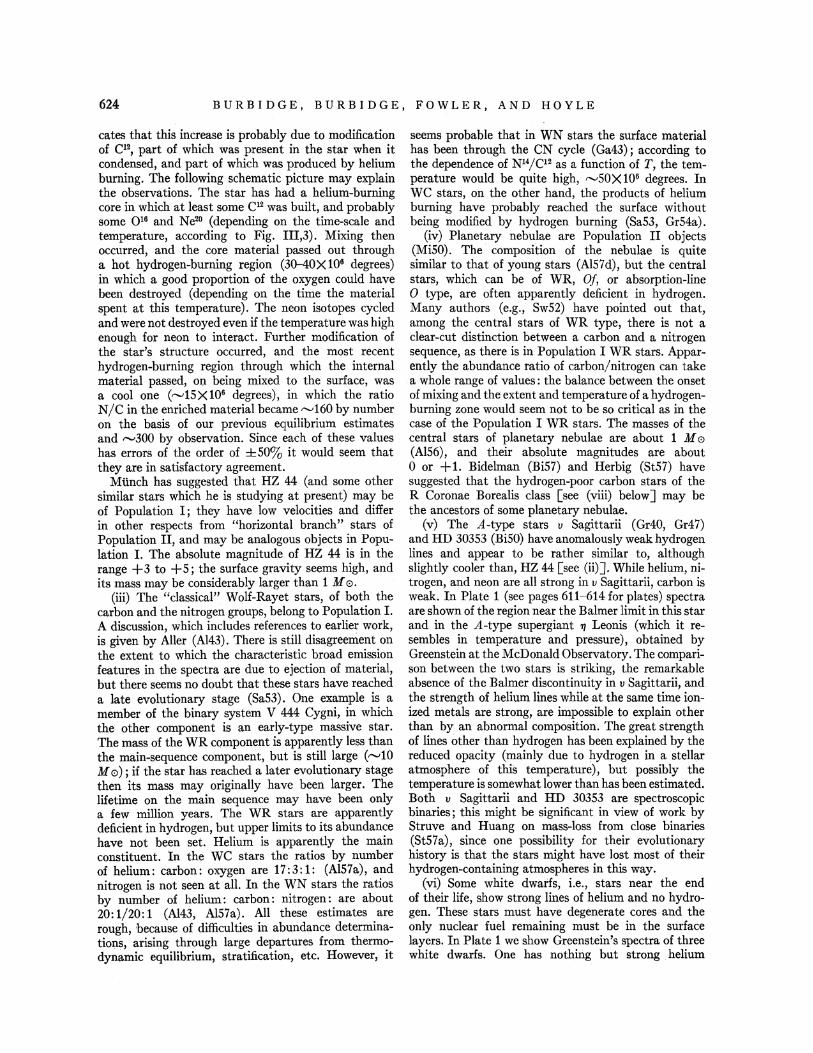
624 BURBIDGE, BURBIDGE, FOWLER, AND HOYLE
cates that this increase is probably due to modification of C12, part of which was present in the star when it condensed, and part of which was produced by helium burning. The following schematic picture may explain the observations. The star has had a helium-burning core in which at least some Cl2 was built, and probably some 018 and N e2° (depending on the time-scale and temperature, according to Fig. III,3). Mixing then occurred, and the core material passed out through a hot hydrogen-burning region (3(}-40X 108 degrees) in which a good proportion of the oxygen could have been destroyed (depending on the time the material spent at this temperature). The neon isotopes cycled and were not destroyed even if the temperature was high enough for neon to interact. Further modification of the star's structure occurred, and the most recent hydrogen-burning region through which the internal material passed, on being mixed to the surface, was a cool one ("-'1SX106 degrees), in which the ratio N/C in the enriched material became "-'160 by number on the basis of our previous equilibrium estimates and ,_.300 by observation. Since each of these values has errors of the order of ±SO% it would seem that they are in satisfactory agreement.
Miinch has suggested that HZ 44 (and some other similar stars which he is studying at present) may be of Population I; they have low velocities and differ in other respects from "horizontal branch" stars of Population II, and may be analogous objects in Population I. The absolute magnitude of HZ 44 is in the range +3 to +S; the surface gravity seems high, and its mass may be considerably larger than 1 M 0.
(iii) The "classical" Wolf-Rayet stars, of both the carbon and the nitrogen groups, belong to Population I. A discussion, which includes references to earlier work, is given by Aller (Al43). There is still disagreement on the extent to which the characteristic broad emission features in the spectra are due to ejection of material, but there seems no doubt that these stars have reached a late evolutionary stage (Sa53). One example is a member of the binary system V 444 Cygni, in which the other component is an early-type massive star. The mass of the WR component is apparently less than the main-sequence component, but is still large (,....,10 M 0); if the star has reached a later evolutionary stage then its mass may originally have been larger. The lifetime on the main sequence may have been only a few million years. The WR stars are apparently deficient in hydrogen, but upper limits to its abundance have not been set. Helium ·is apparently the main constituent. In the WC stars the ratios by number of helium: carbon: oxygen are 17:3:1: (Al57a), and nitrogen is not seen at all. In the WN stars the ratios by number of helium: carbon: nitrogen: are about 20:1/20:1 (Al43, Al57a). All these estimates are rough, because of difficulties in abundance determinations, arising through large departures from thermodynamic equilibrium, stratification, etc. However, it
seems probable that in WN stars the surface material has been through the CN cycle (Ga43); according to the dependence of N14/Cl2 as a function ofT, the temperature would be quite high, rv50X106 degrees. In we stars, on the other hand, the products of helium burning have probably reached the surface without being modified by hydrogen burning (Sa53, Gr54a).
(iv) Planetary nebulae are Population II objects (MiSO). The· composition of the nebulae is quite similar to that of young stars (Al57d), but the central stars, which can be of WR, Of, or absorption-line 0 type, are often apparently deficient in hydrogen. Many authors (e.g., Sw52) have pointed out that, among the central stars of WR type, there is not a clear.,.cut distinction between a carbon and a nitrogen sequence, as there is in Population I WR stars. Apparently the abundance ratio of carbon/nitrogen can take a whole range of values: the balance between the onset of mixing and the extent and temperature of a hydrogenburning zone would seem not to be so critical as in the case of the Population I WR stars. The masses of the central stars of planetary nebulae are about 1 M 0
(Al56), and their absolute magnitudes are about 0 or + 1. Bidelman (Bi57) and Herbig (St57) have suggested that the hydrogen-poor carbon stars of the R Coronae Borealis class [see (viii) below] may be the ancestors of some planetary nebulae.
(v) The A-type stars v Sagittarii (Gr40, Gr47) and HD 30353 (BiSO) have anomalously weak hydrogen lines and appear to be rather similar to, although slightly cooler than, HZ 44 [see (ii)]. While helium, nitrogen, and neon are all strong in v Sagittarii, carbon is weak. In Plate 1 (see pages 611-614 for plates) spectra are shown of the region near the Balmer limit in this star and in the A-type supergiant f1 Leonis (which it resembles in temperature and pressure), obtained by Greenstein at the McDonald Observatory. The comparison between the two stars is striking, the remarkable absence of the Balmer discontinuity in v Sagittarii, and the strength of helium lines while at the same time ionized metals are strong, are impossible to explain other than by an abnormal composition. The great strength of lines other than hydrogen has been explained by the reduced opacity (mainly due to hydrogen in a stellar atmosphere of this temperature), but possibly the temperature is somewhat lower than has been estimated. Both v Sagittarii and HD 30353 are spectroscopic binaries; this might be significant in view of work by Struve and Huang on mass-loss from close binaries (St57a), since one possibility for their evolutionary history is that the stars might have lost most of their hydrogen--containing atmospheres in this way.
(vi) Some white dwarfs, i.e., stars near the end of their life, show strong lines of helium and no hydrogen. These stars must have degenerate cores and the only nuclear fuel remaining must be in the surface layers. In Plate 1 we show Greenstein's spectra of three white dwarfs. One has nothing but strong helium
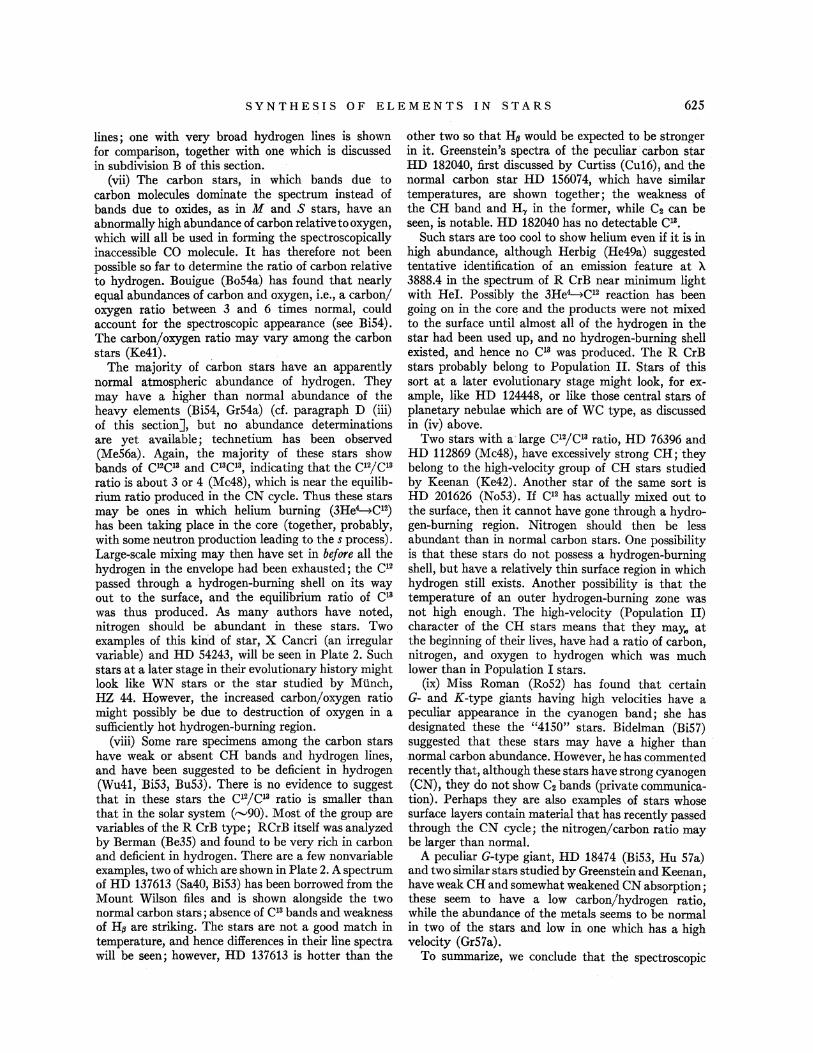
SYNTHESIS OF ELEMENTS IN STARS 625
lines; one with very broad hydrogen lines is shown for comparison, together with one which is discussed in subdivision B of this section.
(vii) The carbon stars, in which bands due to carbon molecules dominate the spectrum instead of bands due to oxides, as in M and S stars, have an abnormally high abundance of carbon relative to oxygen, which will all be used in forming the spectroscopically inaccessible CO molecule. It has therefore not been possible so far to determine the ratio of carbon relative to hydrogen. Bouigue (Bo54a) has found that nearly equal abundances of carbon and oxygen, i.e., a carbon/ oxygen ratio between 3 and 6 times normal, could account for the spectroscopic appearance (see Bi54). The carbon/oxygen ratio may vary among the carbon stars (Ke41).
The majority of carbon stars have an apparently normal atmospheric abundance of hydrogen. They may have a higher than normal abundance of the heavy elements (Bi54, Gr54a) (cf. paragraph D (iii) of this section], but no abundance determinations are yet available; technetium has been observed (Me56a). Again, the majority of these stars show bands of CI2C13 and C13CI3, indicating that the CI2/C13 ratio is about 3 or 4 (Mc48), which is near the equilibrium ratio produced in the CN cycle. Thus these stars may be ones in which helium burning (3He4C12) has been taking place in the core (together, probably, with some neutron production leading to the s process). Large-scale mixing may then have set in before all the hydrogen in the envelope had been exhausted; the CI2 passed through a hydrogen-burning shell on its way out to the surface, and the equilibrium ratio of CI3
was thus produced. As many authors have noted, nitrogen should be abundant in these stars. Two examples of this kind of star, X Cancri (an irregular variable) and HD 54243, will be seen in Plate 2. Such stars at a later stage in their evolutionary history might look like WN stars or the star studied by MUnch, HZ 44. However, the increased carbon/oxygen ratio might possibly be due to destruction of oxygen in a sufficiently hot hydrogen-burning region.
(viii) Some rare specimens among the carbon stars have weak or absent CH bands and hydrogen lines, and have been suggested to be deficient in hydrogen (Wu41, Bi53, Bu53). There is no evidence to suggest that in these stars the C12/C13 ratio is smaller than that in the solar system (,_,90). Most of the group are variables of the R CrB type; RCrB itself was analyzed by Berman (Be35) and found to be very rich in carbon and deficient in hydrogen. There are a few nonvariable examples, two of which are shown in Plate 2. A spectrum of HD 137613 (Sa40, Bi53) has been borrowed from the Mount Wilson files and is shown alongside the two normal carbon stars ; absence of C13 bands and weakness of H11 are striking. The stars are not a good match in temperature, and hence differences in their line spectra will be seen; however, HD 137613 is hotter than the
other two so that H11 would be expected to be stronger in it. Greenstein's spectra of the peculiar ·carbon star HD 182040, first discussed by Curtiss (Cu16), and the normal carbon star HD 156074, which have similar temperatures, are shown together; the weakness of the CH band and H'Y in the former, while C2 can be seen, is notable. HD 182040 has no detectable C13.
Such stars are too cool to show helium even if it is in high abundance, although Herbig (He49a) suggested tentative identification of an emission feature at A. 3888.4 in the spectrum of R CrB near minimum light with Hei. Possibly the 3He4C12 reaction has been going on in the core and the products were not mixed to the surface until almost all of the hydrogen in the star had been used up, and no hydrogen-burning shell existed, and hence no C13 was produced. The R CrB stars probably belong to Population II. Stars of this sort at a later evolutionary stage might look, for example, like HD 124448, or like those central stars of planetary nebulae which are of we type, as discussed in (iv) above.
Two stars with a large C12/C13 ratio, HD 76396 and HD 112869 (Mc48), have excessively strong CH; they belong to the high-velocity group of CH stars studied by Keenan (Ke42). Another star of the same sort is HD 201626 (No53). If C12 has actually mixed out to the surface, then it cannot have gone through a hydrogen-burning region. Nitrogen should then be less abundant than in normal carbon stars. One possibility is that these stars do not possess a hydrogen-burning shell, but have a relatively thin surface region in which hydrogen still exists. Another possibility is that the temperature of an outer hydrogen-burning zone was not high enough. The high-velocity (Population II) character of the CH stars means that they may., at the beginning of their lives, have had a ratio of carbon, nitrogen, and oxygen to hydrogen which was much lower than in Population I stars.
(ix) Miss Roman (Ro52) has found that certain G- and K-type giants having high velocities have a peculiar appearance in the cyanogen band; she has designated these the "4150" stars. Bidelman (Bi57) suggested that these stars may have a higher than normal carbon abundance. However, he has commented recently that, although these stars have strong cyanogen (CN), they do not show C2 bands (private communication). Perhaps they are also examples of stars whose surface layers contain material that has recently passed through the CN cycle; the nitrogen/carbon ratio may be larger than normal.
A peculiar G-type giant, HD 18474 (Bi53, Hu 57a) and two similar stars studied by Greenstein and Keenan, have weak CHand somewhat weakened CN absorption; these seem to have a low carbon/hydrogen ratio, while the abundance of the metals seems to be normal in two of the stars and low in one which has a high velocity (Gr57a).
To summarize, we conclude that the spectroscopic
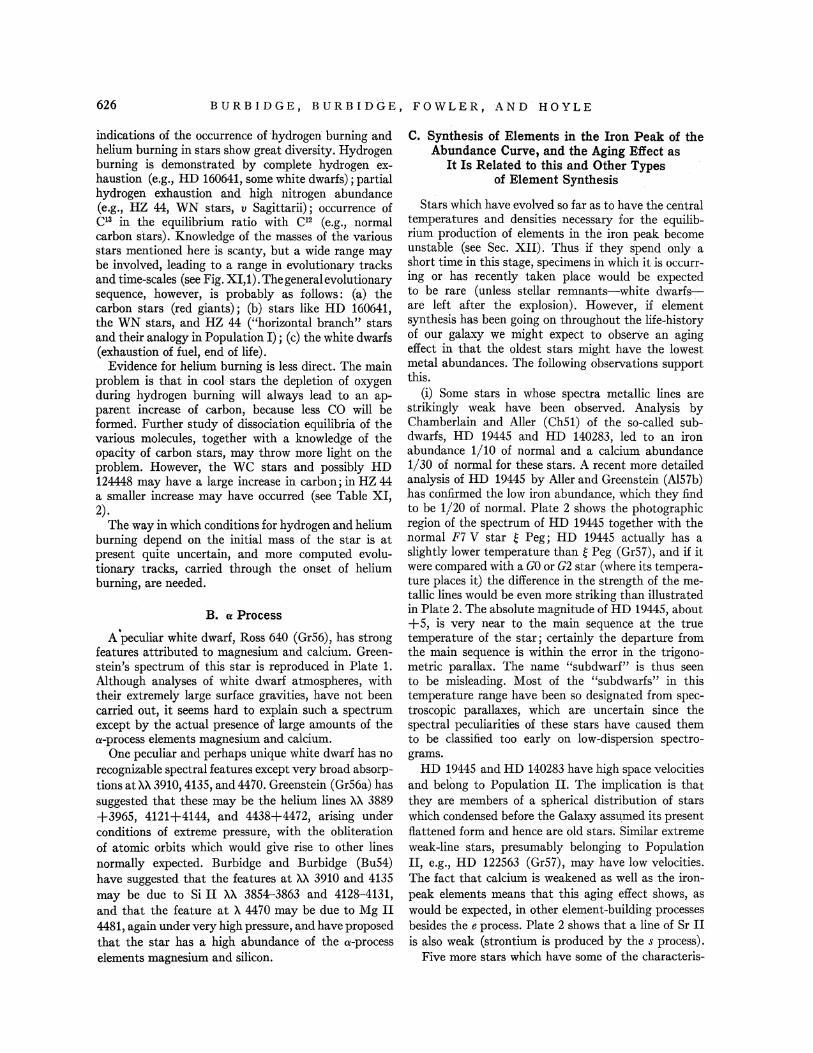
626 BURBIDGE, BURBIDGE, FOWLER, AND HOYLE
indications of the occurrence of ·hydrogen burning and helium burning in stars show great diversity. Hydrogen burning is demonstrated by complete hydrogen exhaustion (e.g., HD 160641, some white dwarfs); partial hydrogen exhaustion and high nitrogen abundance (e.g., HZ 44, WN stars, v Sagittarii); occurrence of C13 in the equilibrium ratio with C12 (e.g., normal carbon stars). Knowledge of the masses of the various stars mentioned here is scanty, but a wide range may be inyolved, leading to a range in evolutionary tracks and time-scales (see Fig. XI,1). The general evolutionary sequence, however, is probably as follows: (a) the carbon stars (red giants); (b) stars like HD 160641, the WN stars, and HZ 44 ("horizontal branch" stars and their analogy in Population I); (c) the white dwarfs (exhaustion of fuel, end of life).
Evidence for helium burning is less direct. The main problem is that in cool stars the depletion of oxygen during hydrogen burning will always lead to an apparent increase of carbon, because less CO will be formed. Further study of dissociation equilibria of the various molecules, together with a knowledge of the opacity of carbon stars, may throw more light on the problem. However, the WC stars and possibly HD 124448 may have a large increase in carbon; in HZ 44 a smaller increase may have occurred (see Table XI, 2).
The way in which conditions for hydrogen and helium burning depend on the initial mass of the star is at present quite uncertain, and more computed evolutionary tracks, carried through the onset of helium burning, are needed.
B. o: Process
A peculiar white dwarf, Ross 640 (Gr56), has strong features attributed to magnesium and calcium. Greenstein's spectrum of this star is reproduced in Plate 1. Although analyses of white dwarf atmospheres, with their extremely large surface gravities, have not been carried out, it seems hard to explain such a spectrum except by the actual presence of large amounts of the a-process elements magnesium and calcium.
One peculiar and perhaps unique white dwarf has no recognizable spectral features except very broad absorptions at XX 3910,4135, and 4470. Greenstein (Gr56a) has suggested that these may be the helium lines n 3889 +3965, 4121+4144, and 4438+4472, arising under conditions of extreme pressure, with the obliteration of atomic orbits which would give rise to other lines normally expected. Burbidge and Burbidge (Bu54) have suggested that the features at XX 3910 and 4135 may be due to Si II XX 3854--3863 and 4128-4131, and that the feature at X 4470 may be due to Mg II 4481, again under very high pressure, and have proposed that the star has a high abundance of the a-process elements magnesium and silicon.
C. Synthesis of Elements in the Iron Peak of the Abundance Curve, and the Aging Effect as
It Is Related to this and Other Types of Element Synthesis
Stars which have evolved so far as to have the central temperatures and densities necessary for the equilibc rium production of elements in the iron peak become unstable (see Sec. XII). Thus if they spend only a short time in this stage, specimens in which it is occurring or has recently taken place would be expected to be rare (unless stellar remnants-white dwarfsare left after the explosion). However, if element synthesis has been going on throughout the life-history of our galaxy we might expect to observe an aging effect in that the oldest stars might have the lowest metal abundances. The following observations support this.
(i) Some stars in whose spectra metallic lines are strikingly weak have been observed. Analysis by Chamberlain and Aller (Ch51) of the so-called subdwarfs, HD 19445 and HD 140283, led to an iron abundance 1/10 of normal and a calcium abundance 1/30 of normal for these stars. A recent more detailed analysis of HD 19445 by Aller and Greenstein (Al57b) has confirmed the low iron abundance, which they find to be 1/20 of normal. Plate 2 shows the photographic region of the spectrum of HD 19445 together with the normal F7 V star ~ Peg; HD 19445 actually has a slightly lower temperature than~ Peg (Gr57), and if it were compared with a GO or G2 star (where its temperature places it) the difference in the strength of the metallic lines would be even more striking than illustrated in Plate 2. The absolute magnitude of HD 19445, about +5, is very near to the main sequence at the true temperature of the star; certainly the departure from the main sequence is within the error in the trigonometric parallax. The name "subdwarf" is thus seen to be misleading. Most of the "subdwarfs" in this temperature range have been so designated from spectroscopic parallaxes, which are uncertain since the spectral peculiarities of these stars have caused them to be classified too early on low-dispersion spectrograms.
HD 19445 and HD 140283 have high space velocities and belong to Population II. The implication is that they are members of a spherical distribution of stars which condensed before the Galaxy assumed its present flattened form and hence are old stars. Similar extreme weak-line stars, presumably belonging to Population II, e.g., HD 122563 (Gr57), may have low velocities. The fact that calcium is weakened as well as the ironpeak elements means that this aging effect shows, as would be expected, in other element-building processes besides the e process. Plate 2 shows that a line of Sr II is also weak (strontium is produced by the s process).
Five more stars which have some of the characteris-
SYNTHESIS OF ELEMENTS IN STARS 627
tics of Population II were analyzed by Burbidge and Burbidge (Bu56a), by the curve-of-growth method without allowing for the effect of a lowered metal abundance on the opacity. In each star the abundances of a selection among the elements magnesium, aluminum, calcium, scandium, titanium, chromium, manganese, iron, strontium, yttrium, zirconium, and barium were determined. The stars showed a spread in the ratio of the abundances of these elements relative to hydrogen which indicated a range in ages; the most extreme case had a similar ratio to those in HD 19445 and HD 140283. The abundance ratios for strontium, yttrium, and zirconium showed no significant differences from those for iron, but tentative results for barium gave smaller ratios than those for iron (this result was however, uncertain).
(ii) Stars with high space velocities do not belong to the solar neighborhood, and in particular those with high z velocities may be presumed to belong to an older more spherical population. The so-called subdwarfs have very high space motions, but Miss Roman (RoSO, Ro52) and Keenan and Keller . (Ke53) found a general correlation between space motion and spectral peculiarities in that high-velocity stars tend to have strong CH and weak CN and metallic lines. A recent analysis of a group of high-velocity stars by Schwarzschild, Schwarzschild, Searle, and Meltzer (Sc57b) has shown that the most extreme example measured by them, rp2 Orionis, has ratios of the metals to hydrogen and of carbon, nitrogen, and oxygen to hydrogen, that are both one quarter of the solar values. The heavy elements also are under-abundant by the same factor as iron. Thus if the different compositions of the socalled subdwarfs, the less extreme high-velocity stars, and the solar-neighborhood stars are due to an aging effect, then elements produced by hydrogen burning, helium burning and the a, e, and s processes are all affected, and in the high-velocity stars the factors are all about the same. Seven high-velocity G-type giants analyzed by Greenstein and Keenan (Gr57a) have values for the metals/hydrogen ratio varying from 0.4 to 0.6 times normal.
(iii) The globular clusters may contain the oldest stars in our galaxy. The age of M3 has been given as 6X:109 years by Johnson and Sandage (Jo56). It might therefore be expected that the stars in such a cluster would have lower abundances of the metals and other elements than normal. Also, theoretical evolutionary tracks can be made to agree with the observed color-magnitude diagram only if a low metal abundance is used (HoSS). Unfortunately, the brightest main-sequence stars of this cluster (in which turbulence and opacity should have only small effects on abundance determinations) are too faint· for spectrophotometric analysis. However, information may be derivable from the colors. Thetwo-color (U- B, B-V) plot for M3 lies well above the normal solar-neighbor-: hood plot throughout its length, while the so-called
subdwarf HD 19445 [see C (i)] lies very near to the M3 plot. This position of HD 19445 may be the result of different "blanketing" of the continuous spectrum by the spectrum lines. All lines are weakened in HD 19445; the metallic lines are more numerous in the blue (B) than in the visual (V) spectral region, and still more numerous in the ultraviolet (U). The effect of weakened metallic lines would therefore be to increase the blue intensity relative to the visual, and to increase the ultraviolet relative to the blue. Qualitatively therefore, as discussed by Johnson and Sandage (Jo56), this is in the same sense as that required to explain the abnormal position of HD 19445 on the U-B, B-V diagram. An accurate evaluation of the effect is currently being made by Sandage, Burbidge, and Burbidge. If this explanation is found to be satis~ factory then we shall have indirect proof that the stars of M3 have low metal abundances. Sandage has shown by an approximate calculation that if the amount of light subtracted from the sun's continuum by the spectrum lines is added in the appropriate regions (without allowing for any redistribution of energy caused by blanketing), the effect is to shift the sun on to the M3 line in the (U- B, B-V) plot, at a value of B-V corresponding to a normal F5 star.
(iv) Studies of colors and spectra of external galaxies are still too uncorrelated for us to make deductions concerning abundance variations. It may, however, be worth entertaining the possibility that some of the elliptical galaxies which have much earlier-type spectra than would correspond to their color classes may prove to have low calcium and iron abundances, relative to hydrogen.
(v) Apart from the foregoing discussion of possible aging effects (in other processes besides the e process), no undoubted examples of stars exhibiting the eprocess abundances predominantly are known. However, a speculative possibility may be considered. The white dwarf van Maanen 2 shows strong, very broadened lines of iron (Gr56); possibly it has a high abundance of iron. Such stars may be the remnants (perhaps after large mass loss) of stars which reached a central temperature sufficient to build the iron peak, but did not suffer complete catastrophic explosion.
D. s Process
Three groups of giant stars have abundance anomalies that indicate the occurrence of the s process in their interiors. These are (i) the S stars; (ii) the Ba Il stars; and (iii) the carbon stars.
(i) The S stars probably have luminosities in the range of normal giants. Elements with neutron magicnumbers appear more predominantly in the spectra of S stars than in M stars of the same temperature (Me47, Al51, Bu52, Bi53a, Me56, Te56). It has been realized for some time that this must he a real atmospheric abundance effect and not an ionization,
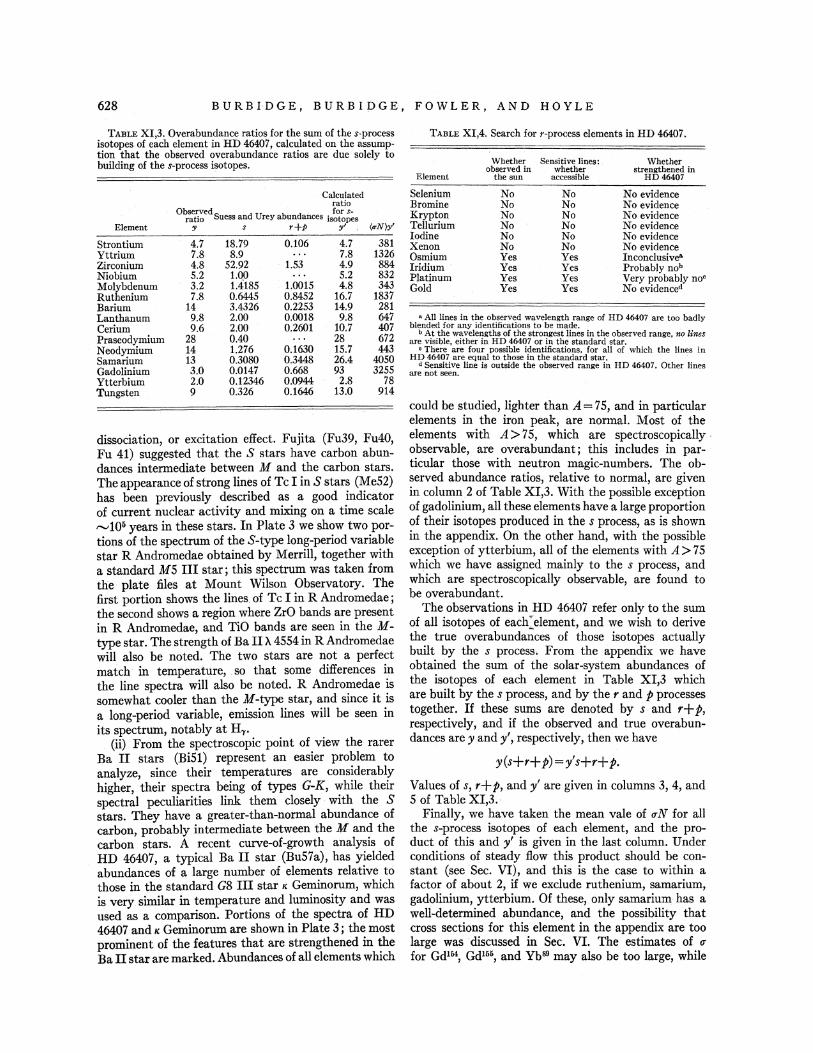
628 BURBIDGE, BURBIDGE, FOWLER, AND HOYLE
TABLE XI,3. Overabundance ratios for the sum of the s-process isotopes of each element in HD 46407, calculated on the assump-tion that the observed overabundance ratios are due solely to building of the s-process isotopes.
Calculated ratio
Observed . for s-ratio Suess and Urey abundances isotopes
Element :v s r+P :v' (uN):v'
Strontium 4.7 18.79 0.106 4.7 381 Yttrium 7.8 8.9 7.8 1326 Zirconium 4.8 52.92 1.53 4.9 884 Niobium 5.2 Lop 5.2 832 Molybdenum 3.2 1.4185 1.0015. 4.8 343 Ruthenium 7.8 0.6445 0.8452 16.7 1837 Barium 14 3.4326 0.2253 14.9 281 Lanthanum 9.8 2.00 0.0018 9.8 647 Cerium 9.6 2.00 0.2601 10.7 407 Praseodymium 28 0.40 28 672 Neodymium 14 1.276 0.1630 15.7 443 Samarium 13 0.3080 0.3448 26.4 4050 Gadolinium 3.0 0.0147 0.668 93 3255 Ytterbium 2.0 0.12346 0.0944 2.8 78 Tungsten 9 0.326 0.1646 13.0 914
dissociation, or excitation effect. Fujita (Fu39, Fu40, Fu 41) suggested that the S stars have carbon abundances intermediate between M and the carbon stars. The appearance of strong lines of Tc I inS stars (Me52) has been previously described as a good indicator of current nuclear activity and mixing on a time scale ,...,106 years in these stars. In Plate 3 we show two portions of the spectrum of the S-type long-period variable star R Andromedae obtained by Merrill, together with a standard M5 III star; this spectrum was taken from the plate files at Mount Wilson Observatory. The first portion shows the lines. of Tc I in R Andromedae; the second shows a region where ZrO bands are present in R Andromedae, and TiO bands are seen in theMtype star. The strength of Ba II}.. 4554 in R Andromedae will also be noted. The two stars are not a perfect match in temperature, so that some differences in the line spectra will also be noted. R Andromedae is somewhat cooler than theM-type star, and since it is a long-period variable, emission lines will be seen in its spectrum, notably at H.,..
(ii) From the spectroscopic point of view the rarer Ba II stars (Bi51) represent an easier problem to analyze, since their temperatures are considerably higher, their spectra being of types G-K, while their spectral peculiarities link them closely with the S stars. They have a greater-than-normal abundance of carbon, probably intermediate between the M and the carbon stars. A recent curve-of-growth analysis of HD 46407, a typical Ba II star (Bu57a), has yielded abundances of a large number of elements relative to those in the standard G8 III star " Geminorum, which is very. similar in temperature and luminosity and was used as a comparison. Portions of the spectra of HD 46407 and" Geminorum are shown in Plate 3; the most prominent of the features that are strengthened in the Ba II star are marked. Abundances of all elements which
TABLE XI,4. Search for r-process elements in HD 46407.
Whether Sensitive lines: Whether observed in whether strengthened in
Element the sun accessible HD46407
Selenium No No No evidence Bromine No No No evidence Krypton No No No evidence Tellurium No No No evidence Iodine No No No evidence Xenon No No No evidence Osmium Yes Yes Inconclusive" Iridium Yes Yes Probably nob Platinum Yes Yes Very probably no• Gold Yes Yes No evidenced
• All lines In the observed wavelength range of HD 46407 are too badly blended for any identifications to be made.
b At the wavelengths of the strongest lines in the observed range no lines are visible, either in HD 46407 or in the standard star. '
• There are four possible identifications, for all of which the lines In HD 46407 are equal to those in the standard star.
d Sensitive line is outside the observed range in HD 46407. Other lines ate not seen.
could be studied, lighter than A= 7 5, and in particular elements in the iron peak, are normal. Most of the elements with A> 7 5, which are spectroscopically . observable, are overabundant; this includes in particular those with neutron magic-numbers. The ob~erved abundance ratios, relative to normal, are given m column 2 of Table XI,3. With the possible exception of gadolinium, all these elements have a large proportion of their isotopes produced in the s process, as is shown in the appendix. On the other hand, with the possible exception of ytterbium, all of the elements with A > 7 5 which we have assigned mainly to the s process, and which are spectroscopically observable, are found to be overabundant.
The observations in HD 46407 refer only to the sum of all isotopes of each: element, and we wish to derive the true overabundances of those isotopes actually built by the s process. From the appendix we have obtained the sum of the solar-system abundances of the isotopes of each element in Table XI,3 which are built by the s process, and by the ,. and p processes together. If these sums are denoted by s and r+p, respectively, and if the observed and true overabundances are y andy', respectively, then we have
y(s+r+ p) = y' s+r+p.
Values of s, r+p, andy' are given in columns 3, 4, and 5 of Table XI,3. ·
Finally, we have taken the mean vale of uN for all the s-process isotopes of each element, and the product of this andy' is given in the last column. Under conditions of steady flow this product should be constant (see Sec. VI), and this is the case to within a factor of about 2, if we exclude ruthenium, samarium, gadolinium, ytterbium. Of these, only samarium has a well-determined abundance, and the possibility that cross sections for this element in the appendix are too large was ·discussed in Sec. VI. The estimates of rr for Gd164, Gd166, and Yb89 may also be too large, while
SYNTHESIS OF ELEMENTS IN STARS 629
that for Bal34 may be too low. If further abundance determinations confirm the low value of y for ytterbium then it may be found that a smaller proportion of its abundance should be assigned to the s process.
Europium, both of whose isotopes have been assigned to the r process, turned out not to be overabundant in HD 46407. A search for the most abundant of the r process elements in the spectrum of HD 46407 was inconclusive; most of these elements cannot be identified in HD 46407 or in the standard star. However, none were found to be strengthened in HD 46407. The results of this search are given in Table XI,4. This table is given in order to show how difficult it is to identify spectrum lines due to many of the r-process heavy elements, let alone determine abundances, in stars other than the sun.
The elements copper, zinc, gallium, and germanium are all produced predominantly by the s process, yet the first two and probably the last are not overabundant in HD 46407 (we have no evidence concerning gallium). These elements fall on the steep part of r:rN versus A plot in Fig. VI,3, and this suggests, therefore, that there is a plentiful supply of neutrons produced in Ba II stars, giving the shorter of the two capture-timescales discussed in Sec. II, and leading to building ·of elements according to the flat part of the curve in Fig. VI,3. If this process occurs in a volume containing 10-2-10-3 of the mass of the star, then subsequent mixing could produce the observed overabundances; normal abundances would be expected to be observed for copper, zinc, gallium, and germanium, and depletion of the iron-peak elements would not be detectable. Such a copious flux of neutrons means that interior temperatures of "'108 degrees must have been reached. However, we have independent indications, from ·the presence of an excess amount of carbon in this and other Ba II stars (as also in the S stars), that a temperature sufficient for the reaction 3He~C12 to occur has been achieved.
Tc I lines have not been observed in Ba II stars; before it can certainly be said that technetium is absent a search should be made for Tc II in the ultraviolet. Possibly the Ba II stars represent a later evolutionary stage than the S stars, or they may evolve from stars in a different mass range in which mixing to the surface takes a time »106 years.
HD 26 is a Ba II star with Population II character~ istics (abnormally strong CH, weak metallic lines, and a high velocity). The strongest spectrum lines include those of the rare earths [Vrabec, quoted by Greenstein (GrS4a)]. This suggests that the s process is also taking place in the oldest stars.
(iii) As was mentioned in paragraph A(vii), the carbon stars also have apparent overabundances of the heavy elements, less striking than in the S stars, together with the presence of technetium. Actual abundances have not been determined, but it seems as though the s process has been occurring here also,
perhaps in a smaller volume of the star, while a core containing more carbon is developed. More abundance determinations, together with computations of evolutionary tracks of stars, will be helpful in elucidating the evolutionary differences between M, C, S, and Ba II stars.
E. r Process
The outstanding piece of observational evidence that this takes place is given by the explanation of the light curves of supernovae of Type I as being due to the decay of C£264 (BuS6, BaS6), together with some other isotopes produced in the r process. Further evidence can be obtained only by interpreting the spectra of Type I supernovae, a problem which has so far remained unsolved.
F. p Process
No astrophysical evidence is at present available for the occurrence of this process. The present theory might suggest that isotopes built in this way should be seen in the spectra of supernovae of Type II.
G. x Process
The situation as far as the astrophysical circumstances of the x process are concerned has been discussed in Sec. X.
H. Nuclear Reactions and Element Synthesis in the Surfaces of Stars
The peculiar A stars, in which large magnetic fields have recently been found (see BaS7), have long been known to have anomalously strong (and often variable) lines of certain elements in their spectra. Abundances of all the observable elements have been determined in two magnetic stars, a2 Canum Venaticorum and HD 133029, and in one peculiar A star, HD 1Sl199, in which a magnetic field has not been detected, owing to the greater intrinsic width of the spectrum lines, but may well be present (BuSS, BuSSa, BuS6b). The results are given in Table XI,S, which should be compared with Table XI,3 and the discussion of the Ba II star HD 46407. At first glance the results are very similar, particularly in the fact that predominantly the elements with neutron magic-numbers are overabundant, but there are some striking differences, as follows: (a) barium is overabundant in HD 46407, and normal in the peculiar A stars; (h) europium is the most prominently overabundant element in the peculiar A stars, and is normal in HD 46407; (c) silicon, calcium, chromium, and manganese are normal in HD 46S07 while calcium is underabundant and the rest are overabundant in the peculiar A stars; and (d) the overabundance ratios of the strontium group and the rare earth group differ by factors of about 2 in HD 46407 and by factors varying from 2 in HD 151199 to 40 in a2 Canum Venaticorum.
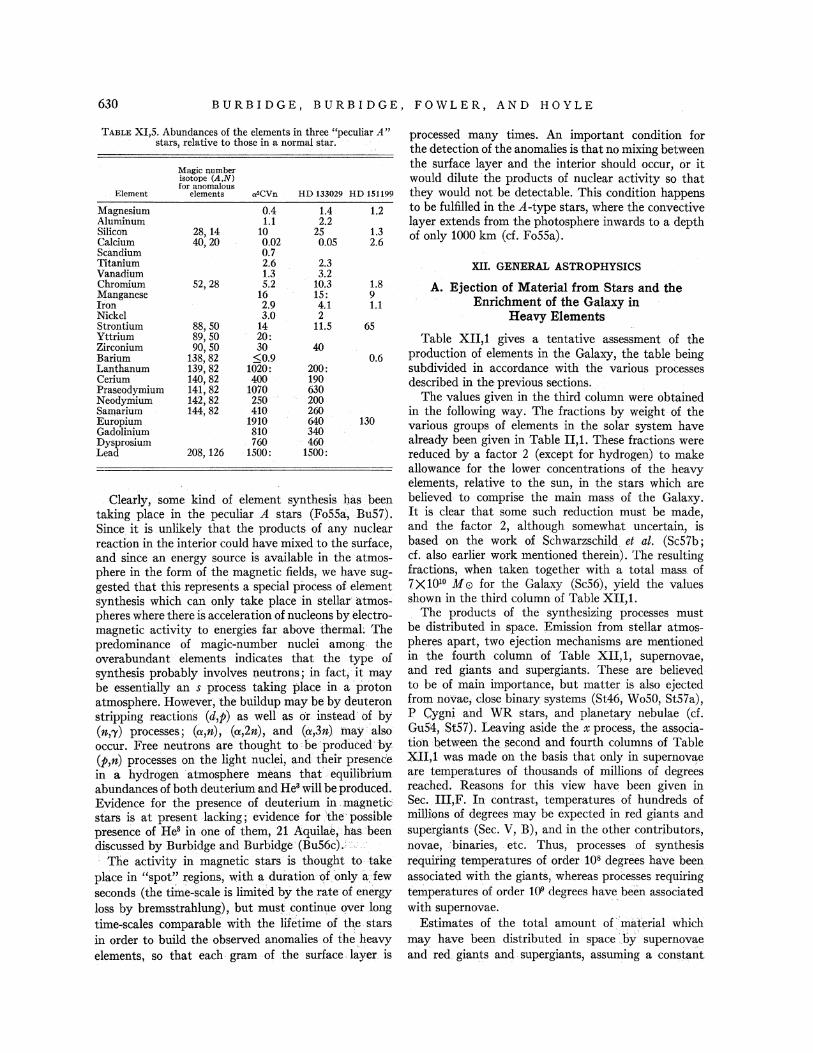
630 BURBIDGE, BURBIDGE, FOWLER, AND HOYLE
TABLE XI,5. Abundances of the elements in three "peculiar A" stars, relative to those in a normal star.
Magic number Isotope (A,N) for anomalous
Element elements a•CVn HD 1330<!9 HD 151199
Magnesium 0.4 1.4 1.2 Aluminum 1.1 2.2 Silicon 28, 14 10 25 1.3 Calcium 40,20 0.02 0.05 2.6 Scandium 0.7 Titanium 2.6 2.3 Vanadium 1.3 3.2 Chromium 52,28 5.2 10.3 1.8 Manganese 16 15: 9 Iron 2.9 4.1 1.1 Nickel 3.0 2 Strontium 88,50 14 11.5 65 Yttrium 89,50 20: Zirconium 90,50 30 40 Barium 138,82 ~0.9 0.6 Lanthanum 139,82 1020: 200: Cerium 140,82 400 190 Praseodymium 141, 82 1070 630 Neodymium 142,82 250 200 Samarium 144,82 410 260 Europium 1910 640 130 Gadolinium 810 340 Dysprosium 760 460 Lead 208, 126 1500: 1500:
Clearly, some kind of element synthesis has been taking place in the peculiar A stars (FoSSa, BuS7). Since it is unlikely that the products of any nuclear reaction in the interior could have mixed to the surface, and since an energy source is available in the atmosphere in the form of the magnetic fields, we have suggested that this represents a special process of element synthesis which can only take place in stellar atmos~ pheres where there is acceleration of nucleons by electromagnetic activity to energies far above thermaL The predominance of magic-number nuclei amorig· the overabundant elements indicates that the type of synthesis probably involves neutrons; in fact, • it may be essentially an s process taking place in a pri>ton atmosphere. However, the buildup may be by deuteron stripping reactions (d,p) as well as or instead of by (n,'Y) processes; (a,n), (a,2n), and (a,3n) mayalso occur. Free neutrons are thought to • be ·produced· by (p,n) processes on the light nuclei, and their presence in a hydrogen atmosphere means that equilibrium abundances of both deuterium and He3 will be produced. Evidence for the presence of deuterium in magnetic stars is at present lacking; evidence for .'the possible presence of He3 in one of them, 21 Aquilae; ha.s ·been discussed by Burbidge and Burbidge (BuS6c).: ..
The activity in magnetic stars is thought to take place in "spot" :~;egions, with a duration ~fonly it few seconds (the tim.e-scale is limited by the rate of energy loss by bremsstrahlung), but musf continue ovet long time-scales comparable with the lifetime of th,e stars in order to build the observed anomalies of the heavy elements, so that each gram of the surface layer is
processed many times. An important condition for the detection of the anomalies is that no mixing between the surface layer and the interior should occur, or it would dilute the products of nuclear activity so that they would not be detectable. This condition happens to be fulfilled in the A-type stars, where the convective layer extends from the photosphere inwards to a depth of only 1000 km (cf. FoSSa).
XII. GENERAL ASTROPHYSICS
A. Ejection of Material from Stars and the Enrichment of the Galaxy in
Heavy Elements
Table XII,l gives a tentative assessment of the production of elements in the Galaxy, the table being subdivided in accordance with the various processes described in the previous sections.
The values given in the third column were obtained in the following way. The fractions by weight of the various groups of elements in the solar system have already been given in Table II,l. These fractions were reduced by a factor 2 (except for hydrogen) to make allowance for the lower concentrations of the heavy elements, relative to the sun, in the stars which are believed to comprise the main mass of the Galaxy. It is clear that some such reduction must be made, and the factor· 2, although somewhat uncertain, is based on the work of Schwarzschild. et al. (ScS7b; cf. also earlier work mentioned therein). The resulting fractions, when taken together with a total mass. of 7X10¹⁰ M 0 for the Galaxy (ScS6), yield the values shown in the third column of Table XII,l.
The products of. the synthesizing processes must be distributed in space. Emission from stellar atmospheres apart, two ejection mechanisms are mentioned in the fourth column of Table XII,l, supernovae, and red giants and supergiants. These are believed to be of main importance, but matter is also ejected from novae; close binary systems (St46, WoSO, St57a), P Cygl;lj and WR stars, and planetary nebulae (cf. GuS4, St57)~ Leaving aside the x process, the association between the second and fourth columns of Table XII,l was made on the basis that only in supernovae are temperatures of thousands of millions of degre~s reached. Reasons for this view have been given in Sec .. IIJ,F. In contrast, temperatures of hundreds of milHom~ of d,egrees may be expected in red giants and supergiants (Sec. V, B), and in the other contributors, novae, binaries, etc. Thus, processes of synthesis requiring temperatures of order 108 degrees have been associated with the giants, whereas processes requiring temperatures of order 109 degrees have been associated with supernovae. -
Estimates of the total amount of'miiterial which may have been distributed in space. by' supernovae and red. giants and supergiants, assuming a consta~t
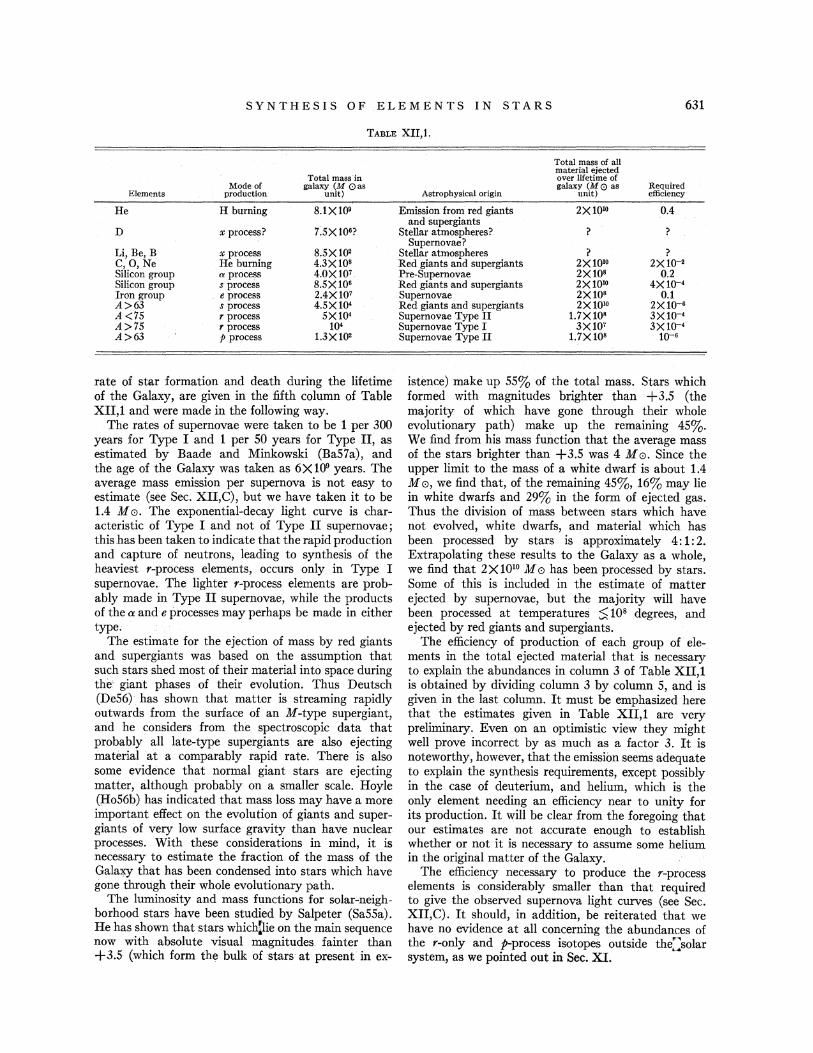
SYNTHESIS OF ELEMENTS IN STARS 631
TABLE XII,1.
Totalmasscin Mode of galaxy (M 0as
Elements production unit)
He H burning 8.1X10⁹
D x process? nx 1Q6?
Li, Be, B x process 8.5X 1Q2 C,O,Ne He burning 4.3Xl08
Silicon group "'process 4.0X10⁷
Silicon group s process 8.5X10⁶ Iron group e process 2.4X10⁷
A>63 s process 4.5X1Q4 A<75 r process 5X10⁴
A>75 r process 104 A>63 p process 1.3X1Q2
rate of star formation and death during the lifetime of the Galaxy, are given in the fifth column of Table XII,1 and were made in the following way.
The rates of supernovae were taken to be 1 per 300 years for Type I and 1 per 50 years for Type II, as estimated by Baade and Minkowski (Ba57a), and the age of the Galaxy was taken as 6X10⁹ years. The average mass emission per supernova is not easy to estimate (see Sec. XII,C), but we have taken it to be 1.4 M 0. The exponential-decay light curve is characteristic of Type I and not of Type II supernovae; this has been taken to indicate that the rapid production and capture of neutrons, leading to synthesis of the heaviest r-process elements, occurs only in Type I supernovae. The lighter r-process elements are probably made in Type II supernovae, while the products of the a and e processes may perhaps be made in either type.
The estimate for the· ejection of mass by red giants and supergiants was based on the assumption that such stars shed most of their material into space during the' giant phases of their evolution. Thus Deutsch (De56). has shown that matter is streaming rapidly outwards from the surface of an M-type supergiant, and he considers from the spectroscopic data that probably all late-type supergiants are also ejecting material at a comparably rapid rate. There is also some evidence that normal giant stars are ejecting matter, although probably on a smaller scale. Hoyle (Ho56b) has indicated that mass loss may have a more important effect on the evolution of giants and supergiants of very low surface gravity than have nuclear processes. With these considerations in mind, it is necessary to estimate the fraction of the mass of the Galaxy that has been condensed into stars which have gone through their whole evolutionary path.
The luminosity and mass functions for solar-neighborhood stars have been studied by Salpeter (Sa55a). He has shown that stars which(lie on the main sequence now with absolute visual magnitudes. fainter than +3.5 (which form the bulk of stars at present in ex-
Total mass of all material ejected over lifetime of galaxy (M 0 as Required
Astrophysical origin unit) efficiency
Emission from red giants 2Xl()IO 0.4 and supergiants
Stellar atmospheres? ? ? Supernovae?
? ? Stellar atmospheres Red giants and supergiants 2X10to 2X10-11
Pre-Supernovae 2X10⁸ 0.2 Red giants and supergiants 2X10¹⁰ 4X1Q-4
Supernovae 2X10⁸ 0.1 Red giants and supergiants 2XlOJO 2XlQ-6 Supernovae Type II 1.7X10⁸ 3X1Q-4
Supernovae Type I 3X10⁷ 3X1Q-4
Supernovae Type II 1.7X10⁸ lQ-6
istence) make up 55% of the total mass. Stars which formed with magnitudes brighter than +3.5 (the majority of which have gone through their whole evolutionary path) make up the remaining 45%. We find from his mass function that the average mass of the stars brighter than +3.5 was 4 M 0. Since the upper limit to the mass of a white dwarf is about 1.4 M 0, we find that, of the remaining 45%, 16% may lie in white dwarfs and 29% in the form of ejected gas. Thus the division of mass between stars which have not evolved, white dwarfs, and material which has been processed by stars is approximately 4: 1:2. Extrapolating these results to the Galaxy as a whole, we find that 2X10¹⁰ M0 has been processed by stars. Some of this is included in the estimate of matter ejected by supernovae, but the majority will have been processed at temperatures $108 degrees, and ejected by red giants and supergiants.
The efficiency of production of each group of elements in the total ejected material that is necessary to explain the abundances in column 3 of Table XII,1 is obtained by dividing column 3 by column 5, and is given in the last column. It must be emphasized here that the estimates given in Table XII,1 are very preliminary. Even on an optimistic view they might well prove incorrect by as much as a factor 3. It is noteworthy, however, that the emission seems adequate to explain the synthesis requirements, except possibly in the case of deuterium, and helium, which is the only element needing an efficiency near to unity for its production. It will be clear from the foregoing that our estimates are not accurate enough to establish whether or not it is necessary to assume some helium in the original matter of the Galaxy.
The efficiency necessary to produce the r-process elements is considerably smaller than that required to give the observed supernova light curves (see Sec. XII,C). It should, in addition, be reiterated that we have no evidence at all concerning the abundances of the r-only and p-process isotopes outside the,::solar system, as we pointed out in Sec. XI.
632 BURBIDGE, BURBIDGE, FOWLER, AND HOYLE
If the universal value of the deuterium to hydrogen ratio turns out to be of order 1Q-4, it will be difficult to provide for an adequate abundance of deuterium by processes of an electromagnetic nature occurring in stellar atmospheres, as has already been pointed out in Sec. X,C. The possible alternative process of origin, also discussed in Sec. X,C, rests on considerations to be given in Sec. XII,B. At sufficiently high temperatures (T>7X10⁹ degrees) elements of the iron group break down into a particles and neutrons. For example, Fe56-t13a+4n. In Sec. XII,B the onset of a supernova is associated with such breakdown reactions developing in the central regions of a star. In Type II supernovae, hydrogen is present in the outer expanding envelope, and capture of the neutrons by relatively cool hydrogen yields deuterium without subsequent disintegration. As was pointed out in Sec. X,C, if one supernova converted one solar mass of its envelope into deuterium and was then diluted by mixture with 104 solar masses, the terrestrial abundance would result. These estimates of production and dilution are not at all unreasonable. On this basis the galactic abundance of deuterium would not necessarily be as large as in the solar system.
The balance between the observed solar-system abundances and the material ejected from stars has been made on the assumption of a constant rate of star formation and death during 6X 10⁹ years. There are some considerations which suggest that the rate may have been greater in the early history of the Galaxy.
First, recent work on the 21-cm radiation by hydrogen, reviewed by van de Hulst (Hu56), has shown that neutral atomic hydrogen makes up only a few percent of the total mass of both our Galaxy and M31 (and it probably comprises the major part of the gas and dust). Star formation is currently occurring only in Population I regions, which comprise about 10% of the mass of the Galaxy (by analogy with the ratio found by Schwarzschild (Sc54) in M31). Originally the Galaxy must have been composed entirely of gas. Thus it would seem probable that star formation and element synthesis would have occurred at a greater rate early in the life of the Galaxy, and, as a larger and larger fraction of the mass became tied up in small stars and in white dwarfs, so nuclear activity would have been a decreasing function of the age of the Galaxy.
Second, the solar system is 4.5 X 10⁹ years old, and the uranium isotope ratio (Sec. VIII) gives 6.6X1Q9 years as the minimum age of the r-process isotopes. Thus the abundances that we are discussing (which are half the solar system abundances) must have been formed (by all 8 synthesizing processes) in a time less than the age of the Galaxy, say 1-2X10⁹ years. Also, there are apparently large abundance differences between extreme Population II stars such as the globular clusters M92 (and M3) and, for example, the old
galactic cluster M67, while the ages that have been given do not differ correspondingly and are both "-'6X 10⁹ years (Jo56, Sa57 a). It is of interest to mention recent investigations of the color-magnitude diagram of the nearby stars by Sandage (Sa57b) and by Eggen (Eg57), based on the data of Eggen (Eg55, Eg56) and the Yale Parallax Catalogue (Ya52). There are a few stars to the right of the main sequence at M =3.5 to 4; if the parallaxes are accurate then they may be either stars which are still contracting and have not yet reached the main sequence, or they may have evolved off the main sequence. In the latter case, their ages would be ~8Xl09 years.
These facts may be reconciled if we suppose that star formation and death in the originally spherical gaseous Galaxy occurred at a sufficient rate to produce element abundances which then recondensed into the oldest star systems that we see today in the halo. The initial differentiation of Populations I and II was interpreted as one of location in the Galaxy and of comparative youth (spiral arms) and age (halo, nucleus). However, it is clear that a number of subclassifications are demanded (PaSO, We51, Bu56a). While the oldest halo stars that we see today were condensing, we may suppose that concentration towards the center and the equatorial plane was occurring, and the formation of stars was favored by conditions in the flattening higher-density region, leading to a rapid gradient of heavy-element enrichment so that star systems forming in the disk at nearly the same time as the globular clusters had higher abundances of heavy elements. Only gas will contract in this way; stars, once formed, become "frozen" in the shape of the system at the time of their formation. The remaining gas became concentrated into the spiral arms, so that these were the only places where any star formation could any longer occur. If, during the first 1-2X10⁹
years in the life of the Galaxy, the average proportion of the mass in which star formation was occurring is taken as 50% (instead of 10% as now), then the increased rate of nuclear activity would compensate for the shorter time scale for element synthesis.
Finally, it is of some importance to discuss the cosmological background to this problem. In an evolutionary explosive cosmology we have that, if T is the age of a system, Tuniverse> Tgataxy> Tsome clusters > Tsun· Apart from the products of an initial ylem, if this type of initial condition is proposed, the Galaxy will condense out of primeval hydrogen, and the synthesis will go on as we have already described it. It is of interest that possibly the ylem production of deuterium could be incorporated in a model of this sort. Alternatively, in a steady-state cosmology we have only that Tgataxy> Tsome clusters> Tsun, and we should expect that the initial condensation of the Galaxy would take place out of gas which already had a weak admixture of the heavy elements that had been synthesized in other galaxies. Thus it might be that a search for low-mass stars of pure hydrogen would present
SYNTHESIS OF ELEMENTS IN STARS 633
a possible cosmological test, although such stars might take so long to condense (HeSS) that they would have become contaminated with the products of the death of massive stars before they had been able to contract themselves into self-contained stars.
It is also of interest to remark on the final stages of galactic evolution. Although, as remarked in the Introduction, the lowest energy state of the elements would be reached when the galaxy was transmuted to iron, it appears that the astrophysical circumstances lead to the matter being finally all contained in white dwarfs (degenerate matter), so that such an extreme condition as an iron galaxy may never be reached.
It should be emphasized that the present value of 1/ H determined from the red-shift measurements by Humason, Mayall, and Sandage (Hu56a) is 5.4X10⁹
years, and this in the evolutionary cosmologies is a time of the order of the age of the universe. However, this value is in conflict with the ages of some star clusters in our galaxy. Thus any attempt to relate the synthesis of the elements in the galaxy through a number of necessarily complex steps to a particular cosmological model must await the resolution of this dilemma.
B. Supernova Outbursts
In the following discussion we consider the course of evolution that in our view leads to the outbursts of supernovae. According to a well-known calculation by Chandrasekhar the pressure balance in a star cannot be wholly maintained by degeneracy for masses greater than a certain critical mass. For pure He4 this critical mass turns out to be 1.44 M 0, while for pure iron the value is 1.24 M 0.
It follows that stars with masses greater than the critical value cannot be in mechanical support unless there is an appreciably temperature contribution to their internal pressures. Mechanical support therefore demands high internal temperatures in such stars.
Our arguments depend on these considerations. We are concerned with stars above the Chandrasekhar limit, and assume that mechanical support is initially operative to a high degree of approximation. This is not a restriction on the discussion, since our eventual aim will be to show that mechanical support ceases to be operative. A discussion of catastrophic stars would indeed be trivial if a lack of mechanical support were assumed from the outset.
The next step is to realize that a star (with mass greater than the critical value) must go on shrinking indefinitely unless there is some process by which it can eject material into space. The argument for this startling conclusion is very simple. Because of the high internal temperature, energy leaks outwards from the interior to the surface of the star, whence it is radiated into space. This loss of energy can be made good either by a slow shrinkage of the whole mass of the star (the shrinkage being "slow" means that mechanical support is still operative to a high
degree of approximation), or by a corresponding gain of energy from nuclear processes. But no nuclear fuel can last indefinitely, so that a balance between nuclear energy generation and the loss from the surface of the star can only be temporary. For stars of small mass the permissible period of balance exceeds the present age of the galaxy, but this is not so for the stars of larger mass now under consideration. Hence for these stars shrinkage must occur, a shrinkage that is interrupted, but only temporarily, whenever some nuclear fuel happens for a time to make good the steady outflow ofenergy into space.
Shrinkage implies a rising internal temperature, since mechanical support demands an increasing thermal pressure as shrinkage proceeds. It follows that the internal temperature must continue to rise so long as the critical mass is exceeded, and so long as mechanical support is maintained. The nuclear processes consequent on the rise of temperature are, first, production of the a-particle nuclei at temperatures from 1-3 X 10⁹ degrees and, second, production of the nuclei of the iron peak at temperatures in excess of 3X10⁹
degrees. It is important in this connection that the temperature is not uniform inside a star. Thus near the center, where the temperature is highest, nuclei of the iron peak may be formed, while outside the immediate central regions would be the a-particle nuclei, formed at a somewhat lower temperature, and still further outwards would be the light nuclei together with the products of the s process, formed at a much lower temperature. Indeed some hydrogen may still be present in the outermost regions of the star near the surface. The operation of the r process turns out to depend on such hydrogen being present in low concentration. The p process depends, on the other hand, on the outer hydrogen being present in high concentration.
Turning now to the nuclei of the iron peak, the statistical equations given in Sec. IV show that the peak is very narrow at T"-'3X10⁹ degrees, the calculated abundances falling away sharply as the atomic weight either decreases or increases from 56 by a few units. At higher temperatures the peak becomes somewhat wider, ranging to copper on the upper side and down to vanadium on the lower side. Beyond these limits the abundances still fall rapidly away to negligible values with one exception, the case of He4• From (6) in Sec. IV we find that the statistical equations yield the following relation between the abundances of He4 and Fe56
logn(4,2)=34.67+! logTg
1 34.62 () +-{logn(S6,26)-36.40-j logTg}---+-
14 T9 7 or
logn(S6,26) 34;62 () logn(4,2) 32.08+1.39logT9---+-.
14 T9 7
634 BURBIDGE, BURBIDGE, FOWLER, AND HOYLE
Under the conditions of the present discussion the densities of free protons and neutrons are comparable and small compared with the helium and iron densities, so that the 8 term is small and is neglected.
We consider the application of this equation for a fixed value of the total density equal to 108 g/ cm3• This is a plausible value for T,...._,7X109 degrees (T~7), and is the mean density of a stellar core of 1M 0 with a radius of 1.7Xl08 em. Supposing that conditions in this core are such that the mass is equally divided between He4 and Fe66, then log ( 4,2) = 30.88 and log n(56,26) = 29.73, since no other nucleus makes an appreciable contribution to the density. Substituting in the equation above we find that then T=7.6X10⁹
degrees. Thus when T rises above about 7 X 10⁹ degrees there is a very considerable conversion of iron into helium.
This result is not very dependent on the particular value of 108 g/ cm3 used above, since the critical temperature at which the masses of helium and iron are comparable increases only slowly with the density (Ho46). The density cannot differ very much from 108 g/cm3• Thus a value much less than 106 g/cm3 would be most implausible for T"-'7X10⁹ degrees, while a value appreciably greater than 108 g/cm3 is forbidden by the condition that there must be an appreciable thermal contribution to the pressure.
The argument now runs as follows. Let us suppose that the temperature increases to 8.2Xl09 degrees. In this case the right-hand side of the equation increases by 0.4 and in order that the equation is satisfied, the difference between logn(4,2) and (1/14) logn(56, 26) must also increase by 0.4. However, logn(4,2) can only increase by 0.3 since at this point the total mass of the core will be in the form of helium. Thus an increase in temperature of 0.6X10⁹ degrees implies that the numerical value of the term (1/14) logn(56,26) is decreased by at least 0.1, and this implies a drop in the amount of iron of at least a factor of 25. So we conclude that an increase in temperature from 7.6 to 8.2Xl09 degrees causes nearly all of the iron to be converted to helium; i.e., from the situation that the mass is equally divided between helium and iron we reach conditions in which "-'98% of the mass is helium and "-'2% is iron. A similar conclusion follows for other values of the total density. However, for much higher temperatures the term in 8 becomes important, refle~ting the approach toward a neutron c0re which would be achieved at extremes of density and temperature.
To convert 1 g of iron into helium demands an energy supply of 1.65 X 10¹⁸ ergs. This may be compared with the total thermal energy of 1 gram of material at 8X10⁹ degrees which amounts to only 3X10¹⁷ ergs. Evidently the conversion of iron into helium demands a supply of energy much greater than the thermal content of the material. The supply must come from gravitation, from a shrinkage of the star, and clearly
the shrinkage must be very considerable in order that sufficient energy becomes available. This whole energy supply must go into the conversion and hence into nuclear energy, so that very little energy is available to increase the thermal content of the material. However, instantaneous mechanical stability in such a contraction would demand a very large increase in the internal temperature. Thus we conclude that in this contraction, in which the thermal energy is, by hypothesis, only increased by a few percent, there is no mechanical stability, so that the contraction takes place by free fall inward of the central parts of the star. At a density of 108 g/cm3, this implies an implosion of the central regions in a time of the order of 1/5 of a second (r ~C4/31i'"Gp)-! and in our view it is just this catastrophic implosion that triggers the outburst of a supernova.
Before considering the consequences of implosion, it is worthwhile emphasizing that loss of energy by neutrino emission, the urea process (Ga41), is very weak compared to the process described above. Neutrino emission does not rob a star of energy at a sufficiently rapid rate to demand catastrophic implosion, though at temperatures in excess of ,..,._,3X109 degrees it does promote a much more rapid shrinkage of the star than would otherwise arise from the loss of energy through normal radiation into space. The reaction Mn66 (,8-v)Fe66 with a half-life of 2.58 hr probably gives the main contribution to the loss of energy through neutrino emission. The binding energy of Mn66
is less than that of Fe56 by 2.895 Mev. Thus, under conditions of statistical equilibrium near T=5X10⁹
degrees, this implies that Mn56 is less abundant than Fe56 by a factor ,..,._,103• Hence, it is reasonable to suppose that a fraction of about 10-3 of the mass is in the form of Mn66• The beta decay of this nucleus leads to an energy loss of about 3X10¹² ergs per gram of Mn56• Thus a time-scale of about 108 sec is demanded to produce an energy loss by neutrino emission comparable with the thermal energy possessed by the stellar material. Hence we conclude that under these conditions in the stellar core, the urea process is quite ineffective as compared with the refrigerating action of the conversion of Fe56 to He4•
The last question to be discussed is the relationship between the implosion of the central regions of a star and the explosion of the outer regions. Two factors contribute to produce explosion in the outer regions. The temperature in the outer regions is very much lower than the central temperature. Because of this the outer material does not experience the same extensive nuclear evolution that the central material does. Particularly, the outer material retains elements that are capable of giving a large energy yield if they become subject to sudden heating, e.g., C12, 0 16, Ne2o, N e2\ He4, and perhaps even hydrogen. The second point concerns the possibility of the outer material experiencing a sudden heating. Because under normal
SYNTHESIS OF ELEMENTS IN STARS 635
conditions the surface temperature of a star is much smaller than the central temperature, material in the outer regions normally possesses a thermal energy per unit mass that is small compared with the gravitational potential energy per unit mass. Hence any abnormal process that causes the thermal energy suddenly to become comparable with the gravitational energy must lead to a sudden heating of the outer material. This is precisely the effect of an implosion of the central regions of a star. Consequent on implosion there is a large-scale conversion of gravitational energy into dynamical and thermal energy in the outer zones of the star.
One last point remains. Will the gravitational energy thus released be sufficient to trigger a thermonuclear explosion in the outer parts of the star? The answer plainly depends on the value of the gravitational potential. Explosion must occur if the gravitational potential is large enough. In a former paper (Bu56) it was estimated that a sudden heating to 108 degrees would be sufficient to trigger an explosion. This corresponds to a thermal energy "-'1016 ergs per gram. If the gravitational potential per gram at the surface of an imploding star is appreciably greater than this value, explosion is· almost certain to take place. For a star of mass 1.5 M 0, for instance, the gravitational potential energy per unit mass appreciably exceeds 1016 ergs per gram at the surface if the radius of the star is less than 1010 em. At the highly advanced evolutionary state at present under consideration it seems most probable that this condition on the radius of the star is well satisfied. Hence it would appear as if implosion of the central regions of such stars must imply explosion of the outer regions.
Two cases may be distinguished, leading to the occurrence of the r and p processes. A star with mass only slightly greater than Chandrasekhar's limit can evolve in the manner described above only after almost all nuclear fuels are exhausted. Hence any hydrogen present in the outer material must comprise at most only a small proportion of the total mass. This is the case of hydrogen deficiency that we associate with Type I supernovae, and with "the operation of the r process. In much more massive stars, however, the central regions may be expected to exhaust all nuclear fuels and proceed to the point of implosion while much hydrogen still remains in the outer regions. Indeed the "central region" is to be defined in this connection as an innermost region containing a mass that exceeds Chandrasekhar's limit. For massive stars the central region need be only a moderate fraction of the total mass, so that it is possible for a considerable proportion of the original hydrogen to survive to the stage where central implosion takes place. This is the case of hydrogen excess that in the former paper we associated with the Type II supernovae, where the p process may occur. However, the rarity of the p-process isotopes, and hence the small amount of
material which must be processed to synthesize them, suggests that if Type II supernovae are responsible, the p process is a comparatively rare occurrence even among them. On the other hand, in any supernova in which a large flux of neutrons was produced, a small fraction of those having very high energies might escape to the outer parts of the envelope, and after decaying there to protons, might interact with the envelope material and produce the p-process isotopes.
Energy from the explosive thermonuclear reactions, perhaps as much as fifty percent of it, will be carried inwards, causing a heating of the material. of the central regions. It is to this heating that we attribute the emission of the elements of the iron peak during the explosion of supernovae.
C. Supernova Light Curves
The left-hand side of Plfte 4 shows the Crab Nebula, the remnant of a supern va which exploded in 1054 A.D. The right-hand sid of Plate 4 shows three exposures of the galaxy IC 182 during the outburst and fading of the supernova of 1937. The first exposure (20 min) shows the supernova at maximum brightness; the second (45 min) shows it about 400 days after maximum; on the third (85 min) the supernova is too faint to be detected.
Throughout this paper we have proposed that the production of the e-process, r-process, and p-process isotopes takes place immediately preceding or during such outbursts of supernovae. This is the only type of astrophysical process that we know of, apart from an initial state in an evolutionary cosmology, in which it can be presumed that the necessary high-energy, rapidly evolving conditions can be expected. Thus while we were searching for such an astrophysical situation the discovery that the half-life for decay by spontaneous fission of Cf264 was equal to the halflife for decay of the light curve of the supernova in IC 4182 (Bu56, Ba56) led us to make the detailed calculations which are described in Sees. VII and VIII.
Since this original work was carried out, there has been further investigation of the half-life of Cf264
(see Sec. VIII). Also we have re-examined the evidence concerning the light curves of supernovae. Results of the calculations have allowed us to re-examine the basic assumption made in our earlier papers, that the energy released in the decay of Cf264 must dominate over all of the other possible sources of decay energy.
The half-life of 55± 1 days was obtained from Baade's result on the supernova in IC 4128. In Fig. XII, 1 we show Baade's light curve of the supernova in IC 4182, and the light curves of Tycho Brahe's nova and Kepler's nova (Ba43, Ba45), together with estimated points for the supernova of 1054 (the Crab Nebula) (Ma42). For SN IC 4182 the observations have been made for as long as 600 days after maximum. The absolute magnitude of this supernova at maximum has been
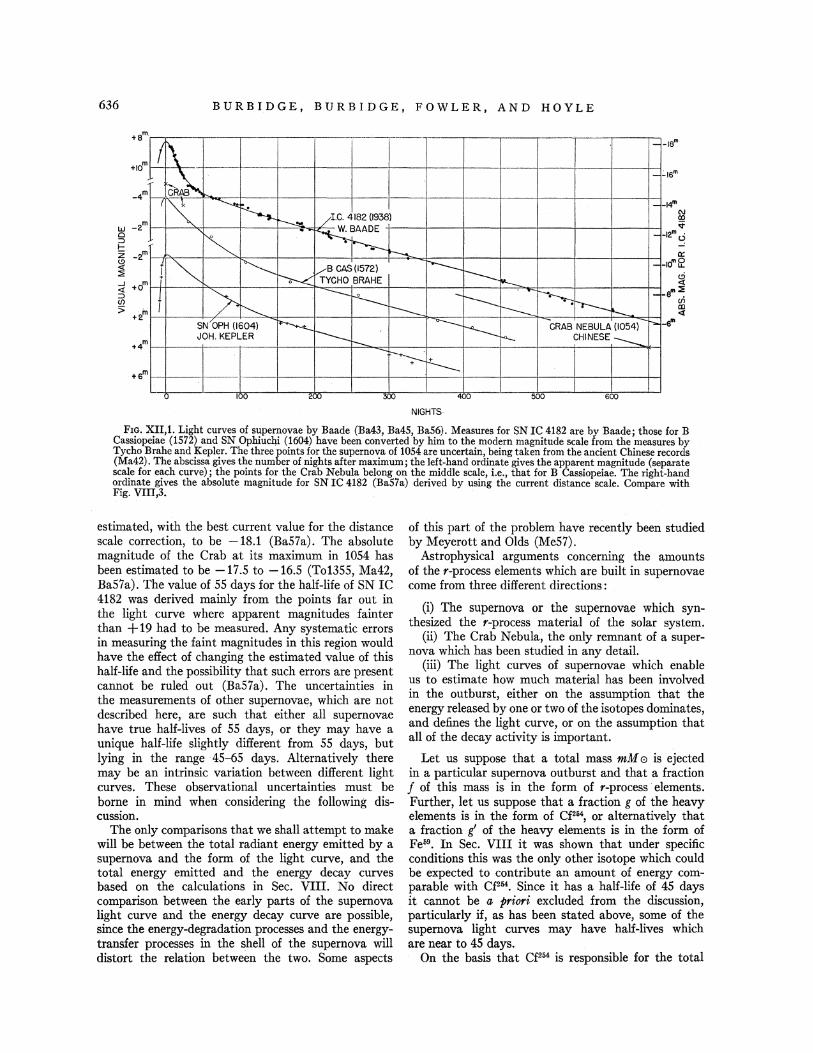
636 BURBIDGE, BURBIDGE, FOWLER, AND HOYLE
I 1\ --
~~· _.:.
'I~ ............. ~
-I
r--. ... /I.e. 4182 (19381 .. --1
~ ~ ~ f ~ ~ vB CAS (1572) ---!--.
--i ~ TYCHO BRAHE ..__
---- - -I > 1--- --- ~ '----- r-- -----
'"t----. '-.... SN OPH (1604) ~ ~ _,_____ CRAB NEBULA (1054)
..,.,_ JOH. KEPLER 1--- ...,_ CHINESE.--r--
~ -t._____
0 100 2JV 300 'I<JV 500 600
NIGHTS
FIG. XII,l. Light curves of supernovae by Baade (Ba43, Ba45, Ba56). Measures for SN IC 4182 are by Baade; those forB Cassiopeiae (1572) and SN Ophiuc¥ (1604) have been converted by him to the modern magnitude scale from the measures by Tycho Brahe and Kepler. The three points for the supernova of 1054 are uncertain, being taken from the ancient Chinese records (Ma42). The abscissa gives the number of nights after maximum; the left-hand ordinate gives the apparent magnitude (separate scale for each curve); the points for the Crab Nebula belong on the middle scale, i.e., that for B Cassiopeiae. The right-hand ordinate gives the absolute magnitude for SN IC 4182 (Ba57a) derived by using the current distance scale. Compare with Fig. VIII,3.
estimated, with the best current value for the distance scale correction, to be -18.1 (Ba57a). The absolute magnitude of the Crab at its maximum in 1054 has been estimated to be -17.5 to -16.5 (To1355, Ma42, Ba57a). The value of 55 days for the half-life of SN IC 4182 was derived mainly from the points far out in the light curve where apparent magnitudes fainter than + 19 had to be measured. Any systematic errors in measuring the faint magnitudes in this region would have the effect of changing the estimated value of this half-life and the possibility that such errors are present cannot be ruled out (Ba57a). The uncertainties in the measurements of other supernovae, which are not described here, are such that either all supernovae have true half-lives of 55 days, or they may have a unique half-life slightly different from 55 days, but lying in the range 45-65 days. Alternatively there may be an intrinsic variation between different light curves. These observational uncertainties must be borne in mind when considering the following discussion.
The only comparisons that we shall attempt to make will be between the total radiant energy emitted by a supernova and the form of the light curve, and the total energy emitted and the energy decay curves based on the calculations in Sec. VIII. No direct comparison between the early parts of the supernova light curve and the energy decay curve are possible, since the energy-degradation processes and the energytransfer processes in the shell of the supernova will distort the relation between the two. Some aspects
of this part of the problem have recently been studied by Meyerott and Olds (Me57).
Astrophysical arguments concerning the amounts of the r-process elements which are built in supernovae come from three different directions :
(i) The supernova or the supernovae which synthesized the r-process material of the solar system.
(ii) The Crab Nebula, the only remnant of a supernova which has been studied in any detail.
(iii) The light curves of supernovae which enable us to estimate how much material has been involved in the outburst, either on the assumption that the energy released by one or two of the isotopes dominates, and defines the light curve, or on the assumption that all of the decay activity is important.
Let us suppose that a total mass mM 0 is ejected in a particular supernova outburst and that a fraction f of this mass is in the form of r-process · elements. Further, let us suppose that a fraction g of the heavy elements is in the form of C£264, or alternatively that a fraction i of the heavy elements is in the form of Fe69• In Sec. VIII it was shown that under specific conditions this was the only other isotope which could be expected to contribute an amount of energy comparable with C£264• Since it has a half-life of 45 days it cannot be a priori excluded from the discussion, particularly if, as has been stated above, some of the supernova light curves may have half-lives which are near to 45 days.
On the basis that C£264 is responsible for the total
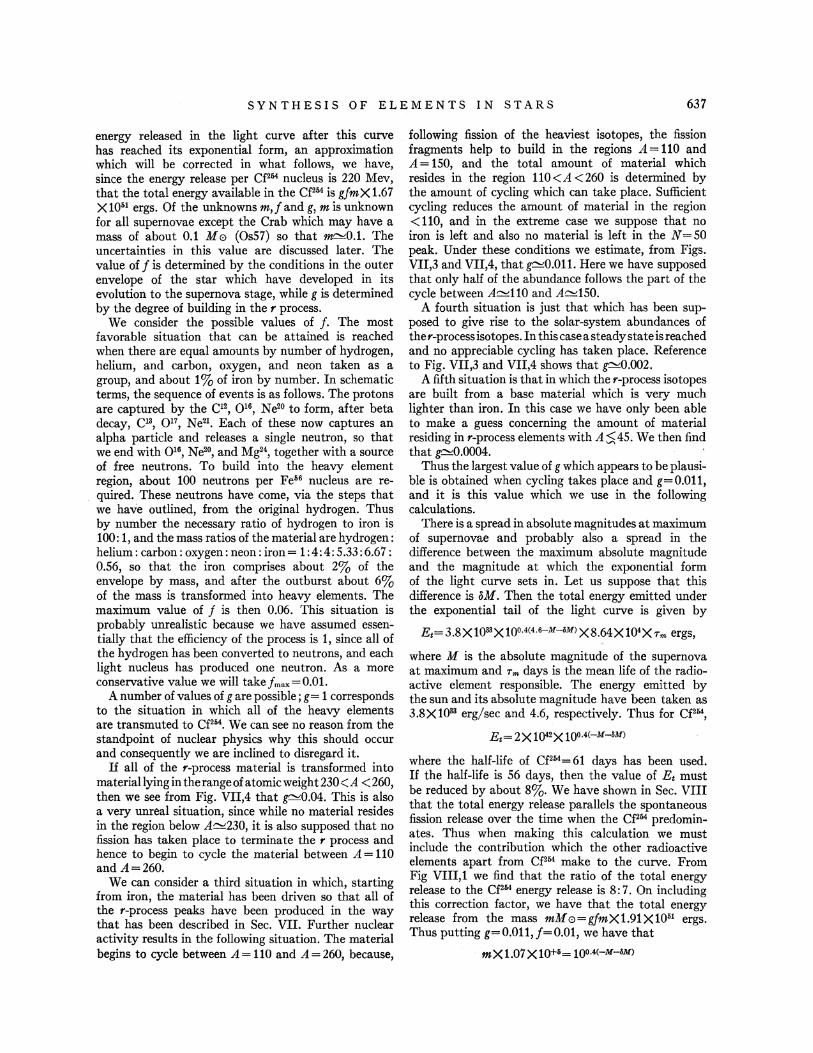
SYNTHESIS OF ELEMENTS IN STARS 637
energy released in the light curve after this curve has reached its exponential form, an approximation which will be corrected in what follows, we have, since the energy release per Cf264 nucleus is 220 Mev, that the total energy available in the C£254 is gfmX1.67 X 10•1 ergs. Of the unknowns m, f and g, m is unknown for all supernovae except the Crab which may have a mass of about 0.1 M 0 (Os57) so that ~0.1. The uncertainties in this value are discussed later. The value off is determined by the conditions in the outer envelope of the star which have developed in its evolution to the supernova stage, while g is determined by the degree of building in the r process.
We consider the possible values of f. The most favorable situation that can be attained is reached when there are equal amounts by number of hydrogen, helium, and carbon, oxygen, and neon taken as a group, and about 1% of iron by number. In schematic terms, the sequence of events is as follows. The protons are captured by the C12, 0 16, Ne20 to form, after beta decay, Cl3, 0 17, Ne21• Each of these now captures an alpha particle and releases a single neutron, so that we end with 0 16, Ne20, and Mg24, together with a source of free neutrons. To build into the heavy element region, about 100 neutrons per Fe66 nucleus are required. These neutrons have come, via the steps that we have outlined, from the original hydrogen. Thus by number the necessary ratio of hydrogen to iron is 100: 1, and the mass ratios of the material are hydrogen: helium: carbon: oxygen: neon: iron= 1:4:4:5.33:6.67: 0.56, so that the iron comprises about 2% of the envelope by mass, and after the outburst about 6% of the mass is transformed into heavy elements. The maximum value of f is then 0.06. This situation is probably unrealistic because we have assumed essentially that the efficiency of the process is 1, since all of the hydrogen has been converted to neutrons, and each light nucleus has produced one neutron. As a more conservative value we will take f max= 0.01.
A number of values of g are possible; g= 1 corresponds to the situation in which all of the heavy elements are transmuted to Cf204• We can see no reason from the standpoint of nuclear physics why this should occur and consequently we are inclined to disregard it.
If all of the r-process material is transformed into materiallyingin therangeofatomicweight230<A <260, then we see from Fig. VII,4 that g"-'0.04. This is also a very unreal situation, since while no material resides in the region below A~230, it is also supposed that no fission has taken place to terminate the r process and hence to begin to cycle the material between A= 110 and A=260.
We can consider a third situation in which, starting from iron, the material has been driven so that all of the r-process peaks have been produced in the way that has been described in Sec. VII. Further nuclear activity results in the following situation. The material begins to cycle between A= 110 and A= 260, because,
following fission of the heaviest isotopes, the fission fragments help to build in the regions A= 110 and A= 150, and the total amount of material which resides in the region 110<A <260 is determined by the amount of cycling which can take place. Sufficient cycling reduces the amount of material in the region < 110, and in the extreme case we suppose that no iron is left and also no material is left in the N =SO peak. Under these conditions we estimate, from Figs~ VII,3 and VII,4, that ~0.011. Here we have supposed that only half of the abundance follows the part of the cycle between A~110 and A~150.
A fourth situation is just that which has been supposed to give rise to the solar-system abundances of ther-processisotopes.In thiscaseasteadystateisreached and no appreciable cycling has taken place. Reference to Fig. VII,3 and VII,4 shows that ~0.002.
A fifth situation is that in which the r-process isotopes are built from a base material which is very much lighter than iron. In this case we have only been able to make a guess concerning the amount of material residing in r-process elements with A$45. We then find that g"-'0.0004.
Thus the largest value of g which appears to be plausible is obtained when cycling takes place and g=O.Oll, and it is this value which we use in the following calculations.
There is a spread in absolute magnitudes at maximum of supernovae and probably also a spread in the difference between the maximum absolute magnitude and the magnitude at which the exponential form of the light curve sets in. Let us suppose that this difference is oM. Then the total energy emitted under the exponential tail of the light curve is given by
Ee=3.8X1033 Xl0°·4<4 ·6-M-oM>X8.64X104X Tm ergs,
where M is the absolute magnitude of the supernova at maximum and Tm days is the mean life of the radioactive element responsible. The energy emitted by the sun and its absolute magnitude have been taken as 3.8Xl033 erg/sec and 4.6, respectively. Thus for Cf264,
Ee= 2X 1Q42X 100.4(-M-oM)
where the half-life of Cf264 =61 days has been used. If the half-life is 56 days, then the value of E 1 must be reduced by about 8%. We have shown in Sec. VIII that the total energy release parallels the spontaneous fission release over the time when the Cf264 predominates. Thus when making this calculation we must include the contribution which the other radioactive elements apart from C£254 make to the curve. From Fig VIII,1 we find that the ratio of the total energy release to the Cf264 energy release is 8:7. On including this correction factor, we have that the total energy release from the mass mM0=gfmX1.91X10•1 ergs. Thus putting g=0.011,j=0.01, we have that
m X 1.07 X to+o= 100.4(-M-<~M>
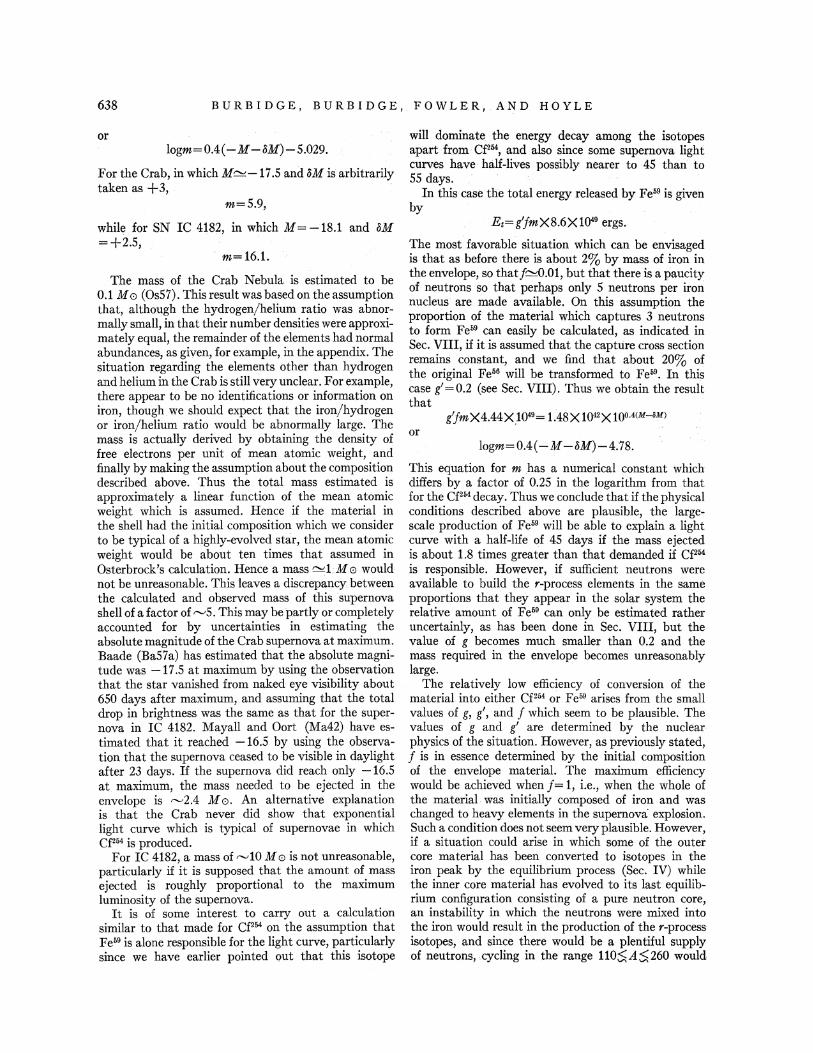
638 BURBIDGE, BURBIDGE, FOWLER, AND HOYLE
or logm= 0.4(-M -oM)-5.029.
For the Crab, in which M"'-'-17.5 and oM is arbitrarily taken as +3,
m=5.9,
while for SN IC 4182, in which M = -18.1 and oM =+2.5,
· m=16.1.
The mass of the Crab Nebula is estimated to be 0.1 M 0 (Os57). This resultwas based on the assumption that, although the hydrogen/helium ratio was abnormally small, in that their number densities were approximately equal, the remainder of the elements had normal abundances, as given, for example, in the appendix. The situation regarding the elements other than hydrogen and helium in the Crab is still very unclear. For example, there appear to be no identifications or information on iron, though. we should expect that the iron/hydrogen or iron/helium ratio would be abnormally large. The mass is actually derived by obtaining the density of free electrons per unit of mean atomic weight, and finally by making the assumption about the composition described above. Thus the total mass estimated is approximately a linear function of the mean atomic weight which is assumed. Hence if the material in the shell had the initial composition which we consider to be typical of a highly-evolved star, the mean atomic weight would be about ten times that assumed in Osterbrock's calculation. Hence a mass ~LM 0 would not be unreasonable. This leaves a discrepancy between the calculated and observed mass of this supernova shell of a factor of "-'5. This may be 'partly or completely accounted for by uncertainties in estimating the absolute magnitude of the Crab supernova at maximum. Baade (Ba57a) has estimated that the absolute magnitude was -17.5 at maximum by using the observation that the star vanished from naked eye visibility about 650 days after maximum, and assuming that the total drop in brightness was the same as that for the supernova in IC 4182. Mayall and Oort (Ma42) have estimated that it reached -16.5 by using the observation that the supernova ceased to be visible in daylight after 23 days. If the supernova did reach only -16.5 at maximum, the mass needed to be ejected in the envelope is "-'2.4 M 0. An alternative explanation is that the Crab never did show that exponential light curve which is typical of supernovae in which C£254 is produced.
For IC 4182, a mass of rv10 M 0 is not unreasonable, particularly if it is supposed that the amount of mass ejected is roughly proportional to the maximum luminosity of the supernova.
It is of some interest to carry out a calculation similar to that made for C£254 on the assumption that Fe•9 is alone responsible for the light curve, particularly since we have earlier pointed out that this isotope
will dominate. • the energy· decay among the isotopes apart from· C£254, and also since some supernova light curves have half-lives possibly nearer to 45 than to 55 days.
In this case the total energy released by Fe69 is given by
Ee=tfmX8.6X1049 ergs.
The most favorable situation which can be envisaged is that as before there is about 2% by mass of iron in the envelope, so thatf"'-'0.01, but that there is a paucity of neutrons so that perhaps only 5 neutrons per iron nucleus are made available. On this assumption the proportion of the material which captures 3 neutrons to form Fe69 can easily be calculated, as indicated in Sec. VIII, if it is assumed that the capttire cross section remains constant, and we find that about 20% of the original Fe56 will be transformed to Fe59• In this case g' = 0.2 (see Sec. VIII). Thus we obtain the· result that
g'fm X 4.44X _1049= 1.48 X 1042X 10°A<M-&M> or
logm=0.4( -M -llM)-4.78.
This equation for m has a numerical constant which differs by a factor of 0.25 in the logarithm from that for the Cf254 decay. Thus we conclude that if the physical conditions described above are plausible, the largescale production of Fe59 will be able to explain a light curve with a half-life of 45 days if the mass ejected is about 1.8 times greater than that demanded if C£254
is responsible. However, if sufficient neutrons were available to build the r-process elements in the same proportions that they appear in the solar system the relative amount of Fe59 can only be estimated rather uncertainly, as has been done in Sec. VIII, but the value of g becomes much smaller than 0.2 and the mass required in the envelope becomes unreasonably large.
The relatively low efficiency of conversion of the material into either Cf254 or Fe59 arises from the small values of g, g', and f which seem to be plausible. The values of g and g' are determined by the nuclear physics of the situation. However, as previously stated, f is in essence determined by the initial composition of the envelope material. The maximum efficiency would be achieved when f= 1, i.e., when the whole of the material. was initially composed of iron and was changed to heavy elements in the supernova· explosion. Such a condition does not seem very plausible. However, if a situation could arise in which some of the outer core material has been converted to isotopes in the iron peak by the equilibrium process (Sec. IV) while the inner core material has evolved to its last equilibrium configuration consisting of a pure neutron core, an instability in which the neutrons were mixed into the iron would result in the production of the r-process isotopes, and since there would be a plentiful supply of neutrons, cycling in the range 110;SA;S260 would
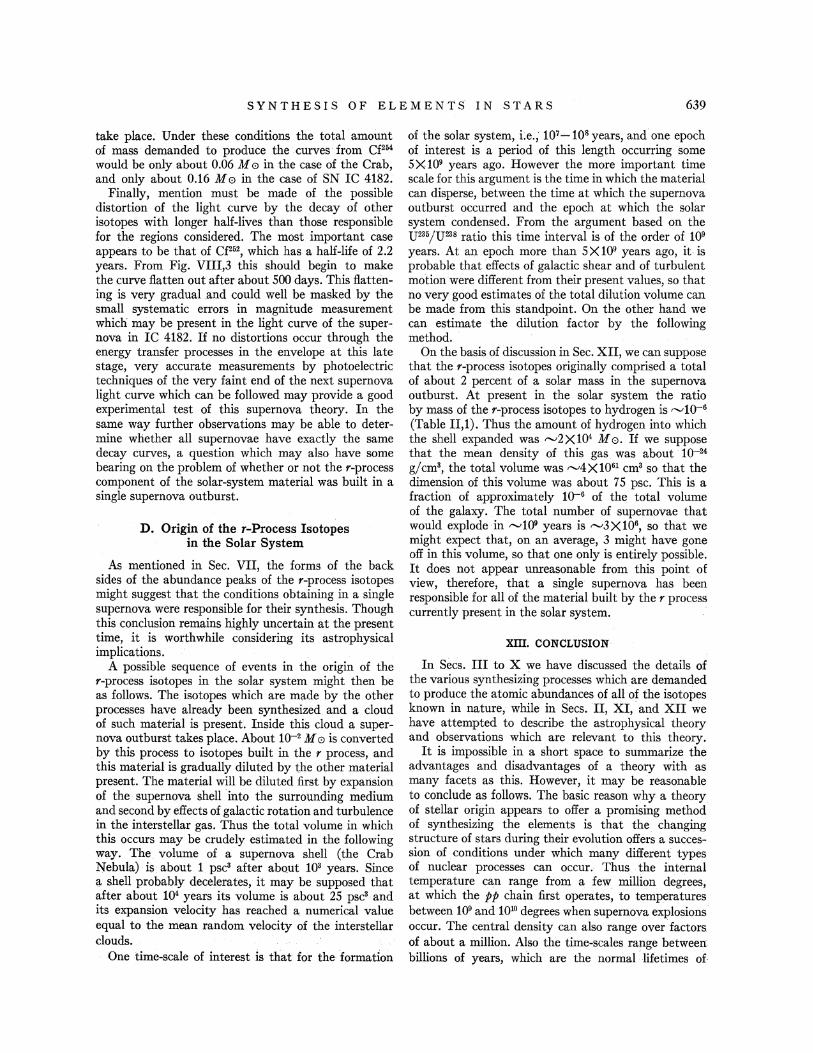
SYNTHESIS OF ELEMENTS IN STARS 639
take place. Under these conditions the total amount of mass demanded to produce the curves from C£254
would be only about 0.06 M 0 in the case of the Crab, and only about 0.16 M 0 in the case of SN IC 4182.
Finally, mention must be made of the possible distortion of the light curve by the decay of other isotopes with longer half-lives than those responsible for the regions considered. The most important case appears to be that of Cf252, which has a half-life of 2.2 years. From Fig. VIII,3 this should begin to make the curve flatten out after about 500 days. This flattening is very gradual .and could well be masked by the small systematic errors in magnitude measurement which may be present in the light curve of the supernova in IC 4182. If no distortions occur through the energy transfer processes in the envelope at this late stage, very accurate measurements by photoelectri~ techniques of the very faint end of the next supernova light curve which can be followed may provide a good experimental test of this supernova theory. In the same way further observations may be able to determine whether all supernovae have exactly the same decay curves, a question which may also have some bearing on the problem of whether or not the r-process component of the solar-system material was built in a single supernova outburst.
D. Origin of the r-Process Isotopes in the Solar System
As mentioned in Sec. VII, the forms of the back sides of the abundance peaks of the r-process isotopes might suggest that the conditions obtaining in a single supernova were responsible for their synthesis. Though this conclusion remains highly uncertain at the present time, it is worthwhile considering its astrophysical implications.
A possible sequence of events in the origin of the r-process isotopes in the solar system might then be as follows. The isotopes which are made by the other processes have already been synthesized and a cloud of such material is present. Inside this cloud a supernova outburst takes place. About lQ-2 M 0 is converted by this process to isotopes built in the r process, and this material is gradually diluted by the other material present. The material will be diluted first by expansion of the, supernova shell ·into the surrounding medium and second by effects of galactic rotation and turbulence in the interstellar gas. Thus the total volume in which this occurs may be crudely estimated in the following way. The volume of a supernova shell (the Crab Nebula) is about 1 psc3 after about 1()3 years. Since IJ. shell probably decelerates, it may be supposed that after about 1()4 years its volume is about 25 psc3 and its expansion velocity has reached a. numerical value equal to the mean rand~m velocity of the interstellar clouds.
One time-scale of interest is that for the formation
of the solar system, Le.; 107~ 108 years, and one epoch of interest is a period of this length occurring some 5 X 10⁹ years ago. However the more important time scale for this argument is the time in which the material can disperse, between the time at which the supernova outburst occurred and the epoch at which the solar system condensed. From the argument based on the U235/U238 ratio this time interval is of the order of 109
years. At an epoch more than 5Xl09 years ago, it is probable that effects of galactic shear and of turbulent motion were different from their present values, so that no very good estimates of the total dilution volume can be made from this standpoint. On the other hand we can estimate the dilution factor by the following method.
On the basis of discussion in Sec. XII, we can suppose that the r-process isotopes originally comprised a total of about 2 percent of a solar mass in the supernova outburst. At present in the solar system the ratio by mass of the r-process isotopes to hydrogen is "-'lQ-6
(Table II,l). Thus the amount of hydrogen into which the shell expanded was "-'2Xl()4 M 0. If we suppose that the mean density of this gas was about lQ-24
g/cm3, the total volume was "-'4Xl061 cm3 so that the dimension of this volume was about 75 psc. This is a fraction of approximately lQ-6 of the total volume of the galaxy. The total number of supernovae that would explode in ......,1()9 years is ......,3Xl06, so that we might expect that, on an average, 3 might have gone off in this volume, so that one only is entirely possible. It does not appear unreasonable from this point of view, therefore, that a single supernova has been responsible for all of the material built by the r process currently present in the solar system.
XIII; CONCLUSION
In Sees. III to X we have discussed the details of the various synthesizing processes which are demanded to produce the atomic abundances of all of the isotopes known in nature, while in Sees. II, XI, and XII we have attempted to describe the astrophysical theory and observations which are relevant to this theory.
It is impossible in a short space to summarize the advantages and disadvantages of a theory with as many facets as this. However, it may be reasonable to conclude as follows. The basic reason why a theory of stellar origin appears to offer a promising method of synthesizing the elements is that the changing structure of stars during their evolution offers a succession of conditions under which many different types of nuclear processes can occur. Thus the internal temperature can range from a few million degrees, at which the pp chain first operates, to temperatures between 109 and 1010 degrees when supernova explosions occur. The central density can also range over factors of about a million. Also the time-scales range between billions of years, whkh are the normal .·lifetimes of.
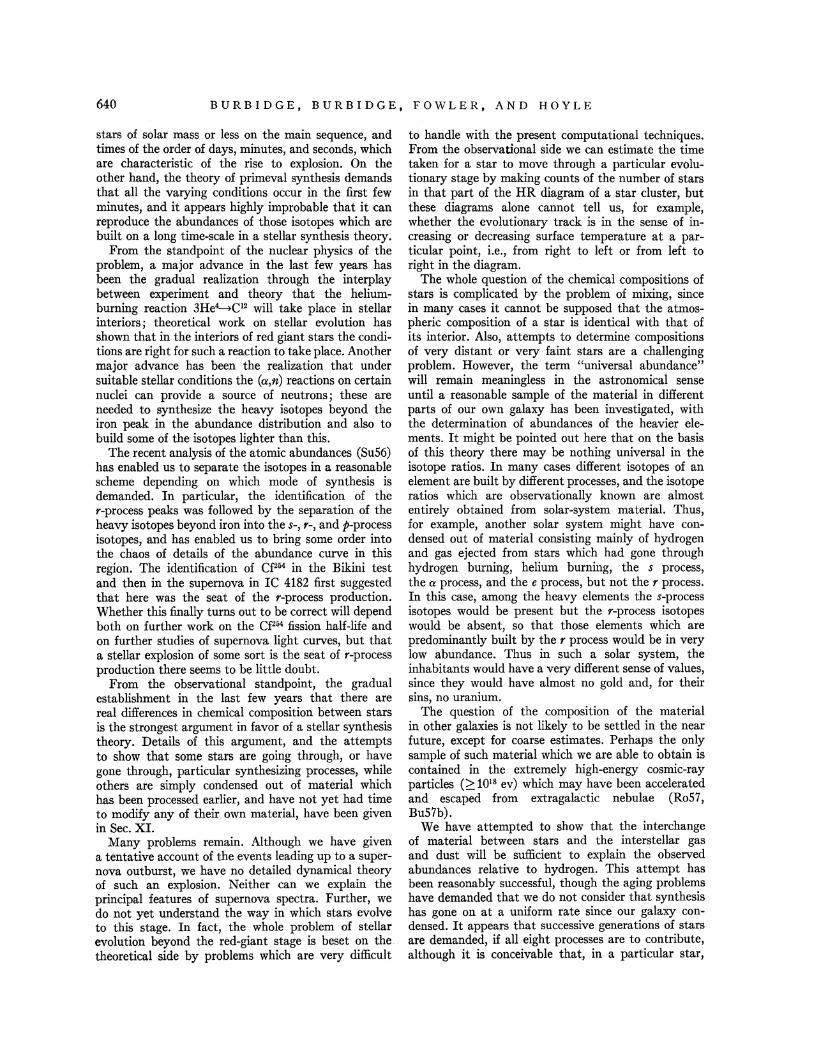
640 BURBIDGE, BURBIDGE, FOWLER, AND HOYLE
stars of solar mass or less on the main sequence, and times of the order of days, minutes, and seconds, which are characteristic of the rise to explosion. On the other hand, the theory of primeval synthesis demands that all the varying conditions occur in the first few minutes, and it appears highly improbable that it can reproduce the abundances of those isotopes which are built on a long time-scale in a stellar synthesis theory.
From the standpoint of the nuclear physics of the problem, a major advance in the last few years has been the gradual realization through the interplay between experiment and theory that the heliumburning reaction 3He4C12 will take place in stellar interiors; theoretical work on stellar evolution has shown that in the interiors of red giant stars the conditions are right for such a reaction to take place. Another major advance has been the realization that under suitable stellar conditions the (a,n) reactions on certain nuclei can provide a source of neutrons; these are needed to synthesize the heavy isotopes beyond the iron peak in the abundance distribution and also to build some of the isotopes lighter than this.
The recent analysis of the atomic abundances (Su56) has enabled us to separate the isotopes in a reasonable scheme depending on which mode of synthesis is demanded. In particular, the identification of the r-process peaks was followed by the separation of the heavy isotopes beyond iron into the s-, r-, and p-process isotopes, and has enabled us to bring some order into the cliaos of details of the abundance curve in this region. The identification of C£254 in the Bikini test and then in the supernova in IC 4182 first suggested that here was the seat of the r-process production. Whether this :finally turns out to be correct will depend both on further work on the Cf254 fission half-life and on further studies of supernova light curves, but that a stellar explosion of some sort is the seat of r-process production there seems to be little doubt.
From the observational standpoint, the gradual establishment in the last few years that there are real differences in chemical composition between stars is the strongest argument in favor of a stellar synthesis theory. Details of this argument, and the attempts to show that some stars are going through, or have gone through, particular synthesizing processes, while others are simply condensed out of material which has been processed earlier, and have not yet had time to modify any of their own material, have been given in Sec. XI.
Many problems remain. Although we have given a tentative account of the events leading up to a supernova outburst, we have no detailed dynamical theory of such an explosion. Neither can we explain the principal features of supernova spectra. Further, we do not yet understand the way in which stars evolve to this stage. In fact, the whole problem of stellar evolution beyond the red-giant stage is beset on the theoretical side by problems which are very difficult
to handle with the present computational techniques. From the observational side we can estimate the time taken for a star to move through a particular evolutionary stage by making counts of the number of stars in that part of the HR diagram of a star cluster, but these diagrams alone cannot tell us, for example, whether the evolutionary track is in the sense of increasing or decreasing surface temperature at a particular point, i.e., from right to left or from left to right in the diagram.
The whole question of the chemical compositions of stars is complicated by the problem of mixing, since in many cases it cannot be supposed that the atmospheric composition of a star is identical with that of its interior. Also, attempts to determine compositions of very distant or very faint stars are a challenging problem. However, the term "universal abundance" will remain meaningless in the astronomical sense until a reasonable sample of the material in different parts of our own galaxy has been investigated, with the determination of abundances of the heavier elements. It might be pointed out here that on the basis of this theory there may be nothing universal in the isotope ratios. In many cases different isotopes of an element are built by different processes, and the isotope ratios which are observationally known are almost entirely obtained from solar-system material. Thus, for example, another solar system might have condensed out of material consisting mainly of hydrogen and gas ejected from stars which had gone through hydrogen burning, helium burning, the s process, the a process, and the e process, but not the r process. In this case, among the heavy elements the s-process isotopes would be present but the r-process isotopes would be absent, so that those elements which are predominantly built by the r process would be in very low abundance. Thus in such a solar system, the inhabitants would have a very different sense of values, since they would have almost no gold and, for their sins, no uranium.
The question of the composition of the material in other galaxies is not likely to be settled in the near future, except for coarse estimates. Perhaps the only sample of such material which we are able to obtain is contained in the extremely high-energy cosmic-ray particles (?::: 1018 ev) which may have been accelerated and escaped from extragalactic nebulae (Ro57, Bu57b).
We have attempted to show that the interchange of material between stars and the interstellar gas and dust will be sufficient to explain the observed abundances relative to hydrogen. This attempt has been reasonably successful, though the aging problems have demanded that we do not consider that synthesis has gone on at a uniform rate since our galaxy condensed. It appears that successive generations of stars are demanded, if all eight processes are to contribute, although it is conceivable that, in a particular star,
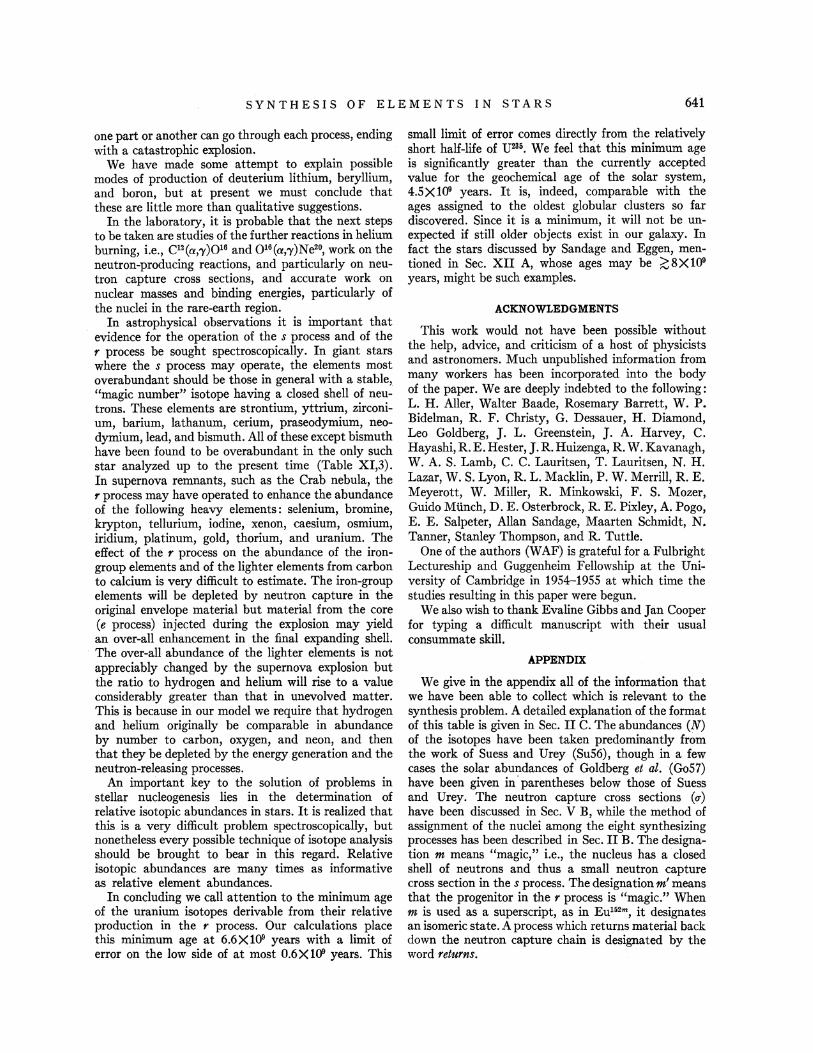
SYNTHESIS OF ELEMENTS IN STARS 641
one part or another can go through each process, ending with a catastrophic explosion.
We have made some attempt to explain possible modes of production of deuterium lithium, beryllium, and boron, but at present we must conclude that these are little more than qualitative suggestions.
In the laboratory, it is probable that the next steps to be taken are studies of the further reactions in helium burning, i.e., C12(a,'Y)016 and 0 16(a,'Y)Ne2°, work on the neutron-producing reactions, and particularly on neutron capture cross sections, and accurate work on nuclear masses and binding energies, particularly of the nuclei in the rare-earth region.
In astrophysical observations it is important that evidence for the operation of the s process and of the r process be sought spectroscopically. In giant stars where the s process may operate, the elements most overabundant should be those in general with a stable, "magic number" isotope having a closed shell of neutrons. These elements are strontium, yttrium, zirconium, barium, lathanum, cerium, praseodymium, neodymium, lead, and bismuth. All of these except bismuth have been found to be overabundant in the only such star analyzed up to the present time (Table XI,3). In supernova remnants, such as the Crab nebula, the r process may have operated to enhance the abundance of the following heavy elements: selenium, bromine, krypton, tellurium, iodine, xenon, caesium, osmium, iridium, platinum, gold, thorium, and uranium. The effect of the r process on the abundance of the irongroup elements and of the lighter elements from carbon to calcium is very difficult to estimate. The iron-group elements will be depleted by neutron capture in the original envelope material but material from the core (e process) injected during the explosion may yield an over-all enhancement in the final expanding shell.
· The over-all abundance of the lighter elements is not appreciably changed by the supernova explosion but the ratio to hydrogen and helium will rise to a value considerably greater than that in unevolved matter. This is because in our model we require that hydrogen and helium originally be comparable in abundance by number to carbon, oxygen, and neon, and then that they be depleted by the energy generation and the neutron-releasing processes.
An important key to the solution of problems in stellar nucleogenesis lies in the determination of relative isotopic abundances in stars. It is realized that this is a very difficult problem spectroscopically, but nonetheless every possible technique of isotope analysis should be brought to bear in this regard. Relative isotopic abundances are many times as informative as relative element abundances.
In concluding we call attention to the minimum age of the uranium isotopes derivable from their relative production in the r process. Our calculations place this minimum age at 6.6X10⁹ years with a limit of error on the low side of at most 0.6X10⁹ years. This
small limit of error comes directly from the relatively short half-life of U235• We feel that this minimum age is significantly greater than the currently accepted value for the geochemical age of the solar system, 4.5X10⁹ years. It is, indeed, comparable with the ages assigned to the oldest globular dusters so far discovered. Since it is a minimum, it will not be unexpected if still older objects exist in our galaxy. In fact the stars discussed by Sandage and Eggen, mentioned in Sec. XII A, whose ages may be ~8X10⁹ years, might be such examples.
ACKNOWLEDGMENTS
This work would not have been possible without the help, advice, and criticism of a host of physicists and astronomers. Much unpublished information from many workers has been incorporated into the body of the paper. We are deeply indebted to the following : L. H. Aller, Walter Baade, Rosemary Barrett, W. P. Bidelman, R. F. Christy, G. Dessauer, H. Diamond, Leo Goldberg, J. L. Greenstein, J. A. Harvey, C. Hayashi, R. E. Hester, J. R. Huizenga, R. W. Kavanagh, W. A. S. Lamb, C. C. Lauritsen, T. Lauritsen, N.H. Lazar, W. S. Lyon, R. L. Macklin, P. W. Merrill, R. E. Meyerott, W. Miller, R. Minkowski, F. S. Mozer, Guido Miinch, D. E. Osterbrock, R. E. Pixley, A. Pogo, E. E. Salpeter, Allan Sandage, Maarten Schmidt, N. Tanner, Stanley Thompson, and R. Tuttle.
One of the authors (WAF) is grateful for a Fulbright Lectureship and Guggenheim Fellowship at the University of Cambridge in 1954-1955 at which time the studies resulting in this paper were begun.
We also wish to thank Evaline Gibbs and Jan Cooper for typing a difficult manuscript with their usual consummate skill.
APPENDIX
We give in the appendix all of the information that we have been able to collect which is relevant to the synthesis problem. A detailed explanation of the format of this table is given in Sec. II C. The abundances (N) of the isotopes have been taken predominantly from the work of Suess and Urey (Su56), though in a few cases the solar abundances of Goldberg et al. {Go57) have been given in· parentheses below those of Suess and Urey. The neutron capture cross sections (u) have been discussed in Sec. V B, while the method of assignment of the nuclei among the eight synthesizing processes has been described in Sec. II B. The designation m means "magic," i.e., the nucleus has a closed shell of neutrons and thus a small neutron capture cross section in the s process. The designation m' means that the progenitor in the r process is "magic." When m is used as a superscript, as in Eu152m, it designates an isomeric state. A process which returns material back down the neutron capture chain is designated by the word returns.
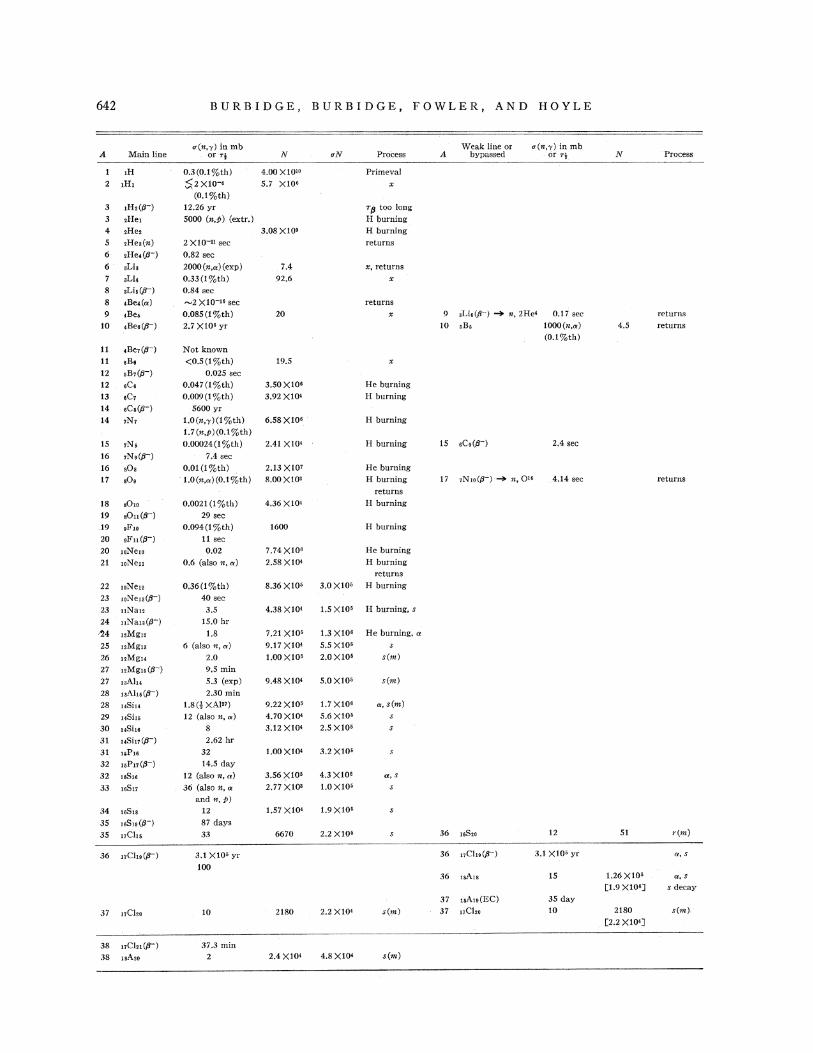
642 BURBJ DGE, BURBIDGE, FOWLER, AND HOYLE
.-(n,y) in mb Weak line or u(n,')') in mb A Mainline or Ti N uN Process A bypassed , Or Ti N Process
,H 0.3(0.1%th) 4.00X10IO Primeval 2 ,H, $2x1o-< 5.7 X10' " (0.1%th) 3 ,H,(P-) 12.26 yr T(J too long 3 oHe1 5000 (n,p) (extr.) H burning 4 2Heo 3.08 X10• H burning 5 ,H'ea(n) 2 X10⁻²I sec returns 6 ,He•(li-) 0.82 sec 6 oLio 2000(n,a)(exp) 7.4 x, returns
7 aLl• 0.33(1%th) 92.6 " 8 oLi&(P-) 0.84 sec 8 ,se,(a) -2 X10-" sec returns
9 ,Be, 0.085 (1 %th) 20 " 9 oLio(/1-) -+ n, 2He< 0.17 sec returns
10 ,Beo(P-) 2.7 X10' yr 10 ,s, IOOO(n,a) 4.5 returns (O.l%th)
11 ,se,(P-) Not known 11 aBe <0.5(1%th) 19.5 " 12 ,s,(P-) 0.025 sec 12 .c. 0.047(1%th) 3.50X10' He burning
13 ,c, 0.009(1 %th) 3.92 X10< H burning 14 eCs(li-) 5600 yr 14 1N1 l.O(n,,.)(1%th) 6.58X10⁸ H burning
1.7(n,p)(0,1%th) 15 1Ns 0.00024(1 %th) 2.41 X10' H burning 15 sCo(P-) 2.4 sec
16 ,N,(/1-) 7.4 sec 16 ,o, 0.01(1%th) 2.13X10' He burning 17 .o. 1.0(n,a)(0.1%th) 8.oox1o• H burning 17 1N ••(li-) -+ n, Oto 4.14 sec returns
returns 18 .o .. 0.0021 (I %th) 4.36 XIO< H burning
19 .On(li-) 29 sec ,19 gF1o 0.094(1 %th) 1600 H burning
20 oFu(li-) 11 sec 20 IoNeto 0.02 7.74X10' He burning
21 toN en 0.6 (also n, a) 2.58XIO' H burning returns
22 10Neu 0.36(1%th) 8.36 X10' 3.0X10' H burning
23 10Neu(P-) 40 sec 23 nNau 3.5 4.38Xl0' 1.5 X10' H burning, s
24 uNau(~) 15.0 hr
~4 aMg, 1.8 7.21 X10' 1.3 X10' He burning, a
25 uMgu 6 (also n, a) 9.17 XIO< 5.5 X10' s
26 uMga 2.0 t.OOX10' 2.0X10' s(m)
27 12Mgu(li-) 9.5 min 27 IBAlu 5.3 (exp) 9.48 X10' 5.0X10' s(m)
28 uAlu(li-) 2.30 min 28 14Sia 1.8(! XA12'1) 9.22 X10' 1.7 x1o• a, s(m)
29 uSiu 12 (also n, a) 4.70X10< 5.6X10'
30 uShs 8 3.12 X10' 2.5X10'
31 uSiu(P-) 2.62 hr 31 u.P•• 32 l.OOXIO< 3.2 XIO'
32 uPn(li-) 14.5 day
32 • .s .. 12. (also n, a) 3.56xto• 4.3X10' a, s
33 1eS11 36 (also n, a 2.77 X100 l.OX10' and n, p)
34 • .s .. 12 1.57 X10< 1.9X10' s
35 I.Su(li-) 87 days
35 nChs 33 6670 2.2 XlO' s 36 us •• 12 51 r(m)
36 I7Cho(P-) 3.1 XlO' yr 36 .,ci"<P-> 3.1X10' yr a,s
100 36 taAIS 15 1.26X10' a,s
[1.9X10'] sdecay
37 18Au(EC) 35 day
37 uCI•o 10 2180 2.2 X10' s(m) 37 nCho 10 2180 s(m).
[2.2 X10<]
38 uCiu (li-) 37.3 min 38 ,,A,. 2 2.4X10' 4.8 X10< s(m)
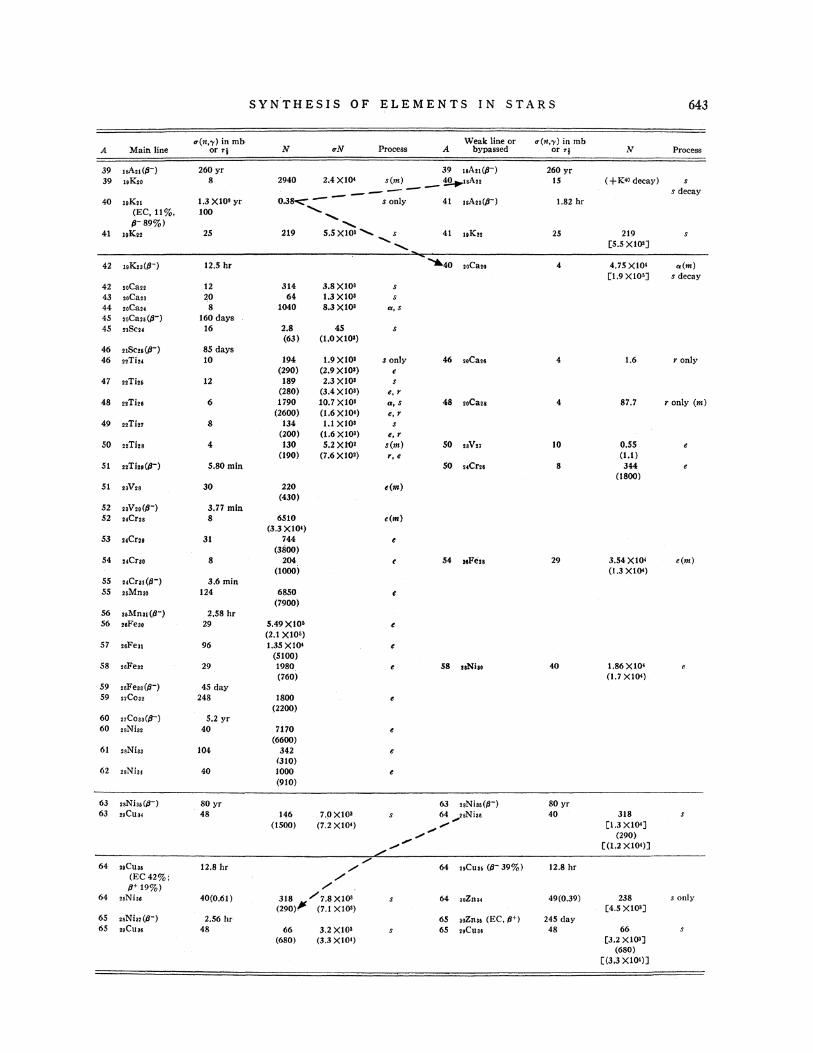
SYNTHESIS OF ELEMENTS IN STARS 643
u(n,,.) inmb Weak line or u(n,'l') inmb A Main line or •l N uN Process A bypassed or •i N Process
39 ISAu(fJ-) 260yr 39 "An(/J-) 260yr 39 uKoo 8 2940 2.4X10< s(m)--~'A" 15 (+K••decay) s -- s decay 40 uKu 1.3 XlOO yr 0.3~ - - - s only 41 18A.,(IJ-) 1.82 hr
(EC,ll%, 100 ......... ..........
(J-89%) .......... 41 ~tKu 25 219 5.5X101 ......._ ......._ s 41 uKto 25 219 s
.......... [5.5 X1()1]
42 uKtS((J-) 12.5 hr ~0 toCato 4 4.75 XIO• a(m) [1.9XIO•] s decay
42 ooCa,. 12 314 3.8X10' $
43 soC au 2,0 64 1.3XI()I s 44 2oCaa4 8 1040 8.3XIOS a,s 45 ooCau(/J-) 160 days 45 nSctc 16 2.8 45 s
(63) (I.OXIOS) 46 nScu(fJ-) 85 days 46 .. Tl,. 10 194 1.9X101 sonly 46 .. ca .. 4 1.6 r only
(290) (2.9X10') e 47 uTlu 12 189 2.3 X lOS s
(280) (3.4X10') e, r 48 21Tiu 6 1790 10.7X10' a, s 48 ooCaos 4 87.1 r only (m)
(2600) (1.6X10<) e, r 49 .. Tin 8 134 1.1 XIO• s
(200) (1.6 Xtoa) e, r so otTiu 4 130 s.2 xto• s(m) 50 uVt1 10 0.55
(190) (7.6X100) r, e (1.1) 51 .,Tis.(fJ-) 5.80mln so uCru 8 344
(1800) 51 •• v .. 30 220 e(m)
(430) 52 .. vu(fJ-) 3.11 min 52 •• c ... 8 6510 e(m)
(3.3XIO<) 53 uCr., 31 744 e
(3SOO) 54 uCrao 8 204 54 teFeu 29 3.54XIO• e(m)
(1000) (1.3 XIO') 55 .. cru(fJ-) 3.6 min 55 oaMnao 124 6850 e
(7900) 56 .. Mnu((J-) 2.58 hr 56 .. Feao 29 5.49 XIO' e
(2.1 X10') 57 ,.Fen 96 1.35 XIO< e
(5100) 58 taFe., 29 1980 e 58 10Niso 40 1.86X10<
(760) (1.7 XlO<) 59 .. Feaa((J-) 45 day 59 .,co .. 248 1800
(2200) 60 ,cosa(tJ-) 5.2 yr 60 .. Ni, 40 7170 e
(6600) 61 ,Ni,. 104 342 e
(310) 62 uNi11 40 1000 e
(910)
63 JSNill(ll-) 80 yr 63 uNha(ll-) 80 yr 63 .. cu .. 48 146 1.ox1oa s 64 ,..;sNiao 40 318 s
(1500) (7.2X10<) ,., [1.3 XIO<] ,., ..... (290) ,.,,., [(1.2 XIO<)]
64 soCuaa 12.8 hr / /
64 ,.cu,. (II- 39%) 12.8 hr (EC42%; / 11+19%) /
64 uNiaa 40(0.61) 318 /7.8X10S, 64 aoZna• 49(0.39) 238 sonly (290)!ft (7.1 X1()1) [4.5X1()1]
65 .. Nln(ll-) 2.56 hr 65 soZnu (EC,II+) 245 day 65 .. cu,. 48 66 3.2 x1o• 65 ,.cuao 48 66
(680) (3.3X10') [3.2 X10S] (680)
[(3,3 X10<)]
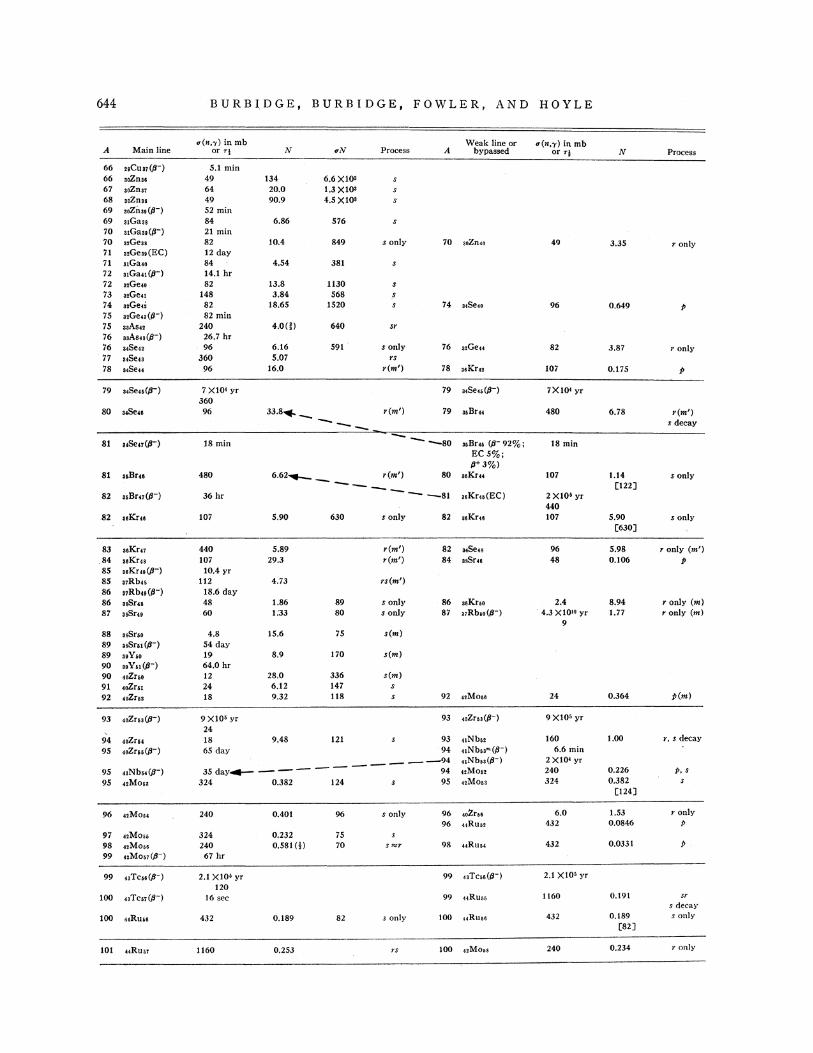
644
A Mainline
66 uCun(ll-) 66 s.Zn,. 67 s.Zn., 68 sozn .. 69 •oZiuo(ll-) 69 uGa., 70 atGaao(ll-) 70 .,Geas 71 .,Ge.,(EC) 71 uGa" 72 uGau(ll-) 72 .,Geu 73 .. Ge .. 74 aoGe,; 75 ,.Ge.,(ll-) 75 aaAs., 76 saAs.,(ll-) 76 .. se., 77 .. se .. 78 ,.seu
80 ,,se.e
81
81
82
82 aeKr<e
83 •• Kr., .84 aeKru 85 aeKr.,(ll-) 85 .,Rb<S 86 87Rb4t(ll-) 86 asSr" 87 aaSno
88 asSr&o 89 asSrn (II-) 89 •• v •• 90 aoYn.(ll-) 90 ,.zr,o 91 <oZrn 92 ,.z, ..
93
' 94 95
95 95
uNb .. (ll-) .. Mo.,
96 uMou
97 .,Mo .. 98 .,Mo" 99 uMon(ll-)
100 .. Ru ..
101 uRuu
BURBIDGE, BURBIDGE, FOWLER, AND HOYLE
.. (n,y) inmb or Tl
5.1 min 49 64 49 52 min 84 21 min 82 12 day 84 14.1 hr 82
148 82 82 min
240 26.7 hr 96
360 96
7 X11l' yr 360 96
18 min
480
36 hr
107
440 107
10.4 yr 112
18.6 day 48 60
4.8 54 day 19 64.0 hr 12 24 18
N
134 20.0 90.9
6.86
10.4
4,54
13.8 3.84
18.65
4.om
6.16 5.07
16.0
33.8 .. _
6.62...._
5.90
5.89 29.3
4.73
1.86 1;33
15.6
8.9
28.0 6.12 9.32
.. N
6.6X10' 1.3 X10³ 4.5 X10³
576
849
381
1130 568
1520
640
591
---
Process
s
s
s only
s
sr
sonly rs
r(m')
r(m')
Weak line or A bypassed
70 a.Zn ..
74 .. se ..
78 "Kru
79 ,.Bru
---so ,.sr .. (11-92%; EC5%; 11+3%)
r(m') 80 aeKr.u ------- --st aoKr.,(EC)
630
89 80
75
170
336 147 118
s only
r(m') r(m')
rs(m')
sonly sonly
s(m)
s(m)
s(m) s
82
82 • .se .. 84 asSr"
86 aoKroo 87 .,Rb,o(ll-)
92 uMo&o
9X10' yr 93 24 18 9.48 121 93 uNb.,
uNb.,m(/1-) uNb.,(ll-) .uMoat 4tMou
65 day 94 ____ -94
35day...------ 94 324 0.382 124 95
240
324 240
67 hr
2.1 X10' yr 120
16 sec
432
1160
0.401
0.232 0.581(i)
0.189
0.253
96
75 70
82
s only
s ""'
s only
rs
96 ,.z, .. 96 uRu.,
98 uRu ..
100 .,Mo ..
.. (n,y) inmb or rJ
49
96
82
107
7X10' yr
480
18 min
107
2X10' yr 440 107
96 48
2.4 4.3 X10•• yr
9
24
9X10' yr
160 6.6min
2 X10• yr 240 324
6.0 432
432
2.1 X10' yr
1160
432
240
N
3.35
0.649
3.87
0.175
6.78
1.14 [122]
5.90 [630]
5.98 0.106
8.94 1.77
0.364
1.00
0.226 0.382
[124]
1.53 0.0846
0.0331
0.191
0.189 [82]
0.234
Process
r only
r only
p
r(m') s decay
sonly
sonly
r only (m') p
r only (m) ronly (m)
p(m)
r, s decay
p,s
r only p
p.
sr s decay s only
r only
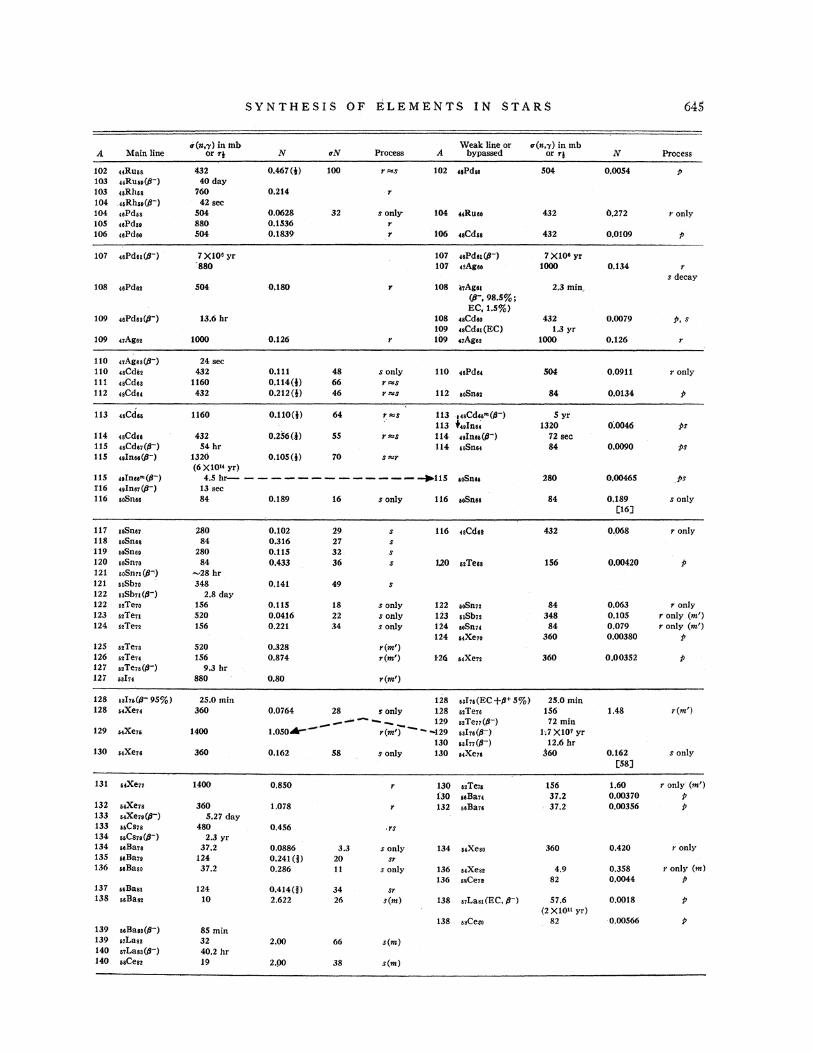
A Mainline
102 .. Ru,. 103 uRu.,(p-) 103 uRhu 104 .•• Rh .. (tl-) 104 ,,Pdoa 105 ••Pdso 106 nPdeo
108 •ePdo
109 nPdu(tl'")
10!1 nAgeo
110 uAg.,(tl'") 110 • .Cdit 111 •• cdu 112 csCde<
113
114 115 115
115 rt6 116
•• c<i ..
,.cd .. uCd.,(p-) .. rn .. {P-)
.,rn .... (p-) coin.,(p-) ooSn11
117 •oSnu 118 ooSnes 119 •oSnoo 120 IOSD70 121 .. snn<P"') 121 nSb7o 122 nSbn{P-) 122 uTe1o 123 ••Ten 124 i2Ter•
125 12Te,. 126 .. Te,. 127 ,,Tero{P-) 127 13174
128 128
129
130
.. In(p-"95%)
.. xer.
uXen
131 ,.Xen
132 uXe78 133 o.Xero{P-) 133 .. c.,. 134 .. cs,.(tl-) 134 .,Bars 135 •sBa,. 136 11Baao
137 11Bast 138 .. Baa•
139 ••Baso{P-) 139 11Laso 140 11Laaa(tl'") 140 .. ce ..
432 40day
760 42·sec
504 880 504
7Xl0' yr ·sao
504
13.6 hr
1000
24 sec 432
1160 432
1160
432 54 hr
1320 (6X10•• yr)
SYNTHESIS OF ELEMENTS IN STARS
N
0.467(i)
0.214
0.0628 0.1536 0.183!t
.(),180
0.126
0.111 0,114(t) 0.212(!)
0.110(f)
0.256(!)
0.105(!)
vN
100
32
48 66 46
64
55
10
Process
r
sonly r r
r
sonly ..... s ..... s
T"'S
Weak line or A bypassed
102 uPd ..
104 uRueo
106 uCdu
I 07 cePdet (p-) 107 ,;Ageo
108 ~,Ag .. {tl'", 98.5%: EC,l.S%)
108 uCdeo 10!1 uCdet (EC) 109 .. Ag ..
112 ooSnet
113 .... c&, .. <P-> 113 +tolna~ 114 ••ln11{P-) 114 ,.sn,.
cr(n•r) in mb or ~t
504
432
432
7Xl0' yr 1000
2.3 min,
432 1.3 yr
1000
S04
84
s yr 1320
72 sec 84
4.5 h,_ - -------------..us 280 13 sec 84
280 84
280 84
-28hr 348
2.8 day 156 520 !56
520 !56
9.3 hr 880
25.0 min 360
1400
360
1400
360 5.21 day
480 2.3 yr
37.2 124 37.2
124 10
85 min 32 40.2 hr 19
0.189
0.102 0.316 0.115 0.433
0.141
0.115 0.0416 0.221
0.328 0.874
0.80
0.0764
16
29 27 32. 36
49
18 22 34
sonly
s s s s
s
sonly a only sonly
r(m') r(m')
r(m')
116 .oSnes
116 uCdet
1.20 .. Tees
122 aoSnn 123 etSbn 124 aoSn74 124 uXero
126 .. xe,
128 28 s only 128
uln(EC+tJ+ 5%) .,Ten
_,.....,. ..... --.... 129 t.oso41fr-_....- r(m')-- ... --t29
.,Ten{P-)
.. ~r.{P:-.)
0.162
0,850
1.078
0.456
0.0886 0.241(i) 0,286
0.414(f) 2.622
2.00
2.oo
130 .,In{P-) 58 s only 130 .. xen
3.3 20 11
34 26
66
38
r
·YS
sonly sr
sonly
sr s(m)
s(m)
s(m)
130 .. Tera i30 uBa74 132 ••Ban
134 uXeao
136 .. xe .. 136 .. ee,.
138 11La81 (EC, tJ-)
138 .. ce...,
84
432
156
84 348
84 360
360
25.omin 156 72 min
h7X10' yr 12.6 hr
360
156 37.2
' 37.2
360
4.9 82
57.6 (2 XIOU yr)
82
N
0.0054
0,272
0,010!1
0.134
0.0079
0.126
0.0!111
0.0134
o'.0046
0.0090
0.00465
0.189 [16]
0.068
0.00420
0.063 0.105 0.079 0.00380
0,00352
1.48
0.162 [58]
1.60 0.00370 0.00356
0.420
0,358 0.0044
0.0018
0.00566
645
Process
p
r only
p
r s decay
p,s
ronly
p
ps
ps
.Ps
sonly
r only
r only r only (m') r only (m')
p
p
r(m')
s only
r onty· (m') p p
r only
r only (m) p
p
p
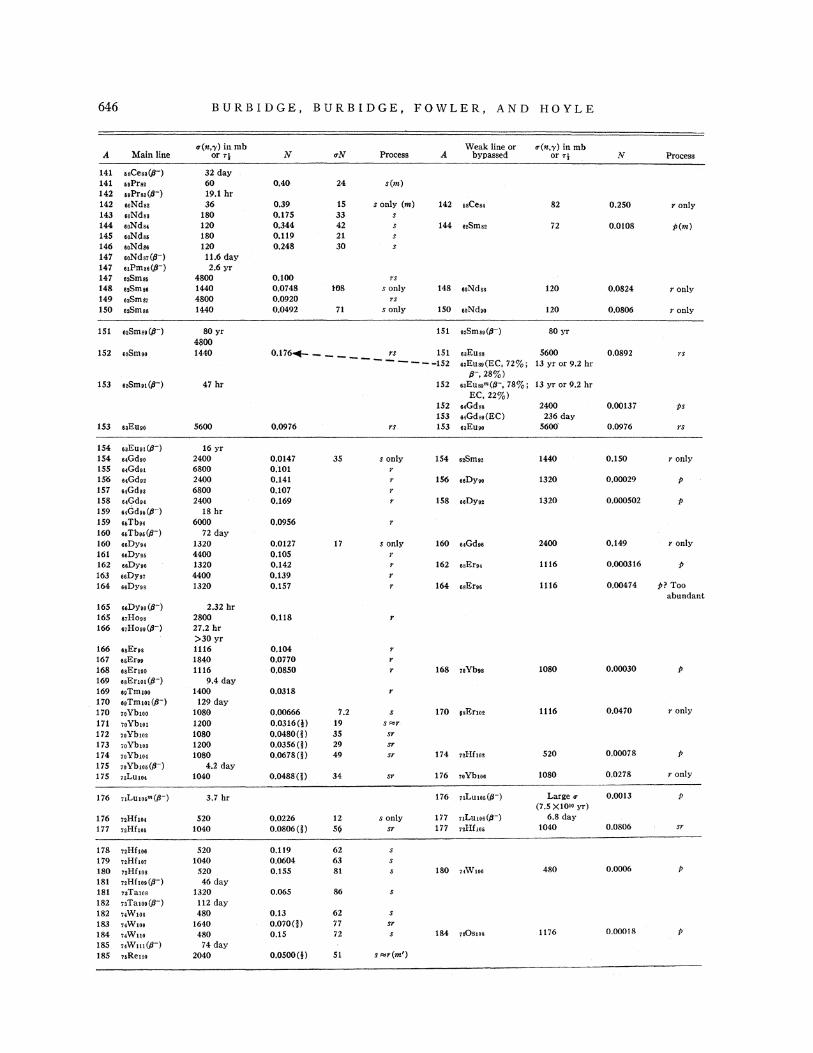
646 BURBIDGE, BURBIDGE, FOWLER, AND HOYLE
a(n,y) inmb Weak line or O'{n,')') inmb A Mainline or ~1 N aN Process A bypassed or ~i N Process
141 a.Ceaa~-) 32 day 141 uPr .. 60 0.40 24 s(m) 142 uPrsa~-) 19.1 hr 142 eoN d., 36 0.39 1S s only (m) 142 ssCeso~ 82 0.250 ronly 143 soN d., 180 0.17S 33 s 144 soN dB< 120 0,344 42 s 144 .. sm .. 72 0.0108 p(m) 145 eoNd" 180 0.119 21 146 aoNdtt 120 0.248 30 147 aoNds7~-) 11.6 day 147 11Pm .. ~-) 2.6yr 147 e.Smss 4800 0.100 rs 148 a.Smsa 1440 0.0748 tt)8 s only 148 .,Ndss 120 0.0824 ronly 149 a.Sm87 4800 0.0920 TS
150 a.Sm .. 1440 0.0492 71 sonly 150 soNdoo 120 0.0806 r only
!51 e~Smso~-) 80 yr 151 ,,sm.,(/l-) 80 yr 4(100
152 .. smoo 1440 0.176~----- rs 151 .,Euss 5600 0.0892 rs ------152 oaEu.,(EC, 12%; 13 yr or 9.2 hr
tl-,28%) 153 e.Sm,.(tl-) 47 hr !52 saEu,."'(/l-, 78%; 13 yr or 9.2 hr
EC, 22%) 152 o<Gdss 2400 0.00137 Ps 153 ,.Gdso(EC) 236 day
153 eaEuoo 5600 0.0976 rs 153 .,Euoo 5600' 0.0976 rs
IS4 .,Euot(tl-) 16 yr 154 .. Gdoo 2400 0.0147 35 s only 154 o.Sm,. 1440 0.150 r only ISS O<Gdot 6800 0,101 r !56 ,.Gd., 2400 0,141 r 156 ooDyoe 1320 0.00029 p 157 "Gdoa 6800 0.107 r 158 ,.Gd,. 2400 0.169 r 158 eeDyu2 1320 0.000502 p 159 "Gdoo(/l-) 18 hr 159 ,.Tb" 6000 0.0956 160 oaTb.,~-) 72 day 160 .. oy,. 1320 0.0127 17 s only 160 .. Gdos 2400 0.149 r only 161 .. oy,. 4400 0.10S r 162 .,oy,. 1320 0.142 162 esErtt 1116 0.000316 p 163 seDy01 4400 0,139 r 164 .,oy., 1320 0.157 r 164 e.sErea 1116 0.00474 p? Too
abundant 165 eeDy.,(tl-) 2.32 hr 165 17HOn 2800 0,118 r 166 erHooo~-) 27.2 hr
>30 yr 166 esEros 1116 0.104 r 167 aaEreo 18~0 0.0770 r 168 osErtoo 1116 0.0850 r 168 7oYbts 1080 0.00030 p
169 osEr101(tl-) 9.4 day 169 ooTmtoo 1400 0.0318 r 170 eoTmtot(tl-) 129 day 170 1oYb10o 1080 0.00666 7.2 s 170 esErtot 1116 0.0470 r only
171 7oYbtot 1200 0.0316(1) 19 S"'f
172 1oYb102 1080 0.0480(i) 35 sr 173 7oYbtoa 1200 O.OJ56(i) 29 sr 174 7oYbtO< 1080 0.0678(i) 49 sr 174 7tHftot 520 0.00078 p
175 7oYbm~-) 4.2 day 175 7!LUt04 1040 0.0488(1) 34 sr 176 70YbtGf 1080 0.0278 ronly
176 nLumm~-) 3.7 hr 176 nLum~-) Large .. 0.0013 p (7.5 X10tO yr)
176 7tHftO< 520 0.0226 12 s only 177 nLu ... ~-) 6.8 day 177 ,.Hr ... 1040 0.0806(f) 5~ sr 177 nHf ... 1040 0.0806 sr
178 nHf ... 520 0.119 62 s 179 ,.Hft., 1040 0.0604 63 180 7tHftoa 520 0.155 81 s 180 74Wtoe 480 0.0006 p
181 nHftoo~-) 46 day 181 uTatos 1320 0.065 86 s 182 7aTam(/l-) 112 day 182 uWtos 480 0.13 62 s 183 uWtoe 1640 o.o1om 77 sr 184 74Wno 480 0,15 72 184 uOsto& 1176 0.00018 p
185 7<Wm(tl-) 74 day 185 71Reuo 2040 o.osoom 51 s"'r(m')
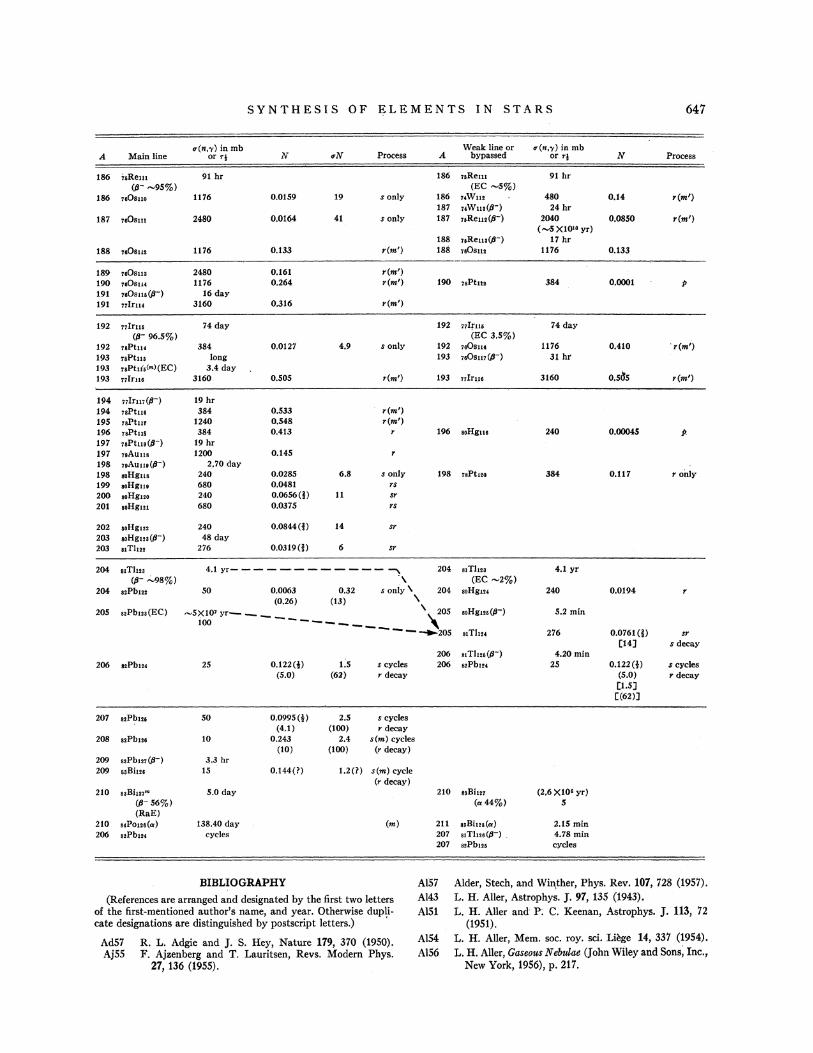
SYNTHESIS OF ELEMENTS IN STARS 647
v(n,y) in mb Weak line or v(n,y) inmb A Mainline or Tl N vN Process A bypassed or Ti N Process
186 7oRem 91 hr 186 '16Ren1 91 hr (Jr -95%> (EC -5%)
186 nOs no 1176 0.0159 19 sonly 186 ••Wm 480 0.14 r(m') 187 :oWua{IJ-) 24 hr
187 :eOsm 2480 0.0164 41 sonly 187 nReus{IJ-) 2040 0,0850 r(m') ( -5 X10•• yr)
188 nReua{IJ-) 17 hr 188 :.Osm 1176 0.133 r(m') 188 :aOsm 1176 0.133
189 nOsua 2480 0.161 r(m') 190 :eOSu< 1176 0.264 r(m') 190 :sPtm 384 0.0001 p 191 :.Osm{IJ-) 16 day 191 ::Iru< 3160 0.316 r(m')
192 ::Irm 74 day 192 ::Ipu 74 day (Jr 96.5%> (EC 3.5%)
192 :sPtm 384 0.0127 4.9 s only 192 :eOsua 1176 0.410 'r(m;) 193 :sPtm long 193 :oOsm(/l-) 31 hi' 193 :sPtdo<ml(EC) 3.4 day 193 nirua 3160 0.505 r(m') 193 nirJ,tt 3160 o.5cl5 r(m')
194 nlrm{IJ-) 19 hr 194 :sPtua 384 0.533 r(m') 195 :sPtur 1240 0.548 r(m') 196 :oPtus 384 0.413 196 soHguo 240 0.00045 fJ. 197 :sPtm{IJ-) 19 hr 197 nAuua 1200 0.145 198 :eAum(/l-) 2 .• 70 day 198 aoHgus 240 0.0285 6.8 sonly 198 :sPt120 384 0,117 r only 199 aoHgm 680 0.0481 rs 200 aoHguo 240 0.0656(j) 11 sr 201 soHgm 680 0.0375 rs
202 soH gus 240 0.0844(J) 14 sr 203 soHgm{IJ-) 48 day 203 .. Tt, 276 0.0319(f) 6 sr
204 a•Tlus 4.1 yr------------'"" 204 81Tlm 4.1 yr {IJ-~8%)
., (EC -2%)
204 stPbm so 0.0063 0.32 s oniy \ 204 soHgm 240 0.0194 r (0.26) (13) \
205 .,Pbus(EC) -5X10'yr-- \. 205 soHgm{IJ-) 5.2 min 100 --------- \ ----..205 a1Tlm 276 0.0761(f) sr
[14] s decay 206 .,Tlm{IJ-) 4.20mln
206 atPbm 25 0.122(!) 1;5 s cycles 206 .,pb,., 25 0.122(i) s cycles (5.0) (62) r decay (S.O) ,decay
[1.5] [{62)]
207 stPbm so 0.0995(l) 2.5 s cycles (4.1) (100) r decay
208 .,Pbno 10 0.243 2.4 s(m) cycles (10) (100) (r decay)
209 .. Pbm{IJ-) 3.3 hr 209 s•Bim 15 0.144(?) 1.2(?) s(m) cycle
(r decay) 210 saBiu7"' 5.0 day 210 ssBim (2,6 X10• yr)
{IJ-56%) (a44%) s (RaE)
210 ,.Pom(a) 138.40 day (m) 211 ssBius(a) 2.15 min 206 stPbm cycles 207 81Tlue(/l-) 4.78 min
207 .,Pbm cycles
BIBLIOGRAPHY Al57 Alder, Stech, and Win,ther, Phys. Rev. 107, 728 (1957).
(References are arranged and designated by the first two letters Al43 L. H. Aller, Astrophys. J. 97, 135 (1943). of the first-mentioned author's name, and year. Otherwise dupli- A151 L. H. Aller and P; C. Keenan, Astrophys. J. 113, 72 cate designations are distinguished by postscript letters.) ' (1951).
Ad57 R. L. Adgie and J. S. Hey, Nature 179, 370 (1950). Al54 L. H. Aller, Mem. soc. roy. sci. Liege 14, 337 (1954),
Aj55 F. Ajzenberg and T. Lauritsen, Revs. Modern Phys. AI 56 L. H. Aller, Gaseous Nebulae (John Wiley and Sons; Inc., 27, 136 (1955). New York, 1956), p. 217.
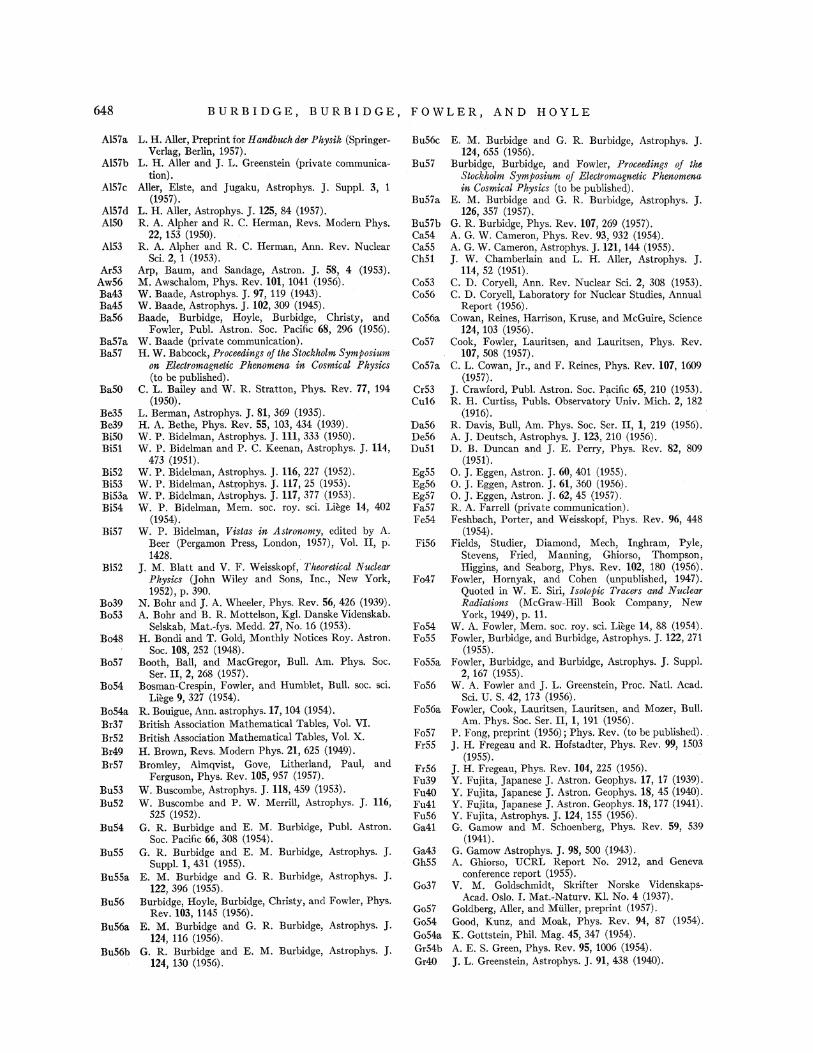
648
Al57a
Al57b
Al57c
Al57d AlSO
Al53
Ar53 Aw56 Ba43 Ba45 Ba56
Ba57a Ba57
Ba50
Be35 Be39 BiSO Bi51
BiS2 Bi53 Bi53a Bi54
BiS7
BIS2
Bo39 BoS3
Bo48
Bo57
Bo54
Bo54a Br37 Br52 Br49 Br57
BuS3 BuS2
Bu54
BuSS
BuSSa
BuS6
Bu56a
Bu56b
BURBIDGE, BURBIDGE, FOWLER, AND HOYLE
L. H. Aller, Preprint for Hantlbuch tler Physik (SpringerVerlag, Berlin, 1957).
L. H. Aller and J. L. Greenstein (private communication).
Aller, Elste, and Jugaku, Astrophys. J. Suppl. 3, 1 (1957).
L. H. Aller, Astrophys. J. 125, 84 (19S7). R. A. Alpher and R. C. Herman, Revs. Modern Phys.
22, 1S3 (19SO). R. A. Alpher and R. C. Herman, Ann. Rev. Nuclear
Sci. 2, 1 (19S3). Arp, Baum, and Sandage, Astron. J. 58, 4 (1953). M. Awschalom, Phys. Rev. 101, 1041 (19S6). W. Baade, Astrophys. J. 97, 119 (1943). W. Baade, Astrophys. J. 102, 309 (194S). Baade, Burbidge, Hoyle, Burbidge, Christy, and
Fowler, Publ. Astron. Soc. Pacific 68, 296 (1956). W. Baade (private communication). H. W. Babcock, Proceedings of the Stockholm Symposium
on Electromagnetic Phenomena in Cosmical Physics (to be published).
C. L. Bailey and W. R. Stratton, Phys. Rev. 77, 194 (1950).
L. Berman, Astrophys. J. 81, 369 (193S). H. A. Bethe, Phys. Rev. 55, 103, 434 (1939). W. P. Bidelman, Astrophys. J. 111, 333 (1950). W. P. Bidelman and P. C. Keenan, Astrophys. J. 114,
473 (19S1). W. P. Bidelman, Astrophys. J. 116, 227 (1952). W. P. Bidelman, Asb;ophys. J. 117, 25 (1953). W. P. Bidelman, Astrophys. J. 117, 377 (19S3). W. P. Bidelman, Mem. soc. roy. sci. Liege 14, 402
(1954). W. P. Bidelman, Vistas in Astronomy, edited by A.
Beer (Pergamon Press, London, 1957), Vol. II, p. 1428.
J. M. Blatt and V. F. Weisskopf, Theoretical Nuclear Physics (John Wiley and Sons, Inc., New York, 1952), p. 390.
N. Bohr and J. A. Wheeler, Phys. Rev. 56, 426 (1939). A. Bohr and B. R. Mottelson, Kgl. Danske Videnskab.
Selskab, Mat.-fys. Medd. 27, No. 16 (1953). H. Bondi and T. Gold, Monthly Notices Roy. Astron.
Soc. 108, 2S2 (1948). Booth, Ball, and MacGregor, Bull. Am. Phys. Soc.
Ser. II, 2, 268 (1957). Bosman-Crespin, Fowler, and Humblet, Bull. soc. sci.
Liege 9, 327 (1954). R. Bouigue, Ann. astrophys.17, 104 (19S4). British Association Mathematical Tables, Vol. VI. British Association Mathematical Tables, Vol. X. H. Brown, Revs. Modern Phys. 21, 62S (1949). Bromley, Almqvist, Gove, Litherland, Paul, and
Ferguson, Phys. Rev. 105, 9S7 (1957). W. Buscombe, Astrophys. J. 118, 4S9 (1953). W. Buscombe and P. W. Merrill, Astrophys. J. 116,
525 (19S2). G. R. Burbidge and E. M. Burbidge, Publ. Astron.
Soc. Pacific 66, 308 (19S4). G. R. Burbidge and E. M. Burbidge, Astrophys. J.
Suppl. 1, 431 (1955). E. M. Burbidge and G. R. Burbidge, Astrophys. J.
122, 396 (19S5). Burbidge, Hoyle, Burbidge, Christy, and Fowler, Phys.
Rev. 103, 114S (19S6). E. M. Burbidge and G. R. Burbidge, Astrophys. J.
124, 116 (1956). G. R. Burbidge and E. M. Burbidge, Astrophys. J.
124, 130 (1956).
Bu56c
Bu57
Bu57a
Bu57b Ca54 CaSS ChSl
Co 53 CoS6
CoS6a
Co57
Co57a
Cr53 Cu16
Da56 De56 Du51
Eg55 Eg56 Eg57 FaS7 FeS4
FiS6
Fo47
Fo54 FoSS
FoSSa
Fo56
FoS6a
Fo57 FrSS
FrS6 Fu39 Fu40 Fu41 Fu56 Ga41
Ga43 GhSS
Go37
Go57 Go 54 Go54a Gr54b Gr40
E. M. Burbidge and G. R. Burbidge, Astrophys. J. 124, 655 (1956).
Burbidge, Burbid~e, and Fowler, Proceedings of the Stockholm Symposium of Electromagnetic Phenomena in Cosmical Physics (to be published).
E. M. Burbidge and G. R. Burbidge, Astrophys. J. 126, 357 (1957).
G. R. Burbidge, Phys. Rev. 107, 269 (1957). A. G. W. Cameron; Phys. Rev. 93, 932 (1954). A. G. W. Cameron, Astrophys. J. 121, 144 (1955). J. W. Chamberlain and L. H. Aller, Astrophys. J.
114, 52 (1951). C. D. Coryell, Ann. Rev. Nuclear Sci. 2, 308 (1953). C. D. Coryell, Laboratory for Nuclear Studies, Annual
Report (1956). Cowan, Reines, Harrison, Kruse, and McGuire, Science
124, 103 (1956). Cook, Fowler, Lauritsen, and Lauritsen, Phys. Rev.
107, 508 (1957). C. L. Cowan, Jr., and F. Reines, Phys. Rev. 107, 1609
(1957). J. Crawford, Publ. Astron. Soc. Pacific 65, 210 (1953). R. H. Curtiss, Publs. Observatory Univ. Mich. 2, 182
(1916). R. Davis, Bull, Am. Phys. Soc. Ser. II, 1, 219 (1956). A. J. Deutsch, Astrophys. J. 123, 210 (1956). D. B. Duncan and J. E. Perry, Phys. Rev. 82, 809
(19S1). 0. J. Eggen, Astron. J. 60, 401 (19S5). 0. J. Eggen, Astron. J. 61, 360 (1956). 0. J. Eggen, Astron. J. 62, 45 (1957). R. A. Farrell (private communication). Feshbach, Porter, and Weisskopf, Phys. Rev. %, 448
(19S4). Fields, Studier, Diamond, Mech, Inghram, Pyle,
Stevens, Fried, Manning, Ghiorso, Thompson, Higgins, and Seaborg, Phys. Rev. 102, 180 (1956).
Fowler, Hornyak, and Cohen (unpublished, 1947). Quoted in W. E. Siri, Isotopic Tracers and Nuclear Radiations (McGraw-Hill Book Company, New York, 1949), p. 11.
W. A. Fowler, Mem. soc. roy. sci. Liege 14, 88 (1954). Fowler, Burbidge, and Burbidge, Astrophys. J. 122, 271
(19SS). Fowler, Burbidge, and Burbidge, Astrophys. J. Suppl.
2, 167 (1955). W. A. Fowler and J. L. Greenstein, Proc. Natl. Acad.
Sci. U.S. 42, 173 (19S6). Fowler, Cook, Lauritsen, Lauritsen, and Mozer, Bull.
Am. Phys. Soc. Ser. II, 1, 191 (1956). P. Fong, preprint (19S6); Phys. Rev. (to be published). J. H. Fregeau and R. Hofstadter, Phys. Rev. 99, 1S03
(19S5). J. H. Fregeau, Phys. Rev. 104, 22S (1956). Y. Fujita, Japanese J. Astron. Geophys. 17, 17 (1939). Y. Fujita, Japanese J. Astron. Geophys. 18, 45 (1940). Y. Fujita, Japanese J. Astron. Geophys. 18,177 (1941). Y. Fujita, Astrophys. J. 124, 155 (1956). G. Gamow and M. Schoenberg, Phys. Rev. 59, S39
(1941). G. Gamow Astrophys. J. 98, 500 (1943). A. Ghiorso, UCRL Report No. 2912, and Geneva
conference report (195S). V. M. Goldschmidt, Skrifter Norske Videnskaps-
Acad. Oslo. I. Mat.-Naturv. Kl. No.4 (1937). Goldberg, Aller, and Miiller, preprint (1957). Good, Kunz, and Moak, Phys. Rev. 94, 87 (19S4). K. Gottstein, Phil. Mag. 45, 347 (1954). A. E. S. Green, Phys. Rev. 95, 1006 (1954). J. L. Greenstein, Astrophys. J. 91, 438 (1940).
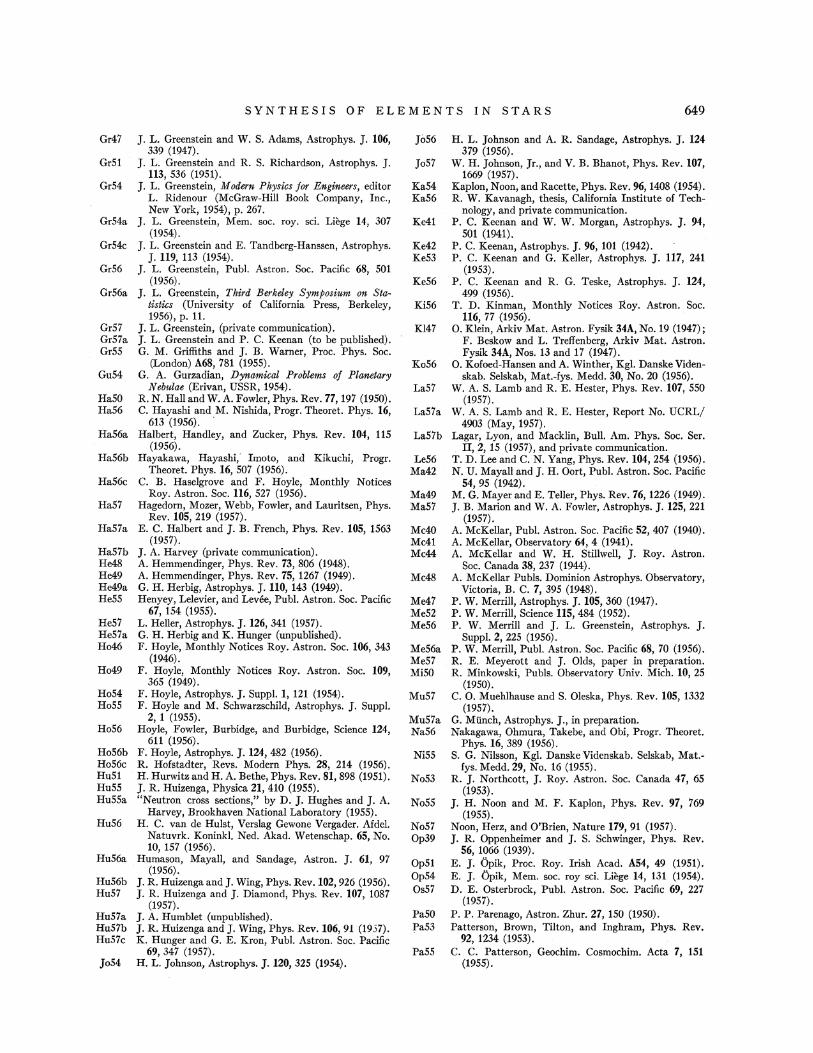
Gr47
Gr51
Gr54
Gr54a
Gr54c
Gr56
Gr56a
Gr57 Gr57a Gr55
Gu54
Ha50 Ha56
Ha56a
Ha56b
Ha56c
Ha57
Ha57a
Ha57b He48 He49 He49a HeSS
He57 He57a Ho46
Ho49
Ho54 Ho55
Ho56
Ho56b Ho56c Hu51 Hu55 Hu55a
Hu56
Hu56a
Hu56b Hu57
Hu57a Hu57b Hu57c
Jo54
SYNTHESIS OF ELEMENTS IN STARS 649
J. L. Greenstein and W. S. Adams, Astrophys. J. 106, 339 (1947).
J. L. Greenstein and R. S. Richardson, Astrophys. J. 113, 536 (1951).
J. L. Greenstein, Modern Physics for Engineers, editor L. Ridenour (McGraw-Hill Book Company, Inc., New York, 1954), p. 267.
]. L. Greenstein, Mem. soc. roy. sci. Liege 14, 307 (1954).
J. L. Greenstein and E. Tandberg-Hanssen, Astrophys. J. 119, 113 (1954).
J. L. Greenstein, Publ. Astron. Soc. Pacific 68, 501 (1956).
J. L. Greenstein, Third Berkeley Symposium on Statistics (University of California Press, Berkeley, 1956)' p. 11.
J. L. Greenstein, (private communication). J. L. Greenstein and P. C. Keenan (to be published). G. M. Griffiths and J. B. Warner, Proc. Phys. Soc.
(London) A68, 781 (1955). G. A. Gurzadian, Dynamical Problems of Planetary
Nebulae (Erivan, USSR, 1954). R.N. Hall and W. A. Fowler, Phys. Rev. 77, 197 (1950). C. Hayashi and M. Nishida, Progr. Theoret. Phys. 16,
613 (1956). . . Halbert, Handley, and Zucker, Phys. Rev. 104, 115
(1956). Hayakawa, Hayashi; Imoto, and Kikuchi, Progr.
Theoret. Phys. 16, 507 (1956). C. B. Haselgrove and F. Hoyle, Monthly Notices
Roy. Astron. Soc. 116, 527 (1956). Hagedorn, Mozer, Webb, Fowler, and Lauritsen, Phys.
Rev. 105, 219 (1957). E. C. Halbert and J. B. French, Phys. Rev. 105, 1563
(1957). J. A. Harvey (private communication). A. Hemmendinger, Phys. Rev. 73, 806 (1948). A. Hemmendinger, Phys. Rev. 75, 1267 (1949). G. H. Herbig, Astrophys. J. 110, 143 (1949). Henyey, Lelevier, and Lev~e, Pub!. Astron. Soc. Pacific
61, 154 (1955). L. Heller, Astrophys. J. 126, 341 (1957). G. H. Herbig and K. Hunger (unpublished). F. Hoyle, Monthly Notices Roy. Astron. Soc. 106, 343
(1946). F. Hoyle, Monthly Notices Roy. Astron. Soc. 109,
365 (1949). F. Hoyle, Astrophys. J. Suppl. 1, 121 (1954). F. Hoyle and M. Schwarzschild, Astrophys. J. Suppl.
2, 1 (1955). Hoyle, Fowler, Burbidge, and Burbidge, Science 124,
611 (1956). F. Hoyle, Astrophys. J. 124, 482 (1956). R. Hofstadter, Revs. Modern Phys. 28, 214 (1956). H. Hurwitz and H. A. Bethe, Phys. Rev. 81, 898 (1951). J. R. Hnizenga, Physica 21, 410 (1955). "Neutron cross sections," by D. J. Hughes and J. A.
Harvey, Brookhaven National Laboratory (1955). H. C. van de Hulst, Verslag Gewone Vergader. Mdel.
Natuvrk. Koninkl. Ned. Akad. Wetenschap. 65, No. 10, 157 (1956).
Humason, Mayall, and Sandage, Astron. J. 61, 97 (1956).
J. R. Huizenga and J. Wing, Phys. Rev. 102, 926 (1956). J. R. Huizenga and J. Diamond, Phys. Rev. 107, 1087
(1957). J. A. Humblet (unpublished). J. R. Huizenga and J. Wing, Phys. Rev. 106, 91 (1937). K. Hunger and G. E. Kron, Publ. Astron. Soc. Pacific
69, 347 (1957). H. L. Johnson, Astrophys. J. 120,325 (1954).
Jo56
Jo57
Ka54 Ka56
Ke41
Ke42 KeS3
Ke56
KiS6
Kl47
Ko56
LaS7
La57a
La57b
Le56 Ma42.
Ma49 Ma57
Mc40 Mc41 Mc44
Mc48
Me47 Me52 Me56
Me56a Me57 Mi50
Mu57
Mu57a Na56
NiS5
No53
No55
No57 Op39
Op51 Op54 Os57
PaSO PaS3
PaSS
H. L. Johnson and A. R. Sandage, Astrophys. J. 124 379 (1956).
W. H. Johnson, Jr., and V. B. Bhanot, Phys. Rev. 107, 1669 (1957).
Kaplon, Noon, and Racette, Phys. Rev. 96, 1408 (1954). R. W. Kavanagh, thesis, California Institute of Tech
nology, and private communication. P. C. Keenan and W. W. Morgan, Astrophys. J. 94,
501 (1941). P. C. Keenan, Astrophys. J. 96, 101 (1942). P. C. Keenan and G. Keller, Astrophys. J. 117, 241
(1953). P. C. Keenan and R. G. Teske, Astrophys. J. 124,
499 (1956). T. D. Kinman, Monthly Notices Roy. Astron. Soc.
116, 77 (1956). 0. Klein, Arkiv Mat. Astron. Fysik 34A, No. 19 (1947);
F. Beskow and L. Treffenberg, Arkiv Mat. Astron. Fysik 34A, Nos. 13 and 17 (1947).
0. Kofoed-Hansen and A. Winther, Kgl. Danske Videnskab. Selskab, Mat.-fys. Medd. 30, No. 20 (1956).
W. A. S. Lamb and R. E. Hester, Phys. Rev. 107, 550 (1957).
W. A. S. Lamb and R. E. Hester, Report No. UCRL/ 4903 (May, 1957).
Lagar, Lyon, and Macklin, Bull. Am. Phys. Soc. Ser. II, 2, 15 (1957), and private communication.
T. D. Lee and C. N. Yang, Phys. Rev.104, 254 (1956). N. U. Mayall and J. H. Oort, Publ. Astron. Soc. Pacific
54, 95 (1942). M.G. Mayer and E. Teller, Phys. Rev. 76, 1226 (1949). J. B. Marion and W. A. Fowler, Astrophys. J. 125, 221
(1957). A. McKellar, Pub!. Astron. Soc. Pacific 52, 407 (1940). A. McKellar, Observatory 64, 4 (1941). A. McKellar and W. H. Stillwell, J. Roy. Astron.
Soc. Canada 38, 237 (1944). A. McKellar Pubis. Dominion Astrophys. Observatory,
Victoria, B. C. 7, 395 (1948). P. W. Merrill, Astrophys. J. 105, 360 (1947). P. W. Merrill, Science 115, 484 (1952). P. W. Merrill and J. L. Greenstein, Astrophys. J.
Suppl. 2, 225 (1956). P. W. Merrill, Publ. Astron. Soc. Pacific 68, 70 (1956). R. E. Meyerott and J. Olds, paper in preparation. R. Minkowski, Pubis. Observatory Univ. Mich. 10, 25
(1950). C. 0. Muehlhause and S. Oleska, Phys. Rev. 105, 1332
(1957). G. Miinch, Astrophys. J., in preparation. Nakagawa, Ohmura, Takebe, and Obi, Progr. Theoret.
Phys. 16, 389 (1956). S. G. Nilsson, Kgl. Danske Videnskab. Selskab, Mat.
fys. Medd. 29, No. 16 (1955). R. J. Northcott, J. Roy. Astron. Soc. Canada 47, 65
(1953). J. H. Noon and M. F. Kaplon, Phys. Rev. 97, 769
(1955). Noon, Herz, and O'Brien, Nature 179, 91 (1957). J. R. Oppenheimer and J. S. Schwinger, Phys. Rev.
56, 1066 (1939). E. J. 6pik, Proc. Roy. Irish Acad. A54, 49 (1951). E. J. 6pik, Mem. soc. roy sci. Liege 14, 131 (1954). D. E. Osterbrock, Publ. Astron. Soc. Pacific 69, 227
(1957). P. P. Parenago, Astron. Zhur. 27, 150 (1950). Patterson, Brown, Tilton, and Inghram, Phys. Rev.
92, 1234 (1953). C. C. Patterson, Geochim. Cosmochim. Acta 7, 1S1
(195S).
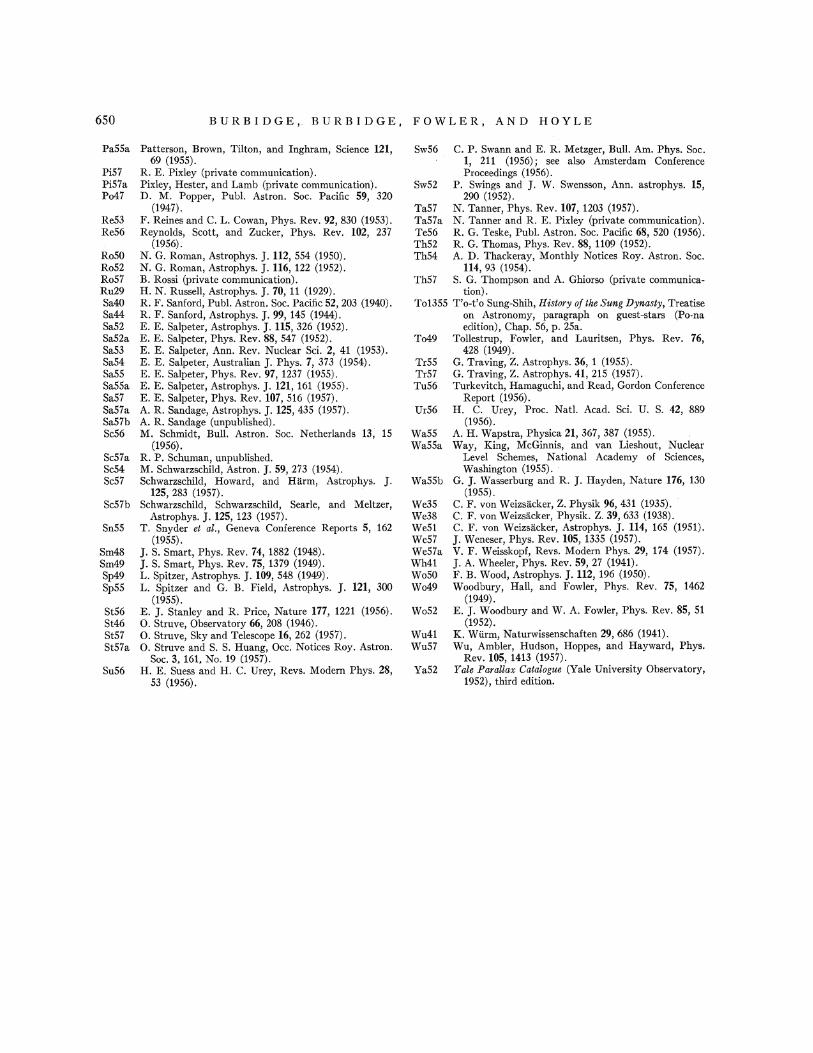
650
PaSS a
Pi57 Pi57a Po47
Re53 Re56
RoSO Ro52 Ro57 Ru29 Sa40 Sa44 Sa52 Sa52a Sa53 Sa54 SaSS SaSSa Sa57 Sa57a Sa57b Sc56
Sc57a Sc54 Sc57
Sc57b
SnSS
Sm48 Sm49 Sp49 SpSS
St56 St46 St57 St57a
Su56
BURBIDGE, BURBIDGE, FOWLER, AND HOYLE
Patterson, Brown, Tilton, and Inghram, Science 121, 69 (1955).
R. E. Pixley (private communication). Pixley, Hester, and Lamb (private communication). D. M. Popper, Pub!. Astron. Soc. Pacific 59, 320
(1947). F. Reines and C. L. Cowan, Phys. Rev. 92, 830 (1953). Reynolds, Scott, and Zucker, Phys. Rev. 102, 237
(1956). N. G. Roman, Astrophys. J. 112, 554 (1950). N. G. Roman, Astrophys. J. 116, 122 (1952). B. Rossi (private communication). H. N. Russell, Astrophys. J. 70, 11 (1929). R. F. Sanford, Pub!. Astron. Soc. Pacific 52, 203 (1940). R. F. Sanford, Astrophys. J. 99, 145 (1944). E. E. Salpeter, Astrophys. J. 115, 326 (1952). E. E. Salpeter, Phys. Rev. 88, 547 (1952). E. E. Salpeter, Ann. Rev. Nuclear Sci. 2, 41 (1953). E. E. Salpeter, Australian J. Phys. 7, 373 (1954). E. E. Salpeter, Phys. Rev. 97, 1237 (1955). E. E. Salpeter, Astrophys. J. 121, 161 (1955). E. E. Salpeter, Phys. Rev. 107, 516 (1957). A. R. Sandage, Astrophys. J. 125, 435 (1957). A. R. Sandage (unpublished). M. Schmidt, Bull. Astron. Soc. Netherlands 13, 15
(1956). R. P. Schuman, unpublished. M. Schwarzschild, Astron. J. 59, 273 (1954). Schwarzschild, Howard, and Harm, Astrophys. J.
125, 283 (1957). Schwarzschild, Schwarzschild, Searle, and Meltzer,
Astrophys. J. 125, 123 (1957). T. Snyder et al., Geneva Conference Reports 5, 162
(1955). J. S. Smart, Phys. Rev. 74, 1882 (1948). J. S. Smart, Phys. Rev. 75, 1379 (1949). L. Spitzer, Astrophys. J. 109, 548 (1949). L. Spitzer and G. B. Field, Astrophys. J. 121, 300
(1955). E. J. Stanley and R. Price, Nature 177, 1221 (1956). 0. Struve, Observatory 66, 208 (1946). 0. Struve, Sky and Telescope 16, 262 (1957). 0. Struve and S. S. Huang, Occ. Notices Roy. Astron.
Soc. 3, 161. No. 19 (1957). H. E. Suess and H. C. Urey, Revs. Modern Phys. 28,
53 (1956).
Sw56 C. P. Swann and E. R. Metzger, Bull. Am. Phys. Soc. 1, 211 (1956); see also Amsterdam Conference Proceedings (1956).
Sw52 P. Swings and J. W. Swensson, Ann. astrophys. 15,
Ta57 Ta57a Te56 Th52 Th54
290 (1952). N. Tanner, Phys. Rev. 107, 1203 (1957). N. Tanner and R. E. Pixley (private communication). R. G. Teske, Pub!. Astron. Soc. Pacific 68, 520 (1956). R. G. Thomas, Phys. Rev. 88, 1109 (1952). A. D. Thackeray, Monthly Notices Roy. Astron. Soc.
114, 93 (1954). Th57 S. G. Thompson and A. Ghiorso (private communica
tion). To1355 T'o-t'o Sung-Shih, History of the Sung Dynasty, Treatise
on Astronomy, paragraph on guest-stars (Po-na edition), Chap. 56, p. 25a.
To49 Tollestrup, Fowler, and Lauritsen, Phys. Rev. 76,
Tr55 Tr57 Tu56
428 (1949). G. Traving, Z. Astrophys. 36, 1 (1955). G. Traving, Z. Astrophys. 41, 215 (1957). Turkevitch, Hamaguchi, and Read, Gordon Conference
Report (1956). Ur56 H. C. Urey, Proc. Nat!. Acad. Sci. U. S. 42, 889
(1956). WaSS A. H. Wapstra, Physica 21, 367, 387 (1955). Wa55a Way, King, McGinnis, and van Lieshout, Nuclear
Level Schemes, National Academy of Sciences, Washington (1955). ·
Wa55b G. J. Wasserburg and R. J. Hayden, Nature 176, 130
We35 We38 We51 We57 We57a Wh41 Wo50 Wo49
(1955). C. F. von Weizsacker, Z. Physik 96, 431 (1935). C. F. von Weizsacker, Physik. Z. 39, 633 (1938). C. F. von Weizsacker, Astrophys. J. 114, 165 (1951). J. Weneser, Phys. Rev. 105, 1335 (1957). V. F. Weisskopf, Revs. Modern Phys. 29, 174 (1957). J. A. Wheeler, Phys. Rev. 59, 27 (1941). F. B. Wood, Astrophys. J. 112, 196 (1950). Woodbury, Hall, and Fowler, Phys. Rev. 75, 1462
(1949). Wo52 E. J. Woodbury and W. A. Fowler, Phys. Rev. 85, 51
(1952). Wu41 K. Wiirm, Naturwissenschaften 29, 686 (1941). Wu57 Wu, Ambler, Hudson, Hoppes, and Hayward, Phys.
Rev. 105, 1413 (1957). Ya52 Yale Parallax Catalogue (Yale University Observatory,
1952), third edition.
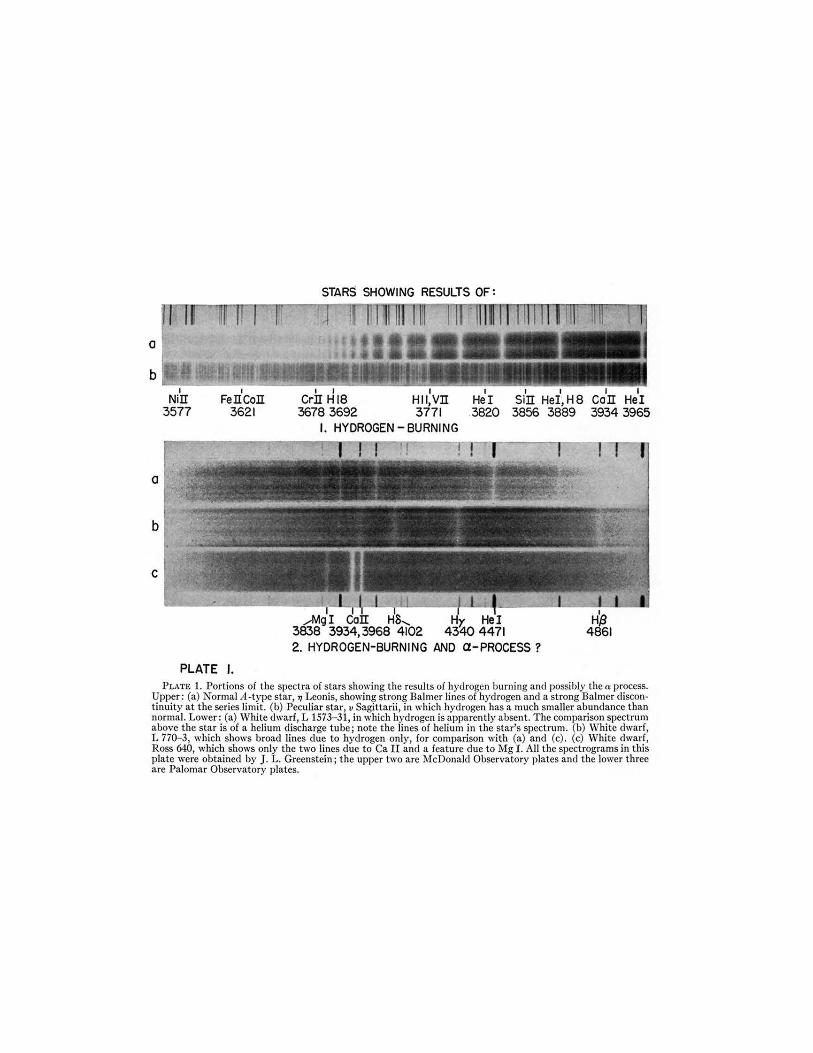
0
b
0
b
c
I
Nil! 3577
I
FellColl 3621
STARS SHOWING RESULTS OF :
I I I Crll HIS HII,Vll 3678 3692 3771
I. HYDROGEN- BURNING
I
He! 3820
·.• ._, 1...... . ' .
I I I I Sill Hei,H8 Call He! 3856 3889 3934 3965
. . . ; A . .- ,... ..... -.:.~~,. .
·~.~. •o - I "<• .r._ ,........, , ... ; "'"~ ,
,..Mg 3838 3934,3968 4471 2. HYDROGEN-BURNING AND a-PROCESS ?
PLATE J. PLATE 1. Portions of the spectra of stars showing the results of hydrogen burning and possibly the a process.
Upper: (a) Normal A-type star, '1 Leonis, showing strong Balmer lines of hydrogen and a strong Balmer discont inuity at the series limit. (b) Peculiar star, u Sagittarii, in which hydrogen has a much smaller abundance than normal. Lower: (a) White dwarf, L 1573- 31, in which hydrogen is apparently absent. The comparison spectrum above the star is of a helium discharge tube; note the lines of helium in the star's spectrum. (b) Whi te dwarf, L 770- 3, which shows broad lines due to hydrogen only, for comparison with (a) and (c) . (c) White dwarf, Ross 640, which shows only the two lines due to Ca II and a feature due to Mg I. All the spectrograms in this plate were obtained by J. L. Greenstein ; the upper two are McDonald Observatory plates and the lower three are Palomar Observatory plates.
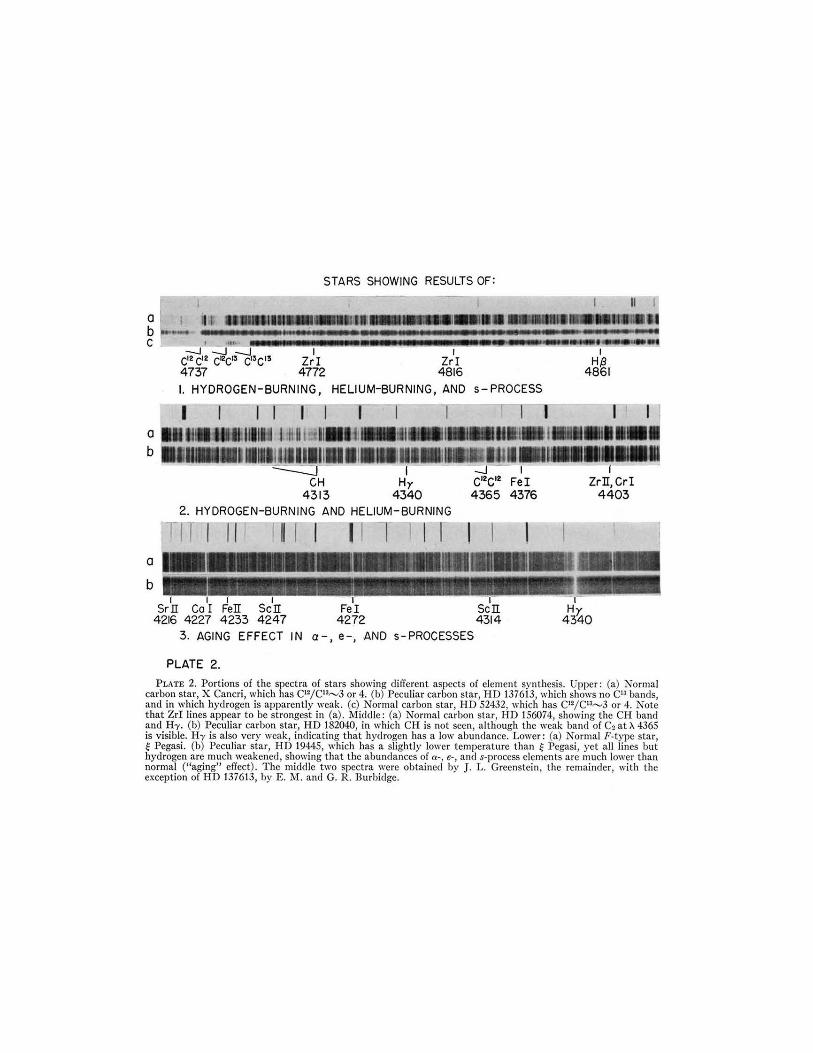
a b
a
b
STARS SHOWING RESULTS OF:
I. HYDROGEN-BURNING, HELIUM-BURNING, AND s-PROCESS
I I I I I I UIIH I Hli ll.li-•t~ 1111.111111.11 ~
CH 4313
2. HYDROGEN-BURNING AND HELIUM-BURNING
I I
EFFECT IN a -, e-, AND s-PROCESSES
PLATE 2.
I Fe I 4376
I Zrll,Crl
4403
PLATE 2. Portions of the spectra of stars showing diiTerent aspects of element synthesis. Upper: (a) Normal carbon star, X Cancri, which has C'2/C13"-'3 or 4. (b) Peculiar carbon star, HD 137613, which shows no C13 bands, and in which hydrogen is apparently weak. (c) Normal carbon star, HD 52432, which has C'2/ C'3"'3 or 4. Note that Zri Jines appear to be strongest in (a). Middle: (a) Normal carbon star, HD 156074, showing the CH band and H-y. (b) Peculiar carbon star, HD 182040, in which CH is not seen, although the weak band of C2 at A 4365 is visible. H-y is also very weak, indicating that hydrogen has a low abundance. Lower: (a) Normal F-type star, ~ Pegasi. (b) Peculiar star, HD 19445, which has a slight ly lower temperature than ~ Pegasi, yet all lines but hydrogen are much weakened, showing that the abundances of cr-, e-, and s-process elements are much lower than normal ("aging" effect) . The middle two spectra were obtained by J. L. Greenstein, the remainder, with the exception of HD 137613, by E. M. and G. R. Burbidge.
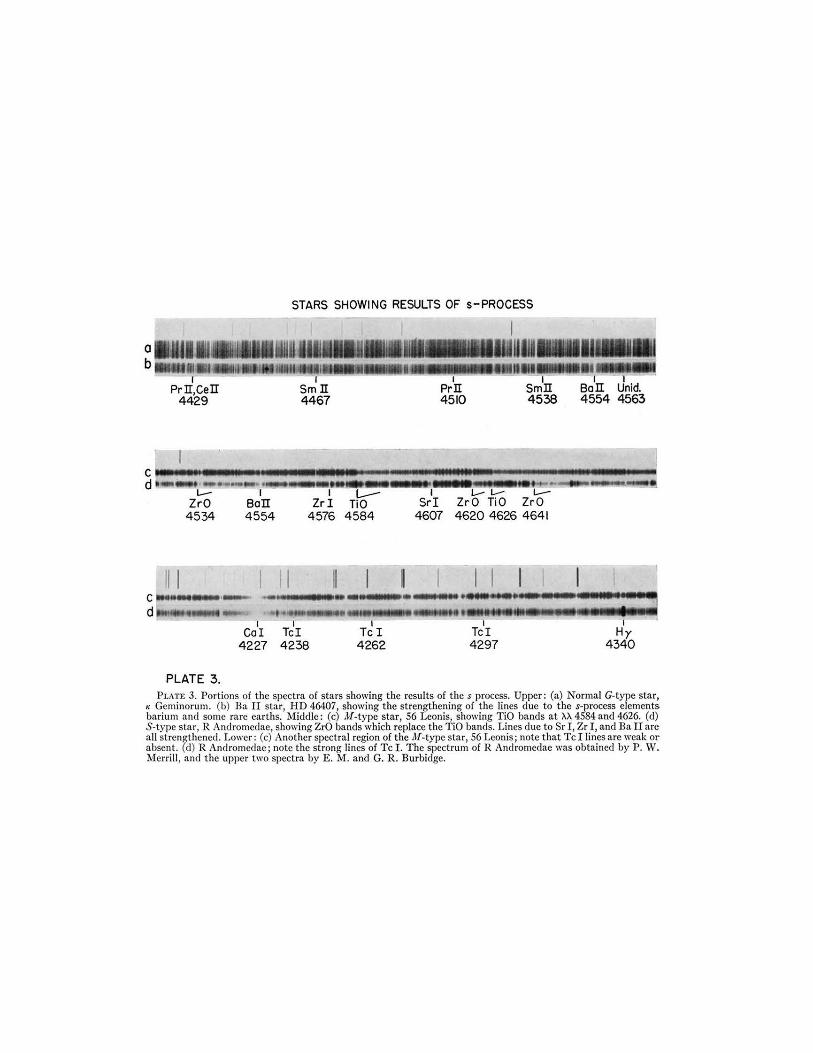
a b
c ~-···· d --- -· 1...--
II I
ZrO 4534
PLATE 3 .
STARS SHOWING RESULTS OF s-PROCESS
I Prii 4510
I Smii 4538
·-- ·----··l·~·-··--.. ·•••· ........ I - I !--- I 1.-- I.--Bali Zr I TiO Sri ZrO TiO ZrO 4554 4576 4584 4607 4620 4626 4641
I Col
4227
PLATE 3. Portions of the spectra of stars showing the results of the s process. Upper: (a) Normal G-type star, K Geminorum. (b) Ba II star, HD 46407, showing the strengthening of the lines due to the s-process elements barium and some rare earths. Middle: (c) M-type star, 56 Leonis, showing TiO bands at >.>. 4584 and 4626. (d) S-type star, R Androrncdae, showing ZrO bands which replace the TiO bands. Lines due to Sr I , Zr I, and Ba II are all strengthened. Lower: (c) Another spectral region of the Jlf-type star, 56 Leon is; note that Tc I lines are weak or absent. (d) R Andromedae; note the strong lines of Tc I. T he spectrum of R Andrornedae was obtained by P. W. ?.•Ierrill, and the upper two spectra by E. M. and G. R. Burbidge.
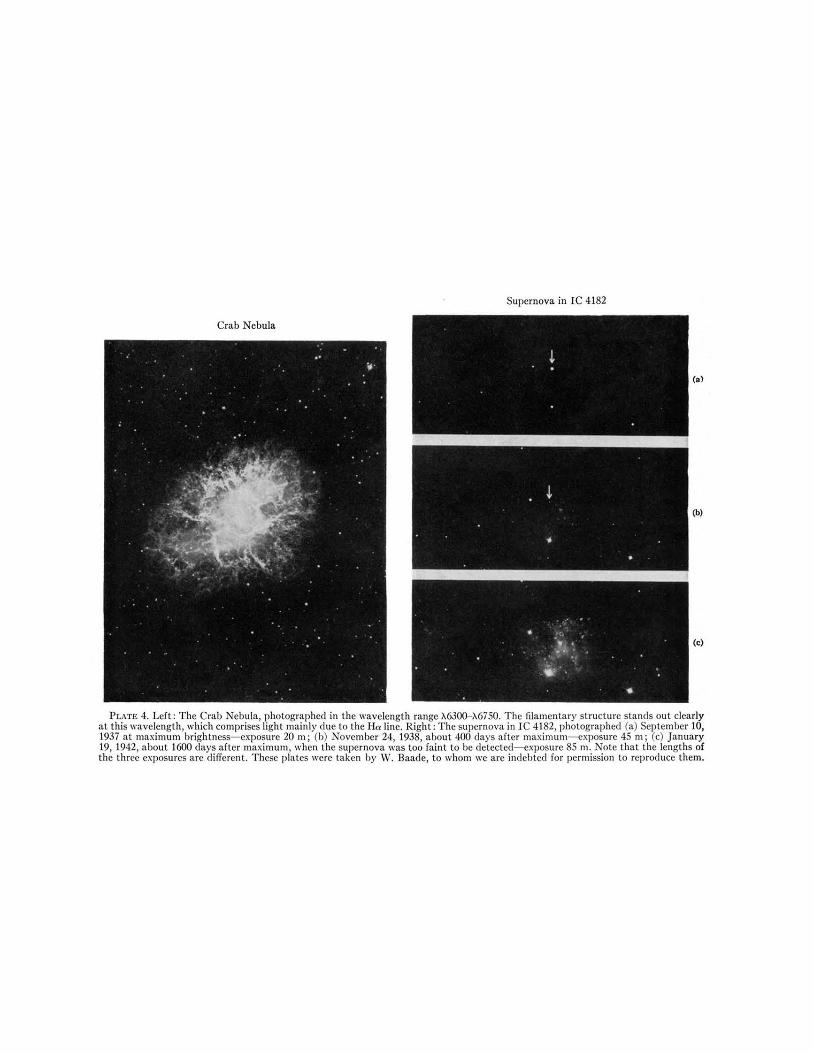
Supernova in I C 4182
Crab Nebula
(a)
(b)
(c)
PLATE 4. Left: The Crab Nebula, photographed in the wavelength range li630Q-M750. The filamentary structure stands out clearly at this wavelength, which comprises light mainly due to the Her line. Right: The supernova in I C 4182, photographed (a) September 10, 1937 at maximum brightness- exposure 20m; (b) November 24, 1938, about 400 days after maximum- exposure 45 m; (c) January 19, 1942, about 1600 days after maximum, when the supernova was too faint to be detected- exposure 85 m. Note that the lengths of the three exposures arc difi"erent. These plates were taken by W. Baade, to whom we are indebted for permission to reproduce them.


