Embed Size (px)
Citation preview
Chemical Engineering Science 62 (2007) 3882–3893www.elsevier.com/locate/ces
Modelling NOx adsorption in a thin NaZSM-5 film supportedon a cordierite monolith
Indra Perdanaa,b, Derek Creasera,∗, I. Made Bendiyasab, Rochmadib, Boma Wikan Tyosob
aChemical Reaction Engineering, Chalmers University of Technology, Kemivägen 4, S-412 96 Gothenburg, SwedenbDepartment of Chemical Engineering, Gadjah Mada University, Indonesia
Received 25 April 2006; received in revised form 31 March 2007; accepted 11 April 2007Available online 24 April 2007
Abstract
Transient two dimensional (2-D) and three dimensional (3-D) single channel models (SCMs) describing transport of NOx into a NaZSM-5film and kinetics for reactions forming nitrate species were developed. The film consisted of a continuous thin layer of inter-grown NaZSM-5 crystals supported on a cordierite monolith support. The 2-D model which included a comprehensive transport model was developed forstudying the adsorption kinetics, whereas the more rigorous 3-D model was used to provide a better picture of radial and axial concentration andvelocity variations in the monolith channel and the film. The overall adsorption–desorption mechanism, consisting of two competing reactionschemes for nitrate formation, was sufficient to predict the dynamic development of surface nitrate species. The simulation results showed thatthe adsorption is strongly influenced by transport resistance in the NaZSM-5 film. Also, the effective diffusion of NOx in the NaZSM-5 filmis apparently surface nitrate concentration dependent.� 2007 Elsevier Ltd. All rights reserved.
Keywords: Adsorption modelling; NOx adsorption; Monolith; NaZSM-5 film
1. Introduction
Due to their low pressure drop, high thermal stability, andlarge surface area per volume the use of monoliths is com-mon in applications and research as structured catalyst sup-ports (Gulati, 1998). In order to enhance the surface area ofa monolith, other porous materials are often washcoated onthe monolith walls. Recently, it was reported that MFI typezeolites could be coated on monolith surfaces to form a thinand continuous film (Basaldella et al., 2001; Caro et al., 2000;Öhrman et al., 2004; Ulla et al., 2003). Such zeolite films areinteresting due to their potential for applications as membranesor structured binder free catalysts (Caro et al., 2000; Coronasand Santamaria, 2004a,b; Jansen et al., 1998). As recently re-ported (Perdana et al., 2005), a high loading of zeolite film onmonolith surfaces offered a possibility to study detailed NOx
adsorption and transport in zeolite films.
∗ Corresponding author. Tel.: +46 31 7723818; fax: +46 31 7723035.E-mail address: [email protected] (D. Creaser).
0009-2509/$ - see front matter � 2007 Elsevier Ltd. All rights reserved.doi:10.1016/j.ces.2007.04.012
Mathematical modelling of monolithic catalysis has been anarea attracting significant interest. An appropriate model couldhelp to better understand the impact of physical phenomenainvolved in the catalytic process. In order to describe suchphenomena, one dimensional (1-D), two dimensional (2-D),and three dimensional (3-D) models have been utilized eitherfor monolith channels or for washcoats (Groppi and Tronconi,2000; Hayes et al., 2004b; Jahn et al., 1997; Koci et al., 2004;Kolaczkowski, 1999; Kryl et al., 2005; Liu et al., 2005; Tomašicet al., 2002). In some cases, not only external and internal trans-port resistances but also a detailed reaction scheme has beenintroduced into the models. It has been found that the Sher-wood number, which is frequently used to represent interfacialmass transport in a monolith channel (Antia and Govind, 1995;Grande et al., 2006; Hoebink and Marin, 1998), varies alongthe gas–washcoat interface for non-uniform washcoats (Hayeset al., 2004a) as well as along the channel (Tomašic et al.,2004). Including all of these different features into modellingmight considerably increase the complexity of the model whichrequires a sophisticated solver. Increased computational capa-bility has made numerical techniques increasingly attractive

I. Perdana et al. / Chemical Engineering Science 62 (2007) 3882–3893 3883
to solve complex problems. However, in order to have a realisticmodel, reliable physical and chemical parameters are required(Kolaczkowski, 1999).
In kinetic modelling, experimental data are frequently usedto validate a reaction mechanism and later to extract valuesof the kinetic parameters (Hedlund et al., 2004; Olsson et al.,2001; Valdés-Solis et al., 2004). It is often the case that thesemodels are simplified since they ignore transport complexitiesbecause they focus more on resolving the reaction kinetics. Formodelling a monolithic catalyst, less computationally demand-ing 1-D channel models are commonly chosen which in somecases include either internal or external mass transport limita-tions. The simplicity of the transport models used may jeopar-dize not only the general applicability of the kinetic parametervalues but even the reaction mechanism. Tomašic et al. (2002,2004) reported the results of a kinetic study based on a 2-Dmodel considering mass transport in both the monolith channeland the washcoat. Since the model was for steady state con-ditions, a simple Langmuir–Hinshelwood type kinetic modelcould be implemented. However, under transient operation ev-ery step of transport and reaction might play a significant roleat certain time intervals. Increasing computation capacity andadvances in the application of numerical techniques has pro-vided possibilities for including more complex transport andmore detailed reaction steps in kinetic model studies. This ap-proach cannot only reduce the risk that the kinetic models areconvoluted with transport limitations but it also gives a morecomplete and realistic picture of the function of the catalyst.
Modelling transport and reaction in a thin zeolite film sup-ported on monolith walls has additional complexities due to thelarge difference in geometric scales of the monolith channeland the film. Also, diffusive mass transport of a component inzeolites is relatively very slow in comparison with that in thegas phase (van de Graaf et al., 1998). Thus, although the filmmight be very thin, transport resistance in the film must be in-cluded in the model. A steady state kinetic model for describ-ing diffusion and simple reaction kinetics in a ZSM-5 coatedmonolithic reactor with a 1-D monolith channel and 2-D coat-ing representations has been reported (Antia and Govind, 1995;Antia et al., 1997). Due to multi-component counter diffusion,effective diffusion of a component in the film could be up toan order of magnitude lower than that for purely single com-ponent transport. It is often found that such models neglect orsimplify external mass transport resistance and consider onlydiffusion in the zeolite (Hedlund et al., 2004).
A mathematical model describing NOx adsorption and des-orption on a NaY zeolite coated monolith has been presented inthe literature (Brilhac et al., 2002). The model was developedfor steady state conditions and it neglected diffusion resistancein the zeolite. At the moment, reports on modelling NOx ad-sorption in zeolites supported on a monolith structure that in-clude a complete transport model are still scarce. The presentwork is devoted to mathematical modelling of NOx adsorptionin a thin NaZSM-5 film supported on a monolith structure athigh temperatures. With the inclusion of transport limitationsin the monolith channel and in the NaZSM-5 film, a 2-D kineticmodel of a single monolith channel (SCM) was developed for
transient operation and was used to investigate the NOx adsorp-tion mechanism and to evaluate kinetic and transport parame-ters. Radial variations in the monolith channel and in the filmwere further simulated using a more rigorous 3-D model. Theproposed model offers improved insight into NOx adsorption inzeolite films at high temperatures which is of potential interestfor zeolitic structured catalysts, sensors, and membrane appli-cations (Caro et al., 2000; Coronas and Santamaria, 2004a,b;Moos et al., 2002).
2. Experimental methods
The experimental results are taken from our previous report(Perdana et al., 2005) where the methods used are described indetail. Briefly, NOx adsorption measurements were performedin a flow reactor having a total length of 880 mm and a di-ameter of 22 mm with a monolith sample that had a length of75 mm and 188 square channels each with a size of 1 × 1 mm.The monolith sample was placed about 185 mm from the down-stream end of the reactor, while the whole of the reactor wasequipped with an electrical heating device and was thermallyisolated. NOx adsorption was carried out at a constant tem-perature of 350 ◦C. The adsorbate mixture had a total flowrateof 2600 ml min−1 (STP) and contained a certain concentrationof NOx species in argon. After equilibration, the sample wasflushed with only argon for several minutes. In some experi-ments, the sample was then re-exposed to NO2 or NO for sev-eral minutes followed by additional argon flushing. Finally, inorder to release or decompose all the adsorbed species, the sam-ple was heated from the adsorption temperature to 550 ◦C witha temperature ramp of 20 ◦C min−1 in an argon flow duringtemperature programmed desorption (TPD). In addition, testswith the empty reactor showed that there was a significant de-lay in NO measurements in response to the NO concentrationchange at the reactor inlet, due to analytical instrument lag. Formodelling purposes, the delay was taken into account by cor-recting the NO response by adding flow through one volumeof a continuous stirred tank reactor (CSTR) that was equal to648 ml.
As reported (Perdana et al., 2005), the NaZSM-5 film onthe walls of the monolith sample homogeneously covered theentire wall surface. The film thickness was about 1.7 �m andthe surface of the film was rough due to the porous surface ofthe cordierite. Some crystal deposits originating from the bulkof the synthesis solution, cracks, and open grain boundarieswere found in several parts of the film. The zeolite loading inthe monolith sample was 0.14 g zeolite/g sample.
3. Mathematical model development
3.1. Adsorption–desorption mechanism
The NOx adsorption mechanism in NaZSM-5 films com-prises several reaction steps and different surface species arepresent at different adsorption temperatures (Perdana et al.,2005). At temperatures above about 300 ◦C, the adsorption
3884 I. Perdana et al. / Chemical Engineering Science 62 (2007) 3882–3893
Table 1Reaction mechanism and rate equations used in the model
(i) 3NO2 + H2O(s)
k1,f
�k1,b
2HNO3(s) + NO r1 = k1,f cNO2 csH2O−
k1,bcsHNO3
cNO
(ii) HNO3(s) + Sk2,f
�k2,b
S · (HNO3) r2 = k2,f csHNO3
�v − k2,b�1
(iii) 2NO2 + Sk3,f
�k3,b
S · (NO2)2 r3 = k3,f cNO2 �v − k3,b�2
(iv) 2HNO3(s)k4,f−→ H2O + 2NO2 + 1/2O2 r4 = k4,f cs
HNO3
mainly consisted of nitrate species formation through two dif-ferent pathways:
HNO3 + ZeoO-Na�NaNO3 + ZeoO-H, (a)
2NO2 + ZeoO-Na�NaNO3 + ZeoO-NO. (b)
The nitrate species formed by an NO2 disproportionation reac-tion (b) were found to have a higher thermal stability than thatformed via nitric acid in the presence of residual water (a).
Therefore, in the present work the adsorption–desorptionmechanism at high temperatures is represented by the reactionslisted in Table 1. S in the reaction mechanism denotes the va-cant active sites where cationic Na is situated. Nitric acid andresidual water are also considered to be surface species but it isassumed that they are not strictly bound to the Na sites. In thezeolite framework, residual water is initially situated nearby theNa sites (Tsutsumi and Mizoe, 1989). However, it can easilyinteract with NO2 to produce nitric acid leading to the forma-tion of nitrate species which are strongly bound to the Na sites.Therefore, in the model, residual water and nitric acid are notconsidered to compete for the same adsorption sites. For sim-plicity, the rate of each reaction is considered to follow firstorder kinetics with respect to the concentration of gas phase oradsorbed species. The gas phase species (NO2 and NO) mustdiffuse through the interior of the zeolite film where most of theactive sites (S) are situated. On the active sites, two differentnitrate species are formed, written as S-(HNO3) and S-(NO2)2,via reactions (a) and (b) represented in the model as reactions(ii) and (iii). Reaction (iv) was added to the mechanism to al-low for decomposition of nitric acid at elevated temperaturesand thus for the release of NO2 during TPD.
3.2. Geometric scaling
The thickness of the zeolite film is several hundred timesless than the dimension of the monolith channels. In addition,diffusivity of a component in zeolites is typically several ordersof magnitude lower than that in the gas phase (van de Graafet al., 1998). This may cause diffusion in the film to be theslowest transport step. Also, due to the very low componentdiffusivity, a steep concentration gradient could develop in thefilm near the gas–solid interface that can be difficult to resolvenumerically.
The surface of the monolith walls is not flat from a micro-scale perspective. They are in fact porous (Hedlund et al., 2004;
Öhrman et al., 2005, 2004; Perdana et al., 2005) which leadsto a high zeolite loading per total monolith volume. Thus, inmodelling a thin zeolite film, the roughness of the channelwall surface is also of importance. However, for simplicity, inthe present model the gas–solid interface and the film wereassumed to be flat surfaces. As a consequence, to preserve thecorrect zeolite loading based on experimental measurements,the length of the flat film (Lf ) in the model was set to beabout 10.9 times longer than that of the monolith channel (L).This ratio was arrived at based on the observed average filmthickness by electron microscopy, the zeolite loading measuredby nitrogen gas adsorption (Perdana et al., 2005) , the zeolitedensity, and finally the geometrical surface area of the channelwalls. However, this difference in film versus channel lengthcaused a discontinuity condition at the gas–solid interface.
To solve the aforementioned problems, all differential equa-tions in the model were expressed in a spatially dimensionlessform with respect to the monolith channel and the film dimen-sions. As a result, the monolith channel and the film becomegeometrical units having dimensions of unity. This approachovercomes the discontinuity at the gas–film interface and avoidsthe risk for stiff calculations to resolve concentrations near thegas–film interface. Since the channel and the film have differ-ent true dimensions, different geometric scaling factors wereintroduced into the mass and momentum balance equations forthe channel and the film.
3.3. Governing differential equations
The monolith used in the present work was a structure con-sisting of a number of identical channels and the volume of themonolith was relatively small in comparison with the total vol-ume of the reactor. The feed gas could thus be considered to beuniformly distributed and well pre-heated before entering thechannels. Therefore, a single channel model (SCM) could beimplemented to represent each of the individual channels in themonolith. Since the concentrations of reacting compounds werevery low, the heat of reactions are negligible and the systemcould be assumed to always be in an isothermal state (Tomašicet al., 2004).
3.3.1. Momentum balanceIn order to resolve the velocity profile in the monolith chan-
nel, a momentum balance was applied in Cartesian coordinatesfollowing the Navier–Stoke equations. The scaled continuityand momentum balance equations are
�
[(Fa
�u�t
)+ u · (Fc · ∇u)
]= �∇ · [(Fd · ∇u)] − Fc · ∇p,
(1)
Fc · ∇ · u = 0, (2)
where u is the velocity vector. Fa , Fc, and Fd are the scalingfactors for the accumulation term scalar, the convection termvector, and the diffusion term vector, respectively, in the mono-lith channel. The scaling factors for 2-D and 3-D models arelisted in Table 2.

I. Perdana et al. / Chemical Engineering Science 62 (2007) 3882–3893 3885
Table 2The scaling factors for the 2-D and 3-D models
2-D 3-D
Fa L · dch/2 Ld2ch/4
F∗a Lf · tf Lf tf dch/2
Fc (dch/2)x (L)y (Ldch/2)x (Ldch/2)y (d2ch/4)z
Fd (dch/2L)x (2L/dch)y (L)x (L)y (d2ch/4L)z
F∗d (tf /Lf )x (Lf /tf )y (2tf Lf /dch)x (dchLf /2tf )y (tf dch/2Lf )z
3.3.2. Mass balanceThe mass balance for the bulk flow in the monolith channel
consists of diffusive and convective transport:(Fa
�ci
�t
)+ u · (Fc · ∇ci) = Di∇ · [(Fd · ∇ci)]. (3)
The values of the molecular diffusion coefficients were pre-dicted from the Fuller correlation (Cussler, 1984). Whereas themass balances for diffusing components and surface species inthe zeolite film are(
F∗a�
�ci
�t
)= Deff,i∇ · [(F∗
d · ∇ci)] + F∗a�bRi , (4)
qtot��j
�t= Rj , (5)
�csk
�t= Rk , (6)
where the effective diffusivity is assumed to have isometricproperties. F∗
a and F∗d are scaling factors for the accumu-
lation term scalar and the diffusion term vector in the film(see Table 2).
Observations from our previous experimental work showedthat there is no significant quantity of physisorption at 350 ◦C.Thus, a constant effective diffusion coefficient of NO2 and NOcould be applied and Fick’s law should be adequate in thepresent model. The surface nitrate coverages in the zeolite filmmust fulfil the following constraint:
1 − �v =ns∑
j=1
�j . (7)
The amount of residual water involved in the reaction was ex-perimentally estimated from the amount of NO produced dur-ing NO2 adsorption via reaction (i) above. It was assumed thatwater and nitric acid are immobile in the zeolite framework.The total amount of surface sites for nitrate species formationwas predicted by assuming that all nitrate species are formedvia nitric acid, i.e., reactions (i) and (ii) above. Szanyi et al.(2004) reported that due to the presence of water, nitrate for-mation via nitric acid is more dominant. The dependence of therate constants and effective diffusivities on temperature wereexpressed in the Arrhenius forms as
k = k0 exp[−E/Rg · (1/T − 1/T0)], (8)
Deff = D0eff exp[−Ed/Rg · (1/T − 1/T0)]. (9)
3.4. The 2-D kinetic model
The purpose of the 2-D model was to study the adsorptionkinetics. The model comprised not only reactions in the filmbut also diffusive transport in the monolith channel and in thefilm. Since the model was used iteratively for parameter op-timization, the 2-D simplification was necessary to make theoptimization computationally tractable. In the present work, tosatisfy a 2-D model, the monolith structure is represented bya single slit-shaped channel with the opening dimensions ofdch × wsl bounded by two thin slabs of zeolite film. The di-mension of dch is the true dimension of the square channelsof the monolith, whereas wsl is calculated to preserve the totalvolume of the zeolite film from
wsl = total film volume
2 · tf · Lf
= 4 · tf · dch · Lf · Nch
2 · tf · Lf
,
= 2 · dch · Nch. (10)
The average gas velocity (u) for the 2-D slab model is then
u = qv
dch · wsl. (11)
Using this geometric representation, a slab model can be uti-lized for the film. Since the 2-D channel has axially symmet-rical properties, only half of the channel is considered in the2-D model.
3.5. The 3-D model
The rigorous 3-D model was used to validate the results ofthe optimized 2-D model. Also, the 3-D model simulation givesan opportunity to examine radial concentration and velocityvariations in the monolith channel and the film that is beneficialto obtain a complete picture of the NOx adsorption–desorptionprocess. The use of the spatially dimensionless approach causesthe 3-D view of the monolith channel and the film to be ge-ometrically deformed into cubic shapes having dimensions ofunity. However, since the channel has symmetrical proper-ties, only 1
8 th of the total volume of the monolith channelis considered in the model. Also, because the zeolite film isvery thin compared to the channel dimensions, the volumeof the film in each corner of the channel was neglected inthe model.
3886 I. Perdana et al. / Chemical Engineering Science 62 (2007) 3882–3893
Table 3General boundary and initial conditions
Location Condition
Boundary conditionsInlet of monolith channel Inlet velocity u = uz = uin
Inlet concentration ci = cin,i
Outlet of monolith channel Outflow n · (Fd · �∇u) = 0Convective flow n · (Fd · Di∇ci ) = 0
Gas–film interface No slip n · u = 0Continuity n · (Fd · Di∇ci ) = n · (F∗
d · Deff,i∇ci )
Film–cordierite monolith interface Insulation n · (F∗d · Deff,i∇ci ) = 0
Edges of the film Insulation n · (F∗d · Deff,i∇ci ) = 0
Axisymmetric location Symmetry n · (Fd · �∇u) = 0n · (Fd · Di∇ci ) = 0
Initial conditionu = u(0); ci = 0; cs
HNO3= 0; cs
H2O = csH2O(0); �j = 0
3.6. Numerical solution
The PDEs that represent the system studied with their re-spective initial and boundary conditions, as listed in Table 3,were developed and solved using the finite element method(FEM) in the commercial software FEMLAB 3.1 (Comsol AB).In the FEMLAB software the equations were written in theappropriate multiphysics modules. The concentration of NOx
involved in the reactions was relatively low and the dynamicconcentration changes were assumed not to significantly affectthe physical properties of the flowing gas. Thus, for simplicity,the NS equations could be solved independently to generate thetime-dependent velocity profiles. The transient velocity profilesobtained were further used to resolve transient concentrationchanges of diffusing components and surface species.
When using the 2-D model, the kinetic and transport param-eter values were optimized so that the calculated outlet NOx
concentration profile fitted the experimental data. In order toobtain reliable optimum parameter values, results from threedifferent transient NOx adsorption and TPD experiments wereincluded in the parameter fitting. The average outlet concen-tration from the model was calculated from integration of theoutlet gas concentration and velocity across the channel at theoutlet, via the following expression:
〈ci〉 =∫A
ci · u dA∫A
u dA. (12)
Parameter optimization was carried out with the commercialprogram MATLAB 6.5, using specialized non-linear optimiza-tion functions included in the software. The objective of the op-timizations was to minimize the squared residual (SSR) whichis defined as
SSR =∑g
∑h
∑i
(〈cg,h,i〉 − cobsg,h,i)
2. (13)
A preliminary parameter fitting calculation showed that theactivation energies for the forward reactions (i) and (ii) werenot significant and the values were relatively small. Later, thetwo parameters were excluded from the fitting. Also, because
zeolites are known to interact with and adsorb much less NOthan NO2, the diffusion of NO should be much less thermallyactivated than that of NO2 and its diffusivity is assumed tobe independent of temperature in the model. In the presentmodel, during TPD (temperature increase after NOx adsorptiontreatments) the surface water concentration is assumed to benegligible. Therefore, activation energy values for the reversalof reaction (i) could not be verified and were thus excludedfrom the fitting.
In the present work, 13 parameter values were optimizedto fit the experimental data. Initially, the orders of magni-tude of the unknown parameters were optimized using anunconstrained search of the direct Nelder–Mead method(‘fminsearch’ function in MATLAB 6.5) and finally the param-eter values were finely tuned using a constrained search of theLevenberg–Marquardt method (‘lsqnonlin’ function in MAT-LAB 6.5). Also, variations of the SSR near the optimum valuesin response to small changes of parameter values were used todetermine the confidence interval of each parameter and cor-relations between parameters. The optimum kinetic parametervalues were finally used in simulations with the 3-D model.
4. Results and discussion
4.1. Kinetic study with 2-D model
4.1.1. NO2 adsorption and NOx-TPDTo study the kinetic model of NOx adsorption in a NaZSM-5
film supported on a monolith, the 2-D transient model was used.The calculated outlet NOx concentrations were then comparedwith the experimental data. Observation from three experimentswith different adsorption treatments were used to validate themodel. As discussed in our previous report (Perdana et al.,2005), the experimental results chosen could clearly show thepresence of two different nitrate species in the NaZSM-5 filmsfollowing an exposure to an NO2 atmosphere. Fig. 1 showsNO2 and NO concentration profiles at the outlet of the reactorfrom three different NOx treatments and subsequent TPD ofthe NaZSM-5 films. Fig. 1a depicts results when the monolith
I. Perdana et al. / Chemical Engineering Science 62 (2007) 3882–3893 3887
600
500
400
300
200
100
0
conc., p
pm
/tem
p.,
°C
3500300025002000150010005000
600
500
400
300
200
100
0
conc., p
pm
/tem
p.
°C
500040003000200010000
600
500
400
300
200
100
0
conc., p
pm
/tem
p.
°C
300025002000150010005000
time, sec.
400
300
200
100
0
806040200
60
40
20
0
30002000
40
30
20
10
0
50004000
50
40
30
20
10
0
30002200
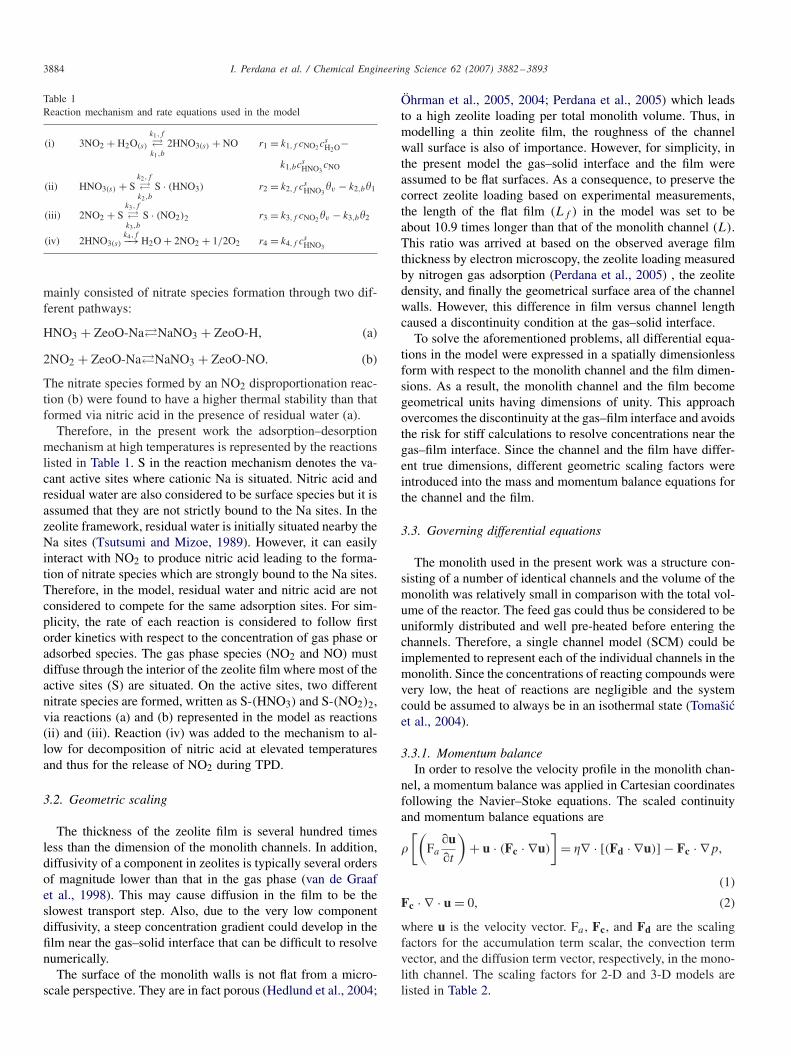
Fig. 1. Outlet NOx concentration profiles of experimental data (solid lines) and results of parameter fitting (dotted lines). Black and grey colour lines are forNO2 and NO, respectively. Dashed line indicates operating temperature.
sample was, at a constant temperature of 350 ◦C, sequentiallyexposed to 600 ppm NO2 for 20 min, flushed for 5 min withargon, re-exposed to 600 ppm NO2 for 15 min, re-flushed for5 min with argon, and then was finally heated in a stream ofpure argon to 550 ◦C with a rate of 20 ◦C min−1. Meanwhile, inFig. 1b after NO2 equilibration and argon flushing, the mono-lith sample was flushed with 600 ppm NO for 20 min before itwas heated up to 550 ◦C. Another treatment is, as depicted inFig. 1c, when the NaZSM-5 film was exposed to a flowing gasmixture containing 600 ppm NO2 and 400 ppm NO in argonfollowed by argon flushing and TPD. As reported elsewhere(Perdana et al., 2005), the appearance of NO during exposureto NO2 is due to the formation of surface nitric acid whichleads subsequently to the formation of surface nitrate species,
as seen in reaction (a) above. In addition, other nitrate specieshaving a higher thermal stability could also be formed througha disproportionation reaction of NO2 (reaction (b) above).
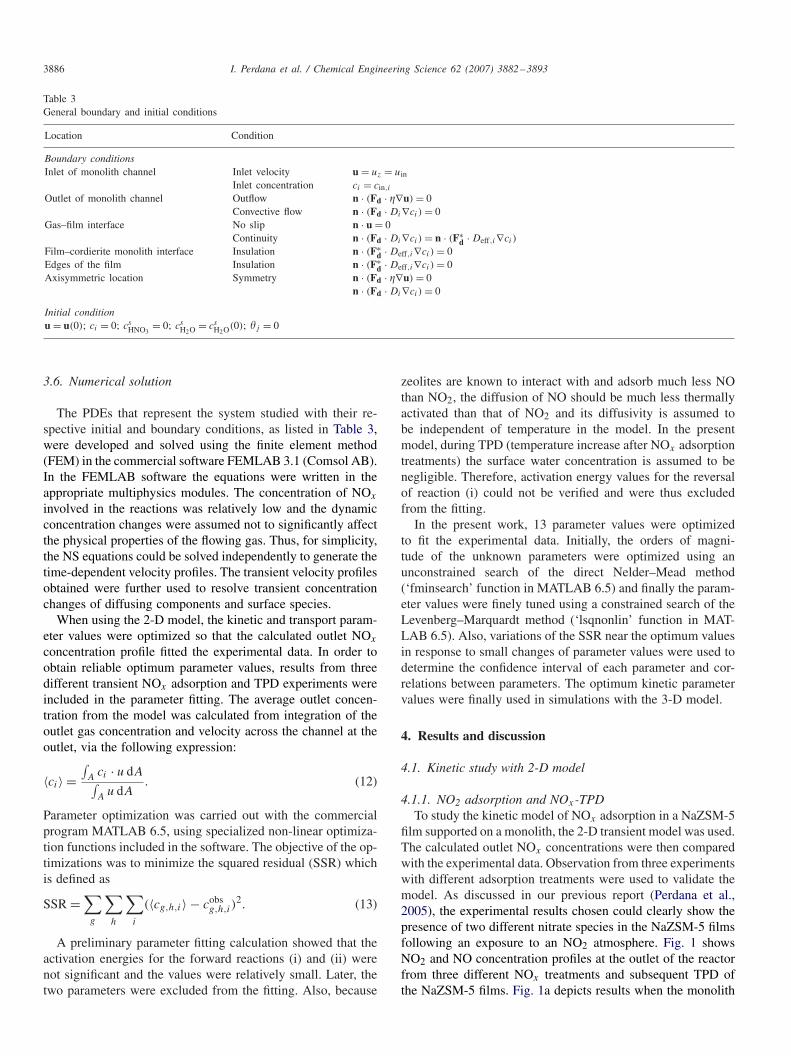
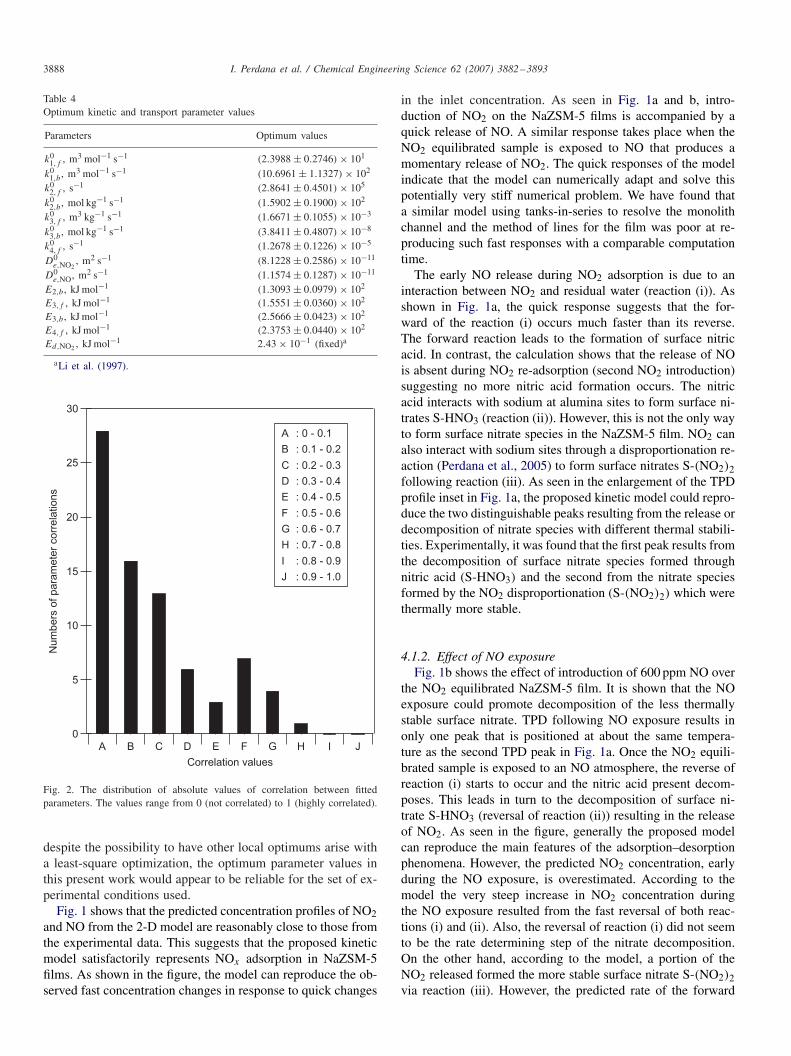
The optimum values of the fitted parameters with their con-fidence intervals are listed in Table 4. As shown in the table,the 95% confidence interval of each parameter is relatively nar-row. This indicates that the optimization methods used in thepresent work could successfully lead the search to a set of op-timum parameter values. Statistical calculations based on theJacobian matrix near the optimum values also showed thatamong the fitted parameters most of the parameter correlationvalues are relatively small. As shown in Fig. 2, the majorityof correlation values are less than 0.4 and there is only onegreater than 0.7, namely that between E3,b and E4,f . Therefore,
3888 I. Perdana et al. / Chemical Engineering Science 62 (2007) 3882–3893
Table 4Optimum kinetic and transport parameter values
Parameters Optimum values
k01,f , m3 mol−1 s−1 (2.3988 ± 0.2746) × 101
k01,b , m3 mol−1 s−1 (10.6961 ± 1.1327) × 102
k02,f , s−1 (2.8641 ± 0.4501) × 105
k02,b , mol kg−1 s−1 (1.5902 ± 0.1900) × 102
k03,f , m3 kg−1 s−1 (1.6671 ± 0.1055) × 10−3
k03,b , mol kg−1 s−1 (3.8411 ± 0.4807) × 10−8
k04,f , s−1 (1.2678 ± 0.1226) × 10−5
D0e,NO2
, m2 s−1 (8.1228 ± 0.2586) × 10−11
D0e,NO, m2 s−1 (1.1574 ± 0.1287) × 10−11
E2,b , kJ mol−1 (1.3093 ± 0.0979) × 102
E3,f , kJ mol−1 (1.5551 ± 0.0360) × 102
E3,b , kJ mol−1 (2.5666 ± 0.0423) × 102
E4,f , kJ mol−1 (2.3753 ± 0.0440) × 102
Ed,NO2 , kJ mol−1 2.43 × 10⁻¹ (fixed)a
aLi et al. (1997).
30
25
20
15
10
5
0
Num
bers
of para
mete
r corr
ela
tions
A B C D E F G H I J
Correlation values
A : 0 - 0.1
B : 0.1 - 0.2
C : 0.2 - 0.3
D : 0.3 - 0.4
E : 0.4 - 0.5
F : 0.5 - 0.6
G : 0.6 - 0.7
H : 0.7 - 0.8
I : 0.8 - 0.9
J : 0.9 - 1.0
Fig. 2. The distribution of absolute values of correlation between fittedparameters. The values range from 0 (not correlated) to 1 (highly correlated).
despite the possibility to have other local optimums arise witha least-square optimization, the optimum parameter values inthis present work would appear to be reliable for the set of ex-perimental conditions used.
Fig. 1 shows that the predicted concentration profiles of NO2and NO from the 2-D model are reasonably close to those fromthe experimental data. This suggests that the proposed kineticmodel satisfactorily represents NOx adsorption in NaZSM-5films. As shown in the figure, the model can reproduce the ob-served fast concentration changes in response to quick changes
in the inlet concentration. As seen in Fig. 1a and b, intro-duction of NO2 on the NaZSM-5 films is accompanied by aquick release of NO. A similar response takes place when theNO2 equilibrated sample is exposed to NO that produces amomentary release of NO2. The quick responses of the modelindicate that the model can numerically adapt and solve thispotentially very stiff numerical problem. We have found thata similar model using tanks-in-series to resolve the monolithchannel and the method of lines for the film was poor at re-producing such fast responses with a comparable computationtime.
The early NO release during NO2 adsorption is due to aninteraction between NO2 and residual water (reaction (i)). Asshown in Fig. 1a, the quick response suggests that the for-ward of the reaction (i) occurs much faster than its reverse.The forward reaction leads to the formation of surface nitricacid. In contrast, the calculation shows that the release of NOis absent during NO2 re-adsorption (second NO2 introduction)suggesting no more nitric acid formation occurs. The nitricacid interacts with sodium at alumina sites to form surface ni-trates S-HNO3 (reaction (ii)). However, this is not the only wayto form surface nitrate species in the NaZSM-5 film. NO2 canalso interact with sodium sites through a disproportionation re-action (Perdana et al., 2005) to form surface nitrates S-(NO2)2following reaction (iii). As seen in the enlargement of the TPDprofile inset in Fig. 1a, the proposed kinetic model could repro-duce the two distinguishable peaks resulting from the release ordecomposition of nitrate species with different thermal stabili-ties. Experimentally, it was found that the first peak results fromthe decomposition of surface nitrate species formed throughnitric acid (S-HNO3) and the second from the nitrate speciesformed by the NO2 disproportionation (S-(NO2)2) which werethermally more stable.
4.1.2. Effect of NO exposureFig. 1b shows the effect of introduction of 600 ppm NO over
the NO2 equilibrated NaZSM-5 film. It is shown that the NOexposure could promote decomposition of the less thermallystable surface nitrate. TPD following NO exposure results inonly one peak that is positioned at about the same tempera-ture as the second TPD peak in Fig. 1a. Once the NO2 equili-brated sample is exposed to an NO atmosphere, the reverse ofreaction (i) starts to occur and the nitric acid present decom-poses. This leads in turn to the decomposition of surface ni-trate S-HNO3 (reversal of reaction (ii)) resulting in the releaseof NO2. As seen in the figure, generally the proposed modelcan reproduce the main features of the adsorption–desorptionphenomena. However, the predicted NO2 concentration, earlyduring the NO exposure, is overestimated. According to themodel the very steep increase in NO2 concentration duringthe NO exposure resulted from the fast reversal of both reac-tions (i) and (ii). Also, the reversal of reaction (i) did not seemto be the rate determining step of the nitrate decomposition.On the other hand, according to the model, a portion of theNO2 released formed the more stable surface nitrate S-(NO2)2via reaction (iii). However, the predicted rate of the forward
I. Perdana et al. / Chemical Engineering Science 62 (2007) 3882–3893 3889
reaction (iii) was apparently not fast enough to re-adsorb theNO2 released which in turn led to an excessive NO2 release.
As seen in Fig. 1b, TPD following the NO equilibration andflushing with inert gas results in mainly the desorption of thesurface nitrate with the higher thermally stable S-(NO2)2 (re-versal of reaction (iii)). An enlargement of the TPD profile insetin Fig. 1b shows that the predicted NOx was underestimated.Again, this was due to the fact that the forward reaction (iii)formed an insufficient amount of the stable surface nitrate S-(NO2)2 during the previous NO exposure.
The effect of NO on the surface nitrate formation in theNaZSM-5 film can also be studied by conducting NO/NO2co-adsorption. As shown in Fig. 1c, TPD following the co-adsorption and inert gas flushing results in only one NOx des-orption peak which corresponds to the desorption of the morestable surface nitrate. As shown in the enlargement of the TPDprofile inset in Fig. 1c, the predicted NOx concentration profileagrees with the experimental data. The desorption of a smallamount of the less stable surface nitrate S-HNO3 is still ap-parent. The presence of NO during the adsorption hinders theforward reaction (i) leading to less formation of the surfacenitrate S-HNO3. However, as seen in the Fig. 1c, the steep in-crease in the NO concentration early during the NO2 exposureindicates that the presence of NO does not completely preventthe formation of the less stable surface nitrate S-HNO3 and theforward reaction (i) appears to be relatively fast. Despite therapid forward reaction (i), the reaction is equilibrium limitedby the presence of NO. On the other hand, the role of reaction(iii) to form the more stable surface nitrate S-(NO2)2 becomesmore important as it consumes a larger portion of the availablecationic Na or S sites in the model.
4.1.3. Mass transport limitation in NaZSM-5 filmThe fitted parameters in Table 4 indicate that at 350◦C the ef-
fective diffusivity of NO2 is several times larger than that of NO.However, both values are in the order of magnitude expected forconfigurational diffusion in zeolites (van de Graaf et al., 1998).In contrast, the gas phase molecular diffusion coefficients forNO2 and NO at 350 ◦C calculated using the Fuller correlationindicated that the diffusivity of NO2 (6.63 × 10⁻⁵ m2 s−1) issmaller compared to that of NO (8.42 × 10⁻⁵ m2 s−1). There-fore, although the NO2 molecule is larger in size than the NOmolecule, the diffusivity of NO in the NaZSM-5 film is lessthan that of NO2. This may be due to the fact that the presenceof the surface nitrates may hinder the movement of the NO inthe NaZSM-5 film. On the other hand, theNO2 diffusion in theNaZSM-5 film may also be influenced by the formation of sur-face nitrates and nitric acid. Free NO2 molecules may be ableto replace NO2 molecules incorporated in the nitrates and ni-tric acid, by for example reactions (i) and (iii) or their elemen-tary steps. This exchange of NO2 molecules may facilitate thetransport of NO2 molecules through the NaZSM-5. This NOx
transport mechanism results in a surface-like diffusion effect(van den Broeke et al., 1998; Xiao and Wei, 1992).
The dependence of the NO2 diffusion on the surface concen-tration is also experimentally observed. As seen in the enlarge-
250
200
150
100
50
0
NO
x c
onc., p
pm
600
500
400
300
200
100
0
Tem
p., °
C
a
b
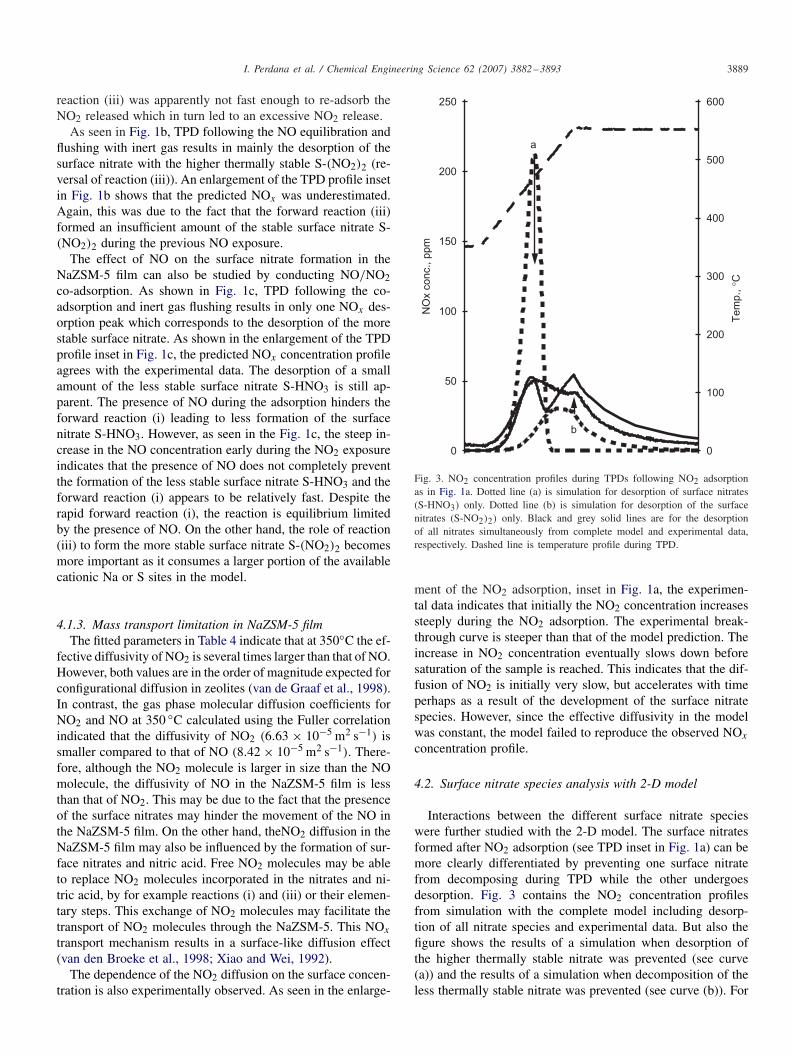
Fig. 3. NO2 concentration profiles during TPDs following NO2 adsorptionas in Fig. 1a. Dotted line (a) is simulation for desorption of surface nitrates(S-HNO3) only. Dotted line (b) is simulation for desorption of the surfacenitrates (S-NO2)2) only. Black and grey solid lines are for the desorptionof all nitrates simultaneously from complete model and experimental data,respectively. Dashed line is temperature profile during TPD.
ment of the NO2 adsorption, inset in Fig. 1a, the experimen-tal data indicates that initially the NO2 concentration increasessteeply during the NO2 adsorption. The experimental break-through curve is steeper than that of the model prediction. Theincrease in NO2 concentration eventually slows down beforesaturation of the sample is reached. This indicates that the dif-fusion of NO2 is initially very slow, but accelerates with timeperhaps as a result of the development of the surface nitratespecies. However, since the effective diffusivity in the modelwas constant, the model failed to reproduce the observed NOx
concentration profile.
4.2. Surface nitrate species analysis with 2-D model
Interactions between the different surface nitrate specieswere further studied with the 2-D model. The surface nitratesformed after NO2 adsorption (see TPD inset in Fig. 1a) can bemore clearly differentiated by preventing one surface nitratefrom decomposing during TPD while the other undergoesdesorption. Fig. 3 contains the NO2 concentration profilesfrom simulation with the complete model including desorp-tion of all nitrate species and experimental data. But also thefigure shows the results of a simulation when desorption ofthe higher thermally stable nitrate was prevented (see curve(a)) and the results of a simulation when decomposition of theless thermally stable nitrate was prevented (see curve (b)). For
3890 I. Perdana et al. / Chemical Engineering Science 62 (2007) 3882–3893
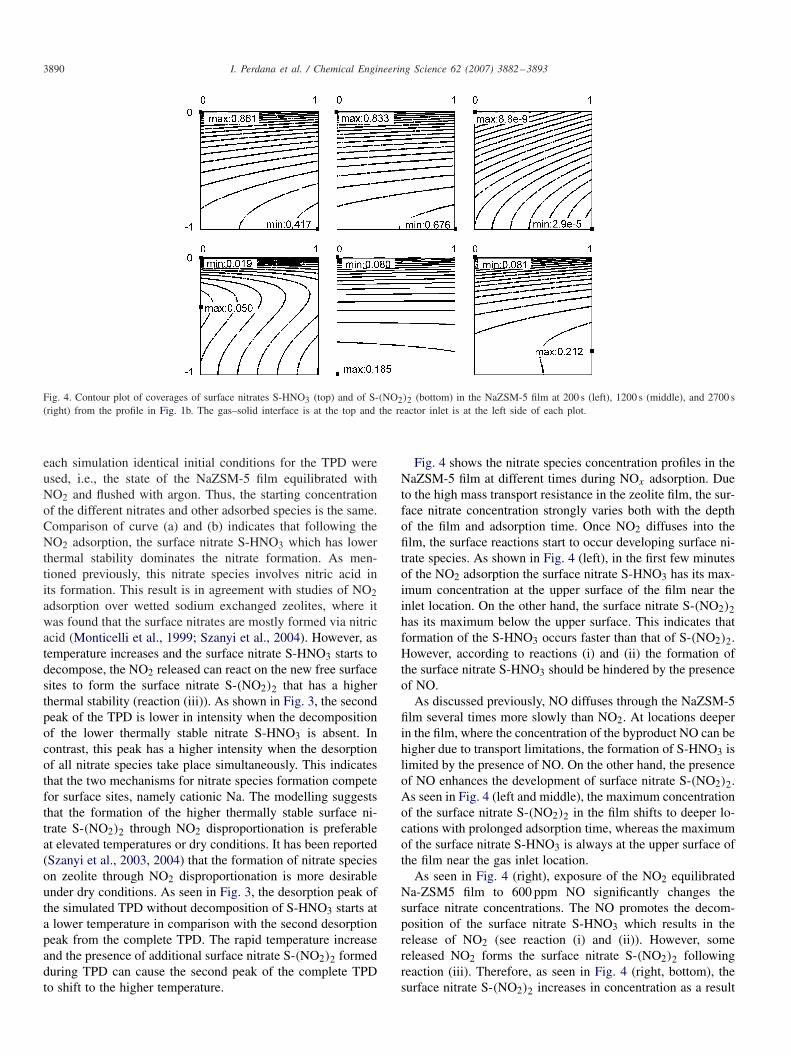
Fig. 4. Contour plot of coverages of surface nitrates S-HNO3 (top) and of S-(NO2)2 (bottom) in the NaZSM-5 film at 200 s (left), 1200 s (middle), and 2700 s(right) from the profile in Fig. 1b. The gas–solid interface is at the top and the reactor inlet is at the left side of each plot.
each simulation identical initial conditions for the TPD wereused, i.e., the state of the NaZSM-5 film equilibrated withNO2 and flushed with argon. Thus, the starting concentrationof the different nitrates and other adsorbed species is the same.Comparison of curve (a) and (b) indicates that following theNO2 adsorption, the surface nitrate S-HNO3 which has lowerthermal stability dominates the nitrate formation. As men-tioned previously, this nitrate species involves nitric acid inits formation. This result is in agreement with studies of NO2adsorption over wetted sodium exchanged zeolites, where itwas found that the surface nitrates are mostly formed via nitricacid (Monticelli et al., 1999; Szanyi et al., 2004). However, astemperature increases and the surface nitrate S-HNO3 starts todecompose, the NO2 released can react on the new free surfacesites to form the surface nitrate S-(NO2)2 that has a higherthermal stability (reaction (iii)). As shown in Fig. 3, the secondpeak of the TPD is lower in intensity when the decompositionof the lower thermally stable nitrate S-HNO3 is absent. Incontrast, this peak has a higher intensity when the desorptionof all nitrate species take place simultaneously. This indicatesthat the two mechanisms for nitrate species formation competefor surface sites, namely cationic Na. The modelling suggeststhat the formation of the higher thermally stable surface ni-trate S-(NO2)2 through NO2 disproportionation is preferableat elevated temperatures or dry conditions. It has been reported(Szanyi et al., 2003, 2004) that the formation of nitrate specieson zeolite through NO2 disproportionation is more desirableunder dry conditions. As seen in Fig. 3, the desorption peak ofthe simulated TPD without decomposition of S-HNO3 starts ata lower temperature in comparison with the second desorptionpeak from the complete TPD. The rapid temperature increaseand the presence of additional surface nitrate S-(NO2)2 formedduring TPD can cause the second peak of the complete TPDto shift to the higher temperature.
Fig. 4 shows the nitrate species concentration profiles in theNaZSM-5 film at different times during NOx adsorption. Dueto the high mass transport resistance in the zeolite film, the sur-face nitrate concentration strongly varies both with the depthof the film and adsorption time. Once NO2 diffuses into thefilm, the surface reactions start to occur developing surface ni-trate species. As shown in Fig. 4 (left), in the first few minutesof the NO2 adsorption the surface nitrate S-HNO3 has its max-imum concentration at the upper surface of the film near theinlet location. On the other hand, the surface nitrate S-(NO2)2has its maximum below the upper surface. This indicates thatformation of the S-HNO3 occurs faster than that of S-(NO2)2.However, according to reactions (i) and (ii) the formation ofthe surface nitrate S-HNO3 should be hindered by the presenceof NO.
As discussed previously, NO diffuses through the NaZSM-5film several times more slowly than NO2. At locations deeperin the film, where the concentration of the byproduct NO can behigher due to transport limitations, the formation of S-HNO3 islimited by the presence of NO. On the other hand, the presenceof NO enhances the development of surface nitrate S-(NO2)2.As seen in Fig. 4 (left and middle), the maximum concentrationof the surface nitrate S-(NO2)2 in the film shifts to deeper lo-cations with prolonged adsorption time, whereas the maximumof the surface nitrate S-HNO3 is always at the upper surface ofthe film near the gas inlet location.
As seen in Fig. 4 (right), exposure of the NO2 equilibratedNa-ZSM5 film to 600 ppm NO significantly changes thesurface nitrate concentrations. The NO promotes the decom-position of the surface nitrate S-HNO3 which results in therelease of NO2 (see reaction (i) and (ii)). However, somereleased NO2 forms the surface nitrate S-(NO2)2 followingreaction (iii). Therefore, as seen in Fig. 4 (right, bottom), thesurface nitrate S-(NO2)2 increases in concentration as a result
I. Perdana et al. / Chemical Engineering Science 62 (2007) 3882–3893 3891
0.85
0.80
0.75
0.70
0.65
0.60
0.55
Min: 0.500
Max: 0.861 Max: 0.865
0.85
0.80
0.75
0.70
0.65
0.60
0.55
0.55
Min: 0.490
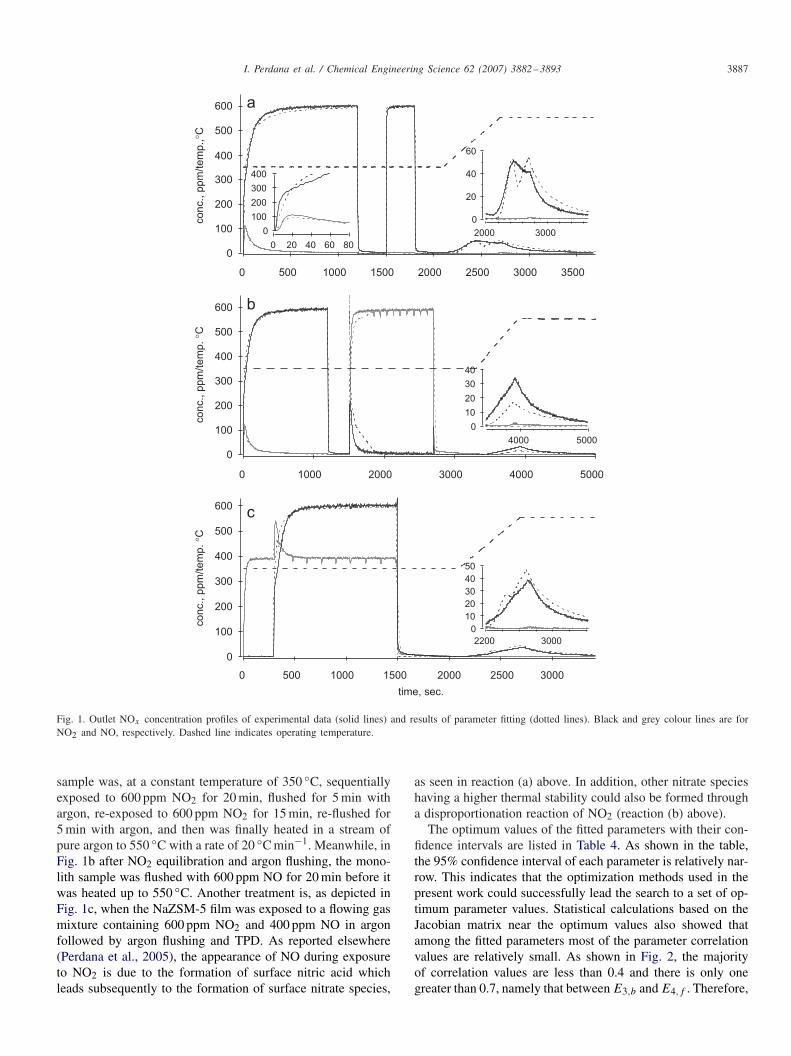
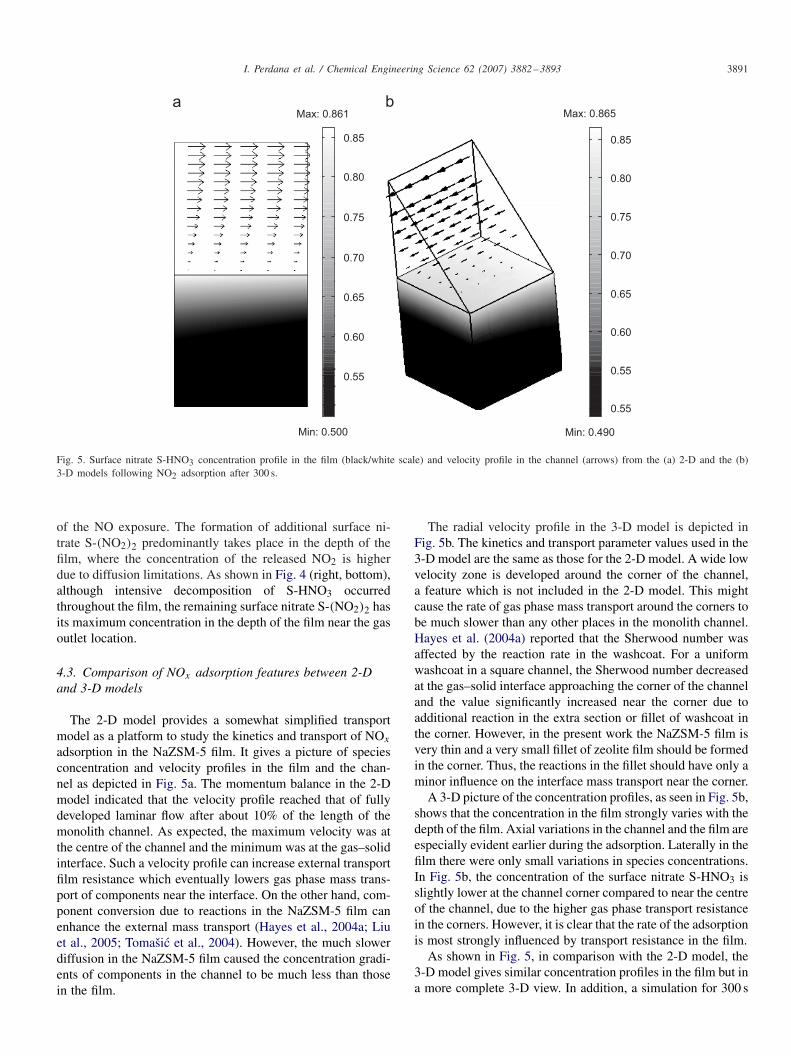
Fig. 5. Surface nitrate S-HNO3 concentration profile in the film (black/white scale) and velocity profile in the channel (arrows) from the (a) 2-D and the (b)3-D models following NO2 adsorption after 300 s.
of the NO exposure. The formation of additional surface ni-trate S-(NO2)2 predominantly takes place in the depth of thefilm, where the concentration of the released NO2 is higherdue to diffusion limitations. As shown in Fig. 4 (right, bottom),although intensive decomposition of S-HNO3 occurredthroughout the film, the remaining surface nitrate S-(NO2)2 hasits maximum concentration in the depth of the film near the gasoutlet location.
4.3. Comparison of NOx adsorption features between 2-Dand 3-D models
The 2-D model provides a somewhat simplified transportmodel as a platform to study the kinetics and transport of NOx
adsorption in the NaZSM-5 film. It gives a picture of speciesconcentration and velocity profiles in the film and the chan-nel as depicted in Fig. 5a. The momentum balance in the 2-Dmodel indicated that the velocity profile reached that of fullydeveloped laminar flow after about 10% of the length of themonolith channel. As expected, the maximum velocity was atthe centre of the channel and the minimum was at the gas–solidinterface. Such a velocity profile can increase external transportfilm resistance which eventually lowers gas phase mass trans-port of components near the interface. On the other hand, com-ponent conversion due to reactions in the NaZSM-5 film canenhance the external mass transport (Hayes et al., 2004a; Liuet al., 2005; Tomašic et al., 2004). However, the much slowerdiffusion in the NaZSM-5 film caused the concentration gradi-ents of components in the channel to be much less than thosein the film.
The radial velocity profile in the 3-D model is depicted inFig. 5b. The kinetics and transport parameter values used in the3-D model are the same as those for the 2-D model. A wide lowvelocity zone is developed around the corner of the channel,a feature which is not included in the 2-D model. This mightcause the rate of gas phase mass transport around the corners tobe much slower than any other places in the monolith channel.Hayes et al. (2004a) reported that the Sherwood number wasaffected by the reaction rate in the washcoat. For a uniformwashcoat in a square channel, the Sherwood number decreasedat the gas–solid interface approaching the corner of the channeland the value significantly increased near the corner due toadditional reaction in the extra section or fillet of washcoat inthe corner. However, in the present work the NaZSM-5 film isvery thin and a very small fillet of zeolite film should be formedin the corner. Thus, the reactions in the fillet should have only aminor influence on the interface mass transport near the corner.
A 3-D picture of the concentration profiles, as seen in Fig. 5b,shows that the concentration in the film strongly varies with thedepth of the film. Axial variations in the channel and the film areespecially evident earlier during the adsorption. Laterally in thefilm there were only small variations in species concentrations.In Fig. 5b, the concentration of the surface nitrate S-HNO3 isslightly lower at the channel corner compared to near the centreof the channel, due to the higher gas phase transport resistancein the corners. However, it is clear that the rate of the adsorptionis most strongly influenced by transport resistance in the film.
As shown in Fig. 5, in comparison with the 2-D model, the3-D model gives similar concentration profiles in the film but ina more complete 3-D view. In addition, a simulation for 300 s
3892 I. Perdana et al. / Chemical Engineering Science 62 (2007) 3882–3893
600
500
400
300
200
100
0
Conc., p
pm
3002001000
Time, sec.
NO2
NO
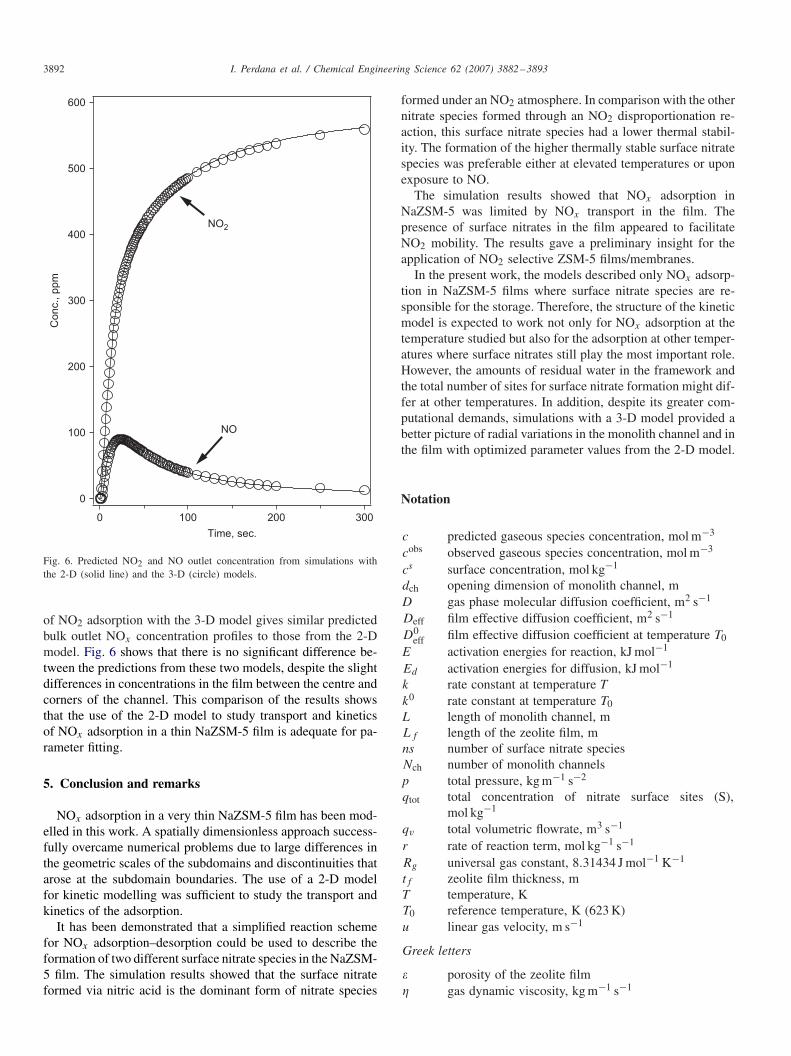
Fig. 6. Predicted NO2 and NO outlet concentration from simulations withthe 2-D (solid line) and the 3-D (circle) models.
of NO2 adsorption with the 3-D model gives similar predictedbulk outlet NOx concentration profiles to those from the 2-Dmodel. Fig. 6 shows that there is no significant difference be-tween the predictions from these two models, despite the slightdifferences in concentrations in the film between the centre andcorners of the channel. This comparison of the results showsthat the use of the 2-D model to study transport and kineticsof NOx adsorption in a thin NaZSM-5 film is adequate for pa-rameter fitting.
5. Conclusion and remarks
NOx adsorption in a very thin NaZSM-5 film has been mod-elled in this work. A spatially dimensionless approach success-fully overcame numerical problems due to large differences inthe geometric scales of the subdomains and discontinuities thatarose at the subdomain boundaries. The use of a 2-D modelfor kinetic modelling was sufficient to study the transport andkinetics of the adsorption.
It has been demonstrated that a simplified reaction schemefor NOx adsorption–desorption could be used to describe theformation of two different surface nitrate species in the NaZSM-5 film. The simulation results showed that the surface nitrateformed via nitric acid is the dominant form of nitrate species
formed under an NO2 atmosphere. In comparison with the othernitrate species formed through an NO2 disproportionation re-action, this surface nitrate species had a lower thermal stabil-ity. The formation of the higher thermally stable surface nitratespecies was preferable either at elevated temperatures or uponexposure to NO.
The simulation results showed that NOx adsorption inNaZSM-5 was limited by NOx transport in the film. Thepresence of surface nitrates in the film appeared to facilitateNO2 mobility. The results gave a preliminary insight for theapplication of NO2 selective ZSM-5 films/membranes.
In the present work, the models described only NOx adsorp-tion in NaZSM-5 films where surface nitrate species are re-sponsible for the storage. Therefore, the structure of the kineticmodel is expected to work not only for NOx adsorption at thetemperature studied but also for the adsorption at other temper-atures where surface nitrates still play the most important role.However, the amounts of residual water in the framework andthe total number of sites for surface nitrate formation might dif-fer at other temperatures. In addition, despite its greater com-putational demands, simulations with a 3-D model provided abetter picture of radial variations in the monolith channel and inthe film with optimized parameter values from the 2-D model.
Notation
c predicted gaseous species concentration, mol m−3
cobs observed gaseous species concentration, mol m−3
cs surface concentration, mol kg−1
dch opening dimension of monolith channel, mD gas phase molecular diffusion coefficient, m2 s−1
Deff film effective diffusion coefficient, m2 s−1
D0eff film effective diffusion coefficient at temperature T0
E activation energies for reaction, kJ mol−1
Ed activation energies for diffusion, kJ mol−1
k rate constant at temperature Tk0 rate constant at temperature T0L length of monolith channel, mLf length of the zeolite film, mns number of surface nitrate speciesNch number of monolith channelsp total pressure, kg m−1 s−2
qtot total concentration of nitrate surface sites (S),mol kg−1
qv total volumetric flowrate, m3 s−1
r rate of reaction term, mol kg−1 s−1
Rg universal gas constant, 8.31434 J mol−1 K−1
tf zeolite film thickness, mT temperature, KT0 reference temperature, K (623 K)u linear gas velocity, m s−1
Greek letters
� porosity of the zeolite film� gas dynamic viscosity, kg m−1 s−1

I. Perdana et al. / Chemical Engineering Science 62 (2007) 3882–3893 3893
� fractional surface coverage�v fraction of unoccupied sites� gas density, kg m−3
�b bulk density of zeolite, kg m−3
Subscripts
b backwardf forwardg index of number of observationh index of transient observationi index of the gaseous/diffusing componentsj index of surface nitratesk index of surface components excluding nitrates
Acknowledgements
The authors are grateful for the financial support of theSwedish Research Council. I. Perdana and D. Creaser also thankthe SIDA-Swedish Research Links program for support. Theauthors also thank Dr. Olov Öhrman at the Division of Chem-ical Technology, Luleå University of Technology for prepara-tion and characterization of the monolith samples.
References
Antia, J.E., Govind, R., 1995. Conversion of methanol to gasoline-rangehydrocarbons in a ZSM-5 coated monolithic reactor. Industrial &Engineering Chemistry Research 34, 140–147.
Antia, J.E., et al., 1997. n-Hexane cracking on binderless zeolite HZSM-5coated monolithic reactors. Applied Catalysis A: General 159, 89–99.
Basaldella, E.I., et al., 2001. Preparation of supported Cu/ZSM-5 zeolite filmsfor DeNOx reaction. Materials Letters 51, 289–294.
Brilhac, J.F., et al., 2002. Adsorption and pressure swing desorption of NOx
in Na-Y zeolite: experiments and modeling. Environmental Science andTechnology 36, 1136–1140.
Caro, J., et al., 2000. Zeolite membranes—state of their development andperspective. Microporous and Mesoporous Materials 38, 3–24.
Coronas, J., Santamaria, J., 2004a. State-of-the-art in zeolite membranereactors. Topics in Catalysis 29, 29–44.
Coronas, J., Santamaria, J., 2004b. The use of zeolite films in small-scale andmicro-scale applications. Chemical Engineering Science 59, 4879–4885.
Cussler, E.L., 1984. Diffusion: Mass Transfer in Fluid System. CambridgeUniversity Press, Cambridge.
Grande, C.A., et al., 2006. Adsorption of propane and propylene in zeolite4A honeycomb monolith. Chemical Engineering Science 61, 3053–3067.
Groppi, G., Tronconi, E., 2000. Design of novel monolith catalyst supportsfor gas/solid reactions with heat exchange. Chemical Engineering Science55, 2161–2171.
Gulati, S.T., 1998. Ceramic catalyst support for gasoline fuel. In: Cybulski,A., Moulijn, J.A. (Eds.), Structured Catalysts and Reactors. Marcel Dekker,New York, pp. 15–57.
Hayes, R.E., et al., 2004a. The effect of washcoat geometry on mass transferin monolith reactors. Chemical Engineering Science 59, 3169–3181.
Hayes, R.E., et al., 2004b. Three-way catalytic converter modelling withdetailed kinetics and washcoat diffusion. Topics in Catalysis 30/31,411–415.
Hedlund, J., et al., 2004. The synthesis and testing of thin film ZSM-5catalysts. Chemical Engineering Science 59, 2647–2657.
Hoebink, J.H.B.J., Marin, G.B., 1998. Modeling of Monolithic Reactorsfor Automotive Exhaust Gas Treatment. Marcel Dekker, New York. pp.209–237.
Jahn, R., et al., 1997. 3-D modeling of monolith reactors. Catalysis Today38, 39–46.
Jansen, J.C., et al., 1998. Zeolitic coatings and their potential use in catalysis.Microporous and Mesoporous Materials 21, 213–226.
Koci, P., et al., 2004. Modeling of three-way-catalyst monolith converterswith microkinetics and diffusion in the washcoat. Industrial & EngineeringChemistry Research 43, 4503–4510.
Kolaczkowski, S.T., 1999. Modeling catalytic combustion in monolithreactors—challenges faced. Catalysis Today 47, 209–218.
Kryl, D., et al., 2005. Catalytic converters for automobile diesel engineswith adsorption of hydrocarbons on zeolites. Industrial & EngineeringChemistry Research 44, 9524–9534.
Li, H., et al., 1997. Chemical Physics Letters 271, 84–89.Liu, H., et al., 2005. Conceptual design and CFD simulation of a novel metal-
based monolith reactor with enhanced mass transfer. Catalysis Today 105,401–406.
Monticelli, O., et al., 1999. NOx removal from exhaust gas from lean burninternal combustion engines through adsorption on FAU type zeolitescation exchanged with alkali metals and alkaline earth metals. AppliedCatalysis B: Environmental 21, 215–220.
Moos, R., et al., 2002. Selective ammonia exhaust gas sensor for automotiveapplications. Sensors and Actuators B: Chemical B83, 181–189.
Öhrman, O., et al., 2004. Synthesis and evaluation of ZSM-5 films oncordierite monoliths. Applied Catalysis A: General 270, 193–199.
Öhrman, O., et al., 2005. Thin ZSM-5 film catalysts on quartz and aluminasupports. Microporous and Mesoporous Materials 78, 199–208.
Olsson, L., et al., 2001. A kinetic study of NO oxidation and NOx storageon Pt/Al2O3 and Pt/BaO/Al2O3. Journal of Physical Chemistry B 105,6895–6906.
Perdana, I., et al., 2005. NOx adsorption over a wide temperature range onNaZSM-5 films. Journal of Catalysis 234, 219–229.
Szanyi, J., et al., 2003. The adsorption of NO2 and the NO + O2 reaction onNa-Y, FAU: an in situ FTIR investigation. Physical Chemistry ChemicalPhysics 5, 4045–4051.
Szanyi, J., et al., 2004. The effect of water on the adsorption of NO2 in Na-and Ba-Y, FAU zeolites: a combined FTIR and TPD investigation. Journalof Physical Chemistry B 108, 3746–3753.
Tomašic, V., et al., 2002. Reaction and mass transfer effects in a catalyticmonolith reactor. Reaction Kinetics and Catalysis Letters 77, 245–253.
Tomašic, V., et al., 2004. Direct decomposition of NO in a monolith reactor:comparison of mathematical models. Catalysis Today 90, 77–83.
Tsutsumi, K., Mizoe, K., 1989. Heats of adsorption of water on hydrophobiczeolites. Colloids and Surfaces 37, 29–38.
Ulla, M.A., et al., 2003. Synthesis and characterization of ZSM-5 coatingsonto cordierite honeycomb supports. Applied Catalysis A: General 253,257–269.
Valdés-Solis, T., et al., 2004. Kinetics and mechanism of low-temperatureSCR of NOx with NH3 over vanadium oxide supported on carbon-ceramiccellular monoliths. Industrial & Engineering Chemistry Research 43,2349–2355.
van de Graaf, J.M., et al., 1998. Zeolitic membranes. In: Cybulski, A.,Moulijn, J.A. (Eds.), Structured Catalysts and Reactors. Marcel Dekker,New York, pp. 543–573.
van den Broeke, L.J.P., et al., 1998. Transport and separation properties ofa silicalite-1 membrane—I. Operating conditions. Chemical EngineeringScience 54, 245–258.
Xiao, J., Wei, J., 1992. Diffusion mechanism of hydrocarbons in zeolites. I.Theory. Chemical Engineering Science 47, 1123–1141.


