Embed Size (px)
Citation preview
Modeling ASEAN Global Linkages
Prepared for
Asian Development Bank
Submitted by
Montague J. Lord
August 1999
ii
Table of Contents
Executive Summary.......................................................................................................... v
I. ASEAN Global Economic Linkages .................................................................... 1
II. The Global Framework of ASEAN ...................................................................... 5
III. International Transmission of Income Changes ................................................... 9
IV. Transmission Effects of Bilateral Exchange Rate Differentials ......................... 14
V. Modeling International Transmission Effects..................................................... 20
VI. Conclusions......................................................................................................... 31
Technical Appendix ........................................................................................................ 34
References....................................................................................................................... 38
iii
Tables
1.1 ASEAN-5 Real GDP: Trend Growth Rates and Average Annual Deviations ..... 12.1 Changing Exposure of ASEAN-5 Economies to Global Economy...................... 63.1 ASEAN-5 Distribution of Trade, 1998................................................................. 93.2 Regression Results of ASEAN-5 GDP Relationships to Foreign Income.......... 113.3 Foreign Income Elasticities ................................................................................ 124.1 Nominal Exchange Rate Indices, 1980-98.......................................................... 154.2 ASEAN-5 Real Effective Exchange Rates (REER) by Region, 1970-98 .......... 164.3 Capital Inflows by Type, 1985-97 ...................................................................... 185.1 Regression Results of Yen/US Dollar Exchange Rate Transmissions .............. 215.2 Foreign Income and Exchange Rate Elasticities................................................. 225.3 Regression Results of ASEAN-5 GDP Relationships to Foreign Income,
International Financial Indicators and World Trade........................................... 235.4 Foreign Income, Financial Indicator and World Trade Elasticities .................... 245.5 Regression Results of ASEAN-5 GDP Relationships to Balance of Payments and
Other External Sector Indicators......................................................................... 295.6 Balance of Payments and Other Indicator Elasticities........................................ 30A.1 Descriptive Statistics for Real GDP of ASEAN-5 and Global Regions............. 35
Figures
1.1 Real GDP of ASEAN-5 ........................................................................................ 21.2 ASEAN-5 Annual Percentage Change of Real GDP............................................ 31.3 GDP Growth Rate of ASEAN-5 and Other Global Regions ................................ 42.1 Globalization Trends, 1991-97 ............................................................................. 74.1 ASEAN-5 Trade of Goods and Services and Real Effective Exchange Rate..... 144.2 Bilateral Nominal and Real Yen-US$ Exchange Rate ....................................... 15
iv
Acronyms
ADF Augmented Dickey-Fuller (test)ASEAN Association of Southeast Asian countriesDF Dickey-Fuller (test)ECM Equilibrium correction mechanismEU European UnionFDI Foreign direct investmentGDP Gross domestic productGNP Gross national productMUV Manufactured unit value (index)PRC Peoples Republic of ChinaQR Quantitative restrictionREER Real effective exchange rateSITC Standard International Trade Classification
v
Executive Summary
This study examines the global linkages of selected ASEAN countries composed ofIndonesia, Malaysia, Philippines, Singapore and Thailand (hereafter ASEAN-5). Whileeconomic growth of each country undoubtedly hinges on domestic developments, it alsodepends on foreign trade and capital movements in the form of direct and portfolioinvestments. These external influences are largely driven by global developments,particularly in Japan, other Northeast Asian countries, the United States, the EuropeanUnion, and within the ASEAN region. While the systematic determinants of the ASEAN-5 countries’ linkages to these regions are relatively stable and robust, our focus is on the short-term dynamics underlying the transmission of income, price and other changesfrom the global economy.
ASEAN-5 Growth and the Global Context
For purposes of framing the analysis, we examine three widely recognized explanationsof economic growth in Southeast Asia. The first focuses on supply growth in the regionto explain the ‘Asian Miracle’ associated with capital accumulation, the absorption or assimilation of increasingly modern technology and the change in industrial structures. Aclosely related but more recent explanation is the fundamentalist view that structuralfactors have explained, first, the long-term growth of the Southeast Asian economies untilmid-1997 and, second, the crisis in late 1997 and 1998. During the stellar years of the‘miracle’ economies the dominant factors producing an outward-oriented, export-ledgrowth were high domestic savings, human capital development, sound macromanagement and limited price distortions combined with careful policy interventions.During the 1997-98 crisis structural factors also dominated events, but this time in theform of weak financial systems that were undermined by large capital flows andexchange rate misalignments associated with the widespread use of relatively fixedexchange rate regimes. An alternative interpretation is that cyclical variations in the realdollar-yen rate created the misalignment and effected large changes in the pattern of tradeand direct and portfolio investments throughout the Southeast Asian countries.
The third explanation of economic growth in Southeast Asia focuses on the rapidassimilation of the region in the global economy. While recognizing that industrialgrowth and transformation have been the driving force behind the economic growth ofSoutheast Asia, the handmaiden of that expansion has been the large growth ofinternational trade and direct and portfolio investments generated by the rapid expansionof global production and markets. For the ASEAN-5 countries these systemic changes inthe world economy have generated large volumes of international capital flows andtransactions in goods and services, and brought about a widespread diffusion ofproduction, transportation, and communication technologies from corporate contractingarrangements. This new globalization process emphasizes demand-led growth and thepolicy environment as a critical determinant of that growth. Over the long run, the
vi
growing openness of the Southeast Asian economies until 1996 deepened the close linkbetween economic growth and the rapidly changing global economy, but more recentlythey have made the ASEAN-5 economies susceptible to especially large changes in thetrade and cross-border production activities.
The focus of this study is on demand-led growth in the ASEAN-5 economies in thecontext of the global economy. In examining linkages between the ASEAN-5 and theglobal economy, our focus is on the short-term or year-to-year impact of the globaleconomy through real effective exchange rates, trade balances, international capital flowsand changes in the structure of production, trade and investment in the ASEAN-5economies. Notwithstanding the pervasive influence of the 1997-98 crisis on short-termmovements in the near term, today’s global linkages are rooted in behavioral relationships that have developed since the 1970s and 1980s. Our interest is therefore toidentify and quantitatively represent the essential features that underlie the internationaltransmission of income, prices and other factors, as distinct from an attempt to describethe complete ASEAN system of economic growth. As such, the set of causalrelationships is parsimonious and does not explicitly consider the determinants of eithersupply growth or structural factors.
Modeling International Income Transmissions
Our estimates of the international transmission of income and other changes on theASEAN-5 countries separate the long-run or equilibrium relationships between domesticincome and foreign income, prices and other variables from the short-run or dynamicdisequilibrium components of those relationships. We examine global linkages of theASEAN-5 using an Equilibrium Correction Mechanism (ECM) specification thatprovides the means by which the short-run observed behavior of variables is associatedwith their long-run equilibrium growth paths. The ECM adjusts for any disequilibriumbetween variables that are cointegrated. As a result, it provides the means by which theshort-run observed behavior of variables is associated with their long-run equilibriumgrowth paths. A closely related specification known as the “error-correcting mechanism” (also having the acronym ECM) models both the short and long-run relationshipsbetween variables.
Using the ECM we initially derive estimates of the international transmission of incomechanges on the ASEAN-5 economies and then extend that relationship to includeexchange rates, international prices, interest rates, investment risks and otherinternational influences on these countries. Our estimates of the foreign incomeelasticities of the ASEAN-5 countries are consistent with expectations. The short-termforeign income elasticities have a mean average of 0.4, and they range from near 0 for therelationship between Singapore and the United States to 0.9 for that between Thailandand Japan. The long-term foreign income elasticities have a mean average of 2, and theyrange from 0.6 for the relationship between the Philippines and Japan to over 3 forSingapore with that of the European Union. Estimates of the international transmission ofincome changes based on aggregate data from all the regions show a similar pattern as
vii
those for individual regional estimates. These aggregated relationships are therefore usedto estimate the international transmission of exchange rates and other influences on theASEAN-5 countries.
Exchange Rates and Other International Transmissions
In additional to foreign income effects, we examine the effects of the following variableson ASEAN-5 economic activity: (a) exchange rates in the form of either the overall realeffective exchange rate of the ASEAN-5 countries, bilateral real effective exchange rateswith the major global regions, or the real yen/dollar exchange rate; (b) internationalprices in the form of either the terms of trade of the ASEAN-5 or world market prices forprimary commodities relative to those of manufactures; (c) ) interest rates in the form ofinterest rate differentials either between those in Japan and those in the United States,those for ASEAN-5 lending and those for Japanese borrowing, or those for ASEAN-5lending and those for borrowing in the Eurodollar market; (d) investment risks onportfolio and direct investments in the form of either real exchange rate fluctuations ormore generally imbalances in the balance of payments that reflect the risk of realexchange rate changes and/or capital controls; (e) world trade and capital inflows in theform of world trade volumes, current account balances, the ratio of exports to GDP, andthe importance of portfolio and direct investments to the economy; and (f) intra-ASEANlinkages in the form of the bilateral real effective exchange rate (REER) with otherASEAN-5 countries, the aggregate current account deficit of the ASEAN-5, and theregion’s reserve losses. In all cases, empirical measurement has been based on individualASEAN-5 country estimates.
Exchange Rate Effects - The motivation for including real effective exchange rates inthe relationship for the global linkages of the ASEAN-5 countries is well developed.During the period of rapid economic expansion in the 1980 and until 1996 a highpremium was placed on keeping stable exchange rates and moderate to low inflation. Inthe subsequent crisis years, the exchange rate misalignments that emerged in the mid-1980s are believed to have created the framework for the worsening of domesticeconomic fundamentals a decade later. In analyzing these effects, past research hasusually relied on measures of REER changes of the Southeast Asian economies with alltheir partner countries. In addition to this measure, we also test the bilateral real effectiveexchange rates of each ASEAN-5 country with the major global region of Japan, otherNortheast Asian countries, the United States, the European Union and other ASEAN-5countries.
We also examine the alternative hypothesis that the dollar-pegged Southeast Asianeconomies have been mainly influenced by yen-dollar exchange rate movements. Earlierworks have shown that aggregate output of these countries has been closely linked tomovements in the yen/dollar exchange rate. Those results have shown output in the Asianeconomies to be positively related to the yen/dollar exchange rate: when the yenweakened, output growth in the dollar-pegged Asian economies slows; when the yenstrengthened, output growth accelerates.
viii
We find real yen/dollar exchange rate movements to be significant in explaining realGDP changes in the ASEAN-5 countries. On average, the short-term elasticity of incomewith respect to the real yen/dollar exchange rate is equal to 0.05, while the average long-term elasticity is 0.8. All the coefficients had the expected positive sign suggesting thatoutput in the ASEAN-5 economies is positively related to the yen/dollar exchange rate.The explanation for these findings is that when the yen has risen against the dollar, theexport competitiveness of the dollar-pegged Asian economies has improved in theJapanese market and production costs have became more attractive to Japanese investors.Alternatively, when the yen has weakened (for example, as it did between mid-1995 andmid-1997) Japanese export demand and FDI outflows have contracted and economicgrowth in the Southeast Asian economies has fallen.
The REERs of the ASEAN-5 countries are statistically significant in explaining incomechanges of Indonesia, Malaysia and the Philippines. However, only in the case ofMalaysia is the REER significant in the long run. These findings are not surprising sincereduced form estimates that relate real GDP of countries to their REER are often unableto capture the transmission effects of this variable through the demand for exports andimports and direct and portfolio investments. Instead it is usually necessary to estimatestructural equations relating each of the national income components (for example, exportdemand) to the REER and then estimating the individual effects on aggregate income.
International Price and Trade Volume Effects - In addition to real exchange ratechanges, movements in world market prices for traded commodities and manufactureshave impacted on the foreign demand for ASEAN-5 exports and domestic demand forimports. Moreover, international prices have had an indirect effect on ASEAN-5 growththrough their impact on export-oriented FDI activities. We initially attempt to use twoalternative measures of relative prices: the terms of trade of each economy, and worldmarket prices for primary commodities relative to those of manufactures. Data for theterms of trade of most ASEAN-5 countries, however, are not available for the morerecent years and these series were therefore not included in the final estimates. Thealternative series on world commodity prices is more readily available. To approximate aterms of trade measure for individual countries, we derive a global terms of tradeestimate based on the ratio of the index of commodity prices to that of prices formanufactures.
As expected, world trade volumes and world commodity market prices relative to thoseof manufactures are found to be significant in explaining changes in the ASEAN-5countries’ real GDP. The average of the estimated world trade volume elasticities equalsonly 0.02 in the short run but increases to 1.2 in the long run. This pattern is consistentamong the ASEAN-5 countries: the short-term elasticity is low for all countries but themagnitude of all elasticities increases significantly in the long run, which suggests thatadjustments take time but have an important influence on GDP. In the case of the globalterms of trade, the average elasticity is generally higher in the short-run than that of worldtrade. These findings indicate that price transmissions occur more quickly that trade
ix
volume effects, but that movements in trade volumes tend to have a relatively largerimpact on ASEAN-5 GDP than do price variations.
Differential Interest Rate Effects - Interest rate differentials tend to affect movements inequity and debt securities on capital markets more than they do FDI movements, andtherefore are likely to have a large influence on portfolio investments in the ASEAN-5. Inaddition, it is generally acknowledged that interest rate differentials resulting from thelong-term upward movement in the nominal dollar value of the yen drove nominalinterest rates on yen-denominated assets below those prevailing on dollar-denominatedassets. That change led banks in East Asia to undertake foreign currency indebtedness byaccepting cheap yen deposits without covering their foreign exchange risk.
To measure the effect that these interest rate disparities have had on the ASEAN-5economies, we use the ratio of the nominal lending rates in each ASEAN-5 country toboth the Japanese yen LIBOR three-month rate and US dollar LIBOR rate. However, theresults do not support the use of this variable in explaining economic activity, except inthe case of the Philippines, where the ratio of the Japanese yen LIBOR three-month rateto the US dollar LIBOR rate is statistically significant in explaining changes in real GDP.The reason for the general lack of significance of this variable in other countries may bethe relatively short time period over which it influenced the Southeast Asian economies,compared with the fairly long time series (beginning in 1970) used for the equationestimates.
Investment Risk Effects - The main sources of risk for investors are interest rates, stockmarket returns, and contagion effects. Changes in interest rates can have largeconsequences on the macroeconomic performance and creditworthiness of developingcountries, and more so through changes in portfolio investments than FDI. If investmentsin emerging markets are used only to increase portfolio returns when investments inindustrial countries are under-performing, then the investments will be very sensitive tochanges in industrial countries’ interest rates. In the case of the Asian financial crisis,however, it was the lack of confidence in the asset market that led to panic liquidation inall the Southeast Asian stock markets. The liquidation, in turn, instigated largemovements of funds offshore that reversed capital flows and drained official reserves.The resulting downward pressure on exchange rates was essentially domesticallyinduced, although there were spillovers that gave rise to contagion and the pervasivenessof the Asian financial crisis. To test the effect of investment risk, we measure the riskpremium on foreign loans made by financial intermediaries in the ASEAN-5 countriesusing the uncovered interest parity relationship. Using this measure we find the effect ofrisk premium on economic growth of the ASEAN-5 countries to generally be statisticallysignificant. The average risk premium elasticity is –0.04 in the short run and it rises to –0.23 in the long run.
Balance of Payments Effects - A widely-used approach to identifying external sectoreffects on economies is the use of balance of payments and other indicators in place ofprice-related variables in the form of exchange rates, international prices and interestrates. To test the usefulness of this approach we adopt the indicators used by Little,
x
Cooper, Corden and Rajapatirana (1993) to the ASEAN-5 economies with some minoradaptations to ensure readily available time-series data. These indicators consist of thefollowing variables: (a) foreign market GDP; (b) exports of goods and services as apercent of domestic GDP; (c) global terms of trade; (d) volume of world trade; and (e)FDI inflows as a percentage of domestic GDP.
The results generally support the use of these indicators in explaining income changes inthe ASEAN-5 countries. The limitation of this approach, however, is the relatively longdelay in the publication of information for the selected indicators compared with themore up-to-date information available for exchange rates, international prices and interestrates. These delays are important when data are used either to explain recentdevelopments or to generate short-term forecasts. Nevertheless, the robustness of theestimates makes the approach useful in explaining movements in ASEAN-5 economicactivity. Both exports and FDI changes are found to be significant in explaining real GDPchanges. The export/GDP elasticities of the ASEAN-5 countries average 0.04 in the shortrun and then increase to 0.6 in the long run. Similarly, the short-term FDI/GDPelasticities average 0.03 in the short run and then increase to 0.2 in the long run. Only inthe case of the Philippines are these variables not statistically significant. Insteadmovements in the global terms of trade and world trade volumes are found to beimportant in explaining GDP changes of that country.
We recommend extending the analysis of ASEAN global linkages in two areas. The firstis the measurement of economic policy effects on growth. Balance of payments policiesusing trade policy instruments and capital controls have been found to play an importantrole in the macroeconomic histories of Southeast Asia and other developing regions.Financial policies are also likely to influence capital movements during tightening orliberalization episodes. Quantification of these policy effects would help to identify theirimpact on ASEAN economic activity. Similar econometric techniques could also be usedto examine whether exchange rate policy differences among ASEAN countries explaindivergent economic growth rates among these countries despite other similarities.
Another useful area of research would consider ASEAN global linkages based onestimates of the structural relationships in the economies of the member countries. It islikely that such an approach would yield more robust estimates of the internationaltransmission mechanisms impacting on these countries than those based on reduced formequations.
1
I. ASEAN Global Economic Linkages
The link between the performance of the Association of Southeast Asian Countries(ASEAN) countries and global economic activity is central to the recovery of thesecountries. While the growth prospects of each country will undoubtedly build onexpansionary domestic policies, they will also hinge on the recovery of exports and thereturn of foreign capital in the form of portfolio investment and foreign direct investment.These external conditions will be largely driven by global development, particularly inJapan, other Northeast Asian countries, the United States, the European Union, andwithin ASEAN. While the magnitude of these effects on the ASEAN countries can bebroadly measured by the transmission of foreign income changes on domestic economicactivity of those countries, there is no presumption about the direction and causality ofthose changes. Though the financial crisis in the Asian economies did not become aglobal crisis, it did slow the growth of the global economy by one-half of that it wouldotherwise have achieved.
The study is composed of the following parts: this section provides an introduction byexamining the trend growth rates and year-to-year changes in the economic activity of theASEAN-5 countries and the global regions. Section II reviews the literature on factorsaffecting the past performance of the ASEAN-5, particularly as they relate to the globaleconomy, and it sets forth the main framework for analyzing the global determinants ofeconomic growth in the ASEAN-5 (comprised of Indonesia, Malaysia, Philippines,Singapore and Thailand). Sections III and IV examine the international transmission ofchanges in income, exchange rates and other important determinants of ASEAN-5economic growth, and present the empirical findings on the international transmission ofincome changes. Section V describes the other variables used in modeling the linkagesand sets forth the empirical results. Section VI presents the conclusions. Details of themodeling methodology are laid out in the Technical Appendix.
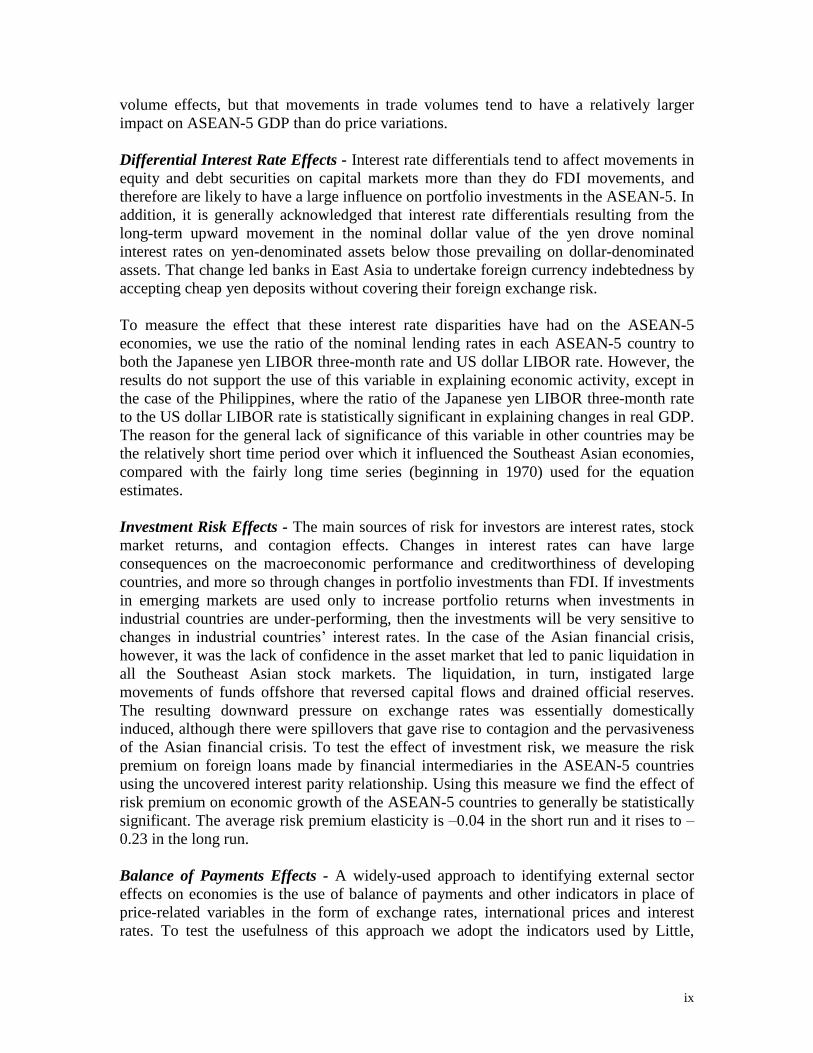
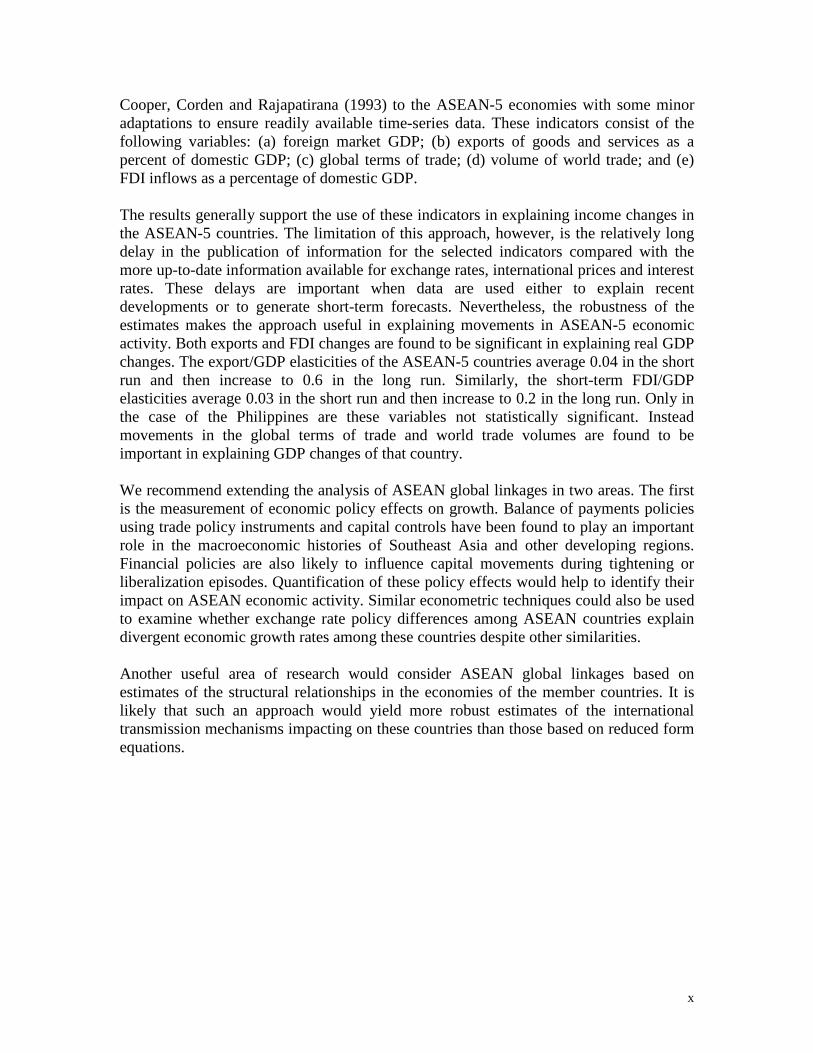
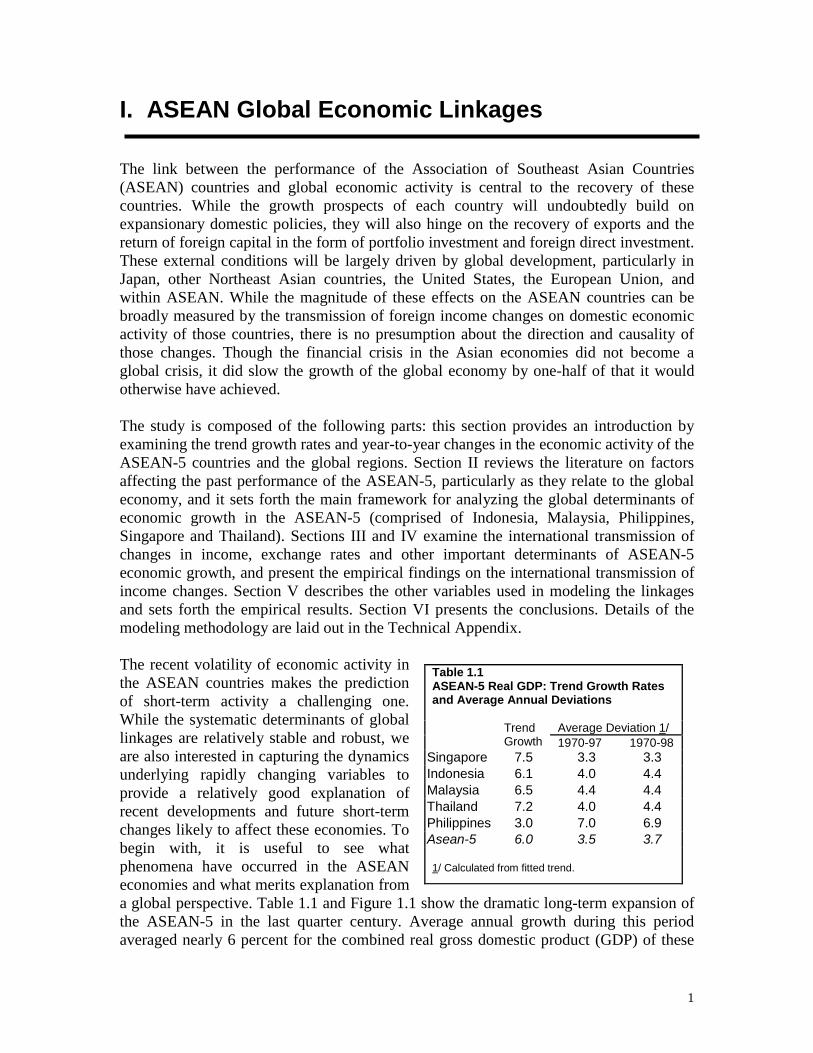
The recent volatility of economic activity inthe ASEAN countries makes the predictionof short-term activity a challenging one.While the systematic determinants of globallinkages are relatively stable and robust, weare also interested in capturing the dynamicsunderlying rapidly changing variables toprovide a relatively good explanation ofrecent developments and future short-termchanges likely to affect these economies. Tobegin with, it is useful to see whatphenomena have occurred in the ASEANeconomies and what merits explanation froma global perspective. Table 1.1 and Figure 1.1 show the dramatic long-term expansion ofthe ASEAN-5 in the last quarter century. Average annual growth during this periodaveraged nearly 6 percent for the combined real gross domestic product (GDP) of these
Table 1.1ASEAN-5 Real GDP: Trend Growth Ratesand Average Annual Deviations
Average Deviation 1/TrendGrowth 1970-97 1970-98
Singapore 7.5 3.3 3.3Indonesia 6.1 4.0 4.4Malaysia 6.5 4.4 4.4Thailand 7.2 4.0 4.4Philippines 3.0 7.0 6.9Asean-5 6.0 3.5 3.7
1/ Calculated from fitted trend.
2
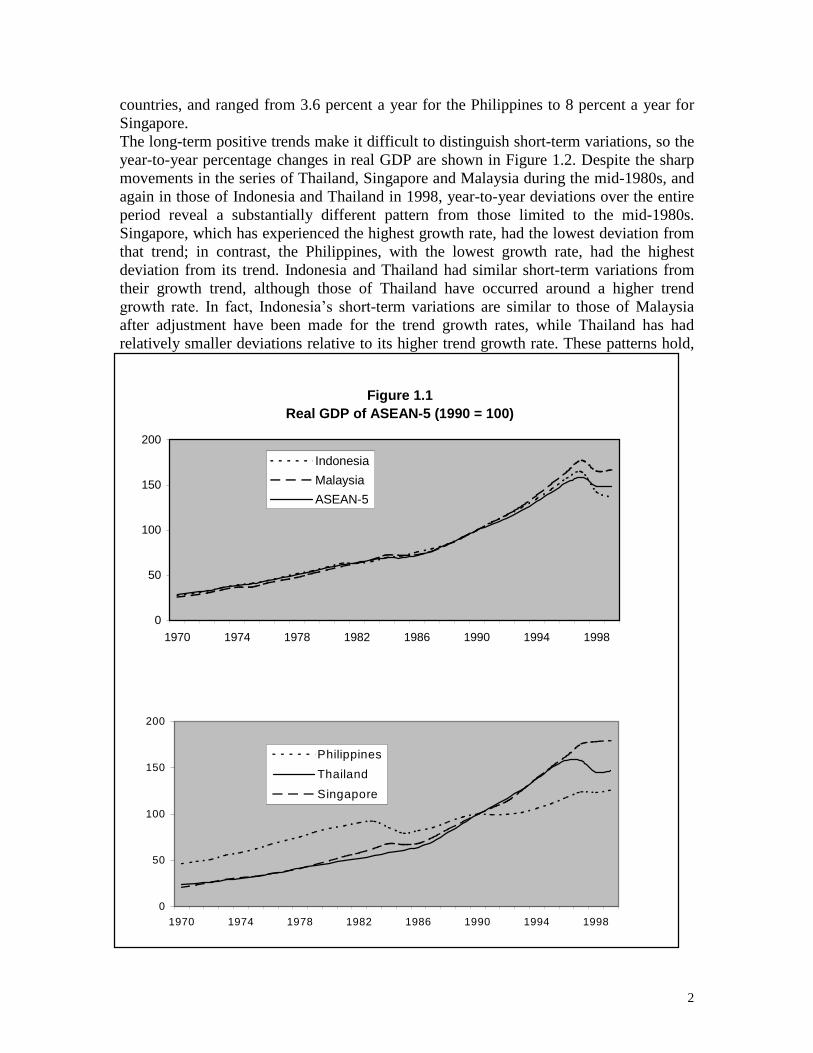
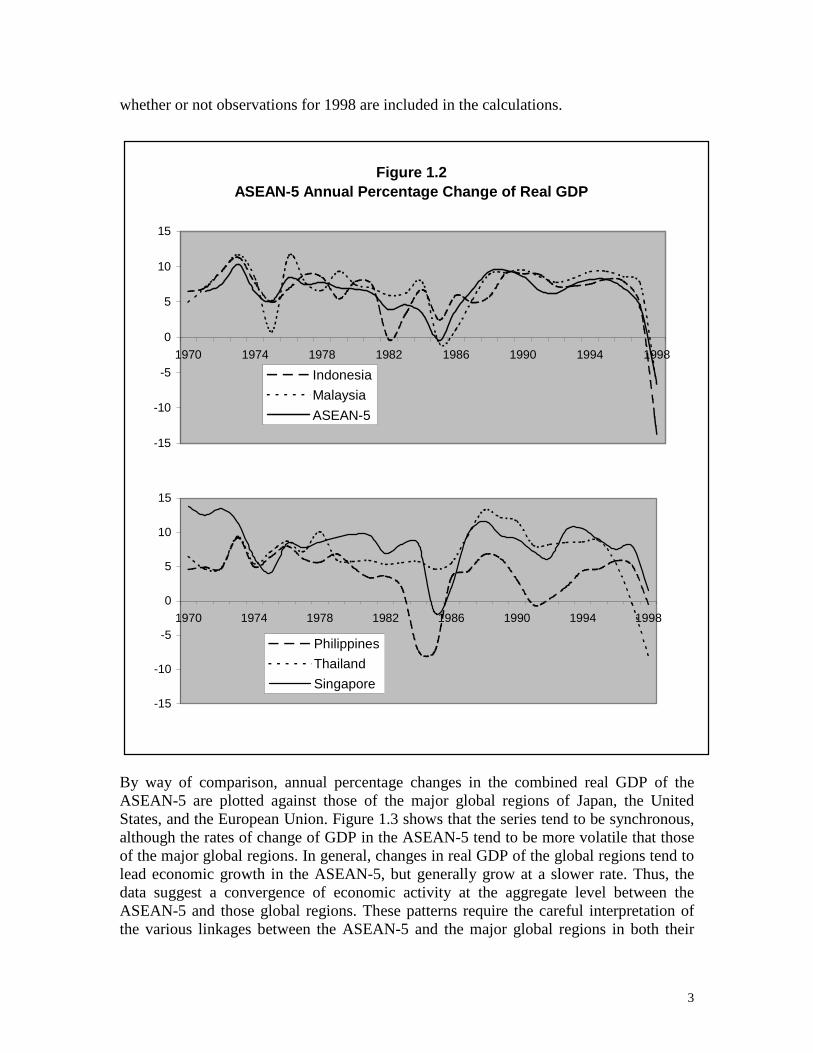
countries, and ranged from 3.6 percent a year for the Philippines to 8 percent a year forSingapore.The long-term positive trends make it difficult to distinguish short-term variations, so theyear-to-year percentage changes in real GDP are shown in Figure 1.2. Despite the sharpmovements in the series of Thailand, Singapore and Malaysia during the mid-1980s, andagain in those of Indonesia and Thailand in 1998, year-to-year deviations over the entireperiod reveal a substantially different pattern from those limited to the mid-1980s.Singapore, which has experienced the highest growth rate, had the lowest deviation fromthat trend; in contrast, the Philippines, with the lowest growth rate, had the highestdeviation from its trend. Indonesia and Thailand had similar short-term variations fromtheir growth trend, although those of Thailand have occurred around a higher trendgrowth rate. In fact, Indonesia’s short-term variations are similar to those of Malaysiaafter adjustment have been made for the trend growth rates, while Thailand has hadrelatively smaller deviations relative to its higher trend growth rate. These patterns hold,
Figure 1.1Real GDP of ASEAN-5 (1990 = 100)
0
50
100
150
200
1970 1974 1978 1982 1986 1990 1994 1998
Indonesia
Malaysia
ASEAN-5
0
50
100
150
200
1970 1974 1978 1982 1986 1990 1994 1998
Philippines
Thailand
Singapore
3
whether or not observations for 1998 are included in the calculations.
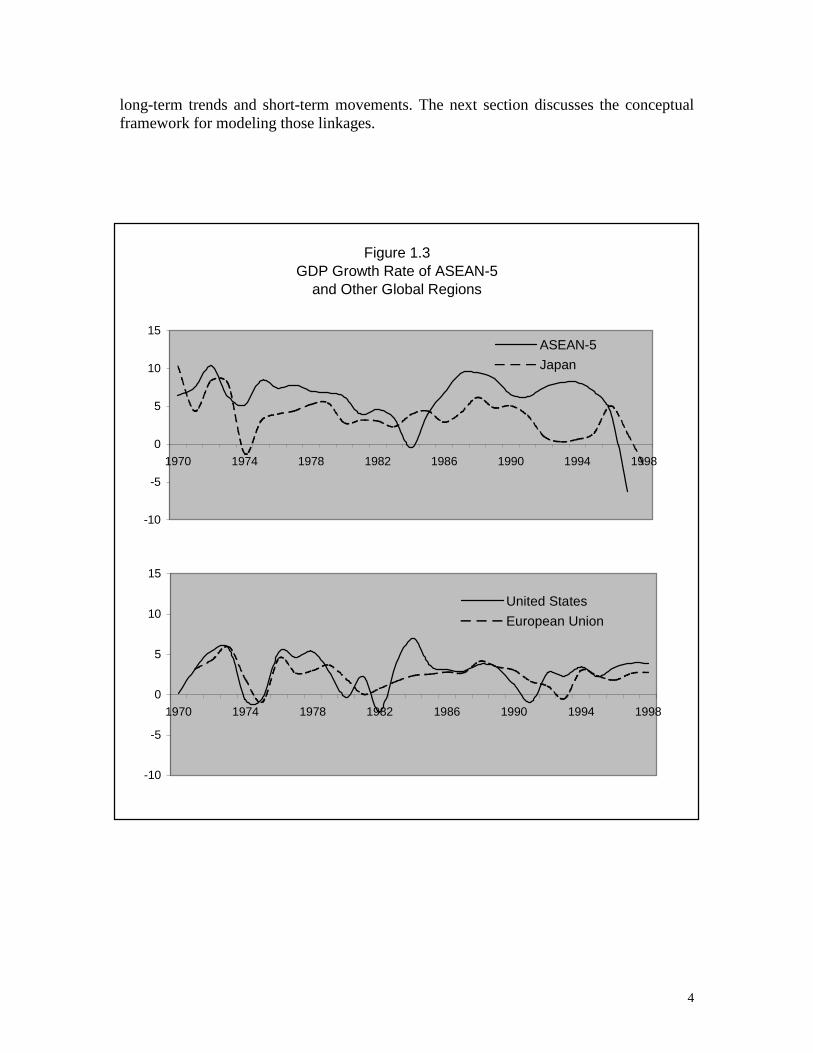
By way of comparison, annual percentage changes in the combined real GDP of theASEAN-5 are plotted against those of the major global regions of Japan, the UnitedStates, and the European Union. Figure 1.3 shows that the series tend to be synchronous,although the rates of change of GDP in the ASEAN-5 tend to be more volatile that thoseof the major global regions. In general, changes in real GDP of the global regions tend tolead economic growth in the ASEAN-5, but generally grow at a slower rate. Thus, thedata suggest a convergence of economic activity at the aggregate level between theASEAN-5 and those global regions. These patterns require the careful interpretation ofthe various linkages between the ASEAN-5 and the major global regions in both their
Figure 1.2ASEAN-5 Annual Percentage Change of Real GDP
-15
-10
-5
0
5
10
15
1970 1974 1978 1982 1986 1990 1994 1998
IndonesiaMalaysiaASEAN-5
-15
-10
-5
0
5
10
15
1970 1974 1978 1982 1986 1990 1994 1998
PhilippinesThailandSingapore
4
long-term trends and short-term movements. The next section discusses the conceptualframework for modeling those linkages.
Figure 1.3GDP Growth Rate of ASEAN-5
and Other Global Regions
-10
-5
0
5
10
15
1970 1974 1978 1982 1986 1990 1994 1998
ASEAN-5Japan
-10
-5
0
5
10
15
1970 1974 1978 1982 1986 1990 1994 1998
United StatesEuropean Union
5
II. The Global Framework of ASEAN
For purposes of framing the present analysis, we can distinguish three widely recognizedexplanations of economic growth in Southeast Asia. The first focuses on supply growthin the region to explain the ‘Asian Miracle’ associated with capital accumulation, the absorption or assimilation of increasingly modern technology and the change in industrialstructures (Kim and Lau, 1994; Stiglitz, 1996; World Bank, 1993; Young, 1995).Whether driven by capital accumulation or by its productive assimilation, the growthprocess was accompanied by major changes in the structure of the Southeast Asianeconomies (Nelson and Pack, 1999). Notwithstanding the severe economic and financialcrisis that hit all the countries in late 1997 and 1998, the view holds that the factorsdetermining supply growth are largely in tact and will undoubtedly continue to influencethe region under a favorable policy environment.
A closely related but more recent explanation is the fundamentalist view that structuralfactors have explained, first, the long-term growth of the Southeast Asian economies untilmid-1997 and, second, the crisis in late 1997 and 1998. During the stellar years of the‘miracle’ economies the dominant factors producing an outward-oriented, export-ledgrowth were high domestic savings, human capital development, sound macromanagement and limited price distortions combined with careful policy interventions.During the 1997-98 crisis, structural factors also dominated events, but this time in theform of weak financial systems that were undermined by large capital flows andexchange rate misalignments. One explanation of these misalignments is the widespreaduse of relatively fixed exchange rate regimes. These regimes eventually needed to bereversed through the process of nominal and real deprecations of currencies that tookplace beginning in the latter part of 1997 (Krugman, 1998), Goldstein (1998), andCorsetti, Pesenti, and Roubini (1998).1 An alternative explanation is that the cyclicalvariations in the real dollar-yen rate created the misalignment and impacted on trade,investment and capital flows of the Southeast Asian countries, rather than exchange ratemismanagement on the part of these countries (McKinnon, 1999, and Ohno, 1999).Dollar-yen rate variations are believed to have affected the region’s international competitiveness, FDI flows, and short-term foreign currency indebtedness well before thecrisis, and to have had a pervasive influence on the pattern of trade and investment inthroughout the region.
1 The other major explanation of the 1997-98 crisis focuses on the possible impact of expectations in theasset market as they affected the recent financial crisis in Asia (Sachs, 1997, and Stiglitz, 1997). Thesenegative expectations reflected a lack of confidence in the asset market that led to panic liquidation in allthe Southeast Asian stock markets. The liquidation, in turn, instigated large movements of funds offshorethat reversed capital flows and drained official reserves. The resulting downward pressure on exchangerates was essentially domestically induced, although there were spillovers that gave rise to contagion andthe pervasiveness of the Asian financial crisis. Since in this study we are concerned with real internationalproduct and financial linkages of the ASEAN-5, this interpretation of events during 1997-98 will not beexamined here.
6
The third explanation of economic growth in Southeast Asia focuses on the rapidassimilation of the region in the global economy. While recognizing that industrialgrowth and transformation have been the driving force behind the economic growth ofSoutheast Asia, the handmaiden of that expansion has been the large growth ofinternational trade and direct and portfolio investment generated by the rapid expansionof global production and markets. For the ASEAN-5 countries the systemic changes inthe world economy have generated large volumes of international capital flows andtransactions in goods and services, as well as generating a widespread diffusion ofproduction, transportation, and communication technologies from corporate contractingarrangements. The introduction of new technologies through cross-border productionnetworks and the dissemination of new skills in the workforce have now become asimportant to the specialization of production activities in the Asian economies as theircapital, labor and natural resource endowments.
This new globalization process emphasizes demand-led growth and the policyenvironment as a critical determinant of that growth. Until roughly the mid-1980s manyof the region's countries relied on exports as the main engine for economic growth, whichimplied a liberalization of trade and an emphasis on the facilitating role of thegovernment. The shift from an export-driven growth strategy by many Asian countries toa growth strategy targeting global production and market networks was largely driven byefforts to exploit the worldwide growth of cross-border production and internationalcapital movements. While the earlier outward-oriented strategy promoted economicgrowth in a number of Asian economies through the introduction of high value-addedproducts into their economies, the new strategy has targeted the broad-based transmissionof domestic learning and knowledge accumulation as a means of sustaining higheconomic growth rates.
Although all of the Southeast Asian economies initially embarked on import-substitutingindustrialization, over time they shifted to export-oriented industrialization policies,starting with Singapore in the late 1960s, followed by Malaysia, the Philippines, and
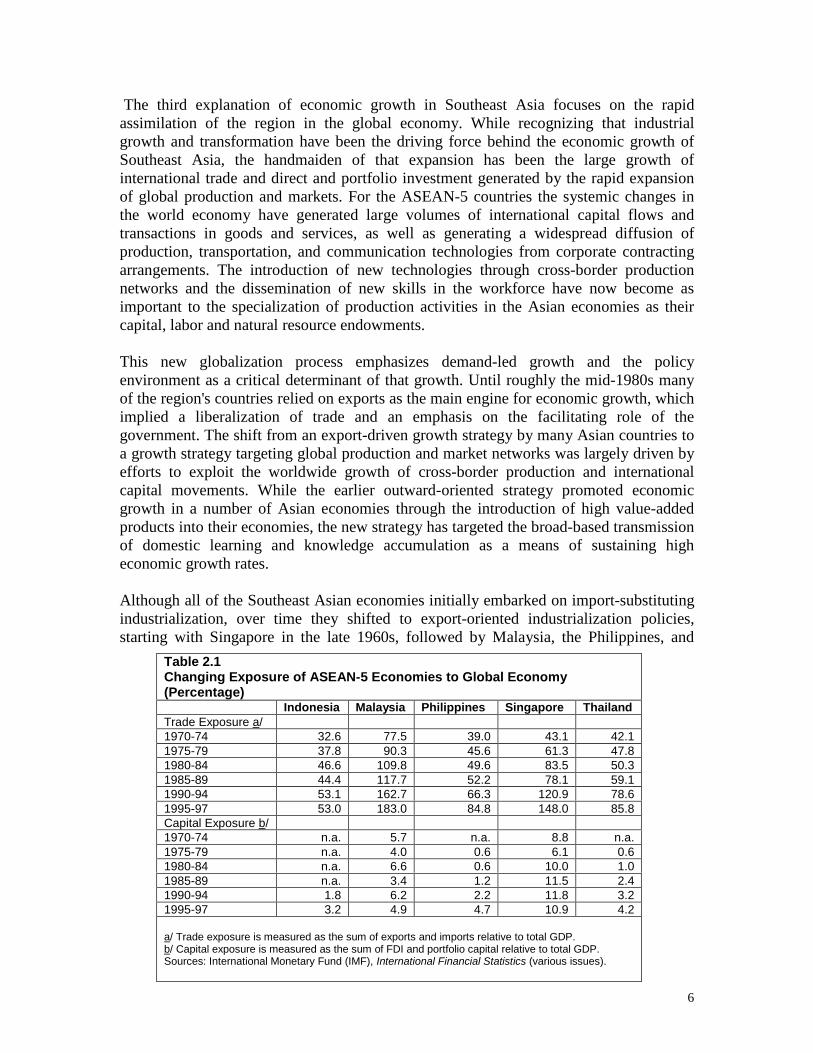
Table 2.1Changing Exposure of ASEAN-5 Economies to Global Economy(Percentage)
Indonesia Malaysia Philippines Singapore ThailandTrade Exposure a/1970-74 32.6 77.5 39.0 43.1 42.11975-79 37.8 90.3 45.6 61.3 47.81980-84 46.6 109.8 49.6 83.5 50.31985-89 44.4 117.7 52.2 78.1 59.11990-94 53.1 162.7 66.3 120.9 78.61995-97 53.0 183.0 84.8 148.0 85.8Capital Exposure b/1970-74 n.a. 5.7 n.a. 8.8 n.a.1975-79 n.a. 4.0 0.6 6.1 0.61980-84 n.a. 6.6 0.6 10.0 1.01985-89 n.a. 3.4 1.2 11.5 2.41990-94 1.8 6.2 2.2 11.8 3.21995-97 3.2 4.9 4.7 10.9 4.2
a/ Trade exposure is measured as the sum of exports and imports relative to total GDP.b/ Capital exposure is measured as the sum of FDI and portfolio capital relative to total GDP.Sources: International Monetary Fund (IMF), International Financial Statistics (various issues).
7
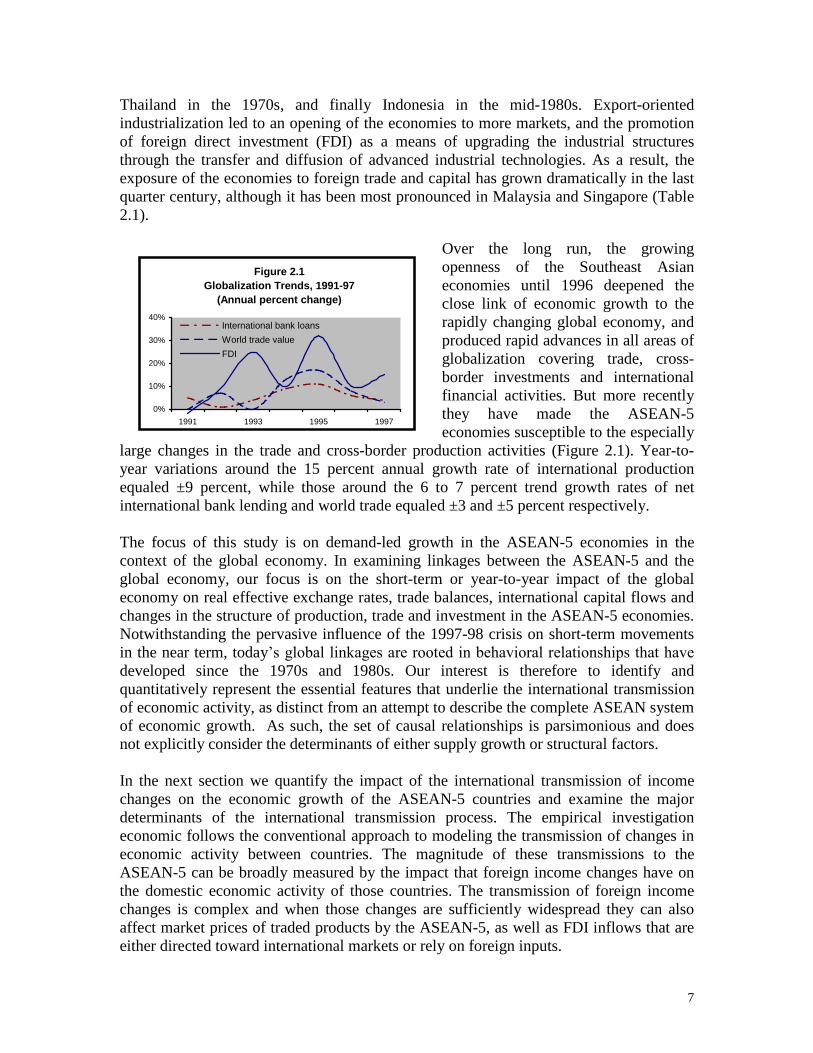
Thailand in the 1970s, and finally Indonesia in the mid-1980s. Export-orientedindustrialization led to an opening of the economies to more markets, and the promotionof foreign direct investment (FDI) as a means of upgrading the industrial structuresthrough the transfer and diffusion of advanced industrial technologies. As a result, theexposure of the economies to foreign trade and capital has grown dramatically in the lastquarter century, although it has been most pronounced in Malaysia and Singapore (Table2.1).
Over the long run, the growingopenness of the Southeast Asianeconomies until 1996 deepened theclose link of economic growth to therapidly changing global economy, andproduced rapid advances in all areas ofglobalization covering trade, cross-border investments and internationalfinancial activities. But more recentlythey have made the ASEAN-5economies susceptible to the especially
large changes in the trade and cross-border production activities (Figure 2.1). Year-to-year variations around the 15 percent annual growth rate of international productionequaled ±9 percent, while those around the 6 to 7 percent trend growth rates of netinternational bank lending and world trade equaled ±3 and ±5 percent respectively.
The focus of this study is on demand-led growth in the ASEAN-5 economies in thecontext of the global economy. In examining linkages between the ASEAN-5 and theglobal economy, our focus is on the short-term or year-to-year impact of the globaleconomy on real effective exchange rates, trade balances, international capital flows andchanges in the structure of production, trade and investment in the ASEAN-5 economies.Notwithstanding the pervasive influence of the 1997-98 crisis on short-term movementsin the near term, today’s global linkages are rooted in behavioral relationships that have developed since the 1970s and 1980s. Our interest is therefore to identify andquantitatively represent the essential features that underlie the international transmissionof economic activity, as distinct from an attempt to describe the complete ASEAN systemof economic growth. As such, the set of causal relationships is parsimonious and doesnot explicitly consider the determinants of either supply growth or structural factors.
In the next section we quantify the impact of the international transmission of incomechanges on the economic growth of the ASEAN-5 countries and examine the majordeterminants of the international transmission process. The empirical investigationeconomic follows the conventional approach to modeling the transmission of changes ineconomic activity between countries. The magnitude of these transmissions to theASEAN-5 can be broadly measured by the impact that foreign income changes have onthe domestic economic activity of those countries. The transmission of foreign incomechanges is complex and when those changes are sufficiently widespread they can alsoaffect market prices of traded products by the ASEAN-5, as well as FDI inflows that areeither directed toward international markets or rely on foreign inputs.
Figure 2.1Globalization Trends, 1991-97
(Annual percent change)
0%
10%
20%
30%
40%
1991 1993 1995 1997
International bank loans
World trade value
FDI
8
In addition to the transmission of income changes, we include in the model otherdeterminants of trade and capital flows impacting on the economic growth of theASEAN-5. For trade, the two other major determinants of demand considered are relativeprices of traded products, or the terms of trade, and the real effective exchange rate ofeach ASEAN-5 country. For capital flows, including portfolio investment and directinvestment, the other determinants considered are real interest rate differentials, the realexchange rate, and the risks associated with portfolio and direct investment. That risk ismeasured by real exchange rate fluctuations, or more generally, imbalances in the balanceof payments that reflect the risk of real exchange rate changes and/or capital controls.
9
III. International Transmission of Income Changes
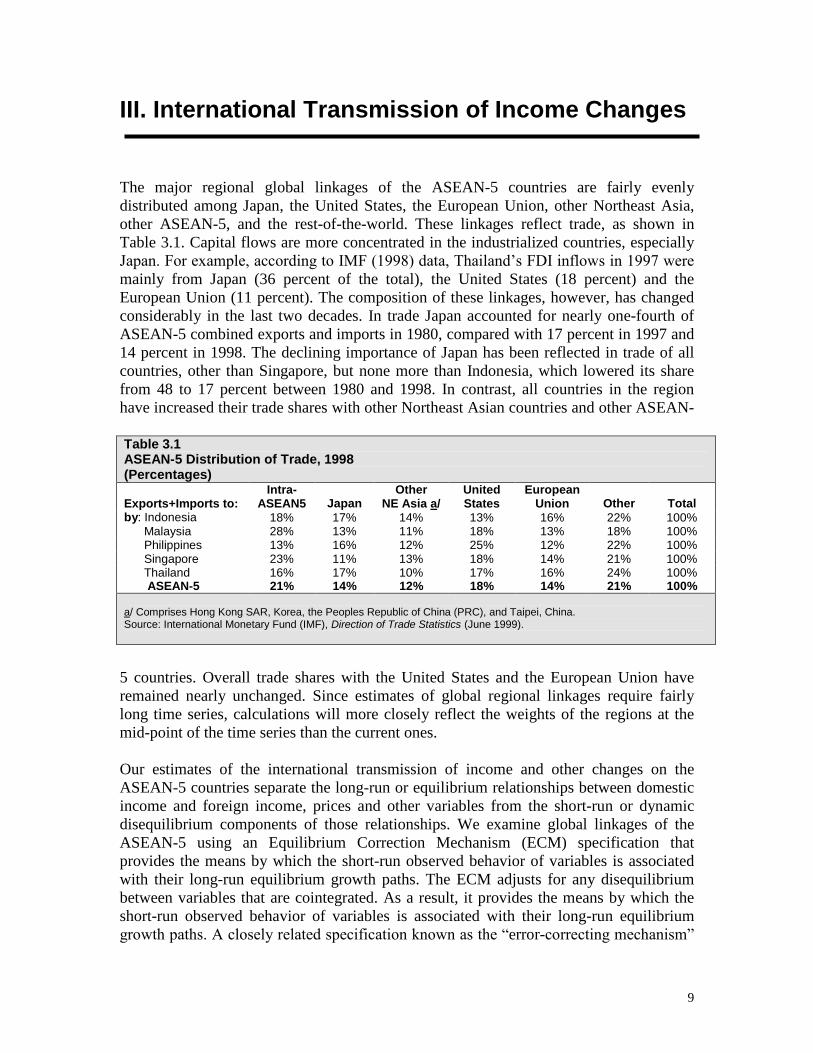
The major regional global linkages of the ASEAN-5 countries are fairly evenlydistributed among Japan, the United States, the European Union, other Northeast Asia,other ASEAN-5, and the rest-of-the-world. These linkages reflect trade, as shown inTable 3.1. Capital flows are more concentrated in the industrialized countries, especiallyJapan. For example, according to IMF (1998) data, Thailand’s FDI inflows in 1997 were mainly from Japan (36 percent of the total), the United States (18 percent) and theEuropean Union (11 percent). The composition of these linkages, however, has changedconsiderably in the last two decades. In trade Japan accounted for nearly one-fourth ofASEAN-5 combined exports and imports in 1980, compared with 17 percent in 1997 and14 percent in 1998. The declining importance of Japan has been reflected in trade of allcountries, other than Singapore, but none more than Indonesia, which lowered its sharefrom 48 to 17 percent between 1980 and 1998. In contrast, all countries in the regionhave increased their trade shares with other Northeast Asian countries and other ASEAN-
5 countries. Overall trade shares with the United States and the European Union haveremained nearly unchanged. Since estimates of global regional linkages require fairlylong time series, calculations will more closely reflect the weights of the regions at themid-point of the time series than the current ones.
Our estimates of the international transmission of income and other changes on theASEAN-5 countries separate the long-run or equilibrium relationships between domesticincome and foreign income, prices and other variables from the short-run or dynamicdisequilibrium components of those relationships. We examine global linkages of theASEAN-5 using an Equilibrium Correction Mechanism (ECM) specification thatprovides the means by which the short-run observed behavior of variables is associatedwith their long-run equilibrium growth paths. The ECM adjusts for any disequilibriumbetween variables that are cointegrated. As a result, it provides the means by which theshort-run observed behavior of variables is associated with their long-run equilibriumgrowth paths. A closely related specification known as the “error-correcting mechanism”
Table 3.1ASEAN-5 Distribution of Trade, 1998(Percentages)
Exports+Imports to:Intra-
ASEAN5 JapanOther
NE Asia a/UnitedStates
EuropeanUnion Other Total
by: Indonesia 18% 17% 14% 13% 16% 22% 100%Malaysia 28% 13% 11% 18% 13% 18% 100%Philippines 13% 16% 12% 25% 12% 22% 100%Singapore 23% 11% 13% 18% 14% 21% 100%Thailand 16% 17% 10% 17% 16% 24% 100%ASEAN-5 21% 14% 12% 18% 14% 21% 100%
a/ Comprises Hong Kong SAR, Korea, the Peoples Republic of China (PRC), and Taipei, China.Source: International Monetary Fund (IMF), Direction of Trade Statistics (June 1999).
10
(also having the acronym ECM) models both the short and long-run relationshipsbetween variables.
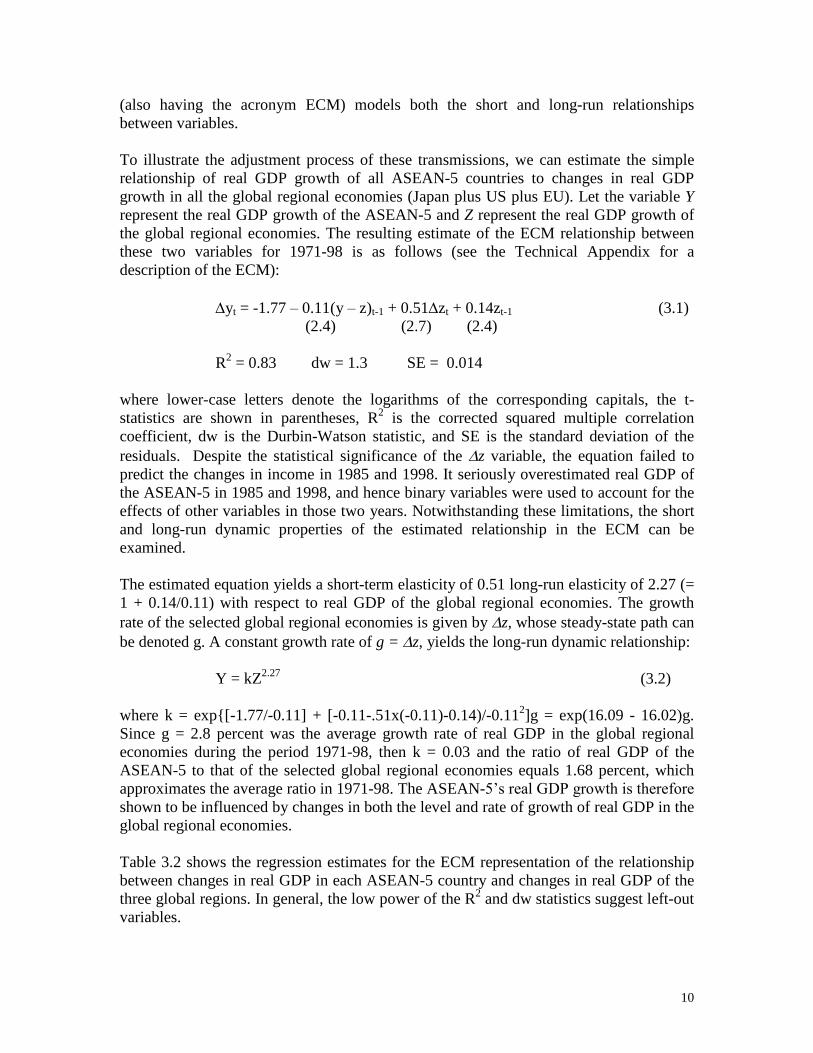
To illustrate the adjustment process of these transmissions, we can estimate the simplerelationship of real GDP growth of all ASEAN-5 countries to changes in real GDPgrowth in all the global regional economies (Japan plus US plus EU). Let the variable Yrepresent the real GDP growth of the ASEAN-5 and Z represent the real GDP growth ofthe global regional economies. The resulting estimate of the ECM relationship betweenthese two variables for 1971-98 is as follows (see the Technical Appendix for adescription of the ECM):
yt = -1.77–0.11(y–z)t-1 + 0.51zt + 0.14zt-1 (3.1)(2.4) (2.7) (2.4)
R2 = 0.83 dw = 1.3 SE = 0.014
where lower-case letters denote the logarithms of the corresponding capitals, the t-statistics are shown in parentheses, R2 is the corrected squared multiple correlationcoefficient, dw is the Durbin-Watson statistic, and SE is the standard deviation of theresiduals. Despite the statistical significance of the z variable, the equation failed topredict the changes in income in 1985 and 1998. It seriously overestimated real GDP ofthe ASEAN-5 in 1985 and 1998, and hence binary variables were used to account for theeffects of other variables in those two years. Notwithstanding these limitations, the shortand long-run dynamic properties of the estimated relationship in the ECM can beexamined.
The estimated equation yields a short-term elasticity of 0.51 long-run elasticity of 2.27 (=1 + 0.14/0.11) with respect to real GDP of the global regional economies. The growthrate of the selected global regional economies is given by z, whose steady-state path canbe denoted g. A constant growth rate of g = z, yields the long-run dynamic relationship:
Y = kZ2.27 (3.2)
where k = exp{[-1.77/-0.11] + [-0.11-.51x(-0.11)-0.14)/-0.112]g = exp(16.09 - 16.02)g.Since g = 2.8 percent was the average growth rate of real GDP in the global regionaleconomies during the period 1971-98, then k = 0.03 and the ratio of real GDP of theASEAN-5 to that of the selected global regional economies equals 1.68 percent, whichapproximates the average ratio in 1971-98. The ASEAN-5’s real GDP growth is therefore shown to be influenced by changes in both the level and rate of growth of real GDP in theglobal regional economies.
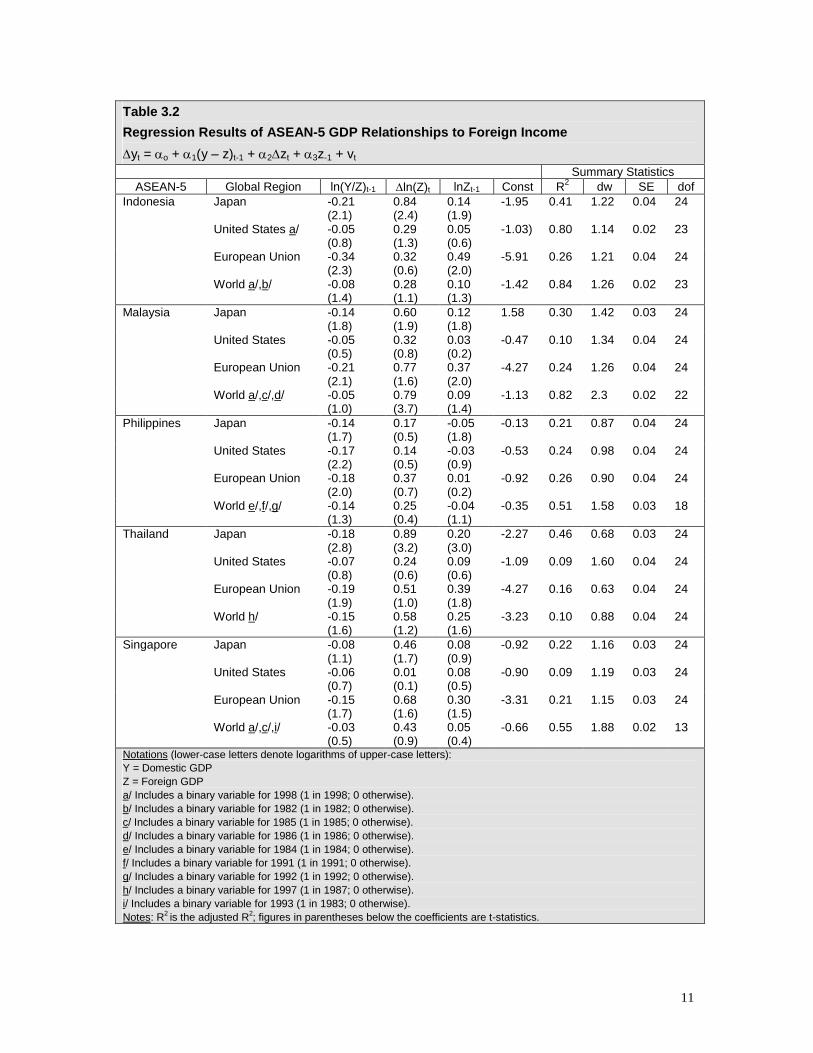
Table 3.2 shows the regression estimates for the ECM representation of the relationshipbetween changes in real GDP in each ASEAN-5 country and changes in real GDP of thethree global regions. In general, the low power of the R2 and dw statistics suggest left-outvariables.
11
Table 3.2
Regression Results of ASEAN-5 GDP Relationships to Foreign Income
yt = o + 1(y –z)t-1 + 2zt + 3z-1 + vt
Summary StatisticsASEAN-5 Global Region ln(Y/Z)t-1 ln(Z)t lnZt-1 Const R2 dw SE dof
Indonesia Japan -0.21(2.1)
0.84(2.4)
0.14(1.9)
-1.95 0.41 1.22 0.04 24
United States a/ -0.05(0.8)
0.29(1.3)
0.05(0.6)
-1.03) 0.80 1.14 0.02 23
European Union -0.34(2.3)
0.32(0.6)
0.49(2.0)
-5.91 0.26 1.21 0.04 24
World a/,b/ -0.08(1.4)
0.28(1.1)
0.10(1.3)
-1.42 0.84 1.26 0.02 23
Malaysia Japan -0.14(1.8)
0.60(1.9)
0.12(1.8)
1.58 0.30 1.42 0.03 24
United States -0.05(0.5)
0.32(0.8)
0.03(0.2)
-0.47 0.10 1.34 0.04 24
European Union -0.21(2.1)
0.77(1.6)
0.37(2.0)
-4.27 0.24 1.26 0.04 24
World a/,c/,d/ -0.05(1.0)
0.79(3.7)
0.09(1.4)
-1.13 0.82 2.3 0.02 22
Philippines Japan -0.14(1.7)
0.17(0.5)
-0.05(1.8)
-0.13 0.21 0.87 0.04 24
United States -0.17(2.2)
0.14(0.5)
-0.03(0.9)
-0.53 0.24 0.98 0.04 24
European Union -0.18(2.0)
0.37(0.7)
0.01(0.2)
-0.92 0.26 0.90 0.04 24
World e/,f/,g/ -0.14(1.3)
0.25(0.4)
-0.04(1.1)
-0.35 0.51 1.58 0.03 18
Thailand Japan -0.18(2.8)
0.89(3.2)
0.20(3.0)
-2.27 0.46 0.68 0.03 24
United States -0.07(0.8)
0.24(0.6)
0.09(0.6)
-1.09 0.09 1.60 0.04 24
European Union -0.19(1.9)
0.51(1.0)
0.39(1.8)
-4.27 0.16 0.63 0.04 24
World h/ -0.15(1.6)
0.58(1.2)
0.25(1.6)
-3.23 0.10 0.88 0.04 24
Singapore Japan -0.08(1.1)
0.46(1.7)
0.08(0.9)
-0.92 0.22 1.16 0.03 24
United States -0.06(0.7)
0.01(0.1)
0.08(0.5)
-0.90 0.09 1.19 0.03 24
European Union -0.15(1.7)
0.68(1.6)
0.30(1.5)
-3.31 0.21 1.15 0.03 24
World a/,c/,i/ -0.03(0.5)
0.43(0.9)
0.05(0.4)
-0.66 0.55 1.88 0.02 13
Notations (lower-case letters denote logarithms of upper-case letters):Y = Domestic GDPZ = Foreign GDPa/ Includes a binary variable for 1998 (1 in 1998; 0 otherwise).b/ Includes a binary variable for 1982 (1 in 1982; 0 otherwise).c/ Includes a binary variable for 1985 (1 in 1985; 0 otherwise).d/ Includes a binary variable for 1986 (1 in 1986; 0 otherwise).e/ Includes a binary variable for 1984 (1 in 1984; 0 otherwise).f/ Includes a binary variable for 1991 (1 in 1991; 0 otherwise).g/ Includes a binary variable for 1992 (1 in 1992; 0 otherwise).h/ Includes a binary variable for 1997 (1 in 1987; 0 otherwise).i/ Includes a binary variable for 1993 (1 in 1983; 0 otherwise).Notes: R2 is the adjusted R2; figures in parentheses below the coefficients are t-statistics.
12
As expected, the relationships between each of the ASEAN-5 and Japan are more robustthan those between the region and the United States and the European Union. Since thegrowth rates of all the ASEAN-5 countries are of integrated order I(2) and that of Japan isalso I(2), the individual coefficient estimates are robust. In contrast, the coefficientestimates for the relationship between economic growth of the ASEAN-5 countries andthose of the United States and the European Union are much less robust and theindividual coefficient estimates are often not significantly different from zero.
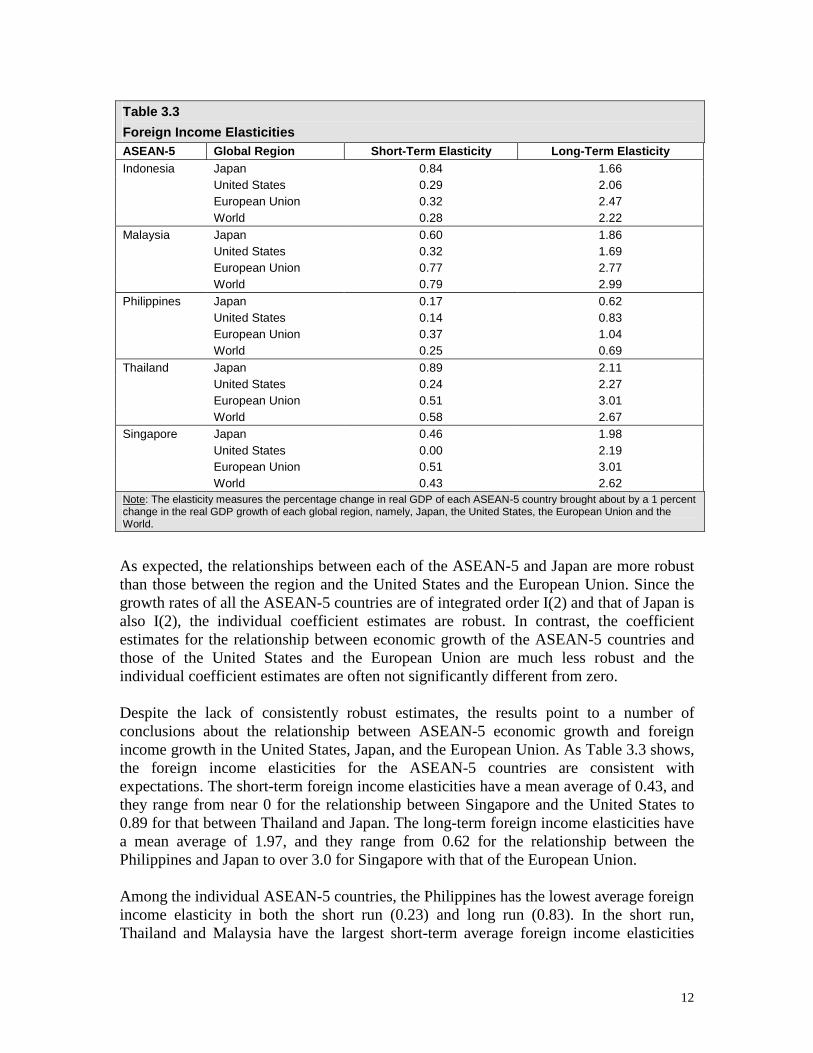
Despite the lack of consistently robust estimates, the results point to a number ofconclusions about the relationship between ASEAN-5 economic growth and foreignincome growth in the United States, Japan, and the European Union. As Table 3.3 shows,the foreign income elasticities for the ASEAN-5 countries are consistent withexpectations. The short-term foreign income elasticities have a mean average of 0.43, andthey range from near 0 for the relationship between Singapore and the United States to0.89 for that between Thailand and Japan. The long-term foreign income elasticities havea mean average of 1.97, and they range from 0.62 for the relationship between thePhilippines and Japan to over 3.0 for Singapore with that of the European Union.
Among the individual ASEAN-5 countries, the Philippines has the lowest average foreignincome elasticity in both the short run (0.23) and long run (0.83). In the short run,Thailand and Malaysia have the largest short-term average foreign income elasticities
Table 3.3
Foreign Income ElasticitiesASEAN-5 Global Region Short-Term Elasticity Long-Term ElasticityIndonesia Japan 0.84 1.66
United States 0.29 2.06European Union 0.32 2.47World 0.28 2.22
Malaysia Japan 0.60 1.86United States 0.32 1.69European Union 0.77 2.77World 0.79 2.99
Philippines Japan 0.17 0.62United States 0.14 0.83European Union 0.37 1.04World 0.25 0.69
Thailand Japan 0.89 2.11United States 0.24 2.27European Union 0.51 3.01World 0.58 2.67
Singapore Japan 0.46 1.98United States 0.00 2.19European Union 0.51 3.01World 0.43 2.62
Note: The elasticity measures the percentage change in real GDP of each ASEAN-5 country brought about by a 1 percentchange in the real GDP growth of each global region, namely, Japan, the United States, the European Union and theWorld.
13
(0.55 and 0.56 respectively), while Thailand has the largest average long-term elasticity(2.46), followed by Singapore (2.39). Among the global regions, the United States has thesmallest foreign income elasticity in the short run (1.98) while Japan has the largestshort-term elasticity (0.59). That of the European Union is 5.0 in the short run. In thelong-run, Japan has the smallest income elasticity (1.65), while the European Union hasthe largest elasticity (2.46). That of the United States is equal to 1.81. Estimates of theinternational transmission of income changes based on aggregate data from all theregions show a similar pattern as those for individual regional estimates.
14
IV. Transmission Effects of Bilateral ExchangeRate Differentials
Real effective exchange rate movements favored economic growth in the ASEAN-5countries in the 1980s and until 1996, despite the loss of competitiveness in someregional markets. Up to the mid-1990s, export growth was favorably affected byimprovements in the ASEAN-5’s international competitiveness, and foreign investment grew from the relative strength of foreign currencies and favorable export prospects.However, the situation reversed itself in the mid-1990s when a gradually wideningdifferential between the inflation rates of the ASEAN countries and major trade andinvestment partners caused the real effective exchange rates of the ASEAN-5 countries toappreciate. The resulting deterioration in export competitiveness led to large increases inthe current account deficit of the region as a whole, and Malaysia and Thailand inparticular.
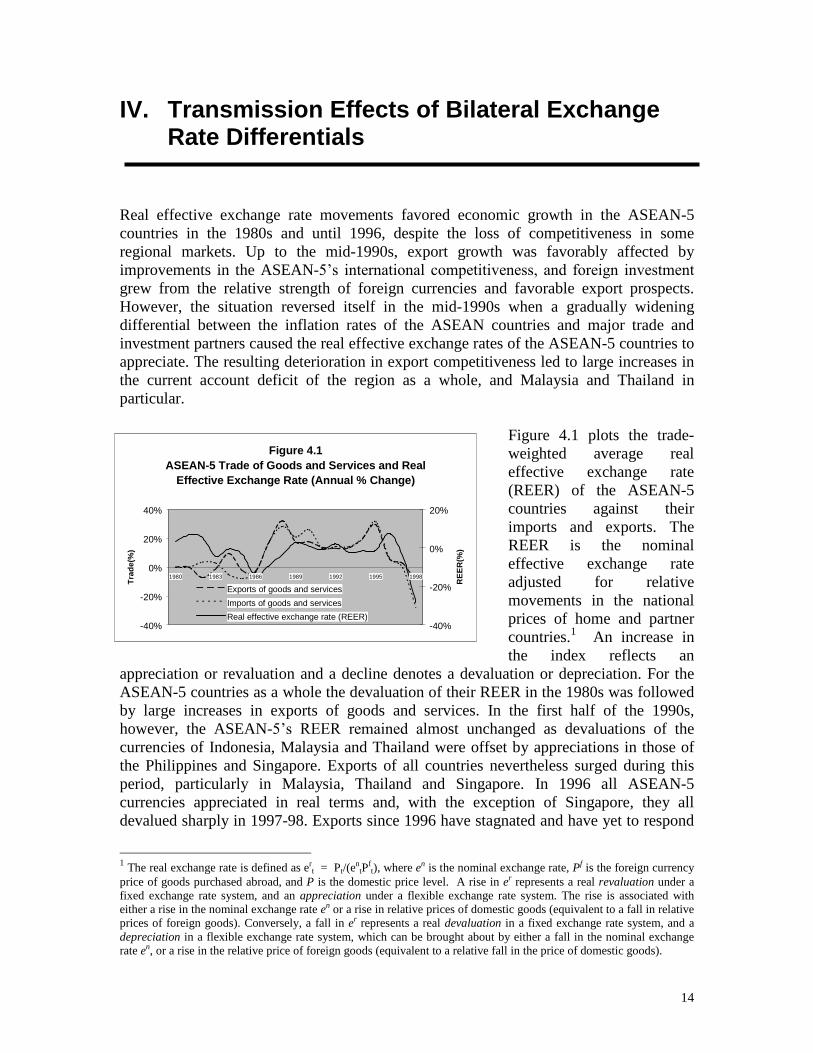
Figure 4.1 plots the trade-weighted average realeffective exchange rate(REER) of the ASEAN-5countries against theirimports and exports. TheREER is the nominaleffective exchange rateadjusted for relativemovements in the nationalprices of home and partnercountries.1 An increase inthe index reflects an
appreciation or revaluation and a decline denotes a devaluation or depreciation. For theASEAN-5 countries as a whole the devaluation of their REER in the 1980s was followedby large increases in exports of goods and services. In the first half of the 1990s,however, the ASEAN-5’s REER remained almost unchanged as devaluations of thecurrencies of Indonesia, Malaysia and Thailand were offset by appreciations in those ofthe Philippines and Singapore. Exports of all countries nevertheless surged during thisperiod, particularly in Malaysia, Thailand and Singapore. In 1996 all ASEAN-5currencies appreciated in real terms and, with the exception of Singapore, they alldevalued sharply in 1997-98. Exports since 1996 have stagnated and have yet to respond
1 The real exchange rate is defined as ert = Pt/(e
ntP
ft), where en is the nominal exchange rate, Pf is the foreign currency
price of goods purchased abroad, and P is the domestic price level. A rise in er represents a real revaluation under afixed exchange rate system, and an appreciation under a flexible exchange rate system. The rise is associated witheither a rise in the nominal exchange rate en or a rise in relative prices of domestic goods (equivalent to a fall in relativeprices of foreign goods). Conversely, a fall in er represents a real devaluation in a fixed exchange rate system, and adepreciation in a flexible exchange rate system, which can be brought about by either a fall in the nominal exchangerate en, or a rise in the relative price of foreign goods (equivalent to a relative fall in the price of domestic goods).
Figure 4.1ASEAN-5 Trade of Goods and Services and Real
Effective Exchange Rate (Annual % Change)
-40%
-20%
0%
20%
40%
1980 1983 1986 1989 1992 1995 1998
Tra
de(
%)
-40%
-20%
0%
20%
RE
ER
(%)
Exports of goods and services
Imports of goods and services
Real effective exchange rate (REER)
15
to the sharp devaluations during 1997-98.Imports, however, did fall sharply in1998. In Indonesia, for example, thecutbacks in imported inputs following the80 percent devaluation of the rupiahagainst the US dollar in early 1998 causedmany manufacturing industries engagedin assembly production to reduceproduction or cease production altogether.These industries included both export-oriented industries engaged in textile,garment, footwear, and consumerelectronics production, and domesticmarket-oriented industries such as thesteel, automotive and pharmaceuticalindustries (Thee, 1999).
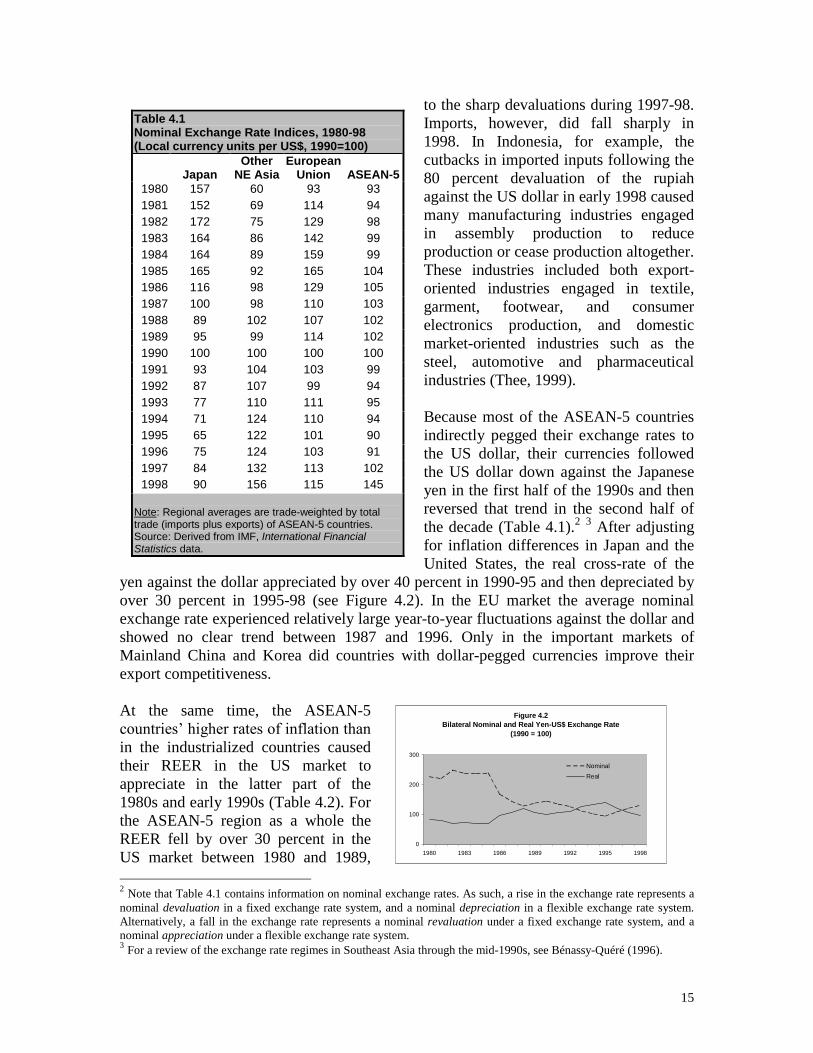
Because most of the ASEAN-5 countriesindirectly pegged their exchange rates tothe US dollar, their currencies followedthe US dollar down against the Japaneseyen in the first half of the 1990s and thenreversed that trend in the second half ofthe decade (Table 4.1).2 3 After adjustingfor inflation differences in Japan and theUnited States, the real cross-rate of the
yen against the dollar appreciated by over 40 percent in 1990-95 and then depreciated byover 30 percent in 1995-98 (see Figure 4.2). In the EU market the average nominalexchange rate experienced relatively large year-to-year fluctuations against the dollar andshowed no clear trend between 1987 and 1996. Only in the important markets ofMainland China and Korea did countries with dollar-pegged currencies improve theirexport competitiveness.
At the same time, the ASEAN-5countries’ higher rates of inflation than in the industrialized countries causedtheir REER in the US market toappreciate in the latter part of the1980s and early 1990s (Table 4.2). Forthe ASEAN-5 region as a whole theREER fell by over 30 percent in theUS market between 1980 and 1989,
2 Note that Table 4.1 contains information on nominal exchange rates. As such, a rise in the exchange rate represents anominal devaluation in a fixed exchange rate system, and a nominal depreciation in a flexible exchange rate system.Alternatively, a fall in the exchange rate represents a nominal revaluation under a fixed exchange rate system, and anominal appreciation under a flexible exchange rate system.3 For a review of the exchange rate regimes in Southeast Asia through the mid-1990s, see Bénassy-Quéré (1996).
Table 4.1Nominal Exchange Rate Indices, 1980-98(Local currency units per US$, 1990=100)
JapanOther
NE AsiaEuropean
Union ASEAN-51980 157 60 93 931981 152 69 114 941982 172 75 129 981983 164 86 142 991984 164 89 159 991985 165 92 165 1041986 116 98 129 1051987 100 98 110 1031988 89 102 107 1021989 95 99 114 1021990 100 100 100 1001991 93 104 103 991992 87 107 99 941993 77 110 111 951994 71 124 110 941995 65 122 101 901996 75 124 103 911997 84 132 113 1021998 90 156 115 145
Note: Regional averages are trade-weighted by totaltrade (imports plus exports) of ASEAN-5 countries.Source: Derived from IMF, International FinancialStatistics data.
Figure 4.2Bilateral Nominal and Real Yen-US$ Exchange Rate
(1990 = 100)
0
100
200
300
1980 1983 1986 1989 1992 1995 1998
Nominal
Real
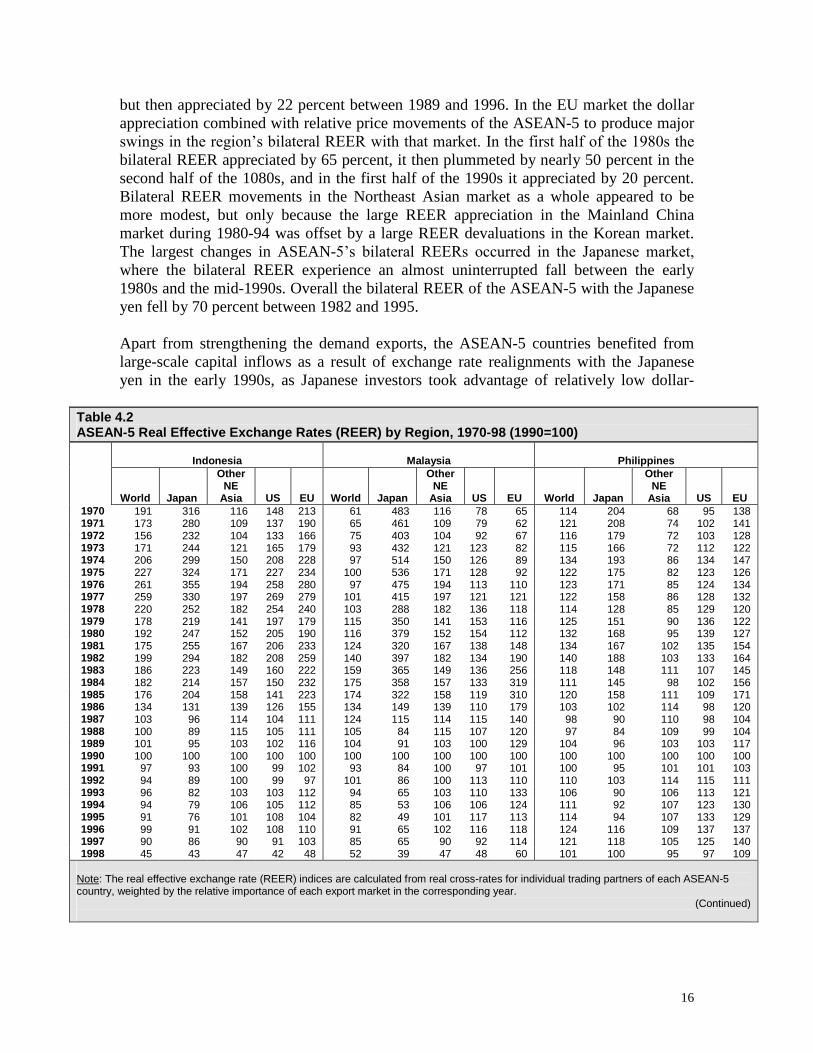
16
but then appreciated by 22 percent between 1989 and 1996. In the EU market the dollarappreciation combined with relative price movements of the ASEAN-5 to produce majorswings in the region’s bilateral REER with that market. In the first half of the 1980s the bilateral REER appreciated by 65 percent, it then plummeted by nearly 50 percent in thesecond half of the 1080s, and in the first half of the 1990s it appreciated by 20 percent.Bilateral REER movements in the Northeast Asian market as a whole appeared to bemore modest, but only because the large REER appreciation in the Mainland Chinamarket during 1980-94 was offset by a large REER devaluations in the Korean market.The largest changes in ASEAN-5’s bilateral REERs occurred in the Japanese market, where the bilateral REER experience an almost uninterrupted fall between the early1980s and the mid-1990s. Overall the bilateral REER of the ASEAN-5 with the Japaneseyen fell by 70 percent between 1982 and 1995.
Apart from strengthening the demand exports, the ASEAN-5 countries benefited fromlarge-scale capital inflows as a result of exchange rate realignments with the Japaneseyen in the early 1990s, as Japanese investors took advantage of relatively low dollar-
Table 4.2ASEAN-5 Real Effective Exchange Rates (REER) by Region, 1970-98 (1990=100)
Indonesia Malaysia Philippines
World Japan
OtherNE
Asia US EU World Japan
OtherNE
Asia US EU World Japan
OtherNE
Asia US EU1970 191 316 116 148 213 61 483 116 78 65 114 204 68 95 1381971 173 280 109 137 190 65 461 109 79 62 121 208 74 102 1411972 156 232 104 133 166 75 403 104 92 67 116 179 72 103 1281973 171 244 121 165 179 93 432 121 123 82 115 166 72 112 1221974 206 299 150 208 228 97 514 150 126 89 134 193 86 134 1471975 227 324 171 227 234 100 536 171 128 92 122 175 82 123 1261976 261 355 194 258 280 97 475 194 113 110 123 171 85 124 1341977 259 330 197 269 279 101 415 197 121 121 122 158 86 128 1321978 220 252 182 254 240 103 288 182 136 118 114 128 85 129 1201979 178 219 141 197 179 115 350 141 153 116 125 151 90 136 1221980 192 247 152 205 190 116 379 152 154 112 132 168 95 139 1271981 175 255 167 206 233 124 320 167 138 148 134 167 102 135 1541982 199 294 182 208 259 140 397 182 134 190 140 188 103 133 1641983 186 223 149 160 222 159 365 149 136 256 118 148 111 107 1451984 182 214 157 150 232 175 358 157 133 319 111 145 98 102 1561985 176 204 158 141 223 174 322 158 119 310 120 158 111 109 1711986 134 131 139 126 155 134 149 139 110 179 103 102 114 98 1201987 103 96 114 104 111 124 115 114 115 140 98 90 110 98 1041988 100 89 115 105 111 105 84 115 107 120 97 84 109 99 1041989 101 95 103 102 116 104 91 103 100 129 104 96 103 103 1171990 100 100 100 100 100 100 100 100 100 100 100 100 100 100 1001991 97 93 100 99 102 93 84 100 97 101 100 95 101 101 1031992 94 89 100 99 97 101 86 100 113 110 110 103 114 115 1111993 96 82 103 103 112 94 65 103 110 133 106 90 106 113 1211994 94 79 106 105 112 85 53 106 106 124 111 92 107 123 1301995 91 76 101 108 104 82 49 101 117 113 114 94 107 133 1291996 99 91 102 108 110 91 65 102 116 118 124 116 109 137 1371997 90 86 90 91 103 85 65 90 92 114 121 118 105 125 1401998 45 43 47 42 48 52 39 47 48 60 101 100 95 97 109
Note: The real effective exchange rate (REER) indices are calculated from real cross-rates for individual trading partners of each ASEAN-5country, weighted by the relative importance of each export market in the corresponding year.
(Continued)
17
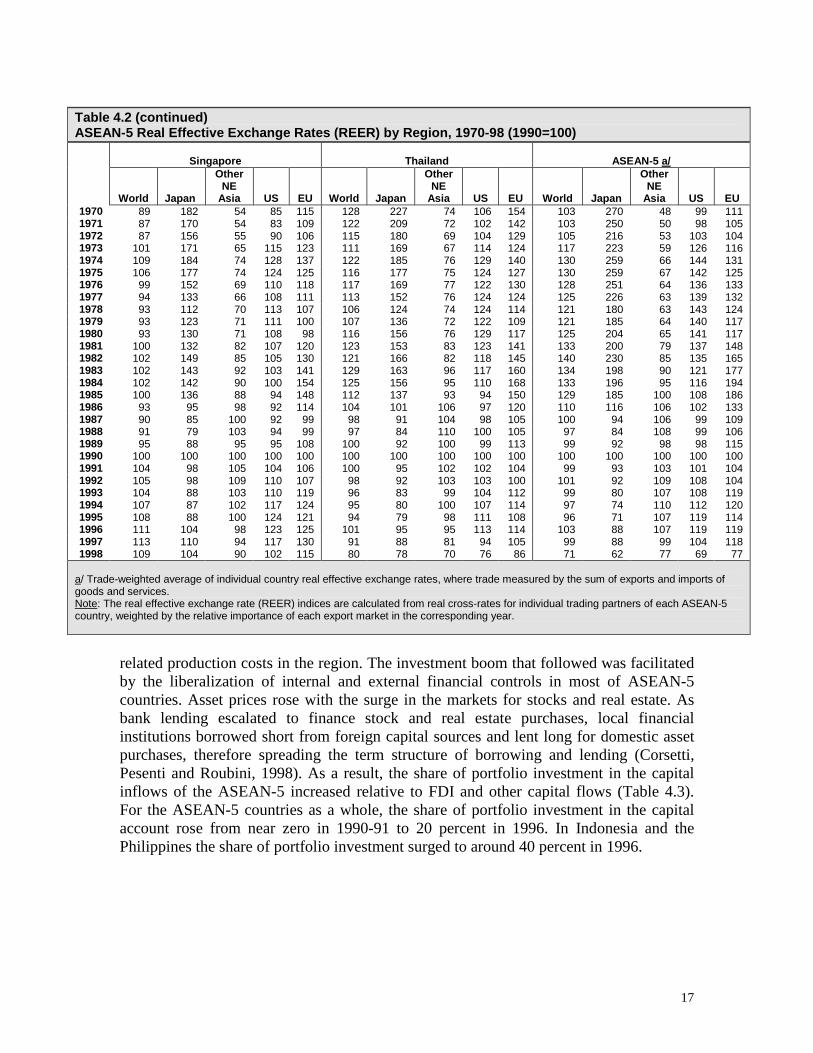
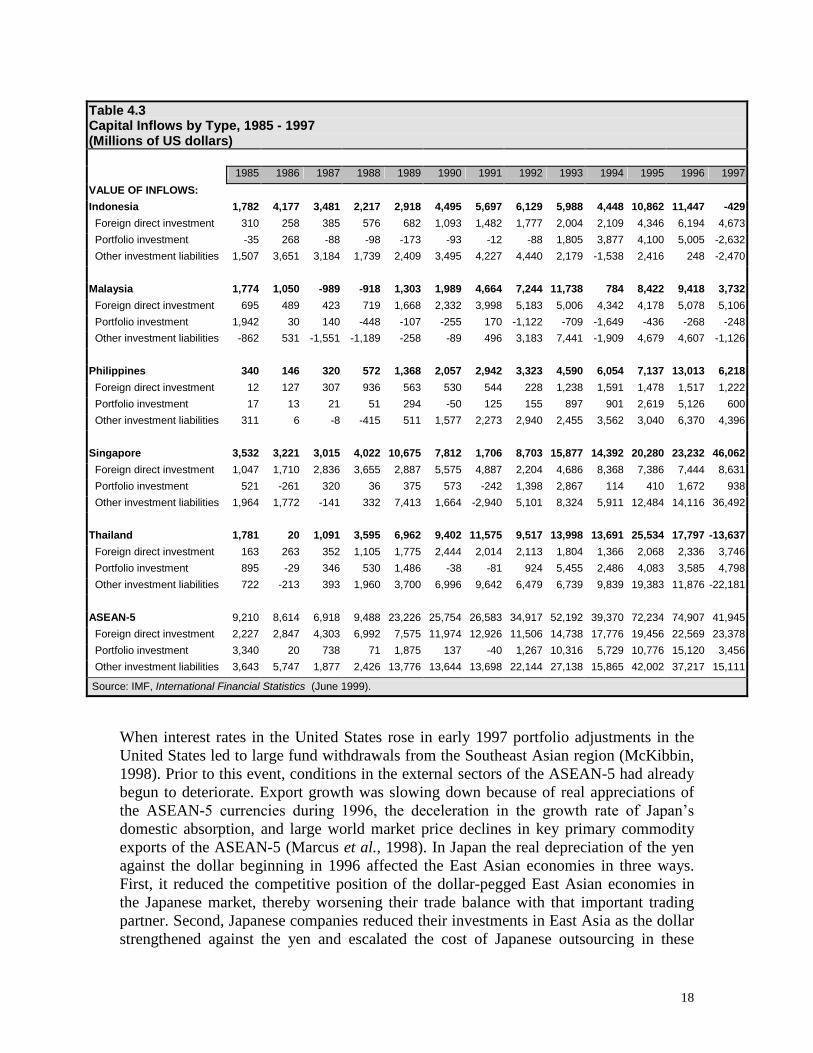
related production costs in the region. The investment boom that followed was facilitatedby the liberalization of internal and external financial controls in most of ASEAN-5countries. Asset prices rose with the surge in the markets for stocks and real estate. Asbank lending escalated to finance stock and real estate purchases, local financialinstitutions borrowed short from foreign capital sources and lent long for domestic assetpurchases, therefore spreading the term structure of borrowing and lending (Corsetti,Pesenti and Roubini, 1998). As a result, the share of portfolio investment in the capitalinflows of the ASEAN-5 increased relative to FDI and other capital flows (Table 4.3).For the ASEAN-5 countries as a whole, the share of portfolio investment in the capitalaccount rose from near zero in 1990-91 to 20 percent in 1996. In Indonesia and thePhilippines the share of portfolio investment surged to around 40 percent in 1996.
Table 4.2 (continued)ASEAN-5 Real Effective Exchange Rates (REER) by Region, 1970-98 (1990=100)
Singapore Thailand ASEAN-5 a/
World Japan
OtherNE
Asia US EU World Japan
OtherNE
Asia US EU World Japan
OtherNE
Asia US EU1970 89 182 54 85 115 128 227 74 106 154 103 270 48 99 1111971 87 170 54 83 109 122 209 72 102 142 103 250 50 98 1051972 87 156 55 90 106 115 180 69 104 129 105 216 53 103 1041973 101 171 65 115 123 111 169 67 114 124 117 223 59 126 1161974 109 184 74 128 137 122 185 76 129 140 130 259 66 144 1311975 106 177 74 124 125 116 177 75 124 127 130 259 67 142 1251976 99 152 69 110 118 117 169 77 122 130 128 251 64 136 1331977 94 133 66 108 111 113 152 76 124 124 125 226 63 139 1321978 93 112 70 113 107 106 124 74 124 114 121 180 63 143 1241979 93 123 71 111 100 107 136 72 122 109 121 185 64 140 1171980 93 130 71 108 98 116 156 76 129 117 125 204 65 141 1171981 100 132 82 107 120 123 153 83 123 141 133 200 79 137 1481982 102 149 85 105 130 121 166 82 118 145 140 230 85 135 1651983 102 143 92 103 141 129 163 96 117 160 134 198 90 121 1771984 102 142 90 100 154 125 156 95 110 168 133 196 95 116 1941985 100 136 88 94 148 112 137 93 94 150 129 185 100 108 1861986 93 95 98 92 114 104 101 106 97 120 110 116 106 102 1331987 90 85 100 92 99 98 91 104 98 105 100 94 106 99 1091988 91 79 103 94 99 97 84 110 100 105 97 84 108 99 1061989 95 88 95 95 108 100 92 100 99 113 99 92 98 98 1151990 100 100 100 100 100 100 100 100 100 100 100 100 100 100 1001991 104 98 105 104 106 100 95 102 102 104 99 93 103 101 1041992 105 98 109 110 107 98 92 103 103 100 101 92 109 108 1041993 104 88 103 110 119 96 83 99 104 112 99 80 107 108 1191994 107 87 102 117 124 95 80 100 107 114 97 74 110 112 1201995 108 88 100 124 121 94 79 98 111 108 96 71 107 119 1141996 111 104 98 123 125 101 95 95 113 114 103 88 107 119 1191997 113 110 94 117 130 91 88 81 94 105 99 88 99 104 1181998 109 104 90 102 115 80 78 70 76 86 71 62 77 69 77
a/ Trade-weighted average of individual country real effective exchange rates, where trade measured by the sum of exports and imports ofgoods and services.Note: The real effective exchange rate (REER) indices are calculated from real cross-rates for individual trading partners of each ASEAN-5country, weighted by the relative importance of each export market in the corresponding year.
18
When interest rates in the United States rose in early 1997 portfolio adjustments in theUnited States led to large fund withdrawals from the Southeast Asian region (McKibbin,1998). Prior to this event, conditions in the external sectors of the ASEAN-5 had alreadybegun to deteriorate. Export growth was slowing down because of real appreciations ofthe ASEAN-5 currencies during 1996, the deceleration in the growth rate of Japan’s domestic absorption, and large world market price declines in key primary commodityexports of the ASEAN-5 (Marcus et al., 1998). In Japan the real depreciation of the yenagainst the dollar beginning in 1996 affected the East Asian economies in three ways.First, it reduced the competitive position of the dollar-pegged East Asian economies inthe Japanese market, thereby worsening their trade balance with that important tradingpartner. Second, Japanese companies reduced their investments in East Asia as the dollarstrengthened against the yen and escalated the cost of Japanese outsourcing in these
Table 4.3Capital Inflows by Type, 1985 - 1997(Millions of US dollars)
1985 1986 1987 1988 1989 1990 1991 1992 1993 1994 1995 1996 1997
VALUE OF INFLOWS:
Indonesia 1,782 4,177 3,481 2,217 2,918 4,495 5,697 6,129 5,988 4,448 10,862 11,447 -429
Foreign direct investment 310 258 385 576 682 1,093 1,482 1,777 2,004 2,109 4,346 6,194 4,673
Portfolio investment -35 268 -88 -98 -173 -93 -12 -88 1,805 3,877 4,100 5,005 -2,632
Other investment liabilities 1,507 3,651 3,184 1,739 2,409 3,495 4,227 4,440 2,179 -1,538 2,416 248 -2,470
Malaysia 1,774 1,050 -989 -918 1,303 1,989 4,664 7,244 11,738 784 8,422 9,418 3,732
Foreign direct investment 695 489 423 719 1,668 2,332 3,998 5,183 5,006 4,342 4,178 5,078 5,106
Portfolio investment 1,942 30 140 -448 -107 -255 170 -1,122 -709 -1,649 -436 -268 -248
Other investment liabilities -862 531 -1,551 -1,189 -258 -89 496 3,183 7,441 -1,909 4,679 4,607 -1,126
Philippines 340 146 320 572 1,368 2,057 2,942 3,323 4,590 6,054 7,137 13,013 6,218
Foreign direct investment 12 127 307 936 563 530 544 228 1,238 1,591 1,478 1,517 1,222
Portfolio investment 17 13 21 51 294 -50 125 155 897 901 2,619 5,126 600
Other investment liabilities 311 6 -8 -415 511 1,577 2,273 2,940 2,455 3,562 3,040 6,370 4,396
Singapore 3,532 3,221 3,015 4,022 10,675 7,812 1,706 8,703 15,877 14,392 20,280 23,232 46,062
Foreign direct investment 1,047 1,710 2,836 3,655 2,887 5,575 4,887 2,204 4,686 8,368 7,386 7,444 8,631
Portfolio investment 521 -261 320 36 375 573 -242 1,398 2,867 114 410 1,672 938
Other investment liabilities 1,964 1,772 -141 332 7,413 1,664 -2,940 5,101 8,324 5,911 12,484 14,116 36,492
Thailand 1,781 20 1,091 3,595 6,962 9,402 11,575 9,517 13,998 13,691 25,534 17,797 -13,637
Foreign direct investment 163 263 352 1,105 1,775 2,444 2,014 2,113 1,804 1,366 2,068 2,336 3,746
Portfolio investment 895 -29 346 530 1,486 -38 -81 924 5,455 2,486 4,083 3,585 4,798
Other investment liabilities 722 -213 393 1,960 3,700 6,996 9,642 6,479 6,739 9,839 19,383 11,876 -22,181
ASEAN-5 9,210 8,614 6,918 9,488 23,226 25,754 26,583 34,917 52,192 39,370 72,234 74,907 41,945
Foreign direct investment 2,227 2,847 4,303 6,992 7,575 11,974 12,926 11,506 14,738 17,776 19,456 22,569 23,378
Portfolio investment 3,340 20 738 71 1,875 137 -40 1,267 10,316 5,729 10,776 15,120 3,456
Other investment liabilities 3,643 5,747 1,877 2,426 13,776 13,644 13,698 22,144 27,138 15,865 42,002 37,217 15,111
Source: IMF, International Financial Statistics (June 1999).
19
dollar-pegged economies. Third, the long-term upward movement in the nominal dollarvalue of the yen drove nominal interest rates on yen-denominated assets below thoseprevailing on dollar-denominated assets (McKinnon and Ohno, 1997, 1998). Theresulting interest rate differential induced banks in East Asia to undertake additionalforeign currency indebtedness by accepting cheap yen deposits without covering theirforeign exchange risk.
With expectations of growth revised downward in 1997, the stock markets in Thailand,Malaysia and the Philippines fell steadily throughout the year, and that of Indonesiafollowed the downward spiral during the second half of that year. Domestic and foreigninvestors moved their funds offshore and the resulting net capital outflow drained officialreserves in these countries. Without the reserves needed to defend their currencies,Thailand, Malaysia, the Philippines and Indonesia abandoned the dollar peg and sharplydevaluated their currencies. With the large spread in the term structure of foreigndenominated debt and lending for domestic assets purchases, financial intermediaries inthese countries found themselves confronting huge debt burdens. The financial panic ofinternational investors that followed sharply reversed international capital flows and ledto wide-ranging competitive devaluations (Goldstein, 1998).
Notwithstanding the contagion of 1997-98, the informal pegging of currencies to the USdollar within the ASEAN-5 region had kept bilateral real exchange rate movements fairlystable. For this reason, McKinnon (1999) has maintained that the pegging of the EastAsian currencies to the dollar anchored domestic price levels in those countries andinsulated them from beggar-thy-neighbor devaluations during the region’s rapid growth in the 1980s through 1996. In a similar vein, Ohno (1999) has argued that the widespreaduse of dollar invoicing of foreign trade by East Asian countries protected them againstcompetitive devaluations by neighboring countries until the abandonment of the dollarpegs during the 1997-98 crisis. This situation also led to the buildup of short-term foreigncurrency indebtedness because of the lack of capital controls in the balance of paymentsor bank regulations requiring banks and corporations to cover their foreign currency andterm structure risks. According to McKinnon, the inadequate regulations and excessiveinterest rate disparities were the factors that led to over-borrowing and the accumulationof short-term debt.
In the next section we attempt to quantify the effects of these price variables on theASEAN-5 economies as manifested from movements in world market prices forcommodities and manufactures, interest rate differentials, and exchange rates. Inestimating the significance of these variables, we examine some of the alternativehypotheses that have been advanced to explain the international transmission effects onthe ASEAN-5 economies.
20
V. Modeling International Transmission Effects
In this section we extend the earlier estimates of the relationship between foreign and domesticincome activity to include price-related effects and other influences on ASEAN-5 economicgrowth. The motivation for including these other effects is based on the previous section’s review of the recent macroeconomic histories of these countries. Specifically, we examine theeffects of the following variables:
Exchange rates in the form of either the overall real effective exchange rate of the ASEAN-5countries, bilateral real effective exchange rates with the major global regions, or the realyen/dollar exchange rate;
International prices in the form of either the terms of trade of the ASEAN-5 countries orworld market prices for primary commodities relative to those of manufactures;
Interest rates in the form of interest rate differentials either between those in Japan and thosein the United States, those for ASEAN-5 lending and those for Japanese borrowing, or thosefor ASEAN-5 lending and those for borrowing in the Eurodollar market;
Investment risks on portfolio and direct investments in the form of either real exchange ratefluctuations or more generally imbalances in the balance of payments that reflect the risk ofreal exchange rate changes and/or capital controls.
World trade and capital inflows in the form of world trade volumes, current accountbalances, the ratio of exports to GDP, and the importance of portfolio and direct investmentsto the economy.
Intra-ASEAN Linkages in the form of the bilateral real effective exchange rate (REER) withother ASEAN-5 countries, the aggregate current account deficit of the ASEAN-5, and theregion’s reserve losses.
The empirical measurement of these effects is based on individual ASEAN-5 country estimates.In all cases, we maintain the earlier specification for the international transmission of incomeschanges from the global, and extend that specification to include these other factors influencingeconomic growth.
5.1 Exchange Rate Effects
The motivation for including real effective exchange rates in the relationship for the globallinkages of the ASEAN-5 countries is well developed. During the period of rapid economicexpansion in the 1980s and until 1996 a high premium was place on keeping stable exchangerates and moderate to low inflation (World Bank, 1993). In the subsequent crisis years, theexchange rate misalignments that emerged in the mid-1980s is believed to have created the
21
framework for the worsening of domestic economic fundamentals a decade later (Corsetti,Pesenti, and Roubini, 1998; Goldstein, 1998; Huh and Kasa, 1997; Makin, 1997; Noland et al.,1998). In analyzing these effects, past research has usually relied on measures of REER changesin the Southeast Asian economies with all their partner countries. In addition to this measure, wehave also tested the bilateral real effective exchange rates of each ASEAN-5 country with themajor global regions of Japan, other Northeast Asian countries, the United States, the EuropeanUnion and other ASEAN-5 countries.
The alternative hypothesis is that the dollar-pegged Southeast Asian economies have beenmainly influenced by yen-dollar exchange rate movements. Kwan (1998) has shown thataggregate output of these countries has been closely linked to movements in the yen/dollarexchange rate. His results are based on estimates of the relationship between aggregate outputgrowth of the Asian economies and the US gross national product (GNP) growth rate andpercentage changes in the yen/dollar exchange rate. Output in the Asian economies was found tobe positively related to the yen/dollar exchange rate: when the yen weakened, output growth inthe dollar-pegged Asian economies slowed; when the yen strengthened, output growthaccelerated.
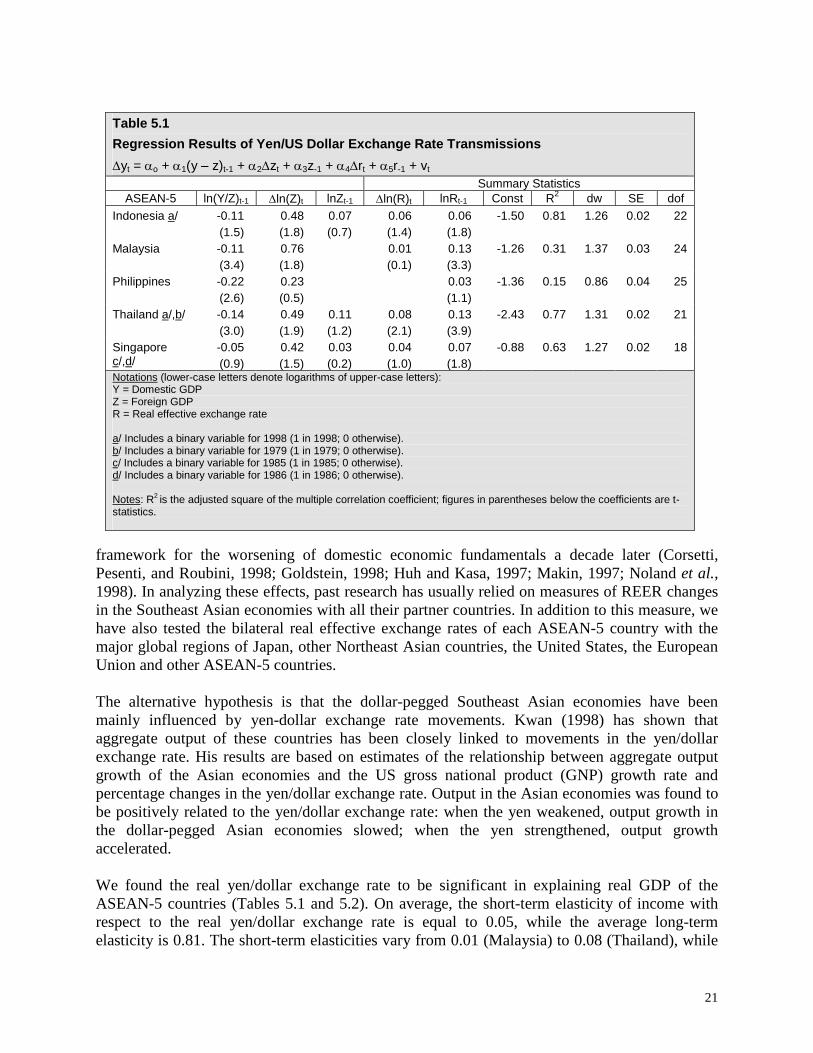
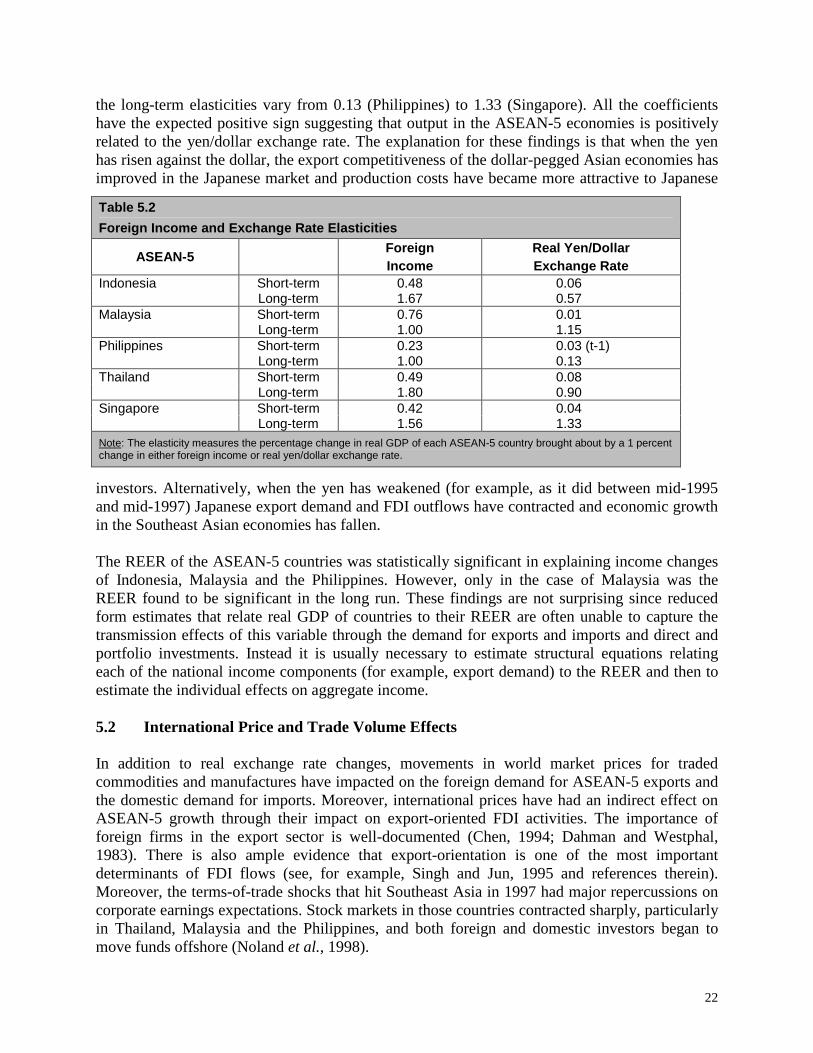
We found the real yen/dollar exchange rate to be significant in explaining real GDP of theASEAN-5 countries (Tables 5.1 and 5.2). On average, the short-term elasticity of income withrespect to the real yen/dollar exchange rate is equal to 0.05, while the average long-termelasticity is 0.81. The short-term elasticities vary from 0.01 (Malaysia) to 0.08 (Thailand), while
Table 5.1
Regression Results of Yen/US Dollar Exchange Rate Transmissions
yt = o + 1(y –z)t-1 + 2zt + 3z-1 + 4rt + 5r-1 + vt
Summary StatisticsASEAN-5 ln(Y/Z)t-1 ln(Z)t lnZt-1 ln(R)t lnRt-1 Const R2 dw SE dof
Indonesia a/ -0.11(1.5)
0.48(1.8)
0.07(0.7)
0.06(1.4)
0.06(1.8)
-1.50 0.81 1.26 0.02 22
Malaysia -0.11(3.4)
0.76(1.8)
0.01(0.1)
0.13(3.3)
-1.26 0.31 1.37 0.03 24
Philippines -0.22(2.6)
0.23(0.5)
0.03(1.1)
-1.36 0.15 0.86 0.04 25
Thailand a/,b/ -0.14(3.0)
0.49(1.9)
0.11(1.2)
0.08(2.1)
0.13(3.9)
-2.43 0.77 1.31 0.02 21
Singaporec/,d/
-0.05(0.9)
0.42(1.5)
0.03(0.2)
0.04(1.0)
0.07(1.8)
-0.88 0.63 1.27 0.02 18
Notations (lower-case letters denote logarithms of upper-case letters):Y = Domestic GDPZ = Foreign GDPR = Real effective exchange rate
a/ Includes a binary variable for 1998 (1 in 1998; 0 otherwise).b/ Includes a binary variable for 1979 (1 in 1979; 0 otherwise).c/ Includes a binary variable for 1985 (1 in 1985; 0 otherwise).d/ Includes a binary variable for 1986 (1 in 1986; 0 otherwise).
Notes: R2 is the adjusted square of the multiple correlation coefficient; figures in parentheses below the coefficients are t-statistics.
22
the long-term elasticities vary from 0.13 (Philippines) to 1.33 (Singapore). All the coefficientshave the expected positive sign suggesting that output in the ASEAN-5 economies is positivelyrelated to the yen/dollar exchange rate. The explanation for these findings is that when the yenhas risen against the dollar, the export competitiveness of the dollar-pegged Asian economies hasimproved in the Japanese market and production costs have became more attractive to Japanese
investors. Alternatively, when the yen has weakened (for example, as it did between mid-1995and mid-1997) Japanese export demand and FDI outflows have contracted and economic growthin the Southeast Asian economies has fallen.
The REER of the ASEAN-5 countries was statistically significant in explaining income changesof Indonesia, Malaysia and the Philippines. However, only in the case of Malaysia was theREER found to be significant in the long run. These findings are not surprising since reducedform estimates that relate real GDP of countries to their REER are often unable to capture thetransmission effects of this variable through the demand for exports and imports and direct andportfolio investments. Instead it is usually necessary to estimate structural equations relatingeach of the national income components (for example, export demand) to the REER and then toestimate the individual effects on aggregate income.
5.2 International Price and Trade Volume Effects
In addition to real exchange rate changes, movements in world market prices for tradedcommodities and manufactures have impacted on the foreign demand for ASEAN-5 exports andthe domestic demand for imports. Moreover, international prices have had an indirect effect onASEAN-5 growth through their impact on export-oriented FDI activities. The importance offoreign firms in the export sector is well-documented (Chen, 1994; Dahman and Westphal,1983). There is also ample evidence that export-orientation is one of the most importantdeterminants of FDI flows (see, for example, Singh and Jun, 1995 and references therein).Moreover, the terms-of-trade shocks that hit Southeast Asia in 1997 had major repercussions oncorporate earnings expectations. Stock markets in those countries contracted sharply, particularlyin Thailand, Malaysia and the Philippines, and both foreign and domestic investors began tomove funds offshore (Noland et al., 1998).
Table 5.2
Foreign Income and Exchange Rate Elasticities
ASEAN-5ForeignIncome
Real Yen/DollarExchange Rate
Indonesia Short-term 0.48 0.06Long-term 1.67 0.57
Malaysia Short-term 0.76 0.01Long-term 1.00 1.15
Philippines Short-term 0.23 0.03 (t-1)Long-term 1.00 0.13
Thailand Short-term 0.49 0.08Long-term 1.80 0.90
Singapore Short-term 0.42 0.04Long-term 1.56 1.33
Note: The elasticity measures the percentage change in real GDP of each ASEAN-5 country brought about by a 1 percentchange in either foreign income or real yen/dollar exchange rate.
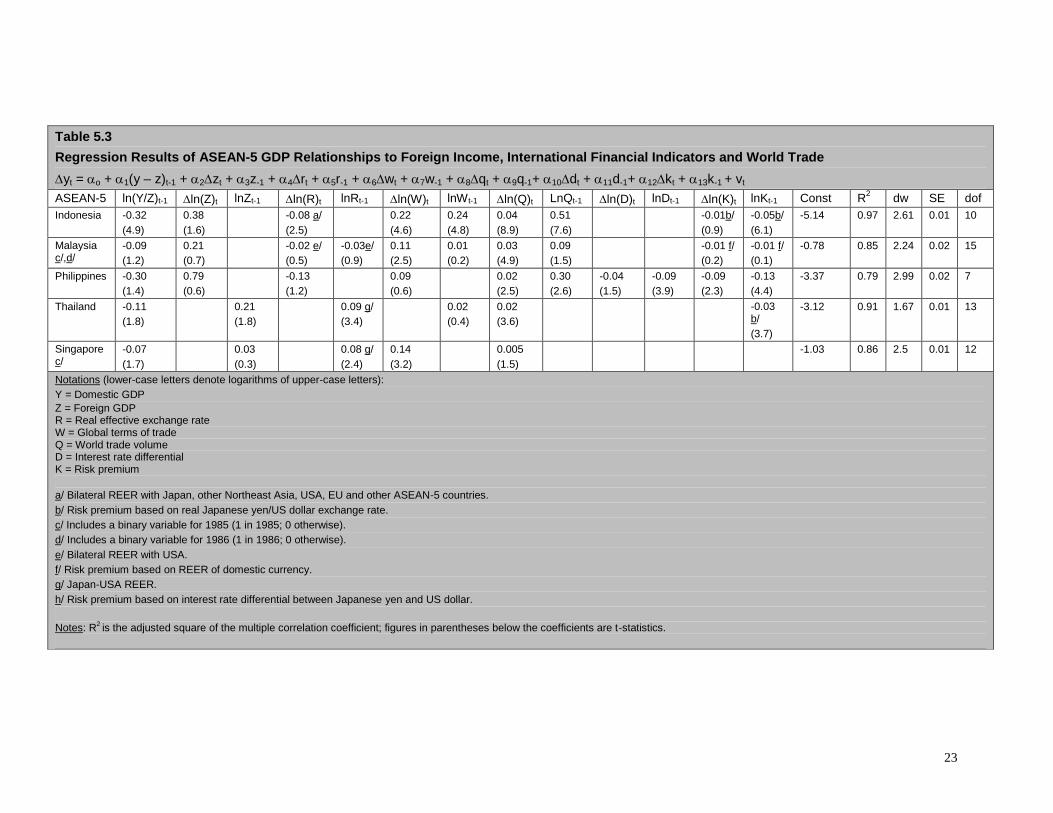
23
Table 5.3
Regression Results of ASEAN-5 GDP Relationships to Foreign Income, International Financial Indicators and World Trade
yt = o + 1(y –z)t-1 + 2zt + 3z-1 + 4rt + 5r-1 + 6wt + 7w-1 + 8qt + 9q-1+ 10dt + 11d-1+ 12kt + 13k-1 + vt
ASEAN-5 ln(Y/Z)t-1 ln(Z)t lnZt-1 ln(R)t lnRt-1 ln(W)t lnWt-1 ln(Q)t LnQt-1 ln(D)t lnDt-1 ln(K)t lnKt-1 Const R2 dw SE dofIndonesia -0.32
(4.9)0.38(1.6)
-0.08 a/(2.5)
0.22(4.6)
0.24(4.8)
0.04(8.9)
0.51(7.6)
-0.01b/(0.9)
-0.05b/(6.1)
-5.14 0.97 2.61 0.01 10
Malaysiac/,d/
-0.09(1.2)
0.21(0.7)
-0.02 e/(0.5)
-0.03e/(0.9)
0.11(2.5)
0.01(0.2)
0.03(4.9)
0.09(1.5)
-0.01 f/(0.2)
-0.01 f/(0.1)
-0.78 0.85 2.24 0.02 15
Philippines -0.30(1.4)
0.79(0.6)
-0.13(1.2)
0.09(0.6)
0.02(2.5)
0.30(2.6)
-0.04(1.5)
-0.09(3.9)
-0.09(2.3)
-0.13(4.4)
-3.37 0.79 2.99 0.02 7
Thailand -0.11(1.8)
0.21(1.8)
0.09 g/(3.4)
0.02(0.4)
0.02(3.6)
-0.03b/(3.7)
-3.12 0.91 1.67 0.01 13
Singaporec/
-0.07(1.7)
0.03(0.3)
0.08 g/(2.4)
0.14(3.2)
0.005(1.5)
-1.03 0.86 2.5 0.01 12
Notations (lower-case letters denote logarithms of upper-case letters):Y = Domestic GDPZ = Foreign GDPR = Real effective exchange rateW = Global terms of tradeQ = World trade volumeD = Interest rate differentialK = Risk premium
a/ Bilateral REER with Japan, other Northeast Asia, USA, EU and other ASEAN-5 countries.b/ Risk premium based on real Japanese yen/US dollar exchange rate.c/ Includes a binary variable for 1985 (1 in 1985; 0 otherwise).d/ Includes a binary variable for 1986 (1 in 1986; 0 otherwise).e/ Bilateral REER with USA.f/ Risk premium based on REER of domestic currency.g/ Japan-USA REER.h/ Risk premium based on interest rate differential between Japanese yen and US dollar.
Notes: R2 is the adjusted square of the multiple correlation coefficient; figures in parentheses below the coefficients are t-statistics.
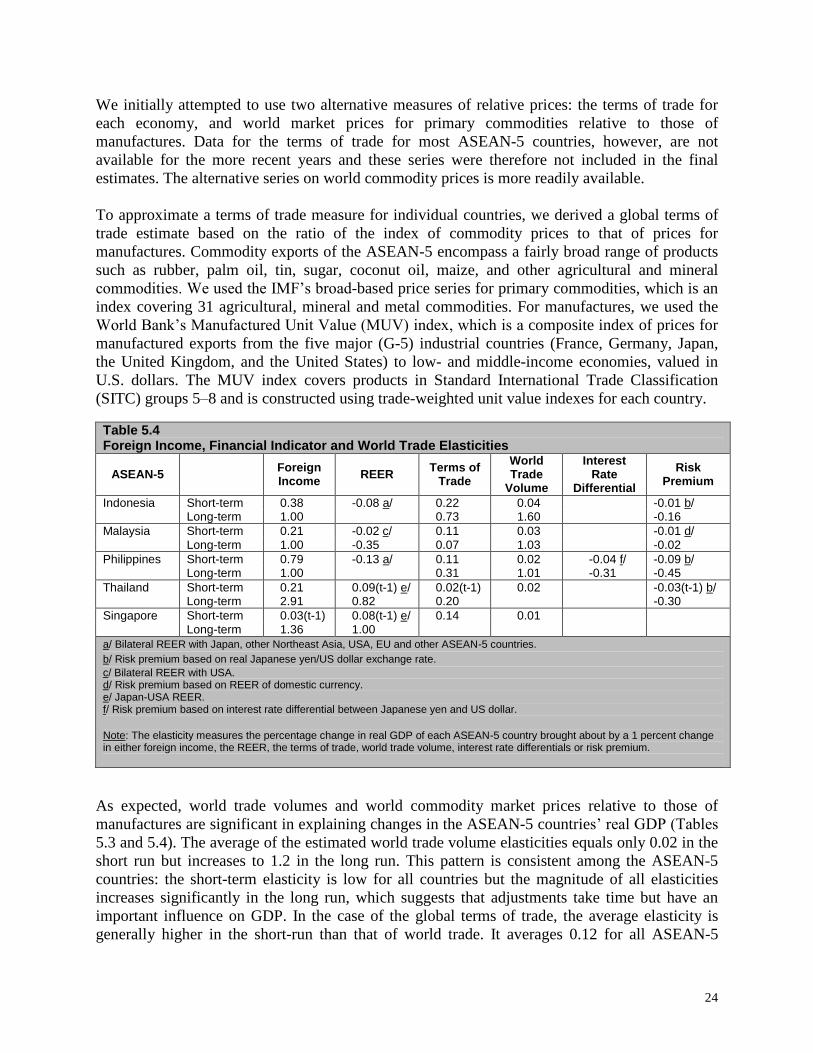
24
We initially attempted to use two alternative measures of relative prices: the terms of trade foreach economy, and world market prices for primary commodities relative to those ofmanufactures. Data for the terms of trade for most ASEAN-5 countries, however, are notavailable for the more recent years and these series were therefore not included in the finalestimates. The alternative series on world commodity prices is more readily available.
To approximate a terms of trade measure for individual countries, we derived a global terms oftrade estimate based on the ratio of the index of commodity prices to that of prices formanufactures. Commodity exports of the ASEAN-5 encompass a fairly broad range of productssuch as rubber, palm oil, tin, sugar, coconut oil, maize, and other agricultural and mineralcommodities. We used the IMF’s broad-based price series for primary commodities, which is anindex covering 31 agricultural, mineral and metal commodities. For manufactures, we used theWorld Bank’s Manufactured Unit Value (MUV) index, which is a composite index of prices formanufactured exports from the five major (G-5) industrial countries (France, Germany, Japan,the United Kingdom, and the United States) to low- and middle-income economies, valued inU.S. dollars. The MUV index covers products in Standard International Trade Classification(SITC) groups 5–8 and is constructed using trade-weighted unit value indexes for each country.
As expected, world trade volumes and world commodity market prices relative to those ofmanufactures are significant in explaining changes in the ASEAN-5 countries’ real GDP (Tables 5.3 and 5.4). The average of the estimated world trade volume elasticities equals only 0.02 in theshort run but increases to 1.2 in the long run. This pattern is consistent among the ASEAN-5countries: the short-term elasticity is low for all countries but the magnitude of all elasticitiesincreases significantly in the long run, which suggests that adjustments take time but have animportant influence on GDP. In the case of the global terms of trade, the average elasticity isgenerally higher in the short-run than that of world trade. It averages 0.12 for all ASEAN-5
Table 5.4Foreign Income, Financial Indicator and World Trade Elasticities
ASEAN-5 ForeignIncome REER Terms of
Trade
WorldTrade
Volume
InterestRate
Differential
RiskPremium
Indonesia Short-term 0.38 -0.08 a/ 0.22 0.04 -0.01 b/Long-term 1.00 0.73 1.60 -0.16
Malaysia Short-term 0.21 -0.02 c/ 0.11 0.03 -0.01 d/Long-term 1.00 -0.35 0.07 1.03 -0.02
Philippines Short-term 0.79 -0.13 a/ 0.11 0.02 -0.04 f/ -0.09 b/Long-term 1.00 0.31 1.01 -0.31 -0.45
Thailand Short-term 0.21 0.09(t-1) e/ 0.02(t-1) 0.02 -0.03(t-1) b/Long-term 2.91 0.82 0.20 -0.30
Singapore Short-term 0.03(t-1) 0.08(t-1) e/ 0.14 0.01Long-term 1.36 1.00
a/ Bilateral REER with Japan, other Northeast Asia, USA, EU and other ASEAN-5 countries.b/ Risk premium based on real Japanese yen/US dollar exchange rate.c/ Bilateral REER with USA.d/ Risk premium based on REER of domestic currency.e/ Japan-USA REER.f/ Risk premium based on interest rate differential between Japanese yen and US dollar.
Note: The elasticity measures the percentage change in real GDP of each ASEAN-5 country brought about by a 1 percent changein either foreign income, the REER, the terms of trade, world trade volume, interest rate differentials or risk premium.
25
countries, but it is considerably smaller in the long-run (0.33), compared with the average tradevolume elasticity (1.2). These findings suggest that price transmissions occur more quickly thantrade volume effects, but that changes in trade volumes tend to have a relatively larger impact onASEAN-5 GDP than do price movements.
5.3 Differential Interest Rate Effects
Interest rate differentials affect movements in equity and debt securities on capital markets morethan they do FDI movements, and therefore are likely to influence portfolio investments in theASEAN-5 countries. In addition, it is generally acknowledged that the interest rate differentialresulting from the long-term upward movement in the nominal dollar value of the yen drovenominal interest rates on yen-denominated assets below those prevailing on dollar-denominatedassets. That change led banks in East Asia to undertake foreign currency indebtedness byaccepting cheap yen deposits without covering their foreign exchange risk (McKinnon, 1998;Krugman, 1998). Financial intermediaries that over-borrowed and accumulated large short-termdebt did not consider the risk associated with exchange rate changes, at least in their immediatefuture.
To measure the effect that these interest rate disparities have had on the ASEAN-5 economies,we used four alternative measures: (a) the ratio of the Japanese yen LIBOR three-month rate tothe US dollar LIBOR rate, (b) the ratio of the Japanese yen lending rate to the US dollar LIBORrate, (c) ratio of the nominal lending rates in each ASEAN-5 country to the Japanese yen LIBORthree-month rate, and (d) ratio of the nominal lending rates in each ASEAN-5 country to the USdollar LIBOR rate. In general the results did not support the use of this variable in explainingeconomic activity in the ASEAN-5 countries. The exception is the Philippines, where the ratio ofthe Japanese yen LIBOR three-month rate to the US dollar LIBOR rate was found to bestatistically significant in explaining changes in real GDP (Tables 5.3 and 5.4). The reason forthe general lack of significance of this variable in other countries may be the relatively short timeperiod over which it influenced the Southeast Asian economies (mainly through portfolioinvestments, which did not become important to these countries until the early 1990s), comparedwith the fairly long time series (beginning in 1970) used for the equation estimates.
5.4 Investment Risk Effects
The main sources of risk for investors are interest rates, stock market returns, and contagioneffects (Lopez-Mejia, 1999). Changes in interest rates can have large consequences on themacroeconomic performance and creditworthiness of developing countries, and more so throughchanges in portfolio investments than FDI (World Bank, 1997; Chuhan, Perez-Quiros, andPopper, 1996). If investments in emerging markets are used only to increase portfolio returnswhen investments in industrial countries are under-performing, then the investments will be verysensitive to changes in industrial countries’ interest rates. In the case of the Asian financial crisis,however, it was the lack of confidence in the asset market that led to panic liquidation in all theSoutheast Asian stock markets. The liquidation, in turn, instigated large movements of fundsoffshore that reversed capital flows and drained official reserves. The resulting downward
26
pressure on exchange rates was essentially domestically induced, although there were spilloversthat gave rise to contagion and the pervasiveness of the Asian financial crisis (Sachs, 1997;Stiglitz, 1997).
We measured investment risk from the risk premium on foreign loans made by financialintermediaries in the ASEAN-5 countries. Based on the uncovered interest parity relationship, aninvestor will be indifferent between borrowing abroad or at home if the following relationshipholds:
it = ift + Δset + γt (5.1)
where i is the domestic loan rate, if is the foreign loan rate, γ is the risk premium from the riskdifferential of the foreign and domestic loans, and the term Δset = (Se
t+k –St)/St is the expectedchange in the real exchange rate.1 Since γt = (it - if
t) - Δset, the expectation of a devaluation of thedomestic currency will increase the risk premium for foreign loans, while the expectation of anappreciation will lower the risk premium. If Δγt > 0 domestic intermediaries will reduce foreignborrowing, as well as domestic loans for asset purchases. Alternatively, if Δγt < 0 domesticintermediaries will increase foreign borrowing and domestic loans for asset purchases.
In practice we used the ratio of domestic to foreign loan rates and the ratio of current to pastexchange rates to obtain non-negative numbers that can be used in the log-linear specification ofthe estimated relationships. In addition, we assumed that the formation of expectations forintermediaries in the dollar-pegged ASEAN-5 countries can take place in one of two ways. Thefirst is from observed movements in the dollar-yen exchange rate; the second is through changesin the REER of the domestic currency. In the first case, an expected devaluation (appreciation) ofthe yen vis-à-vis the dollar would decrease (increase) the risk premium to ASEAN-5intermediaries since it would lower (raise) their debt repayment costs to Japanese lenders. In thesecond case, an expected REER depreciation (appreciation) of the domestic currency wouldincrease (decrease) the risk premium since it would raise (lower) the expected debt repaymentcost of domestic intermediaries to foreign lenders.
A more accurate approach would be to use the expected change in the exchange rate as providedby a number of financial institutions (for an application, see MacDonald and Torrance, 1990).However, our need for fairly long time series prevented using this approach and we insteadadopted the naïve rule that expectations are based on current observations. The resulting seriesnonetheless appears to provide a reasonable approximation of the risk premium during the periodused to estimate the relationships. Using this measure we found the effect of risk premium oneconomic growth of the ASEAN-5 countries to generally be statistically significant. The averagerisk premium elasticity is –0.04 in the short run and it rises to –0.23 in the long run. The shortrun elasticity ranges from –0.01 (Indonesia and Malaysia) to –0.09 (Philippines), while the longrun elasticity ranges from–0.02 (Malaysia) to–0.45 (Philippines).
1 For details, see Hallwood and MacDonald (1994) and Obstfeld and Rogoff (1998). For applications to Southeast Asia, seeMcKibbin (1998) and McKibbin and Martin (1999).
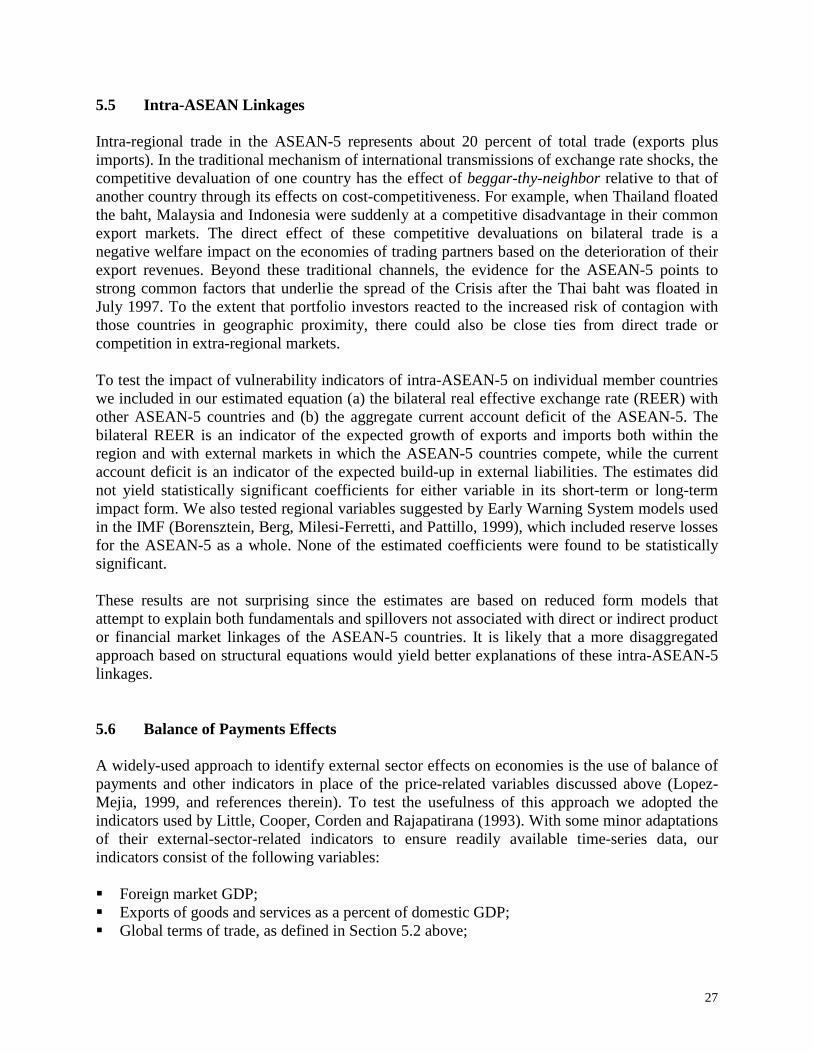
27
5.5 Intra-ASEAN Linkages
Intra-regional trade in the ASEAN-5 represents about 20 percent of total trade (exports plusimports). In the traditional mechanism of international transmissions of exchange rate shocks, thecompetitive devaluation of one country has the effect of beggar-thy-neighbor relative to that ofanother country through its effects on cost-competitiveness. For example, when Thailand floatedthe baht, Malaysia and Indonesia were suddenly at a competitive disadvantage in their commonexport markets. The direct effect of these competitive devaluations on bilateral trade is anegative welfare impact on the economies of trading partners based on the deterioration of theirexport revenues. Beyond these traditional channels, the evidence for the ASEAN-5 points tostrong common factors that underlie the spread of the Crisis after the Thai baht was floated inJuly 1997. To the extent that portfolio investors reacted to the increased risk of contagion withthose countries in geographic proximity, there could also be close ties from direct trade orcompetition in extra-regional markets.
To test the impact of vulnerability indicators of intra-ASEAN-5 on individual member countrieswe included in our estimated equation (a) the bilateral real effective exchange rate (REER) withother ASEAN-5 countries and (b) the aggregate current account deficit of the ASEAN-5. Thebilateral REER is an indicator of the expected growth of exports and imports both within theregion and with external markets in which the ASEAN-5 countries compete, while the currentaccount deficit is an indicator of the expected build-up in external liabilities. The estimates didnot yield statistically significant coefficients for either variable in its short-term or long-termimpact form. We also tested regional variables suggested by Early Warning System models usedin the IMF (Borensztein, Berg, Milesi-Ferretti, and Pattillo, 1999), which included reserve lossesfor the ASEAN-5 as a whole. None of the estimated coefficients were found to be statisticallysignificant.
These results are not surprising since the estimates are based on reduced form models thatattempt to explain both fundamentals and spillovers not associated with direct or indirect productor financial market linkages of the ASEAN-5 countries. It is likely that a more disaggregatedapproach based on structural equations would yield better explanations of these intra-ASEAN-5linkages.
5.6 Balance of Payments Effects
A widely-used approach to identify external sector effects on economies is the use of balance ofpayments and other indicators in place of the price-related variables discussed above (Lopez-Mejia, 1999, and references therein). To test the usefulness of this approach we adopted theindicators used by Little, Cooper, Corden and Rajapatirana (1993). With some minor adaptationsof their external-sector-related indicators to ensure readily available time-series data, ourindicators consist of the following variables:
Foreign market GDP; Exports of goods and services as a percent of domestic GDP; Global terms of trade, as defined in Section 5.2 above;
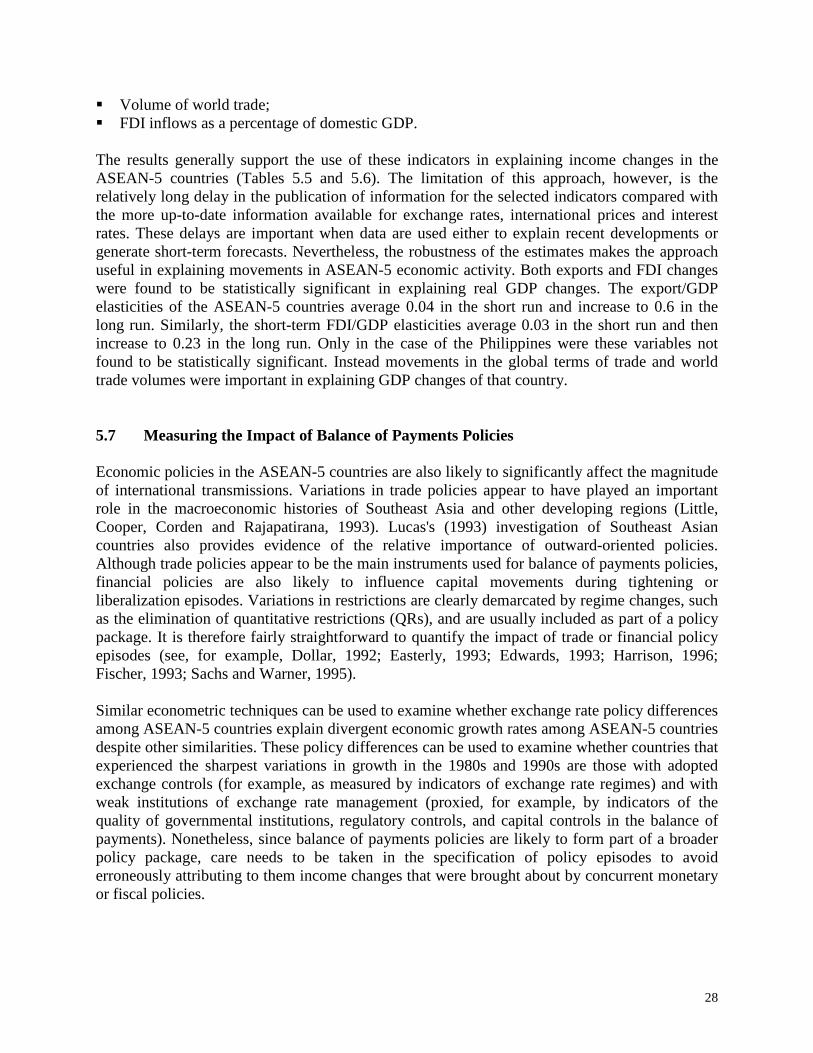
28
Volume of world trade; FDI inflows as a percentage of domestic GDP.
The results generally support the use of these indicators in explaining income changes in theASEAN-5 countries (Tables 5.5 and 5.6). The limitation of this approach, however, is therelatively long delay in the publication of information for the selected indicators compared withthe more up-to-date information available for exchange rates, international prices and interestrates. These delays are important when data are used either to explain recent developments orgenerate short-term forecasts. Nevertheless, the robustness of the estimates makes the approachuseful in explaining movements in ASEAN-5 economic activity. Both exports and FDI changeswere found to be statistically significant in explaining real GDP changes. The export/GDPelasticities of the ASEAN-5 countries average 0.04 in the short run and increase to 0.6 in thelong run. Similarly, the short-term FDI/GDP elasticities average 0.03 in the short run and thenincrease to 0.23 in the long run. Only in the case of the Philippines were these variables notfound to be statistically significant. Instead movements in the global terms of trade and worldtrade volumes were important in explaining GDP changes of that country.
5.7 Measuring the Impact of Balance of Payments Policies
Economic policies in the ASEAN-5 countries are also likely to significantly affect the magnitudeof international transmissions. Variations in trade policies appear to have played an importantrole in the macroeconomic histories of Southeast Asia and other developing regions (Little,Cooper, Corden and Rajapatirana, 1993). Lucas's (1993) investigation of Southeast Asiancountries also provides evidence of the relative importance of outward-oriented policies.Although trade policies appear to be the main instruments used for balance of payments policies,financial policies are also likely to influence capital movements during tightening orliberalization episodes. Variations in restrictions are clearly demarcated by regime changes, suchas the elimination of quantitative restrictions (QRs), and are usually included as part of a policypackage. It is therefore fairly straightforward to quantify the impact of trade or financial policyepisodes (see, for example, Dollar, 1992; Easterly, 1993; Edwards, 1993; Harrison, 1996;Fischer, 1993; Sachs and Warner, 1995).
Similar econometric techniques can be used to examine whether exchange rate policy differencesamong ASEAN-5 countries explain divergent economic growth rates among ASEAN-5 countriesdespite other similarities. These policy differences can be used to examine whether countries thatexperienced the sharpest variations in growth in the 1980s and 1990s are those with adoptedexchange controls (for example, as measured by indicators of exchange rate regimes) and withweak institutions of exchange rate management (proxied, for example, by indicators of thequality of governmental institutions, regulatory controls, and capital controls in the balance ofpayments). Nonetheless, since balance of payments policies are likely to form part of a broaderpolicy package, care needs to be taken in the specification of policy episodes to avoiderroneously attributing to them income changes that were brought about by concurrent monetaryor fiscal policies.

29
It is also likely that as countries become increasingly open and the markets for goods, capital andtechnology become liberalized, they will experience a tendency towards income convergence.However, the evidence points to a slow convergence between developing and industrializedcountries (for a review, see Obstfeld and Rogoff, 1998, Ch. 7). Since our focus is on short-termeffects from global linkages, we have not explicitly addressed convergence conditions in ouranalysis of global linkages. Nevertheless, our estimates identify both short and long-termcomponents and implicitly offer some evidence on the convergence issue, albeit for a relativelyshorter time period than the 100-plus year sample used by Maddison (1982) and others.
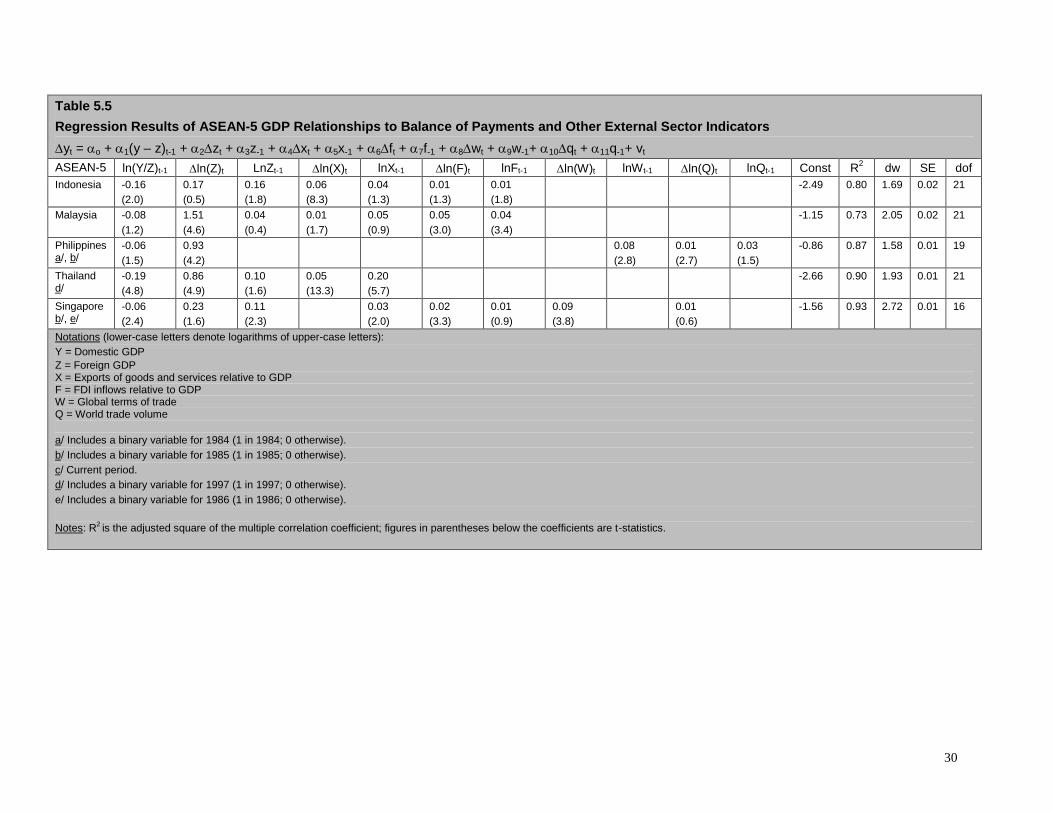
30
Table 5.5
Regression Results of ASEAN-5 GDP Relationships to Balance of Payments and Other External Sector Indicators
yt = o + 1(y –z)t-1 + 2zt + 3z-1 + 4xt + 5x-1 + 6ft + 7f-1 + 8wt + 9w-1+ 10qt + 11q-1+ vt
ASEAN-5 ln(Y/Z)t-1 ln(Z)t LnZt-1 ln(X)t lnXt-1 ln(F)t lnFt-1 ln(W)t lnWt-1 ln(Q)t lnQt-1 Const R2 dw SE dofIndonesia -0.16
(2.0)0.17(0.5)
0.16(1.8)
0.06(8.3)
0.04(1.3)
0.01(1.3)
0.01(1.8)
-2.49 0.80 1.69 0.02 21
Malaysia -0.08(1.2)
1.51(4.6)
0.04(0.4)
0.01(1.7)
0.05(0.9)
0.05(3.0)
0.04(3.4)
-1.15 0.73 2.05 0.02 21
Philippinesa/, b/
-0.06(1.5)
0.93(4.2)
0.08(2.8)
0.01(2.7)
0.03(1.5)
-0.86 0.87 1.58 0.01 19
Thailandd/
-0.19(4.8)
0.86(4.9)
0.10(1.6)
0.05(13.3)
0.20(5.7)
-2.66 0.90 1.93 0.01 21
Singaporeb/, e/
-0.06(2.4)
0.23(1.6)
0.11(2.3)
0.03(2.0)
0.02(3.3)
0.01(0.9)
0.09(3.8)
0.01(0.6)
-1.56 0.93 2.72 0.01 16
Notations (lower-case letters denote logarithms of upper-case letters):Y = Domestic GDPZ = Foreign GDPX = Exports of goods and services relative to GDPF = FDI inflows relative to GDPW = Global terms of tradeQ = World trade volume
a/ Includes a binary variable for 1984 (1 in 1984; 0 otherwise).b/ Includes a binary variable for 1985 (1 in 1985; 0 otherwise).c/ Current period.d/ Includes a binary variable for 1997 (1 in 1997; 0 otherwise).e/ Includes a binary variable for 1986 (1 in 1986; 0 otherwise).
Notes: R2 is the adjusted square of the multiple correlation coefficient; figures in parentheses below the coefficients are t-statistics.
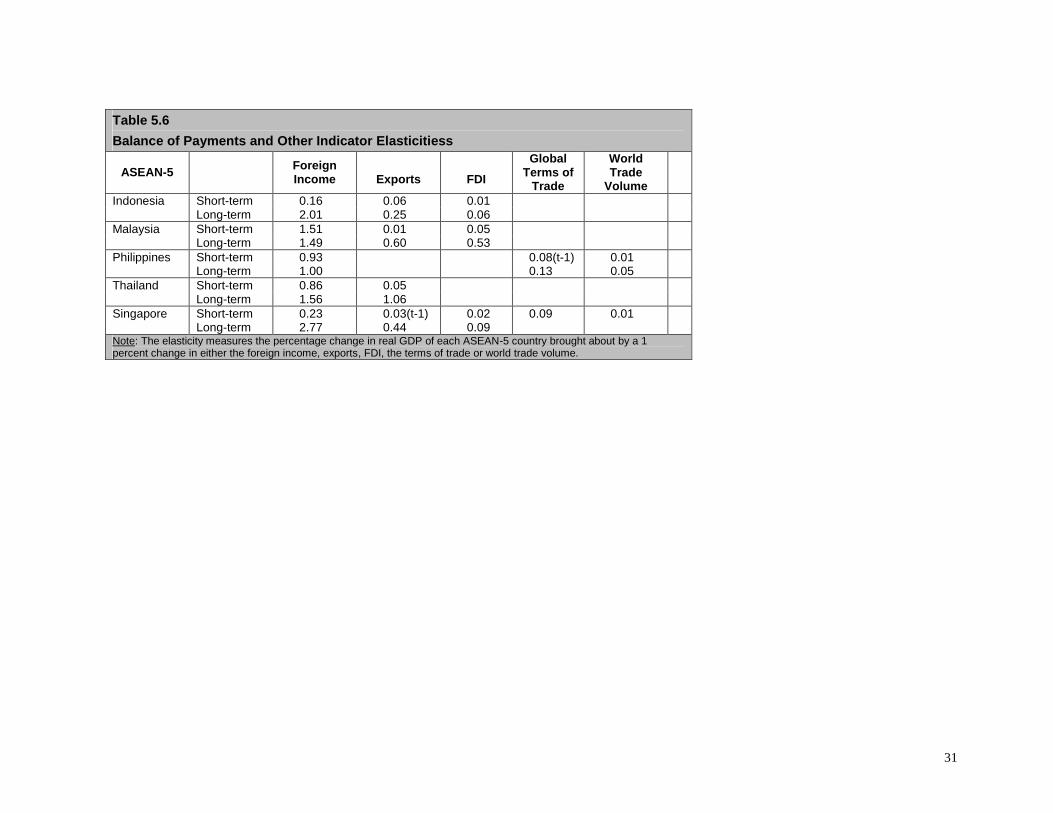
31
Table 5.6
Balance of Payments and Other Indicator Elasticitiess
ASEAN-5 ForeignIncome Exports FDI
GlobalTerms of
Trade
WorldTrade
VolumeIndonesia Short-term 0.16 0.06 0.01
Long-term 2.01 0.25 0.06Malaysia Short-term 1.51 0.01 0.05
Long-term 1.49 0.60 0.53Philippines Short-term 0.93 0.08(t-1) 0.01
Long-term 1.00 0.13 0.05Thailand Short-term 0.86 0.05
Long-term 1.56 1.06Singapore Short-term 0.23 0.03(t-1) 0.02 0.09 0.01
Long-term 2.77 0.44 0.09Note: The elasticity measures the percentage change in real GDP of each ASEAN-5 country brought about by a 1percent change in either the foreign income, exports, FDI, the terms of trade or world trade volume.
31
VI. Conclusions
This study has examined the global linkages of the ASEAN-5 countries consisting ofIndonesia, Malaysia, Philippines, Singapore and Thailand. External influences on thesecountries are largely driven by developments in Japan, other Northeast Asian countries,the United States, the European Union, and within the ASEAN region. Our estimates ofthe international transmission of income and other changes have separated the long run orequilibrium relationships between domestic income and foreign income, price and othervariables from the short-run or dynamic disequilibrium components of thoserelationships. While the systematic determinants of the ASEAN-5 countries’ global linkages are fairly stable and robust, our focus in this study has been on the short-termdynamics underlying the transmission of income, price and other factors in the globaleconomy.
The findings confirm expectations of strong economic linkages between selected ASEANmember countries and the major regions of the global economy. The transmission offoreign income changes has been found to have important consequences for the ASEAN-5 countries in both the short run and long run. Estimates of the international transmissionof income changes based on aggregate data from all the regions show a similar pattern asthose for individual regional estimates. These aggregated relationships were thereforeused to estimate the international transmission of exchange rates and other influences onthe ASEAN-5 countries.
In additional to foreign income effects, we have examined the effects of the followingvariables on ASEAN-5 economic activity: (a) exchange rates in the form of either theoverall real effective exchange rate of the ASEAN-5 countries, bilateral real effectiveexchange rates with the major global regions, or the real yen/dollar exchange rate; (b)international prices in the form of either the terms of trade of the ASEAN-5 or worldmarket prices for primary commodities relative to those of manufactures; (c) interestrates in the form of interest rate differentials either between those in Japan and those inthe United States, those for ASEAN-5 lending and those for Japanese borrowing, or thosefor ASEAN-5 lending and those for borrowing in the Eurodollar market; (d) investmentrisks on portfolio and direct investments in the form of either real exchange ratefluctuations or more generally imbalances in the balance of payments that reflect the riskof real exchange rate changes and/or capital controls; (e) world trade and capital inflowsin the form of world trade volumes, current account balances, the ratio of exports to GDP,and the importance of portfolio and direct investments to the economy; and (f) intra-ASEAN linkages in the form of the bilateral real effective exchange rate (REER) withother ASEAN-5 countries, the aggregate current account deficit of the ASEAN-5, and theregion’s reserve losses. In all cases, empirical measurement has been based on individualASEAN-5 country estimates.
32
We have found real yen/dollar exchange rate variations to be significant in explainingreal GDP changes in the ASEAN-5 countries. On average, the short-term elasticity ofincome with respect to the real yen/dollar exchange rate is equal to 0.05, while theaverage long-term elasticity is 0.8. All the coefficients have the expected positive signsuggesting that output in the ASEAN-5 economies is positively related to the yen/dollarexchange rate. The explanation for these findings is that when the yen has risen againstthe dollar, the export competitiveness of the dollar-pegged Asian economies hasimproved in the Japanese market and production costs have became more attractive toJapanese investors. Alternatively, when the yen has weakened (for example, as it didbetween mid-1995 and mid-1997) Japanese export demand and FDI outflows havecontracted and economic growth in the Southeast Asian economies has fallen.
The REER of the ASEAN-5 countries was found to be statistically significant inexplaining income changes of Indonesia, Malaysia and the Philippines. However, only inthe case of Malaysia was the REER significant in the long run. These findings are notsurprising since reduced form estimates that related real GDP of countries to their REERare often unable to capture the transmission effects of this variable through the demandfor exports and imports and direct and portfolio investments. Instead it is usuallynecessary to estimate structural equations relating each of the national incomecomponents (for example, export demand) to the REER and then estimating theindividual effects on aggregate income.
In addition to real exchange rate changes, movements in world market prices for tradedcommodities and manufactures have impacted on the foreign demand for ASEAN-5exports and domestic demand for imports, as well as export-oriented FDI activities. Asexpected, world trade volumes and world commodity market prices relative to those ofmanufactures have been found to be significant in explaining changes in the ASEAN-5countries’ real GDP. The average of the estimated world trade volume elasticities equalsonly 0.02 in the short run and increases to 1.2 in the long run. This pattern is consistentamong the ASEAN-5 countries: the short-term elasticity is low for all countries but themagnitude of all elasticities increases significantly in the long run, which suggests thatadjustments take time but have an important influence on GDP. In the case of the globalterms of trade, the average elasticity is generally higher in the short-run than that of worldtrade. These findings suggest that price transmissions occur more quickly than tradevolume effects, but that movements in trade volumes tend to have a relatively largerimpact on ASEAN-5 GDP than do price variations.
Interest rate differentials tend to affect movements in equity and debt securities on capitalmarkets more than they do FDI movements, and therefore are likely to have had a largeinfluence on portfolio investments. However, in the ASEAN-5 the results did not supportthe use of this variable in explaining economic activity. The exception is the Philippines,where the ratio of the Japanese yen LIBOR three-month rate to the US dollar LIBOR ratewas found to be statistically significant in explaining changes in real GDP. The reason forthe general lack of significance of this variable in other countries may be the relativelyshort time period over which it influenced the Southeast Asian economies, comparedwith the fairly long time series (beginning in 1970) used for the equation estimates.
33
Investment risk has been measured from the risk premium on foreign loans made byfinancial intermediaries in the ASEAN-5 countries using the uncovered interest parityrelationship. Using this measure we found the effect of risk premium on economicgrowth of the ASEAN-5 countries to be statistically significant in most cases. Theaverage risk premium elasticity is –0.04 in the short run and it rises to –0.23 in the longrun.
We also examined the global linkages of ASEAN-5 based on alternative set of data withbalance of payments and world trade indicators. The results generally support the use ofthese indicators in explaining income changes in the ASEAN-5 countries. The limitationof this approach, however, is the relatively long delay in the publication of informationfor the selected indicators compared with the more up-to-date information available forexchange rates, international prices and interest rates. These delays are important whendata are being used either to explain recent developments or to generate short-termforecasts. Nevertheless, the robustness of the estimates makes the approach useful inexplaining movements in ASEAN-5 economic activity. Both exports and FDI changeswere found to be significant in explaining real GDP changes. The export/GDP elasticitiesof the ASEAN-5 countries average 0.04 in the short run and then increase to 0.6 in thelong run. Similarly, the short-term FDI/GDP elasticities average 0.03 in the short run andthen increase to 0.23 in the long run. Only in the case of the Philippines were thesevariables not found to be statistically significant. Instead movements in the global termsof trade and world trade volumes were important in explaining GDP changes of thatcountry.
Additional research on the global linkages of the ASEAN countries would benefit fromextensions in two areas. The first is the measurement of the effects of economic policies.Balance of payments policies using trade policy instruments and capital controls havebeen found to play an important role in the macroeconomic histories of Southeast Asiaand other developing regions. Financial policies are also likely to influence capitalmovements during tightening or liberalization episodes. Quantification of these policyeffects would help to identify their effects on ASEAN economic activity. Similareconometric techniques could also be used to examine whether exchange rate policydifferences among ASEAN countries explain divergent economic growth rates amongthese countries despite other similarities.
Another useful area of research would consider ASEAN global linkages based onestimates of the structural relationships in the economies of the member countries. It islikely that such an approach would yield more robust estimates of the internationaltransmission mechanisms impacting on these countries than those based on reduced formequations.
34
Technical Appendix
A.1 Unit Root Tests
In modeling the global linkages of the ASEAN-5 economies, we are initially concernedwith two questions: the first is whether the individual variables are stationary or non-stationary and therefore may require some linear transformation before estimating theirrelationship to one another; the second is whether the order of integration of theindividual time series that are included in the empirical relationship is the same andtherefore allows us to estimate their long-run equilibrium relationship and derive theshort-term deviations from that relationship.
For series that tend to grow either positively or negatively over time, it is first necessaryto examine whether or not the series are themselves stationary before proceeding to findthe long-term equilibrium relationship of two or more economic variables. In practice,when only a one-period lag of the dependent variable is included in the regression, then aDickey-Fuller (DF) test is performed to determine whether the series is stationary. Whenfirst difference terms are included in the regression, then an Augmented Dickey-Fuller(ADF) test is performed. The number of lagged first difference terms to include in theregression should be sufficient to remove any serial correlation in the residuals, in whichcase the DW statistic should approximate 2.1
Initially the test is performed on the levels form of the regression. If the test fails to rejectthe test in levels then a first difference test regression should be performed. If the testfails to reject the test in levels but rejects the test in first differences, then the series is ofintegrated order one I(1). If, on the other hand, the test fails to reject the test in levels andfirst differences but rejects the test in second differences, then the series is of integratedorder two I(2).
The results of the Augmented Dickey-Fuller test and the Durbin-Watson test arepresented in Table 1. As expected, the tests all fail to establish stationarity of the loglevels and indicate that all the log levels are integrated processes. For all the ASEAN-5countries, the real GDP series are all of integrated order 2. For the three global regions,the real GDP series of Japan is also of integrated order 2, but those of the United Statesand the European Union are of integrated order 1. The properties of the series for thelatter two global regions suggest that complications are likely to arise in estimates of therelationship between the real GDP time series of the ASEAN members and those of theUnited States and the European Union. In particular, when the series are integrated ofdifferent orders, then the two series cannot then be cointegrated. In such a case, itbecomes difficult to describe the existence of an equilibrium, or stationary, relationshipbetween, say, the transmission of changes in economic activity of the United States to
1 A constant and trend variable should be included if the series exhibits a trend and non-zero mean in thedescriptive statistics. Alternatively, if the series does not exhibit any trend but has a non-zero mean, only aconstant should be included in the test regression. Finally, if the series appears to fluctuate around a zero mean,neither a constant nor a trend should be included in the test regression.
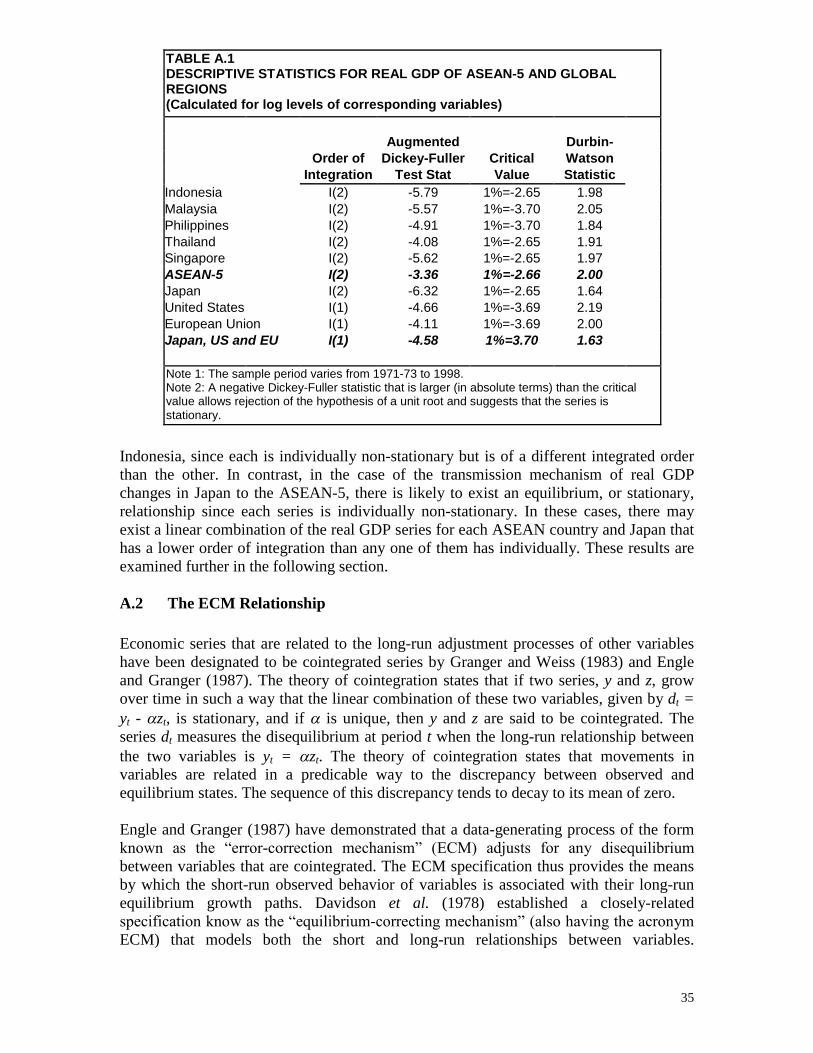
35
Indonesia, since each is individually non-stationary but is of a different integrated orderthan the other. In contrast, in the case of the transmission mechanism of real GDPchanges in Japan to the ASEAN-5, there is likely to exist an equilibrium, or stationary,relationship since each series is individually non-stationary. In these cases, there mayexist a linear combination of the real GDP series for each ASEAN country and Japan thathas a lower order of integration than any one of them has individually. These results areexamined further in the following section.
A.2 The ECM Relationship
Economic series that are related to the long-run adjustment processes of other variableshave been designated to be cointegrated series by Granger and Weiss (1983) and Engleand Granger (1987). The theory of cointegration states that if two series, y and z, growover time in such a way that the linear combination of these two variables, given by dt =yt - zt, is stationary, and if is unique, then y and z are said to be cointegrated. Theseries dt measures the disequilibrium at period t when the long-run relationship betweenthe two variables is yt = zt. The theory of cointegration states that movements invariables are related in a predicable way to the discrepancy between observed andequilibrium states. The sequence of this discrepancy tends to decay to its mean of zero.
Engle and Granger (1987) have demonstrated that a data-generating process of the formknown as the “error-correction mechanism” (ECM) adjusts for any disequilibrium between variables that are cointegrated. The ECM specification thus provides the meansby which the short-run observed behavior of variables is associated with their long-runequilibrium growth paths. Davidson et al. (1978) established a closely-relatedspecification know as the “equilibrium-correcting mechanism” (also having the acronym ECM) that models both the short and long-run relationships between variables.
TABLE A.1DESCRIPTIVE STATISTICS FOR REAL GDP OF ASEAN-5 AND GLOBALREGIONS(Calculated for log levels of corresponding variables)
Augmented Durbin-Order of Dickey-Fuller Critical Watson
Integration Test Stat Value StatisticIndonesia I(2) -5.79 1%=-2.65 1.98Malaysia I(2) -5.57 1%=-3.70 2.05Philippines I(2) -4.91 1%=-3.70 1.84Thailand I(2) -4.08 1%=-2.65 1.91Singapore I(2) -5.62 1%=-2.65 1.97ASEAN-5 I(2) -3.36 1%=-2.66 2.00Japan I(2) -6.32 1%=-2.65 1.64United States I(1) -4.66 1%=-3.69 2.19European Union I(1) -4.11 1%=-3.69 2.00Japan, US and EU I(1) -4.58 1%=3.70 1.63
Note 1: The sample period varies from 1971-73 to 1998.Note 2: A negative Dickey-Fuller statistic that is larger (in absolute terms) than the criticalvalue allows rejection of the hypothesis of a unit root and suggests that the series isstationary.
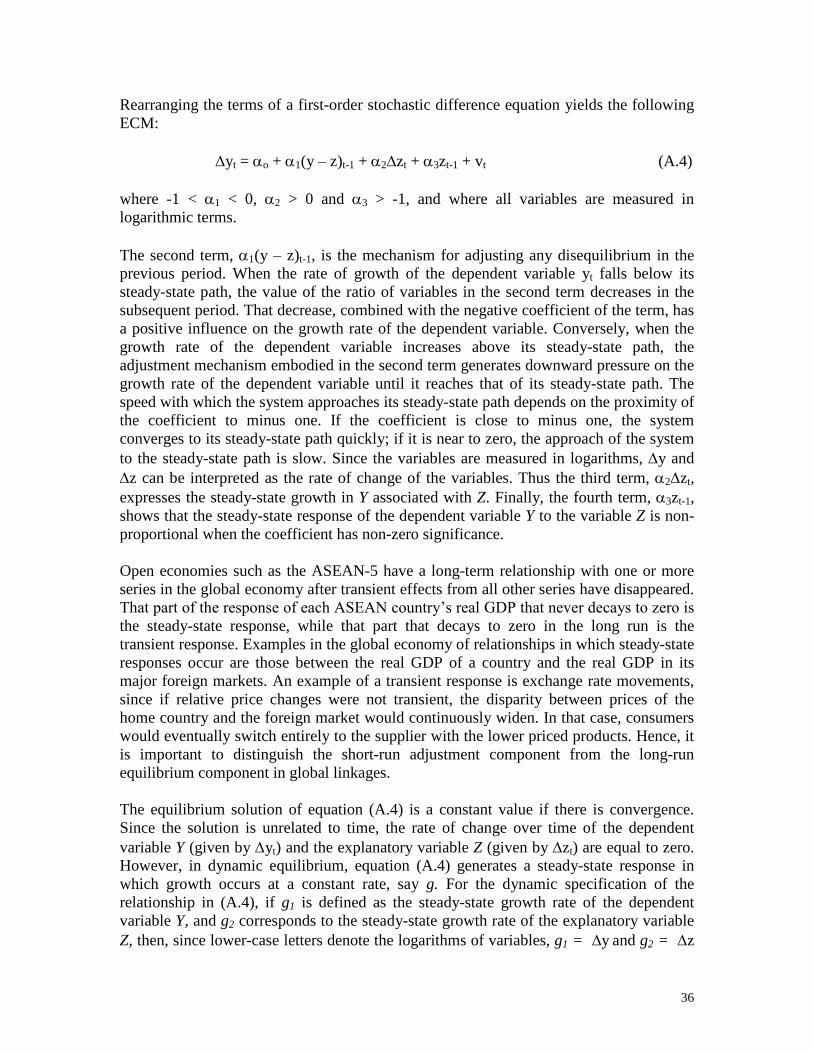
36
Rearranging the terms of a first-order stochastic difference equation yields the followingECM:
yt = o + 1(y–z)t-1 + 2zt + 3zt-1 + vt (A.4)
where -1 < 1 < 0, 2 > 0 and 3 > -1, and where all variables are measured inlogarithmic terms.
The second term, 1(y –z)t-1, is the mechanism for adjusting any disequilibrium in theprevious period. When the rate of growth of the dependent variable yt falls below itssteady-state path, the value of the ratio of variables in the second term decreases in thesubsequent period. That decrease, combined with the negative coefficient of the term, hasa positive influence on the growth rate of the dependent variable. Conversely, when thegrowth rate of the dependent variable increases above its steady-state path, theadjustment mechanism embodied in the second term generates downward pressure on thegrowth rate of the dependent variable until it reaches that of its steady-state path. Thespeed with which the system approaches its steady-state path depends on the proximity ofthe coefficient to minus one. If the coefficient is close to minus one, the systemconverges to its steady-state path quickly; if it is near to zero, the approach of the systemto the steady-state path is slow. Since the variables are measured in logarithms, y andz can be interpreted as the rate of change of the variables. Thus the third term, 2zt,expresses the steady-state growth in Y associated with Z. Finally, the fourth term, 3zt-1,shows that the steady-state response of the dependent variable Y to the variable Z is non-proportional when the coefficient has non-zero significance.
Open economies such as the ASEAN-5 have a long-term relationship with one or moreseries in the global economy after transient effects from all other series have disappeared.That part of the response of each ASEAN country’s real GDP that never decays to zero is the steady-state response, while that part that decays to zero in the long run is thetransient response. Examples in the global economy of relationships in which steady-stateresponses occur are those between the real GDP of a country and the real GDP in itsmajor foreign markets. An example of a transient response is exchange rate movements,since if relative price changes were not transient, the disparity between prices of thehome country and the foreign market would continuously widen. In that case, consumerswould eventually switch entirely to the supplier with the lower priced products. Hence, itis important to distinguish the short-run adjustment component from the long-runequilibrium component in global linkages.
The equilibrium solution of equation (A.4) is a constant value if there is convergence.Since the solution is unrelated to time, the rate of change over time of the dependentvariable Y (given by yt) and the explanatory variable Z (given by zt) are equal to zero.However, in dynamic equilibrium, equation (A.4) generates a steady-state response inwhich growth occurs at a constant rate, say g. For the dynamic specification of therelationship in (A.4), if g1 is defined as the steady-state growth rate of the dependentvariable Y, and g2 corresponds to the steady-state growth rate of the explanatory variableZ, then, since lower-case letters denote the logarithms of variables, g1 = y and g2 = z
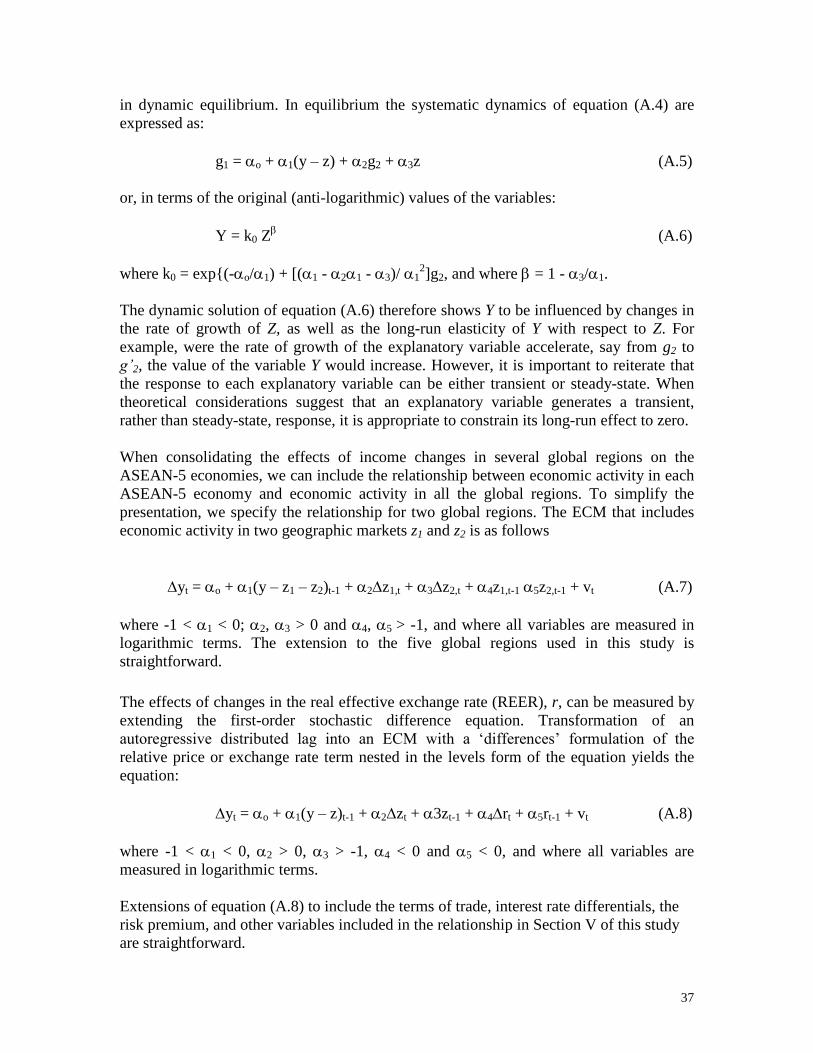
37
in dynamic equilibrium. In equilibrium the systematic dynamics of equation (A.4) areexpressed as:
g1 = o + 1(y–z) + 2g2 + 3z (A.5)
or, in terms of the original (anti-logarithmic) values of the variables:
Y = k0 Z (A.6)
where k0 = exp{(-o/1) + [(1 - 21 - 3)/ 12]g2, and where = 1 - 3/1.
The dynamic solution of equation (A.6) therefore shows Y to be influenced by changes inthe rate of growth of Z, as well as the long-run elasticity of Y with respect to Z. Forexample, were the rate of growth of the explanatory variable accelerate, say from g2 tog’2, the value of the variable Y would increase. However, it is important to reiterate thatthe response to each explanatory variable can be either transient or steady-state. Whentheoretical considerations suggest that an explanatory variable generates a transient,rather than steady-state, response, it is appropriate to constrain its long-run effect to zero.
When consolidating the effects of income changes in several global regions on theASEAN-5 economies, we can include the relationship between economic activity in eachASEAN-5 economy and economic activity in all the global regions. To simplify thepresentation, we specify the relationship for two global regions. The ECM that includeseconomic activity in two geographic markets z1 and z2 is as follows
yt = o + 1(y–z1–z2)t-1 + 2z1,t + 3z2,t + 4z1,t-1 5z2,t-1 + vt (A.7)
where -1 < 1 < 0; 2, 3 > 0 and 4, 5 > -1, and where all variables are measured inlogarithmic terms. The extension to the five global regions used in this study isstraightforward.
The effects of changes in the real effective exchange rate (REER), r, can be measured byextending the first-order stochastic difference equation. Transformation of anautoregressive distributed lag into an ECM with a ‘differences’ formulation of the relative price or exchange rate term nested in the levels form of the equation yields theequation:
yt = o + 1(y–z)t-1 + 2zt + 3zt-1 + 4rt + 5rt-1 + vt (A.8)
where -1 < 1 < 0, 2 > 0, 3 > -1, 4 < 0 and 5 < 0, and where all variables aremeasured in logarithmic terms.
Extensions of equation (A.8) to include the terms of trade, interest rate differentials, therisk premium, and other variables included in the relationship in Section V of this studyare straightforward.

Statistical Appendix
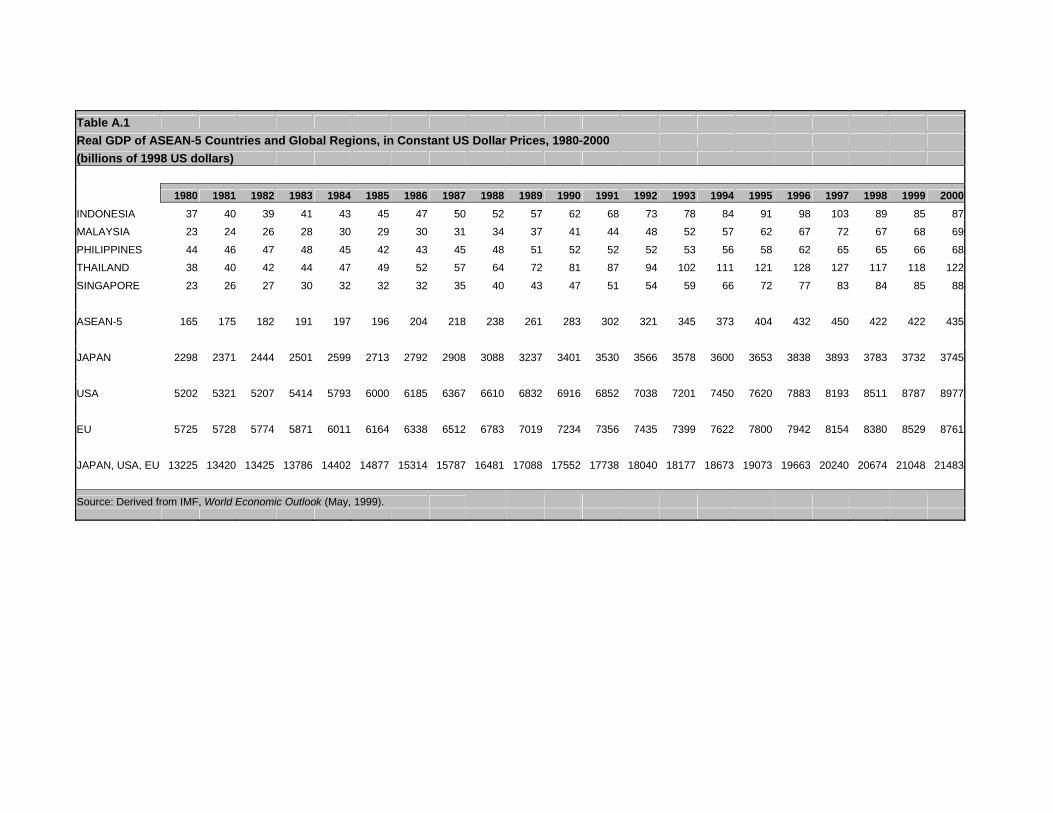
Table A.1Real GDP of ASEAN-5 Countries and Global Regions, in Constant US Dollar Prices, 1980-2000(billions of 1998 US dollars)
1980 1981 1982 1983 1984 1985 1986 1987 1988 1989 1990 1991 1992 1993 1994 1995 1996 1997 1998 1999 2000
INDONESIA 37 40 39 41 43 45 47 50 52 57 62 68 73 78 84 91 98 103 89 85 87
MALAYSIA 23 24 26 28 30 29 30 31 34 37 41 44 48 52 57 62 67 72 67 68 69
PHILIPPINES 44 46 47 48 45 42 43 45 48 51 52 52 52 53 56 58 62 65 65 66 68
THAILAND 38 40 42 44 47 49 52 57 64 72 81 87 94 102 111 121 128 127 117 118 122
SINGAPORE 23 26 27 30 32 32 32 35 40 43 47 51 54 59 66 72 77 83 84 85 88
ASEAN-5 165 175 182 191 197 196 204 218 238 261 283 302 321 345 373 404 432 450 422 422 435
JAPAN 2298 2371 2444 2501 2599 2713 2792 2908 3088 3237 3401 3530 3566 3578 3600 3653 3838 3893 3783 3732 3745
USA 5202 5321 5207 5414 5793 6000 6185 6367 6610 6832 6916 6852 7038 7201 7450 7620 7883 8193 8511 8787 8977
EU 5725 5728 5774 5871 6011 6164 6338 6512 6783 7019 7234 7356 7435 7399 7622 7800 7942 8154 8380 8529 8761
JAPAN, USA, EU 13225 13420 13425 13786 14402 14877 15314 15787 16481 17088 17552 17738 18040 18177 18673 19073 19663 20240 20674 21048 21483
Source: Derived from IMF, World Economic Outlook (May, 1999).
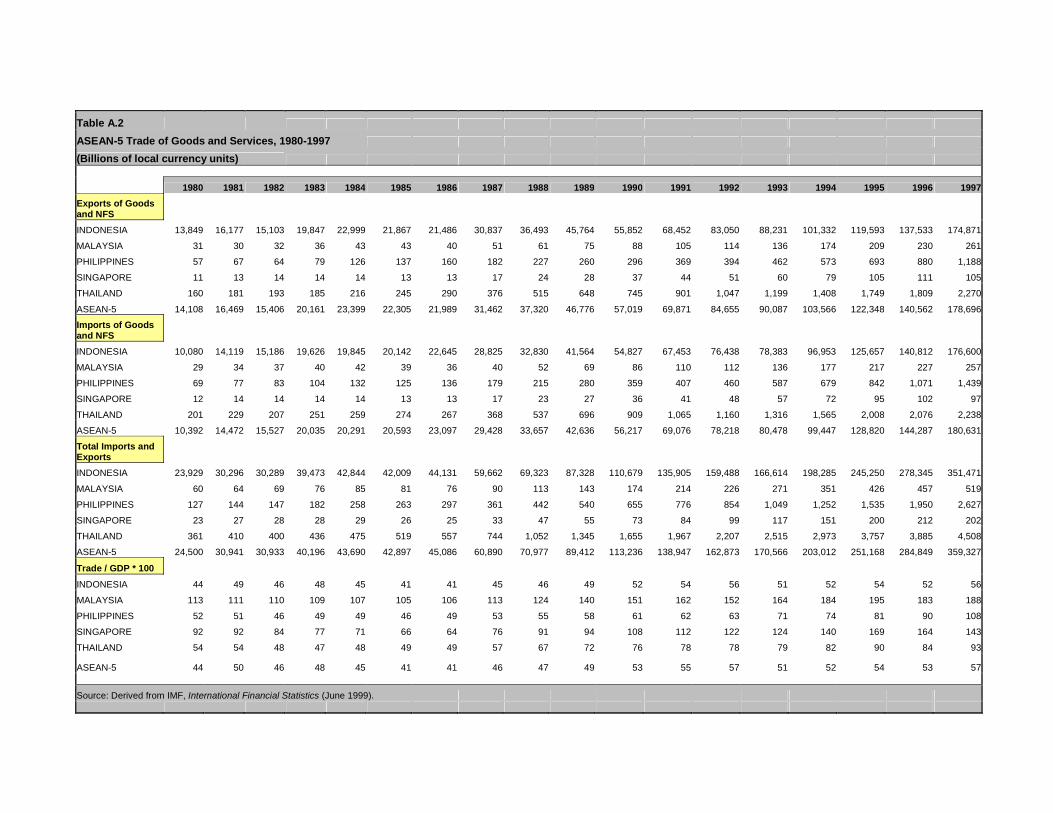
Table A.2
ASEAN-5 Trade of Goods and Services, 1980-1997
(Billions of local currency units)
1980 1981 1982 1983 1984 1985 1986 1987 1988 1989 1990 1991 1992 1993 1994 1995 1996 1997
Exports of Goodsand NFS
INDONESIA 13,849 16,177 15,103 19,847 22,999 21,867 21,486 30,837 36,493 45,764 55,852 68,452 83,050 88,231 101,332 119,593 137,533 174,871
MALAYSIA 31 30 32 36 43 43 40 51 61 75 88 105 114 136 174 209 230 261
PHILIPPINES 57 67 64 79 126 137 160 182 227 260 296 369 394 462 573 693 880 1,188
SINGAPORE 11 13 14 14 14 13 13 17 24 28 37 44 51 60 79 105 111 105
THAILAND 160 181 193 185 216 245 290 376 515 648 745 901 1,047 1,199 1,408 1,749 1,809 2,270
ASEAN-5 14,108 16,469 15,406 20,161 23,399 22,305 21,989 31,462 37,320 46,776 57,019 69,871 84,655 90,087 103,566 122,348 140,562 178,696
Imports of Goodsand NFS
INDONESIA 10,080 14,119 15,186 19,626 19,845 20,142 22,645 28,825 32,830 41,564 54,827 67,453 76,438 78,383 96,953 125,657 140,812 176,600
MALAYSIA 29 34 37 40 42 39 36 40 52 69 86 110 112 136 177 217 227 257
PHILIPPINES 69 77 83 104 132 125 136 179 215 280 359 407 460 587 679 842 1,071 1,439
SINGAPORE 12 14 14 14 14 13 13 17 23 27 36 41 48 57 72 95 102 97
THAILAND 201 229 207 251 259 274 267 368 537 696 909 1,065 1,160 1,316 1,565 2,008 2,076 2,238
ASEAN-5 10,392 14,472 15,527 20,035 20,291 20,593 23,097 29,428 33,657 42,636 56,217 69,076 78,218 80,478 99,447 128,820 144,287 180,631
Total Imports andExports
INDONESIA 23,929 30,296 30,289 39,473 42,844 42,009 44,131 59,662 69,323 87,328 110,679 135,905 159,488 166,614 198,285 245,250 278,345 351,471
MALAYSIA 60 64 69 76 85 81 76 90 113 143 174 214 226 271 351 426 457 519
PHILIPPINES 127 144 147 182 258 263 297 361 442 540 655 776 854 1,049 1,252 1,535 1,950 2,627
SINGAPORE 23 27 28 28 29 26 25 33 47 55 73 84 99 117 151 200 212 202
THAILAND 361 410 400 436 475 519 557 744 1,052 1,345 1,655 1,967 2,207 2,515 2,973 3,757 3,885 4,508
ASEAN-5 24,500 30,941 30,933 40,196 43,690 42,897 45,086 60,890 70,977 89,412 113,236 138,947 162,873 170,566 203,012 251,168 284,849 359,327
Trade / GDP * 100
INDONESIA 44 49 46 48 45 41 41 45 46 49 52 54 56 51 52 54 52 56
MALAYSIA 113 111 110 109 107 105 106 113 124 140 151 162 152 164 184 195 183 188
PHILIPPINES 52 51 46 49 49 46 49 53 55 58 61 62 63 71 74 81 90 108
SINGAPORE 92 92 84 77 71 66 64 76 91 94 108 112 122 124 140 169 164 143
THAILAND 54 54 48 47 48 49 49 57 67 72 76 78 78 79 82 90 84 93
ASEAN-5 44 50 46 48 45 41 41 46 47 49 53 55 57 51 52 54 53 57
Source: Derived from IMF, International Financial Statistics (June 1999).
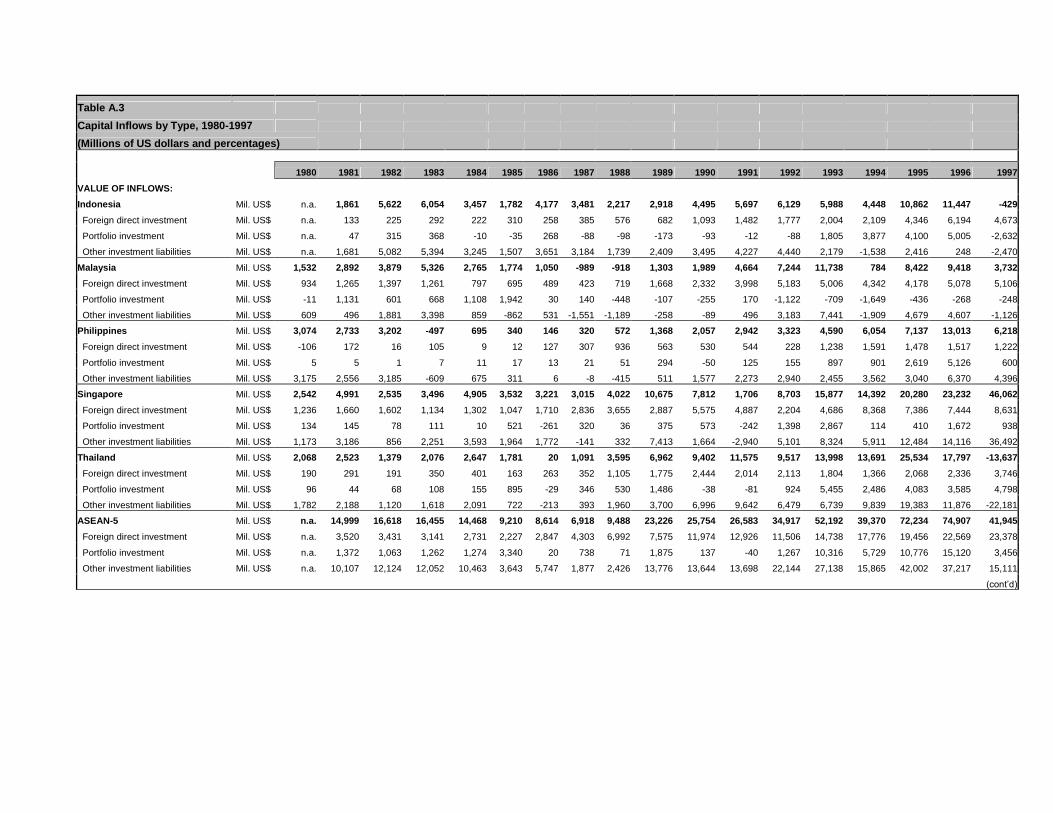
Table A.3
Capital Inflows by Type, 1980-1997
(Millions of US dollars and percentages)
1980 1981 1982 1983 1984 1985 1986 1987 1988 1989 1990 1991 1992 1993 1994 1995 1996 1997
VALUE OF INFLOWS:
Indonesia Mil. US$ n.a. 1,861 5,622 6,054 3,457 1,782 4,177 3,481 2,217 2,918 4,495 5,697 6,129 5,988 4,448 10,862 11,447 -429
Foreign direct investment Mil. US$ n.a. 133 225 292 222 310 258 385 576 682 1,093 1,482 1,777 2,004 2,109 4,346 6,194 4,673
Portfolio investment Mil. US$ n.a. 47 315 368 -10 -35 268 -88 -98 -173 -93 -12 -88 1,805 3,877 4,100 5,005 -2,632
Other investment liabilities Mil. US$ n.a. 1,681 5,082 5,394 3,245 1,507 3,651 3,184 1,739 2,409 3,495 4,227 4,440 2,179 -1,538 2,416 248 -2,470
Malaysia Mil. US$ 1,532 2,892 3,879 5,326 2,765 1,774 1,050 -989 -918 1,303 1,989 4,664 7,244 11,738 784 8,422 9,418 3,732
Foreign direct investment Mil. US$ 934 1,265 1,397 1,261 797 695 489 423 719 1,668 2,332 3,998 5,183 5,006 4,342 4,178 5,078 5,106
Portfolio investment Mil. US$ -11 1,131 601 668 1,108 1,942 30 140 -448 -107 -255 170 -1,122 -709 -1,649 -436 -268 -248
Other investment liabilities Mil. US$ 609 496 1,881 3,398 859 -862 531 -1,551 -1,189 -258 -89 496 3,183 7,441 -1,909 4,679 4,607 -1,126
Philippines Mil. US$ 3,074 2,733 3,202 -497 695 340 146 320 572 1,368 2,057 2,942 3,323 4,590 6,054 7,137 13,013 6,218
Foreign direct investment Mil. US$ -106 172 16 105 9 12 127 307 936 563 530 544 228 1,238 1,591 1,478 1,517 1,222
Portfolio investment Mil. US$ 5 5 1 7 11 17 13 21 51 294 -50 125 155 897 901 2,619 5,126 600
Other investment liabilities Mil. US$ 3,175 2,556 3,185 -609 675 311 6 -8 -415 511 1,577 2,273 2,940 2,455 3,562 3,040 6,370 4,396
Singapore Mil. US$ 2,542 4,991 2,535 3,496 4,905 3,532 3,221 3,015 4,022 10,675 7,812 1,706 8,703 15,877 14,392 20,280 23,232 46,062
Foreign direct investment Mil. US$ 1,236 1,660 1,602 1,134 1,302 1,047 1,710 2,836 3,655 2,887 5,575 4,887 2,204 4,686 8,368 7,386 7,444 8,631
Portfolio investment Mil. US$ 134 145 78 111 10 521 -261 320 36 375 573 -242 1,398 2,867 114 410 1,672 938
Other investment liabilities Mil. US$ 1,173 3,186 856 2,251 3,593 1,964 1,772 -141 332 7,413 1,664 -2,940 5,101 8,324 5,911 12,484 14,116 36,492
Thailand Mil. US$ 2,068 2,523 1,379 2,076 2,647 1,781 20 1,091 3,595 6,962 9,402 11,575 9,517 13,998 13,691 25,534 17,797 -13,637
Foreign direct investment Mil. US$ 190 291 191 350 401 163 263 352 1,105 1,775 2,444 2,014 2,113 1,804 1,366 2,068 2,336 3,746
Portfolio investment Mil. US$ 96 44 68 108 155 895 -29 346 530 1,486 -38 -81 924 5,455 2,486 4,083 3,585 4,798
Other investment liabilities Mil. US$ 1,782 2,188 1,120 1,618 2,091 722 -213 393 1,960 3,700 6,996 9,642 6,479 6,739 9,839 19,383 11,876 -22,181
ASEAN-5 Mil. US$ n.a. 14,999 16,618 16,455 14,468 9,210 8,614 6,918 9,488 23,226 25,754 26,583 34,917 52,192 39,370 72,234 74,907 41,945
Foreign direct investment Mil. US$ n.a. 3,520 3,431 3,141 2,731 2,227 2,847 4,303 6,992 7,575 11,974 12,926 11,506 14,738 17,776 19,456 22,569 23,378
Portfolio investment Mil. US$ n.a. 1,372 1,063 1,262 1,274 3,340 20 738 71 1,875 137 -40 1,267 10,316 5,729 10,776 15,120 3,456
Other investment liabilities Mil. US$ n.a. 10,107 12,124 12,052 10,463 3,643 5,747 1,877 2,426 13,776 13,644 13,698 22,144 27,138 15,865 42,002 37,217 15,111
(cont’d)
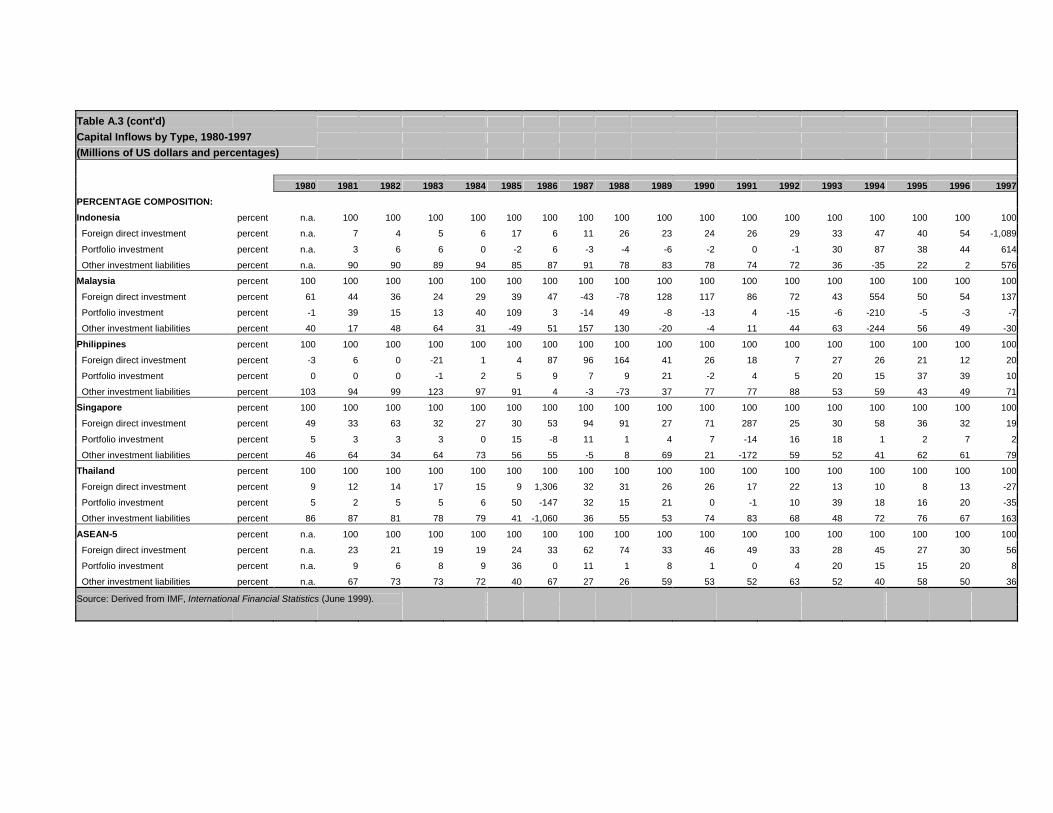
Table A.3 (cont'd)Capital Inflows by Type, 1980-1997(Millions of US dollars and percentages)
1980 1981 1982 1983 1984 1985 1986 1987 1988 1989 1990 1991 1992 1993 1994 1995 1996 1997
PERCENTAGE COMPOSITION:
Indonesia percent n.a. 100 100 100 100 100 100 100 100 100 100 100 100 100 100 100 100 100
Foreign direct investment percent n.a. 7 4 5 6 17 6 11 26 23 24 26 29 33 47 40 54 -1,089
Portfolio investment percent n.a. 3 6 6 0 -2 6 -3 -4 -6 -2 0 -1 30 87 38 44 614
Other investment liabilities percent n.a. 90 90 89 94 85 87 91 78 83 78 74 72 36 -35 22 2 576
Malaysia percent 100 100 100 100 100 100 100 100 100 100 100 100 100 100 100 100 100 100
Foreign direct investment percent 61 44 36 24 29 39 47 -43 -78 128 117 86 72 43 554 50 54 137
Portfolio investment percent -1 39 15 13 40 109 3 -14 49 -8 -13 4 -15 -6 -210 -5 -3 -7
Other investment liabilities percent 40 17 48 64 31 -49 51 157 130 -20 -4 11 44 63 -244 56 49 -30
Philippines percent 100 100 100 100 100 100 100 100 100 100 100 100 100 100 100 100 100 100
Foreign direct investment percent -3 6 0 -21 1 4 87 96 164 41 26 18 7 27 26 21 12 20
Portfolio investment percent 0 0 0 -1 2 5 9 7 9 21 -2 4 5 20 15 37 39 10
Other investment liabilities percent 103 94 99 123 97 91 4 -3 -73 37 77 77 88 53 59 43 49 71
Singapore percent 100 100 100 100 100 100 100 100 100 100 100 100 100 100 100 100 100 100
Foreign direct investment percent 49 33 63 32 27 30 53 94 91 27 71 287 25 30 58 36 32 19
Portfolio investment percent 5 3 3 3 0 15 -8 11 1 4 7 -14 16 18 1 2 7 2
Other investment liabilities percent 46 64 34 64 73 56 55 -5 8 69 21 -172 59 52 41 62 61 79
Thailand percent 100 100 100 100 100 100 100 100 100 100 100 100 100 100 100 100 100 100
Foreign direct investment percent 9 12 14 17 15 9 1,306 32 31 26 26 17 22 13 10 8 13 -27
Portfolio investment percent 5 2 5 5 6 50 -147 32 15 21 0 -1 10 39 18 16 20 -35
Other investment liabilities percent 86 87 81 78 79 41 -1,060 36 55 53 74 83 68 48 72 76 67 163
ASEAN-5 percent n.a. 100 100 100 100 100 100 100 100 100 100 100 100 100 100 100 100 100
Foreign direct investment percent n.a. 23 21 19 19 24 33 62 74 33 46 49 33 28 45 27 30 56
Portfolio investment percent n.a. 9 6 8 9 36 0 11 1 8 1 0 4 20 15 15 20 8
Other investment liabilities percent n.a. 67 73 73 72 40 67 27 26 59 53 52 63 52 40 58 50 36
Source: Derived from IMF, International Financial Statistics (June 1999).
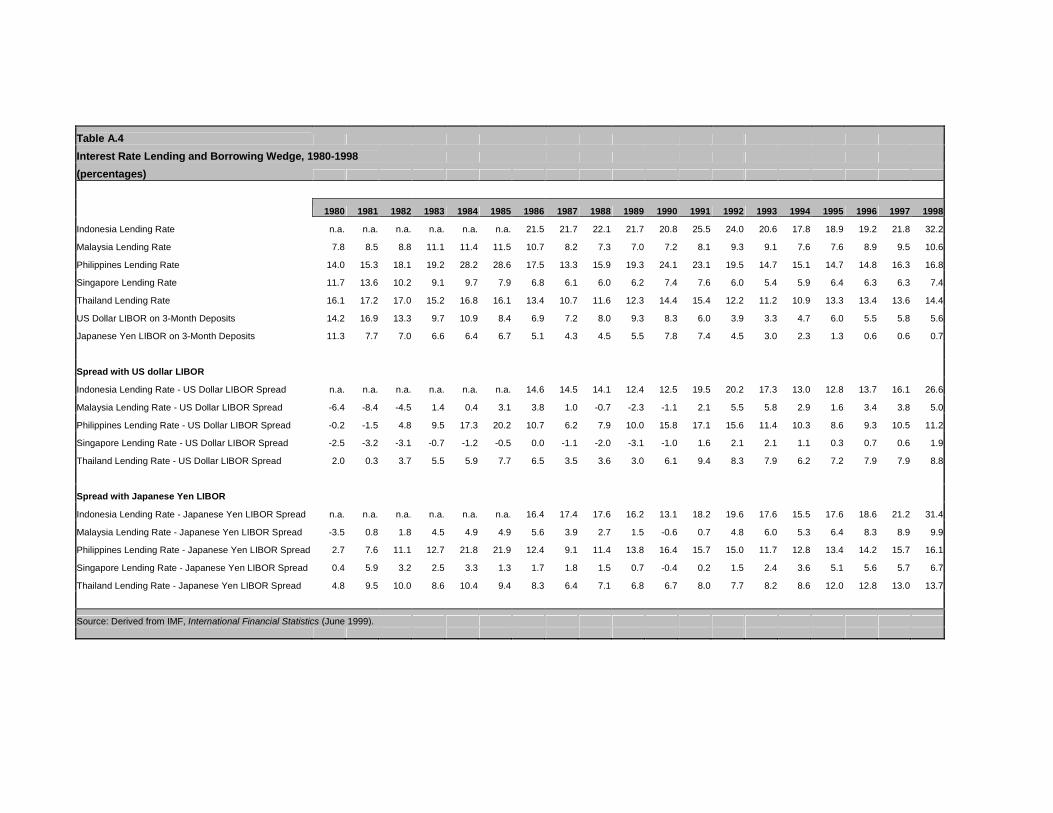
Table A.4
Interest Rate Lending and Borrowing Wedge, 1980-1998
(percentages)
1980 1981 1982 1983 1984 1985 1986 1987 1988 1989 1990 1991 1992 1993 1994 1995 1996 1997 1998
Indonesia Lending Rate n.a. n.a. n.a. n.a. n.a. n.a. 21.5 21.7 22.1 21.7 20.8 25.5 24.0 20.6 17.8 18.9 19.2 21.8 32.2
Malaysia Lending Rate 7.8 8.5 8.8 11.1 11.4 11.5 10.7 8.2 7.3 7.0 7.2 8.1 9.3 9.1 7.6 7.6 8.9 9.5 10.6
Philippines Lending Rate 14.0 15.3 18.1 19.2 28.2 28.6 17.5 13.3 15.9 19.3 24.1 23.1 19.5 14.7 15.1 14.7 14.8 16.3 16.8
Singapore Lending Rate 11.7 13.6 10.2 9.1 9.7 7.9 6.8 6.1 6.0 6.2 7.4 7.6 6.0 5.4 5.9 6.4 6.3 6.3 7.4
Thailand Lending Rate 16.1 17.2 17.0 15.2 16.8 16.1 13.4 10.7 11.6 12.3 14.4 15.4 12.2 11.2 10.9 13.3 13.4 13.6 14.4
US Dollar LIBOR on 3-Month Deposits 14.2 16.9 13.3 9.7 10.9 8.4 6.9 7.2 8.0 9.3 8.3 6.0 3.9 3.3 4.7 6.0 5.5 5.8 5.6
Japanese Yen LIBOR on 3-Month Deposits 11.3 7.7 7.0 6.6 6.4 6.7 5.1 4.3 4.5 5.5 7.8 7.4 4.5 3.0 2.3 1.3 0.6 0.6 0.7
Spread with US dollar LIBOR
Indonesia Lending Rate - US Dollar LIBOR Spread n.a. n.a. n.a. n.a. n.a. n.a. 14.6 14.5 14.1 12.4 12.5 19.5 20.2 17.3 13.0 12.8 13.7 16.1 26.6
Malaysia Lending Rate - US Dollar LIBOR Spread -6.4 -8.4 -4.5 1.4 0.4 3.1 3.8 1.0 -0.7 -2.3 -1.1 2.1 5.5 5.8 2.9 1.6 3.4 3.8 5.0
Philippines Lending Rate - US Dollar LIBOR Spread -0.2 -1.5 4.8 9.5 17.3 20.2 10.7 6.2 7.9 10.0 15.8 17.1 15.6 11.4 10.3 8.6 9.3 10.5 11.2
Singapore Lending Rate - US Dollar LIBOR Spread -2.5 -3.2 -3.1 -0.7 -1.2 -0.5 0.0 -1.1 -2.0 -3.1 -1.0 1.6 2.1 2.1 1.1 0.3 0.7 0.6 1.9
Thailand Lending Rate - US Dollar LIBOR Spread 2.0 0.3 3.7 5.5 5.9 7.7 6.5 3.5 3.6 3.0 6.1 9.4 8.3 7.9 6.2 7.2 7.9 7.9 8.8
Spread with Japanese Yen LIBOR
Indonesia Lending Rate - Japanese Yen LIBOR Spread n.a. n.a. n.a. n.a. n.a. n.a. 16.4 17.4 17.6 16.2 13.1 18.2 19.6 17.6 15.5 17.6 18.6 21.2 31.4
Malaysia Lending Rate - Japanese Yen LIBOR Spread -3.5 0.8 1.8 4.5 4.9 4.9 5.6 3.9 2.7 1.5 -0.6 0.7 4.8 6.0 5.3 6.4 8.3 8.9 9.9
Philippines Lending Rate - Japanese Yen LIBOR Spread 2.7 7.6 11.1 12.7 21.8 21.9 12.4 9.1 11.4 13.8 16.4 15.7 15.0 11.7 12.8 13.4 14.2 15.7 16.1
Singapore Lending Rate - Japanese Yen LIBOR Spread 0.4 5.9 3.2 2.5 3.3 1.3 1.7 1.8 1.5 0.7 -0.4 0.2 1.5 2.4 3.6 5.1 5.6 5.7 6.7
Thailand Lending Rate - Japanese Yen LIBOR Spread 4.8 9.5 10.0 8.6 10.4 9.4 8.3 6.4 7.1 6.8 6.7 8.0 7.7 8.2 8.6 12.0 12.8 13.0 13.7
Source: Derived from IMF, International Financial Statistics (June 1999).
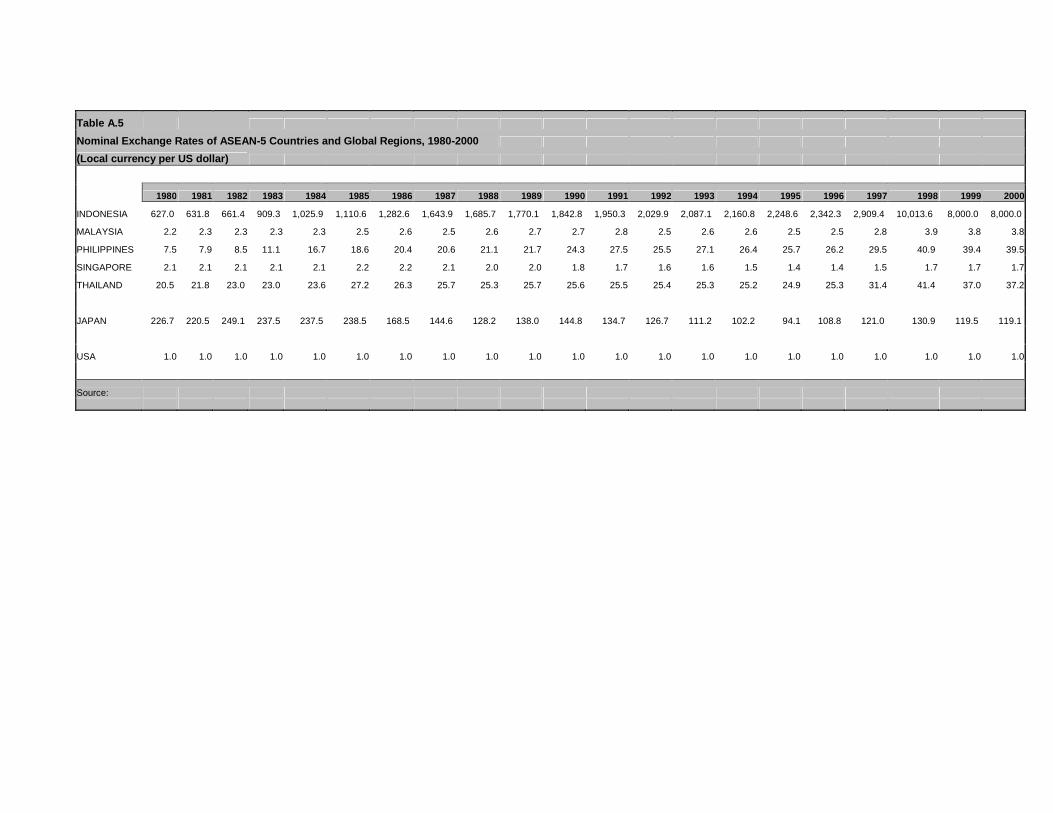
Table A.5
Nominal Exchange Rates of ASEAN-5 Countries and Global Regions, 1980-2000
(Local currency per US dollar)
1980 1981 1982 1983 1984 1985 1986 1987 1988 1989 1990 1991 1992 1993 1994 1995 1996 1997 1998 1999 2000
INDONESIA 627.0 631.8 661.4 909.3 1,025.9 1,110.6 1,282.6 1,643.9 1,685.7 1,770.1 1,842.8 1,950.3 2,029.9 2,087.1 2,160.8 2,248.6 2,342.3 2,909.4 10,013.6 8,000.0 8,000.0
MALAYSIA 2.2 2.3 2.3 2.3 2.3 2.5 2.6 2.5 2.6 2.7 2.7 2.8 2.5 2.6 2.6 2.5 2.5 2.8 3.9 3.8 3.8
PHILIPPINES 7.5 7.9 8.5 11.1 16.7 18.6 20.4 20.6 21.1 21.7 24.3 27.5 25.5 27.1 26.4 25.7 26.2 29.5 40.9 39.4 39.5
SINGAPORE 2.1 2.1 2.1 2.1 2.1 2.2 2.2 2.1 2.0 2.0 1.8 1.7 1.6 1.6 1.5 1.4 1.4 1.5 1.7 1.7 1.7
THAILAND 20.5 21.8 23.0 23.0 23.6 27.2 26.3 25.7 25.3 25.7 25.6 25.5 25.4 25.3 25.2 24.9 25.3 31.4 41.4 37.0 37.2
JAPAN 226.7 220.5 249.1 237.5 237.5 238.5 168.5 144.6 128.2 138.0 144.8 134.7 126.7 111.2 102.2 94.1 108.8 121.0 130.9 119.5 119.1
USA 1.0 1.0 1.0 1.0 1.0 1.0 1.0 1.0 1.0 1.0 1.0 1.0 1.0 1.0 1.0 1.0 1.0 1.0 1.0 1.0 1.0
Source:
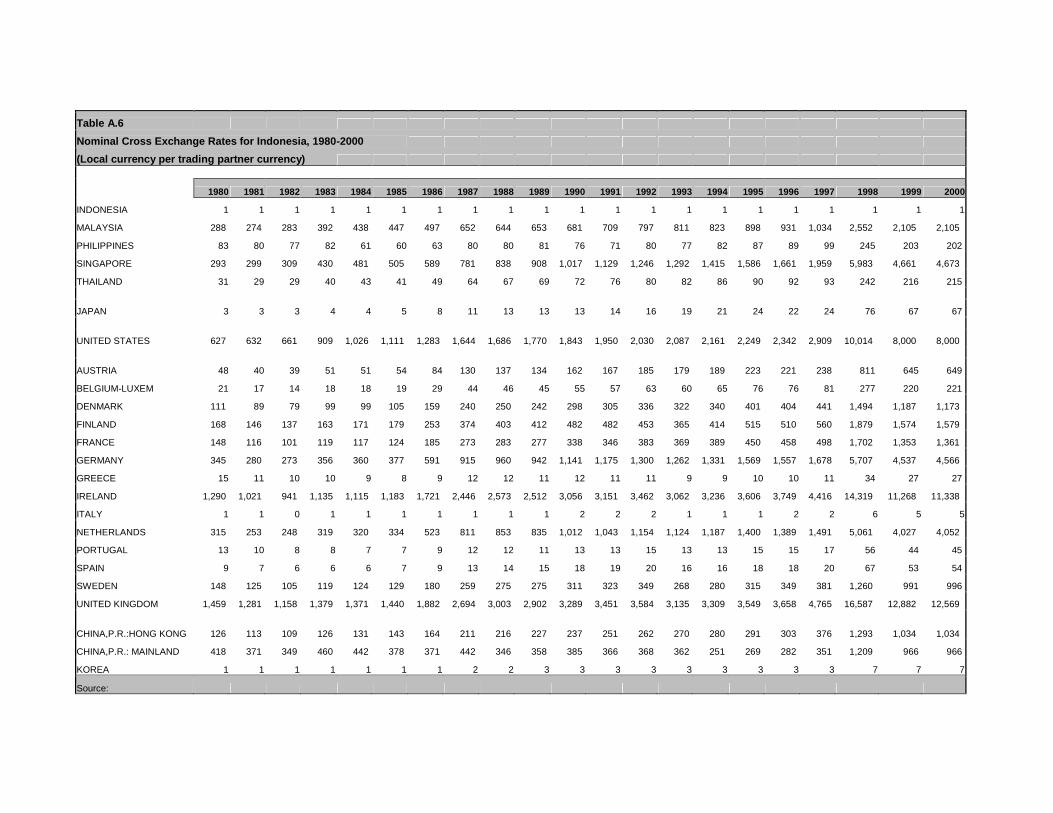
Table A.6
Nominal Cross Exchange Rates for Indonesia, 1980-2000
(Local currency per trading partner currency)
1980 1981 1982 1983 1984 1985 1986 1987 1988 1989 1990 1991 1992 1993 1994 1995 1996 1997 1998 1999 2000
INDONESIA 1 1 1 1 1 1 1 1 1 1 1 1 1 1 1 1 1 1 1 1 1
MALAYSIA 288 274 283 392 438 447 497 652 644 653 681 709 797 811 823 898 931 1,034 2,552 2,105 2,105
PHILIPPINES 83 80 77 82 61 60 63 80 80 81 76 71 80 77 82 87 89 99 245 203 202
SINGAPORE 293 299 309 430 481 505 589 781 838 908 1,017 1,129 1,246 1,292 1,415 1,586 1,661 1,959 5,983 4,661 4,673
THAILAND 31 29 29 40 43 41 49 64 67 69 72 76 80 82 86 90 92 93 242 216 215
JAPAN 3 3 3 4 4 5 8 11 13 13 13 14 16 19 21 24 22 24 76 67 67
UNITED STATES 627 632 661 909 1,026 1,111 1,283 1,644 1,686 1,770 1,843 1,950 2,030 2,087 2,161 2,249 2,342 2,909 10,014 8,000 8,000
AUSTRIA 48 40 39 51 51 54 84 130 137 134 162 167 185 179 189 223 221 238 811 645 649
BELGIUM-LUXEM 21 17 14 18 18 19 29 44 46 45 55 57 63 60 65 76 76 81 277 220 221
DENMARK 111 89 79 99 99 105 159 240 250 242 298 305 336 322 340 401 404 441 1,494 1,187 1,173
FINLAND 168 146 137 163 171 179 253 374 403 412 482 482 453 365 414 515 510 560 1,879 1,574 1,579
FRANCE 148 116 101 119 117 124 185 273 283 277 338 346 383 369 389 450 458 498 1,702 1,353 1,361
GERMANY 345 280 273 356 360 377 591 915 960 942 1,141 1,175 1,300 1,262 1,331 1,569 1,557 1,678 5,707 4,537 4,566
GREECE 15 11 10 10 9 8 9 12 12 11 12 11 11 9 9 10 10 11 34 27 27
IRELAND 1,290 1,021 941 1,135 1,115 1,183 1,721 2,446 2,573 2,512 3,056 3,151 3,462 3,062 3,236 3,606 3,749 4,416 14,319 11,268 11,338
ITALY 1 1 0 1 1 1 1 1 1 1 2 2 2 1 1 1 2 2 6 5 5
NETHERLANDS 315 253 248 319 320 334 523 811 853 835 1,012 1,043 1,154 1,124 1,187 1,400 1,389 1,491 5,061 4,027 4,052
PORTUGAL 13 10 8 8 7 7 9 12 12 11 13 13 15 13 13 15 15 17 56 44 45
SPAIN 9 7 6 6 6 7 9 13 14 15 18 19 20 16 16 18 18 20 67 53 54
SWEDEN 148 125 105 119 124 129 180 259 275 275 311 323 349 268 280 315 349 381 1,260 991 996
UNITED KINGDOM 1,459 1,281 1,158 1,379 1,371 1,440 1,882 2,694 3,003 2,902 3,289 3,451 3,584 3,135 3,309 3,549 3,658 4,765 16,587 12,882 12,569
CHINA,P.R.:HONG KONG 126 113 109 126 131 143 164 211 216 227 237 251 262 270 280 291 303 376 1,293 1,034 1,034
CHINA,P.R.: MAINLAND 418 371 349 460 442 378 371 442 346 358 385 366 368 362 251 269 282 351 1,209 966 966
KOREA 1 1 1 1 1 1 1 2 2 3 3 3 3 3 3 3 3 3 7 7 7
Source:
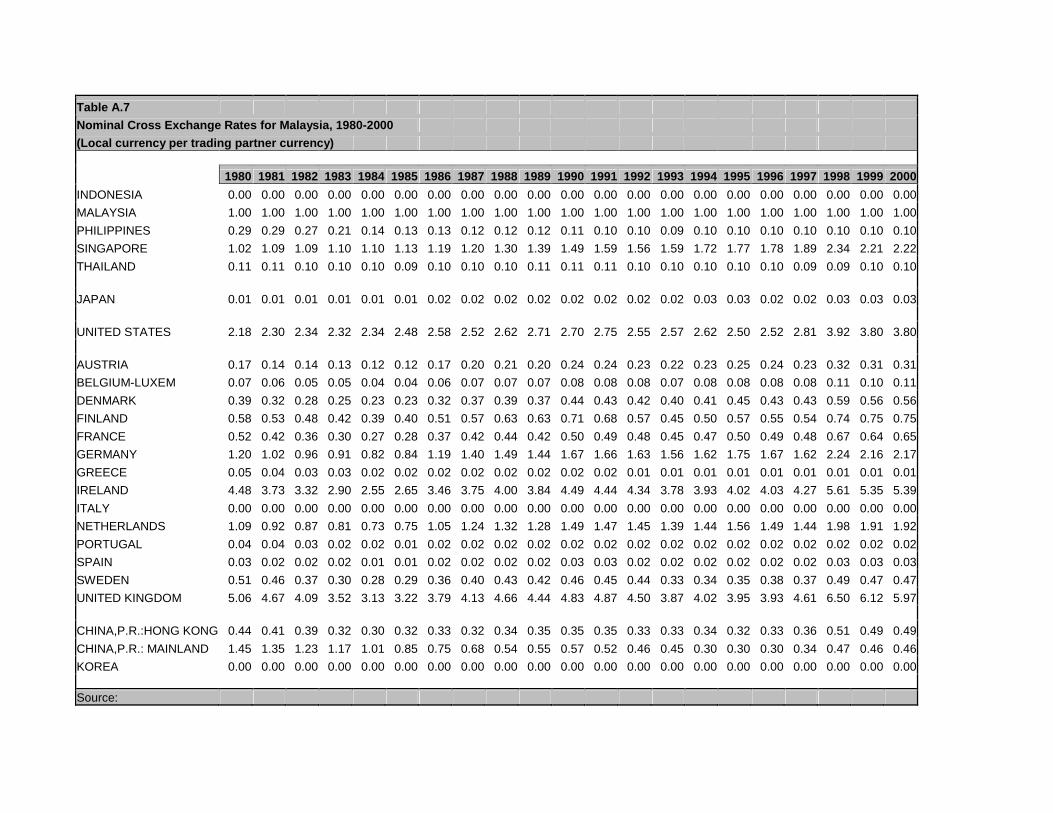
Table A.7Nominal Cross Exchange Rates for Malaysia, 1980-2000(Local currency per trading partner currency)
1980 1981 1982 1983 1984 1985 1986 1987 1988 1989 1990 1991 1992 1993 1994 1995 1996 1997 1998 1999 2000
INDONESIA 0.00 0.00 0.00 0.00 0.00 0.00 0.00 0.00 0.00 0.00 0.00 0.00 0.00 0.00 0.00 0.00 0.00 0.00 0.00 0.00 0.00MALAYSIA 1.00 1.00 1.00 1.00 1.00 1.00 1.00 1.00 1.00 1.00 1.00 1.00 1.00 1.00 1.00 1.00 1.00 1.00 1.00 1.00 1.00PHILIPPINES 0.29 0.29 0.27 0.21 0.14 0.13 0.13 0.12 0.12 0.12 0.11 0.10 0.10 0.09 0.10 0.10 0.10 0.10 0.10 0.10 0.10SINGAPORE 1.02 1.09 1.09 1.10 1.10 1.13 1.19 1.20 1.30 1.39 1.49 1.59 1.56 1.59 1.72 1.77 1.78 1.89 2.34 2.21 2.22THAILAND 0.11 0.11 0.10 0.10 0.10 0.09 0.10 0.10 0.10 0.11 0.11 0.11 0.10 0.10 0.10 0.10 0.10 0.09 0.09 0.10 0.10
JAPAN 0.01 0.01 0.01 0.01 0.01 0.01 0.02 0.02 0.02 0.02 0.02 0.02 0.02 0.02 0.03 0.03 0.02 0.02 0.03 0.03 0.03
UNITED STATES 2.18 2.30 2.34 2.32 2.34 2.48 2.58 2.52 2.62 2.71 2.70 2.75 2.55 2.57 2.62 2.50 2.52 2.81 3.92 3.80 3.80
AUSTRIA 0.17 0.14 0.14 0.13 0.12 0.12 0.17 0.20 0.21 0.20 0.24 0.24 0.23 0.22 0.23 0.25 0.24 0.23 0.32 0.31 0.31BELGIUM-LUXEM 0.07 0.06 0.05 0.05 0.04 0.04 0.06 0.07 0.07 0.07 0.08 0.08 0.08 0.07 0.08 0.08 0.08 0.08 0.11 0.10 0.11DENMARK 0.39 0.32 0.28 0.25 0.23 0.23 0.32 0.37 0.39 0.37 0.44 0.43 0.42 0.40 0.41 0.45 0.43 0.43 0.59 0.56 0.56FINLAND 0.58 0.53 0.48 0.42 0.39 0.40 0.51 0.57 0.63 0.63 0.71 0.68 0.57 0.45 0.50 0.57 0.55 0.54 0.74 0.75 0.75FRANCE 0.52 0.42 0.36 0.30 0.27 0.28 0.37 0.42 0.44 0.42 0.50 0.49 0.48 0.45 0.47 0.50 0.49 0.48 0.67 0.64 0.65GERMANY 1.20 1.02 0.96 0.91 0.82 0.84 1.19 1.40 1.49 1.44 1.67 1.66 1.63 1.56 1.62 1.75 1.67 1.62 2.24 2.16 2.17GREECE 0.05 0.04 0.03 0.03 0.02 0.02 0.02 0.02 0.02 0.02 0.02 0.02 0.01 0.01 0.01 0.01 0.01 0.01 0.01 0.01 0.01IRELAND 4.48 3.73 3.32 2.90 2.55 2.65 3.46 3.75 4.00 3.84 4.49 4.44 4.34 3.78 3.93 4.02 4.03 4.27 5.61 5.35 5.39ITALY 0.00 0.00 0.00 0.00 0.00 0.00 0.00 0.00 0.00 0.00 0.00 0.00 0.00 0.00 0.00 0.00 0.00 0.00 0.00 0.00 0.00NETHERLANDS 1.09 0.92 0.87 0.81 0.73 0.75 1.05 1.24 1.32 1.28 1.49 1.47 1.45 1.39 1.44 1.56 1.49 1.44 1.98 1.91 1.92PORTUGAL 0.04 0.04 0.03 0.02 0.02 0.01 0.02 0.02 0.02 0.02 0.02 0.02 0.02 0.02 0.02 0.02 0.02 0.02 0.02 0.02 0.02SPAIN 0.03 0.02 0.02 0.02 0.01 0.01 0.02 0.02 0.02 0.02 0.03 0.03 0.02 0.02 0.02 0.02 0.02 0.02 0.03 0.03 0.03SWEDEN 0.51 0.46 0.37 0.30 0.28 0.29 0.36 0.40 0.43 0.42 0.46 0.45 0.44 0.33 0.34 0.35 0.38 0.37 0.49 0.47 0.47UNITED KINGDOM 5.06 4.67 4.09 3.52 3.13 3.22 3.79 4.13 4.66 4.44 4.83 4.87 4.50 3.87 4.02 3.95 3.93 4.61 6.50 6.12 5.97
CHINA,P.R.:HONG KONG 0.44 0.41 0.39 0.32 0.30 0.32 0.33 0.32 0.34 0.35 0.35 0.35 0.33 0.33 0.34 0.32 0.33 0.36 0.51 0.49 0.49CHINA,P.R.: MAINLAND 1.45 1.35 1.23 1.17 1.01 0.85 0.75 0.68 0.54 0.55 0.57 0.52 0.46 0.45 0.30 0.30 0.30 0.34 0.47 0.46 0.46KOREA 0.00 0.00 0.00 0.00 0.00 0.00 0.00 0.00 0.00 0.00 0.00 0.00 0.00 0.00 0.00 0.00 0.00 0.00 0.00 0.00 0.00
Source:
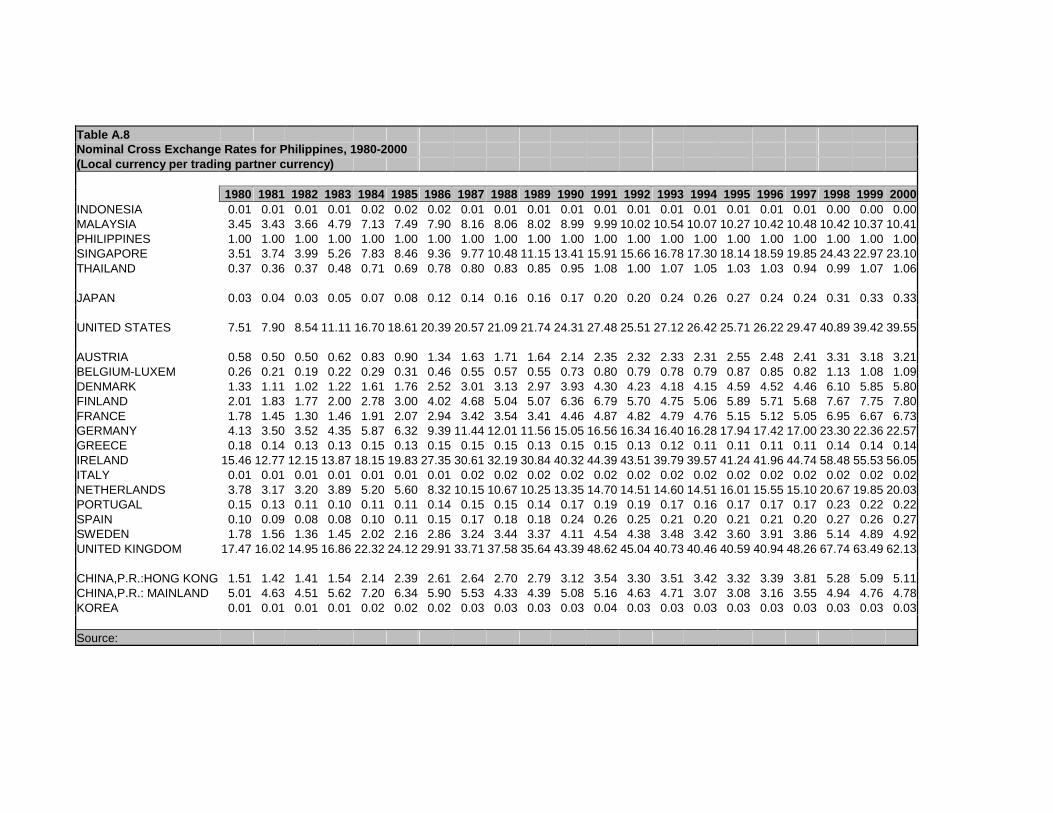
Table A.8Nominal Cross Exchange Rates for Philippines, 1980-2000(Local currency per trading partner currency)
1980 1981 1982 1983 1984 1985 1986 1987 1988 1989 1990 1991 1992 1993 1994 1995 1996 1997 1998 1999 2000INDONESIA 0.01 0.01 0.01 0.01 0.02 0.02 0.02 0.01 0.01 0.01 0.01 0.01 0.01 0.01 0.01 0.01 0.01 0.01 0.00 0.00 0.00MALAYSIA 3.45 3.43 3.66 4.79 7.13 7.49 7.90 8.16 8.06 8.02 8.99 9.99 10.02 10.54 10.07 10.27 10.42 10.48 10.42 10.37 10.41PHILIPPINES 1.00 1.00 1.00 1.00 1.00 1.00 1.00 1.00 1.00 1.00 1.00 1.00 1.00 1.00 1.00 1.00 1.00 1.00 1.00 1.00 1.00SINGAPORE 3.51 3.74 3.99 5.26 7.83 8.46 9.36 9.77 10.48 11.15 13.41 15.91 15.66 16.78 17.30 18.14 18.59 19.85 24.43 22.97 23.10THAILAND 0.37 0.36 0.37 0.48 0.71 0.69 0.78 0.80 0.83 0.85 0.95 1.08 1.00 1.07 1.05 1.03 1.03 0.94 0.99 1.07 1.06
JAPAN 0.03 0.04 0.03 0.05 0.07 0.08 0.12 0.14 0.16 0.16 0.17 0.20 0.20 0.24 0.26 0.27 0.24 0.24 0.31 0.33 0.33
UNITED STATES 7.51 7.90 8.54 11.11 16.70 18.61 20.39 20.57 21.09 21.74 24.31 27.48 25.51 27.12 26.42 25.71 26.22 29.47 40.89 39.42 39.55
AUSTRIA 0.58 0.50 0.50 0.62 0.83 0.90 1.34 1.63 1.71 1.64 2.14 2.35 2.32 2.33 2.31 2.55 2.48 2.41 3.31 3.18 3.21BELGIUM-LUXEM 0.26 0.21 0.19 0.22 0.29 0.31 0.46 0.55 0.57 0.55 0.73 0.80 0.79 0.78 0.79 0.87 0.85 0.82 1.13 1.08 1.09DENMARK 1.33 1.11 1.02 1.22 1.61 1.76 2.52 3.01 3.13 2.97 3.93 4.30 4.23 4.18 4.15 4.59 4.52 4.46 6.10 5.85 5.80FINLAND 2.01 1.83 1.77 2.00 2.78 3.00 4.02 4.68 5.04 5.07 6.36 6.79 5.70 4.75 5.06 5.89 5.71 5.68 7.67 7.75 7.80FRANCE 1.78 1.45 1.30 1.46 1.91 2.07 2.94 3.42 3.54 3.41 4.46 4.87 4.82 4.79 4.76 5.15 5.12 5.05 6.95 6.67 6.73GERMANY 4.13 3.50 3.52 4.35 5.87 6.32 9.39 11.44 12.01 11.56 15.05 16.56 16.34 16.40 16.28 17.94 17.42 17.00 23.30 22.36 22.57GREECE 0.18 0.14 0.13 0.13 0.15 0.13 0.15 0.15 0.15 0.13 0.15 0.15 0.13 0.12 0.11 0.11 0.11 0.11 0.14 0.14 0.14IRELAND 15.46 12.77 12.15 13.87 18.15 19.83 27.35 30.61 32.19 30.84 40.32 44.39 43.51 39.79 39.57 41.24 41.96 44.74 58.48 55.53 56.05ITALY 0.01 0.01 0.01 0.01 0.01 0.01 0.01 0.02 0.02 0.02 0.02 0.02 0.02 0.02 0.02 0.02 0.02 0.02 0.02 0.02 0.02NETHERLANDS 3.78 3.17 3.20 3.89 5.20 5.60 8.32 10.15 10.67 10.25 13.35 14.70 14.51 14.60 14.51 16.01 15.55 15.10 20.67 19.85 20.03PORTUGAL 0.15 0.13 0.11 0.10 0.11 0.11 0.14 0.15 0.15 0.14 0.17 0.19 0.19 0.17 0.16 0.17 0.17 0.17 0.23 0.22 0.22SPAIN 0.10 0.09 0.08 0.08 0.10 0.11 0.15 0.17 0.18 0.18 0.24 0.26 0.25 0.21 0.20 0.21 0.21 0.20 0.27 0.26 0.27SWEDEN 1.78 1.56 1.36 1.45 2.02 2.16 2.86 3.24 3.44 3.37 4.11 4.54 4.38 3.48 3.42 3.60 3.91 3.86 5.14 4.89 4.92UNITED KINGDOM 17.47 16.02 14.95 16.86 22.32 24.12 29.91 33.71 37.58 35.64 43.39 48.62 45.04 40.73 40.46 40.59 40.94 48.26 67.74 63.49 62.13
CHINA,P.R.:HONG KONG 1.51 1.42 1.41 1.54 2.14 2.39 2.61 2.64 2.70 2.79 3.12 3.54 3.30 3.51 3.42 3.32 3.39 3.81 5.28 5.09 5.11CHINA,P.R.: MAINLAND 5.01 4.63 4.51 5.62 7.20 6.34 5.90 5.53 4.33 4.39 5.08 5.16 4.63 4.71 3.07 3.08 3.16 3.55 4.94 4.76 4.78KOREA 0.01 0.01 0.01 0.01 0.02 0.02 0.02 0.03 0.03 0.03 0.03 0.04 0.03 0.03 0.03 0.03 0.03 0.03 0.03 0.03 0.03
Source:
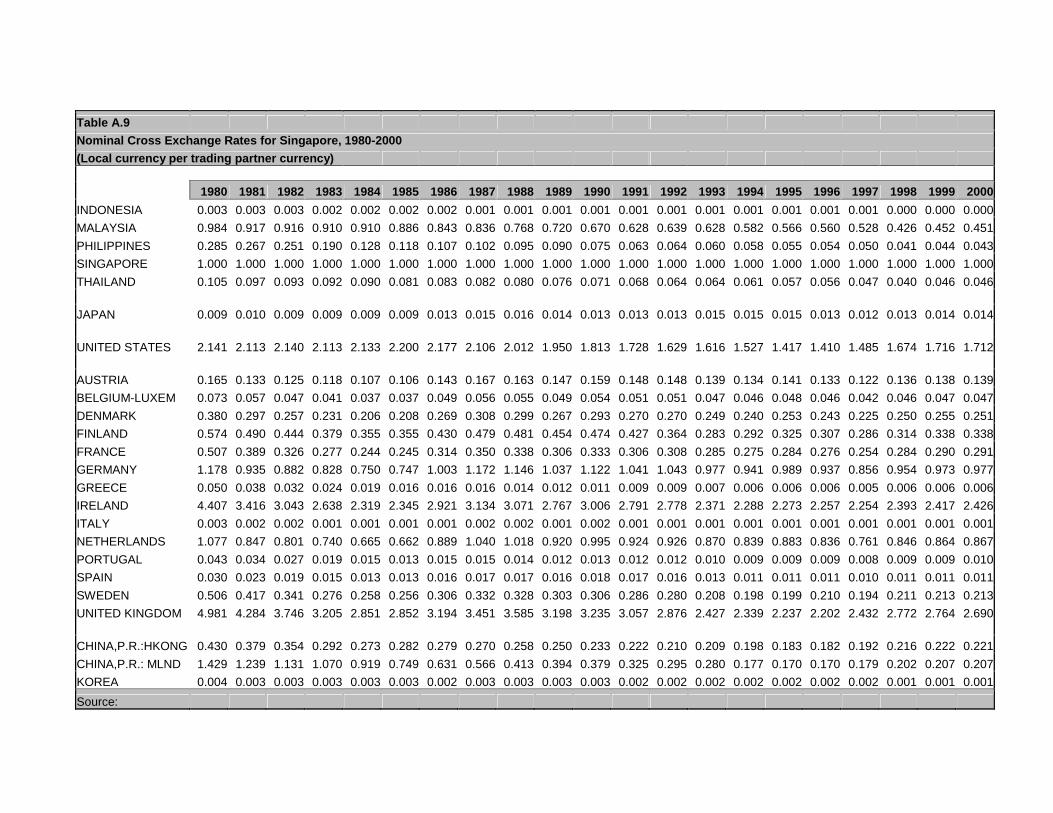
Table A.9Nominal Cross Exchange Rates for Singapore, 1980-2000(Local currency per trading partner currency)
1980 1981 1982 1983 1984 1985 1986 1987 1988 1989 1990 1991 1992 1993 1994 1995 1996 1997 1998 1999 2000
INDONESIA 0.003 0.003 0.003 0.002 0.002 0.002 0.002 0.001 0.001 0.001 0.001 0.001 0.001 0.001 0.001 0.001 0.001 0.001 0.000 0.000 0.000MALAYSIA 0.984 0.917 0.916 0.910 0.910 0.886 0.843 0.836 0.768 0.720 0.670 0.628 0.639 0.628 0.582 0.566 0.560 0.528 0.426 0.452 0.451PHILIPPINES 0.285 0.267 0.251 0.190 0.128 0.118 0.107 0.102 0.095 0.090 0.075 0.063 0.064 0.060 0.058 0.055 0.054 0.050 0.041 0.044 0.043SINGAPORE 1.000 1.000 1.000 1.000 1.000 1.000 1.000 1.000 1.000 1.000 1.000 1.000 1.000 1.000 1.000 1.000 1.000 1.000 1.000 1.000 1.000THAILAND 0.105 0.097 0.093 0.092 0.090 0.081 0.083 0.082 0.080 0.076 0.071 0.068 0.064 0.064 0.061 0.057 0.056 0.047 0.040 0.046 0.046
JAPAN 0.009 0.010 0.009 0.009 0.009 0.009 0.013 0.015 0.016 0.014 0.013 0.013 0.013 0.015 0.015 0.015 0.013 0.012 0.013 0.014 0.014
UNITED STATES 2.141 2.113 2.140 2.113 2.133 2.200 2.177 2.106 2.012 1.950 1.813 1.728 1.629 1.616 1.527 1.417 1.410 1.485 1.674 1.716 1.712
AUSTRIA 0.165 0.133 0.125 0.118 0.107 0.106 0.143 0.167 0.163 0.147 0.159 0.148 0.148 0.139 0.134 0.141 0.133 0.122 0.136 0.138 0.139BELGIUM-LUXEM 0.073 0.057 0.047 0.041 0.037 0.037 0.049 0.056 0.055 0.049 0.054 0.051 0.051 0.047 0.046 0.048 0.046 0.042 0.046 0.047 0.047DENMARK 0.380 0.297 0.257 0.231 0.206 0.208 0.269 0.308 0.299 0.267 0.293 0.270 0.270 0.249 0.240 0.253 0.243 0.225 0.250 0.255 0.251FINLAND 0.574 0.490 0.444 0.379 0.355 0.355 0.430 0.479 0.481 0.454 0.474 0.427 0.364 0.283 0.292 0.325 0.307 0.286 0.314 0.338 0.338FRANCE 0.507 0.389 0.326 0.277 0.244 0.245 0.314 0.350 0.338 0.306 0.333 0.306 0.308 0.285 0.275 0.284 0.276 0.254 0.284 0.290 0.291GERMANY 1.178 0.935 0.882 0.828 0.750 0.747 1.003 1.172 1.146 1.037 1.122 1.041 1.043 0.977 0.941 0.989 0.937 0.856 0.954 0.973 0.977GREECE 0.050 0.038 0.032 0.024 0.019 0.016 0.016 0.016 0.014 0.012 0.011 0.009 0.009 0.007 0.006 0.006 0.006 0.005 0.006 0.006 0.006IRELAND 4.407 3.416 3.043 2.638 2.319 2.345 2.921 3.134 3.071 2.767 3.006 2.791 2.778 2.371 2.288 2.273 2.257 2.254 2.393 2.417 2.426ITALY 0.003 0.002 0.002 0.001 0.001 0.001 0.001 0.002 0.002 0.001 0.002 0.001 0.001 0.001 0.001 0.001 0.001 0.001 0.001 0.001 0.001NETHERLANDS 1.077 0.847 0.801 0.740 0.665 0.662 0.889 1.040 1.018 0.920 0.995 0.924 0.926 0.870 0.839 0.883 0.836 0.761 0.846 0.864 0.867PORTUGAL 0.043 0.034 0.027 0.019 0.015 0.013 0.015 0.015 0.014 0.012 0.013 0.012 0.012 0.010 0.009 0.009 0.009 0.008 0.009 0.009 0.010SPAIN 0.030 0.023 0.019 0.015 0.013 0.013 0.016 0.017 0.017 0.016 0.018 0.017 0.016 0.013 0.011 0.011 0.011 0.010 0.011 0.011 0.011SWEDEN 0.506 0.417 0.341 0.276 0.258 0.256 0.306 0.332 0.328 0.303 0.306 0.286 0.280 0.208 0.198 0.199 0.210 0.194 0.211 0.213 0.213UNITED KINGDOM 4.981 4.284 3.746 3.205 2.851 2.852 3.194 3.451 3.585 3.198 3.235 3.057 2.876 2.427 2.339 2.237 2.202 2.432 2.772 2.764 2.690
CHINA,P.R.:HKONG 0.430 0.379 0.354 0.292 0.273 0.282 0.279 0.270 0.258 0.250 0.233 0.222 0.210 0.209 0.198 0.183 0.182 0.192 0.216 0.222 0.221CHINA,P.R.: MLND 1.429 1.239 1.131 1.070 0.919 0.749 0.631 0.566 0.413 0.394 0.379 0.325 0.295 0.280 0.177 0.170 0.170 0.179 0.202 0.207 0.207KOREA 0.004 0.003 0.003 0.003 0.003 0.003 0.002 0.003 0.003 0.003 0.003 0.002 0.002 0.002 0.002 0.002 0.002 0.002 0.001 0.001 0.001
Source:
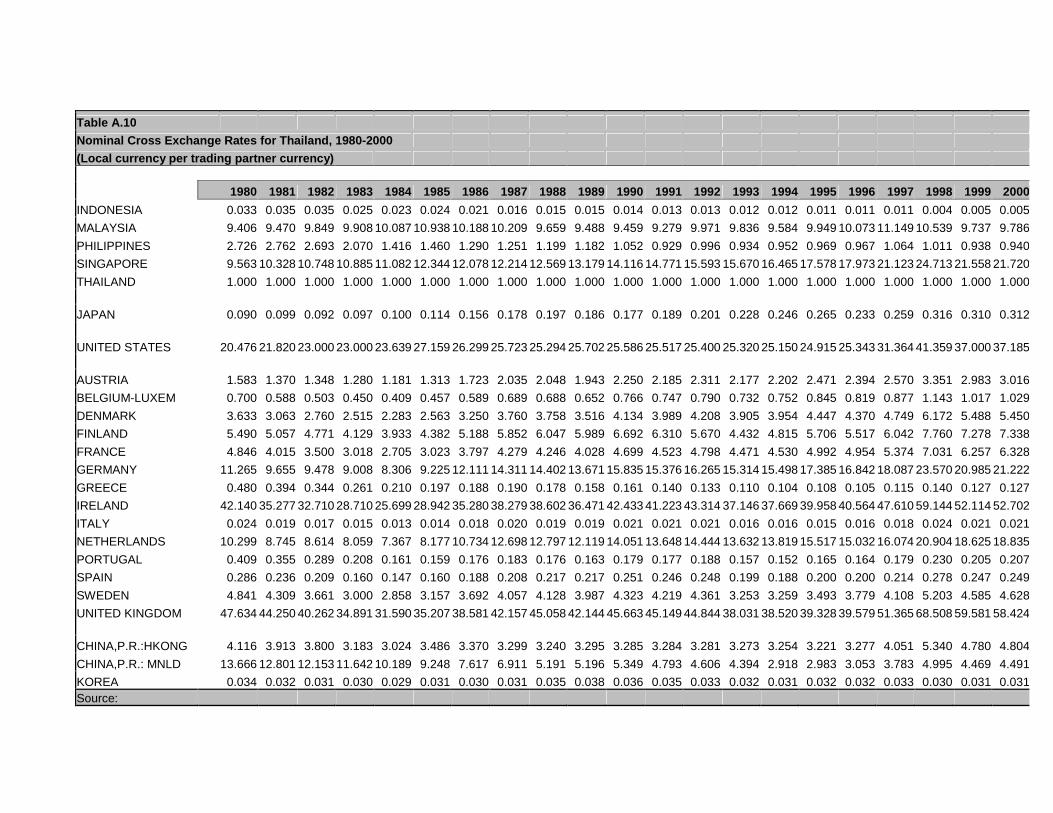
Table A.10Nominal Cross Exchange Rates for Thailand, 1980-2000(Local currency per trading partner currency)
1980 1981 1982 1983 1984 1985 1986 1987 1988 1989 1990 1991 1992 1993 1994 1995 1996 1997 1998 1999 2000
INDONESIA 0.033 0.035 0.035 0.025 0.023 0.024 0.021 0.016 0.015 0.015 0.014 0.013 0.013 0.012 0.012 0.011 0.011 0.011 0.004 0.005 0.005MALAYSIA 9.406 9.470 9.849 9.908 10.087 10.938 10.188 10.209 9.659 9.488 9.459 9.279 9.971 9.836 9.584 9.949 10.073 11.149 10.539 9.737 9.786PHILIPPINES 2.726 2.762 2.693 2.070 1.416 1.460 1.290 1.251 1.199 1.182 1.052 0.929 0.996 0.934 0.952 0.969 0.967 1.064 1.011 0.938 0.940SINGAPORE 9.563 10.328 10.748 10.885 11.082 12.344 12.078 12.214 12.569 13.179 14.116 14.771 15.593 15.670 16.465 17.578 17.973 21.123 24.713 21.558 21.720THAILAND 1.000 1.000 1.000 1.000 1.000 1.000 1.000 1.000 1.000 1.000 1.000 1.000 1.000 1.000 1.000 1.000 1.000 1.000 1.000 1.000 1.000
JAPAN 0.090 0.099 0.092 0.097 0.100 0.114 0.156 0.178 0.197 0.186 0.177 0.189 0.201 0.228 0.246 0.265 0.233 0.259 0.316 0.310 0.312
UNITED STATES 20.476 21.820 23.000 23.000 23.639 27.159 26.299 25.723 25.294 25.702 25.586 25.517 25.400 25.320 25.150 24.915 25.343 31.364 41.359 37.000 37.185
AUSTRIA 1.583 1.370 1.348 1.280 1.181 1.313 1.723 2.035 2.048 1.943 2.250 2.185 2.311 2.177 2.202 2.471 2.394 2.570 3.351 2.983 3.016BELGIUM-LUXEM 0.700 0.588 0.503 0.450 0.409 0.457 0.589 0.689 0.688 0.652 0.766 0.747 0.790 0.732 0.752 0.845 0.819 0.877 1.143 1.017 1.029DENMARK 3.633 3.063 2.760 2.515 2.283 2.563 3.250 3.760 3.758 3.516 4.134 3.989 4.208 3.905 3.954 4.447 4.370 4.749 6.172 5.488 5.450FINLAND 5.490 5.057 4.771 4.129 3.933 4.382 5.188 5.852 6.047 5.989 6.692 6.310 5.670 4.432 4.815 5.706 5.517 6.042 7.760 7.278 7.338FRANCE 4.846 4.015 3.500 3.018 2.705 3.023 3.797 4.279 4.246 4.028 4.699 4.523 4.798 4.471 4.530 4.992 4.954 5.374 7.031 6.257 6.328GERMANY 11.265 9.655 9.478 9.008 8.306 9.225 12.111 14.311 14.402 13.671 15.835 15.376 16.265 15.314 15.498 17.385 16.842 18.087 23.570 20.985 21.222GREECE 0.480 0.394 0.344 0.261 0.210 0.197 0.188 0.190 0.178 0.158 0.161 0.140 0.133 0.110 0.104 0.108 0.105 0.115 0.140 0.127 0.127IRELAND 42.140 35.277 32.710 28.710 25.699 28.942 35.280 38.279 38.602 36.471 42.433 41.223 43.314 37.146 37.669 39.958 40.564 47.610 59.144 52.114 52.702ITALY 0.024 0.019 0.017 0.015 0.013 0.014 0.018 0.020 0.019 0.019 0.021 0.021 0.021 0.016 0.016 0.015 0.016 0.018 0.024 0.021 0.021NETHERLANDS 10.299 8.745 8.614 8.059 7.367 8.177 10.734 12.698 12.797 12.119 14.051 13.648 14.444 13.632 13.819 15.517 15.032 16.074 20.904 18.625 18.835PORTUGAL 0.409 0.355 0.289 0.208 0.161 0.159 0.176 0.183 0.176 0.163 0.179 0.177 0.188 0.157 0.152 0.165 0.164 0.179 0.230 0.205 0.207SPAIN 0.286 0.236 0.209 0.160 0.147 0.160 0.188 0.208 0.217 0.217 0.251 0.246 0.248 0.199 0.188 0.200 0.200 0.214 0.278 0.247 0.249SWEDEN 4.841 4.309 3.661 3.000 2.858 3.157 3.692 4.057 4.128 3.987 4.323 4.219 4.361 3.253 3.259 3.493 3.779 4.108 5.203 4.585 4.628UNITED KINGDOM 47.634 44.250 40.262 34.891 31.590 35.207 38.581 42.157 45.058 42.144 45.663 45.149 44.844 38.031 38.520 39.328 39.579 51.365 68.508 59.581 58.424
CHINA,P.R.:HKONG 4.116 3.913 3.800 3.183 3.024 3.486 3.370 3.299 3.240 3.295 3.285 3.284 3.281 3.273 3.254 3.221 3.277 4.051 5.340 4.780 4.804CHINA,P.R.: MNLD 13.666 12.801 12.153 11.642 10.189 9.248 7.617 6.911 5.191 5.196 5.349 4.793 4.606 4.394 2.918 2.983 3.053 3.783 4.995 4.469 4.491KOREA 0.034 0.032 0.031 0.030 0.029 0.031 0.030 0.031 0.035 0.038 0.036 0.035 0.033 0.032 0.031 0.032 0.032 0.033 0.030 0.031 0.031Source:
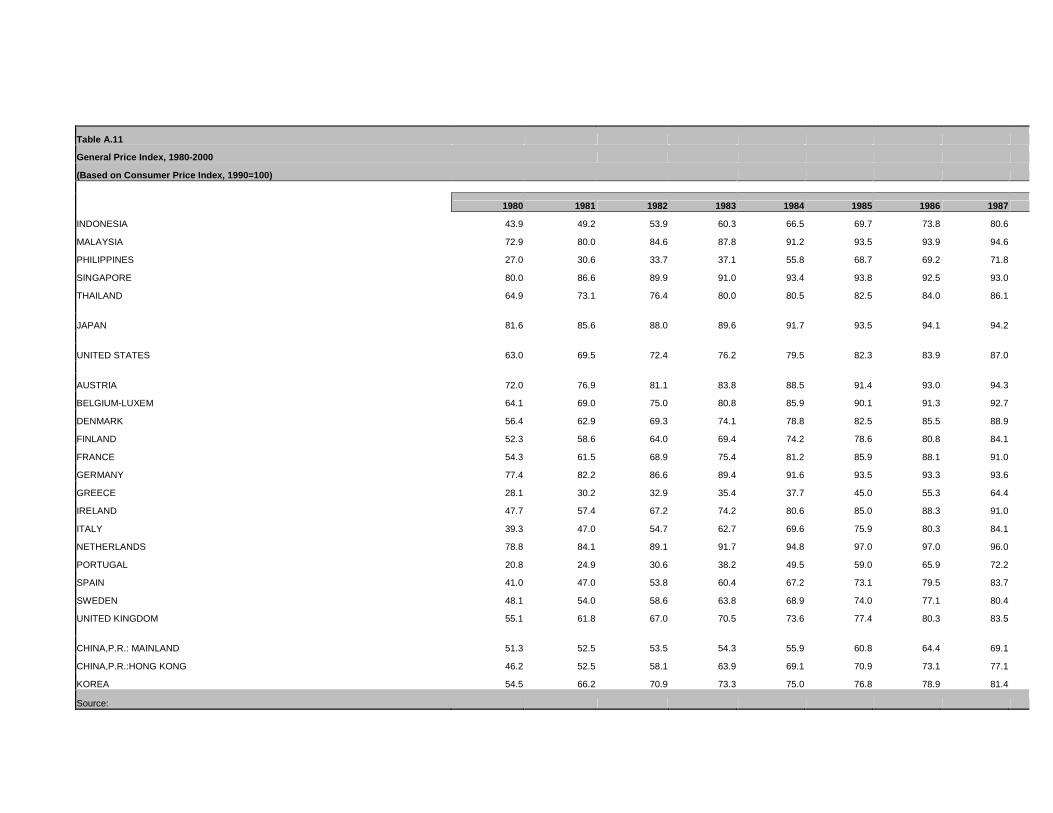
Table A.11
General Price Index, 1980-2000
(Based on Consumer Price Index, 1990=100)
1980 1981 1982 1983 1984 1985 1986 1987
INDONESIA 43.9 49.2 53.9 60.3 66.5 69.7 73.8 80.6
MALAYSIA 72.9 80.0 84.6 87.8 91.2 93.5 93.9 94.6
PHILIPPINES 27.0 30.6 33.7 37.1 55.8 68.7 69.2 71.8
SINGAPORE 80.0 86.6 89.9 91.0 93.4 93.8 92.5 93.0
THAILAND 64.9 73.1 76.4 80.0 80.5 82.5 84.0 86.1
JAPAN 81.6 85.6 88.0 89.6 91.7 93.5 94.1 94.2
UNITED STATES 63.0 69.5 72.4 76.2 79.5 82.3 83.9 87.0
AUSTRIA 72.0 76.9 81.1 83.8 88.5 91.4 93.0 94.3
BELGIUM-LUXEM 64.1 69.0 75.0 80.8 85.9 90.1 91.3 92.7
DENMARK 56.4 62.9 69.3 74.1 78.8 82.5 85.5 88.9
FINLAND 52.3 58.6 64.0 69.4 74.2 78.6 80.8 84.1
FRANCE 54.3 61.5 68.9 75.4 81.2 85.9 88.1 91.0
GERMANY 77.4 82.2 86.6 89.4 91.6 93.5 93.3 93.6
GREECE 28.1 30.2 32.9 35.4 37.7 45.0 55.3 64.4
IRELAND 47.7 57.4 67.2 74.2 80.6 85.0 88.3 91.0
ITALY 39.3 47.0 54.7 62.7 69.6 75.9 80.3 84.1
NETHERLANDS 78.8 84.1 89.1 91.7 94.8 97.0 97.0 96.0
PORTUGAL 20.8 24.9 30.6 38.2 49.5 59.0 65.9 72.2
SPAIN 41.0 47.0 53.8 60.4 67.2 73.1 79.5 83.7
SWEDEN 48.1 54.0 58.6 63.8 68.9 74.0 77.1 80.4
UNITED KINGDOM 55.1 61.8 67.0 70.5 73.6 77.4 80.3 83.5
CHINA,P.R.: MAINLAND 51.3 52.5 53.5 54.3 55.9 60.8 64.4 69.1
CHINA,P.R.:HONG KONG 46.2 52.5 58.1 63.9 69.1 70.9 73.1 77.1
KOREA 54.5 66.2 70.9 73.3 75.0 76.8 78.9 81.4
Source:
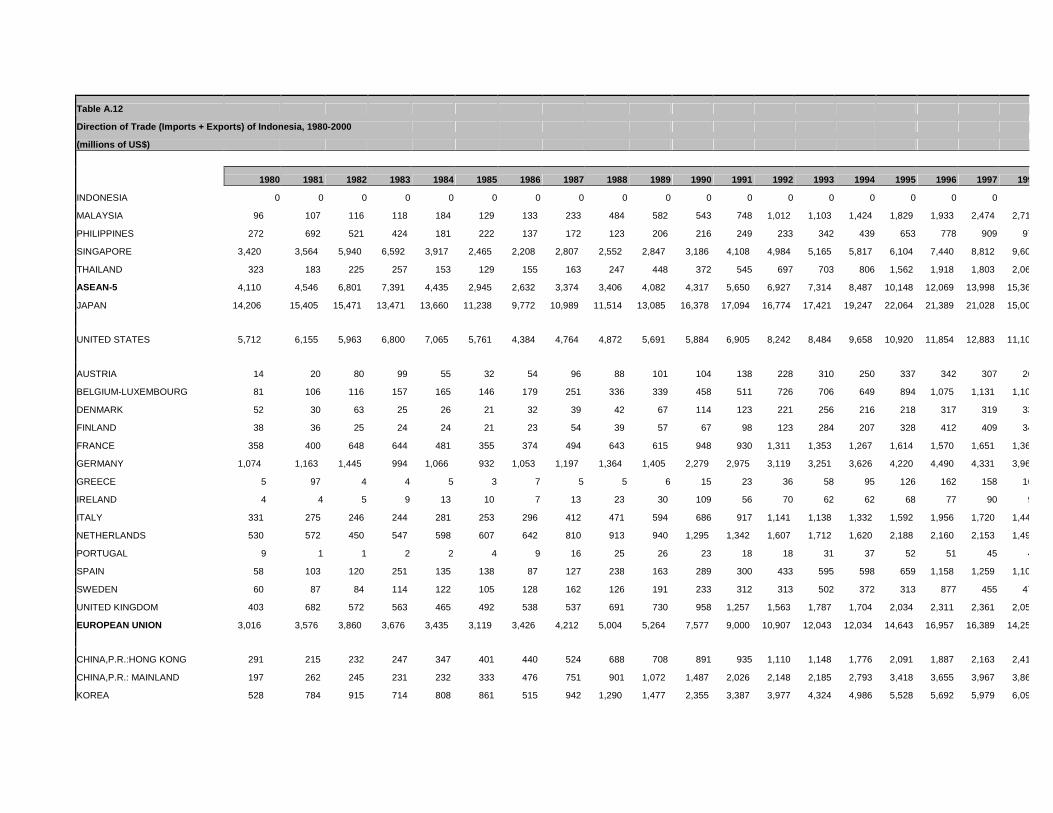
Table A.12
Direction of Trade (Imports + Exports) of Indonesia, 1980-2000
(millions of US$)
1980 1981 1982 1983 1984 1985 1986 1987 1988 1989 1990 1991 1992 1993 1994 1995 1996 1997 1998
INDONESIA 0 0 0 0 0 0 0 0 0 0 0 0 0 0 0 0 0 0
MALAYSIA 96 107 116 118 184 129 133 233 484 582 543 748 1,012 1,103 1,424 1,829 1,933 2,474 2,718
PHILIPPINES 272 692 521 424 181 222 137 172 123 206 216 249 233 342 439 653 778 909 977
SINGAPORE 3,420 3,564 5,940 6,592 3,917 2,465 2,208 2,807 2,552 2,847 3,186 4,108 4,984 5,165 5,817 6,104 7,440 8,812 9,608
THAILAND 323 183 225 257 153 129 155 163 247 448 372 545 697 703 806 1,562 1,918 1,803 2,060
ASEAN-5 4,110 4,546 6,801 7,391 4,435 2,945 2,632 3,374 3,406 4,082 4,317 5,650 6,927 7,314 8,487 10,148 12,069 13,998 15,363
JAPAN 14,206 15,405 15,471 13,471 13,660 11,238 9,772 10,989 11,514 13,085 16,378 17,094 16,774 17,421 19,247 22,064 21,389 21,028 15,004
UNITED STATES 5,712 6,155 5,963 6,800 7,065 5,761 4,384 4,764 4,872 5,691 5,884 6,905 8,242 8,484 9,658 10,920 11,854 12,883 11,103
AUSTRIA 14 20 80 99 55 32 54 96 88 101 104 138 228 310 250 337 342 307 262
BELGIUM-LUXEMBOURG 81 106 116 157 165 146 179 251 336 339 458 511 726 706 649 894 1,075 1,131 1,101
DENMARK 52 30 63 25 26 21 32 39 42 67 114 123 221 256 216 218 317 319 337
FINLAND 38 36 25 24 24 21 23 54 39 57 67 98 123 284 207 328 412 409 340
FRANCE 358 400 648 644 481 355 374 494 643 615 948 930 1,311 1,353 1,267 1,614 1,570 1,651 1,369
GERMANY 1,074 1,163 1,445 994 1,066 932 1,053 1,197 1,364 1,405 2,279 2,975 3,119 3,251 3,626 4,220 4,490 4,331 3,967
GREECE 5 97 4 4 5 3 7 5 5 6 15 23 36 58 95 126 162 158 163
IRELAND 4 4 5 9 13 10 7 13 23 30 109 56 70 62 62 68 77 90 94
ITALY 331 275 246 244 281 253 296 412 471 594 686 917 1,141 1,138 1,332 1,592 1,956 1,720 1,443
NETHERLANDS 530 572 450 547 598 607 642 810 913 940 1,295 1,342 1,607 1,712 1,620 2,188 2,160 2,153 1,494
PORTUGAL 9 1 1 2 2 4 9 16 25 26 23 18 18 31 37 52 51 45 43
SPAIN 58 103 120 251 135 138 87 127 238 163 289 300 433 595 598 659 1,158 1,259 1,107
SWEDEN 60 87 84 114 122 105 128 162 126 191 233 312 313 502 372 313 877 455 478
UNITED KINGDOM 403 682 572 563 465 492 538 537 691 730 958 1,257 1,563 1,787 1,704 2,034 2,311 2,361 2,054
EUROPEAN UNION 3,016 3,576 3,860 3,676 3,435 3,119 3,426 4,212 5,004 5,264 7,577 9,000 10,907 12,043 12,034 14,643 16,957 16,389 14,252
CHINA,P.R.:HONG KONG 291 215 232 247 347 401 440 524 688 708 891 935 1,110 1,148 1,776 2,091 1,887 2,163 2,410
CHINA,P.R.: MAINLAND 197 262 245 231 232 333 476 751 901 1,072 1,487 2,026 2,148 2,185 2,793 3,418 3,655 3,967 3,866
KOREA 528 784 915 714 808 861 515 942 1,290 1,477 2,355 3,387 3,977 4,324 4,986 5,528 5,692 5,979 6,094
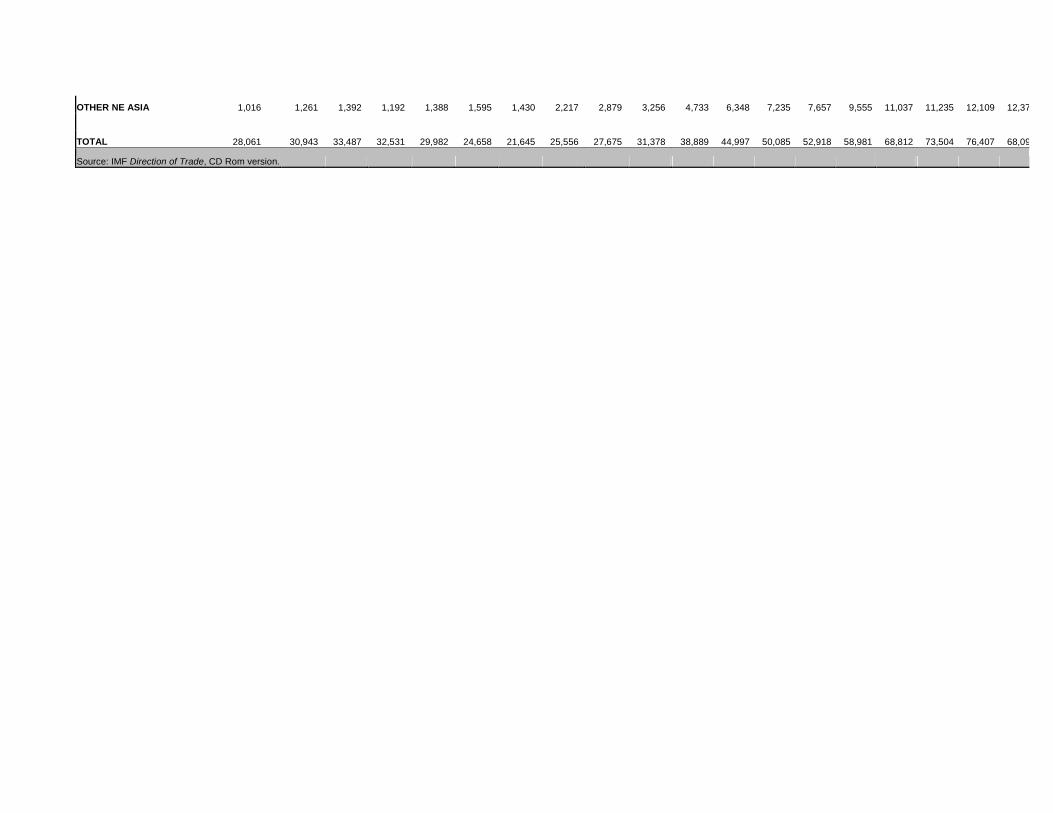
OTHER NE ASIA 1,016 1,261 1,392 1,192 1,388 1,595 1,430 2,217 2,879 3,256 4,733 6,348 7,235 7,657 9,555 11,037 11,235 12,109 12,370
TOTAL 28,061 30,943 33,487 32,531 29,982 24,658 21,645 25,556 27,675 31,378 38,889 44,997 50,085 52,918 58,981 68,812 73,504 76,407 68,092
Source: IMF Direction of Trade, CD Rom version.
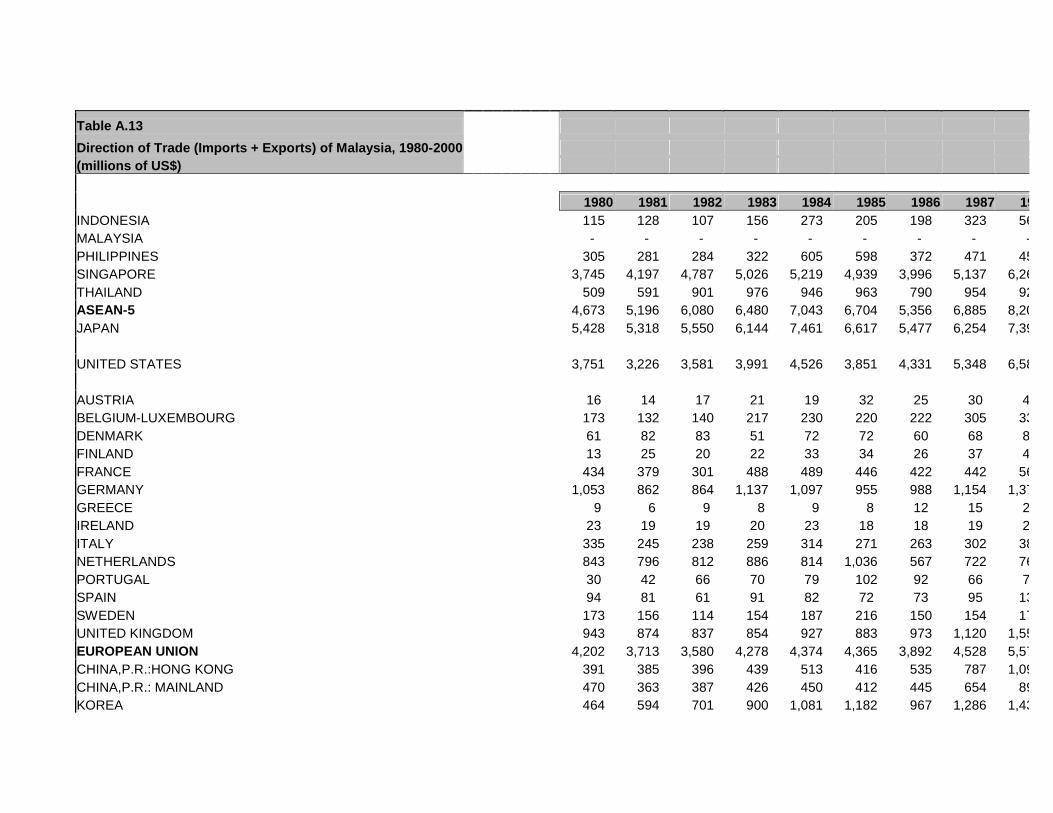
Table A.13
Direction of Trade (Imports + Exports) of Malaysia, 1980-2000(millions of US$)
1980 1981 1982 1983 1984 1985 1986 1987 1988INDONESIA 115 128 107 156 273 205 198 323 563MALAYSIA - - - - - - - - -PHILIPPINES 305 281 284 322 605 598 372 471 450SINGAPORE 3,745 4,197 4,787 5,026 5,219 4,939 3,996 5,137 6,267THAILAND 509 591 901 976 946 963 790 954 921ASEAN-5 4,673 5,196 6,080 6,480 7,043 6,704 5,356 6,885 8,201JAPAN 5,428 5,318 5,550 6,144 7,461 6,617 5,477 6,254 7,394
UNITED STATES 3,751 3,226 3,581 3,991 4,526 3,851 4,331 5,348 6,588
AUSTRIA 16 14 17 21 19 32 25 30 47BELGIUM-LUXEMBOURG 173 132 140 217 230 220 222 305 334DENMARK 61 82 83 51 72 72 60 68 89FINLAND 13 25 20 22 33 34 26 37 46FRANCE 434 379 301 488 489 446 422 442 562GERMANY 1,053 862 864 1,137 1,097 955 988 1,154 1,370GREECE 9 6 9 8 9 8 12 15 22IRELAND 23 19 19 20 23 18 18 19 29ITALY 335 245 238 259 314 271 263 302 381NETHERLANDS 843 796 812 886 814 1,036 567 722 761PORTUGAL 30 42 66 70 79 102 92 66 77SPAIN 94 81 61 91 82 72 73 95 135SWEDEN 173 156 114 154 187 216 150 154 170UNITED KINGDOM 943 874 837 854 927 883 973 1,120 1,551EUROPEAN UNION 4,202 3,713 3,580 4,278 4,374 4,365 3,892 4,528 5,574CHINA,P.R.:HONG KONG 391 385 396 439 513 416 535 787 1,097CHINA,P.R.: MAINLAND 470 363 387 426 450 412 445 654 897KOREA 464 594 701 900 1,081 1,182 967 1,286 1,439
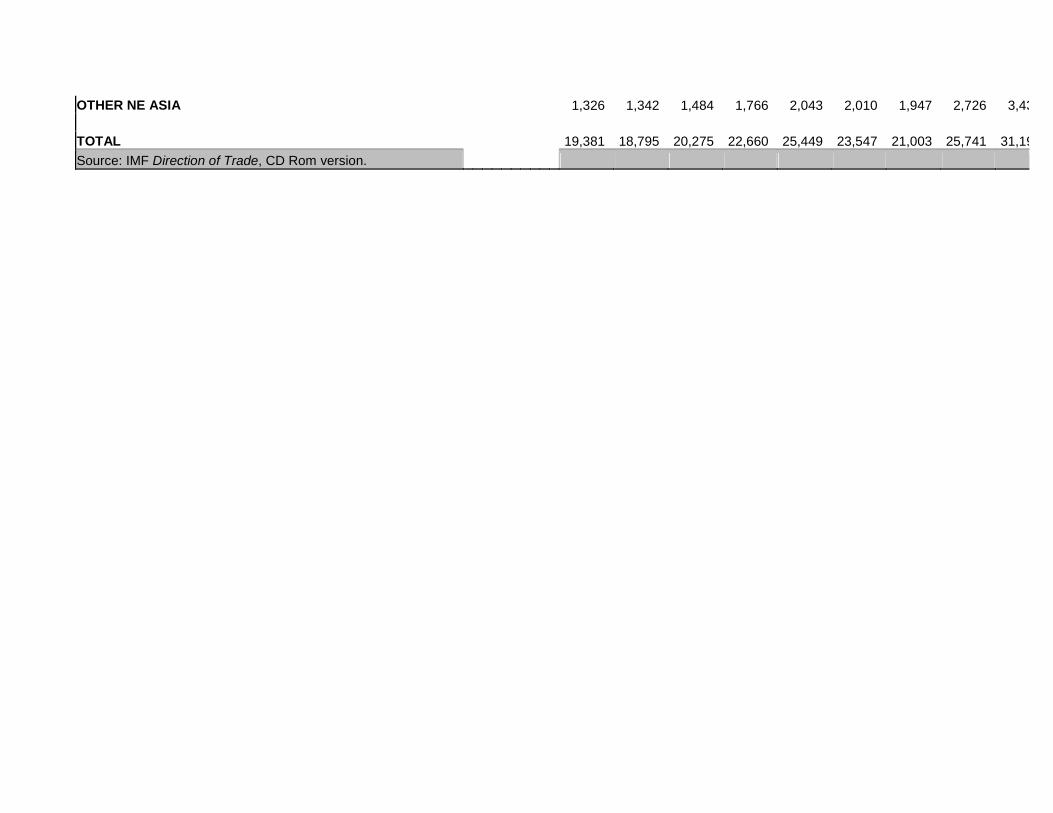
OTHER NE ASIA 1,326 1,342 1,484 1,766 2,043 2,010 1,947 2,726 3,434
TOTAL 19,381 18,795 20,275 22,660 25,449 23,547 21,003 25,741 31,191Source: IMF Direction of Trade, CD Rom version.
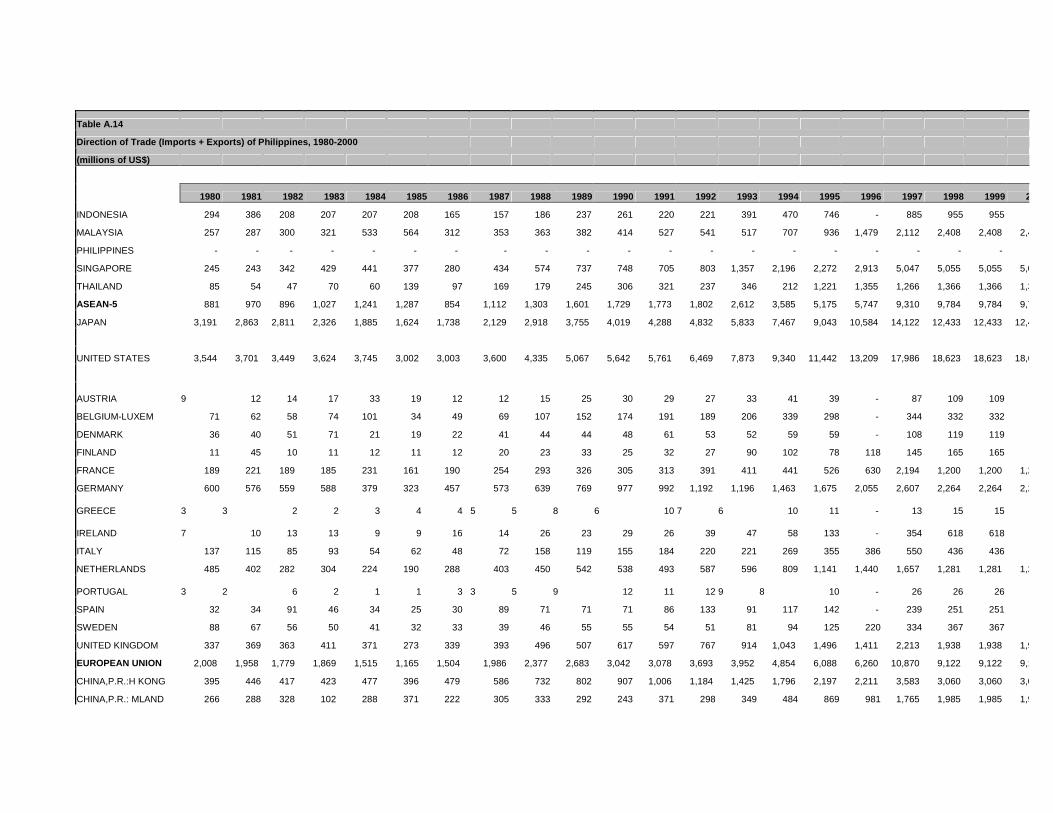
Table A.14
Direction of Trade (Imports + Exports) of Philippines, 1980-2000
(millions of US$)
1980 1981 1982 1983 1984 1985 1986 1987 1988 1989 1990 1991 1992 1993 1994 1995 1996 1997 1998 1999 2000
INDONESIA 294 386 208 207 207 208 165 157 186 237 261 220 221 391 470 746 - 885 955 955 955
MALAYSIA 257 287 300 321 533 564 312 353 363 382 414 527 541 517 707 936 1,479 2,112 2,408 2,408 2,408
PHILIPPINES - - - - - - - - - - - - - - - - - - - -
SINGAPORE 245 243 342 429 441 377 280 434 574 737 748 705 803 1,357 2,196 2,272 2,913 5,047 5,055 5,055 5,055
THAILAND 85 54 47 70 60 139 97 169 179 245 306 321 237 346 212 1,221 1,355 1,266 1,366 1,366 1,366
ASEAN-5 881 970 896 1,027 1,241 1,287 854 1,112 1,303 1,601 1,729 1,773 1,802 2,612 3,585 5,175 5,747 9,310 9,784 9,784 9,784
JAPAN 3,191 2,863 2,811 2,326 1,885 1,624 1,738 2,129 2,918 3,755 4,019 4,288 4,832 5,833 7,467 9,043 10,584 14,122 12,433 12,433 12,433
UNITED STATES 3,544 3,701 3,449 3,624 3,745 3,002 3,003 3,600 4,335 5,067 5,642 5,761 6,469 7,873 9,340 11,442 13,209 17,986 18,623 18,623 18,623
AUSTRIA 9 12 14 17 33 19 12 12 15 25 30 29 27 33 41 39 - 87 109 109 109
BELGIUM-LUXEM 71 62 58 74 101 34 49 69 107 152 174 191 189 206 339 298 - 344 332 332 332
DENMARK 36 40 51 71 21 19 22 41 44 44 48 61 53 52 59 59 - 108 119 119 119
FINLAND 11 45 10 11 12 11 12 20 23 33 25 32 27 90 102 78 118 145 165 165 165
FRANCE 189 221 189 185 231 161 190 254 293 326 305 313 391 411 441 526 630 2,194 1,200 1,200 1,200
GERMANY 600 576 559 588 379 323 457 573 639 769 977 992 1,192 1,196 1,463 1,675 2,055 2,607 2,264 2,264 2,264
GREECE 3 3 2 2 3 4 4 5 5 8 6 10 7 6 10 11 - 13 15 15 15
IRELAND 7 10 13 13 9 9 16 14 26 23 29 26 39 47 58 133 - 354 618 618 618
ITALY 137 115 85 93 54 62 48 72 158 119 155 184 220 221 269 355 386 550 436 436 436
NETHERLANDS 485 402 282 304 224 190 288 403 450 542 538 493 587 596 809 1,141 1,440 1,657 1,281 1,281 1,281
PORTUGAL 3 2 6 2 1 1 3 3 5 9 12 11 12 9 8 10 - 26 26 26 26
SPAIN 32 34 91 46 34 25 30 89 71 71 71 86 133 91 117 142 - 239 251 251 251
SWEDEN 88 67 56 50 41 32 33 39 46 55 55 54 51 81 94 125 220 334 367 367 367
UNITED KINGDOM 337 369 363 411 371 273 339 393 496 507 617 597 767 914 1,043 1,496 1,411 2,213 1,938 1,938 1,938
EUROPEAN UNION 2,008 1,958 1,779 1,869 1,515 1,165 1,504 1,986 2,377 2,683 3,042 3,078 3,693 3,952 4,854 6,088 6,260 10,870 9,122 9,122 9,122
CHINA,P.R.:H KONG 395 446 417 423 477 396 479 586 732 802 907 1,006 1,184 1,425 1,796 2,197 2,211 3,583 3,060 3,060 3,060
CHINA,P.R.: MLAND 266 288 328 102 288 371 222 305 333 292 243 371 298 349 484 869 981 1,765 1,985 1,985 1,985
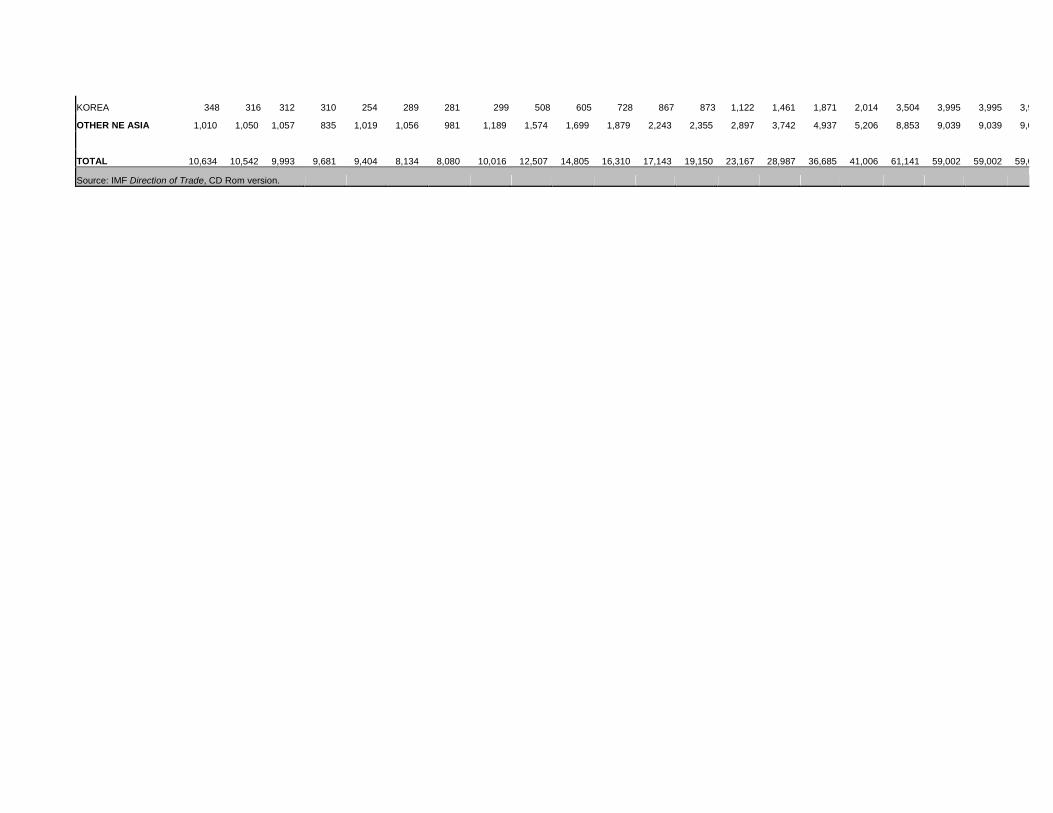
KOREA 348 316 312 310 254 289 281 299 508 605 728 867 873 1,122 1,461 1,871 2,014 3,504 3,995 3,995 3,995
OTHER NE ASIA 1,010 1,050 1,057 835 1,019 1,056 981 1,189 1,574 1,699 1,879 2,243 2,355 2,897 3,742 4,937 5,206 8,853 9,039 9,039 9,039
TOTAL 10,634 10,542 9,993 9,681 9,404 8,134 8,080 10,016 12,507 14,805 16,310 17,143 19,150 23,167 28,987 36,685 41,006 61,141 59,002 59,002 59,002
Source: IMF Direction of Trade, CD Rom version.
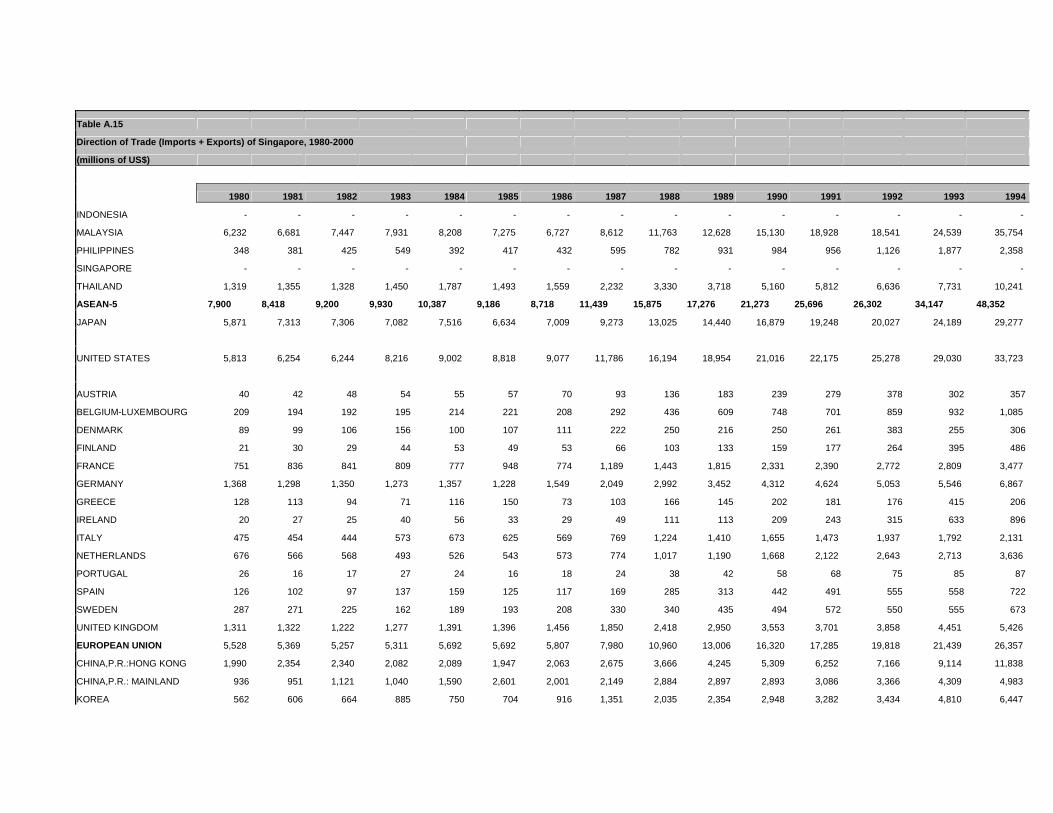
Table A.15
Direction of Trade (Imports + Exports) of Singapore, 1980-2000
(millions of US$)
1980 1981 1982 1983 1984 1985 1986 1987 1988 1989 1990 1991 1992 1993 1994
INDONESIA - - - - - - - - - - - - - - -
MALAYSIA 6,232 6,681 7,447 7,931 8,208 7,275 6,727 8,612 11,763 12,628 15,130 18,928 18,541 24,539 35,754 41,915
PHILIPPINES 348 381 425 549 392 417 432 595 782 931 984 956 1,126 1,877 2,358 3,027
SINGAPORE - - - - - - - - - - - - - - -
THAILAND 1,319 1,355 1,328 1,450 1,787 1,493 1,559 2,232 3,330 3,718 5,160 5,812 6,636 7,731 10,241 13,242
ASEAN-5 7,900 8,418 9,200 9,930 10,387 9,186 8,718 11,439 15,875 17,276 21,273 25,696 26,302 34,147 48,352 58,185
JAPAN 5,871 7,313 7,306 7,082 7,516 6,634 7,009 9,273 13,025 14,440 16,879 19,248 20,027 24,189 29,277 35,527
UNITED STATES 5,813 6,254 6,244 8,216 9,002 8,818 9,077 11,786 16,194 18,954 21,016 22,175 25,278 29,030 33,723 40,301
AUSTRIA 40 42 48 54 55 57 70 93 136 183 239 279 378 302 357 511
BELGIUM-LUXEMBOURG 209 194 192 195 214 221 208 292 436 609 748 701 859 932 1,085 1,186
DENMARK 89 99 106 156 100 107 111 222 250 216 250 261 383 255 306 334
FINLAND 21 30 29 44 53 49 53 66 103 133 159 177 264 395 486 549
FRANCE 751 836 841 809 777 948 774 1,189 1,443 1,815 2,331 2,390 2,772 2,809 3,477 4,809
GERMANY 1,368 1,298 1,350 1,273 1,357 1,228 1,549 2,049 2,992 3,452 4,312 4,624 5,053 5,546 6,867 8,321
GREECE 128 113 94 71 116 150 73 103 166 145 202 181 176 415 206 204
IRELAND 20 27 25 40 56 33 29 49 111 113 209 243 315 633 896 1,466
ITALY 475 454 444 573 673 625 569 769 1,224 1,410 1,655 1,473 1,937 1,792 2,131 2,541
NETHERLANDS 676 566 568 493 526 543 573 774 1,017 1,190 1,668 2,122 2,643 2,713 3,636 4,276
PORTUGAL 26 16 17 27 24 16 18 24 38 42 58 68 75 85 87 99
SPAIN 126 102 97 137 159 125 117 169 285 313 442 491 555 558 722 893
SWEDEN 287 271 225 162 189 193 208 330 340 435 494 572 550 555 673 836
UNITED KINGDOM 1,311 1,322 1,222 1,277 1,391 1,396 1,456 1,850 2,418 2,950 3,553 3,701 3,858 4,451 5,426 6,377
EUROPEAN UNION 5,528 5,369 5,257 5,311 5,692 5,692 5,807 7,980 10,960 13,006 16,320 17,285 19,818 21,439 26,357 32,403
CHINA,P.R.:HONG KONG 1,990 2,354 2,340 2,082 2,089 1,947 2,063 2,675 3,666 4,245 5,309 6,252 7,166 9,114 11,838 14,233
CHINA,P.R.: MAINLAND 936 951 1,121 1,040 1,590 2,601 2,001 2,149 2,884 2,897 2,893 3,086 3,366 4,309 4,983 6,801
KOREA 562 606 664 885 750 704 916 1,351 2,035 2,354 2,948 3,282 3,434 4,810 6,447 8,642

OTHER NE ASIA 3,488 3,911 4,125 4,006 4,428 5,252 4,980 6,175 8,584 9,496 11,151 12,619 13,965 18,232 23,268 29,676
TOTAL 28,599 31,265 32,132 34,546 37,026 35,581 35,591 46,654 64,639 73,173 86,639 97,023 105,390 127,036 160,977 196,091
Source: IMF Direction of Trade, CD Rom version.
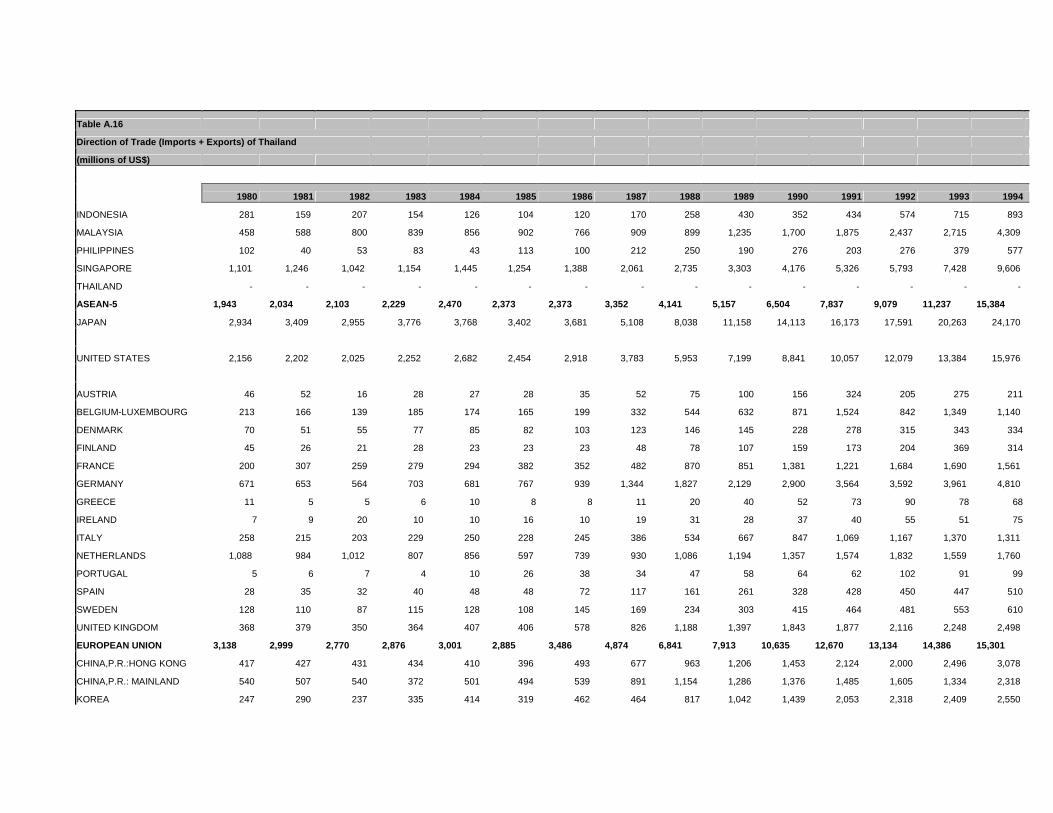
Table A.16
Direction of Trade (Imports + Exports) of Thailand
(millions of US$)
1980 1981 1982 1983 1984 1985 1986 1987 1988 1989 1990 1991 1992 1993 1994
INDONESIA 281 159 207 154 126 104 120 170 258 430 352 434 574 715 893 1,483
MALAYSIA 458 588 800 839 856 902 766 909 899 1,235 1,700 1,875 2,437 2,715 4,309 4,788
PHILIPPINES 102 40 53 83 43 113 100 212 250 190 276 203 276 379 577 994
SINGAPORE 1,101 1,246 1,042 1,154 1,445 1,254 1,388 2,061 2,735 3,303 4,176 5,326 5,793 7,428 9,606 12,079
THAILAND - - - - - - - - - - - - - - -
ASEAN-5 1,943 2,034 2,103 2,229 2,470 2,373 2,373 3,352 4,141 5,157 6,504 7,837 9,079 11,237 15,384 19,345
JAPAN 2,934 3,409 2,955 3,776 3,768 3,402 3,681 5,108 8,038 11,158 14,113 16,173 17,591 20,263 24,170 31,102
UNITED STATES 2,156 2,202 2,025 2,252 2,682 2,454 2,918 3,783 5,953 7,199 8,841 10,057 12,079 13,384 15,976 18,585
AUSTRIA 46 52 16 28 27 28 35 52 75 100 156 324 205 275 211 179
BELGIUM-LUXEMBOURG 213 166 139 185 174 165 199 332 544 632 871 1,524 842 1,349 1,140 1,396
DENMARK 70 51 55 77 85 82 103 123 146 145 228 278 315 343 334 427
FINLAND 45 26 21 28 23 23 23 48 78 107 159 173 204 369 314 464
FRANCE 200 307 259 279 294 382 352 482 870 851 1,381 1,221 1,684 1,690 1,561 2,836
GERMANY 671 653 564 703 681 767 939 1,344 1,827 2,129 2,900 3,564 3,592 3,961 4,810 5,386
GREECE 11 5 5 6 10 8 8 11 20 40 52 73 90 78 68
IRELAND 7 9 20 10 10 16 10 19 31 28 37 40 55 51 75 145
ITALY 258 215 203 229 250 228 245 386 534 667 847 1,069 1,167 1,370 1,311 1,659
NETHERLANDS 1,088 984 1,012 807 856 597 739 930 1,086 1,194 1,357 1,574 1,832 1,559 1,760 2,499
PORTUGAL 5 6 7 4 10 26 38 34 47 58 64 62 102 91 99 111
SPAIN 28 35 32 40 48 48 72 117 161 261 328 428 450 447 510 706
SWEDEN 128 110 87 115 128 108 145 169 234 303 415 464 481 553 610 733
UNITED KINGDOM 368 379 350 364 407 406 578 826 1,188 1,397 1,843 1,877 2,116 2,248 2,498 3,077
EUROPEAN UNION 3,138 2,999 2,770 2,876 3,001 2,885 3,486 4,874 6,841 7,913 10,635 12,670 13,134 14,386 15,301 19,717
CHINA,P.R.:HONG KONG 417 427 431 434 410 396 493 677 963 1,206 1,453 2,124 2,000 2,496 3,078 3,667
CHINA,P.R.: MAINLAND 540 507 540 372 501 494 539 891 1,154 1,286 1,376 1,485 1,605 1,334 2,318 3,738
KOREA 247 290 237 335 414 319 462 464 817 1,042 1,439 2,053 2,318 2,409 2,550 3,275
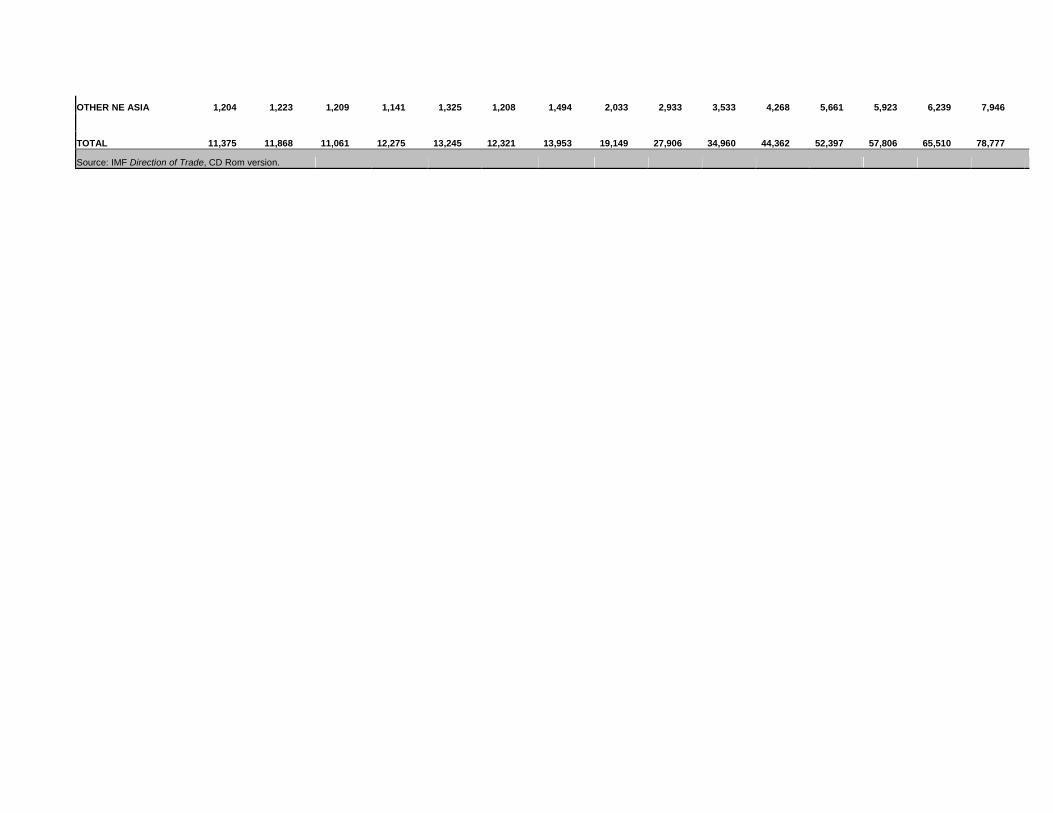
OTHER NE ASIA 1,204 1,223 1,209 1,141 1,325 1,208 1,494 2,033 2,933 3,533 4,268 5,661 5,923 6,239 7,946 10,680
TOTAL 11,375 11,868 11,061 12,275 13,245 12,321 13,953 19,149 27,906 34,960 44,362 52,397 57,806 65,510 78,777 99,429
Source: IMF Direction of Trade, CD Rom version.
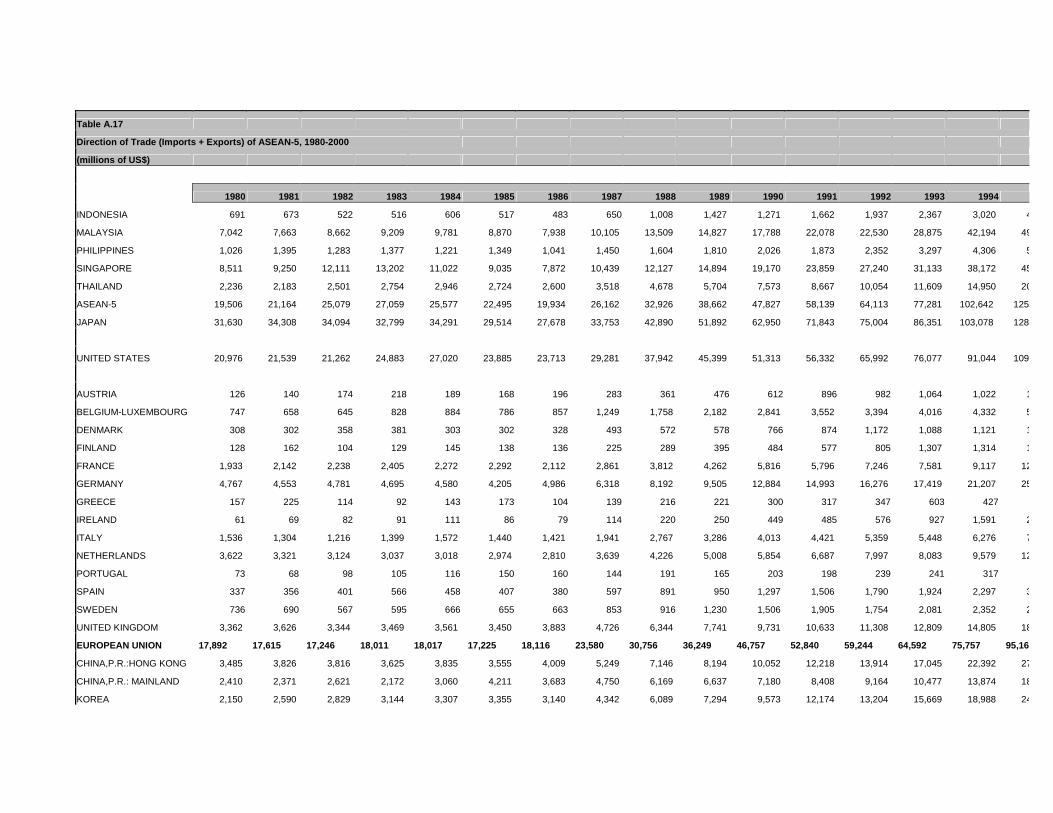
Table A.17
Direction of Trade (Imports + Exports) of ASEAN-5, 1980-2000
(millions of US$)
1980 1981 1982 1983 1984 1985 1986 1987 1988 1989 1990 1991 1992 1993 1994
INDONESIA 691 673 522 516 606 517 483 650 1,008 1,427 1,271 1,662 1,937 2,367 3,020 4,412
MALAYSIA 7,042 7,663 8,662 9,209 9,781 8,870 7,938 10,105 13,509 14,827 17,788 22,078 22,530 28,875 42,194 49,469
PHILIPPINES 1,026 1,395 1,283 1,377 1,221 1,349 1,041 1,450 1,604 1,810 2,026 1,873 2,352 3,297 4,306 5,786
SINGAPORE 8,511 9,250 12,111 13,202 11,022 9,035 7,872 10,439 12,127 14,894 19,170 23,859 27,240 31,133 38,172 45,029
THAILAND 2,236 2,183 2,501 2,754 2,946 2,724 2,600 3,518 4,678 5,704 7,573 8,667 10,054 11,609 14,950 20,929
ASEAN-5 19,506 21,164 25,079 27,059 25,577 22,495 19,934 26,162 32,926 38,662 47,827 58,139 64,113 77,281 102,642 125,625
JAPAN 31,630 34,308 34,094 32,799 34,291 29,514 27,678 33,753 42,890 51,892 62,950 71,843 75,004 86,351 103,078 128,113
UNITED STATES 20,976 21,539 21,262 24,883 27,020 23,885 23,713 29,281 37,942 45,399 51,313 56,332 65,992 76,077 91,044 109,218
AUSTRIA 126 140 174 218 189 168 196 283 361 476 612 896 982 1,064 1,022 1,243
BELGIUM-LUXEMBOURG 747 658 645 828 884 786 857 1,249 1,758 2,182 2,841 3,552 3,394 4,016 4,332 5,031
DENMARK 308 302 358 381 303 302 328 493 572 578 766 874 1,172 1,088 1,121 1,282
FINLAND 128 162 104 129 145 138 136 225 289 395 484 577 805 1,307 1,314 1,742
FRANCE 1,933 2,142 2,238 2,405 2,272 2,292 2,112 2,861 3,812 4,262 5,816 5,796 7,246 7,581 9,117 12,761
GERMANY 4,767 4,553 4,781 4,695 4,580 4,205 4,986 6,318 8,192 9,505 12,884 14,993 16,276 17,419 21,207 25,399
GREECE 157 225 114 92 143 173 104 139 216 221 300 317 347 603 427 507
IRELAND 61 69 82 91 111 86 79 114 220 250 449 485 576 927 1,591 2,687
ITALY 1,536 1,304 1,216 1,399 1,572 1,440 1,421 1,941 2,767 3,286 4,013 4,421 5,359 5,448 6,276 7,698
NETHERLANDS 3,622 3,321 3,124 3,037 3,018 2,974 2,810 3,639 4,226 5,008 5,854 6,687 7,997 8,083 9,579 12,409
PORTUGAL 73 68 98 105 116 150 160 144 191 165 203 198 239 241 317 398
SPAIN 337 356 401 566 458 407 380 597 891 950 1,297 1,506 1,790 1,924 2,297 3,032
SWEDEN 736 690 567 595 666 655 663 853 916 1,230 1,506 1,905 1,754 2,081 2,352 2,830
UNITED KINGDOM 3,362 3,626 3,344 3,469 3,561 3,450 3,883 4,726 6,344 7,741 9,731 10,633 11,308 12,809 14,805 18,147
EUROPEAN UNION 17,892 17,615 17,246 18,011 18,017 17,225 18,116 23,580 30,756 36,249 46,757 52,840 59,244 64,592 75,757 95,164
CHINA,P.R.:HONG KONG 3,485 3,826 3,816 3,625 3,835 3,555 4,009 5,249 7,146 8,194 10,052 12,218 13,914 17,045 22,392 27,803
CHINA,P.R.: MAINLAND 2,410 2,371 2,621 2,172 3,060 4,211 3,683 4,750 6,169 6,637 7,180 8,408 9,164 10,477 13,874 18,425
KOREA 2,150 2,590 2,829 3,144 3,307 3,355 3,140 4,342 6,089 7,294 9,573 12,174 13,204 15,669 18,988 24,509

OTHER NE ASIA 8,045 8,787 9,267 8,940 10,203 11,121 10,832 14,340 19,405 22,126 26,805 32,800 36,282 43,192 55,254 70,738
TOTAL 98,050 103,413 106,948 111,692 115,107 104,241 100,272 127,116 163,918 194,328 235,652 271,953 300,635 347,493 427,775 528,858
Source: IMF Direction of Trade, CD Rom version.
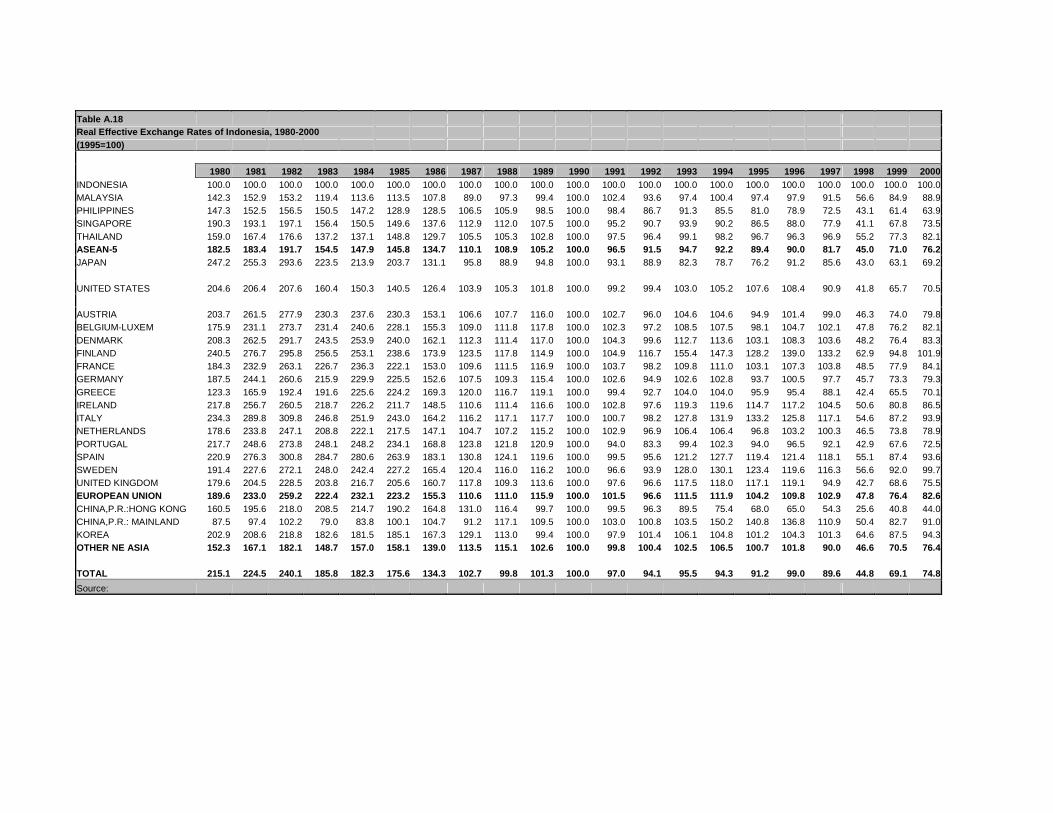
Table A.18Real Effective Exchange Rates of Indonesia, 1980-2000(1995=100)
1980 1981 1982 1983 1984 1985 1986 1987 1988 1989 1990 1991 1992 1993 1994 1995 1996 1997 1998 1999 2000INDONESIA 100.0 100.0 100.0 100.0 100.0 100.0 100.0 100.0 100.0 100.0 100.0 100.0 100.0 100.0 100.0 100.0 100.0 100.0 100.0 100.0 100.0MALAYSIA 142.3 152.9 153.2 119.4 113.6 113.5 107.8 89.0 97.3 99.4 100.0 102.4 93.6 97.4 100.4 97.4 97.9 91.5 56.6 84.9 88.9PHILIPPINES 147.3 152.5 156.5 150.5 147.2 128.9 128.5 106.5 105.9 98.5 100.0 98.4 86.7 91.3 85.5 81.0 78.9 72.5 43.1 61.4 63.9SINGAPORE 190.3 193.1 197.1 156.4 150.5 149.6 137.6 112.9 112.0 107.5 100.0 95.2 90.7 93.9 90.2 86.5 88.0 77.9 41.1 67.8 73.5THAILAND 159.0 167.4 176.6 137.2 137.1 148.8 129.7 105.5 105.3 102.8 100.0 97.5 96.4 99.1 98.2 96.7 96.3 96.9 55.2 77.3 82.1ASEAN-5 182.5 183.4 191.7 154.5 147.9 145.8 134.7 110.1 108.9 105.2 100.0 96.5 91.5 94.7 92.2 89.4 90.0 81.7 45.0 71.0 76.2JAPAN 247.2 255.3 293.6 223.5 213.9 203.7 131.1 95.8 88.9 94.8 100.0 93.1 88.9 82.3 78.7 76.2 91.2 85.6 43.0 63.1 69.2
UNITED STATES 204.6 206.4 207.6 160.4 150.3 140.5 126.4 103.9 105.3 101.8 100.0 99.2 99.4 103.0 105.2 107.6 108.4 90.9 41.8 65.7 70.5
AUSTRIA 203.7 261.5 277.9 230.3 237.6 230.3 153.1 106.6 107.7 116.0 100.0 102.7 96.0 104.6 104.6 94.9 101.4 99.0 46.3 74.0 79.8BELGIUM-LUXEM 175.9 231.1 273.7 231.4 240.6 228.1 155.3 109.0 111.8 117.8 100.0 102.3 97.2 108.5 107.5 98.1 104.7 102.1 47.8 76.2 82.1DENMARK 208.3 262.5 291.7 243.5 253.9 240.0 162.1 112.3 111.4 117.0 100.0 104.3 99.6 112.7 113.6 103.1 108.3 103.6 48.2 76.4 83.3FINLAND 240.5 276.7 295.8 256.5 253.1 238.6 173.9 123.5 117.8 114.9 100.0 104.9 116.7 155.4 147.3 128.2 139.0 133.2 62.9 94.8 101.9FRANCE 184.3 232.9 263.1 226.7 236.3 222.1 153.0 109.6 111.5 116.9 100.0 103.7 98.2 109.8 111.0 103.1 107.3 103.8 48.5 77.9 84.1GERMANY 187.5 244.1 260.6 215.9 229.9 225.5 152.6 107.5 109.3 115.4 100.0 102.6 94.9 102.6 102.8 93.7 100.5 97.7 45.7 73.3 79.3GREECE 123.3 165.9 192.4 191.6 225.6 224.2 169.3 120.0 116.7 119.1 100.0 99.4 92.7 104.0 104.0 95.9 95.4 88.1 42.4 65.5 70.1IRELAND 217.8 256.7 260.5 218.7 226.2 211.7 148.5 110.6 111.4 116.6 100.0 102.8 97.6 119.3 119.6 114.7 117.2 104.5 50.6 80.8 86.5ITALY 234.3 289.8 309.8 246.8 251.9 243.0 164.2 116.2 117.1 117.7 100.0 100.7 98.2 127.8 131.9 133.2 125.8 117.1 54.6 87.2 93.9NETHERLANDS 178.6 233.8 247.1 208.8 222.1 217.5 147.1 104.7 107.2 115.2 100.0 102.9 96.9 106.4 106.4 96.8 103.2 100.3 46.5 73.8 78.9PORTUGAL 217.7 248.6 273.8 248.1 248.2 234.1 168.8 123.8 121.8 120.9 100.0 94.0 83.3 99.4 102.3 94.0 96.5 92.1 42.9 67.6 72.5SPAIN 220.9 276.3 300.8 284.7 280.6 263.9 183.1 130.8 124.1 119.6 100.0 99.5 95.6 121.2 127.7 119.4 121.4 118.1 55.1 87.4 93.6SWEDEN 191.4 227.6 272.1 248.0 242.4 227.2 165.4 120.4 116.0 116.2 100.0 96.6 93.9 128.0 130.1 123.4 119.6 116.3 56.6 92.0 99.7UNITED KINGDOM 179.6 204.5 228.5 203.8 216.7 205.6 160.7 117.8 109.3 113.6 100.0 97.6 96.6 117.5 118.0 117.1 119.1 94.9 42.7 68.6 75.5EUROPEAN UNION 189.6 233.0 259.2 222.4 232.1 223.2 155.3 110.6 111.0 115.9 100.0 101.5 96.6 111.5 111.9 104.2 109.8 102.9 47.8 76.4 82.6CHINA,P.R.:HONG KONG 160.5 195.6 218.0 208.5 214.7 190.2 164.8 131.0 116.4 99.7 100.0 99.5 96.3 89.5 75.4 68.0 65.0 54.3 25.6 40.8 44.0CHINA,P.R.: MAINLAND 87.5 97.4 102.2 79.0 83.8 100.1 104.7 91.2 117.1 109.5 100.0 103.0 100.8 103.5 150.2 140.8 136.8 110.9 50.4 82.7 91.0KOREA 202.9 208.6 218.8 182.6 181.5 185.1 167.3 129.1 113.0 99.4 100.0 97.9 101.4 106.1 104.8 101.2 104.3 101.3 64.6 87.5 94.3OTHER NE ASIA 152.3 167.1 182.1 148.7 157.0 158.1 139.0 113.5 115.1 102.6 100.0 99.8 100.4 102.5 106.5 100.7 101.8 90.0 46.6 70.5 76.4
TOTAL 215.1 224.5 240.1 185.8 182.3 175.6 134.3 102.7 99.8 101.3 100.0 97.0 94.1 95.5 94.3 91.2 99.0 89.6 44.8 69.1 74.8
Source:
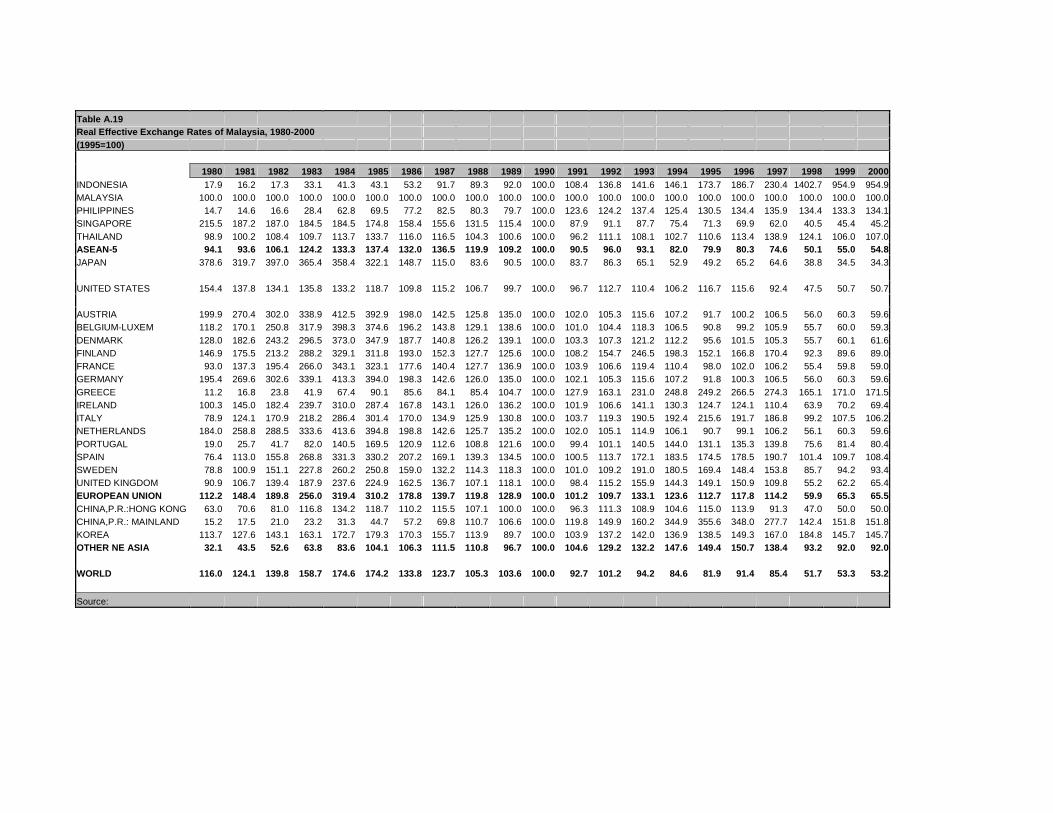
Table A.19Real Effective Exchange Rates of Malaysia, 1980-2000(1995=100)
1980 1981 1982 1983 1984 1985 1986 1987 1988 1989 1990 1991 1992 1993 1994 1995 1996 1997 1998 1999 2000INDONESIA 17.9 16.2 17.3 33.1 41.3 43.1 53.2 91.7 89.3 92.0 100.0 108.4 136.8 141.6 146.1 173.7 186.7 230.4 1402.7 954.9 954.9MALAYSIA 100.0 100.0 100.0 100.0 100.0 100.0 100.0 100.0 100.0 100.0 100.0 100.0 100.0 100.0 100.0 100.0 100.0 100.0 100.0 100.0 100.0PHILIPPINES 14.7 14.6 16.6 28.4 62.8 69.5 77.2 82.5 80.3 79.7 100.0 123.6 124.2 137.4 125.4 130.5 134.4 135.9 134.4 133.3 134.1SINGAPORE 215.5 187.2 187.0 184.5 184.5 174.8 158.4 155.6 131.5 115.4 100.0 87.9 91.1 87.7 75.4 71.3 69.9 62.0 40.5 45.4 45.2THAILAND 98.9 100.2 108.4 109.7 113.7 133.7 116.0 116.5 104.3 100.6 100.0 96.2 111.1 108.1 102.7 110.6 113.4 138.9 124.1 106.0 107.0ASEAN-5 94.1 93.6 106.1 124.2 133.3 137.4 132.0 136.5 119.9 109.2 100.0 90.5 96.0 93.1 82.0 79.9 80.3 74.6 50.1 55.0 54.8JAPAN 378.6 319.7 397.0 365.4 358.4 322.1 148.7 115.0 83.6 90.5 100.0 83.7 86.3 65.1 52.9 49.2 65.2 64.6 38.8 34.5 34.3
UNITED STATES 154.4 137.8 134.1 135.8 133.2 118.7 109.8 115.2 106.7 99.7 100.0 96.7 112.7 110.4 106.2 116.7 115.6 92.4 47.5 50.7 50.7
AUSTRIA 199.9 270.4 302.0 338.9 412.5 392.9 198.0 142.5 125.8 135.0 100.0 102.0 105.3 115.6 107.2 91.7 100.2 106.5 56.0 60.3 59.6BELGIUM-LUXEM 118.2 170.1 250.8 317.9 398.3 374.6 196.2 143.8 129.1 138.6 100.0 101.0 104.4 118.3 106.5 90.8 99.2 105.9 55.7 60.0 59.3DENMARK 128.0 182.6 243.2 296.5 373.0 347.9 187.7 140.8 126.2 139.1 100.0 103.3 107.3 121.2 112.2 95.6 101.5 105.3 55.7 60.1 61.6FINLAND 146.9 175.5 213.2 288.2 329.1 311.8 193.0 152.3 127.7 125.6 100.0 108.2 154.7 246.5 198.3 152.1 166.8 170.4 92.3 89.6 89.0FRANCE 93.0 137.3 195.4 266.0 343.1 323.1 177.6 140.4 127.7 136.9 100.0 103.9 106.6 119.4 110.4 98.0 102.0 106.2 55.4 59.8 59.0GERMANY 195.4 269.6 302.6 339.1 413.3 394.0 198.3 142.6 126.0 135.0 100.0 102.1 105.3 115.6 107.2 91.8 100.3 106.5 56.0 60.3 59.6GREECE 11.2 16.8 23.8 41.9 67.4 90.1 85.6 84.1 85.4 104.7 100.0 127.9 163.1 231.0 248.8 249.2 266.5 274.3 165.1 171.0 171.5IRELAND 100.3 145.0 182.4 239.7 310.0 287.4 167.8 143.1 126.0 136.2 100.0 101.9 106.6 141.1 130.3 124.7 124.1 110.4 63.9 70.2 69.4ITALY 78.9 124.1 170.9 218.2 286.4 301.4 170.0 134.9 125.9 130.8 100.0 103.7 119.3 190.5 192.4 215.6 191.7 186.8 99.2 107.5 106.2NETHERLANDS 184.0 258.8 288.5 333.6 413.6 394.8 198.8 142.6 125.7 135.2 100.0 102.0 105.1 114.9 106.1 90.7 99.1 106.2 56.1 60.3 59.6PORTUGAL 19.0 25.7 41.7 82.0 140.5 169.5 120.9 112.6 108.8 121.6 100.0 99.4 101.1 140.5 144.0 131.1 135.3 139.8 75.6 81.4 80.4SPAIN 76.4 113.0 155.8 268.8 331.3 330.2 207.2 169.1 139.3 134.5 100.0 100.5 113.7 172.1 183.5 174.5 178.5 190.7 101.4 109.7 108.4SWEDEN 78.8 100.9 151.1 227.8 260.2 250.8 159.0 132.2 114.3 118.3 100.0 101.0 109.2 191.0 180.5 169.4 148.4 153.8 85.7 94.2 93.4UNITED KINGDOM 90.9 106.7 139.4 187.9 237.6 224.9 162.5 136.7 107.1 118.1 100.0 98.4 115.2 155.9 144.3 149.1 150.9 109.8 55.2 62.2 65.4EUROPEAN UNION 112.2 148.4 189.8 256.0 319.4 310.2 178.8 139.7 119.8 128.9 100.0 101.2 109.7 133.1 123.6 112.7 117.8 114.2 59.9 65.3 65.5CHINA,P.R.:HONG KONG 63.0 70.6 81.0 116.8 134.2 118.7 110.2 115.5 107.1 100.0 100.0 96.3 111.3 108.9 104.6 115.0 113.9 91.3 47.0 50.0 50.0CHINA,P.R.: MAINLAND 15.2 17.5 21.0 23.2 31.3 44.7 57.2 69.8 110.7 106.6 100.0 119.8 149.9 160.2 344.9 355.6 348.0 277.7 142.4 151.8 151.8KOREA 113.7 127.6 143.1 163.1 172.7 179.3 170.3 155.7 113.9 89.7 100.0 103.9 137.2 142.0 136.9 138.5 149.3 167.0 184.8 145.7 145.7OTHER NE ASIA 32.1 43.5 52.6 63.8 83.6 104.1 106.3 111.5 110.8 96.7 100.0 104.6 129.2 132.2 147.6 149.4 150.7 138.4 93.2 92.0 92.0
WORLD 116.0 124.1 139.8 158.7 174.6 174.2 133.8 123.7 105.3 103.6 100.0 92.7 101.2 94.2 84.6 81.9 91.4 85.4 51.7 53.3 53.2
Source:
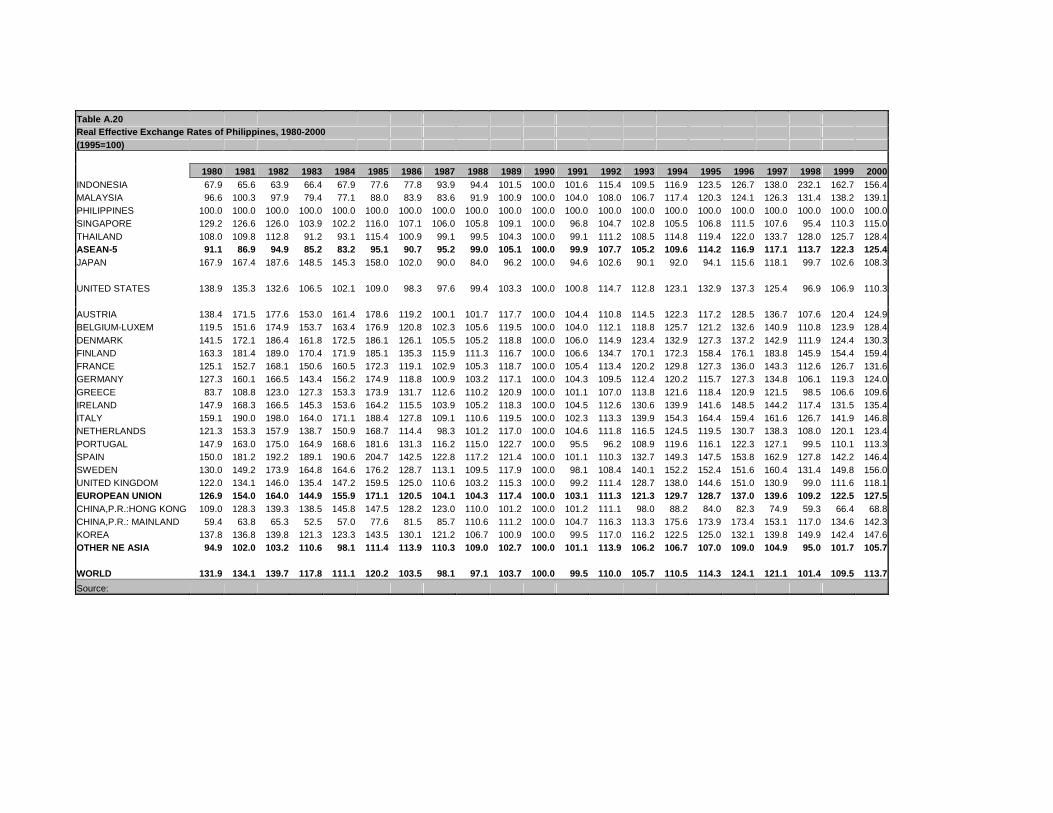
Table A.20Real Effective Exchange Rates of Philippines, 1980-2000(1995=100)
1980 1981 1982 1983 1984 1985 1986 1987 1988 1989 1990 1991 1992 1993 1994 1995 1996 1997 1998 1999 2000INDONESIA 67.9 65.6 63.9 66.4 67.9 77.6 77.8 93.9 94.4 101.5 100.0 101.6 115.4 109.5 116.9 123.5 126.7 138.0 232.1 162.7 156.4MALAYSIA 96.6 100.3 97.9 79.4 77.1 88.0 83.9 83.6 91.9 100.9 100.0 104.0 108.0 106.7 117.4 120.3 124.1 126.3 131.4 138.2 139.1PHILIPPINES 100.0 100.0 100.0 100.0 100.0 100.0 100.0 100.0 100.0 100.0 100.0 100.0 100.0 100.0 100.0 100.0 100.0 100.0 100.0 100.0 100.0SINGAPORE 129.2 126.6 126.0 103.9 102.2 116.0 107.1 106.0 105.8 109.1 100.0 96.8 104.7 102.8 105.5 106.8 111.5 107.6 95.4 110.3 115.0THAILAND 108.0 109.8 112.8 91.2 93.1 115.4 100.9 99.1 99.5 104.3 100.0 99.1 111.2 108.5 114.8 119.4 122.0 133.7 128.0 125.7 128.4ASEAN-5 91.1 86.9 94.9 85.2 83.2 95.1 90.7 95.2 99.0 105.1 100.0 99.9 107.7 105.2 109.6 114.2 116.9 117.1 113.7 122.3 125.4JAPAN 167.9 167.4 187.6 148.5 145.3 158.0 102.0 90.0 84.0 96.2 100.0 94.6 102.6 90.1 92.0 94.1 115.6 118.1 99.7 102.6 108.3
UNITED STATES 138.9 135.3 132.6 106.5 102.1 109.0 98.3 97.6 99.4 103.3 100.0 100.8 114.7 112.8 123.1 132.9 137.3 125.4 96.9 106.9 110.3
AUSTRIA 138.4 171.5 177.6 153.0 161.4 178.6 119.2 100.1 101.7 117.7 100.0 104.4 110.8 114.5 122.3 117.2 128.5 136.7 107.6 120.4 124.9BELGIUM-LUXEM 119.5 151.6 174.9 153.7 163.4 176.9 120.8 102.3 105.6 119.5 100.0 104.0 112.1 118.8 125.7 121.2 132.6 140.9 110.8 123.9 128.4DENMARK 141.5 172.1 186.4 161.8 172.5 186.1 126.1 105.5 105.2 118.8 100.0 106.0 114.9 123.4 132.9 127.3 137.2 142.9 111.9 124.4 130.3FINLAND 163.3 181.4 189.0 170.4 171.9 185.1 135.3 115.9 111.3 116.7 100.0 106.6 134.7 170.1 172.3 158.4 176.1 183.8 145.9 154.4 159.4FRANCE 125.1 152.7 168.1 150.6 160.5 172.3 119.1 102.9 105.3 118.7 100.0 105.4 113.4 120.2 129.8 127.3 136.0 143.3 112.6 126.7 131.6GERMANY 127.3 160.1 166.5 143.4 156.2 174.9 118.8 100.9 103.2 117.1 100.0 104.3 109.5 112.4 120.2 115.7 127.3 134.8 106.1 119.3 124.0GREECE 83.7 108.8 123.0 127.3 153.3 173.9 131.7 112.6 110.2 120.9 100.0 101.1 107.0 113.8 121.6 118.4 120.9 121.5 98.5 106.6 109.6IRELAND 147.9 168.3 166.5 145.3 153.6 164.2 115.5 103.9 105.2 118.3 100.0 104.5 112.6 130.6 139.9 141.6 148.5 144.2 117.4 131.5 135.4ITALY 159.1 190.0 198.0 164.0 171.1 188.4 127.8 109.1 110.6 119.5 100.0 102.3 113.3 139.9 154.3 164.4 159.4 161.6 126.7 141.9 146.8NETHERLANDS 121.3 153.3 157.9 138.7 150.9 168.7 114.4 98.3 101.2 117.0 100.0 104.6 111.8 116.5 124.5 119.5 130.7 138.3 108.0 120.1 123.4PORTUGAL 147.9 163.0 175.0 164.9 168.6 181.6 131.3 116.2 115.0 122.7 100.0 95.5 96.2 108.9 119.6 116.1 122.3 127.1 99.5 110.1 113.3SPAIN 150.0 181.2 192.2 189.1 190.6 204.7 142.5 122.8 117.2 121.4 100.0 101.1 110.3 132.7 149.3 147.5 153.8 162.9 127.8 142.2 146.4SWEDEN 130.0 149.2 173.9 164.8 164.6 176.2 128.7 113.1 109.5 117.9 100.0 98.1 108.4 140.1 152.2 152.4 151.6 160.4 131.4 149.8 156.0UNITED KINGDOM 122.0 134.1 146.0 135.4 147.2 159.5 125.0 110.6 103.2 115.3 100.0 99.2 111.4 128.7 138.0 144.6 151.0 130.9 99.0 111.6 118.1EUROPEAN UNION 126.9 154.0 164.0 144.9 155.9 171.1 120.5 104.1 104.3 117.4 100.0 103.1 111.3 121.3 129.7 128.7 137.0 139.6 109.2 122.5 127.5CHINA,P.R.:HONG KONG 109.0 128.3 139.3 138.5 145.8 147.5 128.2 123.0 110.0 101.2 100.0 101.2 111.1 98.0 88.2 84.0 82.3 74.9 59.3 66.4 68.8CHINA,P.R.: MAINLAND 59.4 63.8 65.3 52.5 57.0 77.6 81.5 85.7 110.6 111.2 100.0 104.7 116.3 113.3 175.6 173.9 173.4 153.1 117.0 134.6 142.3KOREA 137.8 136.8 139.8 121.3 123.3 143.5 130.1 121.2 106.7 100.9 100.0 99.5 117.0 116.2 122.5 125.0 132.1 139.8 149.9 142.4 147.6OTHER NE ASIA 94.9 102.0 103.2 110.6 98.1 111.4 113.9 110.3 109.0 102.7 100.0 101.1 113.9 106.2 106.7 107.0 109.0 104.9 95.0 101.7 105.7
WORLD 131.9 134.1 139.7 117.8 111.1 120.2 103.5 98.1 97.1 103.7 100.0 99.5 110.0 105.7 110.5 114.3 124.1 121.1 101.4 109.5 113.7
Source:
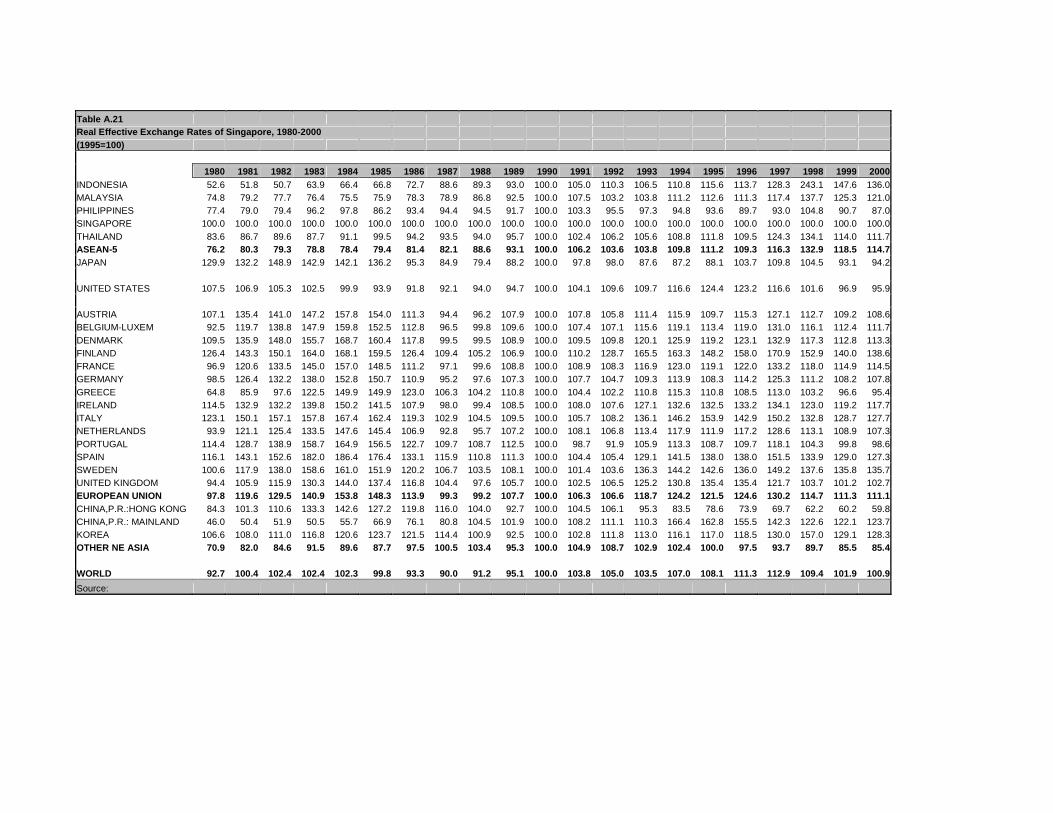
Table A.21Real Effective Exchange Rates of Singapore, 1980-2000(1995=100)
1980 1981 1982 1983 1984 1985 1986 1987 1988 1989 1990 1991 1992 1993 1994 1995 1996 1997 1998 1999 2000INDONESIA 52.6 51.8 50.7 63.9 66.4 66.8 72.7 88.6 89.3 93.0 100.0 105.0 110.3 106.5 110.8 115.6 113.7 128.3 243.1 147.6 136.0MALAYSIA 74.8 79.2 77.7 76.4 75.5 75.9 78.3 78.9 86.8 92.5 100.0 107.5 103.2 103.8 111.2 112.6 111.3 117.4 137.7 125.3 121.0PHILIPPINES 77.4 79.0 79.4 96.2 97.8 86.2 93.4 94.4 94.5 91.7 100.0 103.3 95.5 97.3 94.8 93.6 89.7 93.0 104.8 90.7 87.0SINGAPORE 100.0 100.0 100.0 100.0 100.0 100.0 100.0 100.0 100.0 100.0 100.0 100.0 100.0 100.0 100.0 100.0 100.0 100.0 100.0 100.0 100.0THAILAND 83.6 86.7 89.6 87.7 91.1 99.5 94.2 93.5 94.0 95.7 100.0 102.4 106.2 105.6 108.8 111.8 109.5 124.3 134.1 114.0 111.7ASEAN-5 76.2 80.3 79.3 78.8 78.4 79.4 81.4 82.1 88.6 93.1 100.0 106.2 103.6 103.8 109.8 111.2 109.3 116.3 132.9 118.5 114.7JAPAN 129.9 132.2 148.9 142.9 142.1 136.2 95.3 84.9 79.4 88.2 100.0 97.8 98.0 87.6 87.2 88.1 103.7 109.8 104.5 93.1 94.2
UNITED STATES 107.5 106.9 105.3 102.5 99.9 93.9 91.8 92.1 94.0 94.7 100.0 104.1 109.6 109.7 116.6 124.4 123.2 116.6 101.6 96.9 95.9
AUSTRIA 107.1 135.4 141.0 147.2 157.8 154.0 111.3 94.4 96.2 107.9 100.0 107.8 105.8 111.4 115.9 109.7 115.3 127.1 112.7 109.2 108.6BELGIUM-LUXEM 92.5 119.7 138.8 147.9 159.8 152.5 112.8 96.5 99.8 109.6 100.0 107.4 107.1 115.6 119.1 113.4 119.0 131.0 116.1 112.4 111.7DENMARK 109.5 135.9 148.0 155.7 168.7 160.4 117.8 99.5 99.5 108.9 100.0 109.5 109.8 120.1 125.9 119.2 123.1 132.9 117.3 112.8 113.3FINLAND 126.4 143.3 150.1 164.0 168.1 159.5 126.4 109.4 105.2 106.9 100.0 110.2 128.7 165.5 163.3 148.2 158.0 170.9 152.9 140.0 138.6FRANCE 96.9 120.6 133.5 145.0 157.0 148.5 111.2 97.1 99.6 108.8 100.0 108.9 108.3 116.9 123.0 119.1 122.0 133.2 118.0 114.9 114.5GERMANY 98.5 126.4 132.2 138.0 152.8 150.7 110.9 95.2 97.6 107.3 100.0 107.7 104.7 109.3 113.9 108.3 114.2 125.3 111.2 108.2 107.8GREECE 64.8 85.9 97.6 122.5 149.9 149.9 123.0 106.3 104.2 110.8 100.0 104.4 102.2 110.8 115.3 110.8 108.5 113.0 103.2 96.6 95.4IRELAND 114.5 132.9 132.2 139.8 150.2 141.5 107.9 98.0 99.4 108.5 100.0 108.0 107.6 127.1 132.6 132.5 133.2 134.1 123.0 119.2 117.7ITALY 123.1 150.1 157.1 157.8 167.4 162.4 119.3 102.9 104.5 109.5 100.0 105.7 108.2 136.1 146.2 153.9 142.9 150.2 132.8 128.7 127.7NETHERLANDS 93.9 121.1 125.4 133.5 147.6 145.4 106.9 92.8 95.7 107.2 100.0 108.1 106.8 113.4 117.9 111.9 117.2 128.6 113.1 108.9 107.3PORTUGAL 114.4 128.7 138.9 158.7 164.9 156.5 122.7 109.7 108.7 112.5 100.0 98.7 91.9 105.9 113.3 108.7 109.7 118.1 104.3 99.8 98.6SPAIN 116.1 143.1 152.6 182.0 186.4 176.4 133.1 115.9 110.8 111.3 100.0 104.4 105.4 129.1 141.5 138.0 138.0 151.5 133.9 129.0 127.3SWEDEN 100.6 117.9 138.0 158.6 161.0 151.9 120.2 106.7 103.5 108.1 100.0 101.4 103.6 136.3 144.2 142.6 136.0 149.2 137.6 135.8 135.7UNITED KINGDOM 94.4 105.9 115.9 130.3 144.0 137.4 116.8 104.4 97.6 105.7 100.0 102.5 106.5 125.2 130.8 135.4 135.4 121.7 103.7 101.2 102.7EUROPEAN UNION 97.8 119.6 129.5 140.9 153.8 148.3 113.9 99.3 99.2 107.7 100.0 106.3 106.6 118.7 124.2 121.5 124.6 130.2 114.7 111.3 111.1CHINA,P.R.:HONG KONG 84.3 101.3 110.6 133.3 142.6 127.2 119.8 116.0 104.0 92.7 100.0 104.5 106.1 95.3 83.5 78.6 73.9 69.7 62.2 60.2 59.8CHINA,P.R.: MAINLAND 46.0 50.4 51.9 50.5 55.7 66.9 76.1 80.8 104.5 101.9 100.0 108.2 111.1 110.3 166.4 162.8 155.5 142.3 122.6 122.1 123.7KOREA 106.6 108.0 111.0 116.8 120.6 123.7 121.5 114.4 100.9 92.5 100.0 102.8 111.8 113.0 116.1 117.0 118.5 130.0 157.0 129.1 128.3OTHER NE ASIA 70.9 82.0 84.6 91.5 89.6 87.7 97.5 100.5 103.4 95.3 100.0 104.9 108.7 102.9 102.4 100.0 97.5 93.7 89.7 85.5 85.4
WORLD 92.7 100.4 102.4 102.4 102.3 99.8 93.3 90.0 91.2 95.1 100.0 103.8 105.0 103.5 107.0 108.1 111.3 112.9 109.4 101.9 100.9
Source:
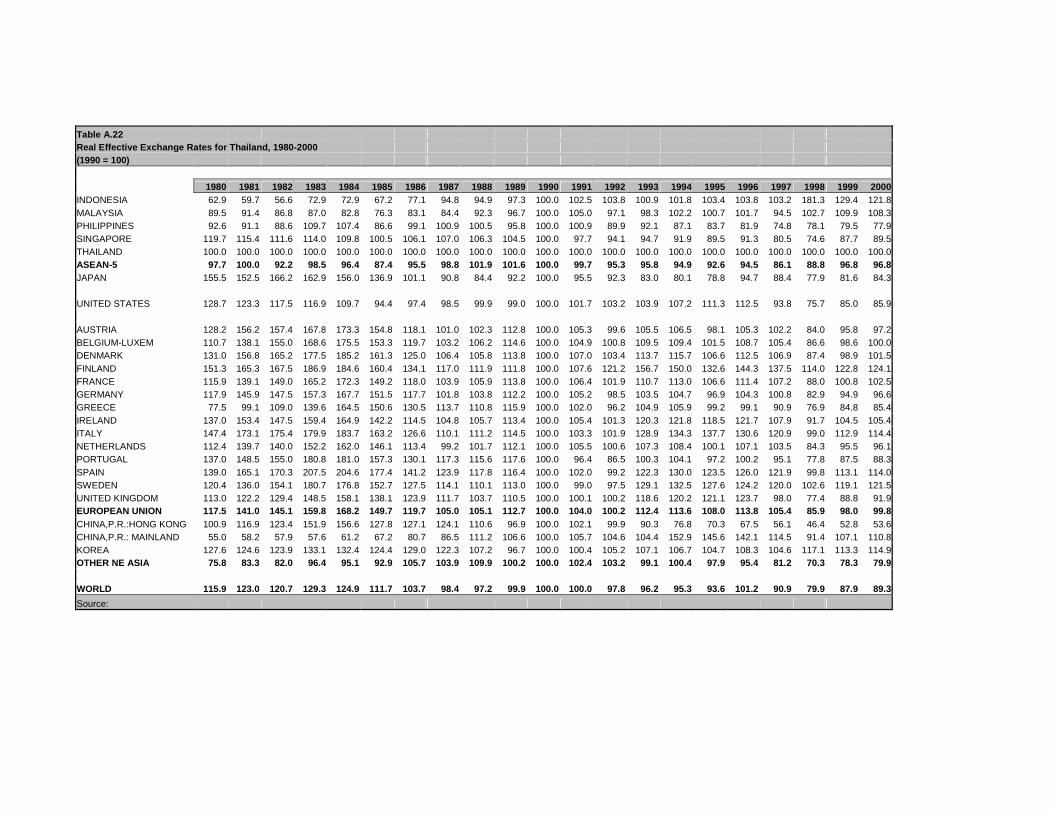
Table A.22Real Effective Exchange Rates for Thailand, 1980-2000(1990 = 100)
1980 1981 1982 1983 1984 1985 1986 1987 1988 1989 1990 1991 1992 1993 1994 1995 1996 1997 1998 1999 2000INDONESIA 62.9 59.7 56.6 72.9 72.9 67.2 77.1 94.8 94.9 97.3 100.0 102.5 103.8 100.9 101.8 103.4 103.8 103.2 181.3 129.4 121.8MALAYSIA 89.5 91.4 86.8 87.0 82.8 76.3 83.1 84.4 92.3 96.7 100.0 105.0 97.1 98.3 102.2 100.7 101.7 94.5 102.7 109.9 108.3PHILIPPINES 92.6 91.1 88.6 109.7 107.4 86.6 99.1 100.9 100.5 95.8 100.0 100.9 89.9 92.1 87.1 83.7 81.9 74.8 78.1 79.5 77.9SINGAPORE 119.7 115.4 111.6 114.0 109.8 100.5 106.1 107.0 106.3 104.5 100.0 97.7 94.1 94.7 91.9 89.5 91.3 80.5 74.6 87.7 89.5THAILAND 100.0 100.0 100.0 100.0 100.0 100.0 100.0 100.0 100.0 100.0 100.0 100.0 100.0 100.0 100.0 100.0 100.0 100.0 100.0 100.0 100.0ASEAN-5 97.7 100.0 92.2 98.5 96.4 87.4 95.5 98.8 101.9 101.6 100.0 99.7 95.3 95.8 94.9 92.6 94.5 86.1 88.8 96.8 96.8JAPAN 155.5 152.5 166.2 162.9 156.0 136.9 101.1 90.8 84.4 92.2 100.0 95.5 92.3 83.0 80.1 78.8 94.7 88.4 77.9 81.6 84.3
UNITED STATES 128.7 123.3 117.5 116.9 109.7 94.4 97.4 98.5 99.9 99.0 100.0 101.7 103.2 103.9 107.2 111.3 112.5 93.8 75.7 85.0 85.9
AUSTRIA 128.2 156.2 157.4 167.8 173.3 154.8 118.1 101.0 102.3 112.8 100.0 105.3 99.6 105.5 106.5 98.1 105.3 102.2 84.0 95.8 97.2BELGIUM-LUXEM 110.7 138.1 155.0 168.6 175.5 153.3 119.7 103.2 106.2 114.6 100.0 104.9 100.8 109.5 109.4 101.5 108.7 105.4 86.6 98.6 100.0DENMARK 131.0 156.8 165.2 177.5 185.2 161.3 125.0 106.4 105.8 113.8 100.0 107.0 103.4 113.7 115.7 106.6 112.5 106.9 87.4 98.9 101.5FINLAND 151.3 165.3 167.5 186.9 184.6 160.4 134.1 117.0 111.9 111.8 100.0 107.6 121.2 156.7 150.0 132.6 144.3 137.5 114.0 122.8 124.1FRANCE 115.9 139.1 149.0 165.2 172.3 149.2 118.0 103.9 105.9 113.8 100.0 106.4 101.9 110.7 113.0 106.6 111.4 107.2 88.0 100.8 102.5GERMANY 117.9 145.9 147.5 157.3 167.7 151.5 117.7 101.8 103.8 112.2 100.0 105.2 98.5 103.5 104.7 96.9 104.3 100.8 82.9 94.9 96.6GREECE 77.5 99.1 109.0 139.6 164.5 150.6 130.5 113.7 110.8 115.9 100.0 102.0 96.2 104.9 105.9 99.2 99.1 90.9 76.9 84.8 85.4IRELAND 137.0 153.4 147.5 159.4 164.9 142.2 114.5 104.8 105.7 113.4 100.0 105.4 101.3 120.3 121.8 118.5 121.7 107.9 91.7 104.5 105.4ITALY 147.4 173.1 175.4 179.9 183.7 163.2 126.6 110.1 111.2 114.5 100.0 103.3 101.9 128.9 134.3 137.7 130.6 120.9 99.0 112.9 114.4NETHERLANDS 112.4 139.7 140.0 152.2 162.0 146.1 113.4 99.2 101.7 112.1 100.0 105.5 100.6 107.3 108.4 100.1 107.1 103.5 84.3 95.5 96.1PORTUGAL 137.0 148.5 155.0 180.8 181.0 157.3 130.1 117.3 115.6 117.6 100.0 96.4 86.5 100.3 104.1 97.2 100.2 95.1 77.8 87.5 88.3SPAIN 139.0 165.1 170.3 207.5 204.6 177.4 141.2 123.9 117.8 116.4 100.0 102.0 99.2 122.3 130.0 123.5 126.0 121.9 99.8 113.1 114.0SWEDEN 120.4 136.0 154.1 180.7 176.8 152.7 127.5 114.1 110.1 113.0 100.0 99.0 97.5 129.1 132.5 127.6 124.2 120.0 102.6 119.1 121.5UNITED KINGDOM 113.0 122.2 129.4 148.5 158.1 138.1 123.9 111.7 103.7 110.5 100.0 100.1 100.2 118.6 120.2 121.1 123.7 98.0 77.4 88.8 91.9EUROPEAN UNION 117.5 141.0 145.1 159.8 168.2 149.7 119.7 105.0 105.1 112.7 100.0 104.0 100.2 112.4 113.6 108.0 113.8 105.4 85.9 98.0 99.8CHINA,P.R.:HONG KONG 100.9 116.9 123.4 151.9 156.6 127.8 127.1 124.1 110.6 96.9 100.0 102.1 99.9 90.3 76.8 70.3 67.5 56.1 46.4 52.8 53.6CHINA,P.R.: MAINLAND 55.0 58.2 57.9 57.6 61.2 67.2 80.7 86.5 111.2 106.6 100.0 105.7 104.6 104.4 152.9 145.6 142.1 114.5 91.4 107.1 110.8KOREA 127.6 124.6 123.9 133.1 132.4 124.4 129.0 122.3 107.2 96.7 100.0 100.4 105.2 107.1 106.7 104.7 108.3 104.6 117.1 113.3 114.9OTHER NE ASIA 75.8 83.3 82.0 96.4 95.1 92.9 105.7 103.9 109.9 100.2 100.0 102.4 103.2 99.1 100.4 97.9 95.4 81.2 70.3 78.3 79.9
WORLD 115.9 123.0 120.7 129.3 124.9 111.7 103.7 98.4 97.2 99.9 100.0 100.0 97.8 96.2 95.3 93.6 101.2 90.9 79.9 87.9 89.3
Source:
38
References
Bénassy-Quéré, A. (1996), “Exchange Rate Regimes and Policies in Asia”. CEPII, document de travail No. 96-07,
Borensztein, E., A. Berg, C.-M. Milesi-Ferretti, and C. Pattillo, (1999) “Anticipating Balance of Payments Crises---The Role of Early Warning Systems,” IMF Occasional Paper.
Chen, J-A. (1994), “Japanese Firms with Direct Investments in China and Their Local Management” in S. Tunaga, ed., Japan's foreign investment and Asian economicinterdependence: Production, trade, and financial systems. Tyo: University ofTyo Press.
Chuhan, P., G. Perez-Quiros, and H. Popper (1996), “International Capital Flows: Do Short-Term Investment and Direct Investment Differ?” Policy Research Working Papers. Washington, DC: World Bank, International EconomicsDivision.
Corsetti, G., P. Pesenti, and N. Roubini (1998), “What Caused the Asian Currency and Financial Crisis?” New York: Stern School of Business. New York University.
Dahman, C. and L. Westphal (19), “The Transfer of Technology”. Finance and Development 20(4): 6-9.
Davidson et al. (1978), “Econometric Modelling of the Aggregate Time-SeriesRelationship Between Consumers’ Expenditure and Income in the United Kingdom”, Economic Journal 88: 661-92.
Diwan and Hoeckman (1999), “Competition, Complementarity and Contagion in EastAsia”. Centre for Economic Policy Research. CEPR Discussion Paper No. 2112.
Dollar, D. (1992), “Outward-Oriented Developing Economies Really Do Grow MoreRapidly: Evidence from 95 LDCs, 1976-1985”. Economic Development andCultural Change 40(3): 523-44.
Easterly, W. (1993), “How Much Do Distortions Affect Growth?” Journal of MonetaryEconomics 32(2): 187-212.
Edwards, S. (1993), “Openness, Trade Liberalization, and Growth in Developing Countries”. Journal of Economic Literature 31(3): 1358-1393.
39
Engle, R. and C.W.J. Granger (1987), “Co-Integration and Error Correction:Representation, Estimation, and Testing”, Econometrica 55(2): 251-276.
Fischer, S. (1991), “Growth, Macroeconomics, and Development”, in O.J. Blanchard andS. Fischer (eds), NBER Macroeconomics Annual 1991. Cambridge, MA: MITPress.
Fischer, S. (1993), “The Role of Macroeconomic Factors in Growth,” Journal ofMonetary Economics. 32: 485-5 12.
Fry, M.J., S. Claessens, P. Burridge, and M-C. Blanchet (1997), “Foreign Direct Investment, Other Capital Flows, and Current Account Deficits: What CausesWhat?” Policy Research Working Papers. Washington, DC: World Bank, International Economics Division.
Goldstein (1998), The Asian Financial Crisis: Causes, Cures, and Systemic Implications.Policy Analyses in International Economics 55. Washington, DC: Institute forInternational Economics.
Granger, C.W.J., and A.A. Weiss (1983), “Time Series Analysis of Error-CorrectingModels”, in S. Karlin, T. Amemiya, and L.A. Goodman (eds), Studies inEconometrics, Time Series, and Multivariate Statistics. New York: AcademicPress.
Hallwood, C.P., and R. MacDonald (1994), International Money and Finance. Oxford:Blackwell Publishers Ltd.
Harrison, A. (1996), “Openness and Growth: A Time-Series, Cross-Country Analysis forDeveloping Countries”. Journal of Development Economics 48(2): 419-447.
Huh, C. and K. Kasa (1997), “A Dynamic Model of Export Competition, Policy Coordination, and Simultaneous Currency Collapse”. Pacific Basin WorkingPaper Series No. PB97-08. San Francisco, DA: Federal Reserve Bank, CA:Federal Reserve Bank of San Francisco.
International Monetary Fund (1998), “Thailand: Statistical Appendix”. Country Staff Report No. 98/119.
Kim, J.I. and L.J. Lau (1994), “The Sources of Economic Growth in the East Asian Newly Industrialized Countries”. Journal of Japanese and International Economics. 8: 235-71.
Krugman, P. (1998), “What Happened to Asia?” Cambridge: Department of Economics, Massachusetts Institute of Technology. http://web.mit.edu/krugman/www/disinter.html
40
Krugman, P. (1999), “Balance Sheets, the Transfer Problem, and Financial Crises". Cambridge: Department of Economics, Massachusetts Institute of Technology.http://web.mit.edu/krugman/www/flood.pdf
Kwan, C.H. (1998), “The Yen, the Yuan and the Asian Currency Crisis: Changing Fortune between Japan and China”. Nomura Research Institute.
Levis, M. (1979), "Does Political Instability in Developing Countries Affect ForeignInvestment Flow? An Empirical examination". Management InternationalReview 19: 59-68.
Lim, L.Y. and P.E. Fong (1991), Foreign Direct Investment and Industrialization inMalaysia, Singapore, Taiwan and Thailand. Paris: Development Centre of theOrganization for Economic Cooperation and Development
Little, I.M.D., R.N. Cooper, W.M. Corden, and S. Rajapatirana (1993), Boom, Crisis, andAdjustment: The Macroeconomic Experience of Developing Countries. Oxford:Oxford University Press for the World Bank.
Lopez-Mejia, A. (1999), “Large Capital Flows: A Survey of the Causes, Consequences,and Policy Responses”. IMF Working Paper P/99/17. Washington, DC: International Monetary Fund.
Lucas, R. (1993), "On the Determinants of Direct Foreign Investment: Evidence fromEast and Southeast Asia." World Development 21(3): 391-406.
Maddison, A. (1982), Phases of Capitalist Development. Oxford: Oxford UniversityPress.
Makin, J. (1997), Two New Paradigms. Washington: American Enterprise Institute.
MacDonald, R. and T.S. Torrance (1990), “Expectations Formation and Risk in Four Foreign Exchange Markets”. Oxford Economic Papers 42: 544-561.
McKibbin, R. (1998), “The Crisis in Asia: An Empirical Assessment”. Working Paper. Washington, DC: Broings Institution.
McKinnon, R. (1999), “The East Asian Dollar Standard, Life After Death?”. Presented to the Workshop on “Rethinking the East Asian Miracle”. The Asia Foundation, San Francisco, California (16-17 February).
McKinnon, R. and K. Ohno (1997), Dollar and yen: Resolving Economic ConflictBetween the United States and Japan. Cambridge, MA: MIT Press.
41
McKinnon, R. and K. Ohno (1998), “The Exchange Rate Origins of Japan’s Economic Slump in the 1990s”. The World Economy.
Nelson, R.R., and H. Pack (1999), “The Asian Miracle and Modern Growth Theory”. Economic Journal 109 (July).
Noland, M., L-G Liu, S. Robinson, and Z. Wang (1998), Global Economic Effects of theAsian Currency Devaluations. Policy Analyses in International Economics 56.Washington, DC: Institute for International Economics.
Obstfeld, M., and K. Rogoff (1998), Foundations of International Macroeconomics.Cambridge, MA: MIT Press.
Ohno, K. (1999), “Exchange Rate Management in Developing Asia: A Reassessment of the Pre-crisis Soft Dollar Zone”. ADBI Working Paper 1. Asian Development Bank, Tokyo.
Sachs, J. D. (1997), “Personal View”. Financial Times (30 July).
Sachs, J. D., and A. M. Warner (1995), “Economic Reform and the Process of Global Integration”. Broings Papers on Economic Activity. 1: 1-118.
Singh, H. and K.W. Jun (1995), “Some New Evidence on Determinants of Foreign Direct Investment in Developing Countries”. Policy Research Working Papers. Washington, DC: World Bank, International Economics Division.
Stiglitz, J. (1997), “The Role of International Financial Institutions in the Current Global Economy”. Address to the Chicago Council on Foreign Relations. Chicago (27 February).
Thee, K.W. (1999), “Export-Oriented Industrialisation and Foreign Direct Investment inthe ASEAN countries”. http://www.unu.edu/hq/ academic/Pg_area4/Thee.html
World Bank (1993), The Asian Miracle: Economic Growth and Public Policy. Oxford:Oxford University Press for the World Bank.
World Bank (1997), Private Capital Flows to Developing Countries: The Road toFinancial Integration. Oxford: Oxford University Press for the World Bank.
Young, A. (1995), “The Tyranny of Numbers: Confronting the Statistical Realities of theEast Asian Growth Experience”. Quarterly Journal of Economics. 110: 64 l-680.


