Embed Size (px)
Citation preview
ISSN 0378-4738 = Water SA Vol. 28 No. 4 October 2002 423Available on website http://www.wrc.org.za
Model evaluation and optimisation of nutrient removalpotential for sequencing batch reactors
N Artan1*, P Wilderer2, D Orhon1, R Tasli1 and E Morgenroth3
1Environmental Engineering Department, Istanbul Technical University, I.T.U. Insaat Fakültesi, 80626 Maslak, Istanbul, Turkey2 Institute of Water Quality Control and Waste Management, Technical University of Munich, D-85748 Munich, Germany
3 Department of Civil and Eniron. Engineering, University of Illinois at Urbana-Champaign, 3219 Newmark Civil Engineering Lab., 205North Mathews Avenue, MC-250, Urbana, IL, 61801, USA
Abstract
Performance of sequencing batch reactors for simultaneous nitrogen and phosphorus removal is evaluated by means of modelsimulation, using the activated sludge model, ASM2d, involving anoxic phosphorus uptake, recently proposed by the IAWQ Taskgroup. The evaluation includes all major process configurations with different aerobic, anoxic, anaerobic sequences, and fillconditions. Basic relationships between modelling and design based on overall process stoichiometry are established for theinterpretation of nutrient profiles associated with different operation modes. A similar approach is also used for the assessment ofthe effect of major operating parameters on system performance.
Introduction
The SBR technology, despite its simplicity as a batch reactor, offersa great flexibility of operation where the sequence of successivephases can be adjusted to sustain any desired combination ofgrowth conditions for different biochemical processes (Irvine etal., 1997; Ketchum, 1997; Morgenroth and Wilderer, 1998). Thisfeature is particularly significant for simultaneous nitrogen andphosphorus removal, now a prerequisite for most wastewaters. Theprocess is an attractive research tool as the batch operation is mostsuitable for the observation and interpretation of transient responsesof any selected process component. It is also used in practice at anincreasing pace, as an effective biological treatment technology fora large spectrum of various wastes, ranging from simple domesticsewage to different industrial effluents (Goronszy, 1995; Artan etal., 1996; Wilderer et al., 2001).
Biological nutrient removal involves an intricate array ofbiochemical processes to be sustained in an appropriate sequenceof aerobic, anoxic and anaerobic conditions. The number ofprocesses and components together with the complexity of SBRhydraulics makes it impossible to come up with an accurateprediction of effluent quality, without the use of appropriatemodelling. Simulation programs based on models reflectingmicrobial behaviour with reasonable accuracy are now regarded asvaluable tools to systematically assess various design and operatingstrategies, thus allowing for system optimisation. In the last years,a number of modelling approaches has been proposed for thispurpose. For example the IWA (formerly IAWQ) Task Group hasdeveloped the Activated Sludge Model No.2 (ASM2) incorporatingEBPR (Henze et al., 1995). These models, while providing anacceptably reliable description for nitrogen transformations,generally lacked sufficient credibility for the fate of phosphorus,mainly because they did not incorporate sufficient experimentalsupport, and also, the behaviour of phosphate accumulating
organisms (PAOs) did not always appear quite predictable (Sormet al., 1996; Kuba et al., 1997; Ekama and Wentzel, 1999). In thelight of recent research (Mino et al., 1995; Artan et al., 1998; Barkerand Dold, 1997), ASM2 was modified as ASM2d to includedenitrification by PAOs with reduced anoxic P uptake (Henze et al.,1999).
Model simulation of SBR performance provides informationfor a selected set of different operating conditions. Interpretationof the simulation results for process design is only meaningfulwhen support is provided in terms of relevant process stoichiometryand mass balance relationships for related model components. Thebasic stoichiometry of nitrogen oxidation and removal is wellunderstood; it was recently translated into a rational design procedurefor SBR systems (Artan et al., 2001). A similar approach is yet tobe developed for excess biological phosphorus removal (EBPR),due to the complexity of processes and the excessive number ofprocess components involved. Therefore, evaluation of the fate ofnitrogen and phosphorus forms competing for the same organiccarbon source in the anoxic/anaerobic phases, within thesimultaneous N/P removal systems, still requires model simulation.
The objective of this study was to evaluate the performance ofSBRs for simultaneous nitrogen and phosphorus removal by meansof model simulation, using the activated sludge model, ASM2d.The evaluation included all major process configurations withdifferent aerobic, anoxic, anaerobic sequences, and fill conditions.Basic relationships between modelling and design based on overallprocess stoichiometry were established for the interpretation ofnutrient profiles associated with different operation modes. Asimilar approach was used for the assessment of the effect of majoroperating parameters on system performance. The impact ofanoxic P uptake on process performance was also reviewed bycomparing ASM2d with ASM2.
Conceptual approach for model simulation
Reactor kinetics
Mechanistic understanding of the SBR process is best secured byidentifying significant operational parameters and by interpreting
* To whom all correspondence should be addressed.� 90 212 285 65 47; fax 90 212 285 37 93; e-mail: [email protected] 24 July 2001; accepted in revised form 8 July 2002.

ISSN 0378-4738 = Water SA Vol. 28 No. 4 October 2002424 Available on website http://www.wrc.org.za
them in a way that allows comparison with respect to continuousflow systems. The striking feature of the system is that it involvesa single reactor both for biochemical processes and solid-liquidseparation taking place in a temporal sequence of engineeredcycles.
The total cycle time, TC, is basically the sum of five phases,
namely fill, TF, react, T
R, settling, T
S, draw, T
D, and idle, T
I, phases.
Biological processes are assumed to take place only during theprocess period, T
P, corresponding to the sum of fill and react
phases. In nutrient removal SBR systems, the process phase includesan aerated period, T
A and a mixed period, T
M. Depending on the
presence or absence of nitrate in the mixed liquor, the portions ofthe mixed period can be anoxic (T
DN) or anaerobic (T
AN).
The wastewater is introduced and held in the reactor underdifferent conditions necessary for the desired package of biochemicalprocesses, allowed to settle and finally removed from the reactorfor the start of a new cycle. Consequently, an important parameterto be considered is the required volumetric capacity; the totalreactor volume, V
T, consists of a stationary or an initial volume, V
0,
that basically holds the settled biomass with a safety margin and afill volume, V
F, corresponding to the volume of wastewater filled
and discharged in each cycle. In this context, SBR may be regardedas a single tank activated sludge plant with a cyclic operation anda variable volume within the fill phase which may be selected as thedesired portion of the operation cycle. During the fill phase,biochemical reactions take place in a reactor volume that graduallyincreases from an initial level, V
0, to the total reactor volume, V
T,
defined as
FT QTVV += 0 (1)
where:Q = flow rate
For the fill phase, the mass balance for each model component, Ci,
may be formulated as follows, with the understanding that an SBRalways operates as a completely mixed reactor,
[ ]ii
i VrQCdt
VCd += 1 (2)
where:V = reactor volume at a given time , tC
i1= influent C
i concentration
ri
= observed conversion rate for Ci
By definition:
Qdt
dV = (3)
Taking the differential of the left-hand side and rearranging toinclude the above definition, Eq. (2) may be written as:
( )i
iii rQtV
CCQ
dt
dC+
+−
=0
1(4)
During the react portion of the process period where the SBRfunctions as a completely mixed batch reactor of constant volume,mass balance equations are reduced to the following expression:
rdt
dCi = (5)
Mass balances for all the model components may be written as a setof coupled ordinary differential equations, which are non-linear forthe generally accepted reaction kinetics. As the reaction term forany selected model component may be a function of the
concentrations of several other components, it is generally necessaryto solve these mass balance equations simultaneously. For the rateexpressions associated with the adopted models, these differentialexpressions can be integrated over the duration of the cycle todetermine the concentration profiles of the model componentsduring the cycle. Numerical integration techniques are usuallyrequired for the solution of these equations.
With the commonly accepted assumption that no biologicalconversion takes place during settling, draw and idle phases, theconcentration of a soluble component at the end of the react phaseremains the same at the end of the cycle; the concentration of aparticulate component, however, is bound to change due to sludgewaste securing cyclic steady-state operation. Assuming that excesssludge is wasted at the end of the react phase at the rate dictated bythe selected sludge age, θ
X, and settling is ideal with no carry-over
of suspended solids in the effluent stream, the concentration of anyparticulate component at the beginning of the next cycle, X
i0, can
be calculated from the following mass balance expression:
( )0
0
/11
V
mXVX XieT
i
θ−= (6)
where:X
ie= concentration of any particulate component at the end
of the react phasem = number of cycles per day
The system will reach a cyclic steady-state through continuousoperation in the sense that the progression of each cycle remainsidentical to any other and therefore, the initial concentration of asoluble component, S
i0, becomes equal to the concentration of the
same component at the end of the cycle, Sie.
The number of model components, i, may range from three insimple models for carbon removal alone, to double figures as incomplex models for nutrient removal, depending on whateverpurpose the model is expected to serve. The reaction term, r
i,
represents the sum of all the rates for all the j number of processesin which the model component i participates, where j may also varyaccording to the complexity of the model. The selected biokineticmodel can be implemented in various computer codes for thesimulation of the behaviour of SBR systems.
Basis for model simulation
In this study, ASM2d implemented by AQUASIM (Reichert,1994) was used for the simulation of nutrient removal in SBRsystems. Simulations were carried out with the assumption that themixed liquor dissolved oxygen concentration would be zero duringthe mixed periods, instantaneously rising to its set point concentrationof S
0 = 6.0 mg·�-1 at the start of the subsequent aerobic period.
An influent wastewater composition, mainly consisting of atotal COD = 260 mg·�-1, TKN = 25 mg·�-1 and total P = 6 mg·�-1,together with their fractionation into soluble and particulate modelcomponents, and the entire spectrum of kinetic and stoichiometriccoefficients, suggested as default values at 20oC in ASM2d, wereselected for the simulation runs. The basic design of SBR systemsrequired to run the simulation program, was performed in accordancewith the rational design approach formulated by Artan et al. (2001).An effective sludge age value of θ
XE = 15 d was adopted as a
constant design parameter for all the simulation runs. The modelsimulation was performed with three different aeration ratios,T
A/T
P, in the range of 0.4 to 0.6, all corresponding to aerobic sludge
age values to ensure complete nitrification. One hour was devotedto settle, draw and idle phases in each cycle, (T
S+T
D+T
I = 1.0 h), so
ISSN 0378-4738 = Water SA Vol. 28 No. 4 October 2002 425Available on website http://www.wrc.org.za
that the total sludge retention time, θX could be
calculated as below:
1−=
C
CXEX T
Tθθ (7)
Three different cycle times, TC, of 4.0, 4.8 and
6.0 h were selected to ensure appropriate reactorvolume operated with reasonable MLSS levels.The cycle times resulted in nominal hydraulicretention time, µh, in close vicinity of 0.45 d(10.8 h) based on the selected sludge volumeindex (SVI) for adopted wastewater compo-sition and sludge age. This value of θh = 0.45d was used and held constant for all the runs,mainly to visualise the effect of otheroperational conditions on the nutrient removalperformance of SBR systems. In this context,three different V
0/V
F ratios could be computed,
based on the selected cycle times, for the samehydraulic retention time, according to the equation below:
CFF
TCh T
V
V
V
VT
+== 01θ (8)
The rational design procedure also allows for the calculation ofthree basic parameters for nitrogen removal, namely, nitrificationcapacity, N
OX, denitrification potential, N
DP, and available nitrate,
NA, thus providing a basis for the evaluation of simulation results
concerning both N and P removal competing for the same organiccarbon source. In this study, the nitrification capacity, N
OX, reflecting
the concentration of ammonia nitrogen oxidised or the nitratenitrogen produced could be calculated from mass balance for TKNas N
OX = 20 mg·�-1, for the selected effective sludge age of θ
XE = 15
d, assuming complete nitrification. This NOX
value could be acceptedas approximately constant for all runs.
An important parameter in designing nitrogen removal systemsis the denitrification potential, N
DP, defining the nitrate concentration
that may be potentially removed through oxidation of availableorganic carbon during the anoxic phase. This parameter isconveniently defined as the fraction of the nitrate nitrogen equivalentof the total electron acceptor demand associated with the organiccarbon removal (Orhon and Artan, 1994; Artan et al., 1995). ForSBR systems, N
DP may be calculated in two different ways, based
on filling and aeration patterns, for the selected mixing ratio,TM
/TP:
It may be defined with the expression below, assuming an evendistribution of electron acceptor demand throughout the aerobicand anoxic periods:
( )86.2
1 1SNH
P
MDP
CY
T
TN −
= η (9)
where:T
M/T
P= mixing period to process period ratio
CS1
= influent biodegradable substrate, M COD L-3
YNH
= observed heterotrophic yield, cell COD (COD)-1
η = correction factor for anoxic respiration
When filling is performed only during the anoxic periods, theexpression for N
DP needs to be rearranged as follows, with the
stipulation that the entire electron acceptor demand associated withgrowth on influent readily biodegradable substrate, S
S1 is exerted
in the anoxic periods and the remaining portion is distributedbetween the anoxic and aerobic periods in accordance with the T
M/
TP ratio:
( ) ( )86.2
186.2
1 11 SNH
P
ASNH
P
MDP
SY
T
TCY
T
TN −
+−
= ηη (10)
where:T
A/T
P= aeration period to process period ratio
SS1
= influent readily biodegradable substrate,M COD L-3
The available nitrate, NA, is the other significant parameter to
assess the performance of nitrogen removal in single sludge reactors.In view of the fact that only the nitrate remaining with the volumeV
0 at the end of the previous cycle can be available for
predenitrification, NA may be defined with the following expression
for SBR systems:
( ) OXV
V
VV
OXT
A NNV
VN
F
F
0
0
10
+== (11)
The various operating strategies used in the simulation studies areoutlined in Table 1. The model simulation basically involved 10runs with different operation conditions. A fill time ratio, T
F/T
C, of
1/3 is selected for all runs except for Runs 8, 9 and 10. In Runs 9and 10, filling is maintained during the whole cycle time except forthe settle and draw phases while in Run 8 dump filling is applied.Table 1 also lists predicted values of the denitrification potential,N
DP, calculated from expressions 9 or 10 depending on filling and
aeration patterns, together with the available nitrate values, N
A only
applicable to operating modes that can be identified aspredenitrification systems. The respective N
DP and N
A values given
in Table 1 set the basis for evaluating model simulation of systemperformance using process stoichiometry, as elaborated in detail inthe following section.
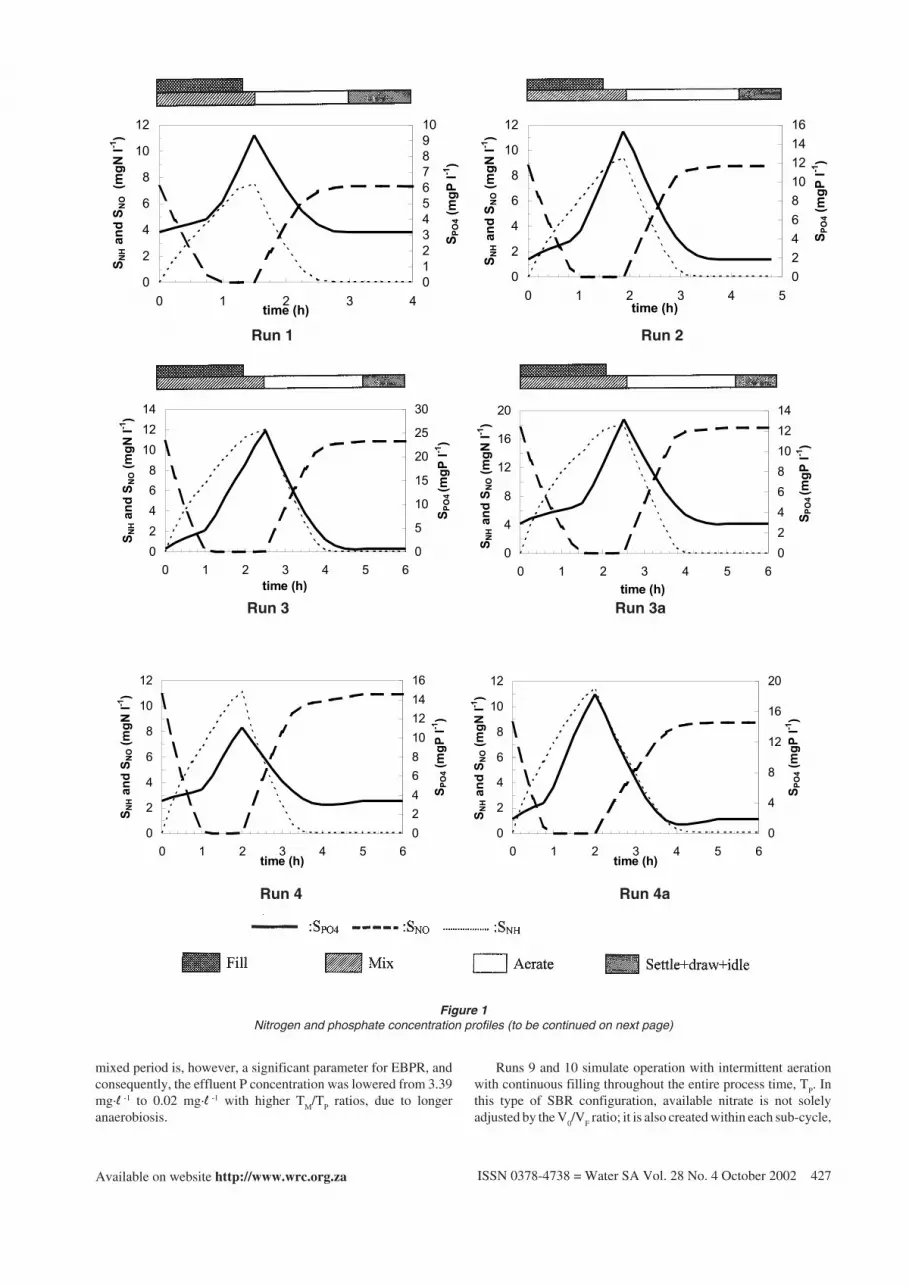
Evaluation of simulation results
The SPO4,
SNO
and SNH
profiles associated with the cyclic operationof the SBR systems at steady state are illustrated in Fig. 1.Significant results of the study are also shown in Table 2, in a wayto allow comparative evaluation of the effect of different operatingparameters on simulated nutrient removal performance. Values ofthe soluble components in the Table 2 reflect effluent quality. Totalsuspended solids, X
TSS, were calculated from particulate model
components, in accordance with the stoichiometric coefficientsproposed in ASM2d, as indicated by the following expression:
TABLE 1Operation conditions used in simulation studies and calculated
values of NDP and NA
RUN Tc (h) V0/VF TM/TP Filling pattern Aeration NDP NA pattern (mg·� -1) (mg·� -1)
1 4 1.7 0.5 Single mixed Single 22 12.62 4.8 1.25 0.5 Single mixed Single 22 11.13 6 0.8 0.5 Single mixed Single 22 8.94 6 0.8 0.4 Single mixed Single 17.6 8.95 6 0.8 0.6 Single mixed Single 25.7 8.96 6 0.8 0.6 Single mixed Double 23.3 -7 6 0.8 0.6 Double mixed Double 25.7 -8 6 0.8 0.6 Dump Intermittent 23.3 -9 6 0.8 0.6 Continuous Intermittent 23.3 -
10 6 0.8 0.4 Continuous Intermittent 15.5 -

ISSN 0378-4738 = Water SA Vol. 28 No. 4 October 2002426 Available on website http://www.wrc.org.za
( ) PPPHAISPAOAHTSS XXXXXXXX 23.360.075.075.09.0 ++++++= (12)
where:X
TSS= total suspended solids, M(TSS) L-3
XH, X
A, X
PAO = heterotrophic, autotrophic and phosphate
accumulating organisms, M(COD) L-3
XS
= slowly biodegradable substrate, M(COD) L-3
XI
= inert particulate organic material, M(COD) L-3
XPHA
= stored poly-hydroxy-alkanoates, M(COD) L-3
XPP
= stored poly-phosphate, M(P) L-3
The MLSS values in Table 2 represent the corresponding XTSS
levels in the reactor at the end of the reaction phase. Similarly, asdefined in ASM2d, the phosphorus content of the sludge wascomputed as
( )TSS
PPIPXIPAOAHPBMcont X
XXiXXXiP
++++= (13)
where:iPBM
= P fraction of biomassiPXI
= P content of XI
Effect of cycle time
The effect of cycle time on nutrient removal performance wasanalysed and demonstrated with the first three runs, where T
C was
increased from 4 h in Run 1 to 4.8 h and 6.0 h in Runs 2 and 3respectively. As shown in Table 2, an increase in the cycle times fora constant hydraulic retention time, θ
h, inevitably results in lower
V0/V
F ratios, a key parameter comparable to the sludge recycle ratio
in continuous-flow systems, and consequently, in lower NA levels.
The fate of nitrogen closely depends upon the balance between NDP
and NA within the non-aerated phase with the assumption that full
nitrification is secured in the aerobic phase, and the lower one actsas the limiting parameter in setting the effluent nitrate concentration,S
NO. As the process stoichiometry yields N
DP > N
A for these runs
all simulating a predenitrification configuration, the SNO
levelsincrease from 7.3 mg·�-1 to 10.9 mg·�-1 as the selected cycle timeincreases, indicated by the following expression:
( )FV
VOX
AOXNO
NNNS
01+=−= (14)
It should be noted that SBR systems do not have the same operationflexibility for simultaneous N and P removal as continuous-flowconfigurations in the sense that an anoxic phase is inherentlyestablished before truly anaerobic conditions: If N
DP < N
A, the non-
aerated phase, TM
, becomes fully anoxic with an SNO
surplus, wheredenitrification preferentially consumes available organic carbon,thus blocking biological processes related to EBPR; if N
DP > N
A, as
simulated in these runs, SNO
is fully depleted, allowing fordevelopment of a subsequent anaerobic phase within the non-aerated (mixed) period. A relatively high amount of nitrate nitrogenintroduced into the mixed period is likely to result in a longer anoxicphase, with a following anaerobic phase too short for an effectiveEBPR, an operation mode illustrated by Run 1, where an effluentP concentration of not lower than 3.16 mg·� -1 could be obtained. InSBR systems operated with filling and aeration patternsapproximating predenitrification, a compromise is often neededbetween a lower nitrogen removal efficiency and an effectiveEBPR. In fact, S
PO4 could be reduced to 0.65 mg·� -1 in Run 3, at the
expense of a higher cycle time and lower V0/V
F ratio, and
consequently a lower N removal efficiency. The increase in the Pcontent and the PAO fraction of the MLSS should also be observedas signs of improved EBPR in Run 3.
Effect of TM/TP ratio
Simulation results of 5 different runs (Runs 3, 4, 5, 9, and 10) wereused to evaluate the effect of T
M/T
P ratio on nutrient removal
performance. TC was maintained as 6 h and V
0/V
F ratio as 0.8 in all
the runs. As previously mentioned, Runs 3, 4 and 5 were allsimulated as single mixed, predenitrification systems with N
DP
levels highly exceeding NA to allow simultaneus P removal.
Therefore, the available nitrate was rate-limiting and increasing theT
M/T
P ratio from 0.4 to 0.6 did not exert, as expected, any influence
on the effluent nitrate nitrogen concentration which remainedconstant as 10.9 mg·� -1, a level directly corresponding to theselected V
0/V
F ratio. The duration of the anaerobic phase during the
TABLE 2Selected results of the simulation studies
RUN SPO4 SNH SNO MLSS Pcont (%) (%) EBPR NOX -SNO(mg·� -1) (mg·� -1) (mg·� -1) (mg·� -1) P/TSS XPAO/TSS (mg·� -1) (mg·� -1)
1 3.16 0.07 7.3 3515 3.7 6.6 1.5 12.72 1.86 0.06 8.8 3510 5.0 10.9 2.8 11.23 0.65 0.06 10.9 3498 6.2 14.7 4.1 9.13a 2.92 0.05 17.6 3228 3.9 6.9 1.8 14.44a 1.91 0.11 8.7 3318 4.9 10.8 2.8 11.35 0.02 0.10 10.9 3574 6.5 20.2 4.7 9.15a 2.2 0.04 10.9 3694 7.4 18.7 5.5 9.16 0.45 0.07 7.8 3517 6.3 15.8 4.3 12.26a 3.36 0.07 7.7 3542 6.5 15.7 4.3 12.36b 3.69 0.05 8.6 3538 6.1 14.5 4.0 11.47 0.32 0.31 6.3 3530 6.3 16.0 4.4 13.78 4.71 0.10 2.2 2925 1.8 0.3 0 17.89 4.68 0.76 2.1 2913 1.9 0.3 0 17.910 4.69 0.36 5.2 2894 1.7 0.0 0 14.8
ISSN 0378-4738 = Water SA Vol. 28 No. 4 October 2002 427Available on website http://www.wrc.org.za
mixed period is, however, a significant parameter for EBPR, andconsequently, the effluent P concentration was lowered from 3.39mg·� -1 to 0.02 mg·� -1 with higher T
M/T
P ratios, due to longer
anaerobiosis.
Runs 9 and 10 simulate operation with intermittent aerationwith continuous filling throughout the entire process time, T
P. In
this type of SBR configuration, available nitrate is not solelyadjusted by the V
0/V
F ratio; it is also created within each sub-cycle,
Run 1 Run 2
Run 3 Run 3a
Run 4 Run 4a
Figure 1Nitrogen and phosphate concentration profiles (to be continued on next page)
�
�
�
�
�
��
��
� � � � ���������
���
�
�
���
���
��
���
�
�
�
�
�
�
�
�
��
�
����
��
���
���
�
�
�
�
�
��
��
� � � � � ���������
���
�
�
���
��
��
���
�
�
�
�
�
��
��
��
��
�
����
��
���
���
�
�
�
��
��
��
� � � � � � �
��������
���
�
�
���
��
��
���
�
�
�
�
�
��
��
��
�
��
���
��
����
�
�
�
�
�
�
��
��
��
� � � � � � �
��������
���
�
�
���
��
��
���
�
�
��
��
��
��
��
�
��
���
��
����
�
�
�
�
�
�
��
��
� � � � � � ���������
���
�
�
���
��
��
���
�
�
�
�
�
��
��
��
��
�
����
��
���
���
�
�
�
�
�
��
��
� � � � � � ���������
���
�
�
���
��
��
���
�
�
�
��
��
��
�
����
��
���
���

ISSN 0378-4738 = Water SA Vol. 28 No. 4 October 2002428 Available on website http://www.wrc.org.za
TSC
, of the intermittent aeration. The TM
/TP
ratio has a stronginfluence on the balance between N
DP and the available nitrate in
the sub-cycles and hence it has a controlling effect on the effluentquality: As shown in Table 2, an increase in the T
M/T
P ratio from
0.4 to 0.6, reduced the effluent nitrate concentration from 5.2 mg·� -1
in Run 10 to 2.2 mg·� -1 in Run 9, together with a slight increase inthe ammonia concentration.
A TM
/TP ratio of 0.4 in Run 10 was observed to provide an N
DP
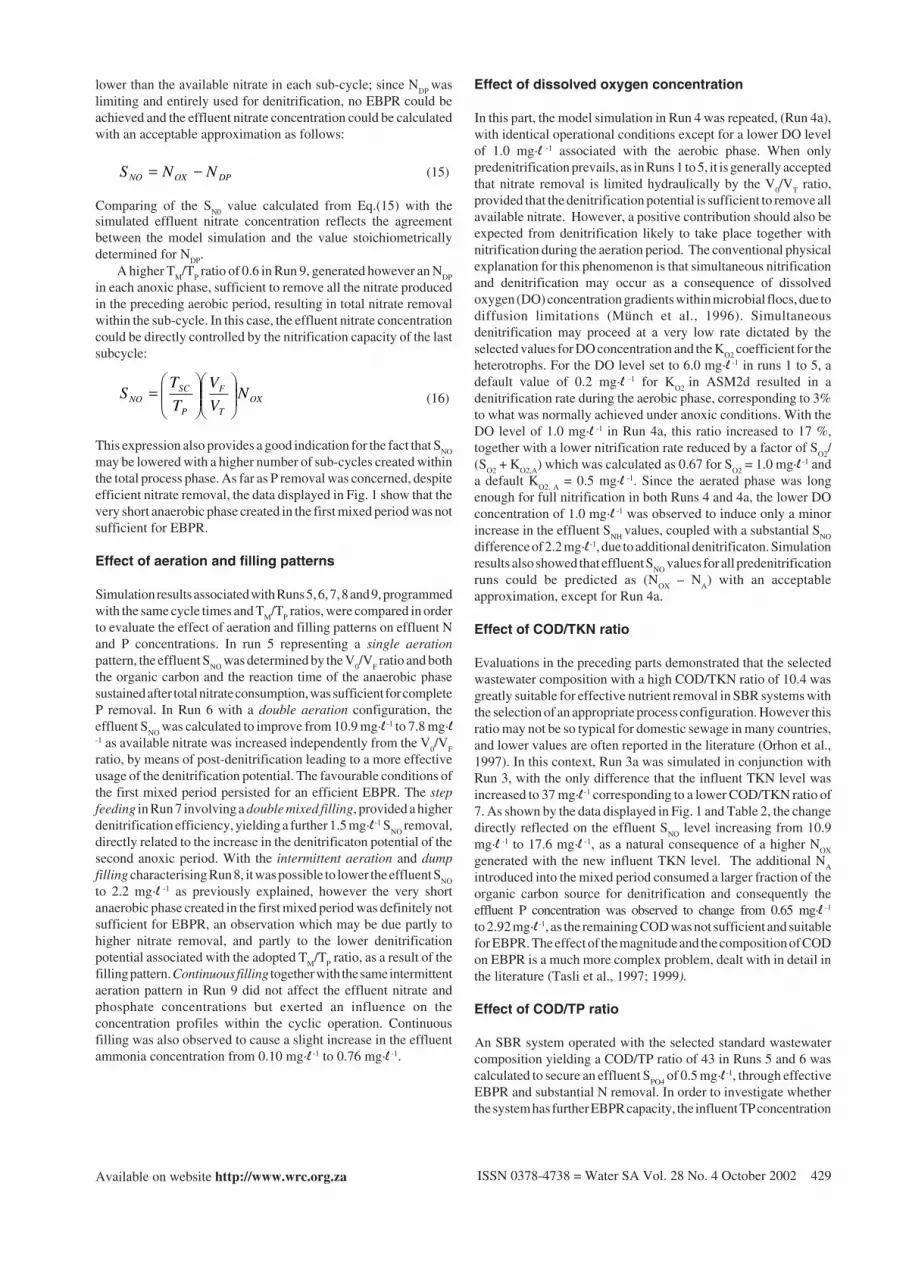
Figure 1 (continued)Nitrogen and phosphate concentration profiles
�
�
�
�
�
��
��
��
� � � � � � ���������
���
�
�
���
��
��
���
�
�
�
��
��
��
��
��
��
�
����
��
���
���
�
�
�
�
�
��
��
��
� � � � � � ���������
���
�
�
���
��
��
���
�
�
��
��
��
��
��
�
����
��
���
���
�
�
�
�
�
��
��
� � � � � � ���������
���
�
�
���
��
��
���
�
�
�
��
��
��
��
��
��
�
����
��
���
���
�
�
�
�
�
��
��
� � � � � � ���������
��
���
�
��
�����
���
���
�
�
�
�
�
�
�
� � � � � � ���������
���
���
�
��
����
���
����
�
�
�
�
�
�
�
�
� � � � � � ���������
���
���
�
��
����
���
����
�
ISSN 0378-4738 = Water SA Vol. 28 No. 4 October 2002 429Available on website http://www.wrc.org.za
lower than the available nitrate in each sub-cycle; since NDP
waslimiting and entirely used for denitrification, no EBPR could beachieved and the effluent nitrate concentration could be calculatedwith an acceptable approximation as follows:
DPOXNO NNS −= (15)
Comparing of the SN0
value calculated from Eq.(15) with thesimulated effluent nitrate concentration reflects the agreementbetween the model simulation and the value stoichiometricallydetermined for N
DP.
A higher TM
/TP ratio of 0.6 in Run 9, generated however an N
DP
in each anoxic phase, sufficient to remove all the nitrate producedin the preceding aerobic period, resulting in total nitrate removalwithin the sub-cycle. In this case, the effluent nitrate concentrationcould be directly controlled by the nitrification capacity of the lastsubcycle:
OXT
F
P
SCNO N
V
V
T
TS
= (16)
This expression also provides a good indication for the fact that SNO
may be lowered with a higher number of sub-cycles created withinthe total process phase. As far as P removal was concerned, despiteefficient nitrate removal, the data displayed in Fig. 1 show that thevery short anaerobic phase created in the first mixed period was notsufficient for EBPR.
Effect of aeration and filling patterns
Simulation results associated with Runs 5, 6, 7, 8 and 9, programmedwith the same cycle times and T
M/T
P ratios, were compared in order
to evaluate the effect of aeration and filling patterns on effluent Nand P concentrations. In run 5 representing a single aerationpattern, the effluent S
NO was determined by the V
0/V
F ratio and both
the organic carbon and the reaction time of the anaerobic phasesustained after total nitrate consumption, was sufficient for completeP removal. In Run 6 with a double aeration configuration, theeffluent S
NO was calculated to improve from 10.9 mg·� -1 to 7.8 mg·�
-1 as available nitrate was increased independently from the V0/V
F
ratio, by means of post-denitrification leading to a more effectiveusage of the denitrification potential. The favourable conditions ofthe first mixed period persisted for an efficient EBPR. The stepfeeding in Run 7 involving a double mixed filling, provided a higherdenitrification efficiency, yielding a further 1.5 mg·� -1 S
NO removal,
directly related to the increase in the denitrificaton potential of thesecond anoxic period. With the intermittent aeration and dumpfilling characterising Run 8, it was possible to lower the effluent S
NO
to 2.2 mg·� -1 as previously explained, however the very shortanaerobic phase created in the first mixed period was definitely notsufficient for EBPR, an observation which may be due partly tohigher nitrate removal, and partly to the lower denitrificationpotential associated with the adopted T
M/T
P ratio, as a result of the
filling pattern. Continuous filling together with the same intermittentaeration pattern in Run 9 did not affect the effluent nitrate andphosphate concentrations but exerted an influence on theconcentration profiles within the cyclic operation. Continuousfilling was also observed to cause a slight increase in the effluentammonia concentration from 0.10 mg·� -1 to 0.76 mg·� -1.
Effect of dissolved oxygen concentration
In this part, the model simulation in Run 4 was repeated, (Run 4a),with identical operational conditions except for a lower DO levelof 1.0 mg·� -1 associated with the aerobic phase. When onlypredenitrification prevails, as in Runs 1 to 5, it is generally acceptedthat nitrate removal is limited hydraulically by the V
0/V
T ratio,
provided that the denitrification potential is sufficient to remove allavailable nitrate. However, a positive contribution should also beexpected from denitrification likely to take place together withnitrification during the aeration period. The conventional physicalexplanation for this phenomenon is that simultaneous nitrificationand denitrification may occur as a consequence of dissolvedoxygen (DO) concentration gradients within microbial flocs, due todiffusion limitations (Münch et al., 1996). Simultaneousdenitrification may proceed at a very low rate dictated by theselected values for DO concentration and the K
O2 coefficient for the
heterotrophs. For the DO level set to 6.0 mg·� -1 in runs 1 to 5, adefault value of 0.2 mg·� -1 for K
O2 in ASM2d resulted in a
denitrification rate during the aerobic phase, corresponding to 3%to what was normally achieved under anoxic conditions. With theDO level of 1.0 mg·� -1 in Run 4a, this ratio increased to 17 %,together with a lower nitrification rate reduced by a factor of S
O2/
(SO2
+ KO2,A
) which was calculated as 0.67 for SO2
= 1.0 mg·� -1 anda default K
O2, A = 0.5 mg·� -1. Since the aerated phase was long
enough for full nitrification in both Runs 4 and 4a, the lower DOconcentration of 1.0 mg·� -1 was observed to induce only a minorincrease in the effluent S
NH values, coupled with a substantial S
NO
difference of 2.2 mg·� -1, due to additional denitrificaton. Simulationresults also showed that effluent S
NO values for all predenitrification
runs could be predicted as (NOX
– NA) with an acceptable
approximation, except for Run 4a.
Effect of COD/TKN ratio
Evaluations in the preceding parts demonstrated that the selectedwastewater composition with a high COD/TKN ratio of 10.4 wasgreatly suitable for effective nutrient removal in SBR systems withthe selection of an appropriate process configuration. However thisratio may not be so typical for domestic sewage in many countries,and lower values are often reported in the literature (Orhon et al.,1997). In this context, Run 3a was simulated in conjunction withRun 3, with the only difference that the influent TKN level wasincreased to 37 mg·� -1 corresponding to a lower COD/TKN ratio of7. As shown by the data displayed in Fig. 1 and Table 2, the changedirectly reflected on the effluent S
NO level increasing from 10.9
mg·� -1 to 17.6 mg·� -1, as a natural consequence of a higher NOX
generated with the new influent TKN level. The additional NA
introduced into the mixed period consumed a larger fraction of theorganic carbon source for denitrification and consequently theeffluent P concentration was observed to change from 0.65 mg·� -1
to 2.92 mg·� -1, as the remaining COD was not sufficient and suitablefor EBPR. The effect of the magnitude and the composition of CODon EBPR is a much more complex problem, dealt with in detail inthe literature (Tasli et al., 1997; 1999).
Effect of COD/TP ratio
An SBR system operated with the selected standard wastewatercomposition yielding a COD/TP ratio of 43 in Runs 5 and 6 wascalculated to secure an effluent S
PO4 of 0.5 mg·� -1, through effective
EBPR and substantial N removal. In order to investigate whetherthe system has further EBPR capacity, the influent TP concentration

ISSN 0378-4738 = Water SA Vol. 28 No. 4 October 2002430 Available on website http://www.wrc.org.za
���
���
���
���
���
���
���
���
� � � � � � �
��������
��
���
��
���
���
�
��
��
��
��
��
��
��
����
��
��
���
���
�� ����������� �� ����������
�� ����������� �� ����������
����
�����
�
�
�
��
��
��
��
��
��
� � � � � � ���������
�
����
��
���
���
�
�
�
�
�
��
��
���
��
��
���
�� ����������� �� ����������
�� ����������� �� ����������
����
���
a: Runs 5 (Inf TP: 6 mg·�-1) and 5a (Inf TP: 9 mg·�-1)
b: Runs 6 (Inf TP: 6 mg·�-1) and 6a (Inf TP: 9 mg·�-1)
Figure 3Comparison of ASM2d (Run 6a) and ASM2 (Run 6b)
Figure 2Effect of COD/TP ratio on SPO4, XPP and XPHA concentration profiles
was increased to 9 mg·� -1 (a 3 mg·� -1 increase) in Runs 5a and 6a,corresponding to a COD/TP ratio of 30.
Two different conditions reflecting P limitation and P storagecapacity limitation should be envisaged for evaluating the effect ofCOD/TP ratio on EBPR. In the case of P limitation, indicating that
the system still has an additional EBPR potential, increasing the Plevel for a given COD concentration and composition in theinfluent, will not seriously affect the effluent S
PO4 level until the
existing P storage capacity is exceeded. The system will respondwith a corresponding increase in the PP concentration and in the P
�
��
���
���
���
���
���
���
���
���
���
� � � � � � �
��������
��
����
���
���
�
��
��
��
��
��
��
�
��
��
����
��
����
�
�� �� �� ����� �� �� ���
����
���
�
�
��
��
��
��
��
��
��
� � � � � � �
��������
�
��
���
���
���
�� �� �� ���
�
��
���
���
���
���
���
���
���
���
���
� � � � � � �
��������
��
�����
���
���
�
��
��
��
��
��
��
�
��
��
����
��
����
�
�� ��� �� ����� �� �� ���
����
���
�
�
��
��
��
��
��
��
��
� � � � � � �
��������
�
����
��
����
�
�� ��� �� ���
ISSN 0378-4738 = Water SA Vol. 28 No. 4 October 2002 431Available on website http://www.wrc.org.za
content of the activated sludge. This situation is partly illustratedwith Runs 5 and 5a: Simulation results for Run 5a reveal that theincrease in the effluent S
PO4 was less than the change imposed on the
influent SPO4
, indicating that the system had an available EBPRcapacity before the change in the COD/TP ratio. In fact, towards theend of the aerobic period, a decrease in the rate of PHA consumptioncould be observed due to P limitation, from the PHA concentrationprofiles of Run 5, displayed in Fig 2a. The same figure also showsa significant increase in the PP concentration, along with acompatible increase in the P content of the activated sludge from6.5% to 7.4%, as given in Table 2.
In the case of P storage capacity limitation, an increase in theinfluent S
PO4 concentration will reflect entirely on the effluent, as
the system has no biochemical tools to remove the additional Pinput. This situation was simulated with Run 6a, where the effluentS
PO4 increased nearly 3 mg·� -1 as could be seen in Table 2 and Fig.
2b. No differences in PHA concentration profiles, with a veryminor increase in PP concentration and in the P content of thesludge, were observed as compared to Run 6. These results give aclear indication of a COD limitation under adopted operatingconditions.
Effect of denitrifying PAOs
The ASM2d model incorporates a correction factor, ηNO3
with adefault value of 0.6, which reflects the assumption that 60% of thePAOs possess denitrification capability. In order to demonstratethe effect of this additional denitrification capacity on nutrientremoval performance, the simulation for Run 6a with two anoxicperiods was repeated as Run 6b, using the original ASM2 modelwhere the metabolic activities of PAOs were defined with nopotential for denitrification. Without this potential in Run 6b,ASM2 was observed to yield a higher effluent S
NO of 8.6 mg·� -1
compared to 7.7 mg·� -1 in Run 6a, with a similar increase in SPO4
from 3.36 mg·� -1 to 3.69 mg·� -1 as shown in Table 2 and Fig. 3.Figure 3 also exhibits for Run 6a, a slightly lower phosphateconcentration at the end of the first anoxic period, as compared toRun 6b, an observation that may be attributed to the anoxic P uptakeof denitrifying PAOs. As a smaller amount of nitrate was introducedinto the first mixed period, a longer anaerobic phase could besustained, causing a slight increase in P release. Since there was nofilling and acetate to be stored in the second anoxic period of Run6a, release was lower than uptake, resulting in a net phosphateuptake. In Run 6b however, the second anoxic period could be
considered as anaerobic as far as metabolic activities of PAOs wereconcerned, leading to a secondary P release, thus necessitating asuccessive aerobic period for improving the effluent P level,through P uptake. The data shows that, despite the P uptake in thefollowing aerobic period, a slightly higher effluent S
PO4 was observed
compared to Run 6a. The interpretation of PHA profiles in Fig. 3provides a clearer evidence on the effect of denitrifying PAOs,since the assumption that PAOs cannot denitrify should beinterpreted as PHA consumption is not likely to take place in theanoxic periods.
Effect of model coefficients
Although modelling is a very convenient tool for evaluation, themerit of model simulation is entirely dependent on the validity ofvalues selected for the various model constants. The expectedperformance of an SBR system for a specific wastewater is boundto relate to pertinent wastewater characteristics and model constantsthat best describe the selected wastewater. It should be noted thatdefault values for model constants suggested together with ASM2dwere adopted in this study, mainly because the objective was not toprovide experimental proof to model simulations. Such an approachwould be too wastewater specific and therefore, not compatiblewith the conceptual/theoretical evaluation of process performancefor nutrient removal.
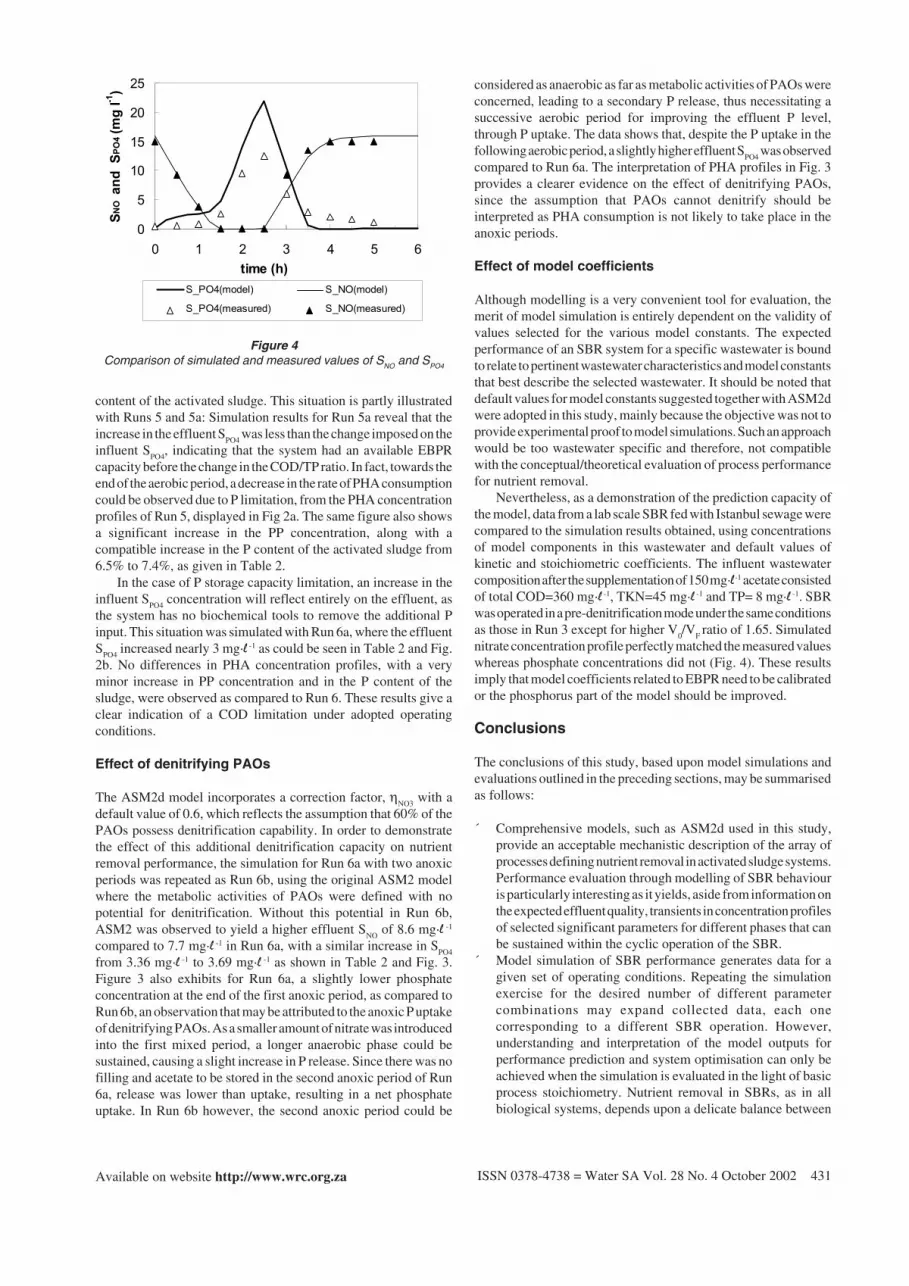
Nevertheless, as a demonstration of the prediction capacity ofthe model, data from a lab scale SBR fed with Istanbul sewage werecompared to the simulation results obtained, using concentrationsof model components in this wastewater and default values ofkinetic and stoichiometric coefficients. The influent wastewatercomposition after the supplementation of 150 mg·� -1 acetate consistedof total COD=360 mg·� -1, TKN=45 mg·� -1 and TP= 8 mg·� -1. SBRwas operated in a pre-denitrification mode under the same conditionsas those in Run 3 except for higher V
0/V
F ratio of 1.65. Simulated
nitrate concentration profile perfectly matched the measured valueswhereas phosphate concentrations did not (Fig. 4). These resultsimply that model coefficients related to EBPR need to be calibratedor the phosphorus part of the model should be improved.
Conclusions
The conclusions of this study, based upon model simulations andevaluations outlined in the preceding sections, may be summarisedas follows:
´ Comprehensive models, such as ASM2d used in this study,provide an acceptable mechanistic description of the array ofprocesses defining nutrient removal in activated sludge systems.Performance evaluation through modelling of SBR behaviouris particularly interesting as it yields, aside from information onthe expected effluent quality, transients in concentration profilesof selected significant parameters for different phases that canbe sustained within the cyclic operation of the SBR.
´ Model simulation of SBR performance generates data for agiven set of operating conditions. Repeating the simulationexercise for the desired number of different parametercombinations may expand collected data, each onecorresponding to a different SBR operation. However,understanding and interpretation of the model outputs forperformance prediction and system optimisation can only beachieved when the simulation is evaluated in the light of basicprocess stoichiometry. Nutrient removal in SBRs, as in allbiological systems, depends upon a delicate balance between
Figure 4Comparison of simulated and measured values of SNO and SPO4
�
�
��
��
��
��
� � � � � � �
��������
���
�
���
�
�� �
���
����
�
���������� � ��������� �
���������!����� ��������!�����
ISSN 0378-4738 = Water SA Vol. 28 No. 4 October 2002432 Available on website http://www.wrc.org.za
nitrification capacity, NOX,
denitrification potential, NDP
, andnitrate concentration introduced in the mixed period(s), N
A.
This balance is numerically indicative for all nitrogentransformations. A similar approach is not yet possible forEBPR, due to the complexity of the biochemical processesinvolved. It may be partly realised, as illustrated in this study,using indirect information on relevant parameters such as theextent of nitrogen removal, the remaining P storage capacity,etc.
´ Validity of simulation results for performance predictiondepends upon the values selected for different kinetic andstoichiometric coefficients associated with a wide spectrum ofbiochemical processes defined in the model. The results obtainedwill be of direct consequence of the values selected. Therefore,appropriate calibration of the model for specific wastewaters ofinterest is recommended as a significant area for future work.
´ SBR operation for nutrient removal is observed to possessstriking similarities with major continuous-flow activated sludgeconfigurations. SBR performance also benefits from additionaloperational features such as sequential use of different aerationand filling patterns, resulting from the flexibility inherentlyassociated with the system. However, strategies to preventnitrate from utilising readily biodegradable carbon in theinfluent stream must be different from continuous-flow systemsas different schemes of internal recycle is not possible withSBR. Thus, an anoxic period is inherently established prior toanaerobic phase due to introduction of nitrate with sludgerecycle into the first mixed period. Results related to SBRbehaviour and basic process stoichiometry.
´ Selection of a desired cycle time, TC, provides SBR with further
flexibility. This way, SBR can be adjusted to operate withdifferent recycle ratios for the same hydraulic retention time. Ifnitrogen removal without EBPR is the main objective, thesystem should be operated with the shortest possible cycle timeat high recycle ratios. If however, EBPR along with N removalis required, longer cycle time should be selected in order tooperate with minimum (sludge) recycle ratio. High nitrateremoval with EBPR can be achieved with a dual or triple mixedfilling. Although a part of the denitrification potential is wastedwhen applied, continuous filling may still be preferable for asimpler operation mode, especially for wastewaters with highCOD/N ratio.
Acknowledgments
This study was conducted as part of the sponsored research activitiesof The Environmental Biotechnology Centre of the Scientific andResearch Council of Turkey. It was also supported by The Researchand Development Fund of Istanbul Technical University.
References
ARTAN N, ORHON D and SÖZEN S (1995) Conceptual basis of wastewaternitrogen removal in sensitive coastal areas. Water Sci. Technol. 32 (11)77-84.
ARTAN N, AKKAYA M and ARTAN S.R. (1996) Experiences with theSBR treatment of industrial wastewaters. Proc. First IAWQ SpecializedConference on SBR Technology, 197 - 204, Munich.
ARTAN N, TA^LI R, ÖZGÜR N and ORHON D (1998) The fate ofphosphorus under anoxic conditions in biological nutrient removalactivated sludge systems. Biotechnol. Lett. 20 (11) 1085 – 1090.
ARTAN N, WILDERER P, ORHON D, MORGENROTH E and ÖZGÜRN (2001) The mechanism and design of sequencing batch reactorsystems for nutrient removal – The state of the art, Water Sci. Technol.43 (3) 53-60.
BARKER P S and DOLD P L (1997) General model for biological nutrientremoval activated - sludge systems: Model presentation. Water Environ.Res. 69 (5) 969-984.
EKAMA G A and WENTZEL M C (1999) Difficulties and developmentsin biological nutrient removal technology and modelling. Water. Sci.Technol. 39 (6) 1-11.
GORONSZY M C (1995) Large scale application of cyclically operatedactivated sludge technology. In proceedings 7th International conferenceon design and operation of large treatment plants. Viena.
HENZE M, GUJER W, MINO T, MATSUO T, WENTZEL M C andMARAIS G v R (1995) Activated Sludge Model No.2 IAWQ Scientificand Technical Report No:3. IAWQ London. 32 pp.
HENZE M, GUJER W, MINO T, MATSUO T, WENTZEL M C, MARAISG v R and VAN LOOSDRECHT M C M (1999) Activated sludgemodel No 2d. ASM2d. Water Sci. Technol. 39 (1) 165-183.
IRVINE RL, WILDERER P A and FLEMMING H C (1997) Controlledunsteady state processes and technologies-an overview. Water Sci.Technol. 35 (1) 1-10.
KETCHUM L H Jr (1997) Design and physical features of sequencingbatch reactors. Water Sci. Technol. 35 (1) 11-18.
KUBA T, VAN LOOSDRECHT M C M, BRANDSE F A and HEIJEN JJ (1997) Occurrence of denitrifying phosphorus removing bacteria inmodified UCT-type wastewater treatment plants. Water Res. 31 (4)777-786.
MINO T, LIU W T, KURISU F and MATSUO T (1995) Modelingglycogen storage and denitrification capability of microorganisms inenhanced biological phosphate removal processes. Water Sci. Technol.31 (2) 25-34.
MORGENROTH E and WILDERER P A (1998) Sequencing batch reactortechnology-Concepts, design, experience. J. CIWEM, 12 (5) 314-321.
MÜNH E V, LANT P and KELLER J (1996) Simultaneous nitrificationand denitrification in bench-scale sequencing batch reactors, WaterRes. 30 (2) 277-284.
ORHON D and ARTAN N (1994) Modelling of Activated Sludge Systems.Technomic Publ. Co. Inc., Lancaster, Basel.
ORHON D, ATES E, SÖZEN S and UBAY ÇOKGÖR E (1997)Characterization and COD fractionation of domestic wastewaters,Environ. Pollut. 95 (2) 191-203.
REICHERT P(1994) AQUASIM-A Tool for simulation and data analysisof aquatic systems. Water Sci.Technol. 30 (2) 21-30.
SORM R, BORTONE G, SALTARELLI R, JENICEK P, WANNER J andTILCHE A (1996) Phosphate uptake under anoxic conditions andfixed - film nitrification in nutrient removal activated sludge system.Water Res. 30(7) 1573-1584.
TASLI R, ARTAN N and ORHON D (1997) The influence of differentsubstrates on enhanced biological phosphorus removal (EBPR) in asequencing batch reactor, Water Sci Technol. 35 (1) 75-80.
TASLI R, ORHON D and ARTAN N (1999) The effect of substratecomposition on the nutrient potential of sequencing batch reactors.Water SA, 25 (3) 337 - 344.
WILDERER P A, IRVINE R L, GORONSZY M C, ARTAN N,DEMOULIN G, KELLER J, MORGENROTH E, NYHUIS G,TANAKA K and TORRIJOS M (2001) Sequencing Batch ReactorTechnology, IWA Scientific and Technical Report No:10, London.


