Embed Size (px)
Citation preview
Mineralogy of autoclaved aerated concrete and characterizationof tobermorite - advanced analytical methods and effect of
changes in the chemical composition
Mineralogische Charakterisierung von Porenbeton und Tobermorit -verbesserte Analysemethoden und Einfluss veraumlnderter chemischer
Zusammensetzung
Der Naturwissenschaftlichen Fakultaumlt derFriedrich-Alexander-Universitaumlt Erlangen-Nuumlrnberg
zur Erlangung des DoktorgradesDr rer nat
vorgelegt von
Juumlrgen Schreineraus Regensburg
Als Dissertation genehmigt von der NaturwissenschaftlichenFakultaumlt der Friedrich-Alexander-Universitaumlt Erlangen-Nuumlrnberg
Vorsitzender des Pruumlfungsorgans Prof Dr Georg KreimerGutachter Prof Dr Juumlrgen Neubauer
Prof Dr Rainer HockTag der muumlndlichen Pruumlfung 14082020
Abstract
This dissertation offers new concepts for the mineralogical characterization of hydrother-mally synthesized tobermorite and commercial autoclaved aerated concrete (AAC) Theapplied key methods include X-ray powder diffraction (XRD) combined with Rietveldrefinement scanning electron microscopy (SEM) and differential thermal analysis (DTA)11 Aring tobermorite was synthesized from various compounds characterized by differentdosages of metakaolin The Al3+ incorporation into the lattice of tobermorite and theformation of katoite are verified by XRD analysis The impact of Al3+ incorporationon the microstructural properties of tobermorite is determined by the change of latticeparameters and by use of a Rietveld-compatible approach to anisotropic peak broadeningdue to domain morphology Any change of the Al2O3 dosage in the raw mix affected thelattice parameters of tobermorite while the domain morphology was only altered withina small range of Al2O3 contents The disadvantages of SEM analysis of tobermorite inAAC compared to XRD analysis are presented in detail Regardless of the chemicalcomposition the morphology of tobermorite in AAC appeared heterogeneous and couldonly be observed clearly in the pores and pore surfaces Investigation of the effect ofsulfate dosage on tobermorite in AAC revealed that in most samples all of the sulfate waspresent in anhydrite and did consequently not affect the structure of tobermorite Finallyimprovements of the monitoring of the phase development during the entire productionprocess of AAC are presented Especially the tracking and characterization of portlanditeand tobermorite during AAC manufacturing are refined
I
Kurzfassung
Im Rahmen dieser Dissertation wurden neue Herangehensweisen zur Charakterisierungvon hydrothermal synthetisiertem Tobermorit und groszligtechnisch hergestelltem Poren-beton ausgerarbeitet Die dabei wichtigsten angwandten Analysemethoden umfassenRoumltgenbeugungsanalyse (XRD) kombiniert mit Rietveld-Verfeinerung Rasterelektronen-mikroskopie (REM) und Differenz-Thermoanalyse (DTA) 11 Aring-Tobermorit wurde ausverschiedenen Anteilen an Metakaolin in der Ausgangsmischung synthetisiert Der Ein-bau von Al3+ in die Struktur von Tobermorit und die Bildung von Katoit wurden mittelsXRD untersucht Die Auswirkungen des Einbaus auf strukturelle Eigenschaften von To-bermorit wurden anhand der veraumlnderlichen Gitterparameter und anhand einer mit derRietveld-Analyse kombinierten Methode zur Beruumlcksichtigung der anisotropen Relflexver-breiterung erfasst Der Ursprung der Reflexverbreiterung liegt dabei in der Morphologiekohaumlrent streuender Domaumlnen Waumlhrend jegliche Veraumlnderungen des Al2O3-Gehalts in derAusgangsmischung einen Einfluss auf die Gitterparameter zeigten wurden Auswirkungenauf die Domaumlnen-Morphologie nur innerhalb eines geringen Bereichs von Al2O3-Gehaltenbeobachtet Die Problematiken bei der REM-Analyse im Vergleich zur XRD-Analyse vonTobermorit in Porenbeton werden genauer veranschaulicht Unabhaumlngig von der chem-ischen Zusammensetzung des Porenbetons zeigte sich bei der REM-Analyse eine sehrheterogene Morphologie der Tobermorit-Kristalle die allerdings nur in den Poren und anPorenoberflaumlchen beobachtet werden konnte Die Untersuchung der Auswirkungen desSulfatgehalts auf die Bildung von Tobermorit in Porenbeton ergab dass das gesamte Sul-fat im System in Form von Anhydrit vorliegt und somit kein Einfluss auf die Struktur vonTobermorit besteht Weiterhin werden Verbesserungen zur Erfassung des Phasenbestandsaufgezeigt die beide der grundlegenden Fertigungsschritte bei der Herstellung von Poren-beton betreffen Dabei stehen die Quantifizierung und Charakterisierung der Bildung vonPortlandit und Tobermorit im Vordergrund
II
List of papers and declaration of authorcontribution
This thesis is based on the following three publications
Hydrothermal synthesis of 11 Aring tobermorite ndash Effect of adding metakaolinto the basic compound
Schreiner J Goetz-Neunhoeffer F Neubauer J Jansen D 2020 Hydrothermalsynthesis of 11 Aring tobermorite ndash Effect of adding metakaolin to the basic compoundApplied Clay Science 185 httpsdoiorg101016jclay2019105432
This publication was in principle written by J Schreiner in discussion with F Goetz-Neunhoeffer J Neubauer and D Jansen J Schreiner conceptualized the experimentsand made all calculations that were needed for the aimed composition of compounds JSchreiner conducted all sample preparations including the hydrothermal syntheses JSchreiner evaluated XRD experiments and created the tables and figures included in thepublication after consultation with F Goetz-Neunhoeffer J Neubauer and D Jansen
Advanced Rietveld refinement and SEM analysis of tobermorite in chemicallydiverse autoclaved aerated concrete
Schreiner J Goetz-Neunhoeffer F Neubauer J Volkmann S Bergold S WeblerR Jansen D 2019 Advanced Rietveld refinement and SEM analysis of tobermorite inchemically diverse autoclaved aerated concrete Powder Diffraction 34 143ndash150 httpsdoiorg101017s0885715619000149
This publication was basically written by J Schreiner in discussion with F Goetz-NeunhoefferJ Neubauer D Jansen S Bergold R Webler and S Volkmann J Schreiner conductedand evaluated all XRD experiments R Webler S Bergold and S Volkmann performedSEM analysis and the method section for SEM analysis was written by R Webler and S
III
Bergold accordingly Raw SEM figures were provided by R Webler and S Bergold Allfinal figures included in the publication were compiled and created by J Schreiner
New analytical possibilities for monitoring the phase development during theproduction of autoclaved aerated concrete
Schreiner J Jansen D Ectors D Goetz-Neunhoeffer F Neubauer J VolkmannS 2018 New analytical possibilities for monitoring the phase development during theproduction of autoclaved aerated concrete Cement and Concrete Research 107 247ndash252httpsdoiorg101016jcemconres201802028
The results and discussion of this paper were mainly written by J Schreiner in discus-sion with F Goetz-Neunhoeffer J Neubauer D Jansen D Ectors and S VolkmannD Jansen and J Schreiner both created the introduction and experimental sections JSchreiner conducted and evaluated XRD and laser scattering experiments and createdmost of the figures included in the publication GADDS-system experiments were con-ducted by D Jansen and D Ectors Figure 7 was created by D Jansen accordinglySample preparations for all experiments except for the GADDS-system were performedby J Schreiner
IV
Contents
Abstract I
Kurzfassung II
List of papers and declaration of author contribution III
1 Introduction 1
2 State of research 321 Mineralogical characteristics of 11 Aring tobermorite 3
211 Tobermorite structure 3212 Synthesis of stoichiometric 11 Aring tobermorite 5213 Substitutions in the lattice of tobermorite 6
22 Characterization of autoclaved aerated concrete 7221 SEM analysis 8222 XRD analysis 10
3 Main results 1231 Hydrothermal synthesis of tobermorite on a laboratory scale - application
of two types of metakaolin 1332 Structural properties of tobermorite in AAC - SEM versus XRD analysis 1733 Improved monitoring of the phase development during the production of
AAC 19
4 Conclusions 23
5 References 25
6 Publications 3061 Hydrothermal synthesis of 11 Aring tobermorite ndash Effect of adding metakaolin
to the basic compound 3062 Advanced Rietveld refinement and SEM analysis of tobermorite in chemi-
cally diverse autoclaved aerated concrete 3763 New analytical possibilities for monitoring the phase development during
the production of autoclaved aerated concrete 38
7 Acknowledgement 45
1 Introduction
1 Introduction
Tobermorite is a naturally occurring calcium silicate hydrate forming under hydrother-mal conditions It is mainly found in calcium-rich metamorphic rocks such as marble andskarn [1] In 1880 the mineral was described for the first time by Heddle at its type local-ity of Tobermory (Scotland) [2 3] The tobermorite supergroup includes various relatedmineral species characterized by basal spacings of 9 11 and 14 Aring and different sub-cellsymmetries [4]Besides its occurrence in rocks tobermorite is a major well-crystalline mineral phasepresent in commercial masonry units such as sand-lime bricks and autoclaved aeratedconcrete (AAC) Commonly in these products the 11 Aring species with the chemical for-mula Ca5Si6O16(OH)2middot4H2O and orthorhombic sub-cell symmetry is present In equiva-lence to the crystallization of 11 Aring tobermorite in a geological environment hydrothermaltreatment of masonry units triggers its formation during production Thermal and me-chanical properties of these products depend on the microstructure and mineralogicalphase composition For this reason the investigation of the crystallization process andthe morphology of tobermorite1 crystals have been subject of numerous studies [5 6 7]Conventionally scanning electron microscopy (SEM) analysis is the most applied methodfor this purpose [8 9 10 11] In addition poorly-crystalline C-S-H in hydrating cementpastes was structurally derived from a tobermorite species [12] Apart from constructiontechnology tobermorite has found several applications due to its ion exchange capacity[13] - for instance in wastewater treatment or radioactive waste management [14 15]
AAC is an established masonry material due to its thermally insulating capacities com-bined with low densities of 275 - 750 kgm3 [16] and sufficient compressive strength forconstruction The fabrication is divided in two fundamental process stages and was exem-plarily portrayed in the work of Schober [17] The major materials needed for productionare quartz sand burnt lime cement a sulfate source and water Compared to foamedconcrete the pores in AAC are generated based on the release of hydrogen gas due to achemical reaction of aluminum powder triggered by an alkaline environment during thecement hydration [17 18] The first production step includes the green body hydrationas well as the generation of pores which endure the hydrothermal curing and are present
1Unless otherwise specified tobermorite in the following always refers to the 11 Aring species
1
1 Introduction
Figure 11 Porous structure of autoclaved aerated concrete
in the final product (Figure 11) During the second production step the green cakesare treated hydrothermally under saturated steam pressure in order to gain compressivestrength A shift of the pore size distribution during the autoclaving process was reportedby Mitsuda et al [10]
Generally the rather complex phase development during the production process of AACis insufficiently considered Established AAC products are very often the result of purelyempirical and time-consuming test series Therefore a better understanding and moni-toring of the phase development is the preferable way This thesis is intended to demon-strate advanced analytical methods for the characterization of 11 Aring tobermorite in bothlab-scale samples and commercial AAC The majority of innovations are gained from X-ray diffraction (XRD) and an approach to fit anisotropic peak broadening [19] compatiblewith Rietveld refinement [20] The suitability of SEM analysis in this context is discussedMoreover effects of changes in the chemical composition in the starting compound areinvestigated Finally the new analytical possibilities are applied to the entire productionprocess of AAC
2
2 State of research
2 State of research
21 Mineralogical characteristics of 11 Aring tobermorite
211 Tobermorite structure
The orthorhombic tobermorite structure basically consists of sevenfold coordinated [21]calcium polyhedral layers and silicate tetrahedral chains (Figure 21) [3] Running alongb two pairing tetrahedra centered by Si cations are connected by another Si-centeredbridging tetrahedron [3]Apart from the undisputed layered structure and the wollastonite-like chains severalapproaches have coexisted regarding the possible space groups and the location of theremaining calcium cations and water molecules in the lattice of 11 Aring tobermorite [321 22 23] However Biagioni et al presented a new nomenclature for the tobermoritesupergroup including very precise structures [4] Oxygen atoms hydroxyl groups andwater molecules are located at the apical sites of the calcium polyhedra The Si-centeredbridging tetrahedra of the wollastonite-like chains share the oxygen and hydroxyl groupswith the calcium polyhedra Merlino et al and Biagioni et al stated that additional watermolecules and cations are located in structural cavities running along b [3 4] According toMerlino et al and Bonaccorsi et al the content of these zeolitic cavities is the determiningfactor for the resulting tobermorite species [3 24] The additional cation in the interlayeris primarily calcium so that there is a variability of calcium content between 4 and 5 atomsper formula unit [4] 11 Aring tobermorite is characterized by the calcium-rich endmemberof this series [4] The interlayer calcium is then sixfold-coordinated by framework oxygenatoms The amount of interlayer water molecules determine the degree of hydration andthe basal spacing of the resulting tobermorite species [24] The reader is referred to awell-specified categorization of all tobermorite polytypes provided in the publications byMerlino et al Bonaccorsi et al and Biagioni et al [3 4 24 25]
3
2 State of research
Figure 21 Calcium polyhedral layers and silicate tetrahedral chains in 11 Aring tobermoritestructure according to Merlino et al [3] Si1 and Si3 = pairing tetrahedra Si2= bridging tetrahedra Interlayer water molecules and cations are not shownFigure created with VESTA 316 [26]
4
2 State of research
212 Synthesis of stoichiometric 11 Aring tobermorite
The starting materials required for the hydrothermal synthesis of stoichiometric tober-morite are quartz flour or a different silica source calcium oxide or calcium hydroxideand deionized water [7 22] In accordance with the chemical formula the starting mixappropriately conforms to a CaSi molar ratio of about 08 [9 27]After preparing the slurry a distinct temperature setting of 170-180 degC autogenous satu-rated steam pressure (1ndash12 MPa) and a curing time of 12 h were recommended [5 7 28]Consequently an elevated water-to-solid ratio [7 23] in the starting mix and high over-all water content are required in order to ensure a saturated steam atmosphere in thelaboratory autoclave Qu et al showed that shorter curing times led to a lower reac-tion turnover [6] According to Šiaučiunas amp Baltakys at prolonged curing duration theformation of xonotlite (Ca6Si6O17(OH)2) was favored [7] It has been reported that thesurface area and solubility of all raw materials have an effect on the reaction time andreaction products [7 9 29] For instance gyrolite formation was triggered by highly sol-uble amorphous SiO2 in a study by Šiaučiunas amp Baltakys [7] El-Hemaly et al showedthat when amorphous type of silica was used the formation of C-S-H was accelerated butthe subsequent conversion to tobermorite was slowed down [22]The simplified hydrothermal reaction path (equation 21) [10 27 30] for the formationof stoichiometric tobermorite was described as follows Depending on the surface areaof raw materials the dissolution of Ca(OH)2 and SiO2 in the hydrothermal environmentinitially leads to the formation of a C-S-H gel which is characterized by poor structuralorder in c direction [22 27] The CaSi molar ratio in this precursor is variable [30] Thehydrothermal reaction proceeds and the C-S-H gel transforms into tobermorite but with amore particular CaSi ratio of approximately 083 The CaSi ratio decreases in this stepas further SiO2 is dissolved and supplied for reaction [10] Within this step periodicityin c direction increases and the calcium polyhedral layers and silicate chains gain morestructural order as reported by Shaw et al [27]
xCa(OH)2 + ySiO2 +H2O =rArr C-S-H gel =rArr C-S-H gel + zSiO2 =rArr tobermorite
(21)
Commonly pure phase synthesis of tobermorite is hardly attainable and some minorphases and amorphous content are frequently present in samples after hydrothermal cur-ing Common additional phases occurring in this system include calcite quartz xonotlitescawtite and poorly crystalline C-S-H with varying CaSi composition [7 9 31]In most studies autoclaved samples were dried at 60 - 100 degC [6 29] and ground prior
5
2 State of research
to further analyses Synthesized samples are commonly investigated by means of ther-mogravimetric analysis (TGA) combined with differential thermal analysis (DTA) SEManalysis and X-ray diffraction For estimation of the chemical purity of tobermorite usu-ally the basal spacing of 113 Aring is verified by XRD analysis as substitutions such as Al3+
incorporation would reflect in it [15 28] Moreover according to Mostafa et al and Quet al stoichiometric tobermorite showed plate-like morphology in SEM images [6 32]
213 Substitutions in the lattice of tobermorite
The incorporation of foreign ions into the lattice of tobermorite has been investigated intwo major respects In the first case the substitutions occur during the application ofpreviously synthesized tobermorite The potentials of these substitutions were exemplar-ily highlighted in chapter 1 [14 15] In the second case the substitutions occur duringthe hydrothermal formation of tobermorite Whenever a basic compound includes chem-ical components apart from calcareous materials and silica substitution in the lattice oftobermorite is likely to happen during the hydrothermal reaction Biagioni et al statedthat Al-free natural tobermorite is extremely rare [4]Supplementary cementitous materials (SCMs) are established components in various ap-plications - equally in AAC production Merchantable SCMs are usually limited to wellavailable materials so that only distinct foreign ions are supplied in a considerable scaleCalcined clays diatomite blast furnace slag and especially metakaolin are amongst themost frequent materials for this purpose [31 33 34 35] They are in turn characterizedby a specific chemical composition These raw materials supply primarily aluminum andalkali metal cations In addition the presence of sulfate ions in the system has been con-sidered by some authors since sulfate is a component in most composites for construction[32 36]Sakiyama amp Mitsuda and Rios et al successfully synthesized Al-substituted tobermoriteby applying different amounts of kaolinite and metakaolin [5 23] The incorporation ofAl3+ into the lattice of tobermorite resulted in lath-like crystals1 observed by SEM anal-ysis At a higher Al3+ dosage the formation of katoite was reported Skawinska et alinvestigated various halloysite contents in the initial mix [34] They confirmed katoiteformation caused by increased supply of Al3+ The substitution of Si4+ by Al3+ in thetetrahedral chains ranges to a possible 16 substitution of the tetrahedral sites reaching anAl content up to 1 Al atom per formula unit [4] Merlino et al explained that this mainlyoccurred in the bridging tetrahedron and for charge balance additional (OH)ndash substitutedO2ndash in one site [3] This leads to an increase of the basal spacing and lattice parameter c
1The terminology of observed crystalline particles is addressed in subsection 222
6
2 State of research
which was observed in several studies [15 28 37] In a different publication by Jacksonet al the incorporation of additional Na+ or K+ for charge balance was suggested [38]Matekonis et al stated that in this case tobermorite showed anomalous thermal behavior[29] Furthermore 29Si NMR measurements revealed that the substitution by Al3+ led toan increase of the chain length in b direction [38 39] Klimesch amp Ray performed thermalanalysis of Al-free and Al-substituted tobermorites [40] They reported that in the caseof Al3+ incorporation the conversion of 93 Aring tobermorite into β-wollastonite required ahigher temperature This observation is discussed later in this thesis (section 31) Qu etal performed XRD analysis and considered relative intensity broadening of Al-substitutedtobermorite reflections in order to estimate the crystallinity [6] However the broaden-ing was not measured and evaluated The present thesis provides extensive insights intothe evaluation of the peak broadening of tobermorite depending on the supply of Al3+ (section 31 and section 32)According to Mostafa et al substitution by (SO4)2ndash in the lattice of tobermorite led tobasal imperfection [32] Their study was mainly based on XRD analysis and FTIR spec-troscopy It was suggested that charge balance was achieved by substitution of (SO4)2ndash
and 2 (OH)ndash for (SiO4)4ndash Moreover the transformation of C-S-H gel into tobermorite wasaccelerated The sulfate-substituted tobermorite showed leafy crystals in SEM imagesBy contrast Sauman amp Valtr stated that the morphology of sulfate-substituted tober-morite did not differ substantially from the morphology of stoichiometric tobermoritecrystals [41] Instead anhydrite formation was observed by means of XRD analysis Insection 32 of this thesis a new perspective on this discussion is provided
22 Characterization of autoclaved aerated concrete
Supplied materials for AAC fabrication are transforming continuously during the pro-duction process which is displayed in Figure 22 [42] It can be seen that the phasetransitions before autoclaving remind of ordinary portland cement (OPC) hydration [43]The following main reactions run during the hydration before autoclaving [10 12 17]
CaO +H2O =rArr Ca(OH)2 (22)
Ca3SiO5 + 39H2O =rArr C17SH26 + 13Ca(OH)2 (23)
Ca3Al2O6 + 3CaSO4 + 32H2O =rArr Ca6Al2(OH)12(SO4)3 middot 26H2O (24)
This process step is finished when the generation of pores along with simultaneous expan-sion is completed and sufficient strength for wire cutting has developed through hydration
7
2 State of research
The reaction of aluminum powder does not only lead to the formation of hydrogen gasbut to very low amounts of different modifications of aluminum hydroxide [17] Howeverit can be seen that none of the hydrate phases forming during the green cake settingendure the autoclaving process Only quartz does partially not react and is consequentlypresent in the final product After transforming into ettringite and later AFm phasesinitially supplied anhydrite recrystallizes during the hydrothermal treatment A multi-step reaction sequence of C-S-H portlandite and further intermediate hydration productsleads to the crystallization of tobermorite The reader is referred to the comprehensivestudy of Schober for a more detailed presentation [17] Further supply of dissolved silicaat hydrothermal conditions contributes to the formation of tobermorite in the manneroutlined in equation 21 Clearly tobermorite is the major mineral phase present afterautoclaving and is therefore the main focus of research In the following subsections 221and 222 the state of knowledge concerning the characterization of AAC by means ofSEM analysis and XRD analysis is provided
Figure 22 Exemplary phase development during the entire production process of AACFigure adopted with permission from Schober [42]
221 SEM analysis
At first sight AAC has rather favorable properties compared to hydrated Portland cementwhen it comes to SEM analysis Due to the hydrothermal treatment several phases such
8
2 State of research
as tobermorite show better crystallinity In addition the hardly evitable effects of dam-age to poorly crystalline phases and removal of water are not as significant in the case ofAAC This is why environmental scanning electronic microscopy (ESEM) was suggestedin order to investigate hydrated Portland cement after early hydration [44 45] Howeverwhile hydrated OPC is a reasonably homogeneous material AAC shows heterogeneitydue to the porous structure (Figure 11)As reported in subsection 213 several authors investigated the morphology of tober-morite in AAC in order to verify the influence of foreign ions supplied by SCMs andestimate their effect on the thermal and mechanical properties Well crystallized tober-morite often shows a house-of-cards structure in AAC (Figure 23) which was observedin numerous studies [46 47 48]
Figure 23 House-of-cards appearance of tobermorite crystals in AAC
Wongkeo amp Chaipanich stated that the application of coal bottom ash for partial replace-ment of cement in the starting compound resulted in a change of plate-like to lath-likemorphology of tobermorite crystals [49] Equally thin lath-like plates of tobermorite wereobserved by Roacuteżycka et al in samples prepared from perlite waste [50] Venhodovaacute etal investigated AAC samples prepared from mixes including fly ash and Al(OH)3 andconfirmed the elongated shape of Al-incorporated tobermorite [8] In these studies thefraction of aluminum ions was increased by adding the respective SCM An effect on themorphology of tobermorite was respectively reported which conforms to the conclusionsmade by different authors in subsection 213 Nevertheless the heterogeneity of AACsamples in SEM images was barely addressed in all of these examples By contrast Mit-suda et al differentiated between macropores and micropores in their SEM images ofindustrially manufactured AAC [10] Huang et al separately analyzed walls and pores in
9
2 State of research
their samples prepared from copper tailings and blast furnace slag [48] The wall sectionsappeared dense while in pores platy tobermorite and long-strip shaped anhydrite wasobserved Only the tobermorite crystals in the pores showed the previously describedhouse-of-cards structure As is evident from these published results there is a lack ofclarity about the meaning and informative value of observations made in AAC samplesby SEM analysis In the main results of this present thesis (section 32) a substantiatedassessment of this circumstance is given
222 XRD analysis
While SEM analysis of AAC is majorly performed in order to characterize the crystallinityand morphology of tobermorite XRD analysis is mainly applied in order to assess theoverall phase composition Apart from the phases shown in Figure 22 additional calcitefeldspar mica gypsum and bassanite occur frequently in AAC depending on the miner-alogical composition of the used raw materials Frequently minor phases are unreactedresidual components of raw materials such as sericite in the publication of Isu et al [51] orphlogopite in the study of Huang et al who applied skarn-type copper tailings for AACpreparation [48] Prolonged curing duration resulted in minor quantities of xonotlite inthe study by Mitsuda et al [10]Mainly qualitative phase contents have been determined based on XRD in studies dealingwith the mineralogy of AAC A clear recognition of amorphous content in AAC along withthe crystalline phases has been barely addressed and discussed Relative quantities weredetermined by Matsui et al by plotting normalized intensities [28] They estimated thequantity of C-S-H gel by regarding the integrated intensity of the assumed tobermoriteprecursor in a distinct section of the XRD pattern Coming in agreement with the authorscited in subsection 213 increased d spacing along c in Al-substituted tobermorite wasreported in the same study Venhodovaacute et al performed XRD analysis of AAC samplesin their publication previously addressed in subsection 221 [8] They compared relativeintensities of tobermorite in their samples but no absolute quantities of the phases werecalculated either Mitsuda et al applied an internal standard method in order to quantifyunreacted quartz in their AAC samples [10]More recently Ectors proposed a promising method for the tracking of portlandite forma-tion during the green cake hydration [52] By applying a Rietveld compatible approachfor TOPAS 50 (Bruker AXS) to fit anisotropic peak broadening due to domain mor-phology [19] two generations of portlandite could be refined separately and assigned tothe hydration of calcium oxide and tricalcium silicate respectively The key idea behindthis approach is that the average domain morphology of a mineral phase in a powder
10
2 State of research
sample implies certain mineralogical characteristics The simplified domain morphologycan be calculated on the basis of geometrical shapes such as cylinder ellipsoid or cuboidDepending on the crystal system and the expected morphology the geometrical shapecan be adjusted accordingly In the example reported by Ectors the one generation ofportlandite originating from burnt lime hydration showed anisotropic peak broadening- unlike the generation forming from tricalcium silicate hydration In accordance withthe trigonal crystal system a biaxial cylinder model was applied for the fitting of theanisotropic generation The operating principle of the approach to fit the anisotropicpeak broadening due to domain morphology can be precisely explored by accessing fur-ther publications by Ectors et al [53 54] Apart from this benefit a better fit to themeasured data enables a more accurate refinement and quantification of all phases Thetwo generations of portlandite were additionally quantified by means of an external stan-dard method [55] The combination of quantitative phase analysis by XRD (QXRD) withthe refinement of anisotropic peak broadening is a promising approach in this context -especially in consideration of the fact that phase quantifications in AAC samples havebeen barely performed ever before Hence the application of these methods is the keymatter of this present thesis Especially the potential of the domain morphology analysisof tobermorite is precisely investigated The terms domain size and domain morphology inthis sense refer to the coherently scattering unit measured by XRD analysis Crystallineparticles observed by means of electron microscopy which are frequently termed grainscrystals or crystallites are for the most part clusters of coherently scattering domains[56 57]
11
3 Main results
3 Main results
This chapter introduces the main results presented in three peer reviewed publications[58 59 60] incorporated in chapter 6 The new findings are put in a general context andsubsequently they are summarized and discussed in chapter 4 The sections 31 and 32deal with the characterization of tobermorite in both lab-scale samples and AAC sam-ples produced on an industrial scale In section 33 the entire production process of AACincluding the hydration before autoclaving is addressed
Figure 31 Application of a triaxial cylinder model for the calculation of anisotropic do-main sizes of tobermorite implemented with Rietveld refinement and influenceon the fit compared to ordinary refinement [60]
12
3 Main results
One particular main result is a key element in each of the following sections In Figure 31the fit of tobermorite after two Rietveld refinements of different accuracy is shown In aregular Rietveld refinement for simplification the coherently scattering units are treatedas spherical shapes as usually only one size value for each mineral phase is calculated Asaverage domain sizes of a mineral phase in different crystallographic directions are in manycases indeed close to one value this approximation is often sufficient in order to achievea satisfactory fit to the measured diffractogram The crystal system and surroundingconditions during the formation of a mineral phase are significant factors in this context Amisfit at different (hkl) reflections as displayed in Figure 31 is an indication of anisotropicpeak broadening Clearly orthorhombic tobermorite shows anisotropic peak broadeningdue to its anisotropic domain morphology For the possible origins of anisotropic peakbroadening apart from size broadening the reader is referred to section 61 In accordancewith the orthorhombic crystal system a triaxial model is applied in order to fit the peakbroadening [19] By implementing the macro during the refinement no longer one butthree sizes (x y and z for respectively a b and c direction) are calculated Besides theimproved fit the calculated domain morphology is an additional information extractedfrom XRD analysis and it is representative for the average value of the phase in the entiresample In each of the following sections the different benefits regarding this approachare outlined in more detail
31 Hydrothermal synthesis of tobermorite on alaboratory scale - application of two types ofmetakaolin
This study covers mineralogical properties of tobermorite synthesized from a set of variouscompounds including different amounts and types of metakaolin [58] Unlike in sections32 and 33 the samples were not aerated before autoclaving and their composition isadjusted to the CaSi molar ratio of stoichiometric tobermorite On the one hand thereactivity of metakaolin and minor phases at hydrothermal conditions for the possible usein AAC production was investigated On the other hand the effects of consequent changesof the bulk chemistry in the basic compound on the mineralogical characteristics of to-bermorite such as lattice parameters and domain morphology were analyzed In additionfor one particular compound the effect of different curing times was explored While theconventional raw materials for AAC production are rather low-cost resources metakaolinis a high-priced SCM in this regard For this reason besides one comparatively pure com-mercial metakaolin (MK) a second by-product type of metakaolin (MKg) was applied
13
3 Main results
at equivalent dosages All investigated mix composites and the chemical composition ofMK and MKg are summed up in tables in section 61In Figure 32 the effect of different amounts of the two types of metakaolin on the phasequantities is displayed Clearly at moderate dosages of MK and MKg tobermorite waspresent in comparable quantities However the application of any amount of metakaolinreduced the amount of tobermorite compared to the blank mixture It can be seen thatkatoite was present whenever the content of Al2O3 in the starting drymix exceeded 2wt which fits well with the state of knowledge [5 23] For the highest possible dosagesof the two types of metakaolin (MK60 and MKg60) contrary effects were observed Ap-plication of impure metakaolin (MKg) led to a considerable amount of tobermorite whilein MK60 no tobermorite was present The high content of Al2O3 seems to have hinderedthe formation of tobermorite Not all of the Al2O3 in MKg was supplied for reactionas minor phases such as feldspar remained unreacted which is shown accurately in therespective publication in section 61
Figure 32 Weight fractions of tobermorite quartz and katoite measured by QXRD anal-ysis and contents of Al2O3 in the starting drymix Amorphous content andminor phases are not shown
The results of thermal analysis of samples characterized by MK addition in small stepsare shown in Figure 33 It can be seen that the conversion of 93 Aring tobermorite into β-
14
3 Main results
wollastonite depended on the dosage of MK However unlike suggested by Klimesch ampRay there was no effect of lower contents of Al2O3 in the drymix [40] Consequently theinfluence of Al3+ at low dosages (MK25 and MK5) could not be observed on the basisof this method Apart from this result the other signals showed good agreement with thesuggested conversion ranges by Klimesch amp Ray as for samples MK9 and MK16 a clearshift towards higher temperature was measured However the role of Al3+ incorporationverified by this method is not necessarily conclusive as additional reactions during theheating experiment involving Al3+ are possible On that basis the observations madeby means of DTA would not reflect the amount of Al3+ originally incorporated into thestructure of 11 Aring tobermorite
Figure 33 Conversion of 93 Aring tobermorite into β-wollastonite in samples synthesizedwith various amounts of metakaolin and suggested temperature ranges ac-cording to Klimesch amp Ray [40]
In accordance with authors referenced in subsection 213 lattice parameter c of tober-morite increased with elevated dosages of Al2O3 in the basic dry mix (Figure 34) Theimpact could be observed for the complete range of samples as displayed in section 61which indicates that a limit of Al3+ incorporation was not reached in this study Forcomparison the relative domain morphology is plotted in Figure 34 Unlike the DTA
15
3 Main results
signals both lattice parameter c and the domain morphology are impacted by very lowdosages of Al2O3 There is a good accordance of the relation of growth in b direction to adirection and the c parameter This is valid up to 20 wt of Al2O3 in the starting drymix By contrast more elevated contents of Al2O3 did not affect the domain morphologyany further even though the incorporation is verified through the increased c parameterIt follows that the impact of Al3+ incorporation on the domain morphology is limited tovery low contents while the impact on lattice parameter c can be tracked throughoutthe entire examined range of samples In section 61 additional results show that growthin b direction increased with reaction time These observations are solely based on XRDanalysis and offer new benefits for the structural understanding of tobermorite
Figure 34 Impact of the calculated Al2O3 content in the basic dry mix on the latticeparameter c and on the relation of calculated domain sizes of tobermorite ina (x) and b (y) direction
16
3 Main results
32 Structural properties of tobermorite in AAC - SEMversus XRD analysis
This section and the respective publication [59] mainly deal with the suitability of SEManalysis of tobermorite in AAC The effects of varying amounts of SO3 and Al2O3 in thedry mix on structural properties of tobermorite are discussed based on XRD analysisAs shown in subsection 221 and Figure 23 tobermorite often shows a house-of-cardsstructure in AAC samples This property has been considered to be relevant for thethermal and mechanical properties of AAC (subsection 221) However SEM analysiswithin this study revealed that this type of appearance is mainly found in the poresand pore surfaces (Figure 35) This finding comes in agreement with the observationsmade by Huang et al [48] In the solid skeleton of the dense AAC material neither themorphology nor the house-of-cards structure could be observed properly which can beseen very clearly in additional micrographs provided in section 62 It should be consideredthat the major amount of tobermorite by weight is located in the dense material and notat the pore surfaces In this way these findings are clear disadvantages coming along withonly SEM analysis of AAC as representative results can hardly be obtained
Figure 35 House-of-cards structure of tobermorite in a pore surrounded by dense mate-rial
Moreover several authors in subsection 221 justified the morphology of tobermorite withthe incorporation of foreign ions Al-substituted tobermorite showed lath-like morphologywhereas Al-free tobermorite showed rather plate-like morphology [6 32 49] Howeverthe present investigation revealed that independent of Al2O3 content in the raw mix there
17
3 Main results
is always heterogeneity regarding the morphology of tobermorite In Figure 36 plate-likeand lath-like morphology of tobermorite in AAC observed in two statistical chemicallyvarious samples are displayed This result supports the previous assumption that theobservations made by SEM analysis of tobermorite in AAC strongly depend on whatpart of the sample is selected Yet again no clear observations could be made that wererepresentative for the entire sample
Figure 36 Heterogeneous morphology of tobermorite (plate-like in a and c lath-like in band d) in two AAC samples characterized by different Al2O3 contents in theraw mix
The effects of Al3+ on the domain morphology of tobermorite were measured and evaluatedin a similar manner as in section 61 and the results could be confirmed The relativedomain growth in b direction was increased by Al3+ incorporation in both studies [5859] Moreover lattice parameter c was increased with Al3+ incorporation which can beseen more accurately in section 62 Unlike SEM analysis XRD analysis allowed clearconclusions whenever structural properties of Al-substituted tobermorite were affectedInstead of a local observation as made with SEM representative and statistical resultswere obtained The reader is referred to section 61 and section 62 for further results and
18
3 Main results
more specific conclusionsIn addition the effect of various amounts of sulfate in the raw mix was analyzed Unlikein the case of different dosages of Al3+ neither the domain morphology nor the latticeparameters of tobermorite were affected by the SO3 content in the dry mix In Figure 37these observations and additionally the amounts of anhydrite measured by QXRD areshown As the amount of available SO3 in the dry mix is known the maximum possibleamount of anhydrite could be calculated for each of the samples in focus Obviouslythe measured amounts of anhydrite are either equal or slightly higher compared to theexpected quantities This result leads to the assumption that all of the available sulfateis transformed into anhydrite so that no more sulfate could be incorporated into thestructure of tobermorite The over-estimation of anhydrite in some of the samples can beexplained due to the inaccuracy of the quantification method The present results rathermatch with the suggestions by Sauman amp Valtr [41] as in their study no effect of sulfateon the structure of tobermorite was observed either
Figure 37 Impact of the sulfate content in the AAC raw mix on lattice parameter cand relative domain morphology of tobermorite (a) and comparison of theexpected maximum amount of anhydrite to the measured amount determinedby QXRD (b)
33 Improved monitoring of the phase developmentduring the production of AAC
In this study not only autoclaved samples were analyzed but additionally a lab-scale slurrywhich included the reactive components of the green cake stage during AAC productionat equivalent weight proportions In-situ XRD was performed at 70 degC and at a water-to-
19
3 Main results
solid ratio of 08 for 24 h (Figure 38) which are respective conditions during commercialproduction Clearly the phase development is dominated by OPC and lime hydration asdescribed in section 22 It can be seen that the major reaction turnover occurs duringthe first 200 minutes which is the average duration of the green stage After only 30minutes all of the quicklime had transformed into portlandite whereas Schober proposeda duration of one hour for this reaction [42] The amount of portlandite is composed oftwo different generations as proposed by Ectors [52] Equally a biaxial cylinder modelwas applied in order to fit the peak broadening of the first generation of portlandite in thepresent investigation Minor phase developments such as the formation of AFm phases arenot shown in Figure 38 A coarse fraction of anhydrite did not react so that constantlyaround 15 wt were measured after 6 h As the decomposition of ettringite due tosulfate depletion [55] does not occur prior to 12 h the green cake strength is not affected
Figure 38 In-situ XRD measurement of AAC model slurry at water-to-solid ratio of 08and 70 degC For clarity and comprehensibility not all phases are shown
The separation of two generations of portlandite in the system does not only translate intodifferent domain morphologies as shown by Ectors [52] In Figure 39 more indicationsfor different mineralogical properties are displayed The shape of the (0 0 1) reflection inXRD patterns after only quicklime hydration and after both quicklime and alite hydrationshows a distinct feature While portlandite originating from quicklime hydration showsa broad peak implying lower crystallinity the peak after alite hydration is characterized
20
3 Main results
Figure 39 Formation of two generations of portlandite in AAC slurry in XRD (a) andDTA (b) plots
by a sharper component Yet the peak breadth did not change indicating that the firstgeneration is still present with the original characteristics This observation is supportedby DTA measurements additionally demonstrating two degrees of crystallinity only afteralite hydration In agreement with XRD analysis the better crystalline second generationof portlandite decomposes at a higher temperature
Figure 310 Quantification of tobermorite in statistical chemically various AAC sampleswith and without the application of the macro for the fitting of anisotropicpeak broadening
21
3 Main results
Furthermore commercial AAC samples were considered in this study By applying themethod for the refinement of anisotropic peak broadening (Figure 31) a more accuratequantification of tobermorite can be achieved In Figure 310 the calculated amounts oftobermorite in statistical chemically various AAC samples are plotted In some samplesthe refinement using the macro leads to considerably higher but never lower quantitiesof tobermorite whereas in other samples nearly the same amount of tobermorite is cal-culated This observation can be well understood taking into account that the macroallows to account more peak area for tobermorite as shown in Figure 31 Clearly thereis evidence that the anisotropy of tobermorite domains is not uniform from one sampleto another which was basically justified in the previous sections As an improved quan-tification of a single phase leads to a better quantification of other phases in the samplethis adaption is very valuable in order to assess the phase development Here the peakbroadening of tobermorite equally observed by Qu et al [6] could be tracked and evalu-ated in order to gain more accurate results Moreover in section 63 McCrone milling issuggested in order to avoid spottiness in XRD patterns caused by coarse grains of quartzor anhydrite (Figure 38)
22
4 Conclusions
4 Conclusions
The research results presented in the previous sections yield advances in the mineralogicalinvestigation of tobermorite and autoclaved aerated concrete Recorded diffraction pat-terns contain plenty of usually unused data regarding the microstructural characteristicsof the sample and phases therein The profit of XRD measurements can be significantlyimproved whenever one or more phases show anisotropic peak broadening and appro-priate models for the respective domain morphology are implemented into the Rietveldenvironment Within the scope of the present investigations portlandite and tobermoriteshow this particularityThe effects of changes in the chemistry of the starting mix were examined based on dif-ferent dosages of metakaolin Al-substituted tobermorite showed increased growth in b
direction and an increase of lattice parameter c compared to Al-free tobermorite The rel-ative domain sizes were determined based on anisotropic peak broadening However whilethe effect of Al3+ incorporation into the lattice of tobermorite was limited regarding thedomain morphology lattice parameter c showed an increase throughout the entire rangeof samples The consequent effects suggested by Klimesch amp Ray observed by means ofDTA are debatable as reactions during the heating experiment may lead to to a changeof Al3+ content in tobermorite [40] While both types of applied metakaolin showed goodreactivity at hydrothermal conditions some included minor phases such as feldspar oranatase remained unreacted At high dosages of Al2O3 in the starting mix the formationof either only katoite or katoite along with tobermorite was observed (Figure 32)SEM analysis of tobermorite in AAC cannot be suggested based on the observationspresented in this work as it is only visually accessible in the pores or at pore surfacesThe dense material of the AAC skeleton contains several crystalline and X-ray amorphousphases which hardly allows a proper investigation Even in single pores tobermorite crys-tals appeared very heterogeneous at various chemical compositions As a result lath-liketobermorite was not only present in samples characterized by elevated Al3+ incorporationBy contrast the benefits of XRD analysis presented in section 61 equally accounted fortobermorite in AAC samples Sulfate incorporation into the lattice of tobermorite wasnot observed All of the sulfate in the system was detected to be present in anhydriteThe phase transitions in the AAC raw slurry during the green stage hydration were show-cased by in-situ XRD analysis of a model mix at 70 degC Additional DTA and XRD mea-
23
4 Conclusions
surements during this step confirmed the presence of two generations of portlandite char-acterized by different crystallinity as suggested by Ectors [52] The inclusion of anisotropicdomain morphology during the Rietveld refinement allowed a more accurate quantifica-tion of tobermorite in autoclaved samples Sample preparation adjusted to the grain sizedistribution in AAC samples (section 63) the external standard method for quantita-tive XRD analysis [55] and the approach to evaluate anisotropic peak broadening [19]are the key methods for a more accurate tracking of the phase development during AACproduction
24
5 References
5 References
[1] A E Zadov A I Grabezhev N N Pertsev N V Chukanov and S V PribavkinTobermorite-plombierite metasomatites of the Gumeshevsk skarn-porphyry copper depositmiddle Urals Doklady Earth Sciences 407(3)495ndash497 2006
[2] M F Heddle Preliminary notice of substances which may prove to be new minerals MinMag 4117ndash123 1880
[3] S Merlino E Bonaccorsi and T Armbruster The real structure of tobermorite 11AringNormal and anomalous forms OD character and polytypic modifications European Journalof Mineralogy 13(3)577ndash590 2001
[4] C Biagioni S Merlino and E Bonaccorsi The tobermorite supergroup a new nomencla-ture Mineralogical Magazine 79(2)485ndash495 2015
[5] C A Riacuteos C D Williams and M A Fullen Hydrothermal synthesis of hydrogarnetand tobermorite at 175 degC from kaolinite and metakaolinite in the CaO-Al2O3-SiO2-H2Osystem A comparative study Applied Clay Science 43(2)228ndash237 2009
[6] X Qu Z Zhao and X Zhao Microstructure and characterization of aluminum-incorporated calcium silicate hydrates (C-S-H) under hydrothermal conditions RSC Ad-vances 8(49)28198ndash28208 2018
[7] R Šiaučiunas and K Baltakys Formation of gyrolite during hydrothermal synthesis inthe mixtures of CaO and amorphous SiO2 or quartz Cement and Concrete Research34(11)2029ndash2036 2004
[8] E Venhodovaacute R Janovskyacute and R Drochytka Formation of Tobermorite at Different Ma-terials Composition of Aerated Concrete Applied Mechanics and Materials 752-753247ndash250 2015
[9] L Galvaacutenkovaacute E Bartoniacutečkovaacute T Opravil J Tkacz and P Ptaacuteček The influence ofstarting materials solubility on tobermorite structure formation under the hydrothermalconditions IOP Conference Series Materials Science and Engineering 379(1)1ndash8 2018
[10] T Mitsuda K Sasaki and H Ishida Phase Evolution during Autoclaving Process J AmCeram Soc 75(75)1858ndash1863 1992
[11] A Skawińska The influence of metahalloysite addition on tobermorite formation studied byX-ray powder diffraction and scanning electron microscope MATEC Web of Conferences16305008 2018
[12] S T Bergold F Goetz-Neunhoeffer and J Neubauer Quantitative analysis of C-S-H in
25
5 References
hydrating alite pastes by in-situ XRD Cement and Concrete Research 53119ndash126 2013
[13] O P Shrivastava and F P Glasser Ion-exchange properties of 11-Aring tobermorite Reactivityof Solids 2(3)261ndash268 1986
[14] H Maeda Y Ogawa E H Ishida and T Kasuga Hydrothermal synthesis of tobermoritedoped with phosphorus species for removing heavy metal ions Journal of the AustralianCeramic Society 48(1)8ndash11 2012
[15] O P Shrivastava and R Shrivastava Cation exchange applications of synthetic tobermoritefor the immobilization and solidification of cesium and strontium in cement matrix Bulletinof Materials Science 23(6)515ndash520 2000
[16] G Renman and A Renman Sustainable Use of Crushed Autoclaved Aerated Concrete(CAAC) as a Filter Medium in Wastewater Purification 8th International conferenceon sustainable management of waste and recycled materials in construction GothenburgSweden 30 Mayndash1 June 2012 Proceedings pages 1ndash7 2012
[17] G Schober Chemical transformations during the manufacturing of autoclaved aeratedconcrete (ACC) Cement lime gypsum and quartz sand become cellular concrete ZKG58(7)63ndash70 2005
[18] A J Hamad Materials Production Properties and Application of Aerated LightweightConcrete Review International Journal of Materials Science and Engineering 2(2)152ndash157 2014
[19] D Ectors F Goetz-Neunhoeffer and J Neubauer A generalized geometric approach toanisotropic peak broadening due to domain morphology Journal of Applied Crystallogra-phy 48(1)189ndash194 2015
[20] H M Rietveld A profile refinement method for nuclear and magnetic structures Journalof Applied Crystallography 2(2)65ndash71 1969
[21] S A Hamid The crystal structure of the 11 Aring natural tobermoriteCa225[Si3O75(OH)15]1H2O Zeitschrift fuer Kristallographie - New Crystal Struc-tures 154(3-4)189ndash198 1981
[22] S A S El-Hemaly T Mitsuda and H F W Taylor Synthesis of normal and anomaloustobermorites Cement and Concrete Research 7429ndash438 1977
[23] M Sakiyama and T Mitsuda Hydrothermal reaction between C-S-H and kaolinite for theformation of tobermorite at 180degC Cement and Concrete Research 7(6)681ndash685 1977
[24] E Bonaccorsi S Merlino and A R Kampf The crystal structure of tobermorite 14 Aring(plombierite) a C-S-H phase Journal of the American Ceramic Society 88(3)505ndash5122005
[25] S Merlino E Bonaccorsi and T Armbruster The real structures of clinotobermorite andtobermorite 9 Aring OD character polytypes and structural relationships European Journalof Mineralogy 12(2)411ndash429 2000
[26] K Momma and F Izumi VESTA 3 for three-dimensional visualization of crystal volu-metric and morphology data Journal of Applied Crystallography 44(6)1272ndash1276 2011
26
5 References
[27] S Shaw S M Clark and C MB Henderson Hydrothermal formation of the calcium sil-icate hydrates tobermorite (Ca5Si6O16(OH)2 middot 4H2O) and xonotlite (Ca6Si6O17(OH)2)An in situ synchrotron study Chemical Geology 167(1-2)129ndash140 2000
[28] K Matsui J Kikuma M Tsunashima T Ishikawa S Matsuno A Ogawa and M SatoIn situ time-resolved X-ray diffraction of tobermorite synthesis process under hydrothermalcondition IOP Conference Series Materials Science and Engineering 18(2)60ndash66 2011
[29] G Matekonis R Šiaučiunas and D Vaičiukyniene Hydrothermal Synthesis and Charac-terization of Na + and [ Al 3 + + Na + ] -substituted Tobermorite in CaO-SiO2middotnH2O-H2OSystem MATERIALS SCIENCE 16(3)242ndash248 2010
[30] G Geng R J Myers M J A Qomi and P JM Monteiro Densification of the inter-layer spacing governs the nanomechanical properties of calcium-silicate-hydrate ScientificReports 7(1)1ndash8 2017
[31] D Klimesch and A Ray Autoclaved cement-quartz pastes with metakaolin additionsAdvanced Cement Based Materials 7(3-4)109ndash118 1998
[32] N Y Mostafa A A Shaltout H Omar and S A Abo-El-Enein Hydrothermal synthesisand characterization of aluminium and sulfate substituted 11 nm tobermorites Journal ofAlloys and Compounds 467(1-2)332ndash337 2009
[33] İ Demir M S Başpınar E Kahraman E Ccedilalışkan and G Goumlrhan An Investigation onthe Usability of Diatomite in Aerated Concrete Production In Proc of the Intl Conf onAdvances In Civil Structural And Construction Engineering - CSCE 2014 pages 97ndash1002014
[34] A Skawinska Z Owsiak T Baran and K Hernik The influence of halloysite additionon tobermorite formation in CaO and quartz mix under hydrothermal conditions CementWapno Beton 17(12)426ndash434 2017
[35] N Y Mostafa Influence of air-cooled slag on physicochemical properties of autoclavedaerated concrete Cement and Concrete Research 35(7)1349ndash1357 2005
[36] D Małaszkiewicz and J Chojnowski Influence of addition of calcium sulfate dihydrate ondrying of autoclaved aerated concrete Open Engineering 7(1)273ndash278 2017
[37] N Hara and N Inoue Thermal behaviour of 11Aring tobermorite and its lattice parametersCement and Concrete Research (10)53ndash60 1980
[38] M D Jackson S R Chae S R Mulcahy C Meral R Taylor P Li A H EmwasJ Moon S Yoon G Vola H R Wenk and P JM Monteiro Unlocking the secretsof Al-tobermorite in Roman seawater concrete American Mineralogist 98(10)1669ndash16872012
[39] W Liao W Li Z Fang C Lu and Z Xu Effect of different aluminum substitution rateson the structure of Tobermorite Materials 12(22)1ndash10 2019
[40] D Klimesch and A Ray DTA-TG Study of the CaO-SiO2-H2O and CaO-Al2O3-SiO2-H2OSystems Under Hydrothermal Conditions Journal of Thermal Analysis and Calorimetry56(1)27ndash34 1999
27
5 References
[41] Z Sauman and Z Valtr Substitution of sulphate ions in the crystal lattice of 11 Aring to-bermorite In The VI International Congress on the Chemistry of Cement pages 1ndash14Moscow 1974
[42] G Schober Reaction of raw materials to the final product AAC httpwwwpb-aacde
chemmin2_ehtml 2012 accessed 2020-01-31
[43] D Jansen C Stabler F Goetz-Neunhoeffer S Dittrich and J Neubauer Does Ordi-nary Portland Cement contain amorphous phase A quantitative study using an externalstandard method Powder Diffraction 26(01)31ndash38 2011
[44] C Roumlszligler J Stark F Steiniger and W Tichelaar Limited-dose electron microscopyreveals the crystallinity of fibrous C-S-H phases Journal of the American Ceramic Society89(2)627ndash632 2006
[45] Y Sakalli and R Trettin Investigation of C3S hydration by environmental scanning elec-tron microscope Journal of Microscopy 259(1)53ndash58 2015
[46] F Matsushita Y Aono and S Shibata Expansion and shrinkage behavior of green cakeof Autoclaved Aerated Concrete In Autoclaved Aerated Concrete - Innovation and Devel-opment Proceedings of the 4th International Conference on Autoclaved Aerated ConcreteKingston UK 8-9 September 2005 pages 101ndash108 CRC Press 2005
[47] C Chucholowski M Holger and K-C Thienel Improving the recyclability environmentalcompatibility and CO2 balance of autoclaved aerated concrete by replacing sulfate carrierand cement with calcined clays CePapers 2(4)503ndash512 2018
[48] X Y Huang W Ni W H Cui Z J Wang and L P Zhu Preparation of autoclavedaerated concrete using copper tailings and blast furnace slag Construction and BuildingMaterials 27(1)1ndash5 2012
[49] W Wongkeo and A Chaipanich Compressive strength microstructure and thermal anal-ysis of autoclaved and air cured structural lightweight concrete made with coal bottom ashand silica fume Materials Science and Engineering A 527(16-17)3676ndash3684 2010
[50] A Roacuteżycka and W Pichoacuter Effect of perlite waste addition on the properties of autoclavedaerated concrete Construction and Building Materials 12065ndash71 2016
[51] N Isu H Ishida and T Mitsuda Influence of quartz particle size on the chemical andmechanical properties of autoclaved aerated concrete (I) tobermorite formation Cementand Concrete Research 25(25)243ndash248 1995
[52] D Ectors Advances in the analysis of cementitious reactions and hydrate phases doctoralthesis PhD thesis Friedrich-Alexander-Universitaumlt Erlangen-Nuumlrnberg 2016
[53] D Ectors F Goetz-Neunhoeffer and J Neubauer Domain size anisotropy in the double-Voigt approach An extended model Journal of Applied Crystallography 481998ndash20012015
[54] D Ectors F Goetz-Neunhoeffer and J Neubauer Routine (an)isotropic crystallite sizeanalysis in the double-Voigt approximation done right Powder Diffraction 32(S1)27ndash342017
28
5 References
[55] D Jansen F Goetz-Neunhoeffer C Stabler and J Neubauer A remastered external stan-dard method applied to the quantification of early OPC hydration Cement and ConcreteResearch 41(6)602ndash608 2011
[56] T Ungaacuter G Tichy J Gubicza and R J Hellmig Correlation between subgrains andcoherently scattering domains Powder Diffraction 20(04)366ndash375 2005
[57] Triloki P Garg R Rai and B K Singh Structural characterization of as-depositedcesium iodide films studied by X-ray diffraction and transmission electron microscopy tech-niques Nuclear Instruments and Methods in Physics Research Section A AcceleratorsSpectrometers Detectors and Associated Equipment 736128ndash134 2014
[58] J Schreiner F Goetz-Neunhoeffer J Neubauer and D Jansen Hydrothermal synthesisof 11 Aring tobermorite ndash Effect of adding metakaolin to the basic compound Applied ClayScience 185 2020
[59] J Schreiner F Goetz-Neunhoeffer J Neubauer S Volkmann S Bergold R Webler andD Jansen Advanced Rietveld refinement and SEM analysis of tobermorite in chemicallydiverse autoclaved aerated concrete Powder Diffraction 34143ndash150 2019
[60] J Schreiner D Jansen D Ectors F Goetz-Neunhoeffer J Neubauer and S VolkmannNew analytical possibilities for monitoring the phase development during the production ofautoclaved aerated concrete Cement and Concrete Research 107247ndash252 2018
29
6 Publications
6 Publications
61 Hydrothermal synthesis of 11 Aring tobermorite ndash Effectof adding metakaolin to the basic compound
Reprint of the peer reviewed publication
Schreiner J Goetz-Neunhoeffer F Neubauer J Jansen D 2020 Hydrothermalsynthesis of 11 Aring tobermorite ndash Effect of adding metakaolin to the basic compoundApplied Clay Science 185 httpsdoiorg101016jclay2019105432
with permission from Elsevier
30
Contents lists available at ScienceDirect
Applied Clay Science
journal homepage wwwelseviercomlocateclay
Research paper
Hydrothermal synthesis of 11 Aring tobermorite ndash Effect of adding metakaolin tothe basic compound
J Schreiner F Goetz-Neunhoeffer J Neubauer D JansenUniversity of Erlangen-Nuremberg GeoZentrum Nordbayern Mineralogy Schlossgarten 5a 91054 Erlangen Germany
A R T I C L E I N F O
KeywordsHydrothermal synthesis11 Aring tobermoriteMetakaolinPowder diffractionKatoite
A B S T R A C T
Different amounts and types of metakaolin were analyzed and applied for the hydrothermal synthesis of 11 Aringtobermorite All synthesized samples were investigated by means of powder XRD combined with Rietveld re-finement Al-substituted 11 Aring tobermorite was successfully synthesized on the basis of a broad range of com-pounds characterized by a varying content of metakaolin Katoite was present depending on the amount ofsupplied Al3+ which was determined by the dosage of metakaolin Minor crystalline components included in thetwo types of metakaolin sources varied greatly in their reactivity under hydrothermal conditions Despite adifferent degree of purity the two types of metakaolin showed corresponding effects at moderate dosages butcontrary effects at higher dosages as for the synthesis of 11 Aring tobermorite The domain morphology of to-bermorite could be associated with Al3+ incorporation for low dosages of metakaolin represented by up to 2 wt- Al2O3 in the dry mix By contrast Al3+ affected tobermorite lattice parameters at equivalent and even athigher dosages with c reaching 2295 Aring at 12 wt- Al2O3 in the dry mix
1 Introduction
11 Application of metakaolin as a reactive material in constructionindustry
The application of supplementary cementitious materials (SCMs) inthe field of construction technology has received a lot of attention inrecent years Due to limited resources and an urgent need for alter-native and more eco-friendly construction materials SCMs such asmetakaolin offer a great potential The usage of SCMs has not onlyspread to the cement and mortar industry but also to advanced appli-cations such as autoclaved aerated concrete (AAC) (Demir et al 2014Koutnyacute et al 2014 Walczak et al 2015 Roacuteżycka and Pichoacuter 2016Chucholowski et al 2018) Unlike ordinary cementitious constructionmaterials AAC is produced from hydrothermal curing Due to the dif-ferent thermodynamic environment the hydration process and the re-activity of raw materials have to be investigated properly in order tounderstand the effects on the AAC product The leading mineral phasein AAC is 11 Aring tobermorite (Ca5Si6O16(OH)2middot4H2O) As a consequencethe thermal and mechanical properties of AAC depend on micro-structure and crystallinity of tobermorite to some extent In addition tothe curing time and the fineness of raw materials the supply of ionsthat can substitute in the tobermorite structure is a crucial factor in thiscontext Especially substitutions by aluminum sodium and potassium
ions have been investigated thoroughly (Sauman 1974 Klimesch andRay 1998 Mostafa et al 2009 Matekonis et al 2010 Skawinskaet al 2017) Calcined clays usually contain a considerable amount ofthe mentioned ions
There is a vast amount of literature on the reactivity of SCMs atambient temperature and standard pressure but there is little when itcomes to hydrothermal conditions In previous publications the beha-vior of metakaolin under hydrothermal conditions was mainly in-vestigated for the synthesis of zeolites (Zhang et al 2007 Aguilar-Mamani et al 2014 Setthaya et al 2016 Luo et al 2018) In thesestudies the reactivity of metakaolin was observed at a wide range oftemperature and pH values During the transformation of kaolin intometakaolin a loss of framework alumina was observed (Ayodele et al2019) In recent decades metakaolin has been the subject of studies inthe field of geopolymer research (Rashad 2013 Chen et al 2016) Forthe synthesis of 11 Aring tobermorite a more distinct setting of temperaturesetting (180ndash200 degC) and steam pressure (1ndash12 MPa) are required
This publication is intended to make a new contribution to thechallenging field of hydrothermal synthesis in the system CaO-Al2O3-SiO2-H2O based on XRD analysis combined with Rietveld refinementVarious dosages of two types of metakaolin with different chemical andmineralogical purities are compared for the effects on the hydrothermalsynthesis of Al-substituted 11 Aring tobermorite Especially changes of thebulk chemistry in the raw mixes the reactivity of minor crystalline
httpsdoiorg101016jclay2019105432Received 20 August 2019 Received in revised form 13 November 2019 Accepted 30 December 2019
Corresponding authorE-mail address juergenjsschreinerfaude (J Schreiner)
Applied Clay Science 185 (2020) 105432
0169-1317 copy 2020 Elsevier BV All rights reserved
T
6 Publications
31
phases of the two types of metakaolin and the effect of different curingtimes are the focus of interest On the one hand metakaolin offers agreat potential in the AAC industry On the other hand of all SCMsmetakaolin is a good source material for investigating the influence ofAl3+ on the synthesis of Al-substituted 11 Aring tobermorite
12 Synthesis of Al-substituted 11 Aring tobermorite
In addition to being present in AAC tobermorite has found appli-cation in wastewater treatment and nuclear waste management due toits ion exchange capacity (Maeda et al 2012 Monasterio et al 2015)The substitution of silicon by aluminum results in a different to-bermorite structure due to general and local charge balance affectingthe lattice parameters Especially c is impacted by this substitutionbecause it occurs in the bridging tetrahedron and additional OHndash sub-stitutes O2ndash (Komarneni et al 1985 Merlino et al 2000) As suggestedin some additional studies the substitution of Si4+ by Al3+ and Na+ orK+ leads to a lath-like morphology of tobermorite crystals (Mostafa2005 Mostafa et al 2009 Venhodovaacute et al 2015 Qu et al 2018)However because of the heterogeneous appearance of tobermorite inAAC it is hardly possible to conduct a proper characterization based onSEM analysis In our recent work the anisotropic peak broadening oftobermorite in XRD diffractograms was successfully linked with theincorporation of foreign ions supplied in a common AAC production(Schreiner et al 2019) This finding allowed a more statistical struc-tural characterization of tobermorite in bulk compositions compared toSEM analysis Moreover it was reported in other studies that differenthydrate phases occur depending on the amount of supplied ions and onthe experimental settings In compounds with a high content of Al3+formation of katoite could be observed (Klimesch and Ray 1998 Riacuteoset al 2009 Matsui et al 2011) In the case of a longer curing durationinstead of 11 Aring tobermorite the formation of xonotlite (Siauciunas andBaltakys 2004 Galvaacutenkovaacute et al 2018) or - depending on the finenessof used silica source (Siauciunas and Baltakys 2004) - gyrolite is fa-voured
Kalousek (1956) suggested that tobermorite can contain up to 5Al2O3 More Al2O3 in the system resulted in the formation of hydro-garnet Klimesch and Ray (1998) additionally investigated the stabilityof hydrogarnet depending on the Al(Si + Al) ratio and its role in re-lation to the formation of 11 Aring tobermorite in an equivalent systemThey suggest that hydrogarnet always appears before tobermorite butthe former can only be detected for higher Al(Si + Al) ratios in theevent of longer curing times Riacuteos et al (2009) and Qu et al (2018)confirmed these findings in extensive investigations In the latter pub-lication it is additionally suggested that samples prepared at lowertemperatures (160 degC) are less impacted by the supply of Al3+ Theyalso consider the peak broadening of tobermorite in their XRD plotsbased on the amount of incorporated Al3+ In two recent publicationswe suggested that the peak broadening of tobermorite enables a mi-crostructural analysis by calculating the orientation dependent domainsizes (Schreiner et al 2018 2019) However these studies are based onsamples of industrially produced AAC so that the curing time was fixedThe studied AAC was produced from raw materials with a broad che-mical spectrum such as ordinary Portland cement (OPC) whichsomehow complicates the interpretation of results
In this work the influence of aluminum ions - provided by meta-kaolin - on dominant crystallographic direction-dependent domaingrowth of tobermorite is investigated by analysis of anisotropic peakbroadening (Ectors et al 2015 2017) In Fig 1 of the supplementarymaterial the method of fitting the anisotropic peak broadening of to-bermorite using a triaxial cylinder model is visualized (Schreiner et al2018) Fitting of the anisotropic peak broadening of tobermorite Thismethod is used to calculate the average and reliable values for to-bermorite domain sizes in the powder sample and associate them withaverage Al3+ incorporation Microstrain should be considered becauseit is an additional source of peak broadening However this usually
accounts for materials that have been exposed to different kinds ofstress such as metals and alloys (Badawi et al 2019) In addition theinstrumental contribution to peak broadening should be consideredHydration products such as tobermorite are characterized by crystallitesizes in the range of nanometers so that anisotropic size broadeningclearly outweighs the effect of instrumental broadening (Jenkins andSnyder 1996) Moreover the impact of Al3+ on the lattice parametersof tobermorite is considered It should additionally be clarified whe-ther the results from our previous publication (Schreiner et al 2019)based on industrially produced AAC can be confirmed by investigationwith less complex raw mixes and purely based on laboratory experi-ments
2 Material and methods
21 Starting materials
The starting materials for hydrothermal synthesis included deio-nized water quartz flour portlandite (999 pure) and two types ofmetakaolin One type was ordinary commercially available metakaolin(MK) with nearly a stoichiometric composition For comparison thesecond type of commercially available metakaolin was a by-productfrom expanded glass production (MKg) and consequently highly im-pure The chemical composition of MK and MKg determined by XRF isgiven in Table 1 With MKg containing less Al2O3 but considerably moreNa2O than MK the effects on hydrothermal synthesis were of interestBoth types of metakaolin have been characterized in previous pub-lications (Schmidt et al 2012 Naber et al 2019) In addition weverified the mineral phase content by XRD analysis Besides amorphousmetakaolin MK contained minor amounts of anatase quartz and mica
Fig 1 Weight fractions of tobermorite quartz and katoite determined byquantitative XRD analysis ndash samples including MKg crosshatched
Table 1Chemical composition of MK and MKg determined by XRF analysis ndash majorcontrasts in bold letters
Oxides [wt-] MK MKg
SiO2 536 604Al2O3 392 206CaO 01 40MgO 01 12Na2O 0 96K2O 10 18Fe2O3 18 05TiO2 21 03P2O5 01 02Loss on ignition 15 1
J Schreiner et al Applied Clay Science 185 (2020) 105432
2
6 Publications
32
MKg contained additional kaolinite feldspar and quartz
22 Investigated mix composites
For the preparation of raw mixtures the powders were weighed andhomogenized using a lab-scale mixing mill Table 2 lists the composi-tion and nomenclature of all samples including Al2O3 content andcuring time in the autoclave
bull Besides one blank mixture (MK0) that did not contain any type ofmetakaolin eleven more compounds were prepared of which threeincluded different dosages of MKg (MKg16 MKg23 and MKg60)Three more mixes contained equivalent amounts of MK instead ofMKg (MK16 MK23 and MK60) These mixes were investigated inorder to have a direct comparison concerning the effects of differentraw material on the synthesis of tobermorite
bull Additionally the mixes MK9 MK5 and MK25 with lower dosages ofmetakaolin were analyzed In the referenced literature (Schreineret al 2019) the effect of Al3+ on the anisotropic peak broadeningof tobermorite could only be observed in the case of Al2O3 contentslower than 4 in the drymix In the latter three mixes Al2O3 con-tents range from 1 to 35 Al2O3 (calculated from XRF data) whichmeets the region of interest for the analysis of tobermorite domainmorphology
bull The curing time for nearly all of the investigated samples was 12 hbut compound MK9 was prepared two more times for curing timesof 2 h and 6 h The different curing times were chosen in this par-ticular sample so that the reactivity of metakaolin and the phasetransitions could be observed more precisely
23 Hydrothermal treatment
Due to the different fineness of raw materials there was a differentwater demand from one mixture to another In order to obtain slurriesof comparable rheology the amount of water was adapted respectivelyresulting in water-to-solid ratios of 25 to 3 which matches the sug-gested water-to-solid ratio for this purpose (Roacutezycka et al 2014Galvaacutenkovaacute et al 2018) The weighed water was added to the dry mixand after stirring for 1 min at 23 degC the slurry was poured into thereactor Minor changes in the quantity of added water did not have aninfluence on the measured steam pressure All experiments were con-ducted using a PTFE-lined stainless steel autoclave with a reactor vo-lume of 300 ml The oven temperature was fixed at 180 degC and auto-genous steam pressure of 11ndash12 MPa was measured during eachexperiment with an external manometer After cooling to room tem-perature the sample was removed from the reactor coarsely ground
using an agate mortar and dried at 60 degC for 12 h After drying thesample was ground with an agate mortar again in order to deagglo-merate the particles As no coarse raw materials were used there wasno need for wet McCrone milling (Schreiner et al 2018)
24 XRD analysis
After preparation into front-loading sample holders the powdersamples were measured with a D8 diffractometer (Bruker) equippedwith a LynxEye detection system and Bragg-Brentano geometry Thesettings for XRD analysis included a tube voltage of 40 kV a current of40 mA an angular range from 6 to 80deg 2θ (Cu Kα radiation) a time perstep of 054 s a step width of 00236deg 2θ and a PSD opening of 33deg Thebackground was fitted with Chebyshev polynomial of the fifth orderThe major contribution of amorphous phase was fitted with a singlepeak with a fixed position at 308deg 2θ so that tobermorite reflectionswere not affected An external quartzite standard was measured withthe same parameters in order to determine phase quantities (Jansenet al 2011) Bruker AXS software TOPAS 50 was used for Rietveldrefinement (Rietveld 1969) and the used structures are shown inTable 3
3 Results and discussion
31 Different dosages of MK and MKg
In Fig 1 the quantities of tobermorite quartz and katoite present inmost of the samples determined by XRD analysis are illustratedWhenever tobermorite was the leading mineral hydrate phase a basalspacing of 113 Aring could be verified in each of the diffractograms Thequantities of minor crystalline phases and amorphous content are notshown For low dosages of MK it can be seen that the weight fraction oftobermorite decreased At moderate dosage of both types of metakaolin(MK16 MK23 MKg16 MKg23) tobermorite was present in comparablequantities It can be seen that the amount of katoite in the mixes de-pended on the dosage of metakaolin and it appeared only at dosages ofMK5 or more Due to the higher content of aluminum in MK comparedto MKg more katoite could always be observed in the MK mixes atequivalent dosages Despite equal amounts of quartz as starting mate-rial in mixes for both types of metakaolin the resulting weight fractionsin the cured samples were not alike Considerably more quartz waspresent in the MK samples Even though less quartz was used for mixescontaining higher amounts of MK even more quartz was present afterhydrothermal curing (Table 2 Fig 1) Consequently some of the SiO2
provided by MK did not transform into an amorphous phase or to-bermorite but into quartz This finding is verified by the presence ofquartz in MK60 because no quartz was included in the raw mixture Thefeldspar present in MKg did not react so Na2O and an unknown amountof Al2O3 may not have been supplied for hydrothermal reaction Besidestobermorite and quartz additional calcite scawtite (Ca7Si6(CO3)
Table 2Basic powder compounds prepared for the hydrothermal synthesis of to-bermorite with the respectively calculated Al2O3 content and curing time in thereactor
Sample Portlandite[wt-]
Quartz[wt-]
MK[wt-]
MKg
[wt-]
Al2O3
[wt-]Curingtime [h]
MK0 49 51 ndash ndash 0 12MK25 495 48 25 ndash 1 12MK5 49 46 5 ndash 2 12MK9_2h 48 43 9 ndash 35 2MK9_6h 48 43 9 ndash 35 6MK9_12h 48 43 9 ndash 35 12MK16 47 37 16 ndash 63 12MK23 46 31 23 ndash 9 12MK60 40 ndash 60 ndash 235 12MKg16 47 37 ndash 16 33 12MKg23 46 31 ndash 23 47 12MKg60 40 ndash ndash 60 124 12
Table 3Structural data used for the investigation with powder XRD analysis
Phase Author
Anatase (Horn et al 1972)Biotite (Brigatti et al 2000)Calcite (Maslen et al 1995)Kaolinite (Zvyagin 1960)Katoite (Bartl 1969)Microcline (Bailey 1969)Plazolite (Basso et al 1983)Portlandite (Busing and Levy 1957)Quartz (Le Page and Donnay 1976)Scawtite (Grice 2005)Tobermorite (Hamid 1981)Xonotlite (Hejny and Armbruster 2001)
J Schreiner et al Applied Clay Science 185 (2020) 105432
3
6 Publications
33
O18bull2(H2O)) and xonotlite (Ca6Si6O17(OH)2) could be identified insample MK0 (XRD plots of samples MK0 MKg16 MKg23 MK16 andMK23) Comparing MK0 and MK25 scawtite and xonotlite could stillbe identified in a very low amount in MK25 but no longer in samplesthat contained even more MK (XRD plots of samples MK0 MK25 MK5and MK9_12h)
Two additional experiments were done without quartz in the rawmixes (MK60 and MKg60) The according diffractograms after hydro-thermal curing are shown in Fig 2 In sample MKg60 tobermorite (gt 50wt-) was successfully synthesized without any other silica sourcethan MKg whereas no crystalline quartz occurred By contrast no to-bermorite but quartz could be identified in equivalent mixture MK60containing MK It can be seen that crystalline components such as micaand anatase in the raw MK did not react at the selected conditions andremained present in the autoclaved samples Except for feldspar in MKgall of the crystalline components appeared to be reactive at the chosenhydrothermal conditions A minor unidentified phase occurred at328deg2θ and additional xonotlite was identified in sample MKg60 Insample MK60 more calcium was needed for the formation of morehydrogarnet (Fig 1) resulting in a lower CaSi ratio for the remainingsystem Sample MKg60 contained only half of the amount of Al3+ and itwas not completely supplied for reaction due to its partial presence infeldspar Consequently essentially less hydrogarnet (Fig 1) was presentin MKg60 after hydrothermal treatment and the CaSi ratio in the re-maining system was affected to a lesser extent
32 Application of MK for different curing times
The development of hydrate phases in the autoclave for compoundMK9 is displayed in Fig 3 After only 2 h of hydrothermal curing all ofthe available portlandite had reacted and katoite (95 wt-) was pre-sent The applied type of metakaolin appeared to react quickly as itsupplied aluminum for formation of katoite No formation of to-bermorite could be observed at this stage yet An assumably amorphousprecursor can be seen at 28 to 30deg2θ Calcium was provided by thedissolution of portlandite After 6 h of hydrothermal reaction amountsof katoite (85 wt-) and quartz (from 31 wt- at 2 h to 165 wt- at6 h) had decreased and a major amount of tobermorite (35 wt-) waspresent Apparently between 2 and 6 h under hydrothermal conditionsthe amorphous precursor and quartz reacted resulting in the formationof tobermorite An additional 6 h of reaction time (MK9_12h) did notchange the phase composition significantly Slightly more tobermorite
(365 wt-) less quartz (16 wt-) and katoite (65 wt-) weremeasured
33 Tobermorite domain morphology and lattice parameters
In the referenced literature an analysis of tobermorite domainmorphology based on anisotropic peak broadening was possible forsamples that contained notgt 4 wt- Al2O3 in the drymix (Schreineret al 2019) Accordingly in this study samples MK0 MK25 MK5MK9_6h and MK9_12h were suitable (Table 2) with MK9_2h not con-taining any tobermorite In Fig 4 the respective growth in a and b di-rection is visualized with x indicating the domain size in a direction andy indicating domain size in b direction using a macro for TOPAS 50(Ectors et al 2015 2017) The calculated cylinder models in Fig 4represent the relation of yx and not absolute sizes With no supply ofaluminum ions (MK0) the relative domain growth in b direction islower compared to samples containing metakaolin This finding agreeswith the results from a similar investigation of tobermorite in AAC(Schreiner et al 2019) However within the samples MK5 andMK9_12h the different amounts of supplied aluminum ions did notshow a clear effect It appeared that low dosages of Al3+ (1 wt- Al2O3
in MK25 and 2 wt- Al2O3 in MK5) were enough to determine thedomain growth of tobermorite Additional results from the samplesMK9_6h and MK9_12h indicated that growth in b direction increasedwith reaction time
In Fig 5 lattice parameters of tobermorite depending on metakaolindosages are plotted B clearly remained unaffected throughout therange of samples Increasing amounts of metakaolin led to a slightlysmaller parameter a However both types of metakaolin showed acorresponding impact on parameter a By contrast parameter c in-creased strongly with increasing amounts of MK and MKg but the typeof metakaolin was significant At an equivalent dosage MK affected thecell dimension in c direction considerably more than MKg so that thefraction of Al3+ appeared to be the decisive parameter Different metaloxides in MKg did not show a notable effect certainly as they werepartially not provided for reaction Unlike for the domain morphologyof tobermorite the impact on lattice parameters could be observedwithin the complete range of examined dosages
4 Conclusions
The results obtained from the introduced investigations allow con-cluding remarks on the effects of the applied types of metakaolin on thesynthesis of 11 Aring tobermorite the phase transitions and the in-corporation of Al3+ into the lattice of tobermorite
With a critical dosage the use of any type of metakaolin led to theformation of katoite in an according amount At moderate dosages(MKg16 MKg23 MK16 and MK23) the two types of metakaolin showeda good correspondence in consideration of the quantities of to-bermorite For higher dosages there were contrary effects Lower do-sages of MK led to considerable quantities of Al-substituted to-bermorite Samples containing low dosages of MK revealed that katoiteappeared in the case ofgt 5 wt- of MK - corresponding to 2 wt-Al2O3 - in the basic compound Minor crystalline phases in MKg showedbetter reactivity than those in MK The observation that no tobermoritewas present in sample MK60 indicated that high dosages of Al3+ hin-dered the formation of tobermorite
Investigations of MK9 at 2 6 and 12 h displayed the evolution ofhydrate phases At first katoite was the only crystalline hydrate phasepresent after 2 h which corresponded to observations in a differentpublication (Klimesch and Ray 1999) The amount of katoite andquartz then decreased and a major amount of tobermorite formed from2 to 6 h curing time In order to gain more information on the trans-formation of amorphous C-(A)-S-H into tobermorite additional ex-periments in the range of 2 to 6 h curing time will be needed
Domain morphology analysis of tobermorite revealed that low
Fig 2 Diffractograms of MKg MKg60 MK and MK60 from 7 to 34deg2θ CuKα Aanatase C calcite F feldspar k kaolinite K katoite M mica Q quartz Ttobermorite U unidentified phase X xonotlite
J Schreiner et al Applied Clay Science 185 (2020) 105432
4
6 Publications
34
dosages of Al3+ determined the domain growth which agreed with theresults published on tobermorite in AAC samples (Schreiner et al2019) Different curing times unveiled that growth in b direction in-creased with the reaction time Al3+ incorporation into the lattice oftobermorite only reflected to a limited extent in the domain mor-phology By contrast an increase of lattice parameter c was triggered byAl3+ even at the highest dosage in this study Ultimately there is no
evidence for a limit of incorporation of Al3+ but there is a limit ofinfluence on the domain morphology These results additionally re-confirm this assumption similarly made in the previous work (Schreineret al 2019) and suggest a new mechanism of tobermorite crystal-lization depending on the presence of Al3+
Supplementary data to this article can be found online at httpsdoiorg101016jclay2019105432
Declaration of Competing Interest
The authors declare that they have no known competing financialinterests or personal relationships that could have appeared to influ-ence the work reported in this paper
Acknowledgement
The authors thank Rodgauer Baustoffwerke GmbH amp Co KG forsupplying raw materials for laboratory experiments
References
Aguilar-Mamani W Garciacutea G Hedlund J Mouzon J 2014 Comparison betweenleached metakaolin and leached diatomaceous earth as raw materials for the synth-esis of ZSM-5 Springerplus 3 1ndash10 httpsdoiorg1011862193-1801-3-292
Ayodele OB Sulaimon AA Alaba PA Tian Z-Y 2019 Influence of metakaolini-zation temperature on the structure and activity of metakaolin supported Ni catalystin dry methane reforming J Environ Chem Eng httpsdoiorg101016jjece2019103239 (in press)
Badawi EA Abdel-Rahman MA Mostafa A Abdel-Rahman M 2019 Determinationof the crystallite size amp micro- strain by novel method from XRD profile Appl Phys2 1ndash15 httpsdoiorg1031058jap201921001
Bailey SW 1969 Refinement of an intermediate microcline structure Am Miner 541540ndash1545
Bartl H 1969 Roentgen-Einkristalluntersuchungen an (CaO)3 (Al2O3) (H2O)6 und an(CaO)12 (Al2O3)7 (H2O) neuer Vorschlag zur (CaO)12 (Al2O3)7-Struktur NeuesJahrb fuer Mineral Monatshefte 1969 404ndash413
Basso R Giusta AD Zefiro L 1983 Crystal structure refinement of plazolite A highlyhydrated natural hydrogrossular Neues Jahrb Miner Monatsh (Neues Jahrb fuerMineral Monatshefte) 1983 251ndash258
Brigatti MF Lugli C Poppi L Foord EE Kile DE 2000 Crystal chemical varia-tions in Li- and Fe-rich micas from Pikes Peak batholith (Central Colorado) AmMineral 85 1275ndash1286 httpsdoiorg102138am-2000-8-920
Busing WR Levy HA 1957 Neutron diffraction study of calcium hydroxide J ChemPhys 26 563 httpsdoiorg10106311743345
Chen L Wang Z Wang Y Feng J 2016 Preparation and properties of alkali acti-vated metakaolin-based geopolymer Materials (Basel) 9 1ndash12 httpsdoiorg103390ma9090767
Chucholowski C Holger M Thienel K-C 2018 Improving the recyclability en-vironmental compatibility and CO2 balance of autoclaved aerated concrete by re-placing sulfate carrier and cement with calcined clays CePapers 2 503ndash512httpsdoiorg101002cepa846
Fig 3 Diffractograms of MK9_2h MK9_6h and MK9_12h from 7 to 38deg2θ CuKα C calcite K katoite Q quartz T tobermorite
Fig 4 Relation of calculated domain sizes of 11 Aring tobermorite in selectedsamples (MK0 MK25 MK5 MK9_6h and MK9_12h) in a (x) and b (y) direction
Fig 5 Lattice parameters of tobermorite depending on MK or MKg dosageincluding blank mix MK0
J Schreiner et al Applied Clay Science 185 (2020) 105432
5
6 Publications
35
Demir İ Başpınar MS Kahraman E Ccedilalışkan E Goumlrhan G 2014 An investigationon the usability of diatomite in aerated concrete production In Proc of the IntlConf on Advances in Civil Structural and Construction Engineering ndash CSCE 2014 pp97ndash100
Ectors D Goetz-Neunhoeffer F Neubauer J 2015 A generalized geometric approachto anisotropic peak broadening due to domain morphology J Appl Crystallogr 48189ndash194 httpsdoiorg101107S1600576714026557
Ectors D Goetz-Neunhoeffer F Neubauer J 2017 Routine (an)isotropic crystallitesize analysis in the double-Voigt approximation done right Powder Diffract 3227ndash34 httpsdoiorg101017S0885715617000070
Galvaacutenkovaacute L Bartoniacutečkovaacute E Opravil T Tkacz J Ptaacuteček P 2018 The influence ofstarting materials solubility on tobermorite structure formation under the hydro-thermal conditions IOP Conf Ser Mater Sci Eng 379 1ndash8 httpsdoiorg1010881757-899X3791012001
Grice JD 2005 The structure of spurrite tilleyite and scawtite and relationships toother silicate-carbonate minerals Can Mineral 43 1489ndash1500 httpsdoiorg102113gscanmin4351489
Hamid SA 1981 The crystal structure of the 11 Aring natural tobermoriteCa225[Si3O75(OH)15]1H2O Zeitschrift fuer Krist 154 189ndash198 httpsdoiorg101524zkri19811543-4189
Hejny C Armbruster T 2001 Polytypism in xonotlite Ca6Si6O17(OH)2 Zeitschrift furKrist 216 396ndash408
Horn M Schwerdtfeger CF Meagher EP 1972 Refinement of the structure of ana-tase at several temperatures Zeitschrift fur Krist 136 273ndash281 httpsdoiorg101524zkri19721363-4273
Jansen D Goetz-Neunhoeffer F Stabler C Neubauer J 2011 A remastered externalstandard method applied to the quantification of early OPC hydration Cem ConcrRes 41 602ndash608 httpsdoiorg101016jcemconres201103004
Jenkins R Snyder R 1996 Introduction to X-ray Powder Diffractometry ChemicalAnalysis Wiley pp 90
Kalousek GL 1956 Crystal Chemistry of Hydrous Calcium Silicates J Am Ceram Soc40 74ndash80
Klimesch D Ray A 1998 Autoclaved cement-quartz pastes with metakaolin additionsAdv Cem Based Mater 7 109ndash118 httpsdoiorg101016S1065-7355(97)00073-4
Klimesch D Ray A 1999 DTA-TGA evaluations of the CaOndashAl2O3ndashSiO2ndashH2O systemtreated hydrothermally Thermochim Acta 334 115ndash122 httpsdoiorg101016s0040-6031(99)00140-9
Komarneni S Roy R Roy DM Fyfe CA Kennedy GJ Bothner-By AA Dadok JChesnick AS 1985 27Al and29Si magic angle spinning nuclear magnetic resonancespectroscopy of Al-substituted tobermorites J Mater Sci 20 4209ndash4214 httpsdoiorg101007BF00552416
Koutnyacute O Opravil T Pořiacutezka J 2014 Application of metakaoline in autoclavedaerated concrete technology Adv Mater Res 1000 174ndash177 httpsdoiorg104028wwwscientificnetAMR1000174
Le Page Y Donnay G 1976 Refinement of the crystal structure of low-quartz ActaCrystallogr Sect B 32 2456ndash2459 httpsdoiorg101107S0567740876007966
Luo H Law WW Wu Y Zhu W Yang EH 2018 Hydrothermal synthesis of needle-like nanocrystalline zeolites from metakaolin and their applications for efficient re-moval of organic pollutants and heavy metals Microporous Mesoporous Mater 2728ndash15 httpsdoiorg101016jmicromeso201806015
Maeda H Ogawa Y Ishida EH Kasuga T 2012 Hydrothermal synthesis of to-bermorite doped with phosphorus species for removing heavy metal ions J AustCeram Soc 48 8ndash11
Maslen EN Streltsov VA Streltsova NR Ishizawa N 1995 Electron density andoptical anisotropy in rhombohedral carbonates III Synchrotron Xray studies ofCaCO3 MgCO3 and MnCO3 Acta Crystallogr Sect B 51 929ndash939 httpsdoiorg101107S0108768195006434
Matekonis G Šiaučiūnas R Vaičiukynienė D 2010 Hydrothermal Synthesis andCharacterization of Na + and [ Al 3 + + Na + ] -substituted Tobermorite in CaO-SiO2middotnH2O-H2O System Mater Sci 16 242ndash248
Matsui K Kikuma J Tsunashima M Ishikawa T Matsuno S Ogawa A Sato M2011 In situ time-resolved X-ray diffraction of tobermorite synthesis process underhydrothermal condition IOP Conf Ser Mater Sci Eng 18 60ndash66 httpsdoiorg1010881757-899X182022017
Merlino S Bonaccorsi E Armbruster T 2000 The real structures of clinotobermoriteand tobermorite 9 Aring OD character polytypes and structural relationships Eur JMineral 12 411ndash429 httpsdoiorg1011270935-122120000012-0411
Monasterio M Gaitero JJ Manzano H Dolado JS Cerveny S 2015 Effect ofchemical environment on the dynamics of water confined in calcium silicate mi-nerals Natural and synthetic tobermorite Langmuir 31 4964ndash4972 httpsdoiorg101021acslangmuir5b00614
Mostafa NY 2005 Influence of air-cooled slag on physicochemical properties of auto-claved aerated concrete Cem Concr Res 35 1349ndash1357 httpsdoiorg101016jcemconres200410011
Mostafa NY Shaltout AA Omar H Abo-El-Enein SA 2009 Hydrothermal synth-esis and characterization of aluminium and sulfate substituted 11 nm tobermoritesJ Alloys Compd 467 332ndash337 httpsdoiorg101016jjallcom200711130
Naber C Stegmeyer S Jansen D Goetz-Neunhoeffer F Neubauer J 2019 ThePONKCS method applied for time resolved XRD quantification of supplementarycementitious material reactivity in hydrating mixtures with ordinary Portland ce-ment Constr Build Mater 214 449ndash457 httpsdoiorg101016jconbuildmat201904157
Qu X Zhao Z Zhao X 2018 Microstructure and characterization of aluminum-in-corporated calcium silicate hydrates (C-S-H) under hydrothermal conditions RSCAdv 8 28198ndash28208 httpsdoiorg101039c8ra04423f
Rashad AM 2013 Metakaolin as cementitious material history scours production andcomposition - a comprehensive overview Constr Build Mater 41 303ndash318 httpsdoiorg101016jconbuildmat201212001
Rietveld HM 1969 A profile refinement method for nuclear and magnetic structures JAppl Crystallogr 2 65ndash71 httpsdoiorg101107S0021889869006558
Riacuteos CA Williams CD Fullen MA 2009 Hydrothermal synthesis of hydrogarnet andtobermorite at 175 degC from kaolinite and metakaolinite in the CaO-Al2O3-SiO2-H2Osystem a comparative study Appl Clay Sci 43 228ndash237 httpsdoiorg101016jclay200809014
Roacuteżycka A Pichoacuter W 2016 Effect of perlite waste addition on the properties of au-toclaved aerated concrete Constr Build Mater 120 65ndash71 httpsdoiorg101016jconbuildmat201605019
Roacutezycka A Kotwica Ł Małolepszy J 2014 Synthesis of single phase gyrolite in theCaO-quartz-Na2O-H2O system Mater Lett 120 166ndash169 httpsdoiorg101016jmatlet201401003
Sauman Z 1974 Influence of SO4 2ndash ions on the formation of 11 Aring tobermorite InProceedings of the 2nd International Symposium on Science and Research in SilicateChemistry Moscow pp 25ndash39
Schmidt M Egersdoumlrfer A Poumlllmann H 2012 Increased reactivity using a glass-containing metakaolin as an active filler in lime-based binder systems ZKG Int 6554ndash62
Schreiner J Jansen D Ectors D Goetz-Neunhoeffer F Neubauer J Volkmann S2018 New analytical possibilities for monitoring the phase development during theproduction of autoclaved aerated concrete Cem Concr Res 107 247ndash252 httpsdoiorg101016jcemconres201802028
Schreiner J Goetz-Neunhoeffer F Neubauer J Volkmann S Bergold S Webler RJansen D 2019 Advanced Rietveld refinement and SEM analysis of tobermorite inchemically diverse autoclaved aerated concrete Powder Diffract 34 143ndash150httpsdoiorg101017s0885715619000149
Setthaya N Chindaprasirt P Pimraksa K 2016 Preparation of zeolite nanocrystals viahydrothermal and solvothermal synthesis using of rice husk ash and metakaolinMater Sci Forum 872 242ndash247 httpsdoiorg104028wwwscientificnetmsf872242
Siauciunas R Baltakys K 2004 Formation of gyrolite during hydrothermal synthesis inthe mixtures of CaO and amorphous SiO2 or quartz Cem Concr Res 34 2029ndash2036httpsdoiorg101016jcemconres200403009
Skawinska A Owsiak Z Baran T Hernik K 2017 The influence of halloysite ad-dition on tobermorite formation in CaO and quartz mix under hydrothermal condi-tions Cem Wapno Bet 17 426ndash434
Venhodovaacute E Janovskyacute R Drochytka R 2015 Formation of tobermorite at differentmaterials composition of aerated concrete Appl Mech Mater 752ndash753 247ndash250httpsdoiorg104028wwwscientificnetamm752-753247
Walczak P Małolepszy J Reben M Szymański P Rzepa K 2015 Utilization ofwaste glass in autoclaved aerated concrete Proc Eng 122 302ndash309 httpsdoiorg101016jproeng201510040
Zhang Y Gao W Cui L 2007 The transformation of acid leached metakaolin tozeolite beta Stud Surf Sci Catal 170 420ndash425 httpsdoiorg101016S0167-2991(07)80870-6
Zvyagin BB 1960 An attempt to electronographic determination of kaolinite structureJ Dokl Akad Nauk SSSR 130 1023ndash1026
J Schreiner et al Applied Clay Science 185 (2020) 105432
6
6 Publications
36
6 Publications
62 Advanced Rietveld refinement and SEM analysis oftobermorite in chemically diverse autoclaved aeratedconcrete
Following the copyright guidelines by Cambridge University Press the publication
Schreiner J Goetz-Neunhoeffer F Neubauer J Volkmann S Bergold S WeblerR Jansen D 2019 Advanced Rietveld refinement and SEM analysis of tobermorite inchemically diverse autoclaved aerated concrete Powder Diffraction 34 143ndash150 httpsdoiorg101017s0885715619000149
may not be reprinted It can be accessed at
httpswwwcambridgeorgcorejournalspowder-diffractionarticleadvanced-rietveld-refinement-and-sem-analysis-of-tobermorite-in-chemically-diverse-autoclaved-aerated-concrete51597C2A66F6F225D29DEB2675E74249
37
6 Publications
63 New analytical possibilities for monitoring the phasedevelopment during the production of autoclavedaerated concrete
Reprint of the peer reviewed publication
Schreiner J Jansen D Ectors D Goetz-Neunhoeffer F Neubauer J VolkmannS 2018 New analytical possibilities for monitoring the phase development during theproduction of autoclaved aerated concrete Cement and Concrete Research 107 247ndash252httpsdoiorg101016jcemconres201802028
with permission from Elsevier
38
Contents lists available at ScienceDirect
Cement and Concrete Research
journal homepage wwwelseviercomlocatecemconres
Short communication
New analytical possibilities for monitoring the phase development duringthe production of autoclaved aerated concrete
J Schreinera D Jansena D Ectorsa F Goetz-Neunhoeffera J Neubauera S Volkmannb
aUniversity of Erlangen-Nuremberg GeoZentrum Nordbayern Mineralogy Schlossgarten 5a 91054 Erlangen Germanyb Rodgauer Baustoffwerke GmbH amp Co KG Am Opel-Pruumlffeld 3 63110 Rodgau-Dudenhofen Germany
A B S T R A C T
This work presents improved analytical methods for both steps of the production process of autoclaved aeratedconcrete (AAC) the phase development during the hydration before autoclaving and during the autoclavingprocess itself The improvement includes new insights into preparation methods of AAC samples for powderdiffraction as well as Rietveld refinement strategies For the first time a new implementation for calculatinganisotropic crystal domain sizes is applied to major hydrate phases occurring during AAC production namelyportlandite during the hydration before autoclaving and tobermorite during the autoclaving process The cal-culation of anisotropic domain size growth which can be implemented in the Rietveld environment is based oncrystallographically and geometrically appropriate models The implementation of calculating anisotropic do-main sizes for the Rietveld software TOPAS 50 allows a superior Rietveld fit and a more accurate quantificationof the phase development Additionally it enables the tracking of growth mechanism of portlandite duringhydration
1 Introduction
Autoclaved aerated concrete (AAC) is known as a lightweight con-struction material which offers outstanding properties such as suffi-cient strength for construction in addition with excellent thermal in-sulation [12] AAC is produced by autoclaving from calcareous rawmaterials such as lime (CaO) and cement quartz sulfate carrier andother additives such as foaming agents and water
The production process (Fig 1) can be separated into the hydrationof the mixed slurry before the procedure of autoclaving and the auto-claving at elevated temperature (180 degC to 200 degC) under saturatedsteam pressure (12MPa) for several hours
The hydration process before autoclaving is necessary to achievesufficient strength in order to cut the green cake blocks as they shouldhave a specific shape and dimension after autoclaving Furthermorethe porous structure is generated by the foaming agent during hydra-tion in the first process step During autoclaving the final propertiesnamely strength and low thermal conductivity are achieved
It is already well understood that the autoclaving process leads tothe formation of several phases first of all tobermorite(Ca5Si6O16(OH)2lowast4H2O) [3ndash5] Newest research has shown im-pressively which reactions are running from the mineralogical point ofview Insitu XRD measurements were carried out during the
autoclaving process and the phase development was shown by plottingnormalized intensities [6] The study of Mitsuda et al [3] was mainlyfocused on the tracking of the phase evolution during the autoclavingprocess of AAC However their statements concerning phase evolutionare mainly based on XRD data and TGA measurements There is acommon agreement that the following reactions occur The consump-tion of the alite (OPC) leads to the formation of an initial C-S-H phaseduring the first processing step Portlandite which was initially formedduring the first process step (from CaO and C3S) further quartz and theC-S-H phase are consumed during autoclaving resulting in the crystal-lization of tobermorite Hence the crystallization process of to-bermorite as well as the crystal structure of tobermorite was an issue ofresearch and discussion over the last years and numerous publicationsto these topics are available Concerning the crystal structure of to-bermorite respectively the tobermorite supergroup a new publicationoutlines all important references and recommends a new nomenclature[7]
The presented study was performed to create new analytical possi-bilities for the characterization of the production process of AAC Bothof the production process steps are essential for the final productHence the present work focuses on crystallization of hydrate phases inboth processes
Firstly an external standard method [89] was published and
httpsdoiorg101016jcemconres201802028Received 6 October 2017 Received in revised form 1 February 2018 Accepted 26 February 2018
Corresponding authorsE-mail addresses juergenjsschreinerfaude (J Schreiner) danieljansenfaude (D Jansen)
Cement and Concrete Research 107 (2018) 247ndash252
0008-8846 copy 2018 Elsevier Ltd All rights reserved
T
6 Publications
39
recommended for the determination of absolute phase contents inmixtures with amorphous content It was shown that the method canabsolutely be recommended for hydrating cement pastes in which watercannot be quantified directly by XRD [10] This method seems to bevery promising for both the quantification of the hydration of the AACslurry before autoclaving and the quantification of the phase evolutionduring autoclaving inasmuch as both production steps form crystallineand amorphous phases
Secondly a new approach to anisotropic peak broadening due toanisotropic domain morphology which was developed [1112] is ap-plied to AAC samples to improve the fit of portlandite and tobermoriteby Rietveld refinement [13] By applying this approach the refinementof both portlandite and tobermorite should additionally lead to betterquantitative results as well as to better insights into the development ofthe domain size morphology of both phases formed
It was already shown that in a hydrating raw mixture for AAC twospecies of portlandite precipitate at 23 degC one showing dynamicallyanisotropic peak broadening and another one following the isotropictrend [14] The application of the anisotropic refinement model led toan improved fitting of portlandite Moreover the mechanism of aniso-tropic domain growth of portlandite was tracked
2 Materials and methods
In order to examine the hydration of the AAC slurry before auto-claving a mixture of the hydraulic reactive components was weighedand measured in-situ at a Bruker D8 diffractometer with a LynxEyedetection system
Ordinary Portland cement (OPC) was mixed with lime (CaO) andanhydrite (C$) The raw materials were taken from the same batches asfor the industrial samples The drymix (58 OPC 36 CaO and 6 C$by weight) was then mixed with water (ws= 08) and placed into anappropriate sample holder The samples were not aerated The slurrysamples were covered with a kapton film to avoid evaporation andcarbonation Diffractograms were recorded with an angular range from7 to 545deg 2θ and a step width of 0011deg 2θ Measurements were carriedout every 15min For each measurement 96 XRD patterns were re-corded over the first 24 h The temperature was fixed at 70 degC which isthe mean temperature generally prevailing in the industrial processduring hydration before autoclaving Rietveld refinement was carriedout using the G-factor method All structures used for Rietveld refine-ment are shown in Table 1
For investigation of the autoclaved samples five different specimenswere taken at different autoclaving times The specimens were takenout of a technical production process hence it was not possible to in-terrupt the process at an earlier time inasmuch it would lead to damageof a whole concrete production batch The specimens were firstly driedat 60 degC until weight constancy The whole blocks were then broken andstatistical samples of 20 g were taken In order to receive the right massattenuation coefficient (MAC) for G-factor method the loss on ignitionand the chemical composition (XRF) were determined For energydispersive XRF analysis (Spectro Xepos) tube voltage from 20 kV to50 kV and tube current from 08 to 20mA were used for differenttargets
The final sample preparation (grinding) before XRD measurementswas carried out using both an agate mortar and a McCrone micronizingmill for wet milling with isopropanol Both preparation methods wereapplied separately to see which one is suitable in order to get the bestpreparation for XRD investigations Six preparations were performed byone operator of which two were prepared with an agate mortar andfour with a McCrone mill For the McCrone milling 3 g of the sampleand 10ml of isopropanol were used for grinding for 12min The grainsize distribution of one sample prepared with an agate mortar and onesample prepared using a McCrone mill was measured by laser granu-lometry in isopropanol using a Mastersizer 3000 (MALVERN)
After milling the samples in these two ways for XRD analysis thepowders were prepared into a front loading sample holder and mea-sured Diffractograms were recorded with an angular range from 6 to80deg 2θ a step width of 00236deg 2θ and a time per step of 054 s Rietveldrefinement combined with external standard (G-factor) was applied inorder to get absolute quantities for each phase The refinement strategyfor portlandite and tobermorite in the TOPAS Launch Mode (TOPAS50 Bruker AXS) is attached as a Supplementary material file
3 Results and discussion
31 Hydration of the mixture before autoclaving
The hydration of the investigated paste before autoclaving isdominated by the hydration of the cement as well as the reaction of thefree lime (CaO) resulting in the formation of portlandite It can beclearly seen from Fig 2 that the hydration of the paste leads to theformation of ettringite portlandite and C-S-H phase For simplificationthe remaining phase developments are not shown in Fig 2 because theyare not in the focus of this study The hydration of CaO forming
Fig 1 Simplified process steps of AAC production and hydrate phase evolution
Table 1Structures used for Rietveld refinement
Phase Author
Alite [15]Anhydrite [16]Bassanite [17]Belite (β) [18]Belite (αprime) [19]Brownmillerite [20]C-S-H [21]Calcite [22]Ettringite [23]Gypsum [24]Hemicarbonate [25]Hydroxylellestadite [26]Lime (CaO) [27]Microcline [28]Portlandite [29]Quartz [30]Tobermorite [31]Tricalciumaluminate (cubic) [32]Tricalciumaluminate (orthorhombic) [33]PONCKS model for Water [21]
J Schreiner et al Cement and Concrete Research 107 (2018) 247ndash252
248
6 Publications
40
portlandite begins rapidly after the addition of water to the mixture andlime is fully consumed after only 1 h of hydration This translates into aquick rise of heat of hydration so that cement hydration is acceleratedwhich leads to further portlandite formation by the reaction of aliteEttringite formation stalls after few hours of hydration After 12 h et-tringite is partially decomposed probably due to sulfate depletion [9]
and poorly crystalline AFm phases (not shown in Fig 2) are formedIn Fig 3 it can be seen that in fact two generations of portlandite
are formed a 1st dominant generation showing anisotropic peakbroadening and 2nd one occurring considerably later following theisotropic domain size refinement which is usually carried out using theRietveld method This occurrence comes along firstly with lime hy-dration and secondly with alite hydration The expected quantity ofportlandite formed from lime hydration very well complies with the
Fig 2 Phase development in AAC paste on a laboratory scale before autoclaving ana-lyzed by in-situ XRD at 70 degC
Fig 3 Formation of two generations of portlandite by hydration of lime (1st) and C3S(2nd) at 70 degC before autoclaving with the major generation showing anisotropic peakbroadening
Fig 4 Biaxial cylinder domain size model of portlandite used for Rietveld refinement of anisotropic peak broadening
Fig 5 Morphological evolution of portlandite showing anisotropic domain size growthduring hydration at 70 degC
Fig 6 Comparison of quantification of crystalline quartz in samples prepared withMcCrone mill and agate mortar at different autoclaving times
J Schreiner et al Cement and Concrete Research 107 (2018) 247ndash252
249
6 Publications
41
quantity of the observed 1st generation The development of portlan-dite growth was already tracked in an equivalent slurry at 23 degC [14]Thus this observation confirms that the crystallinity of portlandite inmixtures for AAC production depends on the starting phase for hydra-tion as already indicated by Ectors [14]
Fig 4 shows the used biaxial cylindrical model for anisotropic do-main size calculation and the portlandite structure which was createdwith structural software VESTA 318 [34] Using the cylindrical ap-proach domain sizes in a (here equating to b) and c direction(dz= cylinder height) can be calculated which comes along with theexpected symmetrical parameters of portlandite
The 1st portlandite generation showing anisotropic domain growthcan be tracked in terms of cylinder diameter and height which is rea-lized in Fig 5 The blue cylinder represents the geometric approach andcylinder height and diameter are calculated newly for each range Thecylinder height remains rather stable throughout the hydration processwhile the cylinder diameter increases during the first hours of hydra-tion After 10 h of hydration the mean cylinder diameter no longer in-creases Consequently these observations match the results of the ex-aminations conducted at 23 degC [14] as well as the assumption thatdifferent mechanisms of growth exist for portlandite depending on the
hydration educt The maximum cylinder diameter is reached earlier inthis work very likely because of the higher hydration temperature
32 Quantification of the reactions during autoclaving
Autoclaved samples were ground with an agate mortar and com-pared to samples which were wet-ground with a McCrone mill Fig 6shows precisely that the determination of the amount of crystallinequartz is more reproducible in the two shown samples which were
Fig 7 2D XRD with Bruker GADDS-system plots of samples prepared with agate mortar and McCrone mill Coarse quartz grains are pointed out in the plot of the sample prepared withagate mortar
Fig 8 Particle size distribution of one sample prepared with an agate mortar and of onesample prepared with a McCrone mill measured by laser granulometry
Fig 9 Rietveld refinement for Tobermorite of autoclaved AAC sample by use of isotropicdomain size model (a) and of anisotropic domain size model (b)
J Schreiner et al Cement and Concrete Research 107 (2018) 247ndash252
250
6 Publications
42
prepared with a McCrone mill The high variance of crystalline quartzin the samples which were prepared with an agate mortar is a result ofinsufficient grinding and remaining of too large quartz grains Whenthis spottiness occurs a reliable quantification using the G-factormethod is not possible
The 2D XRD with Bruker GADDS-system plots in Fig 7 demonstratethe insufficient grinding when using an agate mortar compared to wetmilling with a McCrone mill Quartz would be overrepresented in a one-dimensional XRD pattern focusing on a section with bright spots (greenarrows) The lack of bright spots in the right plot shows that the quartzgrains are milled more thoroughly using a McCrone mill In Fig 8 theparticle size distribution after both ways of sample preparation iscompared Most grains in the sample prepared with an agate mortar arelarger than in the sample prepared with a McCrone mill The grain sizedistribution of the sample prepared with a McCrone mill complies withthe recommended particle size range for XRD analysis of under 5 to50 μm [3536] while the other sample exceeds the range
In Fig 9 Rietveld refinement of an autoclaved sample is shown Thedominant peaks at 77 290 and 301deg 2θ are attributed to tobermoriteIn the upper diagram (a) Rietveld refinement was carried out regularlycalculating isotropic domain sizes for tobermorite However the cal-culated fit differs significantly from the raw data It can be assumed thattobermorite shows a similar pattern to portlandite in terms of aniso-tropic peak broadening taking into account that tobermorite is as-signed to the orthorhombic crystal system Thus instead of a biaxialcylinder model an elliptic cylinder model (Fig 10 structure createdwith VESTA 318 [34]) was applied for the refinement in the lowerdiagram (b) The elliptic cylinder model is a sufficient approach to the
orthorhombic crystal system as it allows the distinction between do-main sizes in a b and c direction The fit is clearly superior using theanisotropic domain size model highlighted by the difference plot inFig 9b The comparison refinement with isotropic and anisotropic ap-proach was done for all of the five autoclaved samples In Fig 11 theresulting Rwp values for the whole pattern and the RBragg values of to-bermorite are shown The refinement using the anisotropic model leadsto both lower Rwp and RBragg values and consequently to a better fit anda more accurate quantification of tobermorite in all refined samples
4 Summary and conclusions
Improved analytical methods for both the phase developmentduring the hydration before autoclaving and during the autoclavingprocess of AAC are presented It could be shown that wet McCronemilling is the best way of preparation of AAC samples in order to obtainsuitable samples for powder diffraction A new approach to treat ani-sotropic domain sizes for Rietveld refinement could be successfullyapplied ndash with the benefit that portlandite and tobermorite in AACsamples could be refined more accurately using the Rietveld methodThus this application allows an improved quantification of the phasedevelopment during both of the production steps
For the future there are still plenty of possibilities to apply thepresented approach of calculating anisotropic domain sizes to AACproduction As exemplified with portlandite the mechanisms of growthof tobermorite can be tracked likewise during the autoclaving processIn addition the effect of variations in the chemical composition of AACraw mixtures on the crystal morphology of tobermorite can be ex-amined This leaves a new perspective to discuss the link between mi-neral phase morphology and the thermal and mechanical properties ofAAC
Acknowledgement
The autoclaved samples were generously provided by RodgauerBaustoffwerke GmbH amp Co KG The authors express gratitude for allsupport
Appendix A Supplementary data
Supplementary data to this article can be found online at httpsdoiorg101016jcemconres201802028
References
[1] MW Grutzeck Cellular concrete in M Scheffler P Colombo (Eds) CellularCeramics Wiley-VCH Weinheim 2005 pp 193ndash223
[2] M Haas The future of AAC ndash from a material scientists point of view inMC Limbachiya JJ Roberts (Eds) Autoclaved Aerated Concrete Taylor FrLondon 2005 pp 187ndash194
[3] T Mitsuda K Sasaki H Ishida Phase evolution during autoclaving process ofaerated concrete J Am Ceram Soc 75 (1992) 1858ndash1863
[4] N Isu H Ishida T Mitsuda Influence of quartz particle size on the chemical and
Fig 10 Triaxial cylinder domain size model of Tobermorite used for Rietveld refinement of anisotropic peak broadening
Fig 11 Comparison of Rwp and RBragg values of Rietveld refinements of autoclavedsamples and tobermorite using the isotropic and the anisotropic domain size model
J Schreiner et al Cement and Concrete Research 107 (2018) 247ndash252
251
6 Publications
43
mechanical properties of autoclaved aerated concrete (I) tobermorite formationCem Concr Res 25 (1995) 243ndash248
[5] NY Mostafa Influence of air-cooled slag on physicochemical properties of auto-claved aerated concrete Cem Concr Res 35 (2005) 1349ndash1357 httpdxdoiorg101016jcemconres200410011
[6] K Matsui J Kikuma M Tsunashima T Ishikawa S Matsuno A Ogawa M SatoIn situ time-resolved X-ray diffraction of tobermorite formation in autoclaved aer-ated concrete influence of silica source reactivity and Al addition Cem Concr Res41 (2011) 510ndash519
[7] C Biagioni S Merlino E Bonaccorsi The tobermorite supergroup a new no-menclature Mineral Mag 79 (2015) 485ndash495 httpdxdoiorg101180minmag2015079222
[8] BH OConnor MD Raven Application of the Rietveld refinement procedure inassaying powdered mixtures Powder Diffract 3 (1988) 2ndash6 httpdxdoiorg101017S0885715600013026
[9] D Jansen F Goetz-Neunhoeffer C Stabler J Neubauer A remastered externalstandard method applied to the quantification of early OPC hydration Cem ConcrRes 41 (2011) 602ndash608 httpdxdoiorg101016jcemconres201103004
[10] D Jansen C Stabler F Goetz-Neunhoeffer S Dittrich J Neubauer Does OrdinaryPortland Cement contain amorphous phase A quantitative study using an externalstandard method Powder Diffract 26 (2011) 31ndash38 httpdxdoiorg10115413549186
[11] D Ectors F Goetz-Neunhoeffer J Neubauer A generalized geometric approach toanisotropic peak broadening due to domain morphology J Appl Crystallogr 48(2015) 189ndash194 httpdxdoiorg101107S1600576714026557
[12] D Ectors F Goetz-Neunhoeffer J Neubauer Routine (an)isotropic crystallite sizeanalysis in the double-Voigt approximation done right Powder Diffract 32 (S1)(2017) 27ndash34 httpdxdoiorg101017S0885715617000070
[13] HM Rietveld A profile refinement method for nuclear and magnetic structures JAppl Crystallogr 2 (1969) 65ndash71 httpdxdoiorg101107S0021889869006558
[14] D Ectors Advances in the Analysis of Cementitious Reactions and Hydrate Phases(Doctoral Thesis) (2016) pp 12ndash14 (urnnbndebvb29-opus4-71743)
[15] AacuteG De La Torre S Bruque J Campo MAG Aranda The superstructure of C3Sfrom synchrotron and neutron powder diffraction and its role in quantitative phaseanalyses Cem Concr Res 32 (2002) 1347ndash1356 httpdxdoiorg101016S0008-8846(02)00796-2
[16] A Kirfel G Will Charge density in anhydrite CaSO4 from X-ray and neutrondiffraction measurements Acta Crystallogr Sect B Struct Crystallogr CrystChem 36 (1980) 2881ndash2890 httpdxdoiorg101107S0567740880010461
[17] C Bezou AN Christensen D Cox M Lehman A Nonat Structures cristallines deCaSO405H2O et CaSO406H2O Comptes Rendus Hebd Des Seacuteances lAcadeacutemieDes Sci Seacuterie 2 (312) (1991) 43ndash48
[18] KH Jost B Ziemer R Seydel Redetermination of the structure of β-dicalciumsilicate Acta Crystallogr Sect B Struct Crystallogr Cryst Chem 33 (1977)1696ndash1700 httpdxdoiorg101107S0567740877006918
[19] W Mumme LMD Cranswick BC Chakoumakos Rietveld crystal structure re-finements from high temperature neutron powder diffraction data for the poly-morphs of dicalcium silicate Neues Jahrb Fuer Mineral Abhandlungen 170 (1996)171ndash188
[20] A Colville S Geller The crystal structure of brownmillerite Ca2FeAlO5Crystallographica 50 (1971) 2311ndash2315 httpdxdoiorg101107S056774087100579X
[21] ST Bergold F Goetz-Neunhoeffer J Neubauer Quantitative analysis of C-S-H inhydrating alite pastes by in-situ XRD Cem Concr Res 53 (2013) 119ndash126 httpdxdoiorg101016jcemconres201306001
[22] EN Maslen VA Streltsov NR Streltsova N Ishizawa Electron density and op-tical anisotropy in rhombohedral carbonates III Synchrotron Xray studies ofCaCO3 MgCO3 and MnCO3 Acta Crystallogr Sect B 51 (1995) 929ndash939 httpdxdoiorg101107S0108768195006434
[23] G Renaudin Y Filinchuk J Neubauer F Goetz-Neunhoeffer A comparativestructural study of wet and dried ettringite Cem Concr Res 40 (2010) 370ndash375httpdxdoiorg101016jcemconres200911002
[24] WF Cole CJ Lancucki A refinement of the crystal structure of gypsumCaSO42H2O Acta Cryst B30 (1974) 921ndash929 httpdxdoiorg101107S0567740874004055
[25] T Runčevski RE Dinnebier OV Magdysyuk H Poumlllmann Crystal structures ofcalcium hemicarboaluminate and carbonated calcium hemicarboaluminate fromsynchrotron powder diffraction data Acta Crystallogr Sect B Struct Sci 68 (2012)493ndash500 httpdxdoiorg101107S010876811203042X
[26] JM Hughes JW Drexler Cation substitution in the apatite tetrahedral site crystalstructures of type hydroxylellestadite and type fermorite Neues Jahrb FuerMineral (1991) 327ndash336
[27] CH Shen RS Liu JG Lin CY Huang Phase stability study of La12Ca18Mn2O7Mater Res Bull 36 (2001) 1139ndash1148
[28] SW Bailey Refinement of an intermediate microcline structure Am Miner 54(1969) 1540ndash1545
[29] WR Busing HA Levy Neutron diffraction study of calcium hydroxide J ChemPhys 26 (1957) 563 httpdxdoiorg10106311743345
[30] Y Le Page G Donnay Refinement of the crystal structure of low-quartz ActaCrystallogr Sect B 32 (1976) 2456ndash2459 httpdxdoiorg101107S0567740876007966
[31] SA Hamid The crystal structure of the 11 Aring natural tobermoriteCa225[Si3O75(OH)15]1H2O Zeitschrift Fuer Krist - New Cryst Struct 154 (1981)189ndash198 httpdxdoiorg101524zkri19811543-4189
[32] P Mondal JW Jeffery The crystal structure of tricalcium aluminate Ca3Al2O6Acta Crystallogr B 31 (1975) 689ndash697 httpdxdoiorg101107S0567740875003639
[33] Y Takeuchi F Nishi I Maki Crystal-chemical characterization of the tricalciumaluminate-sodium oxide (3CaOtimesAl2O3-Na2O) solid-solution series Zeitschrift FuumlrKrist (1980) 259ndash307
[34] K Momma F Izumi VESTA 3 for three-dimensional visualization of crystal vo-lumetric and morphology data J Appl Crystallogr 44 (2011) 1272ndash1276 httpdxdoiorg101107S0021889811038970
[35] K Scrivener R Snellings B Lothenbach A Practical Guide to MicrostructuralAnalysis of Cementitious Materials CRC Press 2016 pp 123ndash125 httpdxdoiorg107693wl20150205
[36] V Pecharsky P Zavalij Fundamentals of Powder Diffraction and StructuralCharacterization of Materials Springer second edition 2005 p 302 httpdxdoiorg101007978-0-387-09579-0
J Schreiner et al Cement and Concrete Research 107 (2018) 247ndash252
252
6 Publications
44
7 Acknowledgement
7 Acknowledgement
Ich moumlchte mich bei einigen Personen bedanken ohne die es wohl kaum zum erfolgreichenAbschluss dieser Arbeit gekommen waumlreMein Doktorvater Prof Dr Juumlrgen Neubauer hat sich stets die Zeit genommen die noumltigwar um Angelegenheiten aller Art mit mir zu klaumlren Er gab mir fachlich immer zumrichtigen Zeitpunkt einen gewissen wissenschaftlichen Impuls Zugleich habe ich mich den-noch immer frei in meiner eigenen Konzeption gefuumlhlt Groszligen Dank spreche ich Prof DrFriedlinde Goumltz-Neunhoeffer aus die fuumlr mich ebenso immer eine verlaumlssliche Ansprech-partnerin fuumlr fachliche und organisatorische Angelegenheiten aller Art war Danke anDr Daniel Jansen fuumlr die gute Zusammenarbeit und dafuumlr dass er mich im Zuge meinerMasterarbeit in ein Forschungsprojekt aufgenommen hat das den Weg zur Promotionmoumlglich machte Zusaumltzlich gilt mein Dank Prof Dr Matthias Goumlbbels der fuumlr dieMitarbeiter am Lehrstuhl immer motivierende Worte fand Fuumlr die Ermoumlglichung meinerTeilnahme an diversen Dienstreisen Fortbildungen und Tagungen moumlchte ich mich viel-mals bedankenWeiterhin bedanke ich mich bei Dr Stephan Volkmann und den Rodgauer BaustoffwerkenGmbH amp Co KG fuumlr die gute Zusammenarbeit und die Bereitstellung von Versuchsma-terialienVielen Dank an meine studentischen Hilfskraumlfte Daniel Wagner Laura MoldenhauerFabian Lang Jakob Schreiber und Felix Klaassen die alle Aufgaben im Labor einwand-frei und mit Bedacht erledigten Bei meinen aktuellen und ehemaligen Kollegen DrKatrin Hurle Dr Dominique Ectors Dr Christoph Naber Dr Florian Huumlller JoumlrgNehring Frank Riedel Julian Wolf Tanja Manninger Daniel Wagner Nicolas FobbeKarla Spaumlth Julian Goergens Andreas Koumlhler Cordula Jakob Franz Becker und LisaKlemenz bedanke ich mich fuumlr die gelungene Zusammenarbeit und gegenseitige Unter-stuumltzung Besonderer Dank geht auch an Kerstin Kreszlig Bettina Engl Christian HankeBernd Schleifer und Christian Abe fuumlr die verlaumlssliche Unterstuumltzung bei technischen Fra-gen und Messungen im LaborFuumlr jegliche Unterstuumltzungen moumlchte ich mich auch bei meinen Eltern bedanken sowiebei meinem Bruder Ralf der mir mit einem LaTex Crashkurs viel Frustration ersparthat Danke Thomas dass du immer fuumlr mich da bist und mit mir zusammen fuumlr genugAusgleich gesorgt hast
45
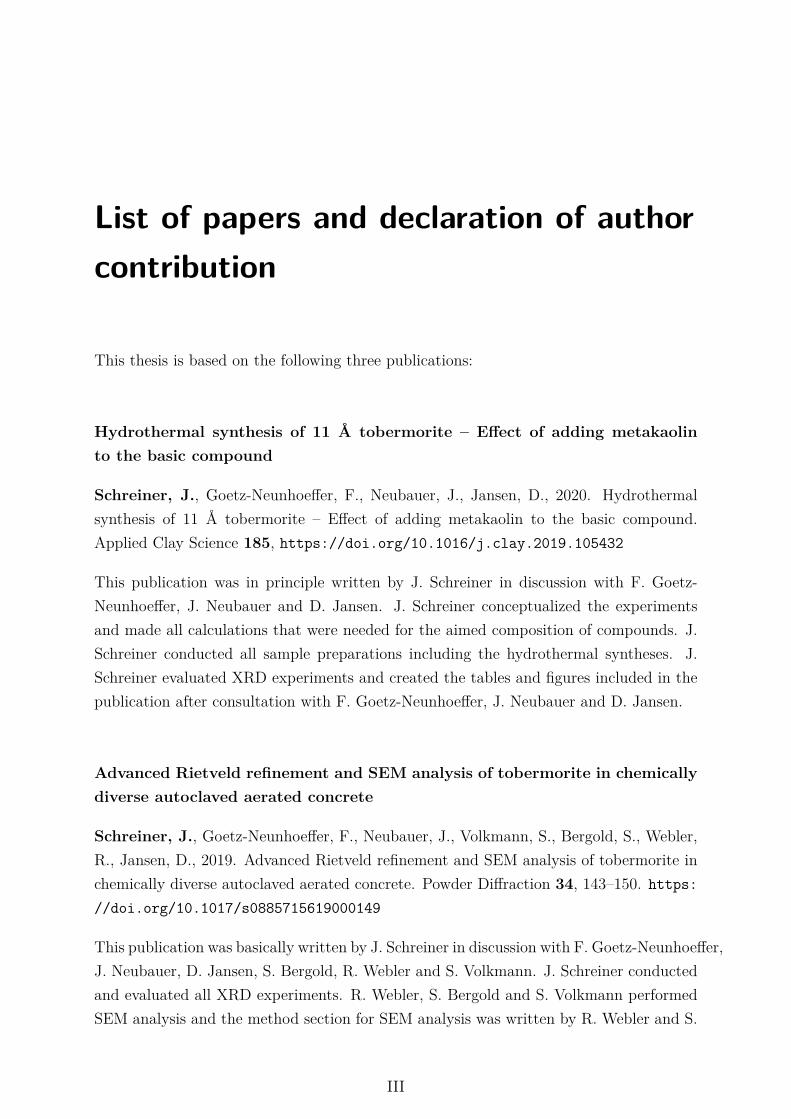
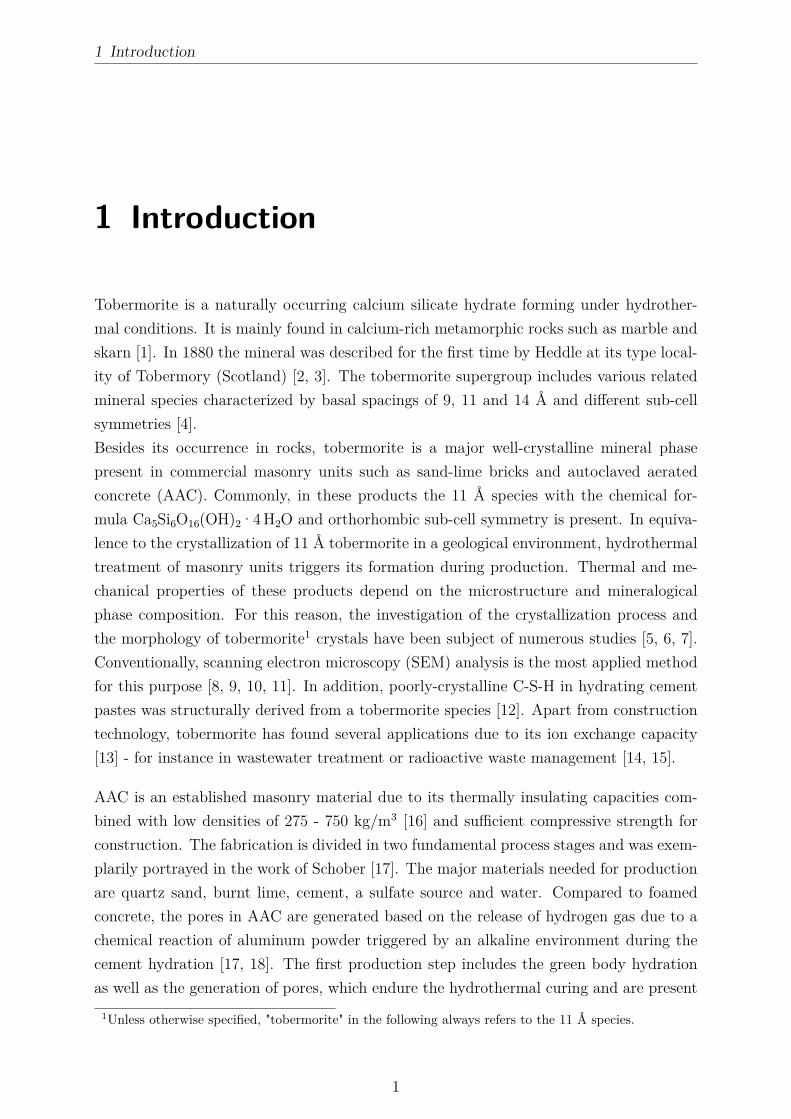
1 Introduction
1 Introduction
Tobermorite is a naturally occurring calcium silicate hydrate forming under hydrother-mal conditions It is mainly found in calcium-rich metamorphic rocks such as marble andskarn [1] In 1880 the mineral was described for the first time by Heddle at its type local-ity of Tobermory (Scotland) [2 3] The tobermorite supergroup includes various relatedmineral species characterized by basal spacings of 9 11 and 14 Aring and different sub-cellsymmetries [4]Besides its occurrence in rocks tobermorite is a major well-crystalline mineral phasepresent in commercial masonry units such as sand-lime bricks and autoclaved aeratedconcrete (AAC) Commonly in these products the 11 Aring species with the chemical for-mula Ca5Si6O16(OH)2middot4H2O and orthorhombic sub-cell symmetry is present In equiva-lence to the crystallization of 11 Aring tobermorite in a geological environment hydrothermaltreatment of masonry units triggers its formation during production Thermal and me-chanical properties of these products depend on the microstructure and mineralogicalphase composition For this reason the investigation of the crystallization process andthe morphology of tobermorite1 crystals have been subject of numerous studies [5 6 7]Conventionally scanning electron microscopy (SEM) analysis is the most applied methodfor this purpose [8 9 10 11] In addition poorly-crystalline C-S-H in hydrating cementpastes was structurally derived from a tobermorite species [12] Apart from constructiontechnology tobermorite has found several applications due to its ion exchange capacity[13] - for instance in wastewater treatment or radioactive waste management [14 15]
AAC is an established masonry material due to its thermally insulating capacities com-bined with low densities of 275 - 750 kgm3 [16] and sufficient compressive strength forconstruction The fabrication is divided in two fundamental process stages and was exem-plarily portrayed in the work of Schober [17] The major materials needed for productionare quartz sand burnt lime cement a sulfate source and water Compared to foamedconcrete the pores in AAC are generated based on the release of hydrogen gas due to achemical reaction of aluminum powder triggered by an alkaline environment during thecement hydration [17 18] The first production step includes the green body hydrationas well as the generation of pores which endure the hydrothermal curing and are present
1Unless otherwise specified tobermorite in the following always refers to the 11 Aring species
1
1 Introduction
Figure 11 Porous structure of autoclaved aerated concrete
in the final product (Figure 11) During the second production step the green cakesare treated hydrothermally under saturated steam pressure in order to gain compressivestrength A shift of the pore size distribution during the autoclaving process was reportedby Mitsuda et al [10]
Generally the rather complex phase development during the production process of AACis insufficiently considered Established AAC products are very often the result of purelyempirical and time-consuming test series Therefore a better understanding and moni-toring of the phase development is the preferable way This thesis is intended to demon-strate advanced analytical methods for the characterization of 11 Aring tobermorite in bothlab-scale samples and commercial AAC The majority of innovations are gained from X-ray diffraction (XRD) and an approach to fit anisotropic peak broadening [19] compatiblewith Rietveld refinement [20] The suitability of SEM analysis in this context is discussedMoreover effects of changes in the chemical composition in the starting compound areinvestigated Finally the new analytical possibilities are applied to the entire productionprocess of AAC
2
2 State of research
2 State of research
21 Mineralogical characteristics of 11 Aring tobermorite
211 Tobermorite structure
The orthorhombic tobermorite structure basically consists of sevenfold coordinated [21]calcium polyhedral layers and silicate tetrahedral chains (Figure 21) [3] Running alongb two pairing tetrahedra centered by Si cations are connected by another Si-centeredbridging tetrahedron [3]Apart from the undisputed layered structure and the wollastonite-like chains severalapproaches have coexisted regarding the possible space groups and the location of theremaining calcium cations and water molecules in the lattice of 11 Aring tobermorite [321 22 23] However Biagioni et al presented a new nomenclature for the tobermoritesupergroup including very precise structures [4] Oxygen atoms hydroxyl groups andwater molecules are located at the apical sites of the calcium polyhedra The Si-centeredbridging tetrahedra of the wollastonite-like chains share the oxygen and hydroxyl groupswith the calcium polyhedra Merlino et al and Biagioni et al stated that additional watermolecules and cations are located in structural cavities running along b [3 4] According toMerlino et al and Bonaccorsi et al the content of these zeolitic cavities is the determiningfactor for the resulting tobermorite species [3 24] The additional cation in the interlayeris primarily calcium so that there is a variability of calcium content between 4 and 5 atomsper formula unit [4] 11 Aring tobermorite is characterized by the calcium-rich endmemberof this series [4] The interlayer calcium is then sixfold-coordinated by framework oxygenatoms The amount of interlayer water molecules determine the degree of hydration andthe basal spacing of the resulting tobermorite species [24] The reader is referred to awell-specified categorization of all tobermorite polytypes provided in the publications byMerlino et al Bonaccorsi et al and Biagioni et al [3 4 24 25]
3
2 State of research
Figure 21 Calcium polyhedral layers and silicate tetrahedral chains in 11 Aring tobermoritestructure according to Merlino et al [3] Si1 and Si3 = pairing tetrahedra Si2= bridging tetrahedra Interlayer water molecules and cations are not shownFigure created with VESTA 316 [26]
4
2 State of research
212 Synthesis of stoichiometric 11 Aring tobermorite
The starting materials required for the hydrothermal synthesis of stoichiometric tober-morite are quartz flour or a different silica source calcium oxide or calcium hydroxideand deionized water [7 22] In accordance with the chemical formula the starting mixappropriately conforms to a CaSi molar ratio of about 08 [9 27]After preparing the slurry a distinct temperature setting of 170-180 degC autogenous satu-rated steam pressure (1ndash12 MPa) and a curing time of 12 h were recommended [5 7 28]Consequently an elevated water-to-solid ratio [7 23] in the starting mix and high over-all water content are required in order to ensure a saturated steam atmosphere in thelaboratory autoclave Qu et al showed that shorter curing times led to a lower reac-tion turnover [6] According to Šiaučiunas amp Baltakys at prolonged curing duration theformation of xonotlite (Ca6Si6O17(OH)2) was favored [7] It has been reported that thesurface area and solubility of all raw materials have an effect on the reaction time andreaction products [7 9 29] For instance gyrolite formation was triggered by highly sol-uble amorphous SiO2 in a study by Šiaučiunas amp Baltakys [7] El-Hemaly et al showedthat when amorphous type of silica was used the formation of C-S-H was accelerated butthe subsequent conversion to tobermorite was slowed down [22]The simplified hydrothermal reaction path (equation 21) [10 27 30] for the formationof stoichiometric tobermorite was described as follows Depending on the surface areaof raw materials the dissolution of Ca(OH)2 and SiO2 in the hydrothermal environmentinitially leads to the formation of a C-S-H gel which is characterized by poor structuralorder in c direction [22 27] The CaSi molar ratio in this precursor is variable [30] Thehydrothermal reaction proceeds and the C-S-H gel transforms into tobermorite but with amore particular CaSi ratio of approximately 083 The CaSi ratio decreases in this stepas further SiO2 is dissolved and supplied for reaction [10] Within this step periodicityin c direction increases and the calcium polyhedral layers and silicate chains gain morestructural order as reported by Shaw et al [27]
xCa(OH)2 + ySiO2 +H2O =rArr C-S-H gel =rArr C-S-H gel + zSiO2 =rArr tobermorite
(21)
Commonly pure phase synthesis of tobermorite is hardly attainable and some minorphases and amorphous content are frequently present in samples after hydrothermal cur-ing Common additional phases occurring in this system include calcite quartz xonotlitescawtite and poorly crystalline C-S-H with varying CaSi composition [7 9 31]In most studies autoclaved samples were dried at 60 - 100 degC [6 29] and ground prior
5
2 State of research
to further analyses Synthesized samples are commonly investigated by means of ther-mogravimetric analysis (TGA) combined with differential thermal analysis (DTA) SEManalysis and X-ray diffraction For estimation of the chemical purity of tobermorite usu-ally the basal spacing of 113 Aring is verified by XRD analysis as substitutions such as Al3+
incorporation would reflect in it [15 28] Moreover according to Mostafa et al and Quet al stoichiometric tobermorite showed plate-like morphology in SEM images [6 32]
213 Substitutions in the lattice of tobermorite
The incorporation of foreign ions into the lattice of tobermorite has been investigated intwo major respects In the first case the substitutions occur during the application ofpreviously synthesized tobermorite The potentials of these substitutions were exemplar-ily highlighted in chapter 1 [14 15] In the second case the substitutions occur duringthe hydrothermal formation of tobermorite Whenever a basic compound includes chem-ical components apart from calcareous materials and silica substitution in the lattice oftobermorite is likely to happen during the hydrothermal reaction Biagioni et al statedthat Al-free natural tobermorite is extremely rare [4]Supplementary cementitous materials (SCMs) are established components in various ap-plications - equally in AAC production Merchantable SCMs are usually limited to wellavailable materials so that only distinct foreign ions are supplied in a considerable scaleCalcined clays diatomite blast furnace slag and especially metakaolin are amongst themost frequent materials for this purpose [31 33 34 35] They are in turn characterizedby a specific chemical composition These raw materials supply primarily aluminum andalkali metal cations In addition the presence of sulfate ions in the system has been con-sidered by some authors since sulfate is a component in most composites for construction[32 36]Sakiyama amp Mitsuda and Rios et al successfully synthesized Al-substituted tobermoriteby applying different amounts of kaolinite and metakaolin [5 23] The incorporation ofAl3+ into the lattice of tobermorite resulted in lath-like crystals1 observed by SEM anal-ysis At a higher Al3+ dosage the formation of katoite was reported Skawinska et alinvestigated various halloysite contents in the initial mix [34] They confirmed katoiteformation caused by increased supply of Al3+ The substitution of Si4+ by Al3+ in thetetrahedral chains ranges to a possible 16 substitution of the tetrahedral sites reaching anAl content up to 1 Al atom per formula unit [4] Merlino et al explained that this mainlyoccurred in the bridging tetrahedron and for charge balance additional (OH)ndash substitutedO2ndash in one site [3] This leads to an increase of the basal spacing and lattice parameter c
1The terminology of observed crystalline particles is addressed in subsection 222
6
2 State of research
which was observed in several studies [15 28 37] In a different publication by Jacksonet al the incorporation of additional Na+ or K+ for charge balance was suggested [38]Matekonis et al stated that in this case tobermorite showed anomalous thermal behavior[29] Furthermore 29Si NMR measurements revealed that the substitution by Al3+ led toan increase of the chain length in b direction [38 39] Klimesch amp Ray performed thermalanalysis of Al-free and Al-substituted tobermorites [40] They reported that in the caseof Al3+ incorporation the conversion of 93 Aring tobermorite into β-wollastonite required ahigher temperature This observation is discussed later in this thesis (section 31) Qu etal performed XRD analysis and considered relative intensity broadening of Al-substitutedtobermorite reflections in order to estimate the crystallinity [6] However the broaden-ing was not measured and evaluated The present thesis provides extensive insights intothe evaluation of the peak broadening of tobermorite depending on the supply of Al3+ (section 31 and section 32)According to Mostafa et al substitution by (SO4)2ndash in the lattice of tobermorite led tobasal imperfection [32] Their study was mainly based on XRD analysis and FTIR spec-troscopy It was suggested that charge balance was achieved by substitution of (SO4)2ndash
and 2 (OH)ndash for (SiO4)4ndash Moreover the transformation of C-S-H gel into tobermorite wasaccelerated The sulfate-substituted tobermorite showed leafy crystals in SEM imagesBy contrast Sauman amp Valtr stated that the morphology of sulfate-substituted tober-morite did not differ substantially from the morphology of stoichiometric tobermoritecrystals [41] Instead anhydrite formation was observed by means of XRD analysis Insection 32 of this thesis a new perspective on this discussion is provided
22 Characterization of autoclaved aerated concrete
Supplied materials for AAC fabrication are transforming continuously during the pro-duction process which is displayed in Figure 22 [42] It can be seen that the phasetransitions before autoclaving remind of ordinary portland cement (OPC) hydration [43]The following main reactions run during the hydration before autoclaving [10 12 17]
CaO +H2O =rArr Ca(OH)2 (22)
Ca3SiO5 + 39H2O =rArr C17SH26 + 13Ca(OH)2 (23)
Ca3Al2O6 + 3CaSO4 + 32H2O =rArr Ca6Al2(OH)12(SO4)3 middot 26H2O (24)
This process step is finished when the generation of pores along with simultaneous expan-sion is completed and sufficient strength for wire cutting has developed through hydration
7
2 State of research
The reaction of aluminum powder does not only lead to the formation of hydrogen gasbut to very low amounts of different modifications of aluminum hydroxide [17] Howeverit can be seen that none of the hydrate phases forming during the green cake settingendure the autoclaving process Only quartz does partially not react and is consequentlypresent in the final product After transforming into ettringite and later AFm phasesinitially supplied anhydrite recrystallizes during the hydrothermal treatment A multi-step reaction sequence of C-S-H portlandite and further intermediate hydration productsleads to the crystallization of tobermorite The reader is referred to the comprehensivestudy of Schober for a more detailed presentation [17] Further supply of dissolved silicaat hydrothermal conditions contributes to the formation of tobermorite in the manneroutlined in equation 21 Clearly tobermorite is the major mineral phase present afterautoclaving and is therefore the main focus of research In the following subsections 221and 222 the state of knowledge concerning the characterization of AAC by means ofSEM analysis and XRD analysis is provided
Figure 22 Exemplary phase development during the entire production process of AACFigure adopted with permission from Schober [42]
221 SEM analysis
At first sight AAC has rather favorable properties compared to hydrated Portland cementwhen it comes to SEM analysis Due to the hydrothermal treatment several phases such
8
2 State of research
as tobermorite show better crystallinity In addition the hardly evitable effects of dam-age to poorly crystalline phases and removal of water are not as significant in the case ofAAC This is why environmental scanning electronic microscopy (ESEM) was suggestedin order to investigate hydrated Portland cement after early hydration [44 45] Howeverwhile hydrated OPC is a reasonably homogeneous material AAC shows heterogeneitydue to the porous structure (Figure 11)As reported in subsection 213 several authors investigated the morphology of tober-morite in AAC in order to verify the influence of foreign ions supplied by SCMs andestimate their effect on the thermal and mechanical properties Well crystallized tober-morite often shows a house-of-cards structure in AAC (Figure 23) which was observedin numerous studies [46 47 48]
Figure 23 House-of-cards appearance of tobermorite crystals in AAC
Wongkeo amp Chaipanich stated that the application of coal bottom ash for partial replace-ment of cement in the starting compound resulted in a change of plate-like to lath-likemorphology of tobermorite crystals [49] Equally thin lath-like plates of tobermorite wereobserved by Roacuteżycka et al in samples prepared from perlite waste [50] Venhodovaacute etal investigated AAC samples prepared from mixes including fly ash and Al(OH)3 andconfirmed the elongated shape of Al-incorporated tobermorite [8] In these studies thefraction of aluminum ions was increased by adding the respective SCM An effect on themorphology of tobermorite was respectively reported which conforms to the conclusionsmade by different authors in subsection 213 Nevertheless the heterogeneity of AACsamples in SEM images was barely addressed in all of these examples By contrast Mit-suda et al differentiated between macropores and micropores in their SEM images ofindustrially manufactured AAC [10] Huang et al separately analyzed walls and pores in
9
2 State of research
their samples prepared from copper tailings and blast furnace slag [48] The wall sectionsappeared dense while in pores platy tobermorite and long-strip shaped anhydrite wasobserved Only the tobermorite crystals in the pores showed the previously describedhouse-of-cards structure As is evident from these published results there is a lack ofclarity about the meaning and informative value of observations made in AAC samplesby SEM analysis In the main results of this present thesis (section 32) a substantiatedassessment of this circumstance is given
222 XRD analysis
While SEM analysis of AAC is majorly performed in order to characterize the crystallinityand morphology of tobermorite XRD analysis is mainly applied in order to assess theoverall phase composition Apart from the phases shown in Figure 22 additional calcitefeldspar mica gypsum and bassanite occur frequently in AAC depending on the miner-alogical composition of the used raw materials Frequently minor phases are unreactedresidual components of raw materials such as sericite in the publication of Isu et al [51] orphlogopite in the study of Huang et al who applied skarn-type copper tailings for AACpreparation [48] Prolonged curing duration resulted in minor quantities of xonotlite inthe study by Mitsuda et al [10]Mainly qualitative phase contents have been determined based on XRD in studies dealingwith the mineralogy of AAC A clear recognition of amorphous content in AAC along withthe crystalline phases has been barely addressed and discussed Relative quantities weredetermined by Matsui et al by plotting normalized intensities [28] They estimated thequantity of C-S-H gel by regarding the integrated intensity of the assumed tobermoriteprecursor in a distinct section of the XRD pattern Coming in agreement with the authorscited in subsection 213 increased d spacing along c in Al-substituted tobermorite wasreported in the same study Venhodovaacute et al performed XRD analysis of AAC samplesin their publication previously addressed in subsection 221 [8] They compared relativeintensities of tobermorite in their samples but no absolute quantities of the phases werecalculated either Mitsuda et al applied an internal standard method in order to quantifyunreacted quartz in their AAC samples [10]More recently Ectors proposed a promising method for the tracking of portlandite forma-tion during the green cake hydration [52] By applying a Rietveld compatible approachfor TOPAS 50 (Bruker AXS) to fit anisotropic peak broadening due to domain mor-phology [19] two generations of portlandite could be refined separately and assigned tothe hydration of calcium oxide and tricalcium silicate respectively The key idea behindthis approach is that the average domain morphology of a mineral phase in a powder
10
2 State of research
sample implies certain mineralogical characteristics The simplified domain morphologycan be calculated on the basis of geometrical shapes such as cylinder ellipsoid or cuboidDepending on the crystal system and the expected morphology the geometrical shapecan be adjusted accordingly In the example reported by Ectors the one generation ofportlandite originating from burnt lime hydration showed anisotropic peak broadening- unlike the generation forming from tricalcium silicate hydration In accordance withthe trigonal crystal system a biaxial cylinder model was applied for the fitting of theanisotropic generation The operating principle of the approach to fit the anisotropicpeak broadening due to domain morphology can be precisely explored by accessing fur-ther publications by Ectors et al [53 54] Apart from this benefit a better fit to themeasured data enables a more accurate refinement and quantification of all phases Thetwo generations of portlandite were additionally quantified by means of an external stan-dard method [55] The combination of quantitative phase analysis by XRD (QXRD) withthe refinement of anisotropic peak broadening is a promising approach in this context -especially in consideration of the fact that phase quantifications in AAC samples havebeen barely performed ever before Hence the application of these methods is the keymatter of this present thesis Especially the potential of the domain morphology analysisof tobermorite is precisely investigated The terms domain size and domain morphology inthis sense refer to the coherently scattering unit measured by XRD analysis Crystallineparticles observed by means of electron microscopy which are frequently termed grainscrystals or crystallites are for the most part clusters of coherently scattering domains[56 57]
11
3 Main results
3 Main results
This chapter introduces the main results presented in three peer reviewed publications[58 59 60] incorporated in chapter 6 The new findings are put in a general context andsubsequently they are summarized and discussed in chapter 4 The sections 31 and 32deal with the characterization of tobermorite in both lab-scale samples and AAC sam-ples produced on an industrial scale In section 33 the entire production process of AACincluding the hydration before autoclaving is addressed
Figure 31 Application of a triaxial cylinder model for the calculation of anisotropic do-main sizes of tobermorite implemented with Rietveld refinement and influenceon the fit compared to ordinary refinement [60]
12
3 Main results
One particular main result is a key element in each of the following sections In Figure 31the fit of tobermorite after two Rietveld refinements of different accuracy is shown In aregular Rietveld refinement for simplification the coherently scattering units are treatedas spherical shapes as usually only one size value for each mineral phase is calculated Asaverage domain sizes of a mineral phase in different crystallographic directions are in manycases indeed close to one value this approximation is often sufficient in order to achievea satisfactory fit to the measured diffractogram The crystal system and surroundingconditions during the formation of a mineral phase are significant factors in this context Amisfit at different (hkl) reflections as displayed in Figure 31 is an indication of anisotropicpeak broadening Clearly orthorhombic tobermorite shows anisotropic peak broadeningdue to its anisotropic domain morphology For the possible origins of anisotropic peakbroadening apart from size broadening the reader is referred to section 61 In accordancewith the orthorhombic crystal system a triaxial model is applied in order to fit the peakbroadening [19] By implementing the macro during the refinement no longer one butthree sizes (x y and z for respectively a b and c direction) are calculated Besides theimproved fit the calculated domain morphology is an additional information extractedfrom XRD analysis and it is representative for the average value of the phase in the entiresample In each of the following sections the different benefits regarding this approachare outlined in more detail
31 Hydrothermal synthesis of tobermorite on alaboratory scale - application of two types ofmetakaolin
This study covers mineralogical properties of tobermorite synthesized from a set of variouscompounds including different amounts and types of metakaolin [58] Unlike in sections32 and 33 the samples were not aerated before autoclaving and their composition isadjusted to the CaSi molar ratio of stoichiometric tobermorite On the one hand thereactivity of metakaolin and minor phases at hydrothermal conditions for the possible usein AAC production was investigated On the other hand the effects of consequent changesof the bulk chemistry in the basic compound on the mineralogical characteristics of to-bermorite such as lattice parameters and domain morphology were analyzed In additionfor one particular compound the effect of different curing times was explored While theconventional raw materials for AAC production are rather low-cost resources metakaolinis a high-priced SCM in this regard For this reason besides one comparatively pure com-mercial metakaolin (MK) a second by-product type of metakaolin (MKg) was applied
13
3 Main results
at equivalent dosages All investigated mix composites and the chemical composition ofMK and MKg are summed up in tables in section 61In Figure 32 the effect of different amounts of the two types of metakaolin on the phasequantities is displayed Clearly at moderate dosages of MK and MKg tobermorite waspresent in comparable quantities However the application of any amount of metakaolinreduced the amount of tobermorite compared to the blank mixture It can be seen thatkatoite was present whenever the content of Al2O3 in the starting drymix exceeded 2wt which fits well with the state of knowledge [5 23] For the highest possible dosagesof the two types of metakaolin (MK60 and MKg60) contrary effects were observed Ap-plication of impure metakaolin (MKg) led to a considerable amount of tobermorite whilein MK60 no tobermorite was present The high content of Al2O3 seems to have hinderedthe formation of tobermorite Not all of the Al2O3 in MKg was supplied for reactionas minor phases such as feldspar remained unreacted which is shown accurately in therespective publication in section 61
Figure 32 Weight fractions of tobermorite quartz and katoite measured by QXRD anal-ysis and contents of Al2O3 in the starting drymix Amorphous content andminor phases are not shown
The results of thermal analysis of samples characterized by MK addition in small stepsare shown in Figure 33 It can be seen that the conversion of 93 Aring tobermorite into β-
14
3 Main results
wollastonite depended on the dosage of MK However unlike suggested by Klimesch ampRay there was no effect of lower contents of Al2O3 in the drymix [40] Consequently theinfluence of Al3+ at low dosages (MK25 and MK5) could not be observed on the basisof this method Apart from this result the other signals showed good agreement with thesuggested conversion ranges by Klimesch amp Ray as for samples MK9 and MK16 a clearshift towards higher temperature was measured However the role of Al3+ incorporationverified by this method is not necessarily conclusive as additional reactions during theheating experiment involving Al3+ are possible On that basis the observations madeby means of DTA would not reflect the amount of Al3+ originally incorporated into thestructure of 11 Aring tobermorite
Figure 33 Conversion of 93 Aring tobermorite into β-wollastonite in samples synthesizedwith various amounts of metakaolin and suggested temperature ranges ac-cording to Klimesch amp Ray [40]
In accordance with authors referenced in subsection 213 lattice parameter c of tober-morite increased with elevated dosages of Al2O3 in the basic dry mix (Figure 34) Theimpact could be observed for the complete range of samples as displayed in section 61which indicates that a limit of Al3+ incorporation was not reached in this study Forcomparison the relative domain morphology is plotted in Figure 34 Unlike the DTA
15
3 Main results
signals both lattice parameter c and the domain morphology are impacted by very lowdosages of Al2O3 There is a good accordance of the relation of growth in b direction to adirection and the c parameter This is valid up to 20 wt of Al2O3 in the starting drymix By contrast more elevated contents of Al2O3 did not affect the domain morphologyany further even though the incorporation is verified through the increased c parameterIt follows that the impact of Al3+ incorporation on the domain morphology is limited tovery low contents while the impact on lattice parameter c can be tracked throughoutthe entire examined range of samples In section 61 additional results show that growthin b direction increased with reaction time These observations are solely based on XRDanalysis and offer new benefits for the structural understanding of tobermorite
Figure 34 Impact of the calculated Al2O3 content in the basic dry mix on the latticeparameter c and on the relation of calculated domain sizes of tobermorite ina (x) and b (y) direction
16
3 Main results
32 Structural properties of tobermorite in AAC - SEMversus XRD analysis
This section and the respective publication [59] mainly deal with the suitability of SEManalysis of tobermorite in AAC The effects of varying amounts of SO3 and Al2O3 in thedry mix on structural properties of tobermorite are discussed based on XRD analysisAs shown in subsection 221 and Figure 23 tobermorite often shows a house-of-cardsstructure in AAC samples This property has been considered to be relevant for thethermal and mechanical properties of AAC (subsection 221) However SEM analysiswithin this study revealed that this type of appearance is mainly found in the poresand pore surfaces (Figure 35) This finding comes in agreement with the observationsmade by Huang et al [48] In the solid skeleton of the dense AAC material neither themorphology nor the house-of-cards structure could be observed properly which can beseen very clearly in additional micrographs provided in section 62 It should be consideredthat the major amount of tobermorite by weight is located in the dense material and notat the pore surfaces In this way these findings are clear disadvantages coming along withonly SEM analysis of AAC as representative results can hardly be obtained
Figure 35 House-of-cards structure of tobermorite in a pore surrounded by dense mate-rial
Moreover several authors in subsection 221 justified the morphology of tobermorite withthe incorporation of foreign ions Al-substituted tobermorite showed lath-like morphologywhereas Al-free tobermorite showed rather plate-like morphology [6 32 49] Howeverthe present investigation revealed that independent of Al2O3 content in the raw mix there
17
3 Main results
is always heterogeneity regarding the morphology of tobermorite In Figure 36 plate-likeand lath-like morphology of tobermorite in AAC observed in two statistical chemicallyvarious samples are displayed This result supports the previous assumption that theobservations made by SEM analysis of tobermorite in AAC strongly depend on whatpart of the sample is selected Yet again no clear observations could be made that wererepresentative for the entire sample
Figure 36 Heterogeneous morphology of tobermorite (plate-like in a and c lath-like in band d) in two AAC samples characterized by different Al2O3 contents in theraw mix
The effects of Al3+ on the domain morphology of tobermorite were measured and evaluatedin a similar manner as in section 61 and the results could be confirmed The relativedomain growth in b direction was increased by Al3+ incorporation in both studies [5859] Moreover lattice parameter c was increased with Al3+ incorporation which can beseen more accurately in section 62 Unlike SEM analysis XRD analysis allowed clearconclusions whenever structural properties of Al-substituted tobermorite were affectedInstead of a local observation as made with SEM representative and statistical resultswere obtained The reader is referred to section 61 and section 62 for further results and
18
3 Main results
more specific conclusionsIn addition the effect of various amounts of sulfate in the raw mix was analyzed Unlikein the case of different dosages of Al3+ neither the domain morphology nor the latticeparameters of tobermorite were affected by the SO3 content in the dry mix In Figure 37these observations and additionally the amounts of anhydrite measured by QXRD areshown As the amount of available SO3 in the dry mix is known the maximum possibleamount of anhydrite could be calculated for each of the samples in focus Obviouslythe measured amounts of anhydrite are either equal or slightly higher compared to theexpected quantities This result leads to the assumption that all of the available sulfateis transformed into anhydrite so that no more sulfate could be incorporated into thestructure of tobermorite The over-estimation of anhydrite in some of the samples can beexplained due to the inaccuracy of the quantification method The present results rathermatch with the suggestions by Sauman amp Valtr [41] as in their study no effect of sulfateon the structure of tobermorite was observed either
Figure 37 Impact of the sulfate content in the AAC raw mix on lattice parameter cand relative domain morphology of tobermorite (a) and comparison of theexpected maximum amount of anhydrite to the measured amount determinedby QXRD (b)
33 Improved monitoring of the phase developmentduring the production of AAC
In this study not only autoclaved samples were analyzed but additionally a lab-scale slurrywhich included the reactive components of the green cake stage during AAC productionat equivalent weight proportions In-situ XRD was performed at 70 degC and at a water-to-
19
3 Main results
solid ratio of 08 for 24 h (Figure 38) which are respective conditions during commercialproduction Clearly the phase development is dominated by OPC and lime hydration asdescribed in section 22 It can be seen that the major reaction turnover occurs duringthe first 200 minutes which is the average duration of the green stage After only 30minutes all of the quicklime had transformed into portlandite whereas Schober proposeda duration of one hour for this reaction [42] The amount of portlandite is composed oftwo different generations as proposed by Ectors [52] Equally a biaxial cylinder modelwas applied in order to fit the peak broadening of the first generation of portlandite in thepresent investigation Minor phase developments such as the formation of AFm phases arenot shown in Figure 38 A coarse fraction of anhydrite did not react so that constantlyaround 15 wt were measured after 6 h As the decomposition of ettringite due tosulfate depletion [55] does not occur prior to 12 h the green cake strength is not affected
Figure 38 In-situ XRD measurement of AAC model slurry at water-to-solid ratio of 08and 70 degC For clarity and comprehensibility not all phases are shown
The separation of two generations of portlandite in the system does not only translate intodifferent domain morphologies as shown by Ectors [52] In Figure 39 more indicationsfor different mineralogical properties are displayed The shape of the (0 0 1) reflection inXRD patterns after only quicklime hydration and after both quicklime and alite hydrationshows a distinct feature While portlandite originating from quicklime hydration showsa broad peak implying lower crystallinity the peak after alite hydration is characterized
20
3 Main results
Figure 39 Formation of two generations of portlandite in AAC slurry in XRD (a) andDTA (b) plots
by a sharper component Yet the peak breadth did not change indicating that the firstgeneration is still present with the original characteristics This observation is supportedby DTA measurements additionally demonstrating two degrees of crystallinity only afteralite hydration In agreement with XRD analysis the better crystalline second generationof portlandite decomposes at a higher temperature
Figure 310 Quantification of tobermorite in statistical chemically various AAC sampleswith and without the application of the macro for the fitting of anisotropicpeak broadening
21
3 Main results
Furthermore commercial AAC samples were considered in this study By applying themethod for the refinement of anisotropic peak broadening (Figure 31) a more accuratequantification of tobermorite can be achieved In Figure 310 the calculated amounts oftobermorite in statistical chemically various AAC samples are plotted In some samplesthe refinement using the macro leads to considerably higher but never lower quantitiesof tobermorite whereas in other samples nearly the same amount of tobermorite is cal-culated This observation can be well understood taking into account that the macroallows to account more peak area for tobermorite as shown in Figure 31 Clearly thereis evidence that the anisotropy of tobermorite domains is not uniform from one sampleto another which was basically justified in the previous sections As an improved quan-tification of a single phase leads to a better quantification of other phases in the samplethis adaption is very valuable in order to assess the phase development Here the peakbroadening of tobermorite equally observed by Qu et al [6] could be tracked and evalu-ated in order to gain more accurate results Moreover in section 63 McCrone milling issuggested in order to avoid spottiness in XRD patterns caused by coarse grains of quartzor anhydrite (Figure 38)
22
4 Conclusions
4 Conclusions
The research results presented in the previous sections yield advances in the mineralogicalinvestigation of tobermorite and autoclaved aerated concrete Recorded diffraction pat-terns contain plenty of usually unused data regarding the microstructural characteristicsof the sample and phases therein The profit of XRD measurements can be significantlyimproved whenever one or more phases show anisotropic peak broadening and appro-priate models for the respective domain morphology are implemented into the Rietveldenvironment Within the scope of the present investigations portlandite and tobermoriteshow this particularityThe effects of changes in the chemistry of the starting mix were examined based on dif-ferent dosages of metakaolin Al-substituted tobermorite showed increased growth in b
direction and an increase of lattice parameter c compared to Al-free tobermorite The rel-ative domain sizes were determined based on anisotropic peak broadening However whilethe effect of Al3+ incorporation into the lattice of tobermorite was limited regarding thedomain morphology lattice parameter c showed an increase throughout the entire rangeof samples The consequent effects suggested by Klimesch amp Ray observed by means ofDTA are debatable as reactions during the heating experiment may lead to to a changeof Al3+ content in tobermorite [40] While both types of applied metakaolin showed goodreactivity at hydrothermal conditions some included minor phases such as feldspar oranatase remained unreacted At high dosages of Al2O3 in the starting mix the formationof either only katoite or katoite along with tobermorite was observed (Figure 32)SEM analysis of tobermorite in AAC cannot be suggested based on the observationspresented in this work as it is only visually accessible in the pores or at pore surfacesThe dense material of the AAC skeleton contains several crystalline and X-ray amorphousphases which hardly allows a proper investigation Even in single pores tobermorite crys-tals appeared very heterogeneous at various chemical compositions As a result lath-liketobermorite was not only present in samples characterized by elevated Al3+ incorporationBy contrast the benefits of XRD analysis presented in section 61 equally accounted fortobermorite in AAC samples Sulfate incorporation into the lattice of tobermorite wasnot observed All of the sulfate in the system was detected to be present in anhydriteThe phase transitions in the AAC raw slurry during the green stage hydration were show-cased by in-situ XRD analysis of a model mix at 70 degC Additional DTA and XRD mea-
23
4 Conclusions
surements during this step confirmed the presence of two generations of portlandite char-acterized by different crystallinity as suggested by Ectors [52] The inclusion of anisotropicdomain morphology during the Rietveld refinement allowed a more accurate quantifica-tion of tobermorite in autoclaved samples Sample preparation adjusted to the grain sizedistribution in AAC samples (section 63) the external standard method for quantita-tive XRD analysis [55] and the approach to evaluate anisotropic peak broadening [19]are the key methods for a more accurate tracking of the phase development during AACproduction
24
5 References
5 References
[1] A E Zadov A I Grabezhev N N Pertsev N V Chukanov and S V PribavkinTobermorite-plombierite metasomatites of the Gumeshevsk skarn-porphyry copper depositmiddle Urals Doklady Earth Sciences 407(3)495ndash497 2006
[2] M F Heddle Preliminary notice of substances which may prove to be new minerals MinMag 4117ndash123 1880
[3] S Merlino E Bonaccorsi and T Armbruster The real structure of tobermorite 11AringNormal and anomalous forms OD character and polytypic modifications European Journalof Mineralogy 13(3)577ndash590 2001
[4] C Biagioni S Merlino and E Bonaccorsi The tobermorite supergroup a new nomencla-ture Mineralogical Magazine 79(2)485ndash495 2015
[5] C A Riacuteos C D Williams and M A Fullen Hydrothermal synthesis of hydrogarnetand tobermorite at 175 degC from kaolinite and metakaolinite in the CaO-Al2O3-SiO2-H2Osystem A comparative study Applied Clay Science 43(2)228ndash237 2009
[6] X Qu Z Zhao and X Zhao Microstructure and characterization of aluminum-incorporated calcium silicate hydrates (C-S-H) under hydrothermal conditions RSC Ad-vances 8(49)28198ndash28208 2018
[7] R Šiaučiunas and K Baltakys Formation of gyrolite during hydrothermal synthesis inthe mixtures of CaO and amorphous SiO2 or quartz Cement and Concrete Research34(11)2029ndash2036 2004
[8] E Venhodovaacute R Janovskyacute and R Drochytka Formation of Tobermorite at Different Ma-terials Composition of Aerated Concrete Applied Mechanics and Materials 752-753247ndash250 2015
[9] L Galvaacutenkovaacute E Bartoniacutečkovaacute T Opravil J Tkacz and P Ptaacuteček The influence ofstarting materials solubility on tobermorite structure formation under the hydrothermalconditions IOP Conference Series Materials Science and Engineering 379(1)1ndash8 2018
[10] T Mitsuda K Sasaki and H Ishida Phase Evolution during Autoclaving Process J AmCeram Soc 75(75)1858ndash1863 1992
[11] A Skawińska The influence of metahalloysite addition on tobermorite formation studied byX-ray powder diffraction and scanning electron microscope MATEC Web of Conferences16305008 2018
[12] S T Bergold F Goetz-Neunhoeffer and J Neubauer Quantitative analysis of C-S-H in
25
5 References
hydrating alite pastes by in-situ XRD Cement and Concrete Research 53119ndash126 2013
[13] O P Shrivastava and F P Glasser Ion-exchange properties of 11-Aring tobermorite Reactivityof Solids 2(3)261ndash268 1986
[14] H Maeda Y Ogawa E H Ishida and T Kasuga Hydrothermal synthesis of tobermoritedoped with phosphorus species for removing heavy metal ions Journal of the AustralianCeramic Society 48(1)8ndash11 2012
[15] O P Shrivastava and R Shrivastava Cation exchange applications of synthetic tobermoritefor the immobilization and solidification of cesium and strontium in cement matrix Bulletinof Materials Science 23(6)515ndash520 2000
[16] G Renman and A Renman Sustainable Use of Crushed Autoclaved Aerated Concrete(CAAC) as a Filter Medium in Wastewater Purification 8th International conferenceon sustainable management of waste and recycled materials in construction GothenburgSweden 30 Mayndash1 June 2012 Proceedings pages 1ndash7 2012
[17] G Schober Chemical transformations during the manufacturing of autoclaved aeratedconcrete (ACC) Cement lime gypsum and quartz sand become cellular concrete ZKG58(7)63ndash70 2005
[18] A J Hamad Materials Production Properties and Application of Aerated LightweightConcrete Review International Journal of Materials Science and Engineering 2(2)152ndash157 2014
[19] D Ectors F Goetz-Neunhoeffer and J Neubauer A generalized geometric approach toanisotropic peak broadening due to domain morphology Journal of Applied Crystallogra-phy 48(1)189ndash194 2015
[20] H M Rietveld A profile refinement method for nuclear and magnetic structures Journalof Applied Crystallography 2(2)65ndash71 1969
[21] S A Hamid The crystal structure of the 11 Aring natural tobermoriteCa225[Si3O75(OH)15]1H2O Zeitschrift fuer Kristallographie - New Crystal Struc-tures 154(3-4)189ndash198 1981
[22] S A S El-Hemaly T Mitsuda and H F W Taylor Synthesis of normal and anomaloustobermorites Cement and Concrete Research 7429ndash438 1977
[23] M Sakiyama and T Mitsuda Hydrothermal reaction between C-S-H and kaolinite for theformation of tobermorite at 180degC Cement and Concrete Research 7(6)681ndash685 1977
[24] E Bonaccorsi S Merlino and A R Kampf The crystal structure of tobermorite 14 Aring(plombierite) a C-S-H phase Journal of the American Ceramic Society 88(3)505ndash5122005
[25] S Merlino E Bonaccorsi and T Armbruster The real structures of clinotobermorite andtobermorite 9 Aring OD character polytypes and structural relationships European Journalof Mineralogy 12(2)411ndash429 2000
[26] K Momma and F Izumi VESTA 3 for three-dimensional visualization of crystal volu-metric and morphology data Journal of Applied Crystallography 44(6)1272ndash1276 2011
26
5 References
[27] S Shaw S M Clark and C MB Henderson Hydrothermal formation of the calcium sil-icate hydrates tobermorite (Ca5Si6O16(OH)2 middot 4H2O) and xonotlite (Ca6Si6O17(OH)2)An in situ synchrotron study Chemical Geology 167(1-2)129ndash140 2000
[28] K Matsui J Kikuma M Tsunashima T Ishikawa S Matsuno A Ogawa and M SatoIn situ time-resolved X-ray diffraction of tobermorite synthesis process under hydrothermalcondition IOP Conference Series Materials Science and Engineering 18(2)60ndash66 2011
[29] G Matekonis R Šiaučiunas and D Vaičiukyniene Hydrothermal Synthesis and Charac-terization of Na + and [ Al 3 + + Na + ] -substituted Tobermorite in CaO-SiO2middotnH2O-H2OSystem MATERIALS SCIENCE 16(3)242ndash248 2010
[30] G Geng R J Myers M J A Qomi and P JM Monteiro Densification of the inter-layer spacing governs the nanomechanical properties of calcium-silicate-hydrate ScientificReports 7(1)1ndash8 2017
[31] D Klimesch and A Ray Autoclaved cement-quartz pastes with metakaolin additionsAdvanced Cement Based Materials 7(3-4)109ndash118 1998
[32] N Y Mostafa A A Shaltout H Omar and S A Abo-El-Enein Hydrothermal synthesisand characterization of aluminium and sulfate substituted 11 nm tobermorites Journal ofAlloys and Compounds 467(1-2)332ndash337 2009
[33] İ Demir M S Başpınar E Kahraman E Ccedilalışkan and G Goumlrhan An Investigation onthe Usability of Diatomite in Aerated Concrete Production In Proc of the Intl Conf onAdvances In Civil Structural And Construction Engineering - CSCE 2014 pages 97ndash1002014
[34] A Skawinska Z Owsiak T Baran and K Hernik The influence of halloysite additionon tobermorite formation in CaO and quartz mix under hydrothermal conditions CementWapno Beton 17(12)426ndash434 2017
[35] N Y Mostafa Influence of air-cooled slag on physicochemical properties of autoclavedaerated concrete Cement and Concrete Research 35(7)1349ndash1357 2005
[36] D Małaszkiewicz and J Chojnowski Influence of addition of calcium sulfate dihydrate ondrying of autoclaved aerated concrete Open Engineering 7(1)273ndash278 2017
[37] N Hara and N Inoue Thermal behaviour of 11Aring tobermorite and its lattice parametersCement and Concrete Research (10)53ndash60 1980
[38] M D Jackson S R Chae S R Mulcahy C Meral R Taylor P Li A H EmwasJ Moon S Yoon G Vola H R Wenk and P JM Monteiro Unlocking the secretsof Al-tobermorite in Roman seawater concrete American Mineralogist 98(10)1669ndash16872012
[39] W Liao W Li Z Fang C Lu and Z Xu Effect of different aluminum substitution rateson the structure of Tobermorite Materials 12(22)1ndash10 2019
[40] D Klimesch and A Ray DTA-TG Study of the CaO-SiO2-H2O and CaO-Al2O3-SiO2-H2OSystems Under Hydrothermal Conditions Journal of Thermal Analysis and Calorimetry56(1)27ndash34 1999
27
5 References
[41] Z Sauman and Z Valtr Substitution of sulphate ions in the crystal lattice of 11 Aring to-bermorite In The VI International Congress on the Chemistry of Cement pages 1ndash14Moscow 1974
[42] G Schober Reaction of raw materials to the final product AAC httpwwwpb-aacde
chemmin2_ehtml 2012 accessed 2020-01-31
[43] D Jansen C Stabler F Goetz-Neunhoeffer S Dittrich and J Neubauer Does Ordi-nary Portland Cement contain amorphous phase A quantitative study using an externalstandard method Powder Diffraction 26(01)31ndash38 2011
[44] C Roumlszligler J Stark F Steiniger and W Tichelaar Limited-dose electron microscopyreveals the crystallinity of fibrous C-S-H phases Journal of the American Ceramic Society89(2)627ndash632 2006
[45] Y Sakalli and R Trettin Investigation of C3S hydration by environmental scanning elec-tron microscope Journal of Microscopy 259(1)53ndash58 2015
[46] F Matsushita Y Aono and S Shibata Expansion and shrinkage behavior of green cakeof Autoclaved Aerated Concrete In Autoclaved Aerated Concrete - Innovation and Devel-opment Proceedings of the 4th International Conference on Autoclaved Aerated ConcreteKingston UK 8-9 September 2005 pages 101ndash108 CRC Press 2005
[47] C Chucholowski M Holger and K-C Thienel Improving the recyclability environmentalcompatibility and CO2 balance of autoclaved aerated concrete by replacing sulfate carrierand cement with calcined clays CePapers 2(4)503ndash512 2018
[48] X Y Huang W Ni W H Cui Z J Wang and L P Zhu Preparation of autoclavedaerated concrete using copper tailings and blast furnace slag Construction and BuildingMaterials 27(1)1ndash5 2012
[49] W Wongkeo and A Chaipanich Compressive strength microstructure and thermal anal-ysis of autoclaved and air cured structural lightweight concrete made with coal bottom ashand silica fume Materials Science and Engineering A 527(16-17)3676ndash3684 2010
[50] A Roacuteżycka and W Pichoacuter Effect of perlite waste addition on the properties of autoclavedaerated concrete Construction and Building Materials 12065ndash71 2016
[51] N Isu H Ishida and T Mitsuda Influence of quartz particle size on the chemical andmechanical properties of autoclaved aerated concrete (I) tobermorite formation Cementand Concrete Research 25(25)243ndash248 1995
[52] D Ectors Advances in the analysis of cementitious reactions and hydrate phases doctoralthesis PhD thesis Friedrich-Alexander-Universitaumlt Erlangen-Nuumlrnberg 2016
[53] D Ectors F Goetz-Neunhoeffer and J Neubauer Domain size anisotropy in the double-Voigt approach An extended model Journal of Applied Crystallography 481998ndash20012015
[54] D Ectors F Goetz-Neunhoeffer and J Neubauer Routine (an)isotropic crystallite sizeanalysis in the double-Voigt approximation done right Powder Diffraction 32(S1)27ndash342017
28
5 References
[55] D Jansen F Goetz-Neunhoeffer C Stabler and J Neubauer A remastered external stan-dard method applied to the quantification of early OPC hydration Cement and ConcreteResearch 41(6)602ndash608 2011
[56] T Ungaacuter G Tichy J Gubicza and R J Hellmig Correlation between subgrains andcoherently scattering domains Powder Diffraction 20(04)366ndash375 2005
[57] Triloki P Garg R Rai and B K Singh Structural characterization of as-depositedcesium iodide films studied by X-ray diffraction and transmission electron microscopy tech-niques Nuclear Instruments and Methods in Physics Research Section A AcceleratorsSpectrometers Detectors and Associated Equipment 736128ndash134 2014
[58] J Schreiner F Goetz-Neunhoeffer J Neubauer and D Jansen Hydrothermal synthesisof 11 Aring tobermorite ndash Effect of adding metakaolin to the basic compound Applied ClayScience 185 2020
[59] J Schreiner F Goetz-Neunhoeffer J Neubauer S Volkmann S Bergold R Webler andD Jansen Advanced Rietveld refinement and SEM analysis of tobermorite in chemicallydiverse autoclaved aerated concrete Powder Diffraction 34143ndash150 2019
[60] J Schreiner D Jansen D Ectors F Goetz-Neunhoeffer J Neubauer and S VolkmannNew analytical possibilities for monitoring the phase development during the production ofautoclaved aerated concrete Cement and Concrete Research 107247ndash252 2018
29
6 Publications
6 Publications
61 Hydrothermal synthesis of 11 Aring tobermorite ndash Effectof adding metakaolin to the basic compound
Reprint of the peer reviewed publication
Schreiner J Goetz-Neunhoeffer F Neubauer J Jansen D 2020 Hydrothermalsynthesis of 11 Aring tobermorite ndash Effect of adding metakaolin to the basic compoundApplied Clay Science 185 httpsdoiorg101016jclay2019105432
with permission from Elsevier
30
Contents lists available at ScienceDirect
Applied Clay Science
journal homepage wwwelseviercomlocateclay
Research paper
Hydrothermal synthesis of 11 Aring tobermorite ndash Effect of adding metakaolin tothe basic compound
J Schreiner F Goetz-Neunhoeffer J Neubauer D JansenUniversity of Erlangen-Nuremberg GeoZentrum Nordbayern Mineralogy Schlossgarten 5a 91054 Erlangen Germany
A R T I C L E I N F O
KeywordsHydrothermal synthesis11 Aring tobermoriteMetakaolinPowder diffractionKatoite
A B S T R A C T
Different amounts and types of metakaolin were analyzed and applied for the hydrothermal synthesis of 11 Aringtobermorite All synthesized samples were investigated by means of powder XRD combined with Rietveld re-finement Al-substituted 11 Aring tobermorite was successfully synthesized on the basis of a broad range of com-pounds characterized by a varying content of metakaolin Katoite was present depending on the amount ofsupplied Al3+ which was determined by the dosage of metakaolin Minor crystalline components included in thetwo types of metakaolin sources varied greatly in their reactivity under hydrothermal conditions Despite adifferent degree of purity the two types of metakaolin showed corresponding effects at moderate dosages butcontrary effects at higher dosages as for the synthesis of 11 Aring tobermorite The domain morphology of to-bermorite could be associated with Al3+ incorporation for low dosages of metakaolin represented by up to 2 wt- Al2O3 in the dry mix By contrast Al3+ affected tobermorite lattice parameters at equivalent and even athigher dosages with c reaching 2295 Aring at 12 wt- Al2O3 in the dry mix
1 Introduction
11 Application of metakaolin as a reactive material in constructionindustry
The application of supplementary cementitious materials (SCMs) inthe field of construction technology has received a lot of attention inrecent years Due to limited resources and an urgent need for alter-native and more eco-friendly construction materials SCMs such asmetakaolin offer a great potential The usage of SCMs has not onlyspread to the cement and mortar industry but also to advanced appli-cations such as autoclaved aerated concrete (AAC) (Demir et al 2014Koutnyacute et al 2014 Walczak et al 2015 Roacuteżycka and Pichoacuter 2016Chucholowski et al 2018) Unlike ordinary cementitious constructionmaterials AAC is produced from hydrothermal curing Due to the dif-ferent thermodynamic environment the hydration process and the re-activity of raw materials have to be investigated properly in order tounderstand the effects on the AAC product The leading mineral phasein AAC is 11 Aring tobermorite (Ca5Si6O16(OH)2middot4H2O) As a consequencethe thermal and mechanical properties of AAC depend on micro-structure and crystallinity of tobermorite to some extent In addition tothe curing time and the fineness of raw materials the supply of ionsthat can substitute in the tobermorite structure is a crucial factor in thiscontext Especially substitutions by aluminum sodium and potassium
ions have been investigated thoroughly (Sauman 1974 Klimesch andRay 1998 Mostafa et al 2009 Matekonis et al 2010 Skawinskaet al 2017) Calcined clays usually contain a considerable amount ofthe mentioned ions
There is a vast amount of literature on the reactivity of SCMs atambient temperature and standard pressure but there is little when itcomes to hydrothermal conditions In previous publications the beha-vior of metakaolin under hydrothermal conditions was mainly in-vestigated for the synthesis of zeolites (Zhang et al 2007 Aguilar-Mamani et al 2014 Setthaya et al 2016 Luo et al 2018) In thesestudies the reactivity of metakaolin was observed at a wide range oftemperature and pH values During the transformation of kaolin intometakaolin a loss of framework alumina was observed (Ayodele et al2019) In recent decades metakaolin has been the subject of studies inthe field of geopolymer research (Rashad 2013 Chen et al 2016) Forthe synthesis of 11 Aring tobermorite a more distinct setting of temperaturesetting (180ndash200 degC) and steam pressure (1ndash12 MPa) are required
This publication is intended to make a new contribution to thechallenging field of hydrothermal synthesis in the system CaO-Al2O3-SiO2-H2O based on XRD analysis combined with Rietveld refinementVarious dosages of two types of metakaolin with different chemical andmineralogical purities are compared for the effects on the hydrothermalsynthesis of Al-substituted 11 Aring tobermorite Especially changes of thebulk chemistry in the raw mixes the reactivity of minor crystalline
httpsdoiorg101016jclay2019105432Received 20 August 2019 Received in revised form 13 November 2019 Accepted 30 December 2019
Corresponding authorE-mail address juergenjsschreinerfaude (J Schreiner)
Applied Clay Science 185 (2020) 105432
0169-1317 copy 2020 Elsevier BV All rights reserved
T
6 Publications
31
phases of the two types of metakaolin and the effect of different curingtimes are the focus of interest On the one hand metakaolin offers agreat potential in the AAC industry On the other hand of all SCMsmetakaolin is a good source material for investigating the influence ofAl3+ on the synthesis of Al-substituted 11 Aring tobermorite
12 Synthesis of Al-substituted 11 Aring tobermorite
In addition to being present in AAC tobermorite has found appli-cation in wastewater treatment and nuclear waste management due toits ion exchange capacity (Maeda et al 2012 Monasterio et al 2015)The substitution of silicon by aluminum results in a different to-bermorite structure due to general and local charge balance affectingthe lattice parameters Especially c is impacted by this substitutionbecause it occurs in the bridging tetrahedron and additional OHndash sub-stitutes O2ndash (Komarneni et al 1985 Merlino et al 2000) As suggestedin some additional studies the substitution of Si4+ by Al3+ and Na+ orK+ leads to a lath-like morphology of tobermorite crystals (Mostafa2005 Mostafa et al 2009 Venhodovaacute et al 2015 Qu et al 2018)However because of the heterogeneous appearance of tobermorite inAAC it is hardly possible to conduct a proper characterization based onSEM analysis In our recent work the anisotropic peak broadening oftobermorite in XRD diffractograms was successfully linked with theincorporation of foreign ions supplied in a common AAC production(Schreiner et al 2019) This finding allowed a more statistical struc-tural characterization of tobermorite in bulk compositions compared toSEM analysis Moreover it was reported in other studies that differenthydrate phases occur depending on the amount of supplied ions and onthe experimental settings In compounds with a high content of Al3+formation of katoite could be observed (Klimesch and Ray 1998 Riacuteoset al 2009 Matsui et al 2011) In the case of a longer curing durationinstead of 11 Aring tobermorite the formation of xonotlite (Siauciunas andBaltakys 2004 Galvaacutenkovaacute et al 2018) or - depending on the finenessof used silica source (Siauciunas and Baltakys 2004) - gyrolite is fa-voured
Kalousek (1956) suggested that tobermorite can contain up to 5Al2O3 More Al2O3 in the system resulted in the formation of hydro-garnet Klimesch and Ray (1998) additionally investigated the stabilityof hydrogarnet depending on the Al(Si + Al) ratio and its role in re-lation to the formation of 11 Aring tobermorite in an equivalent systemThey suggest that hydrogarnet always appears before tobermorite butthe former can only be detected for higher Al(Si + Al) ratios in theevent of longer curing times Riacuteos et al (2009) and Qu et al (2018)confirmed these findings in extensive investigations In the latter pub-lication it is additionally suggested that samples prepared at lowertemperatures (160 degC) are less impacted by the supply of Al3+ Theyalso consider the peak broadening of tobermorite in their XRD plotsbased on the amount of incorporated Al3+ In two recent publicationswe suggested that the peak broadening of tobermorite enables a mi-crostructural analysis by calculating the orientation dependent domainsizes (Schreiner et al 2018 2019) However these studies are based onsamples of industrially produced AAC so that the curing time was fixedThe studied AAC was produced from raw materials with a broad che-mical spectrum such as ordinary Portland cement (OPC) whichsomehow complicates the interpretation of results
In this work the influence of aluminum ions - provided by meta-kaolin - on dominant crystallographic direction-dependent domaingrowth of tobermorite is investigated by analysis of anisotropic peakbroadening (Ectors et al 2015 2017) In Fig 1 of the supplementarymaterial the method of fitting the anisotropic peak broadening of to-bermorite using a triaxial cylinder model is visualized (Schreiner et al2018) Fitting of the anisotropic peak broadening of tobermorite Thismethod is used to calculate the average and reliable values for to-bermorite domain sizes in the powder sample and associate them withaverage Al3+ incorporation Microstrain should be considered becauseit is an additional source of peak broadening However this usually
accounts for materials that have been exposed to different kinds ofstress such as metals and alloys (Badawi et al 2019) In addition theinstrumental contribution to peak broadening should be consideredHydration products such as tobermorite are characterized by crystallitesizes in the range of nanometers so that anisotropic size broadeningclearly outweighs the effect of instrumental broadening (Jenkins andSnyder 1996) Moreover the impact of Al3+ on the lattice parametersof tobermorite is considered It should additionally be clarified whe-ther the results from our previous publication (Schreiner et al 2019)based on industrially produced AAC can be confirmed by investigationwith less complex raw mixes and purely based on laboratory experi-ments
2 Material and methods
21 Starting materials
The starting materials for hydrothermal synthesis included deio-nized water quartz flour portlandite (999 pure) and two types ofmetakaolin One type was ordinary commercially available metakaolin(MK) with nearly a stoichiometric composition For comparison thesecond type of commercially available metakaolin was a by-productfrom expanded glass production (MKg) and consequently highly im-pure The chemical composition of MK and MKg determined by XRF isgiven in Table 1 With MKg containing less Al2O3 but considerably moreNa2O than MK the effects on hydrothermal synthesis were of interestBoth types of metakaolin have been characterized in previous pub-lications (Schmidt et al 2012 Naber et al 2019) In addition weverified the mineral phase content by XRD analysis Besides amorphousmetakaolin MK contained minor amounts of anatase quartz and mica
Fig 1 Weight fractions of tobermorite quartz and katoite determined byquantitative XRD analysis ndash samples including MKg crosshatched
Table 1Chemical composition of MK and MKg determined by XRF analysis ndash majorcontrasts in bold letters
Oxides [wt-] MK MKg
SiO2 536 604Al2O3 392 206CaO 01 40MgO 01 12Na2O 0 96K2O 10 18Fe2O3 18 05TiO2 21 03P2O5 01 02Loss on ignition 15 1
J Schreiner et al Applied Clay Science 185 (2020) 105432
2
6 Publications
32
MKg contained additional kaolinite feldspar and quartz
22 Investigated mix composites
For the preparation of raw mixtures the powders were weighed andhomogenized using a lab-scale mixing mill Table 2 lists the composi-tion and nomenclature of all samples including Al2O3 content andcuring time in the autoclave
bull Besides one blank mixture (MK0) that did not contain any type ofmetakaolin eleven more compounds were prepared of which threeincluded different dosages of MKg (MKg16 MKg23 and MKg60)Three more mixes contained equivalent amounts of MK instead ofMKg (MK16 MK23 and MK60) These mixes were investigated inorder to have a direct comparison concerning the effects of differentraw material on the synthesis of tobermorite
bull Additionally the mixes MK9 MK5 and MK25 with lower dosages ofmetakaolin were analyzed In the referenced literature (Schreineret al 2019) the effect of Al3+ on the anisotropic peak broadeningof tobermorite could only be observed in the case of Al2O3 contentslower than 4 in the drymix In the latter three mixes Al2O3 con-tents range from 1 to 35 Al2O3 (calculated from XRF data) whichmeets the region of interest for the analysis of tobermorite domainmorphology
bull The curing time for nearly all of the investigated samples was 12 hbut compound MK9 was prepared two more times for curing timesof 2 h and 6 h The different curing times were chosen in this par-ticular sample so that the reactivity of metakaolin and the phasetransitions could be observed more precisely
23 Hydrothermal treatment
Due to the different fineness of raw materials there was a differentwater demand from one mixture to another In order to obtain slurriesof comparable rheology the amount of water was adapted respectivelyresulting in water-to-solid ratios of 25 to 3 which matches the sug-gested water-to-solid ratio for this purpose (Roacutezycka et al 2014Galvaacutenkovaacute et al 2018) The weighed water was added to the dry mixand after stirring for 1 min at 23 degC the slurry was poured into thereactor Minor changes in the quantity of added water did not have aninfluence on the measured steam pressure All experiments were con-ducted using a PTFE-lined stainless steel autoclave with a reactor vo-lume of 300 ml The oven temperature was fixed at 180 degC and auto-genous steam pressure of 11ndash12 MPa was measured during eachexperiment with an external manometer After cooling to room tem-perature the sample was removed from the reactor coarsely ground
using an agate mortar and dried at 60 degC for 12 h After drying thesample was ground with an agate mortar again in order to deagglo-merate the particles As no coarse raw materials were used there wasno need for wet McCrone milling (Schreiner et al 2018)
24 XRD analysis
After preparation into front-loading sample holders the powdersamples were measured with a D8 diffractometer (Bruker) equippedwith a LynxEye detection system and Bragg-Brentano geometry Thesettings for XRD analysis included a tube voltage of 40 kV a current of40 mA an angular range from 6 to 80deg 2θ (Cu Kα radiation) a time perstep of 054 s a step width of 00236deg 2θ and a PSD opening of 33deg Thebackground was fitted with Chebyshev polynomial of the fifth orderThe major contribution of amorphous phase was fitted with a singlepeak with a fixed position at 308deg 2θ so that tobermorite reflectionswere not affected An external quartzite standard was measured withthe same parameters in order to determine phase quantities (Jansenet al 2011) Bruker AXS software TOPAS 50 was used for Rietveldrefinement (Rietveld 1969) and the used structures are shown inTable 3
3 Results and discussion
31 Different dosages of MK and MKg
In Fig 1 the quantities of tobermorite quartz and katoite present inmost of the samples determined by XRD analysis are illustratedWhenever tobermorite was the leading mineral hydrate phase a basalspacing of 113 Aring could be verified in each of the diffractograms Thequantities of minor crystalline phases and amorphous content are notshown For low dosages of MK it can be seen that the weight fraction oftobermorite decreased At moderate dosage of both types of metakaolin(MK16 MK23 MKg16 MKg23) tobermorite was present in comparablequantities It can be seen that the amount of katoite in the mixes de-pended on the dosage of metakaolin and it appeared only at dosages ofMK5 or more Due to the higher content of aluminum in MK comparedto MKg more katoite could always be observed in the MK mixes atequivalent dosages Despite equal amounts of quartz as starting mate-rial in mixes for both types of metakaolin the resulting weight fractionsin the cured samples were not alike Considerably more quartz waspresent in the MK samples Even though less quartz was used for mixescontaining higher amounts of MK even more quartz was present afterhydrothermal curing (Table 2 Fig 1) Consequently some of the SiO2
provided by MK did not transform into an amorphous phase or to-bermorite but into quartz This finding is verified by the presence ofquartz in MK60 because no quartz was included in the raw mixture Thefeldspar present in MKg did not react so Na2O and an unknown amountof Al2O3 may not have been supplied for hydrothermal reaction Besidestobermorite and quartz additional calcite scawtite (Ca7Si6(CO3)
Table 2Basic powder compounds prepared for the hydrothermal synthesis of to-bermorite with the respectively calculated Al2O3 content and curing time in thereactor
Sample Portlandite[wt-]
Quartz[wt-]
MK[wt-]
MKg
[wt-]
Al2O3
[wt-]Curingtime [h]
MK0 49 51 ndash ndash 0 12MK25 495 48 25 ndash 1 12MK5 49 46 5 ndash 2 12MK9_2h 48 43 9 ndash 35 2MK9_6h 48 43 9 ndash 35 6MK9_12h 48 43 9 ndash 35 12MK16 47 37 16 ndash 63 12MK23 46 31 23 ndash 9 12MK60 40 ndash 60 ndash 235 12MKg16 47 37 ndash 16 33 12MKg23 46 31 ndash 23 47 12MKg60 40 ndash ndash 60 124 12
Table 3Structural data used for the investigation with powder XRD analysis
Phase Author
Anatase (Horn et al 1972)Biotite (Brigatti et al 2000)Calcite (Maslen et al 1995)Kaolinite (Zvyagin 1960)Katoite (Bartl 1969)Microcline (Bailey 1969)Plazolite (Basso et al 1983)Portlandite (Busing and Levy 1957)Quartz (Le Page and Donnay 1976)Scawtite (Grice 2005)Tobermorite (Hamid 1981)Xonotlite (Hejny and Armbruster 2001)
J Schreiner et al Applied Clay Science 185 (2020) 105432
3
6 Publications
33
O18bull2(H2O)) and xonotlite (Ca6Si6O17(OH)2) could be identified insample MK0 (XRD plots of samples MK0 MKg16 MKg23 MK16 andMK23) Comparing MK0 and MK25 scawtite and xonotlite could stillbe identified in a very low amount in MK25 but no longer in samplesthat contained even more MK (XRD plots of samples MK0 MK25 MK5and MK9_12h)
Two additional experiments were done without quartz in the rawmixes (MK60 and MKg60) The according diffractograms after hydro-thermal curing are shown in Fig 2 In sample MKg60 tobermorite (gt 50wt-) was successfully synthesized without any other silica sourcethan MKg whereas no crystalline quartz occurred By contrast no to-bermorite but quartz could be identified in equivalent mixture MK60containing MK It can be seen that crystalline components such as micaand anatase in the raw MK did not react at the selected conditions andremained present in the autoclaved samples Except for feldspar in MKgall of the crystalline components appeared to be reactive at the chosenhydrothermal conditions A minor unidentified phase occurred at328deg2θ and additional xonotlite was identified in sample MKg60 Insample MK60 more calcium was needed for the formation of morehydrogarnet (Fig 1) resulting in a lower CaSi ratio for the remainingsystem Sample MKg60 contained only half of the amount of Al3+ and itwas not completely supplied for reaction due to its partial presence infeldspar Consequently essentially less hydrogarnet (Fig 1) was presentin MKg60 after hydrothermal treatment and the CaSi ratio in the re-maining system was affected to a lesser extent
32 Application of MK for different curing times
The development of hydrate phases in the autoclave for compoundMK9 is displayed in Fig 3 After only 2 h of hydrothermal curing all ofthe available portlandite had reacted and katoite (95 wt-) was pre-sent The applied type of metakaolin appeared to react quickly as itsupplied aluminum for formation of katoite No formation of to-bermorite could be observed at this stage yet An assumably amorphousprecursor can be seen at 28 to 30deg2θ Calcium was provided by thedissolution of portlandite After 6 h of hydrothermal reaction amountsof katoite (85 wt-) and quartz (from 31 wt- at 2 h to 165 wt- at6 h) had decreased and a major amount of tobermorite (35 wt-) waspresent Apparently between 2 and 6 h under hydrothermal conditionsthe amorphous precursor and quartz reacted resulting in the formationof tobermorite An additional 6 h of reaction time (MK9_12h) did notchange the phase composition significantly Slightly more tobermorite
(365 wt-) less quartz (16 wt-) and katoite (65 wt-) weremeasured
33 Tobermorite domain morphology and lattice parameters
In the referenced literature an analysis of tobermorite domainmorphology based on anisotropic peak broadening was possible forsamples that contained notgt 4 wt- Al2O3 in the drymix (Schreineret al 2019) Accordingly in this study samples MK0 MK25 MK5MK9_6h and MK9_12h were suitable (Table 2) with MK9_2h not con-taining any tobermorite In Fig 4 the respective growth in a and b di-rection is visualized with x indicating the domain size in a direction andy indicating domain size in b direction using a macro for TOPAS 50(Ectors et al 2015 2017) The calculated cylinder models in Fig 4represent the relation of yx and not absolute sizes With no supply ofaluminum ions (MK0) the relative domain growth in b direction islower compared to samples containing metakaolin This finding agreeswith the results from a similar investigation of tobermorite in AAC(Schreiner et al 2019) However within the samples MK5 andMK9_12h the different amounts of supplied aluminum ions did notshow a clear effect It appeared that low dosages of Al3+ (1 wt- Al2O3
in MK25 and 2 wt- Al2O3 in MK5) were enough to determine thedomain growth of tobermorite Additional results from the samplesMK9_6h and MK9_12h indicated that growth in b direction increasedwith reaction time
In Fig 5 lattice parameters of tobermorite depending on metakaolindosages are plotted B clearly remained unaffected throughout therange of samples Increasing amounts of metakaolin led to a slightlysmaller parameter a However both types of metakaolin showed acorresponding impact on parameter a By contrast parameter c in-creased strongly with increasing amounts of MK and MKg but the typeof metakaolin was significant At an equivalent dosage MK affected thecell dimension in c direction considerably more than MKg so that thefraction of Al3+ appeared to be the decisive parameter Different metaloxides in MKg did not show a notable effect certainly as they werepartially not provided for reaction Unlike for the domain morphologyof tobermorite the impact on lattice parameters could be observedwithin the complete range of examined dosages
4 Conclusions
The results obtained from the introduced investigations allow con-cluding remarks on the effects of the applied types of metakaolin on thesynthesis of 11 Aring tobermorite the phase transitions and the in-corporation of Al3+ into the lattice of tobermorite
With a critical dosage the use of any type of metakaolin led to theformation of katoite in an according amount At moderate dosages(MKg16 MKg23 MK16 and MK23) the two types of metakaolin showeda good correspondence in consideration of the quantities of to-bermorite For higher dosages there were contrary effects Lower do-sages of MK led to considerable quantities of Al-substituted to-bermorite Samples containing low dosages of MK revealed that katoiteappeared in the case ofgt 5 wt- of MK - corresponding to 2 wt-Al2O3 - in the basic compound Minor crystalline phases in MKg showedbetter reactivity than those in MK The observation that no tobermoritewas present in sample MK60 indicated that high dosages of Al3+ hin-dered the formation of tobermorite
Investigations of MK9 at 2 6 and 12 h displayed the evolution ofhydrate phases At first katoite was the only crystalline hydrate phasepresent after 2 h which corresponded to observations in a differentpublication (Klimesch and Ray 1999) The amount of katoite andquartz then decreased and a major amount of tobermorite formed from2 to 6 h curing time In order to gain more information on the trans-formation of amorphous C-(A)-S-H into tobermorite additional ex-periments in the range of 2 to 6 h curing time will be needed
Domain morphology analysis of tobermorite revealed that low
Fig 2 Diffractograms of MKg MKg60 MK and MK60 from 7 to 34deg2θ CuKα Aanatase C calcite F feldspar k kaolinite K katoite M mica Q quartz Ttobermorite U unidentified phase X xonotlite
J Schreiner et al Applied Clay Science 185 (2020) 105432
4
6 Publications
34
dosages of Al3+ determined the domain growth which agreed with theresults published on tobermorite in AAC samples (Schreiner et al2019) Different curing times unveiled that growth in b direction in-creased with the reaction time Al3+ incorporation into the lattice oftobermorite only reflected to a limited extent in the domain mor-phology By contrast an increase of lattice parameter c was triggered byAl3+ even at the highest dosage in this study Ultimately there is no
evidence for a limit of incorporation of Al3+ but there is a limit ofinfluence on the domain morphology These results additionally re-confirm this assumption similarly made in the previous work (Schreineret al 2019) and suggest a new mechanism of tobermorite crystal-lization depending on the presence of Al3+
Supplementary data to this article can be found online at httpsdoiorg101016jclay2019105432
Declaration of Competing Interest
The authors declare that they have no known competing financialinterests or personal relationships that could have appeared to influ-ence the work reported in this paper
Acknowledgement
The authors thank Rodgauer Baustoffwerke GmbH amp Co KG forsupplying raw materials for laboratory experiments
References
Aguilar-Mamani W Garciacutea G Hedlund J Mouzon J 2014 Comparison betweenleached metakaolin and leached diatomaceous earth as raw materials for the synth-esis of ZSM-5 Springerplus 3 1ndash10 httpsdoiorg1011862193-1801-3-292
Ayodele OB Sulaimon AA Alaba PA Tian Z-Y 2019 Influence of metakaolini-zation temperature on the structure and activity of metakaolin supported Ni catalystin dry methane reforming J Environ Chem Eng httpsdoiorg101016jjece2019103239 (in press)
Badawi EA Abdel-Rahman MA Mostafa A Abdel-Rahman M 2019 Determinationof the crystallite size amp micro- strain by novel method from XRD profile Appl Phys2 1ndash15 httpsdoiorg1031058jap201921001
Bailey SW 1969 Refinement of an intermediate microcline structure Am Miner 541540ndash1545
Bartl H 1969 Roentgen-Einkristalluntersuchungen an (CaO)3 (Al2O3) (H2O)6 und an(CaO)12 (Al2O3)7 (H2O) neuer Vorschlag zur (CaO)12 (Al2O3)7-Struktur NeuesJahrb fuer Mineral Monatshefte 1969 404ndash413
Basso R Giusta AD Zefiro L 1983 Crystal structure refinement of plazolite A highlyhydrated natural hydrogrossular Neues Jahrb Miner Monatsh (Neues Jahrb fuerMineral Monatshefte) 1983 251ndash258
Brigatti MF Lugli C Poppi L Foord EE Kile DE 2000 Crystal chemical varia-tions in Li- and Fe-rich micas from Pikes Peak batholith (Central Colorado) AmMineral 85 1275ndash1286 httpsdoiorg102138am-2000-8-920
Busing WR Levy HA 1957 Neutron diffraction study of calcium hydroxide J ChemPhys 26 563 httpsdoiorg10106311743345
Chen L Wang Z Wang Y Feng J 2016 Preparation and properties of alkali acti-vated metakaolin-based geopolymer Materials (Basel) 9 1ndash12 httpsdoiorg103390ma9090767
Chucholowski C Holger M Thienel K-C 2018 Improving the recyclability en-vironmental compatibility and CO2 balance of autoclaved aerated concrete by re-placing sulfate carrier and cement with calcined clays CePapers 2 503ndash512httpsdoiorg101002cepa846
Fig 3 Diffractograms of MK9_2h MK9_6h and MK9_12h from 7 to 38deg2θ CuKα C calcite K katoite Q quartz T tobermorite
Fig 4 Relation of calculated domain sizes of 11 Aring tobermorite in selectedsamples (MK0 MK25 MK5 MK9_6h and MK9_12h) in a (x) and b (y) direction
Fig 5 Lattice parameters of tobermorite depending on MK or MKg dosageincluding blank mix MK0
J Schreiner et al Applied Clay Science 185 (2020) 105432
5
6 Publications
35
Demir İ Başpınar MS Kahraman E Ccedilalışkan E Goumlrhan G 2014 An investigationon the usability of diatomite in aerated concrete production In Proc of the IntlConf on Advances in Civil Structural and Construction Engineering ndash CSCE 2014 pp97ndash100
Ectors D Goetz-Neunhoeffer F Neubauer J 2015 A generalized geometric approachto anisotropic peak broadening due to domain morphology J Appl Crystallogr 48189ndash194 httpsdoiorg101107S1600576714026557
Ectors D Goetz-Neunhoeffer F Neubauer J 2017 Routine (an)isotropic crystallitesize analysis in the double-Voigt approximation done right Powder Diffract 3227ndash34 httpsdoiorg101017S0885715617000070
Galvaacutenkovaacute L Bartoniacutečkovaacute E Opravil T Tkacz J Ptaacuteček P 2018 The influence ofstarting materials solubility on tobermorite structure formation under the hydro-thermal conditions IOP Conf Ser Mater Sci Eng 379 1ndash8 httpsdoiorg1010881757-899X3791012001
Grice JD 2005 The structure of spurrite tilleyite and scawtite and relationships toother silicate-carbonate minerals Can Mineral 43 1489ndash1500 httpsdoiorg102113gscanmin4351489
Hamid SA 1981 The crystal structure of the 11 Aring natural tobermoriteCa225[Si3O75(OH)15]1H2O Zeitschrift fuer Krist 154 189ndash198 httpsdoiorg101524zkri19811543-4189
Hejny C Armbruster T 2001 Polytypism in xonotlite Ca6Si6O17(OH)2 Zeitschrift furKrist 216 396ndash408
Horn M Schwerdtfeger CF Meagher EP 1972 Refinement of the structure of ana-tase at several temperatures Zeitschrift fur Krist 136 273ndash281 httpsdoiorg101524zkri19721363-4273
Jansen D Goetz-Neunhoeffer F Stabler C Neubauer J 2011 A remastered externalstandard method applied to the quantification of early OPC hydration Cem ConcrRes 41 602ndash608 httpsdoiorg101016jcemconres201103004
Jenkins R Snyder R 1996 Introduction to X-ray Powder Diffractometry ChemicalAnalysis Wiley pp 90
Kalousek GL 1956 Crystal Chemistry of Hydrous Calcium Silicates J Am Ceram Soc40 74ndash80
Klimesch D Ray A 1998 Autoclaved cement-quartz pastes with metakaolin additionsAdv Cem Based Mater 7 109ndash118 httpsdoiorg101016S1065-7355(97)00073-4
Klimesch D Ray A 1999 DTA-TGA evaluations of the CaOndashAl2O3ndashSiO2ndashH2O systemtreated hydrothermally Thermochim Acta 334 115ndash122 httpsdoiorg101016s0040-6031(99)00140-9
Komarneni S Roy R Roy DM Fyfe CA Kennedy GJ Bothner-By AA Dadok JChesnick AS 1985 27Al and29Si magic angle spinning nuclear magnetic resonancespectroscopy of Al-substituted tobermorites J Mater Sci 20 4209ndash4214 httpsdoiorg101007BF00552416
Koutnyacute O Opravil T Pořiacutezka J 2014 Application of metakaoline in autoclavedaerated concrete technology Adv Mater Res 1000 174ndash177 httpsdoiorg104028wwwscientificnetAMR1000174
Le Page Y Donnay G 1976 Refinement of the crystal structure of low-quartz ActaCrystallogr Sect B 32 2456ndash2459 httpsdoiorg101107S0567740876007966
Luo H Law WW Wu Y Zhu W Yang EH 2018 Hydrothermal synthesis of needle-like nanocrystalline zeolites from metakaolin and their applications for efficient re-moval of organic pollutants and heavy metals Microporous Mesoporous Mater 2728ndash15 httpsdoiorg101016jmicromeso201806015
Maeda H Ogawa Y Ishida EH Kasuga T 2012 Hydrothermal synthesis of to-bermorite doped with phosphorus species for removing heavy metal ions J AustCeram Soc 48 8ndash11
Maslen EN Streltsov VA Streltsova NR Ishizawa N 1995 Electron density andoptical anisotropy in rhombohedral carbonates III Synchrotron Xray studies ofCaCO3 MgCO3 and MnCO3 Acta Crystallogr Sect B 51 929ndash939 httpsdoiorg101107S0108768195006434
Matekonis G Šiaučiūnas R Vaičiukynienė D 2010 Hydrothermal Synthesis andCharacterization of Na + and [ Al 3 + + Na + ] -substituted Tobermorite in CaO-SiO2middotnH2O-H2O System Mater Sci 16 242ndash248
Matsui K Kikuma J Tsunashima M Ishikawa T Matsuno S Ogawa A Sato M2011 In situ time-resolved X-ray diffraction of tobermorite synthesis process underhydrothermal condition IOP Conf Ser Mater Sci Eng 18 60ndash66 httpsdoiorg1010881757-899X182022017
Merlino S Bonaccorsi E Armbruster T 2000 The real structures of clinotobermoriteand tobermorite 9 Aring OD character polytypes and structural relationships Eur JMineral 12 411ndash429 httpsdoiorg1011270935-122120000012-0411
Monasterio M Gaitero JJ Manzano H Dolado JS Cerveny S 2015 Effect ofchemical environment on the dynamics of water confined in calcium silicate mi-nerals Natural and synthetic tobermorite Langmuir 31 4964ndash4972 httpsdoiorg101021acslangmuir5b00614
Mostafa NY 2005 Influence of air-cooled slag on physicochemical properties of auto-claved aerated concrete Cem Concr Res 35 1349ndash1357 httpsdoiorg101016jcemconres200410011
Mostafa NY Shaltout AA Omar H Abo-El-Enein SA 2009 Hydrothermal synth-esis and characterization of aluminium and sulfate substituted 11 nm tobermoritesJ Alloys Compd 467 332ndash337 httpsdoiorg101016jjallcom200711130
Naber C Stegmeyer S Jansen D Goetz-Neunhoeffer F Neubauer J 2019 ThePONKCS method applied for time resolved XRD quantification of supplementarycementitious material reactivity in hydrating mixtures with ordinary Portland ce-ment Constr Build Mater 214 449ndash457 httpsdoiorg101016jconbuildmat201904157
Qu X Zhao Z Zhao X 2018 Microstructure and characterization of aluminum-in-corporated calcium silicate hydrates (C-S-H) under hydrothermal conditions RSCAdv 8 28198ndash28208 httpsdoiorg101039c8ra04423f
Rashad AM 2013 Metakaolin as cementitious material history scours production andcomposition - a comprehensive overview Constr Build Mater 41 303ndash318 httpsdoiorg101016jconbuildmat201212001
Rietveld HM 1969 A profile refinement method for nuclear and magnetic structures JAppl Crystallogr 2 65ndash71 httpsdoiorg101107S0021889869006558
Riacuteos CA Williams CD Fullen MA 2009 Hydrothermal synthesis of hydrogarnet andtobermorite at 175 degC from kaolinite and metakaolinite in the CaO-Al2O3-SiO2-H2Osystem a comparative study Appl Clay Sci 43 228ndash237 httpsdoiorg101016jclay200809014
Roacuteżycka A Pichoacuter W 2016 Effect of perlite waste addition on the properties of au-toclaved aerated concrete Constr Build Mater 120 65ndash71 httpsdoiorg101016jconbuildmat201605019
Roacutezycka A Kotwica Ł Małolepszy J 2014 Synthesis of single phase gyrolite in theCaO-quartz-Na2O-H2O system Mater Lett 120 166ndash169 httpsdoiorg101016jmatlet201401003
Sauman Z 1974 Influence of SO4 2ndash ions on the formation of 11 Aring tobermorite InProceedings of the 2nd International Symposium on Science and Research in SilicateChemistry Moscow pp 25ndash39
Schmidt M Egersdoumlrfer A Poumlllmann H 2012 Increased reactivity using a glass-containing metakaolin as an active filler in lime-based binder systems ZKG Int 6554ndash62
Schreiner J Jansen D Ectors D Goetz-Neunhoeffer F Neubauer J Volkmann S2018 New analytical possibilities for monitoring the phase development during theproduction of autoclaved aerated concrete Cem Concr Res 107 247ndash252 httpsdoiorg101016jcemconres201802028
Schreiner J Goetz-Neunhoeffer F Neubauer J Volkmann S Bergold S Webler RJansen D 2019 Advanced Rietveld refinement and SEM analysis of tobermorite inchemically diverse autoclaved aerated concrete Powder Diffract 34 143ndash150httpsdoiorg101017s0885715619000149
Setthaya N Chindaprasirt P Pimraksa K 2016 Preparation of zeolite nanocrystals viahydrothermal and solvothermal synthesis using of rice husk ash and metakaolinMater Sci Forum 872 242ndash247 httpsdoiorg104028wwwscientificnetmsf872242
Siauciunas R Baltakys K 2004 Formation of gyrolite during hydrothermal synthesis inthe mixtures of CaO and amorphous SiO2 or quartz Cem Concr Res 34 2029ndash2036httpsdoiorg101016jcemconres200403009
Skawinska A Owsiak Z Baran T Hernik K 2017 The influence of halloysite ad-dition on tobermorite formation in CaO and quartz mix under hydrothermal condi-tions Cem Wapno Bet 17 426ndash434
Venhodovaacute E Janovskyacute R Drochytka R 2015 Formation of tobermorite at differentmaterials composition of aerated concrete Appl Mech Mater 752ndash753 247ndash250httpsdoiorg104028wwwscientificnetamm752-753247
Walczak P Małolepszy J Reben M Szymański P Rzepa K 2015 Utilization ofwaste glass in autoclaved aerated concrete Proc Eng 122 302ndash309 httpsdoiorg101016jproeng201510040
Zhang Y Gao W Cui L 2007 The transformation of acid leached metakaolin tozeolite beta Stud Surf Sci Catal 170 420ndash425 httpsdoiorg101016S0167-2991(07)80870-6
Zvyagin BB 1960 An attempt to electronographic determination of kaolinite structureJ Dokl Akad Nauk SSSR 130 1023ndash1026
J Schreiner et al Applied Clay Science 185 (2020) 105432
6
6 Publications
36
6 Publications
62 Advanced Rietveld refinement and SEM analysis oftobermorite in chemically diverse autoclaved aeratedconcrete
Following the copyright guidelines by Cambridge University Press the publication
Schreiner J Goetz-Neunhoeffer F Neubauer J Volkmann S Bergold S WeblerR Jansen D 2019 Advanced Rietveld refinement and SEM analysis of tobermorite inchemically diverse autoclaved aerated concrete Powder Diffraction 34 143ndash150 httpsdoiorg101017s0885715619000149
may not be reprinted It can be accessed at
httpswwwcambridgeorgcorejournalspowder-diffractionarticleadvanced-rietveld-refinement-and-sem-analysis-of-tobermorite-in-chemically-diverse-autoclaved-aerated-concrete51597C2A66F6F225D29DEB2675E74249
37
6 Publications
63 New analytical possibilities for monitoring the phasedevelopment during the production of autoclavedaerated concrete
Reprint of the peer reviewed publication
Schreiner J Jansen D Ectors D Goetz-Neunhoeffer F Neubauer J VolkmannS 2018 New analytical possibilities for monitoring the phase development during theproduction of autoclaved aerated concrete Cement and Concrete Research 107 247ndash252httpsdoiorg101016jcemconres201802028
with permission from Elsevier
38
Contents lists available at ScienceDirect
Cement and Concrete Research
journal homepage wwwelseviercomlocatecemconres
Short communication
New analytical possibilities for monitoring the phase development duringthe production of autoclaved aerated concrete
J Schreinera D Jansena D Ectorsa F Goetz-Neunhoeffera J Neubauera S Volkmannb
aUniversity of Erlangen-Nuremberg GeoZentrum Nordbayern Mineralogy Schlossgarten 5a 91054 Erlangen Germanyb Rodgauer Baustoffwerke GmbH amp Co KG Am Opel-Pruumlffeld 3 63110 Rodgau-Dudenhofen Germany
A B S T R A C T
This work presents improved analytical methods for both steps of the production process of autoclaved aeratedconcrete (AAC) the phase development during the hydration before autoclaving and during the autoclavingprocess itself The improvement includes new insights into preparation methods of AAC samples for powderdiffraction as well as Rietveld refinement strategies For the first time a new implementation for calculatinganisotropic crystal domain sizes is applied to major hydrate phases occurring during AAC production namelyportlandite during the hydration before autoclaving and tobermorite during the autoclaving process The cal-culation of anisotropic domain size growth which can be implemented in the Rietveld environment is based oncrystallographically and geometrically appropriate models The implementation of calculating anisotropic do-main sizes for the Rietveld software TOPAS 50 allows a superior Rietveld fit and a more accurate quantificationof the phase development Additionally it enables the tracking of growth mechanism of portlandite duringhydration
1 Introduction
Autoclaved aerated concrete (AAC) is known as a lightweight con-struction material which offers outstanding properties such as suffi-cient strength for construction in addition with excellent thermal in-sulation [12] AAC is produced by autoclaving from calcareous rawmaterials such as lime (CaO) and cement quartz sulfate carrier andother additives such as foaming agents and water
The production process (Fig 1) can be separated into the hydrationof the mixed slurry before the procedure of autoclaving and the auto-claving at elevated temperature (180 degC to 200 degC) under saturatedsteam pressure (12MPa) for several hours
The hydration process before autoclaving is necessary to achievesufficient strength in order to cut the green cake blocks as they shouldhave a specific shape and dimension after autoclaving Furthermorethe porous structure is generated by the foaming agent during hydra-tion in the first process step During autoclaving the final propertiesnamely strength and low thermal conductivity are achieved
It is already well understood that the autoclaving process leads tothe formation of several phases first of all tobermorite(Ca5Si6O16(OH)2lowast4H2O) [3ndash5] Newest research has shown im-pressively which reactions are running from the mineralogical point ofview Insitu XRD measurements were carried out during the
autoclaving process and the phase development was shown by plottingnormalized intensities [6] The study of Mitsuda et al [3] was mainlyfocused on the tracking of the phase evolution during the autoclavingprocess of AAC However their statements concerning phase evolutionare mainly based on XRD data and TGA measurements There is acommon agreement that the following reactions occur The consump-tion of the alite (OPC) leads to the formation of an initial C-S-H phaseduring the first processing step Portlandite which was initially formedduring the first process step (from CaO and C3S) further quartz and theC-S-H phase are consumed during autoclaving resulting in the crystal-lization of tobermorite Hence the crystallization process of to-bermorite as well as the crystal structure of tobermorite was an issue ofresearch and discussion over the last years and numerous publicationsto these topics are available Concerning the crystal structure of to-bermorite respectively the tobermorite supergroup a new publicationoutlines all important references and recommends a new nomenclature[7]
The presented study was performed to create new analytical possi-bilities for the characterization of the production process of AAC Bothof the production process steps are essential for the final productHence the present work focuses on crystallization of hydrate phases inboth processes
Firstly an external standard method [89] was published and
httpsdoiorg101016jcemconres201802028Received 6 October 2017 Received in revised form 1 February 2018 Accepted 26 February 2018
Corresponding authorsE-mail addresses juergenjsschreinerfaude (J Schreiner) danieljansenfaude (D Jansen)
Cement and Concrete Research 107 (2018) 247ndash252
0008-8846 copy 2018 Elsevier Ltd All rights reserved
T
6 Publications
39
recommended for the determination of absolute phase contents inmixtures with amorphous content It was shown that the method canabsolutely be recommended for hydrating cement pastes in which watercannot be quantified directly by XRD [10] This method seems to bevery promising for both the quantification of the hydration of the AACslurry before autoclaving and the quantification of the phase evolutionduring autoclaving inasmuch as both production steps form crystallineand amorphous phases
Secondly a new approach to anisotropic peak broadening due toanisotropic domain morphology which was developed [1112] is ap-plied to AAC samples to improve the fit of portlandite and tobermoriteby Rietveld refinement [13] By applying this approach the refinementof both portlandite and tobermorite should additionally lead to betterquantitative results as well as to better insights into the development ofthe domain size morphology of both phases formed
It was already shown that in a hydrating raw mixture for AAC twospecies of portlandite precipitate at 23 degC one showing dynamicallyanisotropic peak broadening and another one following the isotropictrend [14] The application of the anisotropic refinement model led toan improved fitting of portlandite Moreover the mechanism of aniso-tropic domain growth of portlandite was tracked
2 Materials and methods
In order to examine the hydration of the AAC slurry before auto-claving a mixture of the hydraulic reactive components was weighedand measured in-situ at a Bruker D8 diffractometer with a LynxEyedetection system
Ordinary Portland cement (OPC) was mixed with lime (CaO) andanhydrite (C$) The raw materials were taken from the same batches asfor the industrial samples The drymix (58 OPC 36 CaO and 6 C$by weight) was then mixed with water (ws= 08) and placed into anappropriate sample holder The samples were not aerated The slurrysamples were covered with a kapton film to avoid evaporation andcarbonation Diffractograms were recorded with an angular range from7 to 545deg 2θ and a step width of 0011deg 2θ Measurements were carriedout every 15min For each measurement 96 XRD patterns were re-corded over the first 24 h The temperature was fixed at 70 degC which isthe mean temperature generally prevailing in the industrial processduring hydration before autoclaving Rietveld refinement was carriedout using the G-factor method All structures used for Rietveld refine-ment are shown in Table 1
For investigation of the autoclaved samples five different specimenswere taken at different autoclaving times The specimens were takenout of a technical production process hence it was not possible to in-terrupt the process at an earlier time inasmuch it would lead to damageof a whole concrete production batch The specimens were firstly driedat 60 degC until weight constancy The whole blocks were then broken andstatistical samples of 20 g were taken In order to receive the right massattenuation coefficient (MAC) for G-factor method the loss on ignitionand the chemical composition (XRF) were determined For energydispersive XRF analysis (Spectro Xepos) tube voltage from 20 kV to50 kV and tube current from 08 to 20mA were used for differenttargets
The final sample preparation (grinding) before XRD measurementswas carried out using both an agate mortar and a McCrone micronizingmill for wet milling with isopropanol Both preparation methods wereapplied separately to see which one is suitable in order to get the bestpreparation for XRD investigations Six preparations were performed byone operator of which two were prepared with an agate mortar andfour with a McCrone mill For the McCrone milling 3 g of the sampleand 10ml of isopropanol were used for grinding for 12min The grainsize distribution of one sample prepared with an agate mortar and onesample prepared using a McCrone mill was measured by laser granu-lometry in isopropanol using a Mastersizer 3000 (MALVERN)
After milling the samples in these two ways for XRD analysis thepowders were prepared into a front loading sample holder and mea-sured Diffractograms were recorded with an angular range from 6 to80deg 2θ a step width of 00236deg 2θ and a time per step of 054 s Rietveldrefinement combined with external standard (G-factor) was applied inorder to get absolute quantities for each phase The refinement strategyfor portlandite and tobermorite in the TOPAS Launch Mode (TOPAS50 Bruker AXS) is attached as a Supplementary material file
3 Results and discussion
31 Hydration of the mixture before autoclaving
The hydration of the investigated paste before autoclaving isdominated by the hydration of the cement as well as the reaction of thefree lime (CaO) resulting in the formation of portlandite It can beclearly seen from Fig 2 that the hydration of the paste leads to theformation of ettringite portlandite and C-S-H phase For simplificationthe remaining phase developments are not shown in Fig 2 because theyare not in the focus of this study The hydration of CaO forming
Fig 1 Simplified process steps of AAC production and hydrate phase evolution
Table 1Structures used for Rietveld refinement
Phase Author
Alite [15]Anhydrite [16]Bassanite [17]Belite (β) [18]Belite (αprime) [19]Brownmillerite [20]C-S-H [21]Calcite [22]Ettringite [23]Gypsum [24]Hemicarbonate [25]Hydroxylellestadite [26]Lime (CaO) [27]Microcline [28]Portlandite [29]Quartz [30]Tobermorite [31]Tricalciumaluminate (cubic) [32]Tricalciumaluminate (orthorhombic) [33]PONCKS model for Water [21]
J Schreiner et al Cement and Concrete Research 107 (2018) 247ndash252
248
6 Publications
40
portlandite begins rapidly after the addition of water to the mixture andlime is fully consumed after only 1 h of hydration This translates into aquick rise of heat of hydration so that cement hydration is acceleratedwhich leads to further portlandite formation by the reaction of aliteEttringite formation stalls after few hours of hydration After 12 h et-tringite is partially decomposed probably due to sulfate depletion [9]
and poorly crystalline AFm phases (not shown in Fig 2) are formedIn Fig 3 it can be seen that in fact two generations of portlandite
are formed a 1st dominant generation showing anisotropic peakbroadening and 2nd one occurring considerably later following theisotropic domain size refinement which is usually carried out using theRietveld method This occurrence comes along firstly with lime hy-dration and secondly with alite hydration The expected quantity ofportlandite formed from lime hydration very well complies with the
Fig 2 Phase development in AAC paste on a laboratory scale before autoclaving ana-lyzed by in-situ XRD at 70 degC
Fig 3 Formation of two generations of portlandite by hydration of lime (1st) and C3S(2nd) at 70 degC before autoclaving with the major generation showing anisotropic peakbroadening
Fig 4 Biaxial cylinder domain size model of portlandite used for Rietveld refinement of anisotropic peak broadening
Fig 5 Morphological evolution of portlandite showing anisotropic domain size growthduring hydration at 70 degC
Fig 6 Comparison of quantification of crystalline quartz in samples prepared withMcCrone mill and agate mortar at different autoclaving times
J Schreiner et al Cement and Concrete Research 107 (2018) 247ndash252
249
6 Publications
41
quantity of the observed 1st generation The development of portlan-dite growth was already tracked in an equivalent slurry at 23 degC [14]Thus this observation confirms that the crystallinity of portlandite inmixtures for AAC production depends on the starting phase for hydra-tion as already indicated by Ectors [14]
Fig 4 shows the used biaxial cylindrical model for anisotropic do-main size calculation and the portlandite structure which was createdwith structural software VESTA 318 [34] Using the cylindrical ap-proach domain sizes in a (here equating to b) and c direction(dz= cylinder height) can be calculated which comes along with theexpected symmetrical parameters of portlandite
The 1st portlandite generation showing anisotropic domain growthcan be tracked in terms of cylinder diameter and height which is rea-lized in Fig 5 The blue cylinder represents the geometric approach andcylinder height and diameter are calculated newly for each range Thecylinder height remains rather stable throughout the hydration processwhile the cylinder diameter increases during the first hours of hydra-tion After 10 h of hydration the mean cylinder diameter no longer in-creases Consequently these observations match the results of the ex-aminations conducted at 23 degC [14] as well as the assumption thatdifferent mechanisms of growth exist for portlandite depending on the
hydration educt The maximum cylinder diameter is reached earlier inthis work very likely because of the higher hydration temperature
32 Quantification of the reactions during autoclaving
Autoclaved samples were ground with an agate mortar and com-pared to samples which were wet-ground with a McCrone mill Fig 6shows precisely that the determination of the amount of crystallinequartz is more reproducible in the two shown samples which were
Fig 7 2D XRD with Bruker GADDS-system plots of samples prepared with agate mortar and McCrone mill Coarse quartz grains are pointed out in the plot of the sample prepared withagate mortar
Fig 8 Particle size distribution of one sample prepared with an agate mortar and of onesample prepared with a McCrone mill measured by laser granulometry
Fig 9 Rietveld refinement for Tobermorite of autoclaved AAC sample by use of isotropicdomain size model (a) and of anisotropic domain size model (b)
J Schreiner et al Cement and Concrete Research 107 (2018) 247ndash252
250
6 Publications
42
prepared with a McCrone mill The high variance of crystalline quartzin the samples which were prepared with an agate mortar is a result ofinsufficient grinding and remaining of too large quartz grains Whenthis spottiness occurs a reliable quantification using the G-factormethod is not possible
The 2D XRD with Bruker GADDS-system plots in Fig 7 demonstratethe insufficient grinding when using an agate mortar compared to wetmilling with a McCrone mill Quartz would be overrepresented in a one-dimensional XRD pattern focusing on a section with bright spots (greenarrows) The lack of bright spots in the right plot shows that the quartzgrains are milled more thoroughly using a McCrone mill In Fig 8 theparticle size distribution after both ways of sample preparation iscompared Most grains in the sample prepared with an agate mortar arelarger than in the sample prepared with a McCrone mill The grain sizedistribution of the sample prepared with a McCrone mill complies withthe recommended particle size range for XRD analysis of under 5 to50 μm [3536] while the other sample exceeds the range
In Fig 9 Rietveld refinement of an autoclaved sample is shown Thedominant peaks at 77 290 and 301deg 2θ are attributed to tobermoriteIn the upper diagram (a) Rietveld refinement was carried out regularlycalculating isotropic domain sizes for tobermorite However the cal-culated fit differs significantly from the raw data It can be assumed thattobermorite shows a similar pattern to portlandite in terms of aniso-tropic peak broadening taking into account that tobermorite is as-signed to the orthorhombic crystal system Thus instead of a biaxialcylinder model an elliptic cylinder model (Fig 10 structure createdwith VESTA 318 [34]) was applied for the refinement in the lowerdiagram (b) The elliptic cylinder model is a sufficient approach to the
orthorhombic crystal system as it allows the distinction between do-main sizes in a b and c direction The fit is clearly superior using theanisotropic domain size model highlighted by the difference plot inFig 9b The comparison refinement with isotropic and anisotropic ap-proach was done for all of the five autoclaved samples In Fig 11 theresulting Rwp values for the whole pattern and the RBragg values of to-bermorite are shown The refinement using the anisotropic model leadsto both lower Rwp and RBragg values and consequently to a better fit anda more accurate quantification of tobermorite in all refined samples
4 Summary and conclusions
Improved analytical methods for both the phase developmentduring the hydration before autoclaving and during the autoclavingprocess of AAC are presented It could be shown that wet McCronemilling is the best way of preparation of AAC samples in order to obtainsuitable samples for powder diffraction A new approach to treat ani-sotropic domain sizes for Rietveld refinement could be successfullyapplied ndash with the benefit that portlandite and tobermorite in AACsamples could be refined more accurately using the Rietveld methodThus this application allows an improved quantification of the phasedevelopment during both of the production steps
For the future there are still plenty of possibilities to apply thepresented approach of calculating anisotropic domain sizes to AACproduction As exemplified with portlandite the mechanisms of growthof tobermorite can be tracked likewise during the autoclaving processIn addition the effect of variations in the chemical composition of AACraw mixtures on the crystal morphology of tobermorite can be ex-amined This leaves a new perspective to discuss the link between mi-neral phase morphology and the thermal and mechanical properties ofAAC
Acknowledgement
The autoclaved samples were generously provided by RodgauerBaustoffwerke GmbH amp Co KG The authors express gratitude for allsupport
Appendix A Supplementary data
Supplementary data to this article can be found online at httpsdoiorg101016jcemconres201802028
References
[1] MW Grutzeck Cellular concrete in M Scheffler P Colombo (Eds) CellularCeramics Wiley-VCH Weinheim 2005 pp 193ndash223
[2] M Haas The future of AAC ndash from a material scientists point of view inMC Limbachiya JJ Roberts (Eds) Autoclaved Aerated Concrete Taylor FrLondon 2005 pp 187ndash194
[3] T Mitsuda K Sasaki H Ishida Phase evolution during autoclaving process ofaerated concrete J Am Ceram Soc 75 (1992) 1858ndash1863
[4] N Isu H Ishida T Mitsuda Influence of quartz particle size on the chemical and
Fig 10 Triaxial cylinder domain size model of Tobermorite used for Rietveld refinement of anisotropic peak broadening
Fig 11 Comparison of Rwp and RBragg values of Rietveld refinements of autoclavedsamples and tobermorite using the isotropic and the anisotropic domain size model
J Schreiner et al Cement and Concrete Research 107 (2018) 247ndash252
251
6 Publications
43
mechanical properties of autoclaved aerated concrete (I) tobermorite formationCem Concr Res 25 (1995) 243ndash248
[5] NY Mostafa Influence of air-cooled slag on physicochemical properties of auto-claved aerated concrete Cem Concr Res 35 (2005) 1349ndash1357 httpdxdoiorg101016jcemconres200410011
[6] K Matsui J Kikuma M Tsunashima T Ishikawa S Matsuno A Ogawa M SatoIn situ time-resolved X-ray diffraction of tobermorite formation in autoclaved aer-ated concrete influence of silica source reactivity and Al addition Cem Concr Res41 (2011) 510ndash519
[7] C Biagioni S Merlino E Bonaccorsi The tobermorite supergroup a new no-menclature Mineral Mag 79 (2015) 485ndash495 httpdxdoiorg101180minmag2015079222
[8] BH OConnor MD Raven Application of the Rietveld refinement procedure inassaying powdered mixtures Powder Diffract 3 (1988) 2ndash6 httpdxdoiorg101017S0885715600013026
[9] D Jansen F Goetz-Neunhoeffer C Stabler J Neubauer A remastered externalstandard method applied to the quantification of early OPC hydration Cem ConcrRes 41 (2011) 602ndash608 httpdxdoiorg101016jcemconres201103004
[10] D Jansen C Stabler F Goetz-Neunhoeffer S Dittrich J Neubauer Does OrdinaryPortland Cement contain amorphous phase A quantitative study using an externalstandard method Powder Diffract 26 (2011) 31ndash38 httpdxdoiorg10115413549186
[11] D Ectors F Goetz-Neunhoeffer J Neubauer A generalized geometric approach toanisotropic peak broadening due to domain morphology J Appl Crystallogr 48(2015) 189ndash194 httpdxdoiorg101107S1600576714026557
[12] D Ectors F Goetz-Neunhoeffer J Neubauer Routine (an)isotropic crystallite sizeanalysis in the double-Voigt approximation done right Powder Diffract 32 (S1)(2017) 27ndash34 httpdxdoiorg101017S0885715617000070
[13] HM Rietveld A profile refinement method for nuclear and magnetic structures JAppl Crystallogr 2 (1969) 65ndash71 httpdxdoiorg101107S0021889869006558
[14] D Ectors Advances in the Analysis of Cementitious Reactions and Hydrate Phases(Doctoral Thesis) (2016) pp 12ndash14 (urnnbndebvb29-opus4-71743)
[15] AacuteG De La Torre S Bruque J Campo MAG Aranda The superstructure of C3Sfrom synchrotron and neutron powder diffraction and its role in quantitative phaseanalyses Cem Concr Res 32 (2002) 1347ndash1356 httpdxdoiorg101016S0008-8846(02)00796-2
[16] A Kirfel G Will Charge density in anhydrite CaSO4 from X-ray and neutrondiffraction measurements Acta Crystallogr Sect B Struct Crystallogr CrystChem 36 (1980) 2881ndash2890 httpdxdoiorg101107S0567740880010461
[17] C Bezou AN Christensen D Cox M Lehman A Nonat Structures cristallines deCaSO405H2O et CaSO406H2O Comptes Rendus Hebd Des Seacuteances lAcadeacutemieDes Sci Seacuterie 2 (312) (1991) 43ndash48
[18] KH Jost B Ziemer R Seydel Redetermination of the structure of β-dicalciumsilicate Acta Crystallogr Sect B Struct Crystallogr Cryst Chem 33 (1977)1696ndash1700 httpdxdoiorg101107S0567740877006918
[19] W Mumme LMD Cranswick BC Chakoumakos Rietveld crystal structure re-finements from high temperature neutron powder diffraction data for the poly-morphs of dicalcium silicate Neues Jahrb Fuer Mineral Abhandlungen 170 (1996)171ndash188
[20] A Colville S Geller The crystal structure of brownmillerite Ca2FeAlO5Crystallographica 50 (1971) 2311ndash2315 httpdxdoiorg101107S056774087100579X
[21] ST Bergold F Goetz-Neunhoeffer J Neubauer Quantitative analysis of C-S-H inhydrating alite pastes by in-situ XRD Cem Concr Res 53 (2013) 119ndash126 httpdxdoiorg101016jcemconres201306001
[22] EN Maslen VA Streltsov NR Streltsova N Ishizawa Electron density and op-tical anisotropy in rhombohedral carbonates III Synchrotron Xray studies ofCaCO3 MgCO3 and MnCO3 Acta Crystallogr Sect B 51 (1995) 929ndash939 httpdxdoiorg101107S0108768195006434
[23] G Renaudin Y Filinchuk J Neubauer F Goetz-Neunhoeffer A comparativestructural study of wet and dried ettringite Cem Concr Res 40 (2010) 370ndash375httpdxdoiorg101016jcemconres200911002
[24] WF Cole CJ Lancucki A refinement of the crystal structure of gypsumCaSO42H2O Acta Cryst B30 (1974) 921ndash929 httpdxdoiorg101107S0567740874004055
[25] T Runčevski RE Dinnebier OV Magdysyuk H Poumlllmann Crystal structures ofcalcium hemicarboaluminate and carbonated calcium hemicarboaluminate fromsynchrotron powder diffraction data Acta Crystallogr Sect B Struct Sci 68 (2012)493ndash500 httpdxdoiorg101107S010876811203042X
[26] JM Hughes JW Drexler Cation substitution in the apatite tetrahedral site crystalstructures of type hydroxylellestadite and type fermorite Neues Jahrb FuerMineral (1991) 327ndash336
[27] CH Shen RS Liu JG Lin CY Huang Phase stability study of La12Ca18Mn2O7Mater Res Bull 36 (2001) 1139ndash1148
[28] SW Bailey Refinement of an intermediate microcline structure Am Miner 54(1969) 1540ndash1545
[29] WR Busing HA Levy Neutron diffraction study of calcium hydroxide J ChemPhys 26 (1957) 563 httpdxdoiorg10106311743345
[30] Y Le Page G Donnay Refinement of the crystal structure of low-quartz ActaCrystallogr Sect B 32 (1976) 2456ndash2459 httpdxdoiorg101107S0567740876007966
[31] SA Hamid The crystal structure of the 11 Aring natural tobermoriteCa225[Si3O75(OH)15]1H2O Zeitschrift Fuer Krist - New Cryst Struct 154 (1981)189ndash198 httpdxdoiorg101524zkri19811543-4189
[32] P Mondal JW Jeffery The crystal structure of tricalcium aluminate Ca3Al2O6Acta Crystallogr B 31 (1975) 689ndash697 httpdxdoiorg101107S0567740875003639
[33] Y Takeuchi F Nishi I Maki Crystal-chemical characterization of the tricalciumaluminate-sodium oxide (3CaOtimesAl2O3-Na2O) solid-solution series Zeitschrift FuumlrKrist (1980) 259ndash307
[34] K Momma F Izumi VESTA 3 for three-dimensional visualization of crystal vo-lumetric and morphology data J Appl Crystallogr 44 (2011) 1272ndash1276 httpdxdoiorg101107S0021889811038970
[35] K Scrivener R Snellings B Lothenbach A Practical Guide to MicrostructuralAnalysis of Cementitious Materials CRC Press 2016 pp 123ndash125 httpdxdoiorg107693wl20150205
[36] V Pecharsky P Zavalij Fundamentals of Powder Diffraction and StructuralCharacterization of Materials Springer second edition 2005 p 302 httpdxdoiorg101007978-0-387-09579-0
J Schreiner et al Cement and Concrete Research 107 (2018) 247ndash252
252
6 Publications
44
7 Acknowledgement
7 Acknowledgement
Ich moumlchte mich bei einigen Personen bedanken ohne die es wohl kaum zum erfolgreichenAbschluss dieser Arbeit gekommen waumlreMein Doktorvater Prof Dr Juumlrgen Neubauer hat sich stets die Zeit genommen die noumltigwar um Angelegenheiten aller Art mit mir zu klaumlren Er gab mir fachlich immer zumrichtigen Zeitpunkt einen gewissen wissenschaftlichen Impuls Zugleich habe ich mich den-noch immer frei in meiner eigenen Konzeption gefuumlhlt Groszligen Dank spreche ich Prof DrFriedlinde Goumltz-Neunhoeffer aus die fuumlr mich ebenso immer eine verlaumlssliche Ansprech-partnerin fuumlr fachliche und organisatorische Angelegenheiten aller Art war Danke anDr Daniel Jansen fuumlr die gute Zusammenarbeit und dafuumlr dass er mich im Zuge meinerMasterarbeit in ein Forschungsprojekt aufgenommen hat das den Weg zur Promotionmoumlglich machte Zusaumltzlich gilt mein Dank Prof Dr Matthias Goumlbbels der fuumlr dieMitarbeiter am Lehrstuhl immer motivierende Worte fand Fuumlr die Ermoumlglichung meinerTeilnahme an diversen Dienstreisen Fortbildungen und Tagungen moumlchte ich mich viel-mals bedankenWeiterhin bedanke ich mich bei Dr Stephan Volkmann und den Rodgauer BaustoffwerkenGmbH amp Co KG fuumlr die gute Zusammenarbeit und die Bereitstellung von Versuchsma-terialienVielen Dank an meine studentischen Hilfskraumlfte Daniel Wagner Laura MoldenhauerFabian Lang Jakob Schreiber und Felix Klaassen die alle Aufgaben im Labor einwand-frei und mit Bedacht erledigten Bei meinen aktuellen und ehemaligen Kollegen DrKatrin Hurle Dr Dominique Ectors Dr Christoph Naber Dr Florian Huumlller JoumlrgNehring Frank Riedel Julian Wolf Tanja Manninger Daniel Wagner Nicolas FobbeKarla Spaumlth Julian Goergens Andreas Koumlhler Cordula Jakob Franz Becker und LisaKlemenz bedanke ich mich fuumlr die gelungene Zusammenarbeit und gegenseitige Unter-stuumltzung Besonderer Dank geht auch an Kerstin Kreszlig Bettina Engl Christian HankeBernd Schleifer und Christian Abe fuumlr die verlaumlssliche Unterstuumltzung bei technischen Fra-gen und Messungen im LaborFuumlr jegliche Unterstuumltzungen moumlchte ich mich auch bei meinen Eltern bedanken sowiebei meinem Bruder Ralf der mir mit einem LaTex Crashkurs viel Frustration ersparthat Danke Thomas dass du immer fuumlr mich da bist und mit mir zusammen fuumlr genugAusgleich gesorgt hast
45
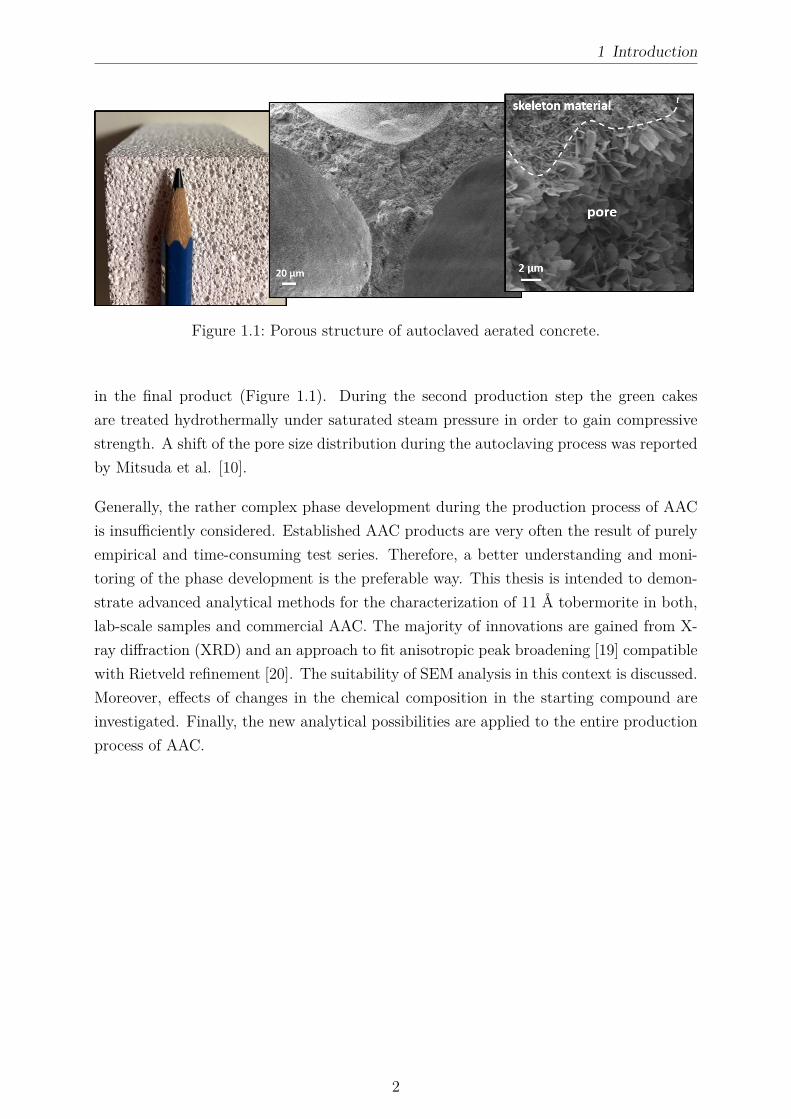
1 Introduction
Figure 11 Porous structure of autoclaved aerated concrete
in the final product (Figure 11) During the second production step the green cakesare treated hydrothermally under saturated steam pressure in order to gain compressivestrength A shift of the pore size distribution during the autoclaving process was reportedby Mitsuda et al [10]
Generally the rather complex phase development during the production process of AACis insufficiently considered Established AAC products are very often the result of purelyempirical and time-consuming test series Therefore a better understanding and moni-toring of the phase development is the preferable way This thesis is intended to demon-strate advanced analytical methods for the characterization of 11 Aring tobermorite in bothlab-scale samples and commercial AAC The majority of innovations are gained from X-ray diffraction (XRD) and an approach to fit anisotropic peak broadening [19] compatiblewith Rietveld refinement [20] The suitability of SEM analysis in this context is discussedMoreover effects of changes in the chemical composition in the starting compound areinvestigated Finally the new analytical possibilities are applied to the entire productionprocess of AAC
2
2 State of research
2 State of research
21 Mineralogical characteristics of 11 Aring tobermorite
211 Tobermorite structure
The orthorhombic tobermorite structure basically consists of sevenfold coordinated [21]calcium polyhedral layers and silicate tetrahedral chains (Figure 21) [3] Running alongb two pairing tetrahedra centered by Si cations are connected by another Si-centeredbridging tetrahedron [3]Apart from the undisputed layered structure and the wollastonite-like chains severalapproaches have coexisted regarding the possible space groups and the location of theremaining calcium cations and water molecules in the lattice of 11 Aring tobermorite [321 22 23] However Biagioni et al presented a new nomenclature for the tobermoritesupergroup including very precise structures [4] Oxygen atoms hydroxyl groups andwater molecules are located at the apical sites of the calcium polyhedra The Si-centeredbridging tetrahedra of the wollastonite-like chains share the oxygen and hydroxyl groupswith the calcium polyhedra Merlino et al and Biagioni et al stated that additional watermolecules and cations are located in structural cavities running along b [3 4] According toMerlino et al and Bonaccorsi et al the content of these zeolitic cavities is the determiningfactor for the resulting tobermorite species [3 24] The additional cation in the interlayeris primarily calcium so that there is a variability of calcium content between 4 and 5 atomsper formula unit [4] 11 Aring tobermorite is characterized by the calcium-rich endmemberof this series [4] The interlayer calcium is then sixfold-coordinated by framework oxygenatoms The amount of interlayer water molecules determine the degree of hydration andthe basal spacing of the resulting tobermorite species [24] The reader is referred to awell-specified categorization of all tobermorite polytypes provided in the publications byMerlino et al Bonaccorsi et al and Biagioni et al [3 4 24 25]
3
2 State of research
Figure 21 Calcium polyhedral layers and silicate tetrahedral chains in 11 Aring tobermoritestructure according to Merlino et al [3] Si1 and Si3 = pairing tetrahedra Si2= bridging tetrahedra Interlayer water molecules and cations are not shownFigure created with VESTA 316 [26]
4
2 State of research
212 Synthesis of stoichiometric 11 Aring tobermorite
The starting materials required for the hydrothermal synthesis of stoichiometric tober-morite are quartz flour or a different silica source calcium oxide or calcium hydroxideand deionized water [7 22] In accordance with the chemical formula the starting mixappropriately conforms to a CaSi molar ratio of about 08 [9 27]After preparing the slurry a distinct temperature setting of 170-180 degC autogenous satu-rated steam pressure (1ndash12 MPa) and a curing time of 12 h were recommended [5 7 28]Consequently an elevated water-to-solid ratio [7 23] in the starting mix and high over-all water content are required in order to ensure a saturated steam atmosphere in thelaboratory autoclave Qu et al showed that shorter curing times led to a lower reac-tion turnover [6] According to Šiaučiunas amp Baltakys at prolonged curing duration theformation of xonotlite (Ca6Si6O17(OH)2) was favored [7] It has been reported that thesurface area and solubility of all raw materials have an effect on the reaction time andreaction products [7 9 29] For instance gyrolite formation was triggered by highly sol-uble amorphous SiO2 in a study by Šiaučiunas amp Baltakys [7] El-Hemaly et al showedthat when amorphous type of silica was used the formation of C-S-H was accelerated butthe subsequent conversion to tobermorite was slowed down [22]The simplified hydrothermal reaction path (equation 21) [10 27 30] for the formationof stoichiometric tobermorite was described as follows Depending on the surface areaof raw materials the dissolution of Ca(OH)2 and SiO2 in the hydrothermal environmentinitially leads to the formation of a C-S-H gel which is characterized by poor structuralorder in c direction [22 27] The CaSi molar ratio in this precursor is variable [30] Thehydrothermal reaction proceeds and the C-S-H gel transforms into tobermorite but with amore particular CaSi ratio of approximately 083 The CaSi ratio decreases in this stepas further SiO2 is dissolved and supplied for reaction [10] Within this step periodicityin c direction increases and the calcium polyhedral layers and silicate chains gain morestructural order as reported by Shaw et al [27]
xCa(OH)2 + ySiO2 +H2O =rArr C-S-H gel =rArr C-S-H gel + zSiO2 =rArr tobermorite
(21)
Commonly pure phase synthesis of tobermorite is hardly attainable and some minorphases and amorphous content are frequently present in samples after hydrothermal cur-ing Common additional phases occurring in this system include calcite quartz xonotlitescawtite and poorly crystalline C-S-H with varying CaSi composition [7 9 31]In most studies autoclaved samples were dried at 60 - 100 degC [6 29] and ground prior
5
2 State of research
to further analyses Synthesized samples are commonly investigated by means of ther-mogravimetric analysis (TGA) combined with differential thermal analysis (DTA) SEManalysis and X-ray diffraction For estimation of the chemical purity of tobermorite usu-ally the basal spacing of 113 Aring is verified by XRD analysis as substitutions such as Al3+
incorporation would reflect in it [15 28] Moreover according to Mostafa et al and Quet al stoichiometric tobermorite showed plate-like morphology in SEM images [6 32]
213 Substitutions in the lattice of tobermorite
The incorporation of foreign ions into the lattice of tobermorite has been investigated intwo major respects In the first case the substitutions occur during the application ofpreviously synthesized tobermorite The potentials of these substitutions were exemplar-ily highlighted in chapter 1 [14 15] In the second case the substitutions occur duringthe hydrothermal formation of tobermorite Whenever a basic compound includes chem-ical components apart from calcareous materials and silica substitution in the lattice oftobermorite is likely to happen during the hydrothermal reaction Biagioni et al statedthat Al-free natural tobermorite is extremely rare [4]Supplementary cementitous materials (SCMs) are established components in various ap-plications - equally in AAC production Merchantable SCMs are usually limited to wellavailable materials so that only distinct foreign ions are supplied in a considerable scaleCalcined clays diatomite blast furnace slag and especially metakaolin are amongst themost frequent materials for this purpose [31 33 34 35] They are in turn characterizedby a specific chemical composition These raw materials supply primarily aluminum andalkali metal cations In addition the presence of sulfate ions in the system has been con-sidered by some authors since sulfate is a component in most composites for construction[32 36]Sakiyama amp Mitsuda and Rios et al successfully synthesized Al-substituted tobermoriteby applying different amounts of kaolinite and metakaolin [5 23] The incorporation ofAl3+ into the lattice of tobermorite resulted in lath-like crystals1 observed by SEM anal-ysis At a higher Al3+ dosage the formation of katoite was reported Skawinska et alinvestigated various halloysite contents in the initial mix [34] They confirmed katoiteformation caused by increased supply of Al3+ The substitution of Si4+ by Al3+ in thetetrahedral chains ranges to a possible 16 substitution of the tetrahedral sites reaching anAl content up to 1 Al atom per formula unit [4] Merlino et al explained that this mainlyoccurred in the bridging tetrahedron and for charge balance additional (OH)ndash substitutedO2ndash in one site [3] This leads to an increase of the basal spacing and lattice parameter c
1The terminology of observed crystalline particles is addressed in subsection 222
6
2 State of research
which was observed in several studies [15 28 37] In a different publication by Jacksonet al the incorporation of additional Na+ or K+ for charge balance was suggested [38]Matekonis et al stated that in this case tobermorite showed anomalous thermal behavior[29] Furthermore 29Si NMR measurements revealed that the substitution by Al3+ led toan increase of the chain length in b direction [38 39] Klimesch amp Ray performed thermalanalysis of Al-free and Al-substituted tobermorites [40] They reported that in the caseof Al3+ incorporation the conversion of 93 Aring tobermorite into β-wollastonite required ahigher temperature This observation is discussed later in this thesis (section 31) Qu etal performed XRD analysis and considered relative intensity broadening of Al-substitutedtobermorite reflections in order to estimate the crystallinity [6] However the broaden-ing was not measured and evaluated The present thesis provides extensive insights intothe evaluation of the peak broadening of tobermorite depending on the supply of Al3+ (section 31 and section 32)According to Mostafa et al substitution by (SO4)2ndash in the lattice of tobermorite led tobasal imperfection [32] Their study was mainly based on XRD analysis and FTIR spec-troscopy It was suggested that charge balance was achieved by substitution of (SO4)2ndash
and 2 (OH)ndash for (SiO4)4ndash Moreover the transformation of C-S-H gel into tobermorite wasaccelerated The sulfate-substituted tobermorite showed leafy crystals in SEM imagesBy contrast Sauman amp Valtr stated that the morphology of sulfate-substituted tober-morite did not differ substantially from the morphology of stoichiometric tobermoritecrystals [41] Instead anhydrite formation was observed by means of XRD analysis Insection 32 of this thesis a new perspective on this discussion is provided
22 Characterization of autoclaved aerated concrete
Supplied materials for AAC fabrication are transforming continuously during the pro-duction process which is displayed in Figure 22 [42] It can be seen that the phasetransitions before autoclaving remind of ordinary portland cement (OPC) hydration [43]The following main reactions run during the hydration before autoclaving [10 12 17]
CaO +H2O =rArr Ca(OH)2 (22)
Ca3SiO5 + 39H2O =rArr C17SH26 + 13Ca(OH)2 (23)
Ca3Al2O6 + 3CaSO4 + 32H2O =rArr Ca6Al2(OH)12(SO4)3 middot 26H2O (24)
This process step is finished when the generation of pores along with simultaneous expan-sion is completed and sufficient strength for wire cutting has developed through hydration
7
2 State of research
The reaction of aluminum powder does not only lead to the formation of hydrogen gasbut to very low amounts of different modifications of aluminum hydroxide [17] Howeverit can be seen that none of the hydrate phases forming during the green cake settingendure the autoclaving process Only quartz does partially not react and is consequentlypresent in the final product After transforming into ettringite and later AFm phasesinitially supplied anhydrite recrystallizes during the hydrothermal treatment A multi-step reaction sequence of C-S-H portlandite and further intermediate hydration productsleads to the crystallization of tobermorite The reader is referred to the comprehensivestudy of Schober for a more detailed presentation [17] Further supply of dissolved silicaat hydrothermal conditions contributes to the formation of tobermorite in the manneroutlined in equation 21 Clearly tobermorite is the major mineral phase present afterautoclaving and is therefore the main focus of research In the following subsections 221and 222 the state of knowledge concerning the characterization of AAC by means ofSEM analysis and XRD analysis is provided
Figure 22 Exemplary phase development during the entire production process of AACFigure adopted with permission from Schober [42]
221 SEM analysis
At first sight AAC has rather favorable properties compared to hydrated Portland cementwhen it comes to SEM analysis Due to the hydrothermal treatment several phases such
8
2 State of research
as tobermorite show better crystallinity In addition the hardly evitable effects of dam-age to poorly crystalline phases and removal of water are not as significant in the case ofAAC This is why environmental scanning electronic microscopy (ESEM) was suggestedin order to investigate hydrated Portland cement after early hydration [44 45] Howeverwhile hydrated OPC is a reasonably homogeneous material AAC shows heterogeneitydue to the porous structure (Figure 11)As reported in subsection 213 several authors investigated the morphology of tober-morite in AAC in order to verify the influence of foreign ions supplied by SCMs andestimate their effect on the thermal and mechanical properties Well crystallized tober-morite often shows a house-of-cards structure in AAC (Figure 23) which was observedin numerous studies [46 47 48]
Figure 23 House-of-cards appearance of tobermorite crystals in AAC
Wongkeo amp Chaipanich stated that the application of coal bottom ash for partial replace-ment of cement in the starting compound resulted in a change of plate-like to lath-likemorphology of tobermorite crystals [49] Equally thin lath-like plates of tobermorite wereobserved by Roacuteżycka et al in samples prepared from perlite waste [50] Venhodovaacute etal investigated AAC samples prepared from mixes including fly ash and Al(OH)3 andconfirmed the elongated shape of Al-incorporated tobermorite [8] In these studies thefraction of aluminum ions was increased by adding the respective SCM An effect on themorphology of tobermorite was respectively reported which conforms to the conclusionsmade by different authors in subsection 213 Nevertheless the heterogeneity of AACsamples in SEM images was barely addressed in all of these examples By contrast Mit-suda et al differentiated between macropores and micropores in their SEM images ofindustrially manufactured AAC [10] Huang et al separately analyzed walls and pores in
9
2 State of research
their samples prepared from copper tailings and blast furnace slag [48] The wall sectionsappeared dense while in pores platy tobermorite and long-strip shaped anhydrite wasobserved Only the tobermorite crystals in the pores showed the previously describedhouse-of-cards structure As is evident from these published results there is a lack ofclarity about the meaning and informative value of observations made in AAC samplesby SEM analysis In the main results of this present thesis (section 32) a substantiatedassessment of this circumstance is given
222 XRD analysis
While SEM analysis of AAC is majorly performed in order to characterize the crystallinityand morphology of tobermorite XRD analysis is mainly applied in order to assess theoverall phase composition Apart from the phases shown in Figure 22 additional calcitefeldspar mica gypsum and bassanite occur frequently in AAC depending on the miner-alogical composition of the used raw materials Frequently minor phases are unreactedresidual components of raw materials such as sericite in the publication of Isu et al [51] orphlogopite in the study of Huang et al who applied skarn-type copper tailings for AACpreparation [48] Prolonged curing duration resulted in minor quantities of xonotlite inthe study by Mitsuda et al [10]Mainly qualitative phase contents have been determined based on XRD in studies dealingwith the mineralogy of AAC A clear recognition of amorphous content in AAC along withthe crystalline phases has been barely addressed and discussed Relative quantities weredetermined by Matsui et al by plotting normalized intensities [28] They estimated thequantity of C-S-H gel by regarding the integrated intensity of the assumed tobermoriteprecursor in a distinct section of the XRD pattern Coming in agreement with the authorscited in subsection 213 increased d spacing along c in Al-substituted tobermorite wasreported in the same study Venhodovaacute et al performed XRD analysis of AAC samplesin their publication previously addressed in subsection 221 [8] They compared relativeintensities of tobermorite in their samples but no absolute quantities of the phases werecalculated either Mitsuda et al applied an internal standard method in order to quantifyunreacted quartz in their AAC samples [10]More recently Ectors proposed a promising method for the tracking of portlandite forma-tion during the green cake hydration [52] By applying a Rietveld compatible approachfor TOPAS 50 (Bruker AXS) to fit anisotropic peak broadening due to domain mor-phology [19] two generations of portlandite could be refined separately and assigned tothe hydration of calcium oxide and tricalcium silicate respectively The key idea behindthis approach is that the average domain morphology of a mineral phase in a powder
10
2 State of research
sample implies certain mineralogical characteristics The simplified domain morphologycan be calculated on the basis of geometrical shapes such as cylinder ellipsoid or cuboidDepending on the crystal system and the expected morphology the geometrical shapecan be adjusted accordingly In the example reported by Ectors the one generation ofportlandite originating from burnt lime hydration showed anisotropic peak broadening- unlike the generation forming from tricalcium silicate hydration In accordance withthe trigonal crystal system a biaxial cylinder model was applied for the fitting of theanisotropic generation The operating principle of the approach to fit the anisotropicpeak broadening due to domain morphology can be precisely explored by accessing fur-ther publications by Ectors et al [53 54] Apart from this benefit a better fit to themeasured data enables a more accurate refinement and quantification of all phases Thetwo generations of portlandite were additionally quantified by means of an external stan-dard method [55] The combination of quantitative phase analysis by XRD (QXRD) withthe refinement of anisotropic peak broadening is a promising approach in this context -especially in consideration of the fact that phase quantifications in AAC samples havebeen barely performed ever before Hence the application of these methods is the keymatter of this present thesis Especially the potential of the domain morphology analysisof tobermorite is precisely investigated The terms domain size and domain morphology inthis sense refer to the coherently scattering unit measured by XRD analysis Crystallineparticles observed by means of electron microscopy which are frequently termed grainscrystals or crystallites are for the most part clusters of coherently scattering domains[56 57]
11
3 Main results
3 Main results
This chapter introduces the main results presented in three peer reviewed publications[58 59 60] incorporated in chapter 6 The new findings are put in a general context andsubsequently they are summarized and discussed in chapter 4 The sections 31 and 32deal with the characterization of tobermorite in both lab-scale samples and AAC sam-ples produced on an industrial scale In section 33 the entire production process of AACincluding the hydration before autoclaving is addressed
Figure 31 Application of a triaxial cylinder model for the calculation of anisotropic do-main sizes of tobermorite implemented with Rietveld refinement and influenceon the fit compared to ordinary refinement [60]
12
3 Main results
One particular main result is a key element in each of the following sections In Figure 31the fit of tobermorite after two Rietveld refinements of different accuracy is shown In aregular Rietveld refinement for simplification the coherently scattering units are treatedas spherical shapes as usually only one size value for each mineral phase is calculated Asaverage domain sizes of a mineral phase in different crystallographic directions are in manycases indeed close to one value this approximation is often sufficient in order to achievea satisfactory fit to the measured diffractogram The crystal system and surroundingconditions during the formation of a mineral phase are significant factors in this context Amisfit at different (hkl) reflections as displayed in Figure 31 is an indication of anisotropicpeak broadening Clearly orthorhombic tobermorite shows anisotropic peak broadeningdue to its anisotropic domain morphology For the possible origins of anisotropic peakbroadening apart from size broadening the reader is referred to section 61 In accordancewith the orthorhombic crystal system a triaxial model is applied in order to fit the peakbroadening [19] By implementing the macro during the refinement no longer one butthree sizes (x y and z for respectively a b and c direction) are calculated Besides theimproved fit the calculated domain morphology is an additional information extractedfrom XRD analysis and it is representative for the average value of the phase in the entiresample In each of the following sections the different benefits regarding this approachare outlined in more detail
31 Hydrothermal synthesis of tobermorite on alaboratory scale - application of two types ofmetakaolin
This study covers mineralogical properties of tobermorite synthesized from a set of variouscompounds including different amounts and types of metakaolin [58] Unlike in sections32 and 33 the samples were not aerated before autoclaving and their composition isadjusted to the CaSi molar ratio of stoichiometric tobermorite On the one hand thereactivity of metakaolin and minor phases at hydrothermal conditions for the possible usein AAC production was investigated On the other hand the effects of consequent changesof the bulk chemistry in the basic compound on the mineralogical characteristics of to-bermorite such as lattice parameters and domain morphology were analyzed In additionfor one particular compound the effect of different curing times was explored While theconventional raw materials for AAC production are rather low-cost resources metakaolinis a high-priced SCM in this regard For this reason besides one comparatively pure com-mercial metakaolin (MK) a second by-product type of metakaolin (MKg) was applied
13
3 Main results
at equivalent dosages All investigated mix composites and the chemical composition ofMK and MKg are summed up in tables in section 61In Figure 32 the effect of different amounts of the two types of metakaolin on the phasequantities is displayed Clearly at moderate dosages of MK and MKg tobermorite waspresent in comparable quantities However the application of any amount of metakaolinreduced the amount of tobermorite compared to the blank mixture It can be seen thatkatoite was present whenever the content of Al2O3 in the starting drymix exceeded 2wt which fits well with the state of knowledge [5 23] For the highest possible dosagesof the two types of metakaolin (MK60 and MKg60) contrary effects were observed Ap-plication of impure metakaolin (MKg) led to a considerable amount of tobermorite whilein MK60 no tobermorite was present The high content of Al2O3 seems to have hinderedthe formation of tobermorite Not all of the Al2O3 in MKg was supplied for reactionas minor phases such as feldspar remained unreacted which is shown accurately in therespective publication in section 61
Figure 32 Weight fractions of tobermorite quartz and katoite measured by QXRD anal-ysis and contents of Al2O3 in the starting drymix Amorphous content andminor phases are not shown
The results of thermal analysis of samples characterized by MK addition in small stepsare shown in Figure 33 It can be seen that the conversion of 93 Aring tobermorite into β-
14
3 Main results
wollastonite depended on the dosage of MK However unlike suggested by Klimesch ampRay there was no effect of lower contents of Al2O3 in the drymix [40] Consequently theinfluence of Al3+ at low dosages (MK25 and MK5) could not be observed on the basisof this method Apart from this result the other signals showed good agreement with thesuggested conversion ranges by Klimesch amp Ray as for samples MK9 and MK16 a clearshift towards higher temperature was measured However the role of Al3+ incorporationverified by this method is not necessarily conclusive as additional reactions during theheating experiment involving Al3+ are possible On that basis the observations madeby means of DTA would not reflect the amount of Al3+ originally incorporated into thestructure of 11 Aring tobermorite
Figure 33 Conversion of 93 Aring tobermorite into β-wollastonite in samples synthesizedwith various amounts of metakaolin and suggested temperature ranges ac-cording to Klimesch amp Ray [40]
In accordance with authors referenced in subsection 213 lattice parameter c of tober-morite increased with elevated dosages of Al2O3 in the basic dry mix (Figure 34) Theimpact could be observed for the complete range of samples as displayed in section 61which indicates that a limit of Al3+ incorporation was not reached in this study Forcomparison the relative domain morphology is plotted in Figure 34 Unlike the DTA
15
3 Main results
signals both lattice parameter c and the domain morphology are impacted by very lowdosages of Al2O3 There is a good accordance of the relation of growth in b direction to adirection and the c parameter This is valid up to 20 wt of Al2O3 in the starting drymix By contrast more elevated contents of Al2O3 did not affect the domain morphologyany further even though the incorporation is verified through the increased c parameterIt follows that the impact of Al3+ incorporation on the domain morphology is limited tovery low contents while the impact on lattice parameter c can be tracked throughoutthe entire examined range of samples In section 61 additional results show that growthin b direction increased with reaction time These observations are solely based on XRDanalysis and offer new benefits for the structural understanding of tobermorite
Figure 34 Impact of the calculated Al2O3 content in the basic dry mix on the latticeparameter c and on the relation of calculated domain sizes of tobermorite ina (x) and b (y) direction
16
3 Main results
32 Structural properties of tobermorite in AAC - SEMversus XRD analysis
This section and the respective publication [59] mainly deal with the suitability of SEManalysis of tobermorite in AAC The effects of varying amounts of SO3 and Al2O3 in thedry mix on structural properties of tobermorite are discussed based on XRD analysisAs shown in subsection 221 and Figure 23 tobermorite often shows a house-of-cardsstructure in AAC samples This property has been considered to be relevant for thethermal and mechanical properties of AAC (subsection 221) However SEM analysiswithin this study revealed that this type of appearance is mainly found in the poresand pore surfaces (Figure 35) This finding comes in agreement with the observationsmade by Huang et al [48] In the solid skeleton of the dense AAC material neither themorphology nor the house-of-cards structure could be observed properly which can beseen very clearly in additional micrographs provided in section 62 It should be consideredthat the major amount of tobermorite by weight is located in the dense material and notat the pore surfaces In this way these findings are clear disadvantages coming along withonly SEM analysis of AAC as representative results can hardly be obtained
Figure 35 House-of-cards structure of tobermorite in a pore surrounded by dense mate-rial
Moreover several authors in subsection 221 justified the morphology of tobermorite withthe incorporation of foreign ions Al-substituted tobermorite showed lath-like morphologywhereas Al-free tobermorite showed rather plate-like morphology [6 32 49] Howeverthe present investigation revealed that independent of Al2O3 content in the raw mix there
17
3 Main results
is always heterogeneity regarding the morphology of tobermorite In Figure 36 plate-likeand lath-like morphology of tobermorite in AAC observed in two statistical chemicallyvarious samples are displayed This result supports the previous assumption that theobservations made by SEM analysis of tobermorite in AAC strongly depend on whatpart of the sample is selected Yet again no clear observations could be made that wererepresentative for the entire sample
Figure 36 Heterogeneous morphology of tobermorite (plate-like in a and c lath-like in band d) in two AAC samples characterized by different Al2O3 contents in theraw mix
The effects of Al3+ on the domain morphology of tobermorite were measured and evaluatedin a similar manner as in section 61 and the results could be confirmed The relativedomain growth in b direction was increased by Al3+ incorporation in both studies [5859] Moreover lattice parameter c was increased with Al3+ incorporation which can beseen more accurately in section 62 Unlike SEM analysis XRD analysis allowed clearconclusions whenever structural properties of Al-substituted tobermorite were affectedInstead of a local observation as made with SEM representative and statistical resultswere obtained The reader is referred to section 61 and section 62 for further results and
18
3 Main results
more specific conclusionsIn addition the effect of various amounts of sulfate in the raw mix was analyzed Unlikein the case of different dosages of Al3+ neither the domain morphology nor the latticeparameters of tobermorite were affected by the SO3 content in the dry mix In Figure 37these observations and additionally the amounts of anhydrite measured by QXRD areshown As the amount of available SO3 in the dry mix is known the maximum possibleamount of anhydrite could be calculated for each of the samples in focus Obviouslythe measured amounts of anhydrite are either equal or slightly higher compared to theexpected quantities This result leads to the assumption that all of the available sulfateis transformed into anhydrite so that no more sulfate could be incorporated into thestructure of tobermorite The over-estimation of anhydrite in some of the samples can beexplained due to the inaccuracy of the quantification method The present results rathermatch with the suggestions by Sauman amp Valtr [41] as in their study no effect of sulfateon the structure of tobermorite was observed either
Figure 37 Impact of the sulfate content in the AAC raw mix on lattice parameter cand relative domain morphology of tobermorite (a) and comparison of theexpected maximum amount of anhydrite to the measured amount determinedby QXRD (b)
33 Improved monitoring of the phase developmentduring the production of AAC
In this study not only autoclaved samples were analyzed but additionally a lab-scale slurrywhich included the reactive components of the green cake stage during AAC productionat equivalent weight proportions In-situ XRD was performed at 70 degC and at a water-to-
19
3 Main results
solid ratio of 08 for 24 h (Figure 38) which are respective conditions during commercialproduction Clearly the phase development is dominated by OPC and lime hydration asdescribed in section 22 It can be seen that the major reaction turnover occurs duringthe first 200 minutes which is the average duration of the green stage After only 30minutes all of the quicklime had transformed into portlandite whereas Schober proposeda duration of one hour for this reaction [42] The amount of portlandite is composed oftwo different generations as proposed by Ectors [52] Equally a biaxial cylinder modelwas applied in order to fit the peak broadening of the first generation of portlandite in thepresent investigation Minor phase developments such as the formation of AFm phases arenot shown in Figure 38 A coarse fraction of anhydrite did not react so that constantlyaround 15 wt were measured after 6 h As the decomposition of ettringite due tosulfate depletion [55] does not occur prior to 12 h the green cake strength is not affected
Figure 38 In-situ XRD measurement of AAC model slurry at water-to-solid ratio of 08and 70 degC For clarity and comprehensibility not all phases are shown
The separation of two generations of portlandite in the system does not only translate intodifferent domain morphologies as shown by Ectors [52] In Figure 39 more indicationsfor different mineralogical properties are displayed The shape of the (0 0 1) reflection inXRD patterns after only quicklime hydration and after both quicklime and alite hydrationshows a distinct feature While portlandite originating from quicklime hydration showsa broad peak implying lower crystallinity the peak after alite hydration is characterized
20
3 Main results
Figure 39 Formation of two generations of portlandite in AAC slurry in XRD (a) andDTA (b) plots
by a sharper component Yet the peak breadth did not change indicating that the firstgeneration is still present with the original characteristics This observation is supportedby DTA measurements additionally demonstrating two degrees of crystallinity only afteralite hydration In agreement with XRD analysis the better crystalline second generationof portlandite decomposes at a higher temperature
Figure 310 Quantification of tobermorite in statistical chemically various AAC sampleswith and without the application of the macro for the fitting of anisotropicpeak broadening
21
3 Main results
Furthermore commercial AAC samples were considered in this study By applying themethod for the refinement of anisotropic peak broadening (Figure 31) a more accuratequantification of tobermorite can be achieved In Figure 310 the calculated amounts oftobermorite in statistical chemically various AAC samples are plotted In some samplesthe refinement using the macro leads to considerably higher but never lower quantitiesof tobermorite whereas in other samples nearly the same amount of tobermorite is cal-culated This observation can be well understood taking into account that the macroallows to account more peak area for tobermorite as shown in Figure 31 Clearly thereis evidence that the anisotropy of tobermorite domains is not uniform from one sampleto another which was basically justified in the previous sections As an improved quan-tification of a single phase leads to a better quantification of other phases in the samplethis adaption is very valuable in order to assess the phase development Here the peakbroadening of tobermorite equally observed by Qu et al [6] could be tracked and evalu-ated in order to gain more accurate results Moreover in section 63 McCrone milling issuggested in order to avoid spottiness in XRD patterns caused by coarse grains of quartzor anhydrite (Figure 38)
22
4 Conclusions
4 Conclusions
The research results presented in the previous sections yield advances in the mineralogicalinvestigation of tobermorite and autoclaved aerated concrete Recorded diffraction pat-terns contain plenty of usually unused data regarding the microstructural characteristicsof the sample and phases therein The profit of XRD measurements can be significantlyimproved whenever one or more phases show anisotropic peak broadening and appro-priate models for the respective domain morphology are implemented into the Rietveldenvironment Within the scope of the present investigations portlandite and tobermoriteshow this particularityThe effects of changes in the chemistry of the starting mix were examined based on dif-ferent dosages of metakaolin Al-substituted tobermorite showed increased growth in b
direction and an increase of lattice parameter c compared to Al-free tobermorite The rel-ative domain sizes were determined based on anisotropic peak broadening However whilethe effect of Al3+ incorporation into the lattice of tobermorite was limited regarding thedomain morphology lattice parameter c showed an increase throughout the entire rangeof samples The consequent effects suggested by Klimesch amp Ray observed by means ofDTA are debatable as reactions during the heating experiment may lead to to a changeof Al3+ content in tobermorite [40] While both types of applied metakaolin showed goodreactivity at hydrothermal conditions some included minor phases such as feldspar oranatase remained unreacted At high dosages of Al2O3 in the starting mix the formationof either only katoite or katoite along with tobermorite was observed (Figure 32)SEM analysis of tobermorite in AAC cannot be suggested based on the observationspresented in this work as it is only visually accessible in the pores or at pore surfacesThe dense material of the AAC skeleton contains several crystalline and X-ray amorphousphases which hardly allows a proper investigation Even in single pores tobermorite crys-tals appeared very heterogeneous at various chemical compositions As a result lath-liketobermorite was not only present in samples characterized by elevated Al3+ incorporationBy contrast the benefits of XRD analysis presented in section 61 equally accounted fortobermorite in AAC samples Sulfate incorporation into the lattice of tobermorite wasnot observed All of the sulfate in the system was detected to be present in anhydriteThe phase transitions in the AAC raw slurry during the green stage hydration were show-cased by in-situ XRD analysis of a model mix at 70 degC Additional DTA and XRD mea-
23
4 Conclusions
surements during this step confirmed the presence of two generations of portlandite char-acterized by different crystallinity as suggested by Ectors [52] The inclusion of anisotropicdomain morphology during the Rietveld refinement allowed a more accurate quantifica-tion of tobermorite in autoclaved samples Sample preparation adjusted to the grain sizedistribution in AAC samples (section 63) the external standard method for quantita-tive XRD analysis [55] and the approach to evaluate anisotropic peak broadening [19]are the key methods for a more accurate tracking of the phase development during AACproduction
24
5 References
5 References
[1] A E Zadov A I Grabezhev N N Pertsev N V Chukanov and S V PribavkinTobermorite-plombierite metasomatites of the Gumeshevsk skarn-porphyry copper depositmiddle Urals Doklady Earth Sciences 407(3)495ndash497 2006
[2] M F Heddle Preliminary notice of substances which may prove to be new minerals MinMag 4117ndash123 1880
[3] S Merlino E Bonaccorsi and T Armbruster The real structure of tobermorite 11AringNormal and anomalous forms OD character and polytypic modifications European Journalof Mineralogy 13(3)577ndash590 2001
[4] C Biagioni S Merlino and E Bonaccorsi The tobermorite supergroup a new nomencla-ture Mineralogical Magazine 79(2)485ndash495 2015
[5] C A Riacuteos C D Williams and M A Fullen Hydrothermal synthesis of hydrogarnetand tobermorite at 175 degC from kaolinite and metakaolinite in the CaO-Al2O3-SiO2-H2Osystem A comparative study Applied Clay Science 43(2)228ndash237 2009
[6] X Qu Z Zhao and X Zhao Microstructure and characterization of aluminum-incorporated calcium silicate hydrates (C-S-H) under hydrothermal conditions RSC Ad-vances 8(49)28198ndash28208 2018
[7] R Šiaučiunas and K Baltakys Formation of gyrolite during hydrothermal synthesis inthe mixtures of CaO and amorphous SiO2 or quartz Cement and Concrete Research34(11)2029ndash2036 2004
[8] E Venhodovaacute R Janovskyacute and R Drochytka Formation of Tobermorite at Different Ma-terials Composition of Aerated Concrete Applied Mechanics and Materials 752-753247ndash250 2015
[9] L Galvaacutenkovaacute E Bartoniacutečkovaacute T Opravil J Tkacz and P Ptaacuteček The influence ofstarting materials solubility on tobermorite structure formation under the hydrothermalconditions IOP Conference Series Materials Science and Engineering 379(1)1ndash8 2018
[10] T Mitsuda K Sasaki and H Ishida Phase Evolution during Autoclaving Process J AmCeram Soc 75(75)1858ndash1863 1992
[11] A Skawińska The influence of metahalloysite addition on tobermorite formation studied byX-ray powder diffraction and scanning electron microscope MATEC Web of Conferences16305008 2018
[12] S T Bergold F Goetz-Neunhoeffer and J Neubauer Quantitative analysis of C-S-H in
25
5 References
hydrating alite pastes by in-situ XRD Cement and Concrete Research 53119ndash126 2013
[13] O P Shrivastava and F P Glasser Ion-exchange properties of 11-Aring tobermorite Reactivityof Solids 2(3)261ndash268 1986
[14] H Maeda Y Ogawa E H Ishida and T Kasuga Hydrothermal synthesis of tobermoritedoped with phosphorus species for removing heavy metal ions Journal of the AustralianCeramic Society 48(1)8ndash11 2012
[15] O P Shrivastava and R Shrivastava Cation exchange applications of synthetic tobermoritefor the immobilization and solidification of cesium and strontium in cement matrix Bulletinof Materials Science 23(6)515ndash520 2000
[16] G Renman and A Renman Sustainable Use of Crushed Autoclaved Aerated Concrete(CAAC) as a Filter Medium in Wastewater Purification 8th International conferenceon sustainable management of waste and recycled materials in construction GothenburgSweden 30 Mayndash1 June 2012 Proceedings pages 1ndash7 2012
[17] G Schober Chemical transformations during the manufacturing of autoclaved aeratedconcrete (ACC) Cement lime gypsum and quartz sand become cellular concrete ZKG58(7)63ndash70 2005
[18] A J Hamad Materials Production Properties and Application of Aerated LightweightConcrete Review International Journal of Materials Science and Engineering 2(2)152ndash157 2014
[19] D Ectors F Goetz-Neunhoeffer and J Neubauer A generalized geometric approach toanisotropic peak broadening due to domain morphology Journal of Applied Crystallogra-phy 48(1)189ndash194 2015
[20] H M Rietveld A profile refinement method for nuclear and magnetic structures Journalof Applied Crystallography 2(2)65ndash71 1969
[21] S A Hamid The crystal structure of the 11 Aring natural tobermoriteCa225[Si3O75(OH)15]1H2O Zeitschrift fuer Kristallographie - New Crystal Struc-tures 154(3-4)189ndash198 1981
[22] S A S El-Hemaly T Mitsuda and H F W Taylor Synthesis of normal and anomaloustobermorites Cement and Concrete Research 7429ndash438 1977
[23] M Sakiyama and T Mitsuda Hydrothermal reaction between C-S-H and kaolinite for theformation of tobermorite at 180degC Cement and Concrete Research 7(6)681ndash685 1977
[24] E Bonaccorsi S Merlino and A R Kampf The crystal structure of tobermorite 14 Aring(plombierite) a C-S-H phase Journal of the American Ceramic Society 88(3)505ndash5122005
[25] S Merlino E Bonaccorsi and T Armbruster The real structures of clinotobermorite andtobermorite 9 Aring OD character polytypes and structural relationships European Journalof Mineralogy 12(2)411ndash429 2000
[26] K Momma and F Izumi VESTA 3 for three-dimensional visualization of crystal volu-metric and morphology data Journal of Applied Crystallography 44(6)1272ndash1276 2011
26
5 References
[27] S Shaw S M Clark and C MB Henderson Hydrothermal formation of the calcium sil-icate hydrates tobermorite (Ca5Si6O16(OH)2 middot 4H2O) and xonotlite (Ca6Si6O17(OH)2)An in situ synchrotron study Chemical Geology 167(1-2)129ndash140 2000
[28] K Matsui J Kikuma M Tsunashima T Ishikawa S Matsuno A Ogawa and M SatoIn situ time-resolved X-ray diffraction of tobermorite synthesis process under hydrothermalcondition IOP Conference Series Materials Science and Engineering 18(2)60ndash66 2011
[29] G Matekonis R Šiaučiunas and D Vaičiukyniene Hydrothermal Synthesis and Charac-terization of Na + and [ Al 3 + + Na + ] -substituted Tobermorite in CaO-SiO2middotnH2O-H2OSystem MATERIALS SCIENCE 16(3)242ndash248 2010
[30] G Geng R J Myers M J A Qomi and P JM Monteiro Densification of the inter-layer spacing governs the nanomechanical properties of calcium-silicate-hydrate ScientificReports 7(1)1ndash8 2017
[31] D Klimesch and A Ray Autoclaved cement-quartz pastes with metakaolin additionsAdvanced Cement Based Materials 7(3-4)109ndash118 1998
[32] N Y Mostafa A A Shaltout H Omar and S A Abo-El-Enein Hydrothermal synthesisand characterization of aluminium and sulfate substituted 11 nm tobermorites Journal ofAlloys and Compounds 467(1-2)332ndash337 2009
[33] İ Demir M S Başpınar E Kahraman E Ccedilalışkan and G Goumlrhan An Investigation onthe Usability of Diatomite in Aerated Concrete Production In Proc of the Intl Conf onAdvances In Civil Structural And Construction Engineering - CSCE 2014 pages 97ndash1002014
[34] A Skawinska Z Owsiak T Baran and K Hernik The influence of halloysite additionon tobermorite formation in CaO and quartz mix under hydrothermal conditions CementWapno Beton 17(12)426ndash434 2017
[35] N Y Mostafa Influence of air-cooled slag on physicochemical properties of autoclavedaerated concrete Cement and Concrete Research 35(7)1349ndash1357 2005
[36] D Małaszkiewicz and J Chojnowski Influence of addition of calcium sulfate dihydrate ondrying of autoclaved aerated concrete Open Engineering 7(1)273ndash278 2017
[37] N Hara and N Inoue Thermal behaviour of 11Aring tobermorite and its lattice parametersCement and Concrete Research (10)53ndash60 1980
[38] M D Jackson S R Chae S R Mulcahy C Meral R Taylor P Li A H EmwasJ Moon S Yoon G Vola H R Wenk and P JM Monteiro Unlocking the secretsof Al-tobermorite in Roman seawater concrete American Mineralogist 98(10)1669ndash16872012
[39] W Liao W Li Z Fang C Lu and Z Xu Effect of different aluminum substitution rateson the structure of Tobermorite Materials 12(22)1ndash10 2019
[40] D Klimesch and A Ray DTA-TG Study of the CaO-SiO2-H2O and CaO-Al2O3-SiO2-H2OSystems Under Hydrothermal Conditions Journal of Thermal Analysis and Calorimetry56(1)27ndash34 1999
27
5 References
[41] Z Sauman and Z Valtr Substitution of sulphate ions in the crystal lattice of 11 Aring to-bermorite In The VI International Congress on the Chemistry of Cement pages 1ndash14Moscow 1974
[42] G Schober Reaction of raw materials to the final product AAC httpwwwpb-aacde
chemmin2_ehtml 2012 accessed 2020-01-31
[43] D Jansen C Stabler F Goetz-Neunhoeffer S Dittrich and J Neubauer Does Ordi-nary Portland Cement contain amorphous phase A quantitative study using an externalstandard method Powder Diffraction 26(01)31ndash38 2011
[44] C Roumlszligler J Stark F Steiniger and W Tichelaar Limited-dose electron microscopyreveals the crystallinity of fibrous C-S-H phases Journal of the American Ceramic Society89(2)627ndash632 2006
[45] Y Sakalli and R Trettin Investigation of C3S hydration by environmental scanning elec-tron microscope Journal of Microscopy 259(1)53ndash58 2015
[46] F Matsushita Y Aono and S Shibata Expansion and shrinkage behavior of green cakeof Autoclaved Aerated Concrete In Autoclaved Aerated Concrete - Innovation and Devel-opment Proceedings of the 4th International Conference on Autoclaved Aerated ConcreteKingston UK 8-9 September 2005 pages 101ndash108 CRC Press 2005
[47] C Chucholowski M Holger and K-C Thienel Improving the recyclability environmentalcompatibility and CO2 balance of autoclaved aerated concrete by replacing sulfate carrierand cement with calcined clays CePapers 2(4)503ndash512 2018
[48] X Y Huang W Ni W H Cui Z J Wang and L P Zhu Preparation of autoclavedaerated concrete using copper tailings and blast furnace slag Construction and BuildingMaterials 27(1)1ndash5 2012
[49] W Wongkeo and A Chaipanich Compressive strength microstructure and thermal anal-ysis of autoclaved and air cured structural lightweight concrete made with coal bottom ashand silica fume Materials Science and Engineering A 527(16-17)3676ndash3684 2010
[50] A Roacuteżycka and W Pichoacuter Effect of perlite waste addition on the properties of autoclavedaerated concrete Construction and Building Materials 12065ndash71 2016
[51] N Isu H Ishida and T Mitsuda Influence of quartz particle size on the chemical andmechanical properties of autoclaved aerated concrete (I) tobermorite formation Cementand Concrete Research 25(25)243ndash248 1995
[52] D Ectors Advances in the analysis of cementitious reactions and hydrate phases doctoralthesis PhD thesis Friedrich-Alexander-Universitaumlt Erlangen-Nuumlrnberg 2016
[53] D Ectors F Goetz-Neunhoeffer and J Neubauer Domain size anisotropy in the double-Voigt approach An extended model Journal of Applied Crystallography 481998ndash20012015
[54] D Ectors F Goetz-Neunhoeffer and J Neubauer Routine (an)isotropic crystallite sizeanalysis in the double-Voigt approximation done right Powder Diffraction 32(S1)27ndash342017
28
5 References
[55] D Jansen F Goetz-Neunhoeffer C Stabler and J Neubauer A remastered external stan-dard method applied to the quantification of early OPC hydration Cement and ConcreteResearch 41(6)602ndash608 2011
[56] T Ungaacuter G Tichy J Gubicza and R J Hellmig Correlation between subgrains andcoherently scattering domains Powder Diffraction 20(04)366ndash375 2005
[57] Triloki P Garg R Rai and B K Singh Structural characterization of as-depositedcesium iodide films studied by X-ray diffraction and transmission electron microscopy tech-niques Nuclear Instruments and Methods in Physics Research Section A AcceleratorsSpectrometers Detectors and Associated Equipment 736128ndash134 2014
[58] J Schreiner F Goetz-Neunhoeffer J Neubauer and D Jansen Hydrothermal synthesisof 11 Aring tobermorite ndash Effect of adding metakaolin to the basic compound Applied ClayScience 185 2020
[59] J Schreiner F Goetz-Neunhoeffer J Neubauer S Volkmann S Bergold R Webler andD Jansen Advanced Rietveld refinement and SEM analysis of tobermorite in chemicallydiverse autoclaved aerated concrete Powder Diffraction 34143ndash150 2019
[60] J Schreiner D Jansen D Ectors F Goetz-Neunhoeffer J Neubauer and S VolkmannNew analytical possibilities for monitoring the phase development during the production ofautoclaved aerated concrete Cement and Concrete Research 107247ndash252 2018
29
6 Publications
6 Publications
61 Hydrothermal synthesis of 11 Aring tobermorite ndash Effectof adding metakaolin to the basic compound
Reprint of the peer reviewed publication
Schreiner J Goetz-Neunhoeffer F Neubauer J Jansen D 2020 Hydrothermalsynthesis of 11 Aring tobermorite ndash Effect of adding metakaolin to the basic compoundApplied Clay Science 185 httpsdoiorg101016jclay2019105432
with permission from Elsevier
30
Contents lists available at ScienceDirect
Applied Clay Science
journal homepage wwwelseviercomlocateclay
Research paper
Hydrothermal synthesis of 11 Aring tobermorite ndash Effect of adding metakaolin tothe basic compound
J Schreiner F Goetz-Neunhoeffer J Neubauer D JansenUniversity of Erlangen-Nuremberg GeoZentrum Nordbayern Mineralogy Schlossgarten 5a 91054 Erlangen Germany
A R T I C L E I N F O
KeywordsHydrothermal synthesis11 Aring tobermoriteMetakaolinPowder diffractionKatoite
A B S T R A C T
Different amounts and types of metakaolin were analyzed and applied for the hydrothermal synthesis of 11 Aringtobermorite All synthesized samples were investigated by means of powder XRD combined with Rietveld re-finement Al-substituted 11 Aring tobermorite was successfully synthesized on the basis of a broad range of com-pounds characterized by a varying content of metakaolin Katoite was present depending on the amount ofsupplied Al3+ which was determined by the dosage of metakaolin Minor crystalline components included in thetwo types of metakaolin sources varied greatly in their reactivity under hydrothermal conditions Despite adifferent degree of purity the two types of metakaolin showed corresponding effects at moderate dosages butcontrary effects at higher dosages as for the synthesis of 11 Aring tobermorite The domain morphology of to-bermorite could be associated with Al3+ incorporation for low dosages of metakaolin represented by up to 2 wt- Al2O3 in the dry mix By contrast Al3+ affected tobermorite lattice parameters at equivalent and even athigher dosages with c reaching 2295 Aring at 12 wt- Al2O3 in the dry mix
1 Introduction
11 Application of metakaolin as a reactive material in constructionindustry
The application of supplementary cementitious materials (SCMs) inthe field of construction technology has received a lot of attention inrecent years Due to limited resources and an urgent need for alter-native and more eco-friendly construction materials SCMs such asmetakaolin offer a great potential The usage of SCMs has not onlyspread to the cement and mortar industry but also to advanced appli-cations such as autoclaved aerated concrete (AAC) (Demir et al 2014Koutnyacute et al 2014 Walczak et al 2015 Roacuteżycka and Pichoacuter 2016Chucholowski et al 2018) Unlike ordinary cementitious constructionmaterials AAC is produced from hydrothermal curing Due to the dif-ferent thermodynamic environment the hydration process and the re-activity of raw materials have to be investigated properly in order tounderstand the effects on the AAC product The leading mineral phasein AAC is 11 Aring tobermorite (Ca5Si6O16(OH)2middot4H2O) As a consequencethe thermal and mechanical properties of AAC depend on micro-structure and crystallinity of tobermorite to some extent In addition tothe curing time and the fineness of raw materials the supply of ionsthat can substitute in the tobermorite structure is a crucial factor in thiscontext Especially substitutions by aluminum sodium and potassium
ions have been investigated thoroughly (Sauman 1974 Klimesch andRay 1998 Mostafa et al 2009 Matekonis et al 2010 Skawinskaet al 2017) Calcined clays usually contain a considerable amount ofthe mentioned ions
There is a vast amount of literature on the reactivity of SCMs atambient temperature and standard pressure but there is little when itcomes to hydrothermal conditions In previous publications the beha-vior of metakaolin under hydrothermal conditions was mainly in-vestigated for the synthesis of zeolites (Zhang et al 2007 Aguilar-Mamani et al 2014 Setthaya et al 2016 Luo et al 2018) In thesestudies the reactivity of metakaolin was observed at a wide range oftemperature and pH values During the transformation of kaolin intometakaolin a loss of framework alumina was observed (Ayodele et al2019) In recent decades metakaolin has been the subject of studies inthe field of geopolymer research (Rashad 2013 Chen et al 2016) Forthe synthesis of 11 Aring tobermorite a more distinct setting of temperaturesetting (180ndash200 degC) and steam pressure (1ndash12 MPa) are required
This publication is intended to make a new contribution to thechallenging field of hydrothermal synthesis in the system CaO-Al2O3-SiO2-H2O based on XRD analysis combined with Rietveld refinementVarious dosages of two types of metakaolin with different chemical andmineralogical purities are compared for the effects on the hydrothermalsynthesis of Al-substituted 11 Aring tobermorite Especially changes of thebulk chemistry in the raw mixes the reactivity of minor crystalline
httpsdoiorg101016jclay2019105432Received 20 August 2019 Received in revised form 13 November 2019 Accepted 30 December 2019
Corresponding authorE-mail address juergenjsschreinerfaude (J Schreiner)
Applied Clay Science 185 (2020) 105432
0169-1317 copy 2020 Elsevier BV All rights reserved
T
6 Publications
31
phases of the two types of metakaolin and the effect of different curingtimes are the focus of interest On the one hand metakaolin offers agreat potential in the AAC industry On the other hand of all SCMsmetakaolin is a good source material for investigating the influence ofAl3+ on the synthesis of Al-substituted 11 Aring tobermorite
12 Synthesis of Al-substituted 11 Aring tobermorite
In addition to being present in AAC tobermorite has found appli-cation in wastewater treatment and nuclear waste management due toits ion exchange capacity (Maeda et al 2012 Monasterio et al 2015)The substitution of silicon by aluminum results in a different to-bermorite structure due to general and local charge balance affectingthe lattice parameters Especially c is impacted by this substitutionbecause it occurs in the bridging tetrahedron and additional OHndash sub-stitutes O2ndash (Komarneni et al 1985 Merlino et al 2000) As suggestedin some additional studies the substitution of Si4+ by Al3+ and Na+ orK+ leads to a lath-like morphology of tobermorite crystals (Mostafa2005 Mostafa et al 2009 Venhodovaacute et al 2015 Qu et al 2018)However because of the heterogeneous appearance of tobermorite inAAC it is hardly possible to conduct a proper characterization based onSEM analysis In our recent work the anisotropic peak broadening oftobermorite in XRD diffractograms was successfully linked with theincorporation of foreign ions supplied in a common AAC production(Schreiner et al 2019) This finding allowed a more statistical struc-tural characterization of tobermorite in bulk compositions compared toSEM analysis Moreover it was reported in other studies that differenthydrate phases occur depending on the amount of supplied ions and onthe experimental settings In compounds with a high content of Al3+formation of katoite could be observed (Klimesch and Ray 1998 Riacuteoset al 2009 Matsui et al 2011) In the case of a longer curing durationinstead of 11 Aring tobermorite the formation of xonotlite (Siauciunas andBaltakys 2004 Galvaacutenkovaacute et al 2018) or - depending on the finenessof used silica source (Siauciunas and Baltakys 2004) - gyrolite is fa-voured
Kalousek (1956) suggested that tobermorite can contain up to 5Al2O3 More Al2O3 in the system resulted in the formation of hydro-garnet Klimesch and Ray (1998) additionally investigated the stabilityof hydrogarnet depending on the Al(Si + Al) ratio and its role in re-lation to the formation of 11 Aring tobermorite in an equivalent systemThey suggest that hydrogarnet always appears before tobermorite butthe former can only be detected for higher Al(Si + Al) ratios in theevent of longer curing times Riacuteos et al (2009) and Qu et al (2018)confirmed these findings in extensive investigations In the latter pub-lication it is additionally suggested that samples prepared at lowertemperatures (160 degC) are less impacted by the supply of Al3+ Theyalso consider the peak broadening of tobermorite in their XRD plotsbased on the amount of incorporated Al3+ In two recent publicationswe suggested that the peak broadening of tobermorite enables a mi-crostructural analysis by calculating the orientation dependent domainsizes (Schreiner et al 2018 2019) However these studies are based onsamples of industrially produced AAC so that the curing time was fixedThe studied AAC was produced from raw materials with a broad che-mical spectrum such as ordinary Portland cement (OPC) whichsomehow complicates the interpretation of results
In this work the influence of aluminum ions - provided by meta-kaolin - on dominant crystallographic direction-dependent domaingrowth of tobermorite is investigated by analysis of anisotropic peakbroadening (Ectors et al 2015 2017) In Fig 1 of the supplementarymaterial the method of fitting the anisotropic peak broadening of to-bermorite using a triaxial cylinder model is visualized (Schreiner et al2018) Fitting of the anisotropic peak broadening of tobermorite Thismethod is used to calculate the average and reliable values for to-bermorite domain sizes in the powder sample and associate them withaverage Al3+ incorporation Microstrain should be considered becauseit is an additional source of peak broadening However this usually
accounts for materials that have been exposed to different kinds ofstress such as metals and alloys (Badawi et al 2019) In addition theinstrumental contribution to peak broadening should be consideredHydration products such as tobermorite are characterized by crystallitesizes in the range of nanometers so that anisotropic size broadeningclearly outweighs the effect of instrumental broadening (Jenkins andSnyder 1996) Moreover the impact of Al3+ on the lattice parametersof tobermorite is considered It should additionally be clarified whe-ther the results from our previous publication (Schreiner et al 2019)based on industrially produced AAC can be confirmed by investigationwith less complex raw mixes and purely based on laboratory experi-ments
2 Material and methods
21 Starting materials
The starting materials for hydrothermal synthesis included deio-nized water quartz flour portlandite (999 pure) and two types ofmetakaolin One type was ordinary commercially available metakaolin(MK) with nearly a stoichiometric composition For comparison thesecond type of commercially available metakaolin was a by-productfrom expanded glass production (MKg) and consequently highly im-pure The chemical composition of MK and MKg determined by XRF isgiven in Table 1 With MKg containing less Al2O3 but considerably moreNa2O than MK the effects on hydrothermal synthesis were of interestBoth types of metakaolin have been characterized in previous pub-lications (Schmidt et al 2012 Naber et al 2019) In addition weverified the mineral phase content by XRD analysis Besides amorphousmetakaolin MK contained minor amounts of anatase quartz and mica
Fig 1 Weight fractions of tobermorite quartz and katoite determined byquantitative XRD analysis ndash samples including MKg crosshatched
Table 1Chemical composition of MK and MKg determined by XRF analysis ndash majorcontrasts in bold letters
Oxides [wt-] MK MKg
SiO2 536 604Al2O3 392 206CaO 01 40MgO 01 12Na2O 0 96K2O 10 18Fe2O3 18 05TiO2 21 03P2O5 01 02Loss on ignition 15 1
J Schreiner et al Applied Clay Science 185 (2020) 105432
2
6 Publications
32
MKg contained additional kaolinite feldspar and quartz
22 Investigated mix composites
For the preparation of raw mixtures the powders were weighed andhomogenized using a lab-scale mixing mill Table 2 lists the composi-tion and nomenclature of all samples including Al2O3 content andcuring time in the autoclave
bull Besides one blank mixture (MK0) that did not contain any type ofmetakaolin eleven more compounds were prepared of which threeincluded different dosages of MKg (MKg16 MKg23 and MKg60)Three more mixes contained equivalent amounts of MK instead ofMKg (MK16 MK23 and MK60) These mixes were investigated inorder to have a direct comparison concerning the effects of differentraw material on the synthesis of tobermorite
bull Additionally the mixes MK9 MK5 and MK25 with lower dosages ofmetakaolin were analyzed In the referenced literature (Schreineret al 2019) the effect of Al3+ on the anisotropic peak broadeningof tobermorite could only be observed in the case of Al2O3 contentslower than 4 in the drymix In the latter three mixes Al2O3 con-tents range from 1 to 35 Al2O3 (calculated from XRF data) whichmeets the region of interest for the analysis of tobermorite domainmorphology
bull The curing time for nearly all of the investigated samples was 12 hbut compound MK9 was prepared two more times for curing timesof 2 h and 6 h The different curing times were chosen in this par-ticular sample so that the reactivity of metakaolin and the phasetransitions could be observed more precisely
23 Hydrothermal treatment
Due to the different fineness of raw materials there was a differentwater demand from one mixture to another In order to obtain slurriesof comparable rheology the amount of water was adapted respectivelyresulting in water-to-solid ratios of 25 to 3 which matches the sug-gested water-to-solid ratio for this purpose (Roacutezycka et al 2014Galvaacutenkovaacute et al 2018) The weighed water was added to the dry mixand after stirring for 1 min at 23 degC the slurry was poured into thereactor Minor changes in the quantity of added water did not have aninfluence on the measured steam pressure All experiments were con-ducted using a PTFE-lined stainless steel autoclave with a reactor vo-lume of 300 ml The oven temperature was fixed at 180 degC and auto-genous steam pressure of 11ndash12 MPa was measured during eachexperiment with an external manometer After cooling to room tem-perature the sample was removed from the reactor coarsely ground
using an agate mortar and dried at 60 degC for 12 h After drying thesample was ground with an agate mortar again in order to deagglo-merate the particles As no coarse raw materials were used there wasno need for wet McCrone milling (Schreiner et al 2018)
24 XRD analysis
After preparation into front-loading sample holders the powdersamples were measured with a D8 diffractometer (Bruker) equippedwith a LynxEye detection system and Bragg-Brentano geometry Thesettings for XRD analysis included a tube voltage of 40 kV a current of40 mA an angular range from 6 to 80deg 2θ (Cu Kα radiation) a time perstep of 054 s a step width of 00236deg 2θ and a PSD opening of 33deg Thebackground was fitted with Chebyshev polynomial of the fifth orderThe major contribution of amorphous phase was fitted with a singlepeak with a fixed position at 308deg 2θ so that tobermorite reflectionswere not affected An external quartzite standard was measured withthe same parameters in order to determine phase quantities (Jansenet al 2011) Bruker AXS software TOPAS 50 was used for Rietveldrefinement (Rietveld 1969) and the used structures are shown inTable 3
3 Results and discussion
31 Different dosages of MK and MKg
In Fig 1 the quantities of tobermorite quartz and katoite present inmost of the samples determined by XRD analysis are illustratedWhenever tobermorite was the leading mineral hydrate phase a basalspacing of 113 Aring could be verified in each of the diffractograms Thequantities of minor crystalline phases and amorphous content are notshown For low dosages of MK it can be seen that the weight fraction oftobermorite decreased At moderate dosage of both types of metakaolin(MK16 MK23 MKg16 MKg23) tobermorite was present in comparablequantities It can be seen that the amount of katoite in the mixes de-pended on the dosage of metakaolin and it appeared only at dosages ofMK5 or more Due to the higher content of aluminum in MK comparedto MKg more katoite could always be observed in the MK mixes atequivalent dosages Despite equal amounts of quartz as starting mate-rial in mixes for both types of metakaolin the resulting weight fractionsin the cured samples were not alike Considerably more quartz waspresent in the MK samples Even though less quartz was used for mixescontaining higher amounts of MK even more quartz was present afterhydrothermal curing (Table 2 Fig 1) Consequently some of the SiO2
provided by MK did not transform into an amorphous phase or to-bermorite but into quartz This finding is verified by the presence ofquartz in MK60 because no quartz was included in the raw mixture Thefeldspar present in MKg did not react so Na2O and an unknown amountof Al2O3 may not have been supplied for hydrothermal reaction Besidestobermorite and quartz additional calcite scawtite (Ca7Si6(CO3)
Table 2Basic powder compounds prepared for the hydrothermal synthesis of to-bermorite with the respectively calculated Al2O3 content and curing time in thereactor
Sample Portlandite[wt-]
Quartz[wt-]
MK[wt-]
MKg
[wt-]
Al2O3
[wt-]Curingtime [h]
MK0 49 51 ndash ndash 0 12MK25 495 48 25 ndash 1 12MK5 49 46 5 ndash 2 12MK9_2h 48 43 9 ndash 35 2MK9_6h 48 43 9 ndash 35 6MK9_12h 48 43 9 ndash 35 12MK16 47 37 16 ndash 63 12MK23 46 31 23 ndash 9 12MK60 40 ndash 60 ndash 235 12MKg16 47 37 ndash 16 33 12MKg23 46 31 ndash 23 47 12MKg60 40 ndash ndash 60 124 12
Table 3Structural data used for the investigation with powder XRD analysis
Phase Author
Anatase (Horn et al 1972)Biotite (Brigatti et al 2000)Calcite (Maslen et al 1995)Kaolinite (Zvyagin 1960)Katoite (Bartl 1969)Microcline (Bailey 1969)Plazolite (Basso et al 1983)Portlandite (Busing and Levy 1957)Quartz (Le Page and Donnay 1976)Scawtite (Grice 2005)Tobermorite (Hamid 1981)Xonotlite (Hejny and Armbruster 2001)
J Schreiner et al Applied Clay Science 185 (2020) 105432
3
6 Publications
33
O18bull2(H2O)) and xonotlite (Ca6Si6O17(OH)2) could be identified insample MK0 (XRD plots of samples MK0 MKg16 MKg23 MK16 andMK23) Comparing MK0 and MK25 scawtite and xonotlite could stillbe identified in a very low amount in MK25 but no longer in samplesthat contained even more MK (XRD plots of samples MK0 MK25 MK5and MK9_12h)
Two additional experiments were done without quartz in the rawmixes (MK60 and MKg60) The according diffractograms after hydro-thermal curing are shown in Fig 2 In sample MKg60 tobermorite (gt 50wt-) was successfully synthesized without any other silica sourcethan MKg whereas no crystalline quartz occurred By contrast no to-bermorite but quartz could be identified in equivalent mixture MK60containing MK It can be seen that crystalline components such as micaand anatase in the raw MK did not react at the selected conditions andremained present in the autoclaved samples Except for feldspar in MKgall of the crystalline components appeared to be reactive at the chosenhydrothermal conditions A minor unidentified phase occurred at328deg2θ and additional xonotlite was identified in sample MKg60 Insample MK60 more calcium was needed for the formation of morehydrogarnet (Fig 1) resulting in a lower CaSi ratio for the remainingsystem Sample MKg60 contained only half of the amount of Al3+ and itwas not completely supplied for reaction due to its partial presence infeldspar Consequently essentially less hydrogarnet (Fig 1) was presentin MKg60 after hydrothermal treatment and the CaSi ratio in the re-maining system was affected to a lesser extent
32 Application of MK for different curing times
The development of hydrate phases in the autoclave for compoundMK9 is displayed in Fig 3 After only 2 h of hydrothermal curing all ofthe available portlandite had reacted and katoite (95 wt-) was pre-sent The applied type of metakaolin appeared to react quickly as itsupplied aluminum for formation of katoite No formation of to-bermorite could be observed at this stage yet An assumably amorphousprecursor can be seen at 28 to 30deg2θ Calcium was provided by thedissolution of portlandite After 6 h of hydrothermal reaction amountsof katoite (85 wt-) and quartz (from 31 wt- at 2 h to 165 wt- at6 h) had decreased and a major amount of tobermorite (35 wt-) waspresent Apparently between 2 and 6 h under hydrothermal conditionsthe amorphous precursor and quartz reacted resulting in the formationof tobermorite An additional 6 h of reaction time (MK9_12h) did notchange the phase composition significantly Slightly more tobermorite
(365 wt-) less quartz (16 wt-) and katoite (65 wt-) weremeasured
33 Tobermorite domain morphology and lattice parameters
In the referenced literature an analysis of tobermorite domainmorphology based on anisotropic peak broadening was possible forsamples that contained notgt 4 wt- Al2O3 in the drymix (Schreineret al 2019) Accordingly in this study samples MK0 MK25 MK5MK9_6h and MK9_12h were suitable (Table 2) with MK9_2h not con-taining any tobermorite In Fig 4 the respective growth in a and b di-rection is visualized with x indicating the domain size in a direction andy indicating domain size in b direction using a macro for TOPAS 50(Ectors et al 2015 2017) The calculated cylinder models in Fig 4represent the relation of yx and not absolute sizes With no supply ofaluminum ions (MK0) the relative domain growth in b direction islower compared to samples containing metakaolin This finding agreeswith the results from a similar investigation of tobermorite in AAC(Schreiner et al 2019) However within the samples MK5 andMK9_12h the different amounts of supplied aluminum ions did notshow a clear effect It appeared that low dosages of Al3+ (1 wt- Al2O3
in MK25 and 2 wt- Al2O3 in MK5) were enough to determine thedomain growth of tobermorite Additional results from the samplesMK9_6h and MK9_12h indicated that growth in b direction increasedwith reaction time
In Fig 5 lattice parameters of tobermorite depending on metakaolindosages are plotted B clearly remained unaffected throughout therange of samples Increasing amounts of metakaolin led to a slightlysmaller parameter a However both types of metakaolin showed acorresponding impact on parameter a By contrast parameter c in-creased strongly with increasing amounts of MK and MKg but the typeof metakaolin was significant At an equivalent dosage MK affected thecell dimension in c direction considerably more than MKg so that thefraction of Al3+ appeared to be the decisive parameter Different metaloxides in MKg did not show a notable effect certainly as they werepartially not provided for reaction Unlike for the domain morphologyof tobermorite the impact on lattice parameters could be observedwithin the complete range of examined dosages
4 Conclusions
The results obtained from the introduced investigations allow con-cluding remarks on the effects of the applied types of metakaolin on thesynthesis of 11 Aring tobermorite the phase transitions and the in-corporation of Al3+ into the lattice of tobermorite
With a critical dosage the use of any type of metakaolin led to theformation of katoite in an according amount At moderate dosages(MKg16 MKg23 MK16 and MK23) the two types of metakaolin showeda good correspondence in consideration of the quantities of to-bermorite For higher dosages there were contrary effects Lower do-sages of MK led to considerable quantities of Al-substituted to-bermorite Samples containing low dosages of MK revealed that katoiteappeared in the case ofgt 5 wt- of MK - corresponding to 2 wt-Al2O3 - in the basic compound Minor crystalline phases in MKg showedbetter reactivity than those in MK The observation that no tobermoritewas present in sample MK60 indicated that high dosages of Al3+ hin-dered the formation of tobermorite
Investigations of MK9 at 2 6 and 12 h displayed the evolution ofhydrate phases At first katoite was the only crystalline hydrate phasepresent after 2 h which corresponded to observations in a differentpublication (Klimesch and Ray 1999) The amount of katoite andquartz then decreased and a major amount of tobermorite formed from2 to 6 h curing time In order to gain more information on the trans-formation of amorphous C-(A)-S-H into tobermorite additional ex-periments in the range of 2 to 6 h curing time will be needed
Domain morphology analysis of tobermorite revealed that low
Fig 2 Diffractograms of MKg MKg60 MK and MK60 from 7 to 34deg2θ CuKα Aanatase C calcite F feldspar k kaolinite K katoite M mica Q quartz Ttobermorite U unidentified phase X xonotlite
J Schreiner et al Applied Clay Science 185 (2020) 105432
4
6 Publications
34
dosages of Al3+ determined the domain growth which agreed with theresults published on tobermorite in AAC samples (Schreiner et al2019) Different curing times unveiled that growth in b direction in-creased with the reaction time Al3+ incorporation into the lattice oftobermorite only reflected to a limited extent in the domain mor-phology By contrast an increase of lattice parameter c was triggered byAl3+ even at the highest dosage in this study Ultimately there is no
evidence for a limit of incorporation of Al3+ but there is a limit ofinfluence on the domain morphology These results additionally re-confirm this assumption similarly made in the previous work (Schreineret al 2019) and suggest a new mechanism of tobermorite crystal-lization depending on the presence of Al3+
Supplementary data to this article can be found online at httpsdoiorg101016jclay2019105432
Declaration of Competing Interest
The authors declare that they have no known competing financialinterests or personal relationships that could have appeared to influ-ence the work reported in this paper
Acknowledgement
The authors thank Rodgauer Baustoffwerke GmbH amp Co KG forsupplying raw materials for laboratory experiments
References
Aguilar-Mamani W Garciacutea G Hedlund J Mouzon J 2014 Comparison betweenleached metakaolin and leached diatomaceous earth as raw materials for the synth-esis of ZSM-5 Springerplus 3 1ndash10 httpsdoiorg1011862193-1801-3-292
Ayodele OB Sulaimon AA Alaba PA Tian Z-Y 2019 Influence of metakaolini-zation temperature on the structure and activity of metakaolin supported Ni catalystin dry methane reforming J Environ Chem Eng httpsdoiorg101016jjece2019103239 (in press)
Badawi EA Abdel-Rahman MA Mostafa A Abdel-Rahman M 2019 Determinationof the crystallite size amp micro- strain by novel method from XRD profile Appl Phys2 1ndash15 httpsdoiorg1031058jap201921001
Bailey SW 1969 Refinement of an intermediate microcline structure Am Miner 541540ndash1545
Bartl H 1969 Roentgen-Einkristalluntersuchungen an (CaO)3 (Al2O3) (H2O)6 und an(CaO)12 (Al2O3)7 (H2O) neuer Vorschlag zur (CaO)12 (Al2O3)7-Struktur NeuesJahrb fuer Mineral Monatshefte 1969 404ndash413
Basso R Giusta AD Zefiro L 1983 Crystal structure refinement of plazolite A highlyhydrated natural hydrogrossular Neues Jahrb Miner Monatsh (Neues Jahrb fuerMineral Monatshefte) 1983 251ndash258
Brigatti MF Lugli C Poppi L Foord EE Kile DE 2000 Crystal chemical varia-tions in Li- and Fe-rich micas from Pikes Peak batholith (Central Colorado) AmMineral 85 1275ndash1286 httpsdoiorg102138am-2000-8-920
Busing WR Levy HA 1957 Neutron diffraction study of calcium hydroxide J ChemPhys 26 563 httpsdoiorg10106311743345
Chen L Wang Z Wang Y Feng J 2016 Preparation and properties of alkali acti-vated metakaolin-based geopolymer Materials (Basel) 9 1ndash12 httpsdoiorg103390ma9090767
Chucholowski C Holger M Thienel K-C 2018 Improving the recyclability en-vironmental compatibility and CO2 balance of autoclaved aerated concrete by re-placing sulfate carrier and cement with calcined clays CePapers 2 503ndash512httpsdoiorg101002cepa846
Fig 3 Diffractograms of MK9_2h MK9_6h and MK9_12h from 7 to 38deg2θ CuKα C calcite K katoite Q quartz T tobermorite
Fig 4 Relation of calculated domain sizes of 11 Aring tobermorite in selectedsamples (MK0 MK25 MK5 MK9_6h and MK9_12h) in a (x) and b (y) direction
Fig 5 Lattice parameters of tobermorite depending on MK or MKg dosageincluding blank mix MK0
J Schreiner et al Applied Clay Science 185 (2020) 105432
5
6 Publications
35
Demir İ Başpınar MS Kahraman E Ccedilalışkan E Goumlrhan G 2014 An investigationon the usability of diatomite in aerated concrete production In Proc of the IntlConf on Advances in Civil Structural and Construction Engineering ndash CSCE 2014 pp97ndash100
Ectors D Goetz-Neunhoeffer F Neubauer J 2015 A generalized geometric approachto anisotropic peak broadening due to domain morphology J Appl Crystallogr 48189ndash194 httpsdoiorg101107S1600576714026557
Ectors D Goetz-Neunhoeffer F Neubauer J 2017 Routine (an)isotropic crystallitesize analysis in the double-Voigt approximation done right Powder Diffract 3227ndash34 httpsdoiorg101017S0885715617000070
Galvaacutenkovaacute L Bartoniacutečkovaacute E Opravil T Tkacz J Ptaacuteček P 2018 The influence ofstarting materials solubility on tobermorite structure formation under the hydro-thermal conditions IOP Conf Ser Mater Sci Eng 379 1ndash8 httpsdoiorg1010881757-899X3791012001
Grice JD 2005 The structure of spurrite tilleyite and scawtite and relationships toother silicate-carbonate minerals Can Mineral 43 1489ndash1500 httpsdoiorg102113gscanmin4351489
Hamid SA 1981 The crystal structure of the 11 Aring natural tobermoriteCa225[Si3O75(OH)15]1H2O Zeitschrift fuer Krist 154 189ndash198 httpsdoiorg101524zkri19811543-4189
Hejny C Armbruster T 2001 Polytypism in xonotlite Ca6Si6O17(OH)2 Zeitschrift furKrist 216 396ndash408
Horn M Schwerdtfeger CF Meagher EP 1972 Refinement of the structure of ana-tase at several temperatures Zeitschrift fur Krist 136 273ndash281 httpsdoiorg101524zkri19721363-4273
Jansen D Goetz-Neunhoeffer F Stabler C Neubauer J 2011 A remastered externalstandard method applied to the quantification of early OPC hydration Cem ConcrRes 41 602ndash608 httpsdoiorg101016jcemconres201103004
Jenkins R Snyder R 1996 Introduction to X-ray Powder Diffractometry ChemicalAnalysis Wiley pp 90
Kalousek GL 1956 Crystal Chemistry of Hydrous Calcium Silicates J Am Ceram Soc40 74ndash80
Klimesch D Ray A 1998 Autoclaved cement-quartz pastes with metakaolin additionsAdv Cem Based Mater 7 109ndash118 httpsdoiorg101016S1065-7355(97)00073-4
Klimesch D Ray A 1999 DTA-TGA evaluations of the CaOndashAl2O3ndashSiO2ndashH2O systemtreated hydrothermally Thermochim Acta 334 115ndash122 httpsdoiorg101016s0040-6031(99)00140-9
Komarneni S Roy R Roy DM Fyfe CA Kennedy GJ Bothner-By AA Dadok JChesnick AS 1985 27Al and29Si magic angle spinning nuclear magnetic resonancespectroscopy of Al-substituted tobermorites J Mater Sci 20 4209ndash4214 httpsdoiorg101007BF00552416
Koutnyacute O Opravil T Pořiacutezka J 2014 Application of metakaoline in autoclavedaerated concrete technology Adv Mater Res 1000 174ndash177 httpsdoiorg104028wwwscientificnetAMR1000174
Le Page Y Donnay G 1976 Refinement of the crystal structure of low-quartz ActaCrystallogr Sect B 32 2456ndash2459 httpsdoiorg101107S0567740876007966
Luo H Law WW Wu Y Zhu W Yang EH 2018 Hydrothermal synthesis of needle-like nanocrystalline zeolites from metakaolin and their applications for efficient re-moval of organic pollutants and heavy metals Microporous Mesoporous Mater 2728ndash15 httpsdoiorg101016jmicromeso201806015
Maeda H Ogawa Y Ishida EH Kasuga T 2012 Hydrothermal synthesis of to-bermorite doped with phosphorus species for removing heavy metal ions J AustCeram Soc 48 8ndash11
Maslen EN Streltsov VA Streltsova NR Ishizawa N 1995 Electron density andoptical anisotropy in rhombohedral carbonates III Synchrotron Xray studies ofCaCO3 MgCO3 and MnCO3 Acta Crystallogr Sect B 51 929ndash939 httpsdoiorg101107S0108768195006434
Matekonis G Šiaučiūnas R Vaičiukynienė D 2010 Hydrothermal Synthesis andCharacterization of Na + and [ Al 3 + + Na + ] -substituted Tobermorite in CaO-SiO2middotnH2O-H2O System Mater Sci 16 242ndash248
Matsui K Kikuma J Tsunashima M Ishikawa T Matsuno S Ogawa A Sato M2011 In situ time-resolved X-ray diffraction of tobermorite synthesis process underhydrothermal condition IOP Conf Ser Mater Sci Eng 18 60ndash66 httpsdoiorg1010881757-899X182022017
Merlino S Bonaccorsi E Armbruster T 2000 The real structures of clinotobermoriteand tobermorite 9 Aring OD character polytypes and structural relationships Eur JMineral 12 411ndash429 httpsdoiorg1011270935-122120000012-0411
Monasterio M Gaitero JJ Manzano H Dolado JS Cerveny S 2015 Effect ofchemical environment on the dynamics of water confined in calcium silicate mi-nerals Natural and synthetic tobermorite Langmuir 31 4964ndash4972 httpsdoiorg101021acslangmuir5b00614
Mostafa NY 2005 Influence of air-cooled slag on physicochemical properties of auto-claved aerated concrete Cem Concr Res 35 1349ndash1357 httpsdoiorg101016jcemconres200410011
Mostafa NY Shaltout AA Omar H Abo-El-Enein SA 2009 Hydrothermal synth-esis and characterization of aluminium and sulfate substituted 11 nm tobermoritesJ Alloys Compd 467 332ndash337 httpsdoiorg101016jjallcom200711130
Naber C Stegmeyer S Jansen D Goetz-Neunhoeffer F Neubauer J 2019 ThePONKCS method applied for time resolved XRD quantification of supplementarycementitious material reactivity in hydrating mixtures with ordinary Portland ce-ment Constr Build Mater 214 449ndash457 httpsdoiorg101016jconbuildmat201904157
Qu X Zhao Z Zhao X 2018 Microstructure and characterization of aluminum-in-corporated calcium silicate hydrates (C-S-H) under hydrothermal conditions RSCAdv 8 28198ndash28208 httpsdoiorg101039c8ra04423f
Rashad AM 2013 Metakaolin as cementitious material history scours production andcomposition - a comprehensive overview Constr Build Mater 41 303ndash318 httpsdoiorg101016jconbuildmat201212001
Rietveld HM 1969 A profile refinement method for nuclear and magnetic structures JAppl Crystallogr 2 65ndash71 httpsdoiorg101107S0021889869006558
Riacuteos CA Williams CD Fullen MA 2009 Hydrothermal synthesis of hydrogarnet andtobermorite at 175 degC from kaolinite and metakaolinite in the CaO-Al2O3-SiO2-H2Osystem a comparative study Appl Clay Sci 43 228ndash237 httpsdoiorg101016jclay200809014
Roacuteżycka A Pichoacuter W 2016 Effect of perlite waste addition on the properties of au-toclaved aerated concrete Constr Build Mater 120 65ndash71 httpsdoiorg101016jconbuildmat201605019
Roacutezycka A Kotwica Ł Małolepszy J 2014 Synthesis of single phase gyrolite in theCaO-quartz-Na2O-H2O system Mater Lett 120 166ndash169 httpsdoiorg101016jmatlet201401003
Sauman Z 1974 Influence of SO4 2ndash ions on the formation of 11 Aring tobermorite InProceedings of the 2nd International Symposium on Science and Research in SilicateChemistry Moscow pp 25ndash39
Schmidt M Egersdoumlrfer A Poumlllmann H 2012 Increased reactivity using a glass-containing metakaolin as an active filler in lime-based binder systems ZKG Int 6554ndash62
Schreiner J Jansen D Ectors D Goetz-Neunhoeffer F Neubauer J Volkmann S2018 New analytical possibilities for monitoring the phase development during theproduction of autoclaved aerated concrete Cem Concr Res 107 247ndash252 httpsdoiorg101016jcemconres201802028
Schreiner J Goetz-Neunhoeffer F Neubauer J Volkmann S Bergold S Webler RJansen D 2019 Advanced Rietveld refinement and SEM analysis of tobermorite inchemically diverse autoclaved aerated concrete Powder Diffract 34 143ndash150httpsdoiorg101017s0885715619000149
Setthaya N Chindaprasirt P Pimraksa K 2016 Preparation of zeolite nanocrystals viahydrothermal and solvothermal synthesis using of rice husk ash and metakaolinMater Sci Forum 872 242ndash247 httpsdoiorg104028wwwscientificnetmsf872242
Siauciunas R Baltakys K 2004 Formation of gyrolite during hydrothermal synthesis inthe mixtures of CaO and amorphous SiO2 or quartz Cem Concr Res 34 2029ndash2036httpsdoiorg101016jcemconres200403009
Skawinska A Owsiak Z Baran T Hernik K 2017 The influence of halloysite ad-dition on tobermorite formation in CaO and quartz mix under hydrothermal condi-tions Cem Wapno Bet 17 426ndash434
Venhodovaacute E Janovskyacute R Drochytka R 2015 Formation of tobermorite at differentmaterials composition of aerated concrete Appl Mech Mater 752ndash753 247ndash250httpsdoiorg104028wwwscientificnetamm752-753247
Walczak P Małolepszy J Reben M Szymański P Rzepa K 2015 Utilization ofwaste glass in autoclaved aerated concrete Proc Eng 122 302ndash309 httpsdoiorg101016jproeng201510040
Zhang Y Gao W Cui L 2007 The transformation of acid leached metakaolin tozeolite beta Stud Surf Sci Catal 170 420ndash425 httpsdoiorg101016S0167-2991(07)80870-6
Zvyagin BB 1960 An attempt to electronographic determination of kaolinite structureJ Dokl Akad Nauk SSSR 130 1023ndash1026
J Schreiner et al Applied Clay Science 185 (2020) 105432
6
6 Publications
36
6 Publications
62 Advanced Rietveld refinement and SEM analysis oftobermorite in chemically diverse autoclaved aeratedconcrete
Following the copyright guidelines by Cambridge University Press the publication
Schreiner J Goetz-Neunhoeffer F Neubauer J Volkmann S Bergold S WeblerR Jansen D 2019 Advanced Rietveld refinement and SEM analysis of tobermorite inchemically diverse autoclaved aerated concrete Powder Diffraction 34 143ndash150 httpsdoiorg101017s0885715619000149
may not be reprinted It can be accessed at
httpswwwcambridgeorgcorejournalspowder-diffractionarticleadvanced-rietveld-refinement-and-sem-analysis-of-tobermorite-in-chemically-diverse-autoclaved-aerated-concrete51597C2A66F6F225D29DEB2675E74249
37
6 Publications
63 New analytical possibilities for monitoring the phasedevelopment during the production of autoclavedaerated concrete
Reprint of the peer reviewed publication
Schreiner J Jansen D Ectors D Goetz-Neunhoeffer F Neubauer J VolkmannS 2018 New analytical possibilities for monitoring the phase development during theproduction of autoclaved aerated concrete Cement and Concrete Research 107 247ndash252httpsdoiorg101016jcemconres201802028
with permission from Elsevier
38
Contents lists available at ScienceDirect
Cement and Concrete Research
journal homepage wwwelseviercomlocatecemconres
Short communication
New analytical possibilities for monitoring the phase development duringthe production of autoclaved aerated concrete
J Schreinera D Jansena D Ectorsa F Goetz-Neunhoeffera J Neubauera S Volkmannb
aUniversity of Erlangen-Nuremberg GeoZentrum Nordbayern Mineralogy Schlossgarten 5a 91054 Erlangen Germanyb Rodgauer Baustoffwerke GmbH amp Co KG Am Opel-Pruumlffeld 3 63110 Rodgau-Dudenhofen Germany
A B S T R A C T
This work presents improved analytical methods for both steps of the production process of autoclaved aeratedconcrete (AAC) the phase development during the hydration before autoclaving and during the autoclavingprocess itself The improvement includes new insights into preparation methods of AAC samples for powderdiffraction as well as Rietveld refinement strategies For the first time a new implementation for calculatinganisotropic crystal domain sizes is applied to major hydrate phases occurring during AAC production namelyportlandite during the hydration before autoclaving and tobermorite during the autoclaving process The cal-culation of anisotropic domain size growth which can be implemented in the Rietveld environment is based oncrystallographically and geometrically appropriate models The implementation of calculating anisotropic do-main sizes for the Rietveld software TOPAS 50 allows a superior Rietveld fit and a more accurate quantificationof the phase development Additionally it enables the tracking of growth mechanism of portlandite duringhydration
1 Introduction
Autoclaved aerated concrete (AAC) is known as a lightweight con-struction material which offers outstanding properties such as suffi-cient strength for construction in addition with excellent thermal in-sulation [12] AAC is produced by autoclaving from calcareous rawmaterials such as lime (CaO) and cement quartz sulfate carrier andother additives such as foaming agents and water
The production process (Fig 1) can be separated into the hydrationof the mixed slurry before the procedure of autoclaving and the auto-claving at elevated temperature (180 degC to 200 degC) under saturatedsteam pressure (12MPa) for several hours
The hydration process before autoclaving is necessary to achievesufficient strength in order to cut the green cake blocks as they shouldhave a specific shape and dimension after autoclaving Furthermorethe porous structure is generated by the foaming agent during hydra-tion in the first process step During autoclaving the final propertiesnamely strength and low thermal conductivity are achieved
It is already well understood that the autoclaving process leads tothe formation of several phases first of all tobermorite(Ca5Si6O16(OH)2lowast4H2O) [3ndash5] Newest research has shown im-pressively which reactions are running from the mineralogical point ofview Insitu XRD measurements were carried out during the
autoclaving process and the phase development was shown by plottingnormalized intensities [6] The study of Mitsuda et al [3] was mainlyfocused on the tracking of the phase evolution during the autoclavingprocess of AAC However their statements concerning phase evolutionare mainly based on XRD data and TGA measurements There is acommon agreement that the following reactions occur The consump-tion of the alite (OPC) leads to the formation of an initial C-S-H phaseduring the first processing step Portlandite which was initially formedduring the first process step (from CaO and C3S) further quartz and theC-S-H phase are consumed during autoclaving resulting in the crystal-lization of tobermorite Hence the crystallization process of to-bermorite as well as the crystal structure of tobermorite was an issue ofresearch and discussion over the last years and numerous publicationsto these topics are available Concerning the crystal structure of to-bermorite respectively the tobermorite supergroup a new publicationoutlines all important references and recommends a new nomenclature[7]
The presented study was performed to create new analytical possi-bilities for the characterization of the production process of AAC Bothof the production process steps are essential for the final productHence the present work focuses on crystallization of hydrate phases inboth processes
Firstly an external standard method [89] was published and
httpsdoiorg101016jcemconres201802028Received 6 October 2017 Received in revised form 1 February 2018 Accepted 26 February 2018
Corresponding authorsE-mail addresses juergenjsschreinerfaude (J Schreiner) danieljansenfaude (D Jansen)
Cement and Concrete Research 107 (2018) 247ndash252
0008-8846 copy 2018 Elsevier Ltd All rights reserved
T
6 Publications
39
recommended for the determination of absolute phase contents inmixtures with amorphous content It was shown that the method canabsolutely be recommended for hydrating cement pastes in which watercannot be quantified directly by XRD [10] This method seems to bevery promising for both the quantification of the hydration of the AACslurry before autoclaving and the quantification of the phase evolutionduring autoclaving inasmuch as both production steps form crystallineand amorphous phases
Secondly a new approach to anisotropic peak broadening due toanisotropic domain morphology which was developed [1112] is ap-plied to AAC samples to improve the fit of portlandite and tobermoriteby Rietveld refinement [13] By applying this approach the refinementof both portlandite and tobermorite should additionally lead to betterquantitative results as well as to better insights into the development ofthe domain size morphology of both phases formed
It was already shown that in a hydrating raw mixture for AAC twospecies of portlandite precipitate at 23 degC one showing dynamicallyanisotropic peak broadening and another one following the isotropictrend [14] The application of the anisotropic refinement model led toan improved fitting of portlandite Moreover the mechanism of aniso-tropic domain growth of portlandite was tracked
2 Materials and methods
In order to examine the hydration of the AAC slurry before auto-claving a mixture of the hydraulic reactive components was weighedand measured in-situ at a Bruker D8 diffractometer with a LynxEyedetection system
Ordinary Portland cement (OPC) was mixed with lime (CaO) andanhydrite (C$) The raw materials were taken from the same batches asfor the industrial samples The drymix (58 OPC 36 CaO and 6 C$by weight) was then mixed with water (ws= 08) and placed into anappropriate sample holder The samples were not aerated The slurrysamples were covered with a kapton film to avoid evaporation andcarbonation Diffractograms were recorded with an angular range from7 to 545deg 2θ and a step width of 0011deg 2θ Measurements were carriedout every 15min For each measurement 96 XRD patterns were re-corded over the first 24 h The temperature was fixed at 70 degC which isthe mean temperature generally prevailing in the industrial processduring hydration before autoclaving Rietveld refinement was carriedout using the G-factor method All structures used for Rietveld refine-ment are shown in Table 1
For investigation of the autoclaved samples five different specimenswere taken at different autoclaving times The specimens were takenout of a technical production process hence it was not possible to in-terrupt the process at an earlier time inasmuch it would lead to damageof a whole concrete production batch The specimens were firstly driedat 60 degC until weight constancy The whole blocks were then broken andstatistical samples of 20 g were taken In order to receive the right massattenuation coefficient (MAC) for G-factor method the loss on ignitionand the chemical composition (XRF) were determined For energydispersive XRF analysis (Spectro Xepos) tube voltage from 20 kV to50 kV and tube current from 08 to 20mA were used for differenttargets
The final sample preparation (grinding) before XRD measurementswas carried out using both an agate mortar and a McCrone micronizingmill for wet milling with isopropanol Both preparation methods wereapplied separately to see which one is suitable in order to get the bestpreparation for XRD investigations Six preparations were performed byone operator of which two were prepared with an agate mortar andfour with a McCrone mill For the McCrone milling 3 g of the sampleand 10ml of isopropanol were used for grinding for 12min The grainsize distribution of one sample prepared with an agate mortar and onesample prepared using a McCrone mill was measured by laser granu-lometry in isopropanol using a Mastersizer 3000 (MALVERN)
After milling the samples in these two ways for XRD analysis thepowders were prepared into a front loading sample holder and mea-sured Diffractograms were recorded with an angular range from 6 to80deg 2θ a step width of 00236deg 2θ and a time per step of 054 s Rietveldrefinement combined with external standard (G-factor) was applied inorder to get absolute quantities for each phase The refinement strategyfor portlandite and tobermorite in the TOPAS Launch Mode (TOPAS50 Bruker AXS) is attached as a Supplementary material file
3 Results and discussion
31 Hydration of the mixture before autoclaving
The hydration of the investigated paste before autoclaving isdominated by the hydration of the cement as well as the reaction of thefree lime (CaO) resulting in the formation of portlandite It can beclearly seen from Fig 2 that the hydration of the paste leads to theformation of ettringite portlandite and C-S-H phase For simplificationthe remaining phase developments are not shown in Fig 2 because theyare not in the focus of this study The hydration of CaO forming
Fig 1 Simplified process steps of AAC production and hydrate phase evolution
Table 1Structures used for Rietveld refinement
Phase Author
Alite [15]Anhydrite [16]Bassanite [17]Belite (β) [18]Belite (αprime) [19]Brownmillerite [20]C-S-H [21]Calcite [22]Ettringite [23]Gypsum [24]Hemicarbonate [25]Hydroxylellestadite [26]Lime (CaO) [27]Microcline [28]Portlandite [29]Quartz [30]Tobermorite [31]Tricalciumaluminate (cubic) [32]Tricalciumaluminate (orthorhombic) [33]PONCKS model for Water [21]
J Schreiner et al Cement and Concrete Research 107 (2018) 247ndash252
248
6 Publications
40
portlandite begins rapidly after the addition of water to the mixture andlime is fully consumed after only 1 h of hydration This translates into aquick rise of heat of hydration so that cement hydration is acceleratedwhich leads to further portlandite formation by the reaction of aliteEttringite formation stalls after few hours of hydration After 12 h et-tringite is partially decomposed probably due to sulfate depletion [9]
and poorly crystalline AFm phases (not shown in Fig 2) are formedIn Fig 3 it can be seen that in fact two generations of portlandite
are formed a 1st dominant generation showing anisotropic peakbroadening and 2nd one occurring considerably later following theisotropic domain size refinement which is usually carried out using theRietveld method This occurrence comes along firstly with lime hy-dration and secondly with alite hydration The expected quantity ofportlandite formed from lime hydration very well complies with the
Fig 2 Phase development in AAC paste on a laboratory scale before autoclaving ana-lyzed by in-situ XRD at 70 degC
Fig 3 Formation of two generations of portlandite by hydration of lime (1st) and C3S(2nd) at 70 degC before autoclaving with the major generation showing anisotropic peakbroadening
Fig 4 Biaxial cylinder domain size model of portlandite used for Rietveld refinement of anisotropic peak broadening
Fig 5 Morphological evolution of portlandite showing anisotropic domain size growthduring hydration at 70 degC
Fig 6 Comparison of quantification of crystalline quartz in samples prepared withMcCrone mill and agate mortar at different autoclaving times
J Schreiner et al Cement and Concrete Research 107 (2018) 247ndash252
249
6 Publications
41
quantity of the observed 1st generation The development of portlan-dite growth was already tracked in an equivalent slurry at 23 degC [14]Thus this observation confirms that the crystallinity of portlandite inmixtures for AAC production depends on the starting phase for hydra-tion as already indicated by Ectors [14]
Fig 4 shows the used biaxial cylindrical model for anisotropic do-main size calculation and the portlandite structure which was createdwith structural software VESTA 318 [34] Using the cylindrical ap-proach domain sizes in a (here equating to b) and c direction(dz= cylinder height) can be calculated which comes along with theexpected symmetrical parameters of portlandite
The 1st portlandite generation showing anisotropic domain growthcan be tracked in terms of cylinder diameter and height which is rea-lized in Fig 5 The blue cylinder represents the geometric approach andcylinder height and diameter are calculated newly for each range Thecylinder height remains rather stable throughout the hydration processwhile the cylinder diameter increases during the first hours of hydra-tion After 10 h of hydration the mean cylinder diameter no longer in-creases Consequently these observations match the results of the ex-aminations conducted at 23 degC [14] as well as the assumption thatdifferent mechanisms of growth exist for portlandite depending on the
hydration educt The maximum cylinder diameter is reached earlier inthis work very likely because of the higher hydration temperature
32 Quantification of the reactions during autoclaving
Autoclaved samples were ground with an agate mortar and com-pared to samples which were wet-ground with a McCrone mill Fig 6shows precisely that the determination of the amount of crystallinequartz is more reproducible in the two shown samples which were
Fig 7 2D XRD with Bruker GADDS-system plots of samples prepared with agate mortar and McCrone mill Coarse quartz grains are pointed out in the plot of the sample prepared withagate mortar
Fig 8 Particle size distribution of one sample prepared with an agate mortar and of onesample prepared with a McCrone mill measured by laser granulometry
Fig 9 Rietveld refinement for Tobermorite of autoclaved AAC sample by use of isotropicdomain size model (a) and of anisotropic domain size model (b)
J Schreiner et al Cement and Concrete Research 107 (2018) 247ndash252
250
6 Publications
42
prepared with a McCrone mill The high variance of crystalline quartzin the samples which were prepared with an agate mortar is a result ofinsufficient grinding and remaining of too large quartz grains Whenthis spottiness occurs a reliable quantification using the G-factormethod is not possible
The 2D XRD with Bruker GADDS-system plots in Fig 7 demonstratethe insufficient grinding when using an agate mortar compared to wetmilling with a McCrone mill Quartz would be overrepresented in a one-dimensional XRD pattern focusing on a section with bright spots (greenarrows) The lack of bright spots in the right plot shows that the quartzgrains are milled more thoroughly using a McCrone mill In Fig 8 theparticle size distribution after both ways of sample preparation iscompared Most grains in the sample prepared with an agate mortar arelarger than in the sample prepared with a McCrone mill The grain sizedistribution of the sample prepared with a McCrone mill complies withthe recommended particle size range for XRD analysis of under 5 to50 μm [3536] while the other sample exceeds the range
In Fig 9 Rietveld refinement of an autoclaved sample is shown Thedominant peaks at 77 290 and 301deg 2θ are attributed to tobermoriteIn the upper diagram (a) Rietveld refinement was carried out regularlycalculating isotropic domain sizes for tobermorite However the cal-culated fit differs significantly from the raw data It can be assumed thattobermorite shows a similar pattern to portlandite in terms of aniso-tropic peak broadening taking into account that tobermorite is as-signed to the orthorhombic crystal system Thus instead of a biaxialcylinder model an elliptic cylinder model (Fig 10 structure createdwith VESTA 318 [34]) was applied for the refinement in the lowerdiagram (b) The elliptic cylinder model is a sufficient approach to the
orthorhombic crystal system as it allows the distinction between do-main sizes in a b and c direction The fit is clearly superior using theanisotropic domain size model highlighted by the difference plot inFig 9b The comparison refinement with isotropic and anisotropic ap-proach was done for all of the five autoclaved samples In Fig 11 theresulting Rwp values for the whole pattern and the RBragg values of to-bermorite are shown The refinement using the anisotropic model leadsto both lower Rwp and RBragg values and consequently to a better fit anda more accurate quantification of tobermorite in all refined samples
4 Summary and conclusions
Improved analytical methods for both the phase developmentduring the hydration before autoclaving and during the autoclavingprocess of AAC are presented It could be shown that wet McCronemilling is the best way of preparation of AAC samples in order to obtainsuitable samples for powder diffraction A new approach to treat ani-sotropic domain sizes for Rietveld refinement could be successfullyapplied ndash with the benefit that portlandite and tobermorite in AACsamples could be refined more accurately using the Rietveld methodThus this application allows an improved quantification of the phasedevelopment during both of the production steps
For the future there are still plenty of possibilities to apply thepresented approach of calculating anisotropic domain sizes to AACproduction As exemplified with portlandite the mechanisms of growthof tobermorite can be tracked likewise during the autoclaving processIn addition the effect of variations in the chemical composition of AACraw mixtures on the crystal morphology of tobermorite can be ex-amined This leaves a new perspective to discuss the link between mi-neral phase morphology and the thermal and mechanical properties ofAAC
Acknowledgement
The autoclaved samples were generously provided by RodgauerBaustoffwerke GmbH amp Co KG The authors express gratitude for allsupport
Appendix A Supplementary data
Supplementary data to this article can be found online at httpsdoiorg101016jcemconres201802028
References
[1] MW Grutzeck Cellular concrete in M Scheffler P Colombo (Eds) CellularCeramics Wiley-VCH Weinheim 2005 pp 193ndash223
[2] M Haas The future of AAC ndash from a material scientists point of view inMC Limbachiya JJ Roberts (Eds) Autoclaved Aerated Concrete Taylor FrLondon 2005 pp 187ndash194
[3] T Mitsuda K Sasaki H Ishida Phase evolution during autoclaving process ofaerated concrete J Am Ceram Soc 75 (1992) 1858ndash1863
[4] N Isu H Ishida T Mitsuda Influence of quartz particle size on the chemical and
Fig 10 Triaxial cylinder domain size model of Tobermorite used for Rietveld refinement of anisotropic peak broadening
Fig 11 Comparison of Rwp and RBragg values of Rietveld refinements of autoclavedsamples and tobermorite using the isotropic and the anisotropic domain size model
J Schreiner et al Cement and Concrete Research 107 (2018) 247ndash252
251
6 Publications
43
mechanical properties of autoclaved aerated concrete (I) tobermorite formationCem Concr Res 25 (1995) 243ndash248
[5] NY Mostafa Influence of air-cooled slag on physicochemical properties of auto-claved aerated concrete Cem Concr Res 35 (2005) 1349ndash1357 httpdxdoiorg101016jcemconres200410011
[6] K Matsui J Kikuma M Tsunashima T Ishikawa S Matsuno A Ogawa M SatoIn situ time-resolved X-ray diffraction of tobermorite formation in autoclaved aer-ated concrete influence of silica source reactivity and Al addition Cem Concr Res41 (2011) 510ndash519
[7] C Biagioni S Merlino E Bonaccorsi The tobermorite supergroup a new no-menclature Mineral Mag 79 (2015) 485ndash495 httpdxdoiorg101180minmag2015079222
[8] BH OConnor MD Raven Application of the Rietveld refinement procedure inassaying powdered mixtures Powder Diffract 3 (1988) 2ndash6 httpdxdoiorg101017S0885715600013026
[9] D Jansen F Goetz-Neunhoeffer C Stabler J Neubauer A remastered externalstandard method applied to the quantification of early OPC hydration Cem ConcrRes 41 (2011) 602ndash608 httpdxdoiorg101016jcemconres201103004
[10] D Jansen C Stabler F Goetz-Neunhoeffer S Dittrich J Neubauer Does OrdinaryPortland Cement contain amorphous phase A quantitative study using an externalstandard method Powder Diffract 26 (2011) 31ndash38 httpdxdoiorg10115413549186
[11] D Ectors F Goetz-Neunhoeffer J Neubauer A generalized geometric approach toanisotropic peak broadening due to domain morphology J Appl Crystallogr 48(2015) 189ndash194 httpdxdoiorg101107S1600576714026557
[12] D Ectors F Goetz-Neunhoeffer J Neubauer Routine (an)isotropic crystallite sizeanalysis in the double-Voigt approximation done right Powder Diffract 32 (S1)(2017) 27ndash34 httpdxdoiorg101017S0885715617000070
[13] HM Rietveld A profile refinement method for nuclear and magnetic structures JAppl Crystallogr 2 (1969) 65ndash71 httpdxdoiorg101107S0021889869006558
[14] D Ectors Advances in the Analysis of Cementitious Reactions and Hydrate Phases(Doctoral Thesis) (2016) pp 12ndash14 (urnnbndebvb29-opus4-71743)
[15] AacuteG De La Torre S Bruque J Campo MAG Aranda The superstructure of C3Sfrom synchrotron and neutron powder diffraction and its role in quantitative phaseanalyses Cem Concr Res 32 (2002) 1347ndash1356 httpdxdoiorg101016S0008-8846(02)00796-2
[16] A Kirfel G Will Charge density in anhydrite CaSO4 from X-ray and neutrondiffraction measurements Acta Crystallogr Sect B Struct Crystallogr CrystChem 36 (1980) 2881ndash2890 httpdxdoiorg101107S0567740880010461
[17] C Bezou AN Christensen D Cox M Lehman A Nonat Structures cristallines deCaSO405H2O et CaSO406H2O Comptes Rendus Hebd Des Seacuteances lAcadeacutemieDes Sci Seacuterie 2 (312) (1991) 43ndash48
[18] KH Jost B Ziemer R Seydel Redetermination of the structure of β-dicalciumsilicate Acta Crystallogr Sect B Struct Crystallogr Cryst Chem 33 (1977)1696ndash1700 httpdxdoiorg101107S0567740877006918
[19] W Mumme LMD Cranswick BC Chakoumakos Rietveld crystal structure re-finements from high temperature neutron powder diffraction data for the poly-morphs of dicalcium silicate Neues Jahrb Fuer Mineral Abhandlungen 170 (1996)171ndash188
[20] A Colville S Geller The crystal structure of brownmillerite Ca2FeAlO5Crystallographica 50 (1971) 2311ndash2315 httpdxdoiorg101107S056774087100579X
[21] ST Bergold F Goetz-Neunhoeffer J Neubauer Quantitative analysis of C-S-H inhydrating alite pastes by in-situ XRD Cem Concr Res 53 (2013) 119ndash126 httpdxdoiorg101016jcemconres201306001
[22] EN Maslen VA Streltsov NR Streltsova N Ishizawa Electron density and op-tical anisotropy in rhombohedral carbonates III Synchrotron Xray studies ofCaCO3 MgCO3 and MnCO3 Acta Crystallogr Sect B 51 (1995) 929ndash939 httpdxdoiorg101107S0108768195006434
[23] G Renaudin Y Filinchuk J Neubauer F Goetz-Neunhoeffer A comparativestructural study of wet and dried ettringite Cem Concr Res 40 (2010) 370ndash375httpdxdoiorg101016jcemconres200911002
[24] WF Cole CJ Lancucki A refinement of the crystal structure of gypsumCaSO42H2O Acta Cryst B30 (1974) 921ndash929 httpdxdoiorg101107S0567740874004055
[25] T Runčevski RE Dinnebier OV Magdysyuk H Poumlllmann Crystal structures ofcalcium hemicarboaluminate and carbonated calcium hemicarboaluminate fromsynchrotron powder diffraction data Acta Crystallogr Sect B Struct Sci 68 (2012)493ndash500 httpdxdoiorg101107S010876811203042X
[26] JM Hughes JW Drexler Cation substitution in the apatite tetrahedral site crystalstructures of type hydroxylellestadite and type fermorite Neues Jahrb FuerMineral (1991) 327ndash336
[27] CH Shen RS Liu JG Lin CY Huang Phase stability study of La12Ca18Mn2O7Mater Res Bull 36 (2001) 1139ndash1148
[28] SW Bailey Refinement of an intermediate microcline structure Am Miner 54(1969) 1540ndash1545
[29] WR Busing HA Levy Neutron diffraction study of calcium hydroxide J ChemPhys 26 (1957) 563 httpdxdoiorg10106311743345
[30] Y Le Page G Donnay Refinement of the crystal structure of low-quartz ActaCrystallogr Sect B 32 (1976) 2456ndash2459 httpdxdoiorg101107S0567740876007966
[31] SA Hamid The crystal structure of the 11 Aring natural tobermoriteCa225[Si3O75(OH)15]1H2O Zeitschrift Fuer Krist - New Cryst Struct 154 (1981)189ndash198 httpdxdoiorg101524zkri19811543-4189
[32] P Mondal JW Jeffery The crystal structure of tricalcium aluminate Ca3Al2O6Acta Crystallogr B 31 (1975) 689ndash697 httpdxdoiorg101107S0567740875003639
[33] Y Takeuchi F Nishi I Maki Crystal-chemical characterization of the tricalciumaluminate-sodium oxide (3CaOtimesAl2O3-Na2O) solid-solution series Zeitschrift FuumlrKrist (1980) 259ndash307
[34] K Momma F Izumi VESTA 3 for three-dimensional visualization of crystal vo-lumetric and morphology data J Appl Crystallogr 44 (2011) 1272ndash1276 httpdxdoiorg101107S0021889811038970
[35] K Scrivener R Snellings B Lothenbach A Practical Guide to MicrostructuralAnalysis of Cementitious Materials CRC Press 2016 pp 123ndash125 httpdxdoiorg107693wl20150205
[36] V Pecharsky P Zavalij Fundamentals of Powder Diffraction and StructuralCharacterization of Materials Springer second edition 2005 p 302 httpdxdoiorg101007978-0-387-09579-0
J Schreiner et al Cement and Concrete Research 107 (2018) 247ndash252
252
6 Publications
44
7 Acknowledgement
7 Acknowledgement
Ich moumlchte mich bei einigen Personen bedanken ohne die es wohl kaum zum erfolgreichenAbschluss dieser Arbeit gekommen waumlreMein Doktorvater Prof Dr Juumlrgen Neubauer hat sich stets die Zeit genommen die noumltigwar um Angelegenheiten aller Art mit mir zu klaumlren Er gab mir fachlich immer zumrichtigen Zeitpunkt einen gewissen wissenschaftlichen Impuls Zugleich habe ich mich den-noch immer frei in meiner eigenen Konzeption gefuumlhlt Groszligen Dank spreche ich Prof DrFriedlinde Goumltz-Neunhoeffer aus die fuumlr mich ebenso immer eine verlaumlssliche Ansprech-partnerin fuumlr fachliche und organisatorische Angelegenheiten aller Art war Danke anDr Daniel Jansen fuumlr die gute Zusammenarbeit und dafuumlr dass er mich im Zuge meinerMasterarbeit in ein Forschungsprojekt aufgenommen hat das den Weg zur Promotionmoumlglich machte Zusaumltzlich gilt mein Dank Prof Dr Matthias Goumlbbels der fuumlr dieMitarbeiter am Lehrstuhl immer motivierende Worte fand Fuumlr die Ermoumlglichung meinerTeilnahme an diversen Dienstreisen Fortbildungen und Tagungen moumlchte ich mich viel-mals bedankenWeiterhin bedanke ich mich bei Dr Stephan Volkmann und den Rodgauer BaustoffwerkenGmbH amp Co KG fuumlr die gute Zusammenarbeit und die Bereitstellung von Versuchsma-terialienVielen Dank an meine studentischen Hilfskraumlfte Daniel Wagner Laura MoldenhauerFabian Lang Jakob Schreiber und Felix Klaassen die alle Aufgaben im Labor einwand-frei und mit Bedacht erledigten Bei meinen aktuellen und ehemaligen Kollegen DrKatrin Hurle Dr Dominique Ectors Dr Christoph Naber Dr Florian Huumlller JoumlrgNehring Frank Riedel Julian Wolf Tanja Manninger Daniel Wagner Nicolas FobbeKarla Spaumlth Julian Goergens Andreas Koumlhler Cordula Jakob Franz Becker und LisaKlemenz bedanke ich mich fuumlr die gelungene Zusammenarbeit und gegenseitige Unter-stuumltzung Besonderer Dank geht auch an Kerstin Kreszlig Bettina Engl Christian HankeBernd Schleifer und Christian Abe fuumlr die verlaumlssliche Unterstuumltzung bei technischen Fra-gen und Messungen im LaborFuumlr jegliche Unterstuumltzungen moumlchte ich mich auch bei meinen Eltern bedanken sowiebei meinem Bruder Ralf der mir mit einem LaTex Crashkurs viel Frustration ersparthat Danke Thomas dass du immer fuumlr mich da bist und mit mir zusammen fuumlr genugAusgleich gesorgt hast
45
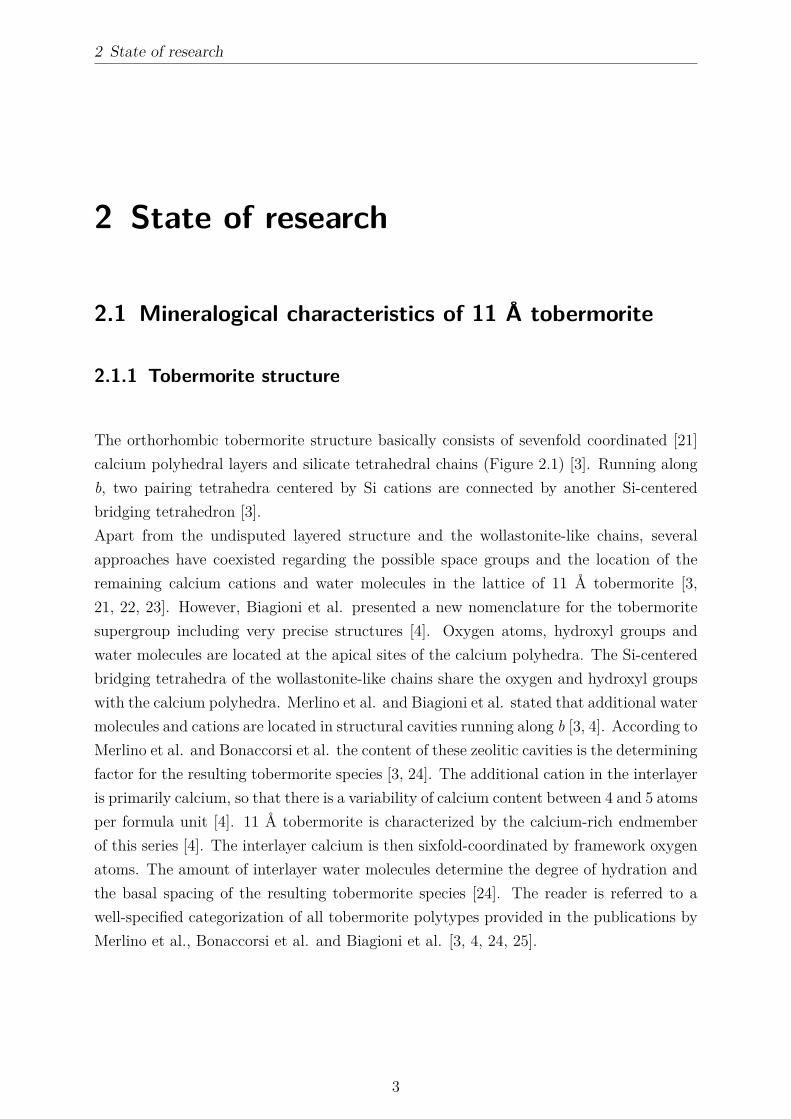
2 State of research
2 State of research
21 Mineralogical characteristics of 11 Aring tobermorite
211 Tobermorite structure
The orthorhombic tobermorite structure basically consists of sevenfold coordinated [21]calcium polyhedral layers and silicate tetrahedral chains (Figure 21) [3] Running alongb two pairing tetrahedra centered by Si cations are connected by another Si-centeredbridging tetrahedron [3]Apart from the undisputed layered structure and the wollastonite-like chains severalapproaches have coexisted regarding the possible space groups and the location of theremaining calcium cations and water molecules in the lattice of 11 Aring tobermorite [321 22 23] However Biagioni et al presented a new nomenclature for the tobermoritesupergroup including very precise structures [4] Oxygen atoms hydroxyl groups andwater molecules are located at the apical sites of the calcium polyhedra The Si-centeredbridging tetrahedra of the wollastonite-like chains share the oxygen and hydroxyl groupswith the calcium polyhedra Merlino et al and Biagioni et al stated that additional watermolecules and cations are located in structural cavities running along b [3 4] According toMerlino et al and Bonaccorsi et al the content of these zeolitic cavities is the determiningfactor for the resulting tobermorite species [3 24] The additional cation in the interlayeris primarily calcium so that there is a variability of calcium content between 4 and 5 atomsper formula unit [4] 11 Aring tobermorite is characterized by the calcium-rich endmemberof this series [4] The interlayer calcium is then sixfold-coordinated by framework oxygenatoms The amount of interlayer water molecules determine the degree of hydration andthe basal spacing of the resulting tobermorite species [24] The reader is referred to awell-specified categorization of all tobermorite polytypes provided in the publications byMerlino et al Bonaccorsi et al and Biagioni et al [3 4 24 25]
3
2 State of research
Figure 21 Calcium polyhedral layers and silicate tetrahedral chains in 11 Aring tobermoritestructure according to Merlino et al [3] Si1 and Si3 = pairing tetrahedra Si2= bridging tetrahedra Interlayer water molecules and cations are not shownFigure created with VESTA 316 [26]
4
2 State of research
212 Synthesis of stoichiometric 11 Aring tobermorite
The starting materials required for the hydrothermal synthesis of stoichiometric tober-morite are quartz flour or a different silica source calcium oxide or calcium hydroxideand deionized water [7 22] In accordance with the chemical formula the starting mixappropriately conforms to a CaSi molar ratio of about 08 [9 27]After preparing the slurry a distinct temperature setting of 170-180 degC autogenous satu-rated steam pressure (1ndash12 MPa) and a curing time of 12 h were recommended [5 7 28]Consequently an elevated water-to-solid ratio [7 23] in the starting mix and high over-all water content are required in order to ensure a saturated steam atmosphere in thelaboratory autoclave Qu et al showed that shorter curing times led to a lower reac-tion turnover [6] According to Šiaučiunas amp Baltakys at prolonged curing duration theformation of xonotlite (Ca6Si6O17(OH)2) was favored [7] It has been reported that thesurface area and solubility of all raw materials have an effect on the reaction time andreaction products [7 9 29] For instance gyrolite formation was triggered by highly sol-uble amorphous SiO2 in a study by Šiaučiunas amp Baltakys [7] El-Hemaly et al showedthat when amorphous type of silica was used the formation of C-S-H was accelerated butthe subsequent conversion to tobermorite was slowed down [22]The simplified hydrothermal reaction path (equation 21) [10 27 30] for the formationof stoichiometric tobermorite was described as follows Depending on the surface areaof raw materials the dissolution of Ca(OH)2 and SiO2 in the hydrothermal environmentinitially leads to the formation of a C-S-H gel which is characterized by poor structuralorder in c direction [22 27] The CaSi molar ratio in this precursor is variable [30] Thehydrothermal reaction proceeds and the C-S-H gel transforms into tobermorite but with amore particular CaSi ratio of approximately 083 The CaSi ratio decreases in this stepas further SiO2 is dissolved and supplied for reaction [10] Within this step periodicityin c direction increases and the calcium polyhedral layers and silicate chains gain morestructural order as reported by Shaw et al [27]
xCa(OH)2 + ySiO2 +H2O =rArr C-S-H gel =rArr C-S-H gel + zSiO2 =rArr tobermorite
(21)
Commonly pure phase synthesis of tobermorite is hardly attainable and some minorphases and amorphous content are frequently present in samples after hydrothermal cur-ing Common additional phases occurring in this system include calcite quartz xonotlitescawtite and poorly crystalline C-S-H with varying CaSi composition [7 9 31]In most studies autoclaved samples were dried at 60 - 100 degC [6 29] and ground prior
5
2 State of research
to further analyses Synthesized samples are commonly investigated by means of ther-mogravimetric analysis (TGA) combined with differential thermal analysis (DTA) SEManalysis and X-ray diffraction For estimation of the chemical purity of tobermorite usu-ally the basal spacing of 113 Aring is verified by XRD analysis as substitutions such as Al3+
incorporation would reflect in it [15 28] Moreover according to Mostafa et al and Quet al stoichiometric tobermorite showed plate-like morphology in SEM images [6 32]
213 Substitutions in the lattice of tobermorite
The incorporation of foreign ions into the lattice of tobermorite has been investigated intwo major respects In the first case the substitutions occur during the application ofpreviously synthesized tobermorite The potentials of these substitutions were exemplar-ily highlighted in chapter 1 [14 15] In the second case the substitutions occur duringthe hydrothermal formation of tobermorite Whenever a basic compound includes chem-ical components apart from calcareous materials and silica substitution in the lattice oftobermorite is likely to happen during the hydrothermal reaction Biagioni et al statedthat Al-free natural tobermorite is extremely rare [4]Supplementary cementitous materials (SCMs) are established components in various ap-plications - equally in AAC production Merchantable SCMs are usually limited to wellavailable materials so that only distinct foreign ions are supplied in a considerable scaleCalcined clays diatomite blast furnace slag and especially metakaolin are amongst themost frequent materials for this purpose [31 33 34 35] They are in turn characterizedby a specific chemical composition These raw materials supply primarily aluminum andalkali metal cations In addition the presence of sulfate ions in the system has been con-sidered by some authors since sulfate is a component in most composites for construction[32 36]Sakiyama amp Mitsuda and Rios et al successfully synthesized Al-substituted tobermoriteby applying different amounts of kaolinite and metakaolin [5 23] The incorporation ofAl3+ into the lattice of tobermorite resulted in lath-like crystals1 observed by SEM anal-ysis At a higher Al3+ dosage the formation of katoite was reported Skawinska et alinvestigated various halloysite contents in the initial mix [34] They confirmed katoiteformation caused by increased supply of Al3+ The substitution of Si4+ by Al3+ in thetetrahedral chains ranges to a possible 16 substitution of the tetrahedral sites reaching anAl content up to 1 Al atom per formula unit [4] Merlino et al explained that this mainlyoccurred in the bridging tetrahedron and for charge balance additional (OH)ndash substitutedO2ndash in one site [3] This leads to an increase of the basal spacing and lattice parameter c
1The terminology of observed crystalline particles is addressed in subsection 222
6
2 State of research
which was observed in several studies [15 28 37] In a different publication by Jacksonet al the incorporation of additional Na+ or K+ for charge balance was suggested [38]Matekonis et al stated that in this case tobermorite showed anomalous thermal behavior[29] Furthermore 29Si NMR measurements revealed that the substitution by Al3+ led toan increase of the chain length in b direction [38 39] Klimesch amp Ray performed thermalanalysis of Al-free and Al-substituted tobermorites [40] They reported that in the caseof Al3+ incorporation the conversion of 93 Aring tobermorite into β-wollastonite required ahigher temperature This observation is discussed later in this thesis (section 31) Qu etal performed XRD analysis and considered relative intensity broadening of Al-substitutedtobermorite reflections in order to estimate the crystallinity [6] However the broaden-ing was not measured and evaluated The present thesis provides extensive insights intothe evaluation of the peak broadening of tobermorite depending on the supply of Al3+ (section 31 and section 32)According to Mostafa et al substitution by (SO4)2ndash in the lattice of tobermorite led tobasal imperfection [32] Their study was mainly based on XRD analysis and FTIR spec-troscopy It was suggested that charge balance was achieved by substitution of (SO4)2ndash
and 2 (OH)ndash for (SiO4)4ndash Moreover the transformation of C-S-H gel into tobermorite wasaccelerated The sulfate-substituted tobermorite showed leafy crystals in SEM imagesBy contrast Sauman amp Valtr stated that the morphology of sulfate-substituted tober-morite did not differ substantially from the morphology of stoichiometric tobermoritecrystals [41] Instead anhydrite formation was observed by means of XRD analysis Insection 32 of this thesis a new perspective on this discussion is provided
22 Characterization of autoclaved aerated concrete
Supplied materials for AAC fabrication are transforming continuously during the pro-duction process which is displayed in Figure 22 [42] It can be seen that the phasetransitions before autoclaving remind of ordinary portland cement (OPC) hydration [43]The following main reactions run during the hydration before autoclaving [10 12 17]
CaO +H2O =rArr Ca(OH)2 (22)
Ca3SiO5 + 39H2O =rArr C17SH26 + 13Ca(OH)2 (23)
Ca3Al2O6 + 3CaSO4 + 32H2O =rArr Ca6Al2(OH)12(SO4)3 middot 26H2O (24)
This process step is finished when the generation of pores along with simultaneous expan-sion is completed and sufficient strength for wire cutting has developed through hydration
7
2 State of research
The reaction of aluminum powder does not only lead to the formation of hydrogen gasbut to very low amounts of different modifications of aluminum hydroxide [17] Howeverit can be seen that none of the hydrate phases forming during the green cake settingendure the autoclaving process Only quartz does partially not react and is consequentlypresent in the final product After transforming into ettringite and later AFm phasesinitially supplied anhydrite recrystallizes during the hydrothermal treatment A multi-step reaction sequence of C-S-H portlandite and further intermediate hydration productsleads to the crystallization of tobermorite The reader is referred to the comprehensivestudy of Schober for a more detailed presentation [17] Further supply of dissolved silicaat hydrothermal conditions contributes to the formation of tobermorite in the manneroutlined in equation 21 Clearly tobermorite is the major mineral phase present afterautoclaving and is therefore the main focus of research In the following subsections 221and 222 the state of knowledge concerning the characterization of AAC by means ofSEM analysis and XRD analysis is provided
Figure 22 Exemplary phase development during the entire production process of AACFigure adopted with permission from Schober [42]
221 SEM analysis
At first sight AAC has rather favorable properties compared to hydrated Portland cementwhen it comes to SEM analysis Due to the hydrothermal treatment several phases such
8
2 State of research
as tobermorite show better crystallinity In addition the hardly evitable effects of dam-age to poorly crystalline phases and removal of water are not as significant in the case ofAAC This is why environmental scanning electronic microscopy (ESEM) was suggestedin order to investigate hydrated Portland cement after early hydration [44 45] Howeverwhile hydrated OPC is a reasonably homogeneous material AAC shows heterogeneitydue to the porous structure (Figure 11)As reported in subsection 213 several authors investigated the morphology of tober-morite in AAC in order to verify the influence of foreign ions supplied by SCMs andestimate their effect on the thermal and mechanical properties Well crystallized tober-morite often shows a house-of-cards structure in AAC (Figure 23) which was observedin numerous studies [46 47 48]
Figure 23 House-of-cards appearance of tobermorite crystals in AAC
Wongkeo amp Chaipanich stated that the application of coal bottom ash for partial replace-ment of cement in the starting compound resulted in a change of plate-like to lath-likemorphology of tobermorite crystals [49] Equally thin lath-like plates of tobermorite wereobserved by Roacuteżycka et al in samples prepared from perlite waste [50] Venhodovaacute etal investigated AAC samples prepared from mixes including fly ash and Al(OH)3 andconfirmed the elongated shape of Al-incorporated tobermorite [8] In these studies thefraction of aluminum ions was increased by adding the respective SCM An effect on themorphology of tobermorite was respectively reported which conforms to the conclusionsmade by different authors in subsection 213 Nevertheless the heterogeneity of AACsamples in SEM images was barely addressed in all of these examples By contrast Mit-suda et al differentiated between macropores and micropores in their SEM images ofindustrially manufactured AAC [10] Huang et al separately analyzed walls and pores in
9
2 State of research
their samples prepared from copper tailings and blast furnace slag [48] The wall sectionsappeared dense while in pores platy tobermorite and long-strip shaped anhydrite wasobserved Only the tobermorite crystals in the pores showed the previously describedhouse-of-cards structure As is evident from these published results there is a lack ofclarity about the meaning and informative value of observations made in AAC samplesby SEM analysis In the main results of this present thesis (section 32) a substantiatedassessment of this circumstance is given
222 XRD analysis
While SEM analysis of AAC is majorly performed in order to characterize the crystallinityand morphology of tobermorite XRD analysis is mainly applied in order to assess theoverall phase composition Apart from the phases shown in Figure 22 additional calcitefeldspar mica gypsum and bassanite occur frequently in AAC depending on the miner-alogical composition of the used raw materials Frequently minor phases are unreactedresidual components of raw materials such as sericite in the publication of Isu et al [51] orphlogopite in the study of Huang et al who applied skarn-type copper tailings for AACpreparation [48] Prolonged curing duration resulted in minor quantities of xonotlite inthe study by Mitsuda et al [10]Mainly qualitative phase contents have been determined based on XRD in studies dealingwith the mineralogy of AAC A clear recognition of amorphous content in AAC along withthe crystalline phases has been barely addressed and discussed Relative quantities weredetermined by Matsui et al by plotting normalized intensities [28] They estimated thequantity of C-S-H gel by regarding the integrated intensity of the assumed tobermoriteprecursor in a distinct section of the XRD pattern Coming in agreement with the authorscited in subsection 213 increased d spacing along c in Al-substituted tobermorite wasreported in the same study Venhodovaacute et al performed XRD analysis of AAC samplesin their publication previously addressed in subsection 221 [8] They compared relativeintensities of tobermorite in their samples but no absolute quantities of the phases werecalculated either Mitsuda et al applied an internal standard method in order to quantifyunreacted quartz in their AAC samples [10]More recently Ectors proposed a promising method for the tracking of portlandite forma-tion during the green cake hydration [52] By applying a Rietveld compatible approachfor TOPAS 50 (Bruker AXS) to fit anisotropic peak broadening due to domain mor-phology [19] two generations of portlandite could be refined separately and assigned tothe hydration of calcium oxide and tricalcium silicate respectively The key idea behindthis approach is that the average domain morphology of a mineral phase in a powder
10
2 State of research
sample implies certain mineralogical characteristics The simplified domain morphologycan be calculated on the basis of geometrical shapes such as cylinder ellipsoid or cuboidDepending on the crystal system and the expected morphology the geometrical shapecan be adjusted accordingly In the example reported by Ectors the one generation ofportlandite originating from burnt lime hydration showed anisotropic peak broadening- unlike the generation forming from tricalcium silicate hydration In accordance withthe trigonal crystal system a biaxial cylinder model was applied for the fitting of theanisotropic generation The operating principle of the approach to fit the anisotropicpeak broadening due to domain morphology can be precisely explored by accessing fur-ther publications by Ectors et al [53 54] Apart from this benefit a better fit to themeasured data enables a more accurate refinement and quantification of all phases Thetwo generations of portlandite were additionally quantified by means of an external stan-dard method [55] The combination of quantitative phase analysis by XRD (QXRD) withthe refinement of anisotropic peak broadening is a promising approach in this context -especially in consideration of the fact that phase quantifications in AAC samples havebeen barely performed ever before Hence the application of these methods is the keymatter of this present thesis Especially the potential of the domain morphology analysisof tobermorite is precisely investigated The terms domain size and domain morphology inthis sense refer to the coherently scattering unit measured by XRD analysis Crystallineparticles observed by means of electron microscopy which are frequently termed grainscrystals or crystallites are for the most part clusters of coherently scattering domains[56 57]
11
3 Main results
3 Main results
This chapter introduces the main results presented in three peer reviewed publications[58 59 60] incorporated in chapter 6 The new findings are put in a general context andsubsequently they are summarized and discussed in chapter 4 The sections 31 and 32deal with the characterization of tobermorite in both lab-scale samples and AAC sam-ples produced on an industrial scale In section 33 the entire production process of AACincluding the hydration before autoclaving is addressed
Figure 31 Application of a triaxial cylinder model for the calculation of anisotropic do-main sizes of tobermorite implemented with Rietveld refinement and influenceon the fit compared to ordinary refinement [60]
12
3 Main results
One particular main result is a key element in each of the following sections In Figure 31the fit of tobermorite after two Rietveld refinements of different accuracy is shown In aregular Rietveld refinement for simplification the coherently scattering units are treatedas spherical shapes as usually only one size value for each mineral phase is calculated Asaverage domain sizes of a mineral phase in different crystallographic directions are in manycases indeed close to one value this approximation is often sufficient in order to achievea satisfactory fit to the measured diffractogram The crystal system and surroundingconditions during the formation of a mineral phase are significant factors in this context Amisfit at different (hkl) reflections as displayed in Figure 31 is an indication of anisotropicpeak broadening Clearly orthorhombic tobermorite shows anisotropic peak broadeningdue to its anisotropic domain morphology For the possible origins of anisotropic peakbroadening apart from size broadening the reader is referred to section 61 In accordancewith the orthorhombic crystal system a triaxial model is applied in order to fit the peakbroadening [19] By implementing the macro during the refinement no longer one butthree sizes (x y and z for respectively a b and c direction) are calculated Besides theimproved fit the calculated domain morphology is an additional information extractedfrom XRD analysis and it is representative for the average value of the phase in the entiresample In each of the following sections the different benefits regarding this approachare outlined in more detail
31 Hydrothermal synthesis of tobermorite on alaboratory scale - application of two types ofmetakaolin
This study covers mineralogical properties of tobermorite synthesized from a set of variouscompounds including different amounts and types of metakaolin [58] Unlike in sections32 and 33 the samples were not aerated before autoclaving and their composition isadjusted to the CaSi molar ratio of stoichiometric tobermorite On the one hand thereactivity of metakaolin and minor phases at hydrothermal conditions for the possible usein AAC production was investigated On the other hand the effects of consequent changesof the bulk chemistry in the basic compound on the mineralogical characteristics of to-bermorite such as lattice parameters and domain morphology were analyzed In additionfor one particular compound the effect of different curing times was explored While theconventional raw materials for AAC production are rather low-cost resources metakaolinis a high-priced SCM in this regard For this reason besides one comparatively pure com-mercial metakaolin (MK) a second by-product type of metakaolin (MKg) was applied
13
3 Main results
at equivalent dosages All investigated mix composites and the chemical composition ofMK and MKg are summed up in tables in section 61In Figure 32 the effect of different amounts of the two types of metakaolin on the phasequantities is displayed Clearly at moderate dosages of MK and MKg tobermorite waspresent in comparable quantities However the application of any amount of metakaolinreduced the amount of tobermorite compared to the blank mixture It can be seen thatkatoite was present whenever the content of Al2O3 in the starting drymix exceeded 2wt which fits well with the state of knowledge [5 23] For the highest possible dosagesof the two types of metakaolin (MK60 and MKg60) contrary effects were observed Ap-plication of impure metakaolin (MKg) led to a considerable amount of tobermorite whilein MK60 no tobermorite was present The high content of Al2O3 seems to have hinderedthe formation of tobermorite Not all of the Al2O3 in MKg was supplied for reactionas minor phases such as feldspar remained unreacted which is shown accurately in therespective publication in section 61
Figure 32 Weight fractions of tobermorite quartz and katoite measured by QXRD anal-ysis and contents of Al2O3 in the starting drymix Amorphous content andminor phases are not shown
The results of thermal analysis of samples characterized by MK addition in small stepsare shown in Figure 33 It can be seen that the conversion of 93 Aring tobermorite into β-
14
3 Main results
wollastonite depended on the dosage of MK However unlike suggested by Klimesch ampRay there was no effect of lower contents of Al2O3 in the drymix [40] Consequently theinfluence of Al3+ at low dosages (MK25 and MK5) could not be observed on the basisof this method Apart from this result the other signals showed good agreement with thesuggested conversion ranges by Klimesch amp Ray as for samples MK9 and MK16 a clearshift towards higher temperature was measured However the role of Al3+ incorporationverified by this method is not necessarily conclusive as additional reactions during theheating experiment involving Al3+ are possible On that basis the observations madeby means of DTA would not reflect the amount of Al3+ originally incorporated into thestructure of 11 Aring tobermorite
Figure 33 Conversion of 93 Aring tobermorite into β-wollastonite in samples synthesizedwith various amounts of metakaolin and suggested temperature ranges ac-cording to Klimesch amp Ray [40]
In accordance with authors referenced in subsection 213 lattice parameter c of tober-morite increased with elevated dosages of Al2O3 in the basic dry mix (Figure 34) Theimpact could be observed for the complete range of samples as displayed in section 61which indicates that a limit of Al3+ incorporation was not reached in this study Forcomparison the relative domain morphology is plotted in Figure 34 Unlike the DTA
15
3 Main results
signals both lattice parameter c and the domain morphology are impacted by very lowdosages of Al2O3 There is a good accordance of the relation of growth in b direction to adirection and the c parameter This is valid up to 20 wt of Al2O3 in the starting drymix By contrast more elevated contents of Al2O3 did not affect the domain morphologyany further even though the incorporation is verified through the increased c parameterIt follows that the impact of Al3+ incorporation on the domain morphology is limited tovery low contents while the impact on lattice parameter c can be tracked throughoutthe entire examined range of samples In section 61 additional results show that growthin b direction increased with reaction time These observations are solely based on XRDanalysis and offer new benefits for the structural understanding of tobermorite
Figure 34 Impact of the calculated Al2O3 content in the basic dry mix on the latticeparameter c and on the relation of calculated domain sizes of tobermorite ina (x) and b (y) direction
16
3 Main results
32 Structural properties of tobermorite in AAC - SEMversus XRD analysis
This section and the respective publication [59] mainly deal with the suitability of SEManalysis of tobermorite in AAC The effects of varying amounts of SO3 and Al2O3 in thedry mix on structural properties of tobermorite are discussed based on XRD analysisAs shown in subsection 221 and Figure 23 tobermorite often shows a house-of-cardsstructure in AAC samples This property has been considered to be relevant for thethermal and mechanical properties of AAC (subsection 221) However SEM analysiswithin this study revealed that this type of appearance is mainly found in the poresand pore surfaces (Figure 35) This finding comes in agreement with the observationsmade by Huang et al [48] In the solid skeleton of the dense AAC material neither themorphology nor the house-of-cards structure could be observed properly which can beseen very clearly in additional micrographs provided in section 62 It should be consideredthat the major amount of tobermorite by weight is located in the dense material and notat the pore surfaces In this way these findings are clear disadvantages coming along withonly SEM analysis of AAC as representative results can hardly be obtained
Figure 35 House-of-cards structure of tobermorite in a pore surrounded by dense mate-rial
Moreover several authors in subsection 221 justified the morphology of tobermorite withthe incorporation of foreign ions Al-substituted tobermorite showed lath-like morphologywhereas Al-free tobermorite showed rather plate-like morphology [6 32 49] Howeverthe present investigation revealed that independent of Al2O3 content in the raw mix there
17
3 Main results
is always heterogeneity regarding the morphology of tobermorite In Figure 36 plate-likeand lath-like morphology of tobermorite in AAC observed in two statistical chemicallyvarious samples are displayed This result supports the previous assumption that theobservations made by SEM analysis of tobermorite in AAC strongly depend on whatpart of the sample is selected Yet again no clear observations could be made that wererepresentative for the entire sample
Figure 36 Heterogeneous morphology of tobermorite (plate-like in a and c lath-like in band d) in two AAC samples characterized by different Al2O3 contents in theraw mix
The effects of Al3+ on the domain morphology of tobermorite were measured and evaluatedin a similar manner as in section 61 and the results could be confirmed The relativedomain growth in b direction was increased by Al3+ incorporation in both studies [5859] Moreover lattice parameter c was increased with Al3+ incorporation which can beseen more accurately in section 62 Unlike SEM analysis XRD analysis allowed clearconclusions whenever structural properties of Al-substituted tobermorite were affectedInstead of a local observation as made with SEM representative and statistical resultswere obtained The reader is referred to section 61 and section 62 for further results and
18
3 Main results
more specific conclusionsIn addition the effect of various amounts of sulfate in the raw mix was analyzed Unlikein the case of different dosages of Al3+ neither the domain morphology nor the latticeparameters of tobermorite were affected by the SO3 content in the dry mix In Figure 37these observations and additionally the amounts of anhydrite measured by QXRD areshown As the amount of available SO3 in the dry mix is known the maximum possibleamount of anhydrite could be calculated for each of the samples in focus Obviouslythe measured amounts of anhydrite are either equal or slightly higher compared to theexpected quantities This result leads to the assumption that all of the available sulfateis transformed into anhydrite so that no more sulfate could be incorporated into thestructure of tobermorite The over-estimation of anhydrite in some of the samples can beexplained due to the inaccuracy of the quantification method The present results rathermatch with the suggestions by Sauman amp Valtr [41] as in their study no effect of sulfateon the structure of tobermorite was observed either
Figure 37 Impact of the sulfate content in the AAC raw mix on lattice parameter cand relative domain morphology of tobermorite (a) and comparison of theexpected maximum amount of anhydrite to the measured amount determinedby QXRD (b)
33 Improved monitoring of the phase developmentduring the production of AAC
In this study not only autoclaved samples were analyzed but additionally a lab-scale slurrywhich included the reactive components of the green cake stage during AAC productionat equivalent weight proportions In-situ XRD was performed at 70 degC and at a water-to-
19
3 Main results
solid ratio of 08 for 24 h (Figure 38) which are respective conditions during commercialproduction Clearly the phase development is dominated by OPC and lime hydration asdescribed in section 22 It can be seen that the major reaction turnover occurs duringthe first 200 minutes which is the average duration of the green stage After only 30minutes all of the quicklime had transformed into portlandite whereas Schober proposeda duration of one hour for this reaction [42] The amount of portlandite is composed oftwo different generations as proposed by Ectors [52] Equally a biaxial cylinder modelwas applied in order to fit the peak broadening of the first generation of portlandite in thepresent investigation Minor phase developments such as the formation of AFm phases arenot shown in Figure 38 A coarse fraction of anhydrite did not react so that constantlyaround 15 wt were measured after 6 h As the decomposition of ettringite due tosulfate depletion [55] does not occur prior to 12 h the green cake strength is not affected
Figure 38 In-situ XRD measurement of AAC model slurry at water-to-solid ratio of 08and 70 degC For clarity and comprehensibility not all phases are shown
The separation of two generations of portlandite in the system does not only translate intodifferent domain morphologies as shown by Ectors [52] In Figure 39 more indicationsfor different mineralogical properties are displayed The shape of the (0 0 1) reflection inXRD patterns after only quicklime hydration and after both quicklime and alite hydrationshows a distinct feature While portlandite originating from quicklime hydration showsa broad peak implying lower crystallinity the peak after alite hydration is characterized
20
3 Main results
Figure 39 Formation of two generations of portlandite in AAC slurry in XRD (a) andDTA (b) plots
by a sharper component Yet the peak breadth did not change indicating that the firstgeneration is still present with the original characteristics This observation is supportedby DTA measurements additionally demonstrating two degrees of crystallinity only afteralite hydration In agreement with XRD analysis the better crystalline second generationof portlandite decomposes at a higher temperature
Figure 310 Quantification of tobermorite in statistical chemically various AAC sampleswith and without the application of the macro for the fitting of anisotropicpeak broadening
21
3 Main results
Furthermore commercial AAC samples were considered in this study By applying themethod for the refinement of anisotropic peak broadening (Figure 31) a more accuratequantification of tobermorite can be achieved In Figure 310 the calculated amounts oftobermorite in statistical chemically various AAC samples are plotted In some samplesthe refinement using the macro leads to considerably higher but never lower quantitiesof tobermorite whereas in other samples nearly the same amount of tobermorite is cal-culated This observation can be well understood taking into account that the macroallows to account more peak area for tobermorite as shown in Figure 31 Clearly thereis evidence that the anisotropy of tobermorite domains is not uniform from one sampleto another which was basically justified in the previous sections As an improved quan-tification of a single phase leads to a better quantification of other phases in the samplethis adaption is very valuable in order to assess the phase development Here the peakbroadening of tobermorite equally observed by Qu et al [6] could be tracked and evalu-ated in order to gain more accurate results Moreover in section 63 McCrone milling issuggested in order to avoid spottiness in XRD patterns caused by coarse grains of quartzor anhydrite (Figure 38)
22
4 Conclusions
4 Conclusions
The research results presented in the previous sections yield advances in the mineralogicalinvestigation of tobermorite and autoclaved aerated concrete Recorded diffraction pat-terns contain plenty of usually unused data regarding the microstructural characteristicsof the sample and phases therein The profit of XRD measurements can be significantlyimproved whenever one or more phases show anisotropic peak broadening and appro-priate models for the respective domain morphology are implemented into the Rietveldenvironment Within the scope of the present investigations portlandite and tobermoriteshow this particularityThe effects of changes in the chemistry of the starting mix were examined based on dif-ferent dosages of metakaolin Al-substituted tobermorite showed increased growth in b
direction and an increase of lattice parameter c compared to Al-free tobermorite The rel-ative domain sizes were determined based on anisotropic peak broadening However whilethe effect of Al3+ incorporation into the lattice of tobermorite was limited regarding thedomain morphology lattice parameter c showed an increase throughout the entire rangeof samples The consequent effects suggested by Klimesch amp Ray observed by means ofDTA are debatable as reactions during the heating experiment may lead to to a changeof Al3+ content in tobermorite [40] While both types of applied metakaolin showed goodreactivity at hydrothermal conditions some included minor phases such as feldspar oranatase remained unreacted At high dosages of Al2O3 in the starting mix the formationof either only katoite or katoite along with tobermorite was observed (Figure 32)SEM analysis of tobermorite in AAC cannot be suggested based on the observationspresented in this work as it is only visually accessible in the pores or at pore surfacesThe dense material of the AAC skeleton contains several crystalline and X-ray amorphousphases which hardly allows a proper investigation Even in single pores tobermorite crys-tals appeared very heterogeneous at various chemical compositions As a result lath-liketobermorite was not only present in samples characterized by elevated Al3+ incorporationBy contrast the benefits of XRD analysis presented in section 61 equally accounted fortobermorite in AAC samples Sulfate incorporation into the lattice of tobermorite wasnot observed All of the sulfate in the system was detected to be present in anhydriteThe phase transitions in the AAC raw slurry during the green stage hydration were show-cased by in-situ XRD analysis of a model mix at 70 degC Additional DTA and XRD mea-
23
4 Conclusions
surements during this step confirmed the presence of two generations of portlandite char-acterized by different crystallinity as suggested by Ectors [52] The inclusion of anisotropicdomain morphology during the Rietveld refinement allowed a more accurate quantifica-tion of tobermorite in autoclaved samples Sample preparation adjusted to the grain sizedistribution in AAC samples (section 63) the external standard method for quantita-tive XRD analysis [55] and the approach to evaluate anisotropic peak broadening [19]are the key methods for a more accurate tracking of the phase development during AACproduction
24
5 References
5 References
[1] A E Zadov A I Grabezhev N N Pertsev N V Chukanov and S V PribavkinTobermorite-plombierite metasomatites of the Gumeshevsk skarn-porphyry copper depositmiddle Urals Doklady Earth Sciences 407(3)495ndash497 2006
[2] M F Heddle Preliminary notice of substances which may prove to be new minerals MinMag 4117ndash123 1880
[3] S Merlino E Bonaccorsi and T Armbruster The real structure of tobermorite 11AringNormal and anomalous forms OD character and polytypic modifications European Journalof Mineralogy 13(3)577ndash590 2001
[4] C Biagioni S Merlino and E Bonaccorsi The tobermorite supergroup a new nomencla-ture Mineralogical Magazine 79(2)485ndash495 2015
[5] C A Riacuteos C D Williams and M A Fullen Hydrothermal synthesis of hydrogarnetand tobermorite at 175 degC from kaolinite and metakaolinite in the CaO-Al2O3-SiO2-H2Osystem A comparative study Applied Clay Science 43(2)228ndash237 2009
[6] X Qu Z Zhao and X Zhao Microstructure and characterization of aluminum-incorporated calcium silicate hydrates (C-S-H) under hydrothermal conditions RSC Ad-vances 8(49)28198ndash28208 2018
[7] R Šiaučiunas and K Baltakys Formation of gyrolite during hydrothermal synthesis inthe mixtures of CaO and amorphous SiO2 or quartz Cement and Concrete Research34(11)2029ndash2036 2004
[8] E Venhodovaacute R Janovskyacute and R Drochytka Formation of Tobermorite at Different Ma-terials Composition of Aerated Concrete Applied Mechanics and Materials 752-753247ndash250 2015
[9] L Galvaacutenkovaacute E Bartoniacutečkovaacute T Opravil J Tkacz and P Ptaacuteček The influence ofstarting materials solubility on tobermorite structure formation under the hydrothermalconditions IOP Conference Series Materials Science and Engineering 379(1)1ndash8 2018
[10] T Mitsuda K Sasaki and H Ishida Phase Evolution during Autoclaving Process J AmCeram Soc 75(75)1858ndash1863 1992
[11] A Skawińska The influence of metahalloysite addition on tobermorite formation studied byX-ray powder diffraction and scanning electron microscope MATEC Web of Conferences16305008 2018
[12] S T Bergold F Goetz-Neunhoeffer and J Neubauer Quantitative analysis of C-S-H in
25
5 References
hydrating alite pastes by in-situ XRD Cement and Concrete Research 53119ndash126 2013
[13] O P Shrivastava and F P Glasser Ion-exchange properties of 11-Aring tobermorite Reactivityof Solids 2(3)261ndash268 1986
[14] H Maeda Y Ogawa E H Ishida and T Kasuga Hydrothermal synthesis of tobermoritedoped with phosphorus species for removing heavy metal ions Journal of the AustralianCeramic Society 48(1)8ndash11 2012
[15] O P Shrivastava and R Shrivastava Cation exchange applications of synthetic tobermoritefor the immobilization and solidification of cesium and strontium in cement matrix Bulletinof Materials Science 23(6)515ndash520 2000
[16] G Renman and A Renman Sustainable Use of Crushed Autoclaved Aerated Concrete(CAAC) as a Filter Medium in Wastewater Purification 8th International conferenceon sustainable management of waste and recycled materials in construction GothenburgSweden 30 Mayndash1 June 2012 Proceedings pages 1ndash7 2012
[17] G Schober Chemical transformations during the manufacturing of autoclaved aeratedconcrete (ACC) Cement lime gypsum and quartz sand become cellular concrete ZKG58(7)63ndash70 2005
[18] A J Hamad Materials Production Properties and Application of Aerated LightweightConcrete Review International Journal of Materials Science and Engineering 2(2)152ndash157 2014
[19] D Ectors F Goetz-Neunhoeffer and J Neubauer A generalized geometric approach toanisotropic peak broadening due to domain morphology Journal of Applied Crystallogra-phy 48(1)189ndash194 2015
[20] H M Rietveld A profile refinement method for nuclear and magnetic structures Journalof Applied Crystallography 2(2)65ndash71 1969
[21] S A Hamid The crystal structure of the 11 Aring natural tobermoriteCa225[Si3O75(OH)15]1H2O Zeitschrift fuer Kristallographie - New Crystal Struc-tures 154(3-4)189ndash198 1981
[22] S A S El-Hemaly T Mitsuda and H F W Taylor Synthesis of normal and anomaloustobermorites Cement and Concrete Research 7429ndash438 1977
[23] M Sakiyama and T Mitsuda Hydrothermal reaction between C-S-H and kaolinite for theformation of tobermorite at 180degC Cement and Concrete Research 7(6)681ndash685 1977
[24] E Bonaccorsi S Merlino and A R Kampf The crystal structure of tobermorite 14 Aring(plombierite) a C-S-H phase Journal of the American Ceramic Society 88(3)505ndash5122005
[25] S Merlino E Bonaccorsi and T Armbruster The real structures of clinotobermorite andtobermorite 9 Aring OD character polytypes and structural relationships European Journalof Mineralogy 12(2)411ndash429 2000
[26] K Momma and F Izumi VESTA 3 for three-dimensional visualization of crystal volu-metric and morphology data Journal of Applied Crystallography 44(6)1272ndash1276 2011
26
5 References
[27] S Shaw S M Clark and C MB Henderson Hydrothermal formation of the calcium sil-icate hydrates tobermorite (Ca5Si6O16(OH)2 middot 4H2O) and xonotlite (Ca6Si6O17(OH)2)An in situ synchrotron study Chemical Geology 167(1-2)129ndash140 2000
[28] K Matsui J Kikuma M Tsunashima T Ishikawa S Matsuno A Ogawa and M SatoIn situ time-resolved X-ray diffraction of tobermorite synthesis process under hydrothermalcondition IOP Conference Series Materials Science and Engineering 18(2)60ndash66 2011
[29] G Matekonis R Šiaučiunas and D Vaičiukyniene Hydrothermal Synthesis and Charac-terization of Na + and [ Al 3 + + Na + ] -substituted Tobermorite in CaO-SiO2middotnH2O-H2OSystem MATERIALS SCIENCE 16(3)242ndash248 2010
[30] G Geng R J Myers M J A Qomi and P JM Monteiro Densification of the inter-layer spacing governs the nanomechanical properties of calcium-silicate-hydrate ScientificReports 7(1)1ndash8 2017
[31] D Klimesch and A Ray Autoclaved cement-quartz pastes with metakaolin additionsAdvanced Cement Based Materials 7(3-4)109ndash118 1998
[32] N Y Mostafa A A Shaltout H Omar and S A Abo-El-Enein Hydrothermal synthesisand characterization of aluminium and sulfate substituted 11 nm tobermorites Journal ofAlloys and Compounds 467(1-2)332ndash337 2009
[33] İ Demir M S Başpınar E Kahraman E Ccedilalışkan and G Goumlrhan An Investigation onthe Usability of Diatomite in Aerated Concrete Production In Proc of the Intl Conf onAdvances In Civil Structural And Construction Engineering - CSCE 2014 pages 97ndash1002014
[34] A Skawinska Z Owsiak T Baran and K Hernik The influence of halloysite additionon tobermorite formation in CaO and quartz mix under hydrothermal conditions CementWapno Beton 17(12)426ndash434 2017
[35] N Y Mostafa Influence of air-cooled slag on physicochemical properties of autoclavedaerated concrete Cement and Concrete Research 35(7)1349ndash1357 2005
[36] D Małaszkiewicz and J Chojnowski Influence of addition of calcium sulfate dihydrate ondrying of autoclaved aerated concrete Open Engineering 7(1)273ndash278 2017
[37] N Hara and N Inoue Thermal behaviour of 11Aring tobermorite and its lattice parametersCement and Concrete Research (10)53ndash60 1980
[38] M D Jackson S R Chae S R Mulcahy C Meral R Taylor P Li A H EmwasJ Moon S Yoon G Vola H R Wenk and P JM Monteiro Unlocking the secretsof Al-tobermorite in Roman seawater concrete American Mineralogist 98(10)1669ndash16872012
[39] W Liao W Li Z Fang C Lu and Z Xu Effect of different aluminum substitution rateson the structure of Tobermorite Materials 12(22)1ndash10 2019
[40] D Klimesch and A Ray DTA-TG Study of the CaO-SiO2-H2O and CaO-Al2O3-SiO2-H2OSystems Under Hydrothermal Conditions Journal of Thermal Analysis and Calorimetry56(1)27ndash34 1999
27
5 References
[41] Z Sauman and Z Valtr Substitution of sulphate ions in the crystal lattice of 11 Aring to-bermorite In The VI International Congress on the Chemistry of Cement pages 1ndash14Moscow 1974
[42] G Schober Reaction of raw materials to the final product AAC httpwwwpb-aacde
chemmin2_ehtml 2012 accessed 2020-01-31
[43] D Jansen C Stabler F Goetz-Neunhoeffer S Dittrich and J Neubauer Does Ordi-nary Portland Cement contain amorphous phase A quantitative study using an externalstandard method Powder Diffraction 26(01)31ndash38 2011
[44] C Roumlszligler J Stark F Steiniger and W Tichelaar Limited-dose electron microscopyreveals the crystallinity of fibrous C-S-H phases Journal of the American Ceramic Society89(2)627ndash632 2006
[45] Y Sakalli and R Trettin Investigation of C3S hydration by environmental scanning elec-tron microscope Journal of Microscopy 259(1)53ndash58 2015
[46] F Matsushita Y Aono and S Shibata Expansion and shrinkage behavior of green cakeof Autoclaved Aerated Concrete In Autoclaved Aerated Concrete - Innovation and Devel-opment Proceedings of the 4th International Conference on Autoclaved Aerated ConcreteKingston UK 8-9 September 2005 pages 101ndash108 CRC Press 2005
[47] C Chucholowski M Holger and K-C Thienel Improving the recyclability environmentalcompatibility and CO2 balance of autoclaved aerated concrete by replacing sulfate carrierand cement with calcined clays CePapers 2(4)503ndash512 2018
[48] X Y Huang W Ni W H Cui Z J Wang and L P Zhu Preparation of autoclavedaerated concrete using copper tailings and blast furnace slag Construction and BuildingMaterials 27(1)1ndash5 2012
[49] W Wongkeo and A Chaipanich Compressive strength microstructure and thermal anal-ysis of autoclaved and air cured structural lightweight concrete made with coal bottom ashand silica fume Materials Science and Engineering A 527(16-17)3676ndash3684 2010
[50] A Roacuteżycka and W Pichoacuter Effect of perlite waste addition on the properties of autoclavedaerated concrete Construction and Building Materials 12065ndash71 2016
[51] N Isu H Ishida and T Mitsuda Influence of quartz particle size on the chemical andmechanical properties of autoclaved aerated concrete (I) tobermorite formation Cementand Concrete Research 25(25)243ndash248 1995
[52] D Ectors Advances in the analysis of cementitious reactions and hydrate phases doctoralthesis PhD thesis Friedrich-Alexander-Universitaumlt Erlangen-Nuumlrnberg 2016
[53] D Ectors F Goetz-Neunhoeffer and J Neubauer Domain size anisotropy in the double-Voigt approach An extended model Journal of Applied Crystallography 481998ndash20012015
[54] D Ectors F Goetz-Neunhoeffer and J Neubauer Routine (an)isotropic crystallite sizeanalysis in the double-Voigt approximation done right Powder Diffraction 32(S1)27ndash342017
28
5 References
[55] D Jansen F Goetz-Neunhoeffer C Stabler and J Neubauer A remastered external stan-dard method applied to the quantification of early OPC hydration Cement and ConcreteResearch 41(6)602ndash608 2011
[56] T Ungaacuter G Tichy J Gubicza and R J Hellmig Correlation between subgrains andcoherently scattering domains Powder Diffraction 20(04)366ndash375 2005
[57] Triloki P Garg R Rai and B K Singh Structural characterization of as-depositedcesium iodide films studied by X-ray diffraction and transmission electron microscopy tech-niques Nuclear Instruments and Methods in Physics Research Section A AcceleratorsSpectrometers Detectors and Associated Equipment 736128ndash134 2014
[58] J Schreiner F Goetz-Neunhoeffer J Neubauer and D Jansen Hydrothermal synthesisof 11 Aring tobermorite ndash Effect of adding metakaolin to the basic compound Applied ClayScience 185 2020
[59] J Schreiner F Goetz-Neunhoeffer J Neubauer S Volkmann S Bergold R Webler andD Jansen Advanced Rietveld refinement and SEM analysis of tobermorite in chemicallydiverse autoclaved aerated concrete Powder Diffraction 34143ndash150 2019
[60] J Schreiner D Jansen D Ectors F Goetz-Neunhoeffer J Neubauer and S VolkmannNew analytical possibilities for monitoring the phase development during the production ofautoclaved aerated concrete Cement and Concrete Research 107247ndash252 2018
29
6 Publications
6 Publications
61 Hydrothermal synthesis of 11 Aring tobermorite ndash Effectof adding metakaolin to the basic compound
Reprint of the peer reviewed publication
Schreiner J Goetz-Neunhoeffer F Neubauer J Jansen D 2020 Hydrothermalsynthesis of 11 Aring tobermorite ndash Effect of adding metakaolin to the basic compoundApplied Clay Science 185 httpsdoiorg101016jclay2019105432
with permission from Elsevier
30
Contents lists available at ScienceDirect
Applied Clay Science
journal homepage wwwelseviercomlocateclay
Research paper
Hydrothermal synthesis of 11 Aring tobermorite ndash Effect of adding metakaolin tothe basic compound
J Schreiner F Goetz-Neunhoeffer J Neubauer D JansenUniversity of Erlangen-Nuremberg GeoZentrum Nordbayern Mineralogy Schlossgarten 5a 91054 Erlangen Germany
A R T I C L E I N F O
KeywordsHydrothermal synthesis11 Aring tobermoriteMetakaolinPowder diffractionKatoite
A B S T R A C T
Different amounts and types of metakaolin were analyzed and applied for the hydrothermal synthesis of 11 Aringtobermorite All synthesized samples were investigated by means of powder XRD combined with Rietveld re-finement Al-substituted 11 Aring tobermorite was successfully synthesized on the basis of a broad range of com-pounds characterized by a varying content of metakaolin Katoite was present depending on the amount ofsupplied Al3+ which was determined by the dosage of metakaolin Minor crystalline components included in thetwo types of metakaolin sources varied greatly in their reactivity under hydrothermal conditions Despite adifferent degree of purity the two types of metakaolin showed corresponding effects at moderate dosages butcontrary effects at higher dosages as for the synthesis of 11 Aring tobermorite The domain morphology of to-bermorite could be associated with Al3+ incorporation for low dosages of metakaolin represented by up to 2 wt- Al2O3 in the dry mix By contrast Al3+ affected tobermorite lattice parameters at equivalent and even athigher dosages with c reaching 2295 Aring at 12 wt- Al2O3 in the dry mix
1 Introduction
11 Application of metakaolin as a reactive material in constructionindustry
The application of supplementary cementitious materials (SCMs) inthe field of construction technology has received a lot of attention inrecent years Due to limited resources and an urgent need for alter-native and more eco-friendly construction materials SCMs such asmetakaolin offer a great potential The usage of SCMs has not onlyspread to the cement and mortar industry but also to advanced appli-cations such as autoclaved aerated concrete (AAC) (Demir et al 2014Koutnyacute et al 2014 Walczak et al 2015 Roacuteżycka and Pichoacuter 2016Chucholowski et al 2018) Unlike ordinary cementitious constructionmaterials AAC is produced from hydrothermal curing Due to the dif-ferent thermodynamic environment the hydration process and the re-activity of raw materials have to be investigated properly in order tounderstand the effects on the AAC product The leading mineral phasein AAC is 11 Aring tobermorite (Ca5Si6O16(OH)2middot4H2O) As a consequencethe thermal and mechanical properties of AAC depend on micro-structure and crystallinity of tobermorite to some extent In addition tothe curing time and the fineness of raw materials the supply of ionsthat can substitute in the tobermorite structure is a crucial factor in thiscontext Especially substitutions by aluminum sodium and potassium
ions have been investigated thoroughly (Sauman 1974 Klimesch andRay 1998 Mostafa et al 2009 Matekonis et al 2010 Skawinskaet al 2017) Calcined clays usually contain a considerable amount ofthe mentioned ions
There is a vast amount of literature on the reactivity of SCMs atambient temperature and standard pressure but there is little when itcomes to hydrothermal conditions In previous publications the beha-vior of metakaolin under hydrothermal conditions was mainly in-vestigated for the synthesis of zeolites (Zhang et al 2007 Aguilar-Mamani et al 2014 Setthaya et al 2016 Luo et al 2018) In thesestudies the reactivity of metakaolin was observed at a wide range oftemperature and pH values During the transformation of kaolin intometakaolin a loss of framework alumina was observed (Ayodele et al2019) In recent decades metakaolin has been the subject of studies inthe field of geopolymer research (Rashad 2013 Chen et al 2016) Forthe synthesis of 11 Aring tobermorite a more distinct setting of temperaturesetting (180ndash200 degC) and steam pressure (1ndash12 MPa) are required
This publication is intended to make a new contribution to thechallenging field of hydrothermal synthesis in the system CaO-Al2O3-SiO2-H2O based on XRD analysis combined with Rietveld refinementVarious dosages of two types of metakaolin with different chemical andmineralogical purities are compared for the effects on the hydrothermalsynthesis of Al-substituted 11 Aring tobermorite Especially changes of thebulk chemistry in the raw mixes the reactivity of minor crystalline
httpsdoiorg101016jclay2019105432Received 20 August 2019 Received in revised form 13 November 2019 Accepted 30 December 2019
Corresponding authorE-mail address juergenjsschreinerfaude (J Schreiner)
Applied Clay Science 185 (2020) 105432
0169-1317 copy 2020 Elsevier BV All rights reserved
T
6 Publications
31
phases of the two types of metakaolin and the effect of different curingtimes are the focus of interest On the one hand metakaolin offers agreat potential in the AAC industry On the other hand of all SCMsmetakaolin is a good source material for investigating the influence ofAl3+ on the synthesis of Al-substituted 11 Aring tobermorite
12 Synthesis of Al-substituted 11 Aring tobermorite
In addition to being present in AAC tobermorite has found appli-cation in wastewater treatment and nuclear waste management due toits ion exchange capacity (Maeda et al 2012 Monasterio et al 2015)The substitution of silicon by aluminum results in a different to-bermorite structure due to general and local charge balance affectingthe lattice parameters Especially c is impacted by this substitutionbecause it occurs in the bridging tetrahedron and additional OHndash sub-stitutes O2ndash (Komarneni et al 1985 Merlino et al 2000) As suggestedin some additional studies the substitution of Si4+ by Al3+ and Na+ orK+ leads to a lath-like morphology of tobermorite crystals (Mostafa2005 Mostafa et al 2009 Venhodovaacute et al 2015 Qu et al 2018)However because of the heterogeneous appearance of tobermorite inAAC it is hardly possible to conduct a proper characterization based onSEM analysis In our recent work the anisotropic peak broadening oftobermorite in XRD diffractograms was successfully linked with theincorporation of foreign ions supplied in a common AAC production(Schreiner et al 2019) This finding allowed a more statistical struc-tural characterization of tobermorite in bulk compositions compared toSEM analysis Moreover it was reported in other studies that differenthydrate phases occur depending on the amount of supplied ions and onthe experimental settings In compounds with a high content of Al3+formation of katoite could be observed (Klimesch and Ray 1998 Riacuteoset al 2009 Matsui et al 2011) In the case of a longer curing durationinstead of 11 Aring tobermorite the formation of xonotlite (Siauciunas andBaltakys 2004 Galvaacutenkovaacute et al 2018) or - depending on the finenessof used silica source (Siauciunas and Baltakys 2004) - gyrolite is fa-voured
Kalousek (1956) suggested that tobermorite can contain up to 5Al2O3 More Al2O3 in the system resulted in the formation of hydro-garnet Klimesch and Ray (1998) additionally investigated the stabilityof hydrogarnet depending on the Al(Si + Al) ratio and its role in re-lation to the formation of 11 Aring tobermorite in an equivalent systemThey suggest that hydrogarnet always appears before tobermorite butthe former can only be detected for higher Al(Si + Al) ratios in theevent of longer curing times Riacuteos et al (2009) and Qu et al (2018)confirmed these findings in extensive investigations In the latter pub-lication it is additionally suggested that samples prepared at lowertemperatures (160 degC) are less impacted by the supply of Al3+ Theyalso consider the peak broadening of tobermorite in their XRD plotsbased on the amount of incorporated Al3+ In two recent publicationswe suggested that the peak broadening of tobermorite enables a mi-crostructural analysis by calculating the orientation dependent domainsizes (Schreiner et al 2018 2019) However these studies are based onsamples of industrially produced AAC so that the curing time was fixedThe studied AAC was produced from raw materials with a broad che-mical spectrum such as ordinary Portland cement (OPC) whichsomehow complicates the interpretation of results
In this work the influence of aluminum ions - provided by meta-kaolin - on dominant crystallographic direction-dependent domaingrowth of tobermorite is investigated by analysis of anisotropic peakbroadening (Ectors et al 2015 2017) In Fig 1 of the supplementarymaterial the method of fitting the anisotropic peak broadening of to-bermorite using a triaxial cylinder model is visualized (Schreiner et al2018) Fitting of the anisotropic peak broadening of tobermorite Thismethod is used to calculate the average and reliable values for to-bermorite domain sizes in the powder sample and associate them withaverage Al3+ incorporation Microstrain should be considered becauseit is an additional source of peak broadening However this usually
accounts for materials that have been exposed to different kinds ofstress such as metals and alloys (Badawi et al 2019) In addition theinstrumental contribution to peak broadening should be consideredHydration products such as tobermorite are characterized by crystallitesizes in the range of nanometers so that anisotropic size broadeningclearly outweighs the effect of instrumental broadening (Jenkins andSnyder 1996) Moreover the impact of Al3+ on the lattice parametersof tobermorite is considered It should additionally be clarified whe-ther the results from our previous publication (Schreiner et al 2019)based on industrially produced AAC can be confirmed by investigationwith less complex raw mixes and purely based on laboratory experi-ments
2 Material and methods
21 Starting materials
The starting materials for hydrothermal synthesis included deio-nized water quartz flour portlandite (999 pure) and two types ofmetakaolin One type was ordinary commercially available metakaolin(MK) with nearly a stoichiometric composition For comparison thesecond type of commercially available metakaolin was a by-productfrom expanded glass production (MKg) and consequently highly im-pure The chemical composition of MK and MKg determined by XRF isgiven in Table 1 With MKg containing less Al2O3 but considerably moreNa2O than MK the effects on hydrothermal synthesis were of interestBoth types of metakaolin have been characterized in previous pub-lications (Schmidt et al 2012 Naber et al 2019) In addition weverified the mineral phase content by XRD analysis Besides amorphousmetakaolin MK contained minor amounts of anatase quartz and mica
Fig 1 Weight fractions of tobermorite quartz and katoite determined byquantitative XRD analysis ndash samples including MKg crosshatched
Table 1Chemical composition of MK and MKg determined by XRF analysis ndash majorcontrasts in bold letters
Oxides [wt-] MK MKg
SiO2 536 604Al2O3 392 206CaO 01 40MgO 01 12Na2O 0 96K2O 10 18Fe2O3 18 05TiO2 21 03P2O5 01 02Loss on ignition 15 1
J Schreiner et al Applied Clay Science 185 (2020) 105432
2
6 Publications
32
MKg contained additional kaolinite feldspar and quartz
22 Investigated mix composites
For the preparation of raw mixtures the powders were weighed andhomogenized using a lab-scale mixing mill Table 2 lists the composi-tion and nomenclature of all samples including Al2O3 content andcuring time in the autoclave
bull Besides one blank mixture (MK0) that did not contain any type ofmetakaolin eleven more compounds were prepared of which threeincluded different dosages of MKg (MKg16 MKg23 and MKg60)Three more mixes contained equivalent amounts of MK instead ofMKg (MK16 MK23 and MK60) These mixes were investigated inorder to have a direct comparison concerning the effects of differentraw material on the synthesis of tobermorite
bull Additionally the mixes MK9 MK5 and MK25 with lower dosages ofmetakaolin were analyzed In the referenced literature (Schreineret al 2019) the effect of Al3+ on the anisotropic peak broadeningof tobermorite could only be observed in the case of Al2O3 contentslower than 4 in the drymix In the latter three mixes Al2O3 con-tents range from 1 to 35 Al2O3 (calculated from XRF data) whichmeets the region of interest for the analysis of tobermorite domainmorphology
bull The curing time for nearly all of the investigated samples was 12 hbut compound MK9 was prepared two more times for curing timesof 2 h and 6 h The different curing times were chosen in this par-ticular sample so that the reactivity of metakaolin and the phasetransitions could be observed more precisely
23 Hydrothermal treatment
Due to the different fineness of raw materials there was a differentwater demand from one mixture to another In order to obtain slurriesof comparable rheology the amount of water was adapted respectivelyresulting in water-to-solid ratios of 25 to 3 which matches the sug-gested water-to-solid ratio for this purpose (Roacutezycka et al 2014Galvaacutenkovaacute et al 2018) The weighed water was added to the dry mixand after stirring for 1 min at 23 degC the slurry was poured into thereactor Minor changes in the quantity of added water did not have aninfluence on the measured steam pressure All experiments were con-ducted using a PTFE-lined stainless steel autoclave with a reactor vo-lume of 300 ml The oven temperature was fixed at 180 degC and auto-genous steam pressure of 11ndash12 MPa was measured during eachexperiment with an external manometer After cooling to room tem-perature the sample was removed from the reactor coarsely ground
using an agate mortar and dried at 60 degC for 12 h After drying thesample was ground with an agate mortar again in order to deagglo-merate the particles As no coarse raw materials were used there wasno need for wet McCrone milling (Schreiner et al 2018)
24 XRD analysis
After preparation into front-loading sample holders the powdersamples were measured with a D8 diffractometer (Bruker) equippedwith a LynxEye detection system and Bragg-Brentano geometry Thesettings for XRD analysis included a tube voltage of 40 kV a current of40 mA an angular range from 6 to 80deg 2θ (Cu Kα radiation) a time perstep of 054 s a step width of 00236deg 2θ and a PSD opening of 33deg Thebackground was fitted with Chebyshev polynomial of the fifth orderThe major contribution of amorphous phase was fitted with a singlepeak with a fixed position at 308deg 2θ so that tobermorite reflectionswere not affected An external quartzite standard was measured withthe same parameters in order to determine phase quantities (Jansenet al 2011) Bruker AXS software TOPAS 50 was used for Rietveldrefinement (Rietveld 1969) and the used structures are shown inTable 3
3 Results and discussion
31 Different dosages of MK and MKg
In Fig 1 the quantities of tobermorite quartz and katoite present inmost of the samples determined by XRD analysis are illustratedWhenever tobermorite was the leading mineral hydrate phase a basalspacing of 113 Aring could be verified in each of the diffractograms Thequantities of minor crystalline phases and amorphous content are notshown For low dosages of MK it can be seen that the weight fraction oftobermorite decreased At moderate dosage of both types of metakaolin(MK16 MK23 MKg16 MKg23) tobermorite was present in comparablequantities It can be seen that the amount of katoite in the mixes de-pended on the dosage of metakaolin and it appeared only at dosages ofMK5 or more Due to the higher content of aluminum in MK comparedto MKg more katoite could always be observed in the MK mixes atequivalent dosages Despite equal amounts of quartz as starting mate-rial in mixes for both types of metakaolin the resulting weight fractionsin the cured samples were not alike Considerably more quartz waspresent in the MK samples Even though less quartz was used for mixescontaining higher amounts of MK even more quartz was present afterhydrothermal curing (Table 2 Fig 1) Consequently some of the SiO2
provided by MK did not transform into an amorphous phase or to-bermorite but into quartz This finding is verified by the presence ofquartz in MK60 because no quartz was included in the raw mixture Thefeldspar present in MKg did not react so Na2O and an unknown amountof Al2O3 may not have been supplied for hydrothermal reaction Besidestobermorite and quartz additional calcite scawtite (Ca7Si6(CO3)
Table 2Basic powder compounds prepared for the hydrothermal synthesis of to-bermorite with the respectively calculated Al2O3 content and curing time in thereactor
Sample Portlandite[wt-]
Quartz[wt-]
MK[wt-]
MKg
[wt-]
Al2O3
[wt-]Curingtime [h]
MK0 49 51 ndash ndash 0 12MK25 495 48 25 ndash 1 12MK5 49 46 5 ndash 2 12MK9_2h 48 43 9 ndash 35 2MK9_6h 48 43 9 ndash 35 6MK9_12h 48 43 9 ndash 35 12MK16 47 37 16 ndash 63 12MK23 46 31 23 ndash 9 12MK60 40 ndash 60 ndash 235 12MKg16 47 37 ndash 16 33 12MKg23 46 31 ndash 23 47 12MKg60 40 ndash ndash 60 124 12
Table 3Structural data used for the investigation with powder XRD analysis
Phase Author
Anatase (Horn et al 1972)Biotite (Brigatti et al 2000)Calcite (Maslen et al 1995)Kaolinite (Zvyagin 1960)Katoite (Bartl 1969)Microcline (Bailey 1969)Plazolite (Basso et al 1983)Portlandite (Busing and Levy 1957)Quartz (Le Page and Donnay 1976)Scawtite (Grice 2005)Tobermorite (Hamid 1981)Xonotlite (Hejny and Armbruster 2001)
J Schreiner et al Applied Clay Science 185 (2020) 105432
3
6 Publications
33
O18bull2(H2O)) and xonotlite (Ca6Si6O17(OH)2) could be identified insample MK0 (XRD plots of samples MK0 MKg16 MKg23 MK16 andMK23) Comparing MK0 and MK25 scawtite and xonotlite could stillbe identified in a very low amount in MK25 but no longer in samplesthat contained even more MK (XRD plots of samples MK0 MK25 MK5and MK9_12h)
Two additional experiments were done without quartz in the rawmixes (MK60 and MKg60) The according diffractograms after hydro-thermal curing are shown in Fig 2 In sample MKg60 tobermorite (gt 50wt-) was successfully synthesized without any other silica sourcethan MKg whereas no crystalline quartz occurred By contrast no to-bermorite but quartz could be identified in equivalent mixture MK60containing MK It can be seen that crystalline components such as micaand anatase in the raw MK did not react at the selected conditions andremained present in the autoclaved samples Except for feldspar in MKgall of the crystalline components appeared to be reactive at the chosenhydrothermal conditions A minor unidentified phase occurred at328deg2θ and additional xonotlite was identified in sample MKg60 Insample MK60 more calcium was needed for the formation of morehydrogarnet (Fig 1) resulting in a lower CaSi ratio for the remainingsystem Sample MKg60 contained only half of the amount of Al3+ and itwas not completely supplied for reaction due to its partial presence infeldspar Consequently essentially less hydrogarnet (Fig 1) was presentin MKg60 after hydrothermal treatment and the CaSi ratio in the re-maining system was affected to a lesser extent
32 Application of MK for different curing times
The development of hydrate phases in the autoclave for compoundMK9 is displayed in Fig 3 After only 2 h of hydrothermal curing all ofthe available portlandite had reacted and katoite (95 wt-) was pre-sent The applied type of metakaolin appeared to react quickly as itsupplied aluminum for formation of katoite No formation of to-bermorite could be observed at this stage yet An assumably amorphousprecursor can be seen at 28 to 30deg2θ Calcium was provided by thedissolution of portlandite After 6 h of hydrothermal reaction amountsof katoite (85 wt-) and quartz (from 31 wt- at 2 h to 165 wt- at6 h) had decreased and a major amount of tobermorite (35 wt-) waspresent Apparently between 2 and 6 h under hydrothermal conditionsthe amorphous precursor and quartz reacted resulting in the formationof tobermorite An additional 6 h of reaction time (MK9_12h) did notchange the phase composition significantly Slightly more tobermorite
(365 wt-) less quartz (16 wt-) and katoite (65 wt-) weremeasured
33 Tobermorite domain morphology and lattice parameters
In the referenced literature an analysis of tobermorite domainmorphology based on anisotropic peak broadening was possible forsamples that contained notgt 4 wt- Al2O3 in the drymix (Schreineret al 2019) Accordingly in this study samples MK0 MK25 MK5MK9_6h and MK9_12h were suitable (Table 2) with MK9_2h not con-taining any tobermorite In Fig 4 the respective growth in a and b di-rection is visualized with x indicating the domain size in a direction andy indicating domain size in b direction using a macro for TOPAS 50(Ectors et al 2015 2017) The calculated cylinder models in Fig 4represent the relation of yx and not absolute sizes With no supply ofaluminum ions (MK0) the relative domain growth in b direction islower compared to samples containing metakaolin This finding agreeswith the results from a similar investigation of tobermorite in AAC(Schreiner et al 2019) However within the samples MK5 andMK9_12h the different amounts of supplied aluminum ions did notshow a clear effect It appeared that low dosages of Al3+ (1 wt- Al2O3
in MK25 and 2 wt- Al2O3 in MK5) were enough to determine thedomain growth of tobermorite Additional results from the samplesMK9_6h and MK9_12h indicated that growth in b direction increasedwith reaction time
In Fig 5 lattice parameters of tobermorite depending on metakaolindosages are plotted B clearly remained unaffected throughout therange of samples Increasing amounts of metakaolin led to a slightlysmaller parameter a However both types of metakaolin showed acorresponding impact on parameter a By contrast parameter c in-creased strongly with increasing amounts of MK and MKg but the typeof metakaolin was significant At an equivalent dosage MK affected thecell dimension in c direction considerably more than MKg so that thefraction of Al3+ appeared to be the decisive parameter Different metaloxides in MKg did not show a notable effect certainly as they werepartially not provided for reaction Unlike for the domain morphologyof tobermorite the impact on lattice parameters could be observedwithin the complete range of examined dosages
4 Conclusions
The results obtained from the introduced investigations allow con-cluding remarks on the effects of the applied types of metakaolin on thesynthesis of 11 Aring tobermorite the phase transitions and the in-corporation of Al3+ into the lattice of tobermorite
With a critical dosage the use of any type of metakaolin led to theformation of katoite in an according amount At moderate dosages(MKg16 MKg23 MK16 and MK23) the two types of metakaolin showeda good correspondence in consideration of the quantities of to-bermorite For higher dosages there were contrary effects Lower do-sages of MK led to considerable quantities of Al-substituted to-bermorite Samples containing low dosages of MK revealed that katoiteappeared in the case ofgt 5 wt- of MK - corresponding to 2 wt-Al2O3 - in the basic compound Minor crystalline phases in MKg showedbetter reactivity than those in MK The observation that no tobermoritewas present in sample MK60 indicated that high dosages of Al3+ hin-dered the formation of tobermorite
Investigations of MK9 at 2 6 and 12 h displayed the evolution ofhydrate phases At first katoite was the only crystalline hydrate phasepresent after 2 h which corresponded to observations in a differentpublication (Klimesch and Ray 1999) The amount of katoite andquartz then decreased and a major amount of tobermorite formed from2 to 6 h curing time In order to gain more information on the trans-formation of amorphous C-(A)-S-H into tobermorite additional ex-periments in the range of 2 to 6 h curing time will be needed
Domain morphology analysis of tobermorite revealed that low
Fig 2 Diffractograms of MKg MKg60 MK and MK60 from 7 to 34deg2θ CuKα Aanatase C calcite F feldspar k kaolinite K katoite M mica Q quartz Ttobermorite U unidentified phase X xonotlite
J Schreiner et al Applied Clay Science 185 (2020) 105432
4
6 Publications
34
dosages of Al3+ determined the domain growth which agreed with theresults published on tobermorite in AAC samples (Schreiner et al2019) Different curing times unveiled that growth in b direction in-creased with the reaction time Al3+ incorporation into the lattice oftobermorite only reflected to a limited extent in the domain mor-phology By contrast an increase of lattice parameter c was triggered byAl3+ even at the highest dosage in this study Ultimately there is no
evidence for a limit of incorporation of Al3+ but there is a limit ofinfluence on the domain morphology These results additionally re-confirm this assumption similarly made in the previous work (Schreineret al 2019) and suggest a new mechanism of tobermorite crystal-lization depending on the presence of Al3+
Supplementary data to this article can be found online at httpsdoiorg101016jclay2019105432
Declaration of Competing Interest
The authors declare that they have no known competing financialinterests or personal relationships that could have appeared to influ-ence the work reported in this paper
Acknowledgement
The authors thank Rodgauer Baustoffwerke GmbH amp Co KG forsupplying raw materials for laboratory experiments
References
Aguilar-Mamani W Garciacutea G Hedlund J Mouzon J 2014 Comparison betweenleached metakaolin and leached diatomaceous earth as raw materials for the synth-esis of ZSM-5 Springerplus 3 1ndash10 httpsdoiorg1011862193-1801-3-292
Ayodele OB Sulaimon AA Alaba PA Tian Z-Y 2019 Influence of metakaolini-zation temperature on the structure and activity of metakaolin supported Ni catalystin dry methane reforming J Environ Chem Eng httpsdoiorg101016jjece2019103239 (in press)
Badawi EA Abdel-Rahman MA Mostafa A Abdel-Rahman M 2019 Determinationof the crystallite size amp micro- strain by novel method from XRD profile Appl Phys2 1ndash15 httpsdoiorg1031058jap201921001
Bailey SW 1969 Refinement of an intermediate microcline structure Am Miner 541540ndash1545
Bartl H 1969 Roentgen-Einkristalluntersuchungen an (CaO)3 (Al2O3) (H2O)6 und an(CaO)12 (Al2O3)7 (H2O) neuer Vorschlag zur (CaO)12 (Al2O3)7-Struktur NeuesJahrb fuer Mineral Monatshefte 1969 404ndash413
Basso R Giusta AD Zefiro L 1983 Crystal structure refinement of plazolite A highlyhydrated natural hydrogrossular Neues Jahrb Miner Monatsh (Neues Jahrb fuerMineral Monatshefte) 1983 251ndash258
Brigatti MF Lugli C Poppi L Foord EE Kile DE 2000 Crystal chemical varia-tions in Li- and Fe-rich micas from Pikes Peak batholith (Central Colorado) AmMineral 85 1275ndash1286 httpsdoiorg102138am-2000-8-920
Busing WR Levy HA 1957 Neutron diffraction study of calcium hydroxide J ChemPhys 26 563 httpsdoiorg10106311743345
Chen L Wang Z Wang Y Feng J 2016 Preparation and properties of alkali acti-vated metakaolin-based geopolymer Materials (Basel) 9 1ndash12 httpsdoiorg103390ma9090767
Chucholowski C Holger M Thienel K-C 2018 Improving the recyclability en-vironmental compatibility and CO2 balance of autoclaved aerated concrete by re-placing sulfate carrier and cement with calcined clays CePapers 2 503ndash512httpsdoiorg101002cepa846
Fig 3 Diffractograms of MK9_2h MK9_6h and MK9_12h from 7 to 38deg2θ CuKα C calcite K katoite Q quartz T tobermorite
Fig 4 Relation of calculated domain sizes of 11 Aring tobermorite in selectedsamples (MK0 MK25 MK5 MK9_6h and MK9_12h) in a (x) and b (y) direction
Fig 5 Lattice parameters of tobermorite depending on MK or MKg dosageincluding blank mix MK0
J Schreiner et al Applied Clay Science 185 (2020) 105432
5
6 Publications
35
Demir İ Başpınar MS Kahraman E Ccedilalışkan E Goumlrhan G 2014 An investigationon the usability of diatomite in aerated concrete production In Proc of the IntlConf on Advances in Civil Structural and Construction Engineering ndash CSCE 2014 pp97ndash100
Ectors D Goetz-Neunhoeffer F Neubauer J 2015 A generalized geometric approachto anisotropic peak broadening due to domain morphology J Appl Crystallogr 48189ndash194 httpsdoiorg101107S1600576714026557
Ectors D Goetz-Neunhoeffer F Neubauer J 2017 Routine (an)isotropic crystallitesize analysis in the double-Voigt approximation done right Powder Diffract 3227ndash34 httpsdoiorg101017S0885715617000070
Galvaacutenkovaacute L Bartoniacutečkovaacute E Opravil T Tkacz J Ptaacuteček P 2018 The influence ofstarting materials solubility on tobermorite structure formation under the hydro-thermal conditions IOP Conf Ser Mater Sci Eng 379 1ndash8 httpsdoiorg1010881757-899X3791012001
Grice JD 2005 The structure of spurrite tilleyite and scawtite and relationships toother silicate-carbonate minerals Can Mineral 43 1489ndash1500 httpsdoiorg102113gscanmin4351489
Hamid SA 1981 The crystal structure of the 11 Aring natural tobermoriteCa225[Si3O75(OH)15]1H2O Zeitschrift fuer Krist 154 189ndash198 httpsdoiorg101524zkri19811543-4189
Hejny C Armbruster T 2001 Polytypism in xonotlite Ca6Si6O17(OH)2 Zeitschrift furKrist 216 396ndash408
Horn M Schwerdtfeger CF Meagher EP 1972 Refinement of the structure of ana-tase at several temperatures Zeitschrift fur Krist 136 273ndash281 httpsdoiorg101524zkri19721363-4273
Jansen D Goetz-Neunhoeffer F Stabler C Neubauer J 2011 A remastered externalstandard method applied to the quantification of early OPC hydration Cem ConcrRes 41 602ndash608 httpsdoiorg101016jcemconres201103004
Jenkins R Snyder R 1996 Introduction to X-ray Powder Diffractometry ChemicalAnalysis Wiley pp 90
Kalousek GL 1956 Crystal Chemistry of Hydrous Calcium Silicates J Am Ceram Soc40 74ndash80
Klimesch D Ray A 1998 Autoclaved cement-quartz pastes with metakaolin additionsAdv Cem Based Mater 7 109ndash118 httpsdoiorg101016S1065-7355(97)00073-4
Klimesch D Ray A 1999 DTA-TGA evaluations of the CaOndashAl2O3ndashSiO2ndashH2O systemtreated hydrothermally Thermochim Acta 334 115ndash122 httpsdoiorg101016s0040-6031(99)00140-9
Komarneni S Roy R Roy DM Fyfe CA Kennedy GJ Bothner-By AA Dadok JChesnick AS 1985 27Al and29Si magic angle spinning nuclear magnetic resonancespectroscopy of Al-substituted tobermorites J Mater Sci 20 4209ndash4214 httpsdoiorg101007BF00552416
Koutnyacute O Opravil T Pořiacutezka J 2014 Application of metakaoline in autoclavedaerated concrete technology Adv Mater Res 1000 174ndash177 httpsdoiorg104028wwwscientificnetAMR1000174
Le Page Y Donnay G 1976 Refinement of the crystal structure of low-quartz ActaCrystallogr Sect B 32 2456ndash2459 httpsdoiorg101107S0567740876007966
Luo H Law WW Wu Y Zhu W Yang EH 2018 Hydrothermal synthesis of needle-like nanocrystalline zeolites from metakaolin and their applications for efficient re-moval of organic pollutants and heavy metals Microporous Mesoporous Mater 2728ndash15 httpsdoiorg101016jmicromeso201806015
Maeda H Ogawa Y Ishida EH Kasuga T 2012 Hydrothermal synthesis of to-bermorite doped with phosphorus species for removing heavy metal ions J AustCeram Soc 48 8ndash11
Maslen EN Streltsov VA Streltsova NR Ishizawa N 1995 Electron density andoptical anisotropy in rhombohedral carbonates III Synchrotron Xray studies ofCaCO3 MgCO3 and MnCO3 Acta Crystallogr Sect B 51 929ndash939 httpsdoiorg101107S0108768195006434
Matekonis G Šiaučiūnas R Vaičiukynienė D 2010 Hydrothermal Synthesis andCharacterization of Na + and [ Al 3 + + Na + ] -substituted Tobermorite in CaO-SiO2middotnH2O-H2O System Mater Sci 16 242ndash248
Matsui K Kikuma J Tsunashima M Ishikawa T Matsuno S Ogawa A Sato M2011 In situ time-resolved X-ray diffraction of tobermorite synthesis process underhydrothermal condition IOP Conf Ser Mater Sci Eng 18 60ndash66 httpsdoiorg1010881757-899X182022017
Merlino S Bonaccorsi E Armbruster T 2000 The real structures of clinotobermoriteand tobermorite 9 Aring OD character polytypes and structural relationships Eur JMineral 12 411ndash429 httpsdoiorg1011270935-122120000012-0411
Monasterio M Gaitero JJ Manzano H Dolado JS Cerveny S 2015 Effect ofchemical environment on the dynamics of water confined in calcium silicate mi-nerals Natural and synthetic tobermorite Langmuir 31 4964ndash4972 httpsdoiorg101021acslangmuir5b00614
Mostafa NY 2005 Influence of air-cooled slag on physicochemical properties of auto-claved aerated concrete Cem Concr Res 35 1349ndash1357 httpsdoiorg101016jcemconres200410011
Mostafa NY Shaltout AA Omar H Abo-El-Enein SA 2009 Hydrothermal synth-esis and characterization of aluminium and sulfate substituted 11 nm tobermoritesJ Alloys Compd 467 332ndash337 httpsdoiorg101016jjallcom200711130
Naber C Stegmeyer S Jansen D Goetz-Neunhoeffer F Neubauer J 2019 ThePONKCS method applied for time resolved XRD quantification of supplementarycementitious material reactivity in hydrating mixtures with ordinary Portland ce-ment Constr Build Mater 214 449ndash457 httpsdoiorg101016jconbuildmat201904157
Qu X Zhao Z Zhao X 2018 Microstructure and characterization of aluminum-in-corporated calcium silicate hydrates (C-S-H) under hydrothermal conditions RSCAdv 8 28198ndash28208 httpsdoiorg101039c8ra04423f
Rashad AM 2013 Metakaolin as cementitious material history scours production andcomposition - a comprehensive overview Constr Build Mater 41 303ndash318 httpsdoiorg101016jconbuildmat201212001
Rietveld HM 1969 A profile refinement method for nuclear and magnetic structures JAppl Crystallogr 2 65ndash71 httpsdoiorg101107S0021889869006558
Riacuteos CA Williams CD Fullen MA 2009 Hydrothermal synthesis of hydrogarnet andtobermorite at 175 degC from kaolinite and metakaolinite in the CaO-Al2O3-SiO2-H2Osystem a comparative study Appl Clay Sci 43 228ndash237 httpsdoiorg101016jclay200809014
Roacuteżycka A Pichoacuter W 2016 Effect of perlite waste addition on the properties of au-toclaved aerated concrete Constr Build Mater 120 65ndash71 httpsdoiorg101016jconbuildmat201605019
Roacutezycka A Kotwica Ł Małolepszy J 2014 Synthesis of single phase gyrolite in theCaO-quartz-Na2O-H2O system Mater Lett 120 166ndash169 httpsdoiorg101016jmatlet201401003
Sauman Z 1974 Influence of SO4 2ndash ions on the formation of 11 Aring tobermorite InProceedings of the 2nd International Symposium on Science and Research in SilicateChemistry Moscow pp 25ndash39
Schmidt M Egersdoumlrfer A Poumlllmann H 2012 Increased reactivity using a glass-containing metakaolin as an active filler in lime-based binder systems ZKG Int 6554ndash62
Schreiner J Jansen D Ectors D Goetz-Neunhoeffer F Neubauer J Volkmann S2018 New analytical possibilities for monitoring the phase development during theproduction of autoclaved aerated concrete Cem Concr Res 107 247ndash252 httpsdoiorg101016jcemconres201802028
Schreiner J Goetz-Neunhoeffer F Neubauer J Volkmann S Bergold S Webler RJansen D 2019 Advanced Rietveld refinement and SEM analysis of tobermorite inchemically diverse autoclaved aerated concrete Powder Diffract 34 143ndash150httpsdoiorg101017s0885715619000149
Setthaya N Chindaprasirt P Pimraksa K 2016 Preparation of zeolite nanocrystals viahydrothermal and solvothermal synthesis using of rice husk ash and metakaolinMater Sci Forum 872 242ndash247 httpsdoiorg104028wwwscientificnetmsf872242
Siauciunas R Baltakys K 2004 Formation of gyrolite during hydrothermal synthesis inthe mixtures of CaO and amorphous SiO2 or quartz Cem Concr Res 34 2029ndash2036httpsdoiorg101016jcemconres200403009
Skawinska A Owsiak Z Baran T Hernik K 2017 The influence of halloysite ad-dition on tobermorite formation in CaO and quartz mix under hydrothermal condi-tions Cem Wapno Bet 17 426ndash434
Venhodovaacute E Janovskyacute R Drochytka R 2015 Formation of tobermorite at differentmaterials composition of aerated concrete Appl Mech Mater 752ndash753 247ndash250httpsdoiorg104028wwwscientificnetamm752-753247
Walczak P Małolepszy J Reben M Szymański P Rzepa K 2015 Utilization ofwaste glass in autoclaved aerated concrete Proc Eng 122 302ndash309 httpsdoiorg101016jproeng201510040
Zhang Y Gao W Cui L 2007 The transformation of acid leached metakaolin tozeolite beta Stud Surf Sci Catal 170 420ndash425 httpsdoiorg101016S0167-2991(07)80870-6
Zvyagin BB 1960 An attempt to electronographic determination of kaolinite structureJ Dokl Akad Nauk SSSR 130 1023ndash1026
J Schreiner et al Applied Clay Science 185 (2020) 105432
6
6 Publications
36
6 Publications
62 Advanced Rietveld refinement and SEM analysis oftobermorite in chemically diverse autoclaved aeratedconcrete
Following the copyright guidelines by Cambridge University Press the publication
Schreiner J Goetz-Neunhoeffer F Neubauer J Volkmann S Bergold S WeblerR Jansen D 2019 Advanced Rietveld refinement and SEM analysis of tobermorite inchemically diverse autoclaved aerated concrete Powder Diffraction 34 143ndash150 httpsdoiorg101017s0885715619000149
may not be reprinted It can be accessed at
httpswwwcambridgeorgcorejournalspowder-diffractionarticleadvanced-rietveld-refinement-and-sem-analysis-of-tobermorite-in-chemically-diverse-autoclaved-aerated-concrete51597C2A66F6F225D29DEB2675E74249
37
6 Publications
63 New analytical possibilities for monitoring the phasedevelopment during the production of autoclavedaerated concrete
Reprint of the peer reviewed publication
Schreiner J Jansen D Ectors D Goetz-Neunhoeffer F Neubauer J VolkmannS 2018 New analytical possibilities for monitoring the phase development during theproduction of autoclaved aerated concrete Cement and Concrete Research 107 247ndash252httpsdoiorg101016jcemconres201802028
with permission from Elsevier
38
Contents lists available at ScienceDirect
Cement and Concrete Research
journal homepage wwwelseviercomlocatecemconres
Short communication
New analytical possibilities for monitoring the phase development duringthe production of autoclaved aerated concrete
J Schreinera D Jansena D Ectorsa F Goetz-Neunhoeffera J Neubauera S Volkmannb
aUniversity of Erlangen-Nuremberg GeoZentrum Nordbayern Mineralogy Schlossgarten 5a 91054 Erlangen Germanyb Rodgauer Baustoffwerke GmbH amp Co KG Am Opel-Pruumlffeld 3 63110 Rodgau-Dudenhofen Germany
A B S T R A C T
This work presents improved analytical methods for both steps of the production process of autoclaved aeratedconcrete (AAC) the phase development during the hydration before autoclaving and during the autoclavingprocess itself The improvement includes new insights into preparation methods of AAC samples for powderdiffraction as well as Rietveld refinement strategies For the first time a new implementation for calculatinganisotropic crystal domain sizes is applied to major hydrate phases occurring during AAC production namelyportlandite during the hydration before autoclaving and tobermorite during the autoclaving process The cal-culation of anisotropic domain size growth which can be implemented in the Rietveld environment is based oncrystallographically and geometrically appropriate models The implementation of calculating anisotropic do-main sizes for the Rietveld software TOPAS 50 allows a superior Rietveld fit and a more accurate quantificationof the phase development Additionally it enables the tracking of growth mechanism of portlandite duringhydration
1 Introduction
Autoclaved aerated concrete (AAC) is known as a lightweight con-struction material which offers outstanding properties such as suffi-cient strength for construction in addition with excellent thermal in-sulation [12] AAC is produced by autoclaving from calcareous rawmaterials such as lime (CaO) and cement quartz sulfate carrier andother additives such as foaming agents and water
The production process (Fig 1) can be separated into the hydrationof the mixed slurry before the procedure of autoclaving and the auto-claving at elevated temperature (180 degC to 200 degC) under saturatedsteam pressure (12MPa) for several hours
The hydration process before autoclaving is necessary to achievesufficient strength in order to cut the green cake blocks as they shouldhave a specific shape and dimension after autoclaving Furthermorethe porous structure is generated by the foaming agent during hydra-tion in the first process step During autoclaving the final propertiesnamely strength and low thermal conductivity are achieved
It is already well understood that the autoclaving process leads tothe formation of several phases first of all tobermorite(Ca5Si6O16(OH)2lowast4H2O) [3ndash5] Newest research has shown im-pressively which reactions are running from the mineralogical point ofview Insitu XRD measurements were carried out during the
autoclaving process and the phase development was shown by plottingnormalized intensities [6] The study of Mitsuda et al [3] was mainlyfocused on the tracking of the phase evolution during the autoclavingprocess of AAC However their statements concerning phase evolutionare mainly based on XRD data and TGA measurements There is acommon agreement that the following reactions occur The consump-tion of the alite (OPC) leads to the formation of an initial C-S-H phaseduring the first processing step Portlandite which was initially formedduring the first process step (from CaO and C3S) further quartz and theC-S-H phase are consumed during autoclaving resulting in the crystal-lization of tobermorite Hence the crystallization process of to-bermorite as well as the crystal structure of tobermorite was an issue ofresearch and discussion over the last years and numerous publicationsto these topics are available Concerning the crystal structure of to-bermorite respectively the tobermorite supergroup a new publicationoutlines all important references and recommends a new nomenclature[7]
The presented study was performed to create new analytical possi-bilities for the characterization of the production process of AAC Bothof the production process steps are essential for the final productHence the present work focuses on crystallization of hydrate phases inboth processes
Firstly an external standard method [89] was published and
httpsdoiorg101016jcemconres201802028Received 6 October 2017 Received in revised form 1 February 2018 Accepted 26 February 2018
Corresponding authorsE-mail addresses juergenjsschreinerfaude (J Schreiner) danieljansenfaude (D Jansen)
Cement and Concrete Research 107 (2018) 247ndash252
0008-8846 copy 2018 Elsevier Ltd All rights reserved
T
6 Publications
39
recommended for the determination of absolute phase contents inmixtures with amorphous content It was shown that the method canabsolutely be recommended for hydrating cement pastes in which watercannot be quantified directly by XRD [10] This method seems to bevery promising for both the quantification of the hydration of the AACslurry before autoclaving and the quantification of the phase evolutionduring autoclaving inasmuch as both production steps form crystallineand amorphous phases
Secondly a new approach to anisotropic peak broadening due toanisotropic domain morphology which was developed [1112] is ap-plied to AAC samples to improve the fit of portlandite and tobermoriteby Rietveld refinement [13] By applying this approach the refinementof both portlandite and tobermorite should additionally lead to betterquantitative results as well as to better insights into the development ofthe domain size morphology of both phases formed
It was already shown that in a hydrating raw mixture for AAC twospecies of portlandite precipitate at 23 degC one showing dynamicallyanisotropic peak broadening and another one following the isotropictrend [14] The application of the anisotropic refinement model led toan improved fitting of portlandite Moreover the mechanism of aniso-tropic domain growth of portlandite was tracked
2 Materials and methods
In order to examine the hydration of the AAC slurry before auto-claving a mixture of the hydraulic reactive components was weighedand measured in-situ at a Bruker D8 diffractometer with a LynxEyedetection system
Ordinary Portland cement (OPC) was mixed with lime (CaO) andanhydrite (C$) The raw materials were taken from the same batches asfor the industrial samples The drymix (58 OPC 36 CaO and 6 C$by weight) was then mixed with water (ws= 08) and placed into anappropriate sample holder The samples were not aerated The slurrysamples were covered with a kapton film to avoid evaporation andcarbonation Diffractograms were recorded with an angular range from7 to 545deg 2θ and a step width of 0011deg 2θ Measurements were carriedout every 15min For each measurement 96 XRD patterns were re-corded over the first 24 h The temperature was fixed at 70 degC which isthe mean temperature generally prevailing in the industrial processduring hydration before autoclaving Rietveld refinement was carriedout using the G-factor method All structures used for Rietveld refine-ment are shown in Table 1
For investigation of the autoclaved samples five different specimenswere taken at different autoclaving times The specimens were takenout of a technical production process hence it was not possible to in-terrupt the process at an earlier time inasmuch it would lead to damageof a whole concrete production batch The specimens were firstly driedat 60 degC until weight constancy The whole blocks were then broken andstatistical samples of 20 g were taken In order to receive the right massattenuation coefficient (MAC) for G-factor method the loss on ignitionand the chemical composition (XRF) were determined For energydispersive XRF analysis (Spectro Xepos) tube voltage from 20 kV to50 kV and tube current from 08 to 20mA were used for differenttargets
The final sample preparation (grinding) before XRD measurementswas carried out using both an agate mortar and a McCrone micronizingmill for wet milling with isopropanol Both preparation methods wereapplied separately to see which one is suitable in order to get the bestpreparation for XRD investigations Six preparations were performed byone operator of which two were prepared with an agate mortar andfour with a McCrone mill For the McCrone milling 3 g of the sampleand 10ml of isopropanol were used for grinding for 12min The grainsize distribution of one sample prepared with an agate mortar and onesample prepared using a McCrone mill was measured by laser granu-lometry in isopropanol using a Mastersizer 3000 (MALVERN)
After milling the samples in these two ways for XRD analysis thepowders were prepared into a front loading sample holder and mea-sured Diffractograms were recorded with an angular range from 6 to80deg 2θ a step width of 00236deg 2θ and a time per step of 054 s Rietveldrefinement combined with external standard (G-factor) was applied inorder to get absolute quantities for each phase The refinement strategyfor portlandite and tobermorite in the TOPAS Launch Mode (TOPAS50 Bruker AXS) is attached as a Supplementary material file
3 Results and discussion
31 Hydration of the mixture before autoclaving
The hydration of the investigated paste before autoclaving isdominated by the hydration of the cement as well as the reaction of thefree lime (CaO) resulting in the formation of portlandite It can beclearly seen from Fig 2 that the hydration of the paste leads to theformation of ettringite portlandite and C-S-H phase For simplificationthe remaining phase developments are not shown in Fig 2 because theyare not in the focus of this study The hydration of CaO forming
Fig 1 Simplified process steps of AAC production and hydrate phase evolution
Table 1Structures used for Rietveld refinement
Phase Author
Alite [15]Anhydrite [16]Bassanite [17]Belite (β) [18]Belite (αprime) [19]Brownmillerite [20]C-S-H [21]Calcite [22]Ettringite [23]Gypsum [24]Hemicarbonate [25]Hydroxylellestadite [26]Lime (CaO) [27]Microcline [28]Portlandite [29]Quartz [30]Tobermorite [31]Tricalciumaluminate (cubic) [32]Tricalciumaluminate (orthorhombic) [33]PONCKS model for Water [21]
J Schreiner et al Cement and Concrete Research 107 (2018) 247ndash252
248
6 Publications
40
portlandite begins rapidly after the addition of water to the mixture andlime is fully consumed after only 1 h of hydration This translates into aquick rise of heat of hydration so that cement hydration is acceleratedwhich leads to further portlandite formation by the reaction of aliteEttringite formation stalls after few hours of hydration After 12 h et-tringite is partially decomposed probably due to sulfate depletion [9]
and poorly crystalline AFm phases (not shown in Fig 2) are formedIn Fig 3 it can be seen that in fact two generations of portlandite
are formed a 1st dominant generation showing anisotropic peakbroadening and 2nd one occurring considerably later following theisotropic domain size refinement which is usually carried out using theRietveld method This occurrence comes along firstly with lime hy-dration and secondly with alite hydration The expected quantity ofportlandite formed from lime hydration very well complies with the
Fig 2 Phase development in AAC paste on a laboratory scale before autoclaving ana-lyzed by in-situ XRD at 70 degC
Fig 3 Formation of two generations of portlandite by hydration of lime (1st) and C3S(2nd) at 70 degC before autoclaving with the major generation showing anisotropic peakbroadening
Fig 4 Biaxial cylinder domain size model of portlandite used for Rietveld refinement of anisotropic peak broadening
Fig 5 Morphological evolution of portlandite showing anisotropic domain size growthduring hydration at 70 degC
Fig 6 Comparison of quantification of crystalline quartz in samples prepared withMcCrone mill and agate mortar at different autoclaving times
J Schreiner et al Cement and Concrete Research 107 (2018) 247ndash252
249
6 Publications
41
quantity of the observed 1st generation The development of portlan-dite growth was already tracked in an equivalent slurry at 23 degC [14]Thus this observation confirms that the crystallinity of portlandite inmixtures for AAC production depends on the starting phase for hydra-tion as already indicated by Ectors [14]
Fig 4 shows the used biaxial cylindrical model for anisotropic do-main size calculation and the portlandite structure which was createdwith structural software VESTA 318 [34] Using the cylindrical ap-proach domain sizes in a (here equating to b) and c direction(dz= cylinder height) can be calculated which comes along with theexpected symmetrical parameters of portlandite
The 1st portlandite generation showing anisotropic domain growthcan be tracked in terms of cylinder diameter and height which is rea-lized in Fig 5 The blue cylinder represents the geometric approach andcylinder height and diameter are calculated newly for each range Thecylinder height remains rather stable throughout the hydration processwhile the cylinder diameter increases during the first hours of hydra-tion After 10 h of hydration the mean cylinder diameter no longer in-creases Consequently these observations match the results of the ex-aminations conducted at 23 degC [14] as well as the assumption thatdifferent mechanisms of growth exist for portlandite depending on the
hydration educt The maximum cylinder diameter is reached earlier inthis work very likely because of the higher hydration temperature
32 Quantification of the reactions during autoclaving
Autoclaved samples were ground with an agate mortar and com-pared to samples which were wet-ground with a McCrone mill Fig 6shows precisely that the determination of the amount of crystallinequartz is more reproducible in the two shown samples which were
Fig 7 2D XRD with Bruker GADDS-system plots of samples prepared with agate mortar and McCrone mill Coarse quartz grains are pointed out in the plot of the sample prepared withagate mortar
Fig 8 Particle size distribution of one sample prepared with an agate mortar and of onesample prepared with a McCrone mill measured by laser granulometry
Fig 9 Rietveld refinement for Tobermorite of autoclaved AAC sample by use of isotropicdomain size model (a) and of anisotropic domain size model (b)
J Schreiner et al Cement and Concrete Research 107 (2018) 247ndash252
250
6 Publications
42
prepared with a McCrone mill The high variance of crystalline quartzin the samples which were prepared with an agate mortar is a result ofinsufficient grinding and remaining of too large quartz grains Whenthis spottiness occurs a reliable quantification using the G-factormethod is not possible
The 2D XRD with Bruker GADDS-system plots in Fig 7 demonstratethe insufficient grinding when using an agate mortar compared to wetmilling with a McCrone mill Quartz would be overrepresented in a one-dimensional XRD pattern focusing on a section with bright spots (greenarrows) The lack of bright spots in the right plot shows that the quartzgrains are milled more thoroughly using a McCrone mill In Fig 8 theparticle size distribution after both ways of sample preparation iscompared Most grains in the sample prepared with an agate mortar arelarger than in the sample prepared with a McCrone mill The grain sizedistribution of the sample prepared with a McCrone mill complies withthe recommended particle size range for XRD analysis of under 5 to50 μm [3536] while the other sample exceeds the range
In Fig 9 Rietveld refinement of an autoclaved sample is shown Thedominant peaks at 77 290 and 301deg 2θ are attributed to tobermoriteIn the upper diagram (a) Rietveld refinement was carried out regularlycalculating isotropic domain sizes for tobermorite However the cal-culated fit differs significantly from the raw data It can be assumed thattobermorite shows a similar pattern to portlandite in terms of aniso-tropic peak broadening taking into account that tobermorite is as-signed to the orthorhombic crystal system Thus instead of a biaxialcylinder model an elliptic cylinder model (Fig 10 structure createdwith VESTA 318 [34]) was applied for the refinement in the lowerdiagram (b) The elliptic cylinder model is a sufficient approach to the
orthorhombic crystal system as it allows the distinction between do-main sizes in a b and c direction The fit is clearly superior using theanisotropic domain size model highlighted by the difference plot inFig 9b The comparison refinement with isotropic and anisotropic ap-proach was done for all of the five autoclaved samples In Fig 11 theresulting Rwp values for the whole pattern and the RBragg values of to-bermorite are shown The refinement using the anisotropic model leadsto both lower Rwp and RBragg values and consequently to a better fit anda more accurate quantification of tobermorite in all refined samples
4 Summary and conclusions
Improved analytical methods for both the phase developmentduring the hydration before autoclaving and during the autoclavingprocess of AAC are presented It could be shown that wet McCronemilling is the best way of preparation of AAC samples in order to obtainsuitable samples for powder diffraction A new approach to treat ani-sotropic domain sizes for Rietveld refinement could be successfullyapplied ndash with the benefit that portlandite and tobermorite in AACsamples could be refined more accurately using the Rietveld methodThus this application allows an improved quantification of the phasedevelopment during both of the production steps
For the future there are still plenty of possibilities to apply thepresented approach of calculating anisotropic domain sizes to AACproduction As exemplified with portlandite the mechanisms of growthof tobermorite can be tracked likewise during the autoclaving processIn addition the effect of variations in the chemical composition of AACraw mixtures on the crystal morphology of tobermorite can be ex-amined This leaves a new perspective to discuss the link between mi-neral phase morphology and the thermal and mechanical properties ofAAC
Acknowledgement
The autoclaved samples were generously provided by RodgauerBaustoffwerke GmbH amp Co KG The authors express gratitude for allsupport
Appendix A Supplementary data
Supplementary data to this article can be found online at httpsdoiorg101016jcemconres201802028
References
[1] MW Grutzeck Cellular concrete in M Scheffler P Colombo (Eds) CellularCeramics Wiley-VCH Weinheim 2005 pp 193ndash223
[2] M Haas The future of AAC ndash from a material scientists point of view inMC Limbachiya JJ Roberts (Eds) Autoclaved Aerated Concrete Taylor FrLondon 2005 pp 187ndash194
[3] T Mitsuda K Sasaki H Ishida Phase evolution during autoclaving process ofaerated concrete J Am Ceram Soc 75 (1992) 1858ndash1863
[4] N Isu H Ishida T Mitsuda Influence of quartz particle size on the chemical and
Fig 10 Triaxial cylinder domain size model of Tobermorite used for Rietveld refinement of anisotropic peak broadening
Fig 11 Comparison of Rwp and RBragg values of Rietveld refinements of autoclavedsamples and tobermorite using the isotropic and the anisotropic domain size model
J Schreiner et al Cement and Concrete Research 107 (2018) 247ndash252
251
6 Publications
43
mechanical properties of autoclaved aerated concrete (I) tobermorite formationCem Concr Res 25 (1995) 243ndash248
[5] NY Mostafa Influence of air-cooled slag on physicochemical properties of auto-claved aerated concrete Cem Concr Res 35 (2005) 1349ndash1357 httpdxdoiorg101016jcemconres200410011
[6] K Matsui J Kikuma M Tsunashima T Ishikawa S Matsuno A Ogawa M SatoIn situ time-resolved X-ray diffraction of tobermorite formation in autoclaved aer-ated concrete influence of silica source reactivity and Al addition Cem Concr Res41 (2011) 510ndash519
[7] C Biagioni S Merlino E Bonaccorsi The tobermorite supergroup a new no-menclature Mineral Mag 79 (2015) 485ndash495 httpdxdoiorg101180minmag2015079222
[8] BH OConnor MD Raven Application of the Rietveld refinement procedure inassaying powdered mixtures Powder Diffract 3 (1988) 2ndash6 httpdxdoiorg101017S0885715600013026
[9] D Jansen F Goetz-Neunhoeffer C Stabler J Neubauer A remastered externalstandard method applied to the quantification of early OPC hydration Cem ConcrRes 41 (2011) 602ndash608 httpdxdoiorg101016jcemconres201103004
[10] D Jansen C Stabler F Goetz-Neunhoeffer S Dittrich J Neubauer Does OrdinaryPortland Cement contain amorphous phase A quantitative study using an externalstandard method Powder Diffract 26 (2011) 31ndash38 httpdxdoiorg10115413549186
[11] D Ectors F Goetz-Neunhoeffer J Neubauer A generalized geometric approach toanisotropic peak broadening due to domain morphology J Appl Crystallogr 48(2015) 189ndash194 httpdxdoiorg101107S1600576714026557
[12] D Ectors F Goetz-Neunhoeffer J Neubauer Routine (an)isotropic crystallite sizeanalysis in the double-Voigt approximation done right Powder Diffract 32 (S1)(2017) 27ndash34 httpdxdoiorg101017S0885715617000070
[13] HM Rietveld A profile refinement method for nuclear and magnetic structures JAppl Crystallogr 2 (1969) 65ndash71 httpdxdoiorg101107S0021889869006558
[14] D Ectors Advances in the Analysis of Cementitious Reactions and Hydrate Phases(Doctoral Thesis) (2016) pp 12ndash14 (urnnbndebvb29-opus4-71743)
[15] AacuteG De La Torre S Bruque J Campo MAG Aranda The superstructure of C3Sfrom synchrotron and neutron powder diffraction and its role in quantitative phaseanalyses Cem Concr Res 32 (2002) 1347ndash1356 httpdxdoiorg101016S0008-8846(02)00796-2
[16] A Kirfel G Will Charge density in anhydrite CaSO4 from X-ray and neutrondiffraction measurements Acta Crystallogr Sect B Struct Crystallogr CrystChem 36 (1980) 2881ndash2890 httpdxdoiorg101107S0567740880010461
[17] C Bezou AN Christensen D Cox M Lehman A Nonat Structures cristallines deCaSO405H2O et CaSO406H2O Comptes Rendus Hebd Des Seacuteances lAcadeacutemieDes Sci Seacuterie 2 (312) (1991) 43ndash48
[18] KH Jost B Ziemer R Seydel Redetermination of the structure of β-dicalciumsilicate Acta Crystallogr Sect B Struct Crystallogr Cryst Chem 33 (1977)1696ndash1700 httpdxdoiorg101107S0567740877006918
[19] W Mumme LMD Cranswick BC Chakoumakos Rietveld crystal structure re-finements from high temperature neutron powder diffraction data for the poly-morphs of dicalcium silicate Neues Jahrb Fuer Mineral Abhandlungen 170 (1996)171ndash188
[20] A Colville S Geller The crystal structure of brownmillerite Ca2FeAlO5Crystallographica 50 (1971) 2311ndash2315 httpdxdoiorg101107S056774087100579X
[21] ST Bergold F Goetz-Neunhoeffer J Neubauer Quantitative analysis of C-S-H inhydrating alite pastes by in-situ XRD Cem Concr Res 53 (2013) 119ndash126 httpdxdoiorg101016jcemconres201306001
[22] EN Maslen VA Streltsov NR Streltsova N Ishizawa Electron density and op-tical anisotropy in rhombohedral carbonates III Synchrotron Xray studies ofCaCO3 MgCO3 and MnCO3 Acta Crystallogr Sect B 51 (1995) 929ndash939 httpdxdoiorg101107S0108768195006434
[23] G Renaudin Y Filinchuk J Neubauer F Goetz-Neunhoeffer A comparativestructural study of wet and dried ettringite Cem Concr Res 40 (2010) 370ndash375httpdxdoiorg101016jcemconres200911002
[24] WF Cole CJ Lancucki A refinement of the crystal structure of gypsumCaSO42H2O Acta Cryst B30 (1974) 921ndash929 httpdxdoiorg101107S0567740874004055
[25] T Runčevski RE Dinnebier OV Magdysyuk H Poumlllmann Crystal structures ofcalcium hemicarboaluminate and carbonated calcium hemicarboaluminate fromsynchrotron powder diffraction data Acta Crystallogr Sect B Struct Sci 68 (2012)493ndash500 httpdxdoiorg101107S010876811203042X
[26] JM Hughes JW Drexler Cation substitution in the apatite tetrahedral site crystalstructures of type hydroxylellestadite and type fermorite Neues Jahrb FuerMineral (1991) 327ndash336
[27] CH Shen RS Liu JG Lin CY Huang Phase stability study of La12Ca18Mn2O7Mater Res Bull 36 (2001) 1139ndash1148
[28] SW Bailey Refinement of an intermediate microcline structure Am Miner 54(1969) 1540ndash1545
[29] WR Busing HA Levy Neutron diffraction study of calcium hydroxide J ChemPhys 26 (1957) 563 httpdxdoiorg10106311743345
[30] Y Le Page G Donnay Refinement of the crystal structure of low-quartz ActaCrystallogr Sect B 32 (1976) 2456ndash2459 httpdxdoiorg101107S0567740876007966
[31] SA Hamid The crystal structure of the 11 Aring natural tobermoriteCa225[Si3O75(OH)15]1H2O Zeitschrift Fuer Krist - New Cryst Struct 154 (1981)189ndash198 httpdxdoiorg101524zkri19811543-4189
[32] P Mondal JW Jeffery The crystal structure of tricalcium aluminate Ca3Al2O6Acta Crystallogr B 31 (1975) 689ndash697 httpdxdoiorg101107S0567740875003639
[33] Y Takeuchi F Nishi I Maki Crystal-chemical characterization of the tricalciumaluminate-sodium oxide (3CaOtimesAl2O3-Na2O) solid-solution series Zeitschrift FuumlrKrist (1980) 259ndash307
[34] K Momma F Izumi VESTA 3 for three-dimensional visualization of crystal vo-lumetric and morphology data J Appl Crystallogr 44 (2011) 1272ndash1276 httpdxdoiorg101107S0021889811038970
[35] K Scrivener R Snellings B Lothenbach A Practical Guide to MicrostructuralAnalysis of Cementitious Materials CRC Press 2016 pp 123ndash125 httpdxdoiorg107693wl20150205
[36] V Pecharsky P Zavalij Fundamentals of Powder Diffraction and StructuralCharacterization of Materials Springer second edition 2005 p 302 httpdxdoiorg101007978-0-387-09579-0
J Schreiner et al Cement and Concrete Research 107 (2018) 247ndash252
252
6 Publications
44
7 Acknowledgement
7 Acknowledgement
Ich moumlchte mich bei einigen Personen bedanken ohne die es wohl kaum zum erfolgreichenAbschluss dieser Arbeit gekommen waumlreMein Doktorvater Prof Dr Juumlrgen Neubauer hat sich stets die Zeit genommen die noumltigwar um Angelegenheiten aller Art mit mir zu klaumlren Er gab mir fachlich immer zumrichtigen Zeitpunkt einen gewissen wissenschaftlichen Impuls Zugleich habe ich mich den-noch immer frei in meiner eigenen Konzeption gefuumlhlt Groszligen Dank spreche ich Prof DrFriedlinde Goumltz-Neunhoeffer aus die fuumlr mich ebenso immer eine verlaumlssliche Ansprech-partnerin fuumlr fachliche und organisatorische Angelegenheiten aller Art war Danke anDr Daniel Jansen fuumlr die gute Zusammenarbeit und dafuumlr dass er mich im Zuge meinerMasterarbeit in ein Forschungsprojekt aufgenommen hat das den Weg zur Promotionmoumlglich machte Zusaumltzlich gilt mein Dank Prof Dr Matthias Goumlbbels der fuumlr dieMitarbeiter am Lehrstuhl immer motivierende Worte fand Fuumlr die Ermoumlglichung meinerTeilnahme an diversen Dienstreisen Fortbildungen und Tagungen moumlchte ich mich viel-mals bedankenWeiterhin bedanke ich mich bei Dr Stephan Volkmann und den Rodgauer BaustoffwerkenGmbH amp Co KG fuumlr die gute Zusammenarbeit und die Bereitstellung von Versuchsma-terialienVielen Dank an meine studentischen Hilfskraumlfte Daniel Wagner Laura MoldenhauerFabian Lang Jakob Schreiber und Felix Klaassen die alle Aufgaben im Labor einwand-frei und mit Bedacht erledigten Bei meinen aktuellen und ehemaligen Kollegen DrKatrin Hurle Dr Dominique Ectors Dr Christoph Naber Dr Florian Huumlller JoumlrgNehring Frank Riedel Julian Wolf Tanja Manninger Daniel Wagner Nicolas FobbeKarla Spaumlth Julian Goergens Andreas Koumlhler Cordula Jakob Franz Becker und LisaKlemenz bedanke ich mich fuumlr die gelungene Zusammenarbeit und gegenseitige Unter-stuumltzung Besonderer Dank geht auch an Kerstin Kreszlig Bettina Engl Christian HankeBernd Schleifer und Christian Abe fuumlr die verlaumlssliche Unterstuumltzung bei technischen Fra-gen und Messungen im LaborFuumlr jegliche Unterstuumltzungen moumlchte ich mich auch bei meinen Eltern bedanken sowiebei meinem Bruder Ralf der mir mit einem LaTex Crashkurs viel Frustration ersparthat Danke Thomas dass du immer fuumlr mich da bist und mit mir zusammen fuumlr genugAusgleich gesorgt hast
45
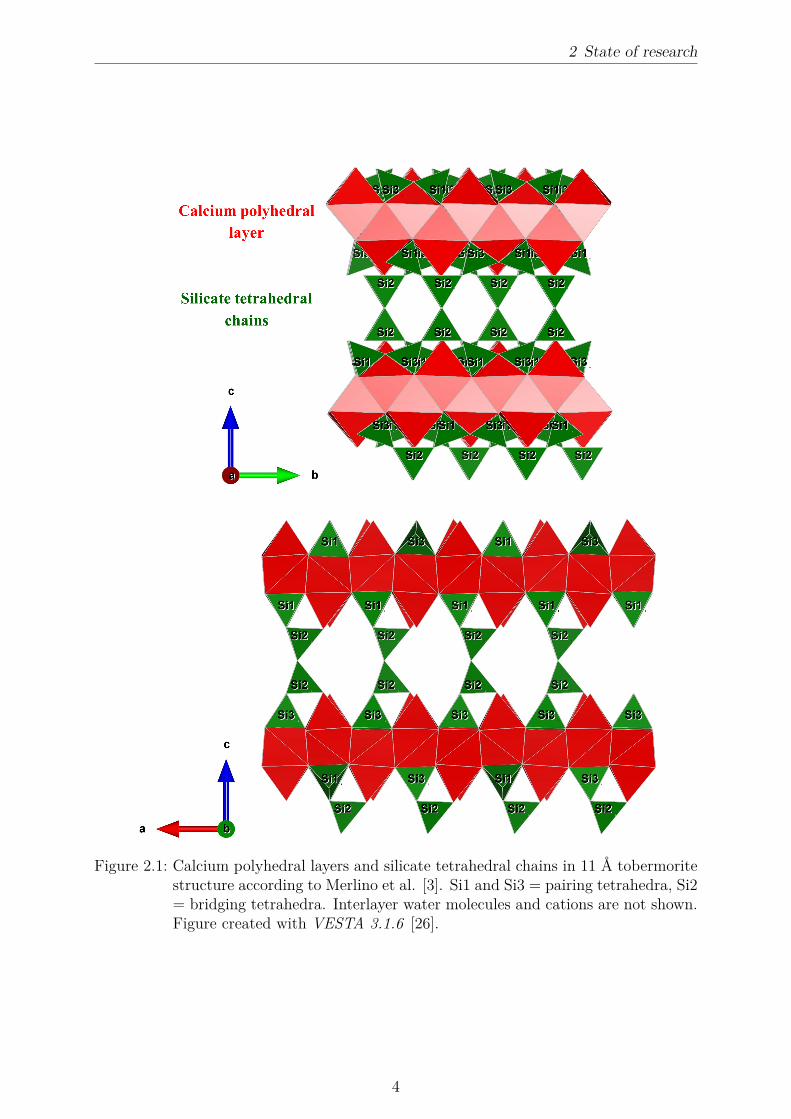
2 State of research
Figure 21 Calcium polyhedral layers and silicate tetrahedral chains in 11 Aring tobermoritestructure according to Merlino et al [3] Si1 and Si3 = pairing tetrahedra Si2= bridging tetrahedra Interlayer water molecules and cations are not shownFigure created with VESTA 316 [26]
4
2 State of research
212 Synthesis of stoichiometric 11 Aring tobermorite
The starting materials required for the hydrothermal synthesis of stoichiometric tober-morite are quartz flour or a different silica source calcium oxide or calcium hydroxideand deionized water [7 22] In accordance with the chemical formula the starting mixappropriately conforms to a CaSi molar ratio of about 08 [9 27]After preparing the slurry a distinct temperature setting of 170-180 degC autogenous satu-rated steam pressure (1ndash12 MPa) and a curing time of 12 h were recommended [5 7 28]Consequently an elevated water-to-solid ratio [7 23] in the starting mix and high over-all water content are required in order to ensure a saturated steam atmosphere in thelaboratory autoclave Qu et al showed that shorter curing times led to a lower reac-tion turnover [6] According to Šiaučiunas amp Baltakys at prolonged curing duration theformation of xonotlite (Ca6Si6O17(OH)2) was favored [7] It has been reported that thesurface area and solubility of all raw materials have an effect on the reaction time andreaction products [7 9 29] For instance gyrolite formation was triggered by highly sol-uble amorphous SiO2 in a study by Šiaučiunas amp Baltakys [7] El-Hemaly et al showedthat when amorphous type of silica was used the formation of C-S-H was accelerated butthe subsequent conversion to tobermorite was slowed down [22]The simplified hydrothermal reaction path (equation 21) [10 27 30] for the formationof stoichiometric tobermorite was described as follows Depending on the surface areaof raw materials the dissolution of Ca(OH)2 and SiO2 in the hydrothermal environmentinitially leads to the formation of a C-S-H gel which is characterized by poor structuralorder in c direction [22 27] The CaSi molar ratio in this precursor is variable [30] Thehydrothermal reaction proceeds and the C-S-H gel transforms into tobermorite but with amore particular CaSi ratio of approximately 083 The CaSi ratio decreases in this stepas further SiO2 is dissolved and supplied for reaction [10] Within this step periodicityin c direction increases and the calcium polyhedral layers and silicate chains gain morestructural order as reported by Shaw et al [27]
xCa(OH)2 + ySiO2 +H2O =rArr C-S-H gel =rArr C-S-H gel + zSiO2 =rArr tobermorite
(21)
Commonly pure phase synthesis of tobermorite is hardly attainable and some minorphases and amorphous content are frequently present in samples after hydrothermal cur-ing Common additional phases occurring in this system include calcite quartz xonotlitescawtite and poorly crystalline C-S-H with varying CaSi composition [7 9 31]In most studies autoclaved samples were dried at 60 - 100 degC [6 29] and ground prior
5
2 State of research
to further analyses Synthesized samples are commonly investigated by means of ther-mogravimetric analysis (TGA) combined with differential thermal analysis (DTA) SEManalysis and X-ray diffraction For estimation of the chemical purity of tobermorite usu-ally the basal spacing of 113 Aring is verified by XRD analysis as substitutions such as Al3+
incorporation would reflect in it [15 28] Moreover according to Mostafa et al and Quet al stoichiometric tobermorite showed plate-like morphology in SEM images [6 32]
213 Substitutions in the lattice of tobermorite
The incorporation of foreign ions into the lattice of tobermorite has been investigated intwo major respects In the first case the substitutions occur during the application ofpreviously synthesized tobermorite The potentials of these substitutions were exemplar-ily highlighted in chapter 1 [14 15] In the second case the substitutions occur duringthe hydrothermal formation of tobermorite Whenever a basic compound includes chem-ical components apart from calcareous materials and silica substitution in the lattice oftobermorite is likely to happen during the hydrothermal reaction Biagioni et al statedthat Al-free natural tobermorite is extremely rare [4]Supplementary cementitous materials (SCMs) are established components in various ap-plications - equally in AAC production Merchantable SCMs are usually limited to wellavailable materials so that only distinct foreign ions are supplied in a considerable scaleCalcined clays diatomite blast furnace slag and especially metakaolin are amongst themost frequent materials for this purpose [31 33 34 35] They are in turn characterizedby a specific chemical composition These raw materials supply primarily aluminum andalkali metal cations In addition the presence of sulfate ions in the system has been con-sidered by some authors since sulfate is a component in most composites for construction[32 36]Sakiyama amp Mitsuda and Rios et al successfully synthesized Al-substituted tobermoriteby applying different amounts of kaolinite and metakaolin [5 23] The incorporation ofAl3+ into the lattice of tobermorite resulted in lath-like crystals1 observed by SEM anal-ysis At a higher Al3+ dosage the formation of katoite was reported Skawinska et alinvestigated various halloysite contents in the initial mix [34] They confirmed katoiteformation caused by increased supply of Al3+ The substitution of Si4+ by Al3+ in thetetrahedral chains ranges to a possible 16 substitution of the tetrahedral sites reaching anAl content up to 1 Al atom per formula unit [4] Merlino et al explained that this mainlyoccurred in the bridging tetrahedron and for charge balance additional (OH)ndash substitutedO2ndash in one site [3] This leads to an increase of the basal spacing and lattice parameter c
1The terminology of observed crystalline particles is addressed in subsection 222
6
2 State of research
which was observed in several studies [15 28 37] In a different publication by Jacksonet al the incorporation of additional Na+ or K+ for charge balance was suggested [38]Matekonis et al stated that in this case tobermorite showed anomalous thermal behavior[29] Furthermore 29Si NMR measurements revealed that the substitution by Al3+ led toan increase of the chain length in b direction [38 39] Klimesch amp Ray performed thermalanalysis of Al-free and Al-substituted tobermorites [40] They reported that in the caseof Al3+ incorporation the conversion of 93 Aring tobermorite into β-wollastonite required ahigher temperature This observation is discussed later in this thesis (section 31) Qu etal performed XRD analysis and considered relative intensity broadening of Al-substitutedtobermorite reflections in order to estimate the crystallinity [6] However the broaden-ing was not measured and evaluated The present thesis provides extensive insights intothe evaluation of the peak broadening of tobermorite depending on the supply of Al3+ (section 31 and section 32)According to Mostafa et al substitution by (SO4)2ndash in the lattice of tobermorite led tobasal imperfection [32] Their study was mainly based on XRD analysis and FTIR spec-troscopy It was suggested that charge balance was achieved by substitution of (SO4)2ndash
and 2 (OH)ndash for (SiO4)4ndash Moreover the transformation of C-S-H gel into tobermorite wasaccelerated The sulfate-substituted tobermorite showed leafy crystals in SEM imagesBy contrast Sauman amp Valtr stated that the morphology of sulfate-substituted tober-morite did not differ substantially from the morphology of stoichiometric tobermoritecrystals [41] Instead anhydrite formation was observed by means of XRD analysis Insection 32 of this thesis a new perspective on this discussion is provided
22 Characterization of autoclaved aerated concrete
Supplied materials for AAC fabrication are transforming continuously during the pro-duction process which is displayed in Figure 22 [42] It can be seen that the phasetransitions before autoclaving remind of ordinary portland cement (OPC) hydration [43]The following main reactions run during the hydration before autoclaving [10 12 17]
CaO +H2O =rArr Ca(OH)2 (22)
Ca3SiO5 + 39H2O =rArr C17SH26 + 13Ca(OH)2 (23)
Ca3Al2O6 + 3CaSO4 + 32H2O =rArr Ca6Al2(OH)12(SO4)3 middot 26H2O (24)
This process step is finished when the generation of pores along with simultaneous expan-sion is completed and sufficient strength for wire cutting has developed through hydration
7
2 State of research
The reaction of aluminum powder does not only lead to the formation of hydrogen gasbut to very low amounts of different modifications of aluminum hydroxide [17] Howeverit can be seen that none of the hydrate phases forming during the green cake settingendure the autoclaving process Only quartz does partially not react and is consequentlypresent in the final product After transforming into ettringite and later AFm phasesinitially supplied anhydrite recrystallizes during the hydrothermal treatment A multi-step reaction sequence of C-S-H portlandite and further intermediate hydration productsleads to the crystallization of tobermorite The reader is referred to the comprehensivestudy of Schober for a more detailed presentation [17] Further supply of dissolved silicaat hydrothermal conditions contributes to the formation of tobermorite in the manneroutlined in equation 21 Clearly tobermorite is the major mineral phase present afterautoclaving and is therefore the main focus of research In the following subsections 221and 222 the state of knowledge concerning the characterization of AAC by means ofSEM analysis and XRD analysis is provided
Figure 22 Exemplary phase development during the entire production process of AACFigure adopted with permission from Schober [42]
221 SEM analysis
At first sight AAC has rather favorable properties compared to hydrated Portland cementwhen it comes to SEM analysis Due to the hydrothermal treatment several phases such
8
2 State of research
as tobermorite show better crystallinity In addition the hardly evitable effects of dam-age to poorly crystalline phases and removal of water are not as significant in the case ofAAC This is why environmental scanning electronic microscopy (ESEM) was suggestedin order to investigate hydrated Portland cement after early hydration [44 45] Howeverwhile hydrated OPC is a reasonably homogeneous material AAC shows heterogeneitydue to the porous structure (Figure 11)As reported in subsection 213 several authors investigated the morphology of tober-morite in AAC in order to verify the influence of foreign ions supplied by SCMs andestimate their effect on the thermal and mechanical properties Well crystallized tober-morite often shows a house-of-cards structure in AAC (Figure 23) which was observedin numerous studies [46 47 48]
Figure 23 House-of-cards appearance of tobermorite crystals in AAC
Wongkeo amp Chaipanich stated that the application of coal bottom ash for partial replace-ment of cement in the starting compound resulted in a change of plate-like to lath-likemorphology of tobermorite crystals [49] Equally thin lath-like plates of tobermorite wereobserved by Roacuteżycka et al in samples prepared from perlite waste [50] Venhodovaacute etal investigated AAC samples prepared from mixes including fly ash and Al(OH)3 andconfirmed the elongated shape of Al-incorporated tobermorite [8] In these studies thefraction of aluminum ions was increased by adding the respective SCM An effect on themorphology of tobermorite was respectively reported which conforms to the conclusionsmade by different authors in subsection 213 Nevertheless the heterogeneity of AACsamples in SEM images was barely addressed in all of these examples By contrast Mit-suda et al differentiated between macropores and micropores in their SEM images ofindustrially manufactured AAC [10] Huang et al separately analyzed walls and pores in
9
2 State of research
their samples prepared from copper tailings and blast furnace slag [48] The wall sectionsappeared dense while in pores platy tobermorite and long-strip shaped anhydrite wasobserved Only the tobermorite crystals in the pores showed the previously describedhouse-of-cards structure As is evident from these published results there is a lack ofclarity about the meaning and informative value of observations made in AAC samplesby SEM analysis In the main results of this present thesis (section 32) a substantiatedassessment of this circumstance is given
222 XRD analysis
While SEM analysis of AAC is majorly performed in order to characterize the crystallinityand morphology of tobermorite XRD analysis is mainly applied in order to assess theoverall phase composition Apart from the phases shown in Figure 22 additional calcitefeldspar mica gypsum and bassanite occur frequently in AAC depending on the miner-alogical composition of the used raw materials Frequently minor phases are unreactedresidual components of raw materials such as sericite in the publication of Isu et al [51] orphlogopite in the study of Huang et al who applied skarn-type copper tailings for AACpreparation [48] Prolonged curing duration resulted in minor quantities of xonotlite inthe study by Mitsuda et al [10]Mainly qualitative phase contents have been determined based on XRD in studies dealingwith the mineralogy of AAC A clear recognition of amorphous content in AAC along withthe crystalline phases has been barely addressed and discussed Relative quantities weredetermined by Matsui et al by plotting normalized intensities [28] They estimated thequantity of C-S-H gel by regarding the integrated intensity of the assumed tobermoriteprecursor in a distinct section of the XRD pattern Coming in agreement with the authorscited in subsection 213 increased d spacing along c in Al-substituted tobermorite wasreported in the same study Venhodovaacute et al performed XRD analysis of AAC samplesin their publication previously addressed in subsection 221 [8] They compared relativeintensities of tobermorite in their samples but no absolute quantities of the phases werecalculated either Mitsuda et al applied an internal standard method in order to quantifyunreacted quartz in their AAC samples [10]More recently Ectors proposed a promising method for the tracking of portlandite forma-tion during the green cake hydration [52] By applying a Rietveld compatible approachfor TOPAS 50 (Bruker AXS) to fit anisotropic peak broadening due to domain mor-phology [19] two generations of portlandite could be refined separately and assigned tothe hydration of calcium oxide and tricalcium silicate respectively The key idea behindthis approach is that the average domain morphology of a mineral phase in a powder
10
2 State of research
sample implies certain mineralogical characteristics The simplified domain morphologycan be calculated on the basis of geometrical shapes such as cylinder ellipsoid or cuboidDepending on the crystal system and the expected morphology the geometrical shapecan be adjusted accordingly In the example reported by Ectors the one generation ofportlandite originating from burnt lime hydration showed anisotropic peak broadening- unlike the generation forming from tricalcium silicate hydration In accordance withthe trigonal crystal system a biaxial cylinder model was applied for the fitting of theanisotropic generation The operating principle of the approach to fit the anisotropicpeak broadening due to domain morphology can be precisely explored by accessing fur-ther publications by Ectors et al [53 54] Apart from this benefit a better fit to themeasured data enables a more accurate refinement and quantification of all phases Thetwo generations of portlandite were additionally quantified by means of an external stan-dard method [55] The combination of quantitative phase analysis by XRD (QXRD) withthe refinement of anisotropic peak broadening is a promising approach in this context -especially in consideration of the fact that phase quantifications in AAC samples havebeen barely performed ever before Hence the application of these methods is the keymatter of this present thesis Especially the potential of the domain morphology analysisof tobermorite is precisely investigated The terms domain size and domain morphology inthis sense refer to the coherently scattering unit measured by XRD analysis Crystallineparticles observed by means of electron microscopy which are frequently termed grainscrystals or crystallites are for the most part clusters of coherently scattering domains[56 57]
11
3 Main results
3 Main results
This chapter introduces the main results presented in three peer reviewed publications[58 59 60] incorporated in chapter 6 The new findings are put in a general context andsubsequently they are summarized and discussed in chapter 4 The sections 31 and 32deal with the characterization of tobermorite in both lab-scale samples and AAC sam-ples produced on an industrial scale In section 33 the entire production process of AACincluding the hydration before autoclaving is addressed
Figure 31 Application of a triaxial cylinder model for the calculation of anisotropic do-main sizes of tobermorite implemented with Rietveld refinement and influenceon the fit compared to ordinary refinement [60]
12
3 Main results
One particular main result is a key element in each of the following sections In Figure 31the fit of tobermorite after two Rietveld refinements of different accuracy is shown In aregular Rietveld refinement for simplification the coherently scattering units are treatedas spherical shapes as usually only one size value for each mineral phase is calculated Asaverage domain sizes of a mineral phase in different crystallographic directions are in manycases indeed close to one value this approximation is often sufficient in order to achievea satisfactory fit to the measured diffractogram The crystal system and surroundingconditions during the formation of a mineral phase are significant factors in this context Amisfit at different (hkl) reflections as displayed in Figure 31 is an indication of anisotropicpeak broadening Clearly orthorhombic tobermorite shows anisotropic peak broadeningdue to its anisotropic domain morphology For the possible origins of anisotropic peakbroadening apart from size broadening the reader is referred to section 61 In accordancewith the orthorhombic crystal system a triaxial model is applied in order to fit the peakbroadening [19] By implementing the macro during the refinement no longer one butthree sizes (x y and z for respectively a b and c direction) are calculated Besides theimproved fit the calculated domain morphology is an additional information extractedfrom XRD analysis and it is representative for the average value of the phase in the entiresample In each of the following sections the different benefits regarding this approachare outlined in more detail
31 Hydrothermal synthesis of tobermorite on alaboratory scale - application of two types ofmetakaolin
This study covers mineralogical properties of tobermorite synthesized from a set of variouscompounds including different amounts and types of metakaolin [58] Unlike in sections32 and 33 the samples were not aerated before autoclaving and their composition isadjusted to the CaSi molar ratio of stoichiometric tobermorite On the one hand thereactivity of metakaolin and minor phases at hydrothermal conditions for the possible usein AAC production was investigated On the other hand the effects of consequent changesof the bulk chemistry in the basic compound on the mineralogical characteristics of to-bermorite such as lattice parameters and domain morphology were analyzed In additionfor one particular compound the effect of different curing times was explored While theconventional raw materials for AAC production are rather low-cost resources metakaolinis a high-priced SCM in this regard For this reason besides one comparatively pure com-mercial metakaolin (MK) a second by-product type of metakaolin (MKg) was applied
13
3 Main results
at equivalent dosages All investigated mix composites and the chemical composition ofMK and MKg are summed up in tables in section 61In Figure 32 the effect of different amounts of the two types of metakaolin on the phasequantities is displayed Clearly at moderate dosages of MK and MKg tobermorite waspresent in comparable quantities However the application of any amount of metakaolinreduced the amount of tobermorite compared to the blank mixture It can be seen thatkatoite was present whenever the content of Al2O3 in the starting drymix exceeded 2wt which fits well with the state of knowledge [5 23] For the highest possible dosagesof the two types of metakaolin (MK60 and MKg60) contrary effects were observed Ap-plication of impure metakaolin (MKg) led to a considerable amount of tobermorite whilein MK60 no tobermorite was present The high content of Al2O3 seems to have hinderedthe formation of tobermorite Not all of the Al2O3 in MKg was supplied for reactionas minor phases such as feldspar remained unreacted which is shown accurately in therespective publication in section 61
Figure 32 Weight fractions of tobermorite quartz and katoite measured by QXRD anal-ysis and contents of Al2O3 in the starting drymix Amorphous content andminor phases are not shown
The results of thermal analysis of samples characterized by MK addition in small stepsare shown in Figure 33 It can be seen that the conversion of 93 Aring tobermorite into β-
14
3 Main results
wollastonite depended on the dosage of MK However unlike suggested by Klimesch ampRay there was no effect of lower contents of Al2O3 in the drymix [40] Consequently theinfluence of Al3+ at low dosages (MK25 and MK5) could not be observed on the basisof this method Apart from this result the other signals showed good agreement with thesuggested conversion ranges by Klimesch amp Ray as for samples MK9 and MK16 a clearshift towards higher temperature was measured However the role of Al3+ incorporationverified by this method is not necessarily conclusive as additional reactions during theheating experiment involving Al3+ are possible On that basis the observations madeby means of DTA would not reflect the amount of Al3+ originally incorporated into thestructure of 11 Aring tobermorite
Figure 33 Conversion of 93 Aring tobermorite into β-wollastonite in samples synthesizedwith various amounts of metakaolin and suggested temperature ranges ac-cording to Klimesch amp Ray [40]
In accordance with authors referenced in subsection 213 lattice parameter c of tober-morite increased with elevated dosages of Al2O3 in the basic dry mix (Figure 34) Theimpact could be observed for the complete range of samples as displayed in section 61which indicates that a limit of Al3+ incorporation was not reached in this study Forcomparison the relative domain morphology is plotted in Figure 34 Unlike the DTA
15
3 Main results
signals both lattice parameter c and the domain morphology are impacted by very lowdosages of Al2O3 There is a good accordance of the relation of growth in b direction to adirection and the c parameter This is valid up to 20 wt of Al2O3 in the starting drymix By contrast more elevated contents of Al2O3 did not affect the domain morphologyany further even though the incorporation is verified through the increased c parameterIt follows that the impact of Al3+ incorporation on the domain morphology is limited tovery low contents while the impact on lattice parameter c can be tracked throughoutthe entire examined range of samples In section 61 additional results show that growthin b direction increased with reaction time These observations are solely based on XRDanalysis and offer new benefits for the structural understanding of tobermorite
Figure 34 Impact of the calculated Al2O3 content in the basic dry mix on the latticeparameter c and on the relation of calculated domain sizes of tobermorite ina (x) and b (y) direction
16
3 Main results
32 Structural properties of tobermorite in AAC - SEMversus XRD analysis
This section and the respective publication [59] mainly deal with the suitability of SEManalysis of tobermorite in AAC The effects of varying amounts of SO3 and Al2O3 in thedry mix on structural properties of tobermorite are discussed based on XRD analysisAs shown in subsection 221 and Figure 23 tobermorite often shows a house-of-cardsstructure in AAC samples This property has been considered to be relevant for thethermal and mechanical properties of AAC (subsection 221) However SEM analysiswithin this study revealed that this type of appearance is mainly found in the poresand pore surfaces (Figure 35) This finding comes in agreement with the observationsmade by Huang et al [48] In the solid skeleton of the dense AAC material neither themorphology nor the house-of-cards structure could be observed properly which can beseen very clearly in additional micrographs provided in section 62 It should be consideredthat the major amount of tobermorite by weight is located in the dense material and notat the pore surfaces In this way these findings are clear disadvantages coming along withonly SEM analysis of AAC as representative results can hardly be obtained
Figure 35 House-of-cards structure of tobermorite in a pore surrounded by dense mate-rial
Moreover several authors in subsection 221 justified the morphology of tobermorite withthe incorporation of foreign ions Al-substituted tobermorite showed lath-like morphologywhereas Al-free tobermorite showed rather plate-like morphology [6 32 49] Howeverthe present investigation revealed that independent of Al2O3 content in the raw mix there
17
3 Main results
is always heterogeneity regarding the morphology of tobermorite In Figure 36 plate-likeand lath-like morphology of tobermorite in AAC observed in two statistical chemicallyvarious samples are displayed This result supports the previous assumption that theobservations made by SEM analysis of tobermorite in AAC strongly depend on whatpart of the sample is selected Yet again no clear observations could be made that wererepresentative for the entire sample
Figure 36 Heterogeneous morphology of tobermorite (plate-like in a and c lath-like in band d) in two AAC samples characterized by different Al2O3 contents in theraw mix
The effects of Al3+ on the domain morphology of tobermorite were measured and evaluatedin a similar manner as in section 61 and the results could be confirmed The relativedomain growth in b direction was increased by Al3+ incorporation in both studies [5859] Moreover lattice parameter c was increased with Al3+ incorporation which can beseen more accurately in section 62 Unlike SEM analysis XRD analysis allowed clearconclusions whenever structural properties of Al-substituted tobermorite were affectedInstead of a local observation as made with SEM representative and statistical resultswere obtained The reader is referred to section 61 and section 62 for further results and
18
3 Main results
more specific conclusionsIn addition the effect of various amounts of sulfate in the raw mix was analyzed Unlikein the case of different dosages of Al3+ neither the domain morphology nor the latticeparameters of tobermorite were affected by the SO3 content in the dry mix In Figure 37these observations and additionally the amounts of anhydrite measured by QXRD areshown As the amount of available SO3 in the dry mix is known the maximum possibleamount of anhydrite could be calculated for each of the samples in focus Obviouslythe measured amounts of anhydrite are either equal or slightly higher compared to theexpected quantities This result leads to the assumption that all of the available sulfateis transformed into anhydrite so that no more sulfate could be incorporated into thestructure of tobermorite The over-estimation of anhydrite in some of the samples can beexplained due to the inaccuracy of the quantification method The present results rathermatch with the suggestions by Sauman amp Valtr [41] as in their study no effect of sulfateon the structure of tobermorite was observed either
Figure 37 Impact of the sulfate content in the AAC raw mix on lattice parameter cand relative domain morphology of tobermorite (a) and comparison of theexpected maximum amount of anhydrite to the measured amount determinedby QXRD (b)
33 Improved monitoring of the phase developmentduring the production of AAC
In this study not only autoclaved samples were analyzed but additionally a lab-scale slurrywhich included the reactive components of the green cake stage during AAC productionat equivalent weight proportions In-situ XRD was performed at 70 degC and at a water-to-
19
3 Main results
solid ratio of 08 for 24 h (Figure 38) which are respective conditions during commercialproduction Clearly the phase development is dominated by OPC and lime hydration asdescribed in section 22 It can be seen that the major reaction turnover occurs duringthe first 200 minutes which is the average duration of the green stage After only 30minutes all of the quicklime had transformed into portlandite whereas Schober proposeda duration of one hour for this reaction [42] The amount of portlandite is composed oftwo different generations as proposed by Ectors [52] Equally a biaxial cylinder modelwas applied in order to fit the peak broadening of the first generation of portlandite in thepresent investigation Minor phase developments such as the formation of AFm phases arenot shown in Figure 38 A coarse fraction of anhydrite did not react so that constantlyaround 15 wt were measured after 6 h As the decomposition of ettringite due tosulfate depletion [55] does not occur prior to 12 h the green cake strength is not affected
Figure 38 In-situ XRD measurement of AAC model slurry at water-to-solid ratio of 08and 70 degC For clarity and comprehensibility not all phases are shown
The separation of two generations of portlandite in the system does not only translate intodifferent domain morphologies as shown by Ectors [52] In Figure 39 more indicationsfor different mineralogical properties are displayed The shape of the (0 0 1) reflection inXRD patterns after only quicklime hydration and after both quicklime and alite hydrationshows a distinct feature While portlandite originating from quicklime hydration showsa broad peak implying lower crystallinity the peak after alite hydration is characterized
20
3 Main results
Figure 39 Formation of two generations of portlandite in AAC slurry in XRD (a) andDTA (b) plots
by a sharper component Yet the peak breadth did not change indicating that the firstgeneration is still present with the original characteristics This observation is supportedby DTA measurements additionally demonstrating two degrees of crystallinity only afteralite hydration In agreement with XRD analysis the better crystalline second generationof portlandite decomposes at a higher temperature
Figure 310 Quantification of tobermorite in statistical chemically various AAC sampleswith and without the application of the macro for the fitting of anisotropicpeak broadening
21
3 Main results
Furthermore commercial AAC samples were considered in this study By applying themethod for the refinement of anisotropic peak broadening (Figure 31) a more accuratequantification of tobermorite can be achieved In Figure 310 the calculated amounts oftobermorite in statistical chemically various AAC samples are plotted In some samplesthe refinement using the macro leads to considerably higher but never lower quantitiesof tobermorite whereas in other samples nearly the same amount of tobermorite is cal-culated This observation can be well understood taking into account that the macroallows to account more peak area for tobermorite as shown in Figure 31 Clearly thereis evidence that the anisotropy of tobermorite domains is not uniform from one sampleto another which was basically justified in the previous sections As an improved quan-tification of a single phase leads to a better quantification of other phases in the samplethis adaption is very valuable in order to assess the phase development Here the peakbroadening of tobermorite equally observed by Qu et al [6] could be tracked and evalu-ated in order to gain more accurate results Moreover in section 63 McCrone milling issuggested in order to avoid spottiness in XRD patterns caused by coarse grains of quartzor anhydrite (Figure 38)
22
4 Conclusions
4 Conclusions
The research results presented in the previous sections yield advances in the mineralogicalinvestigation of tobermorite and autoclaved aerated concrete Recorded diffraction pat-terns contain plenty of usually unused data regarding the microstructural characteristicsof the sample and phases therein The profit of XRD measurements can be significantlyimproved whenever one or more phases show anisotropic peak broadening and appro-priate models for the respective domain morphology are implemented into the Rietveldenvironment Within the scope of the present investigations portlandite and tobermoriteshow this particularityThe effects of changes in the chemistry of the starting mix were examined based on dif-ferent dosages of metakaolin Al-substituted tobermorite showed increased growth in b
direction and an increase of lattice parameter c compared to Al-free tobermorite The rel-ative domain sizes were determined based on anisotropic peak broadening However whilethe effect of Al3+ incorporation into the lattice of tobermorite was limited regarding thedomain morphology lattice parameter c showed an increase throughout the entire rangeof samples The consequent effects suggested by Klimesch amp Ray observed by means ofDTA are debatable as reactions during the heating experiment may lead to to a changeof Al3+ content in tobermorite [40] While both types of applied metakaolin showed goodreactivity at hydrothermal conditions some included minor phases such as feldspar oranatase remained unreacted At high dosages of Al2O3 in the starting mix the formationof either only katoite or katoite along with tobermorite was observed (Figure 32)SEM analysis of tobermorite in AAC cannot be suggested based on the observationspresented in this work as it is only visually accessible in the pores or at pore surfacesThe dense material of the AAC skeleton contains several crystalline and X-ray amorphousphases which hardly allows a proper investigation Even in single pores tobermorite crys-tals appeared very heterogeneous at various chemical compositions As a result lath-liketobermorite was not only present in samples characterized by elevated Al3+ incorporationBy contrast the benefits of XRD analysis presented in section 61 equally accounted fortobermorite in AAC samples Sulfate incorporation into the lattice of tobermorite wasnot observed All of the sulfate in the system was detected to be present in anhydriteThe phase transitions in the AAC raw slurry during the green stage hydration were show-cased by in-situ XRD analysis of a model mix at 70 degC Additional DTA and XRD mea-
23
4 Conclusions
surements during this step confirmed the presence of two generations of portlandite char-acterized by different crystallinity as suggested by Ectors [52] The inclusion of anisotropicdomain morphology during the Rietveld refinement allowed a more accurate quantifica-tion of tobermorite in autoclaved samples Sample preparation adjusted to the grain sizedistribution in AAC samples (section 63) the external standard method for quantita-tive XRD analysis [55] and the approach to evaluate anisotropic peak broadening [19]are the key methods for a more accurate tracking of the phase development during AACproduction
24
5 References
5 References
[1] A E Zadov A I Grabezhev N N Pertsev N V Chukanov and S V PribavkinTobermorite-plombierite metasomatites of the Gumeshevsk skarn-porphyry copper depositmiddle Urals Doklady Earth Sciences 407(3)495ndash497 2006
[2] M F Heddle Preliminary notice of substances which may prove to be new minerals MinMag 4117ndash123 1880
[3] S Merlino E Bonaccorsi and T Armbruster The real structure of tobermorite 11AringNormal and anomalous forms OD character and polytypic modifications European Journalof Mineralogy 13(3)577ndash590 2001
[4] C Biagioni S Merlino and E Bonaccorsi The tobermorite supergroup a new nomencla-ture Mineralogical Magazine 79(2)485ndash495 2015
[5] C A Riacuteos C D Williams and M A Fullen Hydrothermal synthesis of hydrogarnetand tobermorite at 175 degC from kaolinite and metakaolinite in the CaO-Al2O3-SiO2-H2Osystem A comparative study Applied Clay Science 43(2)228ndash237 2009
[6] X Qu Z Zhao and X Zhao Microstructure and characterization of aluminum-incorporated calcium silicate hydrates (C-S-H) under hydrothermal conditions RSC Ad-vances 8(49)28198ndash28208 2018
[7] R Šiaučiunas and K Baltakys Formation of gyrolite during hydrothermal synthesis inthe mixtures of CaO and amorphous SiO2 or quartz Cement and Concrete Research34(11)2029ndash2036 2004
[8] E Venhodovaacute R Janovskyacute and R Drochytka Formation of Tobermorite at Different Ma-terials Composition of Aerated Concrete Applied Mechanics and Materials 752-753247ndash250 2015
[9] L Galvaacutenkovaacute E Bartoniacutečkovaacute T Opravil J Tkacz and P Ptaacuteček The influence ofstarting materials solubility on tobermorite structure formation under the hydrothermalconditions IOP Conference Series Materials Science and Engineering 379(1)1ndash8 2018
[10] T Mitsuda K Sasaki and H Ishida Phase Evolution during Autoclaving Process J AmCeram Soc 75(75)1858ndash1863 1992
[11] A Skawińska The influence of metahalloysite addition on tobermorite formation studied byX-ray powder diffraction and scanning electron microscope MATEC Web of Conferences16305008 2018
[12] S T Bergold F Goetz-Neunhoeffer and J Neubauer Quantitative analysis of C-S-H in
25
5 References
hydrating alite pastes by in-situ XRD Cement and Concrete Research 53119ndash126 2013
[13] O P Shrivastava and F P Glasser Ion-exchange properties of 11-Aring tobermorite Reactivityof Solids 2(3)261ndash268 1986
[14] H Maeda Y Ogawa E H Ishida and T Kasuga Hydrothermal synthesis of tobermoritedoped with phosphorus species for removing heavy metal ions Journal of the AustralianCeramic Society 48(1)8ndash11 2012
[15] O P Shrivastava and R Shrivastava Cation exchange applications of synthetic tobermoritefor the immobilization and solidification of cesium and strontium in cement matrix Bulletinof Materials Science 23(6)515ndash520 2000
[16] G Renman and A Renman Sustainable Use of Crushed Autoclaved Aerated Concrete(CAAC) as a Filter Medium in Wastewater Purification 8th International conferenceon sustainable management of waste and recycled materials in construction GothenburgSweden 30 Mayndash1 June 2012 Proceedings pages 1ndash7 2012
[17] G Schober Chemical transformations during the manufacturing of autoclaved aeratedconcrete (ACC) Cement lime gypsum and quartz sand become cellular concrete ZKG58(7)63ndash70 2005
[18] A J Hamad Materials Production Properties and Application of Aerated LightweightConcrete Review International Journal of Materials Science and Engineering 2(2)152ndash157 2014
[19] D Ectors F Goetz-Neunhoeffer and J Neubauer A generalized geometric approach toanisotropic peak broadening due to domain morphology Journal of Applied Crystallogra-phy 48(1)189ndash194 2015
[20] H M Rietveld A profile refinement method for nuclear and magnetic structures Journalof Applied Crystallography 2(2)65ndash71 1969
[21] S A Hamid The crystal structure of the 11 Aring natural tobermoriteCa225[Si3O75(OH)15]1H2O Zeitschrift fuer Kristallographie - New Crystal Struc-tures 154(3-4)189ndash198 1981
[22] S A S El-Hemaly T Mitsuda and H F W Taylor Synthesis of normal and anomaloustobermorites Cement and Concrete Research 7429ndash438 1977
[23] M Sakiyama and T Mitsuda Hydrothermal reaction between C-S-H and kaolinite for theformation of tobermorite at 180degC Cement and Concrete Research 7(6)681ndash685 1977
[24] E Bonaccorsi S Merlino and A R Kampf The crystal structure of tobermorite 14 Aring(plombierite) a C-S-H phase Journal of the American Ceramic Society 88(3)505ndash5122005
[25] S Merlino E Bonaccorsi and T Armbruster The real structures of clinotobermorite andtobermorite 9 Aring OD character polytypes and structural relationships European Journalof Mineralogy 12(2)411ndash429 2000
[26] K Momma and F Izumi VESTA 3 for three-dimensional visualization of crystal volu-metric and morphology data Journal of Applied Crystallography 44(6)1272ndash1276 2011
26
5 References
[27] S Shaw S M Clark and C MB Henderson Hydrothermal formation of the calcium sil-icate hydrates tobermorite (Ca5Si6O16(OH)2 middot 4H2O) and xonotlite (Ca6Si6O17(OH)2)An in situ synchrotron study Chemical Geology 167(1-2)129ndash140 2000
[28] K Matsui J Kikuma M Tsunashima T Ishikawa S Matsuno A Ogawa and M SatoIn situ time-resolved X-ray diffraction of tobermorite synthesis process under hydrothermalcondition IOP Conference Series Materials Science and Engineering 18(2)60ndash66 2011
[29] G Matekonis R Šiaučiunas and D Vaičiukyniene Hydrothermal Synthesis and Charac-terization of Na + and [ Al 3 + + Na + ] -substituted Tobermorite in CaO-SiO2middotnH2O-H2OSystem MATERIALS SCIENCE 16(3)242ndash248 2010
[30] G Geng R J Myers M J A Qomi and P JM Monteiro Densification of the inter-layer spacing governs the nanomechanical properties of calcium-silicate-hydrate ScientificReports 7(1)1ndash8 2017
[31] D Klimesch and A Ray Autoclaved cement-quartz pastes with metakaolin additionsAdvanced Cement Based Materials 7(3-4)109ndash118 1998
[32] N Y Mostafa A A Shaltout H Omar and S A Abo-El-Enein Hydrothermal synthesisand characterization of aluminium and sulfate substituted 11 nm tobermorites Journal ofAlloys and Compounds 467(1-2)332ndash337 2009
[33] İ Demir M S Başpınar E Kahraman E Ccedilalışkan and G Goumlrhan An Investigation onthe Usability of Diatomite in Aerated Concrete Production In Proc of the Intl Conf onAdvances In Civil Structural And Construction Engineering - CSCE 2014 pages 97ndash1002014
[34] A Skawinska Z Owsiak T Baran and K Hernik The influence of halloysite additionon tobermorite formation in CaO and quartz mix under hydrothermal conditions CementWapno Beton 17(12)426ndash434 2017
[35] N Y Mostafa Influence of air-cooled slag on physicochemical properties of autoclavedaerated concrete Cement and Concrete Research 35(7)1349ndash1357 2005
[36] D Małaszkiewicz and J Chojnowski Influence of addition of calcium sulfate dihydrate ondrying of autoclaved aerated concrete Open Engineering 7(1)273ndash278 2017
[37] N Hara and N Inoue Thermal behaviour of 11Aring tobermorite and its lattice parametersCement and Concrete Research (10)53ndash60 1980
[38] M D Jackson S R Chae S R Mulcahy C Meral R Taylor P Li A H EmwasJ Moon S Yoon G Vola H R Wenk and P JM Monteiro Unlocking the secretsof Al-tobermorite in Roman seawater concrete American Mineralogist 98(10)1669ndash16872012
[39] W Liao W Li Z Fang C Lu and Z Xu Effect of different aluminum substitution rateson the structure of Tobermorite Materials 12(22)1ndash10 2019
[40] D Klimesch and A Ray DTA-TG Study of the CaO-SiO2-H2O and CaO-Al2O3-SiO2-H2OSystems Under Hydrothermal Conditions Journal of Thermal Analysis and Calorimetry56(1)27ndash34 1999
27
5 References
[41] Z Sauman and Z Valtr Substitution of sulphate ions in the crystal lattice of 11 Aring to-bermorite In The VI International Congress on the Chemistry of Cement pages 1ndash14Moscow 1974
[42] G Schober Reaction of raw materials to the final product AAC httpwwwpb-aacde
chemmin2_ehtml 2012 accessed 2020-01-31
[43] D Jansen C Stabler F Goetz-Neunhoeffer S Dittrich and J Neubauer Does Ordi-nary Portland Cement contain amorphous phase A quantitative study using an externalstandard method Powder Diffraction 26(01)31ndash38 2011
[44] C Roumlszligler J Stark F Steiniger and W Tichelaar Limited-dose electron microscopyreveals the crystallinity of fibrous C-S-H phases Journal of the American Ceramic Society89(2)627ndash632 2006
[45] Y Sakalli and R Trettin Investigation of C3S hydration by environmental scanning elec-tron microscope Journal of Microscopy 259(1)53ndash58 2015
[46] F Matsushita Y Aono and S Shibata Expansion and shrinkage behavior of green cakeof Autoclaved Aerated Concrete In Autoclaved Aerated Concrete - Innovation and Devel-opment Proceedings of the 4th International Conference on Autoclaved Aerated ConcreteKingston UK 8-9 September 2005 pages 101ndash108 CRC Press 2005
[47] C Chucholowski M Holger and K-C Thienel Improving the recyclability environmentalcompatibility and CO2 balance of autoclaved aerated concrete by replacing sulfate carrierand cement with calcined clays CePapers 2(4)503ndash512 2018
[48] X Y Huang W Ni W H Cui Z J Wang and L P Zhu Preparation of autoclavedaerated concrete using copper tailings and blast furnace slag Construction and BuildingMaterials 27(1)1ndash5 2012
[49] W Wongkeo and A Chaipanich Compressive strength microstructure and thermal anal-ysis of autoclaved and air cured structural lightweight concrete made with coal bottom ashand silica fume Materials Science and Engineering A 527(16-17)3676ndash3684 2010
[50] A Roacuteżycka and W Pichoacuter Effect of perlite waste addition on the properties of autoclavedaerated concrete Construction and Building Materials 12065ndash71 2016
[51] N Isu H Ishida and T Mitsuda Influence of quartz particle size on the chemical andmechanical properties of autoclaved aerated concrete (I) tobermorite formation Cementand Concrete Research 25(25)243ndash248 1995
[52] D Ectors Advances in the analysis of cementitious reactions and hydrate phases doctoralthesis PhD thesis Friedrich-Alexander-Universitaumlt Erlangen-Nuumlrnberg 2016
[53] D Ectors F Goetz-Neunhoeffer and J Neubauer Domain size anisotropy in the double-Voigt approach An extended model Journal of Applied Crystallography 481998ndash20012015
[54] D Ectors F Goetz-Neunhoeffer and J Neubauer Routine (an)isotropic crystallite sizeanalysis in the double-Voigt approximation done right Powder Diffraction 32(S1)27ndash342017
28
5 References
[55] D Jansen F Goetz-Neunhoeffer C Stabler and J Neubauer A remastered external stan-dard method applied to the quantification of early OPC hydration Cement and ConcreteResearch 41(6)602ndash608 2011
[56] T Ungaacuter G Tichy J Gubicza and R J Hellmig Correlation between subgrains andcoherently scattering domains Powder Diffraction 20(04)366ndash375 2005
[57] Triloki P Garg R Rai and B K Singh Structural characterization of as-depositedcesium iodide films studied by X-ray diffraction and transmission electron microscopy tech-niques Nuclear Instruments and Methods in Physics Research Section A AcceleratorsSpectrometers Detectors and Associated Equipment 736128ndash134 2014
[58] J Schreiner F Goetz-Neunhoeffer J Neubauer and D Jansen Hydrothermal synthesisof 11 Aring tobermorite ndash Effect of adding metakaolin to the basic compound Applied ClayScience 185 2020
[59] J Schreiner F Goetz-Neunhoeffer J Neubauer S Volkmann S Bergold R Webler andD Jansen Advanced Rietveld refinement and SEM analysis of tobermorite in chemicallydiverse autoclaved aerated concrete Powder Diffraction 34143ndash150 2019
[60] J Schreiner D Jansen D Ectors F Goetz-Neunhoeffer J Neubauer and S VolkmannNew analytical possibilities for monitoring the phase development during the production ofautoclaved aerated concrete Cement and Concrete Research 107247ndash252 2018
29
6 Publications
6 Publications
61 Hydrothermal synthesis of 11 Aring tobermorite ndash Effectof adding metakaolin to the basic compound
Reprint of the peer reviewed publication
Schreiner J Goetz-Neunhoeffer F Neubauer J Jansen D 2020 Hydrothermalsynthesis of 11 Aring tobermorite ndash Effect of adding metakaolin to the basic compoundApplied Clay Science 185 httpsdoiorg101016jclay2019105432
with permission from Elsevier
30
Contents lists available at ScienceDirect
Applied Clay Science
journal homepage wwwelseviercomlocateclay
Research paper
Hydrothermal synthesis of 11 Aring tobermorite ndash Effect of adding metakaolin tothe basic compound
J Schreiner F Goetz-Neunhoeffer J Neubauer D JansenUniversity of Erlangen-Nuremberg GeoZentrum Nordbayern Mineralogy Schlossgarten 5a 91054 Erlangen Germany
A R T I C L E I N F O
KeywordsHydrothermal synthesis11 Aring tobermoriteMetakaolinPowder diffractionKatoite
A B S T R A C T
Different amounts and types of metakaolin were analyzed and applied for the hydrothermal synthesis of 11 Aringtobermorite All synthesized samples were investigated by means of powder XRD combined with Rietveld re-finement Al-substituted 11 Aring tobermorite was successfully synthesized on the basis of a broad range of com-pounds characterized by a varying content of metakaolin Katoite was present depending on the amount ofsupplied Al3+ which was determined by the dosage of metakaolin Minor crystalline components included in thetwo types of metakaolin sources varied greatly in their reactivity under hydrothermal conditions Despite adifferent degree of purity the two types of metakaolin showed corresponding effects at moderate dosages butcontrary effects at higher dosages as for the synthesis of 11 Aring tobermorite The domain morphology of to-bermorite could be associated with Al3+ incorporation for low dosages of metakaolin represented by up to 2 wt- Al2O3 in the dry mix By contrast Al3+ affected tobermorite lattice parameters at equivalent and even athigher dosages with c reaching 2295 Aring at 12 wt- Al2O3 in the dry mix
1 Introduction
11 Application of metakaolin as a reactive material in constructionindustry
The application of supplementary cementitious materials (SCMs) inthe field of construction technology has received a lot of attention inrecent years Due to limited resources and an urgent need for alter-native and more eco-friendly construction materials SCMs such asmetakaolin offer a great potential The usage of SCMs has not onlyspread to the cement and mortar industry but also to advanced appli-cations such as autoclaved aerated concrete (AAC) (Demir et al 2014Koutnyacute et al 2014 Walczak et al 2015 Roacuteżycka and Pichoacuter 2016Chucholowski et al 2018) Unlike ordinary cementitious constructionmaterials AAC is produced from hydrothermal curing Due to the dif-ferent thermodynamic environment the hydration process and the re-activity of raw materials have to be investigated properly in order tounderstand the effects on the AAC product The leading mineral phasein AAC is 11 Aring tobermorite (Ca5Si6O16(OH)2middot4H2O) As a consequencethe thermal and mechanical properties of AAC depend on micro-structure and crystallinity of tobermorite to some extent In addition tothe curing time and the fineness of raw materials the supply of ionsthat can substitute in the tobermorite structure is a crucial factor in thiscontext Especially substitutions by aluminum sodium and potassium
ions have been investigated thoroughly (Sauman 1974 Klimesch andRay 1998 Mostafa et al 2009 Matekonis et al 2010 Skawinskaet al 2017) Calcined clays usually contain a considerable amount ofthe mentioned ions
There is a vast amount of literature on the reactivity of SCMs atambient temperature and standard pressure but there is little when itcomes to hydrothermal conditions In previous publications the beha-vior of metakaolin under hydrothermal conditions was mainly in-vestigated for the synthesis of zeolites (Zhang et al 2007 Aguilar-Mamani et al 2014 Setthaya et al 2016 Luo et al 2018) In thesestudies the reactivity of metakaolin was observed at a wide range oftemperature and pH values During the transformation of kaolin intometakaolin a loss of framework alumina was observed (Ayodele et al2019) In recent decades metakaolin has been the subject of studies inthe field of geopolymer research (Rashad 2013 Chen et al 2016) Forthe synthesis of 11 Aring tobermorite a more distinct setting of temperaturesetting (180ndash200 degC) and steam pressure (1ndash12 MPa) are required
This publication is intended to make a new contribution to thechallenging field of hydrothermal synthesis in the system CaO-Al2O3-SiO2-H2O based on XRD analysis combined with Rietveld refinementVarious dosages of two types of metakaolin with different chemical andmineralogical purities are compared for the effects on the hydrothermalsynthesis of Al-substituted 11 Aring tobermorite Especially changes of thebulk chemistry in the raw mixes the reactivity of minor crystalline
httpsdoiorg101016jclay2019105432Received 20 August 2019 Received in revised form 13 November 2019 Accepted 30 December 2019
Corresponding authorE-mail address juergenjsschreinerfaude (J Schreiner)
Applied Clay Science 185 (2020) 105432
0169-1317 copy 2020 Elsevier BV All rights reserved
T
6 Publications
31
phases of the two types of metakaolin and the effect of different curingtimes are the focus of interest On the one hand metakaolin offers agreat potential in the AAC industry On the other hand of all SCMsmetakaolin is a good source material for investigating the influence ofAl3+ on the synthesis of Al-substituted 11 Aring tobermorite
12 Synthesis of Al-substituted 11 Aring tobermorite
In addition to being present in AAC tobermorite has found appli-cation in wastewater treatment and nuclear waste management due toits ion exchange capacity (Maeda et al 2012 Monasterio et al 2015)The substitution of silicon by aluminum results in a different to-bermorite structure due to general and local charge balance affectingthe lattice parameters Especially c is impacted by this substitutionbecause it occurs in the bridging tetrahedron and additional OHndash sub-stitutes O2ndash (Komarneni et al 1985 Merlino et al 2000) As suggestedin some additional studies the substitution of Si4+ by Al3+ and Na+ orK+ leads to a lath-like morphology of tobermorite crystals (Mostafa2005 Mostafa et al 2009 Venhodovaacute et al 2015 Qu et al 2018)However because of the heterogeneous appearance of tobermorite inAAC it is hardly possible to conduct a proper characterization based onSEM analysis In our recent work the anisotropic peak broadening oftobermorite in XRD diffractograms was successfully linked with theincorporation of foreign ions supplied in a common AAC production(Schreiner et al 2019) This finding allowed a more statistical struc-tural characterization of tobermorite in bulk compositions compared toSEM analysis Moreover it was reported in other studies that differenthydrate phases occur depending on the amount of supplied ions and onthe experimental settings In compounds with a high content of Al3+formation of katoite could be observed (Klimesch and Ray 1998 Riacuteoset al 2009 Matsui et al 2011) In the case of a longer curing durationinstead of 11 Aring tobermorite the formation of xonotlite (Siauciunas andBaltakys 2004 Galvaacutenkovaacute et al 2018) or - depending on the finenessof used silica source (Siauciunas and Baltakys 2004) - gyrolite is fa-voured
Kalousek (1956) suggested that tobermorite can contain up to 5Al2O3 More Al2O3 in the system resulted in the formation of hydro-garnet Klimesch and Ray (1998) additionally investigated the stabilityof hydrogarnet depending on the Al(Si + Al) ratio and its role in re-lation to the formation of 11 Aring tobermorite in an equivalent systemThey suggest that hydrogarnet always appears before tobermorite butthe former can only be detected for higher Al(Si + Al) ratios in theevent of longer curing times Riacuteos et al (2009) and Qu et al (2018)confirmed these findings in extensive investigations In the latter pub-lication it is additionally suggested that samples prepared at lowertemperatures (160 degC) are less impacted by the supply of Al3+ Theyalso consider the peak broadening of tobermorite in their XRD plotsbased on the amount of incorporated Al3+ In two recent publicationswe suggested that the peak broadening of tobermorite enables a mi-crostructural analysis by calculating the orientation dependent domainsizes (Schreiner et al 2018 2019) However these studies are based onsamples of industrially produced AAC so that the curing time was fixedThe studied AAC was produced from raw materials with a broad che-mical spectrum such as ordinary Portland cement (OPC) whichsomehow complicates the interpretation of results
In this work the influence of aluminum ions - provided by meta-kaolin - on dominant crystallographic direction-dependent domaingrowth of tobermorite is investigated by analysis of anisotropic peakbroadening (Ectors et al 2015 2017) In Fig 1 of the supplementarymaterial the method of fitting the anisotropic peak broadening of to-bermorite using a triaxial cylinder model is visualized (Schreiner et al2018) Fitting of the anisotropic peak broadening of tobermorite Thismethod is used to calculate the average and reliable values for to-bermorite domain sizes in the powder sample and associate them withaverage Al3+ incorporation Microstrain should be considered becauseit is an additional source of peak broadening However this usually
accounts for materials that have been exposed to different kinds ofstress such as metals and alloys (Badawi et al 2019) In addition theinstrumental contribution to peak broadening should be consideredHydration products such as tobermorite are characterized by crystallitesizes in the range of nanometers so that anisotropic size broadeningclearly outweighs the effect of instrumental broadening (Jenkins andSnyder 1996) Moreover the impact of Al3+ on the lattice parametersof tobermorite is considered It should additionally be clarified whe-ther the results from our previous publication (Schreiner et al 2019)based on industrially produced AAC can be confirmed by investigationwith less complex raw mixes and purely based on laboratory experi-ments
2 Material and methods
21 Starting materials
The starting materials for hydrothermal synthesis included deio-nized water quartz flour portlandite (999 pure) and two types ofmetakaolin One type was ordinary commercially available metakaolin(MK) with nearly a stoichiometric composition For comparison thesecond type of commercially available metakaolin was a by-productfrom expanded glass production (MKg) and consequently highly im-pure The chemical composition of MK and MKg determined by XRF isgiven in Table 1 With MKg containing less Al2O3 but considerably moreNa2O than MK the effects on hydrothermal synthesis were of interestBoth types of metakaolin have been characterized in previous pub-lications (Schmidt et al 2012 Naber et al 2019) In addition weverified the mineral phase content by XRD analysis Besides amorphousmetakaolin MK contained minor amounts of anatase quartz and mica
Fig 1 Weight fractions of tobermorite quartz and katoite determined byquantitative XRD analysis ndash samples including MKg crosshatched
Table 1Chemical composition of MK and MKg determined by XRF analysis ndash majorcontrasts in bold letters
Oxides [wt-] MK MKg
SiO2 536 604Al2O3 392 206CaO 01 40MgO 01 12Na2O 0 96K2O 10 18Fe2O3 18 05TiO2 21 03P2O5 01 02Loss on ignition 15 1
J Schreiner et al Applied Clay Science 185 (2020) 105432
2
6 Publications
32
MKg contained additional kaolinite feldspar and quartz
22 Investigated mix composites
For the preparation of raw mixtures the powders were weighed andhomogenized using a lab-scale mixing mill Table 2 lists the composi-tion and nomenclature of all samples including Al2O3 content andcuring time in the autoclave
bull Besides one blank mixture (MK0) that did not contain any type ofmetakaolin eleven more compounds were prepared of which threeincluded different dosages of MKg (MKg16 MKg23 and MKg60)Three more mixes contained equivalent amounts of MK instead ofMKg (MK16 MK23 and MK60) These mixes were investigated inorder to have a direct comparison concerning the effects of differentraw material on the synthesis of tobermorite
bull Additionally the mixes MK9 MK5 and MK25 with lower dosages ofmetakaolin were analyzed In the referenced literature (Schreineret al 2019) the effect of Al3+ on the anisotropic peak broadeningof tobermorite could only be observed in the case of Al2O3 contentslower than 4 in the drymix In the latter three mixes Al2O3 con-tents range from 1 to 35 Al2O3 (calculated from XRF data) whichmeets the region of interest for the analysis of tobermorite domainmorphology
bull The curing time for nearly all of the investigated samples was 12 hbut compound MK9 was prepared two more times for curing timesof 2 h and 6 h The different curing times were chosen in this par-ticular sample so that the reactivity of metakaolin and the phasetransitions could be observed more precisely
23 Hydrothermal treatment
Due to the different fineness of raw materials there was a differentwater demand from one mixture to another In order to obtain slurriesof comparable rheology the amount of water was adapted respectivelyresulting in water-to-solid ratios of 25 to 3 which matches the sug-gested water-to-solid ratio for this purpose (Roacutezycka et al 2014Galvaacutenkovaacute et al 2018) The weighed water was added to the dry mixand after stirring for 1 min at 23 degC the slurry was poured into thereactor Minor changes in the quantity of added water did not have aninfluence on the measured steam pressure All experiments were con-ducted using a PTFE-lined stainless steel autoclave with a reactor vo-lume of 300 ml The oven temperature was fixed at 180 degC and auto-genous steam pressure of 11ndash12 MPa was measured during eachexperiment with an external manometer After cooling to room tem-perature the sample was removed from the reactor coarsely ground
using an agate mortar and dried at 60 degC for 12 h After drying thesample was ground with an agate mortar again in order to deagglo-merate the particles As no coarse raw materials were used there wasno need for wet McCrone milling (Schreiner et al 2018)
24 XRD analysis
After preparation into front-loading sample holders the powdersamples were measured with a D8 diffractometer (Bruker) equippedwith a LynxEye detection system and Bragg-Brentano geometry Thesettings for XRD analysis included a tube voltage of 40 kV a current of40 mA an angular range from 6 to 80deg 2θ (Cu Kα radiation) a time perstep of 054 s a step width of 00236deg 2θ and a PSD opening of 33deg Thebackground was fitted with Chebyshev polynomial of the fifth orderThe major contribution of amorphous phase was fitted with a singlepeak with a fixed position at 308deg 2θ so that tobermorite reflectionswere not affected An external quartzite standard was measured withthe same parameters in order to determine phase quantities (Jansenet al 2011) Bruker AXS software TOPAS 50 was used for Rietveldrefinement (Rietveld 1969) and the used structures are shown inTable 3
3 Results and discussion
31 Different dosages of MK and MKg
In Fig 1 the quantities of tobermorite quartz and katoite present inmost of the samples determined by XRD analysis are illustratedWhenever tobermorite was the leading mineral hydrate phase a basalspacing of 113 Aring could be verified in each of the diffractograms Thequantities of minor crystalline phases and amorphous content are notshown For low dosages of MK it can be seen that the weight fraction oftobermorite decreased At moderate dosage of both types of metakaolin(MK16 MK23 MKg16 MKg23) tobermorite was present in comparablequantities It can be seen that the amount of katoite in the mixes de-pended on the dosage of metakaolin and it appeared only at dosages ofMK5 or more Due to the higher content of aluminum in MK comparedto MKg more katoite could always be observed in the MK mixes atequivalent dosages Despite equal amounts of quartz as starting mate-rial in mixes for both types of metakaolin the resulting weight fractionsin the cured samples were not alike Considerably more quartz waspresent in the MK samples Even though less quartz was used for mixescontaining higher amounts of MK even more quartz was present afterhydrothermal curing (Table 2 Fig 1) Consequently some of the SiO2
provided by MK did not transform into an amorphous phase or to-bermorite but into quartz This finding is verified by the presence ofquartz in MK60 because no quartz was included in the raw mixture Thefeldspar present in MKg did not react so Na2O and an unknown amountof Al2O3 may not have been supplied for hydrothermal reaction Besidestobermorite and quartz additional calcite scawtite (Ca7Si6(CO3)
Table 2Basic powder compounds prepared for the hydrothermal synthesis of to-bermorite with the respectively calculated Al2O3 content and curing time in thereactor
Sample Portlandite[wt-]
Quartz[wt-]
MK[wt-]
MKg
[wt-]
Al2O3
[wt-]Curingtime [h]
MK0 49 51 ndash ndash 0 12MK25 495 48 25 ndash 1 12MK5 49 46 5 ndash 2 12MK9_2h 48 43 9 ndash 35 2MK9_6h 48 43 9 ndash 35 6MK9_12h 48 43 9 ndash 35 12MK16 47 37 16 ndash 63 12MK23 46 31 23 ndash 9 12MK60 40 ndash 60 ndash 235 12MKg16 47 37 ndash 16 33 12MKg23 46 31 ndash 23 47 12MKg60 40 ndash ndash 60 124 12
Table 3Structural data used for the investigation with powder XRD analysis
Phase Author
Anatase (Horn et al 1972)Biotite (Brigatti et al 2000)Calcite (Maslen et al 1995)Kaolinite (Zvyagin 1960)Katoite (Bartl 1969)Microcline (Bailey 1969)Plazolite (Basso et al 1983)Portlandite (Busing and Levy 1957)Quartz (Le Page and Donnay 1976)Scawtite (Grice 2005)Tobermorite (Hamid 1981)Xonotlite (Hejny and Armbruster 2001)
J Schreiner et al Applied Clay Science 185 (2020) 105432
3
6 Publications
33
O18bull2(H2O)) and xonotlite (Ca6Si6O17(OH)2) could be identified insample MK0 (XRD plots of samples MK0 MKg16 MKg23 MK16 andMK23) Comparing MK0 and MK25 scawtite and xonotlite could stillbe identified in a very low amount in MK25 but no longer in samplesthat contained even more MK (XRD plots of samples MK0 MK25 MK5and MK9_12h)
Two additional experiments were done without quartz in the rawmixes (MK60 and MKg60) The according diffractograms after hydro-thermal curing are shown in Fig 2 In sample MKg60 tobermorite (gt 50wt-) was successfully synthesized without any other silica sourcethan MKg whereas no crystalline quartz occurred By contrast no to-bermorite but quartz could be identified in equivalent mixture MK60containing MK It can be seen that crystalline components such as micaand anatase in the raw MK did not react at the selected conditions andremained present in the autoclaved samples Except for feldspar in MKgall of the crystalline components appeared to be reactive at the chosenhydrothermal conditions A minor unidentified phase occurred at328deg2θ and additional xonotlite was identified in sample MKg60 Insample MK60 more calcium was needed for the formation of morehydrogarnet (Fig 1) resulting in a lower CaSi ratio for the remainingsystem Sample MKg60 contained only half of the amount of Al3+ and itwas not completely supplied for reaction due to its partial presence infeldspar Consequently essentially less hydrogarnet (Fig 1) was presentin MKg60 after hydrothermal treatment and the CaSi ratio in the re-maining system was affected to a lesser extent
32 Application of MK for different curing times
The development of hydrate phases in the autoclave for compoundMK9 is displayed in Fig 3 After only 2 h of hydrothermal curing all ofthe available portlandite had reacted and katoite (95 wt-) was pre-sent The applied type of metakaolin appeared to react quickly as itsupplied aluminum for formation of katoite No formation of to-bermorite could be observed at this stage yet An assumably amorphousprecursor can be seen at 28 to 30deg2θ Calcium was provided by thedissolution of portlandite After 6 h of hydrothermal reaction amountsof katoite (85 wt-) and quartz (from 31 wt- at 2 h to 165 wt- at6 h) had decreased and a major amount of tobermorite (35 wt-) waspresent Apparently between 2 and 6 h under hydrothermal conditionsthe amorphous precursor and quartz reacted resulting in the formationof tobermorite An additional 6 h of reaction time (MK9_12h) did notchange the phase composition significantly Slightly more tobermorite
(365 wt-) less quartz (16 wt-) and katoite (65 wt-) weremeasured
33 Tobermorite domain morphology and lattice parameters
In the referenced literature an analysis of tobermorite domainmorphology based on anisotropic peak broadening was possible forsamples that contained notgt 4 wt- Al2O3 in the drymix (Schreineret al 2019) Accordingly in this study samples MK0 MK25 MK5MK9_6h and MK9_12h were suitable (Table 2) with MK9_2h not con-taining any tobermorite In Fig 4 the respective growth in a and b di-rection is visualized with x indicating the domain size in a direction andy indicating domain size in b direction using a macro for TOPAS 50(Ectors et al 2015 2017) The calculated cylinder models in Fig 4represent the relation of yx and not absolute sizes With no supply ofaluminum ions (MK0) the relative domain growth in b direction islower compared to samples containing metakaolin This finding agreeswith the results from a similar investigation of tobermorite in AAC(Schreiner et al 2019) However within the samples MK5 andMK9_12h the different amounts of supplied aluminum ions did notshow a clear effect It appeared that low dosages of Al3+ (1 wt- Al2O3
in MK25 and 2 wt- Al2O3 in MK5) were enough to determine thedomain growth of tobermorite Additional results from the samplesMK9_6h and MK9_12h indicated that growth in b direction increasedwith reaction time
In Fig 5 lattice parameters of tobermorite depending on metakaolindosages are plotted B clearly remained unaffected throughout therange of samples Increasing amounts of metakaolin led to a slightlysmaller parameter a However both types of metakaolin showed acorresponding impact on parameter a By contrast parameter c in-creased strongly with increasing amounts of MK and MKg but the typeof metakaolin was significant At an equivalent dosage MK affected thecell dimension in c direction considerably more than MKg so that thefraction of Al3+ appeared to be the decisive parameter Different metaloxides in MKg did not show a notable effect certainly as they werepartially not provided for reaction Unlike for the domain morphologyof tobermorite the impact on lattice parameters could be observedwithin the complete range of examined dosages
4 Conclusions
The results obtained from the introduced investigations allow con-cluding remarks on the effects of the applied types of metakaolin on thesynthesis of 11 Aring tobermorite the phase transitions and the in-corporation of Al3+ into the lattice of tobermorite
With a critical dosage the use of any type of metakaolin led to theformation of katoite in an according amount At moderate dosages(MKg16 MKg23 MK16 and MK23) the two types of metakaolin showeda good correspondence in consideration of the quantities of to-bermorite For higher dosages there were contrary effects Lower do-sages of MK led to considerable quantities of Al-substituted to-bermorite Samples containing low dosages of MK revealed that katoiteappeared in the case ofgt 5 wt- of MK - corresponding to 2 wt-Al2O3 - in the basic compound Minor crystalline phases in MKg showedbetter reactivity than those in MK The observation that no tobermoritewas present in sample MK60 indicated that high dosages of Al3+ hin-dered the formation of tobermorite
Investigations of MK9 at 2 6 and 12 h displayed the evolution ofhydrate phases At first katoite was the only crystalline hydrate phasepresent after 2 h which corresponded to observations in a differentpublication (Klimesch and Ray 1999) The amount of katoite andquartz then decreased and a major amount of tobermorite formed from2 to 6 h curing time In order to gain more information on the trans-formation of amorphous C-(A)-S-H into tobermorite additional ex-periments in the range of 2 to 6 h curing time will be needed
Domain morphology analysis of tobermorite revealed that low
Fig 2 Diffractograms of MKg MKg60 MK and MK60 from 7 to 34deg2θ CuKα Aanatase C calcite F feldspar k kaolinite K katoite M mica Q quartz Ttobermorite U unidentified phase X xonotlite
J Schreiner et al Applied Clay Science 185 (2020) 105432
4
6 Publications
34
dosages of Al3+ determined the domain growth which agreed with theresults published on tobermorite in AAC samples (Schreiner et al2019) Different curing times unveiled that growth in b direction in-creased with the reaction time Al3+ incorporation into the lattice oftobermorite only reflected to a limited extent in the domain mor-phology By contrast an increase of lattice parameter c was triggered byAl3+ even at the highest dosage in this study Ultimately there is no
evidence for a limit of incorporation of Al3+ but there is a limit ofinfluence on the domain morphology These results additionally re-confirm this assumption similarly made in the previous work (Schreineret al 2019) and suggest a new mechanism of tobermorite crystal-lization depending on the presence of Al3+
Supplementary data to this article can be found online at httpsdoiorg101016jclay2019105432
Declaration of Competing Interest
The authors declare that they have no known competing financialinterests or personal relationships that could have appeared to influ-ence the work reported in this paper
Acknowledgement
The authors thank Rodgauer Baustoffwerke GmbH amp Co KG forsupplying raw materials for laboratory experiments
References
Aguilar-Mamani W Garciacutea G Hedlund J Mouzon J 2014 Comparison betweenleached metakaolin and leached diatomaceous earth as raw materials for the synth-esis of ZSM-5 Springerplus 3 1ndash10 httpsdoiorg1011862193-1801-3-292
Ayodele OB Sulaimon AA Alaba PA Tian Z-Y 2019 Influence of metakaolini-zation temperature on the structure and activity of metakaolin supported Ni catalystin dry methane reforming J Environ Chem Eng httpsdoiorg101016jjece2019103239 (in press)
Badawi EA Abdel-Rahman MA Mostafa A Abdel-Rahman M 2019 Determinationof the crystallite size amp micro- strain by novel method from XRD profile Appl Phys2 1ndash15 httpsdoiorg1031058jap201921001
Bailey SW 1969 Refinement of an intermediate microcline structure Am Miner 541540ndash1545
Bartl H 1969 Roentgen-Einkristalluntersuchungen an (CaO)3 (Al2O3) (H2O)6 und an(CaO)12 (Al2O3)7 (H2O) neuer Vorschlag zur (CaO)12 (Al2O3)7-Struktur NeuesJahrb fuer Mineral Monatshefte 1969 404ndash413
Basso R Giusta AD Zefiro L 1983 Crystal structure refinement of plazolite A highlyhydrated natural hydrogrossular Neues Jahrb Miner Monatsh (Neues Jahrb fuerMineral Monatshefte) 1983 251ndash258
Brigatti MF Lugli C Poppi L Foord EE Kile DE 2000 Crystal chemical varia-tions in Li- and Fe-rich micas from Pikes Peak batholith (Central Colorado) AmMineral 85 1275ndash1286 httpsdoiorg102138am-2000-8-920
Busing WR Levy HA 1957 Neutron diffraction study of calcium hydroxide J ChemPhys 26 563 httpsdoiorg10106311743345
Chen L Wang Z Wang Y Feng J 2016 Preparation and properties of alkali acti-vated metakaolin-based geopolymer Materials (Basel) 9 1ndash12 httpsdoiorg103390ma9090767
Chucholowski C Holger M Thienel K-C 2018 Improving the recyclability en-vironmental compatibility and CO2 balance of autoclaved aerated concrete by re-placing sulfate carrier and cement with calcined clays CePapers 2 503ndash512httpsdoiorg101002cepa846
Fig 3 Diffractograms of MK9_2h MK9_6h and MK9_12h from 7 to 38deg2θ CuKα C calcite K katoite Q quartz T tobermorite
Fig 4 Relation of calculated domain sizes of 11 Aring tobermorite in selectedsamples (MK0 MK25 MK5 MK9_6h and MK9_12h) in a (x) and b (y) direction
Fig 5 Lattice parameters of tobermorite depending on MK or MKg dosageincluding blank mix MK0
J Schreiner et al Applied Clay Science 185 (2020) 105432
5
6 Publications
35
Demir İ Başpınar MS Kahraman E Ccedilalışkan E Goumlrhan G 2014 An investigationon the usability of diatomite in aerated concrete production In Proc of the IntlConf on Advances in Civil Structural and Construction Engineering ndash CSCE 2014 pp97ndash100
Ectors D Goetz-Neunhoeffer F Neubauer J 2015 A generalized geometric approachto anisotropic peak broadening due to domain morphology J Appl Crystallogr 48189ndash194 httpsdoiorg101107S1600576714026557
Ectors D Goetz-Neunhoeffer F Neubauer J 2017 Routine (an)isotropic crystallitesize analysis in the double-Voigt approximation done right Powder Diffract 3227ndash34 httpsdoiorg101017S0885715617000070
Galvaacutenkovaacute L Bartoniacutečkovaacute E Opravil T Tkacz J Ptaacuteček P 2018 The influence ofstarting materials solubility on tobermorite structure formation under the hydro-thermal conditions IOP Conf Ser Mater Sci Eng 379 1ndash8 httpsdoiorg1010881757-899X3791012001
Grice JD 2005 The structure of spurrite tilleyite and scawtite and relationships toother silicate-carbonate minerals Can Mineral 43 1489ndash1500 httpsdoiorg102113gscanmin4351489
Hamid SA 1981 The crystal structure of the 11 Aring natural tobermoriteCa225[Si3O75(OH)15]1H2O Zeitschrift fuer Krist 154 189ndash198 httpsdoiorg101524zkri19811543-4189
Hejny C Armbruster T 2001 Polytypism in xonotlite Ca6Si6O17(OH)2 Zeitschrift furKrist 216 396ndash408
Horn M Schwerdtfeger CF Meagher EP 1972 Refinement of the structure of ana-tase at several temperatures Zeitschrift fur Krist 136 273ndash281 httpsdoiorg101524zkri19721363-4273
Jansen D Goetz-Neunhoeffer F Stabler C Neubauer J 2011 A remastered externalstandard method applied to the quantification of early OPC hydration Cem ConcrRes 41 602ndash608 httpsdoiorg101016jcemconres201103004
Jenkins R Snyder R 1996 Introduction to X-ray Powder Diffractometry ChemicalAnalysis Wiley pp 90
Kalousek GL 1956 Crystal Chemistry of Hydrous Calcium Silicates J Am Ceram Soc40 74ndash80
Klimesch D Ray A 1998 Autoclaved cement-quartz pastes with metakaolin additionsAdv Cem Based Mater 7 109ndash118 httpsdoiorg101016S1065-7355(97)00073-4
Klimesch D Ray A 1999 DTA-TGA evaluations of the CaOndashAl2O3ndashSiO2ndashH2O systemtreated hydrothermally Thermochim Acta 334 115ndash122 httpsdoiorg101016s0040-6031(99)00140-9
Komarneni S Roy R Roy DM Fyfe CA Kennedy GJ Bothner-By AA Dadok JChesnick AS 1985 27Al and29Si magic angle spinning nuclear magnetic resonancespectroscopy of Al-substituted tobermorites J Mater Sci 20 4209ndash4214 httpsdoiorg101007BF00552416
Koutnyacute O Opravil T Pořiacutezka J 2014 Application of metakaoline in autoclavedaerated concrete technology Adv Mater Res 1000 174ndash177 httpsdoiorg104028wwwscientificnetAMR1000174
Le Page Y Donnay G 1976 Refinement of the crystal structure of low-quartz ActaCrystallogr Sect B 32 2456ndash2459 httpsdoiorg101107S0567740876007966
Luo H Law WW Wu Y Zhu W Yang EH 2018 Hydrothermal synthesis of needle-like nanocrystalline zeolites from metakaolin and their applications for efficient re-moval of organic pollutants and heavy metals Microporous Mesoporous Mater 2728ndash15 httpsdoiorg101016jmicromeso201806015
Maeda H Ogawa Y Ishida EH Kasuga T 2012 Hydrothermal synthesis of to-bermorite doped with phosphorus species for removing heavy metal ions J AustCeram Soc 48 8ndash11
Maslen EN Streltsov VA Streltsova NR Ishizawa N 1995 Electron density andoptical anisotropy in rhombohedral carbonates III Synchrotron Xray studies ofCaCO3 MgCO3 and MnCO3 Acta Crystallogr Sect B 51 929ndash939 httpsdoiorg101107S0108768195006434
Matekonis G Šiaučiūnas R Vaičiukynienė D 2010 Hydrothermal Synthesis andCharacterization of Na + and [ Al 3 + + Na + ] -substituted Tobermorite in CaO-SiO2middotnH2O-H2O System Mater Sci 16 242ndash248
Matsui K Kikuma J Tsunashima M Ishikawa T Matsuno S Ogawa A Sato M2011 In situ time-resolved X-ray diffraction of tobermorite synthesis process underhydrothermal condition IOP Conf Ser Mater Sci Eng 18 60ndash66 httpsdoiorg1010881757-899X182022017
Merlino S Bonaccorsi E Armbruster T 2000 The real structures of clinotobermoriteand tobermorite 9 Aring OD character polytypes and structural relationships Eur JMineral 12 411ndash429 httpsdoiorg1011270935-122120000012-0411
Monasterio M Gaitero JJ Manzano H Dolado JS Cerveny S 2015 Effect ofchemical environment on the dynamics of water confined in calcium silicate mi-nerals Natural and synthetic tobermorite Langmuir 31 4964ndash4972 httpsdoiorg101021acslangmuir5b00614
Mostafa NY 2005 Influence of air-cooled slag on physicochemical properties of auto-claved aerated concrete Cem Concr Res 35 1349ndash1357 httpsdoiorg101016jcemconres200410011
Mostafa NY Shaltout AA Omar H Abo-El-Enein SA 2009 Hydrothermal synth-esis and characterization of aluminium and sulfate substituted 11 nm tobermoritesJ Alloys Compd 467 332ndash337 httpsdoiorg101016jjallcom200711130
Naber C Stegmeyer S Jansen D Goetz-Neunhoeffer F Neubauer J 2019 ThePONKCS method applied for time resolved XRD quantification of supplementarycementitious material reactivity in hydrating mixtures with ordinary Portland ce-ment Constr Build Mater 214 449ndash457 httpsdoiorg101016jconbuildmat201904157
Qu X Zhao Z Zhao X 2018 Microstructure and characterization of aluminum-in-corporated calcium silicate hydrates (C-S-H) under hydrothermal conditions RSCAdv 8 28198ndash28208 httpsdoiorg101039c8ra04423f
Rashad AM 2013 Metakaolin as cementitious material history scours production andcomposition - a comprehensive overview Constr Build Mater 41 303ndash318 httpsdoiorg101016jconbuildmat201212001
Rietveld HM 1969 A profile refinement method for nuclear and magnetic structures JAppl Crystallogr 2 65ndash71 httpsdoiorg101107S0021889869006558
Riacuteos CA Williams CD Fullen MA 2009 Hydrothermal synthesis of hydrogarnet andtobermorite at 175 degC from kaolinite and metakaolinite in the CaO-Al2O3-SiO2-H2Osystem a comparative study Appl Clay Sci 43 228ndash237 httpsdoiorg101016jclay200809014
Roacuteżycka A Pichoacuter W 2016 Effect of perlite waste addition on the properties of au-toclaved aerated concrete Constr Build Mater 120 65ndash71 httpsdoiorg101016jconbuildmat201605019
Roacutezycka A Kotwica Ł Małolepszy J 2014 Synthesis of single phase gyrolite in theCaO-quartz-Na2O-H2O system Mater Lett 120 166ndash169 httpsdoiorg101016jmatlet201401003
Sauman Z 1974 Influence of SO4 2ndash ions on the formation of 11 Aring tobermorite InProceedings of the 2nd International Symposium on Science and Research in SilicateChemistry Moscow pp 25ndash39
Schmidt M Egersdoumlrfer A Poumlllmann H 2012 Increased reactivity using a glass-containing metakaolin as an active filler in lime-based binder systems ZKG Int 6554ndash62
Schreiner J Jansen D Ectors D Goetz-Neunhoeffer F Neubauer J Volkmann S2018 New analytical possibilities for monitoring the phase development during theproduction of autoclaved aerated concrete Cem Concr Res 107 247ndash252 httpsdoiorg101016jcemconres201802028
Schreiner J Goetz-Neunhoeffer F Neubauer J Volkmann S Bergold S Webler RJansen D 2019 Advanced Rietveld refinement and SEM analysis of tobermorite inchemically diverse autoclaved aerated concrete Powder Diffract 34 143ndash150httpsdoiorg101017s0885715619000149
Setthaya N Chindaprasirt P Pimraksa K 2016 Preparation of zeolite nanocrystals viahydrothermal and solvothermal synthesis using of rice husk ash and metakaolinMater Sci Forum 872 242ndash247 httpsdoiorg104028wwwscientificnetmsf872242
Siauciunas R Baltakys K 2004 Formation of gyrolite during hydrothermal synthesis inthe mixtures of CaO and amorphous SiO2 or quartz Cem Concr Res 34 2029ndash2036httpsdoiorg101016jcemconres200403009
Skawinska A Owsiak Z Baran T Hernik K 2017 The influence of halloysite ad-dition on tobermorite formation in CaO and quartz mix under hydrothermal condi-tions Cem Wapno Bet 17 426ndash434
Venhodovaacute E Janovskyacute R Drochytka R 2015 Formation of tobermorite at differentmaterials composition of aerated concrete Appl Mech Mater 752ndash753 247ndash250httpsdoiorg104028wwwscientificnetamm752-753247
Walczak P Małolepszy J Reben M Szymański P Rzepa K 2015 Utilization ofwaste glass in autoclaved aerated concrete Proc Eng 122 302ndash309 httpsdoiorg101016jproeng201510040
Zhang Y Gao W Cui L 2007 The transformation of acid leached metakaolin tozeolite beta Stud Surf Sci Catal 170 420ndash425 httpsdoiorg101016S0167-2991(07)80870-6
Zvyagin BB 1960 An attempt to electronographic determination of kaolinite structureJ Dokl Akad Nauk SSSR 130 1023ndash1026
J Schreiner et al Applied Clay Science 185 (2020) 105432
6
6 Publications
36
6 Publications
62 Advanced Rietveld refinement and SEM analysis oftobermorite in chemically diverse autoclaved aeratedconcrete
Following the copyright guidelines by Cambridge University Press the publication
Schreiner J Goetz-Neunhoeffer F Neubauer J Volkmann S Bergold S WeblerR Jansen D 2019 Advanced Rietveld refinement and SEM analysis of tobermorite inchemically diverse autoclaved aerated concrete Powder Diffraction 34 143ndash150 httpsdoiorg101017s0885715619000149
may not be reprinted It can be accessed at
httpswwwcambridgeorgcorejournalspowder-diffractionarticleadvanced-rietveld-refinement-and-sem-analysis-of-tobermorite-in-chemically-diverse-autoclaved-aerated-concrete51597C2A66F6F225D29DEB2675E74249
37
6 Publications
63 New analytical possibilities for monitoring the phasedevelopment during the production of autoclavedaerated concrete
Reprint of the peer reviewed publication
Schreiner J Jansen D Ectors D Goetz-Neunhoeffer F Neubauer J VolkmannS 2018 New analytical possibilities for monitoring the phase development during theproduction of autoclaved aerated concrete Cement and Concrete Research 107 247ndash252httpsdoiorg101016jcemconres201802028
with permission from Elsevier
38
Contents lists available at ScienceDirect
Cement and Concrete Research
journal homepage wwwelseviercomlocatecemconres
Short communication
New analytical possibilities for monitoring the phase development duringthe production of autoclaved aerated concrete
J Schreinera D Jansena D Ectorsa F Goetz-Neunhoeffera J Neubauera S Volkmannb
aUniversity of Erlangen-Nuremberg GeoZentrum Nordbayern Mineralogy Schlossgarten 5a 91054 Erlangen Germanyb Rodgauer Baustoffwerke GmbH amp Co KG Am Opel-Pruumlffeld 3 63110 Rodgau-Dudenhofen Germany
A B S T R A C T
This work presents improved analytical methods for both steps of the production process of autoclaved aeratedconcrete (AAC) the phase development during the hydration before autoclaving and during the autoclavingprocess itself The improvement includes new insights into preparation methods of AAC samples for powderdiffraction as well as Rietveld refinement strategies For the first time a new implementation for calculatinganisotropic crystal domain sizes is applied to major hydrate phases occurring during AAC production namelyportlandite during the hydration before autoclaving and tobermorite during the autoclaving process The cal-culation of anisotropic domain size growth which can be implemented in the Rietveld environment is based oncrystallographically and geometrically appropriate models The implementation of calculating anisotropic do-main sizes for the Rietveld software TOPAS 50 allows a superior Rietveld fit and a more accurate quantificationof the phase development Additionally it enables the tracking of growth mechanism of portlandite duringhydration
1 Introduction
Autoclaved aerated concrete (AAC) is known as a lightweight con-struction material which offers outstanding properties such as suffi-cient strength for construction in addition with excellent thermal in-sulation [12] AAC is produced by autoclaving from calcareous rawmaterials such as lime (CaO) and cement quartz sulfate carrier andother additives such as foaming agents and water
The production process (Fig 1) can be separated into the hydrationof the mixed slurry before the procedure of autoclaving and the auto-claving at elevated temperature (180 degC to 200 degC) under saturatedsteam pressure (12MPa) for several hours
The hydration process before autoclaving is necessary to achievesufficient strength in order to cut the green cake blocks as they shouldhave a specific shape and dimension after autoclaving Furthermorethe porous structure is generated by the foaming agent during hydra-tion in the first process step During autoclaving the final propertiesnamely strength and low thermal conductivity are achieved
It is already well understood that the autoclaving process leads tothe formation of several phases first of all tobermorite(Ca5Si6O16(OH)2lowast4H2O) [3ndash5] Newest research has shown im-pressively which reactions are running from the mineralogical point ofview Insitu XRD measurements were carried out during the
autoclaving process and the phase development was shown by plottingnormalized intensities [6] The study of Mitsuda et al [3] was mainlyfocused on the tracking of the phase evolution during the autoclavingprocess of AAC However their statements concerning phase evolutionare mainly based on XRD data and TGA measurements There is acommon agreement that the following reactions occur The consump-tion of the alite (OPC) leads to the formation of an initial C-S-H phaseduring the first processing step Portlandite which was initially formedduring the first process step (from CaO and C3S) further quartz and theC-S-H phase are consumed during autoclaving resulting in the crystal-lization of tobermorite Hence the crystallization process of to-bermorite as well as the crystal structure of tobermorite was an issue ofresearch and discussion over the last years and numerous publicationsto these topics are available Concerning the crystal structure of to-bermorite respectively the tobermorite supergroup a new publicationoutlines all important references and recommends a new nomenclature[7]
The presented study was performed to create new analytical possi-bilities for the characterization of the production process of AAC Bothof the production process steps are essential for the final productHence the present work focuses on crystallization of hydrate phases inboth processes
Firstly an external standard method [89] was published and
httpsdoiorg101016jcemconres201802028Received 6 October 2017 Received in revised form 1 February 2018 Accepted 26 February 2018
Corresponding authorsE-mail addresses juergenjsschreinerfaude (J Schreiner) danieljansenfaude (D Jansen)
Cement and Concrete Research 107 (2018) 247ndash252
0008-8846 copy 2018 Elsevier Ltd All rights reserved
T
6 Publications
39
recommended for the determination of absolute phase contents inmixtures with amorphous content It was shown that the method canabsolutely be recommended for hydrating cement pastes in which watercannot be quantified directly by XRD [10] This method seems to bevery promising for both the quantification of the hydration of the AACslurry before autoclaving and the quantification of the phase evolutionduring autoclaving inasmuch as both production steps form crystallineand amorphous phases
Secondly a new approach to anisotropic peak broadening due toanisotropic domain morphology which was developed [1112] is ap-plied to AAC samples to improve the fit of portlandite and tobermoriteby Rietveld refinement [13] By applying this approach the refinementof both portlandite and tobermorite should additionally lead to betterquantitative results as well as to better insights into the development ofthe domain size morphology of both phases formed
It was already shown that in a hydrating raw mixture for AAC twospecies of portlandite precipitate at 23 degC one showing dynamicallyanisotropic peak broadening and another one following the isotropictrend [14] The application of the anisotropic refinement model led toan improved fitting of portlandite Moreover the mechanism of aniso-tropic domain growth of portlandite was tracked
2 Materials and methods
In order to examine the hydration of the AAC slurry before auto-claving a mixture of the hydraulic reactive components was weighedand measured in-situ at a Bruker D8 diffractometer with a LynxEyedetection system
Ordinary Portland cement (OPC) was mixed with lime (CaO) andanhydrite (C$) The raw materials were taken from the same batches asfor the industrial samples The drymix (58 OPC 36 CaO and 6 C$by weight) was then mixed with water (ws= 08) and placed into anappropriate sample holder The samples were not aerated The slurrysamples were covered with a kapton film to avoid evaporation andcarbonation Diffractograms were recorded with an angular range from7 to 545deg 2θ and a step width of 0011deg 2θ Measurements were carriedout every 15min For each measurement 96 XRD patterns were re-corded over the first 24 h The temperature was fixed at 70 degC which isthe mean temperature generally prevailing in the industrial processduring hydration before autoclaving Rietveld refinement was carriedout using the G-factor method All structures used for Rietveld refine-ment are shown in Table 1
For investigation of the autoclaved samples five different specimenswere taken at different autoclaving times The specimens were takenout of a technical production process hence it was not possible to in-terrupt the process at an earlier time inasmuch it would lead to damageof a whole concrete production batch The specimens were firstly driedat 60 degC until weight constancy The whole blocks were then broken andstatistical samples of 20 g were taken In order to receive the right massattenuation coefficient (MAC) for G-factor method the loss on ignitionand the chemical composition (XRF) were determined For energydispersive XRF analysis (Spectro Xepos) tube voltage from 20 kV to50 kV and tube current from 08 to 20mA were used for differenttargets
The final sample preparation (grinding) before XRD measurementswas carried out using both an agate mortar and a McCrone micronizingmill for wet milling with isopropanol Both preparation methods wereapplied separately to see which one is suitable in order to get the bestpreparation for XRD investigations Six preparations were performed byone operator of which two were prepared with an agate mortar andfour with a McCrone mill For the McCrone milling 3 g of the sampleand 10ml of isopropanol were used for grinding for 12min The grainsize distribution of one sample prepared with an agate mortar and onesample prepared using a McCrone mill was measured by laser granu-lometry in isopropanol using a Mastersizer 3000 (MALVERN)
After milling the samples in these two ways for XRD analysis thepowders were prepared into a front loading sample holder and mea-sured Diffractograms were recorded with an angular range from 6 to80deg 2θ a step width of 00236deg 2θ and a time per step of 054 s Rietveldrefinement combined with external standard (G-factor) was applied inorder to get absolute quantities for each phase The refinement strategyfor portlandite and tobermorite in the TOPAS Launch Mode (TOPAS50 Bruker AXS) is attached as a Supplementary material file
3 Results and discussion
31 Hydration of the mixture before autoclaving
The hydration of the investigated paste before autoclaving isdominated by the hydration of the cement as well as the reaction of thefree lime (CaO) resulting in the formation of portlandite It can beclearly seen from Fig 2 that the hydration of the paste leads to theformation of ettringite portlandite and C-S-H phase For simplificationthe remaining phase developments are not shown in Fig 2 because theyare not in the focus of this study The hydration of CaO forming
Fig 1 Simplified process steps of AAC production and hydrate phase evolution
Table 1Structures used for Rietveld refinement
Phase Author
Alite [15]Anhydrite [16]Bassanite [17]Belite (β) [18]Belite (αprime) [19]Brownmillerite [20]C-S-H [21]Calcite [22]Ettringite [23]Gypsum [24]Hemicarbonate [25]Hydroxylellestadite [26]Lime (CaO) [27]Microcline [28]Portlandite [29]Quartz [30]Tobermorite [31]Tricalciumaluminate (cubic) [32]Tricalciumaluminate (orthorhombic) [33]PONCKS model for Water [21]
J Schreiner et al Cement and Concrete Research 107 (2018) 247ndash252
248
6 Publications
40
portlandite begins rapidly after the addition of water to the mixture andlime is fully consumed after only 1 h of hydration This translates into aquick rise of heat of hydration so that cement hydration is acceleratedwhich leads to further portlandite formation by the reaction of aliteEttringite formation stalls after few hours of hydration After 12 h et-tringite is partially decomposed probably due to sulfate depletion [9]
and poorly crystalline AFm phases (not shown in Fig 2) are formedIn Fig 3 it can be seen that in fact two generations of portlandite
are formed a 1st dominant generation showing anisotropic peakbroadening and 2nd one occurring considerably later following theisotropic domain size refinement which is usually carried out using theRietveld method This occurrence comes along firstly with lime hy-dration and secondly with alite hydration The expected quantity ofportlandite formed from lime hydration very well complies with the
Fig 2 Phase development in AAC paste on a laboratory scale before autoclaving ana-lyzed by in-situ XRD at 70 degC
Fig 3 Formation of two generations of portlandite by hydration of lime (1st) and C3S(2nd) at 70 degC before autoclaving with the major generation showing anisotropic peakbroadening
Fig 4 Biaxial cylinder domain size model of portlandite used for Rietveld refinement of anisotropic peak broadening
Fig 5 Morphological evolution of portlandite showing anisotropic domain size growthduring hydration at 70 degC
Fig 6 Comparison of quantification of crystalline quartz in samples prepared withMcCrone mill and agate mortar at different autoclaving times
J Schreiner et al Cement and Concrete Research 107 (2018) 247ndash252
249
6 Publications
41
quantity of the observed 1st generation The development of portlan-dite growth was already tracked in an equivalent slurry at 23 degC [14]Thus this observation confirms that the crystallinity of portlandite inmixtures for AAC production depends on the starting phase for hydra-tion as already indicated by Ectors [14]
Fig 4 shows the used biaxial cylindrical model for anisotropic do-main size calculation and the portlandite structure which was createdwith structural software VESTA 318 [34] Using the cylindrical ap-proach domain sizes in a (here equating to b) and c direction(dz= cylinder height) can be calculated which comes along with theexpected symmetrical parameters of portlandite
The 1st portlandite generation showing anisotropic domain growthcan be tracked in terms of cylinder diameter and height which is rea-lized in Fig 5 The blue cylinder represents the geometric approach andcylinder height and diameter are calculated newly for each range Thecylinder height remains rather stable throughout the hydration processwhile the cylinder diameter increases during the first hours of hydra-tion After 10 h of hydration the mean cylinder diameter no longer in-creases Consequently these observations match the results of the ex-aminations conducted at 23 degC [14] as well as the assumption thatdifferent mechanisms of growth exist for portlandite depending on the
hydration educt The maximum cylinder diameter is reached earlier inthis work very likely because of the higher hydration temperature
32 Quantification of the reactions during autoclaving
Autoclaved samples were ground with an agate mortar and com-pared to samples which were wet-ground with a McCrone mill Fig 6shows precisely that the determination of the amount of crystallinequartz is more reproducible in the two shown samples which were
Fig 7 2D XRD with Bruker GADDS-system plots of samples prepared with agate mortar and McCrone mill Coarse quartz grains are pointed out in the plot of the sample prepared withagate mortar
Fig 8 Particle size distribution of one sample prepared with an agate mortar and of onesample prepared with a McCrone mill measured by laser granulometry
Fig 9 Rietveld refinement for Tobermorite of autoclaved AAC sample by use of isotropicdomain size model (a) and of anisotropic domain size model (b)
J Schreiner et al Cement and Concrete Research 107 (2018) 247ndash252
250
6 Publications
42
prepared with a McCrone mill The high variance of crystalline quartzin the samples which were prepared with an agate mortar is a result ofinsufficient grinding and remaining of too large quartz grains Whenthis spottiness occurs a reliable quantification using the G-factormethod is not possible
The 2D XRD with Bruker GADDS-system plots in Fig 7 demonstratethe insufficient grinding when using an agate mortar compared to wetmilling with a McCrone mill Quartz would be overrepresented in a one-dimensional XRD pattern focusing on a section with bright spots (greenarrows) The lack of bright spots in the right plot shows that the quartzgrains are milled more thoroughly using a McCrone mill In Fig 8 theparticle size distribution after both ways of sample preparation iscompared Most grains in the sample prepared with an agate mortar arelarger than in the sample prepared with a McCrone mill The grain sizedistribution of the sample prepared with a McCrone mill complies withthe recommended particle size range for XRD analysis of under 5 to50 μm [3536] while the other sample exceeds the range
In Fig 9 Rietveld refinement of an autoclaved sample is shown Thedominant peaks at 77 290 and 301deg 2θ are attributed to tobermoriteIn the upper diagram (a) Rietveld refinement was carried out regularlycalculating isotropic domain sizes for tobermorite However the cal-culated fit differs significantly from the raw data It can be assumed thattobermorite shows a similar pattern to portlandite in terms of aniso-tropic peak broadening taking into account that tobermorite is as-signed to the orthorhombic crystal system Thus instead of a biaxialcylinder model an elliptic cylinder model (Fig 10 structure createdwith VESTA 318 [34]) was applied for the refinement in the lowerdiagram (b) The elliptic cylinder model is a sufficient approach to the
orthorhombic crystal system as it allows the distinction between do-main sizes in a b and c direction The fit is clearly superior using theanisotropic domain size model highlighted by the difference plot inFig 9b The comparison refinement with isotropic and anisotropic ap-proach was done for all of the five autoclaved samples In Fig 11 theresulting Rwp values for the whole pattern and the RBragg values of to-bermorite are shown The refinement using the anisotropic model leadsto both lower Rwp and RBragg values and consequently to a better fit anda more accurate quantification of tobermorite in all refined samples
4 Summary and conclusions
Improved analytical methods for both the phase developmentduring the hydration before autoclaving and during the autoclavingprocess of AAC are presented It could be shown that wet McCronemilling is the best way of preparation of AAC samples in order to obtainsuitable samples for powder diffraction A new approach to treat ani-sotropic domain sizes for Rietveld refinement could be successfullyapplied ndash with the benefit that portlandite and tobermorite in AACsamples could be refined more accurately using the Rietveld methodThus this application allows an improved quantification of the phasedevelopment during both of the production steps
For the future there are still plenty of possibilities to apply thepresented approach of calculating anisotropic domain sizes to AACproduction As exemplified with portlandite the mechanisms of growthof tobermorite can be tracked likewise during the autoclaving processIn addition the effect of variations in the chemical composition of AACraw mixtures on the crystal morphology of tobermorite can be ex-amined This leaves a new perspective to discuss the link between mi-neral phase morphology and the thermal and mechanical properties ofAAC
Acknowledgement
The autoclaved samples were generously provided by RodgauerBaustoffwerke GmbH amp Co KG The authors express gratitude for allsupport
Appendix A Supplementary data
Supplementary data to this article can be found online at httpsdoiorg101016jcemconres201802028
References
[1] MW Grutzeck Cellular concrete in M Scheffler P Colombo (Eds) CellularCeramics Wiley-VCH Weinheim 2005 pp 193ndash223
[2] M Haas The future of AAC ndash from a material scientists point of view inMC Limbachiya JJ Roberts (Eds) Autoclaved Aerated Concrete Taylor FrLondon 2005 pp 187ndash194
[3] T Mitsuda K Sasaki H Ishida Phase evolution during autoclaving process ofaerated concrete J Am Ceram Soc 75 (1992) 1858ndash1863
[4] N Isu H Ishida T Mitsuda Influence of quartz particle size on the chemical and
Fig 10 Triaxial cylinder domain size model of Tobermorite used for Rietveld refinement of anisotropic peak broadening
Fig 11 Comparison of Rwp and RBragg values of Rietveld refinements of autoclavedsamples and tobermorite using the isotropic and the anisotropic domain size model
J Schreiner et al Cement and Concrete Research 107 (2018) 247ndash252
251
6 Publications
43
mechanical properties of autoclaved aerated concrete (I) tobermorite formationCem Concr Res 25 (1995) 243ndash248
[5] NY Mostafa Influence of air-cooled slag on physicochemical properties of auto-claved aerated concrete Cem Concr Res 35 (2005) 1349ndash1357 httpdxdoiorg101016jcemconres200410011
[6] K Matsui J Kikuma M Tsunashima T Ishikawa S Matsuno A Ogawa M SatoIn situ time-resolved X-ray diffraction of tobermorite formation in autoclaved aer-ated concrete influence of silica source reactivity and Al addition Cem Concr Res41 (2011) 510ndash519
[7] C Biagioni S Merlino E Bonaccorsi The tobermorite supergroup a new no-menclature Mineral Mag 79 (2015) 485ndash495 httpdxdoiorg101180minmag2015079222
[8] BH OConnor MD Raven Application of the Rietveld refinement procedure inassaying powdered mixtures Powder Diffract 3 (1988) 2ndash6 httpdxdoiorg101017S0885715600013026
[9] D Jansen F Goetz-Neunhoeffer C Stabler J Neubauer A remastered externalstandard method applied to the quantification of early OPC hydration Cem ConcrRes 41 (2011) 602ndash608 httpdxdoiorg101016jcemconres201103004
[10] D Jansen C Stabler F Goetz-Neunhoeffer S Dittrich J Neubauer Does OrdinaryPortland Cement contain amorphous phase A quantitative study using an externalstandard method Powder Diffract 26 (2011) 31ndash38 httpdxdoiorg10115413549186
[11] D Ectors F Goetz-Neunhoeffer J Neubauer A generalized geometric approach toanisotropic peak broadening due to domain morphology J Appl Crystallogr 48(2015) 189ndash194 httpdxdoiorg101107S1600576714026557
[12] D Ectors F Goetz-Neunhoeffer J Neubauer Routine (an)isotropic crystallite sizeanalysis in the double-Voigt approximation done right Powder Diffract 32 (S1)(2017) 27ndash34 httpdxdoiorg101017S0885715617000070
[13] HM Rietveld A profile refinement method for nuclear and magnetic structures JAppl Crystallogr 2 (1969) 65ndash71 httpdxdoiorg101107S0021889869006558
[14] D Ectors Advances in the Analysis of Cementitious Reactions and Hydrate Phases(Doctoral Thesis) (2016) pp 12ndash14 (urnnbndebvb29-opus4-71743)
[15] AacuteG De La Torre S Bruque J Campo MAG Aranda The superstructure of C3Sfrom synchrotron and neutron powder diffraction and its role in quantitative phaseanalyses Cem Concr Res 32 (2002) 1347ndash1356 httpdxdoiorg101016S0008-8846(02)00796-2
[16] A Kirfel G Will Charge density in anhydrite CaSO4 from X-ray and neutrondiffraction measurements Acta Crystallogr Sect B Struct Crystallogr CrystChem 36 (1980) 2881ndash2890 httpdxdoiorg101107S0567740880010461
[17] C Bezou AN Christensen D Cox M Lehman A Nonat Structures cristallines deCaSO405H2O et CaSO406H2O Comptes Rendus Hebd Des Seacuteances lAcadeacutemieDes Sci Seacuterie 2 (312) (1991) 43ndash48
[18] KH Jost B Ziemer R Seydel Redetermination of the structure of β-dicalciumsilicate Acta Crystallogr Sect B Struct Crystallogr Cryst Chem 33 (1977)1696ndash1700 httpdxdoiorg101107S0567740877006918
[19] W Mumme LMD Cranswick BC Chakoumakos Rietveld crystal structure re-finements from high temperature neutron powder diffraction data for the poly-morphs of dicalcium silicate Neues Jahrb Fuer Mineral Abhandlungen 170 (1996)171ndash188
[20] A Colville S Geller The crystal structure of brownmillerite Ca2FeAlO5Crystallographica 50 (1971) 2311ndash2315 httpdxdoiorg101107S056774087100579X
[21] ST Bergold F Goetz-Neunhoeffer J Neubauer Quantitative analysis of C-S-H inhydrating alite pastes by in-situ XRD Cem Concr Res 53 (2013) 119ndash126 httpdxdoiorg101016jcemconres201306001
[22] EN Maslen VA Streltsov NR Streltsova N Ishizawa Electron density and op-tical anisotropy in rhombohedral carbonates III Synchrotron Xray studies ofCaCO3 MgCO3 and MnCO3 Acta Crystallogr Sect B 51 (1995) 929ndash939 httpdxdoiorg101107S0108768195006434
[23] G Renaudin Y Filinchuk J Neubauer F Goetz-Neunhoeffer A comparativestructural study of wet and dried ettringite Cem Concr Res 40 (2010) 370ndash375httpdxdoiorg101016jcemconres200911002
[24] WF Cole CJ Lancucki A refinement of the crystal structure of gypsumCaSO42H2O Acta Cryst B30 (1974) 921ndash929 httpdxdoiorg101107S0567740874004055
[25] T Runčevski RE Dinnebier OV Magdysyuk H Poumlllmann Crystal structures ofcalcium hemicarboaluminate and carbonated calcium hemicarboaluminate fromsynchrotron powder diffraction data Acta Crystallogr Sect B Struct Sci 68 (2012)493ndash500 httpdxdoiorg101107S010876811203042X
[26] JM Hughes JW Drexler Cation substitution in the apatite tetrahedral site crystalstructures of type hydroxylellestadite and type fermorite Neues Jahrb FuerMineral (1991) 327ndash336
[27] CH Shen RS Liu JG Lin CY Huang Phase stability study of La12Ca18Mn2O7Mater Res Bull 36 (2001) 1139ndash1148
[28] SW Bailey Refinement of an intermediate microcline structure Am Miner 54(1969) 1540ndash1545
[29] WR Busing HA Levy Neutron diffraction study of calcium hydroxide J ChemPhys 26 (1957) 563 httpdxdoiorg10106311743345
[30] Y Le Page G Donnay Refinement of the crystal structure of low-quartz ActaCrystallogr Sect B 32 (1976) 2456ndash2459 httpdxdoiorg101107S0567740876007966
[31] SA Hamid The crystal structure of the 11 Aring natural tobermoriteCa225[Si3O75(OH)15]1H2O Zeitschrift Fuer Krist - New Cryst Struct 154 (1981)189ndash198 httpdxdoiorg101524zkri19811543-4189
[32] P Mondal JW Jeffery The crystal structure of tricalcium aluminate Ca3Al2O6Acta Crystallogr B 31 (1975) 689ndash697 httpdxdoiorg101107S0567740875003639
[33] Y Takeuchi F Nishi I Maki Crystal-chemical characterization of the tricalciumaluminate-sodium oxide (3CaOtimesAl2O3-Na2O) solid-solution series Zeitschrift FuumlrKrist (1980) 259ndash307
[34] K Momma F Izumi VESTA 3 for three-dimensional visualization of crystal vo-lumetric and morphology data J Appl Crystallogr 44 (2011) 1272ndash1276 httpdxdoiorg101107S0021889811038970
[35] K Scrivener R Snellings B Lothenbach A Practical Guide to MicrostructuralAnalysis of Cementitious Materials CRC Press 2016 pp 123ndash125 httpdxdoiorg107693wl20150205
[36] V Pecharsky P Zavalij Fundamentals of Powder Diffraction and StructuralCharacterization of Materials Springer second edition 2005 p 302 httpdxdoiorg101007978-0-387-09579-0
J Schreiner et al Cement and Concrete Research 107 (2018) 247ndash252
252
6 Publications
44
7 Acknowledgement
7 Acknowledgement
Ich moumlchte mich bei einigen Personen bedanken ohne die es wohl kaum zum erfolgreichenAbschluss dieser Arbeit gekommen waumlreMein Doktorvater Prof Dr Juumlrgen Neubauer hat sich stets die Zeit genommen die noumltigwar um Angelegenheiten aller Art mit mir zu klaumlren Er gab mir fachlich immer zumrichtigen Zeitpunkt einen gewissen wissenschaftlichen Impuls Zugleich habe ich mich den-noch immer frei in meiner eigenen Konzeption gefuumlhlt Groszligen Dank spreche ich Prof DrFriedlinde Goumltz-Neunhoeffer aus die fuumlr mich ebenso immer eine verlaumlssliche Ansprech-partnerin fuumlr fachliche und organisatorische Angelegenheiten aller Art war Danke anDr Daniel Jansen fuumlr die gute Zusammenarbeit und dafuumlr dass er mich im Zuge meinerMasterarbeit in ein Forschungsprojekt aufgenommen hat das den Weg zur Promotionmoumlglich machte Zusaumltzlich gilt mein Dank Prof Dr Matthias Goumlbbels der fuumlr dieMitarbeiter am Lehrstuhl immer motivierende Worte fand Fuumlr die Ermoumlglichung meinerTeilnahme an diversen Dienstreisen Fortbildungen und Tagungen moumlchte ich mich viel-mals bedankenWeiterhin bedanke ich mich bei Dr Stephan Volkmann und den Rodgauer BaustoffwerkenGmbH amp Co KG fuumlr die gute Zusammenarbeit und die Bereitstellung von Versuchsma-terialienVielen Dank an meine studentischen Hilfskraumlfte Daniel Wagner Laura MoldenhauerFabian Lang Jakob Schreiber und Felix Klaassen die alle Aufgaben im Labor einwand-frei und mit Bedacht erledigten Bei meinen aktuellen und ehemaligen Kollegen DrKatrin Hurle Dr Dominique Ectors Dr Christoph Naber Dr Florian Huumlller JoumlrgNehring Frank Riedel Julian Wolf Tanja Manninger Daniel Wagner Nicolas FobbeKarla Spaumlth Julian Goergens Andreas Koumlhler Cordula Jakob Franz Becker und LisaKlemenz bedanke ich mich fuumlr die gelungene Zusammenarbeit und gegenseitige Unter-stuumltzung Besonderer Dank geht auch an Kerstin Kreszlig Bettina Engl Christian HankeBernd Schleifer und Christian Abe fuumlr die verlaumlssliche Unterstuumltzung bei technischen Fra-gen und Messungen im LaborFuumlr jegliche Unterstuumltzungen moumlchte ich mich auch bei meinen Eltern bedanken sowiebei meinem Bruder Ralf der mir mit einem LaTex Crashkurs viel Frustration ersparthat Danke Thomas dass du immer fuumlr mich da bist und mit mir zusammen fuumlr genugAusgleich gesorgt hast
45
2 State of research
to further analyses Synthesized samples are commonly investigated by means of ther-mogravimetric analysis (TGA) combined with differential thermal analysis (DTA) SEManalysis and X-ray diffraction For estimation of the chemical purity of tobermorite usu-ally the basal spacing of 113 Aring is verified by XRD analysis as substitutions such as Al3+
incorporation would reflect in it [15 28] Moreover according to Mostafa et al and Quet al stoichiometric tobermorite showed plate-like morphology in SEM images [6 32]
213 Substitutions in the lattice of tobermorite
The incorporation of foreign ions into the lattice of tobermorite has been investigated intwo major respects In the first case the substitutions occur during the application ofpreviously synthesized tobermorite The potentials of these substitutions were exemplar-ily highlighted in chapter 1 [14 15] In the second case the substitutions occur duringthe hydrothermal formation of tobermorite Whenever a basic compound includes chem-ical components apart from calcareous materials and silica substitution in the lattice oftobermorite is likely to happen during the hydrothermal reaction Biagioni et al statedthat Al-free natural tobermorite is extremely rare [4]Supplementary cementitous materials (SCMs) are established components in various ap-plications - equally in AAC production Merchantable SCMs are usually limited to wellavailable materials so that only distinct foreign ions are supplied in a considerable scaleCalcined clays diatomite blast furnace slag and especially metakaolin are amongst themost frequent materials for this purpose [31 33 34 35] They are in turn characterizedby a specific chemical composition These raw materials supply primarily aluminum andalkali metal cations In addition the presence of sulfate ions in the system has been con-sidered by some authors since sulfate is a component in most composites for construction[32 36]Sakiyama amp Mitsuda and Rios et al successfully synthesized Al-substituted tobermoriteby applying different amounts of kaolinite and metakaolin [5 23] The incorporation ofAl3+ into the lattice of tobermorite resulted in lath-like crystals1 observed by SEM anal-ysis At a higher Al3+ dosage the formation of katoite was reported Skawinska et alinvestigated various halloysite contents in the initial mix [34] They confirmed katoiteformation caused by increased supply of Al3+ The substitution of Si4+ by Al3+ in thetetrahedral chains ranges to a possible 16 substitution of the tetrahedral sites reaching anAl content up to 1 Al atom per formula unit [4] Merlino et al explained that this mainlyoccurred in the bridging tetrahedron and for charge balance additional (OH)ndash substitutedO2ndash in one site [3] This leads to an increase of the basal spacing and lattice parameter c
1The terminology of observed crystalline particles is addressed in subsection 222
6
2 State of research
which was observed in several studies [15 28 37] In a different publication by Jacksonet al the incorporation of additional Na+ or K+ for charge balance was suggested [38]Matekonis et al stated that in this case tobermorite showed anomalous thermal behavior[29] Furthermore 29Si NMR measurements revealed that the substitution by Al3+ led toan increase of the chain length in b direction [38 39] Klimesch amp Ray performed thermalanalysis of Al-free and Al-substituted tobermorites [40] They reported that in the caseof Al3+ incorporation the conversion of 93 Aring tobermorite into β-wollastonite required ahigher temperature This observation is discussed later in this thesis (section 31) Qu etal performed XRD analysis and considered relative intensity broadening of Al-substitutedtobermorite reflections in order to estimate the crystallinity [6] However the broaden-ing was not measured and evaluated The present thesis provides extensive insights intothe evaluation of the peak broadening of tobermorite depending on the supply of Al3+ (section 31 and section 32)According to Mostafa et al substitution by (SO4)2ndash in the lattice of tobermorite led tobasal imperfection [32] Their study was mainly based on XRD analysis and FTIR spec-troscopy It was suggested that charge balance was achieved by substitution of (SO4)2ndash
and 2 (OH)ndash for (SiO4)4ndash Moreover the transformation of C-S-H gel into tobermorite wasaccelerated The sulfate-substituted tobermorite showed leafy crystals in SEM imagesBy contrast Sauman amp Valtr stated that the morphology of sulfate-substituted tober-morite did not differ substantially from the morphology of stoichiometric tobermoritecrystals [41] Instead anhydrite formation was observed by means of XRD analysis Insection 32 of this thesis a new perspective on this discussion is provided
22 Characterization of autoclaved aerated concrete
Supplied materials for AAC fabrication are transforming continuously during the pro-duction process which is displayed in Figure 22 [42] It can be seen that the phasetransitions before autoclaving remind of ordinary portland cement (OPC) hydration [43]The following main reactions run during the hydration before autoclaving [10 12 17]
CaO +H2O =rArr Ca(OH)2 (22)
Ca3SiO5 + 39H2O =rArr C17SH26 + 13Ca(OH)2 (23)
Ca3Al2O6 + 3CaSO4 + 32H2O =rArr Ca6Al2(OH)12(SO4)3 middot 26H2O (24)
This process step is finished when the generation of pores along with simultaneous expan-sion is completed and sufficient strength for wire cutting has developed through hydration
7
2 State of research
The reaction of aluminum powder does not only lead to the formation of hydrogen gasbut to very low amounts of different modifications of aluminum hydroxide [17] Howeverit can be seen that none of the hydrate phases forming during the green cake settingendure the autoclaving process Only quartz does partially not react and is consequentlypresent in the final product After transforming into ettringite and later AFm phasesinitially supplied anhydrite recrystallizes during the hydrothermal treatment A multi-step reaction sequence of C-S-H portlandite and further intermediate hydration productsleads to the crystallization of tobermorite The reader is referred to the comprehensivestudy of Schober for a more detailed presentation [17] Further supply of dissolved silicaat hydrothermal conditions contributes to the formation of tobermorite in the manneroutlined in equation 21 Clearly tobermorite is the major mineral phase present afterautoclaving and is therefore the main focus of research In the following subsections 221and 222 the state of knowledge concerning the characterization of AAC by means ofSEM analysis and XRD analysis is provided
Figure 22 Exemplary phase development during the entire production process of AACFigure adopted with permission from Schober [42]
221 SEM analysis
At first sight AAC has rather favorable properties compared to hydrated Portland cementwhen it comes to SEM analysis Due to the hydrothermal treatment several phases such
8
2 State of research
as tobermorite show better crystallinity In addition the hardly evitable effects of dam-age to poorly crystalline phases and removal of water are not as significant in the case ofAAC This is why environmental scanning electronic microscopy (ESEM) was suggestedin order to investigate hydrated Portland cement after early hydration [44 45] Howeverwhile hydrated OPC is a reasonably homogeneous material AAC shows heterogeneitydue to the porous structure (Figure 11)As reported in subsection 213 several authors investigated the morphology of tober-morite in AAC in order to verify the influence of foreign ions supplied by SCMs andestimate their effect on the thermal and mechanical properties Well crystallized tober-morite often shows a house-of-cards structure in AAC (Figure 23) which was observedin numerous studies [46 47 48]
Figure 23 House-of-cards appearance of tobermorite crystals in AAC
Wongkeo amp Chaipanich stated that the application of coal bottom ash for partial replace-ment of cement in the starting compound resulted in a change of plate-like to lath-likemorphology of tobermorite crystals [49] Equally thin lath-like plates of tobermorite wereobserved by Roacuteżycka et al in samples prepared from perlite waste [50] Venhodovaacute etal investigated AAC samples prepared from mixes including fly ash and Al(OH)3 andconfirmed the elongated shape of Al-incorporated tobermorite [8] In these studies thefraction of aluminum ions was increased by adding the respective SCM An effect on themorphology of tobermorite was respectively reported which conforms to the conclusionsmade by different authors in subsection 213 Nevertheless the heterogeneity of AACsamples in SEM images was barely addressed in all of these examples By contrast Mit-suda et al differentiated between macropores and micropores in their SEM images ofindustrially manufactured AAC [10] Huang et al separately analyzed walls and pores in
9
2 State of research
their samples prepared from copper tailings and blast furnace slag [48] The wall sectionsappeared dense while in pores platy tobermorite and long-strip shaped anhydrite wasobserved Only the tobermorite crystals in the pores showed the previously describedhouse-of-cards structure As is evident from these published results there is a lack ofclarity about the meaning and informative value of observations made in AAC samplesby SEM analysis In the main results of this present thesis (section 32) a substantiatedassessment of this circumstance is given
222 XRD analysis
While SEM analysis of AAC is majorly performed in order to characterize the crystallinityand morphology of tobermorite XRD analysis is mainly applied in order to assess theoverall phase composition Apart from the phases shown in Figure 22 additional calcitefeldspar mica gypsum and bassanite occur frequently in AAC depending on the miner-alogical composition of the used raw materials Frequently minor phases are unreactedresidual components of raw materials such as sericite in the publication of Isu et al [51] orphlogopite in the study of Huang et al who applied skarn-type copper tailings for AACpreparation [48] Prolonged curing duration resulted in minor quantities of xonotlite inthe study by Mitsuda et al [10]Mainly qualitative phase contents have been determined based on XRD in studies dealingwith the mineralogy of AAC A clear recognition of amorphous content in AAC along withthe crystalline phases has been barely addressed and discussed Relative quantities weredetermined by Matsui et al by plotting normalized intensities [28] They estimated thequantity of C-S-H gel by regarding the integrated intensity of the assumed tobermoriteprecursor in a distinct section of the XRD pattern Coming in agreement with the authorscited in subsection 213 increased d spacing along c in Al-substituted tobermorite wasreported in the same study Venhodovaacute et al performed XRD analysis of AAC samplesin their publication previously addressed in subsection 221 [8] They compared relativeintensities of tobermorite in their samples but no absolute quantities of the phases werecalculated either Mitsuda et al applied an internal standard method in order to quantifyunreacted quartz in their AAC samples [10]More recently Ectors proposed a promising method for the tracking of portlandite forma-tion during the green cake hydration [52] By applying a Rietveld compatible approachfor TOPAS 50 (Bruker AXS) to fit anisotropic peak broadening due to domain mor-phology [19] two generations of portlandite could be refined separately and assigned tothe hydration of calcium oxide and tricalcium silicate respectively The key idea behindthis approach is that the average domain morphology of a mineral phase in a powder
10
2 State of research
sample implies certain mineralogical characteristics The simplified domain morphologycan be calculated on the basis of geometrical shapes such as cylinder ellipsoid or cuboidDepending on the crystal system and the expected morphology the geometrical shapecan be adjusted accordingly In the example reported by Ectors the one generation ofportlandite originating from burnt lime hydration showed anisotropic peak broadening- unlike the generation forming from tricalcium silicate hydration In accordance withthe trigonal crystal system a biaxial cylinder model was applied for the fitting of theanisotropic generation The operating principle of the approach to fit the anisotropicpeak broadening due to domain morphology can be precisely explored by accessing fur-ther publications by Ectors et al [53 54] Apart from this benefit a better fit to themeasured data enables a more accurate refinement and quantification of all phases Thetwo generations of portlandite were additionally quantified by means of an external stan-dard method [55] The combination of quantitative phase analysis by XRD (QXRD) withthe refinement of anisotropic peak broadening is a promising approach in this context -especially in consideration of the fact that phase quantifications in AAC samples havebeen barely performed ever before Hence the application of these methods is the keymatter of this present thesis Especially the potential of the domain morphology analysisof tobermorite is precisely investigated The terms domain size and domain morphology inthis sense refer to the coherently scattering unit measured by XRD analysis Crystallineparticles observed by means of electron microscopy which are frequently termed grainscrystals or crystallites are for the most part clusters of coherently scattering domains[56 57]
11
3 Main results
3 Main results
This chapter introduces the main results presented in three peer reviewed publications[58 59 60] incorporated in chapter 6 The new findings are put in a general context andsubsequently they are summarized and discussed in chapter 4 The sections 31 and 32deal with the characterization of tobermorite in both lab-scale samples and AAC sam-ples produced on an industrial scale In section 33 the entire production process of AACincluding the hydration before autoclaving is addressed
Figure 31 Application of a triaxial cylinder model for the calculation of anisotropic do-main sizes of tobermorite implemented with Rietveld refinement and influenceon the fit compared to ordinary refinement [60]
12
3 Main results
One particular main result is a key element in each of the following sections In Figure 31the fit of tobermorite after two Rietveld refinements of different accuracy is shown In aregular Rietveld refinement for simplification the coherently scattering units are treatedas spherical shapes as usually only one size value for each mineral phase is calculated Asaverage domain sizes of a mineral phase in different crystallographic directions are in manycases indeed close to one value this approximation is often sufficient in order to achievea satisfactory fit to the measured diffractogram The crystal system and surroundingconditions during the formation of a mineral phase are significant factors in this context Amisfit at different (hkl) reflections as displayed in Figure 31 is an indication of anisotropicpeak broadening Clearly orthorhombic tobermorite shows anisotropic peak broadeningdue to its anisotropic domain morphology For the possible origins of anisotropic peakbroadening apart from size broadening the reader is referred to section 61 In accordancewith the orthorhombic crystal system a triaxial model is applied in order to fit the peakbroadening [19] By implementing the macro during the refinement no longer one butthree sizes (x y and z for respectively a b and c direction) are calculated Besides theimproved fit the calculated domain morphology is an additional information extractedfrom XRD analysis and it is representative for the average value of the phase in the entiresample In each of the following sections the different benefits regarding this approachare outlined in more detail
31 Hydrothermal synthesis of tobermorite on alaboratory scale - application of two types ofmetakaolin
This study covers mineralogical properties of tobermorite synthesized from a set of variouscompounds including different amounts and types of metakaolin [58] Unlike in sections32 and 33 the samples were not aerated before autoclaving and their composition isadjusted to the CaSi molar ratio of stoichiometric tobermorite On the one hand thereactivity of metakaolin and minor phases at hydrothermal conditions for the possible usein AAC production was investigated On the other hand the effects of consequent changesof the bulk chemistry in the basic compound on the mineralogical characteristics of to-bermorite such as lattice parameters and domain morphology were analyzed In additionfor one particular compound the effect of different curing times was explored While theconventional raw materials for AAC production are rather low-cost resources metakaolinis a high-priced SCM in this regard For this reason besides one comparatively pure com-mercial metakaolin (MK) a second by-product type of metakaolin (MKg) was applied
13
3 Main results
at equivalent dosages All investigated mix composites and the chemical composition ofMK and MKg are summed up in tables in section 61In Figure 32 the effect of different amounts of the two types of metakaolin on the phasequantities is displayed Clearly at moderate dosages of MK and MKg tobermorite waspresent in comparable quantities However the application of any amount of metakaolinreduced the amount of tobermorite compared to the blank mixture It can be seen thatkatoite was present whenever the content of Al2O3 in the starting drymix exceeded 2wt which fits well with the state of knowledge [5 23] For the highest possible dosagesof the two types of metakaolin (MK60 and MKg60) contrary effects were observed Ap-plication of impure metakaolin (MKg) led to a considerable amount of tobermorite whilein MK60 no tobermorite was present The high content of Al2O3 seems to have hinderedthe formation of tobermorite Not all of the Al2O3 in MKg was supplied for reactionas minor phases such as feldspar remained unreacted which is shown accurately in therespective publication in section 61
Figure 32 Weight fractions of tobermorite quartz and katoite measured by QXRD anal-ysis and contents of Al2O3 in the starting drymix Amorphous content andminor phases are not shown
The results of thermal analysis of samples characterized by MK addition in small stepsare shown in Figure 33 It can be seen that the conversion of 93 Aring tobermorite into β-
14
3 Main results
wollastonite depended on the dosage of MK However unlike suggested by Klimesch ampRay there was no effect of lower contents of Al2O3 in the drymix [40] Consequently theinfluence of Al3+ at low dosages (MK25 and MK5) could not be observed on the basisof this method Apart from this result the other signals showed good agreement with thesuggested conversion ranges by Klimesch amp Ray as for samples MK9 and MK16 a clearshift towards higher temperature was measured However the role of Al3+ incorporationverified by this method is not necessarily conclusive as additional reactions during theheating experiment involving Al3+ are possible On that basis the observations madeby means of DTA would not reflect the amount of Al3+ originally incorporated into thestructure of 11 Aring tobermorite
Figure 33 Conversion of 93 Aring tobermorite into β-wollastonite in samples synthesizedwith various amounts of metakaolin and suggested temperature ranges ac-cording to Klimesch amp Ray [40]
In accordance with authors referenced in subsection 213 lattice parameter c of tober-morite increased with elevated dosages of Al2O3 in the basic dry mix (Figure 34) Theimpact could be observed for the complete range of samples as displayed in section 61which indicates that a limit of Al3+ incorporation was not reached in this study Forcomparison the relative domain morphology is plotted in Figure 34 Unlike the DTA
15
3 Main results
signals both lattice parameter c and the domain morphology are impacted by very lowdosages of Al2O3 There is a good accordance of the relation of growth in b direction to adirection and the c parameter This is valid up to 20 wt of Al2O3 in the starting drymix By contrast more elevated contents of Al2O3 did not affect the domain morphologyany further even though the incorporation is verified through the increased c parameterIt follows that the impact of Al3+ incorporation on the domain morphology is limited tovery low contents while the impact on lattice parameter c can be tracked throughoutthe entire examined range of samples In section 61 additional results show that growthin b direction increased with reaction time These observations are solely based on XRDanalysis and offer new benefits for the structural understanding of tobermorite
Figure 34 Impact of the calculated Al2O3 content in the basic dry mix on the latticeparameter c and on the relation of calculated domain sizes of tobermorite ina (x) and b (y) direction
16
3 Main results
32 Structural properties of tobermorite in AAC - SEMversus XRD analysis
This section and the respective publication [59] mainly deal with the suitability of SEManalysis of tobermorite in AAC The effects of varying amounts of SO3 and Al2O3 in thedry mix on structural properties of tobermorite are discussed based on XRD analysisAs shown in subsection 221 and Figure 23 tobermorite often shows a house-of-cardsstructure in AAC samples This property has been considered to be relevant for thethermal and mechanical properties of AAC (subsection 221) However SEM analysiswithin this study revealed that this type of appearance is mainly found in the poresand pore surfaces (Figure 35) This finding comes in agreement with the observationsmade by Huang et al [48] In the solid skeleton of the dense AAC material neither themorphology nor the house-of-cards structure could be observed properly which can beseen very clearly in additional micrographs provided in section 62 It should be consideredthat the major amount of tobermorite by weight is located in the dense material and notat the pore surfaces In this way these findings are clear disadvantages coming along withonly SEM analysis of AAC as representative results can hardly be obtained
Figure 35 House-of-cards structure of tobermorite in a pore surrounded by dense mate-rial
Moreover several authors in subsection 221 justified the morphology of tobermorite withthe incorporation of foreign ions Al-substituted tobermorite showed lath-like morphologywhereas Al-free tobermorite showed rather plate-like morphology [6 32 49] Howeverthe present investigation revealed that independent of Al2O3 content in the raw mix there
17
3 Main results
is always heterogeneity regarding the morphology of tobermorite In Figure 36 plate-likeand lath-like morphology of tobermorite in AAC observed in two statistical chemicallyvarious samples are displayed This result supports the previous assumption that theobservations made by SEM analysis of tobermorite in AAC strongly depend on whatpart of the sample is selected Yet again no clear observations could be made that wererepresentative for the entire sample
Figure 36 Heterogeneous morphology of tobermorite (plate-like in a and c lath-like in band d) in two AAC samples characterized by different Al2O3 contents in theraw mix
The effects of Al3+ on the domain morphology of tobermorite were measured and evaluatedin a similar manner as in section 61 and the results could be confirmed The relativedomain growth in b direction was increased by Al3+ incorporation in both studies [5859] Moreover lattice parameter c was increased with Al3+ incorporation which can beseen more accurately in section 62 Unlike SEM analysis XRD analysis allowed clearconclusions whenever structural properties of Al-substituted tobermorite were affectedInstead of a local observation as made with SEM representative and statistical resultswere obtained The reader is referred to section 61 and section 62 for further results and
18
3 Main results
more specific conclusionsIn addition the effect of various amounts of sulfate in the raw mix was analyzed Unlikein the case of different dosages of Al3+ neither the domain morphology nor the latticeparameters of tobermorite were affected by the SO3 content in the dry mix In Figure 37these observations and additionally the amounts of anhydrite measured by QXRD areshown As the amount of available SO3 in the dry mix is known the maximum possibleamount of anhydrite could be calculated for each of the samples in focus Obviouslythe measured amounts of anhydrite are either equal or slightly higher compared to theexpected quantities This result leads to the assumption that all of the available sulfateis transformed into anhydrite so that no more sulfate could be incorporated into thestructure of tobermorite The over-estimation of anhydrite in some of the samples can beexplained due to the inaccuracy of the quantification method The present results rathermatch with the suggestions by Sauman amp Valtr [41] as in their study no effect of sulfateon the structure of tobermorite was observed either
Figure 37 Impact of the sulfate content in the AAC raw mix on lattice parameter cand relative domain morphology of tobermorite (a) and comparison of theexpected maximum amount of anhydrite to the measured amount determinedby QXRD (b)
33 Improved monitoring of the phase developmentduring the production of AAC
In this study not only autoclaved samples were analyzed but additionally a lab-scale slurrywhich included the reactive components of the green cake stage during AAC productionat equivalent weight proportions In-situ XRD was performed at 70 degC and at a water-to-
19
3 Main results
solid ratio of 08 for 24 h (Figure 38) which are respective conditions during commercialproduction Clearly the phase development is dominated by OPC and lime hydration asdescribed in section 22 It can be seen that the major reaction turnover occurs duringthe first 200 minutes which is the average duration of the green stage After only 30minutes all of the quicklime had transformed into portlandite whereas Schober proposeda duration of one hour for this reaction [42] The amount of portlandite is composed oftwo different generations as proposed by Ectors [52] Equally a biaxial cylinder modelwas applied in order to fit the peak broadening of the first generation of portlandite in thepresent investigation Minor phase developments such as the formation of AFm phases arenot shown in Figure 38 A coarse fraction of anhydrite did not react so that constantlyaround 15 wt were measured after 6 h As the decomposition of ettringite due tosulfate depletion [55] does not occur prior to 12 h the green cake strength is not affected
Figure 38 In-situ XRD measurement of AAC model slurry at water-to-solid ratio of 08and 70 degC For clarity and comprehensibility not all phases are shown
The separation of two generations of portlandite in the system does not only translate intodifferent domain morphologies as shown by Ectors [52] In Figure 39 more indicationsfor different mineralogical properties are displayed The shape of the (0 0 1) reflection inXRD patterns after only quicklime hydration and after both quicklime and alite hydrationshows a distinct feature While portlandite originating from quicklime hydration showsa broad peak implying lower crystallinity the peak after alite hydration is characterized
20
3 Main results
Figure 39 Formation of two generations of portlandite in AAC slurry in XRD (a) andDTA (b) plots
by a sharper component Yet the peak breadth did not change indicating that the firstgeneration is still present with the original characteristics This observation is supportedby DTA measurements additionally demonstrating two degrees of crystallinity only afteralite hydration In agreement with XRD analysis the better crystalline second generationof portlandite decomposes at a higher temperature
Figure 310 Quantification of tobermorite in statistical chemically various AAC sampleswith and without the application of the macro for the fitting of anisotropicpeak broadening
21
3 Main results
Furthermore commercial AAC samples were considered in this study By applying themethod for the refinement of anisotropic peak broadening (Figure 31) a more accuratequantification of tobermorite can be achieved In Figure 310 the calculated amounts oftobermorite in statistical chemically various AAC samples are plotted In some samplesthe refinement using the macro leads to considerably higher but never lower quantitiesof tobermorite whereas in other samples nearly the same amount of tobermorite is cal-culated This observation can be well understood taking into account that the macroallows to account more peak area for tobermorite as shown in Figure 31 Clearly thereis evidence that the anisotropy of tobermorite domains is not uniform from one sampleto another which was basically justified in the previous sections As an improved quan-tification of a single phase leads to a better quantification of other phases in the samplethis adaption is very valuable in order to assess the phase development Here the peakbroadening of tobermorite equally observed by Qu et al [6] could be tracked and evalu-ated in order to gain more accurate results Moreover in section 63 McCrone milling issuggested in order to avoid spottiness in XRD patterns caused by coarse grains of quartzor anhydrite (Figure 38)
22
4 Conclusions
4 Conclusions
The research results presented in the previous sections yield advances in the mineralogicalinvestigation of tobermorite and autoclaved aerated concrete Recorded diffraction pat-terns contain plenty of usually unused data regarding the microstructural characteristicsof the sample and phases therein The profit of XRD measurements can be significantlyimproved whenever one or more phases show anisotropic peak broadening and appro-priate models for the respective domain morphology are implemented into the Rietveldenvironment Within the scope of the present investigations portlandite and tobermoriteshow this particularityThe effects of changes in the chemistry of the starting mix were examined based on dif-ferent dosages of metakaolin Al-substituted tobermorite showed increased growth in b
direction and an increase of lattice parameter c compared to Al-free tobermorite The rel-ative domain sizes were determined based on anisotropic peak broadening However whilethe effect of Al3+ incorporation into the lattice of tobermorite was limited regarding thedomain morphology lattice parameter c showed an increase throughout the entire rangeof samples The consequent effects suggested by Klimesch amp Ray observed by means ofDTA are debatable as reactions during the heating experiment may lead to to a changeof Al3+ content in tobermorite [40] While both types of applied metakaolin showed goodreactivity at hydrothermal conditions some included minor phases such as feldspar oranatase remained unreacted At high dosages of Al2O3 in the starting mix the formationof either only katoite or katoite along with tobermorite was observed (Figure 32)SEM analysis of tobermorite in AAC cannot be suggested based on the observationspresented in this work as it is only visually accessible in the pores or at pore surfacesThe dense material of the AAC skeleton contains several crystalline and X-ray amorphousphases which hardly allows a proper investigation Even in single pores tobermorite crys-tals appeared very heterogeneous at various chemical compositions As a result lath-liketobermorite was not only present in samples characterized by elevated Al3+ incorporationBy contrast the benefits of XRD analysis presented in section 61 equally accounted fortobermorite in AAC samples Sulfate incorporation into the lattice of tobermorite wasnot observed All of the sulfate in the system was detected to be present in anhydriteThe phase transitions in the AAC raw slurry during the green stage hydration were show-cased by in-situ XRD analysis of a model mix at 70 degC Additional DTA and XRD mea-
23
4 Conclusions
surements during this step confirmed the presence of two generations of portlandite char-acterized by different crystallinity as suggested by Ectors [52] The inclusion of anisotropicdomain morphology during the Rietveld refinement allowed a more accurate quantifica-tion of tobermorite in autoclaved samples Sample preparation adjusted to the grain sizedistribution in AAC samples (section 63) the external standard method for quantita-tive XRD analysis [55] and the approach to evaluate anisotropic peak broadening [19]are the key methods for a more accurate tracking of the phase development during AACproduction
24
5 References
5 References
[1] A E Zadov A I Grabezhev N N Pertsev N V Chukanov and S V PribavkinTobermorite-plombierite metasomatites of the Gumeshevsk skarn-porphyry copper depositmiddle Urals Doklady Earth Sciences 407(3)495ndash497 2006
[2] M F Heddle Preliminary notice of substances which may prove to be new minerals MinMag 4117ndash123 1880
[3] S Merlino E Bonaccorsi and T Armbruster The real structure of tobermorite 11AringNormal and anomalous forms OD character and polytypic modifications European Journalof Mineralogy 13(3)577ndash590 2001
[4] C Biagioni S Merlino and E Bonaccorsi The tobermorite supergroup a new nomencla-ture Mineralogical Magazine 79(2)485ndash495 2015
[5] C A Riacuteos C D Williams and M A Fullen Hydrothermal synthesis of hydrogarnetand tobermorite at 175 degC from kaolinite and metakaolinite in the CaO-Al2O3-SiO2-H2Osystem A comparative study Applied Clay Science 43(2)228ndash237 2009
[6] X Qu Z Zhao and X Zhao Microstructure and characterization of aluminum-incorporated calcium silicate hydrates (C-S-H) under hydrothermal conditions RSC Ad-vances 8(49)28198ndash28208 2018
[7] R Šiaučiunas and K Baltakys Formation of gyrolite during hydrothermal synthesis inthe mixtures of CaO and amorphous SiO2 or quartz Cement and Concrete Research34(11)2029ndash2036 2004
[8] E Venhodovaacute R Janovskyacute and R Drochytka Formation of Tobermorite at Different Ma-terials Composition of Aerated Concrete Applied Mechanics and Materials 752-753247ndash250 2015
[9] L Galvaacutenkovaacute E Bartoniacutečkovaacute T Opravil J Tkacz and P Ptaacuteček The influence ofstarting materials solubility on tobermorite structure formation under the hydrothermalconditions IOP Conference Series Materials Science and Engineering 379(1)1ndash8 2018
[10] T Mitsuda K Sasaki and H Ishida Phase Evolution during Autoclaving Process J AmCeram Soc 75(75)1858ndash1863 1992
[11] A Skawińska The influence of metahalloysite addition on tobermorite formation studied byX-ray powder diffraction and scanning electron microscope MATEC Web of Conferences16305008 2018
[12] S T Bergold F Goetz-Neunhoeffer and J Neubauer Quantitative analysis of C-S-H in
25
5 References
hydrating alite pastes by in-situ XRD Cement and Concrete Research 53119ndash126 2013
[13] O P Shrivastava and F P Glasser Ion-exchange properties of 11-Aring tobermorite Reactivityof Solids 2(3)261ndash268 1986
[14] H Maeda Y Ogawa E H Ishida and T Kasuga Hydrothermal synthesis of tobermoritedoped with phosphorus species for removing heavy metal ions Journal of the AustralianCeramic Society 48(1)8ndash11 2012
[15] O P Shrivastava and R Shrivastava Cation exchange applications of synthetic tobermoritefor the immobilization and solidification of cesium and strontium in cement matrix Bulletinof Materials Science 23(6)515ndash520 2000
[16] G Renman and A Renman Sustainable Use of Crushed Autoclaved Aerated Concrete(CAAC) as a Filter Medium in Wastewater Purification 8th International conferenceon sustainable management of waste and recycled materials in construction GothenburgSweden 30 Mayndash1 June 2012 Proceedings pages 1ndash7 2012
[17] G Schober Chemical transformations during the manufacturing of autoclaved aeratedconcrete (ACC) Cement lime gypsum and quartz sand become cellular concrete ZKG58(7)63ndash70 2005
[18] A J Hamad Materials Production Properties and Application of Aerated LightweightConcrete Review International Journal of Materials Science and Engineering 2(2)152ndash157 2014
[19] D Ectors F Goetz-Neunhoeffer and J Neubauer A generalized geometric approach toanisotropic peak broadening due to domain morphology Journal of Applied Crystallogra-phy 48(1)189ndash194 2015
[20] H M Rietveld A profile refinement method for nuclear and magnetic structures Journalof Applied Crystallography 2(2)65ndash71 1969
[21] S A Hamid The crystal structure of the 11 Aring natural tobermoriteCa225[Si3O75(OH)15]1H2O Zeitschrift fuer Kristallographie - New Crystal Struc-tures 154(3-4)189ndash198 1981
[22] S A S El-Hemaly T Mitsuda and H F W Taylor Synthesis of normal and anomaloustobermorites Cement and Concrete Research 7429ndash438 1977
[23] M Sakiyama and T Mitsuda Hydrothermal reaction between C-S-H and kaolinite for theformation of tobermorite at 180degC Cement and Concrete Research 7(6)681ndash685 1977
[24] E Bonaccorsi S Merlino and A R Kampf The crystal structure of tobermorite 14 Aring(plombierite) a C-S-H phase Journal of the American Ceramic Society 88(3)505ndash5122005
[25] S Merlino E Bonaccorsi and T Armbruster The real structures of clinotobermorite andtobermorite 9 Aring OD character polytypes and structural relationships European Journalof Mineralogy 12(2)411ndash429 2000
[26] K Momma and F Izumi VESTA 3 for three-dimensional visualization of crystal volu-metric and morphology data Journal of Applied Crystallography 44(6)1272ndash1276 2011
26
5 References
[27] S Shaw S M Clark and C MB Henderson Hydrothermal formation of the calcium sil-icate hydrates tobermorite (Ca5Si6O16(OH)2 middot 4H2O) and xonotlite (Ca6Si6O17(OH)2)An in situ synchrotron study Chemical Geology 167(1-2)129ndash140 2000
[28] K Matsui J Kikuma M Tsunashima T Ishikawa S Matsuno A Ogawa and M SatoIn situ time-resolved X-ray diffraction of tobermorite synthesis process under hydrothermalcondition IOP Conference Series Materials Science and Engineering 18(2)60ndash66 2011
[29] G Matekonis R Šiaučiunas and D Vaičiukyniene Hydrothermal Synthesis and Charac-terization of Na + and [ Al 3 + + Na + ] -substituted Tobermorite in CaO-SiO2middotnH2O-H2OSystem MATERIALS SCIENCE 16(3)242ndash248 2010
[30] G Geng R J Myers M J A Qomi and P JM Monteiro Densification of the inter-layer spacing governs the nanomechanical properties of calcium-silicate-hydrate ScientificReports 7(1)1ndash8 2017
[31] D Klimesch and A Ray Autoclaved cement-quartz pastes with metakaolin additionsAdvanced Cement Based Materials 7(3-4)109ndash118 1998
[32] N Y Mostafa A A Shaltout H Omar and S A Abo-El-Enein Hydrothermal synthesisand characterization of aluminium and sulfate substituted 11 nm tobermorites Journal ofAlloys and Compounds 467(1-2)332ndash337 2009
[33] İ Demir M S Başpınar E Kahraman E Ccedilalışkan and G Goumlrhan An Investigation onthe Usability of Diatomite in Aerated Concrete Production In Proc of the Intl Conf onAdvances In Civil Structural And Construction Engineering - CSCE 2014 pages 97ndash1002014
[34] A Skawinska Z Owsiak T Baran and K Hernik The influence of halloysite additionon tobermorite formation in CaO and quartz mix under hydrothermal conditions CementWapno Beton 17(12)426ndash434 2017
[35] N Y Mostafa Influence of air-cooled slag on physicochemical properties of autoclavedaerated concrete Cement and Concrete Research 35(7)1349ndash1357 2005
[36] D Małaszkiewicz and J Chojnowski Influence of addition of calcium sulfate dihydrate ondrying of autoclaved aerated concrete Open Engineering 7(1)273ndash278 2017
[37] N Hara and N Inoue Thermal behaviour of 11Aring tobermorite and its lattice parametersCement and Concrete Research (10)53ndash60 1980
[38] M D Jackson S R Chae S R Mulcahy C Meral R Taylor P Li A H EmwasJ Moon S Yoon G Vola H R Wenk and P JM Monteiro Unlocking the secretsof Al-tobermorite in Roman seawater concrete American Mineralogist 98(10)1669ndash16872012
[39] W Liao W Li Z Fang C Lu and Z Xu Effect of different aluminum substitution rateson the structure of Tobermorite Materials 12(22)1ndash10 2019
[40] D Klimesch and A Ray DTA-TG Study of the CaO-SiO2-H2O and CaO-Al2O3-SiO2-H2OSystems Under Hydrothermal Conditions Journal of Thermal Analysis and Calorimetry56(1)27ndash34 1999
27
5 References
[41] Z Sauman and Z Valtr Substitution of sulphate ions in the crystal lattice of 11 Aring to-bermorite In The VI International Congress on the Chemistry of Cement pages 1ndash14Moscow 1974
[42] G Schober Reaction of raw materials to the final product AAC httpwwwpb-aacde
chemmin2_ehtml 2012 accessed 2020-01-31
[43] D Jansen C Stabler F Goetz-Neunhoeffer S Dittrich and J Neubauer Does Ordi-nary Portland Cement contain amorphous phase A quantitative study using an externalstandard method Powder Diffraction 26(01)31ndash38 2011
[44] C Roumlszligler J Stark F Steiniger and W Tichelaar Limited-dose electron microscopyreveals the crystallinity of fibrous C-S-H phases Journal of the American Ceramic Society89(2)627ndash632 2006
[45] Y Sakalli and R Trettin Investigation of C3S hydration by environmental scanning elec-tron microscope Journal of Microscopy 259(1)53ndash58 2015
[46] F Matsushita Y Aono and S Shibata Expansion and shrinkage behavior of green cakeof Autoclaved Aerated Concrete In Autoclaved Aerated Concrete - Innovation and Devel-opment Proceedings of the 4th International Conference on Autoclaved Aerated ConcreteKingston UK 8-9 September 2005 pages 101ndash108 CRC Press 2005
[47] C Chucholowski M Holger and K-C Thienel Improving the recyclability environmentalcompatibility and CO2 balance of autoclaved aerated concrete by replacing sulfate carrierand cement with calcined clays CePapers 2(4)503ndash512 2018
[48] X Y Huang W Ni W H Cui Z J Wang and L P Zhu Preparation of autoclavedaerated concrete using copper tailings and blast furnace slag Construction and BuildingMaterials 27(1)1ndash5 2012
[49] W Wongkeo and A Chaipanich Compressive strength microstructure and thermal anal-ysis of autoclaved and air cured structural lightweight concrete made with coal bottom ashand silica fume Materials Science and Engineering A 527(16-17)3676ndash3684 2010
[50] A Roacuteżycka and W Pichoacuter Effect of perlite waste addition on the properties of autoclavedaerated concrete Construction and Building Materials 12065ndash71 2016
[51] N Isu H Ishida and T Mitsuda Influence of quartz particle size on the chemical andmechanical properties of autoclaved aerated concrete (I) tobermorite formation Cementand Concrete Research 25(25)243ndash248 1995
[52] D Ectors Advances in the analysis of cementitious reactions and hydrate phases doctoralthesis PhD thesis Friedrich-Alexander-Universitaumlt Erlangen-Nuumlrnberg 2016
[53] D Ectors F Goetz-Neunhoeffer and J Neubauer Domain size anisotropy in the double-Voigt approach An extended model Journal of Applied Crystallography 481998ndash20012015
[54] D Ectors F Goetz-Neunhoeffer and J Neubauer Routine (an)isotropic crystallite sizeanalysis in the double-Voigt approximation done right Powder Diffraction 32(S1)27ndash342017
28
5 References
[55] D Jansen F Goetz-Neunhoeffer C Stabler and J Neubauer A remastered external stan-dard method applied to the quantification of early OPC hydration Cement and ConcreteResearch 41(6)602ndash608 2011
[56] T Ungaacuter G Tichy J Gubicza and R J Hellmig Correlation between subgrains andcoherently scattering domains Powder Diffraction 20(04)366ndash375 2005
[57] Triloki P Garg R Rai and B K Singh Structural characterization of as-depositedcesium iodide films studied by X-ray diffraction and transmission electron microscopy tech-niques Nuclear Instruments and Methods in Physics Research Section A AcceleratorsSpectrometers Detectors and Associated Equipment 736128ndash134 2014
[58] J Schreiner F Goetz-Neunhoeffer J Neubauer and D Jansen Hydrothermal synthesisof 11 Aring tobermorite ndash Effect of adding metakaolin to the basic compound Applied ClayScience 185 2020
[59] J Schreiner F Goetz-Neunhoeffer J Neubauer S Volkmann S Bergold R Webler andD Jansen Advanced Rietveld refinement and SEM analysis of tobermorite in chemicallydiverse autoclaved aerated concrete Powder Diffraction 34143ndash150 2019
[60] J Schreiner D Jansen D Ectors F Goetz-Neunhoeffer J Neubauer and S VolkmannNew analytical possibilities for monitoring the phase development during the production ofautoclaved aerated concrete Cement and Concrete Research 107247ndash252 2018
29
6 Publications
6 Publications
61 Hydrothermal synthesis of 11 Aring tobermorite ndash Effectof adding metakaolin to the basic compound
Reprint of the peer reviewed publication
Schreiner J Goetz-Neunhoeffer F Neubauer J Jansen D 2020 Hydrothermalsynthesis of 11 Aring tobermorite ndash Effect of adding metakaolin to the basic compoundApplied Clay Science 185 httpsdoiorg101016jclay2019105432
with permission from Elsevier
30
Contents lists available at ScienceDirect
Applied Clay Science
journal homepage wwwelseviercomlocateclay
Research paper
Hydrothermal synthesis of 11 Aring tobermorite ndash Effect of adding metakaolin tothe basic compound
J Schreiner F Goetz-Neunhoeffer J Neubauer D JansenUniversity of Erlangen-Nuremberg GeoZentrum Nordbayern Mineralogy Schlossgarten 5a 91054 Erlangen Germany
A R T I C L E I N F O
KeywordsHydrothermal synthesis11 Aring tobermoriteMetakaolinPowder diffractionKatoite
A B S T R A C T
Different amounts and types of metakaolin were analyzed and applied for the hydrothermal synthesis of 11 Aringtobermorite All synthesized samples were investigated by means of powder XRD combined with Rietveld re-finement Al-substituted 11 Aring tobermorite was successfully synthesized on the basis of a broad range of com-pounds characterized by a varying content of metakaolin Katoite was present depending on the amount ofsupplied Al3+ which was determined by the dosage of metakaolin Minor crystalline components included in thetwo types of metakaolin sources varied greatly in their reactivity under hydrothermal conditions Despite adifferent degree of purity the two types of metakaolin showed corresponding effects at moderate dosages butcontrary effects at higher dosages as for the synthesis of 11 Aring tobermorite The domain morphology of to-bermorite could be associated with Al3+ incorporation for low dosages of metakaolin represented by up to 2 wt- Al2O3 in the dry mix By contrast Al3+ affected tobermorite lattice parameters at equivalent and even athigher dosages with c reaching 2295 Aring at 12 wt- Al2O3 in the dry mix
1 Introduction
11 Application of metakaolin as a reactive material in constructionindustry
The application of supplementary cementitious materials (SCMs) inthe field of construction technology has received a lot of attention inrecent years Due to limited resources and an urgent need for alter-native and more eco-friendly construction materials SCMs such asmetakaolin offer a great potential The usage of SCMs has not onlyspread to the cement and mortar industry but also to advanced appli-cations such as autoclaved aerated concrete (AAC) (Demir et al 2014Koutnyacute et al 2014 Walczak et al 2015 Roacuteżycka and Pichoacuter 2016Chucholowski et al 2018) Unlike ordinary cementitious constructionmaterials AAC is produced from hydrothermal curing Due to the dif-ferent thermodynamic environment the hydration process and the re-activity of raw materials have to be investigated properly in order tounderstand the effects on the AAC product The leading mineral phasein AAC is 11 Aring tobermorite (Ca5Si6O16(OH)2middot4H2O) As a consequencethe thermal and mechanical properties of AAC depend on micro-structure and crystallinity of tobermorite to some extent In addition tothe curing time and the fineness of raw materials the supply of ionsthat can substitute in the tobermorite structure is a crucial factor in thiscontext Especially substitutions by aluminum sodium and potassium
ions have been investigated thoroughly (Sauman 1974 Klimesch andRay 1998 Mostafa et al 2009 Matekonis et al 2010 Skawinskaet al 2017) Calcined clays usually contain a considerable amount ofthe mentioned ions
There is a vast amount of literature on the reactivity of SCMs atambient temperature and standard pressure but there is little when itcomes to hydrothermal conditions In previous publications the beha-vior of metakaolin under hydrothermal conditions was mainly in-vestigated for the synthesis of zeolites (Zhang et al 2007 Aguilar-Mamani et al 2014 Setthaya et al 2016 Luo et al 2018) In thesestudies the reactivity of metakaolin was observed at a wide range oftemperature and pH values During the transformation of kaolin intometakaolin a loss of framework alumina was observed (Ayodele et al2019) In recent decades metakaolin has been the subject of studies inthe field of geopolymer research (Rashad 2013 Chen et al 2016) Forthe synthesis of 11 Aring tobermorite a more distinct setting of temperaturesetting (180ndash200 degC) and steam pressure (1ndash12 MPa) are required
This publication is intended to make a new contribution to thechallenging field of hydrothermal synthesis in the system CaO-Al2O3-SiO2-H2O based on XRD analysis combined with Rietveld refinementVarious dosages of two types of metakaolin with different chemical andmineralogical purities are compared for the effects on the hydrothermalsynthesis of Al-substituted 11 Aring tobermorite Especially changes of thebulk chemistry in the raw mixes the reactivity of minor crystalline
httpsdoiorg101016jclay2019105432Received 20 August 2019 Received in revised form 13 November 2019 Accepted 30 December 2019
Corresponding authorE-mail address juergenjsschreinerfaude (J Schreiner)
Applied Clay Science 185 (2020) 105432
0169-1317 copy 2020 Elsevier BV All rights reserved
T
6 Publications
31
phases of the two types of metakaolin and the effect of different curingtimes are the focus of interest On the one hand metakaolin offers agreat potential in the AAC industry On the other hand of all SCMsmetakaolin is a good source material for investigating the influence ofAl3+ on the synthesis of Al-substituted 11 Aring tobermorite
12 Synthesis of Al-substituted 11 Aring tobermorite
In addition to being present in AAC tobermorite has found appli-cation in wastewater treatment and nuclear waste management due toits ion exchange capacity (Maeda et al 2012 Monasterio et al 2015)The substitution of silicon by aluminum results in a different to-bermorite structure due to general and local charge balance affectingthe lattice parameters Especially c is impacted by this substitutionbecause it occurs in the bridging tetrahedron and additional OHndash sub-stitutes O2ndash (Komarneni et al 1985 Merlino et al 2000) As suggestedin some additional studies the substitution of Si4+ by Al3+ and Na+ orK+ leads to a lath-like morphology of tobermorite crystals (Mostafa2005 Mostafa et al 2009 Venhodovaacute et al 2015 Qu et al 2018)However because of the heterogeneous appearance of tobermorite inAAC it is hardly possible to conduct a proper characterization based onSEM analysis In our recent work the anisotropic peak broadening oftobermorite in XRD diffractograms was successfully linked with theincorporation of foreign ions supplied in a common AAC production(Schreiner et al 2019) This finding allowed a more statistical struc-tural characterization of tobermorite in bulk compositions compared toSEM analysis Moreover it was reported in other studies that differenthydrate phases occur depending on the amount of supplied ions and onthe experimental settings In compounds with a high content of Al3+formation of katoite could be observed (Klimesch and Ray 1998 Riacuteoset al 2009 Matsui et al 2011) In the case of a longer curing durationinstead of 11 Aring tobermorite the formation of xonotlite (Siauciunas andBaltakys 2004 Galvaacutenkovaacute et al 2018) or - depending on the finenessof used silica source (Siauciunas and Baltakys 2004) - gyrolite is fa-voured
Kalousek (1956) suggested that tobermorite can contain up to 5Al2O3 More Al2O3 in the system resulted in the formation of hydro-garnet Klimesch and Ray (1998) additionally investigated the stabilityof hydrogarnet depending on the Al(Si + Al) ratio and its role in re-lation to the formation of 11 Aring tobermorite in an equivalent systemThey suggest that hydrogarnet always appears before tobermorite butthe former can only be detected for higher Al(Si + Al) ratios in theevent of longer curing times Riacuteos et al (2009) and Qu et al (2018)confirmed these findings in extensive investigations In the latter pub-lication it is additionally suggested that samples prepared at lowertemperatures (160 degC) are less impacted by the supply of Al3+ Theyalso consider the peak broadening of tobermorite in their XRD plotsbased on the amount of incorporated Al3+ In two recent publicationswe suggested that the peak broadening of tobermorite enables a mi-crostructural analysis by calculating the orientation dependent domainsizes (Schreiner et al 2018 2019) However these studies are based onsamples of industrially produced AAC so that the curing time was fixedThe studied AAC was produced from raw materials with a broad che-mical spectrum such as ordinary Portland cement (OPC) whichsomehow complicates the interpretation of results
In this work the influence of aluminum ions - provided by meta-kaolin - on dominant crystallographic direction-dependent domaingrowth of tobermorite is investigated by analysis of anisotropic peakbroadening (Ectors et al 2015 2017) In Fig 1 of the supplementarymaterial the method of fitting the anisotropic peak broadening of to-bermorite using a triaxial cylinder model is visualized (Schreiner et al2018) Fitting of the anisotropic peak broadening of tobermorite Thismethod is used to calculate the average and reliable values for to-bermorite domain sizes in the powder sample and associate them withaverage Al3+ incorporation Microstrain should be considered becauseit is an additional source of peak broadening However this usually
accounts for materials that have been exposed to different kinds ofstress such as metals and alloys (Badawi et al 2019) In addition theinstrumental contribution to peak broadening should be consideredHydration products such as tobermorite are characterized by crystallitesizes in the range of nanometers so that anisotropic size broadeningclearly outweighs the effect of instrumental broadening (Jenkins andSnyder 1996) Moreover the impact of Al3+ on the lattice parametersof tobermorite is considered It should additionally be clarified whe-ther the results from our previous publication (Schreiner et al 2019)based on industrially produced AAC can be confirmed by investigationwith less complex raw mixes and purely based on laboratory experi-ments
2 Material and methods
21 Starting materials
The starting materials for hydrothermal synthesis included deio-nized water quartz flour portlandite (999 pure) and two types ofmetakaolin One type was ordinary commercially available metakaolin(MK) with nearly a stoichiometric composition For comparison thesecond type of commercially available metakaolin was a by-productfrom expanded glass production (MKg) and consequently highly im-pure The chemical composition of MK and MKg determined by XRF isgiven in Table 1 With MKg containing less Al2O3 but considerably moreNa2O than MK the effects on hydrothermal synthesis were of interestBoth types of metakaolin have been characterized in previous pub-lications (Schmidt et al 2012 Naber et al 2019) In addition weverified the mineral phase content by XRD analysis Besides amorphousmetakaolin MK contained minor amounts of anatase quartz and mica
Fig 1 Weight fractions of tobermorite quartz and katoite determined byquantitative XRD analysis ndash samples including MKg crosshatched
Table 1Chemical composition of MK and MKg determined by XRF analysis ndash majorcontrasts in bold letters
Oxides [wt-] MK MKg
SiO2 536 604Al2O3 392 206CaO 01 40MgO 01 12Na2O 0 96K2O 10 18Fe2O3 18 05TiO2 21 03P2O5 01 02Loss on ignition 15 1
J Schreiner et al Applied Clay Science 185 (2020) 105432
2
6 Publications
32
MKg contained additional kaolinite feldspar and quartz
22 Investigated mix composites
For the preparation of raw mixtures the powders were weighed andhomogenized using a lab-scale mixing mill Table 2 lists the composi-tion and nomenclature of all samples including Al2O3 content andcuring time in the autoclave
bull Besides one blank mixture (MK0) that did not contain any type ofmetakaolin eleven more compounds were prepared of which threeincluded different dosages of MKg (MKg16 MKg23 and MKg60)Three more mixes contained equivalent amounts of MK instead ofMKg (MK16 MK23 and MK60) These mixes were investigated inorder to have a direct comparison concerning the effects of differentraw material on the synthesis of tobermorite
bull Additionally the mixes MK9 MK5 and MK25 with lower dosages ofmetakaolin were analyzed In the referenced literature (Schreineret al 2019) the effect of Al3+ on the anisotropic peak broadeningof tobermorite could only be observed in the case of Al2O3 contentslower than 4 in the drymix In the latter three mixes Al2O3 con-tents range from 1 to 35 Al2O3 (calculated from XRF data) whichmeets the region of interest for the analysis of tobermorite domainmorphology
bull The curing time for nearly all of the investigated samples was 12 hbut compound MK9 was prepared two more times for curing timesof 2 h and 6 h The different curing times were chosen in this par-ticular sample so that the reactivity of metakaolin and the phasetransitions could be observed more precisely
23 Hydrothermal treatment
Due to the different fineness of raw materials there was a differentwater demand from one mixture to another In order to obtain slurriesof comparable rheology the amount of water was adapted respectivelyresulting in water-to-solid ratios of 25 to 3 which matches the sug-gested water-to-solid ratio for this purpose (Roacutezycka et al 2014Galvaacutenkovaacute et al 2018) The weighed water was added to the dry mixand after stirring for 1 min at 23 degC the slurry was poured into thereactor Minor changes in the quantity of added water did not have aninfluence on the measured steam pressure All experiments were con-ducted using a PTFE-lined stainless steel autoclave with a reactor vo-lume of 300 ml The oven temperature was fixed at 180 degC and auto-genous steam pressure of 11ndash12 MPa was measured during eachexperiment with an external manometer After cooling to room tem-perature the sample was removed from the reactor coarsely ground
using an agate mortar and dried at 60 degC for 12 h After drying thesample was ground with an agate mortar again in order to deagglo-merate the particles As no coarse raw materials were used there wasno need for wet McCrone milling (Schreiner et al 2018)
24 XRD analysis
After preparation into front-loading sample holders the powdersamples were measured with a D8 diffractometer (Bruker) equippedwith a LynxEye detection system and Bragg-Brentano geometry Thesettings for XRD analysis included a tube voltage of 40 kV a current of40 mA an angular range from 6 to 80deg 2θ (Cu Kα radiation) a time perstep of 054 s a step width of 00236deg 2θ and a PSD opening of 33deg Thebackground was fitted with Chebyshev polynomial of the fifth orderThe major contribution of amorphous phase was fitted with a singlepeak with a fixed position at 308deg 2θ so that tobermorite reflectionswere not affected An external quartzite standard was measured withthe same parameters in order to determine phase quantities (Jansenet al 2011) Bruker AXS software TOPAS 50 was used for Rietveldrefinement (Rietveld 1969) and the used structures are shown inTable 3
3 Results and discussion
31 Different dosages of MK and MKg
In Fig 1 the quantities of tobermorite quartz and katoite present inmost of the samples determined by XRD analysis are illustratedWhenever tobermorite was the leading mineral hydrate phase a basalspacing of 113 Aring could be verified in each of the diffractograms Thequantities of minor crystalline phases and amorphous content are notshown For low dosages of MK it can be seen that the weight fraction oftobermorite decreased At moderate dosage of both types of metakaolin(MK16 MK23 MKg16 MKg23) tobermorite was present in comparablequantities It can be seen that the amount of katoite in the mixes de-pended on the dosage of metakaolin and it appeared only at dosages ofMK5 or more Due to the higher content of aluminum in MK comparedto MKg more katoite could always be observed in the MK mixes atequivalent dosages Despite equal amounts of quartz as starting mate-rial in mixes for both types of metakaolin the resulting weight fractionsin the cured samples were not alike Considerably more quartz waspresent in the MK samples Even though less quartz was used for mixescontaining higher amounts of MK even more quartz was present afterhydrothermal curing (Table 2 Fig 1) Consequently some of the SiO2
provided by MK did not transform into an amorphous phase or to-bermorite but into quartz This finding is verified by the presence ofquartz in MK60 because no quartz was included in the raw mixture Thefeldspar present in MKg did not react so Na2O and an unknown amountof Al2O3 may not have been supplied for hydrothermal reaction Besidestobermorite and quartz additional calcite scawtite (Ca7Si6(CO3)
Table 2Basic powder compounds prepared for the hydrothermal synthesis of to-bermorite with the respectively calculated Al2O3 content and curing time in thereactor
Sample Portlandite[wt-]
Quartz[wt-]
MK[wt-]
MKg
[wt-]
Al2O3
[wt-]Curingtime [h]
MK0 49 51 ndash ndash 0 12MK25 495 48 25 ndash 1 12MK5 49 46 5 ndash 2 12MK9_2h 48 43 9 ndash 35 2MK9_6h 48 43 9 ndash 35 6MK9_12h 48 43 9 ndash 35 12MK16 47 37 16 ndash 63 12MK23 46 31 23 ndash 9 12MK60 40 ndash 60 ndash 235 12MKg16 47 37 ndash 16 33 12MKg23 46 31 ndash 23 47 12MKg60 40 ndash ndash 60 124 12
Table 3Structural data used for the investigation with powder XRD analysis
Phase Author
Anatase (Horn et al 1972)Biotite (Brigatti et al 2000)Calcite (Maslen et al 1995)Kaolinite (Zvyagin 1960)Katoite (Bartl 1969)Microcline (Bailey 1969)Plazolite (Basso et al 1983)Portlandite (Busing and Levy 1957)Quartz (Le Page and Donnay 1976)Scawtite (Grice 2005)Tobermorite (Hamid 1981)Xonotlite (Hejny and Armbruster 2001)
J Schreiner et al Applied Clay Science 185 (2020) 105432
3
6 Publications
33
O18bull2(H2O)) and xonotlite (Ca6Si6O17(OH)2) could be identified insample MK0 (XRD plots of samples MK0 MKg16 MKg23 MK16 andMK23) Comparing MK0 and MK25 scawtite and xonotlite could stillbe identified in a very low amount in MK25 but no longer in samplesthat contained even more MK (XRD plots of samples MK0 MK25 MK5and MK9_12h)
Two additional experiments were done without quartz in the rawmixes (MK60 and MKg60) The according diffractograms after hydro-thermal curing are shown in Fig 2 In sample MKg60 tobermorite (gt 50wt-) was successfully synthesized without any other silica sourcethan MKg whereas no crystalline quartz occurred By contrast no to-bermorite but quartz could be identified in equivalent mixture MK60containing MK It can be seen that crystalline components such as micaand anatase in the raw MK did not react at the selected conditions andremained present in the autoclaved samples Except for feldspar in MKgall of the crystalline components appeared to be reactive at the chosenhydrothermal conditions A minor unidentified phase occurred at328deg2θ and additional xonotlite was identified in sample MKg60 Insample MK60 more calcium was needed for the formation of morehydrogarnet (Fig 1) resulting in a lower CaSi ratio for the remainingsystem Sample MKg60 contained only half of the amount of Al3+ and itwas not completely supplied for reaction due to its partial presence infeldspar Consequently essentially less hydrogarnet (Fig 1) was presentin MKg60 after hydrothermal treatment and the CaSi ratio in the re-maining system was affected to a lesser extent
32 Application of MK for different curing times
The development of hydrate phases in the autoclave for compoundMK9 is displayed in Fig 3 After only 2 h of hydrothermal curing all ofthe available portlandite had reacted and katoite (95 wt-) was pre-sent The applied type of metakaolin appeared to react quickly as itsupplied aluminum for formation of katoite No formation of to-bermorite could be observed at this stage yet An assumably amorphousprecursor can be seen at 28 to 30deg2θ Calcium was provided by thedissolution of portlandite After 6 h of hydrothermal reaction amountsof katoite (85 wt-) and quartz (from 31 wt- at 2 h to 165 wt- at6 h) had decreased and a major amount of tobermorite (35 wt-) waspresent Apparently between 2 and 6 h under hydrothermal conditionsthe amorphous precursor and quartz reacted resulting in the formationof tobermorite An additional 6 h of reaction time (MK9_12h) did notchange the phase composition significantly Slightly more tobermorite
(365 wt-) less quartz (16 wt-) and katoite (65 wt-) weremeasured
33 Tobermorite domain morphology and lattice parameters
In the referenced literature an analysis of tobermorite domainmorphology based on anisotropic peak broadening was possible forsamples that contained notgt 4 wt- Al2O3 in the drymix (Schreineret al 2019) Accordingly in this study samples MK0 MK25 MK5MK9_6h and MK9_12h were suitable (Table 2) with MK9_2h not con-taining any tobermorite In Fig 4 the respective growth in a and b di-rection is visualized with x indicating the domain size in a direction andy indicating domain size in b direction using a macro for TOPAS 50(Ectors et al 2015 2017) The calculated cylinder models in Fig 4represent the relation of yx and not absolute sizes With no supply ofaluminum ions (MK0) the relative domain growth in b direction islower compared to samples containing metakaolin This finding agreeswith the results from a similar investigation of tobermorite in AAC(Schreiner et al 2019) However within the samples MK5 andMK9_12h the different amounts of supplied aluminum ions did notshow a clear effect It appeared that low dosages of Al3+ (1 wt- Al2O3
in MK25 and 2 wt- Al2O3 in MK5) were enough to determine thedomain growth of tobermorite Additional results from the samplesMK9_6h and MK9_12h indicated that growth in b direction increasedwith reaction time
In Fig 5 lattice parameters of tobermorite depending on metakaolindosages are plotted B clearly remained unaffected throughout therange of samples Increasing amounts of metakaolin led to a slightlysmaller parameter a However both types of metakaolin showed acorresponding impact on parameter a By contrast parameter c in-creased strongly with increasing amounts of MK and MKg but the typeof metakaolin was significant At an equivalent dosage MK affected thecell dimension in c direction considerably more than MKg so that thefraction of Al3+ appeared to be the decisive parameter Different metaloxides in MKg did not show a notable effect certainly as they werepartially not provided for reaction Unlike for the domain morphologyof tobermorite the impact on lattice parameters could be observedwithin the complete range of examined dosages
4 Conclusions
The results obtained from the introduced investigations allow con-cluding remarks on the effects of the applied types of metakaolin on thesynthesis of 11 Aring tobermorite the phase transitions and the in-corporation of Al3+ into the lattice of tobermorite
With a critical dosage the use of any type of metakaolin led to theformation of katoite in an according amount At moderate dosages(MKg16 MKg23 MK16 and MK23) the two types of metakaolin showeda good correspondence in consideration of the quantities of to-bermorite For higher dosages there were contrary effects Lower do-sages of MK led to considerable quantities of Al-substituted to-bermorite Samples containing low dosages of MK revealed that katoiteappeared in the case ofgt 5 wt- of MK - corresponding to 2 wt-Al2O3 - in the basic compound Minor crystalline phases in MKg showedbetter reactivity than those in MK The observation that no tobermoritewas present in sample MK60 indicated that high dosages of Al3+ hin-dered the formation of tobermorite
Investigations of MK9 at 2 6 and 12 h displayed the evolution ofhydrate phases At first katoite was the only crystalline hydrate phasepresent after 2 h which corresponded to observations in a differentpublication (Klimesch and Ray 1999) The amount of katoite andquartz then decreased and a major amount of tobermorite formed from2 to 6 h curing time In order to gain more information on the trans-formation of amorphous C-(A)-S-H into tobermorite additional ex-periments in the range of 2 to 6 h curing time will be needed
Domain morphology analysis of tobermorite revealed that low
Fig 2 Diffractograms of MKg MKg60 MK and MK60 from 7 to 34deg2θ CuKα Aanatase C calcite F feldspar k kaolinite K katoite M mica Q quartz Ttobermorite U unidentified phase X xonotlite
J Schreiner et al Applied Clay Science 185 (2020) 105432
4
6 Publications
34
dosages of Al3+ determined the domain growth which agreed with theresults published on tobermorite in AAC samples (Schreiner et al2019) Different curing times unveiled that growth in b direction in-creased with the reaction time Al3+ incorporation into the lattice oftobermorite only reflected to a limited extent in the domain mor-phology By contrast an increase of lattice parameter c was triggered byAl3+ even at the highest dosage in this study Ultimately there is no
evidence for a limit of incorporation of Al3+ but there is a limit ofinfluence on the domain morphology These results additionally re-confirm this assumption similarly made in the previous work (Schreineret al 2019) and suggest a new mechanism of tobermorite crystal-lization depending on the presence of Al3+
Supplementary data to this article can be found online at httpsdoiorg101016jclay2019105432
Declaration of Competing Interest
The authors declare that they have no known competing financialinterests or personal relationships that could have appeared to influ-ence the work reported in this paper
Acknowledgement
The authors thank Rodgauer Baustoffwerke GmbH amp Co KG forsupplying raw materials for laboratory experiments
References
Aguilar-Mamani W Garciacutea G Hedlund J Mouzon J 2014 Comparison betweenleached metakaolin and leached diatomaceous earth as raw materials for the synth-esis of ZSM-5 Springerplus 3 1ndash10 httpsdoiorg1011862193-1801-3-292
Ayodele OB Sulaimon AA Alaba PA Tian Z-Y 2019 Influence of metakaolini-zation temperature on the structure and activity of metakaolin supported Ni catalystin dry methane reforming J Environ Chem Eng httpsdoiorg101016jjece2019103239 (in press)
Badawi EA Abdel-Rahman MA Mostafa A Abdel-Rahman M 2019 Determinationof the crystallite size amp micro- strain by novel method from XRD profile Appl Phys2 1ndash15 httpsdoiorg1031058jap201921001
Bailey SW 1969 Refinement of an intermediate microcline structure Am Miner 541540ndash1545
Bartl H 1969 Roentgen-Einkristalluntersuchungen an (CaO)3 (Al2O3) (H2O)6 und an(CaO)12 (Al2O3)7 (H2O) neuer Vorschlag zur (CaO)12 (Al2O3)7-Struktur NeuesJahrb fuer Mineral Monatshefte 1969 404ndash413
Basso R Giusta AD Zefiro L 1983 Crystal structure refinement of plazolite A highlyhydrated natural hydrogrossular Neues Jahrb Miner Monatsh (Neues Jahrb fuerMineral Monatshefte) 1983 251ndash258
Brigatti MF Lugli C Poppi L Foord EE Kile DE 2000 Crystal chemical varia-tions in Li- and Fe-rich micas from Pikes Peak batholith (Central Colorado) AmMineral 85 1275ndash1286 httpsdoiorg102138am-2000-8-920
Busing WR Levy HA 1957 Neutron diffraction study of calcium hydroxide J ChemPhys 26 563 httpsdoiorg10106311743345
Chen L Wang Z Wang Y Feng J 2016 Preparation and properties of alkali acti-vated metakaolin-based geopolymer Materials (Basel) 9 1ndash12 httpsdoiorg103390ma9090767
Chucholowski C Holger M Thienel K-C 2018 Improving the recyclability en-vironmental compatibility and CO2 balance of autoclaved aerated concrete by re-placing sulfate carrier and cement with calcined clays CePapers 2 503ndash512httpsdoiorg101002cepa846
Fig 3 Diffractograms of MK9_2h MK9_6h and MK9_12h from 7 to 38deg2θ CuKα C calcite K katoite Q quartz T tobermorite
Fig 4 Relation of calculated domain sizes of 11 Aring tobermorite in selectedsamples (MK0 MK25 MK5 MK9_6h and MK9_12h) in a (x) and b (y) direction
Fig 5 Lattice parameters of tobermorite depending on MK or MKg dosageincluding blank mix MK0
J Schreiner et al Applied Clay Science 185 (2020) 105432
5
6 Publications
35
Demir İ Başpınar MS Kahraman E Ccedilalışkan E Goumlrhan G 2014 An investigationon the usability of diatomite in aerated concrete production In Proc of the IntlConf on Advances in Civil Structural and Construction Engineering ndash CSCE 2014 pp97ndash100
Ectors D Goetz-Neunhoeffer F Neubauer J 2015 A generalized geometric approachto anisotropic peak broadening due to domain morphology J Appl Crystallogr 48189ndash194 httpsdoiorg101107S1600576714026557
Ectors D Goetz-Neunhoeffer F Neubauer J 2017 Routine (an)isotropic crystallitesize analysis in the double-Voigt approximation done right Powder Diffract 3227ndash34 httpsdoiorg101017S0885715617000070
Galvaacutenkovaacute L Bartoniacutečkovaacute E Opravil T Tkacz J Ptaacuteček P 2018 The influence ofstarting materials solubility on tobermorite structure formation under the hydro-thermal conditions IOP Conf Ser Mater Sci Eng 379 1ndash8 httpsdoiorg1010881757-899X3791012001
Grice JD 2005 The structure of spurrite tilleyite and scawtite and relationships toother silicate-carbonate minerals Can Mineral 43 1489ndash1500 httpsdoiorg102113gscanmin4351489
Hamid SA 1981 The crystal structure of the 11 Aring natural tobermoriteCa225[Si3O75(OH)15]1H2O Zeitschrift fuer Krist 154 189ndash198 httpsdoiorg101524zkri19811543-4189
Hejny C Armbruster T 2001 Polytypism in xonotlite Ca6Si6O17(OH)2 Zeitschrift furKrist 216 396ndash408
Horn M Schwerdtfeger CF Meagher EP 1972 Refinement of the structure of ana-tase at several temperatures Zeitschrift fur Krist 136 273ndash281 httpsdoiorg101524zkri19721363-4273
Jansen D Goetz-Neunhoeffer F Stabler C Neubauer J 2011 A remastered externalstandard method applied to the quantification of early OPC hydration Cem ConcrRes 41 602ndash608 httpsdoiorg101016jcemconres201103004
Jenkins R Snyder R 1996 Introduction to X-ray Powder Diffractometry ChemicalAnalysis Wiley pp 90
Kalousek GL 1956 Crystal Chemistry of Hydrous Calcium Silicates J Am Ceram Soc40 74ndash80
Klimesch D Ray A 1998 Autoclaved cement-quartz pastes with metakaolin additionsAdv Cem Based Mater 7 109ndash118 httpsdoiorg101016S1065-7355(97)00073-4
Klimesch D Ray A 1999 DTA-TGA evaluations of the CaOndashAl2O3ndashSiO2ndashH2O systemtreated hydrothermally Thermochim Acta 334 115ndash122 httpsdoiorg101016s0040-6031(99)00140-9
Komarneni S Roy R Roy DM Fyfe CA Kennedy GJ Bothner-By AA Dadok JChesnick AS 1985 27Al and29Si magic angle spinning nuclear magnetic resonancespectroscopy of Al-substituted tobermorites J Mater Sci 20 4209ndash4214 httpsdoiorg101007BF00552416
Koutnyacute O Opravil T Pořiacutezka J 2014 Application of metakaoline in autoclavedaerated concrete technology Adv Mater Res 1000 174ndash177 httpsdoiorg104028wwwscientificnetAMR1000174
Le Page Y Donnay G 1976 Refinement of the crystal structure of low-quartz ActaCrystallogr Sect B 32 2456ndash2459 httpsdoiorg101107S0567740876007966
Luo H Law WW Wu Y Zhu W Yang EH 2018 Hydrothermal synthesis of needle-like nanocrystalline zeolites from metakaolin and their applications for efficient re-moval of organic pollutants and heavy metals Microporous Mesoporous Mater 2728ndash15 httpsdoiorg101016jmicromeso201806015
Maeda H Ogawa Y Ishida EH Kasuga T 2012 Hydrothermal synthesis of to-bermorite doped with phosphorus species for removing heavy metal ions J AustCeram Soc 48 8ndash11
Maslen EN Streltsov VA Streltsova NR Ishizawa N 1995 Electron density andoptical anisotropy in rhombohedral carbonates III Synchrotron Xray studies ofCaCO3 MgCO3 and MnCO3 Acta Crystallogr Sect B 51 929ndash939 httpsdoiorg101107S0108768195006434
Matekonis G Šiaučiūnas R Vaičiukynienė D 2010 Hydrothermal Synthesis andCharacterization of Na + and [ Al 3 + + Na + ] -substituted Tobermorite in CaO-SiO2middotnH2O-H2O System Mater Sci 16 242ndash248
Matsui K Kikuma J Tsunashima M Ishikawa T Matsuno S Ogawa A Sato M2011 In situ time-resolved X-ray diffraction of tobermorite synthesis process underhydrothermal condition IOP Conf Ser Mater Sci Eng 18 60ndash66 httpsdoiorg1010881757-899X182022017
Merlino S Bonaccorsi E Armbruster T 2000 The real structures of clinotobermoriteand tobermorite 9 Aring OD character polytypes and structural relationships Eur JMineral 12 411ndash429 httpsdoiorg1011270935-122120000012-0411
Monasterio M Gaitero JJ Manzano H Dolado JS Cerveny S 2015 Effect ofchemical environment on the dynamics of water confined in calcium silicate mi-nerals Natural and synthetic tobermorite Langmuir 31 4964ndash4972 httpsdoiorg101021acslangmuir5b00614
Mostafa NY 2005 Influence of air-cooled slag on physicochemical properties of auto-claved aerated concrete Cem Concr Res 35 1349ndash1357 httpsdoiorg101016jcemconres200410011
Mostafa NY Shaltout AA Omar H Abo-El-Enein SA 2009 Hydrothermal synth-esis and characterization of aluminium and sulfate substituted 11 nm tobermoritesJ Alloys Compd 467 332ndash337 httpsdoiorg101016jjallcom200711130
Naber C Stegmeyer S Jansen D Goetz-Neunhoeffer F Neubauer J 2019 ThePONKCS method applied for time resolved XRD quantification of supplementarycementitious material reactivity in hydrating mixtures with ordinary Portland ce-ment Constr Build Mater 214 449ndash457 httpsdoiorg101016jconbuildmat201904157
Qu X Zhao Z Zhao X 2018 Microstructure and characterization of aluminum-in-corporated calcium silicate hydrates (C-S-H) under hydrothermal conditions RSCAdv 8 28198ndash28208 httpsdoiorg101039c8ra04423f
Rashad AM 2013 Metakaolin as cementitious material history scours production andcomposition - a comprehensive overview Constr Build Mater 41 303ndash318 httpsdoiorg101016jconbuildmat201212001
Rietveld HM 1969 A profile refinement method for nuclear and magnetic structures JAppl Crystallogr 2 65ndash71 httpsdoiorg101107S0021889869006558
Riacuteos CA Williams CD Fullen MA 2009 Hydrothermal synthesis of hydrogarnet andtobermorite at 175 degC from kaolinite and metakaolinite in the CaO-Al2O3-SiO2-H2Osystem a comparative study Appl Clay Sci 43 228ndash237 httpsdoiorg101016jclay200809014
Roacuteżycka A Pichoacuter W 2016 Effect of perlite waste addition on the properties of au-toclaved aerated concrete Constr Build Mater 120 65ndash71 httpsdoiorg101016jconbuildmat201605019
Roacutezycka A Kotwica Ł Małolepszy J 2014 Synthesis of single phase gyrolite in theCaO-quartz-Na2O-H2O system Mater Lett 120 166ndash169 httpsdoiorg101016jmatlet201401003
Sauman Z 1974 Influence of SO4 2ndash ions on the formation of 11 Aring tobermorite InProceedings of the 2nd International Symposium on Science and Research in SilicateChemistry Moscow pp 25ndash39
Schmidt M Egersdoumlrfer A Poumlllmann H 2012 Increased reactivity using a glass-containing metakaolin as an active filler in lime-based binder systems ZKG Int 6554ndash62
Schreiner J Jansen D Ectors D Goetz-Neunhoeffer F Neubauer J Volkmann S2018 New analytical possibilities for monitoring the phase development during theproduction of autoclaved aerated concrete Cem Concr Res 107 247ndash252 httpsdoiorg101016jcemconres201802028
Schreiner J Goetz-Neunhoeffer F Neubauer J Volkmann S Bergold S Webler RJansen D 2019 Advanced Rietveld refinement and SEM analysis of tobermorite inchemically diverse autoclaved aerated concrete Powder Diffract 34 143ndash150httpsdoiorg101017s0885715619000149
Setthaya N Chindaprasirt P Pimraksa K 2016 Preparation of zeolite nanocrystals viahydrothermal and solvothermal synthesis using of rice husk ash and metakaolinMater Sci Forum 872 242ndash247 httpsdoiorg104028wwwscientificnetmsf872242
Siauciunas R Baltakys K 2004 Formation of gyrolite during hydrothermal synthesis inthe mixtures of CaO and amorphous SiO2 or quartz Cem Concr Res 34 2029ndash2036httpsdoiorg101016jcemconres200403009
Skawinska A Owsiak Z Baran T Hernik K 2017 The influence of halloysite ad-dition on tobermorite formation in CaO and quartz mix under hydrothermal condi-tions Cem Wapno Bet 17 426ndash434
Venhodovaacute E Janovskyacute R Drochytka R 2015 Formation of tobermorite at differentmaterials composition of aerated concrete Appl Mech Mater 752ndash753 247ndash250httpsdoiorg104028wwwscientificnetamm752-753247
Walczak P Małolepszy J Reben M Szymański P Rzepa K 2015 Utilization ofwaste glass in autoclaved aerated concrete Proc Eng 122 302ndash309 httpsdoiorg101016jproeng201510040
Zhang Y Gao W Cui L 2007 The transformation of acid leached metakaolin tozeolite beta Stud Surf Sci Catal 170 420ndash425 httpsdoiorg101016S0167-2991(07)80870-6
Zvyagin BB 1960 An attempt to electronographic determination of kaolinite structureJ Dokl Akad Nauk SSSR 130 1023ndash1026
J Schreiner et al Applied Clay Science 185 (2020) 105432
6
6 Publications
36
6 Publications
62 Advanced Rietveld refinement and SEM analysis oftobermorite in chemically diverse autoclaved aeratedconcrete
Following the copyright guidelines by Cambridge University Press the publication
Schreiner J Goetz-Neunhoeffer F Neubauer J Volkmann S Bergold S WeblerR Jansen D 2019 Advanced Rietveld refinement and SEM analysis of tobermorite inchemically diverse autoclaved aerated concrete Powder Diffraction 34 143ndash150 httpsdoiorg101017s0885715619000149
may not be reprinted It can be accessed at
httpswwwcambridgeorgcorejournalspowder-diffractionarticleadvanced-rietveld-refinement-and-sem-analysis-of-tobermorite-in-chemically-diverse-autoclaved-aerated-concrete51597C2A66F6F225D29DEB2675E74249
37
6 Publications
63 New analytical possibilities for monitoring the phasedevelopment during the production of autoclavedaerated concrete
Reprint of the peer reviewed publication
Schreiner J Jansen D Ectors D Goetz-Neunhoeffer F Neubauer J VolkmannS 2018 New analytical possibilities for monitoring the phase development during theproduction of autoclaved aerated concrete Cement and Concrete Research 107 247ndash252httpsdoiorg101016jcemconres201802028
with permission from Elsevier
38
Contents lists available at ScienceDirect
Cement and Concrete Research
journal homepage wwwelseviercomlocatecemconres
Short communication
New analytical possibilities for monitoring the phase development duringthe production of autoclaved aerated concrete
J Schreinera D Jansena D Ectorsa F Goetz-Neunhoeffera J Neubauera S Volkmannb
aUniversity of Erlangen-Nuremberg GeoZentrum Nordbayern Mineralogy Schlossgarten 5a 91054 Erlangen Germanyb Rodgauer Baustoffwerke GmbH amp Co KG Am Opel-Pruumlffeld 3 63110 Rodgau-Dudenhofen Germany
A B S T R A C T
This work presents improved analytical methods for both steps of the production process of autoclaved aeratedconcrete (AAC) the phase development during the hydration before autoclaving and during the autoclavingprocess itself The improvement includes new insights into preparation methods of AAC samples for powderdiffraction as well as Rietveld refinement strategies For the first time a new implementation for calculatinganisotropic crystal domain sizes is applied to major hydrate phases occurring during AAC production namelyportlandite during the hydration before autoclaving and tobermorite during the autoclaving process The cal-culation of anisotropic domain size growth which can be implemented in the Rietveld environment is based oncrystallographically and geometrically appropriate models The implementation of calculating anisotropic do-main sizes for the Rietveld software TOPAS 50 allows a superior Rietveld fit and a more accurate quantificationof the phase development Additionally it enables the tracking of growth mechanism of portlandite duringhydration
1 Introduction
Autoclaved aerated concrete (AAC) is known as a lightweight con-struction material which offers outstanding properties such as suffi-cient strength for construction in addition with excellent thermal in-sulation [12] AAC is produced by autoclaving from calcareous rawmaterials such as lime (CaO) and cement quartz sulfate carrier andother additives such as foaming agents and water
The production process (Fig 1) can be separated into the hydrationof the mixed slurry before the procedure of autoclaving and the auto-claving at elevated temperature (180 degC to 200 degC) under saturatedsteam pressure (12MPa) for several hours
The hydration process before autoclaving is necessary to achievesufficient strength in order to cut the green cake blocks as they shouldhave a specific shape and dimension after autoclaving Furthermorethe porous structure is generated by the foaming agent during hydra-tion in the first process step During autoclaving the final propertiesnamely strength and low thermal conductivity are achieved
It is already well understood that the autoclaving process leads tothe formation of several phases first of all tobermorite(Ca5Si6O16(OH)2lowast4H2O) [3ndash5] Newest research has shown im-pressively which reactions are running from the mineralogical point ofview Insitu XRD measurements were carried out during the
autoclaving process and the phase development was shown by plottingnormalized intensities [6] The study of Mitsuda et al [3] was mainlyfocused on the tracking of the phase evolution during the autoclavingprocess of AAC However their statements concerning phase evolutionare mainly based on XRD data and TGA measurements There is acommon agreement that the following reactions occur The consump-tion of the alite (OPC) leads to the formation of an initial C-S-H phaseduring the first processing step Portlandite which was initially formedduring the first process step (from CaO and C3S) further quartz and theC-S-H phase are consumed during autoclaving resulting in the crystal-lization of tobermorite Hence the crystallization process of to-bermorite as well as the crystal structure of tobermorite was an issue ofresearch and discussion over the last years and numerous publicationsto these topics are available Concerning the crystal structure of to-bermorite respectively the tobermorite supergroup a new publicationoutlines all important references and recommends a new nomenclature[7]
The presented study was performed to create new analytical possi-bilities for the characterization of the production process of AAC Bothof the production process steps are essential for the final productHence the present work focuses on crystallization of hydrate phases inboth processes
Firstly an external standard method [89] was published and
httpsdoiorg101016jcemconres201802028Received 6 October 2017 Received in revised form 1 February 2018 Accepted 26 February 2018
Corresponding authorsE-mail addresses juergenjsschreinerfaude (J Schreiner) danieljansenfaude (D Jansen)
Cement and Concrete Research 107 (2018) 247ndash252
0008-8846 copy 2018 Elsevier Ltd All rights reserved
T
6 Publications
39
recommended for the determination of absolute phase contents inmixtures with amorphous content It was shown that the method canabsolutely be recommended for hydrating cement pastes in which watercannot be quantified directly by XRD [10] This method seems to bevery promising for both the quantification of the hydration of the AACslurry before autoclaving and the quantification of the phase evolutionduring autoclaving inasmuch as both production steps form crystallineand amorphous phases
Secondly a new approach to anisotropic peak broadening due toanisotropic domain morphology which was developed [1112] is ap-plied to AAC samples to improve the fit of portlandite and tobermoriteby Rietveld refinement [13] By applying this approach the refinementof both portlandite and tobermorite should additionally lead to betterquantitative results as well as to better insights into the development ofthe domain size morphology of both phases formed
It was already shown that in a hydrating raw mixture for AAC twospecies of portlandite precipitate at 23 degC one showing dynamicallyanisotropic peak broadening and another one following the isotropictrend [14] The application of the anisotropic refinement model led toan improved fitting of portlandite Moreover the mechanism of aniso-tropic domain growth of portlandite was tracked
2 Materials and methods
In order to examine the hydration of the AAC slurry before auto-claving a mixture of the hydraulic reactive components was weighedand measured in-situ at a Bruker D8 diffractometer with a LynxEyedetection system
Ordinary Portland cement (OPC) was mixed with lime (CaO) andanhydrite (C$) The raw materials were taken from the same batches asfor the industrial samples The drymix (58 OPC 36 CaO and 6 C$by weight) was then mixed with water (ws= 08) and placed into anappropriate sample holder The samples were not aerated The slurrysamples were covered with a kapton film to avoid evaporation andcarbonation Diffractograms were recorded with an angular range from7 to 545deg 2θ and a step width of 0011deg 2θ Measurements were carriedout every 15min For each measurement 96 XRD patterns were re-corded over the first 24 h The temperature was fixed at 70 degC which isthe mean temperature generally prevailing in the industrial processduring hydration before autoclaving Rietveld refinement was carriedout using the G-factor method All structures used for Rietveld refine-ment are shown in Table 1
For investigation of the autoclaved samples five different specimenswere taken at different autoclaving times The specimens were takenout of a technical production process hence it was not possible to in-terrupt the process at an earlier time inasmuch it would lead to damageof a whole concrete production batch The specimens were firstly driedat 60 degC until weight constancy The whole blocks were then broken andstatistical samples of 20 g were taken In order to receive the right massattenuation coefficient (MAC) for G-factor method the loss on ignitionand the chemical composition (XRF) were determined For energydispersive XRF analysis (Spectro Xepos) tube voltage from 20 kV to50 kV and tube current from 08 to 20mA were used for differenttargets
The final sample preparation (grinding) before XRD measurementswas carried out using both an agate mortar and a McCrone micronizingmill for wet milling with isopropanol Both preparation methods wereapplied separately to see which one is suitable in order to get the bestpreparation for XRD investigations Six preparations were performed byone operator of which two were prepared with an agate mortar andfour with a McCrone mill For the McCrone milling 3 g of the sampleand 10ml of isopropanol were used for grinding for 12min The grainsize distribution of one sample prepared with an agate mortar and onesample prepared using a McCrone mill was measured by laser granu-lometry in isopropanol using a Mastersizer 3000 (MALVERN)
After milling the samples in these two ways for XRD analysis thepowders were prepared into a front loading sample holder and mea-sured Diffractograms were recorded with an angular range from 6 to80deg 2θ a step width of 00236deg 2θ and a time per step of 054 s Rietveldrefinement combined with external standard (G-factor) was applied inorder to get absolute quantities for each phase The refinement strategyfor portlandite and tobermorite in the TOPAS Launch Mode (TOPAS50 Bruker AXS) is attached as a Supplementary material file
3 Results and discussion
31 Hydration of the mixture before autoclaving
The hydration of the investigated paste before autoclaving isdominated by the hydration of the cement as well as the reaction of thefree lime (CaO) resulting in the formation of portlandite It can beclearly seen from Fig 2 that the hydration of the paste leads to theformation of ettringite portlandite and C-S-H phase For simplificationthe remaining phase developments are not shown in Fig 2 because theyare not in the focus of this study The hydration of CaO forming
Fig 1 Simplified process steps of AAC production and hydrate phase evolution
Table 1Structures used for Rietveld refinement
Phase Author
Alite [15]Anhydrite [16]Bassanite [17]Belite (β) [18]Belite (αprime) [19]Brownmillerite [20]C-S-H [21]Calcite [22]Ettringite [23]Gypsum [24]Hemicarbonate [25]Hydroxylellestadite [26]Lime (CaO) [27]Microcline [28]Portlandite [29]Quartz [30]Tobermorite [31]Tricalciumaluminate (cubic) [32]Tricalciumaluminate (orthorhombic) [33]PONCKS model for Water [21]
J Schreiner et al Cement and Concrete Research 107 (2018) 247ndash252
248
6 Publications
40
portlandite begins rapidly after the addition of water to the mixture andlime is fully consumed after only 1 h of hydration This translates into aquick rise of heat of hydration so that cement hydration is acceleratedwhich leads to further portlandite formation by the reaction of aliteEttringite formation stalls after few hours of hydration After 12 h et-tringite is partially decomposed probably due to sulfate depletion [9]
and poorly crystalline AFm phases (not shown in Fig 2) are formedIn Fig 3 it can be seen that in fact two generations of portlandite
are formed a 1st dominant generation showing anisotropic peakbroadening and 2nd one occurring considerably later following theisotropic domain size refinement which is usually carried out using theRietveld method This occurrence comes along firstly with lime hy-dration and secondly with alite hydration The expected quantity ofportlandite formed from lime hydration very well complies with the
Fig 2 Phase development in AAC paste on a laboratory scale before autoclaving ana-lyzed by in-situ XRD at 70 degC
Fig 3 Formation of two generations of portlandite by hydration of lime (1st) and C3S(2nd) at 70 degC before autoclaving with the major generation showing anisotropic peakbroadening
Fig 4 Biaxial cylinder domain size model of portlandite used for Rietveld refinement of anisotropic peak broadening
Fig 5 Morphological evolution of portlandite showing anisotropic domain size growthduring hydration at 70 degC
Fig 6 Comparison of quantification of crystalline quartz in samples prepared withMcCrone mill and agate mortar at different autoclaving times
J Schreiner et al Cement and Concrete Research 107 (2018) 247ndash252
249
6 Publications
41
quantity of the observed 1st generation The development of portlan-dite growth was already tracked in an equivalent slurry at 23 degC [14]Thus this observation confirms that the crystallinity of portlandite inmixtures for AAC production depends on the starting phase for hydra-tion as already indicated by Ectors [14]
Fig 4 shows the used biaxial cylindrical model for anisotropic do-main size calculation and the portlandite structure which was createdwith structural software VESTA 318 [34] Using the cylindrical ap-proach domain sizes in a (here equating to b) and c direction(dz= cylinder height) can be calculated which comes along with theexpected symmetrical parameters of portlandite
The 1st portlandite generation showing anisotropic domain growthcan be tracked in terms of cylinder diameter and height which is rea-lized in Fig 5 The blue cylinder represents the geometric approach andcylinder height and diameter are calculated newly for each range Thecylinder height remains rather stable throughout the hydration processwhile the cylinder diameter increases during the first hours of hydra-tion After 10 h of hydration the mean cylinder diameter no longer in-creases Consequently these observations match the results of the ex-aminations conducted at 23 degC [14] as well as the assumption thatdifferent mechanisms of growth exist for portlandite depending on the
hydration educt The maximum cylinder diameter is reached earlier inthis work very likely because of the higher hydration temperature
32 Quantification of the reactions during autoclaving
Autoclaved samples were ground with an agate mortar and com-pared to samples which were wet-ground with a McCrone mill Fig 6shows precisely that the determination of the amount of crystallinequartz is more reproducible in the two shown samples which were
Fig 7 2D XRD with Bruker GADDS-system plots of samples prepared with agate mortar and McCrone mill Coarse quartz grains are pointed out in the plot of the sample prepared withagate mortar
Fig 8 Particle size distribution of one sample prepared with an agate mortar and of onesample prepared with a McCrone mill measured by laser granulometry
Fig 9 Rietveld refinement for Tobermorite of autoclaved AAC sample by use of isotropicdomain size model (a) and of anisotropic domain size model (b)
J Schreiner et al Cement and Concrete Research 107 (2018) 247ndash252
250
6 Publications
42
prepared with a McCrone mill The high variance of crystalline quartzin the samples which were prepared with an agate mortar is a result ofinsufficient grinding and remaining of too large quartz grains Whenthis spottiness occurs a reliable quantification using the G-factormethod is not possible
The 2D XRD with Bruker GADDS-system plots in Fig 7 demonstratethe insufficient grinding when using an agate mortar compared to wetmilling with a McCrone mill Quartz would be overrepresented in a one-dimensional XRD pattern focusing on a section with bright spots (greenarrows) The lack of bright spots in the right plot shows that the quartzgrains are milled more thoroughly using a McCrone mill In Fig 8 theparticle size distribution after both ways of sample preparation iscompared Most grains in the sample prepared with an agate mortar arelarger than in the sample prepared with a McCrone mill The grain sizedistribution of the sample prepared with a McCrone mill complies withthe recommended particle size range for XRD analysis of under 5 to50 μm [3536] while the other sample exceeds the range
In Fig 9 Rietveld refinement of an autoclaved sample is shown Thedominant peaks at 77 290 and 301deg 2θ are attributed to tobermoriteIn the upper diagram (a) Rietveld refinement was carried out regularlycalculating isotropic domain sizes for tobermorite However the cal-culated fit differs significantly from the raw data It can be assumed thattobermorite shows a similar pattern to portlandite in terms of aniso-tropic peak broadening taking into account that tobermorite is as-signed to the orthorhombic crystal system Thus instead of a biaxialcylinder model an elliptic cylinder model (Fig 10 structure createdwith VESTA 318 [34]) was applied for the refinement in the lowerdiagram (b) The elliptic cylinder model is a sufficient approach to the
orthorhombic crystal system as it allows the distinction between do-main sizes in a b and c direction The fit is clearly superior using theanisotropic domain size model highlighted by the difference plot inFig 9b The comparison refinement with isotropic and anisotropic ap-proach was done for all of the five autoclaved samples In Fig 11 theresulting Rwp values for the whole pattern and the RBragg values of to-bermorite are shown The refinement using the anisotropic model leadsto both lower Rwp and RBragg values and consequently to a better fit anda more accurate quantification of tobermorite in all refined samples
4 Summary and conclusions
Improved analytical methods for both the phase developmentduring the hydration before autoclaving and during the autoclavingprocess of AAC are presented It could be shown that wet McCronemilling is the best way of preparation of AAC samples in order to obtainsuitable samples for powder diffraction A new approach to treat ani-sotropic domain sizes for Rietveld refinement could be successfullyapplied ndash with the benefit that portlandite and tobermorite in AACsamples could be refined more accurately using the Rietveld methodThus this application allows an improved quantification of the phasedevelopment during both of the production steps
For the future there are still plenty of possibilities to apply thepresented approach of calculating anisotropic domain sizes to AACproduction As exemplified with portlandite the mechanisms of growthof tobermorite can be tracked likewise during the autoclaving processIn addition the effect of variations in the chemical composition of AACraw mixtures on the crystal morphology of tobermorite can be ex-amined This leaves a new perspective to discuss the link between mi-neral phase morphology and the thermal and mechanical properties ofAAC
Acknowledgement
The autoclaved samples were generously provided by RodgauerBaustoffwerke GmbH amp Co KG The authors express gratitude for allsupport
Appendix A Supplementary data
Supplementary data to this article can be found online at httpsdoiorg101016jcemconres201802028
References
[1] MW Grutzeck Cellular concrete in M Scheffler P Colombo (Eds) CellularCeramics Wiley-VCH Weinheim 2005 pp 193ndash223
[2] M Haas The future of AAC ndash from a material scientists point of view inMC Limbachiya JJ Roberts (Eds) Autoclaved Aerated Concrete Taylor FrLondon 2005 pp 187ndash194
[3] T Mitsuda K Sasaki H Ishida Phase evolution during autoclaving process ofaerated concrete J Am Ceram Soc 75 (1992) 1858ndash1863
[4] N Isu H Ishida T Mitsuda Influence of quartz particle size on the chemical and
Fig 10 Triaxial cylinder domain size model of Tobermorite used for Rietveld refinement of anisotropic peak broadening
Fig 11 Comparison of Rwp and RBragg values of Rietveld refinements of autoclavedsamples and tobermorite using the isotropic and the anisotropic domain size model
J Schreiner et al Cement and Concrete Research 107 (2018) 247ndash252
251
6 Publications
43
mechanical properties of autoclaved aerated concrete (I) tobermorite formationCem Concr Res 25 (1995) 243ndash248
[5] NY Mostafa Influence of air-cooled slag on physicochemical properties of auto-claved aerated concrete Cem Concr Res 35 (2005) 1349ndash1357 httpdxdoiorg101016jcemconres200410011
[6] K Matsui J Kikuma M Tsunashima T Ishikawa S Matsuno A Ogawa M SatoIn situ time-resolved X-ray diffraction of tobermorite formation in autoclaved aer-ated concrete influence of silica source reactivity and Al addition Cem Concr Res41 (2011) 510ndash519
[7] C Biagioni S Merlino E Bonaccorsi The tobermorite supergroup a new no-menclature Mineral Mag 79 (2015) 485ndash495 httpdxdoiorg101180minmag2015079222
[8] BH OConnor MD Raven Application of the Rietveld refinement procedure inassaying powdered mixtures Powder Diffract 3 (1988) 2ndash6 httpdxdoiorg101017S0885715600013026
[9] D Jansen F Goetz-Neunhoeffer C Stabler J Neubauer A remastered externalstandard method applied to the quantification of early OPC hydration Cem ConcrRes 41 (2011) 602ndash608 httpdxdoiorg101016jcemconres201103004
[10] D Jansen C Stabler F Goetz-Neunhoeffer S Dittrich J Neubauer Does OrdinaryPortland Cement contain amorphous phase A quantitative study using an externalstandard method Powder Diffract 26 (2011) 31ndash38 httpdxdoiorg10115413549186
[11] D Ectors F Goetz-Neunhoeffer J Neubauer A generalized geometric approach toanisotropic peak broadening due to domain morphology J Appl Crystallogr 48(2015) 189ndash194 httpdxdoiorg101107S1600576714026557
[12] D Ectors F Goetz-Neunhoeffer J Neubauer Routine (an)isotropic crystallite sizeanalysis in the double-Voigt approximation done right Powder Diffract 32 (S1)(2017) 27ndash34 httpdxdoiorg101017S0885715617000070
[13] HM Rietveld A profile refinement method for nuclear and magnetic structures JAppl Crystallogr 2 (1969) 65ndash71 httpdxdoiorg101107S0021889869006558
[14] D Ectors Advances in the Analysis of Cementitious Reactions and Hydrate Phases(Doctoral Thesis) (2016) pp 12ndash14 (urnnbndebvb29-opus4-71743)
[15] AacuteG De La Torre S Bruque J Campo MAG Aranda The superstructure of C3Sfrom synchrotron and neutron powder diffraction and its role in quantitative phaseanalyses Cem Concr Res 32 (2002) 1347ndash1356 httpdxdoiorg101016S0008-8846(02)00796-2
[16] A Kirfel G Will Charge density in anhydrite CaSO4 from X-ray and neutrondiffraction measurements Acta Crystallogr Sect B Struct Crystallogr CrystChem 36 (1980) 2881ndash2890 httpdxdoiorg101107S0567740880010461
[17] C Bezou AN Christensen D Cox M Lehman A Nonat Structures cristallines deCaSO405H2O et CaSO406H2O Comptes Rendus Hebd Des Seacuteances lAcadeacutemieDes Sci Seacuterie 2 (312) (1991) 43ndash48
[18] KH Jost B Ziemer R Seydel Redetermination of the structure of β-dicalciumsilicate Acta Crystallogr Sect B Struct Crystallogr Cryst Chem 33 (1977)1696ndash1700 httpdxdoiorg101107S0567740877006918
[19] W Mumme LMD Cranswick BC Chakoumakos Rietveld crystal structure re-finements from high temperature neutron powder diffraction data for the poly-morphs of dicalcium silicate Neues Jahrb Fuer Mineral Abhandlungen 170 (1996)171ndash188
[20] A Colville S Geller The crystal structure of brownmillerite Ca2FeAlO5Crystallographica 50 (1971) 2311ndash2315 httpdxdoiorg101107S056774087100579X
[21] ST Bergold F Goetz-Neunhoeffer J Neubauer Quantitative analysis of C-S-H inhydrating alite pastes by in-situ XRD Cem Concr Res 53 (2013) 119ndash126 httpdxdoiorg101016jcemconres201306001
[22] EN Maslen VA Streltsov NR Streltsova N Ishizawa Electron density and op-tical anisotropy in rhombohedral carbonates III Synchrotron Xray studies ofCaCO3 MgCO3 and MnCO3 Acta Crystallogr Sect B 51 (1995) 929ndash939 httpdxdoiorg101107S0108768195006434
[23] G Renaudin Y Filinchuk J Neubauer F Goetz-Neunhoeffer A comparativestructural study of wet and dried ettringite Cem Concr Res 40 (2010) 370ndash375httpdxdoiorg101016jcemconres200911002
[24] WF Cole CJ Lancucki A refinement of the crystal structure of gypsumCaSO42H2O Acta Cryst B30 (1974) 921ndash929 httpdxdoiorg101107S0567740874004055
[25] T Runčevski RE Dinnebier OV Magdysyuk H Poumlllmann Crystal structures ofcalcium hemicarboaluminate and carbonated calcium hemicarboaluminate fromsynchrotron powder diffraction data Acta Crystallogr Sect B Struct Sci 68 (2012)493ndash500 httpdxdoiorg101107S010876811203042X
[26] JM Hughes JW Drexler Cation substitution in the apatite tetrahedral site crystalstructures of type hydroxylellestadite and type fermorite Neues Jahrb FuerMineral (1991) 327ndash336
[27] CH Shen RS Liu JG Lin CY Huang Phase stability study of La12Ca18Mn2O7Mater Res Bull 36 (2001) 1139ndash1148
[28] SW Bailey Refinement of an intermediate microcline structure Am Miner 54(1969) 1540ndash1545
[29] WR Busing HA Levy Neutron diffraction study of calcium hydroxide J ChemPhys 26 (1957) 563 httpdxdoiorg10106311743345
[30] Y Le Page G Donnay Refinement of the crystal structure of low-quartz ActaCrystallogr Sect B 32 (1976) 2456ndash2459 httpdxdoiorg101107S0567740876007966
[31] SA Hamid The crystal structure of the 11 Aring natural tobermoriteCa225[Si3O75(OH)15]1H2O Zeitschrift Fuer Krist - New Cryst Struct 154 (1981)189ndash198 httpdxdoiorg101524zkri19811543-4189
[32] P Mondal JW Jeffery The crystal structure of tricalcium aluminate Ca3Al2O6Acta Crystallogr B 31 (1975) 689ndash697 httpdxdoiorg101107S0567740875003639
[33] Y Takeuchi F Nishi I Maki Crystal-chemical characterization of the tricalciumaluminate-sodium oxide (3CaOtimesAl2O3-Na2O) solid-solution series Zeitschrift FuumlrKrist (1980) 259ndash307
[34] K Momma F Izumi VESTA 3 for three-dimensional visualization of crystal vo-lumetric and morphology data J Appl Crystallogr 44 (2011) 1272ndash1276 httpdxdoiorg101107S0021889811038970
[35] K Scrivener R Snellings B Lothenbach A Practical Guide to MicrostructuralAnalysis of Cementitious Materials CRC Press 2016 pp 123ndash125 httpdxdoiorg107693wl20150205
[36] V Pecharsky P Zavalij Fundamentals of Powder Diffraction and StructuralCharacterization of Materials Springer second edition 2005 p 302 httpdxdoiorg101007978-0-387-09579-0
J Schreiner et al Cement and Concrete Research 107 (2018) 247ndash252
252
6 Publications
44
7 Acknowledgement
7 Acknowledgement
Ich moumlchte mich bei einigen Personen bedanken ohne die es wohl kaum zum erfolgreichenAbschluss dieser Arbeit gekommen waumlreMein Doktorvater Prof Dr Juumlrgen Neubauer hat sich stets die Zeit genommen die noumltigwar um Angelegenheiten aller Art mit mir zu klaumlren Er gab mir fachlich immer zumrichtigen Zeitpunkt einen gewissen wissenschaftlichen Impuls Zugleich habe ich mich den-noch immer frei in meiner eigenen Konzeption gefuumlhlt Groszligen Dank spreche ich Prof DrFriedlinde Goumltz-Neunhoeffer aus die fuumlr mich ebenso immer eine verlaumlssliche Ansprech-partnerin fuumlr fachliche und organisatorische Angelegenheiten aller Art war Danke anDr Daniel Jansen fuumlr die gute Zusammenarbeit und dafuumlr dass er mich im Zuge meinerMasterarbeit in ein Forschungsprojekt aufgenommen hat das den Weg zur Promotionmoumlglich machte Zusaumltzlich gilt mein Dank Prof Dr Matthias Goumlbbels der fuumlr dieMitarbeiter am Lehrstuhl immer motivierende Worte fand Fuumlr die Ermoumlglichung meinerTeilnahme an diversen Dienstreisen Fortbildungen und Tagungen moumlchte ich mich viel-mals bedankenWeiterhin bedanke ich mich bei Dr Stephan Volkmann und den Rodgauer BaustoffwerkenGmbH amp Co KG fuumlr die gute Zusammenarbeit und die Bereitstellung von Versuchsma-terialienVielen Dank an meine studentischen Hilfskraumlfte Daniel Wagner Laura MoldenhauerFabian Lang Jakob Schreiber und Felix Klaassen die alle Aufgaben im Labor einwand-frei und mit Bedacht erledigten Bei meinen aktuellen und ehemaligen Kollegen DrKatrin Hurle Dr Dominique Ectors Dr Christoph Naber Dr Florian Huumlller JoumlrgNehring Frank Riedel Julian Wolf Tanja Manninger Daniel Wagner Nicolas FobbeKarla Spaumlth Julian Goergens Andreas Koumlhler Cordula Jakob Franz Becker und LisaKlemenz bedanke ich mich fuumlr die gelungene Zusammenarbeit und gegenseitige Unter-stuumltzung Besonderer Dank geht auch an Kerstin Kreszlig Bettina Engl Christian HankeBernd Schleifer und Christian Abe fuumlr die verlaumlssliche Unterstuumltzung bei technischen Fra-gen und Messungen im LaborFuumlr jegliche Unterstuumltzungen moumlchte ich mich auch bei meinen Eltern bedanken sowiebei meinem Bruder Ralf der mir mit einem LaTex Crashkurs viel Frustration ersparthat Danke Thomas dass du immer fuumlr mich da bist und mit mir zusammen fuumlr genugAusgleich gesorgt hast
45
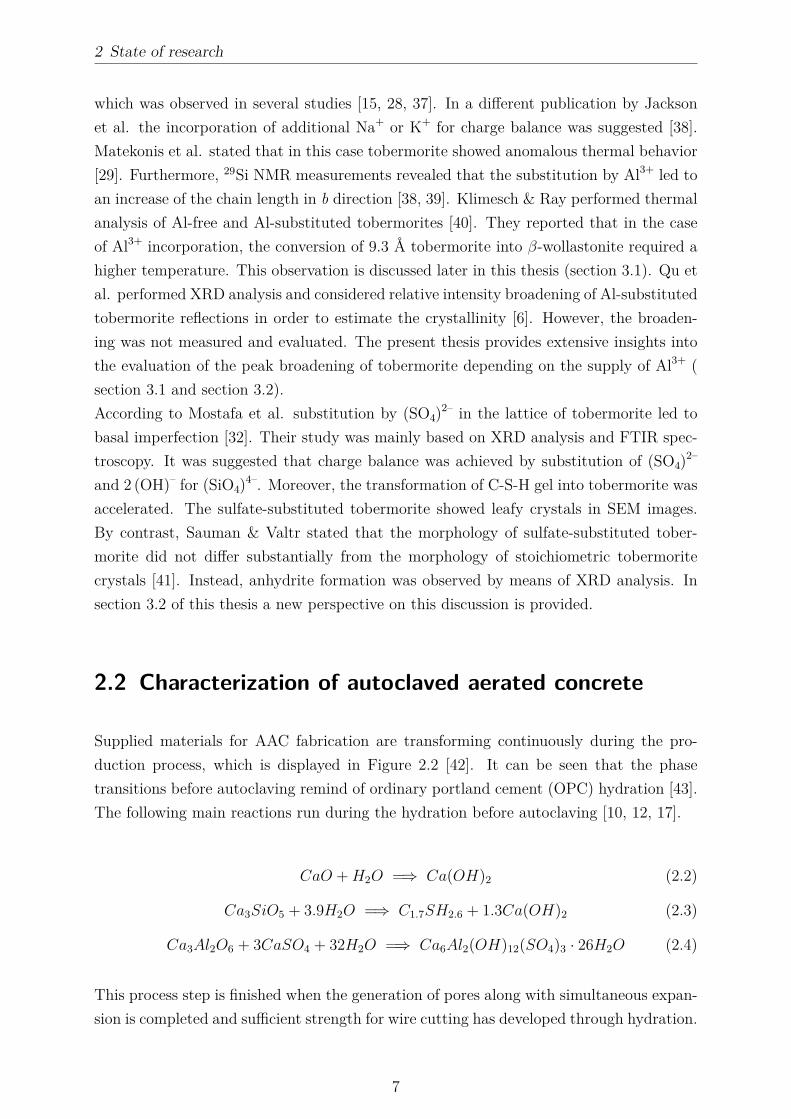
2 State of research
which was observed in several studies [15 28 37] In a different publication by Jacksonet al the incorporation of additional Na+ or K+ for charge balance was suggested [38]Matekonis et al stated that in this case tobermorite showed anomalous thermal behavior[29] Furthermore 29Si NMR measurements revealed that the substitution by Al3+ led toan increase of the chain length in b direction [38 39] Klimesch amp Ray performed thermalanalysis of Al-free and Al-substituted tobermorites [40] They reported that in the caseof Al3+ incorporation the conversion of 93 Aring tobermorite into β-wollastonite required ahigher temperature This observation is discussed later in this thesis (section 31) Qu etal performed XRD analysis and considered relative intensity broadening of Al-substitutedtobermorite reflections in order to estimate the crystallinity [6] However the broaden-ing was not measured and evaluated The present thesis provides extensive insights intothe evaluation of the peak broadening of tobermorite depending on the supply of Al3+ (section 31 and section 32)According to Mostafa et al substitution by (SO4)2ndash in the lattice of tobermorite led tobasal imperfection [32] Their study was mainly based on XRD analysis and FTIR spec-troscopy It was suggested that charge balance was achieved by substitution of (SO4)2ndash
and 2 (OH)ndash for (SiO4)4ndash Moreover the transformation of C-S-H gel into tobermorite wasaccelerated The sulfate-substituted tobermorite showed leafy crystals in SEM imagesBy contrast Sauman amp Valtr stated that the morphology of sulfate-substituted tober-morite did not differ substantially from the morphology of stoichiometric tobermoritecrystals [41] Instead anhydrite formation was observed by means of XRD analysis Insection 32 of this thesis a new perspective on this discussion is provided
22 Characterization of autoclaved aerated concrete
Supplied materials for AAC fabrication are transforming continuously during the pro-duction process which is displayed in Figure 22 [42] It can be seen that the phasetransitions before autoclaving remind of ordinary portland cement (OPC) hydration [43]The following main reactions run during the hydration before autoclaving [10 12 17]
CaO +H2O =rArr Ca(OH)2 (22)
Ca3SiO5 + 39H2O =rArr C17SH26 + 13Ca(OH)2 (23)
Ca3Al2O6 + 3CaSO4 + 32H2O =rArr Ca6Al2(OH)12(SO4)3 middot 26H2O (24)
This process step is finished when the generation of pores along with simultaneous expan-sion is completed and sufficient strength for wire cutting has developed through hydration
7
2 State of research
The reaction of aluminum powder does not only lead to the formation of hydrogen gasbut to very low amounts of different modifications of aluminum hydroxide [17] Howeverit can be seen that none of the hydrate phases forming during the green cake settingendure the autoclaving process Only quartz does partially not react and is consequentlypresent in the final product After transforming into ettringite and later AFm phasesinitially supplied anhydrite recrystallizes during the hydrothermal treatment A multi-step reaction sequence of C-S-H portlandite and further intermediate hydration productsleads to the crystallization of tobermorite The reader is referred to the comprehensivestudy of Schober for a more detailed presentation [17] Further supply of dissolved silicaat hydrothermal conditions contributes to the formation of tobermorite in the manneroutlined in equation 21 Clearly tobermorite is the major mineral phase present afterautoclaving and is therefore the main focus of research In the following subsections 221and 222 the state of knowledge concerning the characterization of AAC by means ofSEM analysis and XRD analysis is provided
Figure 22 Exemplary phase development during the entire production process of AACFigure adopted with permission from Schober [42]
221 SEM analysis
At first sight AAC has rather favorable properties compared to hydrated Portland cementwhen it comes to SEM analysis Due to the hydrothermal treatment several phases such
8
2 State of research
as tobermorite show better crystallinity In addition the hardly evitable effects of dam-age to poorly crystalline phases and removal of water are not as significant in the case ofAAC This is why environmental scanning electronic microscopy (ESEM) was suggestedin order to investigate hydrated Portland cement after early hydration [44 45] Howeverwhile hydrated OPC is a reasonably homogeneous material AAC shows heterogeneitydue to the porous structure (Figure 11)As reported in subsection 213 several authors investigated the morphology of tober-morite in AAC in order to verify the influence of foreign ions supplied by SCMs andestimate their effect on the thermal and mechanical properties Well crystallized tober-morite often shows a house-of-cards structure in AAC (Figure 23) which was observedin numerous studies [46 47 48]
Figure 23 House-of-cards appearance of tobermorite crystals in AAC
Wongkeo amp Chaipanich stated that the application of coal bottom ash for partial replace-ment of cement in the starting compound resulted in a change of plate-like to lath-likemorphology of tobermorite crystals [49] Equally thin lath-like plates of tobermorite wereobserved by Roacuteżycka et al in samples prepared from perlite waste [50] Venhodovaacute etal investigated AAC samples prepared from mixes including fly ash and Al(OH)3 andconfirmed the elongated shape of Al-incorporated tobermorite [8] In these studies thefraction of aluminum ions was increased by adding the respective SCM An effect on themorphology of tobermorite was respectively reported which conforms to the conclusionsmade by different authors in subsection 213 Nevertheless the heterogeneity of AACsamples in SEM images was barely addressed in all of these examples By contrast Mit-suda et al differentiated between macropores and micropores in their SEM images ofindustrially manufactured AAC [10] Huang et al separately analyzed walls and pores in
9
2 State of research
their samples prepared from copper tailings and blast furnace slag [48] The wall sectionsappeared dense while in pores platy tobermorite and long-strip shaped anhydrite wasobserved Only the tobermorite crystals in the pores showed the previously describedhouse-of-cards structure As is evident from these published results there is a lack ofclarity about the meaning and informative value of observations made in AAC samplesby SEM analysis In the main results of this present thesis (section 32) a substantiatedassessment of this circumstance is given
222 XRD analysis
While SEM analysis of AAC is majorly performed in order to characterize the crystallinityand morphology of tobermorite XRD analysis is mainly applied in order to assess theoverall phase composition Apart from the phases shown in Figure 22 additional calcitefeldspar mica gypsum and bassanite occur frequently in AAC depending on the miner-alogical composition of the used raw materials Frequently minor phases are unreactedresidual components of raw materials such as sericite in the publication of Isu et al [51] orphlogopite in the study of Huang et al who applied skarn-type copper tailings for AACpreparation [48] Prolonged curing duration resulted in minor quantities of xonotlite inthe study by Mitsuda et al [10]Mainly qualitative phase contents have been determined based on XRD in studies dealingwith the mineralogy of AAC A clear recognition of amorphous content in AAC along withthe crystalline phases has been barely addressed and discussed Relative quantities weredetermined by Matsui et al by plotting normalized intensities [28] They estimated thequantity of C-S-H gel by regarding the integrated intensity of the assumed tobermoriteprecursor in a distinct section of the XRD pattern Coming in agreement with the authorscited in subsection 213 increased d spacing along c in Al-substituted tobermorite wasreported in the same study Venhodovaacute et al performed XRD analysis of AAC samplesin their publication previously addressed in subsection 221 [8] They compared relativeintensities of tobermorite in their samples but no absolute quantities of the phases werecalculated either Mitsuda et al applied an internal standard method in order to quantifyunreacted quartz in their AAC samples [10]More recently Ectors proposed a promising method for the tracking of portlandite forma-tion during the green cake hydration [52] By applying a Rietveld compatible approachfor TOPAS 50 (Bruker AXS) to fit anisotropic peak broadening due to domain mor-phology [19] two generations of portlandite could be refined separately and assigned tothe hydration of calcium oxide and tricalcium silicate respectively The key idea behindthis approach is that the average domain morphology of a mineral phase in a powder
10
2 State of research
sample implies certain mineralogical characteristics The simplified domain morphologycan be calculated on the basis of geometrical shapes such as cylinder ellipsoid or cuboidDepending on the crystal system and the expected morphology the geometrical shapecan be adjusted accordingly In the example reported by Ectors the one generation ofportlandite originating from burnt lime hydration showed anisotropic peak broadening- unlike the generation forming from tricalcium silicate hydration In accordance withthe trigonal crystal system a biaxial cylinder model was applied for the fitting of theanisotropic generation The operating principle of the approach to fit the anisotropicpeak broadening due to domain morphology can be precisely explored by accessing fur-ther publications by Ectors et al [53 54] Apart from this benefit a better fit to themeasured data enables a more accurate refinement and quantification of all phases Thetwo generations of portlandite were additionally quantified by means of an external stan-dard method [55] The combination of quantitative phase analysis by XRD (QXRD) withthe refinement of anisotropic peak broadening is a promising approach in this context -especially in consideration of the fact that phase quantifications in AAC samples havebeen barely performed ever before Hence the application of these methods is the keymatter of this present thesis Especially the potential of the domain morphology analysisof tobermorite is precisely investigated The terms domain size and domain morphology inthis sense refer to the coherently scattering unit measured by XRD analysis Crystallineparticles observed by means of electron microscopy which are frequently termed grainscrystals or crystallites are for the most part clusters of coherently scattering domains[56 57]
11
3 Main results
3 Main results
This chapter introduces the main results presented in three peer reviewed publications[58 59 60] incorporated in chapter 6 The new findings are put in a general context andsubsequently they are summarized and discussed in chapter 4 The sections 31 and 32deal with the characterization of tobermorite in both lab-scale samples and AAC sam-ples produced on an industrial scale In section 33 the entire production process of AACincluding the hydration before autoclaving is addressed
Figure 31 Application of a triaxial cylinder model for the calculation of anisotropic do-main sizes of tobermorite implemented with Rietveld refinement and influenceon the fit compared to ordinary refinement [60]
12
3 Main results
One particular main result is a key element in each of the following sections In Figure 31the fit of tobermorite after two Rietveld refinements of different accuracy is shown In aregular Rietveld refinement for simplification the coherently scattering units are treatedas spherical shapes as usually only one size value for each mineral phase is calculated Asaverage domain sizes of a mineral phase in different crystallographic directions are in manycases indeed close to one value this approximation is often sufficient in order to achievea satisfactory fit to the measured diffractogram The crystal system and surroundingconditions during the formation of a mineral phase are significant factors in this context Amisfit at different (hkl) reflections as displayed in Figure 31 is an indication of anisotropicpeak broadening Clearly orthorhombic tobermorite shows anisotropic peak broadeningdue to its anisotropic domain morphology For the possible origins of anisotropic peakbroadening apart from size broadening the reader is referred to section 61 In accordancewith the orthorhombic crystal system a triaxial model is applied in order to fit the peakbroadening [19] By implementing the macro during the refinement no longer one butthree sizes (x y and z for respectively a b and c direction) are calculated Besides theimproved fit the calculated domain morphology is an additional information extractedfrom XRD analysis and it is representative for the average value of the phase in the entiresample In each of the following sections the different benefits regarding this approachare outlined in more detail
31 Hydrothermal synthesis of tobermorite on alaboratory scale - application of two types ofmetakaolin
This study covers mineralogical properties of tobermorite synthesized from a set of variouscompounds including different amounts and types of metakaolin [58] Unlike in sections32 and 33 the samples were not aerated before autoclaving and their composition isadjusted to the CaSi molar ratio of stoichiometric tobermorite On the one hand thereactivity of metakaolin and minor phases at hydrothermal conditions for the possible usein AAC production was investigated On the other hand the effects of consequent changesof the bulk chemistry in the basic compound on the mineralogical characteristics of to-bermorite such as lattice parameters and domain morphology were analyzed In additionfor one particular compound the effect of different curing times was explored While theconventional raw materials for AAC production are rather low-cost resources metakaolinis a high-priced SCM in this regard For this reason besides one comparatively pure com-mercial metakaolin (MK) a second by-product type of metakaolin (MKg) was applied
13
3 Main results
at equivalent dosages All investigated mix composites and the chemical composition ofMK and MKg are summed up in tables in section 61In Figure 32 the effect of different amounts of the two types of metakaolin on the phasequantities is displayed Clearly at moderate dosages of MK and MKg tobermorite waspresent in comparable quantities However the application of any amount of metakaolinreduced the amount of tobermorite compared to the blank mixture It can be seen thatkatoite was present whenever the content of Al2O3 in the starting drymix exceeded 2wt which fits well with the state of knowledge [5 23] For the highest possible dosagesof the two types of metakaolin (MK60 and MKg60) contrary effects were observed Ap-plication of impure metakaolin (MKg) led to a considerable amount of tobermorite whilein MK60 no tobermorite was present The high content of Al2O3 seems to have hinderedthe formation of tobermorite Not all of the Al2O3 in MKg was supplied for reactionas minor phases such as feldspar remained unreacted which is shown accurately in therespective publication in section 61
Figure 32 Weight fractions of tobermorite quartz and katoite measured by QXRD anal-ysis and contents of Al2O3 in the starting drymix Amorphous content andminor phases are not shown
The results of thermal analysis of samples characterized by MK addition in small stepsare shown in Figure 33 It can be seen that the conversion of 93 Aring tobermorite into β-
14
3 Main results
wollastonite depended on the dosage of MK However unlike suggested by Klimesch ampRay there was no effect of lower contents of Al2O3 in the drymix [40] Consequently theinfluence of Al3+ at low dosages (MK25 and MK5) could not be observed on the basisof this method Apart from this result the other signals showed good agreement with thesuggested conversion ranges by Klimesch amp Ray as for samples MK9 and MK16 a clearshift towards higher temperature was measured However the role of Al3+ incorporationverified by this method is not necessarily conclusive as additional reactions during theheating experiment involving Al3+ are possible On that basis the observations madeby means of DTA would not reflect the amount of Al3+ originally incorporated into thestructure of 11 Aring tobermorite
Figure 33 Conversion of 93 Aring tobermorite into β-wollastonite in samples synthesizedwith various amounts of metakaolin and suggested temperature ranges ac-cording to Klimesch amp Ray [40]
In accordance with authors referenced in subsection 213 lattice parameter c of tober-morite increased with elevated dosages of Al2O3 in the basic dry mix (Figure 34) Theimpact could be observed for the complete range of samples as displayed in section 61which indicates that a limit of Al3+ incorporation was not reached in this study Forcomparison the relative domain morphology is plotted in Figure 34 Unlike the DTA
15
3 Main results
signals both lattice parameter c and the domain morphology are impacted by very lowdosages of Al2O3 There is a good accordance of the relation of growth in b direction to adirection and the c parameter This is valid up to 20 wt of Al2O3 in the starting drymix By contrast more elevated contents of Al2O3 did not affect the domain morphologyany further even though the incorporation is verified through the increased c parameterIt follows that the impact of Al3+ incorporation on the domain morphology is limited tovery low contents while the impact on lattice parameter c can be tracked throughoutthe entire examined range of samples In section 61 additional results show that growthin b direction increased with reaction time These observations are solely based on XRDanalysis and offer new benefits for the structural understanding of tobermorite
Figure 34 Impact of the calculated Al2O3 content in the basic dry mix on the latticeparameter c and on the relation of calculated domain sizes of tobermorite ina (x) and b (y) direction
16
3 Main results
32 Structural properties of tobermorite in AAC - SEMversus XRD analysis
This section and the respective publication [59] mainly deal with the suitability of SEManalysis of tobermorite in AAC The effects of varying amounts of SO3 and Al2O3 in thedry mix on structural properties of tobermorite are discussed based on XRD analysisAs shown in subsection 221 and Figure 23 tobermorite often shows a house-of-cardsstructure in AAC samples This property has been considered to be relevant for thethermal and mechanical properties of AAC (subsection 221) However SEM analysiswithin this study revealed that this type of appearance is mainly found in the poresand pore surfaces (Figure 35) This finding comes in agreement with the observationsmade by Huang et al [48] In the solid skeleton of the dense AAC material neither themorphology nor the house-of-cards structure could be observed properly which can beseen very clearly in additional micrographs provided in section 62 It should be consideredthat the major amount of tobermorite by weight is located in the dense material and notat the pore surfaces In this way these findings are clear disadvantages coming along withonly SEM analysis of AAC as representative results can hardly be obtained
Figure 35 House-of-cards structure of tobermorite in a pore surrounded by dense mate-rial
Moreover several authors in subsection 221 justified the morphology of tobermorite withthe incorporation of foreign ions Al-substituted tobermorite showed lath-like morphologywhereas Al-free tobermorite showed rather plate-like morphology [6 32 49] Howeverthe present investigation revealed that independent of Al2O3 content in the raw mix there
17
3 Main results
is always heterogeneity regarding the morphology of tobermorite In Figure 36 plate-likeand lath-like morphology of tobermorite in AAC observed in two statistical chemicallyvarious samples are displayed This result supports the previous assumption that theobservations made by SEM analysis of tobermorite in AAC strongly depend on whatpart of the sample is selected Yet again no clear observations could be made that wererepresentative for the entire sample
Figure 36 Heterogeneous morphology of tobermorite (plate-like in a and c lath-like in band d) in two AAC samples characterized by different Al2O3 contents in theraw mix
The effects of Al3+ on the domain morphology of tobermorite were measured and evaluatedin a similar manner as in section 61 and the results could be confirmed The relativedomain growth in b direction was increased by Al3+ incorporation in both studies [5859] Moreover lattice parameter c was increased with Al3+ incorporation which can beseen more accurately in section 62 Unlike SEM analysis XRD analysis allowed clearconclusions whenever structural properties of Al-substituted tobermorite were affectedInstead of a local observation as made with SEM representative and statistical resultswere obtained The reader is referred to section 61 and section 62 for further results and
18
3 Main results
more specific conclusionsIn addition the effect of various amounts of sulfate in the raw mix was analyzed Unlikein the case of different dosages of Al3+ neither the domain morphology nor the latticeparameters of tobermorite were affected by the SO3 content in the dry mix In Figure 37these observations and additionally the amounts of anhydrite measured by QXRD areshown As the amount of available SO3 in the dry mix is known the maximum possibleamount of anhydrite could be calculated for each of the samples in focus Obviouslythe measured amounts of anhydrite are either equal or slightly higher compared to theexpected quantities This result leads to the assumption that all of the available sulfateis transformed into anhydrite so that no more sulfate could be incorporated into thestructure of tobermorite The over-estimation of anhydrite in some of the samples can beexplained due to the inaccuracy of the quantification method The present results rathermatch with the suggestions by Sauman amp Valtr [41] as in their study no effect of sulfateon the structure of tobermorite was observed either
Figure 37 Impact of the sulfate content in the AAC raw mix on lattice parameter cand relative domain morphology of tobermorite (a) and comparison of theexpected maximum amount of anhydrite to the measured amount determinedby QXRD (b)
33 Improved monitoring of the phase developmentduring the production of AAC
In this study not only autoclaved samples were analyzed but additionally a lab-scale slurrywhich included the reactive components of the green cake stage during AAC productionat equivalent weight proportions In-situ XRD was performed at 70 degC and at a water-to-
19
3 Main results
solid ratio of 08 for 24 h (Figure 38) which are respective conditions during commercialproduction Clearly the phase development is dominated by OPC and lime hydration asdescribed in section 22 It can be seen that the major reaction turnover occurs duringthe first 200 minutes which is the average duration of the green stage After only 30minutes all of the quicklime had transformed into portlandite whereas Schober proposeda duration of one hour for this reaction [42] The amount of portlandite is composed oftwo different generations as proposed by Ectors [52] Equally a biaxial cylinder modelwas applied in order to fit the peak broadening of the first generation of portlandite in thepresent investigation Minor phase developments such as the formation of AFm phases arenot shown in Figure 38 A coarse fraction of anhydrite did not react so that constantlyaround 15 wt were measured after 6 h As the decomposition of ettringite due tosulfate depletion [55] does not occur prior to 12 h the green cake strength is not affected
Figure 38 In-situ XRD measurement of AAC model slurry at water-to-solid ratio of 08and 70 degC For clarity and comprehensibility not all phases are shown
The separation of two generations of portlandite in the system does not only translate intodifferent domain morphologies as shown by Ectors [52] In Figure 39 more indicationsfor different mineralogical properties are displayed The shape of the (0 0 1) reflection inXRD patterns after only quicklime hydration and after both quicklime and alite hydrationshows a distinct feature While portlandite originating from quicklime hydration showsa broad peak implying lower crystallinity the peak after alite hydration is characterized
20
3 Main results
Figure 39 Formation of two generations of portlandite in AAC slurry in XRD (a) andDTA (b) plots
by a sharper component Yet the peak breadth did not change indicating that the firstgeneration is still present with the original characteristics This observation is supportedby DTA measurements additionally demonstrating two degrees of crystallinity only afteralite hydration In agreement with XRD analysis the better crystalline second generationof portlandite decomposes at a higher temperature
Figure 310 Quantification of tobermorite in statistical chemically various AAC sampleswith and without the application of the macro for the fitting of anisotropicpeak broadening
21
3 Main results
Furthermore commercial AAC samples were considered in this study By applying themethod for the refinement of anisotropic peak broadening (Figure 31) a more accuratequantification of tobermorite can be achieved In Figure 310 the calculated amounts oftobermorite in statistical chemically various AAC samples are plotted In some samplesthe refinement using the macro leads to considerably higher but never lower quantitiesof tobermorite whereas in other samples nearly the same amount of tobermorite is cal-culated This observation can be well understood taking into account that the macroallows to account more peak area for tobermorite as shown in Figure 31 Clearly thereis evidence that the anisotropy of tobermorite domains is not uniform from one sampleto another which was basically justified in the previous sections As an improved quan-tification of a single phase leads to a better quantification of other phases in the samplethis adaption is very valuable in order to assess the phase development Here the peakbroadening of tobermorite equally observed by Qu et al [6] could be tracked and evalu-ated in order to gain more accurate results Moreover in section 63 McCrone milling issuggested in order to avoid spottiness in XRD patterns caused by coarse grains of quartzor anhydrite (Figure 38)
22
4 Conclusions
4 Conclusions
The research results presented in the previous sections yield advances in the mineralogicalinvestigation of tobermorite and autoclaved aerated concrete Recorded diffraction pat-terns contain plenty of usually unused data regarding the microstructural characteristicsof the sample and phases therein The profit of XRD measurements can be significantlyimproved whenever one or more phases show anisotropic peak broadening and appro-priate models for the respective domain morphology are implemented into the Rietveldenvironment Within the scope of the present investigations portlandite and tobermoriteshow this particularityThe effects of changes in the chemistry of the starting mix were examined based on dif-ferent dosages of metakaolin Al-substituted tobermorite showed increased growth in b
direction and an increase of lattice parameter c compared to Al-free tobermorite The rel-ative domain sizes were determined based on anisotropic peak broadening However whilethe effect of Al3+ incorporation into the lattice of tobermorite was limited regarding thedomain morphology lattice parameter c showed an increase throughout the entire rangeof samples The consequent effects suggested by Klimesch amp Ray observed by means ofDTA are debatable as reactions during the heating experiment may lead to to a changeof Al3+ content in tobermorite [40] While both types of applied metakaolin showed goodreactivity at hydrothermal conditions some included minor phases such as feldspar oranatase remained unreacted At high dosages of Al2O3 in the starting mix the formationof either only katoite or katoite along with tobermorite was observed (Figure 32)SEM analysis of tobermorite in AAC cannot be suggested based on the observationspresented in this work as it is only visually accessible in the pores or at pore surfacesThe dense material of the AAC skeleton contains several crystalline and X-ray amorphousphases which hardly allows a proper investigation Even in single pores tobermorite crys-tals appeared very heterogeneous at various chemical compositions As a result lath-liketobermorite was not only present in samples characterized by elevated Al3+ incorporationBy contrast the benefits of XRD analysis presented in section 61 equally accounted fortobermorite in AAC samples Sulfate incorporation into the lattice of tobermorite wasnot observed All of the sulfate in the system was detected to be present in anhydriteThe phase transitions in the AAC raw slurry during the green stage hydration were show-cased by in-situ XRD analysis of a model mix at 70 degC Additional DTA and XRD mea-
23
4 Conclusions
surements during this step confirmed the presence of two generations of portlandite char-acterized by different crystallinity as suggested by Ectors [52] The inclusion of anisotropicdomain morphology during the Rietveld refinement allowed a more accurate quantifica-tion of tobermorite in autoclaved samples Sample preparation adjusted to the grain sizedistribution in AAC samples (section 63) the external standard method for quantita-tive XRD analysis [55] and the approach to evaluate anisotropic peak broadening [19]are the key methods for a more accurate tracking of the phase development during AACproduction
24
5 References
5 References
[1] A E Zadov A I Grabezhev N N Pertsev N V Chukanov and S V PribavkinTobermorite-plombierite metasomatites of the Gumeshevsk skarn-porphyry copper depositmiddle Urals Doklady Earth Sciences 407(3)495ndash497 2006
[2] M F Heddle Preliminary notice of substances which may prove to be new minerals MinMag 4117ndash123 1880
[3] S Merlino E Bonaccorsi and T Armbruster The real structure of tobermorite 11AringNormal and anomalous forms OD character and polytypic modifications European Journalof Mineralogy 13(3)577ndash590 2001
[4] C Biagioni S Merlino and E Bonaccorsi The tobermorite supergroup a new nomencla-ture Mineralogical Magazine 79(2)485ndash495 2015
[5] C A Riacuteos C D Williams and M A Fullen Hydrothermal synthesis of hydrogarnetand tobermorite at 175 degC from kaolinite and metakaolinite in the CaO-Al2O3-SiO2-H2Osystem A comparative study Applied Clay Science 43(2)228ndash237 2009
[6] X Qu Z Zhao and X Zhao Microstructure and characterization of aluminum-incorporated calcium silicate hydrates (C-S-H) under hydrothermal conditions RSC Ad-vances 8(49)28198ndash28208 2018
[7] R Šiaučiunas and K Baltakys Formation of gyrolite during hydrothermal synthesis inthe mixtures of CaO and amorphous SiO2 or quartz Cement and Concrete Research34(11)2029ndash2036 2004
[8] E Venhodovaacute R Janovskyacute and R Drochytka Formation of Tobermorite at Different Ma-terials Composition of Aerated Concrete Applied Mechanics and Materials 752-753247ndash250 2015
[9] L Galvaacutenkovaacute E Bartoniacutečkovaacute T Opravil J Tkacz and P Ptaacuteček The influence ofstarting materials solubility on tobermorite structure formation under the hydrothermalconditions IOP Conference Series Materials Science and Engineering 379(1)1ndash8 2018
[10] T Mitsuda K Sasaki and H Ishida Phase Evolution during Autoclaving Process J AmCeram Soc 75(75)1858ndash1863 1992
[11] A Skawińska The influence of metahalloysite addition on tobermorite formation studied byX-ray powder diffraction and scanning electron microscope MATEC Web of Conferences16305008 2018
[12] S T Bergold F Goetz-Neunhoeffer and J Neubauer Quantitative analysis of C-S-H in
25
5 References
hydrating alite pastes by in-situ XRD Cement and Concrete Research 53119ndash126 2013
[13] O P Shrivastava and F P Glasser Ion-exchange properties of 11-Aring tobermorite Reactivityof Solids 2(3)261ndash268 1986
[14] H Maeda Y Ogawa E H Ishida and T Kasuga Hydrothermal synthesis of tobermoritedoped with phosphorus species for removing heavy metal ions Journal of the AustralianCeramic Society 48(1)8ndash11 2012
[15] O P Shrivastava and R Shrivastava Cation exchange applications of synthetic tobermoritefor the immobilization and solidification of cesium and strontium in cement matrix Bulletinof Materials Science 23(6)515ndash520 2000
[16] G Renman and A Renman Sustainable Use of Crushed Autoclaved Aerated Concrete(CAAC) as a Filter Medium in Wastewater Purification 8th International conferenceon sustainable management of waste and recycled materials in construction GothenburgSweden 30 Mayndash1 June 2012 Proceedings pages 1ndash7 2012
[17] G Schober Chemical transformations during the manufacturing of autoclaved aeratedconcrete (ACC) Cement lime gypsum and quartz sand become cellular concrete ZKG58(7)63ndash70 2005
[18] A J Hamad Materials Production Properties and Application of Aerated LightweightConcrete Review International Journal of Materials Science and Engineering 2(2)152ndash157 2014
[19] D Ectors F Goetz-Neunhoeffer and J Neubauer A generalized geometric approach toanisotropic peak broadening due to domain morphology Journal of Applied Crystallogra-phy 48(1)189ndash194 2015
[20] H M Rietveld A profile refinement method for nuclear and magnetic structures Journalof Applied Crystallography 2(2)65ndash71 1969
[21] S A Hamid The crystal structure of the 11 Aring natural tobermoriteCa225[Si3O75(OH)15]1H2O Zeitschrift fuer Kristallographie - New Crystal Struc-tures 154(3-4)189ndash198 1981
[22] S A S El-Hemaly T Mitsuda and H F W Taylor Synthesis of normal and anomaloustobermorites Cement and Concrete Research 7429ndash438 1977
[23] M Sakiyama and T Mitsuda Hydrothermal reaction between C-S-H and kaolinite for theformation of tobermorite at 180degC Cement and Concrete Research 7(6)681ndash685 1977
[24] E Bonaccorsi S Merlino and A R Kampf The crystal structure of tobermorite 14 Aring(plombierite) a C-S-H phase Journal of the American Ceramic Society 88(3)505ndash5122005
[25] S Merlino E Bonaccorsi and T Armbruster The real structures of clinotobermorite andtobermorite 9 Aring OD character polytypes and structural relationships European Journalof Mineralogy 12(2)411ndash429 2000
[26] K Momma and F Izumi VESTA 3 for three-dimensional visualization of crystal volu-metric and morphology data Journal of Applied Crystallography 44(6)1272ndash1276 2011
26
5 References
[27] S Shaw S M Clark and C MB Henderson Hydrothermal formation of the calcium sil-icate hydrates tobermorite (Ca5Si6O16(OH)2 middot 4H2O) and xonotlite (Ca6Si6O17(OH)2)An in situ synchrotron study Chemical Geology 167(1-2)129ndash140 2000
[28] K Matsui J Kikuma M Tsunashima T Ishikawa S Matsuno A Ogawa and M SatoIn situ time-resolved X-ray diffraction of tobermorite synthesis process under hydrothermalcondition IOP Conference Series Materials Science and Engineering 18(2)60ndash66 2011
[29] G Matekonis R Šiaučiunas and D Vaičiukyniene Hydrothermal Synthesis and Charac-terization of Na + and [ Al 3 + + Na + ] -substituted Tobermorite in CaO-SiO2middotnH2O-H2OSystem MATERIALS SCIENCE 16(3)242ndash248 2010
[30] G Geng R J Myers M J A Qomi and P JM Monteiro Densification of the inter-layer spacing governs the nanomechanical properties of calcium-silicate-hydrate ScientificReports 7(1)1ndash8 2017
[31] D Klimesch and A Ray Autoclaved cement-quartz pastes with metakaolin additionsAdvanced Cement Based Materials 7(3-4)109ndash118 1998
[32] N Y Mostafa A A Shaltout H Omar and S A Abo-El-Enein Hydrothermal synthesisand characterization of aluminium and sulfate substituted 11 nm tobermorites Journal ofAlloys and Compounds 467(1-2)332ndash337 2009
[33] İ Demir M S Başpınar E Kahraman E Ccedilalışkan and G Goumlrhan An Investigation onthe Usability of Diatomite in Aerated Concrete Production In Proc of the Intl Conf onAdvances In Civil Structural And Construction Engineering - CSCE 2014 pages 97ndash1002014
[34] A Skawinska Z Owsiak T Baran and K Hernik The influence of halloysite additionon tobermorite formation in CaO and quartz mix under hydrothermal conditions CementWapno Beton 17(12)426ndash434 2017
[35] N Y Mostafa Influence of air-cooled slag on physicochemical properties of autoclavedaerated concrete Cement and Concrete Research 35(7)1349ndash1357 2005
[36] D Małaszkiewicz and J Chojnowski Influence of addition of calcium sulfate dihydrate ondrying of autoclaved aerated concrete Open Engineering 7(1)273ndash278 2017
[37] N Hara and N Inoue Thermal behaviour of 11Aring tobermorite and its lattice parametersCement and Concrete Research (10)53ndash60 1980
[38] M D Jackson S R Chae S R Mulcahy C Meral R Taylor P Li A H EmwasJ Moon S Yoon G Vola H R Wenk and P JM Monteiro Unlocking the secretsof Al-tobermorite in Roman seawater concrete American Mineralogist 98(10)1669ndash16872012
[39] W Liao W Li Z Fang C Lu and Z Xu Effect of different aluminum substitution rateson the structure of Tobermorite Materials 12(22)1ndash10 2019
[40] D Klimesch and A Ray DTA-TG Study of the CaO-SiO2-H2O and CaO-Al2O3-SiO2-H2OSystems Under Hydrothermal Conditions Journal of Thermal Analysis and Calorimetry56(1)27ndash34 1999
27
5 References
[41] Z Sauman and Z Valtr Substitution of sulphate ions in the crystal lattice of 11 Aring to-bermorite In The VI International Congress on the Chemistry of Cement pages 1ndash14Moscow 1974
[42] G Schober Reaction of raw materials to the final product AAC httpwwwpb-aacde
chemmin2_ehtml 2012 accessed 2020-01-31
[43] D Jansen C Stabler F Goetz-Neunhoeffer S Dittrich and J Neubauer Does Ordi-nary Portland Cement contain amorphous phase A quantitative study using an externalstandard method Powder Diffraction 26(01)31ndash38 2011
[44] C Roumlszligler J Stark F Steiniger and W Tichelaar Limited-dose electron microscopyreveals the crystallinity of fibrous C-S-H phases Journal of the American Ceramic Society89(2)627ndash632 2006
[45] Y Sakalli and R Trettin Investigation of C3S hydration by environmental scanning elec-tron microscope Journal of Microscopy 259(1)53ndash58 2015
[46] F Matsushita Y Aono and S Shibata Expansion and shrinkage behavior of green cakeof Autoclaved Aerated Concrete In Autoclaved Aerated Concrete - Innovation and Devel-opment Proceedings of the 4th International Conference on Autoclaved Aerated ConcreteKingston UK 8-9 September 2005 pages 101ndash108 CRC Press 2005
[47] C Chucholowski M Holger and K-C Thienel Improving the recyclability environmentalcompatibility and CO2 balance of autoclaved aerated concrete by replacing sulfate carrierand cement with calcined clays CePapers 2(4)503ndash512 2018
[48] X Y Huang W Ni W H Cui Z J Wang and L P Zhu Preparation of autoclavedaerated concrete using copper tailings and blast furnace slag Construction and BuildingMaterials 27(1)1ndash5 2012
[49] W Wongkeo and A Chaipanich Compressive strength microstructure and thermal anal-ysis of autoclaved and air cured structural lightweight concrete made with coal bottom ashand silica fume Materials Science and Engineering A 527(16-17)3676ndash3684 2010
[50] A Roacuteżycka and W Pichoacuter Effect of perlite waste addition on the properties of autoclavedaerated concrete Construction and Building Materials 12065ndash71 2016
[51] N Isu H Ishida and T Mitsuda Influence of quartz particle size on the chemical andmechanical properties of autoclaved aerated concrete (I) tobermorite formation Cementand Concrete Research 25(25)243ndash248 1995
[52] D Ectors Advances in the analysis of cementitious reactions and hydrate phases doctoralthesis PhD thesis Friedrich-Alexander-Universitaumlt Erlangen-Nuumlrnberg 2016
[53] D Ectors F Goetz-Neunhoeffer and J Neubauer Domain size anisotropy in the double-Voigt approach An extended model Journal of Applied Crystallography 481998ndash20012015
[54] D Ectors F Goetz-Neunhoeffer and J Neubauer Routine (an)isotropic crystallite sizeanalysis in the double-Voigt approximation done right Powder Diffraction 32(S1)27ndash342017
28
5 References
[55] D Jansen F Goetz-Neunhoeffer C Stabler and J Neubauer A remastered external stan-dard method applied to the quantification of early OPC hydration Cement and ConcreteResearch 41(6)602ndash608 2011
[56] T Ungaacuter G Tichy J Gubicza and R J Hellmig Correlation between subgrains andcoherently scattering domains Powder Diffraction 20(04)366ndash375 2005
[57] Triloki P Garg R Rai and B K Singh Structural characterization of as-depositedcesium iodide films studied by X-ray diffraction and transmission electron microscopy tech-niques Nuclear Instruments and Methods in Physics Research Section A AcceleratorsSpectrometers Detectors and Associated Equipment 736128ndash134 2014
[58] J Schreiner F Goetz-Neunhoeffer J Neubauer and D Jansen Hydrothermal synthesisof 11 Aring tobermorite ndash Effect of adding metakaolin to the basic compound Applied ClayScience 185 2020
[59] J Schreiner F Goetz-Neunhoeffer J Neubauer S Volkmann S Bergold R Webler andD Jansen Advanced Rietveld refinement and SEM analysis of tobermorite in chemicallydiverse autoclaved aerated concrete Powder Diffraction 34143ndash150 2019
[60] J Schreiner D Jansen D Ectors F Goetz-Neunhoeffer J Neubauer and S VolkmannNew analytical possibilities for monitoring the phase development during the production ofautoclaved aerated concrete Cement and Concrete Research 107247ndash252 2018
29
6 Publications
6 Publications
61 Hydrothermal synthesis of 11 Aring tobermorite ndash Effectof adding metakaolin to the basic compound
Reprint of the peer reviewed publication
Schreiner J Goetz-Neunhoeffer F Neubauer J Jansen D 2020 Hydrothermalsynthesis of 11 Aring tobermorite ndash Effect of adding metakaolin to the basic compoundApplied Clay Science 185 httpsdoiorg101016jclay2019105432
with permission from Elsevier
30
Contents lists available at ScienceDirect
Applied Clay Science
journal homepage wwwelseviercomlocateclay
Research paper
Hydrothermal synthesis of 11 Aring tobermorite ndash Effect of adding metakaolin tothe basic compound
J Schreiner F Goetz-Neunhoeffer J Neubauer D JansenUniversity of Erlangen-Nuremberg GeoZentrum Nordbayern Mineralogy Schlossgarten 5a 91054 Erlangen Germany
A R T I C L E I N F O
KeywordsHydrothermal synthesis11 Aring tobermoriteMetakaolinPowder diffractionKatoite
A B S T R A C T
Different amounts and types of metakaolin were analyzed and applied for the hydrothermal synthesis of 11 Aringtobermorite All synthesized samples were investigated by means of powder XRD combined with Rietveld re-finement Al-substituted 11 Aring tobermorite was successfully synthesized on the basis of a broad range of com-pounds characterized by a varying content of metakaolin Katoite was present depending on the amount ofsupplied Al3+ which was determined by the dosage of metakaolin Minor crystalline components included in thetwo types of metakaolin sources varied greatly in their reactivity under hydrothermal conditions Despite adifferent degree of purity the two types of metakaolin showed corresponding effects at moderate dosages butcontrary effects at higher dosages as for the synthesis of 11 Aring tobermorite The domain morphology of to-bermorite could be associated with Al3+ incorporation for low dosages of metakaolin represented by up to 2 wt- Al2O3 in the dry mix By contrast Al3+ affected tobermorite lattice parameters at equivalent and even athigher dosages with c reaching 2295 Aring at 12 wt- Al2O3 in the dry mix
1 Introduction
11 Application of metakaolin as a reactive material in constructionindustry
The application of supplementary cementitious materials (SCMs) inthe field of construction technology has received a lot of attention inrecent years Due to limited resources and an urgent need for alter-native and more eco-friendly construction materials SCMs such asmetakaolin offer a great potential The usage of SCMs has not onlyspread to the cement and mortar industry but also to advanced appli-cations such as autoclaved aerated concrete (AAC) (Demir et al 2014Koutnyacute et al 2014 Walczak et al 2015 Roacuteżycka and Pichoacuter 2016Chucholowski et al 2018) Unlike ordinary cementitious constructionmaterials AAC is produced from hydrothermal curing Due to the dif-ferent thermodynamic environment the hydration process and the re-activity of raw materials have to be investigated properly in order tounderstand the effects on the AAC product The leading mineral phasein AAC is 11 Aring tobermorite (Ca5Si6O16(OH)2middot4H2O) As a consequencethe thermal and mechanical properties of AAC depend on micro-structure and crystallinity of tobermorite to some extent In addition tothe curing time and the fineness of raw materials the supply of ionsthat can substitute in the tobermorite structure is a crucial factor in thiscontext Especially substitutions by aluminum sodium and potassium
ions have been investigated thoroughly (Sauman 1974 Klimesch andRay 1998 Mostafa et al 2009 Matekonis et al 2010 Skawinskaet al 2017) Calcined clays usually contain a considerable amount ofthe mentioned ions
There is a vast amount of literature on the reactivity of SCMs atambient temperature and standard pressure but there is little when itcomes to hydrothermal conditions In previous publications the beha-vior of metakaolin under hydrothermal conditions was mainly in-vestigated for the synthesis of zeolites (Zhang et al 2007 Aguilar-Mamani et al 2014 Setthaya et al 2016 Luo et al 2018) In thesestudies the reactivity of metakaolin was observed at a wide range oftemperature and pH values During the transformation of kaolin intometakaolin a loss of framework alumina was observed (Ayodele et al2019) In recent decades metakaolin has been the subject of studies inthe field of geopolymer research (Rashad 2013 Chen et al 2016) Forthe synthesis of 11 Aring tobermorite a more distinct setting of temperaturesetting (180ndash200 degC) and steam pressure (1ndash12 MPa) are required
This publication is intended to make a new contribution to thechallenging field of hydrothermal synthesis in the system CaO-Al2O3-SiO2-H2O based on XRD analysis combined with Rietveld refinementVarious dosages of two types of metakaolin with different chemical andmineralogical purities are compared for the effects on the hydrothermalsynthesis of Al-substituted 11 Aring tobermorite Especially changes of thebulk chemistry in the raw mixes the reactivity of minor crystalline
httpsdoiorg101016jclay2019105432Received 20 August 2019 Received in revised form 13 November 2019 Accepted 30 December 2019
Corresponding authorE-mail address juergenjsschreinerfaude (J Schreiner)
Applied Clay Science 185 (2020) 105432
0169-1317 copy 2020 Elsevier BV All rights reserved
T
6 Publications
31
phases of the two types of metakaolin and the effect of different curingtimes are the focus of interest On the one hand metakaolin offers agreat potential in the AAC industry On the other hand of all SCMsmetakaolin is a good source material for investigating the influence ofAl3+ on the synthesis of Al-substituted 11 Aring tobermorite
12 Synthesis of Al-substituted 11 Aring tobermorite
In addition to being present in AAC tobermorite has found appli-cation in wastewater treatment and nuclear waste management due toits ion exchange capacity (Maeda et al 2012 Monasterio et al 2015)The substitution of silicon by aluminum results in a different to-bermorite structure due to general and local charge balance affectingthe lattice parameters Especially c is impacted by this substitutionbecause it occurs in the bridging tetrahedron and additional OHndash sub-stitutes O2ndash (Komarneni et al 1985 Merlino et al 2000) As suggestedin some additional studies the substitution of Si4+ by Al3+ and Na+ orK+ leads to a lath-like morphology of tobermorite crystals (Mostafa2005 Mostafa et al 2009 Venhodovaacute et al 2015 Qu et al 2018)However because of the heterogeneous appearance of tobermorite inAAC it is hardly possible to conduct a proper characterization based onSEM analysis In our recent work the anisotropic peak broadening oftobermorite in XRD diffractograms was successfully linked with theincorporation of foreign ions supplied in a common AAC production(Schreiner et al 2019) This finding allowed a more statistical struc-tural characterization of tobermorite in bulk compositions compared toSEM analysis Moreover it was reported in other studies that differenthydrate phases occur depending on the amount of supplied ions and onthe experimental settings In compounds with a high content of Al3+formation of katoite could be observed (Klimesch and Ray 1998 Riacuteoset al 2009 Matsui et al 2011) In the case of a longer curing durationinstead of 11 Aring tobermorite the formation of xonotlite (Siauciunas andBaltakys 2004 Galvaacutenkovaacute et al 2018) or - depending on the finenessof used silica source (Siauciunas and Baltakys 2004) - gyrolite is fa-voured
Kalousek (1956) suggested that tobermorite can contain up to 5Al2O3 More Al2O3 in the system resulted in the formation of hydro-garnet Klimesch and Ray (1998) additionally investigated the stabilityof hydrogarnet depending on the Al(Si + Al) ratio and its role in re-lation to the formation of 11 Aring tobermorite in an equivalent systemThey suggest that hydrogarnet always appears before tobermorite butthe former can only be detected for higher Al(Si + Al) ratios in theevent of longer curing times Riacuteos et al (2009) and Qu et al (2018)confirmed these findings in extensive investigations In the latter pub-lication it is additionally suggested that samples prepared at lowertemperatures (160 degC) are less impacted by the supply of Al3+ Theyalso consider the peak broadening of tobermorite in their XRD plotsbased on the amount of incorporated Al3+ In two recent publicationswe suggested that the peak broadening of tobermorite enables a mi-crostructural analysis by calculating the orientation dependent domainsizes (Schreiner et al 2018 2019) However these studies are based onsamples of industrially produced AAC so that the curing time was fixedThe studied AAC was produced from raw materials with a broad che-mical spectrum such as ordinary Portland cement (OPC) whichsomehow complicates the interpretation of results
In this work the influence of aluminum ions - provided by meta-kaolin - on dominant crystallographic direction-dependent domaingrowth of tobermorite is investigated by analysis of anisotropic peakbroadening (Ectors et al 2015 2017) In Fig 1 of the supplementarymaterial the method of fitting the anisotropic peak broadening of to-bermorite using a triaxial cylinder model is visualized (Schreiner et al2018) Fitting of the anisotropic peak broadening of tobermorite Thismethod is used to calculate the average and reliable values for to-bermorite domain sizes in the powder sample and associate them withaverage Al3+ incorporation Microstrain should be considered becauseit is an additional source of peak broadening However this usually
accounts for materials that have been exposed to different kinds ofstress such as metals and alloys (Badawi et al 2019) In addition theinstrumental contribution to peak broadening should be consideredHydration products such as tobermorite are characterized by crystallitesizes in the range of nanometers so that anisotropic size broadeningclearly outweighs the effect of instrumental broadening (Jenkins andSnyder 1996) Moreover the impact of Al3+ on the lattice parametersof tobermorite is considered It should additionally be clarified whe-ther the results from our previous publication (Schreiner et al 2019)based on industrially produced AAC can be confirmed by investigationwith less complex raw mixes and purely based on laboratory experi-ments
2 Material and methods
21 Starting materials
The starting materials for hydrothermal synthesis included deio-nized water quartz flour portlandite (999 pure) and two types ofmetakaolin One type was ordinary commercially available metakaolin(MK) with nearly a stoichiometric composition For comparison thesecond type of commercially available metakaolin was a by-productfrom expanded glass production (MKg) and consequently highly im-pure The chemical composition of MK and MKg determined by XRF isgiven in Table 1 With MKg containing less Al2O3 but considerably moreNa2O than MK the effects on hydrothermal synthesis were of interestBoth types of metakaolin have been characterized in previous pub-lications (Schmidt et al 2012 Naber et al 2019) In addition weverified the mineral phase content by XRD analysis Besides amorphousmetakaolin MK contained minor amounts of anatase quartz and mica
Fig 1 Weight fractions of tobermorite quartz and katoite determined byquantitative XRD analysis ndash samples including MKg crosshatched
Table 1Chemical composition of MK and MKg determined by XRF analysis ndash majorcontrasts in bold letters
Oxides [wt-] MK MKg
SiO2 536 604Al2O3 392 206CaO 01 40MgO 01 12Na2O 0 96K2O 10 18Fe2O3 18 05TiO2 21 03P2O5 01 02Loss on ignition 15 1
J Schreiner et al Applied Clay Science 185 (2020) 105432
2
6 Publications
32
MKg contained additional kaolinite feldspar and quartz
22 Investigated mix composites
For the preparation of raw mixtures the powders were weighed andhomogenized using a lab-scale mixing mill Table 2 lists the composi-tion and nomenclature of all samples including Al2O3 content andcuring time in the autoclave
bull Besides one blank mixture (MK0) that did not contain any type ofmetakaolin eleven more compounds were prepared of which threeincluded different dosages of MKg (MKg16 MKg23 and MKg60)Three more mixes contained equivalent amounts of MK instead ofMKg (MK16 MK23 and MK60) These mixes were investigated inorder to have a direct comparison concerning the effects of differentraw material on the synthesis of tobermorite
bull Additionally the mixes MK9 MK5 and MK25 with lower dosages ofmetakaolin were analyzed In the referenced literature (Schreineret al 2019) the effect of Al3+ on the anisotropic peak broadeningof tobermorite could only be observed in the case of Al2O3 contentslower than 4 in the drymix In the latter three mixes Al2O3 con-tents range from 1 to 35 Al2O3 (calculated from XRF data) whichmeets the region of interest for the analysis of tobermorite domainmorphology
bull The curing time for nearly all of the investigated samples was 12 hbut compound MK9 was prepared two more times for curing timesof 2 h and 6 h The different curing times were chosen in this par-ticular sample so that the reactivity of metakaolin and the phasetransitions could be observed more precisely
23 Hydrothermal treatment
Due to the different fineness of raw materials there was a differentwater demand from one mixture to another In order to obtain slurriesof comparable rheology the amount of water was adapted respectivelyresulting in water-to-solid ratios of 25 to 3 which matches the sug-gested water-to-solid ratio for this purpose (Roacutezycka et al 2014Galvaacutenkovaacute et al 2018) The weighed water was added to the dry mixand after stirring for 1 min at 23 degC the slurry was poured into thereactor Minor changes in the quantity of added water did not have aninfluence on the measured steam pressure All experiments were con-ducted using a PTFE-lined stainless steel autoclave with a reactor vo-lume of 300 ml The oven temperature was fixed at 180 degC and auto-genous steam pressure of 11ndash12 MPa was measured during eachexperiment with an external manometer After cooling to room tem-perature the sample was removed from the reactor coarsely ground
using an agate mortar and dried at 60 degC for 12 h After drying thesample was ground with an agate mortar again in order to deagglo-merate the particles As no coarse raw materials were used there wasno need for wet McCrone milling (Schreiner et al 2018)
24 XRD analysis
After preparation into front-loading sample holders the powdersamples were measured with a D8 diffractometer (Bruker) equippedwith a LynxEye detection system and Bragg-Brentano geometry Thesettings for XRD analysis included a tube voltage of 40 kV a current of40 mA an angular range from 6 to 80deg 2θ (Cu Kα radiation) a time perstep of 054 s a step width of 00236deg 2θ and a PSD opening of 33deg Thebackground was fitted with Chebyshev polynomial of the fifth orderThe major contribution of amorphous phase was fitted with a singlepeak with a fixed position at 308deg 2θ so that tobermorite reflectionswere not affected An external quartzite standard was measured withthe same parameters in order to determine phase quantities (Jansenet al 2011) Bruker AXS software TOPAS 50 was used for Rietveldrefinement (Rietveld 1969) and the used structures are shown inTable 3
3 Results and discussion
31 Different dosages of MK and MKg
In Fig 1 the quantities of tobermorite quartz and katoite present inmost of the samples determined by XRD analysis are illustratedWhenever tobermorite was the leading mineral hydrate phase a basalspacing of 113 Aring could be verified in each of the diffractograms Thequantities of minor crystalline phases and amorphous content are notshown For low dosages of MK it can be seen that the weight fraction oftobermorite decreased At moderate dosage of both types of metakaolin(MK16 MK23 MKg16 MKg23) tobermorite was present in comparablequantities It can be seen that the amount of katoite in the mixes de-pended on the dosage of metakaolin and it appeared only at dosages ofMK5 or more Due to the higher content of aluminum in MK comparedto MKg more katoite could always be observed in the MK mixes atequivalent dosages Despite equal amounts of quartz as starting mate-rial in mixes for both types of metakaolin the resulting weight fractionsin the cured samples were not alike Considerably more quartz waspresent in the MK samples Even though less quartz was used for mixescontaining higher amounts of MK even more quartz was present afterhydrothermal curing (Table 2 Fig 1) Consequently some of the SiO2
provided by MK did not transform into an amorphous phase or to-bermorite but into quartz This finding is verified by the presence ofquartz in MK60 because no quartz was included in the raw mixture Thefeldspar present in MKg did not react so Na2O and an unknown amountof Al2O3 may not have been supplied for hydrothermal reaction Besidestobermorite and quartz additional calcite scawtite (Ca7Si6(CO3)
Table 2Basic powder compounds prepared for the hydrothermal synthesis of to-bermorite with the respectively calculated Al2O3 content and curing time in thereactor
Sample Portlandite[wt-]
Quartz[wt-]
MK[wt-]
MKg
[wt-]
Al2O3
[wt-]Curingtime [h]
MK0 49 51 ndash ndash 0 12MK25 495 48 25 ndash 1 12MK5 49 46 5 ndash 2 12MK9_2h 48 43 9 ndash 35 2MK9_6h 48 43 9 ndash 35 6MK9_12h 48 43 9 ndash 35 12MK16 47 37 16 ndash 63 12MK23 46 31 23 ndash 9 12MK60 40 ndash 60 ndash 235 12MKg16 47 37 ndash 16 33 12MKg23 46 31 ndash 23 47 12MKg60 40 ndash ndash 60 124 12
Table 3Structural data used for the investigation with powder XRD analysis
Phase Author
Anatase (Horn et al 1972)Biotite (Brigatti et al 2000)Calcite (Maslen et al 1995)Kaolinite (Zvyagin 1960)Katoite (Bartl 1969)Microcline (Bailey 1969)Plazolite (Basso et al 1983)Portlandite (Busing and Levy 1957)Quartz (Le Page and Donnay 1976)Scawtite (Grice 2005)Tobermorite (Hamid 1981)Xonotlite (Hejny and Armbruster 2001)
J Schreiner et al Applied Clay Science 185 (2020) 105432
3
6 Publications
33
O18bull2(H2O)) and xonotlite (Ca6Si6O17(OH)2) could be identified insample MK0 (XRD plots of samples MK0 MKg16 MKg23 MK16 andMK23) Comparing MK0 and MK25 scawtite and xonotlite could stillbe identified in a very low amount in MK25 but no longer in samplesthat contained even more MK (XRD plots of samples MK0 MK25 MK5and MK9_12h)
Two additional experiments were done without quartz in the rawmixes (MK60 and MKg60) The according diffractograms after hydro-thermal curing are shown in Fig 2 In sample MKg60 tobermorite (gt 50wt-) was successfully synthesized without any other silica sourcethan MKg whereas no crystalline quartz occurred By contrast no to-bermorite but quartz could be identified in equivalent mixture MK60containing MK It can be seen that crystalline components such as micaand anatase in the raw MK did not react at the selected conditions andremained present in the autoclaved samples Except for feldspar in MKgall of the crystalline components appeared to be reactive at the chosenhydrothermal conditions A minor unidentified phase occurred at328deg2θ and additional xonotlite was identified in sample MKg60 Insample MK60 more calcium was needed for the formation of morehydrogarnet (Fig 1) resulting in a lower CaSi ratio for the remainingsystem Sample MKg60 contained only half of the amount of Al3+ and itwas not completely supplied for reaction due to its partial presence infeldspar Consequently essentially less hydrogarnet (Fig 1) was presentin MKg60 after hydrothermal treatment and the CaSi ratio in the re-maining system was affected to a lesser extent
32 Application of MK for different curing times
The development of hydrate phases in the autoclave for compoundMK9 is displayed in Fig 3 After only 2 h of hydrothermal curing all ofthe available portlandite had reacted and katoite (95 wt-) was pre-sent The applied type of metakaolin appeared to react quickly as itsupplied aluminum for formation of katoite No formation of to-bermorite could be observed at this stage yet An assumably amorphousprecursor can be seen at 28 to 30deg2θ Calcium was provided by thedissolution of portlandite After 6 h of hydrothermal reaction amountsof katoite (85 wt-) and quartz (from 31 wt- at 2 h to 165 wt- at6 h) had decreased and a major amount of tobermorite (35 wt-) waspresent Apparently between 2 and 6 h under hydrothermal conditionsthe amorphous precursor and quartz reacted resulting in the formationof tobermorite An additional 6 h of reaction time (MK9_12h) did notchange the phase composition significantly Slightly more tobermorite
(365 wt-) less quartz (16 wt-) and katoite (65 wt-) weremeasured
33 Tobermorite domain morphology and lattice parameters
In the referenced literature an analysis of tobermorite domainmorphology based on anisotropic peak broadening was possible forsamples that contained notgt 4 wt- Al2O3 in the drymix (Schreineret al 2019) Accordingly in this study samples MK0 MK25 MK5MK9_6h and MK9_12h were suitable (Table 2) with MK9_2h not con-taining any tobermorite In Fig 4 the respective growth in a and b di-rection is visualized with x indicating the domain size in a direction andy indicating domain size in b direction using a macro for TOPAS 50(Ectors et al 2015 2017) The calculated cylinder models in Fig 4represent the relation of yx and not absolute sizes With no supply ofaluminum ions (MK0) the relative domain growth in b direction islower compared to samples containing metakaolin This finding agreeswith the results from a similar investigation of tobermorite in AAC(Schreiner et al 2019) However within the samples MK5 andMK9_12h the different amounts of supplied aluminum ions did notshow a clear effect It appeared that low dosages of Al3+ (1 wt- Al2O3
in MK25 and 2 wt- Al2O3 in MK5) were enough to determine thedomain growth of tobermorite Additional results from the samplesMK9_6h and MK9_12h indicated that growth in b direction increasedwith reaction time
In Fig 5 lattice parameters of tobermorite depending on metakaolindosages are plotted B clearly remained unaffected throughout therange of samples Increasing amounts of metakaolin led to a slightlysmaller parameter a However both types of metakaolin showed acorresponding impact on parameter a By contrast parameter c in-creased strongly with increasing amounts of MK and MKg but the typeof metakaolin was significant At an equivalent dosage MK affected thecell dimension in c direction considerably more than MKg so that thefraction of Al3+ appeared to be the decisive parameter Different metaloxides in MKg did not show a notable effect certainly as they werepartially not provided for reaction Unlike for the domain morphologyof tobermorite the impact on lattice parameters could be observedwithin the complete range of examined dosages
4 Conclusions
The results obtained from the introduced investigations allow con-cluding remarks on the effects of the applied types of metakaolin on thesynthesis of 11 Aring tobermorite the phase transitions and the in-corporation of Al3+ into the lattice of tobermorite
With a critical dosage the use of any type of metakaolin led to theformation of katoite in an according amount At moderate dosages(MKg16 MKg23 MK16 and MK23) the two types of metakaolin showeda good correspondence in consideration of the quantities of to-bermorite For higher dosages there were contrary effects Lower do-sages of MK led to considerable quantities of Al-substituted to-bermorite Samples containing low dosages of MK revealed that katoiteappeared in the case ofgt 5 wt- of MK - corresponding to 2 wt-Al2O3 - in the basic compound Minor crystalline phases in MKg showedbetter reactivity than those in MK The observation that no tobermoritewas present in sample MK60 indicated that high dosages of Al3+ hin-dered the formation of tobermorite
Investigations of MK9 at 2 6 and 12 h displayed the evolution ofhydrate phases At first katoite was the only crystalline hydrate phasepresent after 2 h which corresponded to observations in a differentpublication (Klimesch and Ray 1999) The amount of katoite andquartz then decreased and a major amount of tobermorite formed from2 to 6 h curing time In order to gain more information on the trans-formation of amorphous C-(A)-S-H into tobermorite additional ex-periments in the range of 2 to 6 h curing time will be needed
Domain morphology analysis of tobermorite revealed that low
Fig 2 Diffractograms of MKg MKg60 MK and MK60 from 7 to 34deg2θ CuKα Aanatase C calcite F feldspar k kaolinite K katoite M mica Q quartz Ttobermorite U unidentified phase X xonotlite
J Schreiner et al Applied Clay Science 185 (2020) 105432
4
6 Publications
34
dosages of Al3+ determined the domain growth which agreed with theresults published on tobermorite in AAC samples (Schreiner et al2019) Different curing times unveiled that growth in b direction in-creased with the reaction time Al3+ incorporation into the lattice oftobermorite only reflected to a limited extent in the domain mor-phology By contrast an increase of lattice parameter c was triggered byAl3+ even at the highest dosage in this study Ultimately there is no
evidence for a limit of incorporation of Al3+ but there is a limit ofinfluence on the domain morphology These results additionally re-confirm this assumption similarly made in the previous work (Schreineret al 2019) and suggest a new mechanism of tobermorite crystal-lization depending on the presence of Al3+
Supplementary data to this article can be found online at httpsdoiorg101016jclay2019105432
Declaration of Competing Interest
The authors declare that they have no known competing financialinterests or personal relationships that could have appeared to influ-ence the work reported in this paper
Acknowledgement
The authors thank Rodgauer Baustoffwerke GmbH amp Co KG forsupplying raw materials for laboratory experiments
References
Aguilar-Mamani W Garciacutea G Hedlund J Mouzon J 2014 Comparison betweenleached metakaolin and leached diatomaceous earth as raw materials for the synth-esis of ZSM-5 Springerplus 3 1ndash10 httpsdoiorg1011862193-1801-3-292
Ayodele OB Sulaimon AA Alaba PA Tian Z-Y 2019 Influence of metakaolini-zation temperature on the structure and activity of metakaolin supported Ni catalystin dry methane reforming J Environ Chem Eng httpsdoiorg101016jjece2019103239 (in press)
Badawi EA Abdel-Rahman MA Mostafa A Abdel-Rahman M 2019 Determinationof the crystallite size amp micro- strain by novel method from XRD profile Appl Phys2 1ndash15 httpsdoiorg1031058jap201921001
Bailey SW 1969 Refinement of an intermediate microcline structure Am Miner 541540ndash1545
Bartl H 1969 Roentgen-Einkristalluntersuchungen an (CaO)3 (Al2O3) (H2O)6 und an(CaO)12 (Al2O3)7 (H2O) neuer Vorschlag zur (CaO)12 (Al2O3)7-Struktur NeuesJahrb fuer Mineral Monatshefte 1969 404ndash413
Basso R Giusta AD Zefiro L 1983 Crystal structure refinement of plazolite A highlyhydrated natural hydrogrossular Neues Jahrb Miner Monatsh (Neues Jahrb fuerMineral Monatshefte) 1983 251ndash258
Brigatti MF Lugli C Poppi L Foord EE Kile DE 2000 Crystal chemical varia-tions in Li- and Fe-rich micas from Pikes Peak batholith (Central Colorado) AmMineral 85 1275ndash1286 httpsdoiorg102138am-2000-8-920
Busing WR Levy HA 1957 Neutron diffraction study of calcium hydroxide J ChemPhys 26 563 httpsdoiorg10106311743345
Chen L Wang Z Wang Y Feng J 2016 Preparation and properties of alkali acti-vated metakaolin-based geopolymer Materials (Basel) 9 1ndash12 httpsdoiorg103390ma9090767
Chucholowski C Holger M Thienel K-C 2018 Improving the recyclability en-vironmental compatibility and CO2 balance of autoclaved aerated concrete by re-placing sulfate carrier and cement with calcined clays CePapers 2 503ndash512httpsdoiorg101002cepa846
Fig 3 Diffractograms of MK9_2h MK9_6h and MK9_12h from 7 to 38deg2θ CuKα C calcite K katoite Q quartz T tobermorite
Fig 4 Relation of calculated domain sizes of 11 Aring tobermorite in selectedsamples (MK0 MK25 MK5 MK9_6h and MK9_12h) in a (x) and b (y) direction
Fig 5 Lattice parameters of tobermorite depending on MK or MKg dosageincluding blank mix MK0
J Schreiner et al Applied Clay Science 185 (2020) 105432
5
6 Publications
35
Demir İ Başpınar MS Kahraman E Ccedilalışkan E Goumlrhan G 2014 An investigationon the usability of diatomite in aerated concrete production In Proc of the IntlConf on Advances in Civil Structural and Construction Engineering ndash CSCE 2014 pp97ndash100
Ectors D Goetz-Neunhoeffer F Neubauer J 2015 A generalized geometric approachto anisotropic peak broadening due to domain morphology J Appl Crystallogr 48189ndash194 httpsdoiorg101107S1600576714026557
Ectors D Goetz-Neunhoeffer F Neubauer J 2017 Routine (an)isotropic crystallitesize analysis in the double-Voigt approximation done right Powder Diffract 3227ndash34 httpsdoiorg101017S0885715617000070
Galvaacutenkovaacute L Bartoniacutečkovaacute E Opravil T Tkacz J Ptaacuteček P 2018 The influence ofstarting materials solubility on tobermorite structure formation under the hydro-thermal conditions IOP Conf Ser Mater Sci Eng 379 1ndash8 httpsdoiorg1010881757-899X3791012001
Grice JD 2005 The structure of spurrite tilleyite and scawtite and relationships toother silicate-carbonate minerals Can Mineral 43 1489ndash1500 httpsdoiorg102113gscanmin4351489
Hamid SA 1981 The crystal structure of the 11 Aring natural tobermoriteCa225[Si3O75(OH)15]1H2O Zeitschrift fuer Krist 154 189ndash198 httpsdoiorg101524zkri19811543-4189
Hejny C Armbruster T 2001 Polytypism in xonotlite Ca6Si6O17(OH)2 Zeitschrift furKrist 216 396ndash408
Horn M Schwerdtfeger CF Meagher EP 1972 Refinement of the structure of ana-tase at several temperatures Zeitschrift fur Krist 136 273ndash281 httpsdoiorg101524zkri19721363-4273
Jansen D Goetz-Neunhoeffer F Stabler C Neubauer J 2011 A remastered externalstandard method applied to the quantification of early OPC hydration Cem ConcrRes 41 602ndash608 httpsdoiorg101016jcemconres201103004
Jenkins R Snyder R 1996 Introduction to X-ray Powder Diffractometry ChemicalAnalysis Wiley pp 90
Kalousek GL 1956 Crystal Chemistry of Hydrous Calcium Silicates J Am Ceram Soc40 74ndash80
Klimesch D Ray A 1998 Autoclaved cement-quartz pastes with metakaolin additionsAdv Cem Based Mater 7 109ndash118 httpsdoiorg101016S1065-7355(97)00073-4
Klimesch D Ray A 1999 DTA-TGA evaluations of the CaOndashAl2O3ndashSiO2ndashH2O systemtreated hydrothermally Thermochim Acta 334 115ndash122 httpsdoiorg101016s0040-6031(99)00140-9
Komarneni S Roy R Roy DM Fyfe CA Kennedy GJ Bothner-By AA Dadok JChesnick AS 1985 27Al and29Si magic angle spinning nuclear magnetic resonancespectroscopy of Al-substituted tobermorites J Mater Sci 20 4209ndash4214 httpsdoiorg101007BF00552416
Koutnyacute O Opravil T Pořiacutezka J 2014 Application of metakaoline in autoclavedaerated concrete technology Adv Mater Res 1000 174ndash177 httpsdoiorg104028wwwscientificnetAMR1000174
Le Page Y Donnay G 1976 Refinement of the crystal structure of low-quartz ActaCrystallogr Sect B 32 2456ndash2459 httpsdoiorg101107S0567740876007966
Luo H Law WW Wu Y Zhu W Yang EH 2018 Hydrothermal synthesis of needle-like nanocrystalline zeolites from metakaolin and their applications for efficient re-moval of organic pollutants and heavy metals Microporous Mesoporous Mater 2728ndash15 httpsdoiorg101016jmicromeso201806015
Maeda H Ogawa Y Ishida EH Kasuga T 2012 Hydrothermal synthesis of to-bermorite doped with phosphorus species for removing heavy metal ions J AustCeram Soc 48 8ndash11
Maslen EN Streltsov VA Streltsova NR Ishizawa N 1995 Electron density andoptical anisotropy in rhombohedral carbonates III Synchrotron Xray studies ofCaCO3 MgCO3 and MnCO3 Acta Crystallogr Sect B 51 929ndash939 httpsdoiorg101107S0108768195006434
Matekonis G Šiaučiūnas R Vaičiukynienė D 2010 Hydrothermal Synthesis andCharacterization of Na + and [ Al 3 + + Na + ] -substituted Tobermorite in CaO-SiO2middotnH2O-H2O System Mater Sci 16 242ndash248
Matsui K Kikuma J Tsunashima M Ishikawa T Matsuno S Ogawa A Sato M2011 In situ time-resolved X-ray diffraction of tobermorite synthesis process underhydrothermal condition IOP Conf Ser Mater Sci Eng 18 60ndash66 httpsdoiorg1010881757-899X182022017
Merlino S Bonaccorsi E Armbruster T 2000 The real structures of clinotobermoriteand tobermorite 9 Aring OD character polytypes and structural relationships Eur JMineral 12 411ndash429 httpsdoiorg1011270935-122120000012-0411
Monasterio M Gaitero JJ Manzano H Dolado JS Cerveny S 2015 Effect ofchemical environment on the dynamics of water confined in calcium silicate mi-nerals Natural and synthetic tobermorite Langmuir 31 4964ndash4972 httpsdoiorg101021acslangmuir5b00614
Mostafa NY 2005 Influence of air-cooled slag on physicochemical properties of auto-claved aerated concrete Cem Concr Res 35 1349ndash1357 httpsdoiorg101016jcemconres200410011
Mostafa NY Shaltout AA Omar H Abo-El-Enein SA 2009 Hydrothermal synth-esis and characterization of aluminium and sulfate substituted 11 nm tobermoritesJ Alloys Compd 467 332ndash337 httpsdoiorg101016jjallcom200711130
Naber C Stegmeyer S Jansen D Goetz-Neunhoeffer F Neubauer J 2019 ThePONKCS method applied for time resolved XRD quantification of supplementarycementitious material reactivity in hydrating mixtures with ordinary Portland ce-ment Constr Build Mater 214 449ndash457 httpsdoiorg101016jconbuildmat201904157
Qu X Zhao Z Zhao X 2018 Microstructure and characterization of aluminum-in-corporated calcium silicate hydrates (C-S-H) under hydrothermal conditions RSCAdv 8 28198ndash28208 httpsdoiorg101039c8ra04423f
Rashad AM 2013 Metakaolin as cementitious material history scours production andcomposition - a comprehensive overview Constr Build Mater 41 303ndash318 httpsdoiorg101016jconbuildmat201212001
Rietveld HM 1969 A profile refinement method for nuclear and magnetic structures JAppl Crystallogr 2 65ndash71 httpsdoiorg101107S0021889869006558
Riacuteos CA Williams CD Fullen MA 2009 Hydrothermal synthesis of hydrogarnet andtobermorite at 175 degC from kaolinite and metakaolinite in the CaO-Al2O3-SiO2-H2Osystem a comparative study Appl Clay Sci 43 228ndash237 httpsdoiorg101016jclay200809014
Roacuteżycka A Pichoacuter W 2016 Effect of perlite waste addition on the properties of au-toclaved aerated concrete Constr Build Mater 120 65ndash71 httpsdoiorg101016jconbuildmat201605019
Roacutezycka A Kotwica Ł Małolepszy J 2014 Synthesis of single phase gyrolite in theCaO-quartz-Na2O-H2O system Mater Lett 120 166ndash169 httpsdoiorg101016jmatlet201401003
Sauman Z 1974 Influence of SO4 2ndash ions on the formation of 11 Aring tobermorite InProceedings of the 2nd International Symposium on Science and Research in SilicateChemistry Moscow pp 25ndash39
Schmidt M Egersdoumlrfer A Poumlllmann H 2012 Increased reactivity using a glass-containing metakaolin as an active filler in lime-based binder systems ZKG Int 6554ndash62
Schreiner J Jansen D Ectors D Goetz-Neunhoeffer F Neubauer J Volkmann S2018 New analytical possibilities for monitoring the phase development during theproduction of autoclaved aerated concrete Cem Concr Res 107 247ndash252 httpsdoiorg101016jcemconres201802028
Schreiner J Goetz-Neunhoeffer F Neubauer J Volkmann S Bergold S Webler RJansen D 2019 Advanced Rietveld refinement and SEM analysis of tobermorite inchemically diverse autoclaved aerated concrete Powder Diffract 34 143ndash150httpsdoiorg101017s0885715619000149
Setthaya N Chindaprasirt P Pimraksa K 2016 Preparation of zeolite nanocrystals viahydrothermal and solvothermal synthesis using of rice husk ash and metakaolinMater Sci Forum 872 242ndash247 httpsdoiorg104028wwwscientificnetmsf872242
Siauciunas R Baltakys K 2004 Formation of gyrolite during hydrothermal synthesis inthe mixtures of CaO and amorphous SiO2 or quartz Cem Concr Res 34 2029ndash2036httpsdoiorg101016jcemconres200403009
Skawinska A Owsiak Z Baran T Hernik K 2017 The influence of halloysite ad-dition on tobermorite formation in CaO and quartz mix under hydrothermal condi-tions Cem Wapno Bet 17 426ndash434
Venhodovaacute E Janovskyacute R Drochytka R 2015 Formation of tobermorite at differentmaterials composition of aerated concrete Appl Mech Mater 752ndash753 247ndash250httpsdoiorg104028wwwscientificnetamm752-753247
Walczak P Małolepszy J Reben M Szymański P Rzepa K 2015 Utilization ofwaste glass in autoclaved aerated concrete Proc Eng 122 302ndash309 httpsdoiorg101016jproeng201510040
Zhang Y Gao W Cui L 2007 The transformation of acid leached metakaolin tozeolite beta Stud Surf Sci Catal 170 420ndash425 httpsdoiorg101016S0167-2991(07)80870-6
Zvyagin BB 1960 An attempt to electronographic determination of kaolinite structureJ Dokl Akad Nauk SSSR 130 1023ndash1026
J Schreiner et al Applied Clay Science 185 (2020) 105432
6
6 Publications
36
6 Publications
62 Advanced Rietveld refinement and SEM analysis oftobermorite in chemically diverse autoclaved aeratedconcrete
Following the copyright guidelines by Cambridge University Press the publication
Schreiner J Goetz-Neunhoeffer F Neubauer J Volkmann S Bergold S WeblerR Jansen D 2019 Advanced Rietveld refinement and SEM analysis of tobermorite inchemically diverse autoclaved aerated concrete Powder Diffraction 34 143ndash150 httpsdoiorg101017s0885715619000149
may not be reprinted It can be accessed at
httpswwwcambridgeorgcorejournalspowder-diffractionarticleadvanced-rietveld-refinement-and-sem-analysis-of-tobermorite-in-chemically-diverse-autoclaved-aerated-concrete51597C2A66F6F225D29DEB2675E74249
37
6 Publications
63 New analytical possibilities for monitoring the phasedevelopment during the production of autoclavedaerated concrete
Reprint of the peer reviewed publication
Schreiner J Jansen D Ectors D Goetz-Neunhoeffer F Neubauer J VolkmannS 2018 New analytical possibilities for monitoring the phase development during theproduction of autoclaved aerated concrete Cement and Concrete Research 107 247ndash252httpsdoiorg101016jcemconres201802028
with permission from Elsevier
38
Contents lists available at ScienceDirect
Cement and Concrete Research
journal homepage wwwelseviercomlocatecemconres
Short communication
New analytical possibilities for monitoring the phase development duringthe production of autoclaved aerated concrete
J Schreinera D Jansena D Ectorsa F Goetz-Neunhoeffera J Neubauera S Volkmannb
aUniversity of Erlangen-Nuremberg GeoZentrum Nordbayern Mineralogy Schlossgarten 5a 91054 Erlangen Germanyb Rodgauer Baustoffwerke GmbH amp Co KG Am Opel-Pruumlffeld 3 63110 Rodgau-Dudenhofen Germany
A B S T R A C T
This work presents improved analytical methods for both steps of the production process of autoclaved aeratedconcrete (AAC) the phase development during the hydration before autoclaving and during the autoclavingprocess itself The improvement includes new insights into preparation methods of AAC samples for powderdiffraction as well as Rietveld refinement strategies For the first time a new implementation for calculatinganisotropic crystal domain sizes is applied to major hydrate phases occurring during AAC production namelyportlandite during the hydration before autoclaving and tobermorite during the autoclaving process The cal-culation of anisotropic domain size growth which can be implemented in the Rietveld environment is based oncrystallographically and geometrically appropriate models The implementation of calculating anisotropic do-main sizes for the Rietveld software TOPAS 50 allows a superior Rietveld fit and a more accurate quantificationof the phase development Additionally it enables the tracking of growth mechanism of portlandite duringhydration
1 Introduction
Autoclaved aerated concrete (AAC) is known as a lightweight con-struction material which offers outstanding properties such as suffi-cient strength for construction in addition with excellent thermal in-sulation [12] AAC is produced by autoclaving from calcareous rawmaterials such as lime (CaO) and cement quartz sulfate carrier andother additives such as foaming agents and water
The production process (Fig 1) can be separated into the hydrationof the mixed slurry before the procedure of autoclaving and the auto-claving at elevated temperature (180 degC to 200 degC) under saturatedsteam pressure (12MPa) for several hours
The hydration process before autoclaving is necessary to achievesufficient strength in order to cut the green cake blocks as they shouldhave a specific shape and dimension after autoclaving Furthermorethe porous structure is generated by the foaming agent during hydra-tion in the first process step During autoclaving the final propertiesnamely strength and low thermal conductivity are achieved
It is already well understood that the autoclaving process leads tothe formation of several phases first of all tobermorite(Ca5Si6O16(OH)2lowast4H2O) [3ndash5] Newest research has shown im-pressively which reactions are running from the mineralogical point ofview Insitu XRD measurements were carried out during the
autoclaving process and the phase development was shown by plottingnormalized intensities [6] The study of Mitsuda et al [3] was mainlyfocused on the tracking of the phase evolution during the autoclavingprocess of AAC However their statements concerning phase evolutionare mainly based on XRD data and TGA measurements There is acommon agreement that the following reactions occur The consump-tion of the alite (OPC) leads to the formation of an initial C-S-H phaseduring the first processing step Portlandite which was initially formedduring the first process step (from CaO and C3S) further quartz and theC-S-H phase are consumed during autoclaving resulting in the crystal-lization of tobermorite Hence the crystallization process of to-bermorite as well as the crystal structure of tobermorite was an issue ofresearch and discussion over the last years and numerous publicationsto these topics are available Concerning the crystal structure of to-bermorite respectively the tobermorite supergroup a new publicationoutlines all important references and recommends a new nomenclature[7]
The presented study was performed to create new analytical possi-bilities for the characterization of the production process of AAC Bothof the production process steps are essential for the final productHence the present work focuses on crystallization of hydrate phases inboth processes
Firstly an external standard method [89] was published and
httpsdoiorg101016jcemconres201802028Received 6 October 2017 Received in revised form 1 February 2018 Accepted 26 February 2018
Corresponding authorsE-mail addresses juergenjsschreinerfaude (J Schreiner) danieljansenfaude (D Jansen)
Cement and Concrete Research 107 (2018) 247ndash252
0008-8846 copy 2018 Elsevier Ltd All rights reserved
T
6 Publications
39
recommended for the determination of absolute phase contents inmixtures with amorphous content It was shown that the method canabsolutely be recommended for hydrating cement pastes in which watercannot be quantified directly by XRD [10] This method seems to bevery promising for both the quantification of the hydration of the AACslurry before autoclaving and the quantification of the phase evolutionduring autoclaving inasmuch as both production steps form crystallineand amorphous phases
Secondly a new approach to anisotropic peak broadening due toanisotropic domain morphology which was developed [1112] is ap-plied to AAC samples to improve the fit of portlandite and tobermoriteby Rietveld refinement [13] By applying this approach the refinementof both portlandite and tobermorite should additionally lead to betterquantitative results as well as to better insights into the development ofthe domain size morphology of both phases formed
It was already shown that in a hydrating raw mixture for AAC twospecies of portlandite precipitate at 23 degC one showing dynamicallyanisotropic peak broadening and another one following the isotropictrend [14] The application of the anisotropic refinement model led toan improved fitting of portlandite Moreover the mechanism of aniso-tropic domain growth of portlandite was tracked
2 Materials and methods
In order to examine the hydration of the AAC slurry before auto-claving a mixture of the hydraulic reactive components was weighedand measured in-situ at a Bruker D8 diffractometer with a LynxEyedetection system
Ordinary Portland cement (OPC) was mixed with lime (CaO) andanhydrite (C$) The raw materials were taken from the same batches asfor the industrial samples The drymix (58 OPC 36 CaO and 6 C$by weight) was then mixed with water (ws= 08) and placed into anappropriate sample holder The samples were not aerated The slurrysamples were covered with a kapton film to avoid evaporation andcarbonation Diffractograms were recorded with an angular range from7 to 545deg 2θ and a step width of 0011deg 2θ Measurements were carriedout every 15min For each measurement 96 XRD patterns were re-corded over the first 24 h The temperature was fixed at 70 degC which isthe mean temperature generally prevailing in the industrial processduring hydration before autoclaving Rietveld refinement was carriedout using the G-factor method All structures used for Rietveld refine-ment are shown in Table 1
For investigation of the autoclaved samples five different specimenswere taken at different autoclaving times The specimens were takenout of a technical production process hence it was not possible to in-terrupt the process at an earlier time inasmuch it would lead to damageof a whole concrete production batch The specimens were firstly driedat 60 degC until weight constancy The whole blocks were then broken andstatistical samples of 20 g were taken In order to receive the right massattenuation coefficient (MAC) for G-factor method the loss on ignitionand the chemical composition (XRF) were determined For energydispersive XRF analysis (Spectro Xepos) tube voltage from 20 kV to50 kV and tube current from 08 to 20mA were used for differenttargets
The final sample preparation (grinding) before XRD measurementswas carried out using both an agate mortar and a McCrone micronizingmill for wet milling with isopropanol Both preparation methods wereapplied separately to see which one is suitable in order to get the bestpreparation for XRD investigations Six preparations were performed byone operator of which two were prepared with an agate mortar andfour with a McCrone mill For the McCrone milling 3 g of the sampleand 10ml of isopropanol were used for grinding for 12min The grainsize distribution of one sample prepared with an agate mortar and onesample prepared using a McCrone mill was measured by laser granu-lometry in isopropanol using a Mastersizer 3000 (MALVERN)
After milling the samples in these two ways for XRD analysis thepowders were prepared into a front loading sample holder and mea-sured Diffractograms were recorded with an angular range from 6 to80deg 2θ a step width of 00236deg 2θ and a time per step of 054 s Rietveldrefinement combined with external standard (G-factor) was applied inorder to get absolute quantities for each phase The refinement strategyfor portlandite and tobermorite in the TOPAS Launch Mode (TOPAS50 Bruker AXS) is attached as a Supplementary material file
3 Results and discussion
31 Hydration of the mixture before autoclaving
The hydration of the investigated paste before autoclaving isdominated by the hydration of the cement as well as the reaction of thefree lime (CaO) resulting in the formation of portlandite It can beclearly seen from Fig 2 that the hydration of the paste leads to theformation of ettringite portlandite and C-S-H phase For simplificationthe remaining phase developments are not shown in Fig 2 because theyare not in the focus of this study The hydration of CaO forming
Fig 1 Simplified process steps of AAC production and hydrate phase evolution
Table 1Structures used for Rietveld refinement
Phase Author
Alite [15]Anhydrite [16]Bassanite [17]Belite (β) [18]Belite (αprime) [19]Brownmillerite [20]C-S-H [21]Calcite [22]Ettringite [23]Gypsum [24]Hemicarbonate [25]Hydroxylellestadite [26]Lime (CaO) [27]Microcline [28]Portlandite [29]Quartz [30]Tobermorite [31]Tricalciumaluminate (cubic) [32]Tricalciumaluminate (orthorhombic) [33]PONCKS model for Water [21]
J Schreiner et al Cement and Concrete Research 107 (2018) 247ndash252
248
6 Publications
40
portlandite begins rapidly after the addition of water to the mixture andlime is fully consumed after only 1 h of hydration This translates into aquick rise of heat of hydration so that cement hydration is acceleratedwhich leads to further portlandite formation by the reaction of aliteEttringite formation stalls after few hours of hydration After 12 h et-tringite is partially decomposed probably due to sulfate depletion [9]
and poorly crystalline AFm phases (not shown in Fig 2) are formedIn Fig 3 it can be seen that in fact two generations of portlandite
are formed a 1st dominant generation showing anisotropic peakbroadening and 2nd one occurring considerably later following theisotropic domain size refinement which is usually carried out using theRietveld method This occurrence comes along firstly with lime hy-dration and secondly with alite hydration The expected quantity ofportlandite formed from lime hydration very well complies with the
Fig 2 Phase development in AAC paste on a laboratory scale before autoclaving ana-lyzed by in-situ XRD at 70 degC
Fig 3 Formation of two generations of portlandite by hydration of lime (1st) and C3S(2nd) at 70 degC before autoclaving with the major generation showing anisotropic peakbroadening
Fig 4 Biaxial cylinder domain size model of portlandite used for Rietveld refinement of anisotropic peak broadening
Fig 5 Morphological evolution of portlandite showing anisotropic domain size growthduring hydration at 70 degC
Fig 6 Comparison of quantification of crystalline quartz in samples prepared withMcCrone mill and agate mortar at different autoclaving times
J Schreiner et al Cement and Concrete Research 107 (2018) 247ndash252
249
6 Publications
41
quantity of the observed 1st generation The development of portlan-dite growth was already tracked in an equivalent slurry at 23 degC [14]Thus this observation confirms that the crystallinity of portlandite inmixtures for AAC production depends on the starting phase for hydra-tion as already indicated by Ectors [14]
Fig 4 shows the used biaxial cylindrical model for anisotropic do-main size calculation and the portlandite structure which was createdwith structural software VESTA 318 [34] Using the cylindrical ap-proach domain sizes in a (here equating to b) and c direction(dz= cylinder height) can be calculated which comes along with theexpected symmetrical parameters of portlandite
The 1st portlandite generation showing anisotropic domain growthcan be tracked in terms of cylinder diameter and height which is rea-lized in Fig 5 The blue cylinder represents the geometric approach andcylinder height and diameter are calculated newly for each range Thecylinder height remains rather stable throughout the hydration processwhile the cylinder diameter increases during the first hours of hydra-tion After 10 h of hydration the mean cylinder diameter no longer in-creases Consequently these observations match the results of the ex-aminations conducted at 23 degC [14] as well as the assumption thatdifferent mechanisms of growth exist for portlandite depending on the
hydration educt The maximum cylinder diameter is reached earlier inthis work very likely because of the higher hydration temperature
32 Quantification of the reactions during autoclaving
Autoclaved samples were ground with an agate mortar and com-pared to samples which were wet-ground with a McCrone mill Fig 6shows precisely that the determination of the amount of crystallinequartz is more reproducible in the two shown samples which were
Fig 7 2D XRD with Bruker GADDS-system plots of samples prepared with agate mortar and McCrone mill Coarse quartz grains are pointed out in the plot of the sample prepared withagate mortar
Fig 8 Particle size distribution of one sample prepared with an agate mortar and of onesample prepared with a McCrone mill measured by laser granulometry
Fig 9 Rietveld refinement for Tobermorite of autoclaved AAC sample by use of isotropicdomain size model (a) and of anisotropic domain size model (b)
J Schreiner et al Cement and Concrete Research 107 (2018) 247ndash252
250
6 Publications
42
prepared with a McCrone mill The high variance of crystalline quartzin the samples which were prepared with an agate mortar is a result ofinsufficient grinding and remaining of too large quartz grains Whenthis spottiness occurs a reliable quantification using the G-factormethod is not possible
The 2D XRD with Bruker GADDS-system plots in Fig 7 demonstratethe insufficient grinding when using an agate mortar compared to wetmilling with a McCrone mill Quartz would be overrepresented in a one-dimensional XRD pattern focusing on a section with bright spots (greenarrows) The lack of bright spots in the right plot shows that the quartzgrains are milled more thoroughly using a McCrone mill In Fig 8 theparticle size distribution after both ways of sample preparation iscompared Most grains in the sample prepared with an agate mortar arelarger than in the sample prepared with a McCrone mill The grain sizedistribution of the sample prepared with a McCrone mill complies withthe recommended particle size range for XRD analysis of under 5 to50 μm [3536] while the other sample exceeds the range
In Fig 9 Rietveld refinement of an autoclaved sample is shown Thedominant peaks at 77 290 and 301deg 2θ are attributed to tobermoriteIn the upper diagram (a) Rietveld refinement was carried out regularlycalculating isotropic domain sizes for tobermorite However the cal-culated fit differs significantly from the raw data It can be assumed thattobermorite shows a similar pattern to portlandite in terms of aniso-tropic peak broadening taking into account that tobermorite is as-signed to the orthorhombic crystal system Thus instead of a biaxialcylinder model an elliptic cylinder model (Fig 10 structure createdwith VESTA 318 [34]) was applied for the refinement in the lowerdiagram (b) The elliptic cylinder model is a sufficient approach to the
orthorhombic crystal system as it allows the distinction between do-main sizes in a b and c direction The fit is clearly superior using theanisotropic domain size model highlighted by the difference plot inFig 9b The comparison refinement with isotropic and anisotropic ap-proach was done for all of the five autoclaved samples In Fig 11 theresulting Rwp values for the whole pattern and the RBragg values of to-bermorite are shown The refinement using the anisotropic model leadsto both lower Rwp and RBragg values and consequently to a better fit anda more accurate quantification of tobermorite in all refined samples
4 Summary and conclusions
Improved analytical methods for both the phase developmentduring the hydration before autoclaving and during the autoclavingprocess of AAC are presented It could be shown that wet McCronemilling is the best way of preparation of AAC samples in order to obtainsuitable samples for powder diffraction A new approach to treat ani-sotropic domain sizes for Rietveld refinement could be successfullyapplied ndash with the benefit that portlandite and tobermorite in AACsamples could be refined more accurately using the Rietveld methodThus this application allows an improved quantification of the phasedevelopment during both of the production steps
For the future there are still plenty of possibilities to apply thepresented approach of calculating anisotropic domain sizes to AACproduction As exemplified with portlandite the mechanisms of growthof tobermorite can be tracked likewise during the autoclaving processIn addition the effect of variations in the chemical composition of AACraw mixtures on the crystal morphology of tobermorite can be ex-amined This leaves a new perspective to discuss the link between mi-neral phase morphology and the thermal and mechanical properties ofAAC
Acknowledgement
The autoclaved samples were generously provided by RodgauerBaustoffwerke GmbH amp Co KG The authors express gratitude for allsupport
Appendix A Supplementary data
Supplementary data to this article can be found online at httpsdoiorg101016jcemconres201802028
References
[1] MW Grutzeck Cellular concrete in M Scheffler P Colombo (Eds) CellularCeramics Wiley-VCH Weinheim 2005 pp 193ndash223
[2] M Haas The future of AAC ndash from a material scientists point of view inMC Limbachiya JJ Roberts (Eds) Autoclaved Aerated Concrete Taylor FrLondon 2005 pp 187ndash194
[3] T Mitsuda K Sasaki H Ishida Phase evolution during autoclaving process ofaerated concrete J Am Ceram Soc 75 (1992) 1858ndash1863
[4] N Isu H Ishida T Mitsuda Influence of quartz particle size on the chemical and
Fig 10 Triaxial cylinder domain size model of Tobermorite used for Rietveld refinement of anisotropic peak broadening
Fig 11 Comparison of Rwp and RBragg values of Rietveld refinements of autoclavedsamples and tobermorite using the isotropic and the anisotropic domain size model
J Schreiner et al Cement and Concrete Research 107 (2018) 247ndash252
251
6 Publications
43
mechanical properties of autoclaved aerated concrete (I) tobermorite formationCem Concr Res 25 (1995) 243ndash248
[5] NY Mostafa Influence of air-cooled slag on physicochemical properties of auto-claved aerated concrete Cem Concr Res 35 (2005) 1349ndash1357 httpdxdoiorg101016jcemconres200410011
[6] K Matsui J Kikuma M Tsunashima T Ishikawa S Matsuno A Ogawa M SatoIn situ time-resolved X-ray diffraction of tobermorite formation in autoclaved aer-ated concrete influence of silica source reactivity and Al addition Cem Concr Res41 (2011) 510ndash519
[7] C Biagioni S Merlino E Bonaccorsi The tobermorite supergroup a new no-menclature Mineral Mag 79 (2015) 485ndash495 httpdxdoiorg101180minmag2015079222
[8] BH OConnor MD Raven Application of the Rietveld refinement procedure inassaying powdered mixtures Powder Diffract 3 (1988) 2ndash6 httpdxdoiorg101017S0885715600013026
[9] D Jansen F Goetz-Neunhoeffer C Stabler J Neubauer A remastered externalstandard method applied to the quantification of early OPC hydration Cem ConcrRes 41 (2011) 602ndash608 httpdxdoiorg101016jcemconres201103004
[10] D Jansen C Stabler F Goetz-Neunhoeffer S Dittrich J Neubauer Does OrdinaryPortland Cement contain amorphous phase A quantitative study using an externalstandard method Powder Diffract 26 (2011) 31ndash38 httpdxdoiorg10115413549186
[11] D Ectors F Goetz-Neunhoeffer J Neubauer A generalized geometric approach toanisotropic peak broadening due to domain morphology J Appl Crystallogr 48(2015) 189ndash194 httpdxdoiorg101107S1600576714026557
[12] D Ectors F Goetz-Neunhoeffer J Neubauer Routine (an)isotropic crystallite sizeanalysis in the double-Voigt approximation done right Powder Diffract 32 (S1)(2017) 27ndash34 httpdxdoiorg101017S0885715617000070
[13] HM Rietveld A profile refinement method for nuclear and magnetic structures JAppl Crystallogr 2 (1969) 65ndash71 httpdxdoiorg101107S0021889869006558
[14] D Ectors Advances in the Analysis of Cementitious Reactions and Hydrate Phases(Doctoral Thesis) (2016) pp 12ndash14 (urnnbndebvb29-opus4-71743)
[15] AacuteG De La Torre S Bruque J Campo MAG Aranda The superstructure of C3Sfrom synchrotron and neutron powder diffraction and its role in quantitative phaseanalyses Cem Concr Res 32 (2002) 1347ndash1356 httpdxdoiorg101016S0008-8846(02)00796-2
[16] A Kirfel G Will Charge density in anhydrite CaSO4 from X-ray and neutrondiffraction measurements Acta Crystallogr Sect B Struct Crystallogr CrystChem 36 (1980) 2881ndash2890 httpdxdoiorg101107S0567740880010461
[17] C Bezou AN Christensen D Cox M Lehman A Nonat Structures cristallines deCaSO405H2O et CaSO406H2O Comptes Rendus Hebd Des Seacuteances lAcadeacutemieDes Sci Seacuterie 2 (312) (1991) 43ndash48
[18] KH Jost B Ziemer R Seydel Redetermination of the structure of β-dicalciumsilicate Acta Crystallogr Sect B Struct Crystallogr Cryst Chem 33 (1977)1696ndash1700 httpdxdoiorg101107S0567740877006918
[19] W Mumme LMD Cranswick BC Chakoumakos Rietveld crystal structure re-finements from high temperature neutron powder diffraction data for the poly-morphs of dicalcium silicate Neues Jahrb Fuer Mineral Abhandlungen 170 (1996)171ndash188
[20] A Colville S Geller The crystal structure of brownmillerite Ca2FeAlO5Crystallographica 50 (1971) 2311ndash2315 httpdxdoiorg101107S056774087100579X
[21] ST Bergold F Goetz-Neunhoeffer J Neubauer Quantitative analysis of C-S-H inhydrating alite pastes by in-situ XRD Cem Concr Res 53 (2013) 119ndash126 httpdxdoiorg101016jcemconres201306001
[22] EN Maslen VA Streltsov NR Streltsova N Ishizawa Electron density and op-tical anisotropy in rhombohedral carbonates III Synchrotron Xray studies ofCaCO3 MgCO3 and MnCO3 Acta Crystallogr Sect B 51 (1995) 929ndash939 httpdxdoiorg101107S0108768195006434
[23] G Renaudin Y Filinchuk J Neubauer F Goetz-Neunhoeffer A comparativestructural study of wet and dried ettringite Cem Concr Res 40 (2010) 370ndash375httpdxdoiorg101016jcemconres200911002
[24] WF Cole CJ Lancucki A refinement of the crystal structure of gypsumCaSO42H2O Acta Cryst B30 (1974) 921ndash929 httpdxdoiorg101107S0567740874004055
[25] T Runčevski RE Dinnebier OV Magdysyuk H Poumlllmann Crystal structures ofcalcium hemicarboaluminate and carbonated calcium hemicarboaluminate fromsynchrotron powder diffraction data Acta Crystallogr Sect B Struct Sci 68 (2012)493ndash500 httpdxdoiorg101107S010876811203042X
[26] JM Hughes JW Drexler Cation substitution in the apatite tetrahedral site crystalstructures of type hydroxylellestadite and type fermorite Neues Jahrb FuerMineral (1991) 327ndash336
[27] CH Shen RS Liu JG Lin CY Huang Phase stability study of La12Ca18Mn2O7Mater Res Bull 36 (2001) 1139ndash1148
[28] SW Bailey Refinement of an intermediate microcline structure Am Miner 54(1969) 1540ndash1545
[29] WR Busing HA Levy Neutron diffraction study of calcium hydroxide J ChemPhys 26 (1957) 563 httpdxdoiorg10106311743345
[30] Y Le Page G Donnay Refinement of the crystal structure of low-quartz ActaCrystallogr Sect B 32 (1976) 2456ndash2459 httpdxdoiorg101107S0567740876007966
[31] SA Hamid The crystal structure of the 11 Aring natural tobermoriteCa225[Si3O75(OH)15]1H2O Zeitschrift Fuer Krist - New Cryst Struct 154 (1981)189ndash198 httpdxdoiorg101524zkri19811543-4189
[32] P Mondal JW Jeffery The crystal structure of tricalcium aluminate Ca3Al2O6Acta Crystallogr B 31 (1975) 689ndash697 httpdxdoiorg101107S0567740875003639
[33] Y Takeuchi F Nishi I Maki Crystal-chemical characterization of the tricalciumaluminate-sodium oxide (3CaOtimesAl2O3-Na2O) solid-solution series Zeitschrift FuumlrKrist (1980) 259ndash307
[34] K Momma F Izumi VESTA 3 for three-dimensional visualization of crystal vo-lumetric and morphology data J Appl Crystallogr 44 (2011) 1272ndash1276 httpdxdoiorg101107S0021889811038970
[35] K Scrivener R Snellings B Lothenbach A Practical Guide to MicrostructuralAnalysis of Cementitious Materials CRC Press 2016 pp 123ndash125 httpdxdoiorg107693wl20150205
[36] V Pecharsky P Zavalij Fundamentals of Powder Diffraction and StructuralCharacterization of Materials Springer second edition 2005 p 302 httpdxdoiorg101007978-0-387-09579-0
J Schreiner et al Cement and Concrete Research 107 (2018) 247ndash252
252
6 Publications
44
7 Acknowledgement
7 Acknowledgement
Ich moumlchte mich bei einigen Personen bedanken ohne die es wohl kaum zum erfolgreichenAbschluss dieser Arbeit gekommen waumlreMein Doktorvater Prof Dr Juumlrgen Neubauer hat sich stets die Zeit genommen die noumltigwar um Angelegenheiten aller Art mit mir zu klaumlren Er gab mir fachlich immer zumrichtigen Zeitpunkt einen gewissen wissenschaftlichen Impuls Zugleich habe ich mich den-noch immer frei in meiner eigenen Konzeption gefuumlhlt Groszligen Dank spreche ich Prof DrFriedlinde Goumltz-Neunhoeffer aus die fuumlr mich ebenso immer eine verlaumlssliche Ansprech-partnerin fuumlr fachliche und organisatorische Angelegenheiten aller Art war Danke anDr Daniel Jansen fuumlr die gute Zusammenarbeit und dafuumlr dass er mich im Zuge meinerMasterarbeit in ein Forschungsprojekt aufgenommen hat das den Weg zur Promotionmoumlglich machte Zusaumltzlich gilt mein Dank Prof Dr Matthias Goumlbbels der fuumlr dieMitarbeiter am Lehrstuhl immer motivierende Worte fand Fuumlr die Ermoumlglichung meinerTeilnahme an diversen Dienstreisen Fortbildungen und Tagungen moumlchte ich mich viel-mals bedankenWeiterhin bedanke ich mich bei Dr Stephan Volkmann und den Rodgauer BaustoffwerkenGmbH amp Co KG fuumlr die gute Zusammenarbeit und die Bereitstellung von Versuchsma-terialienVielen Dank an meine studentischen Hilfskraumlfte Daniel Wagner Laura MoldenhauerFabian Lang Jakob Schreiber und Felix Klaassen die alle Aufgaben im Labor einwand-frei und mit Bedacht erledigten Bei meinen aktuellen und ehemaligen Kollegen DrKatrin Hurle Dr Dominique Ectors Dr Christoph Naber Dr Florian Huumlller JoumlrgNehring Frank Riedel Julian Wolf Tanja Manninger Daniel Wagner Nicolas FobbeKarla Spaumlth Julian Goergens Andreas Koumlhler Cordula Jakob Franz Becker und LisaKlemenz bedanke ich mich fuumlr die gelungene Zusammenarbeit und gegenseitige Unter-stuumltzung Besonderer Dank geht auch an Kerstin Kreszlig Bettina Engl Christian HankeBernd Schleifer und Christian Abe fuumlr die verlaumlssliche Unterstuumltzung bei technischen Fra-gen und Messungen im LaborFuumlr jegliche Unterstuumltzungen moumlchte ich mich auch bei meinen Eltern bedanken sowiebei meinem Bruder Ralf der mir mit einem LaTex Crashkurs viel Frustration ersparthat Danke Thomas dass du immer fuumlr mich da bist und mit mir zusammen fuumlr genugAusgleich gesorgt hast
45
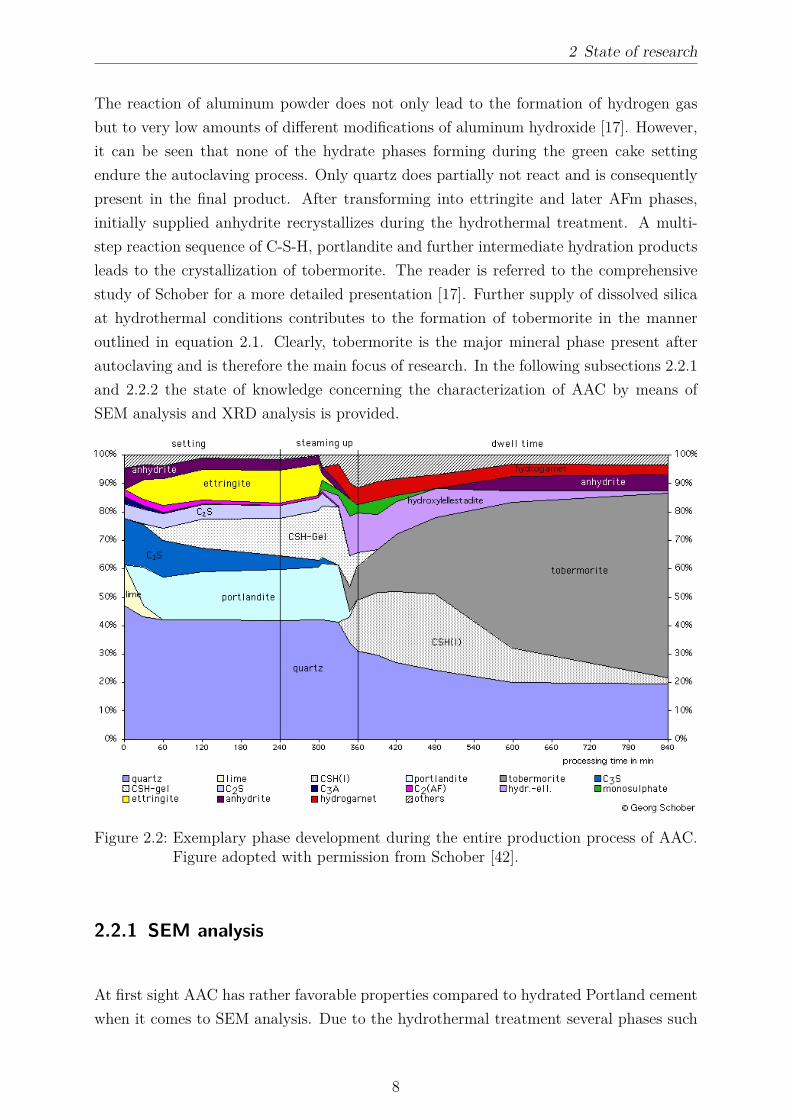
2 State of research
The reaction of aluminum powder does not only lead to the formation of hydrogen gasbut to very low amounts of different modifications of aluminum hydroxide [17] Howeverit can be seen that none of the hydrate phases forming during the green cake settingendure the autoclaving process Only quartz does partially not react and is consequentlypresent in the final product After transforming into ettringite and later AFm phasesinitially supplied anhydrite recrystallizes during the hydrothermal treatment A multi-step reaction sequence of C-S-H portlandite and further intermediate hydration productsleads to the crystallization of tobermorite The reader is referred to the comprehensivestudy of Schober for a more detailed presentation [17] Further supply of dissolved silicaat hydrothermal conditions contributes to the formation of tobermorite in the manneroutlined in equation 21 Clearly tobermorite is the major mineral phase present afterautoclaving and is therefore the main focus of research In the following subsections 221and 222 the state of knowledge concerning the characterization of AAC by means ofSEM analysis and XRD analysis is provided
Figure 22 Exemplary phase development during the entire production process of AACFigure adopted with permission from Schober [42]
221 SEM analysis
At first sight AAC has rather favorable properties compared to hydrated Portland cementwhen it comes to SEM analysis Due to the hydrothermal treatment several phases such
8
2 State of research
as tobermorite show better crystallinity In addition the hardly evitable effects of dam-age to poorly crystalline phases and removal of water are not as significant in the case ofAAC This is why environmental scanning electronic microscopy (ESEM) was suggestedin order to investigate hydrated Portland cement after early hydration [44 45] Howeverwhile hydrated OPC is a reasonably homogeneous material AAC shows heterogeneitydue to the porous structure (Figure 11)As reported in subsection 213 several authors investigated the morphology of tober-morite in AAC in order to verify the influence of foreign ions supplied by SCMs andestimate their effect on the thermal and mechanical properties Well crystallized tober-morite often shows a house-of-cards structure in AAC (Figure 23) which was observedin numerous studies [46 47 48]
Figure 23 House-of-cards appearance of tobermorite crystals in AAC
Wongkeo amp Chaipanich stated that the application of coal bottom ash for partial replace-ment of cement in the starting compound resulted in a change of plate-like to lath-likemorphology of tobermorite crystals [49] Equally thin lath-like plates of tobermorite wereobserved by Roacuteżycka et al in samples prepared from perlite waste [50] Venhodovaacute etal investigated AAC samples prepared from mixes including fly ash and Al(OH)3 andconfirmed the elongated shape of Al-incorporated tobermorite [8] In these studies thefraction of aluminum ions was increased by adding the respective SCM An effect on themorphology of tobermorite was respectively reported which conforms to the conclusionsmade by different authors in subsection 213 Nevertheless the heterogeneity of AACsamples in SEM images was barely addressed in all of these examples By contrast Mit-suda et al differentiated between macropores and micropores in their SEM images ofindustrially manufactured AAC [10] Huang et al separately analyzed walls and pores in
9
2 State of research
their samples prepared from copper tailings and blast furnace slag [48] The wall sectionsappeared dense while in pores platy tobermorite and long-strip shaped anhydrite wasobserved Only the tobermorite crystals in the pores showed the previously describedhouse-of-cards structure As is evident from these published results there is a lack ofclarity about the meaning and informative value of observations made in AAC samplesby SEM analysis In the main results of this present thesis (section 32) a substantiatedassessment of this circumstance is given
222 XRD analysis
While SEM analysis of AAC is majorly performed in order to characterize the crystallinityand morphology of tobermorite XRD analysis is mainly applied in order to assess theoverall phase composition Apart from the phases shown in Figure 22 additional calcitefeldspar mica gypsum and bassanite occur frequently in AAC depending on the miner-alogical composition of the used raw materials Frequently minor phases are unreactedresidual components of raw materials such as sericite in the publication of Isu et al [51] orphlogopite in the study of Huang et al who applied skarn-type copper tailings for AACpreparation [48] Prolonged curing duration resulted in minor quantities of xonotlite inthe study by Mitsuda et al [10]Mainly qualitative phase contents have been determined based on XRD in studies dealingwith the mineralogy of AAC A clear recognition of amorphous content in AAC along withthe crystalline phases has been barely addressed and discussed Relative quantities weredetermined by Matsui et al by plotting normalized intensities [28] They estimated thequantity of C-S-H gel by regarding the integrated intensity of the assumed tobermoriteprecursor in a distinct section of the XRD pattern Coming in agreement with the authorscited in subsection 213 increased d spacing along c in Al-substituted tobermorite wasreported in the same study Venhodovaacute et al performed XRD analysis of AAC samplesin their publication previously addressed in subsection 221 [8] They compared relativeintensities of tobermorite in their samples but no absolute quantities of the phases werecalculated either Mitsuda et al applied an internal standard method in order to quantifyunreacted quartz in their AAC samples [10]More recently Ectors proposed a promising method for the tracking of portlandite forma-tion during the green cake hydration [52] By applying a Rietveld compatible approachfor TOPAS 50 (Bruker AXS) to fit anisotropic peak broadening due to domain mor-phology [19] two generations of portlandite could be refined separately and assigned tothe hydration of calcium oxide and tricalcium silicate respectively The key idea behindthis approach is that the average domain morphology of a mineral phase in a powder
10
2 State of research
sample implies certain mineralogical characteristics The simplified domain morphologycan be calculated on the basis of geometrical shapes such as cylinder ellipsoid or cuboidDepending on the crystal system and the expected morphology the geometrical shapecan be adjusted accordingly In the example reported by Ectors the one generation ofportlandite originating from burnt lime hydration showed anisotropic peak broadening- unlike the generation forming from tricalcium silicate hydration In accordance withthe trigonal crystal system a biaxial cylinder model was applied for the fitting of theanisotropic generation The operating principle of the approach to fit the anisotropicpeak broadening due to domain morphology can be precisely explored by accessing fur-ther publications by Ectors et al [53 54] Apart from this benefit a better fit to themeasured data enables a more accurate refinement and quantification of all phases Thetwo generations of portlandite were additionally quantified by means of an external stan-dard method [55] The combination of quantitative phase analysis by XRD (QXRD) withthe refinement of anisotropic peak broadening is a promising approach in this context -especially in consideration of the fact that phase quantifications in AAC samples havebeen barely performed ever before Hence the application of these methods is the keymatter of this present thesis Especially the potential of the domain morphology analysisof tobermorite is precisely investigated The terms domain size and domain morphology inthis sense refer to the coherently scattering unit measured by XRD analysis Crystallineparticles observed by means of electron microscopy which are frequently termed grainscrystals or crystallites are for the most part clusters of coherently scattering domains[56 57]
11
3 Main results
3 Main results
This chapter introduces the main results presented in three peer reviewed publications[58 59 60] incorporated in chapter 6 The new findings are put in a general context andsubsequently they are summarized and discussed in chapter 4 The sections 31 and 32deal with the characterization of tobermorite in both lab-scale samples and AAC sam-ples produced on an industrial scale In section 33 the entire production process of AACincluding the hydration before autoclaving is addressed
Figure 31 Application of a triaxial cylinder model for the calculation of anisotropic do-main sizes of tobermorite implemented with Rietveld refinement and influenceon the fit compared to ordinary refinement [60]
12
3 Main results
One particular main result is a key element in each of the following sections In Figure 31the fit of tobermorite after two Rietveld refinements of different accuracy is shown In aregular Rietveld refinement for simplification the coherently scattering units are treatedas spherical shapes as usually only one size value for each mineral phase is calculated Asaverage domain sizes of a mineral phase in different crystallographic directions are in manycases indeed close to one value this approximation is often sufficient in order to achievea satisfactory fit to the measured diffractogram The crystal system and surroundingconditions during the formation of a mineral phase are significant factors in this context Amisfit at different (hkl) reflections as displayed in Figure 31 is an indication of anisotropicpeak broadening Clearly orthorhombic tobermorite shows anisotropic peak broadeningdue to its anisotropic domain morphology For the possible origins of anisotropic peakbroadening apart from size broadening the reader is referred to section 61 In accordancewith the orthorhombic crystal system a triaxial model is applied in order to fit the peakbroadening [19] By implementing the macro during the refinement no longer one butthree sizes (x y and z for respectively a b and c direction) are calculated Besides theimproved fit the calculated domain morphology is an additional information extractedfrom XRD analysis and it is representative for the average value of the phase in the entiresample In each of the following sections the different benefits regarding this approachare outlined in more detail
31 Hydrothermal synthesis of tobermorite on alaboratory scale - application of two types ofmetakaolin
This study covers mineralogical properties of tobermorite synthesized from a set of variouscompounds including different amounts and types of metakaolin [58] Unlike in sections32 and 33 the samples were not aerated before autoclaving and their composition isadjusted to the CaSi molar ratio of stoichiometric tobermorite On the one hand thereactivity of metakaolin and minor phases at hydrothermal conditions for the possible usein AAC production was investigated On the other hand the effects of consequent changesof the bulk chemistry in the basic compound on the mineralogical characteristics of to-bermorite such as lattice parameters and domain morphology were analyzed In additionfor one particular compound the effect of different curing times was explored While theconventional raw materials for AAC production are rather low-cost resources metakaolinis a high-priced SCM in this regard For this reason besides one comparatively pure com-mercial metakaolin (MK) a second by-product type of metakaolin (MKg) was applied
13
3 Main results
at equivalent dosages All investigated mix composites and the chemical composition ofMK and MKg are summed up in tables in section 61In Figure 32 the effect of different amounts of the two types of metakaolin on the phasequantities is displayed Clearly at moderate dosages of MK and MKg tobermorite waspresent in comparable quantities However the application of any amount of metakaolinreduced the amount of tobermorite compared to the blank mixture It can be seen thatkatoite was present whenever the content of Al2O3 in the starting drymix exceeded 2wt which fits well with the state of knowledge [5 23] For the highest possible dosagesof the two types of metakaolin (MK60 and MKg60) contrary effects were observed Ap-plication of impure metakaolin (MKg) led to a considerable amount of tobermorite whilein MK60 no tobermorite was present The high content of Al2O3 seems to have hinderedthe formation of tobermorite Not all of the Al2O3 in MKg was supplied for reactionas minor phases such as feldspar remained unreacted which is shown accurately in therespective publication in section 61
Figure 32 Weight fractions of tobermorite quartz and katoite measured by QXRD anal-ysis and contents of Al2O3 in the starting drymix Amorphous content andminor phases are not shown
The results of thermal analysis of samples characterized by MK addition in small stepsare shown in Figure 33 It can be seen that the conversion of 93 Aring tobermorite into β-
14
3 Main results
wollastonite depended on the dosage of MK However unlike suggested by Klimesch ampRay there was no effect of lower contents of Al2O3 in the drymix [40] Consequently theinfluence of Al3+ at low dosages (MK25 and MK5) could not be observed on the basisof this method Apart from this result the other signals showed good agreement with thesuggested conversion ranges by Klimesch amp Ray as for samples MK9 and MK16 a clearshift towards higher temperature was measured However the role of Al3+ incorporationverified by this method is not necessarily conclusive as additional reactions during theheating experiment involving Al3+ are possible On that basis the observations madeby means of DTA would not reflect the amount of Al3+ originally incorporated into thestructure of 11 Aring tobermorite
Figure 33 Conversion of 93 Aring tobermorite into β-wollastonite in samples synthesizedwith various amounts of metakaolin and suggested temperature ranges ac-cording to Klimesch amp Ray [40]
In accordance with authors referenced in subsection 213 lattice parameter c of tober-morite increased with elevated dosages of Al2O3 in the basic dry mix (Figure 34) Theimpact could be observed for the complete range of samples as displayed in section 61which indicates that a limit of Al3+ incorporation was not reached in this study Forcomparison the relative domain morphology is plotted in Figure 34 Unlike the DTA
15
3 Main results
signals both lattice parameter c and the domain morphology are impacted by very lowdosages of Al2O3 There is a good accordance of the relation of growth in b direction to adirection and the c parameter This is valid up to 20 wt of Al2O3 in the starting drymix By contrast more elevated contents of Al2O3 did not affect the domain morphologyany further even though the incorporation is verified through the increased c parameterIt follows that the impact of Al3+ incorporation on the domain morphology is limited tovery low contents while the impact on lattice parameter c can be tracked throughoutthe entire examined range of samples In section 61 additional results show that growthin b direction increased with reaction time These observations are solely based on XRDanalysis and offer new benefits for the structural understanding of tobermorite
Figure 34 Impact of the calculated Al2O3 content in the basic dry mix on the latticeparameter c and on the relation of calculated domain sizes of tobermorite ina (x) and b (y) direction
16
3 Main results
32 Structural properties of tobermorite in AAC - SEMversus XRD analysis
This section and the respective publication [59] mainly deal with the suitability of SEManalysis of tobermorite in AAC The effects of varying amounts of SO3 and Al2O3 in thedry mix on structural properties of tobermorite are discussed based on XRD analysisAs shown in subsection 221 and Figure 23 tobermorite often shows a house-of-cardsstructure in AAC samples This property has been considered to be relevant for thethermal and mechanical properties of AAC (subsection 221) However SEM analysiswithin this study revealed that this type of appearance is mainly found in the poresand pore surfaces (Figure 35) This finding comes in agreement with the observationsmade by Huang et al [48] In the solid skeleton of the dense AAC material neither themorphology nor the house-of-cards structure could be observed properly which can beseen very clearly in additional micrographs provided in section 62 It should be consideredthat the major amount of tobermorite by weight is located in the dense material and notat the pore surfaces In this way these findings are clear disadvantages coming along withonly SEM analysis of AAC as representative results can hardly be obtained
Figure 35 House-of-cards structure of tobermorite in a pore surrounded by dense mate-rial
Moreover several authors in subsection 221 justified the morphology of tobermorite withthe incorporation of foreign ions Al-substituted tobermorite showed lath-like morphologywhereas Al-free tobermorite showed rather plate-like morphology [6 32 49] Howeverthe present investigation revealed that independent of Al2O3 content in the raw mix there
17
3 Main results
is always heterogeneity regarding the morphology of tobermorite In Figure 36 plate-likeand lath-like morphology of tobermorite in AAC observed in two statistical chemicallyvarious samples are displayed This result supports the previous assumption that theobservations made by SEM analysis of tobermorite in AAC strongly depend on whatpart of the sample is selected Yet again no clear observations could be made that wererepresentative for the entire sample
Figure 36 Heterogeneous morphology of tobermorite (plate-like in a and c lath-like in band d) in two AAC samples characterized by different Al2O3 contents in theraw mix
The effects of Al3+ on the domain morphology of tobermorite were measured and evaluatedin a similar manner as in section 61 and the results could be confirmed The relativedomain growth in b direction was increased by Al3+ incorporation in both studies [5859] Moreover lattice parameter c was increased with Al3+ incorporation which can beseen more accurately in section 62 Unlike SEM analysis XRD analysis allowed clearconclusions whenever structural properties of Al-substituted tobermorite were affectedInstead of a local observation as made with SEM representative and statistical resultswere obtained The reader is referred to section 61 and section 62 for further results and
18
3 Main results
more specific conclusionsIn addition the effect of various amounts of sulfate in the raw mix was analyzed Unlikein the case of different dosages of Al3+ neither the domain morphology nor the latticeparameters of tobermorite were affected by the SO3 content in the dry mix In Figure 37these observations and additionally the amounts of anhydrite measured by QXRD areshown As the amount of available SO3 in the dry mix is known the maximum possibleamount of anhydrite could be calculated for each of the samples in focus Obviouslythe measured amounts of anhydrite are either equal or slightly higher compared to theexpected quantities This result leads to the assumption that all of the available sulfateis transformed into anhydrite so that no more sulfate could be incorporated into thestructure of tobermorite The over-estimation of anhydrite in some of the samples can beexplained due to the inaccuracy of the quantification method The present results rathermatch with the suggestions by Sauman amp Valtr [41] as in their study no effect of sulfateon the structure of tobermorite was observed either
Figure 37 Impact of the sulfate content in the AAC raw mix on lattice parameter cand relative domain morphology of tobermorite (a) and comparison of theexpected maximum amount of anhydrite to the measured amount determinedby QXRD (b)
33 Improved monitoring of the phase developmentduring the production of AAC
In this study not only autoclaved samples were analyzed but additionally a lab-scale slurrywhich included the reactive components of the green cake stage during AAC productionat equivalent weight proportions In-situ XRD was performed at 70 degC and at a water-to-
19
3 Main results
solid ratio of 08 for 24 h (Figure 38) which are respective conditions during commercialproduction Clearly the phase development is dominated by OPC and lime hydration asdescribed in section 22 It can be seen that the major reaction turnover occurs duringthe first 200 minutes which is the average duration of the green stage After only 30minutes all of the quicklime had transformed into portlandite whereas Schober proposeda duration of one hour for this reaction [42] The amount of portlandite is composed oftwo different generations as proposed by Ectors [52] Equally a biaxial cylinder modelwas applied in order to fit the peak broadening of the first generation of portlandite in thepresent investigation Minor phase developments such as the formation of AFm phases arenot shown in Figure 38 A coarse fraction of anhydrite did not react so that constantlyaround 15 wt were measured after 6 h As the decomposition of ettringite due tosulfate depletion [55] does not occur prior to 12 h the green cake strength is not affected
Figure 38 In-situ XRD measurement of AAC model slurry at water-to-solid ratio of 08and 70 degC For clarity and comprehensibility not all phases are shown
The separation of two generations of portlandite in the system does not only translate intodifferent domain morphologies as shown by Ectors [52] In Figure 39 more indicationsfor different mineralogical properties are displayed The shape of the (0 0 1) reflection inXRD patterns after only quicklime hydration and after both quicklime and alite hydrationshows a distinct feature While portlandite originating from quicklime hydration showsa broad peak implying lower crystallinity the peak after alite hydration is characterized
20
3 Main results
Figure 39 Formation of two generations of portlandite in AAC slurry in XRD (a) andDTA (b) plots
by a sharper component Yet the peak breadth did not change indicating that the firstgeneration is still present with the original characteristics This observation is supportedby DTA measurements additionally demonstrating two degrees of crystallinity only afteralite hydration In agreement with XRD analysis the better crystalline second generationof portlandite decomposes at a higher temperature
Figure 310 Quantification of tobermorite in statistical chemically various AAC sampleswith and without the application of the macro for the fitting of anisotropicpeak broadening
21
3 Main results
Furthermore commercial AAC samples were considered in this study By applying themethod for the refinement of anisotropic peak broadening (Figure 31) a more accuratequantification of tobermorite can be achieved In Figure 310 the calculated amounts oftobermorite in statistical chemically various AAC samples are plotted In some samplesthe refinement using the macro leads to considerably higher but never lower quantitiesof tobermorite whereas in other samples nearly the same amount of tobermorite is cal-culated This observation can be well understood taking into account that the macroallows to account more peak area for tobermorite as shown in Figure 31 Clearly thereis evidence that the anisotropy of tobermorite domains is not uniform from one sampleto another which was basically justified in the previous sections As an improved quan-tification of a single phase leads to a better quantification of other phases in the samplethis adaption is very valuable in order to assess the phase development Here the peakbroadening of tobermorite equally observed by Qu et al [6] could be tracked and evalu-ated in order to gain more accurate results Moreover in section 63 McCrone milling issuggested in order to avoid spottiness in XRD patterns caused by coarse grains of quartzor anhydrite (Figure 38)
22
4 Conclusions
4 Conclusions
The research results presented in the previous sections yield advances in the mineralogicalinvestigation of tobermorite and autoclaved aerated concrete Recorded diffraction pat-terns contain plenty of usually unused data regarding the microstructural characteristicsof the sample and phases therein The profit of XRD measurements can be significantlyimproved whenever one or more phases show anisotropic peak broadening and appro-priate models for the respective domain morphology are implemented into the Rietveldenvironment Within the scope of the present investigations portlandite and tobermoriteshow this particularityThe effects of changes in the chemistry of the starting mix were examined based on dif-ferent dosages of metakaolin Al-substituted tobermorite showed increased growth in b
direction and an increase of lattice parameter c compared to Al-free tobermorite The rel-ative domain sizes were determined based on anisotropic peak broadening However whilethe effect of Al3+ incorporation into the lattice of tobermorite was limited regarding thedomain morphology lattice parameter c showed an increase throughout the entire rangeof samples The consequent effects suggested by Klimesch amp Ray observed by means ofDTA are debatable as reactions during the heating experiment may lead to to a changeof Al3+ content in tobermorite [40] While both types of applied metakaolin showed goodreactivity at hydrothermal conditions some included minor phases such as feldspar oranatase remained unreacted At high dosages of Al2O3 in the starting mix the formationof either only katoite or katoite along with tobermorite was observed (Figure 32)SEM analysis of tobermorite in AAC cannot be suggested based on the observationspresented in this work as it is only visually accessible in the pores or at pore surfacesThe dense material of the AAC skeleton contains several crystalline and X-ray amorphousphases which hardly allows a proper investigation Even in single pores tobermorite crys-tals appeared very heterogeneous at various chemical compositions As a result lath-liketobermorite was not only present in samples characterized by elevated Al3+ incorporationBy contrast the benefits of XRD analysis presented in section 61 equally accounted fortobermorite in AAC samples Sulfate incorporation into the lattice of tobermorite wasnot observed All of the sulfate in the system was detected to be present in anhydriteThe phase transitions in the AAC raw slurry during the green stage hydration were show-cased by in-situ XRD analysis of a model mix at 70 degC Additional DTA and XRD mea-
23
4 Conclusions
surements during this step confirmed the presence of two generations of portlandite char-acterized by different crystallinity as suggested by Ectors [52] The inclusion of anisotropicdomain morphology during the Rietveld refinement allowed a more accurate quantifica-tion of tobermorite in autoclaved samples Sample preparation adjusted to the grain sizedistribution in AAC samples (section 63) the external standard method for quantita-tive XRD analysis [55] and the approach to evaluate anisotropic peak broadening [19]are the key methods for a more accurate tracking of the phase development during AACproduction
24
5 References
5 References
[1] A E Zadov A I Grabezhev N N Pertsev N V Chukanov and S V PribavkinTobermorite-plombierite metasomatites of the Gumeshevsk skarn-porphyry copper depositmiddle Urals Doklady Earth Sciences 407(3)495ndash497 2006
[2] M F Heddle Preliminary notice of substances which may prove to be new minerals MinMag 4117ndash123 1880
[3] S Merlino E Bonaccorsi and T Armbruster The real structure of tobermorite 11AringNormal and anomalous forms OD character and polytypic modifications European Journalof Mineralogy 13(3)577ndash590 2001
[4] C Biagioni S Merlino and E Bonaccorsi The tobermorite supergroup a new nomencla-ture Mineralogical Magazine 79(2)485ndash495 2015
[5] C A Riacuteos C D Williams and M A Fullen Hydrothermal synthesis of hydrogarnetand tobermorite at 175 degC from kaolinite and metakaolinite in the CaO-Al2O3-SiO2-H2Osystem A comparative study Applied Clay Science 43(2)228ndash237 2009
[6] X Qu Z Zhao and X Zhao Microstructure and characterization of aluminum-incorporated calcium silicate hydrates (C-S-H) under hydrothermal conditions RSC Ad-vances 8(49)28198ndash28208 2018
[7] R Šiaučiunas and K Baltakys Formation of gyrolite during hydrothermal synthesis inthe mixtures of CaO and amorphous SiO2 or quartz Cement and Concrete Research34(11)2029ndash2036 2004
[8] E Venhodovaacute R Janovskyacute and R Drochytka Formation of Tobermorite at Different Ma-terials Composition of Aerated Concrete Applied Mechanics and Materials 752-753247ndash250 2015
[9] L Galvaacutenkovaacute E Bartoniacutečkovaacute T Opravil J Tkacz and P Ptaacuteček The influence ofstarting materials solubility on tobermorite structure formation under the hydrothermalconditions IOP Conference Series Materials Science and Engineering 379(1)1ndash8 2018
[10] T Mitsuda K Sasaki and H Ishida Phase Evolution during Autoclaving Process J AmCeram Soc 75(75)1858ndash1863 1992
[11] A Skawińska The influence of metahalloysite addition on tobermorite formation studied byX-ray powder diffraction and scanning electron microscope MATEC Web of Conferences16305008 2018
[12] S T Bergold F Goetz-Neunhoeffer and J Neubauer Quantitative analysis of C-S-H in
25
5 References
hydrating alite pastes by in-situ XRD Cement and Concrete Research 53119ndash126 2013
[13] O P Shrivastava and F P Glasser Ion-exchange properties of 11-Aring tobermorite Reactivityof Solids 2(3)261ndash268 1986
[14] H Maeda Y Ogawa E H Ishida and T Kasuga Hydrothermal synthesis of tobermoritedoped with phosphorus species for removing heavy metal ions Journal of the AustralianCeramic Society 48(1)8ndash11 2012
[15] O P Shrivastava and R Shrivastava Cation exchange applications of synthetic tobermoritefor the immobilization and solidification of cesium and strontium in cement matrix Bulletinof Materials Science 23(6)515ndash520 2000
[16] G Renman and A Renman Sustainable Use of Crushed Autoclaved Aerated Concrete(CAAC) as a Filter Medium in Wastewater Purification 8th International conferenceon sustainable management of waste and recycled materials in construction GothenburgSweden 30 Mayndash1 June 2012 Proceedings pages 1ndash7 2012
[17] G Schober Chemical transformations during the manufacturing of autoclaved aeratedconcrete (ACC) Cement lime gypsum and quartz sand become cellular concrete ZKG58(7)63ndash70 2005
[18] A J Hamad Materials Production Properties and Application of Aerated LightweightConcrete Review International Journal of Materials Science and Engineering 2(2)152ndash157 2014
[19] D Ectors F Goetz-Neunhoeffer and J Neubauer A generalized geometric approach toanisotropic peak broadening due to domain morphology Journal of Applied Crystallogra-phy 48(1)189ndash194 2015
[20] H M Rietveld A profile refinement method for nuclear and magnetic structures Journalof Applied Crystallography 2(2)65ndash71 1969
[21] S A Hamid The crystal structure of the 11 Aring natural tobermoriteCa225[Si3O75(OH)15]1H2O Zeitschrift fuer Kristallographie - New Crystal Struc-tures 154(3-4)189ndash198 1981
[22] S A S El-Hemaly T Mitsuda and H F W Taylor Synthesis of normal and anomaloustobermorites Cement and Concrete Research 7429ndash438 1977
[23] M Sakiyama and T Mitsuda Hydrothermal reaction between C-S-H and kaolinite for theformation of tobermorite at 180degC Cement and Concrete Research 7(6)681ndash685 1977
[24] E Bonaccorsi S Merlino and A R Kampf The crystal structure of tobermorite 14 Aring(plombierite) a C-S-H phase Journal of the American Ceramic Society 88(3)505ndash5122005
[25] S Merlino E Bonaccorsi and T Armbruster The real structures of clinotobermorite andtobermorite 9 Aring OD character polytypes and structural relationships European Journalof Mineralogy 12(2)411ndash429 2000
[26] K Momma and F Izumi VESTA 3 for three-dimensional visualization of crystal volu-metric and morphology data Journal of Applied Crystallography 44(6)1272ndash1276 2011
26
5 References
[27] S Shaw S M Clark and C MB Henderson Hydrothermal formation of the calcium sil-icate hydrates tobermorite (Ca5Si6O16(OH)2 middot 4H2O) and xonotlite (Ca6Si6O17(OH)2)An in situ synchrotron study Chemical Geology 167(1-2)129ndash140 2000
[28] K Matsui J Kikuma M Tsunashima T Ishikawa S Matsuno A Ogawa and M SatoIn situ time-resolved X-ray diffraction of tobermorite synthesis process under hydrothermalcondition IOP Conference Series Materials Science and Engineering 18(2)60ndash66 2011
[29] G Matekonis R Šiaučiunas and D Vaičiukyniene Hydrothermal Synthesis and Charac-terization of Na + and [ Al 3 + + Na + ] -substituted Tobermorite in CaO-SiO2middotnH2O-H2OSystem MATERIALS SCIENCE 16(3)242ndash248 2010
[30] G Geng R J Myers M J A Qomi and P JM Monteiro Densification of the inter-layer spacing governs the nanomechanical properties of calcium-silicate-hydrate ScientificReports 7(1)1ndash8 2017
[31] D Klimesch and A Ray Autoclaved cement-quartz pastes with metakaolin additionsAdvanced Cement Based Materials 7(3-4)109ndash118 1998
[32] N Y Mostafa A A Shaltout H Omar and S A Abo-El-Enein Hydrothermal synthesisand characterization of aluminium and sulfate substituted 11 nm tobermorites Journal ofAlloys and Compounds 467(1-2)332ndash337 2009
[33] İ Demir M S Başpınar E Kahraman E Ccedilalışkan and G Goumlrhan An Investigation onthe Usability of Diatomite in Aerated Concrete Production In Proc of the Intl Conf onAdvances In Civil Structural And Construction Engineering - CSCE 2014 pages 97ndash1002014
[34] A Skawinska Z Owsiak T Baran and K Hernik The influence of halloysite additionon tobermorite formation in CaO and quartz mix under hydrothermal conditions CementWapno Beton 17(12)426ndash434 2017
[35] N Y Mostafa Influence of air-cooled slag on physicochemical properties of autoclavedaerated concrete Cement and Concrete Research 35(7)1349ndash1357 2005
[36] D Małaszkiewicz and J Chojnowski Influence of addition of calcium sulfate dihydrate ondrying of autoclaved aerated concrete Open Engineering 7(1)273ndash278 2017
[37] N Hara and N Inoue Thermal behaviour of 11Aring tobermorite and its lattice parametersCement and Concrete Research (10)53ndash60 1980
[38] M D Jackson S R Chae S R Mulcahy C Meral R Taylor P Li A H EmwasJ Moon S Yoon G Vola H R Wenk and P JM Monteiro Unlocking the secretsof Al-tobermorite in Roman seawater concrete American Mineralogist 98(10)1669ndash16872012
[39] W Liao W Li Z Fang C Lu and Z Xu Effect of different aluminum substitution rateson the structure of Tobermorite Materials 12(22)1ndash10 2019
[40] D Klimesch and A Ray DTA-TG Study of the CaO-SiO2-H2O and CaO-Al2O3-SiO2-H2OSystems Under Hydrothermal Conditions Journal of Thermal Analysis and Calorimetry56(1)27ndash34 1999
27
5 References
[41] Z Sauman and Z Valtr Substitution of sulphate ions in the crystal lattice of 11 Aring to-bermorite In The VI International Congress on the Chemistry of Cement pages 1ndash14Moscow 1974
[42] G Schober Reaction of raw materials to the final product AAC httpwwwpb-aacde
chemmin2_ehtml 2012 accessed 2020-01-31
[43] D Jansen C Stabler F Goetz-Neunhoeffer S Dittrich and J Neubauer Does Ordi-nary Portland Cement contain amorphous phase A quantitative study using an externalstandard method Powder Diffraction 26(01)31ndash38 2011
[44] C Roumlszligler J Stark F Steiniger and W Tichelaar Limited-dose electron microscopyreveals the crystallinity of fibrous C-S-H phases Journal of the American Ceramic Society89(2)627ndash632 2006
[45] Y Sakalli and R Trettin Investigation of C3S hydration by environmental scanning elec-tron microscope Journal of Microscopy 259(1)53ndash58 2015
[46] F Matsushita Y Aono and S Shibata Expansion and shrinkage behavior of green cakeof Autoclaved Aerated Concrete In Autoclaved Aerated Concrete - Innovation and Devel-opment Proceedings of the 4th International Conference on Autoclaved Aerated ConcreteKingston UK 8-9 September 2005 pages 101ndash108 CRC Press 2005
[47] C Chucholowski M Holger and K-C Thienel Improving the recyclability environmentalcompatibility and CO2 balance of autoclaved aerated concrete by replacing sulfate carrierand cement with calcined clays CePapers 2(4)503ndash512 2018
[48] X Y Huang W Ni W H Cui Z J Wang and L P Zhu Preparation of autoclavedaerated concrete using copper tailings and blast furnace slag Construction and BuildingMaterials 27(1)1ndash5 2012
[49] W Wongkeo and A Chaipanich Compressive strength microstructure and thermal anal-ysis of autoclaved and air cured structural lightweight concrete made with coal bottom ashand silica fume Materials Science and Engineering A 527(16-17)3676ndash3684 2010
[50] A Roacuteżycka and W Pichoacuter Effect of perlite waste addition on the properties of autoclavedaerated concrete Construction and Building Materials 12065ndash71 2016
[51] N Isu H Ishida and T Mitsuda Influence of quartz particle size on the chemical andmechanical properties of autoclaved aerated concrete (I) tobermorite formation Cementand Concrete Research 25(25)243ndash248 1995
[52] D Ectors Advances in the analysis of cementitious reactions and hydrate phases doctoralthesis PhD thesis Friedrich-Alexander-Universitaumlt Erlangen-Nuumlrnberg 2016
[53] D Ectors F Goetz-Neunhoeffer and J Neubauer Domain size anisotropy in the double-Voigt approach An extended model Journal of Applied Crystallography 481998ndash20012015
[54] D Ectors F Goetz-Neunhoeffer and J Neubauer Routine (an)isotropic crystallite sizeanalysis in the double-Voigt approximation done right Powder Diffraction 32(S1)27ndash342017
28
5 References
[55] D Jansen F Goetz-Neunhoeffer C Stabler and J Neubauer A remastered external stan-dard method applied to the quantification of early OPC hydration Cement and ConcreteResearch 41(6)602ndash608 2011
[56] T Ungaacuter G Tichy J Gubicza and R J Hellmig Correlation between subgrains andcoherently scattering domains Powder Diffraction 20(04)366ndash375 2005
[57] Triloki P Garg R Rai and B K Singh Structural characterization of as-depositedcesium iodide films studied by X-ray diffraction and transmission electron microscopy tech-niques Nuclear Instruments and Methods in Physics Research Section A AcceleratorsSpectrometers Detectors and Associated Equipment 736128ndash134 2014
[58] J Schreiner F Goetz-Neunhoeffer J Neubauer and D Jansen Hydrothermal synthesisof 11 Aring tobermorite ndash Effect of adding metakaolin to the basic compound Applied ClayScience 185 2020
[59] J Schreiner F Goetz-Neunhoeffer J Neubauer S Volkmann S Bergold R Webler andD Jansen Advanced Rietveld refinement and SEM analysis of tobermorite in chemicallydiverse autoclaved aerated concrete Powder Diffraction 34143ndash150 2019
[60] J Schreiner D Jansen D Ectors F Goetz-Neunhoeffer J Neubauer and S VolkmannNew analytical possibilities for monitoring the phase development during the production ofautoclaved aerated concrete Cement and Concrete Research 107247ndash252 2018
29
6 Publications
6 Publications
61 Hydrothermal synthesis of 11 Aring tobermorite ndash Effectof adding metakaolin to the basic compound
Reprint of the peer reviewed publication
Schreiner J Goetz-Neunhoeffer F Neubauer J Jansen D 2020 Hydrothermalsynthesis of 11 Aring tobermorite ndash Effect of adding metakaolin to the basic compoundApplied Clay Science 185 httpsdoiorg101016jclay2019105432
with permission from Elsevier
30
Contents lists available at ScienceDirect
Applied Clay Science
journal homepage wwwelseviercomlocateclay
Research paper
Hydrothermal synthesis of 11 Aring tobermorite ndash Effect of adding metakaolin tothe basic compound
J Schreiner F Goetz-Neunhoeffer J Neubauer D JansenUniversity of Erlangen-Nuremberg GeoZentrum Nordbayern Mineralogy Schlossgarten 5a 91054 Erlangen Germany
A R T I C L E I N F O
KeywordsHydrothermal synthesis11 Aring tobermoriteMetakaolinPowder diffractionKatoite
A B S T R A C T
Different amounts and types of metakaolin were analyzed and applied for the hydrothermal synthesis of 11 Aringtobermorite All synthesized samples were investigated by means of powder XRD combined with Rietveld re-finement Al-substituted 11 Aring tobermorite was successfully synthesized on the basis of a broad range of com-pounds characterized by a varying content of metakaolin Katoite was present depending on the amount ofsupplied Al3+ which was determined by the dosage of metakaolin Minor crystalline components included in thetwo types of metakaolin sources varied greatly in their reactivity under hydrothermal conditions Despite adifferent degree of purity the two types of metakaolin showed corresponding effects at moderate dosages butcontrary effects at higher dosages as for the synthesis of 11 Aring tobermorite The domain morphology of to-bermorite could be associated with Al3+ incorporation for low dosages of metakaolin represented by up to 2 wt- Al2O3 in the dry mix By contrast Al3+ affected tobermorite lattice parameters at equivalent and even athigher dosages with c reaching 2295 Aring at 12 wt- Al2O3 in the dry mix
1 Introduction
11 Application of metakaolin as a reactive material in constructionindustry
The application of supplementary cementitious materials (SCMs) inthe field of construction technology has received a lot of attention inrecent years Due to limited resources and an urgent need for alter-native and more eco-friendly construction materials SCMs such asmetakaolin offer a great potential The usage of SCMs has not onlyspread to the cement and mortar industry but also to advanced appli-cations such as autoclaved aerated concrete (AAC) (Demir et al 2014Koutnyacute et al 2014 Walczak et al 2015 Roacuteżycka and Pichoacuter 2016Chucholowski et al 2018) Unlike ordinary cementitious constructionmaterials AAC is produced from hydrothermal curing Due to the dif-ferent thermodynamic environment the hydration process and the re-activity of raw materials have to be investigated properly in order tounderstand the effects on the AAC product The leading mineral phasein AAC is 11 Aring tobermorite (Ca5Si6O16(OH)2middot4H2O) As a consequencethe thermal and mechanical properties of AAC depend on micro-structure and crystallinity of tobermorite to some extent In addition tothe curing time and the fineness of raw materials the supply of ionsthat can substitute in the tobermorite structure is a crucial factor in thiscontext Especially substitutions by aluminum sodium and potassium
ions have been investigated thoroughly (Sauman 1974 Klimesch andRay 1998 Mostafa et al 2009 Matekonis et al 2010 Skawinskaet al 2017) Calcined clays usually contain a considerable amount ofthe mentioned ions
There is a vast amount of literature on the reactivity of SCMs atambient temperature and standard pressure but there is little when itcomes to hydrothermal conditions In previous publications the beha-vior of metakaolin under hydrothermal conditions was mainly in-vestigated for the synthesis of zeolites (Zhang et al 2007 Aguilar-Mamani et al 2014 Setthaya et al 2016 Luo et al 2018) In thesestudies the reactivity of metakaolin was observed at a wide range oftemperature and pH values During the transformation of kaolin intometakaolin a loss of framework alumina was observed (Ayodele et al2019) In recent decades metakaolin has been the subject of studies inthe field of geopolymer research (Rashad 2013 Chen et al 2016) Forthe synthesis of 11 Aring tobermorite a more distinct setting of temperaturesetting (180ndash200 degC) and steam pressure (1ndash12 MPa) are required
This publication is intended to make a new contribution to thechallenging field of hydrothermal synthesis in the system CaO-Al2O3-SiO2-H2O based on XRD analysis combined with Rietveld refinementVarious dosages of two types of metakaolin with different chemical andmineralogical purities are compared for the effects on the hydrothermalsynthesis of Al-substituted 11 Aring tobermorite Especially changes of thebulk chemistry in the raw mixes the reactivity of minor crystalline
httpsdoiorg101016jclay2019105432Received 20 August 2019 Received in revised form 13 November 2019 Accepted 30 December 2019
Corresponding authorE-mail address juergenjsschreinerfaude (J Schreiner)
Applied Clay Science 185 (2020) 105432
0169-1317 copy 2020 Elsevier BV All rights reserved
T
6 Publications
31
phases of the two types of metakaolin and the effect of different curingtimes are the focus of interest On the one hand metakaolin offers agreat potential in the AAC industry On the other hand of all SCMsmetakaolin is a good source material for investigating the influence ofAl3+ on the synthesis of Al-substituted 11 Aring tobermorite
12 Synthesis of Al-substituted 11 Aring tobermorite
In addition to being present in AAC tobermorite has found appli-cation in wastewater treatment and nuclear waste management due toits ion exchange capacity (Maeda et al 2012 Monasterio et al 2015)The substitution of silicon by aluminum results in a different to-bermorite structure due to general and local charge balance affectingthe lattice parameters Especially c is impacted by this substitutionbecause it occurs in the bridging tetrahedron and additional OHndash sub-stitutes O2ndash (Komarneni et al 1985 Merlino et al 2000) As suggestedin some additional studies the substitution of Si4+ by Al3+ and Na+ orK+ leads to a lath-like morphology of tobermorite crystals (Mostafa2005 Mostafa et al 2009 Venhodovaacute et al 2015 Qu et al 2018)However because of the heterogeneous appearance of tobermorite inAAC it is hardly possible to conduct a proper characterization based onSEM analysis In our recent work the anisotropic peak broadening oftobermorite in XRD diffractograms was successfully linked with theincorporation of foreign ions supplied in a common AAC production(Schreiner et al 2019) This finding allowed a more statistical struc-tural characterization of tobermorite in bulk compositions compared toSEM analysis Moreover it was reported in other studies that differenthydrate phases occur depending on the amount of supplied ions and onthe experimental settings In compounds with a high content of Al3+formation of katoite could be observed (Klimesch and Ray 1998 Riacuteoset al 2009 Matsui et al 2011) In the case of a longer curing durationinstead of 11 Aring tobermorite the formation of xonotlite (Siauciunas andBaltakys 2004 Galvaacutenkovaacute et al 2018) or - depending on the finenessof used silica source (Siauciunas and Baltakys 2004) - gyrolite is fa-voured
Kalousek (1956) suggested that tobermorite can contain up to 5Al2O3 More Al2O3 in the system resulted in the formation of hydro-garnet Klimesch and Ray (1998) additionally investigated the stabilityof hydrogarnet depending on the Al(Si + Al) ratio and its role in re-lation to the formation of 11 Aring tobermorite in an equivalent systemThey suggest that hydrogarnet always appears before tobermorite butthe former can only be detected for higher Al(Si + Al) ratios in theevent of longer curing times Riacuteos et al (2009) and Qu et al (2018)confirmed these findings in extensive investigations In the latter pub-lication it is additionally suggested that samples prepared at lowertemperatures (160 degC) are less impacted by the supply of Al3+ Theyalso consider the peak broadening of tobermorite in their XRD plotsbased on the amount of incorporated Al3+ In two recent publicationswe suggested that the peak broadening of tobermorite enables a mi-crostructural analysis by calculating the orientation dependent domainsizes (Schreiner et al 2018 2019) However these studies are based onsamples of industrially produced AAC so that the curing time was fixedThe studied AAC was produced from raw materials with a broad che-mical spectrum such as ordinary Portland cement (OPC) whichsomehow complicates the interpretation of results
In this work the influence of aluminum ions - provided by meta-kaolin - on dominant crystallographic direction-dependent domaingrowth of tobermorite is investigated by analysis of anisotropic peakbroadening (Ectors et al 2015 2017) In Fig 1 of the supplementarymaterial the method of fitting the anisotropic peak broadening of to-bermorite using a triaxial cylinder model is visualized (Schreiner et al2018) Fitting of the anisotropic peak broadening of tobermorite Thismethod is used to calculate the average and reliable values for to-bermorite domain sizes in the powder sample and associate them withaverage Al3+ incorporation Microstrain should be considered becauseit is an additional source of peak broadening However this usually
accounts for materials that have been exposed to different kinds ofstress such as metals and alloys (Badawi et al 2019) In addition theinstrumental contribution to peak broadening should be consideredHydration products such as tobermorite are characterized by crystallitesizes in the range of nanometers so that anisotropic size broadeningclearly outweighs the effect of instrumental broadening (Jenkins andSnyder 1996) Moreover the impact of Al3+ on the lattice parametersof tobermorite is considered It should additionally be clarified whe-ther the results from our previous publication (Schreiner et al 2019)based on industrially produced AAC can be confirmed by investigationwith less complex raw mixes and purely based on laboratory experi-ments
2 Material and methods
21 Starting materials
The starting materials for hydrothermal synthesis included deio-nized water quartz flour portlandite (999 pure) and two types ofmetakaolin One type was ordinary commercially available metakaolin(MK) with nearly a stoichiometric composition For comparison thesecond type of commercially available metakaolin was a by-productfrom expanded glass production (MKg) and consequently highly im-pure The chemical composition of MK and MKg determined by XRF isgiven in Table 1 With MKg containing less Al2O3 but considerably moreNa2O than MK the effects on hydrothermal synthesis were of interestBoth types of metakaolin have been characterized in previous pub-lications (Schmidt et al 2012 Naber et al 2019) In addition weverified the mineral phase content by XRD analysis Besides amorphousmetakaolin MK contained minor amounts of anatase quartz and mica
Fig 1 Weight fractions of tobermorite quartz and katoite determined byquantitative XRD analysis ndash samples including MKg crosshatched
Table 1Chemical composition of MK and MKg determined by XRF analysis ndash majorcontrasts in bold letters
Oxides [wt-] MK MKg
SiO2 536 604Al2O3 392 206CaO 01 40MgO 01 12Na2O 0 96K2O 10 18Fe2O3 18 05TiO2 21 03P2O5 01 02Loss on ignition 15 1
J Schreiner et al Applied Clay Science 185 (2020) 105432
2
6 Publications
32
MKg contained additional kaolinite feldspar and quartz
22 Investigated mix composites
For the preparation of raw mixtures the powders were weighed andhomogenized using a lab-scale mixing mill Table 2 lists the composi-tion and nomenclature of all samples including Al2O3 content andcuring time in the autoclave
bull Besides one blank mixture (MK0) that did not contain any type ofmetakaolin eleven more compounds were prepared of which threeincluded different dosages of MKg (MKg16 MKg23 and MKg60)Three more mixes contained equivalent amounts of MK instead ofMKg (MK16 MK23 and MK60) These mixes were investigated inorder to have a direct comparison concerning the effects of differentraw material on the synthesis of tobermorite
bull Additionally the mixes MK9 MK5 and MK25 with lower dosages ofmetakaolin were analyzed In the referenced literature (Schreineret al 2019) the effect of Al3+ on the anisotropic peak broadeningof tobermorite could only be observed in the case of Al2O3 contentslower than 4 in the drymix In the latter three mixes Al2O3 con-tents range from 1 to 35 Al2O3 (calculated from XRF data) whichmeets the region of interest for the analysis of tobermorite domainmorphology
bull The curing time for nearly all of the investigated samples was 12 hbut compound MK9 was prepared two more times for curing timesof 2 h and 6 h The different curing times were chosen in this par-ticular sample so that the reactivity of metakaolin and the phasetransitions could be observed more precisely
23 Hydrothermal treatment
Due to the different fineness of raw materials there was a differentwater demand from one mixture to another In order to obtain slurriesof comparable rheology the amount of water was adapted respectivelyresulting in water-to-solid ratios of 25 to 3 which matches the sug-gested water-to-solid ratio for this purpose (Roacutezycka et al 2014Galvaacutenkovaacute et al 2018) The weighed water was added to the dry mixand after stirring for 1 min at 23 degC the slurry was poured into thereactor Minor changes in the quantity of added water did not have aninfluence on the measured steam pressure All experiments were con-ducted using a PTFE-lined stainless steel autoclave with a reactor vo-lume of 300 ml The oven temperature was fixed at 180 degC and auto-genous steam pressure of 11ndash12 MPa was measured during eachexperiment with an external manometer After cooling to room tem-perature the sample was removed from the reactor coarsely ground
using an agate mortar and dried at 60 degC for 12 h After drying thesample was ground with an agate mortar again in order to deagglo-merate the particles As no coarse raw materials were used there wasno need for wet McCrone milling (Schreiner et al 2018)
24 XRD analysis
After preparation into front-loading sample holders the powdersamples were measured with a D8 diffractometer (Bruker) equippedwith a LynxEye detection system and Bragg-Brentano geometry Thesettings for XRD analysis included a tube voltage of 40 kV a current of40 mA an angular range from 6 to 80deg 2θ (Cu Kα radiation) a time perstep of 054 s a step width of 00236deg 2θ and a PSD opening of 33deg Thebackground was fitted with Chebyshev polynomial of the fifth orderThe major contribution of amorphous phase was fitted with a singlepeak with a fixed position at 308deg 2θ so that tobermorite reflectionswere not affected An external quartzite standard was measured withthe same parameters in order to determine phase quantities (Jansenet al 2011) Bruker AXS software TOPAS 50 was used for Rietveldrefinement (Rietveld 1969) and the used structures are shown inTable 3
3 Results and discussion
31 Different dosages of MK and MKg
In Fig 1 the quantities of tobermorite quartz and katoite present inmost of the samples determined by XRD analysis are illustratedWhenever tobermorite was the leading mineral hydrate phase a basalspacing of 113 Aring could be verified in each of the diffractograms Thequantities of minor crystalline phases and amorphous content are notshown For low dosages of MK it can be seen that the weight fraction oftobermorite decreased At moderate dosage of both types of metakaolin(MK16 MK23 MKg16 MKg23) tobermorite was present in comparablequantities It can be seen that the amount of katoite in the mixes de-pended on the dosage of metakaolin and it appeared only at dosages ofMK5 or more Due to the higher content of aluminum in MK comparedto MKg more katoite could always be observed in the MK mixes atequivalent dosages Despite equal amounts of quartz as starting mate-rial in mixes for both types of metakaolin the resulting weight fractionsin the cured samples were not alike Considerably more quartz waspresent in the MK samples Even though less quartz was used for mixescontaining higher amounts of MK even more quartz was present afterhydrothermal curing (Table 2 Fig 1) Consequently some of the SiO2
provided by MK did not transform into an amorphous phase or to-bermorite but into quartz This finding is verified by the presence ofquartz in MK60 because no quartz was included in the raw mixture Thefeldspar present in MKg did not react so Na2O and an unknown amountof Al2O3 may not have been supplied for hydrothermal reaction Besidestobermorite and quartz additional calcite scawtite (Ca7Si6(CO3)
Table 2Basic powder compounds prepared for the hydrothermal synthesis of to-bermorite with the respectively calculated Al2O3 content and curing time in thereactor
Sample Portlandite[wt-]
Quartz[wt-]
MK[wt-]
MKg
[wt-]
Al2O3
[wt-]Curingtime [h]
MK0 49 51 ndash ndash 0 12MK25 495 48 25 ndash 1 12MK5 49 46 5 ndash 2 12MK9_2h 48 43 9 ndash 35 2MK9_6h 48 43 9 ndash 35 6MK9_12h 48 43 9 ndash 35 12MK16 47 37 16 ndash 63 12MK23 46 31 23 ndash 9 12MK60 40 ndash 60 ndash 235 12MKg16 47 37 ndash 16 33 12MKg23 46 31 ndash 23 47 12MKg60 40 ndash ndash 60 124 12
Table 3Structural data used for the investigation with powder XRD analysis
Phase Author
Anatase (Horn et al 1972)Biotite (Brigatti et al 2000)Calcite (Maslen et al 1995)Kaolinite (Zvyagin 1960)Katoite (Bartl 1969)Microcline (Bailey 1969)Plazolite (Basso et al 1983)Portlandite (Busing and Levy 1957)Quartz (Le Page and Donnay 1976)Scawtite (Grice 2005)Tobermorite (Hamid 1981)Xonotlite (Hejny and Armbruster 2001)
J Schreiner et al Applied Clay Science 185 (2020) 105432
3
6 Publications
33
O18bull2(H2O)) and xonotlite (Ca6Si6O17(OH)2) could be identified insample MK0 (XRD plots of samples MK0 MKg16 MKg23 MK16 andMK23) Comparing MK0 and MK25 scawtite and xonotlite could stillbe identified in a very low amount in MK25 but no longer in samplesthat contained even more MK (XRD plots of samples MK0 MK25 MK5and MK9_12h)
Two additional experiments were done without quartz in the rawmixes (MK60 and MKg60) The according diffractograms after hydro-thermal curing are shown in Fig 2 In sample MKg60 tobermorite (gt 50wt-) was successfully synthesized without any other silica sourcethan MKg whereas no crystalline quartz occurred By contrast no to-bermorite but quartz could be identified in equivalent mixture MK60containing MK It can be seen that crystalline components such as micaand anatase in the raw MK did not react at the selected conditions andremained present in the autoclaved samples Except for feldspar in MKgall of the crystalline components appeared to be reactive at the chosenhydrothermal conditions A minor unidentified phase occurred at328deg2θ and additional xonotlite was identified in sample MKg60 Insample MK60 more calcium was needed for the formation of morehydrogarnet (Fig 1) resulting in a lower CaSi ratio for the remainingsystem Sample MKg60 contained only half of the amount of Al3+ and itwas not completely supplied for reaction due to its partial presence infeldspar Consequently essentially less hydrogarnet (Fig 1) was presentin MKg60 after hydrothermal treatment and the CaSi ratio in the re-maining system was affected to a lesser extent
32 Application of MK for different curing times
The development of hydrate phases in the autoclave for compoundMK9 is displayed in Fig 3 After only 2 h of hydrothermal curing all ofthe available portlandite had reacted and katoite (95 wt-) was pre-sent The applied type of metakaolin appeared to react quickly as itsupplied aluminum for formation of katoite No formation of to-bermorite could be observed at this stage yet An assumably amorphousprecursor can be seen at 28 to 30deg2θ Calcium was provided by thedissolution of portlandite After 6 h of hydrothermal reaction amountsof katoite (85 wt-) and quartz (from 31 wt- at 2 h to 165 wt- at6 h) had decreased and a major amount of tobermorite (35 wt-) waspresent Apparently between 2 and 6 h under hydrothermal conditionsthe amorphous precursor and quartz reacted resulting in the formationof tobermorite An additional 6 h of reaction time (MK9_12h) did notchange the phase composition significantly Slightly more tobermorite
(365 wt-) less quartz (16 wt-) and katoite (65 wt-) weremeasured
33 Tobermorite domain morphology and lattice parameters
In the referenced literature an analysis of tobermorite domainmorphology based on anisotropic peak broadening was possible forsamples that contained notgt 4 wt- Al2O3 in the drymix (Schreineret al 2019) Accordingly in this study samples MK0 MK25 MK5MK9_6h and MK9_12h were suitable (Table 2) with MK9_2h not con-taining any tobermorite In Fig 4 the respective growth in a and b di-rection is visualized with x indicating the domain size in a direction andy indicating domain size in b direction using a macro for TOPAS 50(Ectors et al 2015 2017) The calculated cylinder models in Fig 4represent the relation of yx and not absolute sizes With no supply ofaluminum ions (MK0) the relative domain growth in b direction islower compared to samples containing metakaolin This finding agreeswith the results from a similar investigation of tobermorite in AAC(Schreiner et al 2019) However within the samples MK5 andMK9_12h the different amounts of supplied aluminum ions did notshow a clear effect It appeared that low dosages of Al3+ (1 wt- Al2O3
in MK25 and 2 wt- Al2O3 in MK5) were enough to determine thedomain growth of tobermorite Additional results from the samplesMK9_6h and MK9_12h indicated that growth in b direction increasedwith reaction time
In Fig 5 lattice parameters of tobermorite depending on metakaolindosages are plotted B clearly remained unaffected throughout therange of samples Increasing amounts of metakaolin led to a slightlysmaller parameter a However both types of metakaolin showed acorresponding impact on parameter a By contrast parameter c in-creased strongly with increasing amounts of MK and MKg but the typeof metakaolin was significant At an equivalent dosage MK affected thecell dimension in c direction considerably more than MKg so that thefraction of Al3+ appeared to be the decisive parameter Different metaloxides in MKg did not show a notable effect certainly as they werepartially not provided for reaction Unlike for the domain morphologyof tobermorite the impact on lattice parameters could be observedwithin the complete range of examined dosages
4 Conclusions
The results obtained from the introduced investigations allow con-cluding remarks on the effects of the applied types of metakaolin on thesynthesis of 11 Aring tobermorite the phase transitions and the in-corporation of Al3+ into the lattice of tobermorite
With a critical dosage the use of any type of metakaolin led to theformation of katoite in an according amount At moderate dosages(MKg16 MKg23 MK16 and MK23) the two types of metakaolin showeda good correspondence in consideration of the quantities of to-bermorite For higher dosages there were contrary effects Lower do-sages of MK led to considerable quantities of Al-substituted to-bermorite Samples containing low dosages of MK revealed that katoiteappeared in the case ofgt 5 wt- of MK - corresponding to 2 wt-Al2O3 - in the basic compound Minor crystalline phases in MKg showedbetter reactivity than those in MK The observation that no tobermoritewas present in sample MK60 indicated that high dosages of Al3+ hin-dered the formation of tobermorite
Investigations of MK9 at 2 6 and 12 h displayed the evolution ofhydrate phases At first katoite was the only crystalline hydrate phasepresent after 2 h which corresponded to observations in a differentpublication (Klimesch and Ray 1999) The amount of katoite andquartz then decreased and a major amount of tobermorite formed from2 to 6 h curing time In order to gain more information on the trans-formation of amorphous C-(A)-S-H into tobermorite additional ex-periments in the range of 2 to 6 h curing time will be needed
Domain morphology analysis of tobermorite revealed that low
Fig 2 Diffractograms of MKg MKg60 MK and MK60 from 7 to 34deg2θ CuKα Aanatase C calcite F feldspar k kaolinite K katoite M mica Q quartz Ttobermorite U unidentified phase X xonotlite
J Schreiner et al Applied Clay Science 185 (2020) 105432
4
6 Publications
34
dosages of Al3+ determined the domain growth which agreed with theresults published on tobermorite in AAC samples (Schreiner et al2019) Different curing times unveiled that growth in b direction in-creased with the reaction time Al3+ incorporation into the lattice oftobermorite only reflected to a limited extent in the domain mor-phology By contrast an increase of lattice parameter c was triggered byAl3+ even at the highest dosage in this study Ultimately there is no
evidence for a limit of incorporation of Al3+ but there is a limit ofinfluence on the domain morphology These results additionally re-confirm this assumption similarly made in the previous work (Schreineret al 2019) and suggest a new mechanism of tobermorite crystal-lization depending on the presence of Al3+
Supplementary data to this article can be found online at httpsdoiorg101016jclay2019105432
Declaration of Competing Interest
The authors declare that they have no known competing financialinterests or personal relationships that could have appeared to influ-ence the work reported in this paper
Acknowledgement
The authors thank Rodgauer Baustoffwerke GmbH amp Co KG forsupplying raw materials for laboratory experiments
References
Aguilar-Mamani W Garciacutea G Hedlund J Mouzon J 2014 Comparison betweenleached metakaolin and leached diatomaceous earth as raw materials for the synth-esis of ZSM-5 Springerplus 3 1ndash10 httpsdoiorg1011862193-1801-3-292
Ayodele OB Sulaimon AA Alaba PA Tian Z-Y 2019 Influence of metakaolini-zation temperature on the structure and activity of metakaolin supported Ni catalystin dry methane reforming J Environ Chem Eng httpsdoiorg101016jjece2019103239 (in press)
Badawi EA Abdel-Rahman MA Mostafa A Abdel-Rahman M 2019 Determinationof the crystallite size amp micro- strain by novel method from XRD profile Appl Phys2 1ndash15 httpsdoiorg1031058jap201921001
Bailey SW 1969 Refinement of an intermediate microcline structure Am Miner 541540ndash1545
Bartl H 1969 Roentgen-Einkristalluntersuchungen an (CaO)3 (Al2O3) (H2O)6 und an(CaO)12 (Al2O3)7 (H2O) neuer Vorschlag zur (CaO)12 (Al2O3)7-Struktur NeuesJahrb fuer Mineral Monatshefte 1969 404ndash413
Basso R Giusta AD Zefiro L 1983 Crystal structure refinement of plazolite A highlyhydrated natural hydrogrossular Neues Jahrb Miner Monatsh (Neues Jahrb fuerMineral Monatshefte) 1983 251ndash258
Brigatti MF Lugli C Poppi L Foord EE Kile DE 2000 Crystal chemical varia-tions in Li- and Fe-rich micas from Pikes Peak batholith (Central Colorado) AmMineral 85 1275ndash1286 httpsdoiorg102138am-2000-8-920
Busing WR Levy HA 1957 Neutron diffraction study of calcium hydroxide J ChemPhys 26 563 httpsdoiorg10106311743345
Chen L Wang Z Wang Y Feng J 2016 Preparation and properties of alkali acti-vated metakaolin-based geopolymer Materials (Basel) 9 1ndash12 httpsdoiorg103390ma9090767
Chucholowski C Holger M Thienel K-C 2018 Improving the recyclability en-vironmental compatibility and CO2 balance of autoclaved aerated concrete by re-placing sulfate carrier and cement with calcined clays CePapers 2 503ndash512httpsdoiorg101002cepa846
Fig 3 Diffractograms of MK9_2h MK9_6h and MK9_12h from 7 to 38deg2θ CuKα C calcite K katoite Q quartz T tobermorite
Fig 4 Relation of calculated domain sizes of 11 Aring tobermorite in selectedsamples (MK0 MK25 MK5 MK9_6h and MK9_12h) in a (x) and b (y) direction
Fig 5 Lattice parameters of tobermorite depending on MK or MKg dosageincluding blank mix MK0
J Schreiner et al Applied Clay Science 185 (2020) 105432
5
6 Publications
35
Demir İ Başpınar MS Kahraman E Ccedilalışkan E Goumlrhan G 2014 An investigationon the usability of diatomite in aerated concrete production In Proc of the IntlConf on Advances in Civil Structural and Construction Engineering ndash CSCE 2014 pp97ndash100
Ectors D Goetz-Neunhoeffer F Neubauer J 2015 A generalized geometric approachto anisotropic peak broadening due to domain morphology J Appl Crystallogr 48189ndash194 httpsdoiorg101107S1600576714026557
Ectors D Goetz-Neunhoeffer F Neubauer J 2017 Routine (an)isotropic crystallitesize analysis in the double-Voigt approximation done right Powder Diffract 3227ndash34 httpsdoiorg101017S0885715617000070
Galvaacutenkovaacute L Bartoniacutečkovaacute E Opravil T Tkacz J Ptaacuteček P 2018 The influence ofstarting materials solubility on tobermorite structure formation under the hydro-thermal conditions IOP Conf Ser Mater Sci Eng 379 1ndash8 httpsdoiorg1010881757-899X3791012001
Grice JD 2005 The structure of spurrite tilleyite and scawtite and relationships toother silicate-carbonate minerals Can Mineral 43 1489ndash1500 httpsdoiorg102113gscanmin4351489
Hamid SA 1981 The crystal structure of the 11 Aring natural tobermoriteCa225[Si3O75(OH)15]1H2O Zeitschrift fuer Krist 154 189ndash198 httpsdoiorg101524zkri19811543-4189
Hejny C Armbruster T 2001 Polytypism in xonotlite Ca6Si6O17(OH)2 Zeitschrift furKrist 216 396ndash408
Horn M Schwerdtfeger CF Meagher EP 1972 Refinement of the structure of ana-tase at several temperatures Zeitschrift fur Krist 136 273ndash281 httpsdoiorg101524zkri19721363-4273
Jansen D Goetz-Neunhoeffer F Stabler C Neubauer J 2011 A remastered externalstandard method applied to the quantification of early OPC hydration Cem ConcrRes 41 602ndash608 httpsdoiorg101016jcemconres201103004
Jenkins R Snyder R 1996 Introduction to X-ray Powder Diffractometry ChemicalAnalysis Wiley pp 90
Kalousek GL 1956 Crystal Chemistry of Hydrous Calcium Silicates J Am Ceram Soc40 74ndash80
Klimesch D Ray A 1998 Autoclaved cement-quartz pastes with metakaolin additionsAdv Cem Based Mater 7 109ndash118 httpsdoiorg101016S1065-7355(97)00073-4
Klimesch D Ray A 1999 DTA-TGA evaluations of the CaOndashAl2O3ndashSiO2ndashH2O systemtreated hydrothermally Thermochim Acta 334 115ndash122 httpsdoiorg101016s0040-6031(99)00140-9
Komarneni S Roy R Roy DM Fyfe CA Kennedy GJ Bothner-By AA Dadok JChesnick AS 1985 27Al and29Si magic angle spinning nuclear magnetic resonancespectroscopy of Al-substituted tobermorites J Mater Sci 20 4209ndash4214 httpsdoiorg101007BF00552416
Koutnyacute O Opravil T Pořiacutezka J 2014 Application of metakaoline in autoclavedaerated concrete technology Adv Mater Res 1000 174ndash177 httpsdoiorg104028wwwscientificnetAMR1000174
Le Page Y Donnay G 1976 Refinement of the crystal structure of low-quartz ActaCrystallogr Sect B 32 2456ndash2459 httpsdoiorg101107S0567740876007966
Luo H Law WW Wu Y Zhu W Yang EH 2018 Hydrothermal synthesis of needle-like nanocrystalline zeolites from metakaolin and their applications for efficient re-moval of organic pollutants and heavy metals Microporous Mesoporous Mater 2728ndash15 httpsdoiorg101016jmicromeso201806015
Maeda H Ogawa Y Ishida EH Kasuga T 2012 Hydrothermal synthesis of to-bermorite doped with phosphorus species for removing heavy metal ions J AustCeram Soc 48 8ndash11
Maslen EN Streltsov VA Streltsova NR Ishizawa N 1995 Electron density andoptical anisotropy in rhombohedral carbonates III Synchrotron Xray studies ofCaCO3 MgCO3 and MnCO3 Acta Crystallogr Sect B 51 929ndash939 httpsdoiorg101107S0108768195006434
Matekonis G Šiaučiūnas R Vaičiukynienė D 2010 Hydrothermal Synthesis andCharacterization of Na + and [ Al 3 + + Na + ] -substituted Tobermorite in CaO-SiO2middotnH2O-H2O System Mater Sci 16 242ndash248
Matsui K Kikuma J Tsunashima M Ishikawa T Matsuno S Ogawa A Sato M2011 In situ time-resolved X-ray diffraction of tobermorite synthesis process underhydrothermal condition IOP Conf Ser Mater Sci Eng 18 60ndash66 httpsdoiorg1010881757-899X182022017
Merlino S Bonaccorsi E Armbruster T 2000 The real structures of clinotobermoriteand tobermorite 9 Aring OD character polytypes and structural relationships Eur JMineral 12 411ndash429 httpsdoiorg1011270935-122120000012-0411
Monasterio M Gaitero JJ Manzano H Dolado JS Cerveny S 2015 Effect ofchemical environment on the dynamics of water confined in calcium silicate mi-nerals Natural and synthetic tobermorite Langmuir 31 4964ndash4972 httpsdoiorg101021acslangmuir5b00614
Mostafa NY 2005 Influence of air-cooled slag on physicochemical properties of auto-claved aerated concrete Cem Concr Res 35 1349ndash1357 httpsdoiorg101016jcemconres200410011
Mostafa NY Shaltout AA Omar H Abo-El-Enein SA 2009 Hydrothermal synth-esis and characterization of aluminium and sulfate substituted 11 nm tobermoritesJ Alloys Compd 467 332ndash337 httpsdoiorg101016jjallcom200711130
Naber C Stegmeyer S Jansen D Goetz-Neunhoeffer F Neubauer J 2019 ThePONKCS method applied for time resolved XRD quantification of supplementarycementitious material reactivity in hydrating mixtures with ordinary Portland ce-ment Constr Build Mater 214 449ndash457 httpsdoiorg101016jconbuildmat201904157
Qu X Zhao Z Zhao X 2018 Microstructure and characterization of aluminum-in-corporated calcium silicate hydrates (C-S-H) under hydrothermal conditions RSCAdv 8 28198ndash28208 httpsdoiorg101039c8ra04423f
Rashad AM 2013 Metakaolin as cementitious material history scours production andcomposition - a comprehensive overview Constr Build Mater 41 303ndash318 httpsdoiorg101016jconbuildmat201212001
Rietveld HM 1969 A profile refinement method for nuclear and magnetic structures JAppl Crystallogr 2 65ndash71 httpsdoiorg101107S0021889869006558
Riacuteos CA Williams CD Fullen MA 2009 Hydrothermal synthesis of hydrogarnet andtobermorite at 175 degC from kaolinite and metakaolinite in the CaO-Al2O3-SiO2-H2Osystem a comparative study Appl Clay Sci 43 228ndash237 httpsdoiorg101016jclay200809014
Roacuteżycka A Pichoacuter W 2016 Effect of perlite waste addition on the properties of au-toclaved aerated concrete Constr Build Mater 120 65ndash71 httpsdoiorg101016jconbuildmat201605019
Roacutezycka A Kotwica Ł Małolepszy J 2014 Synthesis of single phase gyrolite in theCaO-quartz-Na2O-H2O system Mater Lett 120 166ndash169 httpsdoiorg101016jmatlet201401003
Sauman Z 1974 Influence of SO4 2ndash ions on the formation of 11 Aring tobermorite InProceedings of the 2nd International Symposium on Science and Research in SilicateChemistry Moscow pp 25ndash39
Schmidt M Egersdoumlrfer A Poumlllmann H 2012 Increased reactivity using a glass-containing metakaolin as an active filler in lime-based binder systems ZKG Int 6554ndash62
Schreiner J Jansen D Ectors D Goetz-Neunhoeffer F Neubauer J Volkmann S2018 New analytical possibilities for monitoring the phase development during theproduction of autoclaved aerated concrete Cem Concr Res 107 247ndash252 httpsdoiorg101016jcemconres201802028
Schreiner J Goetz-Neunhoeffer F Neubauer J Volkmann S Bergold S Webler RJansen D 2019 Advanced Rietveld refinement and SEM analysis of tobermorite inchemically diverse autoclaved aerated concrete Powder Diffract 34 143ndash150httpsdoiorg101017s0885715619000149
Setthaya N Chindaprasirt P Pimraksa K 2016 Preparation of zeolite nanocrystals viahydrothermal and solvothermal synthesis using of rice husk ash and metakaolinMater Sci Forum 872 242ndash247 httpsdoiorg104028wwwscientificnetmsf872242
Siauciunas R Baltakys K 2004 Formation of gyrolite during hydrothermal synthesis inthe mixtures of CaO and amorphous SiO2 or quartz Cem Concr Res 34 2029ndash2036httpsdoiorg101016jcemconres200403009
Skawinska A Owsiak Z Baran T Hernik K 2017 The influence of halloysite ad-dition on tobermorite formation in CaO and quartz mix under hydrothermal condi-tions Cem Wapno Bet 17 426ndash434
Venhodovaacute E Janovskyacute R Drochytka R 2015 Formation of tobermorite at differentmaterials composition of aerated concrete Appl Mech Mater 752ndash753 247ndash250httpsdoiorg104028wwwscientificnetamm752-753247
Walczak P Małolepszy J Reben M Szymański P Rzepa K 2015 Utilization ofwaste glass in autoclaved aerated concrete Proc Eng 122 302ndash309 httpsdoiorg101016jproeng201510040
Zhang Y Gao W Cui L 2007 The transformation of acid leached metakaolin tozeolite beta Stud Surf Sci Catal 170 420ndash425 httpsdoiorg101016S0167-2991(07)80870-6
Zvyagin BB 1960 An attempt to electronographic determination of kaolinite structureJ Dokl Akad Nauk SSSR 130 1023ndash1026
J Schreiner et al Applied Clay Science 185 (2020) 105432
6
6 Publications
36
6 Publications
62 Advanced Rietveld refinement and SEM analysis oftobermorite in chemically diverse autoclaved aeratedconcrete
Following the copyright guidelines by Cambridge University Press the publication
Schreiner J Goetz-Neunhoeffer F Neubauer J Volkmann S Bergold S WeblerR Jansen D 2019 Advanced Rietveld refinement and SEM analysis of tobermorite inchemically diverse autoclaved aerated concrete Powder Diffraction 34 143ndash150 httpsdoiorg101017s0885715619000149
may not be reprinted It can be accessed at
httpswwwcambridgeorgcorejournalspowder-diffractionarticleadvanced-rietveld-refinement-and-sem-analysis-of-tobermorite-in-chemically-diverse-autoclaved-aerated-concrete51597C2A66F6F225D29DEB2675E74249
37
6 Publications
63 New analytical possibilities for monitoring the phasedevelopment during the production of autoclavedaerated concrete
Reprint of the peer reviewed publication
Schreiner J Jansen D Ectors D Goetz-Neunhoeffer F Neubauer J VolkmannS 2018 New analytical possibilities for monitoring the phase development during theproduction of autoclaved aerated concrete Cement and Concrete Research 107 247ndash252httpsdoiorg101016jcemconres201802028
with permission from Elsevier
38
Contents lists available at ScienceDirect
Cement and Concrete Research
journal homepage wwwelseviercomlocatecemconres
Short communication
New analytical possibilities for monitoring the phase development duringthe production of autoclaved aerated concrete
J Schreinera D Jansena D Ectorsa F Goetz-Neunhoeffera J Neubauera S Volkmannb
aUniversity of Erlangen-Nuremberg GeoZentrum Nordbayern Mineralogy Schlossgarten 5a 91054 Erlangen Germanyb Rodgauer Baustoffwerke GmbH amp Co KG Am Opel-Pruumlffeld 3 63110 Rodgau-Dudenhofen Germany
A B S T R A C T
This work presents improved analytical methods for both steps of the production process of autoclaved aeratedconcrete (AAC) the phase development during the hydration before autoclaving and during the autoclavingprocess itself The improvement includes new insights into preparation methods of AAC samples for powderdiffraction as well as Rietveld refinement strategies For the first time a new implementation for calculatinganisotropic crystal domain sizes is applied to major hydrate phases occurring during AAC production namelyportlandite during the hydration before autoclaving and tobermorite during the autoclaving process The cal-culation of anisotropic domain size growth which can be implemented in the Rietveld environment is based oncrystallographically and geometrically appropriate models The implementation of calculating anisotropic do-main sizes for the Rietveld software TOPAS 50 allows a superior Rietveld fit and a more accurate quantificationof the phase development Additionally it enables the tracking of growth mechanism of portlandite duringhydration
1 Introduction
Autoclaved aerated concrete (AAC) is known as a lightweight con-struction material which offers outstanding properties such as suffi-cient strength for construction in addition with excellent thermal in-sulation [12] AAC is produced by autoclaving from calcareous rawmaterials such as lime (CaO) and cement quartz sulfate carrier andother additives such as foaming agents and water
The production process (Fig 1) can be separated into the hydrationof the mixed slurry before the procedure of autoclaving and the auto-claving at elevated temperature (180 degC to 200 degC) under saturatedsteam pressure (12MPa) for several hours
The hydration process before autoclaving is necessary to achievesufficient strength in order to cut the green cake blocks as they shouldhave a specific shape and dimension after autoclaving Furthermorethe porous structure is generated by the foaming agent during hydra-tion in the first process step During autoclaving the final propertiesnamely strength and low thermal conductivity are achieved
It is already well understood that the autoclaving process leads tothe formation of several phases first of all tobermorite(Ca5Si6O16(OH)2lowast4H2O) [3ndash5] Newest research has shown im-pressively which reactions are running from the mineralogical point ofview Insitu XRD measurements were carried out during the
autoclaving process and the phase development was shown by plottingnormalized intensities [6] The study of Mitsuda et al [3] was mainlyfocused on the tracking of the phase evolution during the autoclavingprocess of AAC However their statements concerning phase evolutionare mainly based on XRD data and TGA measurements There is acommon agreement that the following reactions occur The consump-tion of the alite (OPC) leads to the formation of an initial C-S-H phaseduring the first processing step Portlandite which was initially formedduring the first process step (from CaO and C3S) further quartz and theC-S-H phase are consumed during autoclaving resulting in the crystal-lization of tobermorite Hence the crystallization process of to-bermorite as well as the crystal structure of tobermorite was an issue ofresearch and discussion over the last years and numerous publicationsto these topics are available Concerning the crystal structure of to-bermorite respectively the tobermorite supergroup a new publicationoutlines all important references and recommends a new nomenclature[7]
The presented study was performed to create new analytical possi-bilities for the characterization of the production process of AAC Bothof the production process steps are essential for the final productHence the present work focuses on crystallization of hydrate phases inboth processes
Firstly an external standard method [89] was published and
httpsdoiorg101016jcemconres201802028Received 6 October 2017 Received in revised form 1 February 2018 Accepted 26 February 2018
Corresponding authorsE-mail addresses juergenjsschreinerfaude (J Schreiner) danieljansenfaude (D Jansen)
Cement and Concrete Research 107 (2018) 247ndash252
0008-8846 copy 2018 Elsevier Ltd All rights reserved
T
6 Publications
39
recommended for the determination of absolute phase contents inmixtures with amorphous content It was shown that the method canabsolutely be recommended for hydrating cement pastes in which watercannot be quantified directly by XRD [10] This method seems to bevery promising for both the quantification of the hydration of the AACslurry before autoclaving and the quantification of the phase evolutionduring autoclaving inasmuch as both production steps form crystallineand amorphous phases
Secondly a new approach to anisotropic peak broadening due toanisotropic domain morphology which was developed [1112] is ap-plied to AAC samples to improve the fit of portlandite and tobermoriteby Rietveld refinement [13] By applying this approach the refinementof both portlandite and tobermorite should additionally lead to betterquantitative results as well as to better insights into the development ofthe domain size morphology of both phases formed
It was already shown that in a hydrating raw mixture for AAC twospecies of portlandite precipitate at 23 degC one showing dynamicallyanisotropic peak broadening and another one following the isotropictrend [14] The application of the anisotropic refinement model led toan improved fitting of portlandite Moreover the mechanism of aniso-tropic domain growth of portlandite was tracked
2 Materials and methods
In order to examine the hydration of the AAC slurry before auto-claving a mixture of the hydraulic reactive components was weighedand measured in-situ at a Bruker D8 diffractometer with a LynxEyedetection system
Ordinary Portland cement (OPC) was mixed with lime (CaO) andanhydrite (C$) The raw materials were taken from the same batches asfor the industrial samples The drymix (58 OPC 36 CaO and 6 C$by weight) was then mixed with water (ws= 08) and placed into anappropriate sample holder The samples were not aerated The slurrysamples were covered with a kapton film to avoid evaporation andcarbonation Diffractograms were recorded with an angular range from7 to 545deg 2θ and a step width of 0011deg 2θ Measurements were carriedout every 15min For each measurement 96 XRD patterns were re-corded over the first 24 h The temperature was fixed at 70 degC which isthe mean temperature generally prevailing in the industrial processduring hydration before autoclaving Rietveld refinement was carriedout using the G-factor method All structures used for Rietveld refine-ment are shown in Table 1
For investigation of the autoclaved samples five different specimenswere taken at different autoclaving times The specimens were takenout of a technical production process hence it was not possible to in-terrupt the process at an earlier time inasmuch it would lead to damageof a whole concrete production batch The specimens were firstly driedat 60 degC until weight constancy The whole blocks were then broken andstatistical samples of 20 g were taken In order to receive the right massattenuation coefficient (MAC) for G-factor method the loss on ignitionand the chemical composition (XRF) were determined For energydispersive XRF analysis (Spectro Xepos) tube voltage from 20 kV to50 kV and tube current from 08 to 20mA were used for differenttargets
The final sample preparation (grinding) before XRD measurementswas carried out using both an agate mortar and a McCrone micronizingmill for wet milling with isopropanol Both preparation methods wereapplied separately to see which one is suitable in order to get the bestpreparation for XRD investigations Six preparations were performed byone operator of which two were prepared with an agate mortar andfour with a McCrone mill For the McCrone milling 3 g of the sampleand 10ml of isopropanol were used for grinding for 12min The grainsize distribution of one sample prepared with an agate mortar and onesample prepared using a McCrone mill was measured by laser granu-lometry in isopropanol using a Mastersizer 3000 (MALVERN)
After milling the samples in these two ways for XRD analysis thepowders were prepared into a front loading sample holder and mea-sured Diffractograms were recorded with an angular range from 6 to80deg 2θ a step width of 00236deg 2θ and a time per step of 054 s Rietveldrefinement combined with external standard (G-factor) was applied inorder to get absolute quantities for each phase The refinement strategyfor portlandite and tobermorite in the TOPAS Launch Mode (TOPAS50 Bruker AXS) is attached as a Supplementary material file
3 Results and discussion
31 Hydration of the mixture before autoclaving
The hydration of the investigated paste before autoclaving isdominated by the hydration of the cement as well as the reaction of thefree lime (CaO) resulting in the formation of portlandite It can beclearly seen from Fig 2 that the hydration of the paste leads to theformation of ettringite portlandite and C-S-H phase For simplificationthe remaining phase developments are not shown in Fig 2 because theyare not in the focus of this study The hydration of CaO forming
Fig 1 Simplified process steps of AAC production and hydrate phase evolution
Table 1Structures used for Rietveld refinement
Phase Author
Alite [15]Anhydrite [16]Bassanite [17]Belite (β) [18]Belite (αprime) [19]Brownmillerite [20]C-S-H [21]Calcite [22]Ettringite [23]Gypsum [24]Hemicarbonate [25]Hydroxylellestadite [26]Lime (CaO) [27]Microcline [28]Portlandite [29]Quartz [30]Tobermorite [31]Tricalciumaluminate (cubic) [32]Tricalciumaluminate (orthorhombic) [33]PONCKS model for Water [21]
J Schreiner et al Cement and Concrete Research 107 (2018) 247ndash252
248
6 Publications
40
portlandite begins rapidly after the addition of water to the mixture andlime is fully consumed after only 1 h of hydration This translates into aquick rise of heat of hydration so that cement hydration is acceleratedwhich leads to further portlandite formation by the reaction of aliteEttringite formation stalls after few hours of hydration After 12 h et-tringite is partially decomposed probably due to sulfate depletion [9]
and poorly crystalline AFm phases (not shown in Fig 2) are formedIn Fig 3 it can be seen that in fact two generations of portlandite
are formed a 1st dominant generation showing anisotropic peakbroadening and 2nd one occurring considerably later following theisotropic domain size refinement which is usually carried out using theRietveld method This occurrence comes along firstly with lime hy-dration and secondly with alite hydration The expected quantity ofportlandite formed from lime hydration very well complies with the
Fig 2 Phase development in AAC paste on a laboratory scale before autoclaving ana-lyzed by in-situ XRD at 70 degC
Fig 3 Formation of two generations of portlandite by hydration of lime (1st) and C3S(2nd) at 70 degC before autoclaving with the major generation showing anisotropic peakbroadening
Fig 4 Biaxial cylinder domain size model of portlandite used for Rietveld refinement of anisotropic peak broadening
Fig 5 Morphological evolution of portlandite showing anisotropic domain size growthduring hydration at 70 degC
Fig 6 Comparison of quantification of crystalline quartz in samples prepared withMcCrone mill and agate mortar at different autoclaving times
J Schreiner et al Cement and Concrete Research 107 (2018) 247ndash252
249
6 Publications
41
quantity of the observed 1st generation The development of portlan-dite growth was already tracked in an equivalent slurry at 23 degC [14]Thus this observation confirms that the crystallinity of portlandite inmixtures for AAC production depends on the starting phase for hydra-tion as already indicated by Ectors [14]
Fig 4 shows the used biaxial cylindrical model for anisotropic do-main size calculation and the portlandite structure which was createdwith structural software VESTA 318 [34] Using the cylindrical ap-proach domain sizes in a (here equating to b) and c direction(dz= cylinder height) can be calculated which comes along with theexpected symmetrical parameters of portlandite
The 1st portlandite generation showing anisotropic domain growthcan be tracked in terms of cylinder diameter and height which is rea-lized in Fig 5 The blue cylinder represents the geometric approach andcylinder height and diameter are calculated newly for each range Thecylinder height remains rather stable throughout the hydration processwhile the cylinder diameter increases during the first hours of hydra-tion After 10 h of hydration the mean cylinder diameter no longer in-creases Consequently these observations match the results of the ex-aminations conducted at 23 degC [14] as well as the assumption thatdifferent mechanisms of growth exist for portlandite depending on the
hydration educt The maximum cylinder diameter is reached earlier inthis work very likely because of the higher hydration temperature
32 Quantification of the reactions during autoclaving
Autoclaved samples were ground with an agate mortar and com-pared to samples which were wet-ground with a McCrone mill Fig 6shows precisely that the determination of the amount of crystallinequartz is more reproducible in the two shown samples which were
Fig 7 2D XRD with Bruker GADDS-system plots of samples prepared with agate mortar and McCrone mill Coarse quartz grains are pointed out in the plot of the sample prepared withagate mortar
Fig 8 Particle size distribution of one sample prepared with an agate mortar and of onesample prepared with a McCrone mill measured by laser granulometry
Fig 9 Rietveld refinement for Tobermorite of autoclaved AAC sample by use of isotropicdomain size model (a) and of anisotropic domain size model (b)
J Schreiner et al Cement and Concrete Research 107 (2018) 247ndash252
250
6 Publications
42
prepared with a McCrone mill The high variance of crystalline quartzin the samples which were prepared with an agate mortar is a result ofinsufficient grinding and remaining of too large quartz grains Whenthis spottiness occurs a reliable quantification using the G-factormethod is not possible
The 2D XRD with Bruker GADDS-system plots in Fig 7 demonstratethe insufficient grinding when using an agate mortar compared to wetmilling with a McCrone mill Quartz would be overrepresented in a one-dimensional XRD pattern focusing on a section with bright spots (greenarrows) The lack of bright spots in the right plot shows that the quartzgrains are milled more thoroughly using a McCrone mill In Fig 8 theparticle size distribution after both ways of sample preparation iscompared Most grains in the sample prepared with an agate mortar arelarger than in the sample prepared with a McCrone mill The grain sizedistribution of the sample prepared with a McCrone mill complies withthe recommended particle size range for XRD analysis of under 5 to50 μm [3536] while the other sample exceeds the range
In Fig 9 Rietveld refinement of an autoclaved sample is shown Thedominant peaks at 77 290 and 301deg 2θ are attributed to tobermoriteIn the upper diagram (a) Rietveld refinement was carried out regularlycalculating isotropic domain sizes for tobermorite However the cal-culated fit differs significantly from the raw data It can be assumed thattobermorite shows a similar pattern to portlandite in terms of aniso-tropic peak broadening taking into account that tobermorite is as-signed to the orthorhombic crystal system Thus instead of a biaxialcylinder model an elliptic cylinder model (Fig 10 structure createdwith VESTA 318 [34]) was applied for the refinement in the lowerdiagram (b) The elliptic cylinder model is a sufficient approach to the
orthorhombic crystal system as it allows the distinction between do-main sizes in a b and c direction The fit is clearly superior using theanisotropic domain size model highlighted by the difference plot inFig 9b The comparison refinement with isotropic and anisotropic ap-proach was done for all of the five autoclaved samples In Fig 11 theresulting Rwp values for the whole pattern and the RBragg values of to-bermorite are shown The refinement using the anisotropic model leadsto both lower Rwp and RBragg values and consequently to a better fit anda more accurate quantification of tobermorite in all refined samples
4 Summary and conclusions
Improved analytical methods for both the phase developmentduring the hydration before autoclaving and during the autoclavingprocess of AAC are presented It could be shown that wet McCronemilling is the best way of preparation of AAC samples in order to obtainsuitable samples for powder diffraction A new approach to treat ani-sotropic domain sizes for Rietveld refinement could be successfullyapplied ndash with the benefit that portlandite and tobermorite in AACsamples could be refined more accurately using the Rietveld methodThus this application allows an improved quantification of the phasedevelopment during both of the production steps
For the future there are still plenty of possibilities to apply thepresented approach of calculating anisotropic domain sizes to AACproduction As exemplified with portlandite the mechanisms of growthof tobermorite can be tracked likewise during the autoclaving processIn addition the effect of variations in the chemical composition of AACraw mixtures on the crystal morphology of tobermorite can be ex-amined This leaves a new perspective to discuss the link between mi-neral phase morphology and the thermal and mechanical properties ofAAC
Acknowledgement
The autoclaved samples were generously provided by RodgauerBaustoffwerke GmbH amp Co KG The authors express gratitude for allsupport
Appendix A Supplementary data
Supplementary data to this article can be found online at httpsdoiorg101016jcemconres201802028
References
[1] MW Grutzeck Cellular concrete in M Scheffler P Colombo (Eds) CellularCeramics Wiley-VCH Weinheim 2005 pp 193ndash223
[2] M Haas The future of AAC ndash from a material scientists point of view inMC Limbachiya JJ Roberts (Eds) Autoclaved Aerated Concrete Taylor FrLondon 2005 pp 187ndash194
[3] T Mitsuda K Sasaki H Ishida Phase evolution during autoclaving process ofaerated concrete J Am Ceram Soc 75 (1992) 1858ndash1863
[4] N Isu H Ishida T Mitsuda Influence of quartz particle size on the chemical and
Fig 10 Triaxial cylinder domain size model of Tobermorite used for Rietveld refinement of anisotropic peak broadening
Fig 11 Comparison of Rwp and RBragg values of Rietveld refinements of autoclavedsamples and tobermorite using the isotropic and the anisotropic domain size model
J Schreiner et al Cement and Concrete Research 107 (2018) 247ndash252
251
6 Publications
43
mechanical properties of autoclaved aerated concrete (I) tobermorite formationCem Concr Res 25 (1995) 243ndash248
[5] NY Mostafa Influence of air-cooled slag on physicochemical properties of auto-claved aerated concrete Cem Concr Res 35 (2005) 1349ndash1357 httpdxdoiorg101016jcemconres200410011
[6] K Matsui J Kikuma M Tsunashima T Ishikawa S Matsuno A Ogawa M SatoIn situ time-resolved X-ray diffraction of tobermorite formation in autoclaved aer-ated concrete influence of silica source reactivity and Al addition Cem Concr Res41 (2011) 510ndash519
[7] C Biagioni S Merlino E Bonaccorsi The tobermorite supergroup a new no-menclature Mineral Mag 79 (2015) 485ndash495 httpdxdoiorg101180minmag2015079222
[8] BH OConnor MD Raven Application of the Rietveld refinement procedure inassaying powdered mixtures Powder Diffract 3 (1988) 2ndash6 httpdxdoiorg101017S0885715600013026
[9] D Jansen F Goetz-Neunhoeffer C Stabler J Neubauer A remastered externalstandard method applied to the quantification of early OPC hydration Cem ConcrRes 41 (2011) 602ndash608 httpdxdoiorg101016jcemconres201103004
[10] D Jansen C Stabler F Goetz-Neunhoeffer S Dittrich J Neubauer Does OrdinaryPortland Cement contain amorphous phase A quantitative study using an externalstandard method Powder Diffract 26 (2011) 31ndash38 httpdxdoiorg10115413549186
[11] D Ectors F Goetz-Neunhoeffer J Neubauer A generalized geometric approach toanisotropic peak broadening due to domain morphology J Appl Crystallogr 48(2015) 189ndash194 httpdxdoiorg101107S1600576714026557
[12] D Ectors F Goetz-Neunhoeffer J Neubauer Routine (an)isotropic crystallite sizeanalysis in the double-Voigt approximation done right Powder Diffract 32 (S1)(2017) 27ndash34 httpdxdoiorg101017S0885715617000070
[13] HM Rietveld A profile refinement method for nuclear and magnetic structures JAppl Crystallogr 2 (1969) 65ndash71 httpdxdoiorg101107S0021889869006558
[14] D Ectors Advances in the Analysis of Cementitious Reactions and Hydrate Phases(Doctoral Thesis) (2016) pp 12ndash14 (urnnbndebvb29-opus4-71743)
[15] AacuteG De La Torre S Bruque J Campo MAG Aranda The superstructure of C3Sfrom synchrotron and neutron powder diffraction and its role in quantitative phaseanalyses Cem Concr Res 32 (2002) 1347ndash1356 httpdxdoiorg101016S0008-8846(02)00796-2
[16] A Kirfel G Will Charge density in anhydrite CaSO4 from X-ray and neutrondiffraction measurements Acta Crystallogr Sect B Struct Crystallogr CrystChem 36 (1980) 2881ndash2890 httpdxdoiorg101107S0567740880010461
[17] C Bezou AN Christensen D Cox M Lehman A Nonat Structures cristallines deCaSO405H2O et CaSO406H2O Comptes Rendus Hebd Des Seacuteances lAcadeacutemieDes Sci Seacuterie 2 (312) (1991) 43ndash48
[18] KH Jost B Ziemer R Seydel Redetermination of the structure of β-dicalciumsilicate Acta Crystallogr Sect B Struct Crystallogr Cryst Chem 33 (1977)1696ndash1700 httpdxdoiorg101107S0567740877006918
[19] W Mumme LMD Cranswick BC Chakoumakos Rietveld crystal structure re-finements from high temperature neutron powder diffraction data for the poly-morphs of dicalcium silicate Neues Jahrb Fuer Mineral Abhandlungen 170 (1996)171ndash188
[20] A Colville S Geller The crystal structure of brownmillerite Ca2FeAlO5Crystallographica 50 (1971) 2311ndash2315 httpdxdoiorg101107S056774087100579X
[21] ST Bergold F Goetz-Neunhoeffer J Neubauer Quantitative analysis of C-S-H inhydrating alite pastes by in-situ XRD Cem Concr Res 53 (2013) 119ndash126 httpdxdoiorg101016jcemconres201306001
[22] EN Maslen VA Streltsov NR Streltsova N Ishizawa Electron density and op-tical anisotropy in rhombohedral carbonates III Synchrotron Xray studies ofCaCO3 MgCO3 and MnCO3 Acta Crystallogr Sect B 51 (1995) 929ndash939 httpdxdoiorg101107S0108768195006434
[23] G Renaudin Y Filinchuk J Neubauer F Goetz-Neunhoeffer A comparativestructural study of wet and dried ettringite Cem Concr Res 40 (2010) 370ndash375httpdxdoiorg101016jcemconres200911002
[24] WF Cole CJ Lancucki A refinement of the crystal structure of gypsumCaSO42H2O Acta Cryst B30 (1974) 921ndash929 httpdxdoiorg101107S0567740874004055
[25] T Runčevski RE Dinnebier OV Magdysyuk H Poumlllmann Crystal structures ofcalcium hemicarboaluminate and carbonated calcium hemicarboaluminate fromsynchrotron powder diffraction data Acta Crystallogr Sect B Struct Sci 68 (2012)493ndash500 httpdxdoiorg101107S010876811203042X
[26] JM Hughes JW Drexler Cation substitution in the apatite tetrahedral site crystalstructures of type hydroxylellestadite and type fermorite Neues Jahrb FuerMineral (1991) 327ndash336
[27] CH Shen RS Liu JG Lin CY Huang Phase stability study of La12Ca18Mn2O7Mater Res Bull 36 (2001) 1139ndash1148
[28] SW Bailey Refinement of an intermediate microcline structure Am Miner 54(1969) 1540ndash1545
[29] WR Busing HA Levy Neutron diffraction study of calcium hydroxide J ChemPhys 26 (1957) 563 httpdxdoiorg10106311743345
[30] Y Le Page G Donnay Refinement of the crystal structure of low-quartz ActaCrystallogr Sect B 32 (1976) 2456ndash2459 httpdxdoiorg101107S0567740876007966
[31] SA Hamid The crystal structure of the 11 Aring natural tobermoriteCa225[Si3O75(OH)15]1H2O Zeitschrift Fuer Krist - New Cryst Struct 154 (1981)189ndash198 httpdxdoiorg101524zkri19811543-4189
[32] P Mondal JW Jeffery The crystal structure of tricalcium aluminate Ca3Al2O6Acta Crystallogr B 31 (1975) 689ndash697 httpdxdoiorg101107S0567740875003639
[33] Y Takeuchi F Nishi I Maki Crystal-chemical characterization of the tricalciumaluminate-sodium oxide (3CaOtimesAl2O3-Na2O) solid-solution series Zeitschrift FuumlrKrist (1980) 259ndash307
[34] K Momma F Izumi VESTA 3 for three-dimensional visualization of crystal vo-lumetric and morphology data J Appl Crystallogr 44 (2011) 1272ndash1276 httpdxdoiorg101107S0021889811038970
[35] K Scrivener R Snellings B Lothenbach A Practical Guide to MicrostructuralAnalysis of Cementitious Materials CRC Press 2016 pp 123ndash125 httpdxdoiorg107693wl20150205
[36] V Pecharsky P Zavalij Fundamentals of Powder Diffraction and StructuralCharacterization of Materials Springer second edition 2005 p 302 httpdxdoiorg101007978-0-387-09579-0
J Schreiner et al Cement and Concrete Research 107 (2018) 247ndash252
252
6 Publications
44
7 Acknowledgement
7 Acknowledgement
Ich moumlchte mich bei einigen Personen bedanken ohne die es wohl kaum zum erfolgreichenAbschluss dieser Arbeit gekommen waumlreMein Doktorvater Prof Dr Juumlrgen Neubauer hat sich stets die Zeit genommen die noumltigwar um Angelegenheiten aller Art mit mir zu klaumlren Er gab mir fachlich immer zumrichtigen Zeitpunkt einen gewissen wissenschaftlichen Impuls Zugleich habe ich mich den-noch immer frei in meiner eigenen Konzeption gefuumlhlt Groszligen Dank spreche ich Prof DrFriedlinde Goumltz-Neunhoeffer aus die fuumlr mich ebenso immer eine verlaumlssliche Ansprech-partnerin fuumlr fachliche und organisatorische Angelegenheiten aller Art war Danke anDr Daniel Jansen fuumlr die gute Zusammenarbeit und dafuumlr dass er mich im Zuge meinerMasterarbeit in ein Forschungsprojekt aufgenommen hat das den Weg zur Promotionmoumlglich machte Zusaumltzlich gilt mein Dank Prof Dr Matthias Goumlbbels der fuumlr dieMitarbeiter am Lehrstuhl immer motivierende Worte fand Fuumlr die Ermoumlglichung meinerTeilnahme an diversen Dienstreisen Fortbildungen und Tagungen moumlchte ich mich viel-mals bedankenWeiterhin bedanke ich mich bei Dr Stephan Volkmann und den Rodgauer BaustoffwerkenGmbH amp Co KG fuumlr die gute Zusammenarbeit und die Bereitstellung von Versuchsma-terialienVielen Dank an meine studentischen Hilfskraumlfte Daniel Wagner Laura MoldenhauerFabian Lang Jakob Schreiber und Felix Klaassen die alle Aufgaben im Labor einwand-frei und mit Bedacht erledigten Bei meinen aktuellen und ehemaligen Kollegen DrKatrin Hurle Dr Dominique Ectors Dr Christoph Naber Dr Florian Huumlller JoumlrgNehring Frank Riedel Julian Wolf Tanja Manninger Daniel Wagner Nicolas FobbeKarla Spaumlth Julian Goergens Andreas Koumlhler Cordula Jakob Franz Becker und LisaKlemenz bedanke ich mich fuumlr die gelungene Zusammenarbeit und gegenseitige Unter-stuumltzung Besonderer Dank geht auch an Kerstin Kreszlig Bettina Engl Christian HankeBernd Schleifer und Christian Abe fuumlr die verlaumlssliche Unterstuumltzung bei technischen Fra-gen und Messungen im LaborFuumlr jegliche Unterstuumltzungen moumlchte ich mich auch bei meinen Eltern bedanken sowiebei meinem Bruder Ralf der mir mit einem LaTex Crashkurs viel Frustration ersparthat Danke Thomas dass du immer fuumlr mich da bist und mit mir zusammen fuumlr genugAusgleich gesorgt hast
45
2 State of research
as tobermorite show better crystallinity In addition the hardly evitable effects of dam-age to poorly crystalline phases and removal of water are not as significant in the case ofAAC This is why environmental scanning electronic microscopy (ESEM) was suggestedin order to investigate hydrated Portland cement after early hydration [44 45] Howeverwhile hydrated OPC is a reasonably homogeneous material AAC shows heterogeneitydue to the porous structure (Figure 11)As reported in subsection 213 several authors investigated the morphology of tober-morite in AAC in order to verify the influence of foreign ions supplied by SCMs andestimate their effect on the thermal and mechanical properties Well crystallized tober-morite often shows a house-of-cards structure in AAC (Figure 23) which was observedin numerous studies [46 47 48]
Figure 23 House-of-cards appearance of tobermorite crystals in AAC
Wongkeo amp Chaipanich stated that the application of coal bottom ash for partial replace-ment of cement in the starting compound resulted in a change of plate-like to lath-likemorphology of tobermorite crystals [49] Equally thin lath-like plates of tobermorite wereobserved by Roacuteżycka et al in samples prepared from perlite waste [50] Venhodovaacute etal investigated AAC samples prepared from mixes including fly ash and Al(OH)3 andconfirmed the elongated shape of Al-incorporated tobermorite [8] In these studies thefraction of aluminum ions was increased by adding the respective SCM An effect on themorphology of tobermorite was respectively reported which conforms to the conclusionsmade by different authors in subsection 213 Nevertheless the heterogeneity of AACsamples in SEM images was barely addressed in all of these examples By contrast Mit-suda et al differentiated between macropores and micropores in their SEM images ofindustrially manufactured AAC [10] Huang et al separately analyzed walls and pores in
9
2 State of research
their samples prepared from copper tailings and blast furnace slag [48] The wall sectionsappeared dense while in pores platy tobermorite and long-strip shaped anhydrite wasobserved Only the tobermorite crystals in the pores showed the previously describedhouse-of-cards structure As is evident from these published results there is a lack ofclarity about the meaning and informative value of observations made in AAC samplesby SEM analysis In the main results of this present thesis (section 32) a substantiatedassessment of this circumstance is given
222 XRD analysis
While SEM analysis of AAC is majorly performed in order to characterize the crystallinityand morphology of tobermorite XRD analysis is mainly applied in order to assess theoverall phase composition Apart from the phases shown in Figure 22 additional calcitefeldspar mica gypsum and bassanite occur frequently in AAC depending on the miner-alogical composition of the used raw materials Frequently minor phases are unreactedresidual components of raw materials such as sericite in the publication of Isu et al [51] orphlogopite in the study of Huang et al who applied skarn-type copper tailings for AACpreparation [48] Prolonged curing duration resulted in minor quantities of xonotlite inthe study by Mitsuda et al [10]Mainly qualitative phase contents have been determined based on XRD in studies dealingwith the mineralogy of AAC A clear recognition of amorphous content in AAC along withthe crystalline phases has been barely addressed and discussed Relative quantities weredetermined by Matsui et al by plotting normalized intensities [28] They estimated thequantity of C-S-H gel by regarding the integrated intensity of the assumed tobermoriteprecursor in a distinct section of the XRD pattern Coming in agreement with the authorscited in subsection 213 increased d spacing along c in Al-substituted tobermorite wasreported in the same study Venhodovaacute et al performed XRD analysis of AAC samplesin their publication previously addressed in subsection 221 [8] They compared relativeintensities of tobermorite in their samples but no absolute quantities of the phases werecalculated either Mitsuda et al applied an internal standard method in order to quantifyunreacted quartz in their AAC samples [10]More recently Ectors proposed a promising method for the tracking of portlandite forma-tion during the green cake hydration [52] By applying a Rietveld compatible approachfor TOPAS 50 (Bruker AXS) to fit anisotropic peak broadening due to domain mor-phology [19] two generations of portlandite could be refined separately and assigned tothe hydration of calcium oxide and tricalcium silicate respectively The key idea behindthis approach is that the average domain morphology of a mineral phase in a powder
10
2 State of research
sample implies certain mineralogical characteristics The simplified domain morphologycan be calculated on the basis of geometrical shapes such as cylinder ellipsoid or cuboidDepending on the crystal system and the expected morphology the geometrical shapecan be adjusted accordingly In the example reported by Ectors the one generation ofportlandite originating from burnt lime hydration showed anisotropic peak broadening- unlike the generation forming from tricalcium silicate hydration In accordance withthe trigonal crystal system a biaxial cylinder model was applied for the fitting of theanisotropic generation The operating principle of the approach to fit the anisotropicpeak broadening due to domain morphology can be precisely explored by accessing fur-ther publications by Ectors et al [53 54] Apart from this benefit a better fit to themeasured data enables a more accurate refinement and quantification of all phases Thetwo generations of portlandite were additionally quantified by means of an external stan-dard method [55] The combination of quantitative phase analysis by XRD (QXRD) withthe refinement of anisotropic peak broadening is a promising approach in this context -especially in consideration of the fact that phase quantifications in AAC samples havebeen barely performed ever before Hence the application of these methods is the keymatter of this present thesis Especially the potential of the domain morphology analysisof tobermorite is precisely investigated The terms domain size and domain morphology inthis sense refer to the coherently scattering unit measured by XRD analysis Crystallineparticles observed by means of electron microscopy which are frequently termed grainscrystals or crystallites are for the most part clusters of coherently scattering domains[56 57]
11
3 Main results
3 Main results
This chapter introduces the main results presented in three peer reviewed publications[58 59 60] incorporated in chapter 6 The new findings are put in a general context andsubsequently they are summarized and discussed in chapter 4 The sections 31 and 32deal with the characterization of tobermorite in both lab-scale samples and AAC sam-ples produced on an industrial scale In section 33 the entire production process of AACincluding the hydration before autoclaving is addressed
Figure 31 Application of a triaxial cylinder model for the calculation of anisotropic do-main sizes of tobermorite implemented with Rietveld refinement and influenceon the fit compared to ordinary refinement [60]
12
3 Main results
One particular main result is a key element in each of the following sections In Figure 31the fit of tobermorite after two Rietveld refinements of different accuracy is shown In aregular Rietveld refinement for simplification the coherently scattering units are treatedas spherical shapes as usually only one size value for each mineral phase is calculated Asaverage domain sizes of a mineral phase in different crystallographic directions are in manycases indeed close to one value this approximation is often sufficient in order to achievea satisfactory fit to the measured diffractogram The crystal system and surroundingconditions during the formation of a mineral phase are significant factors in this context Amisfit at different (hkl) reflections as displayed in Figure 31 is an indication of anisotropicpeak broadening Clearly orthorhombic tobermorite shows anisotropic peak broadeningdue to its anisotropic domain morphology For the possible origins of anisotropic peakbroadening apart from size broadening the reader is referred to section 61 In accordancewith the orthorhombic crystal system a triaxial model is applied in order to fit the peakbroadening [19] By implementing the macro during the refinement no longer one butthree sizes (x y and z for respectively a b and c direction) are calculated Besides theimproved fit the calculated domain morphology is an additional information extractedfrom XRD analysis and it is representative for the average value of the phase in the entiresample In each of the following sections the different benefits regarding this approachare outlined in more detail
31 Hydrothermal synthesis of tobermorite on alaboratory scale - application of two types ofmetakaolin
This study covers mineralogical properties of tobermorite synthesized from a set of variouscompounds including different amounts and types of metakaolin [58] Unlike in sections32 and 33 the samples were not aerated before autoclaving and their composition isadjusted to the CaSi molar ratio of stoichiometric tobermorite On the one hand thereactivity of metakaolin and minor phases at hydrothermal conditions for the possible usein AAC production was investigated On the other hand the effects of consequent changesof the bulk chemistry in the basic compound on the mineralogical characteristics of to-bermorite such as lattice parameters and domain morphology were analyzed In additionfor one particular compound the effect of different curing times was explored While theconventional raw materials for AAC production are rather low-cost resources metakaolinis a high-priced SCM in this regard For this reason besides one comparatively pure com-mercial metakaolin (MK) a second by-product type of metakaolin (MKg) was applied
13
3 Main results
at equivalent dosages All investigated mix composites and the chemical composition ofMK and MKg are summed up in tables in section 61In Figure 32 the effect of different amounts of the two types of metakaolin on the phasequantities is displayed Clearly at moderate dosages of MK and MKg tobermorite waspresent in comparable quantities However the application of any amount of metakaolinreduced the amount of tobermorite compared to the blank mixture It can be seen thatkatoite was present whenever the content of Al2O3 in the starting drymix exceeded 2wt which fits well with the state of knowledge [5 23] For the highest possible dosagesof the two types of metakaolin (MK60 and MKg60) contrary effects were observed Ap-plication of impure metakaolin (MKg) led to a considerable amount of tobermorite whilein MK60 no tobermorite was present The high content of Al2O3 seems to have hinderedthe formation of tobermorite Not all of the Al2O3 in MKg was supplied for reactionas minor phases such as feldspar remained unreacted which is shown accurately in therespective publication in section 61
Figure 32 Weight fractions of tobermorite quartz and katoite measured by QXRD anal-ysis and contents of Al2O3 in the starting drymix Amorphous content andminor phases are not shown
The results of thermal analysis of samples characterized by MK addition in small stepsare shown in Figure 33 It can be seen that the conversion of 93 Aring tobermorite into β-
14
3 Main results
wollastonite depended on the dosage of MK However unlike suggested by Klimesch ampRay there was no effect of lower contents of Al2O3 in the drymix [40] Consequently theinfluence of Al3+ at low dosages (MK25 and MK5) could not be observed on the basisof this method Apart from this result the other signals showed good agreement with thesuggested conversion ranges by Klimesch amp Ray as for samples MK9 and MK16 a clearshift towards higher temperature was measured However the role of Al3+ incorporationverified by this method is not necessarily conclusive as additional reactions during theheating experiment involving Al3+ are possible On that basis the observations madeby means of DTA would not reflect the amount of Al3+ originally incorporated into thestructure of 11 Aring tobermorite
Figure 33 Conversion of 93 Aring tobermorite into β-wollastonite in samples synthesizedwith various amounts of metakaolin and suggested temperature ranges ac-cording to Klimesch amp Ray [40]
In accordance with authors referenced in subsection 213 lattice parameter c of tober-morite increased with elevated dosages of Al2O3 in the basic dry mix (Figure 34) Theimpact could be observed for the complete range of samples as displayed in section 61which indicates that a limit of Al3+ incorporation was not reached in this study Forcomparison the relative domain morphology is plotted in Figure 34 Unlike the DTA
15
3 Main results
signals both lattice parameter c and the domain morphology are impacted by very lowdosages of Al2O3 There is a good accordance of the relation of growth in b direction to adirection and the c parameter This is valid up to 20 wt of Al2O3 in the starting drymix By contrast more elevated contents of Al2O3 did not affect the domain morphologyany further even though the incorporation is verified through the increased c parameterIt follows that the impact of Al3+ incorporation on the domain morphology is limited tovery low contents while the impact on lattice parameter c can be tracked throughoutthe entire examined range of samples In section 61 additional results show that growthin b direction increased with reaction time These observations are solely based on XRDanalysis and offer new benefits for the structural understanding of tobermorite
Figure 34 Impact of the calculated Al2O3 content in the basic dry mix on the latticeparameter c and on the relation of calculated domain sizes of tobermorite ina (x) and b (y) direction
16
3 Main results
32 Structural properties of tobermorite in AAC - SEMversus XRD analysis
This section and the respective publication [59] mainly deal with the suitability of SEManalysis of tobermorite in AAC The effects of varying amounts of SO3 and Al2O3 in thedry mix on structural properties of tobermorite are discussed based on XRD analysisAs shown in subsection 221 and Figure 23 tobermorite often shows a house-of-cardsstructure in AAC samples This property has been considered to be relevant for thethermal and mechanical properties of AAC (subsection 221) However SEM analysiswithin this study revealed that this type of appearance is mainly found in the poresand pore surfaces (Figure 35) This finding comes in agreement with the observationsmade by Huang et al [48] In the solid skeleton of the dense AAC material neither themorphology nor the house-of-cards structure could be observed properly which can beseen very clearly in additional micrographs provided in section 62 It should be consideredthat the major amount of tobermorite by weight is located in the dense material and notat the pore surfaces In this way these findings are clear disadvantages coming along withonly SEM analysis of AAC as representative results can hardly be obtained
Figure 35 House-of-cards structure of tobermorite in a pore surrounded by dense mate-rial
Moreover several authors in subsection 221 justified the morphology of tobermorite withthe incorporation of foreign ions Al-substituted tobermorite showed lath-like morphologywhereas Al-free tobermorite showed rather plate-like morphology [6 32 49] Howeverthe present investigation revealed that independent of Al2O3 content in the raw mix there
17
3 Main results
is always heterogeneity regarding the morphology of tobermorite In Figure 36 plate-likeand lath-like morphology of tobermorite in AAC observed in two statistical chemicallyvarious samples are displayed This result supports the previous assumption that theobservations made by SEM analysis of tobermorite in AAC strongly depend on whatpart of the sample is selected Yet again no clear observations could be made that wererepresentative for the entire sample
Figure 36 Heterogeneous morphology of tobermorite (plate-like in a and c lath-like in band d) in two AAC samples characterized by different Al2O3 contents in theraw mix
The effects of Al3+ on the domain morphology of tobermorite were measured and evaluatedin a similar manner as in section 61 and the results could be confirmed The relativedomain growth in b direction was increased by Al3+ incorporation in both studies [5859] Moreover lattice parameter c was increased with Al3+ incorporation which can beseen more accurately in section 62 Unlike SEM analysis XRD analysis allowed clearconclusions whenever structural properties of Al-substituted tobermorite were affectedInstead of a local observation as made with SEM representative and statistical resultswere obtained The reader is referred to section 61 and section 62 for further results and
18
3 Main results
more specific conclusionsIn addition the effect of various amounts of sulfate in the raw mix was analyzed Unlikein the case of different dosages of Al3+ neither the domain morphology nor the latticeparameters of tobermorite were affected by the SO3 content in the dry mix In Figure 37these observations and additionally the amounts of anhydrite measured by QXRD areshown As the amount of available SO3 in the dry mix is known the maximum possibleamount of anhydrite could be calculated for each of the samples in focus Obviouslythe measured amounts of anhydrite are either equal or slightly higher compared to theexpected quantities This result leads to the assumption that all of the available sulfateis transformed into anhydrite so that no more sulfate could be incorporated into thestructure of tobermorite The over-estimation of anhydrite in some of the samples can beexplained due to the inaccuracy of the quantification method The present results rathermatch with the suggestions by Sauman amp Valtr [41] as in their study no effect of sulfateon the structure of tobermorite was observed either
Figure 37 Impact of the sulfate content in the AAC raw mix on lattice parameter cand relative domain morphology of tobermorite (a) and comparison of theexpected maximum amount of anhydrite to the measured amount determinedby QXRD (b)
33 Improved monitoring of the phase developmentduring the production of AAC
In this study not only autoclaved samples were analyzed but additionally a lab-scale slurrywhich included the reactive components of the green cake stage during AAC productionat equivalent weight proportions In-situ XRD was performed at 70 degC and at a water-to-
19
3 Main results
solid ratio of 08 for 24 h (Figure 38) which are respective conditions during commercialproduction Clearly the phase development is dominated by OPC and lime hydration asdescribed in section 22 It can be seen that the major reaction turnover occurs duringthe first 200 minutes which is the average duration of the green stage After only 30minutes all of the quicklime had transformed into portlandite whereas Schober proposeda duration of one hour for this reaction [42] The amount of portlandite is composed oftwo different generations as proposed by Ectors [52] Equally a biaxial cylinder modelwas applied in order to fit the peak broadening of the first generation of portlandite in thepresent investigation Minor phase developments such as the formation of AFm phases arenot shown in Figure 38 A coarse fraction of anhydrite did not react so that constantlyaround 15 wt were measured after 6 h As the decomposition of ettringite due tosulfate depletion [55] does not occur prior to 12 h the green cake strength is not affected
Figure 38 In-situ XRD measurement of AAC model slurry at water-to-solid ratio of 08and 70 degC For clarity and comprehensibility not all phases are shown
The separation of two generations of portlandite in the system does not only translate intodifferent domain morphologies as shown by Ectors [52] In Figure 39 more indicationsfor different mineralogical properties are displayed The shape of the (0 0 1) reflection inXRD patterns after only quicklime hydration and after both quicklime and alite hydrationshows a distinct feature While portlandite originating from quicklime hydration showsa broad peak implying lower crystallinity the peak after alite hydration is characterized
20
3 Main results
Figure 39 Formation of two generations of portlandite in AAC slurry in XRD (a) andDTA (b) plots
by a sharper component Yet the peak breadth did not change indicating that the firstgeneration is still present with the original characteristics This observation is supportedby DTA measurements additionally demonstrating two degrees of crystallinity only afteralite hydration In agreement with XRD analysis the better crystalline second generationof portlandite decomposes at a higher temperature
Figure 310 Quantification of tobermorite in statistical chemically various AAC sampleswith and without the application of the macro for the fitting of anisotropicpeak broadening
21
3 Main results
Furthermore commercial AAC samples were considered in this study By applying themethod for the refinement of anisotropic peak broadening (Figure 31) a more accuratequantification of tobermorite can be achieved In Figure 310 the calculated amounts oftobermorite in statistical chemically various AAC samples are plotted In some samplesthe refinement using the macro leads to considerably higher but never lower quantitiesof tobermorite whereas in other samples nearly the same amount of tobermorite is cal-culated This observation can be well understood taking into account that the macroallows to account more peak area for tobermorite as shown in Figure 31 Clearly thereis evidence that the anisotropy of tobermorite domains is not uniform from one sampleto another which was basically justified in the previous sections As an improved quan-tification of a single phase leads to a better quantification of other phases in the samplethis adaption is very valuable in order to assess the phase development Here the peakbroadening of tobermorite equally observed by Qu et al [6] could be tracked and evalu-ated in order to gain more accurate results Moreover in section 63 McCrone milling issuggested in order to avoid spottiness in XRD patterns caused by coarse grains of quartzor anhydrite (Figure 38)
22
4 Conclusions
4 Conclusions
The research results presented in the previous sections yield advances in the mineralogicalinvestigation of tobermorite and autoclaved aerated concrete Recorded diffraction pat-terns contain plenty of usually unused data regarding the microstructural characteristicsof the sample and phases therein The profit of XRD measurements can be significantlyimproved whenever one or more phases show anisotropic peak broadening and appro-priate models for the respective domain morphology are implemented into the Rietveldenvironment Within the scope of the present investigations portlandite and tobermoriteshow this particularityThe effects of changes in the chemistry of the starting mix were examined based on dif-ferent dosages of metakaolin Al-substituted tobermorite showed increased growth in b
direction and an increase of lattice parameter c compared to Al-free tobermorite The rel-ative domain sizes were determined based on anisotropic peak broadening However whilethe effect of Al3+ incorporation into the lattice of tobermorite was limited regarding thedomain morphology lattice parameter c showed an increase throughout the entire rangeof samples The consequent effects suggested by Klimesch amp Ray observed by means ofDTA are debatable as reactions during the heating experiment may lead to to a changeof Al3+ content in tobermorite [40] While both types of applied metakaolin showed goodreactivity at hydrothermal conditions some included minor phases such as feldspar oranatase remained unreacted At high dosages of Al2O3 in the starting mix the formationof either only katoite or katoite along with tobermorite was observed (Figure 32)SEM analysis of tobermorite in AAC cannot be suggested based on the observationspresented in this work as it is only visually accessible in the pores or at pore surfacesThe dense material of the AAC skeleton contains several crystalline and X-ray amorphousphases which hardly allows a proper investigation Even in single pores tobermorite crys-tals appeared very heterogeneous at various chemical compositions As a result lath-liketobermorite was not only present in samples characterized by elevated Al3+ incorporationBy contrast the benefits of XRD analysis presented in section 61 equally accounted fortobermorite in AAC samples Sulfate incorporation into the lattice of tobermorite wasnot observed All of the sulfate in the system was detected to be present in anhydriteThe phase transitions in the AAC raw slurry during the green stage hydration were show-cased by in-situ XRD analysis of a model mix at 70 degC Additional DTA and XRD mea-
23
4 Conclusions
surements during this step confirmed the presence of two generations of portlandite char-acterized by different crystallinity as suggested by Ectors [52] The inclusion of anisotropicdomain morphology during the Rietveld refinement allowed a more accurate quantifica-tion of tobermorite in autoclaved samples Sample preparation adjusted to the grain sizedistribution in AAC samples (section 63) the external standard method for quantita-tive XRD analysis [55] and the approach to evaluate anisotropic peak broadening [19]are the key methods for a more accurate tracking of the phase development during AACproduction
24
5 References
5 References
[1] A E Zadov A I Grabezhev N N Pertsev N V Chukanov and S V PribavkinTobermorite-plombierite metasomatites of the Gumeshevsk skarn-porphyry copper depositmiddle Urals Doklady Earth Sciences 407(3)495ndash497 2006
[2] M F Heddle Preliminary notice of substances which may prove to be new minerals MinMag 4117ndash123 1880
[3] S Merlino E Bonaccorsi and T Armbruster The real structure of tobermorite 11AringNormal and anomalous forms OD character and polytypic modifications European Journalof Mineralogy 13(3)577ndash590 2001
[4] C Biagioni S Merlino and E Bonaccorsi The tobermorite supergroup a new nomencla-ture Mineralogical Magazine 79(2)485ndash495 2015
[5] C A Riacuteos C D Williams and M A Fullen Hydrothermal synthesis of hydrogarnetand tobermorite at 175 degC from kaolinite and metakaolinite in the CaO-Al2O3-SiO2-H2Osystem A comparative study Applied Clay Science 43(2)228ndash237 2009
[6] X Qu Z Zhao and X Zhao Microstructure and characterization of aluminum-incorporated calcium silicate hydrates (C-S-H) under hydrothermal conditions RSC Ad-vances 8(49)28198ndash28208 2018
[7] R Šiaučiunas and K Baltakys Formation of gyrolite during hydrothermal synthesis inthe mixtures of CaO and amorphous SiO2 or quartz Cement and Concrete Research34(11)2029ndash2036 2004
[8] E Venhodovaacute R Janovskyacute and R Drochytka Formation of Tobermorite at Different Ma-terials Composition of Aerated Concrete Applied Mechanics and Materials 752-753247ndash250 2015
[9] L Galvaacutenkovaacute E Bartoniacutečkovaacute T Opravil J Tkacz and P Ptaacuteček The influence ofstarting materials solubility on tobermorite structure formation under the hydrothermalconditions IOP Conference Series Materials Science and Engineering 379(1)1ndash8 2018
[10] T Mitsuda K Sasaki and H Ishida Phase Evolution during Autoclaving Process J AmCeram Soc 75(75)1858ndash1863 1992
[11] A Skawińska The influence of metahalloysite addition on tobermorite formation studied byX-ray powder diffraction and scanning electron microscope MATEC Web of Conferences16305008 2018
[12] S T Bergold F Goetz-Neunhoeffer and J Neubauer Quantitative analysis of C-S-H in
25
5 References
hydrating alite pastes by in-situ XRD Cement and Concrete Research 53119ndash126 2013
[13] O P Shrivastava and F P Glasser Ion-exchange properties of 11-Aring tobermorite Reactivityof Solids 2(3)261ndash268 1986
[14] H Maeda Y Ogawa E H Ishida and T Kasuga Hydrothermal synthesis of tobermoritedoped with phosphorus species for removing heavy metal ions Journal of the AustralianCeramic Society 48(1)8ndash11 2012
[15] O P Shrivastava and R Shrivastava Cation exchange applications of synthetic tobermoritefor the immobilization and solidification of cesium and strontium in cement matrix Bulletinof Materials Science 23(6)515ndash520 2000
[16] G Renman and A Renman Sustainable Use of Crushed Autoclaved Aerated Concrete(CAAC) as a Filter Medium in Wastewater Purification 8th International conferenceon sustainable management of waste and recycled materials in construction GothenburgSweden 30 Mayndash1 June 2012 Proceedings pages 1ndash7 2012
[17] G Schober Chemical transformations during the manufacturing of autoclaved aeratedconcrete (ACC) Cement lime gypsum and quartz sand become cellular concrete ZKG58(7)63ndash70 2005
[18] A J Hamad Materials Production Properties and Application of Aerated LightweightConcrete Review International Journal of Materials Science and Engineering 2(2)152ndash157 2014
[19] D Ectors F Goetz-Neunhoeffer and J Neubauer A generalized geometric approach toanisotropic peak broadening due to domain morphology Journal of Applied Crystallogra-phy 48(1)189ndash194 2015
[20] H M Rietveld A profile refinement method for nuclear and magnetic structures Journalof Applied Crystallography 2(2)65ndash71 1969
[21] S A Hamid The crystal structure of the 11 Aring natural tobermoriteCa225[Si3O75(OH)15]1H2O Zeitschrift fuer Kristallographie - New Crystal Struc-tures 154(3-4)189ndash198 1981
[22] S A S El-Hemaly T Mitsuda and H F W Taylor Synthesis of normal and anomaloustobermorites Cement and Concrete Research 7429ndash438 1977
[23] M Sakiyama and T Mitsuda Hydrothermal reaction between C-S-H and kaolinite for theformation of tobermorite at 180degC Cement and Concrete Research 7(6)681ndash685 1977
[24] E Bonaccorsi S Merlino and A R Kampf The crystal structure of tobermorite 14 Aring(plombierite) a C-S-H phase Journal of the American Ceramic Society 88(3)505ndash5122005
[25] S Merlino E Bonaccorsi and T Armbruster The real structures of clinotobermorite andtobermorite 9 Aring OD character polytypes and structural relationships European Journalof Mineralogy 12(2)411ndash429 2000
[26] K Momma and F Izumi VESTA 3 for three-dimensional visualization of crystal volu-metric and morphology data Journal of Applied Crystallography 44(6)1272ndash1276 2011
26
5 References
[27] S Shaw S M Clark and C MB Henderson Hydrothermal formation of the calcium sil-icate hydrates tobermorite (Ca5Si6O16(OH)2 middot 4H2O) and xonotlite (Ca6Si6O17(OH)2)An in situ synchrotron study Chemical Geology 167(1-2)129ndash140 2000
[28] K Matsui J Kikuma M Tsunashima T Ishikawa S Matsuno A Ogawa and M SatoIn situ time-resolved X-ray diffraction of tobermorite synthesis process under hydrothermalcondition IOP Conference Series Materials Science and Engineering 18(2)60ndash66 2011
[29] G Matekonis R Šiaučiunas and D Vaičiukyniene Hydrothermal Synthesis and Charac-terization of Na + and [ Al 3 + + Na + ] -substituted Tobermorite in CaO-SiO2middotnH2O-H2OSystem MATERIALS SCIENCE 16(3)242ndash248 2010
[30] G Geng R J Myers M J A Qomi and P JM Monteiro Densification of the inter-layer spacing governs the nanomechanical properties of calcium-silicate-hydrate ScientificReports 7(1)1ndash8 2017
[31] D Klimesch and A Ray Autoclaved cement-quartz pastes with metakaolin additionsAdvanced Cement Based Materials 7(3-4)109ndash118 1998
[32] N Y Mostafa A A Shaltout H Omar and S A Abo-El-Enein Hydrothermal synthesisand characterization of aluminium and sulfate substituted 11 nm tobermorites Journal ofAlloys and Compounds 467(1-2)332ndash337 2009
[33] İ Demir M S Başpınar E Kahraman E Ccedilalışkan and G Goumlrhan An Investigation onthe Usability of Diatomite in Aerated Concrete Production In Proc of the Intl Conf onAdvances In Civil Structural And Construction Engineering - CSCE 2014 pages 97ndash1002014
[34] A Skawinska Z Owsiak T Baran and K Hernik The influence of halloysite additionon tobermorite formation in CaO and quartz mix under hydrothermal conditions CementWapno Beton 17(12)426ndash434 2017
[35] N Y Mostafa Influence of air-cooled slag on physicochemical properties of autoclavedaerated concrete Cement and Concrete Research 35(7)1349ndash1357 2005
[36] D Małaszkiewicz and J Chojnowski Influence of addition of calcium sulfate dihydrate ondrying of autoclaved aerated concrete Open Engineering 7(1)273ndash278 2017
[37] N Hara and N Inoue Thermal behaviour of 11Aring tobermorite and its lattice parametersCement and Concrete Research (10)53ndash60 1980
[38] M D Jackson S R Chae S R Mulcahy C Meral R Taylor P Li A H EmwasJ Moon S Yoon G Vola H R Wenk and P JM Monteiro Unlocking the secretsof Al-tobermorite in Roman seawater concrete American Mineralogist 98(10)1669ndash16872012
[39] W Liao W Li Z Fang C Lu and Z Xu Effect of different aluminum substitution rateson the structure of Tobermorite Materials 12(22)1ndash10 2019
[40] D Klimesch and A Ray DTA-TG Study of the CaO-SiO2-H2O and CaO-Al2O3-SiO2-H2OSystems Under Hydrothermal Conditions Journal of Thermal Analysis and Calorimetry56(1)27ndash34 1999
27
5 References
[41] Z Sauman and Z Valtr Substitution of sulphate ions in the crystal lattice of 11 Aring to-bermorite In The VI International Congress on the Chemistry of Cement pages 1ndash14Moscow 1974
[42] G Schober Reaction of raw materials to the final product AAC httpwwwpb-aacde
chemmin2_ehtml 2012 accessed 2020-01-31
[43] D Jansen C Stabler F Goetz-Neunhoeffer S Dittrich and J Neubauer Does Ordi-nary Portland Cement contain amorphous phase A quantitative study using an externalstandard method Powder Diffraction 26(01)31ndash38 2011
[44] C Roumlszligler J Stark F Steiniger and W Tichelaar Limited-dose electron microscopyreveals the crystallinity of fibrous C-S-H phases Journal of the American Ceramic Society89(2)627ndash632 2006
[45] Y Sakalli and R Trettin Investigation of C3S hydration by environmental scanning elec-tron microscope Journal of Microscopy 259(1)53ndash58 2015
[46] F Matsushita Y Aono and S Shibata Expansion and shrinkage behavior of green cakeof Autoclaved Aerated Concrete In Autoclaved Aerated Concrete - Innovation and Devel-opment Proceedings of the 4th International Conference on Autoclaved Aerated ConcreteKingston UK 8-9 September 2005 pages 101ndash108 CRC Press 2005
[47] C Chucholowski M Holger and K-C Thienel Improving the recyclability environmentalcompatibility and CO2 balance of autoclaved aerated concrete by replacing sulfate carrierand cement with calcined clays CePapers 2(4)503ndash512 2018
[48] X Y Huang W Ni W H Cui Z J Wang and L P Zhu Preparation of autoclavedaerated concrete using copper tailings and blast furnace slag Construction and BuildingMaterials 27(1)1ndash5 2012
[49] W Wongkeo and A Chaipanich Compressive strength microstructure and thermal anal-ysis of autoclaved and air cured structural lightweight concrete made with coal bottom ashand silica fume Materials Science and Engineering A 527(16-17)3676ndash3684 2010
[50] A Roacuteżycka and W Pichoacuter Effect of perlite waste addition on the properties of autoclavedaerated concrete Construction and Building Materials 12065ndash71 2016
[51] N Isu H Ishida and T Mitsuda Influence of quartz particle size on the chemical andmechanical properties of autoclaved aerated concrete (I) tobermorite formation Cementand Concrete Research 25(25)243ndash248 1995
[52] D Ectors Advances in the analysis of cementitious reactions and hydrate phases doctoralthesis PhD thesis Friedrich-Alexander-Universitaumlt Erlangen-Nuumlrnberg 2016
[53] D Ectors F Goetz-Neunhoeffer and J Neubauer Domain size anisotropy in the double-Voigt approach An extended model Journal of Applied Crystallography 481998ndash20012015
[54] D Ectors F Goetz-Neunhoeffer and J Neubauer Routine (an)isotropic crystallite sizeanalysis in the double-Voigt approximation done right Powder Diffraction 32(S1)27ndash342017
28
5 References
[55] D Jansen F Goetz-Neunhoeffer C Stabler and J Neubauer A remastered external stan-dard method applied to the quantification of early OPC hydration Cement and ConcreteResearch 41(6)602ndash608 2011
[56] T Ungaacuter G Tichy J Gubicza and R J Hellmig Correlation between subgrains andcoherently scattering domains Powder Diffraction 20(04)366ndash375 2005
[57] Triloki P Garg R Rai and B K Singh Structural characterization of as-depositedcesium iodide films studied by X-ray diffraction and transmission electron microscopy tech-niques Nuclear Instruments and Methods in Physics Research Section A AcceleratorsSpectrometers Detectors and Associated Equipment 736128ndash134 2014
[58] J Schreiner F Goetz-Neunhoeffer J Neubauer and D Jansen Hydrothermal synthesisof 11 Aring tobermorite ndash Effect of adding metakaolin to the basic compound Applied ClayScience 185 2020
[59] J Schreiner F Goetz-Neunhoeffer J Neubauer S Volkmann S Bergold R Webler andD Jansen Advanced Rietveld refinement and SEM analysis of tobermorite in chemicallydiverse autoclaved aerated concrete Powder Diffraction 34143ndash150 2019
[60] J Schreiner D Jansen D Ectors F Goetz-Neunhoeffer J Neubauer and S VolkmannNew analytical possibilities for monitoring the phase development during the production ofautoclaved aerated concrete Cement and Concrete Research 107247ndash252 2018
29
6 Publications
6 Publications
61 Hydrothermal synthesis of 11 Aring tobermorite ndash Effectof adding metakaolin to the basic compound
Reprint of the peer reviewed publication
Schreiner J Goetz-Neunhoeffer F Neubauer J Jansen D 2020 Hydrothermalsynthesis of 11 Aring tobermorite ndash Effect of adding metakaolin to the basic compoundApplied Clay Science 185 httpsdoiorg101016jclay2019105432
with permission from Elsevier
30
Contents lists available at ScienceDirect
Applied Clay Science
journal homepage wwwelseviercomlocateclay
Research paper
Hydrothermal synthesis of 11 Aring tobermorite ndash Effect of adding metakaolin tothe basic compound
J Schreiner F Goetz-Neunhoeffer J Neubauer D JansenUniversity of Erlangen-Nuremberg GeoZentrum Nordbayern Mineralogy Schlossgarten 5a 91054 Erlangen Germany
A R T I C L E I N F O
KeywordsHydrothermal synthesis11 Aring tobermoriteMetakaolinPowder diffractionKatoite
A B S T R A C T
Different amounts and types of metakaolin were analyzed and applied for the hydrothermal synthesis of 11 Aringtobermorite All synthesized samples were investigated by means of powder XRD combined with Rietveld re-finement Al-substituted 11 Aring tobermorite was successfully synthesized on the basis of a broad range of com-pounds characterized by a varying content of metakaolin Katoite was present depending on the amount ofsupplied Al3+ which was determined by the dosage of metakaolin Minor crystalline components included in thetwo types of metakaolin sources varied greatly in their reactivity under hydrothermal conditions Despite adifferent degree of purity the two types of metakaolin showed corresponding effects at moderate dosages butcontrary effects at higher dosages as for the synthesis of 11 Aring tobermorite The domain morphology of to-bermorite could be associated with Al3+ incorporation for low dosages of metakaolin represented by up to 2 wt- Al2O3 in the dry mix By contrast Al3+ affected tobermorite lattice parameters at equivalent and even athigher dosages with c reaching 2295 Aring at 12 wt- Al2O3 in the dry mix
1 Introduction
11 Application of metakaolin as a reactive material in constructionindustry
The application of supplementary cementitious materials (SCMs) inthe field of construction technology has received a lot of attention inrecent years Due to limited resources and an urgent need for alter-native and more eco-friendly construction materials SCMs such asmetakaolin offer a great potential The usage of SCMs has not onlyspread to the cement and mortar industry but also to advanced appli-cations such as autoclaved aerated concrete (AAC) (Demir et al 2014Koutnyacute et al 2014 Walczak et al 2015 Roacuteżycka and Pichoacuter 2016Chucholowski et al 2018) Unlike ordinary cementitious constructionmaterials AAC is produced from hydrothermal curing Due to the dif-ferent thermodynamic environment the hydration process and the re-activity of raw materials have to be investigated properly in order tounderstand the effects on the AAC product The leading mineral phasein AAC is 11 Aring tobermorite (Ca5Si6O16(OH)2middot4H2O) As a consequencethe thermal and mechanical properties of AAC depend on micro-structure and crystallinity of tobermorite to some extent In addition tothe curing time and the fineness of raw materials the supply of ionsthat can substitute in the tobermorite structure is a crucial factor in thiscontext Especially substitutions by aluminum sodium and potassium
ions have been investigated thoroughly (Sauman 1974 Klimesch andRay 1998 Mostafa et al 2009 Matekonis et al 2010 Skawinskaet al 2017) Calcined clays usually contain a considerable amount ofthe mentioned ions
There is a vast amount of literature on the reactivity of SCMs atambient temperature and standard pressure but there is little when itcomes to hydrothermal conditions In previous publications the beha-vior of metakaolin under hydrothermal conditions was mainly in-vestigated for the synthesis of zeolites (Zhang et al 2007 Aguilar-Mamani et al 2014 Setthaya et al 2016 Luo et al 2018) In thesestudies the reactivity of metakaolin was observed at a wide range oftemperature and pH values During the transformation of kaolin intometakaolin a loss of framework alumina was observed (Ayodele et al2019) In recent decades metakaolin has been the subject of studies inthe field of geopolymer research (Rashad 2013 Chen et al 2016) Forthe synthesis of 11 Aring tobermorite a more distinct setting of temperaturesetting (180ndash200 degC) and steam pressure (1ndash12 MPa) are required
This publication is intended to make a new contribution to thechallenging field of hydrothermal synthesis in the system CaO-Al2O3-SiO2-H2O based on XRD analysis combined with Rietveld refinementVarious dosages of two types of metakaolin with different chemical andmineralogical purities are compared for the effects on the hydrothermalsynthesis of Al-substituted 11 Aring tobermorite Especially changes of thebulk chemistry in the raw mixes the reactivity of minor crystalline
httpsdoiorg101016jclay2019105432Received 20 August 2019 Received in revised form 13 November 2019 Accepted 30 December 2019
Corresponding authorE-mail address juergenjsschreinerfaude (J Schreiner)
Applied Clay Science 185 (2020) 105432
0169-1317 copy 2020 Elsevier BV All rights reserved
T
6 Publications
31
phases of the two types of metakaolin and the effect of different curingtimes are the focus of interest On the one hand metakaolin offers agreat potential in the AAC industry On the other hand of all SCMsmetakaolin is a good source material for investigating the influence ofAl3+ on the synthesis of Al-substituted 11 Aring tobermorite
12 Synthesis of Al-substituted 11 Aring tobermorite
In addition to being present in AAC tobermorite has found appli-cation in wastewater treatment and nuclear waste management due toits ion exchange capacity (Maeda et al 2012 Monasterio et al 2015)The substitution of silicon by aluminum results in a different to-bermorite structure due to general and local charge balance affectingthe lattice parameters Especially c is impacted by this substitutionbecause it occurs in the bridging tetrahedron and additional OHndash sub-stitutes O2ndash (Komarneni et al 1985 Merlino et al 2000) As suggestedin some additional studies the substitution of Si4+ by Al3+ and Na+ orK+ leads to a lath-like morphology of tobermorite crystals (Mostafa2005 Mostafa et al 2009 Venhodovaacute et al 2015 Qu et al 2018)However because of the heterogeneous appearance of tobermorite inAAC it is hardly possible to conduct a proper characterization based onSEM analysis In our recent work the anisotropic peak broadening oftobermorite in XRD diffractograms was successfully linked with theincorporation of foreign ions supplied in a common AAC production(Schreiner et al 2019) This finding allowed a more statistical struc-tural characterization of tobermorite in bulk compositions compared toSEM analysis Moreover it was reported in other studies that differenthydrate phases occur depending on the amount of supplied ions and onthe experimental settings In compounds with a high content of Al3+formation of katoite could be observed (Klimesch and Ray 1998 Riacuteoset al 2009 Matsui et al 2011) In the case of a longer curing durationinstead of 11 Aring tobermorite the formation of xonotlite (Siauciunas andBaltakys 2004 Galvaacutenkovaacute et al 2018) or - depending on the finenessof used silica source (Siauciunas and Baltakys 2004) - gyrolite is fa-voured
Kalousek (1956) suggested that tobermorite can contain up to 5Al2O3 More Al2O3 in the system resulted in the formation of hydro-garnet Klimesch and Ray (1998) additionally investigated the stabilityof hydrogarnet depending on the Al(Si + Al) ratio and its role in re-lation to the formation of 11 Aring tobermorite in an equivalent systemThey suggest that hydrogarnet always appears before tobermorite butthe former can only be detected for higher Al(Si + Al) ratios in theevent of longer curing times Riacuteos et al (2009) and Qu et al (2018)confirmed these findings in extensive investigations In the latter pub-lication it is additionally suggested that samples prepared at lowertemperatures (160 degC) are less impacted by the supply of Al3+ Theyalso consider the peak broadening of tobermorite in their XRD plotsbased on the amount of incorporated Al3+ In two recent publicationswe suggested that the peak broadening of tobermorite enables a mi-crostructural analysis by calculating the orientation dependent domainsizes (Schreiner et al 2018 2019) However these studies are based onsamples of industrially produced AAC so that the curing time was fixedThe studied AAC was produced from raw materials with a broad che-mical spectrum such as ordinary Portland cement (OPC) whichsomehow complicates the interpretation of results
In this work the influence of aluminum ions - provided by meta-kaolin - on dominant crystallographic direction-dependent domaingrowth of tobermorite is investigated by analysis of anisotropic peakbroadening (Ectors et al 2015 2017) In Fig 1 of the supplementarymaterial the method of fitting the anisotropic peak broadening of to-bermorite using a triaxial cylinder model is visualized (Schreiner et al2018) Fitting of the anisotropic peak broadening of tobermorite Thismethod is used to calculate the average and reliable values for to-bermorite domain sizes in the powder sample and associate them withaverage Al3+ incorporation Microstrain should be considered becauseit is an additional source of peak broadening However this usually
accounts for materials that have been exposed to different kinds ofstress such as metals and alloys (Badawi et al 2019) In addition theinstrumental contribution to peak broadening should be consideredHydration products such as tobermorite are characterized by crystallitesizes in the range of nanometers so that anisotropic size broadeningclearly outweighs the effect of instrumental broadening (Jenkins andSnyder 1996) Moreover the impact of Al3+ on the lattice parametersof tobermorite is considered It should additionally be clarified whe-ther the results from our previous publication (Schreiner et al 2019)based on industrially produced AAC can be confirmed by investigationwith less complex raw mixes and purely based on laboratory experi-ments
2 Material and methods
21 Starting materials
The starting materials for hydrothermal synthesis included deio-nized water quartz flour portlandite (999 pure) and two types ofmetakaolin One type was ordinary commercially available metakaolin(MK) with nearly a stoichiometric composition For comparison thesecond type of commercially available metakaolin was a by-productfrom expanded glass production (MKg) and consequently highly im-pure The chemical composition of MK and MKg determined by XRF isgiven in Table 1 With MKg containing less Al2O3 but considerably moreNa2O than MK the effects on hydrothermal synthesis were of interestBoth types of metakaolin have been characterized in previous pub-lications (Schmidt et al 2012 Naber et al 2019) In addition weverified the mineral phase content by XRD analysis Besides amorphousmetakaolin MK contained minor amounts of anatase quartz and mica
Fig 1 Weight fractions of tobermorite quartz and katoite determined byquantitative XRD analysis ndash samples including MKg crosshatched
Table 1Chemical composition of MK and MKg determined by XRF analysis ndash majorcontrasts in bold letters
Oxides [wt-] MK MKg
SiO2 536 604Al2O3 392 206CaO 01 40MgO 01 12Na2O 0 96K2O 10 18Fe2O3 18 05TiO2 21 03P2O5 01 02Loss on ignition 15 1
J Schreiner et al Applied Clay Science 185 (2020) 105432
2
6 Publications
32
MKg contained additional kaolinite feldspar and quartz
22 Investigated mix composites
For the preparation of raw mixtures the powders were weighed andhomogenized using a lab-scale mixing mill Table 2 lists the composi-tion and nomenclature of all samples including Al2O3 content andcuring time in the autoclave
bull Besides one blank mixture (MK0) that did not contain any type ofmetakaolin eleven more compounds were prepared of which threeincluded different dosages of MKg (MKg16 MKg23 and MKg60)Three more mixes contained equivalent amounts of MK instead ofMKg (MK16 MK23 and MK60) These mixes were investigated inorder to have a direct comparison concerning the effects of differentraw material on the synthesis of tobermorite
bull Additionally the mixes MK9 MK5 and MK25 with lower dosages ofmetakaolin were analyzed In the referenced literature (Schreineret al 2019) the effect of Al3+ on the anisotropic peak broadeningof tobermorite could only be observed in the case of Al2O3 contentslower than 4 in the drymix In the latter three mixes Al2O3 con-tents range from 1 to 35 Al2O3 (calculated from XRF data) whichmeets the region of interest for the analysis of tobermorite domainmorphology
bull The curing time for nearly all of the investigated samples was 12 hbut compound MK9 was prepared two more times for curing timesof 2 h and 6 h The different curing times were chosen in this par-ticular sample so that the reactivity of metakaolin and the phasetransitions could be observed more precisely
23 Hydrothermal treatment
Due to the different fineness of raw materials there was a differentwater demand from one mixture to another In order to obtain slurriesof comparable rheology the amount of water was adapted respectivelyresulting in water-to-solid ratios of 25 to 3 which matches the sug-gested water-to-solid ratio for this purpose (Roacutezycka et al 2014Galvaacutenkovaacute et al 2018) The weighed water was added to the dry mixand after stirring for 1 min at 23 degC the slurry was poured into thereactor Minor changes in the quantity of added water did not have aninfluence on the measured steam pressure All experiments were con-ducted using a PTFE-lined stainless steel autoclave with a reactor vo-lume of 300 ml The oven temperature was fixed at 180 degC and auto-genous steam pressure of 11ndash12 MPa was measured during eachexperiment with an external manometer After cooling to room tem-perature the sample was removed from the reactor coarsely ground
using an agate mortar and dried at 60 degC for 12 h After drying thesample was ground with an agate mortar again in order to deagglo-merate the particles As no coarse raw materials were used there wasno need for wet McCrone milling (Schreiner et al 2018)
24 XRD analysis
After preparation into front-loading sample holders the powdersamples were measured with a D8 diffractometer (Bruker) equippedwith a LynxEye detection system and Bragg-Brentano geometry Thesettings for XRD analysis included a tube voltage of 40 kV a current of40 mA an angular range from 6 to 80deg 2θ (Cu Kα radiation) a time perstep of 054 s a step width of 00236deg 2θ and a PSD opening of 33deg Thebackground was fitted with Chebyshev polynomial of the fifth orderThe major contribution of amorphous phase was fitted with a singlepeak with a fixed position at 308deg 2θ so that tobermorite reflectionswere not affected An external quartzite standard was measured withthe same parameters in order to determine phase quantities (Jansenet al 2011) Bruker AXS software TOPAS 50 was used for Rietveldrefinement (Rietveld 1969) and the used structures are shown inTable 3
3 Results and discussion
31 Different dosages of MK and MKg
In Fig 1 the quantities of tobermorite quartz and katoite present inmost of the samples determined by XRD analysis are illustratedWhenever tobermorite was the leading mineral hydrate phase a basalspacing of 113 Aring could be verified in each of the diffractograms Thequantities of minor crystalline phases and amorphous content are notshown For low dosages of MK it can be seen that the weight fraction oftobermorite decreased At moderate dosage of both types of metakaolin(MK16 MK23 MKg16 MKg23) tobermorite was present in comparablequantities It can be seen that the amount of katoite in the mixes de-pended on the dosage of metakaolin and it appeared only at dosages ofMK5 or more Due to the higher content of aluminum in MK comparedto MKg more katoite could always be observed in the MK mixes atequivalent dosages Despite equal amounts of quartz as starting mate-rial in mixes for both types of metakaolin the resulting weight fractionsin the cured samples were not alike Considerably more quartz waspresent in the MK samples Even though less quartz was used for mixescontaining higher amounts of MK even more quartz was present afterhydrothermal curing (Table 2 Fig 1) Consequently some of the SiO2
provided by MK did not transform into an amorphous phase or to-bermorite but into quartz This finding is verified by the presence ofquartz in MK60 because no quartz was included in the raw mixture Thefeldspar present in MKg did not react so Na2O and an unknown amountof Al2O3 may not have been supplied for hydrothermal reaction Besidestobermorite and quartz additional calcite scawtite (Ca7Si6(CO3)
Table 2Basic powder compounds prepared for the hydrothermal synthesis of to-bermorite with the respectively calculated Al2O3 content and curing time in thereactor
Sample Portlandite[wt-]
Quartz[wt-]
MK[wt-]
MKg
[wt-]
Al2O3
[wt-]Curingtime [h]
MK0 49 51 ndash ndash 0 12MK25 495 48 25 ndash 1 12MK5 49 46 5 ndash 2 12MK9_2h 48 43 9 ndash 35 2MK9_6h 48 43 9 ndash 35 6MK9_12h 48 43 9 ndash 35 12MK16 47 37 16 ndash 63 12MK23 46 31 23 ndash 9 12MK60 40 ndash 60 ndash 235 12MKg16 47 37 ndash 16 33 12MKg23 46 31 ndash 23 47 12MKg60 40 ndash ndash 60 124 12
Table 3Structural data used for the investigation with powder XRD analysis
Phase Author
Anatase (Horn et al 1972)Biotite (Brigatti et al 2000)Calcite (Maslen et al 1995)Kaolinite (Zvyagin 1960)Katoite (Bartl 1969)Microcline (Bailey 1969)Plazolite (Basso et al 1983)Portlandite (Busing and Levy 1957)Quartz (Le Page and Donnay 1976)Scawtite (Grice 2005)Tobermorite (Hamid 1981)Xonotlite (Hejny and Armbruster 2001)
J Schreiner et al Applied Clay Science 185 (2020) 105432
3
6 Publications
33
O18bull2(H2O)) and xonotlite (Ca6Si6O17(OH)2) could be identified insample MK0 (XRD plots of samples MK0 MKg16 MKg23 MK16 andMK23) Comparing MK0 and MK25 scawtite and xonotlite could stillbe identified in a very low amount in MK25 but no longer in samplesthat contained even more MK (XRD plots of samples MK0 MK25 MK5and MK9_12h)
Two additional experiments were done without quartz in the rawmixes (MK60 and MKg60) The according diffractograms after hydro-thermal curing are shown in Fig 2 In sample MKg60 tobermorite (gt 50wt-) was successfully synthesized without any other silica sourcethan MKg whereas no crystalline quartz occurred By contrast no to-bermorite but quartz could be identified in equivalent mixture MK60containing MK It can be seen that crystalline components such as micaand anatase in the raw MK did not react at the selected conditions andremained present in the autoclaved samples Except for feldspar in MKgall of the crystalline components appeared to be reactive at the chosenhydrothermal conditions A minor unidentified phase occurred at328deg2θ and additional xonotlite was identified in sample MKg60 Insample MK60 more calcium was needed for the formation of morehydrogarnet (Fig 1) resulting in a lower CaSi ratio for the remainingsystem Sample MKg60 contained only half of the amount of Al3+ and itwas not completely supplied for reaction due to its partial presence infeldspar Consequently essentially less hydrogarnet (Fig 1) was presentin MKg60 after hydrothermal treatment and the CaSi ratio in the re-maining system was affected to a lesser extent
32 Application of MK for different curing times
The development of hydrate phases in the autoclave for compoundMK9 is displayed in Fig 3 After only 2 h of hydrothermal curing all ofthe available portlandite had reacted and katoite (95 wt-) was pre-sent The applied type of metakaolin appeared to react quickly as itsupplied aluminum for formation of katoite No formation of to-bermorite could be observed at this stage yet An assumably amorphousprecursor can be seen at 28 to 30deg2θ Calcium was provided by thedissolution of portlandite After 6 h of hydrothermal reaction amountsof katoite (85 wt-) and quartz (from 31 wt- at 2 h to 165 wt- at6 h) had decreased and a major amount of tobermorite (35 wt-) waspresent Apparently between 2 and 6 h under hydrothermal conditionsthe amorphous precursor and quartz reacted resulting in the formationof tobermorite An additional 6 h of reaction time (MK9_12h) did notchange the phase composition significantly Slightly more tobermorite
(365 wt-) less quartz (16 wt-) and katoite (65 wt-) weremeasured
33 Tobermorite domain morphology and lattice parameters
In the referenced literature an analysis of tobermorite domainmorphology based on anisotropic peak broadening was possible forsamples that contained notgt 4 wt- Al2O3 in the drymix (Schreineret al 2019) Accordingly in this study samples MK0 MK25 MK5MK9_6h and MK9_12h were suitable (Table 2) with MK9_2h not con-taining any tobermorite In Fig 4 the respective growth in a and b di-rection is visualized with x indicating the domain size in a direction andy indicating domain size in b direction using a macro for TOPAS 50(Ectors et al 2015 2017) The calculated cylinder models in Fig 4represent the relation of yx and not absolute sizes With no supply ofaluminum ions (MK0) the relative domain growth in b direction islower compared to samples containing metakaolin This finding agreeswith the results from a similar investigation of tobermorite in AAC(Schreiner et al 2019) However within the samples MK5 andMK9_12h the different amounts of supplied aluminum ions did notshow a clear effect It appeared that low dosages of Al3+ (1 wt- Al2O3
in MK25 and 2 wt- Al2O3 in MK5) were enough to determine thedomain growth of tobermorite Additional results from the samplesMK9_6h and MK9_12h indicated that growth in b direction increasedwith reaction time
In Fig 5 lattice parameters of tobermorite depending on metakaolindosages are plotted B clearly remained unaffected throughout therange of samples Increasing amounts of metakaolin led to a slightlysmaller parameter a However both types of metakaolin showed acorresponding impact on parameter a By contrast parameter c in-creased strongly with increasing amounts of MK and MKg but the typeof metakaolin was significant At an equivalent dosage MK affected thecell dimension in c direction considerably more than MKg so that thefraction of Al3+ appeared to be the decisive parameter Different metaloxides in MKg did not show a notable effect certainly as they werepartially not provided for reaction Unlike for the domain morphologyof tobermorite the impact on lattice parameters could be observedwithin the complete range of examined dosages
4 Conclusions
The results obtained from the introduced investigations allow con-cluding remarks on the effects of the applied types of metakaolin on thesynthesis of 11 Aring tobermorite the phase transitions and the in-corporation of Al3+ into the lattice of tobermorite
With a critical dosage the use of any type of metakaolin led to theformation of katoite in an according amount At moderate dosages(MKg16 MKg23 MK16 and MK23) the two types of metakaolin showeda good correspondence in consideration of the quantities of to-bermorite For higher dosages there were contrary effects Lower do-sages of MK led to considerable quantities of Al-substituted to-bermorite Samples containing low dosages of MK revealed that katoiteappeared in the case ofgt 5 wt- of MK - corresponding to 2 wt-Al2O3 - in the basic compound Minor crystalline phases in MKg showedbetter reactivity than those in MK The observation that no tobermoritewas present in sample MK60 indicated that high dosages of Al3+ hin-dered the formation of tobermorite
Investigations of MK9 at 2 6 and 12 h displayed the evolution ofhydrate phases At first katoite was the only crystalline hydrate phasepresent after 2 h which corresponded to observations in a differentpublication (Klimesch and Ray 1999) The amount of katoite andquartz then decreased and a major amount of tobermorite formed from2 to 6 h curing time In order to gain more information on the trans-formation of amorphous C-(A)-S-H into tobermorite additional ex-periments in the range of 2 to 6 h curing time will be needed
Domain morphology analysis of tobermorite revealed that low
Fig 2 Diffractograms of MKg MKg60 MK and MK60 from 7 to 34deg2θ CuKα Aanatase C calcite F feldspar k kaolinite K katoite M mica Q quartz Ttobermorite U unidentified phase X xonotlite
J Schreiner et al Applied Clay Science 185 (2020) 105432
4
6 Publications
34
dosages of Al3+ determined the domain growth which agreed with theresults published on tobermorite in AAC samples (Schreiner et al2019) Different curing times unveiled that growth in b direction in-creased with the reaction time Al3+ incorporation into the lattice oftobermorite only reflected to a limited extent in the domain mor-phology By contrast an increase of lattice parameter c was triggered byAl3+ even at the highest dosage in this study Ultimately there is no
evidence for a limit of incorporation of Al3+ but there is a limit ofinfluence on the domain morphology These results additionally re-confirm this assumption similarly made in the previous work (Schreineret al 2019) and suggest a new mechanism of tobermorite crystal-lization depending on the presence of Al3+
Supplementary data to this article can be found online at httpsdoiorg101016jclay2019105432
Declaration of Competing Interest
The authors declare that they have no known competing financialinterests or personal relationships that could have appeared to influ-ence the work reported in this paper
Acknowledgement
The authors thank Rodgauer Baustoffwerke GmbH amp Co KG forsupplying raw materials for laboratory experiments
References
Aguilar-Mamani W Garciacutea G Hedlund J Mouzon J 2014 Comparison betweenleached metakaolin and leached diatomaceous earth as raw materials for the synth-esis of ZSM-5 Springerplus 3 1ndash10 httpsdoiorg1011862193-1801-3-292
Ayodele OB Sulaimon AA Alaba PA Tian Z-Y 2019 Influence of metakaolini-zation temperature on the structure and activity of metakaolin supported Ni catalystin dry methane reforming J Environ Chem Eng httpsdoiorg101016jjece2019103239 (in press)
Badawi EA Abdel-Rahman MA Mostafa A Abdel-Rahman M 2019 Determinationof the crystallite size amp micro- strain by novel method from XRD profile Appl Phys2 1ndash15 httpsdoiorg1031058jap201921001
Bailey SW 1969 Refinement of an intermediate microcline structure Am Miner 541540ndash1545
Bartl H 1969 Roentgen-Einkristalluntersuchungen an (CaO)3 (Al2O3) (H2O)6 und an(CaO)12 (Al2O3)7 (H2O) neuer Vorschlag zur (CaO)12 (Al2O3)7-Struktur NeuesJahrb fuer Mineral Monatshefte 1969 404ndash413
Basso R Giusta AD Zefiro L 1983 Crystal structure refinement of plazolite A highlyhydrated natural hydrogrossular Neues Jahrb Miner Monatsh (Neues Jahrb fuerMineral Monatshefte) 1983 251ndash258
Brigatti MF Lugli C Poppi L Foord EE Kile DE 2000 Crystal chemical varia-tions in Li- and Fe-rich micas from Pikes Peak batholith (Central Colorado) AmMineral 85 1275ndash1286 httpsdoiorg102138am-2000-8-920
Busing WR Levy HA 1957 Neutron diffraction study of calcium hydroxide J ChemPhys 26 563 httpsdoiorg10106311743345
Chen L Wang Z Wang Y Feng J 2016 Preparation and properties of alkali acti-vated metakaolin-based geopolymer Materials (Basel) 9 1ndash12 httpsdoiorg103390ma9090767
Chucholowski C Holger M Thienel K-C 2018 Improving the recyclability en-vironmental compatibility and CO2 balance of autoclaved aerated concrete by re-placing sulfate carrier and cement with calcined clays CePapers 2 503ndash512httpsdoiorg101002cepa846
Fig 3 Diffractograms of MK9_2h MK9_6h and MK9_12h from 7 to 38deg2θ CuKα C calcite K katoite Q quartz T tobermorite
Fig 4 Relation of calculated domain sizes of 11 Aring tobermorite in selectedsamples (MK0 MK25 MK5 MK9_6h and MK9_12h) in a (x) and b (y) direction
Fig 5 Lattice parameters of tobermorite depending on MK or MKg dosageincluding blank mix MK0
J Schreiner et al Applied Clay Science 185 (2020) 105432
5
6 Publications
35
Demir İ Başpınar MS Kahraman E Ccedilalışkan E Goumlrhan G 2014 An investigationon the usability of diatomite in aerated concrete production In Proc of the IntlConf on Advances in Civil Structural and Construction Engineering ndash CSCE 2014 pp97ndash100
Ectors D Goetz-Neunhoeffer F Neubauer J 2015 A generalized geometric approachto anisotropic peak broadening due to domain morphology J Appl Crystallogr 48189ndash194 httpsdoiorg101107S1600576714026557
Ectors D Goetz-Neunhoeffer F Neubauer J 2017 Routine (an)isotropic crystallitesize analysis in the double-Voigt approximation done right Powder Diffract 3227ndash34 httpsdoiorg101017S0885715617000070
Galvaacutenkovaacute L Bartoniacutečkovaacute E Opravil T Tkacz J Ptaacuteček P 2018 The influence ofstarting materials solubility on tobermorite structure formation under the hydro-thermal conditions IOP Conf Ser Mater Sci Eng 379 1ndash8 httpsdoiorg1010881757-899X3791012001
Grice JD 2005 The structure of spurrite tilleyite and scawtite and relationships toother silicate-carbonate minerals Can Mineral 43 1489ndash1500 httpsdoiorg102113gscanmin4351489
Hamid SA 1981 The crystal structure of the 11 Aring natural tobermoriteCa225[Si3O75(OH)15]1H2O Zeitschrift fuer Krist 154 189ndash198 httpsdoiorg101524zkri19811543-4189
Hejny C Armbruster T 2001 Polytypism in xonotlite Ca6Si6O17(OH)2 Zeitschrift furKrist 216 396ndash408
Horn M Schwerdtfeger CF Meagher EP 1972 Refinement of the structure of ana-tase at several temperatures Zeitschrift fur Krist 136 273ndash281 httpsdoiorg101524zkri19721363-4273
Jansen D Goetz-Neunhoeffer F Stabler C Neubauer J 2011 A remastered externalstandard method applied to the quantification of early OPC hydration Cem ConcrRes 41 602ndash608 httpsdoiorg101016jcemconres201103004
Jenkins R Snyder R 1996 Introduction to X-ray Powder Diffractometry ChemicalAnalysis Wiley pp 90
Kalousek GL 1956 Crystal Chemistry of Hydrous Calcium Silicates J Am Ceram Soc40 74ndash80
Klimesch D Ray A 1998 Autoclaved cement-quartz pastes with metakaolin additionsAdv Cem Based Mater 7 109ndash118 httpsdoiorg101016S1065-7355(97)00073-4
Klimesch D Ray A 1999 DTA-TGA evaluations of the CaOndashAl2O3ndashSiO2ndashH2O systemtreated hydrothermally Thermochim Acta 334 115ndash122 httpsdoiorg101016s0040-6031(99)00140-9
Komarneni S Roy R Roy DM Fyfe CA Kennedy GJ Bothner-By AA Dadok JChesnick AS 1985 27Al and29Si magic angle spinning nuclear magnetic resonancespectroscopy of Al-substituted tobermorites J Mater Sci 20 4209ndash4214 httpsdoiorg101007BF00552416
Koutnyacute O Opravil T Pořiacutezka J 2014 Application of metakaoline in autoclavedaerated concrete technology Adv Mater Res 1000 174ndash177 httpsdoiorg104028wwwscientificnetAMR1000174
Le Page Y Donnay G 1976 Refinement of the crystal structure of low-quartz ActaCrystallogr Sect B 32 2456ndash2459 httpsdoiorg101107S0567740876007966
Luo H Law WW Wu Y Zhu W Yang EH 2018 Hydrothermal synthesis of needle-like nanocrystalline zeolites from metakaolin and their applications for efficient re-moval of organic pollutants and heavy metals Microporous Mesoporous Mater 2728ndash15 httpsdoiorg101016jmicromeso201806015
Maeda H Ogawa Y Ishida EH Kasuga T 2012 Hydrothermal synthesis of to-bermorite doped with phosphorus species for removing heavy metal ions J AustCeram Soc 48 8ndash11
Maslen EN Streltsov VA Streltsova NR Ishizawa N 1995 Electron density andoptical anisotropy in rhombohedral carbonates III Synchrotron Xray studies ofCaCO3 MgCO3 and MnCO3 Acta Crystallogr Sect B 51 929ndash939 httpsdoiorg101107S0108768195006434
Matekonis G Šiaučiūnas R Vaičiukynienė D 2010 Hydrothermal Synthesis andCharacterization of Na + and [ Al 3 + + Na + ] -substituted Tobermorite in CaO-SiO2middotnH2O-H2O System Mater Sci 16 242ndash248
Matsui K Kikuma J Tsunashima M Ishikawa T Matsuno S Ogawa A Sato M2011 In situ time-resolved X-ray diffraction of tobermorite synthesis process underhydrothermal condition IOP Conf Ser Mater Sci Eng 18 60ndash66 httpsdoiorg1010881757-899X182022017
Merlino S Bonaccorsi E Armbruster T 2000 The real structures of clinotobermoriteand tobermorite 9 Aring OD character polytypes and structural relationships Eur JMineral 12 411ndash429 httpsdoiorg1011270935-122120000012-0411
Monasterio M Gaitero JJ Manzano H Dolado JS Cerveny S 2015 Effect ofchemical environment on the dynamics of water confined in calcium silicate mi-nerals Natural and synthetic tobermorite Langmuir 31 4964ndash4972 httpsdoiorg101021acslangmuir5b00614
Mostafa NY 2005 Influence of air-cooled slag on physicochemical properties of auto-claved aerated concrete Cem Concr Res 35 1349ndash1357 httpsdoiorg101016jcemconres200410011
Mostafa NY Shaltout AA Omar H Abo-El-Enein SA 2009 Hydrothermal synth-esis and characterization of aluminium and sulfate substituted 11 nm tobermoritesJ Alloys Compd 467 332ndash337 httpsdoiorg101016jjallcom200711130
Naber C Stegmeyer S Jansen D Goetz-Neunhoeffer F Neubauer J 2019 ThePONKCS method applied for time resolved XRD quantification of supplementarycementitious material reactivity in hydrating mixtures with ordinary Portland ce-ment Constr Build Mater 214 449ndash457 httpsdoiorg101016jconbuildmat201904157
Qu X Zhao Z Zhao X 2018 Microstructure and characterization of aluminum-in-corporated calcium silicate hydrates (C-S-H) under hydrothermal conditions RSCAdv 8 28198ndash28208 httpsdoiorg101039c8ra04423f
Rashad AM 2013 Metakaolin as cementitious material history scours production andcomposition - a comprehensive overview Constr Build Mater 41 303ndash318 httpsdoiorg101016jconbuildmat201212001
Rietveld HM 1969 A profile refinement method for nuclear and magnetic structures JAppl Crystallogr 2 65ndash71 httpsdoiorg101107S0021889869006558
Riacuteos CA Williams CD Fullen MA 2009 Hydrothermal synthesis of hydrogarnet andtobermorite at 175 degC from kaolinite and metakaolinite in the CaO-Al2O3-SiO2-H2Osystem a comparative study Appl Clay Sci 43 228ndash237 httpsdoiorg101016jclay200809014
Roacuteżycka A Pichoacuter W 2016 Effect of perlite waste addition on the properties of au-toclaved aerated concrete Constr Build Mater 120 65ndash71 httpsdoiorg101016jconbuildmat201605019
Roacutezycka A Kotwica Ł Małolepszy J 2014 Synthesis of single phase gyrolite in theCaO-quartz-Na2O-H2O system Mater Lett 120 166ndash169 httpsdoiorg101016jmatlet201401003
Sauman Z 1974 Influence of SO4 2ndash ions on the formation of 11 Aring tobermorite InProceedings of the 2nd International Symposium on Science and Research in SilicateChemistry Moscow pp 25ndash39
Schmidt M Egersdoumlrfer A Poumlllmann H 2012 Increased reactivity using a glass-containing metakaolin as an active filler in lime-based binder systems ZKG Int 6554ndash62
Schreiner J Jansen D Ectors D Goetz-Neunhoeffer F Neubauer J Volkmann S2018 New analytical possibilities for monitoring the phase development during theproduction of autoclaved aerated concrete Cem Concr Res 107 247ndash252 httpsdoiorg101016jcemconres201802028
Schreiner J Goetz-Neunhoeffer F Neubauer J Volkmann S Bergold S Webler RJansen D 2019 Advanced Rietveld refinement and SEM analysis of tobermorite inchemically diverse autoclaved aerated concrete Powder Diffract 34 143ndash150httpsdoiorg101017s0885715619000149
Setthaya N Chindaprasirt P Pimraksa K 2016 Preparation of zeolite nanocrystals viahydrothermal and solvothermal synthesis using of rice husk ash and metakaolinMater Sci Forum 872 242ndash247 httpsdoiorg104028wwwscientificnetmsf872242
Siauciunas R Baltakys K 2004 Formation of gyrolite during hydrothermal synthesis inthe mixtures of CaO and amorphous SiO2 or quartz Cem Concr Res 34 2029ndash2036httpsdoiorg101016jcemconres200403009
Skawinska A Owsiak Z Baran T Hernik K 2017 The influence of halloysite ad-dition on tobermorite formation in CaO and quartz mix under hydrothermal condi-tions Cem Wapno Bet 17 426ndash434
Venhodovaacute E Janovskyacute R Drochytka R 2015 Formation of tobermorite at differentmaterials composition of aerated concrete Appl Mech Mater 752ndash753 247ndash250httpsdoiorg104028wwwscientificnetamm752-753247
Walczak P Małolepszy J Reben M Szymański P Rzepa K 2015 Utilization ofwaste glass in autoclaved aerated concrete Proc Eng 122 302ndash309 httpsdoiorg101016jproeng201510040
Zhang Y Gao W Cui L 2007 The transformation of acid leached metakaolin tozeolite beta Stud Surf Sci Catal 170 420ndash425 httpsdoiorg101016S0167-2991(07)80870-6
Zvyagin BB 1960 An attempt to electronographic determination of kaolinite structureJ Dokl Akad Nauk SSSR 130 1023ndash1026
J Schreiner et al Applied Clay Science 185 (2020) 105432
6
6 Publications
36
6 Publications
62 Advanced Rietveld refinement and SEM analysis oftobermorite in chemically diverse autoclaved aeratedconcrete
Following the copyright guidelines by Cambridge University Press the publication
Schreiner J Goetz-Neunhoeffer F Neubauer J Volkmann S Bergold S WeblerR Jansen D 2019 Advanced Rietveld refinement and SEM analysis of tobermorite inchemically diverse autoclaved aerated concrete Powder Diffraction 34 143ndash150 httpsdoiorg101017s0885715619000149
may not be reprinted It can be accessed at
httpswwwcambridgeorgcorejournalspowder-diffractionarticleadvanced-rietveld-refinement-and-sem-analysis-of-tobermorite-in-chemically-diverse-autoclaved-aerated-concrete51597C2A66F6F225D29DEB2675E74249
37
6 Publications
63 New analytical possibilities for monitoring the phasedevelopment during the production of autoclavedaerated concrete
Reprint of the peer reviewed publication
Schreiner J Jansen D Ectors D Goetz-Neunhoeffer F Neubauer J VolkmannS 2018 New analytical possibilities for monitoring the phase development during theproduction of autoclaved aerated concrete Cement and Concrete Research 107 247ndash252httpsdoiorg101016jcemconres201802028
with permission from Elsevier
38
Contents lists available at ScienceDirect
Cement and Concrete Research
journal homepage wwwelseviercomlocatecemconres
Short communication
New analytical possibilities for monitoring the phase development duringthe production of autoclaved aerated concrete
J Schreinera D Jansena D Ectorsa F Goetz-Neunhoeffera J Neubauera S Volkmannb
aUniversity of Erlangen-Nuremberg GeoZentrum Nordbayern Mineralogy Schlossgarten 5a 91054 Erlangen Germanyb Rodgauer Baustoffwerke GmbH amp Co KG Am Opel-Pruumlffeld 3 63110 Rodgau-Dudenhofen Germany
A B S T R A C T
This work presents improved analytical methods for both steps of the production process of autoclaved aeratedconcrete (AAC) the phase development during the hydration before autoclaving and during the autoclavingprocess itself The improvement includes new insights into preparation methods of AAC samples for powderdiffraction as well as Rietveld refinement strategies For the first time a new implementation for calculatinganisotropic crystal domain sizes is applied to major hydrate phases occurring during AAC production namelyportlandite during the hydration before autoclaving and tobermorite during the autoclaving process The cal-culation of anisotropic domain size growth which can be implemented in the Rietveld environment is based oncrystallographically and geometrically appropriate models The implementation of calculating anisotropic do-main sizes for the Rietveld software TOPAS 50 allows a superior Rietveld fit and a more accurate quantificationof the phase development Additionally it enables the tracking of growth mechanism of portlandite duringhydration
1 Introduction
Autoclaved aerated concrete (AAC) is known as a lightweight con-struction material which offers outstanding properties such as suffi-cient strength for construction in addition with excellent thermal in-sulation [12] AAC is produced by autoclaving from calcareous rawmaterials such as lime (CaO) and cement quartz sulfate carrier andother additives such as foaming agents and water
The production process (Fig 1) can be separated into the hydrationof the mixed slurry before the procedure of autoclaving and the auto-claving at elevated temperature (180 degC to 200 degC) under saturatedsteam pressure (12MPa) for several hours
The hydration process before autoclaving is necessary to achievesufficient strength in order to cut the green cake blocks as they shouldhave a specific shape and dimension after autoclaving Furthermorethe porous structure is generated by the foaming agent during hydra-tion in the first process step During autoclaving the final propertiesnamely strength and low thermal conductivity are achieved
It is already well understood that the autoclaving process leads tothe formation of several phases first of all tobermorite(Ca5Si6O16(OH)2lowast4H2O) [3ndash5] Newest research has shown im-pressively which reactions are running from the mineralogical point ofview Insitu XRD measurements were carried out during the
autoclaving process and the phase development was shown by plottingnormalized intensities [6] The study of Mitsuda et al [3] was mainlyfocused on the tracking of the phase evolution during the autoclavingprocess of AAC However their statements concerning phase evolutionare mainly based on XRD data and TGA measurements There is acommon agreement that the following reactions occur The consump-tion of the alite (OPC) leads to the formation of an initial C-S-H phaseduring the first processing step Portlandite which was initially formedduring the first process step (from CaO and C3S) further quartz and theC-S-H phase are consumed during autoclaving resulting in the crystal-lization of tobermorite Hence the crystallization process of to-bermorite as well as the crystal structure of tobermorite was an issue ofresearch and discussion over the last years and numerous publicationsto these topics are available Concerning the crystal structure of to-bermorite respectively the tobermorite supergroup a new publicationoutlines all important references and recommends a new nomenclature[7]
The presented study was performed to create new analytical possi-bilities for the characterization of the production process of AAC Bothof the production process steps are essential for the final productHence the present work focuses on crystallization of hydrate phases inboth processes
Firstly an external standard method [89] was published and
httpsdoiorg101016jcemconres201802028Received 6 October 2017 Received in revised form 1 February 2018 Accepted 26 February 2018
Corresponding authorsE-mail addresses juergenjsschreinerfaude (J Schreiner) danieljansenfaude (D Jansen)
Cement and Concrete Research 107 (2018) 247ndash252
0008-8846 copy 2018 Elsevier Ltd All rights reserved
T
6 Publications
39
recommended for the determination of absolute phase contents inmixtures with amorphous content It was shown that the method canabsolutely be recommended for hydrating cement pastes in which watercannot be quantified directly by XRD [10] This method seems to bevery promising for both the quantification of the hydration of the AACslurry before autoclaving and the quantification of the phase evolutionduring autoclaving inasmuch as both production steps form crystallineand amorphous phases
Secondly a new approach to anisotropic peak broadening due toanisotropic domain morphology which was developed [1112] is ap-plied to AAC samples to improve the fit of portlandite and tobermoriteby Rietveld refinement [13] By applying this approach the refinementof both portlandite and tobermorite should additionally lead to betterquantitative results as well as to better insights into the development ofthe domain size morphology of both phases formed
It was already shown that in a hydrating raw mixture for AAC twospecies of portlandite precipitate at 23 degC one showing dynamicallyanisotropic peak broadening and another one following the isotropictrend [14] The application of the anisotropic refinement model led toan improved fitting of portlandite Moreover the mechanism of aniso-tropic domain growth of portlandite was tracked
2 Materials and methods
In order to examine the hydration of the AAC slurry before auto-claving a mixture of the hydraulic reactive components was weighedand measured in-situ at a Bruker D8 diffractometer with a LynxEyedetection system
Ordinary Portland cement (OPC) was mixed with lime (CaO) andanhydrite (C$) The raw materials were taken from the same batches asfor the industrial samples The drymix (58 OPC 36 CaO and 6 C$by weight) was then mixed with water (ws= 08) and placed into anappropriate sample holder The samples were not aerated The slurrysamples were covered with a kapton film to avoid evaporation andcarbonation Diffractograms were recorded with an angular range from7 to 545deg 2θ and a step width of 0011deg 2θ Measurements were carriedout every 15min For each measurement 96 XRD patterns were re-corded over the first 24 h The temperature was fixed at 70 degC which isthe mean temperature generally prevailing in the industrial processduring hydration before autoclaving Rietveld refinement was carriedout using the G-factor method All structures used for Rietveld refine-ment are shown in Table 1
For investigation of the autoclaved samples five different specimenswere taken at different autoclaving times The specimens were takenout of a technical production process hence it was not possible to in-terrupt the process at an earlier time inasmuch it would lead to damageof a whole concrete production batch The specimens were firstly driedat 60 degC until weight constancy The whole blocks were then broken andstatistical samples of 20 g were taken In order to receive the right massattenuation coefficient (MAC) for G-factor method the loss on ignitionand the chemical composition (XRF) were determined For energydispersive XRF analysis (Spectro Xepos) tube voltage from 20 kV to50 kV and tube current from 08 to 20mA were used for differenttargets
The final sample preparation (grinding) before XRD measurementswas carried out using both an agate mortar and a McCrone micronizingmill for wet milling with isopropanol Both preparation methods wereapplied separately to see which one is suitable in order to get the bestpreparation for XRD investigations Six preparations were performed byone operator of which two were prepared with an agate mortar andfour with a McCrone mill For the McCrone milling 3 g of the sampleand 10ml of isopropanol were used for grinding for 12min The grainsize distribution of one sample prepared with an agate mortar and onesample prepared using a McCrone mill was measured by laser granu-lometry in isopropanol using a Mastersizer 3000 (MALVERN)
After milling the samples in these two ways for XRD analysis thepowders were prepared into a front loading sample holder and mea-sured Diffractograms were recorded with an angular range from 6 to80deg 2θ a step width of 00236deg 2θ and a time per step of 054 s Rietveldrefinement combined with external standard (G-factor) was applied inorder to get absolute quantities for each phase The refinement strategyfor portlandite and tobermorite in the TOPAS Launch Mode (TOPAS50 Bruker AXS) is attached as a Supplementary material file
3 Results and discussion
31 Hydration of the mixture before autoclaving
The hydration of the investigated paste before autoclaving isdominated by the hydration of the cement as well as the reaction of thefree lime (CaO) resulting in the formation of portlandite It can beclearly seen from Fig 2 that the hydration of the paste leads to theformation of ettringite portlandite and C-S-H phase For simplificationthe remaining phase developments are not shown in Fig 2 because theyare not in the focus of this study The hydration of CaO forming
Fig 1 Simplified process steps of AAC production and hydrate phase evolution
Table 1Structures used for Rietveld refinement
Phase Author
Alite [15]Anhydrite [16]Bassanite [17]Belite (β) [18]Belite (αprime) [19]Brownmillerite [20]C-S-H [21]Calcite [22]Ettringite [23]Gypsum [24]Hemicarbonate [25]Hydroxylellestadite [26]Lime (CaO) [27]Microcline [28]Portlandite [29]Quartz [30]Tobermorite [31]Tricalciumaluminate (cubic) [32]Tricalciumaluminate (orthorhombic) [33]PONCKS model for Water [21]
J Schreiner et al Cement and Concrete Research 107 (2018) 247ndash252
248
6 Publications
40
portlandite begins rapidly after the addition of water to the mixture andlime is fully consumed after only 1 h of hydration This translates into aquick rise of heat of hydration so that cement hydration is acceleratedwhich leads to further portlandite formation by the reaction of aliteEttringite formation stalls after few hours of hydration After 12 h et-tringite is partially decomposed probably due to sulfate depletion [9]
and poorly crystalline AFm phases (not shown in Fig 2) are formedIn Fig 3 it can be seen that in fact two generations of portlandite
are formed a 1st dominant generation showing anisotropic peakbroadening and 2nd one occurring considerably later following theisotropic domain size refinement which is usually carried out using theRietveld method This occurrence comes along firstly with lime hy-dration and secondly with alite hydration The expected quantity ofportlandite formed from lime hydration very well complies with the
Fig 2 Phase development in AAC paste on a laboratory scale before autoclaving ana-lyzed by in-situ XRD at 70 degC
Fig 3 Formation of two generations of portlandite by hydration of lime (1st) and C3S(2nd) at 70 degC before autoclaving with the major generation showing anisotropic peakbroadening
Fig 4 Biaxial cylinder domain size model of portlandite used for Rietveld refinement of anisotropic peak broadening
Fig 5 Morphological evolution of portlandite showing anisotropic domain size growthduring hydration at 70 degC
Fig 6 Comparison of quantification of crystalline quartz in samples prepared withMcCrone mill and agate mortar at different autoclaving times
J Schreiner et al Cement and Concrete Research 107 (2018) 247ndash252
249
6 Publications
41
quantity of the observed 1st generation The development of portlan-dite growth was already tracked in an equivalent slurry at 23 degC [14]Thus this observation confirms that the crystallinity of portlandite inmixtures for AAC production depends on the starting phase for hydra-tion as already indicated by Ectors [14]
Fig 4 shows the used biaxial cylindrical model for anisotropic do-main size calculation and the portlandite structure which was createdwith structural software VESTA 318 [34] Using the cylindrical ap-proach domain sizes in a (here equating to b) and c direction(dz= cylinder height) can be calculated which comes along with theexpected symmetrical parameters of portlandite
The 1st portlandite generation showing anisotropic domain growthcan be tracked in terms of cylinder diameter and height which is rea-lized in Fig 5 The blue cylinder represents the geometric approach andcylinder height and diameter are calculated newly for each range Thecylinder height remains rather stable throughout the hydration processwhile the cylinder diameter increases during the first hours of hydra-tion After 10 h of hydration the mean cylinder diameter no longer in-creases Consequently these observations match the results of the ex-aminations conducted at 23 degC [14] as well as the assumption thatdifferent mechanisms of growth exist for portlandite depending on the
hydration educt The maximum cylinder diameter is reached earlier inthis work very likely because of the higher hydration temperature
32 Quantification of the reactions during autoclaving
Autoclaved samples were ground with an agate mortar and com-pared to samples which were wet-ground with a McCrone mill Fig 6shows precisely that the determination of the amount of crystallinequartz is more reproducible in the two shown samples which were
Fig 7 2D XRD with Bruker GADDS-system plots of samples prepared with agate mortar and McCrone mill Coarse quartz grains are pointed out in the plot of the sample prepared withagate mortar
Fig 8 Particle size distribution of one sample prepared with an agate mortar and of onesample prepared with a McCrone mill measured by laser granulometry
Fig 9 Rietveld refinement for Tobermorite of autoclaved AAC sample by use of isotropicdomain size model (a) and of anisotropic domain size model (b)
J Schreiner et al Cement and Concrete Research 107 (2018) 247ndash252
250
6 Publications
42
prepared with a McCrone mill The high variance of crystalline quartzin the samples which were prepared with an agate mortar is a result ofinsufficient grinding and remaining of too large quartz grains Whenthis spottiness occurs a reliable quantification using the G-factormethod is not possible
The 2D XRD with Bruker GADDS-system plots in Fig 7 demonstratethe insufficient grinding when using an agate mortar compared to wetmilling with a McCrone mill Quartz would be overrepresented in a one-dimensional XRD pattern focusing on a section with bright spots (greenarrows) The lack of bright spots in the right plot shows that the quartzgrains are milled more thoroughly using a McCrone mill In Fig 8 theparticle size distribution after both ways of sample preparation iscompared Most grains in the sample prepared with an agate mortar arelarger than in the sample prepared with a McCrone mill The grain sizedistribution of the sample prepared with a McCrone mill complies withthe recommended particle size range for XRD analysis of under 5 to50 μm [3536] while the other sample exceeds the range
In Fig 9 Rietveld refinement of an autoclaved sample is shown Thedominant peaks at 77 290 and 301deg 2θ are attributed to tobermoriteIn the upper diagram (a) Rietveld refinement was carried out regularlycalculating isotropic domain sizes for tobermorite However the cal-culated fit differs significantly from the raw data It can be assumed thattobermorite shows a similar pattern to portlandite in terms of aniso-tropic peak broadening taking into account that tobermorite is as-signed to the orthorhombic crystal system Thus instead of a biaxialcylinder model an elliptic cylinder model (Fig 10 structure createdwith VESTA 318 [34]) was applied for the refinement in the lowerdiagram (b) The elliptic cylinder model is a sufficient approach to the
orthorhombic crystal system as it allows the distinction between do-main sizes in a b and c direction The fit is clearly superior using theanisotropic domain size model highlighted by the difference plot inFig 9b The comparison refinement with isotropic and anisotropic ap-proach was done for all of the five autoclaved samples In Fig 11 theresulting Rwp values for the whole pattern and the RBragg values of to-bermorite are shown The refinement using the anisotropic model leadsto both lower Rwp and RBragg values and consequently to a better fit anda more accurate quantification of tobermorite in all refined samples
4 Summary and conclusions
Improved analytical methods for both the phase developmentduring the hydration before autoclaving and during the autoclavingprocess of AAC are presented It could be shown that wet McCronemilling is the best way of preparation of AAC samples in order to obtainsuitable samples for powder diffraction A new approach to treat ani-sotropic domain sizes for Rietveld refinement could be successfullyapplied ndash with the benefit that portlandite and tobermorite in AACsamples could be refined more accurately using the Rietveld methodThus this application allows an improved quantification of the phasedevelopment during both of the production steps
For the future there are still plenty of possibilities to apply thepresented approach of calculating anisotropic domain sizes to AACproduction As exemplified with portlandite the mechanisms of growthof tobermorite can be tracked likewise during the autoclaving processIn addition the effect of variations in the chemical composition of AACraw mixtures on the crystal morphology of tobermorite can be ex-amined This leaves a new perspective to discuss the link between mi-neral phase morphology and the thermal and mechanical properties ofAAC
Acknowledgement
The autoclaved samples were generously provided by RodgauerBaustoffwerke GmbH amp Co KG The authors express gratitude for allsupport
Appendix A Supplementary data
Supplementary data to this article can be found online at httpsdoiorg101016jcemconres201802028
References
[1] MW Grutzeck Cellular concrete in M Scheffler P Colombo (Eds) CellularCeramics Wiley-VCH Weinheim 2005 pp 193ndash223
[2] M Haas The future of AAC ndash from a material scientists point of view inMC Limbachiya JJ Roberts (Eds) Autoclaved Aerated Concrete Taylor FrLondon 2005 pp 187ndash194
[3] T Mitsuda K Sasaki H Ishida Phase evolution during autoclaving process ofaerated concrete J Am Ceram Soc 75 (1992) 1858ndash1863
[4] N Isu H Ishida T Mitsuda Influence of quartz particle size on the chemical and
Fig 10 Triaxial cylinder domain size model of Tobermorite used for Rietveld refinement of anisotropic peak broadening
Fig 11 Comparison of Rwp and RBragg values of Rietveld refinements of autoclavedsamples and tobermorite using the isotropic and the anisotropic domain size model
J Schreiner et al Cement and Concrete Research 107 (2018) 247ndash252
251
6 Publications
43
mechanical properties of autoclaved aerated concrete (I) tobermorite formationCem Concr Res 25 (1995) 243ndash248
[5] NY Mostafa Influence of air-cooled slag on physicochemical properties of auto-claved aerated concrete Cem Concr Res 35 (2005) 1349ndash1357 httpdxdoiorg101016jcemconres200410011
[6] K Matsui J Kikuma M Tsunashima T Ishikawa S Matsuno A Ogawa M SatoIn situ time-resolved X-ray diffraction of tobermorite formation in autoclaved aer-ated concrete influence of silica source reactivity and Al addition Cem Concr Res41 (2011) 510ndash519
[7] C Biagioni S Merlino E Bonaccorsi The tobermorite supergroup a new no-menclature Mineral Mag 79 (2015) 485ndash495 httpdxdoiorg101180minmag2015079222
[8] BH OConnor MD Raven Application of the Rietveld refinement procedure inassaying powdered mixtures Powder Diffract 3 (1988) 2ndash6 httpdxdoiorg101017S0885715600013026
[9] D Jansen F Goetz-Neunhoeffer C Stabler J Neubauer A remastered externalstandard method applied to the quantification of early OPC hydration Cem ConcrRes 41 (2011) 602ndash608 httpdxdoiorg101016jcemconres201103004
[10] D Jansen C Stabler F Goetz-Neunhoeffer S Dittrich J Neubauer Does OrdinaryPortland Cement contain amorphous phase A quantitative study using an externalstandard method Powder Diffract 26 (2011) 31ndash38 httpdxdoiorg10115413549186
[11] D Ectors F Goetz-Neunhoeffer J Neubauer A generalized geometric approach toanisotropic peak broadening due to domain morphology J Appl Crystallogr 48(2015) 189ndash194 httpdxdoiorg101107S1600576714026557
[12] D Ectors F Goetz-Neunhoeffer J Neubauer Routine (an)isotropic crystallite sizeanalysis in the double-Voigt approximation done right Powder Diffract 32 (S1)(2017) 27ndash34 httpdxdoiorg101017S0885715617000070
[13] HM Rietveld A profile refinement method for nuclear and magnetic structures JAppl Crystallogr 2 (1969) 65ndash71 httpdxdoiorg101107S0021889869006558
[14] D Ectors Advances in the Analysis of Cementitious Reactions and Hydrate Phases(Doctoral Thesis) (2016) pp 12ndash14 (urnnbndebvb29-opus4-71743)
[15] AacuteG De La Torre S Bruque J Campo MAG Aranda The superstructure of C3Sfrom synchrotron and neutron powder diffraction and its role in quantitative phaseanalyses Cem Concr Res 32 (2002) 1347ndash1356 httpdxdoiorg101016S0008-8846(02)00796-2
[16] A Kirfel G Will Charge density in anhydrite CaSO4 from X-ray and neutrondiffraction measurements Acta Crystallogr Sect B Struct Crystallogr CrystChem 36 (1980) 2881ndash2890 httpdxdoiorg101107S0567740880010461
[17] C Bezou AN Christensen D Cox M Lehman A Nonat Structures cristallines deCaSO405H2O et CaSO406H2O Comptes Rendus Hebd Des Seacuteances lAcadeacutemieDes Sci Seacuterie 2 (312) (1991) 43ndash48
[18] KH Jost B Ziemer R Seydel Redetermination of the structure of β-dicalciumsilicate Acta Crystallogr Sect B Struct Crystallogr Cryst Chem 33 (1977)1696ndash1700 httpdxdoiorg101107S0567740877006918
[19] W Mumme LMD Cranswick BC Chakoumakos Rietveld crystal structure re-finements from high temperature neutron powder diffraction data for the poly-morphs of dicalcium silicate Neues Jahrb Fuer Mineral Abhandlungen 170 (1996)171ndash188
[20] A Colville S Geller The crystal structure of brownmillerite Ca2FeAlO5Crystallographica 50 (1971) 2311ndash2315 httpdxdoiorg101107S056774087100579X
[21] ST Bergold F Goetz-Neunhoeffer J Neubauer Quantitative analysis of C-S-H inhydrating alite pastes by in-situ XRD Cem Concr Res 53 (2013) 119ndash126 httpdxdoiorg101016jcemconres201306001
[22] EN Maslen VA Streltsov NR Streltsova N Ishizawa Electron density and op-tical anisotropy in rhombohedral carbonates III Synchrotron Xray studies ofCaCO3 MgCO3 and MnCO3 Acta Crystallogr Sect B 51 (1995) 929ndash939 httpdxdoiorg101107S0108768195006434
[23] G Renaudin Y Filinchuk J Neubauer F Goetz-Neunhoeffer A comparativestructural study of wet and dried ettringite Cem Concr Res 40 (2010) 370ndash375httpdxdoiorg101016jcemconres200911002
[24] WF Cole CJ Lancucki A refinement of the crystal structure of gypsumCaSO42H2O Acta Cryst B30 (1974) 921ndash929 httpdxdoiorg101107S0567740874004055
[25] T Runčevski RE Dinnebier OV Magdysyuk H Poumlllmann Crystal structures ofcalcium hemicarboaluminate and carbonated calcium hemicarboaluminate fromsynchrotron powder diffraction data Acta Crystallogr Sect B Struct Sci 68 (2012)493ndash500 httpdxdoiorg101107S010876811203042X
[26] JM Hughes JW Drexler Cation substitution in the apatite tetrahedral site crystalstructures of type hydroxylellestadite and type fermorite Neues Jahrb FuerMineral (1991) 327ndash336
[27] CH Shen RS Liu JG Lin CY Huang Phase stability study of La12Ca18Mn2O7Mater Res Bull 36 (2001) 1139ndash1148
[28] SW Bailey Refinement of an intermediate microcline structure Am Miner 54(1969) 1540ndash1545
[29] WR Busing HA Levy Neutron diffraction study of calcium hydroxide J ChemPhys 26 (1957) 563 httpdxdoiorg10106311743345
[30] Y Le Page G Donnay Refinement of the crystal structure of low-quartz ActaCrystallogr Sect B 32 (1976) 2456ndash2459 httpdxdoiorg101107S0567740876007966
[31] SA Hamid The crystal structure of the 11 Aring natural tobermoriteCa225[Si3O75(OH)15]1H2O Zeitschrift Fuer Krist - New Cryst Struct 154 (1981)189ndash198 httpdxdoiorg101524zkri19811543-4189
[32] P Mondal JW Jeffery The crystal structure of tricalcium aluminate Ca3Al2O6Acta Crystallogr B 31 (1975) 689ndash697 httpdxdoiorg101107S0567740875003639
[33] Y Takeuchi F Nishi I Maki Crystal-chemical characterization of the tricalciumaluminate-sodium oxide (3CaOtimesAl2O3-Na2O) solid-solution series Zeitschrift FuumlrKrist (1980) 259ndash307
[34] K Momma F Izumi VESTA 3 for three-dimensional visualization of crystal vo-lumetric and morphology data J Appl Crystallogr 44 (2011) 1272ndash1276 httpdxdoiorg101107S0021889811038970
[35] K Scrivener R Snellings B Lothenbach A Practical Guide to MicrostructuralAnalysis of Cementitious Materials CRC Press 2016 pp 123ndash125 httpdxdoiorg107693wl20150205
[36] V Pecharsky P Zavalij Fundamentals of Powder Diffraction and StructuralCharacterization of Materials Springer second edition 2005 p 302 httpdxdoiorg101007978-0-387-09579-0
J Schreiner et al Cement and Concrete Research 107 (2018) 247ndash252
252
6 Publications
44
7 Acknowledgement
7 Acknowledgement
Ich moumlchte mich bei einigen Personen bedanken ohne die es wohl kaum zum erfolgreichenAbschluss dieser Arbeit gekommen waumlreMein Doktorvater Prof Dr Juumlrgen Neubauer hat sich stets die Zeit genommen die noumltigwar um Angelegenheiten aller Art mit mir zu klaumlren Er gab mir fachlich immer zumrichtigen Zeitpunkt einen gewissen wissenschaftlichen Impuls Zugleich habe ich mich den-noch immer frei in meiner eigenen Konzeption gefuumlhlt Groszligen Dank spreche ich Prof DrFriedlinde Goumltz-Neunhoeffer aus die fuumlr mich ebenso immer eine verlaumlssliche Ansprech-partnerin fuumlr fachliche und organisatorische Angelegenheiten aller Art war Danke anDr Daniel Jansen fuumlr die gute Zusammenarbeit und dafuumlr dass er mich im Zuge meinerMasterarbeit in ein Forschungsprojekt aufgenommen hat das den Weg zur Promotionmoumlglich machte Zusaumltzlich gilt mein Dank Prof Dr Matthias Goumlbbels der fuumlr dieMitarbeiter am Lehrstuhl immer motivierende Worte fand Fuumlr die Ermoumlglichung meinerTeilnahme an diversen Dienstreisen Fortbildungen und Tagungen moumlchte ich mich viel-mals bedankenWeiterhin bedanke ich mich bei Dr Stephan Volkmann und den Rodgauer BaustoffwerkenGmbH amp Co KG fuumlr die gute Zusammenarbeit und die Bereitstellung von Versuchsma-terialienVielen Dank an meine studentischen Hilfskraumlfte Daniel Wagner Laura MoldenhauerFabian Lang Jakob Schreiber und Felix Klaassen die alle Aufgaben im Labor einwand-frei und mit Bedacht erledigten Bei meinen aktuellen und ehemaligen Kollegen DrKatrin Hurle Dr Dominique Ectors Dr Christoph Naber Dr Florian Huumlller JoumlrgNehring Frank Riedel Julian Wolf Tanja Manninger Daniel Wagner Nicolas FobbeKarla Spaumlth Julian Goergens Andreas Koumlhler Cordula Jakob Franz Becker und LisaKlemenz bedanke ich mich fuumlr die gelungene Zusammenarbeit und gegenseitige Unter-stuumltzung Besonderer Dank geht auch an Kerstin Kreszlig Bettina Engl Christian HankeBernd Schleifer und Christian Abe fuumlr die verlaumlssliche Unterstuumltzung bei technischen Fra-gen und Messungen im LaborFuumlr jegliche Unterstuumltzungen moumlchte ich mich auch bei meinen Eltern bedanken sowiebei meinem Bruder Ralf der mir mit einem LaTex Crashkurs viel Frustration ersparthat Danke Thomas dass du immer fuumlr mich da bist und mit mir zusammen fuumlr genugAusgleich gesorgt hast
45
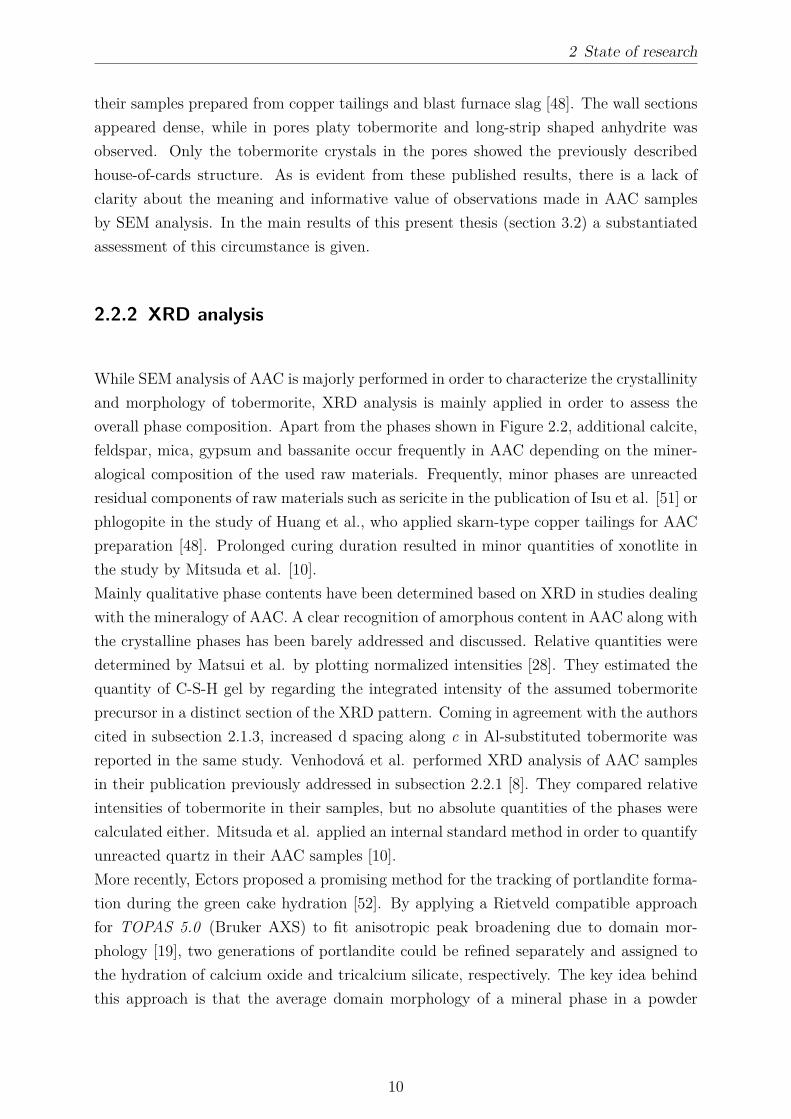
2 State of research
their samples prepared from copper tailings and blast furnace slag [48] The wall sectionsappeared dense while in pores platy tobermorite and long-strip shaped anhydrite wasobserved Only the tobermorite crystals in the pores showed the previously describedhouse-of-cards structure As is evident from these published results there is a lack ofclarity about the meaning and informative value of observations made in AAC samplesby SEM analysis In the main results of this present thesis (section 32) a substantiatedassessment of this circumstance is given
222 XRD analysis
While SEM analysis of AAC is majorly performed in order to characterize the crystallinityand morphology of tobermorite XRD analysis is mainly applied in order to assess theoverall phase composition Apart from the phases shown in Figure 22 additional calcitefeldspar mica gypsum and bassanite occur frequently in AAC depending on the miner-alogical composition of the used raw materials Frequently minor phases are unreactedresidual components of raw materials such as sericite in the publication of Isu et al [51] orphlogopite in the study of Huang et al who applied skarn-type copper tailings for AACpreparation [48] Prolonged curing duration resulted in minor quantities of xonotlite inthe study by Mitsuda et al [10]Mainly qualitative phase contents have been determined based on XRD in studies dealingwith the mineralogy of AAC A clear recognition of amorphous content in AAC along withthe crystalline phases has been barely addressed and discussed Relative quantities weredetermined by Matsui et al by plotting normalized intensities [28] They estimated thequantity of C-S-H gel by regarding the integrated intensity of the assumed tobermoriteprecursor in a distinct section of the XRD pattern Coming in agreement with the authorscited in subsection 213 increased d spacing along c in Al-substituted tobermorite wasreported in the same study Venhodovaacute et al performed XRD analysis of AAC samplesin their publication previously addressed in subsection 221 [8] They compared relativeintensities of tobermorite in their samples but no absolute quantities of the phases werecalculated either Mitsuda et al applied an internal standard method in order to quantifyunreacted quartz in their AAC samples [10]More recently Ectors proposed a promising method for the tracking of portlandite forma-tion during the green cake hydration [52] By applying a Rietveld compatible approachfor TOPAS 50 (Bruker AXS) to fit anisotropic peak broadening due to domain mor-phology [19] two generations of portlandite could be refined separately and assigned tothe hydration of calcium oxide and tricalcium silicate respectively The key idea behindthis approach is that the average domain morphology of a mineral phase in a powder
10
2 State of research
sample implies certain mineralogical characteristics The simplified domain morphologycan be calculated on the basis of geometrical shapes such as cylinder ellipsoid or cuboidDepending on the crystal system and the expected morphology the geometrical shapecan be adjusted accordingly In the example reported by Ectors the one generation ofportlandite originating from burnt lime hydration showed anisotropic peak broadening- unlike the generation forming from tricalcium silicate hydration In accordance withthe trigonal crystal system a biaxial cylinder model was applied for the fitting of theanisotropic generation The operating principle of the approach to fit the anisotropicpeak broadening due to domain morphology can be precisely explored by accessing fur-ther publications by Ectors et al [53 54] Apart from this benefit a better fit to themeasured data enables a more accurate refinement and quantification of all phases Thetwo generations of portlandite were additionally quantified by means of an external stan-dard method [55] The combination of quantitative phase analysis by XRD (QXRD) withthe refinement of anisotropic peak broadening is a promising approach in this context -especially in consideration of the fact that phase quantifications in AAC samples havebeen barely performed ever before Hence the application of these methods is the keymatter of this present thesis Especially the potential of the domain morphology analysisof tobermorite is precisely investigated The terms domain size and domain morphology inthis sense refer to the coherently scattering unit measured by XRD analysis Crystallineparticles observed by means of electron microscopy which are frequently termed grainscrystals or crystallites are for the most part clusters of coherently scattering domains[56 57]
11
3 Main results
3 Main results
This chapter introduces the main results presented in three peer reviewed publications[58 59 60] incorporated in chapter 6 The new findings are put in a general context andsubsequently they are summarized and discussed in chapter 4 The sections 31 and 32deal with the characterization of tobermorite in both lab-scale samples and AAC sam-ples produced on an industrial scale In section 33 the entire production process of AACincluding the hydration before autoclaving is addressed
Figure 31 Application of a triaxial cylinder model for the calculation of anisotropic do-main sizes of tobermorite implemented with Rietveld refinement and influenceon the fit compared to ordinary refinement [60]
12
3 Main results
One particular main result is a key element in each of the following sections In Figure 31the fit of tobermorite after two Rietveld refinements of different accuracy is shown In aregular Rietveld refinement for simplification the coherently scattering units are treatedas spherical shapes as usually only one size value for each mineral phase is calculated Asaverage domain sizes of a mineral phase in different crystallographic directions are in manycases indeed close to one value this approximation is often sufficient in order to achievea satisfactory fit to the measured diffractogram The crystal system and surroundingconditions during the formation of a mineral phase are significant factors in this context Amisfit at different (hkl) reflections as displayed in Figure 31 is an indication of anisotropicpeak broadening Clearly orthorhombic tobermorite shows anisotropic peak broadeningdue to its anisotropic domain morphology For the possible origins of anisotropic peakbroadening apart from size broadening the reader is referred to section 61 In accordancewith the orthorhombic crystal system a triaxial model is applied in order to fit the peakbroadening [19] By implementing the macro during the refinement no longer one butthree sizes (x y and z for respectively a b and c direction) are calculated Besides theimproved fit the calculated domain morphology is an additional information extractedfrom XRD analysis and it is representative for the average value of the phase in the entiresample In each of the following sections the different benefits regarding this approachare outlined in more detail
31 Hydrothermal synthesis of tobermorite on alaboratory scale - application of two types ofmetakaolin
This study covers mineralogical properties of tobermorite synthesized from a set of variouscompounds including different amounts and types of metakaolin [58] Unlike in sections32 and 33 the samples were not aerated before autoclaving and their composition isadjusted to the CaSi molar ratio of stoichiometric tobermorite On the one hand thereactivity of metakaolin and minor phases at hydrothermal conditions for the possible usein AAC production was investigated On the other hand the effects of consequent changesof the bulk chemistry in the basic compound on the mineralogical characteristics of to-bermorite such as lattice parameters and domain morphology were analyzed In additionfor one particular compound the effect of different curing times was explored While theconventional raw materials for AAC production are rather low-cost resources metakaolinis a high-priced SCM in this regard For this reason besides one comparatively pure com-mercial metakaolin (MK) a second by-product type of metakaolin (MKg) was applied
13
3 Main results
at equivalent dosages All investigated mix composites and the chemical composition ofMK and MKg are summed up in tables in section 61In Figure 32 the effect of different amounts of the two types of metakaolin on the phasequantities is displayed Clearly at moderate dosages of MK and MKg tobermorite waspresent in comparable quantities However the application of any amount of metakaolinreduced the amount of tobermorite compared to the blank mixture It can be seen thatkatoite was present whenever the content of Al2O3 in the starting drymix exceeded 2wt which fits well with the state of knowledge [5 23] For the highest possible dosagesof the two types of metakaolin (MK60 and MKg60) contrary effects were observed Ap-plication of impure metakaolin (MKg) led to a considerable amount of tobermorite whilein MK60 no tobermorite was present The high content of Al2O3 seems to have hinderedthe formation of tobermorite Not all of the Al2O3 in MKg was supplied for reactionas minor phases such as feldspar remained unreacted which is shown accurately in therespective publication in section 61
Figure 32 Weight fractions of tobermorite quartz and katoite measured by QXRD anal-ysis and contents of Al2O3 in the starting drymix Amorphous content andminor phases are not shown
The results of thermal analysis of samples characterized by MK addition in small stepsare shown in Figure 33 It can be seen that the conversion of 93 Aring tobermorite into β-
14
3 Main results
wollastonite depended on the dosage of MK However unlike suggested by Klimesch ampRay there was no effect of lower contents of Al2O3 in the drymix [40] Consequently theinfluence of Al3+ at low dosages (MK25 and MK5) could not be observed on the basisof this method Apart from this result the other signals showed good agreement with thesuggested conversion ranges by Klimesch amp Ray as for samples MK9 and MK16 a clearshift towards higher temperature was measured However the role of Al3+ incorporationverified by this method is not necessarily conclusive as additional reactions during theheating experiment involving Al3+ are possible On that basis the observations madeby means of DTA would not reflect the amount of Al3+ originally incorporated into thestructure of 11 Aring tobermorite
Figure 33 Conversion of 93 Aring tobermorite into β-wollastonite in samples synthesizedwith various amounts of metakaolin and suggested temperature ranges ac-cording to Klimesch amp Ray [40]
In accordance with authors referenced in subsection 213 lattice parameter c of tober-morite increased with elevated dosages of Al2O3 in the basic dry mix (Figure 34) Theimpact could be observed for the complete range of samples as displayed in section 61which indicates that a limit of Al3+ incorporation was not reached in this study Forcomparison the relative domain morphology is plotted in Figure 34 Unlike the DTA
15
3 Main results
signals both lattice parameter c and the domain morphology are impacted by very lowdosages of Al2O3 There is a good accordance of the relation of growth in b direction to adirection and the c parameter This is valid up to 20 wt of Al2O3 in the starting drymix By contrast more elevated contents of Al2O3 did not affect the domain morphologyany further even though the incorporation is verified through the increased c parameterIt follows that the impact of Al3+ incorporation on the domain morphology is limited tovery low contents while the impact on lattice parameter c can be tracked throughoutthe entire examined range of samples In section 61 additional results show that growthin b direction increased with reaction time These observations are solely based on XRDanalysis and offer new benefits for the structural understanding of tobermorite
Figure 34 Impact of the calculated Al2O3 content in the basic dry mix on the latticeparameter c and on the relation of calculated domain sizes of tobermorite ina (x) and b (y) direction
16
3 Main results
32 Structural properties of tobermorite in AAC - SEMversus XRD analysis
This section and the respective publication [59] mainly deal with the suitability of SEManalysis of tobermorite in AAC The effects of varying amounts of SO3 and Al2O3 in thedry mix on structural properties of tobermorite are discussed based on XRD analysisAs shown in subsection 221 and Figure 23 tobermorite often shows a house-of-cardsstructure in AAC samples This property has been considered to be relevant for thethermal and mechanical properties of AAC (subsection 221) However SEM analysiswithin this study revealed that this type of appearance is mainly found in the poresand pore surfaces (Figure 35) This finding comes in agreement with the observationsmade by Huang et al [48] In the solid skeleton of the dense AAC material neither themorphology nor the house-of-cards structure could be observed properly which can beseen very clearly in additional micrographs provided in section 62 It should be consideredthat the major amount of tobermorite by weight is located in the dense material and notat the pore surfaces In this way these findings are clear disadvantages coming along withonly SEM analysis of AAC as representative results can hardly be obtained
Figure 35 House-of-cards structure of tobermorite in a pore surrounded by dense mate-rial
Moreover several authors in subsection 221 justified the morphology of tobermorite withthe incorporation of foreign ions Al-substituted tobermorite showed lath-like morphologywhereas Al-free tobermorite showed rather plate-like morphology [6 32 49] Howeverthe present investigation revealed that independent of Al2O3 content in the raw mix there
17
3 Main results
is always heterogeneity regarding the morphology of tobermorite In Figure 36 plate-likeand lath-like morphology of tobermorite in AAC observed in two statistical chemicallyvarious samples are displayed This result supports the previous assumption that theobservations made by SEM analysis of tobermorite in AAC strongly depend on whatpart of the sample is selected Yet again no clear observations could be made that wererepresentative for the entire sample
Figure 36 Heterogeneous morphology of tobermorite (plate-like in a and c lath-like in band d) in two AAC samples characterized by different Al2O3 contents in theraw mix
The effects of Al3+ on the domain morphology of tobermorite were measured and evaluatedin a similar manner as in section 61 and the results could be confirmed The relativedomain growth in b direction was increased by Al3+ incorporation in both studies [5859] Moreover lattice parameter c was increased with Al3+ incorporation which can beseen more accurately in section 62 Unlike SEM analysis XRD analysis allowed clearconclusions whenever structural properties of Al-substituted tobermorite were affectedInstead of a local observation as made with SEM representative and statistical resultswere obtained The reader is referred to section 61 and section 62 for further results and
18
3 Main results
more specific conclusionsIn addition the effect of various amounts of sulfate in the raw mix was analyzed Unlikein the case of different dosages of Al3+ neither the domain morphology nor the latticeparameters of tobermorite were affected by the SO3 content in the dry mix In Figure 37these observations and additionally the amounts of anhydrite measured by QXRD areshown As the amount of available SO3 in the dry mix is known the maximum possibleamount of anhydrite could be calculated for each of the samples in focus Obviouslythe measured amounts of anhydrite are either equal or slightly higher compared to theexpected quantities This result leads to the assumption that all of the available sulfateis transformed into anhydrite so that no more sulfate could be incorporated into thestructure of tobermorite The over-estimation of anhydrite in some of the samples can beexplained due to the inaccuracy of the quantification method The present results rathermatch with the suggestions by Sauman amp Valtr [41] as in their study no effect of sulfateon the structure of tobermorite was observed either
Figure 37 Impact of the sulfate content in the AAC raw mix on lattice parameter cand relative domain morphology of tobermorite (a) and comparison of theexpected maximum amount of anhydrite to the measured amount determinedby QXRD (b)
33 Improved monitoring of the phase developmentduring the production of AAC
In this study not only autoclaved samples were analyzed but additionally a lab-scale slurrywhich included the reactive components of the green cake stage during AAC productionat equivalent weight proportions In-situ XRD was performed at 70 degC and at a water-to-
19
3 Main results
solid ratio of 08 for 24 h (Figure 38) which are respective conditions during commercialproduction Clearly the phase development is dominated by OPC and lime hydration asdescribed in section 22 It can be seen that the major reaction turnover occurs duringthe first 200 minutes which is the average duration of the green stage After only 30minutes all of the quicklime had transformed into portlandite whereas Schober proposeda duration of one hour for this reaction [42] The amount of portlandite is composed oftwo different generations as proposed by Ectors [52] Equally a biaxial cylinder modelwas applied in order to fit the peak broadening of the first generation of portlandite in thepresent investigation Minor phase developments such as the formation of AFm phases arenot shown in Figure 38 A coarse fraction of anhydrite did not react so that constantlyaround 15 wt were measured after 6 h As the decomposition of ettringite due tosulfate depletion [55] does not occur prior to 12 h the green cake strength is not affected
Figure 38 In-situ XRD measurement of AAC model slurry at water-to-solid ratio of 08and 70 degC For clarity and comprehensibility not all phases are shown
The separation of two generations of portlandite in the system does not only translate intodifferent domain morphologies as shown by Ectors [52] In Figure 39 more indicationsfor different mineralogical properties are displayed The shape of the (0 0 1) reflection inXRD patterns after only quicklime hydration and after both quicklime and alite hydrationshows a distinct feature While portlandite originating from quicklime hydration showsa broad peak implying lower crystallinity the peak after alite hydration is characterized
20
3 Main results
Figure 39 Formation of two generations of portlandite in AAC slurry in XRD (a) andDTA (b) plots
by a sharper component Yet the peak breadth did not change indicating that the firstgeneration is still present with the original characteristics This observation is supportedby DTA measurements additionally demonstrating two degrees of crystallinity only afteralite hydration In agreement with XRD analysis the better crystalline second generationof portlandite decomposes at a higher temperature
Figure 310 Quantification of tobermorite in statistical chemically various AAC sampleswith and without the application of the macro for the fitting of anisotropicpeak broadening
21
3 Main results
Furthermore commercial AAC samples were considered in this study By applying themethod for the refinement of anisotropic peak broadening (Figure 31) a more accuratequantification of tobermorite can be achieved In Figure 310 the calculated amounts oftobermorite in statistical chemically various AAC samples are plotted In some samplesthe refinement using the macro leads to considerably higher but never lower quantitiesof tobermorite whereas in other samples nearly the same amount of tobermorite is cal-culated This observation can be well understood taking into account that the macroallows to account more peak area for tobermorite as shown in Figure 31 Clearly thereis evidence that the anisotropy of tobermorite domains is not uniform from one sampleto another which was basically justified in the previous sections As an improved quan-tification of a single phase leads to a better quantification of other phases in the samplethis adaption is very valuable in order to assess the phase development Here the peakbroadening of tobermorite equally observed by Qu et al [6] could be tracked and evalu-ated in order to gain more accurate results Moreover in section 63 McCrone milling issuggested in order to avoid spottiness in XRD patterns caused by coarse grains of quartzor anhydrite (Figure 38)
22
4 Conclusions
4 Conclusions
The research results presented in the previous sections yield advances in the mineralogicalinvestigation of tobermorite and autoclaved aerated concrete Recorded diffraction pat-terns contain plenty of usually unused data regarding the microstructural characteristicsof the sample and phases therein The profit of XRD measurements can be significantlyimproved whenever one or more phases show anisotropic peak broadening and appro-priate models for the respective domain morphology are implemented into the Rietveldenvironment Within the scope of the present investigations portlandite and tobermoriteshow this particularityThe effects of changes in the chemistry of the starting mix were examined based on dif-ferent dosages of metakaolin Al-substituted tobermorite showed increased growth in b
direction and an increase of lattice parameter c compared to Al-free tobermorite The rel-ative domain sizes were determined based on anisotropic peak broadening However whilethe effect of Al3+ incorporation into the lattice of tobermorite was limited regarding thedomain morphology lattice parameter c showed an increase throughout the entire rangeof samples The consequent effects suggested by Klimesch amp Ray observed by means ofDTA are debatable as reactions during the heating experiment may lead to to a changeof Al3+ content in tobermorite [40] While both types of applied metakaolin showed goodreactivity at hydrothermal conditions some included minor phases such as feldspar oranatase remained unreacted At high dosages of Al2O3 in the starting mix the formationof either only katoite or katoite along with tobermorite was observed (Figure 32)SEM analysis of tobermorite in AAC cannot be suggested based on the observationspresented in this work as it is only visually accessible in the pores or at pore surfacesThe dense material of the AAC skeleton contains several crystalline and X-ray amorphousphases which hardly allows a proper investigation Even in single pores tobermorite crys-tals appeared very heterogeneous at various chemical compositions As a result lath-liketobermorite was not only present in samples characterized by elevated Al3+ incorporationBy contrast the benefits of XRD analysis presented in section 61 equally accounted fortobermorite in AAC samples Sulfate incorporation into the lattice of tobermorite wasnot observed All of the sulfate in the system was detected to be present in anhydriteThe phase transitions in the AAC raw slurry during the green stage hydration were show-cased by in-situ XRD analysis of a model mix at 70 degC Additional DTA and XRD mea-
23
4 Conclusions
surements during this step confirmed the presence of two generations of portlandite char-acterized by different crystallinity as suggested by Ectors [52] The inclusion of anisotropicdomain morphology during the Rietveld refinement allowed a more accurate quantifica-tion of tobermorite in autoclaved samples Sample preparation adjusted to the grain sizedistribution in AAC samples (section 63) the external standard method for quantita-tive XRD analysis [55] and the approach to evaluate anisotropic peak broadening [19]are the key methods for a more accurate tracking of the phase development during AACproduction
24
5 References
5 References
[1] A E Zadov A I Grabezhev N N Pertsev N V Chukanov and S V PribavkinTobermorite-plombierite metasomatites of the Gumeshevsk skarn-porphyry copper depositmiddle Urals Doklady Earth Sciences 407(3)495ndash497 2006
[2] M F Heddle Preliminary notice of substances which may prove to be new minerals MinMag 4117ndash123 1880
[3] S Merlino E Bonaccorsi and T Armbruster The real structure of tobermorite 11AringNormal and anomalous forms OD character and polytypic modifications European Journalof Mineralogy 13(3)577ndash590 2001
[4] C Biagioni S Merlino and E Bonaccorsi The tobermorite supergroup a new nomencla-ture Mineralogical Magazine 79(2)485ndash495 2015
[5] C A Riacuteos C D Williams and M A Fullen Hydrothermal synthesis of hydrogarnetand tobermorite at 175 degC from kaolinite and metakaolinite in the CaO-Al2O3-SiO2-H2Osystem A comparative study Applied Clay Science 43(2)228ndash237 2009
[6] X Qu Z Zhao and X Zhao Microstructure and characterization of aluminum-incorporated calcium silicate hydrates (C-S-H) under hydrothermal conditions RSC Ad-vances 8(49)28198ndash28208 2018
[7] R Šiaučiunas and K Baltakys Formation of gyrolite during hydrothermal synthesis inthe mixtures of CaO and amorphous SiO2 or quartz Cement and Concrete Research34(11)2029ndash2036 2004
[8] E Venhodovaacute R Janovskyacute and R Drochytka Formation of Tobermorite at Different Ma-terials Composition of Aerated Concrete Applied Mechanics and Materials 752-753247ndash250 2015
[9] L Galvaacutenkovaacute E Bartoniacutečkovaacute T Opravil J Tkacz and P Ptaacuteček The influence ofstarting materials solubility on tobermorite structure formation under the hydrothermalconditions IOP Conference Series Materials Science and Engineering 379(1)1ndash8 2018
[10] T Mitsuda K Sasaki and H Ishida Phase Evolution during Autoclaving Process J AmCeram Soc 75(75)1858ndash1863 1992
[11] A Skawińska The influence of metahalloysite addition on tobermorite formation studied byX-ray powder diffraction and scanning electron microscope MATEC Web of Conferences16305008 2018
[12] S T Bergold F Goetz-Neunhoeffer and J Neubauer Quantitative analysis of C-S-H in
25
5 References
hydrating alite pastes by in-situ XRD Cement and Concrete Research 53119ndash126 2013
[13] O P Shrivastava and F P Glasser Ion-exchange properties of 11-Aring tobermorite Reactivityof Solids 2(3)261ndash268 1986
[14] H Maeda Y Ogawa E H Ishida and T Kasuga Hydrothermal synthesis of tobermoritedoped with phosphorus species for removing heavy metal ions Journal of the AustralianCeramic Society 48(1)8ndash11 2012
[15] O P Shrivastava and R Shrivastava Cation exchange applications of synthetic tobermoritefor the immobilization and solidification of cesium and strontium in cement matrix Bulletinof Materials Science 23(6)515ndash520 2000
[16] G Renman and A Renman Sustainable Use of Crushed Autoclaved Aerated Concrete(CAAC) as a Filter Medium in Wastewater Purification 8th International conferenceon sustainable management of waste and recycled materials in construction GothenburgSweden 30 Mayndash1 June 2012 Proceedings pages 1ndash7 2012
[17] G Schober Chemical transformations during the manufacturing of autoclaved aeratedconcrete (ACC) Cement lime gypsum and quartz sand become cellular concrete ZKG58(7)63ndash70 2005
[18] A J Hamad Materials Production Properties and Application of Aerated LightweightConcrete Review International Journal of Materials Science and Engineering 2(2)152ndash157 2014
[19] D Ectors F Goetz-Neunhoeffer and J Neubauer A generalized geometric approach toanisotropic peak broadening due to domain morphology Journal of Applied Crystallogra-phy 48(1)189ndash194 2015
[20] H M Rietveld A profile refinement method for nuclear and magnetic structures Journalof Applied Crystallography 2(2)65ndash71 1969
[21] S A Hamid The crystal structure of the 11 Aring natural tobermoriteCa225[Si3O75(OH)15]1H2O Zeitschrift fuer Kristallographie - New Crystal Struc-tures 154(3-4)189ndash198 1981
[22] S A S El-Hemaly T Mitsuda and H F W Taylor Synthesis of normal and anomaloustobermorites Cement and Concrete Research 7429ndash438 1977
[23] M Sakiyama and T Mitsuda Hydrothermal reaction between C-S-H and kaolinite for theformation of tobermorite at 180degC Cement and Concrete Research 7(6)681ndash685 1977
[24] E Bonaccorsi S Merlino and A R Kampf The crystal structure of tobermorite 14 Aring(plombierite) a C-S-H phase Journal of the American Ceramic Society 88(3)505ndash5122005
[25] S Merlino E Bonaccorsi and T Armbruster The real structures of clinotobermorite andtobermorite 9 Aring OD character polytypes and structural relationships European Journalof Mineralogy 12(2)411ndash429 2000
[26] K Momma and F Izumi VESTA 3 for three-dimensional visualization of crystal volu-metric and morphology data Journal of Applied Crystallography 44(6)1272ndash1276 2011
26
5 References
[27] S Shaw S M Clark and C MB Henderson Hydrothermal formation of the calcium sil-icate hydrates tobermorite (Ca5Si6O16(OH)2 middot 4H2O) and xonotlite (Ca6Si6O17(OH)2)An in situ synchrotron study Chemical Geology 167(1-2)129ndash140 2000
[28] K Matsui J Kikuma M Tsunashima T Ishikawa S Matsuno A Ogawa and M SatoIn situ time-resolved X-ray diffraction of tobermorite synthesis process under hydrothermalcondition IOP Conference Series Materials Science and Engineering 18(2)60ndash66 2011
[29] G Matekonis R Šiaučiunas and D Vaičiukyniene Hydrothermal Synthesis and Charac-terization of Na + and [ Al 3 + + Na + ] -substituted Tobermorite in CaO-SiO2middotnH2O-H2OSystem MATERIALS SCIENCE 16(3)242ndash248 2010
[30] G Geng R J Myers M J A Qomi and P JM Monteiro Densification of the inter-layer spacing governs the nanomechanical properties of calcium-silicate-hydrate ScientificReports 7(1)1ndash8 2017
[31] D Klimesch and A Ray Autoclaved cement-quartz pastes with metakaolin additionsAdvanced Cement Based Materials 7(3-4)109ndash118 1998
[32] N Y Mostafa A A Shaltout H Omar and S A Abo-El-Enein Hydrothermal synthesisand characterization of aluminium and sulfate substituted 11 nm tobermorites Journal ofAlloys and Compounds 467(1-2)332ndash337 2009
[33] İ Demir M S Başpınar E Kahraman E Ccedilalışkan and G Goumlrhan An Investigation onthe Usability of Diatomite in Aerated Concrete Production In Proc of the Intl Conf onAdvances In Civil Structural And Construction Engineering - CSCE 2014 pages 97ndash1002014
[34] A Skawinska Z Owsiak T Baran and K Hernik The influence of halloysite additionon tobermorite formation in CaO and quartz mix under hydrothermal conditions CementWapno Beton 17(12)426ndash434 2017
[35] N Y Mostafa Influence of air-cooled slag on physicochemical properties of autoclavedaerated concrete Cement and Concrete Research 35(7)1349ndash1357 2005
[36] D Małaszkiewicz and J Chojnowski Influence of addition of calcium sulfate dihydrate ondrying of autoclaved aerated concrete Open Engineering 7(1)273ndash278 2017
[37] N Hara and N Inoue Thermal behaviour of 11Aring tobermorite and its lattice parametersCement and Concrete Research (10)53ndash60 1980
[38] M D Jackson S R Chae S R Mulcahy C Meral R Taylor P Li A H EmwasJ Moon S Yoon G Vola H R Wenk and P JM Monteiro Unlocking the secretsof Al-tobermorite in Roman seawater concrete American Mineralogist 98(10)1669ndash16872012
[39] W Liao W Li Z Fang C Lu and Z Xu Effect of different aluminum substitution rateson the structure of Tobermorite Materials 12(22)1ndash10 2019
[40] D Klimesch and A Ray DTA-TG Study of the CaO-SiO2-H2O and CaO-Al2O3-SiO2-H2OSystems Under Hydrothermal Conditions Journal of Thermal Analysis and Calorimetry56(1)27ndash34 1999
27
5 References
[41] Z Sauman and Z Valtr Substitution of sulphate ions in the crystal lattice of 11 Aring to-bermorite In The VI International Congress on the Chemistry of Cement pages 1ndash14Moscow 1974
[42] G Schober Reaction of raw materials to the final product AAC httpwwwpb-aacde
chemmin2_ehtml 2012 accessed 2020-01-31
[43] D Jansen C Stabler F Goetz-Neunhoeffer S Dittrich and J Neubauer Does Ordi-nary Portland Cement contain amorphous phase A quantitative study using an externalstandard method Powder Diffraction 26(01)31ndash38 2011
[44] C Roumlszligler J Stark F Steiniger and W Tichelaar Limited-dose electron microscopyreveals the crystallinity of fibrous C-S-H phases Journal of the American Ceramic Society89(2)627ndash632 2006
[45] Y Sakalli and R Trettin Investigation of C3S hydration by environmental scanning elec-tron microscope Journal of Microscopy 259(1)53ndash58 2015
[46] F Matsushita Y Aono and S Shibata Expansion and shrinkage behavior of green cakeof Autoclaved Aerated Concrete In Autoclaved Aerated Concrete - Innovation and Devel-opment Proceedings of the 4th International Conference on Autoclaved Aerated ConcreteKingston UK 8-9 September 2005 pages 101ndash108 CRC Press 2005
[47] C Chucholowski M Holger and K-C Thienel Improving the recyclability environmentalcompatibility and CO2 balance of autoclaved aerated concrete by replacing sulfate carrierand cement with calcined clays CePapers 2(4)503ndash512 2018
[48] X Y Huang W Ni W H Cui Z J Wang and L P Zhu Preparation of autoclavedaerated concrete using copper tailings and blast furnace slag Construction and BuildingMaterials 27(1)1ndash5 2012
[49] W Wongkeo and A Chaipanich Compressive strength microstructure and thermal anal-ysis of autoclaved and air cured structural lightweight concrete made with coal bottom ashand silica fume Materials Science and Engineering A 527(16-17)3676ndash3684 2010
[50] A Roacuteżycka and W Pichoacuter Effect of perlite waste addition on the properties of autoclavedaerated concrete Construction and Building Materials 12065ndash71 2016
[51] N Isu H Ishida and T Mitsuda Influence of quartz particle size on the chemical andmechanical properties of autoclaved aerated concrete (I) tobermorite formation Cementand Concrete Research 25(25)243ndash248 1995
[52] D Ectors Advances in the analysis of cementitious reactions and hydrate phases doctoralthesis PhD thesis Friedrich-Alexander-Universitaumlt Erlangen-Nuumlrnberg 2016
[53] D Ectors F Goetz-Neunhoeffer and J Neubauer Domain size anisotropy in the double-Voigt approach An extended model Journal of Applied Crystallography 481998ndash20012015
[54] D Ectors F Goetz-Neunhoeffer and J Neubauer Routine (an)isotropic crystallite sizeanalysis in the double-Voigt approximation done right Powder Diffraction 32(S1)27ndash342017
28
5 References
[55] D Jansen F Goetz-Neunhoeffer C Stabler and J Neubauer A remastered external stan-dard method applied to the quantification of early OPC hydration Cement and ConcreteResearch 41(6)602ndash608 2011
[56] T Ungaacuter G Tichy J Gubicza and R J Hellmig Correlation between subgrains andcoherently scattering domains Powder Diffraction 20(04)366ndash375 2005
[57] Triloki P Garg R Rai and B K Singh Structural characterization of as-depositedcesium iodide films studied by X-ray diffraction and transmission electron microscopy tech-niques Nuclear Instruments and Methods in Physics Research Section A AcceleratorsSpectrometers Detectors and Associated Equipment 736128ndash134 2014
[58] J Schreiner F Goetz-Neunhoeffer J Neubauer and D Jansen Hydrothermal synthesisof 11 Aring tobermorite ndash Effect of adding metakaolin to the basic compound Applied ClayScience 185 2020
[59] J Schreiner F Goetz-Neunhoeffer J Neubauer S Volkmann S Bergold R Webler andD Jansen Advanced Rietveld refinement and SEM analysis of tobermorite in chemicallydiverse autoclaved aerated concrete Powder Diffraction 34143ndash150 2019
[60] J Schreiner D Jansen D Ectors F Goetz-Neunhoeffer J Neubauer and S VolkmannNew analytical possibilities for monitoring the phase development during the production ofautoclaved aerated concrete Cement and Concrete Research 107247ndash252 2018
29
6 Publications
6 Publications
61 Hydrothermal synthesis of 11 Aring tobermorite ndash Effectof adding metakaolin to the basic compound
Reprint of the peer reviewed publication
Schreiner J Goetz-Neunhoeffer F Neubauer J Jansen D 2020 Hydrothermalsynthesis of 11 Aring tobermorite ndash Effect of adding metakaolin to the basic compoundApplied Clay Science 185 httpsdoiorg101016jclay2019105432
with permission from Elsevier
30
Contents lists available at ScienceDirect
Applied Clay Science
journal homepage wwwelseviercomlocateclay
Research paper
Hydrothermal synthesis of 11 Aring tobermorite ndash Effect of adding metakaolin tothe basic compound
J Schreiner F Goetz-Neunhoeffer J Neubauer D JansenUniversity of Erlangen-Nuremberg GeoZentrum Nordbayern Mineralogy Schlossgarten 5a 91054 Erlangen Germany
A R T I C L E I N F O
KeywordsHydrothermal synthesis11 Aring tobermoriteMetakaolinPowder diffractionKatoite
A B S T R A C T
Different amounts and types of metakaolin were analyzed and applied for the hydrothermal synthesis of 11 Aringtobermorite All synthesized samples were investigated by means of powder XRD combined with Rietveld re-finement Al-substituted 11 Aring tobermorite was successfully synthesized on the basis of a broad range of com-pounds characterized by a varying content of metakaolin Katoite was present depending on the amount ofsupplied Al3+ which was determined by the dosage of metakaolin Minor crystalline components included in thetwo types of metakaolin sources varied greatly in their reactivity under hydrothermal conditions Despite adifferent degree of purity the two types of metakaolin showed corresponding effects at moderate dosages butcontrary effects at higher dosages as for the synthesis of 11 Aring tobermorite The domain morphology of to-bermorite could be associated with Al3+ incorporation for low dosages of metakaolin represented by up to 2 wt- Al2O3 in the dry mix By contrast Al3+ affected tobermorite lattice parameters at equivalent and even athigher dosages with c reaching 2295 Aring at 12 wt- Al2O3 in the dry mix
1 Introduction
11 Application of metakaolin as a reactive material in constructionindustry
The application of supplementary cementitious materials (SCMs) inthe field of construction technology has received a lot of attention inrecent years Due to limited resources and an urgent need for alter-native and more eco-friendly construction materials SCMs such asmetakaolin offer a great potential The usage of SCMs has not onlyspread to the cement and mortar industry but also to advanced appli-cations such as autoclaved aerated concrete (AAC) (Demir et al 2014Koutnyacute et al 2014 Walczak et al 2015 Roacuteżycka and Pichoacuter 2016Chucholowski et al 2018) Unlike ordinary cementitious constructionmaterials AAC is produced from hydrothermal curing Due to the dif-ferent thermodynamic environment the hydration process and the re-activity of raw materials have to be investigated properly in order tounderstand the effects on the AAC product The leading mineral phasein AAC is 11 Aring tobermorite (Ca5Si6O16(OH)2middot4H2O) As a consequencethe thermal and mechanical properties of AAC depend on micro-structure and crystallinity of tobermorite to some extent In addition tothe curing time and the fineness of raw materials the supply of ionsthat can substitute in the tobermorite structure is a crucial factor in thiscontext Especially substitutions by aluminum sodium and potassium
ions have been investigated thoroughly (Sauman 1974 Klimesch andRay 1998 Mostafa et al 2009 Matekonis et al 2010 Skawinskaet al 2017) Calcined clays usually contain a considerable amount ofthe mentioned ions
There is a vast amount of literature on the reactivity of SCMs atambient temperature and standard pressure but there is little when itcomes to hydrothermal conditions In previous publications the beha-vior of metakaolin under hydrothermal conditions was mainly in-vestigated for the synthesis of zeolites (Zhang et al 2007 Aguilar-Mamani et al 2014 Setthaya et al 2016 Luo et al 2018) In thesestudies the reactivity of metakaolin was observed at a wide range oftemperature and pH values During the transformation of kaolin intometakaolin a loss of framework alumina was observed (Ayodele et al2019) In recent decades metakaolin has been the subject of studies inthe field of geopolymer research (Rashad 2013 Chen et al 2016) Forthe synthesis of 11 Aring tobermorite a more distinct setting of temperaturesetting (180ndash200 degC) and steam pressure (1ndash12 MPa) are required
This publication is intended to make a new contribution to thechallenging field of hydrothermal synthesis in the system CaO-Al2O3-SiO2-H2O based on XRD analysis combined with Rietveld refinementVarious dosages of two types of metakaolin with different chemical andmineralogical purities are compared for the effects on the hydrothermalsynthesis of Al-substituted 11 Aring tobermorite Especially changes of thebulk chemistry in the raw mixes the reactivity of minor crystalline
httpsdoiorg101016jclay2019105432Received 20 August 2019 Received in revised form 13 November 2019 Accepted 30 December 2019
Corresponding authorE-mail address juergenjsschreinerfaude (J Schreiner)
Applied Clay Science 185 (2020) 105432
0169-1317 copy 2020 Elsevier BV All rights reserved
T
6 Publications
31
phases of the two types of metakaolin and the effect of different curingtimes are the focus of interest On the one hand metakaolin offers agreat potential in the AAC industry On the other hand of all SCMsmetakaolin is a good source material for investigating the influence ofAl3+ on the synthesis of Al-substituted 11 Aring tobermorite
12 Synthesis of Al-substituted 11 Aring tobermorite
In addition to being present in AAC tobermorite has found appli-cation in wastewater treatment and nuclear waste management due toits ion exchange capacity (Maeda et al 2012 Monasterio et al 2015)The substitution of silicon by aluminum results in a different to-bermorite structure due to general and local charge balance affectingthe lattice parameters Especially c is impacted by this substitutionbecause it occurs in the bridging tetrahedron and additional OHndash sub-stitutes O2ndash (Komarneni et al 1985 Merlino et al 2000) As suggestedin some additional studies the substitution of Si4+ by Al3+ and Na+ orK+ leads to a lath-like morphology of tobermorite crystals (Mostafa2005 Mostafa et al 2009 Venhodovaacute et al 2015 Qu et al 2018)However because of the heterogeneous appearance of tobermorite inAAC it is hardly possible to conduct a proper characterization based onSEM analysis In our recent work the anisotropic peak broadening oftobermorite in XRD diffractograms was successfully linked with theincorporation of foreign ions supplied in a common AAC production(Schreiner et al 2019) This finding allowed a more statistical struc-tural characterization of tobermorite in bulk compositions compared toSEM analysis Moreover it was reported in other studies that differenthydrate phases occur depending on the amount of supplied ions and onthe experimental settings In compounds with a high content of Al3+formation of katoite could be observed (Klimesch and Ray 1998 Riacuteoset al 2009 Matsui et al 2011) In the case of a longer curing durationinstead of 11 Aring tobermorite the formation of xonotlite (Siauciunas andBaltakys 2004 Galvaacutenkovaacute et al 2018) or - depending on the finenessof used silica source (Siauciunas and Baltakys 2004) - gyrolite is fa-voured
Kalousek (1956) suggested that tobermorite can contain up to 5Al2O3 More Al2O3 in the system resulted in the formation of hydro-garnet Klimesch and Ray (1998) additionally investigated the stabilityof hydrogarnet depending on the Al(Si + Al) ratio and its role in re-lation to the formation of 11 Aring tobermorite in an equivalent systemThey suggest that hydrogarnet always appears before tobermorite butthe former can only be detected for higher Al(Si + Al) ratios in theevent of longer curing times Riacuteos et al (2009) and Qu et al (2018)confirmed these findings in extensive investigations In the latter pub-lication it is additionally suggested that samples prepared at lowertemperatures (160 degC) are less impacted by the supply of Al3+ Theyalso consider the peak broadening of tobermorite in their XRD plotsbased on the amount of incorporated Al3+ In two recent publicationswe suggested that the peak broadening of tobermorite enables a mi-crostructural analysis by calculating the orientation dependent domainsizes (Schreiner et al 2018 2019) However these studies are based onsamples of industrially produced AAC so that the curing time was fixedThe studied AAC was produced from raw materials with a broad che-mical spectrum such as ordinary Portland cement (OPC) whichsomehow complicates the interpretation of results
In this work the influence of aluminum ions - provided by meta-kaolin - on dominant crystallographic direction-dependent domaingrowth of tobermorite is investigated by analysis of anisotropic peakbroadening (Ectors et al 2015 2017) In Fig 1 of the supplementarymaterial the method of fitting the anisotropic peak broadening of to-bermorite using a triaxial cylinder model is visualized (Schreiner et al2018) Fitting of the anisotropic peak broadening of tobermorite Thismethod is used to calculate the average and reliable values for to-bermorite domain sizes in the powder sample and associate them withaverage Al3+ incorporation Microstrain should be considered becauseit is an additional source of peak broadening However this usually
accounts for materials that have been exposed to different kinds ofstress such as metals and alloys (Badawi et al 2019) In addition theinstrumental contribution to peak broadening should be consideredHydration products such as tobermorite are characterized by crystallitesizes in the range of nanometers so that anisotropic size broadeningclearly outweighs the effect of instrumental broadening (Jenkins andSnyder 1996) Moreover the impact of Al3+ on the lattice parametersof tobermorite is considered It should additionally be clarified whe-ther the results from our previous publication (Schreiner et al 2019)based on industrially produced AAC can be confirmed by investigationwith less complex raw mixes and purely based on laboratory experi-ments
2 Material and methods
21 Starting materials
The starting materials for hydrothermal synthesis included deio-nized water quartz flour portlandite (999 pure) and two types ofmetakaolin One type was ordinary commercially available metakaolin(MK) with nearly a stoichiometric composition For comparison thesecond type of commercially available metakaolin was a by-productfrom expanded glass production (MKg) and consequently highly im-pure The chemical composition of MK and MKg determined by XRF isgiven in Table 1 With MKg containing less Al2O3 but considerably moreNa2O than MK the effects on hydrothermal synthesis were of interestBoth types of metakaolin have been characterized in previous pub-lications (Schmidt et al 2012 Naber et al 2019) In addition weverified the mineral phase content by XRD analysis Besides amorphousmetakaolin MK contained minor amounts of anatase quartz and mica
Fig 1 Weight fractions of tobermorite quartz and katoite determined byquantitative XRD analysis ndash samples including MKg crosshatched
Table 1Chemical composition of MK and MKg determined by XRF analysis ndash majorcontrasts in bold letters
Oxides [wt-] MK MKg
SiO2 536 604Al2O3 392 206CaO 01 40MgO 01 12Na2O 0 96K2O 10 18Fe2O3 18 05TiO2 21 03P2O5 01 02Loss on ignition 15 1
J Schreiner et al Applied Clay Science 185 (2020) 105432
2
6 Publications
32
MKg contained additional kaolinite feldspar and quartz
22 Investigated mix composites
For the preparation of raw mixtures the powders were weighed andhomogenized using a lab-scale mixing mill Table 2 lists the composi-tion and nomenclature of all samples including Al2O3 content andcuring time in the autoclave
bull Besides one blank mixture (MK0) that did not contain any type ofmetakaolin eleven more compounds were prepared of which threeincluded different dosages of MKg (MKg16 MKg23 and MKg60)Three more mixes contained equivalent amounts of MK instead ofMKg (MK16 MK23 and MK60) These mixes were investigated inorder to have a direct comparison concerning the effects of differentraw material on the synthesis of tobermorite
bull Additionally the mixes MK9 MK5 and MK25 with lower dosages ofmetakaolin were analyzed In the referenced literature (Schreineret al 2019) the effect of Al3+ on the anisotropic peak broadeningof tobermorite could only be observed in the case of Al2O3 contentslower than 4 in the drymix In the latter three mixes Al2O3 con-tents range from 1 to 35 Al2O3 (calculated from XRF data) whichmeets the region of interest for the analysis of tobermorite domainmorphology
bull The curing time for nearly all of the investigated samples was 12 hbut compound MK9 was prepared two more times for curing timesof 2 h and 6 h The different curing times were chosen in this par-ticular sample so that the reactivity of metakaolin and the phasetransitions could be observed more precisely
23 Hydrothermal treatment
Due to the different fineness of raw materials there was a differentwater demand from one mixture to another In order to obtain slurriesof comparable rheology the amount of water was adapted respectivelyresulting in water-to-solid ratios of 25 to 3 which matches the sug-gested water-to-solid ratio for this purpose (Roacutezycka et al 2014Galvaacutenkovaacute et al 2018) The weighed water was added to the dry mixand after stirring for 1 min at 23 degC the slurry was poured into thereactor Minor changes in the quantity of added water did not have aninfluence on the measured steam pressure All experiments were con-ducted using a PTFE-lined stainless steel autoclave with a reactor vo-lume of 300 ml The oven temperature was fixed at 180 degC and auto-genous steam pressure of 11ndash12 MPa was measured during eachexperiment with an external manometer After cooling to room tem-perature the sample was removed from the reactor coarsely ground
using an agate mortar and dried at 60 degC for 12 h After drying thesample was ground with an agate mortar again in order to deagglo-merate the particles As no coarse raw materials were used there wasno need for wet McCrone milling (Schreiner et al 2018)
24 XRD analysis
After preparation into front-loading sample holders the powdersamples were measured with a D8 diffractometer (Bruker) equippedwith a LynxEye detection system and Bragg-Brentano geometry Thesettings for XRD analysis included a tube voltage of 40 kV a current of40 mA an angular range from 6 to 80deg 2θ (Cu Kα radiation) a time perstep of 054 s a step width of 00236deg 2θ and a PSD opening of 33deg Thebackground was fitted with Chebyshev polynomial of the fifth orderThe major contribution of amorphous phase was fitted with a singlepeak with a fixed position at 308deg 2θ so that tobermorite reflectionswere not affected An external quartzite standard was measured withthe same parameters in order to determine phase quantities (Jansenet al 2011) Bruker AXS software TOPAS 50 was used for Rietveldrefinement (Rietveld 1969) and the used structures are shown inTable 3
3 Results and discussion
31 Different dosages of MK and MKg
In Fig 1 the quantities of tobermorite quartz and katoite present inmost of the samples determined by XRD analysis are illustratedWhenever tobermorite was the leading mineral hydrate phase a basalspacing of 113 Aring could be verified in each of the diffractograms Thequantities of minor crystalline phases and amorphous content are notshown For low dosages of MK it can be seen that the weight fraction oftobermorite decreased At moderate dosage of both types of metakaolin(MK16 MK23 MKg16 MKg23) tobermorite was present in comparablequantities It can be seen that the amount of katoite in the mixes de-pended on the dosage of metakaolin and it appeared only at dosages ofMK5 or more Due to the higher content of aluminum in MK comparedto MKg more katoite could always be observed in the MK mixes atequivalent dosages Despite equal amounts of quartz as starting mate-rial in mixes for both types of metakaolin the resulting weight fractionsin the cured samples were not alike Considerably more quartz waspresent in the MK samples Even though less quartz was used for mixescontaining higher amounts of MK even more quartz was present afterhydrothermal curing (Table 2 Fig 1) Consequently some of the SiO2
provided by MK did not transform into an amorphous phase or to-bermorite but into quartz This finding is verified by the presence ofquartz in MK60 because no quartz was included in the raw mixture Thefeldspar present in MKg did not react so Na2O and an unknown amountof Al2O3 may not have been supplied for hydrothermal reaction Besidestobermorite and quartz additional calcite scawtite (Ca7Si6(CO3)
Table 2Basic powder compounds prepared for the hydrothermal synthesis of to-bermorite with the respectively calculated Al2O3 content and curing time in thereactor
Sample Portlandite[wt-]
Quartz[wt-]
MK[wt-]
MKg
[wt-]
Al2O3
[wt-]Curingtime [h]
MK0 49 51 ndash ndash 0 12MK25 495 48 25 ndash 1 12MK5 49 46 5 ndash 2 12MK9_2h 48 43 9 ndash 35 2MK9_6h 48 43 9 ndash 35 6MK9_12h 48 43 9 ndash 35 12MK16 47 37 16 ndash 63 12MK23 46 31 23 ndash 9 12MK60 40 ndash 60 ndash 235 12MKg16 47 37 ndash 16 33 12MKg23 46 31 ndash 23 47 12MKg60 40 ndash ndash 60 124 12
Table 3Structural data used for the investigation with powder XRD analysis
Phase Author
Anatase (Horn et al 1972)Biotite (Brigatti et al 2000)Calcite (Maslen et al 1995)Kaolinite (Zvyagin 1960)Katoite (Bartl 1969)Microcline (Bailey 1969)Plazolite (Basso et al 1983)Portlandite (Busing and Levy 1957)Quartz (Le Page and Donnay 1976)Scawtite (Grice 2005)Tobermorite (Hamid 1981)Xonotlite (Hejny and Armbruster 2001)
J Schreiner et al Applied Clay Science 185 (2020) 105432
3
6 Publications
33
O18bull2(H2O)) and xonotlite (Ca6Si6O17(OH)2) could be identified insample MK0 (XRD plots of samples MK0 MKg16 MKg23 MK16 andMK23) Comparing MK0 and MK25 scawtite and xonotlite could stillbe identified in a very low amount in MK25 but no longer in samplesthat contained even more MK (XRD plots of samples MK0 MK25 MK5and MK9_12h)
Two additional experiments were done without quartz in the rawmixes (MK60 and MKg60) The according diffractograms after hydro-thermal curing are shown in Fig 2 In sample MKg60 tobermorite (gt 50wt-) was successfully synthesized without any other silica sourcethan MKg whereas no crystalline quartz occurred By contrast no to-bermorite but quartz could be identified in equivalent mixture MK60containing MK It can be seen that crystalline components such as micaand anatase in the raw MK did not react at the selected conditions andremained present in the autoclaved samples Except for feldspar in MKgall of the crystalline components appeared to be reactive at the chosenhydrothermal conditions A minor unidentified phase occurred at328deg2θ and additional xonotlite was identified in sample MKg60 Insample MK60 more calcium was needed for the formation of morehydrogarnet (Fig 1) resulting in a lower CaSi ratio for the remainingsystem Sample MKg60 contained only half of the amount of Al3+ and itwas not completely supplied for reaction due to its partial presence infeldspar Consequently essentially less hydrogarnet (Fig 1) was presentin MKg60 after hydrothermal treatment and the CaSi ratio in the re-maining system was affected to a lesser extent
32 Application of MK for different curing times
The development of hydrate phases in the autoclave for compoundMK9 is displayed in Fig 3 After only 2 h of hydrothermal curing all ofthe available portlandite had reacted and katoite (95 wt-) was pre-sent The applied type of metakaolin appeared to react quickly as itsupplied aluminum for formation of katoite No formation of to-bermorite could be observed at this stage yet An assumably amorphousprecursor can be seen at 28 to 30deg2θ Calcium was provided by thedissolution of portlandite After 6 h of hydrothermal reaction amountsof katoite (85 wt-) and quartz (from 31 wt- at 2 h to 165 wt- at6 h) had decreased and a major amount of tobermorite (35 wt-) waspresent Apparently between 2 and 6 h under hydrothermal conditionsthe amorphous precursor and quartz reacted resulting in the formationof tobermorite An additional 6 h of reaction time (MK9_12h) did notchange the phase composition significantly Slightly more tobermorite
(365 wt-) less quartz (16 wt-) and katoite (65 wt-) weremeasured
33 Tobermorite domain morphology and lattice parameters
In the referenced literature an analysis of tobermorite domainmorphology based on anisotropic peak broadening was possible forsamples that contained notgt 4 wt- Al2O3 in the drymix (Schreineret al 2019) Accordingly in this study samples MK0 MK25 MK5MK9_6h and MK9_12h were suitable (Table 2) with MK9_2h not con-taining any tobermorite In Fig 4 the respective growth in a and b di-rection is visualized with x indicating the domain size in a direction andy indicating domain size in b direction using a macro for TOPAS 50(Ectors et al 2015 2017) The calculated cylinder models in Fig 4represent the relation of yx and not absolute sizes With no supply ofaluminum ions (MK0) the relative domain growth in b direction islower compared to samples containing metakaolin This finding agreeswith the results from a similar investigation of tobermorite in AAC(Schreiner et al 2019) However within the samples MK5 andMK9_12h the different amounts of supplied aluminum ions did notshow a clear effect It appeared that low dosages of Al3+ (1 wt- Al2O3
in MK25 and 2 wt- Al2O3 in MK5) were enough to determine thedomain growth of tobermorite Additional results from the samplesMK9_6h and MK9_12h indicated that growth in b direction increasedwith reaction time
In Fig 5 lattice parameters of tobermorite depending on metakaolindosages are plotted B clearly remained unaffected throughout therange of samples Increasing amounts of metakaolin led to a slightlysmaller parameter a However both types of metakaolin showed acorresponding impact on parameter a By contrast parameter c in-creased strongly with increasing amounts of MK and MKg but the typeof metakaolin was significant At an equivalent dosage MK affected thecell dimension in c direction considerably more than MKg so that thefraction of Al3+ appeared to be the decisive parameter Different metaloxides in MKg did not show a notable effect certainly as they werepartially not provided for reaction Unlike for the domain morphologyof tobermorite the impact on lattice parameters could be observedwithin the complete range of examined dosages
4 Conclusions
The results obtained from the introduced investigations allow con-cluding remarks on the effects of the applied types of metakaolin on thesynthesis of 11 Aring tobermorite the phase transitions and the in-corporation of Al3+ into the lattice of tobermorite
With a critical dosage the use of any type of metakaolin led to theformation of katoite in an according amount At moderate dosages(MKg16 MKg23 MK16 and MK23) the two types of metakaolin showeda good correspondence in consideration of the quantities of to-bermorite For higher dosages there were contrary effects Lower do-sages of MK led to considerable quantities of Al-substituted to-bermorite Samples containing low dosages of MK revealed that katoiteappeared in the case ofgt 5 wt- of MK - corresponding to 2 wt-Al2O3 - in the basic compound Minor crystalline phases in MKg showedbetter reactivity than those in MK The observation that no tobermoritewas present in sample MK60 indicated that high dosages of Al3+ hin-dered the formation of tobermorite
Investigations of MK9 at 2 6 and 12 h displayed the evolution ofhydrate phases At first katoite was the only crystalline hydrate phasepresent after 2 h which corresponded to observations in a differentpublication (Klimesch and Ray 1999) The amount of katoite andquartz then decreased and a major amount of tobermorite formed from2 to 6 h curing time In order to gain more information on the trans-formation of amorphous C-(A)-S-H into tobermorite additional ex-periments in the range of 2 to 6 h curing time will be needed
Domain morphology analysis of tobermorite revealed that low
Fig 2 Diffractograms of MKg MKg60 MK and MK60 from 7 to 34deg2θ CuKα Aanatase C calcite F feldspar k kaolinite K katoite M mica Q quartz Ttobermorite U unidentified phase X xonotlite
J Schreiner et al Applied Clay Science 185 (2020) 105432
4
6 Publications
34
dosages of Al3+ determined the domain growth which agreed with theresults published on tobermorite in AAC samples (Schreiner et al2019) Different curing times unveiled that growth in b direction in-creased with the reaction time Al3+ incorporation into the lattice oftobermorite only reflected to a limited extent in the domain mor-phology By contrast an increase of lattice parameter c was triggered byAl3+ even at the highest dosage in this study Ultimately there is no
evidence for a limit of incorporation of Al3+ but there is a limit ofinfluence on the domain morphology These results additionally re-confirm this assumption similarly made in the previous work (Schreineret al 2019) and suggest a new mechanism of tobermorite crystal-lization depending on the presence of Al3+
Supplementary data to this article can be found online at httpsdoiorg101016jclay2019105432
Declaration of Competing Interest
The authors declare that they have no known competing financialinterests or personal relationships that could have appeared to influ-ence the work reported in this paper
Acknowledgement
The authors thank Rodgauer Baustoffwerke GmbH amp Co KG forsupplying raw materials for laboratory experiments
References
Aguilar-Mamani W Garciacutea G Hedlund J Mouzon J 2014 Comparison betweenleached metakaolin and leached diatomaceous earth as raw materials for the synth-esis of ZSM-5 Springerplus 3 1ndash10 httpsdoiorg1011862193-1801-3-292
Ayodele OB Sulaimon AA Alaba PA Tian Z-Y 2019 Influence of metakaolini-zation temperature on the structure and activity of metakaolin supported Ni catalystin dry methane reforming J Environ Chem Eng httpsdoiorg101016jjece2019103239 (in press)
Badawi EA Abdel-Rahman MA Mostafa A Abdel-Rahman M 2019 Determinationof the crystallite size amp micro- strain by novel method from XRD profile Appl Phys2 1ndash15 httpsdoiorg1031058jap201921001
Bailey SW 1969 Refinement of an intermediate microcline structure Am Miner 541540ndash1545
Bartl H 1969 Roentgen-Einkristalluntersuchungen an (CaO)3 (Al2O3) (H2O)6 und an(CaO)12 (Al2O3)7 (H2O) neuer Vorschlag zur (CaO)12 (Al2O3)7-Struktur NeuesJahrb fuer Mineral Monatshefte 1969 404ndash413
Basso R Giusta AD Zefiro L 1983 Crystal structure refinement of plazolite A highlyhydrated natural hydrogrossular Neues Jahrb Miner Monatsh (Neues Jahrb fuerMineral Monatshefte) 1983 251ndash258
Brigatti MF Lugli C Poppi L Foord EE Kile DE 2000 Crystal chemical varia-tions in Li- and Fe-rich micas from Pikes Peak batholith (Central Colorado) AmMineral 85 1275ndash1286 httpsdoiorg102138am-2000-8-920
Busing WR Levy HA 1957 Neutron diffraction study of calcium hydroxide J ChemPhys 26 563 httpsdoiorg10106311743345
Chen L Wang Z Wang Y Feng J 2016 Preparation and properties of alkali acti-vated metakaolin-based geopolymer Materials (Basel) 9 1ndash12 httpsdoiorg103390ma9090767
Chucholowski C Holger M Thienel K-C 2018 Improving the recyclability en-vironmental compatibility and CO2 balance of autoclaved aerated concrete by re-placing sulfate carrier and cement with calcined clays CePapers 2 503ndash512httpsdoiorg101002cepa846
Fig 3 Diffractograms of MK9_2h MK9_6h and MK9_12h from 7 to 38deg2θ CuKα C calcite K katoite Q quartz T tobermorite
Fig 4 Relation of calculated domain sizes of 11 Aring tobermorite in selectedsamples (MK0 MK25 MK5 MK9_6h and MK9_12h) in a (x) and b (y) direction
Fig 5 Lattice parameters of tobermorite depending on MK or MKg dosageincluding blank mix MK0
J Schreiner et al Applied Clay Science 185 (2020) 105432
5
6 Publications
35
Demir İ Başpınar MS Kahraman E Ccedilalışkan E Goumlrhan G 2014 An investigationon the usability of diatomite in aerated concrete production In Proc of the IntlConf on Advances in Civil Structural and Construction Engineering ndash CSCE 2014 pp97ndash100
Ectors D Goetz-Neunhoeffer F Neubauer J 2015 A generalized geometric approachto anisotropic peak broadening due to domain morphology J Appl Crystallogr 48189ndash194 httpsdoiorg101107S1600576714026557
Ectors D Goetz-Neunhoeffer F Neubauer J 2017 Routine (an)isotropic crystallitesize analysis in the double-Voigt approximation done right Powder Diffract 3227ndash34 httpsdoiorg101017S0885715617000070
Galvaacutenkovaacute L Bartoniacutečkovaacute E Opravil T Tkacz J Ptaacuteček P 2018 The influence ofstarting materials solubility on tobermorite structure formation under the hydro-thermal conditions IOP Conf Ser Mater Sci Eng 379 1ndash8 httpsdoiorg1010881757-899X3791012001
Grice JD 2005 The structure of spurrite tilleyite and scawtite and relationships toother silicate-carbonate minerals Can Mineral 43 1489ndash1500 httpsdoiorg102113gscanmin4351489
Hamid SA 1981 The crystal structure of the 11 Aring natural tobermoriteCa225[Si3O75(OH)15]1H2O Zeitschrift fuer Krist 154 189ndash198 httpsdoiorg101524zkri19811543-4189
Hejny C Armbruster T 2001 Polytypism in xonotlite Ca6Si6O17(OH)2 Zeitschrift furKrist 216 396ndash408
Horn M Schwerdtfeger CF Meagher EP 1972 Refinement of the structure of ana-tase at several temperatures Zeitschrift fur Krist 136 273ndash281 httpsdoiorg101524zkri19721363-4273
Jansen D Goetz-Neunhoeffer F Stabler C Neubauer J 2011 A remastered externalstandard method applied to the quantification of early OPC hydration Cem ConcrRes 41 602ndash608 httpsdoiorg101016jcemconres201103004
Jenkins R Snyder R 1996 Introduction to X-ray Powder Diffractometry ChemicalAnalysis Wiley pp 90
Kalousek GL 1956 Crystal Chemistry of Hydrous Calcium Silicates J Am Ceram Soc40 74ndash80
Klimesch D Ray A 1998 Autoclaved cement-quartz pastes with metakaolin additionsAdv Cem Based Mater 7 109ndash118 httpsdoiorg101016S1065-7355(97)00073-4
Klimesch D Ray A 1999 DTA-TGA evaluations of the CaOndashAl2O3ndashSiO2ndashH2O systemtreated hydrothermally Thermochim Acta 334 115ndash122 httpsdoiorg101016s0040-6031(99)00140-9
Komarneni S Roy R Roy DM Fyfe CA Kennedy GJ Bothner-By AA Dadok JChesnick AS 1985 27Al and29Si magic angle spinning nuclear magnetic resonancespectroscopy of Al-substituted tobermorites J Mater Sci 20 4209ndash4214 httpsdoiorg101007BF00552416
Koutnyacute O Opravil T Pořiacutezka J 2014 Application of metakaoline in autoclavedaerated concrete technology Adv Mater Res 1000 174ndash177 httpsdoiorg104028wwwscientificnetAMR1000174
Le Page Y Donnay G 1976 Refinement of the crystal structure of low-quartz ActaCrystallogr Sect B 32 2456ndash2459 httpsdoiorg101107S0567740876007966
Luo H Law WW Wu Y Zhu W Yang EH 2018 Hydrothermal synthesis of needle-like nanocrystalline zeolites from metakaolin and their applications for efficient re-moval of organic pollutants and heavy metals Microporous Mesoporous Mater 2728ndash15 httpsdoiorg101016jmicromeso201806015
Maeda H Ogawa Y Ishida EH Kasuga T 2012 Hydrothermal synthesis of to-bermorite doped with phosphorus species for removing heavy metal ions J AustCeram Soc 48 8ndash11
Maslen EN Streltsov VA Streltsova NR Ishizawa N 1995 Electron density andoptical anisotropy in rhombohedral carbonates III Synchrotron Xray studies ofCaCO3 MgCO3 and MnCO3 Acta Crystallogr Sect B 51 929ndash939 httpsdoiorg101107S0108768195006434
Matekonis G Šiaučiūnas R Vaičiukynienė D 2010 Hydrothermal Synthesis andCharacterization of Na + and [ Al 3 + + Na + ] -substituted Tobermorite in CaO-SiO2middotnH2O-H2O System Mater Sci 16 242ndash248
Matsui K Kikuma J Tsunashima M Ishikawa T Matsuno S Ogawa A Sato M2011 In situ time-resolved X-ray diffraction of tobermorite synthesis process underhydrothermal condition IOP Conf Ser Mater Sci Eng 18 60ndash66 httpsdoiorg1010881757-899X182022017
Merlino S Bonaccorsi E Armbruster T 2000 The real structures of clinotobermoriteand tobermorite 9 Aring OD character polytypes and structural relationships Eur JMineral 12 411ndash429 httpsdoiorg1011270935-122120000012-0411
Monasterio M Gaitero JJ Manzano H Dolado JS Cerveny S 2015 Effect ofchemical environment on the dynamics of water confined in calcium silicate mi-nerals Natural and synthetic tobermorite Langmuir 31 4964ndash4972 httpsdoiorg101021acslangmuir5b00614
Mostafa NY 2005 Influence of air-cooled slag on physicochemical properties of auto-claved aerated concrete Cem Concr Res 35 1349ndash1357 httpsdoiorg101016jcemconres200410011
Mostafa NY Shaltout AA Omar H Abo-El-Enein SA 2009 Hydrothermal synth-esis and characterization of aluminium and sulfate substituted 11 nm tobermoritesJ Alloys Compd 467 332ndash337 httpsdoiorg101016jjallcom200711130
Naber C Stegmeyer S Jansen D Goetz-Neunhoeffer F Neubauer J 2019 ThePONKCS method applied for time resolved XRD quantification of supplementarycementitious material reactivity in hydrating mixtures with ordinary Portland ce-ment Constr Build Mater 214 449ndash457 httpsdoiorg101016jconbuildmat201904157
Qu X Zhao Z Zhao X 2018 Microstructure and characterization of aluminum-in-corporated calcium silicate hydrates (C-S-H) under hydrothermal conditions RSCAdv 8 28198ndash28208 httpsdoiorg101039c8ra04423f
Rashad AM 2013 Metakaolin as cementitious material history scours production andcomposition - a comprehensive overview Constr Build Mater 41 303ndash318 httpsdoiorg101016jconbuildmat201212001
Rietveld HM 1969 A profile refinement method for nuclear and magnetic structures JAppl Crystallogr 2 65ndash71 httpsdoiorg101107S0021889869006558
Riacuteos CA Williams CD Fullen MA 2009 Hydrothermal synthesis of hydrogarnet andtobermorite at 175 degC from kaolinite and metakaolinite in the CaO-Al2O3-SiO2-H2Osystem a comparative study Appl Clay Sci 43 228ndash237 httpsdoiorg101016jclay200809014
Roacuteżycka A Pichoacuter W 2016 Effect of perlite waste addition on the properties of au-toclaved aerated concrete Constr Build Mater 120 65ndash71 httpsdoiorg101016jconbuildmat201605019
Roacutezycka A Kotwica Ł Małolepszy J 2014 Synthesis of single phase gyrolite in theCaO-quartz-Na2O-H2O system Mater Lett 120 166ndash169 httpsdoiorg101016jmatlet201401003
Sauman Z 1974 Influence of SO4 2ndash ions on the formation of 11 Aring tobermorite InProceedings of the 2nd International Symposium on Science and Research in SilicateChemistry Moscow pp 25ndash39
Schmidt M Egersdoumlrfer A Poumlllmann H 2012 Increased reactivity using a glass-containing metakaolin as an active filler in lime-based binder systems ZKG Int 6554ndash62
Schreiner J Jansen D Ectors D Goetz-Neunhoeffer F Neubauer J Volkmann S2018 New analytical possibilities for monitoring the phase development during theproduction of autoclaved aerated concrete Cem Concr Res 107 247ndash252 httpsdoiorg101016jcemconres201802028
Schreiner J Goetz-Neunhoeffer F Neubauer J Volkmann S Bergold S Webler RJansen D 2019 Advanced Rietveld refinement and SEM analysis of tobermorite inchemically diverse autoclaved aerated concrete Powder Diffract 34 143ndash150httpsdoiorg101017s0885715619000149
Setthaya N Chindaprasirt P Pimraksa K 2016 Preparation of zeolite nanocrystals viahydrothermal and solvothermal synthesis using of rice husk ash and metakaolinMater Sci Forum 872 242ndash247 httpsdoiorg104028wwwscientificnetmsf872242
Siauciunas R Baltakys K 2004 Formation of gyrolite during hydrothermal synthesis inthe mixtures of CaO and amorphous SiO2 or quartz Cem Concr Res 34 2029ndash2036httpsdoiorg101016jcemconres200403009
Skawinska A Owsiak Z Baran T Hernik K 2017 The influence of halloysite ad-dition on tobermorite formation in CaO and quartz mix under hydrothermal condi-tions Cem Wapno Bet 17 426ndash434
Venhodovaacute E Janovskyacute R Drochytka R 2015 Formation of tobermorite at differentmaterials composition of aerated concrete Appl Mech Mater 752ndash753 247ndash250httpsdoiorg104028wwwscientificnetamm752-753247
Walczak P Małolepszy J Reben M Szymański P Rzepa K 2015 Utilization ofwaste glass in autoclaved aerated concrete Proc Eng 122 302ndash309 httpsdoiorg101016jproeng201510040
Zhang Y Gao W Cui L 2007 The transformation of acid leached metakaolin tozeolite beta Stud Surf Sci Catal 170 420ndash425 httpsdoiorg101016S0167-2991(07)80870-6
Zvyagin BB 1960 An attempt to electronographic determination of kaolinite structureJ Dokl Akad Nauk SSSR 130 1023ndash1026
J Schreiner et al Applied Clay Science 185 (2020) 105432
6
6 Publications
36
6 Publications
62 Advanced Rietveld refinement and SEM analysis oftobermorite in chemically diverse autoclaved aeratedconcrete
Following the copyright guidelines by Cambridge University Press the publication
Schreiner J Goetz-Neunhoeffer F Neubauer J Volkmann S Bergold S WeblerR Jansen D 2019 Advanced Rietveld refinement and SEM analysis of tobermorite inchemically diverse autoclaved aerated concrete Powder Diffraction 34 143ndash150 httpsdoiorg101017s0885715619000149
may not be reprinted It can be accessed at
httpswwwcambridgeorgcorejournalspowder-diffractionarticleadvanced-rietveld-refinement-and-sem-analysis-of-tobermorite-in-chemically-diverse-autoclaved-aerated-concrete51597C2A66F6F225D29DEB2675E74249
37
6 Publications
63 New analytical possibilities for monitoring the phasedevelopment during the production of autoclavedaerated concrete
Reprint of the peer reviewed publication
Schreiner J Jansen D Ectors D Goetz-Neunhoeffer F Neubauer J VolkmannS 2018 New analytical possibilities for monitoring the phase development during theproduction of autoclaved aerated concrete Cement and Concrete Research 107 247ndash252httpsdoiorg101016jcemconres201802028
with permission from Elsevier
38
Contents lists available at ScienceDirect
Cement and Concrete Research
journal homepage wwwelseviercomlocatecemconres
Short communication
New analytical possibilities for monitoring the phase development duringthe production of autoclaved aerated concrete
J Schreinera D Jansena D Ectorsa F Goetz-Neunhoeffera J Neubauera S Volkmannb
aUniversity of Erlangen-Nuremberg GeoZentrum Nordbayern Mineralogy Schlossgarten 5a 91054 Erlangen Germanyb Rodgauer Baustoffwerke GmbH amp Co KG Am Opel-Pruumlffeld 3 63110 Rodgau-Dudenhofen Germany
A B S T R A C T
This work presents improved analytical methods for both steps of the production process of autoclaved aeratedconcrete (AAC) the phase development during the hydration before autoclaving and during the autoclavingprocess itself The improvement includes new insights into preparation methods of AAC samples for powderdiffraction as well as Rietveld refinement strategies For the first time a new implementation for calculatinganisotropic crystal domain sizes is applied to major hydrate phases occurring during AAC production namelyportlandite during the hydration before autoclaving and tobermorite during the autoclaving process The cal-culation of anisotropic domain size growth which can be implemented in the Rietveld environment is based oncrystallographically and geometrically appropriate models The implementation of calculating anisotropic do-main sizes for the Rietveld software TOPAS 50 allows a superior Rietveld fit and a more accurate quantificationof the phase development Additionally it enables the tracking of growth mechanism of portlandite duringhydration
1 Introduction
Autoclaved aerated concrete (AAC) is known as a lightweight con-struction material which offers outstanding properties such as suffi-cient strength for construction in addition with excellent thermal in-sulation [12] AAC is produced by autoclaving from calcareous rawmaterials such as lime (CaO) and cement quartz sulfate carrier andother additives such as foaming agents and water
The production process (Fig 1) can be separated into the hydrationof the mixed slurry before the procedure of autoclaving and the auto-claving at elevated temperature (180 degC to 200 degC) under saturatedsteam pressure (12MPa) for several hours
The hydration process before autoclaving is necessary to achievesufficient strength in order to cut the green cake blocks as they shouldhave a specific shape and dimension after autoclaving Furthermorethe porous structure is generated by the foaming agent during hydra-tion in the first process step During autoclaving the final propertiesnamely strength and low thermal conductivity are achieved
It is already well understood that the autoclaving process leads tothe formation of several phases first of all tobermorite(Ca5Si6O16(OH)2lowast4H2O) [3ndash5] Newest research has shown im-pressively which reactions are running from the mineralogical point ofview Insitu XRD measurements were carried out during the
autoclaving process and the phase development was shown by plottingnormalized intensities [6] The study of Mitsuda et al [3] was mainlyfocused on the tracking of the phase evolution during the autoclavingprocess of AAC However their statements concerning phase evolutionare mainly based on XRD data and TGA measurements There is acommon agreement that the following reactions occur The consump-tion of the alite (OPC) leads to the formation of an initial C-S-H phaseduring the first processing step Portlandite which was initially formedduring the first process step (from CaO and C3S) further quartz and theC-S-H phase are consumed during autoclaving resulting in the crystal-lization of tobermorite Hence the crystallization process of to-bermorite as well as the crystal structure of tobermorite was an issue ofresearch and discussion over the last years and numerous publicationsto these topics are available Concerning the crystal structure of to-bermorite respectively the tobermorite supergroup a new publicationoutlines all important references and recommends a new nomenclature[7]
The presented study was performed to create new analytical possi-bilities for the characterization of the production process of AAC Bothof the production process steps are essential for the final productHence the present work focuses on crystallization of hydrate phases inboth processes
Firstly an external standard method [89] was published and
httpsdoiorg101016jcemconres201802028Received 6 October 2017 Received in revised form 1 February 2018 Accepted 26 February 2018
Corresponding authorsE-mail addresses juergenjsschreinerfaude (J Schreiner) danieljansenfaude (D Jansen)
Cement and Concrete Research 107 (2018) 247ndash252
0008-8846 copy 2018 Elsevier Ltd All rights reserved
T
6 Publications
39
recommended for the determination of absolute phase contents inmixtures with amorphous content It was shown that the method canabsolutely be recommended for hydrating cement pastes in which watercannot be quantified directly by XRD [10] This method seems to bevery promising for both the quantification of the hydration of the AACslurry before autoclaving and the quantification of the phase evolutionduring autoclaving inasmuch as both production steps form crystallineand amorphous phases
Secondly a new approach to anisotropic peak broadening due toanisotropic domain morphology which was developed [1112] is ap-plied to AAC samples to improve the fit of portlandite and tobermoriteby Rietveld refinement [13] By applying this approach the refinementof both portlandite and tobermorite should additionally lead to betterquantitative results as well as to better insights into the development ofthe domain size morphology of both phases formed
It was already shown that in a hydrating raw mixture for AAC twospecies of portlandite precipitate at 23 degC one showing dynamicallyanisotropic peak broadening and another one following the isotropictrend [14] The application of the anisotropic refinement model led toan improved fitting of portlandite Moreover the mechanism of aniso-tropic domain growth of portlandite was tracked
2 Materials and methods
In order to examine the hydration of the AAC slurry before auto-claving a mixture of the hydraulic reactive components was weighedand measured in-situ at a Bruker D8 diffractometer with a LynxEyedetection system
Ordinary Portland cement (OPC) was mixed with lime (CaO) andanhydrite (C$) The raw materials were taken from the same batches asfor the industrial samples The drymix (58 OPC 36 CaO and 6 C$by weight) was then mixed with water (ws= 08) and placed into anappropriate sample holder The samples were not aerated The slurrysamples were covered with a kapton film to avoid evaporation andcarbonation Diffractograms were recorded with an angular range from7 to 545deg 2θ and a step width of 0011deg 2θ Measurements were carriedout every 15min For each measurement 96 XRD patterns were re-corded over the first 24 h The temperature was fixed at 70 degC which isthe mean temperature generally prevailing in the industrial processduring hydration before autoclaving Rietveld refinement was carriedout using the G-factor method All structures used for Rietveld refine-ment are shown in Table 1
For investigation of the autoclaved samples five different specimenswere taken at different autoclaving times The specimens were takenout of a technical production process hence it was not possible to in-terrupt the process at an earlier time inasmuch it would lead to damageof a whole concrete production batch The specimens were firstly driedat 60 degC until weight constancy The whole blocks were then broken andstatistical samples of 20 g were taken In order to receive the right massattenuation coefficient (MAC) for G-factor method the loss on ignitionand the chemical composition (XRF) were determined For energydispersive XRF analysis (Spectro Xepos) tube voltage from 20 kV to50 kV and tube current from 08 to 20mA were used for differenttargets
The final sample preparation (grinding) before XRD measurementswas carried out using both an agate mortar and a McCrone micronizingmill for wet milling with isopropanol Both preparation methods wereapplied separately to see which one is suitable in order to get the bestpreparation for XRD investigations Six preparations were performed byone operator of which two were prepared with an agate mortar andfour with a McCrone mill For the McCrone milling 3 g of the sampleand 10ml of isopropanol were used for grinding for 12min The grainsize distribution of one sample prepared with an agate mortar and onesample prepared using a McCrone mill was measured by laser granu-lometry in isopropanol using a Mastersizer 3000 (MALVERN)
After milling the samples in these two ways for XRD analysis thepowders were prepared into a front loading sample holder and mea-sured Diffractograms were recorded with an angular range from 6 to80deg 2θ a step width of 00236deg 2θ and a time per step of 054 s Rietveldrefinement combined with external standard (G-factor) was applied inorder to get absolute quantities for each phase The refinement strategyfor portlandite and tobermorite in the TOPAS Launch Mode (TOPAS50 Bruker AXS) is attached as a Supplementary material file
3 Results and discussion
31 Hydration of the mixture before autoclaving
The hydration of the investigated paste before autoclaving isdominated by the hydration of the cement as well as the reaction of thefree lime (CaO) resulting in the formation of portlandite It can beclearly seen from Fig 2 that the hydration of the paste leads to theformation of ettringite portlandite and C-S-H phase For simplificationthe remaining phase developments are not shown in Fig 2 because theyare not in the focus of this study The hydration of CaO forming
Fig 1 Simplified process steps of AAC production and hydrate phase evolution
Table 1Structures used for Rietveld refinement
Phase Author
Alite [15]Anhydrite [16]Bassanite [17]Belite (β) [18]Belite (αprime) [19]Brownmillerite [20]C-S-H [21]Calcite [22]Ettringite [23]Gypsum [24]Hemicarbonate [25]Hydroxylellestadite [26]Lime (CaO) [27]Microcline [28]Portlandite [29]Quartz [30]Tobermorite [31]Tricalciumaluminate (cubic) [32]Tricalciumaluminate (orthorhombic) [33]PONCKS model for Water [21]
J Schreiner et al Cement and Concrete Research 107 (2018) 247ndash252
248
6 Publications
40
portlandite begins rapidly after the addition of water to the mixture andlime is fully consumed after only 1 h of hydration This translates into aquick rise of heat of hydration so that cement hydration is acceleratedwhich leads to further portlandite formation by the reaction of aliteEttringite formation stalls after few hours of hydration After 12 h et-tringite is partially decomposed probably due to sulfate depletion [9]
and poorly crystalline AFm phases (not shown in Fig 2) are formedIn Fig 3 it can be seen that in fact two generations of portlandite
are formed a 1st dominant generation showing anisotropic peakbroadening and 2nd one occurring considerably later following theisotropic domain size refinement which is usually carried out using theRietveld method This occurrence comes along firstly with lime hy-dration and secondly with alite hydration The expected quantity ofportlandite formed from lime hydration very well complies with the
Fig 2 Phase development in AAC paste on a laboratory scale before autoclaving ana-lyzed by in-situ XRD at 70 degC
Fig 3 Formation of two generations of portlandite by hydration of lime (1st) and C3S(2nd) at 70 degC before autoclaving with the major generation showing anisotropic peakbroadening
Fig 4 Biaxial cylinder domain size model of portlandite used for Rietveld refinement of anisotropic peak broadening
Fig 5 Morphological evolution of portlandite showing anisotropic domain size growthduring hydration at 70 degC
Fig 6 Comparison of quantification of crystalline quartz in samples prepared withMcCrone mill and agate mortar at different autoclaving times
J Schreiner et al Cement and Concrete Research 107 (2018) 247ndash252
249
6 Publications
41
quantity of the observed 1st generation The development of portlan-dite growth was already tracked in an equivalent slurry at 23 degC [14]Thus this observation confirms that the crystallinity of portlandite inmixtures for AAC production depends on the starting phase for hydra-tion as already indicated by Ectors [14]
Fig 4 shows the used biaxial cylindrical model for anisotropic do-main size calculation and the portlandite structure which was createdwith structural software VESTA 318 [34] Using the cylindrical ap-proach domain sizes in a (here equating to b) and c direction(dz= cylinder height) can be calculated which comes along with theexpected symmetrical parameters of portlandite
The 1st portlandite generation showing anisotropic domain growthcan be tracked in terms of cylinder diameter and height which is rea-lized in Fig 5 The blue cylinder represents the geometric approach andcylinder height and diameter are calculated newly for each range Thecylinder height remains rather stable throughout the hydration processwhile the cylinder diameter increases during the first hours of hydra-tion After 10 h of hydration the mean cylinder diameter no longer in-creases Consequently these observations match the results of the ex-aminations conducted at 23 degC [14] as well as the assumption thatdifferent mechanisms of growth exist for portlandite depending on the
hydration educt The maximum cylinder diameter is reached earlier inthis work very likely because of the higher hydration temperature
32 Quantification of the reactions during autoclaving
Autoclaved samples were ground with an agate mortar and com-pared to samples which were wet-ground with a McCrone mill Fig 6shows precisely that the determination of the amount of crystallinequartz is more reproducible in the two shown samples which were
Fig 7 2D XRD with Bruker GADDS-system plots of samples prepared with agate mortar and McCrone mill Coarse quartz grains are pointed out in the plot of the sample prepared withagate mortar
Fig 8 Particle size distribution of one sample prepared with an agate mortar and of onesample prepared with a McCrone mill measured by laser granulometry
Fig 9 Rietveld refinement for Tobermorite of autoclaved AAC sample by use of isotropicdomain size model (a) and of anisotropic domain size model (b)
J Schreiner et al Cement and Concrete Research 107 (2018) 247ndash252
250
6 Publications
42
prepared with a McCrone mill The high variance of crystalline quartzin the samples which were prepared with an agate mortar is a result ofinsufficient grinding and remaining of too large quartz grains Whenthis spottiness occurs a reliable quantification using the G-factormethod is not possible
The 2D XRD with Bruker GADDS-system plots in Fig 7 demonstratethe insufficient grinding when using an agate mortar compared to wetmilling with a McCrone mill Quartz would be overrepresented in a one-dimensional XRD pattern focusing on a section with bright spots (greenarrows) The lack of bright spots in the right plot shows that the quartzgrains are milled more thoroughly using a McCrone mill In Fig 8 theparticle size distribution after both ways of sample preparation iscompared Most grains in the sample prepared with an agate mortar arelarger than in the sample prepared with a McCrone mill The grain sizedistribution of the sample prepared with a McCrone mill complies withthe recommended particle size range for XRD analysis of under 5 to50 μm [3536] while the other sample exceeds the range
In Fig 9 Rietveld refinement of an autoclaved sample is shown Thedominant peaks at 77 290 and 301deg 2θ are attributed to tobermoriteIn the upper diagram (a) Rietveld refinement was carried out regularlycalculating isotropic domain sizes for tobermorite However the cal-culated fit differs significantly from the raw data It can be assumed thattobermorite shows a similar pattern to portlandite in terms of aniso-tropic peak broadening taking into account that tobermorite is as-signed to the orthorhombic crystal system Thus instead of a biaxialcylinder model an elliptic cylinder model (Fig 10 structure createdwith VESTA 318 [34]) was applied for the refinement in the lowerdiagram (b) The elliptic cylinder model is a sufficient approach to the
orthorhombic crystal system as it allows the distinction between do-main sizes in a b and c direction The fit is clearly superior using theanisotropic domain size model highlighted by the difference plot inFig 9b The comparison refinement with isotropic and anisotropic ap-proach was done for all of the five autoclaved samples In Fig 11 theresulting Rwp values for the whole pattern and the RBragg values of to-bermorite are shown The refinement using the anisotropic model leadsto both lower Rwp and RBragg values and consequently to a better fit anda more accurate quantification of tobermorite in all refined samples
4 Summary and conclusions
Improved analytical methods for both the phase developmentduring the hydration before autoclaving and during the autoclavingprocess of AAC are presented It could be shown that wet McCronemilling is the best way of preparation of AAC samples in order to obtainsuitable samples for powder diffraction A new approach to treat ani-sotropic domain sizes for Rietveld refinement could be successfullyapplied ndash with the benefit that portlandite and tobermorite in AACsamples could be refined more accurately using the Rietveld methodThus this application allows an improved quantification of the phasedevelopment during both of the production steps
For the future there are still plenty of possibilities to apply thepresented approach of calculating anisotropic domain sizes to AACproduction As exemplified with portlandite the mechanisms of growthof tobermorite can be tracked likewise during the autoclaving processIn addition the effect of variations in the chemical composition of AACraw mixtures on the crystal morphology of tobermorite can be ex-amined This leaves a new perspective to discuss the link between mi-neral phase morphology and the thermal and mechanical properties ofAAC
Acknowledgement
The autoclaved samples were generously provided by RodgauerBaustoffwerke GmbH amp Co KG The authors express gratitude for allsupport
Appendix A Supplementary data
Supplementary data to this article can be found online at httpsdoiorg101016jcemconres201802028
References
[1] MW Grutzeck Cellular concrete in M Scheffler P Colombo (Eds) CellularCeramics Wiley-VCH Weinheim 2005 pp 193ndash223
[2] M Haas The future of AAC ndash from a material scientists point of view inMC Limbachiya JJ Roberts (Eds) Autoclaved Aerated Concrete Taylor FrLondon 2005 pp 187ndash194
[3] T Mitsuda K Sasaki H Ishida Phase evolution during autoclaving process ofaerated concrete J Am Ceram Soc 75 (1992) 1858ndash1863
[4] N Isu H Ishida T Mitsuda Influence of quartz particle size on the chemical and
Fig 10 Triaxial cylinder domain size model of Tobermorite used for Rietveld refinement of anisotropic peak broadening
Fig 11 Comparison of Rwp and RBragg values of Rietveld refinements of autoclavedsamples and tobermorite using the isotropic and the anisotropic domain size model
J Schreiner et al Cement and Concrete Research 107 (2018) 247ndash252
251
6 Publications
43
mechanical properties of autoclaved aerated concrete (I) tobermorite formationCem Concr Res 25 (1995) 243ndash248
[5] NY Mostafa Influence of air-cooled slag on physicochemical properties of auto-claved aerated concrete Cem Concr Res 35 (2005) 1349ndash1357 httpdxdoiorg101016jcemconres200410011
[6] K Matsui J Kikuma M Tsunashima T Ishikawa S Matsuno A Ogawa M SatoIn situ time-resolved X-ray diffraction of tobermorite formation in autoclaved aer-ated concrete influence of silica source reactivity and Al addition Cem Concr Res41 (2011) 510ndash519
[7] C Biagioni S Merlino E Bonaccorsi The tobermorite supergroup a new no-menclature Mineral Mag 79 (2015) 485ndash495 httpdxdoiorg101180minmag2015079222
[8] BH OConnor MD Raven Application of the Rietveld refinement procedure inassaying powdered mixtures Powder Diffract 3 (1988) 2ndash6 httpdxdoiorg101017S0885715600013026
[9] D Jansen F Goetz-Neunhoeffer C Stabler J Neubauer A remastered externalstandard method applied to the quantification of early OPC hydration Cem ConcrRes 41 (2011) 602ndash608 httpdxdoiorg101016jcemconres201103004
[10] D Jansen C Stabler F Goetz-Neunhoeffer S Dittrich J Neubauer Does OrdinaryPortland Cement contain amorphous phase A quantitative study using an externalstandard method Powder Diffract 26 (2011) 31ndash38 httpdxdoiorg10115413549186
[11] D Ectors F Goetz-Neunhoeffer J Neubauer A generalized geometric approach toanisotropic peak broadening due to domain morphology J Appl Crystallogr 48(2015) 189ndash194 httpdxdoiorg101107S1600576714026557
[12] D Ectors F Goetz-Neunhoeffer J Neubauer Routine (an)isotropic crystallite sizeanalysis in the double-Voigt approximation done right Powder Diffract 32 (S1)(2017) 27ndash34 httpdxdoiorg101017S0885715617000070
[13] HM Rietveld A profile refinement method for nuclear and magnetic structures JAppl Crystallogr 2 (1969) 65ndash71 httpdxdoiorg101107S0021889869006558
[14] D Ectors Advances in the Analysis of Cementitious Reactions and Hydrate Phases(Doctoral Thesis) (2016) pp 12ndash14 (urnnbndebvb29-opus4-71743)
[15] AacuteG De La Torre S Bruque J Campo MAG Aranda The superstructure of C3Sfrom synchrotron and neutron powder diffraction and its role in quantitative phaseanalyses Cem Concr Res 32 (2002) 1347ndash1356 httpdxdoiorg101016S0008-8846(02)00796-2
[16] A Kirfel G Will Charge density in anhydrite CaSO4 from X-ray and neutrondiffraction measurements Acta Crystallogr Sect B Struct Crystallogr CrystChem 36 (1980) 2881ndash2890 httpdxdoiorg101107S0567740880010461
[17] C Bezou AN Christensen D Cox M Lehman A Nonat Structures cristallines deCaSO405H2O et CaSO406H2O Comptes Rendus Hebd Des Seacuteances lAcadeacutemieDes Sci Seacuterie 2 (312) (1991) 43ndash48
[18] KH Jost B Ziemer R Seydel Redetermination of the structure of β-dicalciumsilicate Acta Crystallogr Sect B Struct Crystallogr Cryst Chem 33 (1977)1696ndash1700 httpdxdoiorg101107S0567740877006918
[19] W Mumme LMD Cranswick BC Chakoumakos Rietveld crystal structure re-finements from high temperature neutron powder diffraction data for the poly-morphs of dicalcium silicate Neues Jahrb Fuer Mineral Abhandlungen 170 (1996)171ndash188
[20] A Colville S Geller The crystal structure of brownmillerite Ca2FeAlO5Crystallographica 50 (1971) 2311ndash2315 httpdxdoiorg101107S056774087100579X
[21] ST Bergold F Goetz-Neunhoeffer J Neubauer Quantitative analysis of C-S-H inhydrating alite pastes by in-situ XRD Cem Concr Res 53 (2013) 119ndash126 httpdxdoiorg101016jcemconres201306001
[22] EN Maslen VA Streltsov NR Streltsova N Ishizawa Electron density and op-tical anisotropy in rhombohedral carbonates III Synchrotron Xray studies ofCaCO3 MgCO3 and MnCO3 Acta Crystallogr Sect B 51 (1995) 929ndash939 httpdxdoiorg101107S0108768195006434
[23] G Renaudin Y Filinchuk J Neubauer F Goetz-Neunhoeffer A comparativestructural study of wet and dried ettringite Cem Concr Res 40 (2010) 370ndash375httpdxdoiorg101016jcemconres200911002
[24] WF Cole CJ Lancucki A refinement of the crystal structure of gypsumCaSO42H2O Acta Cryst B30 (1974) 921ndash929 httpdxdoiorg101107S0567740874004055
[25] T Runčevski RE Dinnebier OV Magdysyuk H Poumlllmann Crystal structures ofcalcium hemicarboaluminate and carbonated calcium hemicarboaluminate fromsynchrotron powder diffraction data Acta Crystallogr Sect B Struct Sci 68 (2012)493ndash500 httpdxdoiorg101107S010876811203042X
[26] JM Hughes JW Drexler Cation substitution in the apatite tetrahedral site crystalstructures of type hydroxylellestadite and type fermorite Neues Jahrb FuerMineral (1991) 327ndash336
[27] CH Shen RS Liu JG Lin CY Huang Phase stability study of La12Ca18Mn2O7Mater Res Bull 36 (2001) 1139ndash1148
[28] SW Bailey Refinement of an intermediate microcline structure Am Miner 54(1969) 1540ndash1545
[29] WR Busing HA Levy Neutron diffraction study of calcium hydroxide J ChemPhys 26 (1957) 563 httpdxdoiorg10106311743345
[30] Y Le Page G Donnay Refinement of the crystal structure of low-quartz ActaCrystallogr Sect B 32 (1976) 2456ndash2459 httpdxdoiorg101107S0567740876007966
[31] SA Hamid The crystal structure of the 11 Aring natural tobermoriteCa225[Si3O75(OH)15]1H2O Zeitschrift Fuer Krist - New Cryst Struct 154 (1981)189ndash198 httpdxdoiorg101524zkri19811543-4189
[32] P Mondal JW Jeffery The crystal structure of tricalcium aluminate Ca3Al2O6Acta Crystallogr B 31 (1975) 689ndash697 httpdxdoiorg101107S0567740875003639
[33] Y Takeuchi F Nishi I Maki Crystal-chemical characterization of the tricalciumaluminate-sodium oxide (3CaOtimesAl2O3-Na2O) solid-solution series Zeitschrift FuumlrKrist (1980) 259ndash307
[34] K Momma F Izumi VESTA 3 for three-dimensional visualization of crystal vo-lumetric and morphology data J Appl Crystallogr 44 (2011) 1272ndash1276 httpdxdoiorg101107S0021889811038970
[35] K Scrivener R Snellings B Lothenbach A Practical Guide to MicrostructuralAnalysis of Cementitious Materials CRC Press 2016 pp 123ndash125 httpdxdoiorg107693wl20150205
[36] V Pecharsky P Zavalij Fundamentals of Powder Diffraction and StructuralCharacterization of Materials Springer second edition 2005 p 302 httpdxdoiorg101007978-0-387-09579-0
J Schreiner et al Cement and Concrete Research 107 (2018) 247ndash252
252
6 Publications
44
7 Acknowledgement
7 Acknowledgement
Ich moumlchte mich bei einigen Personen bedanken ohne die es wohl kaum zum erfolgreichenAbschluss dieser Arbeit gekommen waumlreMein Doktorvater Prof Dr Juumlrgen Neubauer hat sich stets die Zeit genommen die noumltigwar um Angelegenheiten aller Art mit mir zu klaumlren Er gab mir fachlich immer zumrichtigen Zeitpunkt einen gewissen wissenschaftlichen Impuls Zugleich habe ich mich den-noch immer frei in meiner eigenen Konzeption gefuumlhlt Groszligen Dank spreche ich Prof DrFriedlinde Goumltz-Neunhoeffer aus die fuumlr mich ebenso immer eine verlaumlssliche Ansprech-partnerin fuumlr fachliche und organisatorische Angelegenheiten aller Art war Danke anDr Daniel Jansen fuumlr die gute Zusammenarbeit und dafuumlr dass er mich im Zuge meinerMasterarbeit in ein Forschungsprojekt aufgenommen hat das den Weg zur Promotionmoumlglich machte Zusaumltzlich gilt mein Dank Prof Dr Matthias Goumlbbels der fuumlr dieMitarbeiter am Lehrstuhl immer motivierende Worte fand Fuumlr die Ermoumlglichung meinerTeilnahme an diversen Dienstreisen Fortbildungen und Tagungen moumlchte ich mich viel-mals bedankenWeiterhin bedanke ich mich bei Dr Stephan Volkmann und den Rodgauer BaustoffwerkenGmbH amp Co KG fuumlr die gute Zusammenarbeit und die Bereitstellung von Versuchsma-terialienVielen Dank an meine studentischen Hilfskraumlfte Daniel Wagner Laura MoldenhauerFabian Lang Jakob Schreiber und Felix Klaassen die alle Aufgaben im Labor einwand-frei und mit Bedacht erledigten Bei meinen aktuellen und ehemaligen Kollegen DrKatrin Hurle Dr Dominique Ectors Dr Christoph Naber Dr Florian Huumlller JoumlrgNehring Frank Riedel Julian Wolf Tanja Manninger Daniel Wagner Nicolas FobbeKarla Spaumlth Julian Goergens Andreas Koumlhler Cordula Jakob Franz Becker und LisaKlemenz bedanke ich mich fuumlr die gelungene Zusammenarbeit und gegenseitige Unter-stuumltzung Besonderer Dank geht auch an Kerstin Kreszlig Bettina Engl Christian HankeBernd Schleifer und Christian Abe fuumlr die verlaumlssliche Unterstuumltzung bei technischen Fra-gen und Messungen im LaborFuumlr jegliche Unterstuumltzungen moumlchte ich mich auch bei meinen Eltern bedanken sowiebei meinem Bruder Ralf der mir mit einem LaTex Crashkurs viel Frustration ersparthat Danke Thomas dass du immer fuumlr mich da bist und mit mir zusammen fuumlr genugAusgleich gesorgt hast
45
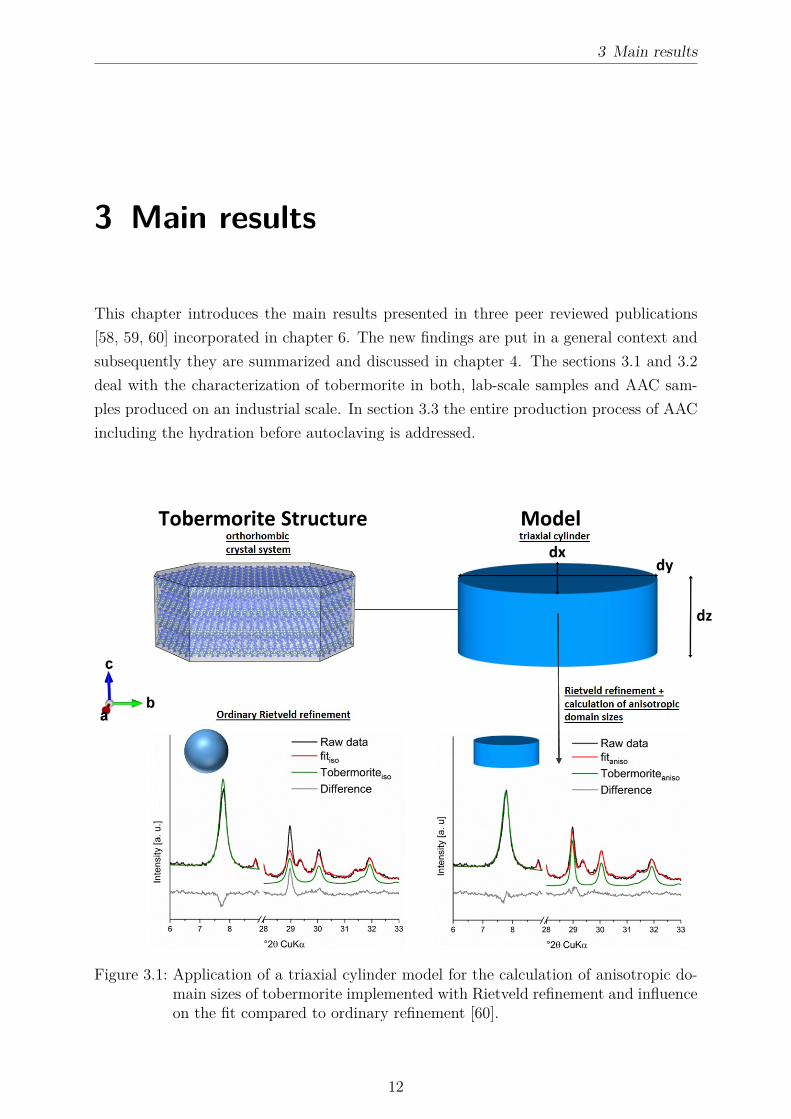
3 Main results
3 Main results
This chapter introduces the main results presented in three peer reviewed publications[58 59 60] incorporated in chapter 6 The new findings are put in a general context andsubsequently they are summarized and discussed in chapter 4 The sections 31 and 32deal with the characterization of tobermorite in both lab-scale samples and AAC sam-ples produced on an industrial scale In section 33 the entire production process of AACincluding the hydration before autoclaving is addressed
Figure 31 Application of a triaxial cylinder model for the calculation of anisotropic do-main sizes of tobermorite implemented with Rietveld refinement and influenceon the fit compared to ordinary refinement [60]
12
3 Main results
One particular main result is a key element in each of the following sections In Figure 31the fit of tobermorite after two Rietveld refinements of different accuracy is shown In aregular Rietveld refinement for simplification the coherently scattering units are treatedas spherical shapes as usually only one size value for each mineral phase is calculated Asaverage domain sizes of a mineral phase in different crystallographic directions are in manycases indeed close to one value this approximation is often sufficient in order to achievea satisfactory fit to the measured diffractogram The crystal system and surroundingconditions during the formation of a mineral phase are significant factors in this context Amisfit at different (hkl) reflections as displayed in Figure 31 is an indication of anisotropicpeak broadening Clearly orthorhombic tobermorite shows anisotropic peak broadeningdue to its anisotropic domain morphology For the possible origins of anisotropic peakbroadening apart from size broadening the reader is referred to section 61 In accordancewith the orthorhombic crystal system a triaxial model is applied in order to fit the peakbroadening [19] By implementing the macro during the refinement no longer one butthree sizes (x y and z for respectively a b and c direction) are calculated Besides theimproved fit the calculated domain morphology is an additional information extractedfrom XRD analysis and it is representative for the average value of the phase in the entiresample In each of the following sections the different benefits regarding this approachare outlined in more detail
31 Hydrothermal synthesis of tobermorite on alaboratory scale - application of two types ofmetakaolin
This study covers mineralogical properties of tobermorite synthesized from a set of variouscompounds including different amounts and types of metakaolin [58] Unlike in sections32 and 33 the samples were not aerated before autoclaving and their composition isadjusted to the CaSi molar ratio of stoichiometric tobermorite On the one hand thereactivity of metakaolin and minor phases at hydrothermal conditions for the possible usein AAC production was investigated On the other hand the effects of consequent changesof the bulk chemistry in the basic compound on the mineralogical characteristics of to-bermorite such as lattice parameters and domain morphology were analyzed In additionfor one particular compound the effect of different curing times was explored While theconventional raw materials for AAC production are rather low-cost resources metakaolinis a high-priced SCM in this regard For this reason besides one comparatively pure com-mercial metakaolin (MK) a second by-product type of metakaolin (MKg) was applied
13
3 Main results
at equivalent dosages All investigated mix composites and the chemical composition ofMK and MKg are summed up in tables in section 61In Figure 32 the effect of different amounts of the two types of metakaolin on the phasequantities is displayed Clearly at moderate dosages of MK and MKg tobermorite waspresent in comparable quantities However the application of any amount of metakaolinreduced the amount of tobermorite compared to the blank mixture It can be seen thatkatoite was present whenever the content of Al2O3 in the starting drymix exceeded 2wt which fits well with the state of knowledge [5 23] For the highest possible dosagesof the two types of metakaolin (MK60 and MKg60) contrary effects were observed Ap-plication of impure metakaolin (MKg) led to a considerable amount of tobermorite whilein MK60 no tobermorite was present The high content of Al2O3 seems to have hinderedthe formation of tobermorite Not all of the Al2O3 in MKg was supplied for reactionas minor phases such as feldspar remained unreacted which is shown accurately in therespective publication in section 61
Figure 32 Weight fractions of tobermorite quartz and katoite measured by QXRD anal-ysis and contents of Al2O3 in the starting drymix Amorphous content andminor phases are not shown
The results of thermal analysis of samples characterized by MK addition in small stepsare shown in Figure 33 It can be seen that the conversion of 93 Aring tobermorite into β-
14
3 Main results
wollastonite depended on the dosage of MK However unlike suggested by Klimesch ampRay there was no effect of lower contents of Al2O3 in the drymix [40] Consequently theinfluence of Al3+ at low dosages (MK25 and MK5) could not be observed on the basisof this method Apart from this result the other signals showed good agreement with thesuggested conversion ranges by Klimesch amp Ray as for samples MK9 and MK16 a clearshift towards higher temperature was measured However the role of Al3+ incorporationverified by this method is not necessarily conclusive as additional reactions during theheating experiment involving Al3+ are possible On that basis the observations madeby means of DTA would not reflect the amount of Al3+ originally incorporated into thestructure of 11 Aring tobermorite
Figure 33 Conversion of 93 Aring tobermorite into β-wollastonite in samples synthesizedwith various amounts of metakaolin and suggested temperature ranges ac-cording to Klimesch amp Ray [40]
In accordance with authors referenced in subsection 213 lattice parameter c of tober-morite increased with elevated dosages of Al2O3 in the basic dry mix (Figure 34) Theimpact could be observed for the complete range of samples as displayed in section 61which indicates that a limit of Al3+ incorporation was not reached in this study Forcomparison the relative domain morphology is plotted in Figure 34 Unlike the DTA
15
3 Main results
signals both lattice parameter c and the domain morphology are impacted by very lowdosages of Al2O3 There is a good accordance of the relation of growth in b direction to adirection and the c parameter This is valid up to 20 wt of Al2O3 in the starting drymix By contrast more elevated contents of Al2O3 did not affect the domain morphologyany further even though the incorporation is verified through the increased c parameterIt follows that the impact of Al3+ incorporation on the domain morphology is limited tovery low contents while the impact on lattice parameter c can be tracked throughoutthe entire examined range of samples In section 61 additional results show that growthin b direction increased with reaction time These observations are solely based on XRDanalysis and offer new benefits for the structural understanding of tobermorite
Figure 34 Impact of the calculated Al2O3 content in the basic dry mix on the latticeparameter c and on the relation of calculated domain sizes of tobermorite ina (x) and b (y) direction
16
3 Main results
32 Structural properties of tobermorite in AAC - SEMversus XRD analysis
This section and the respective publication [59] mainly deal with the suitability of SEManalysis of tobermorite in AAC The effects of varying amounts of SO3 and Al2O3 in thedry mix on structural properties of tobermorite are discussed based on XRD analysisAs shown in subsection 221 and Figure 23 tobermorite often shows a house-of-cardsstructure in AAC samples This property has been considered to be relevant for thethermal and mechanical properties of AAC (subsection 221) However SEM analysiswithin this study revealed that this type of appearance is mainly found in the poresand pore surfaces (Figure 35) This finding comes in agreement with the observationsmade by Huang et al [48] In the solid skeleton of the dense AAC material neither themorphology nor the house-of-cards structure could be observed properly which can beseen very clearly in additional micrographs provided in section 62 It should be consideredthat the major amount of tobermorite by weight is located in the dense material and notat the pore surfaces In this way these findings are clear disadvantages coming along withonly SEM analysis of AAC as representative results can hardly be obtained
Figure 35 House-of-cards structure of tobermorite in a pore surrounded by dense mate-rial
Moreover several authors in subsection 221 justified the morphology of tobermorite withthe incorporation of foreign ions Al-substituted tobermorite showed lath-like morphologywhereas Al-free tobermorite showed rather plate-like morphology [6 32 49] Howeverthe present investigation revealed that independent of Al2O3 content in the raw mix there
17
3 Main results
is always heterogeneity regarding the morphology of tobermorite In Figure 36 plate-likeand lath-like morphology of tobermorite in AAC observed in two statistical chemicallyvarious samples are displayed This result supports the previous assumption that theobservations made by SEM analysis of tobermorite in AAC strongly depend on whatpart of the sample is selected Yet again no clear observations could be made that wererepresentative for the entire sample
Figure 36 Heterogeneous morphology of tobermorite (plate-like in a and c lath-like in band d) in two AAC samples characterized by different Al2O3 contents in theraw mix
The effects of Al3+ on the domain morphology of tobermorite were measured and evaluatedin a similar manner as in section 61 and the results could be confirmed The relativedomain growth in b direction was increased by Al3+ incorporation in both studies [5859] Moreover lattice parameter c was increased with Al3+ incorporation which can beseen more accurately in section 62 Unlike SEM analysis XRD analysis allowed clearconclusions whenever structural properties of Al-substituted tobermorite were affectedInstead of a local observation as made with SEM representative and statistical resultswere obtained The reader is referred to section 61 and section 62 for further results and
18
3 Main results
more specific conclusionsIn addition the effect of various amounts of sulfate in the raw mix was analyzed Unlikein the case of different dosages of Al3+ neither the domain morphology nor the latticeparameters of tobermorite were affected by the SO3 content in the dry mix In Figure 37these observations and additionally the amounts of anhydrite measured by QXRD areshown As the amount of available SO3 in the dry mix is known the maximum possibleamount of anhydrite could be calculated for each of the samples in focus Obviouslythe measured amounts of anhydrite are either equal or slightly higher compared to theexpected quantities This result leads to the assumption that all of the available sulfateis transformed into anhydrite so that no more sulfate could be incorporated into thestructure of tobermorite The over-estimation of anhydrite in some of the samples can beexplained due to the inaccuracy of the quantification method The present results rathermatch with the suggestions by Sauman amp Valtr [41] as in their study no effect of sulfateon the structure of tobermorite was observed either
Figure 37 Impact of the sulfate content in the AAC raw mix on lattice parameter cand relative domain morphology of tobermorite (a) and comparison of theexpected maximum amount of anhydrite to the measured amount determinedby QXRD (b)
33 Improved monitoring of the phase developmentduring the production of AAC
In this study not only autoclaved samples were analyzed but additionally a lab-scale slurrywhich included the reactive components of the green cake stage during AAC productionat equivalent weight proportions In-situ XRD was performed at 70 degC and at a water-to-
19
3 Main results
solid ratio of 08 for 24 h (Figure 38) which are respective conditions during commercialproduction Clearly the phase development is dominated by OPC and lime hydration asdescribed in section 22 It can be seen that the major reaction turnover occurs duringthe first 200 minutes which is the average duration of the green stage After only 30minutes all of the quicklime had transformed into portlandite whereas Schober proposeda duration of one hour for this reaction [42] The amount of portlandite is composed oftwo different generations as proposed by Ectors [52] Equally a biaxial cylinder modelwas applied in order to fit the peak broadening of the first generation of portlandite in thepresent investigation Minor phase developments such as the formation of AFm phases arenot shown in Figure 38 A coarse fraction of anhydrite did not react so that constantlyaround 15 wt were measured after 6 h As the decomposition of ettringite due tosulfate depletion [55] does not occur prior to 12 h the green cake strength is not affected
Figure 38 In-situ XRD measurement of AAC model slurry at water-to-solid ratio of 08and 70 degC For clarity and comprehensibility not all phases are shown
The separation of two generations of portlandite in the system does not only translate intodifferent domain morphologies as shown by Ectors [52] In Figure 39 more indicationsfor different mineralogical properties are displayed The shape of the (0 0 1) reflection inXRD patterns after only quicklime hydration and after both quicklime and alite hydrationshows a distinct feature While portlandite originating from quicklime hydration showsa broad peak implying lower crystallinity the peak after alite hydration is characterized
20
3 Main results
Figure 39 Formation of two generations of portlandite in AAC slurry in XRD (a) andDTA (b) plots
by a sharper component Yet the peak breadth did not change indicating that the firstgeneration is still present with the original characteristics This observation is supportedby DTA measurements additionally demonstrating two degrees of crystallinity only afteralite hydration In agreement with XRD analysis the better crystalline second generationof portlandite decomposes at a higher temperature
Figure 310 Quantification of tobermorite in statistical chemically various AAC sampleswith and without the application of the macro for the fitting of anisotropicpeak broadening
21
3 Main results
Furthermore commercial AAC samples were considered in this study By applying themethod for the refinement of anisotropic peak broadening (Figure 31) a more accuratequantification of tobermorite can be achieved In Figure 310 the calculated amounts oftobermorite in statistical chemically various AAC samples are plotted In some samplesthe refinement using the macro leads to considerably higher but never lower quantitiesof tobermorite whereas in other samples nearly the same amount of tobermorite is cal-culated This observation can be well understood taking into account that the macroallows to account more peak area for tobermorite as shown in Figure 31 Clearly thereis evidence that the anisotropy of tobermorite domains is not uniform from one sampleto another which was basically justified in the previous sections As an improved quan-tification of a single phase leads to a better quantification of other phases in the samplethis adaption is very valuable in order to assess the phase development Here the peakbroadening of tobermorite equally observed by Qu et al [6] could be tracked and evalu-ated in order to gain more accurate results Moreover in section 63 McCrone milling issuggested in order to avoid spottiness in XRD patterns caused by coarse grains of quartzor anhydrite (Figure 38)
22
4 Conclusions
4 Conclusions
The research results presented in the previous sections yield advances in the mineralogicalinvestigation of tobermorite and autoclaved aerated concrete Recorded diffraction pat-terns contain plenty of usually unused data regarding the microstructural characteristicsof the sample and phases therein The profit of XRD measurements can be significantlyimproved whenever one or more phases show anisotropic peak broadening and appro-priate models for the respective domain morphology are implemented into the Rietveldenvironment Within the scope of the present investigations portlandite and tobermoriteshow this particularityThe effects of changes in the chemistry of the starting mix were examined based on dif-ferent dosages of metakaolin Al-substituted tobermorite showed increased growth in b
direction and an increase of lattice parameter c compared to Al-free tobermorite The rel-ative domain sizes were determined based on anisotropic peak broadening However whilethe effect of Al3+ incorporation into the lattice of tobermorite was limited regarding thedomain morphology lattice parameter c showed an increase throughout the entire rangeof samples The consequent effects suggested by Klimesch amp Ray observed by means ofDTA are debatable as reactions during the heating experiment may lead to to a changeof Al3+ content in tobermorite [40] While both types of applied metakaolin showed goodreactivity at hydrothermal conditions some included minor phases such as feldspar oranatase remained unreacted At high dosages of Al2O3 in the starting mix the formationof either only katoite or katoite along with tobermorite was observed (Figure 32)SEM analysis of tobermorite in AAC cannot be suggested based on the observationspresented in this work as it is only visually accessible in the pores or at pore surfacesThe dense material of the AAC skeleton contains several crystalline and X-ray amorphousphases which hardly allows a proper investigation Even in single pores tobermorite crys-tals appeared very heterogeneous at various chemical compositions As a result lath-liketobermorite was not only present in samples characterized by elevated Al3+ incorporationBy contrast the benefits of XRD analysis presented in section 61 equally accounted fortobermorite in AAC samples Sulfate incorporation into the lattice of tobermorite wasnot observed All of the sulfate in the system was detected to be present in anhydriteThe phase transitions in the AAC raw slurry during the green stage hydration were show-cased by in-situ XRD analysis of a model mix at 70 degC Additional DTA and XRD mea-
23
4 Conclusions
surements during this step confirmed the presence of two generations of portlandite char-acterized by different crystallinity as suggested by Ectors [52] The inclusion of anisotropicdomain morphology during the Rietveld refinement allowed a more accurate quantifica-tion of tobermorite in autoclaved samples Sample preparation adjusted to the grain sizedistribution in AAC samples (section 63) the external standard method for quantita-tive XRD analysis [55] and the approach to evaluate anisotropic peak broadening [19]are the key methods for a more accurate tracking of the phase development during AACproduction
24
5 References
5 References
[1] A E Zadov A I Grabezhev N N Pertsev N V Chukanov and S V PribavkinTobermorite-plombierite metasomatites of the Gumeshevsk skarn-porphyry copper depositmiddle Urals Doklady Earth Sciences 407(3)495ndash497 2006
[2] M F Heddle Preliminary notice of substances which may prove to be new minerals MinMag 4117ndash123 1880
[3] S Merlino E Bonaccorsi and T Armbruster The real structure of tobermorite 11AringNormal and anomalous forms OD character and polytypic modifications European Journalof Mineralogy 13(3)577ndash590 2001
[4] C Biagioni S Merlino and E Bonaccorsi The tobermorite supergroup a new nomencla-ture Mineralogical Magazine 79(2)485ndash495 2015
[5] C A Riacuteos C D Williams and M A Fullen Hydrothermal synthesis of hydrogarnetand tobermorite at 175 degC from kaolinite and metakaolinite in the CaO-Al2O3-SiO2-H2Osystem A comparative study Applied Clay Science 43(2)228ndash237 2009
[6] X Qu Z Zhao and X Zhao Microstructure and characterization of aluminum-incorporated calcium silicate hydrates (C-S-H) under hydrothermal conditions RSC Ad-vances 8(49)28198ndash28208 2018
[7] R Šiaučiunas and K Baltakys Formation of gyrolite during hydrothermal synthesis inthe mixtures of CaO and amorphous SiO2 or quartz Cement and Concrete Research34(11)2029ndash2036 2004
[8] E Venhodovaacute R Janovskyacute and R Drochytka Formation of Tobermorite at Different Ma-terials Composition of Aerated Concrete Applied Mechanics and Materials 752-753247ndash250 2015
[9] L Galvaacutenkovaacute E Bartoniacutečkovaacute T Opravil J Tkacz and P Ptaacuteček The influence ofstarting materials solubility on tobermorite structure formation under the hydrothermalconditions IOP Conference Series Materials Science and Engineering 379(1)1ndash8 2018
[10] T Mitsuda K Sasaki and H Ishida Phase Evolution during Autoclaving Process J AmCeram Soc 75(75)1858ndash1863 1992
[11] A Skawińska The influence of metahalloysite addition on tobermorite formation studied byX-ray powder diffraction and scanning electron microscope MATEC Web of Conferences16305008 2018
[12] S T Bergold F Goetz-Neunhoeffer and J Neubauer Quantitative analysis of C-S-H in
25
5 References
hydrating alite pastes by in-situ XRD Cement and Concrete Research 53119ndash126 2013
[13] O P Shrivastava and F P Glasser Ion-exchange properties of 11-Aring tobermorite Reactivityof Solids 2(3)261ndash268 1986
[14] H Maeda Y Ogawa E H Ishida and T Kasuga Hydrothermal synthesis of tobermoritedoped with phosphorus species for removing heavy metal ions Journal of the AustralianCeramic Society 48(1)8ndash11 2012
[15] O P Shrivastava and R Shrivastava Cation exchange applications of synthetic tobermoritefor the immobilization and solidification of cesium and strontium in cement matrix Bulletinof Materials Science 23(6)515ndash520 2000
[16] G Renman and A Renman Sustainable Use of Crushed Autoclaved Aerated Concrete(CAAC) as a Filter Medium in Wastewater Purification 8th International conferenceon sustainable management of waste and recycled materials in construction GothenburgSweden 30 Mayndash1 June 2012 Proceedings pages 1ndash7 2012
[17] G Schober Chemical transformations during the manufacturing of autoclaved aeratedconcrete (ACC) Cement lime gypsum and quartz sand become cellular concrete ZKG58(7)63ndash70 2005
[18] A J Hamad Materials Production Properties and Application of Aerated LightweightConcrete Review International Journal of Materials Science and Engineering 2(2)152ndash157 2014
[19] D Ectors F Goetz-Neunhoeffer and J Neubauer A generalized geometric approach toanisotropic peak broadening due to domain morphology Journal of Applied Crystallogra-phy 48(1)189ndash194 2015
[20] H M Rietveld A profile refinement method for nuclear and magnetic structures Journalof Applied Crystallography 2(2)65ndash71 1969
[21] S A Hamid The crystal structure of the 11 Aring natural tobermoriteCa225[Si3O75(OH)15]1H2O Zeitschrift fuer Kristallographie - New Crystal Struc-tures 154(3-4)189ndash198 1981
[22] S A S El-Hemaly T Mitsuda and H F W Taylor Synthesis of normal and anomaloustobermorites Cement and Concrete Research 7429ndash438 1977
[23] M Sakiyama and T Mitsuda Hydrothermal reaction between C-S-H and kaolinite for theformation of tobermorite at 180degC Cement and Concrete Research 7(6)681ndash685 1977
[24] E Bonaccorsi S Merlino and A R Kampf The crystal structure of tobermorite 14 Aring(plombierite) a C-S-H phase Journal of the American Ceramic Society 88(3)505ndash5122005
[25] S Merlino E Bonaccorsi and T Armbruster The real structures of clinotobermorite andtobermorite 9 Aring OD character polytypes and structural relationships European Journalof Mineralogy 12(2)411ndash429 2000
[26] K Momma and F Izumi VESTA 3 for three-dimensional visualization of crystal volu-metric and morphology data Journal of Applied Crystallography 44(6)1272ndash1276 2011
26
5 References
[27] S Shaw S M Clark and C MB Henderson Hydrothermal formation of the calcium sil-icate hydrates tobermorite (Ca5Si6O16(OH)2 middot 4H2O) and xonotlite (Ca6Si6O17(OH)2)An in situ synchrotron study Chemical Geology 167(1-2)129ndash140 2000
[28] K Matsui J Kikuma M Tsunashima T Ishikawa S Matsuno A Ogawa and M SatoIn situ time-resolved X-ray diffraction of tobermorite synthesis process under hydrothermalcondition IOP Conference Series Materials Science and Engineering 18(2)60ndash66 2011
[29] G Matekonis R Šiaučiunas and D Vaičiukyniene Hydrothermal Synthesis and Charac-terization of Na + and [ Al 3 + + Na + ] -substituted Tobermorite in CaO-SiO2middotnH2O-H2OSystem MATERIALS SCIENCE 16(3)242ndash248 2010
[30] G Geng R J Myers M J A Qomi and P JM Monteiro Densification of the inter-layer spacing governs the nanomechanical properties of calcium-silicate-hydrate ScientificReports 7(1)1ndash8 2017
[31] D Klimesch and A Ray Autoclaved cement-quartz pastes with metakaolin additionsAdvanced Cement Based Materials 7(3-4)109ndash118 1998
[32] N Y Mostafa A A Shaltout H Omar and S A Abo-El-Enein Hydrothermal synthesisand characterization of aluminium and sulfate substituted 11 nm tobermorites Journal ofAlloys and Compounds 467(1-2)332ndash337 2009
[33] İ Demir M S Başpınar E Kahraman E Ccedilalışkan and G Goumlrhan An Investigation onthe Usability of Diatomite in Aerated Concrete Production In Proc of the Intl Conf onAdvances In Civil Structural And Construction Engineering - CSCE 2014 pages 97ndash1002014
[34] A Skawinska Z Owsiak T Baran and K Hernik The influence of halloysite additionon tobermorite formation in CaO and quartz mix under hydrothermal conditions CementWapno Beton 17(12)426ndash434 2017
[35] N Y Mostafa Influence of air-cooled slag on physicochemical properties of autoclavedaerated concrete Cement and Concrete Research 35(7)1349ndash1357 2005
[36] D Małaszkiewicz and J Chojnowski Influence of addition of calcium sulfate dihydrate ondrying of autoclaved aerated concrete Open Engineering 7(1)273ndash278 2017
[37] N Hara and N Inoue Thermal behaviour of 11Aring tobermorite and its lattice parametersCement and Concrete Research (10)53ndash60 1980
[38] M D Jackson S R Chae S R Mulcahy C Meral R Taylor P Li A H EmwasJ Moon S Yoon G Vola H R Wenk and P JM Monteiro Unlocking the secretsof Al-tobermorite in Roman seawater concrete American Mineralogist 98(10)1669ndash16872012
[39] W Liao W Li Z Fang C Lu and Z Xu Effect of different aluminum substitution rateson the structure of Tobermorite Materials 12(22)1ndash10 2019
[40] D Klimesch and A Ray DTA-TG Study of the CaO-SiO2-H2O and CaO-Al2O3-SiO2-H2OSystems Under Hydrothermal Conditions Journal of Thermal Analysis and Calorimetry56(1)27ndash34 1999
27
5 References
[41] Z Sauman and Z Valtr Substitution of sulphate ions in the crystal lattice of 11 Aring to-bermorite In The VI International Congress on the Chemistry of Cement pages 1ndash14Moscow 1974
[42] G Schober Reaction of raw materials to the final product AAC httpwwwpb-aacde
chemmin2_ehtml 2012 accessed 2020-01-31
[43] D Jansen C Stabler F Goetz-Neunhoeffer S Dittrich and J Neubauer Does Ordi-nary Portland Cement contain amorphous phase A quantitative study using an externalstandard method Powder Diffraction 26(01)31ndash38 2011
[44] C Roumlszligler J Stark F Steiniger and W Tichelaar Limited-dose electron microscopyreveals the crystallinity of fibrous C-S-H phases Journal of the American Ceramic Society89(2)627ndash632 2006
[45] Y Sakalli and R Trettin Investigation of C3S hydration by environmental scanning elec-tron microscope Journal of Microscopy 259(1)53ndash58 2015
[46] F Matsushita Y Aono and S Shibata Expansion and shrinkage behavior of green cakeof Autoclaved Aerated Concrete In Autoclaved Aerated Concrete - Innovation and Devel-opment Proceedings of the 4th International Conference on Autoclaved Aerated ConcreteKingston UK 8-9 September 2005 pages 101ndash108 CRC Press 2005
[47] C Chucholowski M Holger and K-C Thienel Improving the recyclability environmentalcompatibility and CO2 balance of autoclaved aerated concrete by replacing sulfate carrierand cement with calcined clays CePapers 2(4)503ndash512 2018
[48] X Y Huang W Ni W H Cui Z J Wang and L P Zhu Preparation of autoclavedaerated concrete using copper tailings and blast furnace slag Construction and BuildingMaterials 27(1)1ndash5 2012
[49] W Wongkeo and A Chaipanich Compressive strength microstructure and thermal anal-ysis of autoclaved and air cured structural lightweight concrete made with coal bottom ashand silica fume Materials Science and Engineering A 527(16-17)3676ndash3684 2010
[50] A Roacuteżycka and W Pichoacuter Effect of perlite waste addition on the properties of autoclavedaerated concrete Construction and Building Materials 12065ndash71 2016
[51] N Isu H Ishida and T Mitsuda Influence of quartz particle size on the chemical andmechanical properties of autoclaved aerated concrete (I) tobermorite formation Cementand Concrete Research 25(25)243ndash248 1995
[52] D Ectors Advances in the analysis of cementitious reactions and hydrate phases doctoralthesis PhD thesis Friedrich-Alexander-Universitaumlt Erlangen-Nuumlrnberg 2016
[53] D Ectors F Goetz-Neunhoeffer and J Neubauer Domain size anisotropy in the double-Voigt approach An extended model Journal of Applied Crystallography 481998ndash20012015
[54] D Ectors F Goetz-Neunhoeffer and J Neubauer Routine (an)isotropic crystallite sizeanalysis in the double-Voigt approximation done right Powder Diffraction 32(S1)27ndash342017
28
5 References
[55] D Jansen F Goetz-Neunhoeffer C Stabler and J Neubauer A remastered external stan-dard method applied to the quantification of early OPC hydration Cement and ConcreteResearch 41(6)602ndash608 2011
[56] T Ungaacuter G Tichy J Gubicza and R J Hellmig Correlation between subgrains andcoherently scattering domains Powder Diffraction 20(04)366ndash375 2005
[57] Triloki P Garg R Rai and B K Singh Structural characterization of as-depositedcesium iodide films studied by X-ray diffraction and transmission electron microscopy tech-niques Nuclear Instruments and Methods in Physics Research Section A AcceleratorsSpectrometers Detectors and Associated Equipment 736128ndash134 2014
[58] J Schreiner F Goetz-Neunhoeffer J Neubauer and D Jansen Hydrothermal synthesisof 11 Aring tobermorite ndash Effect of adding metakaolin to the basic compound Applied ClayScience 185 2020
[59] J Schreiner F Goetz-Neunhoeffer J Neubauer S Volkmann S Bergold R Webler andD Jansen Advanced Rietveld refinement and SEM analysis of tobermorite in chemicallydiverse autoclaved aerated concrete Powder Diffraction 34143ndash150 2019
[60] J Schreiner D Jansen D Ectors F Goetz-Neunhoeffer J Neubauer and S VolkmannNew analytical possibilities for monitoring the phase development during the production ofautoclaved aerated concrete Cement and Concrete Research 107247ndash252 2018
29
6 Publications
6 Publications
61 Hydrothermal synthesis of 11 Aring tobermorite ndash Effectof adding metakaolin to the basic compound
Reprint of the peer reviewed publication
Schreiner J Goetz-Neunhoeffer F Neubauer J Jansen D 2020 Hydrothermalsynthesis of 11 Aring tobermorite ndash Effect of adding metakaolin to the basic compoundApplied Clay Science 185 httpsdoiorg101016jclay2019105432
with permission from Elsevier
30
Contents lists available at ScienceDirect
Applied Clay Science
journal homepage wwwelseviercomlocateclay
Research paper
Hydrothermal synthesis of 11 Aring tobermorite ndash Effect of adding metakaolin tothe basic compound
J Schreiner F Goetz-Neunhoeffer J Neubauer D JansenUniversity of Erlangen-Nuremberg GeoZentrum Nordbayern Mineralogy Schlossgarten 5a 91054 Erlangen Germany
A R T I C L E I N F O
KeywordsHydrothermal synthesis11 Aring tobermoriteMetakaolinPowder diffractionKatoite
A B S T R A C T
Different amounts and types of metakaolin were analyzed and applied for the hydrothermal synthesis of 11 Aringtobermorite All synthesized samples were investigated by means of powder XRD combined with Rietveld re-finement Al-substituted 11 Aring tobermorite was successfully synthesized on the basis of a broad range of com-pounds characterized by a varying content of metakaolin Katoite was present depending on the amount ofsupplied Al3+ which was determined by the dosage of metakaolin Minor crystalline components included in thetwo types of metakaolin sources varied greatly in their reactivity under hydrothermal conditions Despite adifferent degree of purity the two types of metakaolin showed corresponding effects at moderate dosages butcontrary effects at higher dosages as for the synthesis of 11 Aring tobermorite The domain morphology of to-bermorite could be associated with Al3+ incorporation for low dosages of metakaolin represented by up to 2 wt- Al2O3 in the dry mix By contrast Al3+ affected tobermorite lattice parameters at equivalent and even athigher dosages with c reaching 2295 Aring at 12 wt- Al2O3 in the dry mix
1 Introduction
11 Application of metakaolin as a reactive material in constructionindustry
The application of supplementary cementitious materials (SCMs) inthe field of construction technology has received a lot of attention inrecent years Due to limited resources and an urgent need for alter-native and more eco-friendly construction materials SCMs such asmetakaolin offer a great potential The usage of SCMs has not onlyspread to the cement and mortar industry but also to advanced appli-cations such as autoclaved aerated concrete (AAC) (Demir et al 2014Koutnyacute et al 2014 Walczak et al 2015 Roacuteżycka and Pichoacuter 2016Chucholowski et al 2018) Unlike ordinary cementitious constructionmaterials AAC is produced from hydrothermal curing Due to the dif-ferent thermodynamic environment the hydration process and the re-activity of raw materials have to be investigated properly in order tounderstand the effects on the AAC product The leading mineral phasein AAC is 11 Aring tobermorite (Ca5Si6O16(OH)2middot4H2O) As a consequencethe thermal and mechanical properties of AAC depend on micro-structure and crystallinity of tobermorite to some extent In addition tothe curing time and the fineness of raw materials the supply of ionsthat can substitute in the tobermorite structure is a crucial factor in thiscontext Especially substitutions by aluminum sodium and potassium
ions have been investigated thoroughly (Sauman 1974 Klimesch andRay 1998 Mostafa et al 2009 Matekonis et al 2010 Skawinskaet al 2017) Calcined clays usually contain a considerable amount ofthe mentioned ions
There is a vast amount of literature on the reactivity of SCMs atambient temperature and standard pressure but there is little when itcomes to hydrothermal conditions In previous publications the beha-vior of metakaolin under hydrothermal conditions was mainly in-vestigated for the synthesis of zeolites (Zhang et al 2007 Aguilar-Mamani et al 2014 Setthaya et al 2016 Luo et al 2018) In thesestudies the reactivity of metakaolin was observed at a wide range oftemperature and pH values During the transformation of kaolin intometakaolin a loss of framework alumina was observed (Ayodele et al2019) In recent decades metakaolin has been the subject of studies inthe field of geopolymer research (Rashad 2013 Chen et al 2016) Forthe synthesis of 11 Aring tobermorite a more distinct setting of temperaturesetting (180ndash200 degC) and steam pressure (1ndash12 MPa) are required
This publication is intended to make a new contribution to thechallenging field of hydrothermal synthesis in the system CaO-Al2O3-SiO2-H2O based on XRD analysis combined with Rietveld refinementVarious dosages of two types of metakaolin with different chemical andmineralogical purities are compared for the effects on the hydrothermalsynthesis of Al-substituted 11 Aring tobermorite Especially changes of thebulk chemistry in the raw mixes the reactivity of minor crystalline
httpsdoiorg101016jclay2019105432Received 20 August 2019 Received in revised form 13 November 2019 Accepted 30 December 2019
Corresponding authorE-mail address juergenjsschreinerfaude (J Schreiner)
Applied Clay Science 185 (2020) 105432
0169-1317 copy 2020 Elsevier BV All rights reserved
T
6 Publications
31
phases of the two types of metakaolin and the effect of different curingtimes are the focus of interest On the one hand metakaolin offers agreat potential in the AAC industry On the other hand of all SCMsmetakaolin is a good source material for investigating the influence ofAl3+ on the synthesis of Al-substituted 11 Aring tobermorite
12 Synthesis of Al-substituted 11 Aring tobermorite
In addition to being present in AAC tobermorite has found appli-cation in wastewater treatment and nuclear waste management due toits ion exchange capacity (Maeda et al 2012 Monasterio et al 2015)The substitution of silicon by aluminum results in a different to-bermorite structure due to general and local charge balance affectingthe lattice parameters Especially c is impacted by this substitutionbecause it occurs in the bridging tetrahedron and additional OHndash sub-stitutes O2ndash (Komarneni et al 1985 Merlino et al 2000) As suggestedin some additional studies the substitution of Si4+ by Al3+ and Na+ orK+ leads to a lath-like morphology of tobermorite crystals (Mostafa2005 Mostafa et al 2009 Venhodovaacute et al 2015 Qu et al 2018)However because of the heterogeneous appearance of tobermorite inAAC it is hardly possible to conduct a proper characterization based onSEM analysis In our recent work the anisotropic peak broadening oftobermorite in XRD diffractograms was successfully linked with theincorporation of foreign ions supplied in a common AAC production(Schreiner et al 2019) This finding allowed a more statistical struc-tural characterization of tobermorite in bulk compositions compared toSEM analysis Moreover it was reported in other studies that differenthydrate phases occur depending on the amount of supplied ions and onthe experimental settings In compounds with a high content of Al3+formation of katoite could be observed (Klimesch and Ray 1998 Riacuteoset al 2009 Matsui et al 2011) In the case of a longer curing durationinstead of 11 Aring tobermorite the formation of xonotlite (Siauciunas andBaltakys 2004 Galvaacutenkovaacute et al 2018) or - depending on the finenessof used silica source (Siauciunas and Baltakys 2004) - gyrolite is fa-voured
Kalousek (1956) suggested that tobermorite can contain up to 5Al2O3 More Al2O3 in the system resulted in the formation of hydro-garnet Klimesch and Ray (1998) additionally investigated the stabilityof hydrogarnet depending on the Al(Si + Al) ratio and its role in re-lation to the formation of 11 Aring tobermorite in an equivalent systemThey suggest that hydrogarnet always appears before tobermorite butthe former can only be detected for higher Al(Si + Al) ratios in theevent of longer curing times Riacuteos et al (2009) and Qu et al (2018)confirmed these findings in extensive investigations In the latter pub-lication it is additionally suggested that samples prepared at lowertemperatures (160 degC) are less impacted by the supply of Al3+ Theyalso consider the peak broadening of tobermorite in their XRD plotsbased on the amount of incorporated Al3+ In two recent publicationswe suggested that the peak broadening of tobermorite enables a mi-crostructural analysis by calculating the orientation dependent domainsizes (Schreiner et al 2018 2019) However these studies are based onsamples of industrially produced AAC so that the curing time was fixedThe studied AAC was produced from raw materials with a broad che-mical spectrum such as ordinary Portland cement (OPC) whichsomehow complicates the interpretation of results
In this work the influence of aluminum ions - provided by meta-kaolin - on dominant crystallographic direction-dependent domaingrowth of tobermorite is investigated by analysis of anisotropic peakbroadening (Ectors et al 2015 2017) In Fig 1 of the supplementarymaterial the method of fitting the anisotropic peak broadening of to-bermorite using a triaxial cylinder model is visualized (Schreiner et al2018) Fitting of the anisotropic peak broadening of tobermorite Thismethod is used to calculate the average and reliable values for to-bermorite domain sizes in the powder sample and associate them withaverage Al3+ incorporation Microstrain should be considered becauseit is an additional source of peak broadening However this usually
accounts for materials that have been exposed to different kinds ofstress such as metals and alloys (Badawi et al 2019) In addition theinstrumental contribution to peak broadening should be consideredHydration products such as tobermorite are characterized by crystallitesizes in the range of nanometers so that anisotropic size broadeningclearly outweighs the effect of instrumental broadening (Jenkins andSnyder 1996) Moreover the impact of Al3+ on the lattice parametersof tobermorite is considered It should additionally be clarified whe-ther the results from our previous publication (Schreiner et al 2019)based on industrially produced AAC can be confirmed by investigationwith less complex raw mixes and purely based on laboratory experi-ments
2 Material and methods
21 Starting materials
The starting materials for hydrothermal synthesis included deio-nized water quartz flour portlandite (999 pure) and two types ofmetakaolin One type was ordinary commercially available metakaolin(MK) with nearly a stoichiometric composition For comparison thesecond type of commercially available metakaolin was a by-productfrom expanded glass production (MKg) and consequently highly im-pure The chemical composition of MK and MKg determined by XRF isgiven in Table 1 With MKg containing less Al2O3 but considerably moreNa2O than MK the effects on hydrothermal synthesis were of interestBoth types of metakaolin have been characterized in previous pub-lications (Schmidt et al 2012 Naber et al 2019) In addition weverified the mineral phase content by XRD analysis Besides amorphousmetakaolin MK contained minor amounts of anatase quartz and mica
Fig 1 Weight fractions of tobermorite quartz and katoite determined byquantitative XRD analysis ndash samples including MKg crosshatched
Table 1Chemical composition of MK and MKg determined by XRF analysis ndash majorcontrasts in bold letters
Oxides [wt-] MK MKg
SiO2 536 604Al2O3 392 206CaO 01 40MgO 01 12Na2O 0 96K2O 10 18Fe2O3 18 05TiO2 21 03P2O5 01 02Loss on ignition 15 1
J Schreiner et al Applied Clay Science 185 (2020) 105432
2
6 Publications
32
MKg contained additional kaolinite feldspar and quartz
22 Investigated mix composites
For the preparation of raw mixtures the powders were weighed andhomogenized using a lab-scale mixing mill Table 2 lists the composi-tion and nomenclature of all samples including Al2O3 content andcuring time in the autoclave
bull Besides one blank mixture (MK0) that did not contain any type ofmetakaolin eleven more compounds were prepared of which threeincluded different dosages of MKg (MKg16 MKg23 and MKg60)Three more mixes contained equivalent amounts of MK instead ofMKg (MK16 MK23 and MK60) These mixes were investigated inorder to have a direct comparison concerning the effects of differentraw material on the synthesis of tobermorite
bull Additionally the mixes MK9 MK5 and MK25 with lower dosages ofmetakaolin were analyzed In the referenced literature (Schreineret al 2019) the effect of Al3+ on the anisotropic peak broadeningof tobermorite could only be observed in the case of Al2O3 contentslower than 4 in the drymix In the latter three mixes Al2O3 con-tents range from 1 to 35 Al2O3 (calculated from XRF data) whichmeets the region of interest for the analysis of tobermorite domainmorphology
bull The curing time for nearly all of the investigated samples was 12 hbut compound MK9 was prepared two more times for curing timesof 2 h and 6 h The different curing times were chosen in this par-ticular sample so that the reactivity of metakaolin and the phasetransitions could be observed more precisely
23 Hydrothermal treatment
Due to the different fineness of raw materials there was a differentwater demand from one mixture to another In order to obtain slurriesof comparable rheology the amount of water was adapted respectivelyresulting in water-to-solid ratios of 25 to 3 which matches the sug-gested water-to-solid ratio for this purpose (Roacutezycka et al 2014Galvaacutenkovaacute et al 2018) The weighed water was added to the dry mixand after stirring for 1 min at 23 degC the slurry was poured into thereactor Minor changes in the quantity of added water did not have aninfluence on the measured steam pressure All experiments were con-ducted using a PTFE-lined stainless steel autoclave with a reactor vo-lume of 300 ml The oven temperature was fixed at 180 degC and auto-genous steam pressure of 11ndash12 MPa was measured during eachexperiment with an external manometer After cooling to room tem-perature the sample was removed from the reactor coarsely ground
using an agate mortar and dried at 60 degC for 12 h After drying thesample was ground with an agate mortar again in order to deagglo-merate the particles As no coarse raw materials were used there wasno need for wet McCrone milling (Schreiner et al 2018)
24 XRD analysis
After preparation into front-loading sample holders the powdersamples were measured with a D8 diffractometer (Bruker) equippedwith a LynxEye detection system and Bragg-Brentano geometry Thesettings for XRD analysis included a tube voltage of 40 kV a current of40 mA an angular range from 6 to 80deg 2θ (Cu Kα radiation) a time perstep of 054 s a step width of 00236deg 2θ and a PSD opening of 33deg Thebackground was fitted with Chebyshev polynomial of the fifth orderThe major contribution of amorphous phase was fitted with a singlepeak with a fixed position at 308deg 2θ so that tobermorite reflectionswere not affected An external quartzite standard was measured withthe same parameters in order to determine phase quantities (Jansenet al 2011) Bruker AXS software TOPAS 50 was used for Rietveldrefinement (Rietveld 1969) and the used structures are shown inTable 3
3 Results and discussion
31 Different dosages of MK and MKg
In Fig 1 the quantities of tobermorite quartz and katoite present inmost of the samples determined by XRD analysis are illustratedWhenever tobermorite was the leading mineral hydrate phase a basalspacing of 113 Aring could be verified in each of the diffractograms Thequantities of minor crystalline phases and amorphous content are notshown For low dosages of MK it can be seen that the weight fraction oftobermorite decreased At moderate dosage of both types of metakaolin(MK16 MK23 MKg16 MKg23) tobermorite was present in comparablequantities It can be seen that the amount of katoite in the mixes de-pended on the dosage of metakaolin and it appeared only at dosages ofMK5 or more Due to the higher content of aluminum in MK comparedto MKg more katoite could always be observed in the MK mixes atequivalent dosages Despite equal amounts of quartz as starting mate-rial in mixes for both types of metakaolin the resulting weight fractionsin the cured samples were not alike Considerably more quartz waspresent in the MK samples Even though less quartz was used for mixescontaining higher amounts of MK even more quartz was present afterhydrothermal curing (Table 2 Fig 1) Consequently some of the SiO2
provided by MK did not transform into an amorphous phase or to-bermorite but into quartz This finding is verified by the presence ofquartz in MK60 because no quartz was included in the raw mixture Thefeldspar present in MKg did not react so Na2O and an unknown amountof Al2O3 may not have been supplied for hydrothermal reaction Besidestobermorite and quartz additional calcite scawtite (Ca7Si6(CO3)
Table 2Basic powder compounds prepared for the hydrothermal synthesis of to-bermorite with the respectively calculated Al2O3 content and curing time in thereactor
Sample Portlandite[wt-]
Quartz[wt-]
MK[wt-]
MKg
[wt-]
Al2O3
[wt-]Curingtime [h]
MK0 49 51 ndash ndash 0 12MK25 495 48 25 ndash 1 12MK5 49 46 5 ndash 2 12MK9_2h 48 43 9 ndash 35 2MK9_6h 48 43 9 ndash 35 6MK9_12h 48 43 9 ndash 35 12MK16 47 37 16 ndash 63 12MK23 46 31 23 ndash 9 12MK60 40 ndash 60 ndash 235 12MKg16 47 37 ndash 16 33 12MKg23 46 31 ndash 23 47 12MKg60 40 ndash ndash 60 124 12
Table 3Structural data used for the investigation with powder XRD analysis
Phase Author
Anatase (Horn et al 1972)Biotite (Brigatti et al 2000)Calcite (Maslen et al 1995)Kaolinite (Zvyagin 1960)Katoite (Bartl 1969)Microcline (Bailey 1969)Plazolite (Basso et al 1983)Portlandite (Busing and Levy 1957)Quartz (Le Page and Donnay 1976)Scawtite (Grice 2005)Tobermorite (Hamid 1981)Xonotlite (Hejny and Armbruster 2001)
J Schreiner et al Applied Clay Science 185 (2020) 105432
3
6 Publications
33
O18bull2(H2O)) and xonotlite (Ca6Si6O17(OH)2) could be identified insample MK0 (XRD plots of samples MK0 MKg16 MKg23 MK16 andMK23) Comparing MK0 and MK25 scawtite and xonotlite could stillbe identified in a very low amount in MK25 but no longer in samplesthat contained even more MK (XRD plots of samples MK0 MK25 MK5and MK9_12h)
Two additional experiments were done without quartz in the rawmixes (MK60 and MKg60) The according diffractograms after hydro-thermal curing are shown in Fig 2 In sample MKg60 tobermorite (gt 50wt-) was successfully synthesized without any other silica sourcethan MKg whereas no crystalline quartz occurred By contrast no to-bermorite but quartz could be identified in equivalent mixture MK60containing MK It can be seen that crystalline components such as micaand anatase in the raw MK did not react at the selected conditions andremained present in the autoclaved samples Except for feldspar in MKgall of the crystalline components appeared to be reactive at the chosenhydrothermal conditions A minor unidentified phase occurred at328deg2θ and additional xonotlite was identified in sample MKg60 Insample MK60 more calcium was needed for the formation of morehydrogarnet (Fig 1) resulting in a lower CaSi ratio for the remainingsystem Sample MKg60 contained only half of the amount of Al3+ and itwas not completely supplied for reaction due to its partial presence infeldspar Consequently essentially less hydrogarnet (Fig 1) was presentin MKg60 after hydrothermal treatment and the CaSi ratio in the re-maining system was affected to a lesser extent
32 Application of MK for different curing times
The development of hydrate phases in the autoclave for compoundMK9 is displayed in Fig 3 After only 2 h of hydrothermal curing all ofthe available portlandite had reacted and katoite (95 wt-) was pre-sent The applied type of metakaolin appeared to react quickly as itsupplied aluminum for formation of katoite No formation of to-bermorite could be observed at this stage yet An assumably amorphousprecursor can be seen at 28 to 30deg2θ Calcium was provided by thedissolution of portlandite After 6 h of hydrothermal reaction amountsof katoite (85 wt-) and quartz (from 31 wt- at 2 h to 165 wt- at6 h) had decreased and a major amount of tobermorite (35 wt-) waspresent Apparently between 2 and 6 h under hydrothermal conditionsthe amorphous precursor and quartz reacted resulting in the formationof tobermorite An additional 6 h of reaction time (MK9_12h) did notchange the phase composition significantly Slightly more tobermorite
(365 wt-) less quartz (16 wt-) and katoite (65 wt-) weremeasured
33 Tobermorite domain morphology and lattice parameters
In the referenced literature an analysis of tobermorite domainmorphology based on anisotropic peak broadening was possible forsamples that contained notgt 4 wt- Al2O3 in the drymix (Schreineret al 2019) Accordingly in this study samples MK0 MK25 MK5MK9_6h and MK9_12h were suitable (Table 2) with MK9_2h not con-taining any tobermorite In Fig 4 the respective growth in a and b di-rection is visualized with x indicating the domain size in a direction andy indicating domain size in b direction using a macro for TOPAS 50(Ectors et al 2015 2017) The calculated cylinder models in Fig 4represent the relation of yx and not absolute sizes With no supply ofaluminum ions (MK0) the relative domain growth in b direction islower compared to samples containing metakaolin This finding agreeswith the results from a similar investigation of tobermorite in AAC(Schreiner et al 2019) However within the samples MK5 andMK9_12h the different amounts of supplied aluminum ions did notshow a clear effect It appeared that low dosages of Al3+ (1 wt- Al2O3
in MK25 and 2 wt- Al2O3 in MK5) were enough to determine thedomain growth of tobermorite Additional results from the samplesMK9_6h and MK9_12h indicated that growth in b direction increasedwith reaction time
In Fig 5 lattice parameters of tobermorite depending on metakaolindosages are plotted B clearly remained unaffected throughout therange of samples Increasing amounts of metakaolin led to a slightlysmaller parameter a However both types of metakaolin showed acorresponding impact on parameter a By contrast parameter c in-creased strongly with increasing amounts of MK and MKg but the typeof metakaolin was significant At an equivalent dosage MK affected thecell dimension in c direction considerably more than MKg so that thefraction of Al3+ appeared to be the decisive parameter Different metaloxides in MKg did not show a notable effect certainly as they werepartially not provided for reaction Unlike for the domain morphologyof tobermorite the impact on lattice parameters could be observedwithin the complete range of examined dosages
4 Conclusions
The results obtained from the introduced investigations allow con-cluding remarks on the effects of the applied types of metakaolin on thesynthesis of 11 Aring tobermorite the phase transitions and the in-corporation of Al3+ into the lattice of tobermorite
With a critical dosage the use of any type of metakaolin led to theformation of katoite in an according amount At moderate dosages(MKg16 MKg23 MK16 and MK23) the two types of metakaolin showeda good correspondence in consideration of the quantities of to-bermorite For higher dosages there were contrary effects Lower do-sages of MK led to considerable quantities of Al-substituted to-bermorite Samples containing low dosages of MK revealed that katoiteappeared in the case ofgt 5 wt- of MK - corresponding to 2 wt-Al2O3 - in the basic compound Minor crystalline phases in MKg showedbetter reactivity than those in MK The observation that no tobermoritewas present in sample MK60 indicated that high dosages of Al3+ hin-dered the formation of tobermorite
Investigations of MK9 at 2 6 and 12 h displayed the evolution ofhydrate phases At first katoite was the only crystalline hydrate phasepresent after 2 h which corresponded to observations in a differentpublication (Klimesch and Ray 1999) The amount of katoite andquartz then decreased and a major amount of tobermorite formed from2 to 6 h curing time In order to gain more information on the trans-formation of amorphous C-(A)-S-H into tobermorite additional ex-periments in the range of 2 to 6 h curing time will be needed
Domain morphology analysis of tobermorite revealed that low
Fig 2 Diffractograms of MKg MKg60 MK and MK60 from 7 to 34deg2θ CuKα Aanatase C calcite F feldspar k kaolinite K katoite M mica Q quartz Ttobermorite U unidentified phase X xonotlite
J Schreiner et al Applied Clay Science 185 (2020) 105432
4
6 Publications
34
dosages of Al3+ determined the domain growth which agreed with theresults published on tobermorite in AAC samples (Schreiner et al2019) Different curing times unveiled that growth in b direction in-creased with the reaction time Al3+ incorporation into the lattice oftobermorite only reflected to a limited extent in the domain mor-phology By contrast an increase of lattice parameter c was triggered byAl3+ even at the highest dosage in this study Ultimately there is no
evidence for a limit of incorporation of Al3+ but there is a limit ofinfluence on the domain morphology These results additionally re-confirm this assumption similarly made in the previous work (Schreineret al 2019) and suggest a new mechanism of tobermorite crystal-lization depending on the presence of Al3+
Supplementary data to this article can be found online at httpsdoiorg101016jclay2019105432
Declaration of Competing Interest
The authors declare that they have no known competing financialinterests or personal relationships that could have appeared to influ-ence the work reported in this paper
Acknowledgement
The authors thank Rodgauer Baustoffwerke GmbH amp Co KG forsupplying raw materials for laboratory experiments
References
Aguilar-Mamani W Garciacutea G Hedlund J Mouzon J 2014 Comparison betweenleached metakaolin and leached diatomaceous earth as raw materials for the synth-esis of ZSM-5 Springerplus 3 1ndash10 httpsdoiorg1011862193-1801-3-292
Ayodele OB Sulaimon AA Alaba PA Tian Z-Y 2019 Influence of metakaolini-zation temperature on the structure and activity of metakaolin supported Ni catalystin dry methane reforming J Environ Chem Eng httpsdoiorg101016jjece2019103239 (in press)
Badawi EA Abdel-Rahman MA Mostafa A Abdel-Rahman M 2019 Determinationof the crystallite size amp micro- strain by novel method from XRD profile Appl Phys2 1ndash15 httpsdoiorg1031058jap201921001
Bailey SW 1969 Refinement of an intermediate microcline structure Am Miner 541540ndash1545
Bartl H 1969 Roentgen-Einkristalluntersuchungen an (CaO)3 (Al2O3) (H2O)6 und an(CaO)12 (Al2O3)7 (H2O) neuer Vorschlag zur (CaO)12 (Al2O3)7-Struktur NeuesJahrb fuer Mineral Monatshefte 1969 404ndash413
Basso R Giusta AD Zefiro L 1983 Crystal structure refinement of plazolite A highlyhydrated natural hydrogrossular Neues Jahrb Miner Monatsh (Neues Jahrb fuerMineral Monatshefte) 1983 251ndash258
Brigatti MF Lugli C Poppi L Foord EE Kile DE 2000 Crystal chemical varia-tions in Li- and Fe-rich micas from Pikes Peak batholith (Central Colorado) AmMineral 85 1275ndash1286 httpsdoiorg102138am-2000-8-920
Busing WR Levy HA 1957 Neutron diffraction study of calcium hydroxide J ChemPhys 26 563 httpsdoiorg10106311743345
Chen L Wang Z Wang Y Feng J 2016 Preparation and properties of alkali acti-vated metakaolin-based geopolymer Materials (Basel) 9 1ndash12 httpsdoiorg103390ma9090767
Chucholowski C Holger M Thienel K-C 2018 Improving the recyclability en-vironmental compatibility and CO2 balance of autoclaved aerated concrete by re-placing sulfate carrier and cement with calcined clays CePapers 2 503ndash512httpsdoiorg101002cepa846
Fig 3 Diffractograms of MK9_2h MK9_6h and MK9_12h from 7 to 38deg2θ CuKα C calcite K katoite Q quartz T tobermorite
Fig 4 Relation of calculated domain sizes of 11 Aring tobermorite in selectedsamples (MK0 MK25 MK5 MK9_6h and MK9_12h) in a (x) and b (y) direction
Fig 5 Lattice parameters of tobermorite depending on MK or MKg dosageincluding blank mix MK0
J Schreiner et al Applied Clay Science 185 (2020) 105432
5
6 Publications
35
Demir İ Başpınar MS Kahraman E Ccedilalışkan E Goumlrhan G 2014 An investigationon the usability of diatomite in aerated concrete production In Proc of the IntlConf on Advances in Civil Structural and Construction Engineering ndash CSCE 2014 pp97ndash100
Ectors D Goetz-Neunhoeffer F Neubauer J 2015 A generalized geometric approachto anisotropic peak broadening due to domain morphology J Appl Crystallogr 48189ndash194 httpsdoiorg101107S1600576714026557
Ectors D Goetz-Neunhoeffer F Neubauer J 2017 Routine (an)isotropic crystallitesize analysis in the double-Voigt approximation done right Powder Diffract 3227ndash34 httpsdoiorg101017S0885715617000070
Galvaacutenkovaacute L Bartoniacutečkovaacute E Opravil T Tkacz J Ptaacuteček P 2018 The influence ofstarting materials solubility on tobermorite structure formation under the hydro-thermal conditions IOP Conf Ser Mater Sci Eng 379 1ndash8 httpsdoiorg1010881757-899X3791012001
Grice JD 2005 The structure of spurrite tilleyite and scawtite and relationships toother silicate-carbonate minerals Can Mineral 43 1489ndash1500 httpsdoiorg102113gscanmin4351489
Hamid SA 1981 The crystal structure of the 11 Aring natural tobermoriteCa225[Si3O75(OH)15]1H2O Zeitschrift fuer Krist 154 189ndash198 httpsdoiorg101524zkri19811543-4189
Hejny C Armbruster T 2001 Polytypism in xonotlite Ca6Si6O17(OH)2 Zeitschrift furKrist 216 396ndash408
Horn M Schwerdtfeger CF Meagher EP 1972 Refinement of the structure of ana-tase at several temperatures Zeitschrift fur Krist 136 273ndash281 httpsdoiorg101524zkri19721363-4273
Jansen D Goetz-Neunhoeffer F Stabler C Neubauer J 2011 A remastered externalstandard method applied to the quantification of early OPC hydration Cem ConcrRes 41 602ndash608 httpsdoiorg101016jcemconres201103004
Jenkins R Snyder R 1996 Introduction to X-ray Powder Diffractometry ChemicalAnalysis Wiley pp 90
Kalousek GL 1956 Crystal Chemistry of Hydrous Calcium Silicates J Am Ceram Soc40 74ndash80
Klimesch D Ray A 1998 Autoclaved cement-quartz pastes with metakaolin additionsAdv Cem Based Mater 7 109ndash118 httpsdoiorg101016S1065-7355(97)00073-4
Klimesch D Ray A 1999 DTA-TGA evaluations of the CaOndashAl2O3ndashSiO2ndashH2O systemtreated hydrothermally Thermochim Acta 334 115ndash122 httpsdoiorg101016s0040-6031(99)00140-9
Komarneni S Roy R Roy DM Fyfe CA Kennedy GJ Bothner-By AA Dadok JChesnick AS 1985 27Al and29Si magic angle spinning nuclear magnetic resonancespectroscopy of Al-substituted tobermorites J Mater Sci 20 4209ndash4214 httpsdoiorg101007BF00552416
Koutnyacute O Opravil T Pořiacutezka J 2014 Application of metakaoline in autoclavedaerated concrete technology Adv Mater Res 1000 174ndash177 httpsdoiorg104028wwwscientificnetAMR1000174
Le Page Y Donnay G 1976 Refinement of the crystal structure of low-quartz ActaCrystallogr Sect B 32 2456ndash2459 httpsdoiorg101107S0567740876007966
Luo H Law WW Wu Y Zhu W Yang EH 2018 Hydrothermal synthesis of needle-like nanocrystalline zeolites from metakaolin and their applications for efficient re-moval of organic pollutants and heavy metals Microporous Mesoporous Mater 2728ndash15 httpsdoiorg101016jmicromeso201806015
Maeda H Ogawa Y Ishida EH Kasuga T 2012 Hydrothermal synthesis of to-bermorite doped with phosphorus species for removing heavy metal ions J AustCeram Soc 48 8ndash11
Maslen EN Streltsov VA Streltsova NR Ishizawa N 1995 Electron density andoptical anisotropy in rhombohedral carbonates III Synchrotron Xray studies ofCaCO3 MgCO3 and MnCO3 Acta Crystallogr Sect B 51 929ndash939 httpsdoiorg101107S0108768195006434
Matekonis G Šiaučiūnas R Vaičiukynienė D 2010 Hydrothermal Synthesis andCharacterization of Na + and [ Al 3 + + Na + ] -substituted Tobermorite in CaO-SiO2middotnH2O-H2O System Mater Sci 16 242ndash248
Matsui K Kikuma J Tsunashima M Ishikawa T Matsuno S Ogawa A Sato M2011 In situ time-resolved X-ray diffraction of tobermorite synthesis process underhydrothermal condition IOP Conf Ser Mater Sci Eng 18 60ndash66 httpsdoiorg1010881757-899X182022017
Merlino S Bonaccorsi E Armbruster T 2000 The real structures of clinotobermoriteand tobermorite 9 Aring OD character polytypes and structural relationships Eur JMineral 12 411ndash429 httpsdoiorg1011270935-122120000012-0411
Monasterio M Gaitero JJ Manzano H Dolado JS Cerveny S 2015 Effect ofchemical environment on the dynamics of water confined in calcium silicate mi-nerals Natural and synthetic tobermorite Langmuir 31 4964ndash4972 httpsdoiorg101021acslangmuir5b00614
Mostafa NY 2005 Influence of air-cooled slag on physicochemical properties of auto-claved aerated concrete Cem Concr Res 35 1349ndash1357 httpsdoiorg101016jcemconres200410011
Mostafa NY Shaltout AA Omar H Abo-El-Enein SA 2009 Hydrothermal synth-esis and characterization of aluminium and sulfate substituted 11 nm tobermoritesJ Alloys Compd 467 332ndash337 httpsdoiorg101016jjallcom200711130
Naber C Stegmeyer S Jansen D Goetz-Neunhoeffer F Neubauer J 2019 ThePONKCS method applied for time resolved XRD quantification of supplementarycementitious material reactivity in hydrating mixtures with ordinary Portland ce-ment Constr Build Mater 214 449ndash457 httpsdoiorg101016jconbuildmat201904157
Qu X Zhao Z Zhao X 2018 Microstructure and characterization of aluminum-in-corporated calcium silicate hydrates (C-S-H) under hydrothermal conditions RSCAdv 8 28198ndash28208 httpsdoiorg101039c8ra04423f
Rashad AM 2013 Metakaolin as cementitious material history scours production andcomposition - a comprehensive overview Constr Build Mater 41 303ndash318 httpsdoiorg101016jconbuildmat201212001
Rietveld HM 1969 A profile refinement method for nuclear and magnetic structures JAppl Crystallogr 2 65ndash71 httpsdoiorg101107S0021889869006558
Riacuteos CA Williams CD Fullen MA 2009 Hydrothermal synthesis of hydrogarnet andtobermorite at 175 degC from kaolinite and metakaolinite in the CaO-Al2O3-SiO2-H2Osystem a comparative study Appl Clay Sci 43 228ndash237 httpsdoiorg101016jclay200809014
Roacuteżycka A Pichoacuter W 2016 Effect of perlite waste addition on the properties of au-toclaved aerated concrete Constr Build Mater 120 65ndash71 httpsdoiorg101016jconbuildmat201605019
Roacutezycka A Kotwica Ł Małolepszy J 2014 Synthesis of single phase gyrolite in theCaO-quartz-Na2O-H2O system Mater Lett 120 166ndash169 httpsdoiorg101016jmatlet201401003
Sauman Z 1974 Influence of SO4 2ndash ions on the formation of 11 Aring tobermorite InProceedings of the 2nd International Symposium on Science and Research in SilicateChemistry Moscow pp 25ndash39
Schmidt M Egersdoumlrfer A Poumlllmann H 2012 Increased reactivity using a glass-containing metakaolin as an active filler in lime-based binder systems ZKG Int 6554ndash62
Schreiner J Jansen D Ectors D Goetz-Neunhoeffer F Neubauer J Volkmann S2018 New analytical possibilities for monitoring the phase development during theproduction of autoclaved aerated concrete Cem Concr Res 107 247ndash252 httpsdoiorg101016jcemconres201802028
Schreiner J Goetz-Neunhoeffer F Neubauer J Volkmann S Bergold S Webler RJansen D 2019 Advanced Rietveld refinement and SEM analysis of tobermorite inchemically diverse autoclaved aerated concrete Powder Diffract 34 143ndash150httpsdoiorg101017s0885715619000149
Setthaya N Chindaprasirt P Pimraksa K 2016 Preparation of zeolite nanocrystals viahydrothermal and solvothermal synthesis using of rice husk ash and metakaolinMater Sci Forum 872 242ndash247 httpsdoiorg104028wwwscientificnetmsf872242
Siauciunas R Baltakys K 2004 Formation of gyrolite during hydrothermal synthesis inthe mixtures of CaO and amorphous SiO2 or quartz Cem Concr Res 34 2029ndash2036httpsdoiorg101016jcemconres200403009
Skawinska A Owsiak Z Baran T Hernik K 2017 The influence of halloysite ad-dition on tobermorite formation in CaO and quartz mix under hydrothermal condi-tions Cem Wapno Bet 17 426ndash434
Venhodovaacute E Janovskyacute R Drochytka R 2015 Formation of tobermorite at differentmaterials composition of aerated concrete Appl Mech Mater 752ndash753 247ndash250httpsdoiorg104028wwwscientificnetamm752-753247
Walczak P Małolepszy J Reben M Szymański P Rzepa K 2015 Utilization ofwaste glass in autoclaved aerated concrete Proc Eng 122 302ndash309 httpsdoiorg101016jproeng201510040
Zhang Y Gao W Cui L 2007 The transformation of acid leached metakaolin tozeolite beta Stud Surf Sci Catal 170 420ndash425 httpsdoiorg101016S0167-2991(07)80870-6
Zvyagin BB 1960 An attempt to electronographic determination of kaolinite structureJ Dokl Akad Nauk SSSR 130 1023ndash1026
J Schreiner et al Applied Clay Science 185 (2020) 105432
6
6 Publications
36
6 Publications
62 Advanced Rietveld refinement and SEM analysis oftobermorite in chemically diverse autoclaved aeratedconcrete
Following the copyright guidelines by Cambridge University Press the publication
Schreiner J Goetz-Neunhoeffer F Neubauer J Volkmann S Bergold S WeblerR Jansen D 2019 Advanced Rietveld refinement and SEM analysis of tobermorite inchemically diverse autoclaved aerated concrete Powder Diffraction 34 143ndash150 httpsdoiorg101017s0885715619000149
may not be reprinted It can be accessed at
httpswwwcambridgeorgcorejournalspowder-diffractionarticleadvanced-rietveld-refinement-and-sem-analysis-of-tobermorite-in-chemically-diverse-autoclaved-aerated-concrete51597C2A66F6F225D29DEB2675E74249
37
6 Publications
63 New analytical possibilities for monitoring the phasedevelopment during the production of autoclavedaerated concrete
Reprint of the peer reviewed publication
Schreiner J Jansen D Ectors D Goetz-Neunhoeffer F Neubauer J VolkmannS 2018 New analytical possibilities for monitoring the phase development during theproduction of autoclaved aerated concrete Cement and Concrete Research 107 247ndash252httpsdoiorg101016jcemconres201802028
with permission from Elsevier
38
Contents lists available at ScienceDirect
Cement and Concrete Research
journal homepage wwwelseviercomlocatecemconres
Short communication
New analytical possibilities for monitoring the phase development duringthe production of autoclaved aerated concrete
J Schreinera D Jansena D Ectorsa F Goetz-Neunhoeffera J Neubauera S Volkmannb
aUniversity of Erlangen-Nuremberg GeoZentrum Nordbayern Mineralogy Schlossgarten 5a 91054 Erlangen Germanyb Rodgauer Baustoffwerke GmbH amp Co KG Am Opel-Pruumlffeld 3 63110 Rodgau-Dudenhofen Germany
A B S T R A C T
This work presents improved analytical methods for both steps of the production process of autoclaved aeratedconcrete (AAC) the phase development during the hydration before autoclaving and during the autoclavingprocess itself The improvement includes new insights into preparation methods of AAC samples for powderdiffraction as well as Rietveld refinement strategies For the first time a new implementation for calculatinganisotropic crystal domain sizes is applied to major hydrate phases occurring during AAC production namelyportlandite during the hydration before autoclaving and tobermorite during the autoclaving process The cal-culation of anisotropic domain size growth which can be implemented in the Rietveld environment is based oncrystallographically and geometrically appropriate models The implementation of calculating anisotropic do-main sizes for the Rietveld software TOPAS 50 allows a superior Rietveld fit and a more accurate quantificationof the phase development Additionally it enables the tracking of growth mechanism of portlandite duringhydration
1 Introduction
Autoclaved aerated concrete (AAC) is known as a lightweight con-struction material which offers outstanding properties such as suffi-cient strength for construction in addition with excellent thermal in-sulation [12] AAC is produced by autoclaving from calcareous rawmaterials such as lime (CaO) and cement quartz sulfate carrier andother additives such as foaming agents and water
The production process (Fig 1) can be separated into the hydrationof the mixed slurry before the procedure of autoclaving and the auto-claving at elevated temperature (180 degC to 200 degC) under saturatedsteam pressure (12MPa) for several hours
The hydration process before autoclaving is necessary to achievesufficient strength in order to cut the green cake blocks as they shouldhave a specific shape and dimension after autoclaving Furthermorethe porous structure is generated by the foaming agent during hydra-tion in the first process step During autoclaving the final propertiesnamely strength and low thermal conductivity are achieved
It is already well understood that the autoclaving process leads tothe formation of several phases first of all tobermorite(Ca5Si6O16(OH)2lowast4H2O) [3ndash5] Newest research has shown im-pressively which reactions are running from the mineralogical point ofview Insitu XRD measurements were carried out during the
autoclaving process and the phase development was shown by plottingnormalized intensities [6] The study of Mitsuda et al [3] was mainlyfocused on the tracking of the phase evolution during the autoclavingprocess of AAC However their statements concerning phase evolutionare mainly based on XRD data and TGA measurements There is acommon agreement that the following reactions occur The consump-tion of the alite (OPC) leads to the formation of an initial C-S-H phaseduring the first processing step Portlandite which was initially formedduring the first process step (from CaO and C3S) further quartz and theC-S-H phase are consumed during autoclaving resulting in the crystal-lization of tobermorite Hence the crystallization process of to-bermorite as well as the crystal structure of tobermorite was an issue ofresearch and discussion over the last years and numerous publicationsto these topics are available Concerning the crystal structure of to-bermorite respectively the tobermorite supergroup a new publicationoutlines all important references and recommends a new nomenclature[7]
The presented study was performed to create new analytical possi-bilities for the characterization of the production process of AAC Bothof the production process steps are essential for the final productHence the present work focuses on crystallization of hydrate phases inboth processes
Firstly an external standard method [89] was published and
httpsdoiorg101016jcemconres201802028Received 6 October 2017 Received in revised form 1 February 2018 Accepted 26 February 2018
Corresponding authorsE-mail addresses juergenjsschreinerfaude (J Schreiner) danieljansenfaude (D Jansen)
Cement and Concrete Research 107 (2018) 247ndash252
0008-8846 copy 2018 Elsevier Ltd All rights reserved
T
6 Publications
39
recommended for the determination of absolute phase contents inmixtures with amorphous content It was shown that the method canabsolutely be recommended for hydrating cement pastes in which watercannot be quantified directly by XRD [10] This method seems to bevery promising for both the quantification of the hydration of the AACslurry before autoclaving and the quantification of the phase evolutionduring autoclaving inasmuch as both production steps form crystallineand amorphous phases
Secondly a new approach to anisotropic peak broadening due toanisotropic domain morphology which was developed [1112] is ap-plied to AAC samples to improve the fit of portlandite and tobermoriteby Rietveld refinement [13] By applying this approach the refinementof both portlandite and tobermorite should additionally lead to betterquantitative results as well as to better insights into the development ofthe domain size morphology of both phases formed
It was already shown that in a hydrating raw mixture for AAC twospecies of portlandite precipitate at 23 degC one showing dynamicallyanisotropic peak broadening and another one following the isotropictrend [14] The application of the anisotropic refinement model led toan improved fitting of portlandite Moreover the mechanism of aniso-tropic domain growth of portlandite was tracked
2 Materials and methods
In order to examine the hydration of the AAC slurry before auto-claving a mixture of the hydraulic reactive components was weighedand measured in-situ at a Bruker D8 diffractometer with a LynxEyedetection system
Ordinary Portland cement (OPC) was mixed with lime (CaO) andanhydrite (C$) The raw materials were taken from the same batches asfor the industrial samples The drymix (58 OPC 36 CaO and 6 C$by weight) was then mixed with water (ws= 08) and placed into anappropriate sample holder The samples were not aerated The slurrysamples were covered with a kapton film to avoid evaporation andcarbonation Diffractograms were recorded with an angular range from7 to 545deg 2θ and a step width of 0011deg 2θ Measurements were carriedout every 15min For each measurement 96 XRD patterns were re-corded over the first 24 h The temperature was fixed at 70 degC which isthe mean temperature generally prevailing in the industrial processduring hydration before autoclaving Rietveld refinement was carriedout using the G-factor method All structures used for Rietveld refine-ment are shown in Table 1
For investigation of the autoclaved samples five different specimenswere taken at different autoclaving times The specimens were takenout of a technical production process hence it was not possible to in-terrupt the process at an earlier time inasmuch it would lead to damageof a whole concrete production batch The specimens were firstly driedat 60 degC until weight constancy The whole blocks were then broken andstatistical samples of 20 g were taken In order to receive the right massattenuation coefficient (MAC) for G-factor method the loss on ignitionand the chemical composition (XRF) were determined For energydispersive XRF analysis (Spectro Xepos) tube voltage from 20 kV to50 kV and tube current from 08 to 20mA were used for differenttargets
The final sample preparation (grinding) before XRD measurementswas carried out using both an agate mortar and a McCrone micronizingmill for wet milling with isopropanol Both preparation methods wereapplied separately to see which one is suitable in order to get the bestpreparation for XRD investigations Six preparations were performed byone operator of which two were prepared with an agate mortar andfour with a McCrone mill For the McCrone milling 3 g of the sampleand 10ml of isopropanol were used for grinding for 12min The grainsize distribution of one sample prepared with an agate mortar and onesample prepared using a McCrone mill was measured by laser granu-lometry in isopropanol using a Mastersizer 3000 (MALVERN)
After milling the samples in these two ways for XRD analysis thepowders were prepared into a front loading sample holder and mea-sured Diffractograms were recorded with an angular range from 6 to80deg 2θ a step width of 00236deg 2θ and a time per step of 054 s Rietveldrefinement combined with external standard (G-factor) was applied inorder to get absolute quantities for each phase The refinement strategyfor portlandite and tobermorite in the TOPAS Launch Mode (TOPAS50 Bruker AXS) is attached as a Supplementary material file
3 Results and discussion
31 Hydration of the mixture before autoclaving
The hydration of the investigated paste before autoclaving isdominated by the hydration of the cement as well as the reaction of thefree lime (CaO) resulting in the formation of portlandite It can beclearly seen from Fig 2 that the hydration of the paste leads to theformation of ettringite portlandite and C-S-H phase For simplificationthe remaining phase developments are not shown in Fig 2 because theyare not in the focus of this study The hydration of CaO forming
Fig 1 Simplified process steps of AAC production and hydrate phase evolution
Table 1Structures used for Rietveld refinement
Phase Author
Alite [15]Anhydrite [16]Bassanite [17]Belite (β) [18]Belite (αprime) [19]Brownmillerite [20]C-S-H [21]Calcite [22]Ettringite [23]Gypsum [24]Hemicarbonate [25]Hydroxylellestadite [26]Lime (CaO) [27]Microcline [28]Portlandite [29]Quartz [30]Tobermorite [31]Tricalciumaluminate (cubic) [32]Tricalciumaluminate (orthorhombic) [33]PONCKS model for Water [21]
J Schreiner et al Cement and Concrete Research 107 (2018) 247ndash252
248
6 Publications
40
portlandite begins rapidly after the addition of water to the mixture andlime is fully consumed after only 1 h of hydration This translates into aquick rise of heat of hydration so that cement hydration is acceleratedwhich leads to further portlandite formation by the reaction of aliteEttringite formation stalls after few hours of hydration After 12 h et-tringite is partially decomposed probably due to sulfate depletion [9]
and poorly crystalline AFm phases (not shown in Fig 2) are formedIn Fig 3 it can be seen that in fact two generations of portlandite
are formed a 1st dominant generation showing anisotropic peakbroadening and 2nd one occurring considerably later following theisotropic domain size refinement which is usually carried out using theRietveld method This occurrence comes along firstly with lime hy-dration and secondly with alite hydration The expected quantity ofportlandite formed from lime hydration very well complies with the
Fig 2 Phase development in AAC paste on a laboratory scale before autoclaving ana-lyzed by in-situ XRD at 70 degC
Fig 3 Formation of two generations of portlandite by hydration of lime (1st) and C3S(2nd) at 70 degC before autoclaving with the major generation showing anisotropic peakbroadening
Fig 4 Biaxial cylinder domain size model of portlandite used for Rietveld refinement of anisotropic peak broadening
Fig 5 Morphological evolution of portlandite showing anisotropic domain size growthduring hydration at 70 degC
Fig 6 Comparison of quantification of crystalline quartz in samples prepared withMcCrone mill and agate mortar at different autoclaving times
J Schreiner et al Cement and Concrete Research 107 (2018) 247ndash252
249
6 Publications
41
quantity of the observed 1st generation The development of portlan-dite growth was already tracked in an equivalent slurry at 23 degC [14]Thus this observation confirms that the crystallinity of portlandite inmixtures for AAC production depends on the starting phase for hydra-tion as already indicated by Ectors [14]
Fig 4 shows the used biaxial cylindrical model for anisotropic do-main size calculation and the portlandite structure which was createdwith structural software VESTA 318 [34] Using the cylindrical ap-proach domain sizes in a (here equating to b) and c direction(dz= cylinder height) can be calculated which comes along with theexpected symmetrical parameters of portlandite
The 1st portlandite generation showing anisotropic domain growthcan be tracked in terms of cylinder diameter and height which is rea-lized in Fig 5 The blue cylinder represents the geometric approach andcylinder height and diameter are calculated newly for each range Thecylinder height remains rather stable throughout the hydration processwhile the cylinder diameter increases during the first hours of hydra-tion After 10 h of hydration the mean cylinder diameter no longer in-creases Consequently these observations match the results of the ex-aminations conducted at 23 degC [14] as well as the assumption thatdifferent mechanisms of growth exist for portlandite depending on the
hydration educt The maximum cylinder diameter is reached earlier inthis work very likely because of the higher hydration temperature
32 Quantification of the reactions during autoclaving
Autoclaved samples were ground with an agate mortar and com-pared to samples which were wet-ground with a McCrone mill Fig 6shows precisely that the determination of the amount of crystallinequartz is more reproducible in the two shown samples which were
Fig 7 2D XRD with Bruker GADDS-system plots of samples prepared with agate mortar and McCrone mill Coarse quartz grains are pointed out in the plot of the sample prepared withagate mortar
Fig 8 Particle size distribution of one sample prepared with an agate mortar and of onesample prepared with a McCrone mill measured by laser granulometry
Fig 9 Rietveld refinement for Tobermorite of autoclaved AAC sample by use of isotropicdomain size model (a) and of anisotropic domain size model (b)
J Schreiner et al Cement and Concrete Research 107 (2018) 247ndash252
250
6 Publications
42
prepared with a McCrone mill The high variance of crystalline quartzin the samples which were prepared with an agate mortar is a result ofinsufficient grinding and remaining of too large quartz grains Whenthis spottiness occurs a reliable quantification using the G-factormethod is not possible
The 2D XRD with Bruker GADDS-system plots in Fig 7 demonstratethe insufficient grinding when using an agate mortar compared to wetmilling with a McCrone mill Quartz would be overrepresented in a one-dimensional XRD pattern focusing on a section with bright spots (greenarrows) The lack of bright spots in the right plot shows that the quartzgrains are milled more thoroughly using a McCrone mill In Fig 8 theparticle size distribution after both ways of sample preparation iscompared Most grains in the sample prepared with an agate mortar arelarger than in the sample prepared with a McCrone mill The grain sizedistribution of the sample prepared with a McCrone mill complies withthe recommended particle size range for XRD analysis of under 5 to50 μm [3536] while the other sample exceeds the range
In Fig 9 Rietveld refinement of an autoclaved sample is shown Thedominant peaks at 77 290 and 301deg 2θ are attributed to tobermoriteIn the upper diagram (a) Rietveld refinement was carried out regularlycalculating isotropic domain sizes for tobermorite However the cal-culated fit differs significantly from the raw data It can be assumed thattobermorite shows a similar pattern to portlandite in terms of aniso-tropic peak broadening taking into account that tobermorite is as-signed to the orthorhombic crystal system Thus instead of a biaxialcylinder model an elliptic cylinder model (Fig 10 structure createdwith VESTA 318 [34]) was applied for the refinement in the lowerdiagram (b) The elliptic cylinder model is a sufficient approach to the
orthorhombic crystal system as it allows the distinction between do-main sizes in a b and c direction The fit is clearly superior using theanisotropic domain size model highlighted by the difference plot inFig 9b The comparison refinement with isotropic and anisotropic ap-proach was done for all of the five autoclaved samples In Fig 11 theresulting Rwp values for the whole pattern and the RBragg values of to-bermorite are shown The refinement using the anisotropic model leadsto both lower Rwp and RBragg values and consequently to a better fit anda more accurate quantification of tobermorite in all refined samples
4 Summary and conclusions
Improved analytical methods for both the phase developmentduring the hydration before autoclaving and during the autoclavingprocess of AAC are presented It could be shown that wet McCronemilling is the best way of preparation of AAC samples in order to obtainsuitable samples for powder diffraction A new approach to treat ani-sotropic domain sizes for Rietveld refinement could be successfullyapplied ndash with the benefit that portlandite and tobermorite in AACsamples could be refined more accurately using the Rietveld methodThus this application allows an improved quantification of the phasedevelopment during both of the production steps
For the future there are still plenty of possibilities to apply thepresented approach of calculating anisotropic domain sizes to AACproduction As exemplified with portlandite the mechanisms of growthof tobermorite can be tracked likewise during the autoclaving processIn addition the effect of variations in the chemical composition of AACraw mixtures on the crystal morphology of tobermorite can be ex-amined This leaves a new perspective to discuss the link between mi-neral phase morphology and the thermal and mechanical properties ofAAC
Acknowledgement
The autoclaved samples were generously provided by RodgauerBaustoffwerke GmbH amp Co KG The authors express gratitude for allsupport
Appendix A Supplementary data
Supplementary data to this article can be found online at httpsdoiorg101016jcemconres201802028
References
[1] MW Grutzeck Cellular concrete in M Scheffler P Colombo (Eds) CellularCeramics Wiley-VCH Weinheim 2005 pp 193ndash223
[2] M Haas The future of AAC ndash from a material scientists point of view inMC Limbachiya JJ Roberts (Eds) Autoclaved Aerated Concrete Taylor FrLondon 2005 pp 187ndash194
[3] T Mitsuda K Sasaki H Ishida Phase evolution during autoclaving process ofaerated concrete J Am Ceram Soc 75 (1992) 1858ndash1863
[4] N Isu H Ishida T Mitsuda Influence of quartz particle size on the chemical and
Fig 10 Triaxial cylinder domain size model of Tobermorite used for Rietveld refinement of anisotropic peak broadening
Fig 11 Comparison of Rwp and RBragg values of Rietveld refinements of autoclavedsamples and tobermorite using the isotropic and the anisotropic domain size model
J Schreiner et al Cement and Concrete Research 107 (2018) 247ndash252
251
6 Publications
43
mechanical properties of autoclaved aerated concrete (I) tobermorite formationCem Concr Res 25 (1995) 243ndash248
[5] NY Mostafa Influence of air-cooled slag on physicochemical properties of auto-claved aerated concrete Cem Concr Res 35 (2005) 1349ndash1357 httpdxdoiorg101016jcemconres200410011
[6] K Matsui J Kikuma M Tsunashima T Ishikawa S Matsuno A Ogawa M SatoIn situ time-resolved X-ray diffraction of tobermorite formation in autoclaved aer-ated concrete influence of silica source reactivity and Al addition Cem Concr Res41 (2011) 510ndash519
[7] C Biagioni S Merlino E Bonaccorsi The tobermorite supergroup a new no-menclature Mineral Mag 79 (2015) 485ndash495 httpdxdoiorg101180minmag2015079222
[8] BH OConnor MD Raven Application of the Rietveld refinement procedure inassaying powdered mixtures Powder Diffract 3 (1988) 2ndash6 httpdxdoiorg101017S0885715600013026
[9] D Jansen F Goetz-Neunhoeffer C Stabler J Neubauer A remastered externalstandard method applied to the quantification of early OPC hydration Cem ConcrRes 41 (2011) 602ndash608 httpdxdoiorg101016jcemconres201103004
[10] D Jansen C Stabler F Goetz-Neunhoeffer S Dittrich J Neubauer Does OrdinaryPortland Cement contain amorphous phase A quantitative study using an externalstandard method Powder Diffract 26 (2011) 31ndash38 httpdxdoiorg10115413549186
[11] D Ectors F Goetz-Neunhoeffer J Neubauer A generalized geometric approach toanisotropic peak broadening due to domain morphology J Appl Crystallogr 48(2015) 189ndash194 httpdxdoiorg101107S1600576714026557
[12] D Ectors F Goetz-Neunhoeffer J Neubauer Routine (an)isotropic crystallite sizeanalysis in the double-Voigt approximation done right Powder Diffract 32 (S1)(2017) 27ndash34 httpdxdoiorg101017S0885715617000070
[13] HM Rietveld A profile refinement method for nuclear and magnetic structures JAppl Crystallogr 2 (1969) 65ndash71 httpdxdoiorg101107S0021889869006558
[14] D Ectors Advances in the Analysis of Cementitious Reactions and Hydrate Phases(Doctoral Thesis) (2016) pp 12ndash14 (urnnbndebvb29-opus4-71743)
[15] AacuteG De La Torre S Bruque J Campo MAG Aranda The superstructure of C3Sfrom synchrotron and neutron powder diffraction and its role in quantitative phaseanalyses Cem Concr Res 32 (2002) 1347ndash1356 httpdxdoiorg101016S0008-8846(02)00796-2
[16] A Kirfel G Will Charge density in anhydrite CaSO4 from X-ray and neutrondiffraction measurements Acta Crystallogr Sect B Struct Crystallogr CrystChem 36 (1980) 2881ndash2890 httpdxdoiorg101107S0567740880010461
[17] C Bezou AN Christensen D Cox M Lehman A Nonat Structures cristallines deCaSO405H2O et CaSO406H2O Comptes Rendus Hebd Des Seacuteances lAcadeacutemieDes Sci Seacuterie 2 (312) (1991) 43ndash48
[18] KH Jost B Ziemer R Seydel Redetermination of the structure of β-dicalciumsilicate Acta Crystallogr Sect B Struct Crystallogr Cryst Chem 33 (1977)1696ndash1700 httpdxdoiorg101107S0567740877006918
[19] W Mumme LMD Cranswick BC Chakoumakos Rietveld crystal structure re-finements from high temperature neutron powder diffraction data for the poly-morphs of dicalcium silicate Neues Jahrb Fuer Mineral Abhandlungen 170 (1996)171ndash188
[20] A Colville S Geller The crystal structure of brownmillerite Ca2FeAlO5Crystallographica 50 (1971) 2311ndash2315 httpdxdoiorg101107S056774087100579X
[21] ST Bergold F Goetz-Neunhoeffer J Neubauer Quantitative analysis of C-S-H inhydrating alite pastes by in-situ XRD Cem Concr Res 53 (2013) 119ndash126 httpdxdoiorg101016jcemconres201306001
[22] EN Maslen VA Streltsov NR Streltsova N Ishizawa Electron density and op-tical anisotropy in rhombohedral carbonates III Synchrotron Xray studies ofCaCO3 MgCO3 and MnCO3 Acta Crystallogr Sect B 51 (1995) 929ndash939 httpdxdoiorg101107S0108768195006434
[23] G Renaudin Y Filinchuk J Neubauer F Goetz-Neunhoeffer A comparativestructural study of wet and dried ettringite Cem Concr Res 40 (2010) 370ndash375httpdxdoiorg101016jcemconres200911002
[24] WF Cole CJ Lancucki A refinement of the crystal structure of gypsumCaSO42H2O Acta Cryst B30 (1974) 921ndash929 httpdxdoiorg101107S0567740874004055
[25] T Runčevski RE Dinnebier OV Magdysyuk H Poumlllmann Crystal structures ofcalcium hemicarboaluminate and carbonated calcium hemicarboaluminate fromsynchrotron powder diffraction data Acta Crystallogr Sect B Struct Sci 68 (2012)493ndash500 httpdxdoiorg101107S010876811203042X
[26] JM Hughes JW Drexler Cation substitution in the apatite tetrahedral site crystalstructures of type hydroxylellestadite and type fermorite Neues Jahrb FuerMineral (1991) 327ndash336
[27] CH Shen RS Liu JG Lin CY Huang Phase stability study of La12Ca18Mn2O7Mater Res Bull 36 (2001) 1139ndash1148
[28] SW Bailey Refinement of an intermediate microcline structure Am Miner 54(1969) 1540ndash1545
[29] WR Busing HA Levy Neutron diffraction study of calcium hydroxide J ChemPhys 26 (1957) 563 httpdxdoiorg10106311743345
[30] Y Le Page G Donnay Refinement of the crystal structure of low-quartz ActaCrystallogr Sect B 32 (1976) 2456ndash2459 httpdxdoiorg101107S0567740876007966
[31] SA Hamid The crystal structure of the 11 Aring natural tobermoriteCa225[Si3O75(OH)15]1H2O Zeitschrift Fuer Krist - New Cryst Struct 154 (1981)189ndash198 httpdxdoiorg101524zkri19811543-4189
[32] P Mondal JW Jeffery The crystal structure of tricalcium aluminate Ca3Al2O6Acta Crystallogr B 31 (1975) 689ndash697 httpdxdoiorg101107S0567740875003639
[33] Y Takeuchi F Nishi I Maki Crystal-chemical characterization of the tricalciumaluminate-sodium oxide (3CaOtimesAl2O3-Na2O) solid-solution series Zeitschrift FuumlrKrist (1980) 259ndash307
[34] K Momma F Izumi VESTA 3 for three-dimensional visualization of crystal vo-lumetric and morphology data J Appl Crystallogr 44 (2011) 1272ndash1276 httpdxdoiorg101107S0021889811038970
[35] K Scrivener R Snellings B Lothenbach A Practical Guide to MicrostructuralAnalysis of Cementitious Materials CRC Press 2016 pp 123ndash125 httpdxdoiorg107693wl20150205
[36] V Pecharsky P Zavalij Fundamentals of Powder Diffraction and StructuralCharacterization of Materials Springer second edition 2005 p 302 httpdxdoiorg101007978-0-387-09579-0
J Schreiner et al Cement and Concrete Research 107 (2018) 247ndash252
252
6 Publications
44
7 Acknowledgement
7 Acknowledgement
Ich moumlchte mich bei einigen Personen bedanken ohne die es wohl kaum zum erfolgreichenAbschluss dieser Arbeit gekommen waumlreMein Doktorvater Prof Dr Juumlrgen Neubauer hat sich stets die Zeit genommen die noumltigwar um Angelegenheiten aller Art mit mir zu klaumlren Er gab mir fachlich immer zumrichtigen Zeitpunkt einen gewissen wissenschaftlichen Impuls Zugleich habe ich mich den-noch immer frei in meiner eigenen Konzeption gefuumlhlt Groszligen Dank spreche ich Prof DrFriedlinde Goumltz-Neunhoeffer aus die fuumlr mich ebenso immer eine verlaumlssliche Ansprech-partnerin fuumlr fachliche und organisatorische Angelegenheiten aller Art war Danke anDr Daniel Jansen fuumlr die gute Zusammenarbeit und dafuumlr dass er mich im Zuge meinerMasterarbeit in ein Forschungsprojekt aufgenommen hat das den Weg zur Promotionmoumlglich machte Zusaumltzlich gilt mein Dank Prof Dr Matthias Goumlbbels der fuumlr dieMitarbeiter am Lehrstuhl immer motivierende Worte fand Fuumlr die Ermoumlglichung meinerTeilnahme an diversen Dienstreisen Fortbildungen und Tagungen moumlchte ich mich viel-mals bedankenWeiterhin bedanke ich mich bei Dr Stephan Volkmann und den Rodgauer BaustoffwerkenGmbH amp Co KG fuumlr die gute Zusammenarbeit und die Bereitstellung von Versuchsma-terialienVielen Dank an meine studentischen Hilfskraumlfte Daniel Wagner Laura MoldenhauerFabian Lang Jakob Schreiber und Felix Klaassen die alle Aufgaben im Labor einwand-frei und mit Bedacht erledigten Bei meinen aktuellen und ehemaligen Kollegen DrKatrin Hurle Dr Dominique Ectors Dr Christoph Naber Dr Florian Huumlller JoumlrgNehring Frank Riedel Julian Wolf Tanja Manninger Daniel Wagner Nicolas FobbeKarla Spaumlth Julian Goergens Andreas Koumlhler Cordula Jakob Franz Becker und LisaKlemenz bedanke ich mich fuumlr die gelungene Zusammenarbeit und gegenseitige Unter-stuumltzung Besonderer Dank geht auch an Kerstin Kreszlig Bettina Engl Christian HankeBernd Schleifer und Christian Abe fuumlr die verlaumlssliche Unterstuumltzung bei technischen Fra-gen und Messungen im LaborFuumlr jegliche Unterstuumltzungen moumlchte ich mich auch bei meinen Eltern bedanken sowiebei meinem Bruder Ralf der mir mit einem LaTex Crashkurs viel Frustration ersparthat Danke Thomas dass du immer fuumlr mich da bist und mit mir zusammen fuumlr genugAusgleich gesorgt hast
45
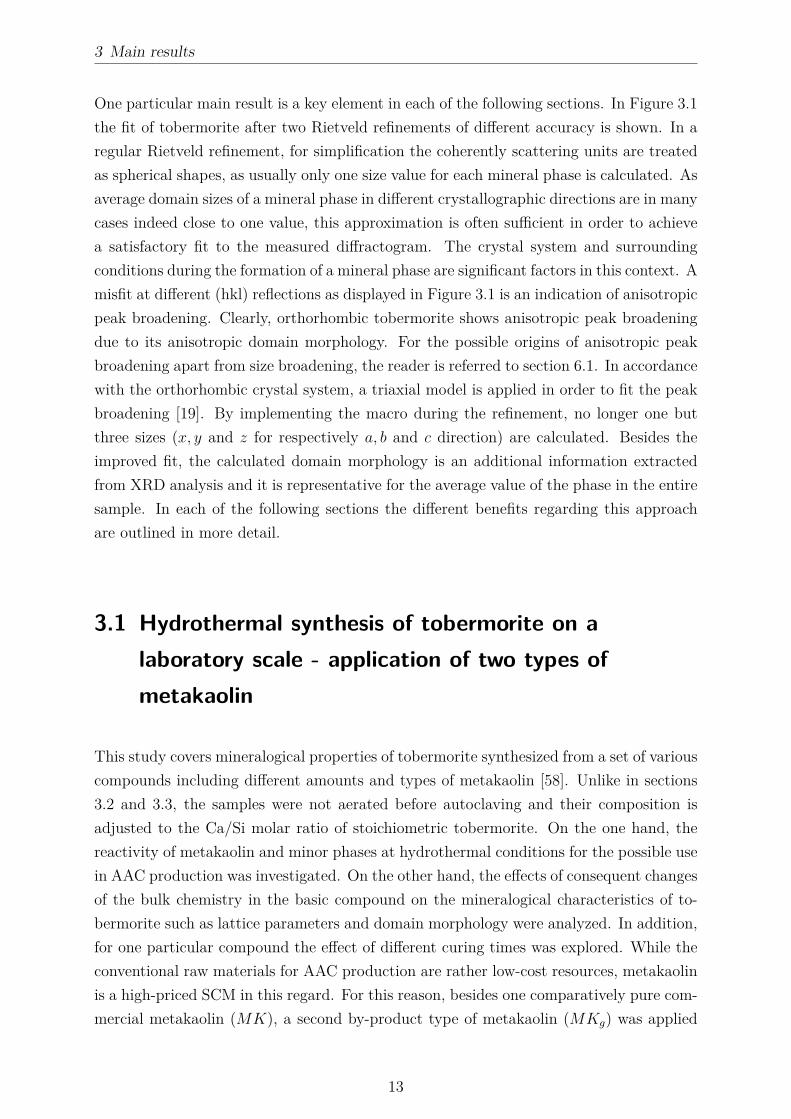
3 Main results
One particular main result is a key element in each of the following sections In Figure 31the fit of tobermorite after two Rietveld refinements of different accuracy is shown In aregular Rietveld refinement for simplification the coherently scattering units are treatedas spherical shapes as usually only one size value for each mineral phase is calculated Asaverage domain sizes of a mineral phase in different crystallographic directions are in manycases indeed close to one value this approximation is often sufficient in order to achievea satisfactory fit to the measured diffractogram The crystal system and surroundingconditions during the formation of a mineral phase are significant factors in this context Amisfit at different (hkl) reflections as displayed in Figure 31 is an indication of anisotropicpeak broadening Clearly orthorhombic tobermorite shows anisotropic peak broadeningdue to its anisotropic domain morphology For the possible origins of anisotropic peakbroadening apart from size broadening the reader is referred to section 61 In accordancewith the orthorhombic crystal system a triaxial model is applied in order to fit the peakbroadening [19] By implementing the macro during the refinement no longer one butthree sizes (x y and z for respectively a b and c direction) are calculated Besides theimproved fit the calculated domain morphology is an additional information extractedfrom XRD analysis and it is representative for the average value of the phase in the entiresample In each of the following sections the different benefits regarding this approachare outlined in more detail
31 Hydrothermal synthesis of tobermorite on alaboratory scale - application of two types ofmetakaolin
This study covers mineralogical properties of tobermorite synthesized from a set of variouscompounds including different amounts and types of metakaolin [58] Unlike in sections32 and 33 the samples were not aerated before autoclaving and their composition isadjusted to the CaSi molar ratio of stoichiometric tobermorite On the one hand thereactivity of metakaolin and minor phases at hydrothermal conditions for the possible usein AAC production was investigated On the other hand the effects of consequent changesof the bulk chemistry in the basic compound on the mineralogical characteristics of to-bermorite such as lattice parameters and domain morphology were analyzed In additionfor one particular compound the effect of different curing times was explored While theconventional raw materials for AAC production are rather low-cost resources metakaolinis a high-priced SCM in this regard For this reason besides one comparatively pure com-mercial metakaolin (MK) a second by-product type of metakaolin (MKg) was applied
13
3 Main results
at equivalent dosages All investigated mix composites and the chemical composition ofMK and MKg are summed up in tables in section 61In Figure 32 the effect of different amounts of the two types of metakaolin on the phasequantities is displayed Clearly at moderate dosages of MK and MKg tobermorite waspresent in comparable quantities However the application of any amount of metakaolinreduced the amount of tobermorite compared to the blank mixture It can be seen thatkatoite was present whenever the content of Al2O3 in the starting drymix exceeded 2wt which fits well with the state of knowledge [5 23] For the highest possible dosagesof the two types of metakaolin (MK60 and MKg60) contrary effects were observed Ap-plication of impure metakaolin (MKg) led to a considerable amount of tobermorite whilein MK60 no tobermorite was present The high content of Al2O3 seems to have hinderedthe formation of tobermorite Not all of the Al2O3 in MKg was supplied for reactionas minor phases such as feldspar remained unreacted which is shown accurately in therespective publication in section 61
Figure 32 Weight fractions of tobermorite quartz and katoite measured by QXRD anal-ysis and contents of Al2O3 in the starting drymix Amorphous content andminor phases are not shown
The results of thermal analysis of samples characterized by MK addition in small stepsare shown in Figure 33 It can be seen that the conversion of 93 Aring tobermorite into β-
14
3 Main results
wollastonite depended on the dosage of MK However unlike suggested by Klimesch ampRay there was no effect of lower contents of Al2O3 in the drymix [40] Consequently theinfluence of Al3+ at low dosages (MK25 and MK5) could not be observed on the basisof this method Apart from this result the other signals showed good agreement with thesuggested conversion ranges by Klimesch amp Ray as for samples MK9 and MK16 a clearshift towards higher temperature was measured However the role of Al3+ incorporationverified by this method is not necessarily conclusive as additional reactions during theheating experiment involving Al3+ are possible On that basis the observations madeby means of DTA would not reflect the amount of Al3+ originally incorporated into thestructure of 11 Aring tobermorite
Figure 33 Conversion of 93 Aring tobermorite into β-wollastonite in samples synthesizedwith various amounts of metakaolin and suggested temperature ranges ac-cording to Klimesch amp Ray [40]
In accordance with authors referenced in subsection 213 lattice parameter c of tober-morite increased with elevated dosages of Al2O3 in the basic dry mix (Figure 34) Theimpact could be observed for the complete range of samples as displayed in section 61which indicates that a limit of Al3+ incorporation was not reached in this study Forcomparison the relative domain morphology is plotted in Figure 34 Unlike the DTA
15
3 Main results
signals both lattice parameter c and the domain morphology are impacted by very lowdosages of Al2O3 There is a good accordance of the relation of growth in b direction to adirection and the c parameter This is valid up to 20 wt of Al2O3 in the starting drymix By contrast more elevated contents of Al2O3 did not affect the domain morphologyany further even though the incorporation is verified through the increased c parameterIt follows that the impact of Al3+ incorporation on the domain morphology is limited tovery low contents while the impact on lattice parameter c can be tracked throughoutthe entire examined range of samples In section 61 additional results show that growthin b direction increased with reaction time These observations are solely based on XRDanalysis and offer new benefits for the structural understanding of tobermorite
Figure 34 Impact of the calculated Al2O3 content in the basic dry mix on the latticeparameter c and on the relation of calculated domain sizes of tobermorite ina (x) and b (y) direction
16
3 Main results
32 Structural properties of tobermorite in AAC - SEMversus XRD analysis
This section and the respective publication [59] mainly deal with the suitability of SEManalysis of tobermorite in AAC The effects of varying amounts of SO3 and Al2O3 in thedry mix on structural properties of tobermorite are discussed based on XRD analysisAs shown in subsection 221 and Figure 23 tobermorite often shows a house-of-cardsstructure in AAC samples This property has been considered to be relevant for thethermal and mechanical properties of AAC (subsection 221) However SEM analysiswithin this study revealed that this type of appearance is mainly found in the poresand pore surfaces (Figure 35) This finding comes in agreement with the observationsmade by Huang et al [48] In the solid skeleton of the dense AAC material neither themorphology nor the house-of-cards structure could be observed properly which can beseen very clearly in additional micrographs provided in section 62 It should be consideredthat the major amount of tobermorite by weight is located in the dense material and notat the pore surfaces In this way these findings are clear disadvantages coming along withonly SEM analysis of AAC as representative results can hardly be obtained
Figure 35 House-of-cards structure of tobermorite in a pore surrounded by dense mate-rial
Moreover several authors in subsection 221 justified the morphology of tobermorite withthe incorporation of foreign ions Al-substituted tobermorite showed lath-like morphologywhereas Al-free tobermorite showed rather plate-like morphology [6 32 49] Howeverthe present investigation revealed that independent of Al2O3 content in the raw mix there
17
3 Main results
is always heterogeneity regarding the morphology of tobermorite In Figure 36 plate-likeand lath-like morphology of tobermorite in AAC observed in two statistical chemicallyvarious samples are displayed This result supports the previous assumption that theobservations made by SEM analysis of tobermorite in AAC strongly depend on whatpart of the sample is selected Yet again no clear observations could be made that wererepresentative for the entire sample
Figure 36 Heterogeneous morphology of tobermorite (plate-like in a and c lath-like in band d) in two AAC samples characterized by different Al2O3 contents in theraw mix
The effects of Al3+ on the domain morphology of tobermorite were measured and evaluatedin a similar manner as in section 61 and the results could be confirmed The relativedomain growth in b direction was increased by Al3+ incorporation in both studies [5859] Moreover lattice parameter c was increased with Al3+ incorporation which can beseen more accurately in section 62 Unlike SEM analysis XRD analysis allowed clearconclusions whenever structural properties of Al-substituted tobermorite were affectedInstead of a local observation as made with SEM representative and statistical resultswere obtained The reader is referred to section 61 and section 62 for further results and
18
3 Main results
more specific conclusionsIn addition the effect of various amounts of sulfate in the raw mix was analyzed Unlikein the case of different dosages of Al3+ neither the domain morphology nor the latticeparameters of tobermorite were affected by the SO3 content in the dry mix In Figure 37these observations and additionally the amounts of anhydrite measured by QXRD areshown As the amount of available SO3 in the dry mix is known the maximum possibleamount of anhydrite could be calculated for each of the samples in focus Obviouslythe measured amounts of anhydrite are either equal or slightly higher compared to theexpected quantities This result leads to the assumption that all of the available sulfateis transformed into anhydrite so that no more sulfate could be incorporated into thestructure of tobermorite The over-estimation of anhydrite in some of the samples can beexplained due to the inaccuracy of the quantification method The present results rathermatch with the suggestions by Sauman amp Valtr [41] as in their study no effect of sulfateon the structure of tobermorite was observed either
Figure 37 Impact of the sulfate content in the AAC raw mix on lattice parameter cand relative domain morphology of tobermorite (a) and comparison of theexpected maximum amount of anhydrite to the measured amount determinedby QXRD (b)
33 Improved monitoring of the phase developmentduring the production of AAC
In this study not only autoclaved samples were analyzed but additionally a lab-scale slurrywhich included the reactive components of the green cake stage during AAC productionat equivalent weight proportions In-situ XRD was performed at 70 degC and at a water-to-
19
3 Main results
solid ratio of 08 for 24 h (Figure 38) which are respective conditions during commercialproduction Clearly the phase development is dominated by OPC and lime hydration asdescribed in section 22 It can be seen that the major reaction turnover occurs duringthe first 200 minutes which is the average duration of the green stage After only 30minutes all of the quicklime had transformed into portlandite whereas Schober proposeda duration of one hour for this reaction [42] The amount of portlandite is composed oftwo different generations as proposed by Ectors [52] Equally a biaxial cylinder modelwas applied in order to fit the peak broadening of the first generation of portlandite in thepresent investigation Minor phase developments such as the formation of AFm phases arenot shown in Figure 38 A coarse fraction of anhydrite did not react so that constantlyaround 15 wt were measured after 6 h As the decomposition of ettringite due tosulfate depletion [55] does not occur prior to 12 h the green cake strength is not affected
Figure 38 In-situ XRD measurement of AAC model slurry at water-to-solid ratio of 08and 70 degC For clarity and comprehensibility not all phases are shown
The separation of two generations of portlandite in the system does not only translate intodifferent domain morphologies as shown by Ectors [52] In Figure 39 more indicationsfor different mineralogical properties are displayed The shape of the (0 0 1) reflection inXRD patterns after only quicklime hydration and after both quicklime and alite hydrationshows a distinct feature While portlandite originating from quicklime hydration showsa broad peak implying lower crystallinity the peak after alite hydration is characterized
20
3 Main results
Figure 39 Formation of two generations of portlandite in AAC slurry in XRD (a) andDTA (b) plots
by a sharper component Yet the peak breadth did not change indicating that the firstgeneration is still present with the original characteristics This observation is supportedby DTA measurements additionally demonstrating two degrees of crystallinity only afteralite hydration In agreement with XRD analysis the better crystalline second generationof portlandite decomposes at a higher temperature
Figure 310 Quantification of tobermorite in statistical chemically various AAC sampleswith and without the application of the macro for the fitting of anisotropicpeak broadening
21
3 Main results
Furthermore commercial AAC samples were considered in this study By applying themethod for the refinement of anisotropic peak broadening (Figure 31) a more accuratequantification of tobermorite can be achieved In Figure 310 the calculated amounts oftobermorite in statistical chemically various AAC samples are plotted In some samplesthe refinement using the macro leads to considerably higher but never lower quantitiesof tobermorite whereas in other samples nearly the same amount of tobermorite is cal-culated This observation can be well understood taking into account that the macroallows to account more peak area for tobermorite as shown in Figure 31 Clearly thereis evidence that the anisotropy of tobermorite domains is not uniform from one sampleto another which was basically justified in the previous sections As an improved quan-tification of a single phase leads to a better quantification of other phases in the samplethis adaption is very valuable in order to assess the phase development Here the peakbroadening of tobermorite equally observed by Qu et al [6] could be tracked and evalu-ated in order to gain more accurate results Moreover in section 63 McCrone milling issuggested in order to avoid spottiness in XRD patterns caused by coarse grains of quartzor anhydrite (Figure 38)
22
4 Conclusions
4 Conclusions
The research results presented in the previous sections yield advances in the mineralogicalinvestigation of tobermorite and autoclaved aerated concrete Recorded diffraction pat-terns contain plenty of usually unused data regarding the microstructural characteristicsof the sample and phases therein The profit of XRD measurements can be significantlyimproved whenever one or more phases show anisotropic peak broadening and appro-priate models for the respective domain morphology are implemented into the Rietveldenvironment Within the scope of the present investigations portlandite and tobermoriteshow this particularityThe effects of changes in the chemistry of the starting mix were examined based on dif-ferent dosages of metakaolin Al-substituted tobermorite showed increased growth in b
direction and an increase of lattice parameter c compared to Al-free tobermorite The rel-ative domain sizes were determined based on anisotropic peak broadening However whilethe effect of Al3+ incorporation into the lattice of tobermorite was limited regarding thedomain morphology lattice parameter c showed an increase throughout the entire rangeof samples The consequent effects suggested by Klimesch amp Ray observed by means ofDTA are debatable as reactions during the heating experiment may lead to to a changeof Al3+ content in tobermorite [40] While both types of applied metakaolin showed goodreactivity at hydrothermal conditions some included minor phases such as feldspar oranatase remained unreacted At high dosages of Al2O3 in the starting mix the formationof either only katoite or katoite along with tobermorite was observed (Figure 32)SEM analysis of tobermorite in AAC cannot be suggested based on the observationspresented in this work as it is only visually accessible in the pores or at pore surfacesThe dense material of the AAC skeleton contains several crystalline and X-ray amorphousphases which hardly allows a proper investigation Even in single pores tobermorite crys-tals appeared very heterogeneous at various chemical compositions As a result lath-liketobermorite was not only present in samples characterized by elevated Al3+ incorporationBy contrast the benefits of XRD analysis presented in section 61 equally accounted fortobermorite in AAC samples Sulfate incorporation into the lattice of tobermorite wasnot observed All of the sulfate in the system was detected to be present in anhydriteThe phase transitions in the AAC raw slurry during the green stage hydration were show-cased by in-situ XRD analysis of a model mix at 70 degC Additional DTA and XRD mea-
23
4 Conclusions
surements during this step confirmed the presence of two generations of portlandite char-acterized by different crystallinity as suggested by Ectors [52] The inclusion of anisotropicdomain morphology during the Rietveld refinement allowed a more accurate quantifica-tion of tobermorite in autoclaved samples Sample preparation adjusted to the grain sizedistribution in AAC samples (section 63) the external standard method for quantita-tive XRD analysis [55] and the approach to evaluate anisotropic peak broadening [19]are the key methods for a more accurate tracking of the phase development during AACproduction
24
5 References
5 References
[1] A E Zadov A I Grabezhev N N Pertsev N V Chukanov and S V PribavkinTobermorite-plombierite metasomatites of the Gumeshevsk skarn-porphyry copper depositmiddle Urals Doklady Earth Sciences 407(3)495ndash497 2006
[2] M F Heddle Preliminary notice of substances which may prove to be new minerals MinMag 4117ndash123 1880
[3] S Merlino E Bonaccorsi and T Armbruster The real structure of tobermorite 11AringNormal and anomalous forms OD character and polytypic modifications European Journalof Mineralogy 13(3)577ndash590 2001
[4] C Biagioni S Merlino and E Bonaccorsi The tobermorite supergroup a new nomencla-ture Mineralogical Magazine 79(2)485ndash495 2015
[5] C A Riacuteos C D Williams and M A Fullen Hydrothermal synthesis of hydrogarnetand tobermorite at 175 degC from kaolinite and metakaolinite in the CaO-Al2O3-SiO2-H2Osystem A comparative study Applied Clay Science 43(2)228ndash237 2009
[6] X Qu Z Zhao and X Zhao Microstructure and characterization of aluminum-incorporated calcium silicate hydrates (C-S-H) under hydrothermal conditions RSC Ad-vances 8(49)28198ndash28208 2018
[7] R Šiaučiunas and K Baltakys Formation of gyrolite during hydrothermal synthesis inthe mixtures of CaO and amorphous SiO2 or quartz Cement and Concrete Research34(11)2029ndash2036 2004
[8] E Venhodovaacute R Janovskyacute and R Drochytka Formation of Tobermorite at Different Ma-terials Composition of Aerated Concrete Applied Mechanics and Materials 752-753247ndash250 2015
[9] L Galvaacutenkovaacute E Bartoniacutečkovaacute T Opravil J Tkacz and P Ptaacuteček The influence ofstarting materials solubility on tobermorite structure formation under the hydrothermalconditions IOP Conference Series Materials Science and Engineering 379(1)1ndash8 2018
[10] T Mitsuda K Sasaki and H Ishida Phase Evolution during Autoclaving Process J AmCeram Soc 75(75)1858ndash1863 1992
[11] A Skawińska The influence of metahalloysite addition on tobermorite formation studied byX-ray powder diffraction and scanning electron microscope MATEC Web of Conferences16305008 2018
[12] S T Bergold F Goetz-Neunhoeffer and J Neubauer Quantitative analysis of C-S-H in
25
5 References
hydrating alite pastes by in-situ XRD Cement and Concrete Research 53119ndash126 2013
[13] O P Shrivastava and F P Glasser Ion-exchange properties of 11-Aring tobermorite Reactivityof Solids 2(3)261ndash268 1986
[14] H Maeda Y Ogawa E H Ishida and T Kasuga Hydrothermal synthesis of tobermoritedoped with phosphorus species for removing heavy metal ions Journal of the AustralianCeramic Society 48(1)8ndash11 2012
[15] O P Shrivastava and R Shrivastava Cation exchange applications of synthetic tobermoritefor the immobilization and solidification of cesium and strontium in cement matrix Bulletinof Materials Science 23(6)515ndash520 2000
[16] G Renman and A Renman Sustainable Use of Crushed Autoclaved Aerated Concrete(CAAC) as a Filter Medium in Wastewater Purification 8th International conferenceon sustainable management of waste and recycled materials in construction GothenburgSweden 30 Mayndash1 June 2012 Proceedings pages 1ndash7 2012
[17] G Schober Chemical transformations during the manufacturing of autoclaved aeratedconcrete (ACC) Cement lime gypsum and quartz sand become cellular concrete ZKG58(7)63ndash70 2005
[18] A J Hamad Materials Production Properties and Application of Aerated LightweightConcrete Review International Journal of Materials Science and Engineering 2(2)152ndash157 2014
[19] D Ectors F Goetz-Neunhoeffer and J Neubauer A generalized geometric approach toanisotropic peak broadening due to domain morphology Journal of Applied Crystallogra-phy 48(1)189ndash194 2015
[20] H M Rietveld A profile refinement method for nuclear and magnetic structures Journalof Applied Crystallography 2(2)65ndash71 1969
[21] S A Hamid The crystal structure of the 11 Aring natural tobermoriteCa225[Si3O75(OH)15]1H2O Zeitschrift fuer Kristallographie - New Crystal Struc-tures 154(3-4)189ndash198 1981
[22] S A S El-Hemaly T Mitsuda and H F W Taylor Synthesis of normal and anomaloustobermorites Cement and Concrete Research 7429ndash438 1977
[23] M Sakiyama and T Mitsuda Hydrothermal reaction between C-S-H and kaolinite for theformation of tobermorite at 180degC Cement and Concrete Research 7(6)681ndash685 1977
[24] E Bonaccorsi S Merlino and A R Kampf The crystal structure of tobermorite 14 Aring(plombierite) a C-S-H phase Journal of the American Ceramic Society 88(3)505ndash5122005
[25] S Merlino E Bonaccorsi and T Armbruster The real structures of clinotobermorite andtobermorite 9 Aring OD character polytypes and structural relationships European Journalof Mineralogy 12(2)411ndash429 2000
[26] K Momma and F Izumi VESTA 3 for three-dimensional visualization of crystal volu-metric and morphology data Journal of Applied Crystallography 44(6)1272ndash1276 2011
26
5 References
[27] S Shaw S M Clark and C MB Henderson Hydrothermal formation of the calcium sil-icate hydrates tobermorite (Ca5Si6O16(OH)2 middot 4H2O) and xonotlite (Ca6Si6O17(OH)2)An in situ synchrotron study Chemical Geology 167(1-2)129ndash140 2000
[28] K Matsui J Kikuma M Tsunashima T Ishikawa S Matsuno A Ogawa and M SatoIn situ time-resolved X-ray diffraction of tobermorite synthesis process under hydrothermalcondition IOP Conference Series Materials Science and Engineering 18(2)60ndash66 2011
[29] G Matekonis R Šiaučiunas and D Vaičiukyniene Hydrothermal Synthesis and Charac-terization of Na + and [ Al 3 + + Na + ] -substituted Tobermorite in CaO-SiO2middotnH2O-H2OSystem MATERIALS SCIENCE 16(3)242ndash248 2010
[30] G Geng R J Myers M J A Qomi and P JM Monteiro Densification of the inter-layer spacing governs the nanomechanical properties of calcium-silicate-hydrate ScientificReports 7(1)1ndash8 2017
[31] D Klimesch and A Ray Autoclaved cement-quartz pastes with metakaolin additionsAdvanced Cement Based Materials 7(3-4)109ndash118 1998
[32] N Y Mostafa A A Shaltout H Omar and S A Abo-El-Enein Hydrothermal synthesisand characterization of aluminium and sulfate substituted 11 nm tobermorites Journal ofAlloys and Compounds 467(1-2)332ndash337 2009
[33] İ Demir M S Başpınar E Kahraman E Ccedilalışkan and G Goumlrhan An Investigation onthe Usability of Diatomite in Aerated Concrete Production In Proc of the Intl Conf onAdvances In Civil Structural And Construction Engineering - CSCE 2014 pages 97ndash1002014
[34] A Skawinska Z Owsiak T Baran and K Hernik The influence of halloysite additionon tobermorite formation in CaO and quartz mix under hydrothermal conditions CementWapno Beton 17(12)426ndash434 2017
[35] N Y Mostafa Influence of air-cooled slag on physicochemical properties of autoclavedaerated concrete Cement and Concrete Research 35(7)1349ndash1357 2005
[36] D Małaszkiewicz and J Chojnowski Influence of addition of calcium sulfate dihydrate ondrying of autoclaved aerated concrete Open Engineering 7(1)273ndash278 2017
[37] N Hara and N Inoue Thermal behaviour of 11Aring tobermorite and its lattice parametersCement and Concrete Research (10)53ndash60 1980
[38] M D Jackson S R Chae S R Mulcahy C Meral R Taylor P Li A H EmwasJ Moon S Yoon G Vola H R Wenk and P JM Monteiro Unlocking the secretsof Al-tobermorite in Roman seawater concrete American Mineralogist 98(10)1669ndash16872012
[39] W Liao W Li Z Fang C Lu and Z Xu Effect of different aluminum substitution rateson the structure of Tobermorite Materials 12(22)1ndash10 2019
[40] D Klimesch and A Ray DTA-TG Study of the CaO-SiO2-H2O and CaO-Al2O3-SiO2-H2OSystems Under Hydrothermal Conditions Journal of Thermal Analysis and Calorimetry56(1)27ndash34 1999
27
5 References
[41] Z Sauman and Z Valtr Substitution of sulphate ions in the crystal lattice of 11 Aring to-bermorite In The VI International Congress on the Chemistry of Cement pages 1ndash14Moscow 1974
[42] G Schober Reaction of raw materials to the final product AAC httpwwwpb-aacde
chemmin2_ehtml 2012 accessed 2020-01-31
[43] D Jansen C Stabler F Goetz-Neunhoeffer S Dittrich and J Neubauer Does Ordi-nary Portland Cement contain amorphous phase A quantitative study using an externalstandard method Powder Diffraction 26(01)31ndash38 2011
[44] C Roumlszligler J Stark F Steiniger and W Tichelaar Limited-dose electron microscopyreveals the crystallinity of fibrous C-S-H phases Journal of the American Ceramic Society89(2)627ndash632 2006
[45] Y Sakalli and R Trettin Investigation of C3S hydration by environmental scanning elec-tron microscope Journal of Microscopy 259(1)53ndash58 2015
[46] F Matsushita Y Aono and S Shibata Expansion and shrinkage behavior of green cakeof Autoclaved Aerated Concrete In Autoclaved Aerated Concrete - Innovation and Devel-opment Proceedings of the 4th International Conference on Autoclaved Aerated ConcreteKingston UK 8-9 September 2005 pages 101ndash108 CRC Press 2005
[47] C Chucholowski M Holger and K-C Thienel Improving the recyclability environmentalcompatibility and CO2 balance of autoclaved aerated concrete by replacing sulfate carrierand cement with calcined clays CePapers 2(4)503ndash512 2018
[48] X Y Huang W Ni W H Cui Z J Wang and L P Zhu Preparation of autoclavedaerated concrete using copper tailings and blast furnace slag Construction and BuildingMaterials 27(1)1ndash5 2012
[49] W Wongkeo and A Chaipanich Compressive strength microstructure and thermal anal-ysis of autoclaved and air cured structural lightweight concrete made with coal bottom ashand silica fume Materials Science and Engineering A 527(16-17)3676ndash3684 2010
[50] A Roacuteżycka and W Pichoacuter Effect of perlite waste addition on the properties of autoclavedaerated concrete Construction and Building Materials 12065ndash71 2016
[51] N Isu H Ishida and T Mitsuda Influence of quartz particle size on the chemical andmechanical properties of autoclaved aerated concrete (I) tobermorite formation Cementand Concrete Research 25(25)243ndash248 1995
[52] D Ectors Advances in the analysis of cementitious reactions and hydrate phases doctoralthesis PhD thesis Friedrich-Alexander-Universitaumlt Erlangen-Nuumlrnberg 2016
[53] D Ectors F Goetz-Neunhoeffer and J Neubauer Domain size anisotropy in the double-Voigt approach An extended model Journal of Applied Crystallography 481998ndash20012015
[54] D Ectors F Goetz-Neunhoeffer and J Neubauer Routine (an)isotropic crystallite sizeanalysis in the double-Voigt approximation done right Powder Diffraction 32(S1)27ndash342017
28
5 References
[55] D Jansen F Goetz-Neunhoeffer C Stabler and J Neubauer A remastered external stan-dard method applied to the quantification of early OPC hydration Cement and ConcreteResearch 41(6)602ndash608 2011
[56] T Ungaacuter G Tichy J Gubicza and R J Hellmig Correlation between subgrains andcoherently scattering domains Powder Diffraction 20(04)366ndash375 2005
[57] Triloki P Garg R Rai and B K Singh Structural characterization of as-depositedcesium iodide films studied by X-ray diffraction and transmission electron microscopy tech-niques Nuclear Instruments and Methods in Physics Research Section A AcceleratorsSpectrometers Detectors and Associated Equipment 736128ndash134 2014
[58] J Schreiner F Goetz-Neunhoeffer J Neubauer and D Jansen Hydrothermal synthesisof 11 Aring tobermorite ndash Effect of adding metakaolin to the basic compound Applied ClayScience 185 2020
[59] J Schreiner F Goetz-Neunhoeffer J Neubauer S Volkmann S Bergold R Webler andD Jansen Advanced Rietveld refinement and SEM analysis of tobermorite in chemicallydiverse autoclaved aerated concrete Powder Diffraction 34143ndash150 2019
[60] J Schreiner D Jansen D Ectors F Goetz-Neunhoeffer J Neubauer and S VolkmannNew analytical possibilities for monitoring the phase development during the production ofautoclaved aerated concrete Cement and Concrete Research 107247ndash252 2018
29
6 Publications
6 Publications
61 Hydrothermal synthesis of 11 Aring tobermorite ndash Effectof adding metakaolin to the basic compound
Reprint of the peer reviewed publication
Schreiner J Goetz-Neunhoeffer F Neubauer J Jansen D 2020 Hydrothermalsynthesis of 11 Aring tobermorite ndash Effect of adding metakaolin to the basic compoundApplied Clay Science 185 httpsdoiorg101016jclay2019105432
with permission from Elsevier
30
Contents lists available at ScienceDirect
Applied Clay Science
journal homepage wwwelseviercomlocateclay
Research paper
Hydrothermal synthesis of 11 Aring tobermorite ndash Effect of adding metakaolin tothe basic compound
J Schreiner F Goetz-Neunhoeffer J Neubauer D JansenUniversity of Erlangen-Nuremberg GeoZentrum Nordbayern Mineralogy Schlossgarten 5a 91054 Erlangen Germany
A R T I C L E I N F O
KeywordsHydrothermal synthesis11 Aring tobermoriteMetakaolinPowder diffractionKatoite
A B S T R A C T
Different amounts and types of metakaolin were analyzed and applied for the hydrothermal synthesis of 11 Aringtobermorite All synthesized samples were investigated by means of powder XRD combined with Rietveld re-finement Al-substituted 11 Aring tobermorite was successfully synthesized on the basis of a broad range of com-pounds characterized by a varying content of metakaolin Katoite was present depending on the amount ofsupplied Al3+ which was determined by the dosage of metakaolin Minor crystalline components included in thetwo types of metakaolin sources varied greatly in their reactivity under hydrothermal conditions Despite adifferent degree of purity the two types of metakaolin showed corresponding effects at moderate dosages butcontrary effects at higher dosages as for the synthesis of 11 Aring tobermorite The domain morphology of to-bermorite could be associated with Al3+ incorporation for low dosages of metakaolin represented by up to 2 wt- Al2O3 in the dry mix By contrast Al3+ affected tobermorite lattice parameters at equivalent and even athigher dosages with c reaching 2295 Aring at 12 wt- Al2O3 in the dry mix
1 Introduction
11 Application of metakaolin as a reactive material in constructionindustry
The application of supplementary cementitious materials (SCMs) inthe field of construction technology has received a lot of attention inrecent years Due to limited resources and an urgent need for alter-native and more eco-friendly construction materials SCMs such asmetakaolin offer a great potential The usage of SCMs has not onlyspread to the cement and mortar industry but also to advanced appli-cations such as autoclaved aerated concrete (AAC) (Demir et al 2014Koutnyacute et al 2014 Walczak et al 2015 Roacuteżycka and Pichoacuter 2016Chucholowski et al 2018) Unlike ordinary cementitious constructionmaterials AAC is produced from hydrothermal curing Due to the dif-ferent thermodynamic environment the hydration process and the re-activity of raw materials have to be investigated properly in order tounderstand the effects on the AAC product The leading mineral phasein AAC is 11 Aring tobermorite (Ca5Si6O16(OH)2middot4H2O) As a consequencethe thermal and mechanical properties of AAC depend on micro-structure and crystallinity of tobermorite to some extent In addition tothe curing time and the fineness of raw materials the supply of ionsthat can substitute in the tobermorite structure is a crucial factor in thiscontext Especially substitutions by aluminum sodium and potassium
ions have been investigated thoroughly (Sauman 1974 Klimesch andRay 1998 Mostafa et al 2009 Matekonis et al 2010 Skawinskaet al 2017) Calcined clays usually contain a considerable amount ofthe mentioned ions
There is a vast amount of literature on the reactivity of SCMs atambient temperature and standard pressure but there is little when itcomes to hydrothermal conditions In previous publications the beha-vior of metakaolin under hydrothermal conditions was mainly in-vestigated for the synthesis of zeolites (Zhang et al 2007 Aguilar-Mamani et al 2014 Setthaya et al 2016 Luo et al 2018) In thesestudies the reactivity of metakaolin was observed at a wide range oftemperature and pH values During the transformation of kaolin intometakaolin a loss of framework alumina was observed (Ayodele et al2019) In recent decades metakaolin has been the subject of studies inthe field of geopolymer research (Rashad 2013 Chen et al 2016) Forthe synthesis of 11 Aring tobermorite a more distinct setting of temperaturesetting (180ndash200 degC) and steam pressure (1ndash12 MPa) are required
This publication is intended to make a new contribution to thechallenging field of hydrothermal synthesis in the system CaO-Al2O3-SiO2-H2O based on XRD analysis combined with Rietveld refinementVarious dosages of two types of metakaolin with different chemical andmineralogical purities are compared for the effects on the hydrothermalsynthesis of Al-substituted 11 Aring tobermorite Especially changes of thebulk chemistry in the raw mixes the reactivity of minor crystalline
httpsdoiorg101016jclay2019105432Received 20 August 2019 Received in revised form 13 November 2019 Accepted 30 December 2019
Corresponding authorE-mail address juergenjsschreinerfaude (J Schreiner)
Applied Clay Science 185 (2020) 105432
0169-1317 copy 2020 Elsevier BV All rights reserved
T
6 Publications
31
phases of the two types of metakaolin and the effect of different curingtimes are the focus of interest On the one hand metakaolin offers agreat potential in the AAC industry On the other hand of all SCMsmetakaolin is a good source material for investigating the influence ofAl3+ on the synthesis of Al-substituted 11 Aring tobermorite
12 Synthesis of Al-substituted 11 Aring tobermorite
In addition to being present in AAC tobermorite has found appli-cation in wastewater treatment and nuclear waste management due toits ion exchange capacity (Maeda et al 2012 Monasterio et al 2015)The substitution of silicon by aluminum results in a different to-bermorite structure due to general and local charge balance affectingthe lattice parameters Especially c is impacted by this substitutionbecause it occurs in the bridging tetrahedron and additional OHndash sub-stitutes O2ndash (Komarneni et al 1985 Merlino et al 2000) As suggestedin some additional studies the substitution of Si4+ by Al3+ and Na+ orK+ leads to a lath-like morphology of tobermorite crystals (Mostafa2005 Mostafa et al 2009 Venhodovaacute et al 2015 Qu et al 2018)However because of the heterogeneous appearance of tobermorite inAAC it is hardly possible to conduct a proper characterization based onSEM analysis In our recent work the anisotropic peak broadening oftobermorite in XRD diffractograms was successfully linked with theincorporation of foreign ions supplied in a common AAC production(Schreiner et al 2019) This finding allowed a more statistical struc-tural characterization of tobermorite in bulk compositions compared toSEM analysis Moreover it was reported in other studies that differenthydrate phases occur depending on the amount of supplied ions and onthe experimental settings In compounds with a high content of Al3+formation of katoite could be observed (Klimesch and Ray 1998 Riacuteoset al 2009 Matsui et al 2011) In the case of a longer curing durationinstead of 11 Aring tobermorite the formation of xonotlite (Siauciunas andBaltakys 2004 Galvaacutenkovaacute et al 2018) or - depending on the finenessof used silica source (Siauciunas and Baltakys 2004) - gyrolite is fa-voured
Kalousek (1956) suggested that tobermorite can contain up to 5Al2O3 More Al2O3 in the system resulted in the formation of hydro-garnet Klimesch and Ray (1998) additionally investigated the stabilityof hydrogarnet depending on the Al(Si + Al) ratio and its role in re-lation to the formation of 11 Aring tobermorite in an equivalent systemThey suggest that hydrogarnet always appears before tobermorite butthe former can only be detected for higher Al(Si + Al) ratios in theevent of longer curing times Riacuteos et al (2009) and Qu et al (2018)confirmed these findings in extensive investigations In the latter pub-lication it is additionally suggested that samples prepared at lowertemperatures (160 degC) are less impacted by the supply of Al3+ Theyalso consider the peak broadening of tobermorite in their XRD plotsbased on the amount of incorporated Al3+ In two recent publicationswe suggested that the peak broadening of tobermorite enables a mi-crostructural analysis by calculating the orientation dependent domainsizes (Schreiner et al 2018 2019) However these studies are based onsamples of industrially produced AAC so that the curing time was fixedThe studied AAC was produced from raw materials with a broad che-mical spectrum such as ordinary Portland cement (OPC) whichsomehow complicates the interpretation of results
In this work the influence of aluminum ions - provided by meta-kaolin - on dominant crystallographic direction-dependent domaingrowth of tobermorite is investigated by analysis of anisotropic peakbroadening (Ectors et al 2015 2017) In Fig 1 of the supplementarymaterial the method of fitting the anisotropic peak broadening of to-bermorite using a triaxial cylinder model is visualized (Schreiner et al2018) Fitting of the anisotropic peak broadening of tobermorite Thismethod is used to calculate the average and reliable values for to-bermorite domain sizes in the powder sample and associate them withaverage Al3+ incorporation Microstrain should be considered becauseit is an additional source of peak broadening However this usually
accounts for materials that have been exposed to different kinds ofstress such as metals and alloys (Badawi et al 2019) In addition theinstrumental contribution to peak broadening should be consideredHydration products such as tobermorite are characterized by crystallitesizes in the range of nanometers so that anisotropic size broadeningclearly outweighs the effect of instrumental broadening (Jenkins andSnyder 1996) Moreover the impact of Al3+ on the lattice parametersof tobermorite is considered It should additionally be clarified whe-ther the results from our previous publication (Schreiner et al 2019)based on industrially produced AAC can be confirmed by investigationwith less complex raw mixes and purely based on laboratory experi-ments
2 Material and methods
21 Starting materials
The starting materials for hydrothermal synthesis included deio-nized water quartz flour portlandite (999 pure) and two types ofmetakaolin One type was ordinary commercially available metakaolin(MK) with nearly a stoichiometric composition For comparison thesecond type of commercially available metakaolin was a by-productfrom expanded glass production (MKg) and consequently highly im-pure The chemical composition of MK and MKg determined by XRF isgiven in Table 1 With MKg containing less Al2O3 but considerably moreNa2O than MK the effects on hydrothermal synthesis were of interestBoth types of metakaolin have been characterized in previous pub-lications (Schmidt et al 2012 Naber et al 2019) In addition weverified the mineral phase content by XRD analysis Besides amorphousmetakaolin MK contained minor amounts of anatase quartz and mica
Fig 1 Weight fractions of tobermorite quartz and katoite determined byquantitative XRD analysis ndash samples including MKg crosshatched
Table 1Chemical composition of MK and MKg determined by XRF analysis ndash majorcontrasts in bold letters
Oxides [wt-] MK MKg
SiO2 536 604Al2O3 392 206CaO 01 40MgO 01 12Na2O 0 96K2O 10 18Fe2O3 18 05TiO2 21 03P2O5 01 02Loss on ignition 15 1
J Schreiner et al Applied Clay Science 185 (2020) 105432
2
6 Publications
32
MKg contained additional kaolinite feldspar and quartz
22 Investigated mix composites
For the preparation of raw mixtures the powders were weighed andhomogenized using a lab-scale mixing mill Table 2 lists the composi-tion and nomenclature of all samples including Al2O3 content andcuring time in the autoclave
bull Besides one blank mixture (MK0) that did not contain any type ofmetakaolin eleven more compounds were prepared of which threeincluded different dosages of MKg (MKg16 MKg23 and MKg60)Three more mixes contained equivalent amounts of MK instead ofMKg (MK16 MK23 and MK60) These mixes were investigated inorder to have a direct comparison concerning the effects of differentraw material on the synthesis of tobermorite
bull Additionally the mixes MK9 MK5 and MK25 with lower dosages ofmetakaolin were analyzed In the referenced literature (Schreineret al 2019) the effect of Al3+ on the anisotropic peak broadeningof tobermorite could only be observed in the case of Al2O3 contentslower than 4 in the drymix In the latter three mixes Al2O3 con-tents range from 1 to 35 Al2O3 (calculated from XRF data) whichmeets the region of interest for the analysis of tobermorite domainmorphology
bull The curing time for nearly all of the investigated samples was 12 hbut compound MK9 was prepared two more times for curing timesof 2 h and 6 h The different curing times were chosen in this par-ticular sample so that the reactivity of metakaolin and the phasetransitions could be observed more precisely
23 Hydrothermal treatment
Due to the different fineness of raw materials there was a differentwater demand from one mixture to another In order to obtain slurriesof comparable rheology the amount of water was adapted respectivelyresulting in water-to-solid ratios of 25 to 3 which matches the sug-gested water-to-solid ratio for this purpose (Roacutezycka et al 2014Galvaacutenkovaacute et al 2018) The weighed water was added to the dry mixand after stirring for 1 min at 23 degC the slurry was poured into thereactor Minor changes in the quantity of added water did not have aninfluence on the measured steam pressure All experiments were con-ducted using a PTFE-lined stainless steel autoclave with a reactor vo-lume of 300 ml The oven temperature was fixed at 180 degC and auto-genous steam pressure of 11ndash12 MPa was measured during eachexperiment with an external manometer After cooling to room tem-perature the sample was removed from the reactor coarsely ground
using an agate mortar and dried at 60 degC for 12 h After drying thesample was ground with an agate mortar again in order to deagglo-merate the particles As no coarse raw materials were used there wasno need for wet McCrone milling (Schreiner et al 2018)
24 XRD analysis
After preparation into front-loading sample holders the powdersamples were measured with a D8 diffractometer (Bruker) equippedwith a LynxEye detection system and Bragg-Brentano geometry Thesettings for XRD analysis included a tube voltage of 40 kV a current of40 mA an angular range from 6 to 80deg 2θ (Cu Kα radiation) a time perstep of 054 s a step width of 00236deg 2θ and a PSD opening of 33deg Thebackground was fitted with Chebyshev polynomial of the fifth orderThe major contribution of amorphous phase was fitted with a singlepeak with a fixed position at 308deg 2θ so that tobermorite reflectionswere not affected An external quartzite standard was measured withthe same parameters in order to determine phase quantities (Jansenet al 2011) Bruker AXS software TOPAS 50 was used for Rietveldrefinement (Rietveld 1969) and the used structures are shown inTable 3
3 Results and discussion
31 Different dosages of MK and MKg
In Fig 1 the quantities of tobermorite quartz and katoite present inmost of the samples determined by XRD analysis are illustratedWhenever tobermorite was the leading mineral hydrate phase a basalspacing of 113 Aring could be verified in each of the diffractograms Thequantities of minor crystalline phases and amorphous content are notshown For low dosages of MK it can be seen that the weight fraction oftobermorite decreased At moderate dosage of both types of metakaolin(MK16 MK23 MKg16 MKg23) tobermorite was present in comparablequantities It can be seen that the amount of katoite in the mixes de-pended on the dosage of metakaolin and it appeared only at dosages ofMK5 or more Due to the higher content of aluminum in MK comparedto MKg more katoite could always be observed in the MK mixes atequivalent dosages Despite equal amounts of quartz as starting mate-rial in mixes for both types of metakaolin the resulting weight fractionsin the cured samples were not alike Considerably more quartz waspresent in the MK samples Even though less quartz was used for mixescontaining higher amounts of MK even more quartz was present afterhydrothermal curing (Table 2 Fig 1) Consequently some of the SiO2
provided by MK did not transform into an amorphous phase or to-bermorite but into quartz This finding is verified by the presence ofquartz in MK60 because no quartz was included in the raw mixture Thefeldspar present in MKg did not react so Na2O and an unknown amountof Al2O3 may not have been supplied for hydrothermal reaction Besidestobermorite and quartz additional calcite scawtite (Ca7Si6(CO3)
Table 2Basic powder compounds prepared for the hydrothermal synthesis of to-bermorite with the respectively calculated Al2O3 content and curing time in thereactor
Sample Portlandite[wt-]
Quartz[wt-]
MK[wt-]
MKg
[wt-]
Al2O3
[wt-]Curingtime [h]
MK0 49 51 ndash ndash 0 12MK25 495 48 25 ndash 1 12MK5 49 46 5 ndash 2 12MK9_2h 48 43 9 ndash 35 2MK9_6h 48 43 9 ndash 35 6MK9_12h 48 43 9 ndash 35 12MK16 47 37 16 ndash 63 12MK23 46 31 23 ndash 9 12MK60 40 ndash 60 ndash 235 12MKg16 47 37 ndash 16 33 12MKg23 46 31 ndash 23 47 12MKg60 40 ndash ndash 60 124 12
Table 3Structural data used for the investigation with powder XRD analysis
Phase Author
Anatase (Horn et al 1972)Biotite (Brigatti et al 2000)Calcite (Maslen et al 1995)Kaolinite (Zvyagin 1960)Katoite (Bartl 1969)Microcline (Bailey 1969)Plazolite (Basso et al 1983)Portlandite (Busing and Levy 1957)Quartz (Le Page and Donnay 1976)Scawtite (Grice 2005)Tobermorite (Hamid 1981)Xonotlite (Hejny and Armbruster 2001)
J Schreiner et al Applied Clay Science 185 (2020) 105432
3
6 Publications
33
O18bull2(H2O)) and xonotlite (Ca6Si6O17(OH)2) could be identified insample MK0 (XRD plots of samples MK0 MKg16 MKg23 MK16 andMK23) Comparing MK0 and MK25 scawtite and xonotlite could stillbe identified in a very low amount in MK25 but no longer in samplesthat contained even more MK (XRD plots of samples MK0 MK25 MK5and MK9_12h)
Two additional experiments were done without quartz in the rawmixes (MK60 and MKg60) The according diffractograms after hydro-thermal curing are shown in Fig 2 In sample MKg60 tobermorite (gt 50wt-) was successfully synthesized without any other silica sourcethan MKg whereas no crystalline quartz occurred By contrast no to-bermorite but quartz could be identified in equivalent mixture MK60containing MK It can be seen that crystalline components such as micaand anatase in the raw MK did not react at the selected conditions andremained present in the autoclaved samples Except for feldspar in MKgall of the crystalline components appeared to be reactive at the chosenhydrothermal conditions A minor unidentified phase occurred at328deg2θ and additional xonotlite was identified in sample MKg60 Insample MK60 more calcium was needed for the formation of morehydrogarnet (Fig 1) resulting in a lower CaSi ratio for the remainingsystem Sample MKg60 contained only half of the amount of Al3+ and itwas not completely supplied for reaction due to its partial presence infeldspar Consequently essentially less hydrogarnet (Fig 1) was presentin MKg60 after hydrothermal treatment and the CaSi ratio in the re-maining system was affected to a lesser extent
32 Application of MK for different curing times
The development of hydrate phases in the autoclave for compoundMK9 is displayed in Fig 3 After only 2 h of hydrothermal curing all ofthe available portlandite had reacted and katoite (95 wt-) was pre-sent The applied type of metakaolin appeared to react quickly as itsupplied aluminum for formation of katoite No formation of to-bermorite could be observed at this stage yet An assumably amorphousprecursor can be seen at 28 to 30deg2θ Calcium was provided by thedissolution of portlandite After 6 h of hydrothermal reaction amountsof katoite (85 wt-) and quartz (from 31 wt- at 2 h to 165 wt- at6 h) had decreased and a major amount of tobermorite (35 wt-) waspresent Apparently between 2 and 6 h under hydrothermal conditionsthe amorphous precursor and quartz reacted resulting in the formationof tobermorite An additional 6 h of reaction time (MK9_12h) did notchange the phase composition significantly Slightly more tobermorite
(365 wt-) less quartz (16 wt-) and katoite (65 wt-) weremeasured
33 Tobermorite domain morphology and lattice parameters
In the referenced literature an analysis of tobermorite domainmorphology based on anisotropic peak broadening was possible forsamples that contained notgt 4 wt- Al2O3 in the drymix (Schreineret al 2019) Accordingly in this study samples MK0 MK25 MK5MK9_6h and MK9_12h were suitable (Table 2) with MK9_2h not con-taining any tobermorite In Fig 4 the respective growth in a and b di-rection is visualized with x indicating the domain size in a direction andy indicating domain size in b direction using a macro for TOPAS 50(Ectors et al 2015 2017) The calculated cylinder models in Fig 4represent the relation of yx and not absolute sizes With no supply ofaluminum ions (MK0) the relative domain growth in b direction islower compared to samples containing metakaolin This finding agreeswith the results from a similar investigation of tobermorite in AAC(Schreiner et al 2019) However within the samples MK5 andMK9_12h the different amounts of supplied aluminum ions did notshow a clear effect It appeared that low dosages of Al3+ (1 wt- Al2O3
in MK25 and 2 wt- Al2O3 in MK5) were enough to determine thedomain growth of tobermorite Additional results from the samplesMK9_6h and MK9_12h indicated that growth in b direction increasedwith reaction time
In Fig 5 lattice parameters of tobermorite depending on metakaolindosages are plotted B clearly remained unaffected throughout therange of samples Increasing amounts of metakaolin led to a slightlysmaller parameter a However both types of metakaolin showed acorresponding impact on parameter a By contrast parameter c in-creased strongly with increasing amounts of MK and MKg but the typeof metakaolin was significant At an equivalent dosage MK affected thecell dimension in c direction considerably more than MKg so that thefraction of Al3+ appeared to be the decisive parameter Different metaloxides in MKg did not show a notable effect certainly as they werepartially not provided for reaction Unlike for the domain morphologyof tobermorite the impact on lattice parameters could be observedwithin the complete range of examined dosages
4 Conclusions
The results obtained from the introduced investigations allow con-cluding remarks on the effects of the applied types of metakaolin on thesynthesis of 11 Aring tobermorite the phase transitions and the in-corporation of Al3+ into the lattice of tobermorite
With a critical dosage the use of any type of metakaolin led to theformation of katoite in an according amount At moderate dosages(MKg16 MKg23 MK16 and MK23) the two types of metakaolin showeda good correspondence in consideration of the quantities of to-bermorite For higher dosages there were contrary effects Lower do-sages of MK led to considerable quantities of Al-substituted to-bermorite Samples containing low dosages of MK revealed that katoiteappeared in the case ofgt 5 wt- of MK - corresponding to 2 wt-Al2O3 - in the basic compound Minor crystalline phases in MKg showedbetter reactivity than those in MK The observation that no tobermoritewas present in sample MK60 indicated that high dosages of Al3+ hin-dered the formation of tobermorite
Investigations of MK9 at 2 6 and 12 h displayed the evolution ofhydrate phases At first katoite was the only crystalline hydrate phasepresent after 2 h which corresponded to observations in a differentpublication (Klimesch and Ray 1999) The amount of katoite andquartz then decreased and a major amount of tobermorite formed from2 to 6 h curing time In order to gain more information on the trans-formation of amorphous C-(A)-S-H into tobermorite additional ex-periments in the range of 2 to 6 h curing time will be needed
Domain morphology analysis of tobermorite revealed that low
Fig 2 Diffractograms of MKg MKg60 MK and MK60 from 7 to 34deg2θ CuKα Aanatase C calcite F feldspar k kaolinite K katoite M mica Q quartz Ttobermorite U unidentified phase X xonotlite
J Schreiner et al Applied Clay Science 185 (2020) 105432
4
6 Publications
34
dosages of Al3+ determined the domain growth which agreed with theresults published on tobermorite in AAC samples (Schreiner et al2019) Different curing times unveiled that growth in b direction in-creased with the reaction time Al3+ incorporation into the lattice oftobermorite only reflected to a limited extent in the domain mor-phology By contrast an increase of lattice parameter c was triggered byAl3+ even at the highest dosage in this study Ultimately there is no
evidence for a limit of incorporation of Al3+ but there is a limit ofinfluence on the domain morphology These results additionally re-confirm this assumption similarly made in the previous work (Schreineret al 2019) and suggest a new mechanism of tobermorite crystal-lization depending on the presence of Al3+
Supplementary data to this article can be found online at httpsdoiorg101016jclay2019105432
Declaration of Competing Interest
The authors declare that they have no known competing financialinterests or personal relationships that could have appeared to influ-ence the work reported in this paper
Acknowledgement
The authors thank Rodgauer Baustoffwerke GmbH amp Co KG forsupplying raw materials for laboratory experiments
References
Aguilar-Mamani W Garciacutea G Hedlund J Mouzon J 2014 Comparison betweenleached metakaolin and leached diatomaceous earth as raw materials for the synth-esis of ZSM-5 Springerplus 3 1ndash10 httpsdoiorg1011862193-1801-3-292
Ayodele OB Sulaimon AA Alaba PA Tian Z-Y 2019 Influence of metakaolini-zation temperature on the structure and activity of metakaolin supported Ni catalystin dry methane reforming J Environ Chem Eng httpsdoiorg101016jjece2019103239 (in press)
Badawi EA Abdel-Rahman MA Mostafa A Abdel-Rahman M 2019 Determinationof the crystallite size amp micro- strain by novel method from XRD profile Appl Phys2 1ndash15 httpsdoiorg1031058jap201921001
Bailey SW 1969 Refinement of an intermediate microcline structure Am Miner 541540ndash1545
Bartl H 1969 Roentgen-Einkristalluntersuchungen an (CaO)3 (Al2O3) (H2O)6 und an(CaO)12 (Al2O3)7 (H2O) neuer Vorschlag zur (CaO)12 (Al2O3)7-Struktur NeuesJahrb fuer Mineral Monatshefte 1969 404ndash413
Basso R Giusta AD Zefiro L 1983 Crystal structure refinement of plazolite A highlyhydrated natural hydrogrossular Neues Jahrb Miner Monatsh (Neues Jahrb fuerMineral Monatshefte) 1983 251ndash258
Brigatti MF Lugli C Poppi L Foord EE Kile DE 2000 Crystal chemical varia-tions in Li- and Fe-rich micas from Pikes Peak batholith (Central Colorado) AmMineral 85 1275ndash1286 httpsdoiorg102138am-2000-8-920
Busing WR Levy HA 1957 Neutron diffraction study of calcium hydroxide J ChemPhys 26 563 httpsdoiorg10106311743345
Chen L Wang Z Wang Y Feng J 2016 Preparation and properties of alkali acti-vated metakaolin-based geopolymer Materials (Basel) 9 1ndash12 httpsdoiorg103390ma9090767
Chucholowski C Holger M Thienel K-C 2018 Improving the recyclability en-vironmental compatibility and CO2 balance of autoclaved aerated concrete by re-placing sulfate carrier and cement with calcined clays CePapers 2 503ndash512httpsdoiorg101002cepa846
Fig 3 Diffractograms of MK9_2h MK9_6h and MK9_12h from 7 to 38deg2θ CuKα C calcite K katoite Q quartz T tobermorite
Fig 4 Relation of calculated domain sizes of 11 Aring tobermorite in selectedsamples (MK0 MK25 MK5 MK9_6h and MK9_12h) in a (x) and b (y) direction
Fig 5 Lattice parameters of tobermorite depending on MK or MKg dosageincluding blank mix MK0
J Schreiner et al Applied Clay Science 185 (2020) 105432
5
6 Publications
35
Demir İ Başpınar MS Kahraman E Ccedilalışkan E Goumlrhan G 2014 An investigationon the usability of diatomite in aerated concrete production In Proc of the IntlConf on Advances in Civil Structural and Construction Engineering ndash CSCE 2014 pp97ndash100
Ectors D Goetz-Neunhoeffer F Neubauer J 2015 A generalized geometric approachto anisotropic peak broadening due to domain morphology J Appl Crystallogr 48189ndash194 httpsdoiorg101107S1600576714026557
Ectors D Goetz-Neunhoeffer F Neubauer J 2017 Routine (an)isotropic crystallitesize analysis in the double-Voigt approximation done right Powder Diffract 3227ndash34 httpsdoiorg101017S0885715617000070
Galvaacutenkovaacute L Bartoniacutečkovaacute E Opravil T Tkacz J Ptaacuteček P 2018 The influence ofstarting materials solubility on tobermorite structure formation under the hydro-thermal conditions IOP Conf Ser Mater Sci Eng 379 1ndash8 httpsdoiorg1010881757-899X3791012001
Grice JD 2005 The structure of spurrite tilleyite and scawtite and relationships toother silicate-carbonate minerals Can Mineral 43 1489ndash1500 httpsdoiorg102113gscanmin4351489
Hamid SA 1981 The crystal structure of the 11 Aring natural tobermoriteCa225[Si3O75(OH)15]1H2O Zeitschrift fuer Krist 154 189ndash198 httpsdoiorg101524zkri19811543-4189
Hejny C Armbruster T 2001 Polytypism in xonotlite Ca6Si6O17(OH)2 Zeitschrift furKrist 216 396ndash408
Horn M Schwerdtfeger CF Meagher EP 1972 Refinement of the structure of ana-tase at several temperatures Zeitschrift fur Krist 136 273ndash281 httpsdoiorg101524zkri19721363-4273
Jansen D Goetz-Neunhoeffer F Stabler C Neubauer J 2011 A remastered externalstandard method applied to the quantification of early OPC hydration Cem ConcrRes 41 602ndash608 httpsdoiorg101016jcemconres201103004
Jenkins R Snyder R 1996 Introduction to X-ray Powder Diffractometry ChemicalAnalysis Wiley pp 90
Kalousek GL 1956 Crystal Chemistry of Hydrous Calcium Silicates J Am Ceram Soc40 74ndash80
Klimesch D Ray A 1998 Autoclaved cement-quartz pastes with metakaolin additionsAdv Cem Based Mater 7 109ndash118 httpsdoiorg101016S1065-7355(97)00073-4
Klimesch D Ray A 1999 DTA-TGA evaluations of the CaOndashAl2O3ndashSiO2ndashH2O systemtreated hydrothermally Thermochim Acta 334 115ndash122 httpsdoiorg101016s0040-6031(99)00140-9
Komarneni S Roy R Roy DM Fyfe CA Kennedy GJ Bothner-By AA Dadok JChesnick AS 1985 27Al and29Si magic angle spinning nuclear magnetic resonancespectroscopy of Al-substituted tobermorites J Mater Sci 20 4209ndash4214 httpsdoiorg101007BF00552416
Koutnyacute O Opravil T Pořiacutezka J 2014 Application of metakaoline in autoclavedaerated concrete technology Adv Mater Res 1000 174ndash177 httpsdoiorg104028wwwscientificnetAMR1000174
Le Page Y Donnay G 1976 Refinement of the crystal structure of low-quartz ActaCrystallogr Sect B 32 2456ndash2459 httpsdoiorg101107S0567740876007966
Luo H Law WW Wu Y Zhu W Yang EH 2018 Hydrothermal synthesis of needle-like nanocrystalline zeolites from metakaolin and their applications for efficient re-moval of organic pollutants and heavy metals Microporous Mesoporous Mater 2728ndash15 httpsdoiorg101016jmicromeso201806015
Maeda H Ogawa Y Ishida EH Kasuga T 2012 Hydrothermal synthesis of to-bermorite doped with phosphorus species for removing heavy metal ions J AustCeram Soc 48 8ndash11
Maslen EN Streltsov VA Streltsova NR Ishizawa N 1995 Electron density andoptical anisotropy in rhombohedral carbonates III Synchrotron Xray studies ofCaCO3 MgCO3 and MnCO3 Acta Crystallogr Sect B 51 929ndash939 httpsdoiorg101107S0108768195006434
Matekonis G Šiaučiūnas R Vaičiukynienė D 2010 Hydrothermal Synthesis andCharacterization of Na + and [ Al 3 + + Na + ] -substituted Tobermorite in CaO-SiO2middotnH2O-H2O System Mater Sci 16 242ndash248
Matsui K Kikuma J Tsunashima M Ishikawa T Matsuno S Ogawa A Sato M2011 In situ time-resolved X-ray diffraction of tobermorite synthesis process underhydrothermal condition IOP Conf Ser Mater Sci Eng 18 60ndash66 httpsdoiorg1010881757-899X182022017
Merlino S Bonaccorsi E Armbruster T 2000 The real structures of clinotobermoriteand tobermorite 9 Aring OD character polytypes and structural relationships Eur JMineral 12 411ndash429 httpsdoiorg1011270935-122120000012-0411
Monasterio M Gaitero JJ Manzano H Dolado JS Cerveny S 2015 Effect ofchemical environment on the dynamics of water confined in calcium silicate mi-nerals Natural and synthetic tobermorite Langmuir 31 4964ndash4972 httpsdoiorg101021acslangmuir5b00614
Mostafa NY 2005 Influence of air-cooled slag on physicochemical properties of auto-claved aerated concrete Cem Concr Res 35 1349ndash1357 httpsdoiorg101016jcemconres200410011
Mostafa NY Shaltout AA Omar H Abo-El-Enein SA 2009 Hydrothermal synth-esis and characterization of aluminium and sulfate substituted 11 nm tobermoritesJ Alloys Compd 467 332ndash337 httpsdoiorg101016jjallcom200711130
Naber C Stegmeyer S Jansen D Goetz-Neunhoeffer F Neubauer J 2019 ThePONKCS method applied for time resolved XRD quantification of supplementarycementitious material reactivity in hydrating mixtures with ordinary Portland ce-ment Constr Build Mater 214 449ndash457 httpsdoiorg101016jconbuildmat201904157
Qu X Zhao Z Zhao X 2018 Microstructure and characterization of aluminum-in-corporated calcium silicate hydrates (C-S-H) under hydrothermal conditions RSCAdv 8 28198ndash28208 httpsdoiorg101039c8ra04423f
Rashad AM 2013 Metakaolin as cementitious material history scours production andcomposition - a comprehensive overview Constr Build Mater 41 303ndash318 httpsdoiorg101016jconbuildmat201212001
Rietveld HM 1969 A profile refinement method for nuclear and magnetic structures JAppl Crystallogr 2 65ndash71 httpsdoiorg101107S0021889869006558
Riacuteos CA Williams CD Fullen MA 2009 Hydrothermal synthesis of hydrogarnet andtobermorite at 175 degC from kaolinite and metakaolinite in the CaO-Al2O3-SiO2-H2Osystem a comparative study Appl Clay Sci 43 228ndash237 httpsdoiorg101016jclay200809014
Roacuteżycka A Pichoacuter W 2016 Effect of perlite waste addition on the properties of au-toclaved aerated concrete Constr Build Mater 120 65ndash71 httpsdoiorg101016jconbuildmat201605019
Roacutezycka A Kotwica Ł Małolepszy J 2014 Synthesis of single phase gyrolite in theCaO-quartz-Na2O-H2O system Mater Lett 120 166ndash169 httpsdoiorg101016jmatlet201401003
Sauman Z 1974 Influence of SO4 2ndash ions on the formation of 11 Aring tobermorite InProceedings of the 2nd International Symposium on Science and Research in SilicateChemistry Moscow pp 25ndash39
Schmidt M Egersdoumlrfer A Poumlllmann H 2012 Increased reactivity using a glass-containing metakaolin as an active filler in lime-based binder systems ZKG Int 6554ndash62
Schreiner J Jansen D Ectors D Goetz-Neunhoeffer F Neubauer J Volkmann S2018 New analytical possibilities for monitoring the phase development during theproduction of autoclaved aerated concrete Cem Concr Res 107 247ndash252 httpsdoiorg101016jcemconres201802028
Schreiner J Goetz-Neunhoeffer F Neubauer J Volkmann S Bergold S Webler RJansen D 2019 Advanced Rietveld refinement and SEM analysis of tobermorite inchemically diverse autoclaved aerated concrete Powder Diffract 34 143ndash150httpsdoiorg101017s0885715619000149
Setthaya N Chindaprasirt P Pimraksa K 2016 Preparation of zeolite nanocrystals viahydrothermal and solvothermal synthesis using of rice husk ash and metakaolinMater Sci Forum 872 242ndash247 httpsdoiorg104028wwwscientificnetmsf872242
Siauciunas R Baltakys K 2004 Formation of gyrolite during hydrothermal synthesis inthe mixtures of CaO and amorphous SiO2 or quartz Cem Concr Res 34 2029ndash2036httpsdoiorg101016jcemconres200403009
Skawinska A Owsiak Z Baran T Hernik K 2017 The influence of halloysite ad-dition on tobermorite formation in CaO and quartz mix under hydrothermal condi-tions Cem Wapno Bet 17 426ndash434
Venhodovaacute E Janovskyacute R Drochytka R 2015 Formation of tobermorite at differentmaterials composition of aerated concrete Appl Mech Mater 752ndash753 247ndash250httpsdoiorg104028wwwscientificnetamm752-753247
Walczak P Małolepszy J Reben M Szymański P Rzepa K 2015 Utilization ofwaste glass in autoclaved aerated concrete Proc Eng 122 302ndash309 httpsdoiorg101016jproeng201510040
Zhang Y Gao W Cui L 2007 The transformation of acid leached metakaolin tozeolite beta Stud Surf Sci Catal 170 420ndash425 httpsdoiorg101016S0167-2991(07)80870-6
Zvyagin BB 1960 An attempt to electronographic determination of kaolinite structureJ Dokl Akad Nauk SSSR 130 1023ndash1026
J Schreiner et al Applied Clay Science 185 (2020) 105432
6
6 Publications
36
6 Publications
62 Advanced Rietveld refinement and SEM analysis oftobermorite in chemically diverse autoclaved aeratedconcrete
Following the copyright guidelines by Cambridge University Press the publication
Schreiner J Goetz-Neunhoeffer F Neubauer J Volkmann S Bergold S WeblerR Jansen D 2019 Advanced Rietveld refinement and SEM analysis of tobermorite inchemically diverse autoclaved aerated concrete Powder Diffraction 34 143ndash150 httpsdoiorg101017s0885715619000149
may not be reprinted It can be accessed at
httpswwwcambridgeorgcorejournalspowder-diffractionarticleadvanced-rietveld-refinement-and-sem-analysis-of-tobermorite-in-chemically-diverse-autoclaved-aerated-concrete51597C2A66F6F225D29DEB2675E74249
37
6 Publications
63 New analytical possibilities for monitoring the phasedevelopment during the production of autoclavedaerated concrete
Reprint of the peer reviewed publication
Schreiner J Jansen D Ectors D Goetz-Neunhoeffer F Neubauer J VolkmannS 2018 New analytical possibilities for monitoring the phase development during theproduction of autoclaved aerated concrete Cement and Concrete Research 107 247ndash252httpsdoiorg101016jcemconres201802028
with permission from Elsevier
38
Contents lists available at ScienceDirect
Cement and Concrete Research
journal homepage wwwelseviercomlocatecemconres
Short communication
New analytical possibilities for monitoring the phase development duringthe production of autoclaved aerated concrete
J Schreinera D Jansena D Ectorsa F Goetz-Neunhoeffera J Neubauera S Volkmannb
aUniversity of Erlangen-Nuremberg GeoZentrum Nordbayern Mineralogy Schlossgarten 5a 91054 Erlangen Germanyb Rodgauer Baustoffwerke GmbH amp Co KG Am Opel-Pruumlffeld 3 63110 Rodgau-Dudenhofen Germany
A B S T R A C T
This work presents improved analytical methods for both steps of the production process of autoclaved aeratedconcrete (AAC) the phase development during the hydration before autoclaving and during the autoclavingprocess itself The improvement includes new insights into preparation methods of AAC samples for powderdiffraction as well as Rietveld refinement strategies For the first time a new implementation for calculatinganisotropic crystal domain sizes is applied to major hydrate phases occurring during AAC production namelyportlandite during the hydration before autoclaving and tobermorite during the autoclaving process The cal-culation of anisotropic domain size growth which can be implemented in the Rietveld environment is based oncrystallographically and geometrically appropriate models The implementation of calculating anisotropic do-main sizes for the Rietveld software TOPAS 50 allows a superior Rietveld fit and a more accurate quantificationof the phase development Additionally it enables the tracking of growth mechanism of portlandite duringhydration
1 Introduction
Autoclaved aerated concrete (AAC) is known as a lightweight con-struction material which offers outstanding properties such as suffi-cient strength for construction in addition with excellent thermal in-sulation [12] AAC is produced by autoclaving from calcareous rawmaterials such as lime (CaO) and cement quartz sulfate carrier andother additives such as foaming agents and water
The production process (Fig 1) can be separated into the hydrationof the mixed slurry before the procedure of autoclaving and the auto-claving at elevated temperature (180 degC to 200 degC) under saturatedsteam pressure (12MPa) for several hours
The hydration process before autoclaving is necessary to achievesufficient strength in order to cut the green cake blocks as they shouldhave a specific shape and dimension after autoclaving Furthermorethe porous structure is generated by the foaming agent during hydra-tion in the first process step During autoclaving the final propertiesnamely strength and low thermal conductivity are achieved
It is already well understood that the autoclaving process leads tothe formation of several phases first of all tobermorite(Ca5Si6O16(OH)2lowast4H2O) [3ndash5] Newest research has shown im-pressively which reactions are running from the mineralogical point ofview Insitu XRD measurements were carried out during the
autoclaving process and the phase development was shown by plottingnormalized intensities [6] The study of Mitsuda et al [3] was mainlyfocused on the tracking of the phase evolution during the autoclavingprocess of AAC However their statements concerning phase evolutionare mainly based on XRD data and TGA measurements There is acommon agreement that the following reactions occur The consump-tion of the alite (OPC) leads to the formation of an initial C-S-H phaseduring the first processing step Portlandite which was initially formedduring the first process step (from CaO and C3S) further quartz and theC-S-H phase are consumed during autoclaving resulting in the crystal-lization of tobermorite Hence the crystallization process of to-bermorite as well as the crystal structure of tobermorite was an issue ofresearch and discussion over the last years and numerous publicationsto these topics are available Concerning the crystal structure of to-bermorite respectively the tobermorite supergroup a new publicationoutlines all important references and recommends a new nomenclature[7]
The presented study was performed to create new analytical possi-bilities for the characterization of the production process of AAC Bothof the production process steps are essential for the final productHence the present work focuses on crystallization of hydrate phases inboth processes
Firstly an external standard method [89] was published and
httpsdoiorg101016jcemconres201802028Received 6 October 2017 Received in revised form 1 February 2018 Accepted 26 February 2018
Corresponding authorsE-mail addresses juergenjsschreinerfaude (J Schreiner) danieljansenfaude (D Jansen)
Cement and Concrete Research 107 (2018) 247ndash252
0008-8846 copy 2018 Elsevier Ltd All rights reserved
T
6 Publications
39
recommended for the determination of absolute phase contents inmixtures with amorphous content It was shown that the method canabsolutely be recommended for hydrating cement pastes in which watercannot be quantified directly by XRD [10] This method seems to bevery promising for both the quantification of the hydration of the AACslurry before autoclaving and the quantification of the phase evolutionduring autoclaving inasmuch as both production steps form crystallineand amorphous phases
Secondly a new approach to anisotropic peak broadening due toanisotropic domain morphology which was developed [1112] is ap-plied to AAC samples to improve the fit of portlandite and tobermoriteby Rietveld refinement [13] By applying this approach the refinementof both portlandite and tobermorite should additionally lead to betterquantitative results as well as to better insights into the development ofthe domain size morphology of both phases formed
It was already shown that in a hydrating raw mixture for AAC twospecies of portlandite precipitate at 23 degC one showing dynamicallyanisotropic peak broadening and another one following the isotropictrend [14] The application of the anisotropic refinement model led toan improved fitting of portlandite Moreover the mechanism of aniso-tropic domain growth of portlandite was tracked
2 Materials and methods
In order to examine the hydration of the AAC slurry before auto-claving a mixture of the hydraulic reactive components was weighedand measured in-situ at a Bruker D8 diffractometer with a LynxEyedetection system
Ordinary Portland cement (OPC) was mixed with lime (CaO) andanhydrite (C$) The raw materials were taken from the same batches asfor the industrial samples The drymix (58 OPC 36 CaO and 6 C$by weight) was then mixed with water (ws= 08) and placed into anappropriate sample holder The samples were not aerated The slurrysamples were covered with a kapton film to avoid evaporation andcarbonation Diffractograms were recorded with an angular range from7 to 545deg 2θ and a step width of 0011deg 2θ Measurements were carriedout every 15min For each measurement 96 XRD patterns were re-corded over the first 24 h The temperature was fixed at 70 degC which isthe mean temperature generally prevailing in the industrial processduring hydration before autoclaving Rietveld refinement was carriedout using the G-factor method All structures used for Rietveld refine-ment are shown in Table 1
For investigation of the autoclaved samples five different specimenswere taken at different autoclaving times The specimens were takenout of a technical production process hence it was not possible to in-terrupt the process at an earlier time inasmuch it would lead to damageof a whole concrete production batch The specimens were firstly driedat 60 degC until weight constancy The whole blocks were then broken andstatistical samples of 20 g were taken In order to receive the right massattenuation coefficient (MAC) for G-factor method the loss on ignitionand the chemical composition (XRF) were determined For energydispersive XRF analysis (Spectro Xepos) tube voltage from 20 kV to50 kV and tube current from 08 to 20mA were used for differenttargets
The final sample preparation (grinding) before XRD measurementswas carried out using both an agate mortar and a McCrone micronizingmill for wet milling with isopropanol Both preparation methods wereapplied separately to see which one is suitable in order to get the bestpreparation for XRD investigations Six preparations were performed byone operator of which two were prepared with an agate mortar andfour with a McCrone mill For the McCrone milling 3 g of the sampleand 10ml of isopropanol were used for grinding for 12min The grainsize distribution of one sample prepared with an agate mortar and onesample prepared using a McCrone mill was measured by laser granu-lometry in isopropanol using a Mastersizer 3000 (MALVERN)
After milling the samples in these two ways for XRD analysis thepowders were prepared into a front loading sample holder and mea-sured Diffractograms were recorded with an angular range from 6 to80deg 2θ a step width of 00236deg 2θ and a time per step of 054 s Rietveldrefinement combined with external standard (G-factor) was applied inorder to get absolute quantities for each phase The refinement strategyfor portlandite and tobermorite in the TOPAS Launch Mode (TOPAS50 Bruker AXS) is attached as a Supplementary material file
3 Results and discussion
31 Hydration of the mixture before autoclaving
The hydration of the investigated paste before autoclaving isdominated by the hydration of the cement as well as the reaction of thefree lime (CaO) resulting in the formation of portlandite It can beclearly seen from Fig 2 that the hydration of the paste leads to theformation of ettringite portlandite and C-S-H phase For simplificationthe remaining phase developments are not shown in Fig 2 because theyare not in the focus of this study The hydration of CaO forming
Fig 1 Simplified process steps of AAC production and hydrate phase evolution
Table 1Structures used for Rietveld refinement
Phase Author
Alite [15]Anhydrite [16]Bassanite [17]Belite (β) [18]Belite (αprime) [19]Brownmillerite [20]C-S-H [21]Calcite [22]Ettringite [23]Gypsum [24]Hemicarbonate [25]Hydroxylellestadite [26]Lime (CaO) [27]Microcline [28]Portlandite [29]Quartz [30]Tobermorite [31]Tricalciumaluminate (cubic) [32]Tricalciumaluminate (orthorhombic) [33]PONCKS model for Water [21]
J Schreiner et al Cement and Concrete Research 107 (2018) 247ndash252
248
6 Publications
40
portlandite begins rapidly after the addition of water to the mixture andlime is fully consumed after only 1 h of hydration This translates into aquick rise of heat of hydration so that cement hydration is acceleratedwhich leads to further portlandite formation by the reaction of aliteEttringite formation stalls after few hours of hydration After 12 h et-tringite is partially decomposed probably due to sulfate depletion [9]
and poorly crystalline AFm phases (not shown in Fig 2) are formedIn Fig 3 it can be seen that in fact two generations of portlandite
are formed a 1st dominant generation showing anisotropic peakbroadening and 2nd one occurring considerably later following theisotropic domain size refinement which is usually carried out using theRietveld method This occurrence comes along firstly with lime hy-dration and secondly with alite hydration The expected quantity ofportlandite formed from lime hydration very well complies with the
Fig 2 Phase development in AAC paste on a laboratory scale before autoclaving ana-lyzed by in-situ XRD at 70 degC
Fig 3 Formation of two generations of portlandite by hydration of lime (1st) and C3S(2nd) at 70 degC before autoclaving with the major generation showing anisotropic peakbroadening
Fig 4 Biaxial cylinder domain size model of portlandite used for Rietveld refinement of anisotropic peak broadening
Fig 5 Morphological evolution of portlandite showing anisotropic domain size growthduring hydration at 70 degC
Fig 6 Comparison of quantification of crystalline quartz in samples prepared withMcCrone mill and agate mortar at different autoclaving times
J Schreiner et al Cement and Concrete Research 107 (2018) 247ndash252
249
6 Publications
41
quantity of the observed 1st generation The development of portlan-dite growth was already tracked in an equivalent slurry at 23 degC [14]Thus this observation confirms that the crystallinity of portlandite inmixtures for AAC production depends on the starting phase for hydra-tion as already indicated by Ectors [14]
Fig 4 shows the used biaxial cylindrical model for anisotropic do-main size calculation and the portlandite structure which was createdwith structural software VESTA 318 [34] Using the cylindrical ap-proach domain sizes in a (here equating to b) and c direction(dz= cylinder height) can be calculated which comes along with theexpected symmetrical parameters of portlandite
The 1st portlandite generation showing anisotropic domain growthcan be tracked in terms of cylinder diameter and height which is rea-lized in Fig 5 The blue cylinder represents the geometric approach andcylinder height and diameter are calculated newly for each range Thecylinder height remains rather stable throughout the hydration processwhile the cylinder diameter increases during the first hours of hydra-tion After 10 h of hydration the mean cylinder diameter no longer in-creases Consequently these observations match the results of the ex-aminations conducted at 23 degC [14] as well as the assumption thatdifferent mechanisms of growth exist for portlandite depending on the
hydration educt The maximum cylinder diameter is reached earlier inthis work very likely because of the higher hydration temperature
32 Quantification of the reactions during autoclaving
Autoclaved samples were ground with an agate mortar and com-pared to samples which were wet-ground with a McCrone mill Fig 6shows precisely that the determination of the amount of crystallinequartz is more reproducible in the two shown samples which were
Fig 7 2D XRD with Bruker GADDS-system plots of samples prepared with agate mortar and McCrone mill Coarse quartz grains are pointed out in the plot of the sample prepared withagate mortar
Fig 8 Particle size distribution of one sample prepared with an agate mortar and of onesample prepared with a McCrone mill measured by laser granulometry
Fig 9 Rietveld refinement for Tobermorite of autoclaved AAC sample by use of isotropicdomain size model (a) and of anisotropic domain size model (b)
J Schreiner et al Cement and Concrete Research 107 (2018) 247ndash252
250
6 Publications
42
prepared with a McCrone mill The high variance of crystalline quartzin the samples which were prepared with an agate mortar is a result ofinsufficient grinding and remaining of too large quartz grains Whenthis spottiness occurs a reliable quantification using the G-factormethod is not possible
The 2D XRD with Bruker GADDS-system plots in Fig 7 demonstratethe insufficient grinding when using an agate mortar compared to wetmilling with a McCrone mill Quartz would be overrepresented in a one-dimensional XRD pattern focusing on a section with bright spots (greenarrows) The lack of bright spots in the right plot shows that the quartzgrains are milled more thoroughly using a McCrone mill In Fig 8 theparticle size distribution after both ways of sample preparation iscompared Most grains in the sample prepared with an agate mortar arelarger than in the sample prepared with a McCrone mill The grain sizedistribution of the sample prepared with a McCrone mill complies withthe recommended particle size range for XRD analysis of under 5 to50 μm [3536] while the other sample exceeds the range
In Fig 9 Rietveld refinement of an autoclaved sample is shown Thedominant peaks at 77 290 and 301deg 2θ are attributed to tobermoriteIn the upper diagram (a) Rietveld refinement was carried out regularlycalculating isotropic domain sizes for tobermorite However the cal-culated fit differs significantly from the raw data It can be assumed thattobermorite shows a similar pattern to portlandite in terms of aniso-tropic peak broadening taking into account that tobermorite is as-signed to the orthorhombic crystal system Thus instead of a biaxialcylinder model an elliptic cylinder model (Fig 10 structure createdwith VESTA 318 [34]) was applied for the refinement in the lowerdiagram (b) The elliptic cylinder model is a sufficient approach to the
orthorhombic crystal system as it allows the distinction between do-main sizes in a b and c direction The fit is clearly superior using theanisotropic domain size model highlighted by the difference plot inFig 9b The comparison refinement with isotropic and anisotropic ap-proach was done for all of the five autoclaved samples In Fig 11 theresulting Rwp values for the whole pattern and the RBragg values of to-bermorite are shown The refinement using the anisotropic model leadsto both lower Rwp and RBragg values and consequently to a better fit anda more accurate quantification of tobermorite in all refined samples
4 Summary and conclusions
Improved analytical methods for both the phase developmentduring the hydration before autoclaving and during the autoclavingprocess of AAC are presented It could be shown that wet McCronemilling is the best way of preparation of AAC samples in order to obtainsuitable samples for powder diffraction A new approach to treat ani-sotropic domain sizes for Rietveld refinement could be successfullyapplied ndash with the benefit that portlandite and tobermorite in AACsamples could be refined more accurately using the Rietveld methodThus this application allows an improved quantification of the phasedevelopment during both of the production steps
For the future there are still plenty of possibilities to apply thepresented approach of calculating anisotropic domain sizes to AACproduction As exemplified with portlandite the mechanisms of growthof tobermorite can be tracked likewise during the autoclaving processIn addition the effect of variations in the chemical composition of AACraw mixtures on the crystal morphology of tobermorite can be ex-amined This leaves a new perspective to discuss the link between mi-neral phase morphology and the thermal and mechanical properties ofAAC
Acknowledgement
The autoclaved samples were generously provided by RodgauerBaustoffwerke GmbH amp Co KG The authors express gratitude for allsupport
Appendix A Supplementary data
Supplementary data to this article can be found online at httpsdoiorg101016jcemconres201802028
References
[1] MW Grutzeck Cellular concrete in M Scheffler P Colombo (Eds) CellularCeramics Wiley-VCH Weinheim 2005 pp 193ndash223
[2] M Haas The future of AAC ndash from a material scientists point of view inMC Limbachiya JJ Roberts (Eds) Autoclaved Aerated Concrete Taylor FrLondon 2005 pp 187ndash194
[3] T Mitsuda K Sasaki H Ishida Phase evolution during autoclaving process ofaerated concrete J Am Ceram Soc 75 (1992) 1858ndash1863
[4] N Isu H Ishida T Mitsuda Influence of quartz particle size on the chemical and
Fig 10 Triaxial cylinder domain size model of Tobermorite used for Rietveld refinement of anisotropic peak broadening
Fig 11 Comparison of Rwp and RBragg values of Rietveld refinements of autoclavedsamples and tobermorite using the isotropic and the anisotropic domain size model
J Schreiner et al Cement and Concrete Research 107 (2018) 247ndash252
251
6 Publications
43
mechanical properties of autoclaved aerated concrete (I) tobermorite formationCem Concr Res 25 (1995) 243ndash248
[5] NY Mostafa Influence of air-cooled slag on physicochemical properties of auto-claved aerated concrete Cem Concr Res 35 (2005) 1349ndash1357 httpdxdoiorg101016jcemconres200410011
[6] K Matsui J Kikuma M Tsunashima T Ishikawa S Matsuno A Ogawa M SatoIn situ time-resolved X-ray diffraction of tobermorite formation in autoclaved aer-ated concrete influence of silica source reactivity and Al addition Cem Concr Res41 (2011) 510ndash519
[7] C Biagioni S Merlino E Bonaccorsi The tobermorite supergroup a new no-menclature Mineral Mag 79 (2015) 485ndash495 httpdxdoiorg101180minmag2015079222
[8] BH OConnor MD Raven Application of the Rietveld refinement procedure inassaying powdered mixtures Powder Diffract 3 (1988) 2ndash6 httpdxdoiorg101017S0885715600013026
[9] D Jansen F Goetz-Neunhoeffer C Stabler J Neubauer A remastered externalstandard method applied to the quantification of early OPC hydration Cem ConcrRes 41 (2011) 602ndash608 httpdxdoiorg101016jcemconres201103004
[10] D Jansen C Stabler F Goetz-Neunhoeffer S Dittrich J Neubauer Does OrdinaryPortland Cement contain amorphous phase A quantitative study using an externalstandard method Powder Diffract 26 (2011) 31ndash38 httpdxdoiorg10115413549186
[11] D Ectors F Goetz-Neunhoeffer J Neubauer A generalized geometric approach toanisotropic peak broadening due to domain morphology J Appl Crystallogr 48(2015) 189ndash194 httpdxdoiorg101107S1600576714026557
[12] D Ectors F Goetz-Neunhoeffer J Neubauer Routine (an)isotropic crystallite sizeanalysis in the double-Voigt approximation done right Powder Diffract 32 (S1)(2017) 27ndash34 httpdxdoiorg101017S0885715617000070
[13] HM Rietveld A profile refinement method for nuclear and magnetic structures JAppl Crystallogr 2 (1969) 65ndash71 httpdxdoiorg101107S0021889869006558
[14] D Ectors Advances in the Analysis of Cementitious Reactions and Hydrate Phases(Doctoral Thesis) (2016) pp 12ndash14 (urnnbndebvb29-opus4-71743)
[15] AacuteG De La Torre S Bruque J Campo MAG Aranda The superstructure of C3Sfrom synchrotron and neutron powder diffraction and its role in quantitative phaseanalyses Cem Concr Res 32 (2002) 1347ndash1356 httpdxdoiorg101016S0008-8846(02)00796-2
[16] A Kirfel G Will Charge density in anhydrite CaSO4 from X-ray and neutrondiffraction measurements Acta Crystallogr Sect B Struct Crystallogr CrystChem 36 (1980) 2881ndash2890 httpdxdoiorg101107S0567740880010461
[17] C Bezou AN Christensen D Cox M Lehman A Nonat Structures cristallines deCaSO405H2O et CaSO406H2O Comptes Rendus Hebd Des Seacuteances lAcadeacutemieDes Sci Seacuterie 2 (312) (1991) 43ndash48
[18] KH Jost B Ziemer R Seydel Redetermination of the structure of β-dicalciumsilicate Acta Crystallogr Sect B Struct Crystallogr Cryst Chem 33 (1977)1696ndash1700 httpdxdoiorg101107S0567740877006918
[19] W Mumme LMD Cranswick BC Chakoumakos Rietveld crystal structure re-finements from high temperature neutron powder diffraction data for the poly-morphs of dicalcium silicate Neues Jahrb Fuer Mineral Abhandlungen 170 (1996)171ndash188
[20] A Colville S Geller The crystal structure of brownmillerite Ca2FeAlO5Crystallographica 50 (1971) 2311ndash2315 httpdxdoiorg101107S056774087100579X
[21] ST Bergold F Goetz-Neunhoeffer J Neubauer Quantitative analysis of C-S-H inhydrating alite pastes by in-situ XRD Cem Concr Res 53 (2013) 119ndash126 httpdxdoiorg101016jcemconres201306001
[22] EN Maslen VA Streltsov NR Streltsova N Ishizawa Electron density and op-tical anisotropy in rhombohedral carbonates III Synchrotron Xray studies ofCaCO3 MgCO3 and MnCO3 Acta Crystallogr Sect B 51 (1995) 929ndash939 httpdxdoiorg101107S0108768195006434
[23] G Renaudin Y Filinchuk J Neubauer F Goetz-Neunhoeffer A comparativestructural study of wet and dried ettringite Cem Concr Res 40 (2010) 370ndash375httpdxdoiorg101016jcemconres200911002
[24] WF Cole CJ Lancucki A refinement of the crystal structure of gypsumCaSO42H2O Acta Cryst B30 (1974) 921ndash929 httpdxdoiorg101107S0567740874004055
[25] T Runčevski RE Dinnebier OV Magdysyuk H Poumlllmann Crystal structures ofcalcium hemicarboaluminate and carbonated calcium hemicarboaluminate fromsynchrotron powder diffraction data Acta Crystallogr Sect B Struct Sci 68 (2012)493ndash500 httpdxdoiorg101107S010876811203042X
[26] JM Hughes JW Drexler Cation substitution in the apatite tetrahedral site crystalstructures of type hydroxylellestadite and type fermorite Neues Jahrb FuerMineral (1991) 327ndash336
[27] CH Shen RS Liu JG Lin CY Huang Phase stability study of La12Ca18Mn2O7Mater Res Bull 36 (2001) 1139ndash1148
[28] SW Bailey Refinement of an intermediate microcline structure Am Miner 54(1969) 1540ndash1545
[29] WR Busing HA Levy Neutron diffraction study of calcium hydroxide J ChemPhys 26 (1957) 563 httpdxdoiorg10106311743345
[30] Y Le Page G Donnay Refinement of the crystal structure of low-quartz ActaCrystallogr Sect B 32 (1976) 2456ndash2459 httpdxdoiorg101107S0567740876007966
[31] SA Hamid The crystal structure of the 11 Aring natural tobermoriteCa225[Si3O75(OH)15]1H2O Zeitschrift Fuer Krist - New Cryst Struct 154 (1981)189ndash198 httpdxdoiorg101524zkri19811543-4189
[32] P Mondal JW Jeffery The crystal structure of tricalcium aluminate Ca3Al2O6Acta Crystallogr B 31 (1975) 689ndash697 httpdxdoiorg101107S0567740875003639
[33] Y Takeuchi F Nishi I Maki Crystal-chemical characterization of the tricalciumaluminate-sodium oxide (3CaOtimesAl2O3-Na2O) solid-solution series Zeitschrift FuumlrKrist (1980) 259ndash307
[34] K Momma F Izumi VESTA 3 for three-dimensional visualization of crystal vo-lumetric and morphology data J Appl Crystallogr 44 (2011) 1272ndash1276 httpdxdoiorg101107S0021889811038970
[35] K Scrivener R Snellings B Lothenbach A Practical Guide to MicrostructuralAnalysis of Cementitious Materials CRC Press 2016 pp 123ndash125 httpdxdoiorg107693wl20150205
[36] V Pecharsky P Zavalij Fundamentals of Powder Diffraction and StructuralCharacterization of Materials Springer second edition 2005 p 302 httpdxdoiorg101007978-0-387-09579-0
J Schreiner et al Cement and Concrete Research 107 (2018) 247ndash252
252
6 Publications
44
7 Acknowledgement
7 Acknowledgement
Ich moumlchte mich bei einigen Personen bedanken ohne die es wohl kaum zum erfolgreichenAbschluss dieser Arbeit gekommen waumlreMein Doktorvater Prof Dr Juumlrgen Neubauer hat sich stets die Zeit genommen die noumltigwar um Angelegenheiten aller Art mit mir zu klaumlren Er gab mir fachlich immer zumrichtigen Zeitpunkt einen gewissen wissenschaftlichen Impuls Zugleich habe ich mich den-noch immer frei in meiner eigenen Konzeption gefuumlhlt Groszligen Dank spreche ich Prof DrFriedlinde Goumltz-Neunhoeffer aus die fuumlr mich ebenso immer eine verlaumlssliche Ansprech-partnerin fuumlr fachliche und organisatorische Angelegenheiten aller Art war Danke anDr Daniel Jansen fuumlr die gute Zusammenarbeit und dafuumlr dass er mich im Zuge meinerMasterarbeit in ein Forschungsprojekt aufgenommen hat das den Weg zur Promotionmoumlglich machte Zusaumltzlich gilt mein Dank Prof Dr Matthias Goumlbbels der fuumlr dieMitarbeiter am Lehrstuhl immer motivierende Worte fand Fuumlr die Ermoumlglichung meinerTeilnahme an diversen Dienstreisen Fortbildungen und Tagungen moumlchte ich mich viel-mals bedankenWeiterhin bedanke ich mich bei Dr Stephan Volkmann und den Rodgauer BaustoffwerkenGmbH amp Co KG fuumlr die gute Zusammenarbeit und die Bereitstellung von Versuchsma-terialienVielen Dank an meine studentischen Hilfskraumlfte Daniel Wagner Laura MoldenhauerFabian Lang Jakob Schreiber und Felix Klaassen die alle Aufgaben im Labor einwand-frei und mit Bedacht erledigten Bei meinen aktuellen und ehemaligen Kollegen DrKatrin Hurle Dr Dominique Ectors Dr Christoph Naber Dr Florian Huumlller JoumlrgNehring Frank Riedel Julian Wolf Tanja Manninger Daniel Wagner Nicolas FobbeKarla Spaumlth Julian Goergens Andreas Koumlhler Cordula Jakob Franz Becker und LisaKlemenz bedanke ich mich fuumlr die gelungene Zusammenarbeit und gegenseitige Unter-stuumltzung Besonderer Dank geht auch an Kerstin Kreszlig Bettina Engl Christian HankeBernd Schleifer und Christian Abe fuumlr die verlaumlssliche Unterstuumltzung bei technischen Fra-gen und Messungen im LaborFuumlr jegliche Unterstuumltzungen moumlchte ich mich auch bei meinen Eltern bedanken sowiebei meinem Bruder Ralf der mir mit einem LaTex Crashkurs viel Frustration ersparthat Danke Thomas dass du immer fuumlr mich da bist und mit mir zusammen fuumlr genugAusgleich gesorgt hast
45
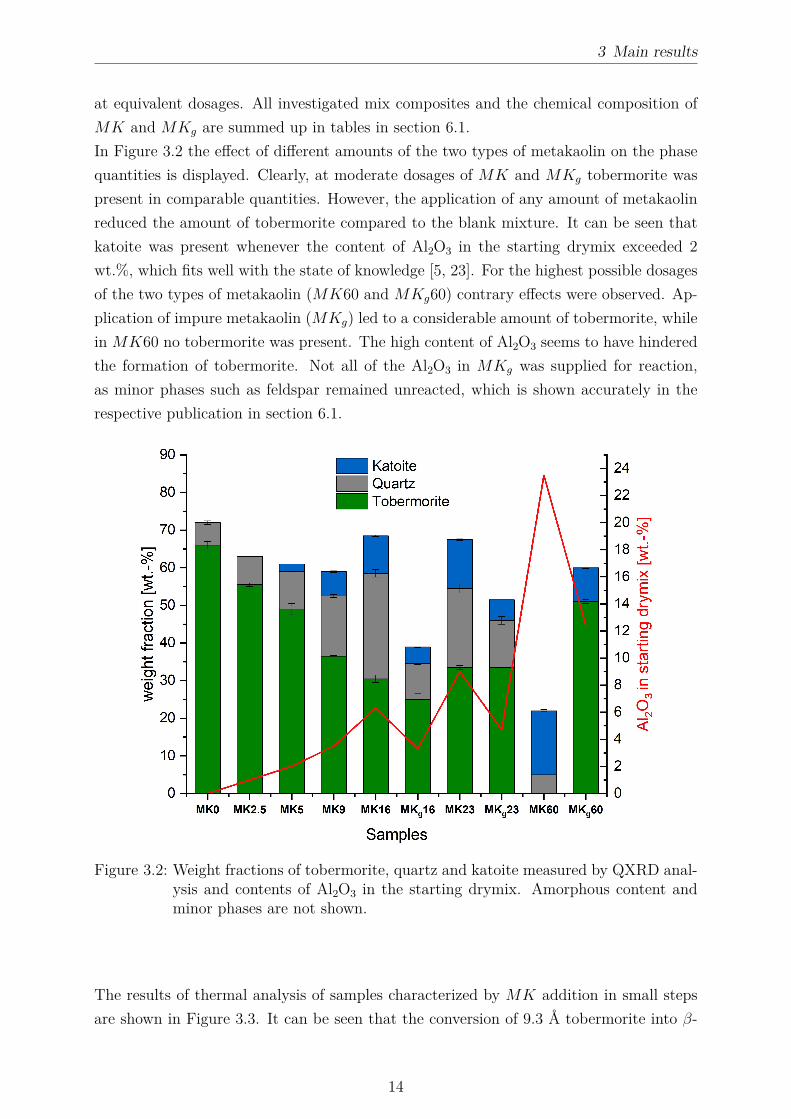
3 Main results
at equivalent dosages All investigated mix composites and the chemical composition ofMK and MKg are summed up in tables in section 61In Figure 32 the effect of different amounts of the two types of metakaolin on the phasequantities is displayed Clearly at moderate dosages of MK and MKg tobermorite waspresent in comparable quantities However the application of any amount of metakaolinreduced the amount of tobermorite compared to the blank mixture It can be seen thatkatoite was present whenever the content of Al2O3 in the starting drymix exceeded 2wt which fits well with the state of knowledge [5 23] For the highest possible dosagesof the two types of metakaolin (MK60 and MKg60) contrary effects were observed Ap-plication of impure metakaolin (MKg) led to a considerable amount of tobermorite whilein MK60 no tobermorite was present The high content of Al2O3 seems to have hinderedthe formation of tobermorite Not all of the Al2O3 in MKg was supplied for reactionas minor phases such as feldspar remained unreacted which is shown accurately in therespective publication in section 61
Figure 32 Weight fractions of tobermorite quartz and katoite measured by QXRD anal-ysis and contents of Al2O3 in the starting drymix Amorphous content andminor phases are not shown
The results of thermal analysis of samples characterized by MK addition in small stepsare shown in Figure 33 It can be seen that the conversion of 93 Aring tobermorite into β-
14
3 Main results
wollastonite depended on the dosage of MK However unlike suggested by Klimesch ampRay there was no effect of lower contents of Al2O3 in the drymix [40] Consequently theinfluence of Al3+ at low dosages (MK25 and MK5) could not be observed on the basisof this method Apart from this result the other signals showed good agreement with thesuggested conversion ranges by Klimesch amp Ray as for samples MK9 and MK16 a clearshift towards higher temperature was measured However the role of Al3+ incorporationverified by this method is not necessarily conclusive as additional reactions during theheating experiment involving Al3+ are possible On that basis the observations madeby means of DTA would not reflect the amount of Al3+ originally incorporated into thestructure of 11 Aring tobermorite
Figure 33 Conversion of 93 Aring tobermorite into β-wollastonite in samples synthesizedwith various amounts of metakaolin and suggested temperature ranges ac-cording to Klimesch amp Ray [40]
In accordance with authors referenced in subsection 213 lattice parameter c of tober-morite increased with elevated dosages of Al2O3 in the basic dry mix (Figure 34) Theimpact could be observed for the complete range of samples as displayed in section 61which indicates that a limit of Al3+ incorporation was not reached in this study Forcomparison the relative domain morphology is plotted in Figure 34 Unlike the DTA
15
3 Main results
signals both lattice parameter c and the domain morphology are impacted by very lowdosages of Al2O3 There is a good accordance of the relation of growth in b direction to adirection and the c parameter This is valid up to 20 wt of Al2O3 in the starting drymix By contrast more elevated contents of Al2O3 did not affect the domain morphologyany further even though the incorporation is verified through the increased c parameterIt follows that the impact of Al3+ incorporation on the domain morphology is limited tovery low contents while the impact on lattice parameter c can be tracked throughoutthe entire examined range of samples In section 61 additional results show that growthin b direction increased with reaction time These observations are solely based on XRDanalysis and offer new benefits for the structural understanding of tobermorite
Figure 34 Impact of the calculated Al2O3 content in the basic dry mix on the latticeparameter c and on the relation of calculated domain sizes of tobermorite ina (x) and b (y) direction
16
3 Main results
32 Structural properties of tobermorite in AAC - SEMversus XRD analysis
This section and the respective publication [59] mainly deal with the suitability of SEManalysis of tobermorite in AAC The effects of varying amounts of SO3 and Al2O3 in thedry mix on structural properties of tobermorite are discussed based on XRD analysisAs shown in subsection 221 and Figure 23 tobermorite often shows a house-of-cardsstructure in AAC samples This property has been considered to be relevant for thethermal and mechanical properties of AAC (subsection 221) However SEM analysiswithin this study revealed that this type of appearance is mainly found in the poresand pore surfaces (Figure 35) This finding comes in agreement with the observationsmade by Huang et al [48] In the solid skeleton of the dense AAC material neither themorphology nor the house-of-cards structure could be observed properly which can beseen very clearly in additional micrographs provided in section 62 It should be consideredthat the major amount of tobermorite by weight is located in the dense material and notat the pore surfaces In this way these findings are clear disadvantages coming along withonly SEM analysis of AAC as representative results can hardly be obtained
Figure 35 House-of-cards structure of tobermorite in a pore surrounded by dense mate-rial
Moreover several authors in subsection 221 justified the morphology of tobermorite withthe incorporation of foreign ions Al-substituted tobermorite showed lath-like morphologywhereas Al-free tobermorite showed rather plate-like morphology [6 32 49] Howeverthe present investigation revealed that independent of Al2O3 content in the raw mix there
17
3 Main results
is always heterogeneity regarding the morphology of tobermorite In Figure 36 plate-likeand lath-like morphology of tobermorite in AAC observed in two statistical chemicallyvarious samples are displayed This result supports the previous assumption that theobservations made by SEM analysis of tobermorite in AAC strongly depend on whatpart of the sample is selected Yet again no clear observations could be made that wererepresentative for the entire sample
Figure 36 Heterogeneous morphology of tobermorite (plate-like in a and c lath-like in band d) in two AAC samples characterized by different Al2O3 contents in theraw mix
The effects of Al3+ on the domain morphology of tobermorite were measured and evaluatedin a similar manner as in section 61 and the results could be confirmed The relativedomain growth in b direction was increased by Al3+ incorporation in both studies [5859] Moreover lattice parameter c was increased with Al3+ incorporation which can beseen more accurately in section 62 Unlike SEM analysis XRD analysis allowed clearconclusions whenever structural properties of Al-substituted tobermorite were affectedInstead of a local observation as made with SEM representative and statistical resultswere obtained The reader is referred to section 61 and section 62 for further results and
18
3 Main results
more specific conclusionsIn addition the effect of various amounts of sulfate in the raw mix was analyzed Unlikein the case of different dosages of Al3+ neither the domain morphology nor the latticeparameters of tobermorite were affected by the SO3 content in the dry mix In Figure 37these observations and additionally the amounts of anhydrite measured by QXRD areshown As the amount of available SO3 in the dry mix is known the maximum possibleamount of anhydrite could be calculated for each of the samples in focus Obviouslythe measured amounts of anhydrite are either equal or slightly higher compared to theexpected quantities This result leads to the assumption that all of the available sulfateis transformed into anhydrite so that no more sulfate could be incorporated into thestructure of tobermorite The over-estimation of anhydrite in some of the samples can beexplained due to the inaccuracy of the quantification method The present results rathermatch with the suggestions by Sauman amp Valtr [41] as in their study no effect of sulfateon the structure of tobermorite was observed either
Figure 37 Impact of the sulfate content in the AAC raw mix on lattice parameter cand relative domain morphology of tobermorite (a) and comparison of theexpected maximum amount of anhydrite to the measured amount determinedby QXRD (b)
33 Improved monitoring of the phase developmentduring the production of AAC
In this study not only autoclaved samples were analyzed but additionally a lab-scale slurrywhich included the reactive components of the green cake stage during AAC productionat equivalent weight proportions In-situ XRD was performed at 70 degC and at a water-to-
19
3 Main results
solid ratio of 08 for 24 h (Figure 38) which are respective conditions during commercialproduction Clearly the phase development is dominated by OPC and lime hydration asdescribed in section 22 It can be seen that the major reaction turnover occurs duringthe first 200 minutes which is the average duration of the green stage After only 30minutes all of the quicklime had transformed into portlandite whereas Schober proposeda duration of one hour for this reaction [42] The amount of portlandite is composed oftwo different generations as proposed by Ectors [52] Equally a biaxial cylinder modelwas applied in order to fit the peak broadening of the first generation of portlandite in thepresent investigation Minor phase developments such as the formation of AFm phases arenot shown in Figure 38 A coarse fraction of anhydrite did not react so that constantlyaround 15 wt were measured after 6 h As the decomposition of ettringite due tosulfate depletion [55] does not occur prior to 12 h the green cake strength is not affected
Figure 38 In-situ XRD measurement of AAC model slurry at water-to-solid ratio of 08and 70 degC For clarity and comprehensibility not all phases are shown
The separation of two generations of portlandite in the system does not only translate intodifferent domain morphologies as shown by Ectors [52] In Figure 39 more indicationsfor different mineralogical properties are displayed The shape of the (0 0 1) reflection inXRD patterns after only quicklime hydration and after both quicklime and alite hydrationshows a distinct feature While portlandite originating from quicklime hydration showsa broad peak implying lower crystallinity the peak after alite hydration is characterized
20
3 Main results
Figure 39 Formation of two generations of portlandite in AAC slurry in XRD (a) andDTA (b) plots
by a sharper component Yet the peak breadth did not change indicating that the firstgeneration is still present with the original characteristics This observation is supportedby DTA measurements additionally demonstrating two degrees of crystallinity only afteralite hydration In agreement with XRD analysis the better crystalline second generationof portlandite decomposes at a higher temperature
Figure 310 Quantification of tobermorite in statistical chemically various AAC sampleswith and without the application of the macro for the fitting of anisotropicpeak broadening
21
3 Main results
Furthermore commercial AAC samples were considered in this study By applying themethod for the refinement of anisotropic peak broadening (Figure 31) a more accuratequantification of tobermorite can be achieved In Figure 310 the calculated amounts oftobermorite in statistical chemically various AAC samples are plotted In some samplesthe refinement using the macro leads to considerably higher but never lower quantitiesof tobermorite whereas in other samples nearly the same amount of tobermorite is cal-culated This observation can be well understood taking into account that the macroallows to account more peak area for tobermorite as shown in Figure 31 Clearly thereis evidence that the anisotropy of tobermorite domains is not uniform from one sampleto another which was basically justified in the previous sections As an improved quan-tification of a single phase leads to a better quantification of other phases in the samplethis adaption is very valuable in order to assess the phase development Here the peakbroadening of tobermorite equally observed by Qu et al [6] could be tracked and evalu-ated in order to gain more accurate results Moreover in section 63 McCrone milling issuggested in order to avoid spottiness in XRD patterns caused by coarse grains of quartzor anhydrite (Figure 38)
22
4 Conclusions
4 Conclusions
The research results presented in the previous sections yield advances in the mineralogicalinvestigation of tobermorite and autoclaved aerated concrete Recorded diffraction pat-terns contain plenty of usually unused data regarding the microstructural characteristicsof the sample and phases therein The profit of XRD measurements can be significantlyimproved whenever one or more phases show anisotropic peak broadening and appro-priate models for the respective domain morphology are implemented into the Rietveldenvironment Within the scope of the present investigations portlandite and tobermoriteshow this particularityThe effects of changes in the chemistry of the starting mix were examined based on dif-ferent dosages of metakaolin Al-substituted tobermorite showed increased growth in b
direction and an increase of lattice parameter c compared to Al-free tobermorite The rel-ative domain sizes were determined based on anisotropic peak broadening However whilethe effect of Al3+ incorporation into the lattice of tobermorite was limited regarding thedomain morphology lattice parameter c showed an increase throughout the entire rangeof samples The consequent effects suggested by Klimesch amp Ray observed by means ofDTA are debatable as reactions during the heating experiment may lead to to a changeof Al3+ content in tobermorite [40] While both types of applied metakaolin showed goodreactivity at hydrothermal conditions some included minor phases such as feldspar oranatase remained unreacted At high dosages of Al2O3 in the starting mix the formationof either only katoite or katoite along with tobermorite was observed (Figure 32)SEM analysis of tobermorite in AAC cannot be suggested based on the observationspresented in this work as it is only visually accessible in the pores or at pore surfacesThe dense material of the AAC skeleton contains several crystalline and X-ray amorphousphases which hardly allows a proper investigation Even in single pores tobermorite crys-tals appeared very heterogeneous at various chemical compositions As a result lath-liketobermorite was not only present in samples characterized by elevated Al3+ incorporationBy contrast the benefits of XRD analysis presented in section 61 equally accounted fortobermorite in AAC samples Sulfate incorporation into the lattice of tobermorite wasnot observed All of the sulfate in the system was detected to be present in anhydriteThe phase transitions in the AAC raw slurry during the green stage hydration were show-cased by in-situ XRD analysis of a model mix at 70 degC Additional DTA and XRD mea-
23
4 Conclusions
surements during this step confirmed the presence of two generations of portlandite char-acterized by different crystallinity as suggested by Ectors [52] The inclusion of anisotropicdomain morphology during the Rietveld refinement allowed a more accurate quantifica-tion of tobermorite in autoclaved samples Sample preparation adjusted to the grain sizedistribution in AAC samples (section 63) the external standard method for quantita-tive XRD analysis [55] and the approach to evaluate anisotropic peak broadening [19]are the key methods for a more accurate tracking of the phase development during AACproduction
24
5 References
5 References
[1] A E Zadov A I Grabezhev N N Pertsev N V Chukanov and S V PribavkinTobermorite-plombierite metasomatites of the Gumeshevsk skarn-porphyry copper depositmiddle Urals Doklady Earth Sciences 407(3)495ndash497 2006
[2] M F Heddle Preliminary notice of substances which may prove to be new minerals MinMag 4117ndash123 1880
[3] S Merlino E Bonaccorsi and T Armbruster The real structure of tobermorite 11AringNormal and anomalous forms OD character and polytypic modifications European Journalof Mineralogy 13(3)577ndash590 2001
[4] C Biagioni S Merlino and E Bonaccorsi The tobermorite supergroup a new nomencla-ture Mineralogical Magazine 79(2)485ndash495 2015
[5] C A Riacuteos C D Williams and M A Fullen Hydrothermal synthesis of hydrogarnetand tobermorite at 175 degC from kaolinite and metakaolinite in the CaO-Al2O3-SiO2-H2Osystem A comparative study Applied Clay Science 43(2)228ndash237 2009
[6] X Qu Z Zhao and X Zhao Microstructure and characterization of aluminum-incorporated calcium silicate hydrates (C-S-H) under hydrothermal conditions RSC Ad-vances 8(49)28198ndash28208 2018
[7] R Šiaučiunas and K Baltakys Formation of gyrolite during hydrothermal synthesis inthe mixtures of CaO and amorphous SiO2 or quartz Cement and Concrete Research34(11)2029ndash2036 2004
[8] E Venhodovaacute R Janovskyacute and R Drochytka Formation of Tobermorite at Different Ma-terials Composition of Aerated Concrete Applied Mechanics and Materials 752-753247ndash250 2015
[9] L Galvaacutenkovaacute E Bartoniacutečkovaacute T Opravil J Tkacz and P Ptaacuteček The influence ofstarting materials solubility on tobermorite structure formation under the hydrothermalconditions IOP Conference Series Materials Science and Engineering 379(1)1ndash8 2018
[10] T Mitsuda K Sasaki and H Ishida Phase Evolution during Autoclaving Process J AmCeram Soc 75(75)1858ndash1863 1992
[11] A Skawińska The influence of metahalloysite addition on tobermorite formation studied byX-ray powder diffraction and scanning electron microscope MATEC Web of Conferences16305008 2018
[12] S T Bergold F Goetz-Neunhoeffer and J Neubauer Quantitative analysis of C-S-H in
25
5 References
hydrating alite pastes by in-situ XRD Cement and Concrete Research 53119ndash126 2013
[13] O P Shrivastava and F P Glasser Ion-exchange properties of 11-Aring tobermorite Reactivityof Solids 2(3)261ndash268 1986
[14] H Maeda Y Ogawa E H Ishida and T Kasuga Hydrothermal synthesis of tobermoritedoped with phosphorus species for removing heavy metal ions Journal of the AustralianCeramic Society 48(1)8ndash11 2012
[15] O P Shrivastava and R Shrivastava Cation exchange applications of synthetic tobermoritefor the immobilization and solidification of cesium and strontium in cement matrix Bulletinof Materials Science 23(6)515ndash520 2000
[16] G Renman and A Renman Sustainable Use of Crushed Autoclaved Aerated Concrete(CAAC) as a Filter Medium in Wastewater Purification 8th International conferenceon sustainable management of waste and recycled materials in construction GothenburgSweden 30 Mayndash1 June 2012 Proceedings pages 1ndash7 2012
[17] G Schober Chemical transformations during the manufacturing of autoclaved aeratedconcrete (ACC) Cement lime gypsum and quartz sand become cellular concrete ZKG58(7)63ndash70 2005
[18] A J Hamad Materials Production Properties and Application of Aerated LightweightConcrete Review International Journal of Materials Science and Engineering 2(2)152ndash157 2014
[19] D Ectors F Goetz-Neunhoeffer and J Neubauer A generalized geometric approach toanisotropic peak broadening due to domain morphology Journal of Applied Crystallogra-phy 48(1)189ndash194 2015
[20] H M Rietveld A profile refinement method for nuclear and magnetic structures Journalof Applied Crystallography 2(2)65ndash71 1969
[21] S A Hamid The crystal structure of the 11 Aring natural tobermoriteCa225[Si3O75(OH)15]1H2O Zeitschrift fuer Kristallographie - New Crystal Struc-tures 154(3-4)189ndash198 1981
[22] S A S El-Hemaly T Mitsuda and H F W Taylor Synthesis of normal and anomaloustobermorites Cement and Concrete Research 7429ndash438 1977
[23] M Sakiyama and T Mitsuda Hydrothermal reaction between C-S-H and kaolinite for theformation of tobermorite at 180degC Cement and Concrete Research 7(6)681ndash685 1977
[24] E Bonaccorsi S Merlino and A R Kampf The crystal structure of tobermorite 14 Aring(plombierite) a C-S-H phase Journal of the American Ceramic Society 88(3)505ndash5122005
[25] S Merlino E Bonaccorsi and T Armbruster The real structures of clinotobermorite andtobermorite 9 Aring OD character polytypes and structural relationships European Journalof Mineralogy 12(2)411ndash429 2000
[26] K Momma and F Izumi VESTA 3 for three-dimensional visualization of crystal volu-metric and morphology data Journal of Applied Crystallography 44(6)1272ndash1276 2011
26
5 References
[27] S Shaw S M Clark and C MB Henderson Hydrothermal formation of the calcium sil-icate hydrates tobermorite (Ca5Si6O16(OH)2 middot 4H2O) and xonotlite (Ca6Si6O17(OH)2)An in situ synchrotron study Chemical Geology 167(1-2)129ndash140 2000
[28] K Matsui J Kikuma M Tsunashima T Ishikawa S Matsuno A Ogawa and M SatoIn situ time-resolved X-ray diffraction of tobermorite synthesis process under hydrothermalcondition IOP Conference Series Materials Science and Engineering 18(2)60ndash66 2011
[29] G Matekonis R Šiaučiunas and D Vaičiukyniene Hydrothermal Synthesis and Charac-terization of Na + and [ Al 3 + + Na + ] -substituted Tobermorite in CaO-SiO2middotnH2O-H2OSystem MATERIALS SCIENCE 16(3)242ndash248 2010
[30] G Geng R J Myers M J A Qomi and P JM Monteiro Densification of the inter-layer spacing governs the nanomechanical properties of calcium-silicate-hydrate ScientificReports 7(1)1ndash8 2017
[31] D Klimesch and A Ray Autoclaved cement-quartz pastes with metakaolin additionsAdvanced Cement Based Materials 7(3-4)109ndash118 1998
[32] N Y Mostafa A A Shaltout H Omar and S A Abo-El-Enein Hydrothermal synthesisand characterization of aluminium and sulfate substituted 11 nm tobermorites Journal ofAlloys and Compounds 467(1-2)332ndash337 2009
[33] İ Demir M S Başpınar E Kahraman E Ccedilalışkan and G Goumlrhan An Investigation onthe Usability of Diatomite in Aerated Concrete Production In Proc of the Intl Conf onAdvances In Civil Structural And Construction Engineering - CSCE 2014 pages 97ndash1002014
[34] A Skawinska Z Owsiak T Baran and K Hernik The influence of halloysite additionon tobermorite formation in CaO and quartz mix under hydrothermal conditions CementWapno Beton 17(12)426ndash434 2017
[35] N Y Mostafa Influence of air-cooled slag on physicochemical properties of autoclavedaerated concrete Cement and Concrete Research 35(7)1349ndash1357 2005
[36] D Małaszkiewicz and J Chojnowski Influence of addition of calcium sulfate dihydrate ondrying of autoclaved aerated concrete Open Engineering 7(1)273ndash278 2017
[37] N Hara and N Inoue Thermal behaviour of 11Aring tobermorite and its lattice parametersCement and Concrete Research (10)53ndash60 1980
[38] M D Jackson S R Chae S R Mulcahy C Meral R Taylor P Li A H EmwasJ Moon S Yoon G Vola H R Wenk and P JM Monteiro Unlocking the secretsof Al-tobermorite in Roman seawater concrete American Mineralogist 98(10)1669ndash16872012
[39] W Liao W Li Z Fang C Lu and Z Xu Effect of different aluminum substitution rateson the structure of Tobermorite Materials 12(22)1ndash10 2019
[40] D Klimesch and A Ray DTA-TG Study of the CaO-SiO2-H2O and CaO-Al2O3-SiO2-H2OSystems Under Hydrothermal Conditions Journal of Thermal Analysis and Calorimetry56(1)27ndash34 1999
27
5 References
[41] Z Sauman and Z Valtr Substitution of sulphate ions in the crystal lattice of 11 Aring to-bermorite In The VI International Congress on the Chemistry of Cement pages 1ndash14Moscow 1974
[42] G Schober Reaction of raw materials to the final product AAC httpwwwpb-aacde
chemmin2_ehtml 2012 accessed 2020-01-31
[43] D Jansen C Stabler F Goetz-Neunhoeffer S Dittrich and J Neubauer Does Ordi-nary Portland Cement contain amorphous phase A quantitative study using an externalstandard method Powder Diffraction 26(01)31ndash38 2011
[44] C Roumlszligler J Stark F Steiniger and W Tichelaar Limited-dose electron microscopyreveals the crystallinity of fibrous C-S-H phases Journal of the American Ceramic Society89(2)627ndash632 2006
[45] Y Sakalli and R Trettin Investigation of C3S hydration by environmental scanning elec-tron microscope Journal of Microscopy 259(1)53ndash58 2015
[46] F Matsushita Y Aono and S Shibata Expansion and shrinkage behavior of green cakeof Autoclaved Aerated Concrete In Autoclaved Aerated Concrete - Innovation and Devel-opment Proceedings of the 4th International Conference on Autoclaved Aerated ConcreteKingston UK 8-9 September 2005 pages 101ndash108 CRC Press 2005
[47] C Chucholowski M Holger and K-C Thienel Improving the recyclability environmentalcompatibility and CO2 balance of autoclaved aerated concrete by replacing sulfate carrierand cement with calcined clays CePapers 2(4)503ndash512 2018
[48] X Y Huang W Ni W H Cui Z J Wang and L P Zhu Preparation of autoclavedaerated concrete using copper tailings and blast furnace slag Construction and BuildingMaterials 27(1)1ndash5 2012
[49] W Wongkeo and A Chaipanich Compressive strength microstructure and thermal anal-ysis of autoclaved and air cured structural lightweight concrete made with coal bottom ashand silica fume Materials Science and Engineering A 527(16-17)3676ndash3684 2010
[50] A Roacuteżycka and W Pichoacuter Effect of perlite waste addition on the properties of autoclavedaerated concrete Construction and Building Materials 12065ndash71 2016
[51] N Isu H Ishida and T Mitsuda Influence of quartz particle size on the chemical andmechanical properties of autoclaved aerated concrete (I) tobermorite formation Cementand Concrete Research 25(25)243ndash248 1995
[52] D Ectors Advances in the analysis of cementitious reactions and hydrate phases doctoralthesis PhD thesis Friedrich-Alexander-Universitaumlt Erlangen-Nuumlrnberg 2016
[53] D Ectors F Goetz-Neunhoeffer and J Neubauer Domain size anisotropy in the double-Voigt approach An extended model Journal of Applied Crystallography 481998ndash20012015
[54] D Ectors F Goetz-Neunhoeffer and J Neubauer Routine (an)isotropic crystallite sizeanalysis in the double-Voigt approximation done right Powder Diffraction 32(S1)27ndash342017
28
5 References
[55] D Jansen F Goetz-Neunhoeffer C Stabler and J Neubauer A remastered external stan-dard method applied to the quantification of early OPC hydration Cement and ConcreteResearch 41(6)602ndash608 2011
[56] T Ungaacuter G Tichy J Gubicza and R J Hellmig Correlation between subgrains andcoherently scattering domains Powder Diffraction 20(04)366ndash375 2005
[57] Triloki P Garg R Rai and B K Singh Structural characterization of as-depositedcesium iodide films studied by X-ray diffraction and transmission electron microscopy tech-niques Nuclear Instruments and Methods in Physics Research Section A AcceleratorsSpectrometers Detectors and Associated Equipment 736128ndash134 2014
[58] J Schreiner F Goetz-Neunhoeffer J Neubauer and D Jansen Hydrothermal synthesisof 11 Aring tobermorite ndash Effect of adding metakaolin to the basic compound Applied ClayScience 185 2020
[59] J Schreiner F Goetz-Neunhoeffer J Neubauer S Volkmann S Bergold R Webler andD Jansen Advanced Rietveld refinement and SEM analysis of tobermorite in chemicallydiverse autoclaved aerated concrete Powder Diffraction 34143ndash150 2019
[60] J Schreiner D Jansen D Ectors F Goetz-Neunhoeffer J Neubauer and S VolkmannNew analytical possibilities for monitoring the phase development during the production ofautoclaved aerated concrete Cement and Concrete Research 107247ndash252 2018
29
6 Publications
6 Publications
61 Hydrothermal synthesis of 11 Aring tobermorite ndash Effectof adding metakaolin to the basic compound
Reprint of the peer reviewed publication
Schreiner J Goetz-Neunhoeffer F Neubauer J Jansen D 2020 Hydrothermalsynthesis of 11 Aring tobermorite ndash Effect of adding metakaolin to the basic compoundApplied Clay Science 185 httpsdoiorg101016jclay2019105432
with permission from Elsevier
30
Contents lists available at ScienceDirect
Applied Clay Science
journal homepage wwwelseviercomlocateclay
Research paper
Hydrothermal synthesis of 11 Aring tobermorite ndash Effect of adding metakaolin tothe basic compound
J Schreiner F Goetz-Neunhoeffer J Neubauer D JansenUniversity of Erlangen-Nuremberg GeoZentrum Nordbayern Mineralogy Schlossgarten 5a 91054 Erlangen Germany
A R T I C L E I N F O
KeywordsHydrothermal synthesis11 Aring tobermoriteMetakaolinPowder diffractionKatoite
A B S T R A C T
Different amounts and types of metakaolin were analyzed and applied for the hydrothermal synthesis of 11 Aringtobermorite All synthesized samples were investigated by means of powder XRD combined with Rietveld re-finement Al-substituted 11 Aring tobermorite was successfully synthesized on the basis of a broad range of com-pounds characterized by a varying content of metakaolin Katoite was present depending on the amount ofsupplied Al3+ which was determined by the dosage of metakaolin Minor crystalline components included in thetwo types of metakaolin sources varied greatly in their reactivity under hydrothermal conditions Despite adifferent degree of purity the two types of metakaolin showed corresponding effects at moderate dosages butcontrary effects at higher dosages as for the synthesis of 11 Aring tobermorite The domain morphology of to-bermorite could be associated with Al3+ incorporation for low dosages of metakaolin represented by up to 2 wt- Al2O3 in the dry mix By contrast Al3+ affected tobermorite lattice parameters at equivalent and even athigher dosages with c reaching 2295 Aring at 12 wt- Al2O3 in the dry mix
1 Introduction
11 Application of metakaolin as a reactive material in constructionindustry
The application of supplementary cementitious materials (SCMs) inthe field of construction technology has received a lot of attention inrecent years Due to limited resources and an urgent need for alter-native and more eco-friendly construction materials SCMs such asmetakaolin offer a great potential The usage of SCMs has not onlyspread to the cement and mortar industry but also to advanced appli-cations such as autoclaved aerated concrete (AAC) (Demir et al 2014Koutnyacute et al 2014 Walczak et al 2015 Roacuteżycka and Pichoacuter 2016Chucholowski et al 2018) Unlike ordinary cementitious constructionmaterials AAC is produced from hydrothermal curing Due to the dif-ferent thermodynamic environment the hydration process and the re-activity of raw materials have to be investigated properly in order tounderstand the effects on the AAC product The leading mineral phasein AAC is 11 Aring tobermorite (Ca5Si6O16(OH)2middot4H2O) As a consequencethe thermal and mechanical properties of AAC depend on micro-structure and crystallinity of tobermorite to some extent In addition tothe curing time and the fineness of raw materials the supply of ionsthat can substitute in the tobermorite structure is a crucial factor in thiscontext Especially substitutions by aluminum sodium and potassium
ions have been investigated thoroughly (Sauman 1974 Klimesch andRay 1998 Mostafa et al 2009 Matekonis et al 2010 Skawinskaet al 2017) Calcined clays usually contain a considerable amount ofthe mentioned ions
There is a vast amount of literature on the reactivity of SCMs atambient temperature and standard pressure but there is little when itcomes to hydrothermal conditions In previous publications the beha-vior of metakaolin under hydrothermal conditions was mainly in-vestigated for the synthesis of zeolites (Zhang et al 2007 Aguilar-Mamani et al 2014 Setthaya et al 2016 Luo et al 2018) In thesestudies the reactivity of metakaolin was observed at a wide range oftemperature and pH values During the transformation of kaolin intometakaolin a loss of framework alumina was observed (Ayodele et al2019) In recent decades metakaolin has been the subject of studies inthe field of geopolymer research (Rashad 2013 Chen et al 2016) Forthe synthesis of 11 Aring tobermorite a more distinct setting of temperaturesetting (180ndash200 degC) and steam pressure (1ndash12 MPa) are required
This publication is intended to make a new contribution to thechallenging field of hydrothermal synthesis in the system CaO-Al2O3-SiO2-H2O based on XRD analysis combined with Rietveld refinementVarious dosages of two types of metakaolin with different chemical andmineralogical purities are compared for the effects on the hydrothermalsynthesis of Al-substituted 11 Aring tobermorite Especially changes of thebulk chemistry in the raw mixes the reactivity of minor crystalline
httpsdoiorg101016jclay2019105432Received 20 August 2019 Received in revised form 13 November 2019 Accepted 30 December 2019
Corresponding authorE-mail address juergenjsschreinerfaude (J Schreiner)
Applied Clay Science 185 (2020) 105432
0169-1317 copy 2020 Elsevier BV All rights reserved
T
6 Publications
31
phases of the two types of metakaolin and the effect of different curingtimes are the focus of interest On the one hand metakaolin offers agreat potential in the AAC industry On the other hand of all SCMsmetakaolin is a good source material for investigating the influence ofAl3+ on the synthesis of Al-substituted 11 Aring tobermorite
12 Synthesis of Al-substituted 11 Aring tobermorite
In addition to being present in AAC tobermorite has found appli-cation in wastewater treatment and nuclear waste management due toits ion exchange capacity (Maeda et al 2012 Monasterio et al 2015)The substitution of silicon by aluminum results in a different to-bermorite structure due to general and local charge balance affectingthe lattice parameters Especially c is impacted by this substitutionbecause it occurs in the bridging tetrahedron and additional OHndash sub-stitutes O2ndash (Komarneni et al 1985 Merlino et al 2000) As suggestedin some additional studies the substitution of Si4+ by Al3+ and Na+ orK+ leads to a lath-like morphology of tobermorite crystals (Mostafa2005 Mostafa et al 2009 Venhodovaacute et al 2015 Qu et al 2018)However because of the heterogeneous appearance of tobermorite inAAC it is hardly possible to conduct a proper characterization based onSEM analysis In our recent work the anisotropic peak broadening oftobermorite in XRD diffractograms was successfully linked with theincorporation of foreign ions supplied in a common AAC production(Schreiner et al 2019) This finding allowed a more statistical struc-tural characterization of tobermorite in bulk compositions compared toSEM analysis Moreover it was reported in other studies that differenthydrate phases occur depending on the amount of supplied ions and onthe experimental settings In compounds with a high content of Al3+formation of katoite could be observed (Klimesch and Ray 1998 Riacuteoset al 2009 Matsui et al 2011) In the case of a longer curing durationinstead of 11 Aring tobermorite the formation of xonotlite (Siauciunas andBaltakys 2004 Galvaacutenkovaacute et al 2018) or - depending on the finenessof used silica source (Siauciunas and Baltakys 2004) - gyrolite is fa-voured
Kalousek (1956) suggested that tobermorite can contain up to 5Al2O3 More Al2O3 in the system resulted in the formation of hydro-garnet Klimesch and Ray (1998) additionally investigated the stabilityof hydrogarnet depending on the Al(Si + Al) ratio and its role in re-lation to the formation of 11 Aring tobermorite in an equivalent systemThey suggest that hydrogarnet always appears before tobermorite butthe former can only be detected for higher Al(Si + Al) ratios in theevent of longer curing times Riacuteos et al (2009) and Qu et al (2018)confirmed these findings in extensive investigations In the latter pub-lication it is additionally suggested that samples prepared at lowertemperatures (160 degC) are less impacted by the supply of Al3+ Theyalso consider the peak broadening of tobermorite in their XRD plotsbased on the amount of incorporated Al3+ In two recent publicationswe suggested that the peak broadening of tobermorite enables a mi-crostructural analysis by calculating the orientation dependent domainsizes (Schreiner et al 2018 2019) However these studies are based onsamples of industrially produced AAC so that the curing time was fixedThe studied AAC was produced from raw materials with a broad che-mical spectrum such as ordinary Portland cement (OPC) whichsomehow complicates the interpretation of results
In this work the influence of aluminum ions - provided by meta-kaolin - on dominant crystallographic direction-dependent domaingrowth of tobermorite is investigated by analysis of anisotropic peakbroadening (Ectors et al 2015 2017) In Fig 1 of the supplementarymaterial the method of fitting the anisotropic peak broadening of to-bermorite using a triaxial cylinder model is visualized (Schreiner et al2018) Fitting of the anisotropic peak broadening of tobermorite Thismethod is used to calculate the average and reliable values for to-bermorite domain sizes in the powder sample and associate them withaverage Al3+ incorporation Microstrain should be considered becauseit is an additional source of peak broadening However this usually
accounts for materials that have been exposed to different kinds ofstress such as metals and alloys (Badawi et al 2019) In addition theinstrumental contribution to peak broadening should be consideredHydration products such as tobermorite are characterized by crystallitesizes in the range of nanometers so that anisotropic size broadeningclearly outweighs the effect of instrumental broadening (Jenkins andSnyder 1996) Moreover the impact of Al3+ on the lattice parametersof tobermorite is considered It should additionally be clarified whe-ther the results from our previous publication (Schreiner et al 2019)based on industrially produced AAC can be confirmed by investigationwith less complex raw mixes and purely based on laboratory experi-ments
2 Material and methods
21 Starting materials
The starting materials for hydrothermal synthesis included deio-nized water quartz flour portlandite (999 pure) and two types ofmetakaolin One type was ordinary commercially available metakaolin(MK) with nearly a stoichiometric composition For comparison thesecond type of commercially available metakaolin was a by-productfrom expanded glass production (MKg) and consequently highly im-pure The chemical composition of MK and MKg determined by XRF isgiven in Table 1 With MKg containing less Al2O3 but considerably moreNa2O than MK the effects on hydrothermal synthesis were of interestBoth types of metakaolin have been characterized in previous pub-lications (Schmidt et al 2012 Naber et al 2019) In addition weverified the mineral phase content by XRD analysis Besides amorphousmetakaolin MK contained minor amounts of anatase quartz and mica
Fig 1 Weight fractions of tobermorite quartz and katoite determined byquantitative XRD analysis ndash samples including MKg crosshatched
Table 1Chemical composition of MK and MKg determined by XRF analysis ndash majorcontrasts in bold letters
Oxides [wt-] MK MKg
SiO2 536 604Al2O3 392 206CaO 01 40MgO 01 12Na2O 0 96K2O 10 18Fe2O3 18 05TiO2 21 03P2O5 01 02Loss on ignition 15 1
J Schreiner et al Applied Clay Science 185 (2020) 105432
2
6 Publications
32
MKg contained additional kaolinite feldspar and quartz
22 Investigated mix composites
For the preparation of raw mixtures the powders were weighed andhomogenized using a lab-scale mixing mill Table 2 lists the composi-tion and nomenclature of all samples including Al2O3 content andcuring time in the autoclave
bull Besides one blank mixture (MK0) that did not contain any type ofmetakaolin eleven more compounds were prepared of which threeincluded different dosages of MKg (MKg16 MKg23 and MKg60)Three more mixes contained equivalent amounts of MK instead ofMKg (MK16 MK23 and MK60) These mixes were investigated inorder to have a direct comparison concerning the effects of differentraw material on the synthesis of tobermorite
bull Additionally the mixes MK9 MK5 and MK25 with lower dosages ofmetakaolin were analyzed In the referenced literature (Schreineret al 2019) the effect of Al3+ on the anisotropic peak broadeningof tobermorite could only be observed in the case of Al2O3 contentslower than 4 in the drymix In the latter three mixes Al2O3 con-tents range from 1 to 35 Al2O3 (calculated from XRF data) whichmeets the region of interest for the analysis of tobermorite domainmorphology
bull The curing time for nearly all of the investigated samples was 12 hbut compound MK9 was prepared two more times for curing timesof 2 h and 6 h The different curing times were chosen in this par-ticular sample so that the reactivity of metakaolin and the phasetransitions could be observed more precisely
23 Hydrothermal treatment
Due to the different fineness of raw materials there was a differentwater demand from one mixture to another In order to obtain slurriesof comparable rheology the amount of water was adapted respectivelyresulting in water-to-solid ratios of 25 to 3 which matches the sug-gested water-to-solid ratio for this purpose (Roacutezycka et al 2014Galvaacutenkovaacute et al 2018) The weighed water was added to the dry mixand after stirring for 1 min at 23 degC the slurry was poured into thereactor Minor changes in the quantity of added water did not have aninfluence on the measured steam pressure All experiments were con-ducted using a PTFE-lined stainless steel autoclave with a reactor vo-lume of 300 ml The oven temperature was fixed at 180 degC and auto-genous steam pressure of 11ndash12 MPa was measured during eachexperiment with an external manometer After cooling to room tem-perature the sample was removed from the reactor coarsely ground
using an agate mortar and dried at 60 degC for 12 h After drying thesample was ground with an agate mortar again in order to deagglo-merate the particles As no coarse raw materials were used there wasno need for wet McCrone milling (Schreiner et al 2018)
24 XRD analysis
After preparation into front-loading sample holders the powdersamples were measured with a D8 diffractometer (Bruker) equippedwith a LynxEye detection system and Bragg-Brentano geometry Thesettings for XRD analysis included a tube voltage of 40 kV a current of40 mA an angular range from 6 to 80deg 2θ (Cu Kα radiation) a time perstep of 054 s a step width of 00236deg 2θ and a PSD opening of 33deg Thebackground was fitted with Chebyshev polynomial of the fifth orderThe major contribution of amorphous phase was fitted with a singlepeak with a fixed position at 308deg 2θ so that tobermorite reflectionswere not affected An external quartzite standard was measured withthe same parameters in order to determine phase quantities (Jansenet al 2011) Bruker AXS software TOPAS 50 was used for Rietveldrefinement (Rietveld 1969) and the used structures are shown inTable 3
3 Results and discussion
31 Different dosages of MK and MKg
In Fig 1 the quantities of tobermorite quartz and katoite present inmost of the samples determined by XRD analysis are illustratedWhenever tobermorite was the leading mineral hydrate phase a basalspacing of 113 Aring could be verified in each of the diffractograms Thequantities of minor crystalline phases and amorphous content are notshown For low dosages of MK it can be seen that the weight fraction oftobermorite decreased At moderate dosage of both types of metakaolin(MK16 MK23 MKg16 MKg23) tobermorite was present in comparablequantities It can be seen that the amount of katoite in the mixes de-pended on the dosage of metakaolin and it appeared only at dosages ofMK5 or more Due to the higher content of aluminum in MK comparedto MKg more katoite could always be observed in the MK mixes atequivalent dosages Despite equal amounts of quartz as starting mate-rial in mixes for both types of metakaolin the resulting weight fractionsin the cured samples were not alike Considerably more quartz waspresent in the MK samples Even though less quartz was used for mixescontaining higher amounts of MK even more quartz was present afterhydrothermal curing (Table 2 Fig 1) Consequently some of the SiO2
provided by MK did not transform into an amorphous phase or to-bermorite but into quartz This finding is verified by the presence ofquartz in MK60 because no quartz was included in the raw mixture Thefeldspar present in MKg did not react so Na2O and an unknown amountof Al2O3 may not have been supplied for hydrothermal reaction Besidestobermorite and quartz additional calcite scawtite (Ca7Si6(CO3)
Table 2Basic powder compounds prepared for the hydrothermal synthesis of to-bermorite with the respectively calculated Al2O3 content and curing time in thereactor
Sample Portlandite[wt-]
Quartz[wt-]
MK[wt-]
MKg
[wt-]
Al2O3
[wt-]Curingtime [h]
MK0 49 51 ndash ndash 0 12MK25 495 48 25 ndash 1 12MK5 49 46 5 ndash 2 12MK9_2h 48 43 9 ndash 35 2MK9_6h 48 43 9 ndash 35 6MK9_12h 48 43 9 ndash 35 12MK16 47 37 16 ndash 63 12MK23 46 31 23 ndash 9 12MK60 40 ndash 60 ndash 235 12MKg16 47 37 ndash 16 33 12MKg23 46 31 ndash 23 47 12MKg60 40 ndash ndash 60 124 12
Table 3Structural data used for the investigation with powder XRD analysis
Phase Author
Anatase (Horn et al 1972)Biotite (Brigatti et al 2000)Calcite (Maslen et al 1995)Kaolinite (Zvyagin 1960)Katoite (Bartl 1969)Microcline (Bailey 1969)Plazolite (Basso et al 1983)Portlandite (Busing and Levy 1957)Quartz (Le Page and Donnay 1976)Scawtite (Grice 2005)Tobermorite (Hamid 1981)Xonotlite (Hejny and Armbruster 2001)
J Schreiner et al Applied Clay Science 185 (2020) 105432
3
6 Publications
33
O18bull2(H2O)) and xonotlite (Ca6Si6O17(OH)2) could be identified insample MK0 (XRD plots of samples MK0 MKg16 MKg23 MK16 andMK23) Comparing MK0 and MK25 scawtite and xonotlite could stillbe identified in a very low amount in MK25 but no longer in samplesthat contained even more MK (XRD plots of samples MK0 MK25 MK5and MK9_12h)
Two additional experiments were done without quartz in the rawmixes (MK60 and MKg60) The according diffractograms after hydro-thermal curing are shown in Fig 2 In sample MKg60 tobermorite (gt 50wt-) was successfully synthesized without any other silica sourcethan MKg whereas no crystalline quartz occurred By contrast no to-bermorite but quartz could be identified in equivalent mixture MK60containing MK It can be seen that crystalline components such as micaand anatase in the raw MK did not react at the selected conditions andremained present in the autoclaved samples Except for feldspar in MKgall of the crystalline components appeared to be reactive at the chosenhydrothermal conditions A minor unidentified phase occurred at328deg2θ and additional xonotlite was identified in sample MKg60 Insample MK60 more calcium was needed for the formation of morehydrogarnet (Fig 1) resulting in a lower CaSi ratio for the remainingsystem Sample MKg60 contained only half of the amount of Al3+ and itwas not completely supplied for reaction due to its partial presence infeldspar Consequently essentially less hydrogarnet (Fig 1) was presentin MKg60 after hydrothermal treatment and the CaSi ratio in the re-maining system was affected to a lesser extent
32 Application of MK for different curing times
The development of hydrate phases in the autoclave for compoundMK9 is displayed in Fig 3 After only 2 h of hydrothermal curing all ofthe available portlandite had reacted and katoite (95 wt-) was pre-sent The applied type of metakaolin appeared to react quickly as itsupplied aluminum for formation of katoite No formation of to-bermorite could be observed at this stage yet An assumably amorphousprecursor can be seen at 28 to 30deg2θ Calcium was provided by thedissolution of portlandite After 6 h of hydrothermal reaction amountsof katoite (85 wt-) and quartz (from 31 wt- at 2 h to 165 wt- at6 h) had decreased and a major amount of tobermorite (35 wt-) waspresent Apparently between 2 and 6 h under hydrothermal conditionsthe amorphous precursor and quartz reacted resulting in the formationof tobermorite An additional 6 h of reaction time (MK9_12h) did notchange the phase composition significantly Slightly more tobermorite
(365 wt-) less quartz (16 wt-) and katoite (65 wt-) weremeasured
33 Tobermorite domain morphology and lattice parameters
In the referenced literature an analysis of tobermorite domainmorphology based on anisotropic peak broadening was possible forsamples that contained notgt 4 wt- Al2O3 in the drymix (Schreineret al 2019) Accordingly in this study samples MK0 MK25 MK5MK9_6h and MK9_12h were suitable (Table 2) with MK9_2h not con-taining any tobermorite In Fig 4 the respective growth in a and b di-rection is visualized with x indicating the domain size in a direction andy indicating domain size in b direction using a macro for TOPAS 50(Ectors et al 2015 2017) The calculated cylinder models in Fig 4represent the relation of yx and not absolute sizes With no supply ofaluminum ions (MK0) the relative domain growth in b direction islower compared to samples containing metakaolin This finding agreeswith the results from a similar investigation of tobermorite in AAC(Schreiner et al 2019) However within the samples MK5 andMK9_12h the different amounts of supplied aluminum ions did notshow a clear effect It appeared that low dosages of Al3+ (1 wt- Al2O3
in MK25 and 2 wt- Al2O3 in MK5) were enough to determine thedomain growth of tobermorite Additional results from the samplesMK9_6h and MK9_12h indicated that growth in b direction increasedwith reaction time
In Fig 5 lattice parameters of tobermorite depending on metakaolindosages are plotted B clearly remained unaffected throughout therange of samples Increasing amounts of metakaolin led to a slightlysmaller parameter a However both types of metakaolin showed acorresponding impact on parameter a By contrast parameter c in-creased strongly with increasing amounts of MK and MKg but the typeof metakaolin was significant At an equivalent dosage MK affected thecell dimension in c direction considerably more than MKg so that thefraction of Al3+ appeared to be the decisive parameter Different metaloxides in MKg did not show a notable effect certainly as they werepartially not provided for reaction Unlike for the domain morphologyof tobermorite the impact on lattice parameters could be observedwithin the complete range of examined dosages
4 Conclusions
The results obtained from the introduced investigations allow con-cluding remarks on the effects of the applied types of metakaolin on thesynthesis of 11 Aring tobermorite the phase transitions and the in-corporation of Al3+ into the lattice of tobermorite
With a critical dosage the use of any type of metakaolin led to theformation of katoite in an according amount At moderate dosages(MKg16 MKg23 MK16 and MK23) the two types of metakaolin showeda good correspondence in consideration of the quantities of to-bermorite For higher dosages there were contrary effects Lower do-sages of MK led to considerable quantities of Al-substituted to-bermorite Samples containing low dosages of MK revealed that katoiteappeared in the case ofgt 5 wt- of MK - corresponding to 2 wt-Al2O3 - in the basic compound Minor crystalline phases in MKg showedbetter reactivity than those in MK The observation that no tobermoritewas present in sample MK60 indicated that high dosages of Al3+ hin-dered the formation of tobermorite
Investigations of MK9 at 2 6 and 12 h displayed the evolution ofhydrate phases At first katoite was the only crystalline hydrate phasepresent after 2 h which corresponded to observations in a differentpublication (Klimesch and Ray 1999) The amount of katoite andquartz then decreased and a major amount of tobermorite formed from2 to 6 h curing time In order to gain more information on the trans-formation of amorphous C-(A)-S-H into tobermorite additional ex-periments in the range of 2 to 6 h curing time will be needed
Domain morphology analysis of tobermorite revealed that low
Fig 2 Diffractograms of MKg MKg60 MK and MK60 from 7 to 34deg2θ CuKα Aanatase C calcite F feldspar k kaolinite K katoite M mica Q quartz Ttobermorite U unidentified phase X xonotlite
J Schreiner et al Applied Clay Science 185 (2020) 105432
4
6 Publications
34
dosages of Al3+ determined the domain growth which agreed with theresults published on tobermorite in AAC samples (Schreiner et al2019) Different curing times unveiled that growth in b direction in-creased with the reaction time Al3+ incorporation into the lattice oftobermorite only reflected to a limited extent in the domain mor-phology By contrast an increase of lattice parameter c was triggered byAl3+ even at the highest dosage in this study Ultimately there is no
evidence for a limit of incorporation of Al3+ but there is a limit ofinfluence on the domain morphology These results additionally re-confirm this assumption similarly made in the previous work (Schreineret al 2019) and suggest a new mechanism of tobermorite crystal-lization depending on the presence of Al3+
Supplementary data to this article can be found online at httpsdoiorg101016jclay2019105432
Declaration of Competing Interest
The authors declare that they have no known competing financialinterests or personal relationships that could have appeared to influ-ence the work reported in this paper
Acknowledgement
The authors thank Rodgauer Baustoffwerke GmbH amp Co KG forsupplying raw materials for laboratory experiments
References
Aguilar-Mamani W Garciacutea G Hedlund J Mouzon J 2014 Comparison betweenleached metakaolin and leached diatomaceous earth as raw materials for the synth-esis of ZSM-5 Springerplus 3 1ndash10 httpsdoiorg1011862193-1801-3-292
Ayodele OB Sulaimon AA Alaba PA Tian Z-Y 2019 Influence of metakaolini-zation temperature on the structure and activity of metakaolin supported Ni catalystin dry methane reforming J Environ Chem Eng httpsdoiorg101016jjece2019103239 (in press)
Badawi EA Abdel-Rahman MA Mostafa A Abdel-Rahman M 2019 Determinationof the crystallite size amp micro- strain by novel method from XRD profile Appl Phys2 1ndash15 httpsdoiorg1031058jap201921001
Bailey SW 1969 Refinement of an intermediate microcline structure Am Miner 541540ndash1545
Bartl H 1969 Roentgen-Einkristalluntersuchungen an (CaO)3 (Al2O3) (H2O)6 und an(CaO)12 (Al2O3)7 (H2O) neuer Vorschlag zur (CaO)12 (Al2O3)7-Struktur NeuesJahrb fuer Mineral Monatshefte 1969 404ndash413
Basso R Giusta AD Zefiro L 1983 Crystal structure refinement of plazolite A highlyhydrated natural hydrogrossular Neues Jahrb Miner Monatsh (Neues Jahrb fuerMineral Monatshefte) 1983 251ndash258
Brigatti MF Lugli C Poppi L Foord EE Kile DE 2000 Crystal chemical varia-tions in Li- and Fe-rich micas from Pikes Peak batholith (Central Colorado) AmMineral 85 1275ndash1286 httpsdoiorg102138am-2000-8-920
Busing WR Levy HA 1957 Neutron diffraction study of calcium hydroxide J ChemPhys 26 563 httpsdoiorg10106311743345
Chen L Wang Z Wang Y Feng J 2016 Preparation and properties of alkali acti-vated metakaolin-based geopolymer Materials (Basel) 9 1ndash12 httpsdoiorg103390ma9090767
Chucholowski C Holger M Thienel K-C 2018 Improving the recyclability en-vironmental compatibility and CO2 balance of autoclaved aerated concrete by re-placing sulfate carrier and cement with calcined clays CePapers 2 503ndash512httpsdoiorg101002cepa846
Fig 3 Diffractograms of MK9_2h MK9_6h and MK9_12h from 7 to 38deg2θ CuKα C calcite K katoite Q quartz T tobermorite
Fig 4 Relation of calculated domain sizes of 11 Aring tobermorite in selectedsamples (MK0 MK25 MK5 MK9_6h and MK9_12h) in a (x) and b (y) direction
Fig 5 Lattice parameters of tobermorite depending on MK or MKg dosageincluding blank mix MK0
J Schreiner et al Applied Clay Science 185 (2020) 105432
5
6 Publications
35
Demir İ Başpınar MS Kahraman E Ccedilalışkan E Goumlrhan G 2014 An investigationon the usability of diatomite in aerated concrete production In Proc of the IntlConf on Advances in Civil Structural and Construction Engineering ndash CSCE 2014 pp97ndash100
Ectors D Goetz-Neunhoeffer F Neubauer J 2015 A generalized geometric approachto anisotropic peak broadening due to domain morphology J Appl Crystallogr 48189ndash194 httpsdoiorg101107S1600576714026557
Ectors D Goetz-Neunhoeffer F Neubauer J 2017 Routine (an)isotropic crystallitesize analysis in the double-Voigt approximation done right Powder Diffract 3227ndash34 httpsdoiorg101017S0885715617000070
Galvaacutenkovaacute L Bartoniacutečkovaacute E Opravil T Tkacz J Ptaacuteček P 2018 The influence ofstarting materials solubility on tobermorite structure formation under the hydro-thermal conditions IOP Conf Ser Mater Sci Eng 379 1ndash8 httpsdoiorg1010881757-899X3791012001
Grice JD 2005 The structure of spurrite tilleyite and scawtite and relationships toother silicate-carbonate minerals Can Mineral 43 1489ndash1500 httpsdoiorg102113gscanmin4351489
Hamid SA 1981 The crystal structure of the 11 Aring natural tobermoriteCa225[Si3O75(OH)15]1H2O Zeitschrift fuer Krist 154 189ndash198 httpsdoiorg101524zkri19811543-4189
Hejny C Armbruster T 2001 Polytypism in xonotlite Ca6Si6O17(OH)2 Zeitschrift furKrist 216 396ndash408
Horn M Schwerdtfeger CF Meagher EP 1972 Refinement of the structure of ana-tase at several temperatures Zeitschrift fur Krist 136 273ndash281 httpsdoiorg101524zkri19721363-4273
Jansen D Goetz-Neunhoeffer F Stabler C Neubauer J 2011 A remastered externalstandard method applied to the quantification of early OPC hydration Cem ConcrRes 41 602ndash608 httpsdoiorg101016jcemconres201103004
Jenkins R Snyder R 1996 Introduction to X-ray Powder Diffractometry ChemicalAnalysis Wiley pp 90
Kalousek GL 1956 Crystal Chemistry of Hydrous Calcium Silicates J Am Ceram Soc40 74ndash80
Klimesch D Ray A 1998 Autoclaved cement-quartz pastes with metakaolin additionsAdv Cem Based Mater 7 109ndash118 httpsdoiorg101016S1065-7355(97)00073-4
Klimesch D Ray A 1999 DTA-TGA evaluations of the CaOndashAl2O3ndashSiO2ndashH2O systemtreated hydrothermally Thermochim Acta 334 115ndash122 httpsdoiorg101016s0040-6031(99)00140-9
Komarneni S Roy R Roy DM Fyfe CA Kennedy GJ Bothner-By AA Dadok JChesnick AS 1985 27Al and29Si magic angle spinning nuclear magnetic resonancespectroscopy of Al-substituted tobermorites J Mater Sci 20 4209ndash4214 httpsdoiorg101007BF00552416
Koutnyacute O Opravil T Pořiacutezka J 2014 Application of metakaoline in autoclavedaerated concrete technology Adv Mater Res 1000 174ndash177 httpsdoiorg104028wwwscientificnetAMR1000174
Le Page Y Donnay G 1976 Refinement of the crystal structure of low-quartz ActaCrystallogr Sect B 32 2456ndash2459 httpsdoiorg101107S0567740876007966
Luo H Law WW Wu Y Zhu W Yang EH 2018 Hydrothermal synthesis of needle-like nanocrystalline zeolites from metakaolin and their applications for efficient re-moval of organic pollutants and heavy metals Microporous Mesoporous Mater 2728ndash15 httpsdoiorg101016jmicromeso201806015
Maeda H Ogawa Y Ishida EH Kasuga T 2012 Hydrothermal synthesis of to-bermorite doped with phosphorus species for removing heavy metal ions J AustCeram Soc 48 8ndash11
Maslen EN Streltsov VA Streltsova NR Ishizawa N 1995 Electron density andoptical anisotropy in rhombohedral carbonates III Synchrotron Xray studies ofCaCO3 MgCO3 and MnCO3 Acta Crystallogr Sect B 51 929ndash939 httpsdoiorg101107S0108768195006434
Matekonis G Šiaučiūnas R Vaičiukynienė D 2010 Hydrothermal Synthesis andCharacterization of Na + and [ Al 3 + + Na + ] -substituted Tobermorite in CaO-SiO2middotnH2O-H2O System Mater Sci 16 242ndash248
Matsui K Kikuma J Tsunashima M Ishikawa T Matsuno S Ogawa A Sato M2011 In situ time-resolved X-ray diffraction of tobermorite synthesis process underhydrothermal condition IOP Conf Ser Mater Sci Eng 18 60ndash66 httpsdoiorg1010881757-899X182022017
Merlino S Bonaccorsi E Armbruster T 2000 The real structures of clinotobermoriteand tobermorite 9 Aring OD character polytypes and structural relationships Eur JMineral 12 411ndash429 httpsdoiorg1011270935-122120000012-0411
Monasterio M Gaitero JJ Manzano H Dolado JS Cerveny S 2015 Effect ofchemical environment on the dynamics of water confined in calcium silicate mi-nerals Natural and synthetic tobermorite Langmuir 31 4964ndash4972 httpsdoiorg101021acslangmuir5b00614
Mostafa NY 2005 Influence of air-cooled slag on physicochemical properties of auto-claved aerated concrete Cem Concr Res 35 1349ndash1357 httpsdoiorg101016jcemconres200410011
Mostafa NY Shaltout AA Omar H Abo-El-Enein SA 2009 Hydrothermal synth-esis and characterization of aluminium and sulfate substituted 11 nm tobermoritesJ Alloys Compd 467 332ndash337 httpsdoiorg101016jjallcom200711130
Naber C Stegmeyer S Jansen D Goetz-Neunhoeffer F Neubauer J 2019 ThePONKCS method applied for time resolved XRD quantification of supplementarycementitious material reactivity in hydrating mixtures with ordinary Portland ce-ment Constr Build Mater 214 449ndash457 httpsdoiorg101016jconbuildmat201904157
Qu X Zhao Z Zhao X 2018 Microstructure and characterization of aluminum-in-corporated calcium silicate hydrates (C-S-H) under hydrothermal conditions RSCAdv 8 28198ndash28208 httpsdoiorg101039c8ra04423f
Rashad AM 2013 Metakaolin as cementitious material history scours production andcomposition - a comprehensive overview Constr Build Mater 41 303ndash318 httpsdoiorg101016jconbuildmat201212001
Rietveld HM 1969 A profile refinement method for nuclear and magnetic structures JAppl Crystallogr 2 65ndash71 httpsdoiorg101107S0021889869006558
Riacuteos CA Williams CD Fullen MA 2009 Hydrothermal synthesis of hydrogarnet andtobermorite at 175 degC from kaolinite and metakaolinite in the CaO-Al2O3-SiO2-H2Osystem a comparative study Appl Clay Sci 43 228ndash237 httpsdoiorg101016jclay200809014
Roacuteżycka A Pichoacuter W 2016 Effect of perlite waste addition on the properties of au-toclaved aerated concrete Constr Build Mater 120 65ndash71 httpsdoiorg101016jconbuildmat201605019
Roacutezycka A Kotwica Ł Małolepszy J 2014 Synthesis of single phase gyrolite in theCaO-quartz-Na2O-H2O system Mater Lett 120 166ndash169 httpsdoiorg101016jmatlet201401003
Sauman Z 1974 Influence of SO4 2ndash ions on the formation of 11 Aring tobermorite InProceedings of the 2nd International Symposium on Science and Research in SilicateChemistry Moscow pp 25ndash39
Schmidt M Egersdoumlrfer A Poumlllmann H 2012 Increased reactivity using a glass-containing metakaolin as an active filler in lime-based binder systems ZKG Int 6554ndash62
Schreiner J Jansen D Ectors D Goetz-Neunhoeffer F Neubauer J Volkmann S2018 New analytical possibilities for monitoring the phase development during theproduction of autoclaved aerated concrete Cem Concr Res 107 247ndash252 httpsdoiorg101016jcemconres201802028
Schreiner J Goetz-Neunhoeffer F Neubauer J Volkmann S Bergold S Webler RJansen D 2019 Advanced Rietveld refinement and SEM analysis of tobermorite inchemically diverse autoclaved aerated concrete Powder Diffract 34 143ndash150httpsdoiorg101017s0885715619000149
Setthaya N Chindaprasirt P Pimraksa K 2016 Preparation of zeolite nanocrystals viahydrothermal and solvothermal synthesis using of rice husk ash and metakaolinMater Sci Forum 872 242ndash247 httpsdoiorg104028wwwscientificnetmsf872242
Siauciunas R Baltakys K 2004 Formation of gyrolite during hydrothermal synthesis inthe mixtures of CaO and amorphous SiO2 or quartz Cem Concr Res 34 2029ndash2036httpsdoiorg101016jcemconres200403009
Skawinska A Owsiak Z Baran T Hernik K 2017 The influence of halloysite ad-dition on tobermorite formation in CaO and quartz mix under hydrothermal condi-tions Cem Wapno Bet 17 426ndash434
Venhodovaacute E Janovskyacute R Drochytka R 2015 Formation of tobermorite at differentmaterials composition of aerated concrete Appl Mech Mater 752ndash753 247ndash250httpsdoiorg104028wwwscientificnetamm752-753247
Walczak P Małolepszy J Reben M Szymański P Rzepa K 2015 Utilization ofwaste glass in autoclaved aerated concrete Proc Eng 122 302ndash309 httpsdoiorg101016jproeng201510040
Zhang Y Gao W Cui L 2007 The transformation of acid leached metakaolin tozeolite beta Stud Surf Sci Catal 170 420ndash425 httpsdoiorg101016S0167-2991(07)80870-6
Zvyagin BB 1960 An attempt to electronographic determination of kaolinite structureJ Dokl Akad Nauk SSSR 130 1023ndash1026
J Schreiner et al Applied Clay Science 185 (2020) 105432
6
6 Publications
36
6 Publications
62 Advanced Rietveld refinement and SEM analysis oftobermorite in chemically diverse autoclaved aeratedconcrete
Following the copyright guidelines by Cambridge University Press the publication
Schreiner J Goetz-Neunhoeffer F Neubauer J Volkmann S Bergold S WeblerR Jansen D 2019 Advanced Rietveld refinement and SEM analysis of tobermorite inchemically diverse autoclaved aerated concrete Powder Diffraction 34 143ndash150 httpsdoiorg101017s0885715619000149
may not be reprinted It can be accessed at
httpswwwcambridgeorgcorejournalspowder-diffractionarticleadvanced-rietveld-refinement-and-sem-analysis-of-tobermorite-in-chemically-diverse-autoclaved-aerated-concrete51597C2A66F6F225D29DEB2675E74249
37
6 Publications
63 New analytical possibilities for monitoring the phasedevelopment during the production of autoclavedaerated concrete
Reprint of the peer reviewed publication
Schreiner J Jansen D Ectors D Goetz-Neunhoeffer F Neubauer J VolkmannS 2018 New analytical possibilities for monitoring the phase development during theproduction of autoclaved aerated concrete Cement and Concrete Research 107 247ndash252httpsdoiorg101016jcemconres201802028
with permission from Elsevier
38
Contents lists available at ScienceDirect
Cement and Concrete Research
journal homepage wwwelseviercomlocatecemconres
Short communication
New analytical possibilities for monitoring the phase development duringthe production of autoclaved aerated concrete
J Schreinera D Jansena D Ectorsa F Goetz-Neunhoeffera J Neubauera S Volkmannb
aUniversity of Erlangen-Nuremberg GeoZentrum Nordbayern Mineralogy Schlossgarten 5a 91054 Erlangen Germanyb Rodgauer Baustoffwerke GmbH amp Co KG Am Opel-Pruumlffeld 3 63110 Rodgau-Dudenhofen Germany
A B S T R A C T
This work presents improved analytical methods for both steps of the production process of autoclaved aeratedconcrete (AAC) the phase development during the hydration before autoclaving and during the autoclavingprocess itself The improvement includes new insights into preparation methods of AAC samples for powderdiffraction as well as Rietveld refinement strategies For the first time a new implementation for calculatinganisotropic crystal domain sizes is applied to major hydrate phases occurring during AAC production namelyportlandite during the hydration before autoclaving and tobermorite during the autoclaving process The cal-culation of anisotropic domain size growth which can be implemented in the Rietveld environment is based oncrystallographically and geometrically appropriate models The implementation of calculating anisotropic do-main sizes for the Rietveld software TOPAS 50 allows a superior Rietveld fit and a more accurate quantificationof the phase development Additionally it enables the tracking of growth mechanism of portlandite duringhydration
1 Introduction
Autoclaved aerated concrete (AAC) is known as a lightweight con-struction material which offers outstanding properties such as suffi-cient strength for construction in addition with excellent thermal in-sulation [12] AAC is produced by autoclaving from calcareous rawmaterials such as lime (CaO) and cement quartz sulfate carrier andother additives such as foaming agents and water
The production process (Fig 1) can be separated into the hydrationof the mixed slurry before the procedure of autoclaving and the auto-claving at elevated temperature (180 degC to 200 degC) under saturatedsteam pressure (12MPa) for several hours
The hydration process before autoclaving is necessary to achievesufficient strength in order to cut the green cake blocks as they shouldhave a specific shape and dimension after autoclaving Furthermorethe porous structure is generated by the foaming agent during hydra-tion in the first process step During autoclaving the final propertiesnamely strength and low thermal conductivity are achieved
It is already well understood that the autoclaving process leads tothe formation of several phases first of all tobermorite(Ca5Si6O16(OH)2lowast4H2O) [3ndash5] Newest research has shown im-pressively which reactions are running from the mineralogical point ofview Insitu XRD measurements were carried out during the
autoclaving process and the phase development was shown by plottingnormalized intensities [6] The study of Mitsuda et al [3] was mainlyfocused on the tracking of the phase evolution during the autoclavingprocess of AAC However their statements concerning phase evolutionare mainly based on XRD data and TGA measurements There is acommon agreement that the following reactions occur The consump-tion of the alite (OPC) leads to the formation of an initial C-S-H phaseduring the first processing step Portlandite which was initially formedduring the first process step (from CaO and C3S) further quartz and theC-S-H phase are consumed during autoclaving resulting in the crystal-lization of tobermorite Hence the crystallization process of to-bermorite as well as the crystal structure of tobermorite was an issue ofresearch and discussion over the last years and numerous publicationsto these topics are available Concerning the crystal structure of to-bermorite respectively the tobermorite supergroup a new publicationoutlines all important references and recommends a new nomenclature[7]
The presented study was performed to create new analytical possi-bilities for the characterization of the production process of AAC Bothof the production process steps are essential for the final productHence the present work focuses on crystallization of hydrate phases inboth processes
Firstly an external standard method [89] was published and
httpsdoiorg101016jcemconres201802028Received 6 October 2017 Received in revised form 1 February 2018 Accepted 26 February 2018
Corresponding authorsE-mail addresses juergenjsschreinerfaude (J Schreiner) danieljansenfaude (D Jansen)
Cement and Concrete Research 107 (2018) 247ndash252
0008-8846 copy 2018 Elsevier Ltd All rights reserved
T
6 Publications
39
recommended for the determination of absolute phase contents inmixtures with amorphous content It was shown that the method canabsolutely be recommended for hydrating cement pastes in which watercannot be quantified directly by XRD [10] This method seems to bevery promising for both the quantification of the hydration of the AACslurry before autoclaving and the quantification of the phase evolutionduring autoclaving inasmuch as both production steps form crystallineand amorphous phases
Secondly a new approach to anisotropic peak broadening due toanisotropic domain morphology which was developed [1112] is ap-plied to AAC samples to improve the fit of portlandite and tobermoriteby Rietveld refinement [13] By applying this approach the refinementof both portlandite and tobermorite should additionally lead to betterquantitative results as well as to better insights into the development ofthe domain size morphology of both phases formed
It was already shown that in a hydrating raw mixture for AAC twospecies of portlandite precipitate at 23 degC one showing dynamicallyanisotropic peak broadening and another one following the isotropictrend [14] The application of the anisotropic refinement model led toan improved fitting of portlandite Moreover the mechanism of aniso-tropic domain growth of portlandite was tracked
2 Materials and methods
In order to examine the hydration of the AAC slurry before auto-claving a mixture of the hydraulic reactive components was weighedand measured in-situ at a Bruker D8 diffractometer with a LynxEyedetection system
Ordinary Portland cement (OPC) was mixed with lime (CaO) andanhydrite (C$) The raw materials were taken from the same batches asfor the industrial samples The drymix (58 OPC 36 CaO and 6 C$by weight) was then mixed with water (ws= 08) and placed into anappropriate sample holder The samples were not aerated The slurrysamples were covered with a kapton film to avoid evaporation andcarbonation Diffractograms were recorded with an angular range from7 to 545deg 2θ and a step width of 0011deg 2θ Measurements were carriedout every 15min For each measurement 96 XRD patterns were re-corded over the first 24 h The temperature was fixed at 70 degC which isthe mean temperature generally prevailing in the industrial processduring hydration before autoclaving Rietveld refinement was carriedout using the G-factor method All structures used for Rietveld refine-ment are shown in Table 1
For investigation of the autoclaved samples five different specimenswere taken at different autoclaving times The specimens were takenout of a technical production process hence it was not possible to in-terrupt the process at an earlier time inasmuch it would lead to damageof a whole concrete production batch The specimens were firstly driedat 60 degC until weight constancy The whole blocks were then broken andstatistical samples of 20 g were taken In order to receive the right massattenuation coefficient (MAC) for G-factor method the loss on ignitionand the chemical composition (XRF) were determined For energydispersive XRF analysis (Spectro Xepos) tube voltage from 20 kV to50 kV and tube current from 08 to 20mA were used for differenttargets
The final sample preparation (grinding) before XRD measurementswas carried out using both an agate mortar and a McCrone micronizingmill for wet milling with isopropanol Both preparation methods wereapplied separately to see which one is suitable in order to get the bestpreparation for XRD investigations Six preparations were performed byone operator of which two were prepared with an agate mortar andfour with a McCrone mill For the McCrone milling 3 g of the sampleand 10ml of isopropanol were used for grinding for 12min The grainsize distribution of one sample prepared with an agate mortar and onesample prepared using a McCrone mill was measured by laser granu-lometry in isopropanol using a Mastersizer 3000 (MALVERN)
After milling the samples in these two ways for XRD analysis thepowders were prepared into a front loading sample holder and mea-sured Diffractograms were recorded with an angular range from 6 to80deg 2θ a step width of 00236deg 2θ and a time per step of 054 s Rietveldrefinement combined with external standard (G-factor) was applied inorder to get absolute quantities for each phase The refinement strategyfor portlandite and tobermorite in the TOPAS Launch Mode (TOPAS50 Bruker AXS) is attached as a Supplementary material file
3 Results and discussion
31 Hydration of the mixture before autoclaving
The hydration of the investigated paste before autoclaving isdominated by the hydration of the cement as well as the reaction of thefree lime (CaO) resulting in the formation of portlandite It can beclearly seen from Fig 2 that the hydration of the paste leads to theformation of ettringite portlandite and C-S-H phase For simplificationthe remaining phase developments are not shown in Fig 2 because theyare not in the focus of this study The hydration of CaO forming
Fig 1 Simplified process steps of AAC production and hydrate phase evolution
Table 1Structures used for Rietveld refinement
Phase Author
Alite [15]Anhydrite [16]Bassanite [17]Belite (β) [18]Belite (αprime) [19]Brownmillerite [20]C-S-H [21]Calcite [22]Ettringite [23]Gypsum [24]Hemicarbonate [25]Hydroxylellestadite [26]Lime (CaO) [27]Microcline [28]Portlandite [29]Quartz [30]Tobermorite [31]Tricalciumaluminate (cubic) [32]Tricalciumaluminate (orthorhombic) [33]PONCKS model for Water [21]
J Schreiner et al Cement and Concrete Research 107 (2018) 247ndash252
248
6 Publications
40
portlandite begins rapidly after the addition of water to the mixture andlime is fully consumed after only 1 h of hydration This translates into aquick rise of heat of hydration so that cement hydration is acceleratedwhich leads to further portlandite formation by the reaction of aliteEttringite formation stalls after few hours of hydration After 12 h et-tringite is partially decomposed probably due to sulfate depletion [9]
and poorly crystalline AFm phases (not shown in Fig 2) are formedIn Fig 3 it can be seen that in fact two generations of portlandite
are formed a 1st dominant generation showing anisotropic peakbroadening and 2nd one occurring considerably later following theisotropic domain size refinement which is usually carried out using theRietveld method This occurrence comes along firstly with lime hy-dration and secondly with alite hydration The expected quantity ofportlandite formed from lime hydration very well complies with the
Fig 2 Phase development in AAC paste on a laboratory scale before autoclaving ana-lyzed by in-situ XRD at 70 degC
Fig 3 Formation of two generations of portlandite by hydration of lime (1st) and C3S(2nd) at 70 degC before autoclaving with the major generation showing anisotropic peakbroadening
Fig 4 Biaxial cylinder domain size model of portlandite used for Rietveld refinement of anisotropic peak broadening
Fig 5 Morphological evolution of portlandite showing anisotropic domain size growthduring hydration at 70 degC
Fig 6 Comparison of quantification of crystalline quartz in samples prepared withMcCrone mill and agate mortar at different autoclaving times
J Schreiner et al Cement and Concrete Research 107 (2018) 247ndash252
249
6 Publications
41
quantity of the observed 1st generation The development of portlan-dite growth was already tracked in an equivalent slurry at 23 degC [14]Thus this observation confirms that the crystallinity of portlandite inmixtures for AAC production depends on the starting phase for hydra-tion as already indicated by Ectors [14]
Fig 4 shows the used biaxial cylindrical model for anisotropic do-main size calculation and the portlandite structure which was createdwith structural software VESTA 318 [34] Using the cylindrical ap-proach domain sizes in a (here equating to b) and c direction(dz= cylinder height) can be calculated which comes along with theexpected symmetrical parameters of portlandite
The 1st portlandite generation showing anisotropic domain growthcan be tracked in terms of cylinder diameter and height which is rea-lized in Fig 5 The blue cylinder represents the geometric approach andcylinder height and diameter are calculated newly for each range Thecylinder height remains rather stable throughout the hydration processwhile the cylinder diameter increases during the first hours of hydra-tion After 10 h of hydration the mean cylinder diameter no longer in-creases Consequently these observations match the results of the ex-aminations conducted at 23 degC [14] as well as the assumption thatdifferent mechanisms of growth exist for portlandite depending on the
hydration educt The maximum cylinder diameter is reached earlier inthis work very likely because of the higher hydration temperature
32 Quantification of the reactions during autoclaving
Autoclaved samples were ground with an agate mortar and com-pared to samples which were wet-ground with a McCrone mill Fig 6shows precisely that the determination of the amount of crystallinequartz is more reproducible in the two shown samples which were
Fig 7 2D XRD with Bruker GADDS-system plots of samples prepared with agate mortar and McCrone mill Coarse quartz grains are pointed out in the plot of the sample prepared withagate mortar
Fig 8 Particle size distribution of one sample prepared with an agate mortar and of onesample prepared with a McCrone mill measured by laser granulometry
Fig 9 Rietveld refinement for Tobermorite of autoclaved AAC sample by use of isotropicdomain size model (a) and of anisotropic domain size model (b)
J Schreiner et al Cement and Concrete Research 107 (2018) 247ndash252
250
6 Publications
42
prepared with a McCrone mill The high variance of crystalline quartzin the samples which were prepared with an agate mortar is a result ofinsufficient grinding and remaining of too large quartz grains Whenthis spottiness occurs a reliable quantification using the G-factormethod is not possible
The 2D XRD with Bruker GADDS-system plots in Fig 7 demonstratethe insufficient grinding when using an agate mortar compared to wetmilling with a McCrone mill Quartz would be overrepresented in a one-dimensional XRD pattern focusing on a section with bright spots (greenarrows) The lack of bright spots in the right plot shows that the quartzgrains are milled more thoroughly using a McCrone mill In Fig 8 theparticle size distribution after both ways of sample preparation iscompared Most grains in the sample prepared with an agate mortar arelarger than in the sample prepared with a McCrone mill The grain sizedistribution of the sample prepared with a McCrone mill complies withthe recommended particle size range for XRD analysis of under 5 to50 μm [3536] while the other sample exceeds the range
In Fig 9 Rietveld refinement of an autoclaved sample is shown Thedominant peaks at 77 290 and 301deg 2θ are attributed to tobermoriteIn the upper diagram (a) Rietveld refinement was carried out regularlycalculating isotropic domain sizes for tobermorite However the cal-culated fit differs significantly from the raw data It can be assumed thattobermorite shows a similar pattern to portlandite in terms of aniso-tropic peak broadening taking into account that tobermorite is as-signed to the orthorhombic crystal system Thus instead of a biaxialcylinder model an elliptic cylinder model (Fig 10 structure createdwith VESTA 318 [34]) was applied for the refinement in the lowerdiagram (b) The elliptic cylinder model is a sufficient approach to the
orthorhombic crystal system as it allows the distinction between do-main sizes in a b and c direction The fit is clearly superior using theanisotropic domain size model highlighted by the difference plot inFig 9b The comparison refinement with isotropic and anisotropic ap-proach was done for all of the five autoclaved samples In Fig 11 theresulting Rwp values for the whole pattern and the RBragg values of to-bermorite are shown The refinement using the anisotropic model leadsto both lower Rwp and RBragg values and consequently to a better fit anda more accurate quantification of tobermorite in all refined samples
4 Summary and conclusions
Improved analytical methods for both the phase developmentduring the hydration before autoclaving and during the autoclavingprocess of AAC are presented It could be shown that wet McCronemilling is the best way of preparation of AAC samples in order to obtainsuitable samples for powder diffraction A new approach to treat ani-sotropic domain sizes for Rietveld refinement could be successfullyapplied ndash with the benefit that portlandite and tobermorite in AACsamples could be refined more accurately using the Rietveld methodThus this application allows an improved quantification of the phasedevelopment during both of the production steps
For the future there are still plenty of possibilities to apply thepresented approach of calculating anisotropic domain sizes to AACproduction As exemplified with portlandite the mechanisms of growthof tobermorite can be tracked likewise during the autoclaving processIn addition the effect of variations in the chemical composition of AACraw mixtures on the crystal morphology of tobermorite can be ex-amined This leaves a new perspective to discuss the link between mi-neral phase morphology and the thermal and mechanical properties ofAAC
Acknowledgement
The autoclaved samples were generously provided by RodgauerBaustoffwerke GmbH amp Co KG The authors express gratitude for allsupport
Appendix A Supplementary data
Supplementary data to this article can be found online at httpsdoiorg101016jcemconres201802028
References
[1] MW Grutzeck Cellular concrete in M Scheffler P Colombo (Eds) CellularCeramics Wiley-VCH Weinheim 2005 pp 193ndash223
[2] M Haas The future of AAC ndash from a material scientists point of view inMC Limbachiya JJ Roberts (Eds) Autoclaved Aerated Concrete Taylor FrLondon 2005 pp 187ndash194
[3] T Mitsuda K Sasaki H Ishida Phase evolution during autoclaving process ofaerated concrete J Am Ceram Soc 75 (1992) 1858ndash1863
[4] N Isu H Ishida T Mitsuda Influence of quartz particle size on the chemical and
Fig 10 Triaxial cylinder domain size model of Tobermorite used for Rietveld refinement of anisotropic peak broadening
Fig 11 Comparison of Rwp and RBragg values of Rietveld refinements of autoclavedsamples and tobermorite using the isotropic and the anisotropic domain size model
J Schreiner et al Cement and Concrete Research 107 (2018) 247ndash252
251
6 Publications
43
mechanical properties of autoclaved aerated concrete (I) tobermorite formationCem Concr Res 25 (1995) 243ndash248
[5] NY Mostafa Influence of air-cooled slag on physicochemical properties of auto-claved aerated concrete Cem Concr Res 35 (2005) 1349ndash1357 httpdxdoiorg101016jcemconres200410011
[6] K Matsui J Kikuma M Tsunashima T Ishikawa S Matsuno A Ogawa M SatoIn situ time-resolved X-ray diffraction of tobermorite formation in autoclaved aer-ated concrete influence of silica source reactivity and Al addition Cem Concr Res41 (2011) 510ndash519
[7] C Biagioni S Merlino E Bonaccorsi The tobermorite supergroup a new no-menclature Mineral Mag 79 (2015) 485ndash495 httpdxdoiorg101180minmag2015079222
[8] BH OConnor MD Raven Application of the Rietveld refinement procedure inassaying powdered mixtures Powder Diffract 3 (1988) 2ndash6 httpdxdoiorg101017S0885715600013026
[9] D Jansen F Goetz-Neunhoeffer C Stabler J Neubauer A remastered externalstandard method applied to the quantification of early OPC hydration Cem ConcrRes 41 (2011) 602ndash608 httpdxdoiorg101016jcemconres201103004
[10] D Jansen C Stabler F Goetz-Neunhoeffer S Dittrich J Neubauer Does OrdinaryPortland Cement contain amorphous phase A quantitative study using an externalstandard method Powder Diffract 26 (2011) 31ndash38 httpdxdoiorg10115413549186
[11] D Ectors F Goetz-Neunhoeffer J Neubauer A generalized geometric approach toanisotropic peak broadening due to domain morphology J Appl Crystallogr 48(2015) 189ndash194 httpdxdoiorg101107S1600576714026557
[12] D Ectors F Goetz-Neunhoeffer J Neubauer Routine (an)isotropic crystallite sizeanalysis in the double-Voigt approximation done right Powder Diffract 32 (S1)(2017) 27ndash34 httpdxdoiorg101017S0885715617000070
[13] HM Rietveld A profile refinement method for nuclear and magnetic structures JAppl Crystallogr 2 (1969) 65ndash71 httpdxdoiorg101107S0021889869006558
[14] D Ectors Advances in the Analysis of Cementitious Reactions and Hydrate Phases(Doctoral Thesis) (2016) pp 12ndash14 (urnnbndebvb29-opus4-71743)
[15] AacuteG De La Torre S Bruque J Campo MAG Aranda The superstructure of C3Sfrom synchrotron and neutron powder diffraction and its role in quantitative phaseanalyses Cem Concr Res 32 (2002) 1347ndash1356 httpdxdoiorg101016S0008-8846(02)00796-2
[16] A Kirfel G Will Charge density in anhydrite CaSO4 from X-ray and neutrondiffraction measurements Acta Crystallogr Sect B Struct Crystallogr CrystChem 36 (1980) 2881ndash2890 httpdxdoiorg101107S0567740880010461
[17] C Bezou AN Christensen D Cox M Lehman A Nonat Structures cristallines deCaSO405H2O et CaSO406H2O Comptes Rendus Hebd Des Seacuteances lAcadeacutemieDes Sci Seacuterie 2 (312) (1991) 43ndash48
[18] KH Jost B Ziemer R Seydel Redetermination of the structure of β-dicalciumsilicate Acta Crystallogr Sect B Struct Crystallogr Cryst Chem 33 (1977)1696ndash1700 httpdxdoiorg101107S0567740877006918
[19] W Mumme LMD Cranswick BC Chakoumakos Rietveld crystal structure re-finements from high temperature neutron powder diffraction data for the poly-morphs of dicalcium silicate Neues Jahrb Fuer Mineral Abhandlungen 170 (1996)171ndash188
[20] A Colville S Geller The crystal structure of brownmillerite Ca2FeAlO5Crystallographica 50 (1971) 2311ndash2315 httpdxdoiorg101107S056774087100579X
[21] ST Bergold F Goetz-Neunhoeffer J Neubauer Quantitative analysis of C-S-H inhydrating alite pastes by in-situ XRD Cem Concr Res 53 (2013) 119ndash126 httpdxdoiorg101016jcemconres201306001
[22] EN Maslen VA Streltsov NR Streltsova N Ishizawa Electron density and op-tical anisotropy in rhombohedral carbonates III Synchrotron Xray studies ofCaCO3 MgCO3 and MnCO3 Acta Crystallogr Sect B 51 (1995) 929ndash939 httpdxdoiorg101107S0108768195006434
[23] G Renaudin Y Filinchuk J Neubauer F Goetz-Neunhoeffer A comparativestructural study of wet and dried ettringite Cem Concr Res 40 (2010) 370ndash375httpdxdoiorg101016jcemconres200911002
[24] WF Cole CJ Lancucki A refinement of the crystal structure of gypsumCaSO42H2O Acta Cryst B30 (1974) 921ndash929 httpdxdoiorg101107S0567740874004055
[25] T Runčevski RE Dinnebier OV Magdysyuk H Poumlllmann Crystal structures ofcalcium hemicarboaluminate and carbonated calcium hemicarboaluminate fromsynchrotron powder diffraction data Acta Crystallogr Sect B Struct Sci 68 (2012)493ndash500 httpdxdoiorg101107S010876811203042X
[26] JM Hughes JW Drexler Cation substitution in the apatite tetrahedral site crystalstructures of type hydroxylellestadite and type fermorite Neues Jahrb FuerMineral (1991) 327ndash336
[27] CH Shen RS Liu JG Lin CY Huang Phase stability study of La12Ca18Mn2O7Mater Res Bull 36 (2001) 1139ndash1148
[28] SW Bailey Refinement of an intermediate microcline structure Am Miner 54(1969) 1540ndash1545
[29] WR Busing HA Levy Neutron diffraction study of calcium hydroxide J ChemPhys 26 (1957) 563 httpdxdoiorg10106311743345
[30] Y Le Page G Donnay Refinement of the crystal structure of low-quartz ActaCrystallogr Sect B 32 (1976) 2456ndash2459 httpdxdoiorg101107S0567740876007966
[31] SA Hamid The crystal structure of the 11 Aring natural tobermoriteCa225[Si3O75(OH)15]1H2O Zeitschrift Fuer Krist - New Cryst Struct 154 (1981)189ndash198 httpdxdoiorg101524zkri19811543-4189
[32] P Mondal JW Jeffery The crystal structure of tricalcium aluminate Ca3Al2O6Acta Crystallogr B 31 (1975) 689ndash697 httpdxdoiorg101107S0567740875003639
[33] Y Takeuchi F Nishi I Maki Crystal-chemical characterization of the tricalciumaluminate-sodium oxide (3CaOtimesAl2O3-Na2O) solid-solution series Zeitschrift FuumlrKrist (1980) 259ndash307
[34] K Momma F Izumi VESTA 3 for three-dimensional visualization of crystal vo-lumetric and morphology data J Appl Crystallogr 44 (2011) 1272ndash1276 httpdxdoiorg101107S0021889811038970
[35] K Scrivener R Snellings B Lothenbach A Practical Guide to MicrostructuralAnalysis of Cementitious Materials CRC Press 2016 pp 123ndash125 httpdxdoiorg107693wl20150205
[36] V Pecharsky P Zavalij Fundamentals of Powder Diffraction and StructuralCharacterization of Materials Springer second edition 2005 p 302 httpdxdoiorg101007978-0-387-09579-0
J Schreiner et al Cement and Concrete Research 107 (2018) 247ndash252
252
6 Publications
44
7 Acknowledgement
7 Acknowledgement
Ich moumlchte mich bei einigen Personen bedanken ohne die es wohl kaum zum erfolgreichenAbschluss dieser Arbeit gekommen waumlreMein Doktorvater Prof Dr Juumlrgen Neubauer hat sich stets die Zeit genommen die noumltigwar um Angelegenheiten aller Art mit mir zu klaumlren Er gab mir fachlich immer zumrichtigen Zeitpunkt einen gewissen wissenschaftlichen Impuls Zugleich habe ich mich den-noch immer frei in meiner eigenen Konzeption gefuumlhlt Groszligen Dank spreche ich Prof DrFriedlinde Goumltz-Neunhoeffer aus die fuumlr mich ebenso immer eine verlaumlssliche Ansprech-partnerin fuumlr fachliche und organisatorische Angelegenheiten aller Art war Danke anDr Daniel Jansen fuumlr die gute Zusammenarbeit und dafuumlr dass er mich im Zuge meinerMasterarbeit in ein Forschungsprojekt aufgenommen hat das den Weg zur Promotionmoumlglich machte Zusaumltzlich gilt mein Dank Prof Dr Matthias Goumlbbels der fuumlr dieMitarbeiter am Lehrstuhl immer motivierende Worte fand Fuumlr die Ermoumlglichung meinerTeilnahme an diversen Dienstreisen Fortbildungen und Tagungen moumlchte ich mich viel-mals bedankenWeiterhin bedanke ich mich bei Dr Stephan Volkmann und den Rodgauer BaustoffwerkenGmbH amp Co KG fuumlr die gute Zusammenarbeit und die Bereitstellung von Versuchsma-terialienVielen Dank an meine studentischen Hilfskraumlfte Daniel Wagner Laura MoldenhauerFabian Lang Jakob Schreiber und Felix Klaassen die alle Aufgaben im Labor einwand-frei und mit Bedacht erledigten Bei meinen aktuellen und ehemaligen Kollegen DrKatrin Hurle Dr Dominique Ectors Dr Christoph Naber Dr Florian Huumlller JoumlrgNehring Frank Riedel Julian Wolf Tanja Manninger Daniel Wagner Nicolas FobbeKarla Spaumlth Julian Goergens Andreas Koumlhler Cordula Jakob Franz Becker und LisaKlemenz bedanke ich mich fuumlr die gelungene Zusammenarbeit und gegenseitige Unter-stuumltzung Besonderer Dank geht auch an Kerstin Kreszlig Bettina Engl Christian HankeBernd Schleifer und Christian Abe fuumlr die verlaumlssliche Unterstuumltzung bei technischen Fra-gen und Messungen im LaborFuumlr jegliche Unterstuumltzungen moumlchte ich mich auch bei meinen Eltern bedanken sowiebei meinem Bruder Ralf der mir mit einem LaTex Crashkurs viel Frustration ersparthat Danke Thomas dass du immer fuumlr mich da bist und mit mir zusammen fuumlr genugAusgleich gesorgt hast
45
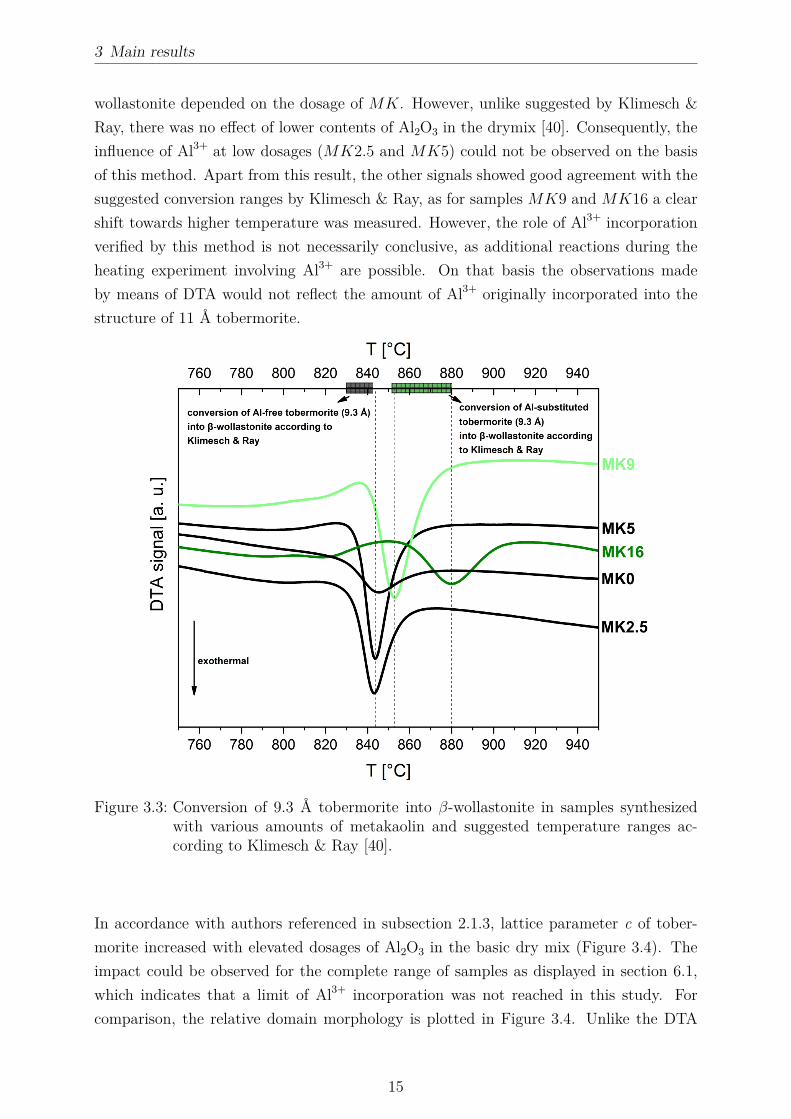
3 Main results
wollastonite depended on the dosage of MK However unlike suggested by Klimesch ampRay there was no effect of lower contents of Al2O3 in the drymix [40] Consequently theinfluence of Al3+ at low dosages (MK25 and MK5) could not be observed on the basisof this method Apart from this result the other signals showed good agreement with thesuggested conversion ranges by Klimesch amp Ray as for samples MK9 and MK16 a clearshift towards higher temperature was measured However the role of Al3+ incorporationverified by this method is not necessarily conclusive as additional reactions during theheating experiment involving Al3+ are possible On that basis the observations madeby means of DTA would not reflect the amount of Al3+ originally incorporated into thestructure of 11 Aring tobermorite
Figure 33 Conversion of 93 Aring tobermorite into β-wollastonite in samples synthesizedwith various amounts of metakaolin and suggested temperature ranges ac-cording to Klimesch amp Ray [40]
In accordance with authors referenced in subsection 213 lattice parameter c of tober-morite increased with elevated dosages of Al2O3 in the basic dry mix (Figure 34) Theimpact could be observed for the complete range of samples as displayed in section 61which indicates that a limit of Al3+ incorporation was not reached in this study Forcomparison the relative domain morphology is plotted in Figure 34 Unlike the DTA
15
3 Main results
signals both lattice parameter c and the domain morphology are impacted by very lowdosages of Al2O3 There is a good accordance of the relation of growth in b direction to adirection and the c parameter This is valid up to 20 wt of Al2O3 in the starting drymix By contrast more elevated contents of Al2O3 did not affect the domain morphologyany further even though the incorporation is verified through the increased c parameterIt follows that the impact of Al3+ incorporation on the domain morphology is limited tovery low contents while the impact on lattice parameter c can be tracked throughoutthe entire examined range of samples In section 61 additional results show that growthin b direction increased with reaction time These observations are solely based on XRDanalysis and offer new benefits for the structural understanding of tobermorite
Figure 34 Impact of the calculated Al2O3 content in the basic dry mix on the latticeparameter c and on the relation of calculated domain sizes of tobermorite ina (x) and b (y) direction
16
3 Main results
32 Structural properties of tobermorite in AAC - SEMversus XRD analysis
This section and the respective publication [59] mainly deal with the suitability of SEManalysis of tobermorite in AAC The effects of varying amounts of SO3 and Al2O3 in thedry mix on structural properties of tobermorite are discussed based on XRD analysisAs shown in subsection 221 and Figure 23 tobermorite often shows a house-of-cardsstructure in AAC samples This property has been considered to be relevant for thethermal and mechanical properties of AAC (subsection 221) However SEM analysiswithin this study revealed that this type of appearance is mainly found in the poresand pore surfaces (Figure 35) This finding comes in agreement with the observationsmade by Huang et al [48] In the solid skeleton of the dense AAC material neither themorphology nor the house-of-cards structure could be observed properly which can beseen very clearly in additional micrographs provided in section 62 It should be consideredthat the major amount of tobermorite by weight is located in the dense material and notat the pore surfaces In this way these findings are clear disadvantages coming along withonly SEM analysis of AAC as representative results can hardly be obtained
Figure 35 House-of-cards structure of tobermorite in a pore surrounded by dense mate-rial
Moreover several authors in subsection 221 justified the morphology of tobermorite withthe incorporation of foreign ions Al-substituted tobermorite showed lath-like morphologywhereas Al-free tobermorite showed rather plate-like morphology [6 32 49] Howeverthe present investigation revealed that independent of Al2O3 content in the raw mix there
17
3 Main results
is always heterogeneity regarding the morphology of tobermorite In Figure 36 plate-likeand lath-like morphology of tobermorite in AAC observed in two statistical chemicallyvarious samples are displayed This result supports the previous assumption that theobservations made by SEM analysis of tobermorite in AAC strongly depend on whatpart of the sample is selected Yet again no clear observations could be made that wererepresentative for the entire sample
Figure 36 Heterogeneous morphology of tobermorite (plate-like in a and c lath-like in band d) in two AAC samples characterized by different Al2O3 contents in theraw mix
The effects of Al3+ on the domain morphology of tobermorite were measured and evaluatedin a similar manner as in section 61 and the results could be confirmed The relativedomain growth in b direction was increased by Al3+ incorporation in both studies [5859] Moreover lattice parameter c was increased with Al3+ incorporation which can beseen more accurately in section 62 Unlike SEM analysis XRD analysis allowed clearconclusions whenever structural properties of Al-substituted tobermorite were affectedInstead of a local observation as made with SEM representative and statistical resultswere obtained The reader is referred to section 61 and section 62 for further results and
18
3 Main results
more specific conclusionsIn addition the effect of various amounts of sulfate in the raw mix was analyzed Unlikein the case of different dosages of Al3+ neither the domain morphology nor the latticeparameters of tobermorite were affected by the SO3 content in the dry mix In Figure 37these observations and additionally the amounts of anhydrite measured by QXRD areshown As the amount of available SO3 in the dry mix is known the maximum possibleamount of anhydrite could be calculated for each of the samples in focus Obviouslythe measured amounts of anhydrite are either equal or slightly higher compared to theexpected quantities This result leads to the assumption that all of the available sulfateis transformed into anhydrite so that no more sulfate could be incorporated into thestructure of tobermorite The over-estimation of anhydrite in some of the samples can beexplained due to the inaccuracy of the quantification method The present results rathermatch with the suggestions by Sauman amp Valtr [41] as in their study no effect of sulfateon the structure of tobermorite was observed either
Figure 37 Impact of the sulfate content in the AAC raw mix on lattice parameter cand relative domain morphology of tobermorite (a) and comparison of theexpected maximum amount of anhydrite to the measured amount determinedby QXRD (b)
33 Improved monitoring of the phase developmentduring the production of AAC
In this study not only autoclaved samples were analyzed but additionally a lab-scale slurrywhich included the reactive components of the green cake stage during AAC productionat equivalent weight proportions In-situ XRD was performed at 70 degC and at a water-to-
19
3 Main results
solid ratio of 08 for 24 h (Figure 38) which are respective conditions during commercialproduction Clearly the phase development is dominated by OPC and lime hydration asdescribed in section 22 It can be seen that the major reaction turnover occurs duringthe first 200 minutes which is the average duration of the green stage After only 30minutes all of the quicklime had transformed into portlandite whereas Schober proposeda duration of one hour for this reaction [42] The amount of portlandite is composed oftwo different generations as proposed by Ectors [52] Equally a biaxial cylinder modelwas applied in order to fit the peak broadening of the first generation of portlandite in thepresent investigation Minor phase developments such as the formation of AFm phases arenot shown in Figure 38 A coarse fraction of anhydrite did not react so that constantlyaround 15 wt were measured after 6 h As the decomposition of ettringite due tosulfate depletion [55] does not occur prior to 12 h the green cake strength is not affected
Figure 38 In-situ XRD measurement of AAC model slurry at water-to-solid ratio of 08and 70 degC For clarity and comprehensibility not all phases are shown
The separation of two generations of portlandite in the system does not only translate intodifferent domain morphologies as shown by Ectors [52] In Figure 39 more indicationsfor different mineralogical properties are displayed The shape of the (0 0 1) reflection inXRD patterns after only quicklime hydration and after both quicklime and alite hydrationshows a distinct feature While portlandite originating from quicklime hydration showsa broad peak implying lower crystallinity the peak after alite hydration is characterized
20
3 Main results
Figure 39 Formation of two generations of portlandite in AAC slurry in XRD (a) andDTA (b) plots
by a sharper component Yet the peak breadth did not change indicating that the firstgeneration is still present with the original characteristics This observation is supportedby DTA measurements additionally demonstrating two degrees of crystallinity only afteralite hydration In agreement with XRD analysis the better crystalline second generationof portlandite decomposes at a higher temperature
Figure 310 Quantification of tobermorite in statistical chemically various AAC sampleswith and without the application of the macro for the fitting of anisotropicpeak broadening
21
3 Main results
Furthermore commercial AAC samples were considered in this study By applying themethod for the refinement of anisotropic peak broadening (Figure 31) a more accuratequantification of tobermorite can be achieved In Figure 310 the calculated amounts oftobermorite in statistical chemically various AAC samples are plotted In some samplesthe refinement using the macro leads to considerably higher but never lower quantitiesof tobermorite whereas in other samples nearly the same amount of tobermorite is cal-culated This observation can be well understood taking into account that the macroallows to account more peak area for tobermorite as shown in Figure 31 Clearly thereis evidence that the anisotropy of tobermorite domains is not uniform from one sampleto another which was basically justified in the previous sections As an improved quan-tification of a single phase leads to a better quantification of other phases in the samplethis adaption is very valuable in order to assess the phase development Here the peakbroadening of tobermorite equally observed by Qu et al [6] could be tracked and evalu-ated in order to gain more accurate results Moreover in section 63 McCrone milling issuggested in order to avoid spottiness in XRD patterns caused by coarse grains of quartzor anhydrite (Figure 38)
22
4 Conclusions
4 Conclusions
The research results presented in the previous sections yield advances in the mineralogicalinvestigation of tobermorite and autoclaved aerated concrete Recorded diffraction pat-terns contain plenty of usually unused data regarding the microstructural characteristicsof the sample and phases therein The profit of XRD measurements can be significantlyimproved whenever one or more phases show anisotropic peak broadening and appro-priate models for the respective domain morphology are implemented into the Rietveldenvironment Within the scope of the present investigations portlandite and tobermoriteshow this particularityThe effects of changes in the chemistry of the starting mix were examined based on dif-ferent dosages of metakaolin Al-substituted tobermorite showed increased growth in b
direction and an increase of lattice parameter c compared to Al-free tobermorite The rel-ative domain sizes were determined based on anisotropic peak broadening However whilethe effect of Al3+ incorporation into the lattice of tobermorite was limited regarding thedomain morphology lattice parameter c showed an increase throughout the entire rangeof samples The consequent effects suggested by Klimesch amp Ray observed by means ofDTA are debatable as reactions during the heating experiment may lead to to a changeof Al3+ content in tobermorite [40] While both types of applied metakaolin showed goodreactivity at hydrothermal conditions some included minor phases such as feldspar oranatase remained unreacted At high dosages of Al2O3 in the starting mix the formationof either only katoite or katoite along with tobermorite was observed (Figure 32)SEM analysis of tobermorite in AAC cannot be suggested based on the observationspresented in this work as it is only visually accessible in the pores or at pore surfacesThe dense material of the AAC skeleton contains several crystalline and X-ray amorphousphases which hardly allows a proper investigation Even in single pores tobermorite crys-tals appeared very heterogeneous at various chemical compositions As a result lath-liketobermorite was not only present in samples characterized by elevated Al3+ incorporationBy contrast the benefits of XRD analysis presented in section 61 equally accounted fortobermorite in AAC samples Sulfate incorporation into the lattice of tobermorite wasnot observed All of the sulfate in the system was detected to be present in anhydriteThe phase transitions in the AAC raw slurry during the green stage hydration were show-cased by in-situ XRD analysis of a model mix at 70 degC Additional DTA and XRD mea-
23
4 Conclusions
surements during this step confirmed the presence of two generations of portlandite char-acterized by different crystallinity as suggested by Ectors [52] The inclusion of anisotropicdomain morphology during the Rietveld refinement allowed a more accurate quantifica-tion of tobermorite in autoclaved samples Sample preparation adjusted to the grain sizedistribution in AAC samples (section 63) the external standard method for quantita-tive XRD analysis [55] and the approach to evaluate anisotropic peak broadening [19]are the key methods for a more accurate tracking of the phase development during AACproduction
24
5 References
5 References
[1] A E Zadov A I Grabezhev N N Pertsev N V Chukanov and S V PribavkinTobermorite-plombierite metasomatites of the Gumeshevsk skarn-porphyry copper depositmiddle Urals Doklady Earth Sciences 407(3)495ndash497 2006
[2] M F Heddle Preliminary notice of substances which may prove to be new minerals MinMag 4117ndash123 1880
[3] S Merlino E Bonaccorsi and T Armbruster The real structure of tobermorite 11AringNormal and anomalous forms OD character and polytypic modifications European Journalof Mineralogy 13(3)577ndash590 2001
[4] C Biagioni S Merlino and E Bonaccorsi The tobermorite supergroup a new nomencla-ture Mineralogical Magazine 79(2)485ndash495 2015
[5] C A Riacuteos C D Williams and M A Fullen Hydrothermal synthesis of hydrogarnetand tobermorite at 175 degC from kaolinite and metakaolinite in the CaO-Al2O3-SiO2-H2Osystem A comparative study Applied Clay Science 43(2)228ndash237 2009
[6] X Qu Z Zhao and X Zhao Microstructure and characterization of aluminum-incorporated calcium silicate hydrates (C-S-H) under hydrothermal conditions RSC Ad-vances 8(49)28198ndash28208 2018
[7] R Šiaučiunas and K Baltakys Formation of gyrolite during hydrothermal synthesis inthe mixtures of CaO and amorphous SiO2 or quartz Cement and Concrete Research34(11)2029ndash2036 2004
[8] E Venhodovaacute R Janovskyacute and R Drochytka Formation of Tobermorite at Different Ma-terials Composition of Aerated Concrete Applied Mechanics and Materials 752-753247ndash250 2015
[9] L Galvaacutenkovaacute E Bartoniacutečkovaacute T Opravil J Tkacz and P Ptaacuteček The influence ofstarting materials solubility on tobermorite structure formation under the hydrothermalconditions IOP Conference Series Materials Science and Engineering 379(1)1ndash8 2018
[10] T Mitsuda K Sasaki and H Ishida Phase Evolution during Autoclaving Process J AmCeram Soc 75(75)1858ndash1863 1992
[11] A Skawińska The influence of metahalloysite addition on tobermorite formation studied byX-ray powder diffraction and scanning electron microscope MATEC Web of Conferences16305008 2018
[12] S T Bergold F Goetz-Neunhoeffer and J Neubauer Quantitative analysis of C-S-H in
25
5 References
hydrating alite pastes by in-situ XRD Cement and Concrete Research 53119ndash126 2013
[13] O P Shrivastava and F P Glasser Ion-exchange properties of 11-Aring tobermorite Reactivityof Solids 2(3)261ndash268 1986
[14] H Maeda Y Ogawa E H Ishida and T Kasuga Hydrothermal synthesis of tobermoritedoped with phosphorus species for removing heavy metal ions Journal of the AustralianCeramic Society 48(1)8ndash11 2012
[15] O P Shrivastava and R Shrivastava Cation exchange applications of synthetic tobermoritefor the immobilization and solidification of cesium and strontium in cement matrix Bulletinof Materials Science 23(6)515ndash520 2000
[16] G Renman and A Renman Sustainable Use of Crushed Autoclaved Aerated Concrete(CAAC) as a Filter Medium in Wastewater Purification 8th International conferenceon sustainable management of waste and recycled materials in construction GothenburgSweden 30 Mayndash1 June 2012 Proceedings pages 1ndash7 2012
[17] G Schober Chemical transformations during the manufacturing of autoclaved aeratedconcrete (ACC) Cement lime gypsum and quartz sand become cellular concrete ZKG58(7)63ndash70 2005
[18] A J Hamad Materials Production Properties and Application of Aerated LightweightConcrete Review International Journal of Materials Science and Engineering 2(2)152ndash157 2014
[19] D Ectors F Goetz-Neunhoeffer and J Neubauer A generalized geometric approach toanisotropic peak broadening due to domain morphology Journal of Applied Crystallogra-phy 48(1)189ndash194 2015
[20] H M Rietveld A profile refinement method for nuclear and magnetic structures Journalof Applied Crystallography 2(2)65ndash71 1969
[21] S A Hamid The crystal structure of the 11 Aring natural tobermoriteCa225[Si3O75(OH)15]1H2O Zeitschrift fuer Kristallographie - New Crystal Struc-tures 154(3-4)189ndash198 1981
[22] S A S El-Hemaly T Mitsuda and H F W Taylor Synthesis of normal and anomaloustobermorites Cement and Concrete Research 7429ndash438 1977
[23] M Sakiyama and T Mitsuda Hydrothermal reaction between C-S-H and kaolinite for theformation of tobermorite at 180degC Cement and Concrete Research 7(6)681ndash685 1977
[24] E Bonaccorsi S Merlino and A R Kampf The crystal structure of tobermorite 14 Aring(plombierite) a C-S-H phase Journal of the American Ceramic Society 88(3)505ndash5122005
[25] S Merlino E Bonaccorsi and T Armbruster The real structures of clinotobermorite andtobermorite 9 Aring OD character polytypes and structural relationships European Journalof Mineralogy 12(2)411ndash429 2000
[26] K Momma and F Izumi VESTA 3 for three-dimensional visualization of crystal volu-metric and morphology data Journal of Applied Crystallography 44(6)1272ndash1276 2011
26
5 References
[27] S Shaw S M Clark and C MB Henderson Hydrothermal formation of the calcium sil-icate hydrates tobermorite (Ca5Si6O16(OH)2 middot 4H2O) and xonotlite (Ca6Si6O17(OH)2)An in situ synchrotron study Chemical Geology 167(1-2)129ndash140 2000
[28] K Matsui J Kikuma M Tsunashima T Ishikawa S Matsuno A Ogawa and M SatoIn situ time-resolved X-ray diffraction of tobermorite synthesis process under hydrothermalcondition IOP Conference Series Materials Science and Engineering 18(2)60ndash66 2011
[29] G Matekonis R Šiaučiunas and D Vaičiukyniene Hydrothermal Synthesis and Charac-terization of Na + and [ Al 3 + + Na + ] -substituted Tobermorite in CaO-SiO2middotnH2O-H2OSystem MATERIALS SCIENCE 16(3)242ndash248 2010
[30] G Geng R J Myers M J A Qomi and P JM Monteiro Densification of the inter-layer spacing governs the nanomechanical properties of calcium-silicate-hydrate ScientificReports 7(1)1ndash8 2017
[31] D Klimesch and A Ray Autoclaved cement-quartz pastes with metakaolin additionsAdvanced Cement Based Materials 7(3-4)109ndash118 1998
[32] N Y Mostafa A A Shaltout H Omar and S A Abo-El-Enein Hydrothermal synthesisand characterization of aluminium and sulfate substituted 11 nm tobermorites Journal ofAlloys and Compounds 467(1-2)332ndash337 2009
[33] İ Demir M S Başpınar E Kahraman E Ccedilalışkan and G Goumlrhan An Investigation onthe Usability of Diatomite in Aerated Concrete Production In Proc of the Intl Conf onAdvances In Civil Structural And Construction Engineering - CSCE 2014 pages 97ndash1002014
[34] A Skawinska Z Owsiak T Baran and K Hernik The influence of halloysite additionon tobermorite formation in CaO and quartz mix under hydrothermal conditions CementWapno Beton 17(12)426ndash434 2017
[35] N Y Mostafa Influence of air-cooled slag on physicochemical properties of autoclavedaerated concrete Cement and Concrete Research 35(7)1349ndash1357 2005
[36] D Małaszkiewicz and J Chojnowski Influence of addition of calcium sulfate dihydrate ondrying of autoclaved aerated concrete Open Engineering 7(1)273ndash278 2017
[37] N Hara and N Inoue Thermal behaviour of 11Aring tobermorite and its lattice parametersCement and Concrete Research (10)53ndash60 1980
[38] M D Jackson S R Chae S R Mulcahy C Meral R Taylor P Li A H EmwasJ Moon S Yoon G Vola H R Wenk and P JM Monteiro Unlocking the secretsof Al-tobermorite in Roman seawater concrete American Mineralogist 98(10)1669ndash16872012
[39] W Liao W Li Z Fang C Lu and Z Xu Effect of different aluminum substitution rateson the structure of Tobermorite Materials 12(22)1ndash10 2019
[40] D Klimesch and A Ray DTA-TG Study of the CaO-SiO2-H2O and CaO-Al2O3-SiO2-H2OSystems Under Hydrothermal Conditions Journal of Thermal Analysis and Calorimetry56(1)27ndash34 1999
27
5 References
[41] Z Sauman and Z Valtr Substitution of sulphate ions in the crystal lattice of 11 Aring to-bermorite In The VI International Congress on the Chemistry of Cement pages 1ndash14Moscow 1974
[42] G Schober Reaction of raw materials to the final product AAC httpwwwpb-aacde
chemmin2_ehtml 2012 accessed 2020-01-31
[43] D Jansen C Stabler F Goetz-Neunhoeffer S Dittrich and J Neubauer Does Ordi-nary Portland Cement contain amorphous phase A quantitative study using an externalstandard method Powder Diffraction 26(01)31ndash38 2011
[44] C Roumlszligler J Stark F Steiniger and W Tichelaar Limited-dose electron microscopyreveals the crystallinity of fibrous C-S-H phases Journal of the American Ceramic Society89(2)627ndash632 2006
[45] Y Sakalli and R Trettin Investigation of C3S hydration by environmental scanning elec-tron microscope Journal of Microscopy 259(1)53ndash58 2015
[46] F Matsushita Y Aono and S Shibata Expansion and shrinkage behavior of green cakeof Autoclaved Aerated Concrete In Autoclaved Aerated Concrete - Innovation and Devel-opment Proceedings of the 4th International Conference on Autoclaved Aerated ConcreteKingston UK 8-9 September 2005 pages 101ndash108 CRC Press 2005
[47] C Chucholowski M Holger and K-C Thienel Improving the recyclability environmentalcompatibility and CO2 balance of autoclaved aerated concrete by replacing sulfate carrierand cement with calcined clays CePapers 2(4)503ndash512 2018
[48] X Y Huang W Ni W H Cui Z J Wang and L P Zhu Preparation of autoclavedaerated concrete using copper tailings and blast furnace slag Construction and BuildingMaterials 27(1)1ndash5 2012
[49] W Wongkeo and A Chaipanich Compressive strength microstructure and thermal anal-ysis of autoclaved and air cured structural lightweight concrete made with coal bottom ashand silica fume Materials Science and Engineering A 527(16-17)3676ndash3684 2010
[50] A Roacuteżycka and W Pichoacuter Effect of perlite waste addition on the properties of autoclavedaerated concrete Construction and Building Materials 12065ndash71 2016
[51] N Isu H Ishida and T Mitsuda Influence of quartz particle size on the chemical andmechanical properties of autoclaved aerated concrete (I) tobermorite formation Cementand Concrete Research 25(25)243ndash248 1995
[52] D Ectors Advances in the analysis of cementitious reactions and hydrate phases doctoralthesis PhD thesis Friedrich-Alexander-Universitaumlt Erlangen-Nuumlrnberg 2016
[53] D Ectors F Goetz-Neunhoeffer and J Neubauer Domain size anisotropy in the double-Voigt approach An extended model Journal of Applied Crystallography 481998ndash20012015
[54] D Ectors F Goetz-Neunhoeffer and J Neubauer Routine (an)isotropic crystallite sizeanalysis in the double-Voigt approximation done right Powder Diffraction 32(S1)27ndash342017
28
5 References
[55] D Jansen F Goetz-Neunhoeffer C Stabler and J Neubauer A remastered external stan-dard method applied to the quantification of early OPC hydration Cement and ConcreteResearch 41(6)602ndash608 2011
[56] T Ungaacuter G Tichy J Gubicza and R J Hellmig Correlation between subgrains andcoherently scattering domains Powder Diffraction 20(04)366ndash375 2005
[57] Triloki P Garg R Rai and B K Singh Structural characterization of as-depositedcesium iodide films studied by X-ray diffraction and transmission electron microscopy tech-niques Nuclear Instruments and Methods in Physics Research Section A AcceleratorsSpectrometers Detectors and Associated Equipment 736128ndash134 2014
[58] J Schreiner F Goetz-Neunhoeffer J Neubauer and D Jansen Hydrothermal synthesisof 11 Aring tobermorite ndash Effect of adding metakaolin to the basic compound Applied ClayScience 185 2020
[59] J Schreiner F Goetz-Neunhoeffer J Neubauer S Volkmann S Bergold R Webler andD Jansen Advanced Rietveld refinement and SEM analysis of tobermorite in chemicallydiverse autoclaved aerated concrete Powder Diffraction 34143ndash150 2019
[60] J Schreiner D Jansen D Ectors F Goetz-Neunhoeffer J Neubauer and S VolkmannNew analytical possibilities for monitoring the phase development during the production ofautoclaved aerated concrete Cement and Concrete Research 107247ndash252 2018
29
6 Publications
6 Publications
61 Hydrothermal synthesis of 11 Aring tobermorite ndash Effectof adding metakaolin to the basic compound
Reprint of the peer reviewed publication
Schreiner J Goetz-Neunhoeffer F Neubauer J Jansen D 2020 Hydrothermalsynthesis of 11 Aring tobermorite ndash Effect of adding metakaolin to the basic compoundApplied Clay Science 185 httpsdoiorg101016jclay2019105432
with permission from Elsevier
30
Contents lists available at ScienceDirect
Applied Clay Science
journal homepage wwwelseviercomlocateclay
Research paper
Hydrothermal synthesis of 11 Aring tobermorite ndash Effect of adding metakaolin tothe basic compound
J Schreiner F Goetz-Neunhoeffer J Neubauer D JansenUniversity of Erlangen-Nuremberg GeoZentrum Nordbayern Mineralogy Schlossgarten 5a 91054 Erlangen Germany
A R T I C L E I N F O
KeywordsHydrothermal synthesis11 Aring tobermoriteMetakaolinPowder diffractionKatoite
A B S T R A C T
Different amounts and types of metakaolin were analyzed and applied for the hydrothermal synthesis of 11 Aringtobermorite All synthesized samples were investigated by means of powder XRD combined with Rietveld re-finement Al-substituted 11 Aring tobermorite was successfully synthesized on the basis of a broad range of com-pounds characterized by a varying content of metakaolin Katoite was present depending on the amount ofsupplied Al3+ which was determined by the dosage of metakaolin Minor crystalline components included in thetwo types of metakaolin sources varied greatly in their reactivity under hydrothermal conditions Despite adifferent degree of purity the two types of metakaolin showed corresponding effects at moderate dosages butcontrary effects at higher dosages as for the synthesis of 11 Aring tobermorite The domain morphology of to-bermorite could be associated with Al3+ incorporation for low dosages of metakaolin represented by up to 2 wt- Al2O3 in the dry mix By contrast Al3+ affected tobermorite lattice parameters at equivalent and even athigher dosages with c reaching 2295 Aring at 12 wt- Al2O3 in the dry mix
1 Introduction
11 Application of metakaolin as a reactive material in constructionindustry
The application of supplementary cementitious materials (SCMs) inthe field of construction technology has received a lot of attention inrecent years Due to limited resources and an urgent need for alter-native and more eco-friendly construction materials SCMs such asmetakaolin offer a great potential The usage of SCMs has not onlyspread to the cement and mortar industry but also to advanced appli-cations such as autoclaved aerated concrete (AAC) (Demir et al 2014Koutnyacute et al 2014 Walczak et al 2015 Roacuteżycka and Pichoacuter 2016Chucholowski et al 2018) Unlike ordinary cementitious constructionmaterials AAC is produced from hydrothermal curing Due to the dif-ferent thermodynamic environment the hydration process and the re-activity of raw materials have to be investigated properly in order tounderstand the effects on the AAC product The leading mineral phasein AAC is 11 Aring tobermorite (Ca5Si6O16(OH)2middot4H2O) As a consequencethe thermal and mechanical properties of AAC depend on micro-structure and crystallinity of tobermorite to some extent In addition tothe curing time and the fineness of raw materials the supply of ionsthat can substitute in the tobermorite structure is a crucial factor in thiscontext Especially substitutions by aluminum sodium and potassium
ions have been investigated thoroughly (Sauman 1974 Klimesch andRay 1998 Mostafa et al 2009 Matekonis et al 2010 Skawinskaet al 2017) Calcined clays usually contain a considerable amount ofthe mentioned ions
There is a vast amount of literature on the reactivity of SCMs atambient temperature and standard pressure but there is little when itcomes to hydrothermal conditions In previous publications the beha-vior of metakaolin under hydrothermal conditions was mainly in-vestigated for the synthesis of zeolites (Zhang et al 2007 Aguilar-Mamani et al 2014 Setthaya et al 2016 Luo et al 2018) In thesestudies the reactivity of metakaolin was observed at a wide range oftemperature and pH values During the transformation of kaolin intometakaolin a loss of framework alumina was observed (Ayodele et al2019) In recent decades metakaolin has been the subject of studies inthe field of geopolymer research (Rashad 2013 Chen et al 2016) Forthe synthesis of 11 Aring tobermorite a more distinct setting of temperaturesetting (180ndash200 degC) and steam pressure (1ndash12 MPa) are required
This publication is intended to make a new contribution to thechallenging field of hydrothermal synthesis in the system CaO-Al2O3-SiO2-H2O based on XRD analysis combined with Rietveld refinementVarious dosages of two types of metakaolin with different chemical andmineralogical purities are compared for the effects on the hydrothermalsynthesis of Al-substituted 11 Aring tobermorite Especially changes of thebulk chemistry in the raw mixes the reactivity of minor crystalline
httpsdoiorg101016jclay2019105432Received 20 August 2019 Received in revised form 13 November 2019 Accepted 30 December 2019
Corresponding authorE-mail address juergenjsschreinerfaude (J Schreiner)
Applied Clay Science 185 (2020) 105432
0169-1317 copy 2020 Elsevier BV All rights reserved
T
6 Publications
31
phases of the two types of metakaolin and the effect of different curingtimes are the focus of interest On the one hand metakaolin offers agreat potential in the AAC industry On the other hand of all SCMsmetakaolin is a good source material for investigating the influence ofAl3+ on the synthesis of Al-substituted 11 Aring tobermorite
12 Synthesis of Al-substituted 11 Aring tobermorite
In addition to being present in AAC tobermorite has found appli-cation in wastewater treatment and nuclear waste management due toits ion exchange capacity (Maeda et al 2012 Monasterio et al 2015)The substitution of silicon by aluminum results in a different to-bermorite structure due to general and local charge balance affectingthe lattice parameters Especially c is impacted by this substitutionbecause it occurs in the bridging tetrahedron and additional OHndash sub-stitutes O2ndash (Komarneni et al 1985 Merlino et al 2000) As suggestedin some additional studies the substitution of Si4+ by Al3+ and Na+ orK+ leads to a lath-like morphology of tobermorite crystals (Mostafa2005 Mostafa et al 2009 Venhodovaacute et al 2015 Qu et al 2018)However because of the heterogeneous appearance of tobermorite inAAC it is hardly possible to conduct a proper characterization based onSEM analysis In our recent work the anisotropic peak broadening oftobermorite in XRD diffractograms was successfully linked with theincorporation of foreign ions supplied in a common AAC production(Schreiner et al 2019) This finding allowed a more statistical struc-tural characterization of tobermorite in bulk compositions compared toSEM analysis Moreover it was reported in other studies that differenthydrate phases occur depending on the amount of supplied ions and onthe experimental settings In compounds with a high content of Al3+formation of katoite could be observed (Klimesch and Ray 1998 Riacuteoset al 2009 Matsui et al 2011) In the case of a longer curing durationinstead of 11 Aring tobermorite the formation of xonotlite (Siauciunas andBaltakys 2004 Galvaacutenkovaacute et al 2018) or - depending on the finenessof used silica source (Siauciunas and Baltakys 2004) - gyrolite is fa-voured
Kalousek (1956) suggested that tobermorite can contain up to 5Al2O3 More Al2O3 in the system resulted in the formation of hydro-garnet Klimesch and Ray (1998) additionally investigated the stabilityof hydrogarnet depending on the Al(Si + Al) ratio and its role in re-lation to the formation of 11 Aring tobermorite in an equivalent systemThey suggest that hydrogarnet always appears before tobermorite butthe former can only be detected for higher Al(Si + Al) ratios in theevent of longer curing times Riacuteos et al (2009) and Qu et al (2018)confirmed these findings in extensive investigations In the latter pub-lication it is additionally suggested that samples prepared at lowertemperatures (160 degC) are less impacted by the supply of Al3+ Theyalso consider the peak broadening of tobermorite in their XRD plotsbased on the amount of incorporated Al3+ In two recent publicationswe suggested that the peak broadening of tobermorite enables a mi-crostructural analysis by calculating the orientation dependent domainsizes (Schreiner et al 2018 2019) However these studies are based onsamples of industrially produced AAC so that the curing time was fixedThe studied AAC was produced from raw materials with a broad che-mical spectrum such as ordinary Portland cement (OPC) whichsomehow complicates the interpretation of results
In this work the influence of aluminum ions - provided by meta-kaolin - on dominant crystallographic direction-dependent domaingrowth of tobermorite is investigated by analysis of anisotropic peakbroadening (Ectors et al 2015 2017) In Fig 1 of the supplementarymaterial the method of fitting the anisotropic peak broadening of to-bermorite using a triaxial cylinder model is visualized (Schreiner et al2018) Fitting of the anisotropic peak broadening of tobermorite Thismethod is used to calculate the average and reliable values for to-bermorite domain sizes in the powder sample and associate them withaverage Al3+ incorporation Microstrain should be considered becauseit is an additional source of peak broadening However this usually
accounts for materials that have been exposed to different kinds ofstress such as metals and alloys (Badawi et al 2019) In addition theinstrumental contribution to peak broadening should be consideredHydration products such as tobermorite are characterized by crystallitesizes in the range of nanometers so that anisotropic size broadeningclearly outweighs the effect of instrumental broadening (Jenkins andSnyder 1996) Moreover the impact of Al3+ on the lattice parametersof tobermorite is considered It should additionally be clarified whe-ther the results from our previous publication (Schreiner et al 2019)based on industrially produced AAC can be confirmed by investigationwith less complex raw mixes and purely based on laboratory experi-ments
2 Material and methods
21 Starting materials
The starting materials for hydrothermal synthesis included deio-nized water quartz flour portlandite (999 pure) and two types ofmetakaolin One type was ordinary commercially available metakaolin(MK) with nearly a stoichiometric composition For comparison thesecond type of commercially available metakaolin was a by-productfrom expanded glass production (MKg) and consequently highly im-pure The chemical composition of MK and MKg determined by XRF isgiven in Table 1 With MKg containing less Al2O3 but considerably moreNa2O than MK the effects on hydrothermal synthesis were of interestBoth types of metakaolin have been characterized in previous pub-lications (Schmidt et al 2012 Naber et al 2019) In addition weverified the mineral phase content by XRD analysis Besides amorphousmetakaolin MK contained minor amounts of anatase quartz and mica
Fig 1 Weight fractions of tobermorite quartz and katoite determined byquantitative XRD analysis ndash samples including MKg crosshatched
Table 1Chemical composition of MK and MKg determined by XRF analysis ndash majorcontrasts in bold letters
Oxides [wt-] MK MKg
SiO2 536 604Al2O3 392 206CaO 01 40MgO 01 12Na2O 0 96K2O 10 18Fe2O3 18 05TiO2 21 03P2O5 01 02Loss on ignition 15 1
J Schreiner et al Applied Clay Science 185 (2020) 105432
2
6 Publications
32
MKg contained additional kaolinite feldspar and quartz
22 Investigated mix composites
For the preparation of raw mixtures the powders were weighed andhomogenized using a lab-scale mixing mill Table 2 lists the composi-tion and nomenclature of all samples including Al2O3 content andcuring time in the autoclave
bull Besides one blank mixture (MK0) that did not contain any type ofmetakaolin eleven more compounds were prepared of which threeincluded different dosages of MKg (MKg16 MKg23 and MKg60)Three more mixes contained equivalent amounts of MK instead ofMKg (MK16 MK23 and MK60) These mixes were investigated inorder to have a direct comparison concerning the effects of differentraw material on the synthesis of tobermorite
bull Additionally the mixes MK9 MK5 and MK25 with lower dosages ofmetakaolin were analyzed In the referenced literature (Schreineret al 2019) the effect of Al3+ on the anisotropic peak broadeningof tobermorite could only be observed in the case of Al2O3 contentslower than 4 in the drymix In the latter three mixes Al2O3 con-tents range from 1 to 35 Al2O3 (calculated from XRF data) whichmeets the region of interest for the analysis of tobermorite domainmorphology
bull The curing time for nearly all of the investigated samples was 12 hbut compound MK9 was prepared two more times for curing timesof 2 h and 6 h The different curing times were chosen in this par-ticular sample so that the reactivity of metakaolin and the phasetransitions could be observed more precisely
23 Hydrothermal treatment
Due to the different fineness of raw materials there was a differentwater demand from one mixture to another In order to obtain slurriesof comparable rheology the amount of water was adapted respectivelyresulting in water-to-solid ratios of 25 to 3 which matches the sug-gested water-to-solid ratio for this purpose (Roacutezycka et al 2014Galvaacutenkovaacute et al 2018) The weighed water was added to the dry mixand after stirring for 1 min at 23 degC the slurry was poured into thereactor Minor changes in the quantity of added water did not have aninfluence on the measured steam pressure All experiments were con-ducted using a PTFE-lined stainless steel autoclave with a reactor vo-lume of 300 ml The oven temperature was fixed at 180 degC and auto-genous steam pressure of 11ndash12 MPa was measured during eachexperiment with an external manometer After cooling to room tem-perature the sample was removed from the reactor coarsely ground
using an agate mortar and dried at 60 degC for 12 h After drying thesample was ground with an agate mortar again in order to deagglo-merate the particles As no coarse raw materials were used there wasno need for wet McCrone milling (Schreiner et al 2018)
24 XRD analysis
After preparation into front-loading sample holders the powdersamples were measured with a D8 diffractometer (Bruker) equippedwith a LynxEye detection system and Bragg-Brentano geometry Thesettings for XRD analysis included a tube voltage of 40 kV a current of40 mA an angular range from 6 to 80deg 2θ (Cu Kα radiation) a time perstep of 054 s a step width of 00236deg 2θ and a PSD opening of 33deg Thebackground was fitted with Chebyshev polynomial of the fifth orderThe major contribution of amorphous phase was fitted with a singlepeak with a fixed position at 308deg 2θ so that tobermorite reflectionswere not affected An external quartzite standard was measured withthe same parameters in order to determine phase quantities (Jansenet al 2011) Bruker AXS software TOPAS 50 was used for Rietveldrefinement (Rietveld 1969) and the used structures are shown inTable 3
3 Results and discussion
31 Different dosages of MK and MKg
In Fig 1 the quantities of tobermorite quartz and katoite present inmost of the samples determined by XRD analysis are illustratedWhenever tobermorite was the leading mineral hydrate phase a basalspacing of 113 Aring could be verified in each of the diffractograms Thequantities of minor crystalline phases and amorphous content are notshown For low dosages of MK it can be seen that the weight fraction oftobermorite decreased At moderate dosage of both types of metakaolin(MK16 MK23 MKg16 MKg23) tobermorite was present in comparablequantities It can be seen that the amount of katoite in the mixes de-pended on the dosage of metakaolin and it appeared only at dosages ofMK5 or more Due to the higher content of aluminum in MK comparedto MKg more katoite could always be observed in the MK mixes atequivalent dosages Despite equal amounts of quartz as starting mate-rial in mixes for both types of metakaolin the resulting weight fractionsin the cured samples were not alike Considerably more quartz waspresent in the MK samples Even though less quartz was used for mixescontaining higher amounts of MK even more quartz was present afterhydrothermal curing (Table 2 Fig 1) Consequently some of the SiO2
provided by MK did not transform into an amorphous phase or to-bermorite but into quartz This finding is verified by the presence ofquartz in MK60 because no quartz was included in the raw mixture Thefeldspar present in MKg did not react so Na2O and an unknown amountof Al2O3 may not have been supplied for hydrothermal reaction Besidestobermorite and quartz additional calcite scawtite (Ca7Si6(CO3)
Table 2Basic powder compounds prepared for the hydrothermal synthesis of to-bermorite with the respectively calculated Al2O3 content and curing time in thereactor
Sample Portlandite[wt-]
Quartz[wt-]
MK[wt-]
MKg
[wt-]
Al2O3
[wt-]Curingtime [h]
MK0 49 51 ndash ndash 0 12MK25 495 48 25 ndash 1 12MK5 49 46 5 ndash 2 12MK9_2h 48 43 9 ndash 35 2MK9_6h 48 43 9 ndash 35 6MK9_12h 48 43 9 ndash 35 12MK16 47 37 16 ndash 63 12MK23 46 31 23 ndash 9 12MK60 40 ndash 60 ndash 235 12MKg16 47 37 ndash 16 33 12MKg23 46 31 ndash 23 47 12MKg60 40 ndash ndash 60 124 12
Table 3Structural data used for the investigation with powder XRD analysis
Phase Author
Anatase (Horn et al 1972)Biotite (Brigatti et al 2000)Calcite (Maslen et al 1995)Kaolinite (Zvyagin 1960)Katoite (Bartl 1969)Microcline (Bailey 1969)Plazolite (Basso et al 1983)Portlandite (Busing and Levy 1957)Quartz (Le Page and Donnay 1976)Scawtite (Grice 2005)Tobermorite (Hamid 1981)Xonotlite (Hejny and Armbruster 2001)
J Schreiner et al Applied Clay Science 185 (2020) 105432
3
6 Publications
33
O18bull2(H2O)) and xonotlite (Ca6Si6O17(OH)2) could be identified insample MK0 (XRD plots of samples MK0 MKg16 MKg23 MK16 andMK23) Comparing MK0 and MK25 scawtite and xonotlite could stillbe identified in a very low amount in MK25 but no longer in samplesthat contained even more MK (XRD plots of samples MK0 MK25 MK5and MK9_12h)
Two additional experiments were done without quartz in the rawmixes (MK60 and MKg60) The according diffractograms after hydro-thermal curing are shown in Fig 2 In sample MKg60 tobermorite (gt 50wt-) was successfully synthesized without any other silica sourcethan MKg whereas no crystalline quartz occurred By contrast no to-bermorite but quartz could be identified in equivalent mixture MK60containing MK It can be seen that crystalline components such as micaand anatase in the raw MK did not react at the selected conditions andremained present in the autoclaved samples Except for feldspar in MKgall of the crystalline components appeared to be reactive at the chosenhydrothermal conditions A minor unidentified phase occurred at328deg2θ and additional xonotlite was identified in sample MKg60 Insample MK60 more calcium was needed for the formation of morehydrogarnet (Fig 1) resulting in a lower CaSi ratio for the remainingsystem Sample MKg60 contained only half of the amount of Al3+ and itwas not completely supplied for reaction due to its partial presence infeldspar Consequently essentially less hydrogarnet (Fig 1) was presentin MKg60 after hydrothermal treatment and the CaSi ratio in the re-maining system was affected to a lesser extent
32 Application of MK for different curing times
The development of hydrate phases in the autoclave for compoundMK9 is displayed in Fig 3 After only 2 h of hydrothermal curing all ofthe available portlandite had reacted and katoite (95 wt-) was pre-sent The applied type of metakaolin appeared to react quickly as itsupplied aluminum for formation of katoite No formation of to-bermorite could be observed at this stage yet An assumably amorphousprecursor can be seen at 28 to 30deg2θ Calcium was provided by thedissolution of portlandite After 6 h of hydrothermal reaction amountsof katoite (85 wt-) and quartz (from 31 wt- at 2 h to 165 wt- at6 h) had decreased and a major amount of tobermorite (35 wt-) waspresent Apparently between 2 and 6 h under hydrothermal conditionsthe amorphous precursor and quartz reacted resulting in the formationof tobermorite An additional 6 h of reaction time (MK9_12h) did notchange the phase composition significantly Slightly more tobermorite
(365 wt-) less quartz (16 wt-) and katoite (65 wt-) weremeasured
33 Tobermorite domain morphology and lattice parameters
In the referenced literature an analysis of tobermorite domainmorphology based on anisotropic peak broadening was possible forsamples that contained notgt 4 wt- Al2O3 in the drymix (Schreineret al 2019) Accordingly in this study samples MK0 MK25 MK5MK9_6h and MK9_12h were suitable (Table 2) with MK9_2h not con-taining any tobermorite In Fig 4 the respective growth in a and b di-rection is visualized with x indicating the domain size in a direction andy indicating domain size in b direction using a macro for TOPAS 50(Ectors et al 2015 2017) The calculated cylinder models in Fig 4represent the relation of yx and not absolute sizes With no supply ofaluminum ions (MK0) the relative domain growth in b direction islower compared to samples containing metakaolin This finding agreeswith the results from a similar investigation of tobermorite in AAC(Schreiner et al 2019) However within the samples MK5 andMK9_12h the different amounts of supplied aluminum ions did notshow a clear effect It appeared that low dosages of Al3+ (1 wt- Al2O3
in MK25 and 2 wt- Al2O3 in MK5) were enough to determine thedomain growth of tobermorite Additional results from the samplesMK9_6h and MK9_12h indicated that growth in b direction increasedwith reaction time
In Fig 5 lattice parameters of tobermorite depending on metakaolindosages are plotted B clearly remained unaffected throughout therange of samples Increasing amounts of metakaolin led to a slightlysmaller parameter a However both types of metakaolin showed acorresponding impact on parameter a By contrast parameter c in-creased strongly with increasing amounts of MK and MKg but the typeof metakaolin was significant At an equivalent dosage MK affected thecell dimension in c direction considerably more than MKg so that thefraction of Al3+ appeared to be the decisive parameter Different metaloxides in MKg did not show a notable effect certainly as they werepartially not provided for reaction Unlike for the domain morphologyof tobermorite the impact on lattice parameters could be observedwithin the complete range of examined dosages
4 Conclusions
The results obtained from the introduced investigations allow con-cluding remarks on the effects of the applied types of metakaolin on thesynthesis of 11 Aring tobermorite the phase transitions and the in-corporation of Al3+ into the lattice of tobermorite
With a critical dosage the use of any type of metakaolin led to theformation of katoite in an according amount At moderate dosages(MKg16 MKg23 MK16 and MK23) the two types of metakaolin showeda good correspondence in consideration of the quantities of to-bermorite For higher dosages there were contrary effects Lower do-sages of MK led to considerable quantities of Al-substituted to-bermorite Samples containing low dosages of MK revealed that katoiteappeared in the case ofgt 5 wt- of MK - corresponding to 2 wt-Al2O3 - in the basic compound Minor crystalline phases in MKg showedbetter reactivity than those in MK The observation that no tobermoritewas present in sample MK60 indicated that high dosages of Al3+ hin-dered the formation of tobermorite
Investigations of MK9 at 2 6 and 12 h displayed the evolution ofhydrate phases At first katoite was the only crystalline hydrate phasepresent after 2 h which corresponded to observations in a differentpublication (Klimesch and Ray 1999) The amount of katoite andquartz then decreased and a major amount of tobermorite formed from2 to 6 h curing time In order to gain more information on the trans-formation of amorphous C-(A)-S-H into tobermorite additional ex-periments in the range of 2 to 6 h curing time will be needed
Domain morphology analysis of tobermorite revealed that low
Fig 2 Diffractograms of MKg MKg60 MK and MK60 from 7 to 34deg2θ CuKα Aanatase C calcite F feldspar k kaolinite K katoite M mica Q quartz Ttobermorite U unidentified phase X xonotlite
J Schreiner et al Applied Clay Science 185 (2020) 105432
4
6 Publications
34
dosages of Al3+ determined the domain growth which agreed with theresults published on tobermorite in AAC samples (Schreiner et al2019) Different curing times unveiled that growth in b direction in-creased with the reaction time Al3+ incorporation into the lattice oftobermorite only reflected to a limited extent in the domain mor-phology By contrast an increase of lattice parameter c was triggered byAl3+ even at the highest dosage in this study Ultimately there is no
evidence for a limit of incorporation of Al3+ but there is a limit ofinfluence on the domain morphology These results additionally re-confirm this assumption similarly made in the previous work (Schreineret al 2019) and suggest a new mechanism of tobermorite crystal-lization depending on the presence of Al3+
Supplementary data to this article can be found online at httpsdoiorg101016jclay2019105432
Declaration of Competing Interest
The authors declare that they have no known competing financialinterests or personal relationships that could have appeared to influ-ence the work reported in this paper
Acknowledgement
The authors thank Rodgauer Baustoffwerke GmbH amp Co KG forsupplying raw materials for laboratory experiments
References
Aguilar-Mamani W Garciacutea G Hedlund J Mouzon J 2014 Comparison betweenleached metakaolin and leached diatomaceous earth as raw materials for the synth-esis of ZSM-5 Springerplus 3 1ndash10 httpsdoiorg1011862193-1801-3-292
Ayodele OB Sulaimon AA Alaba PA Tian Z-Y 2019 Influence of metakaolini-zation temperature on the structure and activity of metakaolin supported Ni catalystin dry methane reforming J Environ Chem Eng httpsdoiorg101016jjece2019103239 (in press)
Badawi EA Abdel-Rahman MA Mostafa A Abdel-Rahman M 2019 Determinationof the crystallite size amp micro- strain by novel method from XRD profile Appl Phys2 1ndash15 httpsdoiorg1031058jap201921001
Bailey SW 1969 Refinement of an intermediate microcline structure Am Miner 541540ndash1545
Bartl H 1969 Roentgen-Einkristalluntersuchungen an (CaO)3 (Al2O3) (H2O)6 und an(CaO)12 (Al2O3)7 (H2O) neuer Vorschlag zur (CaO)12 (Al2O3)7-Struktur NeuesJahrb fuer Mineral Monatshefte 1969 404ndash413
Basso R Giusta AD Zefiro L 1983 Crystal structure refinement of plazolite A highlyhydrated natural hydrogrossular Neues Jahrb Miner Monatsh (Neues Jahrb fuerMineral Monatshefte) 1983 251ndash258
Brigatti MF Lugli C Poppi L Foord EE Kile DE 2000 Crystal chemical varia-tions in Li- and Fe-rich micas from Pikes Peak batholith (Central Colorado) AmMineral 85 1275ndash1286 httpsdoiorg102138am-2000-8-920
Busing WR Levy HA 1957 Neutron diffraction study of calcium hydroxide J ChemPhys 26 563 httpsdoiorg10106311743345
Chen L Wang Z Wang Y Feng J 2016 Preparation and properties of alkali acti-vated metakaolin-based geopolymer Materials (Basel) 9 1ndash12 httpsdoiorg103390ma9090767
Chucholowski C Holger M Thienel K-C 2018 Improving the recyclability en-vironmental compatibility and CO2 balance of autoclaved aerated concrete by re-placing sulfate carrier and cement with calcined clays CePapers 2 503ndash512httpsdoiorg101002cepa846
Fig 3 Diffractograms of MK9_2h MK9_6h and MK9_12h from 7 to 38deg2θ CuKα C calcite K katoite Q quartz T tobermorite
Fig 4 Relation of calculated domain sizes of 11 Aring tobermorite in selectedsamples (MK0 MK25 MK5 MK9_6h and MK9_12h) in a (x) and b (y) direction
Fig 5 Lattice parameters of tobermorite depending on MK or MKg dosageincluding blank mix MK0
J Schreiner et al Applied Clay Science 185 (2020) 105432
5
6 Publications
35
Demir İ Başpınar MS Kahraman E Ccedilalışkan E Goumlrhan G 2014 An investigationon the usability of diatomite in aerated concrete production In Proc of the IntlConf on Advances in Civil Structural and Construction Engineering ndash CSCE 2014 pp97ndash100
Ectors D Goetz-Neunhoeffer F Neubauer J 2015 A generalized geometric approachto anisotropic peak broadening due to domain morphology J Appl Crystallogr 48189ndash194 httpsdoiorg101107S1600576714026557
Ectors D Goetz-Neunhoeffer F Neubauer J 2017 Routine (an)isotropic crystallitesize analysis in the double-Voigt approximation done right Powder Diffract 3227ndash34 httpsdoiorg101017S0885715617000070
Galvaacutenkovaacute L Bartoniacutečkovaacute E Opravil T Tkacz J Ptaacuteček P 2018 The influence ofstarting materials solubility on tobermorite structure formation under the hydro-thermal conditions IOP Conf Ser Mater Sci Eng 379 1ndash8 httpsdoiorg1010881757-899X3791012001
Grice JD 2005 The structure of spurrite tilleyite and scawtite and relationships toother silicate-carbonate minerals Can Mineral 43 1489ndash1500 httpsdoiorg102113gscanmin4351489
Hamid SA 1981 The crystal structure of the 11 Aring natural tobermoriteCa225[Si3O75(OH)15]1H2O Zeitschrift fuer Krist 154 189ndash198 httpsdoiorg101524zkri19811543-4189
Hejny C Armbruster T 2001 Polytypism in xonotlite Ca6Si6O17(OH)2 Zeitschrift furKrist 216 396ndash408
Horn M Schwerdtfeger CF Meagher EP 1972 Refinement of the structure of ana-tase at several temperatures Zeitschrift fur Krist 136 273ndash281 httpsdoiorg101524zkri19721363-4273
Jansen D Goetz-Neunhoeffer F Stabler C Neubauer J 2011 A remastered externalstandard method applied to the quantification of early OPC hydration Cem ConcrRes 41 602ndash608 httpsdoiorg101016jcemconres201103004
Jenkins R Snyder R 1996 Introduction to X-ray Powder Diffractometry ChemicalAnalysis Wiley pp 90
Kalousek GL 1956 Crystal Chemistry of Hydrous Calcium Silicates J Am Ceram Soc40 74ndash80
Klimesch D Ray A 1998 Autoclaved cement-quartz pastes with metakaolin additionsAdv Cem Based Mater 7 109ndash118 httpsdoiorg101016S1065-7355(97)00073-4
Klimesch D Ray A 1999 DTA-TGA evaluations of the CaOndashAl2O3ndashSiO2ndashH2O systemtreated hydrothermally Thermochim Acta 334 115ndash122 httpsdoiorg101016s0040-6031(99)00140-9
Komarneni S Roy R Roy DM Fyfe CA Kennedy GJ Bothner-By AA Dadok JChesnick AS 1985 27Al and29Si magic angle spinning nuclear magnetic resonancespectroscopy of Al-substituted tobermorites J Mater Sci 20 4209ndash4214 httpsdoiorg101007BF00552416
Koutnyacute O Opravil T Pořiacutezka J 2014 Application of metakaoline in autoclavedaerated concrete technology Adv Mater Res 1000 174ndash177 httpsdoiorg104028wwwscientificnetAMR1000174
Le Page Y Donnay G 1976 Refinement of the crystal structure of low-quartz ActaCrystallogr Sect B 32 2456ndash2459 httpsdoiorg101107S0567740876007966
Luo H Law WW Wu Y Zhu W Yang EH 2018 Hydrothermal synthesis of needle-like nanocrystalline zeolites from metakaolin and their applications for efficient re-moval of organic pollutants and heavy metals Microporous Mesoporous Mater 2728ndash15 httpsdoiorg101016jmicromeso201806015
Maeda H Ogawa Y Ishida EH Kasuga T 2012 Hydrothermal synthesis of to-bermorite doped with phosphorus species for removing heavy metal ions J AustCeram Soc 48 8ndash11
Maslen EN Streltsov VA Streltsova NR Ishizawa N 1995 Electron density andoptical anisotropy in rhombohedral carbonates III Synchrotron Xray studies ofCaCO3 MgCO3 and MnCO3 Acta Crystallogr Sect B 51 929ndash939 httpsdoiorg101107S0108768195006434
Matekonis G Šiaučiūnas R Vaičiukynienė D 2010 Hydrothermal Synthesis andCharacterization of Na + and [ Al 3 + + Na + ] -substituted Tobermorite in CaO-SiO2middotnH2O-H2O System Mater Sci 16 242ndash248
Matsui K Kikuma J Tsunashima M Ishikawa T Matsuno S Ogawa A Sato M2011 In situ time-resolved X-ray diffraction of tobermorite synthesis process underhydrothermal condition IOP Conf Ser Mater Sci Eng 18 60ndash66 httpsdoiorg1010881757-899X182022017
Merlino S Bonaccorsi E Armbruster T 2000 The real structures of clinotobermoriteand tobermorite 9 Aring OD character polytypes and structural relationships Eur JMineral 12 411ndash429 httpsdoiorg1011270935-122120000012-0411
Monasterio M Gaitero JJ Manzano H Dolado JS Cerveny S 2015 Effect ofchemical environment on the dynamics of water confined in calcium silicate mi-nerals Natural and synthetic tobermorite Langmuir 31 4964ndash4972 httpsdoiorg101021acslangmuir5b00614
Mostafa NY 2005 Influence of air-cooled slag on physicochemical properties of auto-claved aerated concrete Cem Concr Res 35 1349ndash1357 httpsdoiorg101016jcemconres200410011
Mostafa NY Shaltout AA Omar H Abo-El-Enein SA 2009 Hydrothermal synth-esis and characterization of aluminium and sulfate substituted 11 nm tobermoritesJ Alloys Compd 467 332ndash337 httpsdoiorg101016jjallcom200711130
Naber C Stegmeyer S Jansen D Goetz-Neunhoeffer F Neubauer J 2019 ThePONKCS method applied for time resolved XRD quantification of supplementarycementitious material reactivity in hydrating mixtures with ordinary Portland ce-ment Constr Build Mater 214 449ndash457 httpsdoiorg101016jconbuildmat201904157
Qu X Zhao Z Zhao X 2018 Microstructure and characterization of aluminum-in-corporated calcium silicate hydrates (C-S-H) under hydrothermal conditions RSCAdv 8 28198ndash28208 httpsdoiorg101039c8ra04423f
Rashad AM 2013 Metakaolin as cementitious material history scours production andcomposition - a comprehensive overview Constr Build Mater 41 303ndash318 httpsdoiorg101016jconbuildmat201212001
Rietveld HM 1969 A profile refinement method for nuclear and magnetic structures JAppl Crystallogr 2 65ndash71 httpsdoiorg101107S0021889869006558
Riacuteos CA Williams CD Fullen MA 2009 Hydrothermal synthesis of hydrogarnet andtobermorite at 175 degC from kaolinite and metakaolinite in the CaO-Al2O3-SiO2-H2Osystem a comparative study Appl Clay Sci 43 228ndash237 httpsdoiorg101016jclay200809014
Roacuteżycka A Pichoacuter W 2016 Effect of perlite waste addition on the properties of au-toclaved aerated concrete Constr Build Mater 120 65ndash71 httpsdoiorg101016jconbuildmat201605019
Roacutezycka A Kotwica Ł Małolepszy J 2014 Synthesis of single phase gyrolite in theCaO-quartz-Na2O-H2O system Mater Lett 120 166ndash169 httpsdoiorg101016jmatlet201401003
Sauman Z 1974 Influence of SO4 2ndash ions on the formation of 11 Aring tobermorite InProceedings of the 2nd International Symposium on Science and Research in SilicateChemistry Moscow pp 25ndash39
Schmidt M Egersdoumlrfer A Poumlllmann H 2012 Increased reactivity using a glass-containing metakaolin as an active filler in lime-based binder systems ZKG Int 6554ndash62
Schreiner J Jansen D Ectors D Goetz-Neunhoeffer F Neubauer J Volkmann S2018 New analytical possibilities for monitoring the phase development during theproduction of autoclaved aerated concrete Cem Concr Res 107 247ndash252 httpsdoiorg101016jcemconres201802028
Schreiner J Goetz-Neunhoeffer F Neubauer J Volkmann S Bergold S Webler RJansen D 2019 Advanced Rietveld refinement and SEM analysis of tobermorite inchemically diverse autoclaved aerated concrete Powder Diffract 34 143ndash150httpsdoiorg101017s0885715619000149
Setthaya N Chindaprasirt P Pimraksa K 2016 Preparation of zeolite nanocrystals viahydrothermal and solvothermal synthesis using of rice husk ash and metakaolinMater Sci Forum 872 242ndash247 httpsdoiorg104028wwwscientificnetmsf872242
Siauciunas R Baltakys K 2004 Formation of gyrolite during hydrothermal synthesis inthe mixtures of CaO and amorphous SiO2 or quartz Cem Concr Res 34 2029ndash2036httpsdoiorg101016jcemconres200403009
Skawinska A Owsiak Z Baran T Hernik K 2017 The influence of halloysite ad-dition on tobermorite formation in CaO and quartz mix under hydrothermal condi-tions Cem Wapno Bet 17 426ndash434
Venhodovaacute E Janovskyacute R Drochytka R 2015 Formation of tobermorite at differentmaterials composition of aerated concrete Appl Mech Mater 752ndash753 247ndash250httpsdoiorg104028wwwscientificnetamm752-753247
Walczak P Małolepszy J Reben M Szymański P Rzepa K 2015 Utilization ofwaste glass in autoclaved aerated concrete Proc Eng 122 302ndash309 httpsdoiorg101016jproeng201510040
Zhang Y Gao W Cui L 2007 The transformation of acid leached metakaolin tozeolite beta Stud Surf Sci Catal 170 420ndash425 httpsdoiorg101016S0167-2991(07)80870-6
Zvyagin BB 1960 An attempt to electronographic determination of kaolinite structureJ Dokl Akad Nauk SSSR 130 1023ndash1026
J Schreiner et al Applied Clay Science 185 (2020) 105432
6
6 Publications
36
6 Publications
62 Advanced Rietveld refinement and SEM analysis oftobermorite in chemically diverse autoclaved aeratedconcrete
Following the copyright guidelines by Cambridge University Press the publication
Schreiner J Goetz-Neunhoeffer F Neubauer J Volkmann S Bergold S WeblerR Jansen D 2019 Advanced Rietveld refinement and SEM analysis of tobermorite inchemically diverse autoclaved aerated concrete Powder Diffraction 34 143ndash150 httpsdoiorg101017s0885715619000149
may not be reprinted It can be accessed at
httpswwwcambridgeorgcorejournalspowder-diffractionarticleadvanced-rietveld-refinement-and-sem-analysis-of-tobermorite-in-chemically-diverse-autoclaved-aerated-concrete51597C2A66F6F225D29DEB2675E74249
37
6 Publications
63 New analytical possibilities for monitoring the phasedevelopment during the production of autoclavedaerated concrete
Reprint of the peer reviewed publication
Schreiner J Jansen D Ectors D Goetz-Neunhoeffer F Neubauer J VolkmannS 2018 New analytical possibilities for monitoring the phase development during theproduction of autoclaved aerated concrete Cement and Concrete Research 107 247ndash252httpsdoiorg101016jcemconres201802028
with permission from Elsevier
38
Contents lists available at ScienceDirect
Cement and Concrete Research
journal homepage wwwelseviercomlocatecemconres
Short communication
New analytical possibilities for monitoring the phase development duringthe production of autoclaved aerated concrete
J Schreinera D Jansena D Ectorsa F Goetz-Neunhoeffera J Neubauera S Volkmannb
aUniversity of Erlangen-Nuremberg GeoZentrum Nordbayern Mineralogy Schlossgarten 5a 91054 Erlangen Germanyb Rodgauer Baustoffwerke GmbH amp Co KG Am Opel-Pruumlffeld 3 63110 Rodgau-Dudenhofen Germany
A B S T R A C T
This work presents improved analytical methods for both steps of the production process of autoclaved aeratedconcrete (AAC) the phase development during the hydration before autoclaving and during the autoclavingprocess itself The improvement includes new insights into preparation methods of AAC samples for powderdiffraction as well as Rietveld refinement strategies For the first time a new implementation for calculatinganisotropic crystal domain sizes is applied to major hydrate phases occurring during AAC production namelyportlandite during the hydration before autoclaving and tobermorite during the autoclaving process The cal-culation of anisotropic domain size growth which can be implemented in the Rietveld environment is based oncrystallographically and geometrically appropriate models The implementation of calculating anisotropic do-main sizes for the Rietveld software TOPAS 50 allows a superior Rietveld fit and a more accurate quantificationof the phase development Additionally it enables the tracking of growth mechanism of portlandite duringhydration
1 Introduction
Autoclaved aerated concrete (AAC) is known as a lightweight con-struction material which offers outstanding properties such as suffi-cient strength for construction in addition with excellent thermal in-sulation [12] AAC is produced by autoclaving from calcareous rawmaterials such as lime (CaO) and cement quartz sulfate carrier andother additives such as foaming agents and water
The production process (Fig 1) can be separated into the hydrationof the mixed slurry before the procedure of autoclaving and the auto-claving at elevated temperature (180 degC to 200 degC) under saturatedsteam pressure (12MPa) for several hours
The hydration process before autoclaving is necessary to achievesufficient strength in order to cut the green cake blocks as they shouldhave a specific shape and dimension after autoclaving Furthermorethe porous structure is generated by the foaming agent during hydra-tion in the first process step During autoclaving the final propertiesnamely strength and low thermal conductivity are achieved
It is already well understood that the autoclaving process leads tothe formation of several phases first of all tobermorite(Ca5Si6O16(OH)2lowast4H2O) [3ndash5] Newest research has shown im-pressively which reactions are running from the mineralogical point ofview Insitu XRD measurements were carried out during the
autoclaving process and the phase development was shown by plottingnormalized intensities [6] The study of Mitsuda et al [3] was mainlyfocused on the tracking of the phase evolution during the autoclavingprocess of AAC However their statements concerning phase evolutionare mainly based on XRD data and TGA measurements There is acommon agreement that the following reactions occur The consump-tion of the alite (OPC) leads to the formation of an initial C-S-H phaseduring the first processing step Portlandite which was initially formedduring the first process step (from CaO and C3S) further quartz and theC-S-H phase are consumed during autoclaving resulting in the crystal-lization of tobermorite Hence the crystallization process of to-bermorite as well as the crystal structure of tobermorite was an issue ofresearch and discussion over the last years and numerous publicationsto these topics are available Concerning the crystal structure of to-bermorite respectively the tobermorite supergroup a new publicationoutlines all important references and recommends a new nomenclature[7]
The presented study was performed to create new analytical possi-bilities for the characterization of the production process of AAC Bothof the production process steps are essential for the final productHence the present work focuses on crystallization of hydrate phases inboth processes
Firstly an external standard method [89] was published and
httpsdoiorg101016jcemconres201802028Received 6 October 2017 Received in revised form 1 February 2018 Accepted 26 February 2018
Corresponding authorsE-mail addresses juergenjsschreinerfaude (J Schreiner) danieljansenfaude (D Jansen)
Cement and Concrete Research 107 (2018) 247ndash252
0008-8846 copy 2018 Elsevier Ltd All rights reserved
T
6 Publications
39
recommended for the determination of absolute phase contents inmixtures with amorphous content It was shown that the method canabsolutely be recommended for hydrating cement pastes in which watercannot be quantified directly by XRD [10] This method seems to bevery promising for both the quantification of the hydration of the AACslurry before autoclaving and the quantification of the phase evolutionduring autoclaving inasmuch as both production steps form crystallineand amorphous phases
Secondly a new approach to anisotropic peak broadening due toanisotropic domain morphology which was developed [1112] is ap-plied to AAC samples to improve the fit of portlandite and tobermoriteby Rietveld refinement [13] By applying this approach the refinementof both portlandite and tobermorite should additionally lead to betterquantitative results as well as to better insights into the development ofthe domain size morphology of both phases formed
It was already shown that in a hydrating raw mixture for AAC twospecies of portlandite precipitate at 23 degC one showing dynamicallyanisotropic peak broadening and another one following the isotropictrend [14] The application of the anisotropic refinement model led toan improved fitting of portlandite Moreover the mechanism of aniso-tropic domain growth of portlandite was tracked
2 Materials and methods
In order to examine the hydration of the AAC slurry before auto-claving a mixture of the hydraulic reactive components was weighedand measured in-situ at a Bruker D8 diffractometer with a LynxEyedetection system
Ordinary Portland cement (OPC) was mixed with lime (CaO) andanhydrite (C$) The raw materials were taken from the same batches asfor the industrial samples The drymix (58 OPC 36 CaO and 6 C$by weight) was then mixed with water (ws= 08) and placed into anappropriate sample holder The samples were not aerated The slurrysamples were covered with a kapton film to avoid evaporation andcarbonation Diffractograms were recorded with an angular range from7 to 545deg 2θ and a step width of 0011deg 2θ Measurements were carriedout every 15min For each measurement 96 XRD patterns were re-corded over the first 24 h The temperature was fixed at 70 degC which isthe mean temperature generally prevailing in the industrial processduring hydration before autoclaving Rietveld refinement was carriedout using the G-factor method All structures used for Rietveld refine-ment are shown in Table 1
For investigation of the autoclaved samples five different specimenswere taken at different autoclaving times The specimens were takenout of a technical production process hence it was not possible to in-terrupt the process at an earlier time inasmuch it would lead to damageof a whole concrete production batch The specimens were firstly driedat 60 degC until weight constancy The whole blocks were then broken andstatistical samples of 20 g were taken In order to receive the right massattenuation coefficient (MAC) for G-factor method the loss on ignitionand the chemical composition (XRF) were determined For energydispersive XRF analysis (Spectro Xepos) tube voltage from 20 kV to50 kV and tube current from 08 to 20mA were used for differenttargets
The final sample preparation (grinding) before XRD measurementswas carried out using both an agate mortar and a McCrone micronizingmill for wet milling with isopropanol Both preparation methods wereapplied separately to see which one is suitable in order to get the bestpreparation for XRD investigations Six preparations were performed byone operator of which two were prepared with an agate mortar andfour with a McCrone mill For the McCrone milling 3 g of the sampleand 10ml of isopropanol were used for grinding for 12min The grainsize distribution of one sample prepared with an agate mortar and onesample prepared using a McCrone mill was measured by laser granu-lometry in isopropanol using a Mastersizer 3000 (MALVERN)
After milling the samples in these two ways for XRD analysis thepowders were prepared into a front loading sample holder and mea-sured Diffractograms were recorded with an angular range from 6 to80deg 2θ a step width of 00236deg 2θ and a time per step of 054 s Rietveldrefinement combined with external standard (G-factor) was applied inorder to get absolute quantities for each phase The refinement strategyfor portlandite and tobermorite in the TOPAS Launch Mode (TOPAS50 Bruker AXS) is attached as a Supplementary material file
3 Results and discussion
31 Hydration of the mixture before autoclaving
The hydration of the investigated paste before autoclaving isdominated by the hydration of the cement as well as the reaction of thefree lime (CaO) resulting in the formation of portlandite It can beclearly seen from Fig 2 that the hydration of the paste leads to theformation of ettringite portlandite and C-S-H phase For simplificationthe remaining phase developments are not shown in Fig 2 because theyare not in the focus of this study The hydration of CaO forming
Fig 1 Simplified process steps of AAC production and hydrate phase evolution
Table 1Structures used for Rietveld refinement
Phase Author
Alite [15]Anhydrite [16]Bassanite [17]Belite (β) [18]Belite (αprime) [19]Brownmillerite [20]C-S-H [21]Calcite [22]Ettringite [23]Gypsum [24]Hemicarbonate [25]Hydroxylellestadite [26]Lime (CaO) [27]Microcline [28]Portlandite [29]Quartz [30]Tobermorite [31]Tricalciumaluminate (cubic) [32]Tricalciumaluminate (orthorhombic) [33]PONCKS model for Water [21]
J Schreiner et al Cement and Concrete Research 107 (2018) 247ndash252
248
6 Publications
40
portlandite begins rapidly after the addition of water to the mixture andlime is fully consumed after only 1 h of hydration This translates into aquick rise of heat of hydration so that cement hydration is acceleratedwhich leads to further portlandite formation by the reaction of aliteEttringite formation stalls after few hours of hydration After 12 h et-tringite is partially decomposed probably due to sulfate depletion [9]
and poorly crystalline AFm phases (not shown in Fig 2) are formedIn Fig 3 it can be seen that in fact two generations of portlandite
are formed a 1st dominant generation showing anisotropic peakbroadening and 2nd one occurring considerably later following theisotropic domain size refinement which is usually carried out using theRietveld method This occurrence comes along firstly with lime hy-dration and secondly with alite hydration The expected quantity ofportlandite formed from lime hydration very well complies with the
Fig 2 Phase development in AAC paste on a laboratory scale before autoclaving ana-lyzed by in-situ XRD at 70 degC
Fig 3 Formation of two generations of portlandite by hydration of lime (1st) and C3S(2nd) at 70 degC before autoclaving with the major generation showing anisotropic peakbroadening
Fig 4 Biaxial cylinder domain size model of portlandite used for Rietveld refinement of anisotropic peak broadening
Fig 5 Morphological evolution of portlandite showing anisotropic domain size growthduring hydration at 70 degC
Fig 6 Comparison of quantification of crystalline quartz in samples prepared withMcCrone mill and agate mortar at different autoclaving times
J Schreiner et al Cement and Concrete Research 107 (2018) 247ndash252
249
6 Publications
41
quantity of the observed 1st generation The development of portlan-dite growth was already tracked in an equivalent slurry at 23 degC [14]Thus this observation confirms that the crystallinity of portlandite inmixtures for AAC production depends on the starting phase for hydra-tion as already indicated by Ectors [14]
Fig 4 shows the used biaxial cylindrical model for anisotropic do-main size calculation and the portlandite structure which was createdwith structural software VESTA 318 [34] Using the cylindrical ap-proach domain sizes in a (here equating to b) and c direction(dz= cylinder height) can be calculated which comes along with theexpected symmetrical parameters of portlandite
The 1st portlandite generation showing anisotropic domain growthcan be tracked in terms of cylinder diameter and height which is rea-lized in Fig 5 The blue cylinder represents the geometric approach andcylinder height and diameter are calculated newly for each range Thecylinder height remains rather stable throughout the hydration processwhile the cylinder diameter increases during the first hours of hydra-tion After 10 h of hydration the mean cylinder diameter no longer in-creases Consequently these observations match the results of the ex-aminations conducted at 23 degC [14] as well as the assumption thatdifferent mechanisms of growth exist for portlandite depending on the
hydration educt The maximum cylinder diameter is reached earlier inthis work very likely because of the higher hydration temperature
32 Quantification of the reactions during autoclaving
Autoclaved samples were ground with an agate mortar and com-pared to samples which were wet-ground with a McCrone mill Fig 6shows precisely that the determination of the amount of crystallinequartz is more reproducible in the two shown samples which were
Fig 7 2D XRD with Bruker GADDS-system plots of samples prepared with agate mortar and McCrone mill Coarse quartz grains are pointed out in the plot of the sample prepared withagate mortar
Fig 8 Particle size distribution of one sample prepared with an agate mortar and of onesample prepared with a McCrone mill measured by laser granulometry
Fig 9 Rietveld refinement for Tobermorite of autoclaved AAC sample by use of isotropicdomain size model (a) and of anisotropic domain size model (b)
J Schreiner et al Cement and Concrete Research 107 (2018) 247ndash252
250
6 Publications
42
prepared with a McCrone mill The high variance of crystalline quartzin the samples which were prepared with an agate mortar is a result ofinsufficient grinding and remaining of too large quartz grains Whenthis spottiness occurs a reliable quantification using the G-factormethod is not possible
The 2D XRD with Bruker GADDS-system plots in Fig 7 demonstratethe insufficient grinding when using an agate mortar compared to wetmilling with a McCrone mill Quartz would be overrepresented in a one-dimensional XRD pattern focusing on a section with bright spots (greenarrows) The lack of bright spots in the right plot shows that the quartzgrains are milled more thoroughly using a McCrone mill In Fig 8 theparticle size distribution after both ways of sample preparation iscompared Most grains in the sample prepared with an agate mortar arelarger than in the sample prepared with a McCrone mill The grain sizedistribution of the sample prepared with a McCrone mill complies withthe recommended particle size range for XRD analysis of under 5 to50 μm [3536] while the other sample exceeds the range
In Fig 9 Rietveld refinement of an autoclaved sample is shown Thedominant peaks at 77 290 and 301deg 2θ are attributed to tobermoriteIn the upper diagram (a) Rietveld refinement was carried out regularlycalculating isotropic domain sizes for tobermorite However the cal-culated fit differs significantly from the raw data It can be assumed thattobermorite shows a similar pattern to portlandite in terms of aniso-tropic peak broadening taking into account that tobermorite is as-signed to the orthorhombic crystal system Thus instead of a biaxialcylinder model an elliptic cylinder model (Fig 10 structure createdwith VESTA 318 [34]) was applied for the refinement in the lowerdiagram (b) The elliptic cylinder model is a sufficient approach to the
orthorhombic crystal system as it allows the distinction between do-main sizes in a b and c direction The fit is clearly superior using theanisotropic domain size model highlighted by the difference plot inFig 9b The comparison refinement with isotropic and anisotropic ap-proach was done for all of the five autoclaved samples In Fig 11 theresulting Rwp values for the whole pattern and the RBragg values of to-bermorite are shown The refinement using the anisotropic model leadsto both lower Rwp and RBragg values and consequently to a better fit anda more accurate quantification of tobermorite in all refined samples
4 Summary and conclusions
Improved analytical methods for both the phase developmentduring the hydration before autoclaving and during the autoclavingprocess of AAC are presented It could be shown that wet McCronemilling is the best way of preparation of AAC samples in order to obtainsuitable samples for powder diffraction A new approach to treat ani-sotropic domain sizes for Rietveld refinement could be successfullyapplied ndash with the benefit that portlandite and tobermorite in AACsamples could be refined more accurately using the Rietveld methodThus this application allows an improved quantification of the phasedevelopment during both of the production steps
For the future there are still plenty of possibilities to apply thepresented approach of calculating anisotropic domain sizes to AACproduction As exemplified with portlandite the mechanisms of growthof tobermorite can be tracked likewise during the autoclaving processIn addition the effect of variations in the chemical composition of AACraw mixtures on the crystal morphology of tobermorite can be ex-amined This leaves a new perspective to discuss the link between mi-neral phase morphology and the thermal and mechanical properties ofAAC
Acknowledgement
The autoclaved samples were generously provided by RodgauerBaustoffwerke GmbH amp Co KG The authors express gratitude for allsupport
Appendix A Supplementary data
Supplementary data to this article can be found online at httpsdoiorg101016jcemconres201802028
References
[1] MW Grutzeck Cellular concrete in M Scheffler P Colombo (Eds) CellularCeramics Wiley-VCH Weinheim 2005 pp 193ndash223
[2] M Haas The future of AAC ndash from a material scientists point of view inMC Limbachiya JJ Roberts (Eds) Autoclaved Aerated Concrete Taylor FrLondon 2005 pp 187ndash194
[3] T Mitsuda K Sasaki H Ishida Phase evolution during autoclaving process ofaerated concrete J Am Ceram Soc 75 (1992) 1858ndash1863
[4] N Isu H Ishida T Mitsuda Influence of quartz particle size on the chemical and
Fig 10 Triaxial cylinder domain size model of Tobermorite used for Rietveld refinement of anisotropic peak broadening
Fig 11 Comparison of Rwp and RBragg values of Rietveld refinements of autoclavedsamples and tobermorite using the isotropic and the anisotropic domain size model
J Schreiner et al Cement and Concrete Research 107 (2018) 247ndash252
251
6 Publications
43
mechanical properties of autoclaved aerated concrete (I) tobermorite formationCem Concr Res 25 (1995) 243ndash248
[5] NY Mostafa Influence of air-cooled slag on physicochemical properties of auto-claved aerated concrete Cem Concr Res 35 (2005) 1349ndash1357 httpdxdoiorg101016jcemconres200410011
[6] K Matsui J Kikuma M Tsunashima T Ishikawa S Matsuno A Ogawa M SatoIn situ time-resolved X-ray diffraction of tobermorite formation in autoclaved aer-ated concrete influence of silica source reactivity and Al addition Cem Concr Res41 (2011) 510ndash519
[7] C Biagioni S Merlino E Bonaccorsi The tobermorite supergroup a new no-menclature Mineral Mag 79 (2015) 485ndash495 httpdxdoiorg101180minmag2015079222
[8] BH OConnor MD Raven Application of the Rietveld refinement procedure inassaying powdered mixtures Powder Diffract 3 (1988) 2ndash6 httpdxdoiorg101017S0885715600013026
[9] D Jansen F Goetz-Neunhoeffer C Stabler J Neubauer A remastered externalstandard method applied to the quantification of early OPC hydration Cem ConcrRes 41 (2011) 602ndash608 httpdxdoiorg101016jcemconres201103004
[10] D Jansen C Stabler F Goetz-Neunhoeffer S Dittrich J Neubauer Does OrdinaryPortland Cement contain amorphous phase A quantitative study using an externalstandard method Powder Diffract 26 (2011) 31ndash38 httpdxdoiorg10115413549186
[11] D Ectors F Goetz-Neunhoeffer J Neubauer A generalized geometric approach toanisotropic peak broadening due to domain morphology J Appl Crystallogr 48(2015) 189ndash194 httpdxdoiorg101107S1600576714026557
[12] D Ectors F Goetz-Neunhoeffer J Neubauer Routine (an)isotropic crystallite sizeanalysis in the double-Voigt approximation done right Powder Diffract 32 (S1)(2017) 27ndash34 httpdxdoiorg101017S0885715617000070
[13] HM Rietveld A profile refinement method for nuclear and magnetic structures JAppl Crystallogr 2 (1969) 65ndash71 httpdxdoiorg101107S0021889869006558
[14] D Ectors Advances in the Analysis of Cementitious Reactions and Hydrate Phases(Doctoral Thesis) (2016) pp 12ndash14 (urnnbndebvb29-opus4-71743)
[15] AacuteG De La Torre S Bruque J Campo MAG Aranda The superstructure of C3Sfrom synchrotron and neutron powder diffraction and its role in quantitative phaseanalyses Cem Concr Res 32 (2002) 1347ndash1356 httpdxdoiorg101016S0008-8846(02)00796-2
[16] A Kirfel G Will Charge density in anhydrite CaSO4 from X-ray and neutrondiffraction measurements Acta Crystallogr Sect B Struct Crystallogr CrystChem 36 (1980) 2881ndash2890 httpdxdoiorg101107S0567740880010461
[17] C Bezou AN Christensen D Cox M Lehman A Nonat Structures cristallines deCaSO405H2O et CaSO406H2O Comptes Rendus Hebd Des Seacuteances lAcadeacutemieDes Sci Seacuterie 2 (312) (1991) 43ndash48
[18] KH Jost B Ziemer R Seydel Redetermination of the structure of β-dicalciumsilicate Acta Crystallogr Sect B Struct Crystallogr Cryst Chem 33 (1977)1696ndash1700 httpdxdoiorg101107S0567740877006918
[19] W Mumme LMD Cranswick BC Chakoumakos Rietveld crystal structure re-finements from high temperature neutron powder diffraction data for the poly-morphs of dicalcium silicate Neues Jahrb Fuer Mineral Abhandlungen 170 (1996)171ndash188
[20] A Colville S Geller The crystal structure of brownmillerite Ca2FeAlO5Crystallographica 50 (1971) 2311ndash2315 httpdxdoiorg101107S056774087100579X
[21] ST Bergold F Goetz-Neunhoeffer J Neubauer Quantitative analysis of C-S-H inhydrating alite pastes by in-situ XRD Cem Concr Res 53 (2013) 119ndash126 httpdxdoiorg101016jcemconres201306001
[22] EN Maslen VA Streltsov NR Streltsova N Ishizawa Electron density and op-tical anisotropy in rhombohedral carbonates III Synchrotron Xray studies ofCaCO3 MgCO3 and MnCO3 Acta Crystallogr Sect B 51 (1995) 929ndash939 httpdxdoiorg101107S0108768195006434
[23] G Renaudin Y Filinchuk J Neubauer F Goetz-Neunhoeffer A comparativestructural study of wet and dried ettringite Cem Concr Res 40 (2010) 370ndash375httpdxdoiorg101016jcemconres200911002
[24] WF Cole CJ Lancucki A refinement of the crystal structure of gypsumCaSO42H2O Acta Cryst B30 (1974) 921ndash929 httpdxdoiorg101107S0567740874004055
[25] T Runčevski RE Dinnebier OV Magdysyuk H Poumlllmann Crystal structures ofcalcium hemicarboaluminate and carbonated calcium hemicarboaluminate fromsynchrotron powder diffraction data Acta Crystallogr Sect B Struct Sci 68 (2012)493ndash500 httpdxdoiorg101107S010876811203042X
[26] JM Hughes JW Drexler Cation substitution in the apatite tetrahedral site crystalstructures of type hydroxylellestadite and type fermorite Neues Jahrb FuerMineral (1991) 327ndash336
[27] CH Shen RS Liu JG Lin CY Huang Phase stability study of La12Ca18Mn2O7Mater Res Bull 36 (2001) 1139ndash1148
[28] SW Bailey Refinement of an intermediate microcline structure Am Miner 54(1969) 1540ndash1545
[29] WR Busing HA Levy Neutron diffraction study of calcium hydroxide J ChemPhys 26 (1957) 563 httpdxdoiorg10106311743345
[30] Y Le Page G Donnay Refinement of the crystal structure of low-quartz ActaCrystallogr Sect B 32 (1976) 2456ndash2459 httpdxdoiorg101107S0567740876007966
[31] SA Hamid The crystal structure of the 11 Aring natural tobermoriteCa225[Si3O75(OH)15]1H2O Zeitschrift Fuer Krist - New Cryst Struct 154 (1981)189ndash198 httpdxdoiorg101524zkri19811543-4189
[32] P Mondal JW Jeffery The crystal structure of tricalcium aluminate Ca3Al2O6Acta Crystallogr B 31 (1975) 689ndash697 httpdxdoiorg101107S0567740875003639
[33] Y Takeuchi F Nishi I Maki Crystal-chemical characterization of the tricalciumaluminate-sodium oxide (3CaOtimesAl2O3-Na2O) solid-solution series Zeitschrift FuumlrKrist (1980) 259ndash307
[34] K Momma F Izumi VESTA 3 for three-dimensional visualization of crystal vo-lumetric and morphology data J Appl Crystallogr 44 (2011) 1272ndash1276 httpdxdoiorg101107S0021889811038970
[35] K Scrivener R Snellings B Lothenbach A Practical Guide to MicrostructuralAnalysis of Cementitious Materials CRC Press 2016 pp 123ndash125 httpdxdoiorg107693wl20150205
[36] V Pecharsky P Zavalij Fundamentals of Powder Diffraction and StructuralCharacterization of Materials Springer second edition 2005 p 302 httpdxdoiorg101007978-0-387-09579-0
J Schreiner et al Cement and Concrete Research 107 (2018) 247ndash252
252
6 Publications
44
7 Acknowledgement
7 Acknowledgement
Ich moumlchte mich bei einigen Personen bedanken ohne die es wohl kaum zum erfolgreichenAbschluss dieser Arbeit gekommen waumlreMein Doktorvater Prof Dr Juumlrgen Neubauer hat sich stets die Zeit genommen die noumltigwar um Angelegenheiten aller Art mit mir zu klaumlren Er gab mir fachlich immer zumrichtigen Zeitpunkt einen gewissen wissenschaftlichen Impuls Zugleich habe ich mich den-noch immer frei in meiner eigenen Konzeption gefuumlhlt Groszligen Dank spreche ich Prof DrFriedlinde Goumltz-Neunhoeffer aus die fuumlr mich ebenso immer eine verlaumlssliche Ansprech-partnerin fuumlr fachliche und organisatorische Angelegenheiten aller Art war Danke anDr Daniel Jansen fuumlr die gute Zusammenarbeit und dafuumlr dass er mich im Zuge meinerMasterarbeit in ein Forschungsprojekt aufgenommen hat das den Weg zur Promotionmoumlglich machte Zusaumltzlich gilt mein Dank Prof Dr Matthias Goumlbbels der fuumlr dieMitarbeiter am Lehrstuhl immer motivierende Worte fand Fuumlr die Ermoumlglichung meinerTeilnahme an diversen Dienstreisen Fortbildungen und Tagungen moumlchte ich mich viel-mals bedankenWeiterhin bedanke ich mich bei Dr Stephan Volkmann und den Rodgauer BaustoffwerkenGmbH amp Co KG fuumlr die gute Zusammenarbeit und die Bereitstellung von Versuchsma-terialienVielen Dank an meine studentischen Hilfskraumlfte Daniel Wagner Laura MoldenhauerFabian Lang Jakob Schreiber und Felix Klaassen die alle Aufgaben im Labor einwand-frei und mit Bedacht erledigten Bei meinen aktuellen und ehemaligen Kollegen DrKatrin Hurle Dr Dominique Ectors Dr Christoph Naber Dr Florian Huumlller JoumlrgNehring Frank Riedel Julian Wolf Tanja Manninger Daniel Wagner Nicolas FobbeKarla Spaumlth Julian Goergens Andreas Koumlhler Cordula Jakob Franz Becker und LisaKlemenz bedanke ich mich fuumlr die gelungene Zusammenarbeit und gegenseitige Unter-stuumltzung Besonderer Dank geht auch an Kerstin Kreszlig Bettina Engl Christian HankeBernd Schleifer und Christian Abe fuumlr die verlaumlssliche Unterstuumltzung bei technischen Fra-gen und Messungen im LaborFuumlr jegliche Unterstuumltzungen moumlchte ich mich auch bei meinen Eltern bedanken sowiebei meinem Bruder Ralf der mir mit einem LaTex Crashkurs viel Frustration ersparthat Danke Thomas dass du immer fuumlr mich da bist und mit mir zusammen fuumlr genugAusgleich gesorgt hast
45
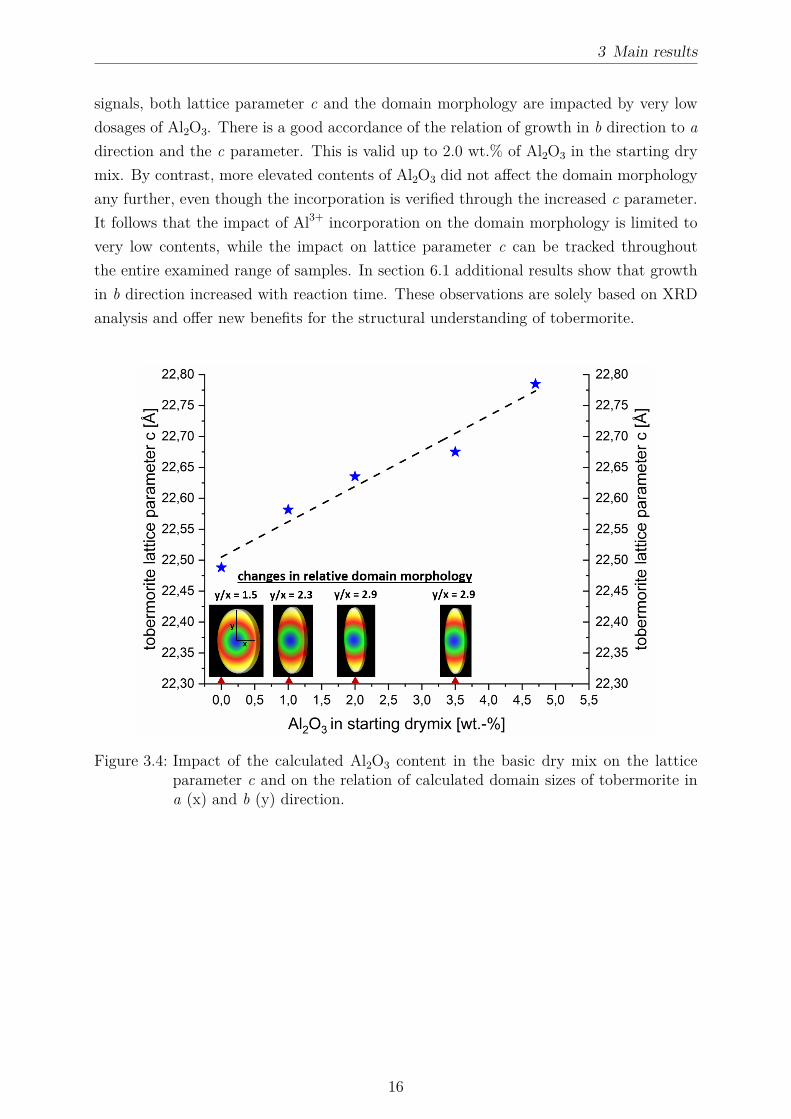
3 Main results
signals both lattice parameter c and the domain morphology are impacted by very lowdosages of Al2O3 There is a good accordance of the relation of growth in b direction to adirection and the c parameter This is valid up to 20 wt of Al2O3 in the starting drymix By contrast more elevated contents of Al2O3 did not affect the domain morphologyany further even though the incorporation is verified through the increased c parameterIt follows that the impact of Al3+ incorporation on the domain morphology is limited tovery low contents while the impact on lattice parameter c can be tracked throughoutthe entire examined range of samples In section 61 additional results show that growthin b direction increased with reaction time These observations are solely based on XRDanalysis and offer new benefits for the structural understanding of tobermorite
Figure 34 Impact of the calculated Al2O3 content in the basic dry mix on the latticeparameter c and on the relation of calculated domain sizes of tobermorite ina (x) and b (y) direction
16
3 Main results
32 Structural properties of tobermorite in AAC - SEMversus XRD analysis
This section and the respective publication [59] mainly deal with the suitability of SEManalysis of tobermorite in AAC The effects of varying amounts of SO3 and Al2O3 in thedry mix on structural properties of tobermorite are discussed based on XRD analysisAs shown in subsection 221 and Figure 23 tobermorite often shows a house-of-cardsstructure in AAC samples This property has been considered to be relevant for thethermal and mechanical properties of AAC (subsection 221) However SEM analysiswithin this study revealed that this type of appearance is mainly found in the poresand pore surfaces (Figure 35) This finding comes in agreement with the observationsmade by Huang et al [48] In the solid skeleton of the dense AAC material neither themorphology nor the house-of-cards structure could be observed properly which can beseen very clearly in additional micrographs provided in section 62 It should be consideredthat the major amount of tobermorite by weight is located in the dense material and notat the pore surfaces In this way these findings are clear disadvantages coming along withonly SEM analysis of AAC as representative results can hardly be obtained
Figure 35 House-of-cards structure of tobermorite in a pore surrounded by dense mate-rial
Moreover several authors in subsection 221 justified the morphology of tobermorite withthe incorporation of foreign ions Al-substituted tobermorite showed lath-like morphologywhereas Al-free tobermorite showed rather plate-like morphology [6 32 49] Howeverthe present investigation revealed that independent of Al2O3 content in the raw mix there
17
3 Main results
is always heterogeneity regarding the morphology of tobermorite In Figure 36 plate-likeand lath-like morphology of tobermorite in AAC observed in two statistical chemicallyvarious samples are displayed This result supports the previous assumption that theobservations made by SEM analysis of tobermorite in AAC strongly depend on whatpart of the sample is selected Yet again no clear observations could be made that wererepresentative for the entire sample
Figure 36 Heterogeneous morphology of tobermorite (plate-like in a and c lath-like in band d) in two AAC samples characterized by different Al2O3 contents in theraw mix
The effects of Al3+ on the domain morphology of tobermorite were measured and evaluatedin a similar manner as in section 61 and the results could be confirmed The relativedomain growth in b direction was increased by Al3+ incorporation in both studies [5859] Moreover lattice parameter c was increased with Al3+ incorporation which can beseen more accurately in section 62 Unlike SEM analysis XRD analysis allowed clearconclusions whenever structural properties of Al-substituted tobermorite were affectedInstead of a local observation as made with SEM representative and statistical resultswere obtained The reader is referred to section 61 and section 62 for further results and
18
3 Main results
more specific conclusionsIn addition the effect of various amounts of sulfate in the raw mix was analyzed Unlikein the case of different dosages of Al3+ neither the domain morphology nor the latticeparameters of tobermorite were affected by the SO3 content in the dry mix In Figure 37these observations and additionally the amounts of anhydrite measured by QXRD areshown As the amount of available SO3 in the dry mix is known the maximum possibleamount of anhydrite could be calculated for each of the samples in focus Obviouslythe measured amounts of anhydrite are either equal or slightly higher compared to theexpected quantities This result leads to the assumption that all of the available sulfateis transformed into anhydrite so that no more sulfate could be incorporated into thestructure of tobermorite The over-estimation of anhydrite in some of the samples can beexplained due to the inaccuracy of the quantification method The present results rathermatch with the suggestions by Sauman amp Valtr [41] as in their study no effect of sulfateon the structure of tobermorite was observed either
Figure 37 Impact of the sulfate content in the AAC raw mix on lattice parameter cand relative domain morphology of tobermorite (a) and comparison of theexpected maximum amount of anhydrite to the measured amount determinedby QXRD (b)
33 Improved monitoring of the phase developmentduring the production of AAC
In this study not only autoclaved samples were analyzed but additionally a lab-scale slurrywhich included the reactive components of the green cake stage during AAC productionat equivalent weight proportions In-situ XRD was performed at 70 degC and at a water-to-
19
3 Main results
solid ratio of 08 for 24 h (Figure 38) which are respective conditions during commercialproduction Clearly the phase development is dominated by OPC and lime hydration asdescribed in section 22 It can be seen that the major reaction turnover occurs duringthe first 200 minutes which is the average duration of the green stage After only 30minutes all of the quicklime had transformed into portlandite whereas Schober proposeda duration of one hour for this reaction [42] The amount of portlandite is composed oftwo different generations as proposed by Ectors [52] Equally a biaxial cylinder modelwas applied in order to fit the peak broadening of the first generation of portlandite in thepresent investigation Minor phase developments such as the formation of AFm phases arenot shown in Figure 38 A coarse fraction of anhydrite did not react so that constantlyaround 15 wt were measured after 6 h As the decomposition of ettringite due tosulfate depletion [55] does not occur prior to 12 h the green cake strength is not affected
Figure 38 In-situ XRD measurement of AAC model slurry at water-to-solid ratio of 08and 70 degC For clarity and comprehensibility not all phases are shown
The separation of two generations of portlandite in the system does not only translate intodifferent domain morphologies as shown by Ectors [52] In Figure 39 more indicationsfor different mineralogical properties are displayed The shape of the (0 0 1) reflection inXRD patterns after only quicklime hydration and after both quicklime and alite hydrationshows a distinct feature While portlandite originating from quicklime hydration showsa broad peak implying lower crystallinity the peak after alite hydration is characterized
20
3 Main results
Figure 39 Formation of two generations of portlandite in AAC slurry in XRD (a) andDTA (b) plots
by a sharper component Yet the peak breadth did not change indicating that the firstgeneration is still present with the original characteristics This observation is supportedby DTA measurements additionally demonstrating two degrees of crystallinity only afteralite hydration In agreement with XRD analysis the better crystalline second generationof portlandite decomposes at a higher temperature
Figure 310 Quantification of tobermorite in statistical chemically various AAC sampleswith and without the application of the macro for the fitting of anisotropicpeak broadening
21
3 Main results
Furthermore commercial AAC samples were considered in this study By applying themethod for the refinement of anisotropic peak broadening (Figure 31) a more accuratequantification of tobermorite can be achieved In Figure 310 the calculated amounts oftobermorite in statistical chemically various AAC samples are plotted In some samplesthe refinement using the macro leads to considerably higher but never lower quantitiesof tobermorite whereas in other samples nearly the same amount of tobermorite is cal-culated This observation can be well understood taking into account that the macroallows to account more peak area for tobermorite as shown in Figure 31 Clearly thereis evidence that the anisotropy of tobermorite domains is not uniform from one sampleto another which was basically justified in the previous sections As an improved quan-tification of a single phase leads to a better quantification of other phases in the samplethis adaption is very valuable in order to assess the phase development Here the peakbroadening of tobermorite equally observed by Qu et al [6] could be tracked and evalu-ated in order to gain more accurate results Moreover in section 63 McCrone milling issuggested in order to avoid spottiness in XRD patterns caused by coarse grains of quartzor anhydrite (Figure 38)
22
4 Conclusions
4 Conclusions
The research results presented in the previous sections yield advances in the mineralogicalinvestigation of tobermorite and autoclaved aerated concrete Recorded diffraction pat-terns contain plenty of usually unused data regarding the microstructural characteristicsof the sample and phases therein The profit of XRD measurements can be significantlyimproved whenever one or more phases show anisotropic peak broadening and appro-priate models for the respective domain morphology are implemented into the Rietveldenvironment Within the scope of the present investigations portlandite and tobermoriteshow this particularityThe effects of changes in the chemistry of the starting mix were examined based on dif-ferent dosages of metakaolin Al-substituted tobermorite showed increased growth in b
direction and an increase of lattice parameter c compared to Al-free tobermorite The rel-ative domain sizes were determined based on anisotropic peak broadening However whilethe effect of Al3+ incorporation into the lattice of tobermorite was limited regarding thedomain morphology lattice parameter c showed an increase throughout the entire rangeof samples The consequent effects suggested by Klimesch amp Ray observed by means ofDTA are debatable as reactions during the heating experiment may lead to to a changeof Al3+ content in tobermorite [40] While both types of applied metakaolin showed goodreactivity at hydrothermal conditions some included minor phases such as feldspar oranatase remained unreacted At high dosages of Al2O3 in the starting mix the formationof either only katoite or katoite along with tobermorite was observed (Figure 32)SEM analysis of tobermorite in AAC cannot be suggested based on the observationspresented in this work as it is only visually accessible in the pores or at pore surfacesThe dense material of the AAC skeleton contains several crystalline and X-ray amorphousphases which hardly allows a proper investigation Even in single pores tobermorite crys-tals appeared very heterogeneous at various chemical compositions As a result lath-liketobermorite was not only present in samples characterized by elevated Al3+ incorporationBy contrast the benefits of XRD analysis presented in section 61 equally accounted fortobermorite in AAC samples Sulfate incorporation into the lattice of tobermorite wasnot observed All of the sulfate in the system was detected to be present in anhydriteThe phase transitions in the AAC raw slurry during the green stage hydration were show-cased by in-situ XRD analysis of a model mix at 70 degC Additional DTA and XRD mea-
23
4 Conclusions
surements during this step confirmed the presence of two generations of portlandite char-acterized by different crystallinity as suggested by Ectors [52] The inclusion of anisotropicdomain morphology during the Rietveld refinement allowed a more accurate quantifica-tion of tobermorite in autoclaved samples Sample preparation adjusted to the grain sizedistribution in AAC samples (section 63) the external standard method for quantita-tive XRD analysis [55] and the approach to evaluate anisotropic peak broadening [19]are the key methods for a more accurate tracking of the phase development during AACproduction
24
5 References
5 References
[1] A E Zadov A I Grabezhev N N Pertsev N V Chukanov and S V PribavkinTobermorite-plombierite metasomatites of the Gumeshevsk skarn-porphyry copper depositmiddle Urals Doklady Earth Sciences 407(3)495ndash497 2006
[2] M F Heddle Preliminary notice of substances which may prove to be new minerals MinMag 4117ndash123 1880
[3] S Merlino E Bonaccorsi and T Armbruster The real structure of tobermorite 11AringNormal and anomalous forms OD character and polytypic modifications European Journalof Mineralogy 13(3)577ndash590 2001
[4] C Biagioni S Merlino and E Bonaccorsi The tobermorite supergroup a new nomencla-ture Mineralogical Magazine 79(2)485ndash495 2015
[5] C A Riacuteos C D Williams and M A Fullen Hydrothermal synthesis of hydrogarnetand tobermorite at 175 degC from kaolinite and metakaolinite in the CaO-Al2O3-SiO2-H2Osystem A comparative study Applied Clay Science 43(2)228ndash237 2009
[6] X Qu Z Zhao and X Zhao Microstructure and characterization of aluminum-incorporated calcium silicate hydrates (C-S-H) under hydrothermal conditions RSC Ad-vances 8(49)28198ndash28208 2018
[7] R Šiaučiunas and K Baltakys Formation of gyrolite during hydrothermal synthesis inthe mixtures of CaO and amorphous SiO2 or quartz Cement and Concrete Research34(11)2029ndash2036 2004
[8] E Venhodovaacute R Janovskyacute and R Drochytka Formation of Tobermorite at Different Ma-terials Composition of Aerated Concrete Applied Mechanics and Materials 752-753247ndash250 2015
[9] L Galvaacutenkovaacute E Bartoniacutečkovaacute T Opravil J Tkacz and P Ptaacuteček The influence ofstarting materials solubility on tobermorite structure formation under the hydrothermalconditions IOP Conference Series Materials Science and Engineering 379(1)1ndash8 2018
[10] T Mitsuda K Sasaki and H Ishida Phase Evolution during Autoclaving Process J AmCeram Soc 75(75)1858ndash1863 1992
[11] A Skawińska The influence of metahalloysite addition on tobermorite formation studied byX-ray powder diffraction and scanning electron microscope MATEC Web of Conferences16305008 2018
[12] S T Bergold F Goetz-Neunhoeffer and J Neubauer Quantitative analysis of C-S-H in
25
5 References
hydrating alite pastes by in-situ XRD Cement and Concrete Research 53119ndash126 2013
[13] O P Shrivastava and F P Glasser Ion-exchange properties of 11-Aring tobermorite Reactivityof Solids 2(3)261ndash268 1986
[14] H Maeda Y Ogawa E H Ishida and T Kasuga Hydrothermal synthesis of tobermoritedoped with phosphorus species for removing heavy metal ions Journal of the AustralianCeramic Society 48(1)8ndash11 2012
[15] O P Shrivastava and R Shrivastava Cation exchange applications of synthetic tobermoritefor the immobilization and solidification of cesium and strontium in cement matrix Bulletinof Materials Science 23(6)515ndash520 2000
[16] G Renman and A Renman Sustainable Use of Crushed Autoclaved Aerated Concrete(CAAC) as a Filter Medium in Wastewater Purification 8th International conferenceon sustainable management of waste and recycled materials in construction GothenburgSweden 30 Mayndash1 June 2012 Proceedings pages 1ndash7 2012
[17] G Schober Chemical transformations during the manufacturing of autoclaved aeratedconcrete (ACC) Cement lime gypsum and quartz sand become cellular concrete ZKG58(7)63ndash70 2005
[18] A J Hamad Materials Production Properties and Application of Aerated LightweightConcrete Review International Journal of Materials Science and Engineering 2(2)152ndash157 2014
[19] D Ectors F Goetz-Neunhoeffer and J Neubauer A generalized geometric approach toanisotropic peak broadening due to domain morphology Journal of Applied Crystallogra-phy 48(1)189ndash194 2015
[20] H M Rietveld A profile refinement method for nuclear and magnetic structures Journalof Applied Crystallography 2(2)65ndash71 1969
[21] S A Hamid The crystal structure of the 11 Aring natural tobermoriteCa225[Si3O75(OH)15]1H2O Zeitschrift fuer Kristallographie - New Crystal Struc-tures 154(3-4)189ndash198 1981
[22] S A S El-Hemaly T Mitsuda and H F W Taylor Synthesis of normal and anomaloustobermorites Cement and Concrete Research 7429ndash438 1977
[23] M Sakiyama and T Mitsuda Hydrothermal reaction between C-S-H and kaolinite for theformation of tobermorite at 180degC Cement and Concrete Research 7(6)681ndash685 1977
[24] E Bonaccorsi S Merlino and A R Kampf The crystal structure of tobermorite 14 Aring(plombierite) a C-S-H phase Journal of the American Ceramic Society 88(3)505ndash5122005
[25] S Merlino E Bonaccorsi and T Armbruster The real structures of clinotobermorite andtobermorite 9 Aring OD character polytypes and structural relationships European Journalof Mineralogy 12(2)411ndash429 2000
[26] K Momma and F Izumi VESTA 3 for three-dimensional visualization of crystal volu-metric and morphology data Journal of Applied Crystallography 44(6)1272ndash1276 2011
26
5 References
[27] S Shaw S M Clark and C MB Henderson Hydrothermal formation of the calcium sil-icate hydrates tobermorite (Ca5Si6O16(OH)2 middot 4H2O) and xonotlite (Ca6Si6O17(OH)2)An in situ synchrotron study Chemical Geology 167(1-2)129ndash140 2000
[28] K Matsui J Kikuma M Tsunashima T Ishikawa S Matsuno A Ogawa and M SatoIn situ time-resolved X-ray diffraction of tobermorite synthesis process under hydrothermalcondition IOP Conference Series Materials Science and Engineering 18(2)60ndash66 2011
[29] G Matekonis R Šiaučiunas and D Vaičiukyniene Hydrothermal Synthesis and Charac-terization of Na + and [ Al 3 + + Na + ] -substituted Tobermorite in CaO-SiO2middotnH2O-H2OSystem MATERIALS SCIENCE 16(3)242ndash248 2010
[30] G Geng R J Myers M J A Qomi and P JM Monteiro Densification of the inter-layer spacing governs the nanomechanical properties of calcium-silicate-hydrate ScientificReports 7(1)1ndash8 2017
[31] D Klimesch and A Ray Autoclaved cement-quartz pastes with metakaolin additionsAdvanced Cement Based Materials 7(3-4)109ndash118 1998
[32] N Y Mostafa A A Shaltout H Omar and S A Abo-El-Enein Hydrothermal synthesisand characterization of aluminium and sulfate substituted 11 nm tobermorites Journal ofAlloys and Compounds 467(1-2)332ndash337 2009
[33] İ Demir M S Başpınar E Kahraman E Ccedilalışkan and G Goumlrhan An Investigation onthe Usability of Diatomite in Aerated Concrete Production In Proc of the Intl Conf onAdvances In Civil Structural And Construction Engineering - CSCE 2014 pages 97ndash1002014
[34] A Skawinska Z Owsiak T Baran and K Hernik The influence of halloysite additionon tobermorite formation in CaO and quartz mix under hydrothermal conditions CementWapno Beton 17(12)426ndash434 2017
[35] N Y Mostafa Influence of air-cooled slag on physicochemical properties of autoclavedaerated concrete Cement and Concrete Research 35(7)1349ndash1357 2005
[36] D Małaszkiewicz and J Chojnowski Influence of addition of calcium sulfate dihydrate ondrying of autoclaved aerated concrete Open Engineering 7(1)273ndash278 2017
[37] N Hara and N Inoue Thermal behaviour of 11Aring tobermorite and its lattice parametersCement and Concrete Research (10)53ndash60 1980
[38] M D Jackson S R Chae S R Mulcahy C Meral R Taylor P Li A H EmwasJ Moon S Yoon G Vola H R Wenk and P JM Monteiro Unlocking the secretsof Al-tobermorite in Roman seawater concrete American Mineralogist 98(10)1669ndash16872012
[39] W Liao W Li Z Fang C Lu and Z Xu Effect of different aluminum substitution rateson the structure of Tobermorite Materials 12(22)1ndash10 2019
[40] D Klimesch and A Ray DTA-TG Study of the CaO-SiO2-H2O and CaO-Al2O3-SiO2-H2OSystems Under Hydrothermal Conditions Journal of Thermal Analysis and Calorimetry56(1)27ndash34 1999
27
5 References
[41] Z Sauman and Z Valtr Substitution of sulphate ions in the crystal lattice of 11 Aring to-bermorite In The VI International Congress on the Chemistry of Cement pages 1ndash14Moscow 1974
[42] G Schober Reaction of raw materials to the final product AAC httpwwwpb-aacde
chemmin2_ehtml 2012 accessed 2020-01-31
[43] D Jansen C Stabler F Goetz-Neunhoeffer S Dittrich and J Neubauer Does Ordi-nary Portland Cement contain amorphous phase A quantitative study using an externalstandard method Powder Diffraction 26(01)31ndash38 2011
[44] C Roumlszligler J Stark F Steiniger and W Tichelaar Limited-dose electron microscopyreveals the crystallinity of fibrous C-S-H phases Journal of the American Ceramic Society89(2)627ndash632 2006
[45] Y Sakalli and R Trettin Investigation of C3S hydration by environmental scanning elec-tron microscope Journal of Microscopy 259(1)53ndash58 2015
[46] F Matsushita Y Aono and S Shibata Expansion and shrinkage behavior of green cakeof Autoclaved Aerated Concrete In Autoclaved Aerated Concrete - Innovation and Devel-opment Proceedings of the 4th International Conference on Autoclaved Aerated ConcreteKingston UK 8-9 September 2005 pages 101ndash108 CRC Press 2005
[47] C Chucholowski M Holger and K-C Thienel Improving the recyclability environmentalcompatibility and CO2 balance of autoclaved aerated concrete by replacing sulfate carrierand cement with calcined clays CePapers 2(4)503ndash512 2018
[48] X Y Huang W Ni W H Cui Z J Wang and L P Zhu Preparation of autoclavedaerated concrete using copper tailings and blast furnace slag Construction and BuildingMaterials 27(1)1ndash5 2012
[49] W Wongkeo and A Chaipanich Compressive strength microstructure and thermal anal-ysis of autoclaved and air cured structural lightweight concrete made with coal bottom ashand silica fume Materials Science and Engineering A 527(16-17)3676ndash3684 2010
[50] A Roacuteżycka and W Pichoacuter Effect of perlite waste addition on the properties of autoclavedaerated concrete Construction and Building Materials 12065ndash71 2016
[51] N Isu H Ishida and T Mitsuda Influence of quartz particle size on the chemical andmechanical properties of autoclaved aerated concrete (I) tobermorite formation Cementand Concrete Research 25(25)243ndash248 1995
[52] D Ectors Advances in the analysis of cementitious reactions and hydrate phases doctoralthesis PhD thesis Friedrich-Alexander-Universitaumlt Erlangen-Nuumlrnberg 2016
[53] D Ectors F Goetz-Neunhoeffer and J Neubauer Domain size anisotropy in the double-Voigt approach An extended model Journal of Applied Crystallography 481998ndash20012015
[54] D Ectors F Goetz-Neunhoeffer and J Neubauer Routine (an)isotropic crystallite sizeanalysis in the double-Voigt approximation done right Powder Diffraction 32(S1)27ndash342017
28
5 References
[55] D Jansen F Goetz-Neunhoeffer C Stabler and J Neubauer A remastered external stan-dard method applied to the quantification of early OPC hydration Cement and ConcreteResearch 41(6)602ndash608 2011
[56] T Ungaacuter G Tichy J Gubicza and R J Hellmig Correlation between subgrains andcoherently scattering domains Powder Diffraction 20(04)366ndash375 2005
[57] Triloki P Garg R Rai and B K Singh Structural characterization of as-depositedcesium iodide films studied by X-ray diffraction and transmission electron microscopy tech-niques Nuclear Instruments and Methods in Physics Research Section A AcceleratorsSpectrometers Detectors and Associated Equipment 736128ndash134 2014
[58] J Schreiner F Goetz-Neunhoeffer J Neubauer and D Jansen Hydrothermal synthesisof 11 Aring tobermorite ndash Effect of adding metakaolin to the basic compound Applied ClayScience 185 2020
[59] J Schreiner F Goetz-Neunhoeffer J Neubauer S Volkmann S Bergold R Webler andD Jansen Advanced Rietveld refinement and SEM analysis of tobermorite in chemicallydiverse autoclaved aerated concrete Powder Diffraction 34143ndash150 2019
[60] J Schreiner D Jansen D Ectors F Goetz-Neunhoeffer J Neubauer and S VolkmannNew analytical possibilities for monitoring the phase development during the production ofautoclaved aerated concrete Cement and Concrete Research 107247ndash252 2018
29
6 Publications
6 Publications
61 Hydrothermal synthesis of 11 Aring tobermorite ndash Effectof adding metakaolin to the basic compound
Reprint of the peer reviewed publication
Schreiner J Goetz-Neunhoeffer F Neubauer J Jansen D 2020 Hydrothermalsynthesis of 11 Aring tobermorite ndash Effect of adding metakaolin to the basic compoundApplied Clay Science 185 httpsdoiorg101016jclay2019105432
with permission from Elsevier
30
Contents lists available at ScienceDirect
Applied Clay Science
journal homepage wwwelseviercomlocateclay
Research paper
Hydrothermal synthesis of 11 Aring tobermorite ndash Effect of adding metakaolin tothe basic compound
J Schreiner F Goetz-Neunhoeffer J Neubauer D JansenUniversity of Erlangen-Nuremberg GeoZentrum Nordbayern Mineralogy Schlossgarten 5a 91054 Erlangen Germany
A R T I C L E I N F O
KeywordsHydrothermal synthesis11 Aring tobermoriteMetakaolinPowder diffractionKatoite
A B S T R A C T
Different amounts and types of metakaolin were analyzed and applied for the hydrothermal synthesis of 11 Aringtobermorite All synthesized samples were investigated by means of powder XRD combined with Rietveld re-finement Al-substituted 11 Aring tobermorite was successfully synthesized on the basis of a broad range of com-pounds characterized by a varying content of metakaolin Katoite was present depending on the amount ofsupplied Al3+ which was determined by the dosage of metakaolin Minor crystalline components included in thetwo types of metakaolin sources varied greatly in their reactivity under hydrothermal conditions Despite adifferent degree of purity the two types of metakaolin showed corresponding effects at moderate dosages butcontrary effects at higher dosages as for the synthesis of 11 Aring tobermorite The domain morphology of to-bermorite could be associated with Al3+ incorporation for low dosages of metakaolin represented by up to 2 wt- Al2O3 in the dry mix By contrast Al3+ affected tobermorite lattice parameters at equivalent and even athigher dosages with c reaching 2295 Aring at 12 wt- Al2O3 in the dry mix
1 Introduction
11 Application of metakaolin as a reactive material in constructionindustry
The application of supplementary cementitious materials (SCMs) inthe field of construction technology has received a lot of attention inrecent years Due to limited resources and an urgent need for alter-native and more eco-friendly construction materials SCMs such asmetakaolin offer a great potential The usage of SCMs has not onlyspread to the cement and mortar industry but also to advanced appli-cations such as autoclaved aerated concrete (AAC) (Demir et al 2014Koutnyacute et al 2014 Walczak et al 2015 Roacuteżycka and Pichoacuter 2016Chucholowski et al 2018) Unlike ordinary cementitious constructionmaterials AAC is produced from hydrothermal curing Due to the dif-ferent thermodynamic environment the hydration process and the re-activity of raw materials have to be investigated properly in order tounderstand the effects on the AAC product The leading mineral phasein AAC is 11 Aring tobermorite (Ca5Si6O16(OH)2middot4H2O) As a consequencethe thermal and mechanical properties of AAC depend on micro-structure and crystallinity of tobermorite to some extent In addition tothe curing time and the fineness of raw materials the supply of ionsthat can substitute in the tobermorite structure is a crucial factor in thiscontext Especially substitutions by aluminum sodium and potassium
ions have been investigated thoroughly (Sauman 1974 Klimesch andRay 1998 Mostafa et al 2009 Matekonis et al 2010 Skawinskaet al 2017) Calcined clays usually contain a considerable amount ofthe mentioned ions
There is a vast amount of literature on the reactivity of SCMs atambient temperature and standard pressure but there is little when itcomes to hydrothermal conditions In previous publications the beha-vior of metakaolin under hydrothermal conditions was mainly in-vestigated for the synthesis of zeolites (Zhang et al 2007 Aguilar-Mamani et al 2014 Setthaya et al 2016 Luo et al 2018) In thesestudies the reactivity of metakaolin was observed at a wide range oftemperature and pH values During the transformation of kaolin intometakaolin a loss of framework alumina was observed (Ayodele et al2019) In recent decades metakaolin has been the subject of studies inthe field of geopolymer research (Rashad 2013 Chen et al 2016) Forthe synthesis of 11 Aring tobermorite a more distinct setting of temperaturesetting (180ndash200 degC) and steam pressure (1ndash12 MPa) are required
This publication is intended to make a new contribution to thechallenging field of hydrothermal synthesis in the system CaO-Al2O3-SiO2-H2O based on XRD analysis combined with Rietveld refinementVarious dosages of two types of metakaolin with different chemical andmineralogical purities are compared for the effects on the hydrothermalsynthesis of Al-substituted 11 Aring tobermorite Especially changes of thebulk chemistry in the raw mixes the reactivity of minor crystalline
httpsdoiorg101016jclay2019105432Received 20 August 2019 Received in revised form 13 November 2019 Accepted 30 December 2019
Corresponding authorE-mail address juergenjsschreinerfaude (J Schreiner)
Applied Clay Science 185 (2020) 105432
0169-1317 copy 2020 Elsevier BV All rights reserved
T
6 Publications
31
phases of the two types of metakaolin and the effect of different curingtimes are the focus of interest On the one hand metakaolin offers agreat potential in the AAC industry On the other hand of all SCMsmetakaolin is a good source material for investigating the influence ofAl3+ on the synthesis of Al-substituted 11 Aring tobermorite
12 Synthesis of Al-substituted 11 Aring tobermorite
In addition to being present in AAC tobermorite has found appli-cation in wastewater treatment and nuclear waste management due toits ion exchange capacity (Maeda et al 2012 Monasterio et al 2015)The substitution of silicon by aluminum results in a different to-bermorite structure due to general and local charge balance affectingthe lattice parameters Especially c is impacted by this substitutionbecause it occurs in the bridging tetrahedron and additional OHndash sub-stitutes O2ndash (Komarneni et al 1985 Merlino et al 2000) As suggestedin some additional studies the substitution of Si4+ by Al3+ and Na+ orK+ leads to a lath-like morphology of tobermorite crystals (Mostafa2005 Mostafa et al 2009 Venhodovaacute et al 2015 Qu et al 2018)However because of the heterogeneous appearance of tobermorite inAAC it is hardly possible to conduct a proper characterization based onSEM analysis In our recent work the anisotropic peak broadening oftobermorite in XRD diffractograms was successfully linked with theincorporation of foreign ions supplied in a common AAC production(Schreiner et al 2019) This finding allowed a more statistical struc-tural characterization of tobermorite in bulk compositions compared toSEM analysis Moreover it was reported in other studies that differenthydrate phases occur depending on the amount of supplied ions and onthe experimental settings In compounds with a high content of Al3+formation of katoite could be observed (Klimesch and Ray 1998 Riacuteoset al 2009 Matsui et al 2011) In the case of a longer curing durationinstead of 11 Aring tobermorite the formation of xonotlite (Siauciunas andBaltakys 2004 Galvaacutenkovaacute et al 2018) or - depending on the finenessof used silica source (Siauciunas and Baltakys 2004) - gyrolite is fa-voured
Kalousek (1956) suggested that tobermorite can contain up to 5Al2O3 More Al2O3 in the system resulted in the formation of hydro-garnet Klimesch and Ray (1998) additionally investigated the stabilityof hydrogarnet depending on the Al(Si + Al) ratio and its role in re-lation to the formation of 11 Aring tobermorite in an equivalent systemThey suggest that hydrogarnet always appears before tobermorite butthe former can only be detected for higher Al(Si + Al) ratios in theevent of longer curing times Riacuteos et al (2009) and Qu et al (2018)confirmed these findings in extensive investigations In the latter pub-lication it is additionally suggested that samples prepared at lowertemperatures (160 degC) are less impacted by the supply of Al3+ Theyalso consider the peak broadening of tobermorite in their XRD plotsbased on the amount of incorporated Al3+ In two recent publicationswe suggested that the peak broadening of tobermorite enables a mi-crostructural analysis by calculating the orientation dependent domainsizes (Schreiner et al 2018 2019) However these studies are based onsamples of industrially produced AAC so that the curing time was fixedThe studied AAC was produced from raw materials with a broad che-mical spectrum such as ordinary Portland cement (OPC) whichsomehow complicates the interpretation of results
In this work the influence of aluminum ions - provided by meta-kaolin - on dominant crystallographic direction-dependent domaingrowth of tobermorite is investigated by analysis of anisotropic peakbroadening (Ectors et al 2015 2017) In Fig 1 of the supplementarymaterial the method of fitting the anisotropic peak broadening of to-bermorite using a triaxial cylinder model is visualized (Schreiner et al2018) Fitting of the anisotropic peak broadening of tobermorite Thismethod is used to calculate the average and reliable values for to-bermorite domain sizes in the powder sample and associate them withaverage Al3+ incorporation Microstrain should be considered becauseit is an additional source of peak broadening However this usually
accounts for materials that have been exposed to different kinds ofstress such as metals and alloys (Badawi et al 2019) In addition theinstrumental contribution to peak broadening should be consideredHydration products such as tobermorite are characterized by crystallitesizes in the range of nanometers so that anisotropic size broadeningclearly outweighs the effect of instrumental broadening (Jenkins andSnyder 1996) Moreover the impact of Al3+ on the lattice parametersof tobermorite is considered It should additionally be clarified whe-ther the results from our previous publication (Schreiner et al 2019)based on industrially produced AAC can be confirmed by investigationwith less complex raw mixes and purely based on laboratory experi-ments
2 Material and methods
21 Starting materials
The starting materials for hydrothermal synthesis included deio-nized water quartz flour portlandite (999 pure) and two types ofmetakaolin One type was ordinary commercially available metakaolin(MK) with nearly a stoichiometric composition For comparison thesecond type of commercially available metakaolin was a by-productfrom expanded glass production (MKg) and consequently highly im-pure The chemical composition of MK and MKg determined by XRF isgiven in Table 1 With MKg containing less Al2O3 but considerably moreNa2O than MK the effects on hydrothermal synthesis were of interestBoth types of metakaolin have been characterized in previous pub-lications (Schmidt et al 2012 Naber et al 2019) In addition weverified the mineral phase content by XRD analysis Besides amorphousmetakaolin MK contained minor amounts of anatase quartz and mica
Fig 1 Weight fractions of tobermorite quartz and katoite determined byquantitative XRD analysis ndash samples including MKg crosshatched
Table 1Chemical composition of MK and MKg determined by XRF analysis ndash majorcontrasts in bold letters
Oxides [wt-] MK MKg
SiO2 536 604Al2O3 392 206CaO 01 40MgO 01 12Na2O 0 96K2O 10 18Fe2O3 18 05TiO2 21 03P2O5 01 02Loss on ignition 15 1
J Schreiner et al Applied Clay Science 185 (2020) 105432
2
6 Publications
32
MKg contained additional kaolinite feldspar and quartz
22 Investigated mix composites
For the preparation of raw mixtures the powders were weighed andhomogenized using a lab-scale mixing mill Table 2 lists the composi-tion and nomenclature of all samples including Al2O3 content andcuring time in the autoclave
bull Besides one blank mixture (MK0) that did not contain any type ofmetakaolin eleven more compounds were prepared of which threeincluded different dosages of MKg (MKg16 MKg23 and MKg60)Three more mixes contained equivalent amounts of MK instead ofMKg (MK16 MK23 and MK60) These mixes were investigated inorder to have a direct comparison concerning the effects of differentraw material on the synthesis of tobermorite
bull Additionally the mixes MK9 MK5 and MK25 with lower dosages ofmetakaolin were analyzed In the referenced literature (Schreineret al 2019) the effect of Al3+ on the anisotropic peak broadeningof tobermorite could only be observed in the case of Al2O3 contentslower than 4 in the drymix In the latter three mixes Al2O3 con-tents range from 1 to 35 Al2O3 (calculated from XRF data) whichmeets the region of interest for the analysis of tobermorite domainmorphology
bull The curing time for nearly all of the investigated samples was 12 hbut compound MK9 was prepared two more times for curing timesof 2 h and 6 h The different curing times were chosen in this par-ticular sample so that the reactivity of metakaolin and the phasetransitions could be observed more precisely
23 Hydrothermal treatment
Due to the different fineness of raw materials there was a differentwater demand from one mixture to another In order to obtain slurriesof comparable rheology the amount of water was adapted respectivelyresulting in water-to-solid ratios of 25 to 3 which matches the sug-gested water-to-solid ratio for this purpose (Roacutezycka et al 2014Galvaacutenkovaacute et al 2018) The weighed water was added to the dry mixand after stirring for 1 min at 23 degC the slurry was poured into thereactor Minor changes in the quantity of added water did not have aninfluence on the measured steam pressure All experiments were con-ducted using a PTFE-lined stainless steel autoclave with a reactor vo-lume of 300 ml The oven temperature was fixed at 180 degC and auto-genous steam pressure of 11ndash12 MPa was measured during eachexperiment with an external manometer After cooling to room tem-perature the sample was removed from the reactor coarsely ground
using an agate mortar and dried at 60 degC for 12 h After drying thesample was ground with an agate mortar again in order to deagglo-merate the particles As no coarse raw materials were used there wasno need for wet McCrone milling (Schreiner et al 2018)
24 XRD analysis
After preparation into front-loading sample holders the powdersamples were measured with a D8 diffractometer (Bruker) equippedwith a LynxEye detection system and Bragg-Brentano geometry Thesettings for XRD analysis included a tube voltage of 40 kV a current of40 mA an angular range from 6 to 80deg 2θ (Cu Kα radiation) a time perstep of 054 s a step width of 00236deg 2θ and a PSD opening of 33deg Thebackground was fitted with Chebyshev polynomial of the fifth orderThe major contribution of amorphous phase was fitted with a singlepeak with a fixed position at 308deg 2θ so that tobermorite reflectionswere not affected An external quartzite standard was measured withthe same parameters in order to determine phase quantities (Jansenet al 2011) Bruker AXS software TOPAS 50 was used for Rietveldrefinement (Rietveld 1969) and the used structures are shown inTable 3
3 Results and discussion
31 Different dosages of MK and MKg
In Fig 1 the quantities of tobermorite quartz and katoite present inmost of the samples determined by XRD analysis are illustratedWhenever tobermorite was the leading mineral hydrate phase a basalspacing of 113 Aring could be verified in each of the diffractograms Thequantities of minor crystalline phases and amorphous content are notshown For low dosages of MK it can be seen that the weight fraction oftobermorite decreased At moderate dosage of both types of metakaolin(MK16 MK23 MKg16 MKg23) tobermorite was present in comparablequantities It can be seen that the amount of katoite in the mixes de-pended on the dosage of metakaolin and it appeared only at dosages ofMK5 or more Due to the higher content of aluminum in MK comparedto MKg more katoite could always be observed in the MK mixes atequivalent dosages Despite equal amounts of quartz as starting mate-rial in mixes for both types of metakaolin the resulting weight fractionsin the cured samples were not alike Considerably more quartz waspresent in the MK samples Even though less quartz was used for mixescontaining higher amounts of MK even more quartz was present afterhydrothermal curing (Table 2 Fig 1) Consequently some of the SiO2
provided by MK did not transform into an amorphous phase or to-bermorite but into quartz This finding is verified by the presence ofquartz in MK60 because no quartz was included in the raw mixture Thefeldspar present in MKg did not react so Na2O and an unknown amountof Al2O3 may not have been supplied for hydrothermal reaction Besidestobermorite and quartz additional calcite scawtite (Ca7Si6(CO3)
Table 2Basic powder compounds prepared for the hydrothermal synthesis of to-bermorite with the respectively calculated Al2O3 content and curing time in thereactor
Sample Portlandite[wt-]
Quartz[wt-]
MK[wt-]
MKg
[wt-]
Al2O3
[wt-]Curingtime [h]
MK0 49 51 ndash ndash 0 12MK25 495 48 25 ndash 1 12MK5 49 46 5 ndash 2 12MK9_2h 48 43 9 ndash 35 2MK9_6h 48 43 9 ndash 35 6MK9_12h 48 43 9 ndash 35 12MK16 47 37 16 ndash 63 12MK23 46 31 23 ndash 9 12MK60 40 ndash 60 ndash 235 12MKg16 47 37 ndash 16 33 12MKg23 46 31 ndash 23 47 12MKg60 40 ndash ndash 60 124 12
Table 3Structural data used for the investigation with powder XRD analysis
Phase Author
Anatase (Horn et al 1972)Biotite (Brigatti et al 2000)Calcite (Maslen et al 1995)Kaolinite (Zvyagin 1960)Katoite (Bartl 1969)Microcline (Bailey 1969)Plazolite (Basso et al 1983)Portlandite (Busing and Levy 1957)Quartz (Le Page and Donnay 1976)Scawtite (Grice 2005)Tobermorite (Hamid 1981)Xonotlite (Hejny and Armbruster 2001)
J Schreiner et al Applied Clay Science 185 (2020) 105432
3
6 Publications
33
O18bull2(H2O)) and xonotlite (Ca6Si6O17(OH)2) could be identified insample MK0 (XRD plots of samples MK0 MKg16 MKg23 MK16 andMK23) Comparing MK0 and MK25 scawtite and xonotlite could stillbe identified in a very low amount in MK25 but no longer in samplesthat contained even more MK (XRD plots of samples MK0 MK25 MK5and MK9_12h)
Two additional experiments were done without quartz in the rawmixes (MK60 and MKg60) The according diffractograms after hydro-thermal curing are shown in Fig 2 In sample MKg60 tobermorite (gt 50wt-) was successfully synthesized without any other silica sourcethan MKg whereas no crystalline quartz occurred By contrast no to-bermorite but quartz could be identified in equivalent mixture MK60containing MK It can be seen that crystalline components such as micaand anatase in the raw MK did not react at the selected conditions andremained present in the autoclaved samples Except for feldspar in MKgall of the crystalline components appeared to be reactive at the chosenhydrothermal conditions A minor unidentified phase occurred at328deg2θ and additional xonotlite was identified in sample MKg60 Insample MK60 more calcium was needed for the formation of morehydrogarnet (Fig 1) resulting in a lower CaSi ratio for the remainingsystem Sample MKg60 contained only half of the amount of Al3+ and itwas not completely supplied for reaction due to its partial presence infeldspar Consequently essentially less hydrogarnet (Fig 1) was presentin MKg60 after hydrothermal treatment and the CaSi ratio in the re-maining system was affected to a lesser extent
32 Application of MK for different curing times
The development of hydrate phases in the autoclave for compoundMK9 is displayed in Fig 3 After only 2 h of hydrothermal curing all ofthe available portlandite had reacted and katoite (95 wt-) was pre-sent The applied type of metakaolin appeared to react quickly as itsupplied aluminum for formation of katoite No formation of to-bermorite could be observed at this stage yet An assumably amorphousprecursor can be seen at 28 to 30deg2θ Calcium was provided by thedissolution of portlandite After 6 h of hydrothermal reaction amountsof katoite (85 wt-) and quartz (from 31 wt- at 2 h to 165 wt- at6 h) had decreased and a major amount of tobermorite (35 wt-) waspresent Apparently between 2 and 6 h under hydrothermal conditionsthe amorphous precursor and quartz reacted resulting in the formationof tobermorite An additional 6 h of reaction time (MK9_12h) did notchange the phase composition significantly Slightly more tobermorite
(365 wt-) less quartz (16 wt-) and katoite (65 wt-) weremeasured
33 Tobermorite domain morphology and lattice parameters
In the referenced literature an analysis of tobermorite domainmorphology based on anisotropic peak broadening was possible forsamples that contained notgt 4 wt- Al2O3 in the drymix (Schreineret al 2019) Accordingly in this study samples MK0 MK25 MK5MK9_6h and MK9_12h were suitable (Table 2) with MK9_2h not con-taining any tobermorite In Fig 4 the respective growth in a and b di-rection is visualized with x indicating the domain size in a direction andy indicating domain size in b direction using a macro for TOPAS 50(Ectors et al 2015 2017) The calculated cylinder models in Fig 4represent the relation of yx and not absolute sizes With no supply ofaluminum ions (MK0) the relative domain growth in b direction islower compared to samples containing metakaolin This finding agreeswith the results from a similar investigation of tobermorite in AAC(Schreiner et al 2019) However within the samples MK5 andMK9_12h the different amounts of supplied aluminum ions did notshow a clear effect It appeared that low dosages of Al3+ (1 wt- Al2O3
in MK25 and 2 wt- Al2O3 in MK5) were enough to determine thedomain growth of tobermorite Additional results from the samplesMK9_6h and MK9_12h indicated that growth in b direction increasedwith reaction time
In Fig 5 lattice parameters of tobermorite depending on metakaolindosages are plotted B clearly remained unaffected throughout therange of samples Increasing amounts of metakaolin led to a slightlysmaller parameter a However both types of metakaolin showed acorresponding impact on parameter a By contrast parameter c in-creased strongly with increasing amounts of MK and MKg but the typeof metakaolin was significant At an equivalent dosage MK affected thecell dimension in c direction considerably more than MKg so that thefraction of Al3+ appeared to be the decisive parameter Different metaloxides in MKg did not show a notable effect certainly as they werepartially not provided for reaction Unlike for the domain morphologyof tobermorite the impact on lattice parameters could be observedwithin the complete range of examined dosages
4 Conclusions
The results obtained from the introduced investigations allow con-cluding remarks on the effects of the applied types of metakaolin on thesynthesis of 11 Aring tobermorite the phase transitions and the in-corporation of Al3+ into the lattice of tobermorite
With a critical dosage the use of any type of metakaolin led to theformation of katoite in an according amount At moderate dosages(MKg16 MKg23 MK16 and MK23) the two types of metakaolin showeda good correspondence in consideration of the quantities of to-bermorite For higher dosages there were contrary effects Lower do-sages of MK led to considerable quantities of Al-substituted to-bermorite Samples containing low dosages of MK revealed that katoiteappeared in the case ofgt 5 wt- of MK - corresponding to 2 wt-Al2O3 - in the basic compound Minor crystalline phases in MKg showedbetter reactivity than those in MK The observation that no tobermoritewas present in sample MK60 indicated that high dosages of Al3+ hin-dered the formation of tobermorite
Investigations of MK9 at 2 6 and 12 h displayed the evolution ofhydrate phases At first katoite was the only crystalline hydrate phasepresent after 2 h which corresponded to observations in a differentpublication (Klimesch and Ray 1999) The amount of katoite andquartz then decreased and a major amount of tobermorite formed from2 to 6 h curing time In order to gain more information on the trans-formation of amorphous C-(A)-S-H into tobermorite additional ex-periments in the range of 2 to 6 h curing time will be needed
Domain morphology analysis of tobermorite revealed that low
Fig 2 Diffractograms of MKg MKg60 MK and MK60 from 7 to 34deg2θ CuKα Aanatase C calcite F feldspar k kaolinite K katoite M mica Q quartz Ttobermorite U unidentified phase X xonotlite
J Schreiner et al Applied Clay Science 185 (2020) 105432
4
6 Publications
34
dosages of Al3+ determined the domain growth which agreed with theresults published on tobermorite in AAC samples (Schreiner et al2019) Different curing times unveiled that growth in b direction in-creased with the reaction time Al3+ incorporation into the lattice oftobermorite only reflected to a limited extent in the domain mor-phology By contrast an increase of lattice parameter c was triggered byAl3+ even at the highest dosage in this study Ultimately there is no
evidence for a limit of incorporation of Al3+ but there is a limit ofinfluence on the domain morphology These results additionally re-confirm this assumption similarly made in the previous work (Schreineret al 2019) and suggest a new mechanism of tobermorite crystal-lization depending on the presence of Al3+
Supplementary data to this article can be found online at httpsdoiorg101016jclay2019105432
Declaration of Competing Interest
The authors declare that they have no known competing financialinterests or personal relationships that could have appeared to influ-ence the work reported in this paper
Acknowledgement
The authors thank Rodgauer Baustoffwerke GmbH amp Co KG forsupplying raw materials for laboratory experiments
References
Aguilar-Mamani W Garciacutea G Hedlund J Mouzon J 2014 Comparison betweenleached metakaolin and leached diatomaceous earth as raw materials for the synth-esis of ZSM-5 Springerplus 3 1ndash10 httpsdoiorg1011862193-1801-3-292
Ayodele OB Sulaimon AA Alaba PA Tian Z-Y 2019 Influence of metakaolini-zation temperature on the structure and activity of metakaolin supported Ni catalystin dry methane reforming J Environ Chem Eng httpsdoiorg101016jjece2019103239 (in press)
Badawi EA Abdel-Rahman MA Mostafa A Abdel-Rahman M 2019 Determinationof the crystallite size amp micro- strain by novel method from XRD profile Appl Phys2 1ndash15 httpsdoiorg1031058jap201921001
Bailey SW 1969 Refinement of an intermediate microcline structure Am Miner 541540ndash1545
Bartl H 1969 Roentgen-Einkristalluntersuchungen an (CaO)3 (Al2O3) (H2O)6 und an(CaO)12 (Al2O3)7 (H2O) neuer Vorschlag zur (CaO)12 (Al2O3)7-Struktur NeuesJahrb fuer Mineral Monatshefte 1969 404ndash413
Basso R Giusta AD Zefiro L 1983 Crystal structure refinement of plazolite A highlyhydrated natural hydrogrossular Neues Jahrb Miner Monatsh (Neues Jahrb fuerMineral Monatshefte) 1983 251ndash258
Brigatti MF Lugli C Poppi L Foord EE Kile DE 2000 Crystal chemical varia-tions in Li- and Fe-rich micas from Pikes Peak batholith (Central Colorado) AmMineral 85 1275ndash1286 httpsdoiorg102138am-2000-8-920
Busing WR Levy HA 1957 Neutron diffraction study of calcium hydroxide J ChemPhys 26 563 httpsdoiorg10106311743345
Chen L Wang Z Wang Y Feng J 2016 Preparation and properties of alkali acti-vated metakaolin-based geopolymer Materials (Basel) 9 1ndash12 httpsdoiorg103390ma9090767
Chucholowski C Holger M Thienel K-C 2018 Improving the recyclability en-vironmental compatibility and CO2 balance of autoclaved aerated concrete by re-placing sulfate carrier and cement with calcined clays CePapers 2 503ndash512httpsdoiorg101002cepa846
Fig 3 Diffractograms of MK9_2h MK9_6h and MK9_12h from 7 to 38deg2θ CuKα C calcite K katoite Q quartz T tobermorite
Fig 4 Relation of calculated domain sizes of 11 Aring tobermorite in selectedsamples (MK0 MK25 MK5 MK9_6h and MK9_12h) in a (x) and b (y) direction
Fig 5 Lattice parameters of tobermorite depending on MK or MKg dosageincluding blank mix MK0
J Schreiner et al Applied Clay Science 185 (2020) 105432
5
6 Publications
35
Demir İ Başpınar MS Kahraman E Ccedilalışkan E Goumlrhan G 2014 An investigationon the usability of diatomite in aerated concrete production In Proc of the IntlConf on Advances in Civil Structural and Construction Engineering ndash CSCE 2014 pp97ndash100
Ectors D Goetz-Neunhoeffer F Neubauer J 2015 A generalized geometric approachto anisotropic peak broadening due to domain morphology J Appl Crystallogr 48189ndash194 httpsdoiorg101107S1600576714026557
Ectors D Goetz-Neunhoeffer F Neubauer J 2017 Routine (an)isotropic crystallitesize analysis in the double-Voigt approximation done right Powder Diffract 3227ndash34 httpsdoiorg101017S0885715617000070
Galvaacutenkovaacute L Bartoniacutečkovaacute E Opravil T Tkacz J Ptaacuteček P 2018 The influence ofstarting materials solubility on tobermorite structure formation under the hydro-thermal conditions IOP Conf Ser Mater Sci Eng 379 1ndash8 httpsdoiorg1010881757-899X3791012001
Grice JD 2005 The structure of spurrite tilleyite and scawtite and relationships toother silicate-carbonate minerals Can Mineral 43 1489ndash1500 httpsdoiorg102113gscanmin4351489
Hamid SA 1981 The crystal structure of the 11 Aring natural tobermoriteCa225[Si3O75(OH)15]1H2O Zeitschrift fuer Krist 154 189ndash198 httpsdoiorg101524zkri19811543-4189
Hejny C Armbruster T 2001 Polytypism in xonotlite Ca6Si6O17(OH)2 Zeitschrift furKrist 216 396ndash408
Horn M Schwerdtfeger CF Meagher EP 1972 Refinement of the structure of ana-tase at several temperatures Zeitschrift fur Krist 136 273ndash281 httpsdoiorg101524zkri19721363-4273
Jansen D Goetz-Neunhoeffer F Stabler C Neubauer J 2011 A remastered externalstandard method applied to the quantification of early OPC hydration Cem ConcrRes 41 602ndash608 httpsdoiorg101016jcemconres201103004
Jenkins R Snyder R 1996 Introduction to X-ray Powder Diffractometry ChemicalAnalysis Wiley pp 90
Kalousek GL 1956 Crystal Chemistry of Hydrous Calcium Silicates J Am Ceram Soc40 74ndash80
Klimesch D Ray A 1998 Autoclaved cement-quartz pastes with metakaolin additionsAdv Cem Based Mater 7 109ndash118 httpsdoiorg101016S1065-7355(97)00073-4
Klimesch D Ray A 1999 DTA-TGA evaluations of the CaOndashAl2O3ndashSiO2ndashH2O systemtreated hydrothermally Thermochim Acta 334 115ndash122 httpsdoiorg101016s0040-6031(99)00140-9
Komarneni S Roy R Roy DM Fyfe CA Kennedy GJ Bothner-By AA Dadok JChesnick AS 1985 27Al and29Si magic angle spinning nuclear magnetic resonancespectroscopy of Al-substituted tobermorites J Mater Sci 20 4209ndash4214 httpsdoiorg101007BF00552416
Koutnyacute O Opravil T Pořiacutezka J 2014 Application of metakaoline in autoclavedaerated concrete technology Adv Mater Res 1000 174ndash177 httpsdoiorg104028wwwscientificnetAMR1000174
Le Page Y Donnay G 1976 Refinement of the crystal structure of low-quartz ActaCrystallogr Sect B 32 2456ndash2459 httpsdoiorg101107S0567740876007966
Luo H Law WW Wu Y Zhu W Yang EH 2018 Hydrothermal synthesis of needle-like nanocrystalline zeolites from metakaolin and their applications for efficient re-moval of organic pollutants and heavy metals Microporous Mesoporous Mater 2728ndash15 httpsdoiorg101016jmicromeso201806015
Maeda H Ogawa Y Ishida EH Kasuga T 2012 Hydrothermal synthesis of to-bermorite doped with phosphorus species for removing heavy metal ions J AustCeram Soc 48 8ndash11
Maslen EN Streltsov VA Streltsova NR Ishizawa N 1995 Electron density andoptical anisotropy in rhombohedral carbonates III Synchrotron Xray studies ofCaCO3 MgCO3 and MnCO3 Acta Crystallogr Sect B 51 929ndash939 httpsdoiorg101107S0108768195006434
Matekonis G Šiaučiūnas R Vaičiukynienė D 2010 Hydrothermal Synthesis andCharacterization of Na + and [ Al 3 + + Na + ] -substituted Tobermorite in CaO-SiO2middotnH2O-H2O System Mater Sci 16 242ndash248
Matsui K Kikuma J Tsunashima M Ishikawa T Matsuno S Ogawa A Sato M2011 In situ time-resolved X-ray diffraction of tobermorite synthesis process underhydrothermal condition IOP Conf Ser Mater Sci Eng 18 60ndash66 httpsdoiorg1010881757-899X182022017
Merlino S Bonaccorsi E Armbruster T 2000 The real structures of clinotobermoriteand tobermorite 9 Aring OD character polytypes and structural relationships Eur JMineral 12 411ndash429 httpsdoiorg1011270935-122120000012-0411
Monasterio M Gaitero JJ Manzano H Dolado JS Cerveny S 2015 Effect ofchemical environment on the dynamics of water confined in calcium silicate mi-nerals Natural and synthetic tobermorite Langmuir 31 4964ndash4972 httpsdoiorg101021acslangmuir5b00614
Mostafa NY 2005 Influence of air-cooled slag on physicochemical properties of auto-claved aerated concrete Cem Concr Res 35 1349ndash1357 httpsdoiorg101016jcemconres200410011
Mostafa NY Shaltout AA Omar H Abo-El-Enein SA 2009 Hydrothermal synth-esis and characterization of aluminium and sulfate substituted 11 nm tobermoritesJ Alloys Compd 467 332ndash337 httpsdoiorg101016jjallcom200711130
Naber C Stegmeyer S Jansen D Goetz-Neunhoeffer F Neubauer J 2019 ThePONKCS method applied for time resolved XRD quantification of supplementarycementitious material reactivity in hydrating mixtures with ordinary Portland ce-ment Constr Build Mater 214 449ndash457 httpsdoiorg101016jconbuildmat201904157
Qu X Zhao Z Zhao X 2018 Microstructure and characterization of aluminum-in-corporated calcium silicate hydrates (C-S-H) under hydrothermal conditions RSCAdv 8 28198ndash28208 httpsdoiorg101039c8ra04423f
Rashad AM 2013 Metakaolin as cementitious material history scours production andcomposition - a comprehensive overview Constr Build Mater 41 303ndash318 httpsdoiorg101016jconbuildmat201212001
Rietveld HM 1969 A profile refinement method for nuclear and magnetic structures JAppl Crystallogr 2 65ndash71 httpsdoiorg101107S0021889869006558
Riacuteos CA Williams CD Fullen MA 2009 Hydrothermal synthesis of hydrogarnet andtobermorite at 175 degC from kaolinite and metakaolinite in the CaO-Al2O3-SiO2-H2Osystem a comparative study Appl Clay Sci 43 228ndash237 httpsdoiorg101016jclay200809014
Roacuteżycka A Pichoacuter W 2016 Effect of perlite waste addition on the properties of au-toclaved aerated concrete Constr Build Mater 120 65ndash71 httpsdoiorg101016jconbuildmat201605019
Roacutezycka A Kotwica Ł Małolepszy J 2014 Synthesis of single phase gyrolite in theCaO-quartz-Na2O-H2O system Mater Lett 120 166ndash169 httpsdoiorg101016jmatlet201401003
Sauman Z 1974 Influence of SO4 2ndash ions on the formation of 11 Aring tobermorite InProceedings of the 2nd International Symposium on Science and Research in SilicateChemistry Moscow pp 25ndash39
Schmidt M Egersdoumlrfer A Poumlllmann H 2012 Increased reactivity using a glass-containing metakaolin as an active filler in lime-based binder systems ZKG Int 6554ndash62
Schreiner J Jansen D Ectors D Goetz-Neunhoeffer F Neubauer J Volkmann S2018 New analytical possibilities for monitoring the phase development during theproduction of autoclaved aerated concrete Cem Concr Res 107 247ndash252 httpsdoiorg101016jcemconres201802028
Schreiner J Goetz-Neunhoeffer F Neubauer J Volkmann S Bergold S Webler RJansen D 2019 Advanced Rietveld refinement and SEM analysis of tobermorite inchemically diverse autoclaved aerated concrete Powder Diffract 34 143ndash150httpsdoiorg101017s0885715619000149
Setthaya N Chindaprasirt P Pimraksa K 2016 Preparation of zeolite nanocrystals viahydrothermal and solvothermal synthesis using of rice husk ash and metakaolinMater Sci Forum 872 242ndash247 httpsdoiorg104028wwwscientificnetmsf872242
Siauciunas R Baltakys K 2004 Formation of gyrolite during hydrothermal synthesis inthe mixtures of CaO and amorphous SiO2 or quartz Cem Concr Res 34 2029ndash2036httpsdoiorg101016jcemconres200403009
Skawinska A Owsiak Z Baran T Hernik K 2017 The influence of halloysite ad-dition on tobermorite formation in CaO and quartz mix under hydrothermal condi-tions Cem Wapno Bet 17 426ndash434
Venhodovaacute E Janovskyacute R Drochytka R 2015 Formation of tobermorite at differentmaterials composition of aerated concrete Appl Mech Mater 752ndash753 247ndash250httpsdoiorg104028wwwscientificnetamm752-753247
Walczak P Małolepszy J Reben M Szymański P Rzepa K 2015 Utilization ofwaste glass in autoclaved aerated concrete Proc Eng 122 302ndash309 httpsdoiorg101016jproeng201510040
Zhang Y Gao W Cui L 2007 The transformation of acid leached metakaolin tozeolite beta Stud Surf Sci Catal 170 420ndash425 httpsdoiorg101016S0167-2991(07)80870-6
Zvyagin BB 1960 An attempt to electronographic determination of kaolinite structureJ Dokl Akad Nauk SSSR 130 1023ndash1026
J Schreiner et al Applied Clay Science 185 (2020) 105432
6
6 Publications
36
6 Publications
62 Advanced Rietveld refinement and SEM analysis oftobermorite in chemically diverse autoclaved aeratedconcrete
Following the copyright guidelines by Cambridge University Press the publication
Schreiner J Goetz-Neunhoeffer F Neubauer J Volkmann S Bergold S WeblerR Jansen D 2019 Advanced Rietveld refinement and SEM analysis of tobermorite inchemically diverse autoclaved aerated concrete Powder Diffraction 34 143ndash150 httpsdoiorg101017s0885715619000149
may not be reprinted It can be accessed at
httpswwwcambridgeorgcorejournalspowder-diffractionarticleadvanced-rietveld-refinement-and-sem-analysis-of-tobermorite-in-chemically-diverse-autoclaved-aerated-concrete51597C2A66F6F225D29DEB2675E74249
37
6 Publications
63 New analytical possibilities for monitoring the phasedevelopment during the production of autoclavedaerated concrete
Reprint of the peer reviewed publication
Schreiner J Jansen D Ectors D Goetz-Neunhoeffer F Neubauer J VolkmannS 2018 New analytical possibilities for monitoring the phase development during theproduction of autoclaved aerated concrete Cement and Concrete Research 107 247ndash252httpsdoiorg101016jcemconres201802028
with permission from Elsevier
38
Contents lists available at ScienceDirect
Cement and Concrete Research
journal homepage wwwelseviercomlocatecemconres
Short communication
New analytical possibilities for monitoring the phase development duringthe production of autoclaved aerated concrete
J Schreinera D Jansena D Ectorsa F Goetz-Neunhoeffera J Neubauera S Volkmannb
aUniversity of Erlangen-Nuremberg GeoZentrum Nordbayern Mineralogy Schlossgarten 5a 91054 Erlangen Germanyb Rodgauer Baustoffwerke GmbH amp Co KG Am Opel-Pruumlffeld 3 63110 Rodgau-Dudenhofen Germany
A B S T R A C T
This work presents improved analytical methods for both steps of the production process of autoclaved aeratedconcrete (AAC) the phase development during the hydration before autoclaving and during the autoclavingprocess itself The improvement includes new insights into preparation methods of AAC samples for powderdiffraction as well as Rietveld refinement strategies For the first time a new implementation for calculatinganisotropic crystal domain sizes is applied to major hydrate phases occurring during AAC production namelyportlandite during the hydration before autoclaving and tobermorite during the autoclaving process The cal-culation of anisotropic domain size growth which can be implemented in the Rietveld environment is based oncrystallographically and geometrically appropriate models The implementation of calculating anisotropic do-main sizes for the Rietveld software TOPAS 50 allows a superior Rietveld fit and a more accurate quantificationof the phase development Additionally it enables the tracking of growth mechanism of portlandite duringhydration
1 Introduction
Autoclaved aerated concrete (AAC) is known as a lightweight con-struction material which offers outstanding properties such as suffi-cient strength for construction in addition with excellent thermal in-sulation [12] AAC is produced by autoclaving from calcareous rawmaterials such as lime (CaO) and cement quartz sulfate carrier andother additives such as foaming agents and water
The production process (Fig 1) can be separated into the hydrationof the mixed slurry before the procedure of autoclaving and the auto-claving at elevated temperature (180 degC to 200 degC) under saturatedsteam pressure (12MPa) for several hours
The hydration process before autoclaving is necessary to achievesufficient strength in order to cut the green cake blocks as they shouldhave a specific shape and dimension after autoclaving Furthermorethe porous structure is generated by the foaming agent during hydra-tion in the first process step During autoclaving the final propertiesnamely strength and low thermal conductivity are achieved
It is already well understood that the autoclaving process leads tothe formation of several phases first of all tobermorite(Ca5Si6O16(OH)2lowast4H2O) [3ndash5] Newest research has shown im-pressively which reactions are running from the mineralogical point ofview Insitu XRD measurements were carried out during the
autoclaving process and the phase development was shown by plottingnormalized intensities [6] The study of Mitsuda et al [3] was mainlyfocused on the tracking of the phase evolution during the autoclavingprocess of AAC However their statements concerning phase evolutionare mainly based on XRD data and TGA measurements There is acommon agreement that the following reactions occur The consump-tion of the alite (OPC) leads to the formation of an initial C-S-H phaseduring the first processing step Portlandite which was initially formedduring the first process step (from CaO and C3S) further quartz and theC-S-H phase are consumed during autoclaving resulting in the crystal-lization of tobermorite Hence the crystallization process of to-bermorite as well as the crystal structure of tobermorite was an issue ofresearch and discussion over the last years and numerous publicationsto these topics are available Concerning the crystal structure of to-bermorite respectively the tobermorite supergroup a new publicationoutlines all important references and recommends a new nomenclature[7]
The presented study was performed to create new analytical possi-bilities for the characterization of the production process of AAC Bothof the production process steps are essential for the final productHence the present work focuses on crystallization of hydrate phases inboth processes
Firstly an external standard method [89] was published and
httpsdoiorg101016jcemconres201802028Received 6 October 2017 Received in revised form 1 February 2018 Accepted 26 February 2018
Corresponding authorsE-mail addresses juergenjsschreinerfaude (J Schreiner) danieljansenfaude (D Jansen)
Cement and Concrete Research 107 (2018) 247ndash252
0008-8846 copy 2018 Elsevier Ltd All rights reserved
T
6 Publications
39
recommended for the determination of absolute phase contents inmixtures with amorphous content It was shown that the method canabsolutely be recommended for hydrating cement pastes in which watercannot be quantified directly by XRD [10] This method seems to bevery promising for both the quantification of the hydration of the AACslurry before autoclaving and the quantification of the phase evolutionduring autoclaving inasmuch as both production steps form crystallineand amorphous phases
Secondly a new approach to anisotropic peak broadening due toanisotropic domain morphology which was developed [1112] is ap-plied to AAC samples to improve the fit of portlandite and tobermoriteby Rietveld refinement [13] By applying this approach the refinementof both portlandite and tobermorite should additionally lead to betterquantitative results as well as to better insights into the development ofthe domain size morphology of both phases formed
It was already shown that in a hydrating raw mixture for AAC twospecies of portlandite precipitate at 23 degC one showing dynamicallyanisotropic peak broadening and another one following the isotropictrend [14] The application of the anisotropic refinement model led toan improved fitting of portlandite Moreover the mechanism of aniso-tropic domain growth of portlandite was tracked
2 Materials and methods
In order to examine the hydration of the AAC slurry before auto-claving a mixture of the hydraulic reactive components was weighedand measured in-situ at a Bruker D8 diffractometer with a LynxEyedetection system
Ordinary Portland cement (OPC) was mixed with lime (CaO) andanhydrite (C$) The raw materials were taken from the same batches asfor the industrial samples The drymix (58 OPC 36 CaO and 6 C$by weight) was then mixed with water (ws= 08) and placed into anappropriate sample holder The samples were not aerated The slurrysamples were covered with a kapton film to avoid evaporation andcarbonation Diffractograms were recorded with an angular range from7 to 545deg 2θ and a step width of 0011deg 2θ Measurements were carriedout every 15min For each measurement 96 XRD patterns were re-corded over the first 24 h The temperature was fixed at 70 degC which isthe mean temperature generally prevailing in the industrial processduring hydration before autoclaving Rietveld refinement was carriedout using the G-factor method All structures used for Rietveld refine-ment are shown in Table 1
For investigation of the autoclaved samples five different specimenswere taken at different autoclaving times The specimens were takenout of a technical production process hence it was not possible to in-terrupt the process at an earlier time inasmuch it would lead to damageof a whole concrete production batch The specimens were firstly driedat 60 degC until weight constancy The whole blocks were then broken andstatistical samples of 20 g were taken In order to receive the right massattenuation coefficient (MAC) for G-factor method the loss on ignitionand the chemical composition (XRF) were determined For energydispersive XRF analysis (Spectro Xepos) tube voltage from 20 kV to50 kV and tube current from 08 to 20mA were used for differenttargets
The final sample preparation (grinding) before XRD measurementswas carried out using both an agate mortar and a McCrone micronizingmill for wet milling with isopropanol Both preparation methods wereapplied separately to see which one is suitable in order to get the bestpreparation for XRD investigations Six preparations were performed byone operator of which two were prepared with an agate mortar andfour with a McCrone mill For the McCrone milling 3 g of the sampleand 10ml of isopropanol were used for grinding for 12min The grainsize distribution of one sample prepared with an agate mortar and onesample prepared using a McCrone mill was measured by laser granu-lometry in isopropanol using a Mastersizer 3000 (MALVERN)
After milling the samples in these two ways for XRD analysis thepowders were prepared into a front loading sample holder and mea-sured Diffractograms were recorded with an angular range from 6 to80deg 2θ a step width of 00236deg 2θ and a time per step of 054 s Rietveldrefinement combined with external standard (G-factor) was applied inorder to get absolute quantities for each phase The refinement strategyfor portlandite and tobermorite in the TOPAS Launch Mode (TOPAS50 Bruker AXS) is attached as a Supplementary material file
3 Results and discussion
31 Hydration of the mixture before autoclaving
The hydration of the investigated paste before autoclaving isdominated by the hydration of the cement as well as the reaction of thefree lime (CaO) resulting in the formation of portlandite It can beclearly seen from Fig 2 that the hydration of the paste leads to theformation of ettringite portlandite and C-S-H phase For simplificationthe remaining phase developments are not shown in Fig 2 because theyare not in the focus of this study The hydration of CaO forming
Fig 1 Simplified process steps of AAC production and hydrate phase evolution
Table 1Structures used for Rietveld refinement
Phase Author
Alite [15]Anhydrite [16]Bassanite [17]Belite (β) [18]Belite (αprime) [19]Brownmillerite [20]C-S-H [21]Calcite [22]Ettringite [23]Gypsum [24]Hemicarbonate [25]Hydroxylellestadite [26]Lime (CaO) [27]Microcline [28]Portlandite [29]Quartz [30]Tobermorite [31]Tricalciumaluminate (cubic) [32]Tricalciumaluminate (orthorhombic) [33]PONCKS model for Water [21]
J Schreiner et al Cement and Concrete Research 107 (2018) 247ndash252
248
6 Publications
40
portlandite begins rapidly after the addition of water to the mixture andlime is fully consumed after only 1 h of hydration This translates into aquick rise of heat of hydration so that cement hydration is acceleratedwhich leads to further portlandite formation by the reaction of aliteEttringite formation stalls after few hours of hydration After 12 h et-tringite is partially decomposed probably due to sulfate depletion [9]
and poorly crystalline AFm phases (not shown in Fig 2) are formedIn Fig 3 it can be seen that in fact two generations of portlandite
are formed a 1st dominant generation showing anisotropic peakbroadening and 2nd one occurring considerably later following theisotropic domain size refinement which is usually carried out using theRietveld method This occurrence comes along firstly with lime hy-dration and secondly with alite hydration The expected quantity ofportlandite formed from lime hydration very well complies with the
Fig 2 Phase development in AAC paste on a laboratory scale before autoclaving ana-lyzed by in-situ XRD at 70 degC
Fig 3 Formation of two generations of portlandite by hydration of lime (1st) and C3S(2nd) at 70 degC before autoclaving with the major generation showing anisotropic peakbroadening
Fig 4 Biaxial cylinder domain size model of portlandite used for Rietveld refinement of anisotropic peak broadening
Fig 5 Morphological evolution of portlandite showing anisotropic domain size growthduring hydration at 70 degC
Fig 6 Comparison of quantification of crystalline quartz in samples prepared withMcCrone mill and agate mortar at different autoclaving times
J Schreiner et al Cement and Concrete Research 107 (2018) 247ndash252
249
6 Publications
41
quantity of the observed 1st generation The development of portlan-dite growth was already tracked in an equivalent slurry at 23 degC [14]Thus this observation confirms that the crystallinity of portlandite inmixtures for AAC production depends on the starting phase for hydra-tion as already indicated by Ectors [14]
Fig 4 shows the used biaxial cylindrical model for anisotropic do-main size calculation and the portlandite structure which was createdwith structural software VESTA 318 [34] Using the cylindrical ap-proach domain sizes in a (here equating to b) and c direction(dz= cylinder height) can be calculated which comes along with theexpected symmetrical parameters of portlandite
The 1st portlandite generation showing anisotropic domain growthcan be tracked in terms of cylinder diameter and height which is rea-lized in Fig 5 The blue cylinder represents the geometric approach andcylinder height and diameter are calculated newly for each range Thecylinder height remains rather stable throughout the hydration processwhile the cylinder diameter increases during the first hours of hydra-tion After 10 h of hydration the mean cylinder diameter no longer in-creases Consequently these observations match the results of the ex-aminations conducted at 23 degC [14] as well as the assumption thatdifferent mechanisms of growth exist for portlandite depending on the
hydration educt The maximum cylinder diameter is reached earlier inthis work very likely because of the higher hydration temperature
32 Quantification of the reactions during autoclaving
Autoclaved samples were ground with an agate mortar and com-pared to samples which were wet-ground with a McCrone mill Fig 6shows precisely that the determination of the amount of crystallinequartz is more reproducible in the two shown samples which were
Fig 7 2D XRD with Bruker GADDS-system plots of samples prepared with agate mortar and McCrone mill Coarse quartz grains are pointed out in the plot of the sample prepared withagate mortar
Fig 8 Particle size distribution of one sample prepared with an agate mortar and of onesample prepared with a McCrone mill measured by laser granulometry
Fig 9 Rietveld refinement for Tobermorite of autoclaved AAC sample by use of isotropicdomain size model (a) and of anisotropic domain size model (b)
J Schreiner et al Cement and Concrete Research 107 (2018) 247ndash252
250
6 Publications
42
prepared with a McCrone mill The high variance of crystalline quartzin the samples which were prepared with an agate mortar is a result ofinsufficient grinding and remaining of too large quartz grains Whenthis spottiness occurs a reliable quantification using the G-factormethod is not possible
The 2D XRD with Bruker GADDS-system plots in Fig 7 demonstratethe insufficient grinding when using an agate mortar compared to wetmilling with a McCrone mill Quartz would be overrepresented in a one-dimensional XRD pattern focusing on a section with bright spots (greenarrows) The lack of bright spots in the right plot shows that the quartzgrains are milled more thoroughly using a McCrone mill In Fig 8 theparticle size distribution after both ways of sample preparation iscompared Most grains in the sample prepared with an agate mortar arelarger than in the sample prepared with a McCrone mill The grain sizedistribution of the sample prepared with a McCrone mill complies withthe recommended particle size range for XRD analysis of under 5 to50 μm [3536] while the other sample exceeds the range
In Fig 9 Rietveld refinement of an autoclaved sample is shown Thedominant peaks at 77 290 and 301deg 2θ are attributed to tobermoriteIn the upper diagram (a) Rietveld refinement was carried out regularlycalculating isotropic domain sizes for tobermorite However the cal-culated fit differs significantly from the raw data It can be assumed thattobermorite shows a similar pattern to portlandite in terms of aniso-tropic peak broadening taking into account that tobermorite is as-signed to the orthorhombic crystal system Thus instead of a biaxialcylinder model an elliptic cylinder model (Fig 10 structure createdwith VESTA 318 [34]) was applied for the refinement in the lowerdiagram (b) The elliptic cylinder model is a sufficient approach to the
orthorhombic crystal system as it allows the distinction between do-main sizes in a b and c direction The fit is clearly superior using theanisotropic domain size model highlighted by the difference plot inFig 9b The comparison refinement with isotropic and anisotropic ap-proach was done for all of the five autoclaved samples In Fig 11 theresulting Rwp values for the whole pattern and the RBragg values of to-bermorite are shown The refinement using the anisotropic model leadsto both lower Rwp and RBragg values and consequently to a better fit anda more accurate quantification of tobermorite in all refined samples
4 Summary and conclusions
Improved analytical methods for both the phase developmentduring the hydration before autoclaving and during the autoclavingprocess of AAC are presented It could be shown that wet McCronemilling is the best way of preparation of AAC samples in order to obtainsuitable samples for powder diffraction A new approach to treat ani-sotropic domain sizes for Rietveld refinement could be successfullyapplied ndash with the benefit that portlandite and tobermorite in AACsamples could be refined more accurately using the Rietveld methodThus this application allows an improved quantification of the phasedevelopment during both of the production steps
For the future there are still plenty of possibilities to apply thepresented approach of calculating anisotropic domain sizes to AACproduction As exemplified with portlandite the mechanisms of growthof tobermorite can be tracked likewise during the autoclaving processIn addition the effect of variations in the chemical composition of AACraw mixtures on the crystal morphology of tobermorite can be ex-amined This leaves a new perspective to discuss the link between mi-neral phase morphology and the thermal and mechanical properties ofAAC
Acknowledgement
The autoclaved samples were generously provided by RodgauerBaustoffwerke GmbH amp Co KG The authors express gratitude for allsupport
Appendix A Supplementary data
Supplementary data to this article can be found online at httpsdoiorg101016jcemconres201802028
References
[1] MW Grutzeck Cellular concrete in M Scheffler P Colombo (Eds) CellularCeramics Wiley-VCH Weinheim 2005 pp 193ndash223
[2] M Haas The future of AAC ndash from a material scientists point of view inMC Limbachiya JJ Roberts (Eds) Autoclaved Aerated Concrete Taylor FrLondon 2005 pp 187ndash194
[3] T Mitsuda K Sasaki H Ishida Phase evolution during autoclaving process ofaerated concrete J Am Ceram Soc 75 (1992) 1858ndash1863
[4] N Isu H Ishida T Mitsuda Influence of quartz particle size on the chemical and
Fig 10 Triaxial cylinder domain size model of Tobermorite used for Rietveld refinement of anisotropic peak broadening
Fig 11 Comparison of Rwp and RBragg values of Rietveld refinements of autoclavedsamples and tobermorite using the isotropic and the anisotropic domain size model
J Schreiner et al Cement and Concrete Research 107 (2018) 247ndash252
251
6 Publications
43
mechanical properties of autoclaved aerated concrete (I) tobermorite formationCem Concr Res 25 (1995) 243ndash248
[5] NY Mostafa Influence of air-cooled slag on physicochemical properties of auto-claved aerated concrete Cem Concr Res 35 (2005) 1349ndash1357 httpdxdoiorg101016jcemconres200410011
[6] K Matsui J Kikuma M Tsunashima T Ishikawa S Matsuno A Ogawa M SatoIn situ time-resolved X-ray diffraction of tobermorite formation in autoclaved aer-ated concrete influence of silica source reactivity and Al addition Cem Concr Res41 (2011) 510ndash519
[7] C Biagioni S Merlino E Bonaccorsi The tobermorite supergroup a new no-menclature Mineral Mag 79 (2015) 485ndash495 httpdxdoiorg101180minmag2015079222
[8] BH OConnor MD Raven Application of the Rietveld refinement procedure inassaying powdered mixtures Powder Diffract 3 (1988) 2ndash6 httpdxdoiorg101017S0885715600013026
[9] D Jansen F Goetz-Neunhoeffer C Stabler J Neubauer A remastered externalstandard method applied to the quantification of early OPC hydration Cem ConcrRes 41 (2011) 602ndash608 httpdxdoiorg101016jcemconres201103004
[10] D Jansen C Stabler F Goetz-Neunhoeffer S Dittrich J Neubauer Does OrdinaryPortland Cement contain amorphous phase A quantitative study using an externalstandard method Powder Diffract 26 (2011) 31ndash38 httpdxdoiorg10115413549186
[11] D Ectors F Goetz-Neunhoeffer J Neubauer A generalized geometric approach toanisotropic peak broadening due to domain morphology J Appl Crystallogr 48(2015) 189ndash194 httpdxdoiorg101107S1600576714026557
[12] D Ectors F Goetz-Neunhoeffer J Neubauer Routine (an)isotropic crystallite sizeanalysis in the double-Voigt approximation done right Powder Diffract 32 (S1)(2017) 27ndash34 httpdxdoiorg101017S0885715617000070
[13] HM Rietveld A profile refinement method for nuclear and magnetic structures JAppl Crystallogr 2 (1969) 65ndash71 httpdxdoiorg101107S0021889869006558
[14] D Ectors Advances in the Analysis of Cementitious Reactions and Hydrate Phases(Doctoral Thesis) (2016) pp 12ndash14 (urnnbndebvb29-opus4-71743)
[15] AacuteG De La Torre S Bruque J Campo MAG Aranda The superstructure of C3Sfrom synchrotron and neutron powder diffraction and its role in quantitative phaseanalyses Cem Concr Res 32 (2002) 1347ndash1356 httpdxdoiorg101016S0008-8846(02)00796-2
[16] A Kirfel G Will Charge density in anhydrite CaSO4 from X-ray and neutrondiffraction measurements Acta Crystallogr Sect B Struct Crystallogr CrystChem 36 (1980) 2881ndash2890 httpdxdoiorg101107S0567740880010461
[17] C Bezou AN Christensen D Cox M Lehman A Nonat Structures cristallines deCaSO405H2O et CaSO406H2O Comptes Rendus Hebd Des Seacuteances lAcadeacutemieDes Sci Seacuterie 2 (312) (1991) 43ndash48
[18] KH Jost B Ziemer R Seydel Redetermination of the structure of β-dicalciumsilicate Acta Crystallogr Sect B Struct Crystallogr Cryst Chem 33 (1977)1696ndash1700 httpdxdoiorg101107S0567740877006918
[19] W Mumme LMD Cranswick BC Chakoumakos Rietveld crystal structure re-finements from high temperature neutron powder diffraction data for the poly-morphs of dicalcium silicate Neues Jahrb Fuer Mineral Abhandlungen 170 (1996)171ndash188
[20] A Colville S Geller The crystal structure of brownmillerite Ca2FeAlO5Crystallographica 50 (1971) 2311ndash2315 httpdxdoiorg101107S056774087100579X
[21] ST Bergold F Goetz-Neunhoeffer J Neubauer Quantitative analysis of C-S-H inhydrating alite pastes by in-situ XRD Cem Concr Res 53 (2013) 119ndash126 httpdxdoiorg101016jcemconres201306001
[22] EN Maslen VA Streltsov NR Streltsova N Ishizawa Electron density and op-tical anisotropy in rhombohedral carbonates III Synchrotron Xray studies ofCaCO3 MgCO3 and MnCO3 Acta Crystallogr Sect B 51 (1995) 929ndash939 httpdxdoiorg101107S0108768195006434
[23] G Renaudin Y Filinchuk J Neubauer F Goetz-Neunhoeffer A comparativestructural study of wet and dried ettringite Cem Concr Res 40 (2010) 370ndash375httpdxdoiorg101016jcemconres200911002
[24] WF Cole CJ Lancucki A refinement of the crystal structure of gypsumCaSO42H2O Acta Cryst B30 (1974) 921ndash929 httpdxdoiorg101107S0567740874004055
[25] T Runčevski RE Dinnebier OV Magdysyuk H Poumlllmann Crystal structures ofcalcium hemicarboaluminate and carbonated calcium hemicarboaluminate fromsynchrotron powder diffraction data Acta Crystallogr Sect B Struct Sci 68 (2012)493ndash500 httpdxdoiorg101107S010876811203042X
[26] JM Hughes JW Drexler Cation substitution in the apatite tetrahedral site crystalstructures of type hydroxylellestadite and type fermorite Neues Jahrb FuerMineral (1991) 327ndash336
[27] CH Shen RS Liu JG Lin CY Huang Phase stability study of La12Ca18Mn2O7Mater Res Bull 36 (2001) 1139ndash1148
[28] SW Bailey Refinement of an intermediate microcline structure Am Miner 54(1969) 1540ndash1545
[29] WR Busing HA Levy Neutron diffraction study of calcium hydroxide J ChemPhys 26 (1957) 563 httpdxdoiorg10106311743345
[30] Y Le Page G Donnay Refinement of the crystal structure of low-quartz ActaCrystallogr Sect B 32 (1976) 2456ndash2459 httpdxdoiorg101107S0567740876007966
[31] SA Hamid The crystal structure of the 11 Aring natural tobermoriteCa225[Si3O75(OH)15]1H2O Zeitschrift Fuer Krist - New Cryst Struct 154 (1981)189ndash198 httpdxdoiorg101524zkri19811543-4189
[32] P Mondal JW Jeffery The crystal structure of tricalcium aluminate Ca3Al2O6Acta Crystallogr B 31 (1975) 689ndash697 httpdxdoiorg101107S0567740875003639
[33] Y Takeuchi F Nishi I Maki Crystal-chemical characterization of the tricalciumaluminate-sodium oxide (3CaOtimesAl2O3-Na2O) solid-solution series Zeitschrift FuumlrKrist (1980) 259ndash307
[34] K Momma F Izumi VESTA 3 for three-dimensional visualization of crystal vo-lumetric and morphology data J Appl Crystallogr 44 (2011) 1272ndash1276 httpdxdoiorg101107S0021889811038970
[35] K Scrivener R Snellings B Lothenbach A Practical Guide to MicrostructuralAnalysis of Cementitious Materials CRC Press 2016 pp 123ndash125 httpdxdoiorg107693wl20150205
[36] V Pecharsky P Zavalij Fundamentals of Powder Diffraction and StructuralCharacterization of Materials Springer second edition 2005 p 302 httpdxdoiorg101007978-0-387-09579-0
J Schreiner et al Cement and Concrete Research 107 (2018) 247ndash252
252
6 Publications
44
7 Acknowledgement
7 Acknowledgement
Ich moumlchte mich bei einigen Personen bedanken ohne die es wohl kaum zum erfolgreichenAbschluss dieser Arbeit gekommen waumlreMein Doktorvater Prof Dr Juumlrgen Neubauer hat sich stets die Zeit genommen die noumltigwar um Angelegenheiten aller Art mit mir zu klaumlren Er gab mir fachlich immer zumrichtigen Zeitpunkt einen gewissen wissenschaftlichen Impuls Zugleich habe ich mich den-noch immer frei in meiner eigenen Konzeption gefuumlhlt Groszligen Dank spreche ich Prof DrFriedlinde Goumltz-Neunhoeffer aus die fuumlr mich ebenso immer eine verlaumlssliche Ansprech-partnerin fuumlr fachliche und organisatorische Angelegenheiten aller Art war Danke anDr Daniel Jansen fuumlr die gute Zusammenarbeit und dafuumlr dass er mich im Zuge meinerMasterarbeit in ein Forschungsprojekt aufgenommen hat das den Weg zur Promotionmoumlglich machte Zusaumltzlich gilt mein Dank Prof Dr Matthias Goumlbbels der fuumlr dieMitarbeiter am Lehrstuhl immer motivierende Worte fand Fuumlr die Ermoumlglichung meinerTeilnahme an diversen Dienstreisen Fortbildungen und Tagungen moumlchte ich mich viel-mals bedankenWeiterhin bedanke ich mich bei Dr Stephan Volkmann und den Rodgauer BaustoffwerkenGmbH amp Co KG fuumlr die gute Zusammenarbeit und die Bereitstellung von Versuchsma-terialienVielen Dank an meine studentischen Hilfskraumlfte Daniel Wagner Laura MoldenhauerFabian Lang Jakob Schreiber und Felix Klaassen die alle Aufgaben im Labor einwand-frei und mit Bedacht erledigten Bei meinen aktuellen und ehemaligen Kollegen DrKatrin Hurle Dr Dominique Ectors Dr Christoph Naber Dr Florian Huumlller JoumlrgNehring Frank Riedel Julian Wolf Tanja Manninger Daniel Wagner Nicolas FobbeKarla Spaumlth Julian Goergens Andreas Koumlhler Cordula Jakob Franz Becker und LisaKlemenz bedanke ich mich fuumlr die gelungene Zusammenarbeit und gegenseitige Unter-stuumltzung Besonderer Dank geht auch an Kerstin Kreszlig Bettina Engl Christian HankeBernd Schleifer und Christian Abe fuumlr die verlaumlssliche Unterstuumltzung bei technischen Fra-gen und Messungen im LaborFuumlr jegliche Unterstuumltzungen moumlchte ich mich auch bei meinen Eltern bedanken sowiebei meinem Bruder Ralf der mir mit einem LaTex Crashkurs viel Frustration ersparthat Danke Thomas dass du immer fuumlr mich da bist und mit mir zusammen fuumlr genugAusgleich gesorgt hast
45
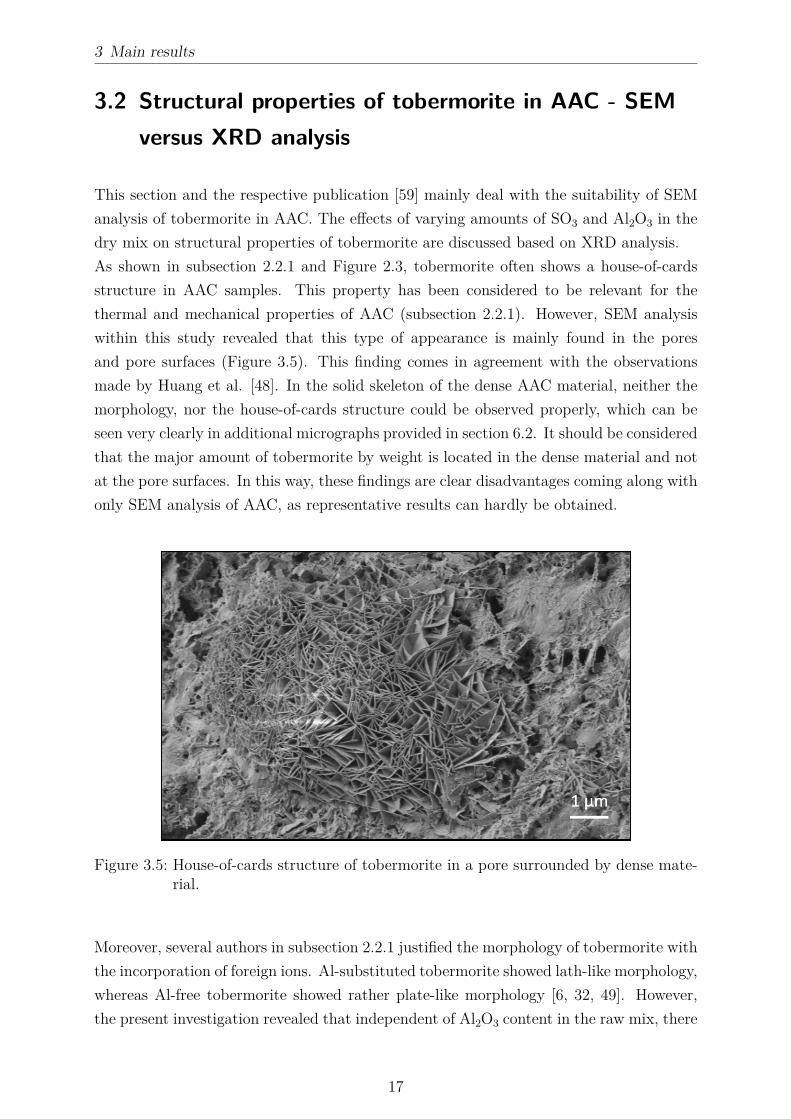
3 Main results
32 Structural properties of tobermorite in AAC - SEMversus XRD analysis
This section and the respective publication [59] mainly deal with the suitability of SEManalysis of tobermorite in AAC The effects of varying amounts of SO3 and Al2O3 in thedry mix on structural properties of tobermorite are discussed based on XRD analysisAs shown in subsection 221 and Figure 23 tobermorite often shows a house-of-cardsstructure in AAC samples This property has been considered to be relevant for thethermal and mechanical properties of AAC (subsection 221) However SEM analysiswithin this study revealed that this type of appearance is mainly found in the poresand pore surfaces (Figure 35) This finding comes in agreement with the observationsmade by Huang et al [48] In the solid skeleton of the dense AAC material neither themorphology nor the house-of-cards structure could be observed properly which can beseen very clearly in additional micrographs provided in section 62 It should be consideredthat the major amount of tobermorite by weight is located in the dense material and notat the pore surfaces In this way these findings are clear disadvantages coming along withonly SEM analysis of AAC as representative results can hardly be obtained
Figure 35 House-of-cards structure of tobermorite in a pore surrounded by dense mate-rial
Moreover several authors in subsection 221 justified the morphology of tobermorite withthe incorporation of foreign ions Al-substituted tobermorite showed lath-like morphologywhereas Al-free tobermorite showed rather plate-like morphology [6 32 49] Howeverthe present investigation revealed that independent of Al2O3 content in the raw mix there
17
3 Main results
is always heterogeneity regarding the morphology of tobermorite In Figure 36 plate-likeand lath-like morphology of tobermorite in AAC observed in two statistical chemicallyvarious samples are displayed This result supports the previous assumption that theobservations made by SEM analysis of tobermorite in AAC strongly depend on whatpart of the sample is selected Yet again no clear observations could be made that wererepresentative for the entire sample
Figure 36 Heterogeneous morphology of tobermorite (plate-like in a and c lath-like in band d) in two AAC samples characterized by different Al2O3 contents in theraw mix
The effects of Al3+ on the domain morphology of tobermorite were measured and evaluatedin a similar manner as in section 61 and the results could be confirmed The relativedomain growth in b direction was increased by Al3+ incorporation in both studies [5859] Moreover lattice parameter c was increased with Al3+ incorporation which can beseen more accurately in section 62 Unlike SEM analysis XRD analysis allowed clearconclusions whenever structural properties of Al-substituted tobermorite were affectedInstead of a local observation as made with SEM representative and statistical resultswere obtained The reader is referred to section 61 and section 62 for further results and
18
3 Main results
more specific conclusionsIn addition the effect of various amounts of sulfate in the raw mix was analyzed Unlikein the case of different dosages of Al3+ neither the domain morphology nor the latticeparameters of tobermorite were affected by the SO3 content in the dry mix In Figure 37these observations and additionally the amounts of anhydrite measured by QXRD areshown As the amount of available SO3 in the dry mix is known the maximum possibleamount of anhydrite could be calculated for each of the samples in focus Obviouslythe measured amounts of anhydrite are either equal or slightly higher compared to theexpected quantities This result leads to the assumption that all of the available sulfateis transformed into anhydrite so that no more sulfate could be incorporated into thestructure of tobermorite The over-estimation of anhydrite in some of the samples can beexplained due to the inaccuracy of the quantification method The present results rathermatch with the suggestions by Sauman amp Valtr [41] as in their study no effect of sulfateon the structure of tobermorite was observed either
Figure 37 Impact of the sulfate content in the AAC raw mix on lattice parameter cand relative domain morphology of tobermorite (a) and comparison of theexpected maximum amount of anhydrite to the measured amount determinedby QXRD (b)
33 Improved monitoring of the phase developmentduring the production of AAC
In this study not only autoclaved samples were analyzed but additionally a lab-scale slurrywhich included the reactive components of the green cake stage during AAC productionat equivalent weight proportions In-situ XRD was performed at 70 degC and at a water-to-
19
3 Main results
solid ratio of 08 for 24 h (Figure 38) which are respective conditions during commercialproduction Clearly the phase development is dominated by OPC and lime hydration asdescribed in section 22 It can be seen that the major reaction turnover occurs duringthe first 200 minutes which is the average duration of the green stage After only 30minutes all of the quicklime had transformed into portlandite whereas Schober proposeda duration of one hour for this reaction [42] The amount of portlandite is composed oftwo different generations as proposed by Ectors [52] Equally a biaxial cylinder modelwas applied in order to fit the peak broadening of the first generation of portlandite in thepresent investigation Minor phase developments such as the formation of AFm phases arenot shown in Figure 38 A coarse fraction of anhydrite did not react so that constantlyaround 15 wt were measured after 6 h As the decomposition of ettringite due tosulfate depletion [55] does not occur prior to 12 h the green cake strength is not affected
Figure 38 In-situ XRD measurement of AAC model slurry at water-to-solid ratio of 08and 70 degC For clarity and comprehensibility not all phases are shown
The separation of two generations of portlandite in the system does not only translate intodifferent domain morphologies as shown by Ectors [52] In Figure 39 more indicationsfor different mineralogical properties are displayed The shape of the (0 0 1) reflection inXRD patterns after only quicklime hydration and after both quicklime and alite hydrationshows a distinct feature While portlandite originating from quicklime hydration showsa broad peak implying lower crystallinity the peak after alite hydration is characterized
20
3 Main results
Figure 39 Formation of two generations of portlandite in AAC slurry in XRD (a) andDTA (b) plots
by a sharper component Yet the peak breadth did not change indicating that the firstgeneration is still present with the original characteristics This observation is supportedby DTA measurements additionally demonstrating two degrees of crystallinity only afteralite hydration In agreement with XRD analysis the better crystalline second generationof portlandite decomposes at a higher temperature
Figure 310 Quantification of tobermorite in statistical chemically various AAC sampleswith and without the application of the macro for the fitting of anisotropicpeak broadening
21
3 Main results
Furthermore commercial AAC samples were considered in this study By applying themethod for the refinement of anisotropic peak broadening (Figure 31) a more accuratequantification of tobermorite can be achieved In Figure 310 the calculated amounts oftobermorite in statistical chemically various AAC samples are plotted In some samplesthe refinement using the macro leads to considerably higher but never lower quantitiesof tobermorite whereas in other samples nearly the same amount of tobermorite is cal-culated This observation can be well understood taking into account that the macroallows to account more peak area for tobermorite as shown in Figure 31 Clearly thereis evidence that the anisotropy of tobermorite domains is not uniform from one sampleto another which was basically justified in the previous sections As an improved quan-tification of a single phase leads to a better quantification of other phases in the samplethis adaption is very valuable in order to assess the phase development Here the peakbroadening of tobermorite equally observed by Qu et al [6] could be tracked and evalu-ated in order to gain more accurate results Moreover in section 63 McCrone milling issuggested in order to avoid spottiness in XRD patterns caused by coarse grains of quartzor anhydrite (Figure 38)
22
4 Conclusions
4 Conclusions
The research results presented in the previous sections yield advances in the mineralogicalinvestigation of tobermorite and autoclaved aerated concrete Recorded diffraction pat-terns contain plenty of usually unused data regarding the microstructural characteristicsof the sample and phases therein The profit of XRD measurements can be significantlyimproved whenever one or more phases show anisotropic peak broadening and appro-priate models for the respective domain morphology are implemented into the Rietveldenvironment Within the scope of the present investigations portlandite and tobermoriteshow this particularityThe effects of changes in the chemistry of the starting mix were examined based on dif-ferent dosages of metakaolin Al-substituted tobermorite showed increased growth in b
direction and an increase of lattice parameter c compared to Al-free tobermorite The rel-ative domain sizes were determined based on anisotropic peak broadening However whilethe effect of Al3+ incorporation into the lattice of tobermorite was limited regarding thedomain morphology lattice parameter c showed an increase throughout the entire rangeof samples The consequent effects suggested by Klimesch amp Ray observed by means ofDTA are debatable as reactions during the heating experiment may lead to to a changeof Al3+ content in tobermorite [40] While both types of applied metakaolin showed goodreactivity at hydrothermal conditions some included minor phases such as feldspar oranatase remained unreacted At high dosages of Al2O3 in the starting mix the formationof either only katoite or katoite along with tobermorite was observed (Figure 32)SEM analysis of tobermorite in AAC cannot be suggested based on the observationspresented in this work as it is only visually accessible in the pores or at pore surfacesThe dense material of the AAC skeleton contains several crystalline and X-ray amorphousphases which hardly allows a proper investigation Even in single pores tobermorite crys-tals appeared very heterogeneous at various chemical compositions As a result lath-liketobermorite was not only present in samples characterized by elevated Al3+ incorporationBy contrast the benefits of XRD analysis presented in section 61 equally accounted fortobermorite in AAC samples Sulfate incorporation into the lattice of tobermorite wasnot observed All of the sulfate in the system was detected to be present in anhydriteThe phase transitions in the AAC raw slurry during the green stage hydration were show-cased by in-situ XRD analysis of a model mix at 70 degC Additional DTA and XRD mea-
23
4 Conclusions
surements during this step confirmed the presence of two generations of portlandite char-acterized by different crystallinity as suggested by Ectors [52] The inclusion of anisotropicdomain morphology during the Rietveld refinement allowed a more accurate quantifica-tion of tobermorite in autoclaved samples Sample preparation adjusted to the grain sizedistribution in AAC samples (section 63) the external standard method for quantita-tive XRD analysis [55] and the approach to evaluate anisotropic peak broadening [19]are the key methods for a more accurate tracking of the phase development during AACproduction
24
5 References
5 References
[1] A E Zadov A I Grabezhev N N Pertsev N V Chukanov and S V PribavkinTobermorite-plombierite metasomatites of the Gumeshevsk skarn-porphyry copper depositmiddle Urals Doklady Earth Sciences 407(3)495ndash497 2006
[2] M F Heddle Preliminary notice of substances which may prove to be new minerals MinMag 4117ndash123 1880
[3] S Merlino E Bonaccorsi and T Armbruster The real structure of tobermorite 11AringNormal and anomalous forms OD character and polytypic modifications European Journalof Mineralogy 13(3)577ndash590 2001
[4] C Biagioni S Merlino and E Bonaccorsi The tobermorite supergroup a new nomencla-ture Mineralogical Magazine 79(2)485ndash495 2015
[5] C A Riacuteos C D Williams and M A Fullen Hydrothermal synthesis of hydrogarnetand tobermorite at 175 degC from kaolinite and metakaolinite in the CaO-Al2O3-SiO2-H2Osystem A comparative study Applied Clay Science 43(2)228ndash237 2009
[6] X Qu Z Zhao and X Zhao Microstructure and characterization of aluminum-incorporated calcium silicate hydrates (C-S-H) under hydrothermal conditions RSC Ad-vances 8(49)28198ndash28208 2018
[7] R Šiaučiunas and K Baltakys Formation of gyrolite during hydrothermal synthesis inthe mixtures of CaO and amorphous SiO2 or quartz Cement and Concrete Research34(11)2029ndash2036 2004
[8] E Venhodovaacute R Janovskyacute and R Drochytka Formation of Tobermorite at Different Ma-terials Composition of Aerated Concrete Applied Mechanics and Materials 752-753247ndash250 2015
[9] L Galvaacutenkovaacute E Bartoniacutečkovaacute T Opravil J Tkacz and P Ptaacuteček The influence ofstarting materials solubility on tobermorite structure formation under the hydrothermalconditions IOP Conference Series Materials Science and Engineering 379(1)1ndash8 2018
[10] T Mitsuda K Sasaki and H Ishida Phase Evolution during Autoclaving Process J AmCeram Soc 75(75)1858ndash1863 1992
[11] A Skawińska The influence of metahalloysite addition on tobermorite formation studied byX-ray powder diffraction and scanning electron microscope MATEC Web of Conferences16305008 2018
[12] S T Bergold F Goetz-Neunhoeffer and J Neubauer Quantitative analysis of C-S-H in
25
5 References
hydrating alite pastes by in-situ XRD Cement and Concrete Research 53119ndash126 2013
[13] O P Shrivastava and F P Glasser Ion-exchange properties of 11-Aring tobermorite Reactivityof Solids 2(3)261ndash268 1986
[14] H Maeda Y Ogawa E H Ishida and T Kasuga Hydrothermal synthesis of tobermoritedoped with phosphorus species for removing heavy metal ions Journal of the AustralianCeramic Society 48(1)8ndash11 2012
[15] O P Shrivastava and R Shrivastava Cation exchange applications of synthetic tobermoritefor the immobilization and solidification of cesium and strontium in cement matrix Bulletinof Materials Science 23(6)515ndash520 2000
[16] G Renman and A Renman Sustainable Use of Crushed Autoclaved Aerated Concrete(CAAC) as a Filter Medium in Wastewater Purification 8th International conferenceon sustainable management of waste and recycled materials in construction GothenburgSweden 30 Mayndash1 June 2012 Proceedings pages 1ndash7 2012
[17] G Schober Chemical transformations during the manufacturing of autoclaved aeratedconcrete (ACC) Cement lime gypsum and quartz sand become cellular concrete ZKG58(7)63ndash70 2005
[18] A J Hamad Materials Production Properties and Application of Aerated LightweightConcrete Review International Journal of Materials Science and Engineering 2(2)152ndash157 2014
[19] D Ectors F Goetz-Neunhoeffer and J Neubauer A generalized geometric approach toanisotropic peak broadening due to domain morphology Journal of Applied Crystallogra-phy 48(1)189ndash194 2015
[20] H M Rietveld A profile refinement method for nuclear and magnetic structures Journalof Applied Crystallography 2(2)65ndash71 1969
[21] S A Hamid The crystal structure of the 11 Aring natural tobermoriteCa225[Si3O75(OH)15]1H2O Zeitschrift fuer Kristallographie - New Crystal Struc-tures 154(3-4)189ndash198 1981
[22] S A S El-Hemaly T Mitsuda and H F W Taylor Synthesis of normal and anomaloustobermorites Cement and Concrete Research 7429ndash438 1977
[23] M Sakiyama and T Mitsuda Hydrothermal reaction between C-S-H and kaolinite for theformation of tobermorite at 180degC Cement and Concrete Research 7(6)681ndash685 1977
[24] E Bonaccorsi S Merlino and A R Kampf The crystal structure of tobermorite 14 Aring(plombierite) a C-S-H phase Journal of the American Ceramic Society 88(3)505ndash5122005
[25] S Merlino E Bonaccorsi and T Armbruster The real structures of clinotobermorite andtobermorite 9 Aring OD character polytypes and structural relationships European Journalof Mineralogy 12(2)411ndash429 2000
[26] K Momma and F Izumi VESTA 3 for three-dimensional visualization of crystal volu-metric and morphology data Journal of Applied Crystallography 44(6)1272ndash1276 2011
26
5 References
[27] S Shaw S M Clark and C MB Henderson Hydrothermal formation of the calcium sil-icate hydrates tobermorite (Ca5Si6O16(OH)2 middot 4H2O) and xonotlite (Ca6Si6O17(OH)2)An in situ synchrotron study Chemical Geology 167(1-2)129ndash140 2000
[28] K Matsui J Kikuma M Tsunashima T Ishikawa S Matsuno A Ogawa and M SatoIn situ time-resolved X-ray diffraction of tobermorite synthesis process under hydrothermalcondition IOP Conference Series Materials Science and Engineering 18(2)60ndash66 2011
[29] G Matekonis R Šiaučiunas and D Vaičiukyniene Hydrothermal Synthesis and Charac-terization of Na + and [ Al 3 + + Na + ] -substituted Tobermorite in CaO-SiO2middotnH2O-H2OSystem MATERIALS SCIENCE 16(3)242ndash248 2010
[30] G Geng R J Myers M J A Qomi and P JM Monteiro Densification of the inter-layer spacing governs the nanomechanical properties of calcium-silicate-hydrate ScientificReports 7(1)1ndash8 2017
[31] D Klimesch and A Ray Autoclaved cement-quartz pastes with metakaolin additionsAdvanced Cement Based Materials 7(3-4)109ndash118 1998
[32] N Y Mostafa A A Shaltout H Omar and S A Abo-El-Enein Hydrothermal synthesisand characterization of aluminium and sulfate substituted 11 nm tobermorites Journal ofAlloys and Compounds 467(1-2)332ndash337 2009
[33] İ Demir M S Başpınar E Kahraman E Ccedilalışkan and G Goumlrhan An Investigation onthe Usability of Diatomite in Aerated Concrete Production In Proc of the Intl Conf onAdvances In Civil Structural And Construction Engineering - CSCE 2014 pages 97ndash1002014
[34] A Skawinska Z Owsiak T Baran and K Hernik The influence of halloysite additionon tobermorite formation in CaO and quartz mix under hydrothermal conditions CementWapno Beton 17(12)426ndash434 2017
[35] N Y Mostafa Influence of air-cooled slag on physicochemical properties of autoclavedaerated concrete Cement and Concrete Research 35(7)1349ndash1357 2005
[36] D Małaszkiewicz and J Chojnowski Influence of addition of calcium sulfate dihydrate ondrying of autoclaved aerated concrete Open Engineering 7(1)273ndash278 2017
[37] N Hara and N Inoue Thermal behaviour of 11Aring tobermorite and its lattice parametersCement and Concrete Research (10)53ndash60 1980
[38] M D Jackson S R Chae S R Mulcahy C Meral R Taylor P Li A H EmwasJ Moon S Yoon G Vola H R Wenk and P JM Monteiro Unlocking the secretsof Al-tobermorite in Roman seawater concrete American Mineralogist 98(10)1669ndash16872012
[39] W Liao W Li Z Fang C Lu and Z Xu Effect of different aluminum substitution rateson the structure of Tobermorite Materials 12(22)1ndash10 2019
[40] D Klimesch and A Ray DTA-TG Study of the CaO-SiO2-H2O and CaO-Al2O3-SiO2-H2OSystems Under Hydrothermal Conditions Journal of Thermal Analysis and Calorimetry56(1)27ndash34 1999
27
5 References
[41] Z Sauman and Z Valtr Substitution of sulphate ions in the crystal lattice of 11 Aring to-bermorite In The VI International Congress on the Chemistry of Cement pages 1ndash14Moscow 1974
[42] G Schober Reaction of raw materials to the final product AAC httpwwwpb-aacde
chemmin2_ehtml 2012 accessed 2020-01-31
[43] D Jansen C Stabler F Goetz-Neunhoeffer S Dittrich and J Neubauer Does Ordi-nary Portland Cement contain amorphous phase A quantitative study using an externalstandard method Powder Diffraction 26(01)31ndash38 2011
[44] C Roumlszligler J Stark F Steiniger and W Tichelaar Limited-dose electron microscopyreveals the crystallinity of fibrous C-S-H phases Journal of the American Ceramic Society89(2)627ndash632 2006
[45] Y Sakalli and R Trettin Investigation of C3S hydration by environmental scanning elec-tron microscope Journal of Microscopy 259(1)53ndash58 2015
[46] F Matsushita Y Aono and S Shibata Expansion and shrinkage behavior of green cakeof Autoclaved Aerated Concrete In Autoclaved Aerated Concrete - Innovation and Devel-opment Proceedings of the 4th International Conference on Autoclaved Aerated ConcreteKingston UK 8-9 September 2005 pages 101ndash108 CRC Press 2005
[47] C Chucholowski M Holger and K-C Thienel Improving the recyclability environmentalcompatibility and CO2 balance of autoclaved aerated concrete by replacing sulfate carrierand cement with calcined clays CePapers 2(4)503ndash512 2018
[48] X Y Huang W Ni W H Cui Z J Wang and L P Zhu Preparation of autoclavedaerated concrete using copper tailings and blast furnace slag Construction and BuildingMaterials 27(1)1ndash5 2012
[49] W Wongkeo and A Chaipanich Compressive strength microstructure and thermal anal-ysis of autoclaved and air cured structural lightweight concrete made with coal bottom ashand silica fume Materials Science and Engineering A 527(16-17)3676ndash3684 2010
[50] A Roacuteżycka and W Pichoacuter Effect of perlite waste addition on the properties of autoclavedaerated concrete Construction and Building Materials 12065ndash71 2016
[51] N Isu H Ishida and T Mitsuda Influence of quartz particle size on the chemical andmechanical properties of autoclaved aerated concrete (I) tobermorite formation Cementand Concrete Research 25(25)243ndash248 1995
[52] D Ectors Advances in the analysis of cementitious reactions and hydrate phases doctoralthesis PhD thesis Friedrich-Alexander-Universitaumlt Erlangen-Nuumlrnberg 2016
[53] D Ectors F Goetz-Neunhoeffer and J Neubauer Domain size anisotropy in the double-Voigt approach An extended model Journal of Applied Crystallography 481998ndash20012015
[54] D Ectors F Goetz-Neunhoeffer and J Neubauer Routine (an)isotropic crystallite sizeanalysis in the double-Voigt approximation done right Powder Diffraction 32(S1)27ndash342017
28
5 References
[55] D Jansen F Goetz-Neunhoeffer C Stabler and J Neubauer A remastered external stan-dard method applied to the quantification of early OPC hydration Cement and ConcreteResearch 41(6)602ndash608 2011
[56] T Ungaacuter G Tichy J Gubicza and R J Hellmig Correlation between subgrains andcoherently scattering domains Powder Diffraction 20(04)366ndash375 2005
[57] Triloki P Garg R Rai and B K Singh Structural characterization of as-depositedcesium iodide films studied by X-ray diffraction and transmission electron microscopy tech-niques Nuclear Instruments and Methods in Physics Research Section A AcceleratorsSpectrometers Detectors and Associated Equipment 736128ndash134 2014
[58] J Schreiner F Goetz-Neunhoeffer J Neubauer and D Jansen Hydrothermal synthesisof 11 Aring tobermorite ndash Effect of adding metakaolin to the basic compound Applied ClayScience 185 2020
[59] J Schreiner F Goetz-Neunhoeffer J Neubauer S Volkmann S Bergold R Webler andD Jansen Advanced Rietveld refinement and SEM analysis of tobermorite in chemicallydiverse autoclaved aerated concrete Powder Diffraction 34143ndash150 2019
[60] J Schreiner D Jansen D Ectors F Goetz-Neunhoeffer J Neubauer and S VolkmannNew analytical possibilities for monitoring the phase development during the production ofautoclaved aerated concrete Cement and Concrete Research 107247ndash252 2018
29
6 Publications
6 Publications
61 Hydrothermal synthesis of 11 Aring tobermorite ndash Effectof adding metakaolin to the basic compound
Reprint of the peer reviewed publication
Schreiner J Goetz-Neunhoeffer F Neubauer J Jansen D 2020 Hydrothermalsynthesis of 11 Aring tobermorite ndash Effect of adding metakaolin to the basic compoundApplied Clay Science 185 httpsdoiorg101016jclay2019105432
with permission from Elsevier
30
Contents lists available at ScienceDirect
Applied Clay Science
journal homepage wwwelseviercomlocateclay
Research paper
Hydrothermal synthesis of 11 Aring tobermorite ndash Effect of adding metakaolin tothe basic compound
J Schreiner F Goetz-Neunhoeffer J Neubauer D JansenUniversity of Erlangen-Nuremberg GeoZentrum Nordbayern Mineralogy Schlossgarten 5a 91054 Erlangen Germany
A R T I C L E I N F O
KeywordsHydrothermal synthesis11 Aring tobermoriteMetakaolinPowder diffractionKatoite
A B S T R A C T
Different amounts and types of metakaolin were analyzed and applied for the hydrothermal synthesis of 11 Aringtobermorite All synthesized samples were investigated by means of powder XRD combined with Rietveld re-finement Al-substituted 11 Aring tobermorite was successfully synthesized on the basis of a broad range of com-pounds characterized by a varying content of metakaolin Katoite was present depending on the amount ofsupplied Al3+ which was determined by the dosage of metakaolin Minor crystalline components included in thetwo types of metakaolin sources varied greatly in their reactivity under hydrothermal conditions Despite adifferent degree of purity the two types of metakaolin showed corresponding effects at moderate dosages butcontrary effects at higher dosages as for the synthesis of 11 Aring tobermorite The domain morphology of to-bermorite could be associated with Al3+ incorporation for low dosages of metakaolin represented by up to 2 wt- Al2O3 in the dry mix By contrast Al3+ affected tobermorite lattice parameters at equivalent and even athigher dosages with c reaching 2295 Aring at 12 wt- Al2O3 in the dry mix
1 Introduction
11 Application of metakaolin as a reactive material in constructionindustry
The application of supplementary cementitious materials (SCMs) inthe field of construction technology has received a lot of attention inrecent years Due to limited resources and an urgent need for alter-native and more eco-friendly construction materials SCMs such asmetakaolin offer a great potential The usage of SCMs has not onlyspread to the cement and mortar industry but also to advanced appli-cations such as autoclaved aerated concrete (AAC) (Demir et al 2014Koutnyacute et al 2014 Walczak et al 2015 Roacuteżycka and Pichoacuter 2016Chucholowski et al 2018) Unlike ordinary cementitious constructionmaterials AAC is produced from hydrothermal curing Due to the dif-ferent thermodynamic environment the hydration process and the re-activity of raw materials have to be investigated properly in order tounderstand the effects on the AAC product The leading mineral phasein AAC is 11 Aring tobermorite (Ca5Si6O16(OH)2middot4H2O) As a consequencethe thermal and mechanical properties of AAC depend on micro-structure and crystallinity of tobermorite to some extent In addition tothe curing time and the fineness of raw materials the supply of ionsthat can substitute in the tobermorite structure is a crucial factor in thiscontext Especially substitutions by aluminum sodium and potassium
ions have been investigated thoroughly (Sauman 1974 Klimesch andRay 1998 Mostafa et al 2009 Matekonis et al 2010 Skawinskaet al 2017) Calcined clays usually contain a considerable amount ofthe mentioned ions
There is a vast amount of literature on the reactivity of SCMs atambient temperature and standard pressure but there is little when itcomes to hydrothermal conditions In previous publications the beha-vior of metakaolin under hydrothermal conditions was mainly in-vestigated for the synthesis of zeolites (Zhang et al 2007 Aguilar-Mamani et al 2014 Setthaya et al 2016 Luo et al 2018) In thesestudies the reactivity of metakaolin was observed at a wide range oftemperature and pH values During the transformation of kaolin intometakaolin a loss of framework alumina was observed (Ayodele et al2019) In recent decades metakaolin has been the subject of studies inthe field of geopolymer research (Rashad 2013 Chen et al 2016) Forthe synthesis of 11 Aring tobermorite a more distinct setting of temperaturesetting (180ndash200 degC) and steam pressure (1ndash12 MPa) are required
This publication is intended to make a new contribution to thechallenging field of hydrothermal synthesis in the system CaO-Al2O3-SiO2-H2O based on XRD analysis combined with Rietveld refinementVarious dosages of two types of metakaolin with different chemical andmineralogical purities are compared for the effects on the hydrothermalsynthesis of Al-substituted 11 Aring tobermorite Especially changes of thebulk chemistry in the raw mixes the reactivity of minor crystalline
httpsdoiorg101016jclay2019105432Received 20 August 2019 Received in revised form 13 November 2019 Accepted 30 December 2019
Corresponding authorE-mail address juergenjsschreinerfaude (J Schreiner)
Applied Clay Science 185 (2020) 105432
0169-1317 copy 2020 Elsevier BV All rights reserved
T
6 Publications
31
phases of the two types of metakaolin and the effect of different curingtimes are the focus of interest On the one hand metakaolin offers agreat potential in the AAC industry On the other hand of all SCMsmetakaolin is a good source material for investigating the influence ofAl3+ on the synthesis of Al-substituted 11 Aring tobermorite
12 Synthesis of Al-substituted 11 Aring tobermorite
In addition to being present in AAC tobermorite has found appli-cation in wastewater treatment and nuclear waste management due toits ion exchange capacity (Maeda et al 2012 Monasterio et al 2015)The substitution of silicon by aluminum results in a different to-bermorite structure due to general and local charge balance affectingthe lattice parameters Especially c is impacted by this substitutionbecause it occurs in the bridging tetrahedron and additional OHndash sub-stitutes O2ndash (Komarneni et al 1985 Merlino et al 2000) As suggestedin some additional studies the substitution of Si4+ by Al3+ and Na+ orK+ leads to a lath-like morphology of tobermorite crystals (Mostafa2005 Mostafa et al 2009 Venhodovaacute et al 2015 Qu et al 2018)However because of the heterogeneous appearance of tobermorite inAAC it is hardly possible to conduct a proper characterization based onSEM analysis In our recent work the anisotropic peak broadening oftobermorite in XRD diffractograms was successfully linked with theincorporation of foreign ions supplied in a common AAC production(Schreiner et al 2019) This finding allowed a more statistical struc-tural characterization of tobermorite in bulk compositions compared toSEM analysis Moreover it was reported in other studies that differenthydrate phases occur depending on the amount of supplied ions and onthe experimental settings In compounds with a high content of Al3+formation of katoite could be observed (Klimesch and Ray 1998 Riacuteoset al 2009 Matsui et al 2011) In the case of a longer curing durationinstead of 11 Aring tobermorite the formation of xonotlite (Siauciunas andBaltakys 2004 Galvaacutenkovaacute et al 2018) or - depending on the finenessof used silica source (Siauciunas and Baltakys 2004) - gyrolite is fa-voured
Kalousek (1956) suggested that tobermorite can contain up to 5Al2O3 More Al2O3 in the system resulted in the formation of hydro-garnet Klimesch and Ray (1998) additionally investigated the stabilityof hydrogarnet depending on the Al(Si + Al) ratio and its role in re-lation to the formation of 11 Aring tobermorite in an equivalent systemThey suggest that hydrogarnet always appears before tobermorite butthe former can only be detected for higher Al(Si + Al) ratios in theevent of longer curing times Riacuteos et al (2009) and Qu et al (2018)confirmed these findings in extensive investigations In the latter pub-lication it is additionally suggested that samples prepared at lowertemperatures (160 degC) are less impacted by the supply of Al3+ Theyalso consider the peak broadening of tobermorite in their XRD plotsbased on the amount of incorporated Al3+ In two recent publicationswe suggested that the peak broadening of tobermorite enables a mi-crostructural analysis by calculating the orientation dependent domainsizes (Schreiner et al 2018 2019) However these studies are based onsamples of industrially produced AAC so that the curing time was fixedThe studied AAC was produced from raw materials with a broad che-mical spectrum such as ordinary Portland cement (OPC) whichsomehow complicates the interpretation of results
In this work the influence of aluminum ions - provided by meta-kaolin - on dominant crystallographic direction-dependent domaingrowth of tobermorite is investigated by analysis of anisotropic peakbroadening (Ectors et al 2015 2017) In Fig 1 of the supplementarymaterial the method of fitting the anisotropic peak broadening of to-bermorite using a triaxial cylinder model is visualized (Schreiner et al2018) Fitting of the anisotropic peak broadening of tobermorite Thismethod is used to calculate the average and reliable values for to-bermorite domain sizes in the powder sample and associate them withaverage Al3+ incorporation Microstrain should be considered becauseit is an additional source of peak broadening However this usually
accounts for materials that have been exposed to different kinds ofstress such as metals and alloys (Badawi et al 2019) In addition theinstrumental contribution to peak broadening should be consideredHydration products such as tobermorite are characterized by crystallitesizes in the range of nanometers so that anisotropic size broadeningclearly outweighs the effect of instrumental broadening (Jenkins andSnyder 1996) Moreover the impact of Al3+ on the lattice parametersof tobermorite is considered It should additionally be clarified whe-ther the results from our previous publication (Schreiner et al 2019)based on industrially produced AAC can be confirmed by investigationwith less complex raw mixes and purely based on laboratory experi-ments
2 Material and methods
21 Starting materials
The starting materials for hydrothermal synthesis included deio-nized water quartz flour portlandite (999 pure) and two types ofmetakaolin One type was ordinary commercially available metakaolin(MK) with nearly a stoichiometric composition For comparison thesecond type of commercially available metakaolin was a by-productfrom expanded glass production (MKg) and consequently highly im-pure The chemical composition of MK and MKg determined by XRF isgiven in Table 1 With MKg containing less Al2O3 but considerably moreNa2O than MK the effects on hydrothermal synthesis were of interestBoth types of metakaolin have been characterized in previous pub-lications (Schmidt et al 2012 Naber et al 2019) In addition weverified the mineral phase content by XRD analysis Besides amorphousmetakaolin MK contained minor amounts of anatase quartz and mica
Fig 1 Weight fractions of tobermorite quartz and katoite determined byquantitative XRD analysis ndash samples including MKg crosshatched
Table 1Chemical composition of MK and MKg determined by XRF analysis ndash majorcontrasts in bold letters
Oxides [wt-] MK MKg
SiO2 536 604Al2O3 392 206CaO 01 40MgO 01 12Na2O 0 96K2O 10 18Fe2O3 18 05TiO2 21 03P2O5 01 02Loss on ignition 15 1
J Schreiner et al Applied Clay Science 185 (2020) 105432
2
6 Publications
32
MKg contained additional kaolinite feldspar and quartz
22 Investigated mix composites
For the preparation of raw mixtures the powders were weighed andhomogenized using a lab-scale mixing mill Table 2 lists the composi-tion and nomenclature of all samples including Al2O3 content andcuring time in the autoclave
bull Besides one blank mixture (MK0) that did not contain any type ofmetakaolin eleven more compounds were prepared of which threeincluded different dosages of MKg (MKg16 MKg23 and MKg60)Three more mixes contained equivalent amounts of MK instead ofMKg (MK16 MK23 and MK60) These mixes were investigated inorder to have a direct comparison concerning the effects of differentraw material on the synthesis of tobermorite
bull Additionally the mixes MK9 MK5 and MK25 with lower dosages ofmetakaolin were analyzed In the referenced literature (Schreineret al 2019) the effect of Al3+ on the anisotropic peak broadeningof tobermorite could only be observed in the case of Al2O3 contentslower than 4 in the drymix In the latter three mixes Al2O3 con-tents range from 1 to 35 Al2O3 (calculated from XRF data) whichmeets the region of interest for the analysis of tobermorite domainmorphology
bull The curing time for nearly all of the investigated samples was 12 hbut compound MK9 was prepared two more times for curing timesof 2 h and 6 h The different curing times were chosen in this par-ticular sample so that the reactivity of metakaolin and the phasetransitions could be observed more precisely
23 Hydrothermal treatment
Due to the different fineness of raw materials there was a differentwater demand from one mixture to another In order to obtain slurriesof comparable rheology the amount of water was adapted respectivelyresulting in water-to-solid ratios of 25 to 3 which matches the sug-gested water-to-solid ratio for this purpose (Roacutezycka et al 2014Galvaacutenkovaacute et al 2018) The weighed water was added to the dry mixand after stirring for 1 min at 23 degC the slurry was poured into thereactor Minor changes in the quantity of added water did not have aninfluence on the measured steam pressure All experiments were con-ducted using a PTFE-lined stainless steel autoclave with a reactor vo-lume of 300 ml The oven temperature was fixed at 180 degC and auto-genous steam pressure of 11ndash12 MPa was measured during eachexperiment with an external manometer After cooling to room tem-perature the sample was removed from the reactor coarsely ground
using an agate mortar and dried at 60 degC for 12 h After drying thesample was ground with an agate mortar again in order to deagglo-merate the particles As no coarse raw materials were used there wasno need for wet McCrone milling (Schreiner et al 2018)
24 XRD analysis
After preparation into front-loading sample holders the powdersamples were measured with a D8 diffractometer (Bruker) equippedwith a LynxEye detection system and Bragg-Brentano geometry Thesettings for XRD analysis included a tube voltage of 40 kV a current of40 mA an angular range from 6 to 80deg 2θ (Cu Kα radiation) a time perstep of 054 s a step width of 00236deg 2θ and a PSD opening of 33deg Thebackground was fitted with Chebyshev polynomial of the fifth orderThe major contribution of amorphous phase was fitted with a singlepeak with a fixed position at 308deg 2θ so that tobermorite reflectionswere not affected An external quartzite standard was measured withthe same parameters in order to determine phase quantities (Jansenet al 2011) Bruker AXS software TOPAS 50 was used for Rietveldrefinement (Rietveld 1969) and the used structures are shown inTable 3
3 Results and discussion
31 Different dosages of MK and MKg
In Fig 1 the quantities of tobermorite quartz and katoite present inmost of the samples determined by XRD analysis are illustratedWhenever tobermorite was the leading mineral hydrate phase a basalspacing of 113 Aring could be verified in each of the diffractograms Thequantities of minor crystalline phases and amorphous content are notshown For low dosages of MK it can be seen that the weight fraction oftobermorite decreased At moderate dosage of both types of metakaolin(MK16 MK23 MKg16 MKg23) tobermorite was present in comparablequantities It can be seen that the amount of katoite in the mixes de-pended on the dosage of metakaolin and it appeared only at dosages ofMK5 or more Due to the higher content of aluminum in MK comparedto MKg more katoite could always be observed in the MK mixes atequivalent dosages Despite equal amounts of quartz as starting mate-rial in mixes for both types of metakaolin the resulting weight fractionsin the cured samples were not alike Considerably more quartz waspresent in the MK samples Even though less quartz was used for mixescontaining higher amounts of MK even more quartz was present afterhydrothermal curing (Table 2 Fig 1) Consequently some of the SiO2
provided by MK did not transform into an amorphous phase or to-bermorite but into quartz This finding is verified by the presence ofquartz in MK60 because no quartz was included in the raw mixture Thefeldspar present in MKg did not react so Na2O and an unknown amountof Al2O3 may not have been supplied for hydrothermal reaction Besidestobermorite and quartz additional calcite scawtite (Ca7Si6(CO3)
Table 2Basic powder compounds prepared for the hydrothermal synthesis of to-bermorite with the respectively calculated Al2O3 content and curing time in thereactor
Sample Portlandite[wt-]
Quartz[wt-]
MK[wt-]
MKg
[wt-]
Al2O3
[wt-]Curingtime [h]
MK0 49 51 ndash ndash 0 12MK25 495 48 25 ndash 1 12MK5 49 46 5 ndash 2 12MK9_2h 48 43 9 ndash 35 2MK9_6h 48 43 9 ndash 35 6MK9_12h 48 43 9 ndash 35 12MK16 47 37 16 ndash 63 12MK23 46 31 23 ndash 9 12MK60 40 ndash 60 ndash 235 12MKg16 47 37 ndash 16 33 12MKg23 46 31 ndash 23 47 12MKg60 40 ndash ndash 60 124 12
Table 3Structural data used for the investigation with powder XRD analysis
Phase Author
Anatase (Horn et al 1972)Biotite (Brigatti et al 2000)Calcite (Maslen et al 1995)Kaolinite (Zvyagin 1960)Katoite (Bartl 1969)Microcline (Bailey 1969)Plazolite (Basso et al 1983)Portlandite (Busing and Levy 1957)Quartz (Le Page and Donnay 1976)Scawtite (Grice 2005)Tobermorite (Hamid 1981)Xonotlite (Hejny and Armbruster 2001)
J Schreiner et al Applied Clay Science 185 (2020) 105432
3
6 Publications
33
O18bull2(H2O)) and xonotlite (Ca6Si6O17(OH)2) could be identified insample MK0 (XRD plots of samples MK0 MKg16 MKg23 MK16 andMK23) Comparing MK0 and MK25 scawtite and xonotlite could stillbe identified in a very low amount in MK25 but no longer in samplesthat contained even more MK (XRD plots of samples MK0 MK25 MK5and MK9_12h)
Two additional experiments were done without quartz in the rawmixes (MK60 and MKg60) The according diffractograms after hydro-thermal curing are shown in Fig 2 In sample MKg60 tobermorite (gt 50wt-) was successfully synthesized without any other silica sourcethan MKg whereas no crystalline quartz occurred By contrast no to-bermorite but quartz could be identified in equivalent mixture MK60containing MK It can be seen that crystalline components such as micaand anatase in the raw MK did not react at the selected conditions andremained present in the autoclaved samples Except for feldspar in MKgall of the crystalline components appeared to be reactive at the chosenhydrothermal conditions A minor unidentified phase occurred at328deg2θ and additional xonotlite was identified in sample MKg60 Insample MK60 more calcium was needed for the formation of morehydrogarnet (Fig 1) resulting in a lower CaSi ratio for the remainingsystem Sample MKg60 contained only half of the amount of Al3+ and itwas not completely supplied for reaction due to its partial presence infeldspar Consequently essentially less hydrogarnet (Fig 1) was presentin MKg60 after hydrothermal treatment and the CaSi ratio in the re-maining system was affected to a lesser extent
32 Application of MK for different curing times
The development of hydrate phases in the autoclave for compoundMK9 is displayed in Fig 3 After only 2 h of hydrothermal curing all ofthe available portlandite had reacted and katoite (95 wt-) was pre-sent The applied type of metakaolin appeared to react quickly as itsupplied aluminum for formation of katoite No formation of to-bermorite could be observed at this stage yet An assumably amorphousprecursor can be seen at 28 to 30deg2θ Calcium was provided by thedissolution of portlandite After 6 h of hydrothermal reaction amountsof katoite (85 wt-) and quartz (from 31 wt- at 2 h to 165 wt- at6 h) had decreased and a major amount of tobermorite (35 wt-) waspresent Apparently between 2 and 6 h under hydrothermal conditionsthe amorphous precursor and quartz reacted resulting in the formationof tobermorite An additional 6 h of reaction time (MK9_12h) did notchange the phase composition significantly Slightly more tobermorite
(365 wt-) less quartz (16 wt-) and katoite (65 wt-) weremeasured
33 Tobermorite domain morphology and lattice parameters
In the referenced literature an analysis of tobermorite domainmorphology based on anisotropic peak broadening was possible forsamples that contained notgt 4 wt- Al2O3 in the drymix (Schreineret al 2019) Accordingly in this study samples MK0 MK25 MK5MK9_6h and MK9_12h were suitable (Table 2) with MK9_2h not con-taining any tobermorite In Fig 4 the respective growth in a and b di-rection is visualized with x indicating the domain size in a direction andy indicating domain size in b direction using a macro for TOPAS 50(Ectors et al 2015 2017) The calculated cylinder models in Fig 4represent the relation of yx and not absolute sizes With no supply ofaluminum ions (MK0) the relative domain growth in b direction islower compared to samples containing metakaolin This finding agreeswith the results from a similar investigation of tobermorite in AAC(Schreiner et al 2019) However within the samples MK5 andMK9_12h the different amounts of supplied aluminum ions did notshow a clear effect It appeared that low dosages of Al3+ (1 wt- Al2O3
in MK25 and 2 wt- Al2O3 in MK5) were enough to determine thedomain growth of tobermorite Additional results from the samplesMK9_6h and MK9_12h indicated that growth in b direction increasedwith reaction time
In Fig 5 lattice parameters of tobermorite depending on metakaolindosages are plotted B clearly remained unaffected throughout therange of samples Increasing amounts of metakaolin led to a slightlysmaller parameter a However both types of metakaolin showed acorresponding impact on parameter a By contrast parameter c in-creased strongly with increasing amounts of MK and MKg but the typeof metakaolin was significant At an equivalent dosage MK affected thecell dimension in c direction considerably more than MKg so that thefraction of Al3+ appeared to be the decisive parameter Different metaloxides in MKg did not show a notable effect certainly as they werepartially not provided for reaction Unlike for the domain morphologyof tobermorite the impact on lattice parameters could be observedwithin the complete range of examined dosages
4 Conclusions
The results obtained from the introduced investigations allow con-cluding remarks on the effects of the applied types of metakaolin on thesynthesis of 11 Aring tobermorite the phase transitions and the in-corporation of Al3+ into the lattice of tobermorite
With a critical dosage the use of any type of metakaolin led to theformation of katoite in an according amount At moderate dosages(MKg16 MKg23 MK16 and MK23) the two types of metakaolin showeda good correspondence in consideration of the quantities of to-bermorite For higher dosages there were contrary effects Lower do-sages of MK led to considerable quantities of Al-substituted to-bermorite Samples containing low dosages of MK revealed that katoiteappeared in the case ofgt 5 wt- of MK - corresponding to 2 wt-Al2O3 - in the basic compound Minor crystalline phases in MKg showedbetter reactivity than those in MK The observation that no tobermoritewas present in sample MK60 indicated that high dosages of Al3+ hin-dered the formation of tobermorite
Investigations of MK9 at 2 6 and 12 h displayed the evolution ofhydrate phases At first katoite was the only crystalline hydrate phasepresent after 2 h which corresponded to observations in a differentpublication (Klimesch and Ray 1999) The amount of katoite andquartz then decreased and a major amount of tobermorite formed from2 to 6 h curing time In order to gain more information on the trans-formation of amorphous C-(A)-S-H into tobermorite additional ex-periments in the range of 2 to 6 h curing time will be needed
Domain morphology analysis of tobermorite revealed that low
Fig 2 Diffractograms of MKg MKg60 MK and MK60 from 7 to 34deg2θ CuKα Aanatase C calcite F feldspar k kaolinite K katoite M mica Q quartz Ttobermorite U unidentified phase X xonotlite
J Schreiner et al Applied Clay Science 185 (2020) 105432
4
6 Publications
34
dosages of Al3+ determined the domain growth which agreed with theresults published on tobermorite in AAC samples (Schreiner et al2019) Different curing times unveiled that growth in b direction in-creased with the reaction time Al3+ incorporation into the lattice oftobermorite only reflected to a limited extent in the domain mor-phology By contrast an increase of lattice parameter c was triggered byAl3+ even at the highest dosage in this study Ultimately there is no
evidence for a limit of incorporation of Al3+ but there is a limit ofinfluence on the domain morphology These results additionally re-confirm this assumption similarly made in the previous work (Schreineret al 2019) and suggest a new mechanism of tobermorite crystal-lization depending on the presence of Al3+
Supplementary data to this article can be found online at httpsdoiorg101016jclay2019105432
Declaration of Competing Interest
The authors declare that they have no known competing financialinterests or personal relationships that could have appeared to influ-ence the work reported in this paper
Acknowledgement
The authors thank Rodgauer Baustoffwerke GmbH amp Co KG forsupplying raw materials for laboratory experiments
References
Aguilar-Mamani W Garciacutea G Hedlund J Mouzon J 2014 Comparison betweenleached metakaolin and leached diatomaceous earth as raw materials for the synth-esis of ZSM-5 Springerplus 3 1ndash10 httpsdoiorg1011862193-1801-3-292
Ayodele OB Sulaimon AA Alaba PA Tian Z-Y 2019 Influence of metakaolini-zation temperature on the structure and activity of metakaolin supported Ni catalystin dry methane reforming J Environ Chem Eng httpsdoiorg101016jjece2019103239 (in press)
Badawi EA Abdel-Rahman MA Mostafa A Abdel-Rahman M 2019 Determinationof the crystallite size amp micro- strain by novel method from XRD profile Appl Phys2 1ndash15 httpsdoiorg1031058jap201921001
Bailey SW 1969 Refinement of an intermediate microcline structure Am Miner 541540ndash1545
Bartl H 1969 Roentgen-Einkristalluntersuchungen an (CaO)3 (Al2O3) (H2O)6 und an(CaO)12 (Al2O3)7 (H2O) neuer Vorschlag zur (CaO)12 (Al2O3)7-Struktur NeuesJahrb fuer Mineral Monatshefte 1969 404ndash413
Basso R Giusta AD Zefiro L 1983 Crystal structure refinement of plazolite A highlyhydrated natural hydrogrossular Neues Jahrb Miner Monatsh (Neues Jahrb fuerMineral Monatshefte) 1983 251ndash258
Brigatti MF Lugli C Poppi L Foord EE Kile DE 2000 Crystal chemical varia-tions in Li- and Fe-rich micas from Pikes Peak batholith (Central Colorado) AmMineral 85 1275ndash1286 httpsdoiorg102138am-2000-8-920
Busing WR Levy HA 1957 Neutron diffraction study of calcium hydroxide J ChemPhys 26 563 httpsdoiorg10106311743345
Chen L Wang Z Wang Y Feng J 2016 Preparation and properties of alkali acti-vated metakaolin-based geopolymer Materials (Basel) 9 1ndash12 httpsdoiorg103390ma9090767
Chucholowski C Holger M Thienel K-C 2018 Improving the recyclability en-vironmental compatibility and CO2 balance of autoclaved aerated concrete by re-placing sulfate carrier and cement with calcined clays CePapers 2 503ndash512httpsdoiorg101002cepa846
Fig 3 Diffractograms of MK9_2h MK9_6h and MK9_12h from 7 to 38deg2θ CuKα C calcite K katoite Q quartz T tobermorite
Fig 4 Relation of calculated domain sizes of 11 Aring tobermorite in selectedsamples (MK0 MK25 MK5 MK9_6h and MK9_12h) in a (x) and b (y) direction
Fig 5 Lattice parameters of tobermorite depending on MK or MKg dosageincluding blank mix MK0
J Schreiner et al Applied Clay Science 185 (2020) 105432
5
6 Publications
35
Demir İ Başpınar MS Kahraman E Ccedilalışkan E Goumlrhan G 2014 An investigationon the usability of diatomite in aerated concrete production In Proc of the IntlConf on Advances in Civil Structural and Construction Engineering ndash CSCE 2014 pp97ndash100
Ectors D Goetz-Neunhoeffer F Neubauer J 2015 A generalized geometric approachto anisotropic peak broadening due to domain morphology J Appl Crystallogr 48189ndash194 httpsdoiorg101107S1600576714026557
Ectors D Goetz-Neunhoeffer F Neubauer J 2017 Routine (an)isotropic crystallitesize analysis in the double-Voigt approximation done right Powder Diffract 3227ndash34 httpsdoiorg101017S0885715617000070
Galvaacutenkovaacute L Bartoniacutečkovaacute E Opravil T Tkacz J Ptaacuteček P 2018 The influence ofstarting materials solubility on tobermorite structure formation under the hydro-thermal conditions IOP Conf Ser Mater Sci Eng 379 1ndash8 httpsdoiorg1010881757-899X3791012001
Grice JD 2005 The structure of spurrite tilleyite and scawtite and relationships toother silicate-carbonate minerals Can Mineral 43 1489ndash1500 httpsdoiorg102113gscanmin4351489
Hamid SA 1981 The crystal structure of the 11 Aring natural tobermoriteCa225[Si3O75(OH)15]1H2O Zeitschrift fuer Krist 154 189ndash198 httpsdoiorg101524zkri19811543-4189
Hejny C Armbruster T 2001 Polytypism in xonotlite Ca6Si6O17(OH)2 Zeitschrift furKrist 216 396ndash408
Horn M Schwerdtfeger CF Meagher EP 1972 Refinement of the structure of ana-tase at several temperatures Zeitschrift fur Krist 136 273ndash281 httpsdoiorg101524zkri19721363-4273
Jansen D Goetz-Neunhoeffer F Stabler C Neubauer J 2011 A remastered externalstandard method applied to the quantification of early OPC hydration Cem ConcrRes 41 602ndash608 httpsdoiorg101016jcemconres201103004
Jenkins R Snyder R 1996 Introduction to X-ray Powder Diffractometry ChemicalAnalysis Wiley pp 90
Kalousek GL 1956 Crystal Chemistry of Hydrous Calcium Silicates J Am Ceram Soc40 74ndash80
Klimesch D Ray A 1998 Autoclaved cement-quartz pastes with metakaolin additionsAdv Cem Based Mater 7 109ndash118 httpsdoiorg101016S1065-7355(97)00073-4
Klimesch D Ray A 1999 DTA-TGA evaluations of the CaOndashAl2O3ndashSiO2ndashH2O systemtreated hydrothermally Thermochim Acta 334 115ndash122 httpsdoiorg101016s0040-6031(99)00140-9
Komarneni S Roy R Roy DM Fyfe CA Kennedy GJ Bothner-By AA Dadok JChesnick AS 1985 27Al and29Si magic angle spinning nuclear magnetic resonancespectroscopy of Al-substituted tobermorites J Mater Sci 20 4209ndash4214 httpsdoiorg101007BF00552416
Koutnyacute O Opravil T Pořiacutezka J 2014 Application of metakaoline in autoclavedaerated concrete technology Adv Mater Res 1000 174ndash177 httpsdoiorg104028wwwscientificnetAMR1000174
Le Page Y Donnay G 1976 Refinement of the crystal structure of low-quartz ActaCrystallogr Sect B 32 2456ndash2459 httpsdoiorg101107S0567740876007966
Luo H Law WW Wu Y Zhu W Yang EH 2018 Hydrothermal synthesis of needle-like nanocrystalline zeolites from metakaolin and their applications for efficient re-moval of organic pollutants and heavy metals Microporous Mesoporous Mater 2728ndash15 httpsdoiorg101016jmicromeso201806015
Maeda H Ogawa Y Ishida EH Kasuga T 2012 Hydrothermal synthesis of to-bermorite doped with phosphorus species for removing heavy metal ions J AustCeram Soc 48 8ndash11
Maslen EN Streltsov VA Streltsova NR Ishizawa N 1995 Electron density andoptical anisotropy in rhombohedral carbonates III Synchrotron Xray studies ofCaCO3 MgCO3 and MnCO3 Acta Crystallogr Sect B 51 929ndash939 httpsdoiorg101107S0108768195006434
Matekonis G Šiaučiūnas R Vaičiukynienė D 2010 Hydrothermal Synthesis andCharacterization of Na + and [ Al 3 + + Na + ] -substituted Tobermorite in CaO-SiO2middotnH2O-H2O System Mater Sci 16 242ndash248
Matsui K Kikuma J Tsunashima M Ishikawa T Matsuno S Ogawa A Sato M2011 In situ time-resolved X-ray diffraction of tobermorite synthesis process underhydrothermal condition IOP Conf Ser Mater Sci Eng 18 60ndash66 httpsdoiorg1010881757-899X182022017
Merlino S Bonaccorsi E Armbruster T 2000 The real structures of clinotobermoriteand tobermorite 9 Aring OD character polytypes and structural relationships Eur JMineral 12 411ndash429 httpsdoiorg1011270935-122120000012-0411
Monasterio M Gaitero JJ Manzano H Dolado JS Cerveny S 2015 Effect ofchemical environment on the dynamics of water confined in calcium silicate mi-nerals Natural and synthetic tobermorite Langmuir 31 4964ndash4972 httpsdoiorg101021acslangmuir5b00614
Mostafa NY 2005 Influence of air-cooled slag on physicochemical properties of auto-claved aerated concrete Cem Concr Res 35 1349ndash1357 httpsdoiorg101016jcemconres200410011
Mostafa NY Shaltout AA Omar H Abo-El-Enein SA 2009 Hydrothermal synth-esis and characterization of aluminium and sulfate substituted 11 nm tobermoritesJ Alloys Compd 467 332ndash337 httpsdoiorg101016jjallcom200711130
Naber C Stegmeyer S Jansen D Goetz-Neunhoeffer F Neubauer J 2019 ThePONKCS method applied for time resolved XRD quantification of supplementarycementitious material reactivity in hydrating mixtures with ordinary Portland ce-ment Constr Build Mater 214 449ndash457 httpsdoiorg101016jconbuildmat201904157
Qu X Zhao Z Zhao X 2018 Microstructure and characterization of aluminum-in-corporated calcium silicate hydrates (C-S-H) under hydrothermal conditions RSCAdv 8 28198ndash28208 httpsdoiorg101039c8ra04423f
Rashad AM 2013 Metakaolin as cementitious material history scours production andcomposition - a comprehensive overview Constr Build Mater 41 303ndash318 httpsdoiorg101016jconbuildmat201212001
Rietveld HM 1969 A profile refinement method for nuclear and magnetic structures JAppl Crystallogr 2 65ndash71 httpsdoiorg101107S0021889869006558
Riacuteos CA Williams CD Fullen MA 2009 Hydrothermal synthesis of hydrogarnet andtobermorite at 175 degC from kaolinite and metakaolinite in the CaO-Al2O3-SiO2-H2Osystem a comparative study Appl Clay Sci 43 228ndash237 httpsdoiorg101016jclay200809014
Roacuteżycka A Pichoacuter W 2016 Effect of perlite waste addition on the properties of au-toclaved aerated concrete Constr Build Mater 120 65ndash71 httpsdoiorg101016jconbuildmat201605019
Roacutezycka A Kotwica Ł Małolepszy J 2014 Synthesis of single phase gyrolite in theCaO-quartz-Na2O-H2O system Mater Lett 120 166ndash169 httpsdoiorg101016jmatlet201401003
Sauman Z 1974 Influence of SO4 2ndash ions on the formation of 11 Aring tobermorite InProceedings of the 2nd International Symposium on Science and Research in SilicateChemistry Moscow pp 25ndash39
Schmidt M Egersdoumlrfer A Poumlllmann H 2012 Increased reactivity using a glass-containing metakaolin as an active filler in lime-based binder systems ZKG Int 6554ndash62
Schreiner J Jansen D Ectors D Goetz-Neunhoeffer F Neubauer J Volkmann S2018 New analytical possibilities for monitoring the phase development during theproduction of autoclaved aerated concrete Cem Concr Res 107 247ndash252 httpsdoiorg101016jcemconres201802028
Schreiner J Goetz-Neunhoeffer F Neubauer J Volkmann S Bergold S Webler RJansen D 2019 Advanced Rietveld refinement and SEM analysis of tobermorite inchemically diverse autoclaved aerated concrete Powder Diffract 34 143ndash150httpsdoiorg101017s0885715619000149
Setthaya N Chindaprasirt P Pimraksa K 2016 Preparation of zeolite nanocrystals viahydrothermal and solvothermal synthesis using of rice husk ash and metakaolinMater Sci Forum 872 242ndash247 httpsdoiorg104028wwwscientificnetmsf872242
Siauciunas R Baltakys K 2004 Formation of gyrolite during hydrothermal synthesis inthe mixtures of CaO and amorphous SiO2 or quartz Cem Concr Res 34 2029ndash2036httpsdoiorg101016jcemconres200403009
Skawinska A Owsiak Z Baran T Hernik K 2017 The influence of halloysite ad-dition on tobermorite formation in CaO and quartz mix under hydrothermal condi-tions Cem Wapno Bet 17 426ndash434
Venhodovaacute E Janovskyacute R Drochytka R 2015 Formation of tobermorite at differentmaterials composition of aerated concrete Appl Mech Mater 752ndash753 247ndash250httpsdoiorg104028wwwscientificnetamm752-753247
Walczak P Małolepszy J Reben M Szymański P Rzepa K 2015 Utilization ofwaste glass in autoclaved aerated concrete Proc Eng 122 302ndash309 httpsdoiorg101016jproeng201510040
Zhang Y Gao W Cui L 2007 The transformation of acid leached metakaolin tozeolite beta Stud Surf Sci Catal 170 420ndash425 httpsdoiorg101016S0167-2991(07)80870-6
Zvyagin BB 1960 An attempt to electronographic determination of kaolinite structureJ Dokl Akad Nauk SSSR 130 1023ndash1026
J Schreiner et al Applied Clay Science 185 (2020) 105432
6
6 Publications
36
6 Publications
62 Advanced Rietveld refinement and SEM analysis oftobermorite in chemically diverse autoclaved aeratedconcrete
Following the copyright guidelines by Cambridge University Press the publication
Schreiner J Goetz-Neunhoeffer F Neubauer J Volkmann S Bergold S WeblerR Jansen D 2019 Advanced Rietveld refinement and SEM analysis of tobermorite inchemically diverse autoclaved aerated concrete Powder Diffraction 34 143ndash150 httpsdoiorg101017s0885715619000149
may not be reprinted It can be accessed at
httpswwwcambridgeorgcorejournalspowder-diffractionarticleadvanced-rietveld-refinement-and-sem-analysis-of-tobermorite-in-chemically-diverse-autoclaved-aerated-concrete51597C2A66F6F225D29DEB2675E74249
37
6 Publications
63 New analytical possibilities for monitoring the phasedevelopment during the production of autoclavedaerated concrete
Reprint of the peer reviewed publication
Schreiner J Jansen D Ectors D Goetz-Neunhoeffer F Neubauer J VolkmannS 2018 New analytical possibilities for monitoring the phase development during theproduction of autoclaved aerated concrete Cement and Concrete Research 107 247ndash252httpsdoiorg101016jcemconres201802028
with permission from Elsevier
38
Contents lists available at ScienceDirect
Cement and Concrete Research
journal homepage wwwelseviercomlocatecemconres
Short communication
New analytical possibilities for monitoring the phase development duringthe production of autoclaved aerated concrete
J Schreinera D Jansena D Ectorsa F Goetz-Neunhoeffera J Neubauera S Volkmannb
aUniversity of Erlangen-Nuremberg GeoZentrum Nordbayern Mineralogy Schlossgarten 5a 91054 Erlangen Germanyb Rodgauer Baustoffwerke GmbH amp Co KG Am Opel-Pruumlffeld 3 63110 Rodgau-Dudenhofen Germany
A B S T R A C T
This work presents improved analytical methods for both steps of the production process of autoclaved aeratedconcrete (AAC) the phase development during the hydration before autoclaving and during the autoclavingprocess itself The improvement includes new insights into preparation methods of AAC samples for powderdiffraction as well as Rietveld refinement strategies For the first time a new implementation for calculatinganisotropic crystal domain sizes is applied to major hydrate phases occurring during AAC production namelyportlandite during the hydration before autoclaving and tobermorite during the autoclaving process The cal-culation of anisotropic domain size growth which can be implemented in the Rietveld environment is based oncrystallographically and geometrically appropriate models The implementation of calculating anisotropic do-main sizes for the Rietveld software TOPAS 50 allows a superior Rietveld fit and a more accurate quantificationof the phase development Additionally it enables the tracking of growth mechanism of portlandite duringhydration
1 Introduction
Autoclaved aerated concrete (AAC) is known as a lightweight con-struction material which offers outstanding properties such as suffi-cient strength for construction in addition with excellent thermal in-sulation [12] AAC is produced by autoclaving from calcareous rawmaterials such as lime (CaO) and cement quartz sulfate carrier andother additives such as foaming agents and water
The production process (Fig 1) can be separated into the hydrationof the mixed slurry before the procedure of autoclaving and the auto-claving at elevated temperature (180 degC to 200 degC) under saturatedsteam pressure (12MPa) for several hours
The hydration process before autoclaving is necessary to achievesufficient strength in order to cut the green cake blocks as they shouldhave a specific shape and dimension after autoclaving Furthermorethe porous structure is generated by the foaming agent during hydra-tion in the first process step During autoclaving the final propertiesnamely strength and low thermal conductivity are achieved
It is already well understood that the autoclaving process leads tothe formation of several phases first of all tobermorite(Ca5Si6O16(OH)2lowast4H2O) [3ndash5] Newest research has shown im-pressively which reactions are running from the mineralogical point ofview Insitu XRD measurements were carried out during the
autoclaving process and the phase development was shown by plottingnormalized intensities [6] The study of Mitsuda et al [3] was mainlyfocused on the tracking of the phase evolution during the autoclavingprocess of AAC However their statements concerning phase evolutionare mainly based on XRD data and TGA measurements There is acommon agreement that the following reactions occur The consump-tion of the alite (OPC) leads to the formation of an initial C-S-H phaseduring the first processing step Portlandite which was initially formedduring the first process step (from CaO and C3S) further quartz and theC-S-H phase are consumed during autoclaving resulting in the crystal-lization of tobermorite Hence the crystallization process of to-bermorite as well as the crystal structure of tobermorite was an issue ofresearch and discussion over the last years and numerous publicationsto these topics are available Concerning the crystal structure of to-bermorite respectively the tobermorite supergroup a new publicationoutlines all important references and recommends a new nomenclature[7]
The presented study was performed to create new analytical possi-bilities for the characterization of the production process of AAC Bothof the production process steps are essential for the final productHence the present work focuses on crystallization of hydrate phases inboth processes
Firstly an external standard method [89] was published and
httpsdoiorg101016jcemconres201802028Received 6 October 2017 Received in revised form 1 February 2018 Accepted 26 February 2018
Corresponding authorsE-mail addresses juergenjsschreinerfaude (J Schreiner) danieljansenfaude (D Jansen)
Cement and Concrete Research 107 (2018) 247ndash252
0008-8846 copy 2018 Elsevier Ltd All rights reserved
T
6 Publications
39
recommended for the determination of absolute phase contents inmixtures with amorphous content It was shown that the method canabsolutely be recommended for hydrating cement pastes in which watercannot be quantified directly by XRD [10] This method seems to bevery promising for both the quantification of the hydration of the AACslurry before autoclaving and the quantification of the phase evolutionduring autoclaving inasmuch as both production steps form crystallineand amorphous phases
Secondly a new approach to anisotropic peak broadening due toanisotropic domain morphology which was developed [1112] is ap-plied to AAC samples to improve the fit of portlandite and tobermoriteby Rietveld refinement [13] By applying this approach the refinementof both portlandite and tobermorite should additionally lead to betterquantitative results as well as to better insights into the development ofthe domain size morphology of both phases formed
It was already shown that in a hydrating raw mixture for AAC twospecies of portlandite precipitate at 23 degC one showing dynamicallyanisotropic peak broadening and another one following the isotropictrend [14] The application of the anisotropic refinement model led toan improved fitting of portlandite Moreover the mechanism of aniso-tropic domain growth of portlandite was tracked
2 Materials and methods
In order to examine the hydration of the AAC slurry before auto-claving a mixture of the hydraulic reactive components was weighedand measured in-situ at a Bruker D8 diffractometer with a LynxEyedetection system
Ordinary Portland cement (OPC) was mixed with lime (CaO) andanhydrite (C$) The raw materials were taken from the same batches asfor the industrial samples The drymix (58 OPC 36 CaO and 6 C$by weight) was then mixed with water (ws= 08) and placed into anappropriate sample holder The samples were not aerated The slurrysamples were covered with a kapton film to avoid evaporation andcarbonation Diffractograms were recorded with an angular range from7 to 545deg 2θ and a step width of 0011deg 2θ Measurements were carriedout every 15min For each measurement 96 XRD patterns were re-corded over the first 24 h The temperature was fixed at 70 degC which isthe mean temperature generally prevailing in the industrial processduring hydration before autoclaving Rietveld refinement was carriedout using the G-factor method All structures used for Rietveld refine-ment are shown in Table 1
For investigation of the autoclaved samples five different specimenswere taken at different autoclaving times The specimens were takenout of a technical production process hence it was not possible to in-terrupt the process at an earlier time inasmuch it would lead to damageof a whole concrete production batch The specimens were firstly driedat 60 degC until weight constancy The whole blocks were then broken andstatistical samples of 20 g were taken In order to receive the right massattenuation coefficient (MAC) for G-factor method the loss on ignitionand the chemical composition (XRF) were determined For energydispersive XRF analysis (Spectro Xepos) tube voltage from 20 kV to50 kV and tube current from 08 to 20mA were used for differenttargets
The final sample preparation (grinding) before XRD measurementswas carried out using both an agate mortar and a McCrone micronizingmill for wet milling with isopropanol Both preparation methods wereapplied separately to see which one is suitable in order to get the bestpreparation for XRD investigations Six preparations were performed byone operator of which two were prepared with an agate mortar andfour with a McCrone mill For the McCrone milling 3 g of the sampleand 10ml of isopropanol were used for grinding for 12min The grainsize distribution of one sample prepared with an agate mortar and onesample prepared using a McCrone mill was measured by laser granu-lometry in isopropanol using a Mastersizer 3000 (MALVERN)
After milling the samples in these two ways for XRD analysis thepowders were prepared into a front loading sample holder and mea-sured Diffractograms were recorded with an angular range from 6 to80deg 2θ a step width of 00236deg 2θ and a time per step of 054 s Rietveldrefinement combined with external standard (G-factor) was applied inorder to get absolute quantities for each phase The refinement strategyfor portlandite and tobermorite in the TOPAS Launch Mode (TOPAS50 Bruker AXS) is attached as a Supplementary material file
3 Results and discussion
31 Hydration of the mixture before autoclaving
The hydration of the investigated paste before autoclaving isdominated by the hydration of the cement as well as the reaction of thefree lime (CaO) resulting in the formation of portlandite It can beclearly seen from Fig 2 that the hydration of the paste leads to theformation of ettringite portlandite and C-S-H phase For simplificationthe remaining phase developments are not shown in Fig 2 because theyare not in the focus of this study The hydration of CaO forming
Fig 1 Simplified process steps of AAC production and hydrate phase evolution
Table 1Structures used for Rietveld refinement
Phase Author
Alite [15]Anhydrite [16]Bassanite [17]Belite (β) [18]Belite (αprime) [19]Brownmillerite [20]C-S-H [21]Calcite [22]Ettringite [23]Gypsum [24]Hemicarbonate [25]Hydroxylellestadite [26]Lime (CaO) [27]Microcline [28]Portlandite [29]Quartz [30]Tobermorite [31]Tricalciumaluminate (cubic) [32]Tricalciumaluminate (orthorhombic) [33]PONCKS model for Water [21]
J Schreiner et al Cement and Concrete Research 107 (2018) 247ndash252
248
6 Publications
40
portlandite begins rapidly after the addition of water to the mixture andlime is fully consumed after only 1 h of hydration This translates into aquick rise of heat of hydration so that cement hydration is acceleratedwhich leads to further portlandite formation by the reaction of aliteEttringite formation stalls after few hours of hydration After 12 h et-tringite is partially decomposed probably due to sulfate depletion [9]
and poorly crystalline AFm phases (not shown in Fig 2) are formedIn Fig 3 it can be seen that in fact two generations of portlandite
are formed a 1st dominant generation showing anisotropic peakbroadening and 2nd one occurring considerably later following theisotropic domain size refinement which is usually carried out using theRietveld method This occurrence comes along firstly with lime hy-dration and secondly with alite hydration The expected quantity ofportlandite formed from lime hydration very well complies with the
Fig 2 Phase development in AAC paste on a laboratory scale before autoclaving ana-lyzed by in-situ XRD at 70 degC
Fig 3 Formation of two generations of portlandite by hydration of lime (1st) and C3S(2nd) at 70 degC before autoclaving with the major generation showing anisotropic peakbroadening
Fig 4 Biaxial cylinder domain size model of portlandite used for Rietveld refinement of anisotropic peak broadening
Fig 5 Morphological evolution of portlandite showing anisotropic domain size growthduring hydration at 70 degC
Fig 6 Comparison of quantification of crystalline quartz in samples prepared withMcCrone mill and agate mortar at different autoclaving times
J Schreiner et al Cement and Concrete Research 107 (2018) 247ndash252
249
6 Publications
41
quantity of the observed 1st generation The development of portlan-dite growth was already tracked in an equivalent slurry at 23 degC [14]Thus this observation confirms that the crystallinity of portlandite inmixtures for AAC production depends on the starting phase for hydra-tion as already indicated by Ectors [14]
Fig 4 shows the used biaxial cylindrical model for anisotropic do-main size calculation and the portlandite structure which was createdwith structural software VESTA 318 [34] Using the cylindrical ap-proach domain sizes in a (here equating to b) and c direction(dz= cylinder height) can be calculated which comes along with theexpected symmetrical parameters of portlandite
The 1st portlandite generation showing anisotropic domain growthcan be tracked in terms of cylinder diameter and height which is rea-lized in Fig 5 The blue cylinder represents the geometric approach andcylinder height and diameter are calculated newly for each range Thecylinder height remains rather stable throughout the hydration processwhile the cylinder diameter increases during the first hours of hydra-tion After 10 h of hydration the mean cylinder diameter no longer in-creases Consequently these observations match the results of the ex-aminations conducted at 23 degC [14] as well as the assumption thatdifferent mechanisms of growth exist for portlandite depending on the
hydration educt The maximum cylinder diameter is reached earlier inthis work very likely because of the higher hydration temperature
32 Quantification of the reactions during autoclaving
Autoclaved samples were ground with an agate mortar and com-pared to samples which were wet-ground with a McCrone mill Fig 6shows precisely that the determination of the amount of crystallinequartz is more reproducible in the two shown samples which were
Fig 7 2D XRD with Bruker GADDS-system plots of samples prepared with agate mortar and McCrone mill Coarse quartz grains are pointed out in the plot of the sample prepared withagate mortar
Fig 8 Particle size distribution of one sample prepared with an agate mortar and of onesample prepared with a McCrone mill measured by laser granulometry
Fig 9 Rietveld refinement for Tobermorite of autoclaved AAC sample by use of isotropicdomain size model (a) and of anisotropic domain size model (b)
J Schreiner et al Cement and Concrete Research 107 (2018) 247ndash252
250
6 Publications
42
prepared with a McCrone mill The high variance of crystalline quartzin the samples which were prepared with an agate mortar is a result ofinsufficient grinding and remaining of too large quartz grains Whenthis spottiness occurs a reliable quantification using the G-factormethod is not possible
The 2D XRD with Bruker GADDS-system plots in Fig 7 demonstratethe insufficient grinding when using an agate mortar compared to wetmilling with a McCrone mill Quartz would be overrepresented in a one-dimensional XRD pattern focusing on a section with bright spots (greenarrows) The lack of bright spots in the right plot shows that the quartzgrains are milled more thoroughly using a McCrone mill In Fig 8 theparticle size distribution after both ways of sample preparation iscompared Most grains in the sample prepared with an agate mortar arelarger than in the sample prepared with a McCrone mill The grain sizedistribution of the sample prepared with a McCrone mill complies withthe recommended particle size range for XRD analysis of under 5 to50 μm [3536] while the other sample exceeds the range
In Fig 9 Rietveld refinement of an autoclaved sample is shown Thedominant peaks at 77 290 and 301deg 2θ are attributed to tobermoriteIn the upper diagram (a) Rietveld refinement was carried out regularlycalculating isotropic domain sizes for tobermorite However the cal-culated fit differs significantly from the raw data It can be assumed thattobermorite shows a similar pattern to portlandite in terms of aniso-tropic peak broadening taking into account that tobermorite is as-signed to the orthorhombic crystal system Thus instead of a biaxialcylinder model an elliptic cylinder model (Fig 10 structure createdwith VESTA 318 [34]) was applied for the refinement in the lowerdiagram (b) The elliptic cylinder model is a sufficient approach to the
orthorhombic crystal system as it allows the distinction between do-main sizes in a b and c direction The fit is clearly superior using theanisotropic domain size model highlighted by the difference plot inFig 9b The comparison refinement with isotropic and anisotropic ap-proach was done for all of the five autoclaved samples In Fig 11 theresulting Rwp values for the whole pattern and the RBragg values of to-bermorite are shown The refinement using the anisotropic model leadsto both lower Rwp and RBragg values and consequently to a better fit anda more accurate quantification of tobermorite in all refined samples
4 Summary and conclusions
Improved analytical methods for both the phase developmentduring the hydration before autoclaving and during the autoclavingprocess of AAC are presented It could be shown that wet McCronemilling is the best way of preparation of AAC samples in order to obtainsuitable samples for powder diffraction A new approach to treat ani-sotropic domain sizes for Rietveld refinement could be successfullyapplied ndash with the benefit that portlandite and tobermorite in AACsamples could be refined more accurately using the Rietveld methodThus this application allows an improved quantification of the phasedevelopment during both of the production steps
For the future there are still plenty of possibilities to apply thepresented approach of calculating anisotropic domain sizes to AACproduction As exemplified with portlandite the mechanisms of growthof tobermorite can be tracked likewise during the autoclaving processIn addition the effect of variations in the chemical composition of AACraw mixtures on the crystal morphology of tobermorite can be ex-amined This leaves a new perspective to discuss the link between mi-neral phase morphology and the thermal and mechanical properties ofAAC
Acknowledgement
The autoclaved samples were generously provided by RodgauerBaustoffwerke GmbH amp Co KG The authors express gratitude for allsupport
Appendix A Supplementary data
Supplementary data to this article can be found online at httpsdoiorg101016jcemconres201802028
References
[1] MW Grutzeck Cellular concrete in M Scheffler P Colombo (Eds) CellularCeramics Wiley-VCH Weinheim 2005 pp 193ndash223
[2] M Haas The future of AAC ndash from a material scientists point of view inMC Limbachiya JJ Roberts (Eds) Autoclaved Aerated Concrete Taylor FrLondon 2005 pp 187ndash194
[3] T Mitsuda K Sasaki H Ishida Phase evolution during autoclaving process ofaerated concrete J Am Ceram Soc 75 (1992) 1858ndash1863
[4] N Isu H Ishida T Mitsuda Influence of quartz particle size on the chemical and
Fig 10 Triaxial cylinder domain size model of Tobermorite used for Rietveld refinement of anisotropic peak broadening
Fig 11 Comparison of Rwp and RBragg values of Rietveld refinements of autoclavedsamples and tobermorite using the isotropic and the anisotropic domain size model
J Schreiner et al Cement and Concrete Research 107 (2018) 247ndash252
251
6 Publications
43
mechanical properties of autoclaved aerated concrete (I) tobermorite formationCem Concr Res 25 (1995) 243ndash248
[5] NY Mostafa Influence of air-cooled slag on physicochemical properties of auto-claved aerated concrete Cem Concr Res 35 (2005) 1349ndash1357 httpdxdoiorg101016jcemconres200410011
[6] K Matsui J Kikuma M Tsunashima T Ishikawa S Matsuno A Ogawa M SatoIn situ time-resolved X-ray diffraction of tobermorite formation in autoclaved aer-ated concrete influence of silica source reactivity and Al addition Cem Concr Res41 (2011) 510ndash519
[7] C Biagioni S Merlino E Bonaccorsi The tobermorite supergroup a new no-menclature Mineral Mag 79 (2015) 485ndash495 httpdxdoiorg101180minmag2015079222
[8] BH OConnor MD Raven Application of the Rietveld refinement procedure inassaying powdered mixtures Powder Diffract 3 (1988) 2ndash6 httpdxdoiorg101017S0885715600013026
[9] D Jansen F Goetz-Neunhoeffer C Stabler J Neubauer A remastered externalstandard method applied to the quantification of early OPC hydration Cem ConcrRes 41 (2011) 602ndash608 httpdxdoiorg101016jcemconres201103004
[10] D Jansen C Stabler F Goetz-Neunhoeffer S Dittrich J Neubauer Does OrdinaryPortland Cement contain amorphous phase A quantitative study using an externalstandard method Powder Diffract 26 (2011) 31ndash38 httpdxdoiorg10115413549186
[11] D Ectors F Goetz-Neunhoeffer J Neubauer A generalized geometric approach toanisotropic peak broadening due to domain morphology J Appl Crystallogr 48(2015) 189ndash194 httpdxdoiorg101107S1600576714026557
[12] D Ectors F Goetz-Neunhoeffer J Neubauer Routine (an)isotropic crystallite sizeanalysis in the double-Voigt approximation done right Powder Diffract 32 (S1)(2017) 27ndash34 httpdxdoiorg101017S0885715617000070
[13] HM Rietveld A profile refinement method for nuclear and magnetic structures JAppl Crystallogr 2 (1969) 65ndash71 httpdxdoiorg101107S0021889869006558
[14] D Ectors Advances in the Analysis of Cementitious Reactions and Hydrate Phases(Doctoral Thesis) (2016) pp 12ndash14 (urnnbndebvb29-opus4-71743)
[15] AacuteG De La Torre S Bruque J Campo MAG Aranda The superstructure of C3Sfrom synchrotron and neutron powder diffraction and its role in quantitative phaseanalyses Cem Concr Res 32 (2002) 1347ndash1356 httpdxdoiorg101016S0008-8846(02)00796-2
[16] A Kirfel G Will Charge density in anhydrite CaSO4 from X-ray and neutrondiffraction measurements Acta Crystallogr Sect B Struct Crystallogr CrystChem 36 (1980) 2881ndash2890 httpdxdoiorg101107S0567740880010461
[17] C Bezou AN Christensen D Cox M Lehman A Nonat Structures cristallines deCaSO405H2O et CaSO406H2O Comptes Rendus Hebd Des Seacuteances lAcadeacutemieDes Sci Seacuterie 2 (312) (1991) 43ndash48
[18] KH Jost B Ziemer R Seydel Redetermination of the structure of β-dicalciumsilicate Acta Crystallogr Sect B Struct Crystallogr Cryst Chem 33 (1977)1696ndash1700 httpdxdoiorg101107S0567740877006918
[19] W Mumme LMD Cranswick BC Chakoumakos Rietveld crystal structure re-finements from high temperature neutron powder diffraction data for the poly-morphs of dicalcium silicate Neues Jahrb Fuer Mineral Abhandlungen 170 (1996)171ndash188
[20] A Colville S Geller The crystal structure of brownmillerite Ca2FeAlO5Crystallographica 50 (1971) 2311ndash2315 httpdxdoiorg101107S056774087100579X
[21] ST Bergold F Goetz-Neunhoeffer J Neubauer Quantitative analysis of C-S-H inhydrating alite pastes by in-situ XRD Cem Concr Res 53 (2013) 119ndash126 httpdxdoiorg101016jcemconres201306001
[22] EN Maslen VA Streltsov NR Streltsova N Ishizawa Electron density and op-tical anisotropy in rhombohedral carbonates III Synchrotron Xray studies ofCaCO3 MgCO3 and MnCO3 Acta Crystallogr Sect B 51 (1995) 929ndash939 httpdxdoiorg101107S0108768195006434
[23] G Renaudin Y Filinchuk J Neubauer F Goetz-Neunhoeffer A comparativestructural study of wet and dried ettringite Cem Concr Res 40 (2010) 370ndash375httpdxdoiorg101016jcemconres200911002
[24] WF Cole CJ Lancucki A refinement of the crystal structure of gypsumCaSO42H2O Acta Cryst B30 (1974) 921ndash929 httpdxdoiorg101107S0567740874004055
[25] T Runčevski RE Dinnebier OV Magdysyuk H Poumlllmann Crystal structures ofcalcium hemicarboaluminate and carbonated calcium hemicarboaluminate fromsynchrotron powder diffraction data Acta Crystallogr Sect B Struct Sci 68 (2012)493ndash500 httpdxdoiorg101107S010876811203042X
[26] JM Hughes JW Drexler Cation substitution in the apatite tetrahedral site crystalstructures of type hydroxylellestadite and type fermorite Neues Jahrb FuerMineral (1991) 327ndash336
[27] CH Shen RS Liu JG Lin CY Huang Phase stability study of La12Ca18Mn2O7Mater Res Bull 36 (2001) 1139ndash1148
[28] SW Bailey Refinement of an intermediate microcline structure Am Miner 54(1969) 1540ndash1545
[29] WR Busing HA Levy Neutron diffraction study of calcium hydroxide J ChemPhys 26 (1957) 563 httpdxdoiorg10106311743345
[30] Y Le Page G Donnay Refinement of the crystal structure of low-quartz ActaCrystallogr Sect B 32 (1976) 2456ndash2459 httpdxdoiorg101107S0567740876007966
[31] SA Hamid The crystal structure of the 11 Aring natural tobermoriteCa225[Si3O75(OH)15]1H2O Zeitschrift Fuer Krist - New Cryst Struct 154 (1981)189ndash198 httpdxdoiorg101524zkri19811543-4189
[32] P Mondal JW Jeffery The crystal structure of tricalcium aluminate Ca3Al2O6Acta Crystallogr B 31 (1975) 689ndash697 httpdxdoiorg101107S0567740875003639
[33] Y Takeuchi F Nishi I Maki Crystal-chemical characterization of the tricalciumaluminate-sodium oxide (3CaOtimesAl2O3-Na2O) solid-solution series Zeitschrift FuumlrKrist (1980) 259ndash307
[34] K Momma F Izumi VESTA 3 for three-dimensional visualization of crystal vo-lumetric and morphology data J Appl Crystallogr 44 (2011) 1272ndash1276 httpdxdoiorg101107S0021889811038970
[35] K Scrivener R Snellings B Lothenbach A Practical Guide to MicrostructuralAnalysis of Cementitious Materials CRC Press 2016 pp 123ndash125 httpdxdoiorg107693wl20150205
[36] V Pecharsky P Zavalij Fundamentals of Powder Diffraction and StructuralCharacterization of Materials Springer second edition 2005 p 302 httpdxdoiorg101007978-0-387-09579-0
J Schreiner et al Cement and Concrete Research 107 (2018) 247ndash252
252
6 Publications
44
7 Acknowledgement
7 Acknowledgement
Ich moumlchte mich bei einigen Personen bedanken ohne die es wohl kaum zum erfolgreichenAbschluss dieser Arbeit gekommen waumlreMein Doktorvater Prof Dr Juumlrgen Neubauer hat sich stets die Zeit genommen die noumltigwar um Angelegenheiten aller Art mit mir zu klaumlren Er gab mir fachlich immer zumrichtigen Zeitpunkt einen gewissen wissenschaftlichen Impuls Zugleich habe ich mich den-noch immer frei in meiner eigenen Konzeption gefuumlhlt Groszligen Dank spreche ich Prof DrFriedlinde Goumltz-Neunhoeffer aus die fuumlr mich ebenso immer eine verlaumlssliche Ansprech-partnerin fuumlr fachliche und organisatorische Angelegenheiten aller Art war Danke anDr Daniel Jansen fuumlr die gute Zusammenarbeit und dafuumlr dass er mich im Zuge meinerMasterarbeit in ein Forschungsprojekt aufgenommen hat das den Weg zur Promotionmoumlglich machte Zusaumltzlich gilt mein Dank Prof Dr Matthias Goumlbbels der fuumlr dieMitarbeiter am Lehrstuhl immer motivierende Worte fand Fuumlr die Ermoumlglichung meinerTeilnahme an diversen Dienstreisen Fortbildungen und Tagungen moumlchte ich mich viel-mals bedankenWeiterhin bedanke ich mich bei Dr Stephan Volkmann und den Rodgauer BaustoffwerkenGmbH amp Co KG fuumlr die gute Zusammenarbeit und die Bereitstellung von Versuchsma-terialienVielen Dank an meine studentischen Hilfskraumlfte Daniel Wagner Laura MoldenhauerFabian Lang Jakob Schreiber und Felix Klaassen die alle Aufgaben im Labor einwand-frei und mit Bedacht erledigten Bei meinen aktuellen und ehemaligen Kollegen DrKatrin Hurle Dr Dominique Ectors Dr Christoph Naber Dr Florian Huumlller JoumlrgNehring Frank Riedel Julian Wolf Tanja Manninger Daniel Wagner Nicolas FobbeKarla Spaumlth Julian Goergens Andreas Koumlhler Cordula Jakob Franz Becker und LisaKlemenz bedanke ich mich fuumlr die gelungene Zusammenarbeit und gegenseitige Unter-stuumltzung Besonderer Dank geht auch an Kerstin Kreszlig Bettina Engl Christian HankeBernd Schleifer und Christian Abe fuumlr die verlaumlssliche Unterstuumltzung bei technischen Fra-gen und Messungen im LaborFuumlr jegliche Unterstuumltzungen moumlchte ich mich auch bei meinen Eltern bedanken sowiebei meinem Bruder Ralf der mir mit einem LaTex Crashkurs viel Frustration ersparthat Danke Thomas dass du immer fuumlr mich da bist und mit mir zusammen fuumlr genugAusgleich gesorgt hast
45
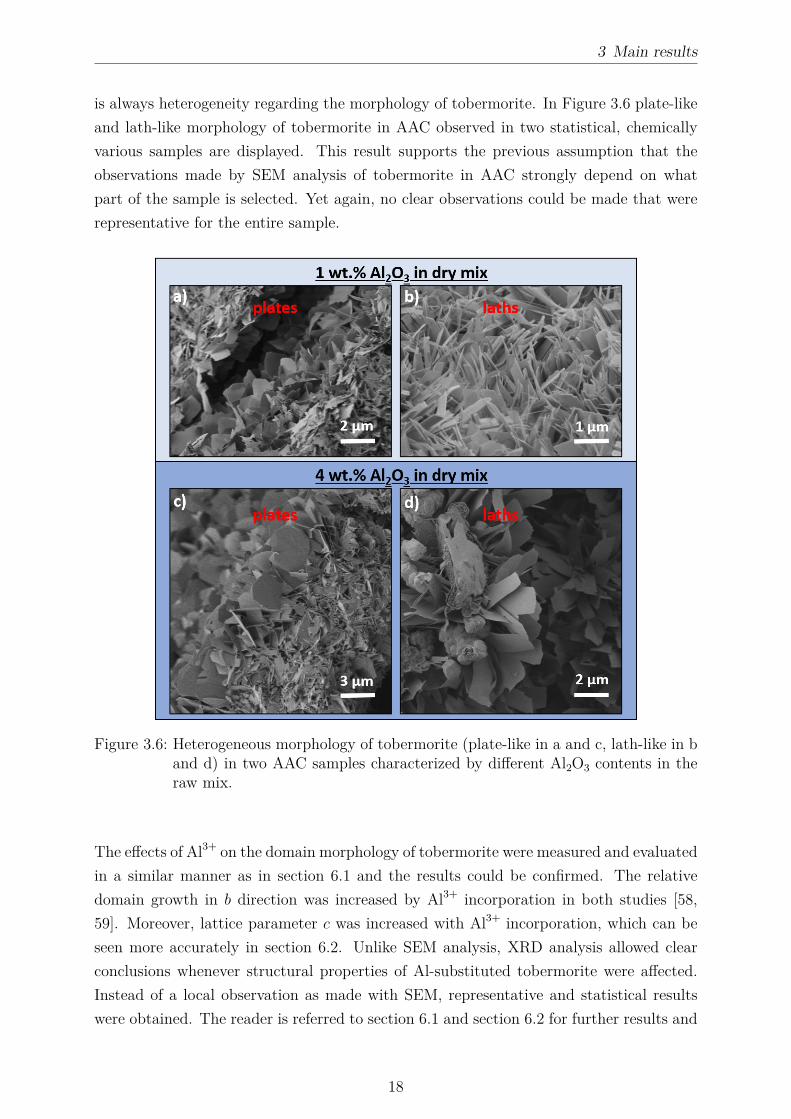
3 Main results
is always heterogeneity regarding the morphology of tobermorite In Figure 36 plate-likeand lath-like morphology of tobermorite in AAC observed in two statistical chemicallyvarious samples are displayed This result supports the previous assumption that theobservations made by SEM analysis of tobermorite in AAC strongly depend on whatpart of the sample is selected Yet again no clear observations could be made that wererepresentative for the entire sample
Figure 36 Heterogeneous morphology of tobermorite (plate-like in a and c lath-like in band d) in two AAC samples characterized by different Al2O3 contents in theraw mix
The effects of Al3+ on the domain morphology of tobermorite were measured and evaluatedin a similar manner as in section 61 and the results could be confirmed The relativedomain growth in b direction was increased by Al3+ incorporation in both studies [5859] Moreover lattice parameter c was increased with Al3+ incorporation which can beseen more accurately in section 62 Unlike SEM analysis XRD analysis allowed clearconclusions whenever structural properties of Al-substituted tobermorite were affectedInstead of a local observation as made with SEM representative and statistical resultswere obtained The reader is referred to section 61 and section 62 for further results and
18
3 Main results
more specific conclusionsIn addition the effect of various amounts of sulfate in the raw mix was analyzed Unlikein the case of different dosages of Al3+ neither the domain morphology nor the latticeparameters of tobermorite were affected by the SO3 content in the dry mix In Figure 37these observations and additionally the amounts of anhydrite measured by QXRD areshown As the amount of available SO3 in the dry mix is known the maximum possibleamount of anhydrite could be calculated for each of the samples in focus Obviouslythe measured amounts of anhydrite are either equal or slightly higher compared to theexpected quantities This result leads to the assumption that all of the available sulfateis transformed into anhydrite so that no more sulfate could be incorporated into thestructure of tobermorite The over-estimation of anhydrite in some of the samples can beexplained due to the inaccuracy of the quantification method The present results rathermatch with the suggestions by Sauman amp Valtr [41] as in their study no effect of sulfateon the structure of tobermorite was observed either
Figure 37 Impact of the sulfate content in the AAC raw mix on lattice parameter cand relative domain morphology of tobermorite (a) and comparison of theexpected maximum amount of anhydrite to the measured amount determinedby QXRD (b)
33 Improved monitoring of the phase developmentduring the production of AAC
In this study not only autoclaved samples were analyzed but additionally a lab-scale slurrywhich included the reactive components of the green cake stage during AAC productionat equivalent weight proportions In-situ XRD was performed at 70 degC and at a water-to-
19
3 Main results
solid ratio of 08 for 24 h (Figure 38) which are respective conditions during commercialproduction Clearly the phase development is dominated by OPC and lime hydration asdescribed in section 22 It can be seen that the major reaction turnover occurs duringthe first 200 minutes which is the average duration of the green stage After only 30minutes all of the quicklime had transformed into portlandite whereas Schober proposeda duration of one hour for this reaction [42] The amount of portlandite is composed oftwo different generations as proposed by Ectors [52] Equally a biaxial cylinder modelwas applied in order to fit the peak broadening of the first generation of portlandite in thepresent investigation Minor phase developments such as the formation of AFm phases arenot shown in Figure 38 A coarse fraction of anhydrite did not react so that constantlyaround 15 wt were measured after 6 h As the decomposition of ettringite due tosulfate depletion [55] does not occur prior to 12 h the green cake strength is not affected
Figure 38 In-situ XRD measurement of AAC model slurry at water-to-solid ratio of 08and 70 degC For clarity and comprehensibility not all phases are shown
The separation of two generations of portlandite in the system does not only translate intodifferent domain morphologies as shown by Ectors [52] In Figure 39 more indicationsfor different mineralogical properties are displayed The shape of the (0 0 1) reflection inXRD patterns after only quicklime hydration and after both quicklime and alite hydrationshows a distinct feature While portlandite originating from quicklime hydration showsa broad peak implying lower crystallinity the peak after alite hydration is characterized
20
3 Main results
Figure 39 Formation of two generations of portlandite in AAC slurry in XRD (a) andDTA (b) plots
by a sharper component Yet the peak breadth did not change indicating that the firstgeneration is still present with the original characteristics This observation is supportedby DTA measurements additionally demonstrating two degrees of crystallinity only afteralite hydration In agreement with XRD analysis the better crystalline second generationof portlandite decomposes at a higher temperature
Figure 310 Quantification of tobermorite in statistical chemically various AAC sampleswith and without the application of the macro for the fitting of anisotropicpeak broadening
21
3 Main results
Furthermore commercial AAC samples were considered in this study By applying themethod for the refinement of anisotropic peak broadening (Figure 31) a more accuratequantification of tobermorite can be achieved In Figure 310 the calculated amounts oftobermorite in statistical chemically various AAC samples are plotted In some samplesthe refinement using the macro leads to considerably higher but never lower quantitiesof tobermorite whereas in other samples nearly the same amount of tobermorite is cal-culated This observation can be well understood taking into account that the macroallows to account more peak area for tobermorite as shown in Figure 31 Clearly thereis evidence that the anisotropy of tobermorite domains is not uniform from one sampleto another which was basically justified in the previous sections As an improved quan-tification of a single phase leads to a better quantification of other phases in the samplethis adaption is very valuable in order to assess the phase development Here the peakbroadening of tobermorite equally observed by Qu et al [6] could be tracked and evalu-ated in order to gain more accurate results Moreover in section 63 McCrone milling issuggested in order to avoid spottiness in XRD patterns caused by coarse grains of quartzor anhydrite (Figure 38)
22
4 Conclusions
4 Conclusions
The research results presented in the previous sections yield advances in the mineralogicalinvestigation of tobermorite and autoclaved aerated concrete Recorded diffraction pat-terns contain plenty of usually unused data regarding the microstructural characteristicsof the sample and phases therein The profit of XRD measurements can be significantlyimproved whenever one or more phases show anisotropic peak broadening and appro-priate models for the respective domain morphology are implemented into the Rietveldenvironment Within the scope of the present investigations portlandite and tobermoriteshow this particularityThe effects of changes in the chemistry of the starting mix were examined based on dif-ferent dosages of metakaolin Al-substituted tobermorite showed increased growth in b
direction and an increase of lattice parameter c compared to Al-free tobermorite The rel-ative domain sizes were determined based on anisotropic peak broadening However whilethe effect of Al3+ incorporation into the lattice of tobermorite was limited regarding thedomain morphology lattice parameter c showed an increase throughout the entire rangeof samples The consequent effects suggested by Klimesch amp Ray observed by means ofDTA are debatable as reactions during the heating experiment may lead to to a changeof Al3+ content in tobermorite [40] While both types of applied metakaolin showed goodreactivity at hydrothermal conditions some included minor phases such as feldspar oranatase remained unreacted At high dosages of Al2O3 in the starting mix the formationof either only katoite or katoite along with tobermorite was observed (Figure 32)SEM analysis of tobermorite in AAC cannot be suggested based on the observationspresented in this work as it is only visually accessible in the pores or at pore surfacesThe dense material of the AAC skeleton contains several crystalline and X-ray amorphousphases which hardly allows a proper investigation Even in single pores tobermorite crys-tals appeared very heterogeneous at various chemical compositions As a result lath-liketobermorite was not only present in samples characterized by elevated Al3+ incorporationBy contrast the benefits of XRD analysis presented in section 61 equally accounted fortobermorite in AAC samples Sulfate incorporation into the lattice of tobermorite wasnot observed All of the sulfate in the system was detected to be present in anhydriteThe phase transitions in the AAC raw slurry during the green stage hydration were show-cased by in-situ XRD analysis of a model mix at 70 degC Additional DTA and XRD mea-
23
4 Conclusions
surements during this step confirmed the presence of two generations of portlandite char-acterized by different crystallinity as suggested by Ectors [52] The inclusion of anisotropicdomain morphology during the Rietveld refinement allowed a more accurate quantifica-tion of tobermorite in autoclaved samples Sample preparation adjusted to the grain sizedistribution in AAC samples (section 63) the external standard method for quantita-tive XRD analysis [55] and the approach to evaluate anisotropic peak broadening [19]are the key methods for a more accurate tracking of the phase development during AACproduction
24
5 References
5 References
[1] A E Zadov A I Grabezhev N N Pertsev N V Chukanov and S V PribavkinTobermorite-plombierite metasomatites of the Gumeshevsk skarn-porphyry copper depositmiddle Urals Doklady Earth Sciences 407(3)495ndash497 2006
[2] M F Heddle Preliminary notice of substances which may prove to be new minerals MinMag 4117ndash123 1880
[3] S Merlino E Bonaccorsi and T Armbruster The real structure of tobermorite 11AringNormal and anomalous forms OD character and polytypic modifications European Journalof Mineralogy 13(3)577ndash590 2001
[4] C Biagioni S Merlino and E Bonaccorsi The tobermorite supergroup a new nomencla-ture Mineralogical Magazine 79(2)485ndash495 2015
[5] C A Riacuteos C D Williams and M A Fullen Hydrothermal synthesis of hydrogarnetand tobermorite at 175 degC from kaolinite and metakaolinite in the CaO-Al2O3-SiO2-H2Osystem A comparative study Applied Clay Science 43(2)228ndash237 2009
[6] X Qu Z Zhao and X Zhao Microstructure and characterization of aluminum-incorporated calcium silicate hydrates (C-S-H) under hydrothermal conditions RSC Ad-vances 8(49)28198ndash28208 2018
[7] R Šiaučiunas and K Baltakys Formation of gyrolite during hydrothermal synthesis inthe mixtures of CaO and amorphous SiO2 or quartz Cement and Concrete Research34(11)2029ndash2036 2004
[8] E Venhodovaacute R Janovskyacute and R Drochytka Formation of Tobermorite at Different Ma-terials Composition of Aerated Concrete Applied Mechanics and Materials 752-753247ndash250 2015
[9] L Galvaacutenkovaacute E Bartoniacutečkovaacute T Opravil J Tkacz and P Ptaacuteček The influence ofstarting materials solubility on tobermorite structure formation under the hydrothermalconditions IOP Conference Series Materials Science and Engineering 379(1)1ndash8 2018
[10] T Mitsuda K Sasaki and H Ishida Phase Evolution during Autoclaving Process J AmCeram Soc 75(75)1858ndash1863 1992
[11] A Skawińska The influence of metahalloysite addition on tobermorite formation studied byX-ray powder diffraction and scanning electron microscope MATEC Web of Conferences16305008 2018
[12] S T Bergold F Goetz-Neunhoeffer and J Neubauer Quantitative analysis of C-S-H in
25
5 References
hydrating alite pastes by in-situ XRD Cement and Concrete Research 53119ndash126 2013
[13] O P Shrivastava and F P Glasser Ion-exchange properties of 11-Aring tobermorite Reactivityof Solids 2(3)261ndash268 1986
[14] H Maeda Y Ogawa E H Ishida and T Kasuga Hydrothermal synthesis of tobermoritedoped with phosphorus species for removing heavy metal ions Journal of the AustralianCeramic Society 48(1)8ndash11 2012
[15] O P Shrivastava and R Shrivastava Cation exchange applications of synthetic tobermoritefor the immobilization and solidification of cesium and strontium in cement matrix Bulletinof Materials Science 23(6)515ndash520 2000
[16] G Renman and A Renman Sustainable Use of Crushed Autoclaved Aerated Concrete(CAAC) as a Filter Medium in Wastewater Purification 8th International conferenceon sustainable management of waste and recycled materials in construction GothenburgSweden 30 Mayndash1 June 2012 Proceedings pages 1ndash7 2012
[17] G Schober Chemical transformations during the manufacturing of autoclaved aeratedconcrete (ACC) Cement lime gypsum and quartz sand become cellular concrete ZKG58(7)63ndash70 2005
[18] A J Hamad Materials Production Properties and Application of Aerated LightweightConcrete Review International Journal of Materials Science and Engineering 2(2)152ndash157 2014
[19] D Ectors F Goetz-Neunhoeffer and J Neubauer A generalized geometric approach toanisotropic peak broadening due to domain morphology Journal of Applied Crystallogra-phy 48(1)189ndash194 2015
[20] H M Rietveld A profile refinement method for nuclear and magnetic structures Journalof Applied Crystallography 2(2)65ndash71 1969
[21] S A Hamid The crystal structure of the 11 Aring natural tobermoriteCa225[Si3O75(OH)15]1H2O Zeitschrift fuer Kristallographie - New Crystal Struc-tures 154(3-4)189ndash198 1981
[22] S A S El-Hemaly T Mitsuda and H F W Taylor Synthesis of normal and anomaloustobermorites Cement and Concrete Research 7429ndash438 1977
[23] M Sakiyama and T Mitsuda Hydrothermal reaction between C-S-H and kaolinite for theformation of tobermorite at 180degC Cement and Concrete Research 7(6)681ndash685 1977
[24] E Bonaccorsi S Merlino and A R Kampf The crystal structure of tobermorite 14 Aring(plombierite) a C-S-H phase Journal of the American Ceramic Society 88(3)505ndash5122005
[25] S Merlino E Bonaccorsi and T Armbruster The real structures of clinotobermorite andtobermorite 9 Aring OD character polytypes and structural relationships European Journalof Mineralogy 12(2)411ndash429 2000
[26] K Momma and F Izumi VESTA 3 for three-dimensional visualization of crystal volu-metric and morphology data Journal of Applied Crystallography 44(6)1272ndash1276 2011
26
5 References
[27] S Shaw S M Clark and C MB Henderson Hydrothermal formation of the calcium sil-icate hydrates tobermorite (Ca5Si6O16(OH)2 middot 4H2O) and xonotlite (Ca6Si6O17(OH)2)An in situ synchrotron study Chemical Geology 167(1-2)129ndash140 2000
[28] K Matsui J Kikuma M Tsunashima T Ishikawa S Matsuno A Ogawa and M SatoIn situ time-resolved X-ray diffraction of tobermorite synthesis process under hydrothermalcondition IOP Conference Series Materials Science and Engineering 18(2)60ndash66 2011
[29] G Matekonis R Šiaučiunas and D Vaičiukyniene Hydrothermal Synthesis and Charac-terization of Na + and [ Al 3 + + Na + ] -substituted Tobermorite in CaO-SiO2middotnH2O-H2OSystem MATERIALS SCIENCE 16(3)242ndash248 2010
[30] G Geng R J Myers M J A Qomi and P JM Monteiro Densification of the inter-layer spacing governs the nanomechanical properties of calcium-silicate-hydrate ScientificReports 7(1)1ndash8 2017
[31] D Klimesch and A Ray Autoclaved cement-quartz pastes with metakaolin additionsAdvanced Cement Based Materials 7(3-4)109ndash118 1998
[32] N Y Mostafa A A Shaltout H Omar and S A Abo-El-Enein Hydrothermal synthesisand characterization of aluminium and sulfate substituted 11 nm tobermorites Journal ofAlloys and Compounds 467(1-2)332ndash337 2009
[33] İ Demir M S Başpınar E Kahraman E Ccedilalışkan and G Goumlrhan An Investigation onthe Usability of Diatomite in Aerated Concrete Production In Proc of the Intl Conf onAdvances In Civil Structural And Construction Engineering - CSCE 2014 pages 97ndash1002014
[34] A Skawinska Z Owsiak T Baran and K Hernik The influence of halloysite additionon tobermorite formation in CaO and quartz mix under hydrothermal conditions CementWapno Beton 17(12)426ndash434 2017
[35] N Y Mostafa Influence of air-cooled slag on physicochemical properties of autoclavedaerated concrete Cement and Concrete Research 35(7)1349ndash1357 2005
[36] D Małaszkiewicz and J Chojnowski Influence of addition of calcium sulfate dihydrate ondrying of autoclaved aerated concrete Open Engineering 7(1)273ndash278 2017
[37] N Hara and N Inoue Thermal behaviour of 11Aring tobermorite and its lattice parametersCement and Concrete Research (10)53ndash60 1980
[38] M D Jackson S R Chae S R Mulcahy C Meral R Taylor P Li A H EmwasJ Moon S Yoon G Vola H R Wenk and P JM Monteiro Unlocking the secretsof Al-tobermorite in Roman seawater concrete American Mineralogist 98(10)1669ndash16872012
[39] W Liao W Li Z Fang C Lu and Z Xu Effect of different aluminum substitution rateson the structure of Tobermorite Materials 12(22)1ndash10 2019
[40] D Klimesch and A Ray DTA-TG Study of the CaO-SiO2-H2O and CaO-Al2O3-SiO2-H2OSystems Under Hydrothermal Conditions Journal of Thermal Analysis and Calorimetry56(1)27ndash34 1999
27
5 References
[41] Z Sauman and Z Valtr Substitution of sulphate ions in the crystal lattice of 11 Aring to-bermorite In The VI International Congress on the Chemistry of Cement pages 1ndash14Moscow 1974
[42] G Schober Reaction of raw materials to the final product AAC httpwwwpb-aacde
chemmin2_ehtml 2012 accessed 2020-01-31
[43] D Jansen C Stabler F Goetz-Neunhoeffer S Dittrich and J Neubauer Does Ordi-nary Portland Cement contain amorphous phase A quantitative study using an externalstandard method Powder Diffraction 26(01)31ndash38 2011
[44] C Roumlszligler J Stark F Steiniger and W Tichelaar Limited-dose electron microscopyreveals the crystallinity of fibrous C-S-H phases Journal of the American Ceramic Society89(2)627ndash632 2006
[45] Y Sakalli and R Trettin Investigation of C3S hydration by environmental scanning elec-tron microscope Journal of Microscopy 259(1)53ndash58 2015
[46] F Matsushita Y Aono and S Shibata Expansion and shrinkage behavior of green cakeof Autoclaved Aerated Concrete In Autoclaved Aerated Concrete - Innovation and Devel-opment Proceedings of the 4th International Conference on Autoclaved Aerated ConcreteKingston UK 8-9 September 2005 pages 101ndash108 CRC Press 2005
[47] C Chucholowski M Holger and K-C Thienel Improving the recyclability environmentalcompatibility and CO2 balance of autoclaved aerated concrete by replacing sulfate carrierand cement with calcined clays CePapers 2(4)503ndash512 2018
[48] X Y Huang W Ni W H Cui Z J Wang and L P Zhu Preparation of autoclavedaerated concrete using copper tailings and blast furnace slag Construction and BuildingMaterials 27(1)1ndash5 2012
[49] W Wongkeo and A Chaipanich Compressive strength microstructure and thermal anal-ysis of autoclaved and air cured structural lightweight concrete made with coal bottom ashand silica fume Materials Science and Engineering A 527(16-17)3676ndash3684 2010
[50] A Roacuteżycka and W Pichoacuter Effect of perlite waste addition on the properties of autoclavedaerated concrete Construction and Building Materials 12065ndash71 2016
[51] N Isu H Ishida and T Mitsuda Influence of quartz particle size on the chemical andmechanical properties of autoclaved aerated concrete (I) tobermorite formation Cementand Concrete Research 25(25)243ndash248 1995
[52] D Ectors Advances in the analysis of cementitious reactions and hydrate phases doctoralthesis PhD thesis Friedrich-Alexander-Universitaumlt Erlangen-Nuumlrnberg 2016
[53] D Ectors F Goetz-Neunhoeffer and J Neubauer Domain size anisotropy in the double-Voigt approach An extended model Journal of Applied Crystallography 481998ndash20012015
[54] D Ectors F Goetz-Neunhoeffer and J Neubauer Routine (an)isotropic crystallite sizeanalysis in the double-Voigt approximation done right Powder Diffraction 32(S1)27ndash342017
28
5 References
[55] D Jansen F Goetz-Neunhoeffer C Stabler and J Neubauer A remastered external stan-dard method applied to the quantification of early OPC hydration Cement and ConcreteResearch 41(6)602ndash608 2011
[56] T Ungaacuter G Tichy J Gubicza and R J Hellmig Correlation between subgrains andcoherently scattering domains Powder Diffraction 20(04)366ndash375 2005
[57] Triloki P Garg R Rai and B K Singh Structural characterization of as-depositedcesium iodide films studied by X-ray diffraction and transmission electron microscopy tech-niques Nuclear Instruments and Methods in Physics Research Section A AcceleratorsSpectrometers Detectors and Associated Equipment 736128ndash134 2014
[58] J Schreiner F Goetz-Neunhoeffer J Neubauer and D Jansen Hydrothermal synthesisof 11 Aring tobermorite ndash Effect of adding metakaolin to the basic compound Applied ClayScience 185 2020
[59] J Schreiner F Goetz-Neunhoeffer J Neubauer S Volkmann S Bergold R Webler andD Jansen Advanced Rietveld refinement and SEM analysis of tobermorite in chemicallydiverse autoclaved aerated concrete Powder Diffraction 34143ndash150 2019
[60] J Schreiner D Jansen D Ectors F Goetz-Neunhoeffer J Neubauer and S VolkmannNew analytical possibilities for monitoring the phase development during the production ofautoclaved aerated concrete Cement and Concrete Research 107247ndash252 2018
29
6 Publications
6 Publications
61 Hydrothermal synthesis of 11 Aring tobermorite ndash Effectof adding metakaolin to the basic compound
Reprint of the peer reviewed publication
Schreiner J Goetz-Neunhoeffer F Neubauer J Jansen D 2020 Hydrothermalsynthesis of 11 Aring tobermorite ndash Effect of adding metakaolin to the basic compoundApplied Clay Science 185 httpsdoiorg101016jclay2019105432
with permission from Elsevier
30
Contents lists available at ScienceDirect
Applied Clay Science
journal homepage wwwelseviercomlocateclay
Research paper
Hydrothermal synthesis of 11 Aring tobermorite ndash Effect of adding metakaolin tothe basic compound
J Schreiner F Goetz-Neunhoeffer J Neubauer D JansenUniversity of Erlangen-Nuremberg GeoZentrum Nordbayern Mineralogy Schlossgarten 5a 91054 Erlangen Germany
A R T I C L E I N F O
KeywordsHydrothermal synthesis11 Aring tobermoriteMetakaolinPowder diffractionKatoite
A B S T R A C T
Different amounts and types of metakaolin were analyzed and applied for the hydrothermal synthesis of 11 Aringtobermorite All synthesized samples were investigated by means of powder XRD combined with Rietveld re-finement Al-substituted 11 Aring tobermorite was successfully synthesized on the basis of a broad range of com-pounds characterized by a varying content of metakaolin Katoite was present depending on the amount ofsupplied Al3+ which was determined by the dosage of metakaolin Minor crystalline components included in thetwo types of metakaolin sources varied greatly in their reactivity under hydrothermal conditions Despite adifferent degree of purity the two types of metakaolin showed corresponding effects at moderate dosages butcontrary effects at higher dosages as for the synthesis of 11 Aring tobermorite The domain morphology of to-bermorite could be associated with Al3+ incorporation for low dosages of metakaolin represented by up to 2 wt- Al2O3 in the dry mix By contrast Al3+ affected tobermorite lattice parameters at equivalent and even athigher dosages with c reaching 2295 Aring at 12 wt- Al2O3 in the dry mix
1 Introduction
11 Application of metakaolin as a reactive material in constructionindustry
The application of supplementary cementitious materials (SCMs) inthe field of construction technology has received a lot of attention inrecent years Due to limited resources and an urgent need for alter-native and more eco-friendly construction materials SCMs such asmetakaolin offer a great potential The usage of SCMs has not onlyspread to the cement and mortar industry but also to advanced appli-cations such as autoclaved aerated concrete (AAC) (Demir et al 2014Koutnyacute et al 2014 Walczak et al 2015 Roacuteżycka and Pichoacuter 2016Chucholowski et al 2018) Unlike ordinary cementitious constructionmaterials AAC is produced from hydrothermal curing Due to the dif-ferent thermodynamic environment the hydration process and the re-activity of raw materials have to be investigated properly in order tounderstand the effects on the AAC product The leading mineral phasein AAC is 11 Aring tobermorite (Ca5Si6O16(OH)2middot4H2O) As a consequencethe thermal and mechanical properties of AAC depend on micro-structure and crystallinity of tobermorite to some extent In addition tothe curing time and the fineness of raw materials the supply of ionsthat can substitute in the tobermorite structure is a crucial factor in thiscontext Especially substitutions by aluminum sodium and potassium
ions have been investigated thoroughly (Sauman 1974 Klimesch andRay 1998 Mostafa et al 2009 Matekonis et al 2010 Skawinskaet al 2017) Calcined clays usually contain a considerable amount ofthe mentioned ions
There is a vast amount of literature on the reactivity of SCMs atambient temperature and standard pressure but there is little when itcomes to hydrothermal conditions In previous publications the beha-vior of metakaolin under hydrothermal conditions was mainly in-vestigated for the synthesis of zeolites (Zhang et al 2007 Aguilar-Mamani et al 2014 Setthaya et al 2016 Luo et al 2018) In thesestudies the reactivity of metakaolin was observed at a wide range oftemperature and pH values During the transformation of kaolin intometakaolin a loss of framework alumina was observed (Ayodele et al2019) In recent decades metakaolin has been the subject of studies inthe field of geopolymer research (Rashad 2013 Chen et al 2016) Forthe synthesis of 11 Aring tobermorite a more distinct setting of temperaturesetting (180ndash200 degC) and steam pressure (1ndash12 MPa) are required
This publication is intended to make a new contribution to thechallenging field of hydrothermal synthesis in the system CaO-Al2O3-SiO2-H2O based on XRD analysis combined with Rietveld refinementVarious dosages of two types of metakaolin with different chemical andmineralogical purities are compared for the effects on the hydrothermalsynthesis of Al-substituted 11 Aring tobermorite Especially changes of thebulk chemistry in the raw mixes the reactivity of minor crystalline
httpsdoiorg101016jclay2019105432Received 20 August 2019 Received in revised form 13 November 2019 Accepted 30 December 2019
Corresponding authorE-mail address juergenjsschreinerfaude (J Schreiner)
Applied Clay Science 185 (2020) 105432
0169-1317 copy 2020 Elsevier BV All rights reserved
T
6 Publications
31
phases of the two types of metakaolin and the effect of different curingtimes are the focus of interest On the one hand metakaolin offers agreat potential in the AAC industry On the other hand of all SCMsmetakaolin is a good source material for investigating the influence ofAl3+ on the synthesis of Al-substituted 11 Aring tobermorite
12 Synthesis of Al-substituted 11 Aring tobermorite
In addition to being present in AAC tobermorite has found appli-cation in wastewater treatment and nuclear waste management due toits ion exchange capacity (Maeda et al 2012 Monasterio et al 2015)The substitution of silicon by aluminum results in a different to-bermorite structure due to general and local charge balance affectingthe lattice parameters Especially c is impacted by this substitutionbecause it occurs in the bridging tetrahedron and additional OHndash sub-stitutes O2ndash (Komarneni et al 1985 Merlino et al 2000) As suggestedin some additional studies the substitution of Si4+ by Al3+ and Na+ orK+ leads to a lath-like morphology of tobermorite crystals (Mostafa2005 Mostafa et al 2009 Venhodovaacute et al 2015 Qu et al 2018)However because of the heterogeneous appearance of tobermorite inAAC it is hardly possible to conduct a proper characterization based onSEM analysis In our recent work the anisotropic peak broadening oftobermorite in XRD diffractograms was successfully linked with theincorporation of foreign ions supplied in a common AAC production(Schreiner et al 2019) This finding allowed a more statistical struc-tural characterization of tobermorite in bulk compositions compared toSEM analysis Moreover it was reported in other studies that differenthydrate phases occur depending on the amount of supplied ions and onthe experimental settings In compounds with a high content of Al3+formation of katoite could be observed (Klimesch and Ray 1998 Riacuteoset al 2009 Matsui et al 2011) In the case of a longer curing durationinstead of 11 Aring tobermorite the formation of xonotlite (Siauciunas andBaltakys 2004 Galvaacutenkovaacute et al 2018) or - depending on the finenessof used silica source (Siauciunas and Baltakys 2004) - gyrolite is fa-voured
Kalousek (1956) suggested that tobermorite can contain up to 5Al2O3 More Al2O3 in the system resulted in the formation of hydro-garnet Klimesch and Ray (1998) additionally investigated the stabilityof hydrogarnet depending on the Al(Si + Al) ratio and its role in re-lation to the formation of 11 Aring tobermorite in an equivalent systemThey suggest that hydrogarnet always appears before tobermorite butthe former can only be detected for higher Al(Si + Al) ratios in theevent of longer curing times Riacuteos et al (2009) and Qu et al (2018)confirmed these findings in extensive investigations In the latter pub-lication it is additionally suggested that samples prepared at lowertemperatures (160 degC) are less impacted by the supply of Al3+ Theyalso consider the peak broadening of tobermorite in their XRD plotsbased on the amount of incorporated Al3+ In two recent publicationswe suggested that the peak broadening of tobermorite enables a mi-crostructural analysis by calculating the orientation dependent domainsizes (Schreiner et al 2018 2019) However these studies are based onsamples of industrially produced AAC so that the curing time was fixedThe studied AAC was produced from raw materials with a broad che-mical spectrum such as ordinary Portland cement (OPC) whichsomehow complicates the interpretation of results
In this work the influence of aluminum ions - provided by meta-kaolin - on dominant crystallographic direction-dependent domaingrowth of tobermorite is investigated by analysis of anisotropic peakbroadening (Ectors et al 2015 2017) In Fig 1 of the supplementarymaterial the method of fitting the anisotropic peak broadening of to-bermorite using a triaxial cylinder model is visualized (Schreiner et al2018) Fitting of the anisotropic peak broadening of tobermorite Thismethod is used to calculate the average and reliable values for to-bermorite domain sizes in the powder sample and associate them withaverage Al3+ incorporation Microstrain should be considered becauseit is an additional source of peak broadening However this usually
accounts for materials that have been exposed to different kinds ofstress such as metals and alloys (Badawi et al 2019) In addition theinstrumental contribution to peak broadening should be consideredHydration products such as tobermorite are characterized by crystallitesizes in the range of nanometers so that anisotropic size broadeningclearly outweighs the effect of instrumental broadening (Jenkins andSnyder 1996) Moreover the impact of Al3+ on the lattice parametersof tobermorite is considered It should additionally be clarified whe-ther the results from our previous publication (Schreiner et al 2019)based on industrially produced AAC can be confirmed by investigationwith less complex raw mixes and purely based on laboratory experi-ments
2 Material and methods
21 Starting materials
The starting materials for hydrothermal synthesis included deio-nized water quartz flour portlandite (999 pure) and two types ofmetakaolin One type was ordinary commercially available metakaolin(MK) with nearly a stoichiometric composition For comparison thesecond type of commercially available metakaolin was a by-productfrom expanded glass production (MKg) and consequently highly im-pure The chemical composition of MK and MKg determined by XRF isgiven in Table 1 With MKg containing less Al2O3 but considerably moreNa2O than MK the effects on hydrothermal synthesis were of interestBoth types of metakaolin have been characterized in previous pub-lications (Schmidt et al 2012 Naber et al 2019) In addition weverified the mineral phase content by XRD analysis Besides amorphousmetakaolin MK contained minor amounts of anatase quartz and mica
Fig 1 Weight fractions of tobermorite quartz and katoite determined byquantitative XRD analysis ndash samples including MKg crosshatched
Table 1Chemical composition of MK and MKg determined by XRF analysis ndash majorcontrasts in bold letters
Oxides [wt-] MK MKg
SiO2 536 604Al2O3 392 206CaO 01 40MgO 01 12Na2O 0 96K2O 10 18Fe2O3 18 05TiO2 21 03P2O5 01 02Loss on ignition 15 1
J Schreiner et al Applied Clay Science 185 (2020) 105432
2
6 Publications
32
MKg contained additional kaolinite feldspar and quartz
22 Investigated mix composites
For the preparation of raw mixtures the powders were weighed andhomogenized using a lab-scale mixing mill Table 2 lists the composi-tion and nomenclature of all samples including Al2O3 content andcuring time in the autoclave
bull Besides one blank mixture (MK0) that did not contain any type ofmetakaolin eleven more compounds were prepared of which threeincluded different dosages of MKg (MKg16 MKg23 and MKg60)Three more mixes contained equivalent amounts of MK instead ofMKg (MK16 MK23 and MK60) These mixes were investigated inorder to have a direct comparison concerning the effects of differentraw material on the synthesis of tobermorite
bull Additionally the mixes MK9 MK5 and MK25 with lower dosages ofmetakaolin were analyzed In the referenced literature (Schreineret al 2019) the effect of Al3+ on the anisotropic peak broadeningof tobermorite could only be observed in the case of Al2O3 contentslower than 4 in the drymix In the latter three mixes Al2O3 con-tents range from 1 to 35 Al2O3 (calculated from XRF data) whichmeets the region of interest for the analysis of tobermorite domainmorphology
bull The curing time for nearly all of the investigated samples was 12 hbut compound MK9 was prepared two more times for curing timesof 2 h and 6 h The different curing times were chosen in this par-ticular sample so that the reactivity of metakaolin and the phasetransitions could be observed more precisely
23 Hydrothermal treatment
Due to the different fineness of raw materials there was a differentwater demand from one mixture to another In order to obtain slurriesof comparable rheology the amount of water was adapted respectivelyresulting in water-to-solid ratios of 25 to 3 which matches the sug-gested water-to-solid ratio for this purpose (Roacutezycka et al 2014Galvaacutenkovaacute et al 2018) The weighed water was added to the dry mixand after stirring for 1 min at 23 degC the slurry was poured into thereactor Minor changes in the quantity of added water did not have aninfluence on the measured steam pressure All experiments were con-ducted using a PTFE-lined stainless steel autoclave with a reactor vo-lume of 300 ml The oven temperature was fixed at 180 degC and auto-genous steam pressure of 11ndash12 MPa was measured during eachexperiment with an external manometer After cooling to room tem-perature the sample was removed from the reactor coarsely ground
using an agate mortar and dried at 60 degC for 12 h After drying thesample was ground with an agate mortar again in order to deagglo-merate the particles As no coarse raw materials were used there wasno need for wet McCrone milling (Schreiner et al 2018)
24 XRD analysis
After preparation into front-loading sample holders the powdersamples were measured with a D8 diffractometer (Bruker) equippedwith a LynxEye detection system and Bragg-Brentano geometry Thesettings for XRD analysis included a tube voltage of 40 kV a current of40 mA an angular range from 6 to 80deg 2θ (Cu Kα radiation) a time perstep of 054 s a step width of 00236deg 2θ and a PSD opening of 33deg Thebackground was fitted with Chebyshev polynomial of the fifth orderThe major contribution of amorphous phase was fitted with a singlepeak with a fixed position at 308deg 2θ so that tobermorite reflectionswere not affected An external quartzite standard was measured withthe same parameters in order to determine phase quantities (Jansenet al 2011) Bruker AXS software TOPAS 50 was used for Rietveldrefinement (Rietveld 1969) and the used structures are shown inTable 3
3 Results and discussion
31 Different dosages of MK and MKg
In Fig 1 the quantities of tobermorite quartz and katoite present inmost of the samples determined by XRD analysis are illustratedWhenever tobermorite was the leading mineral hydrate phase a basalspacing of 113 Aring could be verified in each of the diffractograms Thequantities of minor crystalline phases and amorphous content are notshown For low dosages of MK it can be seen that the weight fraction oftobermorite decreased At moderate dosage of both types of metakaolin(MK16 MK23 MKg16 MKg23) tobermorite was present in comparablequantities It can be seen that the amount of katoite in the mixes de-pended on the dosage of metakaolin and it appeared only at dosages ofMK5 or more Due to the higher content of aluminum in MK comparedto MKg more katoite could always be observed in the MK mixes atequivalent dosages Despite equal amounts of quartz as starting mate-rial in mixes for both types of metakaolin the resulting weight fractionsin the cured samples were not alike Considerably more quartz waspresent in the MK samples Even though less quartz was used for mixescontaining higher amounts of MK even more quartz was present afterhydrothermal curing (Table 2 Fig 1) Consequently some of the SiO2
provided by MK did not transform into an amorphous phase or to-bermorite but into quartz This finding is verified by the presence ofquartz in MK60 because no quartz was included in the raw mixture Thefeldspar present in MKg did not react so Na2O and an unknown amountof Al2O3 may not have been supplied for hydrothermal reaction Besidestobermorite and quartz additional calcite scawtite (Ca7Si6(CO3)
Table 2Basic powder compounds prepared for the hydrothermal synthesis of to-bermorite with the respectively calculated Al2O3 content and curing time in thereactor
Sample Portlandite[wt-]
Quartz[wt-]
MK[wt-]
MKg
[wt-]
Al2O3
[wt-]Curingtime [h]
MK0 49 51 ndash ndash 0 12MK25 495 48 25 ndash 1 12MK5 49 46 5 ndash 2 12MK9_2h 48 43 9 ndash 35 2MK9_6h 48 43 9 ndash 35 6MK9_12h 48 43 9 ndash 35 12MK16 47 37 16 ndash 63 12MK23 46 31 23 ndash 9 12MK60 40 ndash 60 ndash 235 12MKg16 47 37 ndash 16 33 12MKg23 46 31 ndash 23 47 12MKg60 40 ndash ndash 60 124 12
Table 3Structural data used for the investigation with powder XRD analysis
Phase Author
Anatase (Horn et al 1972)Biotite (Brigatti et al 2000)Calcite (Maslen et al 1995)Kaolinite (Zvyagin 1960)Katoite (Bartl 1969)Microcline (Bailey 1969)Plazolite (Basso et al 1983)Portlandite (Busing and Levy 1957)Quartz (Le Page and Donnay 1976)Scawtite (Grice 2005)Tobermorite (Hamid 1981)Xonotlite (Hejny and Armbruster 2001)
J Schreiner et al Applied Clay Science 185 (2020) 105432
3
6 Publications
33
O18bull2(H2O)) and xonotlite (Ca6Si6O17(OH)2) could be identified insample MK0 (XRD plots of samples MK0 MKg16 MKg23 MK16 andMK23) Comparing MK0 and MK25 scawtite and xonotlite could stillbe identified in a very low amount in MK25 but no longer in samplesthat contained even more MK (XRD plots of samples MK0 MK25 MK5and MK9_12h)
Two additional experiments were done without quartz in the rawmixes (MK60 and MKg60) The according diffractograms after hydro-thermal curing are shown in Fig 2 In sample MKg60 tobermorite (gt 50wt-) was successfully synthesized without any other silica sourcethan MKg whereas no crystalline quartz occurred By contrast no to-bermorite but quartz could be identified in equivalent mixture MK60containing MK It can be seen that crystalline components such as micaand anatase in the raw MK did not react at the selected conditions andremained present in the autoclaved samples Except for feldspar in MKgall of the crystalline components appeared to be reactive at the chosenhydrothermal conditions A minor unidentified phase occurred at328deg2θ and additional xonotlite was identified in sample MKg60 Insample MK60 more calcium was needed for the formation of morehydrogarnet (Fig 1) resulting in a lower CaSi ratio for the remainingsystem Sample MKg60 contained only half of the amount of Al3+ and itwas not completely supplied for reaction due to its partial presence infeldspar Consequently essentially less hydrogarnet (Fig 1) was presentin MKg60 after hydrothermal treatment and the CaSi ratio in the re-maining system was affected to a lesser extent
32 Application of MK for different curing times
The development of hydrate phases in the autoclave for compoundMK9 is displayed in Fig 3 After only 2 h of hydrothermal curing all ofthe available portlandite had reacted and katoite (95 wt-) was pre-sent The applied type of metakaolin appeared to react quickly as itsupplied aluminum for formation of katoite No formation of to-bermorite could be observed at this stage yet An assumably amorphousprecursor can be seen at 28 to 30deg2θ Calcium was provided by thedissolution of portlandite After 6 h of hydrothermal reaction amountsof katoite (85 wt-) and quartz (from 31 wt- at 2 h to 165 wt- at6 h) had decreased and a major amount of tobermorite (35 wt-) waspresent Apparently between 2 and 6 h under hydrothermal conditionsthe amorphous precursor and quartz reacted resulting in the formationof tobermorite An additional 6 h of reaction time (MK9_12h) did notchange the phase composition significantly Slightly more tobermorite
(365 wt-) less quartz (16 wt-) and katoite (65 wt-) weremeasured
33 Tobermorite domain morphology and lattice parameters
In the referenced literature an analysis of tobermorite domainmorphology based on anisotropic peak broadening was possible forsamples that contained notgt 4 wt- Al2O3 in the drymix (Schreineret al 2019) Accordingly in this study samples MK0 MK25 MK5MK9_6h and MK9_12h were suitable (Table 2) with MK9_2h not con-taining any tobermorite In Fig 4 the respective growth in a and b di-rection is visualized with x indicating the domain size in a direction andy indicating domain size in b direction using a macro for TOPAS 50(Ectors et al 2015 2017) The calculated cylinder models in Fig 4represent the relation of yx and not absolute sizes With no supply ofaluminum ions (MK0) the relative domain growth in b direction islower compared to samples containing metakaolin This finding agreeswith the results from a similar investigation of tobermorite in AAC(Schreiner et al 2019) However within the samples MK5 andMK9_12h the different amounts of supplied aluminum ions did notshow a clear effect It appeared that low dosages of Al3+ (1 wt- Al2O3
in MK25 and 2 wt- Al2O3 in MK5) were enough to determine thedomain growth of tobermorite Additional results from the samplesMK9_6h and MK9_12h indicated that growth in b direction increasedwith reaction time
In Fig 5 lattice parameters of tobermorite depending on metakaolindosages are plotted B clearly remained unaffected throughout therange of samples Increasing amounts of metakaolin led to a slightlysmaller parameter a However both types of metakaolin showed acorresponding impact on parameter a By contrast parameter c in-creased strongly with increasing amounts of MK and MKg but the typeof metakaolin was significant At an equivalent dosage MK affected thecell dimension in c direction considerably more than MKg so that thefraction of Al3+ appeared to be the decisive parameter Different metaloxides in MKg did not show a notable effect certainly as they werepartially not provided for reaction Unlike for the domain morphologyof tobermorite the impact on lattice parameters could be observedwithin the complete range of examined dosages
4 Conclusions
The results obtained from the introduced investigations allow con-cluding remarks on the effects of the applied types of metakaolin on thesynthesis of 11 Aring tobermorite the phase transitions and the in-corporation of Al3+ into the lattice of tobermorite
With a critical dosage the use of any type of metakaolin led to theformation of katoite in an according amount At moderate dosages(MKg16 MKg23 MK16 and MK23) the two types of metakaolin showeda good correspondence in consideration of the quantities of to-bermorite For higher dosages there were contrary effects Lower do-sages of MK led to considerable quantities of Al-substituted to-bermorite Samples containing low dosages of MK revealed that katoiteappeared in the case ofgt 5 wt- of MK - corresponding to 2 wt-Al2O3 - in the basic compound Minor crystalline phases in MKg showedbetter reactivity than those in MK The observation that no tobermoritewas present in sample MK60 indicated that high dosages of Al3+ hin-dered the formation of tobermorite
Investigations of MK9 at 2 6 and 12 h displayed the evolution ofhydrate phases At first katoite was the only crystalline hydrate phasepresent after 2 h which corresponded to observations in a differentpublication (Klimesch and Ray 1999) The amount of katoite andquartz then decreased and a major amount of tobermorite formed from2 to 6 h curing time In order to gain more information on the trans-formation of amorphous C-(A)-S-H into tobermorite additional ex-periments in the range of 2 to 6 h curing time will be needed
Domain morphology analysis of tobermorite revealed that low
Fig 2 Diffractograms of MKg MKg60 MK and MK60 from 7 to 34deg2θ CuKα Aanatase C calcite F feldspar k kaolinite K katoite M mica Q quartz Ttobermorite U unidentified phase X xonotlite
J Schreiner et al Applied Clay Science 185 (2020) 105432
4
6 Publications
34
dosages of Al3+ determined the domain growth which agreed with theresults published on tobermorite in AAC samples (Schreiner et al2019) Different curing times unveiled that growth in b direction in-creased with the reaction time Al3+ incorporation into the lattice oftobermorite only reflected to a limited extent in the domain mor-phology By contrast an increase of lattice parameter c was triggered byAl3+ even at the highest dosage in this study Ultimately there is no
evidence for a limit of incorporation of Al3+ but there is a limit ofinfluence on the domain morphology These results additionally re-confirm this assumption similarly made in the previous work (Schreineret al 2019) and suggest a new mechanism of tobermorite crystal-lization depending on the presence of Al3+
Supplementary data to this article can be found online at httpsdoiorg101016jclay2019105432
Declaration of Competing Interest
The authors declare that they have no known competing financialinterests or personal relationships that could have appeared to influ-ence the work reported in this paper
Acknowledgement
The authors thank Rodgauer Baustoffwerke GmbH amp Co KG forsupplying raw materials for laboratory experiments
References
Aguilar-Mamani W Garciacutea G Hedlund J Mouzon J 2014 Comparison betweenleached metakaolin and leached diatomaceous earth as raw materials for the synth-esis of ZSM-5 Springerplus 3 1ndash10 httpsdoiorg1011862193-1801-3-292
Ayodele OB Sulaimon AA Alaba PA Tian Z-Y 2019 Influence of metakaolini-zation temperature on the structure and activity of metakaolin supported Ni catalystin dry methane reforming J Environ Chem Eng httpsdoiorg101016jjece2019103239 (in press)
Badawi EA Abdel-Rahman MA Mostafa A Abdel-Rahman M 2019 Determinationof the crystallite size amp micro- strain by novel method from XRD profile Appl Phys2 1ndash15 httpsdoiorg1031058jap201921001
Bailey SW 1969 Refinement of an intermediate microcline structure Am Miner 541540ndash1545
Bartl H 1969 Roentgen-Einkristalluntersuchungen an (CaO)3 (Al2O3) (H2O)6 und an(CaO)12 (Al2O3)7 (H2O) neuer Vorschlag zur (CaO)12 (Al2O3)7-Struktur NeuesJahrb fuer Mineral Monatshefte 1969 404ndash413
Basso R Giusta AD Zefiro L 1983 Crystal structure refinement of plazolite A highlyhydrated natural hydrogrossular Neues Jahrb Miner Monatsh (Neues Jahrb fuerMineral Monatshefte) 1983 251ndash258
Brigatti MF Lugli C Poppi L Foord EE Kile DE 2000 Crystal chemical varia-tions in Li- and Fe-rich micas from Pikes Peak batholith (Central Colorado) AmMineral 85 1275ndash1286 httpsdoiorg102138am-2000-8-920
Busing WR Levy HA 1957 Neutron diffraction study of calcium hydroxide J ChemPhys 26 563 httpsdoiorg10106311743345
Chen L Wang Z Wang Y Feng J 2016 Preparation and properties of alkali acti-vated metakaolin-based geopolymer Materials (Basel) 9 1ndash12 httpsdoiorg103390ma9090767
Chucholowski C Holger M Thienel K-C 2018 Improving the recyclability en-vironmental compatibility and CO2 balance of autoclaved aerated concrete by re-placing sulfate carrier and cement with calcined clays CePapers 2 503ndash512httpsdoiorg101002cepa846
Fig 3 Diffractograms of MK9_2h MK9_6h and MK9_12h from 7 to 38deg2θ CuKα C calcite K katoite Q quartz T tobermorite
Fig 4 Relation of calculated domain sizes of 11 Aring tobermorite in selectedsamples (MK0 MK25 MK5 MK9_6h and MK9_12h) in a (x) and b (y) direction
Fig 5 Lattice parameters of tobermorite depending on MK or MKg dosageincluding blank mix MK0
J Schreiner et al Applied Clay Science 185 (2020) 105432
5
6 Publications
35
Demir İ Başpınar MS Kahraman E Ccedilalışkan E Goumlrhan G 2014 An investigationon the usability of diatomite in aerated concrete production In Proc of the IntlConf on Advances in Civil Structural and Construction Engineering ndash CSCE 2014 pp97ndash100
Ectors D Goetz-Neunhoeffer F Neubauer J 2015 A generalized geometric approachto anisotropic peak broadening due to domain morphology J Appl Crystallogr 48189ndash194 httpsdoiorg101107S1600576714026557
Ectors D Goetz-Neunhoeffer F Neubauer J 2017 Routine (an)isotropic crystallitesize analysis in the double-Voigt approximation done right Powder Diffract 3227ndash34 httpsdoiorg101017S0885715617000070
Galvaacutenkovaacute L Bartoniacutečkovaacute E Opravil T Tkacz J Ptaacuteček P 2018 The influence ofstarting materials solubility on tobermorite structure formation under the hydro-thermal conditions IOP Conf Ser Mater Sci Eng 379 1ndash8 httpsdoiorg1010881757-899X3791012001
Grice JD 2005 The structure of spurrite tilleyite and scawtite and relationships toother silicate-carbonate minerals Can Mineral 43 1489ndash1500 httpsdoiorg102113gscanmin4351489
Hamid SA 1981 The crystal structure of the 11 Aring natural tobermoriteCa225[Si3O75(OH)15]1H2O Zeitschrift fuer Krist 154 189ndash198 httpsdoiorg101524zkri19811543-4189
Hejny C Armbruster T 2001 Polytypism in xonotlite Ca6Si6O17(OH)2 Zeitschrift furKrist 216 396ndash408
Horn M Schwerdtfeger CF Meagher EP 1972 Refinement of the structure of ana-tase at several temperatures Zeitschrift fur Krist 136 273ndash281 httpsdoiorg101524zkri19721363-4273
Jansen D Goetz-Neunhoeffer F Stabler C Neubauer J 2011 A remastered externalstandard method applied to the quantification of early OPC hydration Cem ConcrRes 41 602ndash608 httpsdoiorg101016jcemconres201103004
Jenkins R Snyder R 1996 Introduction to X-ray Powder Diffractometry ChemicalAnalysis Wiley pp 90
Kalousek GL 1956 Crystal Chemistry of Hydrous Calcium Silicates J Am Ceram Soc40 74ndash80
Klimesch D Ray A 1998 Autoclaved cement-quartz pastes with metakaolin additionsAdv Cem Based Mater 7 109ndash118 httpsdoiorg101016S1065-7355(97)00073-4
Klimesch D Ray A 1999 DTA-TGA evaluations of the CaOndashAl2O3ndashSiO2ndashH2O systemtreated hydrothermally Thermochim Acta 334 115ndash122 httpsdoiorg101016s0040-6031(99)00140-9
Komarneni S Roy R Roy DM Fyfe CA Kennedy GJ Bothner-By AA Dadok JChesnick AS 1985 27Al and29Si magic angle spinning nuclear magnetic resonancespectroscopy of Al-substituted tobermorites J Mater Sci 20 4209ndash4214 httpsdoiorg101007BF00552416
Koutnyacute O Opravil T Pořiacutezka J 2014 Application of metakaoline in autoclavedaerated concrete technology Adv Mater Res 1000 174ndash177 httpsdoiorg104028wwwscientificnetAMR1000174
Le Page Y Donnay G 1976 Refinement of the crystal structure of low-quartz ActaCrystallogr Sect B 32 2456ndash2459 httpsdoiorg101107S0567740876007966
Luo H Law WW Wu Y Zhu W Yang EH 2018 Hydrothermal synthesis of needle-like nanocrystalline zeolites from metakaolin and their applications for efficient re-moval of organic pollutants and heavy metals Microporous Mesoporous Mater 2728ndash15 httpsdoiorg101016jmicromeso201806015
Maeda H Ogawa Y Ishida EH Kasuga T 2012 Hydrothermal synthesis of to-bermorite doped with phosphorus species for removing heavy metal ions J AustCeram Soc 48 8ndash11
Maslen EN Streltsov VA Streltsova NR Ishizawa N 1995 Electron density andoptical anisotropy in rhombohedral carbonates III Synchrotron Xray studies ofCaCO3 MgCO3 and MnCO3 Acta Crystallogr Sect B 51 929ndash939 httpsdoiorg101107S0108768195006434
Matekonis G Šiaučiūnas R Vaičiukynienė D 2010 Hydrothermal Synthesis andCharacterization of Na + and [ Al 3 + + Na + ] -substituted Tobermorite in CaO-SiO2middotnH2O-H2O System Mater Sci 16 242ndash248
Matsui K Kikuma J Tsunashima M Ishikawa T Matsuno S Ogawa A Sato M2011 In situ time-resolved X-ray diffraction of tobermorite synthesis process underhydrothermal condition IOP Conf Ser Mater Sci Eng 18 60ndash66 httpsdoiorg1010881757-899X182022017
Merlino S Bonaccorsi E Armbruster T 2000 The real structures of clinotobermoriteand tobermorite 9 Aring OD character polytypes and structural relationships Eur JMineral 12 411ndash429 httpsdoiorg1011270935-122120000012-0411
Monasterio M Gaitero JJ Manzano H Dolado JS Cerveny S 2015 Effect ofchemical environment on the dynamics of water confined in calcium silicate mi-nerals Natural and synthetic tobermorite Langmuir 31 4964ndash4972 httpsdoiorg101021acslangmuir5b00614
Mostafa NY 2005 Influence of air-cooled slag on physicochemical properties of auto-claved aerated concrete Cem Concr Res 35 1349ndash1357 httpsdoiorg101016jcemconres200410011
Mostafa NY Shaltout AA Omar H Abo-El-Enein SA 2009 Hydrothermal synth-esis and characterization of aluminium and sulfate substituted 11 nm tobermoritesJ Alloys Compd 467 332ndash337 httpsdoiorg101016jjallcom200711130
Naber C Stegmeyer S Jansen D Goetz-Neunhoeffer F Neubauer J 2019 ThePONKCS method applied for time resolved XRD quantification of supplementarycementitious material reactivity in hydrating mixtures with ordinary Portland ce-ment Constr Build Mater 214 449ndash457 httpsdoiorg101016jconbuildmat201904157
Qu X Zhao Z Zhao X 2018 Microstructure and characterization of aluminum-in-corporated calcium silicate hydrates (C-S-H) under hydrothermal conditions RSCAdv 8 28198ndash28208 httpsdoiorg101039c8ra04423f
Rashad AM 2013 Metakaolin as cementitious material history scours production andcomposition - a comprehensive overview Constr Build Mater 41 303ndash318 httpsdoiorg101016jconbuildmat201212001
Rietveld HM 1969 A profile refinement method for nuclear and magnetic structures JAppl Crystallogr 2 65ndash71 httpsdoiorg101107S0021889869006558
Riacuteos CA Williams CD Fullen MA 2009 Hydrothermal synthesis of hydrogarnet andtobermorite at 175 degC from kaolinite and metakaolinite in the CaO-Al2O3-SiO2-H2Osystem a comparative study Appl Clay Sci 43 228ndash237 httpsdoiorg101016jclay200809014
Roacuteżycka A Pichoacuter W 2016 Effect of perlite waste addition on the properties of au-toclaved aerated concrete Constr Build Mater 120 65ndash71 httpsdoiorg101016jconbuildmat201605019
Roacutezycka A Kotwica Ł Małolepszy J 2014 Synthesis of single phase gyrolite in theCaO-quartz-Na2O-H2O system Mater Lett 120 166ndash169 httpsdoiorg101016jmatlet201401003
Sauman Z 1974 Influence of SO4 2ndash ions on the formation of 11 Aring tobermorite InProceedings of the 2nd International Symposium on Science and Research in SilicateChemistry Moscow pp 25ndash39
Schmidt M Egersdoumlrfer A Poumlllmann H 2012 Increased reactivity using a glass-containing metakaolin as an active filler in lime-based binder systems ZKG Int 6554ndash62
Schreiner J Jansen D Ectors D Goetz-Neunhoeffer F Neubauer J Volkmann S2018 New analytical possibilities for monitoring the phase development during theproduction of autoclaved aerated concrete Cem Concr Res 107 247ndash252 httpsdoiorg101016jcemconres201802028
Schreiner J Goetz-Neunhoeffer F Neubauer J Volkmann S Bergold S Webler RJansen D 2019 Advanced Rietveld refinement and SEM analysis of tobermorite inchemically diverse autoclaved aerated concrete Powder Diffract 34 143ndash150httpsdoiorg101017s0885715619000149
Setthaya N Chindaprasirt P Pimraksa K 2016 Preparation of zeolite nanocrystals viahydrothermal and solvothermal synthesis using of rice husk ash and metakaolinMater Sci Forum 872 242ndash247 httpsdoiorg104028wwwscientificnetmsf872242
Siauciunas R Baltakys K 2004 Formation of gyrolite during hydrothermal synthesis inthe mixtures of CaO and amorphous SiO2 or quartz Cem Concr Res 34 2029ndash2036httpsdoiorg101016jcemconres200403009
Skawinska A Owsiak Z Baran T Hernik K 2017 The influence of halloysite ad-dition on tobermorite formation in CaO and quartz mix under hydrothermal condi-tions Cem Wapno Bet 17 426ndash434
Venhodovaacute E Janovskyacute R Drochytka R 2015 Formation of tobermorite at differentmaterials composition of aerated concrete Appl Mech Mater 752ndash753 247ndash250httpsdoiorg104028wwwscientificnetamm752-753247
Walczak P Małolepszy J Reben M Szymański P Rzepa K 2015 Utilization ofwaste glass in autoclaved aerated concrete Proc Eng 122 302ndash309 httpsdoiorg101016jproeng201510040
Zhang Y Gao W Cui L 2007 The transformation of acid leached metakaolin tozeolite beta Stud Surf Sci Catal 170 420ndash425 httpsdoiorg101016S0167-2991(07)80870-6
Zvyagin BB 1960 An attempt to electronographic determination of kaolinite structureJ Dokl Akad Nauk SSSR 130 1023ndash1026
J Schreiner et al Applied Clay Science 185 (2020) 105432
6
6 Publications
36
6 Publications
62 Advanced Rietveld refinement and SEM analysis oftobermorite in chemically diverse autoclaved aeratedconcrete
Following the copyright guidelines by Cambridge University Press the publication
Schreiner J Goetz-Neunhoeffer F Neubauer J Volkmann S Bergold S WeblerR Jansen D 2019 Advanced Rietveld refinement and SEM analysis of tobermorite inchemically diverse autoclaved aerated concrete Powder Diffraction 34 143ndash150 httpsdoiorg101017s0885715619000149
may not be reprinted It can be accessed at
httpswwwcambridgeorgcorejournalspowder-diffractionarticleadvanced-rietveld-refinement-and-sem-analysis-of-tobermorite-in-chemically-diverse-autoclaved-aerated-concrete51597C2A66F6F225D29DEB2675E74249
37
6 Publications
63 New analytical possibilities for monitoring the phasedevelopment during the production of autoclavedaerated concrete
Reprint of the peer reviewed publication
Schreiner J Jansen D Ectors D Goetz-Neunhoeffer F Neubauer J VolkmannS 2018 New analytical possibilities for monitoring the phase development during theproduction of autoclaved aerated concrete Cement and Concrete Research 107 247ndash252httpsdoiorg101016jcemconres201802028
with permission from Elsevier
38
Contents lists available at ScienceDirect
Cement and Concrete Research
journal homepage wwwelseviercomlocatecemconres
Short communication
New analytical possibilities for monitoring the phase development duringthe production of autoclaved aerated concrete
J Schreinera D Jansena D Ectorsa F Goetz-Neunhoeffera J Neubauera S Volkmannb
aUniversity of Erlangen-Nuremberg GeoZentrum Nordbayern Mineralogy Schlossgarten 5a 91054 Erlangen Germanyb Rodgauer Baustoffwerke GmbH amp Co KG Am Opel-Pruumlffeld 3 63110 Rodgau-Dudenhofen Germany
A B S T R A C T
This work presents improved analytical methods for both steps of the production process of autoclaved aeratedconcrete (AAC) the phase development during the hydration before autoclaving and during the autoclavingprocess itself The improvement includes new insights into preparation methods of AAC samples for powderdiffraction as well as Rietveld refinement strategies For the first time a new implementation for calculatinganisotropic crystal domain sizes is applied to major hydrate phases occurring during AAC production namelyportlandite during the hydration before autoclaving and tobermorite during the autoclaving process The cal-culation of anisotropic domain size growth which can be implemented in the Rietveld environment is based oncrystallographically and geometrically appropriate models The implementation of calculating anisotropic do-main sizes for the Rietveld software TOPAS 50 allows a superior Rietveld fit and a more accurate quantificationof the phase development Additionally it enables the tracking of growth mechanism of portlandite duringhydration
1 Introduction
Autoclaved aerated concrete (AAC) is known as a lightweight con-struction material which offers outstanding properties such as suffi-cient strength for construction in addition with excellent thermal in-sulation [12] AAC is produced by autoclaving from calcareous rawmaterials such as lime (CaO) and cement quartz sulfate carrier andother additives such as foaming agents and water
The production process (Fig 1) can be separated into the hydrationof the mixed slurry before the procedure of autoclaving and the auto-claving at elevated temperature (180 degC to 200 degC) under saturatedsteam pressure (12MPa) for several hours
The hydration process before autoclaving is necessary to achievesufficient strength in order to cut the green cake blocks as they shouldhave a specific shape and dimension after autoclaving Furthermorethe porous structure is generated by the foaming agent during hydra-tion in the first process step During autoclaving the final propertiesnamely strength and low thermal conductivity are achieved
It is already well understood that the autoclaving process leads tothe formation of several phases first of all tobermorite(Ca5Si6O16(OH)2lowast4H2O) [3ndash5] Newest research has shown im-pressively which reactions are running from the mineralogical point ofview Insitu XRD measurements were carried out during the
autoclaving process and the phase development was shown by plottingnormalized intensities [6] The study of Mitsuda et al [3] was mainlyfocused on the tracking of the phase evolution during the autoclavingprocess of AAC However their statements concerning phase evolutionare mainly based on XRD data and TGA measurements There is acommon agreement that the following reactions occur The consump-tion of the alite (OPC) leads to the formation of an initial C-S-H phaseduring the first processing step Portlandite which was initially formedduring the first process step (from CaO and C3S) further quartz and theC-S-H phase are consumed during autoclaving resulting in the crystal-lization of tobermorite Hence the crystallization process of to-bermorite as well as the crystal structure of tobermorite was an issue ofresearch and discussion over the last years and numerous publicationsto these topics are available Concerning the crystal structure of to-bermorite respectively the tobermorite supergroup a new publicationoutlines all important references and recommends a new nomenclature[7]
The presented study was performed to create new analytical possi-bilities for the characterization of the production process of AAC Bothof the production process steps are essential for the final productHence the present work focuses on crystallization of hydrate phases inboth processes
Firstly an external standard method [89] was published and
httpsdoiorg101016jcemconres201802028Received 6 October 2017 Received in revised form 1 February 2018 Accepted 26 February 2018
Corresponding authorsE-mail addresses juergenjsschreinerfaude (J Schreiner) danieljansenfaude (D Jansen)
Cement and Concrete Research 107 (2018) 247ndash252
0008-8846 copy 2018 Elsevier Ltd All rights reserved
T
6 Publications
39
recommended for the determination of absolute phase contents inmixtures with amorphous content It was shown that the method canabsolutely be recommended for hydrating cement pastes in which watercannot be quantified directly by XRD [10] This method seems to bevery promising for both the quantification of the hydration of the AACslurry before autoclaving and the quantification of the phase evolutionduring autoclaving inasmuch as both production steps form crystallineand amorphous phases
Secondly a new approach to anisotropic peak broadening due toanisotropic domain morphology which was developed [1112] is ap-plied to AAC samples to improve the fit of portlandite and tobermoriteby Rietveld refinement [13] By applying this approach the refinementof both portlandite and tobermorite should additionally lead to betterquantitative results as well as to better insights into the development ofthe domain size morphology of both phases formed
It was already shown that in a hydrating raw mixture for AAC twospecies of portlandite precipitate at 23 degC one showing dynamicallyanisotropic peak broadening and another one following the isotropictrend [14] The application of the anisotropic refinement model led toan improved fitting of portlandite Moreover the mechanism of aniso-tropic domain growth of portlandite was tracked
2 Materials and methods
In order to examine the hydration of the AAC slurry before auto-claving a mixture of the hydraulic reactive components was weighedand measured in-situ at a Bruker D8 diffractometer with a LynxEyedetection system
Ordinary Portland cement (OPC) was mixed with lime (CaO) andanhydrite (C$) The raw materials were taken from the same batches asfor the industrial samples The drymix (58 OPC 36 CaO and 6 C$by weight) was then mixed with water (ws= 08) and placed into anappropriate sample holder The samples were not aerated The slurrysamples were covered with a kapton film to avoid evaporation andcarbonation Diffractograms were recorded with an angular range from7 to 545deg 2θ and a step width of 0011deg 2θ Measurements were carriedout every 15min For each measurement 96 XRD patterns were re-corded over the first 24 h The temperature was fixed at 70 degC which isthe mean temperature generally prevailing in the industrial processduring hydration before autoclaving Rietveld refinement was carriedout using the G-factor method All structures used for Rietveld refine-ment are shown in Table 1
For investigation of the autoclaved samples five different specimenswere taken at different autoclaving times The specimens were takenout of a technical production process hence it was not possible to in-terrupt the process at an earlier time inasmuch it would lead to damageof a whole concrete production batch The specimens were firstly driedat 60 degC until weight constancy The whole blocks were then broken andstatistical samples of 20 g were taken In order to receive the right massattenuation coefficient (MAC) for G-factor method the loss on ignitionand the chemical composition (XRF) were determined For energydispersive XRF analysis (Spectro Xepos) tube voltage from 20 kV to50 kV and tube current from 08 to 20mA were used for differenttargets
The final sample preparation (grinding) before XRD measurementswas carried out using both an agate mortar and a McCrone micronizingmill for wet milling with isopropanol Both preparation methods wereapplied separately to see which one is suitable in order to get the bestpreparation for XRD investigations Six preparations were performed byone operator of which two were prepared with an agate mortar andfour with a McCrone mill For the McCrone milling 3 g of the sampleand 10ml of isopropanol were used for grinding for 12min The grainsize distribution of one sample prepared with an agate mortar and onesample prepared using a McCrone mill was measured by laser granu-lometry in isopropanol using a Mastersizer 3000 (MALVERN)
After milling the samples in these two ways for XRD analysis thepowders were prepared into a front loading sample holder and mea-sured Diffractograms were recorded with an angular range from 6 to80deg 2θ a step width of 00236deg 2θ and a time per step of 054 s Rietveldrefinement combined with external standard (G-factor) was applied inorder to get absolute quantities for each phase The refinement strategyfor portlandite and tobermorite in the TOPAS Launch Mode (TOPAS50 Bruker AXS) is attached as a Supplementary material file
3 Results and discussion
31 Hydration of the mixture before autoclaving
The hydration of the investigated paste before autoclaving isdominated by the hydration of the cement as well as the reaction of thefree lime (CaO) resulting in the formation of portlandite It can beclearly seen from Fig 2 that the hydration of the paste leads to theformation of ettringite portlandite and C-S-H phase For simplificationthe remaining phase developments are not shown in Fig 2 because theyare not in the focus of this study The hydration of CaO forming
Fig 1 Simplified process steps of AAC production and hydrate phase evolution
Table 1Structures used for Rietveld refinement
Phase Author
Alite [15]Anhydrite [16]Bassanite [17]Belite (β) [18]Belite (αprime) [19]Brownmillerite [20]C-S-H [21]Calcite [22]Ettringite [23]Gypsum [24]Hemicarbonate [25]Hydroxylellestadite [26]Lime (CaO) [27]Microcline [28]Portlandite [29]Quartz [30]Tobermorite [31]Tricalciumaluminate (cubic) [32]Tricalciumaluminate (orthorhombic) [33]PONCKS model for Water [21]
J Schreiner et al Cement and Concrete Research 107 (2018) 247ndash252
248
6 Publications
40
portlandite begins rapidly after the addition of water to the mixture andlime is fully consumed after only 1 h of hydration This translates into aquick rise of heat of hydration so that cement hydration is acceleratedwhich leads to further portlandite formation by the reaction of aliteEttringite formation stalls after few hours of hydration After 12 h et-tringite is partially decomposed probably due to sulfate depletion [9]
and poorly crystalline AFm phases (not shown in Fig 2) are formedIn Fig 3 it can be seen that in fact two generations of portlandite
are formed a 1st dominant generation showing anisotropic peakbroadening and 2nd one occurring considerably later following theisotropic domain size refinement which is usually carried out using theRietveld method This occurrence comes along firstly with lime hy-dration and secondly with alite hydration The expected quantity ofportlandite formed from lime hydration very well complies with the
Fig 2 Phase development in AAC paste on a laboratory scale before autoclaving ana-lyzed by in-situ XRD at 70 degC
Fig 3 Formation of two generations of portlandite by hydration of lime (1st) and C3S(2nd) at 70 degC before autoclaving with the major generation showing anisotropic peakbroadening
Fig 4 Biaxial cylinder domain size model of portlandite used for Rietveld refinement of anisotropic peak broadening
Fig 5 Morphological evolution of portlandite showing anisotropic domain size growthduring hydration at 70 degC
Fig 6 Comparison of quantification of crystalline quartz in samples prepared withMcCrone mill and agate mortar at different autoclaving times
J Schreiner et al Cement and Concrete Research 107 (2018) 247ndash252
249
6 Publications
41
quantity of the observed 1st generation The development of portlan-dite growth was already tracked in an equivalent slurry at 23 degC [14]Thus this observation confirms that the crystallinity of portlandite inmixtures for AAC production depends on the starting phase for hydra-tion as already indicated by Ectors [14]
Fig 4 shows the used biaxial cylindrical model for anisotropic do-main size calculation and the portlandite structure which was createdwith structural software VESTA 318 [34] Using the cylindrical ap-proach domain sizes in a (here equating to b) and c direction(dz= cylinder height) can be calculated which comes along with theexpected symmetrical parameters of portlandite
The 1st portlandite generation showing anisotropic domain growthcan be tracked in terms of cylinder diameter and height which is rea-lized in Fig 5 The blue cylinder represents the geometric approach andcylinder height and diameter are calculated newly for each range Thecylinder height remains rather stable throughout the hydration processwhile the cylinder diameter increases during the first hours of hydra-tion After 10 h of hydration the mean cylinder diameter no longer in-creases Consequently these observations match the results of the ex-aminations conducted at 23 degC [14] as well as the assumption thatdifferent mechanisms of growth exist for portlandite depending on the
hydration educt The maximum cylinder diameter is reached earlier inthis work very likely because of the higher hydration temperature
32 Quantification of the reactions during autoclaving
Autoclaved samples were ground with an agate mortar and com-pared to samples which were wet-ground with a McCrone mill Fig 6shows precisely that the determination of the amount of crystallinequartz is more reproducible in the two shown samples which were
Fig 7 2D XRD with Bruker GADDS-system plots of samples prepared with agate mortar and McCrone mill Coarse quartz grains are pointed out in the plot of the sample prepared withagate mortar
Fig 8 Particle size distribution of one sample prepared with an agate mortar and of onesample prepared with a McCrone mill measured by laser granulometry
Fig 9 Rietveld refinement for Tobermorite of autoclaved AAC sample by use of isotropicdomain size model (a) and of anisotropic domain size model (b)
J Schreiner et al Cement and Concrete Research 107 (2018) 247ndash252
250
6 Publications
42
prepared with a McCrone mill The high variance of crystalline quartzin the samples which were prepared with an agate mortar is a result ofinsufficient grinding and remaining of too large quartz grains Whenthis spottiness occurs a reliable quantification using the G-factormethod is not possible
The 2D XRD with Bruker GADDS-system plots in Fig 7 demonstratethe insufficient grinding when using an agate mortar compared to wetmilling with a McCrone mill Quartz would be overrepresented in a one-dimensional XRD pattern focusing on a section with bright spots (greenarrows) The lack of bright spots in the right plot shows that the quartzgrains are milled more thoroughly using a McCrone mill In Fig 8 theparticle size distribution after both ways of sample preparation iscompared Most grains in the sample prepared with an agate mortar arelarger than in the sample prepared with a McCrone mill The grain sizedistribution of the sample prepared with a McCrone mill complies withthe recommended particle size range for XRD analysis of under 5 to50 μm [3536] while the other sample exceeds the range
In Fig 9 Rietveld refinement of an autoclaved sample is shown Thedominant peaks at 77 290 and 301deg 2θ are attributed to tobermoriteIn the upper diagram (a) Rietveld refinement was carried out regularlycalculating isotropic domain sizes for tobermorite However the cal-culated fit differs significantly from the raw data It can be assumed thattobermorite shows a similar pattern to portlandite in terms of aniso-tropic peak broadening taking into account that tobermorite is as-signed to the orthorhombic crystal system Thus instead of a biaxialcylinder model an elliptic cylinder model (Fig 10 structure createdwith VESTA 318 [34]) was applied for the refinement in the lowerdiagram (b) The elliptic cylinder model is a sufficient approach to the
orthorhombic crystal system as it allows the distinction between do-main sizes in a b and c direction The fit is clearly superior using theanisotropic domain size model highlighted by the difference plot inFig 9b The comparison refinement with isotropic and anisotropic ap-proach was done for all of the five autoclaved samples In Fig 11 theresulting Rwp values for the whole pattern and the RBragg values of to-bermorite are shown The refinement using the anisotropic model leadsto both lower Rwp and RBragg values and consequently to a better fit anda more accurate quantification of tobermorite in all refined samples
4 Summary and conclusions
Improved analytical methods for both the phase developmentduring the hydration before autoclaving and during the autoclavingprocess of AAC are presented It could be shown that wet McCronemilling is the best way of preparation of AAC samples in order to obtainsuitable samples for powder diffraction A new approach to treat ani-sotropic domain sizes for Rietveld refinement could be successfullyapplied ndash with the benefit that portlandite and tobermorite in AACsamples could be refined more accurately using the Rietveld methodThus this application allows an improved quantification of the phasedevelopment during both of the production steps
For the future there are still plenty of possibilities to apply thepresented approach of calculating anisotropic domain sizes to AACproduction As exemplified with portlandite the mechanisms of growthof tobermorite can be tracked likewise during the autoclaving processIn addition the effect of variations in the chemical composition of AACraw mixtures on the crystal morphology of tobermorite can be ex-amined This leaves a new perspective to discuss the link between mi-neral phase morphology and the thermal and mechanical properties ofAAC
Acknowledgement
The autoclaved samples were generously provided by RodgauerBaustoffwerke GmbH amp Co KG The authors express gratitude for allsupport
Appendix A Supplementary data
Supplementary data to this article can be found online at httpsdoiorg101016jcemconres201802028
References
[1] MW Grutzeck Cellular concrete in M Scheffler P Colombo (Eds) CellularCeramics Wiley-VCH Weinheim 2005 pp 193ndash223
[2] M Haas The future of AAC ndash from a material scientists point of view inMC Limbachiya JJ Roberts (Eds) Autoclaved Aerated Concrete Taylor FrLondon 2005 pp 187ndash194
[3] T Mitsuda K Sasaki H Ishida Phase evolution during autoclaving process ofaerated concrete J Am Ceram Soc 75 (1992) 1858ndash1863
[4] N Isu H Ishida T Mitsuda Influence of quartz particle size on the chemical and
Fig 10 Triaxial cylinder domain size model of Tobermorite used for Rietveld refinement of anisotropic peak broadening
Fig 11 Comparison of Rwp and RBragg values of Rietveld refinements of autoclavedsamples and tobermorite using the isotropic and the anisotropic domain size model
J Schreiner et al Cement and Concrete Research 107 (2018) 247ndash252
251
6 Publications
43
mechanical properties of autoclaved aerated concrete (I) tobermorite formationCem Concr Res 25 (1995) 243ndash248
[5] NY Mostafa Influence of air-cooled slag on physicochemical properties of auto-claved aerated concrete Cem Concr Res 35 (2005) 1349ndash1357 httpdxdoiorg101016jcemconres200410011
[6] K Matsui J Kikuma M Tsunashima T Ishikawa S Matsuno A Ogawa M SatoIn situ time-resolved X-ray diffraction of tobermorite formation in autoclaved aer-ated concrete influence of silica source reactivity and Al addition Cem Concr Res41 (2011) 510ndash519
[7] C Biagioni S Merlino E Bonaccorsi The tobermorite supergroup a new no-menclature Mineral Mag 79 (2015) 485ndash495 httpdxdoiorg101180minmag2015079222
[8] BH OConnor MD Raven Application of the Rietveld refinement procedure inassaying powdered mixtures Powder Diffract 3 (1988) 2ndash6 httpdxdoiorg101017S0885715600013026
[9] D Jansen F Goetz-Neunhoeffer C Stabler J Neubauer A remastered externalstandard method applied to the quantification of early OPC hydration Cem ConcrRes 41 (2011) 602ndash608 httpdxdoiorg101016jcemconres201103004
[10] D Jansen C Stabler F Goetz-Neunhoeffer S Dittrich J Neubauer Does OrdinaryPortland Cement contain amorphous phase A quantitative study using an externalstandard method Powder Diffract 26 (2011) 31ndash38 httpdxdoiorg10115413549186
[11] D Ectors F Goetz-Neunhoeffer J Neubauer A generalized geometric approach toanisotropic peak broadening due to domain morphology J Appl Crystallogr 48(2015) 189ndash194 httpdxdoiorg101107S1600576714026557
[12] D Ectors F Goetz-Neunhoeffer J Neubauer Routine (an)isotropic crystallite sizeanalysis in the double-Voigt approximation done right Powder Diffract 32 (S1)(2017) 27ndash34 httpdxdoiorg101017S0885715617000070
[13] HM Rietveld A profile refinement method for nuclear and magnetic structures JAppl Crystallogr 2 (1969) 65ndash71 httpdxdoiorg101107S0021889869006558
[14] D Ectors Advances in the Analysis of Cementitious Reactions and Hydrate Phases(Doctoral Thesis) (2016) pp 12ndash14 (urnnbndebvb29-opus4-71743)
[15] AacuteG De La Torre S Bruque J Campo MAG Aranda The superstructure of C3Sfrom synchrotron and neutron powder diffraction and its role in quantitative phaseanalyses Cem Concr Res 32 (2002) 1347ndash1356 httpdxdoiorg101016S0008-8846(02)00796-2
[16] A Kirfel G Will Charge density in anhydrite CaSO4 from X-ray and neutrondiffraction measurements Acta Crystallogr Sect B Struct Crystallogr CrystChem 36 (1980) 2881ndash2890 httpdxdoiorg101107S0567740880010461
[17] C Bezou AN Christensen D Cox M Lehman A Nonat Structures cristallines deCaSO405H2O et CaSO406H2O Comptes Rendus Hebd Des Seacuteances lAcadeacutemieDes Sci Seacuterie 2 (312) (1991) 43ndash48
[18] KH Jost B Ziemer R Seydel Redetermination of the structure of β-dicalciumsilicate Acta Crystallogr Sect B Struct Crystallogr Cryst Chem 33 (1977)1696ndash1700 httpdxdoiorg101107S0567740877006918
[19] W Mumme LMD Cranswick BC Chakoumakos Rietveld crystal structure re-finements from high temperature neutron powder diffraction data for the poly-morphs of dicalcium silicate Neues Jahrb Fuer Mineral Abhandlungen 170 (1996)171ndash188
[20] A Colville S Geller The crystal structure of brownmillerite Ca2FeAlO5Crystallographica 50 (1971) 2311ndash2315 httpdxdoiorg101107S056774087100579X
[21] ST Bergold F Goetz-Neunhoeffer J Neubauer Quantitative analysis of C-S-H inhydrating alite pastes by in-situ XRD Cem Concr Res 53 (2013) 119ndash126 httpdxdoiorg101016jcemconres201306001
[22] EN Maslen VA Streltsov NR Streltsova N Ishizawa Electron density and op-tical anisotropy in rhombohedral carbonates III Synchrotron Xray studies ofCaCO3 MgCO3 and MnCO3 Acta Crystallogr Sect B 51 (1995) 929ndash939 httpdxdoiorg101107S0108768195006434
[23] G Renaudin Y Filinchuk J Neubauer F Goetz-Neunhoeffer A comparativestructural study of wet and dried ettringite Cem Concr Res 40 (2010) 370ndash375httpdxdoiorg101016jcemconres200911002
[24] WF Cole CJ Lancucki A refinement of the crystal structure of gypsumCaSO42H2O Acta Cryst B30 (1974) 921ndash929 httpdxdoiorg101107S0567740874004055
[25] T Runčevski RE Dinnebier OV Magdysyuk H Poumlllmann Crystal structures ofcalcium hemicarboaluminate and carbonated calcium hemicarboaluminate fromsynchrotron powder diffraction data Acta Crystallogr Sect B Struct Sci 68 (2012)493ndash500 httpdxdoiorg101107S010876811203042X
[26] JM Hughes JW Drexler Cation substitution in the apatite tetrahedral site crystalstructures of type hydroxylellestadite and type fermorite Neues Jahrb FuerMineral (1991) 327ndash336
[27] CH Shen RS Liu JG Lin CY Huang Phase stability study of La12Ca18Mn2O7Mater Res Bull 36 (2001) 1139ndash1148
[28] SW Bailey Refinement of an intermediate microcline structure Am Miner 54(1969) 1540ndash1545
[29] WR Busing HA Levy Neutron diffraction study of calcium hydroxide J ChemPhys 26 (1957) 563 httpdxdoiorg10106311743345
[30] Y Le Page G Donnay Refinement of the crystal structure of low-quartz ActaCrystallogr Sect B 32 (1976) 2456ndash2459 httpdxdoiorg101107S0567740876007966
[31] SA Hamid The crystal structure of the 11 Aring natural tobermoriteCa225[Si3O75(OH)15]1H2O Zeitschrift Fuer Krist - New Cryst Struct 154 (1981)189ndash198 httpdxdoiorg101524zkri19811543-4189
[32] P Mondal JW Jeffery The crystal structure of tricalcium aluminate Ca3Al2O6Acta Crystallogr B 31 (1975) 689ndash697 httpdxdoiorg101107S0567740875003639
[33] Y Takeuchi F Nishi I Maki Crystal-chemical characterization of the tricalciumaluminate-sodium oxide (3CaOtimesAl2O3-Na2O) solid-solution series Zeitschrift FuumlrKrist (1980) 259ndash307
[34] K Momma F Izumi VESTA 3 for three-dimensional visualization of crystal vo-lumetric and morphology data J Appl Crystallogr 44 (2011) 1272ndash1276 httpdxdoiorg101107S0021889811038970
[35] K Scrivener R Snellings B Lothenbach A Practical Guide to MicrostructuralAnalysis of Cementitious Materials CRC Press 2016 pp 123ndash125 httpdxdoiorg107693wl20150205
[36] V Pecharsky P Zavalij Fundamentals of Powder Diffraction and StructuralCharacterization of Materials Springer second edition 2005 p 302 httpdxdoiorg101007978-0-387-09579-0
J Schreiner et al Cement and Concrete Research 107 (2018) 247ndash252
252
6 Publications
44
7 Acknowledgement
7 Acknowledgement
Ich moumlchte mich bei einigen Personen bedanken ohne die es wohl kaum zum erfolgreichenAbschluss dieser Arbeit gekommen waumlreMein Doktorvater Prof Dr Juumlrgen Neubauer hat sich stets die Zeit genommen die noumltigwar um Angelegenheiten aller Art mit mir zu klaumlren Er gab mir fachlich immer zumrichtigen Zeitpunkt einen gewissen wissenschaftlichen Impuls Zugleich habe ich mich den-noch immer frei in meiner eigenen Konzeption gefuumlhlt Groszligen Dank spreche ich Prof DrFriedlinde Goumltz-Neunhoeffer aus die fuumlr mich ebenso immer eine verlaumlssliche Ansprech-partnerin fuumlr fachliche und organisatorische Angelegenheiten aller Art war Danke anDr Daniel Jansen fuumlr die gute Zusammenarbeit und dafuumlr dass er mich im Zuge meinerMasterarbeit in ein Forschungsprojekt aufgenommen hat das den Weg zur Promotionmoumlglich machte Zusaumltzlich gilt mein Dank Prof Dr Matthias Goumlbbels der fuumlr dieMitarbeiter am Lehrstuhl immer motivierende Worte fand Fuumlr die Ermoumlglichung meinerTeilnahme an diversen Dienstreisen Fortbildungen und Tagungen moumlchte ich mich viel-mals bedankenWeiterhin bedanke ich mich bei Dr Stephan Volkmann und den Rodgauer BaustoffwerkenGmbH amp Co KG fuumlr die gute Zusammenarbeit und die Bereitstellung von Versuchsma-terialienVielen Dank an meine studentischen Hilfskraumlfte Daniel Wagner Laura MoldenhauerFabian Lang Jakob Schreiber und Felix Klaassen die alle Aufgaben im Labor einwand-frei und mit Bedacht erledigten Bei meinen aktuellen und ehemaligen Kollegen DrKatrin Hurle Dr Dominique Ectors Dr Christoph Naber Dr Florian Huumlller JoumlrgNehring Frank Riedel Julian Wolf Tanja Manninger Daniel Wagner Nicolas FobbeKarla Spaumlth Julian Goergens Andreas Koumlhler Cordula Jakob Franz Becker und LisaKlemenz bedanke ich mich fuumlr die gelungene Zusammenarbeit und gegenseitige Unter-stuumltzung Besonderer Dank geht auch an Kerstin Kreszlig Bettina Engl Christian HankeBernd Schleifer und Christian Abe fuumlr die verlaumlssliche Unterstuumltzung bei technischen Fra-gen und Messungen im LaborFuumlr jegliche Unterstuumltzungen moumlchte ich mich auch bei meinen Eltern bedanken sowiebei meinem Bruder Ralf der mir mit einem LaTex Crashkurs viel Frustration ersparthat Danke Thomas dass du immer fuumlr mich da bist und mit mir zusammen fuumlr genugAusgleich gesorgt hast
45
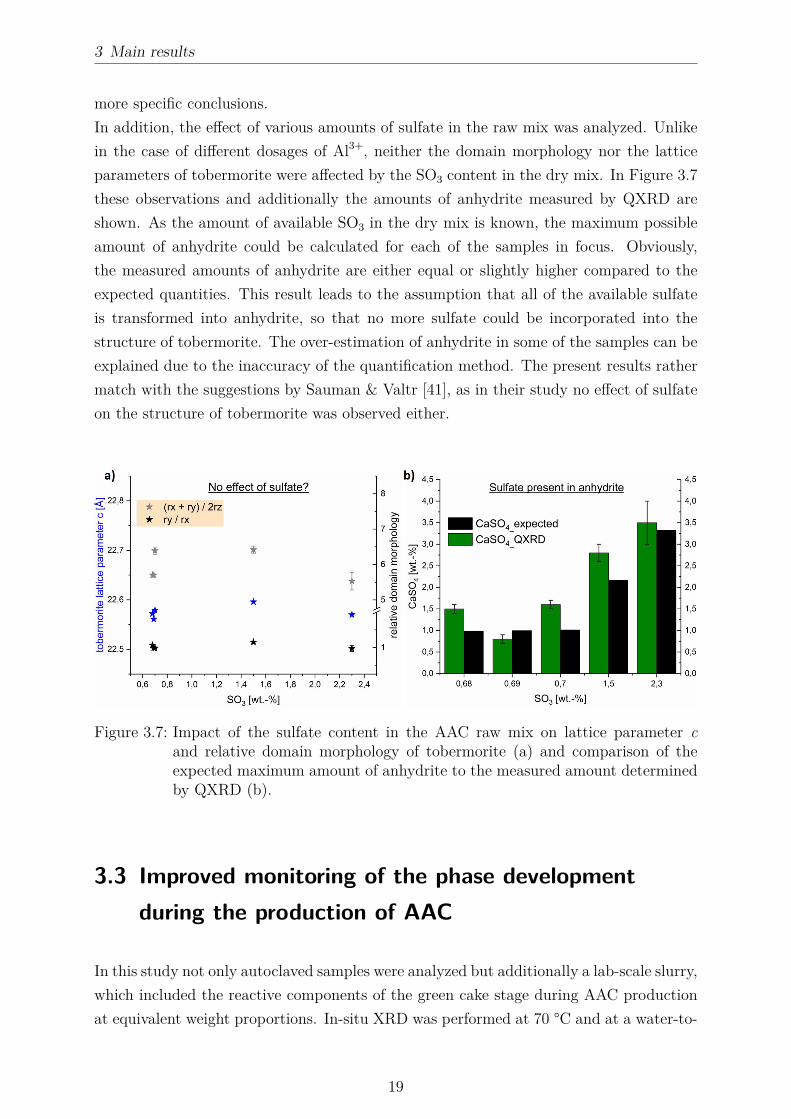
3 Main results
more specific conclusionsIn addition the effect of various amounts of sulfate in the raw mix was analyzed Unlikein the case of different dosages of Al3+ neither the domain morphology nor the latticeparameters of tobermorite were affected by the SO3 content in the dry mix In Figure 37these observations and additionally the amounts of anhydrite measured by QXRD areshown As the amount of available SO3 in the dry mix is known the maximum possibleamount of anhydrite could be calculated for each of the samples in focus Obviouslythe measured amounts of anhydrite are either equal or slightly higher compared to theexpected quantities This result leads to the assumption that all of the available sulfateis transformed into anhydrite so that no more sulfate could be incorporated into thestructure of tobermorite The over-estimation of anhydrite in some of the samples can beexplained due to the inaccuracy of the quantification method The present results rathermatch with the suggestions by Sauman amp Valtr [41] as in their study no effect of sulfateon the structure of tobermorite was observed either
Figure 37 Impact of the sulfate content in the AAC raw mix on lattice parameter cand relative domain morphology of tobermorite (a) and comparison of theexpected maximum amount of anhydrite to the measured amount determinedby QXRD (b)
33 Improved monitoring of the phase developmentduring the production of AAC
In this study not only autoclaved samples were analyzed but additionally a lab-scale slurrywhich included the reactive components of the green cake stage during AAC productionat equivalent weight proportions In-situ XRD was performed at 70 degC and at a water-to-
19
3 Main results
solid ratio of 08 for 24 h (Figure 38) which are respective conditions during commercialproduction Clearly the phase development is dominated by OPC and lime hydration asdescribed in section 22 It can be seen that the major reaction turnover occurs duringthe first 200 minutes which is the average duration of the green stage After only 30minutes all of the quicklime had transformed into portlandite whereas Schober proposeda duration of one hour for this reaction [42] The amount of portlandite is composed oftwo different generations as proposed by Ectors [52] Equally a biaxial cylinder modelwas applied in order to fit the peak broadening of the first generation of portlandite in thepresent investigation Minor phase developments such as the formation of AFm phases arenot shown in Figure 38 A coarse fraction of anhydrite did not react so that constantlyaround 15 wt were measured after 6 h As the decomposition of ettringite due tosulfate depletion [55] does not occur prior to 12 h the green cake strength is not affected
Figure 38 In-situ XRD measurement of AAC model slurry at water-to-solid ratio of 08and 70 degC For clarity and comprehensibility not all phases are shown
The separation of two generations of portlandite in the system does not only translate intodifferent domain morphologies as shown by Ectors [52] In Figure 39 more indicationsfor different mineralogical properties are displayed The shape of the (0 0 1) reflection inXRD patterns after only quicklime hydration and after both quicklime and alite hydrationshows a distinct feature While portlandite originating from quicklime hydration showsa broad peak implying lower crystallinity the peak after alite hydration is characterized
20
3 Main results
Figure 39 Formation of two generations of portlandite in AAC slurry in XRD (a) andDTA (b) plots
by a sharper component Yet the peak breadth did not change indicating that the firstgeneration is still present with the original characteristics This observation is supportedby DTA measurements additionally demonstrating two degrees of crystallinity only afteralite hydration In agreement with XRD analysis the better crystalline second generationof portlandite decomposes at a higher temperature
Figure 310 Quantification of tobermorite in statistical chemically various AAC sampleswith and without the application of the macro for the fitting of anisotropicpeak broadening
21
3 Main results
Furthermore commercial AAC samples were considered in this study By applying themethod for the refinement of anisotropic peak broadening (Figure 31) a more accuratequantification of tobermorite can be achieved In Figure 310 the calculated amounts oftobermorite in statistical chemically various AAC samples are plotted In some samplesthe refinement using the macro leads to considerably higher but never lower quantitiesof tobermorite whereas in other samples nearly the same amount of tobermorite is cal-culated This observation can be well understood taking into account that the macroallows to account more peak area for tobermorite as shown in Figure 31 Clearly thereis evidence that the anisotropy of tobermorite domains is not uniform from one sampleto another which was basically justified in the previous sections As an improved quan-tification of a single phase leads to a better quantification of other phases in the samplethis adaption is very valuable in order to assess the phase development Here the peakbroadening of tobermorite equally observed by Qu et al [6] could be tracked and evalu-ated in order to gain more accurate results Moreover in section 63 McCrone milling issuggested in order to avoid spottiness in XRD patterns caused by coarse grains of quartzor anhydrite (Figure 38)
22
4 Conclusions
4 Conclusions
The research results presented in the previous sections yield advances in the mineralogicalinvestigation of tobermorite and autoclaved aerated concrete Recorded diffraction pat-terns contain plenty of usually unused data regarding the microstructural characteristicsof the sample and phases therein The profit of XRD measurements can be significantlyimproved whenever one or more phases show anisotropic peak broadening and appro-priate models for the respective domain morphology are implemented into the Rietveldenvironment Within the scope of the present investigations portlandite and tobermoriteshow this particularityThe effects of changes in the chemistry of the starting mix were examined based on dif-ferent dosages of metakaolin Al-substituted tobermorite showed increased growth in b
direction and an increase of lattice parameter c compared to Al-free tobermorite The rel-ative domain sizes were determined based on anisotropic peak broadening However whilethe effect of Al3+ incorporation into the lattice of tobermorite was limited regarding thedomain morphology lattice parameter c showed an increase throughout the entire rangeof samples The consequent effects suggested by Klimesch amp Ray observed by means ofDTA are debatable as reactions during the heating experiment may lead to to a changeof Al3+ content in tobermorite [40] While both types of applied metakaolin showed goodreactivity at hydrothermal conditions some included minor phases such as feldspar oranatase remained unreacted At high dosages of Al2O3 in the starting mix the formationof either only katoite or katoite along with tobermorite was observed (Figure 32)SEM analysis of tobermorite in AAC cannot be suggested based on the observationspresented in this work as it is only visually accessible in the pores or at pore surfacesThe dense material of the AAC skeleton contains several crystalline and X-ray amorphousphases which hardly allows a proper investigation Even in single pores tobermorite crys-tals appeared very heterogeneous at various chemical compositions As a result lath-liketobermorite was not only present in samples characterized by elevated Al3+ incorporationBy contrast the benefits of XRD analysis presented in section 61 equally accounted fortobermorite in AAC samples Sulfate incorporation into the lattice of tobermorite wasnot observed All of the sulfate in the system was detected to be present in anhydriteThe phase transitions in the AAC raw slurry during the green stage hydration were show-cased by in-situ XRD analysis of a model mix at 70 degC Additional DTA and XRD mea-
23
4 Conclusions
surements during this step confirmed the presence of two generations of portlandite char-acterized by different crystallinity as suggested by Ectors [52] The inclusion of anisotropicdomain morphology during the Rietveld refinement allowed a more accurate quantifica-tion of tobermorite in autoclaved samples Sample preparation adjusted to the grain sizedistribution in AAC samples (section 63) the external standard method for quantita-tive XRD analysis [55] and the approach to evaluate anisotropic peak broadening [19]are the key methods for a more accurate tracking of the phase development during AACproduction
24
5 References
5 References
[1] A E Zadov A I Grabezhev N N Pertsev N V Chukanov and S V PribavkinTobermorite-plombierite metasomatites of the Gumeshevsk skarn-porphyry copper depositmiddle Urals Doklady Earth Sciences 407(3)495ndash497 2006
[2] M F Heddle Preliminary notice of substances which may prove to be new minerals MinMag 4117ndash123 1880
[3] S Merlino E Bonaccorsi and T Armbruster The real structure of tobermorite 11AringNormal and anomalous forms OD character and polytypic modifications European Journalof Mineralogy 13(3)577ndash590 2001
[4] C Biagioni S Merlino and E Bonaccorsi The tobermorite supergroup a new nomencla-ture Mineralogical Magazine 79(2)485ndash495 2015
[5] C A Riacuteos C D Williams and M A Fullen Hydrothermal synthesis of hydrogarnetand tobermorite at 175 degC from kaolinite and metakaolinite in the CaO-Al2O3-SiO2-H2Osystem A comparative study Applied Clay Science 43(2)228ndash237 2009
[6] X Qu Z Zhao and X Zhao Microstructure and characterization of aluminum-incorporated calcium silicate hydrates (C-S-H) under hydrothermal conditions RSC Ad-vances 8(49)28198ndash28208 2018
[7] R Šiaučiunas and K Baltakys Formation of gyrolite during hydrothermal synthesis inthe mixtures of CaO and amorphous SiO2 or quartz Cement and Concrete Research34(11)2029ndash2036 2004
[8] E Venhodovaacute R Janovskyacute and R Drochytka Formation of Tobermorite at Different Ma-terials Composition of Aerated Concrete Applied Mechanics and Materials 752-753247ndash250 2015
[9] L Galvaacutenkovaacute E Bartoniacutečkovaacute T Opravil J Tkacz and P Ptaacuteček The influence ofstarting materials solubility on tobermorite structure formation under the hydrothermalconditions IOP Conference Series Materials Science and Engineering 379(1)1ndash8 2018
[10] T Mitsuda K Sasaki and H Ishida Phase Evolution during Autoclaving Process J AmCeram Soc 75(75)1858ndash1863 1992
[11] A Skawińska The influence of metahalloysite addition on tobermorite formation studied byX-ray powder diffraction and scanning electron microscope MATEC Web of Conferences16305008 2018
[12] S T Bergold F Goetz-Neunhoeffer and J Neubauer Quantitative analysis of C-S-H in
25
5 References
hydrating alite pastes by in-situ XRD Cement and Concrete Research 53119ndash126 2013
[13] O P Shrivastava and F P Glasser Ion-exchange properties of 11-Aring tobermorite Reactivityof Solids 2(3)261ndash268 1986
[14] H Maeda Y Ogawa E H Ishida and T Kasuga Hydrothermal synthesis of tobermoritedoped with phosphorus species for removing heavy metal ions Journal of the AustralianCeramic Society 48(1)8ndash11 2012
[15] O P Shrivastava and R Shrivastava Cation exchange applications of synthetic tobermoritefor the immobilization and solidification of cesium and strontium in cement matrix Bulletinof Materials Science 23(6)515ndash520 2000
[16] G Renman and A Renman Sustainable Use of Crushed Autoclaved Aerated Concrete(CAAC) as a Filter Medium in Wastewater Purification 8th International conferenceon sustainable management of waste and recycled materials in construction GothenburgSweden 30 Mayndash1 June 2012 Proceedings pages 1ndash7 2012
[17] G Schober Chemical transformations during the manufacturing of autoclaved aeratedconcrete (ACC) Cement lime gypsum and quartz sand become cellular concrete ZKG58(7)63ndash70 2005
[18] A J Hamad Materials Production Properties and Application of Aerated LightweightConcrete Review International Journal of Materials Science and Engineering 2(2)152ndash157 2014
[19] D Ectors F Goetz-Neunhoeffer and J Neubauer A generalized geometric approach toanisotropic peak broadening due to domain morphology Journal of Applied Crystallogra-phy 48(1)189ndash194 2015
[20] H M Rietveld A profile refinement method for nuclear and magnetic structures Journalof Applied Crystallography 2(2)65ndash71 1969
[21] S A Hamid The crystal structure of the 11 Aring natural tobermoriteCa225[Si3O75(OH)15]1H2O Zeitschrift fuer Kristallographie - New Crystal Struc-tures 154(3-4)189ndash198 1981
[22] S A S El-Hemaly T Mitsuda and H F W Taylor Synthesis of normal and anomaloustobermorites Cement and Concrete Research 7429ndash438 1977
[23] M Sakiyama and T Mitsuda Hydrothermal reaction between C-S-H and kaolinite for theformation of tobermorite at 180degC Cement and Concrete Research 7(6)681ndash685 1977
[24] E Bonaccorsi S Merlino and A R Kampf The crystal structure of tobermorite 14 Aring(plombierite) a C-S-H phase Journal of the American Ceramic Society 88(3)505ndash5122005
[25] S Merlino E Bonaccorsi and T Armbruster The real structures of clinotobermorite andtobermorite 9 Aring OD character polytypes and structural relationships European Journalof Mineralogy 12(2)411ndash429 2000
[26] K Momma and F Izumi VESTA 3 for three-dimensional visualization of crystal volu-metric and morphology data Journal of Applied Crystallography 44(6)1272ndash1276 2011
26
5 References
[27] S Shaw S M Clark and C MB Henderson Hydrothermal formation of the calcium sil-icate hydrates tobermorite (Ca5Si6O16(OH)2 middot 4H2O) and xonotlite (Ca6Si6O17(OH)2)An in situ synchrotron study Chemical Geology 167(1-2)129ndash140 2000
[28] K Matsui J Kikuma M Tsunashima T Ishikawa S Matsuno A Ogawa and M SatoIn situ time-resolved X-ray diffraction of tobermorite synthesis process under hydrothermalcondition IOP Conference Series Materials Science and Engineering 18(2)60ndash66 2011
[29] G Matekonis R Šiaučiunas and D Vaičiukyniene Hydrothermal Synthesis and Charac-terization of Na + and [ Al 3 + + Na + ] -substituted Tobermorite in CaO-SiO2middotnH2O-H2OSystem MATERIALS SCIENCE 16(3)242ndash248 2010
[30] G Geng R J Myers M J A Qomi and P JM Monteiro Densification of the inter-layer spacing governs the nanomechanical properties of calcium-silicate-hydrate ScientificReports 7(1)1ndash8 2017
[31] D Klimesch and A Ray Autoclaved cement-quartz pastes with metakaolin additionsAdvanced Cement Based Materials 7(3-4)109ndash118 1998
[32] N Y Mostafa A A Shaltout H Omar and S A Abo-El-Enein Hydrothermal synthesisand characterization of aluminium and sulfate substituted 11 nm tobermorites Journal ofAlloys and Compounds 467(1-2)332ndash337 2009
[33] İ Demir M S Başpınar E Kahraman E Ccedilalışkan and G Goumlrhan An Investigation onthe Usability of Diatomite in Aerated Concrete Production In Proc of the Intl Conf onAdvances In Civil Structural And Construction Engineering - CSCE 2014 pages 97ndash1002014
[34] A Skawinska Z Owsiak T Baran and K Hernik The influence of halloysite additionon tobermorite formation in CaO and quartz mix under hydrothermal conditions CementWapno Beton 17(12)426ndash434 2017
[35] N Y Mostafa Influence of air-cooled slag on physicochemical properties of autoclavedaerated concrete Cement and Concrete Research 35(7)1349ndash1357 2005
[36] D Małaszkiewicz and J Chojnowski Influence of addition of calcium sulfate dihydrate ondrying of autoclaved aerated concrete Open Engineering 7(1)273ndash278 2017
[37] N Hara and N Inoue Thermal behaviour of 11Aring tobermorite and its lattice parametersCement and Concrete Research (10)53ndash60 1980
[38] M D Jackson S R Chae S R Mulcahy C Meral R Taylor P Li A H EmwasJ Moon S Yoon G Vola H R Wenk and P JM Monteiro Unlocking the secretsof Al-tobermorite in Roman seawater concrete American Mineralogist 98(10)1669ndash16872012
[39] W Liao W Li Z Fang C Lu and Z Xu Effect of different aluminum substitution rateson the structure of Tobermorite Materials 12(22)1ndash10 2019
[40] D Klimesch and A Ray DTA-TG Study of the CaO-SiO2-H2O and CaO-Al2O3-SiO2-H2OSystems Under Hydrothermal Conditions Journal of Thermal Analysis and Calorimetry56(1)27ndash34 1999
27
5 References
[41] Z Sauman and Z Valtr Substitution of sulphate ions in the crystal lattice of 11 Aring to-bermorite In The VI International Congress on the Chemistry of Cement pages 1ndash14Moscow 1974
[42] G Schober Reaction of raw materials to the final product AAC httpwwwpb-aacde
chemmin2_ehtml 2012 accessed 2020-01-31
[43] D Jansen C Stabler F Goetz-Neunhoeffer S Dittrich and J Neubauer Does Ordi-nary Portland Cement contain amorphous phase A quantitative study using an externalstandard method Powder Diffraction 26(01)31ndash38 2011
[44] C Roumlszligler J Stark F Steiniger and W Tichelaar Limited-dose electron microscopyreveals the crystallinity of fibrous C-S-H phases Journal of the American Ceramic Society89(2)627ndash632 2006
[45] Y Sakalli and R Trettin Investigation of C3S hydration by environmental scanning elec-tron microscope Journal of Microscopy 259(1)53ndash58 2015
[46] F Matsushita Y Aono and S Shibata Expansion and shrinkage behavior of green cakeof Autoclaved Aerated Concrete In Autoclaved Aerated Concrete - Innovation and Devel-opment Proceedings of the 4th International Conference on Autoclaved Aerated ConcreteKingston UK 8-9 September 2005 pages 101ndash108 CRC Press 2005
[47] C Chucholowski M Holger and K-C Thienel Improving the recyclability environmentalcompatibility and CO2 balance of autoclaved aerated concrete by replacing sulfate carrierand cement with calcined clays CePapers 2(4)503ndash512 2018
[48] X Y Huang W Ni W H Cui Z J Wang and L P Zhu Preparation of autoclavedaerated concrete using copper tailings and blast furnace slag Construction and BuildingMaterials 27(1)1ndash5 2012
[49] W Wongkeo and A Chaipanich Compressive strength microstructure and thermal anal-ysis of autoclaved and air cured structural lightweight concrete made with coal bottom ashand silica fume Materials Science and Engineering A 527(16-17)3676ndash3684 2010
[50] A Roacuteżycka and W Pichoacuter Effect of perlite waste addition on the properties of autoclavedaerated concrete Construction and Building Materials 12065ndash71 2016
[51] N Isu H Ishida and T Mitsuda Influence of quartz particle size on the chemical andmechanical properties of autoclaved aerated concrete (I) tobermorite formation Cementand Concrete Research 25(25)243ndash248 1995
[52] D Ectors Advances in the analysis of cementitious reactions and hydrate phases doctoralthesis PhD thesis Friedrich-Alexander-Universitaumlt Erlangen-Nuumlrnberg 2016
[53] D Ectors F Goetz-Neunhoeffer and J Neubauer Domain size anisotropy in the double-Voigt approach An extended model Journal of Applied Crystallography 481998ndash20012015
[54] D Ectors F Goetz-Neunhoeffer and J Neubauer Routine (an)isotropic crystallite sizeanalysis in the double-Voigt approximation done right Powder Diffraction 32(S1)27ndash342017
28
5 References
[55] D Jansen F Goetz-Neunhoeffer C Stabler and J Neubauer A remastered external stan-dard method applied to the quantification of early OPC hydration Cement and ConcreteResearch 41(6)602ndash608 2011
[56] T Ungaacuter G Tichy J Gubicza and R J Hellmig Correlation between subgrains andcoherently scattering domains Powder Diffraction 20(04)366ndash375 2005
[57] Triloki P Garg R Rai and B K Singh Structural characterization of as-depositedcesium iodide films studied by X-ray diffraction and transmission electron microscopy tech-niques Nuclear Instruments and Methods in Physics Research Section A AcceleratorsSpectrometers Detectors and Associated Equipment 736128ndash134 2014
[58] J Schreiner F Goetz-Neunhoeffer J Neubauer and D Jansen Hydrothermal synthesisof 11 Aring tobermorite ndash Effect of adding metakaolin to the basic compound Applied ClayScience 185 2020
[59] J Schreiner F Goetz-Neunhoeffer J Neubauer S Volkmann S Bergold R Webler andD Jansen Advanced Rietveld refinement and SEM analysis of tobermorite in chemicallydiverse autoclaved aerated concrete Powder Diffraction 34143ndash150 2019
[60] J Schreiner D Jansen D Ectors F Goetz-Neunhoeffer J Neubauer and S VolkmannNew analytical possibilities for monitoring the phase development during the production ofautoclaved aerated concrete Cement and Concrete Research 107247ndash252 2018
29
6 Publications
6 Publications
61 Hydrothermal synthesis of 11 Aring tobermorite ndash Effectof adding metakaolin to the basic compound
Reprint of the peer reviewed publication
Schreiner J Goetz-Neunhoeffer F Neubauer J Jansen D 2020 Hydrothermalsynthesis of 11 Aring tobermorite ndash Effect of adding metakaolin to the basic compoundApplied Clay Science 185 httpsdoiorg101016jclay2019105432
with permission from Elsevier
30
Contents lists available at ScienceDirect
Applied Clay Science
journal homepage wwwelseviercomlocateclay
Research paper
Hydrothermal synthesis of 11 Aring tobermorite ndash Effect of adding metakaolin tothe basic compound
J Schreiner F Goetz-Neunhoeffer J Neubauer D JansenUniversity of Erlangen-Nuremberg GeoZentrum Nordbayern Mineralogy Schlossgarten 5a 91054 Erlangen Germany
A R T I C L E I N F O
KeywordsHydrothermal synthesis11 Aring tobermoriteMetakaolinPowder diffractionKatoite
A B S T R A C T
Different amounts and types of metakaolin were analyzed and applied for the hydrothermal synthesis of 11 Aringtobermorite All synthesized samples were investigated by means of powder XRD combined with Rietveld re-finement Al-substituted 11 Aring tobermorite was successfully synthesized on the basis of a broad range of com-pounds characterized by a varying content of metakaolin Katoite was present depending on the amount ofsupplied Al3+ which was determined by the dosage of metakaolin Minor crystalline components included in thetwo types of metakaolin sources varied greatly in their reactivity under hydrothermal conditions Despite adifferent degree of purity the two types of metakaolin showed corresponding effects at moderate dosages butcontrary effects at higher dosages as for the synthesis of 11 Aring tobermorite The domain morphology of to-bermorite could be associated with Al3+ incorporation for low dosages of metakaolin represented by up to 2 wt- Al2O3 in the dry mix By contrast Al3+ affected tobermorite lattice parameters at equivalent and even athigher dosages with c reaching 2295 Aring at 12 wt- Al2O3 in the dry mix
1 Introduction
11 Application of metakaolin as a reactive material in constructionindustry
The application of supplementary cementitious materials (SCMs) inthe field of construction technology has received a lot of attention inrecent years Due to limited resources and an urgent need for alter-native and more eco-friendly construction materials SCMs such asmetakaolin offer a great potential The usage of SCMs has not onlyspread to the cement and mortar industry but also to advanced appli-cations such as autoclaved aerated concrete (AAC) (Demir et al 2014Koutnyacute et al 2014 Walczak et al 2015 Roacuteżycka and Pichoacuter 2016Chucholowski et al 2018) Unlike ordinary cementitious constructionmaterials AAC is produced from hydrothermal curing Due to the dif-ferent thermodynamic environment the hydration process and the re-activity of raw materials have to be investigated properly in order tounderstand the effects on the AAC product The leading mineral phasein AAC is 11 Aring tobermorite (Ca5Si6O16(OH)2middot4H2O) As a consequencethe thermal and mechanical properties of AAC depend on micro-structure and crystallinity of tobermorite to some extent In addition tothe curing time and the fineness of raw materials the supply of ionsthat can substitute in the tobermorite structure is a crucial factor in thiscontext Especially substitutions by aluminum sodium and potassium
ions have been investigated thoroughly (Sauman 1974 Klimesch andRay 1998 Mostafa et al 2009 Matekonis et al 2010 Skawinskaet al 2017) Calcined clays usually contain a considerable amount ofthe mentioned ions
There is a vast amount of literature on the reactivity of SCMs atambient temperature and standard pressure but there is little when itcomes to hydrothermal conditions In previous publications the beha-vior of metakaolin under hydrothermal conditions was mainly in-vestigated for the synthesis of zeolites (Zhang et al 2007 Aguilar-Mamani et al 2014 Setthaya et al 2016 Luo et al 2018) In thesestudies the reactivity of metakaolin was observed at a wide range oftemperature and pH values During the transformation of kaolin intometakaolin a loss of framework alumina was observed (Ayodele et al2019) In recent decades metakaolin has been the subject of studies inthe field of geopolymer research (Rashad 2013 Chen et al 2016) Forthe synthesis of 11 Aring tobermorite a more distinct setting of temperaturesetting (180ndash200 degC) and steam pressure (1ndash12 MPa) are required
This publication is intended to make a new contribution to thechallenging field of hydrothermal synthesis in the system CaO-Al2O3-SiO2-H2O based on XRD analysis combined with Rietveld refinementVarious dosages of two types of metakaolin with different chemical andmineralogical purities are compared for the effects on the hydrothermalsynthesis of Al-substituted 11 Aring tobermorite Especially changes of thebulk chemistry in the raw mixes the reactivity of minor crystalline
httpsdoiorg101016jclay2019105432Received 20 August 2019 Received in revised form 13 November 2019 Accepted 30 December 2019
Corresponding authorE-mail address juergenjsschreinerfaude (J Schreiner)
Applied Clay Science 185 (2020) 105432
0169-1317 copy 2020 Elsevier BV All rights reserved
T
6 Publications
31
phases of the two types of metakaolin and the effect of different curingtimes are the focus of interest On the one hand metakaolin offers agreat potential in the AAC industry On the other hand of all SCMsmetakaolin is a good source material for investigating the influence ofAl3+ on the synthesis of Al-substituted 11 Aring tobermorite
12 Synthesis of Al-substituted 11 Aring tobermorite
In addition to being present in AAC tobermorite has found appli-cation in wastewater treatment and nuclear waste management due toits ion exchange capacity (Maeda et al 2012 Monasterio et al 2015)The substitution of silicon by aluminum results in a different to-bermorite structure due to general and local charge balance affectingthe lattice parameters Especially c is impacted by this substitutionbecause it occurs in the bridging tetrahedron and additional OHndash sub-stitutes O2ndash (Komarneni et al 1985 Merlino et al 2000) As suggestedin some additional studies the substitution of Si4+ by Al3+ and Na+ orK+ leads to a lath-like morphology of tobermorite crystals (Mostafa2005 Mostafa et al 2009 Venhodovaacute et al 2015 Qu et al 2018)However because of the heterogeneous appearance of tobermorite inAAC it is hardly possible to conduct a proper characterization based onSEM analysis In our recent work the anisotropic peak broadening oftobermorite in XRD diffractograms was successfully linked with theincorporation of foreign ions supplied in a common AAC production(Schreiner et al 2019) This finding allowed a more statistical struc-tural characterization of tobermorite in bulk compositions compared toSEM analysis Moreover it was reported in other studies that differenthydrate phases occur depending on the amount of supplied ions and onthe experimental settings In compounds with a high content of Al3+formation of katoite could be observed (Klimesch and Ray 1998 Riacuteoset al 2009 Matsui et al 2011) In the case of a longer curing durationinstead of 11 Aring tobermorite the formation of xonotlite (Siauciunas andBaltakys 2004 Galvaacutenkovaacute et al 2018) or - depending on the finenessof used silica source (Siauciunas and Baltakys 2004) - gyrolite is fa-voured
Kalousek (1956) suggested that tobermorite can contain up to 5Al2O3 More Al2O3 in the system resulted in the formation of hydro-garnet Klimesch and Ray (1998) additionally investigated the stabilityof hydrogarnet depending on the Al(Si + Al) ratio and its role in re-lation to the formation of 11 Aring tobermorite in an equivalent systemThey suggest that hydrogarnet always appears before tobermorite butthe former can only be detected for higher Al(Si + Al) ratios in theevent of longer curing times Riacuteos et al (2009) and Qu et al (2018)confirmed these findings in extensive investigations In the latter pub-lication it is additionally suggested that samples prepared at lowertemperatures (160 degC) are less impacted by the supply of Al3+ Theyalso consider the peak broadening of tobermorite in their XRD plotsbased on the amount of incorporated Al3+ In two recent publicationswe suggested that the peak broadening of tobermorite enables a mi-crostructural analysis by calculating the orientation dependent domainsizes (Schreiner et al 2018 2019) However these studies are based onsamples of industrially produced AAC so that the curing time was fixedThe studied AAC was produced from raw materials with a broad che-mical spectrum such as ordinary Portland cement (OPC) whichsomehow complicates the interpretation of results
In this work the influence of aluminum ions - provided by meta-kaolin - on dominant crystallographic direction-dependent domaingrowth of tobermorite is investigated by analysis of anisotropic peakbroadening (Ectors et al 2015 2017) In Fig 1 of the supplementarymaterial the method of fitting the anisotropic peak broadening of to-bermorite using a triaxial cylinder model is visualized (Schreiner et al2018) Fitting of the anisotropic peak broadening of tobermorite Thismethod is used to calculate the average and reliable values for to-bermorite domain sizes in the powder sample and associate them withaverage Al3+ incorporation Microstrain should be considered becauseit is an additional source of peak broadening However this usually
accounts for materials that have been exposed to different kinds ofstress such as metals and alloys (Badawi et al 2019) In addition theinstrumental contribution to peak broadening should be consideredHydration products such as tobermorite are characterized by crystallitesizes in the range of nanometers so that anisotropic size broadeningclearly outweighs the effect of instrumental broadening (Jenkins andSnyder 1996) Moreover the impact of Al3+ on the lattice parametersof tobermorite is considered It should additionally be clarified whe-ther the results from our previous publication (Schreiner et al 2019)based on industrially produced AAC can be confirmed by investigationwith less complex raw mixes and purely based on laboratory experi-ments
2 Material and methods
21 Starting materials
The starting materials for hydrothermal synthesis included deio-nized water quartz flour portlandite (999 pure) and two types ofmetakaolin One type was ordinary commercially available metakaolin(MK) with nearly a stoichiometric composition For comparison thesecond type of commercially available metakaolin was a by-productfrom expanded glass production (MKg) and consequently highly im-pure The chemical composition of MK and MKg determined by XRF isgiven in Table 1 With MKg containing less Al2O3 but considerably moreNa2O than MK the effects on hydrothermal synthesis were of interestBoth types of metakaolin have been characterized in previous pub-lications (Schmidt et al 2012 Naber et al 2019) In addition weverified the mineral phase content by XRD analysis Besides amorphousmetakaolin MK contained minor amounts of anatase quartz and mica
Fig 1 Weight fractions of tobermorite quartz and katoite determined byquantitative XRD analysis ndash samples including MKg crosshatched
Table 1Chemical composition of MK and MKg determined by XRF analysis ndash majorcontrasts in bold letters
Oxides [wt-] MK MKg
SiO2 536 604Al2O3 392 206CaO 01 40MgO 01 12Na2O 0 96K2O 10 18Fe2O3 18 05TiO2 21 03P2O5 01 02Loss on ignition 15 1
J Schreiner et al Applied Clay Science 185 (2020) 105432
2
6 Publications
32
MKg contained additional kaolinite feldspar and quartz
22 Investigated mix composites
For the preparation of raw mixtures the powders were weighed andhomogenized using a lab-scale mixing mill Table 2 lists the composi-tion and nomenclature of all samples including Al2O3 content andcuring time in the autoclave
bull Besides one blank mixture (MK0) that did not contain any type ofmetakaolin eleven more compounds were prepared of which threeincluded different dosages of MKg (MKg16 MKg23 and MKg60)Three more mixes contained equivalent amounts of MK instead ofMKg (MK16 MK23 and MK60) These mixes were investigated inorder to have a direct comparison concerning the effects of differentraw material on the synthesis of tobermorite
bull Additionally the mixes MK9 MK5 and MK25 with lower dosages ofmetakaolin were analyzed In the referenced literature (Schreineret al 2019) the effect of Al3+ on the anisotropic peak broadeningof tobermorite could only be observed in the case of Al2O3 contentslower than 4 in the drymix In the latter three mixes Al2O3 con-tents range from 1 to 35 Al2O3 (calculated from XRF data) whichmeets the region of interest for the analysis of tobermorite domainmorphology
bull The curing time for nearly all of the investigated samples was 12 hbut compound MK9 was prepared two more times for curing timesof 2 h and 6 h The different curing times were chosen in this par-ticular sample so that the reactivity of metakaolin and the phasetransitions could be observed more precisely
23 Hydrothermal treatment
Due to the different fineness of raw materials there was a differentwater demand from one mixture to another In order to obtain slurriesof comparable rheology the amount of water was adapted respectivelyresulting in water-to-solid ratios of 25 to 3 which matches the sug-gested water-to-solid ratio for this purpose (Roacutezycka et al 2014Galvaacutenkovaacute et al 2018) The weighed water was added to the dry mixand after stirring for 1 min at 23 degC the slurry was poured into thereactor Minor changes in the quantity of added water did not have aninfluence on the measured steam pressure All experiments were con-ducted using a PTFE-lined stainless steel autoclave with a reactor vo-lume of 300 ml The oven temperature was fixed at 180 degC and auto-genous steam pressure of 11ndash12 MPa was measured during eachexperiment with an external manometer After cooling to room tem-perature the sample was removed from the reactor coarsely ground
using an agate mortar and dried at 60 degC for 12 h After drying thesample was ground with an agate mortar again in order to deagglo-merate the particles As no coarse raw materials were used there wasno need for wet McCrone milling (Schreiner et al 2018)
24 XRD analysis
After preparation into front-loading sample holders the powdersamples were measured with a D8 diffractometer (Bruker) equippedwith a LynxEye detection system and Bragg-Brentano geometry Thesettings for XRD analysis included a tube voltage of 40 kV a current of40 mA an angular range from 6 to 80deg 2θ (Cu Kα radiation) a time perstep of 054 s a step width of 00236deg 2θ and a PSD opening of 33deg Thebackground was fitted with Chebyshev polynomial of the fifth orderThe major contribution of amorphous phase was fitted with a singlepeak with a fixed position at 308deg 2θ so that tobermorite reflectionswere not affected An external quartzite standard was measured withthe same parameters in order to determine phase quantities (Jansenet al 2011) Bruker AXS software TOPAS 50 was used for Rietveldrefinement (Rietveld 1969) and the used structures are shown inTable 3
3 Results and discussion
31 Different dosages of MK and MKg
In Fig 1 the quantities of tobermorite quartz and katoite present inmost of the samples determined by XRD analysis are illustratedWhenever tobermorite was the leading mineral hydrate phase a basalspacing of 113 Aring could be verified in each of the diffractograms Thequantities of minor crystalline phases and amorphous content are notshown For low dosages of MK it can be seen that the weight fraction oftobermorite decreased At moderate dosage of both types of metakaolin(MK16 MK23 MKg16 MKg23) tobermorite was present in comparablequantities It can be seen that the amount of katoite in the mixes de-pended on the dosage of metakaolin and it appeared only at dosages ofMK5 or more Due to the higher content of aluminum in MK comparedto MKg more katoite could always be observed in the MK mixes atequivalent dosages Despite equal amounts of quartz as starting mate-rial in mixes for both types of metakaolin the resulting weight fractionsin the cured samples were not alike Considerably more quartz waspresent in the MK samples Even though less quartz was used for mixescontaining higher amounts of MK even more quartz was present afterhydrothermal curing (Table 2 Fig 1) Consequently some of the SiO2
provided by MK did not transform into an amorphous phase or to-bermorite but into quartz This finding is verified by the presence ofquartz in MK60 because no quartz was included in the raw mixture Thefeldspar present in MKg did not react so Na2O and an unknown amountof Al2O3 may not have been supplied for hydrothermal reaction Besidestobermorite and quartz additional calcite scawtite (Ca7Si6(CO3)
Table 2Basic powder compounds prepared for the hydrothermal synthesis of to-bermorite with the respectively calculated Al2O3 content and curing time in thereactor
Sample Portlandite[wt-]
Quartz[wt-]
MK[wt-]
MKg
[wt-]
Al2O3
[wt-]Curingtime [h]
MK0 49 51 ndash ndash 0 12MK25 495 48 25 ndash 1 12MK5 49 46 5 ndash 2 12MK9_2h 48 43 9 ndash 35 2MK9_6h 48 43 9 ndash 35 6MK9_12h 48 43 9 ndash 35 12MK16 47 37 16 ndash 63 12MK23 46 31 23 ndash 9 12MK60 40 ndash 60 ndash 235 12MKg16 47 37 ndash 16 33 12MKg23 46 31 ndash 23 47 12MKg60 40 ndash ndash 60 124 12
Table 3Structural data used for the investigation with powder XRD analysis
Phase Author
Anatase (Horn et al 1972)Biotite (Brigatti et al 2000)Calcite (Maslen et al 1995)Kaolinite (Zvyagin 1960)Katoite (Bartl 1969)Microcline (Bailey 1969)Plazolite (Basso et al 1983)Portlandite (Busing and Levy 1957)Quartz (Le Page and Donnay 1976)Scawtite (Grice 2005)Tobermorite (Hamid 1981)Xonotlite (Hejny and Armbruster 2001)
J Schreiner et al Applied Clay Science 185 (2020) 105432
3
6 Publications
33
O18bull2(H2O)) and xonotlite (Ca6Si6O17(OH)2) could be identified insample MK0 (XRD plots of samples MK0 MKg16 MKg23 MK16 andMK23) Comparing MK0 and MK25 scawtite and xonotlite could stillbe identified in a very low amount in MK25 but no longer in samplesthat contained even more MK (XRD plots of samples MK0 MK25 MK5and MK9_12h)
Two additional experiments were done without quartz in the rawmixes (MK60 and MKg60) The according diffractograms after hydro-thermal curing are shown in Fig 2 In sample MKg60 tobermorite (gt 50wt-) was successfully synthesized without any other silica sourcethan MKg whereas no crystalline quartz occurred By contrast no to-bermorite but quartz could be identified in equivalent mixture MK60containing MK It can be seen that crystalline components such as micaand anatase in the raw MK did not react at the selected conditions andremained present in the autoclaved samples Except for feldspar in MKgall of the crystalline components appeared to be reactive at the chosenhydrothermal conditions A minor unidentified phase occurred at328deg2θ and additional xonotlite was identified in sample MKg60 Insample MK60 more calcium was needed for the formation of morehydrogarnet (Fig 1) resulting in a lower CaSi ratio for the remainingsystem Sample MKg60 contained only half of the amount of Al3+ and itwas not completely supplied for reaction due to its partial presence infeldspar Consequently essentially less hydrogarnet (Fig 1) was presentin MKg60 after hydrothermal treatment and the CaSi ratio in the re-maining system was affected to a lesser extent
32 Application of MK for different curing times
The development of hydrate phases in the autoclave for compoundMK9 is displayed in Fig 3 After only 2 h of hydrothermal curing all ofthe available portlandite had reacted and katoite (95 wt-) was pre-sent The applied type of metakaolin appeared to react quickly as itsupplied aluminum for formation of katoite No formation of to-bermorite could be observed at this stage yet An assumably amorphousprecursor can be seen at 28 to 30deg2θ Calcium was provided by thedissolution of portlandite After 6 h of hydrothermal reaction amountsof katoite (85 wt-) and quartz (from 31 wt- at 2 h to 165 wt- at6 h) had decreased and a major amount of tobermorite (35 wt-) waspresent Apparently between 2 and 6 h under hydrothermal conditionsthe amorphous precursor and quartz reacted resulting in the formationof tobermorite An additional 6 h of reaction time (MK9_12h) did notchange the phase composition significantly Slightly more tobermorite
(365 wt-) less quartz (16 wt-) and katoite (65 wt-) weremeasured
33 Tobermorite domain morphology and lattice parameters
In the referenced literature an analysis of tobermorite domainmorphology based on anisotropic peak broadening was possible forsamples that contained notgt 4 wt- Al2O3 in the drymix (Schreineret al 2019) Accordingly in this study samples MK0 MK25 MK5MK9_6h and MK9_12h were suitable (Table 2) with MK9_2h not con-taining any tobermorite In Fig 4 the respective growth in a and b di-rection is visualized with x indicating the domain size in a direction andy indicating domain size in b direction using a macro for TOPAS 50(Ectors et al 2015 2017) The calculated cylinder models in Fig 4represent the relation of yx and not absolute sizes With no supply ofaluminum ions (MK0) the relative domain growth in b direction islower compared to samples containing metakaolin This finding agreeswith the results from a similar investigation of tobermorite in AAC(Schreiner et al 2019) However within the samples MK5 andMK9_12h the different amounts of supplied aluminum ions did notshow a clear effect It appeared that low dosages of Al3+ (1 wt- Al2O3
in MK25 and 2 wt- Al2O3 in MK5) were enough to determine thedomain growth of tobermorite Additional results from the samplesMK9_6h and MK9_12h indicated that growth in b direction increasedwith reaction time
In Fig 5 lattice parameters of tobermorite depending on metakaolindosages are plotted B clearly remained unaffected throughout therange of samples Increasing amounts of metakaolin led to a slightlysmaller parameter a However both types of metakaolin showed acorresponding impact on parameter a By contrast parameter c in-creased strongly with increasing amounts of MK and MKg but the typeof metakaolin was significant At an equivalent dosage MK affected thecell dimension in c direction considerably more than MKg so that thefraction of Al3+ appeared to be the decisive parameter Different metaloxides in MKg did not show a notable effect certainly as they werepartially not provided for reaction Unlike for the domain morphologyof tobermorite the impact on lattice parameters could be observedwithin the complete range of examined dosages
4 Conclusions
The results obtained from the introduced investigations allow con-cluding remarks on the effects of the applied types of metakaolin on thesynthesis of 11 Aring tobermorite the phase transitions and the in-corporation of Al3+ into the lattice of tobermorite
With a critical dosage the use of any type of metakaolin led to theformation of katoite in an according amount At moderate dosages(MKg16 MKg23 MK16 and MK23) the two types of metakaolin showeda good correspondence in consideration of the quantities of to-bermorite For higher dosages there were contrary effects Lower do-sages of MK led to considerable quantities of Al-substituted to-bermorite Samples containing low dosages of MK revealed that katoiteappeared in the case ofgt 5 wt- of MK - corresponding to 2 wt-Al2O3 - in the basic compound Minor crystalline phases in MKg showedbetter reactivity than those in MK The observation that no tobermoritewas present in sample MK60 indicated that high dosages of Al3+ hin-dered the formation of tobermorite
Investigations of MK9 at 2 6 and 12 h displayed the evolution ofhydrate phases At first katoite was the only crystalline hydrate phasepresent after 2 h which corresponded to observations in a differentpublication (Klimesch and Ray 1999) The amount of katoite andquartz then decreased and a major amount of tobermorite formed from2 to 6 h curing time In order to gain more information on the trans-formation of amorphous C-(A)-S-H into tobermorite additional ex-periments in the range of 2 to 6 h curing time will be needed
Domain morphology analysis of tobermorite revealed that low
Fig 2 Diffractograms of MKg MKg60 MK and MK60 from 7 to 34deg2θ CuKα Aanatase C calcite F feldspar k kaolinite K katoite M mica Q quartz Ttobermorite U unidentified phase X xonotlite
J Schreiner et al Applied Clay Science 185 (2020) 105432
4
6 Publications
34
dosages of Al3+ determined the domain growth which agreed with theresults published on tobermorite in AAC samples (Schreiner et al2019) Different curing times unveiled that growth in b direction in-creased with the reaction time Al3+ incorporation into the lattice oftobermorite only reflected to a limited extent in the domain mor-phology By contrast an increase of lattice parameter c was triggered byAl3+ even at the highest dosage in this study Ultimately there is no
evidence for a limit of incorporation of Al3+ but there is a limit ofinfluence on the domain morphology These results additionally re-confirm this assumption similarly made in the previous work (Schreineret al 2019) and suggest a new mechanism of tobermorite crystal-lization depending on the presence of Al3+
Supplementary data to this article can be found online at httpsdoiorg101016jclay2019105432
Declaration of Competing Interest
The authors declare that they have no known competing financialinterests or personal relationships that could have appeared to influ-ence the work reported in this paper
Acknowledgement
The authors thank Rodgauer Baustoffwerke GmbH amp Co KG forsupplying raw materials for laboratory experiments
References
Aguilar-Mamani W Garciacutea G Hedlund J Mouzon J 2014 Comparison betweenleached metakaolin and leached diatomaceous earth as raw materials for the synth-esis of ZSM-5 Springerplus 3 1ndash10 httpsdoiorg1011862193-1801-3-292
Ayodele OB Sulaimon AA Alaba PA Tian Z-Y 2019 Influence of metakaolini-zation temperature on the structure and activity of metakaolin supported Ni catalystin dry methane reforming J Environ Chem Eng httpsdoiorg101016jjece2019103239 (in press)
Badawi EA Abdel-Rahman MA Mostafa A Abdel-Rahman M 2019 Determinationof the crystallite size amp micro- strain by novel method from XRD profile Appl Phys2 1ndash15 httpsdoiorg1031058jap201921001
Bailey SW 1969 Refinement of an intermediate microcline structure Am Miner 541540ndash1545
Bartl H 1969 Roentgen-Einkristalluntersuchungen an (CaO)3 (Al2O3) (H2O)6 und an(CaO)12 (Al2O3)7 (H2O) neuer Vorschlag zur (CaO)12 (Al2O3)7-Struktur NeuesJahrb fuer Mineral Monatshefte 1969 404ndash413
Basso R Giusta AD Zefiro L 1983 Crystal structure refinement of plazolite A highlyhydrated natural hydrogrossular Neues Jahrb Miner Monatsh (Neues Jahrb fuerMineral Monatshefte) 1983 251ndash258
Brigatti MF Lugli C Poppi L Foord EE Kile DE 2000 Crystal chemical varia-tions in Li- and Fe-rich micas from Pikes Peak batholith (Central Colorado) AmMineral 85 1275ndash1286 httpsdoiorg102138am-2000-8-920
Busing WR Levy HA 1957 Neutron diffraction study of calcium hydroxide J ChemPhys 26 563 httpsdoiorg10106311743345
Chen L Wang Z Wang Y Feng J 2016 Preparation and properties of alkali acti-vated metakaolin-based geopolymer Materials (Basel) 9 1ndash12 httpsdoiorg103390ma9090767
Chucholowski C Holger M Thienel K-C 2018 Improving the recyclability en-vironmental compatibility and CO2 balance of autoclaved aerated concrete by re-placing sulfate carrier and cement with calcined clays CePapers 2 503ndash512httpsdoiorg101002cepa846
Fig 3 Diffractograms of MK9_2h MK9_6h and MK9_12h from 7 to 38deg2θ CuKα C calcite K katoite Q quartz T tobermorite
Fig 4 Relation of calculated domain sizes of 11 Aring tobermorite in selectedsamples (MK0 MK25 MK5 MK9_6h and MK9_12h) in a (x) and b (y) direction
Fig 5 Lattice parameters of tobermorite depending on MK or MKg dosageincluding blank mix MK0
J Schreiner et al Applied Clay Science 185 (2020) 105432
5
6 Publications
35
Demir İ Başpınar MS Kahraman E Ccedilalışkan E Goumlrhan G 2014 An investigationon the usability of diatomite in aerated concrete production In Proc of the IntlConf on Advances in Civil Structural and Construction Engineering ndash CSCE 2014 pp97ndash100
Ectors D Goetz-Neunhoeffer F Neubauer J 2015 A generalized geometric approachto anisotropic peak broadening due to domain morphology J Appl Crystallogr 48189ndash194 httpsdoiorg101107S1600576714026557
Ectors D Goetz-Neunhoeffer F Neubauer J 2017 Routine (an)isotropic crystallitesize analysis in the double-Voigt approximation done right Powder Diffract 3227ndash34 httpsdoiorg101017S0885715617000070
Galvaacutenkovaacute L Bartoniacutečkovaacute E Opravil T Tkacz J Ptaacuteček P 2018 The influence ofstarting materials solubility on tobermorite structure formation under the hydro-thermal conditions IOP Conf Ser Mater Sci Eng 379 1ndash8 httpsdoiorg1010881757-899X3791012001
Grice JD 2005 The structure of spurrite tilleyite and scawtite and relationships toother silicate-carbonate minerals Can Mineral 43 1489ndash1500 httpsdoiorg102113gscanmin4351489
Hamid SA 1981 The crystal structure of the 11 Aring natural tobermoriteCa225[Si3O75(OH)15]1H2O Zeitschrift fuer Krist 154 189ndash198 httpsdoiorg101524zkri19811543-4189
Hejny C Armbruster T 2001 Polytypism in xonotlite Ca6Si6O17(OH)2 Zeitschrift furKrist 216 396ndash408
Horn M Schwerdtfeger CF Meagher EP 1972 Refinement of the structure of ana-tase at several temperatures Zeitschrift fur Krist 136 273ndash281 httpsdoiorg101524zkri19721363-4273
Jansen D Goetz-Neunhoeffer F Stabler C Neubauer J 2011 A remastered externalstandard method applied to the quantification of early OPC hydration Cem ConcrRes 41 602ndash608 httpsdoiorg101016jcemconres201103004
Jenkins R Snyder R 1996 Introduction to X-ray Powder Diffractometry ChemicalAnalysis Wiley pp 90
Kalousek GL 1956 Crystal Chemistry of Hydrous Calcium Silicates J Am Ceram Soc40 74ndash80
Klimesch D Ray A 1998 Autoclaved cement-quartz pastes with metakaolin additionsAdv Cem Based Mater 7 109ndash118 httpsdoiorg101016S1065-7355(97)00073-4
Klimesch D Ray A 1999 DTA-TGA evaluations of the CaOndashAl2O3ndashSiO2ndashH2O systemtreated hydrothermally Thermochim Acta 334 115ndash122 httpsdoiorg101016s0040-6031(99)00140-9
Komarneni S Roy R Roy DM Fyfe CA Kennedy GJ Bothner-By AA Dadok JChesnick AS 1985 27Al and29Si magic angle spinning nuclear magnetic resonancespectroscopy of Al-substituted tobermorites J Mater Sci 20 4209ndash4214 httpsdoiorg101007BF00552416
Koutnyacute O Opravil T Pořiacutezka J 2014 Application of metakaoline in autoclavedaerated concrete technology Adv Mater Res 1000 174ndash177 httpsdoiorg104028wwwscientificnetAMR1000174
Le Page Y Donnay G 1976 Refinement of the crystal structure of low-quartz ActaCrystallogr Sect B 32 2456ndash2459 httpsdoiorg101107S0567740876007966
Luo H Law WW Wu Y Zhu W Yang EH 2018 Hydrothermal synthesis of needle-like nanocrystalline zeolites from metakaolin and their applications for efficient re-moval of organic pollutants and heavy metals Microporous Mesoporous Mater 2728ndash15 httpsdoiorg101016jmicromeso201806015
Maeda H Ogawa Y Ishida EH Kasuga T 2012 Hydrothermal synthesis of to-bermorite doped with phosphorus species for removing heavy metal ions J AustCeram Soc 48 8ndash11
Maslen EN Streltsov VA Streltsova NR Ishizawa N 1995 Electron density andoptical anisotropy in rhombohedral carbonates III Synchrotron Xray studies ofCaCO3 MgCO3 and MnCO3 Acta Crystallogr Sect B 51 929ndash939 httpsdoiorg101107S0108768195006434
Matekonis G Šiaučiūnas R Vaičiukynienė D 2010 Hydrothermal Synthesis andCharacterization of Na + and [ Al 3 + + Na + ] -substituted Tobermorite in CaO-SiO2middotnH2O-H2O System Mater Sci 16 242ndash248
Matsui K Kikuma J Tsunashima M Ishikawa T Matsuno S Ogawa A Sato M2011 In situ time-resolved X-ray diffraction of tobermorite synthesis process underhydrothermal condition IOP Conf Ser Mater Sci Eng 18 60ndash66 httpsdoiorg1010881757-899X182022017
Merlino S Bonaccorsi E Armbruster T 2000 The real structures of clinotobermoriteand tobermorite 9 Aring OD character polytypes and structural relationships Eur JMineral 12 411ndash429 httpsdoiorg1011270935-122120000012-0411
Monasterio M Gaitero JJ Manzano H Dolado JS Cerveny S 2015 Effect ofchemical environment on the dynamics of water confined in calcium silicate mi-nerals Natural and synthetic tobermorite Langmuir 31 4964ndash4972 httpsdoiorg101021acslangmuir5b00614
Mostafa NY 2005 Influence of air-cooled slag on physicochemical properties of auto-claved aerated concrete Cem Concr Res 35 1349ndash1357 httpsdoiorg101016jcemconres200410011
Mostafa NY Shaltout AA Omar H Abo-El-Enein SA 2009 Hydrothermal synth-esis and characterization of aluminium and sulfate substituted 11 nm tobermoritesJ Alloys Compd 467 332ndash337 httpsdoiorg101016jjallcom200711130
Naber C Stegmeyer S Jansen D Goetz-Neunhoeffer F Neubauer J 2019 ThePONKCS method applied for time resolved XRD quantification of supplementarycementitious material reactivity in hydrating mixtures with ordinary Portland ce-ment Constr Build Mater 214 449ndash457 httpsdoiorg101016jconbuildmat201904157
Qu X Zhao Z Zhao X 2018 Microstructure and characterization of aluminum-in-corporated calcium silicate hydrates (C-S-H) under hydrothermal conditions RSCAdv 8 28198ndash28208 httpsdoiorg101039c8ra04423f
Rashad AM 2013 Metakaolin as cementitious material history scours production andcomposition - a comprehensive overview Constr Build Mater 41 303ndash318 httpsdoiorg101016jconbuildmat201212001
Rietveld HM 1969 A profile refinement method for nuclear and magnetic structures JAppl Crystallogr 2 65ndash71 httpsdoiorg101107S0021889869006558
Riacuteos CA Williams CD Fullen MA 2009 Hydrothermal synthesis of hydrogarnet andtobermorite at 175 degC from kaolinite and metakaolinite in the CaO-Al2O3-SiO2-H2Osystem a comparative study Appl Clay Sci 43 228ndash237 httpsdoiorg101016jclay200809014
Roacuteżycka A Pichoacuter W 2016 Effect of perlite waste addition on the properties of au-toclaved aerated concrete Constr Build Mater 120 65ndash71 httpsdoiorg101016jconbuildmat201605019
Roacutezycka A Kotwica Ł Małolepszy J 2014 Synthesis of single phase gyrolite in theCaO-quartz-Na2O-H2O system Mater Lett 120 166ndash169 httpsdoiorg101016jmatlet201401003
Sauman Z 1974 Influence of SO4 2ndash ions on the formation of 11 Aring tobermorite InProceedings of the 2nd International Symposium on Science and Research in SilicateChemistry Moscow pp 25ndash39
Schmidt M Egersdoumlrfer A Poumlllmann H 2012 Increased reactivity using a glass-containing metakaolin as an active filler in lime-based binder systems ZKG Int 6554ndash62
Schreiner J Jansen D Ectors D Goetz-Neunhoeffer F Neubauer J Volkmann S2018 New analytical possibilities for monitoring the phase development during theproduction of autoclaved aerated concrete Cem Concr Res 107 247ndash252 httpsdoiorg101016jcemconres201802028
Schreiner J Goetz-Neunhoeffer F Neubauer J Volkmann S Bergold S Webler RJansen D 2019 Advanced Rietveld refinement and SEM analysis of tobermorite inchemically diverse autoclaved aerated concrete Powder Diffract 34 143ndash150httpsdoiorg101017s0885715619000149
Setthaya N Chindaprasirt P Pimraksa K 2016 Preparation of zeolite nanocrystals viahydrothermal and solvothermal synthesis using of rice husk ash and metakaolinMater Sci Forum 872 242ndash247 httpsdoiorg104028wwwscientificnetmsf872242
Siauciunas R Baltakys K 2004 Formation of gyrolite during hydrothermal synthesis inthe mixtures of CaO and amorphous SiO2 or quartz Cem Concr Res 34 2029ndash2036httpsdoiorg101016jcemconres200403009
Skawinska A Owsiak Z Baran T Hernik K 2017 The influence of halloysite ad-dition on tobermorite formation in CaO and quartz mix under hydrothermal condi-tions Cem Wapno Bet 17 426ndash434
Venhodovaacute E Janovskyacute R Drochytka R 2015 Formation of tobermorite at differentmaterials composition of aerated concrete Appl Mech Mater 752ndash753 247ndash250httpsdoiorg104028wwwscientificnetamm752-753247
Walczak P Małolepszy J Reben M Szymański P Rzepa K 2015 Utilization ofwaste glass in autoclaved aerated concrete Proc Eng 122 302ndash309 httpsdoiorg101016jproeng201510040
Zhang Y Gao W Cui L 2007 The transformation of acid leached metakaolin tozeolite beta Stud Surf Sci Catal 170 420ndash425 httpsdoiorg101016S0167-2991(07)80870-6
Zvyagin BB 1960 An attempt to electronographic determination of kaolinite structureJ Dokl Akad Nauk SSSR 130 1023ndash1026
J Schreiner et al Applied Clay Science 185 (2020) 105432
6
6 Publications
36
6 Publications
62 Advanced Rietveld refinement and SEM analysis oftobermorite in chemically diverse autoclaved aeratedconcrete
Following the copyright guidelines by Cambridge University Press the publication
Schreiner J Goetz-Neunhoeffer F Neubauer J Volkmann S Bergold S WeblerR Jansen D 2019 Advanced Rietveld refinement and SEM analysis of tobermorite inchemically diverse autoclaved aerated concrete Powder Diffraction 34 143ndash150 httpsdoiorg101017s0885715619000149
may not be reprinted It can be accessed at
httpswwwcambridgeorgcorejournalspowder-diffractionarticleadvanced-rietveld-refinement-and-sem-analysis-of-tobermorite-in-chemically-diverse-autoclaved-aerated-concrete51597C2A66F6F225D29DEB2675E74249
37
6 Publications
63 New analytical possibilities for monitoring the phasedevelopment during the production of autoclavedaerated concrete
Reprint of the peer reviewed publication
Schreiner J Jansen D Ectors D Goetz-Neunhoeffer F Neubauer J VolkmannS 2018 New analytical possibilities for monitoring the phase development during theproduction of autoclaved aerated concrete Cement and Concrete Research 107 247ndash252httpsdoiorg101016jcemconres201802028
with permission from Elsevier
38
Contents lists available at ScienceDirect
Cement and Concrete Research
journal homepage wwwelseviercomlocatecemconres
Short communication
New analytical possibilities for monitoring the phase development duringthe production of autoclaved aerated concrete
J Schreinera D Jansena D Ectorsa F Goetz-Neunhoeffera J Neubauera S Volkmannb
aUniversity of Erlangen-Nuremberg GeoZentrum Nordbayern Mineralogy Schlossgarten 5a 91054 Erlangen Germanyb Rodgauer Baustoffwerke GmbH amp Co KG Am Opel-Pruumlffeld 3 63110 Rodgau-Dudenhofen Germany
A B S T R A C T
This work presents improved analytical methods for both steps of the production process of autoclaved aeratedconcrete (AAC) the phase development during the hydration before autoclaving and during the autoclavingprocess itself The improvement includes new insights into preparation methods of AAC samples for powderdiffraction as well as Rietveld refinement strategies For the first time a new implementation for calculatinganisotropic crystal domain sizes is applied to major hydrate phases occurring during AAC production namelyportlandite during the hydration before autoclaving and tobermorite during the autoclaving process The cal-culation of anisotropic domain size growth which can be implemented in the Rietveld environment is based oncrystallographically and geometrically appropriate models The implementation of calculating anisotropic do-main sizes for the Rietveld software TOPAS 50 allows a superior Rietveld fit and a more accurate quantificationof the phase development Additionally it enables the tracking of growth mechanism of portlandite duringhydration
1 Introduction
Autoclaved aerated concrete (AAC) is known as a lightweight con-struction material which offers outstanding properties such as suffi-cient strength for construction in addition with excellent thermal in-sulation [12] AAC is produced by autoclaving from calcareous rawmaterials such as lime (CaO) and cement quartz sulfate carrier andother additives such as foaming agents and water
The production process (Fig 1) can be separated into the hydrationof the mixed slurry before the procedure of autoclaving and the auto-claving at elevated temperature (180 degC to 200 degC) under saturatedsteam pressure (12MPa) for several hours
The hydration process before autoclaving is necessary to achievesufficient strength in order to cut the green cake blocks as they shouldhave a specific shape and dimension after autoclaving Furthermorethe porous structure is generated by the foaming agent during hydra-tion in the first process step During autoclaving the final propertiesnamely strength and low thermal conductivity are achieved
It is already well understood that the autoclaving process leads tothe formation of several phases first of all tobermorite(Ca5Si6O16(OH)2lowast4H2O) [3ndash5] Newest research has shown im-pressively which reactions are running from the mineralogical point ofview Insitu XRD measurements were carried out during the
autoclaving process and the phase development was shown by plottingnormalized intensities [6] The study of Mitsuda et al [3] was mainlyfocused on the tracking of the phase evolution during the autoclavingprocess of AAC However their statements concerning phase evolutionare mainly based on XRD data and TGA measurements There is acommon agreement that the following reactions occur The consump-tion of the alite (OPC) leads to the formation of an initial C-S-H phaseduring the first processing step Portlandite which was initially formedduring the first process step (from CaO and C3S) further quartz and theC-S-H phase are consumed during autoclaving resulting in the crystal-lization of tobermorite Hence the crystallization process of to-bermorite as well as the crystal structure of tobermorite was an issue ofresearch and discussion over the last years and numerous publicationsto these topics are available Concerning the crystal structure of to-bermorite respectively the tobermorite supergroup a new publicationoutlines all important references and recommends a new nomenclature[7]
The presented study was performed to create new analytical possi-bilities for the characterization of the production process of AAC Bothof the production process steps are essential for the final productHence the present work focuses on crystallization of hydrate phases inboth processes
Firstly an external standard method [89] was published and
httpsdoiorg101016jcemconres201802028Received 6 October 2017 Received in revised form 1 February 2018 Accepted 26 February 2018
Corresponding authorsE-mail addresses juergenjsschreinerfaude (J Schreiner) danieljansenfaude (D Jansen)
Cement and Concrete Research 107 (2018) 247ndash252
0008-8846 copy 2018 Elsevier Ltd All rights reserved
T
6 Publications
39
recommended for the determination of absolute phase contents inmixtures with amorphous content It was shown that the method canabsolutely be recommended for hydrating cement pastes in which watercannot be quantified directly by XRD [10] This method seems to bevery promising for both the quantification of the hydration of the AACslurry before autoclaving and the quantification of the phase evolutionduring autoclaving inasmuch as both production steps form crystallineand amorphous phases
Secondly a new approach to anisotropic peak broadening due toanisotropic domain morphology which was developed [1112] is ap-plied to AAC samples to improve the fit of portlandite and tobermoriteby Rietveld refinement [13] By applying this approach the refinementof both portlandite and tobermorite should additionally lead to betterquantitative results as well as to better insights into the development ofthe domain size morphology of both phases formed
It was already shown that in a hydrating raw mixture for AAC twospecies of portlandite precipitate at 23 degC one showing dynamicallyanisotropic peak broadening and another one following the isotropictrend [14] The application of the anisotropic refinement model led toan improved fitting of portlandite Moreover the mechanism of aniso-tropic domain growth of portlandite was tracked
2 Materials and methods
In order to examine the hydration of the AAC slurry before auto-claving a mixture of the hydraulic reactive components was weighedand measured in-situ at a Bruker D8 diffractometer with a LynxEyedetection system
Ordinary Portland cement (OPC) was mixed with lime (CaO) andanhydrite (C$) The raw materials were taken from the same batches asfor the industrial samples The drymix (58 OPC 36 CaO and 6 C$by weight) was then mixed with water (ws= 08) and placed into anappropriate sample holder The samples were not aerated The slurrysamples were covered with a kapton film to avoid evaporation andcarbonation Diffractograms were recorded with an angular range from7 to 545deg 2θ and a step width of 0011deg 2θ Measurements were carriedout every 15min For each measurement 96 XRD patterns were re-corded over the first 24 h The temperature was fixed at 70 degC which isthe mean temperature generally prevailing in the industrial processduring hydration before autoclaving Rietveld refinement was carriedout using the G-factor method All structures used for Rietveld refine-ment are shown in Table 1
For investigation of the autoclaved samples five different specimenswere taken at different autoclaving times The specimens were takenout of a technical production process hence it was not possible to in-terrupt the process at an earlier time inasmuch it would lead to damageof a whole concrete production batch The specimens were firstly driedat 60 degC until weight constancy The whole blocks were then broken andstatistical samples of 20 g were taken In order to receive the right massattenuation coefficient (MAC) for G-factor method the loss on ignitionand the chemical composition (XRF) were determined For energydispersive XRF analysis (Spectro Xepos) tube voltage from 20 kV to50 kV and tube current from 08 to 20mA were used for differenttargets
The final sample preparation (grinding) before XRD measurementswas carried out using both an agate mortar and a McCrone micronizingmill for wet milling with isopropanol Both preparation methods wereapplied separately to see which one is suitable in order to get the bestpreparation for XRD investigations Six preparations were performed byone operator of which two were prepared with an agate mortar andfour with a McCrone mill For the McCrone milling 3 g of the sampleand 10ml of isopropanol were used for grinding for 12min The grainsize distribution of one sample prepared with an agate mortar and onesample prepared using a McCrone mill was measured by laser granu-lometry in isopropanol using a Mastersizer 3000 (MALVERN)
After milling the samples in these two ways for XRD analysis thepowders were prepared into a front loading sample holder and mea-sured Diffractograms were recorded with an angular range from 6 to80deg 2θ a step width of 00236deg 2θ and a time per step of 054 s Rietveldrefinement combined with external standard (G-factor) was applied inorder to get absolute quantities for each phase The refinement strategyfor portlandite and tobermorite in the TOPAS Launch Mode (TOPAS50 Bruker AXS) is attached as a Supplementary material file
3 Results and discussion
31 Hydration of the mixture before autoclaving
The hydration of the investigated paste before autoclaving isdominated by the hydration of the cement as well as the reaction of thefree lime (CaO) resulting in the formation of portlandite It can beclearly seen from Fig 2 that the hydration of the paste leads to theformation of ettringite portlandite and C-S-H phase For simplificationthe remaining phase developments are not shown in Fig 2 because theyare not in the focus of this study The hydration of CaO forming
Fig 1 Simplified process steps of AAC production and hydrate phase evolution
Table 1Structures used for Rietveld refinement
Phase Author
Alite [15]Anhydrite [16]Bassanite [17]Belite (β) [18]Belite (αprime) [19]Brownmillerite [20]C-S-H [21]Calcite [22]Ettringite [23]Gypsum [24]Hemicarbonate [25]Hydroxylellestadite [26]Lime (CaO) [27]Microcline [28]Portlandite [29]Quartz [30]Tobermorite [31]Tricalciumaluminate (cubic) [32]Tricalciumaluminate (orthorhombic) [33]PONCKS model for Water [21]
J Schreiner et al Cement and Concrete Research 107 (2018) 247ndash252
248
6 Publications
40
portlandite begins rapidly after the addition of water to the mixture andlime is fully consumed after only 1 h of hydration This translates into aquick rise of heat of hydration so that cement hydration is acceleratedwhich leads to further portlandite formation by the reaction of aliteEttringite formation stalls after few hours of hydration After 12 h et-tringite is partially decomposed probably due to sulfate depletion [9]
and poorly crystalline AFm phases (not shown in Fig 2) are formedIn Fig 3 it can be seen that in fact two generations of portlandite
are formed a 1st dominant generation showing anisotropic peakbroadening and 2nd one occurring considerably later following theisotropic domain size refinement which is usually carried out using theRietveld method This occurrence comes along firstly with lime hy-dration and secondly with alite hydration The expected quantity ofportlandite formed from lime hydration very well complies with the
Fig 2 Phase development in AAC paste on a laboratory scale before autoclaving ana-lyzed by in-situ XRD at 70 degC
Fig 3 Formation of two generations of portlandite by hydration of lime (1st) and C3S(2nd) at 70 degC before autoclaving with the major generation showing anisotropic peakbroadening
Fig 4 Biaxial cylinder domain size model of portlandite used for Rietveld refinement of anisotropic peak broadening
Fig 5 Morphological evolution of portlandite showing anisotropic domain size growthduring hydration at 70 degC
Fig 6 Comparison of quantification of crystalline quartz in samples prepared withMcCrone mill and agate mortar at different autoclaving times
J Schreiner et al Cement and Concrete Research 107 (2018) 247ndash252
249
6 Publications
41
quantity of the observed 1st generation The development of portlan-dite growth was already tracked in an equivalent slurry at 23 degC [14]Thus this observation confirms that the crystallinity of portlandite inmixtures for AAC production depends on the starting phase for hydra-tion as already indicated by Ectors [14]
Fig 4 shows the used biaxial cylindrical model for anisotropic do-main size calculation and the portlandite structure which was createdwith structural software VESTA 318 [34] Using the cylindrical ap-proach domain sizes in a (here equating to b) and c direction(dz= cylinder height) can be calculated which comes along with theexpected symmetrical parameters of portlandite
The 1st portlandite generation showing anisotropic domain growthcan be tracked in terms of cylinder diameter and height which is rea-lized in Fig 5 The blue cylinder represents the geometric approach andcylinder height and diameter are calculated newly for each range Thecylinder height remains rather stable throughout the hydration processwhile the cylinder diameter increases during the first hours of hydra-tion After 10 h of hydration the mean cylinder diameter no longer in-creases Consequently these observations match the results of the ex-aminations conducted at 23 degC [14] as well as the assumption thatdifferent mechanisms of growth exist for portlandite depending on the
hydration educt The maximum cylinder diameter is reached earlier inthis work very likely because of the higher hydration temperature
32 Quantification of the reactions during autoclaving
Autoclaved samples were ground with an agate mortar and com-pared to samples which were wet-ground with a McCrone mill Fig 6shows precisely that the determination of the amount of crystallinequartz is more reproducible in the two shown samples which were
Fig 7 2D XRD with Bruker GADDS-system plots of samples prepared with agate mortar and McCrone mill Coarse quartz grains are pointed out in the plot of the sample prepared withagate mortar
Fig 8 Particle size distribution of one sample prepared with an agate mortar and of onesample prepared with a McCrone mill measured by laser granulometry
Fig 9 Rietveld refinement for Tobermorite of autoclaved AAC sample by use of isotropicdomain size model (a) and of anisotropic domain size model (b)
J Schreiner et al Cement and Concrete Research 107 (2018) 247ndash252
250
6 Publications
42
prepared with a McCrone mill The high variance of crystalline quartzin the samples which were prepared with an agate mortar is a result ofinsufficient grinding and remaining of too large quartz grains Whenthis spottiness occurs a reliable quantification using the G-factormethod is not possible
The 2D XRD with Bruker GADDS-system plots in Fig 7 demonstratethe insufficient grinding when using an agate mortar compared to wetmilling with a McCrone mill Quartz would be overrepresented in a one-dimensional XRD pattern focusing on a section with bright spots (greenarrows) The lack of bright spots in the right plot shows that the quartzgrains are milled more thoroughly using a McCrone mill In Fig 8 theparticle size distribution after both ways of sample preparation iscompared Most grains in the sample prepared with an agate mortar arelarger than in the sample prepared with a McCrone mill The grain sizedistribution of the sample prepared with a McCrone mill complies withthe recommended particle size range for XRD analysis of under 5 to50 μm [3536] while the other sample exceeds the range
In Fig 9 Rietveld refinement of an autoclaved sample is shown Thedominant peaks at 77 290 and 301deg 2θ are attributed to tobermoriteIn the upper diagram (a) Rietveld refinement was carried out regularlycalculating isotropic domain sizes for tobermorite However the cal-culated fit differs significantly from the raw data It can be assumed thattobermorite shows a similar pattern to portlandite in terms of aniso-tropic peak broadening taking into account that tobermorite is as-signed to the orthorhombic crystal system Thus instead of a biaxialcylinder model an elliptic cylinder model (Fig 10 structure createdwith VESTA 318 [34]) was applied for the refinement in the lowerdiagram (b) The elliptic cylinder model is a sufficient approach to the
orthorhombic crystal system as it allows the distinction between do-main sizes in a b and c direction The fit is clearly superior using theanisotropic domain size model highlighted by the difference plot inFig 9b The comparison refinement with isotropic and anisotropic ap-proach was done for all of the five autoclaved samples In Fig 11 theresulting Rwp values for the whole pattern and the RBragg values of to-bermorite are shown The refinement using the anisotropic model leadsto both lower Rwp and RBragg values and consequently to a better fit anda more accurate quantification of tobermorite in all refined samples
4 Summary and conclusions
Improved analytical methods for both the phase developmentduring the hydration before autoclaving and during the autoclavingprocess of AAC are presented It could be shown that wet McCronemilling is the best way of preparation of AAC samples in order to obtainsuitable samples for powder diffraction A new approach to treat ani-sotropic domain sizes for Rietveld refinement could be successfullyapplied ndash with the benefit that portlandite and tobermorite in AACsamples could be refined more accurately using the Rietveld methodThus this application allows an improved quantification of the phasedevelopment during both of the production steps
For the future there are still plenty of possibilities to apply thepresented approach of calculating anisotropic domain sizes to AACproduction As exemplified with portlandite the mechanisms of growthof tobermorite can be tracked likewise during the autoclaving processIn addition the effect of variations in the chemical composition of AACraw mixtures on the crystal morphology of tobermorite can be ex-amined This leaves a new perspective to discuss the link between mi-neral phase morphology and the thermal and mechanical properties ofAAC
Acknowledgement
The autoclaved samples were generously provided by RodgauerBaustoffwerke GmbH amp Co KG The authors express gratitude for allsupport
Appendix A Supplementary data
Supplementary data to this article can be found online at httpsdoiorg101016jcemconres201802028
References
[1] MW Grutzeck Cellular concrete in M Scheffler P Colombo (Eds) CellularCeramics Wiley-VCH Weinheim 2005 pp 193ndash223
[2] M Haas The future of AAC ndash from a material scientists point of view inMC Limbachiya JJ Roberts (Eds) Autoclaved Aerated Concrete Taylor FrLondon 2005 pp 187ndash194
[3] T Mitsuda K Sasaki H Ishida Phase evolution during autoclaving process ofaerated concrete J Am Ceram Soc 75 (1992) 1858ndash1863
[4] N Isu H Ishida T Mitsuda Influence of quartz particle size on the chemical and
Fig 10 Triaxial cylinder domain size model of Tobermorite used for Rietveld refinement of anisotropic peak broadening
Fig 11 Comparison of Rwp and RBragg values of Rietveld refinements of autoclavedsamples and tobermorite using the isotropic and the anisotropic domain size model
J Schreiner et al Cement and Concrete Research 107 (2018) 247ndash252
251
6 Publications
43
mechanical properties of autoclaved aerated concrete (I) tobermorite formationCem Concr Res 25 (1995) 243ndash248
[5] NY Mostafa Influence of air-cooled slag on physicochemical properties of auto-claved aerated concrete Cem Concr Res 35 (2005) 1349ndash1357 httpdxdoiorg101016jcemconres200410011
[6] K Matsui J Kikuma M Tsunashima T Ishikawa S Matsuno A Ogawa M SatoIn situ time-resolved X-ray diffraction of tobermorite formation in autoclaved aer-ated concrete influence of silica source reactivity and Al addition Cem Concr Res41 (2011) 510ndash519
[7] C Biagioni S Merlino E Bonaccorsi The tobermorite supergroup a new no-menclature Mineral Mag 79 (2015) 485ndash495 httpdxdoiorg101180minmag2015079222
[8] BH OConnor MD Raven Application of the Rietveld refinement procedure inassaying powdered mixtures Powder Diffract 3 (1988) 2ndash6 httpdxdoiorg101017S0885715600013026
[9] D Jansen F Goetz-Neunhoeffer C Stabler J Neubauer A remastered externalstandard method applied to the quantification of early OPC hydration Cem ConcrRes 41 (2011) 602ndash608 httpdxdoiorg101016jcemconres201103004
[10] D Jansen C Stabler F Goetz-Neunhoeffer S Dittrich J Neubauer Does OrdinaryPortland Cement contain amorphous phase A quantitative study using an externalstandard method Powder Diffract 26 (2011) 31ndash38 httpdxdoiorg10115413549186
[11] D Ectors F Goetz-Neunhoeffer J Neubauer A generalized geometric approach toanisotropic peak broadening due to domain morphology J Appl Crystallogr 48(2015) 189ndash194 httpdxdoiorg101107S1600576714026557
[12] D Ectors F Goetz-Neunhoeffer J Neubauer Routine (an)isotropic crystallite sizeanalysis in the double-Voigt approximation done right Powder Diffract 32 (S1)(2017) 27ndash34 httpdxdoiorg101017S0885715617000070
[13] HM Rietveld A profile refinement method for nuclear and magnetic structures JAppl Crystallogr 2 (1969) 65ndash71 httpdxdoiorg101107S0021889869006558
[14] D Ectors Advances in the Analysis of Cementitious Reactions and Hydrate Phases(Doctoral Thesis) (2016) pp 12ndash14 (urnnbndebvb29-opus4-71743)
[15] AacuteG De La Torre S Bruque J Campo MAG Aranda The superstructure of C3Sfrom synchrotron and neutron powder diffraction and its role in quantitative phaseanalyses Cem Concr Res 32 (2002) 1347ndash1356 httpdxdoiorg101016S0008-8846(02)00796-2
[16] A Kirfel G Will Charge density in anhydrite CaSO4 from X-ray and neutrondiffraction measurements Acta Crystallogr Sect B Struct Crystallogr CrystChem 36 (1980) 2881ndash2890 httpdxdoiorg101107S0567740880010461
[17] C Bezou AN Christensen D Cox M Lehman A Nonat Structures cristallines deCaSO405H2O et CaSO406H2O Comptes Rendus Hebd Des Seacuteances lAcadeacutemieDes Sci Seacuterie 2 (312) (1991) 43ndash48
[18] KH Jost B Ziemer R Seydel Redetermination of the structure of β-dicalciumsilicate Acta Crystallogr Sect B Struct Crystallogr Cryst Chem 33 (1977)1696ndash1700 httpdxdoiorg101107S0567740877006918
[19] W Mumme LMD Cranswick BC Chakoumakos Rietveld crystal structure re-finements from high temperature neutron powder diffraction data for the poly-morphs of dicalcium silicate Neues Jahrb Fuer Mineral Abhandlungen 170 (1996)171ndash188
[20] A Colville S Geller The crystal structure of brownmillerite Ca2FeAlO5Crystallographica 50 (1971) 2311ndash2315 httpdxdoiorg101107S056774087100579X
[21] ST Bergold F Goetz-Neunhoeffer J Neubauer Quantitative analysis of C-S-H inhydrating alite pastes by in-situ XRD Cem Concr Res 53 (2013) 119ndash126 httpdxdoiorg101016jcemconres201306001
[22] EN Maslen VA Streltsov NR Streltsova N Ishizawa Electron density and op-tical anisotropy in rhombohedral carbonates III Synchrotron Xray studies ofCaCO3 MgCO3 and MnCO3 Acta Crystallogr Sect B 51 (1995) 929ndash939 httpdxdoiorg101107S0108768195006434
[23] G Renaudin Y Filinchuk J Neubauer F Goetz-Neunhoeffer A comparativestructural study of wet and dried ettringite Cem Concr Res 40 (2010) 370ndash375httpdxdoiorg101016jcemconres200911002
[24] WF Cole CJ Lancucki A refinement of the crystal structure of gypsumCaSO42H2O Acta Cryst B30 (1974) 921ndash929 httpdxdoiorg101107S0567740874004055
[25] T Runčevski RE Dinnebier OV Magdysyuk H Poumlllmann Crystal structures ofcalcium hemicarboaluminate and carbonated calcium hemicarboaluminate fromsynchrotron powder diffraction data Acta Crystallogr Sect B Struct Sci 68 (2012)493ndash500 httpdxdoiorg101107S010876811203042X
[26] JM Hughes JW Drexler Cation substitution in the apatite tetrahedral site crystalstructures of type hydroxylellestadite and type fermorite Neues Jahrb FuerMineral (1991) 327ndash336
[27] CH Shen RS Liu JG Lin CY Huang Phase stability study of La12Ca18Mn2O7Mater Res Bull 36 (2001) 1139ndash1148
[28] SW Bailey Refinement of an intermediate microcline structure Am Miner 54(1969) 1540ndash1545
[29] WR Busing HA Levy Neutron diffraction study of calcium hydroxide J ChemPhys 26 (1957) 563 httpdxdoiorg10106311743345
[30] Y Le Page G Donnay Refinement of the crystal structure of low-quartz ActaCrystallogr Sect B 32 (1976) 2456ndash2459 httpdxdoiorg101107S0567740876007966
[31] SA Hamid The crystal structure of the 11 Aring natural tobermoriteCa225[Si3O75(OH)15]1H2O Zeitschrift Fuer Krist - New Cryst Struct 154 (1981)189ndash198 httpdxdoiorg101524zkri19811543-4189
[32] P Mondal JW Jeffery The crystal structure of tricalcium aluminate Ca3Al2O6Acta Crystallogr B 31 (1975) 689ndash697 httpdxdoiorg101107S0567740875003639
[33] Y Takeuchi F Nishi I Maki Crystal-chemical characterization of the tricalciumaluminate-sodium oxide (3CaOtimesAl2O3-Na2O) solid-solution series Zeitschrift FuumlrKrist (1980) 259ndash307
[34] K Momma F Izumi VESTA 3 for three-dimensional visualization of crystal vo-lumetric and morphology data J Appl Crystallogr 44 (2011) 1272ndash1276 httpdxdoiorg101107S0021889811038970
[35] K Scrivener R Snellings B Lothenbach A Practical Guide to MicrostructuralAnalysis of Cementitious Materials CRC Press 2016 pp 123ndash125 httpdxdoiorg107693wl20150205
[36] V Pecharsky P Zavalij Fundamentals of Powder Diffraction and StructuralCharacterization of Materials Springer second edition 2005 p 302 httpdxdoiorg101007978-0-387-09579-0
J Schreiner et al Cement and Concrete Research 107 (2018) 247ndash252
252
6 Publications
44
7 Acknowledgement
7 Acknowledgement
Ich moumlchte mich bei einigen Personen bedanken ohne die es wohl kaum zum erfolgreichenAbschluss dieser Arbeit gekommen waumlreMein Doktorvater Prof Dr Juumlrgen Neubauer hat sich stets die Zeit genommen die noumltigwar um Angelegenheiten aller Art mit mir zu klaumlren Er gab mir fachlich immer zumrichtigen Zeitpunkt einen gewissen wissenschaftlichen Impuls Zugleich habe ich mich den-noch immer frei in meiner eigenen Konzeption gefuumlhlt Groszligen Dank spreche ich Prof DrFriedlinde Goumltz-Neunhoeffer aus die fuumlr mich ebenso immer eine verlaumlssliche Ansprech-partnerin fuumlr fachliche und organisatorische Angelegenheiten aller Art war Danke anDr Daniel Jansen fuumlr die gute Zusammenarbeit und dafuumlr dass er mich im Zuge meinerMasterarbeit in ein Forschungsprojekt aufgenommen hat das den Weg zur Promotionmoumlglich machte Zusaumltzlich gilt mein Dank Prof Dr Matthias Goumlbbels der fuumlr dieMitarbeiter am Lehrstuhl immer motivierende Worte fand Fuumlr die Ermoumlglichung meinerTeilnahme an diversen Dienstreisen Fortbildungen und Tagungen moumlchte ich mich viel-mals bedankenWeiterhin bedanke ich mich bei Dr Stephan Volkmann und den Rodgauer BaustoffwerkenGmbH amp Co KG fuumlr die gute Zusammenarbeit und die Bereitstellung von Versuchsma-terialienVielen Dank an meine studentischen Hilfskraumlfte Daniel Wagner Laura MoldenhauerFabian Lang Jakob Schreiber und Felix Klaassen die alle Aufgaben im Labor einwand-frei und mit Bedacht erledigten Bei meinen aktuellen und ehemaligen Kollegen DrKatrin Hurle Dr Dominique Ectors Dr Christoph Naber Dr Florian Huumlller JoumlrgNehring Frank Riedel Julian Wolf Tanja Manninger Daniel Wagner Nicolas FobbeKarla Spaumlth Julian Goergens Andreas Koumlhler Cordula Jakob Franz Becker und LisaKlemenz bedanke ich mich fuumlr die gelungene Zusammenarbeit und gegenseitige Unter-stuumltzung Besonderer Dank geht auch an Kerstin Kreszlig Bettina Engl Christian HankeBernd Schleifer und Christian Abe fuumlr die verlaumlssliche Unterstuumltzung bei technischen Fra-gen und Messungen im LaborFuumlr jegliche Unterstuumltzungen moumlchte ich mich auch bei meinen Eltern bedanken sowiebei meinem Bruder Ralf der mir mit einem LaTex Crashkurs viel Frustration ersparthat Danke Thomas dass du immer fuumlr mich da bist und mit mir zusammen fuumlr genugAusgleich gesorgt hast
45
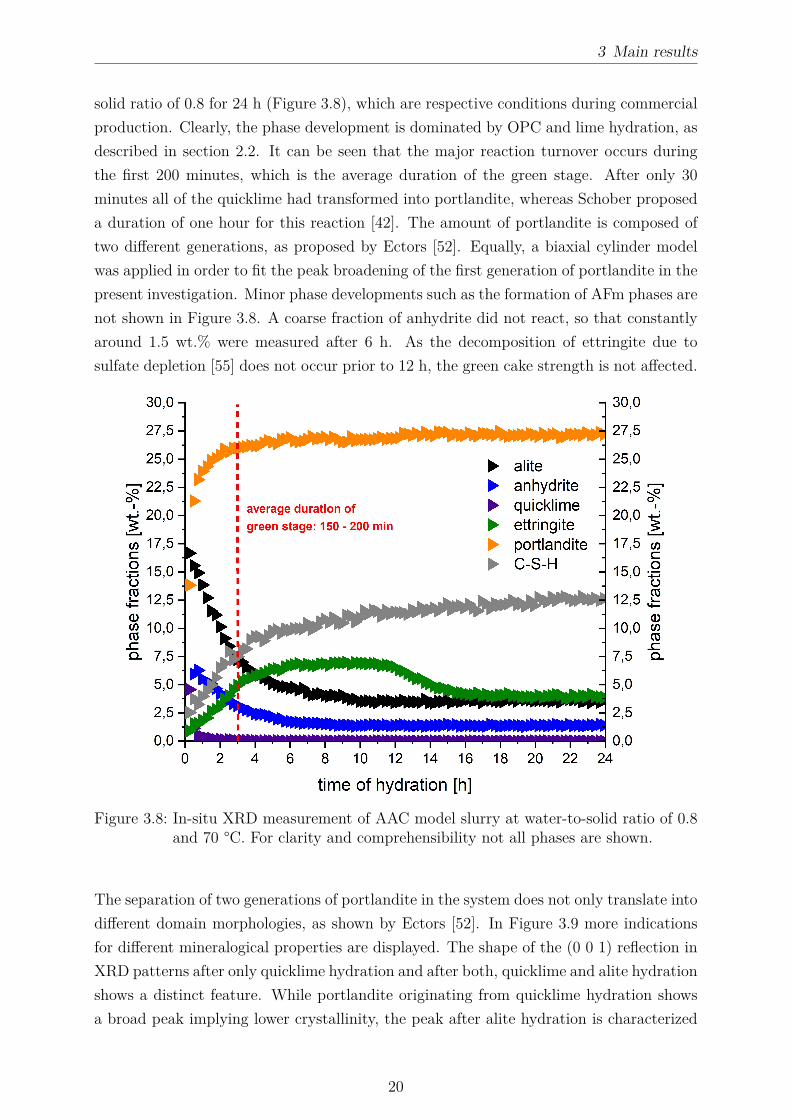
3 Main results
solid ratio of 08 for 24 h (Figure 38) which are respective conditions during commercialproduction Clearly the phase development is dominated by OPC and lime hydration asdescribed in section 22 It can be seen that the major reaction turnover occurs duringthe first 200 minutes which is the average duration of the green stage After only 30minutes all of the quicklime had transformed into portlandite whereas Schober proposeda duration of one hour for this reaction [42] The amount of portlandite is composed oftwo different generations as proposed by Ectors [52] Equally a biaxial cylinder modelwas applied in order to fit the peak broadening of the first generation of portlandite in thepresent investigation Minor phase developments such as the formation of AFm phases arenot shown in Figure 38 A coarse fraction of anhydrite did not react so that constantlyaround 15 wt were measured after 6 h As the decomposition of ettringite due tosulfate depletion [55] does not occur prior to 12 h the green cake strength is not affected
Figure 38 In-situ XRD measurement of AAC model slurry at water-to-solid ratio of 08and 70 degC For clarity and comprehensibility not all phases are shown
The separation of two generations of portlandite in the system does not only translate intodifferent domain morphologies as shown by Ectors [52] In Figure 39 more indicationsfor different mineralogical properties are displayed The shape of the (0 0 1) reflection inXRD patterns after only quicklime hydration and after both quicklime and alite hydrationshows a distinct feature While portlandite originating from quicklime hydration showsa broad peak implying lower crystallinity the peak after alite hydration is characterized
20
3 Main results
Figure 39 Formation of two generations of portlandite in AAC slurry in XRD (a) andDTA (b) plots
by a sharper component Yet the peak breadth did not change indicating that the firstgeneration is still present with the original characteristics This observation is supportedby DTA measurements additionally demonstrating two degrees of crystallinity only afteralite hydration In agreement with XRD analysis the better crystalline second generationof portlandite decomposes at a higher temperature
Figure 310 Quantification of tobermorite in statistical chemically various AAC sampleswith and without the application of the macro for the fitting of anisotropicpeak broadening
21
3 Main results
Furthermore commercial AAC samples were considered in this study By applying themethod for the refinement of anisotropic peak broadening (Figure 31) a more accuratequantification of tobermorite can be achieved In Figure 310 the calculated amounts oftobermorite in statistical chemically various AAC samples are plotted In some samplesthe refinement using the macro leads to considerably higher but never lower quantitiesof tobermorite whereas in other samples nearly the same amount of tobermorite is cal-culated This observation can be well understood taking into account that the macroallows to account more peak area for tobermorite as shown in Figure 31 Clearly thereis evidence that the anisotropy of tobermorite domains is not uniform from one sampleto another which was basically justified in the previous sections As an improved quan-tification of a single phase leads to a better quantification of other phases in the samplethis adaption is very valuable in order to assess the phase development Here the peakbroadening of tobermorite equally observed by Qu et al [6] could be tracked and evalu-ated in order to gain more accurate results Moreover in section 63 McCrone milling issuggested in order to avoid spottiness in XRD patterns caused by coarse grains of quartzor anhydrite (Figure 38)
22
4 Conclusions
4 Conclusions
The research results presented in the previous sections yield advances in the mineralogicalinvestigation of tobermorite and autoclaved aerated concrete Recorded diffraction pat-terns contain plenty of usually unused data regarding the microstructural characteristicsof the sample and phases therein The profit of XRD measurements can be significantlyimproved whenever one or more phases show anisotropic peak broadening and appro-priate models for the respective domain morphology are implemented into the Rietveldenvironment Within the scope of the present investigations portlandite and tobermoriteshow this particularityThe effects of changes in the chemistry of the starting mix were examined based on dif-ferent dosages of metakaolin Al-substituted tobermorite showed increased growth in b
direction and an increase of lattice parameter c compared to Al-free tobermorite The rel-ative domain sizes were determined based on anisotropic peak broadening However whilethe effect of Al3+ incorporation into the lattice of tobermorite was limited regarding thedomain morphology lattice parameter c showed an increase throughout the entire rangeof samples The consequent effects suggested by Klimesch amp Ray observed by means ofDTA are debatable as reactions during the heating experiment may lead to to a changeof Al3+ content in tobermorite [40] While both types of applied metakaolin showed goodreactivity at hydrothermal conditions some included minor phases such as feldspar oranatase remained unreacted At high dosages of Al2O3 in the starting mix the formationof either only katoite or katoite along with tobermorite was observed (Figure 32)SEM analysis of tobermorite in AAC cannot be suggested based on the observationspresented in this work as it is only visually accessible in the pores or at pore surfacesThe dense material of the AAC skeleton contains several crystalline and X-ray amorphousphases which hardly allows a proper investigation Even in single pores tobermorite crys-tals appeared very heterogeneous at various chemical compositions As a result lath-liketobermorite was not only present in samples characterized by elevated Al3+ incorporationBy contrast the benefits of XRD analysis presented in section 61 equally accounted fortobermorite in AAC samples Sulfate incorporation into the lattice of tobermorite wasnot observed All of the sulfate in the system was detected to be present in anhydriteThe phase transitions in the AAC raw slurry during the green stage hydration were show-cased by in-situ XRD analysis of a model mix at 70 degC Additional DTA and XRD mea-
23
4 Conclusions
surements during this step confirmed the presence of two generations of portlandite char-acterized by different crystallinity as suggested by Ectors [52] The inclusion of anisotropicdomain morphology during the Rietveld refinement allowed a more accurate quantifica-tion of tobermorite in autoclaved samples Sample preparation adjusted to the grain sizedistribution in AAC samples (section 63) the external standard method for quantita-tive XRD analysis [55] and the approach to evaluate anisotropic peak broadening [19]are the key methods for a more accurate tracking of the phase development during AACproduction
24
5 References
5 References
[1] A E Zadov A I Grabezhev N N Pertsev N V Chukanov and S V PribavkinTobermorite-plombierite metasomatites of the Gumeshevsk skarn-porphyry copper depositmiddle Urals Doklady Earth Sciences 407(3)495ndash497 2006
[2] M F Heddle Preliminary notice of substances which may prove to be new minerals MinMag 4117ndash123 1880
[3] S Merlino E Bonaccorsi and T Armbruster The real structure of tobermorite 11AringNormal and anomalous forms OD character and polytypic modifications European Journalof Mineralogy 13(3)577ndash590 2001
[4] C Biagioni S Merlino and E Bonaccorsi The tobermorite supergroup a new nomencla-ture Mineralogical Magazine 79(2)485ndash495 2015
[5] C A Riacuteos C D Williams and M A Fullen Hydrothermal synthesis of hydrogarnetand tobermorite at 175 degC from kaolinite and metakaolinite in the CaO-Al2O3-SiO2-H2Osystem A comparative study Applied Clay Science 43(2)228ndash237 2009
[6] X Qu Z Zhao and X Zhao Microstructure and characterization of aluminum-incorporated calcium silicate hydrates (C-S-H) under hydrothermal conditions RSC Ad-vances 8(49)28198ndash28208 2018
[7] R Šiaučiunas and K Baltakys Formation of gyrolite during hydrothermal synthesis inthe mixtures of CaO and amorphous SiO2 or quartz Cement and Concrete Research34(11)2029ndash2036 2004
[8] E Venhodovaacute R Janovskyacute and R Drochytka Formation of Tobermorite at Different Ma-terials Composition of Aerated Concrete Applied Mechanics and Materials 752-753247ndash250 2015
[9] L Galvaacutenkovaacute E Bartoniacutečkovaacute T Opravil J Tkacz and P Ptaacuteček The influence ofstarting materials solubility on tobermorite structure formation under the hydrothermalconditions IOP Conference Series Materials Science and Engineering 379(1)1ndash8 2018
[10] T Mitsuda K Sasaki and H Ishida Phase Evolution during Autoclaving Process J AmCeram Soc 75(75)1858ndash1863 1992
[11] A Skawińska The influence of metahalloysite addition on tobermorite formation studied byX-ray powder diffraction and scanning electron microscope MATEC Web of Conferences16305008 2018
[12] S T Bergold F Goetz-Neunhoeffer and J Neubauer Quantitative analysis of C-S-H in
25
5 References
hydrating alite pastes by in-situ XRD Cement and Concrete Research 53119ndash126 2013
[13] O P Shrivastava and F P Glasser Ion-exchange properties of 11-Aring tobermorite Reactivityof Solids 2(3)261ndash268 1986
[14] H Maeda Y Ogawa E H Ishida and T Kasuga Hydrothermal synthesis of tobermoritedoped with phosphorus species for removing heavy metal ions Journal of the AustralianCeramic Society 48(1)8ndash11 2012
[15] O P Shrivastava and R Shrivastava Cation exchange applications of synthetic tobermoritefor the immobilization and solidification of cesium and strontium in cement matrix Bulletinof Materials Science 23(6)515ndash520 2000
[16] G Renman and A Renman Sustainable Use of Crushed Autoclaved Aerated Concrete(CAAC) as a Filter Medium in Wastewater Purification 8th International conferenceon sustainable management of waste and recycled materials in construction GothenburgSweden 30 Mayndash1 June 2012 Proceedings pages 1ndash7 2012
[17] G Schober Chemical transformations during the manufacturing of autoclaved aeratedconcrete (ACC) Cement lime gypsum and quartz sand become cellular concrete ZKG58(7)63ndash70 2005
[18] A J Hamad Materials Production Properties and Application of Aerated LightweightConcrete Review International Journal of Materials Science and Engineering 2(2)152ndash157 2014
[19] D Ectors F Goetz-Neunhoeffer and J Neubauer A generalized geometric approach toanisotropic peak broadening due to domain morphology Journal of Applied Crystallogra-phy 48(1)189ndash194 2015
[20] H M Rietveld A profile refinement method for nuclear and magnetic structures Journalof Applied Crystallography 2(2)65ndash71 1969
[21] S A Hamid The crystal structure of the 11 Aring natural tobermoriteCa225[Si3O75(OH)15]1H2O Zeitschrift fuer Kristallographie - New Crystal Struc-tures 154(3-4)189ndash198 1981
[22] S A S El-Hemaly T Mitsuda and H F W Taylor Synthesis of normal and anomaloustobermorites Cement and Concrete Research 7429ndash438 1977
[23] M Sakiyama and T Mitsuda Hydrothermal reaction between C-S-H and kaolinite for theformation of tobermorite at 180degC Cement and Concrete Research 7(6)681ndash685 1977
[24] E Bonaccorsi S Merlino and A R Kampf The crystal structure of tobermorite 14 Aring(plombierite) a C-S-H phase Journal of the American Ceramic Society 88(3)505ndash5122005
[25] S Merlino E Bonaccorsi and T Armbruster The real structures of clinotobermorite andtobermorite 9 Aring OD character polytypes and structural relationships European Journalof Mineralogy 12(2)411ndash429 2000
[26] K Momma and F Izumi VESTA 3 for three-dimensional visualization of crystal volu-metric and morphology data Journal of Applied Crystallography 44(6)1272ndash1276 2011
26
5 References
[27] S Shaw S M Clark and C MB Henderson Hydrothermal formation of the calcium sil-icate hydrates tobermorite (Ca5Si6O16(OH)2 middot 4H2O) and xonotlite (Ca6Si6O17(OH)2)An in situ synchrotron study Chemical Geology 167(1-2)129ndash140 2000
[28] K Matsui J Kikuma M Tsunashima T Ishikawa S Matsuno A Ogawa and M SatoIn situ time-resolved X-ray diffraction of tobermorite synthesis process under hydrothermalcondition IOP Conference Series Materials Science and Engineering 18(2)60ndash66 2011
[29] G Matekonis R Šiaučiunas and D Vaičiukyniene Hydrothermal Synthesis and Charac-terization of Na + and [ Al 3 + + Na + ] -substituted Tobermorite in CaO-SiO2middotnH2O-H2OSystem MATERIALS SCIENCE 16(3)242ndash248 2010
[30] G Geng R J Myers M J A Qomi and P JM Monteiro Densification of the inter-layer spacing governs the nanomechanical properties of calcium-silicate-hydrate ScientificReports 7(1)1ndash8 2017
[31] D Klimesch and A Ray Autoclaved cement-quartz pastes with metakaolin additionsAdvanced Cement Based Materials 7(3-4)109ndash118 1998
[32] N Y Mostafa A A Shaltout H Omar and S A Abo-El-Enein Hydrothermal synthesisand characterization of aluminium and sulfate substituted 11 nm tobermorites Journal ofAlloys and Compounds 467(1-2)332ndash337 2009
[33] İ Demir M S Başpınar E Kahraman E Ccedilalışkan and G Goumlrhan An Investigation onthe Usability of Diatomite in Aerated Concrete Production In Proc of the Intl Conf onAdvances In Civil Structural And Construction Engineering - CSCE 2014 pages 97ndash1002014
[34] A Skawinska Z Owsiak T Baran and K Hernik The influence of halloysite additionon tobermorite formation in CaO and quartz mix under hydrothermal conditions CementWapno Beton 17(12)426ndash434 2017
[35] N Y Mostafa Influence of air-cooled slag on physicochemical properties of autoclavedaerated concrete Cement and Concrete Research 35(7)1349ndash1357 2005
[36] D Małaszkiewicz and J Chojnowski Influence of addition of calcium sulfate dihydrate ondrying of autoclaved aerated concrete Open Engineering 7(1)273ndash278 2017
[37] N Hara and N Inoue Thermal behaviour of 11Aring tobermorite and its lattice parametersCement and Concrete Research (10)53ndash60 1980
[38] M D Jackson S R Chae S R Mulcahy C Meral R Taylor P Li A H EmwasJ Moon S Yoon G Vola H R Wenk and P JM Monteiro Unlocking the secretsof Al-tobermorite in Roman seawater concrete American Mineralogist 98(10)1669ndash16872012
[39] W Liao W Li Z Fang C Lu and Z Xu Effect of different aluminum substitution rateson the structure of Tobermorite Materials 12(22)1ndash10 2019
[40] D Klimesch and A Ray DTA-TG Study of the CaO-SiO2-H2O and CaO-Al2O3-SiO2-H2OSystems Under Hydrothermal Conditions Journal of Thermal Analysis and Calorimetry56(1)27ndash34 1999
27
5 References
[41] Z Sauman and Z Valtr Substitution of sulphate ions in the crystal lattice of 11 Aring to-bermorite In The VI International Congress on the Chemistry of Cement pages 1ndash14Moscow 1974
[42] G Schober Reaction of raw materials to the final product AAC httpwwwpb-aacde
chemmin2_ehtml 2012 accessed 2020-01-31
[43] D Jansen C Stabler F Goetz-Neunhoeffer S Dittrich and J Neubauer Does Ordi-nary Portland Cement contain amorphous phase A quantitative study using an externalstandard method Powder Diffraction 26(01)31ndash38 2011
[44] C Roumlszligler J Stark F Steiniger and W Tichelaar Limited-dose electron microscopyreveals the crystallinity of fibrous C-S-H phases Journal of the American Ceramic Society89(2)627ndash632 2006
[45] Y Sakalli and R Trettin Investigation of C3S hydration by environmental scanning elec-tron microscope Journal of Microscopy 259(1)53ndash58 2015
[46] F Matsushita Y Aono and S Shibata Expansion and shrinkage behavior of green cakeof Autoclaved Aerated Concrete In Autoclaved Aerated Concrete - Innovation and Devel-opment Proceedings of the 4th International Conference on Autoclaved Aerated ConcreteKingston UK 8-9 September 2005 pages 101ndash108 CRC Press 2005
[47] C Chucholowski M Holger and K-C Thienel Improving the recyclability environmentalcompatibility and CO2 balance of autoclaved aerated concrete by replacing sulfate carrierand cement with calcined clays CePapers 2(4)503ndash512 2018
[48] X Y Huang W Ni W H Cui Z J Wang and L P Zhu Preparation of autoclavedaerated concrete using copper tailings and blast furnace slag Construction and BuildingMaterials 27(1)1ndash5 2012
[49] W Wongkeo and A Chaipanich Compressive strength microstructure and thermal anal-ysis of autoclaved and air cured structural lightweight concrete made with coal bottom ashand silica fume Materials Science and Engineering A 527(16-17)3676ndash3684 2010
[50] A Roacuteżycka and W Pichoacuter Effect of perlite waste addition on the properties of autoclavedaerated concrete Construction and Building Materials 12065ndash71 2016
[51] N Isu H Ishida and T Mitsuda Influence of quartz particle size on the chemical andmechanical properties of autoclaved aerated concrete (I) tobermorite formation Cementand Concrete Research 25(25)243ndash248 1995
[52] D Ectors Advances in the analysis of cementitious reactions and hydrate phases doctoralthesis PhD thesis Friedrich-Alexander-Universitaumlt Erlangen-Nuumlrnberg 2016
[53] D Ectors F Goetz-Neunhoeffer and J Neubauer Domain size anisotropy in the double-Voigt approach An extended model Journal of Applied Crystallography 481998ndash20012015
[54] D Ectors F Goetz-Neunhoeffer and J Neubauer Routine (an)isotropic crystallite sizeanalysis in the double-Voigt approximation done right Powder Diffraction 32(S1)27ndash342017
28
5 References
[55] D Jansen F Goetz-Neunhoeffer C Stabler and J Neubauer A remastered external stan-dard method applied to the quantification of early OPC hydration Cement and ConcreteResearch 41(6)602ndash608 2011
[56] T Ungaacuter G Tichy J Gubicza and R J Hellmig Correlation between subgrains andcoherently scattering domains Powder Diffraction 20(04)366ndash375 2005
[57] Triloki P Garg R Rai and B K Singh Structural characterization of as-depositedcesium iodide films studied by X-ray diffraction and transmission electron microscopy tech-niques Nuclear Instruments and Methods in Physics Research Section A AcceleratorsSpectrometers Detectors and Associated Equipment 736128ndash134 2014
[58] J Schreiner F Goetz-Neunhoeffer J Neubauer and D Jansen Hydrothermal synthesisof 11 Aring tobermorite ndash Effect of adding metakaolin to the basic compound Applied ClayScience 185 2020
[59] J Schreiner F Goetz-Neunhoeffer J Neubauer S Volkmann S Bergold R Webler andD Jansen Advanced Rietveld refinement and SEM analysis of tobermorite in chemicallydiverse autoclaved aerated concrete Powder Diffraction 34143ndash150 2019
[60] J Schreiner D Jansen D Ectors F Goetz-Neunhoeffer J Neubauer and S VolkmannNew analytical possibilities for monitoring the phase development during the production ofautoclaved aerated concrete Cement and Concrete Research 107247ndash252 2018
29
6 Publications
6 Publications
61 Hydrothermal synthesis of 11 Aring tobermorite ndash Effectof adding metakaolin to the basic compound
Reprint of the peer reviewed publication
Schreiner J Goetz-Neunhoeffer F Neubauer J Jansen D 2020 Hydrothermalsynthesis of 11 Aring tobermorite ndash Effect of adding metakaolin to the basic compoundApplied Clay Science 185 httpsdoiorg101016jclay2019105432
with permission from Elsevier
30
Contents lists available at ScienceDirect
Applied Clay Science
journal homepage wwwelseviercomlocateclay
Research paper
Hydrothermal synthesis of 11 Aring tobermorite ndash Effect of adding metakaolin tothe basic compound
J Schreiner F Goetz-Neunhoeffer J Neubauer D JansenUniversity of Erlangen-Nuremberg GeoZentrum Nordbayern Mineralogy Schlossgarten 5a 91054 Erlangen Germany
A R T I C L E I N F O
KeywordsHydrothermal synthesis11 Aring tobermoriteMetakaolinPowder diffractionKatoite
A B S T R A C T
Different amounts and types of metakaolin were analyzed and applied for the hydrothermal synthesis of 11 Aringtobermorite All synthesized samples were investigated by means of powder XRD combined with Rietveld re-finement Al-substituted 11 Aring tobermorite was successfully synthesized on the basis of a broad range of com-pounds characterized by a varying content of metakaolin Katoite was present depending on the amount ofsupplied Al3+ which was determined by the dosage of metakaolin Minor crystalline components included in thetwo types of metakaolin sources varied greatly in their reactivity under hydrothermal conditions Despite adifferent degree of purity the two types of metakaolin showed corresponding effects at moderate dosages butcontrary effects at higher dosages as for the synthesis of 11 Aring tobermorite The domain morphology of to-bermorite could be associated with Al3+ incorporation for low dosages of metakaolin represented by up to 2 wt- Al2O3 in the dry mix By contrast Al3+ affected tobermorite lattice parameters at equivalent and even athigher dosages with c reaching 2295 Aring at 12 wt- Al2O3 in the dry mix
1 Introduction
11 Application of metakaolin as a reactive material in constructionindustry
The application of supplementary cementitious materials (SCMs) inthe field of construction technology has received a lot of attention inrecent years Due to limited resources and an urgent need for alter-native and more eco-friendly construction materials SCMs such asmetakaolin offer a great potential The usage of SCMs has not onlyspread to the cement and mortar industry but also to advanced appli-cations such as autoclaved aerated concrete (AAC) (Demir et al 2014Koutnyacute et al 2014 Walczak et al 2015 Roacuteżycka and Pichoacuter 2016Chucholowski et al 2018) Unlike ordinary cementitious constructionmaterials AAC is produced from hydrothermal curing Due to the dif-ferent thermodynamic environment the hydration process and the re-activity of raw materials have to be investigated properly in order tounderstand the effects on the AAC product The leading mineral phasein AAC is 11 Aring tobermorite (Ca5Si6O16(OH)2middot4H2O) As a consequencethe thermal and mechanical properties of AAC depend on micro-structure and crystallinity of tobermorite to some extent In addition tothe curing time and the fineness of raw materials the supply of ionsthat can substitute in the tobermorite structure is a crucial factor in thiscontext Especially substitutions by aluminum sodium and potassium
ions have been investigated thoroughly (Sauman 1974 Klimesch andRay 1998 Mostafa et al 2009 Matekonis et al 2010 Skawinskaet al 2017) Calcined clays usually contain a considerable amount ofthe mentioned ions
There is a vast amount of literature on the reactivity of SCMs atambient temperature and standard pressure but there is little when itcomes to hydrothermal conditions In previous publications the beha-vior of metakaolin under hydrothermal conditions was mainly in-vestigated for the synthesis of zeolites (Zhang et al 2007 Aguilar-Mamani et al 2014 Setthaya et al 2016 Luo et al 2018) In thesestudies the reactivity of metakaolin was observed at a wide range oftemperature and pH values During the transformation of kaolin intometakaolin a loss of framework alumina was observed (Ayodele et al2019) In recent decades metakaolin has been the subject of studies inthe field of geopolymer research (Rashad 2013 Chen et al 2016) Forthe synthesis of 11 Aring tobermorite a more distinct setting of temperaturesetting (180ndash200 degC) and steam pressure (1ndash12 MPa) are required
This publication is intended to make a new contribution to thechallenging field of hydrothermal synthesis in the system CaO-Al2O3-SiO2-H2O based on XRD analysis combined with Rietveld refinementVarious dosages of two types of metakaolin with different chemical andmineralogical purities are compared for the effects on the hydrothermalsynthesis of Al-substituted 11 Aring tobermorite Especially changes of thebulk chemistry in the raw mixes the reactivity of minor crystalline
httpsdoiorg101016jclay2019105432Received 20 August 2019 Received in revised form 13 November 2019 Accepted 30 December 2019
Corresponding authorE-mail address juergenjsschreinerfaude (J Schreiner)
Applied Clay Science 185 (2020) 105432
0169-1317 copy 2020 Elsevier BV All rights reserved
T
6 Publications
31
phases of the two types of metakaolin and the effect of different curingtimes are the focus of interest On the one hand metakaolin offers agreat potential in the AAC industry On the other hand of all SCMsmetakaolin is a good source material for investigating the influence ofAl3+ on the synthesis of Al-substituted 11 Aring tobermorite
12 Synthesis of Al-substituted 11 Aring tobermorite
In addition to being present in AAC tobermorite has found appli-cation in wastewater treatment and nuclear waste management due toits ion exchange capacity (Maeda et al 2012 Monasterio et al 2015)The substitution of silicon by aluminum results in a different to-bermorite structure due to general and local charge balance affectingthe lattice parameters Especially c is impacted by this substitutionbecause it occurs in the bridging tetrahedron and additional OHndash sub-stitutes O2ndash (Komarneni et al 1985 Merlino et al 2000) As suggestedin some additional studies the substitution of Si4+ by Al3+ and Na+ orK+ leads to a lath-like morphology of tobermorite crystals (Mostafa2005 Mostafa et al 2009 Venhodovaacute et al 2015 Qu et al 2018)However because of the heterogeneous appearance of tobermorite inAAC it is hardly possible to conduct a proper characterization based onSEM analysis In our recent work the anisotropic peak broadening oftobermorite in XRD diffractograms was successfully linked with theincorporation of foreign ions supplied in a common AAC production(Schreiner et al 2019) This finding allowed a more statistical struc-tural characterization of tobermorite in bulk compositions compared toSEM analysis Moreover it was reported in other studies that differenthydrate phases occur depending on the amount of supplied ions and onthe experimental settings In compounds with a high content of Al3+formation of katoite could be observed (Klimesch and Ray 1998 Riacuteoset al 2009 Matsui et al 2011) In the case of a longer curing durationinstead of 11 Aring tobermorite the formation of xonotlite (Siauciunas andBaltakys 2004 Galvaacutenkovaacute et al 2018) or - depending on the finenessof used silica source (Siauciunas and Baltakys 2004) - gyrolite is fa-voured
Kalousek (1956) suggested that tobermorite can contain up to 5Al2O3 More Al2O3 in the system resulted in the formation of hydro-garnet Klimesch and Ray (1998) additionally investigated the stabilityof hydrogarnet depending on the Al(Si + Al) ratio and its role in re-lation to the formation of 11 Aring tobermorite in an equivalent systemThey suggest that hydrogarnet always appears before tobermorite butthe former can only be detected for higher Al(Si + Al) ratios in theevent of longer curing times Riacuteos et al (2009) and Qu et al (2018)confirmed these findings in extensive investigations In the latter pub-lication it is additionally suggested that samples prepared at lowertemperatures (160 degC) are less impacted by the supply of Al3+ Theyalso consider the peak broadening of tobermorite in their XRD plotsbased on the amount of incorporated Al3+ In two recent publicationswe suggested that the peak broadening of tobermorite enables a mi-crostructural analysis by calculating the orientation dependent domainsizes (Schreiner et al 2018 2019) However these studies are based onsamples of industrially produced AAC so that the curing time was fixedThe studied AAC was produced from raw materials with a broad che-mical spectrum such as ordinary Portland cement (OPC) whichsomehow complicates the interpretation of results
In this work the influence of aluminum ions - provided by meta-kaolin - on dominant crystallographic direction-dependent domaingrowth of tobermorite is investigated by analysis of anisotropic peakbroadening (Ectors et al 2015 2017) In Fig 1 of the supplementarymaterial the method of fitting the anisotropic peak broadening of to-bermorite using a triaxial cylinder model is visualized (Schreiner et al2018) Fitting of the anisotropic peak broadening of tobermorite Thismethod is used to calculate the average and reliable values for to-bermorite domain sizes in the powder sample and associate them withaverage Al3+ incorporation Microstrain should be considered becauseit is an additional source of peak broadening However this usually
accounts for materials that have been exposed to different kinds ofstress such as metals and alloys (Badawi et al 2019) In addition theinstrumental contribution to peak broadening should be consideredHydration products such as tobermorite are characterized by crystallitesizes in the range of nanometers so that anisotropic size broadeningclearly outweighs the effect of instrumental broadening (Jenkins andSnyder 1996) Moreover the impact of Al3+ on the lattice parametersof tobermorite is considered It should additionally be clarified whe-ther the results from our previous publication (Schreiner et al 2019)based on industrially produced AAC can be confirmed by investigationwith less complex raw mixes and purely based on laboratory experi-ments
2 Material and methods
21 Starting materials
The starting materials for hydrothermal synthesis included deio-nized water quartz flour portlandite (999 pure) and two types ofmetakaolin One type was ordinary commercially available metakaolin(MK) with nearly a stoichiometric composition For comparison thesecond type of commercially available metakaolin was a by-productfrom expanded glass production (MKg) and consequently highly im-pure The chemical composition of MK and MKg determined by XRF isgiven in Table 1 With MKg containing less Al2O3 but considerably moreNa2O than MK the effects on hydrothermal synthesis were of interestBoth types of metakaolin have been characterized in previous pub-lications (Schmidt et al 2012 Naber et al 2019) In addition weverified the mineral phase content by XRD analysis Besides amorphousmetakaolin MK contained minor amounts of anatase quartz and mica
Fig 1 Weight fractions of tobermorite quartz and katoite determined byquantitative XRD analysis ndash samples including MKg crosshatched
Table 1Chemical composition of MK and MKg determined by XRF analysis ndash majorcontrasts in bold letters
Oxides [wt-] MK MKg
SiO2 536 604Al2O3 392 206CaO 01 40MgO 01 12Na2O 0 96K2O 10 18Fe2O3 18 05TiO2 21 03P2O5 01 02Loss on ignition 15 1
J Schreiner et al Applied Clay Science 185 (2020) 105432
2
6 Publications
32
MKg contained additional kaolinite feldspar and quartz
22 Investigated mix composites
For the preparation of raw mixtures the powders were weighed andhomogenized using a lab-scale mixing mill Table 2 lists the composi-tion and nomenclature of all samples including Al2O3 content andcuring time in the autoclave
bull Besides one blank mixture (MK0) that did not contain any type ofmetakaolin eleven more compounds were prepared of which threeincluded different dosages of MKg (MKg16 MKg23 and MKg60)Three more mixes contained equivalent amounts of MK instead ofMKg (MK16 MK23 and MK60) These mixes were investigated inorder to have a direct comparison concerning the effects of differentraw material on the synthesis of tobermorite
bull Additionally the mixes MK9 MK5 and MK25 with lower dosages ofmetakaolin were analyzed In the referenced literature (Schreineret al 2019) the effect of Al3+ on the anisotropic peak broadeningof tobermorite could only be observed in the case of Al2O3 contentslower than 4 in the drymix In the latter three mixes Al2O3 con-tents range from 1 to 35 Al2O3 (calculated from XRF data) whichmeets the region of interest for the analysis of tobermorite domainmorphology
bull The curing time for nearly all of the investigated samples was 12 hbut compound MK9 was prepared two more times for curing timesof 2 h and 6 h The different curing times were chosen in this par-ticular sample so that the reactivity of metakaolin and the phasetransitions could be observed more precisely
23 Hydrothermal treatment
Due to the different fineness of raw materials there was a differentwater demand from one mixture to another In order to obtain slurriesof comparable rheology the amount of water was adapted respectivelyresulting in water-to-solid ratios of 25 to 3 which matches the sug-gested water-to-solid ratio for this purpose (Roacutezycka et al 2014Galvaacutenkovaacute et al 2018) The weighed water was added to the dry mixand after stirring for 1 min at 23 degC the slurry was poured into thereactor Minor changes in the quantity of added water did not have aninfluence on the measured steam pressure All experiments were con-ducted using a PTFE-lined stainless steel autoclave with a reactor vo-lume of 300 ml The oven temperature was fixed at 180 degC and auto-genous steam pressure of 11ndash12 MPa was measured during eachexperiment with an external manometer After cooling to room tem-perature the sample was removed from the reactor coarsely ground
using an agate mortar and dried at 60 degC for 12 h After drying thesample was ground with an agate mortar again in order to deagglo-merate the particles As no coarse raw materials were used there wasno need for wet McCrone milling (Schreiner et al 2018)
24 XRD analysis
After preparation into front-loading sample holders the powdersamples were measured with a D8 diffractometer (Bruker) equippedwith a LynxEye detection system and Bragg-Brentano geometry Thesettings for XRD analysis included a tube voltage of 40 kV a current of40 mA an angular range from 6 to 80deg 2θ (Cu Kα radiation) a time perstep of 054 s a step width of 00236deg 2θ and a PSD opening of 33deg Thebackground was fitted with Chebyshev polynomial of the fifth orderThe major contribution of amorphous phase was fitted with a singlepeak with a fixed position at 308deg 2θ so that tobermorite reflectionswere not affected An external quartzite standard was measured withthe same parameters in order to determine phase quantities (Jansenet al 2011) Bruker AXS software TOPAS 50 was used for Rietveldrefinement (Rietveld 1969) and the used structures are shown inTable 3
3 Results and discussion
31 Different dosages of MK and MKg
In Fig 1 the quantities of tobermorite quartz and katoite present inmost of the samples determined by XRD analysis are illustratedWhenever tobermorite was the leading mineral hydrate phase a basalspacing of 113 Aring could be verified in each of the diffractograms Thequantities of minor crystalline phases and amorphous content are notshown For low dosages of MK it can be seen that the weight fraction oftobermorite decreased At moderate dosage of both types of metakaolin(MK16 MK23 MKg16 MKg23) tobermorite was present in comparablequantities It can be seen that the amount of katoite in the mixes de-pended on the dosage of metakaolin and it appeared only at dosages ofMK5 or more Due to the higher content of aluminum in MK comparedto MKg more katoite could always be observed in the MK mixes atequivalent dosages Despite equal amounts of quartz as starting mate-rial in mixes for both types of metakaolin the resulting weight fractionsin the cured samples were not alike Considerably more quartz waspresent in the MK samples Even though less quartz was used for mixescontaining higher amounts of MK even more quartz was present afterhydrothermal curing (Table 2 Fig 1) Consequently some of the SiO2
provided by MK did not transform into an amorphous phase or to-bermorite but into quartz This finding is verified by the presence ofquartz in MK60 because no quartz was included in the raw mixture Thefeldspar present in MKg did not react so Na2O and an unknown amountof Al2O3 may not have been supplied for hydrothermal reaction Besidestobermorite and quartz additional calcite scawtite (Ca7Si6(CO3)
Table 2Basic powder compounds prepared for the hydrothermal synthesis of to-bermorite with the respectively calculated Al2O3 content and curing time in thereactor
Sample Portlandite[wt-]
Quartz[wt-]
MK[wt-]
MKg
[wt-]
Al2O3
[wt-]Curingtime [h]
MK0 49 51 ndash ndash 0 12MK25 495 48 25 ndash 1 12MK5 49 46 5 ndash 2 12MK9_2h 48 43 9 ndash 35 2MK9_6h 48 43 9 ndash 35 6MK9_12h 48 43 9 ndash 35 12MK16 47 37 16 ndash 63 12MK23 46 31 23 ndash 9 12MK60 40 ndash 60 ndash 235 12MKg16 47 37 ndash 16 33 12MKg23 46 31 ndash 23 47 12MKg60 40 ndash ndash 60 124 12
Table 3Structural data used for the investigation with powder XRD analysis
Phase Author
Anatase (Horn et al 1972)Biotite (Brigatti et al 2000)Calcite (Maslen et al 1995)Kaolinite (Zvyagin 1960)Katoite (Bartl 1969)Microcline (Bailey 1969)Plazolite (Basso et al 1983)Portlandite (Busing and Levy 1957)Quartz (Le Page and Donnay 1976)Scawtite (Grice 2005)Tobermorite (Hamid 1981)Xonotlite (Hejny and Armbruster 2001)
J Schreiner et al Applied Clay Science 185 (2020) 105432
3
6 Publications
33
O18bull2(H2O)) and xonotlite (Ca6Si6O17(OH)2) could be identified insample MK0 (XRD plots of samples MK0 MKg16 MKg23 MK16 andMK23) Comparing MK0 and MK25 scawtite and xonotlite could stillbe identified in a very low amount in MK25 but no longer in samplesthat contained even more MK (XRD plots of samples MK0 MK25 MK5and MK9_12h)
Two additional experiments were done without quartz in the rawmixes (MK60 and MKg60) The according diffractograms after hydro-thermal curing are shown in Fig 2 In sample MKg60 tobermorite (gt 50wt-) was successfully synthesized without any other silica sourcethan MKg whereas no crystalline quartz occurred By contrast no to-bermorite but quartz could be identified in equivalent mixture MK60containing MK It can be seen that crystalline components such as micaand anatase in the raw MK did not react at the selected conditions andremained present in the autoclaved samples Except for feldspar in MKgall of the crystalline components appeared to be reactive at the chosenhydrothermal conditions A minor unidentified phase occurred at328deg2θ and additional xonotlite was identified in sample MKg60 Insample MK60 more calcium was needed for the formation of morehydrogarnet (Fig 1) resulting in a lower CaSi ratio for the remainingsystem Sample MKg60 contained only half of the amount of Al3+ and itwas not completely supplied for reaction due to its partial presence infeldspar Consequently essentially less hydrogarnet (Fig 1) was presentin MKg60 after hydrothermal treatment and the CaSi ratio in the re-maining system was affected to a lesser extent
32 Application of MK for different curing times
The development of hydrate phases in the autoclave for compoundMK9 is displayed in Fig 3 After only 2 h of hydrothermal curing all ofthe available portlandite had reacted and katoite (95 wt-) was pre-sent The applied type of metakaolin appeared to react quickly as itsupplied aluminum for formation of katoite No formation of to-bermorite could be observed at this stage yet An assumably amorphousprecursor can be seen at 28 to 30deg2θ Calcium was provided by thedissolution of portlandite After 6 h of hydrothermal reaction amountsof katoite (85 wt-) and quartz (from 31 wt- at 2 h to 165 wt- at6 h) had decreased and a major amount of tobermorite (35 wt-) waspresent Apparently between 2 and 6 h under hydrothermal conditionsthe amorphous precursor and quartz reacted resulting in the formationof tobermorite An additional 6 h of reaction time (MK9_12h) did notchange the phase composition significantly Slightly more tobermorite
(365 wt-) less quartz (16 wt-) and katoite (65 wt-) weremeasured
33 Tobermorite domain morphology and lattice parameters
In the referenced literature an analysis of tobermorite domainmorphology based on anisotropic peak broadening was possible forsamples that contained notgt 4 wt- Al2O3 in the drymix (Schreineret al 2019) Accordingly in this study samples MK0 MK25 MK5MK9_6h and MK9_12h were suitable (Table 2) with MK9_2h not con-taining any tobermorite In Fig 4 the respective growth in a and b di-rection is visualized with x indicating the domain size in a direction andy indicating domain size in b direction using a macro for TOPAS 50(Ectors et al 2015 2017) The calculated cylinder models in Fig 4represent the relation of yx and not absolute sizes With no supply ofaluminum ions (MK0) the relative domain growth in b direction islower compared to samples containing metakaolin This finding agreeswith the results from a similar investigation of tobermorite in AAC(Schreiner et al 2019) However within the samples MK5 andMK9_12h the different amounts of supplied aluminum ions did notshow a clear effect It appeared that low dosages of Al3+ (1 wt- Al2O3
in MK25 and 2 wt- Al2O3 in MK5) were enough to determine thedomain growth of tobermorite Additional results from the samplesMK9_6h and MK9_12h indicated that growth in b direction increasedwith reaction time
In Fig 5 lattice parameters of tobermorite depending on metakaolindosages are plotted B clearly remained unaffected throughout therange of samples Increasing amounts of metakaolin led to a slightlysmaller parameter a However both types of metakaolin showed acorresponding impact on parameter a By contrast parameter c in-creased strongly with increasing amounts of MK and MKg but the typeof metakaolin was significant At an equivalent dosage MK affected thecell dimension in c direction considerably more than MKg so that thefraction of Al3+ appeared to be the decisive parameter Different metaloxides in MKg did not show a notable effect certainly as they werepartially not provided for reaction Unlike for the domain morphologyof tobermorite the impact on lattice parameters could be observedwithin the complete range of examined dosages
4 Conclusions
The results obtained from the introduced investigations allow con-cluding remarks on the effects of the applied types of metakaolin on thesynthesis of 11 Aring tobermorite the phase transitions and the in-corporation of Al3+ into the lattice of tobermorite
With a critical dosage the use of any type of metakaolin led to theformation of katoite in an according amount At moderate dosages(MKg16 MKg23 MK16 and MK23) the two types of metakaolin showeda good correspondence in consideration of the quantities of to-bermorite For higher dosages there were contrary effects Lower do-sages of MK led to considerable quantities of Al-substituted to-bermorite Samples containing low dosages of MK revealed that katoiteappeared in the case ofgt 5 wt- of MK - corresponding to 2 wt-Al2O3 - in the basic compound Minor crystalline phases in MKg showedbetter reactivity than those in MK The observation that no tobermoritewas present in sample MK60 indicated that high dosages of Al3+ hin-dered the formation of tobermorite
Investigations of MK9 at 2 6 and 12 h displayed the evolution ofhydrate phases At first katoite was the only crystalline hydrate phasepresent after 2 h which corresponded to observations in a differentpublication (Klimesch and Ray 1999) The amount of katoite andquartz then decreased and a major amount of tobermorite formed from2 to 6 h curing time In order to gain more information on the trans-formation of amorphous C-(A)-S-H into tobermorite additional ex-periments in the range of 2 to 6 h curing time will be needed
Domain morphology analysis of tobermorite revealed that low
Fig 2 Diffractograms of MKg MKg60 MK and MK60 from 7 to 34deg2θ CuKα Aanatase C calcite F feldspar k kaolinite K katoite M mica Q quartz Ttobermorite U unidentified phase X xonotlite
J Schreiner et al Applied Clay Science 185 (2020) 105432
4
6 Publications
34
dosages of Al3+ determined the domain growth which agreed with theresults published on tobermorite in AAC samples (Schreiner et al2019) Different curing times unveiled that growth in b direction in-creased with the reaction time Al3+ incorporation into the lattice oftobermorite only reflected to a limited extent in the domain mor-phology By contrast an increase of lattice parameter c was triggered byAl3+ even at the highest dosage in this study Ultimately there is no
evidence for a limit of incorporation of Al3+ but there is a limit ofinfluence on the domain morphology These results additionally re-confirm this assumption similarly made in the previous work (Schreineret al 2019) and suggest a new mechanism of tobermorite crystal-lization depending on the presence of Al3+
Supplementary data to this article can be found online at httpsdoiorg101016jclay2019105432
Declaration of Competing Interest
The authors declare that they have no known competing financialinterests or personal relationships that could have appeared to influ-ence the work reported in this paper
Acknowledgement
The authors thank Rodgauer Baustoffwerke GmbH amp Co KG forsupplying raw materials for laboratory experiments
References
Aguilar-Mamani W Garciacutea G Hedlund J Mouzon J 2014 Comparison betweenleached metakaolin and leached diatomaceous earth as raw materials for the synth-esis of ZSM-5 Springerplus 3 1ndash10 httpsdoiorg1011862193-1801-3-292
Ayodele OB Sulaimon AA Alaba PA Tian Z-Y 2019 Influence of metakaolini-zation temperature on the structure and activity of metakaolin supported Ni catalystin dry methane reforming J Environ Chem Eng httpsdoiorg101016jjece2019103239 (in press)
Badawi EA Abdel-Rahman MA Mostafa A Abdel-Rahman M 2019 Determinationof the crystallite size amp micro- strain by novel method from XRD profile Appl Phys2 1ndash15 httpsdoiorg1031058jap201921001
Bailey SW 1969 Refinement of an intermediate microcline structure Am Miner 541540ndash1545
Bartl H 1969 Roentgen-Einkristalluntersuchungen an (CaO)3 (Al2O3) (H2O)6 und an(CaO)12 (Al2O3)7 (H2O) neuer Vorschlag zur (CaO)12 (Al2O3)7-Struktur NeuesJahrb fuer Mineral Monatshefte 1969 404ndash413
Basso R Giusta AD Zefiro L 1983 Crystal structure refinement of plazolite A highlyhydrated natural hydrogrossular Neues Jahrb Miner Monatsh (Neues Jahrb fuerMineral Monatshefte) 1983 251ndash258
Brigatti MF Lugli C Poppi L Foord EE Kile DE 2000 Crystal chemical varia-tions in Li- and Fe-rich micas from Pikes Peak batholith (Central Colorado) AmMineral 85 1275ndash1286 httpsdoiorg102138am-2000-8-920
Busing WR Levy HA 1957 Neutron diffraction study of calcium hydroxide J ChemPhys 26 563 httpsdoiorg10106311743345
Chen L Wang Z Wang Y Feng J 2016 Preparation and properties of alkali acti-vated metakaolin-based geopolymer Materials (Basel) 9 1ndash12 httpsdoiorg103390ma9090767
Chucholowski C Holger M Thienel K-C 2018 Improving the recyclability en-vironmental compatibility and CO2 balance of autoclaved aerated concrete by re-placing sulfate carrier and cement with calcined clays CePapers 2 503ndash512httpsdoiorg101002cepa846
Fig 3 Diffractograms of MK9_2h MK9_6h and MK9_12h from 7 to 38deg2θ CuKα C calcite K katoite Q quartz T tobermorite
Fig 4 Relation of calculated domain sizes of 11 Aring tobermorite in selectedsamples (MK0 MK25 MK5 MK9_6h and MK9_12h) in a (x) and b (y) direction
Fig 5 Lattice parameters of tobermorite depending on MK or MKg dosageincluding blank mix MK0
J Schreiner et al Applied Clay Science 185 (2020) 105432
5
6 Publications
35
Demir İ Başpınar MS Kahraman E Ccedilalışkan E Goumlrhan G 2014 An investigationon the usability of diatomite in aerated concrete production In Proc of the IntlConf on Advances in Civil Structural and Construction Engineering ndash CSCE 2014 pp97ndash100
Ectors D Goetz-Neunhoeffer F Neubauer J 2015 A generalized geometric approachto anisotropic peak broadening due to domain morphology J Appl Crystallogr 48189ndash194 httpsdoiorg101107S1600576714026557
Ectors D Goetz-Neunhoeffer F Neubauer J 2017 Routine (an)isotropic crystallitesize analysis in the double-Voigt approximation done right Powder Diffract 3227ndash34 httpsdoiorg101017S0885715617000070
Galvaacutenkovaacute L Bartoniacutečkovaacute E Opravil T Tkacz J Ptaacuteček P 2018 The influence ofstarting materials solubility on tobermorite structure formation under the hydro-thermal conditions IOP Conf Ser Mater Sci Eng 379 1ndash8 httpsdoiorg1010881757-899X3791012001
Grice JD 2005 The structure of spurrite tilleyite and scawtite and relationships toother silicate-carbonate minerals Can Mineral 43 1489ndash1500 httpsdoiorg102113gscanmin4351489
Hamid SA 1981 The crystal structure of the 11 Aring natural tobermoriteCa225[Si3O75(OH)15]1H2O Zeitschrift fuer Krist 154 189ndash198 httpsdoiorg101524zkri19811543-4189
Hejny C Armbruster T 2001 Polytypism in xonotlite Ca6Si6O17(OH)2 Zeitschrift furKrist 216 396ndash408
Horn M Schwerdtfeger CF Meagher EP 1972 Refinement of the structure of ana-tase at several temperatures Zeitschrift fur Krist 136 273ndash281 httpsdoiorg101524zkri19721363-4273
Jansen D Goetz-Neunhoeffer F Stabler C Neubauer J 2011 A remastered externalstandard method applied to the quantification of early OPC hydration Cem ConcrRes 41 602ndash608 httpsdoiorg101016jcemconres201103004
Jenkins R Snyder R 1996 Introduction to X-ray Powder Diffractometry ChemicalAnalysis Wiley pp 90
Kalousek GL 1956 Crystal Chemistry of Hydrous Calcium Silicates J Am Ceram Soc40 74ndash80
Klimesch D Ray A 1998 Autoclaved cement-quartz pastes with metakaolin additionsAdv Cem Based Mater 7 109ndash118 httpsdoiorg101016S1065-7355(97)00073-4
Klimesch D Ray A 1999 DTA-TGA evaluations of the CaOndashAl2O3ndashSiO2ndashH2O systemtreated hydrothermally Thermochim Acta 334 115ndash122 httpsdoiorg101016s0040-6031(99)00140-9
Komarneni S Roy R Roy DM Fyfe CA Kennedy GJ Bothner-By AA Dadok JChesnick AS 1985 27Al and29Si magic angle spinning nuclear magnetic resonancespectroscopy of Al-substituted tobermorites J Mater Sci 20 4209ndash4214 httpsdoiorg101007BF00552416
Koutnyacute O Opravil T Pořiacutezka J 2014 Application of metakaoline in autoclavedaerated concrete technology Adv Mater Res 1000 174ndash177 httpsdoiorg104028wwwscientificnetAMR1000174
Le Page Y Donnay G 1976 Refinement of the crystal structure of low-quartz ActaCrystallogr Sect B 32 2456ndash2459 httpsdoiorg101107S0567740876007966
Luo H Law WW Wu Y Zhu W Yang EH 2018 Hydrothermal synthesis of needle-like nanocrystalline zeolites from metakaolin and their applications for efficient re-moval of organic pollutants and heavy metals Microporous Mesoporous Mater 2728ndash15 httpsdoiorg101016jmicromeso201806015
Maeda H Ogawa Y Ishida EH Kasuga T 2012 Hydrothermal synthesis of to-bermorite doped with phosphorus species for removing heavy metal ions J AustCeram Soc 48 8ndash11
Maslen EN Streltsov VA Streltsova NR Ishizawa N 1995 Electron density andoptical anisotropy in rhombohedral carbonates III Synchrotron Xray studies ofCaCO3 MgCO3 and MnCO3 Acta Crystallogr Sect B 51 929ndash939 httpsdoiorg101107S0108768195006434
Matekonis G Šiaučiūnas R Vaičiukynienė D 2010 Hydrothermal Synthesis andCharacterization of Na + and [ Al 3 + + Na + ] -substituted Tobermorite in CaO-SiO2middotnH2O-H2O System Mater Sci 16 242ndash248
Matsui K Kikuma J Tsunashima M Ishikawa T Matsuno S Ogawa A Sato M2011 In situ time-resolved X-ray diffraction of tobermorite synthesis process underhydrothermal condition IOP Conf Ser Mater Sci Eng 18 60ndash66 httpsdoiorg1010881757-899X182022017
Merlino S Bonaccorsi E Armbruster T 2000 The real structures of clinotobermoriteand tobermorite 9 Aring OD character polytypes and structural relationships Eur JMineral 12 411ndash429 httpsdoiorg1011270935-122120000012-0411
Monasterio M Gaitero JJ Manzano H Dolado JS Cerveny S 2015 Effect ofchemical environment on the dynamics of water confined in calcium silicate mi-nerals Natural and synthetic tobermorite Langmuir 31 4964ndash4972 httpsdoiorg101021acslangmuir5b00614
Mostafa NY 2005 Influence of air-cooled slag on physicochemical properties of auto-claved aerated concrete Cem Concr Res 35 1349ndash1357 httpsdoiorg101016jcemconres200410011
Mostafa NY Shaltout AA Omar H Abo-El-Enein SA 2009 Hydrothermal synth-esis and characterization of aluminium and sulfate substituted 11 nm tobermoritesJ Alloys Compd 467 332ndash337 httpsdoiorg101016jjallcom200711130
Naber C Stegmeyer S Jansen D Goetz-Neunhoeffer F Neubauer J 2019 ThePONKCS method applied for time resolved XRD quantification of supplementarycementitious material reactivity in hydrating mixtures with ordinary Portland ce-ment Constr Build Mater 214 449ndash457 httpsdoiorg101016jconbuildmat201904157
Qu X Zhao Z Zhao X 2018 Microstructure and characterization of aluminum-in-corporated calcium silicate hydrates (C-S-H) under hydrothermal conditions RSCAdv 8 28198ndash28208 httpsdoiorg101039c8ra04423f
Rashad AM 2013 Metakaolin as cementitious material history scours production andcomposition - a comprehensive overview Constr Build Mater 41 303ndash318 httpsdoiorg101016jconbuildmat201212001
Rietveld HM 1969 A profile refinement method for nuclear and magnetic structures JAppl Crystallogr 2 65ndash71 httpsdoiorg101107S0021889869006558
Riacuteos CA Williams CD Fullen MA 2009 Hydrothermal synthesis of hydrogarnet andtobermorite at 175 degC from kaolinite and metakaolinite in the CaO-Al2O3-SiO2-H2Osystem a comparative study Appl Clay Sci 43 228ndash237 httpsdoiorg101016jclay200809014
Roacuteżycka A Pichoacuter W 2016 Effect of perlite waste addition on the properties of au-toclaved aerated concrete Constr Build Mater 120 65ndash71 httpsdoiorg101016jconbuildmat201605019
Roacutezycka A Kotwica Ł Małolepszy J 2014 Synthesis of single phase gyrolite in theCaO-quartz-Na2O-H2O system Mater Lett 120 166ndash169 httpsdoiorg101016jmatlet201401003
Sauman Z 1974 Influence of SO4 2ndash ions on the formation of 11 Aring tobermorite InProceedings of the 2nd International Symposium on Science and Research in SilicateChemistry Moscow pp 25ndash39
Schmidt M Egersdoumlrfer A Poumlllmann H 2012 Increased reactivity using a glass-containing metakaolin as an active filler in lime-based binder systems ZKG Int 6554ndash62
Schreiner J Jansen D Ectors D Goetz-Neunhoeffer F Neubauer J Volkmann S2018 New analytical possibilities for monitoring the phase development during theproduction of autoclaved aerated concrete Cem Concr Res 107 247ndash252 httpsdoiorg101016jcemconres201802028
Schreiner J Goetz-Neunhoeffer F Neubauer J Volkmann S Bergold S Webler RJansen D 2019 Advanced Rietveld refinement and SEM analysis of tobermorite inchemically diverse autoclaved aerated concrete Powder Diffract 34 143ndash150httpsdoiorg101017s0885715619000149
Setthaya N Chindaprasirt P Pimraksa K 2016 Preparation of zeolite nanocrystals viahydrothermal and solvothermal synthesis using of rice husk ash and metakaolinMater Sci Forum 872 242ndash247 httpsdoiorg104028wwwscientificnetmsf872242
Siauciunas R Baltakys K 2004 Formation of gyrolite during hydrothermal synthesis inthe mixtures of CaO and amorphous SiO2 or quartz Cem Concr Res 34 2029ndash2036httpsdoiorg101016jcemconres200403009
Skawinska A Owsiak Z Baran T Hernik K 2017 The influence of halloysite ad-dition on tobermorite formation in CaO and quartz mix under hydrothermal condi-tions Cem Wapno Bet 17 426ndash434
Venhodovaacute E Janovskyacute R Drochytka R 2015 Formation of tobermorite at differentmaterials composition of aerated concrete Appl Mech Mater 752ndash753 247ndash250httpsdoiorg104028wwwscientificnetamm752-753247
Walczak P Małolepszy J Reben M Szymański P Rzepa K 2015 Utilization ofwaste glass in autoclaved aerated concrete Proc Eng 122 302ndash309 httpsdoiorg101016jproeng201510040
Zhang Y Gao W Cui L 2007 The transformation of acid leached metakaolin tozeolite beta Stud Surf Sci Catal 170 420ndash425 httpsdoiorg101016S0167-2991(07)80870-6
Zvyagin BB 1960 An attempt to electronographic determination of kaolinite structureJ Dokl Akad Nauk SSSR 130 1023ndash1026
J Schreiner et al Applied Clay Science 185 (2020) 105432
6
6 Publications
36
6 Publications
62 Advanced Rietveld refinement and SEM analysis oftobermorite in chemically diverse autoclaved aeratedconcrete
Following the copyright guidelines by Cambridge University Press the publication
Schreiner J Goetz-Neunhoeffer F Neubauer J Volkmann S Bergold S WeblerR Jansen D 2019 Advanced Rietveld refinement and SEM analysis of tobermorite inchemically diverse autoclaved aerated concrete Powder Diffraction 34 143ndash150 httpsdoiorg101017s0885715619000149
may not be reprinted It can be accessed at
httpswwwcambridgeorgcorejournalspowder-diffractionarticleadvanced-rietveld-refinement-and-sem-analysis-of-tobermorite-in-chemically-diverse-autoclaved-aerated-concrete51597C2A66F6F225D29DEB2675E74249
37
6 Publications
63 New analytical possibilities for monitoring the phasedevelopment during the production of autoclavedaerated concrete
Reprint of the peer reviewed publication
Schreiner J Jansen D Ectors D Goetz-Neunhoeffer F Neubauer J VolkmannS 2018 New analytical possibilities for monitoring the phase development during theproduction of autoclaved aerated concrete Cement and Concrete Research 107 247ndash252httpsdoiorg101016jcemconres201802028
with permission from Elsevier
38
Contents lists available at ScienceDirect
Cement and Concrete Research
journal homepage wwwelseviercomlocatecemconres
Short communication
New analytical possibilities for monitoring the phase development duringthe production of autoclaved aerated concrete
J Schreinera D Jansena D Ectorsa F Goetz-Neunhoeffera J Neubauera S Volkmannb
aUniversity of Erlangen-Nuremberg GeoZentrum Nordbayern Mineralogy Schlossgarten 5a 91054 Erlangen Germanyb Rodgauer Baustoffwerke GmbH amp Co KG Am Opel-Pruumlffeld 3 63110 Rodgau-Dudenhofen Germany
A B S T R A C T
This work presents improved analytical methods for both steps of the production process of autoclaved aeratedconcrete (AAC) the phase development during the hydration before autoclaving and during the autoclavingprocess itself The improvement includes new insights into preparation methods of AAC samples for powderdiffraction as well as Rietveld refinement strategies For the first time a new implementation for calculatinganisotropic crystal domain sizes is applied to major hydrate phases occurring during AAC production namelyportlandite during the hydration before autoclaving and tobermorite during the autoclaving process The cal-culation of anisotropic domain size growth which can be implemented in the Rietveld environment is based oncrystallographically and geometrically appropriate models The implementation of calculating anisotropic do-main sizes for the Rietveld software TOPAS 50 allows a superior Rietveld fit and a more accurate quantificationof the phase development Additionally it enables the tracking of growth mechanism of portlandite duringhydration
1 Introduction
Autoclaved aerated concrete (AAC) is known as a lightweight con-struction material which offers outstanding properties such as suffi-cient strength for construction in addition with excellent thermal in-sulation [12] AAC is produced by autoclaving from calcareous rawmaterials such as lime (CaO) and cement quartz sulfate carrier andother additives such as foaming agents and water
The production process (Fig 1) can be separated into the hydrationof the mixed slurry before the procedure of autoclaving and the auto-claving at elevated temperature (180 degC to 200 degC) under saturatedsteam pressure (12MPa) for several hours
The hydration process before autoclaving is necessary to achievesufficient strength in order to cut the green cake blocks as they shouldhave a specific shape and dimension after autoclaving Furthermorethe porous structure is generated by the foaming agent during hydra-tion in the first process step During autoclaving the final propertiesnamely strength and low thermal conductivity are achieved
It is already well understood that the autoclaving process leads tothe formation of several phases first of all tobermorite(Ca5Si6O16(OH)2lowast4H2O) [3ndash5] Newest research has shown im-pressively which reactions are running from the mineralogical point ofview Insitu XRD measurements were carried out during the
autoclaving process and the phase development was shown by plottingnormalized intensities [6] The study of Mitsuda et al [3] was mainlyfocused on the tracking of the phase evolution during the autoclavingprocess of AAC However their statements concerning phase evolutionare mainly based on XRD data and TGA measurements There is acommon agreement that the following reactions occur The consump-tion of the alite (OPC) leads to the formation of an initial C-S-H phaseduring the first processing step Portlandite which was initially formedduring the first process step (from CaO and C3S) further quartz and theC-S-H phase are consumed during autoclaving resulting in the crystal-lization of tobermorite Hence the crystallization process of to-bermorite as well as the crystal structure of tobermorite was an issue ofresearch and discussion over the last years and numerous publicationsto these topics are available Concerning the crystal structure of to-bermorite respectively the tobermorite supergroup a new publicationoutlines all important references and recommends a new nomenclature[7]
The presented study was performed to create new analytical possi-bilities for the characterization of the production process of AAC Bothof the production process steps are essential for the final productHence the present work focuses on crystallization of hydrate phases inboth processes
Firstly an external standard method [89] was published and
httpsdoiorg101016jcemconres201802028Received 6 October 2017 Received in revised form 1 February 2018 Accepted 26 February 2018
Corresponding authorsE-mail addresses juergenjsschreinerfaude (J Schreiner) danieljansenfaude (D Jansen)
Cement and Concrete Research 107 (2018) 247ndash252
0008-8846 copy 2018 Elsevier Ltd All rights reserved
T
6 Publications
39
recommended for the determination of absolute phase contents inmixtures with amorphous content It was shown that the method canabsolutely be recommended for hydrating cement pastes in which watercannot be quantified directly by XRD [10] This method seems to bevery promising for both the quantification of the hydration of the AACslurry before autoclaving and the quantification of the phase evolutionduring autoclaving inasmuch as both production steps form crystallineand amorphous phases
Secondly a new approach to anisotropic peak broadening due toanisotropic domain morphology which was developed [1112] is ap-plied to AAC samples to improve the fit of portlandite and tobermoriteby Rietveld refinement [13] By applying this approach the refinementof both portlandite and tobermorite should additionally lead to betterquantitative results as well as to better insights into the development ofthe domain size morphology of both phases formed
It was already shown that in a hydrating raw mixture for AAC twospecies of portlandite precipitate at 23 degC one showing dynamicallyanisotropic peak broadening and another one following the isotropictrend [14] The application of the anisotropic refinement model led toan improved fitting of portlandite Moreover the mechanism of aniso-tropic domain growth of portlandite was tracked
2 Materials and methods
In order to examine the hydration of the AAC slurry before auto-claving a mixture of the hydraulic reactive components was weighedand measured in-situ at a Bruker D8 diffractometer with a LynxEyedetection system
Ordinary Portland cement (OPC) was mixed with lime (CaO) andanhydrite (C$) The raw materials were taken from the same batches asfor the industrial samples The drymix (58 OPC 36 CaO and 6 C$by weight) was then mixed with water (ws= 08) and placed into anappropriate sample holder The samples were not aerated The slurrysamples were covered with a kapton film to avoid evaporation andcarbonation Diffractograms were recorded with an angular range from7 to 545deg 2θ and a step width of 0011deg 2θ Measurements were carriedout every 15min For each measurement 96 XRD patterns were re-corded over the first 24 h The temperature was fixed at 70 degC which isthe mean temperature generally prevailing in the industrial processduring hydration before autoclaving Rietveld refinement was carriedout using the G-factor method All structures used for Rietveld refine-ment are shown in Table 1
For investigation of the autoclaved samples five different specimenswere taken at different autoclaving times The specimens were takenout of a technical production process hence it was not possible to in-terrupt the process at an earlier time inasmuch it would lead to damageof a whole concrete production batch The specimens were firstly driedat 60 degC until weight constancy The whole blocks were then broken andstatistical samples of 20 g were taken In order to receive the right massattenuation coefficient (MAC) for G-factor method the loss on ignitionand the chemical composition (XRF) were determined For energydispersive XRF analysis (Spectro Xepos) tube voltage from 20 kV to50 kV and tube current from 08 to 20mA were used for differenttargets
The final sample preparation (grinding) before XRD measurementswas carried out using both an agate mortar and a McCrone micronizingmill for wet milling with isopropanol Both preparation methods wereapplied separately to see which one is suitable in order to get the bestpreparation for XRD investigations Six preparations were performed byone operator of which two were prepared with an agate mortar andfour with a McCrone mill For the McCrone milling 3 g of the sampleand 10ml of isopropanol were used for grinding for 12min The grainsize distribution of one sample prepared with an agate mortar and onesample prepared using a McCrone mill was measured by laser granu-lometry in isopropanol using a Mastersizer 3000 (MALVERN)
After milling the samples in these two ways for XRD analysis thepowders were prepared into a front loading sample holder and mea-sured Diffractograms were recorded with an angular range from 6 to80deg 2θ a step width of 00236deg 2θ and a time per step of 054 s Rietveldrefinement combined with external standard (G-factor) was applied inorder to get absolute quantities for each phase The refinement strategyfor portlandite and tobermorite in the TOPAS Launch Mode (TOPAS50 Bruker AXS) is attached as a Supplementary material file
3 Results and discussion
31 Hydration of the mixture before autoclaving
The hydration of the investigated paste before autoclaving isdominated by the hydration of the cement as well as the reaction of thefree lime (CaO) resulting in the formation of portlandite It can beclearly seen from Fig 2 that the hydration of the paste leads to theformation of ettringite portlandite and C-S-H phase For simplificationthe remaining phase developments are not shown in Fig 2 because theyare not in the focus of this study The hydration of CaO forming
Fig 1 Simplified process steps of AAC production and hydrate phase evolution
Table 1Structures used for Rietveld refinement
Phase Author
Alite [15]Anhydrite [16]Bassanite [17]Belite (β) [18]Belite (αprime) [19]Brownmillerite [20]C-S-H [21]Calcite [22]Ettringite [23]Gypsum [24]Hemicarbonate [25]Hydroxylellestadite [26]Lime (CaO) [27]Microcline [28]Portlandite [29]Quartz [30]Tobermorite [31]Tricalciumaluminate (cubic) [32]Tricalciumaluminate (orthorhombic) [33]PONCKS model for Water [21]
J Schreiner et al Cement and Concrete Research 107 (2018) 247ndash252
248
6 Publications
40
portlandite begins rapidly after the addition of water to the mixture andlime is fully consumed after only 1 h of hydration This translates into aquick rise of heat of hydration so that cement hydration is acceleratedwhich leads to further portlandite formation by the reaction of aliteEttringite formation stalls after few hours of hydration After 12 h et-tringite is partially decomposed probably due to sulfate depletion [9]
and poorly crystalline AFm phases (not shown in Fig 2) are formedIn Fig 3 it can be seen that in fact two generations of portlandite
are formed a 1st dominant generation showing anisotropic peakbroadening and 2nd one occurring considerably later following theisotropic domain size refinement which is usually carried out using theRietveld method This occurrence comes along firstly with lime hy-dration and secondly with alite hydration The expected quantity ofportlandite formed from lime hydration very well complies with the
Fig 2 Phase development in AAC paste on a laboratory scale before autoclaving ana-lyzed by in-situ XRD at 70 degC
Fig 3 Formation of two generations of portlandite by hydration of lime (1st) and C3S(2nd) at 70 degC before autoclaving with the major generation showing anisotropic peakbroadening
Fig 4 Biaxial cylinder domain size model of portlandite used for Rietveld refinement of anisotropic peak broadening
Fig 5 Morphological evolution of portlandite showing anisotropic domain size growthduring hydration at 70 degC
Fig 6 Comparison of quantification of crystalline quartz in samples prepared withMcCrone mill and agate mortar at different autoclaving times
J Schreiner et al Cement and Concrete Research 107 (2018) 247ndash252
249
6 Publications
41
quantity of the observed 1st generation The development of portlan-dite growth was already tracked in an equivalent slurry at 23 degC [14]Thus this observation confirms that the crystallinity of portlandite inmixtures for AAC production depends on the starting phase for hydra-tion as already indicated by Ectors [14]
Fig 4 shows the used biaxial cylindrical model for anisotropic do-main size calculation and the portlandite structure which was createdwith structural software VESTA 318 [34] Using the cylindrical ap-proach domain sizes in a (here equating to b) and c direction(dz= cylinder height) can be calculated which comes along with theexpected symmetrical parameters of portlandite
The 1st portlandite generation showing anisotropic domain growthcan be tracked in terms of cylinder diameter and height which is rea-lized in Fig 5 The blue cylinder represents the geometric approach andcylinder height and diameter are calculated newly for each range Thecylinder height remains rather stable throughout the hydration processwhile the cylinder diameter increases during the first hours of hydra-tion After 10 h of hydration the mean cylinder diameter no longer in-creases Consequently these observations match the results of the ex-aminations conducted at 23 degC [14] as well as the assumption thatdifferent mechanisms of growth exist for portlandite depending on the
hydration educt The maximum cylinder diameter is reached earlier inthis work very likely because of the higher hydration temperature
32 Quantification of the reactions during autoclaving
Autoclaved samples were ground with an agate mortar and com-pared to samples which were wet-ground with a McCrone mill Fig 6shows precisely that the determination of the amount of crystallinequartz is more reproducible in the two shown samples which were
Fig 7 2D XRD with Bruker GADDS-system plots of samples prepared with agate mortar and McCrone mill Coarse quartz grains are pointed out in the plot of the sample prepared withagate mortar
Fig 8 Particle size distribution of one sample prepared with an agate mortar and of onesample prepared with a McCrone mill measured by laser granulometry
Fig 9 Rietveld refinement for Tobermorite of autoclaved AAC sample by use of isotropicdomain size model (a) and of anisotropic domain size model (b)
J Schreiner et al Cement and Concrete Research 107 (2018) 247ndash252
250
6 Publications
42
prepared with a McCrone mill The high variance of crystalline quartzin the samples which were prepared with an agate mortar is a result ofinsufficient grinding and remaining of too large quartz grains Whenthis spottiness occurs a reliable quantification using the G-factormethod is not possible
The 2D XRD with Bruker GADDS-system plots in Fig 7 demonstratethe insufficient grinding when using an agate mortar compared to wetmilling with a McCrone mill Quartz would be overrepresented in a one-dimensional XRD pattern focusing on a section with bright spots (greenarrows) The lack of bright spots in the right plot shows that the quartzgrains are milled more thoroughly using a McCrone mill In Fig 8 theparticle size distribution after both ways of sample preparation iscompared Most grains in the sample prepared with an agate mortar arelarger than in the sample prepared with a McCrone mill The grain sizedistribution of the sample prepared with a McCrone mill complies withthe recommended particle size range for XRD analysis of under 5 to50 μm [3536] while the other sample exceeds the range
In Fig 9 Rietveld refinement of an autoclaved sample is shown Thedominant peaks at 77 290 and 301deg 2θ are attributed to tobermoriteIn the upper diagram (a) Rietveld refinement was carried out regularlycalculating isotropic domain sizes for tobermorite However the cal-culated fit differs significantly from the raw data It can be assumed thattobermorite shows a similar pattern to portlandite in terms of aniso-tropic peak broadening taking into account that tobermorite is as-signed to the orthorhombic crystal system Thus instead of a biaxialcylinder model an elliptic cylinder model (Fig 10 structure createdwith VESTA 318 [34]) was applied for the refinement in the lowerdiagram (b) The elliptic cylinder model is a sufficient approach to the
orthorhombic crystal system as it allows the distinction between do-main sizes in a b and c direction The fit is clearly superior using theanisotropic domain size model highlighted by the difference plot inFig 9b The comparison refinement with isotropic and anisotropic ap-proach was done for all of the five autoclaved samples In Fig 11 theresulting Rwp values for the whole pattern and the RBragg values of to-bermorite are shown The refinement using the anisotropic model leadsto both lower Rwp and RBragg values and consequently to a better fit anda more accurate quantification of tobermorite in all refined samples
4 Summary and conclusions
Improved analytical methods for both the phase developmentduring the hydration before autoclaving and during the autoclavingprocess of AAC are presented It could be shown that wet McCronemilling is the best way of preparation of AAC samples in order to obtainsuitable samples for powder diffraction A new approach to treat ani-sotropic domain sizes for Rietveld refinement could be successfullyapplied ndash with the benefit that portlandite and tobermorite in AACsamples could be refined more accurately using the Rietveld methodThus this application allows an improved quantification of the phasedevelopment during both of the production steps
For the future there are still plenty of possibilities to apply thepresented approach of calculating anisotropic domain sizes to AACproduction As exemplified with portlandite the mechanisms of growthof tobermorite can be tracked likewise during the autoclaving processIn addition the effect of variations in the chemical composition of AACraw mixtures on the crystal morphology of tobermorite can be ex-amined This leaves a new perspective to discuss the link between mi-neral phase morphology and the thermal and mechanical properties ofAAC
Acknowledgement
The autoclaved samples were generously provided by RodgauerBaustoffwerke GmbH amp Co KG The authors express gratitude for allsupport
Appendix A Supplementary data
Supplementary data to this article can be found online at httpsdoiorg101016jcemconres201802028
References
[1] MW Grutzeck Cellular concrete in M Scheffler P Colombo (Eds) CellularCeramics Wiley-VCH Weinheim 2005 pp 193ndash223
[2] M Haas The future of AAC ndash from a material scientists point of view inMC Limbachiya JJ Roberts (Eds) Autoclaved Aerated Concrete Taylor FrLondon 2005 pp 187ndash194
[3] T Mitsuda K Sasaki H Ishida Phase evolution during autoclaving process ofaerated concrete J Am Ceram Soc 75 (1992) 1858ndash1863
[4] N Isu H Ishida T Mitsuda Influence of quartz particle size on the chemical and
Fig 10 Triaxial cylinder domain size model of Tobermorite used for Rietveld refinement of anisotropic peak broadening
Fig 11 Comparison of Rwp and RBragg values of Rietveld refinements of autoclavedsamples and tobermorite using the isotropic and the anisotropic domain size model
J Schreiner et al Cement and Concrete Research 107 (2018) 247ndash252
251
6 Publications
43
mechanical properties of autoclaved aerated concrete (I) tobermorite formationCem Concr Res 25 (1995) 243ndash248
[5] NY Mostafa Influence of air-cooled slag on physicochemical properties of auto-claved aerated concrete Cem Concr Res 35 (2005) 1349ndash1357 httpdxdoiorg101016jcemconres200410011
[6] K Matsui J Kikuma M Tsunashima T Ishikawa S Matsuno A Ogawa M SatoIn situ time-resolved X-ray diffraction of tobermorite formation in autoclaved aer-ated concrete influence of silica source reactivity and Al addition Cem Concr Res41 (2011) 510ndash519
[7] C Biagioni S Merlino E Bonaccorsi The tobermorite supergroup a new no-menclature Mineral Mag 79 (2015) 485ndash495 httpdxdoiorg101180minmag2015079222
[8] BH OConnor MD Raven Application of the Rietveld refinement procedure inassaying powdered mixtures Powder Diffract 3 (1988) 2ndash6 httpdxdoiorg101017S0885715600013026
[9] D Jansen F Goetz-Neunhoeffer C Stabler J Neubauer A remastered externalstandard method applied to the quantification of early OPC hydration Cem ConcrRes 41 (2011) 602ndash608 httpdxdoiorg101016jcemconres201103004
[10] D Jansen C Stabler F Goetz-Neunhoeffer S Dittrich J Neubauer Does OrdinaryPortland Cement contain amorphous phase A quantitative study using an externalstandard method Powder Diffract 26 (2011) 31ndash38 httpdxdoiorg10115413549186
[11] D Ectors F Goetz-Neunhoeffer J Neubauer A generalized geometric approach toanisotropic peak broadening due to domain morphology J Appl Crystallogr 48(2015) 189ndash194 httpdxdoiorg101107S1600576714026557
[12] D Ectors F Goetz-Neunhoeffer J Neubauer Routine (an)isotropic crystallite sizeanalysis in the double-Voigt approximation done right Powder Diffract 32 (S1)(2017) 27ndash34 httpdxdoiorg101017S0885715617000070
[13] HM Rietveld A profile refinement method for nuclear and magnetic structures JAppl Crystallogr 2 (1969) 65ndash71 httpdxdoiorg101107S0021889869006558
[14] D Ectors Advances in the Analysis of Cementitious Reactions and Hydrate Phases(Doctoral Thesis) (2016) pp 12ndash14 (urnnbndebvb29-opus4-71743)
[15] AacuteG De La Torre S Bruque J Campo MAG Aranda The superstructure of C3Sfrom synchrotron and neutron powder diffraction and its role in quantitative phaseanalyses Cem Concr Res 32 (2002) 1347ndash1356 httpdxdoiorg101016S0008-8846(02)00796-2
[16] A Kirfel G Will Charge density in anhydrite CaSO4 from X-ray and neutrondiffraction measurements Acta Crystallogr Sect B Struct Crystallogr CrystChem 36 (1980) 2881ndash2890 httpdxdoiorg101107S0567740880010461
[17] C Bezou AN Christensen D Cox M Lehman A Nonat Structures cristallines deCaSO405H2O et CaSO406H2O Comptes Rendus Hebd Des Seacuteances lAcadeacutemieDes Sci Seacuterie 2 (312) (1991) 43ndash48
[18] KH Jost B Ziemer R Seydel Redetermination of the structure of β-dicalciumsilicate Acta Crystallogr Sect B Struct Crystallogr Cryst Chem 33 (1977)1696ndash1700 httpdxdoiorg101107S0567740877006918
[19] W Mumme LMD Cranswick BC Chakoumakos Rietveld crystal structure re-finements from high temperature neutron powder diffraction data for the poly-morphs of dicalcium silicate Neues Jahrb Fuer Mineral Abhandlungen 170 (1996)171ndash188
[20] A Colville S Geller The crystal structure of brownmillerite Ca2FeAlO5Crystallographica 50 (1971) 2311ndash2315 httpdxdoiorg101107S056774087100579X
[21] ST Bergold F Goetz-Neunhoeffer J Neubauer Quantitative analysis of C-S-H inhydrating alite pastes by in-situ XRD Cem Concr Res 53 (2013) 119ndash126 httpdxdoiorg101016jcemconres201306001
[22] EN Maslen VA Streltsov NR Streltsova N Ishizawa Electron density and op-tical anisotropy in rhombohedral carbonates III Synchrotron Xray studies ofCaCO3 MgCO3 and MnCO3 Acta Crystallogr Sect B 51 (1995) 929ndash939 httpdxdoiorg101107S0108768195006434
[23] G Renaudin Y Filinchuk J Neubauer F Goetz-Neunhoeffer A comparativestructural study of wet and dried ettringite Cem Concr Res 40 (2010) 370ndash375httpdxdoiorg101016jcemconres200911002
[24] WF Cole CJ Lancucki A refinement of the crystal structure of gypsumCaSO42H2O Acta Cryst B30 (1974) 921ndash929 httpdxdoiorg101107S0567740874004055
[25] T Runčevski RE Dinnebier OV Magdysyuk H Poumlllmann Crystal structures ofcalcium hemicarboaluminate and carbonated calcium hemicarboaluminate fromsynchrotron powder diffraction data Acta Crystallogr Sect B Struct Sci 68 (2012)493ndash500 httpdxdoiorg101107S010876811203042X
[26] JM Hughes JW Drexler Cation substitution in the apatite tetrahedral site crystalstructures of type hydroxylellestadite and type fermorite Neues Jahrb FuerMineral (1991) 327ndash336
[27] CH Shen RS Liu JG Lin CY Huang Phase stability study of La12Ca18Mn2O7Mater Res Bull 36 (2001) 1139ndash1148
[28] SW Bailey Refinement of an intermediate microcline structure Am Miner 54(1969) 1540ndash1545
[29] WR Busing HA Levy Neutron diffraction study of calcium hydroxide J ChemPhys 26 (1957) 563 httpdxdoiorg10106311743345
[30] Y Le Page G Donnay Refinement of the crystal structure of low-quartz ActaCrystallogr Sect B 32 (1976) 2456ndash2459 httpdxdoiorg101107S0567740876007966
[31] SA Hamid The crystal structure of the 11 Aring natural tobermoriteCa225[Si3O75(OH)15]1H2O Zeitschrift Fuer Krist - New Cryst Struct 154 (1981)189ndash198 httpdxdoiorg101524zkri19811543-4189
[32] P Mondal JW Jeffery The crystal structure of tricalcium aluminate Ca3Al2O6Acta Crystallogr B 31 (1975) 689ndash697 httpdxdoiorg101107S0567740875003639
[33] Y Takeuchi F Nishi I Maki Crystal-chemical characterization of the tricalciumaluminate-sodium oxide (3CaOtimesAl2O3-Na2O) solid-solution series Zeitschrift FuumlrKrist (1980) 259ndash307
[34] K Momma F Izumi VESTA 3 for three-dimensional visualization of crystal vo-lumetric and morphology data J Appl Crystallogr 44 (2011) 1272ndash1276 httpdxdoiorg101107S0021889811038970
[35] K Scrivener R Snellings B Lothenbach A Practical Guide to MicrostructuralAnalysis of Cementitious Materials CRC Press 2016 pp 123ndash125 httpdxdoiorg107693wl20150205
[36] V Pecharsky P Zavalij Fundamentals of Powder Diffraction and StructuralCharacterization of Materials Springer second edition 2005 p 302 httpdxdoiorg101007978-0-387-09579-0
J Schreiner et al Cement and Concrete Research 107 (2018) 247ndash252
252
6 Publications
44
7 Acknowledgement
7 Acknowledgement
Ich moumlchte mich bei einigen Personen bedanken ohne die es wohl kaum zum erfolgreichenAbschluss dieser Arbeit gekommen waumlreMein Doktorvater Prof Dr Juumlrgen Neubauer hat sich stets die Zeit genommen die noumltigwar um Angelegenheiten aller Art mit mir zu klaumlren Er gab mir fachlich immer zumrichtigen Zeitpunkt einen gewissen wissenschaftlichen Impuls Zugleich habe ich mich den-noch immer frei in meiner eigenen Konzeption gefuumlhlt Groszligen Dank spreche ich Prof DrFriedlinde Goumltz-Neunhoeffer aus die fuumlr mich ebenso immer eine verlaumlssliche Ansprech-partnerin fuumlr fachliche und organisatorische Angelegenheiten aller Art war Danke anDr Daniel Jansen fuumlr die gute Zusammenarbeit und dafuumlr dass er mich im Zuge meinerMasterarbeit in ein Forschungsprojekt aufgenommen hat das den Weg zur Promotionmoumlglich machte Zusaumltzlich gilt mein Dank Prof Dr Matthias Goumlbbels der fuumlr dieMitarbeiter am Lehrstuhl immer motivierende Worte fand Fuumlr die Ermoumlglichung meinerTeilnahme an diversen Dienstreisen Fortbildungen und Tagungen moumlchte ich mich viel-mals bedankenWeiterhin bedanke ich mich bei Dr Stephan Volkmann und den Rodgauer BaustoffwerkenGmbH amp Co KG fuumlr die gute Zusammenarbeit und die Bereitstellung von Versuchsma-terialienVielen Dank an meine studentischen Hilfskraumlfte Daniel Wagner Laura MoldenhauerFabian Lang Jakob Schreiber und Felix Klaassen die alle Aufgaben im Labor einwand-frei und mit Bedacht erledigten Bei meinen aktuellen und ehemaligen Kollegen DrKatrin Hurle Dr Dominique Ectors Dr Christoph Naber Dr Florian Huumlller JoumlrgNehring Frank Riedel Julian Wolf Tanja Manninger Daniel Wagner Nicolas FobbeKarla Spaumlth Julian Goergens Andreas Koumlhler Cordula Jakob Franz Becker und LisaKlemenz bedanke ich mich fuumlr die gelungene Zusammenarbeit und gegenseitige Unter-stuumltzung Besonderer Dank geht auch an Kerstin Kreszlig Bettina Engl Christian HankeBernd Schleifer und Christian Abe fuumlr die verlaumlssliche Unterstuumltzung bei technischen Fra-gen und Messungen im LaborFuumlr jegliche Unterstuumltzungen moumlchte ich mich auch bei meinen Eltern bedanken sowiebei meinem Bruder Ralf der mir mit einem LaTex Crashkurs viel Frustration ersparthat Danke Thomas dass du immer fuumlr mich da bist und mit mir zusammen fuumlr genugAusgleich gesorgt hast
45
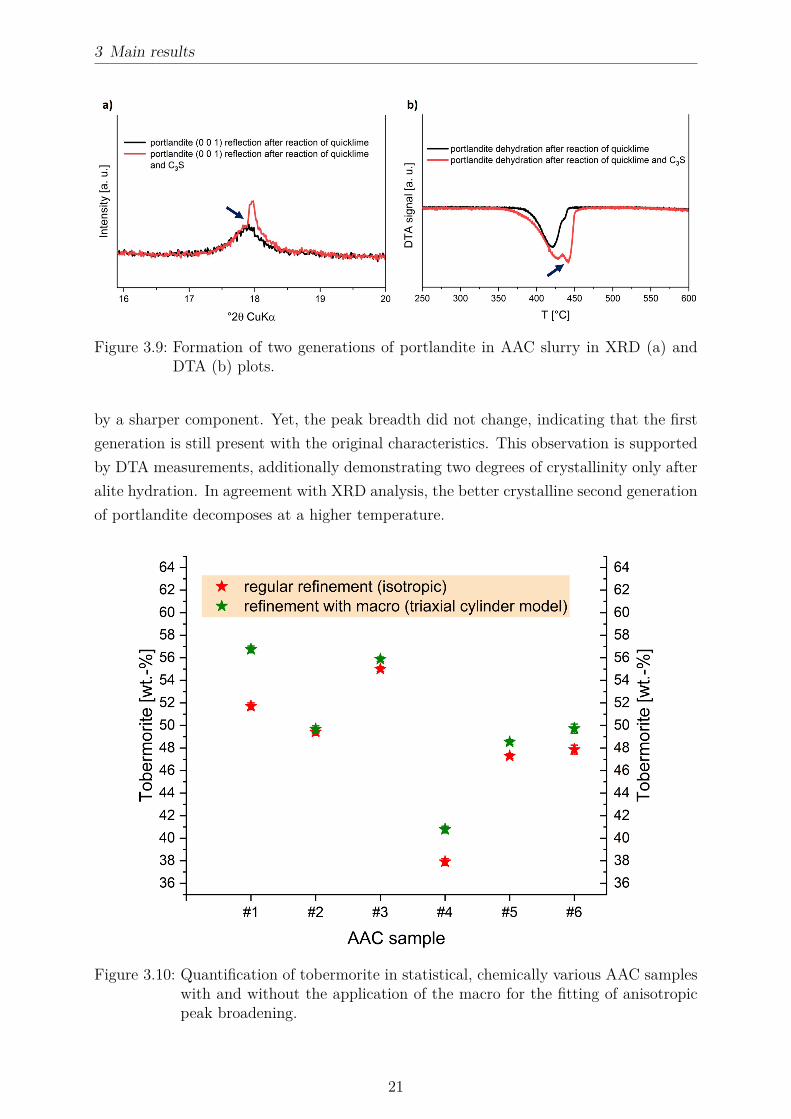
3 Main results
Figure 39 Formation of two generations of portlandite in AAC slurry in XRD (a) andDTA (b) plots
by a sharper component Yet the peak breadth did not change indicating that the firstgeneration is still present with the original characteristics This observation is supportedby DTA measurements additionally demonstrating two degrees of crystallinity only afteralite hydration In agreement with XRD analysis the better crystalline second generationof portlandite decomposes at a higher temperature
Figure 310 Quantification of tobermorite in statistical chemically various AAC sampleswith and without the application of the macro for the fitting of anisotropicpeak broadening
21
3 Main results
Furthermore commercial AAC samples were considered in this study By applying themethod for the refinement of anisotropic peak broadening (Figure 31) a more accuratequantification of tobermorite can be achieved In Figure 310 the calculated amounts oftobermorite in statistical chemically various AAC samples are plotted In some samplesthe refinement using the macro leads to considerably higher but never lower quantitiesof tobermorite whereas in other samples nearly the same amount of tobermorite is cal-culated This observation can be well understood taking into account that the macroallows to account more peak area for tobermorite as shown in Figure 31 Clearly thereis evidence that the anisotropy of tobermorite domains is not uniform from one sampleto another which was basically justified in the previous sections As an improved quan-tification of a single phase leads to a better quantification of other phases in the samplethis adaption is very valuable in order to assess the phase development Here the peakbroadening of tobermorite equally observed by Qu et al [6] could be tracked and evalu-ated in order to gain more accurate results Moreover in section 63 McCrone milling issuggested in order to avoid spottiness in XRD patterns caused by coarse grains of quartzor anhydrite (Figure 38)
22
4 Conclusions
4 Conclusions
The research results presented in the previous sections yield advances in the mineralogicalinvestigation of tobermorite and autoclaved aerated concrete Recorded diffraction pat-terns contain plenty of usually unused data regarding the microstructural characteristicsof the sample and phases therein The profit of XRD measurements can be significantlyimproved whenever one or more phases show anisotropic peak broadening and appro-priate models for the respective domain morphology are implemented into the Rietveldenvironment Within the scope of the present investigations portlandite and tobermoriteshow this particularityThe effects of changes in the chemistry of the starting mix were examined based on dif-ferent dosages of metakaolin Al-substituted tobermorite showed increased growth in b
direction and an increase of lattice parameter c compared to Al-free tobermorite The rel-ative domain sizes were determined based on anisotropic peak broadening However whilethe effect of Al3+ incorporation into the lattice of tobermorite was limited regarding thedomain morphology lattice parameter c showed an increase throughout the entire rangeof samples The consequent effects suggested by Klimesch amp Ray observed by means ofDTA are debatable as reactions during the heating experiment may lead to to a changeof Al3+ content in tobermorite [40] While both types of applied metakaolin showed goodreactivity at hydrothermal conditions some included minor phases such as feldspar oranatase remained unreacted At high dosages of Al2O3 in the starting mix the formationof either only katoite or katoite along with tobermorite was observed (Figure 32)SEM analysis of tobermorite in AAC cannot be suggested based on the observationspresented in this work as it is only visually accessible in the pores or at pore surfacesThe dense material of the AAC skeleton contains several crystalline and X-ray amorphousphases which hardly allows a proper investigation Even in single pores tobermorite crys-tals appeared very heterogeneous at various chemical compositions As a result lath-liketobermorite was not only present in samples characterized by elevated Al3+ incorporationBy contrast the benefits of XRD analysis presented in section 61 equally accounted fortobermorite in AAC samples Sulfate incorporation into the lattice of tobermorite wasnot observed All of the sulfate in the system was detected to be present in anhydriteThe phase transitions in the AAC raw slurry during the green stage hydration were show-cased by in-situ XRD analysis of a model mix at 70 degC Additional DTA and XRD mea-
23
4 Conclusions
surements during this step confirmed the presence of two generations of portlandite char-acterized by different crystallinity as suggested by Ectors [52] The inclusion of anisotropicdomain morphology during the Rietveld refinement allowed a more accurate quantifica-tion of tobermorite in autoclaved samples Sample preparation adjusted to the grain sizedistribution in AAC samples (section 63) the external standard method for quantita-tive XRD analysis [55] and the approach to evaluate anisotropic peak broadening [19]are the key methods for a more accurate tracking of the phase development during AACproduction
24
5 References
5 References
[1] A E Zadov A I Grabezhev N N Pertsev N V Chukanov and S V PribavkinTobermorite-plombierite metasomatites of the Gumeshevsk skarn-porphyry copper depositmiddle Urals Doklady Earth Sciences 407(3)495ndash497 2006
[2] M F Heddle Preliminary notice of substances which may prove to be new minerals MinMag 4117ndash123 1880
[3] S Merlino E Bonaccorsi and T Armbruster The real structure of tobermorite 11AringNormal and anomalous forms OD character and polytypic modifications European Journalof Mineralogy 13(3)577ndash590 2001
[4] C Biagioni S Merlino and E Bonaccorsi The tobermorite supergroup a new nomencla-ture Mineralogical Magazine 79(2)485ndash495 2015
[5] C A Riacuteos C D Williams and M A Fullen Hydrothermal synthesis of hydrogarnetand tobermorite at 175 degC from kaolinite and metakaolinite in the CaO-Al2O3-SiO2-H2Osystem A comparative study Applied Clay Science 43(2)228ndash237 2009
[6] X Qu Z Zhao and X Zhao Microstructure and characterization of aluminum-incorporated calcium silicate hydrates (C-S-H) under hydrothermal conditions RSC Ad-vances 8(49)28198ndash28208 2018
[7] R Šiaučiunas and K Baltakys Formation of gyrolite during hydrothermal synthesis inthe mixtures of CaO and amorphous SiO2 or quartz Cement and Concrete Research34(11)2029ndash2036 2004
[8] E Venhodovaacute R Janovskyacute and R Drochytka Formation of Tobermorite at Different Ma-terials Composition of Aerated Concrete Applied Mechanics and Materials 752-753247ndash250 2015
[9] L Galvaacutenkovaacute E Bartoniacutečkovaacute T Opravil J Tkacz and P Ptaacuteček The influence ofstarting materials solubility on tobermorite structure formation under the hydrothermalconditions IOP Conference Series Materials Science and Engineering 379(1)1ndash8 2018
[10] T Mitsuda K Sasaki and H Ishida Phase Evolution during Autoclaving Process J AmCeram Soc 75(75)1858ndash1863 1992
[11] A Skawińska The influence of metahalloysite addition on tobermorite formation studied byX-ray powder diffraction and scanning electron microscope MATEC Web of Conferences16305008 2018
[12] S T Bergold F Goetz-Neunhoeffer and J Neubauer Quantitative analysis of C-S-H in
25
5 References
hydrating alite pastes by in-situ XRD Cement and Concrete Research 53119ndash126 2013
[13] O P Shrivastava and F P Glasser Ion-exchange properties of 11-Aring tobermorite Reactivityof Solids 2(3)261ndash268 1986
[14] H Maeda Y Ogawa E H Ishida and T Kasuga Hydrothermal synthesis of tobermoritedoped with phosphorus species for removing heavy metal ions Journal of the AustralianCeramic Society 48(1)8ndash11 2012
[15] O P Shrivastava and R Shrivastava Cation exchange applications of synthetic tobermoritefor the immobilization and solidification of cesium and strontium in cement matrix Bulletinof Materials Science 23(6)515ndash520 2000
[16] G Renman and A Renman Sustainable Use of Crushed Autoclaved Aerated Concrete(CAAC) as a Filter Medium in Wastewater Purification 8th International conferenceon sustainable management of waste and recycled materials in construction GothenburgSweden 30 Mayndash1 June 2012 Proceedings pages 1ndash7 2012
[17] G Schober Chemical transformations during the manufacturing of autoclaved aeratedconcrete (ACC) Cement lime gypsum and quartz sand become cellular concrete ZKG58(7)63ndash70 2005
[18] A J Hamad Materials Production Properties and Application of Aerated LightweightConcrete Review International Journal of Materials Science and Engineering 2(2)152ndash157 2014
[19] D Ectors F Goetz-Neunhoeffer and J Neubauer A generalized geometric approach toanisotropic peak broadening due to domain morphology Journal of Applied Crystallogra-phy 48(1)189ndash194 2015
[20] H M Rietveld A profile refinement method for nuclear and magnetic structures Journalof Applied Crystallography 2(2)65ndash71 1969
[21] S A Hamid The crystal structure of the 11 Aring natural tobermoriteCa225[Si3O75(OH)15]1H2O Zeitschrift fuer Kristallographie - New Crystal Struc-tures 154(3-4)189ndash198 1981
[22] S A S El-Hemaly T Mitsuda and H F W Taylor Synthesis of normal and anomaloustobermorites Cement and Concrete Research 7429ndash438 1977
[23] M Sakiyama and T Mitsuda Hydrothermal reaction between C-S-H and kaolinite for theformation of tobermorite at 180degC Cement and Concrete Research 7(6)681ndash685 1977
[24] E Bonaccorsi S Merlino and A R Kampf The crystal structure of tobermorite 14 Aring(plombierite) a C-S-H phase Journal of the American Ceramic Society 88(3)505ndash5122005
[25] S Merlino E Bonaccorsi and T Armbruster The real structures of clinotobermorite andtobermorite 9 Aring OD character polytypes and structural relationships European Journalof Mineralogy 12(2)411ndash429 2000
[26] K Momma and F Izumi VESTA 3 for three-dimensional visualization of crystal volu-metric and morphology data Journal of Applied Crystallography 44(6)1272ndash1276 2011
26
5 References
[27] S Shaw S M Clark and C MB Henderson Hydrothermal formation of the calcium sil-icate hydrates tobermorite (Ca5Si6O16(OH)2 middot 4H2O) and xonotlite (Ca6Si6O17(OH)2)An in situ synchrotron study Chemical Geology 167(1-2)129ndash140 2000
[28] K Matsui J Kikuma M Tsunashima T Ishikawa S Matsuno A Ogawa and M SatoIn situ time-resolved X-ray diffraction of tobermorite synthesis process under hydrothermalcondition IOP Conference Series Materials Science and Engineering 18(2)60ndash66 2011
[29] G Matekonis R Šiaučiunas and D Vaičiukyniene Hydrothermal Synthesis and Charac-terization of Na + and [ Al 3 + + Na + ] -substituted Tobermorite in CaO-SiO2middotnH2O-H2OSystem MATERIALS SCIENCE 16(3)242ndash248 2010
[30] G Geng R J Myers M J A Qomi and P JM Monteiro Densification of the inter-layer spacing governs the nanomechanical properties of calcium-silicate-hydrate ScientificReports 7(1)1ndash8 2017
[31] D Klimesch and A Ray Autoclaved cement-quartz pastes with metakaolin additionsAdvanced Cement Based Materials 7(3-4)109ndash118 1998
[32] N Y Mostafa A A Shaltout H Omar and S A Abo-El-Enein Hydrothermal synthesisand characterization of aluminium and sulfate substituted 11 nm tobermorites Journal ofAlloys and Compounds 467(1-2)332ndash337 2009
[33] İ Demir M S Başpınar E Kahraman E Ccedilalışkan and G Goumlrhan An Investigation onthe Usability of Diatomite in Aerated Concrete Production In Proc of the Intl Conf onAdvances In Civil Structural And Construction Engineering - CSCE 2014 pages 97ndash1002014
[34] A Skawinska Z Owsiak T Baran and K Hernik The influence of halloysite additionon tobermorite formation in CaO and quartz mix under hydrothermal conditions CementWapno Beton 17(12)426ndash434 2017
[35] N Y Mostafa Influence of air-cooled slag on physicochemical properties of autoclavedaerated concrete Cement and Concrete Research 35(7)1349ndash1357 2005
[36] D Małaszkiewicz and J Chojnowski Influence of addition of calcium sulfate dihydrate ondrying of autoclaved aerated concrete Open Engineering 7(1)273ndash278 2017
[37] N Hara and N Inoue Thermal behaviour of 11Aring tobermorite and its lattice parametersCement and Concrete Research (10)53ndash60 1980
[38] M D Jackson S R Chae S R Mulcahy C Meral R Taylor P Li A H EmwasJ Moon S Yoon G Vola H R Wenk and P JM Monteiro Unlocking the secretsof Al-tobermorite in Roman seawater concrete American Mineralogist 98(10)1669ndash16872012
[39] W Liao W Li Z Fang C Lu and Z Xu Effect of different aluminum substitution rateson the structure of Tobermorite Materials 12(22)1ndash10 2019
[40] D Klimesch and A Ray DTA-TG Study of the CaO-SiO2-H2O and CaO-Al2O3-SiO2-H2OSystems Under Hydrothermal Conditions Journal of Thermal Analysis and Calorimetry56(1)27ndash34 1999
27
5 References
[41] Z Sauman and Z Valtr Substitution of sulphate ions in the crystal lattice of 11 Aring to-bermorite In The VI International Congress on the Chemistry of Cement pages 1ndash14Moscow 1974
[42] G Schober Reaction of raw materials to the final product AAC httpwwwpb-aacde
chemmin2_ehtml 2012 accessed 2020-01-31
[43] D Jansen C Stabler F Goetz-Neunhoeffer S Dittrich and J Neubauer Does Ordi-nary Portland Cement contain amorphous phase A quantitative study using an externalstandard method Powder Diffraction 26(01)31ndash38 2011
[44] C Roumlszligler J Stark F Steiniger and W Tichelaar Limited-dose electron microscopyreveals the crystallinity of fibrous C-S-H phases Journal of the American Ceramic Society89(2)627ndash632 2006
[45] Y Sakalli and R Trettin Investigation of C3S hydration by environmental scanning elec-tron microscope Journal of Microscopy 259(1)53ndash58 2015
[46] F Matsushita Y Aono and S Shibata Expansion and shrinkage behavior of green cakeof Autoclaved Aerated Concrete In Autoclaved Aerated Concrete - Innovation and Devel-opment Proceedings of the 4th International Conference on Autoclaved Aerated ConcreteKingston UK 8-9 September 2005 pages 101ndash108 CRC Press 2005
[47] C Chucholowski M Holger and K-C Thienel Improving the recyclability environmentalcompatibility and CO2 balance of autoclaved aerated concrete by replacing sulfate carrierand cement with calcined clays CePapers 2(4)503ndash512 2018
[48] X Y Huang W Ni W H Cui Z J Wang and L P Zhu Preparation of autoclavedaerated concrete using copper tailings and blast furnace slag Construction and BuildingMaterials 27(1)1ndash5 2012
[49] W Wongkeo and A Chaipanich Compressive strength microstructure and thermal anal-ysis of autoclaved and air cured structural lightweight concrete made with coal bottom ashand silica fume Materials Science and Engineering A 527(16-17)3676ndash3684 2010
[50] A Roacuteżycka and W Pichoacuter Effect of perlite waste addition on the properties of autoclavedaerated concrete Construction and Building Materials 12065ndash71 2016
[51] N Isu H Ishida and T Mitsuda Influence of quartz particle size on the chemical andmechanical properties of autoclaved aerated concrete (I) tobermorite formation Cementand Concrete Research 25(25)243ndash248 1995
[52] D Ectors Advances in the analysis of cementitious reactions and hydrate phases doctoralthesis PhD thesis Friedrich-Alexander-Universitaumlt Erlangen-Nuumlrnberg 2016
[53] D Ectors F Goetz-Neunhoeffer and J Neubauer Domain size anisotropy in the double-Voigt approach An extended model Journal of Applied Crystallography 481998ndash20012015
[54] D Ectors F Goetz-Neunhoeffer and J Neubauer Routine (an)isotropic crystallite sizeanalysis in the double-Voigt approximation done right Powder Diffraction 32(S1)27ndash342017
28
5 References
[55] D Jansen F Goetz-Neunhoeffer C Stabler and J Neubauer A remastered external stan-dard method applied to the quantification of early OPC hydration Cement and ConcreteResearch 41(6)602ndash608 2011
[56] T Ungaacuter G Tichy J Gubicza and R J Hellmig Correlation between subgrains andcoherently scattering domains Powder Diffraction 20(04)366ndash375 2005
[57] Triloki P Garg R Rai and B K Singh Structural characterization of as-depositedcesium iodide films studied by X-ray diffraction and transmission electron microscopy tech-niques Nuclear Instruments and Methods in Physics Research Section A AcceleratorsSpectrometers Detectors and Associated Equipment 736128ndash134 2014
[58] J Schreiner F Goetz-Neunhoeffer J Neubauer and D Jansen Hydrothermal synthesisof 11 Aring tobermorite ndash Effect of adding metakaolin to the basic compound Applied ClayScience 185 2020
[59] J Schreiner F Goetz-Neunhoeffer J Neubauer S Volkmann S Bergold R Webler andD Jansen Advanced Rietveld refinement and SEM analysis of tobermorite in chemicallydiverse autoclaved aerated concrete Powder Diffraction 34143ndash150 2019
[60] J Schreiner D Jansen D Ectors F Goetz-Neunhoeffer J Neubauer and S VolkmannNew analytical possibilities for monitoring the phase development during the production ofautoclaved aerated concrete Cement and Concrete Research 107247ndash252 2018
29
6 Publications
6 Publications
61 Hydrothermal synthesis of 11 Aring tobermorite ndash Effectof adding metakaolin to the basic compound
Reprint of the peer reviewed publication
Schreiner J Goetz-Neunhoeffer F Neubauer J Jansen D 2020 Hydrothermalsynthesis of 11 Aring tobermorite ndash Effect of adding metakaolin to the basic compoundApplied Clay Science 185 httpsdoiorg101016jclay2019105432
with permission from Elsevier
30
Contents lists available at ScienceDirect
Applied Clay Science
journal homepage wwwelseviercomlocateclay
Research paper
Hydrothermal synthesis of 11 Aring tobermorite ndash Effect of adding metakaolin tothe basic compound
J Schreiner F Goetz-Neunhoeffer J Neubauer D JansenUniversity of Erlangen-Nuremberg GeoZentrum Nordbayern Mineralogy Schlossgarten 5a 91054 Erlangen Germany
A R T I C L E I N F O
KeywordsHydrothermal synthesis11 Aring tobermoriteMetakaolinPowder diffractionKatoite
A B S T R A C T
Different amounts and types of metakaolin were analyzed and applied for the hydrothermal synthesis of 11 Aringtobermorite All synthesized samples were investigated by means of powder XRD combined with Rietveld re-finement Al-substituted 11 Aring tobermorite was successfully synthesized on the basis of a broad range of com-pounds characterized by a varying content of metakaolin Katoite was present depending on the amount ofsupplied Al3+ which was determined by the dosage of metakaolin Minor crystalline components included in thetwo types of metakaolin sources varied greatly in their reactivity under hydrothermal conditions Despite adifferent degree of purity the two types of metakaolin showed corresponding effects at moderate dosages butcontrary effects at higher dosages as for the synthesis of 11 Aring tobermorite The domain morphology of to-bermorite could be associated with Al3+ incorporation for low dosages of metakaolin represented by up to 2 wt- Al2O3 in the dry mix By contrast Al3+ affected tobermorite lattice parameters at equivalent and even athigher dosages with c reaching 2295 Aring at 12 wt- Al2O3 in the dry mix
1 Introduction
11 Application of metakaolin as a reactive material in constructionindustry
The application of supplementary cementitious materials (SCMs) inthe field of construction technology has received a lot of attention inrecent years Due to limited resources and an urgent need for alter-native and more eco-friendly construction materials SCMs such asmetakaolin offer a great potential The usage of SCMs has not onlyspread to the cement and mortar industry but also to advanced appli-cations such as autoclaved aerated concrete (AAC) (Demir et al 2014Koutnyacute et al 2014 Walczak et al 2015 Roacuteżycka and Pichoacuter 2016Chucholowski et al 2018) Unlike ordinary cementitious constructionmaterials AAC is produced from hydrothermal curing Due to the dif-ferent thermodynamic environment the hydration process and the re-activity of raw materials have to be investigated properly in order tounderstand the effects on the AAC product The leading mineral phasein AAC is 11 Aring tobermorite (Ca5Si6O16(OH)2middot4H2O) As a consequencethe thermal and mechanical properties of AAC depend on micro-structure and crystallinity of tobermorite to some extent In addition tothe curing time and the fineness of raw materials the supply of ionsthat can substitute in the tobermorite structure is a crucial factor in thiscontext Especially substitutions by aluminum sodium and potassium
ions have been investigated thoroughly (Sauman 1974 Klimesch andRay 1998 Mostafa et al 2009 Matekonis et al 2010 Skawinskaet al 2017) Calcined clays usually contain a considerable amount ofthe mentioned ions
There is a vast amount of literature on the reactivity of SCMs atambient temperature and standard pressure but there is little when itcomes to hydrothermal conditions In previous publications the beha-vior of metakaolin under hydrothermal conditions was mainly in-vestigated for the synthesis of zeolites (Zhang et al 2007 Aguilar-Mamani et al 2014 Setthaya et al 2016 Luo et al 2018) In thesestudies the reactivity of metakaolin was observed at a wide range oftemperature and pH values During the transformation of kaolin intometakaolin a loss of framework alumina was observed (Ayodele et al2019) In recent decades metakaolin has been the subject of studies inthe field of geopolymer research (Rashad 2013 Chen et al 2016) Forthe synthesis of 11 Aring tobermorite a more distinct setting of temperaturesetting (180ndash200 degC) and steam pressure (1ndash12 MPa) are required
This publication is intended to make a new contribution to thechallenging field of hydrothermal synthesis in the system CaO-Al2O3-SiO2-H2O based on XRD analysis combined with Rietveld refinementVarious dosages of two types of metakaolin with different chemical andmineralogical purities are compared for the effects on the hydrothermalsynthesis of Al-substituted 11 Aring tobermorite Especially changes of thebulk chemistry in the raw mixes the reactivity of minor crystalline
httpsdoiorg101016jclay2019105432Received 20 August 2019 Received in revised form 13 November 2019 Accepted 30 December 2019
Corresponding authorE-mail address juergenjsschreinerfaude (J Schreiner)
Applied Clay Science 185 (2020) 105432
0169-1317 copy 2020 Elsevier BV All rights reserved
T
6 Publications
31
phases of the two types of metakaolin and the effect of different curingtimes are the focus of interest On the one hand metakaolin offers agreat potential in the AAC industry On the other hand of all SCMsmetakaolin is a good source material for investigating the influence ofAl3+ on the synthesis of Al-substituted 11 Aring tobermorite
12 Synthesis of Al-substituted 11 Aring tobermorite
In addition to being present in AAC tobermorite has found appli-cation in wastewater treatment and nuclear waste management due toits ion exchange capacity (Maeda et al 2012 Monasterio et al 2015)The substitution of silicon by aluminum results in a different to-bermorite structure due to general and local charge balance affectingthe lattice parameters Especially c is impacted by this substitutionbecause it occurs in the bridging tetrahedron and additional OHndash sub-stitutes O2ndash (Komarneni et al 1985 Merlino et al 2000) As suggestedin some additional studies the substitution of Si4+ by Al3+ and Na+ orK+ leads to a lath-like morphology of tobermorite crystals (Mostafa2005 Mostafa et al 2009 Venhodovaacute et al 2015 Qu et al 2018)However because of the heterogeneous appearance of tobermorite inAAC it is hardly possible to conduct a proper characterization based onSEM analysis In our recent work the anisotropic peak broadening oftobermorite in XRD diffractograms was successfully linked with theincorporation of foreign ions supplied in a common AAC production(Schreiner et al 2019) This finding allowed a more statistical struc-tural characterization of tobermorite in bulk compositions compared toSEM analysis Moreover it was reported in other studies that differenthydrate phases occur depending on the amount of supplied ions and onthe experimental settings In compounds with a high content of Al3+formation of katoite could be observed (Klimesch and Ray 1998 Riacuteoset al 2009 Matsui et al 2011) In the case of a longer curing durationinstead of 11 Aring tobermorite the formation of xonotlite (Siauciunas andBaltakys 2004 Galvaacutenkovaacute et al 2018) or - depending on the finenessof used silica source (Siauciunas and Baltakys 2004) - gyrolite is fa-voured
Kalousek (1956) suggested that tobermorite can contain up to 5Al2O3 More Al2O3 in the system resulted in the formation of hydro-garnet Klimesch and Ray (1998) additionally investigated the stabilityof hydrogarnet depending on the Al(Si + Al) ratio and its role in re-lation to the formation of 11 Aring tobermorite in an equivalent systemThey suggest that hydrogarnet always appears before tobermorite butthe former can only be detected for higher Al(Si + Al) ratios in theevent of longer curing times Riacuteos et al (2009) and Qu et al (2018)confirmed these findings in extensive investigations In the latter pub-lication it is additionally suggested that samples prepared at lowertemperatures (160 degC) are less impacted by the supply of Al3+ Theyalso consider the peak broadening of tobermorite in their XRD plotsbased on the amount of incorporated Al3+ In two recent publicationswe suggested that the peak broadening of tobermorite enables a mi-crostructural analysis by calculating the orientation dependent domainsizes (Schreiner et al 2018 2019) However these studies are based onsamples of industrially produced AAC so that the curing time was fixedThe studied AAC was produced from raw materials with a broad che-mical spectrum such as ordinary Portland cement (OPC) whichsomehow complicates the interpretation of results
In this work the influence of aluminum ions - provided by meta-kaolin - on dominant crystallographic direction-dependent domaingrowth of tobermorite is investigated by analysis of anisotropic peakbroadening (Ectors et al 2015 2017) In Fig 1 of the supplementarymaterial the method of fitting the anisotropic peak broadening of to-bermorite using a triaxial cylinder model is visualized (Schreiner et al2018) Fitting of the anisotropic peak broadening of tobermorite Thismethod is used to calculate the average and reliable values for to-bermorite domain sizes in the powder sample and associate them withaverage Al3+ incorporation Microstrain should be considered becauseit is an additional source of peak broadening However this usually
accounts for materials that have been exposed to different kinds ofstress such as metals and alloys (Badawi et al 2019) In addition theinstrumental contribution to peak broadening should be consideredHydration products such as tobermorite are characterized by crystallitesizes in the range of nanometers so that anisotropic size broadeningclearly outweighs the effect of instrumental broadening (Jenkins andSnyder 1996) Moreover the impact of Al3+ on the lattice parametersof tobermorite is considered It should additionally be clarified whe-ther the results from our previous publication (Schreiner et al 2019)based on industrially produced AAC can be confirmed by investigationwith less complex raw mixes and purely based on laboratory experi-ments
2 Material and methods
21 Starting materials
The starting materials for hydrothermal synthesis included deio-nized water quartz flour portlandite (999 pure) and two types ofmetakaolin One type was ordinary commercially available metakaolin(MK) with nearly a stoichiometric composition For comparison thesecond type of commercially available metakaolin was a by-productfrom expanded glass production (MKg) and consequently highly im-pure The chemical composition of MK and MKg determined by XRF isgiven in Table 1 With MKg containing less Al2O3 but considerably moreNa2O than MK the effects on hydrothermal synthesis were of interestBoth types of metakaolin have been characterized in previous pub-lications (Schmidt et al 2012 Naber et al 2019) In addition weverified the mineral phase content by XRD analysis Besides amorphousmetakaolin MK contained minor amounts of anatase quartz and mica
Fig 1 Weight fractions of tobermorite quartz and katoite determined byquantitative XRD analysis ndash samples including MKg crosshatched
Table 1Chemical composition of MK and MKg determined by XRF analysis ndash majorcontrasts in bold letters
Oxides [wt-] MK MKg
SiO2 536 604Al2O3 392 206CaO 01 40MgO 01 12Na2O 0 96K2O 10 18Fe2O3 18 05TiO2 21 03P2O5 01 02Loss on ignition 15 1
J Schreiner et al Applied Clay Science 185 (2020) 105432
2
6 Publications
32
MKg contained additional kaolinite feldspar and quartz
22 Investigated mix composites
For the preparation of raw mixtures the powders were weighed andhomogenized using a lab-scale mixing mill Table 2 lists the composi-tion and nomenclature of all samples including Al2O3 content andcuring time in the autoclave
bull Besides one blank mixture (MK0) that did not contain any type ofmetakaolin eleven more compounds were prepared of which threeincluded different dosages of MKg (MKg16 MKg23 and MKg60)Three more mixes contained equivalent amounts of MK instead ofMKg (MK16 MK23 and MK60) These mixes were investigated inorder to have a direct comparison concerning the effects of differentraw material on the synthesis of tobermorite
bull Additionally the mixes MK9 MK5 and MK25 with lower dosages ofmetakaolin were analyzed In the referenced literature (Schreineret al 2019) the effect of Al3+ on the anisotropic peak broadeningof tobermorite could only be observed in the case of Al2O3 contentslower than 4 in the drymix In the latter three mixes Al2O3 con-tents range from 1 to 35 Al2O3 (calculated from XRF data) whichmeets the region of interest for the analysis of tobermorite domainmorphology
bull The curing time for nearly all of the investigated samples was 12 hbut compound MK9 was prepared two more times for curing timesof 2 h and 6 h The different curing times were chosen in this par-ticular sample so that the reactivity of metakaolin and the phasetransitions could be observed more precisely
23 Hydrothermal treatment
Due to the different fineness of raw materials there was a differentwater demand from one mixture to another In order to obtain slurriesof comparable rheology the amount of water was adapted respectivelyresulting in water-to-solid ratios of 25 to 3 which matches the sug-gested water-to-solid ratio for this purpose (Roacutezycka et al 2014Galvaacutenkovaacute et al 2018) The weighed water was added to the dry mixand after stirring for 1 min at 23 degC the slurry was poured into thereactor Minor changes in the quantity of added water did not have aninfluence on the measured steam pressure All experiments were con-ducted using a PTFE-lined stainless steel autoclave with a reactor vo-lume of 300 ml The oven temperature was fixed at 180 degC and auto-genous steam pressure of 11ndash12 MPa was measured during eachexperiment with an external manometer After cooling to room tem-perature the sample was removed from the reactor coarsely ground
using an agate mortar and dried at 60 degC for 12 h After drying thesample was ground with an agate mortar again in order to deagglo-merate the particles As no coarse raw materials were used there wasno need for wet McCrone milling (Schreiner et al 2018)
24 XRD analysis
After preparation into front-loading sample holders the powdersamples were measured with a D8 diffractometer (Bruker) equippedwith a LynxEye detection system and Bragg-Brentano geometry Thesettings for XRD analysis included a tube voltage of 40 kV a current of40 mA an angular range from 6 to 80deg 2θ (Cu Kα radiation) a time perstep of 054 s a step width of 00236deg 2θ and a PSD opening of 33deg Thebackground was fitted with Chebyshev polynomial of the fifth orderThe major contribution of amorphous phase was fitted with a singlepeak with a fixed position at 308deg 2θ so that tobermorite reflectionswere not affected An external quartzite standard was measured withthe same parameters in order to determine phase quantities (Jansenet al 2011) Bruker AXS software TOPAS 50 was used for Rietveldrefinement (Rietveld 1969) and the used structures are shown inTable 3
3 Results and discussion
31 Different dosages of MK and MKg
In Fig 1 the quantities of tobermorite quartz and katoite present inmost of the samples determined by XRD analysis are illustratedWhenever tobermorite was the leading mineral hydrate phase a basalspacing of 113 Aring could be verified in each of the diffractograms Thequantities of minor crystalline phases and amorphous content are notshown For low dosages of MK it can be seen that the weight fraction oftobermorite decreased At moderate dosage of both types of metakaolin(MK16 MK23 MKg16 MKg23) tobermorite was present in comparablequantities It can be seen that the amount of katoite in the mixes de-pended on the dosage of metakaolin and it appeared only at dosages ofMK5 or more Due to the higher content of aluminum in MK comparedto MKg more katoite could always be observed in the MK mixes atequivalent dosages Despite equal amounts of quartz as starting mate-rial in mixes for both types of metakaolin the resulting weight fractionsin the cured samples were not alike Considerably more quartz waspresent in the MK samples Even though less quartz was used for mixescontaining higher amounts of MK even more quartz was present afterhydrothermal curing (Table 2 Fig 1) Consequently some of the SiO2
provided by MK did not transform into an amorphous phase or to-bermorite but into quartz This finding is verified by the presence ofquartz in MK60 because no quartz was included in the raw mixture Thefeldspar present in MKg did not react so Na2O and an unknown amountof Al2O3 may not have been supplied for hydrothermal reaction Besidestobermorite and quartz additional calcite scawtite (Ca7Si6(CO3)
Table 2Basic powder compounds prepared for the hydrothermal synthesis of to-bermorite with the respectively calculated Al2O3 content and curing time in thereactor
Sample Portlandite[wt-]
Quartz[wt-]
MK[wt-]
MKg
[wt-]
Al2O3
[wt-]Curingtime [h]
MK0 49 51 ndash ndash 0 12MK25 495 48 25 ndash 1 12MK5 49 46 5 ndash 2 12MK9_2h 48 43 9 ndash 35 2MK9_6h 48 43 9 ndash 35 6MK9_12h 48 43 9 ndash 35 12MK16 47 37 16 ndash 63 12MK23 46 31 23 ndash 9 12MK60 40 ndash 60 ndash 235 12MKg16 47 37 ndash 16 33 12MKg23 46 31 ndash 23 47 12MKg60 40 ndash ndash 60 124 12
Table 3Structural data used for the investigation with powder XRD analysis
Phase Author
Anatase (Horn et al 1972)Biotite (Brigatti et al 2000)Calcite (Maslen et al 1995)Kaolinite (Zvyagin 1960)Katoite (Bartl 1969)Microcline (Bailey 1969)Plazolite (Basso et al 1983)Portlandite (Busing and Levy 1957)Quartz (Le Page and Donnay 1976)Scawtite (Grice 2005)Tobermorite (Hamid 1981)Xonotlite (Hejny and Armbruster 2001)
J Schreiner et al Applied Clay Science 185 (2020) 105432
3
6 Publications
33
O18bull2(H2O)) and xonotlite (Ca6Si6O17(OH)2) could be identified insample MK0 (XRD plots of samples MK0 MKg16 MKg23 MK16 andMK23) Comparing MK0 and MK25 scawtite and xonotlite could stillbe identified in a very low amount in MK25 but no longer in samplesthat contained even more MK (XRD plots of samples MK0 MK25 MK5and MK9_12h)
Two additional experiments were done without quartz in the rawmixes (MK60 and MKg60) The according diffractograms after hydro-thermal curing are shown in Fig 2 In sample MKg60 tobermorite (gt 50wt-) was successfully synthesized without any other silica sourcethan MKg whereas no crystalline quartz occurred By contrast no to-bermorite but quartz could be identified in equivalent mixture MK60containing MK It can be seen that crystalline components such as micaand anatase in the raw MK did not react at the selected conditions andremained present in the autoclaved samples Except for feldspar in MKgall of the crystalline components appeared to be reactive at the chosenhydrothermal conditions A minor unidentified phase occurred at328deg2θ and additional xonotlite was identified in sample MKg60 Insample MK60 more calcium was needed for the formation of morehydrogarnet (Fig 1) resulting in a lower CaSi ratio for the remainingsystem Sample MKg60 contained only half of the amount of Al3+ and itwas not completely supplied for reaction due to its partial presence infeldspar Consequently essentially less hydrogarnet (Fig 1) was presentin MKg60 after hydrothermal treatment and the CaSi ratio in the re-maining system was affected to a lesser extent
32 Application of MK for different curing times
The development of hydrate phases in the autoclave for compoundMK9 is displayed in Fig 3 After only 2 h of hydrothermal curing all ofthe available portlandite had reacted and katoite (95 wt-) was pre-sent The applied type of metakaolin appeared to react quickly as itsupplied aluminum for formation of katoite No formation of to-bermorite could be observed at this stage yet An assumably amorphousprecursor can be seen at 28 to 30deg2θ Calcium was provided by thedissolution of portlandite After 6 h of hydrothermal reaction amountsof katoite (85 wt-) and quartz (from 31 wt- at 2 h to 165 wt- at6 h) had decreased and a major amount of tobermorite (35 wt-) waspresent Apparently between 2 and 6 h under hydrothermal conditionsthe amorphous precursor and quartz reacted resulting in the formationof tobermorite An additional 6 h of reaction time (MK9_12h) did notchange the phase composition significantly Slightly more tobermorite
(365 wt-) less quartz (16 wt-) and katoite (65 wt-) weremeasured
33 Tobermorite domain morphology and lattice parameters
In the referenced literature an analysis of tobermorite domainmorphology based on anisotropic peak broadening was possible forsamples that contained notgt 4 wt- Al2O3 in the drymix (Schreineret al 2019) Accordingly in this study samples MK0 MK25 MK5MK9_6h and MK9_12h were suitable (Table 2) with MK9_2h not con-taining any tobermorite In Fig 4 the respective growth in a and b di-rection is visualized with x indicating the domain size in a direction andy indicating domain size in b direction using a macro for TOPAS 50(Ectors et al 2015 2017) The calculated cylinder models in Fig 4represent the relation of yx and not absolute sizes With no supply ofaluminum ions (MK0) the relative domain growth in b direction islower compared to samples containing metakaolin This finding agreeswith the results from a similar investigation of tobermorite in AAC(Schreiner et al 2019) However within the samples MK5 andMK9_12h the different amounts of supplied aluminum ions did notshow a clear effect It appeared that low dosages of Al3+ (1 wt- Al2O3
in MK25 and 2 wt- Al2O3 in MK5) were enough to determine thedomain growth of tobermorite Additional results from the samplesMK9_6h and MK9_12h indicated that growth in b direction increasedwith reaction time
In Fig 5 lattice parameters of tobermorite depending on metakaolindosages are plotted B clearly remained unaffected throughout therange of samples Increasing amounts of metakaolin led to a slightlysmaller parameter a However both types of metakaolin showed acorresponding impact on parameter a By contrast parameter c in-creased strongly with increasing amounts of MK and MKg but the typeof metakaolin was significant At an equivalent dosage MK affected thecell dimension in c direction considerably more than MKg so that thefraction of Al3+ appeared to be the decisive parameter Different metaloxides in MKg did not show a notable effect certainly as they werepartially not provided for reaction Unlike for the domain morphologyof tobermorite the impact on lattice parameters could be observedwithin the complete range of examined dosages
4 Conclusions
The results obtained from the introduced investigations allow con-cluding remarks on the effects of the applied types of metakaolin on thesynthesis of 11 Aring tobermorite the phase transitions and the in-corporation of Al3+ into the lattice of tobermorite
With a critical dosage the use of any type of metakaolin led to theformation of katoite in an according amount At moderate dosages(MKg16 MKg23 MK16 and MK23) the two types of metakaolin showeda good correspondence in consideration of the quantities of to-bermorite For higher dosages there were contrary effects Lower do-sages of MK led to considerable quantities of Al-substituted to-bermorite Samples containing low dosages of MK revealed that katoiteappeared in the case ofgt 5 wt- of MK - corresponding to 2 wt-Al2O3 - in the basic compound Minor crystalline phases in MKg showedbetter reactivity than those in MK The observation that no tobermoritewas present in sample MK60 indicated that high dosages of Al3+ hin-dered the formation of tobermorite
Investigations of MK9 at 2 6 and 12 h displayed the evolution ofhydrate phases At first katoite was the only crystalline hydrate phasepresent after 2 h which corresponded to observations in a differentpublication (Klimesch and Ray 1999) The amount of katoite andquartz then decreased and a major amount of tobermorite formed from2 to 6 h curing time In order to gain more information on the trans-formation of amorphous C-(A)-S-H into tobermorite additional ex-periments in the range of 2 to 6 h curing time will be needed
Domain morphology analysis of tobermorite revealed that low
Fig 2 Diffractograms of MKg MKg60 MK and MK60 from 7 to 34deg2θ CuKα Aanatase C calcite F feldspar k kaolinite K katoite M mica Q quartz Ttobermorite U unidentified phase X xonotlite
J Schreiner et al Applied Clay Science 185 (2020) 105432
4
6 Publications
34
dosages of Al3+ determined the domain growth which agreed with theresults published on tobermorite in AAC samples (Schreiner et al2019) Different curing times unveiled that growth in b direction in-creased with the reaction time Al3+ incorporation into the lattice oftobermorite only reflected to a limited extent in the domain mor-phology By contrast an increase of lattice parameter c was triggered byAl3+ even at the highest dosage in this study Ultimately there is no
evidence for a limit of incorporation of Al3+ but there is a limit ofinfluence on the domain morphology These results additionally re-confirm this assumption similarly made in the previous work (Schreineret al 2019) and suggest a new mechanism of tobermorite crystal-lization depending on the presence of Al3+
Supplementary data to this article can be found online at httpsdoiorg101016jclay2019105432
Declaration of Competing Interest
The authors declare that they have no known competing financialinterests or personal relationships that could have appeared to influ-ence the work reported in this paper
Acknowledgement
The authors thank Rodgauer Baustoffwerke GmbH amp Co KG forsupplying raw materials for laboratory experiments
References
Aguilar-Mamani W Garciacutea G Hedlund J Mouzon J 2014 Comparison betweenleached metakaolin and leached diatomaceous earth as raw materials for the synth-esis of ZSM-5 Springerplus 3 1ndash10 httpsdoiorg1011862193-1801-3-292
Ayodele OB Sulaimon AA Alaba PA Tian Z-Y 2019 Influence of metakaolini-zation temperature on the structure and activity of metakaolin supported Ni catalystin dry methane reforming J Environ Chem Eng httpsdoiorg101016jjece2019103239 (in press)
Badawi EA Abdel-Rahman MA Mostafa A Abdel-Rahman M 2019 Determinationof the crystallite size amp micro- strain by novel method from XRD profile Appl Phys2 1ndash15 httpsdoiorg1031058jap201921001
Bailey SW 1969 Refinement of an intermediate microcline structure Am Miner 541540ndash1545
Bartl H 1969 Roentgen-Einkristalluntersuchungen an (CaO)3 (Al2O3) (H2O)6 und an(CaO)12 (Al2O3)7 (H2O) neuer Vorschlag zur (CaO)12 (Al2O3)7-Struktur NeuesJahrb fuer Mineral Monatshefte 1969 404ndash413
Basso R Giusta AD Zefiro L 1983 Crystal structure refinement of plazolite A highlyhydrated natural hydrogrossular Neues Jahrb Miner Monatsh (Neues Jahrb fuerMineral Monatshefte) 1983 251ndash258
Brigatti MF Lugli C Poppi L Foord EE Kile DE 2000 Crystal chemical varia-tions in Li- and Fe-rich micas from Pikes Peak batholith (Central Colorado) AmMineral 85 1275ndash1286 httpsdoiorg102138am-2000-8-920
Busing WR Levy HA 1957 Neutron diffraction study of calcium hydroxide J ChemPhys 26 563 httpsdoiorg10106311743345
Chen L Wang Z Wang Y Feng J 2016 Preparation and properties of alkali acti-vated metakaolin-based geopolymer Materials (Basel) 9 1ndash12 httpsdoiorg103390ma9090767
Chucholowski C Holger M Thienel K-C 2018 Improving the recyclability en-vironmental compatibility and CO2 balance of autoclaved aerated concrete by re-placing sulfate carrier and cement with calcined clays CePapers 2 503ndash512httpsdoiorg101002cepa846
Fig 3 Diffractograms of MK9_2h MK9_6h and MK9_12h from 7 to 38deg2θ CuKα C calcite K katoite Q quartz T tobermorite
Fig 4 Relation of calculated domain sizes of 11 Aring tobermorite in selectedsamples (MK0 MK25 MK5 MK9_6h and MK9_12h) in a (x) and b (y) direction
Fig 5 Lattice parameters of tobermorite depending on MK or MKg dosageincluding blank mix MK0
J Schreiner et al Applied Clay Science 185 (2020) 105432
5
6 Publications
35
Demir İ Başpınar MS Kahraman E Ccedilalışkan E Goumlrhan G 2014 An investigationon the usability of diatomite in aerated concrete production In Proc of the IntlConf on Advances in Civil Structural and Construction Engineering ndash CSCE 2014 pp97ndash100
Ectors D Goetz-Neunhoeffer F Neubauer J 2015 A generalized geometric approachto anisotropic peak broadening due to domain morphology J Appl Crystallogr 48189ndash194 httpsdoiorg101107S1600576714026557
Ectors D Goetz-Neunhoeffer F Neubauer J 2017 Routine (an)isotropic crystallitesize analysis in the double-Voigt approximation done right Powder Diffract 3227ndash34 httpsdoiorg101017S0885715617000070
Galvaacutenkovaacute L Bartoniacutečkovaacute E Opravil T Tkacz J Ptaacuteček P 2018 The influence ofstarting materials solubility on tobermorite structure formation under the hydro-thermal conditions IOP Conf Ser Mater Sci Eng 379 1ndash8 httpsdoiorg1010881757-899X3791012001
Grice JD 2005 The structure of spurrite tilleyite and scawtite and relationships toother silicate-carbonate minerals Can Mineral 43 1489ndash1500 httpsdoiorg102113gscanmin4351489
Hamid SA 1981 The crystal structure of the 11 Aring natural tobermoriteCa225[Si3O75(OH)15]1H2O Zeitschrift fuer Krist 154 189ndash198 httpsdoiorg101524zkri19811543-4189
Hejny C Armbruster T 2001 Polytypism in xonotlite Ca6Si6O17(OH)2 Zeitschrift furKrist 216 396ndash408
Horn M Schwerdtfeger CF Meagher EP 1972 Refinement of the structure of ana-tase at several temperatures Zeitschrift fur Krist 136 273ndash281 httpsdoiorg101524zkri19721363-4273
Jansen D Goetz-Neunhoeffer F Stabler C Neubauer J 2011 A remastered externalstandard method applied to the quantification of early OPC hydration Cem ConcrRes 41 602ndash608 httpsdoiorg101016jcemconres201103004
Jenkins R Snyder R 1996 Introduction to X-ray Powder Diffractometry ChemicalAnalysis Wiley pp 90
Kalousek GL 1956 Crystal Chemistry of Hydrous Calcium Silicates J Am Ceram Soc40 74ndash80
Klimesch D Ray A 1998 Autoclaved cement-quartz pastes with metakaolin additionsAdv Cem Based Mater 7 109ndash118 httpsdoiorg101016S1065-7355(97)00073-4
Klimesch D Ray A 1999 DTA-TGA evaluations of the CaOndashAl2O3ndashSiO2ndashH2O systemtreated hydrothermally Thermochim Acta 334 115ndash122 httpsdoiorg101016s0040-6031(99)00140-9
Komarneni S Roy R Roy DM Fyfe CA Kennedy GJ Bothner-By AA Dadok JChesnick AS 1985 27Al and29Si magic angle spinning nuclear magnetic resonancespectroscopy of Al-substituted tobermorites J Mater Sci 20 4209ndash4214 httpsdoiorg101007BF00552416
Koutnyacute O Opravil T Pořiacutezka J 2014 Application of metakaoline in autoclavedaerated concrete technology Adv Mater Res 1000 174ndash177 httpsdoiorg104028wwwscientificnetAMR1000174
Le Page Y Donnay G 1976 Refinement of the crystal structure of low-quartz ActaCrystallogr Sect B 32 2456ndash2459 httpsdoiorg101107S0567740876007966
Luo H Law WW Wu Y Zhu W Yang EH 2018 Hydrothermal synthesis of needle-like nanocrystalline zeolites from metakaolin and their applications for efficient re-moval of organic pollutants and heavy metals Microporous Mesoporous Mater 2728ndash15 httpsdoiorg101016jmicromeso201806015
Maeda H Ogawa Y Ishida EH Kasuga T 2012 Hydrothermal synthesis of to-bermorite doped with phosphorus species for removing heavy metal ions J AustCeram Soc 48 8ndash11
Maslen EN Streltsov VA Streltsova NR Ishizawa N 1995 Electron density andoptical anisotropy in rhombohedral carbonates III Synchrotron Xray studies ofCaCO3 MgCO3 and MnCO3 Acta Crystallogr Sect B 51 929ndash939 httpsdoiorg101107S0108768195006434
Matekonis G Šiaučiūnas R Vaičiukynienė D 2010 Hydrothermal Synthesis andCharacterization of Na + and [ Al 3 + + Na + ] -substituted Tobermorite in CaO-SiO2middotnH2O-H2O System Mater Sci 16 242ndash248
Matsui K Kikuma J Tsunashima M Ishikawa T Matsuno S Ogawa A Sato M2011 In situ time-resolved X-ray diffraction of tobermorite synthesis process underhydrothermal condition IOP Conf Ser Mater Sci Eng 18 60ndash66 httpsdoiorg1010881757-899X182022017
Merlino S Bonaccorsi E Armbruster T 2000 The real structures of clinotobermoriteand tobermorite 9 Aring OD character polytypes and structural relationships Eur JMineral 12 411ndash429 httpsdoiorg1011270935-122120000012-0411
Monasterio M Gaitero JJ Manzano H Dolado JS Cerveny S 2015 Effect ofchemical environment on the dynamics of water confined in calcium silicate mi-nerals Natural and synthetic tobermorite Langmuir 31 4964ndash4972 httpsdoiorg101021acslangmuir5b00614
Mostafa NY 2005 Influence of air-cooled slag on physicochemical properties of auto-claved aerated concrete Cem Concr Res 35 1349ndash1357 httpsdoiorg101016jcemconres200410011
Mostafa NY Shaltout AA Omar H Abo-El-Enein SA 2009 Hydrothermal synth-esis and characterization of aluminium and sulfate substituted 11 nm tobermoritesJ Alloys Compd 467 332ndash337 httpsdoiorg101016jjallcom200711130
Naber C Stegmeyer S Jansen D Goetz-Neunhoeffer F Neubauer J 2019 ThePONKCS method applied for time resolved XRD quantification of supplementarycementitious material reactivity in hydrating mixtures with ordinary Portland ce-ment Constr Build Mater 214 449ndash457 httpsdoiorg101016jconbuildmat201904157
Qu X Zhao Z Zhao X 2018 Microstructure and characterization of aluminum-in-corporated calcium silicate hydrates (C-S-H) under hydrothermal conditions RSCAdv 8 28198ndash28208 httpsdoiorg101039c8ra04423f
Rashad AM 2013 Metakaolin as cementitious material history scours production andcomposition - a comprehensive overview Constr Build Mater 41 303ndash318 httpsdoiorg101016jconbuildmat201212001
Rietveld HM 1969 A profile refinement method for nuclear and magnetic structures JAppl Crystallogr 2 65ndash71 httpsdoiorg101107S0021889869006558
Riacuteos CA Williams CD Fullen MA 2009 Hydrothermal synthesis of hydrogarnet andtobermorite at 175 degC from kaolinite and metakaolinite in the CaO-Al2O3-SiO2-H2Osystem a comparative study Appl Clay Sci 43 228ndash237 httpsdoiorg101016jclay200809014
Roacuteżycka A Pichoacuter W 2016 Effect of perlite waste addition on the properties of au-toclaved aerated concrete Constr Build Mater 120 65ndash71 httpsdoiorg101016jconbuildmat201605019
Roacutezycka A Kotwica Ł Małolepszy J 2014 Synthesis of single phase gyrolite in theCaO-quartz-Na2O-H2O system Mater Lett 120 166ndash169 httpsdoiorg101016jmatlet201401003
Sauman Z 1974 Influence of SO4 2ndash ions on the formation of 11 Aring tobermorite InProceedings of the 2nd International Symposium on Science and Research in SilicateChemistry Moscow pp 25ndash39
Schmidt M Egersdoumlrfer A Poumlllmann H 2012 Increased reactivity using a glass-containing metakaolin as an active filler in lime-based binder systems ZKG Int 6554ndash62
Schreiner J Jansen D Ectors D Goetz-Neunhoeffer F Neubauer J Volkmann S2018 New analytical possibilities for monitoring the phase development during theproduction of autoclaved aerated concrete Cem Concr Res 107 247ndash252 httpsdoiorg101016jcemconres201802028
Schreiner J Goetz-Neunhoeffer F Neubauer J Volkmann S Bergold S Webler RJansen D 2019 Advanced Rietveld refinement and SEM analysis of tobermorite inchemically diverse autoclaved aerated concrete Powder Diffract 34 143ndash150httpsdoiorg101017s0885715619000149
Setthaya N Chindaprasirt P Pimraksa K 2016 Preparation of zeolite nanocrystals viahydrothermal and solvothermal synthesis using of rice husk ash and metakaolinMater Sci Forum 872 242ndash247 httpsdoiorg104028wwwscientificnetmsf872242
Siauciunas R Baltakys K 2004 Formation of gyrolite during hydrothermal synthesis inthe mixtures of CaO and amorphous SiO2 or quartz Cem Concr Res 34 2029ndash2036httpsdoiorg101016jcemconres200403009
Skawinska A Owsiak Z Baran T Hernik K 2017 The influence of halloysite ad-dition on tobermorite formation in CaO and quartz mix under hydrothermal condi-tions Cem Wapno Bet 17 426ndash434
Venhodovaacute E Janovskyacute R Drochytka R 2015 Formation of tobermorite at differentmaterials composition of aerated concrete Appl Mech Mater 752ndash753 247ndash250httpsdoiorg104028wwwscientificnetamm752-753247
Walczak P Małolepszy J Reben M Szymański P Rzepa K 2015 Utilization ofwaste glass in autoclaved aerated concrete Proc Eng 122 302ndash309 httpsdoiorg101016jproeng201510040
Zhang Y Gao W Cui L 2007 The transformation of acid leached metakaolin tozeolite beta Stud Surf Sci Catal 170 420ndash425 httpsdoiorg101016S0167-2991(07)80870-6
Zvyagin BB 1960 An attempt to electronographic determination of kaolinite structureJ Dokl Akad Nauk SSSR 130 1023ndash1026
J Schreiner et al Applied Clay Science 185 (2020) 105432
6
6 Publications
36
6 Publications
62 Advanced Rietveld refinement and SEM analysis oftobermorite in chemically diverse autoclaved aeratedconcrete
Following the copyright guidelines by Cambridge University Press the publication
Schreiner J Goetz-Neunhoeffer F Neubauer J Volkmann S Bergold S WeblerR Jansen D 2019 Advanced Rietveld refinement and SEM analysis of tobermorite inchemically diverse autoclaved aerated concrete Powder Diffraction 34 143ndash150 httpsdoiorg101017s0885715619000149
may not be reprinted It can be accessed at
httpswwwcambridgeorgcorejournalspowder-diffractionarticleadvanced-rietveld-refinement-and-sem-analysis-of-tobermorite-in-chemically-diverse-autoclaved-aerated-concrete51597C2A66F6F225D29DEB2675E74249
37
6 Publications
63 New analytical possibilities for monitoring the phasedevelopment during the production of autoclavedaerated concrete
Reprint of the peer reviewed publication
Schreiner J Jansen D Ectors D Goetz-Neunhoeffer F Neubauer J VolkmannS 2018 New analytical possibilities for monitoring the phase development during theproduction of autoclaved aerated concrete Cement and Concrete Research 107 247ndash252httpsdoiorg101016jcemconres201802028
with permission from Elsevier
38
Contents lists available at ScienceDirect
Cement and Concrete Research
journal homepage wwwelseviercomlocatecemconres
Short communication
New analytical possibilities for monitoring the phase development duringthe production of autoclaved aerated concrete
J Schreinera D Jansena D Ectorsa F Goetz-Neunhoeffera J Neubauera S Volkmannb
aUniversity of Erlangen-Nuremberg GeoZentrum Nordbayern Mineralogy Schlossgarten 5a 91054 Erlangen Germanyb Rodgauer Baustoffwerke GmbH amp Co KG Am Opel-Pruumlffeld 3 63110 Rodgau-Dudenhofen Germany
A B S T R A C T
This work presents improved analytical methods for both steps of the production process of autoclaved aeratedconcrete (AAC) the phase development during the hydration before autoclaving and during the autoclavingprocess itself The improvement includes new insights into preparation methods of AAC samples for powderdiffraction as well as Rietveld refinement strategies For the first time a new implementation for calculatinganisotropic crystal domain sizes is applied to major hydrate phases occurring during AAC production namelyportlandite during the hydration before autoclaving and tobermorite during the autoclaving process The cal-culation of anisotropic domain size growth which can be implemented in the Rietveld environment is based oncrystallographically and geometrically appropriate models The implementation of calculating anisotropic do-main sizes for the Rietveld software TOPAS 50 allows a superior Rietveld fit and a more accurate quantificationof the phase development Additionally it enables the tracking of growth mechanism of portlandite duringhydration
1 Introduction
Autoclaved aerated concrete (AAC) is known as a lightweight con-struction material which offers outstanding properties such as suffi-cient strength for construction in addition with excellent thermal in-sulation [12] AAC is produced by autoclaving from calcareous rawmaterials such as lime (CaO) and cement quartz sulfate carrier andother additives such as foaming agents and water
The production process (Fig 1) can be separated into the hydrationof the mixed slurry before the procedure of autoclaving and the auto-claving at elevated temperature (180 degC to 200 degC) under saturatedsteam pressure (12MPa) for several hours
The hydration process before autoclaving is necessary to achievesufficient strength in order to cut the green cake blocks as they shouldhave a specific shape and dimension after autoclaving Furthermorethe porous structure is generated by the foaming agent during hydra-tion in the first process step During autoclaving the final propertiesnamely strength and low thermal conductivity are achieved
It is already well understood that the autoclaving process leads tothe formation of several phases first of all tobermorite(Ca5Si6O16(OH)2lowast4H2O) [3ndash5] Newest research has shown im-pressively which reactions are running from the mineralogical point ofview Insitu XRD measurements were carried out during the
autoclaving process and the phase development was shown by plottingnormalized intensities [6] The study of Mitsuda et al [3] was mainlyfocused on the tracking of the phase evolution during the autoclavingprocess of AAC However their statements concerning phase evolutionare mainly based on XRD data and TGA measurements There is acommon agreement that the following reactions occur The consump-tion of the alite (OPC) leads to the formation of an initial C-S-H phaseduring the first processing step Portlandite which was initially formedduring the first process step (from CaO and C3S) further quartz and theC-S-H phase are consumed during autoclaving resulting in the crystal-lization of tobermorite Hence the crystallization process of to-bermorite as well as the crystal structure of tobermorite was an issue ofresearch and discussion over the last years and numerous publicationsto these topics are available Concerning the crystal structure of to-bermorite respectively the tobermorite supergroup a new publicationoutlines all important references and recommends a new nomenclature[7]
The presented study was performed to create new analytical possi-bilities for the characterization of the production process of AAC Bothof the production process steps are essential for the final productHence the present work focuses on crystallization of hydrate phases inboth processes
Firstly an external standard method [89] was published and
httpsdoiorg101016jcemconres201802028Received 6 October 2017 Received in revised form 1 February 2018 Accepted 26 February 2018
Corresponding authorsE-mail addresses juergenjsschreinerfaude (J Schreiner) danieljansenfaude (D Jansen)
Cement and Concrete Research 107 (2018) 247ndash252
0008-8846 copy 2018 Elsevier Ltd All rights reserved
T
6 Publications
39
recommended for the determination of absolute phase contents inmixtures with amorphous content It was shown that the method canabsolutely be recommended for hydrating cement pastes in which watercannot be quantified directly by XRD [10] This method seems to bevery promising for both the quantification of the hydration of the AACslurry before autoclaving and the quantification of the phase evolutionduring autoclaving inasmuch as both production steps form crystallineand amorphous phases
Secondly a new approach to anisotropic peak broadening due toanisotropic domain morphology which was developed [1112] is ap-plied to AAC samples to improve the fit of portlandite and tobermoriteby Rietveld refinement [13] By applying this approach the refinementof both portlandite and tobermorite should additionally lead to betterquantitative results as well as to better insights into the development ofthe domain size morphology of both phases formed
It was already shown that in a hydrating raw mixture for AAC twospecies of portlandite precipitate at 23 degC one showing dynamicallyanisotropic peak broadening and another one following the isotropictrend [14] The application of the anisotropic refinement model led toan improved fitting of portlandite Moreover the mechanism of aniso-tropic domain growth of portlandite was tracked
2 Materials and methods
In order to examine the hydration of the AAC slurry before auto-claving a mixture of the hydraulic reactive components was weighedand measured in-situ at a Bruker D8 diffractometer with a LynxEyedetection system
Ordinary Portland cement (OPC) was mixed with lime (CaO) andanhydrite (C$) The raw materials were taken from the same batches asfor the industrial samples The drymix (58 OPC 36 CaO and 6 C$by weight) was then mixed with water (ws= 08) and placed into anappropriate sample holder The samples were not aerated The slurrysamples were covered with a kapton film to avoid evaporation andcarbonation Diffractograms were recorded with an angular range from7 to 545deg 2θ and a step width of 0011deg 2θ Measurements were carriedout every 15min For each measurement 96 XRD patterns were re-corded over the first 24 h The temperature was fixed at 70 degC which isthe mean temperature generally prevailing in the industrial processduring hydration before autoclaving Rietveld refinement was carriedout using the G-factor method All structures used for Rietveld refine-ment are shown in Table 1
For investigation of the autoclaved samples five different specimenswere taken at different autoclaving times The specimens were takenout of a technical production process hence it was not possible to in-terrupt the process at an earlier time inasmuch it would lead to damageof a whole concrete production batch The specimens were firstly driedat 60 degC until weight constancy The whole blocks were then broken andstatistical samples of 20 g were taken In order to receive the right massattenuation coefficient (MAC) for G-factor method the loss on ignitionand the chemical composition (XRF) were determined For energydispersive XRF analysis (Spectro Xepos) tube voltage from 20 kV to50 kV and tube current from 08 to 20mA were used for differenttargets
The final sample preparation (grinding) before XRD measurementswas carried out using both an agate mortar and a McCrone micronizingmill for wet milling with isopropanol Both preparation methods wereapplied separately to see which one is suitable in order to get the bestpreparation for XRD investigations Six preparations were performed byone operator of which two were prepared with an agate mortar andfour with a McCrone mill For the McCrone milling 3 g of the sampleand 10ml of isopropanol were used for grinding for 12min The grainsize distribution of one sample prepared with an agate mortar and onesample prepared using a McCrone mill was measured by laser granu-lometry in isopropanol using a Mastersizer 3000 (MALVERN)
After milling the samples in these two ways for XRD analysis thepowders were prepared into a front loading sample holder and mea-sured Diffractograms were recorded with an angular range from 6 to80deg 2θ a step width of 00236deg 2θ and a time per step of 054 s Rietveldrefinement combined with external standard (G-factor) was applied inorder to get absolute quantities for each phase The refinement strategyfor portlandite and tobermorite in the TOPAS Launch Mode (TOPAS50 Bruker AXS) is attached as a Supplementary material file
3 Results and discussion
31 Hydration of the mixture before autoclaving
The hydration of the investigated paste before autoclaving isdominated by the hydration of the cement as well as the reaction of thefree lime (CaO) resulting in the formation of portlandite It can beclearly seen from Fig 2 that the hydration of the paste leads to theformation of ettringite portlandite and C-S-H phase For simplificationthe remaining phase developments are not shown in Fig 2 because theyare not in the focus of this study The hydration of CaO forming
Fig 1 Simplified process steps of AAC production and hydrate phase evolution
Table 1Structures used for Rietveld refinement
Phase Author
Alite [15]Anhydrite [16]Bassanite [17]Belite (β) [18]Belite (αprime) [19]Brownmillerite [20]C-S-H [21]Calcite [22]Ettringite [23]Gypsum [24]Hemicarbonate [25]Hydroxylellestadite [26]Lime (CaO) [27]Microcline [28]Portlandite [29]Quartz [30]Tobermorite [31]Tricalciumaluminate (cubic) [32]Tricalciumaluminate (orthorhombic) [33]PONCKS model for Water [21]
J Schreiner et al Cement and Concrete Research 107 (2018) 247ndash252
248
6 Publications
40
portlandite begins rapidly after the addition of water to the mixture andlime is fully consumed after only 1 h of hydration This translates into aquick rise of heat of hydration so that cement hydration is acceleratedwhich leads to further portlandite formation by the reaction of aliteEttringite formation stalls after few hours of hydration After 12 h et-tringite is partially decomposed probably due to sulfate depletion [9]
and poorly crystalline AFm phases (not shown in Fig 2) are formedIn Fig 3 it can be seen that in fact two generations of portlandite
are formed a 1st dominant generation showing anisotropic peakbroadening and 2nd one occurring considerably later following theisotropic domain size refinement which is usually carried out using theRietveld method This occurrence comes along firstly with lime hy-dration and secondly with alite hydration The expected quantity ofportlandite formed from lime hydration very well complies with the
Fig 2 Phase development in AAC paste on a laboratory scale before autoclaving ana-lyzed by in-situ XRD at 70 degC
Fig 3 Formation of two generations of portlandite by hydration of lime (1st) and C3S(2nd) at 70 degC before autoclaving with the major generation showing anisotropic peakbroadening
Fig 4 Biaxial cylinder domain size model of portlandite used for Rietveld refinement of anisotropic peak broadening
Fig 5 Morphological evolution of portlandite showing anisotropic domain size growthduring hydration at 70 degC
Fig 6 Comparison of quantification of crystalline quartz in samples prepared withMcCrone mill and agate mortar at different autoclaving times
J Schreiner et al Cement and Concrete Research 107 (2018) 247ndash252
249
6 Publications
41
quantity of the observed 1st generation The development of portlan-dite growth was already tracked in an equivalent slurry at 23 degC [14]Thus this observation confirms that the crystallinity of portlandite inmixtures for AAC production depends on the starting phase for hydra-tion as already indicated by Ectors [14]
Fig 4 shows the used biaxial cylindrical model for anisotropic do-main size calculation and the portlandite structure which was createdwith structural software VESTA 318 [34] Using the cylindrical ap-proach domain sizes in a (here equating to b) and c direction(dz= cylinder height) can be calculated which comes along with theexpected symmetrical parameters of portlandite
The 1st portlandite generation showing anisotropic domain growthcan be tracked in terms of cylinder diameter and height which is rea-lized in Fig 5 The blue cylinder represents the geometric approach andcylinder height and diameter are calculated newly for each range Thecylinder height remains rather stable throughout the hydration processwhile the cylinder diameter increases during the first hours of hydra-tion After 10 h of hydration the mean cylinder diameter no longer in-creases Consequently these observations match the results of the ex-aminations conducted at 23 degC [14] as well as the assumption thatdifferent mechanisms of growth exist for portlandite depending on the
hydration educt The maximum cylinder diameter is reached earlier inthis work very likely because of the higher hydration temperature
32 Quantification of the reactions during autoclaving
Autoclaved samples were ground with an agate mortar and com-pared to samples which were wet-ground with a McCrone mill Fig 6shows precisely that the determination of the amount of crystallinequartz is more reproducible in the two shown samples which were
Fig 7 2D XRD with Bruker GADDS-system plots of samples prepared with agate mortar and McCrone mill Coarse quartz grains are pointed out in the plot of the sample prepared withagate mortar
Fig 8 Particle size distribution of one sample prepared with an agate mortar and of onesample prepared with a McCrone mill measured by laser granulometry
Fig 9 Rietveld refinement for Tobermorite of autoclaved AAC sample by use of isotropicdomain size model (a) and of anisotropic domain size model (b)
J Schreiner et al Cement and Concrete Research 107 (2018) 247ndash252
250
6 Publications
42
prepared with a McCrone mill The high variance of crystalline quartzin the samples which were prepared with an agate mortar is a result ofinsufficient grinding and remaining of too large quartz grains Whenthis spottiness occurs a reliable quantification using the G-factormethod is not possible
The 2D XRD with Bruker GADDS-system plots in Fig 7 demonstratethe insufficient grinding when using an agate mortar compared to wetmilling with a McCrone mill Quartz would be overrepresented in a one-dimensional XRD pattern focusing on a section with bright spots (greenarrows) The lack of bright spots in the right plot shows that the quartzgrains are milled more thoroughly using a McCrone mill In Fig 8 theparticle size distribution after both ways of sample preparation iscompared Most grains in the sample prepared with an agate mortar arelarger than in the sample prepared with a McCrone mill The grain sizedistribution of the sample prepared with a McCrone mill complies withthe recommended particle size range for XRD analysis of under 5 to50 μm [3536] while the other sample exceeds the range
In Fig 9 Rietveld refinement of an autoclaved sample is shown Thedominant peaks at 77 290 and 301deg 2θ are attributed to tobermoriteIn the upper diagram (a) Rietveld refinement was carried out regularlycalculating isotropic domain sizes for tobermorite However the cal-culated fit differs significantly from the raw data It can be assumed thattobermorite shows a similar pattern to portlandite in terms of aniso-tropic peak broadening taking into account that tobermorite is as-signed to the orthorhombic crystal system Thus instead of a biaxialcylinder model an elliptic cylinder model (Fig 10 structure createdwith VESTA 318 [34]) was applied for the refinement in the lowerdiagram (b) The elliptic cylinder model is a sufficient approach to the
orthorhombic crystal system as it allows the distinction between do-main sizes in a b and c direction The fit is clearly superior using theanisotropic domain size model highlighted by the difference plot inFig 9b The comparison refinement with isotropic and anisotropic ap-proach was done for all of the five autoclaved samples In Fig 11 theresulting Rwp values for the whole pattern and the RBragg values of to-bermorite are shown The refinement using the anisotropic model leadsto both lower Rwp and RBragg values and consequently to a better fit anda more accurate quantification of tobermorite in all refined samples
4 Summary and conclusions
Improved analytical methods for both the phase developmentduring the hydration before autoclaving and during the autoclavingprocess of AAC are presented It could be shown that wet McCronemilling is the best way of preparation of AAC samples in order to obtainsuitable samples for powder diffraction A new approach to treat ani-sotropic domain sizes for Rietveld refinement could be successfullyapplied ndash with the benefit that portlandite and tobermorite in AACsamples could be refined more accurately using the Rietveld methodThus this application allows an improved quantification of the phasedevelopment during both of the production steps
For the future there are still plenty of possibilities to apply thepresented approach of calculating anisotropic domain sizes to AACproduction As exemplified with portlandite the mechanisms of growthof tobermorite can be tracked likewise during the autoclaving processIn addition the effect of variations in the chemical composition of AACraw mixtures on the crystal morphology of tobermorite can be ex-amined This leaves a new perspective to discuss the link between mi-neral phase morphology and the thermal and mechanical properties ofAAC
Acknowledgement
The autoclaved samples were generously provided by RodgauerBaustoffwerke GmbH amp Co KG The authors express gratitude for allsupport
Appendix A Supplementary data
Supplementary data to this article can be found online at httpsdoiorg101016jcemconres201802028
References
[1] MW Grutzeck Cellular concrete in M Scheffler P Colombo (Eds) CellularCeramics Wiley-VCH Weinheim 2005 pp 193ndash223
[2] M Haas The future of AAC ndash from a material scientists point of view inMC Limbachiya JJ Roberts (Eds) Autoclaved Aerated Concrete Taylor FrLondon 2005 pp 187ndash194
[3] T Mitsuda K Sasaki H Ishida Phase evolution during autoclaving process ofaerated concrete J Am Ceram Soc 75 (1992) 1858ndash1863
[4] N Isu H Ishida T Mitsuda Influence of quartz particle size on the chemical and
Fig 10 Triaxial cylinder domain size model of Tobermorite used for Rietveld refinement of anisotropic peak broadening
Fig 11 Comparison of Rwp and RBragg values of Rietveld refinements of autoclavedsamples and tobermorite using the isotropic and the anisotropic domain size model
J Schreiner et al Cement and Concrete Research 107 (2018) 247ndash252
251
6 Publications
43
mechanical properties of autoclaved aerated concrete (I) tobermorite formationCem Concr Res 25 (1995) 243ndash248
[5] NY Mostafa Influence of air-cooled slag on physicochemical properties of auto-claved aerated concrete Cem Concr Res 35 (2005) 1349ndash1357 httpdxdoiorg101016jcemconres200410011
[6] K Matsui J Kikuma M Tsunashima T Ishikawa S Matsuno A Ogawa M SatoIn situ time-resolved X-ray diffraction of tobermorite formation in autoclaved aer-ated concrete influence of silica source reactivity and Al addition Cem Concr Res41 (2011) 510ndash519
[7] C Biagioni S Merlino E Bonaccorsi The tobermorite supergroup a new no-menclature Mineral Mag 79 (2015) 485ndash495 httpdxdoiorg101180minmag2015079222
[8] BH OConnor MD Raven Application of the Rietveld refinement procedure inassaying powdered mixtures Powder Diffract 3 (1988) 2ndash6 httpdxdoiorg101017S0885715600013026
[9] D Jansen F Goetz-Neunhoeffer C Stabler J Neubauer A remastered externalstandard method applied to the quantification of early OPC hydration Cem ConcrRes 41 (2011) 602ndash608 httpdxdoiorg101016jcemconres201103004
[10] D Jansen C Stabler F Goetz-Neunhoeffer S Dittrich J Neubauer Does OrdinaryPortland Cement contain amorphous phase A quantitative study using an externalstandard method Powder Diffract 26 (2011) 31ndash38 httpdxdoiorg10115413549186
[11] D Ectors F Goetz-Neunhoeffer J Neubauer A generalized geometric approach toanisotropic peak broadening due to domain morphology J Appl Crystallogr 48(2015) 189ndash194 httpdxdoiorg101107S1600576714026557
[12] D Ectors F Goetz-Neunhoeffer J Neubauer Routine (an)isotropic crystallite sizeanalysis in the double-Voigt approximation done right Powder Diffract 32 (S1)(2017) 27ndash34 httpdxdoiorg101017S0885715617000070
[13] HM Rietveld A profile refinement method for nuclear and magnetic structures JAppl Crystallogr 2 (1969) 65ndash71 httpdxdoiorg101107S0021889869006558
[14] D Ectors Advances in the Analysis of Cementitious Reactions and Hydrate Phases(Doctoral Thesis) (2016) pp 12ndash14 (urnnbndebvb29-opus4-71743)
[15] AacuteG De La Torre S Bruque J Campo MAG Aranda The superstructure of C3Sfrom synchrotron and neutron powder diffraction and its role in quantitative phaseanalyses Cem Concr Res 32 (2002) 1347ndash1356 httpdxdoiorg101016S0008-8846(02)00796-2
[16] A Kirfel G Will Charge density in anhydrite CaSO4 from X-ray and neutrondiffraction measurements Acta Crystallogr Sect B Struct Crystallogr CrystChem 36 (1980) 2881ndash2890 httpdxdoiorg101107S0567740880010461
[17] C Bezou AN Christensen D Cox M Lehman A Nonat Structures cristallines deCaSO405H2O et CaSO406H2O Comptes Rendus Hebd Des Seacuteances lAcadeacutemieDes Sci Seacuterie 2 (312) (1991) 43ndash48
[18] KH Jost B Ziemer R Seydel Redetermination of the structure of β-dicalciumsilicate Acta Crystallogr Sect B Struct Crystallogr Cryst Chem 33 (1977)1696ndash1700 httpdxdoiorg101107S0567740877006918
[19] W Mumme LMD Cranswick BC Chakoumakos Rietveld crystal structure re-finements from high temperature neutron powder diffraction data for the poly-morphs of dicalcium silicate Neues Jahrb Fuer Mineral Abhandlungen 170 (1996)171ndash188
[20] A Colville S Geller The crystal structure of brownmillerite Ca2FeAlO5Crystallographica 50 (1971) 2311ndash2315 httpdxdoiorg101107S056774087100579X
[21] ST Bergold F Goetz-Neunhoeffer J Neubauer Quantitative analysis of C-S-H inhydrating alite pastes by in-situ XRD Cem Concr Res 53 (2013) 119ndash126 httpdxdoiorg101016jcemconres201306001
[22] EN Maslen VA Streltsov NR Streltsova N Ishizawa Electron density and op-tical anisotropy in rhombohedral carbonates III Synchrotron Xray studies ofCaCO3 MgCO3 and MnCO3 Acta Crystallogr Sect B 51 (1995) 929ndash939 httpdxdoiorg101107S0108768195006434
[23] G Renaudin Y Filinchuk J Neubauer F Goetz-Neunhoeffer A comparativestructural study of wet and dried ettringite Cem Concr Res 40 (2010) 370ndash375httpdxdoiorg101016jcemconres200911002
[24] WF Cole CJ Lancucki A refinement of the crystal structure of gypsumCaSO42H2O Acta Cryst B30 (1974) 921ndash929 httpdxdoiorg101107S0567740874004055
[25] T Runčevski RE Dinnebier OV Magdysyuk H Poumlllmann Crystal structures ofcalcium hemicarboaluminate and carbonated calcium hemicarboaluminate fromsynchrotron powder diffraction data Acta Crystallogr Sect B Struct Sci 68 (2012)493ndash500 httpdxdoiorg101107S010876811203042X
[26] JM Hughes JW Drexler Cation substitution in the apatite tetrahedral site crystalstructures of type hydroxylellestadite and type fermorite Neues Jahrb FuerMineral (1991) 327ndash336
[27] CH Shen RS Liu JG Lin CY Huang Phase stability study of La12Ca18Mn2O7Mater Res Bull 36 (2001) 1139ndash1148
[28] SW Bailey Refinement of an intermediate microcline structure Am Miner 54(1969) 1540ndash1545
[29] WR Busing HA Levy Neutron diffraction study of calcium hydroxide J ChemPhys 26 (1957) 563 httpdxdoiorg10106311743345
[30] Y Le Page G Donnay Refinement of the crystal structure of low-quartz ActaCrystallogr Sect B 32 (1976) 2456ndash2459 httpdxdoiorg101107S0567740876007966
[31] SA Hamid The crystal structure of the 11 Aring natural tobermoriteCa225[Si3O75(OH)15]1H2O Zeitschrift Fuer Krist - New Cryst Struct 154 (1981)189ndash198 httpdxdoiorg101524zkri19811543-4189
[32] P Mondal JW Jeffery The crystal structure of tricalcium aluminate Ca3Al2O6Acta Crystallogr B 31 (1975) 689ndash697 httpdxdoiorg101107S0567740875003639
[33] Y Takeuchi F Nishi I Maki Crystal-chemical characterization of the tricalciumaluminate-sodium oxide (3CaOtimesAl2O3-Na2O) solid-solution series Zeitschrift FuumlrKrist (1980) 259ndash307
[34] K Momma F Izumi VESTA 3 for three-dimensional visualization of crystal vo-lumetric and morphology data J Appl Crystallogr 44 (2011) 1272ndash1276 httpdxdoiorg101107S0021889811038970
[35] K Scrivener R Snellings B Lothenbach A Practical Guide to MicrostructuralAnalysis of Cementitious Materials CRC Press 2016 pp 123ndash125 httpdxdoiorg107693wl20150205
[36] V Pecharsky P Zavalij Fundamentals of Powder Diffraction and StructuralCharacterization of Materials Springer second edition 2005 p 302 httpdxdoiorg101007978-0-387-09579-0
J Schreiner et al Cement and Concrete Research 107 (2018) 247ndash252
252
6 Publications
44
7 Acknowledgement
7 Acknowledgement
Ich moumlchte mich bei einigen Personen bedanken ohne die es wohl kaum zum erfolgreichenAbschluss dieser Arbeit gekommen waumlreMein Doktorvater Prof Dr Juumlrgen Neubauer hat sich stets die Zeit genommen die noumltigwar um Angelegenheiten aller Art mit mir zu klaumlren Er gab mir fachlich immer zumrichtigen Zeitpunkt einen gewissen wissenschaftlichen Impuls Zugleich habe ich mich den-noch immer frei in meiner eigenen Konzeption gefuumlhlt Groszligen Dank spreche ich Prof DrFriedlinde Goumltz-Neunhoeffer aus die fuumlr mich ebenso immer eine verlaumlssliche Ansprech-partnerin fuumlr fachliche und organisatorische Angelegenheiten aller Art war Danke anDr Daniel Jansen fuumlr die gute Zusammenarbeit und dafuumlr dass er mich im Zuge meinerMasterarbeit in ein Forschungsprojekt aufgenommen hat das den Weg zur Promotionmoumlglich machte Zusaumltzlich gilt mein Dank Prof Dr Matthias Goumlbbels der fuumlr dieMitarbeiter am Lehrstuhl immer motivierende Worte fand Fuumlr die Ermoumlglichung meinerTeilnahme an diversen Dienstreisen Fortbildungen und Tagungen moumlchte ich mich viel-mals bedankenWeiterhin bedanke ich mich bei Dr Stephan Volkmann und den Rodgauer BaustoffwerkenGmbH amp Co KG fuumlr die gute Zusammenarbeit und die Bereitstellung von Versuchsma-terialienVielen Dank an meine studentischen Hilfskraumlfte Daniel Wagner Laura MoldenhauerFabian Lang Jakob Schreiber und Felix Klaassen die alle Aufgaben im Labor einwand-frei und mit Bedacht erledigten Bei meinen aktuellen und ehemaligen Kollegen DrKatrin Hurle Dr Dominique Ectors Dr Christoph Naber Dr Florian Huumlller JoumlrgNehring Frank Riedel Julian Wolf Tanja Manninger Daniel Wagner Nicolas FobbeKarla Spaumlth Julian Goergens Andreas Koumlhler Cordula Jakob Franz Becker und LisaKlemenz bedanke ich mich fuumlr die gelungene Zusammenarbeit und gegenseitige Unter-stuumltzung Besonderer Dank geht auch an Kerstin Kreszlig Bettina Engl Christian HankeBernd Schleifer und Christian Abe fuumlr die verlaumlssliche Unterstuumltzung bei technischen Fra-gen und Messungen im LaborFuumlr jegliche Unterstuumltzungen moumlchte ich mich auch bei meinen Eltern bedanken sowiebei meinem Bruder Ralf der mir mit einem LaTex Crashkurs viel Frustration ersparthat Danke Thomas dass du immer fuumlr mich da bist und mit mir zusammen fuumlr genugAusgleich gesorgt hast
45
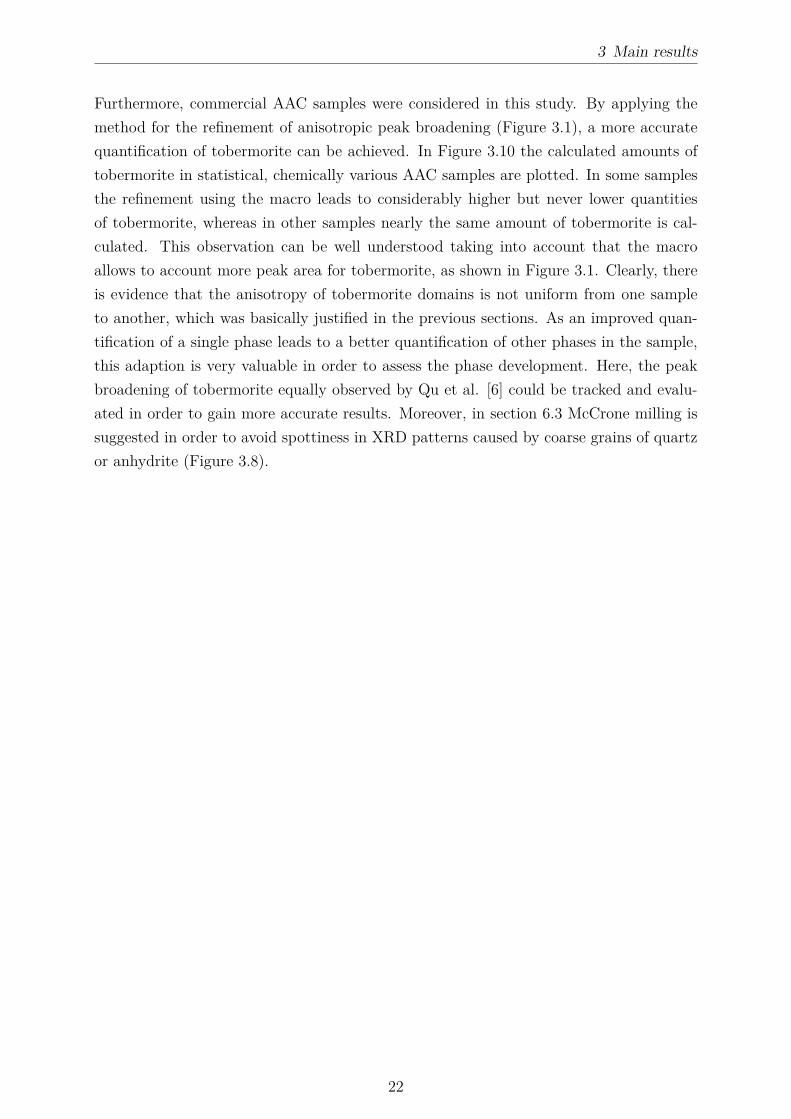
3 Main results
Furthermore commercial AAC samples were considered in this study By applying themethod for the refinement of anisotropic peak broadening (Figure 31) a more accuratequantification of tobermorite can be achieved In Figure 310 the calculated amounts oftobermorite in statistical chemically various AAC samples are plotted In some samplesthe refinement using the macro leads to considerably higher but never lower quantitiesof tobermorite whereas in other samples nearly the same amount of tobermorite is cal-culated This observation can be well understood taking into account that the macroallows to account more peak area for tobermorite as shown in Figure 31 Clearly thereis evidence that the anisotropy of tobermorite domains is not uniform from one sampleto another which was basically justified in the previous sections As an improved quan-tification of a single phase leads to a better quantification of other phases in the samplethis adaption is very valuable in order to assess the phase development Here the peakbroadening of tobermorite equally observed by Qu et al [6] could be tracked and evalu-ated in order to gain more accurate results Moreover in section 63 McCrone milling issuggested in order to avoid spottiness in XRD patterns caused by coarse grains of quartzor anhydrite (Figure 38)
22
4 Conclusions
4 Conclusions
The research results presented in the previous sections yield advances in the mineralogicalinvestigation of tobermorite and autoclaved aerated concrete Recorded diffraction pat-terns contain plenty of usually unused data regarding the microstructural characteristicsof the sample and phases therein The profit of XRD measurements can be significantlyimproved whenever one or more phases show anisotropic peak broadening and appro-priate models for the respective domain morphology are implemented into the Rietveldenvironment Within the scope of the present investigations portlandite and tobermoriteshow this particularityThe effects of changes in the chemistry of the starting mix were examined based on dif-ferent dosages of metakaolin Al-substituted tobermorite showed increased growth in b
direction and an increase of lattice parameter c compared to Al-free tobermorite The rel-ative domain sizes were determined based on anisotropic peak broadening However whilethe effect of Al3+ incorporation into the lattice of tobermorite was limited regarding thedomain morphology lattice parameter c showed an increase throughout the entire rangeof samples The consequent effects suggested by Klimesch amp Ray observed by means ofDTA are debatable as reactions during the heating experiment may lead to to a changeof Al3+ content in tobermorite [40] While both types of applied metakaolin showed goodreactivity at hydrothermal conditions some included minor phases such as feldspar oranatase remained unreacted At high dosages of Al2O3 in the starting mix the formationof either only katoite or katoite along with tobermorite was observed (Figure 32)SEM analysis of tobermorite in AAC cannot be suggested based on the observationspresented in this work as it is only visually accessible in the pores or at pore surfacesThe dense material of the AAC skeleton contains several crystalline and X-ray amorphousphases which hardly allows a proper investigation Even in single pores tobermorite crys-tals appeared very heterogeneous at various chemical compositions As a result lath-liketobermorite was not only present in samples characterized by elevated Al3+ incorporationBy contrast the benefits of XRD analysis presented in section 61 equally accounted fortobermorite in AAC samples Sulfate incorporation into the lattice of tobermorite wasnot observed All of the sulfate in the system was detected to be present in anhydriteThe phase transitions in the AAC raw slurry during the green stage hydration were show-cased by in-situ XRD analysis of a model mix at 70 degC Additional DTA and XRD mea-
23
4 Conclusions
surements during this step confirmed the presence of two generations of portlandite char-acterized by different crystallinity as suggested by Ectors [52] The inclusion of anisotropicdomain morphology during the Rietveld refinement allowed a more accurate quantifica-tion of tobermorite in autoclaved samples Sample preparation adjusted to the grain sizedistribution in AAC samples (section 63) the external standard method for quantita-tive XRD analysis [55] and the approach to evaluate anisotropic peak broadening [19]are the key methods for a more accurate tracking of the phase development during AACproduction
24
5 References
5 References
[1] A E Zadov A I Grabezhev N N Pertsev N V Chukanov and S V PribavkinTobermorite-plombierite metasomatites of the Gumeshevsk skarn-porphyry copper depositmiddle Urals Doklady Earth Sciences 407(3)495ndash497 2006
[2] M F Heddle Preliminary notice of substances which may prove to be new minerals MinMag 4117ndash123 1880
[3] S Merlino E Bonaccorsi and T Armbruster The real structure of tobermorite 11AringNormal and anomalous forms OD character and polytypic modifications European Journalof Mineralogy 13(3)577ndash590 2001
[4] C Biagioni S Merlino and E Bonaccorsi The tobermorite supergroup a new nomencla-ture Mineralogical Magazine 79(2)485ndash495 2015
[5] C A Riacuteos C D Williams and M A Fullen Hydrothermal synthesis of hydrogarnetand tobermorite at 175 degC from kaolinite and metakaolinite in the CaO-Al2O3-SiO2-H2Osystem A comparative study Applied Clay Science 43(2)228ndash237 2009
[6] X Qu Z Zhao and X Zhao Microstructure and characterization of aluminum-incorporated calcium silicate hydrates (C-S-H) under hydrothermal conditions RSC Ad-vances 8(49)28198ndash28208 2018
[7] R Šiaučiunas and K Baltakys Formation of gyrolite during hydrothermal synthesis inthe mixtures of CaO and amorphous SiO2 or quartz Cement and Concrete Research34(11)2029ndash2036 2004
[8] E Venhodovaacute R Janovskyacute and R Drochytka Formation of Tobermorite at Different Ma-terials Composition of Aerated Concrete Applied Mechanics and Materials 752-753247ndash250 2015
[9] L Galvaacutenkovaacute E Bartoniacutečkovaacute T Opravil J Tkacz and P Ptaacuteček The influence ofstarting materials solubility on tobermorite structure formation under the hydrothermalconditions IOP Conference Series Materials Science and Engineering 379(1)1ndash8 2018
[10] T Mitsuda K Sasaki and H Ishida Phase Evolution during Autoclaving Process J AmCeram Soc 75(75)1858ndash1863 1992
[11] A Skawińska The influence of metahalloysite addition on tobermorite formation studied byX-ray powder diffraction and scanning electron microscope MATEC Web of Conferences16305008 2018
[12] S T Bergold F Goetz-Neunhoeffer and J Neubauer Quantitative analysis of C-S-H in
25
5 References
hydrating alite pastes by in-situ XRD Cement and Concrete Research 53119ndash126 2013
[13] O P Shrivastava and F P Glasser Ion-exchange properties of 11-Aring tobermorite Reactivityof Solids 2(3)261ndash268 1986
[14] H Maeda Y Ogawa E H Ishida and T Kasuga Hydrothermal synthesis of tobermoritedoped with phosphorus species for removing heavy metal ions Journal of the AustralianCeramic Society 48(1)8ndash11 2012
[15] O P Shrivastava and R Shrivastava Cation exchange applications of synthetic tobermoritefor the immobilization and solidification of cesium and strontium in cement matrix Bulletinof Materials Science 23(6)515ndash520 2000
[16] G Renman and A Renman Sustainable Use of Crushed Autoclaved Aerated Concrete(CAAC) as a Filter Medium in Wastewater Purification 8th International conferenceon sustainable management of waste and recycled materials in construction GothenburgSweden 30 Mayndash1 June 2012 Proceedings pages 1ndash7 2012
[17] G Schober Chemical transformations during the manufacturing of autoclaved aeratedconcrete (ACC) Cement lime gypsum and quartz sand become cellular concrete ZKG58(7)63ndash70 2005
[18] A J Hamad Materials Production Properties and Application of Aerated LightweightConcrete Review International Journal of Materials Science and Engineering 2(2)152ndash157 2014
[19] D Ectors F Goetz-Neunhoeffer and J Neubauer A generalized geometric approach toanisotropic peak broadening due to domain morphology Journal of Applied Crystallogra-phy 48(1)189ndash194 2015
[20] H M Rietveld A profile refinement method for nuclear and magnetic structures Journalof Applied Crystallography 2(2)65ndash71 1969
[21] S A Hamid The crystal structure of the 11 Aring natural tobermoriteCa225[Si3O75(OH)15]1H2O Zeitschrift fuer Kristallographie - New Crystal Struc-tures 154(3-4)189ndash198 1981
[22] S A S El-Hemaly T Mitsuda and H F W Taylor Synthesis of normal and anomaloustobermorites Cement and Concrete Research 7429ndash438 1977
[23] M Sakiyama and T Mitsuda Hydrothermal reaction between C-S-H and kaolinite for theformation of tobermorite at 180degC Cement and Concrete Research 7(6)681ndash685 1977
[24] E Bonaccorsi S Merlino and A R Kampf The crystal structure of tobermorite 14 Aring(plombierite) a C-S-H phase Journal of the American Ceramic Society 88(3)505ndash5122005
[25] S Merlino E Bonaccorsi and T Armbruster The real structures of clinotobermorite andtobermorite 9 Aring OD character polytypes and structural relationships European Journalof Mineralogy 12(2)411ndash429 2000
[26] K Momma and F Izumi VESTA 3 for three-dimensional visualization of crystal volu-metric and morphology data Journal of Applied Crystallography 44(6)1272ndash1276 2011
26
5 References
[27] S Shaw S M Clark and C MB Henderson Hydrothermal formation of the calcium sil-icate hydrates tobermorite (Ca5Si6O16(OH)2 middot 4H2O) and xonotlite (Ca6Si6O17(OH)2)An in situ synchrotron study Chemical Geology 167(1-2)129ndash140 2000
[28] K Matsui J Kikuma M Tsunashima T Ishikawa S Matsuno A Ogawa and M SatoIn situ time-resolved X-ray diffraction of tobermorite synthesis process under hydrothermalcondition IOP Conference Series Materials Science and Engineering 18(2)60ndash66 2011
[29] G Matekonis R Šiaučiunas and D Vaičiukyniene Hydrothermal Synthesis and Charac-terization of Na + and [ Al 3 + + Na + ] -substituted Tobermorite in CaO-SiO2middotnH2O-H2OSystem MATERIALS SCIENCE 16(3)242ndash248 2010
[30] G Geng R J Myers M J A Qomi and P JM Monteiro Densification of the inter-layer spacing governs the nanomechanical properties of calcium-silicate-hydrate ScientificReports 7(1)1ndash8 2017
[31] D Klimesch and A Ray Autoclaved cement-quartz pastes with metakaolin additionsAdvanced Cement Based Materials 7(3-4)109ndash118 1998
[32] N Y Mostafa A A Shaltout H Omar and S A Abo-El-Enein Hydrothermal synthesisand characterization of aluminium and sulfate substituted 11 nm tobermorites Journal ofAlloys and Compounds 467(1-2)332ndash337 2009
[33] İ Demir M S Başpınar E Kahraman E Ccedilalışkan and G Goumlrhan An Investigation onthe Usability of Diatomite in Aerated Concrete Production In Proc of the Intl Conf onAdvances In Civil Structural And Construction Engineering - CSCE 2014 pages 97ndash1002014
[34] A Skawinska Z Owsiak T Baran and K Hernik The influence of halloysite additionon tobermorite formation in CaO and quartz mix under hydrothermal conditions CementWapno Beton 17(12)426ndash434 2017
[35] N Y Mostafa Influence of air-cooled slag on physicochemical properties of autoclavedaerated concrete Cement and Concrete Research 35(7)1349ndash1357 2005
[36] D Małaszkiewicz and J Chojnowski Influence of addition of calcium sulfate dihydrate ondrying of autoclaved aerated concrete Open Engineering 7(1)273ndash278 2017
[37] N Hara and N Inoue Thermal behaviour of 11Aring tobermorite and its lattice parametersCement and Concrete Research (10)53ndash60 1980
[38] M D Jackson S R Chae S R Mulcahy C Meral R Taylor P Li A H EmwasJ Moon S Yoon G Vola H R Wenk and P JM Monteiro Unlocking the secretsof Al-tobermorite in Roman seawater concrete American Mineralogist 98(10)1669ndash16872012
[39] W Liao W Li Z Fang C Lu and Z Xu Effect of different aluminum substitution rateson the structure of Tobermorite Materials 12(22)1ndash10 2019
[40] D Klimesch and A Ray DTA-TG Study of the CaO-SiO2-H2O and CaO-Al2O3-SiO2-H2OSystems Under Hydrothermal Conditions Journal of Thermal Analysis and Calorimetry56(1)27ndash34 1999
27
5 References
[41] Z Sauman and Z Valtr Substitution of sulphate ions in the crystal lattice of 11 Aring to-bermorite In The VI International Congress on the Chemistry of Cement pages 1ndash14Moscow 1974
[42] G Schober Reaction of raw materials to the final product AAC httpwwwpb-aacde
chemmin2_ehtml 2012 accessed 2020-01-31
[43] D Jansen C Stabler F Goetz-Neunhoeffer S Dittrich and J Neubauer Does Ordi-nary Portland Cement contain amorphous phase A quantitative study using an externalstandard method Powder Diffraction 26(01)31ndash38 2011
[44] C Roumlszligler J Stark F Steiniger and W Tichelaar Limited-dose electron microscopyreveals the crystallinity of fibrous C-S-H phases Journal of the American Ceramic Society89(2)627ndash632 2006
[45] Y Sakalli and R Trettin Investigation of C3S hydration by environmental scanning elec-tron microscope Journal of Microscopy 259(1)53ndash58 2015
[46] F Matsushita Y Aono and S Shibata Expansion and shrinkage behavior of green cakeof Autoclaved Aerated Concrete In Autoclaved Aerated Concrete - Innovation and Devel-opment Proceedings of the 4th International Conference on Autoclaved Aerated ConcreteKingston UK 8-9 September 2005 pages 101ndash108 CRC Press 2005
[47] C Chucholowski M Holger and K-C Thienel Improving the recyclability environmentalcompatibility and CO2 balance of autoclaved aerated concrete by replacing sulfate carrierand cement with calcined clays CePapers 2(4)503ndash512 2018
[48] X Y Huang W Ni W H Cui Z J Wang and L P Zhu Preparation of autoclavedaerated concrete using copper tailings and blast furnace slag Construction and BuildingMaterials 27(1)1ndash5 2012
[49] W Wongkeo and A Chaipanich Compressive strength microstructure and thermal anal-ysis of autoclaved and air cured structural lightweight concrete made with coal bottom ashand silica fume Materials Science and Engineering A 527(16-17)3676ndash3684 2010
[50] A Roacuteżycka and W Pichoacuter Effect of perlite waste addition on the properties of autoclavedaerated concrete Construction and Building Materials 12065ndash71 2016
[51] N Isu H Ishida and T Mitsuda Influence of quartz particle size on the chemical andmechanical properties of autoclaved aerated concrete (I) tobermorite formation Cementand Concrete Research 25(25)243ndash248 1995
[52] D Ectors Advances in the analysis of cementitious reactions and hydrate phases doctoralthesis PhD thesis Friedrich-Alexander-Universitaumlt Erlangen-Nuumlrnberg 2016
[53] D Ectors F Goetz-Neunhoeffer and J Neubauer Domain size anisotropy in the double-Voigt approach An extended model Journal of Applied Crystallography 481998ndash20012015
[54] D Ectors F Goetz-Neunhoeffer and J Neubauer Routine (an)isotropic crystallite sizeanalysis in the double-Voigt approximation done right Powder Diffraction 32(S1)27ndash342017
28
5 References
[55] D Jansen F Goetz-Neunhoeffer C Stabler and J Neubauer A remastered external stan-dard method applied to the quantification of early OPC hydration Cement and ConcreteResearch 41(6)602ndash608 2011
[56] T Ungaacuter G Tichy J Gubicza and R J Hellmig Correlation between subgrains andcoherently scattering domains Powder Diffraction 20(04)366ndash375 2005
[57] Triloki P Garg R Rai and B K Singh Structural characterization of as-depositedcesium iodide films studied by X-ray diffraction and transmission electron microscopy tech-niques Nuclear Instruments and Methods in Physics Research Section A AcceleratorsSpectrometers Detectors and Associated Equipment 736128ndash134 2014
[58] J Schreiner F Goetz-Neunhoeffer J Neubauer and D Jansen Hydrothermal synthesisof 11 Aring tobermorite ndash Effect of adding metakaolin to the basic compound Applied ClayScience 185 2020
[59] J Schreiner F Goetz-Neunhoeffer J Neubauer S Volkmann S Bergold R Webler andD Jansen Advanced Rietveld refinement and SEM analysis of tobermorite in chemicallydiverse autoclaved aerated concrete Powder Diffraction 34143ndash150 2019
[60] J Schreiner D Jansen D Ectors F Goetz-Neunhoeffer J Neubauer and S VolkmannNew analytical possibilities for monitoring the phase development during the production ofautoclaved aerated concrete Cement and Concrete Research 107247ndash252 2018
29
6 Publications
6 Publications
61 Hydrothermal synthesis of 11 Aring tobermorite ndash Effectof adding metakaolin to the basic compound
Reprint of the peer reviewed publication
Schreiner J Goetz-Neunhoeffer F Neubauer J Jansen D 2020 Hydrothermalsynthesis of 11 Aring tobermorite ndash Effect of adding metakaolin to the basic compoundApplied Clay Science 185 httpsdoiorg101016jclay2019105432
with permission from Elsevier
30
Contents lists available at ScienceDirect
Applied Clay Science
journal homepage wwwelseviercomlocateclay
Research paper
Hydrothermal synthesis of 11 Aring tobermorite ndash Effect of adding metakaolin tothe basic compound
J Schreiner F Goetz-Neunhoeffer J Neubauer D JansenUniversity of Erlangen-Nuremberg GeoZentrum Nordbayern Mineralogy Schlossgarten 5a 91054 Erlangen Germany
A R T I C L E I N F O
KeywordsHydrothermal synthesis11 Aring tobermoriteMetakaolinPowder diffractionKatoite
A B S T R A C T
Different amounts and types of metakaolin were analyzed and applied for the hydrothermal synthesis of 11 Aringtobermorite All synthesized samples were investigated by means of powder XRD combined with Rietveld re-finement Al-substituted 11 Aring tobermorite was successfully synthesized on the basis of a broad range of com-pounds characterized by a varying content of metakaolin Katoite was present depending on the amount ofsupplied Al3+ which was determined by the dosage of metakaolin Minor crystalline components included in thetwo types of metakaolin sources varied greatly in their reactivity under hydrothermal conditions Despite adifferent degree of purity the two types of metakaolin showed corresponding effects at moderate dosages butcontrary effects at higher dosages as for the synthesis of 11 Aring tobermorite The domain morphology of to-bermorite could be associated with Al3+ incorporation for low dosages of metakaolin represented by up to 2 wt- Al2O3 in the dry mix By contrast Al3+ affected tobermorite lattice parameters at equivalent and even athigher dosages with c reaching 2295 Aring at 12 wt- Al2O3 in the dry mix
1 Introduction
11 Application of metakaolin as a reactive material in constructionindustry
The application of supplementary cementitious materials (SCMs) inthe field of construction technology has received a lot of attention inrecent years Due to limited resources and an urgent need for alter-native and more eco-friendly construction materials SCMs such asmetakaolin offer a great potential The usage of SCMs has not onlyspread to the cement and mortar industry but also to advanced appli-cations such as autoclaved aerated concrete (AAC) (Demir et al 2014Koutnyacute et al 2014 Walczak et al 2015 Roacuteżycka and Pichoacuter 2016Chucholowski et al 2018) Unlike ordinary cementitious constructionmaterials AAC is produced from hydrothermal curing Due to the dif-ferent thermodynamic environment the hydration process and the re-activity of raw materials have to be investigated properly in order tounderstand the effects on the AAC product The leading mineral phasein AAC is 11 Aring tobermorite (Ca5Si6O16(OH)2middot4H2O) As a consequencethe thermal and mechanical properties of AAC depend on micro-structure and crystallinity of tobermorite to some extent In addition tothe curing time and the fineness of raw materials the supply of ionsthat can substitute in the tobermorite structure is a crucial factor in thiscontext Especially substitutions by aluminum sodium and potassium
ions have been investigated thoroughly (Sauman 1974 Klimesch andRay 1998 Mostafa et al 2009 Matekonis et al 2010 Skawinskaet al 2017) Calcined clays usually contain a considerable amount ofthe mentioned ions
There is a vast amount of literature on the reactivity of SCMs atambient temperature and standard pressure but there is little when itcomes to hydrothermal conditions In previous publications the beha-vior of metakaolin under hydrothermal conditions was mainly in-vestigated for the synthesis of zeolites (Zhang et al 2007 Aguilar-Mamani et al 2014 Setthaya et al 2016 Luo et al 2018) In thesestudies the reactivity of metakaolin was observed at a wide range oftemperature and pH values During the transformation of kaolin intometakaolin a loss of framework alumina was observed (Ayodele et al2019) In recent decades metakaolin has been the subject of studies inthe field of geopolymer research (Rashad 2013 Chen et al 2016) Forthe synthesis of 11 Aring tobermorite a more distinct setting of temperaturesetting (180ndash200 degC) and steam pressure (1ndash12 MPa) are required
This publication is intended to make a new contribution to thechallenging field of hydrothermal synthesis in the system CaO-Al2O3-SiO2-H2O based on XRD analysis combined with Rietveld refinementVarious dosages of two types of metakaolin with different chemical andmineralogical purities are compared for the effects on the hydrothermalsynthesis of Al-substituted 11 Aring tobermorite Especially changes of thebulk chemistry in the raw mixes the reactivity of minor crystalline
httpsdoiorg101016jclay2019105432Received 20 August 2019 Received in revised form 13 November 2019 Accepted 30 December 2019
Corresponding authorE-mail address juergenjsschreinerfaude (J Schreiner)
Applied Clay Science 185 (2020) 105432
0169-1317 copy 2020 Elsevier BV All rights reserved
T
6 Publications
31
phases of the two types of metakaolin and the effect of different curingtimes are the focus of interest On the one hand metakaolin offers agreat potential in the AAC industry On the other hand of all SCMsmetakaolin is a good source material for investigating the influence ofAl3+ on the synthesis of Al-substituted 11 Aring tobermorite
12 Synthesis of Al-substituted 11 Aring tobermorite
In addition to being present in AAC tobermorite has found appli-cation in wastewater treatment and nuclear waste management due toits ion exchange capacity (Maeda et al 2012 Monasterio et al 2015)The substitution of silicon by aluminum results in a different to-bermorite structure due to general and local charge balance affectingthe lattice parameters Especially c is impacted by this substitutionbecause it occurs in the bridging tetrahedron and additional OHndash sub-stitutes O2ndash (Komarneni et al 1985 Merlino et al 2000) As suggestedin some additional studies the substitution of Si4+ by Al3+ and Na+ orK+ leads to a lath-like morphology of tobermorite crystals (Mostafa2005 Mostafa et al 2009 Venhodovaacute et al 2015 Qu et al 2018)However because of the heterogeneous appearance of tobermorite inAAC it is hardly possible to conduct a proper characterization based onSEM analysis In our recent work the anisotropic peak broadening oftobermorite in XRD diffractograms was successfully linked with theincorporation of foreign ions supplied in a common AAC production(Schreiner et al 2019) This finding allowed a more statistical struc-tural characterization of tobermorite in bulk compositions compared toSEM analysis Moreover it was reported in other studies that differenthydrate phases occur depending on the amount of supplied ions and onthe experimental settings In compounds with a high content of Al3+formation of katoite could be observed (Klimesch and Ray 1998 Riacuteoset al 2009 Matsui et al 2011) In the case of a longer curing durationinstead of 11 Aring tobermorite the formation of xonotlite (Siauciunas andBaltakys 2004 Galvaacutenkovaacute et al 2018) or - depending on the finenessof used silica source (Siauciunas and Baltakys 2004) - gyrolite is fa-voured
Kalousek (1956) suggested that tobermorite can contain up to 5Al2O3 More Al2O3 in the system resulted in the formation of hydro-garnet Klimesch and Ray (1998) additionally investigated the stabilityof hydrogarnet depending on the Al(Si + Al) ratio and its role in re-lation to the formation of 11 Aring tobermorite in an equivalent systemThey suggest that hydrogarnet always appears before tobermorite butthe former can only be detected for higher Al(Si + Al) ratios in theevent of longer curing times Riacuteos et al (2009) and Qu et al (2018)confirmed these findings in extensive investigations In the latter pub-lication it is additionally suggested that samples prepared at lowertemperatures (160 degC) are less impacted by the supply of Al3+ Theyalso consider the peak broadening of tobermorite in their XRD plotsbased on the amount of incorporated Al3+ In two recent publicationswe suggested that the peak broadening of tobermorite enables a mi-crostructural analysis by calculating the orientation dependent domainsizes (Schreiner et al 2018 2019) However these studies are based onsamples of industrially produced AAC so that the curing time was fixedThe studied AAC was produced from raw materials with a broad che-mical spectrum such as ordinary Portland cement (OPC) whichsomehow complicates the interpretation of results
In this work the influence of aluminum ions - provided by meta-kaolin - on dominant crystallographic direction-dependent domaingrowth of tobermorite is investigated by analysis of anisotropic peakbroadening (Ectors et al 2015 2017) In Fig 1 of the supplementarymaterial the method of fitting the anisotropic peak broadening of to-bermorite using a triaxial cylinder model is visualized (Schreiner et al2018) Fitting of the anisotropic peak broadening of tobermorite Thismethod is used to calculate the average and reliable values for to-bermorite domain sizes in the powder sample and associate them withaverage Al3+ incorporation Microstrain should be considered becauseit is an additional source of peak broadening However this usually
accounts for materials that have been exposed to different kinds ofstress such as metals and alloys (Badawi et al 2019) In addition theinstrumental contribution to peak broadening should be consideredHydration products such as tobermorite are characterized by crystallitesizes in the range of nanometers so that anisotropic size broadeningclearly outweighs the effect of instrumental broadening (Jenkins andSnyder 1996) Moreover the impact of Al3+ on the lattice parametersof tobermorite is considered It should additionally be clarified whe-ther the results from our previous publication (Schreiner et al 2019)based on industrially produced AAC can be confirmed by investigationwith less complex raw mixes and purely based on laboratory experi-ments
2 Material and methods
21 Starting materials
The starting materials for hydrothermal synthesis included deio-nized water quartz flour portlandite (999 pure) and two types ofmetakaolin One type was ordinary commercially available metakaolin(MK) with nearly a stoichiometric composition For comparison thesecond type of commercially available metakaolin was a by-productfrom expanded glass production (MKg) and consequently highly im-pure The chemical composition of MK and MKg determined by XRF isgiven in Table 1 With MKg containing less Al2O3 but considerably moreNa2O than MK the effects on hydrothermal synthesis were of interestBoth types of metakaolin have been characterized in previous pub-lications (Schmidt et al 2012 Naber et al 2019) In addition weverified the mineral phase content by XRD analysis Besides amorphousmetakaolin MK contained minor amounts of anatase quartz and mica
Fig 1 Weight fractions of tobermorite quartz and katoite determined byquantitative XRD analysis ndash samples including MKg crosshatched
Table 1Chemical composition of MK and MKg determined by XRF analysis ndash majorcontrasts in bold letters
Oxides [wt-] MK MKg
SiO2 536 604Al2O3 392 206CaO 01 40MgO 01 12Na2O 0 96K2O 10 18Fe2O3 18 05TiO2 21 03P2O5 01 02Loss on ignition 15 1
J Schreiner et al Applied Clay Science 185 (2020) 105432
2
6 Publications
32
MKg contained additional kaolinite feldspar and quartz
22 Investigated mix composites
For the preparation of raw mixtures the powders were weighed andhomogenized using a lab-scale mixing mill Table 2 lists the composi-tion and nomenclature of all samples including Al2O3 content andcuring time in the autoclave
bull Besides one blank mixture (MK0) that did not contain any type ofmetakaolin eleven more compounds were prepared of which threeincluded different dosages of MKg (MKg16 MKg23 and MKg60)Three more mixes contained equivalent amounts of MK instead ofMKg (MK16 MK23 and MK60) These mixes were investigated inorder to have a direct comparison concerning the effects of differentraw material on the synthesis of tobermorite
bull Additionally the mixes MK9 MK5 and MK25 with lower dosages ofmetakaolin were analyzed In the referenced literature (Schreineret al 2019) the effect of Al3+ on the anisotropic peak broadeningof tobermorite could only be observed in the case of Al2O3 contentslower than 4 in the drymix In the latter three mixes Al2O3 con-tents range from 1 to 35 Al2O3 (calculated from XRF data) whichmeets the region of interest for the analysis of tobermorite domainmorphology
bull The curing time for nearly all of the investigated samples was 12 hbut compound MK9 was prepared two more times for curing timesof 2 h and 6 h The different curing times were chosen in this par-ticular sample so that the reactivity of metakaolin and the phasetransitions could be observed more precisely
23 Hydrothermal treatment
Due to the different fineness of raw materials there was a differentwater demand from one mixture to another In order to obtain slurriesof comparable rheology the amount of water was adapted respectivelyresulting in water-to-solid ratios of 25 to 3 which matches the sug-gested water-to-solid ratio for this purpose (Roacutezycka et al 2014Galvaacutenkovaacute et al 2018) The weighed water was added to the dry mixand after stirring for 1 min at 23 degC the slurry was poured into thereactor Minor changes in the quantity of added water did not have aninfluence on the measured steam pressure All experiments were con-ducted using a PTFE-lined stainless steel autoclave with a reactor vo-lume of 300 ml The oven temperature was fixed at 180 degC and auto-genous steam pressure of 11ndash12 MPa was measured during eachexperiment with an external manometer After cooling to room tem-perature the sample was removed from the reactor coarsely ground
using an agate mortar and dried at 60 degC for 12 h After drying thesample was ground with an agate mortar again in order to deagglo-merate the particles As no coarse raw materials were used there wasno need for wet McCrone milling (Schreiner et al 2018)
24 XRD analysis
After preparation into front-loading sample holders the powdersamples were measured with a D8 diffractometer (Bruker) equippedwith a LynxEye detection system and Bragg-Brentano geometry Thesettings for XRD analysis included a tube voltage of 40 kV a current of40 mA an angular range from 6 to 80deg 2θ (Cu Kα radiation) a time perstep of 054 s a step width of 00236deg 2θ and a PSD opening of 33deg Thebackground was fitted with Chebyshev polynomial of the fifth orderThe major contribution of amorphous phase was fitted with a singlepeak with a fixed position at 308deg 2θ so that tobermorite reflectionswere not affected An external quartzite standard was measured withthe same parameters in order to determine phase quantities (Jansenet al 2011) Bruker AXS software TOPAS 50 was used for Rietveldrefinement (Rietveld 1969) and the used structures are shown inTable 3
3 Results and discussion
31 Different dosages of MK and MKg
In Fig 1 the quantities of tobermorite quartz and katoite present inmost of the samples determined by XRD analysis are illustratedWhenever tobermorite was the leading mineral hydrate phase a basalspacing of 113 Aring could be verified in each of the diffractograms Thequantities of minor crystalline phases and amorphous content are notshown For low dosages of MK it can be seen that the weight fraction oftobermorite decreased At moderate dosage of both types of metakaolin(MK16 MK23 MKg16 MKg23) tobermorite was present in comparablequantities It can be seen that the amount of katoite in the mixes de-pended on the dosage of metakaolin and it appeared only at dosages ofMK5 or more Due to the higher content of aluminum in MK comparedto MKg more katoite could always be observed in the MK mixes atequivalent dosages Despite equal amounts of quartz as starting mate-rial in mixes for both types of metakaolin the resulting weight fractionsin the cured samples were not alike Considerably more quartz waspresent in the MK samples Even though less quartz was used for mixescontaining higher amounts of MK even more quartz was present afterhydrothermal curing (Table 2 Fig 1) Consequently some of the SiO2
provided by MK did not transform into an amorphous phase or to-bermorite but into quartz This finding is verified by the presence ofquartz in MK60 because no quartz was included in the raw mixture Thefeldspar present in MKg did not react so Na2O and an unknown amountof Al2O3 may not have been supplied for hydrothermal reaction Besidestobermorite and quartz additional calcite scawtite (Ca7Si6(CO3)
Table 2Basic powder compounds prepared for the hydrothermal synthesis of to-bermorite with the respectively calculated Al2O3 content and curing time in thereactor
Sample Portlandite[wt-]
Quartz[wt-]
MK[wt-]
MKg
[wt-]
Al2O3
[wt-]Curingtime [h]
MK0 49 51 ndash ndash 0 12MK25 495 48 25 ndash 1 12MK5 49 46 5 ndash 2 12MK9_2h 48 43 9 ndash 35 2MK9_6h 48 43 9 ndash 35 6MK9_12h 48 43 9 ndash 35 12MK16 47 37 16 ndash 63 12MK23 46 31 23 ndash 9 12MK60 40 ndash 60 ndash 235 12MKg16 47 37 ndash 16 33 12MKg23 46 31 ndash 23 47 12MKg60 40 ndash ndash 60 124 12
Table 3Structural data used for the investigation with powder XRD analysis
Phase Author
Anatase (Horn et al 1972)Biotite (Brigatti et al 2000)Calcite (Maslen et al 1995)Kaolinite (Zvyagin 1960)Katoite (Bartl 1969)Microcline (Bailey 1969)Plazolite (Basso et al 1983)Portlandite (Busing and Levy 1957)Quartz (Le Page and Donnay 1976)Scawtite (Grice 2005)Tobermorite (Hamid 1981)Xonotlite (Hejny and Armbruster 2001)
J Schreiner et al Applied Clay Science 185 (2020) 105432
3
6 Publications
33
O18bull2(H2O)) and xonotlite (Ca6Si6O17(OH)2) could be identified insample MK0 (XRD plots of samples MK0 MKg16 MKg23 MK16 andMK23) Comparing MK0 and MK25 scawtite and xonotlite could stillbe identified in a very low amount in MK25 but no longer in samplesthat contained even more MK (XRD plots of samples MK0 MK25 MK5and MK9_12h)
Two additional experiments were done without quartz in the rawmixes (MK60 and MKg60) The according diffractograms after hydro-thermal curing are shown in Fig 2 In sample MKg60 tobermorite (gt 50wt-) was successfully synthesized without any other silica sourcethan MKg whereas no crystalline quartz occurred By contrast no to-bermorite but quartz could be identified in equivalent mixture MK60containing MK It can be seen that crystalline components such as micaand anatase in the raw MK did not react at the selected conditions andremained present in the autoclaved samples Except for feldspar in MKgall of the crystalline components appeared to be reactive at the chosenhydrothermal conditions A minor unidentified phase occurred at328deg2θ and additional xonotlite was identified in sample MKg60 Insample MK60 more calcium was needed for the formation of morehydrogarnet (Fig 1) resulting in a lower CaSi ratio for the remainingsystem Sample MKg60 contained only half of the amount of Al3+ and itwas not completely supplied for reaction due to its partial presence infeldspar Consequently essentially less hydrogarnet (Fig 1) was presentin MKg60 after hydrothermal treatment and the CaSi ratio in the re-maining system was affected to a lesser extent
32 Application of MK for different curing times
The development of hydrate phases in the autoclave for compoundMK9 is displayed in Fig 3 After only 2 h of hydrothermal curing all ofthe available portlandite had reacted and katoite (95 wt-) was pre-sent The applied type of metakaolin appeared to react quickly as itsupplied aluminum for formation of katoite No formation of to-bermorite could be observed at this stage yet An assumably amorphousprecursor can be seen at 28 to 30deg2θ Calcium was provided by thedissolution of portlandite After 6 h of hydrothermal reaction amountsof katoite (85 wt-) and quartz (from 31 wt- at 2 h to 165 wt- at6 h) had decreased and a major amount of tobermorite (35 wt-) waspresent Apparently between 2 and 6 h under hydrothermal conditionsthe amorphous precursor and quartz reacted resulting in the formationof tobermorite An additional 6 h of reaction time (MK9_12h) did notchange the phase composition significantly Slightly more tobermorite
(365 wt-) less quartz (16 wt-) and katoite (65 wt-) weremeasured
33 Tobermorite domain morphology and lattice parameters
In the referenced literature an analysis of tobermorite domainmorphology based on anisotropic peak broadening was possible forsamples that contained notgt 4 wt- Al2O3 in the drymix (Schreineret al 2019) Accordingly in this study samples MK0 MK25 MK5MK9_6h and MK9_12h were suitable (Table 2) with MK9_2h not con-taining any tobermorite In Fig 4 the respective growth in a and b di-rection is visualized with x indicating the domain size in a direction andy indicating domain size in b direction using a macro for TOPAS 50(Ectors et al 2015 2017) The calculated cylinder models in Fig 4represent the relation of yx and not absolute sizes With no supply ofaluminum ions (MK0) the relative domain growth in b direction islower compared to samples containing metakaolin This finding agreeswith the results from a similar investigation of tobermorite in AAC(Schreiner et al 2019) However within the samples MK5 andMK9_12h the different amounts of supplied aluminum ions did notshow a clear effect It appeared that low dosages of Al3+ (1 wt- Al2O3
in MK25 and 2 wt- Al2O3 in MK5) were enough to determine thedomain growth of tobermorite Additional results from the samplesMK9_6h and MK9_12h indicated that growth in b direction increasedwith reaction time
In Fig 5 lattice parameters of tobermorite depending on metakaolindosages are plotted B clearly remained unaffected throughout therange of samples Increasing amounts of metakaolin led to a slightlysmaller parameter a However both types of metakaolin showed acorresponding impact on parameter a By contrast parameter c in-creased strongly with increasing amounts of MK and MKg but the typeof metakaolin was significant At an equivalent dosage MK affected thecell dimension in c direction considerably more than MKg so that thefraction of Al3+ appeared to be the decisive parameter Different metaloxides in MKg did not show a notable effect certainly as they werepartially not provided for reaction Unlike for the domain morphologyof tobermorite the impact on lattice parameters could be observedwithin the complete range of examined dosages
4 Conclusions
The results obtained from the introduced investigations allow con-cluding remarks on the effects of the applied types of metakaolin on thesynthesis of 11 Aring tobermorite the phase transitions and the in-corporation of Al3+ into the lattice of tobermorite
With a critical dosage the use of any type of metakaolin led to theformation of katoite in an according amount At moderate dosages(MKg16 MKg23 MK16 and MK23) the two types of metakaolin showeda good correspondence in consideration of the quantities of to-bermorite For higher dosages there were contrary effects Lower do-sages of MK led to considerable quantities of Al-substituted to-bermorite Samples containing low dosages of MK revealed that katoiteappeared in the case ofgt 5 wt- of MK - corresponding to 2 wt-Al2O3 - in the basic compound Minor crystalline phases in MKg showedbetter reactivity than those in MK The observation that no tobermoritewas present in sample MK60 indicated that high dosages of Al3+ hin-dered the formation of tobermorite
Investigations of MK9 at 2 6 and 12 h displayed the evolution ofhydrate phases At first katoite was the only crystalline hydrate phasepresent after 2 h which corresponded to observations in a differentpublication (Klimesch and Ray 1999) The amount of katoite andquartz then decreased and a major amount of tobermorite formed from2 to 6 h curing time In order to gain more information on the trans-formation of amorphous C-(A)-S-H into tobermorite additional ex-periments in the range of 2 to 6 h curing time will be needed
Domain morphology analysis of tobermorite revealed that low
Fig 2 Diffractograms of MKg MKg60 MK and MK60 from 7 to 34deg2θ CuKα Aanatase C calcite F feldspar k kaolinite K katoite M mica Q quartz Ttobermorite U unidentified phase X xonotlite
J Schreiner et al Applied Clay Science 185 (2020) 105432
4
6 Publications
34
dosages of Al3+ determined the domain growth which agreed with theresults published on tobermorite in AAC samples (Schreiner et al2019) Different curing times unveiled that growth in b direction in-creased with the reaction time Al3+ incorporation into the lattice oftobermorite only reflected to a limited extent in the domain mor-phology By contrast an increase of lattice parameter c was triggered byAl3+ even at the highest dosage in this study Ultimately there is no
evidence for a limit of incorporation of Al3+ but there is a limit ofinfluence on the domain morphology These results additionally re-confirm this assumption similarly made in the previous work (Schreineret al 2019) and suggest a new mechanism of tobermorite crystal-lization depending on the presence of Al3+
Supplementary data to this article can be found online at httpsdoiorg101016jclay2019105432
Declaration of Competing Interest
The authors declare that they have no known competing financialinterests or personal relationships that could have appeared to influ-ence the work reported in this paper
Acknowledgement
The authors thank Rodgauer Baustoffwerke GmbH amp Co KG forsupplying raw materials for laboratory experiments
References
Aguilar-Mamani W Garciacutea G Hedlund J Mouzon J 2014 Comparison betweenleached metakaolin and leached diatomaceous earth as raw materials for the synth-esis of ZSM-5 Springerplus 3 1ndash10 httpsdoiorg1011862193-1801-3-292
Ayodele OB Sulaimon AA Alaba PA Tian Z-Y 2019 Influence of metakaolini-zation temperature on the structure and activity of metakaolin supported Ni catalystin dry methane reforming J Environ Chem Eng httpsdoiorg101016jjece2019103239 (in press)
Badawi EA Abdel-Rahman MA Mostafa A Abdel-Rahman M 2019 Determinationof the crystallite size amp micro- strain by novel method from XRD profile Appl Phys2 1ndash15 httpsdoiorg1031058jap201921001
Bailey SW 1969 Refinement of an intermediate microcline structure Am Miner 541540ndash1545
Bartl H 1969 Roentgen-Einkristalluntersuchungen an (CaO)3 (Al2O3) (H2O)6 und an(CaO)12 (Al2O3)7 (H2O) neuer Vorschlag zur (CaO)12 (Al2O3)7-Struktur NeuesJahrb fuer Mineral Monatshefte 1969 404ndash413
Basso R Giusta AD Zefiro L 1983 Crystal structure refinement of plazolite A highlyhydrated natural hydrogrossular Neues Jahrb Miner Monatsh (Neues Jahrb fuerMineral Monatshefte) 1983 251ndash258
Brigatti MF Lugli C Poppi L Foord EE Kile DE 2000 Crystal chemical varia-tions in Li- and Fe-rich micas from Pikes Peak batholith (Central Colorado) AmMineral 85 1275ndash1286 httpsdoiorg102138am-2000-8-920
Busing WR Levy HA 1957 Neutron diffraction study of calcium hydroxide J ChemPhys 26 563 httpsdoiorg10106311743345
Chen L Wang Z Wang Y Feng J 2016 Preparation and properties of alkali acti-vated metakaolin-based geopolymer Materials (Basel) 9 1ndash12 httpsdoiorg103390ma9090767
Chucholowski C Holger M Thienel K-C 2018 Improving the recyclability en-vironmental compatibility and CO2 balance of autoclaved aerated concrete by re-placing sulfate carrier and cement with calcined clays CePapers 2 503ndash512httpsdoiorg101002cepa846
Fig 3 Diffractograms of MK9_2h MK9_6h and MK9_12h from 7 to 38deg2θ CuKα C calcite K katoite Q quartz T tobermorite
Fig 4 Relation of calculated domain sizes of 11 Aring tobermorite in selectedsamples (MK0 MK25 MK5 MK9_6h and MK9_12h) in a (x) and b (y) direction
Fig 5 Lattice parameters of tobermorite depending on MK or MKg dosageincluding blank mix MK0
J Schreiner et al Applied Clay Science 185 (2020) 105432
5
6 Publications
35
Demir İ Başpınar MS Kahraman E Ccedilalışkan E Goumlrhan G 2014 An investigationon the usability of diatomite in aerated concrete production In Proc of the IntlConf on Advances in Civil Structural and Construction Engineering ndash CSCE 2014 pp97ndash100
Ectors D Goetz-Neunhoeffer F Neubauer J 2015 A generalized geometric approachto anisotropic peak broadening due to domain morphology J Appl Crystallogr 48189ndash194 httpsdoiorg101107S1600576714026557
Ectors D Goetz-Neunhoeffer F Neubauer J 2017 Routine (an)isotropic crystallitesize analysis in the double-Voigt approximation done right Powder Diffract 3227ndash34 httpsdoiorg101017S0885715617000070
Galvaacutenkovaacute L Bartoniacutečkovaacute E Opravil T Tkacz J Ptaacuteček P 2018 The influence ofstarting materials solubility on tobermorite structure formation under the hydro-thermal conditions IOP Conf Ser Mater Sci Eng 379 1ndash8 httpsdoiorg1010881757-899X3791012001
Grice JD 2005 The structure of spurrite tilleyite and scawtite and relationships toother silicate-carbonate minerals Can Mineral 43 1489ndash1500 httpsdoiorg102113gscanmin4351489
Hamid SA 1981 The crystal structure of the 11 Aring natural tobermoriteCa225[Si3O75(OH)15]1H2O Zeitschrift fuer Krist 154 189ndash198 httpsdoiorg101524zkri19811543-4189
Hejny C Armbruster T 2001 Polytypism in xonotlite Ca6Si6O17(OH)2 Zeitschrift furKrist 216 396ndash408
Horn M Schwerdtfeger CF Meagher EP 1972 Refinement of the structure of ana-tase at several temperatures Zeitschrift fur Krist 136 273ndash281 httpsdoiorg101524zkri19721363-4273
Jansen D Goetz-Neunhoeffer F Stabler C Neubauer J 2011 A remastered externalstandard method applied to the quantification of early OPC hydration Cem ConcrRes 41 602ndash608 httpsdoiorg101016jcemconres201103004
Jenkins R Snyder R 1996 Introduction to X-ray Powder Diffractometry ChemicalAnalysis Wiley pp 90
Kalousek GL 1956 Crystal Chemistry of Hydrous Calcium Silicates J Am Ceram Soc40 74ndash80
Klimesch D Ray A 1998 Autoclaved cement-quartz pastes with metakaolin additionsAdv Cem Based Mater 7 109ndash118 httpsdoiorg101016S1065-7355(97)00073-4
Klimesch D Ray A 1999 DTA-TGA evaluations of the CaOndashAl2O3ndashSiO2ndashH2O systemtreated hydrothermally Thermochim Acta 334 115ndash122 httpsdoiorg101016s0040-6031(99)00140-9
Komarneni S Roy R Roy DM Fyfe CA Kennedy GJ Bothner-By AA Dadok JChesnick AS 1985 27Al and29Si magic angle spinning nuclear magnetic resonancespectroscopy of Al-substituted tobermorites J Mater Sci 20 4209ndash4214 httpsdoiorg101007BF00552416
Koutnyacute O Opravil T Pořiacutezka J 2014 Application of metakaoline in autoclavedaerated concrete technology Adv Mater Res 1000 174ndash177 httpsdoiorg104028wwwscientificnetAMR1000174
Le Page Y Donnay G 1976 Refinement of the crystal structure of low-quartz ActaCrystallogr Sect B 32 2456ndash2459 httpsdoiorg101107S0567740876007966
Luo H Law WW Wu Y Zhu W Yang EH 2018 Hydrothermal synthesis of needle-like nanocrystalline zeolites from metakaolin and their applications for efficient re-moval of organic pollutants and heavy metals Microporous Mesoporous Mater 2728ndash15 httpsdoiorg101016jmicromeso201806015
Maeda H Ogawa Y Ishida EH Kasuga T 2012 Hydrothermal synthesis of to-bermorite doped with phosphorus species for removing heavy metal ions J AustCeram Soc 48 8ndash11
Maslen EN Streltsov VA Streltsova NR Ishizawa N 1995 Electron density andoptical anisotropy in rhombohedral carbonates III Synchrotron Xray studies ofCaCO3 MgCO3 and MnCO3 Acta Crystallogr Sect B 51 929ndash939 httpsdoiorg101107S0108768195006434
Matekonis G Šiaučiūnas R Vaičiukynienė D 2010 Hydrothermal Synthesis andCharacterization of Na + and [ Al 3 + + Na + ] -substituted Tobermorite in CaO-SiO2middotnH2O-H2O System Mater Sci 16 242ndash248
Matsui K Kikuma J Tsunashima M Ishikawa T Matsuno S Ogawa A Sato M2011 In situ time-resolved X-ray diffraction of tobermorite synthesis process underhydrothermal condition IOP Conf Ser Mater Sci Eng 18 60ndash66 httpsdoiorg1010881757-899X182022017
Merlino S Bonaccorsi E Armbruster T 2000 The real structures of clinotobermoriteand tobermorite 9 Aring OD character polytypes and structural relationships Eur JMineral 12 411ndash429 httpsdoiorg1011270935-122120000012-0411
Monasterio M Gaitero JJ Manzano H Dolado JS Cerveny S 2015 Effect ofchemical environment on the dynamics of water confined in calcium silicate mi-nerals Natural and synthetic tobermorite Langmuir 31 4964ndash4972 httpsdoiorg101021acslangmuir5b00614
Mostafa NY 2005 Influence of air-cooled slag on physicochemical properties of auto-claved aerated concrete Cem Concr Res 35 1349ndash1357 httpsdoiorg101016jcemconres200410011
Mostafa NY Shaltout AA Omar H Abo-El-Enein SA 2009 Hydrothermal synth-esis and characterization of aluminium and sulfate substituted 11 nm tobermoritesJ Alloys Compd 467 332ndash337 httpsdoiorg101016jjallcom200711130
Naber C Stegmeyer S Jansen D Goetz-Neunhoeffer F Neubauer J 2019 ThePONKCS method applied for time resolved XRD quantification of supplementarycementitious material reactivity in hydrating mixtures with ordinary Portland ce-ment Constr Build Mater 214 449ndash457 httpsdoiorg101016jconbuildmat201904157
Qu X Zhao Z Zhao X 2018 Microstructure and characterization of aluminum-in-corporated calcium silicate hydrates (C-S-H) under hydrothermal conditions RSCAdv 8 28198ndash28208 httpsdoiorg101039c8ra04423f
Rashad AM 2013 Metakaolin as cementitious material history scours production andcomposition - a comprehensive overview Constr Build Mater 41 303ndash318 httpsdoiorg101016jconbuildmat201212001
Rietveld HM 1969 A profile refinement method for nuclear and magnetic structures JAppl Crystallogr 2 65ndash71 httpsdoiorg101107S0021889869006558
Riacuteos CA Williams CD Fullen MA 2009 Hydrothermal synthesis of hydrogarnet andtobermorite at 175 degC from kaolinite and metakaolinite in the CaO-Al2O3-SiO2-H2Osystem a comparative study Appl Clay Sci 43 228ndash237 httpsdoiorg101016jclay200809014
Roacuteżycka A Pichoacuter W 2016 Effect of perlite waste addition on the properties of au-toclaved aerated concrete Constr Build Mater 120 65ndash71 httpsdoiorg101016jconbuildmat201605019
Roacutezycka A Kotwica Ł Małolepszy J 2014 Synthesis of single phase gyrolite in theCaO-quartz-Na2O-H2O system Mater Lett 120 166ndash169 httpsdoiorg101016jmatlet201401003
Sauman Z 1974 Influence of SO4 2ndash ions on the formation of 11 Aring tobermorite InProceedings of the 2nd International Symposium on Science and Research in SilicateChemistry Moscow pp 25ndash39
Schmidt M Egersdoumlrfer A Poumlllmann H 2012 Increased reactivity using a glass-containing metakaolin as an active filler in lime-based binder systems ZKG Int 6554ndash62
Schreiner J Jansen D Ectors D Goetz-Neunhoeffer F Neubauer J Volkmann S2018 New analytical possibilities for monitoring the phase development during theproduction of autoclaved aerated concrete Cem Concr Res 107 247ndash252 httpsdoiorg101016jcemconres201802028
Schreiner J Goetz-Neunhoeffer F Neubauer J Volkmann S Bergold S Webler RJansen D 2019 Advanced Rietveld refinement and SEM analysis of tobermorite inchemically diverse autoclaved aerated concrete Powder Diffract 34 143ndash150httpsdoiorg101017s0885715619000149
Setthaya N Chindaprasirt P Pimraksa K 2016 Preparation of zeolite nanocrystals viahydrothermal and solvothermal synthesis using of rice husk ash and metakaolinMater Sci Forum 872 242ndash247 httpsdoiorg104028wwwscientificnetmsf872242
Siauciunas R Baltakys K 2004 Formation of gyrolite during hydrothermal synthesis inthe mixtures of CaO and amorphous SiO2 or quartz Cem Concr Res 34 2029ndash2036httpsdoiorg101016jcemconres200403009
Skawinska A Owsiak Z Baran T Hernik K 2017 The influence of halloysite ad-dition on tobermorite formation in CaO and quartz mix under hydrothermal condi-tions Cem Wapno Bet 17 426ndash434
Venhodovaacute E Janovskyacute R Drochytka R 2015 Formation of tobermorite at differentmaterials composition of aerated concrete Appl Mech Mater 752ndash753 247ndash250httpsdoiorg104028wwwscientificnetamm752-753247
Walczak P Małolepszy J Reben M Szymański P Rzepa K 2015 Utilization ofwaste glass in autoclaved aerated concrete Proc Eng 122 302ndash309 httpsdoiorg101016jproeng201510040
Zhang Y Gao W Cui L 2007 The transformation of acid leached metakaolin tozeolite beta Stud Surf Sci Catal 170 420ndash425 httpsdoiorg101016S0167-2991(07)80870-6
Zvyagin BB 1960 An attempt to electronographic determination of kaolinite structureJ Dokl Akad Nauk SSSR 130 1023ndash1026
J Schreiner et al Applied Clay Science 185 (2020) 105432
6
6 Publications
36
6 Publications
62 Advanced Rietveld refinement and SEM analysis oftobermorite in chemically diverse autoclaved aeratedconcrete
Following the copyright guidelines by Cambridge University Press the publication
Schreiner J Goetz-Neunhoeffer F Neubauer J Volkmann S Bergold S WeblerR Jansen D 2019 Advanced Rietveld refinement and SEM analysis of tobermorite inchemically diverse autoclaved aerated concrete Powder Diffraction 34 143ndash150 httpsdoiorg101017s0885715619000149
may not be reprinted It can be accessed at
httpswwwcambridgeorgcorejournalspowder-diffractionarticleadvanced-rietveld-refinement-and-sem-analysis-of-tobermorite-in-chemically-diverse-autoclaved-aerated-concrete51597C2A66F6F225D29DEB2675E74249
37
6 Publications
63 New analytical possibilities for monitoring the phasedevelopment during the production of autoclavedaerated concrete
Reprint of the peer reviewed publication
Schreiner J Jansen D Ectors D Goetz-Neunhoeffer F Neubauer J VolkmannS 2018 New analytical possibilities for monitoring the phase development during theproduction of autoclaved aerated concrete Cement and Concrete Research 107 247ndash252httpsdoiorg101016jcemconres201802028
with permission from Elsevier
38
Contents lists available at ScienceDirect
Cement and Concrete Research
journal homepage wwwelseviercomlocatecemconres
Short communication
New analytical possibilities for monitoring the phase development duringthe production of autoclaved aerated concrete
J Schreinera D Jansena D Ectorsa F Goetz-Neunhoeffera J Neubauera S Volkmannb
aUniversity of Erlangen-Nuremberg GeoZentrum Nordbayern Mineralogy Schlossgarten 5a 91054 Erlangen Germanyb Rodgauer Baustoffwerke GmbH amp Co KG Am Opel-Pruumlffeld 3 63110 Rodgau-Dudenhofen Germany
A B S T R A C T
This work presents improved analytical methods for both steps of the production process of autoclaved aeratedconcrete (AAC) the phase development during the hydration before autoclaving and during the autoclavingprocess itself The improvement includes new insights into preparation methods of AAC samples for powderdiffraction as well as Rietveld refinement strategies For the first time a new implementation for calculatinganisotropic crystal domain sizes is applied to major hydrate phases occurring during AAC production namelyportlandite during the hydration before autoclaving and tobermorite during the autoclaving process The cal-culation of anisotropic domain size growth which can be implemented in the Rietveld environment is based oncrystallographically and geometrically appropriate models The implementation of calculating anisotropic do-main sizes for the Rietveld software TOPAS 50 allows a superior Rietveld fit and a more accurate quantificationof the phase development Additionally it enables the tracking of growth mechanism of portlandite duringhydration
1 Introduction
Autoclaved aerated concrete (AAC) is known as a lightweight con-struction material which offers outstanding properties such as suffi-cient strength for construction in addition with excellent thermal in-sulation [12] AAC is produced by autoclaving from calcareous rawmaterials such as lime (CaO) and cement quartz sulfate carrier andother additives such as foaming agents and water
The production process (Fig 1) can be separated into the hydrationof the mixed slurry before the procedure of autoclaving and the auto-claving at elevated temperature (180 degC to 200 degC) under saturatedsteam pressure (12MPa) for several hours
The hydration process before autoclaving is necessary to achievesufficient strength in order to cut the green cake blocks as they shouldhave a specific shape and dimension after autoclaving Furthermorethe porous structure is generated by the foaming agent during hydra-tion in the first process step During autoclaving the final propertiesnamely strength and low thermal conductivity are achieved
It is already well understood that the autoclaving process leads tothe formation of several phases first of all tobermorite(Ca5Si6O16(OH)2lowast4H2O) [3ndash5] Newest research has shown im-pressively which reactions are running from the mineralogical point ofview Insitu XRD measurements were carried out during the
autoclaving process and the phase development was shown by plottingnormalized intensities [6] The study of Mitsuda et al [3] was mainlyfocused on the tracking of the phase evolution during the autoclavingprocess of AAC However their statements concerning phase evolutionare mainly based on XRD data and TGA measurements There is acommon agreement that the following reactions occur The consump-tion of the alite (OPC) leads to the formation of an initial C-S-H phaseduring the first processing step Portlandite which was initially formedduring the first process step (from CaO and C3S) further quartz and theC-S-H phase are consumed during autoclaving resulting in the crystal-lization of tobermorite Hence the crystallization process of to-bermorite as well as the crystal structure of tobermorite was an issue ofresearch and discussion over the last years and numerous publicationsto these topics are available Concerning the crystal structure of to-bermorite respectively the tobermorite supergroup a new publicationoutlines all important references and recommends a new nomenclature[7]
The presented study was performed to create new analytical possi-bilities for the characterization of the production process of AAC Bothof the production process steps are essential for the final productHence the present work focuses on crystallization of hydrate phases inboth processes
Firstly an external standard method [89] was published and
httpsdoiorg101016jcemconres201802028Received 6 October 2017 Received in revised form 1 February 2018 Accepted 26 February 2018
Corresponding authorsE-mail addresses juergenjsschreinerfaude (J Schreiner) danieljansenfaude (D Jansen)
Cement and Concrete Research 107 (2018) 247ndash252
0008-8846 copy 2018 Elsevier Ltd All rights reserved
T
6 Publications
39
recommended for the determination of absolute phase contents inmixtures with amorphous content It was shown that the method canabsolutely be recommended for hydrating cement pastes in which watercannot be quantified directly by XRD [10] This method seems to bevery promising for both the quantification of the hydration of the AACslurry before autoclaving and the quantification of the phase evolutionduring autoclaving inasmuch as both production steps form crystallineand amorphous phases
Secondly a new approach to anisotropic peak broadening due toanisotropic domain morphology which was developed [1112] is ap-plied to AAC samples to improve the fit of portlandite and tobermoriteby Rietveld refinement [13] By applying this approach the refinementof both portlandite and tobermorite should additionally lead to betterquantitative results as well as to better insights into the development ofthe domain size morphology of both phases formed
It was already shown that in a hydrating raw mixture for AAC twospecies of portlandite precipitate at 23 degC one showing dynamicallyanisotropic peak broadening and another one following the isotropictrend [14] The application of the anisotropic refinement model led toan improved fitting of portlandite Moreover the mechanism of aniso-tropic domain growth of portlandite was tracked
2 Materials and methods
In order to examine the hydration of the AAC slurry before auto-claving a mixture of the hydraulic reactive components was weighedand measured in-situ at a Bruker D8 diffractometer with a LynxEyedetection system
Ordinary Portland cement (OPC) was mixed with lime (CaO) andanhydrite (C$) The raw materials were taken from the same batches asfor the industrial samples The drymix (58 OPC 36 CaO and 6 C$by weight) was then mixed with water (ws= 08) and placed into anappropriate sample holder The samples were not aerated The slurrysamples were covered with a kapton film to avoid evaporation andcarbonation Diffractograms were recorded with an angular range from7 to 545deg 2θ and a step width of 0011deg 2θ Measurements were carriedout every 15min For each measurement 96 XRD patterns were re-corded over the first 24 h The temperature was fixed at 70 degC which isthe mean temperature generally prevailing in the industrial processduring hydration before autoclaving Rietveld refinement was carriedout using the G-factor method All structures used for Rietveld refine-ment are shown in Table 1
For investigation of the autoclaved samples five different specimenswere taken at different autoclaving times The specimens were takenout of a technical production process hence it was not possible to in-terrupt the process at an earlier time inasmuch it would lead to damageof a whole concrete production batch The specimens were firstly driedat 60 degC until weight constancy The whole blocks were then broken andstatistical samples of 20 g were taken In order to receive the right massattenuation coefficient (MAC) for G-factor method the loss on ignitionand the chemical composition (XRF) were determined For energydispersive XRF analysis (Spectro Xepos) tube voltage from 20 kV to50 kV and tube current from 08 to 20mA were used for differenttargets
The final sample preparation (grinding) before XRD measurementswas carried out using both an agate mortar and a McCrone micronizingmill for wet milling with isopropanol Both preparation methods wereapplied separately to see which one is suitable in order to get the bestpreparation for XRD investigations Six preparations were performed byone operator of which two were prepared with an agate mortar andfour with a McCrone mill For the McCrone milling 3 g of the sampleand 10ml of isopropanol were used for grinding for 12min The grainsize distribution of one sample prepared with an agate mortar and onesample prepared using a McCrone mill was measured by laser granu-lometry in isopropanol using a Mastersizer 3000 (MALVERN)
After milling the samples in these two ways for XRD analysis thepowders were prepared into a front loading sample holder and mea-sured Diffractograms were recorded with an angular range from 6 to80deg 2θ a step width of 00236deg 2θ and a time per step of 054 s Rietveldrefinement combined with external standard (G-factor) was applied inorder to get absolute quantities for each phase The refinement strategyfor portlandite and tobermorite in the TOPAS Launch Mode (TOPAS50 Bruker AXS) is attached as a Supplementary material file
3 Results and discussion
31 Hydration of the mixture before autoclaving
The hydration of the investigated paste before autoclaving isdominated by the hydration of the cement as well as the reaction of thefree lime (CaO) resulting in the formation of portlandite It can beclearly seen from Fig 2 that the hydration of the paste leads to theformation of ettringite portlandite and C-S-H phase For simplificationthe remaining phase developments are not shown in Fig 2 because theyare not in the focus of this study The hydration of CaO forming
Fig 1 Simplified process steps of AAC production and hydrate phase evolution
Table 1Structures used for Rietveld refinement
Phase Author
Alite [15]Anhydrite [16]Bassanite [17]Belite (β) [18]Belite (αprime) [19]Brownmillerite [20]C-S-H [21]Calcite [22]Ettringite [23]Gypsum [24]Hemicarbonate [25]Hydroxylellestadite [26]Lime (CaO) [27]Microcline [28]Portlandite [29]Quartz [30]Tobermorite [31]Tricalciumaluminate (cubic) [32]Tricalciumaluminate (orthorhombic) [33]PONCKS model for Water [21]
J Schreiner et al Cement and Concrete Research 107 (2018) 247ndash252
248
6 Publications
40
portlandite begins rapidly after the addition of water to the mixture andlime is fully consumed after only 1 h of hydration This translates into aquick rise of heat of hydration so that cement hydration is acceleratedwhich leads to further portlandite formation by the reaction of aliteEttringite formation stalls after few hours of hydration After 12 h et-tringite is partially decomposed probably due to sulfate depletion [9]
and poorly crystalline AFm phases (not shown in Fig 2) are formedIn Fig 3 it can be seen that in fact two generations of portlandite
are formed a 1st dominant generation showing anisotropic peakbroadening and 2nd one occurring considerably later following theisotropic domain size refinement which is usually carried out using theRietveld method This occurrence comes along firstly with lime hy-dration and secondly with alite hydration The expected quantity ofportlandite formed from lime hydration very well complies with the
Fig 2 Phase development in AAC paste on a laboratory scale before autoclaving ana-lyzed by in-situ XRD at 70 degC
Fig 3 Formation of two generations of portlandite by hydration of lime (1st) and C3S(2nd) at 70 degC before autoclaving with the major generation showing anisotropic peakbroadening
Fig 4 Biaxial cylinder domain size model of portlandite used for Rietveld refinement of anisotropic peak broadening
Fig 5 Morphological evolution of portlandite showing anisotropic domain size growthduring hydration at 70 degC
Fig 6 Comparison of quantification of crystalline quartz in samples prepared withMcCrone mill and agate mortar at different autoclaving times
J Schreiner et al Cement and Concrete Research 107 (2018) 247ndash252
249
6 Publications
41
quantity of the observed 1st generation The development of portlan-dite growth was already tracked in an equivalent slurry at 23 degC [14]Thus this observation confirms that the crystallinity of portlandite inmixtures for AAC production depends on the starting phase for hydra-tion as already indicated by Ectors [14]
Fig 4 shows the used biaxial cylindrical model for anisotropic do-main size calculation and the portlandite structure which was createdwith structural software VESTA 318 [34] Using the cylindrical ap-proach domain sizes in a (here equating to b) and c direction(dz= cylinder height) can be calculated which comes along with theexpected symmetrical parameters of portlandite
The 1st portlandite generation showing anisotropic domain growthcan be tracked in terms of cylinder diameter and height which is rea-lized in Fig 5 The blue cylinder represents the geometric approach andcylinder height and diameter are calculated newly for each range Thecylinder height remains rather stable throughout the hydration processwhile the cylinder diameter increases during the first hours of hydra-tion After 10 h of hydration the mean cylinder diameter no longer in-creases Consequently these observations match the results of the ex-aminations conducted at 23 degC [14] as well as the assumption thatdifferent mechanisms of growth exist for portlandite depending on the
hydration educt The maximum cylinder diameter is reached earlier inthis work very likely because of the higher hydration temperature
32 Quantification of the reactions during autoclaving
Autoclaved samples were ground with an agate mortar and com-pared to samples which were wet-ground with a McCrone mill Fig 6shows precisely that the determination of the amount of crystallinequartz is more reproducible in the two shown samples which were
Fig 7 2D XRD with Bruker GADDS-system plots of samples prepared with agate mortar and McCrone mill Coarse quartz grains are pointed out in the plot of the sample prepared withagate mortar
Fig 8 Particle size distribution of one sample prepared with an agate mortar and of onesample prepared with a McCrone mill measured by laser granulometry
Fig 9 Rietveld refinement for Tobermorite of autoclaved AAC sample by use of isotropicdomain size model (a) and of anisotropic domain size model (b)
J Schreiner et al Cement and Concrete Research 107 (2018) 247ndash252
250
6 Publications
42
prepared with a McCrone mill The high variance of crystalline quartzin the samples which were prepared with an agate mortar is a result ofinsufficient grinding and remaining of too large quartz grains Whenthis spottiness occurs a reliable quantification using the G-factormethod is not possible
The 2D XRD with Bruker GADDS-system plots in Fig 7 demonstratethe insufficient grinding when using an agate mortar compared to wetmilling with a McCrone mill Quartz would be overrepresented in a one-dimensional XRD pattern focusing on a section with bright spots (greenarrows) The lack of bright spots in the right plot shows that the quartzgrains are milled more thoroughly using a McCrone mill In Fig 8 theparticle size distribution after both ways of sample preparation iscompared Most grains in the sample prepared with an agate mortar arelarger than in the sample prepared with a McCrone mill The grain sizedistribution of the sample prepared with a McCrone mill complies withthe recommended particle size range for XRD analysis of under 5 to50 μm [3536] while the other sample exceeds the range
In Fig 9 Rietveld refinement of an autoclaved sample is shown Thedominant peaks at 77 290 and 301deg 2θ are attributed to tobermoriteIn the upper diagram (a) Rietveld refinement was carried out regularlycalculating isotropic domain sizes for tobermorite However the cal-culated fit differs significantly from the raw data It can be assumed thattobermorite shows a similar pattern to portlandite in terms of aniso-tropic peak broadening taking into account that tobermorite is as-signed to the orthorhombic crystal system Thus instead of a biaxialcylinder model an elliptic cylinder model (Fig 10 structure createdwith VESTA 318 [34]) was applied for the refinement in the lowerdiagram (b) The elliptic cylinder model is a sufficient approach to the
orthorhombic crystal system as it allows the distinction between do-main sizes in a b and c direction The fit is clearly superior using theanisotropic domain size model highlighted by the difference plot inFig 9b The comparison refinement with isotropic and anisotropic ap-proach was done for all of the five autoclaved samples In Fig 11 theresulting Rwp values for the whole pattern and the RBragg values of to-bermorite are shown The refinement using the anisotropic model leadsto both lower Rwp and RBragg values and consequently to a better fit anda more accurate quantification of tobermorite in all refined samples
4 Summary and conclusions
Improved analytical methods for both the phase developmentduring the hydration before autoclaving and during the autoclavingprocess of AAC are presented It could be shown that wet McCronemilling is the best way of preparation of AAC samples in order to obtainsuitable samples for powder diffraction A new approach to treat ani-sotropic domain sizes for Rietveld refinement could be successfullyapplied ndash with the benefit that portlandite and tobermorite in AACsamples could be refined more accurately using the Rietveld methodThus this application allows an improved quantification of the phasedevelopment during both of the production steps
For the future there are still plenty of possibilities to apply thepresented approach of calculating anisotropic domain sizes to AACproduction As exemplified with portlandite the mechanisms of growthof tobermorite can be tracked likewise during the autoclaving processIn addition the effect of variations in the chemical composition of AACraw mixtures on the crystal morphology of tobermorite can be ex-amined This leaves a new perspective to discuss the link between mi-neral phase morphology and the thermal and mechanical properties ofAAC
Acknowledgement
The autoclaved samples were generously provided by RodgauerBaustoffwerke GmbH amp Co KG The authors express gratitude for allsupport
Appendix A Supplementary data
Supplementary data to this article can be found online at httpsdoiorg101016jcemconres201802028
References
[1] MW Grutzeck Cellular concrete in M Scheffler P Colombo (Eds) CellularCeramics Wiley-VCH Weinheim 2005 pp 193ndash223
[2] M Haas The future of AAC ndash from a material scientists point of view inMC Limbachiya JJ Roberts (Eds) Autoclaved Aerated Concrete Taylor FrLondon 2005 pp 187ndash194
[3] T Mitsuda K Sasaki H Ishida Phase evolution during autoclaving process ofaerated concrete J Am Ceram Soc 75 (1992) 1858ndash1863
[4] N Isu H Ishida T Mitsuda Influence of quartz particle size on the chemical and
Fig 10 Triaxial cylinder domain size model of Tobermorite used for Rietveld refinement of anisotropic peak broadening
Fig 11 Comparison of Rwp and RBragg values of Rietveld refinements of autoclavedsamples and tobermorite using the isotropic and the anisotropic domain size model
J Schreiner et al Cement and Concrete Research 107 (2018) 247ndash252
251
6 Publications
43
mechanical properties of autoclaved aerated concrete (I) tobermorite formationCem Concr Res 25 (1995) 243ndash248
[5] NY Mostafa Influence of air-cooled slag on physicochemical properties of auto-claved aerated concrete Cem Concr Res 35 (2005) 1349ndash1357 httpdxdoiorg101016jcemconres200410011
[6] K Matsui J Kikuma M Tsunashima T Ishikawa S Matsuno A Ogawa M SatoIn situ time-resolved X-ray diffraction of tobermorite formation in autoclaved aer-ated concrete influence of silica source reactivity and Al addition Cem Concr Res41 (2011) 510ndash519
[7] C Biagioni S Merlino E Bonaccorsi The tobermorite supergroup a new no-menclature Mineral Mag 79 (2015) 485ndash495 httpdxdoiorg101180minmag2015079222
[8] BH OConnor MD Raven Application of the Rietveld refinement procedure inassaying powdered mixtures Powder Diffract 3 (1988) 2ndash6 httpdxdoiorg101017S0885715600013026
[9] D Jansen F Goetz-Neunhoeffer C Stabler J Neubauer A remastered externalstandard method applied to the quantification of early OPC hydration Cem ConcrRes 41 (2011) 602ndash608 httpdxdoiorg101016jcemconres201103004
[10] D Jansen C Stabler F Goetz-Neunhoeffer S Dittrich J Neubauer Does OrdinaryPortland Cement contain amorphous phase A quantitative study using an externalstandard method Powder Diffract 26 (2011) 31ndash38 httpdxdoiorg10115413549186
[11] D Ectors F Goetz-Neunhoeffer J Neubauer A generalized geometric approach toanisotropic peak broadening due to domain morphology J Appl Crystallogr 48(2015) 189ndash194 httpdxdoiorg101107S1600576714026557
[12] D Ectors F Goetz-Neunhoeffer J Neubauer Routine (an)isotropic crystallite sizeanalysis in the double-Voigt approximation done right Powder Diffract 32 (S1)(2017) 27ndash34 httpdxdoiorg101017S0885715617000070
[13] HM Rietveld A profile refinement method for nuclear and magnetic structures JAppl Crystallogr 2 (1969) 65ndash71 httpdxdoiorg101107S0021889869006558
[14] D Ectors Advances in the Analysis of Cementitious Reactions and Hydrate Phases(Doctoral Thesis) (2016) pp 12ndash14 (urnnbndebvb29-opus4-71743)
[15] AacuteG De La Torre S Bruque J Campo MAG Aranda The superstructure of C3Sfrom synchrotron and neutron powder diffraction and its role in quantitative phaseanalyses Cem Concr Res 32 (2002) 1347ndash1356 httpdxdoiorg101016S0008-8846(02)00796-2
[16] A Kirfel G Will Charge density in anhydrite CaSO4 from X-ray and neutrondiffraction measurements Acta Crystallogr Sect B Struct Crystallogr CrystChem 36 (1980) 2881ndash2890 httpdxdoiorg101107S0567740880010461
[17] C Bezou AN Christensen D Cox M Lehman A Nonat Structures cristallines deCaSO405H2O et CaSO406H2O Comptes Rendus Hebd Des Seacuteances lAcadeacutemieDes Sci Seacuterie 2 (312) (1991) 43ndash48
[18] KH Jost B Ziemer R Seydel Redetermination of the structure of β-dicalciumsilicate Acta Crystallogr Sect B Struct Crystallogr Cryst Chem 33 (1977)1696ndash1700 httpdxdoiorg101107S0567740877006918
[19] W Mumme LMD Cranswick BC Chakoumakos Rietveld crystal structure re-finements from high temperature neutron powder diffraction data for the poly-morphs of dicalcium silicate Neues Jahrb Fuer Mineral Abhandlungen 170 (1996)171ndash188
[20] A Colville S Geller The crystal structure of brownmillerite Ca2FeAlO5Crystallographica 50 (1971) 2311ndash2315 httpdxdoiorg101107S056774087100579X
[21] ST Bergold F Goetz-Neunhoeffer J Neubauer Quantitative analysis of C-S-H inhydrating alite pastes by in-situ XRD Cem Concr Res 53 (2013) 119ndash126 httpdxdoiorg101016jcemconres201306001
[22] EN Maslen VA Streltsov NR Streltsova N Ishizawa Electron density and op-tical anisotropy in rhombohedral carbonates III Synchrotron Xray studies ofCaCO3 MgCO3 and MnCO3 Acta Crystallogr Sect B 51 (1995) 929ndash939 httpdxdoiorg101107S0108768195006434
[23] G Renaudin Y Filinchuk J Neubauer F Goetz-Neunhoeffer A comparativestructural study of wet and dried ettringite Cem Concr Res 40 (2010) 370ndash375httpdxdoiorg101016jcemconres200911002
[24] WF Cole CJ Lancucki A refinement of the crystal structure of gypsumCaSO42H2O Acta Cryst B30 (1974) 921ndash929 httpdxdoiorg101107S0567740874004055
[25] T Runčevski RE Dinnebier OV Magdysyuk H Poumlllmann Crystal structures ofcalcium hemicarboaluminate and carbonated calcium hemicarboaluminate fromsynchrotron powder diffraction data Acta Crystallogr Sect B Struct Sci 68 (2012)493ndash500 httpdxdoiorg101107S010876811203042X
[26] JM Hughes JW Drexler Cation substitution in the apatite tetrahedral site crystalstructures of type hydroxylellestadite and type fermorite Neues Jahrb FuerMineral (1991) 327ndash336
[27] CH Shen RS Liu JG Lin CY Huang Phase stability study of La12Ca18Mn2O7Mater Res Bull 36 (2001) 1139ndash1148
[28] SW Bailey Refinement of an intermediate microcline structure Am Miner 54(1969) 1540ndash1545
[29] WR Busing HA Levy Neutron diffraction study of calcium hydroxide J ChemPhys 26 (1957) 563 httpdxdoiorg10106311743345
[30] Y Le Page G Donnay Refinement of the crystal structure of low-quartz ActaCrystallogr Sect B 32 (1976) 2456ndash2459 httpdxdoiorg101107S0567740876007966
[31] SA Hamid The crystal structure of the 11 Aring natural tobermoriteCa225[Si3O75(OH)15]1H2O Zeitschrift Fuer Krist - New Cryst Struct 154 (1981)189ndash198 httpdxdoiorg101524zkri19811543-4189
[32] P Mondal JW Jeffery The crystal structure of tricalcium aluminate Ca3Al2O6Acta Crystallogr B 31 (1975) 689ndash697 httpdxdoiorg101107S0567740875003639
[33] Y Takeuchi F Nishi I Maki Crystal-chemical characterization of the tricalciumaluminate-sodium oxide (3CaOtimesAl2O3-Na2O) solid-solution series Zeitschrift FuumlrKrist (1980) 259ndash307
[34] K Momma F Izumi VESTA 3 for three-dimensional visualization of crystal vo-lumetric and morphology data J Appl Crystallogr 44 (2011) 1272ndash1276 httpdxdoiorg101107S0021889811038970
[35] K Scrivener R Snellings B Lothenbach A Practical Guide to MicrostructuralAnalysis of Cementitious Materials CRC Press 2016 pp 123ndash125 httpdxdoiorg107693wl20150205
[36] V Pecharsky P Zavalij Fundamentals of Powder Diffraction and StructuralCharacterization of Materials Springer second edition 2005 p 302 httpdxdoiorg101007978-0-387-09579-0
J Schreiner et al Cement and Concrete Research 107 (2018) 247ndash252
252
6 Publications
44
7 Acknowledgement
7 Acknowledgement
Ich moumlchte mich bei einigen Personen bedanken ohne die es wohl kaum zum erfolgreichenAbschluss dieser Arbeit gekommen waumlreMein Doktorvater Prof Dr Juumlrgen Neubauer hat sich stets die Zeit genommen die noumltigwar um Angelegenheiten aller Art mit mir zu klaumlren Er gab mir fachlich immer zumrichtigen Zeitpunkt einen gewissen wissenschaftlichen Impuls Zugleich habe ich mich den-noch immer frei in meiner eigenen Konzeption gefuumlhlt Groszligen Dank spreche ich Prof DrFriedlinde Goumltz-Neunhoeffer aus die fuumlr mich ebenso immer eine verlaumlssliche Ansprech-partnerin fuumlr fachliche und organisatorische Angelegenheiten aller Art war Danke anDr Daniel Jansen fuumlr die gute Zusammenarbeit und dafuumlr dass er mich im Zuge meinerMasterarbeit in ein Forschungsprojekt aufgenommen hat das den Weg zur Promotionmoumlglich machte Zusaumltzlich gilt mein Dank Prof Dr Matthias Goumlbbels der fuumlr dieMitarbeiter am Lehrstuhl immer motivierende Worte fand Fuumlr die Ermoumlglichung meinerTeilnahme an diversen Dienstreisen Fortbildungen und Tagungen moumlchte ich mich viel-mals bedankenWeiterhin bedanke ich mich bei Dr Stephan Volkmann und den Rodgauer BaustoffwerkenGmbH amp Co KG fuumlr die gute Zusammenarbeit und die Bereitstellung von Versuchsma-terialienVielen Dank an meine studentischen Hilfskraumlfte Daniel Wagner Laura MoldenhauerFabian Lang Jakob Schreiber und Felix Klaassen die alle Aufgaben im Labor einwand-frei und mit Bedacht erledigten Bei meinen aktuellen und ehemaligen Kollegen DrKatrin Hurle Dr Dominique Ectors Dr Christoph Naber Dr Florian Huumlller JoumlrgNehring Frank Riedel Julian Wolf Tanja Manninger Daniel Wagner Nicolas FobbeKarla Spaumlth Julian Goergens Andreas Koumlhler Cordula Jakob Franz Becker und LisaKlemenz bedanke ich mich fuumlr die gelungene Zusammenarbeit und gegenseitige Unter-stuumltzung Besonderer Dank geht auch an Kerstin Kreszlig Bettina Engl Christian HankeBernd Schleifer und Christian Abe fuumlr die verlaumlssliche Unterstuumltzung bei technischen Fra-gen und Messungen im LaborFuumlr jegliche Unterstuumltzungen moumlchte ich mich auch bei meinen Eltern bedanken sowiebei meinem Bruder Ralf der mir mit einem LaTex Crashkurs viel Frustration ersparthat Danke Thomas dass du immer fuumlr mich da bist und mit mir zusammen fuumlr genugAusgleich gesorgt hast
45
4 Conclusions
4 Conclusions
The research results presented in the previous sections yield advances in the mineralogicalinvestigation of tobermorite and autoclaved aerated concrete Recorded diffraction pat-terns contain plenty of usually unused data regarding the microstructural characteristicsof the sample and phases therein The profit of XRD measurements can be significantlyimproved whenever one or more phases show anisotropic peak broadening and appro-priate models for the respective domain morphology are implemented into the Rietveldenvironment Within the scope of the present investigations portlandite and tobermoriteshow this particularityThe effects of changes in the chemistry of the starting mix were examined based on dif-ferent dosages of metakaolin Al-substituted tobermorite showed increased growth in b
direction and an increase of lattice parameter c compared to Al-free tobermorite The rel-ative domain sizes were determined based on anisotropic peak broadening However whilethe effect of Al3+ incorporation into the lattice of tobermorite was limited regarding thedomain morphology lattice parameter c showed an increase throughout the entire rangeof samples The consequent effects suggested by Klimesch amp Ray observed by means ofDTA are debatable as reactions during the heating experiment may lead to to a changeof Al3+ content in tobermorite [40] While both types of applied metakaolin showed goodreactivity at hydrothermal conditions some included minor phases such as feldspar oranatase remained unreacted At high dosages of Al2O3 in the starting mix the formationof either only katoite or katoite along with tobermorite was observed (Figure 32)SEM analysis of tobermorite in AAC cannot be suggested based on the observationspresented in this work as it is only visually accessible in the pores or at pore surfacesThe dense material of the AAC skeleton contains several crystalline and X-ray amorphousphases which hardly allows a proper investigation Even in single pores tobermorite crys-tals appeared very heterogeneous at various chemical compositions As a result lath-liketobermorite was not only present in samples characterized by elevated Al3+ incorporationBy contrast the benefits of XRD analysis presented in section 61 equally accounted fortobermorite in AAC samples Sulfate incorporation into the lattice of tobermorite wasnot observed All of the sulfate in the system was detected to be present in anhydriteThe phase transitions in the AAC raw slurry during the green stage hydration were show-cased by in-situ XRD analysis of a model mix at 70 degC Additional DTA and XRD mea-
23
4 Conclusions
surements during this step confirmed the presence of two generations of portlandite char-acterized by different crystallinity as suggested by Ectors [52] The inclusion of anisotropicdomain morphology during the Rietveld refinement allowed a more accurate quantifica-tion of tobermorite in autoclaved samples Sample preparation adjusted to the grain sizedistribution in AAC samples (section 63) the external standard method for quantita-tive XRD analysis [55] and the approach to evaluate anisotropic peak broadening [19]are the key methods for a more accurate tracking of the phase development during AACproduction
24
5 References
5 References
[1] A E Zadov A I Grabezhev N N Pertsev N V Chukanov and S V PribavkinTobermorite-plombierite metasomatites of the Gumeshevsk skarn-porphyry copper depositmiddle Urals Doklady Earth Sciences 407(3)495ndash497 2006
[2] M F Heddle Preliminary notice of substances which may prove to be new minerals MinMag 4117ndash123 1880
[3] S Merlino E Bonaccorsi and T Armbruster The real structure of tobermorite 11AringNormal and anomalous forms OD character and polytypic modifications European Journalof Mineralogy 13(3)577ndash590 2001
[4] C Biagioni S Merlino and E Bonaccorsi The tobermorite supergroup a new nomencla-ture Mineralogical Magazine 79(2)485ndash495 2015
[5] C A Riacuteos C D Williams and M A Fullen Hydrothermal synthesis of hydrogarnetand tobermorite at 175 degC from kaolinite and metakaolinite in the CaO-Al2O3-SiO2-H2Osystem A comparative study Applied Clay Science 43(2)228ndash237 2009
[6] X Qu Z Zhao and X Zhao Microstructure and characterization of aluminum-incorporated calcium silicate hydrates (C-S-H) under hydrothermal conditions RSC Ad-vances 8(49)28198ndash28208 2018
[7] R Šiaučiunas and K Baltakys Formation of gyrolite during hydrothermal synthesis inthe mixtures of CaO and amorphous SiO2 or quartz Cement and Concrete Research34(11)2029ndash2036 2004
[8] E Venhodovaacute R Janovskyacute and R Drochytka Formation of Tobermorite at Different Ma-terials Composition of Aerated Concrete Applied Mechanics and Materials 752-753247ndash250 2015
[9] L Galvaacutenkovaacute E Bartoniacutečkovaacute T Opravil J Tkacz and P Ptaacuteček The influence ofstarting materials solubility on tobermorite structure formation under the hydrothermalconditions IOP Conference Series Materials Science and Engineering 379(1)1ndash8 2018
[10] T Mitsuda K Sasaki and H Ishida Phase Evolution during Autoclaving Process J AmCeram Soc 75(75)1858ndash1863 1992
[11] A Skawińska The influence of metahalloysite addition on tobermorite formation studied byX-ray powder diffraction and scanning electron microscope MATEC Web of Conferences16305008 2018
[12] S T Bergold F Goetz-Neunhoeffer and J Neubauer Quantitative analysis of C-S-H in
25
5 References
hydrating alite pastes by in-situ XRD Cement and Concrete Research 53119ndash126 2013
[13] O P Shrivastava and F P Glasser Ion-exchange properties of 11-Aring tobermorite Reactivityof Solids 2(3)261ndash268 1986
[14] H Maeda Y Ogawa E H Ishida and T Kasuga Hydrothermal synthesis of tobermoritedoped with phosphorus species for removing heavy metal ions Journal of the AustralianCeramic Society 48(1)8ndash11 2012
[15] O P Shrivastava and R Shrivastava Cation exchange applications of synthetic tobermoritefor the immobilization and solidification of cesium and strontium in cement matrix Bulletinof Materials Science 23(6)515ndash520 2000
[16] G Renman and A Renman Sustainable Use of Crushed Autoclaved Aerated Concrete(CAAC) as a Filter Medium in Wastewater Purification 8th International conferenceon sustainable management of waste and recycled materials in construction GothenburgSweden 30 Mayndash1 June 2012 Proceedings pages 1ndash7 2012
[17] G Schober Chemical transformations during the manufacturing of autoclaved aeratedconcrete (ACC) Cement lime gypsum and quartz sand become cellular concrete ZKG58(7)63ndash70 2005
[18] A J Hamad Materials Production Properties and Application of Aerated LightweightConcrete Review International Journal of Materials Science and Engineering 2(2)152ndash157 2014
[19] D Ectors F Goetz-Neunhoeffer and J Neubauer A generalized geometric approach toanisotropic peak broadening due to domain morphology Journal of Applied Crystallogra-phy 48(1)189ndash194 2015
[20] H M Rietveld A profile refinement method for nuclear and magnetic structures Journalof Applied Crystallography 2(2)65ndash71 1969
[21] S A Hamid The crystal structure of the 11 Aring natural tobermoriteCa225[Si3O75(OH)15]1H2O Zeitschrift fuer Kristallographie - New Crystal Struc-tures 154(3-4)189ndash198 1981
[22] S A S El-Hemaly T Mitsuda and H F W Taylor Synthesis of normal and anomaloustobermorites Cement and Concrete Research 7429ndash438 1977
[23] M Sakiyama and T Mitsuda Hydrothermal reaction between C-S-H and kaolinite for theformation of tobermorite at 180degC Cement and Concrete Research 7(6)681ndash685 1977
[24] E Bonaccorsi S Merlino and A R Kampf The crystal structure of tobermorite 14 Aring(plombierite) a C-S-H phase Journal of the American Ceramic Society 88(3)505ndash5122005
[25] S Merlino E Bonaccorsi and T Armbruster The real structures of clinotobermorite andtobermorite 9 Aring OD character polytypes and structural relationships European Journalof Mineralogy 12(2)411ndash429 2000
[26] K Momma and F Izumi VESTA 3 for three-dimensional visualization of crystal volu-metric and morphology data Journal of Applied Crystallography 44(6)1272ndash1276 2011
26
5 References
[27] S Shaw S M Clark and C MB Henderson Hydrothermal formation of the calcium sil-icate hydrates tobermorite (Ca5Si6O16(OH)2 middot 4H2O) and xonotlite (Ca6Si6O17(OH)2)An in situ synchrotron study Chemical Geology 167(1-2)129ndash140 2000
[28] K Matsui J Kikuma M Tsunashima T Ishikawa S Matsuno A Ogawa and M SatoIn situ time-resolved X-ray diffraction of tobermorite synthesis process under hydrothermalcondition IOP Conference Series Materials Science and Engineering 18(2)60ndash66 2011
[29] G Matekonis R Šiaučiunas and D Vaičiukyniene Hydrothermal Synthesis and Charac-terization of Na + and [ Al 3 + + Na + ] -substituted Tobermorite in CaO-SiO2middotnH2O-H2OSystem MATERIALS SCIENCE 16(3)242ndash248 2010
[30] G Geng R J Myers M J A Qomi and P JM Monteiro Densification of the inter-layer spacing governs the nanomechanical properties of calcium-silicate-hydrate ScientificReports 7(1)1ndash8 2017
[31] D Klimesch and A Ray Autoclaved cement-quartz pastes with metakaolin additionsAdvanced Cement Based Materials 7(3-4)109ndash118 1998
[32] N Y Mostafa A A Shaltout H Omar and S A Abo-El-Enein Hydrothermal synthesisand characterization of aluminium and sulfate substituted 11 nm tobermorites Journal ofAlloys and Compounds 467(1-2)332ndash337 2009
[33] İ Demir M S Başpınar E Kahraman E Ccedilalışkan and G Goumlrhan An Investigation onthe Usability of Diatomite in Aerated Concrete Production In Proc of the Intl Conf onAdvances In Civil Structural And Construction Engineering - CSCE 2014 pages 97ndash1002014
[34] A Skawinska Z Owsiak T Baran and K Hernik The influence of halloysite additionon tobermorite formation in CaO and quartz mix under hydrothermal conditions CementWapno Beton 17(12)426ndash434 2017
[35] N Y Mostafa Influence of air-cooled slag on physicochemical properties of autoclavedaerated concrete Cement and Concrete Research 35(7)1349ndash1357 2005
[36] D Małaszkiewicz and J Chojnowski Influence of addition of calcium sulfate dihydrate ondrying of autoclaved aerated concrete Open Engineering 7(1)273ndash278 2017
[37] N Hara and N Inoue Thermal behaviour of 11Aring tobermorite and its lattice parametersCement and Concrete Research (10)53ndash60 1980
[38] M D Jackson S R Chae S R Mulcahy C Meral R Taylor P Li A H EmwasJ Moon S Yoon G Vola H R Wenk and P JM Monteiro Unlocking the secretsof Al-tobermorite in Roman seawater concrete American Mineralogist 98(10)1669ndash16872012
[39] W Liao W Li Z Fang C Lu and Z Xu Effect of different aluminum substitution rateson the structure of Tobermorite Materials 12(22)1ndash10 2019
[40] D Klimesch and A Ray DTA-TG Study of the CaO-SiO2-H2O and CaO-Al2O3-SiO2-H2OSystems Under Hydrothermal Conditions Journal of Thermal Analysis and Calorimetry56(1)27ndash34 1999
27
5 References
[41] Z Sauman and Z Valtr Substitution of sulphate ions in the crystal lattice of 11 Aring to-bermorite In The VI International Congress on the Chemistry of Cement pages 1ndash14Moscow 1974
[42] G Schober Reaction of raw materials to the final product AAC httpwwwpb-aacde
chemmin2_ehtml 2012 accessed 2020-01-31
[43] D Jansen C Stabler F Goetz-Neunhoeffer S Dittrich and J Neubauer Does Ordi-nary Portland Cement contain amorphous phase A quantitative study using an externalstandard method Powder Diffraction 26(01)31ndash38 2011
[44] C Roumlszligler J Stark F Steiniger and W Tichelaar Limited-dose electron microscopyreveals the crystallinity of fibrous C-S-H phases Journal of the American Ceramic Society89(2)627ndash632 2006
[45] Y Sakalli and R Trettin Investigation of C3S hydration by environmental scanning elec-tron microscope Journal of Microscopy 259(1)53ndash58 2015
[46] F Matsushita Y Aono and S Shibata Expansion and shrinkage behavior of green cakeof Autoclaved Aerated Concrete In Autoclaved Aerated Concrete - Innovation and Devel-opment Proceedings of the 4th International Conference on Autoclaved Aerated ConcreteKingston UK 8-9 September 2005 pages 101ndash108 CRC Press 2005
[47] C Chucholowski M Holger and K-C Thienel Improving the recyclability environmentalcompatibility and CO2 balance of autoclaved aerated concrete by replacing sulfate carrierand cement with calcined clays CePapers 2(4)503ndash512 2018
[48] X Y Huang W Ni W H Cui Z J Wang and L P Zhu Preparation of autoclavedaerated concrete using copper tailings and blast furnace slag Construction and BuildingMaterials 27(1)1ndash5 2012
[49] W Wongkeo and A Chaipanich Compressive strength microstructure and thermal anal-ysis of autoclaved and air cured structural lightweight concrete made with coal bottom ashand silica fume Materials Science and Engineering A 527(16-17)3676ndash3684 2010
[50] A Roacuteżycka and W Pichoacuter Effect of perlite waste addition on the properties of autoclavedaerated concrete Construction and Building Materials 12065ndash71 2016
[51] N Isu H Ishida and T Mitsuda Influence of quartz particle size on the chemical andmechanical properties of autoclaved aerated concrete (I) tobermorite formation Cementand Concrete Research 25(25)243ndash248 1995
[52] D Ectors Advances in the analysis of cementitious reactions and hydrate phases doctoralthesis PhD thesis Friedrich-Alexander-Universitaumlt Erlangen-Nuumlrnberg 2016
[53] D Ectors F Goetz-Neunhoeffer and J Neubauer Domain size anisotropy in the double-Voigt approach An extended model Journal of Applied Crystallography 481998ndash20012015
[54] D Ectors F Goetz-Neunhoeffer and J Neubauer Routine (an)isotropic crystallite sizeanalysis in the double-Voigt approximation done right Powder Diffraction 32(S1)27ndash342017
28
5 References
[55] D Jansen F Goetz-Neunhoeffer C Stabler and J Neubauer A remastered external stan-dard method applied to the quantification of early OPC hydration Cement and ConcreteResearch 41(6)602ndash608 2011
[56] T Ungaacuter G Tichy J Gubicza and R J Hellmig Correlation between subgrains andcoherently scattering domains Powder Diffraction 20(04)366ndash375 2005
[57] Triloki P Garg R Rai and B K Singh Structural characterization of as-depositedcesium iodide films studied by X-ray diffraction and transmission electron microscopy tech-niques Nuclear Instruments and Methods in Physics Research Section A AcceleratorsSpectrometers Detectors and Associated Equipment 736128ndash134 2014
[58] J Schreiner F Goetz-Neunhoeffer J Neubauer and D Jansen Hydrothermal synthesisof 11 Aring tobermorite ndash Effect of adding metakaolin to the basic compound Applied ClayScience 185 2020
[59] J Schreiner F Goetz-Neunhoeffer J Neubauer S Volkmann S Bergold R Webler andD Jansen Advanced Rietveld refinement and SEM analysis of tobermorite in chemicallydiverse autoclaved aerated concrete Powder Diffraction 34143ndash150 2019
[60] J Schreiner D Jansen D Ectors F Goetz-Neunhoeffer J Neubauer and S VolkmannNew analytical possibilities for monitoring the phase development during the production ofautoclaved aerated concrete Cement and Concrete Research 107247ndash252 2018
29
6 Publications
6 Publications
61 Hydrothermal synthesis of 11 Aring tobermorite ndash Effectof adding metakaolin to the basic compound
Reprint of the peer reviewed publication
Schreiner J Goetz-Neunhoeffer F Neubauer J Jansen D 2020 Hydrothermalsynthesis of 11 Aring tobermorite ndash Effect of adding metakaolin to the basic compoundApplied Clay Science 185 httpsdoiorg101016jclay2019105432
with permission from Elsevier
30
Contents lists available at ScienceDirect
Applied Clay Science
journal homepage wwwelseviercomlocateclay
Research paper
Hydrothermal synthesis of 11 Aring tobermorite ndash Effect of adding metakaolin tothe basic compound
J Schreiner F Goetz-Neunhoeffer J Neubauer D JansenUniversity of Erlangen-Nuremberg GeoZentrum Nordbayern Mineralogy Schlossgarten 5a 91054 Erlangen Germany
A R T I C L E I N F O
KeywordsHydrothermal synthesis11 Aring tobermoriteMetakaolinPowder diffractionKatoite
A B S T R A C T
Different amounts and types of metakaolin were analyzed and applied for the hydrothermal synthesis of 11 Aringtobermorite All synthesized samples were investigated by means of powder XRD combined with Rietveld re-finement Al-substituted 11 Aring tobermorite was successfully synthesized on the basis of a broad range of com-pounds characterized by a varying content of metakaolin Katoite was present depending on the amount ofsupplied Al3+ which was determined by the dosage of metakaolin Minor crystalline components included in thetwo types of metakaolin sources varied greatly in their reactivity under hydrothermal conditions Despite adifferent degree of purity the two types of metakaolin showed corresponding effects at moderate dosages butcontrary effects at higher dosages as for the synthesis of 11 Aring tobermorite The domain morphology of to-bermorite could be associated with Al3+ incorporation for low dosages of metakaolin represented by up to 2 wt- Al2O3 in the dry mix By contrast Al3+ affected tobermorite lattice parameters at equivalent and even athigher dosages with c reaching 2295 Aring at 12 wt- Al2O3 in the dry mix
1 Introduction
11 Application of metakaolin as a reactive material in constructionindustry
The application of supplementary cementitious materials (SCMs) inthe field of construction technology has received a lot of attention inrecent years Due to limited resources and an urgent need for alter-native and more eco-friendly construction materials SCMs such asmetakaolin offer a great potential The usage of SCMs has not onlyspread to the cement and mortar industry but also to advanced appli-cations such as autoclaved aerated concrete (AAC) (Demir et al 2014Koutnyacute et al 2014 Walczak et al 2015 Roacuteżycka and Pichoacuter 2016Chucholowski et al 2018) Unlike ordinary cementitious constructionmaterials AAC is produced from hydrothermal curing Due to the dif-ferent thermodynamic environment the hydration process and the re-activity of raw materials have to be investigated properly in order tounderstand the effects on the AAC product The leading mineral phasein AAC is 11 Aring tobermorite (Ca5Si6O16(OH)2middot4H2O) As a consequencethe thermal and mechanical properties of AAC depend on micro-structure and crystallinity of tobermorite to some extent In addition tothe curing time and the fineness of raw materials the supply of ionsthat can substitute in the tobermorite structure is a crucial factor in thiscontext Especially substitutions by aluminum sodium and potassium
ions have been investigated thoroughly (Sauman 1974 Klimesch andRay 1998 Mostafa et al 2009 Matekonis et al 2010 Skawinskaet al 2017) Calcined clays usually contain a considerable amount ofthe mentioned ions
There is a vast amount of literature on the reactivity of SCMs atambient temperature and standard pressure but there is little when itcomes to hydrothermal conditions In previous publications the beha-vior of metakaolin under hydrothermal conditions was mainly in-vestigated for the synthesis of zeolites (Zhang et al 2007 Aguilar-Mamani et al 2014 Setthaya et al 2016 Luo et al 2018) In thesestudies the reactivity of metakaolin was observed at a wide range oftemperature and pH values During the transformation of kaolin intometakaolin a loss of framework alumina was observed (Ayodele et al2019) In recent decades metakaolin has been the subject of studies inthe field of geopolymer research (Rashad 2013 Chen et al 2016) Forthe synthesis of 11 Aring tobermorite a more distinct setting of temperaturesetting (180ndash200 degC) and steam pressure (1ndash12 MPa) are required
This publication is intended to make a new contribution to thechallenging field of hydrothermal synthesis in the system CaO-Al2O3-SiO2-H2O based on XRD analysis combined with Rietveld refinementVarious dosages of two types of metakaolin with different chemical andmineralogical purities are compared for the effects on the hydrothermalsynthesis of Al-substituted 11 Aring tobermorite Especially changes of thebulk chemistry in the raw mixes the reactivity of minor crystalline
httpsdoiorg101016jclay2019105432Received 20 August 2019 Received in revised form 13 November 2019 Accepted 30 December 2019
Corresponding authorE-mail address juergenjsschreinerfaude (J Schreiner)
Applied Clay Science 185 (2020) 105432
0169-1317 copy 2020 Elsevier BV All rights reserved
T
6 Publications
31
phases of the two types of metakaolin and the effect of different curingtimes are the focus of interest On the one hand metakaolin offers agreat potential in the AAC industry On the other hand of all SCMsmetakaolin is a good source material for investigating the influence ofAl3+ on the synthesis of Al-substituted 11 Aring tobermorite
12 Synthesis of Al-substituted 11 Aring tobermorite
In addition to being present in AAC tobermorite has found appli-cation in wastewater treatment and nuclear waste management due toits ion exchange capacity (Maeda et al 2012 Monasterio et al 2015)The substitution of silicon by aluminum results in a different to-bermorite structure due to general and local charge balance affectingthe lattice parameters Especially c is impacted by this substitutionbecause it occurs in the bridging tetrahedron and additional OHndash sub-stitutes O2ndash (Komarneni et al 1985 Merlino et al 2000) As suggestedin some additional studies the substitution of Si4+ by Al3+ and Na+ orK+ leads to a lath-like morphology of tobermorite crystals (Mostafa2005 Mostafa et al 2009 Venhodovaacute et al 2015 Qu et al 2018)However because of the heterogeneous appearance of tobermorite inAAC it is hardly possible to conduct a proper characterization based onSEM analysis In our recent work the anisotropic peak broadening oftobermorite in XRD diffractograms was successfully linked with theincorporation of foreign ions supplied in a common AAC production(Schreiner et al 2019) This finding allowed a more statistical struc-tural characterization of tobermorite in bulk compositions compared toSEM analysis Moreover it was reported in other studies that differenthydrate phases occur depending on the amount of supplied ions and onthe experimental settings In compounds with a high content of Al3+formation of katoite could be observed (Klimesch and Ray 1998 Riacuteoset al 2009 Matsui et al 2011) In the case of a longer curing durationinstead of 11 Aring tobermorite the formation of xonotlite (Siauciunas andBaltakys 2004 Galvaacutenkovaacute et al 2018) or - depending on the finenessof used silica source (Siauciunas and Baltakys 2004) - gyrolite is fa-voured
Kalousek (1956) suggested that tobermorite can contain up to 5Al2O3 More Al2O3 in the system resulted in the formation of hydro-garnet Klimesch and Ray (1998) additionally investigated the stabilityof hydrogarnet depending on the Al(Si + Al) ratio and its role in re-lation to the formation of 11 Aring tobermorite in an equivalent systemThey suggest that hydrogarnet always appears before tobermorite butthe former can only be detected for higher Al(Si + Al) ratios in theevent of longer curing times Riacuteos et al (2009) and Qu et al (2018)confirmed these findings in extensive investigations In the latter pub-lication it is additionally suggested that samples prepared at lowertemperatures (160 degC) are less impacted by the supply of Al3+ Theyalso consider the peak broadening of tobermorite in their XRD plotsbased on the amount of incorporated Al3+ In two recent publicationswe suggested that the peak broadening of tobermorite enables a mi-crostructural analysis by calculating the orientation dependent domainsizes (Schreiner et al 2018 2019) However these studies are based onsamples of industrially produced AAC so that the curing time was fixedThe studied AAC was produced from raw materials with a broad che-mical spectrum such as ordinary Portland cement (OPC) whichsomehow complicates the interpretation of results
In this work the influence of aluminum ions - provided by meta-kaolin - on dominant crystallographic direction-dependent domaingrowth of tobermorite is investigated by analysis of anisotropic peakbroadening (Ectors et al 2015 2017) In Fig 1 of the supplementarymaterial the method of fitting the anisotropic peak broadening of to-bermorite using a triaxial cylinder model is visualized (Schreiner et al2018) Fitting of the anisotropic peak broadening of tobermorite Thismethod is used to calculate the average and reliable values for to-bermorite domain sizes in the powder sample and associate them withaverage Al3+ incorporation Microstrain should be considered becauseit is an additional source of peak broadening However this usually
accounts for materials that have been exposed to different kinds ofstress such as metals and alloys (Badawi et al 2019) In addition theinstrumental contribution to peak broadening should be consideredHydration products such as tobermorite are characterized by crystallitesizes in the range of nanometers so that anisotropic size broadeningclearly outweighs the effect of instrumental broadening (Jenkins andSnyder 1996) Moreover the impact of Al3+ on the lattice parametersof tobermorite is considered It should additionally be clarified whe-ther the results from our previous publication (Schreiner et al 2019)based on industrially produced AAC can be confirmed by investigationwith less complex raw mixes and purely based on laboratory experi-ments
2 Material and methods
21 Starting materials
The starting materials for hydrothermal synthesis included deio-nized water quartz flour portlandite (999 pure) and two types ofmetakaolin One type was ordinary commercially available metakaolin(MK) with nearly a stoichiometric composition For comparison thesecond type of commercially available metakaolin was a by-productfrom expanded glass production (MKg) and consequently highly im-pure The chemical composition of MK and MKg determined by XRF isgiven in Table 1 With MKg containing less Al2O3 but considerably moreNa2O than MK the effects on hydrothermal synthesis were of interestBoth types of metakaolin have been characterized in previous pub-lications (Schmidt et al 2012 Naber et al 2019) In addition weverified the mineral phase content by XRD analysis Besides amorphousmetakaolin MK contained minor amounts of anatase quartz and mica
Fig 1 Weight fractions of tobermorite quartz and katoite determined byquantitative XRD analysis ndash samples including MKg crosshatched
Table 1Chemical composition of MK and MKg determined by XRF analysis ndash majorcontrasts in bold letters
Oxides [wt-] MK MKg
SiO2 536 604Al2O3 392 206CaO 01 40MgO 01 12Na2O 0 96K2O 10 18Fe2O3 18 05TiO2 21 03P2O5 01 02Loss on ignition 15 1
J Schreiner et al Applied Clay Science 185 (2020) 105432
2
6 Publications
32
MKg contained additional kaolinite feldspar and quartz
22 Investigated mix composites
For the preparation of raw mixtures the powders were weighed andhomogenized using a lab-scale mixing mill Table 2 lists the composi-tion and nomenclature of all samples including Al2O3 content andcuring time in the autoclave
bull Besides one blank mixture (MK0) that did not contain any type ofmetakaolin eleven more compounds were prepared of which threeincluded different dosages of MKg (MKg16 MKg23 and MKg60)Three more mixes contained equivalent amounts of MK instead ofMKg (MK16 MK23 and MK60) These mixes were investigated inorder to have a direct comparison concerning the effects of differentraw material on the synthesis of tobermorite
bull Additionally the mixes MK9 MK5 and MK25 with lower dosages ofmetakaolin were analyzed In the referenced literature (Schreineret al 2019) the effect of Al3+ on the anisotropic peak broadeningof tobermorite could only be observed in the case of Al2O3 contentslower than 4 in the drymix In the latter three mixes Al2O3 con-tents range from 1 to 35 Al2O3 (calculated from XRF data) whichmeets the region of interest for the analysis of tobermorite domainmorphology
bull The curing time for nearly all of the investigated samples was 12 hbut compound MK9 was prepared two more times for curing timesof 2 h and 6 h The different curing times were chosen in this par-ticular sample so that the reactivity of metakaolin and the phasetransitions could be observed more precisely
23 Hydrothermal treatment
Due to the different fineness of raw materials there was a differentwater demand from one mixture to another In order to obtain slurriesof comparable rheology the amount of water was adapted respectivelyresulting in water-to-solid ratios of 25 to 3 which matches the sug-gested water-to-solid ratio for this purpose (Roacutezycka et al 2014Galvaacutenkovaacute et al 2018) The weighed water was added to the dry mixand after stirring for 1 min at 23 degC the slurry was poured into thereactor Minor changes in the quantity of added water did not have aninfluence on the measured steam pressure All experiments were con-ducted using a PTFE-lined stainless steel autoclave with a reactor vo-lume of 300 ml The oven temperature was fixed at 180 degC and auto-genous steam pressure of 11ndash12 MPa was measured during eachexperiment with an external manometer After cooling to room tem-perature the sample was removed from the reactor coarsely ground
using an agate mortar and dried at 60 degC for 12 h After drying thesample was ground with an agate mortar again in order to deagglo-merate the particles As no coarse raw materials were used there wasno need for wet McCrone milling (Schreiner et al 2018)
24 XRD analysis
After preparation into front-loading sample holders the powdersamples were measured with a D8 diffractometer (Bruker) equippedwith a LynxEye detection system and Bragg-Brentano geometry Thesettings for XRD analysis included a tube voltage of 40 kV a current of40 mA an angular range from 6 to 80deg 2θ (Cu Kα radiation) a time perstep of 054 s a step width of 00236deg 2θ and a PSD opening of 33deg Thebackground was fitted with Chebyshev polynomial of the fifth orderThe major contribution of amorphous phase was fitted with a singlepeak with a fixed position at 308deg 2θ so that tobermorite reflectionswere not affected An external quartzite standard was measured withthe same parameters in order to determine phase quantities (Jansenet al 2011) Bruker AXS software TOPAS 50 was used for Rietveldrefinement (Rietveld 1969) and the used structures are shown inTable 3
3 Results and discussion
31 Different dosages of MK and MKg
In Fig 1 the quantities of tobermorite quartz and katoite present inmost of the samples determined by XRD analysis are illustratedWhenever tobermorite was the leading mineral hydrate phase a basalspacing of 113 Aring could be verified in each of the diffractograms Thequantities of minor crystalline phases and amorphous content are notshown For low dosages of MK it can be seen that the weight fraction oftobermorite decreased At moderate dosage of both types of metakaolin(MK16 MK23 MKg16 MKg23) tobermorite was present in comparablequantities It can be seen that the amount of katoite in the mixes de-pended on the dosage of metakaolin and it appeared only at dosages ofMK5 or more Due to the higher content of aluminum in MK comparedto MKg more katoite could always be observed in the MK mixes atequivalent dosages Despite equal amounts of quartz as starting mate-rial in mixes for both types of metakaolin the resulting weight fractionsin the cured samples were not alike Considerably more quartz waspresent in the MK samples Even though less quartz was used for mixescontaining higher amounts of MK even more quartz was present afterhydrothermal curing (Table 2 Fig 1) Consequently some of the SiO2
provided by MK did not transform into an amorphous phase or to-bermorite but into quartz This finding is verified by the presence ofquartz in MK60 because no quartz was included in the raw mixture Thefeldspar present in MKg did not react so Na2O and an unknown amountof Al2O3 may not have been supplied for hydrothermal reaction Besidestobermorite and quartz additional calcite scawtite (Ca7Si6(CO3)
Table 2Basic powder compounds prepared for the hydrothermal synthesis of to-bermorite with the respectively calculated Al2O3 content and curing time in thereactor
Sample Portlandite[wt-]
Quartz[wt-]
MK[wt-]
MKg
[wt-]
Al2O3
[wt-]Curingtime [h]
MK0 49 51 ndash ndash 0 12MK25 495 48 25 ndash 1 12MK5 49 46 5 ndash 2 12MK9_2h 48 43 9 ndash 35 2MK9_6h 48 43 9 ndash 35 6MK9_12h 48 43 9 ndash 35 12MK16 47 37 16 ndash 63 12MK23 46 31 23 ndash 9 12MK60 40 ndash 60 ndash 235 12MKg16 47 37 ndash 16 33 12MKg23 46 31 ndash 23 47 12MKg60 40 ndash ndash 60 124 12
Table 3Structural data used for the investigation with powder XRD analysis
Phase Author
Anatase (Horn et al 1972)Biotite (Brigatti et al 2000)Calcite (Maslen et al 1995)Kaolinite (Zvyagin 1960)Katoite (Bartl 1969)Microcline (Bailey 1969)Plazolite (Basso et al 1983)Portlandite (Busing and Levy 1957)Quartz (Le Page and Donnay 1976)Scawtite (Grice 2005)Tobermorite (Hamid 1981)Xonotlite (Hejny and Armbruster 2001)
J Schreiner et al Applied Clay Science 185 (2020) 105432
3
6 Publications
33
O18bull2(H2O)) and xonotlite (Ca6Si6O17(OH)2) could be identified insample MK0 (XRD plots of samples MK0 MKg16 MKg23 MK16 andMK23) Comparing MK0 and MK25 scawtite and xonotlite could stillbe identified in a very low amount in MK25 but no longer in samplesthat contained even more MK (XRD plots of samples MK0 MK25 MK5and MK9_12h)
Two additional experiments were done without quartz in the rawmixes (MK60 and MKg60) The according diffractograms after hydro-thermal curing are shown in Fig 2 In sample MKg60 tobermorite (gt 50wt-) was successfully synthesized without any other silica sourcethan MKg whereas no crystalline quartz occurred By contrast no to-bermorite but quartz could be identified in equivalent mixture MK60containing MK It can be seen that crystalline components such as micaand anatase in the raw MK did not react at the selected conditions andremained present in the autoclaved samples Except for feldspar in MKgall of the crystalline components appeared to be reactive at the chosenhydrothermal conditions A minor unidentified phase occurred at328deg2θ and additional xonotlite was identified in sample MKg60 Insample MK60 more calcium was needed for the formation of morehydrogarnet (Fig 1) resulting in a lower CaSi ratio for the remainingsystem Sample MKg60 contained only half of the amount of Al3+ and itwas not completely supplied for reaction due to its partial presence infeldspar Consequently essentially less hydrogarnet (Fig 1) was presentin MKg60 after hydrothermal treatment and the CaSi ratio in the re-maining system was affected to a lesser extent
32 Application of MK for different curing times
The development of hydrate phases in the autoclave for compoundMK9 is displayed in Fig 3 After only 2 h of hydrothermal curing all ofthe available portlandite had reacted and katoite (95 wt-) was pre-sent The applied type of metakaolin appeared to react quickly as itsupplied aluminum for formation of katoite No formation of to-bermorite could be observed at this stage yet An assumably amorphousprecursor can be seen at 28 to 30deg2θ Calcium was provided by thedissolution of portlandite After 6 h of hydrothermal reaction amountsof katoite (85 wt-) and quartz (from 31 wt- at 2 h to 165 wt- at6 h) had decreased and a major amount of tobermorite (35 wt-) waspresent Apparently between 2 and 6 h under hydrothermal conditionsthe amorphous precursor and quartz reacted resulting in the formationof tobermorite An additional 6 h of reaction time (MK9_12h) did notchange the phase composition significantly Slightly more tobermorite
(365 wt-) less quartz (16 wt-) and katoite (65 wt-) weremeasured
33 Tobermorite domain morphology and lattice parameters
In the referenced literature an analysis of tobermorite domainmorphology based on anisotropic peak broadening was possible forsamples that contained notgt 4 wt- Al2O3 in the drymix (Schreineret al 2019) Accordingly in this study samples MK0 MK25 MK5MK9_6h and MK9_12h were suitable (Table 2) with MK9_2h not con-taining any tobermorite In Fig 4 the respective growth in a and b di-rection is visualized with x indicating the domain size in a direction andy indicating domain size in b direction using a macro for TOPAS 50(Ectors et al 2015 2017) The calculated cylinder models in Fig 4represent the relation of yx and not absolute sizes With no supply ofaluminum ions (MK0) the relative domain growth in b direction islower compared to samples containing metakaolin This finding agreeswith the results from a similar investigation of tobermorite in AAC(Schreiner et al 2019) However within the samples MK5 andMK9_12h the different amounts of supplied aluminum ions did notshow a clear effect It appeared that low dosages of Al3+ (1 wt- Al2O3
in MK25 and 2 wt- Al2O3 in MK5) were enough to determine thedomain growth of tobermorite Additional results from the samplesMK9_6h and MK9_12h indicated that growth in b direction increasedwith reaction time
In Fig 5 lattice parameters of tobermorite depending on metakaolindosages are plotted B clearly remained unaffected throughout therange of samples Increasing amounts of metakaolin led to a slightlysmaller parameter a However both types of metakaolin showed acorresponding impact on parameter a By contrast parameter c in-creased strongly with increasing amounts of MK and MKg but the typeof metakaolin was significant At an equivalent dosage MK affected thecell dimension in c direction considerably more than MKg so that thefraction of Al3+ appeared to be the decisive parameter Different metaloxides in MKg did not show a notable effect certainly as they werepartially not provided for reaction Unlike for the domain morphologyof tobermorite the impact on lattice parameters could be observedwithin the complete range of examined dosages
4 Conclusions
The results obtained from the introduced investigations allow con-cluding remarks on the effects of the applied types of metakaolin on thesynthesis of 11 Aring tobermorite the phase transitions and the in-corporation of Al3+ into the lattice of tobermorite
With a critical dosage the use of any type of metakaolin led to theformation of katoite in an according amount At moderate dosages(MKg16 MKg23 MK16 and MK23) the two types of metakaolin showeda good correspondence in consideration of the quantities of to-bermorite For higher dosages there were contrary effects Lower do-sages of MK led to considerable quantities of Al-substituted to-bermorite Samples containing low dosages of MK revealed that katoiteappeared in the case ofgt 5 wt- of MK - corresponding to 2 wt-Al2O3 - in the basic compound Minor crystalline phases in MKg showedbetter reactivity than those in MK The observation that no tobermoritewas present in sample MK60 indicated that high dosages of Al3+ hin-dered the formation of tobermorite
Investigations of MK9 at 2 6 and 12 h displayed the evolution ofhydrate phases At first katoite was the only crystalline hydrate phasepresent after 2 h which corresponded to observations in a differentpublication (Klimesch and Ray 1999) The amount of katoite andquartz then decreased and a major amount of tobermorite formed from2 to 6 h curing time In order to gain more information on the trans-formation of amorphous C-(A)-S-H into tobermorite additional ex-periments in the range of 2 to 6 h curing time will be needed
Domain morphology analysis of tobermorite revealed that low
Fig 2 Diffractograms of MKg MKg60 MK and MK60 from 7 to 34deg2θ CuKα Aanatase C calcite F feldspar k kaolinite K katoite M mica Q quartz Ttobermorite U unidentified phase X xonotlite
J Schreiner et al Applied Clay Science 185 (2020) 105432
4
6 Publications
34
dosages of Al3+ determined the domain growth which agreed with theresults published on tobermorite in AAC samples (Schreiner et al2019) Different curing times unveiled that growth in b direction in-creased with the reaction time Al3+ incorporation into the lattice oftobermorite only reflected to a limited extent in the domain mor-phology By contrast an increase of lattice parameter c was triggered byAl3+ even at the highest dosage in this study Ultimately there is no
evidence for a limit of incorporation of Al3+ but there is a limit ofinfluence on the domain morphology These results additionally re-confirm this assumption similarly made in the previous work (Schreineret al 2019) and suggest a new mechanism of tobermorite crystal-lization depending on the presence of Al3+
Supplementary data to this article can be found online at httpsdoiorg101016jclay2019105432
Declaration of Competing Interest
The authors declare that they have no known competing financialinterests or personal relationships that could have appeared to influ-ence the work reported in this paper
Acknowledgement
The authors thank Rodgauer Baustoffwerke GmbH amp Co KG forsupplying raw materials for laboratory experiments
References
Aguilar-Mamani W Garciacutea G Hedlund J Mouzon J 2014 Comparison betweenleached metakaolin and leached diatomaceous earth as raw materials for the synth-esis of ZSM-5 Springerplus 3 1ndash10 httpsdoiorg1011862193-1801-3-292
Ayodele OB Sulaimon AA Alaba PA Tian Z-Y 2019 Influence of metakaolini-zation temperature on the structure and activity of metakaolin supported Ni catalystin dry methane reforming J Environ Chem Eng httpsdoiorg101016jjece2019103239 (in press)
Badawi EA Abdel-Rahman MA Mostafa A Abdel-Rahman M 2019 Determinationof the crystallite size amp micro- strain by novel method from XRD profile Appl Phys2 1ndash15 httpsdoiorg1031058jap201921001
Bailey SW 1969 Refinement of an intermediate microcline structure Am Miner 541540ndash1545
Bartl H 1969 Roentgen-Einkristalluntersuchungen an (CaO)3 (Al2O3) (H2O)6 und an(CaO)12 (Al2O3)7 (H2O) neuer Vorschlag zur (CaO)12 (Al2O3)7-Struktur NeuesJahrb fuer Mineral Monatshefte 1969 404ndash413
Basso R Giusta AD Zefiro L 1983 Crystal structure refinement of plazolite A highlyhydrated natural hydrogrossular Neues Jahrb Miner Monatsh (Neues Jahrb fuerMineral Monatshefte) 1983 251ndash258
Brigatti MF Lugli C Poppi L Foord EE Kile DE 2000 Crystal chemical varia-tions in Li- and Fe-rich micas from Pikes Peak batholith (Central Colorado) AmMineral 85 1275ndash1286 httpsdoiorg102138am-2000-8-920
Busing WR Levy HA 1957 Neutron diffraction study of calcium hydroxide J ChemPhys 26 563 httpsdoiorg10106311743345
Chen L Wang Z Wang Y Feng J 2016 Preparation and properties of alkali acti-vated metakaolin-based geopolymer Materials (Basel) 9 1ndash12 httpsdoiorg103390ma9090767
Chucholowski C Holger M Thienel K-C 2018 Improving the recyclability en-vironmental compatibility and CO2 balance of autoclaved aerated concrete by re-placing sulfate carrier and cement with calcined clays CePapers 2 503ndash512httpsdoiorg101002cepa846
Fig 3 Diffractograms of MK9_2h MK9_6h and MK9_12h from 7 to 38deg2θ CuKα C calcite K katoite Q quartz T tobermorite
Fig 4 Relation of calculated domain sizes of 11 Aring tobermorite in selectedsamples (MK0 MK25 MK5 MK9_6h and MK9_12h) in a (x) and b (y) direction
Fig 5 Lattice parameters of tobermorite depending on MK or MKg dosageincluding blank mix MK0
J Schreiner et al Applied Clay Science 185 (2020) 105432
5
6 Publications
35
Demir İ Başpınar MS Kahraman E Ccedilalışkan E Goumlrhan G 2014 An investigationon the usability of diatomite in aerated concrete production In Proc of the IntlConf on Advances in Civil Structural and Construction Engineering ndash CSCE 2014 pp97ndash100
Ectors D Goetz-Neunhoeffer F Neubauer J 2015 A generalized geometric approachto anisotropic peak broadening due to domain morphology J Appl Crystallogr 48189ndash194 httpsdoiorg101107S1600576714026557
Ectors D Goetz-Neunhoeffer F Neubauer J 2017 Routine (an)isotropic crystallitesize analysis in the double-Voigt approximation done right Powder Diffract 3227ndash34 httpsdoiorg101017S0885715617000070
Galvaacutenkovaacute L Bartoniacutečkovaacute E Opravil T Tkacz J Ptaacuteček P 2018 The influence ofstarting materials solubility on tobermorite structure formation under the hydro-thermal conditions IOP Conf Ser Mater Sci Eng 379 1ndash8 httpsdoiorg1010881757-899X3791012001
Grice JD 2005 The structure of spurrite tilleyite and scawtite and relationships toother silicate-carbonate minerals Can Mineral 43 1489ndash1500 httpsdoiorg102113gscanmin4351489
Hamid SA 1981 The crystal structure of the 11 Aring natural tobermoriteCa225[Si3O75(OH)15]1H2O Zeitschrift fuer Krist 154 189ndash198 httpsdoiorg101524zkri19811543-4189
Hejny C Armbruster T 2001 Polytypism in xonotlite Ca6Si6O17(OH)2 Zeitschrift furKrist 216 396ndash408
Horn M Schwerdtfeger CF Meagher EP 1972 Refinement of the structure of ana-tase at several temperatures Zeitschrift fur Krist 136 273ndash281 httpsdoiorg101524zkri19721363-4273
Jansen D Goetz-Neunhoeffer F Stabler C Neubauer J 2011 A remastered externalstandard method applied to the quantification of early OPC hydration Cem ConcrRes 41 602ndash608 httpsdoiorg101016jcemconres201103004
Jenkins R Snyder R 1996 Introduction to X-ray Powder Diffractometry ChemicalAnalysis Wiley pp 90
Kalousek GL 1956 Crystal Chemistry of Hydrous Calcium Silicates J Am Ceram Soc40 74ndash80
Klimesch D Ray A 1998 Autoclaved cement-quartz pastes with metakaolin additionsAdv Cem Based Mater 7 109ndash118 httpsdoiorg101016S1065-7355(97)00073-4
Klimesch D Ray A 1999 DTA-TGA evaluations of the CaOndashAl2O3ndashSiO2ndashH2O systemtreated hydrothermally Thermochim Acta 334 115ndash122 httpsdoiorg101016s0040-6031(99)00140-9
Komarneni S Roy R Roy DM Fyfe CA Kennedy GJ Bothner-By AA Dadok JChesnick AS 1985 27Al and29Si magic angle spinning nuclear magnetic resonancespectroscopy of Al-substituted tobermorites J Mater Sci 20 4209ndash4214 httpsdoiorg101007BF00552416
Koutnyacute O Opravil T Pořiacutezka J 2014 Application of metakaoline in autoclavedaerated concrete technology Adv Mater Res 1000 174ndash177 httpsdoiorg104028wwwscientificnetAMR1000174
Le Page Y Donnay G 1976 Refinement of the crystal structure of low-quartz ActaCrystallogr Sect B 32 2456ndash2459 httpsdoiorg101107S0567740876007966
Luo H Law WW Wu Y Zhu W Yang EH 2018 Hydrothermal synthesis of needle-like nanocrystalline zeolites from metakaolin and their applications for efficient re-moval of organic pollutants and heavy metals Microporous Mesoporous Mater 2728ndash15 httpsdoiorg101016jmicromeso201806015
Maeda H Ogawa Y Ishida EH Kasuga T 2012 Hydrothermal synthesis of to-bermorite doped with phosphorus species for removing heavy metal ions J AustCeram Soc 48 8ndash11
Maslen EN Streltsov VA Streltsova NR Ishizawa N 1995 Electron density andoptical anisotropy in rhombohedral carbonates III Synchrotron Xray studies ofCaCO3 MgCO3 and MnCO3 Acta Crystallogr Sect B 51 929ndash939 httpsdoiorg101107S0108768195006434
Matekonis G Šiaučiūnas R Vaičiukynienė D 2010 Hydrothermal Synthesis andCharacterization of Na + and [ Al 3 + + Na + ] -substituted Tobermorite in CaO-SiO2middotnH2O-H2O System Mater Sci 16 242ndash248
Matsui K Kikuma J Tsunashima M Ishikawa T Matsuno S Ogawa A Sato M2011 In situ time-resolved X-ray diffraction of tobermorite synthesis process underhydrothermal condition IOP Conf Ser Mater Sci Eng 18 60ndash66 httpsdoiorg1010881757-899X182022017
Merlino S Bonaccorsi E Armbruster T 2000 The real structures of clinotobermoriteand tobermorite 9 Aring OD character polytypes and structural relationships Eur JMineral 12 411ndash429 httpsdoiorg1011270935-122120000012-0411
Monasterio M Gaitero JJ Manzano H Dolado JS Cerveny S 2015 Effect ofchemical environment on the dynamics of water confined in calcium silicate mi-nerals Natural and synthetic tobermorite Langmuir 31 4964ndash4972 httpsdoiorg101021acslangmuir5b00614
Mostafa NY 2005 Influence of air-cooled slag on physicochemical properties of auto-claved aerated concrete Cem Concr Res 35 1349ndash1357 httpsdoiorg101016jcemconres200410011
Mostafa NY Shaltout AA Omar H Abo-El-Enein SA 2009 Hydrothermal synth-esis and characterization of aluminium and sulfate substituted 11 nm tobermoritesJ Alloys Compd 467 332ndash337 httpsdoiorg101016jjallcom200711130
Naber C Stegmeyer S Jansen D Goetz-Neunhoeffer F Neubauer J 2019 ThePONKCS method applied for time resolved XRD quantification of supplementarycementitious material reactivity in hydrating mixtures with ordinary Portland ce-ment Constr Build Mater 214 449ndash457 httpsdoiorg101016jconbuildmat201904157
Qu X Zhao Z Zhao X 2018 Microstructure and characterization of aluminum-in-corporated calcium silicate hydrates (C-S-H) under hydrothermal conditions RSCAdv 8 28198ndash28208 httpsdoiorg101039c8ra04423f
Rashad AM 2013 Metakaolin as cementitious material history scours production andcomposition - a comprehensive overview Constr Build Mater 41 303ndash318 httpsdoiorg101016jconbuildmat201212001
Rietveld HM 1969 A profile refinement method for nuclear and magnetic structures JAppl Crystallogr 2 65ndash71 httpsdoiorg101107S0021889869006558
Riacuteos CA Williams CD Fullen MA 2009 Hydrothermal synthesis of hydrogarnet andtobermorite at 175 degC from kaolinite and metakaolinite in the CaO-Al2O3-SiO2-H2Osystem a comparative study Appl Clay Sci 43 228ndash237 httpsdoiorg101016jclay200809014
Roacuteżycka A Pichoacuter W 2016 Effect of perlite waste addition on the properties of au-toclaved aerated concrete Constr Build Mater 120 65ndash71 httpsdoiorg101016jconbuildmat201605019
Roacutezycka A Kotwica Ł Małolepszy J 2014 Synthesis of single phase gyrolite in theCaO-quartz-Na2O-H2O system Mater Lett 120 166ndash169 httpsdoiorg101016jmatlet201401003
Sauman Z 1974 Influence of SO4 2ndash ions on the formation of 11 Aring tobermorite InProceedings of the 2nd International Symposium on Science and Research in SilicateChemistry Moscow pp 25ndash39
Schmidt M Egersdoumlrfer A Poumlllmann H 2012 Increased reactivity using a glass-containing metakaolin as an active filler in lime-based binder systems ZKG Int 6554ndash62
Schreiner J Jansen D Ectors D Goetz-Neunhoeffer F Neubauer J Volkmann S2018 New analytical possibilities for monitoring the phase development during theproduction of autoclaved aerated concrete Cem Concr Res 107 247ndash252 httpsdoiorg101016jcemconres201802028
Schreiner J Goetz-Neunhoeffer F Neubauer J Volkmann S Bergold S Webler RJansen D 2019 Advanced Rietveld refinement and SEM analysis of tobermorite inchemically diverse autoclaved aerated concrete Powder Diffract 34 143ndash150httpsdoiorg101017s0885715619000149
Setthaya N Chindaprasirt P Pimraksa K 2016 Preparation of zeolite nanocrystals viahydrothermal and solvothermal synthesis using of rice husk ash and metakaolinMater Sci Forum 872 242ndash247 httpsdoiorg104028wwwscientificnetmsf872242
Siauciunas R Baltakys K 2004 Formation of gyrolite during hydrothermal synthesis inthe mixtures of CaO and amorphous SiO2 or quartz Cem Concr Res 34 2029ndash2036httpsdoiorg101016jcemconres200403009
Skawinska A Owsiak Z Baran T Hernik K 2017 The influence of halloysite ad-dition on tobermorite formation in CaO and quartz mix under hydrothermal condi-tions Cem Wapno Bet 17 426ndash434
Venhodovaacute E Janovskyacute R Drochytka R 2015 Formation of tobermorite at differentmaterials composition of aerated concrete Appl Mech Mater 752ndash753 247ndash250httpsdoiorg104028wwwscientificnetamm752-753247
Walczak P Małolepszy J Reben M Szymański P Rzepa K 2015 Utilization ofwaste glass in autoclaved aerated concrete Proc Eng 122 302ndash309 httpsdoiorg101016jproeng201510040
Zhang Y Gao W Cui L 2007 The transformation of acid leached metakaolin tozeolite beta Stud Surf Sci Catal 170 420ndash425 httpsdoiorg101016S0167-2991(07)80870-6
Zvyagin BB 1960 An attempt to electronographic determination of kaolinite structureJ Dokl Akad Nauk SSSR 130 1023ndash1026
J Schreiner et al Applied Clay Science 185 (2020) 105432
6
6 Publications
36
6 Publications
62 Advanced Rietveld refinement and SEM analysis oftobermorite in chemically diverse autoclaved aeratedconcrete
Following the copyright guidelines by Cambridge University Press the publication
Schreiner J Goetz-Neunhoeffer F Neubauer J Volkmann S Bergold S WeblerR Jansen D 2019 Advanced Rietveld refinement and SEM analysis of tobermorite inchemically diverse autoclaved aerated concrete Powder Diffraction 34 143ndash150 httpsdoiorg101017s0885715619000149
may not be reprinted It can be accessed at
httpswwwcambridgeorgcorejournalspowder-diffractionarticleadvanced-rietveld-refinement-and-sem-analysis-of-tobermorite-in-chemically-diverse-autoclaved-aerated-concrete51597C2A66F6F225D29DEB2675E74249
37
6 Publications
63 New analytical possibilities for monitoring the phasedevelopment during the production of autoclavedaerated concrete
Reprint of the peer reviewed publication
Schreiner J Jansen D Ectors D Goetz-Neunhoeffer F Neubauer J VolkmannS 2018 New analytical possibilities for monitoring the phase development during theproduction of autoclaved aerated concrete Cement and Concrete Research 107 247ndash252httpsdoiorg101016jcemconres201802028
with permission from Elsevier
38
Contents lists available at ScienceDirect
Cement and Concrete Research
journal homepage wwwelseviercomlocatecemconres
Short communication
New analytical possibilities for monitoring the phase development duringthe production of autoclaved aerated concrete
J Schreinera D Jansena D Ectorsa F Goetz-Neunhoeffera J Neubauera S Volkmannb
aUniversity of Erlangen-Nuremberg GeoZentrum Nordbayern Mineralogy Schlossgarten 5a 91054 Erlangen Germanyb Rodgauer Baustoffwerke GmbH amp Co KG Am Opel-Pruumlffeld 3 63110 Rodgau-Dudenhofen Germany
A B S T R A C T
This work presents improved analytical methods for both steps of the production process of autoclaved aeratedconcrete (AAC) the phase development during the hydration before autoclaving and during the autoclavingprocess itself The improvement includes new insights into preparation methods of AAC samples for powderdiffraction as well as Rietveld refinement strategies For the first time a new implementation for calculatinganisotropic crystal domain sizes is applied to major hydrate phases occurring during AAC production namelyportlandite during the hydration before autoclaving and tobermorite during the autoclaving process The cal-culation of anisotropic domain size growth which can be implemented in the Rietveld environment is based oncrystallographically and geometrically appropriate models The implementation of calculating anisotropic do-main sizes for the Rietveld software TOPAS 50 allows a superior Rietveld fit and a more accurate quantificationof the phase development Additionally it enables the tracking of growth mechanism of portlandite duringhydration
1 Introduction
Autoclaved aerated concrete (AAC) is known as a lightweight con-struction material which offers outstanding properties such as suffi-cient strength for construction in addition with excellent thermal in-sulation [12] AAC is produced by autoclaving from calcareous rawmaterials such as lime (CaO) and cement quartz sulfate carrier andother additives such as foaming agents and water
The production process (Fig 1) can be separated into the hydrationof the mixed slurry before the procedure of autoclaving and the auto-claving at elevated temperature (180 degC to 200 degC) under saturatedsteam pressure (12MPa) for several hours
The hydration process before autoclaving is necessary to achievesufficient strength in order to cut the green cake blocks as they shouldhave a specific shape and dimension after autoclaving Furthermorethe porous structure is generated by the foaming agent during hydra-tion in the first process step During autoclaving the final propertiesnamely strength and low thermal conductivity are achieved
It is already well understood that the autoclaving process leads tothe formation of several phases first of all tobermorite(Ca5Si6O16(OH)2lowast4H2O) [3ndash5] Newest research has shown im-pressively which reactions are running from the mineralogical point ofview Insitu XRD measurements were carried out during the
autoclaving process and the phase development was shown by plottingnormalized intensities [6] The study of Mitsuda et al [3] was mainlyfocused on the tracking of the phase evolution during the autoclavingprocess of AAC However their statements concerning phase evolutionare mainly based on XRD data and TGA measurements There is acommon agreement that the following reactions occur The consump-tion of the alite (OPC) leads to the formation of an initial C-S-H phaseduring the first processing step Portlandite which was initially formedduring the first process step (from CaO and C3S) further quartz and theC-S-H phase are consumed during autoclaving resulting in the crystal-lization of tobermorite Hence the crystallization process of to-bermorite as well as the crystal structure of tobermorite was an issue ofresearch and discussion over the last years and numerous publicationsto these topics are available Concerning the crystal structure of to-bermorite respectively the tobermorite supergroup a new publicationoutlines all important references and recommends a new nomenclature[7]
The presented study was performed to create new analytical possi-bilities for the characterization of the production process of AAC Bothof the production process steps are essential for the final productHence the present work focuses on crystallization of hydrate phases inboth processes
Firstly an external standard method [89] was published and
httpsdoiorg101016jcemconres201802028Received 6 October 2017 Received in revised form 1 February 2018 Accepted 26 February 2018
Corresponding authorsE-mail addresses juergenjsschreinerfaude (J Schreiner) danieljansenfaude (D Jansen)
Cement and Concrete Research 107 (2018) 247ndash252
0008-8846 copy 2018 Elsevier Ltd All rights reserved
T
6 Publications
39
recommended for the determination of absolute phase contents inmixtures with amorphous content It was shown that the method canabsolutely be recommended for hydrating cement pastes in which watercannot be quantified directly by XRD [10] This method seems to bevery promising for both the quantification of the hydration of the AACslurry before autoclaving and the quantification of the phase evolutionduring autoclaving inasmuch as both production steps form crystallineand amorphous phases
Secondly a new approach to anisotropic peak broadening due toanisotropic domain morphology which was developed [1112] is ap-plied to AAC samples to improve the fit of portlandite and tobermoriteby Rietveld refinement [13] By applying this approach the refinementof both portlandite and tobermorite should additionally lead to betterquantitative results as well as to better insights into the development ofthe domain size morphology of both phases formed
It was already shown that in a hydrating raw mixture for AAC twospecies of portlandite precipitate at 23 degC one showing dynamicallyanisotropic peak broadening and another one following the isotropictrend [14] The application of the anisotropic refinement model led toan improved fitting of portlandite Moreover the mechanism of aniso-tropic domain growth of portlandite was tracked
2 Materials and methods
In order to examine the hydration of the AAC slurry before auto-claving a mixture of the hydraulic reactive components was weighedand measured in-situ at a Bruker D8 diffractometer with a LynxEyedetection system
Ordinary Portland cement (OPC) was mixed with lime (CaO) andanhydrite (C$) The raw materials were taken from the same batches asfor the industrial samples The drymix (58 OPC 36 CaO and 6 C$by weight) was then mixed with water (ws= 08) and placed into anappropriate sample holder The samples were not aerated The slurrysamples were covered with a kapton film to avoid evaporation andcarbonation Diffractograms were recorded with an angular range from7 to 545deg 2θ and a step width of 0011deg 2θ Measurements were carriedout every 15min For each measurement 96 XRD patterns were re-corded over the first 24 h The temperature was fixed at 70 degC which isthe mean temperature generally prevailing in the industrial processduring hydration before autoclaving Rietveld refinement was carriedout using the G-factor method All structures used for Rietveld refine-ment are shown in Table 1
For investigation of the autoclaved samples five different specimenswere taken at different autoclaving times The specimens were takenout of a technical production process hence it was not possible to in-terrupt the process at an earlier time inasmuch it would lead to damageof a whole concrete production batch The specimens were firstly driedat 60 degC until weight constancy The whole blocks were then broken andstatistical samples of 20 g were taken In order to receive the right massattenuation coefficient (MAC) for G-factor method the loss on ignitionand the chemical composition (XRF) were determined For energydispersive XRF analysis (Spectro Xepos) tube voltage from 20 kV to50 kV and tube current from 08 to 20mA were used for differenttargets
The final sample preparation (grinding) before XRD measurementswas carried out using both an agate mortar and a McCrone micronizingmill for wet milling with isopropanol Both preparation methods wereapplied separately to see which one is suitable in order to get the bestpreparation for XRD investigations Six preparations were performed byone operator of which two were prepared with an agate mortar andfour with a McCrone mill For the McCrone milling 3 g of the sampleand 10ml of isopropanol were used for grinding for 12min The grainsize distribution of one sample prepared with an agate mortar and onesample prepared using a McCrone mill was measured by laser granu-lometry in isopropanol using a Mastersizer 3000 (MALVERN)
After milling the samples in these two ways for XRD analysis thepowders were prepared into a front loading sample holder and mea-sured Diffractograms were recorded with an angular range from 6 to80deg 2θ a step width of 00236deg 2θ and a time per step of 054 s Rietveldrefinement combined with external standard (G-factor) was applied inorder to get absolute quantities for each phase The refinement strategyfor portlandite and tobermorite in the TOPAS Launch Mode (TOPAS50 Bruker AXS) is attached as a Supplementary material file
3 Results and discussion
31 Hydration of the mixture before autoclaving
The hydration of the investigated paste before autoclaving isdominated by the hydration of the cement as well as the reaction of thefree lime (CaO) resulting in the formation of portlandite It can beclearly seen from Fig 2 that the hydration of the paste leads to theformation of ettringite portlandite and C-S-H phase For simplificationthe remaining phase developments are not shown in Fig 2 because theyare not in the focus of this study The hydration of CaO forming
Fig 1 Simplified process steps of AAC production and hydrate phase evolution
Table 1Structures used for Rietveld refinement
Phase Author
Alite [15]Anhydrite [16]Bassanite [17]Belite (β) [18]Belite (αprime) [19]Brownmillerite [20]C-S-H [21]Calcite [22]Ettringite [23]Gypsum [24]Hemicarbonate [25]Hydroxylellestadite [26]Lime (CaO) [27]Microcline [28]Portlandite [29]Quartz [30]Tobermorite [31]Tricalciumaluminate (cubic) [32]Tricalciumaluminate (orthorhombic) [33]PONCKS model for Water [21]
J Schreiner et al Cement and Concrete Research 107 (2018) 247ndash252
248
6 Publications
40
portlandite begins rapidly after the addition of water to the mixture andlime is fully consumed after only 1 h of hydration This translates into aquick rise of heat of hydration so that cement hydration is acceleratedwhich leads to further portlandite formation by the reaction of aliteEttringite formation stalls after few hours of hydration After 12 h et-tringite is partially decomposed probably due to sulfate depletion [9]
and poorly crystalline AFm phases (not shown in Fig 2) are formedIn Fig 3 it can be seen that in fact two generations of portlandite
are formed a 1st dominant generation showing anisotropic peakbroadening and 2nd one occurring considerably later following theisotropic domain size refinement which is usually carried out using theRietveld method This occurrence comes along firstly with lime hy-dration and secondly with alite hydration The expected quantity ofportlandite formed from lime hydration very well complies with the
Fig 2 Phase development in AAC paste on a laboratory scale before autoclaving ana-lyzed by in-situ XRD at 70 degC
Fig 3 Formation of two generations of portlandite by hydration of lime (1st) and C3S(2nd) at 70 degC before autoclaving with the major generation showing anisotropic peakbroadening
Fig 4 Biaxial cylinder domain size model of portlandite used for Rietveld refinement of anisotropic peak broadening
Fig 5 Morphological evolution of portlandite showing anisotropic domain size growthduring hydration at 70 degC
Fig 6 Comparison of quantification of crystalline quartz in samples prepared withMcCrone mill and agate mortar at different autoclaving times
J Schreiner et al Cement and Concrete Research 107 (2018) 247ndash252
249
6 Publications
41
quantity of the observed 1st generation The development of portlan-dite growth was already tracked in an equivalent slurry at 23 degC [14]Thus this observation confirms that the crystallinity of portlandite inmixtures for AAC production depends on the starting phase for hydra-tion as already indicated by Ectors [14]
Fig 4 shows the used biaxial cylindrical model for anisotropic do-main size calculation and the portlandite structure which was createdwith structural software VESTA 318 [34] Using the cylindrical ap-proach domain sizes in a (here equating to b) and c direction(dz= cylinder height) can be calculated which comes along with theexpected symmetrical parameters of portlandite
The 1st portlandite generation showing anisotropic domain growthcan be tracked in terms of cylinder diameter and height which is rea-lized in Fig 5 The blue cylinder represents the geometric approach andcylinder height and diameter are calculated newly for each range Thecylinder height remains rather stable throughout the hydration processwhile the cylinder diameter increases during the first hours of hydra-tion After 10 h of hydration the mean cylinder diameter no longer in-creases Consequently these observations match the results of the ex-aminations conducted at 23 degC [14] as well as the assumption thatdifferent mechanisms of growth exist for portlandite depending on the
hydration educt The maximum cylinder diameter is reached earlier inthis work very likely because of the higher hydration temperature
32 Quantification of the reactions during autoclaving
Autoclaved samples were ground with an agate mortar and com-pared to samples which were wet-ground with a McCrone mill Fig 6shows precisely that the determination of the amount of crystallinequartz is more reproducible in the two shown samples which were
Fig 7 2D XRD with Bruker GADDS-system plots of samples prepared with agate mortar and McCrone mill Coarse quartz grains are pointed out in the plot of the sample prepared withagate mortar
Fig 8 Particle size distribution of one sample prepared with an agate mortar and of onesample prepared with a McCrone mill measured by laser granulometry
Fig 9 Rietveld refinement for Tobermorite of autoclaved AAC sample by use of isotropicdomain size model (a) and of anisotropic domain size model (b)
J Schreiner et al Cement and Concrete Research 107 (2018) 247ndash252
250
6 Publications
42
prepared with a McCrone mill The high variance of crystalline quartzin the samples which were prepared with an agate mortar is a result ofinsufficient grinding and remaining of too large quartz grains Whenthis spottiness occurs a reliable quantification using the G-factormethod is not possible
The 2D XRD with Bruker GADDS-system plots in Fig 7 demonstratethe insufficient grinding when using an agate mortar compared to wetmilling with a McCrone mill Quartz would be overrepresented in a one-dimensional XRD pattern focusing on a section with bright spots (greenarrows) The lack of bright spots in the right plot shows that the quartzgrains are milled more thoroughly using a McCrone mill In Fig 8 theparticle size distribution after both ways of sample preparation iscompared Most grains in the sample prepared with an agate mortar arelarger than in the sample prepared with a McCrone mill The grain sizedistribution of the sample prepared with a McCrone mill complies withthe recommended particle size range for XRD analysis of under 5 to50 μm [3536] while the other sample exceeds the range
In Fig 9 Rietveld refinement of an autoclaved sample is shown Thedominant peaks at 77 290 and 301deg 2θ are attributed to tobermoriteIn the upper diagram (a) Rietveld refinement was carried out regularlycalculating isotropic domain sizes for tobermorite However the cal-culated fit differs significantly from the raw data It can be assumed thattobermorite shows a similar pattern to portlandite in terms of aniso-tropic peak broadening taking into account that tobermorite is as-signed to the orthorhombic crystal system Thus instead of a biaxialcylinder model an elliptic cylinder model (Fig 10 structure createdwith VESTA 318 [34]) was applied for the refinement in the lowerdiagram (b) The elliptic cylinder model is a sufficient approach to the
orthorhombic crystal system as it allows the distinction between do-main sizes in a b and c direction The fit is clearly superior using theanisotropic domain size model highlighted by the difference plot inFig 9b The comparison refinement with isotropic and anisotropic ap-proach was done for all of the five autoclaved samples In Fig 11 theresulting Rwp values for the whole pattern and the RBragg values of to-bermorite are shown The refinement using the anisotropic model leadsto both lower Rwp and RBragg values and consequently to a better fit anda more accurate quantification of tobermorite in all refined samples
4 Summary and conclusions
Improved analytical methods for both the phase developmentduring the hydration before autoclaving and during the autoclavingprocess of AAC are presented It could be shown that wet McCronemilling is the best way of preparation of AAC samples in order to obtainsuitable samples for powder diffraction A new approach to treat ani-sotropic domain sizes for Rietveld refinement could be successfullyapplied ndash with the benefit that portlandite and tobermorite in AACsamples could be refined more accurately using the Rietveld methodThus this application allows an improved quantification of the phasedevelopment during both of the production steps
For the future there are still plenty of possibilities to apply thepresented approach of calculating anisotropic domain sizes to AACproduction As exemplified with portlandite the mechanisms of growthof tobermorite can be tracked likewise during the autoclaving processIn addition the effect of variations in the chemical composition of AACraw mixtures on the crystal morphology of tobermorite can be ex-amined This leaves a new perspective to discuss the link between mi-neral phase morphology and the thermal and mechanical properties ofAAC
Acknowledgement
The autoclaved samples were generously provided by RodgauerBaustoffwerke GmbH amp Co KG The authors express gratitude for allsupport
Appendix A Supplementary data
Supplementary data to this article can be found online at httpsdoiorg101016jcemconres201802028
References
[1] MW Grutzeck Cellular concrete in M Scheffler P Colombo (Eds) CellularCeramics Wiley-VCH Weinheim 2005 pp 193ndash223
[2] M Haas The future of AAC ndash from a material scientists point of view inMC Limbachiya JJ Roberts (Eds) Autoclaved Aerated Concrete Taylor FrLondon 2005 pp 187ndash194
[3] T Mitsuda K Sasaki H Ishida Phase evolution during autoclaving process ofaerated concrete J Am Ceram Soc 75 (1992) 1858ndash1863
[4] N Isu H Ishida T Mitsuda Influence of quartz particle size on the chemical and
Fig 10 Triaxial cylinder domain size model of Tobermorite used for Rietveld refinement of anisotropic peak broadening
Fig 11 Comparison of Rwp and RBragg values of Rietveld refinements of autoclavedsamples and tobermorite using the isotropic and the anisotropic domain size model
J Schreiner et al Cement and Concrete Research 107 (2018) 247ndash252
251
6 Publications
43
mechanical properties of autoclaved aerated concrete (I) tobermorite formationCem Concr Res 25 (1995) 243ndash248
[5] NY Mostafa Influence of air-cooled slag on physicochemical properties of auto-claved aerated concrete Cem Concr Res 35 (2005) 1349ndash1357 httpdxdoiorg101016jcemconres200410011
[6] K Matsui J Kikuma M Tsunashima T Ishikawa S Matsuno A Ogawa M SatoIn situ time-resolved X-ray diffraction of tobermorite formation in autoclaved aer-ated concrete influence of silica source reactivity and Al addition Cem Concr Res41 (2011) 510ndash519
[7] C Biagioni S Merlino E Bonaccorsi The tobermorite supergroup a new no-menclature Mineral Mag 79 (2015) 485ndash495 httpdxdoiorg101180minmag2015079222
[8] BH OConnor MD Raven Application of the Rietveld refinement procedure inassaying powdered mixtures Powder Diffract 3 (1988) 2ndash6 httpdxdoiorg101017S0885715600013026
[9] D Jansen F Goetz-Neunhoeffer C Stabler J Neubauer A remastered externalstandard method applied to the quantification of early OPC hydration Cem ConcrRes 41 (2011) 602ndash608 httpdxdoiorg101016jcemconres201103004
[10] D Jansen C Stabler F Goetz-Neunhoeffer S Dittrich J Neubauer Does OrdinaryPortland Cement contain amorphous phase A quantitative study using an externalstandard method Powder Diffract 26 (2011) 31ndash38 httpdxdoiorg10115413549186
[11] D Ectors F Goetz-Neunhoeffer J Neubauer A generalized geometric approach toanisotropic peak broadening due to domain morphology J Appl Crystallogr 48(2015) 189ndash194 httpdxdoiorg101107S1600576714026557
[12] D Ectors F Goetz-Neunhoeffer J Neubauer Routine (an)isotropic crystallite sizeanalysis in the double-Voigt approximation done right Powder Diffract 32 (S1)(2017) 27ndash34 httpdxdoiorg101017S0885715617000070
[13] HM Rietveld A profile refinement method for nuclear and magnetic structures JAppl Crystallogr 2 (1969) 65ndash71 httpdxdoiorg101107S0021889869006558
[14] D Ectors Advances in the Analysis of Cementitious Reactions and Hydrate Phases(Doctoral Thesis) (2016) pp 12ndash14 (urnnbndebvb29-opus4-71743)
[15] AacuteG De La Torre S Bruque J Campo MAG Aranda The superstructure of C3Sfrom synchrotron and neutron powder diffraction and its role in quantitative phaseanalyses Cem Concr Res 32 (2002) 1347ndash1356 httpdxdoiorg101016S0008-8846(02)00796-2
[16] A Kirfel G Will Charge density in anhydrite CaSO4 from X-ray and neutrondiffraction measurements Acta Crystallogr Sect B Struct Crystallogr CrystChem 36 (1980) 2881ndash2890 httpdxdoiorg101107S0567740880010461
[17] C Bezou AN Christensen D Cox M Lehman A Nonat Structures cristallines deCaSO405H2O et CaSO406H2O Comptes Rendus Hebd Des Seacuteances lAcadeacutemieDes Sci Seacuterie 2 (312) (1991) 43ndash48
[18] KH Jost B Ziemer R Seydel Redetermination of the structure of β-dicalciumsilicate Acta Crystallogr Sect B Struct Crystallogr Cryst Chem 33 (1977)1696ndash1700 httpdxdoiorg101107S0567740877006918
[19] W Mumme LMD Cranswick BC Chakoumakos Rietveld crystal structure re-finements from high temperature neutron powder diffraction data for the poly-morphs of dicalcium silicate Neues Jahrb Fuer Mineral Abhandlungen 170 (1996)171ndash188
[20] A Colville S Geller The crystal structure of brownmillerite Ca2FeAlO5Crystallographica 50 (1971) 2311ndash2315 httpdxdoiorg101107S056774087100579X
[21] ST Bergold F Goetz-Neunhoeffer J Neubauer Quantitative analysis of C-S-H inhydrating alite pastes by in-situ XRD Cem Concr Res 53 (2013) 119ndash126 httpdxdoiorg101016jcemconres201306001
[22] EN Maslen VA Streltsov NR Streltsova N Ishizawa Electron density and op-tical anisotropy in rhombohedral carbonates III Synchrotron Xray studies ofCaCO3 MgCO3 and MnCO3 Acta Crystallogr Sect B 51 (1995) 929ndash939 httpdxdoiorg101107S0108768195006434
[23] G Renaudin Y Filinchuk J Neubauer F Goetz-Neunhoeffer A comparativestructural study of wet and dried ettringite Cem Concr Res 40 (2010) 370ndash375httpdxdoiorg101016jcemconres200911002
[24] WF Cole CJ Lancucki A refinement of the crystal structure of gypsumCaSO42H2O Acta Cryst B30 (1974) 921ndash929 httpdxdoiorg101107S0567740874004055
[25] T Runčevski RE Dinnebier OV Magdysyuk H Poumlllmann Crystal structures ofcalcium hemicarboaluminate and carbonated calcium hemicarboaluminate fromsynchrotron powder diffraction data Acta Crystallogr Sect B Struct Sci 68 (2012)493ndash500 httpdxdoiorg101107S010876811203042X
[26] JM Hughes JW Drexler Cation substitution in the apatite tetrahedral site crystalstructures of type hydroxylellestadite and type fermorite Neues Jahrb FuerMineral (1991) 327ndash336
[27] CH Shen RS Liu JG Lin CY Huang Phase stability study of La12Ca18Mn2O7Mater Res Bull 36 (2001) 1139ndash1148
[28] SW Bailey Refinement of an intermediate microcline structure Am Miner 54(1969) 1540ndash1545
[29] WR Busing HA Levy Neutron diffraction study of calcium hydroxide J ChemPhys 26 (1957) 563 httpdxdoiorg10106311743345
[30] Y Le Page G Donnay Refinement of the crystal structure of low-quartz ActaCrystallogr Sect B 32 (1976) 2456ndash2459 httpdxdoiorg101107S0567740876007966
[31] SA Hamid The crystal structure of the 11 Aring natural tobermoriteCa225[Si3O75(OH)15]1H2O Zeitschrift Fuer Krist - New Cryst Struct 154 (1981)189ndash198 httpdxdoiorg101524zkri19811543-4189
[32] P Mondal JW Jeffery The crystal structure of tricalcium aluminate Ca3Al2O6Acta Crystallogr B 31 (1975) 689ndash697 httpdxdoiorg101107S0567740875003639
[33] Y Takeuchi F Nishi I Maki Crystal-chemical characterization of the tricalciumaluminate-sodium oxide (3CaOtimesAl2O3-Na2O) solid-solution series Zeitschrift FuumlrKrist (1980) 259ndash307
[34] K Momma F Izumi VESTA 3 for three-dimensional visualization of crystal vo-lumetric and morphology data J Appl Crystallogr 44 (2011) 1272ndash1276 httpdxdoiorg101107S0021889811038970
[35] K Scrivener R Snellings B Lothenbach A Practical Guide to MicrostructuralAnalysis of Cementitious Materials CRC Press 2016 pp 123ndash125 httpdxdoiorg107693wl20150205
[36] V Pecharsky P Zavalij Fundamentals of Powder Diffraction and StructuralCharacterization of Materials Springer second edition 2005 p 302 httpdxdoiorg101007978-0-387-09579-0
J Schreiner et al Cement and Concrete Research 107 (2018) 247ndash252
252
6 Publications
44
7 Acknowledgement
7 Acknowledgement
Ich moumlchte mich bei einigen Personen bedanken ohne die es wohl kaum zum erfolgreichenAbschluss dieser Arbeit gekommen waumlreMein Doktorvater Prof Dr Juumlrgen Neubauer hat sich stets die Zeit genommen die noumltigwar um Angelegenheiten aller Art mit mir zu klaumlren Er gab mir fachlich immer zumrichtigen Zeitpunkt einen gewissen wissenschaftlichen Impuls Zugleich habe ich mich den-noch immer frei in meiner eigenen Konzeption gefuumlhlt Groszligen Dank spreche ich Prof DrFriedlinde Goumltz-Neunhoeffer aus die fuumlr mich ebenso immer eine verlaumlssliche Ansprech-partnerin fuumlr fachliche und organisatorische Angelegenheiten aller Art war Danke anDr Daniel Jansen fuumlr die gute Zusammenarbeit und dafuumlr dass er mich im Zuge meinerMasterarbeit in ein Forschungsprojekt aufgenommen hat das den Weg zur Promotionmoumlglich machte Zusaumltzlich gilt mein Dank Prof Dr Matthias Goumlbbels der fuumlr dieMitarbeiter am Lehrstuhl immer motivierende Worte fand Fuumlr die Ermoumlglichung meinerTeilnahme an diversen Dienstreisen Fortbildungen und Tagungen moumlchte ich mich viel-mals bedankenWeiterhin bedanke ich mich bei Dr Stephan Volkmann und den Rodgauer BaustoffwerkenGmbH amp Co KG fuumlr die gute Zusammenarbeit und die Bereitstellung von Versuchsma-terialienVielen Dank an meine studentischen Hilfskraumlfte Daniel Wagner Laura MoldenhauerFabian Lang Jakob Schreiber und Felix Klaassen die alle Aufgaben im Labor einwand-frei und mit Bedacht erledigten Bei meinen aktuellen und ehemaligen Kollegen DrKatrin Hurle Dr Dominique Ectors Dr Christoph Naber Dr Florian Huumlller JoumlrgNehring Frank Riedel Julian Wolf Tanja Manninger Daniel Wagner Nicolas FobbeKarla Spaumlth Julian Goergens Andreas Koumlhler Cordula Jakob Franz Becker und LisaKlemenz bedanke ich mich fuumlr die gelungene Zusammenarbeit und gegenseitige Unter-stuumltzung Besonderer Dank geht auch an Kerstin Kreszlig Bettina Engl Christian HankeBernd Schleifer und Christian Abe fuumlr die verlaumlssliche Unterstuumltzung bei technischen Fra-gen und Messungen im LaborFuumlr jegliche Unterstuumltzungen moumlchte ich mich auch bei meinen Eltern bedanken sowiebei meinem Bruder Ralf der mir mit einem LaTex Crashkurs viel Frustration ersparthat Danke Thomas dass du immer fuumlr mich da bist und mit mir zusammen fuumlr genugAusgleich gesorgt hast
45
4 Conclusions
surements during this step confirmed the presence of two generations of portlandite char-acterized by different crystallinity as suggested by Ectors [52] The inclusion of anisotropicdomain morphology during the Rietveld refinement allowed a more accurate quantifica-tion of tobermorite in autoclaved samples Sample preparation adjusted to the grain sizedistribution in AAC samples (section 63) the external standard method for quantita-tive XRD analysis [55] and the approach to evaluate anisotropic peak broadening [19]are the key methods for a more accurate tracking of the phase development during AACproduction
24
5 References
5 References
[1] A E Zadov A I Grabezhev N N Pertsev N V Chukanov and S V PribavkinTobermorite-plombierite metasomatites of the Gumeshevsk skarn-porphyry copper depositmiddle Urals Doklady Earth Sciences 407(3)495ndash497 2006
[2] M F Heddle Preliminary notice of substances which may prove to be new minerals MinMag 4117ndash123 1880
[3] S Merlino E Bonaccorsi and T Armbruster The real structure of tobermorite 11AringNormal and anomalous forms OD character and polytypic modifications European Journalof Mineralogy 13(3)577ndash590 2001
[4] C Biagioni S Merlino and E Bonaccorsi The tobermorite supergroup a new nomencla-ture Mineralogical Magazine 79(2)485ndash495 2015
[5] C A Riacuteos C D Williams and M A Fullen Hydrothermal synthesis of hydrogarnetand tobermorite at 175 degC from kaolinite and metakaolinite in the CaO-Al2O3-SiO2-H2Osystem A comparative study Applied Clay Science 43(2)228ndash237 2009
[6] X Qu Z Zhao and X Zhao Microstructure and characterization of aluminum-incorporated calcium silicate hydrates (C-S-H) under hydrothermal conditions RSC Ad-vances 8(49)28198ndash28208 2018
[7] R Šiaučiunas and K Baltakys Formation of gyrolite during hydrothermal synthesis inthe mixtures of CaO and amorphous SiO2 or quartz Cement and Concrete Research34(11)2029ndash2036 2004
[8] E Venhodovaacute R Janovskyacute and R Drochytka Formation of Tobermorite at Different Ma-terials Composition of Aerated Concrete Applied Mechanics and Materials 752-753247ndash250 2015
[9] L Galvaacutenkovaacute E Bartoniacutečkovaacute T Opravil J Tkacz and P Ptaacuteček The influence ofstarting materials solubility on tobermorite structure formation under the hydrothermalconditions IOP Conference Series Materials Science and Engineering 379(1)1ndash8 2018
[10] T Mitsuda K Sasaki and H Ishida Phase Evolution during Autoclaving Process J AmCeram Soc 75(75)1858ndash1863 1992
[11] A Skawińska The influence of metahalloysite addition on tobermorite formation studied byX-ray powder diffraction and scanning electron microscope MATEC Web of Conferences16305008 2018
[12] S T Bergold F Goetz-Neunhoeffer and J Neubauer Quantitative analysis of C-S-H in
25
5 References
hydrating alite pastes by in-situ XRD Cement and Concrete Research 53119ndash126 2013
[13] O P Shrivastava and F P Glasser Ion-exchange properties of 11-Aring tobermorite Reactivityof Solids 2(3)261ndash268 1986
[14] H Maeda Y Ogawa E H Ishida and T Kasuga Hydrothermal synthesis of tobermoritedoped with phosphorus species for removing heavy metal ions Journal of the AustralianCeramic Society 48(1)8ndash11 2012
[15] O P Shrivastava and R Shrivastava Cation exchange applications of synthetic tobermoritefor the immobilization and solidification of cesium and strontium in cement matrix Bulletinof Materials Science 23(6)515ndash520 2000
[16] G Renman and A Renman Sustainable Use of Crushed Autoclaved Aerated Concrete(CAAC) as a Filter Medium in Wastewater Purification 8th International conferenceon sustainable management of waste and recycled materials in construction GothenburgSweden 30 Mayndash1 June 2012 Proceedings pages 1ndash7 2012
[17] G Schober Chemical transformations during the manufacturing of autoclaved aeratedconcrete (ACC) Cement lime gypsum and quartz sand become cellular concrete ZKG58(7)63ndash70 2005
[18] A J Hamad Materials Production Properties and Application of Aerated LightweightConcrete Review International Journal of Materials Science and Engineering 2(2)152ndash157 2014
[19] D Ectors F Goetz-Neunhoeffer and J Neubauer A generalized geometric approach toanisotropic peak broadening due to domain morphology Journal of Applied Crystallogra-phy 48(1)189ndash194 2015
[20] H M Rietveld A profile refinement method for nuclear and magnetic structures Journalof Applied Crystallography 2(2)65ndash71 1969
[21] S A Hamid The crystal structure of the 11 Aring natural tobermoriteCa225[Si3O75(OH)15]1H2O Zeitschrift fuer Kristallographie - New Crystal Struc-tures 154(3-4)189ndash198 1981
[22] S A S El-Hemaly T Mitsuda and H F W Taylor Synthesis of normal and anomaloustobermorites Cement and Concrete Research 7429ndash438 1977
[23] M Sakiyama and T Mitsuda Hydrothermal reaction between C-S-H and kaolinite for theformation of tobermorite at 180degC Cement and Concrete Research 7(6)681ndash685 1977
[24] E Bonaccorsi S Merlino and A R Kampf The crystal structure of tobermorite 14 Aring(plombierite) a C-S-H phase Journal of the American Ceramic Society 88(3)505ndash5122005
[25] S Merlino E Bonaccorsi and T Armbruster The real structures of clinotobermorite andtobermorite 9 Aring OD character polytypes and structural relationships European Journalof Mineralogy 12(2)411ndash429 2000
[26] K Momma and F Izumi VESTA 3 for three-dimensional visualization of crystal volu-metric and morphology data Journal of Applied Crystallography 44(6)1272ndash1276 2011
26
5 References
[27] S Shaw S M Clark and C MB Henderson Hydrothermal formation of the calcium sil-icate hydrates tobermorite (Ca5Si6O16(OH)2 middot 4H2O) and xonotlite (Ca6Si6O17(OH)2)An in situ synchrotron study Chemical Geology 167(1-2)129ndash140 2000
[28] K Matsui J Kikuma M Tsunashima T Ishikawa S Matsuno A Ogawa and M SatoIn situ time-resolved X-ray diffraction of tobermorite synthesis process under hydrothermalcondition IOP Conference Series Materials Science and Engineering 18(2)60ndash66 2011
[29] G Matekonis R Šiaučiunas and D Vaičiukyniene Hydrothermal Synthesis and Charac-terization of Na + and [ Al 3 + + Na + ] -substituted Tobermorite in CaO-SiO2middotnH2O-H2OSystem MATERIALS SCIENCE 16(3)242ndash248 2010
[30] G Geng R J Myers M J A Qomi and P JM Monteiro Densification of the inter-layer spacing governs the nanomechanical properties of calcium-silicate-hydrate ScientificReports 7(1)1ndash8 2017
[31] D Klimesch and A Ray Autoclaved cement-quartz pastes with metakaolin additionsAdvanced Cement Based Materials 7(3-4)109ndash118 1998
[32] N Y Mostafa A A Shaltout H Omar and S A Abo-El-Enein Hydrothermal synthesisand characterization of aluminium and sulfate substituted 11 nm tobermorites Journal ofAlloys and Compounds 467(1-2)332ndash337 2009
[33] İ Demir M S Başpınar E Kahraman E Ccedilalışkan and G Goumlrhan An Investigation onthe Usability of Diatomite in Aerated Concrete Production In Proc of the Intl Conf onAdvances In Civil Structural And Construction Engineering - CSCE 2014 pages 97ndash1002014
[34] A Skawinska Z Owsiak T Baran and K Hernik The influence of halloysite additionon tobermorite formation in CaO and quartz mix under hydrothermal conditions CementWapno Beton 17(12)426ndash434 2017
[35] N Y Mostafa Influence of air-cooled slag on physicochemical properties of autoclavedaerated concrete Cement and Concrete Research 35(7)1349ndash1357 2005
[36] D Małaszkiewicz and J Chojnowski Influence of addition of calcium sulfate dihydrate ondrying of autoclaved aerated concrete Open Engineering 7(1)273ndash278 2017
[37] N Hara and N Inoue Thermal behaviour of 11Aring tobermorite and its lattice parametersCement and Concrete Research (10)53ndash60 1980
[38] M D Jackson S R Chae S R Mulcahy C Meral R Taylor P Li A H EmwasJ Moon S Yoon G Vola H R Wenk and P JM Monteiro Unlocking the secretsof Al-tobermorite in Roman seawater concrete American Mineralogist 98(10)1669ndash16872012
[39] W Liao W Li Z Fang C Lu and Z Xu Effect of different aluminum substitution rateson the structure of Tobermorite Materials 12(22)1ndash10 2019
[40] D Klimesch and A Ray DTA-TG Study of the CaO-SiO2-H2O and CaO-Al2O3-SiO2-H2OSystems Under Hydrothermal Conditions Journal of Thermal Analysis and Calorimetry56(1)27ndash34 1999
27
5 References
[41] Z Sauman and Z Valtr Substitution of sulphate ions in the crystal lattice of 11 Aring to-bermorite In The VI International Congress on the Chemistry of Cement pages 1ndash14Moscow 1974
[42] G Schober Reaction of raw materials to the final product AAC httpwwwpb-aacde
chemmin2_ehtml 2012 accessed 2020-01-31
[43] D Jansen C Stabler F Goetz-Neunhoeffer S Dittrich and J Neubauer Does Ordi-nary Portland Cement contain amorphous phase A quantitative study using an externalstandard method Powder Diffraction 26(01)31ndash38 2011
[44] C Roumlszligler J Stark F Steiniger and W Tichelaar Limited-dose electron microscopyreveals the crystallinity of fibrous C-S-H phases Journal of the American Ceramic Society89(2)627ndash632 2006
[45] Y Sakalli and R Trettin Investigation of C3S hydration by environmental scanning elec-tron microscope Journal of Microscopy 259(1)53ndash58 2015
[46] F Matsushita Y Aono and S Shibata Expansion and shrinkage behavior of green cakeof Autoclaved Aerated Concrete In Autoclaved Aerated Concrete - Innovation and Devel-opment Proceedings of the 4th International Conference on Autoclaved Aerated ConcreteKingston UK 8-9 September 2005 pages 101ndash108 CRC Press 2005
[47] C Chucholowski M Holger and K-C Thienel Improving the recyclability environmentalcompatibility and CO2 balance of autoclaved aerated concrete by replacing sulfate carrierand cement with calcined clays CePapers 2(4)503ndash512 2018
[48] X Y Huang W Ni W H Cui Z J Wang and L P Zhu Preparation of autoclavedaerated concrete using copper tailings and blast furnace slag Construction and BuildingMaterials 27(1)1ndash5 2012
[49] W Wongkeo and A Chaipanich Compressive strength microstructure and thermal anal-ysis of autoclaved and air cured structural lightweight concrete made with coal bottom ashand silica fume Materials Science and Engineering A 527(16-17)3676ndash3684 2010
[50] A Roacuteżycka and W Pichoacuter Effect of perlite waste addition on the properties of autoclavedaerated concrete Construction and Building Materials 12065ndash71 2016
[51] N Isu H Ishida and T Mitsuda Influence of quartz particle size on the chemical andmechanical properties of autoclaved aerated concrete (I) tobermorite formation Cementand Concrete Research 25(25)243ndash248 1995
[52] D Ectors Advances in the analysis of cementitious reactions and hydrate phases doctoralthesis PhD thesis Friedrich-Alexander-Universitaumlt Erlangen-Nuumlrnberg 2016
[53] D Ectors F Goetz-Neunhoeffer and J Neubauer Domain size anisotropy in the double-Voigt approach An extended model Journal of Applied Crystallography 481998ndash20012015
[54] D Ectors F Goetz-Neunhoeffer and J Neubauer Routine (an)isotropic crystallite sizeanalysis in the double-Voigt approximation done right Powder Diffraction 32(S1)27ndash342017
28
5 References
[55] D Jansen F Goetz-Neunhoeffer C Stabler and J Neubauer A remastered external stan-dard method applied to the quantification of early OPC hydration Cement and ConcreteResearch 41(6)602ndash608 2011
[56] T Ungaacuter G Tichy J Gubicza and R J Hellmig Correlation between subgrains andcoherently scattering domains Powder Diffraction 20(04)366ndash375 2005
[57] Triloki P Garg R Rai and B K Singh Structural characterization of as-depositedcesium iodide films studied by X-ray diffraction and transmission electron microscopy tech-niques Nuclear Instruments and Methods in Physics Research Section A AcceleratorsSpectrometers Detectors and Associated Equipment 736128ndash134 2014
[58] J Schreiner F Goetz-Neunhoeffer J Neubauer and D Jansen Hydrothermal synthesisof 11 Aring tobermorite ndash Effect of adding metakaolin to the basic compound Applied ClayScience 185 2020
[59] J Schreiner F Goetz-Neunhoeffer J Neubauer S Volkmann S Bergold R Webler andD Jansen Advanced Rietveld refinement and SEM analysis of tobermorite in chemicallydiverse autoclaved aerated concrete Powder Diffraction 34143ndash150 2019
[60] J Schreiner D Jansen D Ectors F Goetz-Neunhoeffer J Neubauer and S VolkmannNew analytical possibilities for monitoring the phase development during the production ofautoclaved aerated concrete Cement and Concrete Research 107247ndash252 2018
29
6 Publications
6 Publications
61 Hydrothermal synthesis of 11 Aring tobermorite ndash Effectof adding metakaolin to the basic compound
Reprint of the peer reviewed publication
Schreiner J Goetz-Neunhoeffer F Neubauer J Jansen D 2020 Hydrothermalsynthesis of 11 Aring tobermorite ndash Effect of adding metakaolin to the basic compoundApplied Clay Science 185 httpsdoiorg101016jclay2019105432
with permission from Elsevier
30
Contents lists available at ScienceDirect
Applied Clay Science
journal homepage wwwelseviercomlocateclay
Research paper
Hydrothermal synthesis of 11 Aring tobermorite ndash Effect of adding metakaolin tothe basic compound
J Schreiner F Goetz-Neunhoeffer J Neubauer D JansenUniversity of Erlangen-Nuremberg GeoZentrum Nordbayern Mineralogy Schlossgarten 5a 91054 Erlangen Germany
A R T I C L E I N F O
KeywordsHydrothermal synthesis11 Aring tobermoriteMetakaolinPowder diffractionKatoite
A B S T R A C T
Different amounts and types of metakaolin were analyzed and applied for the hydrothermal synthesis of 11 Aringtobermorite All synthesized samples were investigated by means of powder XRD combined with Rietveld re-finement Al-substituted 11 Aring tobermorite was successfully synthesized on the basis of a broad range of com-pounds characterized by a varying content of metakaolin Katoite was present depending on the amount ofsupplied Al3+ which was determined by the dosage of metakaolin Minor crystalline components included in thetwo types of metakaolin sources varied greatly in their reactivity under hydrothermal conditions Despite adifferent degree of purity the two types of metakaolin showed corresponding effects at moderate dosages butcontrary effects at higher dosages as for the synthesis of 11 Aring tobermorite The domain morphology of to-bermorite could be associated with Al3+ incorporation for low dosages of metakaolin represented by up to 2 wt- Al2O3 in the dry mix By contrast Al3+ affected tobermorite lattice parameters at equivalent and even athigher dosages with c reaching 2295 Aring at 12 wt- Al2O3 in the dry mix
1 Introduction
11 Application of metakaolin as a reactive material in constructionindustry
The application of supplementary cementitious materials (SCMs) inthe field of construction technology has received a lot of attention inrecent years Due to limited resources and an urgent need for alter-native and more eco-friendly construction materials SCMs such asmetakaolin offer a great potential The usage of SCMs has not onlyspread to the cement and mortar industry but also to advanced appli-cations such as autoclaved aerated concrete (AAC) (Demir et al 2014Koutnyacute et al 2014 Walczak et al 2015 Roacuteżycka and Pichoacuter 2016Chucholowski et al 2018) Unlike ordinary cementitious constructionmaterials AAC is produced from hydrothermal curing Due to the dif-ferent thermodynamic environment the hydration process and the re-activity of raw materials have to be investigated properly in order tounderstand the effects on the AAC product The leading mineral phasein AAC is 11 Aring tobermorite (Ca5Si6O16(OH)2middot4H2O) As a consequencethe thermal and mechanical properties of AAC depend on micro-structure and crystallinity of tobermorite to some extent In addition tothe curing time and the fineness of raw materials the supply of ionsthat can substitute in the tobermorite structure is a crucial factor in thiscontext Especially substitutions by aluminum sodium and potassium
ions have been investigated thoroughly (Sauman 1974 Klimesch andRay 1998 Mostafa et al 2009 Matekonis et al 2010 Skawinskaet al 2017) Calcined clays usually contain a considerable amount ofthe mentioned ions
There is a vast amount of literature on the reactivity of SCMs atambient temperature and standard pressure but there is little when itcomes to hydrothermal conditions In previous publications the beha-vior of metakaolin under hydrothermal conditions was mainly in-vestigated for the synthesis of zeolites (Zhang et al 2007 Aguilar-Mamani et al 2014 Setthaya et al 2016 Luo et al 2018) In thesestudies the reactivity of metakaolin was observed at a wide range oftemperature and pH values During the transformation of kaolin intometakaolin a loss of framework alumina was observed (Ayodele et al2019) In recent decades metakaolin has been the subject of studies inthe field of geopolymer research (Rashad 2013 Chen et al 2016) Forthe synthesis of 11 Aring tobermorite a more distinct setting of temperaturesetting (180ndash200 degC) and steam pressure (1ndash12 MPa) are required
This publication is intended to make a new contribution to thechallenging field of hydrothermal synthesis in the system CaO-Al2O3-SiO2-H2O based on XRD analysis combined with Rietveld refinementVarious dosages of two types of metakaolin with different chemical andmineralogical purities are compared for the effects on the hydrothermalsynthesis of Al-substituted 11 Aring tobermorite Especially changes of thebulk chemistry in the raw mixes the reactivity of minor crystalline
httpsdoiorg101016jclay2019105432Received 20 August 2019 Received in revised form 13 November 2019 Accepted 30 December 2019
Corresponding authorE-mail address juergenjsschreinerfaude (J Schreiner)
Applied Clay Science 185 (2020) 105432
0169-1317 copy 2020 Elsevier BV All rights reserved
T
6 Publications
31
phases of the two types of metakaolin and the effect of different curingtimes are the focus of interest On the one hand metakaolin offers agreat potential in the AAC industry On the other hand of all SCMsmetakaolin is a good source material for investigating the influence ofAl3+ on the synthesis of Al-substituted 11 Aring tobermorite
12 Synthesis of Al-substituted 11 Aring tobermorite
In addition to being present in AAC tobermorite has found appli-cation in wastewater treatment and nuclear waste management due toits ion exchange capacity (Maeda et al 2012 Monasterio et al 2015)The substitution of silicon by aluminum results in a different to-bermorite structure due to general and local charge balance affectingthe lattice parameters Especially c is impacted by this substitutionbecause it occurs in the bridging tetrahedron and additional OHndash sub-stitutes O2ndash (Komarneni et al 1985 Merlino et al 2000) As suggestedin some additional studies the substitution of Si4+ by Al3+ and Na+ orK+ leads to a lath-like morphology of tobermorite crystals (Mostafa2005 Mostafa et al 2009 Venhodovaacute et al 2015 Qu et al 2018)However because of the heterogeneous appearance of tobermorite inAAC it is hardly possible to conduct a proper characterization based onSEM analysis In our recent work the anisotropic peak broadening oftobermorite in XRD diffractograms was successfully linked with theincorporation of foreign ions supplied in a common AAC production(Schreiner et al 2019) This finding allowed a more statistical struc-tural characterization of tobermorite in bulk compositions compared toSEM analysis Moreover it was reported in other studies that differenthydrate phases occur depending on the amount of supplied ions and onthe experimental settings In compounds with a high content of Al3+formation of katoite could be observed (Klimesch and Ray 1998 Riacuteoset al 2009 Matsui et al 2011) In the case of a longer curing durationinstead of 11 Aring tobermorite the formation of xonotlite (Siauciunas andBaltakys 2004 Galvaacutenkovaacute et al 2018) or - depending on the finenessof used silica source (Siauciunas and Baltakys 2004) - gyrolite is fa-voured
Kalousek (1956) suggested that tobermorite can contain up to 5Al2O3 More Al2O3 in the system resulted in the formation of hydro-garnet Klimesch and Ray (1998) additionally investigated the stabilityof hydrogarnet depending on the Al(Si + Al) ratio and its role in re-lation to the formation of 11 Aring tobermorite in an equivalent systemThey suggest that hydrogarnet always appears before tobermorite butthe former can only be detected for higher Al(Si + Al) ratios in theevent of longer curing times Riacuteos et al (2009) and Qu et al (2018)confirmed these findings in extensive investigations In the latter pub-lication it is additionally suggested that samples prepared at lowertemperatures (160 degC) are less impacted by the supply of Al3+ Theyalso consider the peak broadening of tobermorite in their XRD plotsbased on the amount of incorporated Al3+ In two recent publicationswe suggested that the peak broadening of tobermorite enables a mi-crostructural analysis by calculating the orientation dependent domainsizes (Schreiner et al 2018 2019) However these studies are based onsamples of industrially produced AAC so that the curing time was fixedThe studied AAC was produced from raw materials with a broad che-mical spectrum such as ordinary Portland cement (OPC) whichsomehow complicates the interpretation of results
In this work the influence of aluminum ions - provided by meta-kaolin - on dominant crystallographic direction-dependent domaingrowth of tobermorite is investigated by analysis of anisotropic peakbroadening (Ectors et al 2015 2017) In Fig 1 of the supplementarymaterial the method of fitting the anisotropic peak broadening of to-bermorite using a triaxial cylinder model is visualized (Schreiner et al2018) Fitting of the anisotropic peak broadening of tobermorite Thismethod is used to calculate the average and reliable values for to-bermorite domain sizes in the powder sample and associate them withaverage Al3+ incorporation Microstrain should be considered becauseit is an additional source of peak broadening However this usually
accounts for materials that have been exposed to different kinds ofstress such as metals and alloys (Badawi et al 2019) In addition theinstrumental contribution to peak broadening should be consideredHydration products such as tobermorite are characterized by crystallitesizes in the range of nanometers so that anisotropic size broadeningclearly outweighs the effect of instrumental broadening (Jenkins andSnyder 1996) Moreover the impact of Al3+ on the lattice parametersof tobermorite is considered It should additionally be clarified whe-ther the results from our previous publication (Schreiner et al 2019)based on industrially produced AAC can be confirmed by investigationwith less complex raw mixes and purely based on laboratory experi-ments
2 Material and methods
21 Starting materials
The starting materials for hydrothermal synthesis included deio-nized water quartz flour portlandite (999 pure) and two types ofmetakaolin One type was ordinary commercially available metakaolin(MK) with nearly a stoichiometric composition For comparison thesecond type of commercially available metakaolin was a by-productfrom expanded glass production (MKg) and consequently highly im-pure The chemical composition of MK and MKg determined by XRF isgiven in Table 1 With MKg containing less Al2O3 but considerably moreNa2O than MK the effects on hydrothermal synthesis were of interestBoth types of metakaolin have been characterized in previous pub-lications (Schmidt et al 2012 Naber et al 2019) In addition weverified the mineral phase content by XRD analysis Besides amorphousmetakaolin MK contained minor amounts of anatase quartz and mica
Fig 1 Weight fractions of tobermorite quartz and katoite determined byquantitative XRD analysis ndash samples including MKg crosshatched
Table 1Chemical composition of MK and MKg determined by XRF analysis ndash majorcontrasts in bold letters
Oxides [wt-] MK MKg
SiO2 536 604Al2O3 392 206CaO 01 40MgO 01 12Na2O 0 96K2O 10 18Fe2O3 18 05TiO2 21 03P2O5 01 02Loss on ignition 15 1
J Schreiner et al Applied Clay Science 185 (2020) 105432
2
6 Publications
32
MKg contained additional kaolinite feldspar and quartz
22 Investigated mix composites
For the preparation of raw mixtures the powders were weighed andhomogenized using a lab-scale mixing mill Table 2 lists the composi-tion and nomenclature of all samples including Al2O3 content andcuring time in the autoclave
bull Besides one blank mixture (MK0) that did not contain any type ofmetakaolin eleven more compounds were prepared of which threeincluded different dosages of MKg (MKg16 MKg23 and MKg60)Three more mixes contained equivalent amounts of MK instead ofMKg (MK16 MK23 and MK60) These mixes were investigated inorder to have a direct comparison concerning the effects of differentraw material on the synthesis of tobermorite
bull Additionally the mixes MK9 MK5 and MK25 with lower dosages ofmetakaolin were analyzed In the referenced literature (Schreineret al 2019) the effect of Al3+ on the anisotropic peak broadeningof tobermorite could only be observed in the case of Al2O3 contentslower than 4 in the drymix In the latter three mixes Al2O3 con-tents range from 1 to 35 Al2O3 (calculated from XRF data) whichmeets the region of interest for the analysis of tobermorite domainmorphology
bull The curing time for nearly all of the investigated samples was 12 hbut compound MK9 was prepared two more times for curing timesof 2 h and 6 h The different curing times were chosen in this par-ticular sample so that the reactivity of metakaolin and the phasetransitions could be observed more precisely
23 Hydrothermal treatment
Due to the different fineness of raw materials there was a differentwater demand from one mixture to another In order to obtain slurriesof comparable rheology the amount of water was adapted respectivelyresulting in water-to-solid ratios of 25 to 3 which matches the sug-gested water-to-solid ratio for this purpose (Roacutezycka et al 2014Galvaacutenkovaacute et al 2018) The weighed water was added to the dry mixand after stirring for 1 min at 23 degC the slurry was poured into thereactor Minor changes in the quantity of added water did not have aninfluence on the measured steam pressure All experiments were con-ducted using a PTFE-lined stainless steel autoclave with a reactor vo-lume of 300 ml The oven temperature was fixed at 180 degC and auto-genous steam pressure of 11ndash12 MPa was measured during eachexperiment with an external manometer After cooling to room tem-perature the sample was removed from the reactor coarsely ground
using an agate mortar and dried at 60 degC for 12 h After drying thesample was ground with an agate mortar again in order to deagglo-merate the particles As no coarse raw materials were used there wasno need for wet McCrone milling (Schreiner et al 2018)
24 XRD analysis
After preparation into front-loading sample holders the powdersamples were measured with a D8 diffractometer (Bruker) equippedwith a LynxEye detection system and Bragg-Brentano geometry Thesettings for XRD analysis included a tube voltage of 40 kV a current of40 mA an angular range from 6 to 80deg 2θ (Cu Kα radiation) a time perstep of 054 s a step width of 00236deg 2θ and a PSD opening of 33deg Thebackground was fitted with Chebyshev polynomial of the fifth orderThe major contribution of amorphous phase was fitted with a singlepeak with a fixed position at 308deg 2θ so that tobermorite reflectionswere not affected An external quartzite standard was measured withthe same parameters in order to determine phase quantities (Jansenet al 2011) Bruker AXS software TOPAS 50 was used for Rietveldrefinement (Rietveld 1969) and the used structures are shown inTable 3
3 Results and discussion
31 Different dosages of MK and MKg
In Fig 1 the quantities of tobermorite quartz and katoite present inmost of the samples determined by XRD analysis are illustratedWhenever tobermorite was the leading mineral hydrate phase a basalspacing of 113 Aring could be verified in each of the diffractograms Thequantities of minor crystalline phases and amorphous content are notshown For low dosages of MK it can be seen that the weight fraction oftobermorite decreased At moderate dosage of both types of metakaolin(MK16 MK23 MKg16 MKg23) tobermorite was present in comparablequantities It can be seen that the amount of katoite in the mixes de-pended on the dosage of metakaolin and it appeared only at dosages ofMK5 or more Due to the higher content of aluminum in MK comparedto MKg more katoite could always be observed in the MK mixes atequivalent dosages Despite equal amounts of quartz as starting mate-rial in mixes for both types of metakaolin the resulting weight fractionsin the cured samples were not alike Considerably more quartz waspresent in the MK samples Even though less quartz was used for mixescontaining higher amounts of MK even more quartz was present afterhydrothermal curing (Table 2 Fig 1) Consequently some of the SiO2
provided by MK did not transform into an amorphous phase or to-bermorite but into quartz This finding is verified by the presence ofquartz in MK60 because no quartz was included in the raw mixture Thefeldspar present in MKg did not react so Na2O and an unknown amountof Al2O3 may not have been supplied for hydrothermal reaction Besidestobermorite and quartz additional calcite scawtite (Ca7Si6(CO3)
Table 2Basic powder compounds prepared for the hydrothermal synthesis of to-bermorite with the respectively calculated Al2O3 content and curing time in thereactor
Sample Portlandite[wt-]
Quartz[wt-]
MK[wt-]
MKg
[wt-]
Al2O3
[wt-]Curingtime [h]
MK0 49 51 ndash ndash 0 12MK25 495 48 25 ndash 1 12MK5 49 46 5 ndash 2 12MK9_2h 48 43 9 ndash 35 2MK9_6h 48 43 9 ndash 35 6MK9_12h 48 43 9 ndash 35 12MK16 47 37 16 ndash 63 12MK23 46 31 23 ndash 9 12MK60 40 ndash 60 ndash 235 12MKg16 47 37 ndash 16 33 12MKg23 46 31 ndash 23 47 12MKg60 40 ndash ndash 60 124 12
Table 3Structural data used for the investigation with powder XRD analysis
Phase Author
Anatase (Horn et al 1972)Biotite (Brigatti et al 2000)Calcite (Maslen et al 1995)Kaolinite (Zvyagin 1960)Katoite (Bartl 1969)Microcline (Bailey 1969)Plazolite (Basso et al 1983)Portlandite (Busing and Levy 1957)Quartz (Le Page and Donnay 1976)Scawtite (Grice 2005)Tobermorite (Hamid 1981)Xonotlite (Hejny and Armbruster 2001)
J Schreiner et al Applied Clay Science 185 (2020) 105432
3
6 Publications
33
O18bull2(H2O)) and xonotlite (Ca6Si6O17(OH)2) could be identified insample MK0 (XRD plots of samples MK0 MKg16 MKg23 MK16 andMK23) Comparing MK0 and MK25 scawtite and xonotlite could stillbe identified in a very low amount in MK25 but no longer in samplesthat contained even more MK (XRD plots of samples MK0 MK25 MK5and MK9_12h)
Two additional experiments were done without quartz in the rawmixes (MK60 and MKg60) The according diffractograms after hydro-thermal curing are shown in Fig 2 In sample MKg60 tobermorite (gt 50wt-) was successfully synthesized without any other silica sourcethan MKg whereas no crystalline quartz occurred By contrast no to-bermorite but quartz could be identified in equivalent mixture MK60containing MK It can be seen that crystalline components such as micaand anatase in the raw MK did not react at the selected conditions andremained present in the autoclaved samples Except for feldspar in MKgall of the crystalline components appeared to be reactive at the chosenhydrothermal conditions A minor unidentified phase occurred at328deg2θ and additional xonotlite was identified in sample MKg60 Insample MK60 more calcium was needed for the formation of morehydrogarnet (Fig 1) resulting in a lower CaSi ratio for the remainingsystem Sample MKg60 contained only half of the amount of Al3+ and itwas not completely supplied for reaction due to its partial presence infeldspar Consequently essentially less hydrogarnet (Fig 1) was presentin MKg60 after hydrothermal treatment and the CaSi ratio in the re-maining system was affected to a lesser extent
32 Application of MK for different curing times
The development of hydrate phases in the autoclave for compoundMK9 is displayed in Fig 3 After only 2 h of hydrothermal curing all ofthe available portlandite had reacted and katoite (95 wt-) was pre-sent The applied type of metakaolin appeared to react quickly as itsupplied aluminum for formation of katoite No formation of to-bermorite could be observed at this stage yet An assumably amorphousprecursor can be seen at 28 to 30deg2θ Calcium was provided by thedissolution of portlandite After 6 h of hydrothermal reaction amountsof katoite (85 wt-) and quartz (from 31 wt- at 2 h to 165 wt- at6 h) had decreased and a major amount of tobermorite (35 wt-) waspresent Apparently between 2 and 6 h under hydrothermal conditionsthe amorphous precursor and quartz reacted resulting in the formationof tobermorite An additional 6 h of reaction time (MK9_12h) did notchange the phase composition significantly Slightly more tobermorite
(365 wt-) less quartz (16 wt-) and katoite (65 wt-) weremeasured
33 Tobermorite domain morphology and lattice parameters
In the referenced literature an analysis of tobermorite domainmorphology based on anisotropic peak broadening was possible forsamples that contained notgt 4 wt- Al2O3 in the drymix (Schreineret al 2019) Accordingly in this study samples MK0 MK25 MK5MK9_6h and MK9_12h were suitable (Table 2) with MK9_2h not con-taining any tobermorite In Fig 4 the respective growth in a and b di-rection is visualized with x indicating the domain size in a direction andy indicating domain size in b direction using a macro for TOPAS 50(Ectors et al 2015 2017) The calculated cylinder models in Fig 4represent the relation of yx and not absolute sizes With no supply ofaluminum ions (MK0) the relative domain growth in b direction islower compared to samples containing metakaolin This finding agreeswith the results from a similar investigation of tobermorite in AAC(Schreiner et al 2019) However within the samples MK5 andMK9_12h the different amounts of supplied aluminum ions did notshow a clear effect It appeared that low dosages of Al3+ (1 wt- Al2O3
in MK25 and 2 wt- Al2O3 in MK5) were enough to determine thedomain growth of tobermorite Additional results from the samplesMK9_6h and MK9_12h indicated that growth in b direction increasedwith reaction time
In Fig 5 lattice parameters of tobermorite depending on metakaolindosages are plotted B clearly remained unaffected throughout therange of samples Increasing amounts of metakaolin led to a slightlysmaller parameter a However both types of metakaolin showed acorresponding impact on parameter a By contrast parameter c in-creased strongly with increasing amounts of MK and MKg but the typeof metakaolin was significant At an equivalent dosage MK affected thecell dimension in c direction considerably more than MKg so that thefraction of Al3+ appeared to be the decisive parameter Different metaloxides in MKg did not show a notable effect certainly as they werepartially not provided for reaction Unlike for the domain morphologyof tobermorite the impact on lattice parameters could be observedwithin the complete range of examined dosages
4 Conclusions
The results obtained from the introduced investigations allow con-cluding remarks on the effects of the applied types of metakaolin on thesynthesis of 11 Aring tobermorite the phase transitions and the in-corporation of Al3+ into the lattice of tobermorite
With a critical dosage the use of any type of metakaolin led to theformation of katoite in an according amount At moderate dosages(MKg16 MKg23 MK16 and MK23) the two types of metakaolin showeda good correspondence in consideration of the quantities of to-bermorite For higher dosages there were contrary effects Lower do-sages of MK led to considerable quantities of Al-substituted to-bermorite Samples containing low dosages of MK revealed that katoiteappeared in the case ofgt 5 wt- of MK - corresponding to 2 wt-Al2O3 - in the basic compound Minor crystalline phases in MKg showedbetter reactivity than those in MK The observation that no tobermoritewas present in sample MK60 indicated that high dosages of Al3+ hin-dered the formation of tobermorite
Investigations of MK9 at 2 6 and 12 h displayed the evolution ofhydrate phases At first katoite was the only crystalline hydrate phasepresent after 2 h which corresponded to observations in a differentpublication (Klimesch and Ray 1999) The amount of katoite andquartz then decreased and a major amount of tobermorite formed from2 to 6 h curing time In order to gain more information on the trans-formation of amorphous C-(A)-S-H into tobermorite additional ex-periments in the range of 2 to 6 h curing time will be needed
Domain morphology analysis of tobermorite revealed that low
Fig 2 Diffractograms of MKg MKg60 MK and MK60 from 7 to 34deg2θ CuKα Aanatase C calcite F feldspar k kaolinite K katoite M mica Q quartz Ttobermorite U unidentified phase X xonotlite
J Schreiner et al Applied Clay Science 185 (2020) 105432
4
6 Publications
34
dosages of Al3+ determined the domain growth which agreed with theresults published on tobermorite in AAC samples (Schreiner et al2019) Different curing times unveiled that growth in b direction in-creased with the reaction time Al3+ incorporation into the lattice oftobermorite only reflected to a limited extent in the domain mor-phology By contrast an increase of lattice parameter c was triggered byAl3+ even at the highest dosage in this study Ultimately there is no
evidence for a limit of incorporation of Al3+ but there is a limit ofinfluence on the domain morphology These results additionally re-confirm this assumption similarly made in the previous work (Schreineret al 2019) and suggest a new mechanism of tobermorite crystal-lization depending on the presence of Al3+
Supplementary data to this article can be found online at httpsdoiorg101016jclay2019105432
Declaration of Competing Interest
The authors declare that they have no known competing financialinterests or personal relationships that could have appeared to influ-ence the work reported in this paper
Acknowledgement
The authors thank Rodgauer Baustoffwerke GmbH amp Co KG forsupplying raw materials for laboratory experiments
References
Aguilar-Mamani W Garciacutea G Hedlund J Mouzon J 2014 Comparison betweenleached metakaolin and leached diatomaceous earth as raw materials for the synth-esis of ZSM-5 Springerplus 3 1ndash10 httpsdoiorg1011862193-1801-3-292
Ayodele OB Sulaimon AA Alaba PA Tian Z-Y 2019 Influence of metakaolini-zation temperature on the structure and activity of metakaolin supported Ni catalystin dry methane reforming J Environ Chem Eng httpsdoiorg101016jjece2019103239 (in press)
Badawi EA Abdel-Rahman MA Mostafa A Abdel-Rahman M 2019 Determinationof the crystallite size amp micro- strain by novel method from XRD profile Appl Phys2 1ndash15 httpsdoiorg1031058jap201921001
Bailey SW 1969 Refinement of an intermediate microcline structure Am Miner 541540ndash1545
Bartl H 1969 Roentgen-Einkristalluntersuchungen an (CaO)3 (Al2O3) (H2O)6 und an(CaO)12 (Al2O3)7 (H2O) neuer Vorschlag zur (CaO)12 (Al2O3)7-Struktur NeuesJahrb fuer Mineral Monatshefte 1969 404ndash413
Basso R Giusta AD Zefiro L 1983 Crystal structure refinement of plazolite A highlyhydrated natural hydrogrossular Neues Jahrb Miner Monatsh (Neues Jahrb fuerMineral Monatshefte) 1983 251ndash258
Brigatti MF Lugli C Poppi L Foord EE Kile DE 2000 Crystal chemical varia-tions in Li- and Fe-rich micas from Pikes Peak batholith (Central Colorado) AmMineral 85 1275ndash1286 httpsdoiorg102138am-2000-8-920
Busing WR Levy HA 1957 Neutron diffraction study of calcium hydroxide J ChemPhys 26 563 httpsdoiorg10106311743345
Chen L Wang Z Wang Y Feng J 2016 Preparation and properties of alkali acti-vated metakaolin-based geopolymer Materials (Basel) 9 1ndash12 httpsdoiorg103390ma9090767
Chucholowski C Holger M Thienel K-C 2018 Improving the recyclability en-vironmental compatibility and CO2 balance of autoclaved aerated concrete by re-placing sulfate carrier and cement with calcined clays CePapers 2 503ndash512httpsdoiorg101002cepa846
Fig 3 Diffractograms of MK9_2h MK9_6h and MK9_12h from 7 to 38deg2θ CuKα C calcite K katoite Q quartz T tobermorite
Fig 4 Relation of calculated domain sizes of 11 Aring tobermorite in selectedsamples (MK0 MK25 MK5 MK9_6h and MK9_12h) in a (x) and b (y) direction
Fig 5 Lattice parameters of tobermorite depending on MK or MKg dosageincluding blank mix MK0
J Schreiner et al Applied Clay Science 185 (2020) 105432
5
6 Publications
35
Demir İ Başpınar MS Kahraman E Ccedilalışkan E Goumlrhan G 2014 An investigationon the usability of diatomite in aerated concrete production In Proc of the IntlConf on Advances in Civil Structural and Construction Engineering ndash CSCE 2014 pp97ndash100
Ectors D Goetz-Neunhoeffer F Neubauer J 2015 A generalized geometric approachto anisotropic peak broadening due to domain morphology J Appl Crystallogr 48189ndash194 httpsdoiorg101107S1600576714026557
Ectors D Goetz-Neunhoeffer F Neubauer J 2017 Routine (an)isotropic crystallitesize analysis in the double-Voigt approximation done right Powder Diffract 3227ndash34 httpsdoiorg101017S0885715617000070
Galvaacutenkovaacute L Bartoniacutečkovaacute E Opravil T Tkacz J Ptaacuteček P 2018 The influence ofstarting materials solubility on tobermorite structure formation under the hydro-thermal conditions IOP Conf Ser Mater Sci Eng 379 1ndash8 httpsdoiorg1010881757-899X3791012001
Grice JD 2005 The structure of spurrite tilleyite and scawtite and relationships toother silicate-carbonate minerals Can Mineral 43 1489ndash1500 httpsdoiorg102113gscanmin4351489
Hamid SA 1981 The crystal structure of the 11 Aring natural tobermoriteCa225[Si3O75(OH)15]1H2O Zeitschrift fuer Krist 154 189ndash198 httpsdoiorg101524zkri19811543-4189
Hejny C Armbruster T 2001 Polytypism in xonotlite Ca6Si6O17(OH)2 Zeitschrift furKrist 216 396ndash408
Horn M Schwerdtfeger CF Meagher EP 1972 Refinement of the structure of ana-tase at several temperatures Zeitschrift fur Krist 136 273ndash281 httpsdoiorg101524zkri19721363-4273
Jansen D Goetz-Neunhoeffer F Stabler C Neubauer J 2011 A remastered externalstandard method applied to the quantification of early OPC hydration Cem ConcrRes 41 602ndash608 httpsdoiorg101016jcemconres201103004
Jenkins R Snyder R 1996 Introduction to X-ray Powder Diffractometry ChemicalAnalysis Wiley pp 90
Kalousek GL 1956 Crystal Chemistry of Hydrous Calcium Silicates J Am Ceram Soc40 74ndash80
Klimesch D Ray A 1998 Autoclaved cement-quartz pastes with metakaolin additionsAdv Cem Based Mater 7 109ndash118 httpsdoiorg101016S1065-7355(97)00073-4
Klimesch D Ray A 1999 DTA-TGA evaluations of the CaOndashAl2O3ndashSiO2ndashH2O systemtreated hydrothermally Thermochim Acta 334 115ndash122 httpsdoiorg101016s0040-6031(99)00140-9
Komarneni S Roy R Roy DM Fyfe CA Kennedy GJ Bothner-By AA Dadok JChesnick AS 1985 27Al and29Si magic angle spinning nuclear magnetic resonancespectroscopy of Al-substituted tobermorites J Mater Sci 20 4209ndash4214 httpsdoiorg101007BF00552416
Koutnyacute O Opravil T Pořiacutezka J 2014 Application of metakaoline in autoclavedaerated concrete technology Adv Mater Res 1000 174ndash177 httpsdoiorg104028wwwscientificnetAMR1000174
Le Page Y Donnay G 1976 Refinement of the crystal structure of low-quartz ActaCrystallogr Sect B 32 2456ndash2459 httpsdoiorg101107S0567740876007966
Luo H Law WW Wu Y Zhu W Yang EH 2018 Hydrothermal synthesis of needle-like nanocrystalline zeolites from metakaolin and their applications for efficient re-moval of organic pollutants and heavy metals Microporous Mesoporous Mater 2728ndash15 httpsdoiorg101016jmicromeso201806015
Maeda H Ogawa Y Ishida EH Kasuga T 2012 Hydrothermal synthesis of to-bermorite doped with phosphorus species for removing heavy metal ions J AustCeram Soc 48 8ndash11
Maslen EN Streltsov VA Streltsova NR Ishizawa N 1995 Electron density andoptical anisotropy in rhombohedral carbonates III Synchrotron Xray studies ofCaCO3 MgCO3 and MnCO3 Acta Crystallogr Sect B 51 929ndash939 httpsdoiorg101107S0108768195006434
Matekonis G Šiaučiūnas R Vaičiukynienė D 2010 Hydrothermal Synthesis andCharacterization of Na + and [ Al 3 + + Na + ] -substituted Tobermorite in CaO-SiO2middotnH2O-H2O System Mater Sci 16 242ndash248
Matsui K Kikuma J Tsunashima M Ishikawa T Matsuno S Ogawa A Sato M2011 In situ time-resolved X-ray diffraction of tobermorite synthesis process underhydrothermal condition IOP Conf Ser Mater Sci Eng 18 60ndash66 httpsdoiorg1010881757-899X182022017
Merlino S Bonaccorsi E Armbruster T 2000 The real structures of clinotobermoriteand tobermorite 9 Aring OD character polytypes and structural relationships Eur JMineral 12 411ndash429 httpsdoiorg1011270935-122120000012-0411
Monasterio M Gaitero JJ Manzano H Dolado JS Cerveny S 2015 Effect ofchemical environment on the dynamics of water confined in calcium silicate mi-nerals Natural and synthetic tobermorite Langmuir 31 4964ndash4972 httpsdoiorg101021acslangmuir5b00614
Mostafa NY 2005 Influence of air-cooled slag on physicochemical properties of auto-claved aerated concrete Cem Concr Res 35 1349ndash1357 httpsdoiorg101016jcemconres200410011
Mostafa NY Shaltout AA Omar H Abo-El-Enein SA 2009 Hydrothermal synth-esis and characterization of aluminium and sulfate substituted 11 nm tobermoritesJ Alloys Compd 467 332ndash337 httpsdoiorg101016jjallcom200711130
Naber C Stegmeyer S Jansen D Goetz-Neunhoeffer F Neubauer J 2019 ThePONKCS method applied for time resolved XRD quantification of supplementarycementitious material reactivity in hydrating mixtures with ordinary Portland ce-ment Constr Build Mater 214 449ndash457 httpsdoiorg101016jconbuildmat201904157
Qu X Zhao Z Zhao X 2018 Microstructure and characterization of aluminum-in-corporated calcium silicate hydrates (C-S-H) under hydrothermal conditions RSCAdv 8 28198ndash28208 httpsdoiorg101039c8ra04423f
Rashad AM 2013 Metakaolin as cementitious material history scours production andcomposition - a comprehensive overview Constr Build Mater 41 303ndash318 httpsdoiorg101016jconbuildmat201212001
Rietveld HM 1969 A profile refinement method for nuclear and magnetic structures JAppl Crystallogr 2 65ndash71 httpsdoiorg101107S0021889869006558
Riacuteos CA Williams CD Fullen MA 2009 Hydrothermal synthesis of hydrogarnet andtobermorite at 175 degC from kaolinite and metakaolinite in the CaO-Al2O3-SiO2-H2Osystem a comparative study Appl Clay Sci 43 228ndash237 httpsdoiorg101016jclay200809014
Roacuteżycka A Pichoacuter W 2016 Effect of perlite waste addition on the properties of au-toclaved aerated concrete Constr Build Mater 120 65ndash71 httpsdoiorg101016jconbuildmat201605019
Roacutezycka A Kotwica Ł Małolepszy J 2014 Synthesis of single phase gyrolite in theCaO-quartz-Na2O-H2O system Mater Lett 120 166ndash169 httpsdoiorg101016jmatlet201401003
Sauman Z 1974 Influence of SO4 2ndash ions on the formation of 11 Aring tobermorite InProceedings of the 2nd International Symposium on Science and Research in SilicateChemistry Moscow pp 25ndash39
Schmidt M Egersdoumlrfer A Poumlllmann H 2012 Increased reactivity using a glass-containing metakaolin as an active filler in lime-based binder systems ZKG Int 6554ndash62
Schreiner J Jansen D Ectors D Goetz-Neunhoeffer F Neubauer J Volkmann S2018 New analytical possibilities for monitoring the phase development during theproduction of autoclaved aerated concrete Cem Concr Res 107 247ndash252 httpsdoiorg101016jcemconres201802028
Schreiner J Goetz-Neunhoeffer F Neubauer J Volkmann S Bergold S Webler RJansen D 2019 Advanced Rietveld refinement and SEM analysis of tobermorite inchemically diverse autoclaved aerated concrete Powder Diffract 34 143ndash150httpsdoiorg101017s0885715619000149
Setthaya N Chindaprasirt P Pimraksa K 2016 Preparation of zeolite nanocrystals viahydrothermal and solvothermal synthesis using of rice husk ash and metakaolinMater Sci Forum 872 242ndash247 httpsdoiorg104028wwwscientificnetmsf872242
Siauciunas R Baltakys K 2004 Formation of gyrolite during hydrothermal synthesis inthe mixtures of CaO and amorphous SiO2 or quartz Cem Concr Res 34 2029ndash2036httpsdoiorg101016jcemconres200403009
Skawinska A Owsiak Z Baran T Hernik K 2017 The influence of halloysite ad-dition on tobermorite formation in CaO and quartz mix under hydrothermal condi-tions Cem Wapno Bet 17 426ndash434
Venhodovaacute E Janovskyacute R Drochytka R 2015 Formation of tobermorite at differentmaterials composition of aerated concrete Appl Mech Mater 752ndash753 247ndash250httpsdoiorg104028wwwscientificnetamm752-753247
Walczak P Małolepszy J Reben M Szymański P Rzepa K 2015 Utilization ofwaste glass in autoclaved aerated concrete Proc Eng 122 302ndash309 httpsdoiorg101016jproeng201510040
Zhang Y Gao W Cui L 2007 The transformation of acid leached metakaolin tozeolite beta Stud Surf Sci Catal 170 420ndash425 httpsdoiorg101016S0167-2991(07)80870-6
Zvyagin BB 1960 An attempt to electronographic determination of kaolinite structureJ Dokl Akad Nauk SSSR 130 1023ndash1026
J Schreiner et al Applied Clay Science 185 (2020) 105432
6
6 Publications
36
6 Publications
62 Advanced Rietveld refinement and SEM analysis oftobermorite in chemically diverse autoclaved aeratedconcrete
Following the copyright guidelines by Cambridge University Press the publication
Schreiner J Goetz-Neunhoeffer F Neubauer J Volkmann S Bergold S WeblerR Jansen D 2019 Advanced Rietveld refinement and SEM analysis of tobermorite inchemically diverse autoclaved aerated concrete Powder Diffraction 34 143ndash150 httpsdoiorg101017s0885715619000149
may not be reprinted It can be accessed at
httpswwwcambridgeorgcorejournalspowder-diffractionarticleadvanced-rietveld-refinement-and-sem-analysis-of-tobermorite-in-chemically-diverse-autoclaved-aerated-concrete51597C2A66F6F225D29DEB2675E74249
37
6 Publications
63 New analytical possibilities for monitoring the phasedevelopment during the production of autoclavedaerated concrete
Reprint of the peer reviewed publication
Schreiner J Jansen D Ectors D Goetz-Neunhoeffer F Neubauer J VolkmannS 2018 New analytical possibilities for monitoring the phase development during theproduction of autoclaved aerated concrete Cement and Concrete Research 107 247ndash252httpsdoiorg101016jcemconres201802028
with permission from Elsevier
38
Contents lists available at ScienceDirect
Cement and Concrete Research
journal homepage wwwelseviercomlocatecemconres
Short communication
New analytical possibilities for monitoring the phase development duringthe production of autoclaved aerated concrete
J Schreinera D Jansena D Ectorsa F Goetz-Neunhoeffera J Neubauera S Volkmannb
aUniversity of Erlangen-Nuremberg GeoZentrum Nordbayern Mineralogy Schlossgarten 5a 91054 Erlangen Germanyb Rodgauer Baustoffwerke GmbH amp Co KG Am Opel-Pruumlffeld 3 63110 Rodgau-Dudenhofen Germany
A B S T R A C T
This work presents improved analytical methods for both steps of the production process of autoclaved aeratedconcrete (AAC) the phase development during the hydration before autoclaving and during the autoclavingprocess itself The improvement includes new insights into preparation methods of AAC samples for powderdiffraction as well as Rietveld refinement strategies For the first time a new implementation for calculatinganisotropic crystal domain sizes is applied to major hydrate phases occurring during AAC production namelyportlandite during the hydration before autoclaving and tobermorite during the autoclaving process The cal-culation of anisotropic domain size growth which can be implemented in the Rietveld environment is based oncrystallographically and geometrically appropriate models The implementation of calculating anisotropic do-main sizes for the Rietveld software TOPAS 50 allows a superior Rietveld fit and a more accurate quantificationof the phase development Additionally it enables the tracking of growth mechanism of portlandite duringhydration
1 Introduction
Autoclaved aerated concrete (AAC) is known as a lightweight con-struction material which offers outstanding properties such as suffi-cient strength for construction in addition with excellent thermal in-sulation [12] AAC is produced by autoclaving from calcareous rawmaterials such as lime (CaO) and cement quartz sulfate carrier andother additives such as foaming agents and water
The production process (Fig 1) can be separated into the hydrationof the mixed slurry before the procedure of autoclaving and the auto-claving at elevated temperature (180 degC to 200 degC) under saturatedsteam pressure (12MPa) for several hours
The hydration process before autoclaving is necessary to achievesufficient strength in order to cut the green cake blocks as they shouldhave a specific shape and dimension after autoclaving Furthermorethe porous structure is generated by the foaming agent during hydra-tion in the first process step During autoclaving the final propertiesnamely strength and low thermal conductivity are achieved
It is already well understood that the autoclaving process leads tothe formation of several phases first of all tobermorite(Ca5Si6O16(OH)2lowast4H2O) [3ndash5] Newest research has shown im-pressively which reactions are running from the mineralogical point ofview Insitu XRD measurements were carried out during the
autoclaving process and the phase development was shown by plottingnormalized intensities [6] The study of Mitsuda et al [3] was mainlyfocused on the tracking of the phase evolution during the autoclavingprocess of AAC However their statements concerning phase evolutionare mainly based on XRD data and TGA measurements There is acommon agreement that the following reactions occur The consump-tion of the alite (OPC) leads to the formation of an initial C-S-H phaseduring the first processing step Portlandite which was initially formedduring the first process step (from CaO and C3S) further quartz and theC-S-H phase are consumed during autoclaving resulting in the crystal-lization of tobermorite Hence the crystallization process of to-bermorite as well as the crystal structure of tobermorite was an issue ofresearch and discussion over the last years and numerous publicationsto these topics are available Concerning the crystal structure of to-bermorite respectively the tobermorite supergroup a new publicationoutlines all important references and recommends a new nomenclature[7]
The presented study was performed to create new analytical possi-bilities for the characterization of the production process of AAC Bothof the production process steps are essential for the final productHence the present work focuses on crystallization of hydrate phases inboth processes
Firstly an external standard method [89] was published and
httpsdoiorg101016jcemconres201802028Received 6 October 2017 Received in revised form 1 February 2018 Accepted 26 February 2018
Corresponding authorsE-mail addresses juergenjsschreinerfaude (J Schreiner) danieljansenfaude (D Jansen)
Cement and Concrete Research 107 (2018) 247ndash252
0008-8846 copy 2018 Elsevier Ltd All rights reserved
T
6 Publications
39
recommended for the determination of absolute phase contents inmixtures with amorphous content It was shown that the method canabsolutely be recommended for hydrating cement pastes in which watercannot be quantified directly by XRD [10] This method seems to bevery promising for both the quantification of the hydration of the AACslurry before autoclaving and the quantification of the phase evolutionduring autoclaving inasmuch as both production steps form crystallineand amorphous phases
Secondly a new approach to anisotropic peak broadening due toanisotropic domain morphology which was developed [1112] is ap-plied to AAC samples to improve the fit of portlandite and tobermoriteby Rietveld refinement [13] By applying this approach the refinementof both portlandite and tobermorite should additionally lead to betterquantitative results as well as to better insights into the development ofthe domain size morphology of both phases formed
It was already shown that in a hydrating raw mixture for AAC twospecies of portlandite precipitate at 23 degC one showing dynamicallyanisotropic peak broadening and another one following the isotropictrend [14] The application of the anisotropic refinement model led toan improved fitting of portlandite Moreover the mechanism of aniso-tropic domain growth of portlandite was tracked
2 Materials and methods
In order to examine the hydration of the AAC slurry before auto-claving a mixture of the hydraulic reactive components was weighedand measured in-situ at a Bruker D8 diffractometer with a LynxEyedetection system
Ordinary Portland cement (OPC) was mixed with lime (CaO) andanhydrite (C$) The raw materials were taken from the same batches asfor the industrial samples The drymix (58 OPC 36 CaO and 6 C$by weight) was then mixed with water (ws= 08) and placed into anappropriate sample holder The samples were not aerated The slurrysamples were covered with a kapton film to avoid evaporation andcarbonation Diffractograms were recorded with an angular range from7 to 545deg 2θ and a step width of 0011deg 2θ Measurements were carriedout every 15min For each measurement 96 XRD patterns were re-corded over the first 24 h The temperature was fixed at 70 degC which isthe mean temperature generally prevailing in the industrial processduring hydration before autoclaving Rietveld refinement was carriedout using the G-factor method All structures used for Rietveld refine-ment are shown in Table 1
For investigation of the autoclaved samples five different specimenswere taken at different autoclaving times The specimens were takenout of a technical production process hence it was not possible to in-terrupt the process at an earlier time inasmuch it would lead to damageof a whole concrete production batch The specimens were firstly driedat 60 degC until weight constancy The whole blocks were then broken andstatistical samples of 20 g were taken In order to receive the right massattenuation coefficient (MAC) for G-factor method the loss on ignitionand the chemical composition (XRF) were determined For energydispersive XRF analysis (Spectro Xepos) tube voltage from 20 kV to50 kV and tube current from 08 to 20mA were used for differenttargets
The final sample preparation (grinding) before XRD measurementswas carried out using both an agate mortar and a McCrone micronizingmill for wet milling with isopropanol Both preparation methods wereapplied separately to see which one is suitable in order to get the bestpreparation for XRD investigations Six preparations were performed byone operator of which two were prepared with an agate mortar andfour with a McCrone mill For the McCrone milling 3 g of the sampleand 10ml of isopropanol were used for grinding for 12min The grainsize distribution of one sample prepared with an agate mortar and onesample prepared using a McCrone mill was measured by laser granu-lometry in isopropanol using a Mastersizer 3000 (MALVERN)
After milling the samples in these two ways for XRD analysis thepowders were prepared into a front loading sample holder and mea-sured Diffractograms were recorded with an angular range from 6 to80deg 2θ a step width of 00236deg 2θ and a time per step of 054 s Rietveldrefinement combined with external standard (G-factor) was applied inorder to get absolute quantities for each phase The refinement strategyfor portlandite and tobermorite in the TOPAS Launch Mode (TOPAS50 Bruker AXS) is attached as a Supplementary material file
3 Results and discussion
31 Hydration of the mixture before autoclaving
The hydration of the investigated paste before autoclaving isdominated by the hydration of the cement as well as the reaction of thefree lime (CaO) resulting in the formation of portlandite It can beclearly seen from Fig 2 that the hydration of the paste leads to theformation of ettringite portlandite and C-S-H phase For simplificationthe remaining phase developments are not shown in Fig 2 because theyare not in the focus of this study The hydration of CaO forming
Fig 1 Simplified process steps of AAC production and hydrate phase evolution
Table 1Structures used for Rietveld refinement
Phase Author
Alite [15]Anhydrite [16]Bassanite [17]Belite (β) [18]Belite (αprime) [19]Brownmillerite [20]C-S-H [21]Calcite [22]Ettringite [23]Gypsum [24]Hemicarbonate [25]Hydroxylellestadite [26]Lime (CaO) [27]Microcline [28]Portlandite [29]Quartz [30]Tobermorite [31]Tricalciumaluminate (cubic) [32]Tricalciumaluminate (orthorhombic) [33]PONCKS model for Water [21]
J Schreiner et al Cement and Concrete Research 107 (2018) 247ndash252
248
6 Publications
40
portlandite begins rapidly after the addition of water to the mixture andlime is fully consumed after only 1 h of hydration This translates into aquick rise of heat of hydration so that cement hydration is acceleratedwhich leads to further portlandite formation by the reaction of aliteEttringite formation stalls after few hours of hydration After 12 h et-tringite is partially decomposed probably due to sulfate depletion [9]
and poorly crystalline AFm phases (not shown in Fig 2) are formedIn Fig 3 it can be seen that in fact two generations of portlandite
are formed a 1st dominant generation showing anisotropic peakbroadening and 2nd one occurring considerably later following theisotropic domain size refinement which is usually carried out using theRietveld method This occurrence comes along firstly with lime hy-dration and secondly with alite hydration The expected quantity ofportlandite formed from lime hydration very well complies with the
Fig 2 Phase development in AAC paste on a laboratory scale before autoclaving ana-lyzed by in-situ XRD at 70 degC
Fig 3 Formation of two generations of portlandite by hydration of lime (1st) and C3S(2nd) at 70 degC before autoclaving with the major generation showing anisotropic peakbroadening
Fig 4 Biaxial cylinder domain size model of portlandite used for Rietveld refinement of anisotropic peak broadening
Fig 5 Morphological evolution of portlandite showing anisotropic domain size growthduring hydration at 70 degC
Fig 6 Comparison of quantification of crystalline quartz in samples prepared withMcCrone mill and agate mortar at different autoclaving times
J Schreiner et al Cement and Concrete Research 107 (2018) 247ndash252
249
6 Publications
41
quantity of the observed 1st generation The development of portlan-dite growth was already tracked in an equivalent slurry at 23 degC [14]Thus this observation confirms that the crystallinity of portlandite inmixtures for AAC production depends on the starting phase for hydra-tion as already indicated by Ectors [14]
Fig 4 shows the used biaxial cylindrical model for anisotropic do-main size calculation and the portlandite structure which was createdwith structural software VESTA 318 [34] Using the cylindrical ap-proach domain sizes in a (here equating to b) and c direction(dz= cylinder height) can be calculated which comes along with theexpected symmetrical parameters of portlandite
The 1st portlandite generation showing anisotropic domain growthcan be tracked in terms of cylinder diameter and height which is rea-lized in Fig 5 The blue cylinder represents the geometric approach andcylinder height and diameter are calculated newly for each range Thecylinder height remains rather stable throughout the hydration processwhile the cylinder diameter increases during the first hours of hydra-tion After 10 h of hydration the mean cylinder diameter no longer in-creases Consequently these observations match the results of the ex-aminations conducted at 23 degC [14] as well as the assumption thatdifferent mechanisms of growth exist for portlandite depending on the
hydration educt The maximum cylinder diameter is reached earlier inthis work very likely because of the higher hydration temperature
32 Quantification of the reactions during autoclaving
Autoclaved samples were ground with an agate mortar and com-pared to samples which were wet-ground with a McCrone mill Fig 6shows precisely that the determination of the amount of crystallinequartz is more reproducible in the two shown samples which were
Fig 7 2D XRD with Bruker GADDS-system plots of samples prepared with agate mortar and McCrone mill Coarse quartz grains are pointed out in the plot of the sample prepared withagate mortar
Fig 8 Particle size distribution of one sample prepared with an agate mortar and of onesample prepared with a McCrone mill measured by laser granulometry
Fig 9 Rietveld refinement for Tobermorite of autoclaved AAC sample by use of isotropicdomain size model (a) and of anisotropic domain size model (b)
J Schreiner et al Cement and Concrete Research 107 (2018) 247ndash252
250
6 Publications
42
prepared with a McCrone mill The high variance of crystalline quartzin the samples which were prepared with an agate mortar is a result ofinsufficient grinding and remaining of too large quartz grains Whenthis spottiness occurs a reliable quantification using the G-factormethod is not possible
The 2D XRD with Bruker GADDS-system plots in Fig 7 demonstratethe insufficient grinding when using an agate mortar compared to wetmilling with a McCrone mill Quartz would be overrepresented in a one-dimensional XRD pattern focusing on a section with bright spots (greenarrows) The lack of bright spots in the right plot shows that the quartzgrains are milled more thoroughly using a McCrone mill In Fig 8 theparticle size distribution after both ways of sample preparation iscompared Most grains in the sample prepared with an agate mortar arelarger than in the sample prepared with a McCrone mill The grain sizedistribution of the sample prepared with a McCrone mill complies withthe recommended particle size range for XRD analysis of under 5 to50 μm [3536] while the other sample exceeds the range
In Fig 9 Rietveld refinement of an autoclaved sample is shown Thedominant peaks at 77 290 and 301deg 2θ are attributed to tobermoriteIn the upper diagram (a) Rietveld refinement was carried out regularlycalculating isotropic domain sizes for tobermorite However the cal-culated fit differs significantly from the raw data It can be assumed thattobermorite shows a similar pattern to portlandite in terms of aniso-tropic peak broadening taking into account that tobermorite is as-signed to the orthorhombic crystal system Thus instead of a biaxialcylinder model an elliptic cylinder model (Fig 10 structure createdwith VESTA 318 [34]) was applied for the refinement in the lowerdiagram (b) The elliptic cylinder model is a sufficient approach to the
orthorhombic crystal system as it allows the distinction between do-main sizes in a b and c direction The fit is clearly superior using theanisotropic domain size model highlighted by the difference plot inFig 9b The comparison refinement with isotropic and anisotropic ap-proach was done for all of the five autoclaved samples In Fig 11 theresulting Rwp values for the whole pattern and the RBragg values of to-bermorite are shown The refinement using the anisotropic model leadsto both lower Rwp and RBragg values and consequently to a better fit anda more accurate quantification of tobermorite in all refined samples
4 Summary and conclusions
Improved analytical methods for both the phase developmentduring the hydration before autoclaving and during the autoclavingprocess of AAC are presented It could be shown that wet McCronemilling is the best way of preparation of AAC samples in order to obtainsuitable samples for powder diffraction A new approach to treat ani-sotropic domain sizes for Rietveld refinement could be successfullyapplied ndash with the benefit that portlandite and tobermorite in AACsamples could be refined more accurately using the Rietveld methodThus this application allows an improved quantification of the phasedevelopment during both of the production steps
For the future there are still plenty of possibilities to apply thepresented approach of calculating anisotropic domain sizes to AACproduction As exemplified with portlandite the mechanisms of growthof tobermorite can be tracked likewise during the autoclaving processIn addition the effect of variations in the chemical composition of AACraw mixtures on the crystal morphology of tobermorite can be ex-amined This leaves a new perspective to discuss the link between mi-neral phase morphology and the thermal and mechanical properties ofAAC
Acknowledgement
The autoclaved samples were generously provided by RodgauerBaustoffwerke GmbH amp Co KG The authors express gratitude for allsupport
Appendix A Supplementary data
Supplementary data to this article can be found online at httpsdoiorg101016jcemconres201802028
References
[1] MW Grutzeck Cellular concrete in M Scheffler P Colombo (Eds) CellularCeramics Wiley-VCH Weinheim 2005 pp 193ndash223
[2] M Haas The future of AAC ndash from a material scientists point of view inMC Limbachiya JJ Roberts (Eds) Autoclaved Aerated Concrete Taylor FrLondon 2005 pp 187ndash194
[3] T Mitsuda K Sasaki H Ishida Phase evolution during autoclaving process ofaerated concrete J Am Ceram Soc 75 (1992) 1858ndash1863
[4] N Isu H Ishida T Mitsuda Influence of quartz particle size on the chemical and
Fig 10 Triaxial cylinder domain size model of Tobermorite used for Rietveld refinement of anisotropic peak broadening
Fig 11 Comparison of Rwp and RBragg values of Rietveld refinements of autoclavedsamples and tobermorite using the isotropic and the anisotropic domain size model
J Schreiner et al Cement and Concrete Research 107 (2018) 247ndash252
251
6 Publications
43
mechanical properties of autoclaved aerated concrete (I) tobermorite formationCem Concr Res 25 (1995) 243ndash248
[5] NY Mostafa Influence of air-cooled slag on physicochemical properties of auto-claved aerated concrete Cem Concr Res 35 (2005) 1349ndash1357 httpdxdoiorg101016jcemconres200410011
[6] K Matsui J Kikuma M Tsunashima T Ishikawa S Matsuno A Ogawa M SatoIn situ time-resolved X-ray diffraction of tobermorite formation in autoclaved aer-ated concrete influence of silica source reactivity and Al addition Cem Concr Res41 (2011) 510ndash519
[7] C Biagioni S Merlino E Bonaccorsi The tobermorite supergroup a new no-menclature Mineral Mag 79 (2015) 485ndash495 httpdxdoiorg101180minmag2015079222
[8] BH OConnor MD Raven Application of the Rietveld refinement procedure inassaying powdered mixtures Powder Diffract 3 (1988) 2ndash6 httpdxdoiorg101017S0885715600013026
[9] D Jansen F Goetz-Neunhoeffer C Stabler J Neubauer A remastered externalstandard method applied to the quantification of early OPC hydration Cem ConcrRes 41 (2011) 602ndash608 httpdxdoiorg101016jcemconres201103004
[10] D Jansen C Stabler F Goetz-Neunhoeffer S Dittrich J Neubauer Does OrdinaryPortland Cement contain amorphous phase A quantitative study using an externalstandard method Powder Diffract 26 (2011) 31ndash38 httpdxdoiorg10115413549186
[11] D Ectors F Goetz-Neunhoeffer J Neubauer A generalized geometric approach toanisotropic peak broadening due to domain morphology J Appl Crystallogr 48(2015) 189ndash194 httpdxdoiorg101107S1600576714026557
[12] D Ectors F Goetz-Neunhoeffer J Neubauer Routine (an)isotropic crystallite sizeanalysis in the double-Voigt approximation done right Powder Diffract 32 (S1)(2017) 27ndash34 httpdxdoiorg101017S0885715617000070
[13] HM Rietveld A profile refinement method for nuclear and magnetic structures JAppl Crystallogr 2 (1969) 65ndash71 httpdxdoiorg101107S0021889869006558
[14] D Ectors Advances in the Analysis of Cementitious Reactions and Hydrate Phases(Doctoral Thesis) (2016) pp 12ndash14 (urnnbndebvb29-opus4-71743)
[15] AacuteG De La Torre S Bruque J Campo MAG Aranda The superstructure of C3Sfrom synchrotron and neutron powder diffraction and its role in quantitative phaseanalyses Cem Concr Res 32 (2002) 1347ndash1356 httpdxdoiorg101016S0008-8846(02)00796-2
[16] A Kirfel G Will Charge density in anhydrite CaSO4 from X-ray and neutrondiffraction measurements Acta Crystallogr Sect B Struct Crystallogr CrystChem 36 (1980) 2881ndash2890 httpdxdoiorg101107S0567740880010461
[17] C Bezou AN Christensen D Cox M Lehman A Nonat Structures cristallines deCaSO405H2O et CaSO406H2O Comptes Rendus Hebd Des Seacuteances lAcadeacutemieDes Sci Seacuterie 2 (312) (1991) 43ndash48
[18] KH Jost B Ziemer R Seydel Redetermination of the structure of β-dicalciumsilicate Acta Crystallogr Sect B Struct Crystallogr Cryst Chem 33 (1977)1696ndash1700 httpdxdoiorg101107S0567740877006918
[19] W Mumme LMD Cranswick BC Chakoumakos Rietveld crystal structure re-finements from high temperature neutron powder diffraction data for the poly-morphs of dicalcium silicate Neues Jahrb Fuer Mineral Abhandlungen 170 (1996)171ndash188
[20] A Colville S Geller The crystal structure of brownmillerite Ca2FeAlO5Crystallographica 50 (1971) 2311ndash2315 httpdxdoiorg101107S056774087100579X
[21] ST Bergold F Goetz-Neunhoeffer J Neubauer Quantitative analysis of C-S-H inhydrating alite pastes by in-situ XRD Cem Concr Res 53 (2013) 119ndash126 httpdxdoiorg101016jcemconres201306001
[22] EN Maslen VA Streltsov NR Streltsova N Ishizawa Electron density and op-tical anisotropy in rhombohedral carbonates III Synchrotron Xray studies ofCaCO3 MgCO3 and MnCO3 Acta Crystallogr Sect B 51 (1995) 929ndash939 httpdxdoiorg101107S0108768195006434
[23] G Renaudin Y Filinchuk J Neubauer F Goetz-Neunhoeffer A comparativestructural study of wet and dried ettringite Cem Concr Res 40 (2010) 370ndash375httpdxdoiorg101016jcemconres200911002
[24] WF Cole CJ Lancucki A refinement of the crystal structure of gypsumCaSO42H2O Acta Cryst B30 (1974) 921ndash929 httpdxdoiorg101107S0567740874004055
[25] T Runčevski RE Dinnebier OV Magdysyuk H Poumlllmann Crystal structures ofcalcium hemicarboaluminate and carbonated calcium hemicarboaluminate fromsynchrotron powder diffraction data Acta Crystallogr Sect B Struct Sci 68 (2012)493ndash500 httpdxdoiorg101107S010876811203042X
[26] JM Hughes JW Drexler Cation substitution in the apatite tetrahedral site crystalstructures of type hydroxylellestadite and type fermorite Neues Jahrb FuerMineral (1991) 327ndash336
[27] CH Shen RS Liu JG Lin CY Huang Phase stability study of La12Ca18Mn2O7Mater Res Bull 36 (2001) 1139ndash1148
[28] SW Bailey Refinement of an intermediate microcline structure Am Miner 54(1969) 1540ndash1545
[29] WR Busing HA Levy Neutron diffraction study of calcium hydroxide J ChemPhys 26 (1957) 563 httpdxdoiorg10106311743345
[30] Y Le Page G Donnay Refinement of the crystal structure of low-quartz ActaCrystallogr Sect B 32 (1976) 2456ndash2459 httpdxdoiorg101107S0567740876007966
[31] SA Hamid The crystal structure of the 11 Aring natural tobermoriteCa225[Si3O75(OH)15]1H2O Zeitschrift Fuer Krist - New Cryst Struct 154 (1981)189ndash198 httpdxdoiorg101524zkri19811543-4189
[32] P Mondal JW Jeffery The crystal structure of tricalcium aluminate Ca3Al2O6Acta Crystallogr B 31 (1975) 689ndash697 httpdxdoiorg101107S0567740875003639
[33] Y Takeuchi F Nishi I Maki Crystal-chemical characterization of the tricalciumaluminate-sodium oxide (3CaOtimesAl2O3-Na2O) solid-solution series Zeitschrift FuumlrKrist (1980) 259ndash307
[34] K Momma F Izumi VESTA 3 for three-dimensional visualization of crystal vo-lumetric and morphology data J Appl Crystallogr 44 (2011) 1272ndash1276 httpdxdoiorg101107S0021889811038970
[35] K Scrivener R Snellings B Lothenbach A Practical Guide to MicrostructuralAnalysis of Cementitious Materials CRC Press 2016 pp 123ndash125 httpdxdoiorg107693wl20150205
[36] V Pecharsky P Zavalij Fundamentals of Powder Diffraction and StructuralCharacterization of Materials Springer second edition 2005 p 302 httpdxdoiorg101007978-0-387-09579-0
J Schreiner et al Cement and Concrete Research 107 (2018) 247ndash252
252
6 Publications
44
7 Acknowledgement
7 Acknowledgement
Ich moumlchte mich bei einigen Personen bedanken ohne die es wohl kaum zum erfolgreichenAbschluss dieser Arbeit gekommen waumlreMein Doktorvater Prof Dr Juumlrgen Neubauer hat sich stets die Zeit genommen die noumltigwar um Angelegenheiten aller Art mit mir zu klaumlren Er gab mir fachlich immer zumrichtigen Zeitpunkt einen gewissen wissenschaftlichen Impuls Zugleich habe ich mich den-noch immer frei in meiner eigenen Konzeption gefuumlhlt Groszligen Dank spreche ich Prof DrFriedlinde Goumltz-Neunhoeffer aus die fuumlr mich ebenso immer eine verlaumlssliche Ansprech-partnerin fuumlr fachliche und organisatorische Angelegenheiten aller Art war Danke anDr Daniel Jansen fuumlr die gute Zusammenarbeit und dafuumlr dass er mich im Zuge meinerMasterarbeit in ein Forschungsprojekt aufgenommen hat das den Weg zur Promotionmoumlglich machte Zusaumltzlich gilt mein Dank Prof Dr Matthias Goumlbbels der fuumlr dieMitarbeiter am Lehrstuhl immer motivierende Worte fand Fuumlr die Ermoumlglichung meinerTeilnahme an diversen Dienstreisen Fortbildungen und Tagungen moumlchte ich mich viel-mals bedankenWeiterhin bedanke ich mich bei Dr Stephan Volkmann und den Rodgauer BaustoffwerkenGmbH amp Co KG fuumlr die gute Zusammenarbeit und die Bereitstellung von Versuchsma-terialienVielen Dank an meine studentischen Hilfskraumlfte Daniel Wagner Laura MoldenhauerFabian Lang Jakob Schreiber und Felix Klaassen die alle Aufgaben im Labor einwand-frei und mit Bedacht erledigten Bei meinen aktuellen und ehemaligen Kollegen DrKatrin Hurle Dr Dominique Ectors Dr Christoph Naber Dr Florian Huumlller JoumlrgNehring Frank Riedel Julian Wolf Tanja Manninger Daniel Wagner Nicolas FobbeKarla Spaumlth Julian Goergens Andreas Koumlhler Cordula Jakob Franz Becker und LisaKlemenz bedanke ich mich fuumlr die gelungene Zusammenarbeit und gegenseitige Unter-stuumltzung Besonderer Dank geht auch an Kerstin Kreszlig Bettina Engl Christian HankeBernd Schleifer und Christian Abe fuumlr die verlaumlssliche Unterstuumltzung bei technischen Fra-gen und Messungen im LaborFuumlr jegliche Unterstuumltzungen moumlchte ich mich auch bei meinen Eltern bedanken sowiebei meinem Bruder Ralf der mir mit einem LaTex Crashkurs viel Frustration ersparthat Danke Thomas dass du immer fuumlr mich da bist und mit mir zusammen fuumlr genugAusgleich gesorgt hast
45
5 References
5 References
[1] A E Zadov A I Grabezhev N N Pertsev N V Chukanov and S V PribavkinTobermorite-plombierite metasomatites of the Gumeshevsk skarn-porphyry copper depositmiddle Urals Doklady Earth Sciences 407(3)495ndash497 2006
[2] M F Heddle Preliminary notice of substances which may prove to be new minerals MinMag 4117ndash123 1880
[3] S Merlino E Bonaccorsi and T Armbruster The real structure of tobermorite 11AringNormal and anomalous forms OD character and polytypic modifications European Journalof Mineralogy 13(3)577ndash590 2001
[4] C Biagioni S Merlino and E Bonaccorsi The tobermorite supergroup a new nomencla-ture Mineralogical Magazine 79(2)485ndash495 2015
[5] C A Riacuteos C D Williams and M A Fullen Hydrothermal synthesis of hydrogarnetand tobermorite at 175 degC from kaolinite and metakaolinite in the CaO-Al2O3-SiO2-H2Osystem A comparative study Applied Clay Science 43(2)228ndash237 2009
[6] X Qu Z Zhao and X Zhao Microstructure and characterization of aluminum-incorporated calcium silicate hydrates (C-S-H) under hydrothermal conditions RSC Ad-vances 8(49)28198ndash28208 2018
[7] R Šiaučiunas and K Baltakys Formation of gyrolite during hydrothermal synthesis inthe mixtures of CaO and amorphous SiO2 or quartz Cement and Concrete Research34(11)2029ndash2036 2004
[8] E Venhodovaacute R Janovskyacute and R Drochytka Formation of Tobermorite at Different Ma-terials Composition of Aerated Concrete Applied Mechanics and Materials 752-753247ndash250 2015
[9] L Galvaacutenkovaacute E Bartoniacutečkovaacute T Opravil J Tkacz and P Ptaacuteček The influence ofstarting materials solubility on tobermorite structure formation under the hydrothermalconditions IOP Conference Series Materials Science and Engineering 379(1)1ndash8 2018
[10] T Mitsuda K Sasaki and H Ishida Phase Evolution during Autoclaving Process J AmCeram Soc 75(75)1858ndash1863 1992
[11] A Skawińska The influence of metahalloysite addition on tobermorite formation studied byX-ray powder diffraction and scanning electron microscope MATEC Web of Conferences16305008 2018
[12] S T Bergold F Goetz-Neunhoeffer and J Neubauer Quantitative analysis of C-S-H in
25
5 References
hydrating alite pastes by in-situ XRD Cement and Concrete Research 53119ndash126 2013
[13] O P Shrivastava and F P Glasser Ion-exchange properties of 11-Aring tobermorite Reactivityof Solids 2(3)261ndash268 1986
[14] H Maeda Y Ogawa E H Ishida and T Kasuga Hydrothermal synthesis of tobermoritedoped with phosphorus species for removing heavy metal ions Journal of the AustralianCeramic Society 48(1)8ndash11 2012
[15] O P Shrivastava and R Shrivastava Cation exchange applications of synthetic tobermoritefor the immobilization and solidification of cesium and strontium in cement matrix Bulletinof Materials Science 23(6)515ndash520 2000
[16] G Renman and A Renman Sustainable Use of Crushed Autoclaved Aerated Concrete(CAAC) as a Filter Medium in Wastewater Purification 8th International conferenceon sustainable management of waste and recycled materials in construction GothenburgSweden 30 Mayndash1 June 2012 Proceedings pages 1ndash7 2012
[17] G Schober Chemical transformations during the manufacturing of autoclaved aeratedconcrete (ACC) Cement lime gypsum and quartz sand become cellular concrete ZKG58(7)63ndash70 2005
[18] A J Hamad Materials Production Properties and Application of Aerated LightweightConcrete Review International Journal of Materials Science and Engineering 2(2)152ndash157 2014
[19] D Ectors F Goetz-Neunhoeffer and J Neubauer A generalized geometric approach toanisotropic peak broadening due to domain morphology Journal of Applied Crystallogra-phy 48(1)189ndash194 2015
[20] H M Rietveld A profile refinement method for nuclear and magnetic structures Journalof Applied Crystallography 2(2)65ndash71 1969
[21] S A Hamid The crystal structure of the 11 Aring natural tobermoriteCa225[Si3O75(OH)15]1H2O Zeitschrift fuer Kristallographie - New Crystal Struc-tures 154(3-4)189ndash198 1981
[22] S A S El-Hemaly T Mitsuda and H F W Taylor Synthesis of normal and anomaloustobermorites Cement and Concrete Research 7429ndash438 1977
[23] M Sakiyama and T Mitsuda Hydrothermal reaction between C-S-H and kaolinite for theformation of tobermorite at 180degC Cement and Concrete Research 7(6)681ndash685 1977
[24] E Bonaccorsi S Merlino and A R Kampf The crystal structure of tobermorite 14 Aring(plombierite) a C-S-H phase Journal of the American Ceramic Society 88(3)505ndash5122005
[25] S Merlino E Bonaccorsi and T Armbruster The real structures of clinotobermorite andtobermorite 9 Aring OD character polytypes and structural relationships European Journalof Mineralogy 12(2)411ndash429 2000
[26] K Momma and F Izumi VESTA 3 for three-dimensional visualization of crystal volu-metric and morphology data Journal of Applied Crystallography 44(6)1272ndash1276 2011
26
5 References
[27] S Shaw S M Clark and C MB Henderson Hydrothermal formation of the calcium sil-icate hydrates tobermorite (Ca5Si6O16(OH)2 middot 4H2O) and xonotlite (Ca6Si6O17(OH)2)An in situ synchrotron study Chemical Geology 167(1-2)129ndash140 2000
[28] K Matsui J Kikuma M Tsunashima T Ishikawa S Matsuno A Ogawa and M SatoIn situ time-resolved X-ray diffraction of tobermorite synthesis process under hydrothermalcondition IOP Conference Series Materials Science and Engineering 18(2)60ndash66 2011
[29] G Matekonis R Šiaučiunas and D Vaičiukyniene Hydrothermal Synthesis and Charac-terization of Na + and [ Al 3 + + Na + ] -substituted Tobermorite in CaO-SiO2middotnH2O-H2OSystem MATERIALS SCIENCE 16(3)242ndash248 2010
[30] G Geng R J Myers M J A Qomi and P JM Monteiro Densification of the inter-layer spacing governs the nanomechanical properties of calcium-silicate-hydrate ScientificReports 7(1)1ndash8 2017
[31] D Klimesch and A Ray Autoclaved cement-quartz pastes with metakaolin additionsAdvanced Cement Based Materials 7(3-4)109ndash118 1998
[32] N Y Mostafa A A Shaltout H Omar and S A Abo-El-Enein Hydrothermal synthesisand characterization of aluminium and sulfate substituted 11 nm tobermorites Journal ofAlloys and Compounds 467(1-2)332ndash337 2009
[33] İ Demir M S Başpınar E Kahraman E Ccedilalışkan and G Goumlrhan An Investigation onthe Usability of Diatomite in Aerated Concrete Production In Proc of the Intl Conf onAdvances In Civil Structural And Construction Engineering - CSCE 2014 pages 97ndash1002014
[34] A Skawinska Z Owsiak T Baran and K Hernik The influence of halloysite additionon tobermorite formation in CaO and quartz mix under hydrothermal conditions CementWapno Beton 17(12)426ndash434 2017
[35] N Y Mostafa Influence of air-cooled slag on physicochemical properties of autoclavedaerated concrete Cement and Concrete Research 35(7)1349ndash1357 2005
[36] D Małaszkiewicz and J Chojnowski Influence of addition of calcium sulfate dihydrate ondrying of autoclaved aerated concrete Open Engineering 7(1)273ndash278 2017
[37] N Hara and N Inoue Thermal behaviour of 11Aring tobermorite and its lattice parametersCement and Concrete Research (10)53ndash60 1980
[38] M D Jackson S R Chae S R Mulcahy C Meral R Taylor P Li A H EmwasJ Moon S Yoon G Vola H R Wenk and P JM Monteiro Unlocking the secretsof Al-tobermorite in Roman seawater concrete American Mineralogist 98(10)1669ndash16872012
[39] W Liao W Li Z Fang C Lu and Z Xu Effect of different aluminum substitution rateson the structure of Tobermorite Materials 12(22)1ndash10 2019
[40] D Klimesch and A Ray DTA-TG Study of the CaO-SiO2-H2O and CaO-Al2O3-SiO2-H2OSystems Under Hydrothermal Conditions Journal of Thermal Analysis and Calorimetry56(1)27ndash34 1999
27
5 References
[41] Z Sauman and Z Valtr Substitution of sulphate ions in the crystal lattice of 11 Aring to-bermorite In The VI International Congress on the Chemistry of Cement pages 1ndash14Moscow 1974
[42] G Schober Reaction of raw materials to the final product AAC httpwwwpb-aacde
chemmin2_ehtml 2012 accessed 2020-01-31
[43] D Jansen C Stabler F Goetz-Neunhoeffer S Dittrich and J Neubauer Does Ordi-nary Portland Cement contain amorphous phase A quantitative study using an externalstandard method Powder Diffraction 26(01)31ndash38 2011
[44] C Roumlszligler J Stark F Steiniger and W Tichelaar Limited-dose electron microscopyreveals the crystallinity of fibrous C-S-H phases Journal of the American Ceramic Society89(2)627ndash632 2006
[45] Y Sakalli and R Trettin Investigation of C3S hydration by environmental scanning elec-tron microscope Journal of Microscopy 259(1)53ndash58 2015
[46] F Matsushita Y Aono and S Shibata Expansion and shrinkage behavior of green cakeof Autoclaved Aerated Concrete In Autoclaved Aerated Concrete - Innovation and Devel-opment Proceedings of the 4th International Conference on Autoclaved Aerated ConcreteKingston UK 8-9 September 2005 pages 101ndash108 CRC Press 2005
[47] C Chucholowski M Holger and K-C Thienel Improving the recyclability environmentalcompatibility and CO2 balance of autoclaved aerated concrete by replacing sulfate carrierand cement with calcined clays CePapers 2(4)503ndash512 2018
[48] X Y Huang W Ni W H Cui Z J Wang and L P Zhu Preparation of autoclavedaerated concrete using copper tailings and blast furnace slag Construction and BuildingMaterials 27(1)1ndash5 2012
[49] W Wongkeo and A Chaipanich Compressive strength microstructure and thermal anal-ysis of autoclaved and air cured structural lightweight concrete made with coal bottom ashand silica fume Materials Science and Engineering A 527(16-17)3676ndash3684 2010
[50] A Roacuteżycka and W Pichoacuter Effect of perlite waste addition on the properties of autoclavedaerated concrete Construction and Building Materials 12065ndash71 2016
[51] N Isu H Ishida and T Mitsuda Influence of quartz particle size on the chemical andmechanical properties of autoclaved aerated concrete (I) tobermorite formation Cementand Concrete Research 25(25)243ndash248 1995
[52] D Ectors Advances in the analysis of cementitious reactions and hydrate phases doctoralthesis PhD thesis Friedrich-Alexander-Universitaumlt Erlangen-Nuumlrnberg 2016
[53] D Ectors F Goetz-Neunhoeffer and J Neubauer Domain size anisotropy in the double-Voigt approach An extended model Journal of Applied Crystallography 481998ndash20012015
[54] D Ectors F Goetz-Neunhoeffer and J Neubauer Routine (an)isotropic crystallite sizeanalysis in the double-Voigt approximation done right Powder Diffraction 32(S1)27ndash342017
28
5 References
[55] D Jansen F Goetz-Neunhoeffer C Stabler and J Neubauer A remastered external stan-dard method applied to the quantification of early OPC hydration Cement and ConcreteResearch 41(6)602ndash608 2011
[56] T Ungaacuter G Tichy J Gubicza and R J Hellmig Correlation between subgrains andcoherently scattering domains Powder Diffraction 20(04)366ndash375 2005
[57] Triloki P Garg R Rai and B K Singh Structural characterization of as-depositedcesium iodide films studied by X-ray diffraction and transmission electron microscopy tech-niques Nuclear Instruments and Methods in Physics Research Section A AcceleratorsSpectrometers Detectors and Associated Equipment 736128ndash134 2014
[58] J Schreiner F Goetz-Neunhoeffer J Neubauer and D Jansen Hydrothermal synthesisof 11 Aring tobermorite ndash Effect of adding metakaolin to the basic compound Applied ClayScience 185 2020
[59] J Schreiner F Goetz-Neunhoeffer J Neubauer S Volkmann S Bergold R Webler andD Jansen Advanced Rietveld refinement and SEM analysis of tobermorite in chemicallydiverse autoclaved aerated concrete Powder Diffraction 34143ndash150 2019
[60] J Schreiner D Jansen D Ectors F Goetz-Neunhoeffer J Neubauer and S VolkmannNew analytical possibilities for monitoring the phase development during the production ofautoclaved aerated concrete Cement and Concrete Research 107247ndash252 2018
29
6 Publications
6 Publications
61 Hydrothermal synthesis of 11 Aring tobermorite ndash Effectof adding metakaolin to the basic compound
Reprint of the peer reviewed publication
Schreiner J Goetz-Neunhoeffer F Neubauer J Jansen D 2020 Hydrothermalsynthesis of 11 Aring tobermorite ndash Effect of adding metakaolin to the basic compoundApplied Clay Science 185 httpsdoiorg101016jclay2019105432
with permission from Elsevier
30
Contents lists available at ScienceDirect
Applied Clay Science
journal homepage wwwelseviercomlocateclay
Research paper
Hydrothermal synthesis of 11 Aring tobermorite ndash Effect of adding metakaolin tothe basic compound
J Schreiner F Goetz-Neunhoeffer J Neubauer D JansenUniversity of Erlangen-Nuremberg GeoZentrum Nordbayern Mineralogy Schlossgarten 5a 91054 Erlangen Germany
A R T I C L E I N F O
KeywordsHydrothermal synthesis11 Aring tobermoriteMetakaolinPowder diffractionKatoite
A B S T R A C T
Different amounts and types of metakaolin were analyzed and applied for the hydrothermal synthesis of 11 Aringtobermorite All synthesized samples were investigated by means of powder XRD combined with Rietveld re-finement Al-substituted 11 Aring tobermorite was successfully synthesized on the basis of a broad range of com-pounds characterized by a varying content of metakaolin Katoite was present depending on the amount ofsupplied Al3+ which was determined by the dosage of metakaolin Minor crystalline components included in thetwo types of metakaolin sources varied greatly in their reactivity under hydrothermal conditions Despite adifferent degree of purity the two types of metakaolin showed corresponding effects at moderate dosages butcontrary effects at higher dosages as for the synthesis of 11 Aring tobermorite The domain morphology of to-bermorite could be associated with Al3+ incorporation for low dosages of metakaolin represented by up to 2 wt- Al2O3 in the dry mix By contrast Al3+ affected tobermorite lattice parameters at equivalent and even athigher dosages with c reaching 2295 Aring at 12 wt- Al2O3 in the dry mix
1 Introduction
11 Application of metakaolin as a reactive material in constructionindustry
The application of supplementary cementitious materials (SCMs) inthe field of construction technology has received a lot of attention inrecent years Due to limited resources and an urgent need for alter-native and more eco-friendly construction materials SCMs such asmetakaolin offer a great potential The usage of SCMs has not onlyspread to the cement and mortar industry but also to advanced appli-cations such as autoclaved aerated concrete (AAC) (Demir et al 2014Koutnyacute et al 2014 Walczak et al 2015 Roacuteżycka and Pichoacuter 2016Chucholowski et al 2018) Unlike ordinary cementitious constructionmaterials AAC is produced from hydrothermal curing Due to the dif-ferent thermodynamic environment the hydration process and the re-activity of raw materials have to be investigated properly in order tounderstand the effects on the AAC product The leading mineral phasein AAC is 11 Aring tobermorite (Ca5Si6O16(OH)2middot4H2O) As a consequencethe thermal and mechanical properties of AAC depend on micro-structure and crystallinity of tobermorite to some extent In addition tothe curing time and the fineness of raw materials the supply of ionsthat can substitute in the tobermorite structure is a crucial factor in thiscontext Especially substitutions by aluminum sodium and potassium
ions have been investigated thoroughly (Sauman 1974 Klimesch andRay 1998 Mostafa et al 2009 Matekonis et al 2010 Skawinskaet al 2017) Calcined clays usually contain a considerable amount ofthe mentioned ions
There is a vast amount of literature on the reactivity of SCMs atambient temperature and standard pressure but there is little when itcomes to hydrothermal conditions In previous publications the beha-vior of metakaolin under hydrothermal conditions was mainly in-vestigated for the synthesis of zeolites (Zhang et al 2007 Aguilar-Mamani et al 2014 Setthaya et al 2016 Luo et al 2018) In thesestudies the reactivity of metakaolin was observed at a wide range oftemperature and pH values During the transformation of kaolin intometakaolin a loss of framework alumina was observed (Ayodele et al2019) In recent decades metakaolin has been the subject of studies inthe field of geopolymer research (Rashad 2013 Chen et al 2016) Forthe synthesis of 11 Aring tobermorite a more distinct setting of temperaturesetting (180ndash200 degC) and steam pressure (1ndash12 MPa) are required
This publication is intended to make a new contribution to thechallenging field of hydrothermal synthesis in the system CaO-Al2O3-SiO2-H2O based on XRD analysis combined with Rietveld refinementVarious dosages of two types of metakaolin with different chemical andmineralogical purities are compared for the effects on the hydrothermalsynthesis of Al-substituted 11 Aring tobermorite Especially changes of thebulk chemistry in the raw mixes the reactivity of minor crystalline
httpsdoiorg101016jclay2019105432Received 20 August 2019 Received in revised form 13 November 2019 Accepted 30 December 2019
Corresponding authorE-mail address juergenjsschreinerfaude (J Schreiner)
Applied Clay Science 185 (2020) 105432
0169-1317 copy 2020 Elsevier BV All rights reserved
T
6 Publications
31
phases of the two types of metakaolin and the effect of different curingtimes are the focus of interest On the one hand metakaolin offers agreat potential in the AAC industry On the other hand of all SCMsmetakaolin is a good source material for investigating the influence ofAl3+ on the synthesis of Al-substituted 11 Aring tobermorite
12 Synthesis of Al-substituted 11 Aring tobermorite
In addition to being present in AAC tobermorite has found appli-cation in wastewater treatment and nuclear waste management due toits ion exchange capacity (Maeda et al 2012 Monasterio et al 2015)The substitution of silicon by aluminum results in a different to-bermorite structure due to general and local charge balance affectingthe lattice parameters Especially c is impacted by this substitutionbecause it occurs in the bridging tetrahedron and additional OHndash sub-stitutes O2ndash (Komarneni et al 1985 Merlino et al 2000) As suggestedin some additional studies the substitution of Si4+ by Al3+ and Na+ orK+ leads to a lath-like morphology of tobermorite crystals (Mostafa2005 Mostafa et al 2009 Venhodovaacute et al 2015 Qu et al 2018)However because of the heterogeneous appearance of tobermorite inAAC it is hardly possible to conduct a proper characterization based onSEM analysis In our recent work the anisotropic peak broadening oftobermorite in XRD diffractograms was successfully linked with theincorporation of foreign ions supplied in a common AAC production(Schreiner et al 2019) This finding allowed a more statistical struc-tural characterization of tobermorite in bulk compositions compared toSEM analysis Moreover it was reported in other studies that differenthydrate phases occur depending on the amount of supplied ions and onthe experimental settings In compounds with a high content of Al3+formation of katoite could be observed (Klimesch and Ray 1998 Riacuteoset al 2009 Matsui et al 2011) In the case of a longer curing durationinstead of 11 Aring tobermorite the formation of xonotlite (Siauciunas andBaltakys 2004 Galvaacutenkovaacute et al 2018) or - depending on the finenessof used silica source (Siauciunas and Baltakys 2004) - gyrolite is fa-voured
Kalousek (1956) suggested that tobermorite can contain up to 5Al2O3 More Al2O3 in the system resulted in the formation of hydro-garnet Klimesch and Ray (1998) additionally investigated the stabilityof hydrogarnet depending on the Al(Si + Al) ratio and its role in re-lation to the formation of 11 Aring tobermorite in an equivalent systemThey suggest that hydrogarnet always appears before tobermorite butthe former can only be detected for higher Al(Si + Al) ratios in theevent of longer curing times Riacuteos et al (2009) and Qu et al (2018)confirmed these findings in extensive investigations In the latter pub-lication it is additionally suggested that samples prepared at lowertemperatures (160 degC) are less impacted by the supply of Al3+ Theyalso consider the peak broadening of tobermorite in their XRD plotsbased on the amount of incorporated Al3+ In two recent publicationswe suggested that the peak broadening of tobermorite enables a mi-crostructural analysis by calculating the orientation dependent domainsizes (Schreiner et al 2018 2019) However these studies are based onsamples of industrially produced AAC so that the curing time was fixedThe studied AAC was produced from raw materials with a broad che-mical spectrum such as ordinary Portland cement (OPC) whichsomehow complicates the interpretation of results
In this work the influence of aluminum ions - provided by meta-kaolin - on dominant crystallographic direction-dependent domaingrowth of tobermorite is investigated by analysis of anisotropic peakbroadening (Ectors et al 2015 2017) In Fig 1 of the supplementarymaterial the method of fitting the anisotropic peak broadening of to-bermorite using a triaxial cylinder model is visualized (Schreiner et al2018) Fitting of the anisotropic peak broadening of tobermorite Thismethod is used to calculate the average and reliable values for to-bermorite domain sizes in the powder sample and associate them withaverage Al3+ incorporation Microstrain should be considered becauseit is an additional source of peak broadening However this usually
accounts for materials that have been exposed to different kinds ofstress such as metals and alloys (Badawi et al 2019) In addition theinstrumental contribution to peak broadening should be consideredHydration products such as tobermorite are characterized by crystallitesizes in the range of nanometers so that anisotropic size broadeningclearly outweighs the effect of instrumental broadening (Jenkins andSnyder 1996) Moreover the impact of Al3+ on the lattice parametersof tobermorite is considered It should additionally be clarified whe-ther the results from our previous publication (Schreiner et al 2019)based on industrially produced AAC can be confirmed by investigationwith less complex raw mixes and purely based on laboratory experi-ments
2 Material and methods
21 Starting materials
The starting materials for hydrothermal synthesis included deio-nized water quartz flour portlandite (999 pure) and two types ofmetakaolin One type was ordinary commercially available metakaolin(MK) with nearly a stoichiometric composition For comparison thesecond type of commercially available metakaolin was a by-productfrom expanded glass production (MKg) and consequently highly im-pure The chemical composition of MK and MKg determined by XRF isgiven in Table 1 With MKg containing less Al2O3 but considerably moreNa2O than MK the effects on hydrothermal synthesis were of interestBoth types of metakaolin have been characterized in previous pub-lications (Schmidt et al 2012 Naber et al 2019) In addition weverified the mineral phase content by XRD analysis Besides amorphousmetakaolin MK contained minor amounts of anatase quartz and mica
Fig 1 Weight fractions of tobermorite quartz and katoite determined byquantitative XRD analysis ndash samples including MKg crosshatched
Table 1Chemical composition of MK and MKg determined by XRF analysis ndash majorcontrasts in bold letters
Oxides [wt-] MK MKg
SiO2 536 604Al2O3 392 206CaO 01 40MgO 01 12Na2O 0 96K2O 10 18Fe2O3 18 05TiO2 21 03P2O5 01 02Loss on ignition 15 1
J Schreiner et al Applied Clay Science 185 (2020) 105432
2
6 Publications
32
MKg contained additional kaolinite feldspar and quartz
22 Investigated mix composites
For the preparation of raw mixtures the powders were weighed andhomogenized using a lab-scale mixing mill Table 2 lists the composi-tion and nomenclature of all samples including Al2O3 content andcuring time in the autoclave
bull Besides one blank mixture (MK0) that did not contain any type ofmetakaolin eleven more compounds were prepared of which threeincluded different dosages of MKg (MKg16 MKg23 and MKg60)Three more mixes contained equivalent amounts of MK instead ofMKg (MK16 MK23 and MK60) These mixes were investigated inorder to have a direct comparison concerning the effects of differentraw material on the synthesis of tobermorite
bull Additionally the mixes MK9 MK5 and MK25 with lower dosages ofmetakaolin were analyzed In the referenced literature (Schreineret al 2019) the effect of Al3+ on the anisotropic peak broadeningof tobermorite could only be observed in the case of Al2O3 contentslower than 4 in the drymix In the latter three mixes Al2O3 con-tents range from 1 to 35 Al2O3 (calculated from XRF data) whichmeets the region of interest for the analysis of tobermorite domainmorphology
bull The curing time for nearly all of the investigated samples was 12 hbut compound MK9 was prepared two more times for curing timesof 2 h and 6 h The different curing times were chosen in this par-ticular sample so that the reactivity of metakaolin and the phasetransitions could be observed more precisely
23 Hydrothermal treatment
Due to the different fineness of raw materials there was a differentwater demand from one mixture to another In order to obtain slurriesof comparable rheology the amount of water was adapted respectivelyresulting in water-to-solid ratios of 25 to 3 which matches the sug-gested water-to-solid ratio for this purpose (Roacutezycka et al 2014Galvaacutenkovaacute et al 2018) The weighed water was added to the dry mixand after stirring for 1 min at 23 degC the slurry was poured into thereactor Minor changes in the quantity of added water did not have aninfluence on the measured steam pressure All experiments were con-ducted using a PTFE-lined stainless steel autoclave with a reactor vo-lume of 300 ml The oven temperature was fixed at 180 degC and auto-genous steam pressure of 11ndash12 MPa was measured during eachexperiment with an external manometer After cooling to room tem-perature the sample was removed from the reactor coarsely ground
using an agate mortar and dried at 60 degC for 12 h After drying thesample was ground with an agate mortar again in order to deagglo-merate the particles As no coarse raw materials were used there wasno need for wet McCrone milling (Schreiner et al 2018)
24 XRD analysis
After preparation into front-loading sample holders the powdersamples were measured with a D8 diffractometer (Bruker) equippedwith a LynxEye detection system and Bragg-Brentano geometry Thesettings for XRD analysis included a tube voltage of 40 kV a current of40 mA an angular range from 6 to 80deg 2θ (Cu Kα radiation) a time perstep of 054 s a step width of 00236deg 2θ and a PSD opening of 33deg Thebackground was fitted with Chebyshev polynomial of the fifth orderThe major contribution of amorphous phase was fitted with a singlepeak with a fixed position at 308deg 2θ so that tobermorite reflectionswere not affected An external quartzite standard was measured withthe same parameters in order to determine phase quantities (Jansenet al 2011) Bruker AXS software TOPAS 50 was used for Rietveldrefinement (Rietveld 1969) and the used structures are shown inTable 3
3 Results and discussion
31 Different dosages of MK and MKg
In Fig 1 the quantities of tobermorite quartz and katoite present inmost of the samples determined by XRD analysis are illustratedWhenever tobermorite was the leading mineral hydrate phase a basalspacing of 113 Aring could be verified in each of the diffractograms Thequantities of minor crystalline phases and amorphous content are notshown For low dosages of MK it can be seen that the weight fraction oftobermorite decreased At moderate dosage of both types of metakaolin(MK16 MK23 MKg16 MKg23) tobermorite was present in comparablequantities It can be seen that the amount of katoite in the mixes de-pended on the dosage of metakaolin and it appeared only at dosages ofMK5 or more Due to the higher content of aluminum in MK comparedto MKg more katoite could always be observed in the MK mixes atequivalent dosages Despite equal amounts of quartz as starting mate-rial in mixes for both types of metakaolin the resulting weight fractionsin the cured samples were not alike Considerably more quartz waspresent in the MK samples Even though less quartz was used for mixescontaining higher amounts of MK even more quartz was present afterhydrothermal curing (Table 2 Fig 1) Consequently some of the SiO2
provided by MK did not transform into an amorphous phase or to-bermorite but into quartz This finding is verified by the presence ofquartz in MK60 because no quartz was included in the raw mixture Thefeldspar present in MKg did not react so Na2O and an unknown amountof Al2O3 may not have been supplied for hydrothermal reaction Besidestobermorite and quartz additional calcite scawtite (Ca7Si6(CO3)
Table 2Basic powder compounds prepared for the hydrothermal synthesis of to-bermorite with the respectively calculated Al2O3 content and curing time in thereactor
Sample Portlandite[wt-]
Quartz[wt-]
MK[wt-]
MKg
[wt-]
Al2O3
[wt-]Curingtime [h]
MK0 49 51 ndash ndash 0 12MK25 495 48 25 ndash 1 12MK5 49 46 5 ndash 2 12MK9_2h 48 43 9 ndash 35 2MK9_6h 48 43 9 ndash 35 6MK9_12h 48 43 9 ndash 35 12MK16 47 37 16 ndash 63 12MK23 46 31 23 ndash 9 12MK60 40 ndash 60 ndash 235 12MKg16 47 37 ndash 16 33 12MKg23 46 31 ndash 23 47 12MKg60 40 ndash ndash 60 124 12
Table 3Structural data used for the investigation with powder XRD analysis
Phase Author
Anatase (Horn et al 1972)Biotite (Brigatti et al 2000)Calcite (Maslen et al 1995)Kaolinite (Zvyagin 1960)Katoite (Bartl 1969)Microcline (Bailey 1969)Plazolite (Basso et al 1983)Portlandite (Busing and Levy 1957)Quartz (Le Page and Donnay 1976)Scawtite (Grice 2005)Tobermorite (Hamid 1981)Xonotlite (Hejny and Armbruster 2001)
J Schreiner et al Applied Clay Science 185 (2020) 105432
3
6 Publications
33
O18bull2(H2O)) and xonotlite (Ca6Si6O17(OH)2) could be identified insample MK0 (XRD plots of samples MK0 MKg16 MKg23 MK16 andMK23) Comparing MK0 and MK25 scawtite and xonotlite could stillbe identified in a very low amount in MK25 but no longer in samplesthat contained even more MK (XRD plots of samples MK0 MK25 MK5and MK9_12h)
Two additional experiments were done without quartz in the rawmixes (MK60 and MKg60) The according diffractograms after hydro-thermal curing are shown in Fig 2 In sample MKg60 tobermorite (gt 50wt-) was successfully synthesized without any other silica sourcethan MKg whereas no crystalline quartz occurred By contrast no to-bermorite but quartz could be identified in equivalent mixture MK60containing MK It can be seen that crystalline components such as micaand anatase in the raw MK did not react at the selected conditions andremained present in the autoclaved samples Except for feldspar in MKgall of the crystalline components appeared to be reactive at the chosenhydrothermal conditions A minor unidentified phase occurred at328deg2θ and additional xonotlite was identified in sample MKg60 Insample MK60 more calcium was needed for the formation of morehydrogarnet (Fig 1) resulting in a lower CaSi ratio for the remainingsystem Sample MKg60 contained only half of the amount of Al3+ and itwas not completely supplied for reaction due to its partial presence infeldspar Consequently essentially less hydrogarnet (Fig 1) was presentin MKg60 after hydrothermal treatment and the CaSi ratio in the re-maining system was affected to a lesser extent
32 Application of MK for different curing times
The development of hydrate phases in the autoclave for compoundMK9 is displayed in Fig 3 After only 2 h of hydrothermal curing all ofthe available portlandite had reacted and katoite (95 wt-) was pre-sent The applied type of metakaolin appeared to react quickly as itsupplied aluminum for formation of katoite No formation of to-bermorite could be observed at this stage yet An assumably amorphousprecursor can be seen at 28 to 30deg2θ Calcium was provided by thedissolution of portlandite After 6 h of hydrothermal reaction amountsof katoite (85 wt-) and quartz (from 31 wt- at 2 h to 165 wt- at6 h) had decreased and a major amount of tobermorite (35 wt-) waspresent Apparently between 2 and 6 h under hydrothermal conditionsthe amorphous precursor and quartz reacted resulting in the formationof tobermorite An additional 6 h of reaction time (MK9_12h) did notchange the phase composition significantly Slightly more tobermorite
(365 wt-) less quartz (16 wt-) and katoite (65 wt-) weremeasured
33 Tobermorite domain morphology and lattice parameters
In the referenced literature an analysis of tobermorite domainmorphology based on anisotropic peak broadening was possible forsamples that contained notgt 4 wt- Al2O3 in the drymix (Schreineret al 2019) Accordingly in this study samples MK0 MK25 MK5MK9_6h and MK9_12h were suitable (Table 2) with MK9_2h not con-taining any tobermorite In Fig 4 the respective growth in a and b di-rection is visualized with x indicating the domain size in a direction andy indicating domain size in b direction using a macro for TOPAS 50(Ectors et al 2015 2017) The calculated cylinder models in Fig 4represent the relation of yx and not absolute sizes With no supply ofaluminum ions (MK0) the relative domain growth in b direction islower compared to samples containing metakaolin This finding agreeswith the results from a similar investigation of tobermorite in AAC(Schreiner et al 2019) However within the samples MK5 andMK9_12h the different amounts of supplied aluminum ions did notshow a clear effect It appeared that low dosages of Al3+ (1 wt- Al2O3
in MK25 and 2 wt- Al2O3 in MK5) were enough to determine thedomain growth of tobermorite Additional results from the samplesMK9_6h and MK9_12h indicated that growth in b direction increasedwith reaction time
In Fig 5 lattice parameters of tobermorite depending on metakaolindosages are plotted B clearly remained unaffected throughout therange of samples Increasing amounts of metakaolin led to a slightlysmaller parameter a However both types of metakaolin showed acorresponding impact on parameter a By contrast parameter c in-creased strongly with increasing amounts of MK and MKg but the typeof metakaolin was significant At an equivalent dosage MK affected thecell dimension in c direction considerably more than MKg so that thefraction of Al3+ appeared to be the decisive parameter Different metaloxides in MKg did not show a notable effect certainly as they werepartially not provided for reaction Unlike for the domain morphologyof tobermorite the impact on lattice parameters could be observedwithin the complete range of examined dosages
4 Conclusions
The results obtained from the introduced investigations allow con-cluding remarks on the effects of the applied types of metakaolin on thesynthesis of 11 Aring tobermorite the phase transitions and the in-corporation of Al3+ into the lattice of tobermorite
With a critical dosage the use of any type of metakaolin led to theformation of katoite in an according amount At moderate dosages(MKg16 MKg23 MK16 and MK23) the two types of metakaolin showeda good correspondence in consideration of the quantities of to-bermorite For higher dosages there were contrary effects Lower do-sages of MK led to considerable quantities of Al-substituted to-bermorite Samples containing low dosages of MK revealed that katoiteappeared in the case ofgt 5 wt- of MK - corresponding to 2 wt-Al2O3 - in the basic compound Minor crystalline phases in MKg showedbetter reactivity than those in MK The observation that no tobermoritewas present in sample MK60 indicated that high dosages of Al3+ hin-dered the formation of tobermorite
Investigations of MK9 at 2 6 and 12 h displayed the evolution ofhydrate phases At first katoite was the only crystalline hydrate phasepresent after 2 h which corresponded to observations in a differentpublication (Klimesch and Ray 1999) The amount of katoite andquartz then decreased and a major amount of tobermorite formed from2 to 6 h curing time In order to gain more information on the trans-formation of amorphous C-(A)-S-H into tobermorite additional ex-periments in the range of 2 to 6 h curing time will be needed
Domain morphology analysis of tobermorite revealed that low
Fig 2 Diffractograms of MKg MKg60 MK and MK60 from 7 to 34deg2θ CuKα Aanatase C calcite F feldspar k kaolinite K katoite M mica Q quartz Ttobermorite U unidentified phase X xonotlite
J Schreiner et al Applied Clay Science 185 (2020) 105432
4
6 Publications
34
dosages of Al3+ determined the domain growth which agreed with theresults published on tobermorite in AAC samples (Schreiner et al2019) Different curing times unveiled that growth in b direction in-creased with the reaction time Al3+ incorporation into the lattice oftobermorite only reflected to a limited extent in the domain mor-phology By contrast an increase of lattice parameter c was triggered byAl3+ even at the highest dosage in this study Ultimately there is no
evidence for a limit of incorporation of Al3+ but there is a limit ofinfluence on the domain morphology These results additionally re-confirm this assumption similarly made in the previous work (Schreineret al 2019) and suggest a new mechanism of tobermorite crystal-lization depending on the presence of Al3+
Supplementary data to this article can be found online at httpsdoiorg101016jclay2019105432
Declaration of Competing Interest
The authors declare that they have no known competing financialinterests or personal relationships that could have appeared to influ-ence the work reported in this paper
Acknowledgement
The authors thank Rodgauer Baustoffwerke GmbH amp Co KG forsupplying raw materials for laboratory experiments
References
Aguilar-Mamani W Garciacutea G Hedlund J Mouzon J 2014 Comparison betweenleached metakaolin and leached diatomaceous earth as raw materials for the synth-esis of ZSM-5 Springerplus 3 1ndash10 httpsdoiorg1011862193-1801-3-292
Ayodele OB Sulaimon AA Alaba PA Tian Z-Y 2019 Influence of metakaolini-zation temperature on the structure and activity of metakaolin supported Ni catalystin dry methane reforming J Environ Chem Eng httpsdoiorg101016jjece2019103239 (in press)
Badawi EA Abdel-Rahman MA Mostafa A Abdel-Rahman M 2019 Determinationof the crystallite size amp micro- strain by novel method from XRD profile Appl Phys2 1ndash15 httpsdoiorg1031058jap201921001
Bailey SW 1969 Refinement of an intermediate microcline structure Am Miner 541540ndash1545
Bartl H 1969 Roentgen-Einkristalluntersuchungen an (CaO)3 (Al2O3) (H2O)6 und an(CaO)12 (Al2O3)7 (H2O) neuer Vorschlag zur (CaO)12 (Al2O3)7-Struktur NeuesJahrb fuer Mineral Monatshefte 1969 404ndash413
Basso R Giusta AD Zefiro L 1983 Crystal structure refinement of plazolite A highlyhydrated natural hydrogrossular Neues Jahrb Miner Monatsh (Neues Jahrb fuerMineral Monatshefte) 1983 251ndash258
Brigatti MF Lugli C Poppi L Foord EE Kile DE 2000 Crystal chemical varia-tions in Li- and Fe-rich micas from Pikes Peak batholith (Central Colorado) AmMineral 85 1275ndash1286 httpsdoiorg102138am-2000-8-920
Busing WR Levy HA 1957 Neutron diffraction study of calcium hydroxide J ChemPhys 26 563 httpsdoiorg10106311743345
Chen L Wang Z Wang Y Feng J 2016 Preparation and properties of alkali acti-vated metakaolin-based geopolymer Materials (Basel) 9 1ndash12 httpsdoiorg103390ma9090767
Chucholowski C Holger M Thienel K-C 2018 Improving the recyclability en-vironmental compatibility and CO2 balance of autoclaved aerated concrete by re-placing sulfate carrier and cement with calcined clays CePapers 2 503ndash512httpsdoiorg101002cepa846
Fig 3 Diffractograms of MK9_2h MK9_6h and MK9_12h from 7 to 38deg2θ CuKα C calcite K katoite Q quartz T tobermorite
Fig 4 Relation of calculated domain sizes of 11 Aring tobermorite in selectedsamples (MK0 MK25 MK5 MK9_6h and MK9_12h) in a (x) and b (y) direction
Fig 5 Lattice parameters of tobermorite depending on MK or MKg dosageincluding blank mix MK0
J Schreiner et al Applied Clay Science 185 (2020) 105432
5
6 Publications
35
Demir İ Başpınar MS Kahraman E Ccedilalışkan E Goumlrhan G 2014 An investigationon the usability of diatomite in aerated concrete production In Proc of the IntlConf on Advances in Civil Structural and Construction Engineering ndash CSCE 2014 pp97ndash100
Ectors D Goetz-Neunhoeffer F Neubauer J 2015 A generalized geometric approachto anisotropic peak broadening due to domain morphology J Appl Crystallogr 48189ndash194 httpsdoiorg101107S1600576714026557
Ectors D Goetz-Neunhoeffer F Neubauer J 2017 Routine (an)isotropic crystallitesize analysis in the double-Voigt approximation done right Powder Diffract 3227ndash34 httpsdoiorg101017S0885715617000070
Galvaacutenkovaacute L Bartoniacutečkovaacute E Opravil T Tkacz J Ptaacuteček P 2018 The influence ofstarting materials solubility on tobermorite structure formation under the hydro-thermal conditions IOP Conf Ser Mater Sci Eng 379 1ndash8 httpsdoiorg1010881757-899X3791012001
Grice JD 2005 The structure of spurrite tilleyite and scawtite and relationships toother silicate-carbonate minerals Can Mineral 43 1489ndash1500 httpsdoiorg102113gscanmin4351489
Hamid SA 1981 The crystal structure of the 11 Aring natural tobermoriteCa225[Si3O75(OH)15]1H2O Zeitschrift fuer Krist 154 189ndash198 httpsdoiorg101524zkri19811543-4189
Hejny C Armbruster T 2001 Polytypism in xonotlite Ca6Si6O17(OH)2 Zeitschrift furKrist 216 396ndash408
Horn M Schwerdtfeger CF Meagher EP 1972 Refinement of the structure of ana-tase at several temperatures Zeitschrift fur Krist 136 273ndash281 httpsdoiorg101524zkri19721363-4273
Jansen D Goetz-Neunhoeffer F Stabler C Neubauer J 2011 A remastered externalstandard method applied to the quantification of early OPC hydration Cem ConcrRes 41 602ndash608 httpsdoiorg101016jcemconres201103004
Jenkins R Snyder R 1996 Introduction to X-ray Powder Diffractometry ChemicalAnalysis Wiley pp 90
Kalousek GL 1956 Crystal Chemistry of Hydrous Calcium Silicates J Am Ceram Soc40 74ndash80
Klimesch D Ray A 1998 Autoclaved cement-quartz pastes with metakaolin additionsAdv Cem Based Mater 7 109ndash118 httpsdoiorg101016S1065-7355(97)00073-4
Klimesch D Ray A 1999 DTA-TGA evaluations of the CaOndashAl2O3ndashSiO2ndashH2O systemtreated hydrothermally Thermochim Acta 334 115ndash122 httpsdoiorg101016s0040-6031(99)00140-9
Komarneni S Roy R Roy DM Fyfe CA Kennedy GJ Bothner-By AA Dadok JChesnick AS 1985 27Al and29Si magic angle spinning nuclear magnetic resonancespectroscopy of Al-substituted tobermorites J Mater Sci 20 4209ndash4214 httpsdoiorg101007BF00552416
Koutnyacute O Opravil T Pořiacutezka J 2014 Application of metakaoline in autoclavedaerated concrete technology Adv Mater Res 1000 174ndash177 httpsdoiorg104028wwwscientificnetAMR1000174
Le Page Y Donnay G 1976 Refinement of the crystal structure of low-quartz ActaCrystallogr Sect B 32 2456ndash2459 httpsdoiorg101107S0567740876007966
Luo H Law WW Wu Y Zhu W Yang EH 2018 Hydrothermal synthesis of needle-like nanocrystalline zeolites from metakaolin and their applications for efficient re-moval of organic pollutants and heavy metals Microporous Mesoporous Mater 2728ndash15 httpsdoiorg101016jmicromeso201806015
Maeda H Ogawa Y Ishida EH Kasuga T 2012 Hydrothermal synthesis of to-bermorite doped with phosphorus species for removing heavy metal ions J AustCeram Soc 48 8ndash11
Maslen EN Streltsov VA Streltsova NR Ishizawa N 1995 Electron density andoptical anisotropy in rhombohedral carbonates III Synchrotron Xray studies ofCaCO3 MgCO3 and MnCO3 Acta Crystallogr Sect B 51 929ndash939 httpsdoiorg101107S0108768195006434
Matekonis G Šiaučiūnas R Vaičiukynienė D 2010 Hydrothermal Synthesis andCharacterization of Na + and [ Al 3 + + Na + ] -substituted Tobermorite in CaO-SiO2middotnH2O-H2O System Mater Sci 16 242ndash248
Matsui K Kikuma J Tsunashima M Ishikawa T Matsuno S Ogawa A Sato M2011 In situ time-resolved X-ray diffraction of tobermorite synthesis process underhydrothermal condition IOP Conf Ser Mater Sci Eng 18 60ndash66 httpsdoiorg1010881757-899X182022017
Merlino S Bonaccorsi E Armbruster T 2000 The real structures of clinotobermoriteand tobermorite 9 Aring OD character polytypes and structural relationships Eur JMineral 12 411ndash429 httpsdoiorg1011270935-122120000012-0411
Monasterio M Gaitero JJ Manzano H Dolado JS Cerveny S 2015 Effect ofchemical environment on the dynamics of water confined in calcium silicate mi-nerals Natural and synthetic tobermorite Langmuir 31 4964ndash4972 httpsdoiorg101021acslangmuir5b00614
Mostafa NY 2005 Influence of air-cooled slag on physicochemical properties of auto-claved aerated concrete Cem Concr Res 35 1349ndash1357 httpsdoiorg101016jcemconres200410011
Mostafa NY Shaltout AA Omar H Abo-El-Enein SA 2009 Hydrothermal synth-esis and characterization of aluminium and sulfate substituted 11 nm tobermoritesJ Alloys Compd 467 332ndash337 httpsdoiorg101016jjallcom200711130
Naber C Stegmeyer S Jansen D Goetz-Neunhoeffer F Neubauer J 2019 ThePONKCS method applied for time resolved XRD quantification of supplementarycementitious material reactivity in hydrating mixtures with ordinary Portland ce-ment Constr Build Mater 214 449ndash457 httpsdoiorg101016jconbuildmat201904157
Qu X Zhao Z Zhao X 2018 Microstructure and characterization of aluminum-in-corporated calcium silicate hydrates (C-S-H) under hydrothermal conditions RSCAdv 8 28198ndash28208 httpsdoiorg101039c8ra04423f
Rashad AM 2013 Metakaolin as cementitious material history scours production andcomposition - a comprehensive overview Constr Build Mater 41 303ndash318 httpsdoiorg101016jconbuildmat201212001
Rietveld HM 1969 A profile refinement method for nuclear and magnetic structures JAppl Crystallogr 2 65ndash71 httpsdoiorg101107S0021889869006558
Riacuteos CA Williams CD Fullen MA 2009 Hydrothermal synthesis of hydrogarnet andtobermorite at 175 degC from kaolinite and metakaolinite in the CaO-Al2O3-SiO2-H2Osystem a comparative study Appl Clay Sci 43 228ndash237 httpsdoiorg101016jclay200809014
Roacuteżycka A Pichoacuter W 2016 Effect of perlite waste addition on the properties of au-toclaved aerated concrete Constr Build Mater 120 65ndash71 httpsdoiorg101016jconbuildmat201605019
Roacutezycka A Kotwica Ł Małolepszy J 2014 Synthesis of single phase gyrolite in theCaO-quartz-Na2O-H2O system Mater Lett 120 166ndash169 httpsdoiorg101016jmatlet201401003
Sauman Z 1974 Influence of SO4 2ndash ions on the formation of 11 Aring tobermorite InProceedings of the 2nd International Symposium on Science and Research in SilicateChemistry Moscow pp 25ndash39
Schmidt M Egersdoumlrfer A Poumlllmann H 2012 Increased reactivity using a glass-containing metakaolin as an active filler in lime-based binder systems ZKG Int 6554ndash62
Schreiner J Jansen D Ectors D Goetz-Neunhoeffer F Neubauer J Volkmann S2018 New analytical possibilities for monitoring the phase development during theproduction of autoclaved aerated concrete Cem Concr Res 107 247ndash252 httpsdoiorg101016jcemconres201802028
Schreiner J Goetz-Neunhoeffer F Neubauer J Volkmann S Bergold S Webler RJansen D 2019 Advanced Rietveld refinement and SEM analysis of tobermorite inchemically diverse autoclaved aerated concrete Powder Diffract 34 143ndash150httpsdoiorg101017s0885715619000149
Setthaya N Chindaprasirt P Pimraksa K 2016 Preparation of zeolite nanocrystals viahydrothermal and solvothermal synthesis using of rice husk ash and metakaolinMater Sci Forum 872 242ndash247 httpsdoiorg104028wwwscientificnetmsf872242
Siauciunas R Baltakys K 2004 Formation of gyrolite during hydrothermal synthesis inthe mixtures of CaO and amorphous SiO2 or quartz Cem Concr Res 34 2029ndash2036httpsdoiorg101016jcemconres200403009
Skawinska A Owsiak Z Baran T Hernik K 2017 The influence of halloysite ad-dition on tobermorite formation in CaO and quartz mix under hydrothermal condi-tions Cem Wapno Bet 17 426ndash434
Venhodovaacute E Janovskyacute R Drochytka R 2015 Formation of tobermorite at differentmaterials composition of aerated concrete Appl Mech Mater 752ndash753 247ndash250httpsdoiorg104028wwwscientificnetamm752-753247
Walczak P Małolepszy J Reben M Szymański P Rzepa K 2015 Utilization ofwaste glass in autoclaved aerated concrete Proc Eng 122 302ndash309 httpsdoiorg101016jproeng201510040
Zhang Y Gao W Cui L 2007 The transformation of acid leached metakaolin tozeolite beta Stud Surf Sci Catal 170 420ndash425 httpsdoiorg101016S0167-2991(07)80870-6
Zvyagin BB 1960 An attempt to electronographic determination of kaolinite structureJ Dokl Akad Nauk SSSR 130 1023ndash1026
J Schreiner et al Applied Clay Science 185 (2020) 105432
6
6 Publications
36
6 Publications
62 Advanced Rietveld refinement and SEM analysis oftobermorite in chemically diverse autoclaved aeratedconcrete
Following the copyright guidelines by Cambridge University Press the publication
Schreiner J Goetz-Neunhoeffer F Neubauer J Volkmann S Bergold S WeblerR Jansen D 2019 Advanced Rietveld refinement and SEM analysis of tobermorite inchemically diverse autoclaved aerated concrete Powder Diffraction 34 143ndash150 httpsdoiorg101017s0885715619000149
may not be reprinted It can be accessed at
httpswwwcambridgeorgcorejournalspowder-diffractionarticleadvanced-rietveld-refinement-and-sem-analysis-of-tobermorite-in-chemically-diverse-autoclaved-aerated-concrete51597C2A66F6F225D29DEB2675E74249
37
6 Publications
63 New analytical possibilities for monitoring the phasedevelopment during the production of autoclavedaerated concrete
Reprint of the peer reviewed publication
Schreiner J Jansen D Ectors D Goetz-Neunhoeffer F Neubauer J VolkmannS 2018 New analytical possibilities for monitoring the phase development during theproduction of autoclaved aerated concrete Cement and Concrete Research 107 247ndash252httpsdoiorg101016jcemconres201802028
with permission from Elsevier
38
Contents lists available at ScienceDirect
Cement and Concrete Research
journal homepage wwwelseviercomlocatecemconres
Short communication
New analytical possibilities for monitoring the phase development duringthe production of autoclaved aerated concrete
J Schreinera D Jansena D Ectorsa F Goetz-Neunhoeffera J Neubauera S Volkmannb
aUniversity of Erlangen-Nuremberg GeoZentrum Nordbayern Mineralogy Schlossgarten 5a 91054 Erlangen Germanyb Rodgauer Baustoffwerke GmbH amp Co KG Am Opel-Pruumlffeld 3 63110 Rodgau-Dudenhofen Germany
A B S T R A C T
This work presents improved analytical methods for both steps of the production process of autoclaved aeratedconcrete (AAC) the phase development during the hydration before autoclaving and during the autoclavingprocess itself The improvement includes new insights into preparation methods of AAC samples for powderdiffraction as well as Rietveld refinement strategies For the first time a new implementation for calculatinganisotropic crystal domain sizes is applied to major hydrate phases occurring during AAC production namelyportlandite during the hydration before autoclaving and tobermorite during the autoclaving process The cal-culation of anisotropic domain size growth which can be implemented in the Rietveld environment is based oncrystallographically and geometrically appropriate models The implementation of calculating anisotropic do-main sizes for the Rietveld software TOPAS 50 allows a superior Rietveld fit and a more accurate quantificationof the phase development Additionally it enables the tracking of growth mechanism of portlandite duringhydration
1 Introduction
Autoclaved aerated concrete (AAC) is known as a lightweight con-struction material which offers outstanding properties such as suffi-cient strength for construction in addition with excellent thermal in-sulation [12] AAC is produced by autoclaving from calcareous rawmaterials such as lime (CaO) and cement quartz sulfate carrier andother additives such as foaming agents and water
The production process (Fig 1) can be separated into the hydrationof the mixed slurry before the procedure of autoclaving and the auto-claving at elevated temperature (180 degC to 200 degC) under saturatedsteam pressure (12MPa) for several hours
The hydration process before autoclaving is necessary to achievesufficient strength in order to cut the green cake blocks as they shouldhave a specific shape and dimension after autoclaving Furthermorethe porous structure is generated by the foaming agent during hydra-tion in the first process step During autoclaving the final propertiesnamely strength and low thermal conductivity are achieved
It is already well understood that the autoclaving process leads tothe formation of several phases first of all tobermorite(Ca5Si6O16(OH)2lowast4H2O) [3ndash5] Newest research has shown im-pressively which reactions are running from the mineralogical point ofview Insitu XRD measurements were carried out during the
autoclaving process and the phase development was shown by plottingnormalized intensities [6] The study of Mitsuda et al [3] was mainlyfocused on the tracking of the phase evolution during the autoclavingprocess of AAC However their statements concerning phase evolutionare mainly based on XRD data and TGA measurements There is acommon agreement that the following reactions occur The consump-tion of the alite (OPC) leads to the formation of an initial C-S-H phaseduring the first processing step Portlandite which was initially formedduring the first process step (from CaO and C3S) further quartz and theC-S-H phase are consumed during autoclaving resulting in the crystal-lization of tobermorite Hence the crystallization process of to-bermorite as well as the crystal structure of tobermorite was an issue ofresearch and discussion over the last years and numerous publicationsto these topics are available Concerning the crystal structure of to-bermorite respectively the tobermorite supergroup a new publicationoutlines all important references and recommends a new nomenclature[7]
The presented study was performed to create new analytical possi-bilities for the characterization of the production process of AAC Bothof the production process steps are essential for the final productHence the present work focuses on crystallization of hydrate phases inboth processes
Firstly an external standard method [89] was published and
httpsdoiorg101016jcemconres201802028Received 6 October 2017 Received in revised form 1 February 2018 Accepted 26 February 2018
Corresponding authorsE-mail addresses juergenjsschreinerfaude (J Schreiner) danieljansenfaude (D Jansen)
Cement and Concrete Research 107 (2018) 247ndash252
0008-8846 copy 2018 Elsevier Ltd All rights reserved
T
6 Publications
39
recommended for the determination of absolute phase contents inmixtures with amorphous content It was shown that the method canabsolutely be recommended for hydrating cement pastes in which watercannot be quantified directly by XRD [10] This method seems to bevery promising for both the quantification of the hydration of the AACslurry before autoclaving and the quantification of the phase evolutionduring autoclaving inasmuch as both production steps form crystallineand amorphous phases
Secondly a new approach to anisotropic peak broadening due toanisotropic domain morphology which was developed [1112] is ap-plied to AAC samples to improve the fit of portlandite and tobermoriteby Rietveld refinement [13] By applying this approach the refinementof both portlandite and tobermorite should additionally lead to betterquantitative results as well as to better insights into the development ofthe domain size morphology of both phases formed
It was already shown that in a hydrating raw mixture for AAC twospecies of portlandite precipitate at 23 degC one showing dynamicallyanisotropic peak broadening and another one following the isotropictrend [14] The application of the anisotropic refinement model led toan improved fitting of portlandite Moreover the mechanism of aniso-tropic domain growth of portlandite was tracked
2 Materials and methods
In order to examine the hydration of the AAC slurry before auto-claving a mixture of the hydraulic reactive components was weighedand measured in-situ at a Bruker D8 diffractometer with a LynxEyedetection system
Ordinary Portland cement (OPC) was mixed with lime (CaO) andanhydrite (C$) The raw materials were taken from the same batches asfor the industrial samples The drymix (58 OPC 36 CaO and 6 C$by weight) was then mixed with water (ws= 08) and placed into anappropriate sample holder The samples were not aerated The slurrysamples were covered with a kapton film to avoid evaporation andcarbonation Diffractograms were recorded with an angular range from7 to 545deg 2θ and a step width of 0011deg 2θ Measurements were carriedout every 15min For each measurement 96 XRD patterns were re-corded over the first 24 h The temperature was fixed at 70 degC which isthe mean temperature generally prevailing in the industrial processduring hydration before autoclaving Rietveld refinement was carriedout using the G-factor method All structures used for Rietveld refine-ment are shown in Table 1
For investigation of the autoclaved samples five different specimenswere taken at different autoclaving times The specimens were takenout of a technical production process hence it was not possible to in-terrupt the process at an earlier time inasmuch it would lead to damageof a whole concrete production batch The specimens were firstly driedat 60 degC until weight constancy The whole blocks were then broken andstatistical samples of 20 g were taken In order to receive the right massattenuation coefficient (MAC) for G-factor method the loss on ignitionand the chemical composition (XRF) were determined For energydispersive XRF analysis (Spectro Xepos) tube voltage from 20 kV to50 kV and tube current from 08 to 20mA were used for differenttargets
The final sample preparation (grinding) before XRD measurementswas carried out using both an agate mortar and a McCrone micronizingmill for wet milling with isopropanol Both preparation methods wereapplied separately to see which one is suitable in order to get the bestpreparation for XRD investigations Six preparations were performed byone operator of which two were prepared with an agate mortar andfour with a McCrone mill For the McCrone milling 3 g of the sampleand 10ml of isopropanol were used for grinding for 12min The grainsize distribution of one sample prepared with an agate mortar and onesample prepared using a McCrone mill was measured by laser granu-lometry in isopropanol using a Mastersizer 3000 (MALVERN)
After milling the samples in these two ways for XRD analysis thepowders were prepared into a front loading sample holder and mea-sured Diffractograms were recorded with an angular range from 6 to80deg 2θ a step width of 00236deg 2θ and a time per step of 054 s Rietveldrefinement combined with external standard (G-factor) was applied inorder to get absolute quantities for each phase The refinement strategyfor portlandite and tobermorite in the TOPAS Launch Mode (TOPAS50 Bruker AXS) is attached as a Supplementary material file
3 Results and discussion
31 Hydration of the mixture before autoclaving
The hydration of the investigated paste before autoclaving isdominated by the hydration of the cement as well as the reaction of thefree lime (CaO) resulting in the formation of portlandite It can beclearly seen from Fig 2 that the hydration of the paste leads to theformation of ettringite portlandite and C-S-H phase For simplificationthe remaining phase developments are not shown in Fig 2 because theyare not in the focus of this study The hydration of CaO forming
Fig 1 Simplified process steps of AAC production and hydrate phase evolution
Table 1Structures used for Rietveld refinement
Phase Author
Alite [15]Anhydrite [16]Bassanite [17]Belite (β) [18]Belite (αprime) [19]Brownmillerite [20]C-S-H [21]Calcite [22]Ettringite [23]Gypsum [24]Hemicarbonate [25]Hydroxylellestadite [26]Lime (CaO) [27]Microcline [28]Portlandite [29]Quartz [30]Tobermorite [31]Tricalciumaluminate (cubic) [32]Tricalciumaluminate (orthorhombic) [33]PONCKS model for Water [21]
J Schreiner et al Cement and Concrete Research 107 (2018) 247ndash252
248
6 Publications
40
portlandite begins rapidly after the addition of water to the mixture andlime is fully consumed after only 1 h of hydration This translates into aquick rise of heat of hydration so that cement hydration is acceleratedwhich leads to further portlandite formation by the reaction of aliteEttringite formation stalls after few hours of hydration After 12 h et-tringite is partially decomposed probably due to sulfate depletion [9]
and poorly crystalline AFm phases (not shown in Fig 2) are formedIn Fig 3 it can be seen that in fact two generations of portlandite
are formed a 1st dominant generation showing anisotropic peakbroadening and 2nd one occurring considerably later following theisotropic domain size refinement which is usually carried out using theRietveld method This occurrence comes along firstly with lime hy-dration and secondly with alite hydration The expected quantity ofportlandite formed from lime hydration very well complies with the
Fig 2 Phase development in AAC paste on a laboratory scale before autoclaving ana-lyzed by in-situ XRD at 70 degC
Fig 3 Formation of two generations of portlandite by hydration of lime (1st) and C3S(2nd) at 70 degC before autoclaving with the major generation showing anisotropic peakbroadening
Fig 4 Biaxial cylinder domain size model of portlandite used for Rietveld refinement of anisotropic peak broadening
Fig 5 Morphological evolution of portlandite showing anisotropic domain size growthduring hydration at 70 degC
Fig 6 Comparison of quantification of crystalline quartz in samples prepared withMcCrone mill and agate mortar at different autoclaving times
J Schreiner et al Cement and Concrete Research 107 (2018) 247ndash252
249
6 Publications
41
quantity of the observed 1st generation The development of portlan-dite growth was already tracked in an equivalent slurry at 23 degC [14]Thus this observation confirms that the crystallinity of portlandite inmixtures for AAC production depends on the starting phase for hydra-tion as already indicated by Ectors [14]
Fig 4 shows the used biaxial cylindrical model for anisotropic do-main size calculation and the portlandite structure which was createdwith structural software VESTA 318 [34] Using the cylindrical ap-proach domain sizes in a (here equating to b) and c direction(dz= cylinder height) can be calculated which comes along with theexpected symmetrical parameters of portlandite
The 1st portlandite generation showing anisotropic domain growthcan be tracked in terms of cylinder diameter and height which is rea-lized in Fig 5 The blue cylinder represents the geometric approach andcylinder height and diameter are calculated newly for each range Thecylinder height remains rather stable throughout the hydration processwhile the cylinder diameter increases during the first hours of hydra-tion After 10 h of hydration the mean cylinder diameter no longer in-creases Consequently these observations match the results of the ex-aminations conducted at 23 degC [14] as well as the assumption thatdifferent mechanisms of growth exist for portlandite depending on the
hydration educt The maximum cylinder diameter is reached earlier inthis work very likely because of the higher hydration temperature
32 Quantification of the reactions during autoclaving
Autoclaved samples were ground with an agate mortar and com-pared to samples which were wet-ground with a McCrone mill Fig 6shows precisely that the determination of the amount of crystallinequartz is more reproducible in the two shown samples which were
Fig 7 2D XRD with Bruker GADDS-system plots of samples prepared with agate mortar and McCrone mill Coarse quartz grains are pointed out in the plot of the sample prepared withagate mortar
Fig 8 Particle size distribution of one sample prepared with an agate mortar and of onesample prepared with a McCrone mill measured by laser granulometry
Fig 9 Rietveld refinement for Tobermorite of autoclaved AAC sample by use of isotropicdomain size model (a) and of anisotropic domain size model (b)
J Schreiner et al Cement and Concrete Research 107 (2018) 247ndash252
250
6 Publications
42
prepared with a McCrone mill The high variance of crystalline quartzin the samples which were prepared with an agate mortar is a result ofinsufficient grinding and remaining of too large quartz grains Whenthis spottiness occurs a reliable quantification using the G-factormethod is not possible
The 2D XRD with Bruker GADDS-system plots in Fig 7 demonstratethe insufficient grinding when using an agate mortar compared to wetmilling with a McCrone mill Quartz would be overrepresented in a one-dimensional XRD pattern focusing on a section with bright spots (greenarrows) The lack of bright spots in the right plot shows that the quartzgrains are milled more thoroughly using a McCrone mill In Fig 8 theparticle size distribution after both ways of sample preparation iscompared Most grains in the sample prepared with an agate mortar arelarger than in the sample prepared with a McCrone mill The grain sizedistribution of the sample prepared with a McCrone mill complies withthe recommended particle size range for XRD analysis of under 5 to50 μm [3536] while the other sample exceeds the range
In Fig 9 Rietveld refinement of an autoclaved sample is shown Thedominant peaks at 77 290 and 301deg 2θ are attributed to tobermoriteIn the upper diagram (a) Rietveld refinement was carried out regularlycalculating isotropic domain sizes for tobermorite However the cal-culated fit differs significantly from the raw data It can be assumed thattobermorite shows a similar pattern to portlandite in terms of aniso-tropic peak broadening taking into account that tobermorite is as-signed to the orthorhombic crystal system Thus instead of a biaxialcylinder model an elliptic cylinder model (Fig 10 structure createdwith VESTA 318 [34]) was applied for the refinement in the lowerdiagram (b) The elliptic cylinder model is a sufficient approach to the
orthorhombic crystal system as it allows the distinction between do-main sizes in a b and c direction The fit is clearly superior using theanisotropic domain size model highlighted by the difference plot inFig 9b The comparison refinement with isotropic and anisotropic ap-proach was done for all of the five autoclaved samples In Fig 11 theresulting Rwp values for the whole pattern and the RBragg values of to-bermorite are shown The refinement using the anisotropic model leadsto both lower Rwp and RBragg values and consequently to a better fit anda more accurate quantification of tobermorite in all refined samples
4 Summary and conclusions
Improved analytical methods for both the phase developmentduring the hydration before autoclaving and during the autoclavingprocess of AAC are presented It could be shown that wet McCronemilling is the best way of preparation of AAC samples in order to obtainsuitable samples for powder diffraction A new approach to treat ani-sotropic domain sizes for Rietveld refinement could be successfullyapplied ndash with the benefit that portlandite and tobermorite in AACsamples could be refined more accurately using the Rietveld methodThus this application allows an improved quantification of the phasedevelopment during both of the production steps
For the future there are still plenty of possibilities to apply thepresented approach of calculating anisotropic domain sizes to AACproduction As exemplified with portlandite the mechanisms of growthof tobermorite can be tracked likewise during the autoclaving processIn addition the effect of variations in the chemical composition of AACraw mixtures on the crystal morphology of tobermorite can be ex-amined This leaves a new perspective to discuss the link between mi-neral phase morphology and the thermal and mechanical properties ofAAC
Acknowledgement
The autoclaved samples were generously provided by RodgauerBaustoffwerke GmbH amp Co KG The authors express gratitude for allsupport
Appendix A Supplementary data
Supplementary data to this article can be found online at httpsdoiorg101016jcemconres201802028
References
[1] MW Grutzeck Cellular concrete in M Scheffler P Colombo (Eds) CellularCeramics Wiley-VCH Weinheim 2005 pp 193ndash223
[2] M Haas The future of AAC ndash from a material scientists point of view inMC Limbachiya JJ Roberts (Eds) Autoclaved Aerated Concrete Taylor FrLondon 2005 pp 187ndash194
[3] T Mitsuda K Sasaki H Ishida Phase evolution during autoclaving process ofaerated concrete J Am Ceram Soc 75 (1992) 1858ndash1863
[4] N Isu H Ishida T Mitsuda Influence of quartz particle size on the chemical and
Fig 10 Triaxial cylinder domain size model of Tobermorite used for Rietveld refinement of anisotropic peak broadening
Fig 11 Comparison of Rwp and RBragg values of Rietveld refinements of autoclavedsamples and tobermorite using the isotropic and the anisotropic domain size model
J Schreiner et al Cement and Concrete Research 107 (2018) 247ndash252
251
6 Publications
43
mechanical properties of autoclaved aerated concrete (I) tobermorite formationCem Concr Res 25 (1995) 243ndash248
[5] NY Mostafa Influence of air-cooled slag on physicochemical properties of auto-claved aerated concrete Cem Concr Res 35 (2005) 1349ndash1357 httpdxdoiorg101016jcemconres200410011
[6] K Matsui J Kikuma M Tsunashima T Ishikawa S Matsuno A Ogawa M SatoIn situ time-resolved X-ray diffraction of tobermorite formation in autoclaved aer-ated concrete influence of silica source reactivity and Al addition Cem Concr Res41 (2011) 510ndash519
[7] C Biagioni S Merlino E Bonaccorsi The tobermorite supergroup a new no-menclature Mineral Mag 79 (2015) 485ndash495 httpdxdoiorg101180minmag2015079222
[8] BH OConnor MD Raven Application of the Rietveld refinement procedure inassaying powdered mixtures Powder Diffract 3 (1988) 2ndash6 httpdxdoiorg101017S0885715600013026
[9] D Jansen F Goetz-Neunhoeffer C Stabler J Neubauer A remastered externalstandard method applied to the quantification of early OPC hydration Cem ConcrRes 41 (2011) 602ndash608 httpdxdoiorg101016jcemconres201103004
[10] D Jansen C Stabler F Goetz-Neunhoeffer S Dittrich J Neubauer Does OrdinaryPortland Cement contain amorphous phase A quantitative study using an externalstandard method Powder Diffract 26 (2011) 31ndash38 httpdxdoiorg10115413549186
[11] D Ectors F Goetz-Neunhoeffer J Neubauer A generalized geometric approach toanisotropic peak broadening due to domain morphology J Appl Crystallogr 48(2015) 189ndash194 httpdxdoiorg101107S1600576714026557
[12] D Ectors F Goetz-Neunhoeffer J Neubauer Routine (an)isotropic crystallite sizeanalysis in the double-Voigt approximation done right Powder Diffract 32 (S1)(2017) 27ndash34 httpdxdoiorg101017S0885715617000070
[13] HM Rietveld A profile refinement method for nuclear and magnetic structures JAppl Crystallogr 2 (1969) 65ndash71 httpdxdoiorg101107S0021889869006558
[14] D Ectors Advances in the Analysis of Cementitious Reactions and Hydrate Phases(Doctoral Thesis) (2016) pp 12ndash14 (urnnbndebvb29-opus4-71743)
[15] AacuteG De La Torre S Bruque J Campo MAG Aranda The superstructure of C3Sfrom synchrotron and neutron powder diffraction and its role in quantitative phaseanalyses Cem Concr Res 32 (2002) 1347ndash1356 httpdxdoiorg101016S0008-8846(02)00796-2
[16] A Kirfel G Will Charge density in anhydrite CaSO4 from X-ray and neutrondiffraction measurements Acta Crystallogr Sect B Struct Crystallogr CrystChem 36 (1980) 2881ndash2890 httpdxdoiorg101107S0567740880010461
[17] C Bezou AN Christensen D Cox M Lehman A Nonat Structures cristallines deCaSO405H2O et CaSO406H2O Comptes Rendus Hebd Des Seacuteances lAcadeacutemieDes Sci Seacuterie 2 (312) (1991) 43ndash48
[18] KH Jost B Ziemer R Seydel Redetermination of the structure of β-dicalciumsilicate Acta Crystallogr Sect B Struct Crystallogr Cryst Chem 33 (1977)1696ndash1700 httpdxdoiorg101107S0567740877006918
[19] W Mumme LMD Cranswick BC Chakoumakos Rietveld crystal structure re-finements from high temperature neutron powder diffraction data for the poly-morphs of dicalcium silicate Neues Jahrb Fuer Mineral Abhandlungen 170 (1996)171ndash188
[20] A Colville S Geller The crystal structure of brownmillerite Ca2FeAlO5Crystallographica 50 (1971) 2311ndash2315 httpdxdoiorg101107S056774087100579X
[21] ST Bergold F Goetz-Neunhoeffer J Neubauer Quantitative analysis of C-S-H inhydrating alite pastes by in-situ XRD Cem Concr Res 53 (2013) 119ndash126 httpdxdoiorg101016jcemconres201306001
[22] EN Maslen VA Streltsov NR Streltsova N Ishizawa Electron density and op-tical anisotropy in rhombohedral carbonates III Synchrotron Xray studies ofCaCO3 MgCO3 and MnCO3 Acta Crystallogr Sect B 51 (1995) 929ndash939 httpdxdoiorg101107S0108768195006434
[23] G Renaudin Y Filinchuk J Neubauer F Goetz-Neunhoeffer A comparativestructural study of wet and dried ettringite Cem Concr Res 40 (2010) 370ndash375httpdxdoiorg101016jcemconres200911002
[24] WF Cole CJ Lancucki A refinement of the crystal structure of gypsumCaSO42H2O Acta Cryst B30 (1974) 921ndash929 httpdxdoiorg101107S0567740874004055
[25] T Runčevski RE Dinnebier OV Magdysyuk H Poumlllmann Crystal structures ofcalcium hemicarboaluminate and carbonated calcium hemicarboaluminate fromsynchrotron powder diffraction data Acta Crystallogr Sect B Struct Sci 68 (2012)493ndash500 httpdxdoiorg101107S010876811203042X
[26] JM Hughes JW Drexler Cation substitution in the apatite tetrahedral site crystalstructures of type hydroxylellestadite and type fermorite Neues Jahrb FuerMineral (1991) 327ndash336
[27] CH Shen RS Liu JG Lin CY Huang Phase stability study of La12Ca18Mn2O7Mater Res Bull 36 (2001) 1139ndash1148
[28] SW Bailey Refinement of an intermediate microcline structure Am Miner 54(1969) 1540ndash1545
[29] WR Busing HA Levy Neutron diffraction study of calcium hydroxide J ChemPhys 26 (1957) 563 httpdxdoiorg10106311743345
[30] Y Le Page G Donnay Refinement of the crystal structure of low-quartz ActaCrystallogr Sect B 32 (1976) 2456ndash2459 httpdxdoiorg101107S0567740876007966
[31] SA Hamid The crystal structure of the 11 Aring natural tobermoriteCa225[Si3O75(OH)15]1H2O Zeitschrift Fuer Krist - New Cryst Struct 154 (1981)189ndash198 httpdxdoiorg101524zkri19811543-4189
[32] P Mondal JW Jeffery The crystal structure of tricalcium aluminate Ca3Al2O6Acta Crystallogr B 31 (1975) 689ndash697 httpdxdoiorg101107S0567740875003639
[33] Y Takeuchi F Nishi I Maki Crystal-chemical characterization of the tricalciumaluminate-sodium oxide (3CaOtimesAl2O3-Na2O) solid-solution series Zeitschrift FuumlrKrist (1980) 259ndash307
[34] K Momma F Izumi VESTA 3 for three-dimensional visualization of crystal vo-lumetric and morphology data J Appl Crystallogr 44 (2011) 1272ndash1276 httpdxdoiorg101107S0021889811038970
[35] K Scrivener R Snellings B Lothenbach A Practical Guide to MicrostructuralAnalysis of Cementitious Materials CRC Press 2016 pp 123ndash125 httpdxdoiorg107693wl20150205
[36] V Pecharsky P Zavalij Fundamentals of Powder Diffraction and StructuralCharacterization of Materials Springer second edition 2005 p 302 httpdxdoiorg101007978-0-387-09579-0
J Schreiner et al Cement and Concrete Research 107 (2018) 247ndash252
252
6 Publications
44
7 Acknowledgement
7 Acknowledgement
Ich moumlchte mich bei einigen Personen bedanken ohne die es wohl kaum zum erfolgreichenAbschluss dieser Arbeit gekommen waumlreMein Doktorvater Prof Dr Juumlrgen Neubauer hat sich stets die Zeit genommen die noumltigwar um Angelegenheiten aller Art mit mir zu klaumlren Er gab mir fachlich immer zumrichtigen Zeitpunkt einen gewissen wissenschaftlichen Impuls Zugleich habe ich mich den-noch immer frei in meiner eigenen Konzeption gefuumlhlt Groszligen Dank spreche ich Prof DrFriedlinde Goumltz-Neunhoeffer aus die fuumlr mich ebenso immer eine verlaumlssliche Ansprech-partnerin fuumlr fachliche und organisatorische Angelegenheiten aller Art war Danke anDr Daniel Jansen fuumlr die gute Zusammenarbeit und dafuumlr dass er mich im Zuge meinerMasterarbeit in ein Forschungsprojekt aufgenommen hat das den Weg zur Promotionmoumlglich machte Zusaumltzlich gilt mein Dank Prof Dr Matthias Goumlbbels der fuumlr dieMitarbeiter am Lehrstuhl immer motivierende Worte fand Fuumlr die Ermoumlglichung meinerTeilnahme an diversen Dienstreisen Fortbildungen und Tagungen moumlchte ich mich viel-mals bedankenWeiterhin bedanke ich mich bei Dr Stephan Volkmann und den Rodgauer BaustoffwerkenGmbH amp Co KG fuumlr die gute Zusammenarbeit und die Bereitstellung von Versuchsma-terialienVielen Dank an meine studentischen Hilfskraumlfte Daniel Wagner Laura MoldenhauerFabian Lang Jakob Schreiber und Felix Klaassen die alle Aufgaben im Labor einwand-frei und mit Bedacht erledigten Bei meinen aktuellen und ehemaligen Kollegen DrKatrin Hurle Dr Dominique Ectors Dr Christoph Naber Dr Florian Huumlller JoumlrgNehring Frank Riedel Julian Wolf Tanja Manninger Daniel Wagner Nicolas FobbeKarla Spaumlth Julian Goergens Andreas Koumlhler Cordula Jakob Franz Becker und LisaKlemenz bedanke ich mich fuumlr die gelungene Zusammenarbeit und gegenseitige Unter-stuumltzung Besonderer Dank geht auch an Kerstin Kreszlig Bettina Engl Christian HankeBernd Schleifer und Christian Abe fuumlr die verlaumlssliche Unterstuumltzung bei technischen Fra-gen und Messungen im LaborFuumlr jegliche Unterstuumltzungen moumlchte ich mich auch bei meinen Eltern bedanken sowiebei meinem Bruder Ralf der mir mit einem LaTex Crashkurs viel Frustration ersparthat Danke Thomas dass du immer fuumlr mich da bist und mit mir zusammen fuumlr genugAusgleich gesorgt hast
45
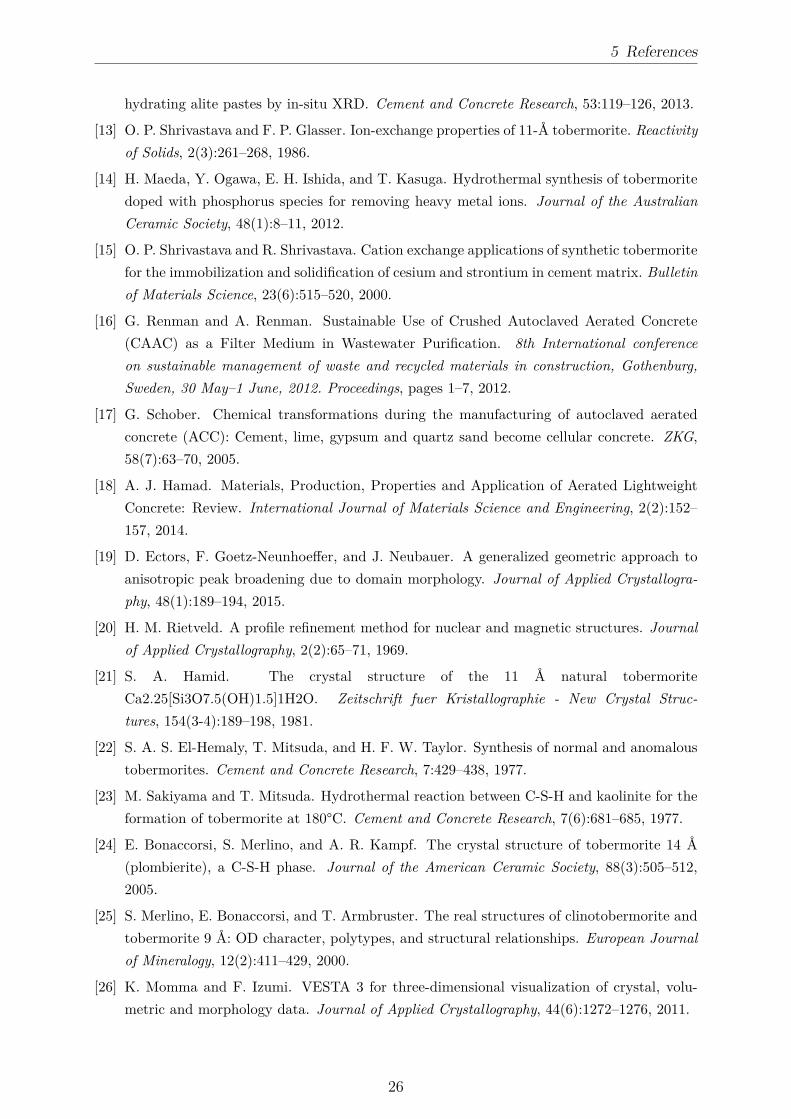
5 References
hydrating alite pastes by in-situ XRD Cement and Concrete Research 53119ndash126 2013
[13] O P Shrivastava and F P Glasser Ion-exchange properties of 11-Aring tobermorite Reactivityof Solids 2(3)261ndash268 1986
[14] H Maeda Y Ogawa E H Ishida and T Kasuga Hydrothermal synthesis of tobermoritedoped with phosphorus species for removing heavy metal ions Journal of the AustralianCeramic Society 48(1)8ndash11 2012
[15] O P Shrivastava and R Shrivastava Cation exchange applications of synthetic tobermoritefor the immobilization and solidification of cesium and strontium in cement matrix Bulletinof Materials Science 23(6)515ndash520 2000
[16] G Renman and A Renman Sustainable Use of Crushed Autoclaved Aerated Concrete(CAAC) as a Filter Medium in Wastewater Purification 8th International conferenceon sustainable management of waste and recycled materials in construction GothenburgSweden 30 Mayndash1 June 2012 Proceedings pages 1ndash7 2012
[17] G Schober Chemical transformations during the manufacturing of autoclaved aeratedconcrete (ACC) Cement lime gypsum and quartz sand become cellular concrete ZKG58(7)63ndash70 2005
[18] A J Hamad Materials Production Properties and Application of Aerated LightweightConcrete Review International Journal of Materials Science and Engineering 2(2)152ndash157 2014
[19] D Ectors F Goetz-Neunhoeffer and J Neubauer A generalized geometric approach toanisotropic peak broadening due to domain morphology Journal of Applied Crystallogra-phy 48(1)189ndash194 2015
[20] H M Rietveld A profile refinement method for nuclear and magnetic structures Journalof Applied Crystallography 2(2)65ndash71 1969
[21] S A Hamid The crystal structure of the 11 Aring natural tobermoriteCa225[Si3O75(OH)15]1H2O Zeitschrift fuer Kristallographie - New Crystal Struc-tures 154(3-4)189ndash198 1981
[22] S A S El-Hemaly T Mitsuda and H F W Taylor Synthesis of normal and anomaloustobermorites Cement and Concrete Research 7429ndash438 1977
[23] M Sakiyama and T Mitsuda Hydrothermal reaction between C-S-H and kaolinite for theformation of tobermorite at 180degC Cement and Concrete Research 7(6)681ndash685 1977
[24] E Bonaccorsi S Merlino and A R Kampf The crystal structure of tobermorite 14 Aring(plombierite) a C-S-H phase Journal of the American Ceramic Society 88(3)505ndash5122005
[25] S Merlino E Bonaccorsi and T Armbruster The real structures of clinotobermorite andtobermorite 9 Aring OD character polytypes and structural relationships European Journalof Mineralogy 12(2)411ndash429 2000
[26] K Momma and F Izumi VESTA 3 for three-dimensional visualization of crystal volu-metric and morphology data Journal of Applied Crystallography 44(6)1272ndash1276 2011
26
5 References
[27] S Shaw S M Clark and C MB Henderson Hydrothermal formation of the calcium sil-icate hydrates tobermorite (Ca5Si6O16(OH)2 middot 4H2O) and xonotlite (Ca6Si6O17(OH)2)An in situ synchrotron study Chemical Geology 167(1-2)129ndash140 2000
[28] K Matsui J Kikuma M Tsunashima T Ishikawa S Matsuno A Ogawa and M SatoIn situ time-resolved X-ray diffraction of tobermorite synthesis process under hydrothermalcondition IOP Conference Series Materials Science and Engineering 18(2)60ndash66 2011
[29] G Matekonis R Šiaučiunas and D Vaičiukyniene Hydrothermal Synthesis and Charac-terization of Na + and [ Al 3 + + Na + ] -substituted Tobermorite in CaO-SiO2middotnH2O-H2OSystem MATERIALS SCIENCE 16(3)242ndash248 2010
[30] G Geng R J Myers M J A Qomi and P JM Monteiro Densification of the inter-layer spacing governs the nanomechanical properties of calcium-silicate-hydrate ScientificReports 7(1)1ndash8 2017
[31] D Klimesch and A Ray Autoclaved cement-quartz pastes with metakaolin additionsAdvanced Cement Based Materials 7(3-4)109ndash118 1998
[32] N Y Mostafa A A Shaltout H Omar and S A Abo-El-Enein Hydrothermal synthesisand characterization of aluminium and sulfate substituted 11 nm tobermorites Journal ofAlloys and Compounds 467(1-2)332ndash337 2009
[33] İ Demir M S Başpınar E Kahraman E Ccedilalışkan and G Goumlrhan An Investigation onthe Usability of Diatomite in Aerated Concrete Production In Proc of the Intl Conf onAdvances In Civil Structural And Construction Engineering - CSCE 2014 pages 97ndash1002014
[34] A Skawinska Z Owsiak T Baran and K Hernik The influence of halloysite additionon tobermorite formation in CaO and quartz mix under hydrothermal conditions CementWapno Beton 17(12)426ndash434 2017
[35] N Y Mostafa Influence of air-cooled slag on physicochemical properties of autoclavedaerated concrete Cement and Concrete Research 35(7)1349ndash1357 2005
[36] D Małaszkiewicz and J Chojnowski Influence of addition of calcium sulfate dihydrate ondrying of autoclaved aerated concrete Open Engineering 7(1)273ndash278 2017
[37] N Hara and N Inoue Thermal behaviour of 11Aring tobermorite and its lattice parametersCement and Concrete Research (10)53ndash60 1980
[38] M D Jackson S R Chae S R Mulcahy C Meral R Taylor P Li A H EmwasJ Moon S Yoon G Vola H R Wenk and P JM Monteiro Unlocking the secretsof Al-tobermorite in Roman seawater concrete American Mineralogist 98(10)1669ndash16872012
[39] W Liao W Li Z Fang C Lu and Z Xu Effect of different aluminum substitution rateson the structure of Tobermorite Materials 12(22)1ndash10 2019
[40] D Klimesch and A Ray DTA-TG Study of the CaO-SiO2-H2O and CaO-Al2O3-SiO2-H2OSystems Under Hydrothermal Conditions Journal of Thermal Analysis and Calorimetry56(1)27ndash34 1999
27
5 References
[41] Z Sauman and Z Valtr Substitution of sulphate ions in the crystal lattice of 11 Aring to-bermorite In The VI International Congress on the Chemistry of Cement pages 1ndash14Moscow 1974
[42] G Schober Reaction of raw materials to the final product AAC httpwwwpb-aacde
chemmin2_ehtml 2012 accessed 2020-01-31
[43] D Jansen C Stabler F Goetz-Neunhoeffer S Dittrich and J Neubauer Does Ordi-nary Portland Cement contain amorphous phase A quantitative study using an externalstandard method Powder Diffraction 26(01)31ndash38 2011
[44] C Roumlszligler J Stark F Steiniger and W Tichelaar Limited-dose electron microscopyreveals the crystallinity of fibrous C-S-H phases Journal of the American Ceramic Society89(2)627ndash632 2006
[45] Y Sakalli and R Trettin Investigation of C3S hydration by environmental scanning elec-tron microscope Journal of Microscopy 259(1)53ndash58 2015
[46] F Matsushita Y Aono and S Shibata Expansion and shrinkage behavior of green cakeof Autoclaved Aerated Concrete In Autoclaved Aerated Concrete - Innovation and Devel-opment Proceedings of the 4th International Conference on Autoclaved Aerated ConcreteKingston UK 8-9 September 2005 pages 101ndash108 CRC Press 2005
[47] C Chucholowski M Holger and K-C Thienel Improving the recyclability environmentalcompatibility and CO2 balance of autoclaved aerated concrete by replacing sulfate carrierand cement with calcined clays CePapers 2(4)503ndash512 2018
[48] X Y Huang W Ni W H Cui Z J Wang and L P Zhu Preparation of autoclavedaerated concrete using copper tailings and blast furnace slag Construction and BuildingMaterials 27(1)1ndash5 2012
[49] W Wongkeo and A Chaipanich Compressive strength microstructure and thermal anal-ysis of autoclaved and air cured structural lightweight concrete made with coal bottom ashand silica fume Materials Science and Engineering A 527(16-17)3676ndash3684 2010
[50] A Roacuteżycka and W Pichoacuter Effect of perlite waste addition on the properties of autoclavedaerated concrete Construction and Building Materials 12065ndash71 2016
[51] N Isu H Ishida and T Mitsuda Influence of quartz particle size on the chemical andmechanical properties of autoclaved aerated concrete (I) tobermorite formation Cementand Concrete Research 25(25)243ndash248 1995
[52] D Ectors Advances in the analysis of cementitious reactions and hydrate phases doctoralthesis PhD thesis Friedrich-Alexander-Universitaumlt Erlangen-Nuumlrnberg 2016
[53] D Ectors F Goetz-Neunhoeffer and J Neubauer Domain size anisotropy in the double-Voigt approach An extended model Journal of Applied Crystallography 481998ndash20012015
[54] D Ectors F Goetz-Neunhoeffer and J Neubauer Routine (an)isotropic crystallite sizeanalysis in the double-Voigt approximation done right Powder Diffraction 32(S1)27ndash342017
28
5 References
[55] D Jansen F Goetz-Neunhoeffer C Stabler and J Neubauer A remastered external stan-dard method applied to the quantification of early OPC hydration Cement and ConcreteResearch 41(6)602ndash608 2011
[56] T Ungaacuter G Tichy J Gubicza and R J Hellmig Correlation between subgrains andcoherently scattering domains Powder Diffraction 20(04)366ndash375 2005
[57] Triloki P Garg R Rai and B K Singh Structural characterization of as-depositedcesium iodide films studied by X-ray diffraction and transmission electron microscopy tech-niques Nuclear Instruments and Methods in Physics Research Section A AcceleratorsSpectrometers Detectors and Associated Equipment 736128ndash134 2014
[58] J Schreiner F Goetz-Neunhoeffer J Neubauer and D Jansen Hydrothermal synthesisof 11 Aring tobermorite ndash Effect of adding metakaolin to the basic compound Applied ClayScience 185 2020
[59] J Schreiner F Goetz-Neunhoeffer J Neubauer S Volkmann S Bergold R Webler andD Jansen Advanced Rietveld refinement and SEM analysis of tobermorite in chemicallydiverse autoclaved aerated concrete Powder Diffraction 34143ndash150 2019
[60] J Schreiner D Jansen D Ectors F Goetz-Neunhoeffer J Neubauer and S VolkmannNew analytical possibilities for monitoring the phase development during the production ofautoclaved aerated concrete Cement and Concrete Research 107247ndash252 2018
29
6 Publications
6 Publications
61 Hydrothermal synthesis of 11 Aring tobermorite ndash Effectof adding metakaolin to the basic compound
Reprint of the peer reviewed publication
Schreiner J Goetz-Neunhoeffer F Neubauer J Jansen D 2020 Hydrothermalsynthesis of 11 Aring tobermorite ndash Effect of adding metakaolin to the basic compoundApplied Clay Science 185 httpsdoiorg101016jclay2019105432
with permission from Elsevier
30
Contents lists available at ScienceDirect
Applied Clay Science
journal homepage wwwelseviercomlocateclay
Research paper
Hydrothermal synthesis of 11 Aring tobermorite ndash Effect of adding metakaolin tothe basic compound
J Schreiner F Goetz-Neunhoeffer J Neubauer D JansenUniversity of Erlangen-Nuremberg GeoZentrum Nordbayern Mineralogy Schlossgarten 5a 91054 Erlangen Germany
A R T I C L E I N F O
KeywordsHydrothermal synthesis11 Aring tobermoriteMetakaolinPowder diffractionKatoite
A B S T R A C T
Different amounts and types of metakaolin were analyzed and applied for the hydrothermal synthesis of 11 Aringtobermorite All synthesized samples were investigated by means of powder XRD combined with Rietveld re-finement Al-substituted 11 Aring tobermorite was successfully synthesized on the basis of a broad range of com-pounds characterized by a varying content of metakaolin Katoite was present depending on the amount ofsupplied Al3+ which was determined by the dosage of metakaolin Minor crystalline components included in thetwo types of metakaolin sources varied greatly in their reactivity under hydrothermal conditions Despite adifferent degree of purity the two types of metakaolin showed corresponding effects at moderate dosages butcontrary effects at higher dosages as for the synthesis of 11 Aring tobermorite The domain morphology of to-bermorite could be associated with Al3+ incorporation for low dosages of metakaolin represented by up to 2 wt- Al2O3 in the dry mix By contrast Al3+ affected tobermorite lattice parameters at equivalent and even athigher dosages with c reaching 2295 Aring at 12 wt- Al2O3 in the dry mix
1 Introduction
11 Application of metakaolin as a reactive material in constructionindustry
The application of supplementary cementitious materials (SCMs) inthe field of construction technology has received a lot of attention inrecent years Due to limited resources and an urgent need for alter-native and more eco-friendly construction materials SCMs such asmetakaolin offer a great potential The usage of SCMs has not onlyspread to the cement and mortar industry but also to advanced appli-cations such as autoclaved aerated concrete (AAC) (Demir et al 2014Koutnyacute et al 2014 Walczak et al 2015 Roacuteżycka and Pichoacuter 2016Chucholowski et al 2018) Unlike ordinary cementitious constructionmaterials AAC is produced from hydrothermal curing Due to the dif-ferent thermodynamic environment the hydration process and the re-activity of raw materials have to be investigated properly in order tounderstand the effects on the AAC product The leading mineral phasein AAC is 11 Aring tobermorite (Ca5Si6O16(OH)2middot4H2O) As a consequencethe thermal and mechanical properties of AAC depend on micro-structure and crystallinity of tobermorite to some extent In addition tothe curing time and the fineness of raw materials the supply of ionsthat can substitute in the tobermorite structure is a crucial factor in thiscontext Especially substitutions by aluminum sodium and potassium
ions have been investigated thoroughly (Sauman 1974 Klimesch andRay 1998 Mostafa et al 2009 Matekonis et al 2010 Skawinskaet al 2017) Calcined clays usually contain a considerable amount ofthe mentioned ions
There is a vast amount of literature on the reactivity of SCMs atambient temperature and standard pressure but there is little when itcomes to hydrothermal conditions In previous publications the beha-vior of metakaolin under hydrothermal conditions was mainly in-vestigated for the synthesis of zeolites (Zhang et al 2007 Aguilar-Mamani et al 2014 Setthaya et al 2016 Luo et al 2018) In thesestudies the reactivity of metakaolin was observed at a wide range oftemperature and pH values During the transformation of kaolin intometakaolin a loss of framework alumina was observed (Ayodele et al2019) In recent decades metakaolin has been the subject of studies inthe field of geopolymer research (Rashad 2013 Chen et al 2016) Forthe synthesis of 11 Aring tobermorite a more distinct setting of temperaturesetting (180ndash200 degC) and steam pressure (1ndash12 MPa) are required
This publication is intended to make a new contribution to thechallenging field of hydrothermal synthesis in the system CaO-Al2O3-SiO2-H2O based on XRD analysis combined with Rietveld refinementVarious dosages of two types of metakaolin with different chemical andmineralogical purities are compared for the effects on the hydrothermalsynthesis of Al-substituted 11 Aring tobermorite Especially changes of thebulk chemistry in the raw mixes the reactivity of minor crystalline
httpsdoiorg101016jclay2019105432Received 20 August 2019 Received in revised form 13 November 2019 Accepted 30 December 2019
Corresponding authorE-mail address juergenjsschreinerfaude (J Schreiner)
Applied Clay Science 185 (2020) 105432
0169-1317 copy 2020 Elsevier BV All rights reserved
T
6 Publications
31
phases of the two types of metakaolin and the effect of different curingtimes are the focus of interest On the one hand metakaolin offers agreat potential in the AAC industry On the other hand of all SCMsmetakaolin is a good source material for investigating the influence ofAl3+ on the synthesis of Al-substituted 11 Aring tobermorite
12 Synthesis of Al-substituted 11 Aring tobermorite
In addition to being present in AAC tobermorite has found appli-cation in wastewater treatment and nuclear waste management due toits ion exchange capacity (Maeda et al 2012 Monasterio et al 2015)The substitution of silicon by aluminum results in a different to-bermorite structure due to general and local charge balance affectingthe lattice parameters Especially c is impacted by this substitutionbecause it occurs in the bridging tetrahedron and additional OHndash sub-stitutes O2ndash (Komarneni et al 1985 Merlino et al 2000) As suggestedin some additional studies the substitution of Si4+ by Al3+ and Na+ orK+ leads to a lath-like morphology of tobermorite crystals (Mostafa2005 Mostafa et al 2009 Venhodovaacute et al 2015 Qu et al 2018)However because of the heterogeneous appearance of tobermorite inAAC it is hardly possible to conduct a proper characterization based onSEM analysis In our recent work the anisotropic peak broadening oftobermorite in XRD diffractograms was successfully linked with theincorporation of foreign ions supplied in a common AAC production(Schreiner et al 2019) This finding allowed a more statistical struc-tural characterization of tobermorite in bulk compositions compared toSEM analysis Moreover it was reported in other studies that differenthydrate phases occur depending on the amount of supplied ions and onthe experimental settings In compounds with a high content of Al3+formation of katoite could be observed (Klimesch and Ray 1998 Riacuteoset al 2009 Matsui et al 2011) In the case of a longer curing durationinstead of 11 Aring tobermorite the formation of xonotlite (Siauciunas andBaltakys 2004 Galvaacutenkovaacute et al 2018) or - depending on the finenessof used silica source (Siauciunas and Baltakys 2004) - gyrolite is fa-voured
Kalousek (1956) suggested that tobermorite can contain up to 5Al2O3 More Al2O3 in the system resulted in the formation of hydro-garnet Klimesch and Ray (1998) additionally investigated the stabilityof hydrogarnet depending on the Al(Si + Al) ratio and its role in re-lation to the formation of 11 Aring tobermorite in an equivalent systemThey suggest that hydrogarnet always appears before tobermorite butthe former can only be detected for higher Al(Si + Al) ratios in theevent of longer curing times Riacuteos et al (2009) and Qu et al (2018)confirmed these findings in extensive investigations In the latter pub-lication it is additionally suggested that samples prepared at lowertemperatures (160 degC) are less impacted by the supply of Al3+ Theyalso consider the peak broadening of tobermorite in their XRD plotsbased on the amount of incorporated Al3+ In two recent publicationswe suggested that the peak broadening of tobermorite enables a mi-crostructural analysis by calculating the orientation dependent domainsizes (Schreiner et al 2018 2019) However these studies are based onsamples of industrially produced AAC so that the curing time was fixedThe studied AAC was produced from raw materials with a broad che-mical spectrum such as ordinary Portland cement (OPC) whichsomehow complicates the interpretation of results
In this work the influence of aluminum ions - provided by meta-kaolin - on dominant crystallographic direction-dependent domaingrowth of tobermorite is investigated by analysis of anisotropic peakbroadening (Ectors et al 2015 2017) In Fig 1 of the supplementarymaterial the method of fitting the anisotropic peak broadening of to-bermorite using a triaxial cylinder model is visualized (Schreiner et al2018) Fitting of the anisotropic peak broadening of tobermorite Thismethod is used to calculate the average and reliable values for to-bermorite domain sizes in the powder sample and associate them withaverage Al3+ incorporation Microstrain should be considered becauseit is an additional source of peak broadening However this usually
accounts for materials that have been exposed to different kinds ofstress such as metals and alloys (Badawi et al 2019) In addition theinstrumental contribution to peak broadening should be consideredHydration products such as tobermorite are characterized by crystallitesizes in the range of nanometers so that anisotropic size broadeningclearly outweighs the effect of instrumental broadening (Jenkins andSnyder 1996) Moreover the impact of Al3+ on the lattice parametersof tobermorite is considered It should additionally be clarified whe-ther the results from our previous publication (Schreiner et al 2019)based on industrially produced AAC can be confirmed by investigationwith less complex raw mixes and purely based on laboratory experi-ments
2 Material and methods
21 Starting materials
The starting materials for hydrothermal synthesis included deio-nized water quartz flour portlandite (999 pure) and two types ofmetakaolin One type was ordinary commercially available metakaolin(MK) with nearly a stoichiometric composition For comparison thesecond type of commercially available metakaolin was a by-productfrom expanded glass production (MKg) and consequently highly im-pure The chemical composition of MK and MKg determined by XRF isgiven in Table 1 With MKg containing less Al2O3 but considerably moreNa2O than MK the effects on hydrothermal synthesis were of interestBoth types of metakaolin have been characterized in previous pub-lications (Schmidt et al 2012 Naber et al 2019) In addition weverified the mineral phase content by XRD analysis Besides amorphousmetakaolin MK contained minor amounts of anatase quartz and mica
Fig 1 Weight fractions of tobermorite quartz and katoite determined byquantitative XRD analysis ndash samples including MKg crosshatched
Table 1Chemical composition of MK and MKg determined by XRF analysis ndash majorcontrasts in bold letters
Oxides [wt-] MK MKg
SiO2 536 604Al2O3 392 206CaO 01 40MgO 01 12Na2O 0 96K2O 10 18Fe2O3 18 05TiO2 21 03P2O5 01 02Loss on ignition 15 1
J Schreiner et al Applied Clay Science 185 (2020) 105432
2
6 Publications
32
MKg contained additional kaolinite feldspar and quartz
22 Investigated mix composites
For the preparation of raw mixtures the powders were weighed andhomogenized using a lab-scale mixing mill Table 2 lists the composi-tion and nomenclature of all samples including Al2O3 content andcuring time in the autoclave
bull Besides one blank mixture (MK0) that did not contain any type ofmetakaolin eleven more compounds were prepared of which threeincluded different dosages of MKg (MKg16 MKg23 and MKg60)Three more mixes contained equivalent amounts of MK instead ofMKg (MK16 MK23 and MK60) These mixes were investigated inorder to have a direct comparison concerning the effects of differentraw material on the synthesis of tobermorite
bull Additionally the mixes MK9 MK5 and MK25 with lower dosages ofmetakaolin were analyzed In the referenced literature (Schreineret al 2019) the effect of Al3+ on the anisotropic peak broadeningof tobermorite could only be observed in the case of Al2O3 contentslower than 4 in the drymix In the latter three mixes Al2O3 con-tents range from 1 to 35 Al2O3 (calculated from XRF data) whichmeets the region of interest for the analysis of tobermorite domainmorphology
bull The curing time for nearly all of the investigated samples was 12 hbut compound MK9 was prepared two more times for curing timesof 2 h and 6 h The different curing times were chosen in this par-ticular sample so that the reactivity of metakaolin and the phasetransitions could be observed more precisely
23 Hydrothermal treatment
Due to the different fineness of raw materials there was a differentwater demand from one mixture to another In order to obtain slurriesof comparable rheology the amount of water was adapted respectivelyresulting in water-to-solid ratios of 25 to 3 which matches the sug-gested water-to-solid ratio for this purpose (Roacutezycka et al 2014Galvaacutenkovaacute et al 2018) The weighed water was added to the dry mixand after stirring for 1 min at 23 degC the slurry was poured into thereactor Minor changes in the quantity of added water did not have aninfluence on the measured steam pressure All experiments were con-ducted using a PTFE-lined stainless steel autoclave with a reactor vo-lume of 300 ml The oven temperature was fixed at 180 degC and auto-genous steam pressure of 11ndash12 MPa was measured during eachexperiment with an external manometer After cooling to room tem-perature the sample was removed from the reactor coarsely ground
using an agate mortar and dried at 60 degC for 12 h After drying thesample was ground with an agate mortar again in order to deagglo-merate the particles As no coarse raw materials were used there wasno need for wet McCrone milling (Schreiner et al 2018)
24 XRD analysis
After preparation into front-loading sample holders the powdersamples were measured with a D8 diffractometer (Bruker) equippedwith a LynxEye detection system and Bragg-Brentano geometry Thesettings for XRD analysis included a tube voltage of 40 kV a current of40 mA an angular range from 6 to 80deg 2θ (Cu Kα radiation) a time perstep of 054 s a step width of 00236deg 2θ and a PSD opening of 33deg Thebackground was fitted with Chebyshev polynomial of the fifth orderThe major contribution of amorphous phase was fitted with a singlepeak with a fixed position at 308deg 2θ so that tobermorite reflectionswere not affected An external quartzite standard was measured withthe same parameters in order to determine phase quantities (Jansenet al 2011) Bruker AXS software TOPAS 50 was used for Rietveldrefinement (Rietveld 1969) and the used structures are shown inTable 3
3 Results and discussion
31 Different dosages of MK and MKg
In Fig 1 the quantities of tobermorite quartz and katoite present inmost of the samples determined by XRD analysis are illustratedWhenever tobermorite was the leading mineral hydrate phase a basalspacing of 113 Aring could be verified in each of the diffractograms Thequantities of minor crystalline phases and amorphous content are notshown For low dosages of MK it can be seen that the weight fraction oftobermorite decreased At moderate dosage of both types of metakaolin(MK16 MK23 MKg16 MKg23) tobermorite was present in comparablequantities It can be seen that the amount of katoite in the mixes de-pended on the dosage of metakaolin and it appeared only at dosages ofMK5 or more Due to the higher content of aluminum in MK comparedto MKg more katoite could always be observed in the MK mixes atequivalent dosages Despite equal amounts of quartz as starting mate-rial in mixes for both types of metakaolin the resulting weight fractionsin the cured samples were not alike Considerably more quartz waspresent in the MK samples Even though less quartz was used for mixescontaining higher amounts of MK even more quartz was present afterhydrothermal curing (Table 2 Fig 1) Consequently some of the SiO2
provided by MK did not transform into an amorphous phase or to-bermorite but into quartz This finding is verified by the presence ofquartz in MK60 because no quartz was included in the raw mixture Thefeldspar present in MKg did not react so Na2O and an unknown amountof Al2O3 may not have been supplied for hydrothermal reaction Besidestobermorite and quartz additional calcite scawtite (Ca7Si6(CO3)
Table 2Basic powder compounds prepared for the hydrothermal synthesis of to-bermorite with the respectively calculated Al2O3 content and curing time in thereactor
Sample Portlandite[wt-]
Quartz[wt-]
MK[wt-]
MKg
[wt-]
Al2O3
[wt-]Curingtime [h]
MK0 49 51 ndash ndash 0 12MK25 495 48 25 ndash 1 12MK5 49 46 5 ndash 2 12MK9_2h 48 43 9 ndash 35 2MK9_6h 48 43 9 ndash 35 6MK9_12h 48 43 9 ndash 35 12MK16 47 37 16 ndash 63 12MK23 46 31 23 ndash 9 12MK60 40 ndash 60 ndash 235 12MKg16 47 37 ndash 16 33 12MKg23 46 31 ndash 23 47 12MKg60 40 ndash ndash 60 124 12
Table 3Structural data used for the investigation with powder XRD analysis
Phase Author
Anatase (Horn et al 1972)Biotite (Brigatti et al 2000)Calcite (Maslen et al 1995)Kaolinite (Zvyagin 1960)Katoite (Bartl 1969)Microcline (Bailey 1969)Plazolite (Basso et al 1983)Portlandite (Busing and Levy 1957)Quartz (Le Page and Donnay 1976)Scawtite (Grice 2005)Tobermorite (Hamid 1981)Xonotlite (Hejny and Armbruster 2001)
J Schreiner et al Applied Clay Science 185 (2020) 105432
3
6 Publications
33
O18bull2(H2O)) and xonotlite (Ca6Si6O17(OH)2) could be identified insample MK0 (XRD plots of samples MK0 MKg16 MKg23 MK16 andMK23) Comparing MK0 and MK25 scawtite and xonotlite could stillbe identified in a very low amount in MK25 but no longer in samplesthat contained even more MK (XRD plots of samples MK0 MK25 MK5and MK9_12h)
Two additional experiments were done without quartz in the rawmixes (MK60 and MKg60) The according diffractograms after hydro-thermal curing are shown in Fig 2 In sample MKg60 tobermorite (gt 50wt-) was successfully synthesized without any other silica sourcethan MKg whereas no crystalline quartz occurred By contrast no to-bermorite but quartz could be identified in equivalent mixture MK60containing MK It can be seen that crystalline components such as micaand anatase in the raw MK did not react at the selected conditions andremained present in the autoclaved samples Except for feldspar in MKgall of the crystalline components appeared to be reactive at the chosenhydrothermal conditions A minor unidentified phase occurred at328deg2θ and additional xonotlite was identified in sample MKg60 Insample MK60 more calcium was needed for the formation of morehydrogarnet (Fig 1) resulting in a lower CaSi ratio for the remainingsystem Sample MKg60 contained only half of the amount of Al3+ and itwas not completely supplied for reaction due to its partial presence infeldspar Consequently essentially less hydrogarnet (Fig 1) was presentin MKg60 after hydrothermal treatment and the CaSi ratio in the re-maining system was affected to a lesser extent
32 Application of MK for different curing times
The development of hydrate phases in the autoclave for compoundMK9 is displayed in Fig 3 After only 2 h of hydrothermal curing all ofthe available portlandite had reacted and katoite (95 wt-) was pre-sent The applied type of metakaolin appeared to react quickly as itsupplied aluminum for formation of katoite No formation of to-bermorite could be observed at this stage yet An assumably amorphousprecursor can be seen at 28 to 30deg2θ Calcium was provided by thedissolution of portlandite After 6 h of hydrothermal reaction amountsof katoite (85 wt-) and quartz (from 31 wt- at 2 h to 165 wt- at6 h) had decreased and a major amount of tobermorite (35 wt-) waspresent Apparently between 2 and 6 h under hydrothermal conditionsthe amorphous precursor and quartz reacted resulting in the formationof tobermorite An additional 6 h of reaction time (MK9_12h) did notchange the phase composition significantly Slightly more tobermorite
(365 wt-) less quartz (16 wt-) and katoite (65 wt-) weremeasured
33 Tobermorite domain morphology and lattice parameters
In the referenced literature an analysis of tobermorite domainmorphology based on anisotropic peak broadening was possible forsamples that contained notgt 4 wt- Al2O3 in the drymix (Schreineret al 2019) Accordingly in this study samples MK0 MK25 MK5MK9_6h and MK9_12h were suitable (Table 2) with MK9_2h not con-taining any tobermorite In Fig 4 the respective growth in a and b di-rection is visualized with x indicating the domain size in a direction andy indicating domain size in b direction using a macro for TOPAS 50(Ectors et al 2015 2017) The calculated cylinder models in Fig 4represent the relation of yx and not absolute sizes With no supply ofaluminum ions (MK0) the relative domain growth in b direction islower compared to samples containing metakaolin This finding agreeswith the results from a similar investigation of tobermorite in AAC(Schreiner et al 2019) However within the samples MK5 andMK9_12h the different amounts of supplied aluminum ions did notshow a clear effect It appeared that low dosages of Al3+ (1 wt- Al2O3
in MK25 and 2 wt- Al2O3 in MK5) were enough to determine thedomain growth of tobermorite Additional results from the samplesMK9_6h and MK9_12h indicated that growth in b direction increasedwith reaction time
In Fig 5 lattice parameters of tobermorite depending on metakaolindosages are plotted B clearly remained unaffected throughout therange of samples Increasing amounts of metakaolin led to a slightlysmaller parameter a However both types of metakaolin showed acorresponding impact on parameter a By contrast parameter c in-creased strongly with increasing amounts of MK and MKg but the typeof metakaolin was significant At an equivalent dosage MK affected thecell dimension in c direction considerably more than MKg so that thefraction of Al3+ appeared to be the decisive parameter Different metaloxides in MKg did not show a notable effect certainly as they werepartially not provided for reaction Unlike for the domain morphologyof tobermorite the impact on lattice parameters could be observedwithin the complete range of examined dosages
4 Conclusions
The results obtained from the introduced investigations allow con-cluding remarks on the effects of the applied types of metakaolin on thesynthesis of 11 Aring tobermorite the phase transitions and the in-corporation of Al3+ into the lattice of tobermorite
With a critical dosage the use of any type of metakaolin led to theformation of katoite in an according amount At moderate dosages(MKg16 MKg23 MK16 and MK23) the two types of metakaolin showeda good correspondence in consideration of the quantities of to-bermorite For higher dosages there were contrary effects Lower do-sages of MK led to considerable quantities of Al-substituted to-bermorite Samples containing low dosages of MK revealed that katoiteappeared in the case ofgt 5 wt- of MK - corresponding to 2 wt-Al2O3 - in the basic compound Minor crystalline phases in MKg showedbetter reactivity than those in MK The observation that no tobermoritewas present in sample MK60 indicated that high dosages of Al3+ hin-dered the formation of tobermorite
Investigations of MK9 at 2 6 and 12 h displayed the evolution ofhydrate phases At first katoite was the only crystalline hydrate phasepresent after 2 h which corresponded to observations in a differentpublication (Klimesch and Ray 1999) The amount of katoite andquartz then decreased and a major amount of tobermorite formed from2 to 6 h curing time In order to gain more information on the trans-formation of amorphous C-(A)-S-H into tobermorite additional ex-periments in the range of 2 to 6 h curing time will be needed
Domain morphology analysis of tobermorite revealed that low
Fig 2 Diffractograms of MKg MKg60 MK and MK60 from 7 to 34deg2θ CuKα Aanatase C calcite F feldspar k kaolinite K katoite M mica Q quartz Ttobermorite U unidentified phase X xonotlite
J Schreiner et al Applied Clay Science 185 (2020) 105432
4
6 Publications
34
dosages of Al3+ determined the domain growth which agreed with theresults published on tobermorite in AAC samples (Schreiner et al2019) Different curing times unveiled that growth in b direction in-creased with the reaction time Al3+ incorporation into the lattice oftobermorite only reflected to a limited extent in the domain mor-phology By contrast an increase of lattice parameter c was triggered byAl3+ even at the highest dosage in this study Ultimately there is no
evidence for a limit of incorporation of Al3+ but there is a limit ofinfluence on the domain morphology These results additionally re-confirm this assumption similarly made in the previous work (Schreineret al 2019) and suggest a new mechanism of tobermorite crystal-lization depending on the presence of Al3+
Supplementary data to this article can be found online at httpsdoiorg101016jclay2019105432
Declaration of Competing Interest
The authors declare that they have no known competing financialinterests or personal relationships that could have appeared to influ-ence the work reported in this paper
Acknowledgement
The authors thank Rodgauer Baustoffwerke GmbH amp Co KG forsupplying raw materials for laboratory experiments
References
Aguilar-Mamani W Garciacutea G Hedlund J Mouzon J 2014 Comparison betweenleached metakaolin and leached diatomaceous earth as raw materials for the synth-esis of ZSM-5 Springerplus 3 1ndash10 httpsdoiorg1011862193-1801-3-292
Ayodele OB Sulaimon AA Alaba PA Tian Z-Y 2019 Influence of metakaolini-zation temperature on the structure and activity of metakaolin supported Ni catalystin dry methane reforming J Environ Chem Eng httpsdoiorg101016jjece2019103239 (in press)
Badawi EA Abdel-Rahman MA Mostafa A Abdel-Rahman M 2019 Determinationof the crystallite size amp micro- strain by novel method from XRD profile Appl Phys2 1ndash15 httpsdoiorg1031058jap201921001
Bailey SW 1969 Refinement of an intermediate microcline structure Am Miner 541540ndash1545
Bartl H 1969 Roentgen-Einkristalluntersuchungen an (CaO)3 (Al2O3) (H2O)6 und an(CaO)12 (Al2O3)7 (H2O) neuer Vorschlag zur (CaO)12 (Al2O3)7-Struktur NeuesJahrb fuer Mineral Monatshefte 1969 404ndash413
Basso R Giusta AD Zefiro L 1983 Crystal structure refinement of plazolite A highlyhydrated natural hydrogrossular Neues Jahrb Miner Monatsh (Neues Jahrb fuerMineral Monatshefte) 1983 251ndash258
Brigatti MF Lugli C Poppi L Foord EE Kile DE 2000 Crystal chemical varia-tions in Li- and Fe-rich micas from Pikes Peak batholith (Central Colorado) AmMineral 85 1275ndash1286 httpsdoiorg102138am-2000-8-920
Busing WR Levy HA 1957 Neutron diffraction study of calcium hydroxide J ChemPhys 26 563 httpsdoiorg10106311743345
Chen L Wang Z Wang Y Feng J 2016 Preparation and properties of alkali acti-vated metakaolin-based geopolymer Materials (Basel) 9 1ndash12 httpsdoiorg103390ma9090767
Chucholowski C Holger M Thienel K-C 2018 Improving the recyclability en-vironmental compatibility and CO2 balance of autoclaved aerated concrete by re-placing sulfate carrier and cement with calcined clays CePapers 2 503ndash512httpsdoiorg101002cepa846
Fig 3 Diffractograms of MK9_2h MK9_6h and MK9_12h from 7 to 38deg2θ CuKα C calcite K katoite Q quartz T tobermorite
Fig 4 Relation of calculated domain sizes of 11 Aring tobermorite in selectedsamples (MK0 MK25 MK5 MK9_6h and MK9_12h) in a (x) and b (y) direction
Fig 5 Lattice parameters of tobermorite depending on MK or MKg dosageincluding blank mix MK0
J Schreiner et al Applied Clay Science 185 (2020) 105432
5
6 Publications
35
Demir İ Başpınar MS Kahraman E Ccedilalışkan E Goumlrhan G 2014 An investigationon the usability of diatomite in aerated concrete production In Proc of the IntlConf on Advances in Civil Structural and Construction Engineering ndash CSCE 2014 pp97ndash100
Ectors D Goetz-Neunhoeffer F Neubauer J 2015 A generalized geometric approachto anisotropic peak broadening due to domain morphology J Appl Crystallogr 48189ndash194 httpsdoiorg101107S1600576714026557
Ectors D Goetz-Neunhoeffer F Neubauer J 2017 Routine (an)isotropic crystallitesize analysis in the double-Voigt approximation done right Powder Diffract 3227ndash34 httpsdoiorg101017S0885715617000070
Galvaacutenkovaacute L Bartoniacutečkovaacute E Opravil T Tkacz J Ptaacuteček P 2018 The influence ofstarting materials solubility on tobermorite structure formation under the hydro-thermal conditions IOP Conf Ser Mater Sci Eng 379 1ndash8 httpsdoiorg1010881757-899X3791012001
Grice JD 2005 The structure of spurrite tilleyite and scawtite and relationships toother silicate-carbonate minerals Can Mineral 43 1489ndash1500 httpsdoiorg102113gscanmin4351489
Hamid SA 1981 The crystal structure of the 11 Aring natural tobermoriteCa225[Si3O75(OH)15]1H2O Zeitschrift fuer Krist 154 189ndash198 httpsdoiorg101524zkri19811543-4189
Hejny C Armbruster T 2001 Polytypism in xonotlite Ca6Si6O17(OH)2 Zeitschrift furKrist 216 396ndash408
Horn M Schwerdtfeger CF Meagher EP 1972 Refinement of the structure of ana-tase at several temperatures Zeitschrift fur Krist 136 273ndash281 httpsdoiorg101524zkri19721363-4273
Jansen D Goetz-Neunhoeffer F Stabler C Neubauer J 2011 A remastered externalstandard method applied to the quantification of early OPC hydration Cem ConcrRes 41 602ndash608 httpsdoiorg101016jcemconres201103004
Jenkins R Snyder R 1996 Introduction to X-ray Powder Diffractometry ChemicalAnalysis Wiley pp 90
Kalousek GL 1956 Crystal Chemistry of Hydrous Calcium Silicates J Am Ceram Soc40 74ndash80
Klimesch D Ray A 1998 Autoclaved cement-quartz pastes with metakaolin additionsAdv Cem Based Mater 7 109ndash118 httpsdoiorg101016S1065-7355(97)00073-4
Klimesch D Ray A 1999 DTA-TGA evaluations of the CaOndashAl2O3ndashSiO2ndashH2O systemtreated hydrothermally Thermochim Acta 334 115ndash122 httpsdoiorg101016s0040-6031(99)00140-9
Komarneni S Roy R Roy DM Fyfe CA Kennedy GJ Bothner-By AA Dadok JChesnick AS 1985 27Al and29Si magic angle spinning nuclear magnetic resonancespectroscopy of Al-substituted tobermorites J Mater Sci 20 4209ndash4214 httpsdoiorg101007BF00552416
Koutnyacute O Opravil T Pořiacutezka J 2014 Application of metakaoline in autoclavedaerated concrete technology Adv Mater Res 1000 174ndash177 httpsdoiorg104028wwwscientificnetAMR1000174
Le Page Y Donnay G 1976 Refinement of the crystal structure of low-quartz ActaCrystallogr Sect B 32 2456ndash2459 httpsdoiorg101107S0567740876007966
Luo H Law WW Wu Y Zhu W Yang EH 2018 Hydrothermal synthesis of needle-like nanocrystalline zeolites from metakaolin and their applications for efficient re-moval of organic pollutants and heavy metals Microporous Mesoporous Mater 2728ndash15 httpsdoiorg101016jmicromeso201806015
Maeda H Ogawa Y Ishida EH Kasuga T 2012 Hydrothermal synthesis of to-bermorite doped with phosphorus species for removing heavy metal ions J AustCeram Soc 48 8ndash11
Maslen EN Streltsov VA Streltsova NR Ishizawa N 1995 Electron density andoptical anisotropy in rhombohedral carbonates III Synchrotron Xray studies ofCaCO3 MgCO3 and MnCO3 Acta Crystallogr Sect B 51 929ndash939 httpsdoiorg101107S0108768195006434
Matekonis G Šiaučiūnas R Vaičiukynienė D 2010 Hydrothermal Synthesis andCharacterization of Na + and [ Al 3 + + Na + ] -substituted Tobermorite in CaO-SiO2middotnH2O-H2O System Mater Sci 16 242ndash248
Matsui K Kikuma J Tsunashima M Ishikawa T Matsuno S Ogawa A Sato M2011 In situ time-resolved X-ray diffraction of tobermorite synthesis process underhydrothermal condition IOP Conf Ser Mater Sci Eng 18 60ndash66 httpsdoiorg1010881757-899X182022017
Merlino S Bonaccorsi E Armbruster T 2000 The real structures of clinotobermoriteand tobermorite 9 Aring OD character polytypes and structural relationships Eur JMineral 12 411ndash429 httpsdoiorg1011270935-122120000012-0411
Monasterio M Gaitero JJ Manzano H Dolado JS Cerveny S 2015 Effect ofchemical environment on the dynamics of water confined in calcium silicate mi-nerals Natural and synthetic tobermorite Langmuir 31 4964ndash4972 httpsdoiorg101021acslangmuir5b00614
Mostafa NY 2005 Influence of air-cooled slag on physicochemical properties of auto-claved aerated concrete Cem Concr Res 35 1349ndash1357 httpsdoiorg101016jcemconres200410011
Mostafa NY Shaltout AA Omar H Abo-El-Enein SA 2009 Hydrothermal synth-esis and characterization of aluminium and sulfate substituted 11 nm tobermoritesJ Alloys Compd 467 332ndash337 httpsdoiorg101016jjallcom200711130
Naber C Stegmeyer S Jansen D Goetz-Neunhoeffer F Neubauer J 2019 ThePONKCS method applied for time resolved XRD quantification of supplementarycementitious material reactivity in hydrating mixtures with ordinary Portland ce-ment Constr Build Mater 214 449ndash457 httpsdoiorg101016jconbuildmat201904157
Qu X Zhao Z Zhao X 2018 Microstructure and characterization of aluminum-in-corporated calcium silicate hydrates (C-S-H) under hydrothermal conditions RSCAdv 8 28198ndash28208 httpsdoiorg101039c8ra04423f
Rashad AM 2013 Metakaolin as cementitious material history scours production andcomposition - a comprehensive overview Constr Build Mater 41 303ndash318 httpsdoiorg101016jconbuildmat201212001
Rietveld HM 1969 A profile refinement method for nuclear and magnetic structures JAppl Crystallogr 2 65ndash71 httpsdoiorg101107S0021889869006558
Riacuteos CA Williams CD Fullen MA 2009 Hydrothermal synthesis of hydrogarnet andtobermorite at 175 degC from kaolinite and metakaolinite in the CaO-Al2O3-SiO2-H2Osystem a comparative study Appl Clay Sci 43 228ndash237 httpsdoiorg101016jclay200809014
Roacuteżycka A Pichoacuter W 2016 Effect of perlite waste addition on the properties of au-toclaved aerated concrete Constr Build Mater 120 65ndash71 httpsdoiorg101016jconbuildmat201605019
Roacutezycka A Kotwica Ł Małolepszy J 2014 Synthesis of single phase gyrolite in theCaO-quartz-Na2O-H2O system Mater Lett 120 166ndash169 httpsdoiorg101016jmatlet201401003
Sauman Z 1974 Influence of SO4 2ndash ions on the formation of 11 Aring tobermorite InProceedings of the 2nd International Symposium on Science and Research in SilicateChemistry Moscow pp 25ndash39
Schmidt M Egersdoumlrfer A Poumlllmann H 2012 Increased reactivity using a glass-containing metakaolin as an active filler in lime-based binder systems ZKG Int 6554ndash62
Schreiner J Jansen D Ectors D Goetz-Neunhoeffer F Neubauer J Volkmann S2018 New analytical possibilities for monitoring the phase development during theproduction of autoclaved aerated concrete Cem Concr Res 107 247ndash252 httpsdoiorg101016jcemconres201802028
Schreiner J Goetz-Neunhoeffer F Neubauer J Volkmann S Bergold S Webler RJansen D 2019 Advanced Rietveld refinement and SEM analysis of tobermorite inchemically diverse autoclaved aerated concrete Powder Diffract 34 143ndash150httpsdoiorg101017s0885715619000149
Setthaya N Chindaprasirt P Pimraksa K 2016 Preparation of zeolite nanocrystals viahydrothermal and solvothermal synthesis using of rice husk ash and metakaolinMater Sci Forum 872 242ndash247 httpsdoiorg104028wwwscientificnetmsf872242
Siauciunas R Baltakys K 2004 Formation of gyrolite during hydrothermal synthesis inthe mixtures of CaO and amorphous SiO2 or quartz Cem Concr Res 34 2029ndash2036httpsdoiorg101016jcemconres200403009
Skawinska A Owsiak Z Baran T Hernik K 2017 The influence of halloysite ad-dition on tobermorite formation in CaO and quartz mix under hydrothermal condi-tions Cem Wapno Bet 17 426ndash434
Venhodovaacute E Janovskyacute R Drochytka R 2015 Formation of tobermorite at differentmaterials composition of aerated concrete Appl Mech Mater 752ndash753 247ndash250httpsdoiorg104028wwwscientificnetamm752-753247
Walczak P Małolepszy J Reben M Szymański P Rzepa K 2015 Utilization ofwaste glass in autoclaved aerated concrete Proc Eng 122 302ndash309 httpsdoiorg101016jproeng201510040
Zhang Y Gao W Cui L 2007 The transformation of acid leached metakaolin tozeolite beta Stud Surf Sci Catal 170 420ndash425 httpsdoiorg101016S0167-2991(07)80870-6
Zvyagin BB 1960 An attempt to electronographic determination of kaolinite structureJ Dokl Akad Nauk SSSR 130 1023ndash1026
J Schreiner et al Applied Clay Science 185 (2020) 105432
6
6 Publications
36
6 Publications
62 Advanced Rietveld refinement and SEM analysis oftobermorite in chemically diverse autoclaved aeratedconcrete
Following the copyright guidelines by Cambridge University Press the publication
Schreiner J Goetz-Neunhoeffer F Neubauer J Volkmann S Bergold S WeblerR Jansen D 2019 Advanced Rietveld refinement and SEM analysis of tobermorite inchemically diverse autoclaved aerated concrete Powder Diffraction 34 143ndash150 httpsdoiorg101017s0885715619000149
may not be reprinted It can be accessed at
httpswwwcambridgeorgcorejournalspowder-diffractionarticleadvanced-rietveld-refinement-and-sem-analysis-of-tobermorite-in-chemically-diverse-autoclaved-aerated-concrete51597C2A66F6F225D29DEB2675E74249
37
6 Publications
63 New analytical possibilities for monitoring the phasedevelopment during the production of autoclavedaerated concrete
Reprint of the peer reviewed publication
Schreiner J Jansen D Ectors D Goetz-Neunhoeffer F Neubauer J VolkmannS 2018 New analytical possibilities for monitoring the phase development during theproduction of autoclaved aerated concrete Cement and Concrete Research 107 247ndash252httpsdoiorg101016jcemconres201802028
with permission from Elsevier
38
Contents lists available at ScienceDirect
Cement and Concrete Research
journal homepage wwwelseviercomlocatecemconres
Short communication
New analytical possibilities for monitoring the phase development duringthe production of autoclaved aerated concrete
J Schreinera D Jansena D Ectorsa F Goetz-Neunhoeffera J Neubauera S Volkmannb
aUniversity of Erlangen-Nuremberg GeoZentrum Nordbayern Mineralogy Schlossgarten 5a 91054 Erlangen Germanyb Rodgauer Baustoffwerke GmbH amp Co KG Am Opel-Pruumlffeld 3 63110 Rodgau-Dudenhofen Germany
A B S T R A C T
This work presents improved analytical methods for both steps of the production process of autoclaved aeratedconcrete (AAC) the phase development during the hydration before autoclaving and during the autoclavingprocess itself The improvement includes new insights into preparation methods of AAC samples for powderdiffraction as well as Rietveld refinement strategies For the first time a new implementation for calculatinganisotropic crystal domain sizes is applied to major hydrate phases occurring during AAC production namelyportlandite during the hydration before autoclaving and tobermorite during the autoclaving process The cal-culation of anisotropic domain size growth which can be implemented in the Rietveld environment is based oncrystallographically and geometrically appropriate models The implementation of calculating anisotropic do-main sizes for the Rietveld software TOPAS 50 allows a superior Rietveld fit and a more accurate quantificationof the phase development Additionally it enables the tracking of growth mechanism of portlandite duringhydration
1 Introduction
Autoclaved aerated concrete (AAC) is known as a lightweight con-struction material which offers outstanding properties such as suffi-cient strength for construction in addition with excellent thermal in-sulation [12] AAC is produced by autoclaving from calcareous rawmaterials such as lime (CaO) and cement quartz sulfate carrier andother additives such as foaming agents and water
The production process (Fig 1) can be separated into the hydrationof the mixed slurry before the procedure of autoclaving and the auto-claving at elevated temperature (180 degC to 200 degC) under saturatedsteam pressure (12MPa) for several hours
The hydration process before autoclaving is necessary to achievesufficient strength in order to cut the green cake blocks as they shouldhave a specific shape and dimension after autoclaving Furthermorethe porous structure is generated by the foaming agent during hydra-tion in the first process step During autoclaving the final propertiesnamely strength and low thermal conductivity are achieved
It is already well understood that the autoclaving process leads tothe formation of several phases first of all tobermorite(Ca5Si6O16(OH)2lowast4H2O) [3ndash5] Newest research has shown im-pressively which reactions are running from the mineralogical point ofview Insitu XRD measurements were carried out during the
autoclaving process and the phase development was shown by plottingnormalized intensities [6] The study of Mitsuda et al [3] was mainlyfocused on the tracking of the phase evolution during the autoclavingprocess of AAC However their statements concerning phase evolutionare mainly based on XRD data and TGA measurements There is acommon agreement that the following reactions occur The consump-tion of the alite (OPC) leads to the formation of an initial C-S-H phaseduring the first processing step Portlandite which was initially formedduring the first process step (from CaO and C3S) further quartz and theC-S-H phase are consumed during autoclaving resulting in the crystal-lization of tobermorite Hence the crystallization process of to-bermorite as well as the crystal structure of tobermorite was an issue ofresearch and discussion over the last years and numerous publicationsto these topics are available Concerning the crystal structure of to-bermorite respectively the tobermorite supergroup a new publicationoutlines all important references and recommends a new nomenclature[7]
The presented study was performed to create new analytical possi-bilities for the characterization of the production process of AAC Bothof the production process steps are essential for the final productHence the present work focuses on crystallization of hydrate phases inboth processes
Firstly an external standard method [89] was published and
httpsdoiorg101016jcemconres201802028Received 6 October 2017 Received in revised form 1 February 2018 Accepted 26 February 2018
Corresponding authorsE-mail addresses juergenjsschreinerfaude (J Schreiner) danieljansenfaude (D Jansen)
Cement and Concrete Research 107 (2018) 247ndash252
0008-8846 copy 2018 Elsevier Ltd All rights reserved
T
6 Publications
39
recommended for the determination of absolute phase contents inmixtures with amorphous content It was shown that the method canabsolutely be recommended for hydrating cement pastes in which watercannot be quantified directly by XRD [10] This method seems to bevery promising for both the quantification of the hydration of the AACslurry before autoclaving and the quantification of the phase evolutionduring autoclaving inasmuch as both production steps form crystallineand amorphous phases
Secondly a new approach to anisotropic peak broadening due toanisotropic domain morphology which was developed [1112] is ap-plied to AAC samples to improve the fit of portlandite and tobermoriteby Rietveld refinement [13] By applying this approach the refinementof both portlandite and tobermorite should additionally lead to betterquantitative results as well as to better insights into the development ofthe domain size morphology of both phases formed
It was already shown that in a hydrating raw mixture for AAC twospecies of portlandite precipitate at 23 degC one showing dynamicallyanisotropic peak broadening and another one following the isotropictrend [14] The application of the anisotropic refinement model led toan improved fitting of portlandite Moreover the mechanism of aniso-tropic domain growth of portlandite was tracked
2 Materials and methods
In order to examine the hydration of the AAC slurry before auto-claving a mixture of the hydraulic reactive components was weighedand measured in-situ at a Bruker D8 diffractometer with a LynxEyedetection system
Ordinary Portland cement (OPC) was mixed with lime (CaO) andanhydrite (C$) The raw materials were taken from the same batches asfor the industrial samples The drymix (58 OPC 36 CaO and 6 C$by weight) was then mixed with water (ws= 08) and placed into anappropriate sample holder The samples were not aerated The slurrysamples were covered with a kapton film to avoid evaporation andcarbonation Diffractograms were recorded with an angular range from7 to 545deg 2θ and a step width of 0011deg 2θ Measurements were carriedout every 15min For each measurement 96 XRD patterns were re-corded over the first 24 h The temperature was fixed at 70 degC which isthe mean temperature generally prevailing in the industrial processduring hydration before autoclaving Rietveld refinement was carriedout using the G-factor method All structures used for Rietveld refine-ment are shown in Table 1
For investigation of the autoclaved samples five different specimenswere taken at different autoclaving times The specimens were takenout of a technical production process hence it was not possible to in-terrupt the process at an earlier time inasmuch it would lead to damageof a whole concrete production batch The specimens were firstly driedat 60 degC until weight constancy The whole blocks were then broken andstatistical samples of 20 g were taken In order to receive the right massattenuation coefficient (MAC) for G-factor method the loss on ignitionand the chemical composition (XRF) were determined For energydispersive XRF analysis (Spectro Xepos) tube voltage from 20 kV to50 kV and tube current from 08 to 20mA were used for differenttargets
The final sample preparation (grinding) before XRD measurementswas carried out using both an agate mortar and a McCrone micronizingmill for wet milling with isopropanol Both preparation methods wereapplied separately to see which one is suitable in order to get the bestpreparation for XRD investigations Six preparations were performed byone operator of which two were prepared with an agate mortar andfour with a McCrone mill For the McCrone milling 3 g of the sampleand 10ml of isopropanol were used for grinding for 12min The grainsize distribution of one sample prepared with an agate mortar and onesample prepared using a McCrone mill was measured by laser granu-lometry in isopropanol using a Mastersizer 3000 (MALVERN)
After milling the samples in these two ways for XRD analysis thepowders were prepared into a front loading sample holder and mea-sured Diffractograms were recorded with an angular range from 6 to80deg 2θ a step width of 00236deg 2θ and a time per step of 054 s Rietveldrefinement combined with external standard (G-factor) was applied inorder to get absolute quantities for each phase The refinement strategyfor portlandite and tobermorite in the TOPAS Launch Mode (TOPAS50 Bruker AXS) is attached as a Supplementary material file
3 Results and discussion
31 Hydration of the mixture before autoclaving
The hydration of the investigated paste before autoclaving isdominated by the hydration of the cement as well as the reaction of thefree lime (CaO) resulting in the formation of portlandite It can beclearly seen from Fig 2 that the hydration of the paste leads to theformation of ettringite portlandite and C-S-H phase For simplificationthe remaining phase developments are not shown in Fig 2 because theyare not in the focus of this study The hydration of CaO forming
Fig 1 Simplified process steps of AAC production and hydrate phase evolution
Table 1Structures used for Rietveld refinement
Phase Author
Alite [15]Anhydrite [16]Bassanite [17]Belite (β) [18]Belite (αprime) [19]Brownmillerite [20]C-S-H [21]Calcite [22]Ettringite [23]Gypsum [24]Hemicarbonate [25]Hydroxylellestadite [26]Lime (CaO) [27]Microcline [28]Portlandite [29]Quartz [30]Tobermorite [31]Tricalciumaluminate (cubic) [32]Tricalciumaluminate (orthorhombic) [33]PONCKS model for Water [21]
J Schreiner et al Cement and Concrete Research 107 (2018) 247ndash252
248
6 Publications
40
portlandite begins rapidly after the addition of water to the mixture andlime is fully consumed after only 1 h of hydration This translates into aquick rise of heat of hydration so that cement hydration is acceleratedwhich leads to further portlandite formation by the reaction of aliteEttringite formation stalls after few hours of hydration After 12 h et-tringite is partially decomposed probably due to sulfate depletion [9]
and poorly crystalline AFm phases (not shown in Fig 2) are formedIn Fig 3 it can be seen that in fact two generations of portlandite
are formed a 1st dominant generation showing anisotropic peakbroadening and 2nd one occurring considerably later following theisotropic domain size refinement which is usually carried out using theRietveld method This occurrence comes along firstly with lime hy-dration and secondly with alite hydration The expected quantity ofportlandite formed from lime hydration very well complies with the
Fig 2 Phase development in AAC paste on a laboratory scale before autoclaving ana-lyzed by in-situ XRD at 70 degC
Fig 3 Formation of two generations of portlandite by hydration of lime (1st) and C3S(2nd) at 70 degC before autoclaving with the major generation showing anisotropic peakbroadening
Fig 4 Biaxial cylinder domain size model of portlandite used for Rietveld refinement of anisotropic peak broadening
Fig 5 Morphological evolution of portlandite showing anisotropic domain size growthduring hydration at 70 degC
Fig 6 Comparison of quantification of crystalline quartz in samples prepared withMcCrone mill and agate mortar at different autoclaving times
J Schreiner et al Cement and Concrete Research 107 (2018) 247ndash252
249
6 Publications
41
quantity of the observed 1st generation The development of portlan-dite growth was already tracked in an equivalent slurry at 23 degC [14]Thus this observation confirms that the crystallinity of portlandite inmixtures for AAC production depends on the starting phase for hydra-tion as already indicated by Ectors [14]
Fig 4 shows the used biaxial cylindrical model for anisotropic do-main size calculation and the portlandite structure which was createdwith structural software VESTA 318 [34] Using the cylindrical ap-proach domain sizes in a (here equating to b) and c direction(dz= cylinder height) can be calculated which comes along with theexpected symmetrical parameters of portlandite
The 1st portlandite generation showing anisotropic domain growthcan be tracked in terms of cylinder diameter and height which is rea-lized in Fig 5 The blue cylinder represents the geometric approach andcylinder height and diameter are calculated newly for each range Thecylinder height remains rather stable throughout the hydration processwhile the cylinder diameter increases during the first hours of hydra-tion After 10 h of hydration the mean cylinder diameter no longer in-creases Consequently these observations match the results of the ex-aminations conducted at 23 degC [14] as well as the assumption thatdifferent mechanisms of growth exist for portlandite depending on the
hydration educt The maximum cylinder diameter is reached earlier inthis work very likely because of the higher hydration temperature
32 Quantification of the reactions during autoclaving
Autoclaved samples were ground with an agate mortar and com-pared to samples which were wet-ground with a McCrone mill Fig 6shows precisely that the determination of the amount of crystallinequartz is more reproducible in the two shown samples which were
Fig 7 2D XRD with Bruker GADDS-system plots of samples prepared with agate mortar and McCrone mill Coarse quartz grains are pointed out in the plot of the sample prepared withagate mortar
Fig 8 Particle size distribution of one sample prepared with an agate mortar and of onesample prepared with a McCrone mill measured by laser granulometry
Fig 9 Rietveld refinement for Tobermorite of autoclaved AAC sample by use of isotropicdomain size model (a) and of anisotropic domain size model (b)
J Schreiner et al Cement and Concrete Research 107 (2018) 247ndash252
250
6 Publications
42
prepared with a McCrone mill The high variance of crystalline quartzin the samples which were prepared with an agate mortar is a result ofinsufficient grinding and remaining of too large quartz grains Whenthis spottiness occurs a reliable quantification using the G-factormethod is not possible
The 2D XRD with Bruker GADDS-system plots in Fig 7 demonstratethe insufficient grinding when using an agate mortar compared to wetmilling with a McCrone mill Quartz would be overrepresented in a one-dimensional XRD pattern focusing on a section with bright spots (greenarrows) The lack of bright spots in the right plot shows that the quartzgrains are milled more thoroughly using a McCrone mill In Fig 8 theparticle size distribution after both ways of sample preparation iscompared Most grains in the sample prepared with an agate mortar arelarger than in the sample prepared with a McCrone mill The grain sizedistribution of the sample prepared with a McCrone mill complies withthe recommended particle size range for XRD analysis of under 5 to50 μm [3536] while the other sample exceeds the range
In Fig 9 Rietveld refinement of an autoclaved sample is shown Thedominant peaks at 77 290 and 301deg 2θ are attributed to tobermoriteIn the upper diagram (a) Rietveld refinement was carried out regularlycalculating isotropic domain sizes for tobermorite However the cal-culated fit differs significantly from the raw data It can be assumed thattobermorite shows a similar pattern to portlandite in terms of aniso-tropic peak broadening taking into account that tobermorite is as-signed to the orthorhombic crystal system Thus instead of a biaxialcylinder model an elliptic cylinder model (Fig 10 structure createdwith VESTA 318 [34]) was applied for the refinement in the lowerdiagram (b) The elliptic cylinder model is a sufficient approach to the
orthorhombic crystal system as it allows the distinction between do-main sizes in a b and c direction The fit is clearly superior using theanisotropic domain size model highlighted by the difference plot inFig 9b The comparison refinement with isotropic and anisotropic ap-proach was done for all of the five autoclaved samples In Fig 11 theresulting Rwp values for the whole pattern and the RBragg values of to-bermorite are shown The refinement using the anisotropic model leadsto both lower Rwp and RBragg values and consequently to a better fit anda more accurate quantification of tobermorite in all refined samples
4 Summary and conclusions
Improved analytical methods for both the phase developmentduring the hydration before autoclaving and during the autoclavingprocess of AAC are presented It could be shown that wet McCronemilling is the best way of preparation of AAC samples in order to obtainsuitable samples for powder diffraction A new approach to treat ani-sotropic domain sizes for Rietveld refinement could be successfullyapplied ndash with the benefit that portlandite and tobermorite in AACsamples could be refined more accurately using the Rietveld methodThus this application allows an improved quantification of the phasedevelopment during both of the production steps
For the future there are still plenty of possibilities to apply thepresented approach of calculating anisotropic domain sizes to AACproduction As exemplified with portlandite the mechanisms of growthof tobermorite can be tracked likewise during the autoclaving processIn addition the effect of variations in the chemical composition of AACraw mixtures on the crystal morphology of tobermorite can be ex-amined This leaves a new perspective to discuss the link between mi-neral phase morphology and the thermal and mechanical properties ofAAC
Acknowledgement
The autoclaved samples were generously provided by RodgauerBaustoffwerke GmbH amp Co KG The authors express gratitude for allsupport
Appendix A Supplementary data
Supplementary data to this article can be found online at httpsdoiorg101016jcemconres201802028
References
[1] MW Grutzeck Cellular concrete in M Scheffler P Colombo (Eds) CellularCeramics Wiley-VCH Weinheim 2005 pp 193ndash223
[2] M Haas The future of AAC ndash from a material scientists point of view inMC Limbachiya JJ Roberts (Eds) Autoclaved Aerated Concrete Taylor FrLondon 2005 pp 187ndash194
[3] T Mitsuda K Sasaki H Ishida Phase evolution during autoclaving process ofaerated concrete J Am Ceram Soc 75 (1992) 1858ndash1863
[4] N Isu H Ishida T Mitsuda Influence of quartz particle size on the chemical and
Fig 10 Triaxial cylinder domain size model of Tobermorite used for Rietveld refinement of anisotropic peak broadening
Fig 11 Comparison of Rwp and RBragg values of Rietveld refinements of autoclavedsamples and tobermorite using the isotropic and the anisotropic domain size model
J Schreiner et al Cement and Concrete Research 107 (2018) 247ndash252
251
6 Publications
43
mechanical properties of autoclaved aerated concrete (I) tobermorite formationCem Concr Res 25 (1995) 243ndash248
[5] NY Mostafa Influence of air-cooled slag on physicochemical properties of auto-claved aerated concrete Cem Concr Res 35 (2005) 1349ndash1357 httpdxdoiorg101016jcemconres200410011
[6] K Matsui J Kikuma M Tsunashima T Ishikawa S Matsuno A Ogawa M SatoIn situ time-resolved X-ray diffraction of tobermorite formation in autoclaved aer-ated concrete influence of silica source reactivity and Al addition Cem Concr Res41 (2011) 510ndash519
[7] C Biagioni S Merlino E Bonaccorsi The tobermorite supergroup a new no-menclature Mineral Mag 79 (2015) 485ndash495 httpdxdoiorg101180minmag2015079222
[8] BH OConnor MD Raven Application of the Rietveld refinement procedure inassaying powdered mixtures Powder Diffract 3 (1988) 2ndash6 httpdxdoiorg101017S0885715600013026
[9] D Jansen F Goetz-Neunhoeffer C Stabler J Neubauer A remastered externalstandard method applied to the quantification of early OPC hydration Cem ConcrRes 41 (2011) 602ndash608 httpdxdoiorg101016jcemconres201103004
[10] D Jansen C Stabler F Goetz-Neunhoeffer S Dittrich J Neubauer Does OrdinaryPortland Cement contain amorphous phase A quantitative study using an externalstandard method Powder Diffract 26 (2011) 31ndash38 httpdxdoiorg10115413549186
[11] D Ectors F Goetz-Neunhoeffer J Neubauer A generalized geometric approach toanisotropic peak broadening due to domain morphology J Appl Crystallogr 48(2015) 189ndash194 httpdxdoiorg101107S1600576714026557
[12] D Ectors F Goetz-Neunhoeffer J Neubauer Routine (an)isotropic crystallite sizeanalysis in the double-Voigt approximation done right Powder Diffract 32 (S1)(2017) 27ndash34 httpdxdoiorg101017S0885715617000070
[13] HM Rietveld A profile refinement method for nuclear and magnetic structures JAppl Crystallogr 2 (1969) 65ndash71 httpdxdoiorg101107S0021889869006558
[14] D Ectors Advances in the Analysis of Cementitious Reactions and Hydrate Phases(Doctoral Thesis) (2016) pp 12ndash14 (urnnbndebvb29-opus4-71743)
[15] AacuteG De La Torre S Bruque J Campo MAG Aranda The superstructure of C3Sfrom synchrotron and neutron powder diffraction and its role in quantitative phaseanalyses Cem Concr Res 32 (2002) 1347ndash1356 httpdxdoiorg101016S0008-8846(02)00796-2
[16] A Kirfel G Will Charge density in anhydrite CaSO4 from X-ray and neutrondiffraction measurements Acta Crystallogr Sect B Struct Crystallogr CrystChem 36 (1980) 2881ndash2890 httpdxdoiorg101107S0567740880010461
[17] C Bezou AN Christensen D Cox M Lehman A Nonat Structures cristallines deCaSO405H2O et CaSO406H2O Comptes Rendus Hebd Des Seacuteances lAcadeacutemieDes Sci Seacuterie 2 (312) (1991) 43ndash48
[18] KH Jost B Ziemer R Seydel Redetermination of the structure of β-dicalciumsilicate Acta Crystallogr Sect B Struct Crystallogr Cryst Chem 33 (1977)1696ndash1700 httpdxdoiorg101107S0567740877006918
[19] W Mumme LMD Cranswick BC Chakoumakos Rietveld crystal structure re-finements from high temperature neutron powder diffraction data for the poly-morphs of dicalcium silicate Neues Jahrb Fuer Mineral Abhandlungen 170 (1996)171ndash188
[20] A Colville S Geller The crystal structure of brownmillerite Ca2FeAlO5Crystallographica 50 (1971) 2311ndash2315 httpdxdoiorg101107S056774087100579X
[21] ST Bergold F Goetz-Neunhoeffer J Neubauer Quantitative analysis of C-S-H inhydrating alite pastes by in-situ XRD Cem Concr Res 53 (2013) 119ndash126 httpdxdoiorg101016jcemconres201306001
[22] EN Maslen VA Streltsov NR Streltsova N Ishizawa Electron density and op-tical anisotropy in rhombohedral carbonates III Synchrotron Xray studies ofCaCO3 MgCO3 and MnCO3 Acta Crystallogr Sect B 51 (1995) 929ndash939 httpdxdoiorg101107S0108768195006434
[23] G Renaudin Y Filinchuk J Neubauer F Goetz-Neunhoeffer A comparativestructural study of wet and dried ettringite Cem Concr Res 40 (2010) 370ndash375httpdxdoiorg101016jcemconres200911002
[24] WF Cole CJ Lancucki A refinement of the crystal structure of gypsumCaSO42H2O Acta Cryst B30 (1974) 921ndash929 httpdxdoiorg101107S0567740874004055
[25] T Runčevski RE Dinnebier OV Magdysyuk H Poumlllmann Crystal structures ofcalcium hemicarboaluminate and carbonated calcium hemicarboaluminate fromsynchrotron powder diffraction data Acta Crystallogr Sect B Struct Sci 68 (2012)493ndash500 httpdxdoiorg101107S010876811203042X
[26] JM Hughes JW Drexler Cation substitution in the apatite tetrahedral site crystalstructures of type hydroxylellestadite and type fermorite Neues Jahrb FuerMineral (1991) 327ndash336
[27] CH Shen RS Liu JG Lin CY Huang Phase stability study of La12Ca18Mn2O7Mater Res Bull 36 (2001) 1139ndash1148
[28] SW Bailey Refinement of an intermediate microcline structure Am Miner 54(1969) 1540ndash1545
[29] WR Busing HA Levy Neutron diffraction study of calcium hydroxide J ChemPhys 26 (1957) 563 httpdxdoiorg10106311743345
[30] Y Le Page G Donnay Refinement of the crystal structure of low-quartz ActaCrystallogr Sect B 32 (1976) 2456ndash2459 httpdxdoiorg101107S0567740876007966
[31] SA Hamid The crystal structure of the 11 Aring natural tobermoriteCa225[Si3O75(OH)15]1H2O Zeitschrift Fuer Krist - New Cryst Struct 154 (1981)189ndash198 httpdxdoiorg101524zkri19811543-4189
[32] P Mondal JW Jeffery The crystal structure of tricalcium aluminate Ca3Al2O6Acta Crystallogr B 31 (1975) 689ndash697 httpdxdoiorg101107S0567740875003639
[33] Y Takeuchi F Nishi I Maki Crystal-chemical characterization of the tricalciumaluminate-sodium oxide (3CaOtimesAl2O3-Na2O) solid-solution series Zeitschrift FuumlrKrist (1980) 259ndash307
[34] K Momma F Izumi VESTA 3 for three-dimensional visualization of crystal vo-lumetric and morphology data J Appl Crystallogr 44 (2011) 1272ndash1276 httpdxdoiorg101107S0021889811038970
[35] K Scrivener R Snellings B Lothenbach A Practical Guide to MicrostructuralAnalysis of Cementitious Materials CRC Press 2016 pp 123ndash125 httpdxdoiorg107693wl20150205
[36] V Pecharsky P Zavalij Fundamentals of Powder Diffraction and StructuralCharacterization of Materials Springer second edition 2005 p 302 httpdxdoiorg101007978-0-387-09579-0
J Schreiner et al Cement and Concrete Research 107 (2018) 247ndash252
252
6 Publications
44
7 Acknowledgement
7 Acknowledgement
Ich moumlchte mich bei einigen Personen bedanken ohne die es wohl kaum zum erfolgreichenAbschluss dieser Arbeit gekommen waumlreMein Doktorvater Prof Dr Juumlrgen Neubauer hat sich stets die Zeit genommen die noumltigwar um Angelegenheiten aller Art mit mir zu klaumlren Er gab mir fachlich immer zumrichtigen Zeitpunkt einen gewissen wissenschaftlichen Impuls Zugleich habe ich mich den-noch immer frei in meiner eigenen Konzeption gefuumlhlt Groszligen Dank spreche ich Prof DrFriedlinde Goumltz-Neunhoeffer aus die fuumlr mich ebenso immer eine verlaumlssliche Ansprech-partnerin fuumlr fachliche und organisatorische Angelegenheiten aller Art war Danke anDr Daniel Jansen fuumlr die gute Zusammenarbeit und dafuumlr dass er mich im Zuge meinerMasterarbeit in ein Forschungsprojekt aufgenommen hat das den Weg zur Promotionmoumlglich machte Zusaumltzlich gilt mein Dank Prof Dr Matthias Goumlbbels der fuumlr dieMitarbeiter am Lehrstuhl immer motivierende Worte fand Fuumlr die Ermoumlglichung meinerTeilnahme an diversen Dienstreisen Fortbildungen und Tagungen moumlchte ich mich viel-mals bedankenWeiterhin bedanke ich mich bei Dr Stephan Volkmann und den Rodgauer BaustoffwerkenGmbH amp Co KG fuumlr die gute Zusammenarbeit und die Bereitstellung von Versuchsma-terialienVielen Dank an meine studentischen Hilfskraumlfte Daniel Wagner Laura MoldenhauerFabian Lang Jakob Schreiber und Felix Klaassen die alle Aufgaben im Labor einwand-frei und mit Bedacht erledigten Bei meinen aktuellen und ehemaligen Kollegen DrKatrin Hurle Dr Dominique Ectors Dr Christoph Naber Dr Florian Huumlller JoumlrgNehring Frank Riedel Julian Wolf Tanja Manninger Daniel Wagner Nicolas FobbeKarla Spaumlth Julian Goergens Andreas Koumlhler Cordula Jakob Franz Becker und LisaKlemenz bedanke ich mich fuumlr die gelungene Zusammenarbeit und gegenseitige Unter-stuumltzung Besonderer Dank geht auch an Kerstin Kreszlig Bettina Engl Christian HankeBernd Schleifer und Christian Abe fuumlr die verlaumlssliche Unterstuumltzung bei technischen Fra-gen und Messungen im LaborFuumlr jegliche Unterstuumltzungen moumlchte ich mich auch bei meinen Eltern bedanken sowiebei meinem Bruder Ralf der mir mit einem LaTex Crashkurs viel Frustration ersparthat Danke Thomas dass du immer fuumlr mich da bist und mit mir zusammen fuumlr genugAusgleich gesorgt hast
45
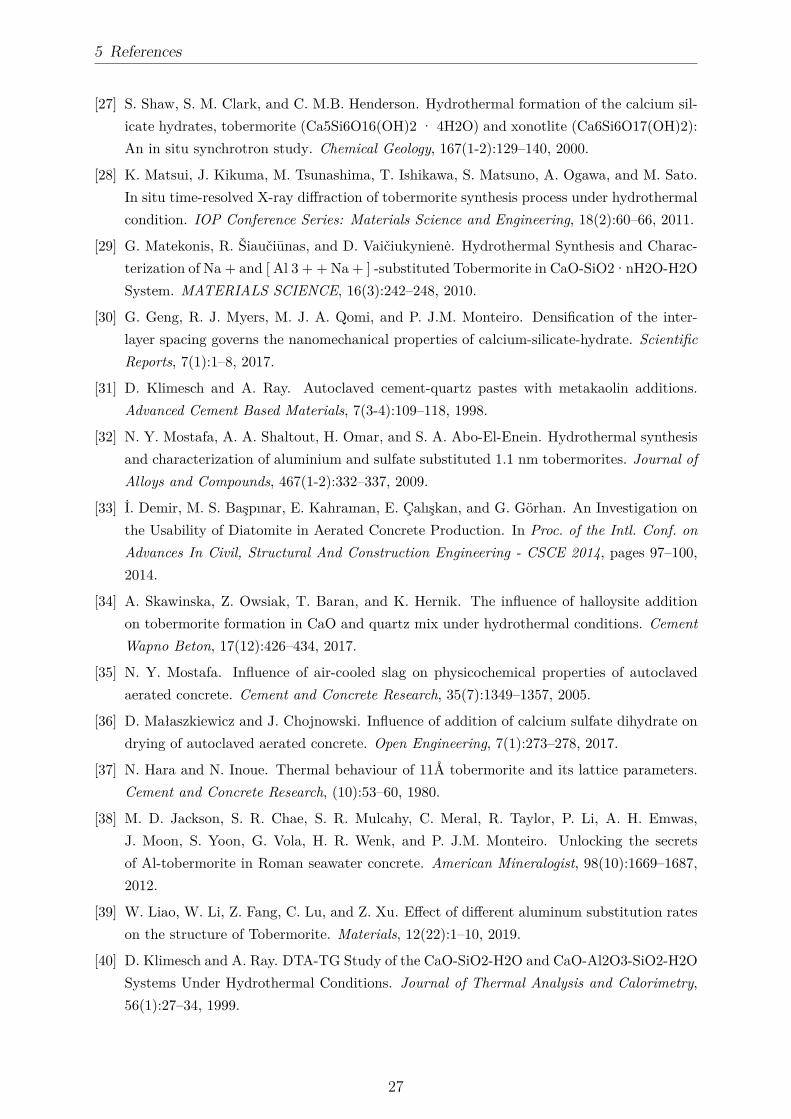
5 References
[27] S Shaw S M Clark and C MB Henderson Hydrothermal formation of the calcium sil-icate hydrates tobermorite (Ca5Si6O16(OH)2 middot 4H2O) and xonotlite (Ca6Si6O17(OH)2)An in situ synchrotron study Chemical Geology 167(1-2)129ndash140 2000
[28] K Matsui J Kikuma M Tsunashima T Ishikawa S Matsuno A Ogawa and M SatoIn situ time-resolved X-ray diffraction of tobermorite synthesis process under hydrothermalcondition IOP Conference Series Materials Science and Engineering 18(2)60ndash66 2011
[29] G Matekonis R Šiaučiunas and D Vaičiukyniene Hydrothermal Synthesis and Charac-terization of Na + and [ Al 3 + + Na + ] -substituted Tobermorite in CaO-SiO2middotnH2O-H2OSystem MATERIALS SCIENCE 16(3)242ndash248 2010
[30] G Geng R J Myers M J A Qomi and P JM Monteiro Densification of the inter-layer spacing governs the nanomechanical properties of calcium-silicate-hydrate ScientificReports 7(1)1ndash8 2017
[31] D Klimesch and A Ray Autoclaved cement-quartz pastes with metakaolin additionsAdvanced Cement Based Materials 7(3-4)109ndash118 1998
[32] N Y Mostafa A A Shaltout H Omar and S A Abo-El-Enein Hydrothermal synthesisand characterization of aluminium and sulfate substituted 11 nm tobermorites Journal ofAlloys and Compounds 467(1-2)332ndash337 2009
[33] İ Demir M S Başpınar E Kahraman E Ccedilalışkan and G Goumlrhan An Investigation onthe Usability of Diatomite in Aerated Concrete Production In Proc of the Intl Conf onAdvances In Civil Structural And Construction Engineering - CSCE 2014 pages 97ndash1002014
[34] A Skawinska Z Owsiak T Baran and K Hernik The influence of halloysite additionon tobermorite formation in CaO and quartz mix under hydrothermal conditions CementWapno Beton 17(12)426ndash434 2017
[35] N Y Mostafa Influence of air-cooled slag on physicochemical properties of autoclavedaerated concrete Cement and Concrete Research 35(7)1349ndash1357 2005
[36] D Małaszkiewicz and J Chojnowski Influence of addition of calcium sulfate dihydrate ondrying of autoclaved aerated concrete Open Engineering 7(1)273ndash278 2017
[37] N Hara and N Inoue Thermal behaviour of 11Aring tobermorite and its lattice parametersCement and Concrete Research (10)53ndash60 1980
[38] M D Jackson S R Chae S R Mulcahy C Meral R Taylor P Li A H EmwasJ Moon S Yoon G Vola H R Wenk and P JM Monteiro Unlocking the secretsof Al-tobermorite in Roman seawater concrete American Mineralogist 98(10)1669ndash16872012
[39] W Liao W Li Z Fang C Lu and Z Xu Effect of different aluminum substitution rateson the structure of Tobermorite Materials 12(22)1ndash10 2019
[40] D Klimesch and A Ray DTA-TG Study of the CaO-SiO2-H2O and CaO-Al2O3-SiO2-H2OSystems Under Hydrothermal Conditions Journal of Thermal Analysis and Calorimetry56(1)27ndash34 1999
27
5 References
[41] Z Sauman and Z Valtr Substitution of sulphate ions in the crystal lattice of 11 Aring to-bermorite In The VI International Congress on the Chemistry of Cement pages 1ndash14Moscow 1974
[42] G Schober Reaction of raw materials to the final product AAC httpwwwpb-aacde
chemmin2_ehtml 2012 accessed 2020-01-31
[43] D Jansen C Stabler F Goetz-Neunhoeffer S Dittrich and J Neubauer Does Ordi-nary Portland Cement contain amorphous phase A quantitative study using an externalstandard method Powder Diffraction 26(01)31ndash38 2011
[44] C Roumlszligler J Stark F Steiniger and W Tichelaar Limited-dose electron microscopyreveals the crystallinity of fibrous C-S-H phases Journal of the American Ceramic Society89(2)627ndash632 2006
[45] Y Sakalli and R Trettin Investigation of C3S hydration by environmental scanning elec-tron microscope Journal of Microscopy 259(1)53ndash58 2015
[46] F Matsushita Y Aono and S Shibata Expansion and shrinkage behavior of green cakeof Autoclaved Aerated Concrete In Autoclaved Aerated Concrete - Innovation and Devel-opment Proceedings of the 4th International Conference on Autoclaved Aerated ConcreteKingston UK 8-9 September 2005 pages 101ndash108 CRC Press 2005
[47] C Chucholowski M Holger and K-C Thienel Improving the recyclability environmentalcompatibility and CO2 balance of autoclaved aerated concrete by replacing sulfate carrierand cement with calcined clays CePapers 2(4)503ndash512 2018
[48] X Y Huang W Ni W H Cui Z J Wang and L P Zhu Preparation of autoclavedaerated concrete using copper tailings and blast furnace slag Construction and BuildingMaterials 27(1)1ndash5 2012
[49] W Wongkeo and A Chaipanich Compressive strength microstructure and thermal anal-ysis of autoclaved and air cured structural lightweight concrete made with coal bottom ashand silica fume Materials Science and Engineering A 527(16-17)3676ndash3684 2010
[50] A Roacuteżycka and W Pichoacuter Effect of perlite waste addition on the properties of autoclavedaerated concrete Construction and Building Materials 12065ndash71 2016
[51] N Isu H Ishida and T Mitsuda Influence of quartz particle size on the chemical andmechanical properties of autoclaved aerated concrete (I) tobermorite formation Cementand Concrete Research 25(25)243ndash248 1995
[52] D Ectors Advances in the analysis of cementitious reactions and hydrate phases doctoralthesis PhD thesis Friedrich-Alexander-Universitaumlt Erlangen-Nuumlrnberg 2016
[53] D Ectors F Goetz-Neunhoeffer and J Neubauer Domain size anisotropy in the double-Voigt approach An extended model Journal of Applied Crystallography 481998ndash20012015
[54] D Ectors F Goetz-Neunhoeffer and J Neubauer Routine (an)isotropic crystallite sizeanalysis in the double-Voigt approximation done right Powder Diffraction 32(S1)27ndash342017
28
5 References
[55] D Jansen F Goetz-Neunhoeffer C Stabler and J Neubauer A remastered external stan-dard method applied to the quantification of early OPC hydration Cement and ConcreteResearch 41(6)602ndash608 2011
[56] T Ungaacuter G Tichy J Gubicza and R J Hellmig Correlation between subgrains andcoherently scattering domains Powder Diffraction 20(04)366ndash375 2005
[57] Triloki P Garg R Rai and B K Singh Structural characterization of as-depositedcesium iodide films studied by X-ray diffraction and transmission electron microscopy tech-niques Nuclear Instruments and Methods in Physics Research Section A AcceleratorsSpectrometers Detectors and Associated Equipment 736128ndash134 2014
[58] J Schreiner F Goetz-Neunhoeffer J Neubauer and D Jansen Hydrothermal synthesisof 11 Aring tobermorite ndash Effect of adding metakaolin to the basic compound Applied ClayScience 185 2020
[59] J Schreiner F Goetz-Neunhoeffer J Neubauer S Volkmann S Bergold R Webler andD Jansen Advanced Rietveld refinement and SEM analysis of tobermorite in chemicallydiverse autoclaved aerated concrete Powder Diffraction 34143ndash150 2019
[60] J Schreiner D Jansen D Ectors F Goetz-Neunhoeffer J Neubauer and S VolkmannNew analytical possibilities for monitoring the phase development during the production ofautoclaved aerated concrete Cement and Concrete Research 107247ndash252 2018
29
6 Publications
6 Publications
61 Hydrothermal synthesis of 11 Aring tobermorite ndash Effectof adding metakaolin to the basic compound
Reprint of the peer reviewed publication
Schreiner J Goetz-Neunhoeffer F Neubauer J Jansen D 2020 Hydrothermalsynthesis of 11 Aring tobermorite ndash Effect of adding metakaolin to the basic compoundApplied Clay Science 185 httpsdoiorg101016jclay2019105432
with permission from Elsevier
30
Contents lists available at ScienceDirect
Applied Clay Science
journal homepage wwwelseviercomlocateclay
Research paper
Hydrothermal synthesis of 11 Aring tobermorite ndash Effect of adding metakaolin tothe basic compound
J Schreiner F Goetz-Neunhoeffer J Neubauer D JansenUniversity of Erlangen-Nuremberg GeoZentrum Nordbayern Mineralogy Schlossgarten 5a 91054 Erlangen Germany
A R T I C L E I N F O
KeywordsHydrothermal synthesis11 Aring tobermoriteMetakaolinPowder diffractionKatoite
A B S T R A C T
Different amounts and types of metakaolin were analyzed and applied for the hydrothermal synthesis of 11 Aringtobermorite All synthesized samples were investigated by means of powder XRD combined with Rietveld re-finement Al-substituted 11 Aring tobermorite was successfully synthesized on the basis of a broad range of com-pounds characterized by a varying content of metakaolin Katoite was present depending on the amount ofsupplied Al3+ which was determined by the dosage of metakaolin Minor crystalline components included in thetwo types of metakaolin sources varied greatly in their reactivity under hydrothermal conditions Despite adifferent degree of purity the two types of metakaolin showed corresponding effects at moderate dosages butcontrary effects at higher dosages as for the synthesis of 11 Aring tobermorite The domain morphology of to-bermorite could be associated with Al3+ incorporation for low dosages of metakaolin represented by up to 2 wt- Al2O3 in the dry mix By contrast Al3+ affected tobermorite lattice parameters at equivalent and even athigher dosages with c reaching 2295 Aring at 12 wt- Al2O3 in the dry mix
1 Introduction
11 Application of metakaolin as a reactive material in constructionindustry
The application of supplementary cementitious materials (SCMs) inthe field of construction technology has received a lot of attention inrecent years Due to limited resources and an urgent need for alter-native and more eco-friendly construction materials SCMs such asmetakaolin offer a great potential The usage of SCMs has not onlyspread to the cement and mortar industry but also to advanced appli-cations such as autoclaved aerated concrete (AAC) (Demir et al 2014Koutnyacute et al 2014 Walczak et al 2015 Roacuteżycka and Pichoacuter 2016Chucholowski et al 2018) Unlike ordinary cementitious constructionmaterials AAC is produced from hydrothermal curing Due to the dif-ferent thermodynamic environment the hydration process and the re-activity of raw materials have to be investigated properly in order tounderstand the effects on the AAC product The leading mineral phasein AAC is 11 Aring tobermorite (Ca5Si6O16(OH)2middot4H2O) As a consequencethe thermal and mechanical properties of AAC depend on micro-structure and crystallinity of tobermorite to some extent In addition tothe curing time and the fineness of raw materials the supply of ionsthat can substitute in the tobermorite structure is a crucial factor in thiscontext Especially substitutions by aluminum sodium and potassium
ions have been investigated thoroughly (Sauman 1974 Klimesch andRay 1998 Mostafa et al 2009 Matekonis et al 2010 Skawinskaet al 2017) Calcined clays usually contain a considerable amount ofthe mentioned ions
There is a vast amount of literature on the reactivity of SCMs atambient temperature and standard pressure but there is little when itcomes to hydrothermal conditions In previous publications the beha-vior of metakaolin under hydrothermal conditions was mainly in-vestigated for the synthesis of zeolites (Zhang et al 2007 Aguilar-Mamani et al 2014 Setthaya et al 2016 Luo et al 2018) In thesestudies the reactivity of metakaolin was observed at a wide range oftemperature and pH values During the transformation of kaolin intometakaolin a loss of framework alumina was observed (Ayodele et al2019) In recent decades metakaolin has been the subject of studies inthe field of geopolymer research (Rashad 2013 Chen et al 2016) Forthe synthesis of 11 Aring tobermorite a more distinct setting of temperaturesetting (180ndash200 degC) and steam pressure (1ndash12 MPa) are required
This publication is intended to make a new contribution to thechallenging field of hydrothermal synthesis in the system CaO-Al2O3-SiO2-H2O based on XRD analysis combined with Rietveld refinementVarious dosages of two types of metakaolin with different chemical andmineralogical purities are compared for the effects on the hydrothermalsynthesis of Al-substituted 11 Aring tobermorite Especially changes of thebulk chemistry in the raw mixes the reactivity of minor crystalline
httpsdoiorg101016jclay2019105432Received 20 August 2019 Received in revised form 13 November 2019 Accepted 30 December 2019
Corresponding authorE-mail address juergenjsschreinerfaude (J Schreiner)
Applied Clay Science 185 (2020) 105432
0169-1317 copy 2020 Elsevier BV All rights reserved
T
6 Publications
31
phases of the two types of metakaolin and the effect of different curingtimes are the focus of interest On the one hand metakaolin offers agreat potential in the AAC industry On the other hand of all SCMsmetakaolin is a good source material for investigating the influence ofAl3+ on the synthesis of Al-substituted 11 Aring tobermorite
12 Synthesis of Al-substituted 11 Aring tobermorite
In addition to being present in AAC tobermorite has found appli-cation in wastewater treatment and nuclear waste management due toits ion exchange capacity (Maeda et al 2012 Monasterio et al 2015)The substitution of silicon by aluminum results in a different to-bermorite structure due to general and local charge balance affectingthe lattice parameters Especially c is impacted by this substitutionbecause it occurs in the bridging tetrahedron and additional OHndash sub-stitutes O2ndash (Komarneni et al 1985 Merlino et al 2000) As suggestedin some additional studies the substitution of Si4+ by Al3+ and Na+ orK+ leads to a lath-like morphology of tobermorite crystals (Mostafa2005 Mostafa et al 2009 Venhodovaacute et al 2015 Qu et al 2018)However because of the heterogeneous appearance of tobermorite inAAC it is hardly possible to conduct a proper characterization based onSEM analysis In our recent work the anisotropic peak broadening oftobermorite in XRD diffractograms was successfully linked with theincorporation of foreign ions supplied in a common AAC production(Schreiner et al 2019) This finding allowed a more statistical struc-tural characterization of tobermorite in bulk compositions compared toSEM analysis Moreover it was reported in other studies that differenthydrate phases occur depending on the amount of supplied ions and onthe experimental settings In compounds with a high content of Al3+formation of katoite could be observed (Klimesch and Ray 1998 Riacuteoset al 2009 Matsui et al 2011) In the case of a longer curing durationinstead of 11 Aring tobermorite the formation of xonotlite (Siauciunas andBaltakys 2004 Galvaacutenkovaacute et al 2018) or - depending on the finenessof used silica source (Siauciunas and Baltakys 2004) - gyrolite is fa-voured
Kalousek (1956) suggested that tobermorite can contain up to 5Al2O3 More Al2O3 in the system resulted in the formation of hydro-garnet Klimesch and Ray (1998) additionally investigated the stabilityof hydrogarnet depending on the Al(Si + Al) ratio and its role in re-lation to the formation of 11 Aring tobermorite in an equivalent systemThey suggest that hydrogarnet always appears before tobermorite butthe former can only be detected for higher Al(Si + Al) ratios in theevent of longer curing times Riacuteos et al (2009) and Qu et al (2018)confirmed these findings in extensive investigations In the latter pub-lication it is additionally suggested that samples prepared at lowertemperatures (160 degC) are less impacted by the supply of Al3+ Theyalso consider the peak broadening of tobermorite in their XRD plotsbased on the amount of incorporated Al3+ In two recent publicationswe suggested that the peak broadening of tobermorite enables a mi-crostructural analysis by calculating the orientation dependent domainsizes (Schreiner et al 2018 2019) However these studies are based onsamples of industrially produced AAC so that the curing time was fixedThe studied AAC was produced from raw materials with a broad che-mical spectrum such as ordinary Portland cement (OPC) whichsomehow complicates the interpretation of results
In this work the influence of aluminum ions - provided by meta-kaolin - on dominant crystallographic direction-dependent domaingrowth of tobermorite is investigated by analysis of anisotropic peakbroadening (Ectors et al 2015 2017) In Fig 1 of the supplementarymaterial the method of fitting the anisotropic peak broadening of to-bermorite using a triaxial cylinder model is visualized (Schreiner et al2018) Fitting of the anisotropic peak broadening of tobermorite Thismethod is used to calculate the average and reliable values for to-bermorite domain sizes in the powder sample and associate them withaverage Al3+ incorporation Microstrain should be considered becauseit is an additional source of peak broadening However this usually
accounts for materials that have been exposed to different kinds ofstress such as metals and alloys (Badawi et al 2019) In addition theinstrumental contribution to peak broadening should be consideredHydration products such as tobermorite are characterized by crystallitesizes in the range of nanometers so that anisotropic size broadeningclearly outweighs the effect of instrumental broadening (Jenkins andSnyder 1996) Moreover the impact of Al3+ on the lattice parametersof tobermorite is considered It should additionally be clarified whe-ther the results from our previous publication (Schreiner et al 2019)based on industrially produced AAC can be confirmed by investigationwith less complex raw mixes and purely based on laboratory experi-ments
2 Material and methods
21 Starting materials
The starting materials for hydrothermal synthesis included deio-nized water quartz flour portlandite (999 pure) and two types ofmetakaolin One type was ordinary commercially available metakaolin(MK) with nearly a stoichiometric composition For comparison thesecond type of commercially available metakaolin was a by-productfrom expanded glass production (MKg) and consequently highly im-pure The chemical composition of MK and MKg determined by XRF isgiven in Table 1 With MKg containing less Al2O3 but considerably moreNa2O than MK the effects on hydrothermal synthesis were of interestBoth types of metakaolin have been characterized in previous pub-lications (Schmidt et al 2012 Naber et al 2019) In addition weverified the mineral phase content by XRD analysis Besides amorphousmetakaolin MK contained minor amounts of anatase quartz and mica
Fig 1 Weight fractions of tobermorite quartz and katoite determined byquantitative XRD analysis ndash samples including MKg crosshatched
Table 1Chemical composition of MK and MKg determined by XRF analysis ndash majorcontrasts in bold letters
Oxides [wt-] MK MKg
SiO2 536 604Al2O3 392 206CaO 01 40MgO 01 12Na2O 0 96K2O 10 18Fe2O3 18 05TiO2 21 03P2O5 01 02Loss on ignition 15 1
J Schreiner et al Applied Clay Science 185 (2020) 105432
2
6 Publications
32
MKg contained additional kaolinite feldspar and quartz
22 Investigated mix composites
For the preparation of raw mixtures the powders were weighed andhomogenized using a lab-scale mixing mill Table 2 lists the composi-tion and nomenclature of all samples including Al2O3 content andcuring time in the autoclave
bull Besides one blank mixture (MK0) that did not contain any type ofmetakaolin eleven more compounds were prepared of which threeincluded different dosages of MKg (MKg16 MKg23 and MKg60)Three more mixes contained equivalent amounts of MK instead ofMKg (MK16 MK23 and MK60) These mixes were investigated inorder to have a direct comparison concerning the effects of differentraw material on the synthesis of tobermorite
bull Additionally the mixes MK9 MK5 and MK25 with lower dosages ofmetakaolin were analyzed In the referenced literature (Schreineret al 2019) the effect of Al3+ on the anisotropic peak broadeningof tobermorite could only be observed in the case of Al2O3 contentslower than 4 in the drymix In the latter three mixes Al2O3 con-tents range from 1 to 35 Al2O3 (calculated from XRF data) whichmeets the region of interest for the analysis of tobermorite domainmorphology
bull The curing time for nearly all of the investigated samples was 12 hbut compound MK9 was prepared two more times for curing timesof 2 h and 6 h The different curing times were chosen in this par-ticular sample so that the reactivity of metakaolin and the phasetransitions could be observed more precisely
23 Hydrothermal treatment
Due to the different fineness of raw materials there was a differentwater demand from one mixture to another In order to obtain slurriesof comparable rheology the amount of water was adapted respectivelyresulting in water-to-solid ratios of 25 to 3 which matches the sug-gested water-to-solid ratio for this purpose (Roacutezycka et al 2014Galvaacutenkovaacute et al 2018) The weighed water was added to the dry mixand after stirring for 1 min at 23 degC the slurry was poured into thereactor Minor changes in the quantity of added water did not have aninfluence on the measured steam pressure All experiments were con-ducted using a PTFE-lined stainless steel autoclave with a reactor vo-lume of 300 ml The oven temperature was fixed at 180 degC and auto-genous steam pressure of 11ndash12 MPa was measured during eachexperiment with an external manometer After cooling to room tem-perature the sample was removed from the reactor coarsely ground
using an agate mortar and dried at 60 degC for 12 h After drying thesample was ground with an agate mortar again in order to deagglo-merate the particles As no coarse raw materials were used there wasno need for wet McCrone milling (Schreiner et al 2018)
24 XRD analysis
After preparation into front-loading sample holders the powdersamples were measured with a D8 diffractometer (Bruker) equippedwith a LynxEye detection system and Bragg-Brentano geometry Thesettings for XRD analysis included a tube voltage of 40 kV a current of40 mA an angular range from 6 to 80deg 2θ (Cu Kα radiation) a time perstep of 054 s a step width of 00236deg 2θ and a PSD opening of 33deg Thebackground was fitted with Chebyshev polynomial of the fifth orderThe major contribution of amorphous phase was fitted with a singlepeak with a fixed position at 308deg 2θ so that tobermorite reflectionswere not affected An external quartzite standard was measured withthe same parameters in order to determine phase quantities (Jansenet al 2011) Bruker AXS software TOPAS 50 was used for Rietveldrefinement (Rietveld 1969) and the used structures are shown inTable 3
3 Results and discussion
31 Different dosages of MK and MKg
In Fig 1 the quantities of tobermorite quartz and katoite present inmost of the samples determined by XRD analysis are illustratedWhenever tobermorite was the leading mineral hydrate phase a basalspacing of 113 Aring could be verified in each of the diffractograms Thequantities of minor crystalline phases and amorphous content are notshown For low dosages of MK it can be seen that the weight fraction oftobermorite decreased At moderate dosage of both types of metakaolin(MK16 MK23 MKg16 MKg23) tobermorite was present in comparablequantities It can be seen that the amount of katoite in the mixes de-pended on the dosage of metakaolin and it appeared only at dosages ofMK5 or more Due to the higher content of aluminum in MK comparedto MKg more katoite could always be observed in the MK mixes atequivalent dosages Despite equal amounts of quartz as starting mate-rial in mixes for both types of metakaolin the resulting weight fractionsin the cured samples were not alike Considerably more quartz waspresent in the MK samples Even though less quartz was used for mixescontaining higher amounts of MK even more quartz was present afterhydrothermal curing (Table 2 Fig 1) Consequently some of the SiO2
provided by MK did not transform into an amorphous phase or to-bermorite but into quartz This finding is verified by the presence ofquartz in MK60 because no quartz was included in the raw mixture Thefeldspar present in MKg did not react so Na2O and an unknown amountof Al2O3 may not have been supplied for hydrothermal reaction Besidestobermorite and quartz additional calcite scawtite (Ca7Si6(CO3)
Table 2Basic powder compounds prepared for the hydrothermal synthesis of to-bermorite with the respectively calculated Al2O3 content and curing time in thereactor
Sample Portlandite[wt-]
Quartz[wt-]
MK[wt-]
MKg
[wt-]
Al2O3
[wt-]Curingtime [h]
MK0 49 51 ndash ndash 0 12MK25 495 48 25 ndash 1 12MK5 49 46 5 ndash 2 12MK9_2h 48 43 9 ndash 35 2MK9_6h 48 43 9 ndash 35 6MK9_12h 48 43 9 ndash 35 12MK16 47 37 16 ndash 63 12MK23 46 31 23 ndash 9 12MK60 40 ndash 60 ndash 235 12MKg16 47 37 ndash 16 33 12MKg23 46 31 ndash 23 47 12MKg60 40 ndash ndash 60 124 12
Table 3Structural data used for the investigation with powder XRD analysis
Phase Author
Anatase (Horn et al 1972)Biotite (Brigatti et al 2000)Calcite (Maslen et al 1995)Kaolinite (Zvyagin 1960)Katoite (Bartl 1969)Microcline (Bailey 1969)Plazolite (Basso et al 1983)Portlandite (Busing and Levy 1957)Quartz (Le Page and Donnay 1976)Scawtite (Grice 2005)Tobermorite (Hamid 1981)Xonotlite (Hejny and Armbruster 2001)
J Schreiner et al Applied Clay Science 185 (2020) 105432
3
6 Publications
33
O18bull2(H2O)) and xonotlite (Ca6Si6O17(OH)2) could be identified insample MK0 (XRD plots of samples MK0 MKg16 MKg23 MK16 andMK23) Comparing MK0 and MK25 scawtite and xonotlite could stillbe identified in a very low amount in MK25 but no longer in samplesthat contained even more MK (XRD plots of samples MK0 MK25 MK5and MK9_12h)
Two additional experiments were done without quartz in the rawmixes (MK60 and MKg60) The according diffractograms after hydro-thermal curing are shown in Fig 2 In sample MKg60 tobermorite (gt 50wt-) was successfully synthesized without any other silica sourcethan MKg whereas no crystalline quartz occurred By contrast no to-bermorite but quartz could be identified in equivalent mixture MK60containing MK It can be seen that crystalline components such as micaand anatase in the raw MK did not react at the selected conditions andremained present in the autoclaved samples Except for feldspar in MKgall of the crystalline components appeared to be reactive at the chosenhydrothermal conditions A minor unidentified phase occurred at328deg2θ and additional xonotlite was identified in sample MKg60 Insample MK60 more calcium was needed for the formation of morehydrogarnet (Fig 1) resulting in a lower CaSi ratio for the remainingsystem Sample MKg60 contained only half of the amount of Al3+ and itwas not completely supplied for reaction due to its partial presence infeldspar Consequently essentially less hydrogarnet (Fig 1) was presentin MKg60 after hydrothermal treatment and the CaSi ratio in the re-maining system was affected to a lesser extent
32 Application of MK for different curing times
The development of hydrate phases in the autoclave for compoundMK9 is displayed in Fig 3 After only 2 h of hydrothermal curing all ofthe available portlandite had reacted and katoite (95 wt-) was pre-sent The applied type of metakaolin appeared to react quickly as itsupplied aluminum for formation of katoite No formation of to-bermorite could be observed at this stage yet An assumably amorphousprecursor can be seen at 28 to 30deg2θ Calcium was provided by thedissolution of portlandite After 6 h of hydrothermal reaction amountsof katoite (85 wt-) and quartz (from 31 wt- at 2 h to 165 wt- at6 h) had decreased and a major amount of tobermorite (35 wt-) waspresent Apparently between 2 and 6 h under hydrothermal conditionsthe amorphous precursor and quartz reacted resulting in the formationof tobermorite An additional 6 h of reaction time (MK9_12h) did notchange the phase composition significantly Slightly more tobermorite
(365 wt-) less quartz (16 wt-) and katoite (65 wt-) weremeasured
33 Tobermorite domain morphology and lattice parameters
In the referenced literature an analysis of tobermorite domainmorphology based on anisotropic peak broadening was possible forsamples that contained notgt 4 wt- Al2O3 in the drymix (Schreineret al 2019) Accordingly in this study samples MK0 MK25 MK5MK9_6h and MK9_12h were suitable (Table 2) with MK9_2h not con-taining any tobermorite In Fig 4 the respective growth in a and b di-rection is visualized with x indicating the domain size in a direction andy indicating domain size in b direction using a macro for TOPAS 50(Ectors et al 2015 2017) The calculated cylinder models in Fig 4represent the relation of yx and not absolute sizes With no supply ofaluminum ions (MK0) the relative domain growth in b direction islower compared to samples containing metakaolin This finding agreeswith the results from a similar investigation of tobermorite in AAC(Schreiner et al 2019) However within the samples MK5 andMK9_12h the different amounts of supplied aluminum ions did notshow a clear effect It appeared that low dosages of Al3+ (1 wt- Al2O3
in MK25 and 2 wt- Al2O3 in MK5) were enough to determine thedomain growth of tobermorite Additional results from the samplesMK9_6h and MK9_12h indicated that growth in b direction increasedwith reaction time
In Fig 5 lattice parameters of tobermorite depending on metakaolindosages are plotted B clearly remained unaffected throughout therange of samples Increasing amounts of metakaolin led to a slightlysmaller parameter a However both types of metakaolin showed acorresponding impact on parameter a By contrast parameter c in-creased strongly with increasing amounts of MK and MKg but the typeof metakaolin was significant At an equivalent dosage MK affected thecell dimension in c direction considerably more than MKg so that thefraction of Al3+ appeared to be the decisive parameter Different metaloxides in MKg did not show a notable effect certainly as they werepartially not provided for reaction Unlike for the domain morphologyof tobermorite the impact on lattice parameters could be observedwithin the complete range of examined dosages
4 Conclusions
The results obtained from the introduced investigations allow con-cluding remarks on the effects of the applied types of metakaolin on thesynthesis of 11 Aring tobermorite the phase transitions and the in-corporation of Al3+ into the lattice of tobermorite
With a critical dosage the use of any type of metakaolin led to theformation of katoite in an according amount At moderate dosages(MKg16 MKg23 MK16 and MK23) the two types of metakaolin showeda good correspondence in consideration of the quantities of to-bermorite For higher dosages there were contrary effects Lower do-sages of MK led to considerable quantities of Al-substituted to-bermorite Samples containing low dosages of MK revealed that katoiteappeared in the case ofgt 5 wt- of MK - corresponding to 2 wt-Al2O3 - in the basic compound Minor crystalline phases in MKg showedbetter reactivity than those in MK The observation that no tobermoritewas present in sample MK60 indicated that high dosages of Al3+ hin-dered the formation of tobermorite
Investigations of MK9 at 2 6 and 12 h displayed the evolution ofhydrate phases At first katoite was the only crystalline hydrate phasepresent after 2 h which corresponded to observations in a differentpublication (Klimesch and Ray 1999) The amount of katoite andquartz then decreased and a major amount of tobermorite formed from2 to 6 h curing time In order to gain more information on the trans-formation of amorphous C-(A)-S-H into tobermorite additional ex-periments in the range of 2 to 6 h curing time will be needed
Domain morphology analysis of tobermorite revealed that low
Fig 2 Diffractograms of MKg MKg60 MK and MK60 from 7 to 34deg2θ CuKα Aanatase C calcite F feldspar k kaolinite K katoite M mica Q quartz Ttobermorite U unidentified phase X xonotlite
J Schreiner et al Applied Clay Science 185 (2020) 105432
4
6 Publications
34
dosages of Al3+ determined the domain growth which agreed with theresults published on tobermorite in AAC samples (Schreiner et al2019) Different curing times unveiled that growth in b direction in-creased with the reaction time Al3+ incorporation into the lattice oftobermorite only reflected to a limited extent in the domain mor-phology By contrast an increase of lattice parameter c was triggered byAl3+ even at the highest dosage in this study Ultimately there is no
evidence for a limit of incorporation of Al3+ but there is a limit ofinfluence on the domain morphology These results additionally re-confirm this assumption similarly made in the previous work (Schreineret al 2019) and suggest a new mechanism of tobermorite crystal-lization depending on the presence of Al3+
Supplementary data to this article can be found online at httpsdoiorg101016jclay2019105432
Declaration of Competing Interest
The authors declare that they have no known competing financialinterests or personal relationships that could have appeared to influ-ence the work reported in this paper
Acknowledgement
The authors thank Rodgauer Baustoffwerke GmbH amp Co KG forsupplying raw materials for laboratory experiments
References
Aguilar-Mamani W Garciacutea G Hedlund J Mouzon J 2014 Comparison betweenleached metakaolin and leached diatomaceous earth as raw materials for the synth-esis of ZSM-5 Springerplus 3 1ndash10 httpsdoiorg1011862193-1801-3-292
Ayodele OB Sulaimon AA Alaba PA Tian Z-Y 2019 Influence of metakaolini-zation temperature on the structure and activity of metakaolin supported Ni catalystin dry methane reforming J Environ Chem Eng httpsdoiorg101016jjece2019103239 (in press)
Badawi EA Abdel-Rahman MA Mostafa A Abdel-Rahman M 2019 Determinationof the crystallite size amp micro- strain by novel method from XRD profile Appl Phys2 1ndash15 httpsdoiorg1031058jap201921001
Bailey SW 1969 Refinement of an intermediate microcline structure Am Miner 541540ndash1545
Bartl H 1969 Roentgen-Einkristalluntersuchungen an (CaO)3 (Al2O3) (H2O)6 und an(CaO)12 (Al2O3)7 (H2O) neuer Vorschlag zur (CaO)12 (Al2O3)7-Struktur NeuesJahrb fuer Mineral Monatshefte 1969 404ndash413
Basso R Giusta AD Zefiro L 1983 Crystal structure refinement of plazolite A highlyhydrated natural hydrogrossular Neues Jahrb Miner Monatsh (Neues Jahrb fuerMineral Monatshefte) 1983 251ndash258
Brigatti MF Lugli C Poppi L Foord EE Kile DE 2000 Crystal chemical varia-tions in Li- and Fe-rich micas from Pikes Peak batholith (Central Colorado) AmMineral 85 1275ndash1286 httpsdoiorg102138am-2000-8-920
Busing WR Levy HA 1957 Neutron diffraction study of calcium hydroxide J ChemPhys 26 563 httpsdoiorg10106311743345
Chen L Wang Z Wang Y Feng J 2016 Preparation and properties of alkali acti-vated metakaolin-based geopolymer Materials (Basel) 9 1ndash12 httpsdoiorg103390ma9090767
Chucholowski C Holger M Thienel K-C 2018 Improving the recyclability en-vironmental compatibility and CO2 balance of autoclaved aerated concrete by re-placing sulfate carrier and cement with calcined clays CePapers 2 503ndash512httpsdoiorg101002cepa846
Fig 3 Diffractograms of MK9_2h MK9_6h and MK9_12h from 7 to 38deg2θ CuKα C calcite K katoite Q quartz T tobermorite
Fig 4 Relation of calculated domain sizes of 11 Aring tobermorite in selectedsamples (MK0 MK25 MK5 MK9_6h and MK9_12h) in a (x) and b (y) direction
Fig 5 Lattice parameters of tobermorite depending on MK or MKg dosageincluding blank mix MK0
J Schreiner et al Applied Clay Science 185 (2020) 105432
5
6 Publications
35
Demir İ Başpınar MS Kahraman E Ccedilalışkan E Goumlrhan G 2014 An investigationon the usability of diatomite in aerated concrete production In Proc of the IntlConf on Advances in Civil Structural and Construction Engineering ndash CSCE 2014 pp97ndash100
Ectors D Goetz-Neunhoeffer F Neubauer J 2015 A generalized geometric approachto anisotropic peak broadening due to domain morphology J Appl Crystallogr 48189ndash194 httpsdoiorg101107S1600576714026557
Ectors D Goetz-Neunhoeffer F Neubauer J 2017 Routine (an)isotropic crystallitesize analysis in the double-Voigt approximation done right Powder Diffract 3227ndash34 httpsdoiorg101017S0885715617000070
Galvaacutenkovaacute L Bartoniacutečkovaacute E Opravil T Tkacz J Ptaacuteček P 2018 The influence ofstarting materials solubility on tobermorite structure formation under the hydro-thermal conditions IOP Conf Ser Mater Sci Eng 379 1ndash8 httpsdoiorg1010881757-899X3791012001
Grice JD 2005 The structure of spurrite tilleyite and scawtite and relationships toother silicate-carbonate minerals Can Mineral 43 1489ndash1500 httpsdoiorg102113gscanmin4351489
Hamid SA 1981 The crystal structure of the 11 Aring natural tobermoriteCa225[Si3O75(OH)15]1H2O Zeitschrift fuer Krist 154 189ndash198 httpsdoiorg101524zkri19811543-4189
Hejny C Armbruster T 2001 Polytypism in xonotlite Ca6Si6O17(OH)2 Zeitschrift furKrist 216 396ndash408
Horn M Schwerdtfeger CF Meagher EP 1972 Refinement of the structure of ana-tase at several temperatures Zeitschrift fur Krist 136 273ndash281 httpsdoiorg101524zkri19721363-4273
Jansen D Goetz-Neunhoeffer F Stabler C Neubauer J 2011 A remastered externalstandard method applied to the quantification of early OPC hydration Cem ConcrRes 41 602ndash608 httpsdoiorg101016jcemconres201103004
Jenkins R Snyder R 1996 Introduction to X-ray Powder Diffractometry ChemicalAnalysis Wiley pp 90
Kalousek GL 1956 Crystal Chemistry of Hydrous Calcium Silicates J Am Ceram Soc40 74ndash80
Klimesch D Ray A 1998 Autoclaved cement-quartz pastes with metakaolin additionsAdv Cem Based Mater 7 109ndash118 httpsdoiorg101016S1065-7355(97)00073-4
Klimesch D Ray A 1999 DTA-TGA evaluations of the CaOndashAl2O3ndashSiO2ndashH2O systemtreated hydrothermally Thermochim Acta 334 115ndash122 httpsdoiorg101016s0040-6031(99)00140-9
Komarneni S Roy R Roy DM Fyfe CA Kennedy GJ Bothner-By AA Dadok JChesnick AS 1985 27Al and29Si magic angle spinning nuclear magnetic resonancespectroscopy of Al-substituted tobermorites J Mater Sci 20 4209ndash4214 httpsdoiorg101007BF00552416
Koutnyacute O Opravil T Pořiacutezka J 2014 Application of metakaoline in autoclavedaerated concrete technology Adv Mater Res 1000 174ndash177 httpsdoiorg104028wwwscientificnetAMR1000174
Le Page Y Donnay G 1976 Refinement of the crystal structure of low-quartz ActaCrystallogr Sect B 32 2456ndash2459 httpsdoiorg101107S0567740876007966
Luo H Law WW Wu Y Zhu W Yang EH 2018 Hydrothermal synthesis of needle-like nanocrystalline zeolites from metakaolin and their applications for efficient re-moval of organic pollutants and heavy metals Microporous Mesoporous Mater 2728ndash15 httpsdoiorg101016jmicromeso201806015
Maeda H Ogawa Y Ishida EH Kasuga T 2012 Hydrothermal synthesis of to-bermorite doped with phosphorus species for removing heavy metal ions J AustCeram Soc 48 8ndash11
Maslen EN Streltsov VA Streltsova NR Ishizawa N 1995 Electron density andoptical anisotropy in rhombohedral carbonates III Synchrotron Xray studies ofCaCO3 MgCO3 and MnCO3 Acta Crystallogr Sect B 51 929ndash939 httpsdoiorg101107S0108768195006434
Matekonis G Šiaučiūnas R Vaičiukynienė D 2010 Hydrothermal Synthesis andCharacterization of Na + and [ Al 3 + + Na + ] -substituted Tobermorite in CaO-SiO2middotnH2O-H2O System Mater Sci 16 242ndash248
Matsui K Kikuma J Tsunashima M Ishikawa T Matsuno S Ogawa A Sato M2011 In situ time-resolved X-ray diffraction of tobermorite synthesis process underhydrothermal condition IOP Conf Ser Mater Sci Eng 18 60ndash66 httpsdoiorg1010881757-899X182022017
Merlino S Bonaccorsi E Armbruster T 2000 The real structures of clinotobermoriteand tobermorite 9 Aring OD character polytypes and structural relationships Eur JMineral 12 411ndash429 httpsdoiorg1011270935-122120000012-0411
Monasterio M Gaitero JJ Manzano H Dolado JS Cerveny S 2015 Effect ofchemical environment on the dynamics of water confined in calcium silicate mi-nerals Natural and synthetic tobermorite Langmuir 31 4964ndash4972 httpsdoiorg101021acslangmuir5b00614
Mostafa NY 2005 Influence of air-cooled slag on physicochemical properties of auto-claved aerated concrete Cem Concr Res 35 1349ndash1357 httpsdoiorg101016jcemconres200410011
Mostafa NY Shaltout AA Omar H Abo-El-Enein SA 2009 Hydrothermal synth-esis and characterization of aluminium and sulfate substituted 11 nm tobermoritesJ Alloys Compd 467 332ndash337 httpsdoiorg101016jjallcom200711130
Naber C Stegmeyer S Jansen D Goetz-Neunhoeffer F Neubauer J 2019 ThePONKCS method applied for time resolved XRD quantification of supplementarycementitious material reactivity in hydrating mixtures with ordinary Portland ce-ment Constr Build Mater 214 449ndash457 httpsdoiorg101016jconbuildmat201904157
Qu X Zhao Z Zhao X 2018 Microstructure and characterization of aluminum-in-corporated calcium silicate hydrates (C-S-H) under hydrothermal conditions RSCAdv 8 28198ndash28208 httpsdoiorg101039c8ra04423f
Rashad AM 2013 Metakaolin as cementitious material history scours production andcomposition - a comprehensive overview Constr Build Mater 41 303ndash318 httpsdoiorg101016jconbuildmat201212001
Rietveld HM 1969 A profile refinement method for nuclear and magnetic structures JAppl Crystallogr 2 65ndash71 httpsdoiorg101107S0021889869006558
Riacuteos CA Williams CD Fullen MA 2009 Hydrothermal synthesis of hydrogarnet andtobermorite at 175 degC from kaolinite and metakaolinite in the CaO-Al2O3-SiO2-H2Osystem a comparative study Appl Clay Sci 43 228ndash237 httpsdoiorg101016jclay200809014
Roacuteżycka A Pichoacuter W 2016 Effect of perlite waste addition on the properties of au-toclaved aerated concrete Constr Build Mater 120 65ndash71 httpsdoiorg101016jconbuildmat201605019
Roacutezycka A Kotwica Ł Małolepszy J 2014 Synthesis of single phase gyrolite in theCaO-quartz-Na2O-H2O system Mater Lett 120 166ndash169 httpsdoiorg101016jmatlet201401003
Sauman Z 1974 Influence of SO4 2ndash ions on the formation of 11 Aring tobermorite InProceedings of the 2nd International Symposium on Science and Research in SilicateChemistry Moscow pp 25ndash39
Schmidt M Egersdoumlrfer A Poumlllmann H 2012 Increased reactivity using a glass-containing metakaolin as an active filler in lime-based binder systems ZKG Int 6554ndash62
Schreiner J Jansen D Ectors D Goetz-Neunhoeffer F Neubauer J Volkmann S2018 New analytical possibilities for monitoring the phase development during theproduction of autoclaved aerated concrete Cem Concr Res 107 247ndash252 httpsdoiorg101016jcemconres201802028
Schreiner J Goetz-Neunhoeffer F Neubauer J Volkmann S Bergold S Webler RJansen D 2019 Advanced Rietveld refinement and SEM analysis of tobermorite inchemically diverse autoclaved aerated concrete Powder Diffract 34 143ndash150httpsdoiorg101017s0885715619000149
Setthaya N Chindaprasirt P Pimraksa K 2016 Preparation of zeolite nanocrystals viahydrothermal and solvothermal synthesis using of rice husk ash and metakaolinMater Sci Forum 872 242ndash247 httpsdoiorg104028wwwscientificnetmsf872242
Siauciunas R Baltakys K 2004 Formation of gyrolite during hydrothermal synthesis inthe mixtures of CaO and amorphous SiO2 or quartz Cem Concr Res 34 2029ndash2036httpsdoiorg101016jcemconres200403009
Skawinska A Owsiak Z Baran T Hernik K 2017 The influence of halloysite ad-dition on tobermorite formation in CaO and quartz mix under hydrothermal condi-tions Cem Wapno Bet 17 426ndash434
Venhodovaacute E Janovskyacute R Drochytka R 2015 Formation of tobermorite at differentmaterials composition of aerated concrete Appl Mech Mater 752ndash753 247ndash250httpsdoiorg104028wwwscientificnetamm752-753247
Walczak P Małolepszy J Reben M Szymański P Rzepa K 2015 Utilization ofwaste glass in autoclaved aerated concrete Proc Eng 122 302ndash309 httpsdoiorg101016jproeng201510040
Zhang Y Gao W Cui L 2007 The transformation of acid leached metakaolin tozeolite beta Stud Surf Sci Catal 170 420ndash425 httpsdoiorg101016S0167-2991(07)80870-6
Zvyagin BB 1960 An attempt to electronographic determination of kaolinite structureJ Dokl Akad Nauk SSSR 130 1023ndash1026
J Schreiner et al Applied Clay Science 185 (2020) 105432
6
6 Publications
36
6 Publications
62 Advanced Rietveld refinement and SEM analysis oftobermorite in chemically diverse autoclaved aeratedconcrete
Following the copyright guidelines by Cambridge University Press the publication
Schreiner J Goetz-Neunhoeffer F Neubauer J Volkmann S Bergold S WeblerR Jansen D 2019 Advanced Rietveld refinement and SEM analysis of tobermorite inchemically diverse autoclaved aerated concrete Powder Diffraction 34 143ndash150 httpsdoiorg101017s0885715619000149
may not be reprinted It can be accessed at
httpswwwcambridgeorgcorejournalspowder-diffractionarticleadvanced-rietveld-refinement-and-sem-analysis-of-tobermorite-in-chemically-diverse-autoclaved-aerated-concrete51597C2A66F6F225D29DEB2675E74249
37
6 Publications
63 New analytical possibilities for monitoring the phasedevelopment during the production of autoclavedaerated concrete
Reprint of the peer reviewed publication
Schreiner J Jansen D Ectors D Goetz-Neunhoeffer F Neubauer J VolkmannS 2018 New analytical possibilities for monitoring the phase development during theproduction of autoclaved aerated concrete Cement and Concrete Research 107 247ndash252httpsdoiorg101016jcemconres201802028
with permission from Elsevier
38
Contents lists available at ScienceDirect
Cement and Concrete Research
journal homepage wwwelseviercomlocatecemconres
Short communication
New analytical possibilities for monitoring the phase development duringthe production of autoclaved aerated concrete
J Schreinera D Jansena D Ectorsa F Goetz-Neunhoeffera J Neubauera S Volkmannb
aUniversity of Erlangen-Nuremberg GeoZentrum Nordbayern Mineralogy Schlossgarten 5a 91054 Erlangen Germanyb Rodgauer Baustoffwerke GmbH amp Co KG Am Opel-Pruumlffeld 3 63110 Rodgau-Dudenhofen Germany
A B S T R A C T
This work presents improved analytical methods for both steps of the production process of autoclaved aeratedconcrete (AAC) the phase development during the hydration before autoclaving and during the autoclavingprocess itself The improvement includes new insights into preparation methods of AAC samples for powderdiffraction as well as Rietveld refinement strategies For the first time a new implementation for calculatinganisotropic crystal domain sizes is applied to major hydrate phases occurring during AAC production namelyportlandite during the hydration before autoclaving and tobermorite during the autoclaving process The cal-culation of anisotropic domain size growth which can be implemented in the Rietveld environment is based oncrystallographically and geometrically appropriate models The implementation of calculating anisotropic do-main sizes for the Rietveld software TOPAS 50 allows a superior Rietveld fit and a more accurate quantificationof the phase development Additionally it enables the tracking of growth mechanism of portlandite duringhydration
1 Introduction
Autoclaved aerated concrete (AAC) is known as a lightweight con-struction material which offers outstanding properties such as suffi-cient strength for construction in addition with excellent thermal in-sulation [12] AAC is produced by autoclaving from calcareous rawmaterials such as lime (CaO) and cement quartz sulfate carrier andother additives such as foaming agents and water
The production process (Fig 1) can be separated into the hydrationof the mixed slurry before the procedure of autoclaving and the auto-claving at elevated temperature (180 degC to 200 degC) under saturatedsteam pressure (12MPa) for several hours
The hydration process before autoclaving is necessary to achievesufficient strength in order to cut the green cake blocks as they shouldhave a specific shape and dimension after autoclaving Furthermorethe porous structure is generated by the foaming agent during hydra-tion in the first process step During autoclaving the final propertiesnamely strength and low thermal conductivity are achieved
It is already well understood that the autoclaving process leads tothe formation of several phases first of all tobermorite(Ca5Si6O16(OH)2lowast4H2O) [3ndash5] Newest research has shown im-pressively which reactions are running from the mineralogical point ofview Insitu XRD measurements were carried out during the
autoclaving process and the phase development was shown by plottingnormalized intensities [6] The study of Mitsuda et al [3] was mainlyfocused on the tracking of the phase evolution during the autoclavingprocess of AAC However their statements concerning phase evolutionare mainly based on XRD data and TGA measurements There is acommon agreement that the following reactions occur The consump-tion of the alite (OPC) leads to the formation of an initial C-S-H phaseduring the first processing step Portlandite which was initially formedduring the first process step (from CaO and C3S) further quartz and theC-S-H phase are consumed during autoclaving resulting in the crystal-lization of tobermorite Hence the crystallization process of to-bermorite as well as the crystal structure of tobermorite was an issue ofresearch and discussion over the last years and numerous publicationsto these topics are available Concerning the crystal structure of to-bermorite respectively the tobermorite supergroup a new publicationoutlines all important references and recommends a new nomenclature[7]
The presented study was performed to create new analytical possi-bilities for the characterization of the production process of AAC Bothof the production process steps are essential for the final productHence the present work focuses on crystallization of hydrate phases inboth processes
Firstly an external standard method [89] was published and
httpsdoiorg101016jcemconres201802028Received 6 October 2017 Received in revised form 1 February 2018 Accepted 26 February 2018
Corresponding authorsE-mail addresses juergenjsschreinerfaude (J Schreiner) danieljansenfaude (D Jansen)
Cement and Concrete Research 107 (2018) 247ndash252
0008-8846 copy 2018 Elsevier Ltd All rights reserved
T
6 Publications
39
recommended for the determination of absolute phase contents inmixtures with amorphous content It was shown that the method canabsolutely be recommended for hydrating cement pastes in which watercannot be quantified directly by XRD [10] This method seems to bevery promising for both the quantification of the hydration of the AACslurry before autoclaving and the quantification of the phase evolutionduring autoclaving inasmuch as both production steps form crystallineand amorphous phases
Secondly a new approach to anisotropic peak broadening due toanisotropic domain morphology which was developed [1112] is ap-plied to AAC samples to improve the fit of portlandite and tobermoriteby Rietveld refinement [13] By applying this approach the refinementof both portlandite and tobermorite should additionally lead to betterquantitative results as well as to better insights into the development ofthe domain size morphology of both phases formed
It was already shown that in a hydrating raw mixture for AAC twospecies of portlandite precipitate at 23 degC one showing dynamicallyanisotropic peak broadening and another one following the isotropictrend [14] The application of the anisotropic refinement model led toan improved fitting of portlandite Moreover the mechanism of aniso-tropic domain growth of portlandite was tracked
2 Materials and methods
In order to examine the hydration of the AAC slurry before auto-claving a mixture of the hydraulic reactive components was weighedand measured in-situ at a Bruker D8 diffractometer with a LynxEyedetection system
Ordinary Portland cement (OPC) was mixed with lime (CaO) andanhydrite (C$) The raw materials were taken from the same batches asfor the industrial samples The drymix (58 OPC 36 CaO and 6 C$by weight) was then mixed with water (ws= 08) and placed into anappropriate sample holder The samples were not aerated The slurrysamples were covered with a kapton film to avoid evaporation andcarbonation Diffractograms were recorded with an angular range from7 to 545deg 2θ and a step width of 0011deg 2θ Measurements were carriedout every 15min For each measurement 96 XRD patterns were re-corded over the first 24 h The temperature was fixed at 70 degC which isthe mean temperature generally prevailing in the industrial processduring hydration before autoclaving Rietveld refinement was carriedout using the G-factor method All structures used for Rietveld refine-ment are shown in Table 1
For investigation of the autoclaved samples five different specimenswere taken at different autoclaving times The specimens were takenout of a technical production process hence it was not possible to in-terrupt the process at an earlier time inasmuch it would lead to damageof a whole concrete production batch The specimens were firstly driedat 60 degC until weight constancy The whole blocks were then broken andstatistical samples of 20 g were taken In order to receive the right massattenuation coefficient (MAC) for G-factor method the loss on ignitionand the chemical composition (XRF) were determined For energydispersive XRF analysis (Spectro Xepos) tube voltage from 20 kV to50 kV and tube current from 08 to 20mA were used for differenttargets
The final sample preparation (grinding) before XRD measurementswas carried out using both an agate mortar and a McCrone micronizingmill for wet milling with isopropanol Both preparation methods wereapplied separately to see which one is suitable in order to get the bestpreparation for XRD investigations Six preparations were performed byone operator of which two were prepared with an agate mortar andfour with a McCrone mill For the McCrone milling 3 g of the sampleand 10ml of isopropanol were used for grinding for 12min The grainsize distribution of one sample prepared with an agate mortar and onesample prepared using a McCrone mill was measured by laser granu-lometry in isopropanol using a Mastersizer 3000 (MALVERN)
After milling the samples in these two ways for XRD analysis thepowders were prepared into a front loading sample holder and mea-sured Diffractograms were recorded with an angular range from 6 to80deg 2θ a step width of 00236deg 2θ and a time per step of 054 s Rietveldrefinement combined with external standard (G-factor) was applied inorder to get absolute quantities for each phase The refinement strategyfor portlandite and tobermorite in the TOPAS Launch Mode (TOPAS50 Bruker AXS) is attached as a Supplementary material file
3 Results and discussion
31 Hydration of the mixture before autoclaving
The hydration of the investigated paste before autoclaving isdominated by the hydration of the cement as well as the reaction of thefree lime (CaO) resulting in the formation of portlandite It can beclearly seen from Fig 2 that the hydration of the paste leads to theformation of ettringite portlandite and C-S-H phase For simplificationthe remaining phase developments are not shown in Fig 2 because theyare not in the focus of this study The hydration of CaO forming
Fig 1 Simplified process steps of AAC production and hydrate phase evolution
Table 1Structures used for Rietveld refinement
Phase Author
Alite [15]Anhydrite [16]Bassanite [17]Belite (β) [18]Belite (αprime) [19]Brownmillerite [20]C-S-H [21]Calcite [22]Ettringite [23]Gypsum [24]Hemicarbonate [25]Hydroxylellestadite [26]Lime (CaO) [27]Microcline [28]Portlandite [29]Quartz [30]Tobermorite [31]Tricalciumaluminate (cubic) [32]Tricalciumaluminate (orthorhombic) [33]PONCKS model for Water [21]
J Schreiner et al Cement and Concrete Research 107 (2018) 247ndash252
248
6 Publications
40
portlandite begins rapidly after the addition of water to the mixture andlime is fully consumed after only 1 h of hydration This translates into aquick rise of heat of hydration so that cement hydration is acceleratedwhich leads to further portlandite formation by the reaction of aliteEttringite formation stalls after few hours of hydration After 12 h et-tringite is partially decomposed probably due to sulfate depletion [9]
and poorly crystalline AFm phases (not shown in Fig 2) are formedIn Fig 3 it can be seen that in fact two generations of portlandite
are formed a 1st dominant generation showing anisotropic peakbroadening and 2nd one occurring considerably later following theisotropic domain size refinement which is usually carried out using theRietveld method This occurrence comes along firstly with lime hy-dration and secondly with alite hydration The expected quantity ofportlandite formed from lime hydration very well complies with the
Fig 2 Phase development in AAC paste on a laboratory scale before autoclaving ana-lyzed by in-situ XRD at 70 degC
Fig 3 Formation of two generations of portlandite by hydration of lime (1st) and C3S(2nd) at 70 degC before autoclaving with the major generation showing anisotropic peakbroadening
Fig 4 Biaxial cylinder domain size model of portlandite used for Rietveld refinement of anisotropic peak broadening
Fig 5 Morphological evolution of portlandite showing anisotropic domain size growthduring hydration at 70 degC
Fig 6 Comparison of quantification of crystalline quartz in samples prepared withMcCrone mill and agate mortar at different autoclaving times
J Schreiner et al Cement and Concrete Research 107 (2018) 247ndash252
249
6 Publications
41
quantity of the observed 1st generation The development of portlan-dite growth was already tracked in an equivalent slurry at 23 degC [14]Thus this observation confirms that the crystallinity of portlandite inmixtures for AAC production depends on the starting phase for hydra-tion as already indicated by Ectors [14]
Fig 4 shows the used biaxial cylindrical model for anisotropic do-main size calculation and the portlandite structure which was createdwith structural software VESTA 318 [34] Using the cylindrical ap-proach domain sizes in a (here equating to b) and c direction(dz= cylinder height) can be calculated which comes along with theexpected symmetrical parameters of portlandite
The 1st portlandite generation showing anisotropic domain growthcan be tracked in terms of cylinder diameter and height which is rea-lized in Fig 5 The blue cylinder represents the geometric approach andcylinder height and diameter are calculated newly for each range Thecylinder height remains rather stable throughout the hydration processwhile the cylinder diameter increases during the first hours of hydra-tion After 10 h of hydration the mean cylinder diameter no longer in-creases Consequently these observations match the results of the ex-aminations conducted at 23 degC [14] as well as the assumption thatdifferent mechanisms of growth exist for portlandite depending on the
hydration educt The maximum cylinder diameter is reached earlier inthis work very likely because of the higher hydration temperature
32 Quantification of the reactions during autoclaving
Autoclaved samples were ground with an agate mortar and com-pared to samples which were wet-ground with a McCrone mill Fig 6shows precisely that the determination of the amount of crystallinequartz is more reproducible in the two shown samples which were
Fig 7 2D XRD with Bruker GADDS-system plots of samples prepared with agate mortar and McCrone mill Coarse quartz grains are pointed out in the plot of the sample prepared withagate mortar
Fig 8 Particle size distribution of one sample prepared with an agate mortar and of onesample prepared with a McCrone mill measured by laser granulometry
Fig 9 Rietveld refinement for Tobermorite of autoclaved AAC sample by use of isotropicdomain size model (a) and of anisotropic domain size model (b)
J Schreiner et al Cement and Concrete Research 107 (2018) 247ndash252
250
6 Publications
42
prepared with a McCrone mill The high variance of crystalline quartzin the samples which were prepared with an agate mortar is a result ofinsufficient grinding and remaining of too large quartz grains Whenthis spottiness occurs a reliable quantification using the G-factormethod is not possible
The 2D XRD with Bruker GADDS-system plots in Fig 7 demonstratethe insufficient grinding when using an agate mortar compared to wetmilling with a McCrone mill Quartz would be overrepresented in a one-dimensional XRD pattern focusing on a section with bright spots (greenarrows) The lack of bright spots in the right plot shows that the quartzgrains are milled more thoroughly using a McCrone mill In Fig 8 theparticle size distribution after both ways of sample preparation iscompared Most grains in the sample prepared with an agate mortar arelarger than in the sample prepared with a McCrone mill The grain sizedistribution of the sample prepared with a McCrone mill complies withthe recommended particle size range for XRD analysis of under 5 to50 μm [3536] while the other sample exceeds the range
In Fig 9 Rietveld refinement of an autoclaved sample is shown Thedominant peaks at 77 290 and 301deg 2θ are attributed to tobermoriteIn the upper diagram (a) Rietveld refinement was carried out regularlycalculating isotropic domain sizes for tobermorite However the cal-culated fit differs significantly from the raw data It can be assumed thattobermorite shows a similar pattern to portlandite in terms of aniso-tropic peak broadening taking into account that tobermorite is as-signed to the orthorhombic crystal system Thus instead of a biaxialcylinder model an elliptic cylinder model (Fig 10 structure createdwith VESTA 318 [34]) was applied for the refinement in the lowerdiagram (b) The elliptic cylinder model is a sufficient approach to the
orthorhombic crystal system as it allows the distinction between do-main sizes in a b and c direction The fit is clearly superior using theanisotropic domain size model highlighted by the difference plot inFig 9b The comparison refinement with isotropic and anisotropic ap-proach was done for all of the five autoclaved samples In Fig 11 theresulting Rwp values for the whole pattern and the RBragg values of to-bermorite are shown The refinement using the anisotropic model leadsto both lower Rwp and RBragg values and consequently to a better fit anda more accurate quantification of tobermorite in all refined samples
4 Summary and conclusions
Improved analytical methods for both the phase developmentduring the hydration before autoclaving and during the autoclavingprocess of AAC are presented It could be shown that wet McCronemilling is the best way of preparation of AAC samples in order to obtainsuitable samples for powder diffraction A new approach to treat ani-sotropic domain sizes for Rietveld refinement could be successfullyapplied ndash with the benefit that portlandite and tobermorite in AACsamples could be refined more accurately using the Rietveld methodThus this application allows an improved quantification of the phasedevelopment during both of the production steps
For the future there are still plenty of possibilities to apply thepresented approach of calculating anisotropic domain sizes to AACproduction As exemplified with portlandite the mechanisms of growthof tobermorite can be tracked likewise during the autoclaving processIn addition the effect of variations in the chemical composition of AACraw mixtures on the crystal morphology of tobermorite can be ex-amined This leaves a new perspective to discuss the link between mi-neral phase morphology and the thermal and mechanical properties ofAAC
Acknowledgement
The autoclaved samples were generously provided by RodgauerBaustoffwerke GmbH amp Co KG The authors express gratitude for allsupport
Appendix A Supplementary data
Supplementary data to this article can be found online at httpsdoiorg101016jcemconres201802028
References
[1] MW Grutzeck Cellular concrete in M Scheffler P Colombo (Eds) CellularCeramics Wiley-VCH Weinheim 2005 pp 193ndash223
[2] M Haas The future of AAC ndash from a material scientists point of view inMC Limbachiya JJ Roberts (Eds) Autoclaved Aerated Concrete Taylor FrLondon 2005 pp 187ndash194
[3] T Mitsuda K Sasaki H Ishida Phase evolution during autoclaving process ofaerated concrete J Am Ceram Soc 75 (1992) 1858ndash1863
[4] N Isu H Ishida T Mitsuda Influence of quartz particle size on the chemical and
Fig 10 Triaxial cylinder domain size model of Tobermorite used for Rietveld refinement of anisotropic peak broadening
Fig 11 Comparison of Rwp and RBragg values of Rietveld refinements of autoclavedsamples and tobermorite using the isotropic and the anisotropic domain size model
J Schreiner et al Cement and Concrete Research 107 (2018) 247ndash252
251
6 Publications
43
mechanical properties of autoclaved aerated concrete (I) tobermorite formationCem Concr Res 25 (1995) 243ndash248
[5] NY Mostafa Influence of air-cooled slag on physicochemical properties of auto-claved aerated concrete Cem Concr Res 35 (2005) 1349ndash1357 httpdxdoiorg101016jcemconres200410011
[6] K Matsui J Kikuma M Tsunashima T Ishikawa S Matsuno A Ogawa M SatoIn situ time-resolved X-ray diffraction of tobermorite formation in autoclaved aer-ated concrete influence of silica source reactivity and Al addition Cem Concr Res41 (2011) 510ndash519
[7] C Biagioni S Merlino E Bonaccorsi The tobermorite supergroup a new no-menclature Mineral Mag 79 (2015) 485ndash495 httpdxdoiorg101180minmag2015079222
[8] BH OConnor MD Raven Application of the Rietveld refinement procedure inassaying powdered mixtures Powder Diffract 3 (1988) 2ndash6 httpdxdoiorg101017S0885715600013026
[9] D Jansen F Goetz-Neunhoeffer C Stabler J Neubauer A remastered externalstandard method applied to the quantification of early OPC hydration Cem ConcrRes 41 (2011) 602ndash608 httpdxdoiorg101016jcemconres201103004
[10] D Jansen C Stabler F Goetz-Neunhoeffer S Dittrich J Neubauer Does OrdinaryPortland Cement contain amorphous phase A quantitative study using an externalstandard method Powder Diffract 26 (2011) 31ndash38 httpdxdoiorg10115413549186
[11] D Ectors F Goetz-Neunhoeffer J Neubauer A generalized geometric approach toanisotropic peak broadening due to domain morphology J Appl Crystallogr 48(2015) 189ndash194 httpdxdoiorg101107S1600576714026557
[12] D Ectors F Goetz-Neunhoeffer J Neubauer Routine (an)isotropic crystallite sizeanalysis in the double-Voigt approximation done right Powder Diffract 32 (S1)(2017) 27ndash34 httpdxdoiorg101017S0885715617000070
[13] HM Rietveld A profile refinement method for nuclear and magnetic structures JAppl Crystallogr 2 (1969) 65ndash71 httpdxdoiorg101107S0021889869006558
[14] D Ectors Advances in the Analysis of Cementitious Reactions and Hydrate Phases(Doctoral Thesis) (2016) pp 12ndash14 (urnnbndebvb29-opus4-71743)
[15] AacuteG De La Torre S Bruque J Campo MAG Aranda The superstructure of C3Sfrom synchrotron and neutron powder diffraction and its role in quantitative phaseanalyses Cem Concr Res 32 (2002) 1347ndash1356 httpdxdoiorg101016S0008-8846(02)00796-2
[16] A Kirfel G Will Charge density in anhydrite CaSO4 from X-ray and neutrondiffraction measurements Acta Crystallogr Sect B Struct Crystallogr CrystChem 36 (1980) 2881ndash2890 httpdxdoiorg101107S0567740880010461
[17] C Bezou AN Christensen D Cox M Lehman A Nonat Structures cristallines deCaSO405H2O et CaSO406H2O Comptes Rendus Hebd Des Seacuteances lAcadeacutemieDes Sci Seacuterie 2 (312) (1991) 43ndash48
[18] KH Jost B Ziemer R Seydel Redetermination of the structure of β-dicalciumsilicate Acta Crystallogr Sect B Struct Crystallogr Cryst Chem 33 (1977)1696ndash1700 httpdxdoiorg101107S0567740877006918
[19] W Mumme LMD Cranswick BC Chakoumakos Rietveld crystal structure re-finements from high temperature neutron powder diffraction data for the poly-morphs of dicalcium silicate Neues Jahrb Fuer Mineral Abhandlungen 170 (1996)171ndash188
[20] A Colville S Geller The crystal structure of brownmillerite Ca2FeAlO5Crystallographica 50 (1971) 2311ndash2315 httpdxdoiorg101107S056774087100579X
[21] ST Bergold F Goetz-Neunhoeffer J Neubauer Quantitative analysis of C-S-H inhydrating alite pastes by in-situ XRD Cem Concr Res 53 (2013) 119ndash126 httpdxdoiorg101016jcemconres201306001
[22] EN Maslen VA Streltsov NR Streltsova N Ishizawa Electron density and op-tical anisotropy in rhombohedral carbonates III Synchrotron Xray studies ofCaCO3 MgCO3 and MnCO3 Acta Crystallogr Sect B 51 (1995) 929ndash939 httpdxdoiorg101107S0108768195006434
[23] G Renaudin Y Filinchuk J Neubauer F Goetz-Neunhoeffer A comparativestructural study of wet and dried ettringite Cem Concr Res 40 (2010) 370ndash375httpdxdoiorg101016jcemconres200911002
[24] WF Cole CJ Lancucki A refinement of the crystal structure of gypsumCaSO42H2O Acta Cryst B30 (1974) 921ndash929 httpdxdoiorg101107S0567740874004055
[25] T Runčevski RE Dinnebier OV Magdysyuk H Poumlllmann Crystal structures ofcalcium hemicarboaluminate and carbonated calcium hemicarboaluminate fromsynchrotron powder diffraction data Acta Crystallogr Sect B Struct Sci 68 (2012)493ndash500 httpdxdoiorg101107S010876811203042X
[26] JM Hughes JW Drexler Cation substitution in the apatite tetrahedral site crystalstructures of type hydroxylellestadite and type fermorite Neues Jahrb FuerMineral (1991) 327ndash336
[27] CH Shen RS Liu JG Lin CY Huang Phase stability study of La12Ca18Mn2O7Mater Res Bull 36 (2001) 1139ndash1148
[28] SW Bailey Refinement of an intermediate microcline structure Am Miner 54(1969) 1540ndash1545
[29] WR Busing HA Levy Neutron diffraction study of calcium hydroxide J ChemPhys 26 (1957) 563 httpdxdoiorg10106311743345
[30] Y Le Page G Donnay Refinement of the crystal structure of low-quartz ActaCrystallogr Sect B 32 (1976) 2456ndash2459 httpdxdoiorg101107S0567740876007966
[31] SA Hamid The crystal structure of the 11 Aring natural tobermoriteCa225[Si3O75(OH)15]1H2O Zeitschrift Fuer Krist - New Cryst Struct 154 (1981)189ndash198 httpdxdoiorg101524zkri19811543-4189
[32] P Mondal JW Jeffery The crystal structure of tricalcium aluminate Ca3Al2O6Acta Crystallogr B 31 (1975) 689ndash697 httpdxdoiorg101107S0567740875003639
[33] Y Takeuchi F Nishi I Maki Crystal-chemical characterization of the tricalciumaluminate-sodium oxide (3CaOtimesAl2O3-Na2O) solid-solution series Zeitschrift FuumlrKrist (1980) 259ndash307
[34] K Momma F Izumi VESTA 3 for three-dimensional visualization of crystal vo-lumetric and morphology data J Appl Crystallogr 44 (2011) 1272ndash1276 httpdxdoiorg101107S0021889811038970
[35] K Scrivener R Snellings B Lothenbach A Practical Guide to MicrostructuralAnalysis of Cementitious Materials CRC Press 2016 pp 123ndash125 httpdxdoiorg107693wl20150205
[36] V Pecharsky P Zavalij Fundamentals of Powder Diffraction and StructuralCharacterization of Materials Springer second edition 2005 p 302 httpdxdoiorg101007978-0-387-09579-0
J Schreiner et al Cement and Concrete Research 107 (2018) 247ndash252
252
6 Publications
44
7 Acknowledgement
7 Acknowledgement
Ich moumlchte mich bei einigen Personen bedanken ohne die es wohl kaum zum erfolgreichenAbschluss dieser Arbeit gekommen waumlreMein Doktorvater Prof Dr Juumlrgen Neubauer hat sich stets die Zeit genommen die noumltigwar um Angelegenheiten aller Art mit mir zu klaumlren Er gab mir fachlich immer zumrichtigen Zeitpunkt einen gewissen wissenschaftlichen Impuls Zugleich habe ich mich den-noch immer frei in meiner eigenen Konzeption gefuumlhlt Groszligen Dank spreche ich Prof DrFriedlinde Goumltz-Neunhoeffer aus die fuumlr mich ebenso immer eine verlaumlssliche Ansprech-partnerin fuumlr fachliche und organisatorische Angelegenheiten aller Art war Danke anDr Daniel Jansen fuumlr die gute Zusammenarbeit und dafuumlr dass er mich im Zuge meinerMasterarbeit in ein Forschungsprojekt aufgenommen hat das den Weg zur Promotionmoumlglich machte Zusaumltzlich gilt mein Dank Prof Dr Matthias Goumlbbels der fuumlr dieMitarbeiter am Lehrstuhl immer motivierende Worte fand Fuumlr die Ermoumlglichung meinerTeilnahme an diversen Dienstreisen Fortbildungen und Tagungen moumlchte ich mich viel-mals bedankenWeiterhin bedanke ich mich bei Dr Stephan Volkmann und den Rodgauer BaustoffwerkenGmbH amp Co KG fuumlr die gute Zusammenarbeit und die Bereitstellung von Versuchsma-terialienVielen Dank an meine studentischen Hilfskraumlfte Daniel Wagner Laura MoldenhauerFabian Lang Jakob Schreiber und Felix Klaassen die alle Aufgaben im Labor einwand-frei und mit Bedacht erledigten Bei meinen aktuellen und ehemaligen Kollegen DrKatrin Hurle Dr Dominique Ectors Dr Christoph Naber Dr Florian Huumlller JoumlrgNehring Frank Riedel Julian Wolf Tanja Manninger Daniel Wagner Nicolas FobbeKarla Spaumlth Julian Goergens Andreas Koumlhler Cordula Jakob Franz Becker und LisaKlemenz bedanke ich mich fuumlr die gelungene Zusammenarbeit und gegenseitige Unter-stuumltzung Besonderer Dank geht auch an Kerstin Kreszlig Bettina Engl Christian HankeBernd Schleifer und Christian Abe fuumlr die verlaumlssliche Unterstuumltzung bei technischen Fra-gen und Messungen im LaborFuumlr jegliche Unterstuumltzungen moumlchte ich mich auch bei meinen Eltern bedanken sowiebei meinem Bruder Ralf der mir mit einem LaTex Crashkurs viel Frustration ersparthat Danke Thomas dass du immer fuumlr mich da bist und mit mir zusammen fuumlr genugAusgleich gesorgt hast
45
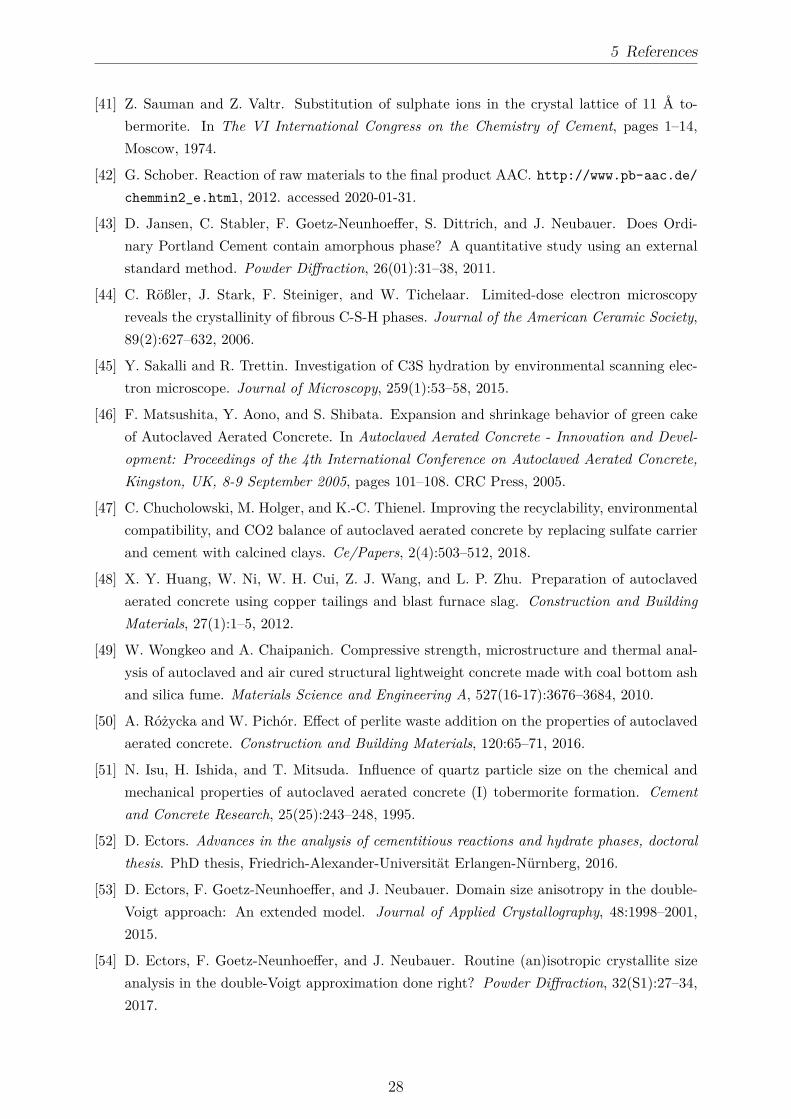
5 References
[41] Z Sauman and Z Valtr Substitution of sulphate ions in the crystal lattice of 11 Aring to-bermorite In The VI International Congress on the Chemistry of Cement pages 1ndash14Moscow 1974
[42] G Schober Reaction of raw materials to the final product AAC httpwwwpb-aacde
chemmin2_ehtml 2012 accessed 2020-01-31
[43] D Jansen C Stabler F Goetz-Neunhoeffer S Dittrich and J Neubauer Does Ordi-nary Portland Cement contain amorphous phase A quantitative study using an externalstandard method Powder Diffraction 26(01)31ndash38 2011
[44] C Roumlszligler J Stark F Steiniger and W Tichelaar Limited-dose electron microscopyreveals the crystallinity of fibrous C-S-H phases Journal of the American Ceramic Society89(2)627ndash632 2006
[45] Y Sakalli and R Trettin Investigation of C3S hydration by environmental scanning elec-tron microscope Journal of Microscopy 259(1)53ndash58 2015
[46] F Matsushita Y Aono and S Shibata Expansion and shrinkage behavior of green cakeof Autoclaved Aerated Concrete In Autoclaved Aerated Concrete - Innovation and Devel-opment Proceedings of the 4th International Conference on Autoclaved Aerated ConcreteKingston UK 8-9 September 2005 pages 101ndash108 CRC Press 2005
[47] C Chucholowski M Holger and K-C Thienel Improving the recyclability environmentalcompatibility and CO2 balance of autoclaved aerated concrete by replacing sulfate carrierand cement with calcined clays CePapers 2(4)503ndash512 2018
[48] X Y Huang W Ni W H Cui Z J Wang and L P Zhu Preparation of autoclavedaerated concrete using copper tailings and blast furnace slag Construction and BuildingMaterials 27(1)1ndash5 2012
[49] W Wongkeo and A Chaipanich Compressive strength microstructure and thermal anal-ysis of autoclaved and air cured structural lightweight concrete made with coal bottom ashand silica fume Materials Science and Engineering A 527(16-17)3676ndash3684 2010
[50] A Roacuteżycka and W Pichoacuter Effect of perlite waste addition on the properties of autoclavedaerated concrete Construction and Building Materials 12065ndash71 2016
[51] N Isu H Ishida and T Mitsuda Influence of quartz particle size on the chemical andmechanical properties of autoclaved aerated concrete (I) tobermorite formation Cementand Concrete Research 25(25)243ndash248 1995
[52] D Ectors Advances in the analysis of cementitious reactions and hydrate phases doctoralthesis PhD thesis Friedrich-Alexander-Universitaumlt Erlangen-Nuumlrnberg 2016
[53] D Ectors F Goetz-Neunhoeffer and J Neubauer Domain size anisotropy in the double-Voigt approach An extended model Journal of Applied Crystallography 481998ndash20012015
[54] D Ectors F Goetz-Neunhoeffer and J Neubauer Routine (an)isotropic crystallite sizeanalysis in the double-Voigt approximation done right Powder Diffraction 32(S1)27ndash342017
28
5 References
[55] D Jansen F Goetz-Neunhoeffer C Stabler and J Neubauer A remastered external stan-dard method applied to the quantification of early OPC hydration Cement and ConcreteResearch 41(6)602ndash608 2011
[56] T Ungaacuter G Tichy J Gubicza and R J Hellmig Correlation between subgrains andcoherently scattering domains Powder Diffraction 20(04)366ndash375 2005
[57] Triloki P Garg R Rai and B K Singh Structural characterization of as-depositedcesium iodide films studied by X-ray diffraction and transmission electron microscopy tech-niques Nuclear Instruments and Methods in Physics Research Section A AcceleratorsSpectrometers Detectors and Associated Equipment 736128ndash134 2014
[58] J Schreiner F Goetz-Neunhoeffer J Neubauer and D Jansen Hydrothermal synthesisof 11 Aring tobermorite ndash Effect of adding metakaolin to the basic compound Applied ClayScience 185 2020
[59] J Schreiner F Goetz-Neunhoeffer J Neubauer S Volkmann S Bergold R Webler andD Jansen Advanced Rietveld refinement and SEM analysis of tobermorite in chemicallydiverse autoclaved aerated concrete Powder Diffraction 34143ndash150 2019
[60] J Schreiner D Jansen D Ectors F Goetz-Neunhoeffer J Neubauer and S VolkmannNew analytical possibilities for monitoring the phase development during the production ofautoclaved aerated concrete Cement and Concrete Research 107247ndash252 2018
29
6 Publications
6 Publications
61 Hydrothermal synthesis of 11 Aring tobermorite ndash Effectof adding metakaolin to the basic compound
Reprint of the peer reviewed publication
Schreiner J Goetz-Neunhoeffer F Neubauer J Jansen D 2020 Hydrothermalsynthesis of 11 Aring tobermorite ndash Effect of adding metakaolin to the basic compoundApplied Clay Science 185 httpsdoiorg101016jclay2019105432
with permission from Elsevier
30
Contents lists available at ScienceDirect
Applied Clay Science
journal homepage wwwelseviercomlocateclay
Research paper
Hydrothermal synthesis of 11 Aring tobermorite ndash Effect of adding metakaolin tothe basic compound
J Schreiner F Goetz-Neunhoeffer J Neubauer D JansenUniversity of Erlangen-Nuremberg GeoZentrum Nordbayern Mineralogy Schlossgarten 5a 91054 Erlangen Germany
A R T I C L E I N F O
KeywordsHydrothermal synthesis11 Aring tobermoriteMetakaolinPowder diffractionKatoite
A B S T R A C T
Different amounts and types of metakaolin were analyzed and applied for the hydrothermal synthesis of 11 Aringtobermorite All synthesized samples were investigated by means of powder XRD combined with Rietveld re-finement Al-substituted 11 Aring tobermorite was successfully synthesized on the basis of a broad range of com-pounds characterized by a varying content of metakaolin Katoite was present depending on the amount ofsupplied Al3+ which was determined by the dosage of metakaolin Minor crystalline components included in thetwo types of metakaolin sources varied greatly in their reactivity under hydrothermal conditions Despite adifferent degree of purity the two types of metakaolin showed corresponding effects at moderate dosages butcontrary effects at higher dosages as for the synthesis of 11 Aring tobermorite The domain morphology of to-bermorite could be associated with Al3+ incorporation for low dosages of metakaolin represented by up to 2 wt- Al2O3 in the dry mix By contrast Al3+ affected tobermorite lattice parameters at equivalent and even athigher dosages with c reaching 2295 Aring at 12 wt- Al2O3 in the dry mix
1 Introduction
11 Application of metakaolin as a reactive material in constructionindustry
The application of supplementary cementitious materials (SCMs) inthe field of construction technology has received a lot of attention inrecent years Due to limited resources and an urgent need for alter-native and more eco-friendly construction materials SCMs such asmetakaolin offer a great potential The usage of SCMs has not onlyspread to the cement and mortar industry but also to advanced appli-cations such as autoclaved aerated concrete (AAC) (Demir et al 2014Koutnyacute et al 2014 Walczak et al 2015 Roacuteżycka and Pichoacuter 2016Chucholowski et al 2018) Unlike ordinary cementitious constructionmaterials AAC is produced from hydrothermal curing Due to the dif-ferent thermodynamic environment the hydration process and the re-activity of raw materials have to be investigated properly in order tounderstand the effects on the AAC product The leading mineral phasein AAC is 11 Aring tobermorite (Ca5Si6O16(OH)2middot4H2O) As a consequencethe thermal and mechanical properties of AAC depend on micro-structure and crystallinity of tobermorite to some extent In addition tothe curing time and the fineness of raw materials the supply of ionsthat can substitute in the tobermorite structure is a crucial factor in thiscontext Especially substitutions by aluminum sodium and potassium
ions have been investigated thoroughly (Sauman 1974 Klimesch andRay 1998 Mostafa et al 2009 Matekonis et al 2010 Skawinskaet al 2017) Calcined clays usually contain a considerable amount ofthe mentioned ions
There is a vast amount of literature on the reactivity of SCMs atambient temperature and standard pressure but there is little when itcomes to hydrothermal conditions In previous publications the beha-vior of metakaolin under hydrothermal conditions was mainly in-vestigated for the synthesis of zeolites (Zhang et al 2007 Aguilar-Mamani et al 2014 Setthaya et al 2016 Luo et al 2018) In thesestudies the reactivity of metakaolin was observed at a wide range oftemperature and pH values During the transformation of kaolin intometakaolin a loss of framework alumina was observed (Ayodele et al2019) In recent decades metakaolin has been the subject of studies inthe field of geopolymer research (Rashad 2013 Chen et al 2016) Forthe synthesis of 11 Aring tobermorite a more distinct setting of temperaturesetting (180ndash200 degC) and steam pressure (1ndash12 MPa) are required
This publication is intended to make a new contribution to thechallenging field of hydrothermal synthesis in the system CaO-Al2O3-SiO2-H2O based on XRD analysis combined with Rietveld refinementVarious dosages of two types of metakaolin with different chemical andmineralogical purities are compared for the effects on the hydrothermalsynthesis of Al-substituted 11 Aring tobermorite Especially changes of thebulk chemistry in the raw mixes the reactivity of minor crystalline
httpsdoiorg101016jclay2019105432Received 20 August 2019 Received in revised form 13 November 2019 Accepted 30 December 2019
Corresponding authorE-mail address juergenjsschreinerfaude (J Schreiner)
Applied Clay Science 185 (2020) 105432
0169-1317 copy 2020 Elsevier BV All rights reserved
T
6 Publications
31
phases of the two types of metakaolin and the effect of different curingtimes are the focus of interest On the one hand metakaolin offers agreat potential in the AAC industry On the other hand of all SCMsmetakaolin is a good source material for investigating the influence ofAl3+ on the synthesis of Al-substituted 11 Aring tobermorite
12 Synthesis of Al-substituted 11 Aring tobermorite
In addition to being present in AAC tobermorite has found appli-cation in wastewater treatment and nuclear waste management due toits ion exchange capacity (Maeda et al 2012 Monasterio et al 2015)The substitution of silicon by aluminum results in a different to-bermorite structure due to general and local charge balance affectingthe lattice parameters Especially c is impacted by this substitutionbecause it occurs in the bridging tetrahedron and additional OHndash sub-stitutes O2ndash (Komarneni et al 1985 Merlino et al 2000) As suggestedin some additional studies the substitution of Si4+ by Al3+ and Na+ orK+ leads to a lath-like morphology of tobermorite crystals (Mostafa2005 Mostafa et al 2009 Venhodovaacute et al 2015 Qu et al 2018)However because of the heterogeneous appearance of tobermorite inAAC it is hardly possible to conduct a proper characterization based onSEM analysis In our recent work the anisotropic peak broadening oftobermorite in XRD diffractograms was successfully linked with theincorporation of foreign ions supplied in a common AAC production(Schreiner et al 2019) This finding allowed a more statistical struc-tural characterization of tobermorite in bulk compositions compared toSEM analysis Moreover it was reported in other studies that differenthydrate phases occur depending on the amount of supplied ions and onthe experimental settings In compounds with a high content of Al3+formation of katoite could be observed (Klimesch and Ray 1998 Riacuteoset al 2009 Matsui et al 2011) In the case of a longer curing durationinstead of 11 Aring tobermorite the formation of xonotlite (Siauciunas andBaltakys 2004 Galvaacutenkovaacute et al 2018) or - depending on the finenessof used silica source (Siauciunas and Baltakys 2004) - gyrolite is fa-voured
Kalousek (1956) suggested that tobermorite can contain up to 5Al2O3 More Al2O3 in the system resulted in the formation of hydro-garnet Klimesch and Ray (1998) additionally investigated the stabilityof hydrogarnet depending on the Al(Si + Al) ratio and its role in re-lation to the formation of 11 Aring tobermorite in an equivalent systemThey suggest that hydrogarnet always appears before tobermorite butthe former can only be detected for higher Al(Si + Al) ratios in theevent of longer curing times Riacuteos et al (2009) and Qu et al (2018)confirmed these findings in extensive investigations In the latter pub-lication it is additionally suggested that samples prepared at lowertemperatures (160 degC) are less impacted by the supply of Al3+ Theyalso consider the peak broadening of tobermorite in their XRD plotsbased on the amount of incorporated Al3+ In two recent publicationswe suggested that the peak broadening of tobermorite enables a mi-crostructural analysis by calculating the orientation dependent domainsizes (Schreiner et al 2018 2019) However these studies are based onsamples of industrially produced AAC so that the curing time was fixedThe studied AAC was produced from raw materials with a broad che-mical spectrum such as ordinary Portland cement (OPC) whichsomehow complicates the interpretation of results
In this work the influence of aluminum ions - provided by meta-kaolin - on dominant crystallographic direction-dependent domaingrowth of tobermorite is investigated by analysis of anisotropic peakbroadening (Ectors et al 2015 2017) In Fig 1 of the supplementarymaterial the method of fitting the anisotropic peak broadening of to-bermorite using a triaxial cylinder model is visualized (Schreiner et al2018) Fitting of the anisotropic peak broadening of tobermorite Thismethod is used to calculate the average and reliable values for to-bermorite domain sizes in the powder sample and associate them withaverage Al3+ incorporation Microstrain should be considered becauseit is an additional source of peak broadening However this usually
accounts for materials that have been exposed to different kinds ofstress such as metals and alloys (Badawi et al 2019) In addition theinstrumental contribution to peak broadening should be consideredHydration products such as tobermorite are characterized by crystallitesizes in the range of nanometers so that anisotropic size broadeningclearly outweighs the effect of instrumental broadening (Jenkins andSnyder 1996) Moreover the impact of Al3+ on the lattice parametersof tobermorite is considered It should additionally be clarified whe-ther the results from our previous publication (Schreiner et al 2019)based on industrially produced AAC can be confirmed by investigationwith less complex raw mixes and purely based on laboratory experi-ments
2 Material and methods
21 Starting materials
The starting materials for hydrothermal synthesis included deio-nized water quartz flour portlandite (999 pure) and two types ofmetakaolin One type was ordinary commercially available metakaolin(MK) with nearly a stoichiometric composition For comparison thesecond type of commercially available metakaolin was a by-productfrom expanded glass production (MKg) and consequently highly im-pure The chemical composition of MK and MKg determined by XRF isgiven in Table 1 With MKg containing less Al2O3 but considerably moreNa2O than MK the effects on hydrothermal synthesis were of interestBoth types of metakaolin have been characterized in previous pub-lications (Schmidt et al 2012 Naber et al 2019) In addition weverified the mineral phase content by XRD analysis Besides amorphousmetakaolin MK contained minor amounts of anatase quartz and mica
Fig 1 Weight fractions of tobermorite quartz and katoite determined byquantitative XRD analysis ndash samples including MKg crosshatched
Table 1Chemical composition of MK and MKg determined by XRF analysis ndash majorcontrasts in bold letters
Oxides [wt-] MK MKg
SiO2 536 604Al2O3 392 206CaO 01 40MgO 01 12Na2O 0 96K2O 10 18Fe2O3 18 05TiO2 21 03P2O5 01 02Loss on ignition 15 1
J Schreiner et al Applied Clay Science 185 (2020) 105432
2
6 Publications
32
MKg contained additional kaolinite feldspar and quartz
22 Investigated mix composites
For the preparation of raw mixtures the powders were weighed andhomogenized using a lab-scale mixing mill Table 2 lists the composi-tion and nomenclature of all samples including Al2O3 content andcuring time in the autoclave
bull Besides one blank mixture (MK0) that did not contain any type ofmetakaolin eleven more compounds were prepared of which threeincluded different dosages of MKg (MKg16 MKg23 and MKg60)Three more mixes contained equivalent amounts of MK instead ofMKg (MK16 MK23 and MK60) These mixes were investigated inorder to have a direct comparison concerning the effects of differentraw material on the synthesis of tobermorite
bull Additionally the mixes MK9 MK5 and MK25 with lower dosages ofmetakaolin were analyzed In the referenced literature (Schreineret al 2019) the effect of Al3+ on the anisotropic peak broadeningof tobermorite could only be observed in the case of Al2O3 contentslower than 4 in the drymix In the latter three mixes Al2O3 con-tents range from 1 to 35 Al2O3 (calculated from XRF data) whichmeets the region of interest for the analysis of tobermorite domainmorphology
bull The curing time for nearly all of the investigated samples was 12 hbut compound MK9 was prepared two more times for curing timesof 2 h and 6 h The different curing times were chosen in this par-ticular sample so that the reactivity of metakaolin and the phasetransitions could be observed more precisely
23 Hydrothermal treatment
Due to the different fineness of raw materials there was a differentwater demand from one mixture to another In order to obtain slurriesof comparable rheology the amount of water was adapted respectivelyresulting in water-to-solid ratios of 25 to 3 which matches the sug-gested water-to-solid ratio for this purpose (Roacutezycka et al 2014Galvaacutenkovaacute et al 2018) The weighed water was added to the dry mixand after stirring for 1 min at 23 degC the slurry was poured into thereactor Minor changes in the quantity of added water did not have aninfluence on the measured steam pressure All experiments were con-ducted using a PTFE-lined stainless steel autoclave with a reactor vo-lume of 300 ml The oven temperature was fixed at 180 degC and auto-genous steam pressure of 11ndash12 MPa was measured during eachexperiment with an external manometer After cooling to room tem-perature the sample was removed from the reactor coarsely ground
using an agate mortar and dried at 60 degC for 12 h After drying thesample was ground with an agate mortar again in order to deagglo-merate the particles As no coarse raw materials were used there wasno need for wet McCrone milling (Schreiner et al 2018)
24 XRD analysis
After preparation into front-loading sample holders the powdersamples were measured with a D8 diffractometer (Bruker) equippedwith a LynxEye detection system and Bragg-Brentano geometry Thesettings for XRD analysis included a tube voltage of 40 kV a current of40 mA an angular range from 6 to 80deg 2θ (Cu Kα radiation) a time perstep of 054 s a step width of 00236deg 2θ and a PSD opening of 33deg Thebackground was fitted with Chebyshev polynomial of the fifth orderThe major contribution of amorphous phase was fitted with a singlepeak with a fixed position at 308deg 2θ so that tobermorite reflectionswere not affected An external quartzite standard was measured withthe same parameters in order to determine phase quantities (Jansenet al 2011) Bruker AXS software TOPAS 50 was used for Rietveldrefinement (Rietveld 1969) and the used structures are shown inTable 3
3 Results and discussion
31 Different dosages of MK and MKg
In Fig 1 the quantities of tobermorite quartz and katoite present inmost of the samples determined by XRD analysis are illustratedWhenever tobermorite was the leading mineral hydrate phase a basalspacing of 113 Aring could be verified in each of the diffractograms Thequantities of minor crystalline phases and amorphous content are notshown For low dosages of MK it can be seen that the weight fraction oftobermorite decreased At moderate dosage of both types of metakaolin(MK16 MK23 MKg16 MKg23) tobermorite was present in comparablequantities It can be seen that the amount of katoite in the mixes de-pended on the dosage of metakaolin and it appeared only at dosages ofMK5 or more Due to the higher content of aluminum in MK comparedto MKg more katoite could always be observed in the MK mixes atequivalent dosages Despite equal amounts of quartz as starting mate-rial in mixes for both types of metakaolin the resulting weight fractionsin the cured samples were not alike Considerably more quartz waspresent in the MK samples Even though less quartz was used for mixescontaining higher amounts of MK even more quartz was present afterhydrothermal curing (Table 2 Fig 1) Consequently some of the SiO2
provided by MK did not transform into an amorphous phase or to-bermorite but into quartz This finding is verified by the presence ofquartz in MK60 because no quartz was included in the raw mixture Thefeldspar present in MKg did not react so Na2O and an unknown amountof Al2O3 may not have been supplied for hydrothermal reaction Besidestobermorite and quartz additional calcite scawtite (Ca7Si6(CO3)
Table 2Basic powder compounds prepared for the hydrothermal synthesis of to-bermorite with the respectively calculated Al2O3 content and curing time in thereactor
Sample Portlandite[wt-]
Quartz[wt-]
MK[wt-]
MKg
[wt-]
Al2O3
[wt-]Curingtime [h]
MK0 49 51 ndash ndash 0 12MK25 495 48 25 ndash 1 12MK5 49 46 5 ndash 2 12MK9_2h 48 43 9 ndash 35 2MK9_6h 48 43 9 ndash 35 6MK9_12h 48 43 9 ndash 35 12MK16 47 37 16 ndash 63 12MK23 46 31 23 ndash 9 12MK60 40 ndash 60 ndash 235 12MKg16 47 37 ndash 16 33 12MKg23 46 31 ndash 23 47 12MKg60 40 ndash ndash 60 124 12
Table 3Structural data used for the investigation with powder XRD analysis
Phase Author
Anatase (Horn et al 1972)Biotite (Brigatti et al 2000)Calcite (Maslen et al 1995)Kaolinite (Zvyagin 1960)Katoite (Bartl 1969)Microcline (Bailey 1969)Plazolite (Basso et al 1983)Portlandite (Busing and Levy 1957)Quartz (Le Page and Donnay 1976)Scawtite (Grice 2005)Tobermorite (Hamid 1981)Xonotlite (Hejny and Armbruster 2001)
J Schreiner et al Applied Clay Science 185 (2020) 105432
3
6 Publications
33
O18bull2(H2O)) and xonotlite (Ca6Si6O17(OH)2) could be identified insample MK0 (XRD plots of samples MK0 MKg16 MKg23 MK16 andMK23) Comparing MK0 and MK25 scawtite and xonotlite could stillbe identified in a very low amount in MK25 but no longer in samplesthat contained even more MK (XRD plots of samples MK0 MK25 MK5and MK9_12h)
Two additional experiments were done without quartz in the rawmixes (MK60 and MKg60) The according diffractograms after hydro-thermal curing are shown in Fig 2 In sample MKg60 tobermorite (gt 50wt-) was successfully synthesized without any other silica sourcethan MKg whereas no crystalline quartz occurred By contrast no to-bermorite but quartz could be identified in equivalent mixture MK60containing MK It can be seen that crystalline components such as micaand anatase in the raw MK did not react at the selected conditions andremained present in the autoclaved samples Except for feldspar in MKgall of the crystalline components appeared to be reactive at the chosenhydrothermal conditions A minor unidentified phase occurred at328deg2θ and additional xonotlite was identified in sample MKg60 Insample MK60 more calcium was needed for the formation of morehydrogarnet (Fig 1) resulting in a lower CaSi ratio for the remainingsystem Sample MKg60 contained only half of the amount of Al3+ and itwas not completely supplied for reaction due to its partial presence infeldspar Consequently essentially less hydrogarnet (Fig 1) was presentin MKg60 after hydrothermal treatment and the CaSi ratio in the re-maining system was affected to a lesser extent
32 Application of MK for different curing times
The development of hydrate phases in the autoclave for compoundMK9 is displayed in Fig 3 After only 2 h of hydrothermal curing all ofthe available portlandite had reacted and katoite (95 wt-) was pre-sent The applied type of metakaolin appeared to react quickly as itsupplied aluminum for formation of katoite No formation of to-bermorite could be observed at this stage yet An assumably amorphousprecursor can be seen at 28 to 30deg2θ Calcium was provided by thedissolution of portlandite After 6 h of hydrothermal reaction amountsof katoite (85 wt-) and quartz (from 31 wt- at 2 h to 165 wt- at6 h) had decreased and a major amount of tobermorite (35 wt-) waspresent Apparently between 2 and 6 h under hydrothermal conditionsthe amorphous precursor and quartz reacted resulting in the formationof tobermorite An additional 6 h of reaction time (MK9_12h) did notchange the phase composition significantly Slightly more tobermorite
(365 wt-) less quartz (16 wt-) and katoite (65 wt-) weremeasured
33 Tobermorite domain morphology and lattice parameters
In the referenced literature an analysis of tobermorite domainmorphology based on anisotropic peak broadening was possible forsamples that contained notgt 4 wt- Al2O3 in the drymix (Schreineret al 2019) Accordingly in this study samples MK0 MK25 MK5MK9_6h and MK9_12h were suitable (Table 2) with MK9_2h not con-taining any tobermorite In Fig 4 the respective growth in a and b di-rection is visualized with x indicating the domain size in a direction andy indicating domain size in b direction using a macro for TOPAS 50(Ectors et al 2015 2017) The calculated cylinder models in Fig 4represent the relation of yx and not absolute sizes With no supply ofaluminum ions (MK0) the relative domain growth in b direction islower compared to samples containing metakaolin This finding agreeswith the results from a similar investigation of tobermorite in AAC(Schreiner et al 2019) However within the samples MK5 andMK9_12h the different amounts of supplied aluminum ions did notshow a clear effect It appeared that low dosages of Al3+ (1 wt- Al2O3
in MK25 and 2 wt- Al2O3 in MK5) were enough to determine thedomain growth of tobermorite Additional results from the samplesMK9_6h and MK9_12h indicated that growth in b direction increasedwith reaction time
In Fig 5 lattice parameters of tobermorite depending on metakaolindosages are plotted B clearly remained unaffected throughout therange of samples Increasing amounts of metakaolin led to a slightlysmaller parameter a However both types of metakaolin showed acorresponding impact on parameter a By contrast parameter c in-creased strongly with increasing amounts of MK and MKg but the typeof metakaolin was significant At an equivalent dosage MK affected thecell dimension in c direction considerably more than MKg so that thefraction of Al3+ appeared to be the decisive parameter Different metaloxides in MKg did not show a notable effect certainly as they werepartially not provided for reaction Unlike for the domain morphologyof tobermorite the impact on lattice parameters could be observedwithin the complete range of examined dosages
4 Conclusions
The results obtained from the introduced investigations allow con-cluding remarks on the effects of the applied types of metakaolin on thesynthesis of 11 Aring tobermorite the phase transitions and the in-corporation of Al3+ into the lattice of tobermorite
With a critical dosage the use of any type of metakaolin led to theformation of katoite in an according amount At moderate dosages(MKg16 MKg23 MK16 and MK23) the two types of metakaolin showeda good correspondence in consideration of the quantities of to-bermorite For higher dosages there were contrary effects Lower do-sages of MK led to considerable quantities of Al-substituted to-bermorite Samples containing low dosages of MK revealed that katoiteappeared in the case ofgt 5 wt- of MK - corresponding to 2 wt-Al2O3 - in the basic compound Minor crystalline phases in MKg showedbetter reactivity than those in MK The observation that no tobermoritewas present in sample MK60 indicated that high dosages of Al3+ hin-dered the formation of tobermorite
Investigations of MK9 at 2 6 and 12 h displayed the evolution ofhydrate phases At first katoite was the only crystalline hydrate phasepresent after 2 h which corresponded to observations in a differentpublication (Klimesch and Ray 1999) The amount of katoite andquartz then decreased and a major amount of tobermorite formed from2 to 6 h curing time In order to gain more information on the trans-formation of amorphous C-(A)-S-H into tobermorite additional ex-periments in the range of 2 to 6 h curing time will be needed
Domain morphology analysis of tobermorite revealed that low
Fig 2 Diffractograms of MKg MKg60 MK and MK60 from 7 to 34deg2θ CuKα Aanatase C calcite F feldspar k kaolinite K katoite M mica Q quartz Ttobermorite U unidentified phase X xonotlite
J Schreiner et al Applied Clay Science 185 (2020) 105432
4
6 Publications
34
dosages of Al3+ determined the domain growth which agreed with theresults published on tobermorite in AAC samples (Schreiner et al2019) Different curing times unveiled that growth in b direction in-creased with the reaction time Al3+ incorporation into the lattice oftobermorite only reflected to a limited extent in the domain mor-phology By contrast an increase of lattice parameter c was triggered byAl3+ even at the highest dosage in this study Ultimately there is no
evidence for a limit of incorporation of Al3+ but there is a limit ofinfluence on the domain morphology These results additionally re-confirm this assumption similarly made in the previous work (Schreineret al 2019) and suggest a new mechanism of tobermorite crystal-lization depending on the presence of Al3+
Supplementary data to this article can be found online at httpsdoiorg101016jclay2019105432
Declaration of Competing Interest
The authors declare that they have no known competing financialinterests or personal relationships that could have appeared to influ-ence the work reported in this paper
Acknowledgement
The authors thank Rodgauer Baustoffwerke GmbH amp Co KG forsupplying raw materials for laboratory experiments
References
Aguilar-Mamani W Garciacutea G Hedlund J Mouzon J 2014 Comparison betweenleached metakaolin and leached diatomaceous earth as raw materials for the synth-esis of ZSM-5 Springerplus 3 1ndash10 httpsdoiorg1011862193-1801-3-292
Ayodele OB Sulaimon AA Alaba PA Tian Z-Y 2019 Influence of metakaolini-zation temperature on the structure and activity of metakaolin supported Ni catalystin dry methane reforming J Environ Chem Eng httpsdoiorg101016jjece2019103239 (in press)
Badawi EA Abdel-Rahman MA Mostafa A Abdel-Rahman M 2019 Determinationof the crystallite size amp micro- strain by novel method from XRD profile Appl Phys2 1ndash15 httpsdoiorg1031058jap201921001
Bailey SW 1969 Refinement of an intermediate microcline structure Am Miner 541540ndash1545
Bartl H 1969 Roentgen-Einkristalluntersuchungen an (CaO)3 (Al2O3) (H2O)6 und an(CaO)12 (Al2O3)7 (H2O) neuer Vorschlag zur (CaO)12 (Al2O3)7-Struktur NeuesJahrb fuer Mineral Monatshefte 1969 404ndash413
Basso R Giusta AD Zefiro L 1983 Crystal structure refinement of plazolite A highlyhydrated natural hydrogrossular Neues Jahrb Miner Monatsh (Neues Jahrb fuerMineral Monatshefte) 1983 251ndash258
Brigatti MF Lugli C Poppi L Foord EE Kile DE 2000 Crystal chemical varia-tions in Li- and Fe-rich micas from Pikes Peak batholith (Central Colorado) AmMineral 85 1275ndash1286 httpsdoiorg102138am-2000-8-920
Busing WR Levy HA 1957 Neutron diffraction study of calcium hydroxide J ChemPhys 26 563 httpsdoiorg10106311743345
Chen L Wang Z Wang Y Feng J 2016 Preparation and properties of alkali acti-vated metakaolin-based geopolymer Materials (Basel) 9 1ndash12 httpsdoiorg103390ma9090767
Chucholowski C Holger M Thienel K-C 2018 Improving the recyclability en-vironmental compatibility and CO2 balance of autoclaved aerated concrete by re-placing sulfate carrier and cement with calcined clays CePapers 2 503ndash512httpsdoiorg101002cepa846
Fig 3 Diffractograms of MK9_2h MK9_6h and MK9_12h from 7 to 38deg2θ CuKα C calcite K katoite Q quartz T tobermorite
Fig 4 Relation of calculated domain sizes of 11 Aring tobermorite in selectedsamples (MK0 MK25 MK5 MK9_6h and MK9_12h) in a (x) and b (y) direction
Fig 5 Lattice parameters of tobermorite depending on MK or MKg dosageincluding blank mix MK0
J Schreiner et al Applied Clay Science 185 (2020) 105432
5
6 Publications
35
Demir İ Başpınar MS Kahraman E Ccedilalışkan E Goumlrhan G 2014 An investigationon the usability of diatomite in aerated concrete production In Proc of the IntlConf on Advances in Civil Structural and Construction Engineering ndash CSCE 2014 pp97ndash100
Ectors D Goetz-Neunhoeffer F Neubauer J 2015 A generalized geometric approachto anisotropic peak broadening due to domain morphology J Appl Crystallogr 48189ndash194 httpsdoiorg101107S1600576714026557
Ectors D Goetz-Neunhoeffer F Neubauer J 2017 Routine (an)isotropic crystallitesize analysis in the double-Voigt approximation done right Powder Diffract 3227ndash34 httpsdoiorg101017S0885715617000070
Galvaacutenkovaacute L Bartoniacutečkovaacute E Opravil T Tkacz J Ptaacuteček P 2018 The influence ofstarting materials solubility on tobermorite structure formation under the hydro-thermal conditions IOP Conf Ser Mater Sci Eng 379 1ndash8 httpsdoiorg1010881757-899X3791012001
Grice JD 2005 The structure of spurrite tilleyite and scawtite and relationships toother silicate-carbonate minerals Can Mineral 43 1489ndash1500 httpsdoiorg102113gscanmin4351489
Hamid SA 1981 The crystal structure of the 11 Aring natural tobermoriteCa225[Si3O75(OH)15]1H2O Zeitschrift fuer Krist 154 189ndash198 httpsdoiorg101524zkri19811543-4189
Hejny C Armbruster T 2001 Polytypism in xonotlite Ca6Si6O17(OH)2 Zeitschrift furKrist 216 396ndash408
Horn M Schwerdtfeger CF Meagher EP 1972 Refinement of the structure of ana-tase at several temperatures Zeitschrift fur Krist 136 273ndash281 httpsdoiorg101524zkri19721363-4273
Jansen D Goetz-Neunhoeffer F Stabler C Neubauer J 2011 A remastered externalstandard method applied to the quantification of early OPC hydration Cem ConcrRes 41 602ndash608 httpsdoiorg101016jcemconres201103004
Jenkins R Snyder R 1996 Introduction to X-ray Powder Diffractometry ChemicalAnalysis Wiley pp 90
Kalousek GL 1956 Crystal Chemistry of Hydrous Calcium Silicates J Am Ceram Soc40 74ndash80
Klimesch D Ray A 1998 Autoclaved cement-quartz pastes with metakaolin additionsAdv Cem Based Mater 7 109ndash118 httpsdoiorg101016S1065-7355(97)00073-4
Klimesch D Ray A 1999 DTA-TGA evaluations of the CaOndashAl2O3ndashSiO2ndashH2O systemtreated hydrothermally Thermochim Acta 334 115ndash122 httpsdoiorg101016s0040-6031(99)00140-9
Komarneni S Roy R Roy DM Fyfe CA Kennedy GJ Bothner-By AA Dadok JChesnick AS 1985 27Al and29Si magic angle spinning nuclear magnetic resonancespectroscopy of Al-substituted tobermorites J Mater Sci 20 4209ndash4214 httpsdoiorg101007BF00552416
Koutnyacute O Opravil T Pořiacutezka J 2014 Application of metakaoline in autoclavedaerated concrete technology Adv Mater Res 1000 174ndash177 httpsdoiorg104028wwwscientificnetAMR1000174
Le Page Y Donnay G 1976 Refinement of the crystal structure of low-quartz ActaCrystallogr Sect B 32 2456ndash2459 httpsdoiorg101107S0567740876007966
Luo H Law WW Wu Y Zhu W Yang EH 2018 Hydrothermal synthesis of needle-like nanocrystalline zeolites from metakaolin and their applications for efficient re-moval of organic pollutants and heavy metals Microporous Mesoporous Mater 2728ndash15 httpsdoiorg101016jmicromeso201806015
Maeda H Ogawa Y Ishida EH Kasuga T 2012 Hydrothermal synthesis of to-bermorite doped with phosphorus species for removing heavy metal ions J AustCeram Soc 48 8ndash11
Maslen EN Streltsov VA Streltsova NR Ishizawa N 1995 Electron density andoptical anisotropy in rhombohedral carbonates III Synchrotron Xray studies ofCaCO3 MgCO3 and MnCO3 Acta Crystallogr Sect B 51 929ndash939 httpsdoiorg101107S0108768195006434
Matekonis G Šiaučiūnas R Vaičiukynienė D 2010 Hydrothermal Synthesis andCharacterization of Na + and [ Al 3 + + Na + ] -substituted Tobermorite in CaO-SiO2middotnH2O-H2O System Mater Sci 16 242ndash248
Matsui K Kikuma J Tsunashima M Ishikawa T Matsuno S Ogawa A Sato M2011 In situ time-resolved X-ray diffraction of tobermorite synthesis process underhydrothermal condition IOP Conf Ser Mater Sci Eng 18 60ndash66 httpsdoiorg1010881757-899X182022017
Merlino S Bonaccorsi E Armbruster T 2000 The real structures of clinotobermoriteand tobermorite 9 Aring OD character polytypes and structural relationships Eur JMineral 12 411ndash429 httpsdoiorg1011270935-122120000012-0411
Monasterio M Gaitero JJ Manzano H Dolado JS Cerveny S 2015 Effect ofchemical environment on the dynamics of water confined in calcium silicate mi-nerals Natural and synthetic tobermorite Langmuir 31 4964ndash4972 httpsdoiorg101021acslangmuir5b00614
Mostafa NY 2005 Influence of air-cooled slag on physicochemical properties of auto-claved aerated concrete Cem Concr Res 35 1349ndash1357 httpsdoiorg101016jcemconres200410011
Mostafa NY Shaltout AA Omar H Abo-El-Enein SA 2009 Hydrothermal synth-esis and characterization of aluminium and sulfate substituted 11 nm tobermoritesJ Alloys Compd 467 332ndash337 httpsdoiorg101016jjallcom200711130
Naber C Stegmeyer S Jansen D Goetz-Neunhoeffer F Neubauer J 2019 ThePONKCS method applied for time resolved XRD quantification of supplementarycementitious material reactivity in hydrating mixtures with ordinary Portland ce-ment Constr Build Mater 214 449ndash457 httpsdoiorg101016jconbuildmat201904157
Qu X Zhao Z Zhao X 2018 Microstructure and characterization of aluminum-in-corporated calcium silicate hydrates (C-S-H) under hydrothermal conditions RSCAdv 8 28198ndash28208 httpsdoiorg101039c8ra04423f
Rashad AM 2013 Metakaolin as cementitious material history scours production andcomposition - a comprehensive overview Constr Build Mater 41 303ndash318 httpsdoiorg101016jconbuildmat201212001
Rietveld HM 1969 A profile refinement method for nuclear and magnetic structures JAppl Crystallogr 2 65ndash71 httpsdoiorg101107S0021889869006558
Riacuteos CA Williams CD Fullen MA 2009 Hydrothermal synthesis of hydrogarnet andtobermorite at 175 degC from kaolinite and metakaolinite in the CaO-Al2O3-SiO2-H2Osystem a comparative study Appl Clay Sci 43 228ndash237 httpsdoiorg101016jclay200809014
Roacuteżycka A Pichoacuter W 2016 Effect of perlite waste addition on the properties of au-toclaved aerated concrete Constr Build Mater 120 65ndash71 httpsdoiorg101016jconbuildmat201605019
Roacutezycka A Kotwica Ł Małolepszy J 2014 Synthesis of single phase gyrolite in theCaO-quartz-Na2O-H2O system Mater Lett 120 166ndash169 httpsdoiorg101016jmatlet201401003
Sauman Z 1974 Influence of SO4 2ndash ions on the formation of 11 Aring tobermorite InProceedings of the 2nd International Symposium on Science and Research in SilicateChemistry Moscow pp 25ndash39
Schmidt M Egersdoumlrfer A Poumlllmann H 2012 Increased reactivity using a glass-containing metakaolin as an active filler in lime-based binder systems ZKG Int 6554ndash62
Schreiner J Jansen D Ectors D Goetz-Neunhoeffer F Neubauer J Volkmann S2018 New analytical possibilities for monitoring the phase development during theproduction of autoclaved aerated concrete Cem Concr Res 107 247ndash252 httpsdoiorg101016jcemconres201802028
Schreiner J Goetz-Neunhoeffer F Neubauer J Volkmann S Bergold S Webler RJansen D 2019 Advanced Rietveld refinement and SEM analysis of tobermorite inchemically diverse autoclaved aerated concrete Powder Diffract 34 143ndash150httpsdoiorg101017s0885715619000149
Setthaya N Chindaprasirt P Pimraksa K 2016 Preparation of zeolite nanocrystals viahydrothermal and solvothermal synthesis using of rice husk ash and metakaolinMater Sci Forum 872 242ndash247 httpsdoiorg104028wwwscientificnetmsf872242
Siauciunas R Baltakys K 2004 Formation of gyrolite during hydrothermal synthesis inthe mixtures of CaO and amorphous SiO2 or quartz Cem Concr Res 34 2029ndash2036httpsdoiorg101016jcemconres200403009
Skawinska A Owsiak Z Baran T Hernik K 2017 The influence of halloysite ad-dition on tobermorite formation in CaO and quartz mix under hydrothermal condi-tions Cem Wapno Bet 17 426ndash434
Venhodovaacute E Janovskyacute R Drochytka R 2015 Formation of tobermorite at differentmaterials composition of aerated concrete Appl Mech Mater 752ndash753 247ndash250httpsdoiorg104028wwwscientificnetamm752-753247
Walczak P Małolepszy J Reben M Szymański P Rzepa K 2015 Utilization ofwaste glass in autoclaved aerated concrete Proc Eng 122 302ndash309 httpsdoiorg101016jproeng201510040
Zhang Y Gao W Cui L 2007 The transformation of acid leached metakaolin tozeolite beta Stud Surf Sci Catal 170 420ndash425 httpsdoiorg101016S0167-2991(07)80870-6
Zvyagin BB 1960 An attempt to electronographic determination of kaolinite structureJ Dokl Akad Nauk SSSR 130 1023ndash1026
J Schreiner et al Applied Clay Science 185 (2020) 105432
6
6 Publications
36
6 Publications
62 Advanced Rietveld refinement and SEM analysis oftobermorite in chemically diverse autoclaved aeratedconcrete
Following the copyright guidelines by Cambridge University Press the publication
Schreiner J Goetz-Neunhoeffer F Neubauer J Volkmann S Bergold S WeblerR Jansen D 2019 Advanced Rietveld refinement and SEM analysis of tobermorite inchemically diverse autoclaved aerated concrete Powder Diffraction 34 143ndash150 httpsdoiorg101017s0885715619000149
may not be reprinted It can be accessed at
httpswwwcambridgeorgcorejournalspowder-diffractionarticleadvanced-rietveld-refinement-and-sem-analysis-of-tobermorite-in-chemically-diverse-autoclaved-aerated-concrete51597C2A66F6F225D29DEB2675E74249
37
6 Publications
63 New analytical possibilities for monitoring the phasedevelopment during the production of autoclavedaerated concrete
Reprint of the peer reviewed publication
Schreiner J Jansen D Ectors D Goetz-Neunhoeffer F Neubauer J VolkmannS 2018 New analytical possibilities for monitoring the phase development during theproduction of autoclaved aerated concrete Cement and Concrete Research 107 247ndash252httpsdoiorg101016jcemconres201802028
with permission from Elsevier
38
Contents lists available at ScienceDirect
Cement and Concrete Research
journal homepage wwwelseviercomlocatecemconres
Short communication
New analytical possibilities for monitoring the phase development duringthe production of autoclaved aerated concrete
J Schreinera D Jansena D Ectorsa F Goetz-Neunhoeffera J Neubauera S Volkmannb
aUniversity of Erlangen-Nuremberg GeoZentrum Nordbayern Mineralogy Schlossgarten 5a 91054 Erlangen Germanyb Rodgauer Baustoffwerke GmbH amp Co KG Am Opel-Pruumlffeld 3 63110 Rodgau-Dudenhofen Germany
A B S T R A C T
This work presents improved analytical methods for both steps of the production process of autoclaved aeratedconcrete (AAC) the phase development during the hydration before autoclaving and during the autoclavingprocess itself The improvement includes new insights into preparation methods of AAC samples for powderdiffraction as well as Rietveld refinement strategies For the first time a new implementation for calculatinganisotropic crystal domain sizes is applied to major hydrate phases occurring during AAC production namelyportlandite during the hydration before autoclaving and tobermorite during the autoclaving process The cal-culation of anisotropic domain size growth which can be implemented in the Rietveld environment is based oncrystallographically and geometrically appropriate models The implementation of calculating anisotropic do-main sizes for the Rietveld software TOPAS 50 allows a superior Rietveld fit and a more accurate quantificationof the phase development Additionally it enables the tracking of growth mechanism of portlandite duringhydration
1 Introduction
Autoclaved aerated concrete (AAC) is known as a lightweight con-struction material which offers outstanding properties such as suffi-cient strength for construction in addition with excellent thermal in-sulation [12] AAC is produced by autoclaving from calcareous rawmaterials such as lime (CaO) and cement quartz sulfate carrier andother additives such as foaming agents and water
The production process (Fig 1) can be separated into the hydrationof the mixed slurry before the procedure of autoclaving and the auto-claving at elevated temperature (180 degC to 200 degC) under saturatedsteam pressure (12MPa) for several hours
The hydration process before autoclaving is necessary to achievesufficient strength in order to cut the green cake blocks as they shouldhave a specific shape and dimension after autoclaving Furthermorethe porous structure is generated by the foaming agent during hydra-tion in the first process step During autoclaving the final propertiesnamely strength and low thermal conductivity are achieved
It is already well understood that the autoclaving process leads tothe formation of several phases first of all tobermorite(Ca5Si6O16(OH)2lowast4H2O) [3ndash5] Newest research has shown im-pressively which reactions are running from the mineralogical point ofview Insitu XRD measurements were carried out during the
autoclaving process and the phase development was shown by plottingnormalized intensities [6] The study of Mitsuda et al [3] was mainlyfocused on the tracking of the phase evolution during the autoclavingprocess of AAC However their statements concerning phase evolutionare mainly based on XRD data and TGA measurements There is acommon agreement that the following reactions occur The consump-tion of the alite (OPC) leads to the formation of an initial C-S-H phaseduring the first processing step Portlandite which was initially formedduring the first process step (from CaO and C3S) further quartz and theC-S-H phase are consumed during autoclaving resulting in the crystal-lization of tobermorite Hence the crystallization process of to-bermorite as well as the crystal structure of tobermorite was an issue ofresearch and discussion over the last years and numerous publicationsto these topics are available Concerning the crystal structure of to-bermorite respectively the tobermorite supergroup a new publicationoutlines all important references and recommends a new nomenclature[7]
The presented study was performed to create new analytical possi-bilities for the characterization of the production process of AAC Bothof the production process steps are essential for the final productHence the present work focuses on crystallization of hydrate phases inboth processes
Firstly an external standard method [89] was published and
httpsdoiorg101016jcemconres201802028Received 6 October 2017 Received in revised form 1 February 2018 Accepted 26 February 2018
Corresponding authorsE-mail addresses juergenjsschreinerfaude (J Schreiner) danieljansenfaude (D Jansen)
Cement and Concrete Research 107 (2018) 247ndash252
0008-8846 copy 2018 Elsevier Ltd All rights reserved
T
6 Publications
39
recommended for the determination of absolute phase contents inmixtures with amorphous content It was shown that the method canabsolutely be recommended for hydrating cement pastes in which watercannot be quantified directly by XRD [10] This method seems to bevery promising for both the quantification of the hydration of the AACslurry before autoclaving and the quantification of the phase evolutionduring autoclaving inasmuch as both production steps form crystallineand amorphous phases
Secondly a new approach to anisotropic peak broadening due toanisotropic domain morphology which was developed [1112] is ap-plied to AAC samples to improve the fit of portlandite and tobermoriteby Rietveld refinement [13] By applying this approach the refinementof both portlandite and tobermorite should additionally lead to betterquantitative results as well as to better insights into the development ofthe domain size morphology of both phases formed
It was already shown that in a hydrating raw mixture for AAC twospecies of portlandite precipitate at 23 degC one showing dynamicallyanisotropic peak broadening and another one following the isotropictrend [14] The application of the anisotropic refinement model led toan improved fitting of portlandite Moreover the mechanism of aniso-tropic domain growth of portlandite was tracked
2 Materials and methods
In order to examine the hydration of the AAC slurry before auto-claving a mixture of the hydraulic reactive components was weighedand measured in-situ at a Bruker D8 diffractometer with a LynxEyedetection system
Ordinary Portland cement (OPC) was mixed with lime (CaO) andanhydrite (C$) The raw materials were taken from the same batches asfor the industrial samples The drymix (58 OPC 36 CaO and 6 C$by weight) was then mixed with water (ws= 08) and placed into anappropriate sample holder The samples were not aerated The slurrysamples were covered with a kapton film to avoid evaporation andcarbonation Diffractograms were recorded with an angular range from7 to 545deg 2θ and a step width of 0011deg 2θ Measurements were carriedout every 15min For each measurement 96 XRD patterns were re-corded over the first 24 h The temperature was fixed at 70 degC which isthe mean temperature generally prevailing in the industrial processduring hydration before autoclaving Rietveld refinement was carriedout using the G-factor method All structures used for Rietveld refine-ment are shown in Table 1
For investigation of the autoclaved samples five different specimenswere taken at different autoclaving times The specimens were takenout of a technical production process hence it was not possible to in-terrupt the process at an earlier time inasmuch it would lead to damageof a whole concrete production batch The specimens were firstly driedat 60 degC until weight constancy The whole blocks were then broken andstatistical samples of 20 g were taken In order to receive the right massattenuation coefficient (MAC) for G-factor method the loss on ignitionand the chemical composition (XRF) were determined For energydispersive XRF analysis (Spectro Xepos) tube voltage from 20 kV to50 kV and tube current from 08 to 20mA were used for differenttargets
The final sample preparation (grinding) before XRD measurementswas carried out using both an agate mortar and a McCrone micronizingmill for wet milling with isopropanol Both preparation methods wereapplied separately to see which one is suitable in order to get the bestpreparation for XRD investigations Six preparations were performed byone operator of which two were prepared with an agate mortar andfour with a McCrone mill For the McCrone milling 3 g of the sampleand 10ml of isopropanol were used for grinding for 12min The grainsize distribution of one sample prepared with an agate mortar and onesample prepared using a McCrone mill was measured by laser granu-lometry in isopropanol using a Mastersizer 3000 (MALVERN)
After milling the samples in these two ways for XRD analysis thepowders were prepared into a front loading sample holder and mea-sured Diffractograms were recorded with an angular range from 6 to80deg 2θ a step width of 00236deg 2θ and a time per step of 054 s Rietveldrefinement combined with external standard (G-factor) was applied inorder to get absolute quantities for each phase The refinement strategyfor portlandite and tobermorite in the TOPAS Launch Mode (TOPAS50 Bruker AXS) is attached as a Supplementary material file
3 Results and discussion
31 Hydration of the mixture before autoclaving
The hydration of the investigated paste before autoclaving isdominated by the hydration of the cement as well as the reaction of thefree lime (CaO) resulting in the formation of portlandite It can beclearly seen from Fig 2 that the hydration of the paste leads to theformation of ettringite portlandite and C-S-H phase For simplificationthe remaining phase developments are not shown in Fig 2 because theyare not in the focus of this study The hydration of CaO forming
Fig 1 Simplified process steps of AAC production and hydrate phase evolution
Table 1Structures used for Rietveld refinement
Phase Author
Alite [15]Anhydrite [16]Bassanite [17]Belite (β) [18]Belite (αprime) [19]Brownmillerite [20]C-S-H [21]Calcite [22]Ettringite [23]Gypsum [24]Hemicarbonate [25]Hydroxylellestadite [26]Lime (CaO) [27]Microcline [28]Portlandite [29]Quartz [30]Tobermorite [31]Tricalciumaluminate (cubic) [32]Tricalciumaluminate (orthorhombic) [33]PONCKS model for Water [21]
J Schreiner et al Cement and Concrete Research 107 (2018) 247ndash252
248
6 Publications
40
portlandite begins rapidly after the addition of water to the mixture andlime is fully consumed after only 1 h of hydration This translates into aquick rise of heat of hydration so that cement hydration is acceleratedwhich leads to further portlandite formation by the reaction of aliteEttringite formation stalls after few hours of hydration After 12 h et-tringite is partially decomposed probably due to sulfate depletion [9]
and poorly crystalline AFm phases (not shown in Fig 2) are formedIn Fig 3 it can be seen that in fact two generations of portlandite
are formed a 1st dominant generation showing anisotropic peakbroadening and 2nd one occurring considerably later following theisotropic domain size refinement which is usually carried out using theRietveld method This occurrence comes along firstly with lime hy-dration and secondly with alite hydration The expected quantity ofportlandite formed from lime hydration very well complies with the
Fig 2 Phase development in AAC paste on a laboratory scale before autoclaving ana-lyzed by in-situ XRD at 70 degC
Fig 3 Formation of two generations of portlandite by hydration of lime (1st) and C3S(2nd) at 70 degC before autoclaving with the major generation showing anisotropic peakbroadening
Fig 4 Biaxial cylinder domain size model of portlandite used for Rietveld refinement of anisotropic peak broadening
Fig 5 Morphological evolution of portlandite showing anisotropic domain size growthduring hydration at 70 degC
Fig 6 Comparison of quantification of crystalline quartz in samples prepared withMcCrone mill and agate mortar at different autoclaving times
J Schreiner et al Cement and Concrete Research 107 (2018) 247ndash252
249
6 Publications
41
quantity of the observed 1st generation The development of portlan-dite growth was already tracked in an equivalent slurry at 23 degC [14]Thus this observation confirms that the crystallinity of portlandite inmixtures for AAC production depends on the starting phase for hydra-tion as already indicated by Ectors [14]
Fig 4 shows the used biaxial cylindrical model for anisotropic do-main size calculation and the portlandite structure which was createdwith structural software VESTA 318 [34] Using the cylindrical ap-proach domain sizes in a (here equating to b) and c direction(dz= cylinder height) can be calculated which comes along with theexpected symmetrical parameters of portlandite
The 1st portlandite generation showing anisotropic domain growthcan be tracked in terms of cylinder diameter and height which is rea-lized in Fig 5 The blue cylinder represents the geometric approach andcylinder height and diameter are calculated newly for each range Thecylinder height remains rather stable throughout the hydration processwhile the cylinder diameter increases during the first hours of hydra-tion After 10 h of hydration the mean cylinder diameter no longer in-creases Consequently these observations match the results of the ex-aminations conducted at 23 degC [14] as well as the assumption thatdifferent mechanisms of growth exist for portlandite depending on the
hydration educt The maximum cylinder diameter is reached earlier inthis work very likely because of the higher hydration temperature
32 Quantification of the reactions during autoclaving
Autoclaved samples were ground with an agate mortar and com-pared to samples which were wet-ground with a McCrone mill Fig 6shows precisely that the determination of the amount of crystallinequartz is more reproducible in the two shown samples which were
Fig 7 2D XRD with Bruker GADDS-system plots of samples prepared with agate mortar and McCrone mill Coarse quartz grains are pointed out in the plot of the sample prepared withagate mortar
Fig 8 Particle size distribution of one sample prepared with an agate mortar and of onesample prepared with a McCrone mill measured by laser granulometry
Fig 9 Rietveld refinement for Tobermorite of autoclaved AAC sample by use of isotropicdomain size model (a) and of anisotropic domain size model (b)
J Schreiner et al Cement and Concrete Research 107 (2018) 247ndash252
250
6 Publications
42
prepared with a McCrone mill The high variance of crystalline quartzin the samples which were prepared with an agate mortar is a result ofinsufficient grinding and remaining of too large quartz grains Whenthis spottiness occurs a reliable quantification using the G-factormethod is not possible
The 2D XRD with Bruker GADDS-system plots in Fig 7 demonstratethe insufficient grinding when using an agate mortar compared to wetmilling with a McCrone mill Quartz would be overrepresented in a one-dimensional XRD pattern focusing on a section with bright spots (greenarrows) The lack of bright spots in the right plot shows that the quartzgrains are milled more thoroughly using a McCrone mill In Fig 8 theparticle size distribution after both ways of sample preparation iscompared Most grains in the sample prepared with an agate mortar arelarger than in the sample prepared with a McCrone mill The grain sizedistribution of the sample prepared with a McCrone mill complies withthe recommended particle size range for XRD analysis of under 5 to50 μm [3536] while the other sample exceeds the range
In Fig 9 Rietveld refinement of an autoclaved sample is shown Thedominant peaks at 77 290 and 301deg 2θ are attributed to tobermoriteIn the upper diagram (a) Rietveld refinement was carried out regularlycalculating isotropic domain sizes for tobermorite However the cal-culated fit differs significantly from the raw data It can be assumed thattobermorite shows a similar pattern to portlandite in terms of aniso-tropic peak broadening taking into account that tobermorite is as-signed to the orthorhombic crystal system Thus instead of a biaxialcylinder model an elliptic cylinder model (Fig 10 structure createdwith VESTA 318 [34]) was applied for the refinement in the lowerdiagram (b) The elliptic cylinder model is a sufficient approach to the
orthorhombic crystal system as it allows the distinction between do-main sizes in a b and c direction The fit is clearly superior using theanisotropic domain size model highlighted by the difference plot inFig 9b The comparison refinement with isotropic and anisotropic ap-proach was done for all of the five autoclaved samples In Fig 11 theresulting Rwp values for the whole pattern and the RBragg values of to-bermorite are shown The refinement using the anisotropic model leadsto both lower Rwp and RBragg values and consequently to a better fit anda more accurate quantification of tobermorite in all refined samples
4 Summary and conclusions
Improved analytical methods for both the phase developmentduring the hydration before autoclaving and during the autoclavingprocess of AAC are presented It could be shown that wet McCronemilling is the best way of preparation of AAC samples in order to obtainsuitable samples for powder diffraction A new approach to treat ani-sotropic domain sizes for Rietveld refinement could be successfullyapplied ndash with the benefit that portlandite and tobermorite in AACsamples could be refined more accurately using the Rietveld methodThus this application allows an improved quantification of the phasedevelopment during both of the production steps
For the future there are still plenty of possibilities to apply thepresented approach of calculating anisotropic domain sizes to AACproduction As exemplified with portlandite the mechanisms of growthof tobermorite can be tracked likewise during the autoclaving processIn addition the effect of variations in the chemical composition of AACraw mixtures on the crystal morphology of tobermorite can be ex-amined This leaves a new perspective to discuss the link between mi-neral phase morphology and the thermal and mechanical properties ofAAC
Acknowledgement
The autoclaved samples were generously provided by RodgauerBaustoffwerke GmbH amp Co KG The authors express gratitude for allsupport
Appendix A Supplementary data
Supplementary data to this article can be found online at httpsdoiorg101016jcemconres201802028
References
[1] MW Grutzeck Cellular concrete in M Scheffler P Colombo (Eds) CellularCeramics Wiley-VCH Weinheim 2005 pp 193ndash223
[2] M Haas The future of AAC ndash from a material scientists point of view inMC Limbachiya JJ Roberts (Eds) Autoclaved Aerated Concrete Taylor FrLondon 2005 pp 187ndash194
[3] T Mitsuda K Sasaki H Ishida Phase evolution during autoclaving process ofaerated concrete J Am Ceram Soc 75 (1992) 1858ndash1863
[4] N Isu H Ishida T Mitsuda Influence of quartz particle size on the chemical and
Fig 10 Triaxial cylinder domain size model of Tobermorite used for Rietveld refinement of anisotropic peak broadening
Fig 11 Comparison of Rwp and RBragg values of Rietveld refinements of autoclavedsamples and tobermorite using the isotropic and the anisotropic domain size model
J Schreiner et al Cement and Concrete Research 107 (2018) 247ndash252
251
6 Publications
43
mechanical properties of autoclaved aerated concrete (I) tobermorite formationCem Concr Res 25 (1995) 243ndash248
[5] NY Mostafa Influence of air-cooled slag on physicochemical properties of auto-claved aerated concrete Cem Concr Res 35 (2005) 1349ndash1357 httpdxdoiorg101016jcemconres200410011
[6] K Matsui J Kikuma M Tsunashima T Ishikawa S Matsuno A Ogawa M SatoIn situ time-resolved X-ray diffraction of tobermorite formation in autoclaved aer-ated concrete influence of silica source reactivity and Al addition Cem Concr Res41 (2011) 510ndash519
[7] C Biagioni S Merlino E Bonaccorsi The tobermorite supergroup a new no-menclature Mineral Mag 79 (2015) 485ndash495 httpdxdoiorg101180minmag2015079222
[8] BH OConnor MD Raven Application of the Rietveld refinement procedure inassaying powdered mixtures Powder Diffract 3 (1988) 2ndash6 httpdxdoiorg101017S0885715600013026
[9] D Jansen F Goetz-Neunhoeffer C Stabler J Neubauer A remastered externalstandard method applied to the quantification of early OPC hydration Cem ConcrRes 41 (2011) 602ndash608 httpdxdoiorg101016jcemconres201103004
[10] D Jansen C Stabler F Goetz-Neunhoeffer S Dittrich J Neubauer Does OrdinaryPortland Cement contain amorphous phase A quantitative study using an externalstandard method Powder Diffract 26 (2011) 31ndash38 httpdxdoiorg10115413549186
[11] D Ectors F Goetz-Neunhoeffer J Neubauer A generalized geometric approach toanisotropic peak broadening due to domain morphology J Appl Crystallogr 48(2015) 189ndash194 httpdxdoiorg101107S1600576714026557
[12] D Ectors F Goetz-Neunhoeffer J Neubauer Routine (an)isotropic crystallite sizeanalysis in the double-Voigt approximation done right Powder Diffract 32 (S1)(2017) 27ndash34 httpdxdoiorg101017S0885715617000070
[13] HM Rietveld A profile refinement method for nuclear and magnetic structures JAppl Crystallogr 2 (1969) 65ndash71 httpdxdoiorg101107S0021889869006558
[14] D Ectors Advances in the Analysis of Cementitious Reactions and Hydrate Phases(Doctoral Thesis) (2016) pp 12ndash14 (urnnbndebvb29-opus4-71743)
[15] AacuteG De La Torre S Bruque J Campo MAG Aranda The superstructure of C3Sfrom synchrotron and neutron powder diffraction and its role in quantitative phaseanalyses Cem Concr Res 32 (2002) 1347ndash1356 httpdxdoiorg101016S0008-8846(02)00796-2
[16] A Kirfel G Will Charge density in anhydrite CaSO4 from X-ray and neutrondiffraction measurements Acta Crystallogr Sect B Struct Crystallogr CrystChem 36 (1980) 2881ndash2890 httpdxdoiorg101107S0567740880010461
[17] C Bezou AN Christensen D Cox M Lehman A Nonat Structures cristallines deCaSO405H2O et CaSO406H2O Comptes Rendus Hebd Des Seacuteances lAcadeacutemieDes Sci Seacuterie 2 (312) (1991) 43ndash48
[18] KH Jost B Ziemer R Seydel Redetermination of the structure of β-dicalciumsilicate Acta Crystallogr Sect B Struct Crystallogr Cryst Chem 33 (1977)1696ndash1700 httpdxdoiorg101107S0567740877006918
[19] W Mumme LMD Cranswick BC Chakoumakos Rietveld crystal structure re-finements from high temperature neutron powder diffraction data for the poly-morphs of dicalcium silicate Neues Jahrb Fuer Mineral Abhandlungen 170 (1996)171ndash188
[20] A Colville S Geller The crystal structure of brownmillerite Ca2FeAlO5Crystallographica 50 (1971) 2311ndash2315 httpdxdoiorg101107S056774087100579X
[21] ST Bergold F Goetz-Neunhoeffer J Neubauer Quantitative analysis of C-S-H inhydrating alite pastes by in-situ XRD Cem Concr Res 53 (2013) 119ndash126 httpdxdoiorg101016jcemconres201306001
[22] EN Maslen VA Streltsov NR Streltsova N Ishizawa Electron density and op-tical anisotropy in rhombohedral carbonates III Synchrotron Xray studies ofCaCO3 MgCO3 and MnCO3 Acta Crystallogr Sect B 51 (1995) 929ndash939 httpdxdoiorg101107S0108768195006434
[23] G Renaudin Y Filinchuk J Neubauer F Goetz-Neunhoeffer A comparativestructural study of wet and dried ettringite Cem Concr Res 40 (2010) 370ndash375httpdxdoiorg101016jcemconres200911002
[24] WF Cole CJ Lancucki A refinement of the crystal structure of gypsumCaSO42H2O Acta Cryst B30 (1974) 921ndash929 httpdxdoiorg101107S0567740874004055
[25] T Runčevski RE Dinnebier OV Magdysyuk H Poumlllmann Crystal structures ofcalcium hemicarboaluminate and carbonated calcium hemicarboaluminate fromsynchrotron powder diffraction data Acta Crystallogr Sect B Struct Sci 68 (2012)493ndash500 httpdxdoiorg101107S010876811203042X
[26] JM Hughes JW Drexler Cation substitution in the apatite tetrahedral site crystalstructures of type hydroxylellestadite and type fermorite Neues Jahrb FuerMineral (1991) 327ndash336
[27] CH Shen RS Liu JG Lin CY Huang Phase stability study of La12Ca18Mn2O7Mater Res Bull 36 (2001) 1139ndash1148
[28] SW Bailey Refinement of an intermediate microcline structure Am Miner 54(1969) 1540ndash1545
[29] WR Busing HA Levy Neutron diffraction study of calcium hydroxide J ChemPhys 26 (1957) 563 httpdxdoiorg10106311743345
[30] Y Le Page G Donnay Refinement of the crystal structure of low-quartz ActaCrystallogr Sect B 32 (1976) 2456ndash2459 httpdxdoiorg101107S0567740876007966
[31] SA Hamid The crystal structure of the 11 Aring natural tobermoriteCa225[Si3O75(OH)15]1H2O Zeitschrift Fuer Krist - New Cryst Struct 154 (1981)189ndash198 httpdxdoiorg101524zkri19811543-4189
[32] P Mondal JW Jeffery The crystal structure of tricalcium aluminate Ca3Al2O6Acta Crystallogr B 31 (1975) 689ndash697 httpdxdoiorg101107S0567740875003639
[33] Y Takeuchi F Nishi I Maki Crystal-chemical characterization of the tricalciumaluminate-sodium oxide (3CaOtimesAl2O3-Na2O) solid-solution series Zeitschrift FuumlrKrist (1980) 259ndash307
[34] K Momma F Izumi VESTA 3 for three-dimensional visualization of crystal vo-lumetric and morphology data J Appl Crystallogr 44 (2011) 1272ndash1276 httpdxdoiorg101107S0021889811038970
[35] K Scrivener R Snellings B Lothenbach A Practical Guide to MicrostructuralAnalysis of Cementitious Materials CRC Press 2016 pp 123ndash125 httpdxdoiorg107693wl20150205
[36] V Pecharsky P Zavalij Fundamentals of Powder Diffraction and StructuralCharacterization of Materials Springer second edition 2005 p 302 httpdxdoiorg101007978-0-387-09579-0
J Schreiner et al Cement and Concrete Research 107 (2018) 247ndash252
252
6 Publications
44
7 Acknowledgement
7 Acknowledgement
Ich moumlchte mich bei einigen Personen bedanken ohne die es wohl kaum zum erfolgreichenAbschluss dieser Arbeit gekommen waumlreMein Doktorvater Prof Dr Juumlrgen Neubauer hat sich stets die Zeit genommen die noumltigwar um Angelegenheiten aller Art mit mir zu klaumlren Er gab mir fachlich immer zumrichtigen Zeitpunkt einen gewissen wissenschaftlichen Impuls Zugleich habe ich mich den-noch immer frei in meiner eigenen Konzeption gefuumlhlt Groszligen Dank spreche ich Prof DrFriedlinde Goumltz-Neunhoeffer aus die fuumlr mich ebenso immer eine verlaumlssliche Ansprech-partnerin fuumlr fachliche und organisatorische Angelegenheiten aller Art war Danke anDr Daniel Jansen fuumlr die gute Zusammenarbeit und dafuumlr dass er mich im Zuge meinerMasterarbeit in ein Forschungsprojekt aufgenommen hat das den Weg zur Promotionmoumlglich machte Zusaumltzlich gilt mein Dank Prof Dr Matthias Goumlbbels der fuumlr dieMitarbeiter am Lehrstuhl immer motivierende Worte fand Fuumlr die Ermoumlglichung meinerTeilnahme an diversen Dienstreisen Fortbildungen und Tagungen moumlchte ich mich viel-mals bedankenWeiterhin bedanke ich mich bei Dr Stephan Volkmann und den Rodgauer BaustoffwerkenGmbH amp Co KG fuumlr die gute Zusammenarbeit und die Bereitstellung von Versuchsma-terialienVielen Dank an meine studentischen Hilfskraumlfte Daniel Wagner Laura MoldenhauerFabian Lang Jakob Schreiber und Felix Klaassen die alle Aufgaben im Labor einwand-frei und mit Bedacht erledigten Bei meinen aktuellen und ehemaligen Kollegen DrKatrin Hurle Dr Dominique Ectors Dr Christoph Naber Dr Florian Huumlller JoumlrgNehring Frank Riedel Julian Wolf Tanja Manninger Daniel Wagner Nicolas FobbeKarla Spaumlth Julian Goergens Andreas Koumlhler Cordula Jakob Franz Becker und LisaKlemenz bedanke ich mich fuumlr die gelungene Zusammenarbeit und gegenseitige Unter-stuumltzung Besonderer Dank geht auch an Kerstin Kreszlig Bettina Engl Christian HankeBernd Schleifer und Christian Abe fuumlr die verlaumlssliche Unterstuumltzung bei technischen Fra-gen und Messungen im LaborFuumlr jegliche Unterstuumltzungen moumlchte ich mich auch bei meinen Eltern bedanken sowiebei meinem Bruder Ralf der mir mit einem LaTex Crashkurs viel Frustration ersparthat Danke Thomas dass du immer fuumlr mich da bist und mit mir zusammen fuumlr genugAusgleich gesorgt hast
45
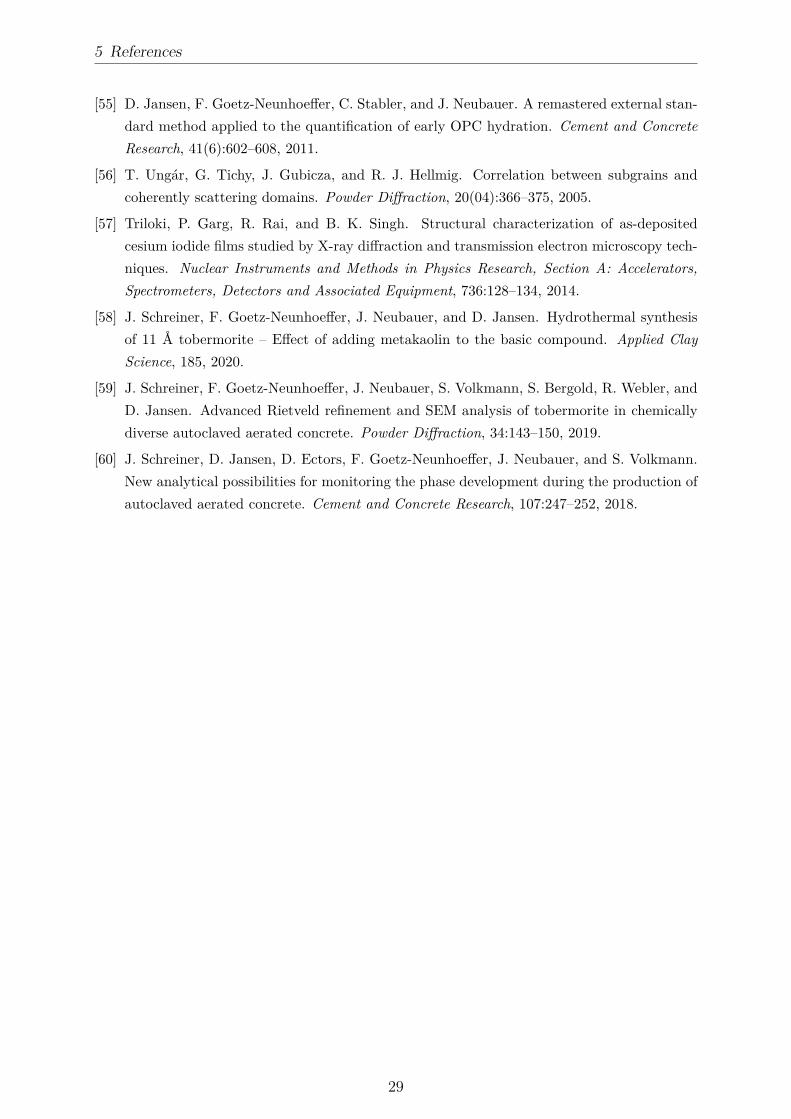
5 References
[55] D Jansen F Goetz-Neunhoeffer C Stabler and J Neubauer A remastered external stan-dard method applied to the quantification of early OPC hydration Cement and ConcreteResearch 41(6)602ndash608 2011
[56] T Ungaacuter G Tichy J Gubicza and R J Hellmig Correlation between subgrains andcoherently scattering domains Powder Diffraction 20(04)366ndash375 2005
[57] Triloki P Garg R Rai and B K Singh Structural characterization of as-depositedcesium iodide films studied by X-ray diffraction and transmission electron microscopy tech-niques Nuclear Instruments and Methods in Physics Research Section A AcceleratorsSpectrometers Detectors and Associated Equipment 736128ndash134 2014
[58] J Schreiner F Goetz-Neunhoeffer J Neubauer and D Jansen Hydrothermal synthesisof 11 Aring tobermorite ndash Effect of adding metakaolin to the basic compound Applied ClayScience 185 2020
[59] J Schreiner F Goetz-Neunhoeffer J Neubauer S Volkmann S Bergold R Webler andD Jansen Advanced Rietveld refinement and SEM analysis of tobermorite in chemicallydiverse autoclaved aerated concrete Powder Diffraction 34143ndash150 2019
[60] J Schreiner D Jansen D Ectors F Goetz-Neunhoeffer J Neubauer and S VolkmannNew analytical possibilities for monitoring the phase development during the production ofautoclaved aerated concrete Cement and Concrete Research 107247ndash252 2018
29
6 Publications
6 Publications
61 Hydrothermal synthesis of 11 Aring tobermorite ndash Effectof adding metakaolin to the basic compound
Reprint of the peer reviewed publication
Schreiner J Goetz-Neunhoeffer F Neubauer J Jansen D 2020 Hydrothermalsynthesis of 11 Aring tobermorite ndash Effect of adding metakaolin to the basic compoundApplied Clay Science 185 httpsdoiorg101016jclay2019105432
with permission from Elsevier
30
Contents lists available at ScienceDirect
Applied Clay Science
journal homepage wwwelseviercomlocateclay
Research paper
Hydrothermal synthesis of 11 Aring tobermorite ndash Effect of adding metakaolin tothe basic compound
J Schreiner F Goetz-Neunhoeffer J Neubauer D JansenUniversity of Erlangen-Nuremberg GeoZentrum Nordbayern Mineralogy Schlossgarten 5a 91054 Erlangen Germany
A R T I C L E I N F O
KeywordsHydrothermal synthesis11 Aring tobermoriteMetakaolinPowder diffractionKatoite
A B S T R A C T
Different amounts and types of metakaolin were analyzed and applied for the hydrothermal synthesis of 11 Aringtobermorite All synthesized samples were investigated by means of powder XRD combined with Rietveld re-finement Al-substituted 11 Aring tobermorite was successfully synthesized on the basis of a broad range of com-pounds characterized by a varying content of metakaolin Katoite was present depending on the amount ofsupplied Al3+ which was determined by the dosage of metakaolin Minor crystalline components included in thetwo types of metakaolin sources varied greatly in their reactivity under hydrothermal conditions Despite adifferent degree of purity the two types of metakaolin showed corresponding effects at moderate dosages butcontrary effects at higher dosages as for the synthesis of 11 Aring tobermorite The domain morphology of to-bermorite could be associated with Al3+ incorporation for low dosages of metakaolin represented by up to 2 wt- Al2O3 in the dry mix By contrast Al3+ affected tobermorite lattice parameters at equivalent and even athigher dosages with c reaching 2295 Aring at 12 wt- Al2O3 in the dry mix
1 Introduction
11 Application of metakaolin as a reactive material in constructionindustry
The application of supplementary cementitious materials (SCMs) inthe field of construction technology has received a lot of attention inrecent years Due to limited resources and an urgent need for alter-native and more eco-friendly construction materials SCMs such asmetakaolin offer a great potential The usage of SCMs has not onlyspread to the cement and mortar industry but also to advanced appli-cations such as autoclaved aerated concrete (AAC) (Demir et al 2014Koutnyacute et al 2014 Walczak et al 2015 Roacuteżycka and Pichoacuter 2016Chucholowski et al 2018) Unlike ordinary cementitious constructionmaterials AAC is produced from hydrothermal curing Due to the dif-ferent thermodynamic environment the hydration process and the re-activity of raw materials have to be investigated properly in order tounderstand the effects on the AAC product The leading mineral phasein AAC is 11 Aring tobermorite (Ca5Si6O16(OH)2middot4H2O) As a consequencethe thermal and mechanical properties of AAC depend on micro-structure and crystallinity of tobermorite to some extent In addition tothe curing time and the fineness of raw materials the supply of ionsthat can substitute in the tobermorite structure is a crucial factor in thiscontext Especially substitutions by aluminum sodium and potassium
ions have been investigated thoroughly (Sauman 1974 Klimesch andRay 1998 Mostafa et al 2009 Matekonis et al 2010 Skawinskaet al 2017) Calcined clays usually contain a considerable amount ofthe mentioned ions
There is a vast amount of literature on the reactivity of SCMs atambient temperature and standard pressure but there is little when itcomes to hydrothermal conditions In previous publications the beha-vior of metakaolin under hydrothermal conditions was mainly in-vestigated for the synthesis of zeolites (Zhang et al 2007 Aguilar-Mamani et al 2014 Setthaya et al 2016 Luo et al 2018) In thesestudies the reactivity of metakaolin was observed at a wide range oftemperature and pH values During the transformation of kaolin intometakaolin a loss of framework alumina was observed (Ayodele et al2019) In recent decades metakaolin has been the subject of studies inthe field of geopolymer research (Rashad 2013 Chen et al 2016) Forthe synthesis of 11 Aring tobermorite a more distinct setting of temperaturesetting (180ndash200 degC) and steam pressure (1ndash12 MPa) are required
This publication is intended to make a new contribution to thechallenging field of hydrothermal synthesis in the system CaO-Al2O3-SiO2-H2O based on XRD analysis combined with Rietveld refinementVarious dosages of two types of metakaolin with different chemical andmineralogical purities are compared for the effects on the hydrothermalsynthesis of Al-substituted 11 Aring tobermorite Especially changes of thebulk chemistry in the raw mixes the reactivity of minor crystalline
httpsdoiorg101016jclay2019105432Received 20 August 2019 Received in revised form 13 November 2019 Accepted 30 December 2019
Corresponding authorE-mail address juergenjsschreinerfaude (J Schreiner)
Applied Clay Science 185 (2020) 105432
0169-1317 copy 2020 Elsevier BV All rights reserved
T
6 Publications
31
phases of the two types of metakaolin and the effect of different curingtimes are the focus of interest On the one hand metakaolin offers agreat potential in the AAC industry On the other hand of all SCMsmetakaolin is a good source material for investigating the influence ofAl3+ on the synthesis of Al-substituted 11 Aring tobermorite
12 Synthesis of Al-substituted 11 Aring tobermorite
In addition to being present in AAC tobermorite has found appli-cation in wastewater treatment and nuclear waste management due toits ion exchange capacity (Maeda et al 2012 Monasterio et al 2015)The substitution of silicon by aluminum results in a different to-bermorite structure due to general and local charge balance affectingthe lattice parameters Especially c is impacted by this substitutionbecause it occurs in the bridging tetrahedron and additional OHndash sub-stitutes O2ndash (Komarneni et al 1985 Merlino et al 2000) As suggestedin some additional studies the substitution of Si4+ by Al3+ and Na+ orK+ leads to a lath-like morphology of tobermorite crystals (Mostafa2005 Mostafa et al 2009 Venhodovaacute et al 2015 Qu et al 2018)However because of the heterogeneous appearance of tobermorite inAAC it is hardly possible to conduct a proper characterization based onSEM analysis In our recent work the anisotropic peak broadening oftobermorite in XRD diffractograms was successfully linked with theincorporation of foreign ions supplied in a common AAC production(Schreiner et al 2019) This finding allowed a more statistical struc-tural characterization of tobermorite in bulk compositions compared toSEM analysis Moreover it was reported in other studies that differenthydrate phases occur depending on the amount of supplied ions and onthe experimental settings In compounds with a high content of Al3+formation of katoite could be observed (Klimesch and Ray 1998 Riacuteoset al 2009 Matsui et al 2011) In the case of a longer curing durationinstead of 11 Aring tobermorite the formation of xonotlite (Siauciunas andBaltakys 2004 Galvaacutenkovaacute et al 2018) or - depending on the finenessof used silica source (Siauciunas and Baltakys 2004) - gyrolite is fa-voured
Kalousek (1956) suggested that tobermorite can contain up to 5Al2O3 More Al2O3 in the system resulted in the formation of hydro-garnet Klimesch and Ray (1998) additionally investigated the stabilityof hydrogarnet depending on the Al(Si + Al) ratio and its role in re-lation to the formation of 11 Aring tobermorite in an equivalent systemThey suggest that hydrogarnet always appears before tobermorite butthe former can only be detected for higher Al(Si + Al) ratios in theevent of longer curing times Riacuteos et al (2009) and Qu et al (2018)confirmed these findings in extensive investigations In the latter pub-lication it is additionally suggested that samples prepared at lowertemperatures (160 degC) are less impacted by the supply of Al3+ Theyalso consider the peak broadening of tobermorite in their XRD plotsbased on the amount of incorporated Al3+ In two recent publicationswe suggested that the peak broadening of tobermorite enables a mi-crostructural analysis by calculating the orientation dependent domainsizes (Schreiner et al 2018 2019) However these studies are based onsamples of industrially produced AAC so that the curing time was fixedThe studied AAC was produced from raw materials with a broad che-mical spectrum such as ordinary Portland cement (OPC) whichsomehow complicates the interpretation of results
In this work the influence of aluminum ions - provided by meta-kaolin - on dominant crystallographic direction-dependent domaingrowth of tobermorite is investigated by analysis of anisotropic peakbroadening (Ectors et al 2015 2017) In Fig 1 of the supplementarymaterial the method of fitting the anisotropic peak broadening of to-bermorite using a triaxial cylinder model is visualized (Schreiner et al2018) Fitting of the anisotropic peak broadening of tobermorite Thismethod is used to calculate the average and reliable values for to-bermorite domain sizes in the powder sample and associate them withaverage Al3+ incorporation Microstrain should be considered becauseit is an additional source of peak broadening However this usually
accounts for materials that have been exposed to different kinds ofstress such as metals and alloys (Badawi et al 2019) In addition theinstrumental contribution to peak broadening should be consideredHydration products such as tobermorite are characterized by crystallitesizes in the range of nanometers so that anisotropic size broadeningclearly outweighs the effect of instrumental broadening (Jenkins andSnyder 1996) Moreover the impact of Al3+ on the lattice parametersof tobermorite is considered It should additionally be clarified whe-ther the results from our previous publication (Schreiner et al 2019)based on industrially produced AAC can be confirmed by investigationwith less complex raw mixes and purely based on laboratory experi-ments
2 Material and methods
21 Starting materials
The starting materials for hydrothermal synthesis included deio-nized water quartz flour portlandite (999 pure) and two types ofmetakaolin One type was ordinary commercially available metakaolin(MK) with nearly a stoichiometric composition For comparison thesecond type of commercially available metakaolin was a by-productfrom expanded glass production (MKg) and consequently highly im-pure The chemical composition of MK and MKg determined by XRF isgiven in Table 1 With MKg containing less Al2O3 but considerably moreNa2O than MK the effects on hydrothermal synthesis were of interestBoth types of metakaolin have been characterized in previous pub-lications (Schmidt et al 2012 Naber et al 2019) In addition weverified the mineral phase content by XRD analysis Besides amorphousmetakaolin MK contained minor amounts of anatase quartz and mica
Fig 1 Weight fractions of tobermorite quartz and katoite determined byquantitative XRD analysis ndash samples including MKg crosshatched
Table 1Chemical composition of MK and MKg determined by XRF analysis ndash majorcontrasts in bold letters
Oxides [wt-] MK MKg
SiO2 536 604Al2O3 392 206CaO 01 40MgO 01 12Na2O 0 96K2O 10 18Fe2O3 18 05TiO2 21 03P2O5 01 02Loss on ignition 15 1
J Schreiner et al Applied Clay Science 185 (2020) 105432
2
6 Publications
32
MKg contained additional kaolinite feldspar and quartz
22 Investigated mix composites
For the preparation of raw mixtures the powders were weighed andhomogenized using a lab-scale mixing mill Table 2 lists the composi-tion and nomenclature of all samples including Al2O3 content andcuring time in the autoclave
bull Besides one blank mixture (MK0) that did not contain any type ofmetakaolin eleven more compounds were prepared of which threeincluded different dosages of MKg (MKg16 MKg23 and MKg60)Three more mixes contained equivalent amounts of MK instead ofMKg (MK16 MK23 and MK60) These mixes were investigated inorder to have a direct comparison concerning the effects of differentraw material on the synthesis of tobermorite
bull Additionally the mixes MK9 MK5 and MK25 with lower dosages ofmetakaolin were analyzed In the referenced literature (Schreineret al 2019) the effect of Al3+ on the anisotropic peak broadeningof tobermorite could only be observed in the case of Al2O3 contentslower than 4 in the drymix In the latter three mixes Al2O3 con-tents range from 1 to 35 Al2O3 (calculated from XRF data) whichmeets the region of interest for the analysis of tobermorite domainmorphology
bull The curing time for nearly all of the investigated samples was 12 hbut compound MK9 was prepared two more times for curing timesof 2 h and 6 h The different curing times were chosen in this par-ticular sample so that the reactivity of metakaolin and the phasetransitions could be observed more precisely
23 Hydrothermal treatment
Due to the different fineness of raw materials there was a differentwater demand from one mixture to another In order to obtain slurriesof comparable rheology the amount of water was adapted respectivelyresulting in water-to-solid ratios of 25 to 3 which matches the sug-gested water-to-solid ratio for this purpose (Roacutezycka et al 2014Galvaacutenkovaacute et al 2018) The weighed water was added to the dry mixand after stirring for 1 min at 23 degC the slurry was poured into thereactor Minor changes in the quantity of added water did not have aninfluence on the measured steam pressure All experiments were con-ducted using a PTFE-lined stainless steel autoclave with a reactor vo-lume of 300 ml The oven temperature was fixed at 180 degC and auto-genous steam pressure of 11ndash12 MPa was measured during eachexperiment with an external manometer After cooling to room tem-perature the sample was removed from the reactor coarsely ground
using an agate mortar and dried at 60 degC for 12 h After drying thesample was ground with an agate mortar again in order to deagglo-merate the particles As no coarse raw materials were used there wasno need for wet McCrone milling (Schreiner et al 2018)
24 XRD analysis
After preparation into front-loading sample holders the powdersamples were measured with a D8 diffractometer (Bruker) equippedwith a LynxEye detection system and Bragg-Brentano geometry Thesettings for XRD analysis included a tube voltage of 40 kV a current of40 mA an angular range from 6 to 80deg 2θ (Cu Kα radiation) a time perstep of 054 s a step width of 00236deg 2θ and a PSD opening of 33deg Thebackground was fitted with Chebyshev polynomial of the fifth orderThe major contribution of amorphous phase was fitted with a singlepeak with a fixed position at 308deg 2θ so that tobermorite reflectionswere not affected An external quartzite standard was measured withthe same parameters in order to determine phase quantities (Jansenet al 2011) Bruker AXS software TOPAS 50 was used for Rietveldrefinement (Rietveld 1969) and the used structures are shown inTable 3
3 Results and discussion
31 Different dosages of MK and MKg
In Fig 1 the quantities of tobermorite quartz and katoite present inmost of the samples determined by XRD analysis are illustratedWhenever tobermorite was the leading mineral hydrate phase a basalspacing of 113 Aring could be verified in each of the diffractograms Thequantities of minor crystalline phases and amorphous content are notshown For low dosages of MK it can be seen that the weight fraction oftobermorite decreased At moderate dosage of both types of metakaolin(MK16 MK23 MKg16 MKg23) tobermorite was present in comparablequantities It can be seen that the amount of katoite in the mixes de-pended on the dosage of metakaolin and it appeared only at dosages ofMK5 or more Due to the higher content of aluminum in MK comparedto MKg more katoite could always be observed in the MK mixes atequivalent dosages Despite equal amounts of quartz as starting mate-rial in mixes for both types of metakaolin the resulting weight fractionsin the cured samples were not alike Considerably more quartz waspresent in the MK samples Even though less quartz was used for mixescontaining higher amounts of MK even more quartz was present afterhydrothermal curing (Table 2 Fig 1) Consequently some of the SiO2
provided by MK did not transform into an amorphous phase or to-bermorite but into quartz This finding is verified by the presence ofquartz in MK60 because no quartz was included in the raw mixture Thefeldspar present in MKg did not react so Na2O and an unknown amountof Al2O3 may not have been supplied for hydrothermal reaction Besidestobermorite and quartz additional calcite scawtite (Ca7Si6(CO3)
Table 2Basic powder compounds prepared for the hydrothermal synthesis of to-bermorite with the respectively calculated Al2O3 content and curing time in thereactor
Sample Portlandite[wt-]
Quartz[wt-]
MK[wt-]
MKg
[wt-]
Al2O3
[wt-]Curingtime [h]
MK0 49 51 ndash ndash 0 12MK25 495 48 25 ndash 1 12MK5 49 46 5 ndash 2 12MK9_2h 48 43 9 ndash 35 2MK9_6h 48 43 9 ndash 35 6MK9_12h 48 43 9 ndash 35 12MK16 47 37 16 ndash 63 12MK23 46 31 23 ndash 9 12MK60 40 ndash 60 ndash 235 12MKg16 47 37 ndash 16 33 12MKg23 46 31 ndash 23 47 12MKg60 40 ndash ndash 60 124 12
Table 3Structural data used for the investigation with powder XRD analysis
Phase Author
Anatase (Horn et al 1972)Biotite (Brigatti et al 2000)Calcite (Maslen et al 1995)Kaolinite (Zvyagin 1960)Katoite (Bartl 1969)Microcline (Bailey 1969)Plazolite (Basso et al 1983)Portlandite (Busing and Levy 1957)Quartz (Le Page and Donnay 1976)Scawtite (Grice 2005)Tobermorite (Hamid 1981)Xonotlite (Hejny and Armbruster 2001)
J Schreiner et al Applied Clay Science 185 (2020) 105432
3
6 Publications
33
O18bull2(H2O)) and xonotlite (Ca6Si6O17(OH)2) could be identified insample MK0 (XRD plots of samples MK0 MKg16 MKg23 MK16 andMK23) Comparing MK0 and MK25 scawtite and xonotlite could stillbe identified in a very low amount in MK25 but no longer in samplesthat contained even more MK (XRD plots of samples MK0 MK25 MK5and MK9_12h)
Two additional experiments were done without quartz in the rawmixes (MK60 and MKg60) The according diffractograms after hydro-thermal curing are shown in Fig 2 In sample MKg60 tobermorite (gt 50wt-) was successfully synthesized without any other silica sourcethan MKg whereas no crystalline quartz occurred By contrast no to-bermorite but quartz could be identified in equivalent mixture MK60containing MK It can be seen that crystalline components such as micaand anatase in the raw MK did not react at the selected conditions andremained present in the autoclaved samples Except for feldspar in MKgall of the crystalline components appeared to be reactive at the chosenhydrothermal conditions A minor unidentified phase occurred at328deg2θ and additional xonotlite was identified in sample MKg60 Insample MK60 more calcium was needed for the formation of morehydrogarnet (Fig 1) resulting in a lower CaSi ratio for the remainingsystem Sample MKg60 contained only half of the amount of Al3+ and itwas not completely supplied for reaction due to its partial presence infeldspar Consequently essentially less hydrogarnet (Fig 1) was presentin MKg60 after hydrothermal treatment and the CaSi ratio in the re-maining system was affected to a lesser extent
32 Application of MK for different curing times
The development of hydrate phases in the autoclave for compoundMK9 is displayed in Fig 3 After only 2 h of hydrothermal curing all ofthe available portlandite had reacted and katoite (95 wt-) was pre-sent The applied type of metakaolin appeared to react quickly as itsupplied aluminum for formation of katoite No formation of to-bermorite could be observed at this stage yet An assumably amorphousprecursor can be seen at 28 to 30deg2θ Calcium was provided by thedissolution of portlandite After 6 h of hydrothermal reaction amountsof katoite (85 wt-) and quartz (from 31 wt- at 2 h to 165 wt- at6 h) had decreased and a major amount of tobermorite (35 wt-) waspresent Apparently between 2 and 6 h under hydrothermal conditionsthe amorphous precursor and quartz reacted resulting in the formationof tobermorite An additional 6 h of reaction time (MK9_12h) did notchange the phase composition significantly Slightly more tobermorite
(365 wt-) less quartz (16 wt-) and katoite (65 wt-) weremeasured
33 Tobermorite domain morphology and lattice parameters
In the referenced literature an analysis of tobermorite domainmorphology based on anisotropic peak broadening was possible forsamples that contained notgt 4 wt- Al2O3 in the drymix (Schreineret al 2019) Accordingly in this study samples MK0 MK25 MK5MK9_6h and MK9_12h were suitable (Table 2) with MK9_2h not con-taining any tobermorite In Fig 4 the respective growth in a and b di-rection is visualized with x indicating the domain size in a direction andy indicating domain size in b direction using a macro for TOPAS 50(Ectors et al 2015 2017) The calculated cylinder models in Fig 4represent the relation of yx and not absolute sizes With no supply ofaluminum ions (MK0) the relative domain growth in b direction islower compared to samples containing metakaolin This finding agreeswith the results from a similar investigation of tobermorite in AAC(Schreiner et al 2019) However within the samples MK5 andMK9_12h the different amounts of supplied aluminum ions did notshow a clear effect It appeared that low dosages of Al3+ (1 wt- Al2O3
in MK25 and 2 wt- Al2O3 in MK5) were enough to determine thedomain growth of tobermorite Additional results from the samplesMK9_6h and MK9_12h indicated that growth in b direction increasedwith reaction time
In Fig 5 lattice parameters of tobermorite depending on metakaolindosages are plotted B clearly remained unaffected throughout therange of samples Increasing amounts of metakaolin led to a slightlysmaller parameter a However both types of metakaolin showed acorresponding impact on parameter a By contrast parameter c in-creased strongly with increasing amounts of MK and MKg but the typeof metakaolin was significant At an equivalent dosage MK affected thecell dimension in c direction considerably more than MKg so that thefraction of Al3+ appeared to be the decisive parameter Different metaloxides in MKg did not show a notable effect certainly as they werepartially not provided for reaction Unlike for the domain morphologyof tobermorite the impact on lattice parameters could be observedwithin the complete range of examined dosages
4 Conclusions
The results obtained from the introduced investigations allow con-cluding remarks on the effects of the applied types of metakaolin on thesynthesis of 11 Aring tobermorite the phase transitions and the in-corporation of Al3+ into the lattice of tobermorite
With a critical dosage the use of any type of metakaolin led to theformation of katoite in an according amount At moderate dosages(MKg16 MKg23 MK16 and MK23) the two types of metakaolin showeda good correspondence in consideration of the quantities of to-bermorite For higher dosages there were contrary effects Lower do-sages of MK led to considerable quantities of Al-substituted to-bermorite Samples containing low dosages of MK revealed that katoiteappeared in the case ofgt 5 wt- of MK - corresponding to 2 wt-Al2O3 - in the basic compound Minor crystalline phases in MKg showedbetter reactivity than those in MK The observation that no tobermoritewas present in sample MK60 indicated that high dosages of Al3+ hin-dered the formation of tobermorite
Investigations of MK9 at 2 6 and 12 h displayed the evolution ofhydrate phases At first katoite was the only crystalline hydrate phasepresent after 2 h which corresponded to observations in a differentpublication (Klimesch and Ray 1999) The amount of katoite andquartz then decreased and a major amount of tobermorite formed from2 to 6 h curing time In order to gain more information on the trans-formation of amorphous C-(A)-S-H into tobermorite additional ex-periments in the range of 2 to 6 h curing time will be needed
Domain morphology analysis of tobermorite revealed that low
Fig 2 Diffractograms of MKg MKg60 MK and MK60 from 7 to 34deg2θ CuKα Aanatase C calcite F feldspar k kaolinite K katoite M mica Q quartz Ttobermorite U unidentified phase X xonotlite
J Schreiner et al Applied Clay Science 185 (2020) 105432
4
6 Publications
34
dosages of Al3+ determined the domain growth which agreed with theresults published on tobermorite in AAC samples (Schreiner et al2019) Different curing times unveiled that growth in b direction in-creased with the reaction time Al3+ incorporation into the lattice oftobermorite only reflected to a limited extent in the domain mor-phology By contrast an increase of lattice parameter c was triggered byAl3+ even at the highest dosage in this study Ultimately there is no
evidence for a limit of incorporation of Al3+ but there is a limit ofinfluence on the domain morphology These results additionally re-confirm this assumption similarly made in the previous work (Schreineret al 2019) and suggest a new mechanism of tobermorite crystal-lization depending on the presence of Al3+
Supplementary data to this article can be found online at httpsdoiorg101016jclay2019105432
Declaration of Competing Interest
The authors declare that they have no known competing financialinterests or personal relationships that could have appeared to influ-ence the work reported in this paper
Acknowledgement
The authors thank Rodgauer Baustoffwerke GmbH amp Co KG forsupplying raw materials for laboratory experiments
References
Aguilar-Mamani W Garciacutea G Hedlund J Mouzon J 2014 Comparison betweenleached metakaolin and leached diatomaceous earth as raw materials for the synth-esis of ZSM-5 Springerplus 3 1ndash10 httpsdoiorg1011862193-1801-3-292
Ayodele OB Sulaimon AA Alaba PA Tian Z-Y 2019 Influence of metakaolini-zation temperature on the structure and activity of metakaolin supported Ni catalystin dry methane reforming J Environ Chem Eng httpsdoiorg101016jjece2019103239 (in press)
Badawi EA Abdel-Rahman MA Mostafa A Abdel-Rahman M 2019 Determinationof the crystallite size amp micro- strain by novel method from XRD profile Appl Phys2 1ndash15 httpsdoiorg1031058jap201921001
Bailey SW 1969 Refinement of an intermediate microcline structure Am Miner 541540ndash1545
Bartl H 1969 Roentgen-Einkristalluntersuchungen an (CaO)3 (Al2O3) (H2O)6 und an(CaO)12 (Al2O3)7 (H2O) neuer Vorschlag zur (CaO)12 (Al2O3)7-Struktur NeuesJahrb fuer Mineral Monatshefte 1969 404ndash413
Basso R Giusta AD Zefiro L 1983 Crystal structure refinement of plazolite A highlyhydrated natural hydrogrossular Neues Jahrb Miner Monatsh (Neues Jahrb fuerMineral Monatshefte) 1983 251ndash258
Brigatti MF Lugli C Poppi L Foord EE Kile DE 2000 Crystal chemical varia-tions in Li- and Fe-rich micas from Pikes Peak batholith (Central Colorado) AmMineral 85 1275ndash1286 httpsdoiorg102138am-2000-8-920
Busing WR Levy HA 1957 Neutron diffraction study of calcium hydroxide J ChemPhys 26 563 httpsdoiorg10106311743345
Chen L Wang Z Wang Y Feng J 2016 Preparation and properties of alkali acti-vated metakaolin-based geopolymer Materials (Basel) 9 1ndash12 httpsdoiorg103390ma9090767
Chucholowski C Holger M Thienel K-C 2018 Improving the recyclability en-vironmental compatibility and CO2 balance of autoclaved aerated concrete by re-placing sulfate carrier and cement with calcined clays CePapers 2 503ndash512httpsdoiorg101002cepa846
Fig 3 Diffractograms of MK9_2h MK9_6h and MK9_12h from 7 to 38deg2θ CuKα C calcite K katoite Q quartz T tobermorite
Fig 4 Relation of calculated domain sizes of 11 Aring tobermorite in selectedsamples (MK0 MK25 MK5 MK9_6h and MK9_12h) in a (x) and b (y) direction
Fig 5 Lattice parameters of tobermorite depending on MK or MKg dosageincluding blank mix MK0
J Schreiner et al Applied Clay Science 185 (2020) 105432
5
6 Publications
35
Demir İ Başpınar MS Kahraman E Ccedilalışkan E Goumlrhan G 2014 An investigationon the usability of diatomite in aerated concrete production In Proc of the IntlConf on Advances in Civil Structural and Construction Engineering ndash CSCE 2014 pp97ndash100
Ectors D Goetz-Neunhoeffer F Neubauer J 2015 A generalized geometric approachto anisotropic peak broadening due to domain morphology J Appl Crystallogr 48189ndash194 httpsdoiorg101107S1600576714026557
Ectors D Goetz-Neunhoeffer F Neubauer J 2017 Routine (an)isotropic crystallitesize analysis in the double-Voigt approximation done right Powder Diffract 3227ndash34 httpsdoiorg101017S0885715617000070
Galvaacutenkovaacute L Bartoniacutečkovaacute E Opravil T Tkacz J Ptaacuteček P 2018 The influence ofstarting materials solubility on tobermorite structure formation under the hydro-thermal conditions IOP Conf Ser Mater Sci Eng 379 1ndash8 httpsdoiorg1010881757-899X3791012001
Grice JD 2005 The structure of spurrite tilleyite and scawtite and relationships toother silicate-carbonate minerals Can Mineral 43 1489ndash1500 httpsdoiorg102113gscanmin4351489
Hamid SA 1981 The crystal structure of the 11 Aring natural tobermoriteCa225[Si3O75(OH)15]1H2O Zeitschrift fuer Krist 154 189ndash198 httpsdoiorg101524zkri19811543-4189
Hejny C Armbruster T 2001 Polytypism in xonotlite Ca6Si6O17(OH)2 Zeitschrift furKrist 216 396ndash408
Horn M Schwerdtfeger CF Meagher EP 1972 Refinement of the structure of ana-tase at several temperatures Zeitschrift fur Krist 136 273ndash281 httpsdoiorg101524zkri19721363-4273
Jansen D Goetz-Neunhoeffer F Stabler C Neubauer J 2011 A remastered externalstandard method applied to the quantification of early OPC hydration Cem ConcrRes 41 602ndash608 httpsdoiorg101016jcemconres201103004
Jenkins R Snyder R 1996 Introduction to X-ray Powder Diffractometry ChemicalAnalysis Wiley pp 90
Kalousek GL 1956 Crystal Chemistry of Hydrous Calcium Silicates J Am Ceram Soc40 74ndash80
Klimesch D Ray A 1998 Autoclaved cement-quartz pastes with metakaolin additionsAdv Cem Based Mater 7 109ndash118 httpsdoiorg101016S1065-7355(97)00073-4
Klimesch D Ray A 1999 DTA-TGA evaluations of the CaOndashAl2O3ndashSiO2ndashH2O systemtreated hydrothermally Thermochim Acta 334 115ndash122 httpsdoiorg101016s0040-6031(99)00140-9
Komarneni S Roy R Roy DM Fyfe CA Kennedy GJ Bothner-By AA Dadok JChesnick AS 1985 27Al and29Si magic angle spinning nuclear magnetic resonancespectroscopy of Al-substituted tobermorites J Mater Sci 20 4209ndash4214 httpsdoiorg101007BF00552416
Koutnyacute O Opravil T Pořiacutezka J 2014 Application of metakaoline in autoclavedaerated concrete technology Adv Mater Res 1000 174ndash177 httpsdoiorg104028wwwscientificnetAMR1000174
Le Page Y Donnay G 1976 Refinement of the crystal structure of low-quartz ActaCrystallogr Sect B 32 2456ndash2459 httpsdoiorg101107S0567740876007966
Luo H Law WW Wu Y Zhu W Yang EH 2018 Hydrothermal synthesis of needle-like nanocrystalline zeolites from metakaolin and their applications for efficient re-moval of organic pollutants and heavy metals Microporous Mesoporous Mater 2728ndash15 httpsdoiorg101016jmicromeso201806015
Maeda H Ogawa Y Ishida EH Kasuga T 2012 Hydrothermal synthesis of to-bermorite doped with phosphorus species for removing heavy metal ions J AustCeram Soc 48 8ndash11
Maslen EN Streltsov VA Streltsova NR Ishizawa N 1995 Electron density andoptical anisotropy in rhombohedral carbonates III Synchrotron Xray studies ofCaCO3 MgCO3 and MnCO3 Acta Crystallogr Sect B 51 929ndash939 httpsdoiorg101107S0108768195006434
Matekonis G Šiaučiūnas R Vaičiukynienė D 2010 Hydrothermal Synthesis andCharacterization of Na + and [ Al 3 + + Na + ] -substituted Tobermorite in CaO-SiO2middotnH2O-H2O System Mater Sci 16 242ndash248
Matsui K Kikuma J Tsunashima M Ishikawa T Matsuno S Ogawa A Sato M2011 In situ time-resolved X-ray diffraction of tobermorite synthesis process underhydrothermal condition IOP Conf Ser Mater Sci Eng 18 60ndash66 httpsdoiorg1010881757-899X182022017
Merlino S Bonaccorsi E Armbruster T 2000 The real structures of clinotobermoriteand tobermorite 9 Aring OD character polytypes and structural relationships Eur JMineral 12 411ndash429 httpsdoiorg1011270935-122120000012-0411
Monasterio M Gaitero JJ Manzano H Dolado JS Cerveny S 2015 Effect ofchemical environment on the dynamics of water confined in calcium silicate mi-nerals Natural and synthetic tobermorite Langmuir 31 4964ndash4972 httpsdoiorg101021acslangmuir5b00614
Mostafa NY 2005 Influence of air-cooled slag on physicochemical properties of auto-claved aerated concrete Cem Concr Res 35 1349ndash1357 httpsdoiorg101016jcemconres200410011
Mostafa NY Shaltout AA Omar H Abo-El-Enein SA 2009 Hydrothermal synth-esis and characterization of aluminium and sulfate substituted 11 nm tobermoritesJ Alloys Compd 467 332ndash337 httpsdoiorg101016jjallcom200711130
Naber C Stegmeyer S Jansen D Goetz-Neunhoeffer F Neubauer J 2019 ThePONKCS method applied for time resolved XRD quantification of supplementarycementitious material reactivity in hydrating mixtures with ordinary Portland ce-ment Constr Build Mater 214 449ndash457 httpsdoiorg101016jconbuildmat201904157
Qu X Zhao Z Zhao X 2018 Microstructure and characterization of aluminum-in-corporated calcium silicate hydrates (C-S-H) under hydrothermal conditions RSCAdv 8 28198ndash28208 httpsdoiorg101039c8ra04423f
Rashad AM 2013 Metakaolin as cementitious material history scours production andcomposition - a comprehensive overview Constr Build Mater 41 303ndash318 httpsdoiorg101016jconbuildmat201212001
Rietveld HM 1969 A profile refinement method for nuclear and magnetic structures JAppl Crystallogr 2 65ndash71 httpsdoiorg101107S0021889869006558
Riacuteos CA Williams CD Fullen MA 2009 Hydrothermal synthesis of hydrogarnet andtobermorite at 175 degC from kaolinite and metakaolinite in the CaO-Al2O3-SiO2-H2Osystem a comparative study Appl Clay Sci 43 228ndash237 httpsdoiorg101016jclay200809014
Roacuteżycka A Pichoacuter W 2016 Effect of perlite waste addition on the properties of au-toclaved aerated concrete Constr Build Mater 120 65ndash71 httpsdoiorg101016jconbuildmat201605019
Roacutezycka A Kotwica Ł Małolepszy J 2014 Synthesis of single phase gyrolite in theCaO-quartz-Na2O-H2O system Mater Lett 120 166ndash169 httpsdoiorg101016jmatlet201401003
Sauman Z 1974 Influence of SO4 2ndash ions on the formation of 11 Aring tobermorite InProceedings of the 2nd International Symposium on Science and Research in SilicateChemistry Moscow pp 25ndash39
Schmidt M Egersdoumlrfer A Poumlllmann H 2012 Increased reactivity using a glass-containing metakaolin as an active filler in lime-based binder systems ZKG Int 6554ndash62
Schreiner J Jansen D Ectors D Goetz-Neunhoeffer F Neubauer J Volkmann S2018 New analytical possibilities for monitoring the phase development during theproduction of autoclaved aerated concrete Cem Concr Res 107 247ndash252 httpsdoiorg101016jcemconres201802028
Schreiner J Goetz-Neunhoeffer F Neubauer J Volkmann S Bergold S Webler RJansen D 2019 Advanced Rietveld refinement and SEM analysis of tobermorite inchemically diverse autoclaved aerated concrete Powder Diffract 34 143ndash150httpsdoiorg101017s0885715619000149
Setthaya N Chindaprasirt P Pimraksa K 2016 Preparation of zeolite nanocrystals viahydrothermal and solvothermal synthesis using of rice husk ash and metakaolinMater Sci Forum 872 242ndash247 httpsdoiorg104028wwwscientificnetmsf872242
Siauciunas R Baltakys K 2004 Formation of gyrolite during hydrothermal synthesis inthe mixtures of CaO and amorphous SiO2 or quartz Cem Concr Res 34 2029ndash2036httpsdoiorg101016jcemconres200403009
Skawinska A Owsiak Z Baran T Hernik K 2017 The influence of halloysite ad-dition on tobermorite formation in CaO and quartz mix under hydrothermal condi-tions Cem Wapno Bet 17 426ndash434
Venhodovaacute E Janovskyacute R Drochytka R 2015 Formation of tobermorite at differentmaterials composition of aerated concrete Appl Mech Mater 752ndash753 247ndash250httpsdoiorg104028wwwscientificnetamm752-753247
Walczak P Małolepszy J Reben M Szymański P Rzepa K 2015 Utilization ofwaste glass in autoclaved aerated concrete Proc Eng 122 302ndash309 httpsdoiorg101016jproeng201510040
Zhang Y Gao W Cui L 2007 The transformation of acid leached metakaolin tozeolite beta Stud Surf Sci Catal 170 420ndash425 httpsdoiorg101016S0167-2991(07)80870-6
Zvyagin BB 1960 An attempt to electronographic determination of kaolinite structureJ Dokl Akad Nauk SSSR 130 1023ndash1026
J Schreiner et al Applied Clay Science 185 (2020) 105432
6
6 Publications
36
6 Publications
62 Advanced Rietveld refinement and SEM analysis oftobermorite in chemically diverse autoclaved aeratedconcrete
Following the copyright guidelines by Cambridge University Press the publication
Schreiner J Goetz-Neunhoeffer F Neubauer J Volkmann S Bergold S WeblerR Jansen D 2019 Advanced Rietveld refinement and SEM analysis of tobermorite inchemically diverse autoclaved aerated concrete Powder Diffraction 34 143ndash150 httpsdoiorg101017s0885715619000149
may not be reprinted It can be accessed at
httpswwwcambridgeorgcorejournalspowder-diffractionarticleadvanced-rietveld-refinement-and-sem-analysis-of-tobermorite-in-chemically-diverse-autoclaved-aerated-concrete51597C2A66F6F225D29DEB2675E74249
37
6 Publications
63 New analytical possibilities for monitoring the phasedevelopment during the production of autoclavedaerated concrete
Reprint of the peer reviewed publication
Schreiner J Jansen D Ectors D Goetz-Neunhoeffer F Neubauer J VolkmannS 2018 New analytical possibilities for monitoring the phase development during theproduction of autoclaved aerated concrete Cement and Concrete Research 107 247ndash252httpsdoiorg101016jcemconres201802028
with permission from Elsevier
38
Contents lists available at ScienceDirect
Cement and Concrete Research
journal homepage wwwelseviercomlocatecemconres
Short communication
New analytical possibilities for monitoring the phase development duringthe production of autoclaved aerated concrete
J Schreinera D Jansena D Ectorsa F Goetz-Neunhoeffera J Neubauera S Volkmannb
aUniversity of Erlangen-Nuremberg GeoZentrum Nordbayern Mineralogy Schlossgarten 5a 91054 Erlangen Germanyb Rodgauer Baustoffwerke GmbH amp Co KG Am Opel-Pruumlffeld 3 63110 Rodgau-Dudenhofen Germany
A B S T R A C T
This work presents improved analytical methods for both steps of the production process of autoclaved aeratedconcrete (AAC) the phase development during the hydration before autoclaving and during the autoclavingprocess itself The improvement includes new insights into preparation methods of AAC samples for powderdiffraction as well as Rietveld refinement strategies For the first time a new implementation for calculatinganisotropic crystal domain sizes is applied to major hydrate phases occurring during AAC production namelyportlandite during the hydration before autoclaving and tobermorite during the autoclaving process The cal-culation of anisotropic domain size growth which can be implemented in the Rietveld environment is based oncrystallographically and geometrically appropriate models The implementation of calculating anisotropic do-main sizes for the Rietveld software TOPAS 50 allows a superior Rietveld fit and a more accurate quantificationof the phase development Additionally it enables the tracking of growth mechanism of portlandite duringhydration
1 Introduction
Autoclaved aerated concrete (AAC) is known as a lightweight con-struction material which offers outstanding properties such as suffi-cient strength for construction in addition with excellent thermal in-sulation [12] AAC is produced by autoclaving from calcareous rawmaterials such as lime (CaO) and cement quartz sulfate carrier andother additives such as foaming agents and water
The production process (Fig 1) can be separated into the hydrationof the mixed slurry before the procedure of autoclaving and the auto-claving at elevated temperature (180 degC to 200 degC) under saturatedsteam pressure (12MPa) for several hours
The hydration process before autoclaving is necessary to achievesufficient strength in order to cut the green cake blocks as they shouldhave a specific shape and dimension after autoclaving Furthermorethe porous structure is generated by the foaming agent during hydra-tion in the first process step During autoclaving the final propertiesnamely strength and low thermal conductivity are achieved
It is already well understood that the autoclaving process leads tothe formation of several phases first of all tobermorite(Ca5Si6O16(OH)2lowast4H2O) [3ndash5] Newest research has shown im-pressively which reactions are running from the mineralogical point ofview Insitu XRD measurements were carried out during the
autoclaving process and the phase development was shown by plottingnormalized intensities [6] The study of Mitsuda et al [3] was mainlyfocused on the tracking of the phase evolution during the autoclavingprocess of AAC However their statements concerning phase evolutionare mainly based on XRD data and TGA measurements There is acommon agreement that the following reactions occur The consump-tion of the alite (OPC) leads to the formation of an initial C-S-H phaseduring the first processing step Portlandite which was initially formedduring the first process step (from CaO and C3S) further quartz and theC-S-H phase are consumed during autoclaving resulting in the crystal-lization of tobermorite Hence the crystallization process of to-bermorite as well as the crystal structure of tobermorite was an issue ofresearch and discussion over the last years and numerous publicationsto these topics are available Concerning the crystal structure of to-bermorite respectively the tobermorite supergroup a new publicationoutlines all important references and recommends a new nomenclature[7]
The presented study was performed to create new analytical possi-bilities for the characterization of the production process of AAC Bothof the production process steps are essential for the final productHence the present work focuses on crystallization of hydrate phases inboth processes
Firstly an external standard method [89] was published and
httpsdoiorg101016jcemconres201802028Received 6 October 2017 Received in revised form 1 February 2018 Accepted 26 February 2018
Corresponding authorsE-mail addresses juergenjsschreinerfaude (J Schreiner) danieljansenfaude (D Jansen)
Cement and Concrete Research 107 (2018) 247ndash252
0008-8846 copy 2018 Elsevier Ltd All rights reserved
T
6 Publications
39
recommended for the determination of absolute phase contents inmixtures with amorphous content It was shown that the method canabsolutely be recommended for hydrating cement pastes in which watercannot be quantified directly by XRD [10] This method seems to bevery promising for both the quantification of the hydration of the AACslurry before autoclaving and the quantification of the phase evolutionduring autoclaving inasmuch as both production steps form crystallineand amorphous phases
Secondly a new approach to anisotropic peak broadening due toanisotropic domain morphology which was developed [1112] is ap-plied to AAC samples to improve the fit of portlandite and tobermoriteby Rietveld refinement [13] By applying this approach the refinementof both portlandite and tobermorite should additionally lead to betterquantitative results as well as to better insights into the development ofthe domain size morphology of both phases formed
It was already shown that in a hydrating raw mixture for AAC twospecies of portlandite precipitate at 23 degC one showing dynamicallyanisotropic peak broadening and another one following the isotropictrend [14] The application of the anisotropic refinement model led toan improved fitting of portlandite Moreover the mechanism of aniso-tropic domain growth of portlandite was tracked
2 Materials and methods
In order to examine the hydration of the AAC slurry before auto-claving a mixture of the hydraulic reactive components was weighedand measured in-situ at a Bruker D8 diffractometer with a LynxEyedetection system
Ordinary Portland cement (OPC) was mixed with lime (CaO) andanhydrite (C$) The raw materials were taken from the same batches asfor the industrial samples The drymix (58 OPC 36 CaO and 6 C$by weight) was then mixed with water (ws= 08) and placed into anappropriate sample holder The samples were not aerated The slurrysamples were covered with a kapton film to avoid evaporation andcarbonation Diffractograms were recorded with an angular range from7 to 545deg 2θ and a step width of 0011deg 2θ Measurements were carriedout every 15min For each measurement 96 XRD patterns were re-corded over the first 24 h The temperature was fixed at 70 degC which isthe mean temperature generally prevailing in the industrial processduring hydration before autoclaving Rietveld refinement was carriedout using the G-factor method All structures used for Rietveld refine-ment are shown in Table 1
For investigation of the autoclaved samples five different specimenswere taken at different autoclaving times The specimens were takenout of a technical production process hence it was not possible to in-terrupt the process at an earlier time inasmuch it would lead to damageof a whole concrete production batch The specimens were firstly driedat 60 degC until weight constancy The whole blocks were then broken andstatistical samples of 20 g were taken In order to receive the right massattenuation coefficient (MAC) for G-factor method the loss on ignitionand the chemical composition (XRF) were determined For energydispersive XRF analysis (Spectro Xepos) tube voltage from 20 kV to50 kV and tube current from 08 to 20mA were used for differenttargets
The final sample preparation (grinding) before XRD measurementswas carried out using both an agate mortar and a McCrone micronizingmill for wet milling with isopropanol Both preparation methods wereapplied separately to see which one is suitable in order to get the bestpreparation for XRD investigations Six preparations were performed byone operator of which two were prepared with an agate mortar andfour with a McCrone mill For the McCrone milling 3 g of the sampleand 10ml of isopropanol were used for grinding for 12min The grainsize distribution of one sample prepared with an agate mortar and onesample prepared using a McCrone mill was measured by laser granu-lometry in isopropanol using a Mastersizer 3000 (MALVERN)
After milling the samples in these two ways for XRD analysis thepowders were prepared into a front loading sample holder and mea-sured Diffractograms were recorded with an angular range from 6 to80deg 2θ a step width of 00236deg 2θ and a time per step of 054 s Rietveldrefinement combined with external standard (G-factor) was applied inorder to get absolute quantities for each phase The refinement strategyfor portlandite and tobermorite in the TOPAS Launch Mode (TOPAS50 Bruker AXS) is attached as a Supplementary material file
3 Results and discussion
31 Hydration of the mixture before autoclaving
The hydration of the investigated paste before autoclaving isdominated by the hydration of the cement as well as the reaction of thefree lime (CaO) resulting in the formation of portlandite It can beclearly seen from Fig 2 that the hydration of the paste leads to theformation of ettringite portlandite and C-S-H phase For simplificationthe remaining phase developments are not shown in Fig 2 because theyare not in the focus of this study The hydration of CaO forming
Fig 1 Simplified process steps of AAC production and hydrate phase evolution
Table 1Structures used for Rietveld refinement
Phase Author
Alite [15]Anhydrite [16]Bassanite [17]Belite (β) [18]Belite (αprime) [19]Brownmillerite [20]C-S-H [21]Calcite [22]Ettringite [23]Gypsum [24]Hemicarbonate [25]Hydroxylellestadite [26]Lime (CaO) [27]Microcline [28]Portlandite [29]Quartz [30]Tobermorite [31]Tricalciumaluminate (cubic) [32]Tricalciumaluminate (orthorhombic) [33]PONCKS model for Water [21]
J Schreiner et al Cement and Concrete Research 107 (2018) 247ndash252
248
6 Publications
40
portlandite begins rapidly after the addition of water to the mixture andlime is fully consumed after only 1 h of hydration This translates into aquick rise of heat of hydration so that cement hydration is acceleratedwhich leads to further portlandite formation by the reaction of aliteEttringite formation stalls after few hours of hydration After 12 h et-tringite is partially decomposed probably due to sulfate depletion [9]
and poorly crystalline AFm phases (not shown in Fig 2) are formedIn Fig 3 it can be seen that in fact two generations of portlandite
are formed a 1st dominant generation showing anisotropic peakbroadening and 2nd one occurring considerably later following theisotropic domain size refinement which is usually carried out using theRietveld method This occurrence comes along firstly with lime hy-dration and secondly with alite hydration The expected quantity ofportlandite formed from lime hydration very well complies with the
Fig 2 Phase development in AAC paste on a laboratory scale before autoclaving ana-lyzed by in-situ XRD at 70 degC
Fig 3 Formation of two generations of portlandite by hydration of lime (1st) and C3S(2nd) at 70 degC before autoclaving with the major generation showing anisotropic peakbroadening
Fig 4 Biaxial cylinder domain size model of portlandite used for Rietveld refinement of anisotropic peak broadening
Fig 5 Morphological evolution of portlandite showing anisotropic domain size growthduring hydration at 70 degC
Fig 6 Comparison of quantification of crystalline quartz in samples prepared withMcCrone mill and agate mortar at different autoclaving times
J Schreiner et al Cement and Concrete Research 107 (2018) 247ndash252
249
6 Publications
41
quantity of the observed 1st generation The development of portlan-dite growth was already tracked in an equivalent slurry at 23 degC [14]Thus this observation confirms that the crystallinity of portlandite inmixtures for AAC production depends on the starting phase for hydra-tion as already indicated by Ectors [14]
Fig 4 shows the used biaxial cylindrical model for anisotropic do-main size calculation and the portlandite structure which was createdwith structural software VESTA 318 [34] Using the cylindrical ap-proach domain sizes in a (here equating to b) and c direction(dz= cylinder height) can be calculated which comes along with theexpected symmetrical parameters of portlandite
The 1st portlandite generation showing anisotropic domain growthcan be tracked in terms of cylinder diameter and height which is rea-lized in Fig 5 The blue cylinder represents the geometric approach andcylinder height and diameter are calculated newly for each range Thecylinder height remains rather stable throughout the hydration processwhile the cylinder diameter increases during the first hours of hydra-tion After 10 h of hydration the mean cylinder diameter no longer in-creases Consequently these observations match the results of the ex-aminations conducted at 23 degC [14] as well as the assumption thatdifferent mechanisms of growth exist for portlandite depending on the
hydration educt The maximum cylinder diameter is reached earlier inthis work very likely because of the higher hydration temperature
32 Quantification of the reactions during autoclaving
Autoclaved samples were ground with an agate mortar and com-pared to samples which were wet-ground with a McCrone mill Fig 6shows precisely that the determination of the amount of crystallinequartz is more reproducible in the two shown samples which were
Fig 7 2D XRD with Bruker GADDS-system plots of samples prepared with agate mortar and McCrone mill Coarse quartz grains are pointed out in the plot of the sample prepared withagate mortar
Fig 8 Particle size distribution of one sample prepared with an agate mortar and of onesample prepared with a McCrone mill measured by laser granulometry
Fig 9 Rietveld refinement for Tobermorite of autoclaved AAC sample by use of isotropicdomain size model (a) and of anisotropic domain size model (b)
J Schreiner et al Cement and Concrete Research 107 (2018) 247ndash252
250
6 Publications
42
prepared with a McCrone mill The high variance of crystalline quartzin the samples which were prepared with an agate mortar is a result ofinsufficient grinding and remaining of too large quartz grains Whenthis spottiness occurs a reliable quantification using the G-factormethod is not possible
The 2D XRD with Bruker GADDS-system plots in Fig 7 demonstratethe insufficient grinding when using an agate mortar compared to wetmilling with a McCrone mill Quartz would be overrepresented in a one-dimensional XRD pattern focusing on a section with bright spots (greenarrows) The lack of bright spots in the right plot shows that the quartzgrains are milled more thoroughly using a McCrone mill In Fig 8 theparticle size distribution after both ways of sample preparation iscompared Most grains in the sample prepared with an agate mortar arelarger than in the sample prepared with a McCrone mill The grain sizedistribution of the sample prepared with a McCrone mill complies withthe recommended particle size range for XRD analysis of under 5 to50 μm [3536] while the other sample exceeds the range
In Fig 9 Rietveld refinement of an autoclaved sample is shown Thedominant peaks at 77 290 and 301deg 2θ are attributed to tobermoriteIn the upper diagram (a) Rietveld refinement was carried out regularlycalculating isotropic domain sizes for tobermorite However the cal-culated fit differs significantly from the raw data It can be assumed thattobermorite shows a similar pattern to portlandite in terms of aniso-tropic peak broadening taking into account that tobermorite is as-signed to the orthorhombic crystal system Thus instead of a biaxialcylinder model an elliptic cylinder model (Fig 10 structure createdwith VESTA 318 [34]) was applied for the refinement in the lowerdiagram (b) The elliptic cylinder model is a sufficient approach to the
orthorhombic crystal system as it allows the distinction between do-main sizes in a b and c direction The fit is clearly superior using theanisotropic domain size model highlighted by the difference plot inFig 9b The comparison refinement with isotropic and anisotropic ap-proach was done for all of the five autoclaved samples In Fig 11 theresulting Rwp values for the whole pattern and the RBragg values of to-bermorite are shown The refinement using the anisotropic model leadsto both lower Rwp and RBragg values and consequently to a better fit anda more accurate quantification of tobermorite in all refined samples
4 Summary and conclusions
Improved analytical methods for both the phase developmentduring the hydration before autoclaving and during the autoclavingprocess of AAC are presented It could be shown that wet McCronemilling is the best way of preparation of AAC samples in order to obtainsuitable samples for powder diffraction A new approach to treat ani-sotropic domain sizes for Rietveld refinement could be successfullyapplied ndash with the benefit that portlandite and tobermorite in AACsamples could be refined more accurately using the Rietveld methodThus this application allows an improved quantification of the phasedevelopment during both of the production steps
For the future there are still plenty of possibilities to apply thepresented approach of calculating anisotropic domain sizes to AACproduction As exemplified with portlandite the mechanisms of growthof tobermorite can be tracked likewise during the autoclaving processIn addition the effect of variations in the chemical composition of AACraw mixtures on the crystal morphology of tobermorite can be ex-amined This leaves a new perspective to discuss the link between mi-neral phase morphology and the thermal and mechanical properties ofAAC
Acknowledgement
The autoclaved samples were generously provided by RodgauerBaustoffwerke GmbH amp Co KG The authors express gratitude for allsupport
Appendix A Supplementary data
Supplementary data to this article can be found online at httpsdoiorg101016jcemconres201802028
References
[1] MW Grutzeck Cellular concrete in M Scheffler P Colombo (Eds) CellularCeramics Wiley-VCH Weinheim 2005 pp 193ndash223
[2] M Haas The future of AAC ndash from a material scientists point of view inMC Limbachiya JJ Roberts (Eds) Autoclaved Aerated Concrete Taylor FrLondon 2005 pp 187ndash194
[3] T Mitsuda K Sasaki H Ishida Phase evolution during autoclaving process ofaerated concrete J Am Ceram Soc 75 (1992) 1858ndash1863
[4] N Isu H Ishida T Mitsuda Influence of quartz particle size on the chemical and
Fig 10 Triaxial cylinder domain size model of Tobermorite used for Rietveld refinement of anisotropic peak broadening
Fig 11 Comparison of Rwp and RBragg values of Rietveld refinements of autoclavedsamples and tobermorite using the isotropic and the anisotropic domain size model
J Schreiner et al Cement and Concrete Research 107 (2018) 247ndash252
251
6 Publications
43
mechanical properties of autoclaved aerated concrete (I) tobermorite formationCem Concr Res 25 (1995) 243ndash248
[5] NY Mostafa Influence of air-cooled slag on physicochemical properties of auto-claved aerated concrete Cem Concr Res 35 (2005) 1349ndash1357 httpdxdoiorg101016jcemconres200410011
[6] K Matsui J Kikuma M Tsunashima T Ishikawa S Matsuno A Ogawa M SatoIn situ time-resolved X-ray diffraction of tobermorite formation in autoclaved aer-ated concrete influence of silica source reactivity and Al addition Cem Concr Res41 (2011) 510ndash519
[7] C Biagioni S Merlino E Bonaccorsi The tobermorite supergroup a new no-menclature Mineral Mag 79 (2015) 485ndash495 httpdxdoiorg101180minmag2015079222
[8] BH OConnor MD Raven Application of the Rietveld refinement procedure inassaying powdered mixtures Powder Diffract 3 (1988) 2ndash6 httpdxdoiorg101017S0885715600013026
[9] D Jansen F Goetz-Neunhoeffer C Stabler J Neubauer A remastered externalstandard method applied to the quantification of early OPC hydration Cem ConcrRes 41 (2011) 602ndash608 httpdxdoiorg101016jcemconres201103004
[10] D Jansen C Stabler F Goetz-Neunhoeffer S Dittrich J Neubauer Does OrdinaryPortland Cement contain amorphous phase A quantitative study using an externalstandard method Powder Diffract 26 (2011) 31ndash38 httpdxdoiorg10115413549186
[11] D Ectors F Goetz-Neunhoeffer J Neubauer A generalized geometric approach toanisotropic peak broadening due to domain morphology J Appl Crystallogr 48(2015) 189ndash194 httpdxdoiorg101107S1600576714026557
[12] D Ectors F Goetz-Neunhoeffer J Neubauer Routine (an)isotropic crystallite sizeanalysis in the double-Voigt approximation done right Powder Diffract 32 (S1)(2017) 27ndash34 httpdxdoiorg101017S0885715617000070
[13] HM Rietveld A profile refinement method for nuclear and magnetic structures JAppl Crystallogr 2 (1969) 65ndash71 httpdxdoiorg101107S0021889869006558
[14] D Ectors Advances in the Analysis of Cementitious Reactions and Hydrate Phases(Doctoral Thesis) (2016) pp 12ndash14 (urnnbndebvb29-opus4-71743)
[15] AacuteG De La Torre S Bruque J Campo MAG Aranda The superstructure of C3Sfrom synchrotron and neutron powder diffraction and its role in quantitative phaseanalyses Cem Concr Res 32 (2002) 1347ndash1356 httpdxdoiorg101016S0008-8846(02)00796-2
[16] A Kirfel G Will Charge density in anhydrite CaSO4 from X-ray and neutrondiffraction measurements Acta Crystallogr Sect B Struct Crystallogr CrystChem 36 (1980) 2881ndash2890 httpdxdoiorg101107S0567740880010461
[17] C Bezou AN Christensen D Cox M Lehman A Nonat Structures cristallines deCaSO405H2O et CaSO406H2O Comptes Rendus Hebd Des Seacuteances lAcadeacutemieDes Sci Seacuterie 2 (312) (1991) 43ndash48
[18] KH Jost B Ziemer R Seydel Redetermination of the structure of β-dicalciumsilicate Acta Crystallogr Sect B Struct Crystallogr Cryst Chem 33 (1977)1696ndash1700 httpdxdoiorg101107S0567740877006918
[19] W Mumme LMD Cranswick BC Chakoumakos Rietveld crystal structure re-finements from high temperature neutron powder diffraction data for the poly-morphs of dicalcium silicate Neues Jahrb Fuer Mineral Abhandlungen 170 (1996)171ndash188
[20] A Colville S Geller The crystal structure of brownmillerite Ca2FeAlO5Crystallographica 50 (1971) 2311ndash2315 httpdxdoiorg101107S056774087100579X
[21] ST Bergold F Goetz-Neunhoeffer J Neubauer Quantitative analysis of C-S-H inhydrating alite pastes by in-situ XRD Cem Concr Res 53 (2013) 119ndash126 httpdxdoiorg101016jcemconres201306001
[22] EN Maslen VA Streltsov NR Streltsova N Ishizawa Electron density and op-tical anisotropy in rhombohedral carbonates III Synchrotron Xray studies ofCaCO3 MgCO3 and MnCO3 Acta Crystallogr Sect B 51 (1995) 929ndash939 httpdxdoiorg101107S0108768195006434
[23] G Renaudin Y Filinchuk J Neubauer F Goetz-Neunhoeffer A comparativestructural study of wet and dried ettringite Cem Concr Res 40 (2010) 370ndash375httpdxdoiorg101016jcemconres200911002
[24] WF Cole CJ Lancucki A refinement of the crystal structure of gypsumCaSO42H2O Acta Cryst B30 (1974) 921ndash929 httpdxdoiorg101107S0567740874004055
[25] T Runčevski RE Dinnebier OV Magdysyuk H Poumlllmann Crystal structures ofcalcium hemicarboaluminate and carbonated calcium hemicarboaluminate fromsynchrotron powder diffraction data Acta Crystallogr Sect B Struct Sci 68 (2012)493ndash500 httpdxdoiorg101107S010876811203042X
[26] JM Hughes JW Drexler Cation substitution in the apatite tetrahedral site crystalstructures of type hydroxylellestadite and type fermorite Neues Jahrb FuerMineral (1991) 327ndash336
[27] CH Shen RS Liu JG Lin CY Huang Phase stability study of La12Ca18Mn2O7Mater Res Bull 36 (2001) 1139ndash1148
[28] SW Bailey Refinement of an intermediate microcline structure Am Miner 54(1969) 1540ndash1545
[29] WR Busing HA Levy Neutron diffraction study of calcium hydroxide J ChemPhys 26 (1957) 563 httpdxdoiorg10106311743345
[30] Y Le Page G Donnay Refinement of the crystal structure of low-quartz ActaCrystallogr Sect B 32 (1976) 2456ndash2459 httpdxdoiorg101107S0567740876007966
[31] SA Hamid The crystal structure of the 11 Aring natural tobermoriteCa225[Si3O75(OH)15]1H2O Zeitschrift Fuer Krist - New Cryst Struct 154 (1981)189ndash198 httpdxdoiorg101524zkri19811543-4189
[32] P Mondal JW Jeffery The crystal structure of tricalcium aluminate Ca3Al2O6Acta Crystallogr B 31 (1975) 689ndash697 httpdxdoiorg101107S0567740875003639
[33] Y Takeuchi F Nishi I Maki Crystal-chemical characterization of the tricalciumaluminate-sodium oxide (3CaOtimesAl2O3-Na2O) solid-solution series Zeitschrift FuumlrKrist (1980) 259ndash307
[34] K Momma F Izumi VESTA 3 for three-dimensional visualization of crystal vo-lumetric and morphology data J Appl Crystallogr 44 (2011) 1272ndash1276 httpdxdoiorg101107S0021889811038970
[35] K Scrivener R Snellings B Lothenbach A Practical Guide to MicrostructuralAnalysis of Cementitious Materials CRC Press 2016 pp 123ndash125 httpdxdoiorg107693wl20150205
[36] V Pecharsky P Zavalij Fundamentals of Powder Diffraction and StructuralCharacterization of Materials Springer second edition 2005 p 302 httpdxdoiorg101007978-0-387-09579-0
J Schreiner et al Cement and Concrete Research 107 (2018) 247ndash252
252
6 Publications
44
7 Acknowledgement
7 Acknowledgement
Ich moumlchte mich bei einigen Personen bedanken ohne die es wohl kaum zum erfolgreichenAbschluss dieser Arbeit gekommen waumlreMein Doktorvater Prof Dr Juumlrgen Neubauer hat sich stets die Zeit genommen die noumltigwar um Angelegenheiten aller Art mit mir zu klaumlren Er gab mir fachlich immer zumrichtigen Zeitpunkt einen gewissen wissenschaftlichen Impuls Zugleich habe ich mich den-noch immer frei in meiner eigenen Konzeption gefuumlhlt Groszligen Dank spreche ich Prof DrFriedlinde Goumltz-Neunhoeffer aus die fuumlr mich ebenso immer eine verlaumlssliche Ansprech-partnerin fuumlr fachliche und organisatorische Angelegenheiten aller Art war Danke anDr Daniel Jansen fuumlr die gute Zusammenarbeit und dafuumlr dass er mich im Zuge meinerMasterarbeit in ein Forschungsprojekt aufgenommen hat das den Weg zur Promotionmoumlglich machte Zusaumltzlich gilt mein Dank Prof Dr Matthias Goumlbbels der fuumlr dieMitarbeiter am Lehrstuhl immer motivierende Worte fand Fuumlr die Ermoumlglichung meinerTeilnahme an diversen Dienstreisen Fortbildungen und Tagungen moumlchte ich mich viel-mals bedankenWeiterhin bedanke ich mich bei Dr Stephan Volkmann und den Rodgauer BaustoffwerkenGmbH amp Co KG fuumlr die gute Zusammenarbeit und die Bereitstellung von Versuchsma-terialienVielen Dank an meine studentischen Hilfskraumlfte Daniel Wagner Laura MoldenhauerFabian Lang Jakob Schreiber und Felix Klaassen die alle Aufgaben im Labor einwand-frei und mit Bedacht erledigten Bei meinen aktuellen und ehemaligen Kollegen DrKatrin Hurle Dr Dominique Ectors Dr Christoph Naber Dr Florian Huumlller JoumlrgNehring Frank Riedel Julian Wolf Tanja Manninger Daniel Wagner Nicolas FobbeKarla Spaumlth Julian Goergens Andreas Koumlhler Cordula Jakob Franz Becker und LisaKlemenz bedanke ich mich fuumlr die gelungene Zusammenarbeit und gegenseitige Unter-stuumltzung Besonderer Dank geht auch an Kerstin Kreszlig Bettina Engl Christian HankeBernd Schleifer und Christian Abe fuumlr die verlaumlssliche Unterstuumltzung bei technischen Fra-gen und Messungen im LaborFuumlr jegliche Unterstuumltzungen moumlchte ich mich auch bei meinen Eltern bedanken sowiebei meinem Bruder Ralf der mir mit einem LaTex Crashkurs viel Frustration ersparthat Danke Thomas dass du immer fuumlr mich da bist und mit mir zusammen fuumlr genugAusgleich gesorgt hast
45
6 Publications
6 Publications
61 Hydrothermal synthesis of 11 Aring tobermorite ndash Effectof adding metakaolin to the basic compound
Reprint of the peer reviewed publication
Schreiner J Goetz-Neunhoeffer F Neubauer J Jansen D 2020 Hydrothermalsynthesis of 11 Aring tobermorite ndash Effect of adding metakaolin to the basic compoundApplied Clay Science 185 httpsdoiorg101016jclay2019105432
with permission from Elsevier
30
Contents lists available at ScienceDirect
Applied Clay Science
journal homepage wwwelseviercomlocateclay
Research paper
Hydrothermal synthesis of 11 Aring tobermorite ndash Effect of adding metakaolin tothe basic compound
J Schreiner F Goetz-Neunhoeffer J Neubauer D JansenUniversity of Erlangen-Nuremberg GeoZentrum Nordbayern Mineralogy Schlossgarten 5a 91054 Erlangen Germany
A R T I C L E I N F O
KeywordsHydrothermal synthesis11 Aring tobermoriteMetakaolinPowder diffractionKatoite
A B S T R A C T
Different amounts and types of metakaolin were analyzed and applied for the hydrothermal synthesis of 11 Aringtobermorite All synthesized samples were investigated by means of powder XRD combined with Rietveld re-finement Al-substituted 11 Aring tobermorite was successfully synthesized on the basis of a broad range of com-pounds characterized by a varying content of metakaolin Katoite was present depending on the amount ofsupplied Al3+ which was determined by the dosage of metakaolin Minor crystalline components included in thetwo types of metakaolin sources varied greatly in their reactivity under hydrothermal conditions Despite adifferent degree of purity the two types of metakaolin showed corresponding effects at moderate dosages butcontrary effects at higher dosages as for the synthesis of 11 Aring tobermorite The domain morphology of to-bermorite could be associated with Al3+ incorporation for low dosages of metakaolin represented by up to 2 wt- Al2O3 in the dry mix By contrast Al3+ affected tobermorite lattice parameters at equivalent and even athigher dosages with c reaching 2295 Aring at 12 wt- Al2O3 in the dry mix
1 Introduction
11 Application of metakaolin as a reactive material in constructionindustry
The application of supplementary cementitious materials (SCMs) inthe field of construction technology has received a lot of attention inrecent years Due to limited resources and an urgent need for alter-native and more eco-friendly construction materials SCMs such asmetakaolin offer a great potential The usage of SCMs has not onlyspread to the cement and mortar industry but also to advanced appli-cations such as autoclaved aerated concrete (AAC) (Demir et al 2014Koutnyacute et al 2014 Walczak et al 2015 Roacuteżycka and Pichoacuter 2016Chucholowski et al 2018) Unlike ordinary cementitious constructionmaterials AAC is produced from hydrothermal curing Due to the dif-ferent thermodynamic environment the hydration process and the re-activity of raw materials have to be investigated properly in order tounderstand the effects on the AAC product The leading mineral phasein AAC is 11 Aring tobermorite (Ca5Si6O16(OH)2middot4H2O) As a consequencethe thermal and mechanical properties of AAC depend on micro-structure and crystallinity of tobermorite to some extent In addition tothe curing time and the fineness of raw materials the supply of ionsthat can substitute in the tobermorite structure is a crucial factor in thiscontext Especially substitutions by aluminum sodium and potassium
ions have been investigated thoroughly (Sauman 1974 Klimesch andRay 1998 Mostafa et al 2009 Matekonis et al 2010 Skawinskaet al 2017) Calcined clays usually contain a considerable amount ofthe mentioned ions
There is a vast amount of literature on the reactivity of SCMs atambient temperature and standard pressure but there is little when itcomes to hydrothermal conditions In previous publications the beha-vior of metakaolin under hydrothermal conditions was mainly in-vestigated for the synthesis of zeolites (Zhang et al 2007 Aguilar-Mamani et al 2014 Setthaya et al 2016 Luo et al 2018) In thesestudies the reactivity of metakaolin was observed at a wide range oftemperature and pH values During the transformation of kaolin intometakaolin a loss of framework alumina was observed (Ayodele et al2019) In recent decades metakaolin has been the subject of studies inthe field of geopolymer research (Rashad 2013 Chen et al 2016) Forthe synthesis of 11 Aring tobermorite a more distinct setting of temperaturesetting (180ndash200 degC) and steam pressure (1ndash12 MPa) are required
This publication is intended to make a new contribution to thechallenging field of hydrothermal synthesis in the system CaO-Al2O3-SiO2-H2O based on XRD analysis combined with Rietveld refinementVarious dosages of two types of metakaolin with different chemical andmineralogical purities are compared for the effects on the hydrothermalsynthesis of Al-substituted 11 Aring tobermorite Especially changes of thebulk chemistry in the raw mixes the reactivity of minor crystalline
httpsdoiorg101016jclay2019105432Received 20 August 2019 Received in revised form 13 November 2019 Accepted 30 December 2019
Corresponding authorE-mail address juergenjsschreinerfaude (J Schreiner)
Applied Clay Science 185 (2020) 105432
0169-1317 copy 2020 Elsevier BV All rights reserved
T
6 Publications
31
phases of the two types of metakaolin and the effect of different curingtimes are the focus of interest On the one hand metakaolin offers agreat potential in the AAC industry On the other hand of all SCMsmetakaolin is a good source material for investigating the influence ofAl3+ on the synthesis of Al-substituted 11 Aring tobermorite
12 Synthesis of Al-substituted 11 Aring tobermorite
In addition to being present in AAC tobermorite has found appli-cation in wastewater treatment and nuclear waste management due toits ion exchange capacity (Maeda et al 2012 Monasterio et al 2015)The substitution of silicon by aluminum results in a different to-bermorite structure due to general and local charge balance affectingthe lattice parameters Especially c is impacted by this substitutionbecause it occurs in the bridging tetrahedron and additional OHndash sub-stitutes O2ndash (Komarneni et al 1985 Merlino et al 2000) As suggestedin some additional studies the substitution of Si4+ by Al3+ and Na+ orK+ leads to a lath-like morphology of tobermorite crystals (Mostafa2005 Mostafa et al 2009 Venhodovaacute et al 2015 Qu et al 2018)However because of the heterogeneous appearance of tobermorite inAAC it is hardly possible to conduct a proper characterization based onSEM analysis In our recent work the anisotropic peak broadening oftobermorite in XRD diffractograms was successfully linked with theincorporation of foreign ions supplied in a common AAC production(Schreiner et al 2019) This finding allowed a more statistical struc-tural characterization of tobermorite in bulk compositions compared toSEM analysis Moreover it was reported in other studies that differenthydrate phases occur depending on the amount of supplied ions and onthe experimental settings In compounds with a high content of Al3+formation of katoite could be observed (Klimesch and Ray 1998 Riacuteoset al 2009 Matsui et al 2011) In the case of a longer curing durationinstead of 11 Aring tobermorite the formation of xonotlite (Siauciunas andBaltakys 2004 Galvaacutenkovaacute et al 2018) or - depending on the finenessof used silica source (Siauciunas and Baltakys 2004) - gyrolite is fa-voured
Kalousek (1956) suggested that tobermorite can contain up to 5Al2O3 More Al2O3 in the system resulted in the formation of hydro-garnet Klimesch and Ray (1998) additionally investigated the stabilityof hydrogarnet depending on the Al(Si + Al) ratio and its role in re-lation to the formation of 11 Aring tobermorite in an equivalent systemThey suggest that hydrogarnet always appears before tobermorite butthe former can only be detected for higher Al(Si + Al) ratios in theevent of longer curing times Riacuteos et al (2009) and Qu et al (2018)confirmed these findings in extensive investigations In the latter pub-lication it is additionally suggested that samples prepared at lowertemperatures (160 degC) are less impacted by the supply of Al3+ Theyalso consider the peak broadening of tobermorite in their XRD plotsbased on the amount of incorporated Al3+ In two recent publicationswe suggested that the peak broadening of tobermorite enables a mi-crostructural analysis by calculating the orientation dependent domainsizes (Schreiner et al 2018 2019) However these studies are based onsamples of industrially produced AAC so that the curing time was fixedThe studied AAC was produced from raw materials with a broad che-mical spectrum such as ordinary Portland cement (OPC) whichsomehow complicates the interpretation of results
In this work the influence of aluminum ions - provided by meta-kaolin - on dominant crystallographic direction-dependent domaingrowth of tobermorite is investigated by analysis of anisotropic peakbroadening (Ectors et al 2015 2017) In Fig 1 of the supplementarymaterial the method of fitting the anisotropic peak broadening of to-bermorite using a triaxial cylinder model is visualized (Schreiner et al2018) Fitting of the anisotropic peak broadening of tobermorite Thismethod is used to calculate the average and reliable values for to-bermorite domain sizes in the powder sample and associate them withaverage Al3+ incorporation Microstrain should be considered becauseit is an additional source of peak broadening However this usually
accounts for materials that have been exposed to different kinds ofstress such as metals and alloys (Badawi et al 2019) In addition theinstrumental contribution to peak broadening should be consideredHydration products such as tobermorite are characterized by crystallitesizes in the range of nanometers so that anisotropic size broadeningclearly outweighs the effect of instrumental broadening (Jenkins andSnyder 1996) Moreover the impact of Al3+ on the lattice parametersof tobermorite is considered It should additionally be clarified whe-ther the results from our previous publication (Schreiner et al 2019)based on industrially produced AAC can be confirmed by investigationwith less complex raw mixes and purely based on laboratory experi-ments
2 Material and methods
21 Starting materials
The starting materials for hydrothermal synthesis included deio-nized water quartz flour portlandite (999 pure) and two types ofmetakaolin One type was ordinary commercially available metakaolin(MK) with nearly a stoichiometric composition For comparison thesecond type of commercially available metakaolin was a by-productfrom expanded glass production (MKg) and consequently highly im-pure The chemical composition of MK and MKg determined by XRF isgiven in Table 1 With MKg containing less Al2O3 but considerably moreNa2O than MK the effects on hydrothermal synthesis were of interestBoth types of metakaolin have been characterized in previous pub-lications (Schmidt et al 2012 Naber et al 2019) In addition weverified the mineral phase content by XRD analysis Besides amorphousmetakaolin MK contained minor amounts of anatase quartz and mica
Fig 1 Weight fractions of tobermorite quartz and katoite determined byquantitative XRD analysis ndash samples including MKg crosshatched
Table 1Chemical composition of MK and MKg determined by XRF analysis ndash majorcontrasts in bold letters
Oxides [wt-] MK MKg
SiO2 536 604Al2O3 392 206CaO 01 40MgO 01 12Na2O 0 96K2O 10 18Fe2O3 18 05TiO2 21 03P2O5 01 02Loss on ignition 15 1
J Schreiner et al Applied Clay Science 185 (2020) 105432
2
6 Publications
32
MKg contained additional kaolinite feldspar and quartz
22 Investigated mix composites
For the preparation of raw mixtures the powders were weighed andhomogenized using a lab-scale mixing mill Table 2 lists the composi-tion and nomenclature of all samples including Al2O3 content andcuring time in the autoclave
bull Besides one blank mixture (MK0) that did not contain any type ofmetakaolin eleven more compounds were prepared of which threeincluded different dosages of MKg (MKg16 MKg23 and MKg60)Three more mixes contained equivalent amounts of MK instead ofMKg (MK16 MK23 and MK60) These mixes were investigated inorder to have a direct comparison concerning the effects of differentraw material on the synthesis of tobermorite
bull Additionally the mixes MK9 MK5 and MK25 with lower dosages ofmetakaolin were analyzed In the referenced literature (Schreineret al 2019) the effect of Al3+ on the anisotropic peak broadeningof tobermorite could only be observed in the case of Al2O3 contentslower than 4 in the drymix In the latter three mixes Al2O3 con-tents range from 1 to 35 Al2O3 (calculated from XRF data) whichmeets the region of interest for the analysis of tobermorite domainmorphology
bull The curing time for nearly all of the investigated samples was 12 hbut compound MK9 was prepared two more times for curing timesof 2 h and 6 h The different curing times were chosen in this par-ticular sample so that the reactivity of metakaolin and the phasetransitions could be observed more precisely
23 Hydrothermal treatment
Due to the different fineness of raw materials there was a differentwater demand from one mixture to another In order to obtain slurriesof comparable rheology the amount of water was adapted respectivelyresulting in water-to-solid ratios of 25 to 3 which matches the sug-gested water-to-solid ratio for this purpose (Roacutezycka et al 2014Galvaacutenkovaacute et al 2018) The weighed water was added to the dry mixand after stirring for 1 min at 23 degC the slurry was poured into thereactor Minor changes in the quantity of added water did not have aninfluence on the measured steam pressure All experiments were con-ducted using a PTFE-lined stainless steel autoclave with a reactor vo-lume of 300 ml The oven temperature was fixed at 180 degC and auto-genous steam pressure of 11ndash12 MPa was measured during eachexperiment with an external manometer After cooling to room tem-perature the sample was removed from the reactor coarsely ground
using an agate mortar and dried at 60 degC for 12 h After drying thesample was ground with an agate mortar again in order to deagglo-merate the particles As no coarse raw materials were used there wasno need for wet McCrone milling (Schreiner et al 2018)
24 XRD analysis
After preparation into front-loading sample holders the powdersamples were measured with a D8 diffractometer (Bruker) equippedwith a LynxEye detection system and Bragg-Brentano geometry Thesettings for XRD analysis included a tube voltage of 40 kV a current of40 mA an angular range from 6 to 80deg 2θ (Cu Kα radiation) a time perstep of 054 s a step width of 00236deg 2θ and a PSD opening of 33deg Thebackground was fitted with Chebyshev polynomial of the fifth orderThe major contribution of amorphous phase was fitted with a singlepeak with a fixed position at 308deg 2θ so that tobermorite reflectionswere not affected An external quartzite standard was measured withthe same parameters in order to determine phase quantities (Jansenet al 2011) Bruker AXS software TOPAS 50 was used for Rietveldrefinement (Rietveld 1969) and the used structures are shown inTable 3
3 Results and discussion
31 Different dosages of MK and MKg
In Fig 1 the quantities of tobermorite quartz and katoite present inmost of the samples determined by XRD analysis are illustratedWhenever tobermorite was the leading mineral hydrate phase a basalspacing of 113 Aring could be verified in each of the diffractograms Thequantities of minor crystalline phases and amorphous content are notshown For low dosages of MK it can be seen that the weight fraction oftobermorite decreased At moderate dosage of both types of metakaolin(MK16 MK23 MKg16 MKg23) tobermorite was present in comparablequantities It can be seen that the amount of katoite in the mixes de-pended on the dosage of metakaolin and it appeared only at dosages ofMK5 or more Due to the higher content of aluminum in MK comparedto MKg more katoite could always be observed in the MK mixes atequivalent dosages Despite equal amounts of quartz as starting mate-rial in mixes for both types of metakaolin the resulting weight fractionsin the cured samples were not alike Considerably more quartz waspresent in the MK samples Even though less quartz was used for mixescontaining higher amounts of MK even more quartz was present afterhydrothermal curing (Table 2 Fig 1) Consequently some of the SiO2
provided by MK did not transform into an amorphous phase or to-bermorite but into quartz This finding is verified by the presence ofquartz in MK60 because no quartz was included in the raw mixture Thefeldspar present in MKg did not react so Na2O and an unknown amountof Al2O3 may not have been supplied for hydrothermal reaction Besidestobermorite and quartz additional calcite scawtite (Ca7Si6(CO3)
Table 2Basic powder compounds prepared for the hydrothermal synthesis of to-bermorite with the respectively calculated Al2O3 content and curing time in thereactor
Sample Portlandite[wt-]
Quartz[wt-]
MK[wt-]
MKg
[wt-]
Al2O3
[wt-]Curingtime [h]
MK0 49 51 ndash ndash 0 12MK25 495 48 25 ndash 1 12MK5 49 46 5 ndash 2 12MK9_2h 48 43 9 ndash 35 2MK9_6h 48 43 9 ndash 35 6MK9_12h 48 43 9 ndash 35 12MK16 47 37 16 ndash 63 12MK23 46 31 23 ndash 9 12MK60 40 ndash 60 ndash 235 12MKg16 47 37 ndash 16 33 12MKg23 46 31 ndash 23 47 12MKg60 40 ndash ndash 60 124 12
Table 3Structural data used for the investigation with powder XRD analysis
Phase Author
Anatase (Horn et al 1972)Biotite (Brigatti et al 2000)Calcite (Maslen et al 1995)Kaolinite (Zvyagin 1960)Katoite (Bartl 1969)Microcline (Bailey 1969)Plazolite (Basso et al 1983)Portlandite (Busing and Levy 1957)Quartz (Le Page and Donnay 1976)Scawtite (Grice 2005)Tobermorite (Hamid 1981)Xonotlite (Hejny and Armbruster 2001)
J Schreiner et al Applied Clay Science 185 (2020) 105432
3
6 Publications
33
O18bull2(H2O)) and xonotlite (Ca6Si6O17(OH)2) could be identified insample MK0 (XRD plots of samples MK0 MKg16 MKg23 MK16 andMK23) Comparing MK0 and MK25 scawtite and xonotlite could stillbe identified in a very low amount in MK25 but no longer in samplesthat contained even more MK (XRD plots of samples MK0 MK25 MK5and MK9_12h)
Two additional experiments were done without quartz in the rawmixes (MK60 and MKg60) The according diffractograms after hydro-thermal curing are shown in Fig 2 In sample MKg60 tobermorite (gt 50wt-) was successfully synthesized without any other silica sourcethan MKg whereas no crystalline quartz occurred By contrast no to-bermorite but quartz could be identified in equivalent mixture MK60containing MK It can be seen that crystalline components such as micaand anatase in the raw MK did not react at the selected conditions andremained present in the autoclaved samples Except for feldspar in MKgall of the crystalline components appeared to be reactive at the chosenhydrothermal conditions A minor unidentified phase occurred at328deg2θ and additional xonotlite was identified in sample MKg60 Insample MK60 more calcium was needed for the formation of morehydrogarnet (Fig 1) resulting in a lower CaSi ratio for the remainingsystem Sample MKg60 contained only half of the amount of Al3+ and itwas not completely supplied for reaction due to its partial presence infeldspar Consequently essentially less hydrogarnet (Fig 1) was presentin MKg60 after hydrothermal treatment and the CaSi ratio in the re-maining system was affected to a lesser extent
32 Application of MK for different curing times
The development of hydrate phases in the autoclave for compoundMK9 is displayed in Fig 3 After only 2 h of hydrothermal curing all ofthe available portlandite had reacted and katoite (95 wt-) was pre-sent The applied type of metakaolin appeared to react quickly as itsupplied aluminum for formation of katoite No formation of to-bermorite could be observed at this stage yet An assumably amorphousprecursor can be seen at 28 to 30deg2θ Calcium was provided by thedissolution of portlandite After 6 h of hydrothermal reaction amountsof katoite (85 wt-) and quartz (from 31 wt- at 2 h to 165 wt- at6 h) had decreased and a major amount of tobermorite (35 wt-) waspresent Apparently between 2 and 6 h under hydrothermal conditionsthe amorphous precursor and quartz reacted resulting in the formationof tobermorite An additional 6 h of reaction time (MK9_12h) did notchange the phase composition significantly Slightly more tobermorite
(365 wt-) less quartz (16 wt-) and katoite (65 wt-) weremeasured
33 Tobermorite domain morphology and lattice parameters
In the referenced literature an analysis of tobermorite domainmorphology based on anisotropic peak broadening was possible forsamples that contained notgt 4 wt- Al2O3 in the drymix (Schreineret al 2019) Accordingly in this study samples MK0 MK25 MK5MK9_6h and MK9_12h were suitable (Table 2) with MK9_2h not con-taining any tobermorite In Fig 4 the respective growth in a and b di-rection is visualized with x indicating the domain size in a direction andy indicating domain size in b direction using a macro for TOPAS 50(Ectors et al 2015 2017) The calculated cylinder models in Fig 4represent the relation of yx and not absolute sizes With no supply ofaluminum ions (MK0) the relative domain growth in b direction islower compared to samples containing metakaolin This finding agreeswith the results from a similar investigation of tobermorite in AAC(Schreiner et al 2019) However within the samples MK5 andMK9_12h the different amounts of supplied aluminum ions did notshow a clear effect It appeared that low dosages of Al3+ (1 wt- Al2O3
in MK25 and 2 wt- Al2O3 in MK5) were enough to determine thedomain growth of tobermorite Additional results from the samplesMK9_6h and MK9_12h indicated that growth in b direction increasedwith reaction time
In Fig 5 lattice parameters of tobermorite depending on metakaolindosages are plotted B clearly remained unaffected throughout therange of samples Increasing amounts of metakaolin led to a slightlysmaller parameter a However both types of metakaolin showed acorresponding impact on parameter a By contrast parameter c in-creased strongly with increasing amounts of MK and MKg but the typeof metakaolin was significant At an equivalent dosage MK affected thecell dimension in c direction considerably more than MKg so that thefraction of Al3+ appeared to be the decisive parameter Different metaloxides in MKg did not show a notable effect certainly as they werepartially not provided for reaction Unlike for the domain morphologyof tobermorite the impact on lattice parameters could be observedwithin the complete range of examined dosages
4 Conclusions
The results obtained from the introduced investigations allow con-cluding remarks on the effects of the applied types of metakaolin on thesynthesis of 11 Aring tobermorite the phase transitions and the in-corporation of Al3+ into the lattice of tobermorite
With a critical dosage the use of any type of metakaolin led to theformation of katoite in an according amount At moderate dosages(MKg16 MKg23 MK16 and MK23) the two types of metakaolin showeda good correspondence in consideration of the quantities of to-bermorite For higher dosages there were contrary effects Lower do-sages of MK led to considerable quantities of Al-substituted to-bermorite Samples containing low dosages of MK revealed that katoiteappeared in the case ofgt 5 wt- of MK - corresponding to 2 wt-Al2O3 - in the basic compound Minor crystalline phases in MKg showedbetter reactivity than those in MK The observation that no tobermoritewas present in sample MK60 indicated that high dosages of Al3+ hin-dered the formation of tobermorite
Investigations of MK9 at 2 6 and 12 h displayed the evolution ofhydrate phases At first katoite was the only crystalline hydrate phasepresent after 2 h which corresponded to observations in a differentpublication (Klimesch and Ray 1999) The amount of katoite andquartz then decreased and a major amount of tobermorite formed from2 to 6 h curing time In order to gain more information on the trans-formation of amorphous C-(A)-S-H into tobermorite additional ex-periments in the range of 2 to 6 h curing time will be needed
Domain morphology analysis of tobermorite revealed that low
Fig 2 Diffractograms of MKg MKg60 MK and MK60 from 7 to 34deg2θ CuKα Aanatase C calcite F feldspar k kaolinite K katoite M mica Q quartz Ttobermorite U unidentified phase X xonotlite
J Schreiner et al Applied Clay Science 185 (2020) 105432
4
6 Publications
34
dosages of Al3+ determined the domain growth which agreed with theresults published on tobermorite in AAC samples (Schreiner et al2019) Different curing times unveiled that growth in b direction in-creased with the reaction time Al3+ incorporation into the lattice oftobermorite only reflected to a limited extent in the domain mor-phology By contrast an increase of lattice parameter c was triggered byAl3+ even at the highest dosage in this study Ultimately there is no
evidence for a limit of incorporation of Al3+ but there is a limit ofinfluence on the domain morphology These results additionally re-confirm this assumption similarly made in the previous work (Schreineret al 2019) and suggest a new mechanism of tobermorite crystal-lization depending on the presence of Al3+
Supplementary data to this article can be found online at httpsdoiorg101016jclay2019105432
Declaration of Competing Interest
The authors declare that they have no known competing financialinterests or personal relationships that could have appeared to influ-ence the work reported in this paper
Acknowledgement
The authors thank Rodgauer Baustoffwerke GmbH amp Co KG forsupplying raw materials for laboratory experiments
References
Aguilar-Mamani W Garciacutea G Hedlund J Mouzon J 2014 Comparison betweenleached metakaolin and leached diatomaceous earth as raw materials for the synth-esis of ZSM-5 Springerplus 3 1ndash10 httpsdoiorg1011862193-1801-3-292
Ayodele OB Sulaimon AA Alaba PA Tian Z-Y 2019 Influence of metakaolini-zation temperature on the structure and activity of metakaolin supported Ni catalystin dry methane reforming J Environ Chem Eng httpsdoiorg101016jjece2019103239 (in press)
Badawi EA Abdel-Rahman MA Mostafa A Abdel-Rahman M 2019 Determinationof the crystallite size amp micro- strain by novel method from XRD profile Appl Phys2 1ndash15 httpsdoiorg1031058jap201921001
Bailey SW 1969 Refinement of an intermediate microcline structure Am Miner 541540ndash1545
Bartl H 1969 Roentgen-Einkristalluntersuchungen an (CaO)3 (Al2O3) (H2O)6 und an(CaO)12 (Al2O3)7 (H2O) neuer Vorschlag zur (CaO)12 (Al2O3)7-Struktur NeuesJahrb fuer Mineral Monatshefte 1969 404ndash413
Basso R Giusta AD Zefiro L 1983 Crystal structure refinement of plazolite A highlyhydrated natural hydrogrossular Neues Jahrb Miner Monatsh (Neues Jahrb fuerMineral Monatshefte) 1983 251ndash258
Brigatti MF Lugli C Poppi L Foord EE Kile DE 2000 Crystal chemical varia-tions in Li- and Fe-rich micas from Pikes Peak batholith (Central Colorado) AmMineral 85 1275ndash1286 httpsdoiorg102138am-2000-8-920
Busing WR Levy HA 1957 Neutron diffraction study of calcium hydroxide J ChemPhys 26 563 httpsdoiorg10106311743345
Chen L Wang Z Wang Y Feng J 2016 Preparation and properties of alkali acti-vated metakaolin-based geopolymer Materials (Basel) 9 1ndash12 httpsdoiorg103390ma9090767
Chucholowski C Holger M Thienel K-C 2018 Improving the recyclability en-vironmental compatibility and CO2 balance of autoclaved aerated concrete by re-placing sulfate carrier and cement with calcined clays CePapers 2 503ndash512httpsdoiorg101002cepa846
Fig 3 Diffractograms of MK9_2h MK9_6h and MK9_12h from 7 to 38deg2θ CuKα C calcite K katoite Q quartz T tobermorite
Fig 4 Relation of calculated domain sizes of 11 Aring tobermorite in selectedsamples (MK0 MK25 MK5 MK9_6h and MK9_12h) in a (x) and b (y) direction
Fig 5 Lattice parameters of tobermorite depending on MK or MKg dosageincluding blank mix MK0
J Schreiner et al Applied Clay Science 185 (2020) 105432
5
6 Publications
35
Demir İ Başpınar MS Kahraman E Ccedilalışkan E Goumlrhan G 2014 An investigationon the usability of diatomite in aerated concrete production In Proc of the IntlConf on Advances in Civil Structural and Construction Engineering ndash CSCE 2014 pp97ndash100
Ectors D Goetz-Neunhoeffer F Neubauer J 2015 A generalized geometric approachto anisotropic peak broadening due to domain morphology J Appl Crystallogr 48189ndash194 httpsdoiorg101107S1600576714026557
Ectors D Goetz-Neunhoeffer F Neubauer J 2017 Routine (an)isotropic crystallitesize analysis in the double-Voigt approximation done right Powder Diffract 3227ndash34 httpsdoiorg101017S0885715617000070
Galvaacutenkovaacute L Bartoniacutečkovaacute E Opravil T Tkacz J Ptaacuteček P 2018 The influence ofstarting materials solubility on tobermorite structure formation under the hydro-thermal conditions IOP Conf Ser Mater Sci Eng 379 1ndash8 httpsdoiorg1010881757-899X3791012001
Grice JD 2005 The structure of spurrite tilleyite and scawtite and relationships toother silicate-carbonate minerals Can Mineral 43 1489ndash1500 httpsdoiorg102113gscanmin4351489
Hamid SA 1981 The crystal structure of the 11 Aring natural tobermoriteCa225[Si3O75(OH)15]1H2O Zeitschrift fuer Krist 154 189ndash198 httpsdoiorg101524zkri19811543-4189
Hejny C Armbruster T 2001 Polytypism in xonotlite Ca6Si6O17(OH)2 Zeitschrift furKrist 216 396ndash408
Horn M Schwerdtfeger CF Meagher EP 1972 Refinement of the structure of ana-tase at several temperatures Zeitschrift fur Krist 136 273ndash281 httpsdoiorg101524zkri19721363-4273
Jansen D Goetz-Neunhoeffer F Stabler C Neubauer J 2011 A remastered externalstandard method applied to the quantification of early OPC hydration Cem ConcrRes 41 602ndash608 httpsdoiorg101016jcemconres201103004
Jenkins R Snyder R 1996 Introduction to X-ray Powder Diffractometry ChemicalAnalysis Wiley pp 90
Kalousek GL 1956 Crystal Chemistry of Hydrous Calcium Silicates J Am Ceram Soc40 74ndash80
Klimesch D Ray A 1998 Autoclaved cement-quartz pastes with metakaolin additionsAdv Cem Based Mater 7 109ndash118 httpsdoiorg101016S1065-7355(97)00073-4
Klimesch D Ray A 1999 DTA-TGA evaluations of the CaOndashAl2O3ndashSiO2ndashH2O systemtreated hydrothermally Thermochim Acta 334 115ndash122 httpsdoiorg101016s0040-6031(99)00140-9
Komarneni S Roy R Roy DM Fyfe CA Kennedy GJ Bothner-By AA Dadok JChesnick AS 1985 27Al and29Si magic angle spinning nuclear magnetic resonancespectroscopy of Al-substituted tobermorites J Mater Sci 20 4209ndash4214 httpsdoiorg101007BF00552416
Koutnyacute O Opravil T Pořiacutezka J 2014 Application of metakaoline in autoclavedaerated concrete technology Adv Mater Res 1000 174ndash177 httpsdoiorg104028wwwscientificnetAMR1000174
Le Page Y Donnay G 1976 Refinement of the crystal structure of low-quartz ActaCrystallogr Sect B 32 2456ndash2459 httpsdoiorg101107S0567740876007966
Luo H Law WW Wu Y Zhu W Yang EH 2018 Hydrothermal synthesis of needle-like nanocrystalline zeolites from metakaolin and their applications for efficient re-moval of organic pollutants and heavy metals Microporous Mesoporous Mater 2728ndash15 httpsdoiorg101016jmicromeso201806015
Maeda H Ogawa Y Ishida EH Kasuga T 2012 Hydrothermal synthesis of to-bermorite doped with phosphorus species for removing heavy metal ions J AustCeram Soc 48 8ndash11
Maslen EN Streltsov VA Streltsova NR Ishizawa N 1995 Electron density andoptical anisotropy in rhombohedral carbonates III Synchrotron Xray studies ofCaCO3 MgCO3 and MnCO3 Acta Crystallogr Sect B 51 929ndash939 httpsdoiorg101107S0108768195006434
Matekonis G Šiaučiūnas R Vaičiukynienė D 2010 Hydrothermal Synthesis andCharacterization of Na + and [ Al 3 + + Na + ] -substituted Tobermorite in CaO-SiO2middotnH2O-H2O System Mater Sci 16 242ndash248
Matsui K Kikuma J Tsunashima M Ishikawa T Matsuno S Ogawa A Sato M2011 In situ time-resolved X-ray diffraction of tobermorite synthesis process underhydrothermal condition IOP Conf Ser Mater Sci Eng 18 60ndash66 httpsdoiorg1010881757-899X182022017
Merlino S Bonaccorsi E Armbruster T 2000 The real structures of clinotobermoriteand tobermorite 9 Aring OD character polytypes and structural relationships Eur JMineral 12 411ndash429 httpsdoiorg1011270935-122120000012-0411
Monasterio M Gaitero JJ Manzano H Dolado JS Cerveny S 2015 Effect ofchemical environment on the dynamics of water confined in calcium silicate mi-nerals Natural and synthetic tobermorite Langmuir 31 4964ndash4972 httpsdoiorg101021acslangmuir5b00614
Mostafa NY 2005 Influence of air-cooled slag on physicochemical properties of auto-claved aerated concrete Cem Concr Res 35 1349ndash1357 httpsdoiorg101016jcemconres200410011
Mostafa NY Shaltout AA Omar H Abo-El-Enein SA 2009 Hydrothermal synth-esis and characterization of aluminium and sulfate substituted 11 nm tobermoritesJ Alloys Compd 467 332ndash337 httpsdoiorg101016jjallcom200711130
Naber C Stegmeyer S Jansen D Goetz-Neunhoeffer F Neubauer J 2019 ThePONKCS method applied for time resolved XRD quantification of supplementarycementitious material reactivity in hydrating mixtures with ordinary Portland ce-ment Constr Build Mater 214 449ndash457 httpsdoiorg101016jconbuildmat201904157
Qu X Zhao Z Zhao X 2018 Microstructure and characterization of aluminum-in-corporated calcium silicate hydrates (C-S-H) under hydrothermal conditions RSCAdv 8 28198ndash28208 httpsdoiorg101039c8ra04423f
Rashad AM 2013 Metakaolin as cementitious material history scours production andcomposition - a comprehensive overview Constr Build Mater 41 303ndash318 httpsdoiorg101016jconbuildmat201212001
Rietveld HM 1969 A profile refinement method for nuclear and magnetic structures JAppl Crystallogr 2 65ndash71 httpsdoiorg101107S0021889869006558
Riacuteos CA Williams CD Fullen MA 2009 Hydrothermal synthesis of hydrogarnet andtobermorite at 175 degC from kaolinite and metakaolinite in the CaO-Al2O3-SiO2-H2Osystem a comparative study Appl Clay Sci 43 228ndash237 httpsdoiorg101016jclay200809014
Roacuteżycka A Pichoacuter W 2016 Effect of perlite waste addition on the properties of au-toclaved aerated concrete Constr Build Mater 120 65ndash71 httpsdoiorg101016jconbuildmat201605019
Roacutezycka A Kotwica Ł Małolepszy J 2014 Synthesis of single phase gyrolite in theCaO-quartz-Na2O-H2O system Mater Lett 120 166ndash169 httpsdoiorg101016jmatlet201401003
Sauman Z 1974 Influence of SO4 2ndash ions on the formation of 11 Aring tobermorite InProceedings of the 2nd International Symposium on Science and Research in SilicateChemistry Moscow pp 25ndash39
Schmidt M Egersdoumlrfer A Poumlllmann H 2012 Increased reactivity using a glass-containing metakaolin as an active filler in lime-based binder systems ZKG Int 6554ndash62
Schreiner J Jansen D Ectors D Goetz-Neunhoeffer F Neubauer J Volkmann S2018 New analytical possibilities for monitoring the phase development during theproduction of autoclaved aerated concrete Cem Concr Res 107 247ndash252 httpsdoiorg101016jcemconres201802028
Schreiner J Goetz-Neunhoeffer F Neubauer J Volkmann S Bergold S Webler RJansen D 2019 Advanced Rietveld refinement and SEM analysis of tobermorite inchemically diverse autoclaved aerated concrete Powder Diffract 34 143ndash150httpsdoiorg101017s0885715619000149
Setthaya N Chindaprasirt P Pimraksa K 2016 Preparation of zeolite nanocrystals viahydrothermal and solvothermal synthesis using of rice husk ash and metakaolinMater Sci Forum 872 242ndash247 httpsdoiorg104028wwwscientificnetmsf872242
Siauciunas R Baltakys K 2004 Formation of gyrolite during hydrothermal synthesis inthe mixtures of CaO and amorphous SiO2 or quartz Cem Concr Res 34 2029ndash2036httpsdoiorg101016jcemconres200403009
Skawinska A Owsiak Z Baran T Hernik K 2017 The influence of halloysite ad-dition on tobermorite formation in CaO and quartz mix under hydrothermal condi-tions Cem Wapno Bet 17 426ndash434
Venhodovaacute E Janovskyacute R Drochytka R 2015 Formation of tobermorite at differentmaterials composition of aerated concrete Appl Mech Mater 752ndash753 247ndash250httpsdoiorg104028wwwscientificnetamm752-753247
Walczak P Małolepszy J Reben M Szymański P Rzepa K 2015 Utilization ofwaste glass in autoclaved aerated concrete Proc Eng 122 302ndash309 httpsdoiorg101016jproeng201510040
Zhang Y Gao W Cui L 2007 The transformation of acid leached metakaolin tozeolite beta Stud Surf Sci Catal 170 420ndash425 httpsdoiorg101016S0167-2991(07)80870-6
Zvyagin BB 1960 An attempt to electronographic determination of kaolinite structureJ Dokl Akad Nauk SSSR 130 1023ndash1026
J Schreiner et al Applied Clay Science 185 (2020) 105432
6
6 Publications
36
6 Publications
62 Advanced Rietveld refinement and SEM analysis oftobermorite in chemically diverse autoclaved aeratedconcrete
Following the copyright guidelines by Cambridge University Press the publication
Schreiner J Goetz-Neunhoeffer F Neubauer J Volkmann S Bergold S WeblerR Jansen D 2019 Advanced Rietveld refinement and SEM analysis of tobermorite inchemically diverse autoclaved aerated concrete Powder Diffraction 34 143ndash150 httpsdoiorg101017s0885715619000149
may not be reprinted It can be accessed at
httpswwwcambridgeorgcorejournalspowder-diffractionarticleadvanced-rietveld-refinement-and-sem-analysis-of-tobermorite-in-chemically-diverse-autoclaved-aerated-concrete51597C2A66F6F225D29DEB2675E74249
37
6 Publications
63 New analytical possibilities for monitoring the phasedevelopment during the production of autoclavedaerated concrete
Reprint of the peer reviewed publication
Schreiner J Jansen D Ectors D Goetz-Neunhoeffer F Neubauer J VolkmannS 2018 New analytical possibilities for monitoring the phase development during theproduction of autoclaved aerated concrete Cement and Concrete Research 107 247ndash252httpsdoiorg101016jcemconres201802028
with permission from Elsevier
38
Contents lists available at ScienceDirect
Cement and Concrete Research
journal homepage wwwelseviercomlocatecemconres
Short communication
New analytical possibilities for monitoring the phase development duringthe production of autoclaved aerated concrete
J Schreinera D Jansena D Ectorsa F Goetz-Neunhoeffera J Neubauera S Volkmannb
aUniversity of Erlangen-Nuremberg GeoZentrum Nordbayern Mineralogy Schlossgarten 5a 91054 Erlangen Germanyb Rodgauer Baustoffwerke GmbH amp Co KG Am Opel-Pruumlffeld 3 63110 Rodgau-Dudenhofen Germany
A B S T R A C T
This work presents improved analytical methods for both steps of the production process of autoclaved aeratedconcrete (AAC) the phase development during the hydration before autoclaving and during the autoclavingprocess itself The improvement includes new insights into preparation methods of AAC samples for powderdiffraction as well as Rietveld refinement strategies For the first time a new implementation for calculatinganisotropic crystal domain sizes is applied to major hydrate phases occurring during AAC production namelyportlandite during the hydration before autoclaving and tobermorite during the autoclaving process The cal-culation of anisotropic domain size growth which can be implemented in the Rietveld environment is based oncrystallographically and geometrically appropriate models The implementation of calculating anisotropic do-main sizes for the Rietveld software TOPAS 50 allows a superior Rietveld fit and a more accurate quantificationof the phase development Additionally it enables the tracking of growth mechanism of portlandite duringhydration
1 Introduction
Autoclaved aerated concrete (AAC) is known as a lightweight con-struction material which offers outstanding properties such as suffi-cient strength for construction in addition with excellent thermal in-sulation [12] AAC is produced by autoclaving from calcareous rawmaterials such as lime (CaO) and cement quartz sulfate carrier andother additives such as foaming agents and water
The production process (Fig 1) can be separated into the hydrationof the mixed slurry before the procedure of autoclaving and the auto-claving at elevated temperature (180 degC to 200 degC) under saturatedsteam pressure (12MPa) for several hours
The hydration process before autoclaving is necessary to achievesufficient strength in order to cut the green cake blocks as they shouldhave a specific shape and dimension after autoclaving Furthermorethe porous structure is generated by the foaming agent during hydra-tion in the first process step During autoclaving the final propertiesnamely strength and low thermal conductivity are achieved
It is already well understood that the autoclaving process leads tothe formation of several phases first of all tobermorite(Ca5Si6O16(OH)2lowast4H2O) [3ndash5] Newest research has shown im-pressively which reactions are running from the mineralogical point ofview Insitu XRD measurements were carried out during the
autoclaving process and the phase development was shown by plottingnormalized intensities [6] The study of Mitsuda et al [3] was mainlyfocused on the tracking of the phase evolution during the autoclavingprocess of AAC However their statements concerning phase evolutionare mainly based on XRD data and TGA measurements There is acommon agreement that the following reactions occur The consump-tion of the alite (OPC) leads to the formation of an initial C-S-H phaseduring the first processing step Portlandite which was initially formedduring the first process step (from CaO and C3S) further quartz and theC-S-H phase are consumed during autoclaving resulting in the crystal-lization of tobermorite Hence the crystallization process of to-bermorite as well as the crystal structure of tobermorite was an issue ofresearch and discussion over the last years and numerous publicationsto these topics are available Concerning the crystal structure of to-bermorite respectively the tobermorite supergroup a new publicationoutlines all important references and recommends a new nomenclature[7]
The presented study was performed to create new analytical possi-bilities for the characterization of the production process of AAC Bothof the production process steps are essential for the final productHence the present work focuses on crystallization of hydrate phases inboth processes
Firstly an external standard method [89] was published and
httpsdoiorg101016jcemconres201802028Received 6 October 2017 Received in revised form 1 February 2018 Accepted 26 February 2018
Corresponding authorsE-mail addresses juergenjsschreinerfaude (J Schreiner) danieljansenfaude (D Jansen)
Cement and Concrete Research 107 (2018) 247ndash252
0008-8846 copy 2018 Elsevier Ltd All rights reserved
T
6 Publications
39
recommended for the determination of absolute phase contents inmixtures with amorphous content It was shown that the method canabsolutely be recommended for hydrating cement pastes in which watercannot be quantified directly by XRD [10] This method seems to bevery promising for both the quantification of the hydration of the AACslurry before autoclaving and the quantification of the phase evolutionduring autoclaving inasmuch as both production steps form crystallineand amorphous phases
Secondly a new approach to anisotropic peak broadening due toanisotropic domain morphology which was developed [1112] is ap-plied to AAC samples to improve the fit of portlandite and tobermoriteby Rietveld refinement [13] By applying this approach the refinementof both portlandite and tobermorite should additionally lead to betterquantitative results as well as to better insights into the development ofthe domain size morphology of both phases formed
It was already shown that in a hydrating raw mixture for AAC twospecies of portlandite precipitate at 23 degC one showing dynamicallyanisotropic peak broadening and another one following the isotropictrend [14] The application of the anisotropic refinement model led toan improved fitting of portlandite Moreover the mechanism of aniso-tropic domain growth of portlandite was tracked
2 Materials and methods
In order to examine the hydration of the AAC slurry before auto-claving a mixture of the hydraulic reactive components was weighedand measured in-situ at a Bruker D8 diffractometer with a LynxEyedetection system
Ordinary Portland cement (OPC) was mixed with lime (CaO) andanhydrite (C$) The raw materials were taken from the same batches asfor the industrial samples The drymix (58 OPC 36 CaO and 6 C$by weight) was then mixed with water (ws= 08) and placed into anappropriate sample holder The samples were not aerated The slurrysamples were covered with a kapton film to avoid evaporation andcarbonation Diffractograms were recorded with an angular range from7 to 545deg 2θ and a step width of 0011deg 2θ Measurements were carriedout every 15min For each measurement 96 XRD patterns were re-corded over the first 24 h The temperature was fixed at 70 degC which isthe mean temperature generally prevailing in the industrial processduring hydration before autoclaving Rietveld refinement was carriedout using the G-factor method All structures used for Rietveld refine-ment are shown in Table 1
For investigation of the autoclaved samples five different specimenswere taken at different autoclaving times The specimens were takenout of a technical production process hence it was not possible to in-terrupt the process at an earlier time inasmuch it would lead to damageof a whole concrete production batch The specimens were firstly driedat 60 degC until weight constancy The whole blocks were then broken andstatistical samples of 20 g were taken In order to receive the right massattenuation coefficient (MAC) for G-factor method the loss on ignitionand the chemical composition (XRF) were determined For energydispersive XRF analysis (Spectro Xepos) tube voltage from 20 kV to50 kV and tube current from 08 to 20mA were used for differenttargets
The final sample preparation (grinding) before XRD measurementswas carried out using both an agate mortar and a McCrone micronizingmill for wet milling with isopropanol Both preparation methods wereapplied separately to see which one is suitable in order to get the bestpreparation for XRD investigations Six preparations were performed byone operator of which two were prepared with an agate mortar andfour with a McCrone mill For the McCrone milling 3 g of the sampleand 10ml of isopropanol were used for grinding for 12min The grainsize distribution of one sample prepared with an agate mortar and onesample prepared using a McCrone mill was measured by laser granu-lometry in isopropanol using a Mastersizer 3000 (MALVERN)
After milling the samples in these two ways for XRD analysis thepowders were prepared into a front loading sample holder and mea-sured Diffractograms were recorded with an angular range from 6 to80deg 2θ a step width of 00236deg 2θ and a time per step of 054 s Rietveldrefinement combined with external standard (G-factor) was applied inorder to get absolute quantities for each phase The refinement strategyfor portlandite and tobermorite in the TOPAS Launch Mode (TOPAS50 Bruker AXS) is attached as a Supplementary material file
3 Results and discussion
31 Hydration of the mixture before autoclaving
The hydration of the investigated paste before autoclaving isdominated by the hydration of the cement as well as the reaction of thefree lime (CaO) resulting in the formation of portlandite It can beclearly seen from Fig 2 that the hydration of the paste leads to theformation of ettringite portlandite and C-S-H phase For simplificationthe remaining phase developments are not shown in Fig 2 because theyare not in the focus of this study The hydration of CaO forming
Fig 1 Simplified process steps of AAC production and hydrate phase evolution
Table 1Structures used for Rietveld refinement
Phase Author
Alite [15]Anhydrite [16]Bassanite [17]Belite (β) [18]Belite (αprime) [19]Brownmillerite [20]C-S-H [21]Calcite [22]Ettringite [23]Gypsum [24]Hemicarbonate [25]Hydroxylellestadite [26]Lime (CaO) [27]Microcline [28]Portlandite [29]Quartz [30]Tobermorite [31]Tricalciumaluminate (cubic) [32]Tricalciumaluminate (orthorhombic) [33]PONCKS model for Water [21]
J Schreiner et al Cement and Concrete Research 107 (2018) 247ndash252
248
6 Publications
40
portlandite begins rapidly after the addition of water to the mixture andlime is fully consumed after only 1 h of hydration This translates into aquick rise of heat of hydration so that cement hydration is acceleratedwhich leads to further portlandite formation by the reaction of aliteEttringite formation stalls after few hours of hydration After 12 h et-tringite is partially decomposed probably due to sulfate depletion [9]
and poorly crystalline AFm phases (not shown in Fig 2) are formedIn Fig 3 it can be seen that in fact two generations of portlandite
are formed a 1st dominant generation showing anisotropic peakbroadening and 2nd one occurring considerably later following theisotropic domain size refinement which is usually carried out using theRietveld method This occurrence comes along firstly with lime hy-dration and secondly with alite hydration The expected quantity ofportlandite formed from lime hydration very well complies with the
Fig 2 Phase development in AAC paste on a laboratory scale before autoclaving ana-lyzed by in-situ XRD at 70 degC
Fig 3 Formation of two generations of portlandite by hydration of lime (1st) and C3S(2nd) at 70 degC before autoclaving with the major generation showing anisotropic peakbroadening
Fig 4 Biaxial cylinder domain size model of portlandite used for Rietveld refinement of anisotropic peak broadening
Fig 5 Morphological evolution of portlandite showing anisotropic domain size growthduring hydration at 70 degC
Fig 6 Comparison of quantification of crystalline quartz in samples prepared withMcCrone mill and agate mortar at different autoclaving times
J Schreiner et al Cement and Concrete Research 107 (2018) 247ndash252
249
6 Publications
41
quantity of the observed 1st generation The development of portlan-dite growth was already tracked in an equivalent slurry at 23 degC [14]Thus this observation confirms that the crystallinity of portlandite inmixtures for AAC production depends on the starting phase for hydra-tion as already indicated by Ectors [14]
Fig 4 shows the used biaxial cylindrical model for anisotropic do-main size calculation and the portlandite structure which was createdwith structural software VESTA 318 [34] Using the cylindrical ap-proach domain sizes in a (here equating to b) and c direction(dz= cylinder height) can be calculated which comes along with theexpected symmetrical parameters of portlandite
The 1st portlandite generation showing anisotropic domain growthcan be tracked in terms of cylinder diameter and height which is rea-lized in Fig 5 The blue cylinder represents the geometric approach andcylinder height and diameter are calculated newly for each range Thecylinder height remains rather stable throughout the hydration processwhile the cylinder diameter increases during the first hours of hydra-tion After 10 h of hydration the mean cylinder diameter no longer in-creases Consequently these observations match the results of the ex-aminations conducted at 23 degC [14] as well as the assumption thatdifferent mechanisms of growth exist for portlandite depending on the
hydration educt The maximum cylinder diameter is reached earlier inthis work very likely because of the higher hydration temperature
32 Quantification of the reactions during autoclaving
Autoclaved samples were ground with an agate mortar and com-pared to samples which were wet-ground with a McCrone mill Fig 6shows precisely that the determination of the amount of crystallinequartz is more reproducible in the two shown samples which were
Fig 7 2D XRD with Bruker GADDS-system plots of samples prepared with agate mortar and McCrone mill Coarse quartz grains are pointed out in the plot of the sample prepared withagate mortar
Fig 8 Particle size distribution of one sample prepared with an agate mortar and of onesample prepared with a McCrone mill measured by laser granulometry
Fig 9 Rietveld refinement for Tobermorite of autoclaved AAC sample by use of isotropicdomain size model (a) and of anisotropic domain size model (b)
J Schreiner et al Cement and Concrete Research 107 (2018) 247ndash252
250
6 Publications
42
prepared with a McCrone mill The high variance of crystalline quartzin the samples which were prepared with an agate mortar is a result ofinsufficient grinding and remaining of too large quartz grains Whenthis spottiness occurs a reliable quantification using the G-factormethod is not possible
The 2D XRD with Bruker GADDS-system plots in Fig 7 demonstratethe insufficient grinding when using an agate mortar compared to wetmilling with a McCrone mill Quartz would be overrepresented in a one-dimensional XRD pattern focusing on a section with bright spots (greenarrows) The lack of bright spots in the right plot shows that the quartzgrains are milled more thoroughly using a McCrone mill In Fig 8 theparticle size distribution after both ways of sample preparation iscompared Most grains in the sample prepared with an agate mortar arelarger than in the sample prepared with a McCrone mill The grain sizedistribution of the sample prepared with a McCrone mill complies withthe recommended particle size range for XRD analysis of under 5 to50 μm [3536] while the other sample exceeds the range
In Fig 9 Rietveld refinement of an autoclaved sample is shown Thedominant peaks at 77 290 and 301deg 2θ are attributed to tobermoriteIn the upper diagram (a) Rietveld refinement was carried out regularlycalculating isotropic domain sizes for tobermorite However the cal-culated fit differs significantly from the raw data It can be assumed thattobermorite shows a similar pattern to portlandite in terms of aniso-tropic peak broadening taking into account that tobermorite is as-signed to the orthorhombic crystal system Thus instead of a biaxialcylinder model an elliptic cylinder model (Fig 10 structure createdwith VESTA 318 [34]) was applied for the refinement in the lowerdiagram (b) The elliptic cylinder model is a sufficient approach to the
orthorhombic crystal system as it allows the distinction between do-main sizes in a b and c direction The fit is clearly superior using theanisotropic domain size model highlighted by the difference plot inFig 9b The comparison refinement with isotropic and anisotropic ap-proach was done for all of the five autoclaved samples In Fig 11 theresulting Rwp values for the whole pattern and the RBragg values of to-bermorite are shown The refinement using the anisotropic model leadsto both lower Rwp and RBragg values and consequently to a better fit anda more accurate quantification of tobermorite in all refined samples
4 Summary and conclusions
Improved analytical methods for both the phase developmentduring the hydration before autoclaving and during the autoclavingprocess of AAC are presented It could be shown that wet McCronemilling is the best way of preparation of AAC samples in order to obtainsuitable samples for powder diffraction A new approach to treat ani-sotropic domain sizes for Rietveld refinement could be successfullyapplied ndash with the benefit that portlandite and tobermorite in AACsamples could be refined more accurately using the Rietveld methodThus this application allows an improved quantification of the phasedevelopment during both of the production steps
For the future there are still plenty of possibilities to apply thepresented approach of calculating anisotropic domain sizes to AACproduction As exemplified with portlandite the mechanisms of growthof tobermorite can be tracked likewise during the autoclaving processIn addition the effect of variations in the chemical composition of AACraw mixtures on the crystal morphology of tobermorite can be ex-amined This leaves a new perspective to discuss the link between mi-neral phase morphology and the thermal and mechanical properties ofAAC
Acknowledgement
The autoclaved samples were generously provided by RodgauerBaustoffwerke GmbH amp Co KG The authors express gratitude for allsupport
Appendix A Supplementary data
Supplementary data to this article can be found online at httpsdoiorg101016jcemconres201802028
References
[1] MW Grutzeck Cellular concrete in M Scheffler P Colombo (Eds) CellularCeramics Wiley-VCH Weinheim 2005 pp 193ndash223
[2] M Haas The future of AAC ndash from a material scientists point of view inMC Limbachiya JJ Roberts (Eds) Autoclaved Aerated Concrete Taylor FrLondon 2005 pp 187ndash194
[3] T Mitsuda K Sasaki H Ishida Phase evolution during autoclaving process ofaerated concrete J Am Ceram Soc 75 (1992) 1858ndash1863
[4] N Isu H Ishida T Mitsuda Influence of quartz particle size on the chemical and
Fig 10 Triaxial cylinder domain size model of Tobermorite used for Rietveld refinement of anisotropic peak broadening
Fig 11 Comparison of Rwp and RBragg values of Rietveld refinements of autoclavedsamples and tobermorite using the isotropic and the anisotropic domain size model
J Schreiner et al Cement and Concrete Research 107 (2018) 247ndash252
251
6 Publications
43
mechanical properties of autoclaved aerated concrete (I) tobermorite formationCem Concr Res 25 (1995) 243ndash248
[5] NY Mostafa Influence of air-cooled slag on physicochemical properties of auto-claved aerated concrete Cem Concr Res 35 (2005) 1349ndash1357 httpdxdoiorg101016jcemconres200410011
[6] K Matsui J Kikuma M Tsunashima T Ishikawa S Matsuno A Ogawa M SatoIn situ time-resolved X-ray diffraction of tobermorite formation in autoclaved aer-ated concrete influence of silica source reactivity and Al addition Cem Concr Res41 (2011) 510ndash519
[7] C Biagioni S Merlino E Bonaccorsi The tobermorite supergroup a new no-menclature Mineral Mag 79 (2015) 485ndash495 httpdxdoiorg101180minmag2015079222
[8] BH OConnor MD Raven Application of the Rietveld refinement procedure inassaying powdered mixtures Powder Diffract 3 (1988) 2ndash6 httpdxdoiorg101017S0885715600013026
[9] D Jansen F Goetz-Neunhoeffer C Stabler J Neubauer A remastered externalstandard method applied to the quantification of early OPC hydration Cem ConcrRes 41 (2011) 602ndash608 httpdxdoiorg101016jcemconres201103004
[10] D Jansen C Stabler F Goetz-Neunhoeffer S Dittrich J Neubauer Does OrdinaryPortland Cement contain amorphous phase A quantitative study using an externalstandard method Powder Diffract 26 (2011) 31ndash38 httpdxdoiorg10115413549186
[11] D Ectors F Goetz-Neunhoeffer J Neubauer A generalized geometric approach toanisotropic peak broadening due to domain morphology J Appl Crystallogr 48(2015) 189ndash194 httpdxdoiorg101107S1600576714026557
[12] D Ectors F Goetz-Neunhoeffer J Neubauer Routine (an)isotropic crystallite sizeanalysis in the double-Voigt approximation done right Powder Diffract 32 (S1)(2017) 27ndash34 httpdxdoiorg101017S0885715617000070
[13] HM Rietveld A profile refinement method for nuclear and magnetic structures JAppl Crystallogr 2 (1969) 65ndash71 httpdxdoiorg101107S0021889869006558
[14] D Ectors Advances in the Analysis of Cementitious Reactions and Hydrate Phases(Doctoral Thesis) (2016) pp 12ndash14 (urnnbndebvb29-opus4-71743)
[15] AacuteG De La Torre S Bruque J Campo MAG Aranda The superstructure of C3Sfrom synchrotron and neutron powder diffraction and its role in quantitative phaseanalyses Cem Concr Res 32 (2002) 1347ndash1356 httpdxdoiorg101016S0008-8846(02)00796-2
[16] A Kirfel G Will Charge density in anhydrite CaSO4 from X-ray and neutrondiffraction measurements Acta Crystallogr Sect B Struct Crystallogr CrystChem 36 (1980) 2881ndash2890 httpdxdoiorg101107S0567740880010461
[17] C Bezou AN Christensen D Cox M Lehman A Nonat Structures cristallines deCaSO405H2O et CaSO406H2O Comptes Rendus Hebd Des Seacuteances lAcadeacutemieDes Sci Seacuterie 2 (312) (1991) 43ndash48
[18] KH Jost B Ziemer R Seydel Redetermination of the structure of β-dicalciumsilicate Acta Crystallogr Sect B Struct Crystallogr Cryst Chem 33 (1977)1696ndash1700 httpdxdoiorg101107S0567740877006918
[19] W Mumme LMD Cranswick BC Chakoumakos Rietveld crystal structure re-finements from high temperature neutron powder diffraction data for the poly-morphs of dicalcium silicate Neues Jahrb Fuer Mineral Abhandlungen 170 (1996)171ndash188
[20] A Colville S Geller The crystal structure of brownmillerite Ca2FeAlO5Crystallographica 50 (1971) 2311ndash2315 httpdxdoiorg101107S056774087100579X
[21] ST Bergold F Goetz-Neunhoeffer J Neubauer Quantitative analysis of C-S-H inhydrating alite pastes by in-situ XRD Cem Concr Res 53 (2013) 119ndash126 httpdxdoiorg101016jcemconres201306001
[22] EN Maslen VA Streltsov NR Streltsova N Ishizawa Electron density and op-tical anisotropy in rhombohedral carbonates III Synchrotron Xray studies ofCaCO3 MgCO3 and MnCO3 Acta Crystallogr Sect B 51 (1995) 929ndash939 httpdxdoiorg101107S0108768195006434
[23] G Renaudin Y Filinchuk J Neubauer F Goetz-Neunhoeffer A comparativestructural study of wet and dried ettringite Cem Concr Res 40 (2010) 370ndash375httpdxdoiorg101016jcemconres200911002
[24] WF Cole CJ Lancucki A refinement of the crystal structure of gypsumCaSO42H2O Acta Cryst B30 (1974) 921ndash929 httpdxdoiorg101107S0567740874004055
[25] T Runčevski RE Dinnebier OV Magdysyuk H Poumlllmann Crystal structures ofcalcium hemicarboaluminate and carbonated calcium hemicarboaluminate fromsynchrotron powder diffraction data Acta Crystallogr Sect B Struct Sci 68 (2012)493ndash500 httpdxdoiorg101107S010876811203042X
[26] JM Hughes JW Drexler Cation substitution in the apatite tetrahedral site crystalstructures of type hydroxylellestadite and type fermorite Neues Jahrb FuerMineral (1991) 327ndash336
[27] CH Shen RS Liu JG Lin CY Huang Phase stability study of La12Ca18Mn2O7Mater Res Bull 36 (2001) 1139ndash1148
[28] SW Bailey Refinement of an intermediate microcline structure Am Miner 54(1969) 1540ndash1545
[29] WR Busing HA Levy Neutron diffraction study of calcium hydroxide J ChemPhys 26 (1957) 563 httpdxdoiorg10106311743345
[30] Y Le Page G Donnay Refinement of the crystal structure of low-quartz ActaCrystallogr Sect B 32 (1976) 2456ndash2459 httpdxdoiorg101107S0567740876007966
[31] SA Hamid The crystal structure of the 11 Aring natural tobermoriteCa225[Si3O75(OH)15]1H2O Zeitschrift Fuer Krist - New Cryst Struct 154 (1981)189ndash198 httpdxdoiorg101524zkri19811543-4189
[32] P Mondal JW Jeffery The crystal structure of tricalcium aluminate Ca3Al2O6Acta Crystallogr B 31 (1975) 689ndash697 httpdxdoiorg101107S0567740875003639
[33] Y Takeuchi F Nishi I Maki Crystal-chemical characterization of the tricalciumaluminate-sodium oxide (3CaOtimesAl2O3-Na2O) solid-solution series Zeitschrift FuumlrKrist (1980) 259ndash307
[34] K Momma F Izumi VESTA 3 for three-dimensional visualization of crystal vo-lumetric and morphology data J Appl Crystallogr 44 (2011) 1272ndash1276 httpdxdoiorg101107S0021889811038970
[35] K Scrivener R Snellings B Lothenbach A Practical Guide to MicrostructuralAnalysis of Cementitious Materials CRC Press 2016 pp 123ndash125 httpdxdoiorg107693wl20150205
[36] V Pecharsky P Zavalij Fundamentals of Powder Diffraction and StructuralCharacterization of Materials Springer second edition 2005 p 302 httpdxdoiorg101007978-0-387-09579-0
J Schreiner et al Cement and Concrete Research 107 (2018) 247ndash252
252
6 Publications
44
7 Acknowledgement
7 Acknowledgement
Ich moumlchte mich bei einigen Personen bedanken ohne die es wohl kaum zum erfolgreichenAbschluss dieser Arbeit gekommen waumlreMein Doktorvater Prof Dr Juumlrgen Neubauer hat sich stets die Zeit genommen die noumltigwar um Angelegenheiten aller Art mit mir zu klaumlren Er gab mir fachlich immer zumrichtigen Zeitpunkt einen gewissen wissenschaftlichen Impuls Zugleich habe ich mich den-noch immer frei in meiner eigenen Konzeption gefuumlhlt Groszligen Dank spreche ich Prof DrFriedlinde Goumltz-Neunhoeffer aus die fuumlr mich ebenso immer eine verlaumlssliche Ansprech-partnerin fuumlr fachliche und organisatorische Angelegenheiten aller Art war Danke anDr Daniel Jansen fuumlr die gute Zusammenarbeit und dafuumlr dass er mich im Zuge meinerMasterarbeit in ein Forschungsprojekt aufgenommen hat das den Weg zur Promotionmoumlglich machte Zusaumltzlich gilt mein Dank Prof Dr Matthias Goumlbbels der fuumlr dieMitarbeiter am Lehrstuhl immer motivierende Worte fand Fuumlr die Ermoumlglichung meinerTeilnahme an diversen Dienstreisen Fortbildungen und Tagungen moumlchte ich mich viel-mals bedankenWeiterhin bedanke ich mich bei Dr Stephan Volkmann und den Rodgauer BaustoffwerkenGmbH amp Co KG fuumlr die gute Zusammenarbeit und die Bereitstellung von Versuchsma-terialienVielen Dank an meine studentischen Hilfskraumlfte Daniel Wagner Laura MoldenhauerFabian Lang Jakob Schreiber und Felix Klaassen die alle Aufgaben im Labor einwand-frei und mit Bedacht erledigten Bei meinen aktuellen und ehemaligen Kollegen DrKatrin Hurle Dr Dominique Ectors Dr Christoph Naber Dr Florian Huumlller JoumlrgNehring Frank Riedel Julian Wolf Tanja Manninger Daniel Wagner Nicolas FobbeKarla Spaumlth Julian Goergens Andreas Koumlhler Cordula Jakob Franz Becker und LisaKlemenz bedanke ich mich fuumlr die gelungene Zusammenarbeit und gegenseitige Unter-stuumltzung Besonderer Dank geht auch an Kerstin Kreszlig Bettina Engl Christian HankeBernd Schleifer und Christian Abe fuumlr die verlaumlssliche Unterstuumltzung bei technischen Fra-gen und Messungen im LaborFuumlr jegliche Unterstuumltzungen moumlchte ich mich auch bei meinen Eltern bedanken sowiebei meinem Bruder Ralf der mir mit einem LaTex Crashkurs viel Frustration ersparthat Danke Thomas dass du immer fuumlr mich da bist und mit mir zusammen fuumlr genugAusgleich gesorgt hast
45
Contents lists available at ScienceDirect
Applied Clay Science
journal homepage wwwelseviercomlocateclay
Research paper
Hydrothermal synthesis of 11 Aring tobermorite ndash Effect of adding metakaolin tothe basic compound
J Schreiner F Goetz-Neunhoeffer J Neubauer D JansenUniversity of Erlangen-Nuremberg GeoZentrum Nordbayern Mineralogy Schlossgarten 5a 91054 Erlangen Germany
A R T I C L E I N F O
KeywordsHydrothermal synthesis11 Aring tobermoriteMetakaolinPowder diffractionKatoite
A B S T R A C T
Different amounts and types of metakaolin were analyzed and applied for the hydrothermal synthesis of 11 Aringtobermorite All synthesized samples were investigated by means of powder XRD combined with Rietveld re-finement Al-substituted 11 Aring tobermorite was successfully synthesized on the basis of a broad range of com-pounds characterized by a varying content of metakaolin Katoite was present depending on the amount ofsupplied Al3+ which was determined by the dosage of metakaolin Minor crystalline components included in thetwo types of metakaolin sources varied greatly in their reactivity under hydrothermal conditions Despite adifferent degree of purity the two types of metakaolin showed corresponding effects at moderate dosages butcontrary effects at higher dosages as for the synthesis of 11 Aring tobermorite The domain morphology of to-bermorite could be associated with Al3+ incorporation for low dosages of metakaolin represented by up to 2 wt- Al2O3 in the dry mix By contrast Al3+ affected tobermorite lattice parameters at equivalent and even athigher dosages with c reaching 2295 Aring at 12 wt- Al2O3 in the dry mix
1 Introduction
11 Application of metakaolin as a reactive material in constructionindustry
The application of supplementary cementitious materials (SCMs) inthe field of construction technology has received a lot of attention inrecent years Due to limited resources and an urgent need for alter-native and more eco-friendly construction materials SCMs such asmetakaolin offer a great potential The usage of SCMs has not onlyspread to the cement and mortar industry but also to advanced appli-cations such as autoclaved aerated concrete (AAC) (Demir et al 2014Koutnyacute et al 2014 Walczak et al 2015 Roacuteżycka and Pichoacuter 2016Chucholowski et al 2018) Unlike ordinary cementitious constructionmaterials AAC is produced from hydrothermal curing Due to the dif-ferent thermodynamic environment the hydration process and the re-activity of raw materials have to be investigated properly in order tounderstand the effects on the AAC product The leading mineral phasein AAC is 11 Aring tobermorite (Ca5Si6O16(OH)2middot4H2O) As a consequencethe thermal and mechanical properties of AAC depend on micro-structure and crystallinity of tobermorite to some extent In addition tothe curing time and the fineness of raw materials the supply of ionsthat can substitute in the tobermorite structure is a crucial factor in thiscontext Especially substitutions by aluminum sodium and potassium
ions have been investigated thoroughly (Sauman 1974 Klimesch andRay 1998 Mostafa et al 2009 Matekonis et al 2010 Skawinskaet al 2017) Calcined clays usually contain a considerable amount ofthe mentioned ions
There is a vast amount of literature on the reactivity of SCMs atambient temperature and standard pressure but there is little when itcomes to hydrothermal conditions In previous publications the beha-vior of metakaolin under hydrothermal conditions was mainly in-vestigated for the synthesis of zeolites (Zhang et al 2007 Aguilar-Mamani et al 2014 Setthaya et al 2016 Luo et al 2018) In thesestudies the reactivity of metakaolin was observed at a wide range oftemperature and pH values During the transformation of kaolin intometakaolin a loss of framework alumina was observed (Ayodele et al2019) In recent decades metakaolin has been the subject of studies inthe field of geopolymer research (Rashad 2013 Chen et al 2016) Forthe synthesis of 11 Aring tobermorite a more distinct setting of temperaturesetting (180ndash200 degC) and steam pressure (1ndash12 MPa) are required
This publication is intended to make a new contribution to thechallenging field of hydrothermal synthesis in the system CaO-Al2O3-SiO2-H2O based on XRD analysis combined with Rietveld refinementVarious dosages of two types of metakaolin with different chemical andmineralogical purities are compared for the effects on the hydrothermalsynthesis of Al-substituted 11 Aring tobermorite Especially changes of thebulk chemistry in the raw mixes the reactivity of minor crystalline
httpsdoiorg101016jclay2019105432Received 20 August 2019 Received in revised form 13 November 2019 Accepted 30 December 2019
Corresponding authorE-mail address juergenjsschreinerfaude (J Schreiner)
Applied Clay Science 185 (2020) 105432
0169-1317 copy 2020 Elsevier BV All rights reserved
T
6 Publications
31
phases of the two types of metakaolin and the effect of different curingtimes are the focus of interest On the one hand metakaolin offers agreat potential in the AAC industry On the other hand of all SCMsmetakaolin is a good source material for investigating the influence ofAl3+ on the synthesis of Al-substituted 11 Aring tobermorite
12 Synthesis of Al-substituted 11 Aring tobermorite
In addition to being present in AAC tobermorite has found appli-cation in wastewater treatment and nuclear waste management due toits ion exchange capacity (Maeda et al 2012 Monasterio et al 2015)The substitution of silicon by aluminum results in a different to-bermorite structure due to general and local charge balance affectingthe lattice parameters Especially c is impacted by this substitutionbecause it occurs in the bridging tetrahedron and additional OHndash sub-stitutes O2ndash (Komarneni et al 1985 Merlino et al 2000) As suggestedin some additional studies the substitution of Si4+ by Al3+ and Na+ orK+ leads to a lath-like morphology of tobermorite crystals (Mostafa2005 Mostafa et al 2009 Venhodovaacute et al 2015 Qu et al 2018)However because of the heterogeneous appearance of tobermorite inAAC it is hardly possible to conduct a proper characterization based onSEM analysis In our recent work the anisotropic peak broadening oftobermorite in XRD diffractograms was successfully linked with theincorporation of foreign ions supplied in a common AAC production(Schreiner et al 2019) This finding allowed a more statistical struc-tural characterization of tobermorite in bulk compositions compared toSEM analysis Moreover it was reported in other studies that differenthydrate phases occur depending on the amount of supplied ions and onthe experimental settings In compounds with a high content of Al3+formation of katoite could be observed (Klimesch and Ray 1998 Riacuteoset al 2009 Matsui et al 2011) In the case of a longer curing durationinstead of 11 Aring tobermorite the formation of xonotlite (Siauciunas andBaltakys 2004 Galvaacutenkovaacute et al 2018) or - depending on the finenessof used silica source (Siauciunas and Baltakys 2004) - gyrolite is fa-voured
Kalousek (1956) suggested that tobermorite can contain up to 5Al2O3 More Al2O3 in the system resulted in the formation of hydro-garnet Klimesch and Ray (1998) additionally investigated the stabilityof hydrogarnet depending on the Al(Si + Al) ratio and its role in re-lation to the formation of 11 Aring tobermorite in an equivalent systemThey suggest that hydrogarnet always appears before tobermorite butthe former can only be detected for higher Al(Si + Al) ratios in theevent of longer curing times Riacuteos et al (2009) and Qu et al (2018)confirmed these findings in extensive investigations In the latter pub-lication it is additionally suggested that samples prepared at lowertemperatures (160 degC) are less impacted by the supply of Al3+ Theyalso consider the peak broadening of tobermorite in their XRD plotsbased on the amount of incorporated Al3+ In two recent publicationswe suggested that the peak broadening of tobermorite enables a mi-crostructural analysis by calculating the orientation dependent domainsizes (Schreiner et al 2018 2019) However these studies are based onsamples of industrially produced AAC so that the curing time was fixedThe studied AAC was produced from raw materials with a broad che-mical spectrum such as ordinary Portland cement (OPC) whichsomehow complicates the interpretation of results
In this work the influence of aluminum ions - provided by meta-kaolin - on dominant crystallographic direction-dependent domaingrowth of tobermorite is investigated by analysis of anisotropic peakbroadening (Ectors et al 2015 2017) In Fig 1 of the supplementarymaterial the method of fitting the anisotropic peak broadening of to-bermorite using a triaxial cylinder model is visualized (Schreiner et al2018) Fitting of the anisotropic peak broadening of tobermorite Thismethod is used to calculate the average and reliable values for to-bermorite domain sizes in the powder sample and associate them withaverage Al3+ incorporation Microstrain should be considered becauseit is an additional source of peak broadening However this usually
accounts for materials that have been exposed to different kinds ofstress such as metals and alloys (Badawi et al 2019) In addition theinstrumental contribution to peak broadening should be consideredHydration products such as tobermorite are characterized by crystallitesizes in the range of nanometers so that anisotropic size broadeningclearly outweighs the effect of instrumental broadening (Jenkins andSnyder 1996) Moreover the impact of Al3+ on the lattice parametersof tobermorite is considered It should additionally be clarified whe-ther the results from our previous publication (Schreiner et al 2019)based on industrially produced AAC can be confirmed by investigationwith less complex raw mixes and purely based on laboratory experi-ments
2 Material and methods
21 Starting materials
The starting materials for hydrothermal synthesis included deio-nized water quartz flour portlandite (999 pure) and two types ofmetakaolin One type was ordinary commercially available metakaolin(MK) with nearly a stoichiometric composition For comparison thesecond type of commercially available metakaolin was a by-productfrom expanded glass production (MKg) and consequently highly im-pure The chemical composition of MK and MKg determined by XRF isgiven in Table 1 With MKg containing less Al2O3 but considerably moreNa2O than MK the effects on hydrothermal synthesis were of interestBoth types of metakaolin have been characterized in previous pub-lications (Schmidt et al 2012 Naber et al 2019) In addition weverified the mineral phase content by XRD analysis Besides amorphousmetakaolin MK contained minor amounts of anatase quartz and mica
Fig 1 Weight fractions of tobermorite quartz and katoite determined byquantitative XRD analysis ndash samples including MKg crosshatched
Table 1Chemical composition of MK and MKg determined by XRF analysis ndash majorcontrasts in bold letters
Oxides [wt-] MK MKg
SiO2 536 604Al2O3 392 206CaO 01 40MgO 01 12Na2O 0 96K2O 10 18Fe2O3 18 05TiO2 21 03P2O5 01 02Loss on ignition 15 1
J Schreiner et al Applied Clay Science 185 (2020) 105432
2
6 Publications
32
MKg contained additional kaolinite feldspar and quartz
22 Investigated mix composites
For the preparation of raw mixtures the powders were weighed andhomogenized using a lab-scale mixing mill Table 2 lists the composi-tion and nomenclature of all samples including Al2O3 content andcuring time in the autoclave
bull Besides one blank mixture (MK0) that did not contain any type ofmetakaolin eleven more compounds were prepared of which threeincluded different dosages of MKg (MKg16 MKg23 and MKg60)Three more mixes contained equivalent amounts of MK instead ofMKg (MK16 MK23 and MK60) These mixes were investigated inorder to have a direct comparison concerning the effects of differentraw material on the synthesis of tobermorite
bull Additionally the mixes MK9 MK5 and MK25 with lower dosages ofmetakaolin were analyzed In the referenced literature (Schreineret al 2019) the effect of Al3+ on the anisotropic peak broadeningof tobermorite could only be observed in the case of Al2O3 contentslower than 4 in the drymix In the latter three mixes Al2O3 con-tents range from 1 to 35 Al2O3 (calculated from XRF data) whichmeets the region of interest for the analysis of tobermorite domainmorphology
bull The curing time for nearly all of the investigated samples was 12 hbut compound MK9 was prepared two more times for curing timesof 2 h and 6 h The different curing times were chosen in this par-ticular sample so that the reactivity of metakaolin and the phasetransitions could be observed more precisely
23 Hydrothermal treatment
Due to the different fineness of raw materials there was a differentwater demand from one mixture to another In order to obtain slurriesof comparable rheology the amount of water was adapted respectivelyresulting in water-to-solid ratios of 25 to 3 which matches the sug-gested water-to-solid ratio for this purpose (Roacutezycka et al 2014Galvaacutenkovaacute et al 2018) The weighed water was added to the dry mixand after stirring for 1 min at 23 degC the slurry was poured into thereactor Minor changes in the quantity of added water did not have aninfluence on the measured steam pressure All experiments were con-ducted using a PTFE-lined stainless steel autoclave with a reactor vo-lume of 300 ml The oven temperature was fixed at 180 degC and auto-genous steam pressure of 11ndash12 MPa was measured during eachexperiment with an external manometer After cooling to room tem-perature the sample was removed from the reactor coarsely ground
using an agate mortar and dried at 60 degC for 12 h After drying thesample was ground with an agate mortar again in order to deagglo-merate the particles As no coarse raw materials were used there wasno need for wet McCrone milling (Schreiner et al 2018)
24 XRD analysis
After preparation into front-loading sample holders the powdersamples were measured with a D8 diffractometer (Bruker) equippedwith a LynxEye detection system and Bragg-Brentano geometry Thesettings for XRD analysis included a tube voltage of 40 kV a current of40 mA an angular range from 6 to 80deg 2θ (Cu Kα radiation) a time perstep of 054 s a step width of 00236deg 2θ and a PSD opening of 33deg Thebackground was fitted with Chebyshev polynomial of the fifth orderThe major contribution of amorphous phase was fitted with a singlepeak with a fixed position at 308deg 2θ so that tobermorite reflectionswere not affected An external quartzite standard was measured withthe same parameters in order to determine phase quantities (Jansenet al 2011) Bruker AXS software TOPAS 50 was used for Rietveldrefinement (Rietveld 1969) and the used structures are shown inTable 3
3 Results and discussion
31 Different dosages of MK and MKg
In Fig 1 the quantities of tobermorite quartz and katoite present inmost of the samples determined by XRD analysis are illustratedWhenever tobermorite was the leading mineral hydrate phase a basalspacing of 113 Aring could be verified in each of the diffractograms Thequantities of minor crystalline phases and amorphous content are notshown For low dosages of MK it can be seen that the weight fraction oftobermorite decreased At moderate dosage of both types of metakaolin(MK16 MK23 MKg16 MKg23) tobermorite was present in comparablequantities It can be seen that the amount of katoite in the mixes de-pended on the dosage of metakaolin and it appeared only at dosages ofMK5 or more Due to the higher content of aluminum in MK comparedto MKg more katoite could always be observed in the MK mixes atequivalent dosages Despite equal amounts of quartz as starting mate-rial in mixes for both types of metakaolin the resulting weight fractionsin the cured samples were not alike Considerably more quartz waspresent in the MK samples Even though less quartz was used for mixescontaining higher amounts of MK even more quartz was present afterhydrothermal curing (Table 2 Fig 1) Consequently some of the SiO2
provided by MK did not transform into an amorphous phase or to-bermorite but into quartz This finding is verified by the presence ofquartz in MK60 because no quartz was included in the raw mixture Thefeldspar present in MKg did not react so Na2O and an unknown amountof Al2O3 may not have been supplied for hydrothermal reaction Besidestobermorite and quartz additional calcite scawtite (Ca7Si6(CO3)
Table 2Basic powder compounds prepared for the hydrothermal synthesis of to-bermorite with the respectively calculated Al2O3 content and curing time in thereactor
Sample Portlandite[wt-]
Quartz[wt-]
MK[wt-]
MKg
[wt-]
Al2O3
[wt-]Curingtime [h]
MK0 49 51 ndash ndash 0 12MK25 495 48 25 ndash 1 12MK5 49 46 5 ndash 2 12MK9_2h 48 43 9 ndash 35 2MK9_6h 48 43 9 ndash 35 6MK9_12h 48 43 9 ndash 35 12MK16 47 37 16 ndash 63 12MK23 46 31 23 ndash 9 12MK60 40 ndash 60 ndash 235 12MKg16 47 37 ndash 16 33 12MKg23 46 31 ndash 23 47 12MKg60 40 ndash ndash 60 124 12
Table 3Structural data used for the investigation with powder XRD analysis
Phase Author
Anatase (Horn et al 1972)Biotite (Brigatti et al 2000)Calcite (Maslen et al 1995)Kaolinite (Zvyagin 1960)Katoite (Bartl 1969)Microcline (Bailey 1969)Plazolite (Basso et al 1983)Portlandite (Busing and Levy 1957)Quartz (Le Page and Donnay 1976)Scawtite (Grice 2005)Tobermorite (Hamid 1981)Xonotlite (Hejny and Armbruster 2001)
J Schreiner et al Applied Clay Science 185 (2020) 105432
3
6 Publications
33
O18bull2(H2O)) and xonotlite (Ca6Si6O17(OH)2) could be identified insample MK0 (XRD plots of samples MK0 MKg16 MKg23 MK16 andMK23) Comparing MK0 and MK25 scawtite and xonotlite could stillbe identified in a very low amount in MK25 but no longer in samplesthat contained even more MK (XRD plots of samples MK0 MK25 MK5and MK9_12h)
Two additional experiments were done without quartz in the rawmixes (MK60 and MKg60) The according diffractograms after hydro-thermal curing are shown in Fig 2 In sample MKg60 tobermorite (gt 50wt-) was successfully synthesized without any other silica sourcethan MKg whereas no crystalline quartz occurred By contrast no to-bermorite but quartz could be identified in equivalent mixture MK60containing MK It can be seen that crystalline components such as micaand anatase in the raw MK did not react at the selected conditions andremained present in the autoclaved samples Except for feldspar in MKgall of the crystalline components appeared to be reactive at the chosenhydrothermal conditions A minor unidentified phase occurred at328deg2θ and additional xonotlite was identified in sample MKg60 Insample MK60 more calcium was needed for the formation of morehydrogarnet (Fig 1) resulting in a lower CaSi ratio for the remainingsystem Sample MKg60 contained only half of the amount of Al3+ and itwas not completely supplied for reaction due to its partial presence infeldspar Consequently essentially less hydrogarnet (Fig 1) was presentin MKg60 after hydrothermal treatment and the CaSi ratio in the re-maining system was affected to a lesser extent
32 Application of MK for different curing times
The development of hydrate phases in the autoclave for compoundMK9 is displayed in Fig 3 After only 2 h of hydrothermal curing all ofthe available portlandite had reacted and katoite (95 wt-) was pre-sent The applied type of metakaolin appeared to react quickly as itsupplied aluminum for formation of katoite No formation of to-bermorite could be observed at this stage yet An assumably amorphousprecursor can be seen at 28 to 30deg2θ Calcium was provided by thedissolution of portlandite After 6 h of hydrothermal reaction amountsof katoite (85 wt-) and quartz (from 31 wt- at 2 h to 165 wt- at6 h) had decreased and a major amount of tobermorite (35 wt-) waspresent Apparently between 2 and 6 h under hydrothermal conditionsthe amorphous precursor and quartz reacted resulting in the formationof tobermorite An additional 6 h of reaction time (MK9_12h) did notchange the phase composition significantly Slightly more tobermorite
(365 wt-) less quartz (16 wt-) and katoite (65 wt-) weremeasured
33 Tobermorite domain morphology and lattice parameters
In the referenced literature an analysis of tobermorite domainmorphology based on anisotropic peak broadening was possible forsamples that contained notgt 4 wt- Al2O3 in the drymix (Schreineret al 2019) Accordingly in this study samples MK0 MK25 MK5MK9_6h and MK9_12h were suitable (Table 2) with MK9_2h not con-taining any tobermorite In Fig 4 the respective growth in a and b di-rection is visualized with x indicating the domain size in a direction andy indicating domain size in b direction using a macro for TOPAS 50(Ectors et al 2015 2017) The calculated cylinder models in Fig 4represent the relation of yx and not absolute sizes With no supply ofaluminum ions (MK0) the relative domain growth in b direction islower compared to samples containing metakaolin This finding agreeswith the results from a similar investigation of tobermorite in AAC(Schreiner et al 2019) However within the samples MK5 andMK9_12h the different amounts of supplied aluminum ions did notshow a clear effect It appeared that low dosages of Al3+ (1 wt- Al2O3
in MK25 and 2 wt- Al2O3 in MK5) were enough to determine thedomain growth of tobermorite Additional results from the samplesMK9_6h and MK9_12h indicated that growth in b direction increasedwith reaction time
In Fig 5 lattice parameters of tobermorite depending on metakaolindosages are plotted B clearly remained unaffected throughout therange of samples Increasing amounts of metakaolin led to a slightlysmaller parameter a However both types of metakaolin showed acorresponding impact on parameter a By contrast parameter c in-creased strongly with increasing amounts of MK and MKg but the typeof metakaolin was significant At an equivalent dosage MK affected thecell dimension in c direction considerably more than MKg so that thefraction of Al3+ appeared to be the decisive parameter Different metaloxides in MKg did not show a notable effect certainly as they werepartially not provided for reaction Unlike for the domain morphologyof tobermorite the impact on lattice parameters could be observedwithin the complete range of examined dosages
4 Conclusions
The results obtained from the introduced investigations allow con-cluding remarks on the effects of the applied types of metakaolin on thesynthesis of 11 Aring tobermorite the phase transitions and the in-corporation of Al3+ into the lattice of tobermorite
With a critical dosage the use of any type of metakaolin led to theformation of katoite in an according amount At moderate dosages(MKg16 MKg23 MK16 and MK23) the two types of metakaolin showeda good correspondence in consideration of the quantities of to-bermorite For higher dosages there were contrary effects Lower do-sages of MK led to considerable quantities of Al-substituted to-bermorite Samples containing low dosages of MK revealed that katoiteappeared in the case ofgt 5 wt- of MK - corresponding to 2 wt-Al2O3 - in the basic compound Minor crystalline phases in MKg showedbetter reactivity than those in MK The observation that no tobermoritewas present in sample MK60 indicated that high dosages of Al3+ hin-dered the formation of tobermorite
Investigations of MK9 at 2 6 and 12 h displayed the evolution ofhydrate phases At first katoite was the only crystalline hydrate phasepresent after 2 h which corresponded to observations in a differentpublication (Klimesch and Ray 1999) The amount of katoite andquartz then decreased and a major amount of tobermorite formed from2 to 6 h curing time In order to gain more information on the trans-formation of amorphous C-(A)-S-H into tobermorite additional ex-periments in the range of 2 to 6 h curing time will be needed
Domain morphology analysis of tobermorite revealed that low
Fig 2 Diffractograms of MKg MKg60 MK and MK60 from 7 to 34deg2θ CuKα Aanatase C calcite F feldspar k kaolinite K katoite M mica Q quartz Ttobermorite U unidentified phase X xonotlite
J Schreiner et al Applied Clay Science 185 (2020) 105432
4
6 Publications
34
dosages of Al3+ determined the domain growth which agreed with theresults published on tobermorite in AAC samples (Schreiner et al2019) Different curing times unveiled that growth in b direction in-creased with the reaction time Al3+ incorporation into the lattice oftobermorite only reflected to a limited extent in the domain mor-phology By contrast an increase of lattice parameter c was triggered byAl3+ even at the highest dosage in this study Ultimately there is no
evidence for a limit of incorporation of Al3+ but there is a limit ofinfluence on the domain morphology These results additionally re-confirm this assumption similarly made in the previous work (Schreineret al 2019) and suggest a new mechanism of tobermorite crystal-lization depending on the presence of Al3+
Supplementary data to this article can be found online at httpsdoiorg101016jclay2019105432
Declaration of Competing Interest
The authors declare that they have no known competing financialinterests or personal relationships that could have appeared to influ-ence the work reported in this paper
Acknowledgement
The authors thank Rodgauer Baustoffwerke GmbH amp Co KG forsupplying raw materials for laboratory experiments
References
Aguilar-Mamani W Garciacutea G Hedlund J Mouzon J 2014 Comparison betweenleached metakaolin and leached diatomaceous earth as raw materials for the synth-esis of ZSM-5 Springerplus 3 1ndash10 httpsdoiorg1011862193-1801-3-292
Ayodele OB Sulaimon AA Alaba PA Tian Z-Y 2019 Influence of metakaolini-zation temperature on the structure and activity of metakaolin supported Ni catalystin dry methane reforming J Environ Chem Eng httpsdoiorg101016jjece2019103239 (in press)
Badawi EA Abdel-Rahman MA Mostafa A Abdel-Rahman M 2019 Determinationof the crystallite size amp micro- strain by novel method from XRD profile Appl Phys2 1ndash15 httpsdoiorg1031058jap201921001
Bailey SW 1969 Refinement of an intermediate microcline structure Am Miner 541540ndash1545
Bartl H 1969 Roentgen-Einkristalluntersuchungen an (CaO)3 (Al2O3) (H2O)6 und an(CaO)12 (Al2O3)7 (H2O) neuer Vorschlag zur (CaO)12 (Al2O3)7-Struktur NeuesJahrb fuer Mineral Monatshefte 1969 404ndash413
Basso R Giusta AD Zefiro L 1983 Crystal structure refinement of plazolite A highlyhydrated natural hydrogrossular Neues Jahrb Miner Monatsh (Neues Jahrb fuerMineral Monatshefte) 1983 251ndash258
Brigatti MF Lugli C Poppi L Foord EE Kile DE 2000 Crystal chemical varia-tions in Li- and Fe-rich micas from Pikes Peak batholith (Central Colorado) AmMineral 85 1275ndash1286 httpsdoiorg102138am-2000-8-920
Busing WR Levy HA 1957 Neutron diffraction study of calcium hydroxide J ChemPhys 26 563 httpsdoiorg10106311743345
Chen L Wang Z Wang Y Feng J 2016 Preparation and properties of alkali acti-vated metakaolin-based geopolymer Materials (Basel) 9 1ndash12 httpsdoiorg103390ma9090767
Chucholowski C Holger M Thienel K-C 2018 Improving the recyclability en-vironmental compatibility and CO2 balance of autoclaved aerated concrete by re-placing sulfate carrier and cement with calcined clays CePapers 2 503ndash512httpsdoiorg101002cepa846
Fig 3 Diffractograms of MK9_2h MK9_6h and MK9_12h from 7 to 38deg2θ CuKα C calcite K katoite Q quartz T tobermorite
Fig 4 Relation of calculated domain sizes of 11 Aring tobermorite in selectedsamples (MK0 MK25 MK5 MK9_6h and MK9_12h) in a (x) and b (y) direction
Fig 5 Lattice parameters of tobermorite depending on MK or MKg dosageincluding blank mix MK0
J Schreiner et al Applied Clay Science 185 (2020) 105432
5
6 Publications
35
Demir İ Başpınar MS Kahraman E Ccedilalışkan E Goumlrhan G 2014 An investigationon the usability of diatomite in aerated concrete production In Proc of the IntlConf on Advances in Civil Structural and Construction Engineering ndash CSCE 2014 pp97ndash100
Ectors D Goetz-Neunhoeffer F Neubauer J 2015 A generalized geometric approachto anisotropic peak broadening due to domain morphology J Appl Crystallogr 48189ndash194 httpsdoiorg101107S1600576714026557
Ectors D Goetz-Neunhoeffer F Neubauer J 2017 Routine (an)isotropic crystallitesize analysis in the double-Voigt approximation done right Powder Diffract 3227ndash34 httpsdoiorg101017S0885715617000070
Galvaacutenkovaacute L Bartoniacutečkovaacute E Opravil T Tkacz J Ptaacuteček P 2018 The influence ofstarting materials solubility on tobermorite structure formation under the hydro-thermal conditions IOP Conf Ser Mater Sci Eng 379 1ndash8 httpsdoiorg1010881757-899X3791012001
Grice JD 2005 The structure of spurrite tilleyite and scawtite and relationships toother silicate-carbonate minerals Can Mineral 43 1489ndash1500 httpsdoiorg102113gscanmin4351489
Hamid SA 1981 The crystal structure of the 11 Aring natural tobermoriteCa225[Si3O75(OH)15]1H2O Zeitschrift fuer Krist 154 189ndash198 httpsdoiorg101524zkri19811543-4189
Hejny C Armbruster T 2001 Polytypism in xonotlite Ca6Si6O17(OH)2 Zeitschrift furKrist 216 396ndash408
Horn M Schwerdtfeger CF Meagher EP 1972 Refinement of the structure of ana-tase at several temperatures Zeitschrift fur Krist 136 273ndash281 httpsdoiorg101524zkri19721363-4273
Jansen D Goetz-Neunhoeffer F Stabler C Neubauer J 2011 A remastered externalstandard method applied to the quantification of early OPC hydration Cem ConcrRes 41 602ndash608 httpsdoiorg101016jcemconres201103004
Jenkins R Snyder R 1996 Introduction to X-ray Powder Diffractometry ChemicalAnalysis Wiley pp 90
Kalousek GL 1956 Crystal Chemistry of Hydrous Calcium Silicates J Am Ceram Soc40 74ndash80
Klimesch D Ray A 1998 Autoclaved cement-quartz pastes with metakaolin additionsAdv Cem Based Mater 7 109ndash118 httpsdoiorg101016S1065-7355(97)00073-4
Klimesch D Ray A 1999 DTA-TGA evaluations of the CaOndashAl2O3ndashSiO2ndashH2O systemtreated hydrothermally Thermochim Acta 334 115ndash122 httpsdoiorg101016s0040-6031(99)00140-9
Komarneni S Roy R Roy DM Fyfe CA Kennedy GJ Bothner-By AA Dadok JChesnick AS 1985 27Al and29Si magic angle spinning nuclear magnetic resonancespectroscopy of Al-substituted tobermorites J Mater Sci 20 4209ndash4214 httpsdoiorg101007BF00552416
Koutnyacute O Opravil T Pořiacutezka J 2014 Application of metakaoline in autoclavedaerated concrete technology Adv Mater Res 1000 174ndash177 httpsdoiorg104028wwwscientificnetAMR1000174
Le Page Y Donnay G 1976 Refinement of the crystal structure of low-quartz ActaCrystallogr Sect B 32 2456ndash2459 httpsdoiorg101107S0567740876007966
Luo H Law WW Wu Y Zhu W Yang EH 2018 Hydrothermal synthesis of needle-like nanocrystalline zeolites from metakaolin and their applications for efficient re-moval of organic pollutants and heavy metals Microporous Mesoporous Mater 2728ndash15 httpsdoiorg101016jmicromeso201806015
Maeda H Ogawa Y Ishida EH Kasuga T 2012 Hydrothermal synthesis of to-bermorite doped with phosphorus species for removing heavy metal ions J AustCeram Soc 48 8ndash11
Maslen EN Streltsov VA Streltsova NR Ishizawa N 1995 Electron density andoptical anisotropy in rhombohedral carbonates III Synchrotron Xray studies ofCaCO3 MgCO3 and MnCO3 Acta Crystallogr Sect B 51 929ndash939 httpsdoiorg101107S0108768195006434
Matekonis G Šiaučiūnas R Vaičiukynienė D 2010 Hydrothermal Synthesis andCharacterization of Na + and [ Al 3 + + Na + ] -substituted Tobermorite in CaO-SiO2middotnH2O-H2O System Mater Sci 16 242ndash248
Matsui K Kikuma J Tsunashima M Ishikawa T Matsuno S Ogawa A Sato M2011 In situ time-resolved X-ray diffraction of tobermorite synthesis process underhydrothermal condition IOP Conf Ser Mater Sci Eng 18 60ndash66 httpsdoiorg1010881757-899X182022017
Merlino S Bonaccorsi E Armbruster T 2000 The real structures of clinotobermoriteand tobermorite 9 Aring OD character polytypes and structural relationships Eur JMineral 12 411ndash429 httpsdoiorg1011270935-122120000012-0411
Monasterio M Gaitero JJ Manzano H Dolado JS Cerveny S 2015 Effect ofchemical environment on the dynamics of water confined in calcium silicate mi-nerals Natural and synthetic tobermorite Langmuir 31 4964ndash4972 httpsdoiorg101021acslangmuir5b00614
Mostafa NY 2005 Influence of air-cooled slag on physicochemical properties of auto-claved aerated concrete Cem Concr Res 35 1349ndash1357 httpsdoiorg101016jcemconres200410011
Mostafa NY Shaltout AA Omar H Abo-El-Enein SA 2009 Hydrothermal synth-esis and characterization of aluminium and sulfate substituted 11 nm tobermoritesJ Alloys Compd 467 332ndash337 httpsdoiorg101016jjallcom200711130
Naber C Stegmeyer S Jansen D Goetz-Neunhoeffer F Neubauer J 2019 ThePONKCS method applied for time resolved XRD quantification of supplementarycementitious material reactivity in hydrating mixtures with ordinary Portland ce-ment Constr Build Mater 214 449ndash457 httpsdoiorg101016jconbuildmat201904157
Qu X Zhao Z Zhao X 2018 Microstructure and characterization of aluminum-in-corporated calcium silicate hydrates (C-S-H) under hydrothermal conditions RSCAdv 8 28198ndash28208 httpsdoiorg101039c8ra04423f
Rashad AM 2013 Metakaolin as cementitious material history scours production andcomposition - a comprehensive overview Constr Build Mater 41 303ndash318 httpsdoiorg101016jconbuildmat201212001
Rietveld HM 1969 A profile refinement method for nuclear and magnetic structures JAppl Crystallogr 2 65ndash71 httpsdoiorg101107S0021889869006558
Riacuteos CA Williams CD Fullen MA 2009 Hydrothermal synthesis of hydrogarnet andtobermorite at 175 degC from kaolinite and metakaolinite in the CaO-Al2O3-SiO2-H2Osystem a comparative study Appl Clay Sci 43 228ndash237 httpsdoiorg101016jclay200809014
Roacuteżycka A Pichoacuter W 2016 Effect of perlite waste addition on the properties of au-toclaved aerated concrete Constr Build Mater 120 65ndash71 httpsdoiorg101016jconbuildmat201605019
Roacutezycka A Kotwica Ł Małolepszy J 2014 Synthesis of single phase gyrolite in theCaO-quartz-Na2O-H2O system Mater Lett 120 166ndash169 httpsdoiorg101016jmatlet201401003
Sauman Z 1974 Influence of SO4 2ndash ions on the formation of 11 Aring tobermorite InProceedings of the 2nd International Symposium on Science and Research in SilicateChemistry Moscow pp 25ndash39
Schmidt M Egersdoumlrfer A Poumlllmann H 2012 Increased reactivity using a glass-containing metakaolin as an active filler in lime-based binder systems ZKG Int 6554ndash62
Schreiner J Jansen D Ectors D Goetz-Neunhoeffer F Neubauer J Volkmann S2018 New analytical possibilities for monitoring the phase development during theproduction of autoclaved aerated concrete Cem Concr Res 107 247ndash252 httpsdoiorg101016jcemconres201802028
Schreiner J Goetz-Neunhoeffer F Neubauer J Volkmann S Bergold S Webler RJansen D 2019 Advanced Rietveld refinement and SEM analysis of tobermorite inchemically diverse autoclaved aerated concrete Powder Diffract 34 143ndash150httpsdoiorg101017s0885715619000149
Setthaya N Chindaprasirt P Pimraksa K 2016 Preparation of zeolite nanocrystals viahydrothermal and solvothermal synthesis using of rice husk ash and metakaolinMater Sci Forum 872 242ndash247 httpsdoiorg104028wwwscientificnetmsf872242
Siauciunas R Baltakys K 2004 Formation of gyrolite during hydrothermal synthesis inthe mixtures of CaO and amorphous SiO2 or quartz Cem Concr Res 34 2029ndash2036httpsdoiorg101016jcemconres200403009
Skawinska A Owsiak Z Baran T Hernik K 2017 The influence of halloysite ad-dition on tobermorite formation in CaO and quartz mix under hydrothermal condi-tions Cem Wapno Bet 17 426ndash434
Venhodovaacute E Janovskyacute R Drochytka R 2015 Formation of tobermorite at differentmaterials composition of aerated concrete Appl Mech Mater 752ndash753 247ndash250httpsdoiorg104028wwwscientificnetamm752-753247
Walczak P Małolepszy J Reben M Szymański P Rzepa K 2015 Utilization ofwaste glass in autoclaved aerated concrete Proc Eng 122 302ndash309 httpsdoiorg101016jproeng201510040
Zhang Y Gao W Cui L 2007 The transformation of acid leached metakaolin tozeolite beta Stud Surf Sci Catal 170 420ndash425 httpsdoiorg101016S0167-2991(07)80870-6
Zvyagin BB 1960 An attempt to electronographic determination of kaolinite structureJ Dokl Akad Nauk SSSR 130 1023ndash1026
J Schreiner et al Applied Clay Science 185 (2020) 105432
6
6 Publications
36
6 Publications
62 Advanced Rietveld refinement and SEM analysis oftobermorite in chemically diverse autoclaved aeratedconcrete
Following the copyright guidelines by Cambridge University Press the publication
Schreiner J Goetz-Neunhoeffer F Neubauer J Volkmann S Bergold S WeblerR Jansen D 2019 Advanced Rietveld refinement and SEM analysis of tobermorite inchemically diverse autoclaved aerated concrete Powder Diffraction 34 143ndash150 httpsdoiorg101017s0885715619000149
may not be reprinted It can be accessed at
httpswwwcambridgeorgcorejournalspowder-diffractionarticleadvanced-rietveld-refinement-and-sem-analysis-of-tobermorite-in-chemically-diverse-autoclaved-aerated-concrete51597C2A66F6F225D29DEB2675E74249
37
6 Publications
63 New analytical possibilities for monitoring the phasedevelopment during the production of autoclavedaerated concrete
Reprint of the peer reviewed publication
Schreiner J Jansen D Ectors D Goetz-Neunhoeffer F Neubauer J VolkmannS 2018 New analytical possibilities for monitoring the phase development during theproduction of autoclaved aerated concrete Cement and Concrete Research 107 247ndash252httpsdoiorg101016jcemconres201802028
with permission from Elsevier
38
Contents lists available at ScienceDirect
Cement and Concrete Research
journal homepage wwwelseviercomlocatecemconres
Short communication
New analytical possibilities for monitoring the phase development duringthe production of autoclaved aerated concrete
J Schreinera D Jansena D Ectorsa F Goetz-Neunhoeffera J Neubauera S Volkmannb
aUniversity of Erlangen-Nuremberg GeoZentrum Nordbayern Mineralogy Schlossgarten 5a 91054 Erlangen Germanyb Rodgauer Baustoffwerke GmbH amp Co KG Am Opel-Pruumlffeld 3 63110 Rodgau-Dudenhofen Germany
A B S T R A C T
This work presents improved analytical methods for both steps of the production process of autoclaved aeratedconcrete (AAC) the phase development during the hydration before autoclaving and during the autoclavingprocess itself The improvement includes new insights into preparation methods of AAC samples for powderdiffraction as well as Rietveld refinement strategies For the first time a new implementation for calculatinganisotropic crystal domain sizes is applied to major hydrate phases occurring during AAC production namelyportlandite during the hydration before autoclaving and tobermorite during the autoclaving process The cal-culation of anisotropic domain size growth which can be implemented in the Rietveld environment is based oncrystallographically and geometrically appropriate models The implementation of calculating anisotropic do-main sizes for the Rietveld software TOPAS 50 allows a superior Rietveld fit and a more accurate quantificationof the phase development Additionally it enables the tracking of growth mechanism of portlandite duringhydration
1 Introduction
Autoclaved aerated concrete (AAC) is known as a lightweight con-struction material which offers outstanding properties such as suffi-cient strength for construction in addition with excellent thermal in-sulation [12] AAC is produced by autoclaving from calcareous rawmaterials such as lime (CaO) and cement quartz sulfate carrier andother additives such as foaming agents and water
The production process (Fig 1) can be separated into the hydrationof the mixed slurry before the procedure of autoclaving and the auto-claving at elevated temperature (180 degC to 200 degC) under saturatedsteam pressure (12MPa) for several hours
The hydration process before autoclaving is necessary to achievesufficient strength in order to cut the green cake blocks as they shouldhave a specific shape and dimension after autoclaving Furthermorethe porous structure is generated by the foaming agent during hydra-tion in the first process step During autoclaving the final propertiesnamely strength and low thermal conductivity are achieved
It is already well understood that the autoclaving process leads tothe formation of several phases first of all tobermorite(Ca5Si6O16(OH)2lowast4H2O) [3ndash5] Newest research has shown im-pressively which reactions are running from the mineralogical point ofview Insitu XRD measurements were carried out during the
autoclaving process and the phase development was shown by plottingnormalized intensities [6] The study of Mitsuda et al [3] was mainlyfocused on the tracking of the phase evolution during the autoclavingprocess of AAC However their statements concerning phase evolutionare mainly based on XRD data and TGA measurements There is acommon agreement that the following reactions occur The consump-tion of the alite (OPC) leads to the formation of an initial C-S-H phaseduring the first processing step Portlandite which was initially formedduring the first process step (from CaO and C3S) further quartz and theC-S-H phase are consumed during autoclaving resulting in the crystal-lization of tobermorite Hence the crystallization process of to-bermorite as well as the crystal structure of tobermorite was an issue ofresearch and discussion over the last years and numerous publicationsto these topics are available Concerning the crystal structure of to-bermorite respectively the tobermorite supergroup a new publicationoutlines all important references and recommends a new nomenclature[7]
The presented study was performed to create new analytical possi-bilities for the characterization of the production process of AAC Bothof the production process steps are essential for the final productHence the present work focuses on crystallization of hydrate phases inboth processes
Firstly an external standard method [89] was published and
httpsdoiorg101016jcemconres201802028Received 6 October 2017 Received in revised form 1 February 2018 Accepted 26 February 2018
Corresponding authorsE-mail addresses juergenjsschreinerfaude (J Schreiner) danieljansenfaude (D Jansen)
Cement and Concrete Research 107 (2018) 247ndash252
0008-8846 copy 2018 Elsevier Ltd All rights reserved
T
6 Publications
39
recommended for the determination of absolute phase contents inmixtures with amorphous content It was shown that the method canabsolutely be recommended for hydrating cement pastes in which watercannot be quantified directly by XRD [10] This method seems to bevery promising for both the quantification of the hydration of the AACslurry before autoclaving and the quantification of the phase evolutionduring autoclaving inasmuch as both production steps form crystallineand amorphous phases
Secondly a new approach to anisotropic peak broadening due toanisotropic domain morphology which was developed [1112] is ap-plied to AAC samples to improve the fit of portlandite and tobermoriteby Rietveld refinement [13] By applying this approach the refinementof both portlandite and tobermorite should additionally lead to betterquantitative results as well as to better insights into the development ofthe domain size morphology of both phases formed
It was already shown that in a hydrating raw mixture for AAC twospecies of portlandite precipitate at 23 degC one showing dynamicallyanisotropic peak broadening and another one following the isotropictrend [14] The application of the anisotropic refinement model led toan improved fitting of portlandite Moreover the mechanism of aniso-tropic domain growth of portlandite was tracked
2 Materials and methods
In order to examine the hydration of the AAC slurry before auto-claving a mixture of the hydraulic reactive components was weighedand measured in-situ at a Bruker D8 diffractometer with a LynxEyedetection system
Ordinary Portland cement (OPC) was mixed with lime (CaO) andanhydrite (C$) The raw materials were taken from the same batches asfor the industrial samples The drymix (58 OPC 36 CaO and 6 C$by weight) was then mixed with water (ws= 08) and placed into anappropriate sample holder The samples were not aerated The slurrysamples were covered with a kapton film to avoid evaporation andcarbonation Diffractograms were recorded with an angular range from7 to 545deg 2θ and a step width of 0011deg 2θ Measurements were carriedout every 15min For each measurement 96 XRD patterns were re-corded over the first 24 h The temperature was fixed at 70 degC which isthe mean temperature generally prevailing in the industrial processduring hydration before autoclaving Rietveld refinement was carriedout using the G-factor method All structures used for Rietveld refine-ment are shown in Table 1
For investigation of the autoclaved samples five different specimenswere taken at different autoclaving times The specimens were takenout of a technical production process hence it was not possible to in-terrupt the process at an earlier time inasmuch it would lead to damageof a whole concrete production batch The specimens were firstly driedat 60 degC until weight constancy The whole blocks were then broken andstatistical samples of 20 g were taken In order to receive the right massattenuation coefficient (MAC) for G-factor method the loss on ignitionand the chemical composition (XRF) were determined For energydispersive XRF analysis (Spectro Xepos) tube voltage from 20 kV to50 kV and tube current from 08 to 20mA were used for differenttargets
The final sample preparation (grinding) before XRD measurementswas carried out using both an agate mortar and a McCrone micronizingmill for wet milling with isopropanol Both preparation methods wereapplied separately to see which one is suitable in order to get the bestpreparation for XRD investigations Six preparations were performed byone operator of which two were prepared with an agate mortar andfour with a McCrone mill For the McCrone milling 3 g of the sampleand 10ml of isopropanol were used for grinding for 12min The grainsize distribution of one sample prepared with an agate mortar and onesample prepared using a McCrone mill was measured by laser granu-lometry in isopropanol using a Mastersizer 3000 (MALVERN)
After milling the samples in these two ways for XRD analysis thepowders were prepared into a front loading sample holder and mea-sured Diffractograms were recorded with an angular range from 6 to80deg 2θ a step width of 00236deg 2θ and a time per step of 054 s Rietveldrefinement combined with external standard (G-factor) was applied inorder to get absolute quantities for each phase The refinement strategyfor portlandite and tobermorite in the TOPAS Launch Mode (TOPAS50 Bruker AXS) is attached as a Supplementary material file
3 Results and discussion
31 Hydration of the mixture before autoclaving
The hydration of the investigated paste before autoclaving isdominated by the hydration of the cement as well as the reaction of thefree lime (CaO) resulting in the formation of portlandite It can beclearly seen from Fig 2 that the hydration of the paste leads to theformation of ettringite portlandite and C-S-H phase For simplificationthe remaining phase developments are not shown in Fig 2 because theyare not in the focus of this study The hydration of CaO forming
Fig 1 Simplified process steps of AAC production and hydrate phase evolution
Table 1Structures used for Rietveld refinement
Phase Author
Alite [15]Anhydrite [16]Bassanite [17]Belite (β) [18]Belite (αprime) [19]Brownmillerite [20]C-S-H [21]Calcite [22]Ettringite [23]Gypsum [24]Hemicarbonate [25]Hydroxylellestadite [26]Lime (CaO) [27]Microcline [28]Portlandite [29]Quartz [30]Tobermorite [31]Tricalciumaluminate (cubic) [32]Tricalciumaluminate (orthorhombic) [33]PONCKS model for Water [21]
J Schreiner et al Cement and Concrete Research 107 (2018) 247ndash252
248
6 Publications
40
portlandite begins rapidly after the addition of water to the mixture andlime is fully consumed after only 1 h of hydration This translates into aquick rise of heat of hydration so that cement hydration is acceleratedwhich leads to further portlandite formation by the reaction of aliteEttringite formation stalls after few hours of hydration After 12 h et-tringite is partially decomposed probably due to sulfate depletion [9]
and poorly crystalline AFm phases (not shown in Fig 2) are formedIn Fig 3 it can be seen that in fact two generations of portlandite
are formed a 1st dominant generation showing anisotropic peakbroadening and 2nd one occurring considerably later following theisotropic domain size refinement which is usually carried out using theRietveld method This occurrence comes along firstly with lime hy-dration and secondly with alite hydration The expected quantity ofportlandite formed from lime hydration very well complies with the
Fig 2 Phase development in AAC paste on a laboratory scale before autoclaving ana-lyzed by in-situ XRD at 70 degC
Fig 3 Formation of two generations of portlandite by hydration of lime (1st) and C3S(2nd) at 70 degC before autoclaving with the major generation showing anisotropic peakbroadening
Fig 4 Biaxial cylinder domain size model of portlandite used for Rietveld refinement of anisotropic peak broadening
Fig 5 Morphological evolution of portlandite showing anisotropic domain size growthduring hydration at 70 degC
Fig 6 Comparison of quantification of crystalline quartz in samples prepared withMcCrone mill and agate mortar at different autoclaving times
J Schreiner et al Cement and Concrete Research 107 (2018) 247ndash252
249
6 Publications
41
quantity of the observed 1st generation The development of portlan-dite growth was already tracked in an equivalent slurry at 23 degC [14]Thus this observation confirms that the crystallinity of portlandite inmixtures for AAC production depends on the starting phase for hydra-tion as already indicated by Ectors [14]
Fig 4 shows the used biaxial cylindrical model for anisotropic do-main size calculation and the portlandite structure which was createdwith structural software VESTA 318 [34] Using the cylindrical ap-proach domain sizes in a (here equating to b) and c direction(dz= cylinder height) can be calculated which comes along with theexpected symmetrical parameters of portlandite
The 1st portlandite generation showing anisotropic domain growthcan be tracked in terms of cylinder diameter and height which is rea-lized in Fig 5 The blue cylinder represents the geometric approach andcylinder height and diameter are calculated newly for each range Thecylinder height remains rather stable throughout the hydration processwhile the cylinder diameter increases during the first hours of hydra-tion After 10 h of hydration the mean cylinder diameter no longer in-creases Consequently these observations match the results of the ex-aminations conducted at 23 degC [14] as well as the assumption thatdifferent mechanisms of growth exist for portlandite depending on the
hydration educt The maximum cylinder diameter is reached earlier inthis work very likely because of the higher hydration temperature
32 Quantification of the reactions during autoclaving
Autoclaved samples were ground with an agate mortar and com-pared to samples which were wet-ground with a McCrone mill Fig 6shows precisely that the determination of the amount of crystallinequartz is more reproducible in the two shown samples which were
Fig 7 2D XRD with Bruker GADDS-system plots of samples prepared with agate mortar and McCrone mill Coarse quartz grains are pointed out in the plot of the sample prepared withagate mortar
Fig 8 Particle size distribution of one sample prepared with an agate mortar and of onesample prepared with a McCrone mill measured by laser granulometry
Fig 9 Rietveld refinement for Tobermorite of autoclaved AAC sample by use of isotropicdomain size model (a) and of anisotropic domain size model (b)
J Schreiner et al Cement and Concrete Research 107 (2018) 247ndash252
250
6 Publications
42
prepared with a McCrone mill The high variance of crystalline quartzin the samples which were prepared with an agate mortar is a result ofinsufficient grinding and remaining of too large quartz grains Whenthis spottiness occurs a reliable quantification using the G-factormethod is not possible
The 2D XRD with Bruker GADDS-system plots in Fig 7 demonstratethe insufficient grinding when using an agate mortar compared to wetmilling with a McCrone mill Quartz would be overrepresented in a one-dimensional XRD pattern focusing on a section with bright spots (greenarrows) The lack of bright spots in the right plot shows that the quartzgrains are milled more thoroughly using a McCrone mill In Fig 8 theparticle size distribution after both ways of sample preparation iscompared Most grains in the sample prepared with an agate mortar arelarger than in the sample prepared with a McCrone mill The grain sizedistribution of the sample prepared with a McCrone mill complies withthe recommended particle size range for XRD analysis of under 5 to50 μm [3536] while the other sample exceeds the range
In Fig 9 Rietveld refinement of an autoclaved sample is shown Thedominant peaks at 77 290 and 301deg 2θ are attributed to tobermoriteIn the upper diagram (a) Rietveld refinement was carried out regularlycalculating isotropic domain sizes for tobermorite However the cal-culated fit differs significantly from the raw data It can be assumed thattobermorite shows a similar pattern to portlandite in terms of aniso-tropic peak broadening taking into account that tobermorite is as-signed to the orthorhombic crystal system Thus instead of a biaxialcylinder model an elliptic cylinder model (Fig 10 structure createdwith VESTA 318 [34]) was applied for the refinement in the lowerdiagram (b) The elliptic cylinder model is a sufficient approach to the
orthorhombic crystal system as it allows the distinction between do-main sizes in a b and c direction The fit is clearly superior using theanisotropic domain size model highlighted by the difference plot inFig 9b The comparison refinement with isotropic and anisotropic ap-proach was done for all of the five autoclaved samples In Fig 11 theresulting Rwp values for the whole pattern and the RBragg values of to-bermorite are shown The refinement using the anisotropic model leadsto both lower Rwp and RBragg values and consequently to a better fit anda more accurate quantification of tobermorite in all refined samples
4 Summary and conclusions
Improved analytical methods for both the phase developmentduring the hydration before autoclaving and during the autoclavingprocess of AAC are presented It could be shown that wet McCronemilling is the best way of preparation of AAC samples in order to obtainsuitable samples for powder diffraction A new approach to treat ani-sotropic domain sizes for Rietveld refinement could be successfullyapplied ndash with the benefit that portlandite and tobermorite in AACsamples could be refined more accurately using the Rietveld methodThus this application allows an improved quantification of the phasedevelopment during both of the production steps
For the future there are still plenty of possibilities to apply thepresented approach of calculating anisotropic domain sizes to AACproduction As exemplified with portlandite the mechanisms of growthof tobermorite can be tracked likewise during the autoclaving processIn addition the effect of variations in the chemical composition of AACraw mixtures on the crystal morphology of tobermorite can be ex-amined This leaves a new perspective to discuss the link between mi-neral phase morphology and the thermal and mechanical properties ofAAC
Acknowledgement
The autoclaved samples were generously provided by RodgauerBaustoffwerke GmbH amp Co KG The authors express gratitude for allsupport
Appendix A Supplementary data
Supplementary data to this article can be found online at httpsdoiorg101016jcemconres201802028
References
[1] MW Grutzeck Cellular concrete in M Scheffler P Colombo (Eds) CellularCeramics Wiley-VCH Weinheim 2005 pp 193ndash223
[2] M Haas The future of AAC ndash from a material scientists point of view inMC Limbachiya JJ Roberts (Eds) Autoclaved Aerated Concrete Taylor FrLondon 2005 pp 187ndash194
[3] T Mitsuda K Sasaki H Ishida Phase evolution during autoclaving process ofaerated concrete J Am Ceram Soc 75 (1992) 1858ndash1863
[4] N Isu H Ishida T Mitsuda Influence of quartz particle size on the chemical and
Fig 10 Triaxial cylinder domain size model of Tobermorite used for Rietveld refinement of anisotropic peak broadening
Fig 11 Comparison of Rwp and RBragg values of Rietveld refinements of autoclavedsamples and tobermorite using the isotropic and the anisotropic domain size model
J Schreiner et al Cement and Concrete Research 107 (2018) 247ndash252
251
6 Publications
43
mechanical properties of autoclaved aerated concrete (I) tobermorite formationCem Concr Res 25 (1995) 243ndash248
[5] NY Mostafa Influence of air-cooled slag on physicochemical properties of auto-claved aerated concrete Cem Concr Res 35 (2005) 1349ndash1357 httpdxdoiorg101016jcemconres200410011
[6] K Matsui J Kikuma M Tsunashima T Ishikawa S Matsuno A Ogawa M SatoIn situ time-resolved X-ray diffraction of tobermorite formation in autoclaved aer-ated concrete influence of silica source reactivity and Al addition Cem Concr Res41 (2011) 510ndash519
[7] C Biagioni S Merlino E Bonaccorsi The tobermorite supergroup a new no-menclature Mineral Mag 79 (2015) 485ndash495 httpdxdoiorg101180minmag2015079222
[8] BH OConnor MD Raven Application of the Rietveld refinement procedure inassaying powdered mixtures Powder Diffract 3 (1988) 2ndash6 httpdxdoiorg101017S0885715600013026
[9] D Jansen F Goetz-Neunhoeffer C Stabler J Neubauer A remastered externalstandard method applied to the quantification of early OPC hydration Cem ConcrRes 41 (2011) 602ndash608 httpdxdoiorg101016jcemconres201103004
[10] D Jansen C Stabler F Goetz-Neunhoeffer S Dittrich J Neubauer Does OrdinaryPortland Cement contain amorphous phase A quantitative study using an externalstandard method Powder Diffract 26 (2011) 31ndash38 httpdxdoiorg10115413549186
[11] D Ectors F Goetz-Neunhoeffer J Neubauer A generalized geometric approach toanisotropic peak broadening due to domain morphology J Appl Crystallogr 48(2015) 189ndash194 httpdxdoiorg101107S1600576714026557
[12] D Ectors F Goetz-Neunhoeffer J Neubauer Routine (an)isotropic crystallite sizeanalysis in the double-Voigt approximation done right Powder Diffract 32 (S1)(2017) 27ndash34 httpdxdoiorg101017S0885715617000070
[13] HM Rietveld A profile refinement method for nuclear and magnetic structures JAppl Crystallogr 2 (1969) 65ndash71 httpdxdoiorg101107S0021889869006558
[14] D Ectors Advances in the Analysis of Cementitious Reactions and Hydrate Phases(Doctoral Thesis) (2016) pp 12ndash14 (urnnbndebvb29-opus4-71743)
[15] AacuteG De La Torre S Bruque J Campo MAG Aranda The superstructure of C3Sfrom synchrotron and neutron powder diffraction and its role in quantitative phaseanalyses Cem Concr Res 32 (2002) 1347ndash1356 httpdxdoiorg101016S0008-8846(02)00796-2
[16] A Kirfel G Will Charge density in anhydrite CaSO4 from X-ray and neutrondiffraction measurements Acta Crystallogr Sect B Struct Crystallogr CrystChem 36 (1980) 2881ndash2890 httpdxdoiorg101107S0567740880010461
[17] C Bezou AN Christensen D Cox M Lehman A Nonat Structures cristallines deCaSO405H2O et CaSO406H2O Comptes Rendus Hebd Des Seacuteances lAcadeacutemieDes Sci Seacuterie 2 (312) (1991) 43ndash48
[18] KH Jost B Ziemer R Seydel Redetermination of the structure of β-dicalciumsilicate Acta Crystallogr Sect B Struct Crystallogr Cryst Chem 33 (1977)1696ndash1700 httpdxdoiorg101107S0567740877006918
[19] W Mumme LMD Cranswick BC Chakoumakos Rietveld crystal structure re-finements from high temperature neutron powder diffraction data for the poly-morphs of dicalcium silicate Neues Jahrb Fuer Mineral Abhandlungen 170 (1996)171ndash188
[20] A Colville S Geller The crystal structure of brownmillerite Ca2FeAlO5Crystallographica 50 (1971) 2311ndash2315 httpdxdoiorg101107S056774087100579X
[21] ST Bergold F Goetz-Neunhoeffer J Neubauer Quantitative analysis of C-S-H inhydrating alite pastes by in-situ XRD Cem Concr Res 53 (2013) 119ndash126 httpdxdoiorg101016jcemconres201306001
[22] EN Maslen VA Streltsov NR Streltsova N Ishizawa Electron density and op-tical anisotropy in rhombohedral carbonates III Synchrotron Xray studies ofCaCO3 MgCO3 and MnCO3 Acta Crystallogr Sect B 51 (1995) 929ndash939 httpdxdoiorg101107S0108768195006434
[23] G Renaudin Y Filinchuk J Neubauer F Goetz-Neunhoeffer A comparativestructural study of wet and dried ettringite Cem Concr Res 40 (2010) 370ndash375httpdxdoiorg101016jcemconres200911002
[24] WF Cole CJ Lancucki A refinement of the crystal structure of gypsumCaSO42H2O Acta Cryst B30 (1974) 921ndash929 httpdxdoiorg101107S0567740874004055
[25] T Runčevski RE Dinnebier OV Magdysyuk H Poumlllmann Crystal structures ofcalcium hemicarboaluminate and carbonated calcium hemicarboaluminate fromsynchrotron powder diffraction data Acta Crystallogr Sect B Struct Sci 68 (2012)493ndash500 httpdxdoiorg101107S010876811203042X
[26] JM Hughes JW Drexler Cation substitution in the apatite tetrahedral site crystalstructures of type hydroxylellestadite and type fermorite Neues Jahrb FuerMineral (1991) 327ndash336
[27] CH Shen RS Liu JG Lin CY Huang Phase stability study of La12Ca18Mn2O7Mater Res Bull 36 (2001) 1139ndash1148
[28] SW Bailey Refinement of an intermediate microcline structure Am Miner 54(1969) 1540ndash1545
[29] WR Busing HA Levy Neutron diffraction study of calcium hydroxide J ChemPhys 26 (1957) 563 httpdxdoiorg10106311743345
[30] Y Le Page G Donnay Refinement of the crystal structure of low-quartz ActaCrystallogr Sect B 32 (1976) 2456ndash2459 httpdxdoiorg101107S0567740876007966
[31] SA Hamid The crystal structure of the 11 Aring natural tobermoriteCa225[Si3O75(OH)15]1H2O Zeitschrift Fuer Krist - New Cryst Struct 154 (1981)189ndash198 httpdxdoiorg101524zkri19811543-4189
[32] P Mondal JW Jeffery The crystal structure of tricalcium aluminate Ca3Al2O6Acta Crystallogr B 31 (1975) 689ndash697 httpdxdoiorg101107S0567740875003639
[33] Y Takeuchi F Nishi I Maki Crystal-chemical characterization of the tricalciumaluminate-sodium oxide (3CaOtimesAl2O3-Na2O) solid-solution series Zeitschrift FuumlrKrist (1980) 259ndash307
[34] K Momma F Izumi VESTA 3 for three-dimensional visualization of crystal vo-lumetric and morphology data J Appl Crystallogr 44 (2011) 1272ndash1276 httpdxdoiorg101107S0021889811038970
[35] K Scrivener R Snellings B Lothenbach A Practical Guide to MicrostructuralAnalysis of Cementitious Materials CRC Press 2016 pp 123ndash125 httpdxdoiorg107693wl20150205
[36] V Pecharsky P Zavalij Fundamentals of Powder Diffraction and StructuralCharacterization of Materials Springer second edition 2005 p 302 httpdxdoiorg101007978-0-387-09579-0
J Schreiner et al Cement and Concrete Research 107 (2018) 247ndash252
252
6 Publications
44
7 Acknowledgement
7 Acknowledgement
Ich moumlchte mich bei einigen Personen bedanken ohne die es wohl kaum zum erfolgreichenAbschluss dieser Arbeit gekommen waumlreMein Doktorvater Prof Dr Juumlrgen Neubauer hat sich stets die Zeit genommen die noumltigwar um Angelegenheiten aller Art mit mir zu klaumlren Er gab mir fachlich immer zumrichtigen Zeitpunkt einen gewissen wissenschaftlichen Impuls Zugleich habe ich mich den-noch immer frei in meiner eigenen Konzeption gefuumlhlt Groszligen Dank spreche ich Prof DrFriedlinde Goumltz-Neunhoeffer aus die fuumlr mich ebenso immer eine verlaumlssliche Ansprech-partnerin fuumlr fachliche und organisatorische Angelegenheiten aller Art war Danke anDr Daniel Jansen fuumlr die gute Zusammenarbeit und dafuumlr dass er mich im Zuge meinerMasterarbeit in ein Forschungsprojekt aufgenommen hat das den Weg zur Promotionmoumlglich machte Zusaumltzlich gilt mein Dank Prof Dr Matthias Goumlbbels der fuumlr dieMitarbeiter am Lehrstuhl immer motivierende Worte fand Fuumlr die Ermoumlglichung meinerTeilnahme an diversen Dienstreisen Fortbildungen und Tagungen moumlchte ich mich viel-mals bedankenWeiterhin bedanke ich mich bei Dr Stephan Volkmann und den Rodgauer BaustoffwerkenGmbH amp Co KG fuumlr die gute Zusammenarbeit und die Bereitstellung von Versuchsma-terialienVielen Dank an meine studentischen Hilfskraumlfte Daniel Wagner Laura MoldenhauerFabian Lang Jakob Schreiber und Felix Klaassen die alle Aufgaben im Labor einwand-frei und mit Bedacht erledigten Bei meinen aktuellen und ehemaligen Kollegen DrKatrin Hurle Dr Dominique Ectors Dr Christoph Naber Dr Florian Huumlller JoumlrgNehring Frank Riedel Julian Wolf Tanja Manninger Daniel Wagner Nicolas FobbeKarla Spaumlth Julian Goergens Andreas Koumlhler Cordula Jakob Franz Becker und LisaKlemenz bedanke ich mich fuumlr die gelungene Zusammenarbeit und gegenseitige Unter-stuumltzung Besonderer Dank geht auch an Kerstin Kreszlig Bettina Engl Christian HankeBernd Schleifer und Christian Abe fuumlr die verlaumlssliche Unterstuumltzung bei technischen Fra-gen und Messungen im LaborFuumlr jegliche Unterstuumltzungen moumlchte ich mich auch bei meinen Eltern bedanken sowiebei meinem Bruder Ralf der mir mit einem LaTex Crashkurs viel Frustration ersparthat Danke Thomas dass du immer fuumlr mich da bist und mit mir zusammen fuumlr genugAusgleich gesorgt hast
45
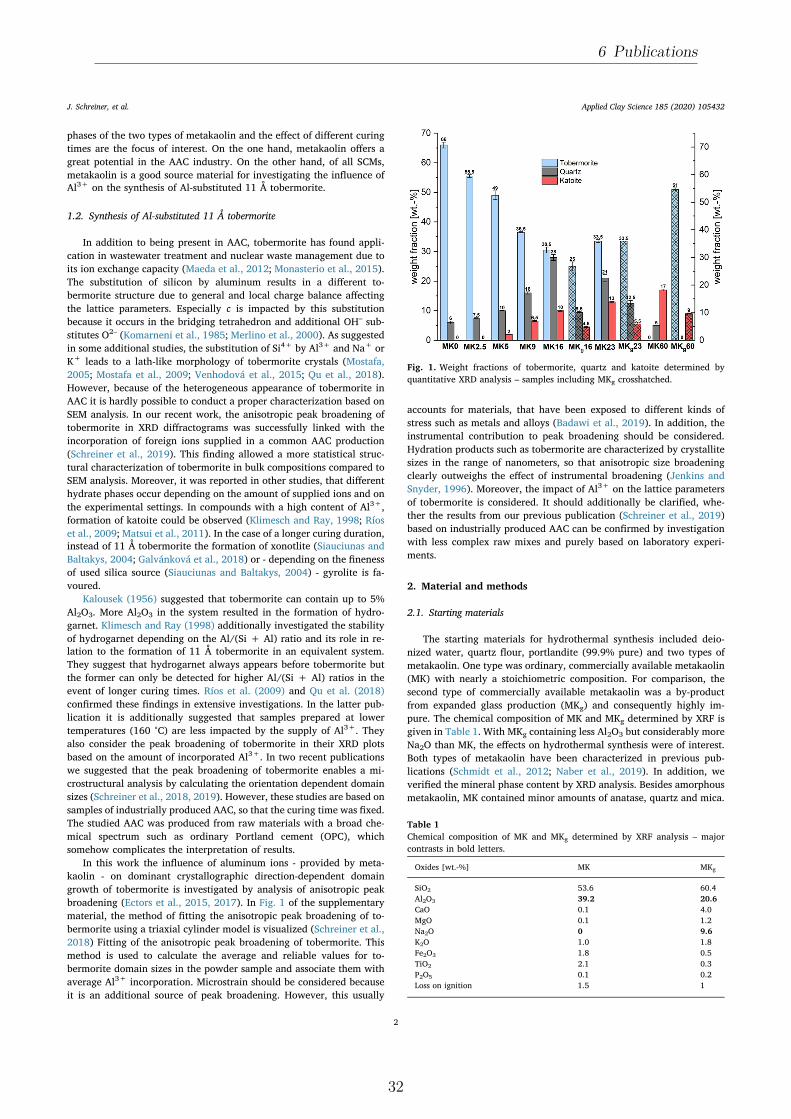
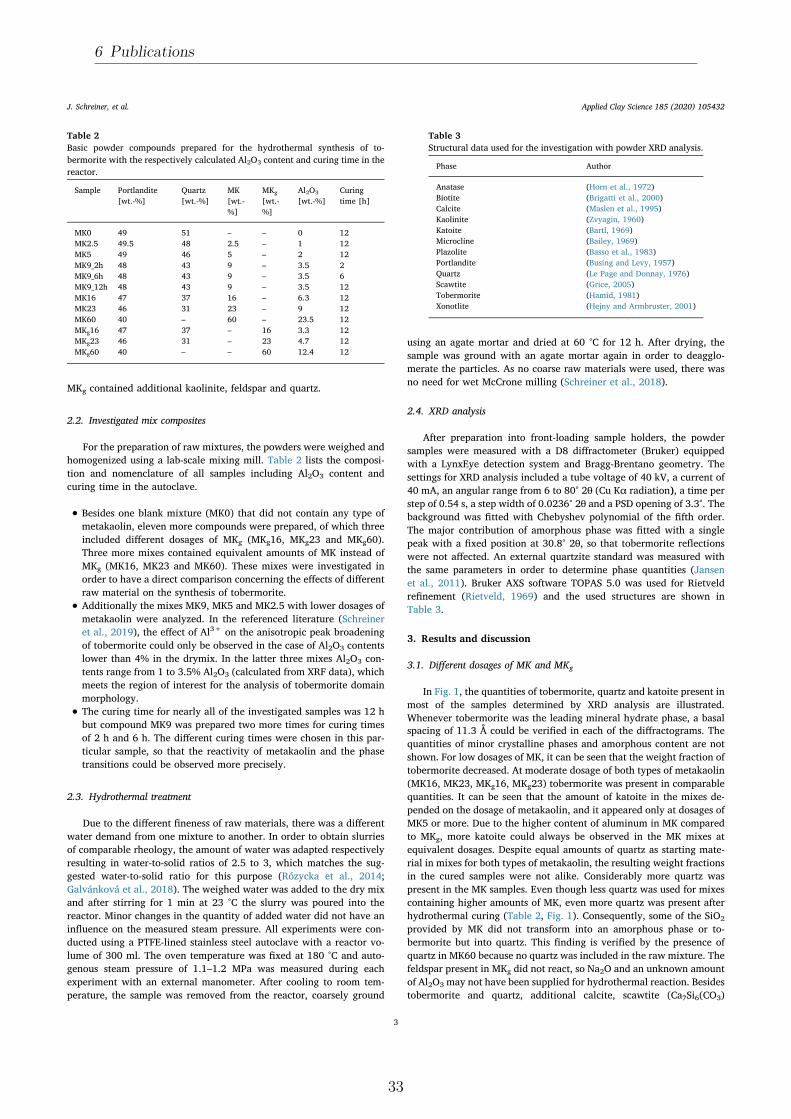
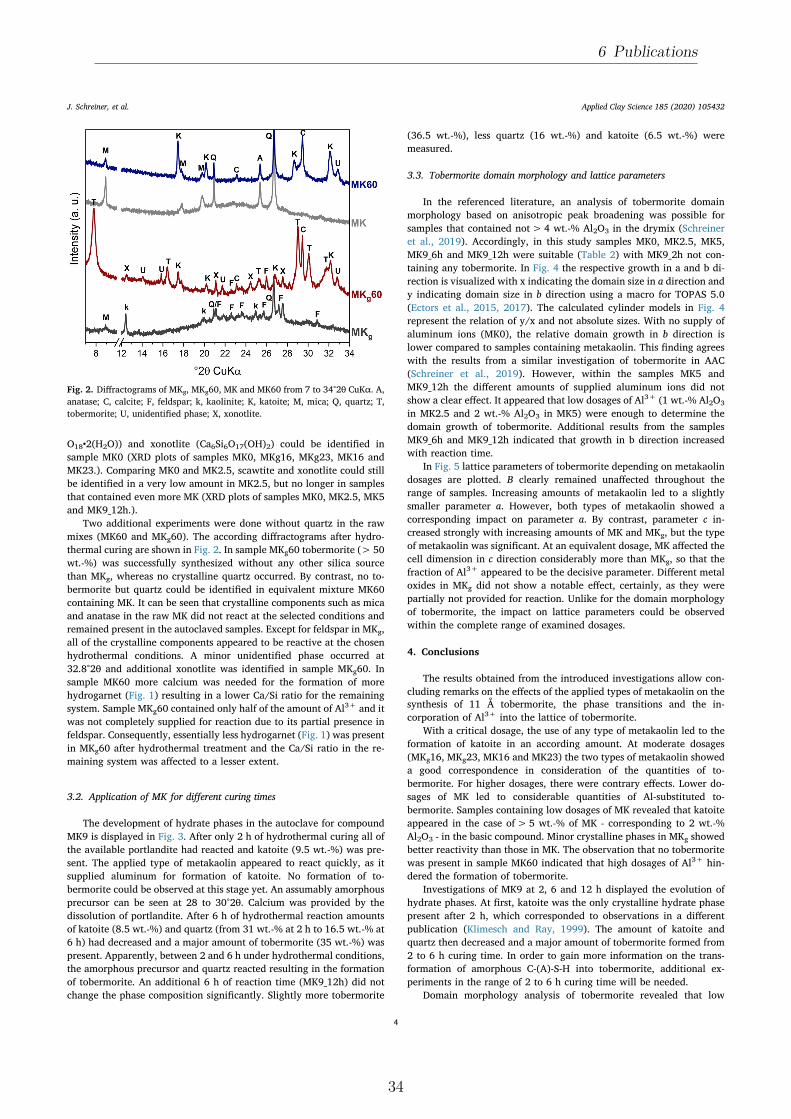
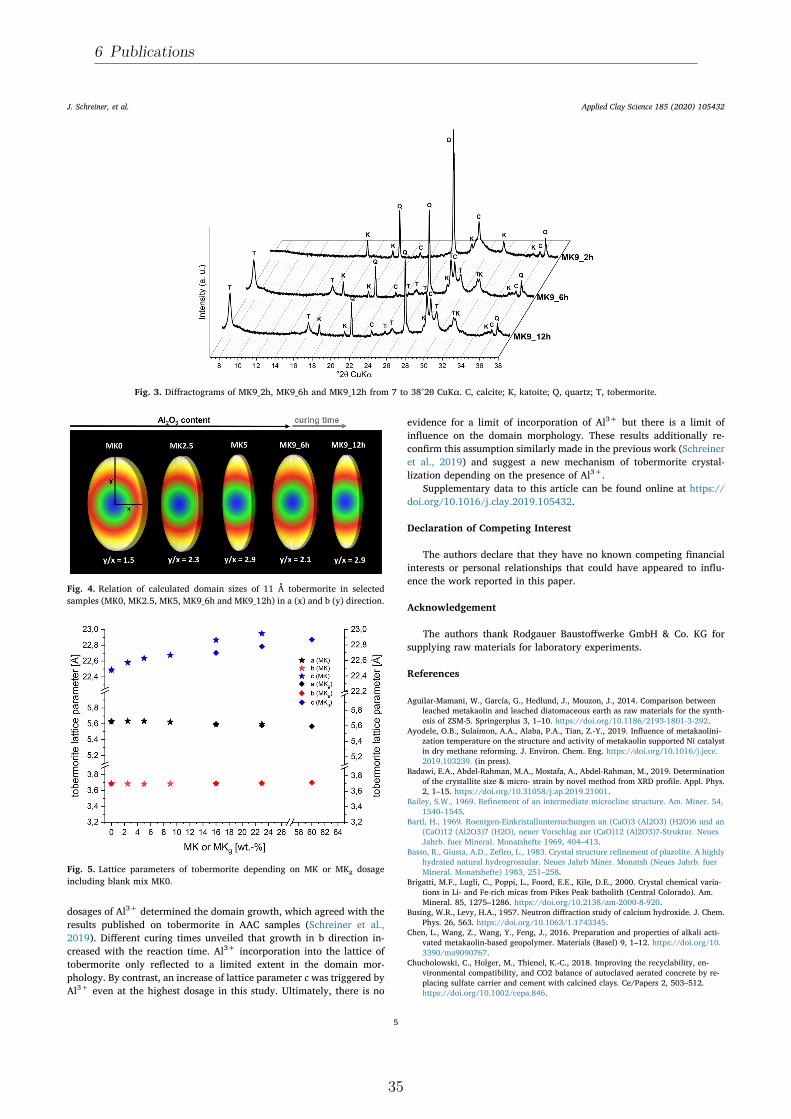
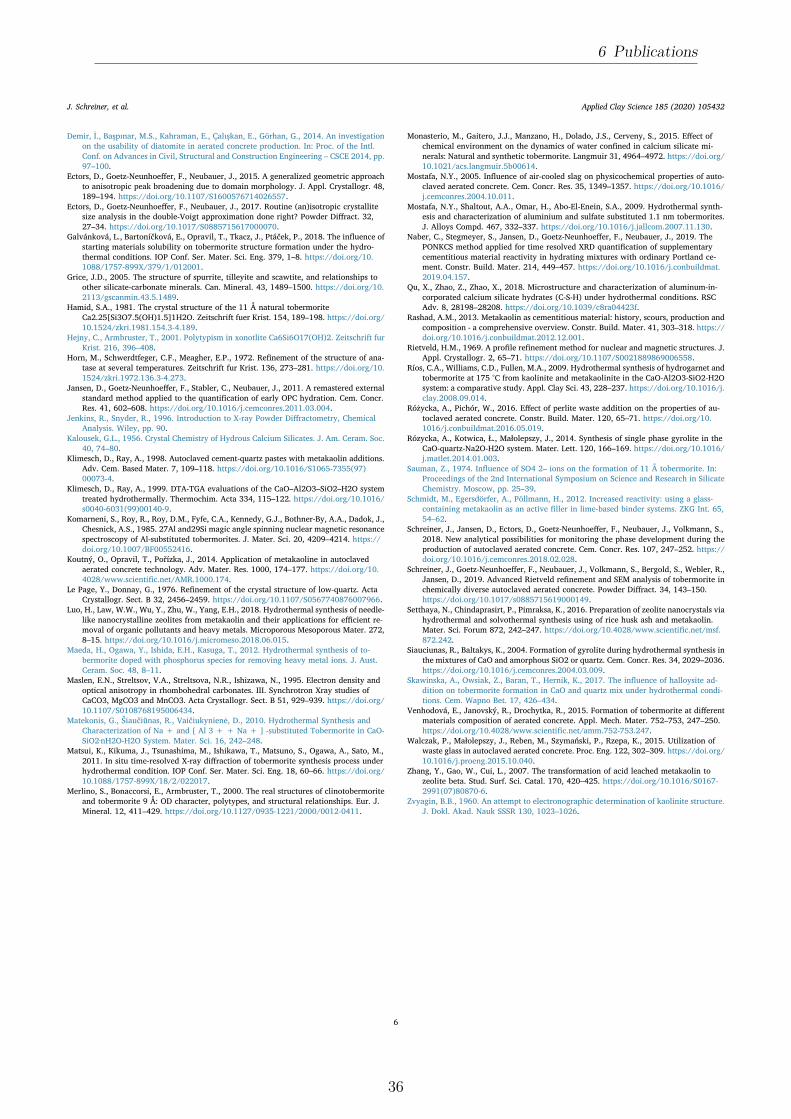
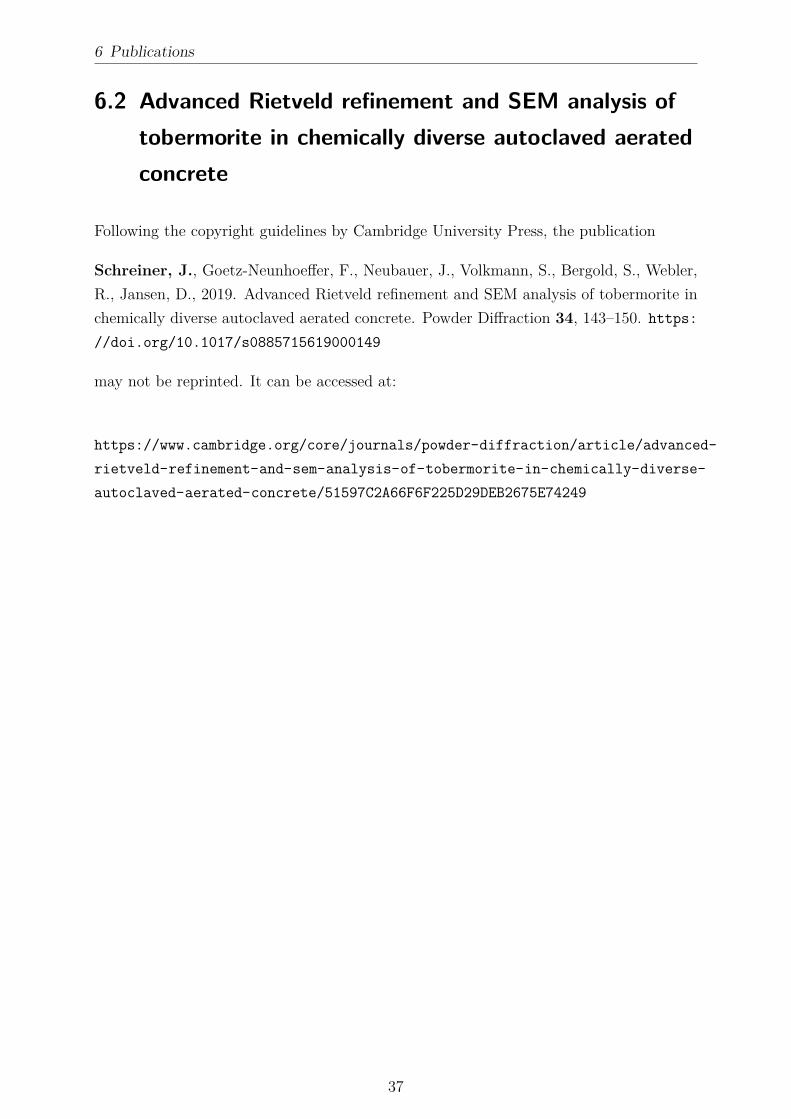
6 Publications
62 Advanced Rietveld refinement and SEM analysis oftobermorite in chemically diverse autoclaved aeratedconcrete
Following the copyright guidelines by Cambridge University Press the publication
Schreiner J Goetz-Neunhoeffer F Neubauer J Volkmann S Bergold S WeblerR Jansen D 2019 Advanced Rietveld refinement and SEM analysis of tobermorite inchemically diverse autoclaved aerated concrete Powder Diffraction 34 143ndash150 httpsdoiorg101017s0885715619000149
may not be reprinted It can be accessed at
httpswwwcambridgeorgcorejournalspowder-diffractionarticleadvanced-rietveld-refinement-and-sem-analysis-of-tobermorite-in-chemically-diverse-autoclaved-aerated-concrete51597C2A66F6F225D29DEB2675E74249
37
6 Publications
63 New analytical possibilities for monitoring the phasedevelopment during the production of autoclavedaerated concrete
Reprint of the peer reviewed publication
Schreiner J Jansen D Ectors D Goetz-Neunhoeffer F Neubauer J VolkmannS 2018 New analytical possibilities for monitoring the phase development during theproduction of autoclaved aerated concrete Cement and Concrete Research 107 247ndash252httpsdoiorg101016jcemconres201802028
with permission from Elsevier
38
Contents lists available at ScienceDirect
Cement and Concrete Research
journal homepage wwwelseviercomlocatecemconres
Short communication
New analytical possibilities for monitoring the phase development duringthe production of autoclaved aerated concrete
J Schreinera D Jansena D Ectorsa F Goetz-Neunhoeffera J Neubauera S Volkmannb
aUniversity of Erlangen-Nuremberg GeoZentrum Nordbayern Mineralogy Schlossgarten 5a 91054 Erlangen Germanyb Rodgauer Baustoffwerke GmbH amp Co KG Am Opel-Pruumlffeld 3 63110 Rodgau-Dudenhofen Germany
A B S T R A C T
This work presents improved analytical methods for both steps of the production process of autoclaved aeratedconcrete (AAC) the phase development during the hydration before autoclaving and during the autoclavingprocess itself The improvement includes new insights into preparation methods of AAC samples for powderdiffraction as well as Rietveld refinement strategies For the first time a new implementation for calculatinganisotropic crystal domain sizes is applied to major hydrate phases occurring during AAC production namelyportlandite during the hydration before autoclaving and tobermorite during the autoclaving process The cal-culation of anisotropic domain size growth which can be implemented in the Rietveld environment is based oncrystallographically and geometrically appropriate models The implementation of calculating anisotropic do-main sizes for the Rietveld software TOPAS 50 allows a superior Rietveld fit and a more accurate quantificationof the phase development Additionally it enables the tracking of growth mechanism of portlandite duringhydration
1 Introduction
Autoclaved aerated concrete (AAC) is known as a lightweight con-struction material which offers outstanding properties such as suffi-cient strength for construction in addition with excellent thermal in-sulation [12] AAC is produced by autoclaving from calcareous rawmaterials such as lime (CaO) and cement quartz sulfate carrier andother additives such as foaming agents and water
The production process (Fig 1) can be separated into the hydrationof the mixed slurry before the procedure of autoclaving and the auto-claving at elevated temperature (180 degC to 200 degC) under saturatedsteam pressure (12MPa) for several hours
The hydration process before autoclaving is necessary to achievesufficient strength in order to cut the green cake blocks as they shouldhave a specific shape and dimension after autoclaving Furthermorethe porous structure is generated by the foaming agent during hydra-tion in the first process step During autoclaving the final propertiesnamely strength and low thermal conductivity are achieved
It is already well understood that the autoclaving process leads tothe formation of several phases first of all tobermorite(Ca5Si6O16(OH)2lowast4H2O) [3ndash5] Newest research has shown im-pressively which reactions are running from the mineralogical point ofview Insitu XRD measurements were carried out during the
autoclaving process and the phase development was shown by plottingnormalized intensities [6] The study of Mitsuda et al [3] was mainlyfocused on the tracking of the phase evolution during the autoclavingprocess of AAC However their statements concerning phase evolutionare mainly based on XRD data and TGA measurements There is acommon agreement that the following reactions occur The consump-tion of the alite (OPC) leads to the formation of an initial C-S-H phaseduring the first processing step Portlandite which was initially formedduring the first process step (from CaO and C3S) further quartz and theC-S-H phase are consumed during autoclaving resulting in the crystal-lization of tobermorite Hence the crystallization process of to-bermorite as well as the crystal structure of tobermorite was an issue ofresearch and discussion over the last years and numerous publicationsto these topics are available Concerning the crystal structure of to-bermorite respectively the tobermorite supergroup a new publicationoutlines all important references and recommends a new nomenclature[7]
The presented study was performed to create new analytical possi-bilities for the characterization of the production process of AAC Bothof the production process steps are essential for the final productHence the present work focuses on crystallization of hydrate phases inboth processes
Firstly an external standard method [89] was published and
httpsdoiorg101016jcemconres201802028Received 6 October 2017 Received in revised form 1 February 2018 Accepted 26 February 2018
Corresponding authorsE-mail addresses juergenjsschreinerfaude (J Schreiner) danieljansenfaude (D Jansen)
Cement and Concrete Research 107 (2018) 247ndash252
0008-8846 copy 2018 Elsevier Ltd All rights reserved
T
6 Publications
39
recommended for the determination of absolute phase contents inmixtures with amorphous content It was shown that the method canabsolutely be recommended for hydrating cement pastes in which watercannot be quantified directly by XRD [10] This method seems to bevery promising for both the quantification of the hydration of the AACslurry before autoclaving and the quantification of the phase evolutionduring autoclaving inasmuch as both production steps form crystallineand amorphous phases
Secondly a new approach to anisotropic peak broadening due toanisotropic domain morphology which was developed [1112] is ap-plied to AAC samples to improve the fit of portlandite and tobermoriteby Rietveld refinement [13] By applying this approach the refinementof both portlandite and tobermorite should additionally lead to betterquantitative results as well as to better insights into the development ofthe domain size morphology of both phases formed
It was already shown that in a hydrating raw mixture for AAC twospecies of portlandite precipitate at 23 degC one showing dynamicallyanisotropic peak broadening and another one following the isotropictrend [14] The application of the anisotropic refinement model led toan improved fitting of portlandite Moreover the mechanism of aniso-tropic domain growth of portlandite was tracked
2 Materials and methods
In order to examine the hydration of the AAC slurry before auto-claving a mixture of the hydraulic reactive components was weighedand measured in-situ at a Bruker D8 diffractometer with a LynxEyedetection system
Ordinary Portland cement (OPC) was mixed with lime (CaO) andanhydrite (C$) The raw materials were taken from the same batches asfor the industrial samples The drymix (58 OPC 36 CaO and 6 C$by weight) was then mixed with water (ws= 08) and placed into anappropriate sample holder The samples were not aerated The slurrysamples were covered with a kapton film to avoid evaporation andcarbonation Diffractograms were recorded with an angular range from7 to 545deg 2θ and a step width of 0011deg 2θ Measurements were carriedout every 15min For each measurement 96 XRD patterns were re-corded over the first 24 h The temperature was fixed at 70 degC which isthe mean temperature generally prevailing in the industrial processduring hydration before autoclaving Rietveld refinement was carriedout using the G-factor method All structures used for Rietveld refine-ment are shown in Table 1
For investigation of the autoclaved samples five different specimenswere taken at different autoclaving times The specimens were takenout of a technical production process hence it was not possible to in-terrupt the process at an earlier time inasmuch it would lead to damageof a whole concrete production batch The specimens were firstly driedat 60 degC until weight constancy The whole blocks were then broken andstatistical samples of 20 g were taken In order to receive the right massattenuation coefficient (MAC) for G-factor method the loss on ignitionand the chemical composition (XRF) were determined For energydispersive XRF analysis (Spectro Xepos) tube voltage from 20 kV to50 kV and tube current from 08 to 20mA were used for differenttargets
The final sample preparation (grinding) before XRD measurementswas carried out using both an agate mortar and a McCrone micronizingmill for wet milling with isopropanol Both preparation methods wereapplied separately to see which one is suitable in order to get the bestpreparation for XRD investigations Six preparations were performed byone operator of which two were prepared with an agate mortar andfour with a McCrone mill For the McCrone milling 3 g of the sampleand 10ml of isopropanol were used for grinding for 12min The grainsize distribution of one sample prepared with an agate mortar and onesample prepared using a McCrone mill was measured by laser granu-lometry in isopropanol using a Mastersizer 3000 (MALVERN)
After milling the samples in these two ways for XRD analysis thepowders were prepared into a front loading sample holder and mea-sured Diffractograms were recorded with an angular range from 6 to80deg 2θ a step width of 00236deg 2θ and a time per step of 054 s Rietveldrefinement combined with external standard (G-factor) was applied inorder to get absolute quantities for each phase The refinement strategyfor portlandite and tobermorite in the TOPAS Launch Mode (TOPAS50 Bruker AXS) is attached as a Supplementary material file
3 Results and discussion
31 Hydration of the mixture before autoclaving
The hydration of the investigated paste before autoclaving isdominated by the hydration of the cement as well as the reaction of thefree lime (CaO) resulting in the formation of portlandite It can beclearly seen from Fig 2 that the hydration of the paste leads to theformation of ettringite portlandite and C-S-H phase For simplificationthe remaining phase developments are not shown in Fig 2 because theyare not in the focus of this study The hydration of CaO forming
Fig 1 Simplified process steps of AAC production and hydrate phase evolution
Table 1Structures used for Rietveld refinement
Phase Author
Alite [15]Anhydrite [16]Bassanite [17]Belite (β) [18]Belite (αprime) [19]Brownmillerite [20]C-S-H [21]Calcite [22]Ettringite [23]Gypsum [24]Hemicarbonate [25]Hydroxylellestadite [26]Lime (CaO) [27]Microcline [28]Portlandite [29]Quartz [30]Tobermorite [31]Tricalciumaluminate (cubic) [32]Tricalciumaluminate (orthorhombic) [33]PONCKS model for Water [21]
J Schreiner et al Cement and Concrete Research 107 (2018) 247ndash252
248
6 Publications
40
portlandite begins rapidly after the addition of water to the mixture andlime is fully consumed after only 1 h of hydration This translates into aquick rise of heat of hydration so that cement hydration is acceleratedwhich leads to further portlandite formation by the reaction of aliteEttringite formation stalls after few hours of hydration After 12 h et-tringite is partially decomposed probably due to sulfate depletion [9]
and poorly crystalline AFm phases (not shown in Fig 2) are formedIn Fig 3 it can be seen that in fact two generations of portlandite
are formed a 1st dominant generation showing anisotropic peakbroadening and 2nd one occurring considerably later following theisotropic domain size refinement which is usually carried out using theRietveld method This occurrence comes along firstly with lime hy-dration and secondly with alite hydration The expected quantity ofportlandite formed from lime hydration very well complies with the
Fig 2 Phase development in AAC paste on a laboratory scale before autoclaving ana-lyzed by in-situ XRD at 70 degC
Fig 3 Formation of two generations of portlandite by hydration of lime (1st) and C3S(2nd) at 70 degC before autoclaving with the major generation showing anisotropic peakbroadening
Fig 4 Biaxial cylinder domain size model of portlandite used for Rietveld refinement of anisotropic peak broadening
Fig 5 Morphological evolution of portlandite showing anisotropic domain size growthduring hydration at 70 degC
Fig 6 Comparison of quantification of crystalline quartz in samples prepared withMcCrone mill and agate mortar at different autoclaving times
J Schreiner et al Cement and Concrete Research 107 (2018) 247ndash252
249
6 Publications
41
quantity of the observed 1st generation The development of portlan-dite growth was already tracked in an equivalent slurry at 23 degC [14]Thus this observation confirms that the crystallinity of portlandite inmixtures for AAC production depends on the starting phase for hydra-tion as already indicated by Ectors [14]
Fig 4 shows the used biaxial cylindrical model for anisotropic do-main size calculation and the portlandite structure which was createdwith structural software VESTA 318 [34] Using the cylindrical ap-proach domain sizes in a (here equating to b) and c direction(dz= cylinder height) can be calculated which comes along with theexpected symmetrical parameters of portlandite
The 1st portlandite generation showing anisotropic domain growthcan be tracked in terms of cylinder diameter and height which is rea-lized in Fig 5 The blue cylinder represents the geometric approach andcylinder height and diameter are calculated newly for each range Thecylinder height remains rather stable throughout the hydration processwhile the cylinder diameter increases during the first hours of hydra-tion After 10 h of hydration the mean cylinder diameter no longer in-creases Consequently these observations match the results of the ex-aminations conducted at 23 degC [14] as well as the assumption thatdifferent mechanisms of growth exist for portlandite depending on the
hydration educt The maximum cylinder diameter is reached earlier inthis work very likely because of the higher hydration temperature
32 Quantification of the reactions during autoclaving
Autoclaved samples were ground with an agate mortar and com-pared to samples which were wet-ground with a McCrone mill Fig 6shows precisely that the determination of the amount of crystallinequartz is more reproducible in the two shown samples which were
Fig 7 2D XRD with Bruker GADDS-system plots of samples prepared with agate mortar and McCrone mill Coarse quartz grains are pointed out in the plot of the sample prepared withagate mortar
Fig 8 Particle size distribution of one sample prepared with an agate mortar and of onesample prepared with a McCrone mill measured by laser granulometry
Fig 9 Rietveld refinement for Tobermorite of autoclaved AAC sample by use of isotropicdomain size model (a) and of anisotropic domain size model (b)
J Schreiner et al Cement and Concrete Research 107 (2018) 247ndash252
250
6 Publications
42
prepared with a McCrone mill The high variance of crystalline quartzin the samples which were prepared with an agate mortar is a result ofinsufficient grinding and remaining of too large quartz grains Whenthis spottiness occurs a reliable quantification using the G-factormethod is not possible
The 2D XRD with Bruker GADDS-system plots in Fig 7 demonstratethe insufficient grinding when using an agate mortar compared to wetmilling with a McCrone mill Quartz would be overrepresented in a one-dimensional XRD pattern focusing on a section with bright spots (greenarrows) The lack of bright spots in the right plot shows that the quartzgrains are milled more thoroughly using a McCrone mill In Fig 8 theparticle size distribution after both ways of sample preparation iscompared Most grains in the sample prepared with an agate mortar arelarger than in the sample prepared with a McCrone mill The grain sizedistribution of the sample prepared with a McCrone mill complies withthe recommended particle size range for XRD analysis of under 5 to50 μm [3536] while the other sample exceeds the range
In Fig 9 Rietveld refinement of an autoclaved sample is shown Thedominant peaks at 77 290 and 301deg 2θ are attributed to tobermoriteIn the upper diagram (a) Rietveld refinement was carried out regularlycalculating isotropic domain sizes for tobermorite However the cal-culated fit differs significantly from the raw data It can be assumed thattobermorite shows a similar pattern to portlandite in terms of aniso-tropic peak broadening taking into account that tobermorite is as-signed to the orthorhombic crystal system Thus instead of a biaxialcylinder model an elliptic cylinder model (Fig 10 structure createdwith VESTA 318 [34]) was applied for the refinement in the lowerdiagram (b) The elliptic cylinder model is a sufficient approach to the
orthorhombic crystal system as it allows the distinction between do-main sizes in a b and c direction The fit is clearly superior using theanisotropic domain size model highlighted by the difference plot inFig 9b The comparison refinement with isotropic and anisotropic ap-proach was done for all of the five autoclaved samples In Fig 11 theresulting Rwp values for the whole pattern and the RBragg values of to-bermorite are shown The refinement using the anisotropic model leadsto both lower Rwp and RBragg values and consequently to a better fit anda more accurate quantification of tobermorite in all refined samples
4 Summary and conclusions
Improved analytical methods for both the phase developmentduring the hydration before autoclaving and during the autoclavingprocess of AAC are presented It could be shown that wet McCronemilling is the best way of preparation of AAC samples in order to obtainsuitable samples for powder diffraction A new approach to treat ani-sotropic domain sizes for Rietveld refinement could be successfullyapplied ndash with the benefit that portlandite and tobermorite in AACsamples could be refined more accurately using the Rietveld methodThus this application allows an improved quantification of the phasedevelopment during both of the production steps
For the future there are still plenty of possibilities to apply thepresented approach of calculating anisotropic domain sizes to AACproduction As exemplified with portlandite the mechanisms of growthof tobermorite can be tracked likewise during the autoclaving processIn addition the effect of variations in the chemical composition of AACraw mixtures on the crystal morphology of tobermorite can be ex-amined This leaves a new perspective to discuss the link between mi-neral phase morphology and the thermal and mechanical properties ofAAC
Acknowledgement
The autoclaved samples were generously provided by RodgauerBaustoffwerke GmbH amp Co KG The authors express gratitude for allsupport
Appendix A Supplementary data
Supplementary data to this article can be found online at httpsdoiorg101016jcemconres201802028
References
[1] MW Grutzeck Cellular concrete in M Scheffler P Colombo (Eds) CellularCeramics Wiley-VCH Weinheim 2005 pp 193ndash223
[2] M Haas The future of AAC ndash from a material scientists point of view inMC Limbachiya JJ Roberts (Eds) Autoclaved Aerated Concrete Taylor FrLondon 2005 pp 187ndash194
[3] T Mitsuda K Sasaki H Ishida Phase evolution during autoclaving process ofaerated concrete J Am Ceram Soc 75 (1992) 1858ndash1863
[4] N Isu H Ishida T Mitsuda Influence of quartz particle size on the chemical and
Fig 10 Triaxial cylinder domain size model of Tobermorite used for Rietveld refinement of anisotropic peak broadening
Fig 11 Comparison of Rwp and RBragg values of Rietveld refinements of autoclavedsamples and tobermorite using the isotropic and the anisotropic domain size model
J Schreiner et al Cement and Concrete Research 107 (2018) 247ndash252
251
6 Publications
43
mechanical properties of autoclaved aerated concrete (I) tobermorite formationCem Concr Res 25 (1995) 243ndash248
[5] NY Mostafa Influence of air-cooled slag on physicochemical properties of auto-claved aerated concrete Cem Concr Res 35 (2005) 1349ndash1357 httpdxdoiorg101016jcemconres200410011
[6] K Matsui J Kikuma M Tsunashima T Ishikawa S Matsuno A Ogawa M SatoIn situ time-resolved X-ray diffraction of tobermorite formation in autoclaved aer-ated concrete influence of silica source reactivity and Al addition Cem Concr Res41 (2011) 510ndash519
[7] C Biagioni S Merlino E Bonaccorsi The tobermorite supergroup a new no-menclature Mineral Mag 79 (2015) 485ndash495 httpdxdoiorg101180minmag2015079222
[8] BH OConnor MD Raven Application of the Rietveld refinement procedure inassaying powdered mixtures Powder Diffract 3 (1988) 2ndash6 httpdxdoiorg101017S0885715600013026
[9] D Jansen F Goetz-Neunhoeffer C Stabler J Neubauer A remastered externalstandard method applied to the quantification of early OPC hydration Cem ConcrRes 41 (2011) 602ndash608 httpdxdoiorg101016jcemconres201103004
[10] D Jansen C Stabler F Goetz-Neunhoeffer S Dittrich J Neubauer Does OrdinaryPortland Cement contain amorphous phase A quantitative study using an externalstandard method Powder Diffract 26 (2011) 31ndash38 httpdxdoiorg10115413549186
[11] D Ectors F Goetz-Neunhoeffer J Neubauer A generalized geometric approach toanisotropic peak broadening due to domain morphology J Appl Crystallogr 48(2015) 189ndash194 httpdxdoiorg101107S1600576714026557
[12] D Ectors F Goetz-Neunhoeffer J Neubauer Routine (an)isotropic crystallite sizeanalysis in the double-Voigt approximation done right Powder Diffract 32 (S1)(2017) 27ndash34 httpdxdoiorg101017S0885715617000070
[13] HM Rietveld A profile refinement method for nuclear and magnetic structures JAppl Crystallogr 2 (1969) 65ndash71 httpdxdoiorg101107S0021889869006558
[14] D Ectors Advances in the Analysis of Cementitious Reactions and Hydrate Phases(Doctoral Thesis) (2016) pp 12ndash14 (urnnbndebvb29-opus4-71743)
[15] AacuteG De La Torre S Bruque J Campo MAG Aranda The superstructure of C3Sfrom synchrotron and neutron powder diffraction and its role in quantitative phaseanalyses Cem Concr Res 32 (2002) 1347ndash1356 httpdxdoiorg101016S0008-8846(02)00796-2
[16] A Kirfel G Will Charge density in anhydrite CaSO4 from X-ray and neutrondiffraction measurements Acta Crystallogr Sect B Struct Crystallogr CrystChem 36 (1980) 2881ndash2890 httpdxdoiorg101107S0567740880010461
[17] C Bezou AN Christensen D Cox M Lehman A Nonat Structures cristallines deCaSO405H2O et CaSO406H2O Comptes Rendus Hebd Des Seacuteances lAcadeacutemieDes Sci Seacuterie 2 (312) (1991) 43ndash48
[18] KH Jost B Ziemer R Seydel Redetermination of the structure of β-dicalciumsilicate Acta Crystallogr Sect B Struct Crystallogr Cryst Chem 33 (1977)1696ndash1700 httpdxdoiorg101107S0567740877006918
[19] W Mumme LMD Cranswick BC Chakoumakos Rietveld crystal structure re-finements from high temperature neutron powder diffraction data for the poly-morphs of dicalcium silicate Neues Jahrb Fuer Mineral Abhandlungen 170 (1996)171ndash188
[20] A Colville S Geller The crystal structure of brownmillerite Ca2FeAlO5Crystallographica 50 (1971) 2311ndash2315 httpdxdoiorg101107S056774087100579X
[21] ST Bergold F Goetz-Neunhoeffer J Neubauer Quantitative analysis of C-S-H inhydrating alite pastes by in-situ XRD Cem Concr Res 53 (2013) 119ndash126 httpdxdoiorg101016jcemconres201306001
[22] EN Maslen VA Streltsov NR Streltsova N Ishizawa Electron density and op-tical anisotropy in rhombohedral carbonates III Synchrotron Xray studies ofCaCO3 MgCO3 and MnCO3 Acta Crystallogr Sect B 51 (1995) 929ndash939 httpdxdoiorg101107S0108768195006434
[23] G Renaudin Y Filinchuk J Neubauer F Goetz-Neunhoeffer A comparativestructural study of wet and dried ettringite Cem Concr Res 40 (2010) 370ndash375httpdxdoiorg101016jcemconres200911002
[24] WF Cole CJ Lancucki A refinement of the crystal structure of gypsumCaSO42H2O Acta Cryst B30 (1974) 921ndash929 httpdxdoiorg101107S0567740874004055
[25] T Runčevski RE Dinnebier OV Magdysyuk H Poumlllmann Crystal structures ofcalcium hemicarboaluminate and carbonated calcium hemicarboaluminate fromsynchrotron powder diffraction data Acta Crystallogr Sect B Struct Sci 68 (2012)493ndash500 httpdxdoiorg101107S010876811203042X
[26] JM Hughes JW Drexler Cation substitution in the apatite tetrahedral site crystalstructures of type hydroxylellestadite and type fermorite Neues Jahrb FuerMineral (1991) 327ndash336
[27] CH Shen RS Liu JG Lin CY Huang Phase stability study of La12Ca18Mn2O7Mater Res Bull 36 (2001) 1139ndash1148
[28] SW Bailey Refinement of an intermediate microcline structure Am Miner 54(1969) 1540ndash1545
[29] WR Busing HA Levy Neutron diffraction study of calcium hydroxide J ChemPhys 26 (1957) 563 httpdxdoiorg10106311743345
[30] Y Le Page G Donnay Refinement of the crystal structure of low-quartz ActaCrystallogr Sect B 32 (1976) 2456ndash2459 httpdxdoiorg101107S0567740876007966
[31] SA Hamid The crystal structure of the 11 Aring natural tobermoriteCa225[Si3O75(OH)15]1H2O Zeitschrift Fuer Krist - New Cryst Struct 154 (1981)189ndash198 httpdxdoiorg101524zkri19811543-4189
[32] P Mondal JW Jeffery The crystal structure of tricalcium aluminate Ca3Al2O6Acta Crystallogr B 31 (1975) 689ndash697 httpdxdoiorg101107S0567740875003639
[33] Y Takeuchi F Nishi I Maki Crystal-chemical characterization of the tricalciumaluminate-sodium oxide (3CaOtimesAl2O3-Na2O) solid-solution series Zeitschrift FuumlrKrist (1980) 259ndash307
[34] K Momma F Izumi VESTA 3 for three-dimensional visualization of crystal vo-lumetric and morphology data J Appl Crystallogr 44 (2011) 1272ndash1276 httpdxdoiorg101107S0021889811038970
[35] K Scrivener R Snellings B Lothenbach A Practical Guide to MicrostructuralAnalysis of Cementitious Materials CRC Press 2016 pp 123ndash125 httpdxdoiorg107693wl20150205
[36] V Pecharsky P Zavalij Fundamentals of Powder Diffraction and StructuralCharacterization of Materials Springer second edition 2005 p 302 httpdxdoiorg101007978-0-387-09579-0
J Schreiner et al Cement and Concrete Research 107 (2018) 247ndash252
252
6 Publications
44
7 Acknowledgement
7 Acknowledgement
Ich moumlchte mich bei einigen Personen bedanken ohne die es wohl kaum zum erfolgreichenAbschluss dieser Arbeit gekommen waumlreMein Doktorvater Prof Dr Juumlrgen Neubauer hat sich stets die Zeit genommen die noumltigwar um Angelegenheiten aller Art mit mir zu klaumlren Er gab mir fachlich immer zumrichtigen Zeitpunkt einen gewissen wissenschaftlichen Impuls Zugleich habe ich mich den-noch immer frei in meiner eigenen Konzeption gefuumlhlt Groszligen Dank spreche ich Prof DrFriedlinde Goumltz-Neunhoeffer aus die fuumlr mich ebenso immer eine verlaumlssliche Ansprech-partnerin fuumlr fachliche und organisatorische Angelegenheiten aller Art war Danke anDr Daniel Jansen fuumlr die gute Zusammenarbeit und dafuumlr dass er mich im Zuge meinerMasterarbeit in ein Forschungsprojekt aufgenommen hat das den Weg zur Promotionmoumlglich machte Zusaumltzlich gilt mein Dank Prof Dr Matthias Goumlbbels der fuumlr dieMitarbeiter am Lehrstuhl immer motivierende Worte fand Fuumlr die Ermoumlglichung meinerTeilnahme an diversen Dienstreisen Fortbildungen und Tagungen moumlchte ich mich viel-mals bedankenWeiterhin bedanke ich mich bei Dr Stephan Volkmann und den Rodgauer BaustoffwerkenGmbH amp Co KG fuumlr die gute Zusammenarbeit und die Bereitstellung von Versuchsma-terialienVielen Dank an meine studentischen Hilfskraumlfte Daniel Wagner Laura MoldenhauerFabian Lang Jakob Schreiber und Felix Klaassen die alle Aufgaben im Labor einwand-frei und mit Bedacht erledigten Bei meinen aktuellen und ehemaligen Kollegen DrKatrin Hurle Dr Dominique Ectors Dr Christoph Naber Dr Florian Huumlller JoumlrgNehring Frank Riedel Julian Wolf Tanja Manninger Daniel Wagner Nicolas FobbeKarla Spaumlth Julian Goergens Andreas Koumlhler Cordula Jakob Franz Becker und LisaKlemenz bedanke ich mich fuumlr die gelungene Zusammenarbeit und gegenseitige Unter-stuumltzung Besonderer Dank geht auch an Kerstin Kreszlig Bettina Engl Christian HankeBernd Schleifer und Christian Abe fuumlr die verlaumlssliche Unterstuumltzung bei technischen Fra-gen und Messungen im LaborFuumlr jegliche Unterstuumltzungen moumlchte ich mich auch bei meinen Eltern bedanken sowiebei meinem Bruder Ralf der mir mit einem LaTex Crashkurs viel Frustration ersparthat Danke Thomas dass du immer fuumlr mich da bist und mit mir zusammen fuumlr genugAusgleich gesorgt hast
45
6 Publications
63 New analytical possibilities for monitoring the phasedevelopment during the production of autoclavedaerated concrete
Reprint of the peer reviewed publication
Schreiner J Jansen D Ectors D Goetz-Neunhoeffer F Neubauer J VolkmannS 2018 New analytical possibilities for monitoring the phase development during theproduction of autoclaved aerated concrete Cement and Concrete Research 107 247ndash252httpsdoiorg101016jcemconres201802028
with permission from Elsevier
38
Contents lists available at ScienceDirect
Cement and Concrete Research
journal homepage wwwelseviercomlocatecemconres
Short communication
New analytical possibilities for monitoring the phase development duringthe production of autoclaved aerated concrete
J Schreinera D Jansena D Ectorsa F Goetz-Neunhoeffera J Neubauera S Volkmannb
aUniversity of Erlangen-Nuremberg GeoZentrum Nordbayern Mineralogy Schlossgarten 5a 91054 Erlangen Germanyb Rodgauer Baustoffwerke GmbH amp Co KG Am Opel-Pruumlffeld 3 63110 Rodgau-Dudenhofen Germany
A B S T R A C T
This work presents improved analytical methods for both steps of the production process of autoclaved aeratedconcrete (AAC) the phase development during the hydration before autoclaving and during the autoclavingprocess itself The improvement includes new insights into preparation methods of AAC samples for powderdiffraction as well as Rietveld refinement strategies For the first time a new implementation for calculatinganisotropic crystal domain sizes is applied to major hydrate phases occurring during AAC production namelyportlandite during the hydration before autoclaving and tobermorite during the autoclaving process The cal-culation of anisotropic domain size growth which can be implemented in the Rietveld environment is based oncrystallographically and geometrically appropriate models The implementation of calculating anisotropic do-main sizes for the Rietveld software TOPAS 50 allows a superior Rietveld fit and a more accurate quantificationof the phase development Additionally it enables the tracking of growth mechanism of portlandite duringhydration
1 Introduction
Autoclaved aerated concrete (AAC) is known as a lightweight con-struction material which offers outstanding properties such as suffi-cient strength for construction in addition with excellent thermal in-sulation [12] AAC is produced by autoclaving from calcareous rawmaterials such as lime (CaO) and cement quartz sulfate carrier andother additives such as foaming agents and water
The production process (Fig 1) can be separated into the hydrationof the mixed slurry before the procedure of autoclaving and the auto-claving at elevated temperature (180 degC to 200 degC) under saturatedsteam pressure (12MPa) for several hours
The hydration process before autoclaving is necessary to achievesufficient strength in order to cut the green cake blocks as they shouldhave a specific shape and dimension after autoclaving Furthermorethe porous structure is generated by the foaming agent during hydra-tion in the first process step During autoclaving the final propertiesnamely strength and low thermal conductivity are achieved
It is already well understood that the autoclaving process leads tothe formation of several phases first of all tobermorite(Ca5Si6O16(OH)2lowast4H2O) [3ndash5] Newest research has shown im-pressively which reactions are running from the mineralogical point ofview Insitu XRD measurements were carried out during the
autoclaving process and the phase development was shown by plottingnormalized intensities [6] The study of Mitsuda et al [3] was mainlyfocused on the tracking of the phase evolution during the autoclavingprocess of AAC However their statements concerning phase evolutionare mainly based on XRD data and TGA measurements There is acommon agreement that the following reactions occur The consump-tion of the alite (OPC) leads to the formation of an initial C-S-H phaseduring the first processing step Portlandite which was initially formedduring the first process step (from CaO and C3S) further quartz and theC-S-H phase are consumed during autoclaving resulting in the crystal-lization of tobermorite Hence the crystallization process of to-bermorite as well as the crystal structure of tobermorite was an issue ofresearch and discussion over the last years and numerous publicationsto these topics are available Concerning the crystal structure of to-bermorite respectively the tobermorite supergroup a new publicationoutlines all important references and recommends a new nomenclature[7]
The presented study was performed to create new analytical possi-bilities for the characterization of the production process of AAC Bothof the production process steps are essential for the final productHence the present work focuses on crystallization of hydrate phases inboth processes
Firstly an external standard method [89] was published and
httpsdoiorg101016jcemconres201802028Received 6 October 2017 Received in revised form 1 February 2018 Accepted 26 February 2018
Corresponding authorsE-mail addresses juergenjsschreinerfaude (J Schreiner) danieljansenfaude (D Jansen)
Cement and Concrete Research 107 (2018) 247ndash252
0008-8846 copy 2018 Elsevier Ltd All rights reserved
T
6 Publications
39
recommended for the determination of absolute phase contents inmixtures with amorphous content It was shown that the method canabsolutely be recommended for hydrating cement pastes in which watercannot be quantified directly by XRD [10] This method seems to bevery promising for both the quantification of the hydration of the AACslurry before autoclaving and the quantification of the phase evolutionduring autoclaving inasmuch as both production steps form crystallineand amorphous phases
Secondly a new approach to anisotropic peak broadening due toanisotropic domain morphology which was developed [1112] is ap-plied to AAC samples to improve the fit of portlandite and tobermoriteby Rietveld refinement [13] By applying this approach the refinementof both portlandite and tobermorite should additionally lead to betterquantitative results as well as to better insights into the development ofthe domain size morphology of both phases formed
It was already shown that in a hydrating raw mixture for AAC twospecies of portlandite precipitate at 23 degC one showing dynamicallyanisotropic peak broadening and another one following the isotropictrend [14] The application of the anisotropic refinement model led toan improved fitting of portlandite Moreover the mechanism of aniso-tropic domain growth of portlandite was tracked
2 Materials and methods
In order to examine the hydration of the AAC slurry before auto-claving a mixture of the hydraulic reactive components was weighedand measured in-situ at a Bruker D8 diffractometer with a LynxEyedetection system
Ordinary Portland cement (OPC) was mixed with lime (CaO) andanhydrite (C$) The raw materials were taken from the same batches asfor the industrial samples The drymix (58 OPC 36 CaO and 6 C$by weight) was then mixed with water (ws= 08) and placed into anappropriate sample holder The samples were not aerated The slurrysamples were covered with a kapton film to avoid evaporation andcarbonation Diffractograms were recorded with an angular range from7 to 545deg 2θ and a step width of 0011deg 2θ Measurements were carriedout every 15min For each measurement 96 XRD patterns were re-corded over the first 24 h The temperature was fixed at 70 degC which isthe mean temperature generally prevailing in the industrial processduring hydration before autoclaving Rietveld refinement was carriedout using the G-factor method All structures used for Rietveld refine-ment are shown in Table 1
For investigation of the autoclaved samples five different specimenswere taken at different autoclaving times The specimens were takenout of a technical production process hence it was not possible to in-terrupt the process at an earlier time inasmuch it would lead to damageof a whole concrete production batch The specimens were firstly driedat 60 degC until weight constancy The whole blocks were then broken andstatistical samples of 20 g were taken In order to receive the right massattenuation coefficient (MAC) for G-factor method the loss on ignitionand the chemical composition (XRF) were determined For energydispersive XRF analysis (Spectro Xepos) tube voltage from 20 kV to50 kV and tube current from 08 to 20mA were used for differenttargets
The final sample preparation (grinding) before XRD measurementswas carried out using both an agate mortar and a McCrone micronizingmill for wet milling with isopropanol Both preparation methods wereapplied separately to see which one is suitable in order to get the bestpreparation for XRD investigations Six preparations were performed byone operator of which two were prepared with an agate mortar andfour with a McCrone mill For the McCrone milling 3 g of the sampleand 10ml of isopropanol were used for grinding for 12min The grainsize distribution of one sample prepared with an agate mortar and onesample prepared using a McCrone mill was measured by laser granu-lometry in isopropanol using a Mastersizer 3000 (MALVERN)
After milling the samples in these two ways for XRD analysis thepowders were prepared into a front loading sample holder and mea-sured Diffractograms were recorded with an angular range from 6 to80deg 2θ a step width of 00236deg 2θ and a time per step of 054 s Rietveldrefinement combined with external standard (G-factor) was applied inorder to get absolute quantities for each phase The refinement strategyfor portlandite and tobermorite in the TOPAS Launch Mode (TOPAS50 Bruker AXS) is attached as a Supplementary material file
3 Results and discussion
31 Hydration of the mixture before autoclaving
The hydration of the investigated paste before autoclaving isdominated by the hydration of the cement as well as the reaction of thefree lime (CaO) resulting in the formation of portlandite It can beclearly seen from Fig 2 that the hydration of the paste leads to theformation of ettringite portlandite and C-S-H phase For simplificationthe remaining phase developments are not shown in Fig 2 because theyare not in the focus of this study The hydration of CaO forming
Fig 1 Simplified process steps of AAC production and hydrate phase evolution
Table 1Structures used for Rietveld refinement
Phase Author
Alite [15]Anhydrite [16]Bassanite [17]Belite (β) [18]Belite (αprime) [19]Brownmillerite [20]C-S-H [21]Calcite [22]Ettringite [23]Gypsum [24]Hemicarbonate [25]Hydroxylellestadite [26]Lime (CaO) [27]Microcline [28]Portlandite [29]Quartz [30]Tobermorite [31]Tricalciumaluminate (cubic) [32]Tricalciumaluminate (orthorhombic) [33]PONCKS model for Water [21]
J Schreiner et al Cement and Concrete Research 107 (2018) 247ndash252
248
6 Publications
40
portlandite begins rapidly after the addition of water to the mixture andlime is fully consumed after only 1 h of hydration This translates into aquick rise of heat of hydration so that cement hydration is acceleratedwhich leads to further portlandite formation by the reaction of aliteEttringite formation stalls after few hours of hydration After 12 h et-tringite is partially decomposed probably due to sulfate depletion [9]
and poorly crystalline AFm phases (not shown in Fig 2) are formedIn Fig 3 it can be seen that in fact two generations of portlandite
are formed a 1st dominant generation showing anisotropic peakbroadening and 2nd one occurring considerably later following theisotropic domain size refinement which is usually carried out using theRietveld method This occurrence comes along firstly with lime hy-dration and secondly with alite hydration The expected quantity ofportlandite formed from lime hydration very well complies with the
Fig 2 Phase development in AAC paste on a laboratory scale before autoclaving ana-lyzed by in-situ XRD at 70 degC
Fig 3 Formation of two generations of portlandite by hydration of lime (1st) and C3S(2nd) at 70 degC before autoclaving with the major generation showing anisotropic peakbroadening
Fig 4 Biaxial cylinder domain size model of portlandite used for Rietveld refinement of anisotropic peak broadening
Fig 5 Morphological evolution of portlandite showing anisotropic domain size growthduring hydration at 70 degC
Fig 6 Comparison of quantification of crystalline quartz in samples prepared withMcCrone mill and agate mortar at different autoclaving times
J Schreiner et al Cement and Concrete Research 107 (2018) 247ndash252
249
6 Publications
41
quantity of the observed 1st generation The development of portlan-dite growth was already tracked in an equivalent slurry at 23 degC [14]Thus this observation confirms that the crystallinity of portlandite inmixtures for AAC production depends on the starting phase for hydra-tion as already indicated by Ectors [14]
Fig 4 shows the used biaxial cylindrical model for anisotropic do-main size calculation and the portlandite structure which was createdwith structural software VESTA 318 [34] Using the cylindrical ap-proach domain sizes in a (here equating to b) and c direction(dz= cylinder height) can be calculated which comes along with theexpected symmetrical parameters of portlandite
The 1st portlandite generation showing anisotropic domain growthcan be tracked in terms of cylinder diameter and height which is rea-lized in Fig 5 The blue cylinder represents the geometric approach andcylinder height and diameter are calculated newly for each range Thecylinder height remains rather stable throughout the hydration processwhile the cylinder diameter increases during the first hours of hydra-tion After 10 h of hydration the mean cylinder diameter no longer in-creases Consequently these observations match the results of the ex-aminations conducted at 23 degC [14] as well as the assumption thatdifferent mechanisms of growth exist for portlandite depending on the
hydration educt The maximum cylinder diameter is reached earlier inthis work very likely because of the higher hydration temperature
32 Quantification of the reactions during autoclaving
Autoclaved samples were ground with an agate mortar and com-pared to samples which were wet-ground with a McCrone mill Fig 6shows precisely that the determination of the amount of crystallinequartz is more reproducible in the two shown samples which were
Fig 7 2D XRD with Bruker GADDS-system plots of samples prepared with agate mortar and McCrone mill Coarse quartz grains are pointed out in the plot of the sample prepared withagate mortar
Fig 8 Particle size distribution of one sample prepared with an agate mortar and of onesample prepared with a McCrone mill measured by laser granulometry
Fig 9 Rietveld refinement for Tobermorite of autoclaved AAC sample by use of isotropicdomain size model (a) and of anisotropic domain size model (b)
J Schreiner et al Cement and Concrete Research 107 (2018) 247ndash252
250
6 Publications
42
prepared with a McCrone mill The high variance of crystalline quartzin the samples which were prepared with an agate mortar is a result ofinsufficient grinding and remaining of too large quartz grains Whenthis spottiness occurs a reliable quantification using the G-factormethod is not possible
The 2D XRD with Bruker GADDS-system plots in Fig 7 demonstratethe insufficient grinding when using an agate mortar compared to wetmilling with a McCrone mill Quartz would be overrepresented in a one-dimensional XRD pattern focusing on a section with bright spots (greenarrows) The lack of bright spots in the right plot shows that the quartzgrains are milled more thoroughly using a McCrone mill In Fig 8 theparticle size distribution after both ways of sample preparation iscompared Most grains in the sample prepared with an agate mortar arelarger than in the sample prepared with a McCrone mill The grain sizedistribution of the sample prepared with a McCrone mill complies withthe recommended particle size range for XRD analysis of under 5 to50 μm [3536] while the other sample exceeds the range
In Fig 9 Rietveld refinement of an autoclaved sample is shown Thedominant peaks at 77 290 and 301deg 2θ are attributed to tobermoriteIn the upper diagram (a) Rietveld refinement was carried out regularlycalculating isotropic domain sizes for tobermorite However the cal-culated fit differs significantly from the raw data It can be assumed thattobermorite shows a similar pattern to portlandite in terms of aniso-tropic peak broadening taking into account that tobermorite is as-signed to the orthorhombic crystal system Thus instead of a biaxialcylinder model an elliptic cylinder model (Fig 10 structure createdwith VESTA 318 [34]) was applied for the refinement in the lowerdiagram (b) The elliptic cylinder model is a sufficient approach to the
orthorhombic crystal system as it allows the distinction between do-main sizes in a b and c direction The fit is clearly superior using theanisotropic domain size model highlighted by the difference plot inFig 9b The comparison refinement with isotropic and anisotropic ap-proach was done for all of the five autoclaved samples In Fig 11 theresulting Rwp values for the whole pattern and the RBragg values of to-bermorite are shown The refinement using the anisotropic model leadsto both lower Rwp and RBragg values and consequently to a better fit anda more accurate quantification of tobermorite in all refined samples
4 Summary and conclusions
Improved analytical methods for both the phase developmentduring the hydration before autoclaving and during the autoclavingprocess of AAC are presented It could be shown that wet McCronemilling is the best way of preparation of AAC samples in order to obtainsuitable samples for powder diffraction A new approach to treat ani-sotropic domain sizes for Rietveld refinement could be successfullyapplied ndash with the benefit that portlandite and tobermorite in AACsamples could be refined more accurately using the Rietveld methodThus this application allows an improved quantification of the phasedevelopment during both of the production steps
For the future there are still plenty of possibilities to apply thepresented approach of calculating anisotropic domain sizes to AACproduction As exemplified with portlandite the mechanisms of growthof tobermorite can be tracked likewise during the autoclaving processIn addition the effect of variations in the chemical composition of AACraw mixtures on the crystal morphology of tobermorite can be ex-amined This leaves a new perspective to discuss the link between mi-neral phase morphology and the thermal and mechanical properties ofAAC
Acknowledgement
The autoclaved samples were generously provided by RodgauerBaustoffwerke GmbH amp Co KG The authors express gratitude for allsupport
Appendix A Supplementary data
Supplementary data to this article can be found online at httpsdoiorg101016jcemconres201802028
References
[1] MW Grutzeck Cellular concrete in M Scheffler P Colombo (Eds) CellularCeramics Wiley-VCH Weinheim 2005 pp 193ndash223
[2] M Haas The future of AAC ndash from a material scientists point of view inMC Limbachiya JJ Roberts (Eds) Autoclaved Aerated Concrete Taylor FrLondon 2005 pp 187ndash194
[3] T Mitsuda K Sasaki H Ishida Phase evolution during autoclaving process ofaerated concrete J Am Ceram Soc 75 (1992) 1858ndash1863
[4] N Isu H Ishida T Mitsuda Influence of quartz particle size on the chemical and
Fig 10 Triaxial cylinder domain size model of Tobermorite used for Rietveld refinement of anisotropic peak broadening
Fig 11 Comparison of Rwp and RBragg values of Rietveld refinements of autoclavedsamples and tobermorite using the isotropic and the anisotropic domain size model
J Schreiner et al Cement and Concrete Research 107 (2018) 247ndash252
251
6 Publications
43
mechanical properties of autoclaved aerated concrete (I) tobermorite formationCem Concr Res 25 (1995) 243ndash248
[5] NY Mostafa Influence of air-cooled slag on physicochemical properties of auto-claved aerated concrete Cem Concr Res 35 (2005) 1349ndash1357 httpdxdoiorg101016jcemconres200410011
[6] K Matsui J Kikuma M Tsunashima T Ishikawa S Matsuno A Ogawa M SatoIn situ time-resolved X-ray diffraction of tobermorite formation in autoclaved aer-ated concrete influence of silica source reactivity and Al addition Cem Concr Res41 (2011) 510ndash519
[7] C Biagioni S Merlino E Bonaccorsi The tobermorite supergroup a new no-menclature Mineral Mag 79 (2015) 485ndash495 httpdxdoiorg101180minmag2015079222
[8] BH OConnor MD Raven Application of the Rietveld refinement procedure inassaying powdered mixtures Powder Diffract 3 (1988) 2ndash6 httpdxdoiorg101017S0885715600013026
[9] D Jansen F Goetz-Neunhoeffer C Stabler J Neubauer A remastered externalstandard method applied to the quantification of early OPC hydration Cem ConcrRes 41 (2011) 602ndash608 httpdxdoiorg101016jcemconres201103004
[10] D Jansen C Stabler F Goetz-Neunhoeffer S Dittrich J Neubauer Does OrdinaryPortland Cement contain amorphous phase A quantitative study using an externalstandard method Powder Diffract 26 (2011) 31ndash38 httpdxdoiorg10115413549186
[11] D Ectors F Goetz-Neunhoeffer J Neubauer A generalized geometric approach toanisotropic peak broadening due to domain morphology J Appl Crystallogr 48(2015) 189ndash194 httpdxdoiorg101107S1600576714026557
[12] D Ectors F Goetz-Neunhoeffer J Neubauer Routine (an)isotropic crystallite sizeanalysis in the double-Voigt approximation done right Powder Diffract 32 (S1)(2017) 27ndash34 httpdxdoiorg101017S0885715617000070
[13] HM Rietveld A profile refinement method for nuclear and magnetic structures JAppl Crystallogr 2 (1969) 65ndash71 httpdxdoiorg101107S0021889869006558
[14] D Ectors Advances in the Analysis of Cementitious Reactions and Hydrate Phases(Doctoral Thesis) (2016) pp 12ndash14 (urnnbndebvb29-opus4-71743)
[15] AacuteG De La Torre S Bruque J Campo MAG Aranda The superstructure of C3Sfrom synchrotron and neutron powder diffraction and its role in quantitative phaseanalyses Cem Concr Res 32 (2002) 1347ndash1356 httpdxdoiorg101016S0008-8846(02)00796-2
[16] A Kirfel G Will Charge density in anhydrite CaSO4 from X-ray and neutrondiffraction measurements Acta Crystallogr Sect B Struct Crystallogr CrystChem 36 (1980) 2881ndash2890 httpdxdoiorg101107S0567740880010461
[17] C Bezou AN Christensen D Cox M Lehman A Nonat Structures cristallines deCaSO405H2O et CaSO406H2O Comptes Rendus Hebd Des Seacuteances lAcadeacutemieDes Sci Seacuterie 2 (312) (1991) 43ndash48
[18] KH Jost B Ziemer R Seydel Redetermination of the structure of β-dicalciumsilicate Acta Crystallogr Sect B Struct Crystallogr Cryst Chem 33 (1977)1696ndash1700 httpdxdoiorg101107S0567740877006918
[19] W Mumme LMD Cranswick BC Chakoumakos Rietveld crystal structure re-finements from high temperature neutron powder diffraction data for the poly-morphs of dicalcium silicate Neues Jahrb Fuer Mineral Abhandlungen 170 (1996)171ndash188
[20] A Colville S Geller The crystal structure of brownmillerite Ca2FeAlO5Crystallographica 50 (1971) 2311ndash2315 httpdxdoiorg101107S056774087100579X
[21] ST Bergold F Goetz-Neunhoeffer J Neubauer Quantitative analysis of C-S-H inhydrating alite pastes by in-situ XRD Cem Concr Res 53 (2013) 119ndash126 httpdxdoiorg101016jcemconres201306001
[22] EN Maslen VA Streltsov NR Streltsova N Ishizawa Electron density and op-tical anisotropy in rhombohedral carbonates III Synchrotron Xray studies ofCaCO3 MgCO3 and MnCO3 Acta Crystallogr Sect B 51 (1995) 929ndash939 httpdxdoiorg101107S0108768195006434
[23] G Renaudin Y Filinchuk J Neubauer F Goetz-Neunhoeffer A comparativestructural study of wet and dried ettringite Cem Concr Res 40 (2010) 370ndash375httpdxdoiorg101016jcemconres200911002
[24] WF Cole CJ Lancucki A refinement of the crystal structure of gypsumCaSO42H2O Acta Cryst B30 (1974) 921ndash929 httpdxdoiorg101107S0567740874004055
[25] T Runčevski RE Dinnebier OV Magdysyuk H Poumlllmann Crystal structures ofcalcium hemicarboaluminate and carbonated calcium hemicarboaluminate fromsynchrotron powder diffraction data Acta Crystallogr Sect B Struct Sci 68 (2012)493ndash500 httpdxdoiorg101107S010876811203042X
[26] JM Hughes JW Drexler Cation substitution in the apatite tetrahedral site crystalstructures of type hydroxylellestadite and type fermorite Neues Jahrb FuerMineral (1991) 327ndash336
[27] CH Shen RS Liu JG Lin CY Huang Phase stability study of La12Ca18Mn2O7Mater Res Bull 36 (2001) 1139ndash1148
[28] SW Bailey Refinement of an intermediate microcline structure Am Miner 54(1969) 1540ndash1545
[29] WR Busing HA Levy Neutron diffraction study of calcium hydroxide J ChemPhys 26 (1957) 563 httpdxdoiorg10106311743345
[30] Y Le Page G Donnay Refinement of the crystal structure of low-quartz ActaCrystallogr Sect B 32 (1976) 2456ndash2459 httpdxdoiorg101107S0567740876007966
[31] SA Hamid The crystal structure of the 11 Aring natural tobermoriteCa225[Si3O75(OH)15]1H2O Zeitschrift Fuer Krist - New Cryst Struct 154 (1981)189ndash198 httpdxdoiorg101524zkri19811543-4189
[32] P Mondal JW Jeffery The crystal structure of tricalcium aluminate Ca3Al2O6Acta Crystallogr B 31 (1975) 689ndash697 httpdxdoiorg101107S0567740875003639
[33] Y Takeuchi F Nishi I Maki Crystal-chemical characterization of the tricalciumaluminate-sodium oxide (3CaOtimesAl2O3-Na2O) solid-solution series Zeitschrift FuumlrKrist (1980) 259ndash307
[34] K Momma F Izumi VESTA 3 for three-dimensional visualization of crystal vo-lumetric and morphology data J Appl Crystallogr 44 (2011) 1272ndash1276 httpdxdoiorg101107S0021889811038970
[35] K Scrivener R Snellings B Lothenbach A Practical Guide to MicrostructuralAnalysis of Cementitious Materials CRC Press 2016 pp 123ndash125 httpdxdoiorg107693wl20150205
[36] V Pecharsky P Zavalij Fundamentals of Powder Diffraction and StructuralCharacterization of Materials Springer second edition 2005 p 302 httpdxdoiorg101007978-0-387-09579-0
J Schreiner et al Cement and Concrete Research 107 (2018) 247ndash252
252
6 Publications
44
7 Acknowledgement
7 Acknowledgement
Ich moumlchte mich bei einigen Personen bedanken ohne die es wohl kaum zum erfolgreichenAbschluss dieser Arbeit gekommen waumlreMein Doktorvater Prof Dr Juumlrgen Neubauer hat sich stets die Zeit genommen die noumltigwar um Angelegenheiten aller Art mit mir zu klaumlren Er gab mir fachlich immer zumrichtigen Zeitpunkt einen gewissen wissenschaftlichen Impuls Zugleich habe ich mich den-noch immer frei in meiner eigenen Konzeption gefuumlhlt Groszligen Dank spreche ich Prof DrFriedlinde Goumltz-Neunhoeffer aus die fuumlr mich ebenso immer eine verlaumlssliche Ansprech-partnerin fuumlr fachliche und organisatorische Angelegenheiten aller Art war Danke anDr Daniel Jansen fuumlr die gute Zusammenarbeit und dafuumlr dass er mich im Zuge meinerMasterarbeit in ein Forschungsprojekt aufgenommen hat das den Weg zur Promotionmoumlglich machte Zusaumltzlich gilt mein Dank Prof Dr Matthias Goumlbbels der fuumlr dieMitarbeiter am Lehrstuhl immer motivierende Worte fand Fuumlr die Ermoumlglichung meinerTeilnahme an diversen Dienstreisen Fortbildungen und Tagungen moumlchte ich mich viel-mals bedankenWeiterhin bedanke ich mich bei Dr Stephan Volkmann und den Rodgauer BaustoffwerkenGmbH amp Co KG fuumlr die gute Zusammenarbeit und die Bereitstellung von Versuchsma-terialienVielen Dank an meine studentischen Hilfskraumlfte Daniel Wagner Laura MoldenhauerFabian Lang Jakob Schreiber und Felix Klaassen die alle Aufgaben im Labor einwand-frei und mit Bedacht erledigten Bei meinen aktuellen und ehemaligen Kollegen DrKatrin Hurle Dr Dominique Ectors Dr Christoph Naber Dr Florian Huumlller JoumlrgNehring Frank Riedel Julian Wolf Tanja Manninger Daniel Wagner Nicolas FobbeKarla Spaumlth Julian Goergens Andreas Koumlhler Cordula Jakob Franz Becker und LisaKlemenz bedanke ich mich fuumlr die gelungene Zusammenarbeit und gegenseitige Unter-stuumltzung Besonderer Dank geht auch an Kerstin Kreszlig Bettina Engl Christian HankeBernd Schleifer und Christian Abe fuumlr die verlaumlssliche Unterstuumltzung bei technischen Fra-gen und Messungen im LaborFuumlr jegliche Unterstuumltzungen moumlchte ich mich auch bei meinen Eltern bedanken sowiebei meinem Bruder Ralf der mir mit einem LaTex Crashkurs viel Frustration ersparthat Danke Thomas dass du immer fuumlr mich da bist und mit mir zusammen fuumlr genugAusgleich gesorgt hast
45
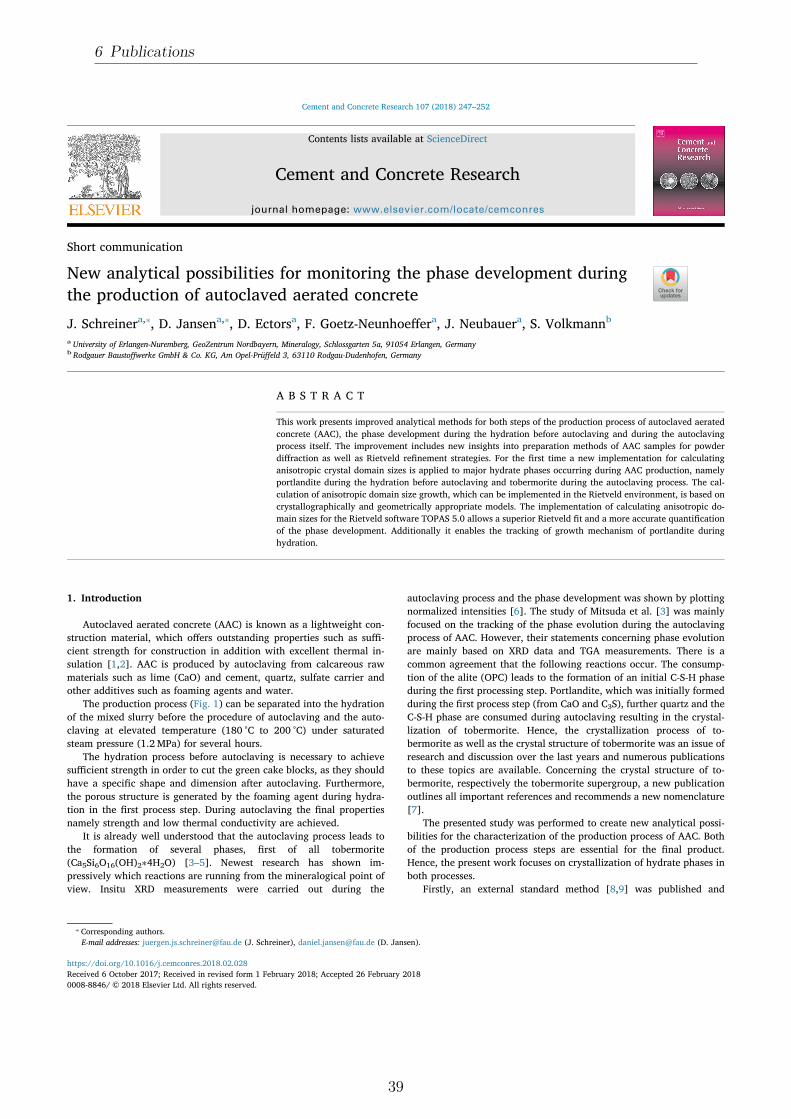
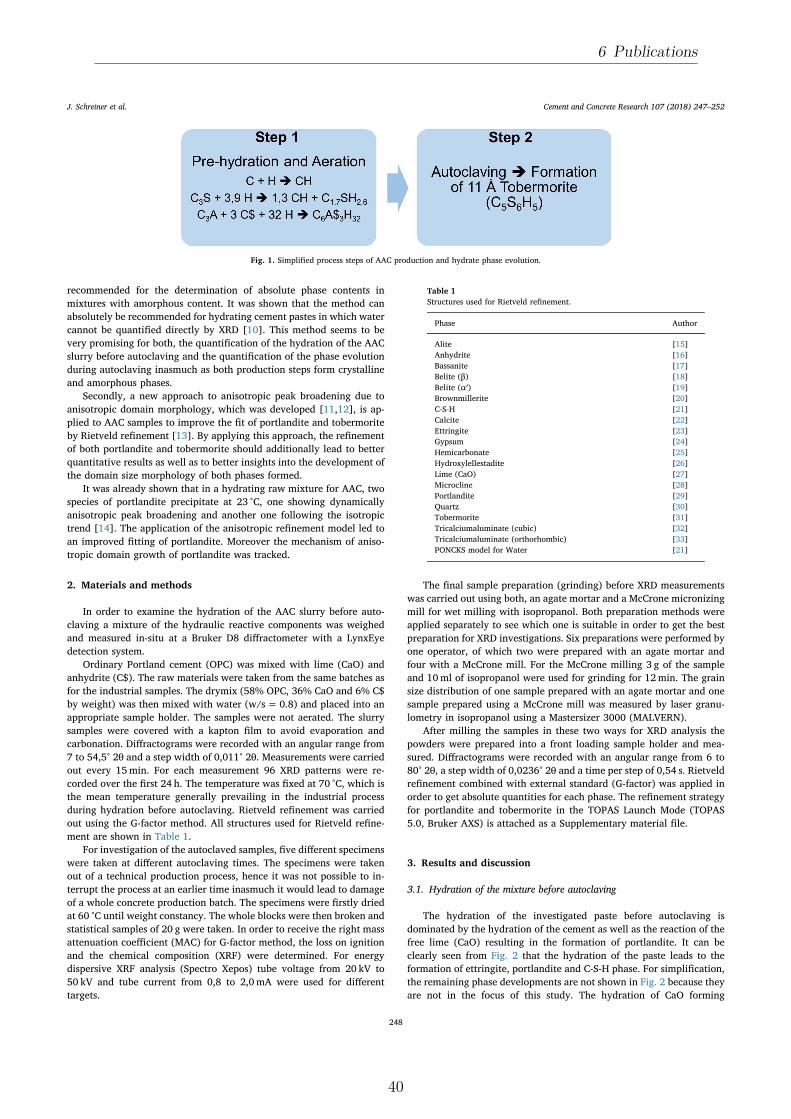
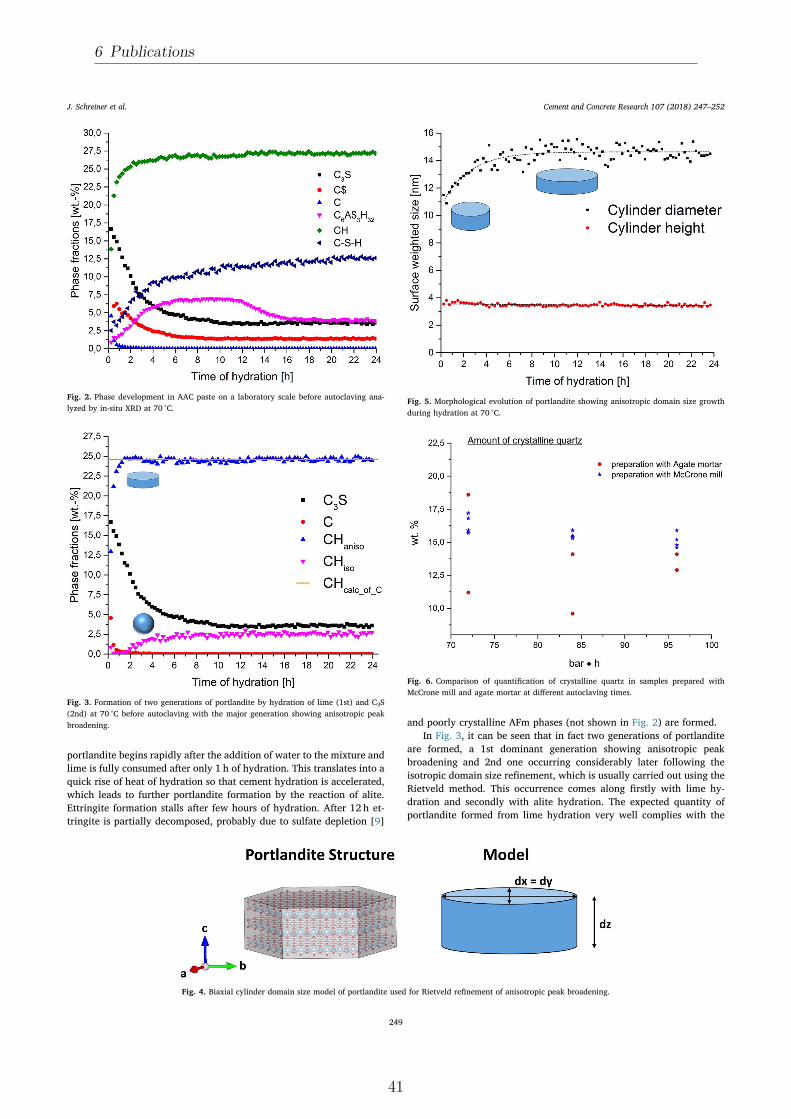
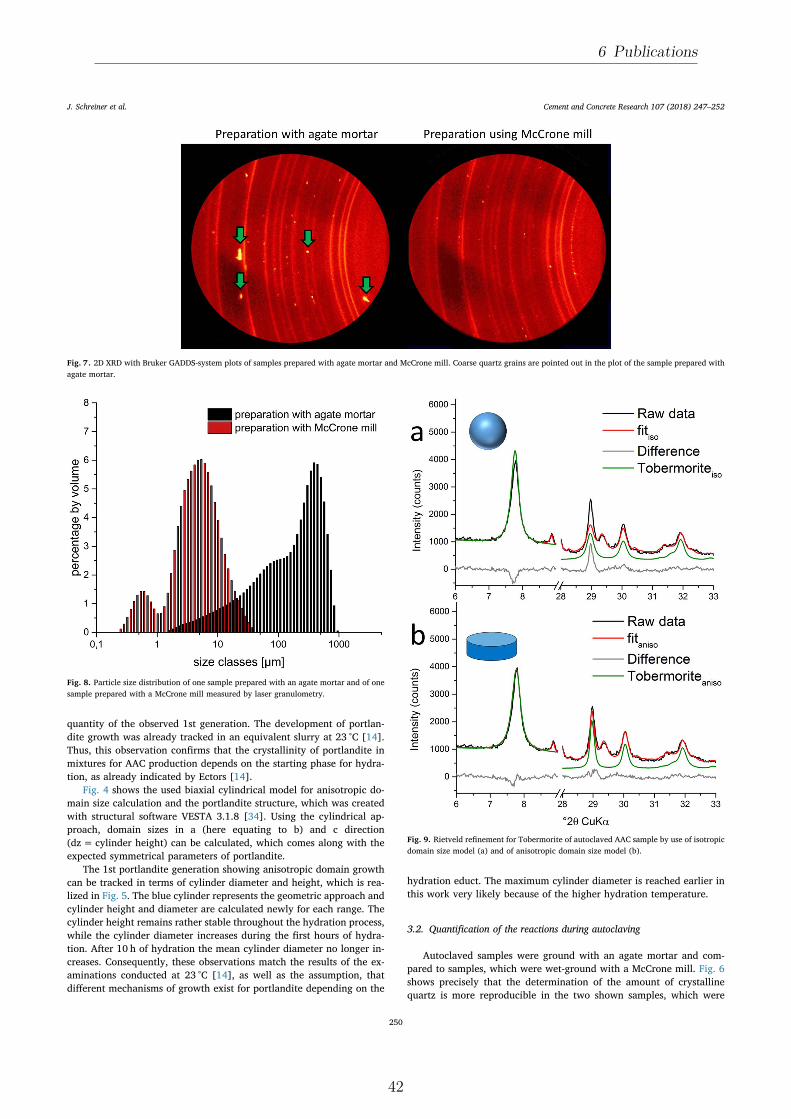
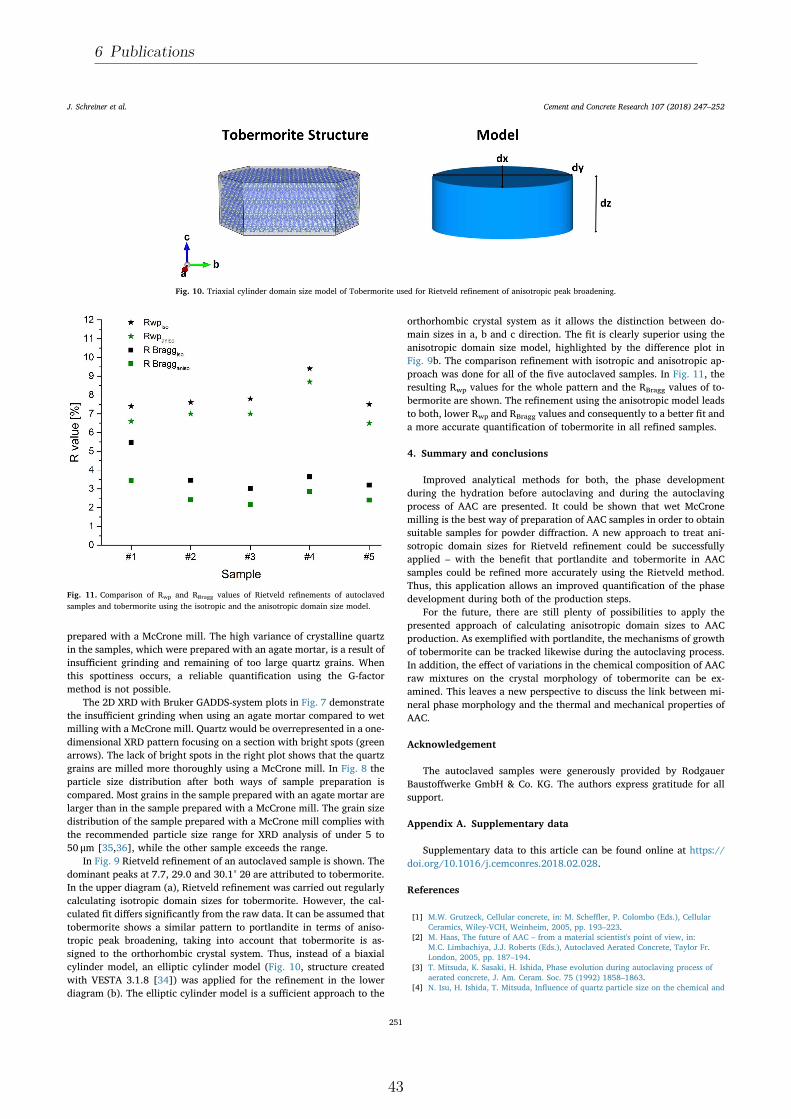
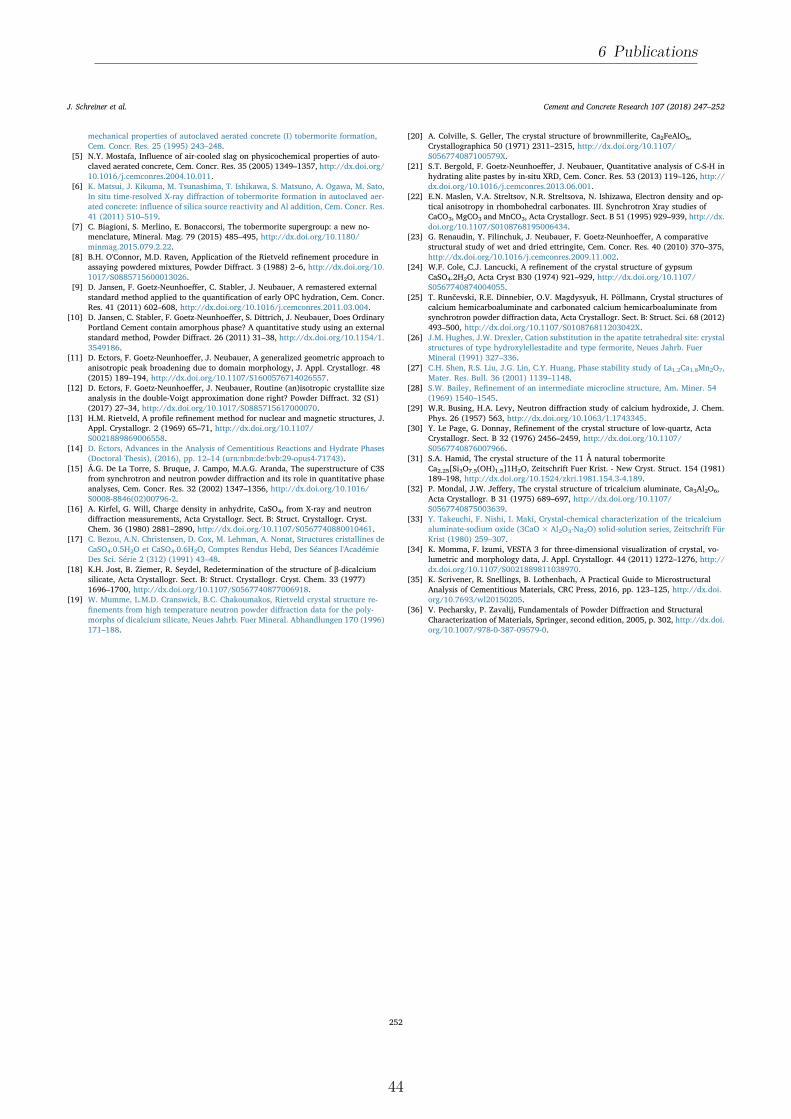
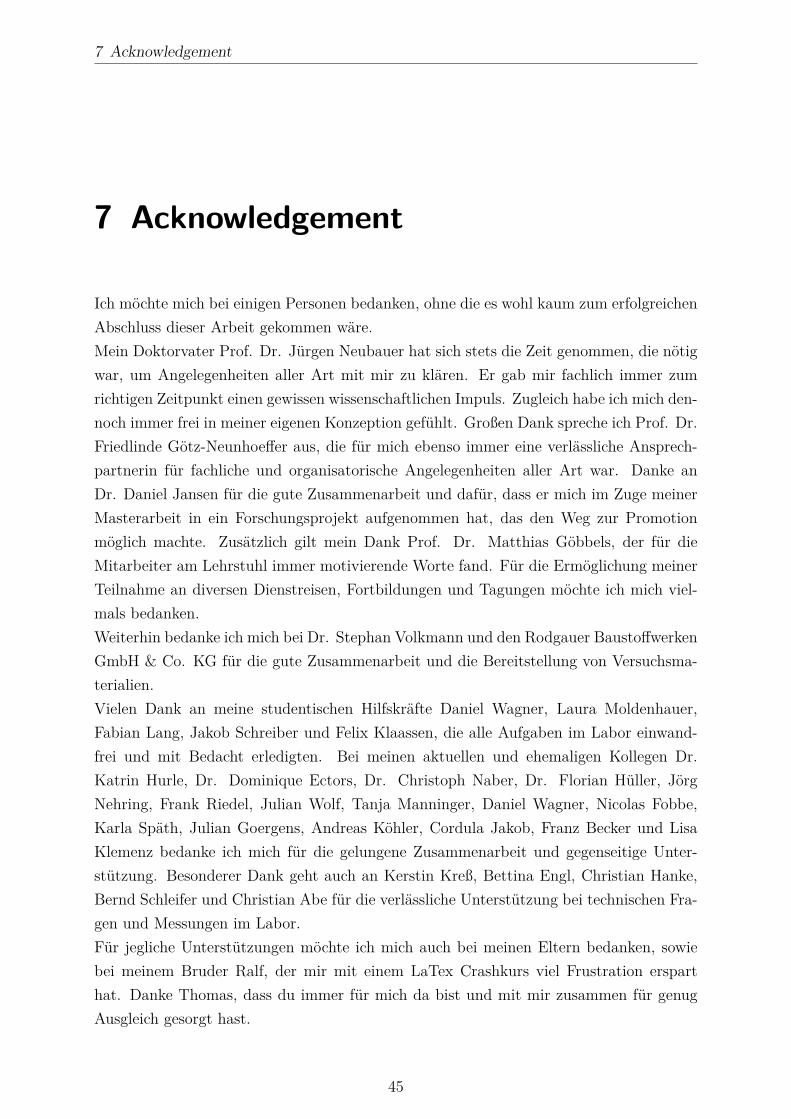
7 Acknowledgement
7 Acknowledgement
Ich moumlchte mich bei einigen Personen bedanken ohne die es wohl kaum zum erfolgreichenAbschluss dieser Arbeit gekommen waumlreMein Doktorvater Prof Dr Juumlrgen Neubauer hat sich stets die Zeit genommen die noumltigwar um Angelegenheiten aller Art mit mir zu klaumlren Er gab mir fachlich immer zumrichtigen Zeitpunkt einen gewissen wissenschaftlichen Impuls Zugleich habe ich mich den-noch immer frei in meiner eigenen Konzeption gefuumlhlt Groszligen Dank spreche ich Prof DrFriedlinde Goumltz-Neunhoeffer aus die fuumlr mich ebenso immer eine verlaumlssliche Ansprech-partnerin fuumlr fachliche und organisatorische Angelegenheiten aller Art war Danke anDr Daniel Jansen fuumlr die gute Zusammenarbeit und dafuumlr dass er mich im Zuge meinerMasterarbeit in ein Forschungsprojekt aufgenommen hat das den Weg zur Promotionmoumlglich machte Zusaumltzlich gilt mein Dank Prof Dr Matthias Goumlbbels der fuumlr dieMitarbeiter am Lehrstuhl immer motivierende Worte fand Fuumlr die Ermoumlglichung meinerTeilnahme an diversen Dienstreisen Fortbildungen und Tagungen moumlchte ich mich viel-mals bedankenWeiterhin bedanke ich mich bei Dr Stephan Volkmann und den Rodgauer BaustoffwerkenGmbH amp Co KG fuumlr die gute Zusammenarbeit und die Bereitstellung von Versuchsma-terialienVielen Dank an meine studentischen Hilfskraumlfte Daniel Wagner Laura MoldenhauerFabian Lang Jakob Schreiber und Felix Klaassen die alle Aufgaben im Labor einwand-frei und mit Bedacht erledigten Bei meinen aktuellen und ehemaligen Kollegen DrKatrin Hurle Dr Dominique Ectors Dr Christoph Naber Dr Florian Huumlller JoumlrgNehring Frank Riedel Julian Wolf Tanja Manninger Daniel Wagner Nicolas FobbeKarla Spaumlth Julian Goergens Andreas Koumlhler Cordula Jakob Franz Becker und LisaKlemenz bedanke ich mich fuumlr die gelungene Zusammenarbeit und gegenseitige Unter-stuumltzung Besonderer Dank geht auch an Kerstin Kreszlig Bettina Engl Christian HankeBernd Schleifer und Christian Abe fuumlr die verlaumlssliche Unterstuumltzung bei technischen Fra-gen und Messungen im LaborFuumlr jegliche Unterstuumltzungen moumlchte ich mich auch bei meinen Eltern bedanken sowiebei meinem Bruder Ralf der mir mit einem LaTex Crashkurs viel Frustration ersparthat Danke Thomas dass du immer fuumlr mich da bist und mit mir zusammen fuumlr genugAusgleich gesorgt hast
45


