Embed Size (px)
Citation preview

“Microstructure, mechanical behavior and corrosion properties of friction stir
welded aluminum alloys used in the aerospace industry”
Von der Fakultät für Georessourcen und Materialtechnik der
Rheinisch -Westfälischen Technischen Hochschule Aachen
zur Erlangung des akademischen Grades eines
Doktors der Ingenieurwissenschaften
genehmigte Dissertation
vorgelegt von
Master of Science Ulises Alfaro Mercado
aus Morelia, Michoacán, Mexiko
Berichter: Univ.-Prof. Dr.-Ing. Stefan Reh Univ.-Prof. Dr.-Ing. Karl Bernhard Friedrich Professor Dr.-Ing habil. Alfons Fischer Tag der mündlichen Prüffung 06. Mai 2011 Diese Dissertation ist auf den Internetseiten der Hochschulbibliothek online verfügbar

Acknowledgments The present work was done during my scientific activities in the Institute of Materials Research (Institut für Werkstoff-Forschung) of the German Aerospace Center (Deutsches Zentrum für Luft- und Raumfahrt). I would like to thank to Univ. Prof. Dr. rer. nat. W.A. Kaysser (former Head-Director of the Institute) and Univ. Prof. Dr.-Ing. Heinz Voggenreiter (current Head-Director of the Institute), for giving me opportunity to do my PhD at the Institute of Materials Research. I would like to express my gratitude to Univ. Prof. Dr.-Ing. Stefan Reh for make possible the accomplishment of this work; as a first referent. I would like to thank to Univ. Prof. Dr.-Ing Alfons Fischer and Univ. Prof. Dr.-Ing. Karl Bernhard Friedrich for their interest and evaluation of this thesis as co-referents. I would like to express my deep gratitude to Dr.-Ing. Gerhard Biallas for the scientific and organizational tutoring of my work. Without his support, this work would not have been possible. I would like to sincerely thank to Dr.-Ing. Reinhold Braun for reading and correcting my thesis and for his invaluable scientific and technical advice. Special thanks to Dr.-Ing. Claudio Dalle Donne, who offered me this very interesting job. I would like to acknowledge and express my gratitude to the excellent technical staff of the Institute of Materials Research of the German Aerospace Center (DLR), especially to Mr. Heinz- Willi Sauer , Mr. Uwe Fuchs, Ing. (grad.) Karl-Heinz Trautmann, Mr. Christian Sick, Mr. Klaus Mull, Mr. Herbert Hinderlich, Mr. Peter Mecke, Mr. Kurt Baumann, Mr. Roland Borath and Mrs. Ursula Krebber for their very professional support. Very special thanks to my friends Dr. Arturo Flores and Dr. Cesar Mondragon, for their unconditional support and advice. I want to sincerely thank my colleagues from DLR, Dipl.-Ing. Janine Schneider, Dipl.- Ing. Tamara Vugrin, Dipl.-Ing Susanne Gebhard, Prof. Dr. Marion Bartsch, Dipl.-Ing. Ulla Dreßler Dr. Riviul Kabir, Dipl.-Ing Katja Erbslöh, Dipl.-Ing Anne Laure Lafly, Dr. Andreas Tesch, Dr. Tommaso Ghidini for their kind help and stimulating discussions, specially for the non-workrelated ones, which allowed me to better know the German culture and language. This work was supported by the Consejo Nacional de Ciencia y Tecnologia (CONACyT) and the Deutscher Akademischer Austauschdienst (DAAD). The Deutsches Zentrum für Luft- und Raumfahrt was also involved in the financial sponsoring of the work.

i
Content 1. INTRODUCTION ............................................................................................................................................. 1
2. BACKGROUND AND LITERATURE SURVEY ......................................................................................... 3 2.1. MICROSTRUCTURE OF HIGH STRENGTH ALUMINUM ALLOYS ................................................................. 3
2.1.1. Microstructure of naturally aged 2xxx aluminum alloys ................................................................. 3 2.1.2. Precipitation sequence of 2xxx aluminum alloys ............................................................................ 3 2.1.3. Differential scanning calorimetric studies of 2xxx aluminum alloys .............................................. 4 2.1.4. Precipitation Sequence of 6xxx aluminum alloys. ........................................................................... 5 2.1.5. Differential scanning calorimetric studies of 6XXX aluminum alloys ............................................ 6
2.2. FRICTION STIR WELDING ...................................................................................................................... 8 2.2.1. Process description ......................................................................................................................... 8 2.2.2. Temperature distribution during FSW process ............................................................................... 9 2.2.3. Microstructural evolution of FSW-joints ....................................................................................... 10 2.2.4. Microstructure and mechanical properties ................................................................................... 12 2.2.5. Process parameters ....................................................................................................................... 13 2.2.6. Tool design .................................................................................................................................... 13 2.2.7. Heat input and welding parameters .............................................................................................. 14 2.2.8. Advantages and disadvantages of FSW ......................................................................................... 15 2.2.9. Dissimilar friction stir welded joints ............................................................................................. 15
2.3. LOCALIZED CORROSION OF HIGH STRENGTH ALUMINUM ALLOYS ....................................................... 16 2.3.1. General effect of alloying elements and impurities ....................................................................... 18 2.3.2. Pitting corrosion ........................................................................................................................... 19 2.3.3. Intergranular corrosion ................................................................................................................ 20 2.3.4. Exfoliation corrosion ..................................................................................................................... 22 2.3.5. Stress corrosion cracking .............................................................................................................. 23 2.3.6. Corrosion behavior of FSW joints ................................................................................................. 26
3. EXPERIMENTAL PROCEDURE ................................................................................................................ 28 3.1. MATERIALS......................................................................................................................................... 28 3.2. WELDING PROCEDURES AND HEAT TREATMENTS ................................................................................ 28
3.2.1. “As welded” joints ........................................................................................................................ 28 3.2.2. Post weld heat treated friction stir welded joints. ......................................................................... 29
3.3. TEMPERATURE AND PROCESS PARAMETER MEASUREMENTS ............................................................... 29 3.4. MICROSTRUCTURAL CHARACTERIZATION ........................................................................................... 30
3.4.1. Light microscopy ........................................................................................................................... 30 3.4.2. Scanning electron microscopy ....................................................................................................... 32 3.4.3. Scanning transmission electron microscopy ................................................................................. 32
3.5. MECHANICAL CHARACTERIZATION ..................................................................................................... 33 3.5.1. Hardness profile ............................................................................................................................ 33 3.5.2. Tensile strength and localized strain measurements ..................................................................... 33
3.6. CORROSION CHARACTERIZATION ........................................................................................................ 34 3.6.1. Intergranular corrosion testing ..................................................................................................... 35 3.6.2. Exfoliation corrosion testing ......................................................................................................... 35 3.6.3. Acidified salt spray tests ................................................................................................................ 35 3.6.4. Stress corrosion cracking test ....................................................................................................... 36 3.6.5. Electrochemical measurements ..................................................................................................... 37
4. BASE METAL CHARACTERIZATION ..................................................................................................... 39 4.1. CHEMICAL COMPOSITIONS .................................................................................................................. 39 4.2. MICROSTRUCTURAL ANALYSIS ........................................................................................................... 39
4.2.1. Light microscopy ........................................................................................................................... 39 4.2.2. SEM analysis ................................................................................................................................. 41 4.2.3. STEM analysis ............................................................................................................................... 41
4.3. HARDNESS AND TENSILE PROPERTIES ................................................................................................. 45 4.4. CORROSION BEHAVIOR ....................................................................................................................... 45
4.4.1. Corrosion potential measurements................................................................................................ 45 4.4.2. Potentiodynamic polarization curves ............................................................................................ 46 4.4.3. Exfoliation corrosion test .............................................................................................................. 47 4.4.4. Intergranular corrosion test .......................................................................................................... 47

ii
4.4.5. Salt spray test ................................................................................................................................ 48
5. FSW 2024 JOINTS .......................................................................................................................................... 50 5.1. MICROSTRUCTURAL EVOLUTION ................................................................................................................ 50
5.1.1. As welded FSW 2024-T3 joint ........................................................................................................... 50 5.1.2. Effect of post weld heat treatment on the microstructure of FSW 2024-T3 ....................................... 55
5.2. MECHANICAL PROPERTIES ......................................................................................................................... 57 5.2.1. Hardness ............................................................................................................................................ 57 5.2.2. Tensile strength.................................................................................................................................. 60
5.3. CORROSION BEHAVIOR ............................................................................................................................... 62 5.3.1. Exfoliation corrosion ......................................................................................................................... 62 5.3.2. Intergranular corrosion ..................................................................................................................... 65 5.3.3. Corrosion behavior of the stirred zone on the top surface of the as welded FSW 2024-T3 joint ...... 67 5.3.4. Salt spray test .................................................................................................................................... 69 5.3.5. Corrosion Potential ........................................................................................................................... 70
5. FSW 6056 JOINTS .......................................................................................................................................... 72 5.1. MICROSTRUCTURAL EVOLUTION ........................................................................................................ 72
5.1.1. FSW 6056-T6 “as welded” ........................................................................................................... 73 5.1.2. FSW 6056-T7x PWHT ................................................................................................................... 74
5.2. MECHANICAL PROPERTIES .................................................................................................................. 77 5.2.1. Hardness ....................................................................................................................................... 77 5.2.2. Tensile strength ............................................................................................................................. 80
5.3. CORROSION BEHAVIOR ....................................................................................................................... 82 5.3.1. Exfoliation corrosion ..................................................................................................................... 82 5.3.2. Intergranular Corrosion ............................................................................................................... 83 5.3.3. Salt spray testing ........................................................................................................................... 86 5.3.4. Corrosion potential ....................................................................................................................... 86
6. DISSIMILAR FSW 2024A/6056 JOINTS ..................................................................................................... 89 6.1. MICROSTRUCTURAL EVOLUTION ........................................................................................................ 89
6.1.1. As welded dissimilar FSW 2024A-T3/6056-T6 joint ..................................................................... 90 6.1.2. Post weld heat treated dissimilar FSW 2024A-T8/6056-T7x joints. ............................................. 93
6.2. MECHANICAL PROPERTIES .................................................................................................................. 95 6.2.1. Hardness ....................................................................................................................................... 95 6.2.2. Tensile Strength ............................................................................................................................. 97
6.3. CORROSION BEHAVIOR ....................................................................................................................... 98 6.3.1. Exfoliation corrosion ..................................................................................................................... 98 6.3.2. Intergranular corrosion ................................................................................................................ 99 6.3.3. Salt spray test .............................................................................................................................. 100 6.3.4. Electrochemical Measurements .................................................................................................. 101 6.3.5. Corrosion and mechanical response ........................................................................................... 107
7. -SUMMARY AND CONCLUSIONS .......................................................................................................... 111 7.1. MICROSTRUCTURE AND MECHANICAL PROPERTIES ......................................................................... 111 7.2. CORROSION BEHAVIOR ..................................................................................................................... 112 7.3. DISSIMILAR FSW 2024A/6056 JOINTS ............................................................................................. 113 7.4. OUTLOOK ......................................................................................................................................... 114
APENDIX A1 ..................................................................................................................................................... 116
SECOND PHASE PARTICLES IN HEAT TREATABLE ALUMINUM ALLOYS USED IN THE AEROSPACE INDUSTRY [185] .............................................................................................................................................................. 116
BIBLIOGRAPHY .............................................................................................................................................. 120
ABSTRACT ....................................................................................................................................................... 129

Chapter 1 Introduction
1
1. Introduction
The materials most widely used in structural components of aircrafts are aluminum alloys. Specific requirements like high strength and high damage tolerance are met by riveting structural components made from different aluminum alloys. However, the need of weight and manufacturing cost reduction in aircrafts has promoted the design of integrally stiffened metallic structures. Another important option to reduce weight has been attained by developing improved precipitation-hardened aluminum alloys, like 2024A, 2524, 6013, 6056, 7055, and 7449. Nevertheless, due to the limited weldability of high strength alloys (i.e. 2xxx and 7xxx aluminum alloy), it is not always possible to replace riveted by fusion welded structures. Friction stir welding (FSW) is an innovative joining process developed and patented by The Welding Institute (TWI) in 1991 [1]. FSW is a solid state process operating below the melting point of the materials to be joined. Therefore, problems associated with solidification, like hot cracking, porosity and low ductility of partially melted zones, are avoided. This allows for producing metallurgically sound joints of low distortion and residual stresses from high strength aluminum alloys, which are difficult to join using fusion welding processes. Moreover, dissimilar welded joints made from materials with different metallurgical characteristics can also be manufactured by FSW. For these reasons, FSW has been identified as “key technology” for primary aerospace structures. The differences in strength and corrosion resistance of different base metals may however bring about problems when employing dissimilar joints. Possible solutions to eliminate low strength areas in the weld region can be the selection of optimized welding parameters and the introduction of a post weld heat treatment, which could lead to an improved weld performance. The real issue, however, seems to be the corrosion resistance of dissimilar friction stir welds. It is generally accepted that the corrosion behavior of dissimilar joints depends basically on the galvanic coupling produced by differences in chemical composition of the base metals. It is still not completely known, how the FSW process affects the corrosion behavior of dissimilar joints. In the open literature very few studies on corrosion behavior of dissimilar FSW joints are available. Previous investigations only focus on the corrosion behavior of the weld nugget region or on the stress corrosion cracking resistance of those joints [2-5]. In none of the studies a correlation between weld thermal cycle, microstructure and corrosion resistance has been established. Moreover, there is a total lack of information on the effects of a post weld heat treatment (PWHT) on the corrosion behavior of dissimilar joints. The main objectives of this work are to understand the corrosion behavior of dissimilar FSW 2024/6056 joints and to investigate the effects induced by the application of a post weld heat treatment. Additionally, the post weld heat treatment is aimed to improve the mechanical performance of the joints. The corrosion mechanisms that may arise in FSW joints made from dissimilar aluminum alloys are quite complex. Therefore, the understanding of the corrosion behavior of similar FS welds made from the correspondent base metals is considered to also provide a basis for the understanding of the behavior of dissimilar joints. Microstructure governs the corrosion behavior of aluminum alloys. Therefore, a detailed microstructural characterization is needed to elucidate the undergoing corrosion mechanisms. In this work, the microstructures of the base metals and the microstructural changes induced by the FSW process are comprehensively characterized employing several techniques. The

Chapter 1 Introduction
2
grain morphology is examined by optical microscopy. Scanning electron microscopy (SEM) and energy dispersive X-ray analyses (EDX) are used to study the constituent particles. The precipitation structure is analyzed by scanning transmission electron microscopy (STEM). Friction stir welding induces characteristic changes of the initial microstructure subsequently affecting the corrosion behavior. Simple immersion tests and electrochemical measurements without additional mechanical loading are used to evaluate and analyze the susceptibility of the FSW joints to local corrosion attack (i.e. pitting, exfoliation and intergranular corrosion). In general, these tests do not exactly predict long-term corrosion behavior of aircraft structures under service conditions; nevertheless, they promptly give information on the corrosion susceptibility of the FSW joints. More realistic conditions are realized by carrying out cyclic acidified salt spray tests. In actual conditions, aircraft structures can experience the concomitant action of corrosion and mechanical loading. In presence of corrosive media, mechanical loading of the fuselage resulting from residual stresses produced during FSW or from pressurizing during the flight can further degrade the corrosion resistance of the alloys eventually leading to a catastrophic failure. However, these two phenomena occur rarely simultaneously on the outer surface of the fuselage. When the aircraft is on ground, it is exposed to a corrosive environment (especially in the vicinity of seacoast). On the other hand, when the aircraft is in operation at high altitudes, the corrosive conditions are less severe, so that mainly cyclic loading due to engine vibration and flutter are present activating the fatigue process. If dissimilar FSW 2024A/6056 joints are being considered to be employed in actual structures, they must demonstrate safe operation under all possible scenarios. For this reason, in this work the resistance to stress corrosion cracking of FSW 2024A/6056 dissimilar joints is studied. Moreover, the effect of corrosion damage on residual fatigue life of pre-corroded dissimilar joints is investigated.

Chapter 2 Background and literature survey
3
2. Background and literature survey
2.1. Microstructure of high strength aluminum alloys
Heat treatable aluminum alloys contain amounts of soluble alloying elements that exceed the equilibrium solid solubility. The solid solution formed at high temperatures may be retained in a supersaturated state by cooling at a sufficiently high rate minimizing the formation of any precipitates. Controlled precipitation of fine particles at room temperature or elevated temperatures is used after quenching to develop the mechanical properties of heat treatable alloys [6]. Precipitation strengthening in age hardenable aluminum alloys is generally due to the formation of thermodynamically metastable precipitated phases. In this section, the precipitation processes of the Al-Cu-Mg (2xxx) and Al-Mg-Si-(Cu) (6xxx) aluminum alloys are summarized from literature.
2.1.1. Microstructure of naturally aged 2xxx aluminum alloys
The progressive hardening of the 2xxx alloys observed at room temperature is attributed to the precipitation of small groups of solute atoms forming the Guiner-Preston-Bagaryastksy zones (GPB). The GPB zones are composed of 1 Cu, 1 Mg and several Al atoms. The GPB zones are fully coherent cylindrical platelets of 1-2 nm in diameter and 4 nm in length and are formed along <100>Al [7, 8].
2.1.2. Precipitation sequence of 2xxx aluminum alloys
Most aluminum alloys of the 2xxx series are based on the Al-Cu-Mg ternary system [9]. These alloys have a chemical composition, which place them in the Al + S region of the ternary phase diagram. The precipitation hardening in Al-Cu-Mg alloys (with an approximate Cu:Mg ratio of 2) has been studied extensively [7-15]. The complete precipitation sequence is still under debate [13, 14]. However, a precipitation sequence in the pseudo-binary Al-Al2CuMg alloy can most probably be represented as follows [7, 8]:
SSSS YGPB zonesY(S’’?)YS’YS (Al2CuMg) (2.1)
It is generally accepted that GPB zones in Al-Mg-Cu alloys are formed and may co-exist with other hardening phases in a broad temperature range (110-240 °C) during artificial aging treatments. There is still some controversy about the existence of the metastable S’’ phase [13-15]. In some studies, an intermediate step in the precipitation sequence of the Al-Cu-Mg alloy is omitted (S’’) [9-11], whilst others present evidence of the precipitation of S’’[7, 14, 15]. For instance, Zahra et al [14] claimed that S’’ appears in HREM as elongated precipitates with several tens of nm in length and up to 10 nm in width. The longer axis of the precipitates is parallel to the [100]Al. They affirmed that the monoclinic S’’ phase is different from the orthorhombic S’(S) precipitate. In contrast, Ring et al.[9, 13] state that they were unable to detect the presence of the metastable precipitate S’’ in Al-1.1Cu-1.7Mg (at. %) after elevated temperature ageing (between 120–200 °C). Moreover, they suggested that the TEM plane-trace and Nano Beam Electron Diffraction (MBED) evidence that Zahra et al. [14] present to support the existence of this phase can be interpreted as arising from S phase precipitates oriented in such direction that their long axis was normal to the electron beam.

Chapter 2 Background and literature survey
4
The semi coherent S’ phase has a face centered orthorhombic structure with lattice parameters a= 4.04, b=9.25 and c= 7.14 Å [16]. Wilson et al. [16] suggest that the S’ phase nucleates heterogeneously on dislocations and dislocation loops; instead of the preceding S’’, which can release partially the misfit between the precipitates and the matrix, and it grows as laths in the <100> directions of habit planes [16, 17]. Further aging of the Al-Mg-Cu alloy produces a loss of coherency of the S’-phase, resulting in the formation of the stable S phase (Al2CuMg). The S-phase has the same structure as its precursor S’-phase (face centered orthorhombic structure), but with slightly different lattice parameters, i.e. a= 4.00, b =9.23, c = 7.14 Å [18]. Since the difference in lattice parameters between S' and S is very small, some authors suggest that both phases should be considered as one phase S’(S) [9, 17].
2.1.3. Differential scanning calorimetric studies of 2xxx aluminum alloys
Figure 2.1 shows a typical differential scanning calorimetric (DSC) thermogramm of an Al-Cu-Mg alloy in different initial temper conditions [7]. In the “as-quenched” state (curve 1), five peaks can be identified, which are associated with GPB zone precipitation between 70 - 120 °C (A peak), the GPB zone dissolution at 150 °C (B peak), the GPB2 zone or S’’ phase dissolution at about 250°C (C peak), S’(S) phase precipitation between 280 and 350 °C (D peak) and the S phase dissolution taking place in a temperature range between 360 and 430 °C (E peak), as suggested by Jena et al [10]. Shih et al. [7] did not find any definite peak for the precipitation of GPB2 zones (or S’’) or for the precipitation of the S phase. They suggested an in situ transformation of the GPB into GBP2 zones and the S’ into S-phase. Shih et al. [7] also mentioned that the B and C peaks seemed to overlap with each other implying that the GPB and GPB2 zones have a similar structure, and that the E peak did not correspond separably to the dissolution of the S’ and S phases. The S’ phase is not easily distinguishable in structure from the S phase and therefore both are considered as a single phase, i.e. S’(S), as mentioned before. During aging at 190 °C, the peaks A and B of curve 2 disappear, whereas the C peak slightly shifts to a higher temperature. This shows that within the time of 1.5 min, GPB zones rapidly precipitate and then in situ transform into GBP2 zones which subsequently grow. After aging for a long time, the area of the C peak gradually increases and its position shifts to higher temperatures (curves 1 though 3), implying that more GBP2 zones precipitate and then grow to larger sizes. When comparing curves 2 and 3, the area of D peak begins to decrease at 30 minutes of aging, indicating the initial precipitation of S’phase. The S’ precipitation then accelerates until about 12 hours because the area of peak D largely reduces before this time (curve 4) and the gradually slows down at much longer aging time. After 49 hr, GPB2 zones were found to still survive in small amounts even though the precipitation of S’ has been finished and the in situ transformation of the S’ into S phases has been progressing (compare C peaks in curves 5 and 6) [7].

Chapter 2 Background and literature survey
5
Figure 2.1 Example of DSC thermogramm for “as-quenched” and differently aged conditions
of a Al-Mg-Cu alloy (After Shih et al. [7]). Strengthening of the Al-Cu-Mg alloys during artificial aging occurs in distinct stages separated by a plateau during which the hardness remains constant for a long time. The first stage is a sharp increase, which occurs very rapidly (within about 60 s of ageing at 150 °C) and accounts for about 60% of the total hardening during ageing [12]. The second stage is a typical peak of hardness and appears after long ageing times (i.e. approximately at 12 h at a temperature of 190 °C [7]). The microstructural causes of both increments of hardness are still in debate. There are two main theories for the strengthening process of the Al-Cu-Mg alloys during artificial aging. The first theory attributes the first increment in hardness to the precipitation of GBP zones [19] and the second hardness peak has been attributed to the precipitation of S’’ (also known as GPB2) [7, 14, 15, 18, 20]. On the other hand, the second theory supports the precipitation of Cu-Mg co-clusters as the cause for the first increase of hardness [12] and the second strengthening has been attributed to the coarsening of GPB zones or to the combined presence of GPB [9, 10, 12] zones and S’(S) [19]. The further precipitation of S’(S) seemed to produced a decrement of the hardness [9, 19].
2.1.4. Precipitation Sequence of 6xxx aluminum alloys.
The properties of 6xxx Al-Mg-Si alloys have been known to be influenced by the precursor phases to the equilibrium Mg2Si (β).The precipitation sequence in the Al-Mg-Si alloys is generally accepted to be [21-24]:
Supersaturated solid solutioni GP i β’’ i β’ i β (2.2). GP zones are generally considered spherical clusters with unknown structure. The β’’, fine needle-shaped zones along <100>Al, have a monoclinic structure (different values of the

Chapter 2 Background and literature survey
6
lattice parameters were reported [25, 26]). The stoichiometry of the β’’ phase has been defined as Mg5Si6 [8]. The β’-phase is formed as rod-shaped precipitates (circular cross sections) along <100>Al, having a hexagonal crystal structure with a = 0.705 nm and c = 0.405 nm [22, 25, 27]. The stable β phase usually consists of Mg2Si platelets on |100| of Al having the fcc CaF2 structure with a = 0.639 nm [28]. In many commercial 6xxx alloys, which often contain Cu in varying amounts, more complex precipitation sequences take place. The metastable β’’ has been observed to be the dominant intermediate phase present in the Al–Mg–Si and in some Al–Mg–Si–Cu alloys at early stages of aging. After peak aging some of the needle shaped β’’ precipitates are replaced by rod shaped phase β’ [29]. However, the Cu content and the Mg:Si ratio can influence the precipitation sequence of Al-Mg-Si alloy system [28, 29]. With additions of copper to an Al-Mg-Si alloy system, lath-shape precipitates appear in addition to the hexagonal β’ [30]. This lath-shaped phase was originally observed in 6061 alloy by Dumult et al. [31], who thought it was a modified β’ called Β’. Later investigations have confirmed the distinct lath morphology of precipitates in Al–Mg–Si–Cu alloys. Chakrabarti et al. [29] have suggested that this lath shaped-phase is the precursor phase of the equilibrium Q phase and designated it as Q’. The Q’- phase has a hexagonal structure with c=1.04 nm and a=0.404 nm. The long axis of the Q’ lath-shape particle is parallel to the <100>Al habit planes of the Al matrix. The quantity of Q’ phase depends on Cu content and Mg:Si ratio [30]. Unlike the β’ to β transition, which involves a change in crystal structure from hexagonal to the cubic CaF2 structure, the Q’ phase maintains the same crystal structure and morphology as Q from peak aged to overaged conditions. Only its size increases [29]. Equilibrium Q-phase can also coexist with the β−phase. The Q-phase structure belongs to the hexagonal system and has the space group P6. It has lattice parameters c=0.405 nm and a=1.04 nm. The exact composition of the phase is unknown but has been preliminary defined as Al5Cu2Mg8Si6 [32] Q formed during solidification from the liquid has complex honeycomb type morphology. The as-cast Q phase morphology changes with long thermal exposure during homogenization, and the Q phase may also precipitate in the solid state during high temperature anneals. In these cases Q often forms as round or oval particles at the grain boundaries [33].
2.1.5. Differential scanning calorimetric studies of 6XXX aluminum alloys
Differential scanning calorimetry has been employed along with TEM analysis to characterize the evolution of microstructure during hardening of 6XXX alloys [23, 28, 34, 35]. Generally, five exothermic peaks are identified in the temperature range of 50°C to 500°C for naturally aged Al-Mg-Si (-Cu) alloys [23]. The designation of each peak is noted in Figure 2.2. The DSC thermogramm shows around 95 °C the first exothermic peak is found, which is related to the precipitation of Mg or Si clusters. A broad exothermic peak associated with the formation of GP-zones appears at an approximate temperature of 190 °C. The most prominent peak on the trace for the as quenched sample is the exothermic peak associated with the β’’ precipitation. This peak is centered at about 240 °C. Around 290 °C, a peak associated with the formation of β and lathe lathlike precipitates (Q’) is observed. The quantity of each phase depends on the chemical composition of the alloy, specifically on the Mg:Si ratio and copper content, as already mentioned. TEM studies made by Miao et al on a naturally aged 6222 aluminum alloy type which Cu content varied from0,07 to 0,91 wt-%, suggest that the low Cu alloy exhibited a mixture of β’ and Q’. On the other hand, in the copper rich alloy only

Chapter 2 Background and literature survey
7
precipitation of Q’ phase occurred. The last peak (~ 345°C) is associated with the precipitation of the equilibrium phase (i. e. β or Q).
Figure 2.2 Example of DSC thermogramm for “as-quenched” and differently underaged
conditions of 6111 aluminum alloy (After Esmaeli at al. [34]). It has also to be noted that several endothermic peaks occurred. These peaks are attributed to the dissolution of a precipitated phase formed during the previous aging processes. For example, the endothermic peak A in the Figure 2.2 represents the dissolution of the strengthening β’’ phase present in the microstructure of the artificially aged 6xxx alloys. The dissolution of β and Q begins at ~ 400 °C. Several investigations suggest that the strengthening phase involved in the Al–Mg–Si ternary alloys is the metastable β’’ phase [23, 28, 36]. The prevailing viewpoint considers β’’ as the most potent if not the sole strengthening precipitate in the Al–Mg–Si ternary alloys. In quaternary Al–Mg–Si–Cu alloys, the strength was observed to increase progressively with increasing Cu additions [29, 30]. Studies on hardness changes as a function of the chemical composition and artificial aging time periods made by Chakrabarti et al. [29] suggested a different strengthening phase to be responsible for the changes in hardness. The hardness changes were compared with the changes of the amount of equilibrium phases after aging. The results of this study showed a simultaneous increment of hardness and the amount of equilibrium Q phase, while the amounts of β phases, well known for the strengthening capability of its precursor phase, decreased. It was assumed that the relative amounts of the precursor phases were proportional to the relative amounts of the stable phases, offering the possibility that a precursor phase of Q; differently to Q’; generally associated with strengthening loss during over aging also has a significant strengthening capability. High Resolution TEM studies of a quaternary 6XXX alloy with high amount of stable Q phase showed, in peak aged condition, the co-existence of β’’ and another phase with a lath shape being similar to that observed by Segalowicz et al [37] who designated it as L phase. The population of the lathe phase increased with increasing the copper content. Miao et al. [28] have also reported the existence of a lathe shape phase with the habit plane parallel to in Al alloys with low and high Cu content. Atoms of Cu were found to be incorporated in the L

Chapter 2 Background and literature survey
8
phase in high Cu content alloys. Therefore, the increment of strength of the Al-Mg-Si-Cu alloys may be attributed to the precipitation of the L phase, which is considered to be the precursor of the Q’ phase.
2.2. Friction Stir Welding
2.2.1. Process description
Friction Stir Welding (FSW) is a relatively new, innovative and environmentally friendly solid state welding process invented and patented at The Welding Institute (TWI) in U.K. in 1991[1]. This welding process is based on a quite simple concept: A non consumable rotating welding tool is plunged into adjoining materials. Frictional heat generated during this process causes the materials to soften and local plastic deformation to occur. The softened material is stirred together from the rotation process resulting in a solid state bond. Figure 2.3 shows a schematic representation of the FSW process.
Figure 2.3 Schematic representation of Friction Stir Welding.
However, material flow and joint consolidation imply a more complex process. Friction Stir Welding has been described as a “metalworking” process consisting of distinct steps [38]: (a) preheat, (b) initial deformation, (c) extrusion, (d) forging, and (e) post heat/cool down, see Figure 2.4b. In the preheat zone in front of the tool, temperature increases due to the frictional heating of the rotating tool and deformation adiabatic heating. As the tool moves forward, an initial deformation zone forms where material is heated above a critical temperature and the magnitude of stress exceeds the critical flow stress of the material, resulting in material flow. The material in this zone is forced both upwards into the shoulder zone and downwards into the extrusion zone, as shown in Figure 2.4a. A small amount of material is captured in the swirl zone beneath the pin tip where a vortex flow pattern exists. In the extrusion zone with a finite width, material flows around the pin from the front to the rear. A critical isotherm on each side of the tool defines the width of the extrusion zone where the magnitudes of stress and temperature are insufficient to allow metal flow. Following the extrusion zone is the forging zone where the material from the front of the tool is forced into the cavity left by the forward moving pin under hydrostatic pressure conditions. The shoulder of the tool helps to constrain material in this cavity and also applies a downward forging force. Behind the

Chapter 2 Background and literature survey
9
forging zone is the post heat/cool down zone where the material cools under either passive or forced cooling conditions. Friction Stir Welding is an asymmetric process with respect to the weld center line. Conventionally, the side of the tool, where the tangential speed of the tool has the same direction as the travel direction, is referred to as the advancing side (AS). The opposite side, where the tangential speed of the tool opposes the travel direction, is referred to as the retreating side (RS) [39]. Material from shoulder zone is dragged across the joint from the retreating side towards the advancing side.
Figure 2.4 (a) Material flow patterns and (b) metallurgical processing zones developed
during Friction Stir Welding [38]
2.2.2. Temperature distribution during FSW process
Thermal cycles occurring during FSW have a direct influence on microstructural evolution of the weld and therefore on the resultant mechanical and corrosion properties of the joints. Therefore, it is important to obtain information on temperature distribution during FSW. Several attempts have been made in order to record the temperature distribution by embedding thermocouples at different distances and depths from the joint line [40-45]. As shown in Figure 2.5, a thermal gradient is produced between the hot stirred zone and the cold base metal. Lower temperatures are recorded as the distance from the weld nugget (WN) increases in direction to the colder base metal. The maximum temperatures have been registered at top of the joint near to the contact surface between the welding tool and the base metal [44]. In the thickness direction, a difference in temperature between the top and bottom of the joint at the vicinity of the weld nugget might also occur. This difference may be influenced by several factors, such as alloy type and sheet thickness, welding parameters, backing plate etc.

Chapter 2 Background and literature survey
10
Figure 2.5 Peak temperature distribution adjacent to a friction stir weld in AA 7075Al-T651.
The line on the right side of figure shows the nugget boundary (after Mahoney et al. [44]). Thermal cycle measurements within the stirred zone are extremely difficult due to the intense plastic deformation. Therefore, the maximum temperatures have been estimated by microstructural observation of the weld nugget. Tang et al. [46] attempted to measure the heat input and temperature distribution within a friction stir weld by embedding thermocouples in the region to be welded. They reported that the thermocouple at the weld center was not destroyed by the pin during welding but did change position due to plastic flow of material ahead of the pin [46]. They found that temperature distribution within the weld nugget was relatively uniform (about 450° C). A nearly isothermal region up to a distance of 4 mm from the weld centerline was measured. The temperature variations between face and root side of the weld nugget were very small.
2.2.3. Microstructural evolution of FSW-joints
Although Friction Stir Welding is a solid state process, the plastic deformation and frictional heat applied to the materials being joined are high enough to produce several microstructural changes. Final properties of FSW joints are determined by the microstructural state after welding. Consequently, intensive investigation on microstructural evolution has been made in the past years [40, 41, 43, 44, 47-58]. Referring to the microstructure, three different zones can be distinguished within a FSW- joint: weld nugget (WN), thermo-mechanically affected zone (TMAZ), and heat-affected zone (HAZ). A typical cross section of a FSW joint is shown in Figure 2.6.
2.2.3.1. Weld nugget:
Frictional heat and intense plastic deformation during FSW produce a very fine equiaxed grain structure. Although the exact mechanism is not well understood, the fine grain structure has been usually attributed to dynamic recrystallization [48, 59]. These grains are initially free of strengthening precipitates and show a low density of dislocations [41]. The grain size varies within the position of the weld nugget. Near the top of the surface, where high temperatures are experienced, larger grains are observed (i.e. 5-6µm) [44]. The contact of the base metals with the “cold” backing plate promotes lower peak temperatures and shorter thermal cycles compared to the nugget top reducing grain growth resulting in smaller recrystallized grains (2-3 µm) [44]. The grain size in the weld nugget can also be influenced by the welding parameters. Essentially, an increment of the rotational speed produces larger

Chapter 2 Background and literature survey
11
grains (higher peak temperatures) [60]. Fragmentation and redistribution of constituent particles also occur during the FSW process [61, 62].
Figure 2.6 Microstructural features of a FSW 2024-T3 joint, A- base metal, B-heat affected
zone, C-thermo-mechanically affected zone, D-weld nugget and E-flow arm Size and shape of the weld nugget are influenced by several parameters, such as processing parameters, tool geometry and thermal conductivity of the material. Basically, the size of the weld nugget is slightly larger than the welding pin and increases as the pin diameter increases [63]. Depending on the welding conditions, the weld nugget structure may consist of a system of concentric tube shape interfaces, the so called “onion ring” macrostructure [62, 64].
2.2.3.2. Material flow arm
The material flow arm is located on the upper surface of the FSW joint and consists of material that is dragged by the shoulder from the retreating side of the weld, around the rear of the tool, and deposited on the advancing side [65].
2.2.3.3. Thermo-mechanically affected zone:
At both sides of the weld nugget a highly deformed region is produced (Figure 2.7). The original grains of the parent material are deformed following the contour of the weld nugget. However, the thermo-mechanical conditions achieved by the FSW-process are not intense enough to produce complete recrystallization of the microstructure. Depending on the welding thermal cycle and the vicinity to WN, several microstructural changes may occur within this zone. It has been found that the grains within the TMAZ contain a high density of sub-grains and dislocations [59]. In several studies heterogeneous precipitation of second phases on dislocations, dispersoids and grain boundaries were observed [49, 55, 59].
2.2.3.4. Heat Affected Zone:
These zones are located at the outer positions beyond the TMAZ with respect to the joint line. In these regions no plastic deformation takes place. Therefore, the grain structure is identical to that of the base metals. However, several microstructural changes are produced due to exposure to high temperatures, leading to fine scale precipitation or overaging.

Chapter 2 Background and literature survey
12
Figure 2.7 Thermo-mechanically affected zone of FSW 2024-T3
2.2.4. Microstructure and mechanical properties
Mechanical properties of friction stir welded age hardenable aluminum alloys have been found to be strongly related to the degree of precipitation. Sato et al studied the relation between microstructure and hardness profile of a FSW 6063-T5 aluminum alloy in the “as welded” condition [43]. A schematic representation of the results is shown in Figure 2.8. The hardness profile depicted a softening of the weld region. The degree of softening was associated with the density of needle-shaped precipitates (β’’ phase). At both hardness minima, a complete absence of this type of precipitates and an increment in rod type precipitates (β’ phase) was observed. The center of the weld region did not reveal any needle or rod shape precipitates after FSW. However, the increment of hardness in this area was attributed to the small grain size and the high density of sub-grain boundaries (Hall-Petch effect [66]) and the precipitation of GP zones during natural aging. The absence of the needle shaped strengthening precipitates was associated with a partial or total dissolution caused by exposure to high temperatures during the heating of the welding thermal cycle. The initial temper condition of the base metal also determines the final mechanical properties of the joint, because the precipitation kinetics during welding depends on it. In the case of FSW naturally aged aluminum alloys, the hardness profiles displayed three different zones at the weld region [49, 67]. The central zone corresponds to the weld nugget with hardness values near those of the base metals. The high temperature experienced in the nugget leads to a dissolution of the precipitates. During natural ageing following welding, the precipitation of GPB zones produces a hardness increment. The TMAZ shows a coarse heterogeneous precipitation. This corresponds to the weakest zone, in which few solute elements are left in solid solution to allow for an increase in hardness during natural ageing after welding. The HAZ can be divided into three parts. In the first one closest to the WN, the exposure to high temperatures (between 250 and 400° C) during the FSW process causes overaging resulting in a gradual loss of hardness. Heterogeneous precipitation, coarsening of precipitates at the grain boundaries [68] and creation and widening of Precipitation Free Zones (PFZ) occur [59]. The second zone of the HAZ presents an increment of hardness due to a homogeneous precipitation of the strengthening phases. Farest from the weld nugget, a second drop of hardness might occur resulting from the reversion of the strengthening GP zones.

Chapter 2 Background and literature survey
13
Figure 2.8 Relationship between precipitate distribution and hardness profile of an FSW
6061-T5 (after Sato et al. [43]) Several studies carried out in FSW heat treatable aluminum alloys [69-72] have found a correlation between the hardness profile and the tensile strength of the joints. In all cases FSW joints fractured in the hardness minimum during the tensile test. Thus, if the weld is free of defects, the fracture is triggered by the degree of overaging in the outer TMAZ/inner HAZ. Genevois et al. [69] used micro tensile test specimens oriented parallel to the weld direction in order to produce a profile of tensile properties of FSW 2024-T3. They observed that the lowest yield stress is found in the TMAZ. This region presented a relatively high ductility, suggesting a high strain hardening capacity. The nugget showed a slight strength increase, related to the formation of GPB zones after welding. A maximum in yield stress was found in the HAZ, corresponding to the fine scale precipitation of the metastable S’(S) phase.
2.2.5. Process parameters
The quality of friction stir welds, in terms of sound joints and good mechanical properties, is influenced by several process parameters, such as tool geometry and welding parameters. These parameters greatly affect the microstructural evolution of material and consequently the mechanical properties due to the material flow and thermal cycle applied during the joining process.
2.2.6. Tool design
The tool geometry plays a dominating role in material flow and in turn governs the travel speed at which FSW can be performed. The primary functions of the tool are: (a) to generate enough frictional heat to plasticize the material, and (b) to stir and move the material. As mentioned before, the welding tool consists of a shoulder and a pin (Figure 2.9 (c)). The frictional heat is mainly produced at the interface between the surface of the shoulder and parent plates [73]. Modeling estimations indicate that the shoulder produces about 80% of the heat during the welding process, while the remaining is produced by the pin [45, 74, 75]. The shoulder also retains plasticized material within the weld zone. The main function of the pin is

Chapter 2 Background and literature survey
14
to stir and move the column of plasticized material under the shoulder and, thus, controlling the material flow. Tool designs are generally considered proprietary and only limited information can be found in open literature. Depending on the application, several configurations of tool geometries can be employed to improve material flow, mixing and reduce process loads [76]. Generally, a concave shoulder and threaded cylindrical pins are used to produce butt joints. Fig. 2.9 shows some examples of advanced welding probes.
(c) Figure 2.9 Pin (probe) variants for FSW: (a) MX TrifluteTM for butt joints [76], (b) Flared
Tri-fluteTM with tip profile for lap welding [76] and (c) MX Trivex toolTM[77]
2.2.7. Heat input and welding parameters
The most important welding parameters that govern the FSW process are the rotational speed of the tool (ω), the travel or welding speed (v) and the forging force (F). These three parameters govern heat input and thermal welding cycle. Heat generation is often assumed to occur predominantly under the shoulder and to be equal to the energy required to overcome the contact forces between tool and the workpieces. Reynolds and Tang [78] equalize the weld power to the mechanical power generated by the welding machine. This power can be calculated as follows:
P= ω T (2.3)
P represents the delivered power, ω is the rotation speed, and T is the torque of the spindle. The specific weld energy input E is simply the power divided by the welding speed v in mm/s and multiplied by a weld efficiency factor η to give the weld energy in joules per millimeter; (see Equation 2.4). This weld efficiency factor includes energy losses via conduction through the back plate and clamps.
E=η P/v (2.4)
The impact of both rotational and welding speeds is complex. In general, it can be concluded that the tool rotation speed governs the peak temperature in the stirred zone [51, 79], while the travel speed determines the heating and cooling rates of the welding thermal cycle [61]. Nevertheless, it has to be noted that the heating of the work piece is coupled with the tool surface by friction. Hence, a proportional increase in heat input with increasing tool rotation rate is not expected as the coefficient of friction at the interface will change with increasing tool rotation rate. In addition to the tool rotation rate and travel speed, another important process parameter is the tilt angle of tool with respect to the work piece surface. A suitable tilt

Chapter 2 Background and literature survey
15
towards trailing direction ensures that the shoulder/tool holds the upcoming material which has been stirred downwards by the threaded pin from the front to the back of the joint. Variations of weld parameters, and therefore heat input, have a great influence on microstructure and mechanical properties of the FSW joints. It has been observed that the recrystallized grain size can be reduced by decreasing the tool rotation speed [51, 79, 80] or by decreasing the ratio (ω / v) [81]. Biallas et al. [62] studied the effect of FSW parameters on the tensile properties of FSW AA2024-T3. It was found that for a constant ratio of tool traverse speed/rotation rate, both yield and ultimate strengths increase with increasing tool rotation rate and ductility also improves. Furthermore, higher strength was observed in thinner plates as compared with thicker plates.
2.2.8. Advantages and disadvantages of FSW
From a technological point of view, FSW presents some significant advantages compared to fusion welding process (i.e. gas metal arc welding, gas tungsten arc welding or laser beam welding). For instance, milling machines can and have been employed to produce joints under position control. A non consumable welding tool is used. Neither shielding gas nor filler metal are required to join aluminum alloys. Great productivity, in terms of length of weld seam produced using a single tool, may be achieved depending on the alloy to be welded. The Friction Stir Welding process can be considered as a green technology due to its energy efficiency, using 84% less power than a fusion welding process [82]. The FSW process generates very little noise and does not emit smoke, dust, dangerous plasma or x-rays [82]. On the other hand, the FSW process presents some limitations. For example, welding speeds are moderately slower than those of some conventional fusion welding processes (i.e. GMAW or LBW). Work pieces must be rigidly clamped. The standard FSW requires always a backing plate. However, it can be eliminated, if a Bobbin Tool system is employed [83]. At the end of the joint there is a keyhole left by the removed pin, if it is non-retractable. The limitations of the FSW process are tried to be reduced by intensive research and development.
2.2.9. Dissimilar friction stir welded joints
Perhaps, the most important advantage of friction stir welding is the capability to produce welded joints in the solid state. Therefore, the undesired solidification microstructures are avoided. This fact allows joining materials without any or with low metallurgical affinity. In the literature, several reports of dissimilar friction stir welded joints can be found. It has been demonstrated that FSW allows to weld dissimilar aluminum alloys [84-88] , Al-Steel [89-91], Al-Mg [88, 92], Al-Al/MMC [93] and Al-Cu[94]. The production of sound dissimilar aluminum alloy welds presents some peculiarities, for example the relative position of the materials with respect to the rotating tool. Generally, it has been observed that the best results are obtained when the softer material is placed on the advancing side of the joint [86, 95, 96]. The resulting weld nugget microstructure also presents an onion ring pattern like in similar FSW-joints. These onion rings are characterized by a dynamic intercalation of dynamically recrystallized grains of both materials. The intercalations consist of vortex or swirl like

Chapter 2 Background and literature survey
16
features, described by Murr et al. [94]. Lee et al. [86] affirmed that the microstructure within the nugget is dominated by the harder material placed on the retreating side. However, no chemical macro mixture (dilution) between both metals takes place. It is believed that the diffusion zone between stripes of the two materials in the nugget is within the nanometer scale [87]. Thus, the metals in the bands within the nugget will display the same characteristics as their corresponding base alloys. Mechanical properties of the dissimilar joint are governed by the weakest zone in the weldment. Tensile fracture normally occurs in the overaged HAZ on the advancing side (softer material) [84, 85]. The reduced joint ductility has been attributed to localized deformation in the low strength HAZ [96].
2.3. Localized corrosion of high strength aluminum alloys
The corrosion behavior of aluminum alloys is mainly related to their microstructure, and therefore, is influenced by the chemistry, processing route and heat treatment. The microstructure determines the occurrence of localized corrosion and the mechanism of attack. The design of an aluminum structure can have an important influence on its corrosion behavior. External factors also influence the corrosion behavior of aluminum alloys. Chemical composition of the environment plays an important roll in corrosion. Also physical variables, such as temperature, agitation and pressure of the corrosive media and presence of electrical current may affect the corrosion resistance of aluminum alloys. Extensive reviews on the corrosion behavior of pure aluminum and its alloys can be found in the open literature [97-100] Pure aluminum is classified as a high reactive metal. It possesses a standard corrosion potential of -1.66 VNHE [101]. However, it presents a low susceptibility to corrosion. The high corrosion resistance of aluminum to different environments is due to the presence of an electric isolating, thin and compact film of adherent aluminum oxide. Whenever a fresh aluminum surface is created and exposed to air or water, a superficial film of aluminum oxide forms instantaneously and grows rapidly. This passive oxide layer has an amphoteric behavior. Pourbaix diagrams show that aluminum oxide film is stable in the pH range from 4.0 to 9.0 [102]. Nevertheless, in presence of concentrated acids or in alkaline environments, dissolution of the protective film takes place. When the aluminum oxide is removed, the metal corrodes rapidly by uniform corrosion. In enviroments in which the surface films is stable, localized corrosion of aluminum may occur at weak spots in the oxide film (i.e. scratches, constituent particles and precipitates) [6]. The localized corrosion of aluminum has an electrochemical mechanism, which can be compared with the operation of a very large number of short circuited wet cell batteries connected in parallel. At the negative plates (anodes, i.e. metal surface) of these batteries, the aluminum leaves the metal lattice and passes into solution in form of aluminum ions. At the positive plates (cathodes, i.e constituent particles or plating of nobler metals at the surface) either hydrogen ions in solution are discharged in form of gaseous hydrogen or hydroxyl ions, or dissolved oxygen in solution is reduced. In either case, the final result is an alkanization of the cathodes. The hydroxyl ions react with the aluminum ions passing into solution at the anodes to form hydratated aluminum oxide corrosion products. Electrical contact is made in the cells by means of electrons liberated at the anodes, flowing through the metal to the cathodes where they promote cathodic reactions. This sequence of reactions can be expressed as [99]:

Chapter 2 Background and literature survey
17
2Al 2Al3+ +6e- Anodic reaction (2.5)
6e- + 6H2O 6 OH- + 3H2 Cathodic reaction (2.6)
6e- + 3/2 O2 + 3H20 6 OH- Cathodic reaction (2.7)
Thus, either by stopping the anodic reaction or by stopping the cathodic reaction corrosion can be essentially arrested. In actual corrosions cells, the open circuit potential of the anodic reaction (EA) depends upon the concentration of aluminum ions in solution according to the equation [99]:
EA= EO +RT/ 3F loge (Al+3) (2.7)
Where EO = -1.67 volts R= gas constant F= Faraday constant The cathodic reaction (Ec) is usually either the evolution of hydrogen or the reduction of oxygen dissolved in solution or a combination of both. The open circuit potentials of those two cathodic reactions are given by equations [99]: For hydrogen evolution:
Ec= EO+ RT/2F loge (H+)2/(P of H2) (2.8) Where EO = 0.00 volts For oxygen reduction:
Ec= EO+ RT/2F loge (H2+)x(P of O2)1/2 (2.9)
Where EO = +1.27 volts It can be seen that these potentials depend on the hydrogen ion concentration (pH), the amount of dissolved oxygen in solution and the presure of both hydrogen and oxygen. In the open circuit condition (no current flowing) and under fixed concentrations of hydrogen ion, oxygen and aluminum ion, a definite potential difference (∆E) exists between the anodic and the cathodic reactions. This open circuit potential difference is the initial driving force for the corrosion reaction [99]. The theoretical driving force is only applicable for the local corrosion cells before the corrosion begins in the given corrodent. After electrical current begins to flow and corrosion proceeds, ∆E decreases as either or both of the open circuit potentials change towards each other. The rate of changes with increasing current flow is a measure of polarization of these reactions. The intercept of the anodic and cathodic curves is considered to define the corrosion potential and the rate of the metal dissolution under the given conditions, as denoted in Figure 2.10.

Chapter 2 Background and literature survey
18
Figure 2.10 Anode and cathode reactions [99]
2.3.1. General effect of alloying elements and impurities
The corrosion behavior of aluminum alloys can be influenced by the alloying elements added to the metal. In solid solution within the aluminum matrix, these elements greatly modify the corrosion potential of aluminum. Generally, the addition of alloying elements less active than aluminum raises the corrosion potential of aluminum, and conversely, elements more active than aluminum produce a decrement on the corrosion potential. Figure 2.11 shows the effects of the principal alloying elements on the corrosion potential of high-purity aluminum. Effects of multiple elements in solid solution are approximately additive [103].
Figure 2.11 Corrosion potentials of high-purity binary alloys solution heat treated and
quenched measured in a solution of 53g/l NaCl + 3g/l H2O2 at 25 °C [103]

Chapter 2 Background and literature survey
19
Heterogeneous microstructures are intentionally developed in many commercial aluminum alloys during solidification and thermo mechanical processing to produce a desirable mix of mechanical properties. From a localized corrosion perspective, the dominant feature of alloy microstructures is the distribution of second-phase particles that contain high concentrations of alloying and impurity elements. Often these particles exhibit different electrochemical characteristics compared to the surrounding microstructure. In many cases, the general electrochemical behavior (relative nobility or activity) can be correctly predicted based on the nobility or activity of the primary alloying element concentrated in the particle. However, when the compounds contain certain mixtures of active and noble elements, e.g., Al2CuMg or A12CuLi, an a priori prediction is difficult [104]. Table 2.1 lists the corrosion potential for a range of intermetallic compounds tested in different environments.
2.3.2. Pitting corrosion
Pitting can be defined as the dissolution of the metal at localized sites on the surface, resulting in the development of open cavities. Pitting corrosion in aluminum alloys is recognized as a significant aspect of degradation mechanism that affects the long term reliability, durability and integrity of structural components used in the aerospace industry [105-108]. For instance, pits can act as initiation site for cracks, reducing dramatically the fatigue life of the structural components [109-116] Pitting may be induced by the presence of cathodic intermetallic particles (generally constituent particles) embedded in the metal surface. The existence of potential differences between intermetallic and matrix is the driving force for the onset of pitting. Moreover, for pitting to occur an electrolyte containing halide ions (i.e. chloride ions) and oxygen must be present [6]. The pitting initiation process is a complex phenomenon which exact mechanism is still not completely understood. Nevertheless, the process of pitting initiation can be devided in the following steps [98, 117-119]: 1. Adsorption of ions at flaws in the oxide film in preference to species such as OH- and H2O that would continue to passivate the metal. 2. Chemical reaction of the halide ion with aluminum ions in the oxide film to form a soluble complex such as Al(OH)2Cl; 3. Diffusion of soluble species away from the reaction site with attendant localized thinning of the oxide film so that, 4. Aluminum ions can form at the metal-electrolyte interface. Due to the hydrolysis of aluminum ion, the pH in the pit tends to become acidic (pH 3.5) When aluminum alloy is exposed to a “neutral” aqueous solution (pH between 4 and 9), the first anodic effect is that of film thickening: Localized dissolution (pitting) of the metal with the formation of soluble corrosion products follows later. The existence of various aluminum ions, i.e. Al3+, Al(OH)2+ Al(OH)22+, leads to a variaty of anodic reactions depending on the pH of the corrodent. However, it is believed that the role of anion is more determinant than the pH per se [99].

Chapter 2 Background and literature survey
20
Table 2.1 Corrosion potentials for intermetallic compounds common in aluminum [104]
Second phase Corrosion potential (mVsce) Enviroment Aeration
Si -170 53 g/l NaC + 3 g/l H2O2
Open to air
Al2Ni -430 53 g/l NaC + 3 g/l H2O2
Open to air
Al2Cu -440 53 g/l NaC + 3 g/l H2O2
Open to air
Al2Cu -760 1.0 M NaCl N2 sparged Al3Fe -650 0.1 M NaCl Air sparged
Al6Mn -760 53 g/l NaC + 3 g/l H2O2
Open to air
Al2MgCu -890 1.0 M NaCl Open to air
Al2MgCu -910 53 g/l NaC + 3 g/l H2O2
Open to air
MgZn2 -960 53 g/l NaC + 3 g/l H2O2
Open to air
Al3Mg2 -1150 53 g/l NaC + 3 g/l H2O2
Open to air
Al6(FeMn)Si -1200 0.1 M NaOH Deaerated Al8Mg5 -1050 1.0 M NaCl N2 Sparged
It is generally recognized that the Al2CuMg phase is responsible for pitting corrosion of 2024 Al alloy [120-123]. When exposed to a chloride containing media, these contituent particles experience preferential dissolution of Al and Mg. The remaining Cu-rich particle turns to a cathode dissolving the adjacent anodic Al matrix. Besides, Cu re-deposition reactions might also occur due to the reduction of Cu2+ ions dissolved in the solution from the matrix. Because of the relative novelty of the 6056 alloy, few studies on the corrosion behavior of this alloy or that of its American equivalent, the 6013 alloy, have been made. However, it has been shown that this alloy is less susceptible to pitting corrosion than the 2024 alloy in chloride media [124]. Al-Si-Mg containing constituent particles present in this alloy are strongly reactive in presence of chloride media. These intermetallic particles act as pitting initiation sites [125], however, they do not seem to have a significant influence on the futher growth of the pits in this alloy [126]. Pits firstly develop within the grains leading to the formation of voluminous corrosion products. Then, the pit environment becomes acidic and high in chloride concentration. In this very aggressive medium, pits grow through microscopic crystallographic tunnels. When some of them penetrate a grain boundary which is contact with the growing pit, intergranular corrosion starts [125].
2.3.3. Intergranular corrosion
Intergranular corrosion (IGC) is a selective attack of the grain boundary zone, with no appreciable attack of the grain body or matrix. This kind of localized corrosion is associated with galvanic coupling resulting from differences in the chemical compositions in this region. Micro galvanic cells are formed between second phase precipitates and the depleted aluminum solid solution from which the precipitates are formed [127]. In the case of the 2024 and 6056 alloys, this micro galvanic couples are formed by “small” Cu- containing second phases (for example S-phase in the case of 2xxx alloy [120, 123] or Q-phase in the case of the 6xxx alloy [128, 129]), precipitated along the grain boundary and adjacent denuded zone free

Chapter 2 Background and literature survey
21
of precipitates (PFZ). The Cu depleted zones are generally the grain boundary anodic path in copper containing aluminum alloys dissolving preferentially in presence of aggressive media.
2.3.3.1. Predicting corrosion characteristics of heat treatable aluminum alloys [130]
The occurrence of intergranular corrosion in wrought heat treatable aluminum alloys may be triggered by inappropriate heat treatments or other thermal processes, such as welding [6]. Cooling rate (quenching) from solution temperature to room temperature is the most critical step of heat treatment, as solute atoms tend to migrate (with extreme rapidity) to disordered regions, such as grain boundaries, dispersoids, or other particles. Thus, the objective of quenching is to preserved the solid solution by rapid cooling. The critical quenching rate can be determined using a Time Transfomation Properties curve, also known as C-curve (Figure 2.12). Generally, these diagrams determine the rate of phase transformation at a constant temperature. In other words a sample is solutionized and then cooled rapidly to a lower temperature and held at that temperature whilst the rate of transformation is measured.
Figure 2.12 C-Curve for intergranular corrosion of 2024-T4 [6]
Willey (citated by [130]) had applied the C-curve to the corrosion of AA 2024-T4 to qualitatively predict the effects of quenching rate. He correlated the corrosion mode of specimens quenched in various media with the cooling rate through the critical temperature range established from the C-curve. When the quench rate was above a critical level, the specimens corroded by the innocuous pitting mode, but below this level they showed evidence of corrosion both by pitting and by the damaging intergranular mode. At lower rates, corrosion was entirely intergranular. The effect of slow quenching on corrosion resistance was attributed to the nature, location, and morphology of the precipitates which form during cooling (e.g. Al2CuMg precipitates at grain boundaries) For quench factor analysis, a model was developed from the idea that the corrosion mode changes from pitting to intergranular when a critical amount of Al2CuMg precipitates during either isothermal or continuous cooling and that the precipitation reaction is isokinetic (i.e when the transformation rates differ only by a time constant). The fraction t of the critical amount of Al2CuMg which precipitates at any particular temperature in any hold time less than the critical time given by the C-curve was assumed to be equal to the quotient of elapsed time t at that temperature divided by the critical time at that temperature:

Chapter 2 Background and literature survey
22
τ=X/Xc=t/Ct. (4)
Where: Ct=critical time at temperature t= elapsed time X= amount of precipitates Xc=critical amount recipitated As an example, let the critical time at 425 °C be l0s, the critical time at 375 °C, 1s and the critical time at 325 °C 20s. When the reaction is isokinetic, the same fraction Xc would precipitate in 1 s at 425 °C, in 0.1 s at 375 °C and in 2 s at 325 °C because 1/10 = 0.1/1= 2/20 = t/Ct. Furthermore, if a specimen could be quenched instantaneously from above the solvus to 425 °C, held for 333 s, cooled instantaneously to 375 °C und held for 0.33 s, cooled instantaneously to 325 °C and held for 6.67 s, and then quenched instantaneously to room temperature, it would have precipitated the same amount fraction Xc because 1.0=3.33/10 + 0.33/1 +6.67/20. For continuous cooling, the hold times at isothermal temperatures become infinitesimally small. The basic principle of quench factor analysis is that the precipitation reactions are isokinetics, so that the fraction of the Xc precipitating during continuous cooling can be integrated. When the result of the integration equals unity, the critical amount Xc represented by the C-curve, has precipitated. Therefore the continously cooled material will exhibit the same microstructure as if it had been quenched instantaneously to an intermediate temperature, held for the critical time at that temperature, and then quenched instantaneously to room temperature.
2.3.4. Exfoliation corrosion
Exfoliation is a localized form of corrosion that can occur on the surface of wrought aluminum alloys having highly directional grain structure. Exfoliation as well as Stress Corrosion Cracking is predominantly characterized by intergranular corrosion attack. The corrosion begins as lateral intergranular corrosion on the subsurface grain boundaries parallel to the metal surface, but the entrapped corrosion product of hydrated aluminum oxide has a higher specific volume than the aluminum alloy and the resulting expansion generates large compressive stresses that lift the surface of the grains. This spalling off of the metal creates fresh metal surfaces for continued corrosion [131-133]. Different factors affect the susceptibility of aluminum alloys to exfoliation. The grain shape and tempering condition of the alloy are important factors [134, 135]. In plate material, the most severe exfoliation occurs where the plate has been machined off between one fourth and one half of the thickness [132] and the surface has been exposed to a corrosive media. This effect is due to the more elongated shape of the grains in this plane produced during rolling [132]. Exfoliation has been generally observed under specific environmental conditions [134, 136]. Critical conditions are high humidity, high acidity level [137] and NaCl-containing environments [133]. Exfoliation ocurrs predominantly in rolled sheets and plates of 2XXX, 5XXX and 7XXX aluminum alloys as a consequence of the highly directional grain structures, which can be subject to intergranular corrosion. Susceptibility to exfoliation can be limited and usually eliminated in all alloy systems by appropriate regulation of thermal treating during processing of mill products, but usually with sacrifice in strength or ductility. Special exfoliation resistance tempers, such as the –H116 temper for 5XXX , the –T7x temper for Al-Zn-Mg-Cu alloys and the –T8 tempers for the 2XXX alloys have been made availabe in recent years.

Chapter 2 Background and literature survey
23
2.3.5. Stress corrosion cracking
Stress corrosion cracking (SCC) can be defined as the failure of an alloy produced under the simultaneous action of a corrosive medium and static tension stresses [138]. Extensive studies have shown that SCC in high-strength aluminum alloys is mainly intergranular [139-143]. As a result, two basic theories have evolved. The first theory states that SCC is associated with highly localized anodic dissolution of grain boundary regions under combined influence of stress and environment. The second theory proposes that embrittlement and loss of ductility is promoted after the ingress of an aggressive species (usually atomic hydrogen) onto or into the alloy. Burleigh reviewed a number of studies through 1989 and highlighted three main theories of SCC in aluminum alloys [141]: (1) the anodic dissolution theory, which states that cracking results from preferential corrosion along the grain boundaries; (2) the hydrogen-induced cracking theory, which states that absorption of atomic hydrogen and weakness of the grain boundaries lead to cracking; and (3) the passive film theory, which states that the rupture of the passive film along the grain boundary causes cracking. Burleigh also indicated that anodic dissolution is generally favored for the 2xxx series aluminum alloys, while hydrogen-induced cracking is favored for the 7xxx series. Conventionally, approaches focused on fracture mechanics have been employed to study SCC kinetics. To simplify the complex processes, a single crack in one specimen is created, such as in the double cantilever beam (DCB) specimen. Figure 2.13 describes the propagation of the crack growth rate as a function of stress intensity factor K at the crack tip. This curve characterizes crack velocity in SCC and the threshold for stress corrosion crack growth, KISCC. A V-K curve consists of three regions. In the first region, when K is just greater than KISCC, the crack velocity increases sharply with an increase in applied K. In the second region, the rate-controlling step is the transport of the electrolyte to the crack tip, and crack growth rate is independent of applied K. In the third region, crack growth is mechanically controlled and K approaches the value of the fracture toughness KIC. In commercial high strength aluminum alloys generally regions I and II are observed, with the region III missing [139]. SCC may occur when stresses in the order of the yield stress are present. However, when stressed in the short transverse direction, for example across the flash line of a forging, SCC can occur at lower stresses. Usually a chloride containing aggressive environment must be present, but in cases of extreme susceptibility, SCC can occur in humid air. Because SCC failures in aluminum alloys are generally intergranular, the microstructure along the grain boundaries plays a primary role in determining SCC susceptibility. In all wrought alloys, SCC susceptibility is greatest in the plane where the most continuous grain boundary path is available. For flat rolled products (sheet and plate), this situation occurs when stress is applied in the short transverse direction (normal to the rolling plane) and crack growth occurs in the rolling plane. For forgings and extrusions, the grain patterns are more complex, but maximum susceptibility occurs when stress is applied normal to the two principal grain flow directions, with crack growth occurring in the plane of metal flow.

Chapter 2 Background and literature survey
24
Figure 2.13 Schematic representation of the variation of stress corrosion crack velocity with
crack tip stress intensity [144]. Stress-corrosion cracking is mainly observed in aluminum-copper-magnesium alloys (2xxx), aluminum-magnesium alloys (5xxx) that contain more than 3% magnesium, and aluminum-zinc-magnesium-copper alloys (7xxx series). On very rare occasions, SCC occurs in the aluminum-magnesium-silicon alloys (6XXX). It does not occur in commercial-purity alloys (1xxx), aluminum-manganese alloys (3XXX), or aluminum-magnesium alloys (5xxx) containing less than 3% magnesium [6]. A brief description of the SCC properties of the 2XXX, 6XXX and 7XXX alloys is given below.
2.3.5.1. Aluminum-copper-magnesium Alloys (2XXX) [6]
The susceptibility of the alloy to both intergranular corrosion and SCC depends on the magnitude of the difference in corrosion potential of the grain boundary precipitates, the depleted zone, and the grain matrix. In the commonly used 2xxx alloys (such as 2014-T451, 2219-T37, 2014-T651 and 2024-T351) in naturally aged tempers, SCC resistance shows a strong dependence on quenching rate. SCC and intergranular corrosion resistance of the as-quenched alloys increase with quenching rate. Heat treatment can also influence the SCC resistance of the 2xxx alloys. For example, the 2024 alloy presents a higher susceptibility in the naturally aged condition, and lower susceptibility with artificial aging to the T851 temper (see Figure 2.14). During artificial aging, susceptibility initially increases, reaches a maximum, and then decreases. The SCC growth rate follows the same trend as IGC sensitivity: initially increasing, reaching a maximum, and finally decreasing. This effect occurs as precipitation in the grain bodies becomes more complete, and the amount of copper in solid solution diminishes, reducing the corrosion potential difference between the grain bodies and the copper -depleted zone at the grain boundaries [6]. Speidel studied the most susceptible 2xxx (Al-Cu-Mg) alloys, 2014-T451, 2219-T37, 2014-T651 and 2024-T351 [139]. He found that the four alloys have nearly identical growth rates in the plateau region (region II) and their stress dependent crack growth rate (region I) are observed at very low stress intensities, i.e., 2024-T351 has the value of KISCC = 8 MPa⋅√m. In contrast, higher values of KISCC are evident for the same composition material in the temper

Chapter 2 Background and literature survey
25
T851. Figure 2.15 shows stress corrosion crack velocity vs. stress intensity (V-K) curves for various 2XXX aluminum alloys [139].
Figure 2.14 Effects of artificial aging on the corrosion and stress-corrosion properties of alloy 2024 in NaCl aqueous solution. The T3 and T8 tempers are indicated by arrows [6]
2.3.5.2. Aluminum-magnesium-silicon alloys (6XXX)
Confirmed service SCC failures of 6XXX-series alloys are rare, despite the fact that these alloys may be susceptible to intergranular corrosion in the T4 and T6 tempers. However, laboratory SCC tests on naturally aged 6061-T4 samples that had been exposed to unusually high solution heat treat temperatures, followed by a slow quench, did produce failure. This sensitivity can be eliminated by aging to the T6 temper. As a general rule, SCC can be prevented by avoiding both higher-than-recommended solution heat treat temperatures and slow quenches [6].
2.3.5.3. Aluminum-zinc-magnesium and aluminum-zinc-magnesium-copper alloys (7XXX) [6].
The medium- and high-strength 7XXX series alloys gain strength by solution heat treatment, quenching and artificial aging through a complex sequence of reactions that finally produce the stable precipitates MgZn2 and MgZn3Al2. Up to 3% copper is added in some alloys for higher strength, however, such additions of copper must be limited if weldability and general corrosion resistance are desired. Small amounts of manganese, chromium and zirconium are usually added to control recrystallization and preserve the highly directional grain structure in wrought alloys. This effect is highly desirable for SCC resistance, because it is extremely difficult to propagate intergranular SCC cracks perpendicular to a highly elongated grain structure. The higher strength, copper-containing alloys (such as 7049, 7050, 7178 and 7075) are quite susceptible to short transverse SCC in the underaged (W) and peak-aged (T6) temper. This generally limits the application of peak-aged temper alloys to structures in which there is no conceivable source of short transverse stress. To minimize SCC susceptibility, overaging treatments are utilized at some sacrifice of tensile strength. Various overaged (T7) tempers are available that offer a range of combinations of SCC resistance and tensile strength. For alloys in the peak aged temper, a rapid quench following solution heat treatment provides increased SCC resistance. Among these alloys, SCC resistance varies with copper content and zinc-

Chapter 2 Background and literature survey
26
magnesium ratio, and also with the zirconium, chromium, and manganese content. Slow quenching of 7075, the most widely used alloy, causes poor resistance to SCC. Improvements in SCC resistance of thick-section products have been achieved with alloys 7049 and 7050, through increased zinc-magnesium ratio and through zirconium additions to reduce susceptibility of 7050 to SCC caused by slow quenching. However, increasing the zinc-magnesium ratio above 3 can be detrimental to SCC resistance.
Figure 2.15 Crack propagation rates in stress-corrosion tests using pre-cracked thick,
double-cantilever beam (DCB) specimens of high strength 2xxx series aluminum alloy plate, TL(S-L) orientation. Specimens were wet twice a day with an aqueous solution of 3.5% NaCl
at 23° C [139].
2.3.6. Corrosion behavior of FSW joints
When FSW high strength aluminum alloy joints were exposed to corrosive environments (containing chloride ions), difference in corrosion behavior of the various joint zones has been observed. Studies performed on the corrosion behavior of FSW 2xxx and 7xxx alloys [4, 145-147] showed a highly corroded zone at the HAZ. Anodic polarization curves obtained from these highly active zones revealed lower corrosion potentials as compared to those of the other parts of the FSW joint. More detailed electrochemical investigations made with a micro cell revealed a highly anodic behavior of the HAZ. Conversely, the remainding surfaces, including the weld nugget, showed a net cathodic reaction, resulting in a corrosion protection. TEM investigations of the corroded zones revealed the presence of coarse intergranular precipitates at the grain boundaries and a contiguous copper depleted zone. This sensitized microstructure has been related to more anodic corrosion potentials. In an attempt to correlate the temperature gradient produced by the welding thermal cycle and the high susceptibility to intergranular corrosion of FSW 7075 joints, Lumsden et al. [145] measured the peak temperatures contiguous to the weld nugget by embedding thermocouples at different distances and depths. As shown in Figure 2.16a, the corrosion attack was localized in the HAZ including the outer part of the TMAZ. The peak temperatures in these corroded zones varied in a range from approximately 330 to 422 °C, as shown in Figure 2.16b.

Chapter 2 Background and literature survey
27
(a) (b)
Figure 2.16 Correlation between (a) corroded HAZ of FSW 7075 and (b) peak temperature “map” after Lumsden et al. [145]
It has to be pointed out, that in some cases no significant differences in the corrosion susceptibility of the different regions of the FSW joints were observed. When FSW 2024 [62, 148] and 2195[148] were immersed in chloride containing media, the WN, TMAZ and HAZ presented similar degree of corrosion. Electrochemical measurements of these zones exhibited similar corrosion potentials avoiding the cathodic protection of the WN. The corrosion behavior may also be affected by welding parameters, particularly by tool rotational speed, as established by Conolly et al. [4] and Davenport et al.[3] in their studies made on 6 mm thick FSW 2024-T3 joints. Higher rotational speeds produce higher heat inputs, which can cause the precipitation of the S-phase. The precipitation of this phase leads to a high cathodic reactivity in the nugget zone and a high anodic reactivity in the HAZ as a result of sensitization of the grain boundaries.
2.3.6.1. Corrosion behavior of dissimilar FSW aluminum alloys
Only quite few studies have been carried out on the corrosion behavior of dissimilar joints. Connolly et al[4] and Davenport et al [3] studied the behavior of a dissimilar FSW 2024/7010 joint. They observed preferential attack of the 7XXX aluminum alloy in weld nugget, when the joint was in contact with a corroding gel containing chloride ions. The galvanic corrosion at the weld nugget was attributed to the enhanced cathodic reactivity of the 2024 aluminum alloy, which protected it from anodic attack.

Chapter 3 Experimental procedure
28
3. Experimental procedure
3.1. Materials
The materials used in this work have been envisaged to produce integrally stiffened aircraft structures by friction stir welding [149-151]. In the production of fuselage and wing areas a compromise between good mechanical properties (specific tensile strength and damage tolerance) and good resistance to corrosion has to be found. Four millimeter thick sheets of the commercial aluminum alloys bare 2024, 6056 and Alclad 2024A in different temper were used to produce similar and dissimilar joints. In the case of the Alclad 2024A aluminum alloy, the cladding layer was only present on one side of the plate. The high strength Al-Cu-Mg alloy 2024 has been one of the most widely used materials for the fabrication of fuselage and airframes, due to its good combination between high tensile strength and damage tolerance. However, the AA 2024 alloy has a limited resistance to localized corrosion in presence of an aggressive medium. Aluminum alloy 2024A exhibits a lower level of residual stresses after machining and a significant improvement in toughness compared with the conventional AA 2024. The improvement in toughness is due to a reduction of the manganese content of the alloy, causing a decrement of volume fraction of constituent particles and manganese-containing dispersoids. An adjustment in Cu-content ensures that less copper is trapped within the Al20Cu2Mn3 precipitates [152]. The Al-Mg-Si-Cu alloy 6056 alloy (patented by Pechiney; now Alcan) is a medium strength aluminum alloy. This alloy offers good weldability and excellent formability in the T4 temper condition. Additionally, this alloy is resistant to intergranular corrosion in an overaged condition (T78). In the overaged heat treatment, the precipitation of the solute elements inside the grains reduces the potential gap between precipitate free zones and grains [152]. The 6056 alloy represents an alternative to the currently used 2024 alloy.
3.2. Welding procedures and heat treatments
3.2.1. “As welded” joints
All FSW butt joints were produced from 4 mm thick sheets using the DLR FSW equipment operated under position control mode following the TWI patent [1]. The welding direction was parallel to the rolling direction of the sheets. The size of the welded panels was 220 mm in width and 460 mm in length. Thin section dissimilar alloys have been successfully joined by friction stir welding. However, dissimilar friction stir welding is difficult due to the difference in high temperature properties of the alloys to be joined. The “more difficult” to weld material generally governed the welding parameters. Since the “difficult to weld” alloy has to be joined with higher heat input, i.e. lower welding speeds, the welding speed chosen for the dissimilar joint is too slow for the "easy to weld” alloy of the bi-metallic combination. Extensive parametric optimization was necessary to find the adequate rotational and travel speed. The 4 mm thick sheets of both alloys were first joined in the tempering states T3 for 2024A and T6 (T6: 4h/190°C) for 6056. The parameters used to produce the weld were a rotational speed of 1200 rpm and a travel

Chapter 3 Experimental procedure
29
speed of 300 mm/min. 6056 aluminum alloy was positioned at the advancing side of the welding tool. Before welding the cladding layer of the Alclad 2024A aluminum alloy was removed by mechanical milling. Similar friction stir welded joints of the 4 mm thick 2024-T3 and 6056-T6 aluminum alloys were produced to assess similarities in mechanical properties and corrosion behavior between similar and dissimilar joints. In case of the aluminum alloy 2024-T3, the welding parameters used were 300 mm/min welding speed and 850 rpm tool rotation. Alloy 6056 was joined in the T4 and T6 tempers employing a tool rotational speed of 2000 rpm and a welding speed of 1000 mm/min. In all cases the tool shoulder was held perpendicular to the welding plates (0º tilt angle). Besides natural aging, no additional post weld heat treatment was carried out on the “as welded” joints. The natural aging process of the FSW joints lasted at least 30 days.
3.2.2. Post weld heat treated friction stir welded joints.
The chosen welding parameters for the dissimilar joints may cause overaging of the easy to weld alloy; in this case the aluminum alloy 6056. This may result in a degradation of tensile strength of the joint. Therefore, an alternative welding procedure was performed to minimize the effect of overaging. The aluminum alloy 6056 in the T4 condition was joined to 2024A-T3 alloy using the same set of welding parameters used for welding of the as welded dissimilar joints. After FSW, the welded sheets were aged at 190°C for 10h, which was beyond peak aging for 6056 alloy designated as T7x. For the 2024A alloy, this heat treatment corresponds to the T8 temper. In artificially aged conditions, 2XXX-series alloys generally exhibit higher strength and corrosion resistance but lower damage tolerance [153]. The 6056-T7x base material probably remained in a condition close to T6, since over-aging at 190°C for moderate time periods has a relatively small effect on the microstructure and mechanical properties of this type of alloys [154]. The same post weld heat treatment was applied to the FSW 2024-T3 and FSW 6056-T4 similar joints. In Table 3.1, the weld parameters and post weld heat treatment conditions for all the investigated friction stir welded joints are summarized.
Table 3.1. Weld joints, process parameters and final temper condition FSW Joint Rotational Speed
(rpm) Travel Speed (mm/min)
Final temper condition
FSW 2024A-T3/6056-T6 1200 300 As welded FSW 6056-T6 2000 1000 As welded FSW 2024-T3 850 300 As welded
FSW 2024A-T3/6056-T4 1200 300 T8/T7X PWHT* FSW 6056-T4 2000 1000 T7X PWHT* FSW 2024-T3 850 300 T8 PWHT*
* Post Weld Heat Treatment (PWHT) = 190 °C for 10 hr
3.3. Temperature and process parameter measurements
Temperature measurements associated with the heat input during friction stir welding require special experimental techniques. In particular, it is difficult to record the temperature in the weld nugget or in the contact surface between shoulder/tool and base metal due to the high deformation experienced by the material.

Chapter 3 Experimental procedure
30
The thermal cycle experienced by the material contiguous to the weld zone of the different FSW joints was measured by plugging-in 0.5 mm diameter K-type thermocouples in 1mm deep holes drilled in the parent plates at a distance of 15 mm from the weld center at both advancing and retreating sides of the joint line (Figure 3.1. A third thermocouple at the weld center is also shown). An analog/digital data acquisition system, being capable to record simultaneously measurements of several thermocouples, was used to register the transient temperatures.
(a) (b)
Figure 3.1 Arrangement of thermocouples to record FSW thermal cycle (a) before and (b) after welding
To estimate the temperatures reached in the weld nugget, the temperature of the tool shoulder was registered using a chromel - alumel thermocouple (type K) and a Hobo® temperature data logger. The thermocouple was attached to the tool shoulder as shown in Figure 3.2. The data acquisition had a time resolution of 0.5 seconds. Additionally, the shoulder temperature was measured using a pyrometer. In some cases, a third thermocouple was inserted at the joint center between the welding plates, representing a special challenge due to the extreme deformation within the plasticized material at the friction stir welding front. The thermocouple was also stirred and moved away from the weld center (see Figure 3.1b.) Loads occurring during the friction stir welding process are an indicator of the soundness of the weld. Variation of the welding loads (Fx, Fy, Fz and torque) are indicative of instability of the metal flow patterns producing flaw formation [65]. The DLR welding machine consists of a modified CNC milling machine, and therefore, welding load control is not possible. A Kistler® dynamometer has been installed to the welding head to register loads in the three main axes (Fx, Fy and Fz) as well as torque in the Z-axis (Figure 3.2).
3.4. Microstructural characterization
3.4.1. Light microscopy
Light microscopy examinations were carried out to determine the microstructural features (i.e. grain size, zones of weldment, corrosion attack, etc) of the parent metal and FSW joints. Conventional metallographic preparation techniques were employed. Specimens were embedded in a mounting resin at room temperature. Afterwards, they were ground using SiC

Chapter 3 Experimental procedure
31
abrasive papers with different grits (120, 340, 500, 800, 1200, 2000 and 4000) and finally polished using an OPS colloidal solution (Streuers). Microstructural observations were done on polished un-etched and etched metallographic sections. A three dimensional characterization of the base metal microstructure was achieved by preparing metallographic coupons in the three different directions with regard to the rolling direction (arbitrarily designated as Longitudinal, Transversal and Top surface, see Figure 3.3). Corrosion attack was characterized on transversal sections of the different corroded specimens.
Figure 3.2 Welding head equipped with dynamometer and thermocouples for temperature
and process loads data acquisition Keller’s etching solution was employed to reveal the microstructure of the 2024-T3 parent metal and similar FSW 2024 joints. The chemical composition of this solution is:
• 6 ml HNO3, 6ml HCl, 3ml HF, 150 ml H2O.
Etching times of 10 seconds to 1 minute were necessary to develop the microstructure.
Figure 3.3 Orientation of metallographic specimens relative to the rolling direction
Keller’s solution did not provide satisfactory etching results for the 6056 alloy specimens. For this reason, other etching solutions were used to display the microstructure of this alloy. The best etching response of 6056 base metal and FSW-joints was achieved using an aqueous 10%

Chapter 3 Experimental procedure
32
vol. HF solution saturated with MnO3. The specimens were immersed in the etching solution for 10 to 30 seconds. Satisfactory macroetching of the friction stir welded joints was achieved using the solutions mentioned above. The immersion time was 2 minutes. After etching the specimens were rinsed with reagent water and dried in moving warm air. The grain size in different metallographic planes was determined using the surface intercept method [155]. In this method, several lines were superimposed on a micro photograph of the etched base aluminium alloys at a known magnification. The number of grains intercepting the line was counted. The mean grain size was calculated using the following equation:
Dm = Lp*103/z V....(3.1) Where: Dm = mean grain size [µm] L= length of the superimposed line [mm] p= number of superimposed lines z = number of grains V = magnification of the microphotograph This procedure was carried out in both directions relative to the rolling direction. Additionally, several grains were randomly measured to confirm the results of the intercept method.
3.4.2. Scanning electron microscopy
In addition to light microscopy, un-etched metallographic sections of parent metal and friction stir welded joints were examined using a field emission gun scanning electron microscope (LEO DSM 982 GEMINI®). Intermetallic phases present in base metal and welded joints were studied with low energy secondary electron and back scatter electron imaging. The chemical composition of these phases was determined by energy dispersive X-ray spectroscopy (EDX). EDX line scans were carried out on the top surface as well as in transversal sections of the weld nugget of dissimilar FSW 2024A/6056 joints. The aim of these measurements was to reveal a possible dilution of the alloying elements at the interface of the bands formed by the two alloys in the weld nugget. The surfaces of anodically polarized and intergranular corrosion tested specimens were examined using SEM. Before SEM inspection, the specimens were removed from embedding material, cleaned in an ultrasonic bath of deionized water for 5 min and dried with warm air.
3.4.3. Scanning transmission electron microscopy
The changes in fine scale precipitation produced by the FSW process were studied using a TEM Tecnai F30®. The TEM was operated in Scanning transmission electron microscopy (STEM) mode using a high-angle annular dark field (HAADF) detector at 300 kV. Complementary energy dispersive X-ray spectroscopy (EDX) analyses were used to determine the chemical composition of the precipitates at the grain boundaries.

Chapter 3 Experimental procedure
33
The TEM thin foils were taken from different weld regions. Strips being 500 µm thick were cut using a diamond saw. The strips were orientated parallel to the weld direction, as schematically shown in Figure 3.4. After cutting, the specimens were ground to a mean thickness of 80 µm and disks of 3 mm diameter were punched out from these thin foils. Then the disks were electrochemically thinned using a twin jet polishing equipment (Tenupol) and a solution of nitric acid (33 vol.%) and methanol (67 vol.%) at -20 °C and 12V. Finally, the specimens were “cleaned” by ion beam polishing (Gatan PIPS) for 30–90 min. The ion-milling equipment was operated at 4.0 kV and a thinning angle of 4.0°.
Figure 3.4 Position of specimens for the TEM analyses
3.5. Mechanical characterization
3.5.1. Hardness profile
The extension of the weld region, within which the material was influenced by the FSW process, was determined from hardness profiles measured along the half thickness line of the welds. Vickers hardness indentations were made on transverse metallographic coupons using a Vickers indenter with a load of 9.81 N and a loading time of 30 seconds. The distance between indentations was 0.5 mm. Additionally, micro hardness indentations with a load of 1.96 N were made in the bands of the two alloys formed the weld nugget of the dissimilar joints.
3.5.2. Tensile strength and localized strain measurements
Tensile strengths of the FSW joints and base metals were determined using flat specimens oriented in transverse direction to the welding (rolling) direction. The geometry of the specimens is shown in Figure 3.5. The material flash and the typical rippled structure surface caused by the rotating FSW tool shoulder were removed by polishing the surface of the specimens.

Chapter 3 Experimental procedure
34
20
511980
220
R 50
12,5
Figure 3.5 Tensile test specimen geometry (in mm)
A laser extensometer was used during tensile testing of FSW joints to measure the local strain distribution across the weld nugget, the thermo-mechanically affected as well as heat affected zones on both advancing and retreating sides of the joint. TiO2 stripes are attached to the surface of the tensile test specimen. The deformation in each welding zone is determined between two black/white regions. (Fig 3.6) [156]. At least 2 tensile tests were performed for each condition, one test with strain measurements on the top surface of the weld and one test with measurements on the weld root surface.
Figure 3.6 Local strain measurements of FSW-joints using a laser extensometer. TiO2 stripes
are attached to the surface of the tensile test specimen. The deformation in each welding zone is determined between two black/white regions.
3.6. Corrosion characterization
New technologies, such as friction stir welding have to demonstrate their adequate long term service performance before being implemented. Long term outdoor exposure tests applied to define corrosion behavior are time consuming, especially when quick information is required for development and optimization procedures of those technologies. An appropriate laboratory corrosion test program should screen the corrosion attacks experienced by aircraft in service. Although accelerated laboratory tests, in generally, do not exactly predict long-

Chapter 3 Experimental procedure
35
term corrosion behavior under service conditions, they may screen the corrosion susceptibility of the alloy, or in this case, the FSW joints. To evaluate the corrosion behavior of the dissimilar 2024A/6056 and similar 2024 and 6056 friction stir welds, intergranular corrosion, exfoliation corrosion, and stress corrosion cracking tests were performed. In Addition, electrochemical measurements of the FSW joints were carried out. On all dissimilar specimens the remaining clad layer on the 2024A-T3 side was removed prior to testing. The weld face and root side were studied. As a reference, base materials were also tested. Details of each corrosion test procedure are given in the following sections.
3.6.1. Intergranular corrosion testing
Susceptibility to intergranular corrosion of the FSW joints was evaluated performing immersion tests according to ASTM G110-92. The size of the specimens used in this test were 50 x 25 mm. Prior to immersion in the test solution, the specimens were etched for 1 minute in an acid solution at 93°C, prepared by adding 50 ml of HNO3 (60%) and 5ml of HF (48%) to 945 ml of distilled water. The specimens were then rinsed in reagent water and immersed in concentrated nitric acid (60%) for 1 minute. Subsequently, the specimens were rinsed in distilled water and dried in moving warm air. The test solution was prepared dissolving 57 g of sodium chloride (NaCl) and 10 ml of 30% vol. hydrogen peroxide (H2O2) in deionized water. The hydrogen peroxide was added just before the beginning of the test. The test solution volume per exposed area was 40 ml/cm2. The coupons were exposed to the chloride-peroxide solution for 24 hr. The temperature of the solution was kept constant at 30°C (± 3°). After immersion, the specimens were cleaned in distilled water for 5 minutes using an ultrasonic bath to eliminate the corrosion products deposited on the surface. Finally, the specimens were dried in moving warm air. To evaluate the intergranular corrosion susceptibility of the base metals and FSW-joints, the corroded specimens were cut perpendicular to the rolling direction (base metals) or perpendicular to the weld seam (FSW-joints) and metallographically prepared (as described in 3.4.1) to carry out microscopic examinations and measurements of the depths of the corrosive attack.
3.6.2. Exfoliation corrosion testing
Exfoliation corrosion behavior of the base metals and FSW-joints was studied conducting EXO tests (ASTM G-34). The panels used for this test were 50 mm wide and 100 mm long. The weld region was placed at the center of the coupon (half length). Before corrosion exposure the specimens were cleaned with a neutral detergent and degreased in ethanol. The surfaces not being tested were covered with a protective mask (TURCO 5580G). The test solution consisted of an aqueous solution of 4 M NaCl + 0,5 M KNO3 + 0,1 M HNO3. The test solution volume per exposed area was 20 ml/cm2. The specimens were permanently immersed for 96 h. Periodic visual inspections (each 24 h of exposure) were carried out to evaluate the development and rating of corrosion attack with regard to the reference photographs presented in ASTM G34-90.
3.6.3. Acidified salt spray tests
Cyclic acidified salt spray testing according to ASTM G85-85 A2 (also known as Mastmaasis test) have been used for exfoliation corrosion testing in the aluminum and aircraft industries.

Chapter 3 Experimental procedure
36
Results with AA7075 and AA7178 alloys in various metallurgical conditions were found to correlate well with results obtained in a seacoast atmosphere exposure (four-year exposure at Point Judith, RI, USA.)[157]. Therefore, cyclic acidified salt spray tests (ASTM G85-85 A2) was employed to evaluate the corrosion behavior of the base metals and similar and dissimilar joints. 50 mm wide and 100 mm long panels were intermittently exposed to an aqueous sodium chloride solution fog. The test solution was prepared dissolving 5 parts of NaCl in 95 parts of distilled water (1M NaCl). The pH of the solution was adjusted to 2.8 by adding acetic acid. One testing cycle consisted of 45 minutes exposure to salt spray fog, 2 hours dry air purge and 3h 15min soak at high relative humidity (6 hours per cycle). A total exposure of 56 cycles (two weeks) was applied during this test. Temperature was kept constant at 49°C during the whole testing program. After exposure, all specimens were rinsed with reagent water and visually inspected using a stereo microscope at low magnifications. The type and degree of corrosion attack were determined in accordance to corrosion rating established in ASTM G-34 (EXCO Test). Figure 3.7 shows the position of the specimens within the salt spray chamber.
Figure 3.7 Specimen deposition within the salt spray chamber
3.6.4. Stress corrosion cracking test
Several investigations on stress corrosion cracking behavior of 2XXX and 7XXX aluminum alloy series have shown that these alloys exhibit high susceptibility to SCC when stress is applied in ST direction [6, 158]. It is well known that aluminum-magnesium-silicon alloys (6XXX) are not generally susceptible to stress corrosion cracking [6, 134]. The resistance to stress corrosion cracking was only evaluated for the dissimilar FSW 2024A/6056 joints in accordance to ASTM G39/44. The face and root sides of the weld were evaluated separately using four-point loaded bent beam specimens (Figure 3.8).Flat specimens with a length of 210 mm and a width of 30 mm were used. The 4 mm FSW joints were milled from the opposite side of the surface to be tested to a thickness of 2 mm. After milling the specimens were cleaned with neutral detergent and degreased in acetone. Three specimens were tested for each condition. The stress applied in long transverse direction corresponded to the lowest measured local yield stress of each dissimilar joint, which was found in the HAZ of the 6056 alloy. This stress was reached by elastic deformation of the outer fibers between contact supports. It was calculated using the following equation:

Chapter 3 Experimental procedure
37
σ = 12Εty / (3H2-4A2)……..(3.2) Where: σ = tensile stress, E = modulus of elasticity, t = thickness y = maximum deflection between outer supports (fig 3.10), H = distance between outer supports, A= distance between inner and outer supports.
H
hA
y
y'
t
Figure 3.8 Four point loaded specimen
The bent beam specimens were alternately immersed according to ASTM G44. The specimens were immersed for 10 minutes in an aqueous 3.5 wt% NaCl solution and subsequently dried in air for 50 minutes (one hour per cycle). The temperature and relative air humidity in the corrosion chamber were kept constant at 27°C and 45%, respectively. The test solution was replaced every week. The maximum exposure time period was 1000 h . Failure criterion was fracture.
3.6.5. Electrochemical measurements
3.6.5.1. Corrosion potential of the different zones of the FSW joints
The corrosion potential across the weld regions was measured using rod-like specimens with a cross-section of 4×4 mm. The specimens were taken from the weld centre and several regions of the joint at distances of 5 and 10 mm from the weld center, corresponding to the hardness minimum at TMAZ and hardness maximum at HAZ, respectively, (Figure 3.9). The through thickness plane normal to the weld direction was exposed to an aqueous solution of 1 M NaCl with addition of hydrogen peroxide according to the standard test method ASTM G69.
3.6.5.2. Potentiodynamic polarization curves
Specimens for potentiodynamic polarization measurements of the dissimilar FSW 2024A/6056 joints were taken as shown in Figure 3.10. The potentiodynamic polarization measurements were carried out in deaerated 0.1 M NaCl solution at a scan rate of 0.1 mVs-1. Before starting the test, the samples were immersed in the electrolyte for 2 h to attain steady state corrosion potential. Then the samples were cathodically polarized at -900 m VSCE for 10 min, before the potential was swept in the anodic direction.

Chapter 3 Experimental procedure
38
Figure 3.9 Positions of specimens taken to determine corrosion potential profile across the
weld region
3.6.5.3. Local electrochemical measurements
Electrochemical measurements using coupons of relatively large size did not have the required resolution to precisely depict the local corrosion behavior of the FSW-joints. Therefore, more localized electrochemical measurements were performed using the “droplet cell” micro-electrochemical method. The droplet cell method involves placing the tip of a micropipette close to the specimen surface that is contacted by a droplet of solution. The lateral resolution of this technique is 1 mm in diameter.
Figure 3.10 Position of specimens taken from different locations in the weld region for
potentiodynamic polarization measurements Local open circuit potential (OCP) measurements of the dissimilar FSW 2024A/6056 were perform at Max-Planck-Institute für Eisen Forschung using a 400 µm diameter “drop-cell” micro-electrochemical device. As reference electrode, an Ag/AgCl electrode was employed. Open circuit potential measurements were carried out in naturally aerated 0.1 M NaC1. The recording time was 1000 s.

Chapter 4 Base metal characterization
39
4. Base metal characterization
As a first step, it is important to know the mechanical properties and corrosion behavior of the base metal, which can be used as reference to understand the effect of Friction Stir Welding on these properties. Therefore, the base metals used in this work were also characterized following the same procedure as employed for the FSW joints. In this section, results of microstructural studies, static mechanical properties and corrosion behavior of 2024, 2024A and 6056 alloys in different tempers are presented.
4.1. Chemical compositions
Table 4.1 lists the nominal chemical compositions of the aluminum alloys employed in this work. Concentrations are given in weight percent.
Table 4.1 Nominal chemical composition of the used alloys (in weight %) Alloy Si Fe Cu Mn Mg Cr Zn Ti Al
2024 ≤ 0.50 ≤ 0.50 3.8-4.9 0.30-0.9 1.2-1.8 ≤ 0.10 ≤ 0.25 ≤ 0.15
Balance 2024A 0.15 0.2 3.7-4.5 0.15-0.8 1.2-1.5 ≤ 0.10 0.25 0.15
6056 0.7-1.3 ≤ 0.50 0.5-1.1 0.40-
1.0 0.6-1.2 ≤ 0.25 0.1-0.7 0.15
4.2. Microstructural analysis
4.2.1. Light microscopy
Grain morphologies in the three different planes relative to the rolling direction (longitudinal, transverse and top surface) of the 2024, 2024A and 6056 aluminum alloys used are shown in figures 4.1 through 4.3. The grain shape in all aluminum alloys differed with respect to the rolling direction. Some common features were found. For instance, the alloys exhibited a “pancake” microstructure in the longitudinal plane. This grain shape was more evident in the 6056 aluminum alloy. In the transversal plane, more “rounded” grains were observed in all metallographic coupons. The top surface of the 2024 and 2024A alloys consisted of homogeneous equiaxial grains, while 6056 alloy exhibited a mixture of small and coarse grains, as can be seen in Figure 4.3(c). Table 4.2 summarizes the grain sizes of the base metal alloys 2024, 2024A and 6056 measured in the three different planes relative to the rolling direction.
Table 4.2 Grain size of 2024, 2024A and 6056 aluminum alloys.
Alloy Longitudinal Transverse Top
Width [µm]
Length [µm
Width [µm]
Length [µm]
Width [µm]
Length [µm]
2024 29 110 40 63 48 67 2024A 23 119 48 60 63 109 6056 445 31 72 304 128 390

Chapter 4 Base metal characterization
40
Figure 4.1 Microstructure of 2024 alloy in different orientations: (a) longitudinal, (b)
transversal and (c) top surface Figure 4.2
Figure 4.3 Microstructure of 2024A alloy in different orientations: (a) longitudinal, (b)
transversal and (c) top surface

Chapter 4 Base metal characterization
41
Figure 4.4 Microstructure of 6056 alloy in different orientations: (a) longitudinal, (b)
transversal and (c) top surface
4.2.2. SEM analysis
In the microstructures of the three alloys, coarse intermetallic particles were observed. These constituent particles were aligned in the rolling direction. In case of 2024 and 2024A, SEM –EDX analysis revealed the presence of two types of intermetallic particles. The first one is an Al6(Cu,Mn,Fe) type, while the second one has a chemical composition similar to Al2CuMg. The size of the intermetallic particles in both alloys varied between 1 and 25 µm, but the number of particles was lower in AA 2024A. The 6056 alloy also presented two types of intermetallic particles. The first one was found to be the Al-Si-Mn-Fe type, while the second one was an Al-Si-Mg precipitate. The sizes of these constituent particles varied between 5 and 20 µm.
4.2.3. STEM analysis
4.2.3.1. AA 2XXX base metals
STEM-HAADF micrographs of both base metals 2024-T3 and 2024A-T3 revealed similar microstructures. Dispersoids about 200 nm long and 50 nm wide were homogeneously distributed within the grains (see Figure 4.4a). Some dispersoids were also observed at the grain boundaries. In some cases, these dispersoids exhibited evidence of heterogeneous precipitation (see Figure 4.4b). The EDX analysis of the precipitates at the dispersoids revealed the presence of copper and manganese in their chemical composition, suggesting to be the S-phase. In some regions, smaller Al2MgCu intergranular precipitates were also observed. These intergranular precipitates were about 20 nm long. Heat treatment produced several changes in the microstructure of the naturally aged 2024-T3 and 2024A-T3 base metal. Fine homogeneous precipitation of hardening S’(S) took place

Chapter 4 Base metal characterization
42
within the grains (Figure 4.5). However, some degree of overaging was also observed at the grain boundary. S-type intergranular precipitates about 100 nm long were aligned with the grain boundary forming a discontinuous line. The distance between the grain boundary particles was approximately 100 nm. A very thin precipitate free zone (PFZ) was also present along the grain boundary (50-100 nm). It is also possible that some heterogeneous precipitates were formed on the dispersoids.
Figure 4.5 Microstructure of the base metal 2024-T3 showing (a) dispersoids within the
grain and at a grain boundary, (b) preferential precipitation of the S phases on dispersoids and at agrain boundary, (c) EDX analyses of the intermetallic particles shown in (b) (the
spectra are shifted 20% in the ordinate) and (d) fine intergranular S precipitates.
4.2.3.2. AA 6XXX base metals
Figure 4.6 shows the typical microstructure of the base metal 6056-T6. Cr and Mn containing rod type dispersoids being 600 nm long and 200 nm wide were observed homogeneously distributed in the interior of the grains.

Chapter 4 Base metal characterization
43
The STEM examination of the 6056-T6 aluminum alloy revealed a microstructure with a fine scale precipitation, as seen in Figure 4.6(a) and (b). 100 nm long lath type precipitates seemed to be the only hardening phase present, being most likely the Q’-phase. In microstructural examinations of 6056 alloy reported in the literature [125, 159, 160], only elongated lath shaped precipitates with long axis lying along the [100] directions of the aluminum matrix were found when the alloy was heat treated at 190° C for 4 hours (peak aged). Delmas et al. [161] suggested precipitation of quaternary particles in the AA 6056-T6 consisting of a population of the copper containing hexagonal phases QP, QC and Q’ particles. based on studies of a quaternary Al-Cu-Mg-Si alloy carried out by Cayron et al. [162]. However, in the homologous 6013-T6 alloy a mixture of β’’ and Q’ phases was observed by TEM analysis [35]. STEM-HAADF analysis performed in this work did not allow to accurately determine whether a second kind of hardening precipitates was also present or not. Further TEM analysis is necessary to answer this question.
Figure 4.6 Microstructure of the base metal 2024-T8: (a) overview and (b) details of the grain boundary.
In some regions, the 6056-T6 aluminum alloy also presented evidence of heterogeneous precipitation. Several coarse precipitates being about 100 nm long and 60 nm wide were observed at the grain boundaries. As illustrated in Figure 4.7, the EDX analysis of the intergranular particles revealed the presence of Si, Mg, and Cu in the chemical composition, suggesting to be the Q-phase. A contiguous PFZ was difficult to determine. Some intragranular precipitates seemed to reach the grain boundary (see Figure 4.6b). Additionally to the intergranular precipitation, some heterogeneous precipitation was also observed at dispersoids, however, in lesser extent than at the grain boundary.

Chapter 4 Base metal characterization
44
Figure 4.7 Microstructure of 6056-T6 alloy: (a) Overview and (b) details of grain boundary precipitation
Figure 4.8 EDX spectra of the precipitates at the grain boundary and of contiguous zone
shown in Figure 4.6b In the T7x temper condition, the 6056 aluminum alloy presented a similar microstructure as in peak aged condition (T6). Only the Q’ phase seemed to be present within the grains. However, the degree of heterogeneous precipitation was higher than in the T6 temper condition. The intergranular precipitates grew to a length of about 200 nm (Figure 4.8a). Besides, more Q-particles were observed at the dispersoids (Figure 4.8b).

Chapter 4 Base metal characterization
45
Figure 4.9 Microstructure of the base meta: (a)overview and 6056-T7x (b) detail of heterogeneous precipitation at grain boundary and dispersoids
4.3. Hardness and tensile properties
Long transverse tensile properties and hardness values of the base metal aluminum alloys in the different tempers are listed in Table 4.3. In the natural aged condition, the alloy 2024 has slightly higher yield strength (σy) and ultimate tensile strength (UTS) compared to 2024A, whereas the strength of both alloys increased to similar values in the T8 condition. For the 6056 aluminum alloy, only a slight decrease in σy and UTS was observed between T6 and T7X thermal treatments due to some degree of overaging. Thus, 6056 T7X remained close to the T6 temper condition.
Table 4.3 Mechanical properties of the base aluminum alloys in different tempers
Alloy σy (MPa)
UTS (MPa)
Elongation % HV1*
2024-T3 329 468 22.4 139 2024-T8 448 479 8.5 149
2024A-T3 305 445 28.2 141 2024A-T8 445 479 8.5 152 6056-T6 349 383 10.2 127
6056-T7X 337 366 10.7 119 *mean values obtained from 10 indentations; tensile properties in LT orientation
4.4. Corrosion behavior
4.4.1. Corrosion potential measurements
In Table 4.4 the corrosion potentials of the base alloys in different tempers are given. Alloy 2024-T3 exhibited the noblest potential when exposed to an aqueous chloride- peroxide solution according to ASTM G69. With increasing aging time (T3/T4T6T7X) the corrosion potential of both base alloys became more active.

Chapter 4 Base metal characterization
46
Table 4.4 Corrosion potentials (in VSCE ) of base metals 2024 and 6056 in different tempers,
measured according to ASTM G69. 2024-T3 2024-T8 6056-T4 6056-T6 6056-T7x -0.604 -0.722 -0.700 -0.749 -0.752
4.4.2. Potentiodynamic polarization curves
Figure 4.9 shows potentiodynamic polarization curves of the base alloys 2024A and 6056 in different tempers. In all cases, the current sharply increased beyond the corrosion potential when polarizing in anodic direction. No passive region was observed. Similar to the open circuit potential (OCP) measurements (Table 4.4), 2024A-T3 presented a less active behavior than 2024-T8 base metal. Alloy 6056 in the overaged T7X temper was found to be the most active metal. However, only a slight difference was observed in the anodic polarization curves between T6 and T7X temper condition.
Figure 4.10 Potentiodynamic polarization curves of: (a ) 2024A and (b)6056 base alloys in
different temper conditions using a deaerated 0.1M NaCl aqueous solution.

Chapter 4 Base metal characterization
47
4.4.3. Exfoliation corrosion test
Figure 4.10 shows the surface appearance of the panels after the EXCO test. Both base alloys presented opened blisters being more evident on the surface of the 6056 alloy. The degree and type of corrosion of the 2XXX alloys varied with the temper condition. The 2024-T3 alloy exhibited general corrosion and superficial exfoliation characterized by the presence of blisters aligned to the rolling direction. The corrosion degree was rated as B/EA (B = “blistering“) in accordance with the ratings given in ASTM G34. On the other hand, the 2024-T8 base metal displayed more corroded areas in comparison to the 2024-T3. The surface of the 2024-T8 panel was characterized by the occurrence of pits after 96 h of immersion in the EXCO solution. When exposed to the EXCO solution, no significant differences in corrosion attack of 6056-T6 and 6056-T7X were found. The degree of corrosion was rated as superficial (EA) for both tempers.
Figure 4.11 Surface appearance of the base metals in different tempers after 96 hours
immersion in the EXCO solution for (a) 2024A- T3 (b) 2024-T8 (c) 6056-T6 (d) 6056-T7x
4.4.4. Intergranular corrosion test
Immersion in an aqueous chloride-peroxide solution (in accordance to ASTM G110) for 24h produced an intergranular corrosion attack in the alloys 2024A and 2024 in the naturally aged state T3, while in the T8 temper a mixture of pitting with some intergranular damage ramification was observed (Figure 4.11). The maximum depth of corrosion attack for the 2XXX alloys in the T3 and T8 tempering conditions was 200 µm. Alloys 6056 presented a higher corrosion resistance in comparison to the 2XXX alloys. Only few corroded areas were observed in metallographic sections of the 6056 coupons. The maximum depth of corrosion pits were 118 µm and 136 µm for 6056 in the T6 and T7x tempers, respectively. As illustrated in Figure 4.12, pitting was the main corrosion mechanism for the tempers T6 and T7X. However, in the T6 tempering state, small intergranular corrosion ramifications emerging from some pits were observed after 24h immersion in the chloride-peroxide solution.

Chapter 4 Base metal characterization
48
Figure 4.12 Corrosion attack in(a) 2024- T3 (b) 2024A-T3 (c) 2024-T8 (d) 2024A-T8 after 24hr immersion in an aqueous chloride-peroxide solution (in accordance with ASTM G110)
Figure 4.13 Maximum corrosion attack of (a) 6056-T6 (b) 6056-T7x after 24hr immersion in
an aqueous chloride-peroxide solution (in accordance with ASTM G110)
4.4.5. Salt spray test
The surface appearance of base metal alloy panels in the different heat treatment conditions after 336 hours (2 weeks) of cyclic exposure to an acidified salt spray fog are shown in Figure 4.13. The 2024 aluminum alloys in the T3 and T8 tempers exhibited moderate exfoliation with rating EB. The 6056 aluminum alloy in T6 and T7x tempering conditions presented pitting as corrosion mechanism after exposure to the acidified salt spray fog.

Chapter 4 Base metal characterization
49
Figure 4.14 Appearance of the base metal panels in different tempers after two weeks of exposure to an intermittent acidified salt spray fog (in accordance to ASTM G85-A2); (a)
2024A-T3, (b) 2024A-T8, (c) 6056-T6 and (d) 6056-T7X

Chapter 5 FSW 2024 joints
50
5. FSW 2024 Joints
5.1. Microstructural evolution
5.1.1.As welded FSW 2024-T3 joint
Optical microscopy examinations of metallographic section of the FSW 2024-T3 revealed a rounded weld nugget (WN) with an approximate diameter of 6 mm, which corresponds to the diameter of the pin used to produce the joint. As shown in Figure 5.1, the typical onion ring structure of the weld nugget was not clearly revealed by etching. The welding parameters (850 rpm and 300 mm/min) and the pin tool used might have influenced the formation of such structure. Additionally, in between the weld nugget and the upper surface of the FSW a material flow arm region is observed. Both the weld nugget and flow arm consisted of fine equiaxed grains. At both sides of the weld nugget, highly deformed grains were found. These zones formed the “so called” thermo mechanically affected zone (TMAZ). A sharp demarcation between weld nugget and TMAZ was observed on the advancing side (Figure 5.2a). Only few grains changed their orientation up to 90°. Conversely, at the retreating side a more gradual transition from weld nugget to TMAZ occurred. A mixture of completely and partially recrystallized grains was observed (Figure 5.2b), so that it was not possible to exactly determine the boundary between WN and TMAZ.
Figure 5.1 Metallographic section of FSW 2024 joint showing the different regions of the
weld: (1) weld nugget, (2) flow arm region, (3) and (4) TMAZ on the AS and RS respectively

Chapter 5 FSW 2024 joints
51
Figure 5.2 Thermo mechanical zones of FSW 2024 joint: (a) advancing side, (b) retreating
side Figures 5.3 (b) and (c) show the presence of intergranular precipitates near the surface of the FSW 2024-T3 face side, being in more quantity in the flow arm on the advancing side of the weld. In some cases, these intergranular particles formed continuous lines, which were oriented parallel to the surface of the joint.
Figure 5.3 Intergranular precipitates found in the flow arm region near to the top surface of
the FSW 2024 T3 revealed after etching with Keller’s reagent. Arrows (b) and (c) indicate the location of the micrographs.
SEM studies of the top surface of the FSW 2024-T3 joint confirmed the presence of the intergranular particles observed by light microscopy. These intermetallic particles exhibited two different morphologies. The first kind of particles was rather equiaxed and exhibited a lamellar microstructure characteristic of an eutectic phase (see Figure 5.4d). The size of these intergranular eutectic phases was 2-3 µm. These eutectic particles were mainly found on the

Chapter 5 FSW 2024 joints
52
advancing side of the FSW joint, being homogeneously distributed. The second type of intergranular particles was relative thin (1-2 µm) and solid. These particles were aligned following an oscillatory path similar to the material flow produced by the pin tool (see Figure 5.4 a). These “aligned” particles were more evident at the retreating side of the flow arm. Both particles contain Al, Cu and Mg, as revealed by EDX analyses, suggesting to belong to the same species, i.e. S-phase (see table 5.1).
Figure 5.4 Intergranular particles found at the top surface of FSW 2024-T3 (plane view): (a)
and (b) “aligned” S phase (white arrow in (a) indicates the welding direction), (c) and (d) “eutectic” S-phase
The existence of these intergranular particles can be attributed to an incipient melting of the constitutional S phases during the welding process. The peak temperature measured at the weld center of FSW 2024-T3 joint was 507 °C before the pin arrived. This temperature is quite close to the eutectic temperature of the 2024 aluminum alloy (518 °C, see Figure 5.5 [163]). Therefore, it can be expected that higher temperatures are reached at the interface between the shoulder and plasticized material due to the heating produced by plastic deformation [164]. These severe thermo mechanical conditions might cause fragmentation and melting of the constitutional S-phase particles, producing a partially liquid film. This film was subsequently redistributed by stirring of the welding tool. The higher temperatures generated by the larger deformation gradients under the shoulder close to the pin on the advancing side [164, 165] might promote a more complete liquation of the S- phase constituents decorating the grain boundaries. On the other hand, the lower temperatures reached on the retreating side, as suggest by the partially recrystallized material at the top

Chapter 5 FSW 2024 joints
53
surface of the joint in this area (Figure 5.3c), might have only caused the liquation of these Al2CuMg constituents, which are situated very closed to the surface. Table 5.1 Chemical composition (in wt.-%) of intermetallic particles found at the top surface
of FSW 2024-T3 joint Particle type Al Cu Mg
Eutectic 46 44.8 9.2 Aligned 63.3 31.8 4.9
Figure 5.5 Pseudo binary Al-Cu-Mg phase diagram [163].
As revealed by STEM examination, the microstructure of the maximum hardness region in the HAZ was characterized by homogeneous precipitation of S’(S) phase. In Figure 5.6, these precipitates are visible as faint rods within the grains. Additionally, heterogeneous precipitation of coarser precipitates was also observed along the grain boundaries. These precipitates were about 50 nm long.
Figure 5.6 STEM-HAADF image showing the typical microstructure of a FSW 2024-T3 joint at the HAZ retreating side.

Chapter 5 FSW 2024 joints
54
In the thermo mechnanically affected zone coarser and more heterogeneously precipitated S-phase particles were found compared to those observed in the HAZ (Figure 5.7). Coarsening of the hardening precipitates leads to loss of coherency. This phenomenon can be attributed to the higher temperature and deformation ocurring in this region during the FSW process. The intergranular precipitates as well as the width of the precipitate free zone (PFZ) grew in this region of the FSW reaching sizes of about 200 nm.
Figure 5.7 Microstructure of the TMAZ of FSW 2024-T3: (a) overview and (b) detail of the grain boundary.
EDX analysis revealed two types of particles in the grain boundary region. The first one contained Cu and Mg (S1 in Figure 5.8 a). Thus it can be concluded that this kind of precipitate is the S-phase. The second kind of precipitates (S2 in Figure 5.8 a) is a dispersoid as indicated by the Cu and Mn signals in the EDX spectrum.
Figure 5.8 STEM-HAADF image showing precipitation at the grain boundary in the TMAZ on the retreating side (approx. 7 mm from the weld center line) and (b) corresponding EDX
spectra of the analyzed particles. Figure 5.9 shows the STEM micrographs of the weld nugget of the FSW 2024-T3 joint. Two types of coarse precipitates were observed in the weld nugget. The first kind (labeled with a) could be identified as a rod shaped dispersoid similar to that found in the 2024-T3 base metal (Figure 4.4). These dispersoids were found both in the grain interiors and at the grain

Chapter 5 FSW 2024 joints
55
boundaries (Figure 5.9a). The second type of precipitates (labeled with b in Figure 5.9 a) was a coarse intermetallic particle similar to the melted constitutional particles found in the flow arm region of the joint (Figure 5.4c). These precipitates are pointed with a red arrow in Figure 5.9b. However, the size of these precipitates was more than one order of magnitude smaller. Additionally, detailed examination of the grain boundaries revealed fine intergranular precipitates similar to those observed in the HAZ and TMAZ of the weld. However, in the WN, the size of these particles was much smaller. The presence of these fine intergranular precipitates might suggest that even the center of the FSW 2024-T3 weld nugget suffered some degree of sensitization during the cooling to the room temperature.
Figure 5.9 Microstructure of the FSW 2024-T3 weld nugget, showing (a) dispersoids (a-
arrows) and melted constituent S-phases (b-arrows) and (b) fine S-phase precipitates aligned parallel to the grain boundaries (red arrow)
In the recrystallized microstructure of the weld nugget of the FSW 2024-T3, dislocations were observed, as shown in Figure 5.10, mostly pinned by particles. These particles were identified as dispersoids as indicated by copper and manganese signals in the EDX- analysis (Figure 5.10). The dislocations were probably formed by thermal stresses during the cooling after welding.
5.1.2.Effect of post weld heat treatment on the microstructure of FSW 2024-T3
The heat affected zone of the FSW 2024 joint in the PWHT T8 condition (see Figure 5.11) exhibited similar microstructure as the correspondent base metal (see Figure 4.5). Fine homogeneous precipitation of S’(S) phase occurred in the interior of the grains, while at the grain boundaries some coarse particles were present. It has to be pointed out that it was difficult to determine the width of the PFZ. In some case, the S’(S) hardening phases reached the grain boundary.

Chapter 5 FSW 2024 joints
56
Figure 5.10 Dislocations and precipitates in the weld nugget of FSW 2024-T3 joint and (b) EDX analysis of the spots S1 and S2 indicated in (a)
Figure 5.12 shows the microstructure at a distance of 5 mm from the joint line (TMAZ). This region corresponds to the hardness minimum of the post weld heat treated FSW 2024-T8, as depicted in Figure 5.14. Heterogeneous precipitation already observed in the TMAZ of the FSW 2024-T3 joint in the as welded condition (see Figure 5.7) was more pronounced after the post weld heat treatment. At the grain boundaries, coarse S-phase type precipitates, highlighted by arrows and labeled with an a in Figure 5.12, were observed within this weld region. Quantity and size of this kind of precipitates increased considerably as compared with that in the HAZ. In some cases these intergranular precipitates grew reaching a length of 500 nm, as found in the center of Figure 5.12 (b-arrowed). The occurrence of the hardening S’(S) phase was significantly reduced and preferential precipitation on dispersoids took place.
Figure 5.11 STEM micrograph of the HAZ of FSW 2024-T8 PWHT at the advancing side
Figure 5.13a shows the weld nugget microstructure of a post weld heat treated FSW 2024-T8 joint. Contrary to what was expected, the weld nugget presented an extremely overaged microstructure. Coarsening of the fine intergranular precipitates formed during the welding process (see Figure 5.9 b) took place after PWHT. The interior of the grains also exhibited evidence of heterogeneous precipitation and coarsening of S’(S) phases. The mechanisms of

Chapter 5 FSW 2024 joints
57
heterogeneous precipitation after PWHT are not clear, especially concerning the precipitation sites. In some cases, the preferential precipitation sites were dispersoids, as reported in the literature [6]. In other cases, S’(S) phases seemed to precipitate following a specific path, as indicated by the arrow in Figure 5.13b. It can be speculated that dislocations acted as preferential heterogeneous precipitation sites.
Figure 5.12 Coarse intergranular precipitation at the retreating side of the TMAZ of FSW
2024-T8 PWHT
5.2. Mechanical Properties
5.2.1.Hardness
The hardness profile of the FSW 2024-T3 in the “as welded” condition exhibited the characteristic shape of naturally aged joints (Fig 5.14). The weld nugget (in the center of the profile) exhibited hardness values similar to those of the base metal. Hardness decreased at both sides of the weld nuggets. Farer away from these softened zones, a hardness recovery was observed, reaching maximal values of 146 HV1. A second drop of hardness appeared at a distance of 11-12 mm from the joint center. Finally, values of the correspondent base metal were attained. For instance, at a distance of 14 mm from the joint line, the peak temperature was 193 °C, which is close to the equilibrium solution temperature of the GPB-zones (endothermic peak B of Figure 2.1). Therefore, a drop of hardness was expected to occur in these regions of the FSW 2024-T3 due to the reversion of the GPB-zones. Although softened regions were observed (second hardness minima in Figure 5.14), these were located at a closer distance to the weld center, implying that the reversion of GPB-zones might occur at higher temperatures due to the limited energy input during welding.

Chapter 5 FSW 2024 joints
58
Figure 5.13 STEM-HAADF images of the post weld heat treated FSW 2024-T8 weld nugget
showing (a) grain boundary particles and (b) S’(S) precipitates (b) details of the heterogeneous precipitation within the grain.
The maximum temperature registered at 10 mm from the welding line was 298 °C. This temperature was high enough to produce some homogeneous precipitation of the hardening S’(S) phases in the interior of the grains, as shown in Figure 5.6. The volume fraction of the hardening phase might increase closer to the weld nugget reaching its maximum at a distance of approximately 8 mm from the weld center values where maximum hardness was measured. However, heterogeneous precipitation of the S phase at grain boundaries also occurred in this region of the FSW joint. As shown in Figure 5.15, the cooling rate at a distance of 10 mm from the weld nugget was slow enough to cross the nose of the C-curve. Consequently, heterogeneous precipitation of intergranular S-phases is predicted. This prediction was confirmed by the STEM studies shown in Figure 5.6.
Figure 5.14 Hardness profiles of FSW 2024 joints in different temper conditions
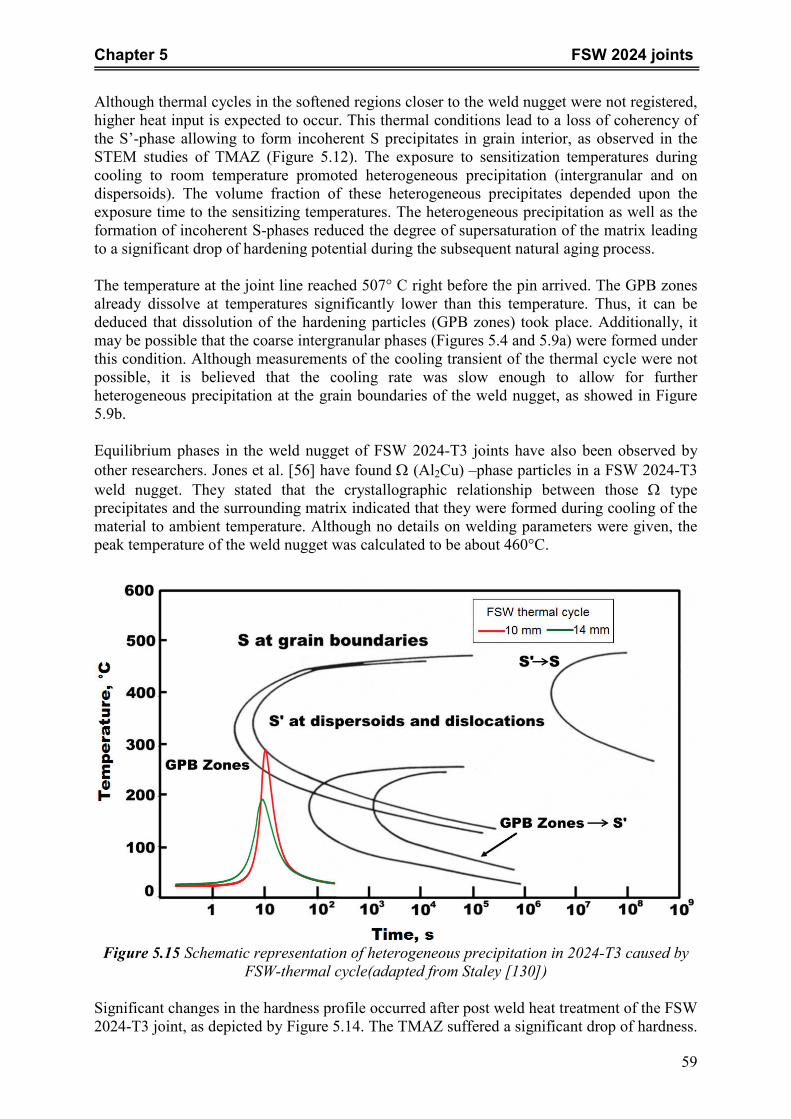
Chapter 5 FSW 2024 joints
59
Although thermal cycles in the softened regions closer to the weld nugget were not registered, higher heat input is expected to occur. This thermal conditions lead to a loss of coherency of the S’-phase allowing to form incoherent S precipitates in grain interior, as observed in the STEM studies of TMAZ (Figure 5.12). The exposure to sensitization temperatures during cooling to room temperature promoted heterogeneous precipitation (intergranular and on dispersoids). The volume fraction of these heterogeneous precipitates depended upon the exposure time to the sensitizing temperatures. The heterogeneous precipitation as well as the formation of incoherent S-phases reduced the degree of supersaturation of the matrix leading to a significant drop of hardening potential during the subsequent natural aging process. The temperature at the joint line reached 507° C right before the pin arrived. The GPB zones already dissolve at temperatures significantly lower than this temperature. Thus, it can be deduced that dissolution of the hardening particles (GPB zones) took place. Additionally, it may be possible that the coarse intergranular phases (Figures 5.4 and 5.9a) were formed under this condition. Although measurements of the cooling transient of the thermal cycle were not possible, it is believed that the cooling rate was slow enough to allow for further heterogeneous precipitation at the grain boundaries of the weld nugget, as showed in Figure 5.9b. Equilibrium phases in the weld nugget of FSW 2024-T3 joints have also been observed by other researchers. Jones et al. [56] have found Ω (Al2Cu) –phase particles in a FSW 2024-T3 weld nugget. They stated that the crystallographic relationship between those Ω type precipitates and the surrounding matrix indicated that they were formed during cooling of the material to ambient temperature. Although no details on welding parameters were given, the peak temperature of the weld nugget was calculated to be about 460°C.
Figure 5.15 Schematic representation of heterogeneous precipitation in 2024-T3 caused by
FSW-thermal cycle(adapted from Staley [130]) Significant changes in the hardness profile occurred after post weld heat treatment of the FSW 2024-T3 joint, as depicted by Figure 5.14. The TMAZ suffered a significant drop of hardness.

Chapter 5 FSW 2024 joints
60
Moreover, the weld nugget suffered from an unexpected drop of hardness, although a recovery of hardness to values similar to those of the 2024-T8 base metal was expected. The decrease in hardness in both TMAZ and weld nugget may be attributed to a reduction of the super saturation of the matrix after welding produced by the coarsening of the heterogeneous precipitates at the grain boundaries and dispersoids (as shown in Figures 5.12. and 5.13). Low amounts of alloying elements were left in solid solution to form hardening precipitates during subsequent PWHT, leading to a reduction of the hardening potential.
5.2.2.Tensile strength
The as welded FSW 2024-T3 joints exhibited high strength, as shown in table 5.2. This FSW joint reached a value of 98% of the ultimate tensile strength of the corresponding base metal. Elongation through the FSW 2024-T3 joint exhibited a heterogeneous distribution being in a good correlation with the hardness profile (see Figure 5.16). In addition to the prevailing multi axial stress state operating during the tensile loading [166], the heterogeneous distribution and concentration of the deformation can be related to the differences in local strength of the different zones of the joint. Higher elongation values were measured on regions of the weld with low hardness values, while lower elongation values were found in the maximum hardness regions. Fracture occurred in the TMAZ at the retreating side of the weld, where the minimum hardness and maximum elongation values were found. The failure of the FSW tensile specimens was characterized by a slant shear fracture confirming high ductility of the joint. Table 5.2 Transverse tensile properties of FSW 2024 joints in the as welded T3 and post-weld
heat treated T8 conditions
Joint Gage length [mm]
UTS [MPa]
σy [MPa]
Elongation [%]
FSW Eff. [%]
FSW 2024-T3 50 459 316 14.7
98 1* (TMAZ) 459 330 20.9
FSW 2024-T8 PWHT
50 397 349 1.2 83 1*
(TMAZ) 397 274 9.6
*measured with a laser extensometer (as shown in Figure 3.6)
The microstructure plays an important role on the strengthening of heat treatable aluminum alloys. Secondary phase particles can act as barriers to dislocation, retarding their motion. The particles either may be cut by dislocations (chemical hardening) or they resist cutting and the dislocations are forced to bypass them (Orwan bowing) [167]. When deformation occurs by cutting of particles, there is little strain hardening as compared to strengthening produced by the bypass process. The degree of strengthening resulting from secondary phase particles depends on the size, shape, volume fraction and average interparticle spacing in the aluminum matrix. The differences in strain hardening of the different weld regions might be related to the interaction between dislocation displacements and local precipitation condition during tensile loading. In the base metal the GPB zones might be cut by moving dislocation during tensile loading offering some degree of strengthening. On the second hardness minima at a distance of 11-12 mm from the weld center, the GPB-zones were dissolved. Consequently, there were less “barriers”, which restrained the movement of the dislocations resulting in a localization

Chapter 5 FSW 2024 joints
61
of deformation in this area. In contrast, in the maximum hardness region, the homogeneously distributed semi coherent S’(S) phases might pin the dislocations forcing them to bypass the particles. This resulted in a higher strengthening with smaller elongation values. The failure zone in the TMAZ, pinning of dislocations might be less effective due to larger size of the incoherent S-phase and interparticle distances, resulting in a highly localized elongation. The finer grain size and GPB zones in the weld nugget allowed for an increase of strengthening in comparison to the TMAZ.
Figure 5.16 Correlation between local elongation and hardness profiles of a FSW 2024-T3
as welded joint. Post weld heat treatment of FSW 2024 produced deterioration in tensile properties compared to the naturally aged FSW joint (see table 5.2). Lower ultimate tensile strengths (83% of the 2024-T8 base alloy) and ductilities (9.6%) were measured. Similar to the naturally aged FSW joint, the failure zone exhibited a slant shear fracture occurring in the TMAZ at the retreating side. The softening of the FSW 2024-T8 PWHT joint can be attributed to the overaged microstructure observed in the TMAZ and weld nugget. However, straining of T8-PWHT joint was different compared to the as welded joint. As shown in Figure 5.17, high localization of deformation took place in the TMAZ and weld nugget region corresponding to the lower hardness regions. This localization of deformation was produced by marked difference contrast in mechanical properties between base metal and TMAZ and WN. Yield strength of the 2024-T8 base metal was higher than the ultimate tensile strength of fracture region in the TMAZ. Consequently, during tensile loading, the base metal remained elastic, whilst the TMAZ and weld nugget underwent plastic deformation. For this reason, the elongation values were lower than those of the as welded FSW 2024-T3 joint, which experienced plastic deformation in all regions of the weld, including the base metal.

Chapter 5 FSW 2024 joints
62
Figure 5.17 Correlation between local elongation and hardness profiles of a FSW 2024-T8
PWHT joint.
5.3. Corrosion behavior
5.3.1.Exfoliation corrosion
The deterioration of panels of FSW 2024 joints in as welded T3 and PWHT T8 conditions caused by 96 h of exposure to the EXCO solution are presented in Figure 5.18. Development of exfoliation corrosion was determined by visual inspection after different periods of time. The main corrosion attack on the FSW 2024-T3 joints occurred within the first 24hr of immersion in the EXCO-test solution. A thin red layer deposited on the whole surface of the FSW-joint specimens. This layer is believed to be rich in copper. Some small pits and blisters were observed on the parent metal. More severely corroded zones were found at both sides of the weld nugget. These highly exfoliated areas were located at the interface between the TMAZ and HAZ on the face side of the joint, while they were situated contiguous to the weld nugget on the root side. The main characteristic of these two zones was the formation of flakes attached to the parent metal, being more evident on the root side. The width of these zones was 1 -1.4 mm on the face side and 4.5 – 5 mm on the root side of the joint. The weld nugget did not present evidence of exfoliation corrosion. Only pitting and blistering were observed on both face and root sides of the FSW joint. Continued immersion in the EXCO-solution did not produce significant changes of the corrosion degradation of the parent metal. However, the degree of corrosion attack of the HAZ and WN slightly increased. The exfoliation corrosion ranking of the different weld zones after the maximum immersion length of 96 h is listed in Table 5.3.

Chapter 5 FSW 2024 joints
63
Figure 5.18 Surface appearance of (a) FSW 2024-T3 face side, (b) FSW 2024-T3 root side
(c) FSW 2024-T8 face side, (d) FSW 2024-T8 root side joints immersed in the EXCO solution for 96 h.
Table 5.3 Ranking of corrosion attack after 96h immersion in the exfoliation corrosion test
solution (ASTM G34)
Joint Base metal HAZ/TMAZ WN
FSW 2024-T3 as welded
General corrosion/ Pitting
Moderate exfoliation (EA+/EB)
Pitting
FSW 2024-T8 PWHT Moderate pitting Severe pitting Pitting
The visual assessment of the exfoliation corrosion behavior of the FSW 2024-T8 PWHT joint presented some difficulties. After 24 h of immersion in the EXCO solution, a thick layer of corrosion products deposited on the whole surface of the specimens. This layer continued to grow with further time of exposure to the corrosive solution. As depicted in Figure 5.19, the different regions of the joint were not recognizable after 96 h of immersion. Some slivers attached to the surface could be recognized during inspection using a stereo microscope at 6x magnification. After this preliminary visual inspection, the specimens were cleaned in HNO3
(65 vol. %) for one minute (according to specification in ASTM G1) in order to accurately determine the type of corrosion attack on the different zones of the joint. The face and root sides of the FSW 2024-T8 PWHT panels after cleaning are shown in Figures 5.18 (c) and (d) respectively. The examination revealed corrosion attack in all regions of the weld. Two stripes with a more severe corrosion attack were observed adjacent to the weld nugget of the joints. Main corrosion mechanism was severe pitting in parent metal, HAZ and TMAZ, while the WN zone exhibited only some small pits. The corrosion ranking on the FSW 2024-T8 PHWT after 96 h of exposure and cleaning is listed in table 5.3

Chapter 5 FSW 2024 joints
64
Figure 5.19 “As corroded” surface appearance of FSW 2024-T8 PWHT joint panels after 96
h of exposure to EXCO solution. Figure 5.20 shows cross sections of FSW 2024-T8 coupons after 96 hours of immersion in the EXCO solution. Face and root sides of the joints were exposed to the corrosive solution, shown in Figures 5.20 a and b, respectively. The advancing side is located on the left. Severely corroded zones were observed on both sides of the weld nugget. This was more evident on the root side of the FSW joint, where no layer of recrystallized grains was covering the TMAZ, as being present in the face side. The maximum depth of the corrosive attack was determined to be 0.73 mm.
Figure 5.20 Cross sections of FSW 2024-T8 PWHT panels after 96 h of exposure to EXCO
solution: (a) face side and (b) root side Metallographic examination of the severely corroded zones at higher magnifications revealed pitting as corrosion mechanism (see a half pit in Figure 5.21 a). Fine intergranular corrosion attack was observed in the weld nugget region at the root side, and in the fine grained material produced by the welding shoulder at the face side (flow arm), as shown in Figure 5.21 (b).

Chapter 5 FSW 2024 joints
65
Figure 5.21 Corrosion attack in (a) HAZ and (b) weld nugget at the face side of a of FSW
2024-T8 PWHT panel after exposure to the EXCO solution for 96 h
5.3.2.Intergranular corrosion
When immersed in the aqueous chloride-peroxide solution specified by ASTM G110, the FSW 2024-T3 as welded and FSW 2024-T8 PWHT joints exhibited different corrosion behaviors.
Figure 5.22 Corrosion attack observed on FSW 2024-T3 face side coupons after immersion
in an aqueous chloride-peroxide solution: ( a) HAZ- at the advancing side and ( b) at the center of stirred zone
The FSW 2024-T3 as welded joint was sensitive to intergranular corrosion. The degree of corrosion varied among the different FSW zones. The parent metal presented just some small and isolated intergranularly corroded areas. Regions with high susceptibility to intergranular corrosion were found on both sides of the material flaw arm at the face side and in the weld nugget at the root side (Figure 5.22 a). The maximal depth of corrosion attack was 300 µm. At the face side of the joint, these highly corroded areas were limited to less than 2 mm width. However, the width of these zones increased to 8 mm when the root side of the joint was immersed in the aqueous chloride-peroxide solution. Only one half of the corroded surface is displayed in Fig 5.23 due to limitation of space. The (yellow) line represents the original joint line. Likewise, the weld nugget presented evidence of intergranular corrosion, although in a smaller extent as compared to the deeply corroded zones (see Figure 5.22 b).

Chapter 5 FSW 2024 joints
66
Corrosion can be considered as process occurring at the surface of the material. The microstructure of the surface region exposed to the corrosive media determines the corrosion behavior. In the case of the FSW 2024-T3 joint, the fine grained material of the flaw arm at the face side of the weld protected the sensitized microstructure of the TMAZ/HAZ regions below it.
Figure 5.23 Intergranular corrosion attack of the weld nugget and TMAZ on the advancing
side of the FSW 2024-T3 root side coupon after 24h immersion in an aqueous chloride-peroxide solution, showing intergranular corrosion attack
If the fine grained surface layer was removed by milling, a totally different corrosion behavior of the face side of the remaining FSW joint was observed. Deeply corroded zones were found on both sides of the weld nugget, as shown in Figure 5.24. The total width of the corroded area was 21 mm covering the WN, TMAZ and HAZ. The intergranular corrosion attack at the retreating side reached a depth of 720 µm, while the maximal corrosion depth on the advancing side was 300 µm. The difference in corrosion attack depth between TMAZs advancing and retreating sides may not only be associated with the degree of overaging (Figure 5.7), because both sides were exposed to similar thermal cycles. Furthermore, grain orientation determined the depth of the intergranular corrosion attack. It has been demonstrated that intergranular corrosion in wrought 2024 aluminum alloy propagates more rapidly along the elongated grains (i.e. in rolling direction) as normal to the pancake struture (i.e. in through thickness direction) [168, 169]. In the TMAZ at the retreating side, the grains were turned in a wider zone following the contour of the weld nugget resulting in a deeper penetration of the corrosion attack (see Fig 5.25).
Figure 5.24 Intergranular corrosion attack of the weld nugget, TMAZ and HAZ on both sides the of FSW 2024-T3 face side coupon after 24h immersion in an aqueous chloride-peroxide
solution. One millimeter of the specimen surface was removed by milling to eliminate the fine grained material. The (red) line indicates the center of the weld nugget.
Below the original surface, in a depth of 1 mm, the weld nugget suffered also of fine intergranular corrosion when immersed in the chloride-peroxide solution. The maximum corrosion depth was 250 µm. This behavior correlates with the grain boundary precipitation observed by STEM studies (Figure 5.9b) The post weld heat treatment applied to the FSW 2024-T3 joint caused a change in corrosion behavior. The FSW 2024 joint in the T8 PWHT condition was susceptible to a mixture of pitting and intergranular corrosion, as shown in Figure 5.26. The corrosion damage was homogeneously distributed over all zones of the FSW joint. In comparison with the “as welded” 2024-T3 joint, The FSW 2024-T8 PWHT presented lower values of the maximal depth corrosion attack (Table 5.4.)

Chapter 5 FSW 2024 joints
67
Figure 5.25 Higher magnification of the region indicated by a red rectangle in Figure 5.24. The (red) line represents the boundary between weld nugget and TMAZ at the retreating side
5.3.3.Corrosion behavior of the stirred zone on the top surface of the as welded FSW 2024-T3 joint
In order to determine the causes of the corrosion attack of the fine grained zone at the top surface of the FSW 2024-T3, as shown in Figure 5.4, this surface was metallographically prepared and immersed in a aqueous 3,5 wt.-% NaCl solution. During preparation, care was taken not to remove the recrystallized surface layer by polishing. After 4 h of immersion in the corrosive solution, the coupons were taken out of the vessel, rinsed with tap water and dried with flowing warm air. The corroded surface was examined by SEM/EDX.
Figure 5.26 Corrosion attack appeareance of FSW 2024-T8 after 6h immersion in a chloride-
peroxide solution As shown in Figure 5.27a, the SEM examination of the corroded surface revealed localized corrosion of the matrix surrounding the liquated S phases found in material flow arm at the top surface of FSW 2024-T3 joint (see Figure 5.4). The regions contiguous to these constituent S phase particles corroded in form of pitting attack. The Al matrix around the S phase particles dissolved substantially leaving smaller particles spread over the corroded matrix (Figure 5.27b).

Chapter 5 FSW 2024 joints
68
Table 5.4 Maximal corrosion attack depth found in FSW 2024 joints in the as welded T3 and PWHT T8 conditions after 24 h of immersion in an chloride –peroxide solution
Joint
Depth of attack
[µm] Face side Root side
FSW 2024-T3 “as welded” 326 (TMAZ/HAZ)
250 (TMAZ/HAZ)
FSW 2024-T8 PWHT 194 (WN)
185 (WN)
EDX analyses of the “eutectic” S-phase remnants (Figure 5.27a) are summarized in Table 5.5. The chemical composition of the S-phase prior to corrosion is also given as reference. The change in chemical composition indicates that the eutectic Al2CuMg particle experienced a severe de-alloying of Mg during immersion. As a result, a remnant enriched in Cu was left behind. The presence of oxygen may indicate the formation of a (hydr) oxide layer on the surface of the S- phase remnant after corrosion. It was not possible to accurately analyze the remnants of the “aligned” particles (Figure 5.27b) due to their small size. However, as the “aligned” particles belong to the S-type phase, a de-alloying similar to that of the “eutectic” intergranular phases is thought to occur.
Table 5.5 Chemical composition of the eutectic S-phase remnant after 4 h immersion in a 3.5% NaCl aqueous solution (concentration in wt %)
Condition Al Cu Mg O Prior to corrosion 46 44.8 9.2 ------
corroded 11.87 76.5 0.81 11
Figure 5.27 SEM micrographs of Al–Cu–Mg-containing eutectic phase particles in FSW
2024-T3 joint after 4h exposure to an aqueous 3.5 wt -% NaCl aqueous solution The above observations indicate that the corrosion attack at the top surface of the FSW joint can be associated with galvanic coupling between the constituent S-phase particles and the aluminum matrix. The mechanism of localized corrosion may be comparable to that occurring between coarse constituent S-phase particles and the surrounding matrix in AA 2024-T3 base material [120, 123, 170-174]. In presence of chloride containing corrosive media, the S-phase precipitates are initially anodic to the aluminum matrix. Due to an unfavorable cathode-to-anode surface ratio, galvanic corrosion concentrates on the small anode, producing an

Chapter 5 FSW 2024 joints
69
accelerated attack of the particle. Preferential dealloying of Mg might occur. As dealloying continues, the intergranular S-phase precipitate remnants become richer in Cu turning into cathodes towards the adjacent Al matrix. Consequently, the opposed galvanic couple of “now” anodic aluminum matrix and cathodic Cu-rich S-phase remnant is activated, causing the preferential dissolution of the surrounding Al matrix.
5.3.4.Salt spray test
After 335h of cyclic salt spray testing, the FSW 2024-T3 panels exhibited different corrosion resistances for the different FSW zones, just like in case of the exfoliation corrosion test. However, the cathodic protection provided by the TMAZ to the rest of the joint was less effective. The weld nugget presented some isolated corroded region, (Figure 5.28). From visual inspection at 10x magnification, pitting could be established as corrosion mechanism. The interface between the material flaw arm and the TMAZ was severely corroded. This attack was more pronounced at the retreating side of the joint. The flash material had a thickness of about 140 µm in this area. Moreover, more constituent particles were observed in this region. The degree of corrosion changed gradually as the distance from the joint line increased. Two stripes free of corrosion in the HAZ adjacent to deeply corroded areas. Farest from the weld center, the base metal exhibited light to moderate exfoliation attack (EA/EB). The main characteristic of this exfoliated surface was the presence of slivers attached to the surface. For the parent metal zone of the FSW 2024-T3 joint, the differences in corrosive attack induced by acidified salt spray testing as compared to the permanent immersion corrosion tests (EXCO, IGC) may be attributed to a different type of galvanic coupling. During intermittent spraying, local galvanic cells can only be formed under isolated droplets of the corrosion test solution at the surface of the specimen. The different zones of the FSW 2024-T3 are not completely covered (immersed) by the corrosive media at any time. Thus a galvanic coupling between different welding zones is not permanently taking place, avoiding the cathodic protection of the less active base metal by the more active TMAZ/HAZ during the dry cycles. Figure 5.28 also shows the surface appearance of a FSW 2024-T8 PWHT panel after cyclic salt spray testing. The parent material exhibited a significantly reduced corrosion attack. Zones free of corrosion observed with FSW 2024-T3 joint were not found for the T8 PWHT panel. Isolated pits were observed on the surface of the specimen. The fine grained region also exhibited homogeneously distributed tiny pits all over the surface.

Chapter 5 FSW 2024 joints
70
Figure 5.28 Surface appearance of the face side of FSW 2024-T3 and FSW 2024-T8 panels
after 2 weeks of cyclic salt spray testing (ASTM G85-A2)
5.3.5.Corrosion Potential
Figure 5.29 shows the corrosion potential profiles of the FSW 2024 joints in the as welded T3 and PWHT T8 conditions. Values of the correspondent base metals are also given. In the as welded condition, the weld region exhibited more negative potentials than the parent material. This highly active zone was confined to a limited width, which includes the weld nugget and the TMAZ’s. The values of corrosion potential of the weld nugget and contiguous TMAZ on the retreating side were similar (-0.662Vsce). The TMAZ on the advancing side presented a slightly nobler corrosion potential (-0.654 Vsce). The potential increased through the FSW regions reaching the values of the 2024-T3 base metal at a distance of 10 mm from the joint center line. It is well known that copper has a strong effect on the corrosion potential of aluminum alloys [103]. In supersaturated solid solution, copper increases the corrosion potential of aluminum. However, once the copper is precipitated, the corrosion potential is shifted to more active values. Thus, the similarities in corrosion potential between the weld nugget and the thermo mechanically affected zone may be attributed to the microstructural state of these regions. As shown by STEM studies, the microstructure of both weld nugget and TMAZ was characterized by the presence of intergranular copper containing S phase. Therefore, the amount of precipitated copper in the weld nugget and TMAZ may be similar, resulting in similar corrosion potentials of both zones. At first glance, the corrosion potential measurements and the degree of corrosion attack in the maximum hardness region do not completely correspond. The FSW 2024-T3 joint presents a gradual microstructural change in the region between 8 and 12 mm (region where the OCP specimens were taken from). Closer to the weld center line, the microstructure presented intergranular precipitation of S-phase (Figure 5.9), promoting intergranular corrosion (Figure 5.24). Due to the degree of precipitation, this microstructure may exhibit more active OCP values as compared to the integral value measured using specimens with 10 mm diameter, however, at a distance of 11 to 12 mm, a second drop of hardness is observed. This softening

Chapter 5 FSW 2024 joints
71
has been associated with the dissolution of the hardening phases (S’(S) and GPB-zones), increasing copper in super saturated solid solution. This enrichment of copper might shift the corrosion potential of the microstructure into the nobler direction. The OCP determined integrally in the region of 8-12 mm distance from the weld center is very close to that of the 2024-T3 base material. Nevertheless, the microstructural gradient within this region has probably produced a galvanic couple with the corresponding localized corrosion attack. The corrosion behavior of FSW 2024-T3 joints observed after EXCO and IGC tests can rationalized by corrosion potential measurements. When the joint was immersed in chloride containing media a galvanic couple between the nobler base metal and the high reactive TMAZ/weld nugget was formed. This couple provides cathodic protection and suppresses corrosion of the nobler parent metal, suppressing corrosion attack on the parent material.
Figure 5.29 Corrosion potential profiles of as welded FSW 2024-T3 and post weld heat
treated FSW 2024-T8 joints After T8 PWHT, a significant drop of the corrosion potential as compared to the FSW 2024-T3 joint took place, reaching values close to those of the 2024-T8 base metal. Both TMAZ and weld nugget presented slightly more active corrosion potentials than the rest of the joint. This can be attributed to coarsening of the intergranular S-phase particles formed during the welding process. The small difference in corrosion potential of the weld region and the parent material did not provide cathodic protection to the latter one. When the FSW 2028-T8 PWHT joint was immersed in the corrosive media all zones of the joint exhibited similar corrosion attack, as confirmed by metallographic examinations of cross section.

Chapter 6 FSW 6056 joints
72
6. FSW 6056 Joints
6.1. Microstructural evolution
A typical transversal cross section of the FSW 6056 joints is shown Figure 6.1. The heat treatment condition of the parent metals (T6 or T4) did not have a noticeable effect on the shape of weld nugget. Both joints exhibited rounded nuggets with an approximate diameter of 6.2 mm. The weld nuggets were characterized by a typical “onion ring” pattern produced by the flow and mixture of the parent plates. This onion rings were particularly marked at the advancing side (Figure 6.1b).
Figure 6.1 (a) Cross section of FSW 6056-T6 showing the nugget region (b) onion rings pattern at advancing side.
The microstructure of the weld nugget exhibited fine equiaxed recrystallized grains with sizes between 5 and 10 µm. At the retreating side near to the top surface, partially recrystallized material was observed (Figure 6.2). Additionally, close to the surface of the joint two continuous black lines were observed (pointed with yellow arrows; the yellow line represents the interface with the WN). These lines of dark phases seemed to be aligned with the grain boundaries. Thus, constitutional melting might also occur in 6056 welds, as found in the FSW 2024-T3 joints (see Section 5.1.1). However, these lines were finer and in less quantity than in the FSW 2024-T3.
Figure 6.2 Partially recrystallized material near the top surface of FSW 6056 joints

Chapter 6 FSW 6056 joints
73
Adjacent to the nugget, the TMAZ had a markedly different microstructure. The grain structure was rotated by plastic deformation up to 90°. The grains were partially recrystallized near the nugget (Figure 6.3a and b). As shown in Fig. 6.3, a more sharp transition from the weld nugget to TMAZ was observed at the advancing side of the joint, while a more “diffuse” transition took place at the retreating side. Beyond the TMAZ, the heat affected zone retained the same pancake grain structure as the base metal.
Figure 6.3 Thermo mechanically affected zones of FSW 6056 joint: (a) advancing side, (b) retreating side.
6.1.1. FSW 6056-T6 “as welded”
6.1.1.1. Heat affected zone
The FSW 6056-T6 exhibited a microstructure similar to that of the base metal at 10 mm from the weld center line. Fine hardening phases were homogeneously distributed within the grains, as shown in Figure 6.4. These intragranular precipitates probably corresponded to the hardening phases Q’ and β’’ or a precursor of Q’. Moreover, few coarse Q-phase precipitates were observed at the grain boundaries. These particles being mostly 200 nm long probably coarsened owing to the welding thermal cycle. A distinct PFZ was difficult to establish. In some cases, lath shaped particles reached the grain boundary. The STEM-HAADF studies also revealed heterogeneous precipitation of Q-phase at dispersoids.
6.1.1.2. Thermo mechanical affected zone
Figure 6.5 shows the typical microstructure of the TMAZ at the retreating side. In this region, the volume fraction of the hardening phases seemed to decrease in comparison to that of the HAZ and base metal. On the contrary, more intergranular precipitates were present. These intergranular Q-phase precipitates had a more rounded shape. The longest axis of the particles was about 200 nm, while the shortest one measured 100 nm wide. A 100 nm PFZ was also observed along the grain boundary. In contrast to the HAZ and base metal, much more dispersoids presented evidence of heterogeneous precipitation.

Chapter 6 FSW 6056 joints
74
Figure 6.4 STEM-HAADF images showing the microstructure of the heat affected zone of a FSW 6056-T6 joint at the retreating side.
6.1.1.3. Weld nugget
The FSW 6056-T6 weld nugget exhibited a completely recrystallized microstructure (Figure 6.6). The main feature of this stirred zone was the absence of any kind of precipitates, e.i. hardening phases or coarse heterogeneously precipitated particles. Only dispersoids were present within the grain matrix and along grain boundaries. Some dislocations were also observed in the grains of the weld nugget.
Figure 6.5 STEM-HAADF image showing the typical microstructure of the TMAZ of FSW 6056-T6 as welded joint
6.1.2. FSW 6056-T7x PWHT
The microstructure of the FSW 6056-T7X PWHT joint was changed due to the heat treatment in comparison to that ones observed in the FSW 6056-T6 as welded joints (the 6056-T7X joints were made with 6056-T4 sheets and subsequently heat treated at 190 °C for 10 hrs).

Chapter 6 FSW 6056 joints
75
The microstructure of all weld regions was more homogeneous with regard to hardening precipitation.
(a) (b)
Figure 6.6 STEM-HAADF images showing the microstructure of the weld nugget of a FSW 6056-T6 joint in the as welded condition.
6.1.2.1. Heat Affected Zone
STEM-HAADF examinations of the HAZ revealed the presence of fine precipitation phases within the grain (Figure 6.7). The qualitative EDX spectrum of these particles (point S4 in Figure 6.8 (a)) revealed enrichment in Cu, Si and Mg, suggesting being the Q-type phase. Additionally, coarse Q phase particles were present at the grain boundaries. These precipitates were smaller and had a more round shape than those observed in the same region of the as welded FSW 6056-T6 joint. Additionally, more heterogeneously precipitated particles were observed on dispersoids. The chemical composition obtained by qualitative EDX analysis suggests the Q-phase.
Figure 6.7 STEM-HAADF images showing the microstructure of the HAZ of FSW 6056-T7X PWHT joint

Chapter 6 FSW 6056 joints
76
(a) (b)
Figure 6.8 STEM analyses of heterogeneous precipitation on heterogeneous precipitation on dispersoids in the HAZ of FSW 6056-T7X PWHT joint: (a)STEM-HAADF
image, (b) respective EDX spectra
6.1.2.2. Thermo mechanical affected zone
Compared to those in the HAZ, the intergranular precipitates in the TMAZ exhibited larger sizes reaching lengths of 200 nm. The STEM analysis of this region of the weld joint also revealed the presence of fine hardening precipitates (see Figure 6.9). A larger amount of intragranular precipitates were observed in the TMAZ of the FSW 6056-T7X PWHT than in the same region of the as welded FSW 6056-T6 joint (Figure 6.5)
Figure 6.9 STEM-HAADF image showing the microstructure of the TMAZ of FSW 6056-T7X PWHT joint
6.1.2.3. Weld nugget
The weld nugget of the FSW 6056-T7X PWHT joint displayed a microstructure similar to the correspondent base metal (Figure 6.10). Fine precipitates were homogeneously distributed within the grain. The degree of heterogeneous precipitation was much less than that in the

Chapter 6 FSW 6056 joints
77
6056-T7X base metal, and the coarse precipitates at the grain boundaries were much smaller. The length of these precipitates was about 100 nm. Additionally, only few dispersoids gave evidence of heterogeneous precipitation of the Q-phase. It was not possible to observe preferential precipitation at dislocations.
Figure 6.10 STEM-HAADF images showing the microstructure of the weld nugget of a FSW 6056-T7X PWHT joint
6.2. Mechanical Properties
6.2.1. Hardness
Figure 6.11 shows hardness profiles across the friction stir welds of similar FSW 6056 alloys in different tempers. Additionally, the hardness values of the 6056 base metal in the T4, T6 and T7X conditions are superimposed. The FSW welding process produced softening of the 6056-T6 base metal alloy in the TMAZ and weld nugget (Figure 6.11). At a distance of 10 mm from the weld center line a gradual loss of hardness took place. The lowest hardness value was reached at 5mm from the weld center line (TMAZ/HAZ). A hardness recovery was observed in the weld nugget. However, the hardness values did not completely reach the values of the naturally aged 6056 aluminum alloy throughout the nugget. Beyond 10 mm from the joint line, hardness values were measured similar to those of the correspondent base metal. The hardness profile of the FSW 6056-T7X PWHT joint exhibited a more asymmetric shape. The hardness minimum at the advancing side dropped down to similar values to those of the “as welded” joint (90 HV1). On the other hand, the hardness drop of the retreating side was less severe after post weld heat treatment, reaching a value of 104 HV1. The PWHT also produced a hardness recovery of the weld nugget reaching values of the correspondent base metal alloy.

Chapter 6 FSW 6056 joints
78
70
75
80
85
90
95
100
105
110
115
120
125
130
135
-25 -20 -15 -10 -5 0 5 10 15 20 25Distance from weld center line [mm]
HV1
FSW 6056-T6 "as welded"FSW 6056-T8 PWHTFSW 6056-T4 "as welded"
6056-T4 6056-T6 6056-T7X
RS AS
Figure 6.11 Hardness profiles across FSW 6056 joints in the as welded and post-weld heat treated (PWHT) conditions.
The softening the FSW 6056-T6 “as welded” joint can be associated with the microstructural changes in this area [175]. The welding thermal cycle produced microstructures with different precipitation state distribution in the low hardness regions in comparison to the correspondent base metal. Figure 6.12 schematically shows the proposed microstructural changes within the weld nugget and TMAZ/HAZ produced by the FSW process in 6056 aluminum alloy.
Figure 6.12 Schematic representation of the correlation between welding thermal cycle and microstructural changes of 6056 aluminum alloy (based on [176])

Chapter 6 FSW 6056 joints
79
The temperature measurements between 10 and 15 mm from the weld center line revealed that the peak temperatures reached were 290 and 190 °C, respectively. In this area, it is expected that no significant changes in the microstructure of the FSW 6056-T6 might happen. Basically, the microstructural evolution within the soften region of the FSW 6056-T6 as welded joint can be divided into two zones. The first region extends from the base metal to the minimum hardness (i.e. from 5 to 9 mm at RS of the hardness profile). The gradual loss of hardness in this region can be associated with a partial dissolution of the hardening phases and the coarsening of stable Q-phases as the peak temperature reached the dissolution point during heating (hypothetical thermal cycle A in Figure. 6.12). During cooling to room temperature a heterogeneous precipitation of Q-phase took place, as revealed by the STEM observation of the TMAZ (Figure 6.5). The most severe overaging was located at the minimum hardness region, where precipitation of equilibrium Q-phase depleted the aluminum matrix reducing the hardening potential during the natural aging process after welding. The second region was located between the minimum hardness and the interface with the weld nugget (from 2.5 to 5 mm at RS of the hardness profile). In this zone a complete dissolution of the hardening precipitates (i.e Q’ and β’’ or Q’ precursor) as well as partial dissolution of the coarse Q-phase might occur during the heating path of the thermal cycle. During cooling, a “substantial” heterogeneous precipitation of Q-phase occurred (hypothetical thermal cycle B in Fig. 6.12). However, certain amount of alloying elements might be retained in super saturated solid solution, producing a hardness recovery during the natural aging process. At the welding center line, the measured peak temperature reached 508 °C. This temperature is closed to the dissolution temperature of Q and β phases (518°). The exposure to this temperature produced the complete dissolution of the precipitates in the microstructure of the 6056-T6 alloy (see Figure 6.6), resulting in a super saturated solid solution rich in alloy elements was produced. After welding, a naturally aging process took place increasing the hardness of the weld nugget. The study of the hardness profile of the FSW 6056-T4 in the as-welded condition is necessary to understand the microstructural evolution of the FSW 6056-T7X PWHT joint. As shown in Figure 6.11, the weld nugget of the as welded FSW 6056-T4 joint exhibited hardness values closed to those of the correspondent base metal. A loss of hardness occurred at regions adjacent to the weld nugget (TMAZ/HAZ). Additionally a second hardness drop took place between 10 and 15 mm from the weld center line. The hardness loss have been associated with heterogeneous precipitation of the Q-phase in FSW 6056-T4 as welded joint [71, 75]. The region from the weld center to 10 mm from the weld center line was exposed to a temperature range between 290 and 508°C, as revealed by temperature measurements of these regions. These temperatures exceeded the solvus temperatures of all hardening phases (GP-zones, β’’ and Q’= 340 °C, Figure 6.12), preventing a homogeneous precipitation during heating. The “slow” cooling after welding might produce a heterogeneous precipitation of the Q- phase. The degree of hardness loss is related to the size and volume fraction of the precipitated Q- phase. This volume fraction increases with the peak temperature and exposure time [75]. Thus, the asymmetry of the hardness profile observed at the TMAZ/HAZ zones (Figure 6.11) can be attributed to the difference of thermal cycles occurring at the RS and AS. For instance, the maximal peak temperature register at the RS was about 10 °C lower than that at the AS. In contrast to the studies made on FSW 6056-T4 by Denquin et al. and Gallais et al. [71, 75], a second hardness minimum occurred at about 12-13 mm from the weld center line. This behavior is quite similar to that observed in the FSW 2024-T3 as welded joint (Figure 5.15). This second hardness drop region might be related to the reversion of the GB-zones following

Chapter 6 FSW 6056 joints
80
a similar mechanism as explained by Murayama et al [36, 177] for an Al-Mg-Si alloy. If the size of the precipitates is smaller than a critical size, they will completely dissolve during the heating phase of the thermal cycle. The atoms of the dissolved GP-zones may occupy the vacancies in the lattice (annihilation of vacancies). The reduction of vacancies, which are preferential sites for the precipitation of GP-zones, may suppress the natural aging process after welding. In the weld nugget a different precipitation mechanisms might take place. Even though a complete recrystallization occurred, a totally recovery of the microstructure did not happen. As it could be observed in the STEM studies, the grains in the weld nuggets of the as welded FSW 6056-T6 joints exhibited some dislocation loops. The presence of this kind of dislocations might be regarded as an indication of the relative quantity of quenched-in vacancies residing in the aluminum matrix [7]. These vacancies might assist the precipitation and growth of GP-zones during the naturally aging process. The T7X post weld heat treatment increased the hardness of the FSW 6056-T4 joint. This can be attributed to an intense precipitation of hardening phases similar to that observed in base metal. The microstructural evolution might follow the precipitation sequence [162]:
SSSSY Clusters/GPZYβ’’YQ’YQ (6.1)
The increase in strength was determined by the hardening potential of the different areas of the FSW joint. For instance, in the softened regions with a depleted super saturated solid solution, reduced hardness values were reached in TMAZ. As shown in Figure 6.9, the thermal cycle did not produce a total depletion of solute at the retreating side, enabling a more homogeneously distributed precipitation of the hardening phases after post weld heat treatment. However, the hardness values of the base metal were not reached due to the heterogeneous precipitation of Q at grain boundaries and dispersoids. On the other hand, the more severe thermal conditions generated at the AS might cause a more coarse precipitation, comparable to that observed in the TMAZ/HAZ of the FSW 2024-T3 “as welded” joint, depleting the matrix in alloying elements. This resulted in a degradation of the hardening potential during the PWHT.
6.2.2. Tensile strength
Transverse tensile properties of the FSW 6056 joints are summarized in Table 7.1. The tensile strength measured for 6056 joint in the as welded condition was 73 % of the ultimate tensile strength of the base alloy 6056-T6. Post-weld artificial aging caused an increase of the strength of naturally aged welded sheet materials. The joint efficiency was 89 % with respect to the ultimate tensile strength of base alloy 6056-T7X. All specimens failed in the thermo mechanically affected zone at the advancing side, exhibiting a slant shear fracture. The location of the fracture corresponded to position of the lowest hardness zone. The low fracture elongation can be associated with inhomogeneous straining within the 50 mm gauge length used. However, strain measured in the failure region using 1 mm gauge length revealed high local ductility. The highest deformations were localized in regions of the joint with low hardness values, being the TMAZ and weld nugget for the T6 as welded joint and TMAZ for T7X PWHT joint (see Figure 6.13). Similar to the FSW 2024-T8 PWHT joint, the localization of deformation was caused by the differences in strength between base metal and softened regions. The lower ductility of the weld nugget of FSW 6056-T7X PWHT joint can be attributed to presence of fine hardening precipitates in the microstructure, as observed in Figure 6.10. In contrast, the weld nugget of the as welded FSW 6056-T6 joint only exhibited

Chapter 6 FSW 6056 joints
81
GP zones, allowing for some deformation during tensile testing. SEM examinations of the fracture surface of the FSW 6056 tensile specimens showed a ductile dimple-like shear fracture confirming the high ductility measured by the laser extensometer.
Table 6.1 Transversal tensile properties of FSW 6056 joint in different thermal states
Joint Gage length [mm]
UTS [Mpa]
σy [Mpa]
Elongation [%]
FSW Eff. [%]
FSW 6056-T6 as welded
50 295 229 1,8 73 1*
(TMAZ) 295 186 17,1
FSW 6056-T7x PWHT
50 328 308 0,9 89 1*
(TMAZ) 328 249 10,4
*measured with a laser extensometer (as shown in Figure 3.6)
Figure 6.13 Correlation between local elongation and hardness profiles of (a) FSW 6056-T6 as welded joint and (b) FSW 6056-T7X PHWT joint.

Chapter 6 FSW 6056 joints
82
6.3. Corrosion Behavior
6.3.1. Exfoliation corrosion
Corrosion immersion to EXCO solution for 96 hours revealed differences in resistance to exfoliation corrosion of the panels of FSW 6056 joints in T6 and T7X temper conditions. The face and root surfaces of the T6 “as welded” joint displayed two zones with different corrosion attack, as shown in Figures 6.14 (a) and (b). The fine grained zone at both face and root sides of the weld joint did not suffer any kind of corrosion. Furthermore, these uncorroded zones included narrow stripes of the contiguous TMAZ at the retreating and advancing sides of the joint. At the root side of the FS weld, this unattacked region had approximately the same width as the diameter of the welding shoulder (see Figure 6.15b). A more homogeneous exfoliation corrosion attack took place on the base metal of the FSW 6056-T6. The corroded surfaces were characterized by the presence of opened blisters and some attached flakes. According to the ASTM G34-90 standard, the exfoliation corrosion attack of the base metal part was rated as superficial (EA) (Table 7.2).
Figure 6.14 Surface appearance of FSW 6056 joints immersed 96h in the EXCO solution according to ASTM G34-90: a) FSW 6056 –T6 face side, b) FSW 6056-T6 root side a) FSW
6056-T7X face side, b) FSW 6056-T7X root side
The FSW 6056-T7X PWHT panels immersed in the EXCO solution displayed a more homogeneous exfoliation corrosion attack, as shown in Figures 6.14(c) and (d). In contrast to the FSW 6056-T6 as welded joint, the original surface of the PWHT joint was still visible after the EXCO test. Corrosion was characterized by the presence of blisters being mainly split opened. For this reason, the exfoliation corrosion attack was rated as slight superficial (EA-). There were no significant differences in the corrosion attack between the base metal, HAZ and weld nugget. This behavior was more visible at the root side of the joint (Fig. 6.15d) where some opened blisters were also observed in the weld nugget region. Table 6.2 summarizes the ratings of exfoliation corrosion of the different weld zones of the FSW 6056 in the T6 and T7X conditions after 96 h of immersion in the exfoliation corrosion solution.

Chapter 6 FSW 6056 joints
83
Figure 6.15 Surface appearance of FSW panels in the weld region after 96 h exposure to the EXCO solution: (a) FSW 6056 –T6 face side, (b) FSW 6056-T6 root side (c) FSW 6056-
T7X face side and (d) FSW 6056-T7X root side
Table 6.2 Ranking of corrosion attack in the face and root sides of FSW 6056 joints in the as welded T6 and PWHT T7X tempers after 96 h immersion in the exfoliation corrosion test
solution (ASTM G34)
Joint Base metal HAZ/TMAZ WN FSW 6056-T6 as welded Superficial
(EA) Not corroded Not corroded
FSW 6056-T7X PWHT Slight superficial (EA-)
Superficial (EA)
Superficial (EA)
6.3.2. Intergranular Corrosion
The maximum depth of corrosion attack found in the FSW 6056-T6 and T7x joints after immersion in an aqueous chloride-peroxide solution for 24 hours is summarized in Table 7.3. Metallographic examinations of cross sections of the as welded FSW 6056-T6 revealed different corrosion behaviors through the various zones of the FSW joint. The fine grained area at the center of the joint was not corroded, as shown in Figure 6.17 (a). Additionally, a 2 mm wide zone being free of corrosion attack was observed adjoining to the recrystallized material flow arm at the retreating side (pointed with an arrow in Fig. 6.16b). It has to be pointed out that this corrosion free zone was found to be closer to the weld nugget at advancing side, approximately at 8 mm from the weld center line. Farther away from these zones, pitting corrosion was observed. Some of the pits also presented small intergranular corrosion ramifications (Fig. 6.17 a). This behavior was more evident with specimens immersed only for 6 hours in the chloride-peroxide solution. No marked differences in corrosion attack between the face and root sides of the joint were observed.

Chapter 6 FSW 6056 joints
84
Table 6.3 Maximum corrosion attack found in the FSW 6056-T6 as welded and T7x PWHT joins after 24 h immersion in a chloride peroxide solution (ASTM G110)
Joint Depth of corrosion attack (region)
Face side [µm]
Root side [µm]
FSW 6056-T6 as welded 173 (BM)
130 (BM/HAZ)
FSW 6056-T7X PWHT 181 WN
195 (BM/HAZ)
Figure 6.16 Face side regions of FSW 6056-T6 as welded exhibiting no corrosion attack: (a) center of the weld nugget and (b) heat affected zone at the retreating side (aprox. 10 mm
from the joint line)
Figure 6.17 Type of corrosion in the base metal at the face side of FSW 6056-T6 as welded joint after (a) 6 h and (b) 24 h immersion in an aqueous chloride-peroxide solution
To study the homogeneity of the corrosion behavior through the thickness of the FSW 6056-T6 joint, 1 mm thick layer was removed from the top surface of the joint by grinding. Afterwards, These coupons were immersed in a chloride-peroxide solution for 24 hours (ASTM G-110). Figure 6.18a shows the appearance of the surface of the as welded FSW joint after removal from the IGC test solution. The black lines outline the weld nugget. In the

Chapter 6 FSW 6056 joints
85
regions adjacent to the weld nugget deposition of corrosion products were observed (black spots). However, metallographic studies of the cross section of this specimen did not reveal any kind of local corrosion attack at distances up to 10 mm from the weld center line. Only superficial attack of the surface was observed in this region (see Figure 6.18 b). These results confirmed that the areas contiguous to the weld nugget exhibited a high resistance to corrosion attack.
Figure 6.18 (a) Appearance of the coupon of FSW 6056-T6 joint with 1 mm reduced thickness from the top after 24h immersion in a chloride-peroxide corrosion solution (b) transversal section of the same specimen showing the absence of any kind of localized
corrosion
In contrast to the T6 “as welded” FSW joint, the FSW 6056-T7X PHWT joint displayed rather uniform pitting corrosion through the weld regions after 24 hour of immersion in the corrosive solution. Figure 6.19 shows typical corrosion attack observed in the weld nugget region and the HAZ. Similar to the 6056-T6 as welded joint, no difference on corrosion attack was found between the face and root sides of the weld. The maximum pit depth was 180 µm. The pitting corrosion attack observed in both FSW 6056-T6 and FSW 6056-T7X joints can be attributed to micro galvanic coupling between the intermetallic particles and the aluminum matrix [125, 178]. When the FSW joints were exposed to a chloride containing media, selective dissolution of the anodic coarse Al-Si-Mg containing constituents took place. Then, the active pit was covered with aluminum hydroxide and corrosion products. As the corrosion attack continued, an acidic electrolyte with high chloride concentration developed, offering the ideal conditions for the growth of the pits. The further development of the pit depended on the precipitated species within the grains. Pitting of Al-Mg-Si-Cu alloys has been related to the precipitation of Q’-phase in the interior of the grains [179]. The precipitation of this phase results in a solute depletion of the surrounding aluminum matrix alloy. The resulting increased electrochemical driving force between the cathodic precipitate and the anodic depleted aluminum matrix promotes the further development of the pit. The mechanisms described above may explain the corrosion attack on areas at distances farther away than 10 mm from the joint line. On the other hand, at regions closer to the weld line, an anodic dissolution of Al-Si-Mg constitutient phases occurred, enabling pit nucleation. However, the amount of precipitates within the grains was less than in the other regions of the FSW joint.

Chapter 6 FSW 6056 joints
86
Hence, the necessary electrochemical driving force for pit growth was reduced or eliminated resulting in an abatement of the corrosion attack after the complete dissolution of the constitutional phase.
Figure 6.19 Corrosion morphology observed in a coupon of FSW 6056-T7X PWHT joint after 24 h immersion in an aqueous chloride-peroxide solution
6.3.3. Salt spray testing
Figure 6.20 shows the surface appearance of panels of FSW 6056 joints in T6 as welded and T7X PWHT conditions after 2 weeks of intermittent acidified salt spray testing. Both joints exhibited pitting as main corrosion attack being similar to the corrosion attack found on the base metals. The nugget region of the FSW 6056-T6 joint was mainly free of pitting; being similar to the results obtained from exfoliation corrosion tests. The other areas of the FSW 6056-T6 joint (TMAZ, HAZ and BM) exhibited randomly distributed pits. On contrary, the FSW 6056-T7X PWHT joint displayed pitting in all weld regions.
6.3.4. Corrosion potential
Figure 6.21 shows the corrosion potential measured according to ASTM G69 across the weld for 6056 joints in the studied heat treatment conditions. Values of the base alloys in different tempers are also given. In the as welded T6 condition, the nugget region exhibited the noblest potential. However, the level of the naturally aged microstructure was not attained. The potential decreased through the thermo-mechanically affected and heat affected zones to the value of the base alloy 6056-T6. For the post-weld heat treated 6056-T7X joint, the potential did not significantly change across the weld, being similar to that of the base alloy 6056-T7X.

Chapter 6 FSW 6056 joints
87
Figure 6.20 . Surface appearance of FSW 6056 joints after cyclic exposure to a salt spray solution according to ASTM G85-85 A2: (a) FSW 6056 –T6 face side, (b) FSW 6056-T6 root
side (c) FSW 6056-T7X face side, (d) FSW 6056-T7X root side
Figure 6.21 Corrosion potential profiles across FSW 6056-T6 AWS and FSW 6056-T7X PWHT joints

Chapter 6 FSW 6056 joints
88
There is still a controversy concerning the hardening phases of the 6056 alloy. Some authors claim Si –Mg containing β’’ phase as the major hardening phase, representing 80% in volume fraction of the strengthening precipitates in the peak aged condition. The remaining part is assumed to be Q’. However, other authors assert that the hardening capability of this alloy is related to a precipitating phase with similar structure to the one of the β’’, but with additions of copper atoms in the structure. This phase has been denominated as Qp by Cayron et al. [162]. The concomitant decrease of the corrosion potential and hardness increment of the base alloy 6056 with progressing precipitation from the naturally aged condition (T4) to the peak age temper (T6) implies that the major hardening phase may contain copper. In comparison, the drop of corrosion potential was less pronounced in an Al-Mg-Si alloy. In similar temper conditions the corrosion potential of 6061 alloy changed from -0.734 Vsce (T4 temper condition) to -0.749 Vsce (T6 temper condition) [180]. In the peak aged condition, the main hardening phase of the 6061 alloy has been identified as the Mg and Si containing β’’-phase. Although copper containing Q’ phase may also precipitate in the 6061 alloy, it only occurs during extended overaging at high temperature (i.e. 24 hr at 200 °C [23]). Thus, the differences in corrosion potential changes between both 6XXX alloys corroborate the hypothesis of a copper containing hardening phase (Qp) in 6056 alloy. The corrosion potential of FSW 6056-T6 as welded joint gradually decreased through the weld region from the weld nugget to the contiguous TMAZ as the amount of copper containing precipitates increased. The dissolution of the precipitates during welding resulted in an enrichment of the aluminum matrix in alloying elements shifting the potentials to less active values. The noblest corrosion potential value was found in the weld nugget of the T6 “as welded” joint, where a complete dissolution of precipitated phases took place, as shown in Figure 6.6. It has to be noticed that the potential value of the naturally aged 6056-T4 alloy was not reached in the stirred region probably due to the presence of heterogeneities in the microstructure. As shown in Figure 6.2, highly deformed and partially recrystallized material was present between the material flow arm produced by the tool shoulder and the main “body” of the weld nugget. This material may have similar electrochemical characteristics to that of the TMAZ, lowering the overall corrosion potential in the central region of the FSW 6056-T6 joint. Despite of the difference in corrosion potential between the nobler WN and the more active TMAZ/HAZ, this zone was still noble enough to be cathodically protected by the remaining part of the FSW joint further away from the weld center line. Similar to the FSW 2024-T8 PHWT joint, the more active corrosion potential values of post weld heat treated FSW 6056-T7X joint can be attributed to a similar microstructures exhibiting advanced precipitation in all regions of the joint. Due to the uniform precipitation, the corrosion potential through the different FSW regions was similar, not providing a cathodic protection of one region of the weld to another one when the FSW joint was permanently immersed in a chloride containing corrosive media (i.e. intergranular corrosion test). Therefore, the random character of the pit nucleation and growth sites within the FSW joint depended on local microstructural heterogeneities, e.g. the distribution of coarse intermetallic phases at the surfaces exposed to the corrosive media, causing micro galvanic coupling.

Chapter 7 Dissimilar FSW 2024A/6056 joints
89
7. Dissimilar FSW 2024A/6056 joints
7.1. Microstructural evolution
Metallographic examinations of cross sections of the dissimilar 2024/6056 joints revealed a weld nugget with an “onion ring” pattern formed by the flow and mixture of the base metals (Figure 7.1a). The microstructure of the weld nuggets was characterized by the presence of fine equiaxed recrystallized grains of the two welded alloys. The grain size in the nugget was in a range between 5 and 10 µm. Metallographic inspections of etched coupons showed round attacked spots at the grain boundaries of 2024A alloy (pointed out with white arrows in Fig. 7.1c). Furthermore, SEM examinations of the weld nugget revealed the presence of intergranular precipitates in the 2024A metal (Figure 7.2). These precipitates were similar to those found in the weld nugget of the similar FSW 2024-T3 joint (see Fig. 5.3). Thus, the formation of such particles implies that the heat input during the FSW process conducted with the parameter used was too high, even for the “difficult to weld” 2xxx series aluminum alloy, producing constitutional melting. In the adjacent thermo mechanically affected zones, grains of the base metals were plastically deformed, as shown in Figures 7.1 (d) and (e).
Figure 7.1 Different microstructural features of a dissimilar FSW 2024A/6056 joint: (a)
macrophotography of the weld nugget, (b) and (c) microstructure of the weld nugget, thermo mechanically affected zones at (d) retreating side and (e) advancing side.

Chapter 7 Dissimilar FSW 2024A/6056 joints
90
Even though there was an intimate contact between the alloys forming the onion ring structure, the sharp demarcation between the strips of the different metals suggested that a significant diffusion of the alloying elements did not occur. The exposure time at high temperatures during the FSW might be too short to allow substantial diffusion. Qualitative line scan EDX–analysis performed on the surface of the un-etched nugget revealed a sharp decrease in copper concentration at the interface between the 2024A and 6056 alloy (Figure 7.2). This difference in the Cu signal corresponds to the different amounts of Cu in both alloys. However, it is assumed that diffusion between the stripes of the two materials in the nugget may occur, but it is only restricted to a nanometer scale. Therefore, the areas of both alloys in the nugget should display basically the same chemical composition, and thus the same properties, as the respective base materials [181].
Figure 7.2 Qualitative line scan EDX analysis of copper concentration carried out on the
surface of FSW 2024A/6056 weld nugget. The Cu concentration was recorded along the line included in the SEM micrograph. The higher peaks corresponded to the Al2CuMg particles
formed by constitutional liquation. In the following sections a detailed description of precipitation state of each region of the dissimilar FSW 2024A/6056 in the as welded and PWHT conditions is given. Both dissimilar FSW joints presented common microstructural features with the similar FSW 2024 and FSW 6056 joints. It is believed that the welding thermal cycle applied in each case may produce microstructures with similar degrees of precipitation.
7.1.1. As welded dissimilar FSW 2024A-T3/6056-T6 joint
7.1.1.1. Heat affected Zones
Figure 7.3 shows a STEM micrograph of the 2024 HAZ at the retreating side of the dissimilar FSW 2024A-T3/6056-T6 joint in the as welded condition corresponding to maximum hardness region 9 mm from the weld center line (Figure 7.13). It was characterized by the presence of fine hardening phases in the interior of the grains. Additionally, evidence of grain boundary precipitation was also revealed by STEM studies of this region of the dissimilar joint. Coarse precipitates of about 100 nm in length were found to be aligned with the grain boundaries. The EDX chemical analyses of these heterogeneous phases suggested being

Chapter 7 Dissimilar FSW 2024A/6056 joints
91
Al2MgCu precipitates. Despite the formation of these intergranular particles, the contiguous precipitate free zone (PFZ) was relative thin (50 nm). At regions closer to the weld nugget (about 8 mm from the weld center line), the intergranular precipitates coarsened in the HAZ of the 2024A-T3 part of the FSW 2024A-T3/6056-T6 joint in the as welded condition (Figure 7.4).
Figure 7.3 STEM-HAADF image showing the microstructure of 2024A-T3 HAZ of the
dissimilar FSW 2024A-T3/6056-T6 joint in the as welded condition (at 9mm from the weld center line)
Figure 7.4 STEM-HAADF image showing microstructure of the 2024A HAZ of the dissimilar
FSW 2024A-T3/6056-T6 joint in the as welded condition (at 7 mm form the weld joint line) The HAZ of the 6056-T6 part of the dissimilar joint (AS) also exhibited a microstructure with very homogeneous precipitation (Figure 7.5). Precipitates with different shapes were observed in this region of the dissimilar joint, suggesting the presence of the Q’ phase and its precursor (the copper containing Qp phase [162]). Similar to the HAZ at the retreating side, the 6056-T6 HAZ presented evidence of heterogeneous precipitation at the grain boundaries. 200 nm long precipitates were aligned with the grain boundaries and were considered to be the Q-phase. It was difficult to identify a PFZ adjacent to the grain boundaries. Few precipitates were observed on dispersoids.

Chapter 7 Dissimilar FSW 2024A/6056 joints
92
Figure 7.5 STEM-HAADF image showing the microstructure of the 6056-T6 HAZ of the
dissimilar FSW 2024A-T3/6056-T6 joint in the as welded condition
7.1.1.2. Thermo mechanically affected zones
The microstructure of the 2024A-T3 TMAZ of the dissimilar FSW 2424A-T3/6056-T6 joint in the as welded condition was found to be severely overaged at the retreating side 4 mm from the weld center. As revealed by the STEM analyses, the precipitates in the grains coarsened and their volume fraction was reduced in comparison to the HAZ (see Figures 7.6). The main microstructural feature was the heterogeneous precipitation of S-phase at grain boundaries and dispersoids.
Figure 7.6 STEM-HAADF images showing (a) an overview of the microstructure of the
2024A TMAZ of the dissimilar FSW 2024A-T3/6056-T6 as welded joint and (b) detailed view showing heterogeneous precipitation of S-phase at dispersoids and grain boundaries
At the advancing side, the 6056 TMAZ of the dissimilar joint exhibited similar microstructural features (in terms of precipitation distribution; Fig 7.7) to those of the TMAZ at RS. Obviously, the precipitates were Q- phase type, being characteristic of the Al-Mg-Si-(Cu) alloys [182]. The density of homogeneous precipitates within the matrix seemed to be reduced in comparison to the 6056-T6 base alloy. Additionally, an increased grain boundary precipitation was found. Large intergranular Q-phase precipitates and the formation of a

Chapter 7 Dissimilar FSW 2024A/6056 joints
93
contiguous PFZ were observed. The dispersoids of the 6056-T6 TMAZ were also decorated with Q-phase particles.
Figure 7.7 STEM-HAADF image showing the microstructure of the 6056 TMAZ of the
dissimilar FSW 2024A-T3/6056-T6 as welded joint
7.1.2. Post weld heat treated dissimilar FSW 2024A-T8/6056-T7x joints.
7.1.2.1. Heat affected Zones
The 2024A heat affected zone of the dissimilar FSW 2024A-T8/6056-T7X PWHT joint was characterized by a fine homogeneous precipitation of the S’(S) phases, as shown in Figure 7.8a. At 9 mm from the weld center line, the 2024A-T8 HAZ presented coarse intergranular S precipitates being in more quantity than in 2024A-T8 base alloy (see Figure 4.5). However, a PFZ was not clearly observed. Two millimeters closer to the weld center line, a more overaged microstructure was revealed by the STEM analyses (Figure 7.8b). The precipitated phases in the grain interior coarsened and a well defined PFZ of about 50 nm width formed along the grain boundaries.
Figure 7.8 STEM-HAADF image showing the microstructure of the 2024A-T8 HAZ
dissimilar FSW 2024A-T8/6056-T7X PWHT joint (a) at 9mm ( maximal hardness) and (b) 7 mm from weld line

Chapter 7 Dissimilar FSW 2024A/6056 joints
94
The 6056 HAZ at the advancing side of the dissimilar FSW 2024A-T7X/6056-T7X PWHT joint presented a highly homogeneous precipitation (Figure 7.9). The precipitates in the 6056-T7X HAZ were extremely fine. Two hardening phases were observed: being the precipitates were 100 nm (Q’) and 40 to 50 nm long (presumably β’’ type precipitate).
Figure 7.9 STEM-HAADF images showing the microstructure of the dissimilar 6056 HAZ of
the dissimilar FSW 2024A-T8/6056-T7X PWHT joint
7.1.2.2. Thermo mechanically affected zones
Figure 7.10 shows the typical microstructure of the 2024A TMAZ at the retreating side of the dissimilar FSW 2024A-T8/6056-T7X PWHT joint. The degree of overaging of the TMAZ at both sides of the joint was greater than in the other regions of the joint. This was more evident at the retreating side of the joint. In the microstructure of the 2024A-T8 TMAZ, only heterogeneous precipitation was observed. The PWHT promoted the precipitation of the S-phase at grain boundaries and dislocations, as it can be seen in STEM images of the 2024A-T8 TMAZ (Figure 7.10). This preferential precipitation depleted the matrix in alloying elements avoiding the precipitation of new hardening phases during PWHT [71]. The small amount of hardening precipitates observed in 2024A-T3 TMAZ might coarsen during of the PWHT. In contrast to the 2024A-T8 TMAZ, the 6056-T7X TMAZ exhibited less evidence of heterogeneous precipitation. STEM studies only revealed preferential precipitation on dispersoids and grain boundaries (see Figure 7.11). Furthermore, hardening phases were present within the matrix, although in less quantity than in the 6056-T7X HAZ and base alloy. The difference between both TMAZ’s might be attributed to the number of dislocations present in the microstructure [183]. At the same position relative to the weld center line, the retreating side (2024A side) still presented partially recrystallized grains with a high degree of deformation. On the other side, the grains in the TMAZ at the AS (6056-T7x) exhibited the same morphology as its correspondent base metal.

Chapter 7 Dissimilar FSW 2024A/6056 joints
95
Figure 7.10 STEM-HAADF image showing the microstructure of the 2024A-T8 TMAZ of the post weld heat treated dissimilar FSW2024A-T8/6056-T7X PWHT joint close to weld nugget: (a) overview and (b) detailed view showing the preferential precipitation of S-phase at grain
boundaries and dislocations.
Figure 7.11 STEM-HAADF image showing the microstructure of the post weld heat treated dissimilar 6056-T7X TMAZ (a) overview and (b) detailed view of the intergranular region
7.1.2.3. Weld nuggets.
Thin TEM foils of dissimilar FSW 2024A/6056 joints in both as welded and PWHT conditions could not be prepared. During electrochemical jet polishing, preferential dissolution of one of the alloys occurred (see Figure 7.12). The regions close to the perforation were mostly too thick to be transparent for electrons. The weld nuggets of the dissimilar joints might have similar microstructural characteristics as found with the similar FSW nuggets (see sections 5.1.1.3, 5.1.2.3, 6.1.1.3 and 6.1.2.3)
7.2. Mechanical properties
7.2.1. Hardness
Figure 7.13 present hardness profiles across dissimilar 2024A-T3/6056-T6 and 2024A-T8/6056-T7x in the as welded and post welded heat treated conditions, respectively.

Chapter 7 Dissimilar FSW 2024A/6056 joints
96
Additionally, hardness values of the different base metals are given. At both advancing and retreating, sides, a loss of hardness was observed in the vicinity of the weld nugget. The most significant softening took place at the TMAZ of the 6056 alloy with a minimum of 80 HV1 for the as welded joint. The post weld heat treatment applied to dissimilar FSW 2024A-T3/6056-T4 joint resulted in a 10% increase of the minimum hardness value compared to that of the FSW 2024A-T3/6056-T6 joint in the as welded condition.
Figure 7.12 Microstructure of a 2024A strip of the dissimilar FSW 2024A-T3/6056-T6 weld
nugget. Comparing Figures 5.16, 6.11 and 7.13, the similar and dissimilar FSW joints exhibited similar hardness profiles across the weld region. This might be attributed to similar microstructural changes in the joints resulting from the friction stir welding process. Thus, the softened areas at the TMAZ/HAZ in the “as welded” joint can be related with absence of hardening phases (dissolution) [70], coarsening of precipitates and heterogeneous precipitation (overaging process) [70], confirmed by STEM studies. The increase in hardness value of the TMAZ/HAZ of the PWHT dissimilar joint can be attributed to precipitation of hardening phases during heat treatment, as it occurring in the similar FSW 6056-T7X PWHT joint.

Chapter 7 Dissimilar FSW 2024A/6056 joints
97
70
75
80
85
90
95
100
105
110
115
120
125
130
135
140
145
150
155
160
-20 -15 -10 -5 0 5 10 15 20Distance to the weld center line [mm]
HV1
FSW 2024A-T3/6056-T6 "as welded" FSW 2024A-T8/6056-T7x PWHT
RSAS
2024A-T8
2024A-T3 6056-T6
6056-T8
6056-T4
Figure 7.13 Hardness profiles across dissimilar FSW 204A/6056 joints in the as welded and
PWHT conditions
7.2.2. Tensile Strength
Transverse tensile properties of dissimilar FSW 2024A/6056 FSW joints in the as welded and post welded heat treated conditions are given in Table 7.1. The FSW 2024/6056 as welded joint attained an ultimate tensile strength of 73% of the 6056-T6 base metal alloy. Higher joint efficiencies were measured for the post weld heat treated dissimilar joint, being 84% of the ultimate strength of the 6056-T7X base metal. However, the real benefits of performing the post weld heat treatment at 190 °C for 10 hours resulted in an increases of around 30 % in yield strength (σy) and 10 % in ultimate strength (UTS) compared to the values obtained for the 2024A-T3/6056-T6 as welded joint. All tested specimens showed the typical slant shear fracture, with the FSW specimens failing in the 6056 HAZ in correspondence to the minimum hardness zone. During the tensile tests of the welded specimens, plastic deformation was mainly restricted to this low hardness region (see Figure 7.14)
Table 7.1 Transverse tensile properties of base material and dissimilar FSW joints
Gage length [mm]
σy [MPa]
UTS [MPa]
A [%]
Joint Eff. [%]
2024A-T3/6056-T6 as welded
50 228 278 1.6 73 1*
(TMAZ,RS) 181 278 16
2024A-T8/6056-T7X
PWHT
50 292 310 0.7 84 1*
(TMAZ,RS) 234 310 8.8
* measured with a laser extensometer as described in [184]

Chapter 7 Dissimilar FSW 2024A/6056 joints
98
Figure 7.14 Correlation between local elongation and hardness profile of a dissimilar FSW
2024A-T8/6056-T7X PWHT joint
7.3. Corrosion Behavior
7.3.1. Exfoliation corrosion
Dissimilar FSW joints exposed to the EXCO solution exhibited completely different corrosion behaviors in comparison to the correspondent base alloys and similar FSW joints. Figure 7.15 shows the surface appearance of the FSW 2024A/6056 joints in the studied temper conditions. The as welded joint exhibited slight uniform corrosion on the 2024A-T3 side, while the 6056-T6 parent metal experienced severe exfoliation corrosion. A considerable amount of loose exfoliation products was found lying on the bottom of the container. Therefore, severity of exfoliation corrosion was rated as EC/ED according to ASTM G34. The fine grained zone did not suffer any kind of localized corrosion. At the root side of the joint a 10 mm wide corrosion free zone was observed on the 6056 part adjacent to the joint line. Figures 7.15 (c) and (d) show the surface appearance of the post weld heat treated dissimilar FSW 2024A-T8/6056-T7X joint after 96 hours of immersion in the EXCO solution. The PWHT dissimilar joints displayed a slightly different behaviour than the 2024A-T3/6056-T6 as welded joint. Although preferential corrosion of the 6056-T7X alloy still took place, the degree of corrosion was less severe. Moderate corrosion attack (EB/EC) was observed on the surface of the 6056-T7X parent metal, while 2024A-T8 presented pitting and superficial corrosion, being rated as P/EA according to ASTM G34. At both sides of the 2024A-T8/6056-T7X bonding line a deeper corroded zone was found. The FSW nugget region did not suffer exfoliation, just general corrosion was found. The exfoliation corrosion ranking of the different weld zones of the dissimilar FSW 2024A-T3/6056-T6 as welded and FSW 2024A-T8/6056-T7X post weld heat treated joints is listed in Table 7.2.

Chapter 7 Dissimilar FSW 2024A/6056 joints
99
Figure 7.15 Surface appearance of (a) FSW 2024A-T3/6056-T6 face side, (b) FSW 2024A-T3/6056-T6 root side (c) FSW 2024A-T8/6056-T7X face side, (d) FSW 2024-T8/6056-T7X
root side joints after 96 hours immersion in the EXCO solution test. The 2024A part is positioned at the lower side of the panels
Table 7.2 Ranking of corrosion attack of the dissimilar FSW 2024A/6056 joints in different
tempers after 96h immersion in the exfoliation corrosion test solution Joint Base metal TMAZ/TMAZ WN 2024A 6056 2024A 6056
FSW 2024-T3/6056-T6 as welded
General corrosion
Moderate/ severe
(EB/EC)
Moderate/ severe
(EB/EC)
10 mm corrosion free zone
No exfoliation
FSW 2024-T3/6056-T6 PWHT Pitting Moderate
(EB) Light (EA)
Moderate/ severe
(EB/EC)
No exfoliation
7.3.2. Intergranular corrosion
Preferential attack of the 6056 alloy was also observed, when the dissimilar FSW 2024A-T3/6056-T6 joint was immersed in an aqueous chloride-peroxide solution (ASTM G110). The preferential attack of the 6XXX series alloy was particularly evident in the weld nugget of the dissimilar joint, where the stripes of the 6056 alloy were dissolved (Figure 7.16 b). The heat affected zone of the 2024A alloy also revealed high intergranular corrosion susceptibility. Maximum depths of attack of 230 µm was measured in this region (Fig /.7.16c), being comparable to the intergranular corrosion attack found in the HAZ of the similar FSW 2024-T3 joint. On the other hand, a region free of corrosion attack was observed at the HAZ of the 6056 side. The 6056-T6 parent metal presented accelerated pitting corrosion with pit depths up to 265 µm, while the 2024A-T3 part was obviously immune to corrosion.

Chapter 7 Dissimilar FSW 2024A/6056 joints
100
Figure 7.16 Metallographic sections of coupons of dissimilar FSW 2024A-T3/6056-T6, which
were immersed in an aqueous chloride peroxide solution (ASTMG 110), showing (a) base metal 6056-T6 (b) preferential corrosion of 6056 metal in weld nugget region and (c) 2024A
HAZ. In the post weld heat treated FSW 2024A-T8/6056-T7X PWHT joint, the immunity to corrosion of the 2024A parent metal was reduced. Several corroded areas were observed on the exposed surface. The heat affected zones of the alloys 6056 and 2024A suffered pitting. The maximum depth of corrosion attack in the 6056-T7X HAZ was 230 µm, while the 2024A-T8 HAZ presented pits up to 155 µm deep. Although preferential corrosion of 6056 strips in the nugget region still occurred, alloy 2024A was not immune to corrosion in the weld nugget. Strips of 2024A alloy presented intergranular corrosion attack. Table 7.3 summarizes the maximum depth of corrosion attack found in the dissimilar FSW 2024A-T3/6056-T6 as welded and FSW 2024A-T8/6056-T7X PWHT joints Table 7.3 Maximum depths of corrosion attack found in FSW 2024A-T3/6056-T6 as welded
and FSW 2024A-T8/6056-T7x post weld heat treated joints after 24 hours of immersion in an aqueous chloride-peroxide solution (ASTM G110)
Material Parent Metal TMAZ/HAZ WN
FSW2024-T3/6056-T6 as welded
6056-T6
2024A-T3
6056-T6
2024A-T3
6056-T6
2024A-T3
Pitting 256 µm
No corrosion
No corrosion
IGC 230 µm
Preferential dissolution No corrosion
FSW2024-T8/6056-T7X PWHT
6056-T7X
2024A-T8
6056-T7x
2024A-T8
6056-T7X
2024A-T8
Pitting 168µm
IGC* 192 µm
Pitting 232µm
IGC 131µm
pitting Pitting and IGC
(* IGC = intergranular corrosion)
7.3.3. Salt spray test
Surface appearance of panels of dissimilar FSW 2024A/6056 joints in the as welded and PWHT conditions after 335 hours of intermittent salt spray testing are shown in Figure 7.17. The 2024A-T3 parent metal of the as welded dissimilar joint exhibited moderate exfoliation corrosion (EB), while the 6056-T6 alloy suffered pitting. No difference in corrosion attack was observed between the base metal and HAZ of the 6056 alloy part. In contrast, the 2024A-HAZ exhibited two different corrosion behaviors. Between this region and the 2024A-T3 parent material, a corrosion free zone was observed. Slight pitting was found in the weld nugget.

Chapter 7 Dissimilar FSW 2024A/6056 joints
101
Figure 7.17 Surface appearance of dissimilar FSW 2024A/6056 panels in (a) as welded and
(b) PWHT conditions after 335 hours of intermittent salt spray testing. The 2024A parent material is at the lower side of the panels.
The post weld heat treated dissimilar FSW joint exhibited a more homogeneous corrosion attack in all joint zones. Both alloys 2024A-T8 and 6056-T7X showed a light to moderate exfoliation attack (EA/EB). The corrosion free zone observed at the 2024A-HAZ of the “as welded” joint was no more visible. The weld nugget presented some pitted regions.
7.3.4. Electrochemical Measurements
7.3.4.1. Corrosion potential measurements
Figure 7.18 shows the corrosion potential across the weld for dissimilar 2024A/6056 joints in the T3/T6 as welded and T8/T7X PWHT conditions measured according to ASTM G69. Values of the base alloys in different tempers are also given. The potential increased when going through the weld region from the 6056 side to the 2024A side. For the as welded 2024A-T3/6056-T6 joint, the corrosion potential at the advancing side at a distance 10 mm from the nugget center (heat affected zone) was similar to that of the parent material (6056-T6), whereas it did not yet reach that of the base alloy 2024A-T3 at the retreating side. In the post-weld heat treated dissimilar FSW joint, the corrosion potential of the weld region of the alloy 6056 was similar to that of the base alloy 6056-T7X. For the 2024A part, the potential of the region adjacent to the nugget was slightly nobler than that of the base alloy 2024A-T8. A mixed potential of both alloys was measured in the nugget zone.

Chapter 7 Dissimilar FSW 2024A/6056 joints
102
Figure 7.18 Corrosion potential profiles across dissimilar FSW 2024A/6056 in different
temper conditions.
7.3.4.2. Localized open circuit measurements
At first glance the “bulk” corrosion potential measurements carried out on the cross section of the dissimilar FSW 2024A-T3/6056-T6 joint did not completely agreed with the intergranular corrosion test results. The deeply corroded 2024A-T3 HAZ was no depicted in the “bulk” corrosion potential profile. However, using a micro cell, open circuit measurements made across the as welded dissimilar joint showed a different potential profile. In Figure 7.19, the “bulk” corrosion potential and the localized potential measurements are superimposed. As it can be seen, similar potentials were measured using both techniques at the center of the weld nugget. However, as the profile advances to the base metal, measurements using a microcell provided a better resolved potential vs. distance curve. Whereas the “bulk” corrosion potential profile exhibited a continuous increase towards the parent metal, the micro cell measurements revealed a minimum at the retreating HAZ (2024A side) at distances between 2 through 9 mm from the joint center line. STEM observations of this region revealed variying degree of heterogeneous precipitation, being mainly characterized by the presence of intergranular copper containing S phase. The minimum of corrosion potential similar to the corrosion potential of the weld nugget was registered at 6 mm from the joint line corresponding to the minimum hardness value. This zone corresponded to the area severely attacked by intergranular corrosion found after immersion in aqueous chloride per chloride solution (Figure 7.16 c).

Chapter 7 Dissimilar FSW 2024A/6056 joints
103
Figure 7.19 Profile of open circuit potential across the retreating side of the as welded
dissimilar FSW 2024A-T3/6056-T6 measured using (a) 4x4 mm rod specimens (blue line) and (b) a 400µm diameter micro electrochemical cell (red line) .
7.3.4.3. Scanning polarization curves
Figure 7.20 shows potentiodynamic polarization curves of the base alloys 2024A and 6056 and the different zones of dissimilar 2024A/6056 FSW joints in different heat treatment conditions. For all samples tested, the current sharply increased beyond the corrosion potential when polarizing in anodic direction. No passive region was observed. For the as welded 2024A-T3/6056-T6 joint, the polarisation curves of the samples taken at different positions across the weld were between the limits of the parent materials (Figure 7.20 a). Corrosion potentials obtained from the polarization scans revealed a nearly similar profile across the weld to that found using the standard method ASTM G69 (Figure 7.20). However, it has to be noted that the current-potential curves of the samples taken at different distances of the weld exhibited a significant scatter regarding corrosion potential. For the base alloys 2024A-T8 and 6056-T7X, quite similar corrosion potentials were obtained from polarization plots (Figure 7.20 b). The polarization scan of the nugget region in the post-weld heat treated 2024A-T8/6056-T7X joint correlated with those of the parent alloys, whereas the zones adjacent the nugget revealed at slightly more inactive potential at both sides.

Chapter 7 Dissimilar FSW 2024A/6056 joints
104
Figure 7.20 . Potentiodynamic polarization curves of (a) as welded 2024A-T3/6056-T6 and (b) post weld heat treated 2024A-T8/6056-T7X joint. Samples were taken at -5(1), 0(2) and
+5 mm (3) from the weld center of dissimilar SEM examinations of the anodically polarized surface of the dissimilar FSW 2024A-T3/6056-T6 joint also revealed the preferential dissolution of one of the metals forming the weld nugget. The corroded areas (Figure 7.21) had a defined shape, being similar to the microstructure observed on the surface of the FSW joint (Figure 7.2). Point and line scan EDX analyses of the surface revealed a lower copper content of the highly corroded zones than the un-corroded areas, indicating that 6056 alloy provided cathodic protection to the 2024A metal (see Figure 7.21, Table 7.4), as suggested before. As shown in Figure 7.22,

Chapter 7 Dissimilar FSW 2024A/6056 joints
105
anodic polarization of the weld nugget caused pitting and intergranular corrosion of the 6056 alloy. No defined crystallographic directions were observed in the pitted grains.
Figure 7.21 Qualitative line scan EDX analysis performed across the anodically polarized
surface of FSW 2024A/6056 weld nugget. The Cu concentration was recorded along the line included in the SEM micrograph.
Metallographic sections of the samples taken at the weld centre which were anodically polarized exhibited again preferential corrosion attack on 6056 strips (Figure 7.21 and 7.23a). Galvanic corrosion was more pronounced in the nugget region of as welded 2024A-T3/6056-T6 joint, but galvanic coupling was also found with the post-weld heat treated dissimilar joint. The fine grained 2024A strips in the latter weld exhibited intergranular corrosion (Figure 7.23 b)
. Figure 7.22 Surface appearance of a coupon of the dissimilar FSW 2024A-T3/6056-T6 joint
after anodic polarization; 1 and 2 indicate spots of EDX-analyses Table 7.4 Chemical compositions (in At.-%) of the positions 1 and 2 indicated in Figure 7.22
obtained by EDX point analysis Spectrum O Mg Al Si Cu
1 20.77 0.62 7.86 1.37 0.38 2 16.32 1.42 80.52 0.46 1.27

Chapter 7 Dissimilar FSW 2024A/6056 joints
106
Figure 7.23 Metallographic cross sections of anodically polarized weld nuggets of dissimilar
FSW 2024A/6056 joints in (a) “as welded” and (b) PWHT conditions Although the dissimilar FSW 2024A/6056 joints presented analogous microstructural features as the similar FSW 2024 and FSW 6056 joints, their corrosion behaviors were significantly different. Generally, the standard electrode potential of an aluminum alloy gives a rough guide to position of that alloy in a galvanic series. Electrode potential will indicate whether or not galvanic corrosion can occur. The corrosion behavior of the dissimilar joints was mainly governed by a macro galvanic couple formed by both aluminum alloys when the dissimilar joint was permanently immersed into a chloride containing solution (i.e. EXCO or IGC –test solutions). This macro galvanic coupling was associated with the difference in chemical compositions of the aluminum matrix at the different regions of the joint. In the case of the dissimilar FSW 2024A/6056 joint copper content greatly affects the formation of the galvanic cells, and thus the final corrosion resistance of the joint. The alloy with less Cu (6056) provides cathodic protection to an alloy with higher Cu content (2024A). The effect of the different chemical compositions of the alloys was evident at the weld nugget. In this region, both alloys presented naturally aged microstructures, provided that most of the alloying elements had been in super saturated solid solution. Thus, the more active alloy (6056) provided cathodic protection to the nobler one (2024A), as it could be seen in sections 7.3.1 and 7.3.2. The cathodic protection provided by the 6056 alloy to the 2024A can be explained as follows: Additionally to the differences in chemical composition, the microstructure of the alloy also influences galvanic coupling. The base alloy 6056 in the peak aged condition exhibits a microstructure with high precipitation of strengthening phases (see Figure 4.6). The precipitation of the copper containing hardening phases (Q’ and its precursor) during welding reduced progressively the copper content of the super saturated solid solution. In contrast, the microstructure of the 2024A-T3 base metal presents only GPB zones as hardening phases, implying that considerable amount of copper remain still in super saturated solid solution. When both alloys being coupled are a corrosive solution, the preferential dissolution of the more active cell component (e.g. 6056-T6) proceeds. Nevertheless, the cathodic protection provided by the 6056 alloy can be suppressed, as revealed by the IGC test results. Sensitization of the 2024A HAZ of the dissimilar FSW 2024A-T3/6056-T6 joint due to the welding thermal cycle might causes a depletion of copper

Chapter 7 Dissimilar FSW 2024A/6056 joints
107
in the aluminum matrix. This resulted in a decrease of the corrosion potential of this area, reaching values close to that of the 6056-T4. This region was confined between the nobler 2024A weld nugget and parent material. Because of the proximity to these nobler regions, a local galvanic cell formed with an “easier” path for the ionic flow (see Figure 7.24), preventing the cathodic protection of the 6056 alloy.
Figure 7.24 Schematic representation of the local corrosion cell formed between the highly
active 2024A-T3 HAZ and nobler 2024A-T3 WN and BM. Moreover, the PWHT produced a more advanced precipitation of both aluminum alloys at all regions of the joints. This precipitation caused a depletion of alloying elements in the aluminum matrix leading to leveling out of the corrosion potentials (see Figure 7.18 and 7.20). The “approximated” corrosion potentials stopped the cathodic protection provided by the 6056-T7X parent material, as shown in Figure 7.15. This was especially evident in the weld nugget, where the 2024A alloy exhibited evidence of intergranular corrosion attack (Figures 7.23b). At regions where both parent alloys were farther separated, the initiation of corrosion damage was governed by local microstructural heterogeneities. Apart from the macro galvanic coupling formed between the different FSW regions, the corrosion type was determined by the local microstructural features, in an analogous manner as in the similar FSW joints. Differences in chemical composition of the precipitated phases and their adjacent depleted areas (i.e. grain boundaries or aluminum matrix) provided the necessary electrochemical driving force for the dissolution of one of the components (micro galvanic cell formation).
7.3.5. Corrosion and mechanical response
7.3.5.1. Stress corrosion cracking
Dissimilar 2024/6056 FSW joints were basically resistant against stress corrosion cracking at applied stresses up to 180 MPa. After 30 days of alternate immersion in aqueous 3.5% NaCl solution only one face side specimen of the as welded FSW 2024A-T3/6056-T6 joint failed. Fractographic examinations revealed an intergranular fracture with dissolved grain boundaries, Figure 7.25. The dissolution of the grains could result from the environmentally assisted crack mechanism being operative (anodic dissolution) [158], but also from a post fracture attack. Metallographic examination of the specimens of the dissimilar joints revealed pitting on the 6056 side (155 µm for the T6 temper) and pitting and intergranular corrosion for the 2024A alloy. The corrosion attack was aggravated at the heat affected zone of both alloys. At the bounding lines between both materials, alloy 6056 corroded again preferentially under this environmental condition, but the severity of corrosion due to galvanic coupling was reduced in comparison to that found under permanent immersion condition in aqueous chloride-peroxide solution. The fine grain areas of the alloy 6056 in the nugget suffered pitting and intergranular corrosion with a maximum depth of 450 µm. The most severe

Chapter 7 Dissimilar FSW 2024A/6056 joints
108
degradation of the dissimilar 2024A-T3/6056-T6 FSW joints occurred in the heat affected zone of alloy 2024A caused predominantly by an intergranular corrosion attack penetrating up to 700µm.
a b Figure 7.25 Fractographic (a) and metallographic (b) examinations of bent-beam specimens of dissimilar 2024A-T3/6056-T6 FSW joints which were alternately immersed in 3.5% NaCl solution, showing (a) intergranular fracture (specimen failed after 30 days of exposure) and
(b) pitting and intergranular corrosion in the heat affected zone of 2024A. For the dissimilar 2024A-T8/6056-T8 FSW joints, no failure was observed during a 1000 h alternate immersion test. Under these testing conditions, alloy 2024A-T8 was not corroded, revealing a marked cathodic protection by alloy 6056-T7X.
7.3.5.2. Residual fatigue life of pre-corroded dissimilar FSW 2024A/6056 joints
Corrosion damage characterization
Figure 7.26 shows the metallographic transversal cross sections of coupons of dissimilar FSW 2024A/6056 in different thermal conditions after 216h immersion in a aqueous solution of a 3% NaCl + 0.3% H2O2. The immersion in this corrosive solution caused similar depths of corrosion attack for both joints as observed after intergranular corrosion test. The as welded joint presented inhomogeneous localized corrosion attack within the different FSW regions. The 2024A-T3 part only experienced generalized corrosion. However, the 6056-T6 base metal suffered severe pitting corrosion with pit depths up to 243 µm. The location of this deep corroded zone was found at about 10.3 mm from the original joint line (represented by the line in Figure 7.26 top). In contrast, the FSW 2024A-T8/6056-T7X joint revealed a more uniform distribution of corroded areas on the whole surface. Both parent alloys suffered pitting. The maximal pit depth was 190 µm found at a distance of approximately 6 mm from the joint line (Orange line in Figure 7.26 below).
Fatigue life of pre-corroded dissimilar FSW 2024A/6056 joints
The diagram in Figure 7.27 shows the effect of corrosion damaged on the fatigue life of dissimilar FSW 2024A/6056 joints in the T3/T6 as welded and T8/T7X PWHT tempers. Additionally, the fatigue life of the FSW 2024A-T3/6056-T6 as welded joint without pre-corrosion is also given. Corrosion has obviously a detrimental effect, producing a significant drop of the fatigue life of dissimilar FSW joints. The final thermal condition of the dissimilar joints (T3/T6 as welded and T8/T7X PWHT conditions) virtually did not influence their fatigue properties. All pre-corroded specimens fall in the same scatter band. The all fatigue tested specimens failed at the advancing side of the joints where 6056 alloy was placed.

Chapter 7 Dissimilar FSW 2024A/6056 joints
109
Figure 7.26 Metallographic transversal cross sections of the advancing sides of dissimilar
FSW 2024A/6056 joints after 216 h immersion in chloride-peroxide solution, (top) in as welded and (below) PWHT condition
Figure 7.27 Residual fatigue life of pre-corroded dissimilar FSW 2024A/6056 joints in
different temper conditions Light microscopy examinations of the cross sections of the pre-corroded fatigue tested dissimilar FSW joints revealed the crack initiation site at a deeply corrosion attacked (Figure 7.28). In the case of the naturally aged FSW-joints the fatigue cracks were initiated at a distance of approximately 10 mm from the center of the nugget, while the failure site for the PWHT joints was localized at 5mm. These distances agreed with the occurrence of corrosion attack. Post failure SEM surface analysis of pre-corroded fatigue tested specimens (Figure 7.29) clearly demonstrated that the fatigue cracks started from the semi-elliptical corroded sites. [185]

Chapter 7 Dissimilar FSW 2024A/6056 joints
110
Figure 7.28 Location of the fatigue crack in pre-corroded dissimilar FSW 2024A/6056 joints
(upper) in “as welded” and (lower) in PWHT conditions
(a) (b)
Figure 7.29 Scanning electron micrographs of the fracture surfaces of pre-corroded fatigue tested samples of FSW 2024A/6056 joints (a) in “as welded” and (b) in PWHT conditions.

Chapter 8 Summary and conclusions
111
8. -Summary and conclusions
The aim of this work was to gain basic knowledge on the corrosion behavior of dissimilar 2024A/6056 joints produced by friction stir welding (FSW). Because of the complexity of the corrosion mechanisms induced by the galvanic coupling between both alloys, the corrosion behavior of similar friction stir welds made from the correspondent base metals was also investigated to provide a basis for the understanding of dissimilar joints. Simultaneous action of mechanical loading and corrosive attack can further deteriorate the performance of the joints thus compromising their safe operation in service applications. Therefore, the resistance to stress corrosion cracking (SCC) and the residual fatigue life of pre-corroded dissimilar FSW coupons were also studied. Moreover, in an effort to obtain better mechanical and corrosion performances, the effect of a post weld heat treatment was evaluated. The similar and dissimilar joints investigated in this study were produced by FSW using 4 mm thick sheets of the aluminum alloys 2024, 2024A and 6056. To create the post-weld heat treated condition the FSW 2024-T3, 6056-T4 and 2024A-T3/6056-T4 as welded joints were artificially aged at 190 °C for 10 h. This heat treatment resulted in a T8 temper for the 2XXX base materials, while the 6056 alloy exhibited a small degree of overaging, but still remained close to the T6 temper.
8.1. Microstructure and Mechanical Properties
The thermo mechanical process produced by FSW resulted in softening of both 2024-T3 and 6056-T6 alloys. However, the mechanism causing this loss in hardness depended on the initial temper of the corresponding base metals. Microstructural changes in FSW 2024-T3 joints were governed by the peak temperature of the welding thermal cycle. Reversion of the GPB zones at a distance of 11-12 mm from the weld nugget was followed by precipitation of fine S’(S) particles (HAZ), which resulted in an increase of hardness reaching a maximum at a distance of approximately 8 mm from the weld center. At closer distances to the nugget, coarsening of the fine precipitates and heterogeneous precipitation of S-phase at grain boundaries and dispersoids produced softening of the TMAZ. The weld nugget region experienced the highest peak temperatures, resulting in dissolution of the precipitates which allowed for forming a super saturated solid solution during subsequent cooling. Post-weld natural aging created “new” GPB zones promoting hardening. The weld nugget was susceptible to some degree of sensitization, as indicated by the existence of fine intergranular S-phase precipitates. In contrast, the FSW process produced softening of the 6056-T6 material in the TMAZ and weld nugget. The microstructural evolution within the softened region was divided into two zones. The first region extended from the parent metal to the hardness minimum (5 to 9 mm from the joint line). Softening in this region was associated with a partial dissolution of the hardening phases and coarsening of stable Q-phase. Heterogeneous precipitation of Q-phase at grain boundaries and dispersoids also occurred. The most severe overaging was located in the minimum hardness region, where precipitation of equilibrium Q-phase depleted the aluminum matrix from alloying elements. The second softened region was located between the hardness minimum and the boundary of the weld nugget (from 2.5 to 5 mm). Complete dissolution of the hardening precipitates (i.e. Q’ and β’’ or Q’ precursor) as well as partial dissolution of the coarse Q-phase was the main characteristic of this region. Additionally, substantially heterogeneous precipitation took place reducing the hardening potential of this region. At the welding center line, the peak temperature reached the dissolution temperature of Q-phase, producing complete dissolution of the precipitates, resulting in a super saturated solid solution. Similar to the weld nugget of the FSW 2024-T3

Chapter 8 Summary and conclusions
112
joint, natural aging after welding also increased the hardness of the weld nugget of the 6056-T6 joints. Post weld heat treatment applied to the naturally aged FSW 2024-T3 and FSW 6056-T4 produced opposite hardening responses. A further softening occurred in the overaged HAZ/TMAZ of the 2024-T3 joint. The PWHT promoted coarsening of the precipitates already formed. Unexpectedly, the weld nugget also suffered a loss of hardness produced by heterogeneous precipitation and coarsening of S-phases on dispersoids and dislocations combined with coarsening of intergranular precipitates. On the contrary, the weld nugget of the 6056-T4 joint exhibited an increase in hardness after PWHT. This was a result of the formation of fine and homogeneously distributed strengthening phases. Although the TMAZ/HAZ of the as-welded 6056-T4 also suffered from softening, PWHT caused a small recovery of hardness, indicating that the aluminum alloy was not completely depleted in alloy elements. Therefore, further precipitation of strengthening phases could take place. Finally, the 2024-T3 and 6056-T4 base metals containing microstructures rich in GP(B) zones experienced a hardness increase due to the precipitation of semi coherent particles (i.e. S’(S) for the 2024 alloy and Q’ and its precursor for the 6056 alloy). In this study, laser extensometry was used to resolve local strain in the FSW joints during tensile testing. Local elongation across the weld exhibited a shape being mirror reversed as compared to the hardness profile. High and low strain values were located in weld regions of low and high hardness, respectively. In all joints, fracture occurred in the softest area of the overaged TMAZ. Furthermore, the post weld heat treated FSW joints exhibited an even more localized straining due to the higher difference in mechanical properties between the weld regions.
8.2. Corrosion Behavior
The microstructural cahnges produced by the friction stir welding process affected the electrochemical response of both alloys. Nevertheless, the results of open circuit potential measurements revealed contrasting profiles of the as welded similar FSW joints. The weld region of the FSW 2024-T3 joint exhibited highly active potentials while more noble values were observed in the weld zone of the FSW 6056-T6 joint. The more active potentials of weld nugget and TMAZ of the FSW 2024-T3 joint were related to a depletion of copper in the aluminum matrix caused by the precipitation of S-phase. In contrast, the more noble potentials of the weld region of the as welded FSW 6056-T6 joint were caused by an enrichment of the aluminum matrix in alloying elements due to the dissolution of copper containing phases (Q’ and its precursor). Furthermore, PWHT induced important changes in the corrosion potential of similar FSW joints. Generally, the drop of corrosion potential dropped down. Moreover, all regions of the weld exhibited similar potentials. Microstructures exhibiting similar degree of precipitation were responsible for leveling of the corrosion potential through out the weld regions. Once the welds were exposed to a corrosive medium, galvanic couples formed between the different regions of the joint were less pronounced. Immersion corrosion tests were carried out to screen the corrosion behavior of the FSW joints. The results of these tests revealed that the friction stir welds were susceptible to localized corrosion. The local microstructure governed the corrosion mechanism and the degree of the attack. Accelerated corrosion occurred in zones of the joint with high reactive microstructures providing cathodic protection to more noble areas. Immersion of the as welded FSW 2024-T3 in an aqueous solution of sodium chloride revealed high corrosion susceptibility in the weld region. The TMAZ exhibited enhanced intergranular corrosion susceptibility caused by the

Chapter 8 Summary and conclusions
113
precipitation of S-phases at the grain boundaries. Additionally, accelerated pitting occurred on the face side of the weld nugget caused by the electrochemical dissolution of the partially melted S-phases. The FSW 6056-T6 as welded joint displayed higher corrosion resistance than the 2XXX joint. The weld nugget and TMAZ were immune to any kind of corrosion attack as a result of the partial dissolution of the precipitates during the weld cycle. In the more active base metal, small pits nucleated and grew. Post weld heat treated similar FSW joints exhibited different corrosion behavior as compared to that of the as welded joints. More uniform distribution of corrosion damage was observed. The localization of corrosion attack in a certain area of the weld joint was avoided as a result of the equalization of the corrosion potentials. Therefore, the nucleation and growth of corrosion pits had a more random nature governed by the local surface and microstructural conditions (i.e. presence of constitutional second phases, scratches, etc.). In addition, after PWHT, the corrosion mechanism of the 2024 alloy joint changed from intergranular to pitting. However, the corrosion mechanism of the 6056 joint was not affected still remaining pitting.
8.3. Dissimilar FSW 2024A/6056 Joints
Microstructural examinations of the dissimilar FSW 2024A/6056 joints in the as welded and PWHT conditions revealed microstructural features similar to those of similar FSW 2024 and 6056 joints. The welding thermal cycles applied produced similar microstructures with nearly identical degrees of precipitation in the similar and dissimilar joints. The microstructural changes introduced by the FSW process affected the mechanical properties of dissimilar joints. Analyses of hardness profiles across welds of 2024A/6056 dissimilar joints revealed that at both advancing and retreating sides, a loss of hardness occurred, resulting from the absence of hardening phases (dissolution), coarsening of precipitates and heterogeneous precipitation (overaging process). The lowest hardness values were located in the TMAZ of the 6056 material. Post weld heat treatment of the dissimilar FSW 2024A-T3/6056-T4 produced contrasting effects on the softened areas. On the one hand, a softening weld nugget took place being attributed to an overaging process of the 2024A alloy (as observed in the similar FSW 2024-T8 PWHT joint). On the other hand, precipitation of new strengthening particles promoted a small hardness recovery of the 6056 TMAZ. The corrosion resistance of the dissimilar welds was completely different from that of the respective base metals and similar joints, despite the microstructural similarities. When immersed in chloride containing aqueous solution, 6056 alloy suffered severe degradation by corrosion attack. This preferential attack was controlled by galvanic interaction between the welded alloys. The more active 6056-T6 alloy provided cathodic protection to the nobler 2024A-T3 material. This was particularly evident in the weld nugget where stripes of the 6056 alloy being in intimate contact with the 2024A dissolved preferentially. Microstructural features also influenced the corrosion behavior of the as welded dissimilar joint. The overaged 2024A TMAZ displayed enhanced intergranular corrosion susceptibility. Localized electrochemical measurements demonstrated that the 2024A TMAZ exhibited more active corrosion potentials being close to those of the 6056 weld nugget. Therefore, the cathodic protection of this area was avoided, and the intergranular attack could proceed. Moreover, the PWHT produced a more intense precipitation in both aluminum alloys at all regions of the joints equalizing the corresponding corrosion potentials. Therefore, the cathodic

Chapter 8 Summary and conclusions
114
protection provided by the 6056-T7X to the rest of the weld was stopped. This was especially evident in the weld nugget, where the 2024A stripes showed intergranular corrosion attack. At a higher distance from the weld center, the initiation of minor corrosion damage areas was governed by local microstructural heterogeneities. The stress corrosion cracking (SCC) behavior of the dissimilar 2024A/6056 joints was investigated using specimens loaded by four point bending, which were alternately immersed in 3.5% NaCl solution. The results of theses tests indicated that the as welded dissimilar joint might be susceptible to SCC at applied tensile stresses close to the yield stress of the joint (180 MPa). The overaged TMAZ at the retreating side (2024A) could fail by stress assisted intergranular corrosion. Alternate immersion in chloride containing solution modified the corrosion behavior of the dissimilar joints as compared to permanent immersion. The severity of the corrosion damage of the 6056 alloy decreased as a result of a less effective galvanic coupling. The preferential attack of the 6XXX alloy took place mostly during the immersion period when all regions of the weld were short-circuited by the electrolyte. Moreover, the SCC susceptibility of the FSW 2024A/6056 joints was reduced after PWHT. It is well known that corrosion unfavorably affects the structural integrity since fatigue cracks can nucleate from corrosion pits, reducing the fatigue life of the component. SN testing of pre-corroded dissimilar FSW 2024A/6056 joints revealed that corrosion damage dramatically decreased fatigue life of the joints. Fatigue cracks initiated at deeply corroded zones on the 6056 side being in good agreement with the corrosion test findings. Moreover, it was also demonstrated that PWHT had no influence on fatigue resistance of the dissimilar joints. Both as welded and post weld heat treated dissimilar FSW joints exhibited similar fatigue lives.
8.4. Outlook
The feasibility to produce good quality linear dissimilar butt joints of the 2024 and 6056 aluminum alloys was demonstrated in this study. Nevertheless, in actual aircraft production, the joining of structural elements is not only limited to linear joints. The different sections of the airplane (i.e. barrels) are still being joined by riveting. The substitution of such riveted assemblies by circumferential friction stir welded joints presents an attractive solution to further reduce weight and manufacturing costs. Therefore, it would be interesting to analyze the feasibility of such radial dissimilar butt joints in terms of FSW tooling and fixturing, joining tolerances, and mechanical performance. More detailed analysis of the microstructural evolution of the FSW 2024 joint after post weld heat treatment is needed to understand the drop of hardness experienced by the weld nugget. Life managing of in service aircraft and designed for the future requires that time dependent processes, such as corrosion and corrosion fatigue, be explicitly considered in inspection and maintenance programs. Then, it has to be clearly determined how environmentally produced damage jeopardizes the performance of welded structures. In this work, it has been shown that corrosion damaged (pitting) severely deteriorates the fatigue life of pre-corroded specimens dissimilar FSW 2024A/6056 joints. However, there is a lack of information about the synergistic effect of cycling loading and corrosion attack on the performance of the dissimilar joints. Therefore, it will be necessary to study the fatigue life of FSW-joints in corrosive media and determine the fatigue crack growth (FCG) rates of environmental induced short and long cracks. It will be also interesting to analyze whether or not the galvanic coupling between the 2XXX and 6XXX alloys influences the fatigue crack growth behavior.

Chapter 8 Summary and conclusions
115
Another objective for further investigations will be to find an appropriate corrosion protection system for the dissimilar FSW 2024A/6056 joints. This will represent a major challenge, since galvanic corrosion between both alloys plays an important role on the corrosion behavior of the welded joint. Numerical methods, such as finite element (FEM) and boundary element (BEM) methods, should be applied to provide information about the long term corrosion performance of aeronautical structures containing dissimilar friction stir welded joints. The numerical methods can to increase the understanding of galvanic corrosion mechanisms and their interactions. More accurate lifetime predictions of the complex structures shall be possible. Last but not least, the critical distances of galvanic interaction could be determine more accurately allowing for design optimization of corrosion protection systems.

Apendix A1
116
Apendix A1 Second phase Particles in heat treatable aluminum alloys used in the aerospace industry [185] Intermetallic particles in heat treatable aluminum alloys are usually classified into intermetallic constituent particles, dispersoid particles, and precipitate particles based on the thermodynamic reactions which produce them and by the solubility of their components in the terminal solid solution. Consituent Particles These form by a liquid-solid eutectic reaction during solidification. Consequently, the interface between constituent particles and the matrix is non coherent. In as-cast ingot, the particles may either be equilibrium or metastable phases. During thermal treatment prior to deformation processing (ingot preheating), the equilibrium phase particles may grow by precipitation of atoms from a supersaturated solution while the metastable phase particles may transform to equilibrium phase particles. Both metastable and equilibrium phase particles may dissolve either partially or completely during subsequent thermal treatments depending on the solid state solubility of the elements forming the phase. Because the low solubility of iron in pure aluminum is reduced by alloying elements, constituent particles containing iron are insoluble. Therefore, the volume fraction after preheating cannot be modified by dissolution. Depending on the iron level and the temperature of thermal processing, however, Al-Fe particles may transform from one phase to another. This may be accompanied by a significant change in volume. Although silicon has appreciable solubility in aluminum, its solubility is decreased by alloying elements, particularly magnesium. Consequently, while soluble in some alloys, Mg2Si is virtually insoluble in alloys such as 7075. The size and size distribution of insoluble constituent particles which do not undergo a phase transformation are controlled by the rate of ingot solidification, the chemical composition, and the extent and nature of bulk deformation. Particle size decreases as solidification rate increases, as iron and/or silicon content decreases, and as the amount of deformation increases. Generally, the insoluble constituent particles are coarsest and most heterogeneously distributed in truck plate and are finer and more homogeneously distributed in thin sheet. Because deformation processing of forgings usually involves working in several directions, the particles in forgings are usually distributed more homogeneously than those in plate of the same thickness. Intermetallic constituent particles which do not contain iron may either be highly soluble or sparsely soluble depending on the solute content of the alloy. For example, the composition of alloy 2024 is broad enough that fully solution heat treated products may contain 1) both Al2Cu and Al2CuMg particles, 2) either Al2Cu or Al2CuMg particles, or 3) none of these particles. Also, Al2CuMg can readily be dissolved in 7075, but it is more difficult to dissolve in 7050. Moreover, Mg2Si particles, which are insoluble in 7075, are highly soluble in 6013. Phases which have been observed to be insoluble and sparsely soluble constituent particles in products of some of the aerospace alloys are presented in the following table. Higher purity versions may not have all of the insoluble constituents present.
ALLOY OBSERVED CONSTITUENT PHASE(S)

Apendix A1
117
2X24 Al7Cu2Fe, Al12(Fe,Mn)3Si, Al2CuMg, Al2Cu, Al6(Fe,Cu)
2Xl9 Al7Cu2Fe, Al12(Fe,Mn)3Si, Al2Cu 6013 Al12(Fe,Mn)3Si 7X75 Al7Cu2Fe, Al6(Fe,Mn), Al(Fe,Mn)3Si,
Mg2Si 7X50 Al7Cu2Fe, Mg2Si, Al2CuMg 7055 Al7Cu2Fe, Mg2Si 2090 Al7Cu2Fe 2091 Al7Cu2Fe, Al3Fe, Al12Fe3Si 2095 AI7Cu2Fe, AI2CuLi, Al6CuLi3 8090 Al3Fe
Dispersoid Particles Transition elements such as chromium, manganese, and zirconium have low solubility in high strength alloys. In the amounts usually used in such alloys, the chromium and zirconium and much of the manganese are in super-saturated solution in as-cast ingot. Depending on the iron and silicon contents, however, some manganese may combine with these elements during solidification to form Al12(Fe,Mn)3Si constituent particles. During ingot preheat the Cr, Mn, and Zr precipitate in most alloys as Al12Mg2Cr, A120Cu2Mn3, and Al3Zr particles, respectively. These high temperature precipitates are referred to as dispersoids. Because they form from a solid-solid reaction, at least one of their interfaces with the matrix is coherent. The Al3Zr particles precipitate in a metastable Ll2 structure which has a lattice parameter dose to that of aluminum and are fully coherent with the matrix. Although the tetragonal form of Al3Zr is the equilibrium phase, the Ll2 structure is remarkably resistant to transformation in the rugh-strength alloys. Moreover, because of the low diffusion coefficient of zirconium in aluminum, the Al3Zr dispersoids are highly resistant to coarsening. Kinetics of precipitation and dispersion of these dispersoids is affected by the nature of the other solute atoms in the alloy. Crystal structures of the other dispersoids are non-cubic, larger, and less resistant to coarsening at high temperatures. All of these particles are sufficiently resistant, however, that their size remains stable after ingot preheating unless subsequent thermal treatments are performed much above the conventional solution treatment temperature. The size and spacing of Al12Mg2Cr dispersoids in 7X75 alloy products can be modified by thermal treatments well above the dissolution temperature for zinc, magnesium, and copper. Because they were formed by a solid-solid reaction and are resistant to coarsening, dispersoids are much smaller than constituent particles. They range in size from about 0.02 to 0.5 µm Furthermore, because of the low solubility of Cr, Mn, and Zr and the low solidus temperatures of most high-strength alloys, dispersoids cannot be dissolved to an appreciable extent by subsequent solid state thermal treatments. Dispersoids found in some high-strength alloy products are presented in the following table:

Apendix A1
118
ALLOY DISPERSOID 2X24 A120Cu2Mn3 6013 Al12Mn3Si 7X75 Al12Mg2Cr 7X50 Al3Zr 7055 Al3Zr 2090 Al3Zr 2091 A13Zr 2095 Al3Zr 8090 Al3Zr
Precipitated Particles These particles form by decomposition of a supersaturated solid solution of the strengthening, or major, alloying elements. In the ideal situation, all of the major alloying elements dissolve during the solution treatment and remain in solid solution during the quench from the solution treatment temperature. Dissolution is readily attained, but preventing some precipitation during the quench is impossible except for the special case of thin product of a lean alloy. During most quenching operations, equilibrium phases precipitate on interfaces such as grain boundaries and the interface between dispersoid particles and the matrix. They may also nucleate during the quench on sub-grain boundaries and on constituent particles. In addition, phases which are metastable may nucleate because of reduced nucleation barrier height considerations and transform to the equilibrium phase if time permits. Possible precipitation reactions during quenching are best appreciated using isotherm al Time- Temperature- Transformation (TIT) diagrams, such as the one shown in Figure 5.15 for alloy 2024. TIT diagrams are C-shaped because of the competing effects of diffusion and solute super saturation. Diffusion kinetics are high at high temperatures but low at low temperatures, while solute super saturation is low at high temperatures but high at low temperatures. Consequently, nucleation rate is highest at intermediate temperatures. Three categories of precipitation heat treatment are generally employed on high-strength aluminium alloy products: natural aging (T3 and T4 tempers), artificial aging to peak strength (T6 and T8), and aging beyond peak strength (T7). In the general case, these treatments produce three types of matrix precipitates: Guinier-Preston (G-P) zones, other metastable precipitates, and equilibrium precipitates. G-P zones are fine, completely coherent clusters of the precipitating elements and have the same crystal structure as the matrix. Their shape and habit plane depend on the balance between strain energy and interfacial free energy. They nucleate primarily in the matrix either homogeneously or heterogeneously at vacancy clusters and less frequently at dislocations. Other metastable precipitates have a crystal structure which is different from that of the matrix and are completely coherent with the matrix on at least one interface. They have misfit dislocations along interfaces which are not completely coherent. They are larger than G-P zones, and often form by transformation of a G-P zone. They may also nucleate at dislocations, and in Al-Cu-X systems they prefer to nucleate at these sites. Equilibrium particles are larger and more widely spaced. They can form by transformation of metastable precipitates. They can also nucleate at dislocations and at interfaces such as grain boundaries and subgrain boundaries, and at the interface between other particles and the matrix. As their size increases, more misfit dislocations must be introduced at certain interfaces to maintain a degree of coherency. The matrix strengthening precipitates in several high-strength alloy products are presented below:

Apendix A1
119
MAJOR PRECIPITATE(S)
ALLOY· TEMPER
GPB zones 2X24-T3, T4 S’’; S’(S) = precursor to
S, Al2CuMg 2X24-T6, T8
θ’ = precursor to e, Al2CU
2X19-T8
Q = AIsCu2MggSi6 6013-T6 η’= precursor to TI,
MgZn2 or Mg(Zn,Cu,Alh
7X75-T6
η’; η 7X75-T76 η 7X75-T73 η’ 7050-T76 η 7050-T74 η’ 7150-T6
η’; η 7150-T77 η’; η 7055-T77
T1=AI2CuLi; S’; δ’=AI3Li
2090-T8
T1; S’ 2095-T6, T8 δ’; Tl 2091-T3 0'; S' 8090-T8,T7

Bibliography
120
Bibliography
1. Thomas, W.M., et al., Improvements Relating to Friction Welding, in European Patent, EP 0 615 480 B1. 1992.
2. Davenport, A.J., et al. Corrosion of Friction Stir Welds in High Strength Aluminum Alloys. in Corrosion science in the 21st Century. 2003.
3. Davenport, A.J., et al., Corrosion and Protection of Friction Stir Welds. Material Science Forum, 2006. 519-521: p. 699-704.
4. Connolly, B.J., et al. Localised Corrosion of Friction Stir Welds in Aluminium Alloys. in 5th International Symposium on Friction Stir Welding. 2004. Metz, France.
5. Srinivasan, P.B., et al., Stress corrosion cracking susceptibility of friction stir welded AA7075-AA6056 dissimilar joint. Materials Science and Engineering A, 2005. 392(1-2): p. 292-300.
6. Hatch, E., J., Aluminum: Properties and physical metallurgy, ed. A.s.f. metals. 1984, Metals Park, Ohio.
7. Shih, H.C., N.J. Ho, and J.C. Huan, Precipitation Behaviors of Al-Cu-Mg 2024 Aluminum Alloys. Metallurgical and Material Transactions A, 1996. 27A: p. 2479-2494.
8. Gouma, P.I., D.J. Lloyd, and M.J. Mills, Precipitation processes in Al-Mg-Cu alloys. Materials Science and Engineering A, 2001. 319-321: p. 439-442.
9. Ringer, S.P., T. Sakurai, and I.J. Polmear, Origins of hardening in aged Al-Cu-Mg-(Ag) alloys. Acta Materialia, 1997. 45(9): p. 3731-3744.
10. Jena, A.K., A.K. Gupta, and M.C. Chaturvedi, A differential scanning calorimetric investigation of precipitation kinetics in the Al-1.53 wt% Cu-0.79 wt% Mg alloy. Acta Metallurgica, 1989. 37(3): p. 885-895.
11. Ratchev, P., B. Verlinden, and P. Van Houtte, S' phase precipitation in Al-4wt.%Mg-1wt.%Cu alloy. Scripta Metallurgica et Materialia, 1994. 30(5): p. 599-604.
12. Ringer, S.P., et al., Cluster hardening in an aged Al-Cu-Mg alloy. Scripta Materialia, 1997. 36(5): p. 517-521.
13. Ringer, S.P., S.K. Caraher, and I.J. Polmear, Response to comments on cluster hardening in an aged Al-Cu-Mg alloy. Scripta Materialia, 1998. 39(11): p. 1559-1567.
14. Zahra, A.M., et al., Comments on "cluster hardening in an aged Al-Cu-Mg alloy". Scripta Materialia, 1998. 39(11): p. 1553-1558.
15. Charai, A., et al., Coexistence of clusters, GPB zones, S''-, S'- and S-phases in an Al-0.9% Cu-1.4% Mg alloy. Acta Materialia, 2000. 48(10): p. 2751-2764.
16. Wilson, R.N. and P.G. Partridge, The nucleation and growth of S' precipitates in an aluminium-2.5% copper-1.2% magnesium alloy. Acta Metallurgica, 1965. 13(12): p. 1321-1327.
17. Radmilovic, V., et al., On the nucleation and growth of Al2CuMg (S') in Al---Li---Cu---Mg and Al---Cu---Mg alloys. Scripta Metallurgica, 1989. 23(7): p. 1141-1146.
18. Ratchev, P., et al., Precipitation hardening of anAl-4.2 wt% Mg-0.6 wt% Cu alloy. Acta Materialia, 1998. 46(10): p. 3523-3533.
19. Silcock, J.M., The structural aging characteristics of Al-Cu-Mg alloys with copper:magnesium weigth ratios of 7:1 and 2.2:1. Journal of the Institut of Metals, 1960-61. 89: p. 203-210.
20. Cuisiat, F., P. Duval, and R. Graf, Etude des premiers stades de decomposition d'un alliage Al---Cu---Mg. Scripta Metallurgica, 1984. 18(10): p. 1051-1056.

Bibliography
121
21. Dutta, I. and S.M. Allen, A calorimetric study of precipitation in commercial aluminium alloy 6061. Journal Materials Science Letters, 1997. 10: p. 323-326.
22. Burger, G.B., et al., Microstructural control of aluminum sheet used in automotive applications. Materials Characterization Microstructural Characterization of Lightweight Structural Materials Transportation, 1995. 35(1): p. 23-39.
23. Edwards, G.A., et al., The precipitation sequence in Al-Mg-Si alloys. Acta Materialia, 1998. 46(11): p. 3893-3904.
24. Zhen, L., et al., Precipitation behaviour of Al–Mg–Si alloys with high silicon content. Journal of Merial Science, 1997. 32.
25. Andersen, S.J., et al., The crystal structure of the β'; phase in Al-Mg-Si alloys. Acta Materialia, 1998. 46(9): p. 3283-3298.
26. Lynch, J.P., L.M. Brown, and M.H. Jacobs, Microanalysis of age-hardening precipitates in aluminium alloys. Acta Metallurgica, 1982. 30(7): p. 1389-1395.
27. Andersen, S.J., Quantification of Mg2Si β'' and β' by Transmition Electron Microscopy. Metallurgical and Material Transactions A, 1995. 26A: p. 1931-1937.
28. Miao, W.F. and D.E. Laughlin, Precipitation hardening in aluminum alloy 6022. Scripta Materialia, 1999. 40(7): p. 873-878.
29. Chakrabarti, D.J. and D.E. Laughlin, Phase relations and precipitation in Al-Mg-Si alloys with Cu additions. Progress in Materials Science A Festschrift in Honor of T. B. Massalski, 2004. 49(3-4): p. 389-410.
30. Matsuda, K., et al., Metastable Phases in Al-Mg-Si Alloy Containing Copper. Metallurgical and Material Transactions A, 2001. 32A: p. 1293-1298.
31. Dumolt, S.D., D.E. Laughlin, and J.C. Williams, Formation of a modified [beta]' phase in aluminum alloy 6061. Scripta Metallurgica, 1984. 18(12): p. 1347-1350.
32. Wolverton, C., Crystal structure and stability of complex precipitate phases in Al-Cu-Mg-(Si) and Al-Zn-Mg alloys. Acta Materialia, 2001. 49(16): p. 3129-3142.
33. Chakrabarti, D.J., B. Cheong, and D.E. Luaghlin. Precipitation in AL-Mg-Si- Alloys and the Role of the Q-phase and it precursors. in Automotive alloys. 1998. San Antoni, TX, USA: TMS.
34. Esmaeli, D.J., et al., On Precipitation-Hardening Behaviour of the Al-Mg-Si-Cu Alloy 6111. Metallurgical and Material Transactions A, 2003. 34A: p. 751-763.
35. Braun, R., Investigations on the long-term stability of 6013-T6 sheet. Materials Characterization, 2006. 56(2): p. 85-95.
36. Murayama, M. and K. Hono, Pre-precipitate clusters and precipitation processes in Al-Mg-Si alloys. Acta Materialia, 1999. 47(5): p. 1537-1548.
37. Segalowicz, L., et al. A study of the structural precipitation in Al-Mg-Si-Cu system. in The Fourth International Conference on Aluminum Alloys (1994). 1994.
38. Arbegast, W.J. Modeling Friction Stir Joining as a Metalworking Process. in Hot Deformation of Aluminum Alloys III. 2003.
39. Colligan, K., Material Flow Behavior during Friction Stir Welding of Aluminum. Welding Journal, 1999. 78(7): p. 229s-237s.
40. Rhodes, C.G., et al., Effects of friction stir welding on microstructure of 7075 aluminum. Scripta Materialia, 1997. 36(1): p. 69-75.
41. Liu, G., et al., Microstructural aspects of the friction-stir welding of 6061-T6 aluminum. Scripta Materialia, 1997. 37(3): p. 355-361.
42. Murr, L.E., G. Liu, and J.C. McClure, A TEM study of precipitation and related microstructures in friction-stir-welded 6061 aluminium. Journal of materials science, 1998. 33: p. 1243-1251.
43. Sato, Y.S., et al., Microstructural Evolutionof 6063 Aluminumduring Friction Stir Welding. Metallurgical and Materials Transactions A, 1999. 30A: p. 2429-2437.

Bibliography
122
44. Mahoney, M.W., et al., Properties of friction-stir-welded 7075 T651 aluminium. Metalurgical and Material Transactions A, 1998. 29A: p. 1955-1964.
45. Simar, A., T. Pardoen, and B. De Meester. Influence of friction stir welding parameters on the power input and temperature distribution in aluminium alloys. in 5th International Symposium on Friction Stir Welding. 2004. Metz, France.
46. Tang, W., et al., Heat Input and Temperature Distribution in Friction Stir Welding. Journal of Materials Processing and Manufacturing Science, 1998. 7(2): p. 163–172.
47. Sato, Y.S., et al., Precipitation sequence in friction stir welded 6063 aluminum during aging. Metallurgical and Materials Transactions A, 1999. 30A.
48. Jata, K.V. and S.L. Semiatin, Continuous dynamic recrystallization during friction stir welding of high strength aluminum alloys. Scripta Materialia, 2000. 43(8): p. 743-749.
49. Denquin, A., et al. Microsctuctural evolution in a friction stir welded Al-Mg-Si-Cu Alloy. 2000
50. Heinz, B. and B. Skrotzki, Characterization of a Friction-Stir-Welded Aluminium Alloy 6013. metallurgical and Materials Transactions B, 2002. 33B: p. 489-498.
51. Sato, Y.S. and U.a.H.K. Mitsunori, Parameters Controlling Microstructure and Hardness during Friction-Stir Welding of Precipitation-Hardenable Aluminum Alloy 6063. Metallurgical and Materials Transactions A, 2002. 33A(3): p. 625-635.
52. Hassan, K.A.A., et al., Effect of welding parameters on nugget zone microstructure and properties in high strength aluminium alloy friction stir welds. Science ancl Technology ofWelding and Joining, 2003. 8(4): p. 257-268.
53. Litynska, L., et al., TEM study of the microstructure evolution in a friction stir-welded AlCuMgAg alloy. Materials Chemistry and Physics, 2003. 81(2-3): p. 293-295.
54. Cabibbo, M., E. Meccia, and E. Evangelista, TEM analysis of a friction stir-welded butt joint of Al-Si-Mg alloys. Materials Chemistry and Physics, 2003. 81(2-3): p. 289-292.
55. Genevois, C., et al., Quantitative investigation of precipitation and mechanical behaviour for AA2024 friction stir welds. Acta Materialia, 2005. 53(8): p. 2447-2458.
56. Jones, M.J., et al., Correlation between microstructure and microhardness in a friction stir welded 2024 aluminium alloy. Scripta Materialia, 2005. 52(8): p. 693-697.
57. Salem, H.G., A.P. Reynolds, and J.S. Lyons, Microstructure and retention of superplasticity of friction stir welded superplastic 2095 sheet. Scripta Materialia, 2002. 46(5): p. 337-342.
58. Benavides, S., et al., Low-temperature friction-stir welding of 2024 aluminum. Scripta Materialia, 1999. 41(8): p. 809-815.
59. Su, J.-Q., et al., Microstructural investigation of friction stir welded 7050-T651 aluminium. Acta Materialia, 2003. 51(3): p. 713-729.
60. Yan, J., M.A. Sutton, and A.P. Reynolds. Process-structure-property relation for and HAZ regions of AA2524-T351FSW joints. in 5th International Friction Stir Welding Symposium. 2004. Metz, France.
61. Yang, B., et al., Banded microstructure in AA2024-T351 and AA2524-T351 aluminum friction stir welds: Part I. Metallurgical studies. Materials Science and Engineering A, 2003. In Press, Corrected Proof.
62. Biallas, G., et al. Mechanical properties and corrosion behavior of friction stir welded 2024-T3. in 1st International Symposium on Friction Stir Welding. 1999. Cambridge, UK.
63. Reynolds, A.P., Visualisation of material flow in autogenous friction stir welds. Science and Technology of Welding and Joining, 2000. 5(2): p. 120-124.
64. Krishnan, K.N., On the formation of onion rings in friction stir welds. Materials Science and Engineering A, 2002. 327(2): p. 246-251.

Bibliography
123
65. Arbegast, W.J. Using process parameters as a statistical process control tool fo friction stir welds. in Friction stir welding and processing III. 2005. San Fracisco, Ca, USA.
66. Sato, Y.S., et al., Hall-Petch relationship in friction stir welds of equal channel angular-pressed aluminium alloys. Materials Science and Engineering A, 2003. 354(1-2): p. 298-305.
67. Genevois, C., A. Deschamps, and A. Denquin. Characterisation of the microstructural evolution during friction stir welding of aluminium alloys: a comparative study of 5251 and 2024 alloys. in 5th International Symposium on Friction Stir Welding, Metz, France, 14-16 September 2004. 2004. Metz, France.
68. Fonda, R.W. and J.F. Bingert, Microstructural Evolution in the Heat Affected Zone. Metalurgical and Material Transactions A, 2004. 35A: p. 1487-1499.
69. Genevois, C., A. Deschamps, and P. Vacher, Comparative study on local and global mechanical properties of 2024 T351, 2024 T6 and 5251 O friction stir welds. Materials Science and Engineering: A, 2006. 415(1-2): p. 162-170.
70. Sato, Y., Relationship between mechanical properties and microstructure. Welding International, 2003(9): p. 706-709.
71. Denquin, A., et al. Microstructural evolution and strength mismatch within a friction stir welded 6056 aluminium alloy. in 3rd International Symposium on Friction Stir Welding. 2001. Kobe, Japan.
72. Heinz, B., B. SKROTZKI, and G. Eggler, Microstructural and Mechanical Characterization of Friction Stir Welded Al-Alloy. Materials Science Forum, 2000. 331-337: p. 1751-1762.
73. Frigaard, O., O. Grong, and O.T. Midling, A process model for friction stir welding of age hardening aluminum alloys. Metallurgical and materials transactions A, 2001. 32A: p. 1189-1200.
74. Song, M. and R. Kovacevic, Thermal modeling of friction stir welding in a moving coordinate system and its validation. International Journal of Machine Tools and Manufacture, 2003. 43(6): p. 605-615.
75. Gallais, C., et al. Modelling the Relationship between Process Parameters , Microstructural Evolutions and Mechanical Behaviour in a Friction Stir Welded 6XXX Aluminium Alloy. in 5th International Symposium on Friction Stir Welding. 2004. Metz, France.
76. Thomas, W.M. and D.R. E. Friction stir welding development. in 6th International trends in welding research. 2003. Pine Mountain, GA, USA.
77. TWI, TrivexTM tool for friction stir welding. 2003. 78. Reynolds, A.P. and W. Tang. Alloy, tool geometry, and parameters effects on friction
stir weld energies and resultant FSW joint properties. in Friction Stir Welding and Processing. 2001. Indianapolis, Indiana, USA.
79. Yan, J., M.A. Sutton, and A.P. Reynolds. Process-structure-property relationship for nugget and HAZ regions of AA2524-T351 FSW joints. in 5th International Friction Stir Welding Symposium. 2004. Metz, France.
80. Li, Y., L.E. Murr, and J.C. McClure, Flow visualization and residual microstructures associated with the friction-stir welding of 2024 aluminum to 6061 aluminum. Materials Science and Engineering A, 1999. 271(1-2): p. 213-223.
81. Ma, Z.Y., R.S. Mishra, and M.W. Mahoney, Superplastic deformation behaviour of friction stir processed 7075Al alloy. Acta Materialia, 2002. 50(17): p. 4419-4430.
82. Wood, M., S. Larson, and H. Dahlstrom. Environmental compairson of FSW against MIG Aluminum Rail Way Rolling Stock. 2001.
83. Marie, F., D. Allehaux, and B. Esmiller. Development of Bobbin Tool technique on Various Aluminum Alloys. in 5th International FSW Symposium. 204. Metz, France.

Bibliography
124
84. Cavaliere, P., E. Cerri, and A. Squillace, Mechanical response of 2024-7075 aluminium alloys joined by Friction Stir Welding. Journal of materials science, 2005. 40: p. 3669-3676.
85. Lee, W.B., Y.M. Yeon, and S.B. Jung, The mechanical properties related to the dominant microstructure in the weld zone of dissimilar formed Al alloy joints by friction stir welding. JOURNAL OF MATERIALS SCIENCE, 2003. 38: p. 4183-4191.
86. Lee, W.-B., Y.-M. Yeon, and S.-B. Jung, The joint properties of dissimilar formed Al alloys by friction stir welding according to the fixed location of materials. Scripta Materialia, 2003. 49(5): p. 423-428.
87. Shigematsu, I., et al., Joining of 5083 and 6061 aluminum alloy by friction stir welding. Journal of materials science letters, 2003. 22: p. 353-356.
88. Somasekharan, A.C. and L.E. Murr, Microstructures in friction-stir welded dissimilar magnesium alloys and magnesium alloys to 6061-T6 aluminum alloy. Materials Characterization, 2004. 52(1): p. 49-64.
89. Yasui, T., et al., Welding of Aluminum and Steel by Friction Stir Welding. Materials Science Forum, 2004. 449-452: p. 433-436.
90. Uzun, H., et al., Friction stir welding of dissimilar Al 6013-T4 To X5CrNi18-10 stainless steel. Materials & Design, 2005. 26(1): p. 41-46.
91. Kimapong, K. and T. Watanabe, Friction Stir Welding of Aluminum Alloy to Steel. Welding Journal, 2004. 83(10): p. 277-s.
92. Sato, Y.S., et al., Constitutional liquation during dissimilar friction stir welding of Al and Mg alloys. Scripta Materialia, 2004. 50(9): p. 1233-1236.
93. Wert, J.A., Microstructures of friction stir weld joints between an aluminium-base metal matrix composite and a monolithic aluminium alloy. Scripta Materialia, 2003. 49(6): p. 607-612.
94. Murr, L.E., et al., Intercalation vortices and related microstructural features in the friction-stir welding of dissimilar metals. 1998. 95. Okomura, H. and K. Aota, Joining dissimilar materials with friction stir welding. Welding International, 2004. 18(11): p. 852-860.
96. Baumann, J.A., et al. Property characterization of 2024 Al/7075 Al Bi-alloy Friction Stir Welding. in Friction Stir Welding and Processing II. 2003. San Diego, CA, USA: TMS.
97. Dix, E.H., R.H. Brown, and W.W. Binger, The Resistance of Aluminum Alloys to Corrosion, in Metals Handbook: Properties and Selection of Materials. 1961, ASM: Metals Park, Novelty, Ohio. p. 916-935.
98. Foley, R.T., Localized corrosion of aluminum alloys- A review. Corrosion, 1986. 42(5): p. 277-288.
99. Summerson, T.J. and D.O. Sprowls. Corrosion behavior of aluminum alloys. in International Conference of Aluminum Alloys. 1986. Charlottesville, Virginia, USA.: EMAS.
100. Lifka, B.W., Aluminum (and Alloys), in Corrosion Test and Standards, R. Baboian, Editor. 1995, ASTM: Philadelphia, PA, USA. p. 447-475.
101. Oldfield, J.W. Electrochemical Theory of Galvanic Corrosion. in Galvanic Corrosion, ASTM STP 978. 1988. Phoenix, AZ, USA: ASTM.
102. West, J.M., Basic Corrosion and Oxidation. Second Edition ed. 1986, Chischetet, England: Ellis Horwood Limited.
103. Holligsworth, E.H. and H.Y. Hunsicker, Corrosion resistance of aluminum alloys, in Metals Handbook Vol.2, ASM, Editor. 1979. p. 204-236.

Bibliography
125
104. Buchheit, R.G., A Compilation of Corrosion Potentials Reported for Intermetallic Phases in Aluminum Alloys. Journal of The Electrochemical Society, 1995. 142(11): p. 3994-3996.
105. Schütz, W. Corrosion Fatigue- The Forgotten Factor in Assesing Durability. in ICAF´'95. 1995. Melbourn, Australia: EMAS.
106. Hoeppner, P.E., et al. Corrosion and Fretting as Critical Aviation Safety Issues: Case studies, Facts, and Figures from US Aircraft Accident and Incidents. in ICAF '95. 1995.
107. Chen, G.S., et al. Corrosion and Corrosion Fatigue of Aiframe Aluminum Alloys. in FAA/NASA International Symposium on Advanced Structural Methods for Airframe Durability and Damage Tolerance. 1994.
108. Wei, R.P., Corrosion/corrosion fatigue and life-cycle managemant. Materials Science Research International, 2001. 7(3): p. 147-156.
109. Du, M.L., et al., Damage of Al 2024 alloy due to sequential exposure to fatigue, corrosion and fatigue. International Journal of Fatigue, 1998. 20(10): p. 743-748.
110. DuQuesnay, D.L., P.R. Underhill, and H.J. Britt, Fatigue crack growth from corrosion damage in 7075-T6511 aluminium alloy under aircraft loading. International Journal of Fatigue, 2003. 25(5): p. 371-377.
111. Medved, J.J., M. Breton, and P.E. Irving, Corrosion pit size distributions and fatigue lives-a study of the EIFS technique for fatigue design in the presence of corrosion. International Journal of Fatigue, 2003. In Press, Corrected Proof.
112. Simon, L.B., et al. Influnce of Pitting Corrosion on Structural Integrity of Aluminum Alloys. in SPIE Conference on Nondestructive Evaluation of Aging Materials and Composites III. 1999. Newport Beach, California.
113. Wei, R.P., Corrosion and Corrosion Fatigue of Airframe materials. 2000. final report.
114. Gruenberg, K.M., et al., Predicting fatigue life of pre-corroded 2024-T3 aluminum. International Journal of Fatigue, 2003. In Press, Corrected Proof.
115. Gruenberg, K.M., et al., Predicting fatigue life of pre-corroded 2024-T3 aluminum from breaking load tests. International Journal of Fatigue, 2003. In Press, Corrected Proof.
116. Alfaro Mercado, U., T. Ghidini, and C. Dalle Donne. Fatigue of Pre-corroded 2024-T3 Friction Stir Welds: Experiment and Prediction. in Friction Stir Welding and Processing III. 2005. San Francisco, CA. USA: TMS.
117. McCafferty, E., Sequence of steps in the pitting of aluminum by chloride ions. Corrosion Science, 2003. 45(7): p. 1421-1438.
118. Sharland, S.M., A review of the theoretical modelling of crevice and pitting corrosion. Corrosion Science, 1987. 27(3): p. 289-323.
119. Szklarska-Smialowska, Z., Pitting corrosion of aluminum. Corrosion Science, 1999. 41(9): p. 1743-1767.
120. Guillaumin, V. and G. Mankowski, Localized corrosion of 2024 T351 aluminium alloy in chloride media. Corrosion Science, 1998. 41(3): p. 421-438.
121. Harlow, D.G. and R.P. Wei, A probability model for the growth of corrosion pits in aluminum alloys induced by constituent particles. Engineering Fracture Mechanics, 1998. 59(3): p. 305-325.
122. Shao, M., et al., A study on pitting corrosion of aluminum alloy 2024-T3 by scanning microreference electrode technique. Materials Science and Engineering A, 2003. 344(1-2): p. 323-327.
123. Zhu, D. and W.J. van Ooij, Corrosion protection of AA 2024-T3 by bis-[3-(triethoxysilyl)propyl]tetrasulfide in neutral sodium chloride solution. Part 1: corrosion of AA 2024-T3. Corrosion Science, 2003. 45(10): p. 2163-2175.

Bibliography
126
124. Blanc, C. and G. Mankowski, Susceptibility to pitting corrosion of 6056 aluminium alloy. Corrosion Science, 1997. 39(5): p. 949-959.
125. Guillaumin, V. and G. Mankowski, Localized corrosion of 6056 T6 aluminium alloy in chloride media. Corrosion Science, 2000. 42(1): p. 105-125.
126. Blanc, C., Y. Roques, and G. Mankowski, Application of phase shifting interferometric microscopy to studies of the behaviour of coarse intermetallic particles in 6056 aluminium alloy. Corrosion Science, 1998. 40(6): p. 1019-1035.
127. Streicher, M.A., Intergranular, in Corrosion Test and Standards, R. Baboian, Editor. 1995, ASTM: Philladelphia, PA, USA. p. 197-217.
128. Svenningsen, G., et al., Effect of low copper content and heat treatment on intergranular corrosion of model AlMgSi alloys. Corrosion Science, 2006. 48(1): p. 226-242.
129. Svenningsen, G., et al., Effect of thermomechanical history on intergranular corrosion of extruded AlMgSi(Cu) model alloy. Corrosion Science, 2006. 48(12): p. 3969-3987.
130. Staley, J.T., Quench factor analysis of aluminum alloys. Materials Science and Technology, 1987. 3.
131. Sprowls, D.O., Exfoliation, in Corrosion Tests and Standards, R. Baboian, Editor. 1995, astm: Philladelphia, PA, USA. p. 218-239.
132. Robinson, M.J. and N.C. Jackson, The influence of grain structure and intergranularcorrosion rate on exfoliation and stress corrosion crackingof high strength Al-Cu-Mg alloys. Corrosion Science, 1999. 41(5): p. 1013-1028.
133. Posada, M., et al., Exfoliation and related microstructures in 2024 aluminum body skins on aging aircraft. Materials Characterization, 1997. 38(4-5): p. 259-272.
134. Lifka, W.D., Corrosion resistance of aluminium alloy plate in rural, industrial and seacost atmospheres. Aluminium, 1987. 67.
135. Robinson, M.J., Mathematical modelling of exfoliation corrosion in high strength aluminium alloys. Corrosion Science, 1982. 22(8): p. 775-790.
136. Ketcham, S.J. and E. Jankowsky. Developing an Accelerated Test: Problems and Pitfalls. in Laboratiry Corrosion Tests and Standards. 1983. Bal Harbour, Fl, USA.
137. Thomson, J.J. Exfoliation Corrosion Testing of Alumnum-Lithium Alloys. in New Methods for Corrosion Testing of Aluminum Alloys. 1990. San Francisco, CA, USA: ASTM.
138. Dieter, G.E., Mechanical Metallurgy, Second Edition. 1976: McGraw-Hill. 139. Speidel, M.O., Stress corrosion cracking of aluminum alloys. Metallurgical and
materials transactions A, 1975. 6A: p. 631-650. 140. Braun, R., Enviromentally assisted cracking of aluminum alloys. Materialwissenchaft
und Werkstofftechnik, 2007. 38(9): p. 674-689. 141. Burleigh, T.D., The Postulated Mechanisms for Stress Corrosion Cracking. Corrosion,
1991. 47(2): p. 89-98. 142. Sieradzki, K. and R.C. Newman, Stress-corrosion cracking. Journal of Physics and
Chemistry of Solids, 1987. 48(11): p. 1101-1113. 143. Palumbo, G., et al., Grain boundary design and control for intergranular stress-
corrosion resistance. Scripta Metallurgica et Materialia, 1991. 25(8): p. 1775-1780. 144. Sedriks, A.J., Stress Corrosion Cracking Test Methods. 1990: NACE. 145. Lumsden, J.B., et al., Intergranular corrosion following friction stir welding of
aluminum alloy 7075-T651. Corrosion, 1999. 55(12): p. 1127-1135. 146. Hannour, F., A.J. Davenport, and M. Strangwood. Corrosion of Friction Stir Welds in
High Strength Aluminium Alloys. in 2nd International Symposium on Friction Stir Welding. 2000. Gothenburg, Sweden.
147. Davenport, A.J., et al. Corrosion of Friction Stir Welds in Aerospace Alloys. in 204th Meeting of The Electrochemical Society. 2003.

Bibliography
127
148. Corral, J., et al., Corrosion of friction stir welded aluminum alloys 2024 and 2195. Journal of materials science letters, 2000. 19: p. 2117-2122.
149. Schmidt, H.-J., et al. Current status of research and development activities for the fuselage of a large Airbus aircraft. in Proc. of the 2Oth Symposium ofthe International Committee on Aeronautical Fatigue ICAF '99. 1999.
150. Collins, R.A., et al. Advanced Materials and Manufacturing Techniques on Future Airbus Aircraft. in ICAF 2003 - Fatigue on Aeronautical Structures as an Engineering Challenge. 2003: EMAS.
151. Lohwasser, D. Friction Stir Welding of Aerospace AIIoys. in 4th International Symposium on Friction Stir Welding. 2003. Park City, USA.
152. Warner, T.J., et al. Aluminium alloy developments for affordable airframe structures. in Processing and modelling of advanced materials. 1997. Paris, France: Alcan.
153. Bucci, R.J., Selecting Aluminum Alloys to Resist Failure by Fracture Mechnisms, in ASM Handbook Vol. 19, Fatigue and Fracture, S.R. Lampman, Editor. 1996, ASM International. p. 771-812.
154. Braun, R. On the Long-Term Stability of 6013-T6 Aluminium Alloy Sheet. in ICAA9, 9th International Conferences on Aluminium Alloys, Bisbane, Australia. 2004.
155. Schumann, Metallographie, ed. V.D.V.f. Grunstoffindustrie. 1960, Liepzig. 156. Biallas, G. and C. Dalle Donne, Reibrührschweißungen aus Aluminium
charakterisieren. Materialprüfung, 2000. 42(6): p. 236-239. 157. Baboian, R., Corrosion and test and standards - Application and interpretation. 1995:
ASTM. 158. Braun, R., Investigation of the SCC behaviour of alloy 2024 using the slow strian rate
technique. Werkstoffe und Korrosion, 1993. 44: p. 73-82. 159. Delmas, F., et al., Quantitative TEM study of the precipitation microstructure in
aluminium alloy Al(MgSiCu) 6056 T6. Materials Science and Engineering A, 2004. 373(1-2): p. 80-89.
160. Fabrègue, D., A. Deschamps, and M. Suery, Microstructure of butt laser joints of aluminum alloy 6056 sheets wiht an AS12 filler. Materials Science and Technology, 2005. 21(11): p. 1329-1336.
161. Delmas, F., et al., Straining mechanisms in aluminium alloy 6056. In-situ investigation by transmission electron microscopy. Materials Science and Engineering A, 2003. 340(1-2): p. 286-291.
162. Cayron, C. and P.A. Buffat, Transmission electron microscopy study of the [beta]' phase (Al-Mg-Si alloys) and QC phase (Al-Cu-Mg-Si alloys): ordering mechanism and crystallographic structure. Acta Materialia, 2000. 48(10): p. 2639-2653.
163. Brewer, L. and C.-. Shi-Ger, Metals Handbook, Metallogrphy, Structrures and phase diagrams, in Metals Handbook,, T. Lyman, Editor. 1973, Americab Society for Metals.
164. Askari, A., et al. Modeling and analysis of friction stir welding. in FSW Flow visualisation and modeling semina. 2003. GKSS Forschungszentrum, Geesthacht, Germany.
165. Cho, J.-H., D.E. Boyce, and P.R. Dawson, Modeling strain hardening and texture evolution in friction stir welding of stainless steel. Materials Science and Engineering A, 2005. 398(1-2): p. 146-163.
166. Sheikhi, S., Herstellung und Bewertung der Umformbarkeit von reibrührgeschweißten Tailored Blanks aus Aluminiumlegierungen, in Fakultät für Ingenieurwissenschaften, Abteilung Maschinenbau. 2006, Universität Duisburg-Essen. p. 174.
167. Dieter, E.G., Strengthening mechanisms, in Mechanical metalurgy, E. Board, Editor. 1976, McGraw-Hill. p. 221-225.

Bibliography
128
168. Zhang, W. and G.S. Frankel, Localized Corrosion Growth Kinetics in AA2024 Alloys. Journal of The Electrochemical Society, 2002. 149: p. 510-519.
169. Zhang, W., et al., Statistical model for intergranular corrosion growth kinetics. Corrosion Science, 2003. 45(2): p. 353-370.
170. Blanc, C., et al., Modelling the corrosion behaviour of Al2CuMg coarse particles in copper-rich aluminium alloys. Corrosion Science, 2006. In Press, Corrected Proof.
171. Buchheit, R.G., et al., Local Dissolution Phenomena Associated with S Phase (Al[sub 2]CuMg) Particles in Aluminum Alloy 2024-T3. Journal of The Electrochemical Society, 1997. 144(8): p. 2621-2628.
172. Blanc, C., B. Lavelle, and G. Mankowski, The role of precipitates enriched with copper on the susceptibility to pitting corrosion of the 2024 aluminium alloy. Corrosion Science, 1997. 39(3): p. 495-510.
173. Campestrini, P., et al., Relation between microstructural aspects of AA2024 and its corrosion behaviour investigated using AFM scanning potential technique. Corrosion Science, 2000. 42(11): p. 1853-1861.
174. Warner, T.J., et al., Characterisation of Corrosion Initiation on 2024 Aluminium Alloy by Atomic Force Microscopy. Zeitschrift für Metallkunde, 1995. 86(7): p. 494-501.
175. Sato, Y., et al., Precipitation sequence in friction stir weld of 6063 aluminum during aging. Metallurgical and Materials Transactions A, 1999. 30(12): p. 3125-3130.
176. Sato, Y., et al., Microstructural evolution of 6063 aluminum during friction-stir welding. Metallurgical and Materials Transactions A, 1999. 30(9): p. 2429-2437.
177. Murayama, M., et al., Atom probe studies on the early stages of precipitation in Al-Mg-Si alloys. Materials Science and Engineering A, 1998. 250(1): p. 127-132.
178. Burleigh, T.D., E. Ludwiczak, and R.A. Petri, Intergranular corrosion of an Aluminum-Magnesium-Silicon-Copper Alloy. Corrosion, 1995. 51(1): p. 50-55.
179. Svenningsen, G., et al., Effect of artificial aging on intergranular corrosion of extruded AlMgSi alloy with small Cu content. Corrosion Science, 2006. 48(6): p. 1528-1543.
180. Braun, R., Effect of thermal exposure on the microstructure, tensile properties and the corrosion behaviour of 6061 aluminium alloy sheet. Material and Corrosion, 2005. 56(3): p. 159-165.
181. Shigematsu, I., et al., Joining of 5083 and 6061 aluminum alloys by friction stir welding. Journal of Materials Science Letters, 2003. 22: p. 353-356.
182. Chakrabarti, D.J. and D.E. Laughlin, Phase relations and precipitation in Al-Mg-Si alloys with Cu additions. Progress in Materials Science, 2004. 49(3-4): p. 389-410.
183. Bardi, F., M. Cabibbo, and S. Spigarelli, An analysis of thermo-mechanical treatments of a 2618 aluminium alloy: study of optimum conditions for warm forging. Materials Science and Engineering A, 2002. 334(1-2): p. 87-95.
184. Biallas, G. and C. Dalle Donne, Reibrührschweißungen aus Aluminium charakterisieren. Materialprüfung, 2000: p. 236-239.
185. Stanley, J.T. Metallurgical aspects affecting strength of heat-treatable alloy peoducts used in aerospace industry. in 3rd International Conference on Aluminum Alloys. 1992. Trondheim, Norway.

129
Abstract Friction stir welding (FSW) has been identified as “key” technology for the production of primary aerospace structures, being able to substitute conventional riveted airframes. FSW is a solid state welding process that avoids any problems caused by the solidification of the melted weld pool. Besides the production of high quality similar joints from high strength aluminum alloys, it allows for joining materials of different metallurgical characteristics. However, problems concerning the corrosion behavior of dissimilar joints may arise, since aircrafts operate in corrosive media. For the safe implementation of dissimilar joints, a good understanding of the relevant corrosion mechanisms is crucial. In this study, the correlation between microstructure, local strength and corrosion behavior of dissimilar FSW joints produced from 2024A and 6056 alloys in two different tempering conditions was investigated. The heat affected zone of 6056 in 2024A-T3/6056-T6 as-welded joints could easily be identified by a marked hardness drop. Coarsening and dissolution of strengthening precipitates in that region brought about the weakest link during static tensile tests. Because of the low strength of as-welded dissimilar joints, welds were also produced from 6056 in the naturally aged T4 condition. After FSW, these joints were aged at 190°C for 10h resulting in a 2024A-T8/6056-T7X tempering condition. Due to a more homogeneous precipitation of hardening particles, the post-weld heat treatment improved hardness and static strength remarkably. The corrosion performance of the dissimilar joints observed in various immersion tests was governed by galvanic coupling between both aluminum alloys. For as-welded joints, the more active 6056-T6 alloy provided cathodic protection to 2024-T3 when exposed to aqueous chloride solutions, particularly under permanent immersion conditions. Strips of alloy 6056 being present in the nugget region corroded preferentially. A significant improvement of the corrosion behavior was observed in the case of the post-weld heat treated 2024A-T8/6056- T7X joints. Although corrosion potential of both alloys considerably decreased, the difference between them was also reduced. Therefore, the post weld heat treatment equalized the corrosive attack and suppressed preferential dissolution of 6056 alloy. Zusammenfassung Das Reibrührschweißen (engl. friction stir welding; FSW) wurde als „Schlüsseltechnologie“ für die Herstellung von Primärluftfahrtstrukturen identifiziert, um herkömmlich genietete Flugzeugstrukturen zu ersetzen. Das FSW ist ein Schweißprozess (im festen Zustand), bei dem die Problematiken, wie zum Beispiel die Erstarrung aus der Schmelze, nicht auftreten. Außer der Herstellung von hochwertigen, gleichartigen Verbindungen aus hochfesten Aluminiumlegierungen ermöglicht das FSW die Verbindung von Materialien mit unterschiedlichen metallurgischen Eigenschaften. Dennoch können Probleme bezüglich des Korrosionsverhaltens der ungleichartigen Verbindungen entstehen, da Flugzeuge in korrosiven Umgebungen operieren. Für die betriebsichere Herstellung von ungleichartigen FSW-Verbindungen ist ein sehr gutes Verständnis der relevanten Korrosionsmechanismen notwendige Voraussetzung. In dieser Arbeit wurde die Korrelation zwischen der Mikrostruktur, der lokalen Festigkeit und dem Korrosionsverhalten von ungleichartigen FSW Verbindungen aus 2024A und 6056 Legierungen in zwei verschiedenen Temper-Zuständen untersucht. Die Wärmeeinflusszone der „as welded“ 2024A-T3/6056-T6 Verbindungen auf der 6056-Seite konnte durch einen deutlichen Härteabfall leicht identifiziert werden. Eine Vergröberung und Auflösung der Ausscheidungen in dieser Region resultieren in einer lokalen Schwachstelle während der

130
statischen Zugversuche. Wegen der niedrigen Festigkeit der „as welded“ ungleichartigen Verbindungen, wurden weitere ungleichartige Schweißungen mit 6056 in kaltausgelagertem Zustand T4 hergestellt. Diese wurden nach dem Reibrührschweißen bei 190°C 10 Stunden warmausgelagert zum endgültigen Temper-Zustand 2024A-T8/6056-T7X. Diese nach dem Schweißen durchgeführte Wärmebehandlung verbesserte bemerkenswert die Härte und die statische Festigkeit der Verbindung, was auf eine homogenere Ausscheidung von Verhärtungspartikeln zurückzuführen ist. Das Korrosionsverhalten der ungleichartigen Verbindungen, die in verschiedenen Tauchtests getestet wurden, wurde durch die galvanische Kopplung zwischen beiden Aluminiumlegierungen gesteuert. Bei den „as welded“ Verbindungen bot die aktivere Legierung 6056-T6 einen kathodischen Schutz für die 2024-T3 Legierung besonders dann, wenn diese ungleichartigen Verbindungen dauerhaft (im Gegensatz zu Wechseltauchuntersuchungen) in eine chlorhaltige, wässrige Lösung getaucht wurden. Bei diesem Versuch korrodierten vorzugsweise die Streifen der 6056 Legierung im Schweißnaht-Bereich. Eine bemerkenswerte Verbesserung des Korrosionsverhaltens wurde bei warmausgelagerten 2024A-T8/6056-T7X Verbindungen beobachtet. Das Korrosionspotential wurde für beide Legierungen deutlich reduziert und ausgeglichener. Folglich wurde der Korrosionsangriff auf beide Legierungen durch die Wärmebehandlung nach dem Schweißprozess ausgeglichener und zusätzlich wurde die bevorzugte Auflösung der 6056-Legierung reduziert .


