Embed Size (px)
Citation preview

Dynamic Article LinksC<Journal ofMaterials Chemistry
Cite this: J. Mater. Chem., 2012, 22, 13268
www.rsc.org/materials PAPER
Publ
ishe
d on
24
Apr
il 20
12. D
ownl
oade
d by
Uni
vers
idad
e N
ova
de L
isbo
a on
22/
10/2
014
16:5
8:06
. View Article Online / Journal Homepage / Table of Contents for this issue
Microstructure control of dual-phase inkjet-printed a-WO3/TiO2/WOX
films for high-performance electrochromic applications
Pawel Jerzy Wojcik,* Ana Sofia Cruz, L�ıdia Santos, Lu�ıs Pereira, Rodrigo Martins and Elvira Fortunato*
Received 27th February 2012, Accepted 23rd April 2012
DOI: 10.1039/c2jm31217d
The microstructural aspects related to crystalline or amorphous structure of as-deposited and annealed
films of sol–gel-derived WO3 are shown in the literature to be critical for electrochromic (EC)
performance. In consideration of ion insertion materials, there is a need for developing light and at the
same time nanocrystalline structures to improve both coloration efficiency and switching kinetics. By
controlling microstructure and morphology, one could design a material with optimal EC performance.
This report compares the microstructural and morphological characteristics of standard WO3 wet
deposition techniques versus inkjet printing technology (IPT), correlating these features with their
optical and electrochemical performances, emphasizing the importance of the dual-phase a-WO3/TiO2/
WOX film composition proposed in this work for high-performance EC applications. The effect of the
type and content of metal oxide nanoparticles in the precursor sols formulated in various
peroxopolytungstic acid (PTA) and oxalic acid (OAD) proportions on film properties is
comprehensively studied using multi-factorial design of experiment (DOE). To the authors’ knowledge,
no other report on sol–gel deposition of inorganic EC materials via the inkjet printing technique exists,
in which furthermore the film crystallinity can be controlled under low-temperature process conditions.
The proposed method enables development of EC films which irrespective of their composition (a-
WO3, a-WO3/TiO2 or a-WO3/TiO2/WOX) outperform their amorphous or nanocrystalline analogues
presented as the state-of-the-art due to their superior chemical and physical properties.
Introduction
Considerable effort has been devoted to the study of WO3 films
prepared from wet chemistry routes such as sol–gel processing1,2
and electrodeposition3,4 which offer several advantages over
conventional vacuum process techniques such as electron beam
evaporation5 or radio frequency magnetron sputtering.6 Besides
higher film uniformity, wet deposition allows also for micro-
structure control by modifying precursor composition and post-
treatment conditions. Although the application of IPT for WO3
nanoparticle deposition from aqueous dispersions has been
recently reported,7 no attempt has been made to print WO3
coatings from sol–gel precursors. The transition from well-
known wet coating techniques to IPT is dictated by the need to
deposit patterns on large surfaces without the need for lithog-
raphy, as those technological aspects are critical in mass
production. Moreover, IPT allows precise patterning with
reduced raw material waste, therefore significantly lowering the
costs of production. Fig. 1 attempts to show the evolution of
microstructure in WO3 films deposited via the peroxo route
Departamento de Ciencia dos Materiais, CENIMAT/I3N, Faculdade deCiencias e Tecnologia – Universidade Nova de Lisboa andCEMOP/Uninova, 2829-516 Caparica, Portugal. E-mail: [email protected]; [email protected]; Fax: +351 21 294 8558; Tel: +351 21294 8562
13268 | J. Mater. Chem., 2012, 22, 13268–13278
(wherein tungsten metal is dissolved in hydrogen peroxide) by
various wet deposition techniques as a function of temperature.
The aim is to compare changes in thickness (d), crystallinity and
estimated grain size of films subjected to different post-deposi-
tion annealing temperatures. By examining those structures, we
have an idea of how this processing–property relationship works.
This brief overview will also serve as background for the evalu-
ation of the results obtained via IPT.
Studies on morphological and microstructural evolution of
spin- and dip-coated films as a function of temperature have been
rarely reported in the electrochromic literature.1,2 It has been
observed (XRD, SEM) that annealing temperature induces an
amorphous to hexagonal to triclinic structure transition of those
films.3 The beginning of crystallization was observed at 250 �Cwhen a small volume of grains (1.2–25 nm for spin- and
55–80 nm for dip-coated films) appeared (see Fig. 1a and b).
Further increase in annealing temperature up to 500 �C led to
a considerable improvement in the crystallinity of both spin- and
dip-coated films (65–100 nm and 75–100 nm, respectively).
Moreover, data show that thickness values of as-deposited and
annealed spin- and dip-coated films reduce upon raising the
annealing temperature. The thickness (da) of spin-coated films
annealed at 250 �C for 1 hour decreases by 94%, while further
annealing for an additional hour at 500 �C decreases this value
by an additional 1% compared to the initial thickness of
This journal is ª The Royal Society of Chemistry 2012

Fig. 1 Graphical review presenting the evolution of microstructure and surface morphology in WO3 films deposited via the peroxo route by (a) spin-
coating, (b) dip-coating and (c) potentiostatic electrodeposition as a function of annealing temperature. Symbols d stand for film thickness.
Publ
ishe
d on
24
Apr
il 20
12. D
ownl
oade
d by
Uni
vers
idad
e N
ova
de L
isbo
a on
22/
10/2
014
16:5
8:06
. View Article Online
as-deposited films. For dip-coated films, the thickness (db) during
the same treatment drops by 92% and an additional 2%,
respectively. The analysis of nanostructured thin films deposited
by those two techniques revealed a superior EC performance of
dip-coated films in terms of optical and electrochemical activity.1
At the same time, dip-coated films could sustain a higher number
of cycles, which is a direct consequence of grain size. It has been
ascertained that among sol–gel-derived WO3 spin- and dip-
coated films, the EC performance of films annealed at 250 �C is
far superior in comparison with their amorphous or
This journal is ª The Royal Society of Chemistry 2012
polycrystalline counterparts obtained upon annealing at
different temperatures.
Potentiostatic electrodeposition is unique among wet pro-
cessing methods in that it allows the low-temperature deposition
of nanocrystalline WO3 films, which additionally are chemically
more stable than their amorphous counterparts while having
a similar performance.3 Detailed studies of annealing tempera-
ture effects on the structure and EC performance of electro-
deposited WO3 films have been reported by M. Deepa et al.3,4
They observed (XRD, TEM) that an as-deposited WO3 film is
J. Mater. Chem., 2012, 22, 13268–13278 | 13269

Publ
ishe
d on
24
Apr
il 20
12. D
ownl
oade
d by
Uni
vers
idad
e N
ova
de L
isbo
a on
22/
10/2
014
16:5
8:06
. View Article Online
composed of nanosized grains with an estimated size of 10–20 nm
embedded in a nanoporous amorphous matrix. Increasing the
temperature (>100 �C) causes the crystal size to grow systemat-
ically. A significant improvement in chemical stability due to
a uniform distribution of grains (12–32 nm) was observed for
films annealed at 250 �C (Fig. 1c). Successive annealing up to
500 �C led to a further particle size increase (63–85 nm). Simul-
taneously, the thermal treatment resulted in a slight decrease in
the film volume. The film thickness (dc) after heat treatment at
250 �C for 1 hour was about 90% of the thickness value of the as-
deposited layer, while further annealing for an additional hour at
500 �C decreased this value down to 85%. The fastest switching
kinetics of the as-deposited film the authors attributed to the
presence of nanocrystallites, which increase the active surface
area, while the highest optical modulation was observed in
amorphous films dried at 60 �C.With crystallization at high temperature the structure not only
becomes ordered, but increases in density, which is known to
inhibit electrochromism. Sensitive to the microstructure, lithium
ion diffusion is significantly limited in heat-treated dense or
crystalline films which contain a limited number of insertion sites
to accommodate the Li+ ions.3 This situation is presented in
corresponding micrograph models of films annealed at 500 �Cwhich reveal a dense, compactly packed microstructure of
polycrystalline metal oxide irrespective of the deposition tech-
nique. When small nanocrystals are dispersed in an amorphous
matrix, EC properties depend on degree of crystallinity and
density of both phases. Therefore, optimal EC properties of the
films are a balance among network formation, organic burnout,
porosity, and crystallization. This dependence has been observed
in all the above examples.1–4 Taylor et al.1 reported that films
annealed at temperatures which promote nanocrystal creation
exhibit lower optical modulation due to the fact that there is less
amorphous material with fewer sites available for coloration.
They concluded that crystallinity does not prohibit electro-
chromism and that the lower EC performance of annealed films
is attributed to the microstructure.
Optimal EC performance of wet processed WO3 films is
a balance among chemical stability, response time and trans-
mission modulation, ion-storage capacity and coloration effi-
ciency. If fast coloring/bleaching operation is required for an
application, then a nanocrystalline film is most suited but at the
penalty of lower optical modulation. On the other hand, an
amorphous film is the most sensible choice when high coloration
efficiency is desired and kinetics is of secondary importance.
Concluding, spin- and dip-coating techniques do not offer much
room for EC performance optimization, due to the film densifi-
cation caused by the high temperature involved in nanocrystal
creation. Electrodeposition partially overcomes the limitations
of those techniques by reducing process temperature for dual-
phase film creation. However, the deposition process is restricted
by the substrate shapes, the expensive equipment and poor
crystallinity of final products. The disadvantages of all described
deposition methods are even more apparent when the large-area
assembly of EC films is considered.
In this work the sol–gel films are processed by IPT which offers
flexibility of deposited film composition, high throughput and
simplicity in material selection, when compared to the conven-
tional techniques. However, fully optimizing the printing process
13270 | J. Mater. Chem., 2012, 22, 13268–13278
by evaluating all possible combinations of factors using single-
factor experiments is prohibitively time-consuming. As there are
several factors to evaluate and potential interactions exist
between the factors, multi-factorial design of experiment (DOE)
should be explored as an alternative to traditional single-variable
experiments. This technique is a time- and cost-effective
approach for testing the effects of many variables
simultaneously.
Materials and methods
Materials
Peroxopolytungstic acid (PTA) was synthesized based on the
procedure reported by T. Kudo et al.8 Tungsten metal mono-
crystalline powder (Aldrich, 0.6–1 mm, 99.9%) was carefully
added to a 50 ml mixture (50 : 50) of distilled water (Millipore)
and hydrogen peroxide (Sigma-Aldrich, 30% by weight). Cooling
was employed and the solution was kept slowly stirring for 24 h
in a refrigerator to prevent thermal changes due to the strong
exothermic nature of dissolution. The excess tungsten powder
was then removed by filtration (Roth, 0.45 mm syringe filter)
leading to a transparent solution. In order to remove the excess
hydrogen peroxide the solution was dried at 65 �C and washed
several times with distilled water. After drying, a water-soluble
WO3$xH2O2$yH2O orange crystal powder (PTA)9 was obtained
as the final result. Two types of commercially available WOX
nanoparticles were used as a source of crystalline phase: WO3,
referred to as yellow (Aldrich, <100 nm); and WO2.9, referred to
as blue (Super Conductor Materials, 99.99%, ceramic oxide
target). Titania paste (Solaronix, Ti-Nanoxide T/SC, 15–20 nm,
3% by weight) was used as a source of nanocrystalline TiO2.
These nanoparticles were used in the form of aqueous (Millipore)
alcohol (Merck, 2-propanol, 99.8%) dispersions in a fixed
proportion of 30 : 70 and solid content of 0.01% by weight.
Oxalic acid dihydrate (Merck) and Triton X-100 (JT Baker
Chemical) were used as received.
In order to obtain 3 g of gel electrolyte, 0.36 g of PMMA
(Fluka), 0.21 g of PEO–PPO (Zeon Chemicals), 0.33 g of LiClO4
(Fluka) and 1.75 g of propylene carbonate (Fluka, 99%) were
mixed with 4 ml of tetrahydrofuran (Aldrich, 99.9%) followed by
stirring for about 4 h until a transparent uniform lightly viscous
gel was obtained.10
Inkjet printing
An ink was formulated according to a DOE recipe for each lab-
testing device with 3 wt% addition of Triton X-100. Particular
layers (1 cm2) were printed 5 times using a conventional desktop
printer (Canon PIXMA IP4850) in regular intervals of around
1 min while being exposed to a relative humidity of 50%, at 28 �C,on ITO PET substrates (Sigma-Aldrich, 1000 �A of ITO, 60 U
sq�1, T > 75% at 550 nm). All films were dried at room temper-
ature for 24 h and annealed in air at 120 �C (EHRET, TK4067,
Germany) for 1 h.
Encapsulation
The devices were assembled as a sandwich structure which
included an inkjet-printed EC film (working electrode), a gel
This journal is ª The Royal Society of Chemistry 2012

Table 1 The list of experimental trials according to mixture design withone non-mixture component methodology
Run wsolvent wPTA wOAD wTiO2wWOX
X
1 0.539 0.010 0 0 0.451 Yellow2 0 0.200 0 0 0.800 Blue3 0 0.113 0.050 0.837 0 Blue4 0 0.200 0 0.800 0 Yellow5 0.800 0.200 0 0 0 Yellow6 0.575 0.010 0 0.415 0 Yellow7 0 0.010 0.050 0 0.940 Blue8 0 0.010 0.050 0.940 0 Yellow9 0 0.010 0 0.498 0.492 Blue10 0.940 0.010 0.050 0 0 Yellow11 0 0.010 0 0 0.990 Yellow12 0 0.200 0.050 0 0.750 Blue13 0 0.010 0 0 0.990 Blue14 0 0.010 0 0.990 0 Yellow15 0 0.200 0 0 0.800 Yellow16 0.465 0.010 0.026 0 0.499 Blue17a 0.940 0.010 0.050 0 0 Blue18a 0.800 0.200 0 0 0 Blue19 0.866 0.109 0.025 0 0 Yellow20 0.441 0.010 0.026 0.523 0 Blue21 0 0.081 0.024 0.445 0.451 Yellow22a 0 0.010 0 0.990 0 Blue23 0 0.200 0.023 0.777 0 Blue24 0 0.200 0.050 0.750 0 Yellow25 0.990 0.010 0 0 0 Blue26a 0 0.010 0.050 0.940 0 Blue27 0.351 0.200 0.050 0 0.399 Yellow28 0 0.010 0.050 0 0.940 Yellow29 0.401 0.108 0 0.491 0 Blue30 0.750 0.200 0.050 0 0 Blue
a Duplicates.
Publ
ishe
d on
24
Apr
il 20
12. D
ownl
oade
d by
Uni
vers
idad
e N
ova
de L
isbo
a on
22/
10/2
014
16:5
8:06
. View Article Online
electrolyte for ion storage, and two transparent conductors (ITO
PET foil) separated by double-sided tape spacer (1 mm thick)
which were utilized to establish electrical contacts. The device
was sealed with thermoplastic glue.
Characterization
The structural analysis of EC printed films was supported by
SEM measurements (Auriga SEM-FIB, Zeiss). Optical
measurements were performed using a spectrometer set-up con-
sisting of an HR4000 high-resolution spectrometer (Ocean
Optics), halogen light source HL-2000-FHSA (Mikropack) and
high current source measure unit (Keithley 238). The electro-
chemical measurements (Gamry Reference 600 Potentiostat,
Gamry Instruments) were performed on assembled devices in
two-electrode configuration in which working and working sense
were connected to a working electrode and reference and counter
were connected to a second (ITO) electrode. Such a simplified EC
system in which ITO coating serves as both transparent
conductor and counter electrode is capable of giving a fairly high
optical modulation in the visible and solar spectral regions,
although it has low charge capacity. An ITO counter electrode,
at which an electrochemical process similar to the one on the
working electrode occurs, causes no significant colour change, as
was demonstrated in the state of the art.11–13
Software
The Design of experiment and statistical data analysis were
performed using JMP 8.0 (SAS Institute Inc., Cary, NC, USA).
Design of experiments
A screening design was performed according to the Design of
experiment methodology using SAS JMP 8.0 statistical software.
The flexible JMP Custom Designer was applied to determine the
main factors and interaction effects and to investigate the
changes of the responses by varying each factor in order to
predict device performance for all possible ink recipe combina-
tions. A screening design method was selected to characterize the
inkjet printing process of dual-phase a-WO3/TiO2/WOX films
because the studied problem involves a large number of input
factors. Designed mixtures can be described as quinary systems
of solvent–PTA–OAD–TiO2–WOX with one additional non-
mixture factor X which stands for experimentally determined
WOX particle oxygen content (dual-level categorical factor with
values of 2.9 for blue and 3 for yellow nanopowder). Mixtures
(inks) must meet strict physicochemical property requirements
(viscosity, surface tension and maximum particle size) which
impose several constraints. An ink composition based on solvent
with isopropyl alcohol to water ratio of 0.3 : 0.7 by weight con-
taining less than 20 wt% of PTA and less than 5 wt% of OAD
results in viscosity and surface tension values of 1.5–2 cP and
30–40 dyne cm�1, respectively, acceptable values for a conven-
tional office printer. The maximum nanoparticle size should be at
least one hundred times smaller than the nozzle diameter (9 mm)
which gives 90 nm (according to Canon FINE technology
specification). Additionally, all samples must contain PTA
component ($1 wt%) in order to ensure the existence of amor-
phous phase which guarantees an EC effect by allowing
This journal is ª The Royal Society of Chemistry 2012
electronic conduction to take place in a low-temperature process.
Based on imposed restrictions, the values of individual weight
fraction ranges and categorical levels of factors were defined as
follow: 0# wsolvent # 0.99; 0.01# wPTA # 0.2; 0# wOAD # 0.05;
0 # wTiO2# 0.99; 0 # wWO3
# 0.99; X ¼ {blue, yellow}. Due to
the complexity of such a constricted experimental area, the
application of D-optimal algorithm for experimental design
seems to be essential. The computer-aided D-optimal design for
six factors studied, shown in Table 1, was composed of 30
experiments and the order of runs was fully randomized to
minimize the effect of uncontrolled factors that could affect the
final results. Since wWOXand X factors are dependent, each pair
of runs (5, 18), (8, 26), (10, 17) and (14, 22) describe the same
experiments. Those experiments cannot be merged, because
deleting the duplicates would cause the need for a new D-optimal
model generation.
Ultimately, there were 26 independent runs and for each of
them printable solution and targets were freshly prepared just
before use. The studied responses, obtained from measurements
of the developed devices, were mechanical, optical, electrical,
fluid (ink) and overall performance parameters, 16 in total. Due
to the complexity of the analysis and the number of studied
responses, the following considerations are limited to the main
parameters describing switching kinetics and overall perfor-
mance of EC films.
Mathematical fitting based on multiple regression was per-
formed for each categorical factor level using a first-order
J. Mater. Chem., 2012, 22, 13268–13278 | 13271

Publ
ishe
d on
24
Apr
il 20
12. D
ownl
oade
d by
Uni
vers
idad
e N
ova
de L
isbo
a on
22/
10/2
014
16:5
8:06
. View Article Online
polynomial function expressed by eqn (1), which helps to trans-
form the complexity of the studied problem into an easy-to-
handle mathematical form:
Y1#k16 ¼X5
i¼1
biXi þX5
i¼1
X5
j¼1þ1
bijXiXj þ 3 (1)
Surface responses Yk (1 # k # 16) were determined by five
controlled mixture components Xi (1 # i # 5), coefficients of
the main factors and the coefficients of the first-order interac-
tions bi, bij, respectively, and 3which represents the random error
of the method. This model can be used to predict the response for
any condition within the experimental space.
Results and discussion
Data fitting and factorial analysis
Measured values of selected parameters, namely coloration time
(scol), bleaching time (sbl), optical density (DOD) and coloration
efficiency (CE), corresponding to each experimental run are
presented in Table 2.
The model optimality was evaluated based on a summary of fit
(least squares regression) and analysis of variance (ANOVA).
The linear responses fitting offered by the screening design
appeared to be sufficient for optical density (DOD) and colora-
tion efficiency (CE) because of its ability to supply high
Table 2 Measured values of selected parameters corresponding to eachexperimental run
Run scol [s] sbl [s] DOD [�10�2] CE [cm2 C�1]
1 14 9 36.18 188.422a 5 3 2.69 9.33a 3 4 97.71 548.954 2 3 4.25 29.135 3 4 11.5 83.956 4 5 46.05 225.727 9 4 8.25 70.518 4 4 3.84 34.879 10 7 37.73 474.0110 4 3 10.23 73.611 4 2 23.31 187.9912 11 9 38.72 175.213 10 7 26.85 80.8814 3 3 50.98 383.3115a 2 2 4.24 22.2216 8 6 4.5 15.2917a 30 30 3.88 20.7418 6 2 1.36 2.8419 4 8 75.3 404.8220 2 4 6.95 43.7221 14 12 82.64 454.0922 4 5 46.44 305.5623 4 2 20.72 199.2224 5 5 18.21 130.0525 3 2 17.56 91.9626 8 5 9.39 46.4827a 30 30 130.93 534.2728 9 2 13.12 48.0429a 7 7 5.72 21.1230 5 6 55.93 321.43
a Experimental runs excluded from subsequent statistical analysis due tothe device malfunction caused by uncontrollable factors (incorrectencapsulation, film failure, etc.).
13272 | J. Mater. Chem., 2012, 22, 13268–13278
coefficient of determination (R2-adj) values of 0.87 and 0.98,
respectively, indicating a good correspondence between the
model prediction (fitting) and the experiments, while simulta-
neously minimizing the overall number of coefficients. The
ANOVA significance probabilities of 0.02 and 0.0006, respec-
tively, support the accuracy of the model. In the case of colora-
tion time (scol) and bleaching time (sbl), regression coefficients
were 0.51 and 0.72, while significance probabilities were 0.22 and
0.09, respectively, which means that the models for those
responses are just slightly better than the overall response mean
and indicates a small number of significant regression factors. As
no nonlinear response was detected for scol and sbl, a more
complex design-type is not required, and the lack of fit comes
from difficulties associated with accurate measurements of those
responses. All response models have been graphically analysed
using leverage plots in order to test the significance of all effects
(factors and first-order interactions).14 The leverage plots for
each factor illustrate the residuals as they are and as they would
be if that component was removed from the model. Analysis
results of all effects based on the leverage plots method and
Student’s t-test statistics for scol, sbl, DOD and CE responses lead
to the conclusions shown in Table 3. Elements in column (a)
marked by (+) indicate coefficients that were determined to be
significant, and thus which factor (or factor interactions) had
a major effect on a particular response value quantifying their
importance. As the emphasis of DOE was screening, the impor-
tance column (b) indicates the most significant effects (starting
from value 1) sorted by the absolute value of the t-ratio, which
lists the test statistics for the hypothesis that each parameter is
zero. Each t-ratio value expresses the ratio of a particular
parameter estimate to its standard error, and has a Student’s
t-distribution, if the hypothesis is true.
The model predicts in general that EC performance of printed
films is enhanced by dual-phase composition, which means that
Table 3 Factorial analysis results obtained via leverage plots methodand Student’s t-test statisticsa
Effect
scol sbl DOD CE
a b a b a b a b
wsolvent � � + 6 + 3wPTA �* +* 6 +* 2 +* 7wOAD �* �* �* �*wTiO2
� + 2 + 1 + 1wWOX
+ 1 + 1 + 5 + 4wsolvent$wPTA � + 5 + 3 + 10wsolvent$wOAD � � � �wsolvent$wTiO2
� � � + 6wsolvent$wWOX
+ 2 + 3 � + 16wsolvent$X � � � + 5wPTA$wOAD � � � + 14wPTA$wTiO2
� + 7 + 5 + 12wPTA$wWOX
� + 4 + 4 + 13wPTA$X � � � + 9wOAD$wTiO2
� � � �wOAD$wWOX
� � � �wOAD$X � � � + 8wTiO2
$wWOX� � � + 2
wTiO2$X � � � + 15
wWOX$X � � � + 11
a a – result:� not significant, + significant, * collinearity; b – importance.
This journal is ª The Royal Society of Chemistry 2012

Publ
ishe
d on
24
Apr
il 20
12. D
ownl
oade
d by
Uni
vers
idad
e N
ova
de L
isbo
a on
22/
10/2
014
16:5
8:06
. View Article Online
metal oxide nanocrystal concentration is crucial. In detail, the
significance analysis leads to the conclusion that the scol dependsmainly on the quantity ofWOX nanocrystals in the EC layer. The
sbl is influenced by the quantity of WOX and TiO2 nanocrystals
and also depends on WO3 amorphous content formed from PTA
precursor. DOD, which describes the optical contrast between
colored and bleached states, mainly depends on the quantity of
TiO2 nanocrystals and WO3 amorphous content. The significant
factors, with regards to their impact on CE which describes
overall device performance, depend to a greater or lesser extent
on almost all mixture components and their interactions, but the
most significant are TiO2 and WOX crystalline nanoparticles.
Collinearity indicated by (*) obtained for the main effects derived
from PTA and OAD components indicates that those two
coefficients have no independent variation to support fitting of
any investigated response variation, because they are linear
functions of other factors. While the role of PTA is evident from
coefficients of the first-order interactions, the impact of OAD on
EC performance is negligible. The OAD component may there-
fore be eliminated from consideration without detriment to the
EC effect, causing simplification of the method by reducing the
number of ingredients.
Application of a computer-aided D-optimal design success-
fully reduced the number of overall experimental trials from 162
defined for three-level full factorial design or 72 defined for
second-degree extreme vertices design down to 30 runs in the
present studies. The proposed experimental design methodology
appeared to offer a sufficiently accurate mathematical modelling
with a complete coverage of experimental trials while the total
number of designed experiments has been significantly reduced.
Fig. 2 SEM images of inkjet-printed (a) amorphous (a-WO3) and (b)
dual-phase (a-WO3/TiO2/WOX) deposited on ITO PET substrates. The
pattern boundaries are indicated by dashed lines. (Insets: ULC-magnified
cross-sectional images; BRC-comparison of printed dual-phase films to
chocolate with nuts).
Microstructure and morphology
The micrograph of the inkjet-printed amorphous a-WO3 film
shown in Fig. 2a represents a continuous film. Sporadically, the
cracks caused by stress are revealed, which are shown here in
order to expose the film cross-section. The difference obvious at
a glance between the morphological characteristics of WO3 films
deposited via standard wet techniques and IPT at low magnifi-
cations is that while continuous layers are observed in the first
case for annealed nanocrystalline films,15 their inkjet-printed
dual-phase a-WO3/TiO2/WOX counterparts are characterized by
a discontinuous pattern as may be seen in Fig. 2b. Film discon-
tinuity is caused by the existence of solid nanoparticles in the
liquid sol–gel precursor, which significantly changes its rheo-
logical behaviour. A clear distinction between the nanocrystal-
line grains distributed randomly throughout an amorphous
phase can be observed in the resultant ‘chocolate with nuts’-like
structure. At high magnifications, however, the surfaces of
printed films exhibit a rather homogeneous topography. The
stress caused by the decomposition of the precursor and the
solvent removal at elevated temperature leads to the creation of
cracks. According to studies conducted by Yamanaka et al.,8
those cracks have no significant effect on electrochemical prop-
erties of sol–gel-processed films.
According to the electrochromism theory, the optical modu-
lation in crystalline WO3 phase arises due to the increasing
Drude-type (metallic) reflection, observed especially in the IR
region, with increasing free electron/lithium injection.16 In the
This journal is ª The Royal Society of Chemistry 2012
amorphous phase, the most widely accepted model assumes that
the optical modulation upon double injection occurs through
increasing absorption arising from the transfer of localized
electrons between W5+ and W6+ sites, so-called small polaron
absorption.17,18 However, the improvement in EC performance
of printed films shown in the next paragraph is related to the film
microstructure, which is not subjected to densification during
deposition and post-treatment, rather than to local electronic
states.
Because of the low temperatures involved, no shrinkage
occurs, which differentiates inkjet-printed amorphous (Fig. 3a)
J. Mater. Chem., 2012, 22, 13268–13278 | 13273
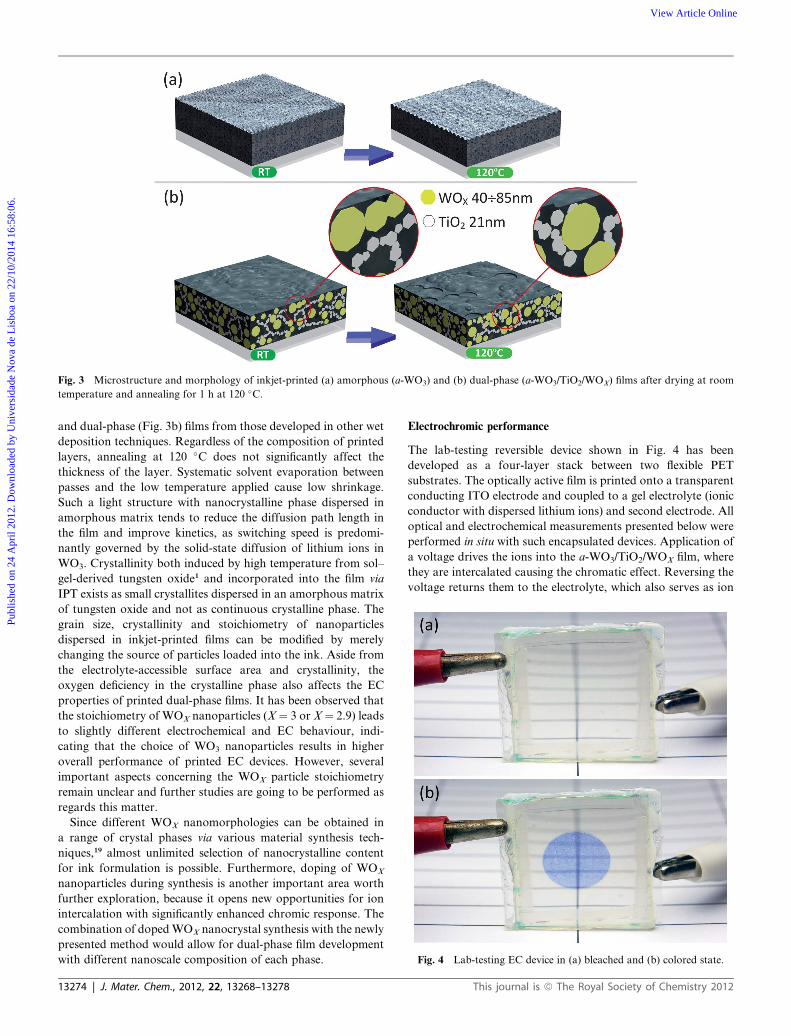
Fig. 3 Microstructure and morphology of inkjet-printed (a) amorphous (a-WO3) and (b) dual-phase (a-WO3/TiO2/WOX) films after drying at room
temperature and annealing for 1 h at 120 �C.
Fig. 4 Lab-testing EC device in (a) bleached and (b) colored state.
Publ
ishe
d on
24
Apr
il 20
12. D
ownl
oade
d by
Uni
vers
idad
e N
ova
de L
isbo
a on
22/
10/2
014
16:5
8:06
. View Article Online
and dual-phase (Fig. 3b) films from those developed in other wet
deposition techniques. Regardless of the composition of printed
layers, annealing at 120 �C does not significantly affect the
thickness of the layer. Systematic solvent evaporation between
passes and the low temperature applied cause low shrinkage.
Such a light structure with nanocrystalline phase dispersed in
amorphous matrix tends to reduce the diffusion path length in
the film and improve kinetics, as switching speed is predomi-
nantly governed by the solid-state diffusion of lithium ions in
WO3. Crystallinity both induced by high temperature from sol–
gel-derived tungsten oxide1 and incorporated into the film via
IPT exists as small crystallites dispersed in an amorphous matrix
of tungsten oxide and not as continuous crystalline phase. The
grain size, crystallinity and stoichiometry of nanoparticles
dispersed in inkjet-printed films can be modified by merely
changing the source of particles loaded into the ink. Aside from
the electrolyte-accessible surface area and crystallinity, the
oxygen deficiency in the crystalline phase also affects the EC
properties of printed dual-phase films. It has been observed that
the stoichiometry of WOX nanoparticles (X¼ 3 or X¼ 2.9) leads
to slightly different electrochemical and EC behaviour, indi-
cating that the choice of WO3 nanoparticles results in higher
overall performance of printed EC devices. However, several
important aspects concerning the WOX particle stoichiometry
remain unclear and further studies are going to be performed as
regards this matter.
Since different WOX nanomorphologies can be obtained in
a range of crystal phases via various material synthesis tech-
niques,19 almost unlimited selection of nanocrystalline content
for ink formulation is possible. Furthermore, doping of WOX
nanoparticles during synthesis is another important area worth
further exploration, because it opens new opportunities for ion
intercalation with significantly enhanced chromic response. The
combination of dopedWOX nanocrystal synthesis with the newly
presented method would allow for dual-phase film development
with different nanoscale composition of each phase.
13274 | J. Mater. Chem., 2012, 22, 13268–13278
Electrochromic performance
The lab-testing reversible device shown in Fig. 4 has been
developed as a four-layer stack between two flexible PET
substrates. The optically active film is printed onto a transparent
conducting ITO electrode and coupled to a gel electrolyte (ionic
conductor with dispersed lithium ions) and second electrode. All
optical and electrochemical measurements presented below were
performed in situ with such encapsulated devices. Application of
a voltage drives the ions into the a-WO3/TiO2/WOX film, where
they are intercalated causing the chromatic effect. Reversing the
voltage returns them to the electrolyte, which also serves as ion
This journal is ª The Royal Society of Chemistry 2012

Publ
ishe
d on
24
Apr
il 20
12. D
ownl
oade
d by
Uni
vers
idad
e N
ova
de L
isbo
a on
22/
10/2
014
16:5
8:06
. View Article Online
storage. Cathodic polarization irreversibly reduces the peroxo
complexes to a-WO3 which is typical for PTA precursor
regardless of the deposition method. This process was manifested
by poor initial responses which improved and stabilized after
a few cycles.
Contour plots on a trilinear coordinate scale were used to
present predictions of experimental results obtained via multiple
regression fitting. This graphical methodology provides an easy
way to demonstrate the efficacy of the enhanced performance of
printed EC films. Ternary plots were generated as a function of
TiO2/WOX nanocrystalline content, while the concentrations of
other components (PTA, OAD) were kept constant (Fig. 5–7).
The third axis stood for pure alcoholic aqueous solvent in order
to quantify the amount of nanocrystals dispersed in the ink and
afterwards transferred to the printed films. Comparison between
corresponding surface responses plotted for different WOX
stoichiometry (WO2.9 and WO3) provides information regarding
the role of oxygen content in the nanocrystalline phase. In the
whole range of studied concentration, films containing WO3
nanoparticles outperform their WO2.9 analogues, while both
show similar relationships between factors and responses. Such
a dual-phase a-WO3/TiO2/WOX microstructure aided ion
movement manifested in coloration/bleach kinetics, optical
density and coloration efficiency faster and to a greater extent
than previously reported sol–gel-derived WO3 films. The appli-
cation of a negative potential causes the active film to turn deep
blue over scol (Fig. 5a) and the initial bleached state can be
restored by applying a reverse potential within sbl (Fig. 5b).
Those parameters were defined as the requisite time for the
transmittance change by 80% of the total difference between final
states. The highest measured colouring and bleaching time values
do not exceed 14 and 12 seconds, respectively. A substantial
reduction in coloration and bleaching time is observed when
increasing the nanocrystalline TiO2 content, reaching values
more than three times lower (scol < 3 and sbl < 2.5). Coloration
kinetics is observed to be slower than bleaching kinetics for all
Fig. 5 Response contour plots presenting variation in (a) coloration and (b)
varied (wPTA ¼ 0.01, wOAD ¼ 0, X ¼ 3{yellow}). The faded regions indicate
This journal is ª The Royal Society of Chemistry 2012
the films under investigation, which is in agreement with the well-
defined, but different mechanism governing the two processes.
While the exchange of current density at the EC film–electrolyte
interface controls coloration kinetics, the space charge-limited
Li+ ion diffusion current governs the bleaching time.18
As a consequence of dual-phase microstructure, there is a large
interface between the oxide layer and gel electrolyte, which
promotes ion diffusion through the porous film. In order to
evaluate the difference in electrochemical properties, one needs
to refer to the values of the total charge inserted during the
coloration cycle (QINS). Our findings allowed us to estimateQINS
values and demonstrate them in a ternary plot as a function of
TiO2/WOX nanocrystalline content (Fig. 6a). The contradiction
between results and the postulated microstructure-dependent
mechanism for films with high nanoparticle loading is due to film
discontinuity which causes overestimation of surface area. In
order to mark these concentrations for further considerations,
ternary plots which present parameters by definition calculated
per unit area and current flowing through the EC device contain
faded rounded regions. QINS higher than 1.4 mC cm�2 was
measured for films containing a high amount of WOX nano-
particles implying a higher anodic current flow though the
crystalline fraction and higher Li+ ion mobility of the film. Very
well-defined anodic (bleaching) peak (ibleaching) for those films
(Fig. 6b) is evidence of improved kinetic performance caused by
the highly porous nanocrystalline structure that greatly reduces
the diffusion length of lithium ions. On the other hand, these
films manifest high values of reduction (coloring) peak maxima
(icoloring), which may indicate that Li+ ion insertion/extraction is
not completely reversible (Fig. 6c). The value of icoloring decreases
significantly with an increase of TiO2 particle loading. By
enhancing the operating voltage, the change in transmittance
between colored and bleached states becomes increasingly
evident. When the voltage exceeds a certain value, the trans-
mittance of the bleached films is markedly lower than that before
coloration which means that the device does not bleach
bleaching time as the weight fractions of TiO2 and WOX dispersions are
unreliable measurements due to the low optical modulation.
J. Mater. Chem., 2012, 22, 13268–13278 | 13275

Fig. 6 Response contour plots showing variation in (a) charge densities, (b) bleaching current maximum peak and (c) coloration current maximum
peak as the weight fractions of TiO2 and WOX dispersions are varied (wPTA ¼ 0.01, wOAD ¼ 0, X ¼ 3{yellow}). The green contour shows the
concentrations of highest electrical response. The regions of rounded faded marks indicate concentrations for which discontinuous patterns were
obtained. (d) Site saturation effect as a function of operating voltage; DTSS is defined as the difference in transmittance of the bleached films to its value
before coloration for particular operating voltage (DTSS ¼ 0 for fully reversible optical effect).
Publ
ishe
d on
24
Apr
il 20
12. D
ownl
oade
d by
Uni
vers
idad
e N
ova
de L
isbo
a on
22/
10/2
014
16:5
8:06
. View Article Online
completely. This specific value of coloring voltage called the
optimum voltage20 (Vopt) lies in the range of �1.5 V to �1 V for
a-WO3, �1 V to 0 V for a-WO3/WOX and 0 V to 0.5 V for
a-WO3/TiO2 films. Color-bleached characteristics recorded at
900 nm show that the EC effect was fully reversible for operating
voltages lower than Vopt, while after applying a higher voltage
the film did not bleach completely, due to the intensive charge
trapping particularly evident for films containing nanocrystalline
WOX phase. Increasing the WOX nanocrystal concentration in
the film increases the volume of the grain boundaries, which
contributes to more trapping of free charge carriers. In addition,
lattice strain and crystal distortion can also affect the Li+ ion
insertion/extraction, causing reversible deterioration. It has been
also reported before that while increasing the TiO2 doping
concentration the amount of residual charges in the WO3-based
13276 | J. Mater. Chem., 2012, 22, 13268–13278
film decreases due to the enhancement in the reversibility of the
redox process.21 The positive impact of TiO2 nanoparticles on the
reversibility of printed EC films is demonstrated in Fig. 6d, which
represents the so-called site saturation effect.22
As a merit of optical performance, values of optical density
change (DOD) and quantitative coloration efficiency (CE) are
given as surface responses shown in Fig. 7. The DOD values are
calculated as a natural logarithm of the ratio of transmittance in
the bleached state to transmittance in the colored state of the
films taken at a certain wavelength.16 In order to reflect the
potential of this method for EC window application, the optical
parameters were measured at high wavelengths, in the NIR
region (l¼ 900 nm). The DOD surface response shown in Fig. 7a
indicates that films containing a large amount of TiO2 nano-
particles with a smaller share of WOX content in amorphous
This journal is ª The Royal Society of Chemistry 2012

Fig. 7 Response contour plots presenting variation in (a) optical density and (b) coloration efficiency as the weight fractions of TiO2 and WOX
dispersions are varied (wPTA ¼ 0.01, wOAD ¼ 0, X ¼ 3{yellow}). The regions of rounded faded marks indicate concentrations for which discontinuous
patterns were obtained.
Publ
ishe
d on
24
Apr
il 20
12. D
ownl
oade
d by
Uni
vers
idad
e N
ova
de L
isbo
a on
22/
10/2
014
16:5
8:06
. View Article Online
matrix exhibit the highest transmission modulation due to the
modification of the internal film structure. The Li+ conductive
network of interconnected TiO2 nanoparticles facilitates ionic
transport into the EC layer. At the same time, mesoscopic TiO2
structure significantly increases the surface area of a-WO3
matrix. As both TiO2 and WOX nanoparticles are hydrophilic,
films with high nanocrystalline content become more hydrated.
Such physisorbed water gives a significant enhancement in ion
dynamics through an amorphous phase,18 consequently leading
to an increase in DOD up to 0.82. The overall device performance
expressed by CE is defined as a ratio between DOD and injected/
ejected charge measured for a specified film area.16 According to
this definition, an ideal coating would exhibit a large optical
modulation with a small amount of operating charge, giving rise
to a large CE value. This is a very convenient performance
indicator; however, its measurement methods vary between
research groups, making difficulties in comparison between
various deposition systems. The application of IPT brings
additional complications in this topic due to the printed film
discontinuity. CE should be then redefined in order to describe
not only continuous films, but also inhomogeneous printed
patterns, in which the sizes of electrochemically active islands
and distances between them are comparable. Such an extended
definition would refer to the active area of the EC device
measured in the device length scale instead of microscale as is
commonly practiced.
Inkjet-printed EC devices irrespective of composition exhibit
higher CEs than sol–gel-derived WO3 films deposited via stan-
dard wet methods. CE values calculated according to the rede-
fined formula for printed amorphous films which are observed to
be continuous vary between 230 and 260 cm2 C�1 while patterns
containing a high amount of TiO2/WOX nanoparticles exhibit
high efficiencies of 440 to 470 cm2 C�1 (Fig. 7b). Although the
accuracy of CE is affected by the method, for which optical and
electrochemical measurements were not performed at the same
time, these values reflect the real EC performance of printed
This journal is ª The Royal Society of Chemistry 2012
devices. It should be also noted that the EC performance of the
presented devices could be increased by applying a counter
electrode with higher charge capacity than ITO.23 In such
a system, the maximal value of charge that can be reversibly
shuttled between counter electrode and active film would be
higher resulting in increased coloration.
The presented data show that dual-phase a-WO3/WOX
microstructure is most favourable for a rapid ion insertion/
extraction process as these printed films exhibit very well-defined
anodic peak and high charge densities. In addition to the
microstructure, the amount of dopant, namely TiO2, plays an
important role manifested in decreased charge trapping effect as
well as in enhanced optical modulation.
TritonX-100 as non-ionic surfactantwas used in order to adjust
the ink surface tension to a value acceptable for printing systems
(30–40 dyne cm�1). The choice of this organic compound was
dictatedby two factors.Firstly, cationic surfactants are unsuitable
for PTA precursor, because their molecules precipitate Keggin-
like PTA polyanions, which prevent the synthesis of a stable
coating solution.24 Secondly, Triton X-100 is a well-known
surfactant often used with success for inkjet-printable inorganic
dispersions.25 It is noteworthy that non-ionic surfactants also play
a key role in the formation of WO3 mesostructures in the organic
template sol–gelmethod.26–28As the coating solutions presented in
those studies are similar to our sol–gel printable precursor, we can
expect that printed hybrid films, annealed at 120 �C, may also
exhibit a mesostructure. However, this phenomenon has not been
investigated and its influence on the EC performance of printed
a-WO3/TiO2/WOX is not known yet.
Conclusions
Tungsten oxide is the most extensively studied inorganic EC
material due to its interesting electrochemical and physical
properties observed for films developed via vacuum as well as wet
techniques. However, for use in practical high-performance EC
J. Mater. Chem., 2012, 22, 13268–13278 | 13277

Publ
ishe
d on
24
Apr
il 20
12. D
ownl
oade
d by
Uni
vers
idad
e N
ova
de L
isbo
a on
22/
10/2
014
16:5
8:06
. View Article Online
devices, WO3-based systems require further improvement in film
composition and processing. In order to augment EC properties,
dual-phase a-WO3/TiO2/WOX deposited via IPT using various
ink formulations has been investigated. It was indeed surprising
to observe that in spite of employing for IPT the same WO3
sol–gel precursor known from former wet deposition techniques
either with nanoparticles or without them, the EC performances
of resulting films exhibit dramatic differences from those
described in the state-of-the-art, which is indicative of the major
role played by the deposition technique.
As-deposited inkjet-printed amorphous a-WO3 films prepared
from PTA printable precursor and dual-phase a-WO3/TiO2/
WOX prepared from WOX and TiO2 nanoparticles dispersed in
the same precursor transform into chemically stable films upon
annealing at 120 �C. The grain size, crystallinity and stoichi-
ometry of the particles are dependent only on the origin of the
crystals and are defined at the ink formulation stage. This flexi-
bility in material selection not only endows printed devices with
a better chemical stability, but is also responsible for the superior
EC performance reflected by high optical density (DODz 0.82),
enhanced coloration efficiency (CE > 400 cm2 C�1 at l¼ 900 nm)
and fast color-bleach kinetics (scol < 3 s and sbl < 2.5).
Furthermore, an inkjet-printed EC window exhibits peak power
consumption at the level of 10 mW cm�2 in the switching process,
which is 40 times lower when compared to the commercial SAGE
Electrochromic’s window29 developed by a physical route.
Considering just the main effects of each variable in eqn (1), it
is clear that the amounts of WOX and TiO2 nanoparticles and
WO3 sol–gel precursor (PTA) have the highest impact on EC
performance expressed by scol, sbl, DOD and CE, while the
impact of OAD is negligible. Besides, first-order interactions also
occurred between WOX, TiO2 and PTA factors justifying the
validity of the applied first-order polynomial model.
Interconnected TiO2/WOX nanocrystals of printed dual-phase
films lead to higher values of transmission modulation and
coloration efficiency over the visible and solar spectral regions as
compared to the poor EC performance of a-WO3 films owing to
their amorphous structure. With an increase in TiO2 nano-
particle loading, kinetics of intercalation and deintercalation
mechanisms improves and significantly reduces the deleterious
site saturation effect. The Li+ conductive network of inter-
connected TiO2 nanoparticles facilitates ionic transport into the
EC layer and increases significantly the active surface area of the
a-WO3 component. These results demonstrate that IPT is an
excellent method for the production of inorganic chromogenic
films with controlled composition and dual-phase microstructure
for low-temperature, direct-write fabrication of high-perfor-
mance EC devices. The presented data provide strong support
for the general paradigm that to achieve the best EC performance
an amorphous phase must be combined with nanocrystalline
content in a light structure that is easily penetrable by cations.
Furthermore, this work demonstrated that combination of
IPT as a novel deposition technique and DOE methodology
provided an effective means to explore and predict the behavior
of high-performance EC devices. The use of D-optimal mixture
design with one no-mixture component could reduce the total
number of experimental trials, while still maintaining high
accuracy of analysis. The identification of the critical process
factors via a screening experiment was essential for method
13278 | J. Mater. Chem., 2012, 22, 13268–13278
optimization and resulted in a reduced number of system
components greatly simplifying the technological process.
Acknowledgements
This work was funded by the Portuguese Science Foundation
(FCT-MCTES) through project Electra, PTDC/CTM/099124/
2008 and the PhD grant SFRH/BD/45224/2008 given to P. J.
Wojcik. Moreover, this work was also supported by E. For-
tunato’s ERC 2008 Advanced Grant (INVISIBLE contract
number 228144), ‘‘APPLE’’ FP7-NMP-2010-SME/262782-2 and
‘‘SMART-EC’’ FP7-ICT-2009.3.9/258203.
Notes and references
1 D. J. Taylor, J. P. Cronin, L. F. Allard and D. P. Birniem, Chem.Mater., 1996, 8, 1396–1401.
2 D. Isxık, M. Ak and C. Durucan, Thin Solid Films, 2009, 518, 104–111.3 M. Deepa, A. Srivastava, T. Saxena and S. Agnihotry, Appl. Surf.Sci., 2005, 252, 1568–1580.
4 M. Deepa, M. Kar and S. A. Agnihotry, Thin Solid Films, 2004, 468,32–42.
5 K. Karuppasamy and A. Subrahmanyam, J. Phys. D: Appl. Phys.,2009, 42, 1–6.
6 R. Sato, N. Kawamura and H. Tokumaru, Appl. Surf. Sci., 2008, 254,7676–7678.
7 C. Costa, C. Pinheiro, I. Henriques and C. a T. Laia, ACS Appl.Mater. Interfaces, 2012, 4, 1330–1340.
8 K. Yamanaka, H. Oakamoto, H. Kidou and T. Kudo, Jpn. J. Appl.Phys., 1986, 25, 1420–1426.
9 B. Pecquenard, S. Castro-Garcia, J. Livage, P. Y. Zavalij,M. S. Whittingham and R. Thouvenot, Chem. Mater., 1998, 10,1882–1888.
10 P. C. Barbosa, L. C. Rodrigues, M. M. Silva, M. J. Smith,P. B. Valente, A. Goncalves and E. Fortunato, Polym. Adv.Technol., 2011, 22, 1753–1759.
11 V.-V. T. F. Benkhelifa, P. V. Ashrit, G. Bader and F. E. Girouard,Thin Solid Films, 1993, 232, 83–86.
12 B. C. H. S. S. J. Golden, Solid State Ionics, 1988, 28–30, 1733–1737.13 Z. Wang and X. Hu, Thin Solid Films, 2001, 392, 22–28.14 J. Sall, Am. Stat., 1990, 44, 308–315.15 M. Deepa, T. Saxena, D. Singh, K. Sood and S. Agnihotry,
Electrochim. Acta, 2006, 51, 1974–1989.16 C. G. Granqvist, Sol. Energy Mater. Sol. Cells, 2000, 60, 201–262.17 Y. Krasnov, Electrochim. Acta, 2004, 49, 2425–2433.18 B. W. Faughnan, R. S. Crandall and M. A. Lampert, Appl. Phys.
Lett., 1975, 27, 275–277.19 H. Zheng, J. Z. Ou, M. S. Strano, R. B. Kaner, A. Mitchell and
K. Kalantar-zadeh, Adv. Funct. Mater., 2011, 1–22.20 N. Naseri, R. Azimirad, O. Akhavan and A. Z. Moshfegh, Thin Solid
Films, 2010, 518, 2250–2257.21 P. S. Patil, S. H. Mujawar, A. I. Inamdar and S. B. Sadale, Appl. Surf.
Sci., 2005, 250, 117–123.22 M. Denesuk and D. R. Uhlmann, J. Electrochem. Soc., 1996, 143,
L186–L188.23 R. Rauh, Electrochim. Acta, 1999, 44, 3165–3176.24 A. Stein, M. Fendorf, T. P. Jarvie, K. T. Mueller, A. J. Benesi and
T. E. Mallouk, Chem. Mater., 1995, 7, 304–313.25 I. Bernacka-Wojcik, R. Senadeera, P. J. Wojcik, L. B. Silva, G. Doria,
P. Baptista, H. Aguas, E. Fortunato and R. Martins, Biosens.Bioelectron., 2010, 25, 1229–1234.
26 M. Deepa, A. K. Srivastava, S. N. Sharma and S. M. Shivaprasad,Appl. Surf. Sci., 2008, 254, 2342–2352.
27 W. Wang, Y. Pang and S. N. B. Hodgson, Microporous MesoporousMater., 2009, 121, 121–128.
28 W. Wang, Y. Pang and S. N. B. Hodgson, J. Sol-Gel Sci. Technol.,2010, 58, 135–141.
29 Lawrence Berkeley National Laboratory, PIER Final Project Report:A Design Guide for Early-Market Electrochromic Windows, CaliforniaEnergy Commission, Berkley, 2006.
This journal is ª The Royal Society of Chemistry 2012


