Embed Size (px)
Citation preview
1
Title: Microsatellite unstable gastrointestinal neuroendocrine carcinomas: a new clinico-pathologic 1
entity 2
3
List of authors: Nora Sahnane1, Daniela Furlan
1, Matilde Monti
1, Chiara Romualdi
2, Alessandro 4
Vanoli3, Emanuela Vicari
1, Enrico Solcia
3, Carlo Capella
1, Fausto Sessa
1, Stefano La Rosa
4 5
6
Authors’ Affiliations: 1Department of Surgical and Morphological Sciences, Section of Anatomic 7
Pathology, University of Insubria, Varese, Italy; 2CRIBI Biotechnology Center, University of 8
Padova, Italy; 3Department of Molecular Medicine, University of Pavia and Institute of Pathology, 9
IRCCS Policlinico San Matteo, Pavia, Italy; 4Department of Pathology, Ospedale di Circolo, 10
Varese, Italy. 11
12
Address for correspondence and reprint requests: Dr. Daniela Furlan, Department of Surgical 13
and Morphological Sciences, Anatomic Pathology Unit, University of Insubria, Via O. Rossi, 9, 14
21100 Varese, Italy. Phone: +39-0332270601; Fax: +39-0332270600; e-mail: 15
17
Short Title: MSI neuroendocrine carcinomas 18
Keywords:; microsatellite instability; mismatch repair; gene methylation; neuroendocrine 19
carcinomas; NEC; MANEC 20
21
Word count of the full manuscript (excluding references and Figure legends): 4534 words 22
23
24
25
26
27
Page 1 of 30 Accepted Preprint first posted on 2 December 2014 as Manuscript ERC-14-0410
Copyright © 2014 by the Society for Endocrinology.
2
ABSTRACT 28
Gastroenteropancreatic (GEP) neuroendocrine carcinomas (NECs) and mixed adenoneuroendocrine 29
carcinomas (MANECs) are heterogeneous neoplasms characterized by poor outcome. Microsatellite 30
instability (MSI) has recently been found in colorectal NECs showing a better prognosis than 31
expected. However, the frequency of MSI in a large series of GEP-NEC/MANECs is still unknown. 32
In this work we investigated the incidence of MSI in GEP-NEC/MANECs and we characterized 33
their clinico-pathologic and molecular features. 34
MSI analysis and immunohistochemistry for mismatch repair proteins (MLH1, MSH2, MSH6, and 35
PMS2) were performed in 89 GEP-NEC/MANECs (6 esophageal, 77 gastrointestinal, 3 pancreatic 36
and 3 of the gallbladder). Methylation of 34 genes was studied by MS-MLPA. BRAF and KRAS 37
mutation analysis was assessed by PCR-pyrosequencing. 38
MSI was observed in 11 NEC/MANECs (12.4%): 7 intestinal and 4 gastric. All but two MSI-cases 39
showed MLH1 methylation and loss of MLH1 protein. The remaining two MSI-cancers showed 40
lack of MSH2 or PMS2 immunohistochemical expression. MSI-NEC/MANECs showed higher 41
methylation levels than microsatellite stable (MSS) NEC/MANECs (40.6% versus 20.2% 42
methylated genes respectively, p<0.001). BRAF mutation was detected in six out of 88 cases (7%) 43
and KRAS mutation was identified in 15 cases (17%). BRAF mutation was associated with MSI 44
(p<0.0008) while KRAS status did not correlate with any clinico-pathologic or molecular feature. 45
Vascular invasion (p=0.0003) and MSI (p=0.0084) were identified as the only independent 46
prognostic factors in multivariate analysis. 47
We conclude that MSI identifies a subset of gastric and intestinal NEC/MANECs with distinct 48
biology and better prognosis. MSI-NEC/MANECs resemble MSI-gastrointestinal adenocarcinomas 49
for frequency, molecular profile, and pathogenetic mechanisms. 50
51
52
Page 2 of 30
3
INTRODUCTION 53
High grade (or poorly differentiated) gastroenteropancreatic (GEP) neuroendocrine 54
carcinomas (NECs) are aggressive cancers with a high propensity for distant metastases. Like the 55
more frequent pulmonary counterparts, they have traditionally been divided into the small and large 56
cell subtypes, depending on the morphological features of neoplastic cells (La Rosa and Sessa 57
2014). Small cell carcinomas are composed of small to medium-sized (2-4 times the size of a 58
lymphocyte), round to oval cells with scant cytoplasm and hyperchromatic nuclei with indistinct 59
nucleoli. Large cell subtypes are composed of large cells with vesicular nuclei showing prominent 60
nucleoli and abundant eosinophilic cytoplasm. In both cases, tumor cells grow forming sheets or 61
nests, although in the large cell subtype a more structured trabecular or organoid architecture is 62
frequently observed. Infiltration of the gut wall or peripancreatic tissue, extensive necrosis, high 63
mitotic count, and perineural and vascular invasion are the rule. 64
Cancers with these morphological features have been named in the past few years using 65
different names including poorly differentiated neuroendocrine carcinomas (PDNECs) and high 66
grade neuroendocrine carcinomas. Accordingly to the 2010 WHO classification of tumors of the 67
digestive system, they are currently named neuroendocrine carcinomas (NECs) and, by definition, 68
they are grade 3 (G3) neoplasms characterized by more than 20 mitoses per 10HPF (high power 69
fields) and/or a Ki67 proliferative index >20%, independently of the morphological features (Rindi, 70
et al. 2010). NECs express general neuroendocrine markers such as synaptophysin and 71
chromogranin A and may be associated with a non-neuroendocrine component. When both the 72
neuroendocrine and non-neuroendocrine components are conspicuous, representing at least 30% of 73
the neoplastic tissue, tumors are classified as mixed adenoneuroendocrine carcinomas (MANECs) 74
(Rindi et al. 2010). Both the exocrine and neuroendocrine components can have different 75
morphological features ranging from adenomas to adenocarcinomas or squamous cell carcinomas 76
with different degrees of differentiation in exocrine components and from well differentiated to 77
poorly differentiated neuroendocrine tumors in neuroendocrine components (La Rosa et al. 2012). 78
Page 3 of 30
4
The pathogenesis of GEP-NECs and MANECs is still largely unknown (Smith and Reidy-79
Lagunes 2013). Regardless of anatomic site, TP53 alterations have been found to be frequent in 80
NECs (Dacic, et al. 2002; Furlan, et al. 2005), together with the impairment of the CDKN2A/p16-81
Rb pathway (Nassar, et al. 2005; Parwani, et al. 2003; Yachida, et al. 2012). Most GEP-NECs have 82
high chromosomal instability (Furlan et al. 2005; Lubensky and Zhuang 2007) while microsatellite 83
instability (MSI) has rarely been observed (Ghimenti, et al. 1999; La Rosa, et al. 2012; Nassar et al. 84
2005; Stelow, et al. 2006) and the role of other epigenetic mechanisms is still poorly understood. 85
Although GEP-NECs are generally aggressive cancers, showing ominous prognosis with a 86
median survival ranging from 6 to 12 months (La Rosa and Sessa 2014), recent findings from a few 87
published studies (La Rosa et al. 2012; Power, et al. 2010; Shia, et al. 2008) and from anecdotal 88
experience seem to suggest that there is a fraction of patients with GEP-NECs showing a better than 89
expected survival rate. We have recently demonstrated that a subset of colorectal NECs exhibiting 90
MSI and extensive gene hypermethylation showed a better prognosis than NECs without these 91
features (La Rosa et al. 2012). Apparent similarities between MSI-NECs and MSI adenocarcinomas 92
of the colon-rectum has led to the hypothesis that similar pathogenetic mechanisms may be 93
involved in the development of these two tumor subsets (Furlan, et al. 2013). However, there are no 94
studies on large series of GEP-NECs demonstrating that MSI and gene hypermethylation can occur 95
in other sites of the GEP system and that this is related to patients’ prognosis. 96
In the present study, we investigated the incidence of the MSI phenotype in a large and well-97
characterized cohort of GEP-NEC/MANECs in order to characterize the clinico-pathologic features 98
and the outcome of such carcinomas, evaluating the type of Mismatch Repair (MMR) defect and its 99
correlation with high levels of gene hypermethylation and KRAS and BRAF mutations. 100
101
MATERIALS AND METHODS 102
103
Cases 104
Page 4 of 30
5
Tissue samples from 89 surgically resected GEP-NECs and MANECs were collected from 105
the files of the Departments of Pathology of the Ospedale di Circolo-Univeristy of Insubria, Varese 106
and from the archives of the Institute of Pathology of the IRCCS Policlinico San Matteo-University 107
of Pavia, Pavia, Italy. All the cases were reviewed to confirm the diagnoses before starting the 108
investigation. Cases included 53 NECs and 36 MANECs located as follow: 6 in the esophagus, 36 109
in the stomach, 4 in the duodenum, 37 in the colon-rectum, 3 in the gallbladder, and 3 in the 110
pancreas. The presence of Lynch syndrome or other inherited tumor syndromes was carefully 111
explored clinically and was not found in any patient. Germline studies were not performed because 112
several patients were died at the time of this retrospective investigation. None of the patients had a 113
history of primary pulmonary neuroendocrine neoplasms. Clinical information including sex, age, 114
type of surgery, clinical history, the presence of distant metastases and follow-up findings were 115
collected by consulting clinical charts. 116
This study was performed according to the clinical standards of the 1975 and 1983 117
Declaration of Helsinki and was approved by the Ethical Committee of the Ospedale di Circolo of 118
Varese (n° 0008465). 119
120
Morphological and immunohistochemical study 121
All tissue samples were fixed in buffered formalin (formaldehyde 4% w/v and acetate buffer 122
0.05M) and routinely processed in paraffin wax. Five µm-thick sections were stained with 123
hematoxylin-eosin (H&E) and alcian-blue/periodic acid-Schiff (AB-PAS) for the morphological 124
evaluations. All cases were thoroughly investigated for the following histological features: 125
neuroendocrine cytologic subtype (small and large cell), type of the exocrine component (adenoma, 126
adenocarcinoma, squamous cell carcinoma), vascular and perineural invasion, presence of necrosis, 127
mitotic count per 10 high power field (HPF), level of gut wall invasion or infiltration of 128
peripancreatic tissues, and presence of metastases in local lymph nodes. Intra and peritumoral 129
lymphoid infiltration was evaluated using H&E stained sections and CD3 immunostaining and 130
Page 5 of 30

6
following the criteria proposed by Walsh et al. (Walsh et al.,2013): peritumoral lymphocytes 131
infiltration was defined as a mantle or cap of lymphoid cells at the deepest point of direct spread. 132
We also counted the number of lymphocytes in three different areas at x40 magnification at this 133
level. Crohn’s-like lymphocytic reaction was considered when at least three nodular lymphoid 134
aggregates were observed deep into the invasive margin in a x 4 field magnification. Intratumoral-135
infiltrating lymphocytes was considered when at least four intraepithelial lymphocytes per x 40 136
field magnification were observed. The Ki67 proliferative index was calculated in all NECs and in 137
the neuroendocrine components of all MANECs. It was expressed as a percentage value 138
corresponding to the count of Ki67 positive cells in 2000 tumor cells performed in areas of the 139
highest immunostaining as previously reported (La Rosa et al.,2009; La Rosa et al.,2011). Finally, a 140
stage was assigned according to the ENETS criteria. 141
For immunohistochemical analyses, 3 µm-thick sections were mounted on poly-L-lysine 142
coated slides, deparaffinized and hydrated through graded alcohols to water. Endogenous 143
peroxidase activity inhibition was carried out by dipping sections in 3% hydrogen peroxide for 10 144
minutes, followed by incubation with the primary antibodies (Supplementary Table 1) at 4°C for 145
18–20 hours and subsequently the avidin-biotin complex (ABC) procedure. Immunoreactions were 146
developed using 0.03% 3,3’diaminobenzidine tetrahydrochloride and then sections were 147
counterstained with Harris’ hematoxylin. 148
149
Microsatellite instability (MSI) analysis 150
Tumor DNA from each patient was obtained from formalin-fixed and paraffin-embedded 151
tissues using three representative 8-um-thick sections of tumor samples. DNA was extracted after 152
manual microdissection, using a QIAamp DNA FFPE tissue kit according to the manufacturer’s 153
protocol (Qiagen, Hilden, Germany). Integrity and amplifiability of each DNA sample was 154
evaluated using BIOMED-2 multiplex PCR (van Dongen, et al. 2003). MSI analysis was carried out 155
Page 6 of 30
7
using a pentaplex panel of monomorphic mononucleotide repeats (BAT25, BAT26, NR-21, NR-22 156
and NR-24) as previously reported (Suraweera, et al. 2002). 157
158
Methylation –Specific Multiplex Ligation Probe Amplification (MS-MLPA) 159
Methylation analysis of 34 gene promoters was performed in two replicates for each sample 160
using MS-MLPA with the SALSA MS-MLPA ME001 tumor suppressor-1 kit and SALSA MS-161
MLPA ME002 tumor suppressor-2 kit (MRC-Holland, Amsterdam, The Netherlands) which were 162
previously validated with other techniques (Furlan et al. 2013). Methylation ratio was calculated 163
using Coffalyser V7 software (MRC Holland) and the presence or absence of promoter methylation 164
were scored as discrete variables using the cut-off values previously reported (La Rosa et al. 2012). 165
We also analyzed the promoter methylation of MMR genes using the SALSA MS-MLPA ME011 166
MMR kit (MRC-Holland) in MSI-cancers. All the genes examined by MS-MLPA are listed in the 167
Supplementary Table 2. 168
169
MLH1 methylation analysis by bisulphite pyrosequencing 170
MLH1 methylation status was confirmed by pyrosequencing analysis in all the cases that 171
were methylated with MS-MLPA. Bisulfite modification of genomic DNA (300 ng) was performed 172
with an EpiTect Bisulfite Kit (Qiagen, Hilden, Germany) according to the manufacturer’s 173
recommendations. A region of 84 nucleotides inside the Deng C-region (Gausachs, et al. 2012) was 174
amplified in two independent reactions using the following primers: Forward: 5’-BIOTIN-175
GAGTTTTTAAAAAAGAATTAATAGGAAGAG-3 and Reverse 5’-176
ATACTACCCCCTACCTAAAAAAATAT-3’. To improve the PCR efficiency using bisulfite-177
treated DNA, PCR was performed with EpiTaq HS (Takara, Shiga, Japan) using 5 µl of the 178
bisulfite-converted DNA (30-60 ng assuming 100% yield) in a 50 µl reaction containing 2.5 mM 179
MgCl2, 0.3 µM primer pairs and 200 µM dNTPs. Thermal cycling conditions were: 2 min at 95°C, 180
35 cycles of 95°C/25 s, 57°C/30 s, 72 °C/30 s and 72°C/2 min. Pyrosequencing was carried out on 181
Page 7 of 30

8
the DNA strand purified by streptavidin-coated beads addressing five consecutive cytosines starting 182
from the sequencing primer: 5’-CTACCCCCTACCTAAAAAAATATAC-3’. Analytical sensitivity 183
and linearity of the assay was assessed using a serial dilution of fully methylated DNA and 184
unmethylated DNA (Chemicon International Inc., Billerica, MA, USA). Coefficient of variation 185
inter-/intra-assay was calculated using 20 DNA samples from healthy donors and was 3.5%. A 186
sample was classified as methylated when the mean of all the five cytosines was greater than 10%. 187
188
BRAF and KRAS mutation analyses 189
Mutations in codon 600 of BRAF and codon 12 and 13 of KRAS gene were analyzed in 190
duplicate by PCR-pyrosequencing using Anti EGFR MoAb response® KRAS status kit and Anti 191
EGFR MoAb response® BRAF status kit (Diatech Pharmacogenomics, Jesi, Italy) according to the 192
manufacturer’s instructions. 193
194
Statistical Analysis 195
Association analyses were performed using the Fisher exact test, ANOVA analysis, and the 196
independent sample t-test. We used a model based cluster algorithm (Raftery 2002) to appropriately 197
define a threshold for the Ki-67 percentage and for gene hypermethylation levels. The method is 198
based on the estimation of different models (mixed Gaussian distribution) characterized by different 199
number of groups; thus, the best model is selected according to the Bayesian Information Criterion 200
or BIC (Schwarz 1978). This analysis was performed with R software (http://www.r-project.com) 201
with the mclust package (Raftery 2002; Schwarz 1978). Patient survival was evaluated using the 202
Kaplan-Meier method and statistically tested with the log-rank test. Patients who died within one 203
month of surgery were excluded from the survival analyses. Multivariate analysis was performed 204
with the Cox Proportional hazard model using the backward method. A p-value <0.05 was 205
considered statistically significant. These analyses were performed using MedCalc Statistical 206
(version 11.0.1.0) and GraphPad Prism V5.0 software. 207
Page 8 of 30
9
208
RESULTS 209
Morphological features of the 89 NEC/MANECs investigated 210
All NECs and the neuroendocrine components of all MANECs were composed of poorly 211
differentiated cells of either small (49 cases) or large cell (40 cases) subtype showing, by definition, 212
>20% of Ki67 proliferative index. Small cell NECs were found in all sites examined, including the 213
esophagus where the large cell subtype was not observed. Barrett metaplasia was found in only one 214
esophageal MANEC. No cases presented as morphologically well/moderately differentiated 215
neoplasms, corresponding to the recently described, but not finally accepted, group of the so called 216
“NET G3” (Vélayoudom-Céphise et al.,2013; Hijioka et al.,2014; La Rosa et al.,2014). 217
The exocrine component of MANECs was represented by squamous cell carcinoma in the 2 218
esophageal MANECs while in MANECs of other sites it was represented by an adenocarcinoma in 219
8 cases, by a tubular or tubulo-villous adenoma in 6 cases, by an adenoma with adenocarcinoma in 220
17 cases, by a squamous cell carcinoma in 2 cases, and by a combination of adenoma with 221
squamous cell carcinoma in 1 case. 222
For 16 MANECs we were able to evaluate both the primary neoplasm and the relative 223
metastasis (Supplementary Table 3 and supplementary Figure 1). Interestingly and as expected, in 224
the metastatic sites the NEC component was more extensively represented than the exocrine one (p: 225
0.0002). 226
227
Microsatellite unstable (MSI) gastroenteropancreatic NEC/MANECs. 228
Mismatch repair defect and clinico-pathologic profile 229
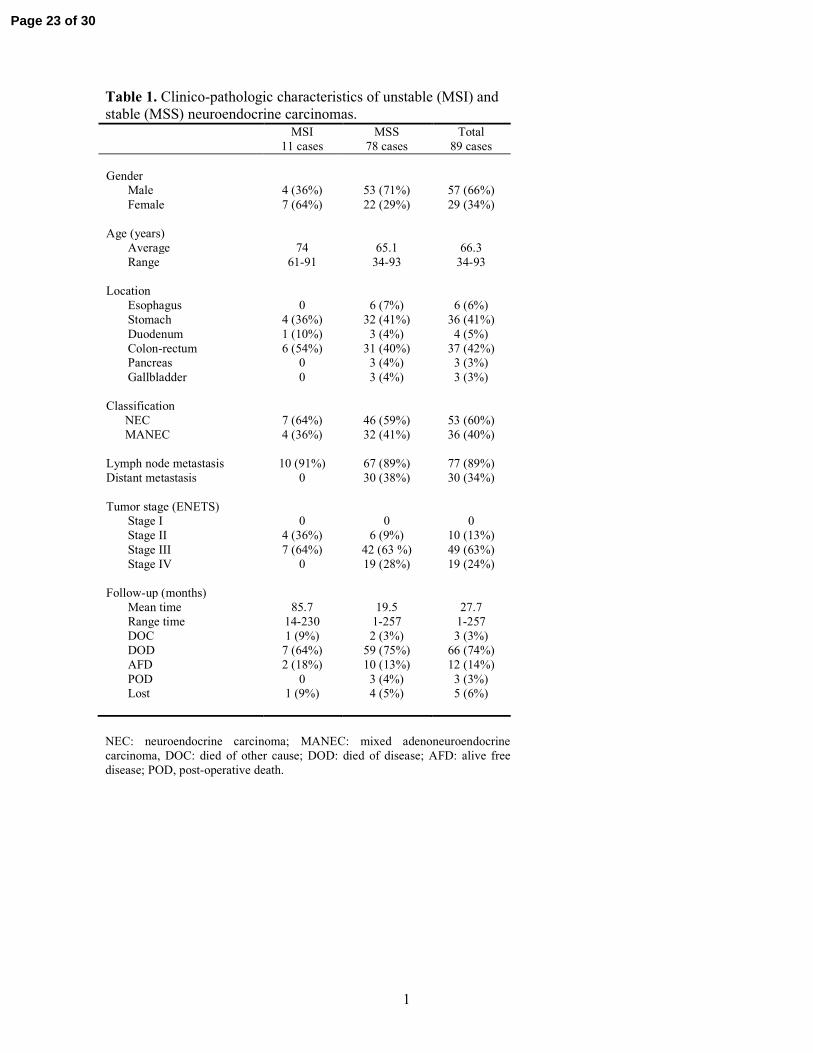
Microsatellite analysis allowed us to identify 11 unstable carcinomas (7 MSI-NECs and 4 230
MSI-MANECs) representing 12.4% of our series of 89 cases (Table 1). In all of them, we evaluated 231
the size of allelic shifts at each marker and we observed that all five loci were affected by deletions 232
ranging from 5.4 to 9.7 base pair (bp). BAT-26 showed the longest allelic shifts with a mean size of 233
Page 9 of 30

10
9.7 bp ± 3.4. The MSI group included 1/6 (16.6%) proximal gastric (cardial), 3/30 (10%) 234
antral/body gastric, 1/4 (25%) duodenal, 3/21 (14.3%) right colonic and 1/12 (8.3%) left colonic 235
neoplasms. For 4 colonic cases, including 2 MSI carcinomas, the exact site was not specified. The 236
remaining 78 cancers (87.6%), including all esophageal, pancreatic and gallbladder NEC/MANECs, 237
were classified as stable neoplasms (MSS-NEC/MANECs) because they did not show instability at 238
any microsatellite locus. 239
All MSI-NEC/MANECs showed lack of immunohistochemical expression of mismatch 240
repair (MMR) proteins (Table 2). Nine cases (five colorectal and four gastric cancers) showed 241
concomitant loss of MLH1 and PMS2 proteins, a colorectal NEC showed PMS2 negativity while a 242
duodenal NEC exhibited loss of both MSH2 and MSH6 expression. By contrast, all MSS-NECs 243
showed MLH1, MSH2, PMS2 and MSH6 immunohistochemical expression. 244
The mean age of patients with MSI-NEC/MANECs was 74 years versus 65 years for 245
patients with MSS-NEC/MANEC and there was a slight female prevalence. Six out of 11 cases 246
were of the large cell subtype and, interestingly, no carcinomas showed distant metastases at the 247
time of diagnosis being classified as stage II or III depending on the nodal status. The main 248
morphological and immunohistochemical findings are summarized in Table 3. Among the various 249
parameters evaluated, it is worth noting that about 54% of MSI carcinomas showed prominent intra-250
peritumoral lymphoid infiltration (Figure 1) (against 25% of MSS cases), large cell subtype (against 251
45% of MSS), and vascular invasion (against 74% of MSS), and that they were all negative for 252
CD117 and TTF1. CDX2 was expressed in 3/4 gastric and in 4/6 colorectal MSI cancers. 253
Interestingly, intra and peritumoural lymphoid infiltration did not differ between MSI and MSS 254
cases when evaluated in H&E stained sections. Using CD3-immunostained sections intratumoral 255
lymphoid infiltration was statistically higher (p: 0.01) in MSI cases (mean value of CD3-positive 256
lymphocytes: 20.40 ± 5.580) than in MSS cases (mean value: 7.13 ± 1.914). Similarly, peritumoral 257
lymphoid infiltration was also statistically higher (p: 0.0002) in MSI cases (mean value of CD3-258
positive lymphocytes 117.6 + 12.41) than in MSS ones (mean value: 55.53 ± 8.05). In MSI-259
Page 10 of 30
11
MANECs, the exocrine component was represented by a mucinous adenocarcinoma in 2 cases and 260
by an adenocarcinoma NOS in the other 2. In such cases the intra and peritumoral lymphoid 261
infiltrate was found close to both exocrine and neuroendocrine neoplastic components. The Ki67 262
index showed a comparable distribution between MSI- and MSS-cancers without any statistical 263
significant difference between small and large cell subtypes. Carcinomas were divided into two 264
groups using a cut-off value of 55% that was calculated with a model based cluster algorithm 265
(Raftery 2002). This threshold value corresponded exactly to that used by Sorbye et al (Sorbye, et 266
al. 2013). More precisely, 80% of MSI- and 72.3% of MSS-cancers showed a Ki-67 ≥ 55%; the 267
mean value of the Ki-67 index was 68.4% for MSI and 63.6% for MSS NEC-MANECs. 268
269
Mismatch repair gene methylation 270
To investigate whether the loss of MMR proteins expression was associated with aberrant 271
methylation, we first checked the promoter methylation status of the MMR genes using MS-MLPA. 272
As reported in Table 2, all the nine cases lacking MLH1 expression showed methylation at the 273
MLH1 promoter. In the two cases showing MLH1 immunoreactivity (case#50 and case#100) 274
MLH1 methylation was not found. MSH2, MSH6, and PMS2 gene methylation was never observed 275
in the 11 MSI-carcinomas. To validate the MS-MLPA results, we performed pyrosequencing 276
analysis addressing the Deng-C region, which has recently been identified as a critical sequence for 277
MLH1 hypermethylation (Gausachs et al. 2012). Pyrosequencing confirmed the MS-MLPA results 278
in all nine cases, with percentages of methylated alleles ranging from 13% to 46% (Table 2). 279
Among the MSI-cases, four MANECs exhibited MLH1 loss (3 cases) or PMS2 loss (1 case). 280
In these cases, loss of the immunohistochemical expression and MSI was observed in both the 281
exocrine and the neuroendocrine components. Accordingly, MLH1 methylation was always found 282
in both tumor areas in the three MANECs showing MLH1 loss (Figure 2). 283
284
Mutation analyses 285
Page 11 of 30
12
Mutation analyses of codon V600 of BRAF and codons 12-13 of KRAS genes were possible 286
for 88 samples. BRAF V600E substitutions were identified in six cases (7%) and all of them were 287
found in colorectal cases. KRAS mutations were identified in 15 cases (17%): 13 in colorectal and 288
two in gastric NECs. The mutations were the following types: G13D (40%), G12D (33%), G12A 289
(20%) and G12V (7%). No cases showed mutations in both genes. 290
A strong association between BRAF mutation and MSI was observed, with 66% of MSI-cases 291
showing BRAF V600E substitution versus 8% of MSS-cancers (p<0.0008). By, contrast no 292
significant correlation was detected between MSI and KRAS mutations. 293
294
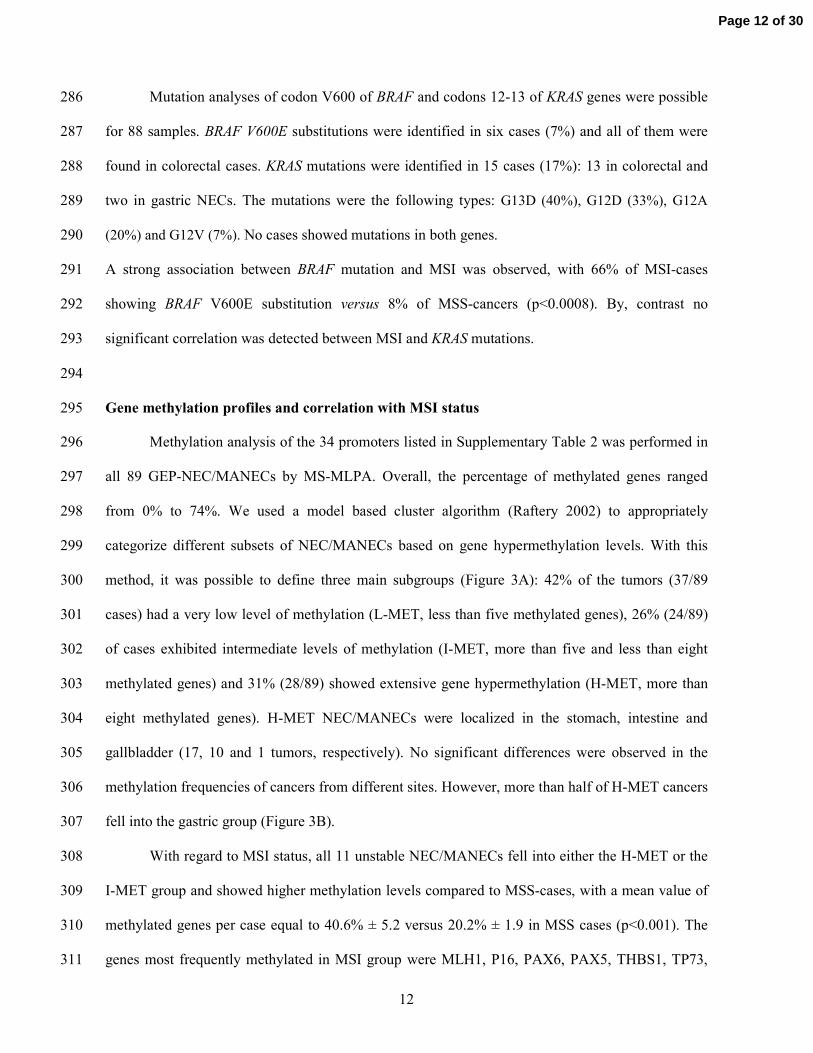
Gene methylation profiles and correlation with MSI status 295
Methylation analysis of the 34 promoters listed in Supplementary Table 2 was performed in 296
all 89 GEP-NEC/MANECs by MS-MLPA. Overall, the percentage of methylated genes ranged 297
from 0% to 74%. We used a model based cluster algorithm (Raftery 2002) to appropriately 298
categorize different subsets of NEC/MANECs based on gene hypermethylation levels. With this 299
method, it was possible to define three main subgroups (Figure 3A): 42% of the tumors (37/89 300
cases) had a very low level of methylation (L-MET, less than five methylated genes), 26% (24/89) 301
of cases exhibited intermediate levels of methylation (I-MET, more than five and less than eight 302
methylated genes) and 31% (28/89) showed extensive gene hypermethylation (H-MET, more than 303
eight methylated genes). H-MET NEC/MANECs were localized in the stomach, intestine and 304
gallbladder (17, 10 and 1 tumors, respectively). No significant differences were observed in the 305
methylation frequencies of cancers from different sites. However, more than half of H-MET cancers 306
fell into the gastric group (Figure 3B). 307
With regard to MSI status, all 11 unstable NEC/MANECs fell into either the H-MET or the 308
I-MET group and showed higher methylation levels compared to MSS-cases, with a mean value of 309
methylated genes per case equal to 40.6% ± 5.2 versus 20.2% ± 1.9 in MSS cases (p<0.001). The 310
genes most frequently methylated in MSI group were MLH1, P16, PAX6, PAX5, THBS1, TP73, 311
Page 12 of 30
13
DAPK1, MGMT, PYCARD, CDH13, HIC1 and TIMP3 (for all p<0.01). No genes were 312
significantly methylated at high frequency in MSS-cancers. 313
314
Survival analyses 315
Survival analyses were carried out to test the prognostic value of all the molecular and 316
clinico-pathologic features examined in this study. Kaplan-Meier curves of all statistically 317
significant variables at univariate analysis are shown in Figure 4. The MSI phenotype was 318
associated with a more favorable prognosis than MSS status, with a median survival (MS) of 60 319
versus 5.5 months, respectively (p=0.0048). GEP-NEC/MANECs showing aberrant methylation of 320
the MLH1 gene were associated with a better outcome, with a MS of 61.5 months compared to 6 321
months for MLH1-unmethylated cases (p=0.01). The methylation status of any of the other genes 322
did not correlate with prognosis. Clinico-pathological characteristics associated with worse 323
prognosis included the presence of vascular invasion (MS: 5 versus 48 months; p<0.0001) and 324
CD117 immunoreactivity (MS: 2 versus 14 months; p=0.0027). Since the Ki67 index has been 325
shown to subdivide NECs into two distinct prognostic groups (Sorbye et al. 2013), we performed 326
survival analysis categorizing patients by using the Ki67 index threshold of 55%, which was 327
identified by a model based cluster algorithm (Raftery 2002). Interestingly, this corresponded to 328
that used by Sorbye and co-workers. In all 23 cases with <55% Ki67 index (11 NECs and 12 329
MANECs) the neuroendocrine component was morphologically poorly differentiated of either small 330
cell (13 cases) or large cell (10 cases) type. The Ki67 index failed to prognosticate NEC/MANECs 331
when applied to the whole series including both MSI- and MSS-cases. However, it successfully 332
identified two different prognostic groups when only MSS carcinomas were considered, after 333
excluding MSI-carcinomas from the analysis (p=0.049). 334
Multivariate analysis was performed including all the variables that were significant at 335
univariate analyses (Table 4). Vascular invasion and MSI phenotype were identified as the only 336
Page 13 of 30
14
independent prognostic factors (p=0.0003 and p=0.0084 respectively). A trend was observed for the 337
Ki67 index using a threshold of 55% (p=0.063). 338
339
DISCUSSION 340
This study demonstrates for the first time that the analysis of MMR defects in GEP-341
NEC/MANECs allows the identification of a new clinico-pathological entity characterized by an 342
unexpected, relatively favorable prognosis and by distinct genetic and epigenetic features. 343
The MSI phenotype was observed in 12.4% of the GEP-NEC/MANECs located in the 344
stomach or intestine, confirming and extending our recently published results obtained in a cohort 345
of colorectal NEC/MANECs (La Rosa et al. 2012). 346
In the present investigation, we demonstrate that the main pathogenetic mechanism leading 347
to the onset of MSI-NEC/MANECs is the methylation-mediated silencing of the MLH1 gene, 348
similar to that which has been widely reported in sporadic exocrine gastrointestinal 349
adenocarcinomas (Bevilacqua and Simpson 2000; Kane, et al. 1997). Accordingly, several other 350
observations suggest similarities between MSI neuroendocrine and exocrine cancers in these 351
anatomic sites. Firstly, the incidence of the MSI phenotype in NEC/MANECs is comparable to that 352
reported for colorectal and gastric adenocarcinomas (Gologan and Sepulveda 2005; Ionov, et al. 353
1993). Secondly, MMR defect seems to occur early in the tumorigenic pathway of MSI-354
NEC/MANECs, if the large size of the allelic shifts observed in the five microsatellites examined is 355
considered. Indeed, it is well known that the progressive shortening of mononucleotide tracts may 356
be used as a simple molecular clock of MSI tumor evolution (Duval, et al. 2001; Percesepe, et al. 357
2000). In this study, we observed microsatellite deletions ranging from 5.4 to 9.7 base pairs that 358
were very similar to those previously reported in advanced gastric and colorectal adenocarcinomas 359
showing MSI (Furlan, et al. 2002). In agreement with this hypothesis, the presence of MSI was 360
found in both exocrine and neuroendocrine areas of all four MSI-MANECs examined, suggesting 361
that the MMR defect occurs before the divergent differentiation starts. Thirdly, MSI-362
Page 14 of 30

15
NEC/MANECs are associated with widespread gene methylation. This finding confirms the close 363
association between MSI and the CpG island methylator phenotype (CIMP) already described in 364
gastric and colorectal adenocarcinomas (Samowitz, et al. 2005; Toyota, et al. 1999). In these sites, 365
genome-wide methylation studies have confirmed that CIMP and MSI are a homogeneous subset of 366
cancers harboring aberrant DNA methylation mechanisms (Hinoue, et al. 2012; Park, et al. 2011; 367
Xu, et al. 2012). Fourthly, we demonstrated that the well-known relationship reported in colorectal 368
adenocarcinomas between MSI phenotype and BRAF V600E mutation (Boland, et al. 2009) is also 369
found in MSI-NEC/MANECs of the colon-rectum. Fifth, at least one case of MLH1-negative large 370
cell NEC arising in a MLH1 negative sessile serrated adenoma, which is recognized to be a 371
precursor of colorectal carcinoma as a part of the MSI pathway of colorectal carcinogenesis, has 372
been reported (Naert and Dupre 2012). 373
It is worth noting that morphology alone did not help to identify MSI-NEC/MANECs. 374
Indeed, none of the histologic features considered predicted the MSI status. On the contrary, 375
immunohistochemistry for neuroendocrine markers and mismatch repair proteins allowed us to 376
identify MSI-NEC/MANECs, which were subsequently confirmed by MSI analysis. 377
A very important finding of our study regards the unexpected, more favorable prognosis of 378
MSI-carcinomas compared to MSS-NEC/MANECs. Indeed, the presence of a MMR defect allowed 379
us to identify a subset of 11 patients with MSI-carcinomas showing a median survival of 60 380
months; much longer than the median survival of 5.5 months observed in the patients with MSS-381
NEC/MANECs. Moreover, MSI status remains the only independent prognostic factor (p=0.0084) 382
at multivariable analysis together with vascular invasion (p=0.0003). Interestingly, the median 383
survival of MSI-NEC/MANECs is similar to that of MSI-adenocarcinomas (Guidoboni, et al. 384
2001). 385
The identification of MSI status may be also useful for therapeutic purposes. It is well 386
known that MSI predicts poor response to 5-fluorouracil and oxaliplatin (Zaanan, et al. 2010). On 387
the contrary, MSI colorectal cancers (CRCs) are sensitive to irinotecan (Bras-Goncalves, et al. 388
Page 15 of 30
16
2000) and patients with MSI tumors have a better survival after adjuvant therapy that includes 389
irinotecan (Bertagnolli, et al. 2009). It remains to be demonstrated if this different response to 390
therapeutic agents is similar in MSI-NEC/MANEC. 391
Regarding the prognostic value of the Ki67 index in our study, we observed an unexpected 392
finding. The 55% threshold index failed to prognosticate NEC/MANECs when applied to the whole 393
series, while it was a significant prognostic predictor in the group of 78 MSS-NEC/MANECs. It is 394
worth noting that a high Ki67 index was not associated with a worse survival in colorectal MSI 395
adenocarcinomas (Kim, et al. 2007), indicating that the Ki67 index has a different prognostic value 396
in MSI-positive and in MSI-negative neoplasms. 397
In conclusion, this study demonstrates that immunohistochemical expression of MMR 398
protein and MSI analysis, two simple tests routinely available in most laboratories of surgical 399
pathology, can identify a subgroup of MSI-NEC/MANECs which are associated with a significantly 400
more favorable prognosis than that of NEC/MANECs without a MMR defect. MSI-NEC/MANECs 401
are observed in gastric and colorectal sites with very similar frequency to that reported for MSI 402
gastrointestinal adenocarcinomas. The pathogenetic mechanisms as well as the clinico-pathologic 403
and the molecular profiles of MSI-NEC/MANECs closely resemble those described for sporadic 404
gastric and colorectal MSI-adenocarcinomas. 405
406
Declaration of Interest: All authors declared no conflict of interest 407
408
Funding: This study has been supported by Epigenomics Flagship Project—EPIGEN (to C.N.R.), 409
by a grant of the Italian Ministry of Health (progetto finalizzato n° 08934412), and by a grant from 410
the University of Insubria, Varese for a post-graduate fellowship. 411
412
Author Contributions 413
N.S.: performed the experiments; analysis and interpretation of data; drafting of the manuscript 414
Page 16 of 30
17
D.F.: study concept and design, analysis and interpretation of data; drafting of the manuscript 415
M.M.: performed the experiments; analysis and interpretation of data 416
C.R.: statistical analysis 417
A.V.: analysis and interpretation of data 418
E.V.: performed the experiments, analysis and interpretation of data 419
E.S.: critical revision of the manuscript 420
F.S.: critical revision of the manuscript 421
C.C.: analysis and interpretation of data; critical revision of the manuscript 422
S.L.R.: study concept and design, analysis and interpretation of data; drafting of the manuscript 423
424
425
426
Page 17 of 30

18
427
REFERENCES 428
429
430
Bertagnolli MM, Niedzwiecki D, Compton CC, Hahn HP, Hall M, Damas B, Jewell SD, Mayer RJ, 431
Goldberg RM, Saltz LB, et al. 2009 Microsatellite instability predicts improved response to 432
adjuvant therapy with irinotecan, fluorouracil, and leucovorin in stage III colon cancer: Cancer and 433
Leukemia Group B Protocol 89803. J Clin Oncol 27 1814-1821. 434
435
Bevilacqua RA & Simpson AJ 2000 Methylation of the hMLH1 promoter but no hMLH1 mutations 436
in sporadic gastric carcinomas with high-level microsatellite instability. Int J Cancer 87 200-203. 437
Boland CR, Shin SK & Goel A 2009 Promoter methylation in the genesis of gastrointestinal cancer. 438
Yonsei Med J 50 309-321. 439
440
Bras-Goncalves RA, Rosty C, Laurent-Puig P, Soulie P, Dutrillaux B & Poupon MF 2000 441
Sensitivity to CPT-11 of xenografted human colorectal cancers as a function of microsatellite 442
instability and p53 status. Br J Cancer 82 913-923. 443
444
Dacic S, Finkelstein SD, Baksh FK, Swalsky PA, Barnes LE & Yousem SA 2002 Small-cell 445
neuroendocrine carcinoma displays unique profiles of tumor-suppressor gene loss in relationship to 446
the primary site of formation. Hum Pathol 33 927-932. 447
448
Duval A, Rolland S, Compoint A, Tubacher E, Iacopetta B, Thomas G & Hamelin R 2001 449
Evolution of instability at coding and non-coding repeat sequences in human MSI-H colorectal 450
cancers. Hum Mol Genet 10 513-518. 451
452
Furlan D, Bernasconi B, Uccella S, Cerutti R, Carnevali I & Capella C 2005 Allelotypes and 453
fluorescence in situ hybridization profiles of poorly differentiated endocrine carcinomas of different 454
sites. Clin Cancer Res 11 1765-1775. 455
456
Furlan D, Casati B, Cerutti R, Facco C, Terracciano L, Capella C & Chiaravalli AM 2002 Genetic 457
progression in sporadic endometrial and gastrointestinal cancers with high microsatellite instability. 458
J Pathol 197 603-609. 459
460
Furlan D, Sahnane N, Mazzoni M, Pastorino R, Carnevali I, Stefanoli M, Ferretti A, Chiaravalli 461
AM, La Rosa S & Capella C 2013 Diagnostic utility of MS-MLPA in DNA methylation profiling of 462
adenocarcinomas and neuroendocrine carcinomas of the colon-rectum. Virchows Arch 462 47-56. 463
464
Gausachs M, Mur P, Corral J, Pineda M, Gonzalez S, Benito L, Menendez M, Espinas JA, Brunet J, 465
Iniesta MD, et al. 2012 MLH1 promoter hypermethylation in the analytical algorithm of Lynch 466
syndrome: a cost-effectiveness study. Eur J Hum Genet 20 762-768. 467
468
Ghimenti C, Lonobile A, Campani D, Bevilacqua G & Caligo MA 1999 Microsatellite instability 469
and allelic losses in neuroendocrine tumors of the gastro-entero-pancreatic system. Int J Oncol 15 470
361-366. 471
472
Gologan A & Sepulveda AR 2005 Microsatellite instability and DNA mismatch repair deficiency 473
testing in hereditary and sporadic gastrointestinal cancers. Clin Lab Med 25 179-196. 474
475
Page 18 of 30
19
Guidoboni M, Gafa R, Viel A, Doglioni C, Russo A, Santini A, Del Tin L, Macri E, Lanza G, 476
Boiocchi M, et al. 2001 Microsatellite instability and high content of activated cytotoxic 477
lymphocytes identify colon cancer patients with a favorable prognosis. Am J Pathol 159 297-304. 478
479
Hijioka S, Hosoda W, Mizuno N, Hara K, Imaoka H, Bhatia V, Mekky MA, Tajika M, Tanaka T, 480
Ishihara M, Yogi T, Tsutumi H, Fujiyoshi T, Sato T, Hieda N, Yoshida T, Okuno N, Shimizu Y, 481
Yatabe Y, Niwa Y, Yamao K 2014 Does the WHO 2010 classification of pancreatic neuroendocrine 482
neoplasms accurately characterize pancreatic neuroendocrine carcinomas? J Gastroenterol 2014 483
Aug 21. [Epub ahead of print] 484
485
Hinoue T, Weisenberger DJ, Lange CP, Shen H, Byun HM, Van Den Berg D, Malik S, Pan F, 486
Noushmehr H, van Dijk CM, et al. 2012 Genome-scale analysis of aberrant DNA methylation in 487
colorectal cancer. Genome Res 22 271-282. 488
489
Ionov Y, Peinado MA, Malkhosyan S, Shibata D & Perucho M 1993 Ubiquitous somatic mutations 490
in simple repeated sequences reveal a new mechanism for colonic carcinogenesis. Nature 363 558-491
561. 492
493
Kane MF, Loda M, Gaida GM, Lipman J, Mishra R, Goldman H, Jessup JM & Kolodner R 1997 494
Methylation of the hMLH1 promoter correlates with lack of expression of hMLH1 in sporadic 495
colon tumors and mismatch repair-defective human tumor cell lines. Cancer Res 57 808-811. 496
497
Kim GP, Colangelo LH, Wieand HS, Paik S, Kirsch IR, Wolmark N & Allegra CJ 2007 Prognostic 498
and predictive roles of high-degree microsatellite instability in colon cancer: a National Cancer 499
Institute-National Surgical Adjuvant Breast and Bowel Project Collaborative Study. J Clin Oncol 500
25 767-772. 501
502
La Rosa S, Klersy C, Uccella S, Dainese L, Albarello L, Sonzogni A, Doglioni C, Capella C, Solcia 503
E 2009 Improved histologic and clinico-pathologic criteria for prognostic evaluation of pancreatic 504
endocrine tumors. Hum Pathol 40 30-40. 505
506
La Rosa S, Inzani F, Vanoli A, Klersy C, Dainese L, Rindi G, Capella C, Bordi C, Solcia E 2011 507
Histologic characterization and improved prognostic evaluation of 209 gastric neuroendocrine 508
neoplasms. Hum Pathol 42 1373-1384. 509
510 La Rosa S, Marando A, Sessa F, Capella C 2012 Mixed adenoneuroendocrine carcinomas 511
(MANECs) of the gastrointestinal tract: an update. Cancers 4 11-30. 512
513
La Rosa S, Marando A, Furlan D, Sahnane N & Capella C 2012 Colorectal poorly differentiated 514
neuroendocrine carcinomas and mixed adenoneuroendocrine carcinomas: insights into the 515
diagnostic immunophenotype, assessment of methylation profile, and search for prognostic 516
markers. Am J Surg Pathol 36 601-611. 517
518
La Rosa S & Sessa F 2014 High-grade poorly differentiated neuroendocrine carcinomas of the 519
gastroenteropancreatic system: from morphology to proliferation and back. Endocr Pathol 25 193-520
198. 521
522
Lubensky IA & Zhuang Z 2007 Molecular genetic events in gastrointestinal and pancreatic 523
neuroendocrine tumors. Endocr Pathol 18 156-162. 524
525
Page 19 of 30

20
Naert K & Dupre MP 2012 Large cell neuroendocrine carcinoma arising in a sessile serrated 526
adenoma: a novel observation. Hum Pathol 43 757-760. 527
528
Nassar H, Albores-Saavedra J & Klimstra DS 2005 High-grade neuroendocrine carcinoma of the 529
ampulla of vater: a clinicopathologic and immunohistochemical analysis of 14 cases. Am J Surg 530
Pathol 29 588-594. 531
532
Park JH, Park J, Choi JK, Lyu J, Bae MG, Lee YG, Bae JB, Park DY, Yang HK, Kim TY, et al. 533
2011 Identification of DNA methylation changes associated with human gastric cancer. BMC Med 534
Genomics 4 82. 535
536
Parwani AV, Geradts J, Caspers E, Offerhaus GJ, Yeo CJ, Cameron JL, Klimstra DS, Maitra A, 537
Hruban RH & Argani P 2003 Immunohistochemical and genetic analysis of non-small cell and 538
small cell gallbladder carcinoma and their precursor lesions. Mod Pathol 16 299-308. 539
540
Percesepe A, Pedroni M, Sala E, Menigatti M, Borghi F, Losi L, Viel A, Genuardi M, Benatti P, 541
Roncucci L, et al. 2000 Genomic instability and target gene mutations in colon cancers with 542
different degrees of allelic shifts. Genes Chromosomes Cancer 27 424-429. 543
Power DG, Asmis TR, Tang LH, Brown K & Kemeny NE 2010 High-grade neuroendocrine 544
carcinoma of the colon, long-term survival in advanced disease. Med Oncol 28 Suppl 1 S169-174. 545
546
Raftery CFaAE 2002 Model-based clustering, discriminant analysis, and density estimation. 547
Journal of the American Statistical Association 97 611-631. 548
549
Rindi G, Arnold R & Bosman FT 2010 Nomenclature and classification of neuroendocrine 550
neoplasms of the digestive system. In WHO classification of tumours of the digestive system. Ed F 551
Bosman. Lyon: IARC Press. 552
553
Samowitz WS, Albertsen H, Herrick J, Levin TR, Sweeney C, Murtaugh MA, Wolff RK & Slattery 554
ML 2005 Evaluation of a large, population-based sample supports a CpG island methylator 555
phenotype in colon cancer. Gastroenterology 129 837-845. 556
557
Schwarz G 1978 Estimating the Dimension of a Model. The Annals of Statistics 6 461-464. 558
559
Shia J, Tang LH, Weiser MR, Brenner B, Adsay NV, Stelow EB, Saltz LB, Qin J, Landmann R, 560
Leonard GD, et al. 2008 Is nonsmall cell type high-grade neuroendocrine carcinoma of the tubular 561
gastrointestinal tract a distinct disease entity? Am J Surg Pathol 32 719-731. 562
563
Smith J & Reidy-Lagunes D 2013 The management of extrapulmonary poorly differentiated (high-564
grade) neuroendocrine carcinomas. Semin Oncol 40 100-108. 565
566
Sorbye H, Welin S, Langer SW, Vestermark LW, Holt N, Osterlund P, Dueland S, Hofsli E, Guren 567
MG, Ohrling K, et al. 2013 Predictive and prognostic factors for treatment and survival in 305 568
patients with advanced gastrointestinal neuroendocrine carcinoma (WHO G3): the NORDIC NEC 569
study. Ann Oncol 24 152-160. 570
571
Stelow EB, Moskaluk CA & Mills SE 2006 The mismatch repair protein status of colorectal small 572
cell neuroendocrine carcinomas. Am J Surg Pathol 30 1401-1404. 573
574
Page 20 of 30

21
Suraweera N, Duval A, Reperant M, Vaury C, Furlan D, Leroy K, Seruca R, Iacopetta B & Hamelin 575
R 2002 Evaluation of tumor microsatellite instability using five quasimonomorphic mononucleotide 576
repeats and pentaplex PCR. Gastroenterology 123 1804-1811. 577
578
Toyota M, Ahuja N, Suzuki H, Itoh F, Ohe-Toyota M, Imai K, Baylin SB & Issa JP 1999 Aberrant 579
methylation in gastric cancer associated with the CpG island methylator phenotype. Cancer Res 59 580
5438-5442. 581
582
van Dongen JJ, Langerak AW, Bruggemann M, Evans PA, Hummel M, Lavender FL, Delabesse E, 583
Davi F, Schuuring E, Garcia-Sanz R, et al. 2003 Design and standardization of PCR primers and 584
protocols for detection of clonal immunoglobulin and T-cell receptor gene recombinations in 585
suspect lymphoproliferations: report of the BIOMED-2 Concerted Action BMH4-CT98-3936. 586
Leukemia 17 2257-2317. 587
588
Vélayoudom-Céphise FL,Duvillard P, Foucan L, Hadoux J, Chougnet CN, Leboulleux S, Malka D, 589
Guigay J, Goere D, Debaere T, Caramella C, Schlumberger M, Planchard D, Elias D, Ducreux M, 590
Scoazec JY, Baudin E 2013 Are G3 ENETS neuroendocrine neoplasms heterogeneous? Endocr 591
Relat Cancer 20 649-657. 592
593
Walsh MD, Clendenning M, Williamson E, Pearson SA, Walters RJ, Nagler B, Packenas D, Win 594
AK, Hopper JL, Jenkins MA, Haydon AM, Rosty C, English DR, Giles GG, McGuckin MA, 595
Young JP, Buchanan DD 2013 Expression of MUC2, MUC5AC, MUC5B, and MUC6 mucins in 596
colorectal cancers and their association with the CpG island methylator phenotype. Mod Pathol 26 597
1642-1656. 598
599
Xu Y, Hu B, Choi AJ, Gopalan B, Lee BH, Kalady MF, Church JM & Ting AH 2012 Unique DNA 600
methylome profiles in CpG island methylator phenotype colon cancers. Genome Res 22 283-291. 601
602
Yachida S, Vakiani E, White CM, Zhong Y, Saunders T, Morgan R, de Wilde RF, Maitra A, Hicks 603
J, Demarzo AM, et al. 2012 Small cell and large cell neuroendocrine carcinomas of the pancreas are 604
genetically similar and distinct from well-differentiated pancreatic neuroendocrine tumors. Am J 605
Surg Pathol 36 173-184. 606
607
Zaanan A, Cuilliere-Dartigues P, Guilloux A, Parc Y, Louvet C, de Gramont A, Tiret E, Dumont S, 608
Gayet B, Validire P, et al. 2010 Impact of p53 expression and microsatellite instability on stage III 609
colon cancer disease-free survival in patients treated by 5-fluorouracil and leucovorin with or 610
without oxaliplatin. Ann Oncol 21 772-780. 611
612
613
Page 21 of 30
22
FIGURE LEGENDS 614
Figure 1. Unstable neuroendocrine carcinoma showing abundant intraepithelial lymphocytes. 615
Although they can be recognized in the H&E-stained section (A), they become much more evident 616
in the CD3-immunostained section (B) (original magnification X 250). 617
Figure 2. Example of unstable colorectal MANEC showing loss of MLH1 protein expression, 618
presence of microsatellite instability, and methylation of MLH1 gene. A: Hematoxylin-eosin 619
stain shows the association of a large cell NEC component (upper left) with a mucinous 620
adenocarcinoma component (bottom right); B: MLH1 immunostaining demonstrates complete loss 621
of MLH1 nuclear expression in tumor cells, while lymphocytes serve as positive control. C, E: 622
Presence of microsatellite instability and of MLH1 methylation in the DNA sample from the 623
adenocarcinoma component; D, F: Presence of microsatellite instability and of MLH1 methylation 624
in the DNA sample from the NEC component 625
626
Figure 3. Distribution of NECs/MANECs based on methylation levels and anatomical sites. 627
A: scatter plot showing three distinct subgroups of tumors with high levels (H-MET), low levels (L-628
MET) and intermediate levels (I-MET) of gene methylation, as determined by the model based 629
cluster method. B: scatter plot showing the distribution of H-MET and I-/L-MET cases in gastro-630
enteropancreatic sites. Black lines indicate the mean values, black dots represent MSI-631
NECs/MANECs while gray dots indicate MSS cases. 632
633
Figure 4. Molecular and clinico-pathological features that were statistically significant at 634
univariate analysis: A) MSI status; B) MLH1 methylation; C) Vascular invasion; D) CD117 635
immunostaining; E) Ki-67 index in the whole series; F) Ki-67 index considering only MSS 636
NEC/MANEC cases. 637
638
639
640
Page 22 of 30
1
Table 1. Clinico-pathologic characteristics of unstable (MSI) and
stable (MSS) neuroendocrine carcinomas.
MSI
11 cases
MSS
78 cases
Total
89 cases
Gender
Male 4 (36%) 53 (71%) 57 (66%)
Female 7 (64%) 22 (29%) 29 (34%)
Age (years)
Average 74 65.1 66.3
Range 61-91 34-93 34-93
Location
Esophagus 0 6 (7%) 6 (6%)
Stomach 4 (36%) 32 (41%) 36 (41%)
Duodenum 1 (10%) 3 (4%) 4 (5%)
Colon-rectum 6 (54%) 31 (40%) 37 (42%)
Pancreas 0 3 (4%) 3 (3%)
Gallbladder 0 3 (4%) 3 (3%)
Classification
NEC 7 (64%) 46 (59%) 53 (60%)
MANEC 4 (36%) 32 (41%) 36 (40%)
Lymph node metastasis 10 (91%) 67 (89%) 77 (89%)
Distant metastasis 0 30 (38%) 30 (34%)
Tumor stage (ENETS)
Stage I 0 0 0
Stage II 4 (36%) 6 (9%) 10 (13%)
Stage III 7 (64%) 42 (63 %) 49 (63%)
Stage IV 0 19 (28%) 19 (24%)
Follow-up (months)
Mean time 85.7 19.5 27.7
Range time 14-230 1-257 1-257
DOC 1 (9%) 2 (3%) 3 (3%)
DOD 7 (64%) 59 (75%) 66 (74%)
AFD 2 (18%) 10 (13%) 12 (14%)
POD 0 3 (4%) 3 (3%)
Lost 1 (9%) 4 (5%) 5 (6%)
NEC: neuroendocrine carcinoma; MANEC: mixed adenoneuroendocrine
carcinoma, DOC: died of other cause; DOD: died of disease; AFD: alive free
disease; POD, post-operative death.
Page 23 of 30

1
Table 2. Immunohistochemical and molecular characterization of mismatch repair genes and
proteins in MSI-NEC/MANECs
MSI cases Anatomic
site Type IHC
Promoter methylation
MS-MLPA Pyrosequencing
MLH1
MSH2
MSH6
PMS2
MLH1
MSH2
MSH6
PMS2
MLH1
Case#25 Stomach NEC - + + - Met U 31%
Case#31 Stomach MANEC - + + - Met U 26.5%
Case#40 Stomach MANEC - + ne - Met U 14%
Case#44 Stomach NEC - + + - Met U 16.6%
Case#50 Duodenum NEC + - - + U U U
Case#58 Colon-rectum NEC - + + - Met U ne
Case#62 Colon-rectum NEC - + + - Met U ne
Case#63 Colon-rectum NEC - + + - Met U 12.3%
Case#74 Colon-rectum NEC - + + - Met U 26.3%
Case#100 Colon-rectum MANEC + + + - U U U
Case#101 Colon-rectum MANEC - + + - Met U 45.9%
ne, not evaluable; Met: methylated; U: unmethylated
Page 24 of 30
1
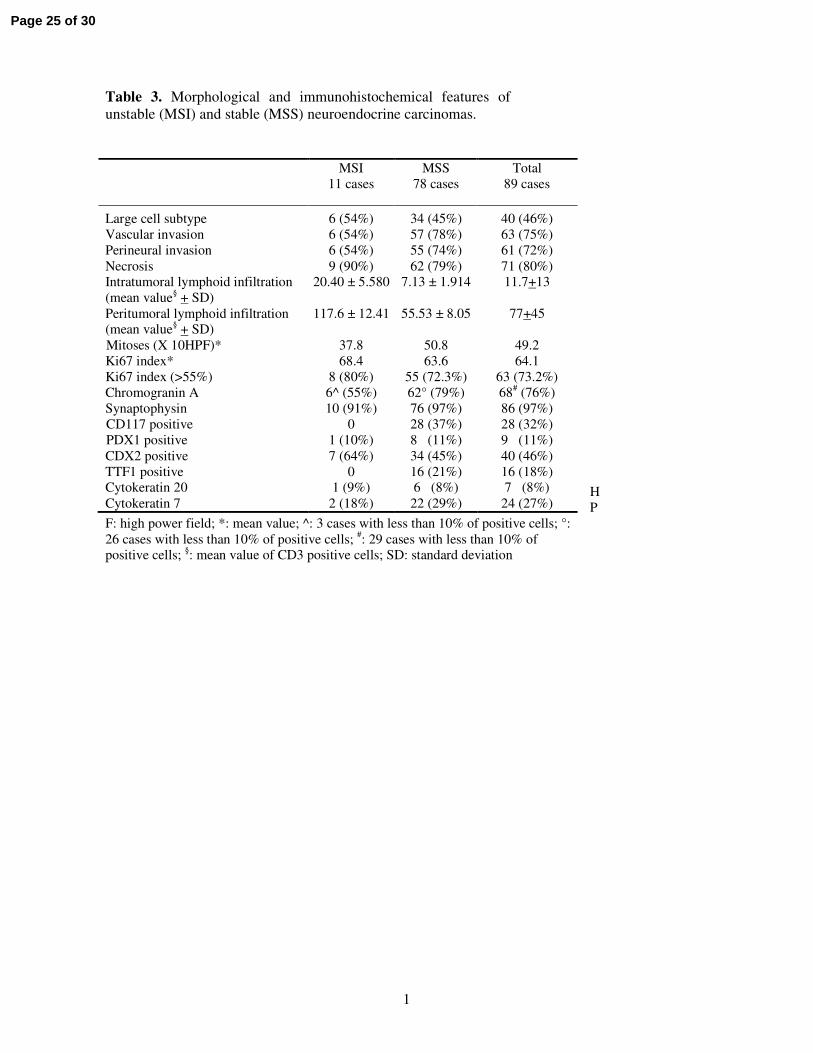
Table 3. Morphological and immunohistochemical features of
unstable (MSI) and stable (MSS) neuroendocrine carcinomas.
H
P
F: high power field; *: mean value; ^: 3 cases with less than 10% of positive cells; °:
26 cases with less than 10% of positive cells; #: 29 cases with less than 10% of
positive cells; §: mean value of CD3 positive cells; SD: standard deviation
MSI
11 cases
MSS
78 cases
Total
89 cases
Large cell subtype 6 (54%) 34 (45%) 40 (46%)
Vascular invasion 6 (54%) 57 (78%) 63 (75%)
Perineural invasion 6 (54%) 55 (74%) 61 (72%)
Necrosis 9 (90%) 62 (79%) 71 (80%)
Intratumoral lymphoid infiltration
(mean value§ + SD)
20.40 ± 5.580 7.13 ± 1.914 11.7+13
Peritumoral lymphoid infiltration
(mean value§ + SD)
117.6 ± 12.41 55.53 ± 8.05 77+45
Mitoses (X 10HPF)* 37.8 50.8 49.2
Ki67 index* 68.4 63.6 64.1
Ki67 index (>55%) 8 (80%) 55 (72.3%) 63 (73.2%)
Chromogranin A 6^ (55%) 62° (79%) 68# (76%)
Synaptophysin 10 (91%) 76 (97%) 86 (97%)
CD117 positive 0 28 (37%) 28 (32%)
PDX1 positive 1 (10%) 8 (11%) 9 (11%)
CDX2 positive 7 (64%) 34 (45%) 40 (46%)
TTF1 positive 0 16 (21%) 16 (18%)
Cytokeratin 20 1 (9%) 6 (8%) 7 (8%)
Cytokeratin 7 2 (18%) 22 (29%) 24 (27%)
Page 25 of 30

1
Table 4. Multivariable analysis
HR CI 95% p-value
Vascular invasion 1.96 1.3631 – 2.813 0.0003 MSI phenotype 1.81 1.1639 – 2.814 0.0084
Ki67 index (55%) 1.36 0.9839 – 1.878 0.063
HR, hazard Ratio; CI, confidence interval
Page 26 of 30
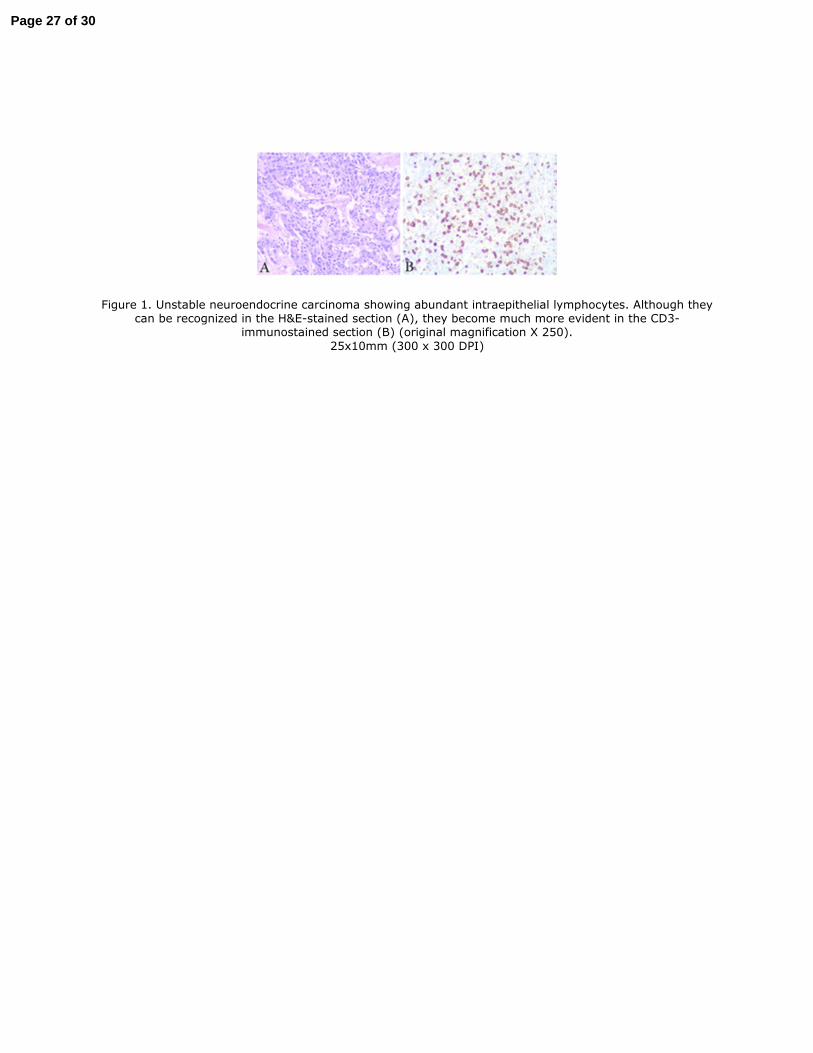
Figure 1. Unstable neuroendocrine carcinoma showing abundant intraepithelial lymphocytes. Although they can be recognized in the H&E-stained section (A), they become much more evident in the CD3-
immunostained section (B) (original magnification X 250).
25x10mm (300 x 300 DPI)
Page 27 of 30
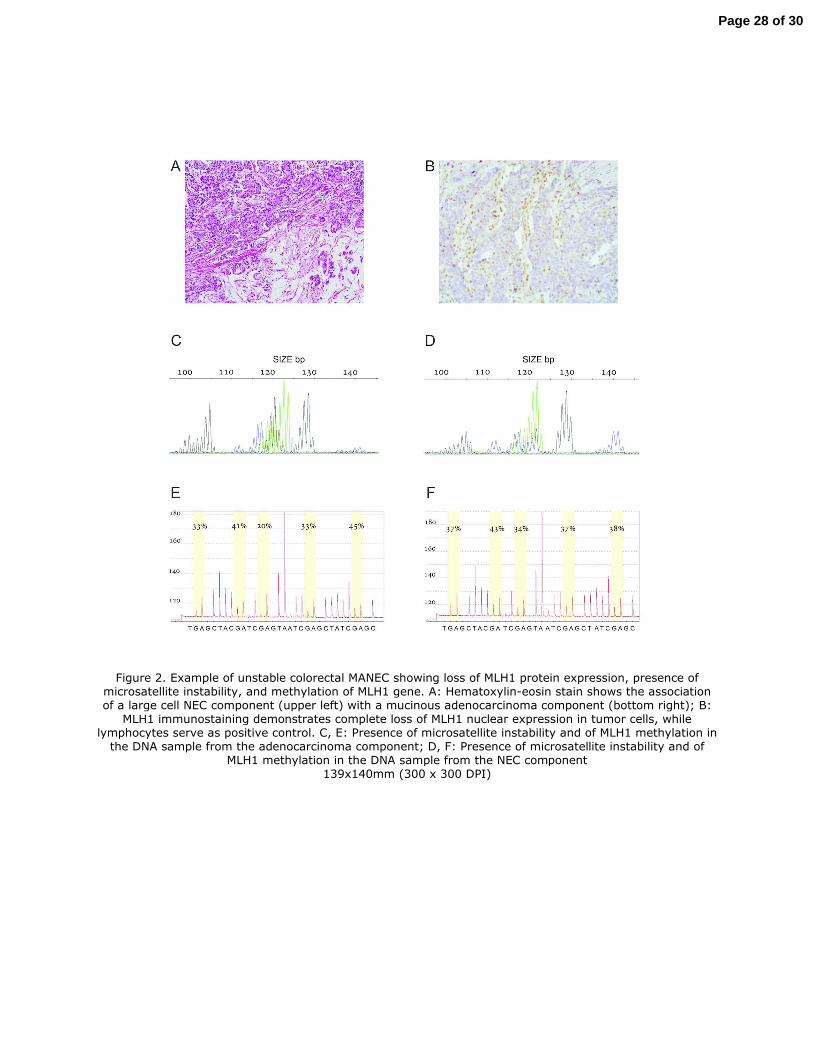
Figure 2. Example of unstable colorectal MANEC showing loss of MLH1 protein expression, presence of microsatellite instability, and methylation of MLH1 gene. A: Hematoxylin-eosin stain shows the association of a large cell NEC component (upper left) with a mucinous adenocarcinoma component (bottom right); B:
MLH1 immunostaining demonstrates complete loss of MLH1 nuclear expression in tumor cells, while lymphocytes serve as positive control. C, E: Presence of microsatellite instability and of MLH1 methylation in
the DNA sample from the adenocarcinoma component; D, F: Presence of microsatellite instability and of MLH1 methylation in the DNA sample from the NEC component
139x140mm (300 x 300 DPI)
Page 28 of 30
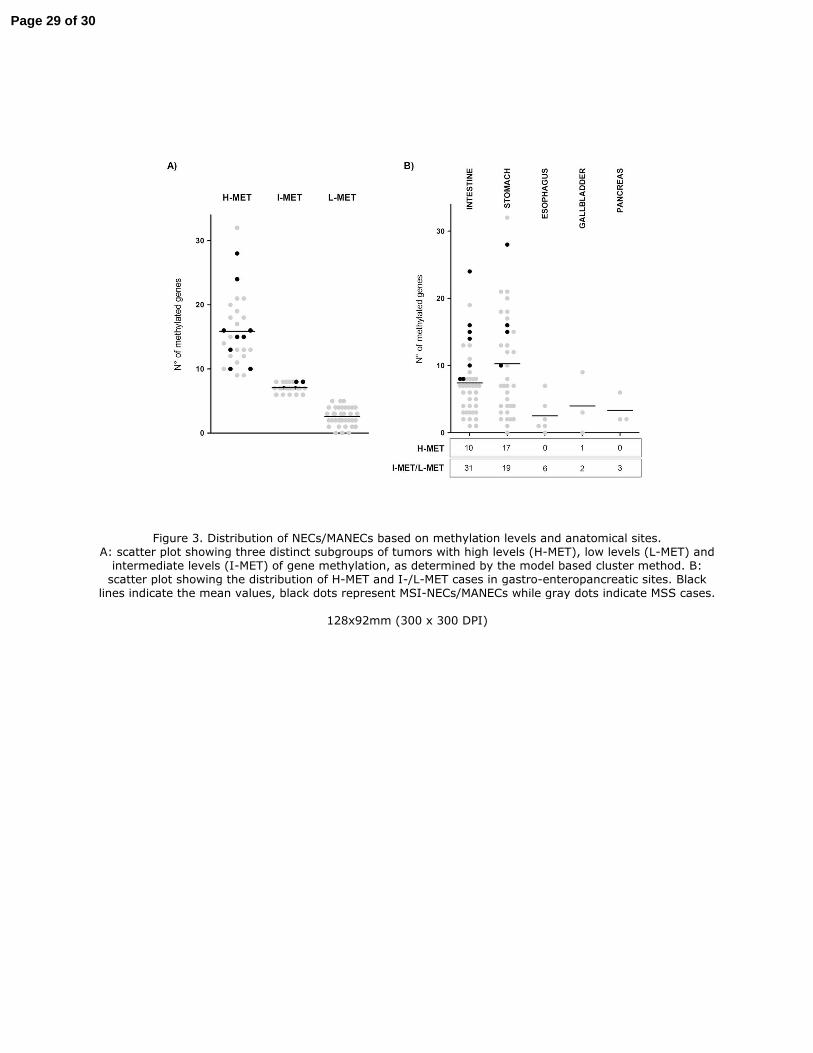
Figure 3. Distribution of NECs/MANECs based on methylation levels and anatomical sites. A: scatter plot showing three distinct subgroups of tumors with high levels (H-MET), low levels (L-MET) and intermediate levels (I-MET) of gene methylation, as determined by the model based cluster method. B: scatter plot showing the distribution of H-MET and I-/L-MET cases in gastro-enteropancreatic sites. Black
lines indicate the mean values, black dots represent MSI-NECs/MANECs while gray dots indicate MSS cases.
128x92mm (300 x 300 DPI)
Page 29 of 30
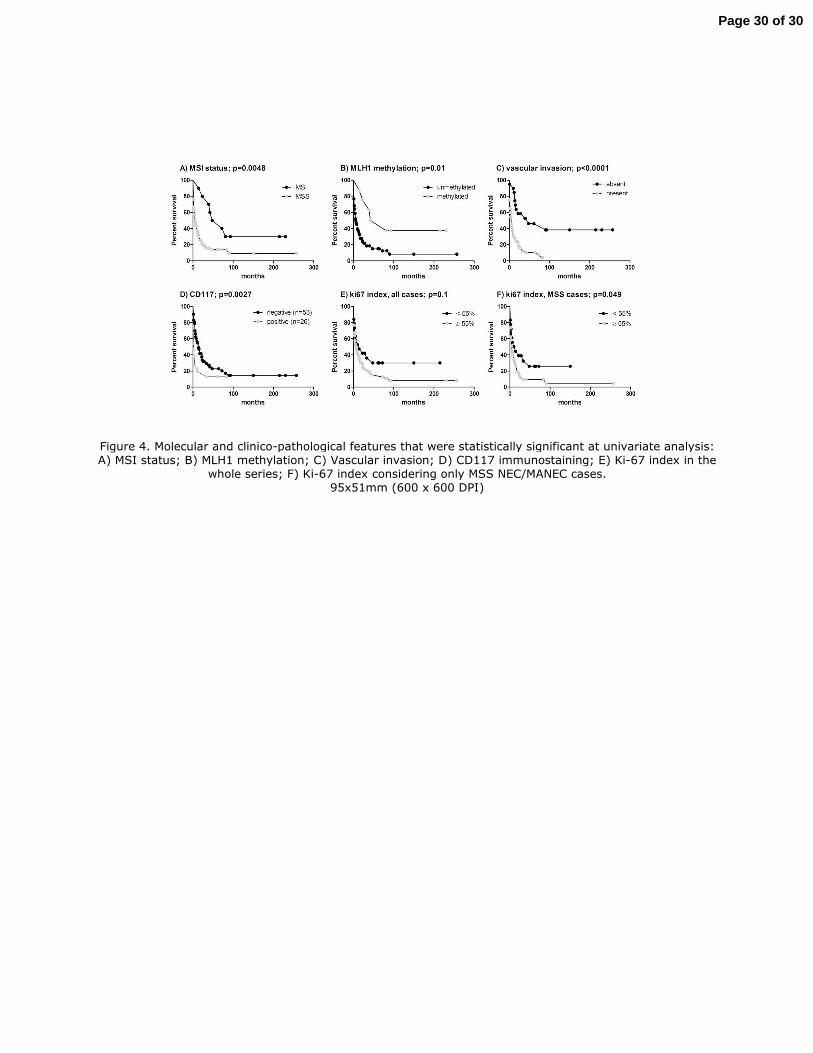
Figure 4. Molecular and clinico-pathological features that were statistically significant at univariate analysis: A) MSI status; B) MLH1 methylation; C) Vascular invasion; D) CD117 immunostaining; E) Ki-67 index in the
whole series; F) Ki-67 index considering only MSS NEC/MANEC cases. 95x51mm (600 x 600 DPI)
Page 30 of 30


