Embed Size (px)
Citation preview
www.elsevier.com/locate/ybbrc
Biochemical and Biophysical Research Communications 341 (2006) 1266–1276
BBRC
Microdosimetry for conventional and supra-electroporationin cells with organelles
Thiruvallur R. Gowrishankar a, Axel T. Esser a, Zlatko Vasilkoski a,Kyle C. Smith a,b, James C. Weaver a,*
a Harvard-M.I.T., Division of Health Sciences and Technology, Massachusetts Institute of Technology, Cambridge, MA 02139, USAb Department of Electrical Engineering and Computer Science, Massachusetts Institute of Technology, Cambridge, MA 02139, USA
Received 12 January 2006Available online 31 January 2006
Abstract
Conventional electroporation (EP) by 0.1 to 1 kV/cm pulses longer than 100 ls, and supra-electroporation by 10 to 300 kV/cm pulsesshorter than 1 ls cause different cellular effects. Conventional EP delivers DNA, proteins, small drugs, and fluorescent indicators acrossthe plasma membrane (PM) and causes moderate levels of phosphatidylserine (PS) translocation at the PM. We hypothesize that supra-EP is central to intracellular effects such as apoptosis induction and higher levels of PS translocation. Our cell system model has 20,000interconnected local models for small areas of the PM and organelle membranes, small regions of aqueous media, appropriate restingpotentials, and the asymptotic EP model. Conventional EP primarily affects the PM, but with a hint of endoplasmic reticulum involve-ment. Supra-EP can involve all of a cell’s membrane at the largest fields. Conventional EP fields tend to go around cells, but supra-EPfields go through cells, extensively penetrating organelles.� 2006 Elsevier Inc. All rights reserved.
Keywords: Nanosecond scale pulses; Megavolt-per-meter fields; Supra-electroporation; Conventional electroporation; Organelles; Cell system model;Microdosimetry
High voltage electrical pulses are hypothesized to altercell membranes by causing the formation of transient aque-ous pores and consequently affecting cell structure, process-es, and signaling. Such pulses are encountered both inpurposefully permeabilizing cell membranes for enhancedmolecular transport and in high voltage electrical injury.
Conventional electroporation protocols involve pulsesof 0.1 to 1 kV/cm magnitude and greater than �100 lsduration [1–5]. Conventional electroporation permeabilizesthe plasma membrane (PM) to effect the release of ions andsmall molecules [6], delivery of molecules such as fluores-cent markers [7–9], delivery of drugs such as bleomycin[10,3], and uptake of large molecules such as proteins[11–16] and DNA [17,3] into cells. Excessive conventionalelectroporation involving too large, too long or too many
0006-291X/$ - see front matter � 2006 Elsevier Inc. All rights reserved.
doi:10.1016/j.bbrc.2006.01.094
* Corresponding author. Fax: +1 617 253 2514.E-mail address: [email protected] (J.C. Weaver).
pulses results in membrane permeabilization that quicklyleads to non-thermal necrotic cell death [18–23].
Recently, submicrosecond, megavolt-per-meter pulseshave been shown to profoundly affect intracellular pro-cesses through supra-electroporation of cell membranes.These experiments involve electric field pulses of dura-tions between about 10 and 300 ns and with correspond-ing magnitudes from 360 to 10 kV/cm. Such pulses causeapoptosis, cytochrome-c release, caspase activation, phos-phatidylserine (PS) translocation, disruption of nuclearDNA, small and delayed amounts of propidium iodide(PI) transport across the PM [24,25], and calcein uptakeinto subcellular granules [26–29,24,30–35]. Even thoughthe applied fields are extremely strong, their effects arenon-thermal due to the limited pulse duration.
The general mechanistic hypothesis underlying electro-poration is the formation of transient aqueous pores by ther-mal fluctuations and an electrically-decreased activation
T.R. Gowrishankar et al. / Biochemical and Biophysical Research Communications 341 (2006) 1266–1276 1267
energy [36,5]. The probability of pore creation is a highlynon-linear function of the transmembrane voltage, Dwm.The electroporation hypothesis is supported qualitativelyby recent molecular dynamics simulations of poreformation [37,38]. We employ a local asymptotic modelof electroporation [39,40], an approximation to the Smolu-chowski equation-based pore models, on a transport latticeto investigate the difference in the electrical response of cellmembranes in conventional and supra-electroporation. Weuse an illustrative model of a biological cell with explicitorganelles (mitochondria, nucleus, and endoplasmicreticulum). The response is quantified in terms of themicrodosimetry of electric fields, a description of the fieldsand membrane potentials that occur at the cellular level inresponse to an externally applied field. In addition, thelocal membrane sites that are electroporated, and thenumbers of pores in the plasma membrane and organellemembranes are used to distinguish the cellular responseto conventional supra-electroporation fields.
Methods
Modular, multiscale modeling. We use a modular and multiscalemodeling method. Local membrane models are constructed frommodules that represent resistive phospholipid regions, a resting potentialsource, local electrical capacitance, and a full representation of the non-linear hysteretic asymptotic electroporation model [39–41]. Thesemodules are distributed spatially to small local membrane areas andconnected to their nearest neighbors to form a transport lattice (the cellsystem model; Fig. 1) [42,39]. Basic features of the lattice transportmethod are described elsewhere [42,39,43–46], and all model parametersare given in Table 1.
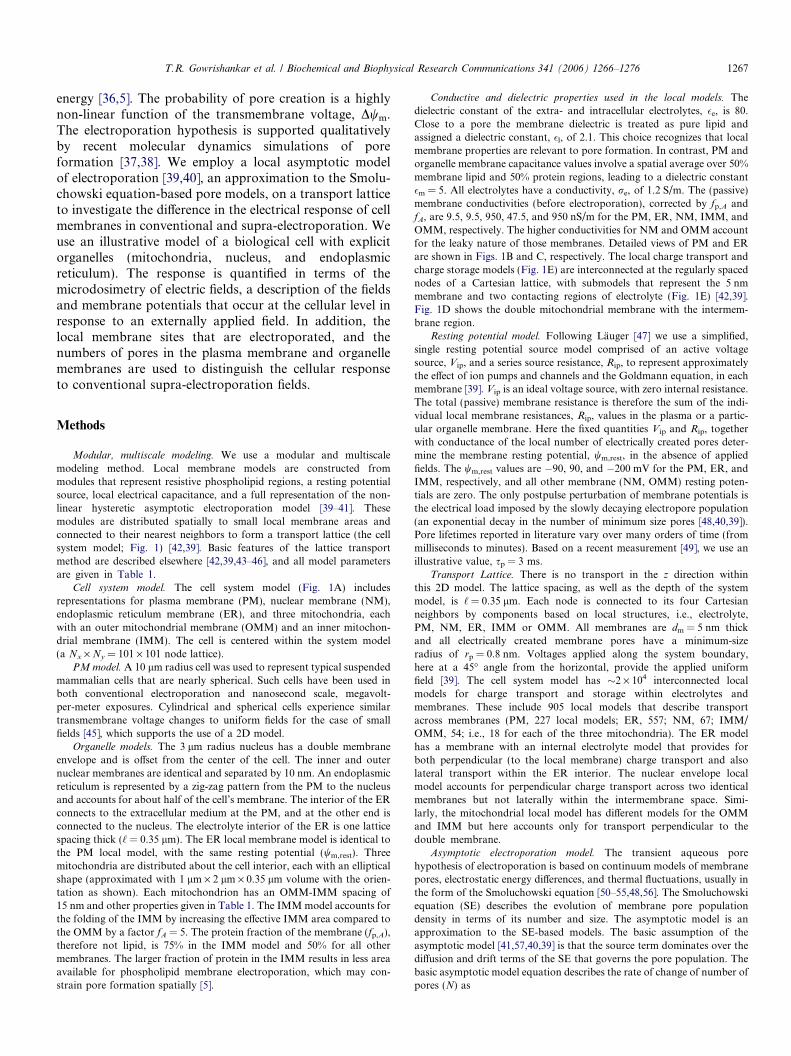
Cell system model. The cell system model (Fig. 1A) includesrepresentations for plasma membrane (PM), nuclear membrane (NM),endoplasmic reticulum membrane (ER), and three mitochondria, eachwith an outer mitochondrial membrane (OMM) and an inner mitochon-drial membrane (IMM). The cell is centered within the system model(a Nx · Ny = 101 · 101 node lattice).
PMmodel. A 10 lm radius cell was used to represent typical suspendedmammalian cells that are nearly spherical. Such cells have been used inboth conventional electroporation and nanosecond scale, megavolt-per-meter exposures. Cylindrical and spherical cells experience similartransmembrane voltage changes to uniform fields for the case of smallfields [45], which supports the use of a 2D model.
Organelle models. The 3 lm radius nucleus has a double membraneenvelope and is offset from the center of the cell. The inner and outernuclear membranes are identical and separated by 10 nm. An endoplasmicreticulum is represented by a zig-zag pattern from the PM to the nucleusand accounts for about half of the cell’s membrane. The interior of the ERconnects to the extracellular medium at the PM, and at the other end isconnected to the nucleus. The electrolyte interior of the ER is one latticespacing thick (‘ = 0.35 lm). The ER local membrane model is identical tothe PM local model, with the same resting potential (wm,rest). Threemitochondria are distributed about the cell interior, each with an ellipticalshape (approximated with 1 lm · 2 lm · 0.35 lm volume with the orien-tation as shown). Each mitochondrion has an OMM-IMM spacing of15 nm and other properties given in Table 1. The IMMmodel accounts forthe folding of the IMM by increasing the effective IMM area compared tothe OMM by a factor fA = 5. The protein fraction of the membrane (fp,A),therefore not lipid, is 75% in the IMM model and 50% for all othermembranes. The larger fraction of protein in the IMM results in less areaavailable for phospholipid membrane electroporation, which may con-strain pore formation spatially [5].
Conductive and dielectric properties used in the local models. Thedielectric constant of the extra- and intracellular electrolytes, �e, is 80.Close to a pore the membrane dielectric is treated as pure lipid andassigned a dielectric constant, �l, of 2.1. This choice recognizes that localmembrane properties are relevant to pore formation. In contrast, PM andorganelle membrane capacitance values involve a spatial average over 50%membrane lipid and 50% protein regions, leading to a dielectric constant�m = 5. All electrolytes have a conductivity, re, of 1.2 S/m. The (passive)membrane conductivities (before electroporation), corrected by fp,A andfA, are 9.5, 9.5, 950, 47.5, and 950 nS/m for the PM, ER, NM, IMM, andOMM, respectively. The higher conductivities for NM and OMM accountfor the leaky nature of those membranes. Detailed views of PM and ERare shown in Figs. 1B and C, respectively. The local charge transport andcharge storage models (Fig. 1E) are interconnected at the regularly spacednodes of a Cartesian lattice, with submodels that represent the 5 nmmembrane and two contacting regions of electrolyte (Fig. 1E) [42,39].Fig. 1D shows the double mitochondrial membrane with the intermem-brane region.
Resting potential model. Following Lauger [47] we use a simplified,single resting potential source model comprised of an active voltagesource, Vip, and a series source resistance, Rip, to represent approximatelythe effect of ion pumps and channels and the Goldmann equation, in eachmembrane [39]. Vip is an ideal voltage source, with zero internal resistance.The total (passive) membrane resistance is therefore the sum of the indi-vidual local membrane resistances, Rip, values in the plasma or a partic-ular organelle membrane. Here the fixed quantities Vip and Rip, togetherwith conductance of the local number of electrically created pores deter-mine the membrane resting potential, wm,rest, in the absence of appliedfields. The wm,rest values are �90, 90, and �200 mV for the PM, ER, andIMM, respectively, and all other membrane (NM, OMM) resting poten-tials are zero. The only postpulse perturbation of membrane potentials isthe electrical load imposed by the slowly decaying electropore population(an exponential decay in the number of minimum size pores [48,40,39]).Pore lifetimes reported in literature vary over many orders of time (frommilliseconds to minutes). Based on a recent measurement [49], we use anillustrative value, sp = 3 ms.
Transport Lattice. There is no transport in the z direction withinthis 2D model. The lattice spacing, as well as the depth of the systemmodel, is ‘ = 0.35 lm. Each node is connected to its four Cartesianneighbors by components based on local structures, i.e., electrolyte,PM, NM, ER, IMM or OMM. All membranes are dm = 5 nm thickand all electrically created membrane pores have a minimum-sizeradius of rp = 0.8 nm. Voltages applied along the system boundary,here at a 45� angle from the horizontal, provide the applied uniformfield [39]. The cell system model has �2 · 104 interconnected localmodels for charge transport and storage within electrolytes andmembranes. These include 905 local models that describe transportacross membranes (PM, 227 local models; ER, 557; NM, 67; IMM/OMM, 54; i.e., 18 for each of the three mitochondria). The ER modelhas a membrane with an internal electrolyte model that provides forboth perpendicular (to the local membrane) charge transport and alsolateral transport within the ER interior. The nuclear envelope localmodel accounts for perpendicular charge transport across two identicalmembranes but not laterally within the intermembrane space. Simi-larly, the mitochondrial local model has different models for the OMMand IMM but here accounts only for transport perpendicular to thedouble membrane.
Asymptotic electroporation model. The transient aqueous porehypothesis of electroporation is based on continuum models of membranepores, electrostatic energy differences, and thermal fluctuations, usually inthe form of the Smoluchowski equation [50–55,48,56]. The Smoluchowskiequation (SE) describes the evolution of membrane pore populationdensity in terms of its number and size. The asymptotic model is anapproximation to the SE-based models. The basic assumption of theasymptotic model [41,57,40,39] is that the source term dominates over thediffusion and drift terms of the SE that governs the pore population. Thebasic asymptotic model equation describes the rate of change of number ofpores (N) as
ER
PM
MM
NM
+
–
mM
mC+-
pRipVm
I (t)
elM
elRelC
eMiM e+PM+iM e+ER+iM
e+NM+iMe+OMM+IMM+ iM
A
B C D
E
Fig. 1. Geometry of cell system model. (A) Transport system model of a cell with a circular (radius 10 lm) plasma membrane (PM) separatingextracellular medium and cytosol. The zig-zag structure is the endoplasmic reticulum (ER) which connects the PM to the nucleus (NM). Threemitochondria (MM), each with a leaky outer mitochondrial membrane (OMM) and a mitochondrial inner membrane (IMM) are part of the cell systemmodel. The highly invaginated IMM is assigned an area 5· the OMM, and therefore a fivefold larger local capacitance. The circles mark the locations forthe Dwm plots shown in Figs. 3, 5. The applied field direction is from the lower left corner (�) to the upper right corner (+). (B) Detail view of the PMsuperimposed with the nodes and lattice connections. The models that span across the PM include the membrane model with electroporation. (C) Detailview of the ER shows the membrane encompassing the ER interior—a layer of electrolyte ‘ = 0.35 lm thick. (D) Detail view of the mitochondrialmembrane (the OMM and IMM are separated by a 15 nm thick layer of electrolyte). (E) Circuit models for transport and storage in electrolyte (Mel; openrectangle) and asymptotic model for membrane (Mm; filled rectangle) are shown. These circuit models are assembled in different configurations torepresent the electrolytes and electrolyte/membrane (PM, ER, NM, OMM, and IMM) interfaces. These combinations are shown in the bottom two rowsof the figure.
1268 T.R. Gowrishankar et al. / Biochemical and Biophysical Research Communications 341 (2006) 1266–1276
dNdt
¼ aðeðDwm=V epÞ2 � N=NoÞ. ð1Þ
Here, Vep sets the scale of the membrane voltage critical for electricalbreakdown, No is the steady state pore number per local area atDwm = Dwm,res, a is determined by the time constant of pore resealingwhen Dwm returns to 0 V. The basic asymptotic model equation isdescribed in detail elsewhere [59].
The membrane conductance is given by
GmðtÞ ¼ NðtÞpr2pre
dm
HðrpÞKðrp;DwmÞ1þ pr2p
2rpdmHðrpÞKðrp;DwmÞ
; ð2Þ
where re is the conductivity of electrolyte, dm is membrane thickness, andH is the pore hindrance factor. Here, K is the transmembrane voltage-dependent partition coefficient given by
Kðrp;DwmÞ ¼ðemm � 1Þ
emm woewo�gmm�gmmwo�gmm
h i� woewoþgmmþgmm
woþgmm
. ð3Þ
Here, the parameter wo is a barrier energy threshold (in units of kT), gis a geometrical factor that accounts for the non-cylindrical geometry ofthe pore, the dimensionless transmembrane voltage is defined asmm = Dwme/kT. The expressions for the membrane conductance andpartition coefficient are described in detail elsewhere [59]. Representation
Table 1Parameters for system model
Parameter Description Value
Nx · Ny Number of nodes 101 · 101Lx · Ly · Lz System model volume (lm3) 35 · 35 · 0.35rcell Cell radius (lm) 10‘ Lattice spacing (lm) 0.35dm Membrane thickness (nm) 5�e Electrolyte relative permittivity 80�m Membrane relative permittivity 5�l Local lipid relative permittivity 2.1re Electrolyte conductivity (S m�1) 1.2T Temperature (K) 310q Electroporation constant 1a Pore creation rate constant (106 m�2 s�1) 0.08No Baseline pore density (106 pores m�2) 0.8Vep Electroporation voltage scale (V) 0.18wo Born energy barrier (kT) 3.1H Pore hindrance factor 0.5g Relative entrance of pore (form factor) 0.15rp Effective pore radius (nm) 0.8dER = ‘ Diameter of ER (lm) 0.35dIMM Mitochrondria intermembrance space thickness (nm) 15dNM Nucleus intermembrance space thickness (nm) 10
PM ER NU IMM OMM
Vip Resting potential (mV) �90 90 0 �200 0Gip Local ion pump conductance (pS) 0.2 0.2 23 1 23rm Membrane conductivity (nS m�1) 9.5 9.5 950 47.5 950fp,A Protein fraction by area 0.5 0.5 0.5 0.75 0.5fA Membrane area correction factor 1 1 1 5 1NM Number of local membrane models 227 557 67 54 54
T.R. Gowrishankar et al. / Biochemical and Biophysical Research Communications 341 (2006) 1266–1276 1269
of the asymptotic model using circuit elements was presented in an earlierpaper [39].
Model solutions and analysis of results. Our approach is equivalentto treating the system model as a large electrical circuit with manyinteracting linear and non-linear components [42,39,43–46,58]. The cir-cuit is solved using Berkeley SPICE 3f5. SPICE generates solutionswhich are processed and displayed in Matlab as equipotentials anddistributions of electroporated regions. Local membrane regions withone or more pores (electroporated regions) are shown in white (Figs. 2and 4).
Results and discussion
Here, the response to conventional electroporationand supra-electroporation fields of a cell system modelwith explicit organelle models was studied using estab-lished pulses. The conventional electroporation pulseused here was 1.1 kV/cm, 100 ls with a rise and fall timeof 1 ls. The supra-electroporation pulse was a 60 kV/cm,60 ns pulse measured in an experimental study [27]. Thepulses were applied along the system boundary, at a 45�angle from the horizontal. If the cell were absent, andonly extracellular electrolyte were present, the w distribu-tion would change linearly from the lower left corner tothe top right corner (a diagonal uniform applied field)and the equipotentials would be parallel and evenlyspaced. The results are shown as electrical potentials(color/grey scale), equipotentials and distributions ofelectroporated sites.
Conventional electroporation response
Spatial and temporal behavior of extra- and intracellular
electric fields and electroporation sites
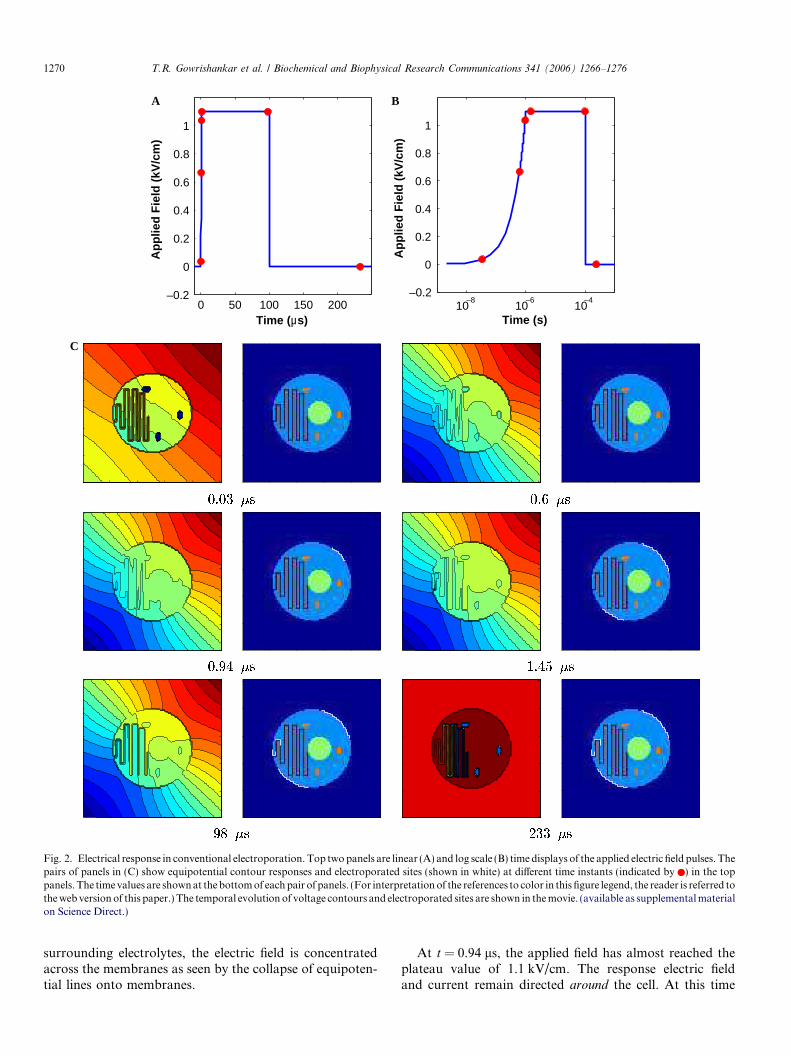
Figs. 2A and B show the applied field in linear and logscales. The logarithmic plot is included to show the initialrise of the applied field. The red dots in the pulse profileindicate the time instants for which the electric potentialand electroporation sites are shown in Fig. 2C. The spatialdistribution of w is represented by a color scale for the elec-tric potential with black lines indicating representative,equipotentials that are separated by a fixed potential differ-ence, Dw, that is particular to each panel.
Electrical response at an early time (Fig. 2;t = 0.03 ls) shows the PM beginning to charge. Theapplied field is less than 0.1 kV/cm at this time. Theequipotential contours are nearly parallel indicating anintracellular electric field due entirely to displacementcurrents associated with the cell’s distributed membranecapacitance. Voltage concentration occurs at the PMand most organelle membranes, indicated by black equi-potential lines at the organelle membrane sites, but nolocal membrane region has yet electroporated.
At t = 0.6 ls, the applied field pulse is still ramping upto the peak value. None of the membrane segments haveelectroporated. The response electric field and current aredirected mostly around the cell. Because the membraneimpedance is orders of magnitude higher than the
0 50 100 150 200
0
0.2
0.4
0.6
0.8
1
Time (µs)
Ap
plie
dF
ield
(kV
/cm
)
10–8
10–6
10–4
0
0.2
0.4
0.6
0.8
1
Time (s)
Ap
plie
dF
ield
(kV
/cm
)
A B
C
–0.2 –0.2
Fig. 2. Electrical response in conventional electroporation. Top two panels are linear (A) and log scale (B) time displays of the applied electric field pulses. Thepairs of panels in (C) show equipotential contour responses and electroporated sites (shown in white) at different time instants (indicated by ) in the toppanels. The timevalues are shownat thebottomof eachpair of panels. (For interpretationof the references to color in this figure legend, the reader is referred totheweb versionof this paper.) The temporal evolution of voltage contours and electroporated sites are shown in themovie. (available as supplementalmaterialon Science Direct.)
1270 T.R. Gowrishankar et al. / Biochemical and Biophysical Research Communications 341 (2006) 1266–1276
surrounding electrolytes, the electric field is concentratedacross the membranes as seen by the collapse of equipoten-tial lines onto membranes.
At t = 0.94 ls, the applied field has almost reached theplateau value of 1.1 kV/cm. The response electric fieldand current remain directed around the cell. At this time
0 0.5 1 1.5 210
8
1010
1012
1014
1016
Applied Field (kV/cm)
Po
reD
ensi
ty(m
– 2)
PM–NMIMMOMMER
A
B
10–2
100
102
–1.5
–1
–0.5
0
0.5
1
1.5
Time (µs)
∆ψm
(V
)
PM+PM–NMERIMMOMM
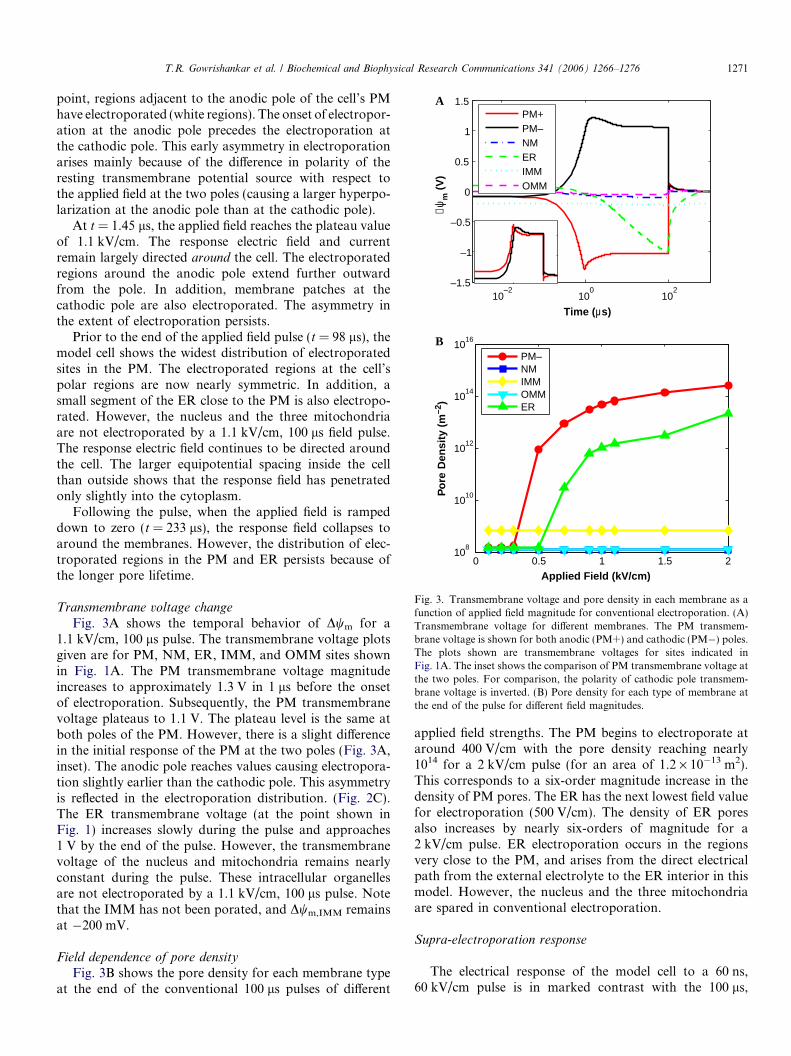
Fig. 3. Transmembrane voltage and pore density in each membrane as afunction of applied field magnitude for conventional electroporation. (A)Transmembrane voltage for different membranes. The PM transmem-brane voltage is shown for both anodic (PM+) and cathodic (PM�) poles.The plots shown are transmembrane voltages for sites indicated inFig. 1A. The inset shows the comparison of PM transmembrane voltage atthe two poles. For comparison, the polarity of cathodic pole transmem-brane voltage is inverted. (B) Pore density for each type of membrane atthe end of the pulse for different field magnitudes.
T.R. Gowrishankar et al. / Biochemical and Biophysical Research Communications 341 (2006) 1266–1276 1271
point, regions adjacent to the anodic pole of the cell’s PMhave electroporated (white regions). The onset of electropor-ation at the anodic pole precedes the electroporation atthe cathodic pole. This early asymmetry in electroporationarises mainly because of the difference in polarity of theresting transmembrane potential source with respect tothe applied field at the two poles (causing a larger hyperpo-larization at the anodic pole than at the cathodic pole).
At t = 1.45 ls, the applied field reaches the plateau valueof 1.1 kV/cm. The response electric field and currentremain largely directed around the cell. The electroporatedregions around the anodic pole extend further outwardfrom the pole. In addition, membrane patches at thecathodic pole are also electroporated. The asymmetry inthe extent of electroporation persists.
Prior to the end of the applied field pulse (t = 98 ls), themodel cell shows the widest distribution of electroporatedsites in the PM. The electroporated regions at the cell’spolar regions are now nearly symmetric. In addition, asmall segment of the ER close to the PM is also electropo-rated. However, the nucleus and the three mitochondriaare not electroporated by a 1.1 kV/cm, 100 ls field pulse.The response electric field continues to be directed aroundthe cell. The larger equipotential spacing inside the cellthan outside shows that the response field has penetratedonly slightly into the cytoplasm.
Following the pulse, when the applied field is rampeddown to zero (t = 233 ls), the response field collapses toaround the membranes. However, the distribution of elec-troporated regions in the PM and ER persists because ofthe longer pore lifetime.
Transmembrane voltage change
Fig. 3A shows the temporal behavior of Dwm for a1.1 kV/cm, 100 ls pulse. The transmembrane voltage plotsgiven are for PM, NM, ER, IMM, and OMM sites shownin Fig. 1A. The PM transmembrane voltage magnitudeincreases to approximately 1.3 V in 1 ls before the onsetof electroporation. Subsequently, the PM transmembranevoltage plateaus to 1.1 V. The plateau level is the same atboth poles of the PM. However, there is a slight differencein the initial response of the PM at the two poles (Fig. 3A,inset). The anodic pole reaches values causing electropora-tion slightly earlier than the cathodic pole. This asymmetryis reflected in the electroporation distribution. (Fig. 2C).The ER transmembrane voltage (at the point shown inFig. 1) increases slowly during the pulse and approaches1 V by the end of the pulse. However, the transmembranevoltage of the nucleus and mitochondria remains nearlyconstant during the pulse. These intracellular organellesare not electroporated by a 1.1 kV/cm, 100 ls pulse. Notethat the IMM has not been porated, and Dwm,IMM remainsat �200 mV.
Field dependence of pore density
Fig. 3B shows the pore density for each membrane typeat the end of the conventional 100 ls pulses of different
applied field strengths. The PM begins to electroporate ataround 400 V/cm with the pore density reaching nearly1014 for a 2 kV/cm pulse (for an area of 1.2 · 10�13 m2).This corresponds to a six-order magnitude increase in thedensity of PM pores. The ER has the next lowest field valuefor electroporation (500 V/cm). The density of ER poresalso increases by nearly six-orders of magnitude for a2 kV/cm pulse. ER electroporation occurs in the regionsvery close to the PM, and arises from the direct electricalpath from the external electrolyte to the ER interior in thismodel. However, the nucleus and the three mitochondriaare spared in conventional electroporation.
Supra-electroporation response
The electrical response of the model cell to a 60 ns,60 kV/cm pulse is in marked contrast with the 100 ls,
0 50 100 150
0
20
40
60
Time (ns)
Ap
plie
dF
ield
(kV
/cm
)
10–8
10–7
10–6
0
20
40
60
Time (s)
Ap
plie
dF
ield
(kV
/cm
)
A B
C
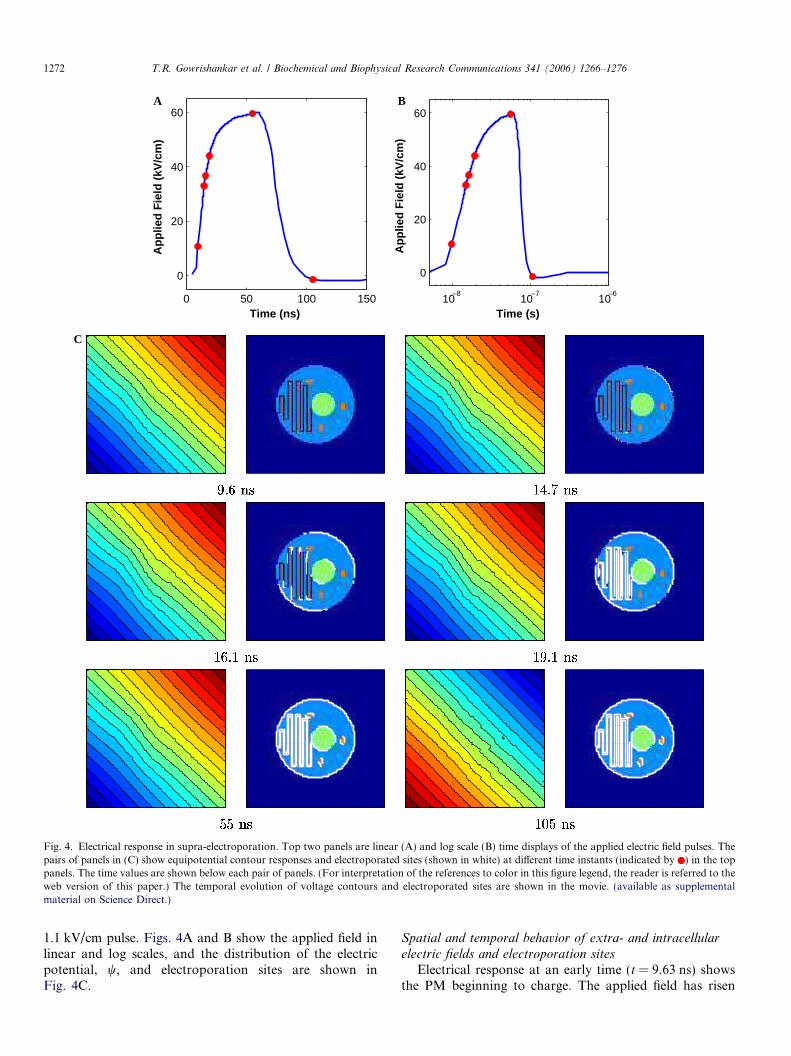
Fig. 4. Electrical response in supra-electroporation. Top two panels are linear (A) and log scale (B) time displays of the applied electric field pulses. Thepairs of panels in (C) show equipotential contour responses and electroporated sites (shown in white) at different time instants (indicated by ) in the toppanels. The time values are shown below each pair of panels. (For interpretation of the references to color in this figure legend, the reader is referred to theweb version of this paper.) The temporal evolution of voltage contours and electroporated sites are shown in the movie. (available as supplementalmaterial on Science Direct.)
1272 T.R. Gowrishankar et al. / Biochemical and Biophysical Research Communications 341 (2006) 1266–1276
1.1 kV/cm pulse. Figs. 4A and B show the applied field inlinear and log scales, and the distribution of the electricpotential, w, and electroporation sites are shown inFig. 4C.
Spatial and temporal behavior of extra- and intracellular
electric fields and electroporation sites
Electrical response at an early time (t = 9.63 ns) showsthe PM beginning to charge. The applied field has risen
0 20 40 60 8010
8
1010
1012
1014
1016
1018
Applied Field (kV/cm)
Po
re D
ensi
ty (
m–2
)
PM–NMIMMOMMER
A
B
101
102
103
–1.5
–1
–0.5
0
0.5
1
1.5
Time (ns)
∆ψm
(V
)
PM+
PM–
NM
ER
IMM
OMM
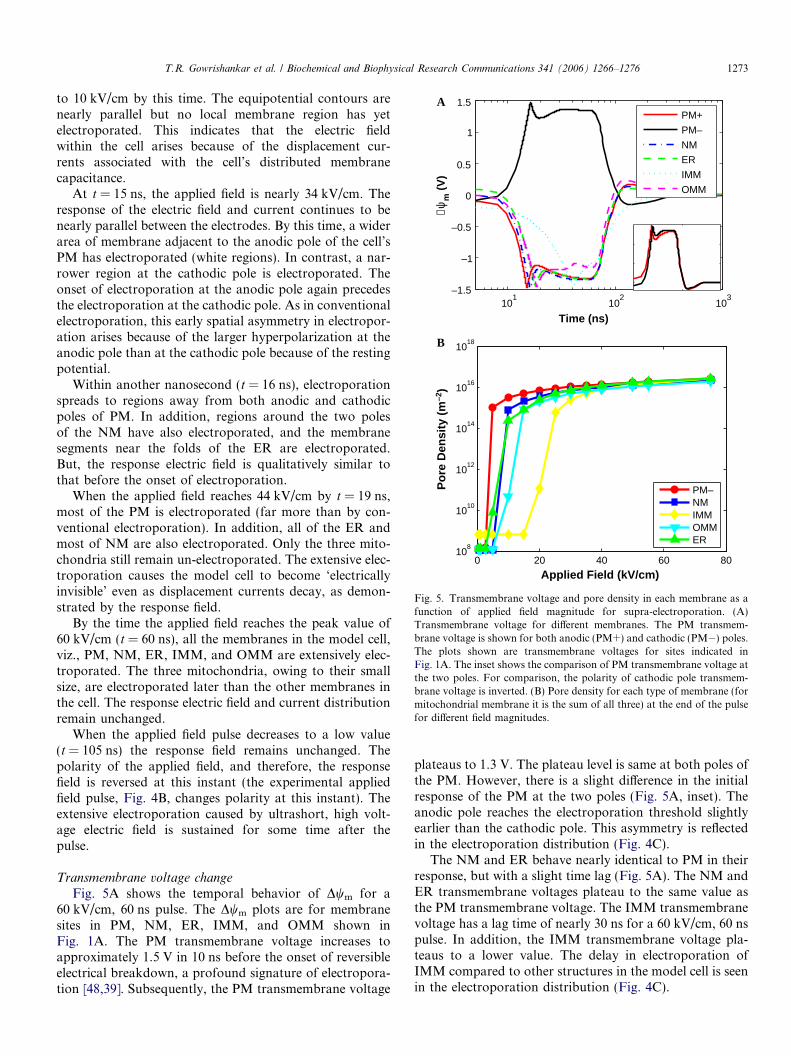
Fig. 5. Transmembrane voltage and pore density in each membrane as afunction of applied field magnitude for supra-electroporation. (A)Transmembrane voltage for different membranes. The PM transmem-brane voltage is shown for both anodic (PM+) and cathodic (PM�) poles.The plots shown are transmembrane voltages for sites indicated inFig. 1A. The inset shows the comparison of PM transmembrane voltage atthe two poles. For comparison, the polarity of cathodic pole transmem-brane voltage is inverted. (B) Pore density for each type of membrane (formitochondrial membrane it is the sum of all three) at the end of the pulsefor different field magnitudes.
T.R. Gowrishankar et al. / Biochemical and Biophysical Research Communications 341 (2006) 1266–1276 1273
to 10 kV/cm by this time. The equipotential contours arenearly parallel but no local membrane region has yetelectroporated. This indicates that the electric fieldwithin the cell arises because of the displacement cur-rents associated with the cell’s distributed membranecapacitance.
At t = 15 ns, the applied field is nearly 34 kV/cm. Theresponse of the electric field and current continues to benearly parallel between the electrodes. By this time, a widerarea of membrane adjacent to the anodic pole of the cell’sPM has electroporated (white regions). In contrast, a nar-rower region at the cathodic pole is electroporated. Theonset of electroporation at the anodic pole again precedesthe electroporation at the cathodic pole. As in conventionalelectroporation, this early spatial asymmetry in electropor-ation arises because of the larger hyperpolarization at theanodic pole than at the cathodic pole because of the restingpotential.
Within another nanosecond (t = 16 ns), electroporationspreads to regions away from both anodic and cathodicpoles of PM. In addition, regions around the two polesof the NM have also electroporated, and the membranesegments near the folds of the ER are electroporated.But, the response electric field is qualitatively similar tothat before the onset of electroporation.
When the applied field reaches 44 kV/cm by t = 19 ns,most of the PM is electroporated (far more than by con-ventional electroporation). In addition, all of the ER andmost of NM are also electroporated. Only the three mito-chondria still remain un-electroporated. The extensive elec-troporation causes the model cell to become ‘electricallyinvisible’ even as displacement currents decay, as demon-strated by the response field.
By the time the applied field reaches the peak value of60 kV/cm (t = 60 ns), all the membranes in the model cell,viz., PM, NM, ER, IMM, and OMM are extensively elec-troporated. The three mitochondria, owing to their smallsize, are electroporated later than the other membranes inthe cell. The response electric field and current distributionremain unchanged.
When the applied field pulse decreases to a low value(t = 105 ns) the response field remains unchanged. Thepolarity of the applied field, and therefore, the responsefield is reversed at this instant (the experimental appliedfield pulse, Fig. 4B, changes polarity at this instant). Theextensive electroporation caused by ultrashort, high volt-age electric field is sustained for some time after thepulse.
Transmembrane voltage change
Fig. 5A shows the temporal behavior of Dwm for a60 kV/cm, 60 ns pulse. The Dwm plots are for membranesites in PM, NM, ER, IMM, and OMM shown inFig. 1A. The PM transmembrane voltage increases toapproximately 1.5 V in 10 ns before the onset of reversibleelectrical breakdown, a profound signature of electropora-tion [48,39]. Subsequently, the PM transmembrane voltage
plateaus to 1.3 V. The plateau level is same at both poles ofthe PM. However, there is a slight difference in the initialresponse of the PM at the two poles (Fig. 5A, inset). Theanodic pole reaches the electroporation threshold slightlyearlier than the cathodic pole. This asymmetry is reflectedin the electroporation distribution (Fig. 4C).
The NM and ER behave nearly identical to PM in theirresponse, but with a slight time lag (Fig. 5A). The NM andER transmembrane voltages plateau to the same value asthe PM transmembrane voltage. The IMM transmembranevoltage has a lag time of nearly 30 ns for a 60 kV/cm, 60 nspulse. In addition, the IMM transmembrane voltage pla-teaus to a lower value. The delay in electroporation ofIMM compared to other structures in the model cell is seenin the electroporation distribution (Fig. 4C).
1274 T.R. Gowrishankar et al. / Biochemical and Biophysical Research Communications 341 (2006) 1266–1276
Field dependence of pore density
Fig. 5B shows the density of pores for each membranetype at the end of 60 ns supra-electroporation pulses of dif-ferent applied field strengths. The PM has the lowest fieldvalue for electroporation (5 kV/cm), ER, NM, and OMMshow onset of electroporation at slightly higher fieldstengths (<10 kV/cm). The IMM begins to electroporateat 20 kV/cm. The pore density at 60 kV/cm for a supra-electroporation pulse is two orders of magnitude higherthan the 1.1 kV/cm, 100 ls conventional electroporationpulse. Unlike in conventional electroporation, the numberof pores increases modestly at higher field strengths for allmembrane types. This corresponds to extensive electropor-ation of all membrane areas in the model cell (Fig. 4C). Thepore density in all the membranes reach the same value athigh field strengths, demonstrating spatially uniformelectroporation (Fig. 4C). The pore density behavior isnot universal, but depends on the specific pulse rise time.
The response of the model cell to a supra-electropora-tion pulse is markedly different from a conventional elec-troporation pulse. A typical mammalian cell PM has acharging time sm,chg � 0.1 to 1 ls. Pulses significantlyshorter than sm charge a (non-electroporated) membranecapacitance linearly, with a displacement current propor-tional to the applied field. In the early charging phase ofthe extremely short pulses (Fig. 4A), an intracellular elec-tric field is generated via displacement current that is nearlythe same as the applied field. Once Dwm reaches �1.3 V thenon-linear pore creation rate becomes so large that revers-ible electrical breakdown (REB) occurs very rapidly. Dur-ing REB the membrane acquires so many pores in a shorttime that the associated high membrane conductancearrests the climb in Dwm, and Dwm actually decreases dur-ing the pulse [48,39]. Fig. 5A shows this behavior aroundthe 10 ns region for all membranes except for the IMM,where the Dwm REB spike and subsequent relaxation isdelayed by roughly 30 ns due to the slower charging timeof the highly invaginated IMM (larger area and capaci-tance). After REB, conduction of small ions through themembrane becomes important, and the intracellular fieldis almost equal to the applied field even as the displacementcurrent falls off. The response electric field (and electricalcurrent) is directed through the cell (both plasma mem-brane and intracellular membranes).
Supra-electroporation creates an extraordinary numberof pores of nanometer scale (rp � 0.8 nm). The short dura-tion of the nanosecond scale, megavolt-per-meter pulseslimits pore expansion, with electrical conductance increas-ing dramatically by creating 2–3 orders of magnitude morepores per area than conventional electroporation (Figs. 3,5B). This limits Dwm to �1.5 V in spite of extremely largeapplied fields. We hypothesize that prompt necrosis isavoided by limiting membrane permeabilization to thesmallest neutral molecules (e.g., water, small sugars) andsmall, monovalent ions. These smallest ions dominate thecurrent through the pores because of their relatively lowelectrostatic energy barrier for entry into a pore, hydrated
ion size, and high concentrations (�0.3 M) near the PMand intracellular membranes. The picture that emerges isthat nanosecond scale, megavolt-per-meter pulses create arelatively specific membrane permeabilization, discriminat-ing strongly against all but the smallest neutral moleculesand monovalent ions. This allows most essential biochem-icals to be retained, thereby delaying or avoiding necrosis,which allows time for triggering of one or more apoptosismechanisms.
Candidate mechanisms for apoptosis include signalingarising from extensive phospholipid translocation through-out the cell and damaging electric field interactions withDNA. Nuclear DNA becomes accessible to the large intra-cellular fields above about 10 kV/cm and mitochondrialDNA becomes exposed above about 25 kV/cm for the60 ns pulse considered here. Supra-EP may also causetransport of calcium out of the ER or across the PM byeither voltage gating of channels because of depolarizationor by direct calcium transport through the large number ofminimum size pores in the PM and ER membranes predict-ed here.
Conclusions
Quantitative descriptions of electric fields near and with-in cells, of Dwm in the presence of channels and electropor-ation, and the distribution of electroporated sites, areessential to understanding the mechanisms underlying cel-lular and intracellular effects due to nanosecond scale, meg-avolt-per-meter pulsed fields. A sequence of membraneresponses is expected from the sudden, externally imposedelectrical changes within the cell. Initially there is spatiallydistributed membrane charging. Redistribution of fieldsand currents can occur at the cellular and subcellular leveldue to passive displacement currents. Our results suggestthat nanosecond scale, megavolt-per-meter pulses alterDwm at essentially all membranes within the cell. OnceDwm reaches �1.3 V pore creation rates become extremelylarge; pores are created more quickly than they can expand.Pore conduction then becomes more important than pas-sive currents. This feature of supra-EP [39] causes theappearance of several orders of magnitude more poresper area than conventional electroporation. But the poresare small, rp � 0.8 nm, so the membrane is relatively imper-meable to all but the smallest neutral and singly chargedmolecules.
The model cell used in this paper (Fig. 1A) includesrepresentations of several organelles. To our knowledge,explicit models of both ER and mitochondria in bioelec-tromagnetic models have not previously been reported. Ameshed version of the transport lattice provides a betterdescription of the membrane-electrolyte interfaces of theintracellular organelles. However, we recently demon-strated that the transmembrane voltage and pore distri-bution results obtained from transport lattice on aCartesian coordinates agree well with a meshed latticerepresentation [60].
T.R. Gowrishankar et al. / Biochemical and Biophysical Research Communications 341 (2006) 1266–1276 1275
Acknowledgments
We thank D.A. Stewart for constructing the model andcontributing to the analysis of results. We thank P.T.Vernier, K.H. Schoenbach, U. Pliquett, R. Nuccitelli,E. Neumann, G.L. McLendon, R.C. Lee, R.P. Joshi, J.C.Kolb, W. Frey, Y.A. Chizmadzhev, E.S. Buescher, and S.J.Beebe for valuable discussions, and K. G. Weaver for com-puter assistance. Supported by NIH Grant RO1-GM63857and an AFOSR/DOD MURI Grant on SubcellularResponses toNarrowband andWidebandRadio FrequencyRadiation, administered throughOldDominionUniversity.
Appendix A. Supplementary data
Supplementary data associated with this article can befound, in the online version, at doi:10.1016/j.bbrc.2006.01.094.
References
[1] D.C. Chang, B.M. Chassy, J.A. Saunders, A.E. Sowers (Eds.), Guideto Electroporation and Electrofusion, Academic Press, New York,1992.
[2] J.C. Weaver, Electroporation: a general phenomenon for manipulat-ing cells and tissue, J. Cell. Biochem. 51 (1993) 426–435.
[3] M.J. Jaroszeski, R. Gilbert, R. Heller (Eds.), Electrically MediatedDelivery of Molecule to Cells: Electrochemotherapy, Electrogene-therapy and Transdermal Delivery by Electroporation, HumanaPress, Totowa, 2000.
[4] L.M. Mir, Therapeutic perspectives of in vivo cell electropermeabi-lization, Bioelectrochemistry 53 (2001) 1–10.
[5] J.C. Weaver, Electroporation of biological membranes from multi-cellular to nano scales, IEEE Trans. Dielect. Elect. Ins. 10 (2003) 754–768.
[6] E. Neumann, K. Rosenheck, Permeability changes induced byelectric impulses in vesicular membranes, J. Membr. Biol. 10 (1972)279–290.
[7] D.C. Bartoletti, G.I. Harrison, J.C. Weaver, The number of moleculestaken up by electroporated cells: quantitative determination, FEBSLett. 256 (1989) 4–10.
[8] M.R. Prausnitz, B.S. Lau, C.D. Milano, S. Conner, R. Langer, J.C.Weaver, A quantitative study of electroporation showing a plateau innet molecular transport, Biophys. J. 65 (1993) 414–422.
[9] E.A. Gift, J.C. Weaver, Simultaneous quantitative determination ofelectroporative molecular uptake and subsquent cell survival using gelmicrodrops and flow cytometery, Cytometry 39 (2000) 243–249.
[10] L.M. Mir, S. Orlowski, J. Belehradek Jr., C. Paoletti, In Vivopotentiation of the bleomycin cytotoxicity by local electric pulses,Eur. J. Cancer 27 (1991) 68–72.
[11] I. Uno, K. Fukami, H. Kato, T. Takenawa, T. Ishikawa, Essentialrole for phosphatidylinositol 4,5-bisphosphate in yeast cell prolifer-ation, Nature 333 (1988) 188–190.
[12] D.L. Berglund, J.R. Starkey, Isolation of viable tumor cells followingintroduction of labelled antibody to an intracellular oncogeneproduct using electroporation, J. Immunol. Methods 125 (1989) 79–87.
[13] L. Graziadei, P. Burfeind, D. Bar-Sagi, Introduction of unlabeledproteins into living cells by electroporation and isolation of viableprotein-loaded cells using dextran-fluorescein isothiocyanate as amarker for protein uptake, Anal. Biochem. 194 (1991) 198–203.
[14] J. Lukas, J. Bartek, M. Strauss, Efficient transfer of antibodies intomammalian cells by electroporation, J. Immuno. Methods 170 (1994)255–259.
[15] E.J. Verspohl, I. Kaiserling-Buddemeier, A. Wienecke, Introducingspecific antibodies into electropermeabilized cells is a valuable tool foreliminating specific cell functions, Cell Biochem. Funct. 15 (1997)127–134.
[16] M.P. Rols, C. Delteil, M. Golzio, P. Dumond, S. Cors, J. Teissie, Invivo electrically mediated protein and gene transfer in murinemelanoma, Nat. Biotechnol. 16 (1998) 168–171.
[17] E. Neumann, M. Schaefer-Ridder, Y. Wang, P.H. Hofschneider,Gene transfer into mouse lyoma cells by electroporation in highelectric fields, EMBO J. 1 (1982) 841–845.
[18] R.C. Lee, M.S. Kolodney, Electrical injury mechanisms: electricalbreakdown of cell membranes, Plast. Reconstr. Surg. 80 (1987) 672–679.
[19] D.L. Bhatt, D.C. Gaylor, R.C. Lee, Rhabdomyolysis due to pulsedelectric fields, Plast. Reconstr. Surg. 86 (1990) 1–11.
[20] R.C. Lee, D. Zhang, J. Hannig, Biophysical injury mechanisms inelectrical shock trauma, Annu. Rev. Biomed. Eng. 2 (2000) 477–509.
[21] T. Kotnik, D. Miklavcic, Second-order model of membrane electricfield induced by alternating external electric fields, IEEE Trans.Biomed. Eng. 47 (2000) 1074–1081.
[22] R.V. Davalos, L.M. Mir, B. Rubinsky, Tissue ablation and irrevers-ible electroporation, Ann. Biomed. Eng. 33 (2005) 223–231.
[23] C.R. Keese, J. Wegner, S.R. Walker, I. Giaver, Electrical wound-healing assay for cells in vitro, Proc. Natl. Acad. Sci. USA 101 (2004)1554–1559.
[24] J. Deng, K.H. Schoenbach, E.S. Buescher, P.S. Hair, P.M. Fox, S.J.Bebe, The effects of intense submicrosecond electrical pulses on cells,Biophys. J. 84 (2003) 2709–2714.
[25] E.S. Buescher, K.H. Schoenbach, The effects of submicrosecond, highintensity pulsed electric fields on living cells—intracellular electroma-nipulation, IEEE Trans. Dielect. Elect. Ins. 10 (2003) 788–794.
[26] S.J. Beebe, P.M. Fox, L.J. Rec, K. Somers, R.H. Stark, K.H.Schoenbach, Nanosecond pulsed electric field (nsPEF) effects on cellsand tissues: apoptosis induction and tumor growth inhibition, IEEETrans. Plasma Sci. 30 (2002) 286–292.
[27] K.H. Schoenbach, S.J. Beebe, E.S. Buescher, Intracellular effect ofultrashort pulses, Bioelectromagnetics 22 (2001) 440–448.
[28] S.J. Beebe, P.M. Fox, L.J. Rec, L.K. Willis, K.H. Schoenbach,Nanosecond, high intensity pulsed electric fields induce apoptosis inhuman cells, FASEB J. 17 (2003) 1493–1495.
[29] P.T. Vernier, Y. Sun, L. Marcu, S. Salemi, C.M. Craft, M.A.Gundersen, Calcium bursts induced by nanosecond electric pulses,Biochem. Biophys. Res. Commun. 310 (2003) 286–295.
[30] P.S. Hair, K.H. Schoenbach, E.S. Buescher, Sub-microsecond,intense pulsed electric field applications to cells show specificity ofeffects, Bioelectrochemistry 61 (2003) 65–72.
[31] S.J. Beebe, J. White, P.F. Blackmore, Y. Deng, K. Sommers, K.H.Schoenbach, Diverse effects of nanosecond pulsed electric fields oncells and tissues, DNA Cell Biol. 22 (2003) 785–796.
[32] M. Stacey, J. Stickley, P. Fox, V. Statler, K. Schoenbach, S.J. Beebe,S. Buescher, Differential effects in cells exposed to ultra-short, highintensity electric fields: cell survival, DNA damage, and cell cycleanalysis, Mutat. Res. 542 (2003) 65–75.
[33] N. Chen, K.H. Schoenbach, J.F. Kolb, R.J. Swanson, A.L. Garner, J.Yang, R.P. Joshi, S.J. Beebe, Leukemic cell intracellular responses tonanosecond electric fields, Biochem. Biophys. Res. Commun. 317(2004) 421–427.
[34] J.A. White, P.F. Blackmore, K.H. Schoenbach, S.J. Beebe, Stimula-tion of capacitive calcium entry in HL-60 cells by nanosecond pulsedelectric fields (nsPEF), J. Biol. Chem. 279 (2004) 22964–22972, Mar16.
[35] P.T. Vernier, Y. Sun, L. Marcu, C.M. Craft, M.A. Gundersen,Nanoelectropulse-induced phosphatidylserine translocation, Biophys.J. 86 (2004) 4040–4048.
[36] J.C. Weaver, Y.A. Chizmadzhev, Theory of electroporation: a review,Bioelectrochem. Bioenerg. 41 (1996) 135–160.
[37] D.P. Tieleman, The molecular basis of electroporation, BMCBiochem. 5 (2004) 10.
1276 T.R. Gowrishankar et al. / Biochemical and Biophysical Research Communications 341 (2006) 1266–1276
[38] Q. Hu, R.P. Joshi, K.H. Schoenbach, Simulations of nanoporeformation and phosphatidylserine externalization in lipid membranessubjected to high-intensity, ultrashort electric pulse, Phys. Rev. E 72(2005) 031902-1–031902-10.
[39] D.A. Stewart, T.R. Gowrishankar, J.C. Weaver, Transport latticeapproach to describing cell electroporation: use of a local asymptoticmodel, IEEE Trans. Plasma Sci. 32 (2004) 1696–1708.
[40] J.C. Neu, W. Krassowska, Asymptotic model of electroporation,Phys. Rev. E 59 (1999) 3471–3482.
[41] K.A. DeBruin, W. Krassowska, Electroporation and shock–inducedtransmembrane potential in a cardiac fiber during defibrillationstrength shocks, Ann. Biomed. Eng. 26 (1998) 584–596.
[42] T.R. Gowrishankar, J.C. Weaver, An approach to electrical modelingof single and multiple cells, Proc. Natl. Acad. Sci. USA 100 (2003)3203–3208.
[43] T.R. Gowrishankar, C. Stewart, J.C. Weaver, Electroporation of amulticellular system: asymptotoic model analysis, in: Proceedings ofthe 26th Annual International Conference of the IEEE EMBS, SanFrancisco (2004).
[44] T.R. Gowrishankar, D.A. Stewart, J.C. Weaver, Model of a confinedspherical cell in uniform and heterogeneous applied electric fields,Bioelectrochemistry (2005) (in press).
[45] D.A. Stewart, T.R. Gowrishankar, K.C. Smith, J.C. Weaver,Cylindrical cell membranes in uniform applied electric fields: valida-tion of a transport lattice method, IEEE Trans. Biomed. Eng. 52(2005) 1643–1653.
[46] T.R. Gowrishankar, Donald A. Stewart, Gregory T. Martin, JamesC. Weaver, Transport lattice models of heat transport in skin withspatially heterogeneous, temperature-dependent perfusion, Biomedi-cal. Eng. Online 3 (2004) 42.
[47] P. Lauger, Electrogenic Ion Pumps, Sinauer Associates, Sunderland,1991.
[48] S.A. Freeman, M.A. Wang, J.C. Weaver, Theory of electroporationfor a planar bilayer membrane: predictions of the fractional aqueousarea, change in capacitance and pore-pore separation, Biophys. J. 67(1994) 42–56.
[49] K.C. Melikov, V.A. Frolov, A. Shcherbakov, A.V. Samsonov, Y.A.Chizmadzhev, L.V. Chernomordik, Voltage-induced nonconductivepre-pores and metastable pores in unmodified planar bilayer,Biophys. J. 80 (2001) 1829–1836.
[50] V.F. Pastushenko, Yu.A. Chizmadzhev, V.B. Arakelyan, Electricbreakdown of bilayer membranes: II. Calculation of the membranelifetime in the steady-state diffusion approximation, Bioelectrochem.Bioenerg. 6 (1979) 53–62.
[51] V.B. Arakelyan, Y.A. Chizmadzhev, V.F. Pastushenko, Electricbreakdown of bilayer membranes: V. consideration of the kineticstage in the case of the membrane containing an arbitrary number ofdefects, Bioelectrochem. Bioenerg. 6 (1979) 81–87.
[52] V.F. Pastushenko, V.B. Arakelyan, Y.A. Chizmadzhev, Electricbreakdown of bilayer membranes: VI.A stochastic theory taking intoaccount theprocessesof defect formationanddeath:membrane lifetimedistribution function, Bioelectrochem. Bioenerg. 6 (1979) 89–95.
[53] V.F. Pastushenko, V.B. Arakelyan, Yu.A. Chizmadzhev, Electricbreakdown of bilayer membranes: VII.A stochastic theory taking intoaccount the processes of defect formation and death: statisticalproperties, Bioelectrochem. Bioenerg. 6 (1979) 97–104.
[54] K.T. Powell, J.C. Weaver, Transient aqueous pores in bilayermembranes: a statistical theory, Bioelectrochem. Bioelectroenerg. 15(1986) 211–227.
[55] A. Barnett, J.C. Weaver, Electroporation: a unified, quantitativetheory of reversible electrical breakdown and rupture, Bioelectro-chem. Bioenerg. 25 (1991) 163–182.
[56] R.P. Joshi, K.H. Schoenbach, Electroporation dynamics in biologicalcells subjected to ultrafast electrical pulses: a numerical simulationstudy, Phys. Rev. E 62 (2000) 1025–1033.
[57] K.A. DeBruin, W. Krassowska, Modeling electroporation in a singlecell: I. effects of field strength and rest potential, Biophys. J. 77 (1999)1213–1224.
[58] D.A. Stewart, T.R. Gowrishankar, J.C. Weaver, Three dimensionaltransport lattice model for describing action potentials in axonsstimulated by external electrodes, Bioelectrochemistry (2006)(accepted).
[59] Z. Vasilkoski, A.T. Esser, T.R. Gowrishankar, J.C. Weaver, Mem-brane electroporation: the absolute rate equation and nanosecondtimescale pore creation (submitted).
[60] K.C. Smith, T.R. Gowrishankar, A.T. Esser, D.A. Stewart, J. C.Weaver, Spatially distributed, dynamic transmembrane voltages oforganelle and cell membranes due to 10 ns pulses: predictions ofmeshed and unmeshed transport network models, IEEE Transactionson Plasma Science (submitted).


