Embed Size (px)
Citation preview

MICHIGAN WILDLIFE CONTAMINANT TREND MONITORING
Nestling Bald Eagle Mercury Report:
Spatial and Temporal Trends 2004-2008 and Statewide Temporal Trends 1987-2008
Prepared by: Dr. Michael R. Wierda, Katherine F. Leith,
and Dr. William Bowerman Department of Forestry and Natural Resources
Institute of Environmental Toxicology Clemson University
Dennis Bush
Surface Water Assessment Section Water Bureau
Michigan Department of Environmental Quality
Dr. James Sikarskie Department of Small Animal Clinical Sciences
Michigan State University
November 12, 2009
MI/DEQ/WB-09/071

Abstract: The bald eagle (Haliaeetus leucocephalus) is one of the most studied birds of North America. A great amount of life history information, including the impacts of various stressors on the eagle’s ability to reproduce, are well known (Bowerman et al., 2002). The bald eagle is a tertiary predator of the Great Lakes Basin aquatic food web and has been shown to be an appropriate model to monitor ecosystem contaminant concentrations. Mercury (Hg) concentrations in feathers of bald eagles have been previously documented in the Great Lakes region (Bowerman et al., 1994). For this study, 958 bald eagle samples spanning 1987-1992 and 1999-2008 were analyzed for Hg. These represent three sampling cycles, in which the entire state was sampled. This report compares temporal and spatial changes among the three cycles. Hg concentrations in the first sampling cycle (1987-1992) and third sampling cycle (2004-2008) were greater than those of the second sampling cycle (1999-2003). Spatially, Lake Superior and the inland Upper Peninsula breeding areas had greater Hg concentrations than Lake Erie breeding areas. Only two samples exceeded the no-observed-adverse-effect-level for Hg in eaglet feathers of 36.4 nanograms per gram for Hg.

INTRODUCTION The bald eagle (Haliaeetus leucocephalus) is one of the most studied birds of North America. Hundreds of scientific studies have delineated its life history information, including the influence of various stressors on reproduction (Bowerman et al., 2002). The bald eagle is a large bird of prey and an opportunistic forager that generally prefers fish over avian, mammalian, and reptilian prey (Buehler, 2000). Bald eagles are associated with aquatic habitats (coastal areas, rivers, lakes, and reservoirs) and forested shorelines of North America. Estimates of territory size vary widely based on nesting density, food supply, and method of measurement (Buehler, 2000). Bald eagles lay one to three eggs per clutch with a mean clutch size of 1.87 (Stalmaster, 1987) and both sexes assist in incubation and rearing young. The bald eagle population in Michigan has recovered strongly since the population bottle-neck of the 1960s. In the 1960s when Michigan’s eagle population was first monitored, less than 100 nests were occupied (i.e., active breeding pairs existed). Today there are approximately 500 occupied nests each year (Figure 1) and over 700 breeding areas in the state. Productivity within each area was determined by dividing the total number of young by the number of occupied breeding areas for each year (Postupalsky, 1974). Productivity rates have increased throughout Michigan. Productivity in the 1960s was 0.59 compared to the recent (2000-2006) productivity of 0.95. Success was determined by dividing the number of nests producing fledged young by the number of occupied breeding areas for each year (Postupalsky, 1974). Rates of success have also increased, increasing from 0.41 in the 1960s compared to 0.62 in 2000-2006. With increases in population size, productivity, and success, the number of nestling bald eagles produced each year has also increased. In the 1960s, less than 50 nestling eagles were produced each year, while in recent years (2000-2006) greater than 400 nestling eagles have been produced annually (Figure 1). The bald eagle is a tertiary predator of the Great Lakes Basin aquatic food web. Due to its position at the top of the food chain, this species is susceptible to biomagnification of a wide array of xenobiotics, including methylmercury (MeHg). The bald eagle has been proposed as a biological indicator of exposure and effect of aquatic pollutants and is used to monitor the effects of bioaccumulation and biomagnification in the Great Lakes regions. Nestling bald eagles receive prey items from within the adults’ local breeding area. Concentrations of MeHg in nestling eagle feathers reflect exposure to MeHg from food items they receive, further substantiating the bald eagle as an appropriate bioindicator of ecosystem quality (Bowerman et al., 2002). There are many sources of Hg, both natural and anthropogenic. Natural sources include volcanoes and mercury deposits. Anthropogenic sources include Hg emissions to the atmosphere, which originate from a variety of sources (Harris et al., 2007; SETAC, 2007). Hg concentrations in many regions of the globe have increased as a result of anthropogenic activities. Most of the Hg released into the environment is inorganic, but a small fraction is converted by bacteria to MeHg, a toxic organic compound. Hg is transformed into MeHg when the oxidized or mercuric species (Hg2+) gains a methyl group (CH3). A variety of microorganisms, particularly methane-producing and sulfate-dependant bacteria, are thought to be involved in the conversion of Hg2+ to MeHg under anaerobic conditions. Methylation occurs primarily in aquatic, acidic environments with high concentrations of organic matter (Environment Canada, 2004). The methylation of Hg2+ is primarily a natural, biological process resulting in the production of highly toxic MeHg, which bioaccumulates and biomagnifies (Environment Canada, 2004). MeHg bioaccumulates through aquatic food webs so effectively
1

that the primary exposure pathway for MeHg in humans and wildlife species is through fish consumption (Harris et al., 2007). There have been numerous studies on the detrimental effects of Hg on different avian species. Hg can cause neuropathology resulting in changes in behavior, which may disrupt foraging and nesting behaviors (Jagoe et al., 2002). Hg concentrations in eggs have been associated with impaired hatchability and embryonic mortality in a number of bird species (Wiener et al., 2003; Scheuhammer et al., 2007). Reproductive failure and altered nesting behavior have been documented in common loons (Gavia immer [Evers et al., 2005]). Laboratory feeding studies have shown acute lethality, neurotoxicity, and altered nesting behavior in northern goshawks (Accipiter gentiles) and red-tailed hawks (Buteo jamaicensis) related to Hg concentrations in food (Borg et al., 1970; Fimreite and Karstad, 1971; Barr, 1986). In a field study with common loons, adult loons in territories with greater Hg concentrations left eggs unattended 14% of the time, compared with 1% in territories with lower Hg concentrations (Thompson, 1996). In wild birds, environmental MeHg exposure may be associated with a higher potential for infection by disease organisms and decreased growth (Scheuhammer et al., 2007; SETAC, 2007). Feathers are commonly used to monitor environmental exposure of birds to heavy metals (Westermark et al., 1975; Buhler and Norheim, 1982; Bruane and Gaskin, 1987; Bowerman et al., 1994). Hg is excreted into growing feathers, bound to the feather keratin molecule, and is then relatively stable both physically and chemically (Applequist et al., 1984; Thompson et al., 1998). In birds, about 70% (Honda et al., 1986; Harris et al., 2007) to 93% (Bruane and Gaskin, 1987; Harris et al., 2007) of the body burden of Hg is in feathers, and greater than 95% of the Hg in feathers is MeHg (Thompson and Furness, 1989; Harris et al., 2007). Hg concentrations in feathers grown after molt are strongly correlated with Hg concentrations in the blood (Evers et al., 2005). Concentrations of Hg in feathers also reflect concentrations in other tissues. Concentrations of Hg in feathers have been shown to reflect 70% to 93% of the MeHg concentrations in muscle (SETAC, 2007; Burgess and Meyer, 2008). Feathers are therefore a relevant tissue for evaluating chronic body burdens (Evers et al., 2005). Hg concentrations in feathers of bald eagles have been previously documented in the Great Lakes region (Bowerman et al., 1994). Atmospheric deposition is considered to be the primary source of Hg accumulating as MeHg in fish inhabiting lakes of the north central United States (Sorensen et al., 2005). Hg concentrations were considered to be sufficiently elevated in bald eagle feathers from Michigan to warrant a number of specific recommendations for assessing the widespread Hg contamination problem due to aerially transported Hg loadings (Evans, 1993). The Michigan Department of Environmental Quality (MDEQ) implemented a monitoring program using the bald eagle to monitor trends of a suite of bioaccumulative pollutants under the Clean Michigan Initiative. These compounds include polychlorinated biphenyls, organochlorine pesticides, and mercury. The state has been divided into major “watershed years” with 20% of Michigan’s watersheds being sampled each year (Figure 2). During annual banding activities, blood and feather samples from nestling bald eagles were collected within these designated watersheds. This sampling procedure allows for the entire state to be sampled and analyzed every five years. The primary objectives of this study were to use Hg concentrations in feathers of nestling bald eagles to:
1. Determine spatial trends of Hg within the state of Michigan at four spatial scales.
2

2. Assess temporal trends of Hg within Michigan at five spatial scales. 3. Determine statewide temporal trends of Hg among three time periods, 1987-1992,
1999-2003, and 2004-2008. METHODS Study Area Michigan’s geomorphology is classified as Central Lowland plains and is a combination of level to gently rolling lowland and lacustrine plains. Dune fields extend out into the plains along the Great Lakes shorelines. Elevations in the Lower Peninsula of Michigan range from 175-396 meters and from 176-256 meters in Upper Peninsula of Michigan. In the Upper Peninsula of Michigan low gradient streams drain into Lakes Superior, Michigan, and Huron. In the Lower Peninsula of Michigan low gradient streams drain into Lakes Michigan, Huron, and Erie except in the southern extremity where they drain into the Ohio-Mississippi drainages. Small to medium lakes are present but not abundant in the Lower Peninsula of Michigan while numerous lakes and wetlands are found in low lying areas in the Upper Peninsula of Michigan. Wetlands may seasonally flood in low-lying glacial lakebeds (McNab and Avers, 1994). Spatial Analysis Hg concentrations in nestling eagle feathers were compared at four spatial scales: Category; Subpopulation; Great Lakes Watershed; and Individual Watershed (Bowerman et al., 1994; Roe, 2001). Breeding areas, which include all nests used by a territorial pair of eagles, were the sampling unit used for all analyses. The breeding area was assigned to a single grouping at each spatial scale for comparison. The Category spatial scale compared Inland (IN) and Great Lakes (GL) breeding areas. At all spatial scales, which are subdivided into Great Lakes and Inland breeding areas, Great Lakes breeding areas are defined as being within 8.0 kilometers of Great Lakes shorelines and/or along tributaries open to Great Lakes fish runs; inland breeding areas are defined as being greater than 8.0 kilometers from the Great Lakes shorelines and not along tributaries open to Great Lakes fish runs (Bowerman et al., 1994; Roe, 2001; Bowerman et al., 2003). The Subpopulation spatial scale subdivided the Category spatial scale into four GL and two IN groups. The GL subpopulations consisted of Lake Superior (LS), Lake Michigan (LM), Lake Huron (LH), and Lake Erie (LE). The IN subpopulations consisted of Upper Peninsula (UP) and Lower Peninsula (LP). At the Great Lakes Watershed spatial scale all breeding areas were sorted into eight groupings, based on Great Lakes Basin drainages, four GL and four IN. The GL groups were Lake Superior Great Lakes (LS-GL), Lake Michigan Great Lakes (LM-GL), Lake Huron Great Lakes (LH-GL), and Lake Erie Great Lakes (LE-GL). The IN groups were Lake Huron Inland (LH-IN), Lake Michigan Inland Upper Peninsula (LM-IN-UP), Lake Michigan Inland Lower Peninsula (LM-IN-LP), and Lake Superior Inland (LS-IN). The Individual Watershed spatial scale was defined by Hydrological Unit Codes (HUCs) as defined by the United States Geological Survey. Individual watersheds were analyzed independently. A second analysis was done by grouping individual watersheds into three types: Great Lakes HUCs (GL-HUCs), Inland HUCs (IN-HUCs), and Mixed HUCs (M-HUCs). These are referred to hereafter as “Grouped HUCs.” A GL-HUC was an individual watershed where all
3

breeding areas were previously defined as GL. An IN-HUC was an individual watershed where all breeding areas were previously defined as IN. M-HUCs included both GL and IN breeding areas. Temporal analyses were conducted to report changes in Hg concentrations over time. Temporal analyses among the three sampling efforts: 1987-1992 (T1), 1999-2003 (T2), and 2004-2008 (T3) were conducted at the state spatial scale. Temporal analyses for Category, Subpopulation, Great Lakes Watershed, and Individual Watershed spatial scales were conducted between T2 and T3. Aerial Surveys Aerial surveys were conducted by Michigan Department of Natural Resources (MDNR) pilots and contracted observers to establish which nest within a breeding area was active. An observer on each flight made note of the nest tree species, reproductive status (e.g., eggs, chicks, or adult brooding behavior), and determined location (latitude and longitude) using Global Positioning System (GPS) units. The first survey each year was conducted in March or early April to establish nest occupancy. The second aerial survey was conducted in early May to mid June to determine nesting success or failure. If successful, the number of young, stage of development, tree condition, and nest access from the ground were determined. From the observer’s notes, field crews were directed to the nests at the appropriate time for sampling. Nestling eagles were sampled at five to nine weeks of age, from early May to July each year. Exact nest locations were determined on the ground using GPS. Field Methods Nestling Eagle Capture At the nest, a trained crew member climbed the nest tree and secured the nestling eagle(s). Climbers used gaffs, flip ropes, and harnesses to ascend the tree. Once the climber was secure at the nest a nestling eagle was captured, placed in a restraining bag, and lowered to the ground. Nestling eagles were typically captured, restrained, processed, and returned to the nest individually. Upon completion of sampling the climber rappelled from the tree. Sample Collection Processing of nestlings consisted of feather collection and morphometric measurements. Nestlings were removed from the restraining bag then placed on their backs with their feet restrained with elastic bandages to avoid injury to the bird or handler. Three to four feathers were collected from each nestling eagle. Feathers were plucked from the breast area and stored in a small sealed envelope at ambient temperatures. Morphological measurements were collected to determine sex and estimate age of the nestling. Morphological measurements of the culmen, hallux claw, and bill depth were measured with calipers (Bortolotti, 1984a; 1984b; and 1984c). The eighth primary feather length and footpad length were measured with a ruler. Procedures developed by Bortolotti (1984b) were used to determine age and sex. After sampling was completed, the nestling eagles were banded with a size 9 United States Fish and Wildlife Service (USFWS) rivet band, placed back in the restraining bag, raised, and released to the nest. Capture and sampling methods were conducted according to approved Clemson University Animal Use Protocols. Handling methods were also approved Animal Use Protocol methods and conducted under UWFWS banding permits.
4

From the field, samples were transferred to prearranged collection points at various MDNR, United States Forest Service, or USFWS field stations. At the end of the sampling effort, all samples were collected and transferred to the USFWS East Lansing field office, entered into sample storage through a chain-of-custody tracking system, and stored at ambient temperature. Upon request to the USFWS chain-of-custody officer at East Lansing field office, samples were transferred to Clemson University, Department of Forestry and Natural Resources for analysis. Lab Methods Feather Preparation Feathers were washed, rinsed, dried, and digested in preparation for Hg analysis. Feathers were placed in a labeled Ziploc® bag containing the detergent Citranox®, agitated, and then rinsed two times with nanopure water. Washed feathers were placed in a freezer for one hour and then in a freeze-dryer overnight to remove moisture. The feathers were then weighed and transferred into glass digestion tubes. If the sample was not at least 0.05 grams, the sample was not used for Hg analysis. Ten milliliters of concentrated nitric acid (HNO3) and sulfuric acid (H2SO4; 70:30 v/v) was added to each glass tube, which was then covered with a glass marble. Feathers were digested in the tube in a block heater at 80oC for 30 minutes or until fully digested. The tube was then removed from the block heater to cool for at least 30 minutes; the digestion solution was then transferred to a sealable jar and diluted to 1:20 v/v by adding 190 milliliters of deionized water. Samples were covered with parafilm, sealed with a cap, and stored at room temperature until instrumental analysis. Mercury Analysis Mercury analysis followed United States Environmental Protection Agency Method 245.7 for total Hg by cold vapor Atomic Fluorescence Spectrometer (AFS [Aurora AI 3200]). The AFS detector was set at a wavelength of 237.7 nanometers and detection limit was reported at less than 1.0 nanograms per liter (Aurora operation manual). The samples were analyzed at the following conditions: gas flow rate = 400 ml/min, pump speed = 60 rpm, atomized temperature = 200°C, rinse time = at least 60 sec, uptake time = 60 sec, integration time = 20 sec, 3 duplicates, and reductant = 10% (w/v SnCl2 in 10% (v/v) HCl. Hg concentrations were estimated and quality assurance/quality control were maintained with standards and regular equipment detection checks. Hg standards were made using a 1,000 milligrams per kilogram (mg/kg) +/- 1% Hg standard. Five standards (1, 2, 5, 10, and 20 mg/kg) were made from appropriate ratios of a 100 mg/kg Hg solution and a 10% HCl solution. A standard curve was established from the above standards and after every 5 samples a detection check was performed with either the 5 mg/kg or 10 mg/kg standard. If the detection check was not within 85% to 115% of the original Hg standard curve, a new standard curve was made and the samples were rerun. Statistical Methods Distributions of contaminant concentrations were tested for normality using the Kolmogorov-Smirnov test and found to be non-normal for both the raw and log-transformed concentrations. Hartley’s Fmax test also revealed significantly differing variances between groups. Analyses for differences between multiple groups were therefore conducted using rank converted ANOVAs, a nonparametric test equivalent to the Kruskal-Wallis test. Because examinations of temporal trends found that simple linear relationships could not satisfactorily
5

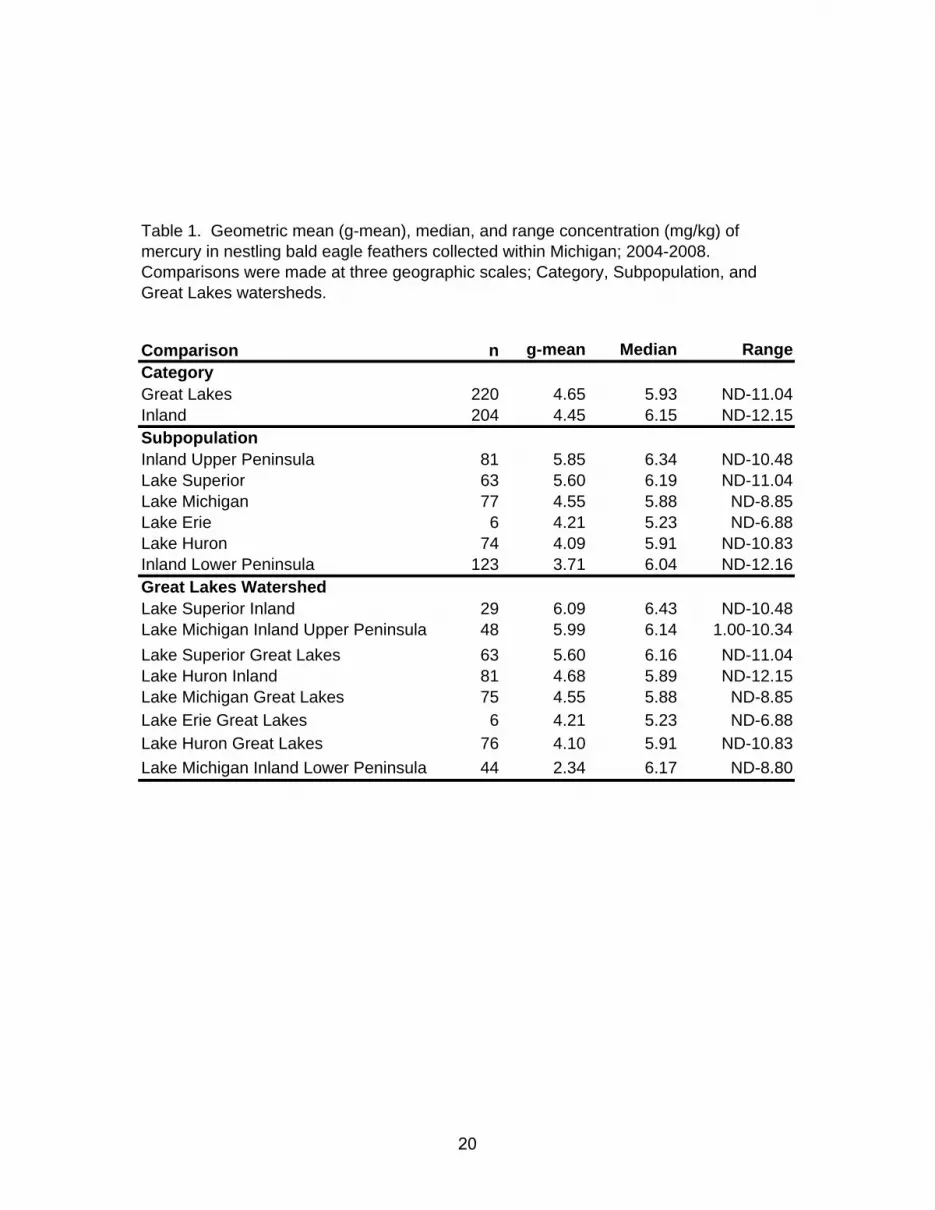
describe the changes in contaminant levels through time and because group variances differed significantly for spatial trends, post-hoc analyses were conducted using the rank converted Fisher’s least significant difference test (LSD). This test is equivalent to the Wilcoxon rank-sum nonparametric analysis. It should be noted that critical values for the Fisher’s LSD are set to control only pair-wise error rate and not experiment-wise error rate. This increases the likelihood of detecting a difference at the cost of increasing Type I error rate as the number of post-hoc comparisons increases. With monitoring as the project’s primary function, Fisher's LSD was the preferable compromise between power and Type I error rate for all comparisons except the individual watershed analysis because the number of comparisons was relatively small at these spatial scales and LSD increased the ability to detect spatial and temporal trends of concern. Individual watershed analysis involved comparisons between 42 watersheds, thus, the more conservative Tukey’s test (rank-converted) was used because it includes a correction to control for experiment-wise Type I error rate. Although log transformation did not successfully normalize the distribution, concentrations were positively skewed in a manner similar to log-normal distributions commonly seen in other contaminant research. For this reason, and in keeping with conventions of environmental toxicology, geometric means were included along with medians as indicators of central tendency in the tables provided. Tables also report ranges to facilitate a better understanding of the data presented. All analyses were performed using SAS 9.2 (SAS Institute, 2007). An a = 0.05 was used to determine statistical significance. RESULTS Spatial Trends A total of 424 feather samples collected from individual nestling eagles from 2004-2008, were analyzed for Hg. These 424 samples represented 226 breeding areas. Comparisons of concentrations of Hg in nestling feathers were made at the Category, Subpopulation, Great Lakes Watershed, and Individual Watershed spatial scales. Category Slight differences in Hg concentrations were observed at the Category spatial scale. No significant differences in Hg concentrations were found between Great Lakes and inland breeding areas (F = 1.711, 422, P > 0.19). Geometric mean Hg concentrations were ranked in the following order from highest to lowest: GL (4.65 mg/kg) and IN (4.45 mg/kg; Table 1). Subpopulation Hg concentrations varied significantly among feathers from nestling eagles at the Subpopulation spatial scale (F = 2.535, 418, P = 0.04). However, post-hoc analysis did not show any significant differences. Geometric mean Hg concentrations were ranked in the following order from highest to lowest: UP (5.85 mg/kg), LS (5.60 mg/kg), LM (4.55 mg/kg), LE (4.21 mg/kg), LH (4.09 mg/kg), and LP (3.71 mg/kg; Table 1). Great Lakes Watershed Hg concentrations varied significantly among Great Lakes Watersheds (F = 2.197, 421, p = 0.03). Post-hoc analysis showed LS-IN breeding areas were greater than LE-GL breeding areas (LSD = 65.38, d.f. = 414, p ≤ 0.05). Geometric mean concentrations of Hg were ranked in the
6

following order from highest to lowest: LS-IN (6.09 mg/kg), LM-IN-UP (5.99 mg/kg), LS-GL (5.60 mg/kg), LH-IN (4.68 mg/kg), LM-GL (4.55 mg/kg), LE-GL (4.21 mg/kg), LH-GL (4.10 mg/kg), and LM-IN-LP (2.34 mg/kg; Table 1). Individual Watersheds Hg concentrations varied significantly among Individual Watersheds (F = 1.4342, 381, P < 0.05). However, post-hoc analysis (Tukey’s) did not show any significant differences. Hg concentrations for Individual Watersheds ranged from 7.16 mg/kg to 0.26 mg/kg.
Hg concentrations did not vary among Grouped HUCs (F = 2.302, 822, P > 0.10). Geometric mean concentrations of Hg for Grouped HUCs were ranked in the following order from highest to lowest: I-HUC (6.11 mg/kg), M-HUC (4.23 mg/kg), and G-HUC (3.95 mg/kg; Table 2). Temporal Trends Statewide 1987-1992 (T1) vs. 1999-2003 (T2) vs. 2004-2008 (T3) Hg concentrations varied among T1, T2, and T3 (F = 28.782, 957, P < 0.0001). Post-hoc analysis found there were significant differences between all time periods. T1 was significantly greater than T2 and T3. T3 was significantly greater than T2 (t ≥ 1.96, d.f. = 955, P ≤ 0.05). Geometric mean Hg concentrations from highest to lowest were T1 (7.44 mg/kg), T3 (4.81 mg/kg), and T2 (3.46 mg/kg; Table 3). Analysis of Temporal Changes T2 vs. T3 The Michigan Bald Eagle Biosentinel Program has now completed two five-year cycles (T2 and T3), so comparison of Hg concentrations between these two time periods is important for assessing the utility of the program. While most comparisons within defined subunits within each spatial scale were not significantly different, some differences were observed. Differences were noted at four spatial scales as well as the Grouped HUC analyses. At the Category spatial scale Hg concentrations were significantly different within GL breeding areas between T2 (geometric mean (gm) = 3.28 mg/kg) and T3 (gm = 4.65 mg/kg; t = -2.05, d.f. = 309.58, p = 0.04; Figure 3). At the Subpopulation spatial scale Hg concentrations were significantly different within UP breeding areas between T2 (gm = 2.62 mg/kg) and T3 (gm = 5.85 mg/kg; t = -3.39, d.f. = 193.17 P = 0.0008; Figure 3). At the Great Lakes Watershed spatial scale Hg concentrations were significantly different within LM-IN-UP (gm = 2.32 and 5.99 mg/kg, t = -2.94, d.f. =127.43, P = 0.0039) and LS-IN (3.21 and 6.09 mg/kg, t = -2.23, d.f. = 127.43, P = 0.0304) breeding areas between T2 and T3 (Figure 4). At the Individual Watershed spatial scale Hg concentrations significantly increased within the Keweenaw Peninsula (gm = 2.71 and 6.18 mg/kg, t = -3.36, d.f. = 14, P = 0.0047), Brule (gm = 1.10 and 6.32 mg/kg, t = -2.86, d.f. = 28.892, P = 0.0072), Menominee (gm = 1.40 and 6.66 mg/kg, t = -2.45, d.f. = 33.246, P = 0.0196), and Shiawassee (gm = 0.39 and 4.05 mg/kg, t = -3.36, d.f. = 5.0164, P = 0.0146) watershed breeding areas between T2 and T3 (Table 4, Figure 5). Also, at the individual watershed spatial scale Hg concentrations significantly decreased within the Manistee watershed breeding areas between T2 (gm = 8.02 mg/kg) and T3 (gm = 3.87mg/kg; t = 3.48, d.f. = 35, P = 0.00, Table 4, Figure 5). Grouped HUCs Hg concentrations were significantly different within IN-HUC breeding areas between T2 (gm = 2.75 mg/kg) and T3 (gm = 6.11 mg/kg; t = -2.87, d.f. = 155.96, P < 0.0046; Figure 4).
7

DISCUSSION This study reports the finding of the first two sampling periods of the Michigan Bald Eagle Biosentinel Program (MBEBP). The MBEBP was designed to monitor spatial and temporal trends of Hg in Michigan’s aquatic ecosystem. While not part of the MBEBP, an affiliated study using nestling eagles to monitor these trends in the lakes of Voyagers National Park in Minnesota is discussed. In addition to trends analysis, the sensitivity of eagles to Hg and their utility as a biosentinel species are discussed. Spatial Trends Hg concentrations were highest in the Upper Peninsula of Michigan. At both Subpopulation and Great Lakes Watershed spatial scales the highest concentrations were from the Upper Peninsula. Also, at the grouped individual watersheds spatial scale IN-HUCs (which included UP nests) showed significantly greater Hg concentrations. Elevated Hg concentrations in the feathers of nestling bald eagles from the Upper Peninsula could be the result of many factors. Atmospheric deposition of Hg in the Upper Peninsula could be heightened as a result of numerous factors. Possible factors include upwind coal consumption in Canada and the northwestern United States, and increased consumption in developing countries (e.g., Asia). The open topography of Lake Superior, prevailing winds, and the relief of the western Upper Peninsula may also facilitate the transportations and release of atmospheric Hg. Locally, large scale environmental changes or environmental characteristics like acid deposition, land use, or climate changes can lead to increased Hg concentrations. Also, local watershed and site conditions can cause large changes in Hg concentration and the ratios of total Hg to MeHg. Freshwater aquatic systems associated with wetlands, periodic dry down, and acidic environments are also at greater risk of enhanced methylation of mercury (Harris et al., 2007). Blood Hg concentrations in common loons in northern Wisconsin decreased with increasing lake pH (Burgess and Meyer, 2008). At Voyagers National Park, lakes with dams (Rainy Lake and Crane Lake/Sandpoint) had higher concentrations of Hg in fish than lakes without a dam (Kabetogama Lake) (Sorensen et al., 1990). Nestling bald eagles had Hg concentrations of 15.1 mg/kg, 13.3 mg/kg, and 5.10 mg/kg on Rainy Lake, Crane Lake/Sandpoint, and Kabetogama Lake, respectively. Watershed drainage, flow rates, and water level fluctuations affect Hg transport, residence times, and nutrient and sulfate loading. These variations can, in turn, influence Hg methylation and biomagnification potential. The stabilization of water levels by the International Joint Commission resulted in similar decreases in mercury in fish and nestling eagles at Voyagers National Park (Thomsen, 2007). Temporal Trends While Hg concentrations in eagles are below historic levels they are currently increasing. Slemr et al. (2003) attempted to reconstruct global trends of atmospheric Hg. They reported that Hg concentrations increased in the late 1970s, peaked in the 1980s, and then decreased into the mid 1990s. Mercury concentrations in feathers of nestling eagles in Michigan support the reconstructed trends of Slemr et al. (2003) with a decrease from T1 to T2. This decrease was possibly related to decreased nonpoint source pollution through the use of cleaner coal and more advanced pollution removal devices (i.e., smoke stack scrubbers). Mercury emissions
8

were also reduced in North America and the European Union between 1990 and 1995 (Slemr et al., 2003). The current trend of increasing Hg concentrations throughout the state may be a result of increased global consumption of coal, specifically, conspicuous consumption in industrially developing countries (e.g., Asia). Increases in Hg concentrations were seen at several spatial scales when T2 and T3 were compared. The greatest increases were concentrated around the Upper Peninsula and inland breeding areas. As of 1995, the USA was the source of only 10% of the global mercury emissions and Asia produced greater than 50% (SETAC, 2007). Increases of Hg in nestling bald eagles statewide coincide with the results of other vertebrate monitoring programs. Increases in Hg concentrations throughout the state of Michigan in the same time period were observed in fish sampled from 265 lakes and impoundments by the MDEQ, Water Bureau (Bohr and VanDusen, 2008). Climate changes could lead to changes in Hg concentrations in Michigan nestling bald eagles. Climate change has been shown to be affecting nesting chronology of bald eagles in Michigan (Bowerman, unpublished data). These changes include earlier laying dates and potential prey base changes. The effects of climate change could alter the bioavailability of Hg to bald eagles and other top predators due to trophic level changes. These changes could come from shifts in available prey base or environmental changes such as increased frequency and intensity of periodic droughts. Sensitivity to Hg No threshold for adverse effects of Hg has been established for bald eagles. Laboratory studies indicated adverse effects, including decreased reproduction with Hg levels of 1.5 mg/kg in eggs and 5 to 40 mg/kg in feathers of multiple species including game birds, waterfowl, and a raptor (Burger and Gochfeld, 1997). Burger and Gochfeld (1997) showed that in sparrow hawks (Accipiter nisus) feather concentrations of 40 mg/kg resulted in sterility. In common loons, adverse effects levels of 3.0 mg/kg in blood and 40.0 mg/kg in feathers were shown to be correlated with a significant decline in reproductive success (Evers et al., 2005). In this study, no breast feathers sampled were greater than 13 mg/kg, much less than the 40.0 mg/kg feather Hg threshold for adverse affects in common loons and sparrow hawks. However, because we were working with nestling eagles that were actively growing feathers, the Hg concentrations are more representative of blood levels. Thus 88% of the nestling bald eagles sampled would exceed the 3.0 mg/kg blood mercury threshold for common loons associated with reproductive impairment or long-term effects in loons. Hg concentrations in adult loons can also be up to 10 times greater compared to nestling loons (Evers et al., 2005). In previous studies that compared adult and nestling feather Hg concentrations from Michigan and Minnesota, adult eagle feathers were up to 10 times higher than feathers of nestling eagles (Thomsen, 2007). If nestling feather Hg concentrations were converted to adult Hg concentrations using a factor of 10 to represent adult exposure, 83% of adults in breeding areas sampled would be above the 40 mg/kg threshold for other avian species. However, no relationships have been observed between Hg concentrations and productivity or nesting success in bald eagles in either study area (Bowerman et al., 1994; Thomsen, 2007). Since eagles can depurate up to 90% of their body burden to feathers while they are being replaced, and molting/feather replacement occurs at the same time period as maximum mercury exposure, this may be a protective mechanism for eagles.
9

Bald eagles may also have a physiological mechanism that allows them to handle a greater insult of Hg by complexing MeHg and Selenium. Bald eagles have a greater ability to demethylate MeHg in the brain than common loons (Scheuhammer et al., 2008). MeHg can be demethylated when complexed with Selenium. Eagles were shown to have a molar excess of Selenium while loons had a molar excess of Hg in the brain (Scheuhammer et al., 2008). This ability to demethylate MeHg may be why eagles in Michigan can have elevated levels of Hg and yet not suffer reproductive declines. Further research may help to understand eagle sensitivity relative to other avian species. Utility as a Biosentinel The MBEBP has now been in effect for two five-year cycles and it is apparent from these results that Hg concentrations in feathers of nestling eagles is an appropriate measure of Hg exposure in aquatic ecosystems. The Michigan Mercury Research Workshop Summary Report (Kohlhepp, 2006) listed the western Upper Peninsula of Michigan as a hot spot (i.e., area of high concentrations) and the Lower Peninsula as having lower Hg levels. These results are also supported by the MBEBP. The fact that the MBEBP has picked up similar trends to those reported for fish concentrations, atmospheric deposition, and water quality monitoring speaks to the utility of the project. These 10 years of data in combination with previously collected data from 1987-1992 represents 3 sampling periods for the entire state of Michigan. The trends of decreasing then increasing Hg concentrations over time among many different monitoring programs shows the utility of using bald eagles to monitor the environment. These changes have been observed both spatially and temporally, and therefore, show the utility of the program. With our current knowledge and data base we can now start to focus on hotspots and monitor these areas more intensively for the effects of Hg. Recommendations Based on the results of this analysis of temporal and spatial trends of Hg in nesting bald eagles in aquatic ecosystems, we recommend:
• A more intensive monitoring program for inland and Upper Peninsula breeding areas, and in areas shown to have greater bioavailability of Hg, should be conducted to investigate the long-term effects of Hg on bald eagle reproductive success.
• Continued monitoring of bald eagle productivity and reproductive success is advisable; if Hg concentrations continue to increase, this project may be in a unique position to observe the threshold at which Hg concentrations start to have detrimental effects on bald eagles.
• Climate change may result in shifts in prey and changing environmental factors, both of which could greatly alter aquatic bioavailability of Hg. Therefore, it is important that we continue to monitor eagles throughout the state of Michigan to document these impacts.
10

Literature Cited Applequist, H., S. Asbirk, and I. Drabaek. 1984. Mercury Monitoring: Mercury Stability in Bird
Feathers." Marine Pollution Bulletin 15: 22-24. Barr, J.F. 1986. Population Dynamics of the Common Loon (Gavia Immer) Associated with
Mercury-Contaminated Waters in Northwest Ontario. Occasional Paper No 56. C. W. Service. Ottawa, Canada.
Bohr, J. and J. VanDusen. 2008. Michigan Fish Contaminant Monitoring Program: 2008
Annual Report. MDEQ Staff Report #MI/DEQ/WB-09/044. Borg, K., K. Erne, E. Hanko, and H. Wanntorp. 1970. Experimental Secondary Methy Mercury
Poisoning in the Goshawk (Accipiter G. gentiles L.). Environmental Pollution 1: 91-104. Bortolotti, G.R. 1984a. Physical Development of Nestling Bald Eagles with Emphasis on the
Timing of Growth Events. Wilson Bulletin 96: 524-542. Bortolotti, G.R. 1984b. Sexual Size Dimorphism and Age-Related Variation in Bald Eeagles.
Journal of Wildlife Management 48: 72-81. Bortolotti, G.R. 1984c. Criteria for Determining Age and Sex of Nestling Bald Eagles. Journal
of Field Ornithology 55: 467-481. Bowerman, D.W., D.A. Best, J.P. Giesy, M.C. Shieldcastle, M. Meyer, S. Postupalsky, and J.G.
Sikarskie. 2003. Associations Between Regional Differences in PCBs and DDE in Blood of Nestling Bald Eagles and Reproductive Productivity. Environmental Toxicology and Chemistry 22(371-376).
Bowerman, D.W., A.S. Roe, M.J. Gilbertons, D.A. Best, J.G. Sikarskie, R.S. Mitchell, and C.L.
Summer. 2002. Using Bald Eagles to Indicate the Health of the Great Lakes’ Environment. Lakes & Reservoirs: Research and Management 7: 183-187.
Bowerman, W.W., E.D. Evans, J.P. Giesy, and S. Postupalsky. 1994. Using Feathers to
Assess Risk of Mercury and Selenium to Bald Eagle Reproduction in the Great Lakes Region. Archives of Environmental Contamination and Toxicology 27(3): 294-298.
Bruane, B.M. and D.E. Gaskin. 1987. Mercury Levels in Bonaparte's Gulls (Larus philadephia)
During Autumn Molt in the Quoddy Region, New Brunswick, Canada. Archives of Environmental Contamination and Toxicology 16: 539-549.
Buehler, D.A. 2000. Bald Eagle. The Birds of North America. 506. Buhler, U. and G. Norheim. 1982. The Mercury Content in Feathers of the Sparrowhawk
Accipiter nisus in Norway. Fauna Norv Ser C Conclus 5: 43-46. Burger, J. and M. Gochfeld. 1997. Risk, Mercury Levels, and Birds: Relating Adverse
Laboratory Effects to Field Biomonitoring. Environmental Research 75(2): 160-172. Burgess, N. and M. Meyer. 2008. Methylmercury Exposure Associated with Reduced
Productivity in Common Loons. Ecotoxicology 17(2): 83-91.
11
Environment Canada. 2004. Mercury and the Environment, Environment Canada. Evans, E.D. 1993. Mercury and Other Metals in Bald Eagle Feathers and Other Tissues from
Michigan, Nearby Areas of Minnesota, Wisconsin, Ohio, Ontario, and Alaska 1985-89. MDNR: 1-56.
Evers, D.C., N.M. Burgess, L. Champoux, B. Hoskins, A. Major, W.M. Goodale, R.J. Taylor,
R. Poppenga and T. Daigle. 2005. Patterns and Interpretation of Mercury Exposure in Freshwater Avian Communities in Northeastern North America. Ecotoxicology 14(1-2): 193-221.
Fimreite, N. and L. Karstad. 1971. Effects of Dietary Methylmercury on Red-Tailed Hawks.
Journal of Wildlife Management 35: 293-300. Harris, R., D.P. Krabbenhoft, R. Mason, M.W. Murry, R. Reash, and T. Saltman. 2007.
Ecosystem Responses to Mercury Contamination: Indicators of Change. CRC Press: 3-10.
Honda, K., T. Nasu, and R. Tatsukawa. 1986. Seasonal Changes in Mercury Accumulation in
the Black-Eared Kkite (Milvus migrans lineatus). Environmental Pollution 42: 325-334. Jagoe, C.H., A.L. Bryan, H.A. Brant, T.M. Murphy, and I.L. Brisbin. 2002. Mercury in Bald
Eagle Nestlings from South Carolina, USA. Journal of Wildlife Diseases 38(4): 706-712. Kohlhepp, G. 2006. Michigan Mercury Research Workshop Summary Report. June 15, 2006.
Romulus, Michigan. MDEQ Staff Report #MI/DEQ/WB-06/108. McNab, W.H. and P.H. Avers. 1994. Ecological Subregions of the United States: Section
Descriptions. United States Forest Service. Washington DC. Postupalsky, S. 1974. Raptor Reproductive Success: Some Problems with Methods, Criteria,
and Terminology. Pp. 21-31 in F.N. Hamerstrom, Jr., B.E. Harrell, and R.R. Ohlendorff (eds.), Management of Raptors. Proc. Conf. Raptor Conserv. Tech., Raptor Res. Report No. 2.
Roe, A.S. 2001. The Development of an Avian Biosentinel Program for Michigan Using the
Bald Eagle, MS Thesis, Clemson University, Clemson, South Carolina, USA. SAS Institute. 2007. SAS 9.2. Cary, NC, USA, SAS Institute, Inc. Scheuhammer, A., M. Meyer, M. Sandheinrich, and M. Murray. 2007. Effects of Environmental
Methylmercury on the Health of Wild Birds, Mammals, and Fish. Ambio 36(1): 12-18. Scheuhammer, A.M., N. Basu, N.M. Burgess, J.E. Elliott, G.D. Campbell, M. Wayland,
L. Champoux, and J. Rodrigue. 2008. Relationships Among Mercury, Selenium, and Neurochemical Parameters in Common Loons (Gavia immer) and Bald Eagles (Haliaeetus leucocephalus). Ecotoxicology 17(2): 93-101.
SETAC. 2007. Ecosystem Responses to Mercury Contamination: Indicators of Change.
Webster, CRC Press.
12
Slemr, F., E. Brinke, R. Ebinghaus, C. Temme, H. Minthe, I. Wangberg, W. Schroeder,
A. Steterren, and T. Berg. 2003. Worldwide Trend of Atmospheric Mercury Since 1977. Geophysical Research Letters 30(10): 1516.
Sorensen, J., G. Glass, K. Schmidt, J. Huber, and G. Rapp. 1990. Airborne Mercury
Deposition and Watershed Characteristics in Relation to Mercury Concentrations in Water, Sediments, Plankton, and Fish of Eighty Northern Minnesota Lakes. Environmental Science & Technology 24(11): 1716-1727.
Sorensen, J., L. Kallemeyn, and M. Sydor. 2005. Relationships between Mercury
Accumulation in Young-of-the-Year Yellow Perch and Water Level Fluctuations. Environmental Science & Technology 39: 9237-9243.
Stalmaster, M.V. 1987. The Bald Eagle. New York, University Books. Thompson, D.R. 1996. Mercury in Birds and Terrestrial Mammals. Environmental
Contaminants in Wildlife: Interpreting Tissue Concentrations. Boca Raton, Florida, Lewis Publishers.
Thompson, D.R., S. Bearhop, J.R. Speakman, and R.W. Furness. 1998. Feathers as a Means
of Monitoring Mercury in Seabirds: Insights from Stable Isotope Analysis. Environmental Pollution 101: 193-200.
Thompson, D.R. and R.W. Furness. 1989. The Chemical Form of Mercury Stored in South
Atlantic Seabirds. Environmental Pollution 60: 305-318. Thomsen, J.M. 2007. Analysis of Hg and Stable Isotope Concentration in Bald Eagle Feathers
from the Great Lakes and Voyagers National Park, Minnesota, MS Thesis, Clemson University, Clemson, South Carolina, USA.
Westermark, T., T. Odsjo, and A. Johnels. 1975. Mercury Content of Bird Feathers Before and
After Swedish Ban on Alkyl Mercury in Agriculture. Ambio 4: 87-92. Wiener, J.G., D.P. Krabbenhoft, G.H. Heinz, and A.M. Scheuhammer. 2003. Ecotoxicology of
Mercury. Boca Roton, CRC Press.
13

Figure 1. Number of active nests and number of young produced from 1961 to 2006.
0
100
200
300
400
500
600
1960 1970 1980 1990 2000 2010
Young Nests
14

Figure 2. Michigan's watershed delineations and monitoring 'basin years'. A. 1999, 2004 basin year watersheds (shaded); B. 2000, 2005 basin year watersheds (shaded); C. 2001, 2006 basin year watersheds (shaded); D. 2002, 2007 basin year watersheds (shaded); and E. 2003, 2008 basin year watersheds (shaded).
A. B. C.
D. E.
16
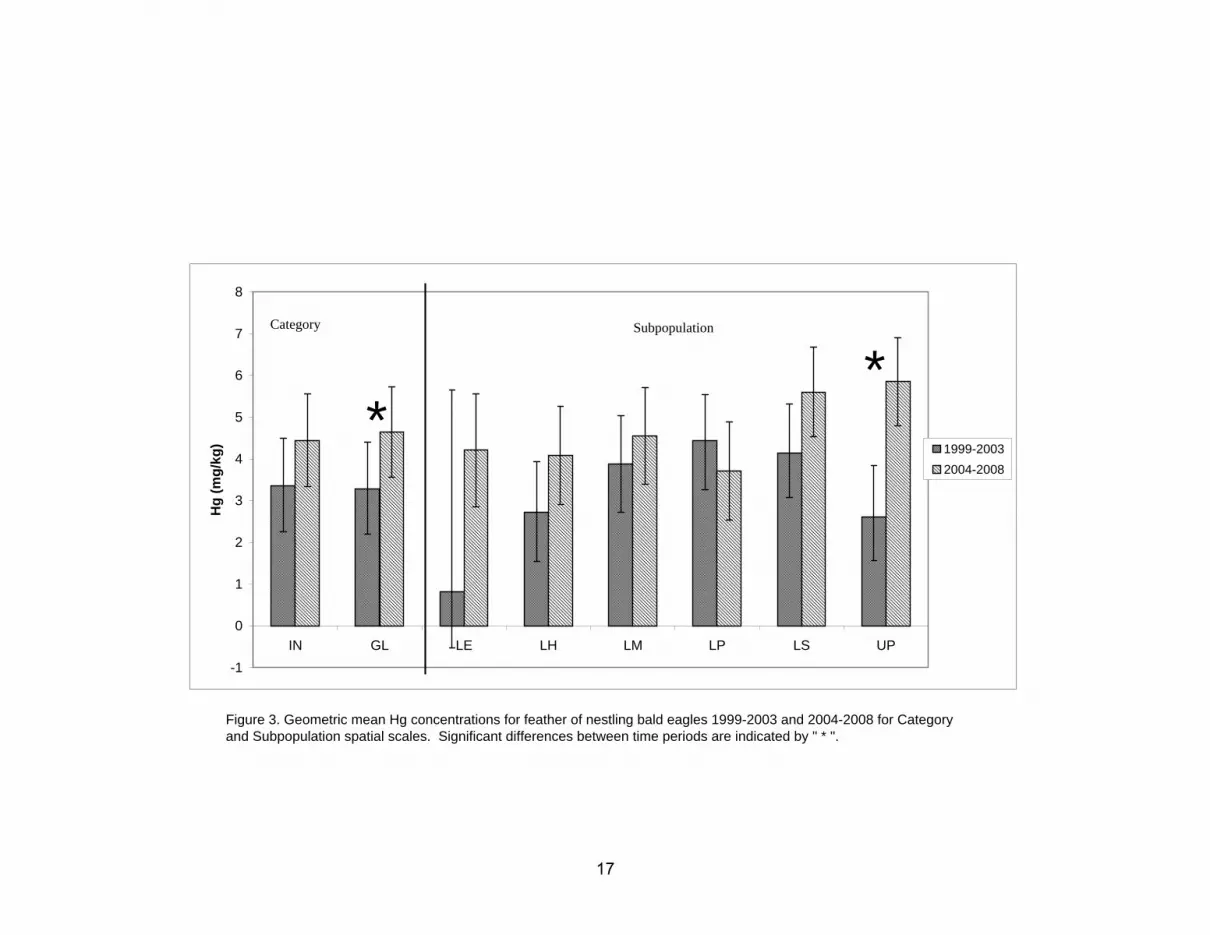
Figure 3. Geometric mean Hg concentrations for feather of nestling bald eagles 1999-2003 and 2004-2008 for Category and Subpopulation spatial scales. Significant differences between time periods are indicated by " * ".
-1
0
1
2
3
4
5
6
7
8
IN GL LE LH LM LP LS UP
Hg
(mg/
kg) 1999-2003
2004-2008
Category Subpopulation
**
17

Figure 4. Geometric mean Hg concentrations for feathers of nestling bald eagles 1999-2003 and 2004-2008 for Great Lakes Watersheds and grouped individual watersheds spatial scales. Significant differences between time periods are indicated by " * ".
-1
0
1
2
3
4
5
6
7
8
LS-IN
LM-IN
-UP
LS-G
LLM
-GL
LM-IN
-LPLH
-INLH
-GL
LE-G
LI-H
UCsM-H
UCsG-H
UCs
Hg
(mg/
kg)
1999-20032004-2008
** *Great Lakes Watershed Grouped
HUCs
18

Figure 5. Geometric mean Hg concentrations for feathers of nestling bald eagles 1999-2003 and 2004-2008 for independent individual watersheds spatial scale. Only comparisons resulting in significant differences between time periods are shown.
-2.0
0.0
2.0
4.0
6.0
8.0
10.0
KeweenawPeninsula
Brule Menominee Shiawassee Manistee
[Hg]
mg/
kg
1999-20032004-2008
19
Comparison n g-mean Median Range
Great Lakes 220 4.65 5.93 ND-11.04Inland 204 4.45 6.15 ND-12.15
Inland Upper Peninsula 81 5.85 6.34 ND-10.48Lake Superior 63 5.60 6.19 ND-11.04Lake Michigan 77 4.55 5.88 ND-8.85Lake Erie 6 4.21 5.23 ND-6.88Lake Huron 74 4.09 5.91 ND-10.83Inland Lower Peninsula 123 3.71 6.04 ND-12.16
Lake Superior Inland 29 6.09 6.43 ND-10.48Lake Michigan Inland Upper Peninsula 48 5.99 6.14 1.00-10.34Lake Superior Great Lakes 63 5.60 6.16 ND-11.04Lake Huron Inland 81 4.68 5.89 ND-12.15Lake Michigan Great Lakes 75 4.55 5.88 ND-8.85Lake Erie Great Lakes 6 4.21 5.23 ND-6.88Lake Huron Great Lakes 76 4.10 5.91 ND-10.83Lake Michigan Inland Lower Peninsula 44 2.34 6.17 ND-8.80
Table 1. Geometric mean (g-mean), median, and range concentration (mg/kg) of mercury in nestling bald eagle feathers collected within Michigan; 2004-2008. Comparisons were made at three geographic scales; Category, Subpopulation, and Great Lakes watersheds.
Great Lakes Watershed
Category
Subpopulation
20

Comparison n g-mean Median RangeI-HUCs 94 6.11 6.26 1.00-10.48M-HUCs 257 4.23 5.96 1.00-12.16G-HUCs 65 3.95 5.90 ND-8.93
Comparison n g-mean Median Range1987-1992 112 7.44 7.90 1.5-18.001999-2003 422 3.46 5.05 ND-41.862004-2008 424 4.81 6.04 ND-12.16
Table 2. Geometric mean (g-mean), median, and range concentration (mg/kg) of mercury in feathers of nestling bald eagles in Michigan 2004-2008 among the Grouped HUCs spatial scale.
Table 3. Geometric mean (g-mean), median, and range concentration (mg/kg) of Hg in feathers of nestling bald eagles in Michigan; 1987-1992, 1999-2003, and 2004-2008.
21

Watershed n 1999-2003 n 2004-2008Black-Presque Isle 11 2.17 1 6.38Ontonagon 20 3.62 6 6.53Keweenaw Peninsula * 11 2.71 5 6.18Sturgeon 4 6.86 10 7.16Dead-Kelsey 20 4.33 24 6.58Chocolay/Betsy-Two-Hearted 16 5.38 15 5.32Tahquamenon 2 6.46 8 4.46Lake Superior Islands 4 2.93 19 5.28Brule * 21 1.10 12 6.32Michigamme 12 3.59 3 6.66Menominee * 24 1.40 19 6.34Cedar-Ford 10 8.29 5 6.50Escanaba 8 4.07 1 5.27Tacoosh-Whitefish 2 11.64 4 3.82Fishdam-Sturgeon 9 3.87 1 1.29Kalamazoo 3 5.46 3 0.26Lower Grand/Rogue-Flat 1 0.50 5 6.32Pere Marquette-Pentwater/White 7 2.91 17 6.07Muskegon 27 3.79 34 2.90Manistee * 14 8.02 23 3.87Betsie-Platte 2 4.58 1 6.38Boardman-Charlevoix 9 2.78 19 5.85Manistique 17 4.06 11 4.90Lake Michigan Islands 5 2.35 7 5.97St. Marys 14 3.30 20 4.76Carp-Pine 7 4.01 1 1.23Long Lake-Ocqueoc/Devils Lake-Black 12 3.05 14 6.45Cheboygan 2 7.70 7 6.29Black 8 8.71 12 6.16Thunder Bay 14 5.24 12 6.16AuSable 36 3.68 30 3.70AuGres-Rifle/East AuGres 15 3.34 20 4.02Kawkawlin-Pine 1 4.33 3 5.80Wiscoggin/Pigeon 7 0.77 3 0.50Tittabawassee 9 3.03 10 4.68Shiawassee * 3 0.50 6 4.05Cass 6 2.80 6 4.40Saginaw 1 2.10 3 1.91Lake Huron Islands 8 5.59 1 5.86Ottawa-Stony 4 3.15 3 2.89Upper Wisconsin 5 4.68 2 6.05
Table 4. Geometric mean concentrations (mg/kg) of mercury in feathers of nestling eagles and sample size for Individual Watersheds in Michigan, 1999-2003 and 2004-2008. Significant differences between time periods are indicated by "*."
22