Embed Size (px)
Citation preview

MIAMI UNIVERSITY
The Graduate School
Certificate for Approving the Dissertation
We hereby approve the Dissertation
of
Aleksey N. Pisarenko
Candidate for the Degree:
Doctor of Philosophy
_____________________________________ Director
Dr. Gilbert E. Pacey
_____________________________________
Director (Committee Chairperson) Dr. Gilbert Gordon
_____________________________________
Reader Dr. Richard T. Taylor
_____________________________________
Reader Dr. Michael W. Crowder
_____________________________________
Graduate School Representative Dr. Luis A. Actis

Abstract
ANALYTICAL MEASUREMENTS AND PREDICTIONS OF PERCHLORATE ION CONCENTRATION IN SODIUM HYPOCHLORITE SOLUTIONS AND
DRINKING WATER: KINETICS OF PERCHLORATE ION FORMATION AND EFFECTS OF ASSOCIATED CONTAMINANTS
by Aleksey N. Pisarenko
The dissertation consists of six chapters that summarize the investigation of
factors impacting perchlorate ion formation in sodium hypochlorite solutions and the
development of a predictive model for perchlorate ion formation. There are also two
appendices detailing the synthesis and applications of nanomaterials for designing
sensors.
Chapter 1 gives a brief history of perchlorate ion as an emerging contaminant. A
background on the occurrence, toxicology, and regulatory actions is provided.
Chapter 2 focuses on the analytical methods that were developed and validated for
analysis of perchlorate, bromate, chlorate, hypochlorite, and chlorite ions in various
hypochlorite ion solutions. Comparison of a LC-MS/MS method and an iodometric
titration method is provided. The chapter also details sample preparation methods, such
as the use of malonic acid to stop formation of perchlorate ion.
Chapter 3 details the experimental matrix to identify factors that impact
perchlorate ion formation. Effects of different contaminants were investigated at elevated
temperatures.
Chapter 4 provides a detailed investigation of the effects of concentration of
hypochlorite and chlorate ions, ionic strength, and temperature. The order of the
perchlorate ion formation with respect to hypochlorite and chlorate ions was determined.
A thorough investigation of the various effects led to derivation of a simple expression
that relates the effects of ionic strength and temperature on the second-order rate
constant.
Chapter 5 focuses on validation and application of the developed predictive
expression on various hypochlorite ion solutions. Bleach 2001 Predictive Model was
used to predict the decomposition of hypochlorite ion, and the output was used together

with the predictive expression developed in this work to predict formation of perchlorate
ion in hypochlorite ion solutions. Potential formation of perchlorate ion in stored
hypochlorite ion solutions is discussed, and recommendations to minimize formation of
perchlorate ion are provided.
Chapter 6 summarizes the findings of this Dissertation and provides conclusions
in the context of perchlorate ion contamination of drinking water when hypochlorite ion
is used as a disinfectant.

ANALYTICAL MEASUREMENTS AND PREDICTIONS OF PERCHLORATE ION CONCENTRATION IN SODIUM HYPOCHLORITE SOLUTIONS AND
DRINKING WATER: KINETICS OF PERCHLORATE ION FORMATION AND EFFECTS OF ASSOCIATED CONTAMINANTS
A DISSERTATION
Submitted to the Faculty of
Miami University in partial
fulfillment of the requirements
for the degree of
Doctor of Philosophy
Department of Chemistry and Biochemistry
by
Aleksey N. Pisarenko
Miami University
Oxford, Ohio
2009
Dissertation Directors: Dr. Gilbert E. Pacey and Dr. Gilbert Gordon

©
Aleksey N. Pisarenko 2009

iii
Table of Contents
List of Tables vii
List of Figures x
Dedication xviii
Acknowledgements xix
1. Introduction 1
1.1 Perchlorate Ion: Introduction 1
1.2 Perchlorate Ion: Toxicity and Regulation 3
1.3 Hypochlorite Ion Solutions as Potential Source of Perchlorate Ion 4
1.4 Research Objectives 5
2. Analysis and Sample Preparation of Hypochlorite Ion Solutions: Analytical
Methods Summary 7
2.1 Introduction to the Analysis of Sodium Hypochlorite Solutions 7
2.1.2 Transition metal ions: Co2+, Cu2+, Fe3+, Mn2+, and Ni2+ 9
2.1.3 Specific Conductance, Ionic Strength, and pH Measurements 10
2.2 Results and discussion 10
2.2.1 The LC-MS/MS Analysis of Perchlorate, Bromate, and Chlorate
Ions 10
2.2.2 Validation of LC-MS/MS Method for the Analysis of
Hypochlorite Solutions 12
2.2.3 Iodometric Titrations: Analysis of Chlorite, Chlorate, and
Hypochlorite Ions 18
2.2.3.1 Adam-Gordon Method 19
2.2.4 Method Selection for the Measurement of Chlorate Ion 21
2.2.5 Selection of Quenching Agent 24
2.2.5.1 Safety, Ease of Handling, Transport, and Stability 26
2.2.5.2 Ability to Quench Hypochlorite Ion Reproducibly 28
2.2.5.3 Impact on the Analysis of Bromate, Chlorate, and

iv
Perchlorate Ion 29
2.2.5.3 Quenching Agent Selection Summary 32
2.3 Conclusions 34
3. Experimental Design: Identifying Factors Impacting the
Perchlorate Ion Formation in Hypochlorite Ion Solutions 36
3.1 Experimental Matrix and Chemicals 38
3.2 Effect of Hypochlorite Ion Concentration 39
3.3 Effect of Chlorate Ion Concentration 41
3.4 Effect of Transition Metal Ions (Co2+, Cu2+, Fe3+, Mn2+, and Ni2+) 43
3.5 Effect of Noble Metal Ions (Ag+, Au+, Ir3+, Pd2+, and Pt2+) 44
3.6 Effect of Chlorite Ion Concentration 46
3.6.1 Combined Effect of Transition Metal Ions, Chlorite and
Bromide Ions 50
3.7 Effect of Bromide Ion and Bromate Ion Concentration 52
3.8 Effect of Ionic Strength 54
3.9 Effect of pH 57
3.10 Conclusions 60
4. Kinetics of Perchlorate Ion Formation and Determination
of the Rate Law 63
4.1 Reaction Order with Respect to Chlorate Ion:
ln (d[ClO4-]/dt) vs. ln [ClO3
-] 64
4.2 Reaction Order with Respect to Chlorate Ion:
ln (d[ClO4-]/dt) vs. ln [OCl-] 69
4.3 Multiple Reaction Pathways 75
4.3.1 Parallel Reaction Pathway 76
4.3.2 Consecutive Reaction Pathway 78
4.4 Ionic Strength Effect on the Rate of Perchlorate Ion Formation 80
4.4.1 Dependence of the Second-Order Rate Constant on
the Ionic Strength 84
v
4.4.2 Dependence of the Second-Order Rate Constant on
the Temperature 88
4.4.3 Combining the Effects of the Ionic Strength and Temperature
on the Second-Order Rate Constant 91
4.5 Conclusions 92
5. The Perchlorate Ion Formation Model: Validation and
Applications 93
5.1 Predicted Perchlorate Ion Formation in Bulk Sodium
Hypochlorite Solutions 95
5.2 Predicted Perchlorate Ion Formation in Real-World Bulk
Sodium Hypochlorite Solutions 98
5.3 Using Perchlorate Ion Formation Model to Determine Implications of Bulk Sodium Hypochlorite Solutions Storage 102 5.4 Application of the Perchlorate Model to OSG Sodium
Hypochlorite Solutions 107
5.5 Application of The Perchlorate Model to Calcium Hypochlorite
Solutions 112
5.6 Potential Contribution of Perchlorate Ion to Drinking Water 114
from Various Hypochlorite Ion Solutions 112
5.7 Conclusions 118
6. Conclusions 119
6.1 Summary 119
6.2 Recommendation to Water Utilities 120
Appendix 1. Detection of Ozone Gas by Gold Nanoislands 122
A1.1 Introduction 122
A1.2 Experimental 123
A1.3 Results and Discussion 124
A1.4. Conclusions 131
vi
Appendix 2. Electrochemically Assisted Processing of Organically
Modified, Perpendicularly Oriented Mesoporous Silica
Films with Fluorescent Functionality 132
A2.1. Introduction 132
A2-2. Experimental Details 136
A2-3. Results and Discussion 137
A2-4. Conclusions 142
A2.5 Acknowledgements 143
References 144

vii
List of Tables
Table 1. ICP-MS MRLs (µg/L) in water and hypochlorite ion solutions 9 Table 2. MDL data for perchlorate, bromate, and chlorate ions (n = 8) 13 Table 3. Spike recoveries of analytes with and without filtration and at different 15 Table 4. Standardization of sulfite and thiosulfate ion solutions by 0.109 M IO3
- 20 Table 5. Comparison of measurements by the LC-MS/MS and iodometric titration for bulk hypochlorite ion solutions (n = 7) 21 Table 6. Comparison of measurements by the LC-MS/MS and iodometric titration for OSG sodium hypochlorite solutions at less than 1.0 g/L ClO3
- (< 10 mM) (n ≥ 3) 22 Table 7. Effects of malonic acid (MA) on recoveries of chlorate, perchlorate, and bromate ions measured by LC-MS/MS (n = 3, replicate Samples Analyzed in triplicate; S.D. = standard deviation) 30 Table 8. Effects of malonic acid (MA) on analysis of perchlorate and bromate ions at different dilutions (n = 3; S.D. = standard deviation) 30 Table 9. Effects of quenching agent on analysis of chlorate comparison of LC-MS/MS and titration results (n = 3, replicate samples analyzed in triplicate; S.D. = standard deviation) 31 Table 10. Perchlorate ion stability in hypochlorite ion solutions quenched with malonic acid over 2-month period 31 Table 11. Bromate ion stability in hypochlorite ion solutions quenched with malonic acid over 2-month period 32 Table 12. Chlorate ion stability in hypochlorite ion solutions quenched with malonic acid over 2-month period 32 Table 13. Summary of quenching agent test results and decision-making matrix 33 Table 14. Changes in perchlorate ion concentration of samples spiked with Ag+, Au+, Ir3+
, Pd2+, and Pt2+ (Noble Me) vs. control (no spike), incubated at 50 ºC 46 Table 15. Decomposition of hypochlorite ion at 30 ºC in solutions, at various initial concentrations of chlorate ion ([ClO3
-]0) at pH ~12.5 66 Table 16. Reaction order with respect to chlorate ion and corresponding
viii
correlation coefficients in solutions at constant hypochlorite ion at pH ~ 12.5 and various temperatures 69 Table 17. Decomposition of hypochlorite ion at 30 ºC in solutions at constant chlorate ion concentration at pH ~12.5 71 Table 18. Parallel reaction pathway experimental rate constants in solutions, at various hypochlorite ion and constant chlorate ion at pH ~12.5 78 Table 19. Consecutive reaction pathway experimental rate constants at various initial concentrations of hypochlorite ion and constant chlorate ion at pH ~12.5 80 Table 20. Ionic strength (μ) of hypochlorite ion solutions at various chlorate ion at 40 ºC experiments (TDS = Total Dissolved Solids) 81 Table 21. Ionic strength (μ) of hypochlorite ion solutions at various hypochlorite ion at 40 ºC experiments (TDS=Total Dissolved Solids) 81 Table 22. Slopes and intercepts of least-squares lines shown in Figure 52 88 Table 23. Experimental and predicted second-order rate constants at variable ionic strength and temperature (kexp = experimental k2; kpred = predicted k2) 91 Table 24. Predicted changes in hypochlorite ion, chlorate ion, and d[ClO4
-]/dt as a function of time at 40 ºC 96 Table 25. Bromate and perchlorate ions, and transition metals in bulk utility hypochlorite ion solutions 98 Table 26. Chlorate and hypochlorite ions, pH, TDS, and ionic strength in bulk utility hypochlorite ion solutions 99 Table 27. Transition metals, bromate, chlorate, and perchlorate ions in OSG
hypochlorite ion solutions 108 Table 28. Concentration of hypochlorite ion, pH, TDS, and ionic strength (μ) in OSG hypochlorite ion solutions 109 Table 29. Second-order rate constants of perchlorate ion formation in OSG hypochlorite ion solutions, experiment vs. model (k2obs= experimental k2, k2cal = predicted k2, in units of L·mol-1·day-1) 111 Table 30. Second-order rate constants of perchlorate ion formation in calcium hypochlorite solutions, experiment vs. model (k2obs= experiment k2, k2cal = k2 predicted in units of L·mol-1·day-1) 114 Table 31. Residence time of the sampled distribution waters 115 Table 32. Perchlorate ion in raw, finished, and distribution waters 115 Table 33. Bromate ion in raw, finished, and distribution waters 115 Table 34. Chlorate ion in raw, finished, and distribution waters 115
ix
Table 35. Contributions of perchlorate, bromate, and chlorate ions per mg FAC in various hypochlorite ion solutions 117

x
List of Figures Figure 1. Perchlorate ion 1
Figure 2. Extracted ion chromatogram of perchlorate ion MRM m/z 98.9/82.8
of standard solution containing 0.02 μg/L of perchlorate ion 13
Figure 3. Extracted ion chromatogram of perchlorate ion MRM m/z 98.9/82.8
of (a) sodium hypochlorite solution with 0.1 μg/L ClO4-; (b) standard
solution with 0.1 μg/L ClO4- 14
Figure 4. Bromate ion chromatograms of sodium hypochlorite sample diluted
by: (a) factor of 1:10; (b) factor of 1:100; (c) factor of 1:1000 16
Figure 5. Actual sample concentrations of analytes measured at different
dilutions 17
Figure 6. Comparison of chlorate ion measurements by (a) iodometric titration
and (b) by the LC-MS/MS, during a chlorate ion spike experiment,
at 75 ºC (Control = solution at initial [OCl-] = 1.46 M and [ClO3-]
= 0.29 M) 23
Figure 7. Stock solutions of ascorbic acid freshly prepared (left), after 20 days
(center), and after 37 days of storage (right) 27
Figure 8. Ascorbic acid -quenched hypochlorite ion sample solutions (left 3
bottles) and malonic acid-quenched solution (right bottle) 28
Figure 9. Chromatogram of bromate (left) and 18O-labeled bromate (right) of
(a) sulfite-quenched sample, and (b) thiosulfate-quenched sample of
13% sodium hypochlorite solution diluted by a factor of 1:10,000 29
Figure 10. Decomposition of hypochlorite ion and formation of chlorate ion at
75 ºC in solutions, at various initial concentrations of hypochlorite
ion 40
Figure 11. Formation of perchlorate ion at 75 ºC in hypochlorite ion solutions,
at various initial concentrations of hypochlorite ion 40
Figure 12. Decomposition of hypochlorite ion and formation of chlorate ion at
75 ºC in solutions, at various initial concentrations of chlorate ion 42
Figure 13. Formation of perchlorate ion at 75 ºC in hypochlorite ion solutions,
at various initial concentrations of chlorate ion 42
xi
Figure 14. Effects of Transition Metals Ions (Me = Co2+, Cu2+, Fe3+, Mn2+,
and Ni2+) on the hypochlorite ion decomposition and the chlorate
ion formation 43
Figure 15. Effects of Transition Metals Ions (Me = Co2+, Cu2+, Fe3+, Mn2+,
and Ni2+) on perchlorate ion formation 44
Figure 16. Effects of noble metal ions (Noble Me = Ag+, Au+, Ir3+, Pd2+,
and Pt2+), plots of hypochlorite ion decomposition and chlorite ion
formation 45
Figure 17. Effects of noble metals ions (Noble Me = Ag+, Au+, Ir3+, Pd2+,
and Pt2+), overlaid plots of perchlorate ion formation 45
Figure 18. Plots of hypochlorite ion decomposition and chlorate ion formation, in
solutions at various initial concentrations of chlorite ion and/or chlorate
ion at (a) 50 ºC, (b) 30 ºC 47
Figure 19. Overlaid plot of changes in molar product and perchlorate ion
formation over time, in solutions at various initial concentrations of
chlorite ion and/or chlorate ion at (a) 50 ºC, (b) 30 ºC 48
Figure 20. Plots of perchlorate ion formation in solutions at various initial
concentrations of chlorite ion and/or chlorate ion at (a) 30 ºC,
(b) 50 ºC 49
Figure 21. Decomposition of hypochlorite ion and formation of chlorate ion at
50 ºC in solutions spiked with bromide, chlorite, and transition metal
ions (Me = Co2+, Cu2+, Fe3+, Mn2+, and Ni2+) 51
Figure 22. Formation of perchlorate ion at 50 ºC in solutions spiked with bromide,
chlorite, and transition metal ions (Me = Co2+, Cu2+, Fe3+, Mn2+,
and Ni2+) 51
Figure 23. Decomposition of hypochlorite ion at 50 ºC in solutions spiked with
bromide and bromate ions at pH~12.5 53
Figure 24. Formation of bromate ion at 50 ºC in solutions spiked with bromide
and bromate ions at pH~12.5 53
Figure 25. Formation of bromate ion at 50 ºC in solutions spiked with bromide
and bromate ions at pH~12.5 54

xii
Figure 26. Decomposition of hypochlorite ion at 40 ºC in solutions at various
initial concentrations of chloride ion 56
Figure 27. Formation of chlorate ion at 40 ºC in solutions at various initial
concentrations of chloride ion 57
Figure 28. Formation of perchlorate ion at 40 ºC in solutions at various initial
concentrations of chloride ion 57
Figure 29. Decomposition of hypochlorite ion and formation of chlorate ion at
40 ºC in (a) 1.4 M OCl-, (b) 0.9 M OCl- solutions at various initial
pH 59
Figure 30. Formation of perchlorate ion at 40 ºC in (a) 1.4 M OCl-, (b) 0.9 M
OCl- solutions at various initial pH 60
Figure 31. Overlaid plots of (a) hypochlorite ion decomposition; (b) chlorate
ion formation at 60 ºC 0.12 M OCl- solutions at various
initial pH 61
Figure 32. Overlaid plots of perchlorate ion formation at 60 ºC 0.12 M OCl-
solutions with various initial pH 62
Figure 33. Overlaid plots of (a) perchlorate ion formation; (b) decomposition
Of hypochlorite ion and formation of chlorate ion at 30 ºC in
solutions at various initial concentrations of chlorate ion at pH ~12.5 65
Figure 34. Overlaid plots of (a) perchlorate ion formation; (b) decomposition
of hypochlorite ion and formation of chlorate ion at 40 ºC in
solutions at various initial concentrations of chlorate ion at pH ~12.5 65
Figure 35. Overlaid plots of (a) perchlorate ion formation; (b) decomposition
of hypochlorite ion and formation of chlorate ion at 50 ºC in
solutions at various initial concentrations of chlorate ion at pH ~12.5 66
Figure 36. Fitted natural log lines of the rate of perchlorate ion formation as
a function of chlorate ion concentration at 30 ºC in solutions
constant in hypochlorite ion at pH ~12.5 67
Figure 37. Fitted natural log lines of the rate of perchlorate ion formation as
a function of chlorate ion concentration at 40 ºC in solutions
constant in hypochlorite ion at pH ~12.5 68
xiii
Figure 38. Fitted natural log lines of the rate of perchlorate ion formation as
a function of chlorate ion concentration at 50 ºC in solutions
constant in hypochlorite ion at pH ~12.5 68
Figure 39. Overlaid plots of (a) perchlorate ion formation; (b) decomposition
of hypochlorite ion and formation of chlorate ion at 30 ºC in
solutions at various initial concentrations of hypochlorite ion
at pH ~12.5 70
Figure 40. Overlaid plots of (a) perchlorate ion formation; (b) decomposition
of hypochlorite ion and formation of chlorate ion at 40 ºC in
solutions at various initial concentrations of hypochlorite ion
at pH ~12.5 70
Figure 41. Overlaid plots of (a) perchlorate ion formation; (b) decomposition
of hypochlorite ion and formation of chlorate ion at 50 ºC in
solutions at various initial concentrations of hypochlorite ion
at pH ~12.5 71
Figure 42. Fitted natural log lines of the rate of perchlorate ion formation as
a function of hypochlorite ion concentration at 30 ºC in solutions
at constant chlorate ion at pH ~12.5 72
Figure 43. Fitted natural log lines of the rate of perchlorate ion formation as
a function of hypochlorite ion concentration at 40 ºC in solutions
at constant chlorate ion at pH ~12.5 72
Figure 44. Fitted natural log lines of the rate of perchlorate ion formation as
a function of hypochlorite ion concentration at 50 ºC in solutions
at constant chlorate ion at pH ~12.5 73
Figure 45. Fitted natural log lines of the rate of perchlorate ion formation as
a function of hypochlorite ion concentration at 75 ºC in solutions
at constant chlorate ion at pH ~12.5 73
Figure 46. Overlaid plots of (a) perchlorate ion formation; (b) decomposition
of hypochlorite ion and formation of chlorate ion at 30 ºC in
solutions at constant molar product at pH ~12.5 74
Figure 47. Overlaid plots of (a) perchlorate ion formation; (b) decomposition
xiv
of hypochlorite ion and formation of chlorate ion at 50 ºC in
solutions at constant molar product at pH ~12.5 75
Figure 48. Parallel reaction pathway linear fitted plots of (a) 30 ºC
experiment; (b) 40 ºC experiment; (c) 50 ºC experiment; in
solutions at constant chlorate ion and various hypochlorite ion
at pH ~12.5 77
Figure 49. Consecutive reaction pathway linear fitted plots of (a) 30 ºC
experiment; (b) 40 ºC experiment; (c) 50 ºC experiment; in
solutions at constant chlorate ion and various hypochlorite ion
at pH ~12.5 79
Figure 50. Rate of perchlorate ion formation as a function of (a) ionic
strength; (b) concentration of hypochlorite ion at 40 ºC 82
Figure 51. Plot of )1/( μμ + and μb term as a function of ionic
strength. Note: value of 0.5 was assumed for the b term as an
approximation 86
Figure 52. Overlaid linear plots of log of second-order rate constant versus
ionic strength in solutions at various initial concentrations of
hypochlorite ion at different temperatures 87
Figure 53. Smooth-line plots of the perchlorate ion formation as a function
of time in solutions at similar initial hypochlorite and chlorate ions
and various temperatures 88
Figure 54. Linear plot of ln(k0/T) as a function of (1/T) 90
Figure 55. Smoothed-line plots of hypochlorite ion decomposition and
chlorate ion formation determined experimentally in conjunction
with Bleach 2001 (Error bars set at ± 10 %), for solutions at (a)
[OCl-]0 = 82 g/L, [ClO3-]0 = 63 g/L at 30 ºC; (b) [OCl-]0 = 70 g/L,
[ClO3-]0 = 51 g/L at 40 ºC; (c) [OCl-]0 = 83 g/L, [ClO3
-]0 = 50 g/L
at 50 ºC 94
Figure 56. Overlaid smoothed-line plots of predicted (Error bars set at ± 10
%) perchlorate ion formation and determined experimentally,
for solutions incubated at (a) 30 ºC; (b) 40 ºC; (c) 50 ºC 97

xv
Figure 57. Overlaid smoothed-line plots of (a) hypochlorite ion
decomposition; (b) chlorate ion formation; (c) perchlorate ion
formation determined experimentally during incubation at 50 ºC 99
Figure 58. Overlaid smoothed-line plots of hypochlorite ion decomposition
and chlorate ion formation determined experimentally in
conjunction with Bleach 2001 (Error bars set at ± 10%), for
solutions with (a) [OCl-]0 = 63 g/L, [ClO3-]0 = 23 g/L; (b) [OCl-]0 =
111 g/L, [ClO3-]0 = 8.7 g/L; (c) [OCl-]0 = 89 g/L, [ClO3
-]0 = 4.4 g/L ;
(d) [OCl-]0 = 97 g/L, [ClO3-]0 = 12 g/L; incubated at 50 ºC 100
Figure 59. Overlaid smoothed-line plots of predicted (Error bars set at ± 10
%) perchlorate ion formation and determined experimentally at
50 ºC in solutions with (a) [OCl-]0 = 63 g/L, [ClO3-]0 = 23 g/L;
(b) [OCl-]0 = 111 g/L, [ClO3-]0 = 8.7 g/L; (c) [OCl-]0 = 89 g/L,
[ClO3-]0 = 4.4 g/L; (d) [OCl-]0 = 97 g/L, [ClO3
-]0 = 12 g/L 101
Figure 60. Smoothed-line plot of the rate of perchlorate ion formation as a
function of (a) temperature; (b) dilution factor. Note: Rate in
solution at 2.54 M OCl-, 0.034 M ClO3-, and μ = 7.5 M; rate at
35 ºC = 100% 103
Figure 61. Overlaid smoothed-line plots of (a) predicted decomposition of
hypochlorite ion and formation of perchlorate ion; (b) plot of μg
ClO4- per mg OCl- as a function of time in solutions at 2.03
M OCl- and 1.02 M OCl- at 35 ºC 105
Figure 62. Overlaid smoothed-line plots of (a) predicted decomposition of
hypochlorite ion and formation of perchlorate ion; (b) plot of μg
ClO4- per mg OCl- as a function of time in solutions at 2.03
M OCl- and 1.02 M OCl- at 25 ºC 106
Figure 63. Overlaid smoothed-line plots of hypochlorite ion decomposition
(a) OSG solutions 1-6; (b) OSG solutions 7-12, 50 ºC 109
Figure 64. Overlaid smoothed-line plots of perchlorate ion formation (a)
OSG solutions 1-6; (b) OSG solutions 7-12, 50 ºC 110
Figure 65. Smoothed-line plots of hypochlorite ion decomposition and

xvi
chlorate ion formation in calcium hypochlorite solutions (a)
incubated at 50 ºC; (b) incubated at 60 ºC 113
Figure 66. Smoothed-line plots of perchlorate ion formation in calcium
hypochlorite solutions (a) incubated at 50 ºC; (b) incubated at
60 ºC 113
Figure A1-1. SEM images of typical gold nanoislands produced by sputtering
process on a polished aluminum substrate 124
Figure A1-2. AFM images of 25 nm (a); and 14 nm (b) gold nanoislands on
quartz substrate 125
Figure A1-3. Overlaid UV-Vis spectra of : dashed line-gold thin film on
quarts, solid line-gold nanoislands, dot-dashed line gold
nanoislands exposed to ozone gas, dotted line-gold nanoislands
reversed by annealing at 375 ºC for 15 min 126
Figure A1-4. Overlaid UV-Vis spectra of 25 nm gold nanoislands with surface
Plasmon absorbance max at 520 nm exposed to concentrations
of ozone, increased in increments form 20.9 μg/L to 166.1μg/L.
Ozone causes a red-shift in the surface-plasmon absorbance max 128
Figure A1-5. Shift of the 25 nm gold nanoislands surface-plasmon max (520
nm) as a function of ozone concentration, logarithmic fit gives
an equation of y=6.8ln(x)-15.19 produced a correlation
coefficient of 0.9659 129
Figure A1-6. Surface plasmon’s shifts of gold nanoislands with absorbance max
At 532 nm as a function of ozone concentration 130
Figure A2-1. (a) Left sample—Blank ITO Electrode, right sample—ITO
Electrode with the EPON film. (b) Samples in same position
under UV light, fluorescence is observed for ITO Electrode with
EPON film 137
Figure A2-2. EPON-Coated ITO Electrode, plating time 10 s at -2.1V. Imaging
of the plating interface shows the difference in surface
morphology that of the ITO and that of EPON film, which
indicates EPON film is deposited on the ITO surface 138

xvii
Figure A2-3. EPON-coated ITO electrode, plating time: (a) 30 s -2.1V. The
Deposited film indicates normal to the electrode surface orientation
of the deposited EPON film. (b) EPON-coated ITO electrode,
magnification of (a) reveals normal orientation of the mesopores 139
Figure A2-4. (a) Dry Sol-Gel Film; (b) Dry, after CTAB and free polymer
extraction; (c) Wetted with water; (d) Dry. (b) and (d) overlap. The
difference in emission intensity between (a) and (b) amounts to
removed 4-methylcoumarin-7-yl 3-(trimethoxysilyl)
propylcarbamate not bound to EPON film. (b) and (d) are the same
film before and after wetting, where (c) shows intensity drop when
the obtained film is washed of CTAB and 4-methylcoumarin-7-yl
3-(trimethoxysilyl)propylcarbamate, that is not bound; dried and
wetted again 140
Figure A2-5. Overlaid excitation spectra of EPON film subjected to different
pH: (a) DI water; (b) pH 1; (c) pH 2.2; (d) pH 13.3. Excitation
maximum and excitation peak shape shifts based on pH of the
wetting solution 141
Figure A2-6. Overlaid emission spectra of EPON film subjected to different
pH: (a) DI water; (b) pH 1; (c) pH 2.2; (d) pH 13.3 Emission
maximum and peak shape, consistent with excitation peak
changes, shifts based on pH of the wetting solution 142
xviii
Dedication
For grandmothers Tamara Vaganova and Nina Pisarenko
Both regrettably ahead of their time
For my dear parents, Nikolai and Liubov Pisarenko,
my sister, Liubov Pisarenko
And last but not least, For Daniel S. Elliott

xix
Acknowledgements
I would like to thank Miami University’s Chemistry and Biochemistry
Department for the continuous support of my graduate studies. I also wish to thank
Southern Nevada Water Authority for selecting me as a graduate intern and allowing me
to be a part of a great research team at Applied Research and Development Center. In
addition, I am grateful to the funding made available through American Water Works
Association (AWWA), Water Research Foundation (WRF), and The Ohio Third Frontier
IDCAST Wright Center for Innovation. I would like to give special thanks to members
of my committee:
To Dr. Gilbert Pacey and Dr. Gilbert Gordon, my Dissertation Directors, who
helped me to shape my graduate career by providing me with freedom to explore new
topics, motivation, and sometimes pressure. This invaluable experience I will use for the
rest of my life. I would like to thank Dr. Pacey for letting me to take on a number of
opportunities and various research projects that have been both very educational and
rewarding in the end. I am very grateful to Dr. Gilbert Gordon for entrusting me to lead
on numerous projects which have led me to great opportunities and have enormously
broadened my understanding of chemistry. Thank you both for enhancing my graduate
career and for being my mentors.
To Dr. Luis Actis, and Dr. Richard Taylor, who have provided contributions to
promote both my research and academic progress, by research collaborations and useful
suggestions to help me stay on-track.
To Dr. Michael Crowder, for your willingness to be part of my committee at later
stages of my research project. I also would like to specially thank you for helping me to
select Miami University and for your help with my transition.
Also, I would like to acknowledge several people that have helped me along the
way during the past several years. I would like to thank Dr. Wolfgang Spendel for his
creative ideas and discussions that have significantly contributed to the work described in
the appendices. I would like to thank several faculty members and their group members:
Dr. James Cox for his useful discussions and help with the project involving sol-
gel and electrochemical methods (Appendix 1). I would like to thank Dr. Diep Ca for

xx
help with ICP-OES training and Kamila Wiaderek, with whom I often shared chemicals
and equipment. Dr. Richard Taylor and Jordan Brown, an undergraduate student
working in Dr. Taylor’s lab, both have significantly contributed to the work described in
Appendix 2. I thank Dr. Shouzong Zou for sharing chemicals and equipment and Dr.
Sachin Kumar for useful discussions on the topic of metal nanoparticles and the use of
AFM. Also I wish to thank Dr. Thomas Riechel and Dr. Neil Danielson for their help and
guidance with the teaching assignments and for their help with instrument
troubleshooting.
In addition I would like to thank several staff members of Chemistry and
Biochemistry department. I wish to thank Dr. Ian Peat for his help with running /
troubleshooting ICP-MS, and for the training to perform analysis by MALDI-TOF and
LC-MS/MS. I wish to acknowledge Barry Landrum for the undisputedly-superb
machinist skills to craft specialty-designed cell holders, adaptors, and other nifty devices,
that have significantly enhanced the lab work and reduced costs. Lynn Johnson has been
very helpful with troubleshooting a number of electrical problems and I would like to
thank him for his efforts and time. I also would like to thank Dr. Hans Bier for
interesting discussions and for his help with finding the “right equipment for the job.” I
also thank Dianna (Deedee) Bear for her logistical help with the teaching assignments,
and Kim Traylor for her help with purchasing chemicals and equipment. I also wish to
acknowledge Shelli Minton and Sharon Weber for being very helpful finding solutions to
problems one encounters outside the research lab.
I wish to acknowledge Richard Edelman and Mathew Dewly for their help with
the training on SEM and TEM, and for their useful suggestions to enhance the analysis.
I also would like to mention several friends that I have acquired while attending
Miami University. Dr. Justin Heuser and Dr. Sean Pucket, who consistently challenged
my “background” but otherwise, have contributed to my general progress through
graduate school. I would like to recognize Dr. Heuser for putting up with me as a
roommate and for being a good friend. It was also my pleasure to have met Dr. Anita
Taulbee-Combs, Kamila Wiaderek, Olaf Borkiewicz, Dr. Sachin Kumar, Dr. Peter Xu,
Dr. Pattraranee Limphong, Patrick Hensley, Sriram Devanathan, Josh Ebel, Jordan
Brown, Matt Bachus, David Hufnagle, and many others.
xxi
I am also very grateful to all of the people at SNWA Applied Research and
Development Center that I had a great pleasure working with and with whom I have
learnt so much. I would like to specially thank Dr. Benjamin Stanford, Dr. Shane Snyder,
and Dr. Gilbert Gordon, for their guidance and experience that has helped me to stay on
track in many ways. In addition I would like to thank Oscar Quiñones, Dr. Douglas
Mawhinney, Brett Vanderford, and Rebecca Trenholm for their assistance with the
development and troubleshooting of the analytical methods employed at SNWA. I am
also thankful to Janie Holady, Shannon Fergusson, Elaine Go, and Christy Meza for the
assistance with the sample handling and preparation. I also wish to thank Dave Rexing
and Linda Parker for their assistance and support of the project.
Lastly, I would like to thank an alumnus of Miami University, Dr. Luke Adam,
for his extensive work on hypochlorite ion solutions with Dr. Gilbert Gordon, which has
greatly enhanced the investigation of perchlorate ion formation.
Adapted from "Hypochlorite—An Assessment of Factors That Influence the
Formation of Perchlorate and Other Contaminants," by permission. Copyright ©
2009, American Water Works Association, co-sponsored by AWWA Water
Industry Technical Action Fund (WITAF), the Water Research Foundation, and
the Southern Nevada Water Authority.
1
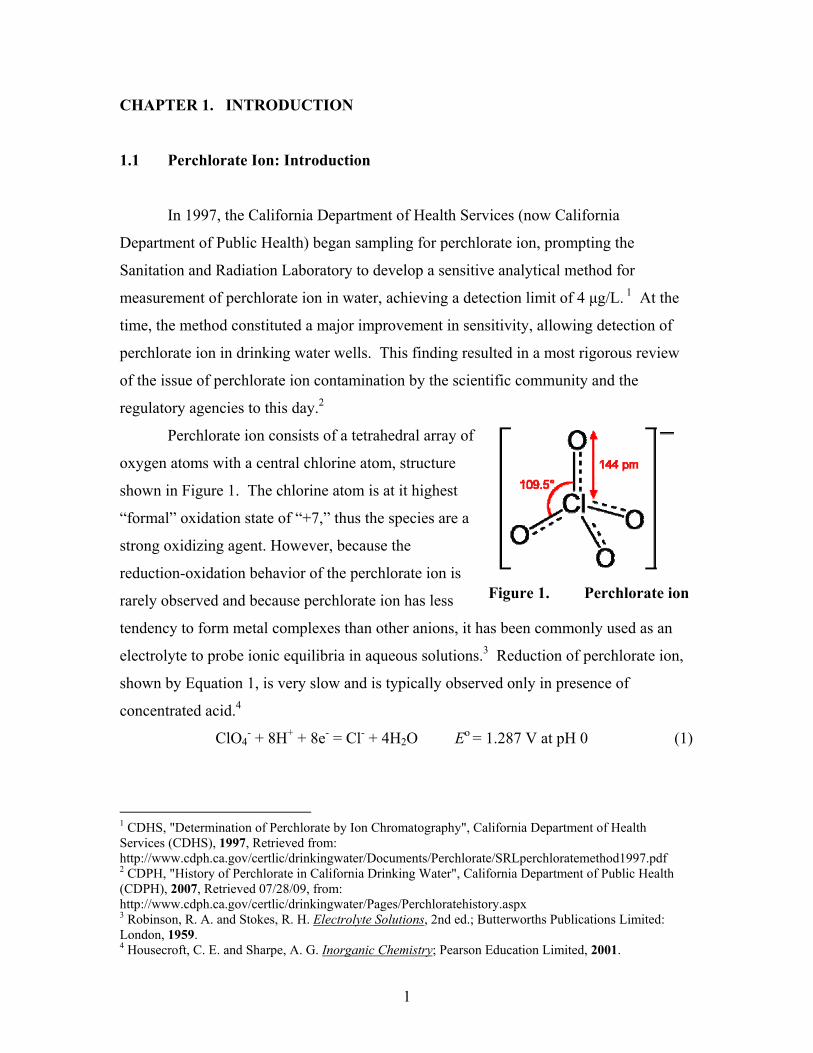
Figure 1. Perchlorate ion
CHAPTER 1. INTRODUCTION
1.1 Perchlorate Ion: Introduction
In 1997, the California Department of Health Services (now California
Department of Public Health) began sampling for perchlorate ion, prompting the
Sanitation and Radiation Laboratory to develop a sensitive analytical method for
measurement of perchlorate ion in water, achieving a detection limit of 4 μg/L. 1 At the
time, the method constituted a major improvement in sensitivity, allowing detection of
perchlorate ion in drinking water wells. This finding resulted in a most rigorous review
of the issue of perchlorate ion contamination by the scientific community and the
regulatory agencies to this day.2
Perchlorate ion consists of a tetrahedral array of
oxygen atoms with a central chlorine atom, structure
shown in Figure 1. The chlorine atom is at it highest
“formal” oxidation state of “+7,” thus the species are a
strong oxidizing agent. However, because the
reduction-oxidation behavior of the perchlorate ion is
rarely observed and because perchlorate ion has less
tendency to form metal complexes than other anions, it has been commonly used as an
electrolyte to probe ionic equilibria in aqueous solutions.3 Reduction of perchlorate ion,
shown by Equation 1, is very slow and is typically observed only in presence of
concentrated acid.4
ClO4- + 8H+ + 8e- = Cl- + 4H2O Eo = 1.287 V at pH 0 (1)
1 CDHS, "Determination of Perchlorate by Ion Chromatography", California Department of Health Services (CDHS), 1997, Retrieved from: http://www.cdph.ca.gov/certlic/drinkingwater/Documents/Perchlorate/SRLperchloratemethod1997.pdf 2 CDPH, "History of Perchlorate in California Drinking Water", California Department of Public Health (CDPH), 2007, Retrieved 07/28/09, from: http://www.cdph.ca.gov/certlic/drinkingwater/Pages/Perchloratehistory.aspx 3 Robinson, R. A. and Stokes, R. H. Electrolyte Solutions, 2nd ed.; Butterworths Publications Limited: London, 1959. 4 Housecroft, C. E. and Sharpe, A. G. Inorganic Chemistry; Pearson Education Limited, 2001.

2
The occurrence of perchlorate ion in the environment has both natural and
anthropogenic origins. Fertilizers have been suspected to contain perchlorate ion.5 The
nitrate rich mineral, known as Chilean Saltpeter, which was found to contain trace
amounts of perchlorate ion,6 is used as a fertilizer in the United States and may have
introduced perchlorate ion contamination into soil and water. Other fertilizer materials
such as phosphate rock, potash, and ammonium dihydrogen phosphate have been also
reported to contain perchlorate ion,7 although the concentration of the perchlorate ion in
these fertilizers has not been attributed to a significant source of environmental
contamination.8 Recently it has been found that perchlorate ion may form naturally by
photochemical oxidation of chloride ion under ultraviolet (UV) light9 and in the presence
of atmospheric ozone.10
Perchlorate ion can be formed by electrolytic production,11 and perchlorate salts
can be isolated; however, they are very explosive and require special care. For example
ammonium perchlorate has been used in pyrotechnics, ammunition, and as a solid rocket
fuel.12 About 825 tons of ammonium perchlorate are used by the space shuttle booster
rockets. Production of perchlorate salts ramped from 2,000 tons in the 1950s to the peak
of 15,000 ton in mid-1980s.13 There has been at least one accident associated with the
production of perchlorate. In 1988, a large ammonium perchlorate plant, owned by this
Pacific Engineering & Production Co. of Nevada (PEPCON), exploded, and the
explosion is suspected of causing a release of perchlorate ion into the environment.
Ten years later, perchlorate ion was detected in the Colorado river in California,
traced to Lake Mead, and eventually to sites associated with ammonium perchlorate
manufacturing. In 2005, USEPA updated a map of perchlorate ion occurrence 5 Renner, R. "Study finding perchlorate in fertilizer rattles industry" Environ. Sci. Technol 1999, 33, 394A-395A. 6 Urbansky, E. T., Brown, S. K., Magnuson, M. L. and Kelty, C. A. "Perchlorate levels in samples of sodium nitrate fertilizer derived from Chilean caliche" Environ. Pollut. 2001, 112, 299-302. 7 Urbansky, E. T., Collette, T. W., Robarge, W. P., Hall, W. L., Skillen, J. M. and Kane, P. F. Survey of fertilizers and related materials for perchlorate (Cl04
-), EPA, 2001. 8 Urbansky, E. T. "Perchlorate as an environmental contaminant" Env. Sci. Pollut. Res. 2002, 9, 187-192. 9 Kang, N., Anderson, T. A. and Andrew Jackson, W. "Photochemical formation of perchlorate from aqueous oxychlorine anions" Anal. Chim. Act. 2006, 567, 48-56. 10 Kang, N., Jackson, W. A., Dasgupta, P. K. and Anderson, T. A. "Perchlorate production by ozone oxidation of chloride in aqueous and dry systems" Sci. Total Environ. 2008, 405, 301-309. 11 Mack, E. L. "Electrolytic Formation of Perchlorate" J. Phys. Chem. 1917, 21, 238-264. 12 Davis, C. O. Perchlorate explosives, E. I. du Pont de Nemours & Co., 1940, USA US 2190703 13 Motzer, W. "Perchlorate: Problems, Detection, and Solutions" Environ. Forensics 2001, 2, 301-311.

3
throughout the country.14 In California, these areas are associated with the facilities that
have manufactured or tested solid rocket fuels for the Department of Defense or the
National Aeronautics and Space Administration.15 In the 2005 Report on Perchlorate, the
United States Government Accountability Office (USGAO) reported the occurrence of
perchlorate ion in ground water, surface water, soil, and drinking water at 395 sites across
35 states.16 Once in water, perchlorate ion appears to be quite stable according to a
previous study,17 and thus is a long-term environmental concern.
1.2 Perchlorate Ion: Toxicity and Regulation
Perchlorate ion is an endocrine-disrupting compound, which inhibits the uptake of
iodine by the thyroid.18 The effects of perchlorate ion on the function of the thyroid and
hormone production in pregnant women are a critical issue to understand in order to
formulate a safe reference dose (RfD).19 In 2005 the National Academy of Sciences and
the United States Environmental Protection Agency (USEPA) established an RfD of
0.0007 mg/kg/day, which corresponds to a drinking water equivalent level (DWEL) of
24.5 µg/L.20 However, perchlorate ion is found not only in waters but also in food
sources.21 Thus, recognizing that there are multiple intake sources of perchlorate ion, the
USEPA issued in December, 2008 an interim health advisory level of 15 μg/L (based on
14 USEPA, "Known Perchlorate Releases in the U.S. - March 25th, 2005", United States Environmental Protection Agency, 2005, Retrieved 08/01/09, from: http://www.epa.gov/swerffrr/pdf/detect0305.pdf 15 Tikkanen, M. W. "Development of a drinking water regulation for perchlorate in California" Anal. Chim. Act. 2006, 567, 20-25. 16 USGAO Perchlorate: A System to Track Sampling and Cleanup Results Is Needed United States Government Accountability Office (USGAO): Washington, D.C., 2005. 17 Stetson, S. J., Wanty, R. B., Helsel, D. R., Kalkhoff, S. J. and Macalady, D. L. "Stability of low levels of perchlorate in drinking water and natural water samples" Anal. Chim. Act. 2006, 567, 108-113. 18 Greer, M. A., Goodman G. G., Pleus R. C, Greer S. E. "Health effects assessment for environmental perchlorate contamination: the dose response for inhibition of thyroidal radioiodine uptake in humans" Environ. Health Perspect. 2002, 110, 927-937. 19 Strawson, J., Zhao, Q. and Dourson, M. "Reference dose for perchlorate based on thyroid hormone change in pregnant women as the critical effect" Regul. Toxicol. Pharmacol. 2004, 39, 44-65. 20 USEPA Draft Regulatory Determinations Support Document for Selected Contaminants from the Second Drinking Water Contaminant Candidate List (CCL2) EPA Report 815-D-06-007, United States Environmental Protection Agency (USEPA): Washington, DC. , 2006. 21 USFDA, "2004-2005 Exploratory Survey Data on Perchlorate in Food", United States Food & Drug Administration, 2005, Retrieved 08/02/09, from: http://www.fda.gov/Food/FoodSafety/FoodContaminantsAdulteration/ChemicalContaminants/Perchlorate/ucm077685.htm

4
the RfD of 0.007 mg / kg but taking into account perchlorate ion intake from sources
other than water). However perchlorate ion is not regulated nationally in drinking water
at this time.22 Recently, perchlorate ion has been identified as a contaminant of concern
in sodium hypochlorite, widely used as a disinfectant for drinking water.23,24 Given a
growing concern of perchlorate ion exposure from multiple sources, it is not clear
whether the USEPA will reconsider regulation of perchlorate ion in drinking water.25
1.3 Hypochlorite Ion Solutions as Potential Source of Perchlorate Ion
In light of anticipated heightened security requirements by Department of
Homeland Security for the use of chlorine gas, water utilities may consider the use of
sodium hypochlorite as an alternative, to disinfect and maintain a chlorine residual level
of disinfectant in drinking water and waste water treatment applications.26 According to
a 2007 survey, 63 % of water treatment facilities use chlorine as the primary disinfectant.
As many as 30% of the drinking water treatment facilities (DWTF) in North America had
switched from using chlorine gas to hypochlorite ion solutions in the past 10 years.27
Chlorine gas was replaced in 81 % of the treatment facilities by bulk sodium hypochlorite
solutions, 17 % of sites switched to the use of on-site generated (OSG) sodium
hypochlorite solutions, and around 1 % of DWTF use calcium hypochlorite.
In addition to the currently unregulated chlorate ion, several regulated
contaminants are present in hypochlorite ion solutions including bromate ion,28,29
22 USEPA, "Interim Drinking Water Health Advisory for Perchlorate", United States Environmental Protection Agency, 2008, Retrieved 07/27/09, from: http://www.epa.gov/OGWDW/contaminants/unregulated/pdfs/healthadvisory_perchlorate_interim.pdf 23 Greiner, P., Mclellan, C., Bennet, D. and Ewing, A. "Occurrence of perchlorate in sodium hypochlorite" J. Am. Water Work Assoc. 2008, 100, 68-74. 24 Asami, M., Kosaka, K. and Kunikane, S. "Bromate, chlorate, chlorite and perchlorate in sodium hypochlorite solution used in water supply" J. Water Supply Res. Technol. 2009, 58, 107-115. 25 Renner, R. "EPA perchlorate decision flawed, say advisers" Environ. Sci. Technol. 2009, 43, 553-554. 26 Shah, J. and Qureshi, N. "Chlorine Gas vs. Sodium Hypochlorite: What's the Best Option" Opflow 2008, 24-27. 27 Routt, J., Mackey, E. and Noack, R. "Committee Report: Disinfection Survey, Part 2 - Alternatives, experiences, and future plans" J. Am. Water Work Assoc. 2008, 100, 110-124. 28 Asami, Kosaka and Kunikane "Bromate, chlorate, chlorite and perchlorate in sodium hypochlorite solution used in water supply". 29 Chlorine Institute, "Bromate in Sodium Hypochlorite Potable Water Treatment," 2004, Retrieved 04/14/09, from: http://www.chlorineinstitute.org/files/FileDownloads/BromateinNaOCl-PotableWaterTreatment.pdf

5
hypochlorite ion itself, and chlorite ion.30 Occurrence of bromate ion in drinking water
has also been linked to the chlorination process.31,32
Perchlorate ion, recently identified as a contaminant, has been shown to increase
during storage in sodium hypochlorite solutions. 33,34 Interestingly, high concentrations
of perchlorate ion in stored sodium hypochlorite solutions were also correlated to high
concentrations of chlorate ion,35 though the factors impacting the rate of formation were
not well understood at the time.
Because sodium hypochlorite is already widely used in drinking water treatment
and the growing number of water treatment facilities that have switched to hypochlorite
ion solutions36 for chlorination and chloramination, the contribution of perchlorate ion
from hypochlorite ion solutions is a critical issue.
1.4 Research Objectives
Sodium hypochlorite is generally manufactured by passing chlorine gas through
sodium hydroxide, which is typically produced by means of the chlor-alkali process, in
which an aqueous sodium chloride solution is electrolyzed to produce chlorine gas and
sodium hydroxide.37 The decomposition of the bulk alkaline hypochlorite ion solutions
has been extensively studied,38,39 and as a result, a predictive hypochlorite ion
30 Gordon, G., Adam, L. C., Bubnis, B., Hoyt, B., Gillette, S. J. and Wilczak, A. "Controlling the formation of chlorate ion in liquid hypochlorite feedstocks" J. Am. Water Work Assoc. 1993, 85, 89-97. 31 Weinberg, H. S., Delcomyn, C. A. and Unnam, V. "Bromate in Chlorinated Drinking Waters: Occurrence and Implications for Future Regulation" Environ. Sci. Technol. 2003, 37, 3104-3110. 32 Bouland, S., Duguet, J. P. and Montiel, A. "Evaluation of bromate ions level introduced by sodium hypochlorite during postdisinfection of drinking water" Environ. Technol. 2005, 26, 121-125. 33 Greiner, Mclellan, Bennet and Ewing "Occurrence of perchlorate in sodium hypochlorite". 34 Asami, Kosaka and Kunikane "Bromate, chlorate, chlorite and perchlorate in sodium hypochlorite solution used in water supply". 35 Asami "Bromate, chlorate, chlorite and perchlorate in sodium hypochlorite solution used in water supply". 36 Routt, Mackey and Noack "Committee Report: Disinfection Survey, Part 2 - Alternatives, experiences, and future plans". 37 Chlorine Institute, "Pamthlet 96 Sodium Hypochlorite Manual, Edition 3," 2006, Retrieved 07/08/09, from: http://www.chlorineinstitute.org/files/Pamphlet096Edition3April2006FinalWebsite.pdf 38 Adam, L. C. An Investigation of Factors Involved In The Decomposition of Sodium Hypochlorite Ph.D. Dissertation, Miami University, Oxford, OH, 1994. 39 Adam, L. C. and Gordon, G. "Hypochlorite ion decomposition: Effects of temperature, ionic strength, and chloride ion" Inorg. Chem. 1999, 38, 1299-1304.
6
decomposition model was developed (referred as Bleach 2001 in later chapters).40 As a
result of these studies, it was found that hypochlorite ion solutions are most stable in the
pH range of 11-13 and at lower temperatures. Decomposition of hypochlorite ion, in
alkaline solutions, is second-order resulting in production of oxygen gas, chlorate, and
chloride ions.41 The presence of transition metals such as Ni(II) and Cu(II) were found to
catalyze decomposition of hypochlorite ion.42
Thus a series of objectives were proposed to investigate factors impacting the
formation of perchlorate ion in hypochlorite ion solutions:
i. Determine which analytical methods are most suitable for analysis of
concentrated sodium hypochlorite solutions to determine concentration of hypochlorite,
chlorite, chlorate, perchlorate, and bromate ions. Because perchlorate ion has been
reported in hypochlorite ion solutions in concentrations below 1 mg/L, a sensitive and
accurate method is needed.
ii. To stop formation of the perchlorate ion in hypochlorite ion solutions, a
quenching agent needs to be selected on the basis of minimum effects on the analytical
measurements.
iii. Determine whether the transition metal ions, noble metal ions, bromate
and chlorite ions catalyze formation of perchlorate ion.
iv. Determine concentration effects of chlorate and hypochlorite ions on the
rate of formation of perchlorate ion.
v. Determine the reaction order of perchlorate ion formation and propose the
simplest rate law. Develop an easily followed model that can predict the formation of the
perchlorate ion in the concentrated sodium hypochlorite solutions with an accuracy of ±
10 %.
vi. Determine strategies to minimize perchlorate ion formation in
concentrated sodium hypochlorite solutions. Develop recommendations to water utilities
that use hypochlorite ion for disinfection.
40 Adam, L., Gordon, G. and Pierce, D., Bleach 2001 Predictive Model, Miami University, Oxford, Ohio. Copyright (c) 2001 AwwaRF and AWWA. 41 Adam and Gordon "Hypochlorite ion decomposition: Effects of temperature, ionic strength, and chloride ion". 42 Adam An Investigation of Factors Involved In The Decomposition of Sodium Hypochlorite.

7
CHAPTER 2. ANALYSIS AND SAMPLE PREPARATION OF
HYPOCHLORITE ION SOLUTIONS: ANALYTICAL
METHODS SUMMARY
The main objective in this portion of the study was to optimize and validate a
previously reported LC-MS/MS method for the simultaneous identification and
quantification of perchlorate, bromate, and chlorate ions in hypochlorite ion solutions. It
was hypothesized that a new, modified LC-MS/MS method would allow shorter run
times while offering higher sensitivity. Because this new method was to be used in the
subsequent investigation into the kinetics of perchlorate ion formation in hypochlorite ion
solutions, a robust, accurate method was required. Thus, an additional objective was to
compare LC-MS/MS methods to other validated methods, such as iodometric titration, to
identify concentration ranges at which the methods provided the most reliable results for
analysis of chlorate ion. Lastly, the selection of a hypochlorite ion quenching agent for
sample preservation was needed, and any effects on analysis were investigated.
2.1 Introduction to the Analysis of Sodium Hypochlorite Solutions
Mass spectrometry (MS) most commonly interfaced with ion-chromatography
(IC-MS)43, 44 or liquid chromatography (LC-MS)45,46 has been utilized for the detection
and quantification of oxyhalide anions. Both US EPA method 331.0, that uses LC with
tandem mass spectrometry (LC-MS/MS),47 and US EPA method 332.0, that uses IC-
43 Jackson, P. E., Gokhale, S., Streib, T., Rohrer, J. S. and Pohl, C. A. "Improved method for the determination of trace perchlorate in ground and drinking waters by ion chromatography" J. Chromatogr., A 2000, 888, 151-158. 44 Roehl, R., Slingsby, R., Avdalovic, N. and Jackson, P. E. "Applications of ion chromatography with electrospray mass spectrometric detection to the determination of environmental contaminants in water" J. Chromatogr., A 2002, 956, 245-254. 45 Salov, V. V. Y., J.; Shibata, Y.; Morita, M. "Determination of inorganic Halogen Species by Liquid Chromatography with Inductively Coupled Argon Plasma Mass Spectrometry" Anal. Chem. 1992, 64, 2425-2428. 46 Urbansky, E. T., Magnuson, M. L., Freeman, D. and Jelks, C. "Quantitation of perchlorate ion by electrospray ionization mass spectrometry (ESI-MS) using stable association complexes wih organic cations and bases to enhance selectivity" J. Anal. At. Spectrom. 1999, 14, 1861-1866. 47 Wendelken S. C., V. L. E., Coleman D. E., Munch D. J. U.S. Environmental Protection Agency Method 331.0 Revision 1.0 2005.
8
MS/MS48 were developed to detect perchlorate ion in water, but neither were developed
to identify and quantify other oxyhalides at the same time.
Measurement of perchlorate ion and other contaminants, such as chlorate and
bromate ions, in concentrated sodium hypochlorite solutions present several challenges to
the analytical chemist. The sodium hypochlorite solutions analyzed ranged from 0.35–
13%, as active chlorine, with specific conductance ranging from 51.8 mS/cm to 498
mS/cm (ionic strength ranging from 0.8-8M). The concentration differences between
hypochlorite ion and other ions of interest can differ by several orders of magnitude, thus
requiring multiple dilutions and/or multiple methods for the determination of each
analyte. Chloride, sulfate, and phosphate ions have been shown to cause potential
interference when determining perchlorate ion concentration by LC-MS/MS in water49,
which may necessitate higher dilutions or sample clean-up steps. Thus, in order to
overcome potential matrix effects and possible ionization suppression, low method
detection limits (MDL) are necessary in order to account for the high sample dilutions.
Given that other contaminants such as chlorate and bromate ions have been detected
together with perchlorate ion in sodium hypochlorite solution50, quantitation of such
analytes must also be validated.
Recently, it has been demonstrated that LC-MS/MS can be used to accurately
quantitatively measure perchlorate ion together with bromate, chlorate, and iodate ions in
a variety of sample matrices, such as bottled water51 and food supplements52. However,
these methods are generally time-consuming and have not been validated for analysis of
concentrated sodium hypochlorite solutions. Electrochemical techniques have been
validated for measuring chlorate, chlorite, and hypochlorite ions, in water and sodium
hypochlorite solutions by amperometric titration.53 Direct potentiometric titrations54 have
48 Hedrick, E. B., T.;Slingsby, R.;Munch, D. U.S. Environmental Agency Method 332.0 Revison 1.0 2005. 49 Li, Y. E., J. George "Analysis of Perchlorate in Water by Reversed-Phase LC/ESI-MS/MS Using an Internal Standard Technique" Anal. Chem. 2005, 77, 4453-4458. 50 Asami, Kosaka and Kunikane "Bromate, chlorate, chlorite and perchlorate in sodium hypochlorite solution used in water supply". 51 Snyder, S. A., Vanderford, B. J. and Rexing, D. J. "Trace analysis of bromate, chlorate, iodate, and perchlorate in natural and bottled waters" Environ. Sci. Technol. 2005, 39, 4586-4593. 52 Snyder, S. A., Pleus, R. C., Vanderford, B. J. and Holady, J. C. "Perchlorate and chlorate in dietary supplements and flavor enhancing ingrediants" Anal. Chim. Act. 2006, 567, 23-32. 53 Clesceri, L. S. G., A. E.; Eaton, A. D. Eds. Standard Methods for the Examination of Water and Wastewater 20th ed.; American Public Health Association: Washington, DC, 1998.
9
been used, but are too time-consuming55 or are optimized for determination of a single
oxyhalide species56. Based on the information in these papers, the iodometric titration
method was chosen as a reference method for measuring the concentration of chlorate ion
in concentrated sodium hypochlorite solutions. Direct potentiometric titration with
sulfite ion was chosen for highly accurate and selective quantitation of hypochlorite ion.
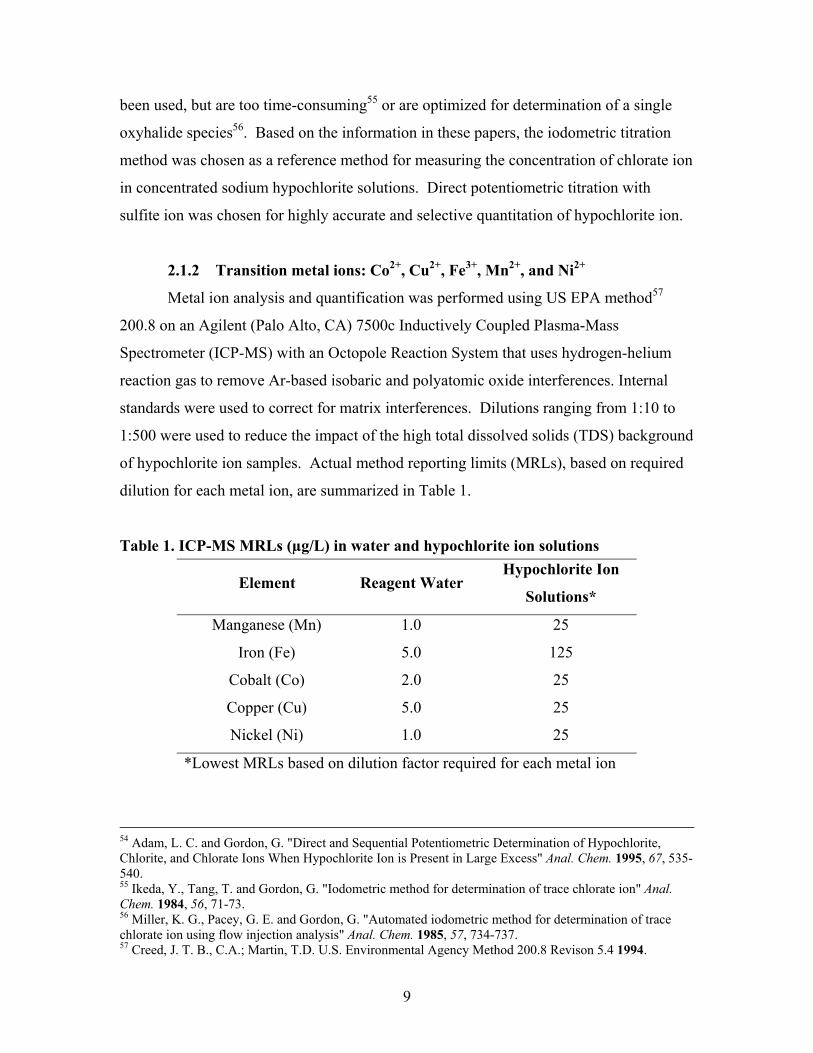
2.1.2 Transition metal ions: Co2+, Cu2+, Fe3+, Mn2+, and Ni2+
Metal ion analysis and quantification was performed using US EPA method57
200.8 on an Agilent (Palo Alto, CA) 7500c Inductively Coupled Plasma-Mass
Spectrometer (ICP-MS) with an Octopole Reaction System that uses hydrogen-helium
reaction gas to remove Ar-based isobaric and polyatomic oxide interferences. Internal
standards were used to correct for matrix interferences. Dilutions ranging from 1:10 to
1:500 were used to reduce the impact of the high total dissolved solids (TDS) background
of hypochlorite ion samples. Actual method reporting limits (MRLs), based on required
dilution for each metal ion, are summarized in Table 1.
Table 1. ICP-MS MRLs (µg/L) in water and hypochlorite ion solutions
Element Reagent Water Hypochlorite Ion
Solutions*
Manganese (Mn) 1.0 25
Iron (Fe) 5.0 125
Cobalt (Co) 2.0 25
Copper (Cu) 5.0 25
Nickel (Ni) 1.0 25
*Lowest MRLs based on dilution factor required for each metal ion
54 Adam, L. C. and Gordon, G. "Direct and Sequential Potentiometric Determination of Hypochlorite, Chlorite, and Chlorate Ions When Hypochlorite Ion is Present in Large Excess" Anal. Chem. 1995, 67, 535-540. 55 Ikeda, Y., Tang, T. and Gordon, G. "Iodometric method for determination of trace chlorate ion" Anal. Chem. 1984, 56, 71-73. 56 Miller, K. G., Pacey, G. E. and Gordon, G. "Automated iodometric method for determination of trace chlorate ion using flow injection analysis" Anal. Chem. 1985, 57, 734-737. 57 Creed, J. T. B., C.A.; Martin, T.D. U.S. Environmental Agency Method 200.8 Revison 5.4 1994.

10
2.1.3 Specific Conductance, Ionic Strength, and pH Measurements Specific conductance measurements were performed using a HACH Ion-Series
Conductivity / Total Dissolved Solids meter (Hach Company, Loveland, CO). A
calibration was performed using a 1,000 µmho/cm standard prior to sample analysis. In
most cases dilutions were required to bring the conductivity of hypochlorite ion solutions
to within the meter’s linear range of 20-200,000 µmho/cm. Specific conductance was
measured in order to determine the ionic strength of hypochlorite ion solutions. Ionic
strength (I) was calculated from specific conductance (σ) based on relationship
established by the Russell approximation given by Equation 2. For convenience μ is used
as the symbol for ionic strength in the later chapters, expressed in units of mol/L.
I (mol/L) = 1.6 x 10⁻⁵ x σ (µmho/cm) (2)
Total dissolved solids (TDS) can be approximated by the Langelier approximation given
by Equation 3:
TDS (mg/L) = I (mol/L) x 4 x 10⁴ (3)
An AP62 pH/mV Meter (Fisher Scientific, Pittsburg, PA) was used to measure
sample pH. Calibration of the pH meter was performed prior to measurements of
samples using standard pH buffers (pH 4, 7, 10). Although, measurement of pH above
11.5 as concentration of hydroxide ion, determined by titration, is more accurate, pH
values are reported for convenience.
2.2 Results and discussion
2.2.1 The LC-MS/MS Analysis of Perchlorate, Bromate, and Chlorate Ions
Tandem mass spectrometry was performed using an API4000 triple-quadrupole
mass spectrometer (Applied Biosystems, Foster City, CA) equipped with an electrospray
ionization source operated in negative ion mode. When using tandem mass spectrometry,
the ionized target analyte (precursor ion) is first selected by the first quadrupole, then the
precursor ion is fragmented in the second quadrupole (by collision-induced dissociation),
while a representative specific fragment (product ion) of the precursor ion is selected by
the third quadrupole. The monitoring of the transition(s) from precursor(s) to product
ion(s), a technique known as multiple reaction monitoring (MRM), makes analysis by
11
MS/MS very selective and sensitive58. The following precursor/product ion transitions
were used: 35ClO4- (m/z 99) to 35ClO3
- (m/z 83) for perchlorate ion; 35ClO3- (m/z 83) to
35ClO2- (m/z 67) for chlorate ion; and 79BrO3
- (m/z 127) to 79BrO2- (m/z 111) for bromate
ion. The following confirmation transitions were used: 37ClO4- (m/z 101) to 37ClO3
-(m/z
85) for perchlorate ion; 37ClO3- (m/z 85) to 37ClO2
- (m/z 69) for chlorate ion; and 81BrO3-
(m/z 129) to 81BrO2- (m/z 113) for bromate ion. Perchlorate and bromate ions were
quantified using isotope dilution. Stable isotope-labeled versions of perchlorate
(35Cl18O4) and bromate (79Br18O4) ions were used. As no source of oxygen-18 labeled
chlorate ion was commercially available, chlorate ion was quantified using external
calibration.
Perchlorate and chlorate ion standards (>99.5 % purity) were obtained from Ultra
Scientific (North Kingstown, RI) and J.T. Baker (Phillipsburg, NJ), respectively.
Bromate ion standard was obtained from Ultra Scientific (North Kingstown, RI). The
stable-isotope labeled perchlorate (Cl18O4-) and bromate (Br18O3
-) ions used as internal
standards were obtained from Icon Isotopes (Summit, NJ). Trace analysis grade
methanol was obtained from Burdick and Jackson (Muskegon, MI). Formic acid (1 mL
ampoules, 99+ %) was purchased from Thermo Scientific (Rockford, IL). Standard and
sample dilutions were done using deionized reagent water purified by Milli-Q Gradient
System (Millipore, Billerica, MA).
In order to reduce the run times, analytes were separated using a 75 x 4.6 mm
Synergi Max-RP C12 column with a 4 μm pore size (Phenomenex, Torrance, CA). An
injection volume of 20 μl was used for all samples. A binary gradient consisting of 0.1
% formic acid (v/v) in water (A) and 100 % methanol (B) at a flow rate of 700 μl/min
was used. The gradient was as follows: 2 % B held for one minute, increased linearly to
15 % B by two minutes, changed to 95 % B and held for four minutes, and finally
changed to 2 % B and held for three minutes. A one minute equilibration step at 2 % B
was used at the beginning of each run to bring the total run time per sample to ten
minutes. With the use of a shorter column, the analysis time was reduced to half of the
58 Zakett, D., Flynn, R. G. A. and Cooks, R. G. "Chlorine isotope effects in mass spectrometry by multiple reaction monitoring" J. Phys. Chem. 1978, 82, 2359-2362.
12
original method59 with all three analytes eluting after two minutes. The effects of faster
separation on method performance were further investigated.
2.2.2 Validation of LC-MS/MS Method for the Analysis of Hypochlorite
Solutions
Using the optimized separation method, standards containing 0.02, 0.1, and 0.5
μg/L standards of perchlorate, bromate, and chlorate ions were injected and analyzed 8
times. To calculate a method detection limit (MDL), standard deviation of the 8 replicate
data points was multiplied by the Student’s T value for 7 degrees of freedom. These
results are shown in Table 2.
When a 0.02 μg/L perchlorate ion standard was injected, an S/N ratio of 6.3 was
obtained, as shown in Figure 2. The relative standard deviation (RSD = Standard
Deviation / Mean x 100%) of 8 replicate measurements of the 0.02 μg/L perchlorate ion
standard is almost twice as large as that of the 0.1 μg/L perchlorate ion standard but is
still below 10% RSD. Bromate and chlorate ions MDLs of 0.06 μg/L and 0.23 μg/L were
obtained, respectively. Practical quantitation limits (PQLs) for each analyte at the
instrument were calculated by multiplying the MDL by 3 for each analyte and rounding
up (the conservative MDL of 0.015 μg/L was used for ClO4-). This resulted in PQLs of
0.05 μg/L for ClO4-, 0.20 μg/L for BrO3
-, and 0.70 μg/L for ClO3
-. Analysis of most
sodium hypochlorite solutions for measurement of perchlorate ion rarely required a
PQL< 0.1 μg/L, thus the lowest calibration standard for typical analysis contained 0.10
μg/L of ClO4-, 0.20 μg/L of BrO3
-, and 1.0 μg/L of ClO3-. To demonstrate the
applicability of the PQL to a complex sample matrix, chromatograms of sample and
standard perchlorate ion solutions are shown in Figure 3.
59 Snyder, Vanderford and Rexing "Trace analysis of bromate, chlorate, iodate, and perchlorate in natural and bottled waters".

13
Table 2. MDL data for perchlorate, bromate, and chlorate ions (n = 8) Standard Concentration
Replicate 0.02 μg/L 0.10 μg /L 0.10 μg /L 0.50 μg /L 1 0.022 0.098 0.108 0.545 2 0.023 0.106 0.086 0.422 3 0.025 0.100 0.133 0.415 4 0.023 0.101 0.121 0.331 5 0.025 0.107 0.076 0.409 6 0.027 0.099 0.122 0.498 7 0.023 0.096 0.099 0.525 8 0.027 0.110 0.112 0.361
Mean 0.024 0.102 0.107 0.438 Std. Dev. 0.002 0.005 0.019 0.077 RSD (%) 8.3 4.9 17.8 17.6
Student' t @ 98% n-1 2.998 2.998 2.998 2.998 MDL = SD X Student's t 0.006 0.015 0.058 0.231 PQL= 3 x MDL(μg /L)* 0.020 0.050 0.200 0.700 *Values rounded up
0.5 1.0 1.5 2.0 2.5 3.5 4.0 4.5Time, min
050100150200250300350400450500550600650700
Inte
nsity
, cps
2.03
S/N = 6.3
Peak Int.(Subt.)=7.0e+2
3xStd.Dev.(Noise)=1.1e+2
3.00.0
0.02 μg/L ClO4- Standard Solution
Figure 2. Extracted ion chromatogram of perchlorate ion MRM m/z 98.9/82.8 of standard solution containing 0.02 μg/L of perchlorate ion

14
200400600800
12001400
1000
2200
Inte
nsity
, cps
2.010.10 μg/L ClO4
- Sodium Hypochlorite Solution
S/N = 13.5
Peak Int.(Subt.)=2.2e+3
3xStd.Dev.(Noise)=1.6e+2
0.5 1.0 1.5 2.0 2.5 3.5 4.0 4.5Time, min
3.00.00
160018002000
0200400600800
1000
18002000220024002600
2.03
S/N = 12.9
Peak Int.(Subt.)=2.6e+33xStd.Dev.(Noise)=2.0e+2
0.10 μg/L ClO4- Standard Solution
14001600
1200
0.5 1.0 1.5 2.0 2.5 3.5 4.0 4.5Time, min
3.00.0
Inte
nsity
, cps
Figure 3. Extracted ion chromatogram of perchlorate ion MRM m/z 98.9/82.8
of (a) sodium hypochlorite solution with 0.1 μg/L ClO4-; (b) standard
solution with 0.1 μg/L ClO4-
The signal-to-noise (S/N) ratio was calculated using Analyst 1.5 Software
(Applied Biosystems) without curve smoothing. As evident from Figure 3, very
comparable S/N ratios and raw counts were observed in standard and sodium
hypochlorite sample solutions containing 0.1 μg/L ClO4-, indicating the applicability of
the method to separate matrix interferences while selectively monitoring for perchlorate
ion. Perchlorate and bromate ions were calibrated using isotope dilution with 1/x2
(a)
(b)
15
weighting and typical R2 ≥ 0.99. For chlorate ion, an external calibration with 1/x2
weighting was used with typical R2 ≥ 0.99.
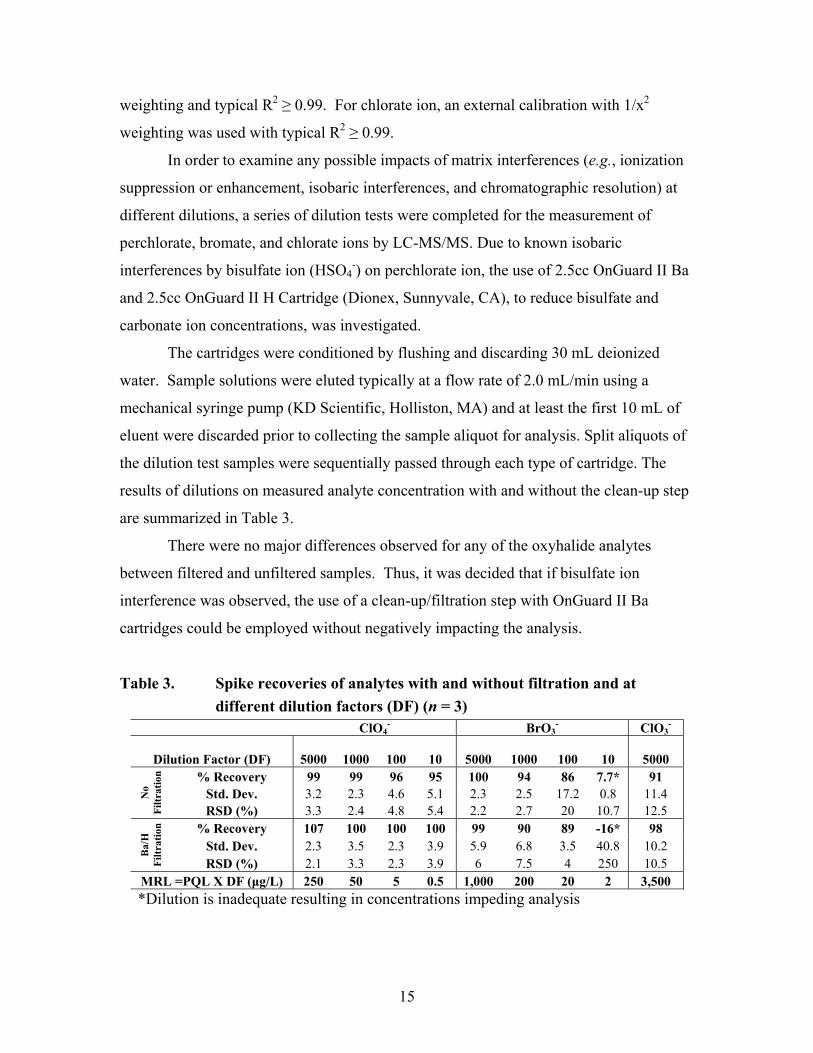
In order to examine any possible impacts of matrix interferences (e.g., ionization
suppression or enhancement, isobaric interferences, and chromatographic resolution) at
different dilutions, a series of dilution tests were completed for the measurement of
perchlorate, bromate, and chlorate ions by LC-MS/MS. Due to known isobaric
interferences by bisulfate ion (HSO4-) on perchlorate ion, the use of 2.5cc OnGuard II Ba
and 2.5cc OnGuard II H Cartridge (Dionex, Sunnyvale, CA), to reduce bisulfate and
carbonate ion concentrations, was investigated.
The cartridges were conditioned by flushing and discarding 30 mL deionized
water. Sample solutions were eluted typically at a flow rate of 2.0 mL/min using a
mechanical syringe pump (KD Scientific, Holliston, MA) and at least the first 10 mL of
eluent were discarded prior to collecting the sample aliquot for analysis. Split aliquots of
the dilution test samples were sequentially passed through each type of cartridge. The
results of dilutions on measured analyte concentration with and without the clean-up step
are summarized in Table 3.
There were no major differences observed for any of the oxyhalide analytes
between filtered and unfiltered samples. Thus, it was decided that if bisulfate ion
interference was observed, the use of a clean-up/filtration step with OnGuard II Ba
cartridges could be employed without negatively impacting the analysis.
Table 3. Spike recoveries of analytes with and without filtration and at different dilution factors (DF) (n = 3)
ClO4- BrO3
- ClO3-
Dilution Factor (DF) 5000 1000 100 10 5000 1000 100 10 5000
% Recovery 99 99 96 95 100 94 86 7.7* 91 Std. Dev. 3.2 2.3 4.6 5.1 2.3 2.5 17.2 0.8 11.4 N
o Fi
ltrat
ion
RSD (%) 3.3 2.4 4.8 5.4 2.2 2.7 20 10.7 12.5 % Recovery 107 100 100 100 99 90 89 -16* 98
Std. Dev. 2.3 3.5 2.3 3.9 5.9 6.8 3.5 40.8 10.2 Ba/
H
Filtr
atio
n
RSD (%) 2.1 3.3 2.3 3.9 6 7.5 4 250 10.5 MRL =PQL X DF (μg/L) 250 50 5 0.5 1,000 200 20 2 3,500 *Dilution is inadequate resulting in concentrations impeding analysis
16
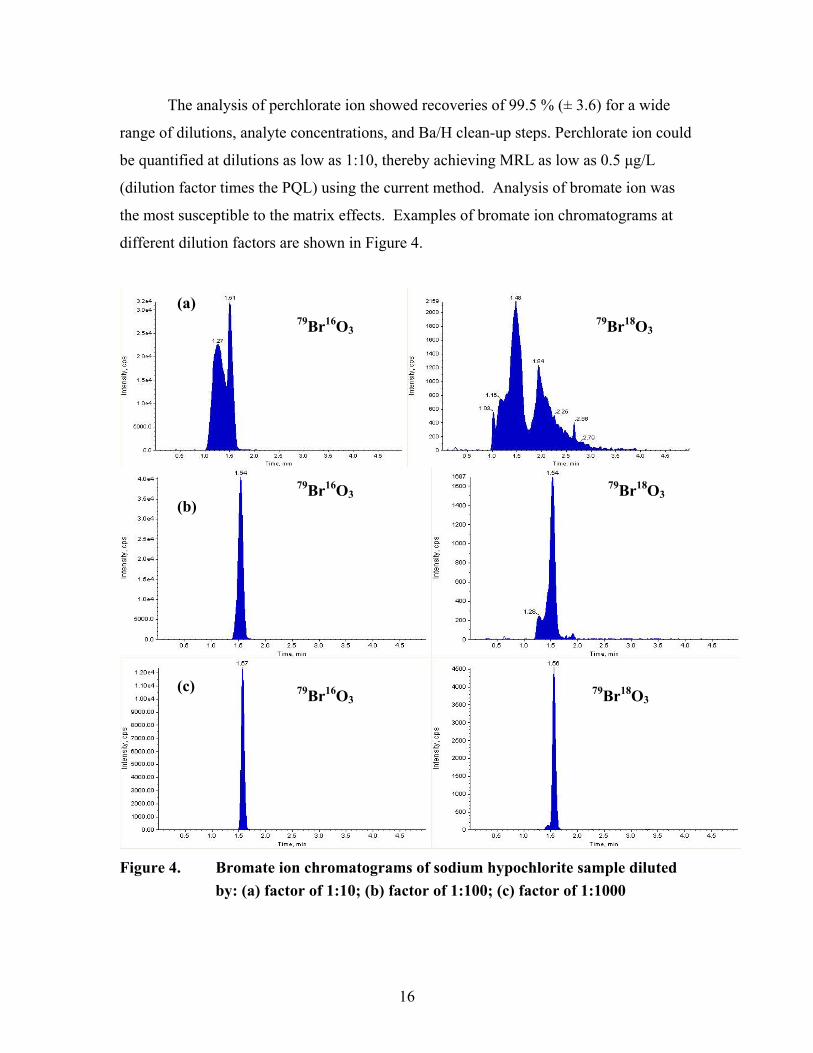
The analysis of perchlorate ion showed recoveries of 99.5 % (± 3.6) for a wide
range of dilutions, analyte concentrations, and Ba/H clean-up steps. Perchlorate ion could
be quantified at dilutions as low as 1:10, thereby achieving MRL as low as 0.5 μg/L
(dilution factor times the PQL) using the current method. Analysis of bromate ion was
the most susceptible to the matrix effects. Examples of bromate ion chromatograms at
different dilution factors are shown in Figure 4.
Figure 4. Bromate ion chromatograms of sodium hypochlorite sample diluted
by: (a) factor of 1:10; (b) factor of 1:100; (c) factor of 1:1000
79Br18O3 79Br16O3
79Br18O3 79Br16O3
(a)
(b)
(c)
79Br18O3 79Br16O3

17
Interestingly, the loss of 18O-labeled bromate ion signal was much higher than
that of the analyte signal at 1:10 and 1:100 dilutions, thereby producing erroneous results
(figure 3). A higher dilution of 1:1000 eliminated this problem since the peak-widening
was significantly reduced and showed no effect on the accuracy based on recovery data
shown in Table 3. In most cases, matrix interferences were minimized by diluting the
samples, while the sensitivity of the LC-MS/MS method still provided low MRLs (Table
3). Thus, the observed signal suppression was resolved simply by analyzing samples at
higher dilutions. Figure 5 illustrates the improvement in accuracy based on the dilution
factor.
0
2
4
6
8
10
10 100 1000 5000Dilution Factor
mg/
L C
lO4-
and
BrO
3-
0
50
100
150
200
250
300
350
mg/
L C
lO3-
Bromate
PerchlorateChlorate
Figure 5. Actual sample concentrations of analytes measured at different
dilutions
In “freshly prepared” hypochlorite ion solutions where chlorate ion concentration
was still low, a single dilution could be used to measure all three oxyhalides. However,
as sodium hypochlorite solutions age, chlorate ion forms, thus higher dilutions may be
needed for the analysis of older solutions, thereby requiring more than one dilution per
sample. Carrying out serial dilutions of several orders of magnitude may compound
errors associated with each dilution resulting in higher variability. Alternatively,
determinations of higher concentrations of chlorate ion can also be performed by
iodometric titration, thereby eliminating the need to analyze multiple dilutions using LC-
MS/MS.
18
2.2.3 Iodometric Titrations: Analysis of Chlorite, Chlorate, and
Hypochlorite Ions
Many variations of iodometric titration methods have been developed over the
years and rely on the principle that hypochlorite, chlorite, and chlorate ions react with
iodide ion (I-) to produce triiodide ion (I3-), in presence of excess iodide ion, shown by
Equations 4-6:
OCl- + 3I- + 2H+ → I3- + Cl- + H2O pH 1.3 (4)
ClO2- + 6I- + 4H+→ 2I3
- + Cl- + 2H2O pH 1.3 (5)
ClO3- + 9I- + 6H+→ 3I3
- + Cl- + 6H2O 6M H+ (6)
Triiodide ion can be titrated with thiosulfate ion (S2O32-) or sulfite ion (SO3
2-),
shown by Equations 7 and 8, thus allowing determination of these oxyhalide anions.
I3- + 2S2O3
2- → 3I- + S4O62- (7)
I3- + SO3
2- + 2OH- → SO42- + 3I- + H2O (8)
However, since both chlorite and hypochlorite ions react with iodide ion at pH
1.3, measuring concentrations of chlorite and hypochlorite ions separately requires an
external technique to measure one of the analytes. However, the reaction of chlorate ion
with iodide ion takes place under highly acidic conditions ([H+] = 6 M), requiring the use
of concentrated hydrochloric acid (HCl). Thus, measurement of chlorate ion is easily
separated from measurement of chlorite and hypochlorite ions.
A well established way to make a standard solution of triiodide ion is to add a
known amount of Reagent Grade iodate ion (IO3-) to an acidic solution containing a small
excess of iodide ion, shown in Equation 10. Thus, the prepared standard solution of
triidodie ion can be used to standardize thiosulfate ion and sulfite ion solutions.
IO3- + 8I- + 6H+ ↔ 3I3
- + 3H2O (9)
Similarly, bromate ion reacts with iodide ion, shown by Equation 10.
BrO3- + 9 I- + 6 H+ →3 I3
- + 3 H2O pH 1.3 (10)
However, if other ions such as hypochlorite and chlorite ions are present,
differentiation of analytes is not possible. Thus, for experiments involving bromate ion
and chlorite ion spikes, measurement of hypochlorite ion by iodometric titration would
require a separate analysis to determine concentrations of bromate and chlorite ions.
19
2.2.3.1 Adam-Gordon Method
Direct potentiometric titration of hypochlorite ion with sulfite ion allows selective
determination of hypochlorite ion from chlorite ion and bromate ions.60 This
potentiometric titration technique, combined with iodometric determination of chlorate
ion allows selective determinations of specific anions. Thus, hypochlorite ion solutions
can be analyzed for all three analytes in sequential steps, outlined below and based on
equations 11, 9, 8, 6, and 5:
Step 1: Determination of hypochlorite ion:
(a) Adjust pH to 10.5, using 0.4 M borate buffer
(b) Titrate hypochlorite ion with sulfite ion, given by equation 11:
OCl- + SO32- → SO4
2- + Cl- pH 10.5 (11)
(c) To remove any excess sulfite ion, add potassium iodide, then
triiodide ion solution. Triiodide ion reacts with sulfite ion,
given by equation 8:
I3- + SO3
2- + 2OH- → SO42- + 3I- + H2O (9)
(d) Remove any excess triiodide ion by adding dilute thiosulfate
ion solution:
I3- + 2S2O3
2- → 3I- + S4O62- (8)
Step 2: Determination of chlorite ion:
a) Adjust pH to 1.3 using 3 M HCl, reaction 4 takes place:
ClO2- + 6I- + 4H+ → 2I3
- + Cl- + 2H2O (5)
b) Back-titrate triiodie ion with thiosulfite ion:
I3- + 2S2O3
2- → 3I- + S4O62- (8)
Step 3: Determination of chlorate ion:
a) Purge sample solution with nitrogen gas at least 5 minutes
b) Add concentrated HCl, reaction 5 takes place:
ClO3- + 9I- + 6H+ → 3I3
- + Cl- + 3H2O 6M H+ (6)
b) Back-titrate triiodie ion with thiosulfite ion:
I3- + 2S2O3
2- → 3I- + S4O62- (8)
60 Adam and Gordon "Direct and Sequential Potentiometric Determination of Hypochlorite, Chlorite, and Chlorate Ions When Hypochlorite Ion is Present in Large Excess".

20
Titrations with sulfite ion were performed using a VIT 90 Video Titrator with a
P101 platinum k401 SCE electrode pair (Radiometer, Copenhagen, Denmark). Titrations
with thiosulfate ion were performed with a standard 50 mL laboratory glass burette.
Borate buffer (0.4 mol/L), was prepared using boric acid (ACS Reagent, 99.5 %), bought
from Alfa Aeser (Ward Hill, MA); and sodium hydroxide (ACS Reagent, 97%), obtained
from VWR (West Chester, PA). Borate buffer was used to adjust hypochlorite ion sample
solutions to pH 10.5. Hydrochloric acid (ACS Reagent, 37 %), obtained from Sigma-
Aldrich (St. Louis, MO) or Fisher Scientific (Pittsburg, PA), and the sample solution
were purged with nitrogen gas to minimize oxidation of iodide ion by oxygen prior to
chlorate ion determination.
To adjust hypochlorite ion sample solutions to pH 1.3, a 3 mol/L HCl solution
was used. Potassium iodate (99.4-100.4 % ACS Reagent) and potassium iodide (99 %)
were obtained from Sigma Aldrich and Alfa Aeser (Ward Hill, MA). Sodium sulfite (98
% ACS Reagent) and sodium thiosulfate (99 %, ACS Reagent) were obtained from
Sigma-Aldrich (St. Louis, MO). Dilute (≤ 10 mmol/L) thiosulfate ion solution was
prepared and used for removal of excess triiodie ion during the determination of
hypochlorite, chlorite and chlorate ions. Potassium iodate standard (0.1 M) was prepared
weekly and used to standardize sulfite and thiosulfate ion solutions daily. A solution
containing ~0.02 M I3- was prepared by adding an aliquot of ~0.1 M IO3
- standard to
acidic solution (pH ~1) containing excess iodide ion (~0.5 M I-) and used to remove
sulfite ion. Standardization of 0.2 M SO32- and 0.1 M S2O3
2- solutions by 0.1 M IO3-
solution resulted in standard deviations of less than three parts per thousand and less than
1% relative standard deviation. Table 4 shows results of typical standardization of sulfite
and thiosulfate ion solutions.
Table 4. Standardization of sulfite and thiosulfate ion solutions by 0.109 M IO3-
mL of IO3-
Standard mL SO32- [SO3
2-] mL of IO3
- Standard mL S2O3
2- [S2O32-]
0.500 0.6837 0.2399 1.000 8.50 0.0772 0.700 0.9505 0.2416 1.000 8.40 0.0781 0.700 0.9539 0.2408 1.000 8.50 0.0772
Mean 0.241 Mean 0.0775 Std. Dev. 0.0009 Std. Dev. 0.0005 RSD (%) 0.353 RSD (%) 0.685

21
2.2.4 Method Selection for the Measurement of Chlorate Ion
Sodium hypochlorite solutions are obtained as either bulk commercial bleach as
3-13 % free available chlorine (FAC), or as on-site generated (OSG) sodium hypochlorite
solutions that can range 0.3 – 3 % as FAC. Bulk sodium hypochlorite solutions, 10–13%
FAC, were obtained from Acros Organics USA (Morris Plains, NJ) and VWR (Brisbane,
CA). OSG sodium hypochlorite solution, ~0.8 % FAC, was obtained from a sodium
hypochlorite on-site generator at River Mountains Water Treatment Facility (RMTF)
(Henderson, NV). To determine which method (iodometric titration or LC-MS/MS) was
most reproducible for chlorate ion analysis of either bulk or OSG sodium hypochlorite
solutions, replicate samples were split and analyzed by both methods and the results
compared. Pure sodium chlorate (ACS Grade, ≥99 %) was purchased from VWR
(Brisbane, CA) and used to spike sodium hypochlorite solutions and prepare chlorate ion
standard solutions. A comparison of the two methods for analysis of seven replicate bulk
hypochlorite ion solutions is shown in Table 5.
Table 5. Comparison of measurements by the LC-MS/MS and iodometric titration for bulk hypochlorite ion solutions (n = 7)
Non-spiked Hypochlorite ClO3- Spiked % Recovery
Replicate LC-MS/MS* Titration* LC-MS/MS* Titration* LC-MS/MS* Titration* 1 16.9 17.7 24.4 25.2 95.7 95.1 2 18.0 17.9 24.4 24.8 81.7 88.3 3 15.9 17.7 23.5 25.2 97.0 95.1 4 15.4 17.7 23.1 25.0 98.3 92.8 5 16.1 17.9 25.1 25.2 115 92.8 6 12.9 17.9 24.0 25.2 142 92.8 7 16.5 18.1 23.0 25.4 83.0 92.8
Mean 16.0 17.9 23.9 25.1 102 92.8 Std. Dev. 1.6 0.1 0.8 0.2 20.8 2.3 RSD (%) 9.9 0.8 3.2 0.7 20.4 2.4 *All concentration data listed as g/L
These results indicate that, although both methods produce similar results,
titration of the concentrated hypochlorite ion solutions resulted in much lower relative
standard deviations (RSD) than the LC-MS/MS. This higher variability observed in the
LC-MS/MS data is most likely a result of carrying out serial dilutions of several orders of

22
magnitude, which may have compounded the errors associated with each dilution. For
example, in order to analyze hypochlorite ion solutions that contain chlorate ion at 100
g/L, a dilution factor of at least 400,000 would be needed to bring the concentration of
chlorate ion to the middle of a typical calibration curve of 1 – 500 μg/L. The effect of
this variability on analysis of samples during a chlorate ion spike experiment can be
visually observed from the comparison of the results from two methods of duplicate
samples, shown in Figure 6 (for illustration purposes, smooth lines were used to follow
changes in chlorate ion concentration as a function of time).
In several chlorate ion spiked experiments, dilutions on the order of 1:2,500,000
were required. The error bars of chlorate ion measurements by LC-MS/MS method,
based on analysis of duplicate samples solutions, were much higher for samples spiked
with higher chlorate ion concentrations, than those obtained by iodometric titration, as
shown in Figure 6.
However, given that the standard deviation (SD) of ± 0.2 g/L (Table 5) or ± 0.002
M, the iodometric titration method should be used to measure concentration of chlorate
ion above 2.0 g/L (SD=0.2 g/L X 10) or 0.025 M to achieve reasonable precision (RSD <
10 %). The results shown in Table 6 indicate poor precision when measuring
concentration of chlorate ion less than 1.0 g/L by iodometric titration.
Table 6. Comparison of measurements by the LC-MS/MS and iodometric titration for OSG sodium hypochlorite solutions at less than 1.0 g/L ClO3
- (< 10 mM) (n ≥ 3) Titration LC-MS/MS
Mean (g/L ClO3-) 0.56 0.31
Std. Dev. (g/L ClO3-) 0.20 0.01
RSD (%) 35.2 1.55 (n=4) (n=3)
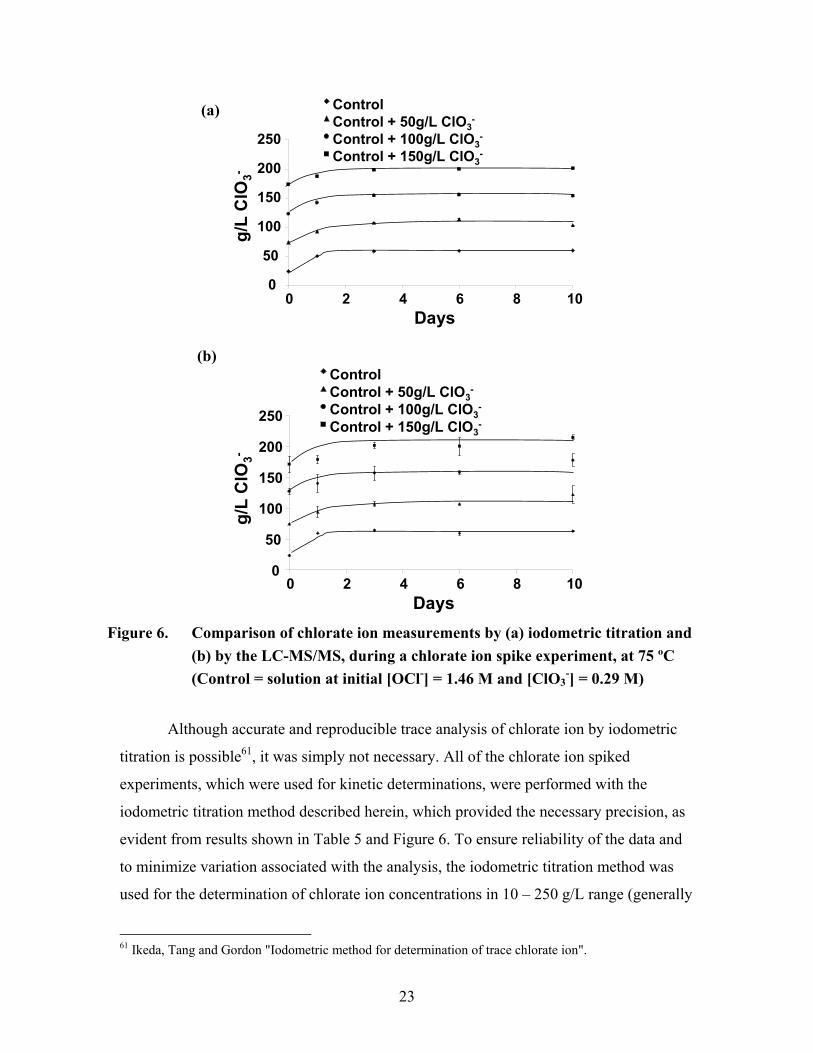
23
0
50
100
150
200
250
0 2 4 6 8 10Days
g/L
ClO
3-
Control Control + 50g/L ClO3
-
Control + 100g/L ClO3-
Control + 150g/L ClO3-
0
50
100
150
200
250
0 2 4 6 8 10Days
g/L
ClO
3-
Control Control + 50g/L ClO3
-
Control + 100g/L ClO3-
Control + 150g/L ClO3-
Figure 6. Comparison of chlorate ion measurements by (a) iodometric titration and
(b) by the LC-MS/MS, during a chlorate ion spike experiment, at 75 ºC (Control = solution at initial [OCl-] = 1.46 M and [ClO3
-] = 0.29 M)
Although accurate and reproducible trace analysis of chlorate ion by iodometric
titration is possible61, it was simply not necessary. All of the chlorate ion spiked
experiments, which were used for kinetic determinations, were performed with the
iodometric titration method described herein, which provided the necessary precision, as
evident from results shown in Table 5 and Figure 6. To ensure reliability of the data and
to minimize variation associated with the analysis, the iodometric titration method was
used for the determination of chlorate ion concentrations in 10 – 250 g/L range (generally
61 Ikeda, Tang and Gordon "Iodometric method for determination of trace chlorate ion".
(a)
(b)

24
in hypochlorite ion solutions with > 5 % FAC i.e. bulk sodium hypochlorite), which
included chlorate ion spike experiments. When analyzing samples that required dilution
factor of less than 1:100,000, chlorate ion measurements by LC-MS/MS method,
typically had an RSD of less than 5 % (n = 3). Thus the LC-MS/MS method can be used
reliably for measurement of chlorate ion in the 0.01 – 10,000 mg/L range, but was not
required for chlorate ion spike experiments.
2.2.5 Selection of Quenching Agent
Refrigerating sample aliquots at 4 ºC significantly slows the decomposition of
hypochlorite ion: the half life of 13% sodium hypochlorite solution at 25 ºC is 130 days;
at 4 ºC the half life is 3184 days, according to the Bleach 2001. However, for any
experiments involving the measurements of concentration of perchlorate ion in
hypochlorite ion sample solutions collected in the field, it was not always possible to
attenuate the decomposition reaction rate of hypochlorite ion. In order to stop the
formation of perchlorate ion in sodium hypochlorite solutions over time and thus preserve
the integrity of the sample for analysis, a quenching agent was needed to neutralize
hypochlorite ion. Thus, quenching agents were considered for sample preservation and
also to reduce instrument maintenance.
A total of seven hypochlorite ion quenching agents were investigated. They were
ascorbic acid, malonic acid, oxalic acid, glycine, sodium sulfite, sodium thiosulfate, and
hydrogen peroxide. A brief summary of the known mechanisms and operating ranges for
each of the quenching agents is summarized below and is based on the Doctoral
Dissertation Research performed by Wood62, Sweetin63, and Adam64 at Miami
University. For example, ascorbic acid was found to be most effective over the pH range
of 3-11, glycine above pH 8.5, oxalic acid below pH 8.5, malonic acid over the pH range
of 3-8.5. A selective reaction of sulfite ion and hypochlorite ion at pH 10.5 led to the
62 Wood, D. W. I. Determination of Disinfectant Residuals in Chlorine Dioxide Treated Water Using Flow Injection Analysis Ph.D. Dissertation, Miami University, Oxford, OH, 1990. 63 Sweetin, D. L. Developments in the Analytical Methodology For the Determination of Free available Chlorine, Inorganic Chloramines, and Oxyhalogen Species Ph.D. Dissertation, Miami University, Oxford, OH, 1993. 64 Adam An Investigation of Factors Involved In The Decomposition of Sodium Hypochlorite.
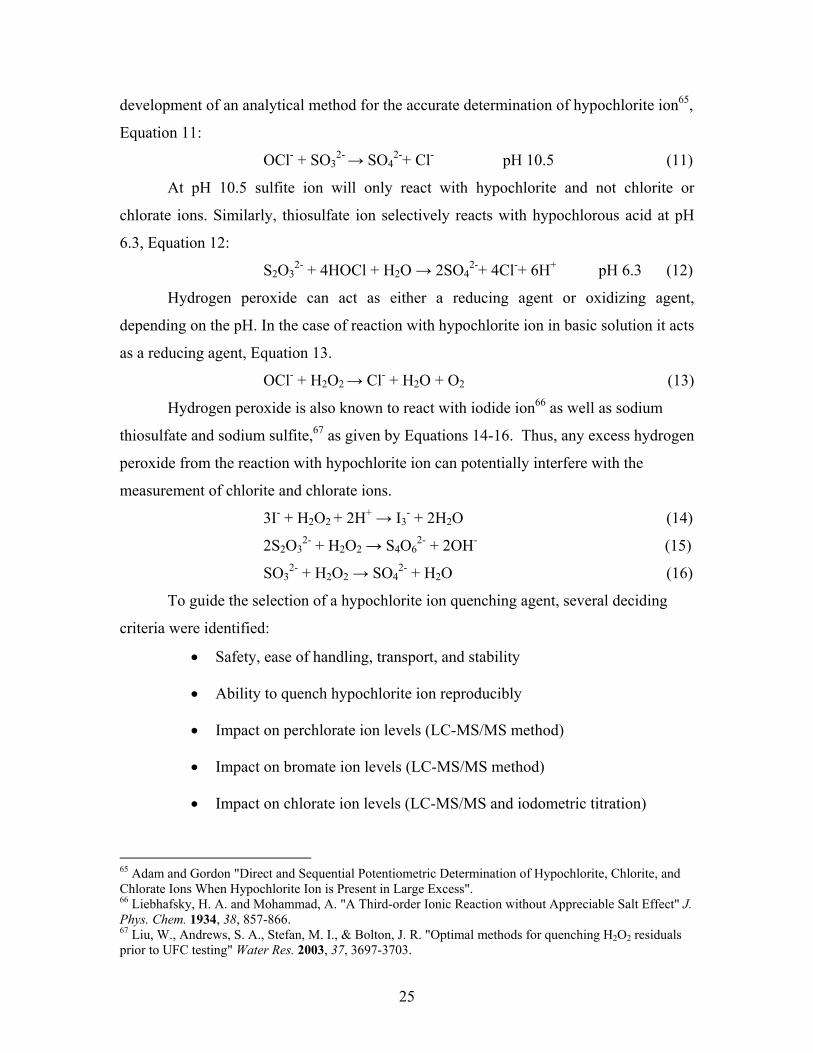
25
development of an analytical method for the accurate determination of hypochlorite ion65,
Equation 11:
OCl- + SO32- → SO4
2-+ Cl- pH 10.5 (11)
At pH 10.5 sulfite ion will only react with hypochlorite and not chlorite or
chlorate ions. Similarly, thiosulfate ion selectively reacts with hypochlorous acid at pH
6.3, Equation 12:
S2O32- + 4HOCl + H2O → 2SO4
2-+ 4Cl-+ 6H+ pH 6.3 (12)
Hydrogen peroxide can act as either a reducing agent or oxidizing agent,
depending on the pH. In the case of reaction with hypochlorite ion in basic solution it acts
as a reducing agent, Equation 13.
OCl- + H2O2 → Cl- + H2O + O2 (13)
Hydrogen peroxide is also known to react with iodide ion66 as well as sodium
thiosulfate and sodium sulfite,67 as given by Equations 14-16. Thus, any excess hydrogen
peroxide from the reaction with hypochlorite ion can potentially interfere with the
measurement of chlorite and chlorate ions.
3I- + H2O2 + 2H+ → I3- + 2H2O (14)
2S2O32- + H2O2 → S4O6
2- + 2OH- (15)
SO32- + H2O2 → SO4
2- + H2O (16)
To guide the selection of a hypochlorite ion quenching agent, several deciding
criteria were identified:
• Safety, ease of handling, transport, and stability
• Ability to quench hypochlorite ion reproducibly
• Impact on perchlorate ion levels (LC-MS/MS method)
• Impact on bromate ion levels (LC-MS/MS method)
• Impact on chlorate ion levels (LC-MS/MS and iodometric titration)
65 Adam and Gordon "Direct and Sequential Potentiometric Determination of Hypochlorite, Chlorite, and Chlorate Ions When Hypochlorite Ion is Present in Large Excess". 66 Liebhafsky, H. A. and Mohammad, A. "A Third-order Ionic Reaction without Appreciable Salt Effect" J. Phys. Chem. 1934, 38, 857-866. 67 Liu, W., Andrews, S. A., Stefan, M. I., & Bolton, J. R. "Optimal methods for quenching H2O2 residuals prior to UFC testing" Water Res. 2003, 37, 3697-3703.

26
Ascorbic acid, USP Grade, was obtained from Mallinckrodt Chemicals
(Philipsburg, NJ). Glycine, ACS Reagent 98.5%, was supplied by Sigma Aldrich.
Hydrogen peroxide, 30-32%, Assay 99.999% min., was obtained from GFS Chemicals
(Columbus, OH). Malonic acid, 99 %, was purchased from Acros Organics USA (Morris
Plains, NJ). Oxalic acid dehydrate, ACS Grade, was obtained from EMD Chemicals
(Gibbstown, NJ). Sodium sulfite and sodium thiosulfate used for the titration methods
described in this chapter were also used in the quenching experiments.
2.2.5.1 Safety, Ease of Handling, Transport, and Stability
An initial ratio of 1 mole of quenching agent to 1 mole of hypochlorite ion was
used for each test. The quenching agent was pre-weighed (in case of oxalic acid, an
aliquot of stock solution was used) and placed in a high density polyethylene (HDPE)
sample container in a chemical hood. An aliquot of 10 mL of 13 % NaOCl solution was
added. The solution was stirred to dissolve the quenching agent and allowed to react for
at least 5 minutes. An aliquot of the sample was tested for FAC residual using Hach
DPD test kit. Several of the quenching agents under consideration (hydrogen peroxide,
glycine, and oxalic acid) reacted vigorously with hypochlorite ion, causing in some cases,
significant loss of sample during the reaction and/or produced heat and noxious fumes.
Concentrated solutions of hydrogen peroxide (32% w/w) required special
handling, due to the hazardous nature of H2O2. Quenching 10 mL of 13 % sodium
hypochlorite solution produced a considerable amount of heat and gas, making this
quenching agent the most dangerous to use. Glycine, though relatively safe itself, reacted
violently and produced a very noxious gas when reacted with hypochlorite ion.
Even though all of the test reactions were performed in a well-ventilated chemical
hood, the gas produced from reaction between glycine and hypochlorite ion caused
feelings of light-headedness, dizziness, and nausea. Thus, the use of glycine would
require special precautions when collecting samples in the field. The remaining
quenching agents also produced heat and gas, but to a lesser extent. Ascorbic and
malonic acids reacted the least vigorously and appear to be the safer and easier-to-handle
quenching agents tested. None of the quenching agents had associated
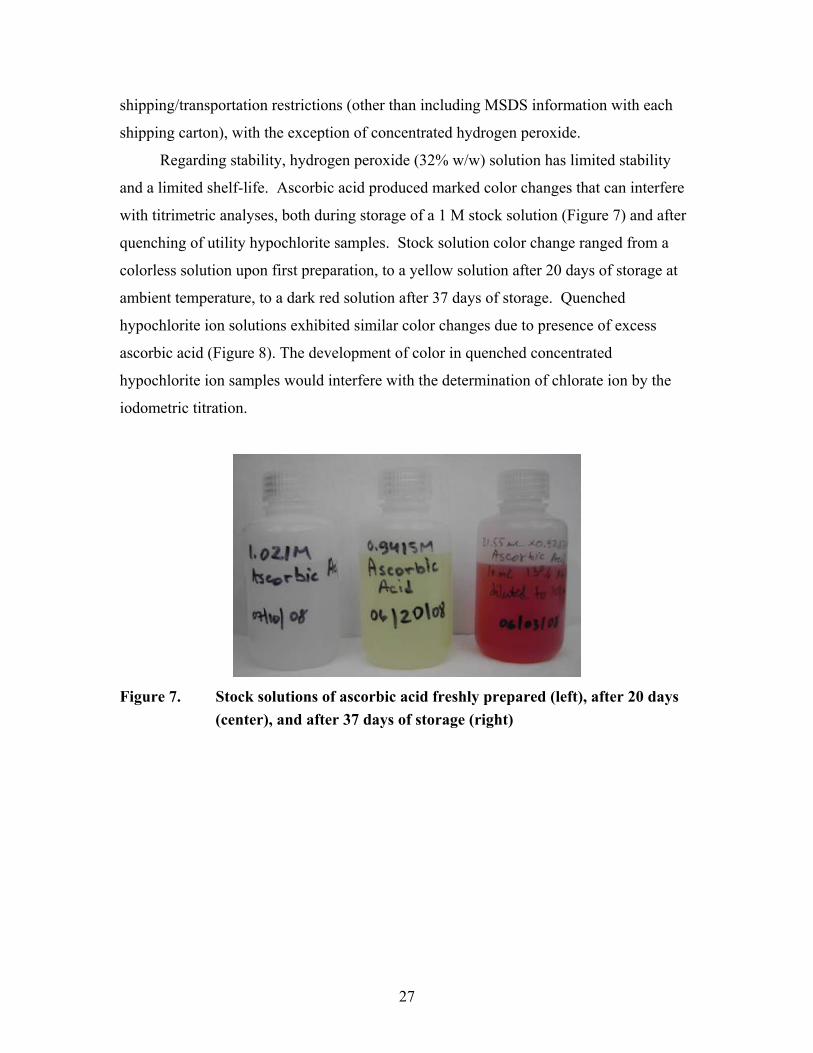
27
shipping/transportation restrictions (other than including MSDS information with each
shipping carton), with the exception of concentrated hydrogen peroxide.
Regarding stability, hydrogen peroxide (32% w/w) solution has limited stability
and a limited shelf-life. Ascorbic acid produced marked color changes that can interfere
with titrimetric analyses, both during storage of a 1 M stock solution (Figure 7) and after
quenching of utility hypochlorite samples. Stock solution color change ranged from a
colorless solution upon first preparation, to a yellow solution after 20 days of storage at
ambient temperature, to a dark red solution after 37 days of storage. Quenched
hypochlorite ion solutions exhibited similar color changes due to presence of excess
ascorbic acid (Figure 8). The development of color in quenched concentrated
hypochlorite ion samples would interfere with the determination of chlorate ion by the
iodometric titration.
Figure 7. Stock solutions of ascorbic acid freshly prepared (left), after 20 days
(center), and after 37 days of storage (right)
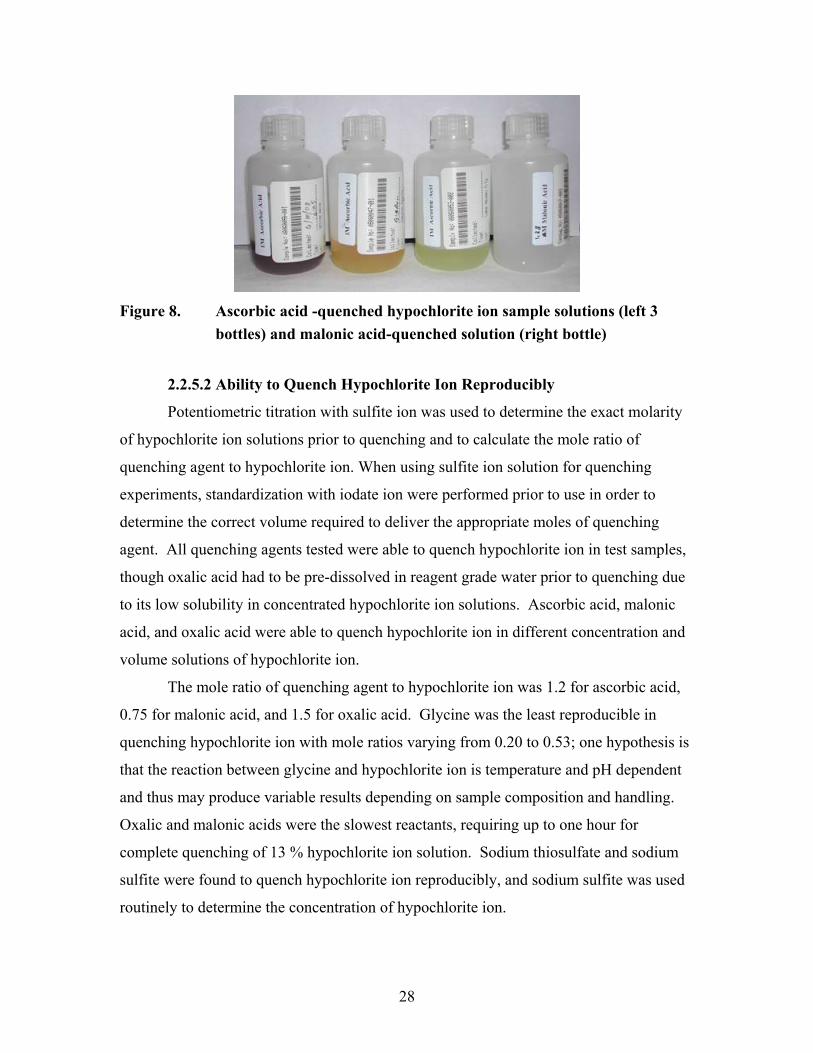
28
Figure 8. Ascorbic acid -quenched hypochlorite ion sample solutions (left 3
bottles) and malonic acid-quenched solution (right bottle)
2.2.5.2 Ability to Quench Hypochlorite Ion Reproducibly
Potentiometric titration with sulfite ion was used to determine the exact molarity
of hypochlorite ion solutions prior to quenching and to calculate the mole ratio of
quenching agent to hypochlorite ion. When using sulfite ion solution for quenching
experiments, standardization with iodate ion were performed prior to use in order to
determine the correct volume required to deliver the appropriate moles of quenching
agent. All quenching agents tested were able to quench hypochlorite ion in test samples,
though oxalic acid had to be pre-dissolved in reagent grade water prior to quenching due
to its low solubility in concentrated hypochlorite ion solutions. Ascorbic acid, malonic
acid, and oxalic acid were able to quench hypochlorite ion in different concentration and
volume solutions of hypochlorite ion.
The mole ratio of quenching agent to hypochlorite ion was 1.2 for ascorbic acid,
0.75 for malonic acid, and 1.5 for oxalic acid. Glycine was the least reproducible in
quenching hypochlorite ion with mole ratios varying from 0.20 to 0.53; one hypothesis is
that the reaction between glycine and hypochlorite ion is temperature and pH dependent
and thus may produce variable results depending on sample composition and handling.
Oxalic and malonic acids were the slowest reactants, requiring up to one hour for
complete quenching of 13 % hypochlorite ion solution. Sodium thiosulfate and sodium
sulfite were found to quench hypochlorite ion reproducibly, and sodium sulfite was used
routinely to determine the concentration of hypochlorite ion.
29
2.2.5.3 Impact on Analysis of Bromate, Chlorate, and Perchlorate Ion
Ascorbic acid, sodium thiosulfate and sodium sulfite were observed to have an
adverse effect on the analysis of bromate ion by LC-MS/MS. Both bromate ion and the
bromate ion internal standard were negatively impacted by the presence of thiosulfate and
sulfite ions. The chromatograms of sulfite-quenched and thiosulfate-quenched samples,
shown in Figure 9, illustrate the peak shifts, peak attenuation, and peak splitting (Figure 4
(c), page 16 can be used as reference).
Figure 9. Chromatogram of bromate (left) and 18O-labeled bromate (right) of
(a) sulfite-quenched sample, and (b) thiosulfate-quenched sample of 13% sodium hypochlorite solution diluted by a factor of 1:10,000
Furthermore, suppression of both analyte and internal standard signals hindered
the ability for adequate correction by isotope-dilution, resulting in poor recoveries for
samples quenched with thiosulfate ion (60%, n = 3) and no quantifiable recoveries for
(a)
(b)
79Br18O3 79Br16O3
79Br18O3 79Br16O3

30
samples quenched with sulfite. Ascorbic acid also negatively impacted analysis of
bromate ion. When hypochlorite ion solutions, quenched with ascorbic acid were
analyzed, no detectible bromate ion was observed. Furthermore, spiked ascorbic acid-
quenched hypochlorite ion solutions with bromate ion standard, showed much lower
recoveries (49%, n=3) than the non-quenched hypochlorite ion solutions, indicating that
excess ascorbic acid in fact may reduce bromate ion. Similarly, sulfite ion is also known
to reduce bromate ion in aqueous solutions.68 Malonic acid was found to have no impact
on bromate, chlorate, and perchlorate ions analysis. Recovery data obtained by LC-
MS/MS analysis of quenched and non-quenched hypochlorite ion samples are shown in
Table 7, while comparisons of quenched and non-quenched hypochlorite ion samples by
the analyte at different dilutions are shown in Tables 8.
Table 7. Effects of malonic acid (MA) on recoveries of chlorate, perchlorate, and bromate ions measured by LC-MS/MS (n = 3, replicate samples analyzed in triplicate; S.D. = standard deviation)
% Recovery (Mean ± S.D.)
Perchlorate Spike μg/L Non-quenched
sample MA quenched
sample 2.1 101.0 ± 1.8 104.0 ± 2.3 41.6 94.3 ± 1.3 94.8 ± 1.2
Bromate Spike μg/L 1.6 94.3 ± 6.5 96.7 ± 1.1
Chlorate Spike μg/L 146.6 90.8 ± 4 88.9 ± 0.5
Table 8. Effects of malonic acid (MA) on analysis of perchlorate and bromate
ions at different dilutions (n = 3; S.D. = standard deviation) Sample ClO4
- mg/L ± S.D. Sample BrO3- mg/L ± S.D.
Dilution Non-quenched
sample MA quenched
sample Non-quenched
sample MA quenched
sample 1:100,000 6.9 ± 0.6 6.7 ±0. 4 14.7 ± 2.1 13.8 ± 0.9 1:10,000 7.2 ± 0.2 6.5 ± 0.2 16.0 ± 0.3 14.8 ± 0.1
1:500 7.4 ± 0.1 7.1 ± 0.5 9.6 ± 0.6 12.9 ± 0.3
68 Keith, J. D., Pacey, G. E., Cotruvo, J. A. and Gordon, G. "Experimental results from the reaction of bromate ion with synthetic and real gastric juices" Toxicology 2006, 221, 225-228.
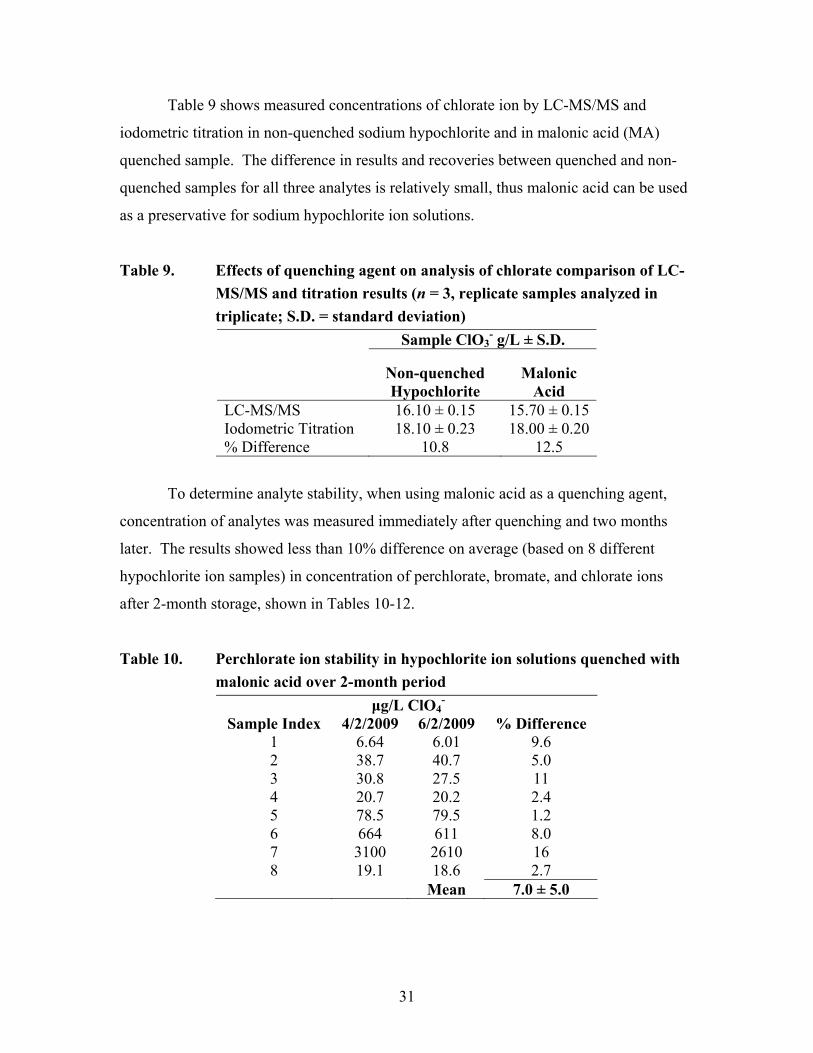
31
Table 9 shows measured concentrations of chlorate ion by LC-MS/MS and
iodometric titration in non-quenched sodium hypochlorite and in malonic acid (MA)
quenched sample. The difference in results and recoveries between quenched and non-
quenched samples for all three analytes is relatively small, thus malonic acid can be used
as a preservative for sodium hypochlorite ion solutions.
Table 9. Effects of quenching agent on analysis of chlorate comparison of LC-MS/MS and titration results (n = 3, replicate samples analyzed in triplicate; S.D. = standard deviation)
Sample ClO3- g/L ± S.D.
Non-quenched Hypochlorite
Malonic Acid
LC-MS/MS 16.10 ± 0.15 15.70 ± 0.15 Iodometric Titration 18.10 ± 0.23 18.00 ± 0.20 % Difference 10.8 12.5
To determine analyte stability, when using malonic acid as a quenching agent,
concentration of analytes was measured immediately after quenching and two months
later. The results showed less than 10% difference on average (based on 8 different
hypochlorite ion samples) in concentration of perchlorate, bromate, and chlorate ions
after 2-month storage, shown in Tables 10-12.
Table 10. Perchlorate ion stability in hypochlorite ion solutions quenched with malonic acid over 2-month period
μg/L ClO4-
Sample Index 4/2/2009 6/2/2009 % Difference 1 6.64 6.01 9.6 2 38.7 40.7 5.0 3 30.8 27.5 11 4 20.7 20.2 2.4 5 78.5 79.5 1.2 6 664 611 8.0 7 3100 2610 16 8 19.1 18.6 2.7 Mean 7.0 ± 5.0
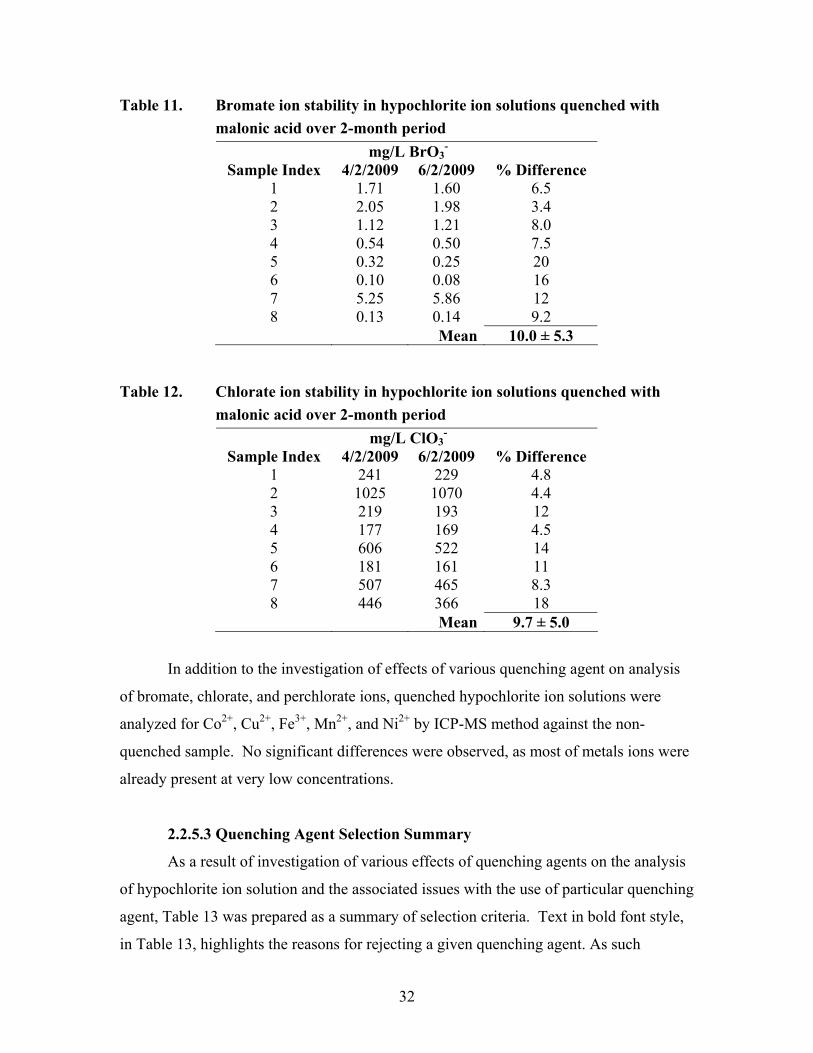
32
Table 11. Bromate ion stability in hypochlorite ion solutions quenched with malonic acid over 2-month period mg/L BrO3
- Sample Index 4/2/2009 6/2/2009 % Difference
1 1.71 1.60 6.5 2 2.05 1.98 3.4 3 1.12 1.21 8.0 4 0.54 0.50 7.5 5 0.32 0.25 20 6 0.10 0.08 16 7 5.25 5.86 12 8 0.13 0.14 9.2
Mean 10.0 ± 5.3 Table 12. Chlorate ion stability in hypochlorite ion solutions quenched with
malonic acid over 2-month period mg/L ClO3
- Sample Index 4/2/2009 6/2/2009 % Difference
1 241 229 4.8 2 1025 1070 4.4 3 219 193 12 4 177 169 4.5 5 606 522 14 6 181 161 11 7 507 465 8.3 8 446 366 18
Mean 9.7 ± 5.0
In addition to the investigation of effects of various quenching agent on analysis
of bromate, chlorate, and perchlorate ions, quenched hypochlorite ion solutions were
analyzed for Co2+, Cu2+, Fe3+, Mn2+, and Ni2+ by ICP-MS method against the non-
quenched sample. No significant differences were observed, as most of metals ions were
already present at very low concentrations.
2.2.5.3 Quenching Agent Selection Summary
As a result of investigation of various effects of quenching agents on the analysis
of hypochlorite ion solution and the associated issues with the use of particular quenching
agent, Table 13 was prepared as a summary of selection criteria. Text in bold font style,
in Table 13, highlights the reasons for rejecting a given quenching agent. As such

33
glycine, hydrogen peroxide, and ascorbic acid were not recommended for quenching
based on safety, ease of handling, transport, and stability issues. Ascorbic acid and
sodium thiosulfate were not recommended for quenching due to negative impacts on
bromate ion analysis. Based on limited solubility of oxalic acid in bulk sodium
hypochlorite ion solutions, oxalic acid was not recommended for quenching. Thus,
malonic acid was chosen as the quenching agent of choice for experiments requiring
preservation (typically for samples collected off-site and requiring shipping).
Table 13. Summary of quenching agent test results and decision-making matrix Quenching Agent (QA)
Ascorbic
Acid Glycine Malonic
Acid Sodium
Thiosulfate Sodium Sulfite
Oxalic Acid
Hydrogen Peroxide
Stoichiometric Ratio (mol QA / mol OCl-)
1.2 0.55 0.75 0.28 1.1 1.5 1.1
Compatible with Iodometric Titration?
No Yes Yes Yes Yes Yes No
Effect on [BrO3-] Decrease No
Effect No
Effect Decrease Decrease No Effect
No Effect
Effect on [ClO4-] No
Effect No
Effect No
Effect No
Effect No
Effect No
Effect No
Effect
Effect on [ClO3-] No
Change No
Change No
Change No Change No Change
No Change
No Change
Solution Stable over Time No Yes Yes Yes No Yes No
Safety Issues? No Noxious
Gas, Hazard!
No No No Heat, Gas
Evolved
Violent Reaction, Hazard!
Soluble in Concentrated NaOCl ?
Yes Yes Yes Yes Yes No Yes

34
2.3 Conclusions
The optimized LC-MS/MS method was shown to meet the objective of producing
accurate and reproducible results for quantifying perchlorate, bromate, and chlorate ions
in sodium hypochlorite solutions, offering conservative PQLs of 0.05 μg/L for ClO4- and
0.20 μg/L for BrO3-. The advantage of this method is two-fold: analysis time of 10
minutes per sample and simultaneous analysis of at least two analytes (perchlorate and
bromate ions) in sodium hypochlorite solutions. This allowed increases in sample
throughput and reduced instrument maintenance.
The observed matrix interference that impacted the 18O-labeled bromate ion
internal standard was resolved by higher dilutions. Inadequate dilutions could result in
false concentrations given the differing matrix effects on the labeled and unlabeled ions.
Due to lack of availability 18O-labeled chlorate ion internal standards to correct for matrix
inferences and ionization suppression, the precision of chlorate measurements must be
monitored, especially at higher dilutions.
The iodometric titration was chosen for determinations of chlorate ion
concentrations in bulk hypochlorite ion solutions and during chlorate ion spike
experiments. The LC-MS/MS method was used for chlorate ion analysis for samples with
≤ 10 g/L ClO3-, which constituted the majority of OSG hypochlorite ion solutions. By
using both methods, the concentration of chlorate ion can be measured over a wide
concentration range, with an LC-MS/MS method PQL of 0.7 μg/L (8 nM), and
iodometric titration determinations of concentrations of chlorate ion up to 210 g/L (2.5
M) in sodium hypochlorite solutions.
Malonic acid was chosen for quenching hypochlorite ion solutions, thus
preserving the levels of perchlorate and chlorate ions based on the reproducibility to
quench, ease of handling, and minimum impacts on LC-MS/MS and titrimetric methods.
Furthermore, it was determined that using OnGuard II Ba and OnGuard II H cartridges
for sample treatment showed no major differences between filtered and unfiltered
samples. Thus if bisulfate ion is present, the use of a clean-up/filtration step with Barium
Cartridges to remove the interference with the perchlorate ion determination, does not
negatively impact analysis by the LC-MS/MS method.

35
The sodium hypochlorite samples, pending analysis, were temporary stored at 4
ºC (typically samples were analyzed within one-week period). Alternatively, malonic
acid was used during collection of hypochlorite ion solutions off-site, and water samples
that contained residual FAC.
Thus, a robust, sensitive LC-MS/MS method was developed and used for
determinations of perchlorate, bromate, and chlorate ions. Potentiometric titration with
sulfite ion was used for determination of hypochlorite ion and iodometric titration method
for determination of chlorate ion concentration in bulk hypochlorite ion solutions. Proper
storage and sample preservation conditions were determined.

36
CHAPTER 3. EXPERIMENTAL DESIGN: IDENTIFYING FACTORS
IMPACTING PERCHLORATE ION FORMATION IN
HYPOCHLORITE ION SOLUTIONS
The main objective in this section of the study was to uncover factors impacting
perchlorate ion formation in hypochlorite ion solutions. Given that perchlorate ion was
found to occur in bulk (>3.0 % FAC) sodium hypochlorite solutions and to increase over
time69 and the fact that aged sodium hypochlorite solutions containing high
concentrations of chlorate ion also had higher perchlorate ion concentrations70, it can be
inferred that perchlorate ion is forming over time and most likely a product of
hypochlorite ion decomposition. Thus, in order to address the main objective and to
design experiments, hypochlorite ion decomposition needs to be understood, and the
factors affecting the rate of decomposition considered.
Sodium hypochlorite solutions that are provided as bulk (typical commercial
bleach) are 3-13 % as FAC and have pH above 11.5. The on-site generated (OSG)
sodium hypochlorite solutions range 0.3 – 3 % as FAC and typically have a pH of 9.5.
Decomposition of hypochlorite ion and formation of chlorate ion (a product of
hypochlorite ion decomposition) in concentrated hypochlorite ion solutions, in the pH 11-
14 range, is second-order in hypochlorite ion and is at a minimum in the pH 12-13
range71. Decomposition of hypochlorite ion is acid-catalyzed and becomes more rapid at
lower pH. In the pH region of 5-8, decomposition of hypochlorite ion is a third-order
process.72 Given, that the pKa of hypochlorous acid73 at 25 ºC is 7.54, the change in the
kinetics of hypochlorite ion decomposition is attributed to the proportion of hypochlorite
ion to form hypochlorous acid.
69 Greiner, Mclellan, Bennet and Ewing "Occurrence of perchlorate in sodium hypochlorite". 70 Asami, Kosaka and Kunikane "Bromate, chlorate, chlorite and perchlorate in sodium hypochlorite solution used in water supply". 71 Adam An Investigation of Factors Involved In The Decomposition of Sodium Hypochlorite. 72 Adam, L. C., Fabian, I., Suzuki, K. and Gordon, G. "Hypochlorous Acid Decomposition in the pH 5-8 Region" Inorg. Chem. 1992, 31, 3534-3541. 73 Gordon, G., Cooper, W. J., Rice, R. G. and Pacey, G. E. Disinfectant Residual Measurement Methods, Second ed.; AWWA Research Foundation and American Water Works Association: Denver, 1992.

37
However, in general the rates of hypochlorite ion decomposition and chlorate ion
formation are dependent on the initial concentration of hypochlorite and chlorate ions,
temperature, pH, and ionic strength.74
Thus in order to begin to understand the factors impacting formation of
perchlorate ion in hypochlorite ion solutions, the following hypotheses were made:
perchlorate ion continuously forms in concentrated hypochlorite ion solutions, and the
rate of perchlorate ion formation is dependent on concentration of chlorate and
hypochlorite ions.
In addition, factors that impact decomposition of hypochlorite ion were also
studied. Transition metal ions have been shown to affect decomposition of hypochlorite
ion,75 and Cu2+ and Ni2+ were specifically shown to catalyze decomposition.76
Furthermore, iridium ion (Ir3+) is also known to catalyze decomposition of hypochlorite
ion,77 and as such, the effects of the following metal ions were investigated: transition
metal ions (Co2+, Cu2+, Fe3+, Mn2+, and Ni2+) and noble metal ions (Ag+, Au+, Ir3+ Pd2+,
and Pt2+).
Chlorite ion is produced during hypochlorite ion decomposition,78 shown by
Equation 17; however, chlorite ion is consumed by the reaction with hypochlorite ion to
produce chlorate ion, as shown by Equation 18. Because the rate of reaction, shown by
Equation 18, is faster, chlorite ion concentration reaches steady state, and typically is
present in trace amounts (typically 0.5 % of hypochlorite ion concentration).79
OCl- + OCl- → ClO2- + Cl- kClO2-(slow) (17)
OCl- + ClO2-→ ClO3
- + Cl- kClO3- (fast) (18)
Thus, if chlorite ion is added to a solution containing hypochlorite ion, it is
expected that the chlorate ion concentration will increase, as hypochlorite and chlorite
74 Adam and Gordon "Hypochlorite ion decomposition: Effects of temperature, ionic strength, and chloride ion". 75 Lister, M. W. "Decomposition of Sodium Hypochlorite: The Catalyzed Reaction" Can. J. Chem. 1956, 34, 479–488. 76 Adam An Investigation of Factors Involved In The Decomposition of Sodium Hypochlorite. 77 Ayers, G. H. B., M. H. "Catalytic Decomposition of Hypochlorite Solution by Iridium Compounds. II. Kinetic Studies" J. Am. Chem. Soc. 1955, 77, 828-833. 78 Lister, M. W. "Decomposition of Sodium Hypochlorite: The Uncatalyzed Reaction" Can. J. Chem. 1956, 34, 465-478. 79 Adam and Gordon "Hypochlorite ion decomposition: Effects of temperature, ionic strength, and chloride ion".

38
ions react. Based on these equations it was hypothesized that chlorite ion may also
potentially affect the formation of perchlorate ion.
Other potentially relevant species such as bromate ion (BrO3-), a known
contaminant found in sodium hypochlorite solutions,80 and bromide ion (Br-) were added
into the experimental matrix to determine any possible effects on the rate of perchlorate
ion formation.
3.1 Experimental Matrix and Chemicals
In this preliminary set of experiments to identify the major factors that affect the
rate of perchlorate ion formation, hypochlorite ion solutions at various concentrations of
hypochlorite and chlorate ions were prepared. In addition, transition metal ions, noble
metal ions, and bromide and bromate ions were added to hypochlorite ion solutions.
Spiked and non-spiked hypochlorite ion solutions were stored to allow decomposition of
hypochlorite ion to occur. As an aid in planning the incubation experiments, Bleach 2001
was used to predict decomposition of hypochlorite ion and formation of chlorate ion at
various concentrations of hypochlorite and chlorate ions, temperature, specific gravity,
pH (11-14), and sodium chloride concentrations. Because the decomposition of pH 11-
13 hypochlorite ion solutions at room temperature is relatively slow (the half life of 13 %
FAC solution at 25 ºC is 130 days), the preliminary experiments were performed at
elevated temperatures, so that multiple factors impacting perchlorate ion formation could
be screened over shorter time periods. Thus, a series of preliminary experiments were
performed at 75°, 60 ºC, and 50 ºC.
Bulk sodium hypochlorite solutions, 10–13% FAC, were obtained from Acros
Organics USA (Morris Plains, NJ) and VWR (Brisbane, CA). OSG sodium hypochlorite
solution, ~0.8 % FAC, was obtained from sodium hypochlorite on-site generator at River
Mountains Water Treatment Facility (Henderson, NV). Pure sodium chlorate (ACS
Grade, ≥99%) was obtained from VWR (Brisbane, CA) and added to hypochlorite ion
solutions, to generate solutions at various initial concentrations of chlorate ion. To
investigate the effects of chlorite ion, unstabilized sodium chlorite (Technical Grade,
80 Chlorine Institute, "Bromate in Sodium Hypochlorite Potable Water Treatment"

39
80%) was acquired from Acros Organics USA (Morris Plains, NJ) and added to sodium
hypochlorite solutions. To investigate the effects of transition metal ions, aliquots of
1,000 ppm Co2+, Cu2+, Fe3+, Ni2+, and Mn2+ standards (SPEX CertiPrep®, Inc.,
Metuchen, NJ) were spiked into sodium hypochlorite solutions. To investigate the effects
of noble metal ions on the rate of perchlorate ion formation, aliquots of 1,000 ppm Ag+,
Au+, Ir3+, Pd2+, and Pt2+ standards (Elements Inc., Shasta Lake, CA) were spiked to
sodium hypochlorite solutions. To determine effects of bromide and bromate ions, ACS
grade potassium bromide (Fisher Scientific, Pittsburgh, PA) and pure sodium bromate,
(99.5% min, EMD Chemicals Inc., Gibbstown, NJ) were spiked into sodium hypochlorite
solutions. Reagent Grade sodium chloride, (>99%, VWR, Brisbane, CA) was used to
spike sodium hypochlorite solutions as a proxy to increase the ionic strength.
Hypochlorite ion sample solutions were stored in 125 mL high density
polyethylene bottles. Analog and digital, general-purpose, heated water baths (VWR,
Brisbane, CA) were used for sample incubations. Temperatures were monitored daily,
using a glass laboratory mercury thermometer or a thermocouple thermometer with an
LCD screen (Fisher Scientific, Pittsburgh, PA). Sample aliquots were collected into 8
mL acid-washed, amber glass vials, cooled, and stored at 4 ºC prior to analysis. Samples
were analyzed by the potentiometric and iodometric titrations methods and by the LC-
MS/MS method, as described in Chapter 2.
3.2 Effect of Hypochlorite Ion Concentration
An aliquot of a stock, concentrated sodium hypochlorite solution was
analyzed by the potentiometric titration with sulfite ion, followed by the sequential
determination of chlorite and chlorate ions by the iodometric titration. Separate aliquots
of the stock hypochlorite ion solution were added to 100 mL volumetric flasks.
Calculations, based on the measured hypochlorite and chlorate ion concentrations of the
stock solution, were performed to determine the appropriate amount of sodium chlorate
to add to the individual diluted hypochlorite ion solutions. As a result the stock
hypochlorite ion solution and diluted hypochlorite ion solutions had the same
concentration of chlorate ion. Changes in the concentration of hypochlorite, chlorite,

40
chlorate, and perchlorate ions for duplicate samples were monitored during ten days of
incubation at 75 ºC in a water bath. Figure 10 shows overlaid smoothed-line plots of
hypochlorite ion decomposition and chlorate ion formation. Note: the downward sloping
smoothed lines represent hypochlorite ion decomposition, and the upward-sloping curves
show formation of chlorate ion shown in Figure 10.
As expected, solutions with the higher hypochlorite ion concentrations decompose
more rapidly, and form higher concentrations of chlorate ion, as depicted in Figure 10.
Figure 11 shows a smoothed-line plot of perchlorate ion formation for this set of samples.
Figure 10. Decomposition of hypochlorite ion and formation of chlorate ion at 75
ºC in solutions, at various initial concentrations of hypochlorite ion
0
200
400
600
800
1000
1200
0 2 4 6 8 10
Days
ClO
4-m
g/L
Form
ed
74g/L OCl- + 50 g/L ClO3-
50g/L OCl- + 50 g/L ClO3-
10g/L OCl- + 50 g/L ClO3-
Figure 11. Formation of perchlorate ion at 75 ºC in hypochlorite ion solutions, at
various initial concentrations of hypochlorite ion
0
10
20
30
40
50
60
70
80
0 2 4 6 8 100
20
40
60
80
100
120
Days
OC
l-g/
L D
ecom
pose
d
ClO
3-g/
L Fo
rmed
74g/L OCl- + 50 g/L ClO3-
50g/L OCl- + 50 g/L ClO3-
10g/L OCl- + 50 g/L ClO3-
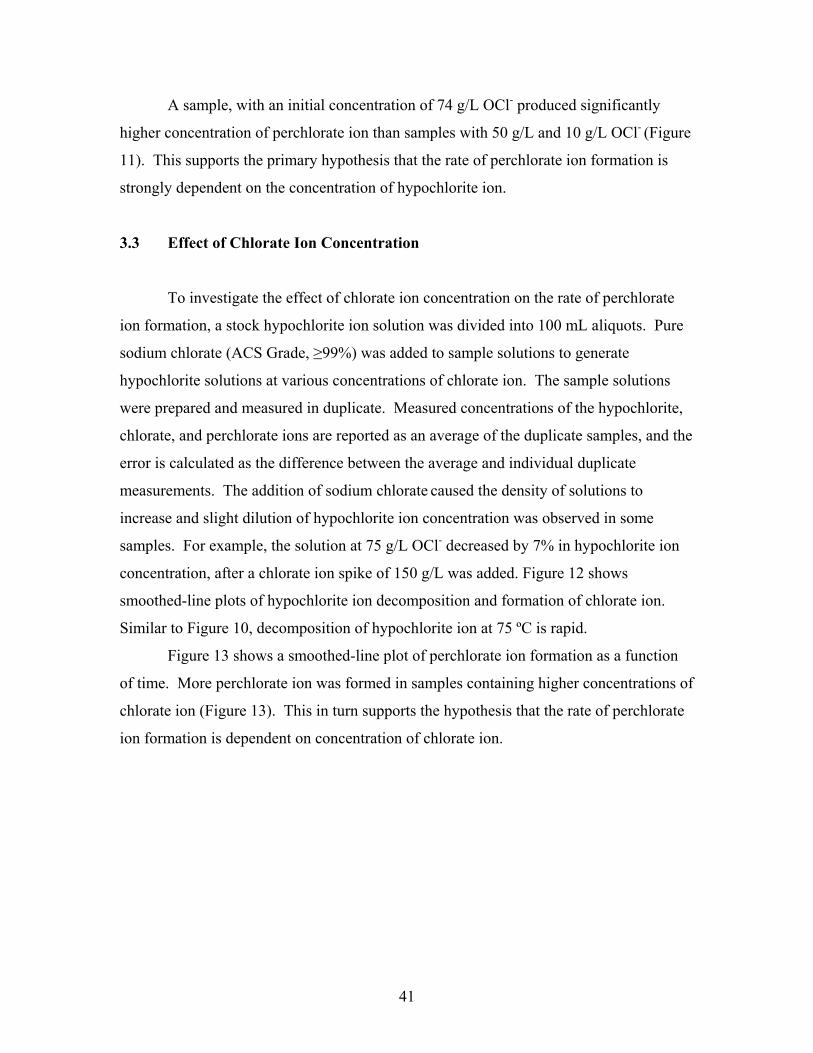
41
A sample, with an initial concentration of 74 g/L OCl- produced significantly
higher concentration of perchlorate ion than samples with 50 g/L and 10 g/L OCl- (Figure
11). This supports the primary hypothesis that the rate of perchlorate ion formation is
strongly dependent on the concentration of hypochlorite ion.
3.3 Effect of Chlorate Ion Concentration
To investigate the effect of chlorate ion concentration on the rate of perchlorate
ion formation, a stock hypochlorite ion solution was divided into 100 mL aliquots. Pure
sodium chlorate (ACS Grade, ≥99%) was added to sample solutions to generate
hypochlorite solutions at various concentrations of chlorate ion. The sample solutions
were prepared and measured in duplicate. Measured concentrations of the hypochlorite,
chlorate, and perchlorate ions are reported as an average of the duplicate samples, and the
error is calculated as the difference between the average and individual duplicate
measurements. The addition of sodium chlorate caused the density of solutions to
increase and slight dilution of hypochlorite ion concentration was observed in some
samples. For example, the solution at 75 g/L OCl- decreased by 7% in hypochlorite ion
concentration, after a chlorate ion spike of 150 g/L was added. Figure 12 shows
smoothed-line plots of hypochlorite ion decomposition and formation of chlorate ion.
Similar to Figure 10, decomposition of hypochlorite ion at 75 ºC is rapid.
Figure 13 shows a smoothed-line plot of perchlorate ion formation as a function
of time. More perchlorate ion was formed in samples containing higher concentrations of
chlorate ion (Figure 13). This in turn supports the hypothesis that the rate of perchlorate
ion formation is dependent on concentration of chlorate ion.
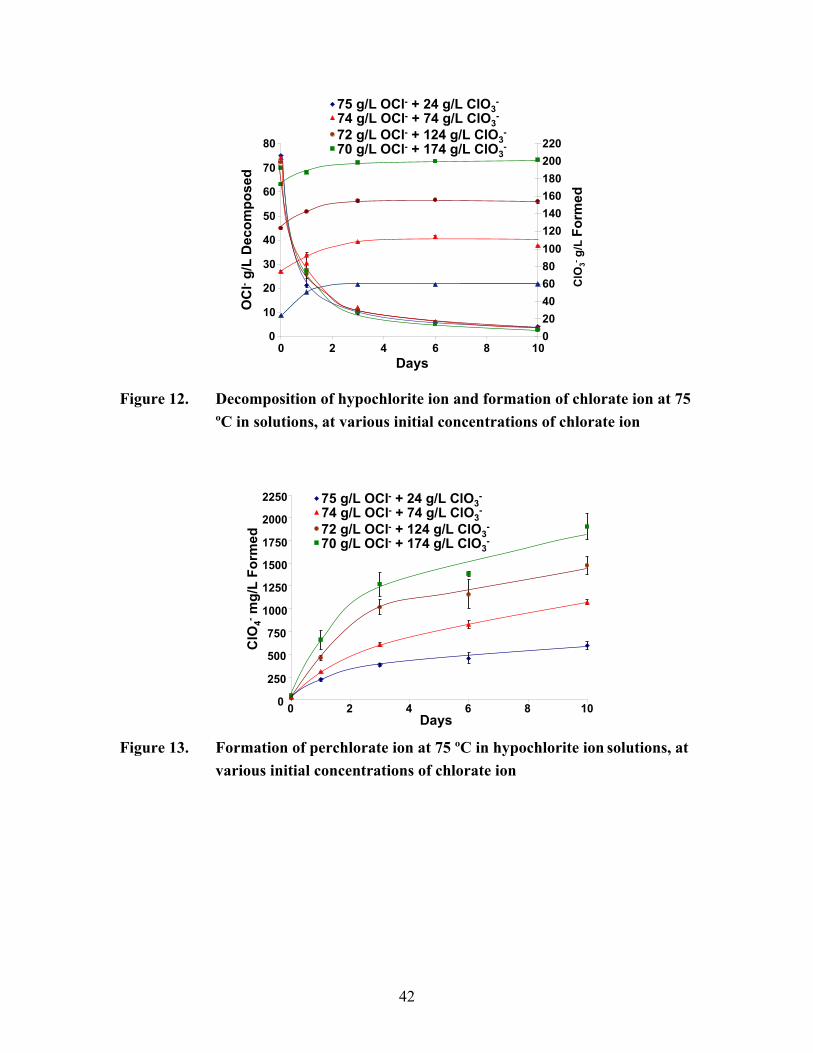
42
0
10
20
30
40
50
60
70
80
0 2 4 6 8 10Days
OC
l-g/
L D
ecom
pose
d
020406080100120140160180200220
ClO
3-g/
L Fo
rmed
75 g/L OCl- + 24 g/L ClO3-
74 g/L OCl- + 74 g/L ClO3-
72 g/L OCl- + 124 g/L ClO3-
70 g/L OCl- + 174 g/L ClO3-
Figure 12. Decomposition of hypochlorite ion and formation of chlorate ion at 75
ºC in solutions, at various initial concentrations of chlorate ion
0
250
500
750
1000
1250
1500
1750
2000
2250
0 2 4 6 8 10Days
ClO
4-m
g/L
Form
ed
75 g/L OCl- + 24 g/L ClO3-
74 g/L OCl- + 74 g/L ClO3-
72 g/L OCl- + 124 g/L ClO3-
70 g/L OCl- + 174 g/L ClO3-
Figure 13. Formation of perchlorate ion at 75 ºC in hypochlorite ion solutions, at
various initial concentrations of chlorate ion

43
3.4 Effect of Transition Metal Ions (Co2+, Cu2+, Fe3+, Mn2+, and Ni2+)
To investigate the effects of transition metal ions, aliquots of 1,000 ppm Co2+,
Cu2+, Fe3+, Ni2+, and Mn2+ standards (SPEX CertiPrep®, Inc., Metuchen, NJ) were
spiked into sodium hypochlorite solutions to achieve final concentration of 20 mg/L, 2
mg/L, and 0.2 mg/L of each metal ion. Following addition of a 20 mg/L spike, it was
observed that the decomposition of hypochlorite ion was very rapid, and no change in
concentration of perchlorate ion was observed after 30 days of incubation at 75 ºC. Even
at a 2 mg/L spike, the catalyzed decomposition of hypochlorite ion is still rapid, as
compared to the control sample shown in Figure 14. The decomposition of hypochlorite
ion is clearly catalyzed by the presence of Co2+, Cu2+, Fe3+, Mn2+, and Ni2+, and the rate
of decomposition increases with higher concentrations of these cations. At the same time
less perchlorate ion was formed as a function of time in metal ion spiked samples, as
shown in Figure 15.
0
10
20
30
40
50
60
70
80
0 1 2 3 4 5 6 7 8 9 10Days
0
10
20
30
40
50
60
70
8075 g/L OCl- + 24 g/L ClO3- + 2 mg/L Me
75 g/L OCl- + 24 g/L ClO3- + 0.2 mg/L Me
OC
l-g/
L D
ecom
pose
d
ClO
3-g/
L Fo
rmed
75 g/L OCl- + 24 g/L ClO3- (Control)
Figure 14. Effects of Transition Metals Ions (Me = Co2+, Cu2+, Fe3+, Mn2+, and
Ni2+) on the hypochlorite ion decomposition and the chlorate ion formation
Observations, drawn from Figures 14 and 15, suggest that the presence of Co2+,
Cu2+, Fe3+, Mn2+, and Ni2+ even at a concentration of 0.2 mg/L exhibits a much stronger
effect on the decomposition of hypochlorite ion such that no additional perchlorate ion

44
formation was observed. Thus, these metal ions can not enhance the rate of perchlorate
ion formation under these conditions (pH 11-13, FAC > 5.0 %), because the primary
reactant to produce perchlorate ion (i.e. hypochlorite ion) is decomposed rapidly.
0
100
200
300
400
500
600
700
0 1 2 3 4 5 6 7 8 9 10Days
75 g/L OCl- + 24 g/L ClO3- (Control)
75 g/L OCl- + 24 g/L ClO3- + 2 mg/L Me
75 g/L OCl- + 24 g/L ClO3- + 0.2 mg/L Me
ClO
4-m
g/L
Form
ed
Figure 15. Effects of Transition Metals Ions (Me = Co2+, Cu2+, Fe3+, Mn2+, and
Ni2+) on perchlorate ion formation
3.5 Effect of Noble Metal Ions (Ag+, Au+, Ir3+, Pd2+, and Pt2+)
Similar to the investigation of transition metal ion effects on the rate of
perchlorate ion formation, aliquots of 1,000 ppm Ag+, Au+, Ir3+, Pd2+, and Pt2+ standards
(Elements Inc., Shasta Lake, CA) were spiked into sodium hypochlorite solutions. The
final concentration of each metal ion was 0.2 mg/L. Spiked samples were divided into
two groups: a set with a spike of 0.2 mg/L Ag+, Au+, Ir3+, Pd2+, and Pt2+, and a set with a
spike of 0.2 mg/L Ir3+ only. This was done to separate the effects of Ir3+, which has been
linked to enhanced decomposition of hypochlorite ion,81 and other metals in this group.
Finally, spiked samples and the control sample (no spike) were incubated at 50 ºC, and
the target analytes were monitored. Figure 16 shows overlaid smoothed-line plots of
hypochlorite ion decomposition and formation of chlorate ion.
81 Ayers "Catalytic Decomposition of Hypochlorite Solution by Iridium Compounds. II. Kinetic Studies".
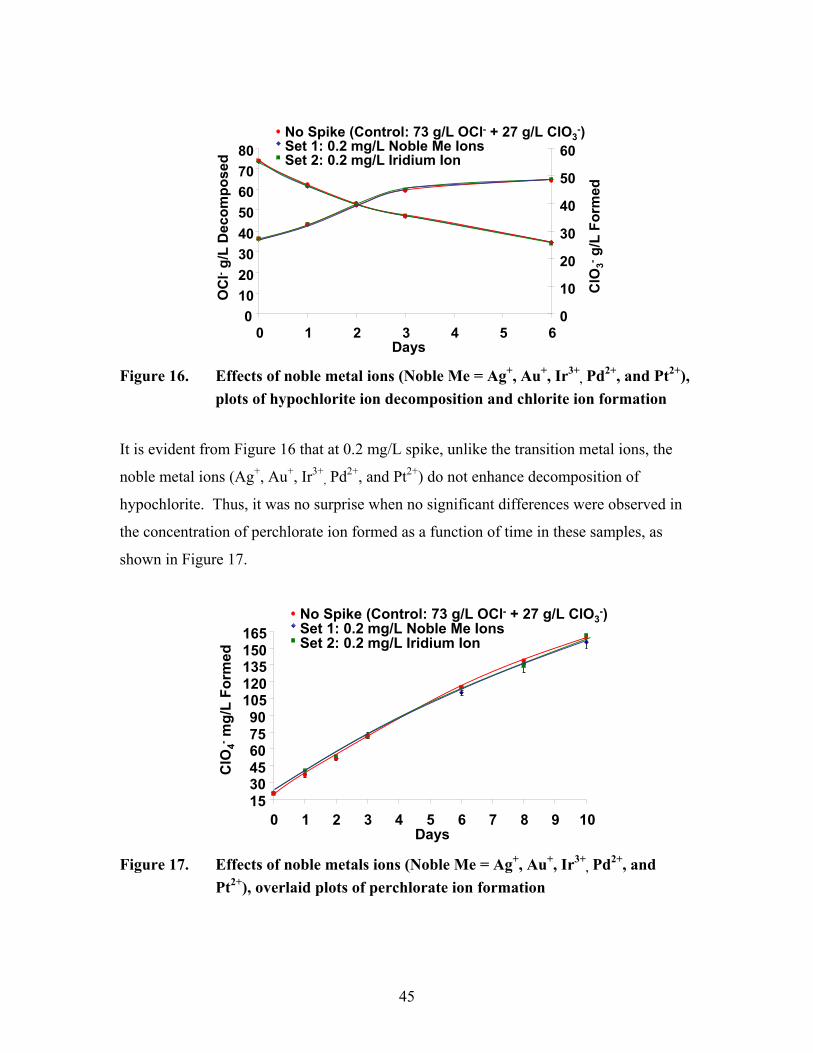
45
01020304050607080
0 1 2 3 4 5 6Days
0
10
20
30
40
50
60Set 1: 0.2 mg/L Noble Me IonsSet 2: 0.2 mg/L Iridium Ion
No Spike (Control: 73 g/L OCl- + 27 g/L ClO3-)
OC
l-g/
L D
ecom
pose
d
ClO
3-g/
L Fo
rmed
Figure 16. Effects of noble metal ions (Noble Me = Ag+, Au+, Ir3+
, Pd2+, and Pt2+), plots of hypochlorite ion decomposition and chlorite ion formation
It is evident from Figure 16 that at 0.2 mg/L spike, unlike the transition metal ions, the
noble metal ions (Ag+, Au+, Ir3+, Pd2+, and Pt2+) do not enhance decomposition of
hypochlorite. Thus, it was no surprise when no significant differences were observed in
the concentration of perchlorate ion formed as a function of time in these samples, as
shown in Figure 17.
153045607590
105120135150165
0 1 2 3 4 5 6 7 8 9 10Days
ClO
4-m
g/L
Form
ed
Set 1: 0.2 mg/L Noble Me IonsSet 2: 0.2 mg/L Iridium Ion
No Spike (Control: 73 g/L OCl- + 27 g/L ClO3-)
Figure 17. Effects of noble metals ions (Noble Me = Ag+, Au+, Ir3+
, Pd2+, and Pt2+), overlaid plots of perchlorate ion formation
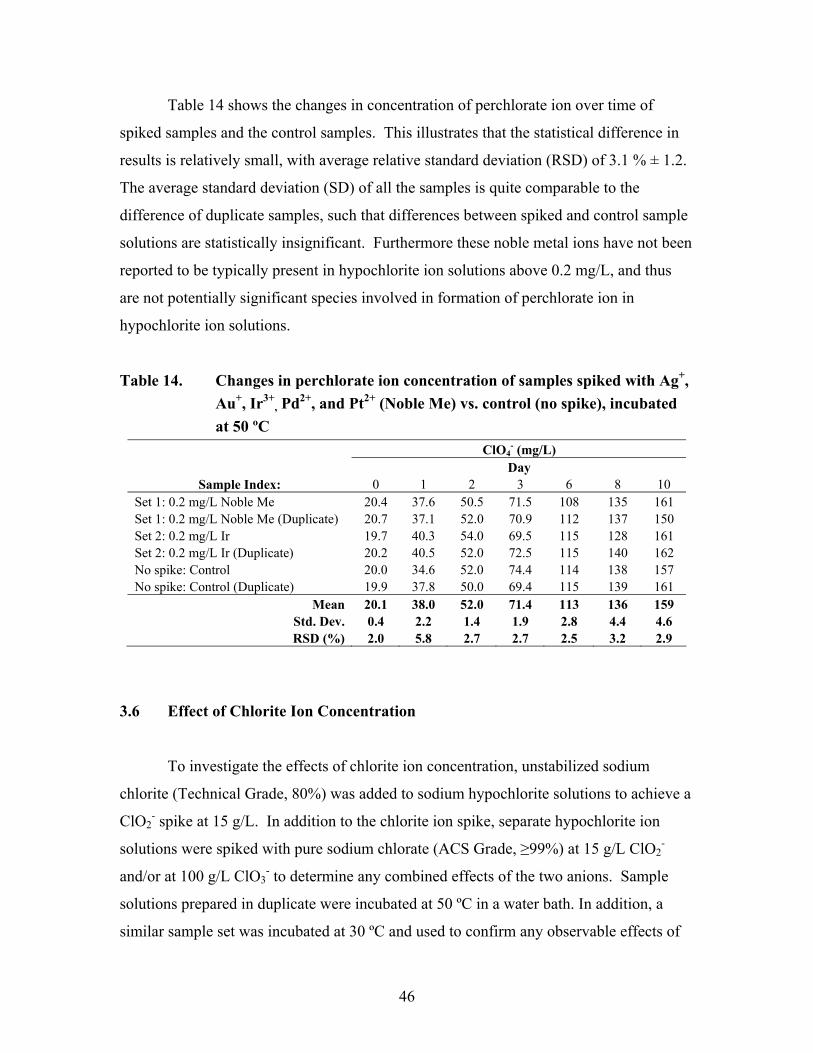
46
Table 14 shows the changes in concentration of perchlorate ion over time of
spiked samples and the control samples. This illustrates that the statistical difference in
results is relatively small, with average relative standard deviation (RSD) of 3.1 % ± 1.2.
The average standard deviation (SD) of all the samples is quite comparable to the
difference of duplicate samples, such that differences between spiked and control sample
solutions are statistically insignificant. Furthermore these noble metal ions have not been
reported to be typically present in hypochlorite ion solutions above 0.2 mg/L, and thus
are not potentially significant species involved in formation of perchlorate ion in
hypochlorite ion solutions.
Table 14. Changes in perchlorate ion concentration of samples spiked with Ag+, Au+, Ir3+
, Pd2+, and Pt2+ (Noble Me) vs. control (no spike), incubated at 50 ºC
ClO4- (mg/L)
Day Sample Index: 0 1 2 3 6 8 10
Set 1: 0.2 mg/L Noble Me 20.4 37.6 50.5 71.5 108 135 161 Set 1: 0.2 mg/L Noble Me (Duplicate) 20.7 37.1 52.0 70.9 112 137 150 Set 2: 0.2 mg/L Ir 19.7 40.3 54.0 69.5 115 128 161 Set 2: 0.2 mg/L Ir (Duplicate) 20.2 40.5 52.0 72.5 115 140 162 No spike: Control 20.0 34.6 52.0 74.4 114 138 157 No spike: Control (Duplicate) 19.9 37.8 50.0 69.4 115 139 161
Mean 20.1 38.0 52.0 71.4 113 136 159 Std. Dev. 0.4 2.2 1.4 1.9 2.8 4.4 4.6 RSD (%) 2.0 5.8 2.7 2.7 2.5 3.2 2.9
3.6 Effect of Chlorite Ion Concentration
To investigate the effects of chlorite ion concentration, unstabilized sodium
chlorite (Technical Grade, 80%) was added to sodium hypochlorite solutions to achieve a
ClO2- spike at 15 g/L. In addition to the chlorite ion spike, separate hypochlorite ion
solutions were spiked with pure sodium chlorate (ACS Grade, ≥99%) at 15 g/L ClO2-
and/or at 100 g/L ClO3- to determine any combined effects of the two anions. Sample
solutions prepared in duplicate were incubated at 50 ºC in a water bath. In addition, a
similar sample set was incubated at 30 ºC and used to confirm any observable effects of
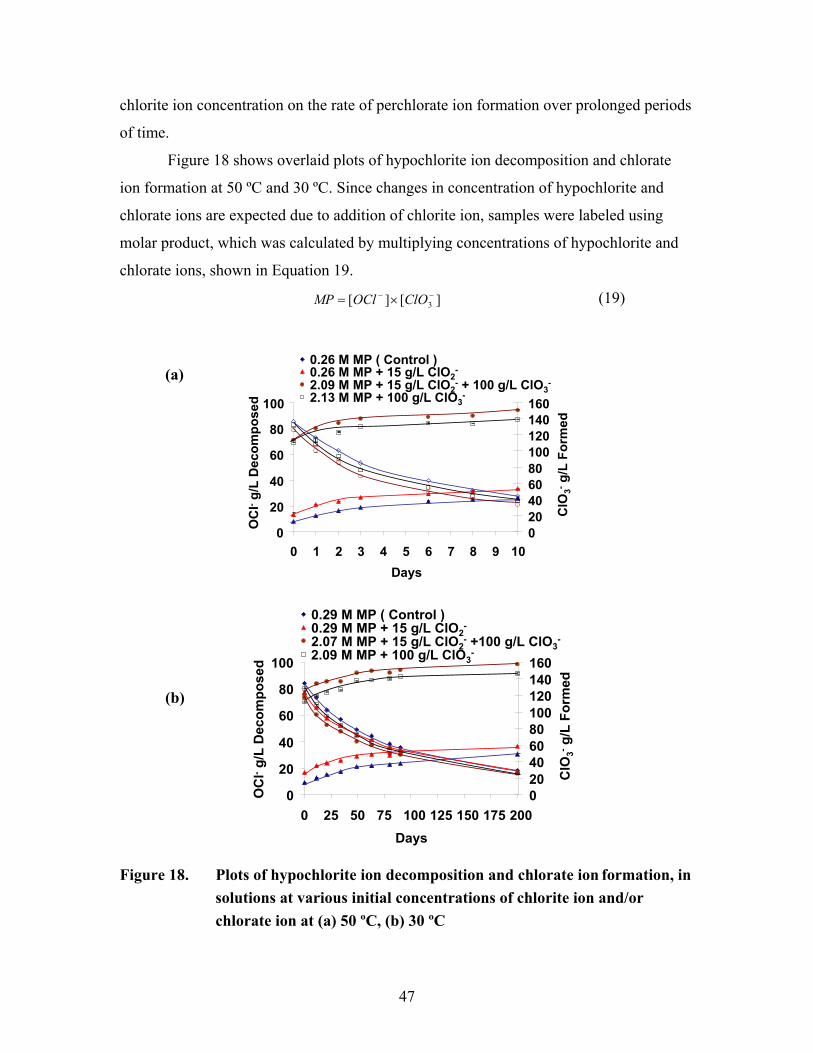
47
chlorite ion concentration on the rate of perchlorate ion formation over prolonged periods
of time.
Figure 18 shows overlaid plots of hypochlorite ion decomposition and chlorate
ion formation at 50 ºC and 30 ºC. Since changes in concentration of hypochlorite and
chlorate ions are expected due to addition of chlorite ion, samples were labeled using
molar product, which was calculated by multiplying concentrations of hypochlorite and
chlorate ions, shown in Equation 19.
][][ 3−− ×= ClOOClMP (19)
0
20
40
60
80
100
0 1 2 3 4 5 6 7 8 9 10Days
020406080100120140160
0.26 M MP ( Control )0.26 M MP + 15 g/L ClO2
-
2.09 M MP + 15 g/L ClO2- + 100 g/L ClO3
-
2.13 M MP + 100 g/L ClO3-
OC
l-g/
L D
ecom
pose
d
ClO
3-g/
L Fo
rmed
0
20
40
60
80
100
0 25 50 75 100 125 150 175 200Days
020406080100120140160
OC
l-g/
L D
ecom
pose
d
0.29 M MP ( Control )0.29 M MP + 15 g/L ClO2
-
2.07 M MP + 15 g/L ClO2- +100 g/L ClO3
-
2.09 M MP + 100 g/L ClO3-
ClO
3-g/
L Fo
rmed
Figure 18. Plots of hypochlorite ion decomposition and chlorate ion formation, in
solutions at various initial concentrations of chlorite ion and/or chlorate ion at (a) 50 ºC, (b) 30 ºC
(a)
(b)
48
As expected, hypochlorite ion solutions at 15 g/L ClO2- spike had noticeably more
chlorate ion formed than the control solution, while also showing faster hypochlorite ion
decomposition, as shown in Figure 18 (a) and (b). This is due to reaction between
hypochlorite and chlorite ions, shown in Equation 20:
OCl- + ClO2-→ ClO3
- + Cl- kClO3- (fast) (20)
If the concentration of chlorate ion is increased, additional amounts of perchlorate
ion can be expected to form. However, as was shown earlier, the formation of
perchlorate ion is dependent on both the concentration of chlorate and hypochlorite ions,
and so the effects of chlorite ion are two-fold. The first effect is due to the conversion of
chlorite ion to chlorate ion, enhancing the formation of perchlorate ion. The second
effect, occurring at the same time, is reduction of hypochlorite ion concentration, which
would decrease the rate of perchlorate ion formation. Overlaid smoothed-line plots of
perchlorate ion formation at 50° and 30 ºC are shown in Figure 19 (a); (b).
For further analysis, changes in molar product of the samples spiked with chlorite
ion and chlorate ion versus just chlorate ion were plotted and overlaid with formation of
perchlorate ion, shown in Figure 20. The observed similarities in changes of the molar
product of the chlorate ion-spiked sample and chlorite/chlorate ion-spiked sample, and
similarities observed in the formation of perchlorate ion indicate that the addition of the
chlorite ion does not appear to offer a substantial change in perchlorate ion formation
beyond what would be observed from addition of the chlorate ion.
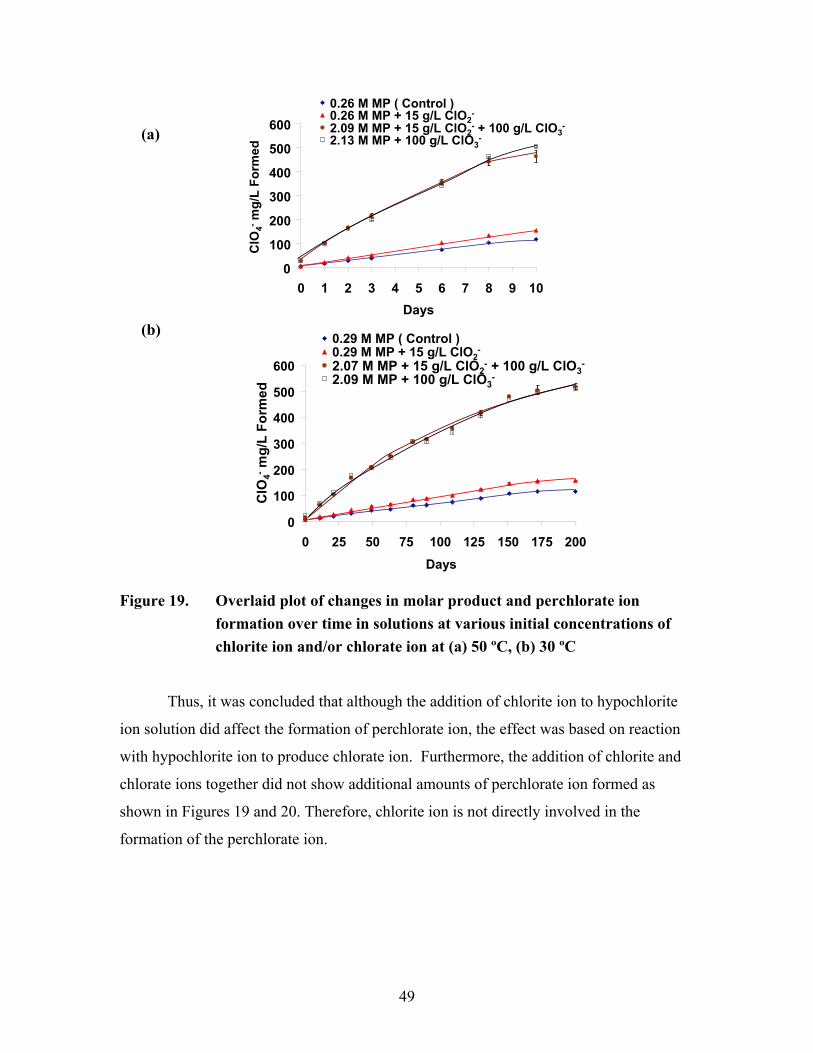
49
0
100
200
300
400
500
600
0 1 2 3 4 5 6 7 8 9 10Days
ClO
4-m
g/L
Form
ed
0.26 M MP ( Control )0.26 M MP + 15 g/L ClO2
-
2.09 M MP + 15 g/L ClO2- + 100 g/L ClO3
-
2.13 M MP + 100 g/L ClO3-
0
100
200
300
400
500
600
0 25 50 75 100 125 150 175 200Days
0.29 M MP ( Control )0.29 M MP + 15 g/L ClO2
-
2.07 M MP + 15 g/L ClO2- + 100 g/L ClO3
-
2.09 M MP + 100 g/L ClO3-
ClO
4-m
g/L
Form
ed
Figure 19. Overlaid plot of changes in molar product and perchlorate ion
formation over time in solutions at various initial concentrations of chlorite ion and/or chlorate ion at (a) 50 ºC, (b) 30 ºC
Thus, it was concluded that although the addition of chlorite ion to hypochlorite
ion solution did affect the formation of perchlorate ion, the effect was based on reaction
with hypochlorite ion to produce chlorate ion. Furthermore, the addition of chlorite and
chlorate ions together did not show additional amounts of perchlorate ion formed as
shown in Figures 19 and 20. Therefore, chlorite ion is not directly involved in the
formation of the perchlorate ion.
(a)
(b)
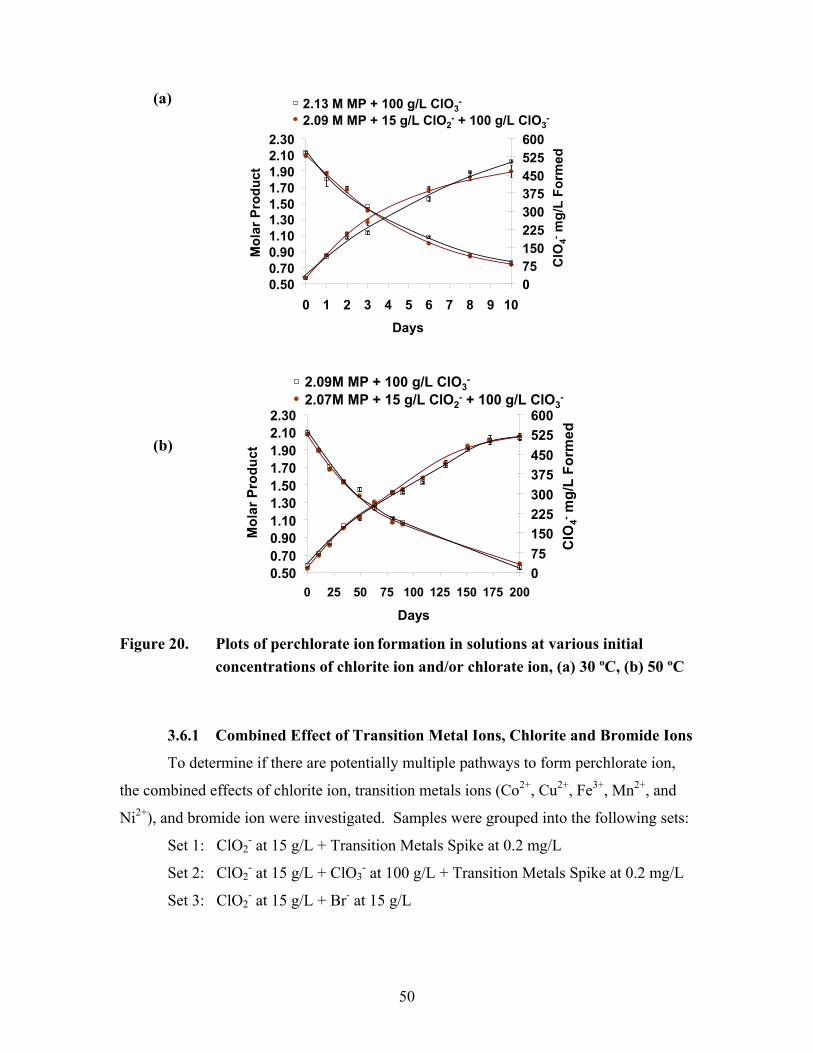
50
0.500.700.901.101.301.501.701.902.102.30
0 1 2 3 4 5 6 7 8 9 10Days
Mol
ar P
rodu
ct
075150225300375450525600
2.13 M MP + 100 g/L ClO3-
2.09 M MP + 15 g/L ClO2- + 100 g/L ClO3
-
ClO
4-m
g/L
Form
ed
0.500.700.901.101.301.501.701.902.102.30
0 25 50 75 100 125 150 175 200
Days
Mol
ar P
rodu
ct
075150225300375450525600
2.09M MP + 100 g/L ClO3-
2.07M MP + 15 g/L ClO2- + 100 g/L ClO3
-
ClO
4-m
g/L
Form
ed
Figure 20. Plots of perchlorate ion formation in solutions at various initial
concentrations of chlorite ion and/or chlorate ion, (a) 30 ºC, (b) 50 ºC
3.6.1 Combined Effect of Transition Metal Ions, Chlorite and Bromide Ions
To determine if there are potentially multiple pathways to form perchlorate ion,
the combined effects of chlorite ion, transition metals ions (Co2+, Cu2+, Fe3+, Mn2+, and
Ni2+), and bromide ion were investigated. Samples were grouped into the following sets:
Set 1: ClO2- at 15 g/L + Transition Metals Spike at 0.2 mg/L
Set 2: ClO2- at 15 g/L + ClO3
- at 100 g/L + Transition Metals Spike at 0.2 mg/L
Set 3: ClO2- at 15 g/L + Br- at 15 g/L
(a)
(b)

51
Pure potassium bromide (ACS Grade) was used for the preparation of bromide
ion spiked solutions. All sample solutions were prepared in duplicate, and incubated at
50 ºC. The reaction between hypochlorite ion and bromide ion, in the pH 10-14 region,82
can be described by Equation 21.
OCl- + Br- → OBr- + Cl- (21)
Thus, similar to chlorite ion, bromide ion is expected to readily react with
hypochlorite ion. The produced hypobromite ion (OBr-) decomposes to produce bromite
and bromate ions,83 as shown in Equations 22 and 23.
OBr- + OBr- → BrO2- + Br- (22)
BrO2- + OBr- → BrO3
- + Br- (23)
Figure 21 shows overlaid smoothed-line plots of hypochlorite ion decomposition
and chlorate ion formation. As, expected, sample solutions spiked with transition metal
ions decompose rapidly, due to the catalytic effects of these ions. Sample solution spiked
with bromide ion results in rapid reaction between hypochlorite and bromide ions, as
described by Equation 21. However, once this reaction is completed (by the first day of
incubation), the rapid decomposition of hypochlorite ion slows down, and for the
remainder of experiment, normal decomposition of hypochlorite ion is observed. Figure
22 shows smoothed-line plots of perchlorate ion formation.
82 Farkas, L., Lewin, M. and Bloch, R. "The Reaction between Hypochlorite and Bromides" J. Am. Chem. Soc. 1949, 71, 1988-1991. 83 Perlmutter-Hayman, B. and Stein, G. "The Kinetics of the Decomposition of Alkaline Solutions of Hypobromite-Specific Ionic Effects on Reaction Rate" J. Phys. Chem. 1959, 63, 734-738.

52
01020304050607080
0 1 2 3 4 5 6Days
OC
l-g/
L D
ecom
pose
d
Set 1: 15 g/L ClO2- + 0.2 mg/L Me
Set 3: 15 g/L ClO2- + 15 g/L Br-
No Spike (Control: 69 g/L OCl- + 27 g/L ClO3-)
Set 2: 15 g/L ClO2- + 100 g/L ClO3
- + 0.2 mg/L Me
Figure 21. Decomposition of hypochlorite ion and formation of chlorate ion at 50
ºC in solutions spiked with bromide, chlorite, and transition metal ions (Me = Co2+, Cu2+, Fe3+, Mn2+, and Ni2+)
0
50
100
150
200
0 1 2 3 4 5 6 7 8 9 10Days
ClO
4-m
g/L
Form
ed
Set 1: 15 g/L ClO2- + 0.2 mg/L Me
Set 2: 15 g/L ClO2- + 100 g/L ClO3
- + 0.2 mg/L MeSet 3: 15 g/L ClO2
- + 15 g/L Br-
No Spike (Control: 69 g/L OCl- + 27 g/L ClO3-)
Figure 22. Formation of perchlorate ion at 50 ºC in solutions spiked with
bromide, chlorite, and transition metal ions (Me = Co2+, Cu2+, Fe3+, Mn2+, and Ni2+)
Figure 22 shows that the non-spiked hypochlorite ion solution (control) produced
considerably more perchlorate ion than in solutions of Set 1 and 3. Thus, it can be
concluded that chlorite ion and transition metal ions, as well as the chlorite and bromide
ion combination do not enhance the formation of perchlorate ion. The solution, spiked
with chlorite/chlorate ions and transition metal ions, produced higher amounts of

53
perchlorate ion than the control solution, due to the higher concentration of chlorate ion
than in the control solution. However, because hypochlorite ion was catalytically-
decomposed, the rate of perchlorate ion formation decreased. Thus, based on the
investigation of the role of chlorite ion, it can be concluded that, there is no additional
pathway to form perchlorate ion, when chlorite ion, bromide ion, and/or transition metals
ions are present. Therefore, these species are not directly involved in formation of
perchlorate ion.
3.7 Effect of Bromide Ion and Bromate Ion Concentration
Conversion of bromide ion to bromate ion was expected by a pathway given by
equations 22-24:
OCl- + Br- → OBr- + Cl- (21)
OBr- + OBr- → BrO2- + Br- (22)
BrO2- + OBr- → BrO3
- + Br- (23)
Thus, in theory the presence of an additional oxidizing agent, such as
hypobromite ion and/or bromite ion, may potentially alter the perchlorate ion formation
pathway. To determine the effects of bromide and bromate ions, potassium bromide,
ACS grade (Fisher Scientific, Pittsburgh, PA), and sodium bromate, 99.5% min (EMD
Chemicals Inc., Gibbstown, NJ), were added to the sodium hypochlorite solutions as
follows:
Set 1: Br- spike at 15 g/L
Set 2: BrO3- spike at 15 g/L
Set 3: Br- + BrO3- spike at 15 g/L
Set 4: Br- spike at 30 g/L
Set 5: BrO3- spike at 30 g/L
Set 6: Br- + BrO3- spike at 30 g/L
Figure 23 shows overlaid plots of hypochlorite ion decomposition in various
hypochlorite ion solutions at pH 12.5. As expected, samples spiked with bromide ion
show a loss in hypochlorite ion initially, and then decompose normally. Figure 23 shows
overlaid plots of bromate ion formation.
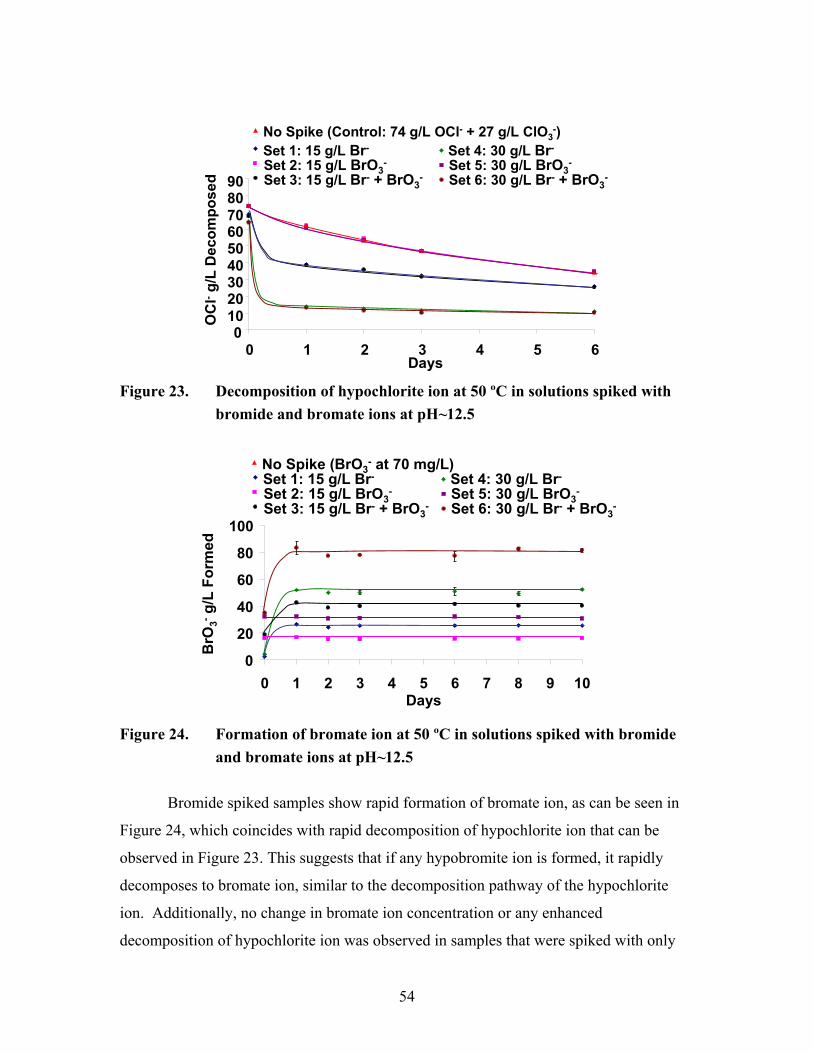
54
0102030405060708090
0 1 2 3 4 5 6Days
Set 1: 15 g/L Br-
Set 2: 15 g/L BrO3-
Set 3: 15 g/L Br- + BrO3-
No Spike (Control: 74 g/L OCl- + 27 g/L ClO3-)
OC
l-g/
L D
ecom
pose
d
Set 4: 30 g/L Br-
Set 5: 30 g/L BrO3-
Set 6: 30 g/L Br- + BrO3-
Figure 23. Decomposition of hypochlorite ion at 50 ºC in solutions spiked with
bromide and bromate ions at pH~12.5
0
20
40
60
80
100
0 1 2 3 4 5 6 7 8 9 10Days
BrO
3-g/
L Fo
rmed
No Spike (BrO3- at 70 mg/L)
Set 1: 15 g/L Br-
Set 2: 15 g/L BrO3-
Set 3: 15 g/L Br- + BrO3-
Set 4: 30 g/L Br-
Set 5: 30 g/L BrO3-
Set 6: 30 g/L Br- + BrO3-
Figure 24. Formation of bromate ion at 50 ºC in solutions spiked with bromide
and bromate ions at pH~12.5 Bromide spiked samples show rapid formation of bromate ion, as can be seen in
Figure 24, which coincides with rapid decomposition of hypochlorite ion that can be
observed in Figure 23. This suggests that if any hypobromite ion is formed, it rapidly
decomposes to bromate ion, similar to the decomposition pathway of the hypochlorite
ion. Additionally, no change in bromate ion concentration or any enhanced
decomposition of hypochlorite ion was observed in samples that were spiked with only

55
bromate ion. Furthermore, Figure 25 show that perchlorate ion formation in bromate ion
spiked samples was identical to control sample (non-spiked sample). This would strongly
suggest that bromate ion is a spectator species that is not involved in formation of
perchlorate ion or decomposition of hypochlorite ion.
Addition of bromide ion caused a decrease in hypochlorite ion concentration,
which in turn lowered the amount of perchlorate ion formed. Thus, similar to effects of
transition metal ions, bromide ion is not involved in perchlorate ion formation; however,
it may affect the rate of perchlorate ion formation due to its reaction with hypochlorite
ion.
020406080
100120140160
0 1 2 3 4 5 6 7 8 9 10Days
No Spike (Control: 74 g/L OCl- + 27 g/L ClO3-)
ClO
4-m
g/L
Form
ed
Set 1: 15 g/L Br-
Set 2: 15 g/L BrO3-
Set 3: 15 g/L Br- + BrO3-
Set 4: 30 g/L Br-
Set 5: 30 g/L BrO3-
Set 6: 30 g/L Br- + BrO3-
Figure 25. Formation of bromate ion at 50 ºC in solutions spiked with bromide
and/or bromate ions at pH~12.5
3.8 Effect of Ionic Strength
The rate of hypochlorite ion decomposition and chlorate ion formation increases
with an increase in the ionic strength, and these effects have been thoroughly quantified
previously.84 As a result it was shown that the rate constant for the hypochlorite ion
84 Adam An Investigation of Factors Involved In The Decomposition of Sodium Hypochlorite.
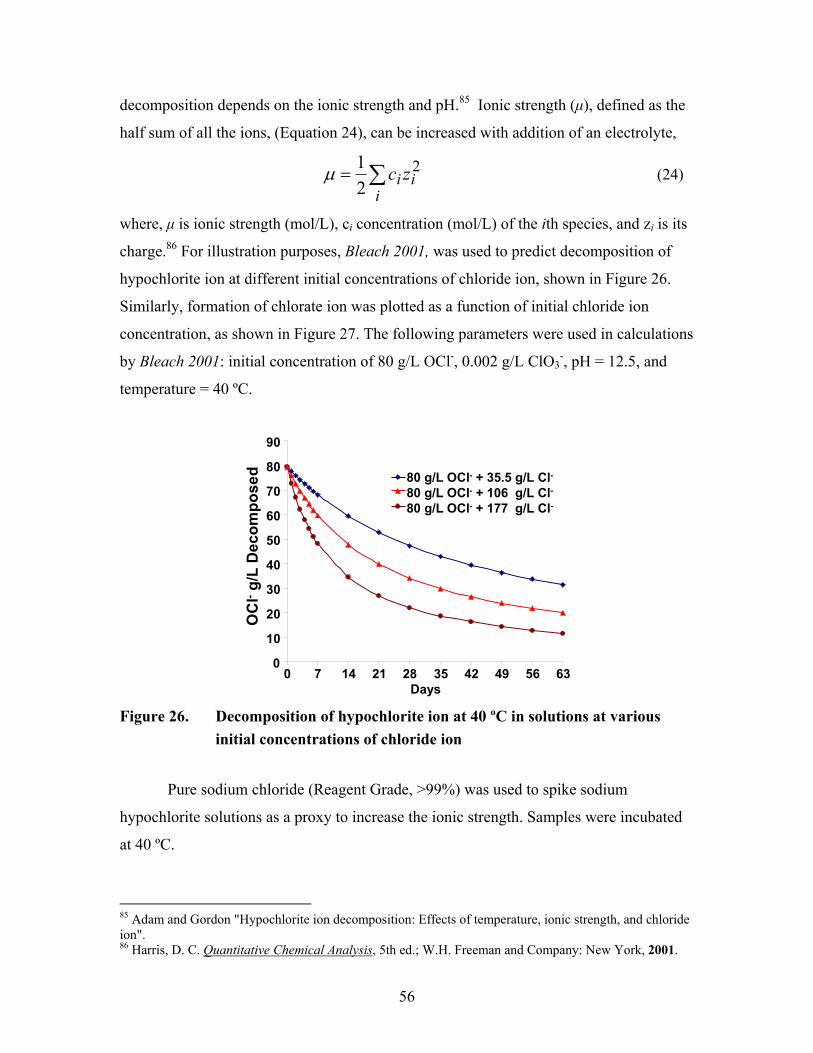
56
decomposition depends on the ionic strength and pH.85 Ionic strength (μ), defined as the
half sum of all the ions, (Equation 24), can be increased with addition of an electrolyte,
221
ii
i zc∑=μ (24)
where, μ is ionic strength (mol/L), ci concentration (mol/L) of the ith species, and zi is its
charge.86 For illustration purposes, Bleach 2001, was used to predict decomposition of
hypochlorite ion at different initial concentrations of chloride ion, shown in Figure 26.
Similarly, formation of chlorate ion was plotted as a function of initial chloride ion
concentration, as shown in Figure 27. The following parameters were used in calculations
by Bleach 2001: initial concentration of 80 g/L OCl-, 0.002 g/L ClO3-, pH = 12.5, and
temperature = 40 ºC.
0
10
20
30
40
50
60
70
80
90
0 7 14 21 28 35 42 49 56 63Days
OC
l-g/
L D
ecom
pose
d 80 g/L OCl- + 35.5 g/L Cl-80 g/L OCl- + 106 g/L Cl-80 g/L OCl- + 177 g/L Cl-
Figure 26. Decomposition of hypochlorite ion at 40 ºC in solutions at various
initial concentrations of chloride ion
Pure sodium chloride (Reagent Grade, >99%) was used to spike sodium
hypochlorite solutions as a proxy to increase the ionic strength. Samples were incubated
at 40 ºC.
85 Adam and Gordon "Hypochlorite ion decomposition: Effects of temperature, ionic strength, and chloride ion". 86 Harris, D. C. Quantitative Chemical Analysis, 5th ed.; W.H. Freeman and Company: New York, 2001.

57
0
5
10
15
20
25
30
35
40
0 7 14 21 28 35 42 49 56 63Days
ClO
3-g/
L Fo
rmed
80 g/L OCl- + 35.5 g/L Cl-80 g/L OCl- + 106 g/L Cl-80 g/L OCl- + 177 g/L Cl-
Figure 27. Formation of chlorate ion at 40 ºC in solutions at various initial concentrations of chloride ion
Figure 28 shows overlaid plots of perchlorate ion formation in sodium
hypochlorite solutions with variable concentrations of chloride ion. Clearly, more
perchlorate ion was formed in samples containing higher concentration of chloride ion.
Thus, it is concluded that the rate of perchlorate ion formation increases at higher ionic
strength. In the bulk, concentrated sodium hypochlorite solutions, concentration of
chloride ion equaled or was greater than hypochlorite ion. In general significant
differences in the ionic strength of the bulk sodium hypochlorite solution were not
expected.
0255075
100125150
0 7 14 21 28 35 42 49 56 63 70 77Day
No Spike (Control: 0.48 M OCl- + 0.62 M ClO3-)
Cl- Spike at 25 g/LCl- Spike at 50 g/LCl- Spike at 100 g/L
ClO
4-m
g/L
Form
ed
Figure 28. Formation of perchlorate ion at 40 ºC in solutions at various initial
concentrations of chloride ion
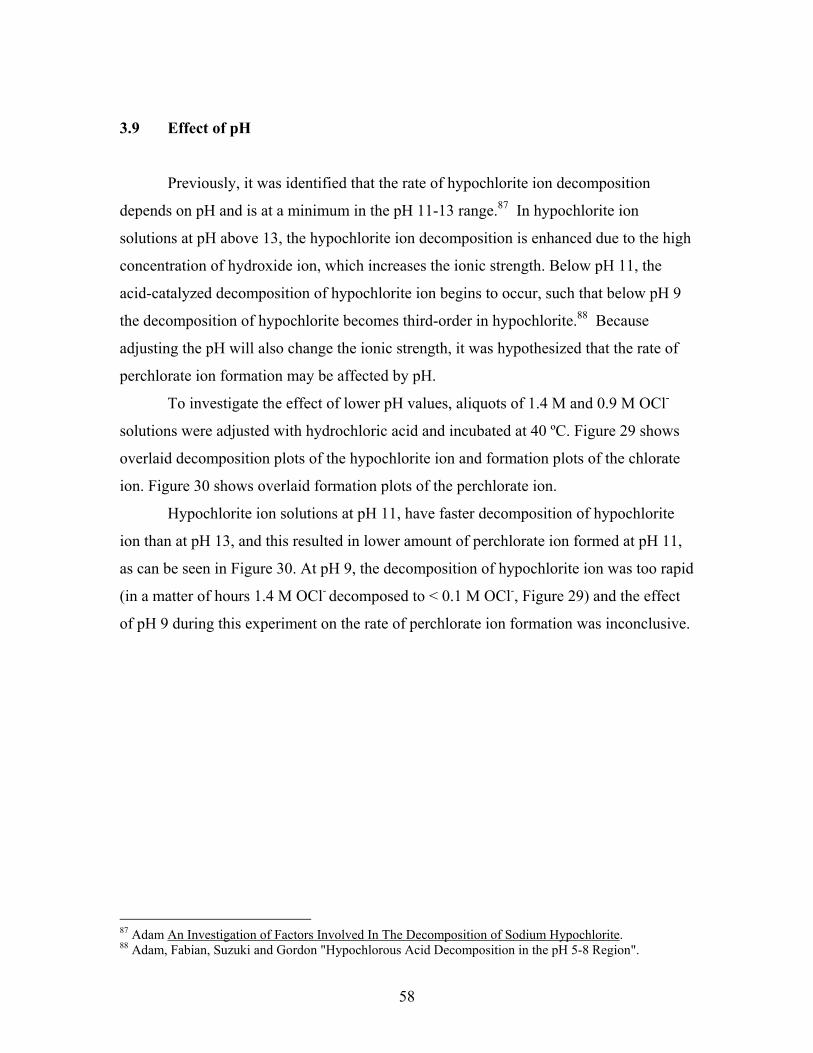
58
3.9 Effect of pH
Previously, it was identified that the rate of hypochlorite ion decomposition
depends on pH and is at a minimum in the pH 11-13 range.87 In hypochlorite ion
solutions at pH above 13, the hypochlorite ion decomposition is enhanced due to the high
concentration of hydroxide ion, which increases the ionic strength. Below pH 11, the
acid-catalyzed decomposition of hypochlorite ion begins to occur, such that below pH 9
the decomposition of hypochlorite becomes third-order in hypochlorite.88 Because
adjusting the pH will also change the ionic strength, it was hypothesized that the rate of
perchlorate ion formation may be affected by pH.
To investigate the effect of lower pH values, aliquots of 1.4 M and 0.9 M OCl-
solutions were adjusted with hydrochloric acid and incubated at 40 ºC. Figure 29 shows
overlaid decomposition plots of the hypochlorite ion and formation plots of the chlorate
ion. Figure 30 shows overlaid formation plots of the perchlorate ion.
Hypochlorite ion solutions at pH 11, have faster decomposition of hypochlorite
ion than at pH 13, and this resulted in lower amount of perchlorate ion formed at pH 11,
as can be seen in Figure 30. At pH 9, the decomposition of hypochlorite ion was too rapid
(in a matter of hours 1.4 M OCl- decomposed to < 0.1 M OCl-, Figure 29) and the effect
of pH 9 during this experiment on the rate of perchlorate ion formation was inconclusive.
87 Adam An Investigation of Factors Involved In The Decomposition of Sodium Hypochlorite. 88 Adam, Fabian, Suzuki and Gordon "Hypochlorous Acid Decomposition in the pH 5-8 Region".
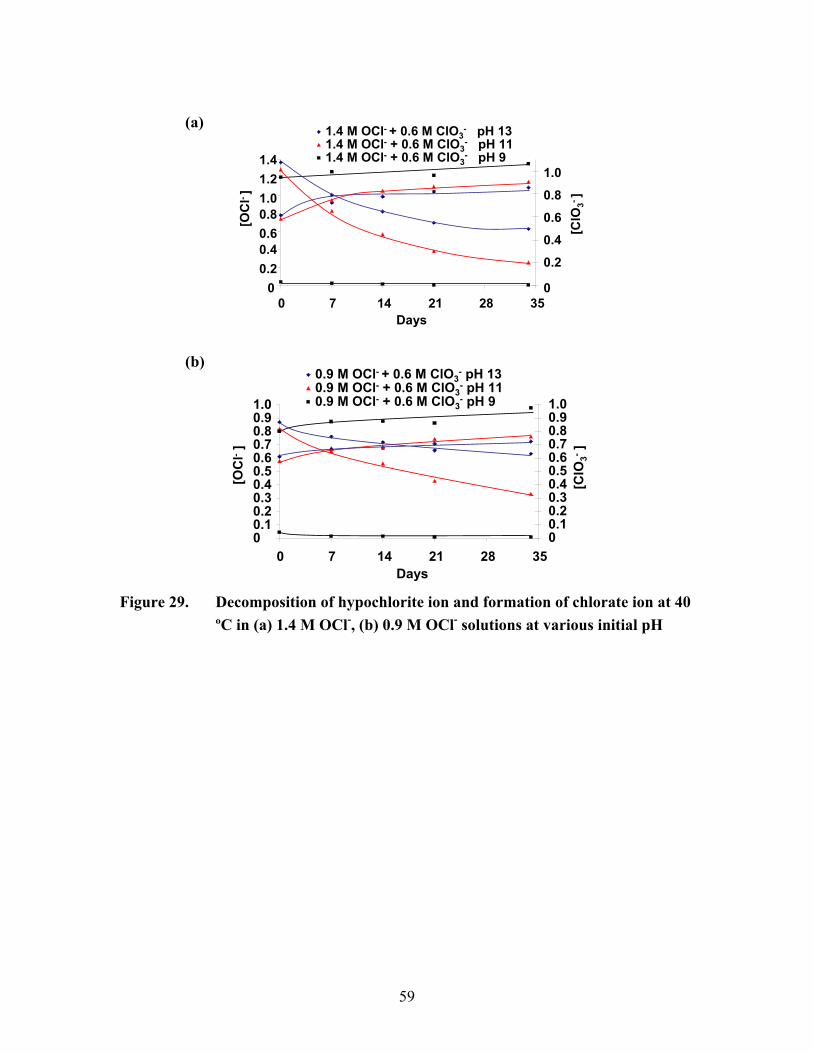
59
00.20.40.60.81.01.21.4
0 7 14 21 28 35Days
[OC
l- ]
0
0.2
0.4
0.6
0.8
1.0
[ClO
3- ]
1.4 M OCl- + 0.6 M ClO3- pH 13
1.4 M OCl- + 0.6 M ClO3- pH 11
1.4 M OCl- + 0.6 M ClO3- pH 9
00.10.20.30.40.50.60.70.80.91.0
0 7 14 21 28 35Days
[OC
l-]
00.10.20.30.40.50.60.70.80.91.0
[ClO
3-]
0.9 M OCl- + 0.6 M ClO3- pH 13
0.9 M OCl- + 0.6 M ClO3- pH 11
0.9 M OCl- + 0.6 M ClO3- pH 9
Figure 29. Decomposition of hypochlorite ion and formation of chlorate ion at 40
ºC in (a) 1.4 M OCl-, (b) 0.9 M OCl- solutions at various initial pH
(a)
(b)

60
050
100150200250300350400
0 7 14 21 28 35 42 49 56 63 70 77Days
1.4 M OCl- + 0.6 M ClO3- pH 13
1.4 M OCl- + 0.6 M ClO3- pH 11
1.4 M OCl- + 0.6 M ClO3- pH 9
ClO
4-m
g/L
Form
ed
0255075
100125150175200
0 7 14 21 28 35 42 49 56 63 70 77Days
ClO
4-m
g/L
Form
ed
0.9 M OCl- + 0.6 M ClO3- pH 13
0.9 M OCl- + 0.6 M ClO3- pH 11
0.9 M OCl- + 0.6 M ClO3- pH 9
Figure 30. Formation of perchlorate ion at 40 ºC in (a) 1.4 M OCl-, (b) 0.9 M
OCl- solutions at various initial pH
As a follow-up experiment to investigate the effects of pH in 9-11 region, aliquots
of an OSG sodium hypochlorite solution were adjusted to different pH values using
sodium hydroxide. Samples solutions at 0.12 M OCl- were adjusted to pH 9.35, 10.65,
11.9, and 13.3. Because decomposition of 0.12 M OCl- solution is quite slow, samples
were incubated at 60 ºC. Figure 31 shows overlaid decomposition plots of hypochlorite
ion and formation plots of chlorate ion for these samples.
(a)
(b)

61
01234567
0 5 10 15 20 25Days
0.12 M OCl- + 0.006 M ClO3- pH 9.35
0.12 M OCl- + 0.006 M ClO3- pH 10.65
0.12 M OCl- + 0.006 M ClO3- pH 11.90
0.12 M OCl- + 0.006 M ClO3- pH 13.30
OC
l-g/
L D
ecom
pose
d
0
0.5
1
1.5
2
2.5
3
0 5 10 15 20 25Days
0.12 M OCl- + 0.006 M ClO3- pH 9.35
0.12 M OCl- + 0.006 M ClO3- pH 10.65
0.12 M OCl- + 0.006 M ClO3- pH 11.90
0.12 M OCl- + 0.006 M ClO3- pH 13.30
ClO
3-g/
L Fo
rmed
Figure 31. Overlaid plots of (a) hypochlorite ion decomposition; (b) chlorate ion
formation at 60 ºC 0.12 M OCl- solutions at various initial pH
As expected, hypochlorite ion solution at pH 9.35 had the fastest rate of
hypochlorite ion decomposition, and the fastest rate of chlorate ion formation as shown in
Figures 31 (a) and (b). Interestingly, the rate of perchlorate ion formation was enhanced
in the sodium hypochlorite solution, having an initial pH of 9.35, as shown in Figure 32.
This would suggest that in dilute hypochlorite ion solutions (such as OSG sodium
hypochlorite), the rate of perchlorate ion formation may be also dependent on pH.
However, from a practical stand-point, perchlorate ion formation is more dependent on
the concentration of hypochlorite and chlorate ions. Thus the effect of pH is relatively
insignificant for bulk, concentrated sodium hypochlorite solutions.
(a)
(b)

62
0
100
200
300
400
500
600
0 3 6 9 12 15 18 21Days
0.12 M OCl- + 0.006 M ClO3- pH 9.35
0.12 M OCl- + 0.006 M ClO3- pH 10.65
0.12 M OCl- + 0.006 M ClO3- pH 11.90
0.12 M OCl- + 0.006 M ClO3- pH 13.30
ClO
4-μg
/L F
orm
ed
Figure 32. Overlaid plots of perchlorate ion formation at 60 ºC 0.12 M OCl-
solutions at various initial pH
3.10 Conclusions
The results of the preliminary experiments, presented in this chapter, indicate that
perchlorate ion formation in sodium hypochlorite solutions is dependent on several
factors: (1) Concentration of hypochlorite and chlorate ions directly impact perchlorate
ion formation; (2) Presence of transition metal ions, chlorite ion or bromide ion indirectly
decrease perchlorate ion formation, by reactions with hypochlorite ion; (3) Presence of
noble metal ions or bromate ion has no observable effect on perchlorate formation; (4)
An increase in chloride ion concentration, as a proxy to increase ionic strength, enhances
perchlorate ion formation and thus would need to be accounted for; (5) pH effects in
concentrated hypochlorite ion solutions are more dominant on hypochlorite ion
decomposition (faster kinetics) than on perchlorate ion formation; however, in more
dilute (i.e. more stable) hypochlorite ion solutions, perchlorate ion formation also appears
to be acid-catalyzed.

63
CHAPTER 4. KINETICS OF PERCHLORATE ION FORMATION AND
DETERMINATION OF THE RATE LAW
The objectives for this portion of the study were to elucidate the rate law for the
formation of perchlorate ion and determine the rate constant(s). The effects of
temperature and ionic strength on the rate constant(s) were investigated in order to
provide a readily usable model (with the fewest number of parameters) for perchlorate
ion formation.
As was shown in the previous chapter, both hypochlorite and chlorate ion
concentrations were found to have a strong effect on the rate of perchlorate ion
formation. An increase in concentration of hypochlorite or chlorate ions consistently
resulted in an increased rate of perchlorate ion formation and the final amount of
perchlorate ion formed. Therefore, the hypothesis that perchlorate ion formation was a
direct result of reactions between hypochlorite and chlorate ions was verified. The most
general stoichiometric reaction, given by Equation 25 was assumed.
−−−− +→+ ClClOClOOCl 43 (25)
Because perchlorate ion formation was dependent on both concentrations of
hypochlorite and chlorate ions, the rate law can be expressed by Equation 26.
pm ClOOClkdt
ClOdRate ][][][32
4 −−−
×== (26)
By taking the natural log of both sides of Equation 26, an expression shown in
Equation 27 is obtained:
]ln[]ln[ln)ln( 32−− ×+×+= ClOpOClmkRate (27)
The rate of perchlorate ion formation and the concentrations of hypochlorite and
chlorate ions can be measured experimentally. The second-order rate constant (k2) can be
determined, if the reaction orders with respect to hypochlorite ion and chlorate ion (m and
p) are known.
To determine the reaction order with respect to hypochlorite and chlorate ions, a
series of experiments were designed where the concentration of hypochlorite or chlorate
ions was varied while holding the concentration of the other reactant constant. Based on
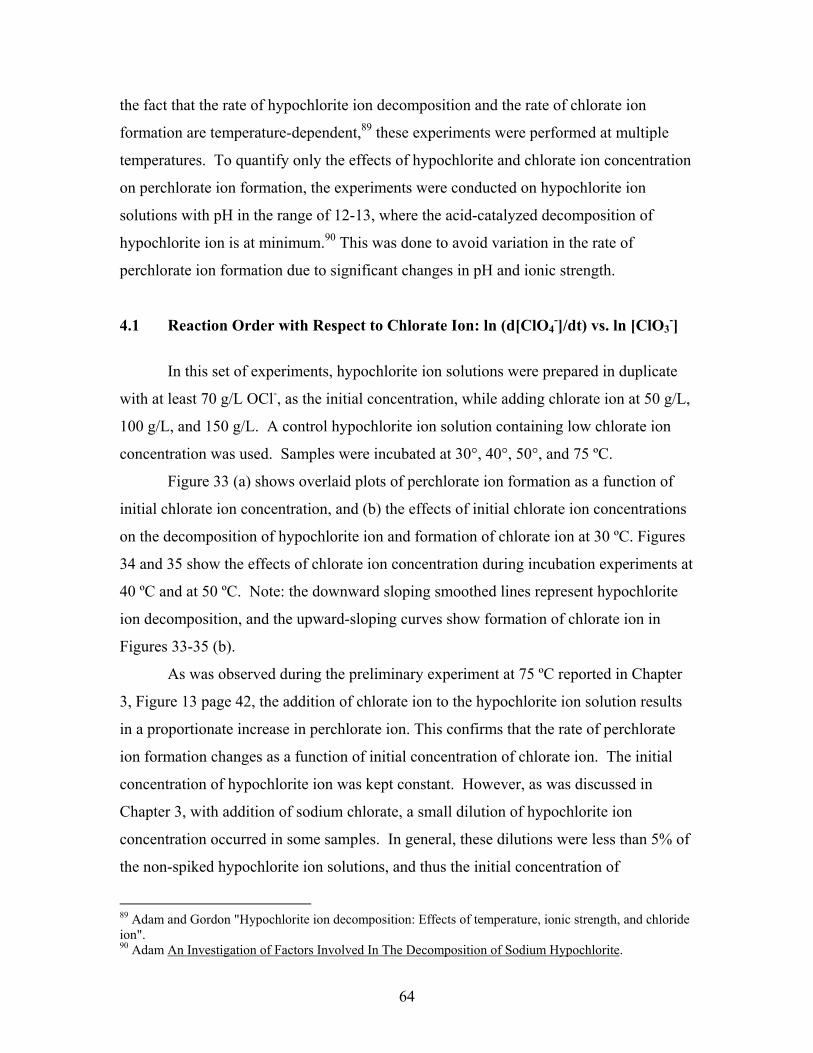
64
the fact that the rate of hypochlorite ion decomposition and the rate of chlorate ion
formation are temperature-dependent,89 these experiments were performed at multiple
temperatures. To quantify only the effects of hypochlorite and chlorate ion concentration
on perchlorate ion formation, the experiments were conducted on hypochlorite ion
solutions with pH in the range of 12-13, where the acid-catalyzed decomposition of
hypochlorite ion is at minimum.90 This was done to avoid variation in the rate of
perchlorate ion formation due to significant changes in pH and ionic strength.
4.1 Reaction Order with Respect to Chlorate Ion: ln (d[ClO4-]/dt) vs. ln [ClO3
-]
In this set of experiments, hypochlorite ion solutions were prepared in duplicate
with at least 70 g/L OCl-, as the initial concentration, while adding chlorate ion at 50 g/L,
100 g/L, and 150 g/L. A control hypochlorite ion solution containing low chlorate ion
concentration was used. Samples were incubated at 30°, 40°, 50°, and 75 ºC.
Figure 33 (a) shows overlaid plots of perchlorate ion formation as a function of
initial chlorate ion concentration, and (b) the effects of initial chlorate ion concentrations
on the decomposition of hypochlorite ion and formation of chlorate ion at 30 ºC. Figures
34 and 35 show the effects of chlorate ion concentration during incubation experiments at
40 ºC and at 50 ºC. Note: the downward sloping smoothed lines represent hypochlorite
ion decomposition, and the upward-sloping curves show formation of chlorate ion in
Figures 33-35 (b).
As was observed during the preliminary experiment at 75 ºC reported in Chapter
3, Figure 13 page 42, the addition of chlorate ion to the hypochlorite ion solution results
in a proportionate increase in perchlorate ion. This confirms that the rate of perchlorate
ion formation changes as a function of initial concentration of chlorate ion. The initial
concentration of hypochlorite ion was kept constant. However, as was discussed in
Chapter 3, with addition of sodium chlorate, a small dilution of hypochlorite ion
concentration occurred in some samples. In general, these dilutions were less than 5% of
the non-spiked hypochlorite ion solutions, and thus the initial concentration of
89 Adam and Gordon "Hypochlorite ion decomposition: Effects of temperature, ionic strength, and chloride ion". 90 Adam An Investigation of Factors Involved In The Decomposition of Sodium Hypochlorite.
65
hypochlorite ion was assumed to be constant. Table 15 shows the changes in
hypochlorite ion concentration in sodium hypochlorite solutions with various
concentrations of chlorate ion.
0100200300400500600700800
0 20 40 60 80 100 120 140 160 180 200Days
ClO
4-m
g/L
84 g/L OCl- + 15 g/L ClO3-84 g/L OCl- + 15 g/L ClO3-
82 g/L OCl- + 63 g/L ClO3-82 g/L OCl- + 63 g/L ClO3-
80 g/L OCl- + 112 g/L ClO3-80 g/L OCl- + 112 g/L ClO3-
77 g/L OCl- + 159 g/L ClO3-77 g/L OCl- + 159 g/L ClO3-
0102030405060708090
100
0 25 50 75 100 125 150 175 200Days
OC
l-g/
L D
ecom
pose
d0
50
100
150
200
250
ClO
3-g/
L Fo
rmed
84 g/L OCl- + 15 g/L ClO3-
82 g/L OCl- + 63 g/L ClO3-
80 g/L OCl- + 112 g/L ClO3-
77 g/L OCl- + 159 g/L ClO3-
Figure 33. Overlaid plots of (a) perchlorate ion formation; (b) decomposition of
hypochlorite ion and formation of chlorate ion at 30 ºC in solutions at various initial concentrations of chlorate ion at pH ~12.5
0100200300400500600700800
0 7 14 21 28 35 42 49 56 63 70 77Days
ClO
4-m
g/L
70 g/L OCl- + 149 g/L ClO3-70 g/L OCl- + 149 g/L ClO3-
72 g/L OCl- + 105 g/L ClO3-72 g/L OCl- + 105 g/L ClO3-
70 g/L OCl- + 28 g/L ClO3-70 g/L OCl- + 28 g/L ClO3-
70 g/L OCl- + 51 g/L ClO3-70 g/L OCl- + 51 g/L ClO3-
0
20
40
60
80
100
0 5 10 15 20 25 30 35Days
0
50
100
150
200
25070 g/L OCl- + 149 g/L ClO3
-70 g/L OCl- + 149 g/L ClO3-
72 g/L OCl- + 105 g/L ClO3-72 g/L OCl- + 105 g/L ClO3-
70 g/L OCl- + 28 g/L ClO3-70 g/L OCl- + 28 g/L ClO3-
70 g/L OCl- + 51 g/L ClO3-70 g/L OCl- + 51 g/L ClO3-
OC
l-g/
L D
ecom
pose
d
ClO
3- g/L
For
med
Figure 34. Overlaid plots of (a) perchlorate ion formation; (b) decomposition of
hypochlorite ion and formation of chlorate ion at 40 ºC in solutions at various initial concentrations of chlorate ion at pH ~12.5
(b) (a)
(b) (a)

66
0100200300400500600700800
0 2 4 6 8 10Days
ClO
4-m
g/L
85 g/L OCl- + 13 g/L ClO3-
84 g/L OCl- + 62 g/L ClO3-
83 g/L OCl- + 110 g/L ClO3-
80 g/L OCl- + 154 g/L ClO3-
0102030405060708090
100
0 2 4 6 8 10Days
OC
l-g/
L D
ecom
pose
d
0
50
100
150
200
250
ClO
3-g/
L Fo
rmed
85 g/L OCl- + 13 g/L ClO3-
84 g/L OCl- + 62 g/L ClO3-
83 g/L OCl- + 110 g/L ClO3-
80 g/L OCl- + 154 g/L ClO3-
Figure 35. Overlaid plots of (a) perchlorate ion formation; (b) decomposition of
hypochlorite ion and formation of chlorate ion at 50 ºC in solutions at various initial concentrations of chlorate ion at pH ~12.5
Table 15. Decomposition of hypochlorite ion at 30 ºC in solutions, at various initial concentrations of chlorate ion ([ClO3
-]0) at pH ~12.5 [OCl-] (mol/L)
Days [ClO3
-]0 15 g/L
[ClO3-]0
63 g/L [ClO3
-]0 112 g/L
[ClO3-]0
159 g/L Mean
(mol/L)Std. Dev.
RSD (%)
0 1.637 1.594 1.557 1.506 1.574 0.056 3.5 11 1.423 1.372 1.322 1.269 1.347 0.066 4.9 21 1.241 1.200 1.148 1.092 1.170 0.065 5.5 34 1.108 1.062 1.012 0.958 1.035 0.065 6.2 49 0.953 0.917 0.877 0.799 0.887 0.066 7.5 63 0.858 0.837 0.777 0.730 0.801 0.058 7.3
As shown in Table 15, the difference in hypochlorite ion concentration becomes
more significant over longer incubation periods. The rates of perchlorate ion formation
were determined during the first thirty-four days of each chlorate ion spike experiment, in
order to minimize the error based on differences in concentration of hypochlorite ion
(after 34 days the difference in hypochlorite ion was 6.2 %, as shown in Table 15). To
calculate the rates of perchlorate ion formation, the change in measured concentration of
perchlorate ion was divided by the incubation interval. For example, after eleven days of
incubation, concentration of perchlorate ion in hypochlorite ion solution with [OCl-]0 =
1.637 M and [ClO3-]0 = 0.178 M increased from 7.10 mg/L ClO4
- to 12.45 mg/L ClO4-,
(b) (a)

67
based on the average of duplicate samples. Thus, 53.8 μmol of ClO4- was produced over
11 days, giving a daily rate of perchlorate ion formation of 4.89 μmol / day. The rates of
perchlorate ion formation were calculated for all samples in each chlorate ion experiment.
To determine the reaction order with respect to the concentration of chlorate ion, the
natural log of the rate of perchlorate ion formation (measured experimentally) was plotted
versus the natural log of the chlorate ion concentration in solutions with the same
concentration of hypochlorite ion. Figure 36 shows the fitted least-squares lines of natural
log of the rate of perchlorate ion formation versus natural log of chlorate ion
concentration over different incubation periods at 30 ºC.
-12.5
-12.0
-11.5
-11.0
-10.5
-10.0
-9.5
-9.0
-2.0 -1.5 -1.0 -0.5 0.0 0.5 1.0ln[ClO3
- ]
y = 1.067x - 10.37R2 = 0.999
y = 0.984x - 10.44R2 = 1.000
y = 1.030x - 10.35R2 = 0.999
Days 0-11
Days 11-21
Days 21-34ln( d
[ClO
4- ]/dt
)
Figure 36. Fitted natural log lines of the rate of perchlorate ion formation as a
function of chlorate ion concentration at 30 ºC in solutions at constant hypochlorite ion at pH ~12.5
Because the rate of hypochlorite ion decomposition increases with temperature,
differences in decomposition rates of solutions at constant hypochlorite ion and at various
concentration of chlorate ion were observed over shorter incubation periods. Figure 34
(b) and Figure 35 (b) shows that hypochlorite ion solutions with higher concentration of
chlorate ion decompose faster. This was taken into account, and the rate of perchlorate
ion formation as a function of chlorate ion concentration was fitted for hypochlorite ion
solutions with a difference in concentration of hypochlorite ion of less than 5 %. Figures
37 and 38 show fitted plots of the ln (Rate) versus ln [ClO3-] for chlorate ion spiked
experiments at 40° and 50 ºC, respectively.

68
y = 1.007x - 9.24R2 = 0.998
y = 1.083x - 9.41R2= 0.985
-11.0
-9.0
-7.0
-5.0
-3.0
-1.2 -0.6 0.0 0.6 1.2
Day 0-7
Day 7-14
ln[ClO3- ]
ln( d
[ClO
4- ]/dt
)
Figure 37. Fitted natural log lines of the rate of perchlorate ion formation as a function of chlorate ion concentration at 40 ºC in solutions at constant hypochlorite ion at pH ~12.5
-3.2
-2.4
-1.6
-0.8
0.0
0.8
-2.0 -1.5 -1.0 -0.5 0.0 0.5 1.0
ln[ClO3- ]
ln( d
[ClO
4- ]/dt
)
y = 0.981x - 0.354R2 = 0.996
Day 0 to 1
y = 1.044x - 0.568R2 = 0.999
Day 1 to 2
Figure 38. Fitted natural log lines of the rate of perchlorate ion formation as a
function of chlorate ion concentration at 50 ºC in solutions at constant hypochlorite ion at pH ~12.5
The slope of the lines in Figures 36-38 represents the reaction order with respect
to chlorate ion concentration (p), while the intercept is the sum of ln(k2) and m× ln[OCl-]
(Equation 28).
]ln[]ln[ln)ln( 32−− ×+×+= ClOpOClmkRate (28)

69
The slope and R-squared values (R2) for the chlorate ion order-fitting at various
temperatures are summarized in Table 16. As can be observed from Table 16, fitting
ln[Rate] versus ln[ClO3-] produces a linear correlation with an average R2=0.994, and
average slope of 1.035 ± 0.042 for experiments conducted at four temperatures. This
strongly suggests that the reaction order is first order in chlorate ion concentration.
Table 16. Reaction order with respect to chlorate ion and corresponding correlation coefficients in solutions at constant hypochlorite ion at pH ~ 12.5 and various temperatures
T, ºC Slope R2 30 1.067 0.999 30 0.984 1.000 30 1.030 0.998 40 1.007 0.998 40 1.083 0.985 50 0.981 0.996 50 1.044 0.999 75 1.086 0.980
Mean 1.035 0.994 Std. Dev. 0.042 0.008
RSD 4.06 0.81
4.2 Reaction Order with Respect to Chlorate Ion: ln (d[ClO4-]/dt) vs. ln [OCl-]
In this set of experiments, aliquots of concentrated stock hypochlorite ion
solutions, with at least 70 g/L OCl- were diluted, to generate duplicate solutions at
various hypochlorite ion concentrations. Sodium chlorate was added to solutions to keep
chlorate ion constant. Samples were incubated at 30°, 40°, 50°, and 75 ºC.
Figure 39 (a) shows overlaid plots of perchlorate ion formation as a function of
initial chlorate ion concentration; (b) the effects of initial chlorate ion concentrations on
the decomposition of hypochlorite ion and formation of chlorate ion at 30 ºC. Figures 40
and 41 show the effects of chlorate ion concentration during incubation experiments at 40
ºC and at 50 ºC. Note: the downward-sloping, smoothed lines in Figures 39-41 (b)
represent hypochlorite ion decomposition, and the upward-sloping, smoothed lines show
formation of chlorate ion. For clarity some plots were omitted in Figure 40 (b). As was

70
predicted, the rate of perchlorate ion formation increases with an increase in
concentration of hypochlorite ion.
0
50
100
150
200
250
300
350
0 20 40 60 80 100 120 140 160 180 200Days
ClO
4-m
g/L
Form
ed
83g/L OCl- + 63g/L ClO3-
51g/L OCl- + 65g/L ClO3-
11g/L OCl- + 65g/L ClO3-
0
20
40
60
80
100
0 25 50 75 100 125 150 175 200O
Cl-
g/L
Dec
ompo
sed
0
20
40
60
80
100
ClO
3-g/
L Fo
rmed
83g/L OCl- + 63g/L ClO3-
51g/L OCl- + 65g/L ClO3-
11g/L OCl- + 65g/L ClO3-
Figure 39. Overlaid plots of (a) perchlorate ion formation; (b) decomposition of
hypochlorite ion and formation of chlorate ion at 30 ºC in solutions at various initial concentrations of hypochlorite ion at pH ~12.5
050
100150200250300350
0 7 14 21 28 35 42 49 56 63 70 77Days
ClO
4-m
g/L
Form
ed
70 g/L OCl- + 51 g/L ClO3-70 g/L OCl- + 51 g/L ClO3-
60 g/L OCl- + 51 g/L ClO3-60 g/L OCl- + 51 g/L ClO3-
52 g/L OCl- + 52 g/L ClO3-52 g/L OCl- + 52 g/L ClO3-
45 g/L OCl- + 51 g/L ClO3-45 g/L OCl- + 51 g/L ClO3-
33 g/L OCl- + 52 g/L ClO3-33 g/L OCl- + 52 g/L ClO3-
25 g/L OCl- + 52 g/L ClO3-25 g/L OCl- + 52 g/L ClO3-
9 g/L OCl- + 51 g/L ClO3-9 g/L OCl- + 51 g/L ClO3-
0102030405060708090
100
0 5 10 15 20 25 30 35Days
g/L
OC
l-D
ecom
pose
d
0102030405060708090100
g/L
ClO
3-Fo
rmed
70 g/L OCl- + 51 g/L ClO3-
52 g/L OCl- + 52 g/L ClO3-
45 g/L OCl- + 51 g/L ClO3-
25 g/L OCl- + 52 g/L ClO3-
Figure 40. Overlaid plots of (a) perchlorate ion formation; (b) decomposition of
hypochlorite ion and formation of chlorate ion at 40 ºC in solutions at various initial concentrations of hypochlorite ion at pH ~12.5
(b) (a)
(b) (a)
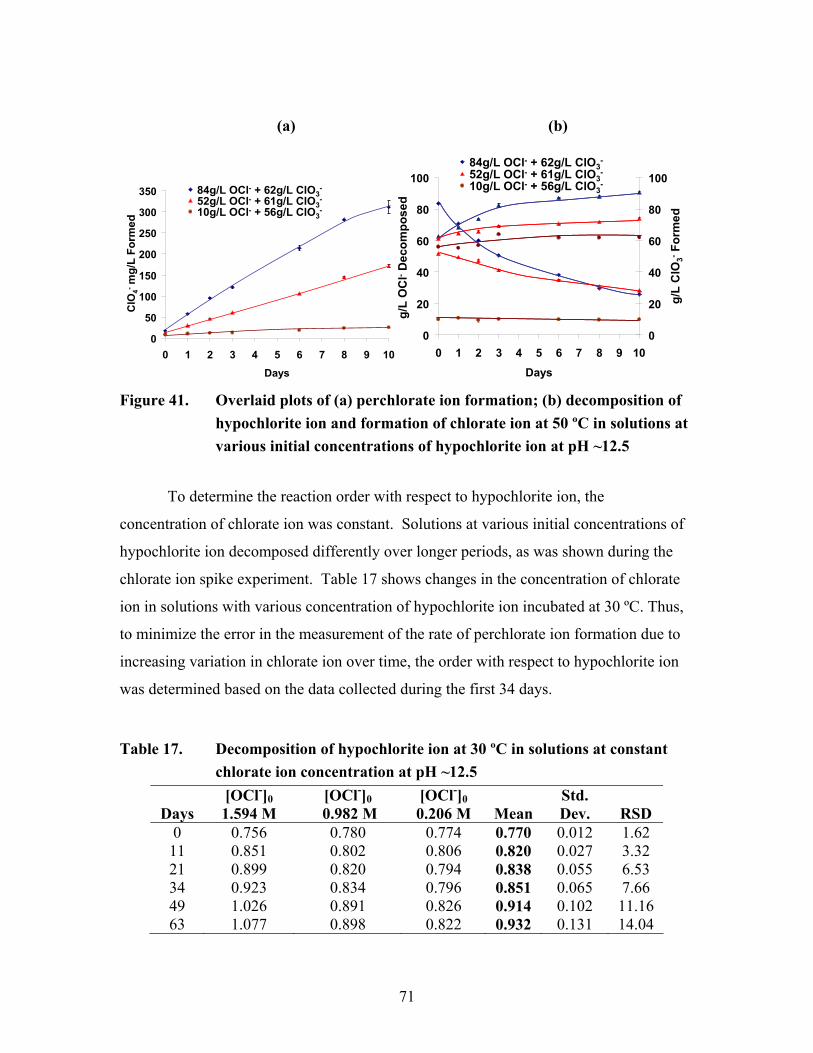
71
0
50
100
150
200
250
300
350
0 1 2 3 4 5 6 7 8 9 10Days
ClO
4-m
g/L
Form
ed
84g/L OCl- + 62g/L ClO3-
52g/L OCl- + 61g/L ClO3-
10g/L OCl- + 56g/L ClO3-
84g/L OCl- + 62g/L ClO3-
52g/L OCl- + 61g/L ClO3-
10g/L OCl- + 56g/L ClO3-
g/L
OC
l-D
ecom
pose
d
g/L
ClO
3-Fo
rmed
0
20
40
60
80
100
0 1 2 3 4 5 6 7 8 9 10Days
0
20
40
60
80
100
Figure 41. Overlaid plots of (a) perchlorate ion formation; (b) decomposition of
hypochlorite ion and formation of chlorate ion at 50 ºC in solutions at various initial concentrations of hypochlorite ion at pH ~12.5
To determine the reaction order with respect to hypochlorite ion, the
concentration of chlorate ion was constant. Solutions at various initial concentrations of
hypochlorite ion decomposed differently over longer periods, as was shown during the
chlorate ion spike experiment. Table 17 shows changes in the concentration of chlorate
ion in solutions with various concentration of hypochlorite ion incubated at 30 ºC. Thus,
to minimize the error in the measurement of the rate of perchlorate ion formation due to
increasing variation in chlorate ion over time, the order with respect to hypochlorite ion
was determined based on the data collected during the first 34 days. Table 17. Decomposition of hypochlorite ion at 30 ºC in solutions at constant
chlorate ion concentration at pH ~12.5
Days [OCl-]0 1.594 M
[OCl-]0 0.982 M
[OCl-]0 0.206 M Mean
Std. Dev. RSD
0 0.756 0.780 0.774 0.770 0.012 1.62 11 0.851 0.802 0.806 0.820 0.027 3.32 21 0.899 0.820 0.794 0.838 0.055 6.53 34 0.923 0.834 0.796 0.851 0.065 7.66 49 1.026 0.891 0.826 0.914 0.102 11.16 63 1.077 0.898 0.822 0.932 0.131 14.04
(b) (a)

72
Figures 42-45 show linear plots of the natural log of the rate of perchlorate ion
formation versus the natural log of hypochlorite ion, at different temperatures. The
observation from these figures is that, in general, the slope of the least squares line is
consistently above 1.0.
-15.0
-14.0
-13.0
-12.0
-11.0
-10.0
-9.0
-2.0 -1.5 -1.0 -0.5 0.0 0.5 1.0
ln[OCl- ]
ln( d
[ClO
4- ]/dt
)y = 1.04x - 11.3R2 = 0.961
y = 1.62x - 11.2R2 = 0.998
y = 1.87x - 11.0R2 = 0.996
Days 0-11
Days 11-21
Days 21-34
Figure 42. Fitted natural log lines of the rate of perchlorate ion formation as a
function of hypochlorite ion concentration at 30 ºC in solutions at constant chlorate ion at pH ~12.5
-14-12-10-8-6-4-20
-2.0 -1.5 -1.0 -0.5 0.0 0.5
y = 1.14x - 7.95R2 = 0.979
y = 1.72x - 9.99R2 = 0.985
y = 1.67x - 9.87R2 = 0.923
Day 0-7
Day 7-14
Day 14-21
ln[OCl- ]
ln( d
[ClO
4- ]/dt
)
Figure 43. Fitted natural log lines of the rate of perchlorate ion formation as a
function of hypochlorite ion concentration at 40 ºC in solutions constant in chlorate ion, with pH ~12.5
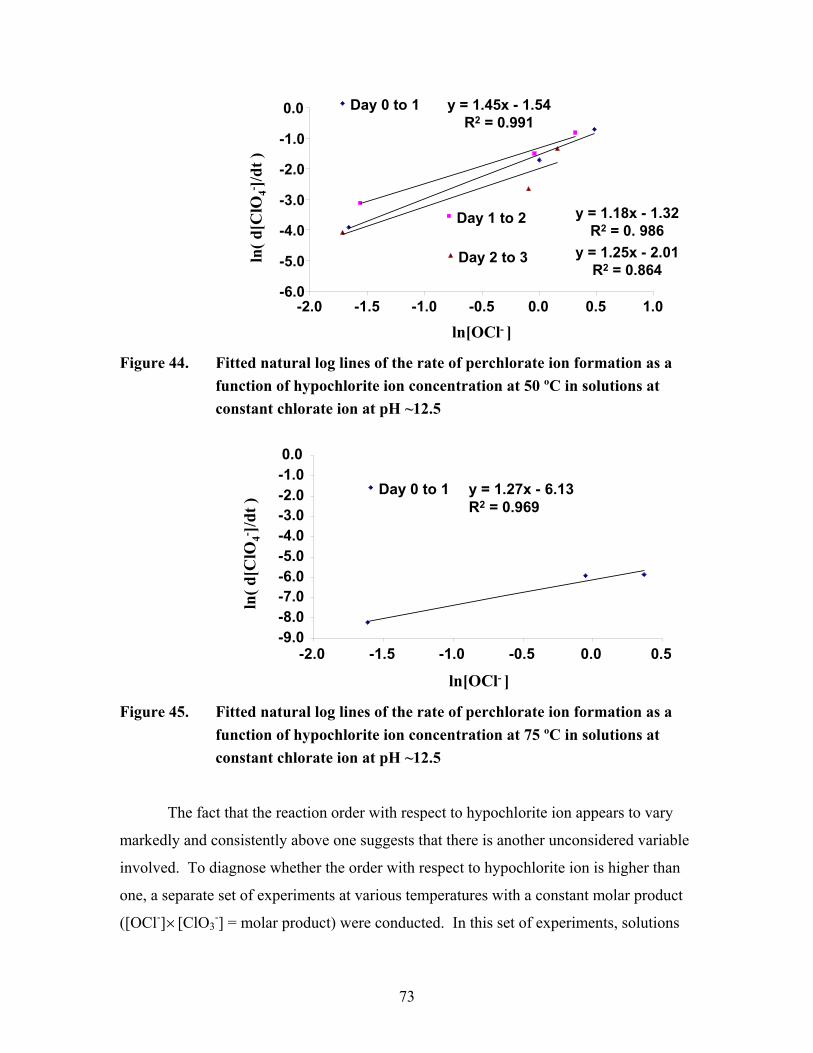
73
-6.0
-5.0
-4.0
-3.0
-2.0
-1.0
0.0
-2.0 -1.5 -1.0 -0.5 0.0 0.5 1.0
Day 0 to 1
Day 1 to 2
Day 2 to 3
y = 1.45x - 1.54R2 = 0.991
y = 1.25x - 2.01R2 = 0.864
y = 1.18x - 1.32R2 = 0. 986
ln[OCl- ]
ln( d
[ClO
4- ]/dt
)
Figure 44. Fitted natural log lines of the rate of perchlorate ion formation as a
function of hypochlorite ion concentration at 50 ºC in solutions at constant chlorate ion at pH ~12.5
-9.0-8.0-7.0-6.0-5.0-4.0-3.0-2.0-1.00.0
-2.0 -1.5 -1.0 -0.5 0.0 0.5
Day 0 to 1 y = 1.27x - 6.13R2 = 0.969
ln[OCl- ]
ln( d
[ClO
4- ]/dt
)
Figure 45. Fitted natural log lines of the rate of perchlorate ion formation as a
function of hypochlorite ion concentration at 75 ºC in solutions at constant chlorate ion at pH ~12.5
The fact that the reaction order with respect to hypochlorite ion appears to vary
markedly and consistently above one suggests that there is another unconsidered variable
involved. To diagnose whether the order with respect to hypochlorite ion is higher than
one, a separate set of experiments at various temperatures with a constant molar product
([OCl-]×[ClO3-] = molar product) were conducted. In this set of experiments, solutions
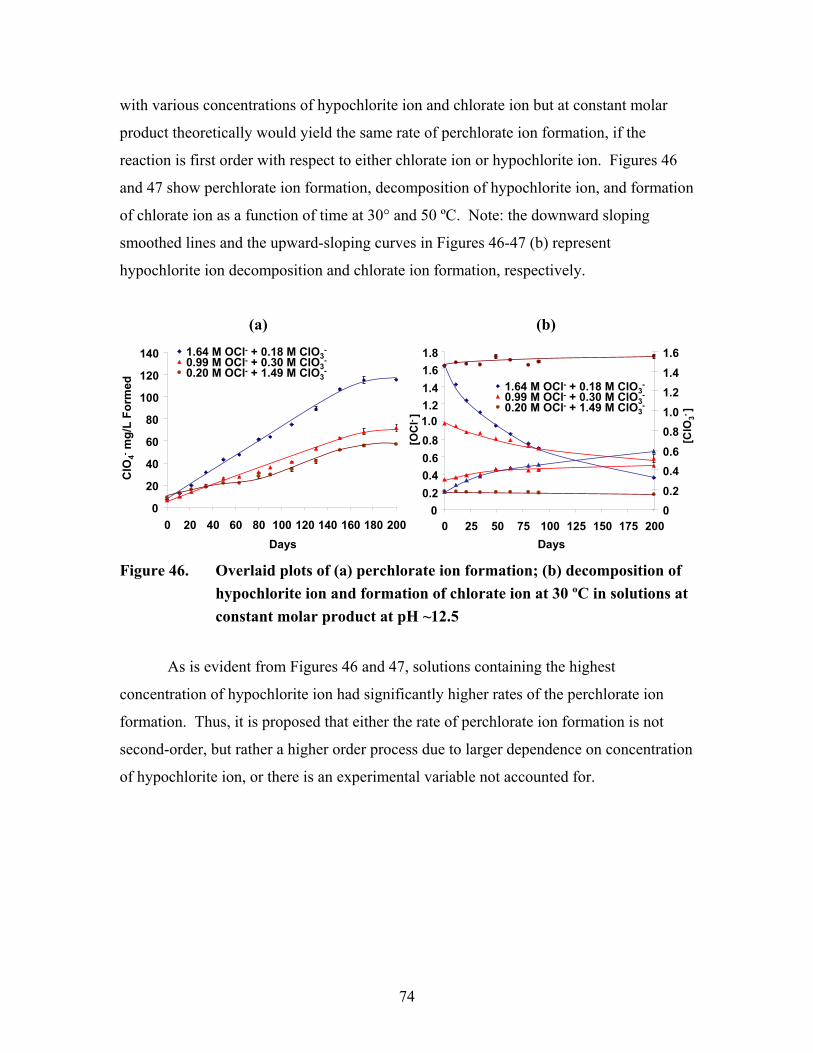
74
with various concentrations of hypochlorite ion and chlorate ion but at constant molar
product theoretically would yield the same rate of perchlorate ion formation, if the
reaction is first order with respect to either chlorate ion or hypochlorite ion. Figures 46
and 47 show perchlorate ion formation, decomposition of hypochlorite ion, and formation
of chlorate ion as a function of time at 30° and 50 ºC. Note: the downward sloping
smoothed lines and the upward-sloping curves in Figures 46-47 (b) represent
hypochlorite ion decomposition and chlorate ion formation, respectively.
0
20
40
60
80
100
120
140
0 20 40 60 80 100 120 140 160 180 200Days
ClO
4-m
g/L
Form
ed
1.64 M OCl- + 0.18 M ClO3-
0.99 M OCl- + 0.30 M ClO3-
0.20 M OCl- + 1.49 M ClO3-
00.20.40.60.81.01.21.41.61.8
0 25 50 75 100 125 150 175 200Days
00.20.40.60.81.01.21.41.6
[OC
l- ]
1.64 M OCl- + 0.18 M ClO3-
0.99 M OCl- + 0.30 M ClO3-
0.20 M OCl- + 1.49 M ClO3-
[ClO
3- ]
Figure 46. Overlaid plots of (a) perchlorate ion formation; (b) decomposition of
hypochlorite ion and formation of chlorate ion at 30 ºC in solutions at constant molar product at pH ~12.5
As is evident from Figures 46 and 47, solutions containing the highest
concentration of hypochlorite ion had significantly higher rates of the perchlorate ion
formation. Thus, it is proposed that either the rate of perchlorate ion formation is not
second-order, but rather a higher order process due to larger dependence on concentration
of hypochlorite ion, or there is an experimental variable not accounted for.
(b) (a)

75
0
20
40
60
80
100
120
140
0 1 2 3 4 5 6 7 8 9 10Days
ClO
4-m
g/L
Form
ed
1.68 M OCl- + 0.16 M ClO3-
1.01 M OCl- + 0.26 M ClO3-
0.20 M OCl- + 1.32 M ClO3-
00.20.40.60.8
11.21.41.61.8
0 1 2 3 4 5 6 7 8 9 10Days
[OC
l- ]
0
0.2
0.4
0.6
0.8
1
1.2
1.4
[ClO
3- ]
1.68 M OCl- + 0.16 M ClO3-
1.01 M OCl- + 0.26 M ClO3-
0.20 M OCl- + 1.32 M ClO3-
Figure 47. Overlaid plots of (a) perchlorate ion formation; (b) decomposition of
hypochlorite ion and formation of chlorate ion at 50 ºC in solutions at constant molar product at pH ~12.5
4.3 Multiple Reaction Pathways
To investigate the discrepancy in the order with respect to hypochlorite ion,
multiple reaction pathways were considered. Fitting of the data, based on the assumption
that perchlorate ion formation is a second-order overall process, resulted in variable
reaction order with respect to hypochlorite ion. This suggested an order higher than one.
Thus, a second reaction involving hypochlorite ion was considered. Thus, hypothetically,
if perchlorate ion formation is a two-reaction process, then the reactions are either
parallel or consecutive pathways.
A parallel reaction pathway, given by Equation 28, may involve a sum of
reactions that are first-order and second-order in hypochlorite ion. Where k1 is a second-
order rate constant, and k2 is a third-order rate constant.
][][]][[][3
2231
4 −−−−−
+== ClOOClkClOOClkdt
ClOdRate (28)
A consecutive reaction pathway, given by Equation 29, may involve a
competitive pre-equilibrium reaction with another hypochlorite ion to form an
(b) (a)

76
intermediate. This pre-equilibrium reaction is followed by decomposition of the
intermediate to form either reactants or products. Where ka, is a rate constant that drives
the reaction to form products, and the value of rate constant, kb, determines the extent of
the forward reaction.
][1
][][][ 32
4−
−−−
+==
OClkClOOClk
dtClOdRate
b
a (29)
4.3.1 Parallel Reaction Pathway
To investigate the parallel reaction pathway, data from experiments that varied in
hypochlorite ion but constant in chlorate ion concentration were used to determine the
values of k1 and k2. If Equation 28 is rearranged by dividing by the concentration of
hypochlorite ion and concentration of chlorate ion (molar product of the two reactants),
Equation 30 is obtained.
][]][[
213
−−−
+= OClkkClOOCl
Rate (30)
When the [Rate / ([OCl-]× [ClO3-])] is plotted versus [OCl-] (for constant chlorate
ion experiments), a linear correlation will provide values of k2 (the slope of the line) and
k1 (the intercept). Figure 48 shows linear plots at different temperatures. Table 18 shows
the values of k2 and k1 at each temperature, calculated from the slope and intercept of the
fitted lines in Figure 48.

77
y = 8.42∗10-6x + 7.29∗10-6
R2 = 0.995
0.0
5.0 ∗10-5
1.0 ∗10-5
1.5 ∗10-5
2.0 ∗10-5
2.5 ∗10-5
0.0 0.2 0.4 0.6 0.8 1.0 1.2 1.4 1.6 1.8[OCl-]
Rat
e/[O
Cl- ][
ClO
3- ]
y = 3.47 ∗10-5x + 1.87∗10-5
R2 = 0.984
0.01.0∗10-52.0∗10-53.0∗10-54.0∗10-55.0∗10-56.0∗10-57.0∗10-5
0.0 0.2 0.4 0.6 0.8 1.0 1.2 1.4 1.6
Rat
e/[O
Cl- ][
ClO
3- ]
[OCl-]
y = 1.32∗10-4x + 8.63∗10-5
R2 = 0.999
0.05.0∗10-41.0∗10-41.5∗10-42.0∗10-42.5∗10-43.0∗10-43.5∗10-4
0.0 0.5 1.0 1.5 2.0
[OCl-]
Rat
e/[O
Cl- ][
ClO
3- ]
Figure 48. Parallel reaction pathway linear fitted plots of (a) 30 ºC experiment;
(b) 40 ºC experiment; (c) 50 ºC experiment; in solutions at constant chlorate ion and various inial voncentrations of hypochlorite ion at pH ~12.5
(a) 30 ºC
(b) 40 ºC
(c) 50 ºC

78
Table 18. Parallel reaction pathway experimental rate constants in solutions, at various hypochlorite ion and constant chlorate ion, at pH ~12.5
T, ºC k2 × 106 M-2·d-1 k1 ×106
M-1·d-1 R2 k2/k1 30 8.43 7.29 0.995 1.16 40 34.7 18.7 0.984 1.85 50 132 86.3 0.999 1.53
An initial analysis of k2 and k1 values shows that both rate constants increase with
temperature; however, the ratio of k2/k1 is changing. In general, it may be expected that if
there is a temperature dependence, the effect of temperature on the two rate constants
may not be the same. The ratio of the rate constants therefore would be expected to
increase or decrease (have a consistent trend) but not go up and down. This suggests that
although a reasonable fitting can be established, there still appears to be a degree of
uncertainty in the parallel pathway model.
4.3.2 Consecutive Reaction Pathway
To investigate the consecutive reaction pathway, data from experiments that
varied in hypochlorite ion concentration at constant chlorate ion concentration were used
to determine the values of ka and kb. Equation 29 can be rearranged by dividing both
sides of the equation by the concentration of hypochlorite ion to obtain Equation 31:
]])[[1(
][][][
32
−−
−−
− +=
OClOClkClOOClk
OClRate
b
a (31)
If, Equation 31 is inverted and both sides are multiplied by the concentration of
chlorate ion, Equation 32 results:
][][
]][])[[1(]][[
32
33−−
−−−−− +=
ClOOClkClOOClOClk
RateClOOCl
a
b (32)
Equation 33 results from cancelling the common terms on the right side of
Equation 32.
a
b
a kk
OClkRateClOOCl
+=−
−−
][1]][[ 3 (33)
By plotting the quantity [OCl-]× [ClO3-]/(Rate) versus 1/[OCl-], the values of ka
and kb can be determined from the least-squares lines: the slope equals 1/ka and the
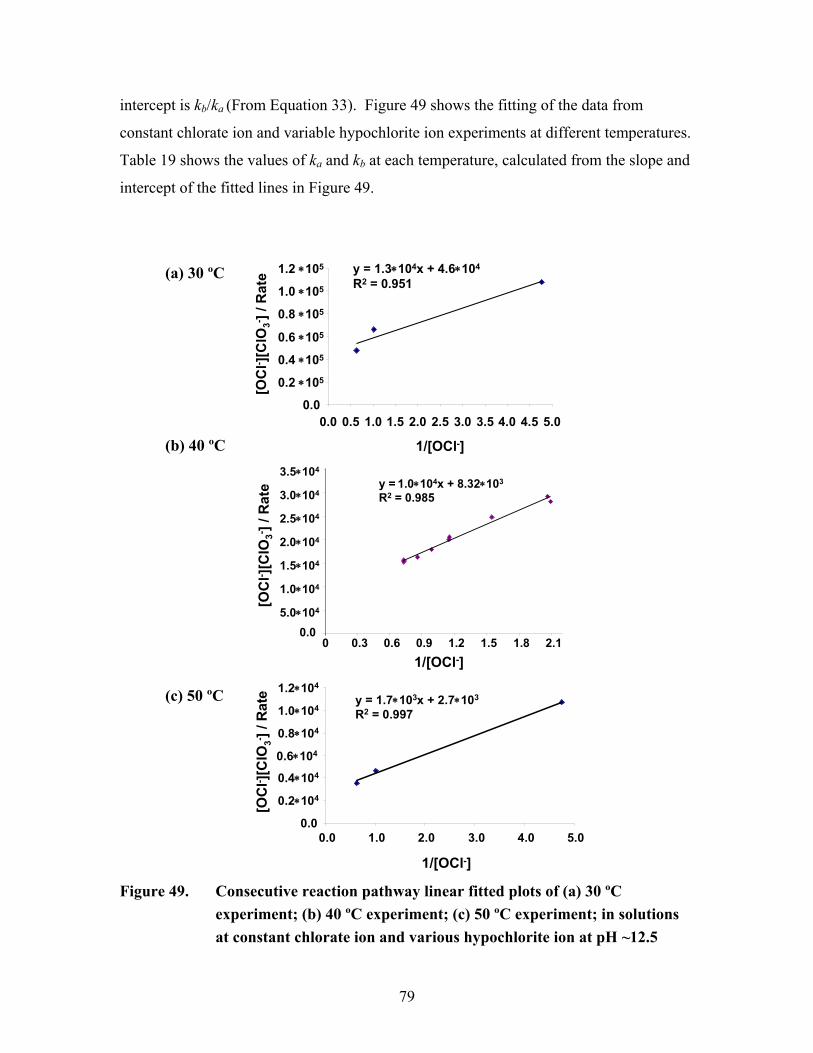
79
intercept is kb/ka (From Equation 33). Figure 49 shows the fitting of the data from
constant chlorate ion and variable hypochlorite ion experiments at different temperatures.
Table 19 shows the values of ka and kb at each temperature, calculated from the slope and
intercept of the fitted lines in Figure 49.
y = 1.3∗104x + 4.6∗104
R2 = 0.951
0.0
0.2 ∗105
0.4 ∗105
0.6 ∗105
0.8 ∗105
1.0 ∗105
1.2 ∗105
0.0 0.5 1.0 1.5 2.0 2.5 3.0 3.5 4.0 4.5 5.0
1/[OCl-]
[OC
l- ][C
lO3- ]
/ Rat
e
0.05.0∗104
1.0∗104
1.5∗104
2.0∗104
2.5∗104
3.0∗104
3.5∗104
0 0.3 0.6 0.9 1.2 1.5 1.8 2.11/[OCl-]
y = 1.0∗104x + 8.32∗103
R2 = 0.985
[OC
l- ][C
lO3- ]
/ Rat
e
y = 1.7∗103x + 2.7∗103
R2 = 0.997
0.0
0.2∗104
0.4∗104
0.6∗104
0.8∗104
1.0∗104
1.2∗104
0.0 1.0 2.0 3.0 4.0 5.0
1/[OCl-]
[OC
l- ][C
lO3- ]
/ Rat
e
Figure 49. Consecutive reaction pathway linear fitted plots of (a) 30 ºC
experiment; (b) 40 ºC experiment; (c) 50 ºC experiment; in solutions at constant chlorate ion and various hypochlorite ion at pH ~12.5
(a) 30 ºC
(b) 40 ºC
(c) 50 ºC

80
Table 19. Consecutive reaction pathway experimental rate constants at various initial concentrations of hypochlorite ion and constant chlorate ion at pH ~12.5 T, ºC ka ×106
M-2·d-1 kb M-1·d-1 R2 kb / ka 30 76.1 3.49 0.951 45,800 40 100 0.83 0.985 8,300 50 591 1.59 0.997 2,700
The linear fit of the experimental data to a consecutive reaction pathway for the
30 ºC experiment, shown in Figure 49, has a low R-squared value of 0.951. In addition,
as shown in Table 19, the second-order rate constant, kb, is highly-variable at different
temperatures, with no consistent trend. This would indicate that either more experiments
are needed to provide better fits or the model based on the consecutive reaction pathway
does not fit the experimental data.
The data analysis in this and previous sections, demonstrates the possibility that
the reaction order with respect to hypochlorite ion may be greater than one; however,
both models based on a parallel or consecutive reaction pathway fit the experimental data
poorly and provide inconsistent trends in the values of determined rate constants. This
strongly indicates a dependence of the rate constant(s) on an additional variable that has
not been considered in attempted models to fit the experimental data.
4.4 Ionic Strength Effect on the Rate of Perchlorate Ion Formation
Based on the analysis of data and observations drawn from experiments, it was
hypothesized that perhaps a simpler explanation for the variability based on the reaction
order for hypochlorite ion may arise from the rate dependence on the ionic strength of
perchlorate ion formation.
In Chapter 3, an increase in ionic strength by addition of sodium chloride to the
hypochlorite solutions resulted in an increased rate of perchlorate ion formation (Figure
28 page 56). When examining the measured ionic strength of solutions with various
concentrations of chlorate ion as presented in Table 20, it was discovered that the
differences in ionic strength of these solutions were not significant. Thus, the
experimentally-measured reaction order with respect to chlorate ion of one must be valid.

81
Table 20. Ionic strength (μ) of hypochlorite ion solutions at various chlorate ion at 40 ºC experiments (TDS = Total Dissolved Solids)
[ClO3-], mol/L [OCl-], mol/L μ, mol/L pH TDS, g/L
1.788 1.355 7.96 12.99 318 1.449 1.384 7.66 12.52 307 1.254 1.395 7.48 12.96 299 0.907 1.393 7.11 12.95 284 0.432 1.372 6.56 12.93 263 0.337 1.370 6.46 12.94 259 Mean 1.38 7.21 12.88
Std. Dev. 0.02 0.60 0.18 RSD 1.11 8.37 1.38
Incubation experiments at 40 ºC had the largest number of sample solutions with
varying hypochlorite ion. The ionic strength and pH values are presented in Table 21.
What is evident from Table 21 is the change in ionic strength of the solutions with
various concentrations of hypochlorite ion is significant (1.76-6.72 mol/L).
Table 21. Ionic strength (μ) of hypochlorite ion solutions at various hypochlorite ion at 40 ºC experiments (TDS=Total Dissolved Solids)
[OCl-], mol/L [ClO3-], mol/L μ, mol/L pH TDS, g/L
1.366 0.619 6.72 13.00 268.7 1.371 0.610 6.80 12.99 272.0 1.166 0.619 6.02 12.96 240.6 1.012 0.623 5.38 12.91 215.1 0.871 0.605 4.80 12.84 192.1 0.867 0.615 4.78 12.82 191.3 0.646 0.618 3.78 12.70 151.4 0.478 0.621 3.14 12.60 125.7 0.485 0.614 3.10 12.56 124.1 0.178 0.610 1.76 12.21 70.2 Mean 0.620 4.63 12.76
Std. Dev. 0.006 1.67 0.25 RSD 0.90 36.09 1.95
In fact, the observed rates of perchlorate ion formation seem to increase with the
increase in ionic strength and coincidently with the increase in hypochlorite ion
concentration, shown in Figure 50.

82
y = 1.24∗10-6x2 – 6.44 ∗10-8x -1.37∗10-6
R2 = 0.999
0.0 1.0 2.0 3.0 4.0 5.0 6.0 7.00.0
2.0∗10-5
4.0∗10-5
6.0∗10-5
ln( d
[ClO
4- ]/dt
)
Ionic Strength (μ), mol/L
0.0 0.2 0.4 0.6 0.8 1.0 1.2 1.4 1.6
y = 1.78∗10-5x2 + 1.70 ∗10-5x -1.63∗10-6
R2 = 0.997
0.0
2.0∗10-5
4.0∗10-5
6.0∗10-5
ln( d
[ClO
4- ]/dt
)
[OCl-], mol/L Figure 50. Rate of perchlorate ion formation as a function of (a) ionic strength;
(b) concentration of hypochlorite ion, at 40 ºC
The plots of the rate of perchlorate formation as a function of ionic strength and
hypochlorite ion show very similar behavior, as can be seen in Figure 50. At low ionic
strength and low concentrations of hypochlorite ion, the rate of perchlorate ion formation
changes more slowly. At ionic strength above 2.0 M and 0.5 M OCl-, the rate of
perchlorate ion formation correlates linearly. The marked agreement between both plots
is a strong indication that both ionic strength and hypochlorite ion concentration affects
the rate of perchlorate ion formation and needs to be deconvoluted.
(a)
(b)

83
The main objectives are to elucidate the rate law for formation of perchlorate ion
and determine the rate constant(s) and provide a readily usable model (with the fewest
number of parameters) for perchlorate ion formation. A strong dependence of the rate of
perchlorate ion formation on the ionic strength, introduces an additional term that must be
related to the rate constant(s). To investigate the relationship of the ionic strength and the
rate constant(s) of perchlorate ion formation, an assumption about the rate law is needed.
Multiple reactions have been considered but involve two rate constants. A
simpler starting point can be based on a single, second-order reaction that takes place
between hypochlorite and chlorate ions. The rate of perchlorate ion formation is shown in
Equation 27:
pm ClOOClkdt
ClOdRate ][][][32
4 −−−
×== (27)
The order with respect to chlorate ion has been determined to be first-order, based
on experimental data from solutions at various chlorate ion and constant ionic strength
(Tables 16 and 21). Because the solutions at various concentration of the hypochlorite
ion were coincidently at various ionic strengths, a hypothesis is needed for differentiation
of the perchlorate ion formation dependence on hypochlorite ion and ionic strength. As
an approach to deconvolute both effects, the order with respect to hypochlorite ion was
assumed to be first-order. Thus, a simpler model based on reaction that is first-order in
both (m, p = 1) chlorate and hypochlorite ions is obtained, allowing determination of the
second-order rate constant by Equation 34.
][ClO][OCl
Ratek3
2 −− ×= (34)
The fitting of the experimental rate of perchlorate ion formation as a function of
ionic strength from the 40 ºC experiments, as shown in Figure 50, demonstrated linearity
at ionic strengths greater than 2 M. However, before any further conclusions can be
made, an expression relating the second-order rate constant, k2, and ionic strength is
needed.
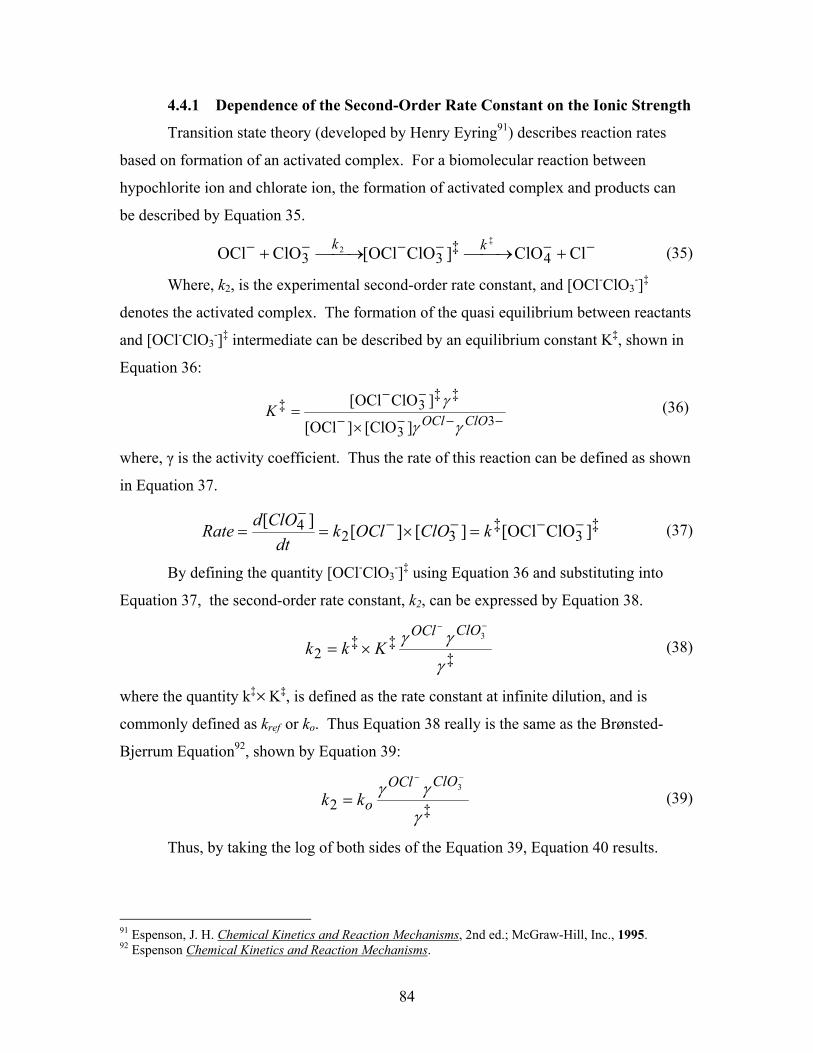
84
4.4.1 Dependence of the Second-Order Rate Constant on the Ionic Strength
Transition state theory (developed by Henry Eyring91) describes reaction rates
based on formation of an activated complex. For a biomolecular reaction between
hypochlorite ion and chlorate ion, the formation of activated complex and products can
be described by Equation 35.
−−−−−− +⎯→⎯⎯→⎯+ ClClO]ClOOCl[ClOOCl 4‡
33‡
2 kk (35)
Where, k2, is the experimental second-order rate constant, and [OCl-ClO3-]‡
denotes the activated complex. The formation of the quasi equilibrium between reactants
and [OCl-ClO3-]‡ intermediate can be described by an equilibrium constant K‡, shown in
Equation 36:
−−−−
−−
×=
33
‡‡3‡
][ClO][OCl
]ClOOCl[ClOOCl
Kγγ
γ (36)
where, γ is the activity coefficient. Thus the rate of this reaction can be defined as shown
in Equation 37.
‡3
‡32
4 ]ClOOCl[][][][ −−−−−
=×== kClOOClkdt
ClOdRate (37)
By defining the quantity [OCl-ClO3-]‡ using Equation 36 and substituting into
Equation 37, the second-order rate constant, k2, can be expressed by Equation 38.
‡
‡‡2
3
γ
γγ−−
×=ClOOCl
Kkk (38)
where the quantity k‡×K‡, is defined as the rate constant at infinite dilution, and is
commonly defined as kref or ko. Thus Equation 38 really is the same as the Brønsted-
Bjerrum Equation92, shown by Equation 39:
‡2
3
γ
γγ−−
=ClOOCl
okk (39)
Thus, by taking the log of both sides of the Equation 39, Equation 40 results.
91 Espenson, J. H. Chemical Kinetics and Reaction Mechanisms, 2nd ed.; McGraw-Hill, Inc., 1995. 92 Espenson Chemical Kinetics and Reaction Mechanisms.
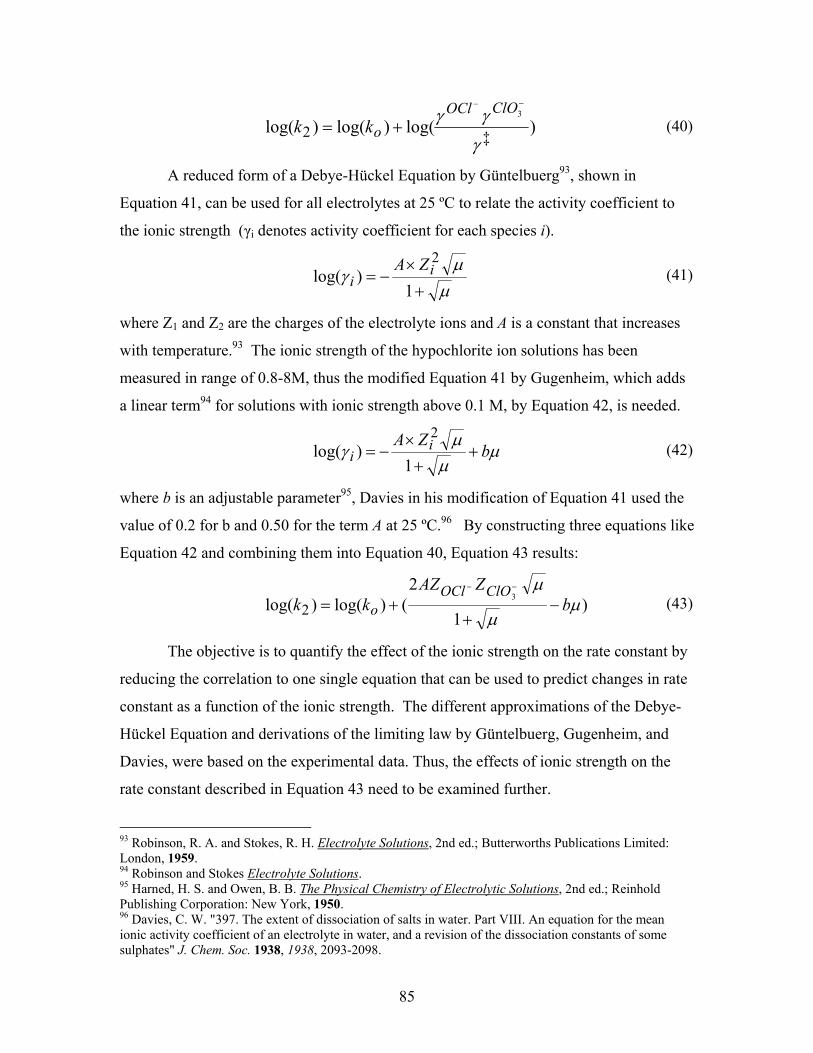
85
)log()log()log( ‡23
γ
γγ−−
+=ClOOCl
okk (40)
A reduced form of a Debye-Hückel Equation by Güntelbuerg93, shown in
Equation 41, can be used for all electrolytes at 25 ºC to relate the activity coefficient to
the ionic strength (γi denotes activity coefficient for each species i).
μμ
γ+×
−=1
)log(2i
iZA (41)
where Z1 and Z2 are the charges of the electrolyte ions and A is a constant that increases
with temperature.93 The ionic strength of the hypochlorite ion solutions has been
measured in range of 0.8-8M, thus the modified Equation 41 by Gugenheim, which adds
a linear term94 for solutions with ionic strength above 0.1 M, by Equation 42, is needed.
μμμ
γ bZA i
i ++×
−=1
)log(2
(42)
where b is an adjustable parameter95, Davies in his modification of Equation 41 used the
value of 0.2 for b and 0.50 for the term A at 25 ºC.96 By constructing three equations like
Equation 42 and combining them into Equation 40, Equation 43 results:
)1
2()log()log( 3
2 μμ
μb
ZAZkk
ClOOClo −
++=
−−
(43)
The objective is to quantify the effect of the ionic strength on the rate constant by
reducing the correlation to one single equation that can be used to predict changes in rate
constant as a function of the ionic strength. The different approximations of the Debye-
Hückel Equation and derivations of the limiting law by Güntelbuerg, Gugenheim, and
Davies, were based on the experimental data. Thus, the effects of ionic strength on the
rate constant described in Equation 43 need to be examined further.
93 Robinson, R. A. and Stokes, R. H. Electrolyte Solutions, 2nd ed.; Butterworths Publications Limited: London, 1959. 94 Robinson and Stokes Electrolyte Solutions. 95 Harned, H. S. and Owen, B. B. The Physical Chemistry of Electrolytic Solutions, 2nd ed.; Reinhold Publishing Corporation: New York, 1950. 96 Davies, C. W. "397. The extent of dissociation of salts in water. Part VIII. An equation for the mean ionic activity coefficient of an electrolyte in water, and a revision of the dissociation constants of some sulphates" J. Chem. Soc. 1938, 1938, 2093-2098.

86
In the context of chemical reactions, higher ionic strength results in an increase of
the net charge of the ionic atmosphere of each ion, thereby reducing attraction between a
cation and an anion and reducing the repulsive forces between ions of the same polarity.
Thus, ions of the same charge polarity are more likely to come together, as they are
stabilized by electrostatic attractions. An increase in ionic strength favors interactions of
the charged ions and activated complex over those between the reactants and the charged
ions, thus the rate constant increases. Furthermore, the formation of activated complex
due to ion-ion pairing becomes increasingly dependent on ionic strength above 0.01
mol/L and because deviations occur, an additional linear term is incorporated in the
Equation 43 for corrections.97 Previously it was found that the decomposition of
hypochlorite ion was found to be strongly dependent on the ionic strength, due to the ion-
ion interactions.98 Equation 43 incorporates both the effect based on increased activity of
ionic species, described by the term )1/( μμ + and the effect of ion-ion interactions,
described by the term μb .
Both terms were plotted as a function of ionic strength, shown in Figure 51, so
that their relative contributions can be evaluated.
0
0.5
1.0
1.5
2.0
2.5
3.0
0 1 2 3 4 5 6 7 8
μ, mol/L
)1/( μμ +
μb
Rel
ativ
e C
ontr
ibut
ion
Figure 51. Plot of the )1/( μμ + and μb terms as a function of ionic strength.
Note: value of 0.5 was assumed for the b term 97 Robinson and Stokes Electrolyte Solutions. 98 Adam An Investigation of Factors Involved In The Decomposition of Sodium Hypochlorite.

87
As can be observed from Figure 51, the contribution of the ion-ion interaction
term99 becomes more significant at μ ≥ 1 M, by assuming b = 0.5. Thus, an empirical
relationship between ionic strength, the second-order rate constant, k2, and the rate
constant at infinite dilution, k0, is approximated by Equation 44:
)log(k)log(k o2 += μb (44)
The values of k2 were calculated for experiments conducted at different
temperatures by using Equation 44 and plotted against the ionic strength of solutions,
shown in Figure 52.
30 ºC: y = 0.0738x - 10.1R2 = 1.000
-10.5
-10.0
-9.5
-9.0
-8.5
-8.0
0.0 1.0 2.0 3.0 4.0 5.0 6.0 7.0
μ, mol/L
log(
k 2)
50 ºC: y = 0.0788x - 9.00R2 = 0.978
40 ºC: y = 0.0838x - 9.66R2 = 0.971
Figure 52. Overlaid linear plots of log of second-order rate constant versus ionic
strength in solutions with various initial concentrations of hypochlorite ion at different temperatures
The slopes of the least-squares lines are equal to the b term, and the intercepts are
log of the second-order rate constant at infinite dilution. The log (ko) values are
summarized in Table 22. Reasonable agreement (RSD = 6.4 %) is observed in the slopes
of the lines at various temperatures. This demonstrates that the ionic strength correlates
with the second-order rate constant of perchlorate ion formation. Thus, Equation 46 99 Adam An Investigation of Factors Involved In The Decomposition of Sodium Hypochlorite.

88
provides the simplified approximation of the changes in the second-order rate constant as
a function of the ionic strength at different temperatures.
Table 22. Slopes and intercepts of least-squares lines shown in Figure 52 Temperature
(ºC) Slope Intercept (log k0)
ko in M-1s-1 (x 10-12)
30 0.0738 -10.1 77.0 40 0.0838 -9.66 217 50 0.0788 -9.00 990
Mean 0.0788 Std. Dev. 0.0050
RSD 6.35
4.4.2 Dependence of the Second-Order Rate Constant on the Temperature
The rate of perchlorate ion formation is enhanced at elevated temperatures in
solutions with similar initial concentrations of hypochlorite and chlorate ions, as can be
seen from Figure 53. This effect must be related to the temperature dependence of the
second-order rate constant at infinite dilution.
0100200300400500600700
0 10 20 30 40 50 60 70 80 90Days
ClO
4-m
g/L
Form
ed
30 ºC [OCl-]0= 84.2 g/L, [ClO3-]0= 14.8 g/L
40 ºC [OCl-]0= 70.5 g/L, [ClO3-]0= 28.1 g/L
50 ºC [OCl-]0= 85.3 g/L, [ClO3-]0= 13.0 g/L
75 ºC [OCl-]0= 75.0 g/L, [ClO3-]0= 24.2 g/L
Figure 53. Smooth-line plots of the perchlorate ion formation as a function of
time in solutions at similar initial hypochlorite and chlorate ions and various temperatures

89
The Arrhenius and the Eyring equations are used to describe the temperature
dependence of a reaction rate. However, the Eyring equation, which is based on
transition state theory, is used for studying kinetics of reactions occurring in liquids. The
Eyring equation100 is shown in Equation 47 below:
)()(
‡‡
RTH
RS
bo eeT
hk
kΔ
−Δ
×××= (45)
ko = Calculated using Equation 27 M-1 · s-1 kb = Boltzmann constant 1.381x10⁻²³ J · K-1 h = Planck constant 6.626x10⁻³⁴ J · s R = Real Gas constant 8.3145 J/mol · K ΔS‡ = Entropy of activation J/mol · K ΔH‡ = Enthalpy of activation kJ/mol T = Temperature Kelvin (K) By dividing both sides of Equation 45 by T and taking the natural log function of
both sides, Equation 46 results:
RTH
RS
hk
Tk bo
‡‡)ln()ln( Δ
−Δ
+= (46)
To determine ΔH‡ and ΔS‡, ln(ko/T) is plotted as a function of 1/T. The slope of
the linear fit is (-ΔH‡ / R), while the intercept equals the sum of constants and entropy
term [ln (kb / h) + (ΔS‡ / R)]. Temperatures in Table 20 were converted from ºC to
Kelvin to determine values of ln(ko/T) and 1/T terms. Figure 54 shows a plot of
experimentally determined ln(ko/T) vs 1/T.
100 Espenson Chemical Kinetics and Reaction Mechanisms.

90
y = -12165x + 11.038R2 = 0.983
-30
-29
-28
-27
-26
-25
0.00300 0.00315 0.00330 0.003451/T, K
ln(k
o/T)
Figure 54. Linear plot of ln(ko/T) as a function of (1/T)
Based on three points the R2 of the line is 0.983. The relatively low r-squared
correlation coefficient of 0.983 is an indication that more temperatures would result in
more information. However, based on the low variation observed in the fitted slopes of
6.4 %, shown in Table 20, the R2 correlation coefficient of 0.983 is satisfactory and
provides a simple model that does not introduce additional power terms.
Thus, the approximate values of thermodynamic activation parameters for the
formation of perchlorate ion in bulk, concentrated hypochlorite ion solutions at infinite
dilution are ΔH‡ = 101 kJ/mol and ΔS‡= -106 J/mol·K. A large value of the ΔH‡ is
indicative of a slow reaction and a large, negative value of ΔS‡ reflects loss of entropy
from the union of hypochlorite and chlorate ions into a single molecule.101
By substituting the calculated values of ΔH‡ and ΔS‡, based on slope and
intercept values shown in Figure 54, into Equation 45, a generalized expression is
obtained relating second-order rate constant at infinite dilution and thermodynamic
activation parameters, shown in Equation 47.
R106
RT1.01x10
10 eeT102.084
5 −−
××××=ok (47)
101 Espenson Chemical Kinetics and Reaction Mechanisms.
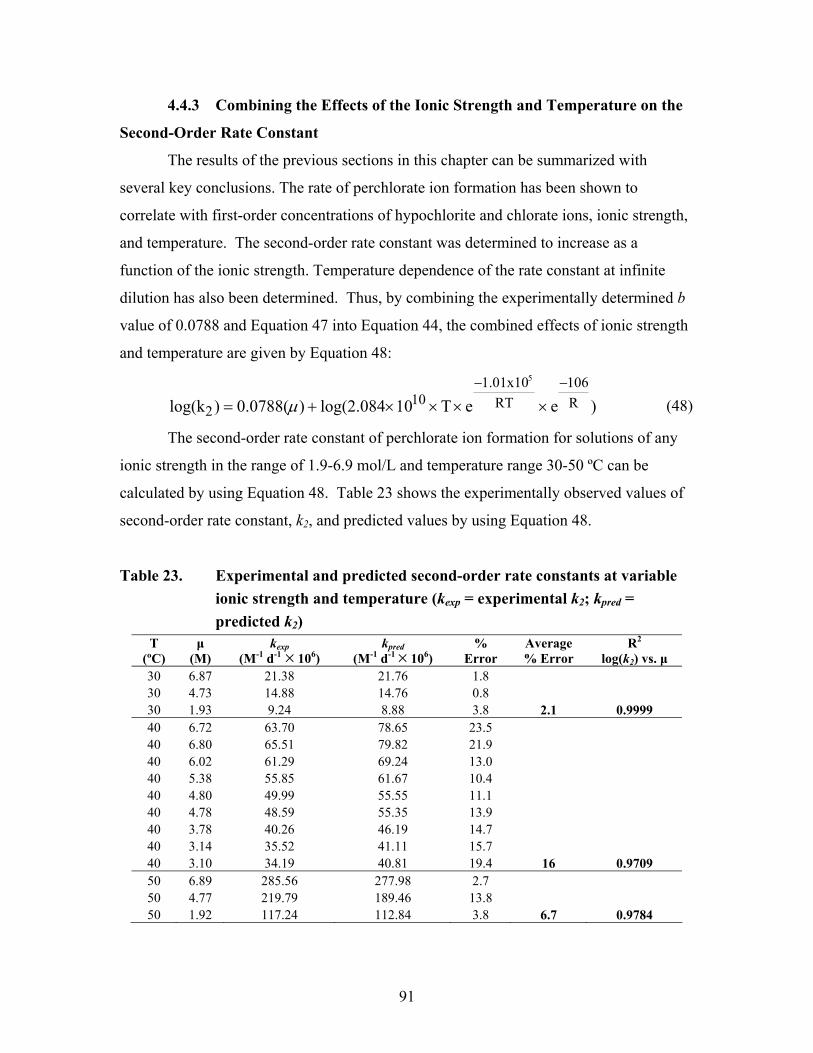
91
4.4.3 Combining the Effects of the Ionic Strength and Temperature on the
Second-Order Rate Constant
The results of the previous sections in this chapter can be summarized with
several key conclusions. The rate of perchlorate ion formation has been shown to
correlate with first-order concentrations of hypochlorite and chlorate ions, ionic strength,
and temperature. The second-order rate constant was determined to increase as a
function of the ionic strength. Temperature dependence of the rate constant at infinite
dilution has also been determined. Thus, by combining the experimentally determined b
value of 0.0788 and Equation 47 into Equation 44, the combined effects of ionic strength
and temperature are given by Equation 48:
)eeT10log(2.084)0.0788()log(k R106
RT1.01x10
102
5 −−
××××+= μ (48)
The second-order rate constant of perchlorate ion formation for solutions of any
ionic strength in the range of 1.9-6.9 mol/L and temperature range 30-50 ºC can be
calculated by using Equation 48. Table 23 shows the experimentally observed values of
second-order rate constant, k2, and predicted values by using Equation 48.
Table 23. Experimental and predicted second-order rate constants at variable ionic strength and temperature (kexp = experimental k2; kpred = predicted k2)
T (ºC)
μ (M)
kexp (M-1 d-1 ×10⁶)
kpred (M-1 d-1 ×10⁶)
% Error
Average % Error
R2
log(k2) vs. μ 30 6.87 21.38 21.76 1.8 30 4.73 14.88 14.76 0.8 30 1.93 9.24 8.88 3.8 2.1 0.9999 40 6.72 63.70 78.65 23.5 40 6.80 65.51 79.82 21.9 40 6.02 61.29 69.24 13.0 40 5.38 55.85 61.67 10.4 40 4.80 49.99 55.55 11.1 40 4.78 48.59 55.35 13.9 40 3.78 40.26 46.19 14.7 40 3.14 35.52 41.11 15.7 40 3.10 34.19 40.81 19.4 16 0.9709 50 6.89 285.56 277.98 2.7 50 4.77 219.79 189.46 13.8 50 1.92 117.24 112.84 3.8 6.7 0.9784

92
The difference between the experimentally-observed and predicted value of k2 is
reported as percent error in Table 23. Given the relatively low R2 values, the average %
errors are acceptable for the hypochlorite ion solutions used in the data fitting. The
predicted values use a minimum number of parameters and provide a simple approach to
the determination of the rate law of perchlorate ion formation based on the bimolecular
reaction between hypochlorite and chlorate ion.
4.5 Conclusions
Multiple reaction models were used to fit the experimental data. The data
analysis revealed that the rate law for perchlorate ion formation can be described as first
order in hypochlorite ion and chlorate ion and a single second-order rate constant with a
strong dependence on the ionic strength. The dependence of the second-order rate
constant on the ionic strength was quantified using a simplified extension of the Debye-
Hückel Equation. The experimental rate constants at infinite dilutions were related to
temperature and thermodynamic parameters determined using the Eyring equation. Thus,
a quantitative expression between identified effects of ionic strength and temperature on
the second-order rate constant is provided to utilities to predict how to decrease the
amount of perchlorate ion formed during storage of hypochlorite ion solutions.

93
CHAPTER 5. THE PERCHLORATE ION FORMATION MODEL:
VALIDATION AND APPLICATIONS
This chapter describes the validation and application of a perchlorate ion
formation model. There are several objectives for this chapter. The first objective is to
validate the established relationship between the second-order rate constant, ionic
strength, and temperature (Equation 50) with the use of hypochlorite ion decomposition
Bleach 2001 to predict perchlorate ion formation in bulk sodium hypochlorite solutions.
The objective for the predictive model is to have an average error of ± 10 %. The
developed model was used to predict the rate of perchlorate ion formation in survey bulk
hypochlorite ion solutions from several utilities in United States, and compared to the
experimental data.
The second objective is to use the model to assist water utilities to assess the
formation of perchlorate ion at different conditions and to discuss the implications of
storing concentrated (undiluted) hypochlorite ion solutions. In addition, the developed
predictive perchlorate ion formation model is applied to survey OSG sodium
hypochlorite solutions and calcium hypochlorite solutions. Finally, the potential
contributions from different sources of hypochlorite ion to perchlorate ion contamination
of drinking water are discussed.
The hypochlorite ion decomposition model, Bleach 2001, was developed as a
predictive tool to guide utilities to develop optimum storage conditions and be used to
predict when the hypochlorite ion solutions are no longer usable. During the
development and validation of Bleach 2001, multiple commercial hypochlorite ion
solutions were tested, and an average error of ± 5 % was reported between
experimentally measured decomposition and predicted decomposition.102 In the design
of the experiments conducted in the current work, Bleach 2001 was used to predict
decomposition of hypochlorite ion and formation of chlorate ion.
Figure 55 shows the decomposition of hypochlorite ion (downward-sloping
curves) and formation of chlorate ion (upward-sloping curves) measured experimentally
and predicted by Bleach 2001 at 30º, 40º, and 50 ºC. 102 Adam An Investigation of Factors Involved In The Decomposition of Sodium Hypochlorite.

94
102030405060708090
0 25 50 75 100 125 150 175 200Days
50
60
70
80
90
100
110
OC
l-g/
L D
ecom
pose
d
ClO
3-g/
L Fo
rmed
ExperimentBleach 2001
0102030405060708090
0 5 10 15 20 25 30 35Days
0102030405060708090Bleach 2001
Experiment
OC
l- g/L
Dec
ompo
sed
ClO
3-g/
L Fo
rmed
0
102030405060708090
100
0 2 4 6 8 1050556065707580859095100
Days
ExperimentBleach 2001
OC
l- g/L
Dec
ompo
sed
ClO
3-g/
L Fo
rmed
Figure 55. Smoothed-line plots of hypochlorite ion decomposition and chlorate
ion formation determined experimentally in conjunction with Bleach 2001 (Error bars set at ± 10 %), for solutions at (a) [OCl-]0 = 82 g/L, [ClO3
-]0 = 63 g/L at 30 ºC; (b) [OCl-]0 = 70 g/L, [ClO3-]0 = 51 g/L at 40
ºC; (c) [OCl-]0 = 83 g/L, [ClO3-]0 = 50 g/L at 50 ºC
(a) 30 ºC
(b) 40 ºC
(c) 50 ºC

95
The average % difference between measured hypochlorite ion and predicted
values by Bleach 2001, at 30 ºC over a 200-day period, was 8.8 % ± 4.2 (n = 7); at 40 ºC
over 34-day period, the average % difference was 2.2 % ± 8.8 (n = 4); and at 50 ºC, the
average % difference over 10 days was 6.6 % ± 4.6 (n = 6). Thus, the predictive
expression for the second-order rate constant (Equation 50) was used with Bleach 2001,
to predict the formation of chlorate and perchlorate ions and the decomposition of
hypochlorite ion at various temperatures, ionic strengths, and initial concentrations of
hypochlorite and chlorate ions.
5.1 Predicted Perchlorate Ion Formation in Bulk Sodium Hypochlorite Solutions
The bulk hypochlorite ion solutions used in various incubation experiments and
eventually for the determination of the perchlorate ion formation rate law were chosen for
validation of the predictive expression of the second-order rate constant. Based on the
ionic strength of the hypochlorite ion solutions and the incubation temperature, second-
order rate constants were generated, using Equation 48.
)eeT10log(2.084)0.0788()log(k R106
RT1.01x10
102
5 −−
××××+= μ (48)
The Bleach 2001 model was used to predict the decomposition of hypochlorite
ion and formation of chlorate ion at various temperatures. The predicted values of k2, and
the predicted concentrations of hypochlorite and chlorate ions were used to generate the
rates of perchlorate ion formation for each solution, using Equation 27.
][][][32
4 −−−
×== ClOOClkdt
ClOdRate (27)
As an example, to simulate the perchlorate ion formation at 70.4 g/L OCl-, 50.1
g/L ClO3-, and μ = 6.76 mol/L during a 40 ºC incubation, the value of k2 was calculated
by entering temperature (converted from 40 ºC to Kelvin) and ionic strength into
Equation 50. The obtained value of k2, 9.15×10⁻¹⁰ L·mol-1·s-1, was converted to units of
L·mol-1·d-1, producing a value of 7.91×10⁻⁵. The predicted value of k2, and predicted
changes in concentration of hypochlorite and chlorate ions by Bleach 2001 were
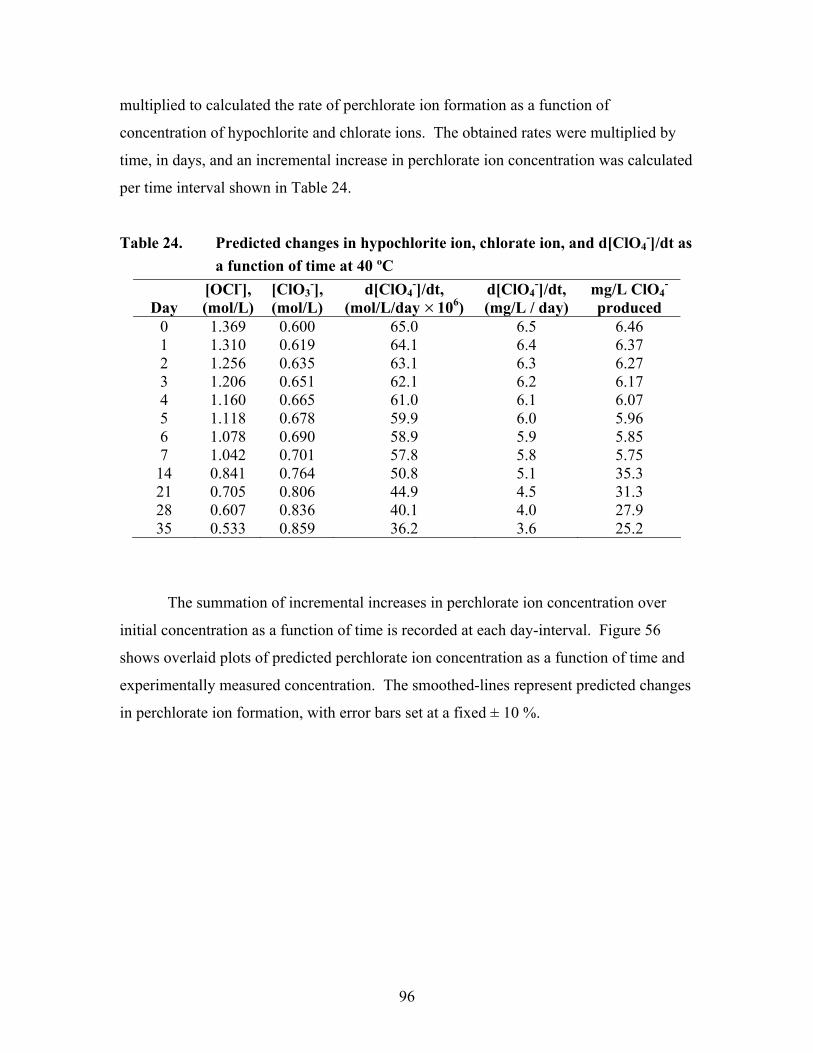
96
multiplied to calculated the rate of perchlorate ion formation as a function of
concentration of hypochlorite and chlorate ions. The obtained rates were multiplied by
time, in days, and an incremental increase in perchlorate ion concentration was calculated
per time interval shown in Table 24.
Table 24. Predicted changes in hypochlorite ion, chlorate ion, and d[ClO4-]/dt as
a function of time at 40 ºC
Day [OCl-], (mol/L)
[ClO3-],
(mol/L) d[ClO4
-]/dt, (mol/L/day ×106)
d[ClO4-]/dt,
(mg/L / day) mg/L ClO4
- produced
0 1.369 0.600 65.0 6.5 6.46 1 1.310 0.619 64.1 6.4 6.37 2 1.256 0.635 63.1 6.3 6.27 3 1.206 0.651 62.1 6.2 6.17 4 1.160 0.665 61.0 6.1 6.07 5 1.118 0.678 59.9 6.0 5.96 6 1.078 0.690 58.9 5.9 5.85 7 1.042 0.701 57.8 5.8 5.75 14 0.841 0.764 50.8 5.1 35.3 21 0.705 0.806 44.9 4.5 31.3 28 0.607 0.836 40.1 4.0 27.9 35 0.533 0.859 36.2 3.6 25.2
The summation of incremental increases in perchlorate ion concentration over
initial concentration as a function of time is recorded at each day-interval. Figure 56
shows overlaid plots of predicted perchlorate ion concentration as a function of time and
experimentally measured concentration. The smoothed-lines represent predicted changes
in perchlorate ion formation, with error bars set at a fixed ± 10 %.

97
0
50
100
150
200
250
300
350
0 50 100 150 200
Days
ClO
4- mg/
L
[OCl-]0= 83 g/L; [ClO3-]0=50 g/L
[OCl-]0= 52 g/L; [ClO3-]0=50 g/L
[OCl-]0= 10 g/L; [ClO3-]0=50 g/L
0
50
100
150
200
250
300
350
0 7 14 21 28 35 42 49 56 63 70 77Days
[OCl-]0= 60 g/L; [ClO3-]0=50 g/L
[OCl-]0= 33 g/L; [ClO3-]0=50 g/L
ClO
4- mg/
L
[OCl-]0= 70 g/L; [ClO3-]0=50 g/L
0
50
100
150
200
250
300
350
0 2 4 6 8 10
Days
[OCl-]0= 83 g/L; [ClO3-]0=50 g/L
[OCl-]0= 52 g/L; [ClO3-]0=50 g/L
[OCl-]0= 10 g/L; [ClO3-]0=50 g/L
ClO
4-m
g/L
Figure 56. Overlaid smoothed-line plots of predicted (Error bars set at ± 10 %)
perchlorate ion formation and determined experimentally, for solutions incubated at (a) 30 ºC; (b) 40 ºC; (c) 50 ºC
(a) 30 ºC
(b) 40 ºC
(c) 50 ºC

98
As can be seen from Figure 56, in general the experimental and predicted
formations of perchlorate ion agree for solutions with various concentrations of
hypochlorite ion stored at different temperatures. On average the initial predicted rates
are well within ± 10 %, and the model is clearly capable of predicting the formation of
perchlorate ion as a function of time. Higher deviations in the predicted concentration of
perchlorate ion were observed in solutions stored at 50 ºC after several days. To test the
model further, several hypochlorite ion solutions were acquired from utilities in United
States and incubated at 50 ºC. These results are discussed in the next section.
5.2 Predicted Perchlorate Ion Formation in Real-World Bulk Sodium
Hypochlorite Solutions
Bulk hypochlorite ion solutions were obtained from five individual utilities
located in AZ, CA, FL, GA, and OH. Samples of raw water, finished water, and
distribution system samples were also collected. Hypochlorite ion solutions were
collected in duplicate, including a sample, quenched with malonic acid, and non-
quenched sample that was cooled to 4 ºC. The samples were analyzed for bromate, and
perchlorate ions by the LC-MS/MS method (Chpater 2). ICP-MS analysis was used to
screen for transition metals ions (Co2+, Cu2+, Fe3+, Mn2+, and Ni2+). These results are
shown in Table 25.
Separately, chlorate ion was determined by iodometric titration and hypochlorite
ion by potentiometric titration with sulfite ion. Conductivity and pH measurements were
used to measure total dissolved solids, ionic strength, and pH. These results are shown in
Table 26.
Table 25. Bromate and perchlorate ions, and transition metals in bulk utility
hypochlorite ion solutions Utility
Solution ClO4
- (mg/L)
BrO3-
(mg/L)Mn
(mg/L)Fe
(mg/L)Co
(mg/L)Ni
(mg/L) Cu
(mg/L) 1 16.5 23.7 < 0.10 9.2 < 0.10 0.20 0.11 2 0.70 22.7 < 0.10 < 500 < 0.10 < 0.10 < 0.10 3 0.22 8.3 < 0.10 1.10 < 0.10 < 0.10 < 0.10 4 0.23 9.3 < 0.10 < 0.50 < 0.10 0.11 < 0.10 5 2.22 6.5 < 0.10 2.30 < 0.10 < 0.10 < 0.10
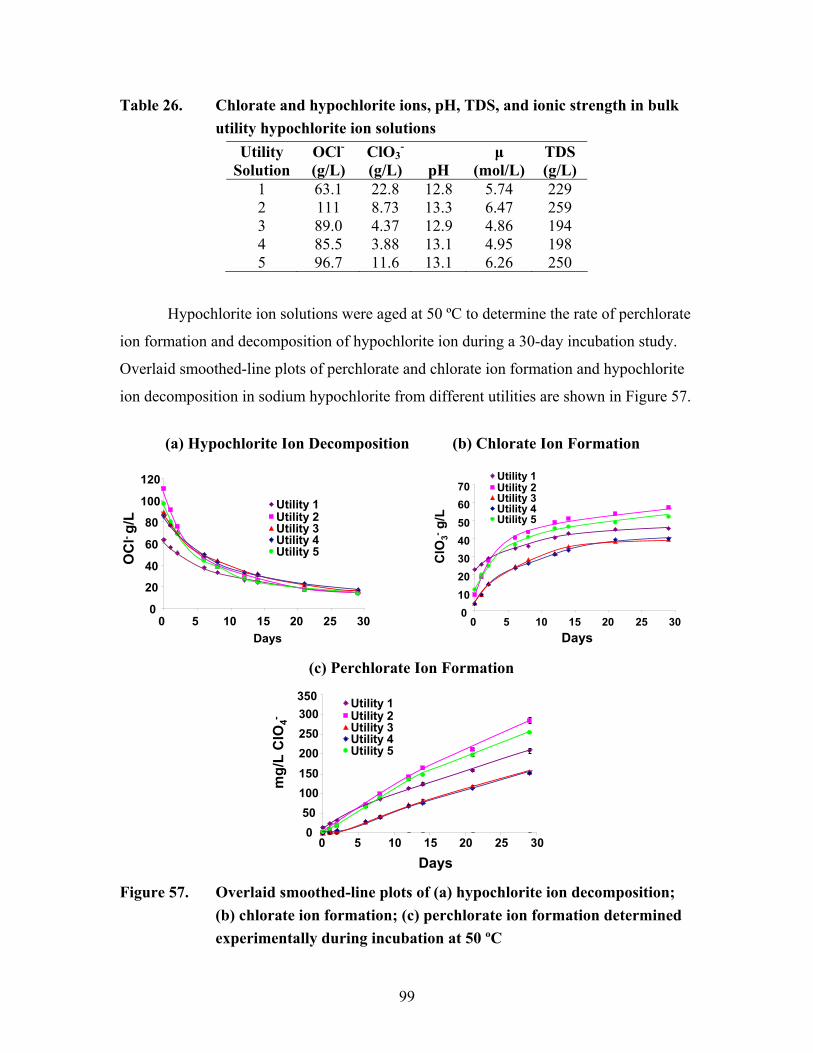
99
Table 26. Chlorate and hypochlorite ions, pH, TDS, and ionic strength in bulk utility hypochlorite ion solutions
Utility Solution
OCl-
(g/L) ClO3
- (g/L) pH
μ (mol/L)
TDS (g/L)
1 63.1 22.8 12.8 5.74 229 2 111 8.73 13.3 6.47 259 3 89.0 4.37 12.9 4.86 194 4 85.5 3.88 13.1 4.95 198 5 96.7 11.6 13.1 6.26 250
Hypochlorite ion solutions were aged at 50 ºC to determine the rate of perchlorate
ion formation and decomposition of hypochlorite ion during a 30-day incubation study.
Overlaid smoothed-line plots of perchlorate and chlorate ion formation and hypochlorite
ion decomposition in sodium hypochlorite from different utilities are shown in Figure 57.
0
20
40
60
80
100
120
0 5 10 15 20 25 30Days
OC
l- g/L
Utility 1Utility 2Utility 3Utility 4Utility 5
0
10203040506070
0 5 10 15 20 25 30Days
ClO
3-g/
L
Utility 1Utility 2Utility 3Utility 4Utility 5
050
100150200250300350
0 5 10 15 20 25 30
Days
mg/
L C
lO4-
Utility 1Utility 2Utility 3Utility 4Utility 5
Figure 57. Overlaid smoothed-line plots of (a) hypochlorite ion decomposition;
(b) chlorate ion formation; (c) perchlorate ion formation determined experimentally during incubation at 50 ºC
(a) Hypochlorite Ion Decomposition (b) Chlorate Ion Formation
(c) Perchlorate Ion Formation

100
It is evident that the hypochlorite solutions from utilities 3 and 4 behave quite
similarly (Figure 57). Thus for purposes of brevity, further discussion of hypochlorite ion
solution from utility 4 is omitted. The initial concentrations of hypochlorite and chlorate
ions, pH and temperature = 50 ºC from Table 26 were entered into Bleach 2001, to
predict hypochlorite ion decomposition and chlorate ion formation during the incubation
study. The predicted changes in concentrations of hypochlorite and chlorate ions were
compared to the measured changes, and these results are shown in Figure 58.
0
20
40
60
80
0 3 6 9 12 15 18 21 24 27 30Days
OC
l-g/
L
0102030405060
ClO
3-g/
L
Utility 1 (Experiment)Bleach 2001
0
20406080
100120
0 3 6 9 12 15 18 21 24 27 30Days
010203040506070Utility 2 (Experiment)
Bleach 2001
OC
l-g/
L
ClO
3-g/
L
020406080
100120
0 3 6 9 12 15 18 21 24 27 30
Days
05101520253035404550Utility 3 (Experiment)
Bleach 2001
OC
l-g/
L
ClO
3-g/
L
0
20406080
100120
0 3 6 9 12 15 18 21 24 27 30
Days
010203040506070Utility 5 (Experiment)
Bleach 2001
OC
l-g/
L
ClO
3-g/
L
Figure 58. Overlaid smoothed-line plots of hypochlorite ion decomposition and
chlorate ion formation determined experimentally in conjunction with Bleach 2001 (Error bars set at ± 10%), for solutions with (a) [OCl-]0 = 63 g/L, [ClO3
-]0 = 23 g/L;(b) [OCl-]0 = 111 g/L, [ClO3-]0 = 8.7 g/L; (c)
[OCl-]0 = 89 g/L, [ClO3-]0 = 4.4 g/L; (d) [OCl-]0 = 97 g/L, [ClO3
-]0 = 12 g/L; incubated at 50 ºC
(a) (b)
(c) (d)

101
Figure 58 shows the observed rates of hypochlorite ion decomposition, chlorate
ion formation and predicted rates of different utilities agree well within ± 10 % error bars.
As can be seen from Table 25 all these samples contain low levels of transition metals
ions, and therefore are expected to exhibit uncatalyzed decomposition of hypochlorite
ion. The Bleach 2001 predicted concentrations of hypochlorite and chlorate ions as a
function of time and the predicted second-order rate constant were used to generate the
change of perchlorate ion concentration as a function of time. An incremental increase in
perchlorate ion concentration over the initial concentration, shown in Table 25, was
calculated per time interval. The summation of incremental values over increments of
time were recorded and plotted. These results are shown in Figure 59.
0
50
100
150
200
250
0 3 6 9 12 15 18 21 24 27 30
Utility 1 (Experiment)Model
Days
ClO
4-m
g/L
0
50
100
150
200
250
300
0 3 6 9 12 15 18 21 24 27 30Days
Utility 2 (Experiment)Model
ClO
4-m
g/L
020406080
100120140160180
0 3 6 9 12 15 18 21 24 27 30Days
Utility 3 (Experiment)Model
ClO
4-m
g/L
0
50
100
150
200
250
300
0 3 6 9 12 15 18 21 24 27 30
Days
Utility 5 (Experiment)Model
ClO
4-m
g/L
Figure 59. Overlaid smoothed-line plots of predicted (Error bars set at ± 10 %)
perchlorate ion formation and determined experimentally at 50 ºC in solutions with (a) [OCl-]0 = 63 g/L, [ClO3
-]0 = 23 g/L; (b) [OCl-]0 = 111 g/L, [ClO3
-]0 = 8.7 g/L(c) [OCl-]0 = 89 g/L, [ClO3-]0 = 4.4 g/L;
(d) [OCl-]0 = 97 g/L, [ClO3-]0 = 12 g/L
(a) (b)
(c) (d)
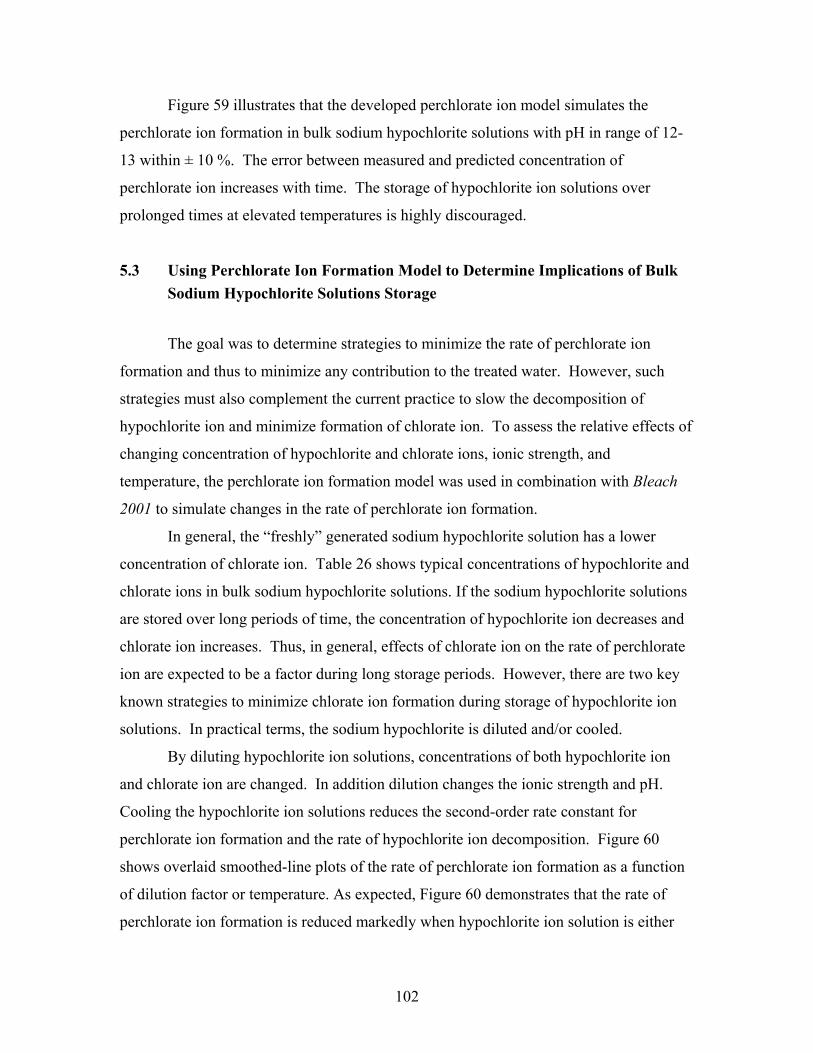
102
Figure 59 illustrates that the developed perchlorate ion model simulates the
perchlorate ion formation in bulk sodium hypochlorite solutions with pH in range of 12-
13 within ± 10 %. The error between measured and predicted concentration of
perchlorate ion increases with time. The storage of hypochlorite ion solutions over
prolonged times at elevated temperatures is highly discouraged.
5.3 Using Perchlorate Ion Formation Model to Determine Implications of Bulk Sodium Hypochlorite Solutions Storage
The goal was to determine strategies to minimize the rate of perchlorate ion
formation and thus to minimize any contribution to the treated water. However, such
strategies must also complement the current practice to slow the decomposition of
hypochlorite ion and minimize formation of chlorate ion. To assess the relative effects of
changing concentration of hypochlorite and chlorate ions, ionic strength, and
temperature, the perchlorate ion formation model was used in combination with Bleach
2001 to simulate changes in the rate of perchlorate ion formation.
In general, the “freshly” generated sodium hypochlorite solution has a lower
concentration of chlorate ion. Table 26 shows typical concentrations of hypochlorite and
chlorate ions in bulk sodium hypochlorite solutions. If the sodium hypochlorite solutions
are stored over long periods of time, the concentration of hypochlorite ion decreases and
chlorate ion increases. Thus, in general, effects of chlorate ion on the rate of perchlorate
ion are expected to be a factor during long storage periods. However, there are two key
known strategies to minimize chlorate ion formation during storage of hypochlorite ion
solutions. In practical terms, the sodium hypochlorite is diluted and/or cooled.
By diluting hypochlorite ion solutions, concentrations of both hypochlorite ion
and chlorate ion are changed. In addition dilution changes the ionic strength and pH.
Cooling the hypochlorite ion solutions reduces the second-order rate constant for
perchlorate ion formation and the rate of hypochlorite ion decomposition. Figure 60
shows overlaid smoothed-line plots of the rate of perchlorate ion formation as a function
of dilution factor or temperature. As expected, Figure 60 demonstrates that the rate of
perchlorate ion formation is reduced markedly when hypochlorite ion solution is either
103
diluted or cooled. By reducing the temperature of sodium hypochlorite solution from 35
ºC to 30 ºC, the rate of perchlorate ion formation decreases by a factor of 1.95. This
factor changes slightly as a function of temperature. For example, cooling hypochlorite
ion solutions from 50 ºC to 40 ºC reduces the rate by factor of 3.4; however, cooling a 30
ºC solution to 20 ºC results in reduction of the rate by a factor of 4.1.
Thus, cooling by as little as 5 ºC, can be an effective strategy to minimize the rate
of perchlorate ion formation approximately by a factor of 2 for any concentration of
hypochlorite ion stored below 40 ºC.
0102030405060708090
100
20 21 22 23 24 25 26 27 28 29 30 31 32 33 34 35
Temperature, ºC
% R
ate
Cooling by 5 ºC reduces the rate to 51.4% (by 1.95)
0102030405060708090
100
0.0 0.1 0.2 0.3 0.4 0.5 0.6 0.7 0.8 0.9
% R
ate
Dilution Factor
1.0
At 1:2 dilution, the rate is reduced to 12.7% (by 7.9)
Figure 60. Smoothed-line plot of the rate of perchlorate ion formation as a
function of (a) temperature; (b) dilution factor. Note: Rate in solution at 2.54 M OCl-, 0.034 M ClO3
-, and μ = 7.5 M; rate at 35 ºC = 100%
(a)
(b)
104
When diluting hypochlorite ion solutions the reduction in the rate of perchlorate
ion formation is dependent on the concentration of hypochlorite and chlorate ions and
ionic strength. For example, if a hypochlorite ion solution with [OCl-]0 = 2.53 M,
[ClO3-]0 = 0.034 M, and ionic strength of 7.5 M is diluted by a factor of two, the rate of
perchlorate ion formation is decreased by a factor of 7.9 (Figure 60). Diluting by a factor
of two with 1.27 M OCl-, causes the rate of perchlorate ion formation to be reduced by a
factor of 5.6. Thus, dilution is a very effective strategy to minimize the rate of
perchlorate ion formation in concentrated sodium hypochlorite solutions. What this
suggests to a water utility is that once the bulk, concentrated sodium hypochlorite ion
solutions are delivered, to minimize the rate of perchlorate ion formation, the “fresh”
concentrated solutions should be diluted immediately.
Furthermore, diluting the concentrated sodium hypochlorite solutions is as
effective strategy as cooling but more cost-efficient. Even if storing at elevated
temperatures is necessary, dilution is a very effective strategy to minimize perchlorate ion
formation. Figure 61 (a) shows overlaid, smooth-line plots of predicted hypochlorite ion
decomposition (downward sloping curves) and perchlorate ion formation (upward
sloping curves) as a function of time at 35 ºC for hypochlorite solutions at 2.03 M OCl-
(equivalent to 13 % FAC) and at 1.02 M OCl- (equivalent to 6.5 % FAC). Dilution not
only minimizes the rate of perchlorate ion formation but also decreases the rate of
hypochlorite ion decomposition. Thus, the disinfectant solutions are stable for longer
periods of time, and when used for water-treatment, less volume will be required since
the concentration of hypochlorite ion will have degraded to a lesser extent.
This point is demonstrated by Figure 61 (b), which shows overlaid plots of μg
ClO4- per mg of FAC as a function of time (concentration of hypochlorite ion is typically
reported as mg/L FAC). Because hypochlorite ion is decomposing over time, the ratio of
μg ClO4- per mg FAC increases and thus more perchlorate ion is introduced into the
treated water per each 1 mg FAC added (1mg FAC equivalent to 0.726 mg OCl-).
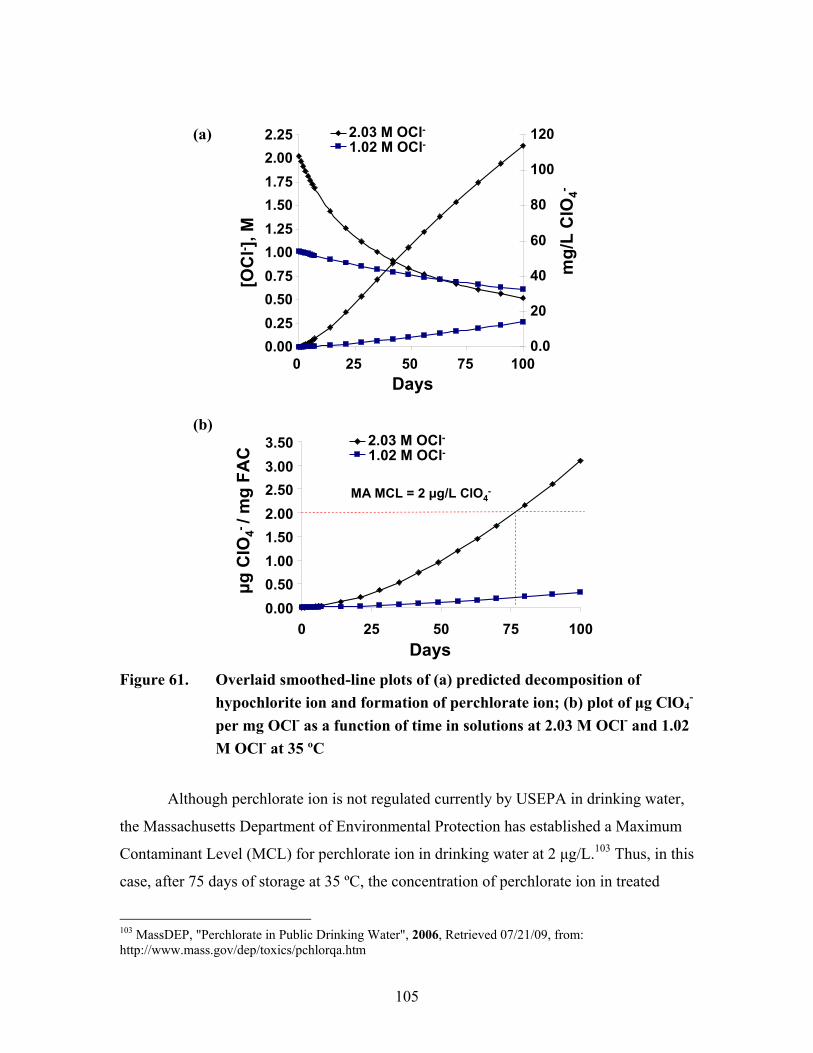
105
0.000.250.500.751.001.251.501.752.002.25
0 25 50 75 100
[OC
l- ], M
0.0
20
40
60
80
100
120
Days
mg/
L C
lO4-
1.02 M OCl-2.03 M OCl-
Days
0.000.501.001.502.002.503.003.50
0 25 50 75 100
μg C
lO4- /
mg
FAC 1.02 M OCl-
2.03 M OCl-
MA MCL = 2 μg/L ClO4-
Figure 61. Overlaid smoothed-line plots of (a) predicted decomposition of
hypochlorite ion and formation of perchlorate ion; (b) plot of μg ClO4-
per mg OCl- as a function of time in solutions at 2.03 M OCl- and 1.02 M OCl- at 35 ºC
Although perchlorate ion is not regulated currently by USEPA in drinking water,
the Massachusetts Department of Environmental Protection has established a Maximum
Contaminant Level (MCL) for perchlorate ion in drinking water at 2 μg/L.103 Thus, in this
case, after 75 days of storage at 35 ºC, the concentration of perchlorate ion in treated
103 MassDEP, "Perchlorate in Public Drinking Water", 2006, Retrieved 07/21/09, from: http://www.mass.gov/dep/toxics/pchlorqa.htm
(a)
(b)
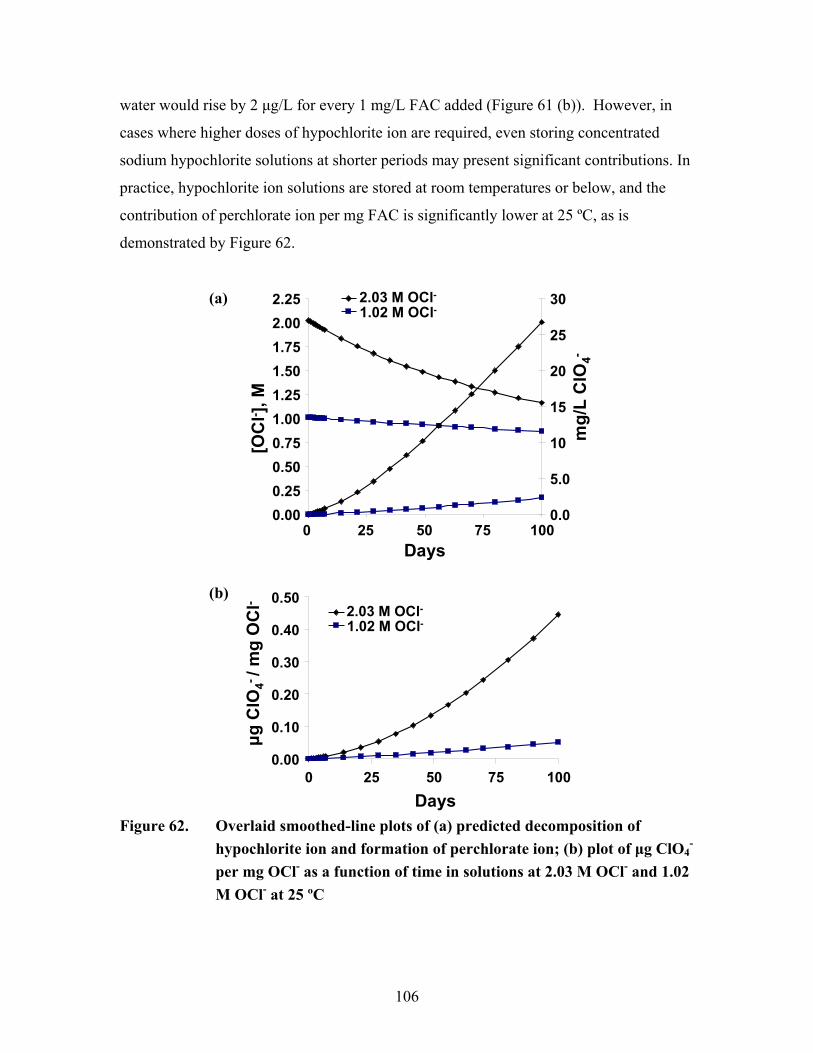
106
water would rise by 2 μg/L for every 1 mg/L FAC added (Figure 61 (b)). However, in
cases where higher doses of hypochlorite ion are required, even storing concentrated
sodium hypochlorite solutions at shorter periods may present significant contributions. In
practice, hypochlorite ion solutions are stored at room temperatures or below, and the
contribution of perchlorate ion per mg FAC is significantly lower at 25 ºC, as is
demonstrated by Figure 62.
0.000.250.500.751.001.251.501.752.002.25
0 25 50 75 1000.0
5.0
10
15
20
25
30
[OC
l- ], M
Daysm
g/L
ClO
4-
1.02 M OCl-2.03 M OCl-
0.00
0.10
0.20
0.30
0.40
0.50
0 25 50 75 100Days
μg C
lO4- /
mg
OC
l-
1.02 M OCl-2.03 M OCl-
Figure 62. Overlaid smoothed-line plots of (a) predicted decomposition of
hypochlorite ion and formation of perchlorate ion; (b) plot of μg ClO4-
per mg OCl- as a function of time in solutions at 2.03 M OCl- and 1.02 M OCl- at 25 ºC
(a)
(b)

107
In this section of the work it has been demonstrated that diluting hypochlorite ion
solutions increases the shelf-life of the disinfectant solution, while at the same time
significantly minimizes formation of perchlorate ion. Cooling diluted hypochlorite ion
solutions by as little as 5-10 ºC, further reduces the formation of perchlorate ion and also
increases the shelf-life of the disinfectant. Thus, by diluting the bulk hypochlorite ion
solutions and storing them below 30 ºC, the formation of perchlorate ion is significantly
minimized.
5.4 Application of the Perchlorate Model to OSG Sodium Hypochlorite Solutions
Because the on-site generated (OSG) sodium hypochlorite solutions (typically <1
% as FAC) are generated on demand for immediate use and thus rarely stored, these
solutions were not part of the sample matrix that was used to develop the perchlorate
predictive model. However, given the growing use of OSG sodium hypochlorite
solutions, these samples were also studied to identify the applicability of the developed
predictive model to various sodium hypochlorite solutions.
A total of 12 OSG hypochlorite ion solutions were obtained from several on-site
sodium hypochlorite generators manufacturers with different capacities, ranging from
10—2,000 pounds per day. The concentration of bromate, chlorate, and perchlorate ions
was determined by the LC-MS/MS method. ICP-MS analysis was used to determine the
concentrations of transition metals ions (Co2+, Cu2+, Fe3+, Mn2+, and Ni2+). These results
are shown in Table 27. The hypochlorite ion concentration (determined by potentiometric
titration with sulfite ion), conductivity, and pH measurements results are shown in Table
28.
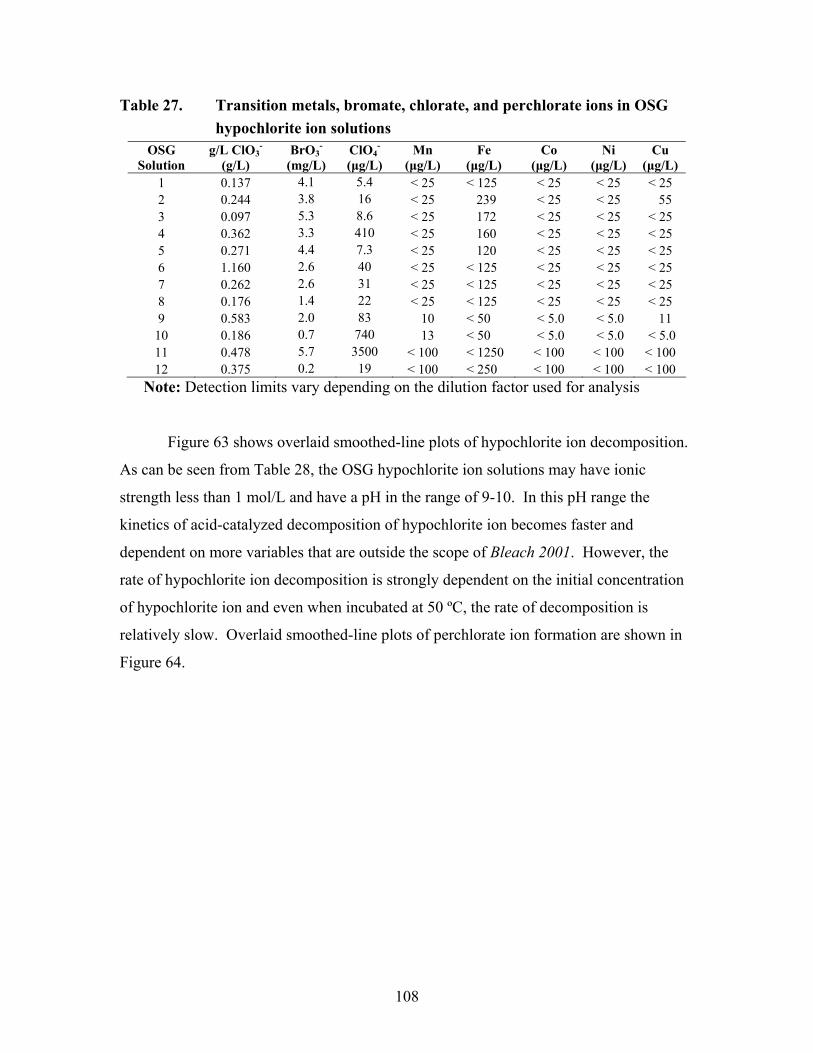
108
Table 27. Transition metals, bromate, chlorate, and perchlorate ions in OSG hypochlorite ion solutions
OSG Solution
g/L ClO3-
(g/L) BrO3
-
(mg/L) ClO4
-
(μg/L) Mn
(μg/L) Fe
(μg/L) Co
(μg/L) Ni
(μg/L) Cu
(μg/L) 1 0.137 4.1 5.4 < 25 < 125 < 25 < 25 < 25 2 0.244 3.8 16 < 25 239 < 25 < 25 55 3 0.097 5.3 8.6 < 25 172 < 25 < 25 < 25 4 0.362 3.3 410 < 25 160 < 25 < 25 < 25 5 0.271 4.4 7.3 < 25 120 < 25 < 25 < 25 6 1.160 2.6 40 < 25 < 125 < 25 < 25 < 25 7 0.262 2.6 31 < 25 < 125 < 25 < 25 < 25 8 0.176 1.4 22 < 25 < 125 < 25 < 25 < 25 9 0.583 2.0 83 10 < 50 < 5.0 < 5.0 11
10 0.186 0.7 740 13 < 50 < 5.0 < 5.0 < 5.0 11 0.478 5.7 3500 < 100 < 1250 < 100 < 100 < 100 12 0.375 0.2 19 < 100 < 250 < 100 < 100 < 100
Note: Detection limits vary depending on the dilution factor used for analysis
Figure 63 shows overlaid smoothed-line plots of hypochlorite ion decomposition.
As can be seen from Table 28, the OSG hypochlorite ion solutions may have ionic
strength less than 1 mol/L and have a pH in the range of 9-10. In this pH range the
kinetics of acid-catalyzed decomposition of hypochlorite ion becomes faster and
dependent on more variables that are outside the scope of Bleach 2001. However, the
rate of hypochlorite ion decomposition is strongly dependent on the initial concentration
of hypochlorite ion and even when incubated at 50 ºC, the rate of decomposition is
relatively slow. Overlaid smoothed-line plots of perchlorate ion formation are shown in
Figure 64.

109
0
1.52.53.54.55.56.57.5
0 5 10 15 20 25 30Days
OC
l-g/
L
OSG 1OSG 2OSG 3OSG 4OSG 5OSG 6
0.5
00.51.52.53.54.55.56.57.5
0 5 10 15 20 25 30
Days
OSG 7OSG 8OSG 9OSG 10OSG 11OSG 12O
Cl-
g/L
Figure 63. Overlaid smoothed-line plots of hypochlorite ion decomposition (a)
OSG solutions 1-6; (b) OSG solutions 7-12, 50 ºC Table 28. Concentration of hypochlorite ion, pH, TDS, and ionic strength (μ) in
OSG hypochlorite ion solutions OSG
Solution μ
(mol/L) TDS (g/L) pH
OCl- (g/L) % FAC
1 0.669 26.7 9.4 7.1 0.95 2 0.589 23.5 9.3 5.8 0.78 3 0.945 37.8 9.1 4.9 0.65 4 0.526 21.1 9.2 5.0 0.67 5 0.682 27.3 9.3 7.4 0.99 6 0.502 20.1 8.8 3.3 0.44 7 1.153 46.1 9.1 5.8 0.77 8 0.546 21.8 9.4 3.8 0.51 9 0.923 36.9 9.5 5.2 0.69 10 0.265 10.6 9. 6 2.6 0.35 11 0.828 33.1 9.4 4.9 0.66 12 0.882 35.3 9.4 6.3 0.84
(a)
(b)

110
050
100150200250300350
0 5 10 15 20 25 30Days
0
100
200
300
400
500
600
ClO
4-μg
/L
OSG 1OSG 2
OSG 3OSG 4
OSG 5OSG 6
ClO
4-μg
/L (O
SG 4
)
050
100150200250300350
0 5 10 15 20 25 30Days
0500100015002000250030003500400045005000
ClO
4-μg
/L
ClO
4-μg
/L (O
SG 1
0, 1
2)OSG 7OSG 8
OSG 9 OSG 10OSG 11 OSG 12
Figure 64. Overlaid smoothed-line plots of perchlorate ion formation (a) OSG
solutions 1-6; (b) OSG solutions 7-12, 50 ºC
As can be seen from Figure 64, the rate of perchlorate ion formation varies by
OSG manufacturer. An average rate over the duration of incubation period was
calculated and used to determine experimental values for the second-order rate constant,
using Equation 36. By using the measured values of ionic strength and temperature, the
predictive model was used to determine the second-order rate constants. Table 29 shows
the experimental and predicted values of the second-order rate constants of perchlorate
ion formation.
(a)
(b)

111
Table 29. Second-order rate constants of perchlorate ion formation in OSG hypochlorite ion solutions, experiment vs. model (k2obs= experimental k2, k2cal = predicted k2, in units of L·mol-1·day-1)
OSG k2obs k2cal k2obs/k2cal 1 302 89.9 3.4 2 143 88.7 1.6 3 406 94.6 4.3 4 109 87.7 1.2 5 203 90.2 2.3 6 24.6 87.3 0.3 7 202 98.2 2.1 8 95.7 88.0 1.1 9 117 94.2 1.2 10 234 83.6 2.8 11 259 92.6 2.8 12 169 93.5 1.8
The effects of pH were discussed in Chapter 3, and the results shown in Table 29
confirm the fact that the rate of perchlorate ion formation is faster in the OSG
hypochlorite ion solutions than in bulk sodium hypochlorite. There is no observable
correlation between the experimentally-observed values of the second-order rate constant
and pH or ionic strength of these solutions; however during this work, it was clearly
shown that the formation of perchlorate is catalyzed at lower pH values. This is an
indication that the formation of perchlorate ion in this type of sample matrix (low pH
values and low ionic strength) is dependent on more variables than the bulk, concentrated
hypochlorite ion solutions. Therefore, although the model may not accurately predict the
formation of perchlorate ion in OSG hypochlorite ion solutions, it does provide
groundwork for additional research.
However, it is clear from these results that perchlorate ion does form in OSG
hypochlorite ion solutions. Thus, to minimize the formation of perchlorate ion, it is
recommended not to store the OSG hypochlorite ion solutions at elevated temperatures or
for more than one to two days, which is typically the practice.

112
5.5 Application of the Perchlorate Model to Calcium Hypochlorite Solutions
As an alternative to sodium hypochlorite, calcium hypochlorite is used for
disinfection of water. Calcium hypochlorite, typically available as a hydrated salt, is
stored as solid and is dissolved upon use. Recently it has been reported that the rate of
calcium hypochlorite decomposition is faster than that of sodium hypochlorite in
solutions at elevated temperatures.104 It also has been reported that perchlorate ion is not
a common contaminant in calcium hypochlorite.105
A sample of calcium hypochlorite, 60-80 % as Ca(OCl)2, was obtained from
Arch Chemicals (Norwalk, CT). Two stock solutions containing approximately 22 g/L
and 44 g/L OCl- (~3 % and 6 % FAC) were prepared. Separate aliquots were stored for
two weeks at 60 ºC and four weeks at 50 ºC. Figure 65 shows smoothed-line plots of
hypochlorite ion decomposition (downward sloping curves) and chlorate ion formation
(upward sloping curves).
Trace amounts of perchlorate ion were detected in both stock calcium
hypochlorite solutions by the optimized LC-MS/MS method described in Chapter 2. The
average perchlorate ion concentration of 624 ± 29 μg/kg in calcium hypochlorite was
determined by the analysis of duplicate samples. The concentration of perchlorate ion
increased in calcium hypochlorite solutions during incubation at 50 ºC and 60 ºC and is
shown in Figure 66.
104 Su, Y. S., Morrison, D. T. and Ogle, R. A. "Chemical kinetics of calcium hypochlorite decomposition in aqueous solutions" J. Chem. Health Safety 2009, 16, 21-25. 105 Greiner, Mclellan, Bennet and Ewing "Occurrence of perchlorate in sodium hypochlorite".
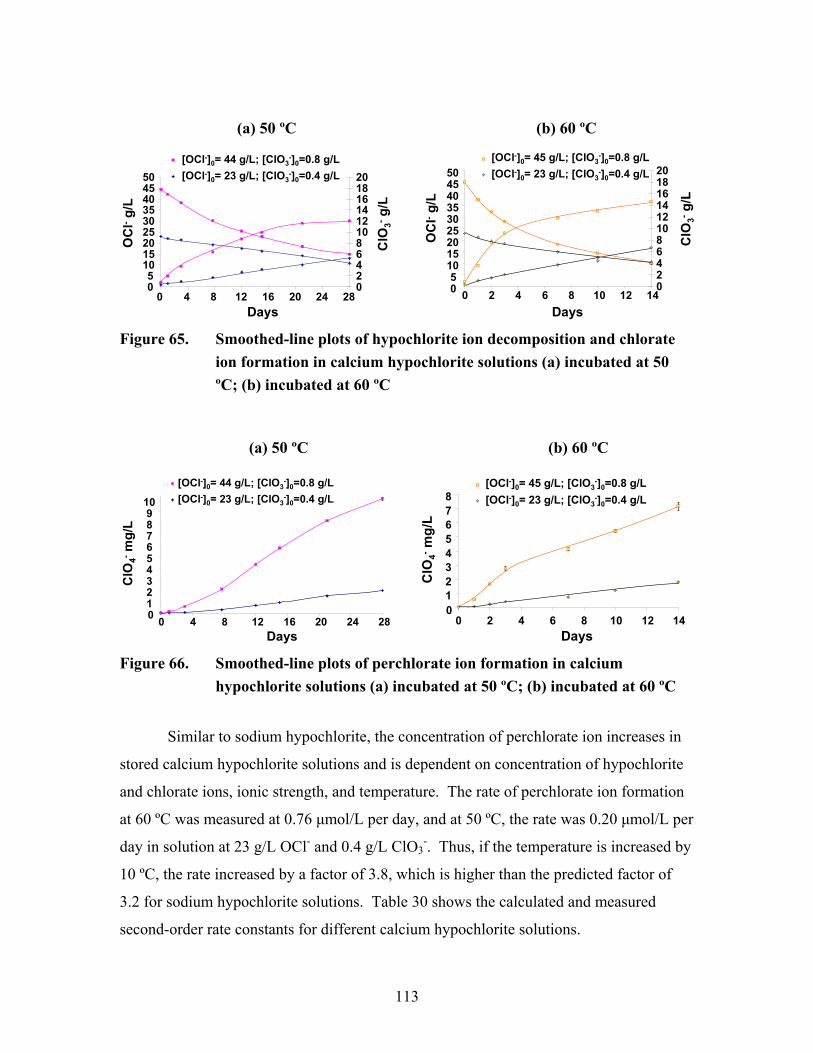
113
05
101520253035404550
0 4 8 12 16 20 24 28Days
02468101214161820
OC
l-g/
L
ClO
3-g/
L
[OCl-]0= 44 g/L; [ClO3-]0=0.8 g/L
[OCl-]0= 23 g/L; [ClO3-]0=0.4 g/L
05
101520253035404550
0 2 4 6 8 10 12 14Days
OC
l-g/
L
02468101214161820
ClO
3-g/
L
[OCl-]0= 45 g/L; [ClO3-]0=0.8 g/L
[OCl-]0= 23 g/L; [ClO3-]0=0.4 g/L
Figure 65. Smoothed-line plots of hypochlorite ion decomposition and chlorate
ion formation in calcium hypochlorite solutions (a) incubated at 50 ºC; (b) incubated at 60 ºC
0123456789
10
0 4 8 12 16 20 24 28Days
ClO
4-m
g/L
[OCl-]0= 44 g/L; [ClO3-]0=0.8 g/L
[OCl-]0= 23 g/L; [ClO3-]0=0.4 g/L
012345678
0 2 4 6 8 10 12 14Days
ClO
4-m
g/L
[OCl-]0= 45 g/L; [ClO3-]0=0.8 g/L
[OCl-]0= 23 g/L; [ClO3-]0=0.4 g/L
Figure 66. Smoothed-line plots of perchlorate ion formation in calcium
hypochlorite solutions (a) incubated at 50 ºC; (b) incubated at 60 ºC
Similar to sodium hypochlorite, the concentration of perchlorate ion increases in
stored calcium hypochlorite solutions and is dependent on concentration of hypochlorite
and chlorate ions, ionic strength, and temperature. The rate of perchlorate ion formation
at 60 ºC was measured at 0.76 μmol/L per day, and at 50 ºC, the rate was 0.20 μmol/L per
day in solution at 23 g/L OCl- and 0.4 g/L ClO3-. Thus, if the temperature is increased by
10 ºC, the rate increased by a factor of 3.8, which is higher than the predicted factor of
3.2 for sodium hypochlorite solutions. Table 30 shows the calculated and measured
second-order rate constants for different calcium hypochlorite solutions.
(a) 50 ºC (b) 60 ºC
(a) 50 ºC (b) 60 ºC

114
Table 30. Second-order rate constants of perchlorate ion formation in calcium
hypochlorite solutions, experiment vs. model (k2obs= experiment k2, k2cal = k2
predicted in units of L·mol-1·day-1)
T, ºC
[OCl-] (mol/L)
[ClO3-]
(mol/L) kobs kcal k2obs / k2cal pH
Ionic strength
50 0.446 0.005 96 91.2 1.0 11.2 0.75 50 0.859 0.010 133 102 1.3 11.5 1.38 60 0.443 0.005 332 291 1.1 11.4 0.75 60 0.874 0.010 594 326 1.8 11.5 1.38
The results shown in Table 27 indicate that the observed second-order rate
constants are higher than predicted (as noted in k2obs / k2cal column). This may be
attributed to the difference in the mean activity of the 1:1 electrolyte solution of sodium
hypochlorite (NaOCl) and 1:2 electrolyte solution of calcium hypochlorite106 (Ca(OCl)2).
Similar to OSG hypochlorite ion solutions, it is recommended not to store the
calcium hypochlorite solutions for more than several days. By using diluted solutions of
calcium hypochlorite and/or cooling while storing, formation of perchlorate ion is
significantly reduced. A survey of calcium hypochlorite from different manufacturers
may reveal additional information that may be useful for comparison to perchlorate ion
formation in sodium hypochlorite solutions.
5.6 Potential Contribution of Perchlorate Ion to Drinking Water from Various
Hypochlorite Ion Solutions
As was noted earlier, the participating utilities provided water samples along with
the bulk sodium hypochlorite solutions. Distribution samples consisted of “finished”
(treated) water at different residence times, shown in Table 31, and are denoted as
Residence (Res.) Time A and Res. Time B. Samples of raw, finished, and distribution
system waters were analyzed for perchlorate, bromate, and chlorate ions by the LC-
MS/MS method (Chapter 2), and results are shown in Tables 32-34.
106 Robinson and Stokes Electrolyte Solutions.

115
Table 31. Residence time of the sampled distribution waters
Utility Res. Time (A) (hrs) Res. Time (B) (hrs) 1 36 72 2 72 216 3 36 72 4 12 24 5 100 150
Table 32. Perchlorate ion in raw, finished, and distribution waters ClO4
- Raw Finished Time A Time B
Utility (μg/L) (μg/L) (μg/L) (μg/L) 1 < 0.5 3.6 < 0.5 3.10 2 < 0.5 < 0.5 < 0.5 < 0.5 3 < 0.5 < 0.5 < 0.5 < 0.5 4 < 0.5 < 0.5 < 0.5 < 0.5 5 1.6 1.2 1.2 0.9
Table 33. Bromate ion in raw, finished, and distribution waters BrO3
- Raw Finished Time A Time B
Utility (μg/L) (μg/L) (μg/L) (μg/L) 1 < 0.5 0.5 0.8 2.9 2 < 0.5 < 0.5 < 0.5 < 0.5 3 1.3 1.4 2.1 2.2 4 < 0.5 0.9 0.8 0.9 5 < 0.5 2.6 5.9 3.2
Table 34. Chlorate ion in raw, finished, and distribution waters ClO3
- Raw Finished Time A Time B
Utility (μg/L) (μg/L) (μg/L) (μg/L) 1 14.0 583 590 1200 2 5.0 19.0 46.0 45.0 3 130 198 < 3.0 < 3.0 4 < 3.0 129 126 133 5 < 3.0 788 1590 823
Results in Table 32 indicate that the levels of perchlorate ion do not increase over
time in the treated waters. None of the water samples contained perchlorate ion

116
concentration above the USEPA established interim health advisory level107 of 15 μg/L.
Bromate ion concentration was measured below an MCL of 10 μg/L in all water samples
(Table 33). However, chlorate ion was present in several samples above the guideline
MCL of 700 µg/L (Table 34), set by the World Health Organization.108 This suggests
that addition of contaminants such as chlorate and bromate ions during disinfection
process may be more of an immediate concern to the drinking water industry, than
potential addition of perchlorate ion (given that a water utility practices strategies to
minimize decomposition of hypochlorite ion and formation of chlorate ion).
To evaluate any potential contributions of perchlorate, bromate, and chlorate ions
from the hypochlorite ion solutions used to disinfect the water, a ratio of concentration of
contaminant per mg FAC was calculated and is presented in Table 35.
The results shown in Tables 26 and 35 support a key point that the bulk
hypochlorite ion solutions that are stored for long periods have higher concentrations of
contaminants introduced into the treated water. For example, the solution obtained from
Utility 1 contained 63.1 g/L OCl- and 22.8 g/L ClO3-, which indicates that this solution
has been decomposing. Solution from Utility 3 contained 89.0 g/L OCl- and 4.37 g/L
ClO3-, which indicates that this solution is “fresher” (Table 26). The ratio of contaminant
per mg FAC is much higher for the solution from Utility 1. Perchlorate ion concentration
in treated water from Utility 1 was significantly higher than in the sample obtained from
Utility 3. Thus, based on the limited data, it can be concluded that using “fresh” solutions
of hypochlorite ion would introduce lower concentrations of contaminants. This leads to
the conclusion that concentrated sodium hypochlorite solutions should be diluted at the
time of delivery and cooled in order to minimize decomposition of the hypochlorite ion
and the concomitant formation of chlorate and perchlorate ions.
The OSG sodium hypochlorite solutions are typically generated and used based
on demand and are not stored for more than one or two days. However, these solutions
vary significantly in the ratio of different contaminant per mg FAC. For example, OSG
solution 12, at 8.7 g/L FAC, had a considerably lower ratio of contaminants per mg FAC.
This emphasizes that there are multiple variables involved during hypochlorite ion
107 USEPA "Interim Drinking Water Health Advisory for Perchlorate" 108 WHO Guidelines for Drinking Water Quality; World Health Organization: Singapore, 2006, http://www.who.int/water_sanitation_health/dwq/gdwq3rd_add1.pdf
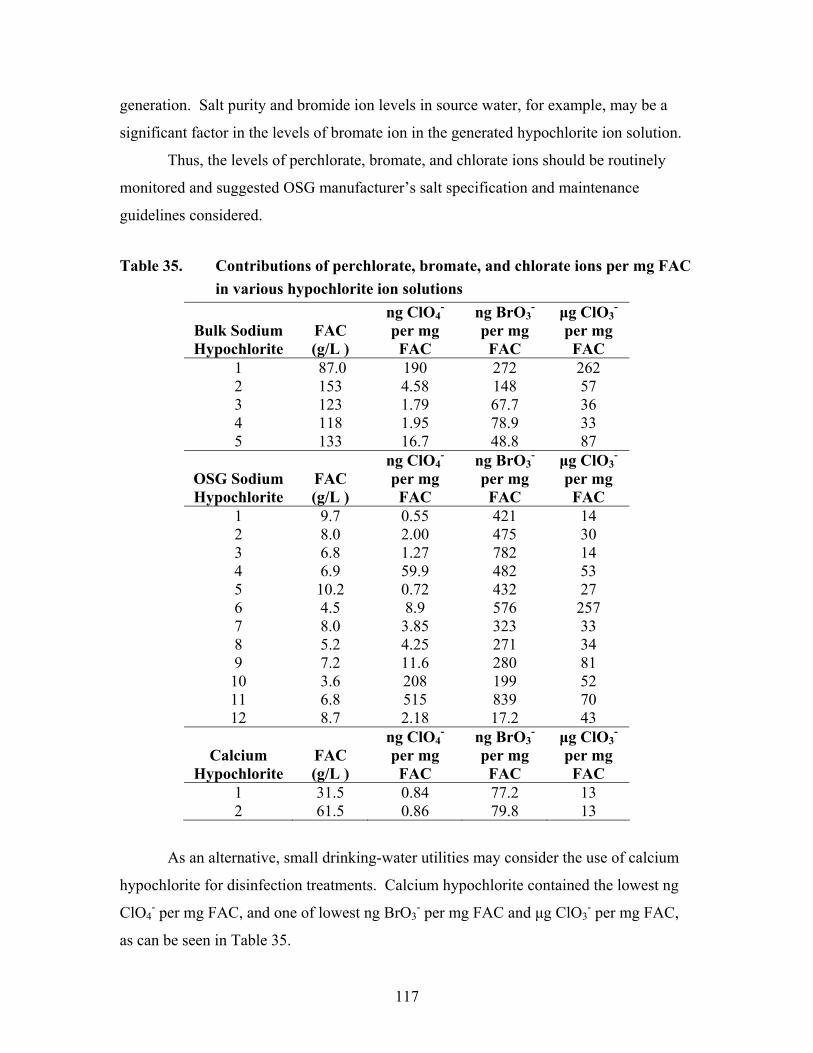
117
generation. Salt purity and bromide ion levels in source water, for example, may be a
significant factor in the levels of bromate ion in the generated hypochlorite ion solution.
Thus, the levels of perchlorate, bromate, and chlorate ions should be routinely
monitored and suggested OSG manufacturer’s salt specification and maintenance
guidelines considered.
Table 35. Contributions of perchlorate, bromate, and chlorate ions per mg FAC
in various hypochlorite ion solutions
Bulk Sodium Hypochlorite
FAC (g/L )
ng ClO4-
per mg FAC
ng BrO3-
per mg FAC
μg ClO3-
per mg FAC
1 87.0 190 272 262 2 153 4.58 148 57 3 123 1.79 67.7 36 4 118 1.95 78.9 33 5 133 16.7 48.8 87
OSG Sodium Hypochlorite
FAC (g/L )
ng ClO4-
per mg FAC
ng BrO3-
per mg FAC
μg ClO3-
per mg FAC
1 9.7 0.55 421 14 2 8.0 2.00 475 30 3 6.8 1.27 782 14 4 6.9 59.9 482 53 5 10.2 0.72 432 27 6 4.5 8.9 576 257 7 8.0 3.85 323 33 8 5.2 4.25 271 34 9 7.2 11.6 280 81 10 3.6 208 199 52 11 6.8 515 839 70 12 8.7 2.18 17.2 43
Calcium Hypochlorite
FAC (g/L )
ng ClO4-
per mg FAC
ng BrO3-
per mg FAC
μg ClO3-
per mg FAC
1 31.5 0.84 77.2 13 2 61.5 0.86 79.8 13
As an alternative, small drinking-water utilities may consider the use of calcium
hypochlorite for disinfection treatments. Calcium hypochlorite contained the lowest ng
ClO4- per mg FAC, and one of lowest ng BrO3
- per mg FAC and μg ClO3- per mg FAC,
as can be seen in Table 35.

118
5.7 Conclusions
The use of Equation 50 to determine the value of second-order rate constant as a
function of the ionic strength of solution at specific temperatures has been validated. A
difference of less than ± 10 % between the experimentally-measured decomposition of
bulk hypochlorite ion and that predicted by Bleach 2001 was demonstrated. Thus, by
using Equation 48 and predicted concentrations of hypochlorite and chlorate ions, a
simple predictive model is provided for perchlorate ion formation in bulk sodium
hypochlorite:
)eeT10log(2.084)0.0788()log(k R106
RT1.01x10
102
5 −−
××××+= μ (48)
• Application of the predictive model on several bulk sodium hypochlorite solutions
obtained from different water utilities demonstrated an accurate estimate of
perchlorate ion formation in the bulk sodium hypochlorite solutions.
• Perchlorate ion concentration increased in OSG sodium hypochlorite and calcium
hypochlorite solutions, exhibiting dependence on more variables than the bulk
sodium hypochlorite solutions. This is due to differences in pH and ionic strength.
• The results of a survey of raw and treated waters demonstrated that currently
perchlorate ion is present at trace concentrations (< 5.0 μg/L). However, the
results revealed that the levels of chlorate ion are considerably higher than the
WHO MCL109 of 700 μg/L. Thus, strategies to minimize formation of chlorate
ion in hypochlorite ion solutions should be considered by the utilities.
• It is evident that the use of stored concentrated hypochlorite ion solutions should
be avoided. Significant reductions in the rate of hypochlorite ion decomposition
and in the rates of chlorate ion and perchlorate ion formation can be achieved by
dilution and cooling of hypochlorite ion solutions.
109 WHO Guidelines for Drinking Water Quality
119
CHAPTER 6. CONCLUSIONS
6.1 Summary
A robust, sensitive LC-MS/MS method was developed and used for the
determination of perchlorate, bromate, and chlorate ions. Potentiometric titration with
sulfite ion was used for the determination of hypochlorite ion, and an iodometric titration
method was used for the determination of chlorate ion in bulk hypochlorite ion solutions.
Proper storage and sample preservation conditions were established.
The results of this study indicate that perchlorate ion formation in sodium
hypochlorite solutions is dependent on several factors: (1) The concentration of
hypochlorite and chlorate ions directly impact perchlorate ion formation; (2) The
presence of transition metal ions, chlorite ion or bromide ion indirectly impact
perchlorate ion formation, by reacting with hypochlorite ion; (3) The presence of noble
metal ions or bromate ion has no observable effect on perchlorate formation; (4) Higher
ionic strength enhances perchlorate ion formation; (5) pH effects in concentrated
hypochlorite ion solutions are more dominant in hypochlorite ion decomposition (faster
kinetics) than in perchlorate ion formation; however, in more dilute (i.e. more stable)
hypochlorite ion solutions, perchlorate ion formation also appears to be acid-catalyzed.
The rate of perchlorate ion formation was found to be first-order with respect to
hypochlorite and chlorate ions and second-order overall. The rate constant was found to
be strongly dependent on the ionic strength and a reduced expression to account for
effects of the ionic strength and temperature was validated. As a result, a perchlorate ion
formation predictive model is provided. Application of the predictive model with Bleach
2001 on several bulk sodium hypochlorite solutions obtained from different water
utilities, demonstrated an accurate approximation of perchlorate ion formation in bulk
sodium hypochlorite solutions.
Perchlorate ion concentration increased in the OSG sodium hypochlorite and
calcium hypochlorite solutions, exhibiting dependence on more variables than in the bulk
sodium hypochlorite solutions over time, due to differences in pH and the ionic strength.
The results of a survey of raw and treated waters demonstrated that currently
perchlorate ion is present at trace concentrations (< 5.0 μg/L). However, the results

120
revealed that the levels of the chlorate ion are considerably higher than the WHO MCL110
of 700 μg/L. Thus, strategies to minimize formation of the chlorate ion in hypochlorite
ion solutions should be considered by utilities.
It is evident that the use of stored concentrated hypochlorite ion solutions should
be avoided. Significant reductions in the rate of hypochlorite ion decomposition and in
the rates of chlorate ion and perchlorate ion formation can be achieved by dilution and
cooling of the stored hypochlorite ion solutions.
6.2 Recommendations to Water Utilities
Based on the results of this study the following recommendations to water utilities
are presented in light of the potential regulation of perchlorate ion in the drinking water:
i. Dilute Bulk Sodium Hypochlorite Solutions Upon Delivery
By diluting a hypochlorite ion solution at 2 M OCl- by a factor of 2, the
rate of perchlorate ion formation decreases by a factor of 7. If the same
solution is diluted by a factor of ten, the rate of perchlorate ion formation
decreases by a factor of 266.
ii. Store the Hypochlorite Ion Solutions At Lower Temperatures
By cooling sodium hypochlorite solutions by 5 ºC, the rate of perchlorate
ion formation is reduced approximately by a factor of 2. Thus, seasonal
changes in the temperature should be taken into consideration when
storing hypochlorite ion solutions.
iii. Maintain the pH of Bulk Hypochlorite Ion Solutions above pH 11 and
Below pH 13 After Dilution
By minimizing the decomposition of hypochlorite ion, a lower ratio of the
contaminants per mg FAC is achieved. Chlorate and perchlorate ions will
increase during prolonged storage. By keeping the pH in the range of
11-13, the decomposition of hypochlorite ion is minimized. 110 WHO Guidelines for Drinking Water Quality
121
iv. Require Removal of Transition Metal Ions From the Bulk Sodium
Hypochlorite Manufacturer
The presence of transition metal ions catalyzes decomposition of
hypochlorite ion thus increasing the ratio of the contaminant per mg FAC.
v. Do Not Store OSG and Calcium Hypochlorite Solutions
OSG sodium hypochlorite solutions are at pH ~9.5 and the rate of
perchlorate ion formation is enhanced. However, the rate of perchlorate
ion formation is still dependent on concentration of both hypochlorite and
chlorate ions. Thus, the on-site generators should be maintained and
optimized to reduce loss of hypochlorite ion to form chlorate ion.
Therefore, OSG solutions should be generated for immediate use and
should not be stored for more than 1-2 days. Perchlorate ion will also
form in calcium hypochlorite solutions and thus only fresh solutions
should be used.
vi. Use a Higher Purity Salt for OSG Sodium Hypochlorite, to Minimize
Conversion of Bromide Ion to Bromate Ion
Bromide ion reacts rapidly with hypochlorite ion to produce hypobromite
ion, which decomposes rapidly to produce bromate ion. Thus, higher
purity salts containing lower amounts of bromide ion will results in less
bromate ion formed during the on-site generation, and thus contribution of
the bromate ion to the drinking water will be significantly minimized.
122
APPENDIX 1. DETECTION OF OZONE GAS BY GOLD NANOISLANDS
A1.1 Introduction
In a previous paper this group reported that aqueous solutions of ozone produced a
shift in the surface plasmon resonance from colloidal gold nanoparticles.111 In most ozone
methods, ozone irreversibly oxidizes the reagents thereby making a sensor based on that
reagent impractical. The surprising finding was that the shift in the surface plasmon
resonance from the colloidal gold nanoparticles reversed to the original wavelength upon
depeletion of ozone. This is surprising since most reports of analytical utilization of
surface plasmons claimed irreversibility since the plasmonic shift was due to irreversible
aggregation of the gold nanoparticles. It was observed that the colloidal gold nanoparticles
were able to reproducibly cycle between the surface plasmon wavelengths as ozone was
introduced and removed. Since the desired outcome was a reversible ozone sensor, the
colloidal solution had to be replaced by a solid state surface.
In that initial report gold nanoislands were made using vapor deposition and were
tested for gaseous ozone response. As was the case in the aqueous system, the surface
plasmon resonance of the gold nanoislands exhibited a cycling effect when ozone was
introduced and removed. The difficulty with this approach was that the process of using
vapor deposition followed by a heat treatment was not very reproducible. The biggest issue
was controlling the size of the gold nanoislands. Described in this paper is a new process
to make more reproducible gold nanoislands and the analytical characterization of this new
material in terms of response to ozone.
The objective is to develop an ozone sensor for the drinking water industry and
other industries that electrolytically produce ozone. Tighter control of the generation
system will produce significant energy cost savings while maximizing the efficacy of the
ozone treatment. Up to now this task has been complicated by the complex nature of ozone
decomposition pathways112 and irreversible oxidation of the reagents/sensing element.113
111 Puckett, S. D., Heuser, J. A., Keith, J. D., Spendel, W. U. and Pacey, G. E. "Interaction of ozone with gold nanoparticles" Talanta 2005, 66, 1242-1246. 112 Tomiyasu, H., Fukutomi, H. and Gordon, G. "Kinetics and mechanism of ozone decomposition in basic aqueous solution" Inorg. Chem. 1985, 24, 2962-2966. 113 Gordon, Cooper, Rice, and Pacey Disinfectant Residual Measurement Methods.
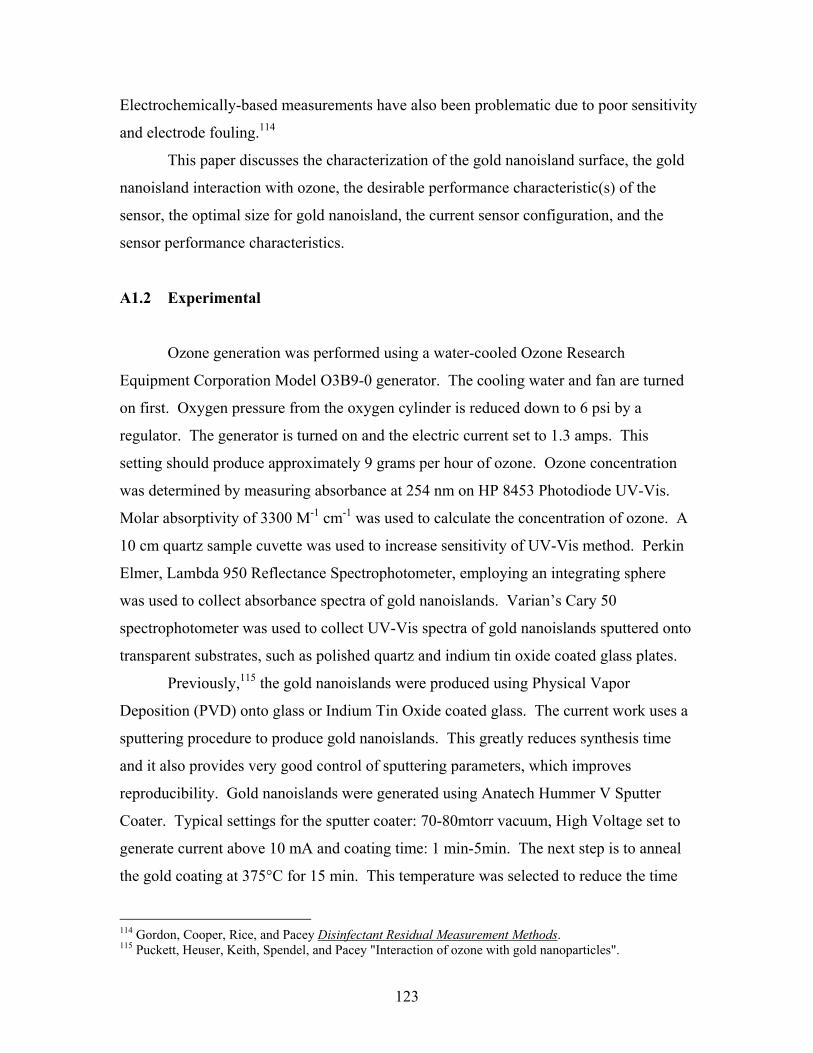
123
Electrochemically-based measurements have also been problematic due to poor sensitivity
and electrode fouling.114
This paper discusses the characterization of the gold nanoisland surface, the gold
nanoisland interaction with ozone, the desirable performance characteristic(s) of the
sensor, the optimal size for gold nanoisland, the current sensor configuration, and the
sensor performance characteristics.
A1.2 Experimental
Ozone generation was performed using a water-cooled Ozone Research
Equipment Corporation Model O3B9-0 generator. The cooling water and fan are turned
on first. Oxygen pressure from the oxygen cylinder is reduced down to 6 psi by a
regulator. The generator is turned on and the electric current set to 1.3 amps. This
setting should produce approximately 9 grams per hour of ozone. Ozone concentration
was determined by measuring absorbance at 254 nm on HP 8453 Photodiode UV-Vis.
Molar absorptivity of 3300 M-1 cm-1 was used to calculate the concentration of ozone. A
10 cm quartz sample cuvette was used to increase sensitivity of UV-Vis method. Perkin
Elmer, Lambda 950 Reflectance Spectrophotometer, employing an integrating sphere
was used to collect absorbance spectra of gold nanoislands. Varian’s Cary 50
spectrophotometer was used to collect UV-Vis spectra of gold nanoislands sputtered onto
transparent substrates, such as polished quartz and indium tin oxide coated glass plates.
Previously,115 the gold nanoislands were produced using Physical Vapor
Deposition (PVD) onto glass or Indium Tin Oxide coated glass. The current work uses a
sputtering procedure to produce gold nanoislands. This greatly reduces synthesis time
and it also provides very good control of sputtering parameters, which improves
reproducibility. Gold nanoislands were generated using Anatech Hummer V Sputter
Coater. Typical settings for the sputter coater: 70-80mtorr vacuum, High Voltage set to
generate current above 10 mA and coating time: 1 min-5min. The next step is to anneal
the gold coating at 375°C for 15 min. This temperature was selected to reduce the time
114 Gordon, Cooper, Rice, and Pacey Disinfectant Residual Measurement Methods. 115 Puckett, Heuser, Keith, Spendel, and Pacey "Interaction of ozone with gold nanoparticles".
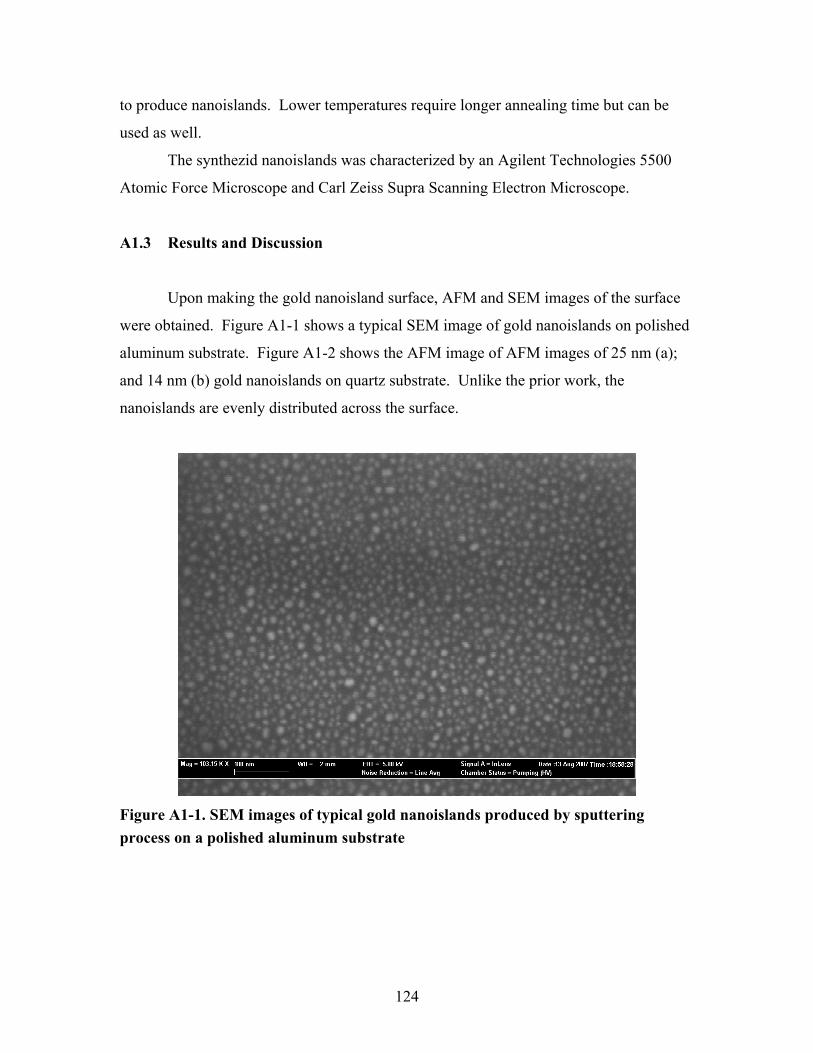
124
to produce nanoislands. Lower temperatures require longer annealing time but can be
used as well.
The synthezid nanoislands was characterized by an Agilent Technologies 5500
Atomic Force Microscope and Carl Zeiss Supra Scanning Electron Microscope.
A1.3 Results and Discussion
Upon making the gold nanoisland surface, AFM and SEM images of the surface
were obtained. Figure A1-1 shows a typical SEM image of gold nanoislands on polished
aluminum substrate. Figure A1-2 shows the AFM image of AFM images of 25 nm (a);
and 14 nm (b) gold nanoislands on quartz substrate. Unlike the prior work, the
nanoislands are evenly distributed across the surface.
Figure A1-1. SEM images of typical gold nanoislands produced by sputtering process on a polished aluminum substrate

125
Figure A1-2. AFM images of 25 nm (a); and 14 nm (b) gold nanoislands on quartz substrate
As can be seen from Figure A1-3, gold nanoislands respond to the presence of
ozone by producing a red-shift in the surface plasmon resonance. The surface plasmon
resonance peak for the gold nanoislands shifts from 520 nm to 540 nm upon exposure to
ozone. The presence and concentration of ozone was monitored by measuring the ozone
absorbance peak at 254 nm. Upon decomposition of ozone from the sample solutions, the
(a)
(b)

126
surface plasmon resonance peak for the gold nanoislands completely return to the original
position at 520 nm.
The top line in Figure A1-3 shows the spectrum for a thin film of gold that produces
a broad absorbance after 600nm and no surface plasmon resonance. In previous studies
surface spectroscopy indicated that the ozone decomposed to oxygen which covered the
surface.116 Formation of gold oxides and chemisorbed oxygen layers was also reported117.
The oxygen layer could be removed by heating the surface to 600 K and that this
desorption process exhibited first-order kinetics.118
Wavelength, nm
200 400 600 800 1000
Abs
orba
nce
0.00
0.05
0.10
0.15
0.20
0.25Sputtered gold thin filmGold nanoislands Gold nanoislands exposed to OzoneGold nanoislands reversed
Figure A1-3. Overlaid UV-Vis spectra of : dashed line-gold thin film on quarts, solid line-gold nanoislands, dot-dashed line gold nanoislands exposed to ozone gas, dotted line-gold nanoislands reversed by annealing at 375 ºC for 15 min
116 Saliba, N., Parker, D. H. and Koel, B. E. "Adsorption of oxygen on Au(111) by exposure to ozone" Surf. Sci. 1998, 410, 270-282. 117 Krozer, A. and Rodahl, M. "X-ray photoemission spectroscopy study of UV/ozone oxidation of Au under ultrahigh vacuum conditions" J. Vac. Sc. Technol. A. 1997, 15, 1704-1709. 118 Saliba, Parker and Koel "Adsorption of oxygen on Au(111) by exposure to ozone".
127
Fortunately, gold nanoislands do not need high temperatures to shift the surface
plasmon resonance back to 520 nm. This suggests that unlike with the thin fold films,
where the ozone decomposed to oxygen which was adsorbed, the ozone is directly
influencing the surface plasmon resonance and when it decomposes, the oxygen that is
produced does not interact with the gold nanoislands. Studies of pure oxygen confirmed
this finding. Exposure of gold nanoislands to oxygen gas does not cause a surface-plasmon
resonance to shift.
In addition shifts in surface plasmon resonance has been explained by aggregation.
Using particle size analysis it has been shown that the size increases (doubles or more)
when the shift is observed. But in the case of ozone particle size analysis shows that the
size has not changed when the shift is observed. The ozone on the particle alone is creating
the shift. This also explains why the ozone produced shift is reversible. Aggregated based
shifts do not reverse since breaking the aggregation is not probable. For the ozone based
shift, the ozone only has to decompose leaving the same size of the nanoparticle that
existed before the ozone exposure.
The desirable performance characteristic(s) of an ozone sensor have been
previously described.119 The ideal method/technique would be specific for only ozone
itself and not respond to its decomposition products. It needs to be selectivity over possible
interferences by at least 500. A detection limit of 0.01 mg/L for ozone with a precision of
at least 0.1% and an accuracy of at least 0.5% is needed. The system must be easily,
absolutely calibrated. A working linear range of five orders of magnitude is desirable but
not mandatory for all situations. The system can not require dilution of the water or gas
sample to mask or minimize potential interferences. The system must work equally well
(and satisfy the above requirements) in batch and automated modes of operation. The
system must be operable by a technician and not require specialized skills or unusual or
ultra-complex instruments. The measurement should be made in less than one minute. The
whole process must be relatively cost effective.
The response of the gold nanoislands sensor to ozone was investigated by
exposing it to different concentrations. Figure A1-4 shows the spectra exhibiting the
amount of red-shift, in nm, with increasing ozone concentration. Figure A1-5 is a
119 Gordon, Cooper, Rice, and Pacey Disinfectant Residual Measurement Methods.
128
calibration plot of spectral shift (nm) of the gold nanoislands surface plasmon resonance
peak versus ozone concentration. The calibration plot shows that with the current design
the detection of gaseous ozone at concentration of less than 20 ppb (µg/L). Starting with
the 20 ppb data point, a curve with an equation of y=6.8ln(x)-15.19 produced a
correlation coefficient of 0.966.
Wavelength (nm)
460 480 500 520 540 560 580 600
Abso
rban
ce
0.035
0.040
0.045
0.050
0.055
0.060
0.065
0.070
0.075
Figure A1-4. Overlaid UV-Vis spectra of 25 nm gold nanoislands with surface Plasmon absorbance max at 520 nm exposed to concentrations of ozone, increased in increments form 20.9 μg/L to 166.1 μg/L. Ozone causes a red-shift in the surface-plasmon absorbance max
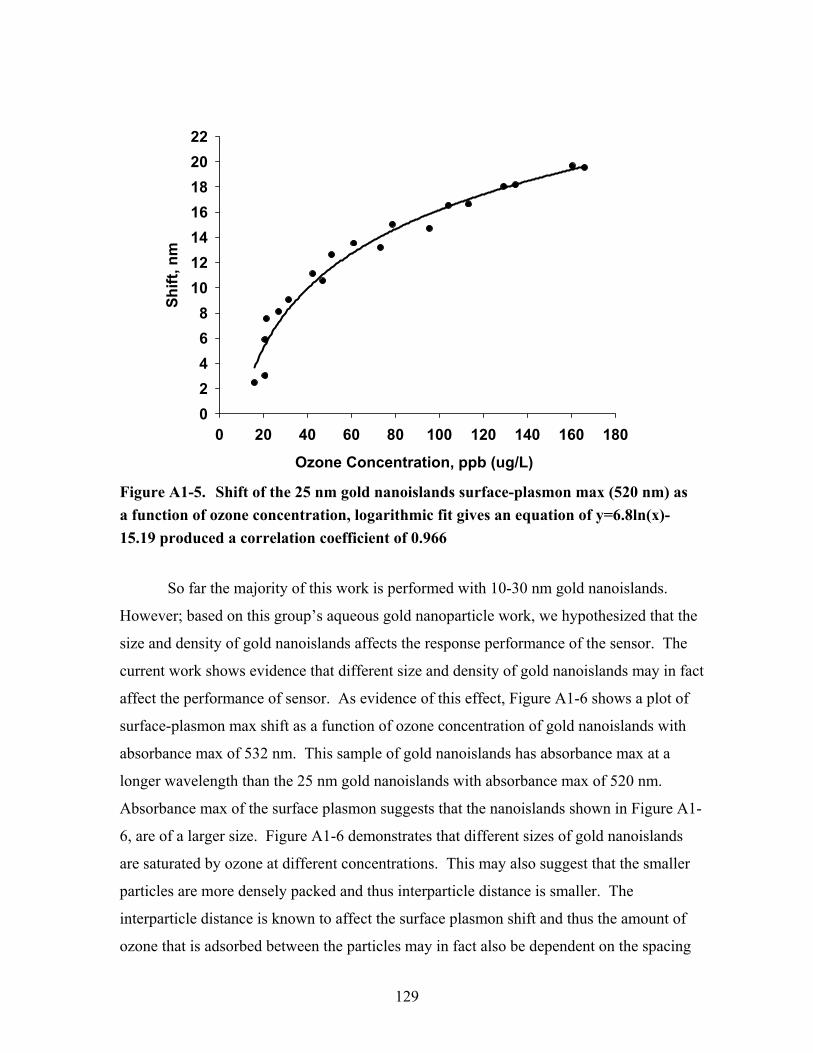
129
Ozone Concentration, ppb (ug/L)
0 20 40 60 80 100 120 140 160 180
Shift
, nm
02468
10121416182022
Figure A1-5. Shift of the 25 nm gold nanoislands surface-plasmon max (520 nm) as a function of ozone concentration, logarithmic fit gives an equation of y=6.8ln(x)-15.19 produced a correlation coefficient of 0.966
So far the majority of this work is performed with 10-30 nm gold nanoislands.
However; based on this group’s aqueous gold nanoparticle work, we hypothesized that the
size and density of gold nanoislands affects the response performance of the sensor. The
current work shows evidence that different size and density of gold nanoislands may in fact
affect the performance of sensor. As evidence of this effect, Figure A1-6 shows a plot of
surface-plasmon max shift as a function of ozone concentration of gold nanoislands with
absorbance max of 532 nm. This sample of gold nanoislands has absorbance max at a
longer wavelength than the 25 nm gold nanoislands with absorbance max of 520 nm.
Absorbance max of the surface plasmon suggests that the nanoislands shown in Figure A1-
6, are of a larger size. Figure A1-6 demonstrates that different sizes of gold nanoislands
are saturated by ozone at different concentrations. This may also suggest that the smaller
particles are more densely packed and thus interparticle distance is smaller. The
interparticle distance is known to affect the surface plasmon shift and thus the amount of
ozone that is adsorbed between the particles may in fact also be dependent on the spacing
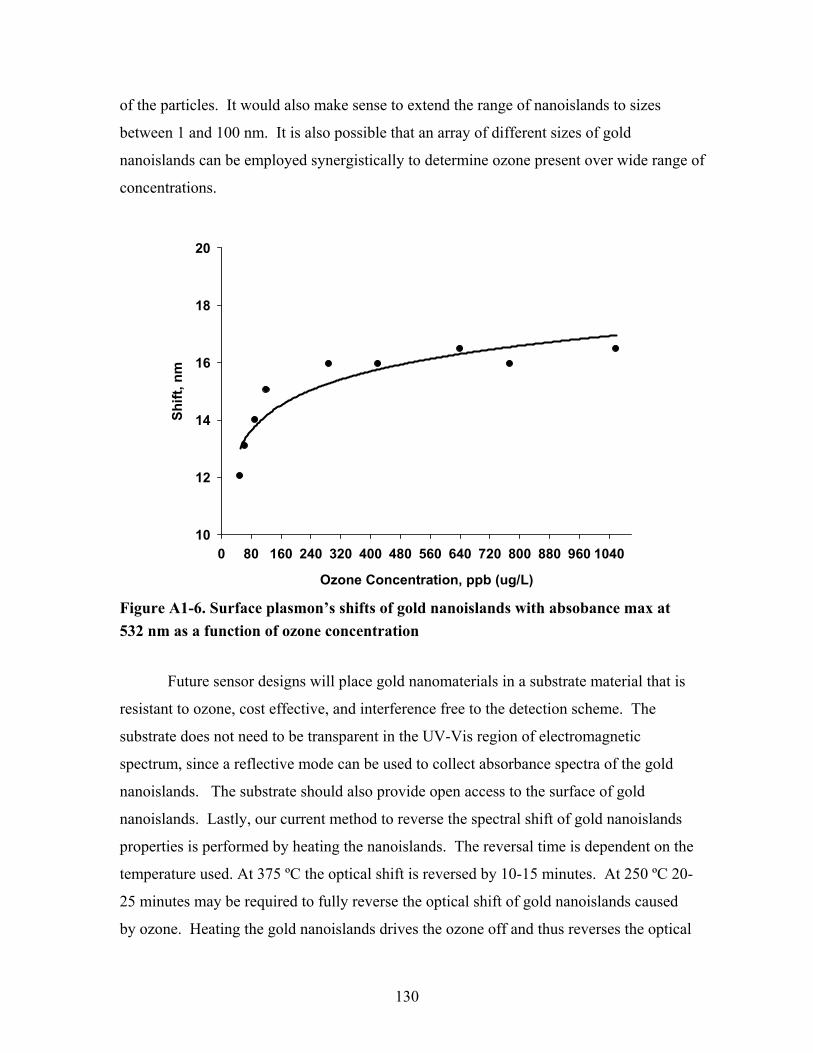
130
of the particles. It would also make sense to extend the range of nanoislands to sizes
between 1 and 100 nm. It is also possible that an array of different sizes of gold
nanoislands can be employed synergistically to determine ozone present over wide range of
concentrations.
Ozone Concentration, ppb (ug/L)
0 80 160 240 320 400 480 560 640 720 800 880 960 1040
Shift
, nm
10
12
14
16
18
20
Figure A1-6. Surface plasmon’s shifts of gold nanoislands with absobance max at 532 nm as a function of ozone concentration
Future sensor designs will place gold nanomaterials in a substrate material that is
resistant to ozone, cost effective, and interference free to the detection scheme. The
substrate does not need to be transparent in the UV-Vis region of electromagnetic
spectrum, since a reflective mode can be used to collect absorbance spectra of the gold
nanoislands. The substrate should also provide open access to the surface of gold
nanoislands. Lastly, our current method to reverse the spectral shift of gold nanoislands
properties is performed by heating the nanoislands. The reversal time is dependent on the
temperature used. At 375 ºC the optical shift is reversed by 10-15 minutes. At 250 ºC 20-
25 minutes may be required to fully reverse the optical shift of gold nanoislands caused
by ozone. Heating the gold nanoislands drives the ozone off and thus reverses the optical
131
shift. No interferences were observed for reversing the gold nanoislands surface Plasmon
by annealing process. Several samples were exposed for significantly longer times and
found that the surface plasmon peak does disappear if the gold nanoislands are heated for
longer periods of time. This is most likely due to forming a gold oxide layer which
inactivates the nanoislands.
A1.4. Conclusions
It has been demonstrated that fabrication of fast and cheap sensor material that
can be used for detection of ozone is possible. Surface Plasmon resonance shift of gold
nanoislands is reversible. We have tested a consistent reversibility has been observed. A
detection limit of 15 ppb was achieved.
132
APPENDIX 2. ELECTROCHEMICALLY ASSISTED PROCESSING OF
ORGANICALLY MODIFIED, PERPENDICULARLY
ORIENTED MESOPOROUS SILICA FILMS WITH
FLUORESCENT FUNCTIONALITY
A2.1. Introduction
Functionalized, mesostructured thin films are of interest in a number of fields,
including the development of optical and electrochemical sensing devices. A key to
optimizing the performance of such sensors is to provide for facile mass transport into
and through the film, which suggests fabrication with a controlled pore structure. In this
regard, the least tortuous path is achieved with pores normal to a substrate such as an
electrode. Ordered mesoporous supports have been achieved in the past by such
approaches as optical lithography,120 ion-track etching,121 electrochemical etching of
Si122, and anodization of Al123. However, these techniques, which impart porosity to an
existing film, suffer from problems such as restricted pore density or disordered pore
structures. Others have identified synthetic approaches to produce structurally controlled
mesoporous thin films with the desired orientation.124,125,126,127 Our objective is to
directly synthesize mesoporous thin films that have cylindrical pores normal to the
substrate and that are functionalized with sensing centers, such as fluorophores.
Early studies of surfactant-templated materials used a liquid-crystal template
mechanism in which aluminosilicate gels were calcined in the presence of surfactant- 120 Choi, Y.-K., King, T.-J. and Hu, C. "Nanoscale CMOS spacer FinFET for the terabit era" Electron. Devic. Lett. 2002, 23, 25-27. 121 Metz, S., Trautmann, C., Bertsch, A. and Renaud, P. "Polyimide microfluidic devices with integrated nanoporous filtration areas manufactured by micromachining and ion track technology" J. Micromech. Microeng. 2004, 14, 324-331. 122 Sato, H., Homma, T. "Fabrication of high-aspect-ratio arrayed structures using Si electrochemical etching" Sci. Technol. Adv. Mat. 2006, 7, 468-474. 123 Xu, C. X., Zhang, X. S. and Sun, X. W. "Preparation of Porous Alumina by Anodization" J. Metastab. Nanocryst. 2005, 23, 75-78. 124 Sanchez, C., Julian, B., Belleville, P. and Popall, M. J. Mater. Chem. 2005, 15, 3559. 125 Scott, B. J., Wirnsberger, G. and Stucky, G. D. "Mesoporous and Mesostructured Materials for Optical Applications" Chem. Mater. 2001, 13, 3140-3150. 126 Hartmann, M. "Ordered Mesoporous Materials for Bioadsorption and Biocatalysis" Chem. Mater. 2005, 17, 4577-4593. 127 Hoffmann, F., Cornelius, M., Morell, J. and Fröba, M. "Silica-Based Mesoporous Organic-Inorganic Hybrid Materials" Angew. Chem., Int. Ed. 2006, 45, 3216-3251.

133
producing silica walls templated around the surfactant micelles that resulted in ordered
mesoporous silica films.128 It was also discovered that mesoporous silica films can be
produced at the interfaces of air-water129 or water-oil systems by using surfactant
micelles as a template to grow mesoporous silica at these interfaces.130 However, it was
found that synthesis of mesoporous silica films using surfactant template had long
deposition times, the film texture was grainy131, and many times the orientation of the
channels was parallel to the substrate.132 The next advance was evaporation-induced self-
assembly (EISA).133,134,135,136 This process was based on silica/surfactant self-assembly
into thin-film mesophases during the evaporation of the solvent and of the alcohol
released by processing after inkjet printing, spin-coating, or dip-coating the substrate.
The EISA approach produced a 3D network of interconnected pores across the film.
However, the limitations on mass transport inherent to a tortuous path were not
eliminated. In addition EISA requires flat surfaces for spin- and dip-coating.
An overview of synthesis methods that produce mesoporous metal-oxide and
other oxide films with pore orientation perpendicular to the substrate surface with the use
of surfactant templating and dimensional confinement has been presented137. In
particular, a porous alumina membrane can be used to provide a dimensional
confinement for the self-assembly process resulting in nanocomposite films with pores 128 Kresge, C. T., Leonowicz, M. E., Roth, W. J., Vartuli, J. C. and Beck, J. S. "Ordered mesoporous molecular sieves synthesized by a liquid-crystal template mechanism" Nature 1992, 359, 710-712. 129 Yang, H., Coombs, N., Sokolov, I. and Ozin, G. A. "Free-standing and oriented mesoporous silica films grown at the air-water interface" Nature 1996, 381, 589-592. 130 Schacht, S., Huo, Q., Voigt-Martin, I. G., Stucky, G. D. and Schüth, F. "Oil-Water Interface Templating of Mesoporous Macroscale Structures" Science 1996, 273, 768-771. 131 Nicole, L., Boissi, egrave, re, C., eacute, dric, Grosso, D., Quach, A., Sanchez, C. and ment "Mesostructured hybrid organic & inorganic thin films" J. Mater. Chem. 2005, 15, 3598-3627. 132 Yang, H., Kuperman, A., Coombs, N., Mamiche-Afara, S. and Ozin, G. A. "Synthesis of oriented films of mesoporous silica on mica" Nature 1996, 379, 703-705. 133 Lu, Y., Ganguli, R., Drewien, C. A., Anderson, M. T., Brinker, C. J., Gong, W., Guo, Y., Soyez, H., Dunn, B., Huang, M. H. and Zink, J. I. "Continuous formation of supported cubic and hexagonal mesoporous films by sol-gel dip-coating" Nature 1997, 389, 364-368. 134 Brinker, C. J., Lu, Y., Sellinger, A. and Fan, H. "Evaporation-Induced Self-Assembly: Nanostructures Made Easy" Adv. Mat. 1999, 11, 579-585. 135 Grosso, D., Cagnol, F., Soler-Illia, G., thinsp, J, de, A, Crepaldi, E., L, Amenitsch, H., Brunet-Bruneau, A., Bourgeois, A. and Sanchez, C. "Fundamentals of Mesostructuring Through Evaporation-Induced Self-Assembly" Adv. Funct. Mater. 2004, 14, 309-322. 136 Minoofar, P. N., Dunn, B. S. and Zink, J. I. "Multiply Doped Nanostructured Silicate Sol-Gel Thin Films: Spatial Segregation of Dopants, Energy Transfer, and Distance Measurements" J. Am. Chem. Soc. 2005, 127, 2656-2665. 137 Brinker, C. J. and Dunphy, D. R. "Morphological control of surfactant-templated metal oxide films" Curr. Opin. Colloid In. 2006, 11, 126-132.
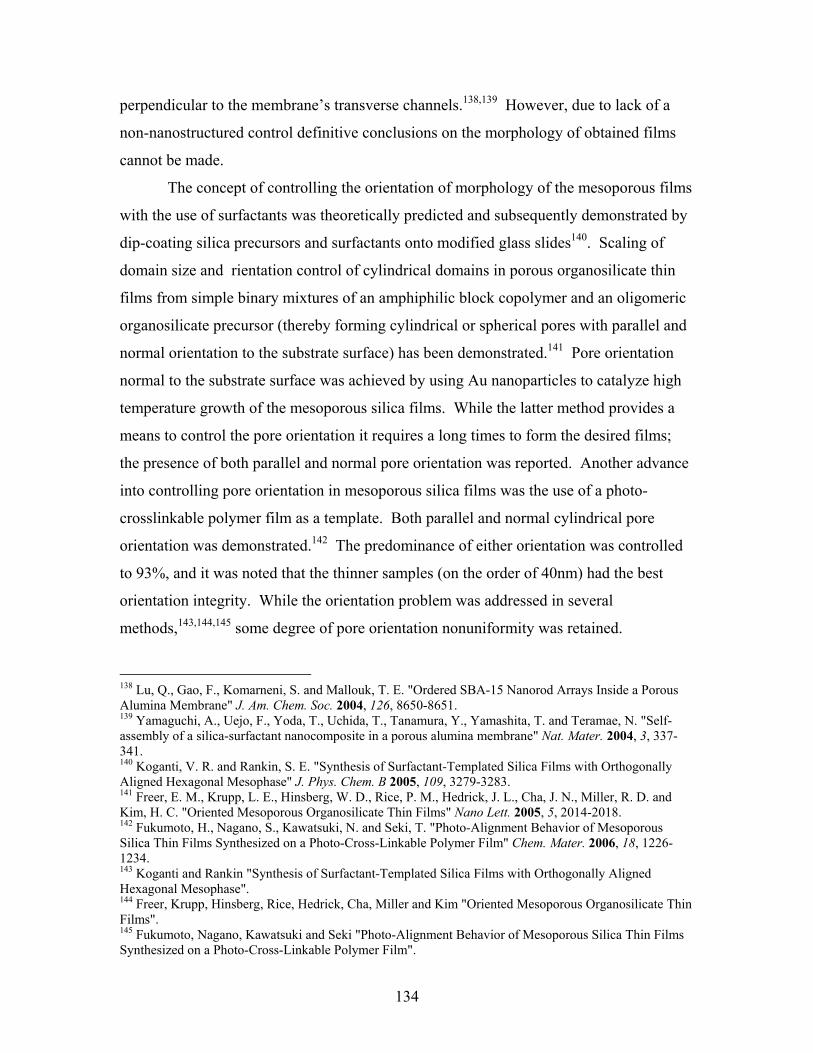
134
perpendicular to the membrane’s transverse channels.138,139 However, due to lack of a
non-nanostructured control definitive conclusions on the morphology of obtained films
cannot be made.
The concept of controlling the orientation of morphology of the mesoporous films
with the use of surfactants was theoretically predicted and subsequently demonstrated by
dip-coating silica precursors and surfactants onto modified glass slides140. Scaling of
domain size and rientation control of cylindrical domains in porous organosilicate thin
films from simple binary mixtures of an amphiphilic block copolymer and an oligomeric
organosilicate precursor (thereby forming cylindrical or spherical pores with parallel and
normal orientation to the substrate surface) has been demonstrated.141 Pore orientation
normal to the substrate surface was achieved by using Au nanoparticles to catalyze high
temperature growth of the mesoporous silica films. While the latter method provides a
means to control the pore orientation it requires a long times to form the desired films;
the presence of both parallel and normal pore orientation was reported. Another advance
into controlling pore orientation in mesoporous silica films was the use of a photo-
crosslinkable polymer film as a template. Both parallel and normal cylindrical pore
orientation was demonstrated.142 The predominance of either orientation was controlled
to 93%, and it was noted that the thinner samples (on the order of 40nm) had the best
orientation integrity. While the orientation problem was addressed in several
methods,143,144,145 some degree of pore orientation nonuniformity was retained.
138 Lu, Q., Gao, F., Komarneni, S. and Mallouk, T. E. "Ordered SBA-15 Nanorod Arrays Inside a Porous Alumina Membrane" J. Am. Chem. Soc. 2004, 126, 8650-8651. 139 Yamaguchi, A., Uejo, F., Yoda, T., Uchida, T., Tanamura, Y., Yamashita, T. and Teramae, N. "Self-assembly of a silica-surfactant nanocomposite in a porous alumina membrane" Nat. Mater. 2004, 3, 337-341. 140 Koganti, V. R. and Rankin, S. E. "Synthesis of Surfactant-Templated Silica Films with Orthogonally Aligned Hexagonal Mesophase" J. Phys. Chem. B 2005, 109, 3279-3283. 141 Freer, E. M., Krupp, L. E., Hinsberg, W. D., Rice, P. M., Hedrick, J. L., Cha, J. N., Miller, R. D. and Kim, H. C. "Oriented Mesoporous Organosilicate Thin Films" Nano Lett. 2005, 5, 2014-2018. 142 Fukumoto, H., Nagano, S., Kawatsuki, N. and Seki, T. "Photo-Alignment Behavior of Mesoporous Silica Thin Films Synthesized on a Photo-Cross-Linkable Polymer Film" Chem. Mater. 2006, 18, 1226-1234. 143 Koganti and Rankin "Synthesis of Surfactant-Templated Silica Films with Orthogonally Aligned Hexagonal Mesophase". 144 Freer, Krupp, Hinsberg, Rice, Hedrick, Cha, Miller and Kim "Oriented Mesoporous Organosilicate Thin Films". 145 Fukumoto, Nagano, Kawatsuki and Seki "Photo-Alignment Behavior of Mesoporous Silica Thin Films Synthesized on a Photo-Cross-Linkable Polymer Film".
135
Another approach to obtaining mesoporous silica films with normal pore
orientation is to combine electrochemically induced self-assembly of surfactants at the
solid-liquid interface146 and an electrochemically assisted deposition method to produce
sol-gels.147,148 This approach was demonstrated to produce highly ordered mesoporous
silica films with pore channels oriented perpendicular to the solid substrate material.149
This method is different from EISA because the mesoporous thin-film growth is guided
by both the surfactant-templated surface and sol-gel controlled by the potential of the
substrate electrode. It is also different from cathodic deposition of ordered metal or
metal-oxide films around polymeric templates150 and electrochemical precipitation of
metal oxides using self-assembly of surfactant molecules in that the electrogenerated
species in this process is a catalyst rather than a component of the final material151.
There is a recognized, pressing demand for rugged, miniaturized and portable
biosensing devices across fields as diverse as in vivo medical monitoring, disease
diagnostics, bioprocess and environmental monitoring, food and drug quality control,
genomics, and proteonomics. Thus, sol-gel films are of importance in the design of such
sensors, but they are limited by the difficulty of controlling their pore structure.
Therefore, the goal of this work is to investigate the design and utility of
electrochemically induced self-assembly of surfactants at the solid-liquid interface to
produce functionalized films with perpendicular nanocapillaries. The present study
reports the electrochemically assisted processing of organically modified silica (ormosil)
films with mesopores normal to the electrode surface (EPONs). This general fabrication
146 Choi, K. S., McFarland, E. W. and Stucky, G. D. "Electrocatalytic Properties of Thin Mesoporous Platinum Films Synthesized Utilizing Potential-Controlled Surfactant Assembly" Adv. Mat. 2003, 15, 2018-2021. 147 Shacham, R., Avnir, D. and Mandler, D. "Electrodeposition of Methylated Sol-Gel Films on Conducting Surfaces" Adv. Mat. 1999, 11, 384-388. 148 Sibottier, E., Sayen, S., eacute, phanie, Gaboriaud, F. and Walcarius, A. "Factors Affecting the Preparation and Properties of Electrodeposited Silica Thin Films Functionalized with Amine or Thiol Groups" Langmuir 2006, 22, 8366-8373. 149 Walcarius, A., Sibottier, E., Etienne, M. and Ghanbaja, J. "Electrochemically assisted self-assembly of mesoporous silica thin films" Nat. Mater. 2007, 6, 602-608. 150 Bartlett, P. N., Birkin, P. R. and Ghanem, M. A. "Electrochemical deposition of macroporous platinum, palladium and cobalt films using polystyrene latex sphere templates" Chem. Commun. 2000, 2000, 1671-1672. 151 Choi, K.-S., Lichtenegger, H. C., Stucky, G. D. and McFarl, E. W. "Electrochemical Synthesis of Nanostructured ZnO Films Utilizing Self-Assembly of Surfactant Molecules at Solid−Liquid Interfaces" J. Am. Chem. Soc. 2002, 124, 12402-12403.
136
method has been previously reported152. The solution was prehydrolyzed for 1 hour to
allow organization of the CTAB on the electrode. This organized structure has spaces
between the CTAB molecules. The electrode is placed in an unbuffered electrolyte that
contains a sol. During a brief cathodization electrolyte hydroxyl ions are produced that
catalyze the polycondensation of the sol to form a thin silica film. The sol-gel is grown
in the aqueous spaces around the CTAB hydrophilic head group in the supramolecular
assembly. Given that the CTAB structure is perpendicular to the substrate surface, the
deposited sol-gel is also perpendicular to the substrate surface. The CTAB is leached
from the film, resulting in a sol-gel coated surface in which the perpendicular
mesoporous structure is maintained. In the reported study153, tetrethylorthosilicate
(TEOS) was the sol.
In this paper, the general EPON frication is extended by organically modifying
the film precursor with a fluorescent functional group.
A2-2. Experimental
The organically modified precursor was prepared by reacting 7-hydroxy-4-methyl
coumarin (coumarin 4) with 3-(triethoxysilyl) propylisocyanate (TriMeOSiC) to produce
4-methylcoumarin-7-yl 3-(trimethoxysilyl)propylcarbamate. Analogous to a previous
report (27), partial hydrolysis of TEOS and TriMeOSiC was performed at pH 3. For
example, 13.6 mmol TEOS; 20 mL ethanol; 20 mL aqueous solution of 0.1 M NaNO3;
10-3 M HCl, and an aliquot of 10-3 M of TriMeOSiC were mixed with 4.35 mmol CTAB
(98%, Fluka) under stirring. This amount of CTAB corresponds to a CTAB/TEOS ratio
of 0.32 (higher or lower ratios give less ordered mesostructures or even non-ordered
materials.154 The mixture was reacted for 2.5 h under stirring before use. An indium tin
oxide (ITO) electrode, which served as substrate, was immersed in the above solution,
and under quiescent conditions, a cathodic potential (e.g. -1.2 to -2.1 V vs Ag/AgCl) was
applied for a defined period (typically 1–10 s, depending on the desired film thickness).
152 Walcarius, Sibottier, Etienne and Ghanbaja "Electrochemically assisted self-assembly of mesoporous silica thin films". 153 Walcarius "Electrochemically assisted self-assembly of mesoporous silica thin films". 154 Walcarius "Electrochemically assisted self-assembly of mesoporous silica thin films".

137
Under these conditions the reduction of water occurs; the OH- released catalyzes the sol-
gel reaction specifically at the electrode surface, thereby forming a functionalized silica
film. The electrode was removed from the solution immediately after the electrolysis and
rinsed with water to avoid any further deposition through an undesired evaporation-
induced condensation process. Blank experiments, performed under the same conditions
but without applying any potential to the electrode, did not yield a film on the ITO. The
samples were dried at room temperature overnight. In some cases, they were dried
further at 110°C. The reported drying at 130°C 155 was not used to avoid possible
thermal decomposition of 4-methylcoumarin-7-yl 3’-trimethoxysilyl)propylcarbamate.
The dried samples were extracted overnight with 10 mL of 50:50 ethanol 0.1M HCl (aq.)
to extract CTAB as well as residual sol.
All fluorescence measurements were obtained with a Horiba Jobin Yvon
Fluorolog-3-22 spectrofluorometer. AFM images were obtained with a Agilent 5500
AFM Microscope.
A2-3. Results and Discussion
An initial screening of the fluorescence from films on ITO is shown in Figure A2-
1. Under UV radiation (Fig. A2-1b), fluorescence is observed. In addition, the EPON-
coated ITO appeared white due to light scattering. Note that the sample used in Figure
A2-1 employed an extended deposition time so that a layer of silica spheres was
deposited on top of the EPON. This procedure was used to achieve visual evidence of
incorporation of coumarin 4 into the sol-gel structures.
Figure A2-1. (a) Left sample—Blank ITO Electrode, right sample—ITO Electrode with the EPON film. (b) Samples in same position under UV light, fluorescence is observed for ITO Electrode with EPON film
155 Walcarius "Electrochemically assisted self-assembly of mesoporous silica thin films".
(a) (b)

138
AFM images of the EPON on ITO are shown in Figure A2-2. Here the
electrochemically assisted deposition was 10 s at -2.1 V vs Ag/AgCl. First, it is apparent
that the coverage of the ITO is not uniform; instead, the EPON forms as islands on the
surface. This pattern is not surprising in that when used as received ITO surfaces exhibit
non-uniform catalysis, so the electrolysis of water, and therefore the pH, will vary across
the electrode surface, as shown by Figure A2-2. Second, within a given island, the film
thickness is uniform, with the deposted mesopores normal to the ITO electrode surface as
can be seen in Figure A2-3. The EPON pore structure previously reported with a TEOS
precursor156 clearly is retained with this fluorescing film prepared from TEOS,
TriMeOSiC mixed sol. Also demonstrated was that, consistent with a TEOS precursor,
the thickness of the film depended upon electroysis time and the applied potential.
Figure A2-2. EPON-Coated ITO Electrode, plating time 10 s at -2.1V. Imaging of the plating interface shows the difference in surface morphology that of the ITO and that of EPON film, which indicates EPON film is deposited on the ITO surface
156 Walcarius "Electrochemically assisted self-assembly of mesoporous silica thin films".
139
Figure A2-3. EPON-coated ITO electrode, plating time: (a) 30 s -2.1V. The deposited film indicates normal to the electrode surface orientation of the deposited EPON film. (b) EPON-coated ITO electrode, magnification of (a) reveals normal orientation of the mesopores
The UV-Vis and fluorescence spectra of 7-hydroxy-4-methyl coumarin and 4-
methylcoumarin-7-yl 3’-(trimethoxysilyl)propylcarbamate solutions of the same
concentration (10 μmol/L) produced identical intensity emission at 387 nm. In addition
the absorbance and excitation spectra were the same, the absorbance maximum was at
322 nm in both cases. This suggests that the incorporation of the silyl group did not
affect the electronic excitation and emission mechanisms, an observation consistent with
prior reports on siloxy-derivatized coumarin 4 that was incorporated into sol-gel
monoliths.157,158, 159
The incorporation of coumarin 4 in the sol-gel film is stable after the initial
washing to remove the unbound fluorophore. For example, Figure A2-4 compares the
fluorescence from a film at various stages of fabrication. After washing the coumarin-4
emission drops by a factor of 2.2, indicating the presence of non-bonded 4-
methylcoumarin-7-yl 3- (trimethoxysilyl) - propylcarbamate. Further washing did not
change the spectra. Wetting the sample with water as well as organic solvents such as n-
157 Suratwala, T., Gardlund, Z., Davidson, K., Uhlmann, D. R., Watson, J. and Peyghambarian, N. "Silylated Coumarin Dyes in Sol-Gel Hosts. 1. Structure and Environmental Factors on Fluorescent Properties" Chem. Mater. 1998, 10, 190-198. 158 Suratwala, T., Gardlund, Z., Davidson, K., Uhlmann, D. R., Watson, J., Bonilla, S. and Peyghambarian, N. "Silylated Coumarin Dyes in Sol-Gel Hosts. 2. Photostability and Sol-Gel Processing" Chem. Mater. 1998, 10, 199-209. 159 Suratwala, T., Gardlund, Z., Boulton, J. M. and Uhlmann, D. R. Series Incorporation of triethoxysilyl functionalized Coumarin 4 in sol-gel hosts, 13 October, 1994 Conference.
(a) (b)

140
hexane makes the opaque, light-scattering sample translucent with an accompanying
fluorescence emission decrease by a factor of 7.3. After the water or organic solvent
evaporates the emission returns to the original intensity obtained after washing procedure.
This shows that the synthesized 4-methylcoumarin-7-yl 3’-(trimethoxysilyl)propyl-
carbamate is permanently bound into the EPON material.
Figure A2-4. (a) Dry Sol-Gel Film; (b) Dry, after CTAB and free polymer extraction; (c) Wetted with water; (d) Dry. (b) and (d) overlap. The difference in emission intensity between (a) and (b) amounts to removed 4-methylcoumarin-7-yl 3-(trimethoxysilyl) propylcarbamate not bound to EPON film. (b) and (d) are the same film before and after wetting, where (c) shows intensity drop when the obtained film is washed of CTAB and 4-methylcoumarin-7-yl 3-(trimethoxysilyl)propylcarbamate, that is not bound; dried and wetted again
The excitation and emission spectra of the TriMeOSiC-containing EPON were
obtained at pH 1, 2.2, and 13.3 as well as in distilled water (Figures A2-5 and A2-6). The
shifts of the fluorescence spectra with pH are consistent with those for coumarin 4 in
homogeneous solutions. This observation demonstrates that the film on ITO is

141
permeable and that coumarin 4 sites are on the phase boundary between the pore volume
and the bulk film. These are requirements for applying this fabrication method to
development of an optical sensor.
Figure A2-5. Overlaid excitation spectra of EPON film subjected to different pH: (a) DI water; (b) pH 1; (c) pH 2.2; (d) pH 13.3. Excitation maximum and excitation peak shape shifts based on pH of the wetting solution
Finally, the results in Figure A2-5 and A2-6 were not changed when drying
overnight at room temperature. This is in contrast to comparable experiments performed
on monolilthic sol-gels.160,161,162,163 With monolithic, the aging process, which is
160 Suratwala, Gardlund, Davidson, Uhlmann, Watson and Peyghambarian "Silylated Coumarin Dyes in Sol-Gel Hosts. 1. Structure and Environmental Factors on Fluorescent Properties". 161 Suratwala, Gardlund, Davidson, Uhlmann, Watson, Bonilla and Peyghambarian "Silylated Coumarin Dyes in Sol-Gel Hosts. 2. Photostability and Sol-Gel Processing". 162 Oh, E. O., Gupta, R. K. and Whang, C. M. "Effects of pH and Dye Concentration on the Optical and Structural Properties of Coumarin-4 Dye-Doped SiO2-PDMS Xerogels" J. Sol-Gel Sci. Technol. 2003, 28, 279-288.

142
accompanied by drying, causes a rigidochromic shift in the fluorescence spectra of
dopants. With a nanoscale film, this aging/drying step is accelerated. From the
agreement of the spectra, apparently sol-gel processing is virtually complete in ca. 24 h,
whether it is performed at room temperature or in an oven.
Figure A2-6. Overlaid emission spectra of EPON film subjected to different pH: (a) DI water; (b) pH 1; (c) pH 2.2; (d) pH 13.3 Emission maximum and peak shape, consistent with excitation peak changes, shifts based on pH of the wetting solution
A2-4. Conclusions
The electrochemically assisted sol-gel processing method that is reported herein
yields a fluorescent, nanoscale film. The obtained EPON films have low tortuosity and
mesopores that are normal to the electrode surface. The synthesized 4-methylcoumarin-
7-yl 3-(trimethoxysilyl)propyl-carbamate sites are stabilized in the EPON by covalent
163 Oh, E. O., Gupta, R. K., Cho, N.-H., Yoo, Y.-C., Cho, W.-S. and Whang, C. M. "Influence of pH and Dye Concentration on the Physical Properties and Microstructure of New Coumarin 4 Doped SiO2-PDMS ORMOSIL " Bull. Korean Chem. Soc. 2003, 24, 299-306.

143
bonding and are sensitive to pH. The emission maximum shifts based on changes in pH
and are consistent with the spectra for coumarin 4 in homogeneous solution. A potential
limitation which we are studying further is that the intensity decreases when the EPON is
wetted. Nanometer scale films are expected to have fast response times especially with
the observed EPON structure, which in combination with the sensing fluorophore
provides a basis for practical optical sensor platforms.
A2.5 Acknowledgements
This work was in-part sponsored by The Ohio Third Frontier IDCAST Wright
Center for Innovation.

144
References:
Adam, L.; Gordon, G.; Pierce, D. Bleach 2001 Predictive Model, Miami University, Oxford, Ohio. Copyright (c) 2001 AwwaRF and AWWA.
Adam, L. C. An Investigation of Factors Involved In The Decomposition of Sodium
Hypochlorite Ph.D. Dissertation, Miami University, Oxford, OH, 1994. Adam, L. C.; Fabian, I.; Suzuki, K.; Gordon, G. "Hypochlorous Acid Decomposition in
the pH 5-8 Region" Inorg. Chem. 1992, 31, 3534-3541. Adam, L. C.; Gordon, G. "Direct and Sequential Potentiometric Determination of
Hypochlorite, Chlorite, and Chlorate Ions When Hypochlorite Ion is Present in Large Excess" Anal. Chem. 1995, 67, 535-540.
Adam, L. C.; Gordon, G. "Hypochlorite ion decomposition: Effects of temperature, ionic
strength, and chloride ion" Inorg. Chem. 1999, 38, 1299-1304. Asami, M.; Kosaka, K.; Kunikane, S. "Bromate, chlorate, chlorite and perchlorate in
sodium hypochlorite solution used in water supply" J. Water Supply Res. Technol. 2009, 58, 107-115.
Ayers, G. H. B., M. H. "Catalytic Decomposition of Hypochlorite Solution by Iridium
Compounds. II. Kinetic Studies" J. Am. Chem. Soc. 1955, 77, 828-833. Bartlett, P. N.; Birkin, P. R.; Ghanem, M. A. "Electrochemical deposition of macroporous
platinum, palladium and cobalt films using polystyrene latex sphere templates" Chem. Commun. 2000, 2000, 1671-1672.
Bouland, S.; Duguet, J. P.; Montiel, A. "Evaluation of bromate ions level introduced by
sodium hypochlorite during postdisinfection of drinking water" Environ. Technol. 2005, 26, 121-125.
Brinker, C. J.; Dunphy, D. R. "Morphological control of surfactant-templated metal oxide
films" Curr. Opin. Colloid In. 2006, 11, 126-132. Brinker, C. J.; Lu, Y.; Sellinger, A.; Fan, H. "Evaporation-Induced Self-Assembly:
Nanostructures Made Easy" Adv. Mat. 1999, 11, 579-585. CDHS, "Determination of Perchlorate by Ion Chromatography", California Department
of Health Services (CDHS), 1997, Retrieved from: http://www.cdph.ca.gov/certlic/drinkingwater/Documents/Perchlorate/SRLperchloratemethod1997.pdf

145
CDPH, "History of Perchlorate in California Drinking Water", California Department of Public Health (CDPH), 2007, Retrieved 07/28/09, from: http://www.cdph.ca.gov/certlic/drinkingwater/Pages/Perchloratehistory.aspx
Chlorine Institute, "Bromate in Sodium Hypochlorite Potable Water Treatment", 2004,
Retrieved 04/14/09, from: http://www.chlorineinstitute.org/files/FileDownloads/BromateinNaOCl-PotableWaterTreatment.pdf
Chlorine Institute, "Pamthlet 96 Sodium Hypochlorite Manual, Edition 3," Chlorine
Institute, 2006, Retrieved 07/08/09, from: http://www.chlorineinstitute.org/files/Pamphlet096Edition3April2006FinalWebsite.pdf
Choi, K.-S.; Lichtenegger, H. C.; Stucky, G. D.; McFarl, E. W. "Electrochemical
Synthesis of Nanostructured ZnO Films Utilizing Self-Assembly of Surfactant Molecules at Solid-Liquid Interfaces" J. Am. Chem. Soc. 2002, 124, 12402-12403.
Choi, K. S.; McFarland, E. W.; Stucky, G. D. "Electrocatalytic Properties of Thin
Mesoporous Platinum Films Synthesized Utilizing Potential-Controlled Surfactant Assembly" Adv. Mat. 2003, 15, 2018-2021.
Choi, Y.-K.; King, T.-J.; Hu, C. "Nanoscale CMOS spacer FinFET for the terabit era"
Electron. Devic. Lett. 2002, 23, 25-27. Clesceri, L. S. G., A. E.; Eaton, A. D. Eds. Standard Methods for the Examination of
Water and Wastewater 20th ed.; American Public Health Association: Washington, DC, 1998.
Creed, J. T. B., C.A.; Martin, T.D. U.S. Environmental Agency Method 200.8 Revison
5.4 1994. Davies, C. W. "397. The extent of dissociation of salts in water. Part VIII. An equation
for the mean ionic activity coefficient of an electrolyte in water, and a revision of the dissociation constants of some sulphates" J. Chem. Soc. 1938, 1938, 2093-2098.
Davis, C. O. Perchlorate explosives, E. I. du Pont de Nemours & Co., 1940, USA US
2190703 Espenson, J. H. Chemical Kinetics and Reaction Mechanisms, 2nd ed.; McGraw-Hill,
Inc., 1995. Farkas, L.; Lewin, M.; Bloch, R. "The Reaction between Hypochlorite and Bromides" J.
Am. Chem. Soc. 1949, 71, 1988-1991.
146
Freer, E. M.; Krupp, L. E.; Hinsberg, W. D.; Rice, P. M.; Hedrick, J. L.; Cha, J. N.; Miller, R. D.; Kim, H. C. "Oriented Mesoporous Organosilicate Thin Films" Nano Lett. 2005, 5, 2014-2018.
Fukumoto, H.; Nagano, S.; Kawatsuki, N.; Seki, T. "Photo-Alignment Behavior of
Mesoporous Silica Thin Films Synthesized on a Photo-Cross-Linkable Polymer Film" Chem. Mater. 2006, 18, 1226-1234.
Gordon, G.; Adam, L. C.; Bubnis, B.; Hoyt, B.; Gillette, S. J.; Wilczak, A. "Controlling
the formation of chlorate ion in liquid hypochlorite feedstocks" J. Am. Water Work Assoc. 1993, 85, 89-97.
Gordon, G.; Cooper, W. J.; Rice, R. G.; Pacey, G. E. Disinfectant Residual Measurement
Methods, Second ed.; AWWA Research Foundation and American Water Works Association: Denver, 1992.
Greer, M. A., Goodman G. G., Pleus R. C, Greer S. E. "Health effects assessment for
environmental perchlorate contamination: the dose response for inhibition of thyroidal radioiodine uptake in humans" Environ. Health Perspect. 2002, 110, 927-937.
Greiner, P.; Mclellan, C.; Bennet, D.; Ewing, A. "Occurrence of perchlorate in sodium
hypochlorite" J. Am. Water Work Assoc. 2008, 100, 68-74. Grosso, D.; Cagnol, F.; Soler-Illia, G.; thinsp; J; de; A; Crepaldi, E.; L; Amenitsch, H.;
Brunet-Bruneau, A.; Bourgeois, A.; Sanchez, C. "Fundamentals of Mesostructuring Through Evaporation-Induced Self-Assembly" Adv. Funct. Mater. 2004, 14, 309-322.
Harned, H. S.; Owen, B. B. The Physical Chemistry of Electrolytic Solutions, 2nd ed.;
Reinhold Publishing Corporation: New York, 1950. Harris, D. C. Quantitative Chemical Analysis, 5th ed.; W.H. Freeman and Company:
New York, 2001. Hartmann, M. "Ordered Mesoporous Materials for Bioadsorption and Biocatalysis"
Chem. Mater. 2005, 17, 4577-4593. Hedrick, E. B., T.;Slingsby, R.;Munch, D. U.S. Environmental Agency Method 332.0
Revison 1.0 2005. Hoffmann, F.; Cornelius, M.; Morell, J.; Fröba, M. "Silica-Based Mesoporous Organic-
Inorganic Hybrid Materials" Angew. Chem., Int. Ed. 2006, 45, 3216-3251. Housecroft, C. E.; Sharpe, A. G. Inorganic Chemistry; Pearson Education Limited, 2001.
147
Ikeda, Y.; Tang, T.; Gordon, G. "Iodometric method for determination of trace chlorate ion" Anal. Chem. 1984, 56, 71-73.
Jackson, P. E.; Gokhale, S.; Streib, T.; Rohrer, J. S.; Pohl, C. A. "Improved method for
the determination of trace perchlorate in ground and drinking waters by ion chromatography" J. Chromatogr., A 2000, 888, 151-158.
Kang, N.; Anderson, T. A.; Andrew Jackson, W. "Photochemical formation of
perchlorate from aqueous oxychlorine anions" Anal. Chim. Act. 2006, 567, 48-56. Kang, N.; Jackson, W. A.; Dasgupta, P. K.; Anderson, T. A. "Perchlorate production by
ozone oxidation of chloride in aqueous and dry systems" Sci. Total Environ. 2008, 405, 301-309.
Keith, J. D.; Pacey, G. E.; Cotruvo, J. A.; Gordon, G. "Experimental results from the
reaction of bromate ion with synthetic and real gastric juices" Toxicology 2006, 221, 225-228.
Koganti, V. R.; Rankin, S. E. "Synthesis of Surfactant-Templated Silica Films with
Orthogonally Aligned Hexagonal Mesophase" J. Phys. Chem. B 2005, 109, 3279-3283.
Kresge, C. T.; Leonowicz, M. E.; Roth, W. J.; Vartuli, J. C.; Beck, J. S. "Ordered
mesoporous molecular sieves synthesized by a liquid-crystal template mechanism" Nature 1992, 359, 710-712.
Krozer, A.; Rodahl, M. "X-ray photoemission spectroscopy study of UV/ozone oxidation
of Au under ultrahigh vacuum conditions" J. Vac. Sc. Technol. A. 1997, 15, 1704-1709.
Li, Y. E., J. George "Analysis of Perchlorate in Water by Reversed-Phase LC/ESI-
MS/MS Using an Internal Standard Technique" Anal. Chem. 2005, 77, 4453-4458.
Liebhafsky, H. A.; Mohammad, A. "A Third-order Ionic Reaction without Appreciable
Salt Effect" J. Phys. Chem. 1934, 38, 857-866. Lister, M. W. "Decomposition of Sodium Hypochlorite: The Catalyzed Reaction" Can. J.
Chem. 1956, 34, 479–488. Lister, M. W. "Decomposition of Sodium Hypochlorite: The Uncatalyzed Reaction" Can.
J. Chem. 1956, 34, 465-478. Liu, W., Andrews, S. A., Stefan, M. I., & Bolton, J. R. "Optimal methods for quenching
H2O2 residuals prior to UFC testing" Water Res. 2003, 37, 3697-3703.

148
Lu, Q.; Gao, F.; Komarneni, S.; Mallouk, T. E. "Ordered SBA-15 Nanorod Arrays Inside a Porous Alumina Membrane" J. Am. Chem. Soc. 2004, 126, 8650-8651.
Lu, Y.; Ganguli, R.; Drewien, C. A.; Anderson, M. T.; Brinker, C. J.; Gong, W.; Guo, Y.;
Soyez, H.; Dunn, B.; Huang, M. H.; Zink, J. I. "Continuous formation of supported cubic and hexagonal mesoporous films by sol-gel dip-coating" Nature 1997, 389, 364-368.
Mack, E. L. "Electrolytic Formation of Perchlorate" J. Phys. Chem. 1917, 21, 238-264. MassDEP, "Perchlorate in Public Drinking Water", 2006, Retrieved 07/21/09, from:
http://www.mass.gov/dep/toxics/pchlorqa.htm Metz, S.; Trautmann, C.; Bertsch, A.; Renaud, P. "Polyimide microfluidic devices with
integrated nanoporous filtration areas manufactured by micromachining and ion track technology" J. Micromech. Microeng. 2004, 14, 324-331.
Miller, K. G.; Pacey, G. E.; Gordon, G. "Automated iodometric method for determination
of trace chlorate ion using flow injection analysis" Anal. Chem. 1985, 57, 734-737.
Minoofar, P. N.; Dunn, B. S.; Zink, J. I. "Multiply Doped Nanostructured Silicate Sol-
Gel Thin Films: Spatial Segregation of Dopants, Energy Transfer, and Distance Measurements" J. Am. Chem. Soc. 2005, 127, 2656-2665.
Motzer, W. "Perchlorate: Problems, Detection, and Solutions" Environ. Forensics 2001,
2, 301-311. Nicole, L.; Boissi; egrave; re, C.; eacute; dric; Grosso, D.; Quach, A.; Sanchez, C.; ment
"Mesostructured hybrid organic & inorganic thin films" J. Mater. Chem. 2005, 15, 3598-3627.
Oh, E. O.; Gupta, R. K.; Cho, N.-H.; Yoo, Y.-C.; Cho, W.-S.; Whang, C. M. "Influence
of pH and Dye Concentration on the Physical Properties and Microstructure of New Coumarin 4 Doped SiO2-PDMS ORMOSIL " Bull. Korean Chem. Soc. 2003, 24, 299-306.
Oh, E. O.; Gupta, R. K.; Whang, C. M. "Effects of pH and Dye Concentration on the
Optical and Structural Properties of Coumarin-4 Dye-Doped SiO2-PDMS Xerogels" J. Sol-Gel Sci. Technol. 2003, 28, 279-288.
Perlmutter-Hayman, B.; Stein, G. "The Kinetics of the Decomposition of Alkaline
Solutions of Hypobromite-Specific Ionic Effects on Reaction Rate" J. Phys. Chem. 1959, 63, 734-738.

149
Puckett, S. D.; Heuser, J. A.; Keith, J. D.; Spendel, W. U.; Pacey, G. E. "Interaction of ozone with gold nanoparticles" Talanta 2005, 66, 1242-1246.
Renner, R. "Study finding perchlorate in fertilizer rattles industry" Environ. Sci. Technol
1999, 33, 394A-395A. Renner, R. "EPA perchlorate decision flawed, say advisers" Environ. Sci. Technol. 2009,
43, 553-554. Robinson, R. A.; Stokes, R. H. Electrolyte Solutions, 2nd ed.; Butterworths Publications
Limited: London, 1959. Roehl, R.; Slingsby, R.; Avdalovic, N.; Jackson, P. E. "Applications of ion
chromatography with electrospray mass spectrometric detection to the determination of environmental contaminants in water" J. Chromatogr., A 2002, 956, 245-254.
Routt, J.; Mackey, E.; Noack, R. "Committee Report: Disinfection Survey, Part 2 -
Alternatives, experiences, and future plans" J. Am. Water Work Assoc. 2008, 100, 110-124.
Saliba, N.; Parker, D. H.; Koel, B. E. "Adsorption of oxygen on Au(111) by exposure to
ozone" Surf. Sci. 1998, 410, 270-282. Salov, V. V. Y., J.; Shibata, Y.; Morita, M. "Determination of inorganic Halogen Species
by Liquid Chromatography with Inductively Coupled Argon Plasma Mass Spectrometry" Anal. Chem. 1992, 64, 2425-2428.
Sanchez, C.; Julian, B.; Belleville, P.; Popall, M. J. Mater. Chem. 2005, 15, 3559. Sato, H., Homma, T. "Fabrication of high-aspect-ratio arrayed structures using Si
electrochemical etching" Sci. Technol. Adv. Mat. 2006, 7, 468-474. Schacht, S.; Huo, Q.; Voigt-Martin, I. G.; Stucky, G. D.; Schüth, F. "Oil-Water Interface
Templating of Mesoporous Macroscale Structures" Science 1996, 273, 768-771. Scott, B. J.; Wirnsberger, G.; Stucky, G. D. "Mesoporous and Mesostructured Materials
for Optical Applications" Chem. Mater. 2001, 13, 3140-3150. Shacham, R.; Avnir, D.; Mandler, D. "Electrodeposition of Methylated Sol-Gel Films on
Conducting Surfaces" Adv. Mat. 1999, 11, 384-388. Shah, J.; Qureshi, N. "Chlorine Gas vs. Sodium Hypochlorite: What's the Best Option"
Opflow 2008, 24-27.
150
Sibottier, E.; Sayen, S.; eacute; phanie; Gaboriaud, F.; Walcarius, A. "Factors Affecting the Preparation and Properties of Electrodeposited Silica Thin Films Functionalized with Amine or Thiol Groups" Langmuir 2006, 22, 8366-8373.
Snyder, S. A.; Pleus, R. C.; Vanderford, B. J.; Holady, J. C. "Perchlorate and chlorate in
dietary supplements and flavor enhancing ingrediants" Anal. Chim. Act. 2006, 567, 23-32.
Snyder, S. A.; Vanderford, B. J.; Rexing, D. J. "Trace analysis of bromate, chlorate,
iodate, and perchlorate in natural and bottled waters" Environ. Sci. Technol. 2005, 39, 4586-4593.
Stetson, S. J.; Wanty, R. B.; Helsel, D. R.; Kalkhoff, S. J.; Macalady, D. L. "Stability of
low levels of perchlorate in drinking water and natural water samples" Anal. Chim. Act. 2006, 567, 108-113.
Strawson, J.; Zhao, Q.; Dourson, M. "Reference dose for perchlorate based on thyroid
hormone change in pregnant women as the critical effect" Regul. Toxicol. Pharmacol. 2004, 39, 44-65.
Su, Y. S.; Morrison, D. T.; Ogle, R. A. "Chemical kinetics of calcium hypochlorite
decomposition in aqueous solutions" J. Chem. Health Safety 2009, 16, 21-25. Suratwala, T.; Gardlund, Z.; Boulton, J. M.; Uhlmann, D. R. In Sol-Gel Optics III;
Mackenzie, J. D., Ed.; SPIE, 1994; Vol. 2288, pp 310-320. Suratwala, T.; Gardlund, Z.; Davidson, K.; Uhlmann, D. R.; Watson, J.; Bonilla, S.;
Peyghambarian, N. "Silylated Coumarin Dyes in Sol-Gel Hosts. 2. Photostability and Sol−Gel Processing" Chem. Mater. 1998, 10, 199-209.
Suratwala, T.; Gardlund, Z.; Davidson, K.; Uhlmann, D. R.; Watson, J.; Peyghambarian,
N. "Silylated Coumarin Dyes in Sol-Gel Hosts. 1. Structure and Environmental Factors on Fluorescent Properties" Chem. Mater. 1998, 10, 190-198.
Sweetin, D. L. Developments in the Analytical Methodology For the Determination of
Free available Chlorine, Inorganic Chloramines, and Oxyhalogen Species Ph.D. Dissertation, Miami University, Oxford, OH, 1993.
Tikkanen, M. W. "Development of a drinking water regulation for perchlorate in
California" Anal. Chim. Act. 2006, 567, 20-25. Tomiyasu, H.; Fukutomi, H.; Gordon, G. "Kinetics and mechanism of ozone
decomposition in basic aqueous solution" Inorg. Chem. 1985, 24, 2962-2966. Urbansky, E. T. "Perchlorate as an environmental contaminant" Env. Sci. Pollut. Res.
2002, 9, 187-192.

151
Urbansky, E. T.; Brown, S. K.; Magnuson, M. L.; Kelty, C. A. "Perchlorate levels in
samples of sodium nitrate fertilizer derived from Chilean caliche" Environ. Pollut. 2001, 112, 299-302.
Urbansky, E. T.; Collette, T. W.; Robarge, W. P.; Hall, W. L.; Skillen, J. M.; Kane, P. F.
Survey of fertilizers and related materials for perchlorate (Cl04-), EPA, 2001.
Urbansky, E. T.; Magnuson, M. L.; Freeman, D.; Jelks, C. "Quantitation of perchlorate
ion by electrospray ionization mass spectrometry (ESI-MS) using stable association complexes wih organic cations and bases to enhance selectivity" J. Anal. At. Spectrom. 1999, 14, 1861-1866.
USEPA, "Known Perchlorate Releases in the U.S. - March 25th, 2005", United States
Environmental Protection Agency, 2005, Retrieved 08/01/09, from: http://www.epa.gov/swerffrr/pdf/detect0305.pdf
USEPA Draft Regulatory Determinations Support Document for Selected Contaminants
from the Second Drinking Water Contaminant Candidate List (CCL2) EPA Report 815-D-06-007, United States Environmental Protection Agency (USEPA): Washington, DC. , 2006.
USEPA, "Interim Drinking Water Health Advisory for Perchlorate", United States
Environmental Protection Agency, 2008, Retrieved 07/27/09, from: http://www.epa.gov/OGWDW/contaminants/unregulated/pdfs/healthadvisory_perchlorate_interim.pdf
USFDA, "2004-2005 Exploratory Survey Data on Perchlorate in Food", United States
Food & Drug Administration, 2005, Retrieved 08/02/09, from: http://www.fda.gov/Food/FoodSafety/FoodContaminantsAdulteration/ChemicalContaminants/Perchlorate/ucm077685.htm
USGAO Perchlorate: A System to Track Sampling and Cleanup Results Is Needed
United States Government Accountability Office (USGAO): Washington, D.C., 2005.
Walcarius, A.; Sibottier, E.; Etienne, M.; Ghanbaja, J. "Electrochemically assisted self-
assembly of mesoporous silica thin films" Nat. Mater. 2007, 6, 602-608. Weinberg, H. S.; Delcomyn, C. A.; Unnam, V. "Bromate in Chlorinated Drinking
Waters: Occurrence and Implications for Future Regulation" Environ. Sci. Technol. 2003, 37, 3104-3110.
Wendelken S. C., V. L. E., Coleman D. E., Munch D. J. U.S. Environmental Protection
Agency Method 331.0 Revision 1.0 2005.

152
WHO Guidelines for Drinking Water Quality; World Health Organization: Singapore, 2006, Retrieved from: http://www.who.int/water_sanitation_health/dwq/gdwq3rd_add1.pdf
Wood, D. W. I. Determination of Disinfectant Residuals in Chlorine Dioxide Treated
Water Using Flow Injection Analysis Ph.D. Dissertation, Miami University, Oxford, OH, 1990.
Xu, C. X.; Zhang, X. S.; Sun, X. W. "Preparation of Porous Alumina by Anodization" J.
Metastab. Nanocryst. 2005, 23, 75-78. Yamaguchi, A.; Uejo, F.; Yoda, T.; Uchida, T.; Tanamura, Y.; Yamashita, T.; Teramae,
N. "Self-assembly of a silica-surfactant nanocomposite in a porous alumina membrane" Nat. Mater. 2004, 3, 337-341.
Yang, H.; Coombs, N.; Sokolov, I.; Ozin, G. A. "Free-standing and oriented mesoporous
silica films grown at the air-water interface" Nature 1996, 381, 589-592. Yang, H.; Kuperman, A.; Coombs, N.; Mamiche-Afara, S.; Ozin, G. A. "Synthesis of
oriented films of mesoporous silica on mica" Nature 1996, 379, 703-705. Zakett, D.; Flynn, R. G. A.; Cooks, R. G. "Chlorine isotope effects in mass spectrometry
by multiple reaction monitoring" J. Phys. Chem. 1978, 82, 2359-2362.


