Embed Size (px)
Citation preview
ARTICLE IN PRESS
0013-9351/$ - se
doi:10.1016/j.en
�CorrespondE-mail addr
Environmental Research ] (]]]]) ]]]–]]]
www.elsevier.com/locate/envres
Methylmercury exposure in Wisconsin: A case study series
Lynda Knobelocha,�, Dyan Steenporta, Candy Schrankb, Henry Andersona
aWisconsin Department of Health and Family Services, Madison, WI, USAbWisconsin Department of Natural Resources, Madison, WI, USA
Received 11 March 2005; received in revised form 27 July 2005; accepted 28 July 2005
Abstract
Many popular varieties of commercially sold fish, including tilefish, seabass, shark, and swordfish, contain enough mercury so
that eating them once or twice a month can lead to high mercury body burdens. Wisconsin has issued mercury-based sport-fish
consumption advice to people of all ages since 1985. Wisconsin’s advisory was revised in 2000 to address all inland waters and again
in 2004 to integrate information about sport-caught fish with advice for commercially sold fish. Because of the increased popularity
of fish as a source of dietary protein, a significant percentage of the US population may be at risk of methylmercury-induced health
problems. Although several studies have assessed mercury exposure among children and women of child-bearing age, very little is
known about mercury body burdens among men or postmenopausal women. This article describes fish consumption and mercury
exposure among 14 people who consumed fish twice a week or more and 1 person who ate no fish. Steady-state blood mercury levels
available for 10 adults and 1 child ranged from o5 to 58 mg/L and correlated well with dietary mercury intake estimates. Three ofthese individuals reported vague, subclinical symptoms such as mental confusion, sleep difficulty, balance problems, or visual
disturbances, which improved after their mercury levels returned to normal.
r 2005 Elsevier Inc. All rights reserved.
Keywords: Fish; Sportfish; Methylmercury; Wisconsin
1. Introduction
Over the past 50 years, several outbreaks and indivi-dual cases of organic mercury poisoning have beenreported. The most recent case involved a prominentresearcher who became ill and died several months aftera brief dermal exposure to a small amount ofdimethylmercury (Siegler et al., 1999). A large epidemicinvolving methylmercury exposure occurred in the cityof Minamata, Japan, during the 1950s. Hundreds ofpeople experienced neurological symptoms such asparesthesia, ataxia, constriction of the visual fields,hearing loss, and mental confusion, and many deathswere reported. Fishermen and their families suffered theworst effects. Government investigators traced thesource of exposure to fish caught from the Minamata
e front matter r 2005 Elsevier Inc. All rights reserved.
vres.2005.07.008
ing author. Fax: +1608 267 4853.
ess: [email protected] (L. Knobeloch).
Bay, which had been polluted by a local factory(Harada, 1995; Smith and Smith, 1975). A series ofepidemics involving methylmercury-treated grain haveoccurred in Iraq (Jalili and Abassi, 1961). The mostrecent outbreak occurred during the winter of1971–1972 and resulted from the use of mercury-treatedwheat to make bread (Bakir et al., 1973). Adult victimsof these incidents experienced severe neurologicaldisorders characterized by paresthesia, tremors, ataxia,visual problems, mental confusion, and, in the mostserious cases, loss of consciousness and death. Prenatalexposures that occurred during these epidemics resultedin a range of disorders including blindness, cerebralpalsy, and developmental delays.Present-day risks to adults who eat frequent meals of
marine and freshwater fish are not well understood.Repeated consumption of large, predatory commercialfish, such as shark, swordfish, tilefish, and albacoretuna, can lead to an elevated mercury body burden

ARTICLE IN PRESSL. Knobeloch et al. / Environmental Research ] (]]]]) ]]]–]]]2
(Mahaffey et al., 2004). Large fresh water gamefish, suchas walleye, bass, and northern pike, can also accumulatehigh mercury levels. Because of the increased popularityof fish as a source of dietary protein, a significantpercentage of the US population consume these speciesas a regular part of their diet and may be at risk ofmethylmercury-induced health problems. Although sev-eral studies have assessed mercury exposure amongwomen of child-bearing age, very little is known aboutmercury body burdens among children, men, or post-menopausal women in the United States.As part of the National Human Exposure Assessment
Survey (NHEXAS), a probability-based populationscoping study conducted by EPA Region V, mercuryexposure was assessed among 182 randomly selectedresidents of several midwestern states (Pellizzari et al.,1999). Hair samples collected between June 1995 andJuly 1997 from 81 males and 101 females of all ages wereanalyzed for mercury. Mercury levels among thesesamples ranged from 0.012 to 3.5 ppm and were slightlyhigher among women (annualized means 0.315 inwomen vs. 0.260 in men). The 1999 CDC NHANESassessment of hair mercury levels among women ofchildbearing age identified 50th and 90th percentilevalues of 0.2 and 1.4 ppm, respectively (MMWR,Centers for Disease Control and Prevention, 2001).Since the EPA released its Mercury Report to
Congress in 1997, in which the agency proposed a dailyintake reference dose of 0.1 mg mercury per kg bodyweight per day, there has been increased interest inmethylmercury as a public health hazard (US EPA,1997). In its report, the EPA described emergingresearch that raised concerns about the effect ofmethylmercury on the adult cardiovascular system(Salonen et al., 1995). Following the report’s release,the agency recommended further restrictions on mer-cury emissions from coal-fired power plants and notedthat frequent fish consumers may be exposed tounhealthy levels of mercury.Following the release of the EPA report, a review of
the human toxicology of mercury was commissioned bythe National Academy of Sciences. After a 1-yearreview, the NAS panel of experts concluded that theEPA recommendations were valid and confirmed theneed for stronger fish consumption advisories andresearch to evaluate methylmercury exposure amongconsumers of commercially sold and sport-caught fish(NAS, 2000). The NAS report also identified the needfor research that would evaluate the health effects ofchronic, low-level methylmercury exposure amongchildren and aging adults. The authors of the reportcited recently published studies by Faroe Islands(Sorenson et al., 1999) and Finnish researchers (Salonenet al., 1995) and emphasized the need to consider theemerging evidence that methylmercury may be moretoxic to the developing and aging cardiovascular system
than has been recognized in the past. The panelrecommended that this effect be considered in thedevelopment and application of the reference dose forthis toxin.The EPA’s reference dose of 0.1 mg/kg/day corre-
sponds to a blood mercury level of 5.8 mg/L (ppb) and ahair mercury level of approximately 1 mg/g (ppm). Thereference dose was based on human studies and isintended to protect against the neurodevelopmentaleffects of prenatal exposure as well as potential effects ofthis toxin on the cardiovascular system and agingnervous system. Symptoms of clinical toxicity such asvision problems, hypertension, and tremors are usuallyassociated with blood mercury levels above 50 mg/L(Agency for Toxic Substances and Disease Registries,1999). In July 2002, the US FDA’s Food AdvisoryCommittee advised the agency to revise its consumeradvisory on methylmercury in fish with special concernfor pregnant women, nursing mothers, women who maybecome pregnant, and young children. One recommen-dation was for the FDA to coordinate its advisory forcommercial fish with the sport-fish consumption advi-sory issued by the EPA. In 2004, these agencies issued ajoint consumer advisory on methylmercury in fish andshellfish that was intended to reduce exposure tomercury among young women and children. The 2004advisory supersedes the FDA’s 2001 advice for com-mercial fish.In 2000, Wisconsin adopted a general consumption
advisory for most inland waters based on the NationalAcademy of Sciences recommendations about mercuryingestion. Wisconsin revised its consumption advisory in2004 to include advice for popular commercial fish. Thiswas done out of recognition that most people who eatsport-caught fish also include commercial fish in theirdiets. The current advisory for men and women beyondtheir childbearing years allows ‘‘unlimited’’ consump-tion of locally caught panfish, purchased salmon,shrimp, Pollock, and canned light tuna, but limitsconsumption of tuna steaks, halibut, canned white tuna,and predatory gamefish such as walleye and northernpike to no more than one meal a week. Shark, swordfish,king mackerel, and tilefish are limited to one meal permonth (see Fig. 1).Recent actions taken by federal and state agencies to
inform citizens about mercury in fish and the possiblehealth effects of mercury exposure, and the resultingmedia attention, has increased public awareness of thisissue. This article summarizes seven case studies thatinvolved frequent consumers of commercial or sport-caught fish who contacted the Wisconsin Division ofPublic Health (WI DPH) regarding their mercuryexposure. Four of the investigations resulted fromconcern about health problems or treatment for mercuryexposure. The remaining investigations resulted fromconcern about potential exposure to mercury due to

ARTICLE IN PRESS
Fig. 1. Wisconsin’s statewide advice (WIDNR, 2004).
L. Knobeloch et al. / Environmental Research ] (]]]]) ]]]–]]] 3
frequent fish consumption. This information is anecdo-tal, in part, but is valuable in terms of identifying at-riskpopulations and providing information on bloodmercury levels associated with fish consumption.
2. Methods
Fish consumption information was collected duringtelephone interviews with these families. Blood and hairmercury data are from physician-ordered laboratoryanalyses or from testing conducted by the WisconsinState Laboratory of Hygiene (WSLH). In cases thatinvolved physician-ordered testing, copies of laboratoryreports were reviewed to verify exposure levels. All fishtissue analyses were performed by the Wisconsin StateLaboratory of Hygiene.
2.1. WSLH mercury analyses
Hair and fish tissue samples were acid-digested innitric and sulfuric acid and analyzed for mercuryaccording to EPA Method 631, Revision B: Mercuryin water by oxidation, purge and trap, and cold vaporatomic absorption fluorescence. This method has adetection limit of 0.011 mg/g for hair and 0.001 mg/g forfish tissue.Mercury in heparin- or EDTA-treated whole blood is
complexed with l-cysteine. After reduction with stan-nous chloride/cadmium chloride, mercury is measuredby cold vapor atomic absorption spectrometry using aPerkin–Elmer Model 360 atomic absorption spectro-photometer. The method has a reporting limit of 5 mg/L.
2.2. Biological half-life calculation
Blood mercury half-lives and elimination rate con-stants were calculated using methods described by
Kershaw et al. (1980). Elimination rate constants wereobtained by plotting the natural logarithm of the ratioof follow-up and initial blood mercury levels (ln Hg/Hg0) vs. follow-up time in days. Elimination rates foreach case were applied to the standard formulat1/2 ¼ ln 2/k to estimate the half-life of mercury in blood.
2.3. Estimation of whole blood levels from red blood cell
analyses
Two cases involved the analysis of mercury concen-trations in red blood cells. Whole blood mercury levelswere estimated, assuming that 95% of methylmercury isbound to red blood cells (Kershaw et al., 1980), andbased on a hematocrit of 50%.
3. Case summaries
Table 1 presents a summary of data from seven caseinvestigations that are described in this article. The tableincludes information on the blood and hair mercurylevels that were measured before and after cessation offish consumption or treatment, the average number offish meals consumed per week based on interviews, andthe estimated or measured concentrations of mercury inthe fish these individuals reported eating.
3.1. Case number 1. Madison, Dane County, 1994
In March of 1994, the Wisconsin Division of PublicHealth (WI DPH) was contacted by a 40-year-oldattorney who was concerned about his exposure tomercury. He explained that his hair had recently beenfound to have a high mercury concentration of 12 mg/g.He complained of sleep disturbances and difficultyconcentrating and wanted information about thetoxicity of mercury and exposure sources. He asked

ARTIC
LEIN
PRES
S
Table 1
Summary of fish consumption and blood mercury levels for cases
Case
No.
Location, year age and gender Hair Hg
level
Initial blood Hg
level
Follow-up blood Hg
level (time in days)
Est. half-life
in days
Ave no. of
fish meals/
week
Types of fish eaten by family Hg concentration
in fish (mg/g)
1 Madison, 1994 Lake superior trout o0.02a
Forty-year-old man 12mg/g 58 mg/L 5mg/L (200 days) 63 4 Lake superior whitefish o0.02a
Forty-year-old woman 10mg/g 37 mg/L 3mg/L (200 days) 58 4 Farm-raised salmon 0.05a
Two-year-old boy NA 37 mg/L NA 4 Farm-raised trout 0.05a
Twenty-five-year-old woman NA o 5mg/L 0 Imported seabass 0.5, 0.7a
2 Two Rivers, 1997 Panfish 0.22 (0.07–0.58)b
Fifty-five-year-old man 2mg/g 13 mg/g* NA NA 2 Walleye 0.68 (0.24–1.3)b
Bass 0.33 (0.17–0.5)b
Northern pike 0.33 (0.1–1.2)b
3 Iola, 1999
Sixty-one-year-old man NA 38 mg/g* 22 ng/g* (34 days**) 42 2–3 Northern pike 0.31 (0.12–0.89)b
12 ng/g* (75 days**)
4 Marinette, 2003 Panfish 0.15 (0.02–0.51)b
Sixty-one-year-old man NA 44 mg/L 15mg/L (100 days) 64 9 Bass 0.31 (0.04–1.7)b
Fifty-nine-year-old woman NA 9 mg/L NA 9 Walleye 0.44 (0.05–3.1)b
Northern pike 0.29 (0.05–1.2)b
5 Green Bay, 2003 Perch 0.049a
Sixty-five-year-old man NA 24 mg/L 16mg/L (23 days) 39 3 Walleye 0.66a
Fifty-nine-year-old woman NA NA 14mg/L 3 Northern pike 0.74a
6 Green Bay, 2004
Forty-four-year-old woman NA 25 mg/L NA NA 7 Canned tuna 0.2 (o0.02-0.85)c
7 Rhinelander, 2004
Sixty-five-year-old man 9mg/g 29 mg/L 13mg/L (38 days**) 33 3 Northern pike 0.37 (0.06–1.9)b
Fifty-six-year–old woman 1mg/g NA NA o1 Bluegill 0.15 (0.025–0.53)b
Sixty-year-old man 9mg/g 24 mg/L NA 2–3 Northern pike 0.5, 0.87, 0.9a
Fifty-seven-year-old woman 4mg/g NA NA 2–3 Brook trout 0.016a
Note: NA—not available.
*Red blood cell analysis.
**Subject underwent chelation during this time interval.aConcentrations found in fish samples provided by the consumer.bMean (min–max) based on Wisconsin DNR sampling data.cMean (min–max) based on (US FDA, 2004).
L.
Kn
ob
eloch
eta
l./
En
viron
men
tal
Resea
rch]
(]]]])
]]]–]]]
4

ARTICLE IN PRESSL. Knobeloch et al. / Environmental Research ] (]]]]) ]]]–]]] 5
whether his dental amalgams might be the source of hisexposure. He was especially concerned about risks to his2.5-year-old son. At the time of his call, he was awaitingtest results for blood samples that the family’s physicianhad collected from him, his wife, and their son formercury analysis. Laboratory analyses revealed bloodmercury levels ranging from 37 to 58 mg/L (normalo10 mg/L). Because the source of the family’s mercuryexposure was unknown, a home inspection and exposurehistory interview were scheduled. During the homeinspection a blood sample was collected from thefamily’s 25-year-old nanny, who was a vegetarian andate no fish or shellfish. The nanny spent approximately9 h a day in the family’s home on weekdays. Theexposure history interview and home inspection failed toidentify any sources of environmental mercury exposureother than frequent consumption of commerciallysold fish. The nanny’s blood tested low in mercury(o5 mg/L).A dietary history determined that this family ate a
restricted, repetitive diet and identified the types of fishthey consumed as Lake Superior whitefish, LakeSuperior trout, farm-raised trout and salmon, andChilean sea bass. All of this fish was purchased at alocal seafood market. Samples of fillets of each of thesefish were obtained for Hg analysis. The family’s diet wasessentially free of red meat and included several meals aweek of fish or poultry along with organic fruits andvegetables. They had been eating fish 4 days a week for 9months and preferred Chilean sea bass, which they atetwice a week on average. Fish tissue analysis identifiedChilean sea bass as the primary source of mercuryexposure (Table 1). The other fish in their diet were lowin mercury. Follow-up testing confirmed that bloodmercury levels returned to normal after the familystopped eating the sea bass. Modeling of blood mercurylevels at days 0, 15, 70, and 200 revealed elimination rateconstants of 0.012 and 0.011 and half-lives of 58 and 63days, respectively, for this man and woman (Knobelochet al., 1995).
3.2. Case number 2. Two Rivers, Manitowoc County,
1997
A 55-year-old man contacted the Wisconsin Depart-ment of Natural Resources (WI DNR) fisheries programto request information about mercury levels in locallycaught sport fish. He reported having caught 300–400panfish annually from Lake Noquebay in MarinetteCounty, as well as occasional walleye, bass, andnorthern pike. Based on limited sampling conductedby the WI DNR, the average mercury concentrations infish from this lake are estimated to be 0.7 mg/g in walleyeand 0.3 mg/g in bass. WI DNR data suggest an estimatedaverage mercury concentration of 0.3 mg/g in northernpike and 0.2 mg/g in panfish from Manitowoc County
waters. This resident indicated that he had eaten thesefish twice a week for 10 years, averaging more than 8ounces (227 g) per meal. He had recently sought medicaltreatment for symptoms of depression, irritability, andtiredness, which his doctor attributed to mercuryexposure. A copy of his laboratory report indicated aprechelation mercury level of 0.013 mg/g red blood cells(approximately 7 mg/L in whole blood) and 2.45 mg/ghair. The laboratory reported expected values of o0.01and o1.0 mg/g for mercury in blood cells and hair,respectively.
3.3. Case number 3. Iola, Waupaca County, 1999
A 61-year-old man contacted the bureau to reportthat he had undergone several intravenous chelationtreatments for mercury removal and was upset that hisinsurance company had denied his claim for reimburse-ment. His physician had diagnosed him as mercury-exposed based on a red blood cell mercury content of0.038 mg/g (approximately 20 mg/L in whole blood).This man’s only known source of mercury exposure
was northern pike that he caught from a local lake andhad consumed two to three times a week over a periodof 30 years. He estimated his average intake to be about1 lb. (454 g) per week. WI DNR data suggests anestimated average mercury concentration of 0.3 mg/g innorthern pike from Waupaca County waters. Follow-upblood tests conducted 34 and 75 days after histreatments began revealed red cell mercury levels of0.022 and 0.012 mg/g, respectively, yielding an elimina-tion rate constant of 0.0165 and blood half-life of 42days.
3.4. Case number 4. Coleman, Marinette County, 2003
A 61-year-old resident contacted the MarinetteCounty Health Department for assistance after a bloodtest ordered by his physician revealed an elevatedmercury level of 44 mg/L (normal o10 mg/L). Hereported that he and his 59-year-old wife ate sport-caught fish several times a week. All of the fish, whichincluded bluegill, perch, bass, walleye, and northernpike, were caught from lakes located in Vilas County,Wisconsin. This couple completed a questionnaire thatprovided a summary of their fish consumption andrequested assistance in having the wife’s blood tested formercury. They estimated their average fish intake at 9meals per week. The man indicated that he ate about 18ounces of fish at each meal, while his wife ate about 6ounces per meal. They had been eating fish several timesa week over a period of 5 years. A blood samplecollected from the wife 4 weeks after their last fish mealcontained an acceptable mercury level of 9 mg/L. Theman reported a history of heart disease and recent pain

ARTICLE IN PRESSL. Knobeloch et al. / Environmental Research ] (]]]]) ]]]–]]]6
in one arm, but neither complained of any healthproblems related to mercury.Although most of the fish in this couple’s diet was
panfish, which are generally low in mercury, they alsoate walleye and northern pike approximately twice aweek. WI DNR data suggest an estimated averagemercury concentration of 0.1 mg/g in panfish species,0.4 mg/g in walleye, 0.3 mg/g in northern pike, bassspecies from Vilas County waters. A blood sample taken100 days after this man stopped eating sport-caught fishhad a mercury concentration of 15 mg/L. Comparison ofthe initial and follow-up mercury levels provided a half-life of 64 days and elimination rate constant of 0.0108.
3.5. Case number 5. Green Bay, Brown County, 2003
A 65-year-old organic farmer and his 59-year-old wifecontacted the WI DPH after reading about mercurycontamination in fish. The man had recently had hisblood analyzed for mercury and had an elevated level of24 mg/L. This couple produced most of their food andate a diet that consisted of homegrown vegetables andturkeys and an assortment of sport-caught fish. Most ofthe fish in their diet were from lakes in Minnesota andOntario Canada. In an effort to lower their risk ofexposure to mercury, they ate a cilantro pesto with thefish. Cilantro has been promoted as a ‘‘natural’’chelating agent (Omura and Beckman, 1995). Prior toreceiving the elevated blood test result, their typicalweekly menu included one meal of perch and two mealsof walleye or northern pike. They were encouraged tosubmit blood for analysis as well as samples of fishfillets. Blood was collected 23 days after they stoppedeating fish. Laboratory testing revealed mercury levels of16 (man) and 14 (woman) mg/L. Mercury concentrationsin one fillet each of northern, walleye, and perchprovided by this couple were 0.74, 0.66, and 0.049 mg/g, respectively. Comparison of steady-state and follow-up blood mercury levels for this man yielded anelimination rate constant of 0.0176 and a half-life of39 days.
3.6. Case number 6. Green Bay, Brown County, 2004
In February of 2004, a Brown County physiciancontacted the WI DPH regarding mercury in a 44-year-old female patient who was a body builder and atecanned tuna once a day as a part of a high-protein diet.This woman requested a mercury test after hearing anews report about mercury contamination in fish.Because her blood mercury level was significantlyelevated at 25 mg/L (laboratory reference range0–10 mg/L), this patient was advised to reduce herconsumption of tuna and other mercury-contaminatedfish. No follow-up testing was conducted.
3.7. Case number 7. Rhinelander, Oneida County, 2004
In October 2004, a Rhinelander resident provided ahair sample to the WI DPH for mercury analysis as partof a statewide mercury exposure assessment study.Laboratory analysis revealed a mercury level of8.78 mg/g in his hair sample. During a follow-uptelephone interview, he indicated that he ate sport-caught northern pike and bluegill about three times aweek. All of the fish in his diet were from lakes locatednear his home in Oneida County, Wisconsin, or fromMedicine Lake in Montana. He estimated that hecaught and ate 50–60 northern pike a year. Afterlearning that his hair mercury level was well above theadvisory level of 1 mg/g, he had his blood tested formercury to confirm his exposure status and providedsamples of fish from some of the lakes he fished formercury analysis. Laboratory analyses confirmed anelevated blood mercury level of 29 mg/L and his doctorprescribed an oral chelation treatment with 2, 3-dimercaptosuccinic acid. A blood sample collected 38days after he stopped eating fish and began chelationtreatments had a mercury concentration of 13 mg/L.Comparison of initial and final mercury levels providedan elimination rate constant of 0.021 and half-life of 33days.This man reported marked improvements in his
health status following treatment, explaining that hisvision had become a ‘‘more three-dimensional’’, hisbalance had improved, and he could think more clearly.Testing of his wife’s hair revealed a mercury level of
1.0 mg/g. She reported ingesting sportcaught fish anaverage of twice a month. This man’s brother and thebrother’s wife were also tested for mercury exposurebecause the men fished together and the couples ate fishfrom the same lakes. Their hair mercury levels were 9.45(man) and 4.48 (woman) mg/g. Follow-up testingordered by the man’s physician confirmed an elevatedblood mercury level of 24 mg/L and he also underwentchelation treatments.Mercury concentrations in three samples of northern
pike that were provided by these families were 0.5, 0.87,and 0.9 mg/g (see Table 1). WI DNR data suggest anestimated average mercury concentration of 0.025 mg/gin bluegill and 0.37 mg/g in northern pike from OneidaCounty waters. Based on limited data, northern pikefrom Medicine Lake have an estimated average mercuryconcentration of 0.39 mg/g wet weight (n ¼ 9, Palawskiet al., 1991).
4. Correlation of mercury intake with blood mercury
levels
Whole blood total mercury concentrations are reflec-tive of organic mercury exposure. Among people who
ARTICLE IN PRESSL. Knobeloch et al. / Environmental Research ] (]]]]) ]]]–]]] 7
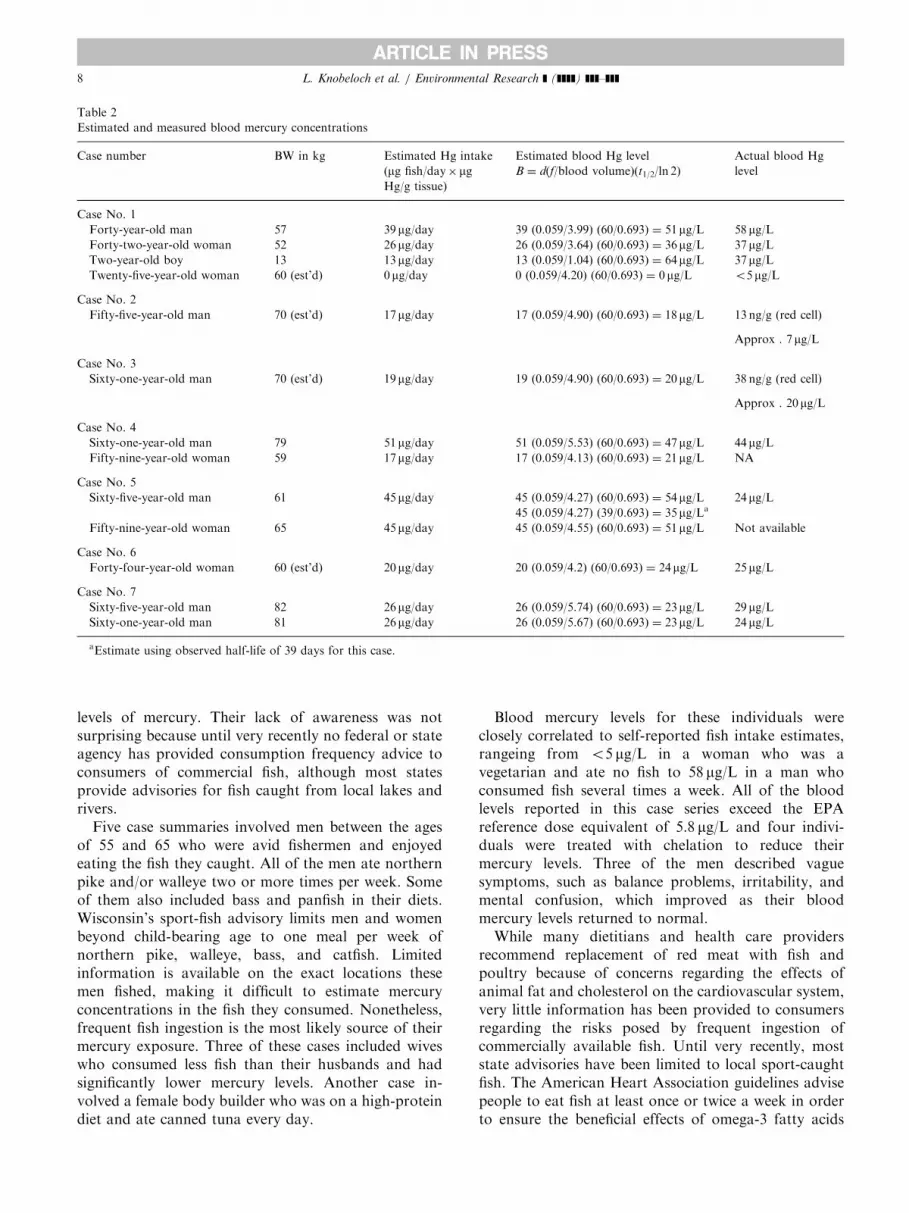
eat fish, methylmercury is the predominant form ofmercury found in blood. More than 95% of themethylmercury in blood is found in the red blood cells(Kershaw et al., 1980). The steady-state blood mercurylevel of a 70-kg adult, expressed in micrograms per liter,is approximately equal to the daily methylmercuryintake, expressed in micrograms per day (Clarkson,1977). This estimate is consistent with our findings forthe adults in Case No. 1 (Knobeloch et al., 1995). Tofurther test this relationship, the model developed byKershaw et al. (1980) was used to estimate bloodmercury levels using fish tissue data and dailyfish consumption estimates for cases 2 through 9 (seeTable 2).Kershaw et al. defined the relationship between the
steady-state concentration of methylmercury in blood(B, mg/L) and the daily mercury intake (d, in mg/day) as
B ¼ dðf =blood volumeÞ ðt1=2= ln 2Þ,
where f is the fraction of daily intake deposited in theblood (5.9%), blood volume is 7% of the body weight inadults and 8% in children, t1=2 is the half-life of mercuryin the blood compartment in days, and ln 2 is the naturallogarithm of 2 or 0.693. This formula was applied to fishconsumption, fish tissue, and body weight data toestimate blood mercury concentrations for each indivi-dual in this case series (Table 2). Steady-state bloodmercury levels are available for 11 individuals. Linearregression of estimated versus measured steady-stateblood mercury levels yielded an R2 value of 0.573(P ¼ 0:006).Predicted and actual blood mercury levels did not
match well for the child in Case No. 1. Kershaw’smodel, which was developed for adult exposures,predicted a much higher blood mercury level thanobserved in this child (64 vs. 37 mg/L). This discrepancycould be caused by a lower than reported fish ingestionrate for this child. It is also possible that young childrenhave a lower absorption or higher excretion rate formethylmercury, or that a smaller fraction of the mercuryin their body is found in the blood compartment. Theestimated blood mercury level was also significantlyhigher than observed for the men in Cases Nos. 2 and 5.The whole blood mercury value for Case No. 2 wasestimated, since the laboratory analysis was done on redblood cells. Additional error in our blood mercuryestimate for this case is likely due to the use of estimatesfor the man’s body weight and the fish tissue mercurylevels. The couple described in Case No. 5 used acilantro-containing salsa as a ‘‘natural chelator’’ ofmercury. Using the default half-life of 60 days, a bloodmercury value of 54 mg/L was predicted for the man inthis investigation. Use of the observed half-life of 39days for this individual provided an estimate of 35 mg/L,which was closer to the measured blood mercury level of24 mg/L. Removal of the child from the regression model
and use of the measured half-life to estimate the bloodmercury concentration for Case No. 5 increased the R2
value to 0.862 (Po0:001).
5. Correlation of hair and blood mercury levels
Hair and blood mercury analyses were available forfive individuals in this case series. If collected at steadystate, the mercury concentration in hair collected closeto the scalp is approximately 300 times higher than theconcentration in whole blood (Phelps et al., 1980).Comparison of matched hair and blood mercury levelsin Table 1 yields whole blood/hair mercury concentra-tion ratios ranging from 206 to 375 (mean 290). Hair-to-blood mercury ratios from the man and woman in CaseNo. 1 were 207 and 270, respectively. In this case, thehair and blood samples were collected within a few daysof each other and their diets were consistent during thistime period. In Case No. 7, hair samples were collectedand analyzed several weeks before the blood sampleswere collected. These men’s diets changed from monthto month depending on their ability to catch fresh fish.Thus, the discrepancy between their hair and bloodmercury levels, with the hair levels being high relative tothe blood levels, is likely due to a change in their diets.
6. Discussion
The cases summarized in this article were collectedover a 10-year time period. Most of these cases werecollected during telephone consultations with theseindividuals or their physicians. Because there is cur-rently no surveillance system in place that can be used totrack the prevalence of mercury exposure amongWisconsin residents, these cases are believed to representonly a few examples of the exposures that have occurredduring this period of time. Mercury testing is notcommonly performed on patients who complain of thevague symptoms such as memory problems or sleepdifficulties, and the levels reported in this article areunlikely to produce overt symptoms of mercurypoisoning. Thus, most people who have an elevatedblood mercury level are likely to be unaware of theirexposure status.The 1994 Madison case, which involved two attorneys
and their young son, was reported in EnvironmentalHealth Perspectives and has been cited as an example ofmethylmercury exposure among consumers of commer-cially sold fish (Knobeloch et al., 1995). This couple wastrying to provide themselves and their son with a healthydiet and lifestyle. They did not allow between-mealsnacks or ‘‘junk food’’ in their home and did notconsume alcohol or caffeine. Yet they were unawarethat commercial marine fish often contain relatively high
ARTICLE IN PRESS
Table 2
Estimated and measured blood mercury concentrations
Case number BW in kg Estimated Hg intake
(mg fish/day�mgHg/g tissue)
Estimated blood Hg level
B ¼ d(f/blood volume)(t1/2/ln 2)
Actual blood Hg
level
Case No. 1
Forty-year-old man 57 39mg/day 39 (0.059/3.99) (60/0.693) ¼ 51mg/L 58mg/LForty-two-year-old woman 52 26mg/day 26 (0.059/3.64) (60/0.693) ¼ 36mg/L 37mg/LTwo-year-old boy 13 13mg/day 13 (0.059/1.04) (60/0.693) ¼ 64mg/L 37mg/LTwenty-five-year-old woman 60 (est’d) 0mg/day 0 (0.059/4.20) (60/0.693) ¼ 0mg/L o5mg/L
Case No. 2
Fifty-five-year-old man 70 (est’d) 17mg/day 17 (0.059/4.90) (60/0.693) ¼ 18mg/L 13 ng/g (red cell)
Approx . 7mg/L
Case No. 3
Sixty-one-year-old man 70 (est’d) 19mg/day 19 (0.059/4.90) (60/0.693) ¼ 20mg/L 38 ng/g (red cell)
Approx . 20mg/L
Case No. 4
Sixty-one-year-old man 79 51mg/day 51 (0.059/5.53) (60/0.693) ¼ 47mg/L 44mg/LFifty-nine-year-old woman 59 17mg/day 17 (0.059/4.13) (60/0.693) ¼ 21mg/L NA
Case No. 5
Sixty-five-year-old man 61 45mg/day 45 (0.059/4.27) (60/0.693) ¼ 54mg/L 24mg/L45 (0.059/4.27) (39/0.693) ¼ 35mg/La
Fifty-nine-year-old woman 65 45mg/day 45 (0.059/4.55) (60/0.693) ¼ 51mg/L Not available
Case No. 6
Forty-four-year-old woman 60 (est’d) 20mg/day 20 (0.059/4.2) (60/0.693) ¼ 24mg/L 25mg/L
Case No. 7
Sixty-five-year-old man 82 26mg/day 26 (0.059/5.74) (60/0.693) ¼ 23mg/L 29mg/LSixty-one-year-old man 81 26mg/day 26 (0.059/5.67) (60/0.693) ¼ 23mg/L 24mg/L
aEstimate using observed half-life of 39 days for this case.
L. Knobeloch et al. / Environmental Research ] (]]]]) ]]]–]]]8
levels of mercury. Their lack of awareness was notsurprising because until very recently no federal or stateagency has provided consumption frequency advice toconsumers of commercial fish, although most statesprovide advisories for fish caught from local lakes andrivers.Five case summaries involved men between the ages
of 55 and 65 who were avid fishermen and enjoyedeating the fish they caught. All of the men ate northernpike and/or walleye two or more times per week. Someof them also included bass and panfish in their diets.Wisconsin’s sport-fish advisory limits men and womenbeyond child-bearing age to one meal per week ofnorthern pike, walleye, bass, and catfish. Limitedinformation is available on the exact locations thesemen fished, making it difficult to estimate mercuryconcentrations in the fish they consumed. Nonetheless,frequent fish ingestion is the most likely source of theirmercury exposure. Three of these cases included wiveswho consumed less fish than their husbands and hadsignificantly lower mercury levels. Another case in-volved a female body builder who was on a high-proteindiet and ate canned tuna every day.
Blood mercury levels for these individuals wereclosely correlated to self-reported fish intake estimates,rangeing from o5 mg/L in a woman who was avegetarian and ate no fish to 58 mg/L in a man whoconsumed fish several times a week. All of the bloodlevels reported in this case series exceed the EPAreference dose equivalent of 5.8 mg/L and four indivi-duals were treated with chelation to reduce theirmercury levels. Three of the men described vaguesymptoms, such as balance problems, irritability, andmental confusion, which improved as their bloodmercury levels returned to normal.While many dietitians and health care providers
recommend replacement of red meat with fish andpoultry because of concerns regarding the effects ofanimal fat and cholesterol on the cardiovascular system,very little information has been provided to consumersregarding the risks posed by frequent ingestion ofcommercially available fish. Until very recently, moststate advisories have been limited to local sport-caughtfish. The American Heart Association guidelines advisepeople to eat fish at least once or twice a week in orderto ensure the beneficial effects of omega-3 fatty acids

ARTICLE IN PRESSL. Knobeloch et al. / Environmental Research ] (]]]]) ]]]–]]] 9
and selenium on the cardiovascular system (AmericanHeart Association, 2004). While a diet that includes amodest amount of fish has been associated with lowerrates of heart disease, the benefits of eating fish must bebalanced against the adverse health effects of methyl-mercury and other persistent, bioaccumulative environ-mental contaminants. Consumers should also be advisedthat the beneficial trace minerals found in fish can alsobe obtained from a variety of nuts, beans, and grains.Walnuts and flax seeds, for example, are rich sources ofomega-3 fatty acids and selenium and are essentially freeof mercury contamination (Kris-Etherton et al., 2000).Several of these cases involved the use of ‘‘natural’’ or
pharmaceutical chelators. The role of chelation in theexcretion of methylmercury is controversial. Our casereports suggest that these agents increased the elimina-tion rate and shortened the half-life of mercury in theblood. Two individuals who underwent chelationtherapy exhibited excretion half-lives of 33 and 42 days.Initial and follow-up blood tests for an individual whoused cilantro as a ‘‘natural chelator’’ indicated a half-lifeof 39 days. In comparison, three individuals who did notundergo chelation or report any ‘‘natural chelator’’ usehad half-lives of 58, 63, and 64 days. While it is temptingto assume that it would be medically beneficial toincrease the rate of excretion of a toxin, the healthbenefits provided by chelation for chronic, low-levelexposure to methylmercury remain uncertain.Health care professionals should be aware of the
subtle symptoms that can result from chronic exposureto methylmercury. Patients who present with complaintsof mental confusion, irritability, ataxia, fine tremors,paresthesia, or changes in vision or hearing should beasked about their diets and tested for mercury if theyconsume fish more than a few times a month. Patientswho regularly consume shark, swordfish, fresh tuna,walleye, northern pike, and other large, predatoryspecies may also benefit from screening. Mercury bindsto red blood cells and is deposited into hair, makingthese tissues the most valuable biomarkers of exposure.Since methylmercury is excreted primarily in the feces,urine testing is not helpful and can be misleading. Hairmercury levels are approximately 300 times higher thanblood mercury levels at steady state.Public health agencies should provide safe fish
consumption advice to families that eat a lot of fish.This is especially important because many people arebeginning to add more fish to their diets due to therecent finding that fish is beneficial to cardiovascularhealth. Individuals who eat fish on a regular basisshould be familiar with federal and local advisories forthe types of fish they eat and encouraged to modify theirdiets, if needed, to reduce their exposure to mercury andother persistent, bioaccumulative toxins.The findings presented in this case series should be
interpreted cautiously due to their anecdotal nature. The
individuals described were not randomly selected.Rather, they are considered to be representative of asmall, but perhaps growing population of avid fishconsumers. Their experiences are summarized here in aneffort to encourage scientific discussion and research ondietary mercury exposure and its long-term healthimpacts.
Acknowledgments
These case studies were collected over a period ofseveral years by health department staff. No specificgrant or contract provided funding for this work.All interviews were conducted in accordance with
Wisconsin statutes that guarantee client privacy. Thecase studies described in this article do not involvehuman research.
References
Agency for Toxic Substances and Disease Registries, 1999. Toxicolo-
gical Profile for Mercury. Agency for Toxic Substances and Disease
Registries, US Dept of Health and Human Services, Atlanta, GA.
American Heart Association, 2004. Eating Plan: Meat, Poultry, Fish.
Available at www.americanheart.org.
Bakir, F., Damluji, S.F., Amin-Zaki, L., Murtadha, M., Khalidi, A.,
Al-Rawi, Y., et al., 1973. Methylmercury poisoning in Iraq. Science
181, 230–241.
Clarkson, T.W., 1977. Mercury poisoning. Dev. Toxicol. Environ. Sci.
1, 189–200.
FDA, 2004. Mercury Levels in Commercial Fish and Shellfish. US
Department of Health and Human Services and US Environmental
Protection Agency. Available at http://www.cfsan.fda.gov/�frf/
sea-mehg.html.
Harada, M., 1995. Minamata disease: methylmercury poisoning in
Japan caused by environmental pollution. Crit. Rev. Toxicol. 25
(1), 1–24.
Jalili, H.A., Abassi, A.H., 1961. Poisoning by ethyl mercury toluene
sulphonamide. Br. J. Ind. Med. 18, 303–308.
Kershaw, T.G., Dhahir, P.H., Clarkson, T.W., 1980. The relationship
between blood levels and dose of methylmercury in man. Arch.
Environ. Health 35, 28–36.
Knobeloch, L., Ziarnik, M., Anderson, H., Dodson, V., 1995.
Imported seabass as a source of mercury exposure: a Wisconsin
case study. Environ. Health Perspect. 103 (6), 604–606.
Kris-Etherton, P.M., Taylor, D.S., Yu-Poth, S., Huth, P., Moriarty,
K., Fishell, V., Hargrove, R.L., Zhao, G., Etherton, T.D., 2000.
Polyunsaturated fatty acids in the food chain in the United States.
Am. J. Clin. Nutr. 71 (Suppl. 1), 179S–188S.
Mahaffey, K.R., Clickner, R.P., Bodurow, C.C., 2004. Blood organic
mercury and dietary mercury intake. Environ. Health Perspect.
112, 562–570.
MMWR, Centers for Disease Control and Prevention, 2001. Blood
and hair mercury levels in young children and women of child-
bearing age—United States 1999. Morb. Mortal. Wky. Rep. 50 (8),
140–143.
National Academy of Sciences (NAS), 2000. Toxicological Effects of
Methylmercury. National Academy Press, Washington, DC.
Omura, Y., Beckman, S.L., 1995. Role of mercury (Hg) in resistant
infections & effective treatment of Chlamydia trachomatis and
Herpes family viral infections (and potential treatment for cancer)
ARTICLE IN PRESSL. Knobeloch et al. / Environmental Research ] (]]]]) ]]]–]]]10
by removing localized Hg deposits with Chinese parsley and
delivering effective antibiotics using various drug uptake enhance-
ment methods. Acupunct. Electrother. Res. 20 (3–4), 195–229.
Palawski, D.U., Malloy, J.C., DuBois, K.L., 1991. Montana National
Wildlife Refuges: Contaminant Issues of Concern. USFWS,
Helena, MT.
Pellizzari, E.D., Fernando, R., Cramer, G.M., Meaburn, G.M.,
Bangerter, K., 1999. Analysis of mercury in hair of EPA Region
V population. J. Expos. Anal. Environ. Epidemiol. 9, 393–401.
Phelps, R.W., Clarkson, T.W., Kershaw, T.G., Wheatley, B., 1980.
Interrelationships of blood and hair mercury concentrations in a
North American population exposed to methylmercury. Arch
Environ Health 35, 161–168.
Salonen, J.T., Seppanen, K., Nyyssonen, K., Korpela, H., Kauhanen,
J., Kantola, M., Tuomilehto, J., Esterbauer, H., Tatzber, F.,
Salonen, R., 1995. Intake of mercury from fish, lipid peroxidation,
and the risk of myocardial infarction and coronary, cardiovascular,
and any death in eastern Finnish men. Circulation 91 (3), 645–655.
Siegler, R.W., Nierenberg, D.W., Hickey, W.F., 1999. Fatal poisoning
from liquid dimethylmercury: a neuropathologic study. Hum.
Pathol. 30 (6), 720–723.
Smith, W.E., Smith, A.M., 1975. Minamata. Holt, Rinehart and
Winston, New York.
Sorenson, N., Murata, K., Budtz-Jorgensen, E., Weihe, P., Grandjean,
P., 1999. Prenatal methylmercury exposure as a cardiovascular risk
factor at seven years of age. Epidemiology 10 (4), 370–377.
US Environmental Protection Agency (USEPA), 1997. Health Effects
of Mercury and Mercury Compounds. Mercury Study Report to
Congress, vol. 5. USEPA.
Wisconsin Department of Natural Resources (WIDNR), 2004. Choose
Wisely. PUB-FH-824. Wisconsin Department of Natural Re-
sources, Madison, WI.


