Embed Size (px)
Citation preview
Method for increasing shear-forcedetection sensitivity with uncoated fiber tips
C. Durkan and I. V. Shvets
A technique that is easy to implement and sensitive for measuring lateral oscillation amplitudes of opticalfibers on the nanometer scale for shear-force microscopy is described. The measurement system ana-lyzed here is based on using the optical fiber tip as a cylindrical lens to focus and deflect a detection beam.It is shown that for our experimental arrangement, this technique is at least 2.5 times as sensitive asmerely shadowing the edge of such a beam, as in most commonly used configurations. As a result,oscillation amplitudes of the order of 2–3 nm may easily be measured. An advantage of this system isthat absolute vibration amplitudes are easily measured. A simple geometric model is used to describethe operation of the system. © 1997 Optical Society of America
1. Introduction
Shear-force damping is generally used for distanceregulation in scanning near-field optical microscopy~SNOM!.1,2 The idea is to oscillate a fiber tip later-ally by a few nanometers near one of its mechanicalresonance frequencies while measuring the oscilla-tion amplitude. At a distance of a few nanometersfrom a surface ~which we call the damping distance!,these oscillations become damped out by a mecha-nism as yet not fully understood, reaching zero atcontact. Therefore, if the approach damping char-acteristics are known, one may in principle measurethe tip–sample separation by measuring this ampli-tude. This may then be used for distance regulationand may also be used as a basis for high-resolutiontopographic imaging. A feature of this technique isthat it may be applied equally well to both conductingand dielectric surfaces. It is particularly suited tothe conventional tip geometry in SNOM, consisting ofa tapered single-mode optical fiber that is sometimesalso coated with aluminum. In contrast to atomicforce microscope cantilevers,3 these fiber tips havesmall lateral spring constants ~0.1–300 Nym! andlarger longitudinal ones. As a result, they are moresensitive to lateral or shearing forces. The predom-inant ideas about the nature of shear-force include
The author is with the Department of Physics, Trinity College,Dublin 2, Ireland.
Received 11 March 1996; revised manuscript received 29 Janu-ary 1997.
0003-6935y97y318173-06$10.00y0© 1997 Optical Society of America
airywater film damping, long-range van der Waalsforces, and current dissipation caused by electrostaticimage charges. In a recent model the interaction asa short-range mechanical contact ~knocking! betweenthe tip and sample, giving rise to nonlinear bendingforces in the tip, is considered.4 However, this hasbeen shown not to be the sole cause of shear force.5
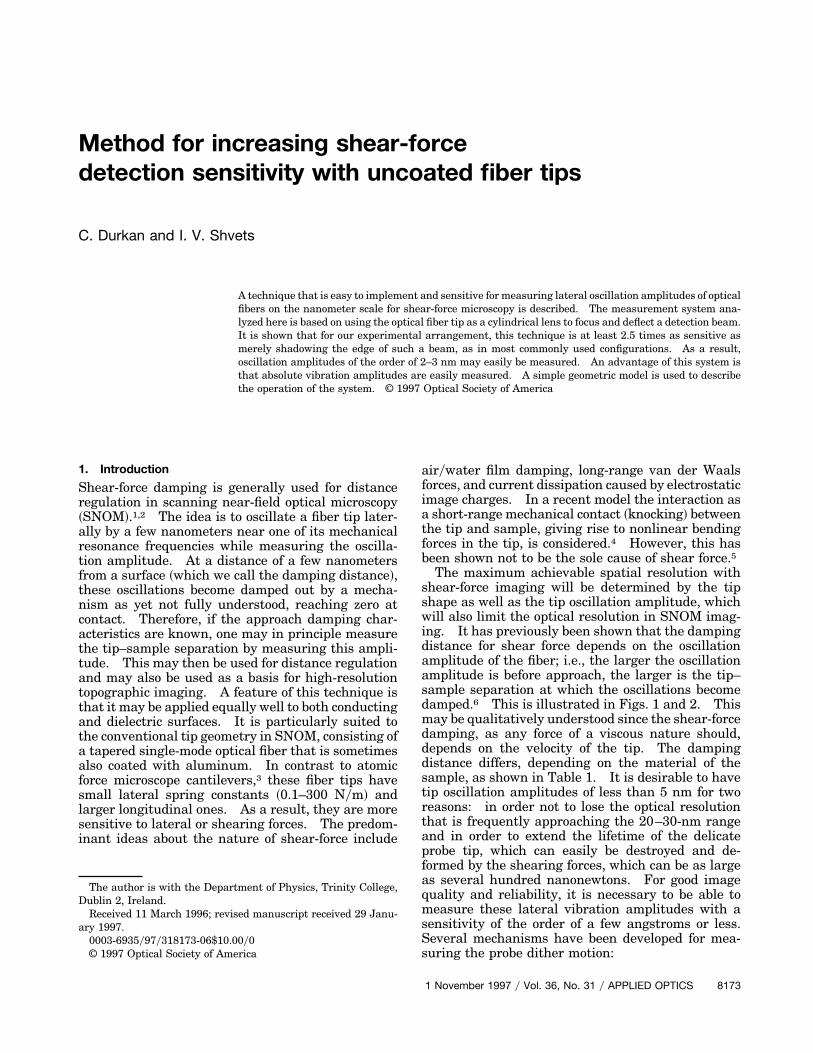
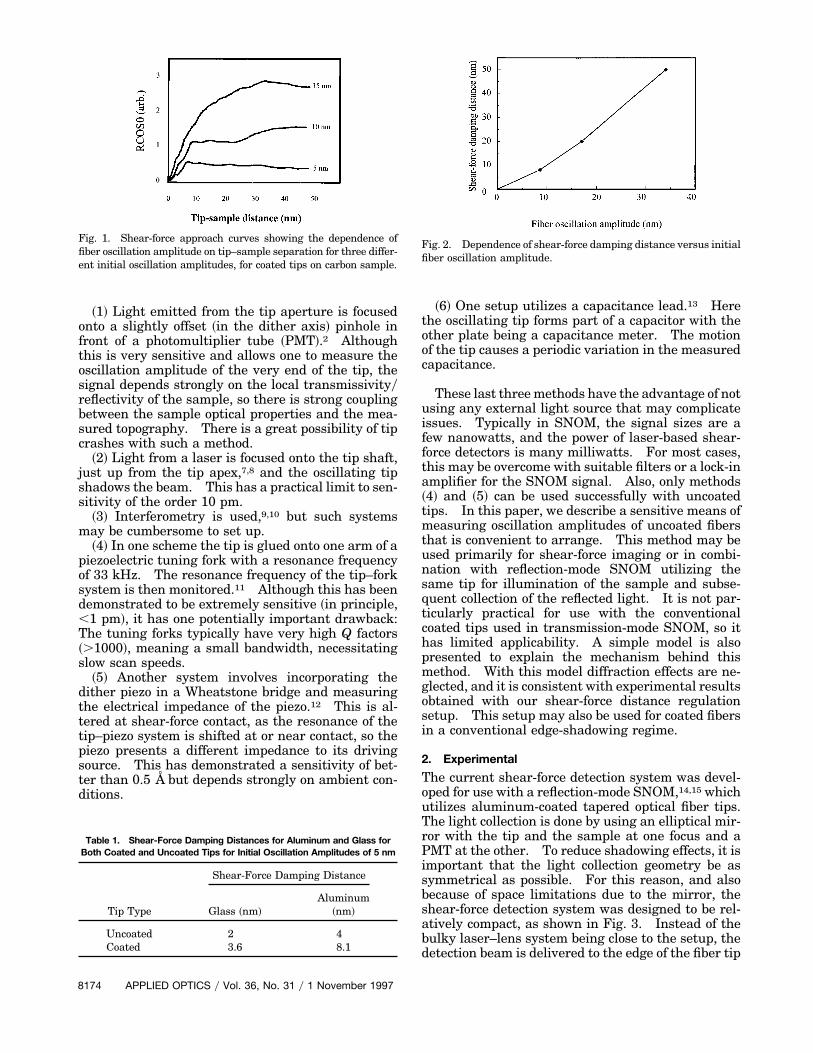
The maximum achievable spatial resolution withshear-force imaging will be determined by the tipshape as well as the tip oscillation amplitude, whichwill also limit the optical resolution in SNOM imag-ing. It has previously been shown that the dampingdistance for shear force depends on the oscillationamplitude of the fiber; i.e., the larger the oscillationamplitude is before approach, the larger is the tip–sample separation at which the oscillations becomedamped.6 This is illustrated in Figs. 1 and 2. Thismay be qualitatively understood since the shear-forcedamping, as any force of a viscous nature should,depends on the velocity of the tip. The dampingdistance differs, depending on the material of thesample, as shown in Table 1. It is desirable to havetip oscillation amplitudes of less than 5 nm for tworeasons: in order not to lose the optical resolutionthat is frequently approaching the 20–30-nm rangeand in order to extend the lifetime of the delicateprobe tip, which can easily be destroyed and de-formed by the shearing forces, which can be as largeas several hundred nanonewtons. For good imagequality and reliability, it is necessary to be able tomeasure these lateral vibration amplitudes with asensitivity of the order of a few angstroms or less.Several mechanisms have been developed for mea-suring the probe dither motion:
1 November 1997 y Vol. 36, No. 31 y APPLIED OPTICS 8173
~1! Light emitted from the tip aperture is focusedonto a slightly offset ~in the dither axis! pinhole infront of a photomultiplier tube ~PMT!.2 Althoughthis is very sensitive and allows one to measure theoscillation amplitude of the very end of the tip, thesignal depends strongly on the local transmissivityyreflectivity of the sample, so there is strong couplingbetween the sample optical properties and the mea-sured topography. There is a great possibility of tipcrashes with such a method.
~2! Light from a laser is focused onto the tip shaft,just up from the tip apex,7,8 and the oscillating tipshadows the beam. This has a practical limit to sen-sitivity of the order 10 pm.
~3! Interferometry is used,9,10 but such systemsmay be cumbersome to set up.
~4! In one scheme the tip is glued onto one arm of apiezoelectric tuning fork with a resonance frequencyof 33 kHz. The resonance frequency of the tip–forksystem is then monitored.11 Although this has beendemonstrated to be extremely sensitive ~in principle,,1 pm!, it has one potentially important drawback:The tuning forks typically have very high Q factors~.1000!, meaning a small bandwidth, necessitatingslow scan speeds.
~5! Another system involves incorporating thedither piezo in a Wheatstone bridge and measuringthe electrical impedance of the piezo.12 This is al-tered at shear-force contact, as the resonance of thetip–piezo system is shifted at or near contact, so thepiezo presents a different impedance to its drivingsource. This has demonstrated a sensitivity of bet-ter than 0.5 Å but depends strongly on ambient con-ditions.
Fig. 1. Shear-force approach curves showing the dependence offiber oscillation amplitude on tip–sample separation for three differ-ent initial oscillation amplitudes, for coated tips on carbon sample.
Table 1. Shear-Force Damping Distances for Aluminum and Glass forBoth Coated and Uncoated Tips for Initial Oscillation Amplitudes of 5 nm
Tip Type
Shear-Force Damping Distance
Glass ~nm!Aluminum
~nm!
Uncoated 2 4Coated 3.6 8.1
8174 APPLIED OPTICS y Vol. 36, No. 31 y 1 November 1997
~6! One setup utilizes a capacitance lead.13 Herethe oscillating tip forms part of a capacitor with theother plate being a capacitance meter. The motionof the tip causes a periodic variation in the measuredcapacitance.
These last three methods have the advantage of notusing any external light source that may complicateissues. Typically in SNOM, the signal sizes are afew nanowatts, and the power of laser-based shear-force detectors is many milliwatts. For most cases,this may be overcome with suitable filters or a lock-inamplifier for the SNOM signal. Also, only methods~4! and ~5! can be used successfully with uncoatedtips. In this paper, we describe a sensitive means ofmeasuring oscillation amplitudes of uncoated fibersthat is convenient to arrange. This method may beused primarily for shear-force imaging or in combi-nation with reflection-mode SNOM utilizing thesame tip for illumination of the sample and subse-quent collection of the reflected light. It is not par-ticularly practical for use with the conventionalcoated tips used in transmission-mode SNOM, so ithas limited applicability. A simple model is alsopresented to explain the mechanism behind thismethod. With this model diffraction effects are ne-glected, and it is consistent with experimental resultsobtained with our shear-force distance regulationsetup. This setup may also be used for coated fibersin a conventional edge-shadowing regime.
2. Experimental
The current shear-force detection system was devel-oped for use with a reflection-mode SNOM,14,15 whichutilizes aluminum-coated tapered optical fiber tips.The light collection is done by using an elliptical mir-ror with the tip and the sample at one focus and aPMT at the other. To reduce shadowing effects, it isimportant that the light collection geometry be assymmetrical as possible. For this reason, and alsobecause of space limitations due to the mirror, theshear-force detection system was designed to be rel-atively compact, as shown in Fig. 3. Instead of thebulky laser–lens system being close to the setup, thedetection beam is delivered to the edge of the fiber tip
Fig. 2. Dependence of shear-force damping distance versus initialfiber oscillation amplitude.
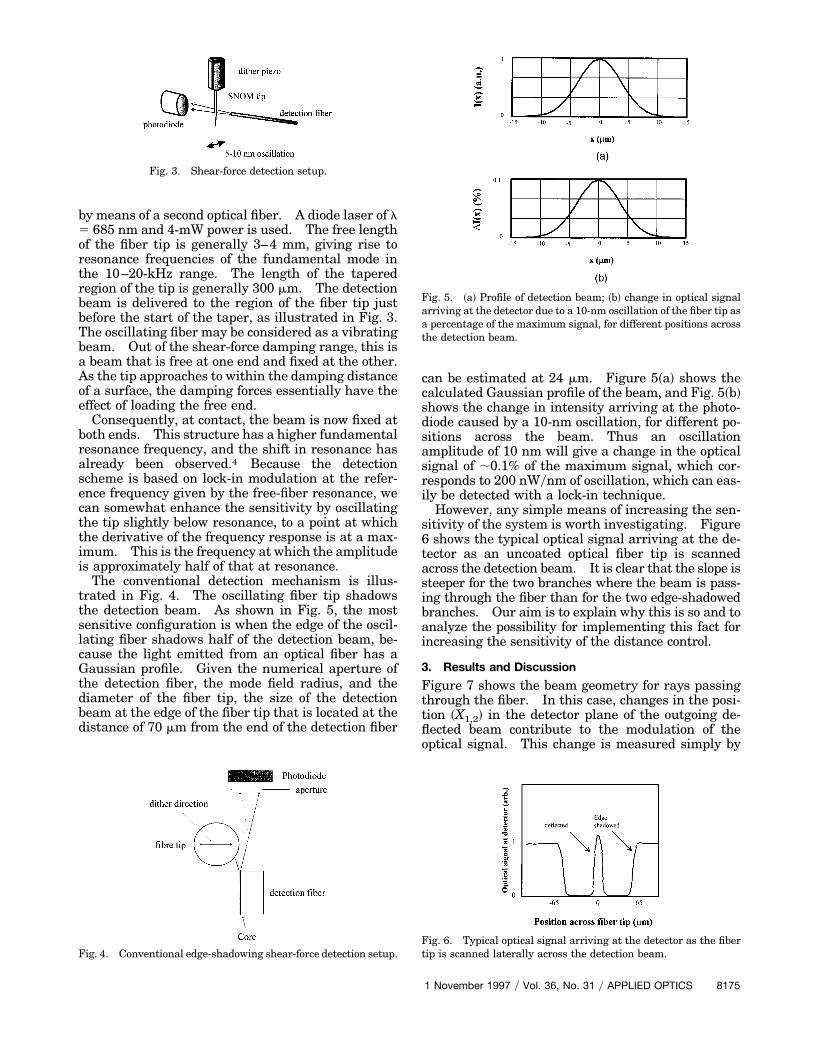
by means of a second optical fiber. A diode laser of l5 685 nm and 4-mW power is used. The free lengthof the fiber tip is generally 3–4 mm, giving rise toresonance frequencies of the fundamental mode inthe 10–20-kHz range. The length of the taperedregion of the tip is generally 300 mm. The detectionbeam is delivered to the region of the fiber tip justbefore the start of the taper, as illustrated in Fig. 3.The oscillating fiber may be considered as a vibratingbeam. Out of the shear-force damping range, this isa beam that is free at one end and fixed at the other.As the tip approaches to within the damping distanceof a surface, the damping forces essentially have theeffect of loading the free end.
Consequently, at contact, the beam is now fixed atboth ends. This structure has a higher fundamentalresonance frequency, and the shift in resonance hasalready been observed.4 Because the detectionscheme is based on lock-in modulation at the refer-ence frequency given by the free-fiber resonance, wecan somewhat enhance the sensitivity by oscillatingthe tip slightly below resonance, to a point at whichthe derivative of the frequency response is at a max-imum. This is the frequency at which the amplitudeis approximately half of that at resonance.
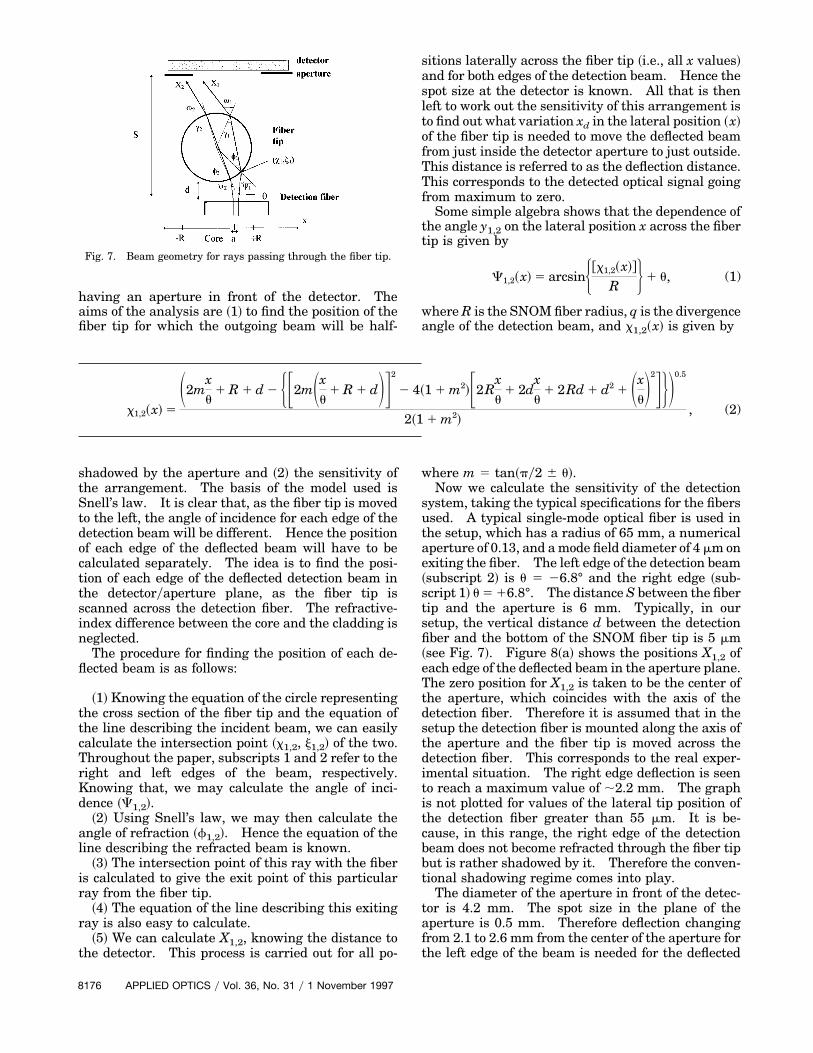
The conventional detection mechanism is illus-trated in Fig. 4. The oscillating fiber tip shadowsthe detection beam. As shown in Fig. 5, the mostsensitive configuration is when the edge of the oscil-lating fiber shadows half of the detection beam, be-cause the light emitted from an optical fiber has aGaussian profile. Given the numerical aperture ofthe detection fiber, the mode field radius, and thediameter of the fiber tip, the size of the detectionbeam at the edge of the fiber tip that is located at thedistance of 70 mm from the end of the detection fiber
Fig. 3. Shear-force detection setup.
Fig. 4. Conventional edge-shadowing shear-force detection setup.
can be estimated at 24 mm. Figure 5~a! shows thecalculated Gaussian profile of the beam, and Fig. 5~b!shows the change in intensity arriving at the photo-diode caused by a 10-nm oscillation, for different po-sitions across the beam. Thus an oscillationamplitude of 10 nm will give a change in the opticalsignal of ;0.1% of the maximum signal, which cor-responds to 200 nWynm of oscillation, which can eas-ily be detected with a lock-in technique.
However, any simple means of increasing the sen-sitivity of the system is worth investigating. Figure6 shows the typical optical signal arriving at the de-tector as an uncoated optical fiber tip is scannedacross the detection beam. It is clear that the slope issteeper for the two branches where the beam is pass-ing through the fiber than for the two edge-shadowedbranches. Our aim is to explain why this is so and toanalyze the possibility for implementing this fact forincreasing the sensitivity of the distance control.
3. Results and Discussion
Figure 7 shows the beam geometry for rays passingthrough the fiber. In this case, changes in the posi-tion ~X1,2! in the detector plane of the outgoing de-flected beam contribute to the modulation of theoptical signal. This change is measured simply by
Fig. 5. ~a! Profile of detection beam; ~b! change in optical signalarriving at the detector due to a 10-nm oscillation of the fiber tip asa percentage of the maximum signal, for different positions acrossthe detection beam.
Fig. 6. Typical optical signal arriving at the detector as the fibertip is scanned laterally across the detection beam.
1 November 1997 y Vol. 36, No. 31 y APPLIED OPTICS 8175
having an aperture in front of the detector. Theaims of the analysis are ~1! to find the position of thefiber tip for which the outgoing beam will be half-
Fig. 7. Beam geometry for rays passing through the fiber tip.
sitions laterally across the fiber tip ~i.e., all x values!and for both edges of the detection beam. Hence thespot size at the detector is known. All that is thenleft to work out the sensitivity of this arrangement isto find out what variation xd in the lateral position ~x!of the fiber tip is needed to move the deflected beamfrom just inside the detector aperture to just outside.This distance is referred to as the deflection distance.This corresponds to the detected optical signal goingfrom maximum to zero.
Some simple algebra shows that the dependence ofthe angle y1,2 on the lateral position x across the fibertip is given by
C1,2~x! 5 arcsinH@x1,2~x!#
R J 1 u, (1)
where R is the SNOM fiber radius, q is the divergenceangle of the detection beam, and x1,2~x! is given by
x1,2~x! 5
S2mxu
1 R 1 d 2 HF2mSxu
1 R 1 dDG2
2 4~1 1 m2!F2Rxu
1 2dxu
1 2Rd 1 d2 1 SxuD
2GJD0.5
2~1 1 m2!, (2)
shadowed by the aperture and ~2! the sensitivity ofthe arrangement. The basis of the model used isSnell’s law. It is clear that, as the fiber tip is movedto the left, the angle of incidence for each edge of thedetection beam will be different. Hence the positionof each edge of the deflected beam will have to becalculated separately. The idea is to find the posi-tion of each edge of the deflected detection beam inthe detectoryaperture plane, as the fiber tip isscanned across the detection fiber. The refractive-index difference between the core and the cladding isneglected.
The procedure for finding the position of each de-flected beam is as follows:
~1! Knowing the equation of the circle representingthe cross section of the fiber tip and the equation ofthe line describing the incident beam, we can easilycalculate the intersection point ~x1,2, j1,2! of the two.Throughout the paper, subscripts 1 and 2 refer to theright and left edges of the beam, respectively.Knowing that, we may calculate the angle of inci-dence ~C1,2!.
~2! Using Snell’s law, we may then calculate theangle of refraction ~f1,2!. Hence the equation of theline describing the refracted beam is known.
~3! The intersection point of this ray with the fiberis calculated to give the exit point of this particularray from the fiber tip.
~4! The equation of the line describing this exitingray is also easy to calculate.
~5! We can calculate X1,2, knowing the distance tothe detector. This process is carried out for all po-
8176 APPLIED OPTICS y Vol. 36, No. 31 y 1 November 1997
where m 5 tan~py2 6 u!.Now we calculate the sensitivity of the detection
system, taking the typical specifications for the fibersused. A typical single-mode optical fiber is used inthe setup, which has a radius of 65 mm, a numericalaperture of 0.13, and a mode field diameter of 4 mm onexiting the fiber. The left edge of the detection beam~subscript 2! is u 5 26.8° and the right edge ~sub-script 1! u 5 16.8°. The distance S between the fibertip and the aperture is 6 mm. Typically, in oursetup, the vertical distance d between the detectionfiber and the bottom of the SNOM fiber tip is 5 mm~see Fig. 7!. Figure 8~a! shows the positions X1,2 ofeach edge of the deflected beam in the aperture plane.The zero position for X1,2 is taken to be the center ofthe aperture, which coincides with the axis of thedetection fiber. Therefore it is assumed that in thesetup the detection fiber is mounted along the axis ofthe aperture and the fiber tip is moved across thedetection fiber. This corresponds to the real exper-imental situation. The right edge deflection is seento reach a maximum value of ;2.2 mm. The graphis not plotted for values of the lateral tip position ofthe detection fiber greater than 55 mm. It is be-cause, in this range, the right edge of the detectionbeam does not become refracted through the fiber tipbut is rather shadowed by it. Therefore the conven-tional shadowing regime comes into play.
The diameter of the aperture in front of the detec-tor is 4.2 mm. The spot size in the plane of theaperture is 0.5 mm. Therefore deflection changingfrom 2.1 to 2.6 mm from the center of the aperture forthe left edge of the beam is needed for the deflected
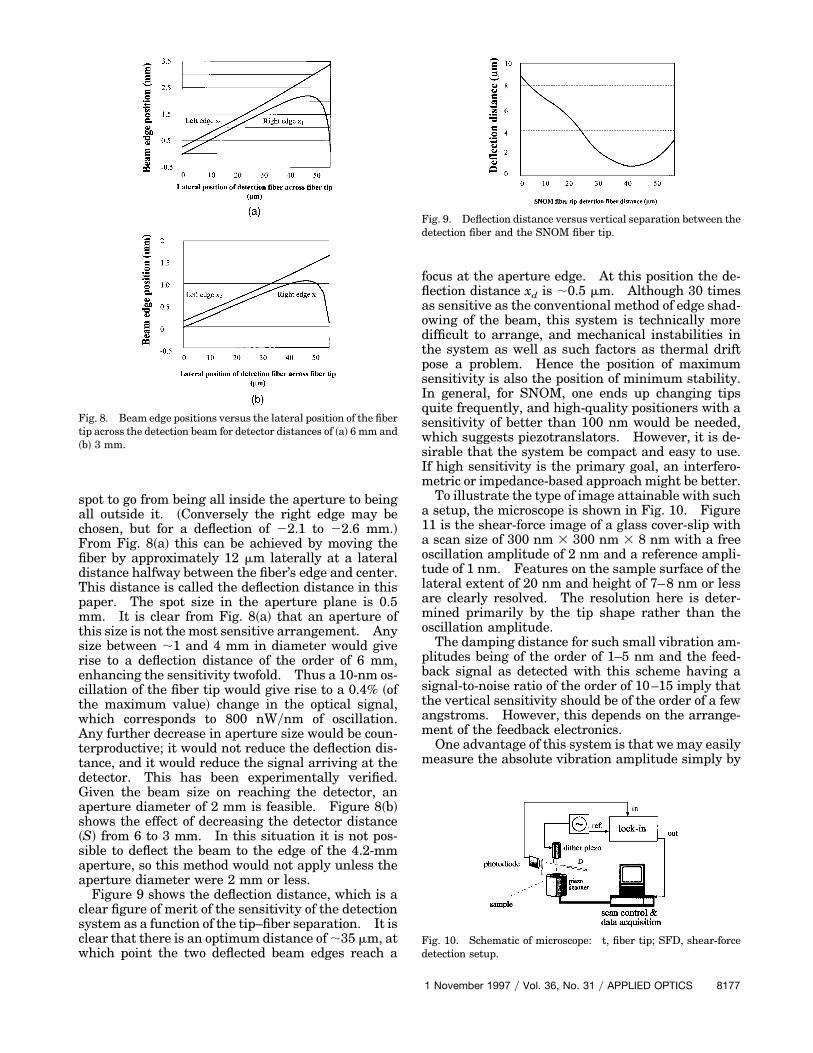
spot to go from being all inside the aperture to beingall outside it. ~Conversely the right edge may bechosen, but for a deflection of 22.1 to 22.6 mm.!From Fig. 8~a! this can be achieved by moving thefiber by approximately 12 mm laterally at a lateraldistance halfway between the fiber’s edge and center.This distance is called the deflection distance in thispaper. The spot size in the aperture plane is 0.5mm. It is clear from Fig. 8~a! that an aperture ofthis size is not the most sensitive arrangement. Anysize between ;1 and 4 mm in diameter would giverise to a deflection distance of the order of 6 mm,enhancing the sensitivity twofold. Thus a 10-nm os-cillation of the fiber tip would give rise to a 0.4% ~ofthe maximum value! change in the optical signal,which corresponds to 800 nWynm of oscillation.Any further decrease in aperture size would be coun-terproductive; it would not reduce the deflection dis-tance, and it would reduce the signal arriving at thedetector. This has been experimentally verified.Given the beam size on reaching the detector, anaperture diameter of 2 mm is feasible. Figure 8~b!shows the effect of decreasing the detector distance~S! from 6 to 3 mm. In this situation it is not pos-sible to deflect the beam to the edge of the 4.2-mmaperture, so this method would not apply unless theaperture diameter were 2 mm or less.
Figure 9 shows the deflection distance, which is aclear figure of merit of the sensitivity of the detectionsystem as a function of the tip–fiber separation. It isclear that there is an optimum distance of ;35 mm, atwhich point the two deflected beam edges reach a
Fig. 8. Beam edge positions versus the lateral position of the fibertip across the detection beam for detector distances of ~a! 6 mm and~b! 3 mm.
focus at the aperture edge. At this position the de-flection distance xd is ;0.5 mm. Although 30 timesas sensitive as the conventional method of edge shad-owing of the beam, this system is technically moredifficult to arrange, and mechanical instabilities inthe system as well as such factors as thermal driftpose a problem. Hence the position of maximumsensitivity is also the position of minimum stability.In general, for SNOM, one ends up changing tipsquite frequently, and high-quality positioners with asensitivity of better than 100 nm would be needed,which suggests piezotranslators. However, it is de-sirable that the system be compact and easy to use.If high sensitivity is the primary goal, an interfero-metric or impedance-based approach might be better.
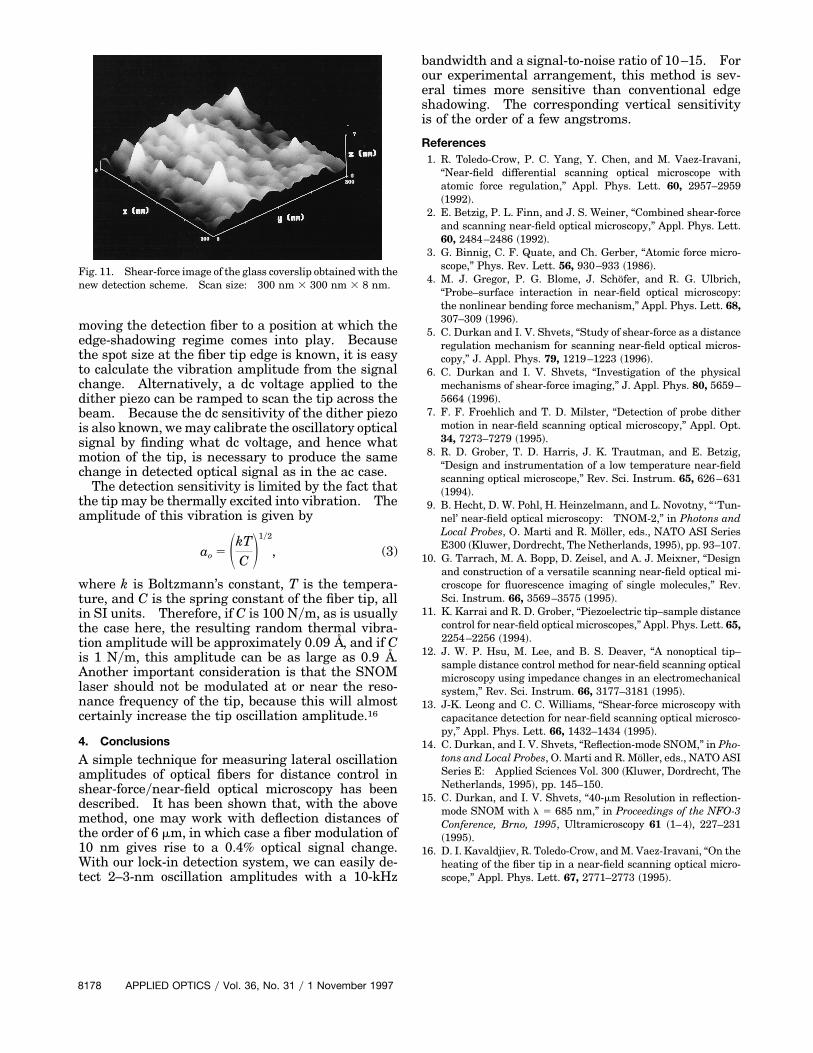
To illustrate the type of image attainable with sucha setup, the microscope is shown in Fig. 10. Figure11 is the shear-force image of a glass cover-slip witha scan size of 300 nm 3 300 nm 3 8 nm with a freeoscillation amplitude of 2 nm and a reference ampli-tude of 1 nm. Features on the sample surface of thelateral extent of 20 nm and height of 7–8 nm or lessare clearly resolved. The resolution here is deter-mined primarily by the tip shape rather than theoscillation amplitude.
The damping distance for such small vibration am-plitudes being of the order of 1–5 nm and the feed-back signal as detected with this scheme having asignal-to-noise ratio of the order of 10–15 imply thatthe vertical sensitivity should be of the order of a fewangstroms. However, this depends on the arrange-ment of the feedback electronics.
One advantage of this system is that we may easilymeasure the absolute vibration amplitude simply by
Fig. 9. Deflection distance versus vertical separation between thedetection fiber and the SNOM fiber tip.
Fig. 10. Schematic of microscope: t, fiber tip; SFD, shear-forcedetection setup.
1 November 1997 y Vol. 36, No. 31 y APPLIED OPTICS 8177
moving the detection fiber to a position at which theedge-shadowing regime comes into play. Becausethe spot size at the fiber tip edge is known, it is easyto calculate the vibration amplitude from the signalchange. Alternatively, a dc voltage applied to thedither piezo can be ramped to scan the tip across thebeam. Because the dc sensitivity of the dither piezois also known, we may calibrate the oscillatory opticalsignal by finding what dc voltage, and hence whatmotion of the tip, is necessary to produce the samechange in detected optical signal as in the ac case.
The detection sensitivity is limited by the fact thatthe tip may be thermally excited into vibration. Theamplitude of this vibration is given by
ao 5 SkTC D1y2
, (3)
where k is Boltzmann’s constant, T is the tempera-ture, and C is the spring constant of the fiber tip, allin SI units. Therefore, if C is 100 Nym, as is usuallythe case here, the resulting random thermal vibra-tion amplitude will be approximately 0.09 Å, and if Cis 1 Nym, this amplitude can be as large as 0.9 Å.Another important consideration is that the SNOMlaser should not be modulated at or near the reso-nance frequency of the tip, because this will almostcertainly increase the tip oscillation amplitude.16
4. Conclusions
A simple technique for measuring lateral oscillationamplitudes of optical fibers for distance control inshear-forceynear-field optical microscopy has beendescribed. It has been shown that, with the abovemethod, one may work with deflection distances ofthe order of 6 mm, in which case a fiber modulation of10 nm gives rise to a 0.4% optical signal change.With our lock-in detection system, we can easily de-tect 2–3-nm oscillation amplitudes with a 10-kHz
Fig. 11. Shear-force image of the glass coverslip obtained with thenew detection scheme. Scan size: 300 nm 3 300 nm 3 8 nm.
8178 APPLIED OPTICS y Vol. 36, No. 31 y 1 November 1997
bandwidth and a signal-to-noise ratio of 10–15. Forour experimental arrangement, this method is sev-eral times more sensitive than conventional edgeshadowing. The corresponding vertical sensitivityis of the order of a few angstroms.
References1. R. Toledo-Crow, P. C. Yang, Y. Chen, and M. Vaez-Iravani,
“Near-field differential scanning optical microscope withatomic force regulation,” Appl. Phys. Lett. 60, 2957–2959~1992!.
2. E. Betzig, P. L. Finn, and J. S. Weiner, “Combined shear-forceand scanning near-field optical microscopy,” Appl. Phys. Lett.60, 2484–2486 ~1992!.
3. G. Binnig, C. F. Quate, and Ch. Gerber, “Atomic force micro-scope,” Phys. Rev. Lett. 56, 930–933 ~1986!.
4. M. J. Gregor, P. G. Blome, J. Schofer, and R. G. Ulbrich,“Probe–surface interaction in near-field optical microscopy:the nonlinear bending force mechanism,” Appl. Phys. Lett. 68,307–309 ~1996!.
5. C. Durkan and I. V. Shvets, “Study of shear-force as a distanceregulation mechanism for scanning near-field optical micros-copy,” J. Appl. Phys. 79, 1219–1223 ~1996!.
6. C. Durkan and I. V. Shvets, “Investigation of the physicalmechanisms of shear-force imaging,” J. Appl. Phys. 80, 5659–5664 ~1996!.
7. F. F. Froehlich and T. D. Milster, “Detection of probe dithermotion in near-field scanning optical microscopy,” Appl. Opt.34, 7273–7279 ~1995!.
8. R. D. Grober, T. D. Harris, J. K. Trautman, and E. Betzig,“Design and instrumentation of a low temperature near-fieldscanning optical microscope,” Rev. Sci. Instrum. 65, 626–631~1994!.
9. B. Hecht, D. W. Pohl, H. Heinzelmann, and L. Novotny, “ ‘Tun-nel’ near-field optical microscopy: TNOM-2,” in Photons andLocal Probes, O. Marti and R. Moller, eds., NATO ASI SeriesE300 ~Kluwer, Dordrecht, The Netherlands, 1995!, pp. 93–107.
10. G. Tarrach, M. A. Bopp, D. Zeisel, and A. J. Meixner, “Designand construction of a versatile scanning near-field optical mi-croscope for fluorescence imaging of single molecules,” Rev.Sci. Instrum. 66, 3569–3575 ~1995!.
11. K. Karrai and R. D. Grober, “Piezoelectric tip–sample distancecontrol for near-field optical microscopes,” Appl. Phys. Lett. 65,2254–2256 ~1994!.
12. J. W. P. Hsu, M. Lee, and B. S. Deaver, “A nonoptical tip–sample distance control method for near-field scanning opticalmicroscopy using impedance changes in an electromechanicalsystem,” Rev. Sci. Instrum. 66, 3177–3181 ~1995!.
13. J-K. Leong and C. C. Williams, “Shear-force microscopy withcapacitance detection for near-field scanning optical microsco-py,” Appl. Phys. Lett. 66, 1432–1434 ~1995!.
14. C. Durkan, and I. V. Shvets, “Reflection-mode SNOM,” in Pho-tons and Local Probes, O. Marti and R. Moller, eds., NATO ASISeries E: Applied Sciences Vol. 300 ~Kluwer, Dordrecht, TheNetherlands, 1995!, pp. 145–150.
15. C. Durkan, and I. V. Shvets, “40-mm Resolution in reflection-mode SNOM with l 5 685 nm,” in Proceedings of the NFO-3Conference, Brno, 1995, Ultramicroscopy 61 ~1–4!, 227–231~1995!.
16. D. I. Kavaldjiev, R. Toledo-Crow, and M. Vaez-Iravani, “On theheating of the fiber tip in a near-field scanning optical micro-scope,” Appl. Phys. Lett. 67, 2771–2773 ~1995!.


