Embed Size (px)
Citation preview

American Mineralogist, Volume 93, pages 806–820, 2008
0003-004X/08/0506–806$05.00/DOI: 10.2138/am.2008.2635 806
Metasomatic thorite and uraninite inclusions in xenotime and monazite from granitic pegmatites, Hidra anorthosite massif, southwestern Norway: Mechanics and fluid chemistry
Callum J. HetHerington1,* and daniel e. Harlov2
1Department of Geosciences, University of Massachusetts, 611 North Pleasant Street, Amherst, Massachusetts 01003-9297, U.S.A.2GeoForschungsZentrum Potsdam, Telegrafenberg, D-14473 Potsdam, FR Germany
abstraCt
Thorite and uraninite inclusions are documented in metasomatized regions in three xenotime crystals and one monazite crystal collected from three granitic pegmatites hosted within an anorthosite intrusion located on the island of Hidra, southwestern Norway. Formation of these inclusions is demonstrated to be the result of dissolution-reprecipitation processes that occurred in an effectively closed chemi-cal system. The reaction was initiated by interaction between the early crystallizing orthophosphate minerals and the evolving pegmatite fluid. This fluid was dominated by H2O, but also contained F and minor amounts of Cl, and significant quantities of dissolved Na+ and K+. This is an example of auto-metasomatism and highlights a natural case where Th-U-Si-enriched orthophosphate minerals have been partially altered such that the Th, U, and Si have been converted to secondary inclusions within the now Th-U-Si-depleted orthophosphate via reaction with fluids rich in alkali elements.
Keywords: Monazite, xenotime, thorite, uraninite, dissolution-reprecipitation, pegmatite, alkali-rich fluids
introduCtion
Xenotime [(Y,HREE)PO4] and monazite [(Ce,LREE)PO4] are relatively common accessory minerals in both igneous and metamorphic rocks. Their role in mineralogy, petrology, and geochemistry from the standpoint of geochronology (Williams et al. 2007), temperature estimation (Gratz and Heinrich 1997, 1998; Andrehs and Heinrich 1998), and secondary involvement in metasomatic processes such as alteration of apatite (Harlov et al. 2002, 2005; Harlov and Förster 2003), have already been well documented. However, metasomatic alteration of xenotime or monazite, although described in the literature (e.g., Bingen et al. 1996; Townsend et al. 2000), is poorly understood with respect to the mechanics of how it occurs as well as with respect to the fluid chemistry.
In this study, backscattered electron (BSE) imaging and electron probe microanalysis (EPMA) are used to describe and interpret textures in three xenotime crystals and one monazite crystal from granitic pegmatites that are themselves hosted by an anorthosite intrusion on the island of Hidra, southwest Nor-way (Fig. 1). The euhedral crystals of xenotime and monazite have extensive altered regions, which contain numerous thorite ± uraninite inclusions. Unaltered regions do not contain these inclusions. Textural, crystal-chemical, and crystallographic evidence suggest that formation of the thorite and uraninite inclu-sions occurred as the result of fluid-mineral interaction within a closed chemical system, i.e., all the components necessary for the nucleation and growth of the inclusions were already present in the host xenotime and monazite.
analytiCal metHodElectron probe microanalysis (EPMA) was done using the Cameca SX50
electron microprobe at the University of Massachusetts (Amherst). The electron microprobe is equipped with 4 wavelength-dispersive spectrometers. Individual spot analyses were made using a focused electron beam having a diameter of 1 µm, an accelerating voltage of 15 kV, and a beam current of 15 nA. Counting times for Th and U were 30 s on the peak and 10 s on each background position. For all other elements, counting times on the peak and the background positions were 20 and 10 s, respectively.
The measured peak and background positions are based on evaluation of detailed wavelength scans run on natural monazite, similar, in principle, to the ap-proach of Scherrer et al. (2000). Techniques have been established for the accurate determination of Pb and U in actinide-bearing phosphates such that the effects of peak and background interferences and background curvature are accounted and corrected for during analysis (Jercinovic and Williams 2005; Pyle et al. 2005; Williams et al. 2007). An overview of peak and background positions is provided in the electronic depository (Item A). To reduce the possible contribution from micro- to nano-scale phase inclusions or phase boundaries that are not seen because of orientation effects, the activation volume of each analysis is minimized using a 15 kV accelerating voltage, while still providing sufficient energy for excitation of all measured lines (Pyle et al. 2005). This also avoids additional complications from efficient L-level ionizations in high-Z elements (e.g., actinides). Higher beam currents are also avoided during major-element analysis to avoid beam damage to the specimen and conductive (carbon) coat that may lead to unpredictable and unquantifiable effects to the X-ray emission (Jercinovic and Williams 2005). An additional benefit of the low beam current is that the heating of the sample during prolonged exposure to the electron beam is reduced, thereby lowering the pos-sibility of diffusion and volatilization of elements in the measured volume, and subsequently, erroneous totals.
Each element was calibrated using well-characterized natural and synthetic standards (electronic depository, Item A). The Cameca PAP correction procedure was used for all data reduction (Pouchou and Pichoir 1985). Calculated absolute detection limits for each element are provided in Item A in the electronic deposi-tory. Note that analytical errors for Y, the REE, and other heavy elements depend on the absolute abundances of each element. Relative 1σ errors are estimated to be <0.5% at the >10 wt% level, 15% at the 10 wt% level, 10–20% at the 0.2 to 1 * E-mail: [email protected]

HETHERINGTON AND HARLOV: THORITE AND URANINITE INCLUSIONS IN XENOTIME AND MONAZITE 807
wt% level, and 20–40% at the <0.1 wt% level. For concentrations below 0.1 wt%, the analytical precision for the actinides is approximately 10% higher.
Selected 2-dimensional major- and trace-element X-ray maps of xenotime and monazite crystals from the pegmatite as well as feldspar in the anorthosite host-rock were made using the same electron microprobe. Operating conditions included beam currents of 100 or 200 nA, an accelerating voltage of 15 kV, and dwell times of between 20 and 50 ms per pixel.
geology, petrology, and mineralogy of tHe Hidra massif and assoCiated granitiC pegmatites
The Hidra anorthosite is a small, concentrically zoned, elongate body of anorthositic-charnockitic rocks located at the southeastern corner of the South Rogaland (Egersund) anortho-sitic-noritic-mangeritic complex, southwest Norway (Falkum 1998) (Fig. 1). In the east it has a sharp, steep, easterly dipping contact with the Farsund charnockite. At its northern limit, it is in contact with charnockitic gneiss that wedges out in the core of the Kvanvik antiform. To the west, the contact is a complicated magmatic zone composed of gneisses that give way to noritic-mangeritic rocks.
The Hidra anorthosite (Fig. 1) consists of a central body of coarse-grained anorthosite with a well-developed orthocumulate texture (Demaiffe et al. 1973). This coarse-grained rock is sur-rounded by a body of leuconorite with subophitic textures that grades into a fine-grained monzonorite toward the contact with the host rocks (Demaiffe and Hertogen 1981). Zircon, sphene, monazite, and uraninite, dated by U-Pb techniques, provide
a minimum age of 937 ± 4 Ma for the anorthosite complex (Pasteels et al. 1979). The same study also concludes that the three rock-types developed by fractional crystallization from a single parental jotunitic magma, which probably originated in the upper mantle, but was later contaminated by the lower crust during formation, ascent, and/or emplacement (Demaiffe and Hertogen 1981; Weis and Demaiffe 1983).
The Hidra massif is cut by charnockitic dikes and granitic pegmatites, which are intimately related to the host anorthositic-leuconoritic rocks, but have no observed relationship with the metamorphic host-gneisses. There is some qualitative petrologi-cal data, supported by a study of the (Y+REE) geochemistry and Sr isotopes, which positively link the charnockitic dikes as a fractionation product of the original magma (Demaiffe 1977; Demaiffe and Hertogen 1981). There are also two zircon ages of 935 ± 6 and 932 ± 4 Ma (Pasteels et al. 1979) from the charnockite dikes that overlap with the U-Pb ages for the anorthosite complex presented by Pasteels et al. (1979).
The granitic pegmatites in the Hidra anorthosite have been the focus of mineralogical research since the discovery and description of type xenotime (Berzelius 1824). The granitic pegmatites range in thickness from 1 to 15 m, have a sheet-like orientation and a shallow dip with no preferred direction noted between localities. They can be followed along strike for up to 30 m before pinching out. The pegmatites are domi-nated by massive quartz, and orthoclase and albite crystals of near end-member composition that measure up to 1 m in size. Graphic textures are particularly well developed in many places. Elongate cavities are often, but not exclusively, found close to the edges of the pegmatites and contain large books of muscovite and biotite, as well as magnetite. Phosphate miner-als present in the pegmatite include xenotime and monazite but not apatite. The xenotime and monazite crystals are not found in the cavities but occur entrapped in large plagioclase and/or K-feldspar crystals. A variety of other minerals, including al-lanite [CaREEAl2Fe2+Si3O11O(OH)], aeschynite [(REECaFeTh)(TiNb)2(O,OH)6], and kainosite [Ca2REE2Si4O12CO3⋅H2O], also occur as discrete minerals directly associated with and included in the feldspars (Neumann 1985). Despite detailed mineralogical work, little previous work has focused on the development and emplacement of the pegmatitic magmas. Two Pb isotope analyses were presented by Weis and Demaiffe (1983), but the data were not interpreted within the larger framework of the anorthosite complex. No geochronological information pertaining to the pegmatites is available.
Examination of the contact between the granitic pegmatites and the host rock reveals that the lowermost contacts are sharp and straight. The upper contacts, on the meter-scale, are also straight and undeformed, and identifiable by the color contrast between the green host-rock and the white-to-pink granitic pegmatite. However, on the millimeter-scale they are indistinct with a crenulated and jagged appearance.
This upper contacts are also characterized by an alteration zone in the primary host rock, which varies from <10 to tens of centimeters in thickness. The extent of the altered zone is most apparent in the leuconorite rocks where the primary, nominally anhydrous assemblage of plagioclase (An43–49), orthopyroxene, fluorapatite, and Fe-Ti oxides (hemo-ilmenite and magnetite)
Anorthosite ComplexLeuconoriteMonzonorite
Aana-Sira anorthositeNoritic-Mangerite Complex
Charnockite
Granulitic Gneiss
1 kmN
Pegmatite LocalitiesA - Urstad B - Rasvåg
C
B
A
Figure 1
C - Hummerli D - Igletjern
D
Hidra
figure 1. Schematic map of the geology of Hidra and location of sampled granitic pegmatites.

HETHERINGTON AND HARLOV: THORITE AND URANINITE INCLUSIONS IN XENOTIME AND MONAZITE808
has been metamorphosed and now contains the hydrous miner-als hornblende (pargasite) ± biotite or chlorite (Table 1). The modal mineralogy of the alteration zone varies with proximity to the contact. Samples furthest from the pegmatite contain the smallest modal amounts of amphibole or biotite. Both minerals are only found along grain boundaries or as mantle textures around pyroxene. In samples where chlorite is present in greater volumes than amphibole, the rims of plagioclase (An43–49) have been altered to albite (Ab100) (Table 1; Fig. 2). The intensity of amphibitolization increases toward the contact with the granitic pegmatite, with a systematic increase in the concentration of the hydrous phases. Fluorapatite in the unaltered anorthosite is euhedral and contains negligible amounts of Cl or OH. Closer to the contact with the granitic pegmatites, the fluorapatite grains show slightly crenulated grain edges, suggesting some dissolu-tion, but are compositionally indistinguishable from grains in the unaltered anorthosite. The increasing intensity in alteration is matched by a decrease in the pyroxene content, a reduction in the grain size of the assemblage, and an increasing darker green color of the rock. Many of the plagioclase crystals show evidence of seritization, as well as albitization of their rims. Despite clear evidence for hydration and alteration of the anorthosite, leuconorite, and monzonorite host-rocks close to the granititic pegmatites, neither they, nor the charnockitic dikes display any evidence for structural deformation.
sample desCription
Three xenotime crystals and one monazite crystal, collected in the late 19th century from three granitic pegmatites in the Flek-kefjord anorthosite complex on Hidra (Fig. 1), were selected from the mineral collections of the Geological Museum (University of Oslo) (Table 2). The xenotime and monazite were found
entrapped in unaltered plagioclase and K-feldspar crystals. All four crystals, including others from the same pegmatites, are typically rusty to dark brown in color, opaque, have roughened crystal faces, and range in size from between a few millimeters and 2–3 cm.
Sample Xnt-1, cut perpendicular to the crystallographic C-axis, displays primary magmatic zoning (Fig. 3a). The zoning is overprinted by areas of alteration that are most pronounced toward the crystal edges. Under backscattered electron (BSE) imaging and X-ray element mapping, altered areas of the crys-tal are relatively darker than unaltered areas, which is due to a relatively lower Th content (Table 3; Figs. 3b−3c, 4a). Altered areas also have a pervasive porosity, cracks, and fractures as well as containing many bright inclusions of thorite and uraninite. In contrast, the lighter, elongate, and apparently homogeneous, unaltered areas show none of these features (Figs. 4a−4b), and have a relatively higher Th content (Table 3; Fig. 3b). The roughly orthogonal unaltered areas are aligned parallel to one another and the crystallographic A-axis of xenotime (Figs. 4a−4b).
The composition of the unaltered areas is characterized by elevated concentrations of SiO2 (~2 wt%), ThO2 (~3 wt%), and UO2 (~4.5 wt%) (Table 3) and the heavy rare earth elements (HREE) Gd2O3 (~2.6 wt%), Dy2O3 (~4.2 wt%), Er2O3 (~2.3 wt%), and Yb2O3 (~3.5 wt%). Concentrations of the light rare-earth elements (LREE) are lower (Table 3). Altered areas have a composition that trends toward end-member xenotime with concentrations of SiO2, ThO2, and UO2 all <0.5 wt% (Table 3). This may be demonstrated using a (Y + P) vs. (Si + Th + U)
2 mm
Amphibole
Plagioclase
figure 2. Sodium X-ray map of plagioclase in the metasomatic alteration zone. Increasing white intensity signifies increasing X-ray counts. Plagioclase grain rims are more albitic in composition than the cores (Table 1). Stage and beam conditions were beam current = 100 nA; accelerating voltage = 15 kV; pixel dwell time = 25 ms; pixel step size = 20 µm; and map size = 512 × 748 pixels.
Table 1. Average mineral chemistry for amphibole, biotite, chlorite, and plagioclase
FF-04-07b FF-04-01b FF-04-03 FF-04-08Distance In pegmatite 30 cm 100 cm 175 cmfrom pegmatite Biotite Amphibole Biotite Chlorite Amphibolen 19 28 35 45 26SiO2 35.29 44.01 36.95 29.08 44.79TiO2 2.71 0.96 4.73 0.10 0.40Al2O3 15.86 10.67 14.19 17.94 11.44Cr2O3 <0.01 0.02 <0.01 <0.01 <0.01FeO 20.36 15.50 17.19 23.54 14.69MgO 10.44 13.18 14.30 17.61 13.14MnO 0.18 0.24 0.12 0.12 0.21CaO <0.02 11.46 <0.02 0.06 11.24Na2O 0.08 1.42 0.01 0.27 1.70K2O 9.14 1.41 9.51 0.02 0.40F 0.73 0.58 1.16 <0.11 0.07Cl 0.50 0.08 0.09 0.02 0.01 Total 95.31 99.54 98.25 88.76 98.08
Plagioclase FF-04-01b FF-04-03 FF-04-08n 24 14 21 19 rim core SiO2 55.24 66.68 55.25 55.46Al2O3 27.94 20.14 27.37 28.59Fe2O3 0.09 0.02 0.08 0.03CaO 9.59 0.05 9.02 9.99BaO 0.08 0.01 0.02 0.07SrO 0.20 0.10 0.15 0.19Na2O 6.29 12.20 6.68 6.27K2O 0.26 0.04 0.08 0.03 Total 99.69 99.25 98.65 100.61

HETHERINGTON AND HARLOV: THORITE AND URANINITE INCLUSIONS IN XENOTIME AND MONAZITE 809
P) vs. (Th + Si + U) diagram (Fig. 5a) have near identical y-axis intercept values to one another, as well as that of a best fit line for the unaltered and altered xenotime data set (Fig. 5b). This finding indicates a high degree of chemical retention in the system during the dissolution of the original xenotime and the reprecipitation of depleted xenotime plus thorite and uraninite inclusions.
Sample Xnt-2 (Table 2) shows little evidence for compo-sitional zoning, and considerable evidence for alteration, with no large domains of unaltered xenotime remaining. Allanite is intergrown along the edges of the crystal. Areas of unaltered xenotime are small (≤75 µm) with a poorly defined shape.
Alteration textures vary with proximity to the crystal edge. In areas deep within the crystal, the altered xenotime commonly
Table 2. Sample descriptionSample Collection Locality† Descriptionlabel number* and featuresXnt-1 13797 Urstad 1 cm diameter steel gray(Fig. 1; Point A) (32W 035755 645660) colored euhedral crystal with pyramidal form. Internal color light tan-brown. Crystal mounted perpendicular to the crystallographic c axis.
Xnt-2 13806 Rasvåg One euhedral 7 mm pale(Fig. 1; Point B) (32W 035800 6455059) pink-brown crystal, and one 5 mm brown fragment with pockmarked surface. Xnt-3 13807 Hummerli One elongate 8 × 6 mm(Fig. 1; Point C) (32W 035788 645473) euhedral dark-brown crystal, with smooth faces, mounted parallel to long axis. Mnz-1 13801 Rasvåg Three dark-brown(Fig. 1; Point B) (32W 035800 6455059) fragments of dark brown monazite with pockmarked and crusty crystal faces.* Numbers refer to the collections of the Geological Museum, University of Oslo.† Norwegian grid references.
A 4 mm
B 200 µm
C 20 µm
Th Mα Si Kα
Th Mα Si Kα
Th Mα Si Kα
figure 3. (a) Overview Th and Si X-ray maps of sample Xnt-1. Stage and beam conditions were beam current = 200 nA; accelerating voltage = 15 kV; pixel dwell time = 20 ms; pixel step size = 10 µm; and map size = 1024 × 980 pixels. (b) X-ray maps showing the distribution of Th and Si between unaltered and altered xenotime domains and thorite inclusions (dotted line box indicates area shown in c). Stage and beam conditions were beam current = 100 nA; accelerating voltage = 15 kV; pixel dwell time = 50 ms; pixel step size = 2 µm; and map size = 512 × 512 pixels. (c) Th and Si X-ray maps of individual thorite inclusions in altered domains and of xenotime. Stage and beam conditions were beam current = 100 nA; accelerating voltage = 15 kV; pixel dwell time = 50 ms; pixel step size = 0.24 µm; and map size = 512 × 512 pixels. Increasing white intensity signifies increasing X-ray intensity in all maps.
discrimination diagram (Figs. 5a−5b), which in the absence of significant CaO, shows that the dominant compositional sub-stitution in the xenotime is coupled and may be defined by the exchange vector: [Y]–1[P]–1[Si][Th+U] (Förster 1998). HREE concentrations in altered areas are broadly equivalent to those found in the unaltered areas, but concentrations of LREE are lower, and in many analyses, are below the EPMA detection limit (Table 3; Fig. 6a).
The size and distribution density of the thorite and uranin-ite inclusions varies across the crystal (Figs. 4a−4b). Areas of alteration in the interior of Xnt-1 contain more numerous but smaller inclusions (<5 µm), which are interspersed with unaltered xenotime (Fig. 4b). In altered areas along the edge of the crystal faces, the inclusions are larger, but fewer in num-ber (Fig. 4b). Where larger inclusions (>25 µm) predominate, many have a subeuhedral form and have grown in a topotactic relationship to the crystallographic axes of the xenotime (Figs. 4c−4e). In such large inclusions, both thorite and uraninite are found as discrete phases in a single inclusion (Figs. 4c−4d), with uraninite occurring as smaller inclusions within a larger thorite grain (Fig. 4d). Around larger inclusions, cracks and fractures have developed and are filled in by a Th- and U-enriched mate-rial, presumably precipitated from the fluid responsible for the alteration (Fig. 4c).
The uraninite has small amounts of ThO2 (~6.5 wt%) and minor amounts of (Y+REE) (Table 3), with an enrichment in (Y+HREE) relative to LREE when normalized against chron-drite values (Fig. 6a). Analyses of thorite show that they contain considerable amounts of UO2 (~10.0 wt%), but it is also noted that the EPMA totals are universally low (Table 3; Fig. 5a). The amounts of (Y+REE) in thorite are similar to those in uraninite, with a similar enrichment of (Y+HREE) relative to LREE when normalized against chondrite values (Fig. 6a).
Linear trend lines for the altered xenotime + thorite and altered xenotime + uraninite data sets when plotted on the (Y +

HETHERINGTON AND HARLOV: THORITE AND URANINITE INCLUSIONS IN XENOTIME AND MONAZITE810
occurs as a halo around very small inclusions of thorite (1–3 µm) (Fig. 4f). Small cavities are found in altered areas of xenotime throughout the crystal (Fig. 4f). Closer to the edge of the crys-tal, the areas of alteration are largest, and the size of the thorite inclusions dramatically increases (up to 160 µm), although at the same time, their overall number dramatically decreases (Fig. 4g). The larger thorite inclusions have a more euhedral form
with straighter crystal edges (Fig. 4g). The areas of unaltered xenotime become smaller, or are not seen at all.
Cracks and fractures are prevalent in the altered areas, particularly toward the edge of the crystal where they can have a radial distribution around larger inclusions (Fig. 4g). These cracks are not characterized by levels of higher brightness un-der BSE imaging, nor is alteration seen along the edges of all
A 500 µm B 1000 µm
D 20 µmC 30 µm
F 10 µm
G 500 µm H 500 µm
E 300 µm
figure 4. Backscattered electron (BSE) images of altered and unaltered regions in xenotime [Xnt-1 (A-E), Xnt-2 (F-H)]. (a) Large orthogonal domains of light-gray unaltered xenotime surrounded by a checkered arrangement of altered xenotime with inclusions. (b) Gradation from the rim toward the core of the xenotime with decrease in size, but increasing number of inclusions in altered domains. There is also an increase in the size and number of unaltered xenotime domains. (c) Two thorite inclusions with multiple small uraninite inclusions hosted in altered xenotime. (d) Single large thorite grain with intergrown uraninite crystals. Note the similar orientation of the orthorhombic and cubic grains. (e) Preferred orientation of tetragonal thorite inclusions in tetragonal xenotime. (f) Altered xenotime occurring as a halo around very small inclusions of thorite. (g) Radial crack and fracture development around larger inclusions. (h) Evidence that alteration domains cross-cutting and showing no relationship with cracks and fractures, indicating that alteration was crystallographically controlled.

HETHERINGTON AND HARLOV: THORITE AND URANINITE INCLUSIONS IN XENOTIME AND MONAZITE 811
cracks (Fig. 4h).Unaltered areas in Xnt-2 are characterized by elevated con-
centrations of SiO2 (~2.3 wt%), ThO2 (~5.0 wt%), and UO2 (~1.5 wt%), and selected HREE [Gd2O3 (~1.5 wt%), Dy2O3 (~4.5 wt%), Er2O3 (~3.7 wt%), and Yb2O3 (~4.2 wt%)] (Table 4). The altered xenotime composition trends toward end-member composition (Figs. 5c−5d), with lower concentrations of SiO2 (~1.0 wt%), ThO2 (~1.65 wt%), and UO2 (~1.0 wt%) (Table 4). Unaltered
xenotime compositions lie on a line of best fit between the altered xenotime and thorite compositions on the (Y + P) vs. (Th + Si + U) plot indicating a high degree of compositional retention of the major elements between the primary and secondary phases (Fig. 5c). When normalized against chondrite values some, LREE in the altered areas show slight depletion compared to concentra-tions in the unaltered areas (Fig. 6b).
The thorite inclusions have UO2 concentrations varying
Table 3. EPMA analyses of phases in sample Xnt-1 Unaltered xenotime Altered xenotime Uraninite Thorite Mean Range Cations Mean Range Cations Mean Range Cations Mean Range CationsP2O5 31.95 29.37–33.43 0.928 37.10 34.33–38.22 1.010 0.13 0.00–1.07 0.011 2.52 0.52–4.97 0.141V2O5 0.02 0.00–0.12 0.001 0.00 0.00–0.00 0.000As2O5 0.17 0.00–0.60 0.004 <0.11 0.00–0.00 0.009 0.09 0.00–0.17 0.006 0.00 0.00–0.02 0.000SiO2 1.95 1.33–3.29 0.067 0.26 0.01–1.19 0.000 0.14 0.00–1.70 0.014 12.99 8.45–16.71 0.749ZrO2 0.03 0.00–0.86 0.001 0.57 0.00–3.69 0.023ThO2 3.19 2.40–5.54 0.025 0.18 0.00–1.51 0.002 6.32 0.51–10.81 0.149 49.65 37.33–66.04 0.628UO2 4.41 2.59–7.44 0.034 0.42 0.00–2.29 0.003 73.83 64.25–85.80 0.860 9.94 3.52–16.86 0.069Al2O3 <0.01 0.00–0.06 0.000 0.26 0.00–0.57 0.022Y2O3 41.98 37.88–43.17 0.767 48.36 45.80–50.78 0.827 2.23 0.10–4.30 0.122 5.98 0.53–10.81 0.212La2O3 0.09 0.00–0.30 0.001 0.00 0.00–0.00 0.000 0.22 0.03–0.47 0.008 0.04 0.00–0.20 0.001Ce2O3 0.15 0.02–0.26 0.002 0.00 0.00–0.00 0.000 0.25 0.04–0.45 0.009 0.19 0.00–0.61 0.005Pr2O3 0.08 0.00–0.36 0.001 0.00 0.00–0.00 0.000 0.78 0.47–1.17 0.029 0.31 0.20–0.35 0.006Nd2O3 0.54 0.39–0.76 0.007 0.25 0.00–0.49 0.003 0.83 0.34–2.36 0.031 0.68 0.20–1.28 0.016Sm2O3 1.07 0.75–1.42 0.013 0.06 0.00–0.31 0.001 1.23 0.67–2.37 0.044 0.53 0.00–0.85 0.012Eu2O3 0.02 0.00–0.16 0.000 0.00 0.00–0.00 0.000 0.31 0.11–0.43 0.011 0.03 0.00–0.15 0.001Gd2O3 2.59 1.93–3.30 0.029 2.03 0.88–3.05 0.022 2.99 2.16–3.83 0.103 0.94 0.22–1.40 0.019Tb2O3 0.61 0.51–0.80 0.007 0.30 0.12–0.53 0.003 Dy2O3 4.21 3.81–4.68 0.047 4.42 3.90–4.83 0.046 0.98 0.50–1.51 0.033 0.78 0.20–1.36 0.016Ho2O3 0.65 0.32–1.28 0.007 0.00 0.00–0.17 0.000 Er2O3 2.29 2.05–2.62 0.025 2.39 1.89–2.66 0.024 0.71 0.45–0.94 0.023 0.34 0.18–0.63 0.007Tm2O3 0.59 0.36–0.84 0.006 0.32 0.08–0.55 0.003 0.44 0.04–0.73 0.014 0.00 0.00–0.00 0.000Yb2O3 3.52 2.98–3.95 0.037 3.60 3.21–3.84 0.035 1.05 0.71–1.45 0.033 0.57 0.20–1.16 0.011FeO 0.01 0.00–0.04 0.000 0.00 0.00–0.00 0.000 0.18 0.08–0.49 0.015 0.36 0.00–5.50 0.057MgO 0.05 0.02–0.09 0.007 0.00 0.00–0.04 0.001CaO 0.03 0.01–0.12 0.001 0.01 0.00–0.18 0.000 0.19 0.10–1.03 0.021 0.72 0.09–1.28 0.050PbO 9.18 3.98–11.55 0.257 2.27 0.13–6.83 0.037F 0.32 0.11–0.51 0.035 0.07 0.00–0.33 0.012 0.23 0.06–0.52 0.042SO2 0.01 0.00–0.04 0.000 0.00 0.00–0.00 0.000 Total 100.40 99.00–102.02 99.78 97.92–101.71 102.10 97.34–106.70 89.84 84.97–97.67
Table 4. EPMA analyses of phases in sample Xnt-2 Unaltered xenotime Altered xenotime Thorite Mean Range Cations Mean Range Cations Mean Range CationsP2O5 31.51 30.34–32.43 0.919 34.94 33.70–35.61 0.986 2.32 0.49–4.81 0.117V2O5 0.02 0.00–0.11 0.001As2O5 0.30 0.00–0.67 0.006 0.05 0.00–0.45 0.001 0.03 0.00–0.15 0.001SiO2 2.27 1.70–2.65 0.078 0.43 0.13–0.79 0.014 13.46 7.71–18.57 0.792ZrO2 0.09 0.00–0.53 0.003ThO2 5.12 2.93–5.76 0.040 0.20 0.00–0.62 0.002 58.49 50.21–67.08 0.792UO2 1.47 0.73–1.65 0.011 0.09 0.00–0.33 0.001 3.52 0.65–10.18 0.022Al2O3 0.60 0.20–1.22 0.042Y2O3 41.81 40.92–43.05 0.767 45.98 44.91–47.14 0.816 1.88 0.59–5.19 0.058La2O3 0.06 0.00–0.20 0.001 0.05 0.00–0.19 0.001 0.10 0.01–0.27 0.002Ce2O3 0.01 0.00–0.08 0.000 0.00 0.00–0.08 0.000 0.21 0.00–0.64 0.005Pr2O3 0.04 0.00–0.24 0.000 0.01 0.00–0.08 0.000 0.08 0.00–0.23 0.002Nd2O3 0.11 0.00–0.25 0.001 0.04 0.00–0.16 0.000 0.10 0.00–0.31 0.002Sm2O3 0.55 0.29–0.85 0.007 0.48 0.25–0.74 0.006 0.43 0.16–0.79 0.009Eu2O3 0.01 0.00–0.04 0.000 0.00 0.00–0.00 0.000 0.00 0.00–0.00 0.000Gd2O3 1.48 0.96–2.02 0.017 1.21 0.45–1.83 0.013 1.00 0.16–1.99 0.019Tb2O3 0.53 0.40–0.65 0.006 0.49 0.34–0.62 0.005 0.00 0.00–0.00 0.000Dy2O3 4.50 3.83–5.04 0.050 4.60 4.27–4.95 0.049 0.25 0.00–0.95 0.005Ho2O3 0.83 0.50–1.28 0.009 0.71 0.28–1.19 0.008 0.00 0.00–0.00 0.000Er2O3 3.71 3.25–4.11 0.040 3.87 3.57–4.19 0.041 0.26 0.00–0.67 0.005Tm2O3 0.83 0.71–1.04 0.009 0.82 0.63–0.99 0.009 0.03 0.00–0.18 0.000Yb2O3 4.25 3.61–4.93 0.045 4.81 4.41–5.34 0.049 0.39 0.00–1.32 0.007FeO 0.09 0.00–0.86 0.003 0.02 0.00–0.18 0.000 3.71 0.59–9.87 0.186MgO 0.00 0.00–0.03 0.000CaO 0.02 0.00–0.13 0.001 0.00 0.00–0.01 0.000 0.66 0.05–1.95 0.041PbO 0.17 0.00–0.34 0.003F 0.49 0.29–0.65 0.054 0.55 0.39–0.77 0.058 SO2 0.05 0.00–0.16 0.002 0.08 0.00–0.15 0.002 Total 100.02 97.72–101.78 99.43 97.33–100.76 87.81 80.11–95.60
HETHERINGTON AND HARLOV: THORITE AND URANINITE INCLUSIONS IN XENOTIME AND MONAZITE812
between 0.5 and 10.0 wt%, and minor amounts of (Y+REE) (Table 4). Chondrite-normalized values for the (Y+REE) show enrichment of the (Y+HREE) relative to the LREE’s (Fig. 6b). Iron is also detected in many of the inclusions, with concentra-tions ranging between 0.5 and 10.0 wt% (Table 4).
Sample Xnt-3 is an equi-dimensional euhedral crystal mounted parallel to the c-axis. It has crenulated crystal edges and displays considerable alteration and inclusion growth in one quadrant. Alteration in other areas of the crystal is more limited, and only observed in areas close to the crystal edges.
Where alteration is more extensive, large thorite inclusions oc-cur, whereas in smaller, mixed areas, the thorite inclusions are much smaller, but more populous. Many of the smaller alteration areas are very elongate and lie parallel to one another and the crystallographic axes of the crystal (cf. Xnt-1; Fig. 4a), as do the larger subhedral thorite inclusions within them (cf. Xnt-1; Fig. 4e). The cracks and fractures in the crystal have no parallel or perpendicular relationship with the crystallographic axes of the crystal, or the preferred orientation of the alteration zones. Nor is there a prevalence of alteration or inclusion growth along the
y = -1.6978x + 1.8724 r2 = 0.9973
y = -1.019x + 1.8434 r2 = 0.9946
0
0.5
1.0
1.5
2.0
0 0.2 0.4 0.6 0.8 1.0 1.2 1.4 1.6 1.8 2.0
Y+P
apf
u
Th+Si+U apfu
1.00
1.25
1.50
1.75
2.00
0 0.25 0.5 0.75Th+Si+U apfu
REE
+P a
pfu
Unaltered xenotimeAltered xenotimeThoriteUraninite
A
C
H
F
y = -1.061x + 1.9807r2 = 0.9989
0
0.5
1.0
1.5
2.0
0 0.2 0.4 0.6 0.8 1.0 1.2 1.4 1.6 1.8 2.0
REE
+P a
pfu
GUnaltered monaziteAltered monaziteThorite
1.6
1.7
1.8
1.9
2.0
0 0.02 0.04 0.06 0.08 0.10 0.12 0.14 0.16
Y+P
apf
u
D
B
y = -0.9507x + 1.8187r2 = 0.9976
0
0.5
1.0
1.5
2.0
0 0.2 0.4 0.6 0.8 1.0 1.2 1.4 1.6 1.8 2.0
Y+P
apf
u
1.6
1.7
1.8
1.9
2.0
0 0.02 0.04 0.06 0.08 0.10 0.12 0.14 0.16
Y+P
apf
uy = -1.0227x + 1.8129r2 = 0.9819
0
0.5
1.0
1.5
2.0
0 0.2 0.4 0.6 0.8 1.0 1.2 1.4 1.6 1.8 2.0
Y+P
apf
u
E
y = -1.2466x + 1.8539 r2 = 0.9876
1.6
1.7
1.8
1.9
2.0
0 0.02 0.04 0.06 0.08 0.10 0.12 0.14 0.16
Y+P
apf
u
Fig. 5B
Fig. 5D
Fig. 5F
Fig. 5H
Figure 5
figure 5. Compositional variation diagrams, plotted in atoms per formula unit, for unaltered, altered, and inclusion assemblage(s) in samples Xnt-1 (a,b), Xnt-2 (c,d), Xnt-3 (e,f), and Mnz-1 (g,h). Parts b, d, f, and g are blow-ups of the inset in a, e, g, and h, respectively.

HETHERINGTON AND HARLOV: THORITE AND URANINITE INCLUSIONS IN XENOTIME AND MONAZITE 813
cracks or fractures (cf. Xnt-2; Fig. 4h).The composition of the primary xenotime is characterized
by elevated SiO2 (~2.3 wt%), ThO2 (~5.5 wt%), and UO2 (~1.5 wt%), and selected HREE [Gd2O3 (~1.3 wt%), Dy2O3 (~4.9 wt%), Ho2O3 (~1.2 wt%), Er2O3 (~4.0 wt%), and Yb2O3 (~3.8 wt%)] (Table 5). There is also some F detected (~0.5 wt%). In the al-tered areas of the crystal, HREE concentrations remain relatively unchanged, while the chondrite normalized LREE values show considerable scatter (Fig. 6c). Concentrations of SiO2 (<0.2 wt%), ThO2 (<0.3 wt%), and UO2 (<0.5 wt%) are significantly lower in the altered xenotime (Table 5) as the composition trends toward the ideal end-member (Figs. 5e−5f).
The thorite inclusions have a consistent chemical composi-tion, which is characterized by ThO2 contents of ~50.0 wt% and UO2 contents of 9.5 wt%. They also have ~2.0 wt% CaO com-pared with both generations of xenotime, which have amounts only slightly above the EMP detection limit (Table 4). The REE concentrations of thorite inclusions in Xnt-3 are depleted rela-tive to both the altered and unaltered xenotime, with the HREE enriched relative to the LREEs (Fig. 6c). The composition of unaltered xenotime lies on the linear trend line of best fit between thorite and altered xenotime (Fig. 5e) indicating a high degree of compositional retention between reactants and products during the alteration process.
Sample Mnz-1 consists of three monazite fragments (Mnz-1) from the Rasvåg locality (Fig. 1; Table 2) that have light-brown, pock-marked, and ragged crystal faces. Internal faces show less evidence for alteration and have a darker brown color. X-ray element maps show evidence for compositional sector zoning in each fragment.
All the inclusions are thorite and have a very broad range in size (Figs. 7a−7c). BSE images indicate that a halo of altered
monazite surrounds each thorite inclusion (Figs. 7a−7c). Primary monazite-(Ce) contains significant amounts of ThO2 (~18.5 wt%) and SiO2 (4–5 wt%) (Table 6). There is very little CaO (0.14 wt%) or UO2 (~0.6 wt%), and minor amounts of (Y+HREE). The altered monazite around the thorite inclusions has a slight enrichment in the LREE content relative to the unaltered mona-zite (Fig. 6d), but significantly less ThO2 (1.5 to 4.0 wt%), a lower SiO2 content (1.5 wt%), and similar amounts of CaO (0.17 wt%) (Table 6). The (Y+REE) trend in the thorite shows slight enrichment in the (Y+HREE) relative to the LREE (Fig. 6d). As observed in each of the xenotime samples, there is a correlation in the chemistry between the two monazite composi-tions and the thorite (Figs. 5g−5h). The variation in Th, U, and Si content is such that the altered monazite is trending toward end-member composition, and the composition of the unaltered monazite lies on a line of best fit between the thorite and altered monazite compositions, once more highlighting inheritance by the thorite inclusions of its principal elements (Th, U, and Si) from the primary monazite.
The size, distribution, and textural setting of the thorite inclu-sions in monazite are in marked contrast to each of the xenotime samples. Inclusions are concentrated along cracks and fractures in the crystal, rather than included in continuous domains. Furthermore, the distribution of cracks, fractures, and domains of unaltered and altered monazite have no regular orthogonal arrangement (Figs. 7a−7c). Smaller thorite inclusions (<100 µm) rarely have a euhedral form, and are not observed as hav-ing a preferred orientation (Figs. 7c−7d). The majority of thorite inclusions in the monazite occur as large crystal agglomerations with anhedral form, measuring up to 500 µm in diameter (Figs. 7a−7b). They are surrounded by larger halos of altered monazite,
10
100
1000
10000
100000
1000000
La Ce Pr Nd Sm Eu Gd Tb Dy Ho Er Tm Yb
Unaltered Xnt-1Altered Xnt-1Uraninite inclusionsThorite inclusionsC
hond
rite
Nor
mal
ised
REE
’s A
10
100
1000
10000
100000
1000000
La Ce Pr Nd Sm Eu Gd Tb Dy Ho Er Tm Yb
Cho
ndrit
e N
orm
alis
ed R
EE’s
C
10
100
1000
10000
100000
1000000
La Ce Pr Nd Sm Eu Gd Tb Dy Ho Er Tm Yb
B
Unaltered Xnt-2Altered Xnt-2Thorite inclusions
Unaltered Xnt-3Altered Xnt-3Thorite inclusions
10
100
1000
10000
100000
1000000
La Ce Pr Nd Sm Eu Gd Tb Dy Ho Er Tm Yb
D
Unaltered Mnz-1Altered Mnz-1Thorite inclusions
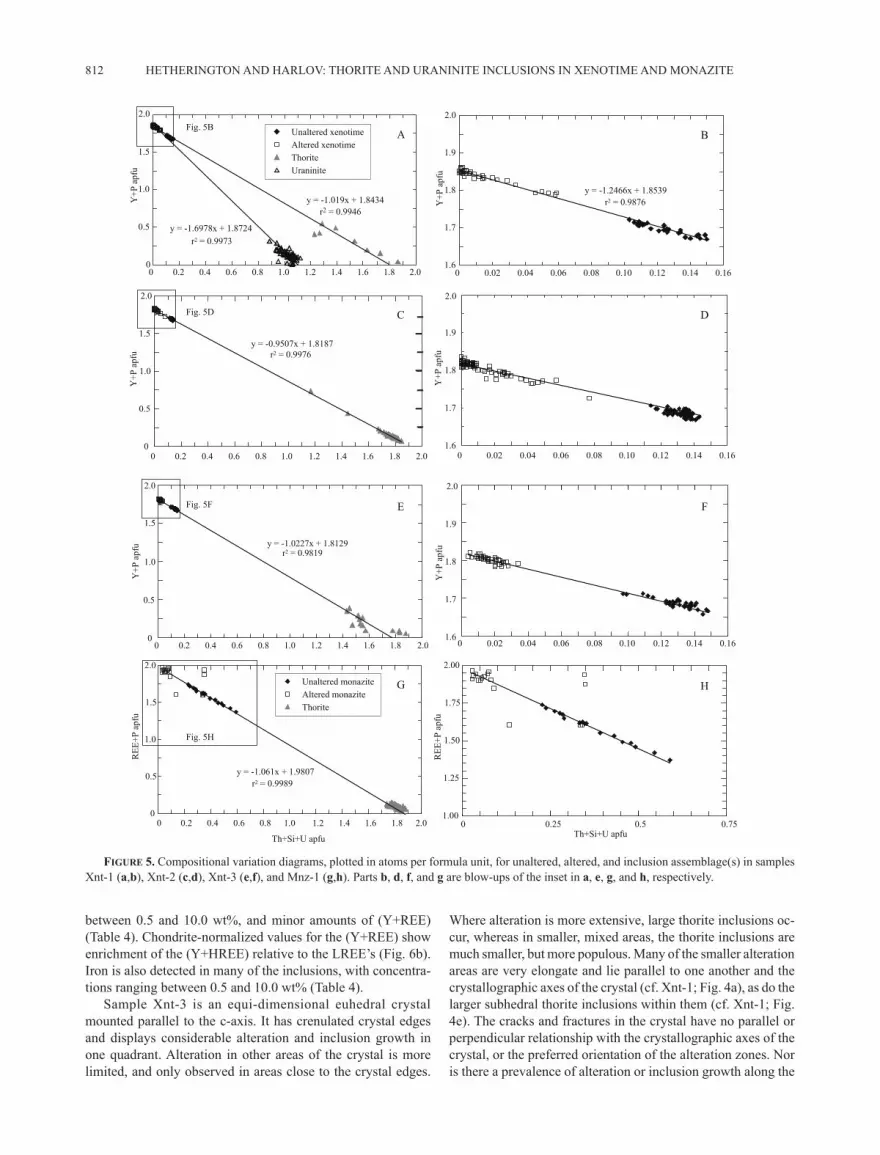
figure 6. Chondrite-normalized distribution plots for the REE in unaltered, altered, and inclusion assemblage(s) in samples Xnt-1 (a), Xnt-2 (b), Xnt-3 (c), and Mnz-1 (d). Data normalized against the values given by Wakita et al. (1971).

HETHERINGTON AND HARLOV: THORITE AND URANINITE INCLUSIONS IN XENOTIME AND MONAZITE814
which is highly fractured, and in most cases has a discontinuous and disrupted interface with the adjacent monazite. Much poros-ity has developed either as cavities or free space at grain edges and in the altered monazite around thorite (Figs. 7b−7d). The
absence of any topotactic relationship between inclusions and host, or preferred orientation of thorite relative to the monazite, highlights the mismatch between their contrasting monoclinic and tetragonal symmetries.
A 1000 µm B 500 µm
100 µmC D 50 µm
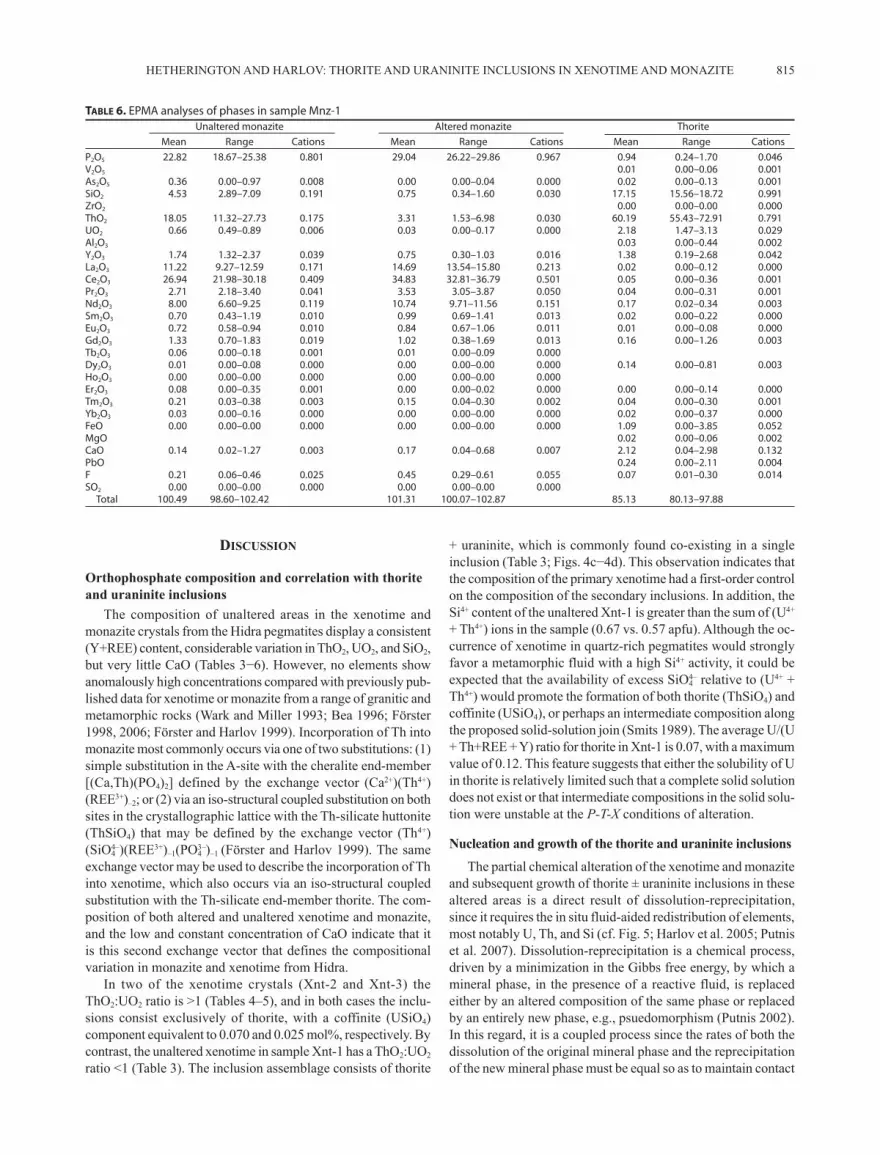
figure 7. Backscattered electron images of altered and unaltered regions in monazite (Mnz-1). (a) Overview of grain showing lineaments of altered monazite with little evidence of preferred orientation. (b) Large anhedral amalgamations of thorite surrounded by altered monazite. (c) Close-up of the cross-cutting bands of altered monazite with anhedral grains of thorite. Note the absence of preferred orientation in both the distribution of altered domains and thorite inclusions. (d) Zone of altered monazite close to grain boundary, with significant porosity development.
Table 5. EPMA analyses of phases in sample Xnt-3 Unaltered xenotime Altered xenotime Thorite Mean Range Cations Mean Range Cations Mean Range CationsP2O5 31.81 30.78–32.56 0.920 35.56 33.80–36.64 0.992 1.12 0.47–1.88 0.054V2O5 0.02 0.00–0.09 0.001As2O5 0.16 0.00–0.63 0.003 0.13 0.00–0.59 0.003 0.00 0.00–0.00 0.000SiO2 2.26 1.98–2.45 0.077 0.16 0.00–0.89 0.005 17.20 15.37–18.91 0.988ZrO2 0.01 0.00–0.13 0.000ThO2 5.47 4.54–5.98 0.043 0.23 0.00–2.05 0.002 50.58 45.51–53.32 0.662UO2 1.55 1.29–1.92 0.012 0.49 0.00–2.34 0.004 9.64 8.08–14.12 0.060Al2O3 0.21 0.00–1.04 0.014Y2O3 42.14 40.80–43.16 0.766 46.55 44.80–47.84 0.816 2.62 1.51–4.76 0.080La2O3 0.01 0.00–0.11 0.000 0.06 0.00–0.19 0.001 0.00 0.00–0.12 0.000Ce2O3 0.02 0.00–0.11 0.000 0.05 0.00–0.18 0.001 0.06 0.00–0.48 0.001Pr2O3 0.05 0.00–0.39 0.001 0.02 0.00–0.19 0.000 0.01 0.00–0.10 0.000Nd2O3 0.22 0.11–0.39 0.003 0.49 0.13–0.75 0.006 0.02 0.00–0.19 0.000Sm2O3 0.30 0.05–0.53 0.003 1.02 0.59–1.39 0.012 0.05 0.00–0.22 0.001Eu2O3 0.13 0.01–0.30 0.001 0.06 0.00–0.19 0.001 0.00 0.00–0.00 0.000Gd2O3 1.34 0.43–2.43 0.015 2.20 1.53–3.12 0.024 0.74 0.05–1.46 0.014Tb2O3 0.57 0.37–0.80 0.006 0.60 0.43–0.90 0.007 Dy2O3 4.86 4.52–5.25 0.053 4.50 4.11–4.95 0.048 0.62 0.38–1.00 0.011Ho2O3 1.24 0.89–1.73 0.013 1.06 0.70–1.46 0.011 Er2O3 4.03 3.62–4.36 0.043 2.33 1.99–2.65 0.024 0.35 0.05–0.51 0.006Tm2O3 0.55 0.38–0.76 0.006 0.48 0.26–0.65 0.005 0.00 0.00–0.12 0.000Yb2O3 3.82 3.54–4.15 0.040 3.97 3.51–4.59 0.040 0.43 0.17–0.68 0.008FeO 0.01 0.00–0.34 0.000 0.03 0.00–0.32 0.001 0.68 0.45–0.96 0.033MgO 0.01 0.00–0.04 0.001CaO 0.01 0.00–0.04 0.000 0.03 0.00–0.18 0.001 2.20 1.25–2.67 0.135PbO 0.29 0.17–0.44 0.005F 0.50 0.30–0.70 0.054 0.43 0.15–0.70 0.045 0.05 0.01–0.09 0.004SO2 0.05 0.00–0.09 0.002 0.03 0.00–0.85 0.001 Total 101.10 99.07–103.24 100.48 98.53–102.98 85.75 82.47–89.93
HETHERINGTON AND HARLOV: THORITE AND URANINITE INCLUSIONS IN XENOTIME AND MONAZITE 815
disCussion
Orthophosphate composition and correlation with thorite and uraninite inclusions
The composition of unaltered areas in the xenotime and monazite crystals from the Hidra pegmatites display a consistent (Y+REE) content, considerable variation in ThO2, UO2, and SiO2, but very little CaO (Tables 3−6). However, no elements show anomalously high concentrations compared with previously pub-lished data for xenotime or monazite from a range of granitic and metamorphic rocks (Wark and Miller 1993; Bea 1996; Förster 1998, 2006; Förster and Harlov 1999). Incorporation of Th into monazite most commonly occurs via one of two substitutions: (1) simple substitution in the A-site with the cheralite end-member [(Ca,Th)(PO4)2] defined by the exchange vector (Ca2+)(Th4+)(REE3+)–2; or (2) via an iso-structural coupled substitution on both sites in the crystallographic lattice with the Th-silicate huttonite (ThSiO4) that may be defined by the exchange vector (Th4+)(SiO4
4–)(REE3+)–1(PO43–)–1 (Förster and Harlov 1999). The same
exchange vector may be used to describe the incorporation of Th into xenotime, which also occurs via an iso-structural coupled substitution with the Th-silicate end-member thorite. The com-position of both altered and unaltered xenotime and monazite, and the low and constant concentration of CaO indicate that it is this second exchange vector that defines the compositional variation in monazite and xenotime from Hidra.
In two of the xenotime crystals (Xnt-2 and Xnt-3) the ThO2:UO2 ratio is >1 (Tables 4–5), and in both cases the inclu-sions consist exclusively of thorite, with a coffinite (USiO4) component equivalent to 0.070 and 0.025 mol%, respectively. By contrast, the unaltered xenotime in sample Xnt-1 has a ThO2:UO2 ratio <1 (Table 3). The inclusion assemblage consists of thorite
+ uraninite, which is commonly found co-existing in a single inclusion (Table 3; Figs. 4c−4d). This observation indicates that the composition of the primary xenotime had a first-order control on the composition of the secondary inclusions. In addition, the Si4+ content of the unaltered Xnt-1 is greater than the sum of (U4+ + Th4+) ions in the sample (0.67 vs. 0.57 apfu). Although the oc-currence of xenotime in quartz-rich pegmatites would strongly favor a metamorphic fluid with a high Si4+ activity, it could be expected that the availability of excess SiO4
4– relative to (U4+ + Th4+) would promote the formation of both thorite (ThSiO4) and coffinite (USiO4), or perhaps an intermediate composition along the proposed solid-solution join (Smits 1989). The average U/(U + Th+REE + Y) ratio for thorite in Xnt-1 is 0.07, with a maximum value of 0.12. This feature suggests that either the solubility of U in thorite is relatively limited such that a complete solid solution does not exist or that intermediate compositions in the solid solu-tion were unstable at the P-T-X conditions of alteration.
Nucleation and growth of the thorite and uraninite inclusions
The partial chemical alteration of the xenotime and monazite and subsequent growth of thorite ± uraninite inclusions in these altered areas is a direct result of dissolution-reprecipitation, since it requires the in situ fluid-aided redistribution of elements, most notably U, Th, and Si (cf. Fig. 5; Harlov et al. 2005; Putnis et al. 2007). Dissolution-reprecipitation is a chemical process, driven by a minimization in the Gibbs free energy, by which a mineral phase, in the presence of a reactive fluid, is replaced either by an altered composition of the same phase or replaced by an entirely new phase, e.g., psuedomorphism (Putnis 2002). In this regard, it is a coupled process since the rates of both the dissolution of the original mineral phase and the reprecipitation of the new mineral phase must be equal so as to maintain contact
Table 6. EPMA analyses of phases in sample Mnz-1 Unaltered monazite Altered monazite Thorite Mean Range Cations Mean Range Cations Mean Range CationsP2O5 22.82 18.67–25.38 0.801 29.04 26.22–29.86 0.967 0.94 0.24–1.70 0.046V2O5 0.01 0.00–0.06 0.001As2O5 0.36 0.00–0.97 0.008 0.00 0.00–0.04 0.000 0.02 0.00–0.13 0.001SiO2 4.53 2.89–7.09 0.191 0.75 0.34–1.60 0.030 17.15 15.56–18.72 0.991ZrO2 0.00 0.00–0.00 0.000ThO2 18.05 11.32–27.73 0.175 3.31 1.53–6.98 0.030 60.19 55.43–72.91 0.791UO2 0.66 0.49–0.89 0.006 0.03 0.00–0.17 0.000 2.18 1.47–3.13 0.029Al2O3 0.03 0.00–0.44 0.002Y2O3 1.74 1.32–2.37 0.039 0.75 0.30–1.03 0.016 1.38 0.19–2.68 0.042La2O3 11.22 9.27–12.59 0.171 14.69 13.54–15.80 0.213 0.02 0.00–0.12 0.000Ce2O3 26.94 21.98–30.18 0.409 34.83 32.81–36.79 0.501 0.05 0.00–0.36 0.001Pr2O3 2.71 2.18–3.40 0.041 3.53 3.05–3.87 0.050 0.04 0.00–0.31 0.001Nd2O3 8.00 6.60–9.25 0.119 10.74 9.71–11.56 0.151 0.17 0.02–0.34 0.003Sm2O3 0.70 0.43–1.19 0.010 0.99 0.69–1.41 0.013 0.02 0.00–0.22 0.000Eu2O3 0.72 0.58–0.94 0.010 0.84 0.67–1.06 0.011 0.01 0.00–0.08 0.000Gd2O3 1.33 0.70–1.83 0.019 1.02 0.38–1.69 0.013 0.16 0.00–1.26 0.003Tb2O3 0.06 0.00–0.18 0.001 0.01 0.00–0.09 0.000 Dy2O3 0.01 0.00–0.08 0.000 0.00 0.00–0.00 0.000 0.14 0.00–0.81 0.003Ho2O3 0.00 0.00–0.00 0.000 0.00 0.00–0.00 0.000 Er2O3 0.08 0.00–0.35 0.001 0.00 0.00–0.02 0.000 0.00 0.00–0.14 0.000Tm2O3 0.21 0.03–0.38 0.003 0.15 0.04–0.30 0.002 0.04 0.00–0.30 0.001Yb2O3 0.03 0.00–0.16 0.000 0.00 0.00–0.00 0.000 0.02 0.00–0.37 0.000FeO 0.00 0.00–0.00 0.000 0.00 0.00–0.00 0.000 1.09 0.00–3.85 0.052MgO 0.02 0.00–0.06 0.002CaO 0.14 0.02–1.27 0.003 0.17 0.04–0.68 0.007 2.12 0.04–2.98 0.132PbO 0.24 0.00–2.11 0.004F 0.21 0.06–0.46 0.025 0.45 0.29–0.61 0.055 0.07 0.01–0.30 0.014SO2 0.00 0.00–0.00 0.000 0.00 0.00–0.00 0.000 Total 100.49 98.60–102.42 101.31 100.07–102.87 85.13 80.13–97.88
HETHERINGTON AND HARLOV: THORITE AND URANINITE INCLUSIONS IN XENOTIME AND MONAZITE816
between the reactants, products, and fluids, allowing for the transportation of material across the reaction front. Dissolution-reprecipitation proceeds by a mechanism whereby the fluid at the reaction interface becomes supersaturated necessitating precipitation of the new mineral phase, which is less soluble in the fluid than the original mineral. Once initiated, the process can be self-perpetuating since the precipitation of a product phase on the parent phase increases the solubility of the parent phase (Andersen et al. 1998a, 1998b).
A consequence of the self-perpetuating reaction is that the reaction front migrates into a crystal. In the case of xenotime, migration has preferentially occurred along planes parallel to the crystallographic axes of the crystal. Left behind the mi-grating front was a metasomatized volume characterized by a pervasive, interconnected nano- and micro-porosity (e.g., Putnis 2002; Harlov et al. 2005; Figs. 4 and 7). A contributing factor to porosity development is the decrease in molar volume between the unaltered and altered orthophosphate as the average ionic radii of the cation filling the A-site decreases (Boatner 2002). However, the principal contributor is probably the partial dis-solution of some of the local xenotime or monazite into the fluid responsible for the dissolution-reprecipitation process and its subsequent removal from the local chemical system (see discussion in Putnis 2002).
Metamictization must also be considered as a mechanism favoring porosity formation, particularly in minerals rich in ra-diogenic actinide elements. Metamictization occurs as a result of α-particle recoil after radioactive decay of a U or Th atom. The recoiled particle will travel a distance equivalent to several unit cells (Onstott et al. 1995) damaging the crystallographic lattice of the host mineral. These damaged zones are susceptible to dis-solution and removal by fluids, leaving behind pores. However, porosity is only observed in altered domains that have lower concentrations of Th and U. Had recoil induced by radioactive decay been responsible for the porosity, unaltered domains of the crystal, which contain higher concentrations of U and Th, should have a higher pore density than the altered areas that have considerably lower amounts of Th and U (Tables 3–6). This is not observed (cf. Figs. 3, 4, and 7).
As dissolution continues, the interface between the fluid and solid migrates as the old phase is replaced by the new phase. An interconnected pore space allows fluids to infiltrate and thus facilitate the fast mass transport of U, Th, and Si over distances on the order of hundreds of micrometers, to and from the reaction front. Such rapid transport would not be possible during simple solid-state diffusion, since it has been shown that the diffusion rate of U and Th in orthophosphates, and monazite in particular, is essentially negligible over geological timescales at tempera-tures up to 750 °C, even during hydrothermal experiments at low pressures (<500 MPa) (Teufel and Heinrich 1997; Seydoux-Guillaume et al. 2002). Furthermore, the sharp compositional boundary between the altered and unaltered orthophosphate also argue against solid-state diffusion that occurs in response to a chemical potential gradient and thus would be reflected in a gradual diffusive boundary between the altered and unaltered areas. Instead, the sharp compositional boundaries seen in Fig-ures 3 and 4 are a characteristic of dissolution-reprecipitation (Harlov et al. 2005). A pervasive fluid-filled micro- and nano-
porosity could also help to promote the enlargement of the thorite and uraninite inclusions as a consequence of Ostwald ripening, i.e., interfacial energy reduction (see discussion in Harlov et al. 2005). Evidence for Ostwald ripening in the altered regions is seen in the paucity of small inclusions in the immediate vicinity of the larger inclusions (Figs. 4c, 4d, and 4g). One factor limit-ing the dissolution-reprecipitation process would be when the reaction interface is isolated from the greater open system due to recrystallization, which would act to effectively obliterate the interconnected porosity in the newly precipitated mineral phase (i.e., Harlov et al. 2005). The rate of reaction as well as the reactivity of the fluid may also influence the relationship between the mineral host and inclusions. High-reactivity fluids enable the formation of relatively larger fluid-filled cavities in which inclusions are allowed to grow in a random orientation. Whereas a lower reactivity fluid discourages the formation of fluid-filled cavities allowing only for the growth of inclusions that are in indirect contact with the host mineral separated only by a thin fluid film, nanometers in thickness. This lower reactivity promotes the topotactic relationship that tends to exist between the inclusion and host mineral (Amli 1977; Pan and Fleet 1993; Harlov et al. 2005).
nature and CHemistry of tHe metasomatizing fluids
Monazite and xenotime in the granitic pegmatites from Hidra occur entrapped in large crystals of plagioclase and/or K-feldspar implying that both orthophosphate minerals grew early in the crystallization sequence of the pegmatite and subsequently could have been metasomatized by the pegmatite magma/fluid as it evolved during and/or shortly after crystallization. Field evidence shows that hydration reactions in the anorthositic host rocks on Hidra are spatially related to the granitic pegmatites, and there is no evidence for post-pegmatite emplacement deformation and/or regional metamorphism. Therefore, alteration of monazite and xenotime must have occurred during the one high-grade fluid event associated with the emplacement and crystallization of the granitic pegmatites. Given that the primary anorthosite is nominally anhydrous, the fluid that caused the alteration of pyroxene to hornblende, biotite, and chlorite, the seritization of the feldspars, and the albitization of plagioclase grain rims must have been introduced into the local system by the pegmatite, and subsequently would also have been available to react with monazite and xenotime. The absence of fluid-inclusion data implies that only the present day mineral assemblage can be used to insinuate the probable fluid composition responsible for observed alteration (e.g., Markl and Piazolo 1998).
There are several studies investigating the direct solubility of xenotime and monazite for a restricted range of fluid composi-tions, temperatures, and pH. For example, Seydoux-Guillaume et al. (2002) found that the solubility of orthophosphates in Cl-rich fluids is limited. Other studies have quantified the low solubility of natural and synthetic REE-phosphates in a range of Cl-bearing fluids and water, but have also concluded that solubility increases with increasing temperature (Teufel and Heinrich 1997; Oelkers and Poitrasson 2002; Poitrasson et al. 2004; Cetiner et al. 2005; Schmidt et al. 2007). The Oelkers and Poitrasson (2002) study also showed that solubility decreased as the fluid approached a

HETHERINGTON AND HARLOV: THORITE AND URANINITE INCLUSIONS IN XENOTIME AND MONAZITE 817
neutral pH, whereas Schmidt et al. (2007) has proposed that grain size may also exert some influence. However, the interaction between fluid and REE-phosphate in all experiments, for a range of grain sizes, was restricted to surface dissolution rather than whole-grain dissolution-reprecipitation and recrystallization, as attested to by the retention of the original U-Pb systematics in the reacted monazite (Teufel and Heinrich 1997).
There is considerably more evidence documented in nature for the dissolution and subsequent reprecipitation or recrystalliza-tion of monazite and xenotime as well as transport of (Y+REE). Yttrium+REE have been shown to be mobilized in a diverse range of high-temperature fluid-rock systems by a wide range of anionic species including F–, Cl–, (CO3)2–, (HCO3)–, (SO4)2–, and OH– (Taylor and Fryer 1983; Wood 1990a; Poitrasson et al. 2000). The solubility of (Y+REE) phases and subsequent mobil-ity of the cations are further enhanced under low pH conditions and when the fluid-to-rock ratio is increased (Michard 1989; Michard and Albarede 1986). The fact that (Y+REE) will readily mobilize in a hydrothermal solution infers that, under the right conditions, the major repository minerals for (Y+REE), such as xenotime and monazite, could be unstable.
For example, the circulation of Cl-rich brines, dominated by NaCl, has led to extensive alteration of monazite and mobiliza-tion of (Y+REE) in the Franceville Basin of Gabon (Cuney and Mathieu 2000; Mathieu et al. 2001). Both these examples deal with low temperature alteration (<350 °C), but the predictions of Wood (1990b), supported by experimental evidence (Oelkers and Poitrasson 2002; Schmidt et al. 2007) suggest that solubility and mobility of (Y+REE) in Cl-rich brines will increase with increasing temperature. However, at Hidra the evidence for high-Cl activity in the pegmatite, or in the fluids exsolved from the magma, is limited; Cl is present in pegmatitic biotite (~0.5 wt%), but its concentrations in amphibole, biotite, and chlorite in the metasomatized host rock is very low, verging on the EPMA detection limit (Table 1). This observation, as well as no textural or compositional evidence that the primary igneous fluorapatite in the anorthosite participated in the metamorphic reaction, sug-gests that even in the very latest stages of fluid evolution, fluids associated with the pegmatite had relatively low Cl activities (Kullerud and Erambert 1999).
From the experimental data available, the solubility of (Y+REE) is greatest in fluorine, and F-bearing fluids are recog-nized as one of the most effective mediums aiding their transpor-tation and mobility (Wood 1990b; Haas et al. 1995). Numerous natural examples of (Y+REE) mobility in F-rich environments have been documented across a range of geological conditions, including regional granulite-facies metamorphism (Pan and Fleet 1996), localized dehydration of an amphibolite-facies gneiss to charnockite (Harlov et al. 2006), fluorite mineraliza-tion (Williams-Jones et al. 2000; Koc et al. 2003), carbonatite magmatism and mineralization (Smith et al. 2000, 1999), granite-to-pegmatite emplacement (e.g., London 1987; Goodenough et al. 2000), as well as U and (Y+REE) enrichment in diagenetic basins (Fayek and Kyser 1997).
Sample Xnt-3, the pegmatitic biotite, and both amphibole and biotite in the surrounding contact aureole contain some F (Table 1), implying that any fluids associated with the pegma-tites contained some F as well. However, Ca released during the
replacement of plagioclase rims by more albitic compositions was partitioned into the amphibole, rather than resulting in the growth of minerals such as fluorite. In addition, fluorapatite is not found in the pegmatites, nor is there evidence for new fluorapatite growth in the altered host rock. This would suggest that, although F was present, the F activity was not particularly high in the fluid. In addition, F-rich fluids are known to promote fractionation of (Y+REE) (Pan and Fleet 1996). In the Hidra samples, (Y+HREE) concentrations in xenotime and LREE con-centrations in monazite are similar between unaltered and altered domains (Fig. 6) indicating that there was no F-aided dispersion of these elements. The observed scatter of the LREE in xenotime and (Y+HREE) in monazite (Fig. 6) could be interpreted as frac-tionation of (Y+REE). However, the LREE and (Y+HREE) are already present in low concentrations in unaltered xenotime and monazite, respectively. Subsequently, depletion in either set of elements is perhaps more a reflection of the Gibb’s energy mini-mization that occurs during dissolution-reprecipitation. Here, the altered areas of each crystal would host those elements that are crystallographically more favorable to either the xenotime or monazite structure. The excess LREE and (Y+REE) would be either hosted by the inclusions (Tables 2–6) or removed from the local chemical system by the fluid.
Mobility of (Y+REE) in (SO4)2– or (CO3)2– fluids is also pos-sible, although the degree of solubility is generally lower than for F or Cl (Haas et al. 1995). Although (SO4)2– has been shown to enhance (Y+REE) transport in lower pH, i.e., acidic, systems, such as those associated with active magmatic-hydrothermal and granitic pegmatite systems (e.g., Fulignati et al. 1999; Gieré 1993), the presence of ilmenite-magnetite assemblages in both the Hidra pegmatites, and the altered anorthosites indicates that the activity of SO4
2– must have been low. The correlation between (Y+REE) mobility and (CO3)2–-activity is well documented, with the largest economic deposits of monazite and bastnäsite related to carbonatites (e.g., the Lemhi Pass and Bayan Obo localities). Kainosite (Ca2REE2Si4O12CO3⋅H2O) has been reported at the Igletjern pegmatite locality on Hidra (Fig. 1), indicating that this pegmatite fluid did contain some CO2. However, its general absence, as well as that of bastnäsite and calcite both in the alteration zones and in the pegmatites does not support a fluid that was dominated by CO2.
Assuming monazite and xenotime growth in the early stages of pegmatite crystallization, they would have to be in contact with a granitic melt rich in K+ and Na+. This is confirmed by the fact that they are principally found as inclusions in plagioclase or K-feldspar or else surrounded by both feldspars. Cations such as K+ and Na+ would presumably have been charge balanced by anionic species, which in the absence of corroborating evidence, could not have been dominated by F–, Cl–, SO4
2–, or CO32–, but rather by
H2O in the melt. Fluids dominated by H2O in equilibrium with feldspar will have a pH > 7 (Huang and Kiang 1972), making the predominant anionic species, OH–. The reactivity of OH– ions with monazite and xenotime, and the solubility of (Y+REE) in such solutions is predicted to be lower than for F–, higher than for HCO3
–, but broadly similar to Cl– and SO42– (Haas et al. 1995;
Wood 1990a). Therefore, reactivity between (Y+REE)-bearing phosphates and alkaline solutions is possible.
Alkali metasomatism, predominantly as Na+ and K+, is known
HETHERINGTON AND HARLOV: THORITE AND URANINITE INCLUSIONS IN XENOTIME AND MONAZITE818
to play an important role in mineralization processes (Flohr 1994), low-grade alteration and metamorphism (Ennis 1996), and very low-grade zeolitization of volcanic glass (Ozaki and Kuwahara 1998). Fluids and melts with dissolved Na+ and K+ are also known to affect monazite stability and REE mobility. For example, partial-melting experiments in the quartz + plagioclase ± muscovite + H2O system favors dissolution of monazite over apatite at lower temperatures and higher water contents (Zeng et al. 2005). Furthermore, significant monazite alteration has been observed in rocks where seritization, chloritization, and greisenization has occurred (Poitrasson et al. 1996, 2000); all three mechanisms involve a high flux of alkali elements either into, or out from, the system. Another example is the circulation of oxidizing peralkaline fluids in the Bohus Granite (Sweden) where enrichment of the HREE and recrystallization of monazite occurred during albitization and desilicification (Petersson and Eliasson 1997). These separate observations lend credence to the idea that the alteration of xenotime and monazite in the Hidra pegmatites could have been due primarily to the action of fluids rich in alkali elements.
Despite the lower predicted reactivity of monazite and xenotime in alkaline fluids compared to acidic solutions, there are complementary reasons supporting an enhanced reactivity in alkali pegmatites. Behrens et al. (2001) has shown that the solubility of H2O in alkali feldspar melts increases as the ionic radius of the cationic species in the melt decreases, and Din-gwell et al. (1997) demonstrated a similar effect of increasing H2O solubility in peralkaline melts as a function of increasing alkali oxide concentration. As a consequence, it is probable that as Fe-Mg silicate phases and Ca-rich feldspar crystallized from the pegmatitic melt, the relative concentration of smaller cations such as Na and K would have increased. This should have led to an increase in the relative solubility and concentra-tion of H2O in the remaining melt and an effective increase in the water:rock ratio. Therefore, the relatively lower mobility of (Y+REE) in alkaline solutions could have been offset by the increased mineral reactivity expected in increasingly H2O-rich fluids (Michard 1989).
The compositional homogenization and post-crystallization Pb loss by diffusion in monazite has been shown to be insig-nificant at temperatures below 800 °C (Cherniak et al. 2000; Gardes et al. 2006). This is the primary reason why individual compositional domains of such minerals formed in an early event survive recycling through a younger metamorphism and is the foundation of their value in deciphering the geochronology of complex metamorphic rocks (Williams et al. 2007). However, monazite from rocks where the peak P-T conditions were lower than those of the granulite facies commonly display complex zonation and individual lobate domains with curved boundaries (e.g., Förster and Harlov 1999; Townsend et al. 2000; Harlov et al. 2007; Williams et al. 2007) and can provide geochronological information that can be geologically meaningless (e.g., Baldwin et al. 2006; Seydoux-Guillaume et al. 2003). There is a general consensus that “fluids” must play a role in the development of such textures, but little is known about the micro- to nano-scale mechanism of monazite resorption, growth, and recrystalliza-tion, or about the specific role of the fluid and its composition. Nevertheless, the ubiquitous presence of feldspar in rocks and
their influence over fluid composition suggests that feldspars may be a significant factor controlling monazite stability, its growth, and recrystallization.
To elucidate which fluid (or fluids) could have been respon-sible for the observed partial metasomatism of the xenotime and monazite, a series of experiments would need to be done involving the metasomatism of well-characterized monazite and xenotime grains of similar composition using fluids that mirror those described above as well as alkali-rich fluids such as KOH, NaOH, or Na2Si2O5 + H2O at temperatures and pressures approxi-mating those under which the Hidra pegmatites were emplaced. Such experiments, while giving insight into the fluids present during the crystallization of the pegmatite and subsequently responsible for the metasomatic alteration of the xenotime and monazite, would, from a broader perspective, allow for deeper insights into the nature of the possible fluids present, not only during the crystallization of mangerites, anorthosites, and gran-ites, and their pegmatic equivalents, but also responsible for the metamorphism of the surrounding country rock into which the magma has been intruded.
ACknowledgmentsGunnar Raade is thanked for providing samples from the collections of the
Natural History Museums, University of Oslo, and Hans-Jørgen Berg is thanked for valuable discussions regarding the mineralogy of each locality. Per Inge and Tor Aas are thanked for their enthusiasm and assistance in the field, and reviews by John Ayers and Carl Spandler that improved the manuscript are also appreciated.
referenCes CitedAmli, R. (1977) Internal structure and mineralogy of Gloserheia granite pegmatite,
Froland, Southern Norway. Norsk Geologisk Tidsskrift, 57(3), 243–262.Andrehs, G. and Heinrich, W. (1998) Experimental determination of REE distribu-
tions between monazite and xenotime: Potential for temperature-calibrated geochronology. Chemical Geology 149, 83–96.
Andersen, J.G., Doraiswamy, L.K., and Larson, M.A. (1998a) Microphase-assisted “autocatalysis” in a solid-liquid reaction with a precipitating product—I. Theory. Chemical Engineering Science, 53, 2451–2458.
——— (1998b) Microphase-assisted “autocatalysis” in a solid-liquid reaction with a precipitating product—II. Experiment. Chemical Engineering Science, 53, 2459–2468.
Baldwin, J.A., Bowring, S.A., Williams, M.L., and Mahan, K.H. (2006) Geo-chronological constraints on the evolution of high-pressure felsic granulites from an integrated electron microprobe and ID-TIMS geochemical study. Lithos, 88, 173–200.
Bea, R. (1996) Residence of REE, Y, Th, and U in granites and crustal protoliths; Implications for the chemistry of crustal melts. Journal of Petrology, 37, 521–552.
Behrens, H., Meyer, M., Holtz, F., Benne, D., and Nowak, M. (2001) The effect of alkali ionic radius temperature, and pressure on the solubility of water in MAlSi3O8 melts (M = Li, Na, K, Rb). Chemical Geology, 174, 275–289.
Berzelius, J.J. (1824) Undersökning af några Mineralier; 1. Phosphorsyrad Yt-terjord. Kungliga swenska Vetenskaps-Akademin Handlingar Stockholm 1824, 334–358.
Bingen, B., Demaiffe, D., and Hertogen J. (1996) Redistribution of rare earth elements, thorium and uranium over accessory minerals in the course of am-phibolite to granulite-facies metamorphism: The role of apatite and monazite in orthogneisses from southwestern Norway. Geochimica et Cosmochimica Acta, 60, 1341–1354.
Boatner, L.A. (2002) Synthesis, structure, and properties of monazite, pretulite, and xenotime. In M.L. Kohn, J. Rakovan, and J.M. Hughes, Eds., Phos-phates —Geochemical, Geobiological, and Materials Importance, 48, p. 87–121. Reviews in Mineralogy and Geochemistry, Mineralogical Society of America, Chantilly, Virginia.
Cetiner, Z.S., Wood, S.A., and Gammons, C.H. (2005) The aqueous geochemistry of the rare earth elements. Part XIV. The solubility of rare earth element phos-phates from 23 to 150 °C. Chemical Geology, 217, 147–169.
Cherniak, D.J., Watson, E.B., Harrison, T.M., and Grove, M. (2000) Pb diffusion in moanzite: A progress report on a combined RBS/SIMS study. EOS Transac-tions of the American Geophysical Union, 81, S25.
Cuney, M. and Mathieu, R. (2000) Extreme light rare earth element mobilization by diagenetic fluids in the geological environment of the Oklo natural reactor
HETHERINGTON AND HARLOV: THORITE AND URANINITE INCLUSIONS IN XENOTIME AND MONAZITE 819
zones, Franceville Basin, Gabon. Geology, 28, 743–746Demaiffe, D. (1977) Les massifs satellites anorthosito-leuconoritiques d’Hidra
et de Garsaknatt: leur signification pétrogénétique. Annales de la Societe Géologique de Belgique, 100, 167–174.
Demaiffe, D. and Hertogen, J. (1981) Rare earth element geochemistry and stron-tium isotopic composition of a massif-type anorthositic-charnockitic body: The Hidra Massif (Rogaland, SW Norway). Geochimica et Cosmochimica Acta, 45, 1545–1561.
Demaiffe, D., Duchesne, J.C., Michot, J., and Pasteels, P. (1973) Le massif anor-thosito-leuconoritique d’Hidra et son faciès de bordure. Comptes rendus de l’Académie des Sciences Série D, 277, 17–20.
Dingwell, D.B., Holtz, F., and Behrens, H. (1997) The solubility of water in peralklaine and peraluminous granitic melts. American Mineralogist, 82, 434–437.
Ennis, D.J. (1996) The effects of K-metasomatism on the mineralogy and geochem-istry of silicic ignimbrites near Socorro, New Mexico, p. 160. M.Sc. thesis, New Mexico Institute of Mining and Technology, Socorro.
Falkum, T. (1998) The Sveconorwegian magmatic and tectono-metamorphic evolution of the high-grade Proterozoic Flekkefjord complex, South Norway. Norges geologiske undersøkelse Bulletin, 434, 5–33.
Fayek, M. and Kyser, T.K. (1997) Characterization of multiple fluid-flow events and rare-earth-element mobility associated with formation of unconformity-type uranium deposits in the Athabasca Basin, Saskatchewan. Canadian Mineralo-gist, 35, 627–658.
Flohr, M.J.K. (1994) Titanium, vanadium, and niobium mineralization and alkali metasomatism from the Magnet Cove Complex, Arkansas. Economic Geol-ogy, 89, 105–130.
Förster, H.-J. (1998) The chemical composition of REE-Y-Th-U-rich accessory minerals in peraluminous granites of the Erzgebirge-Fichtelgebirge region, Germany, Part II: Xenotime. American Mineralogist, 83, 1302–1315.
——— (2006) Composition and origin of intermediate solid solutions in the system thorite-xenotime-zircon-coffinite. Lithos, 88, 35–55.
Förster, H.-J. and Harlov, D.E. (1999) Monazite-(Ce)-huttonite solid solutions in granulite-facies metabasites from the Ivera-Verbano Zone, Italy. Mineralogical Magazine, 63, 587–594.
Fulignati, P., Gioncada, A., and Sbrana, A. (1999) Rare-earth element (REE) behavior in the alteration facies of the active magmatic-hydrothermal system of Vulcano (Aeolian Islands, Italy). Journal of Volcanology and Geothermal Research, 88, 325–342.
Gardes, E., Jaoul, O., Montel, J.-M., Seydoux-Guillaume, A.-M., and Wirth, R. (2006) Pb diffusion in monazite: An experimental study of Pb2+ + Th4+ ⇔ 2Nd3+ interdiffusion. Geochimica et Cosmochimica Acta, 70(9), 2325–2336.
Gieré, R. (1993) Transport and deposition of REE in H2S-rich fluids: Evidence from accessory mineral assemblages. Chemical Geology, 110, 251–268.
Goodenough, K.M., Upton, B.G.J., and Ellam, R.M. (2000) Geochemical evolution of the Ivigtut granite, South Greenland: A fluorine-rich “A-type” intrusion. Lithos, 51, 205–221.
Gratz, R. and Heinrich, W. (1997) Monazite-xenotime thermobarometry: Experi-mental calibration of the miscibility gap in the binary system CePO4-YPO4. American Mineralogist, 82, 772–780.
——— (1998) Monazite-xenotime thermometry. III. Experimental calibration of the partitioning of gadolinium between monazite and xenotime. European Journal of Mineralogy, 10, 579–588.
Haas, J.R., Shock, E.L., and Sassani, D.C. (1995) Rare earth elements in hydrother-mal systems: Estimates of standard partial molal thermodynamic properties of aqueous complexes of rare earth elements at high pressures and temperatures. Geochimica et Cosmochimica Acta, 58, 4329–4359
Harlov, D.E. and Förster, H.-J. (2003) Fluid-induced nucleation of (Y+REE)-phosphate minerals within apatite: Nature and experiment. Part II. Fluorapatite. American Mineralogist, 88, 1209–1229.
Harlov, D.E., Förster, H.-J., and Nijland, T.G. (2002) Fluid-induced nucleation of (Y+REE)-phosphate minerals within apatite: Nature and experiment. Part I. Chlorapatite. American Mineralogist, 87, 245–261.
Harlov, D.E., Wirth, R., and Förster, H.-J. (2005) An experimental study of dis-solution-reprecipitation in fluorapatite: Fluid infiltration and the formation of monazite. Contributions to Mineralogy and Petrology, 150, 268–286.
Harlov, D.E., Johansson, L., van den Kerkhof, A., and Förster, H.-J. (2006) The role of advective fluid flow and diffusion during localized, solid-state dehydration: Söndrum Stenhuggeriet, Halmstad, SW Sweden. Journal of Petrology, 47, 3–33.
Harlov, D.E., Wirth, R., and Hetherington, C.J. (2007) The relative stability of monazite and huttonite at 300–900 °C and 200–1000 MPa: Metasomatism and the propagation of metastable mineral phases. American Mineralogist, 92, 1652–1664.
Huang, W.H. and Kiang, W.C. (1972) Laboratory dissolution of plagioclase feld-spars in water and organic acids at room temperature. American Mineralogist, 57, 1849–1859.
Jercinovic, M.J. and Williams, M.L. (2005) Analytical perils (and progress) in electron microprobe trace element analysis applied to geochronology: Back-
ground acquisition, interferences, and beam irradiation effects. American Mineralogist, 90, 526–546.
Koc, S., Ozmen, O., and Dogan, A.U. (2003) Geochemistry of fluorite mineraliza-tion in Kaman, Kirsehir, Turkey. Journal of the Geological Society of India, 62, 305–317.
Kullerud, K. and Erambert, M. (1999) Cl-scapolite, Cl-amphibole, and plagioclase equilibria in ductile shear zones at Nusfjord, Lofoten, Norway: Implications for fluid compositional evolution during fluid-mineral interaction in the deep crust. Geochimica et Cosmochimica Acta, 63, 3829–3824.
London, D. (1987) Internal differentiation of rare-element pegmatites: effects of boron, phosphorus, and fluorine. Geochimica et Cosmochimica Acta, 51, 403–420.
Markl, G. and Piazolo, S. (1998) Halogen-bearing minerals in syenites and high-grade marbles of Dronning Maud Land, Antartica: Monitors of fluid compositional changes during late-magmatic fluid-rock interaction processes. Contributions to Mineralogy and Petrology, 132, 246–268.
Mathieu, R., Zetterstrom, L., Cuney, M., Gauthier-Laraye, F., and Hidaka, H. (2001) Alteration of monazite and zircon and lead migration as geochemical tracers of fluid paleocirculations around the Oklo-Okelobondo and Bangombe natural nuclear reaction zones (Franceville Basic, Gabon). Chemical Geology, 171, 147–171.
Michard, A. (1989) Rare earth element systematics in hydrothermal fluids. Geo-chimica et Cosmochimica Acta, 53, 745–750.
Michard, A. and Albarede, F. (1986) The REE content of some hydrothermal fluids. Chemical Geology, 55, 51–60.
Neumann, H. (1985) Norges mineraler. Norges Geologiske Undersøkelse Bul-letin, 68, 278.
Oelkers, E. and Poitrasson, F. (2002) An experimental study of the dissolution stoichiometry and rates of a natural monazite as a function of temperature from 230 °C and pH from 1.5 to 10. Chemical Geology, 191, 73–87.
Onstott, T.C., Miller, M.L., Ewing, R.C., and Walsh, D. (1995) Recoil refinements: Implications for the 40Ar/39Ar dating technique. Geochimica et Cosmochimica Acta, 59, 1821–1834.
Ozaki, M. and Kuwahara, Y. (1998) Zeolitization of volcanic glasses by alkaline solution. Kumamoto Journal of Science: Earth Sciences, 15, 27–49.
Pan, Y. and Fleet, M.E. (1993) Oriented monazite inclusions in apatite porphyrob-lasts from the Hemlo gold deposit, Ontario, Canada. Mineralogical Magazine, 57, 697–707.
——— (1996) Rare earth element mobility during prograde granulite facies metamorphism: Significance of fluorine. Contributions to Mineralogy and Petrology, 123, 251–262.
Pasteels, P., Demaiffe, D., and Michot, J. (1979) U-Pb and Rb-Sr geochronology of the eastern part of the south Rogaland igneous complex, southern Norway. Lithos, 12, 199–208.
Petersson, J. and Eliasson, T. (1997) Mineral evolution and element mobility dur-ing episyenitization (dequartzification) and albitization in the postkinematic Bohus granite, southwest Sweden. Lithos, 42, 123–146.
Poitrasson, F., Chernery, S., and Bland, T.J. (1996) Contrasted monazite hydro-thermal alteration mechanisms and their geochemical implications. Earth and Planetary Science Letters, 145, 79–96.
Poitrasson, F., Chernery, S., and Shepherd, T.J. (2000) Electron microprobe and LA-ICP-MS study of monazite hydrothermal alteration: Implications for U-Th-Pb geochronology and nuclear ceramics. Geochimica et Cosmochimica Acta, 64, 3283–3297.
Poitrasson, F., Oelkers, E., Schott, J., and Montel, J-M. (2004) Experimental deter-mination of synthetic NdPO4 monazite end-member solubility in water from 21 to 300 °C: implications for rare earth element mobility in crustal fluids. Geochimica et Cosmochimica Acta, 68, 2207–2221.
Pouchou, J.L. and Pichoir, F. (1985) “PAP” (ϕ-ρ-Z) procedure for improved quantitative microanalysis. In J.T. Armstrong, Ed., Microbeam Analysis, p. 104–106. San Francisco Press, California.
Putnis, A. (2002) Mineral replacement reactions: From macroscopic observations to microscopic mechanisms. Mineralogical Magazine, 66, 689–708.
Putnis, A., Hinrichs, R., Putnis, C.V., Golla-Schindler, U., and Collins, L.G. (2007) Hematite in porous red-clouded feldspars: Evidence of large-scale crustal fluid-rock interation. Lithos, 95, 10–18.
Pyle, J.M., Spear, F.S., Wark, D.A., Daniel, C.G., and Storm, L.C. (2005) Con-tributions to precision and accuracy of monazite microprobe ages. American Mineralogist, 90, 547–577.
Schmidt, C., Rickers, K., Bilderback, D.H., and Huang, R. (2007) In situ synchro-tron-radiation XRF study of REE phosphate dissolution in aqueous fluids to 800 °C. Lithos, 95, 87–102, DOI: 10.1016/j.lithos.2006.07.017.
Seydoux-Guillaume, A.M., Paquette, J.L., Wiedenbeck, M., Montel, J.M., and Heinrich, W. (2002) Experimental resetting of the U-Th-Pb system in monazite. Chemical Geology, 191, 163–179.
Seydoux-Guillaume, A.M., Goncalves, P., Wirth, R., and Deutsch, A. (2003) Trans-mission electron microscope study of polyphase and discordant monazites: Site-specific specimen preparation using the focused ion beam technique. Geology, 31, 973–976.

HETHERINGTON AND HARLOV: THORITE AND URANINITE INCLUSIONS IN XENOTIME AND MONAZITE820
Scherrer, N.C., Engi, M., Gnos, E., Jakob, V., and Liechti, A. (2000) Monazite analysis; from sample preparation to microprobe age dating and REE quantification. Sch-weizerische Mineralogische und Petrographische Mitteilungen, 80, 93–105.
Smith, M.P., Henderson, P., and Campbell, L.S. (2000) Fractionation of the REE during hydrothermal processes: Constraints from the Bayan Obo Fe-REE-Nb deposit, Inner Mongolia, China. Geochimica et Cosmochimica Acta, 64, 3141–3160.
Smith, M.P., Henderson, P., and Zhang, P. (1999) Reaction relationships in the Bayan Obo Fe-REE-Nb deposit Inner Mongolia, China: implications for the relative stability of rare-earth element phosphates and fluorocarbonates. Contributions to Mineralogy and Petrology, 134, 294–310.
Smits, G. (1989) (U,Th)-Bearing silicates in reefs of the Witwatersrand, South Africa. Canadian Mineralogist, 27, 643–655.
Taylor, R.P. and Fryer, B.J. (1983) Rare earth element lithogeochemistry of granitoid mineral deposits. Canadian Mining and Metallurgical Bulletin, 76(860), 74–84.
Teufel, S. and Heinrich, C.A. (1997) Partial resetting of the U-Pb isotope system in monazite through hydrothermal experiments: An SEM and U-Pb isotope study. Chemical Geology, 137, 273–281.
Townsend, K.J., Miller, C.F., D’Andrea, J.L., Ayers, J.C., Harrison, T.M., and Coath, C.D. (2000) Low-temperature replacement of monazite in the Ireteba granite, southern Nevada: geochronological implications. Chemical Geology, 172, 95–112.
Wakita, H., Rey, P., and Schmitt, R.A. (1971) Abundances of the 14 rare-earth elements and 12 other trace elements in Apollo 12 samples: Five igneous and breccia rocks and four soils. Proceedings of the Second Lunar Science Conference, 2, 1319–1329.
Wark, D.A. and Miller, C.F. (1993) Accessory mineral behavior during differentia-tion of a granite suite: monazite, xenotime, and zircon in the Sweetwater Wash
pluton, southwastern California, U.S.A. Chemical Geology, 110, 49–67.Weis, D. and Demaiffe, D. (1983) Pb isotope geochemistry of a massif-type anor-
thositic-charnockitic body: The Hidra Massif (Rogaland, southwest Norway). Geochimica et Cosmochimica Acta, 47, 1405–1413.
Williams, M.L., Jercinovic, M.J., and Hetherington, C.J. (2007) Microprobe monazite geochronology: Understanding geologic processes by integrating composition and chronology. Annual Review of Earth and Planetary Science, 35, 137–175, DOI: 10.1146/annurev.earth.35.031306.140228.
Williams-Jones, A.E., Samson, I.M., and Olivo, G.R. (2000) The genesis of hydrothermal fluorite-REE deposits in the Gallinas Mountains, New Mexico. Economic Geology, 95, 327–341.
Wood, S.A. (1990a) The aqueous geochemistry of the rare earth elements and yt-trium: 1. Review of available low-temperature data for inorganic complexes and the inorganic REE speciation of natural waters. Chemical Geology, 82, 159–186.
——— (1990b) The aqueous geochemistry of the rare-earth elements and yttrium 2. Theoretical predictions of speciation in hydrothermal solutions to 350 °C at saturation water vapor pressure. Chemical Geology, 88, 99–125.
Zeng, L., Asimow, P.D., and Saleeby, J.B. (2005) Coupling of anatectic reactions and dissolution of accessory phases and the Sr and Nd isotope systematics of anatectic melts from a metasedimentary source. Geochimica et Cosmochimica Acta, 69, 3671–3682.
Manuscript received March 13, 2007Manuscript accepted deceMber 3, 2007Manuscript handled by paul hoskin