Embed Size (px)
Citation preview
arX
iv:n
ucl-
th/9
7120
46v1
12
Dec
199
7
UGI-97-29
Meson mT -scaling in heavy-ion collisions at
SIS energies ∗
E. L. Bratkovskaya, W. Cassing and U. Mosel
Institut fur Theoretische Physik, Universitat Giessen
D-35392 Giessen, Germany
Abstract
We perform systematical studies on transverse-mass spectra of π0,
η, ω, φ, K+ and K− mesons for C + C, Ni + Ni, Au + Au collisions
at SIS energies within the HSD transport approach. We find that the
mT -spectra sensitively reflect the in-medium properties of the mesons.
The ’bare mass’ scenario leads to a general scaling behaviour for the
meson mT -spectra when including a mass shift due to the associate
strangeness production threshold for kaons and antikaons whereas a
’dropping’ mass scheme violates this mT -scaling. The relative slope
parameters, however, provide valuable information about the average
meson potentials in the nuclear medium.
PACS: 25.75.-q 14.40.-nKeywords: relativistic heavy-ion collisions, vector mesons, strange mesons
∗Work supported by BMBF and GSI Darmstadt.
1
The properties of hadrons in dense nuclear matter are of fundamentalinterest for our understanding of the strong interaction. QCD sum rules [1]and QCD inspired effective Lagrangian models [2, 3, 4][5, 6, 7, 8, 9] predictchanges of the vector (ρ, ω, φ) and strange (K+, K−) mesons with increasingnuclear density, i.e. a modification of their in-medium dispersion relation.Furthermore, due to scattering and absorption processes at finite baryondensity the width of the mesons is expected to change considerably, too.
The in-medium properties of vector mesons have been studied experi-mentally so far by dilepton measurements at SPS energies for proton-nucleusand nucleus-nucleus collisions [10, 11, 12]. The observed enhancement inA + A reactions compared to p + A collisions in the invariant mass range0.3 ≤ M ≤ 0.7 GeV might be explained by a ’dropping’ ρ-meson mass follow-ing Brown/Rho scaling [2] or the sum rule prediction by Hatsuda and Lee [1](cf. Refs. [13, 14, 15, 16]). However, as found in Ref. [17], the SPS dilep-ton data are also compatible with a hadronic scenario when using a ρ-mesonspectral function that includes the pion modifications in the nuclear mediumdue to resonance-hole loops as well as the polarization of the ρ-meson due toresonant ρ − N scattering [5].
Since the pioneering work of Kaplan and Nelson [7] predicted a kaoncondensation in nuclear matter, a lot of theoretical efforts have been devotedto study the properties of strange mesons at finite baryon density. Accordingto Refs. [7, 8, 9] antikaons should feel strong attractive forces in the mediumwhereas the kaon potential is expected to be slightly repulsive at finite nucleardensity. Kaon spectra and flow have been measured experimentally at SIS,AGS and SPS energies (cf. Ref. [16]). The comparison of transport modelresults with experimental data at SIS energies [18, 19, 20] shows that theantikaon spectra can not be described without a sizeable attractive potential(cf. [21, 22, 23]), whereas the kaon flow observed by the FOPI collaboration[20] indicates a slightly repulsive kaon potential (cf. [24, 25]). Thus thereare several experimental indications for the changes of the meson propertiesin-medium. However, it is very desirable to have additional independentexperimental observables and criteria.
Here we propose to study the meson mT -spectra in heavy-ion collisions,where mT is the transverse mass mT = (p2
T + m2)1/2 and pT the transversemomentum of a meson with bare mass m. The transverse-mass spectra are acommon way to represent experimental information on particle production inheavy-ion physics [16]. The measurement of mT -spectra is usually associated
2
with studies on equilibration phenomena of the system due to the trivialexponential behavior: i.e., if the spectrum 1/m2
T dσ/dmT is of Boltzmanntype ∼ exp(−βmT ), the slope parameter β might be related to the global(inverse) temperature at freeze-out in the absence of flow.
The mT -spectra of π0 and η mesons in heavy-ion collisions at SIS energieswere measured by the TAPS collaboration [26, 27, 28] and mT -scaling hasbeen found for both mesons and all systems investigated. Such a universalproperty of the meson spectra at SIS energies had been predicted alreadyby the Quark-Gluon-String Model calculations in Ref. [29] for the Ar + Casystem at several energies. A systematic analysis of π0 and η spectra was per-formed recently in Ref. [30] within the HSD transport approach [31], wherealso a dropping mass scheme for η mesons has been studied. It was foundthat the transport model gives a reasonable description for the mT -spectraof pions and η’s without incorporating any medium modifications for bothmesons, whereas a dropping mass scheme for η-mesons violates mT -scaling.
In this letter we examine the mT -spectra of all mesons, that can be pro-duced at SIS energies, to obtain information about their in-medium mesonproperties. We perform systematical studies for mT -spectra of π0, η, ω, φ,K+ and K− mesons for C + C, Ni + Ni, Au + Au collisions at SIS ener-gies within the same transport approach [31] which has been used previouslyfor the description of hadronic and dilepton data from SIS to SPS energies[14, 15, 31]. We present calculations with bare meson masses (i.e. no mediummodifications) as well as with in-medium meson masses, however, discardingan explicit momentum dependence of the meson selfenergies so far.
In relativistic heavy-ion collisions at SIS energies the nuclei can be com-pressed up to about 3 times normal nuclear matter density ρ0. In the hotcompression zone the nucleons are excited to baryonic resonances which de-cay by emitting mesons and the produced mesons then can be absorbed, re-emitted and re-scattered. Due to the small cross sections involved we treatthe production of vector mesons, η’s, kaons and antikaons perturbativelyat low energies. The η mesons are produced in pion-baryon and baryon-baryon collisions according to the elementary production cross sections fromRef. [32, 33]. In the present analysis (as in [30]) we assume the pn → pnηcross section to be about 6 times larger than the pp → ppη cross section closeto threshold in line with the new data from the WASA collaboration [34].For the vector mesons we take into account pion-baryon and baryon-baryonproduction channels according to the elementary production cross sections
3
from Refs. [35, 36]. The treatment of ρ and ω meson production and propa-gation is described in detail in Ref. [37]. For kaon and antikaon productionwe include the channels BB → K+Y N , πB → K+Y , BB → NNKK ,πB → NKK, K+B → K+B, KB → KB, Y N → KNN , ππ → KKas well as πY → KN and KN → πY for the antikaon absorption. All el-ementary cross sections are taken as in Refs. [22, 25]. For a more detaileddescription of the transport approach as well as the explicit parametrizationsof all the production and absorption channels employed we refer the readerto our preceeding publications [22, 25, 30, 31] and continue with a directpresentation of our results.
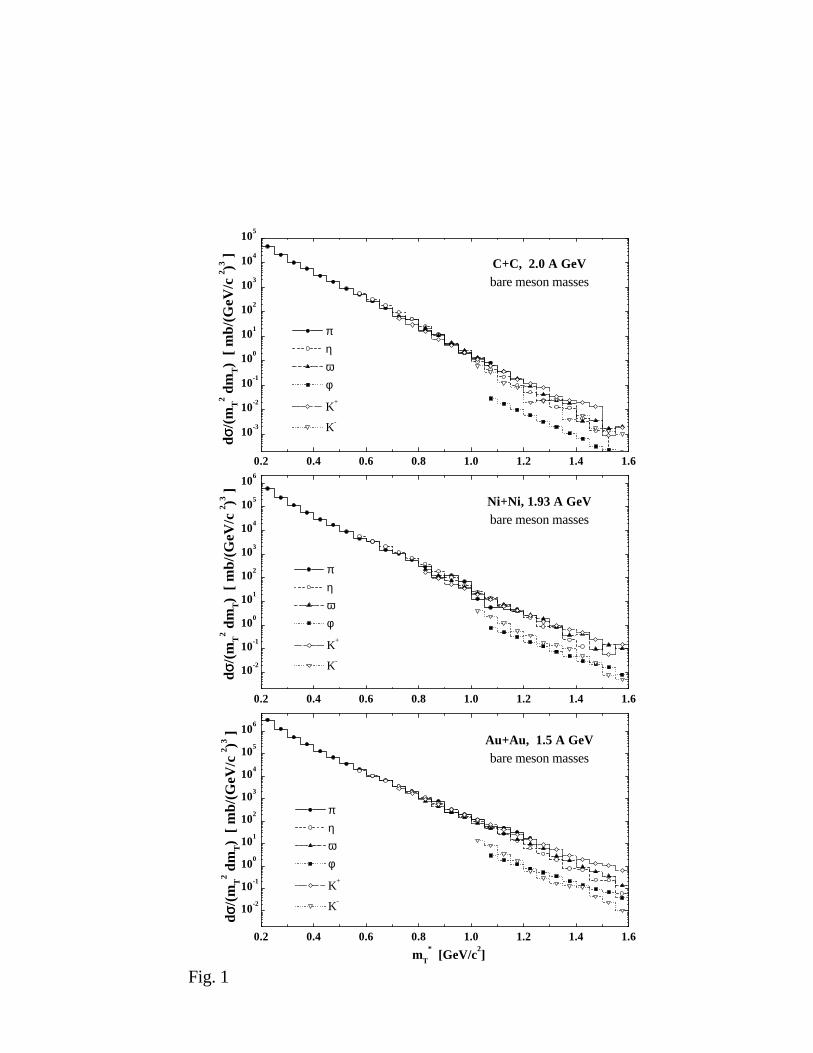
In Fig. 1 we show the results of our calculations with bare meson massesfor the transverse-mass spectra of π0 (solid line with solid circles), η (dashedline with open circles), ω (dot-dashed line with solid ’up’ triangles), φ (dottedline with solid squares), K+ (short dashed line with open diamonds) and K−
(dotted line with open ’down’ triangles) mesons for C + C collisions at 2.0A·GeV (upper part), Ni + Ni at 1.93 A·GeV (middle part) and Au + Au at1.5 A·GeV (lower part). For scalar mesons (π0, η) and vector mesons (ω, φ)we use
m∗
T = mT = (p2T + m2)1/2, (1)
whereas for strange mesons (K+, K−) m∗
T contains the shift in threshold dueto the Λ − N mass difference, i.e.:
m∗
T (K+) =(
p2T + (mK + mΛ − mN )2
)1/2
, (2)
or associated (K+, K0) mesons,
m∗
T (K−) =(
p2T + (2mK)2
)1/2
, (3)
where mK , mΛ and mN are the masses of kaon, Λ and nucleon, respectively.The contributions of vector mesons ω and φ are divided by a factor of 3 due tothe 3 different polarizations of the vector mesons. As can be seen from Fig. 1the π0, η, ω and K+ spectra indicate mT -scaling, whereas the contribution ofthe φ meson is suppressed by a factor ≈10, however, it has the same slopeas the other mesons.
The K− spectra (using (3)) approximately scale only for the light systemC + C; for heavy systems such as Ni + Ni (middle part) and especiallyAu + Au (lower part) the K− spectra are essentially below the scaling line due
4
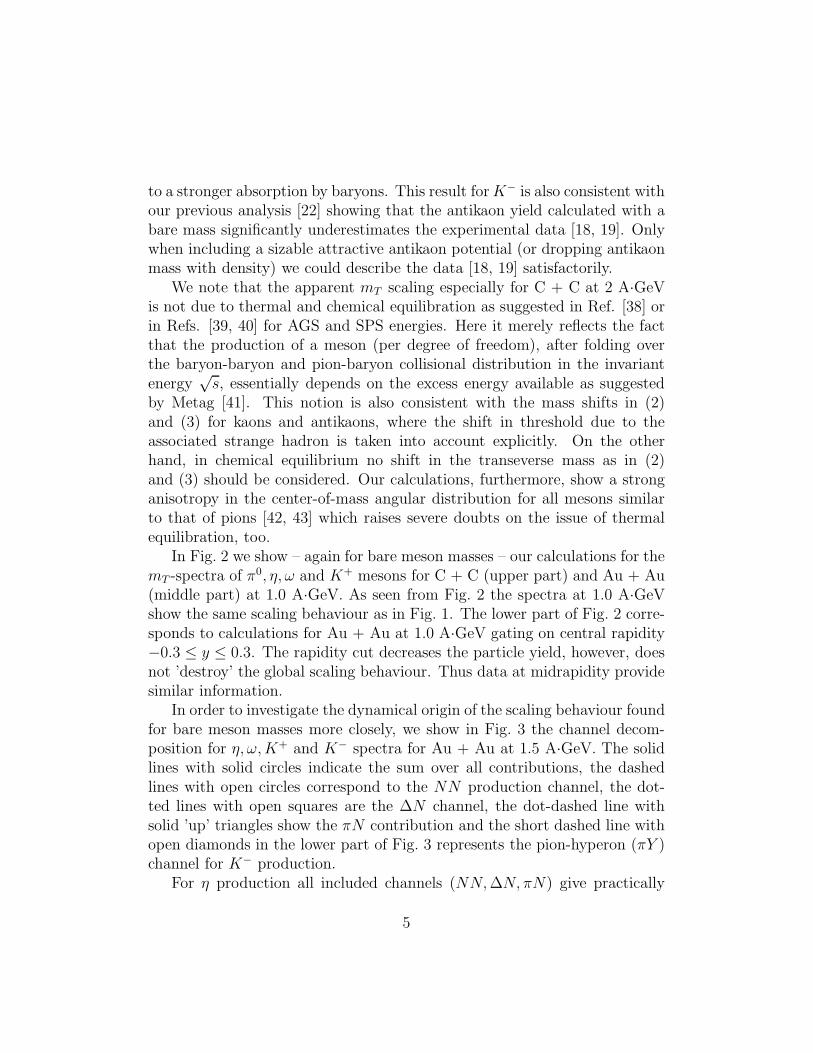
to a stronger absorption by baryons. This result for K− is also consistent withour previous analysis [22] showing that the antikaon yield calculated with abare mass significantly underestimates the experimental data [18, 19]. Onlywhen including a sizable attractive antikaon potential (or dropping antikaonmass with density) we could describe the data [18, 19] satisfactorily.
We note that the apparent mT scaling especially for C + C at 2 A·GeVis not due to thermal and chemical equilibration as suggested in Ref. [38] orin Refs. [39, 40] for AGS and SPS energies. Here it merely reflects the factthat the production of a meson (per degree of freedom), after folding overthe baryon-baryon and pion-baryon collisional distribution in the invariantenergy
√s, essentially depends on the excess energy available as suggested
by Metag [41]. This notion is also consistent with the mass shifts in (2)and (3) for kaons and antikaons, where the shift in threshold due to theassociated strange hadron is taken into account explicitly. On the otherhand, in chemical equilibrium no shift in the transeverse mass as in (2)and (3) should be considered. Our calculations, furthermore, show a stronganisotropy in the center-of-mass angular distribution for all mesons similarto that of pions [42, 43] which raises severe doubts on the issue of thermalequilibration, too.
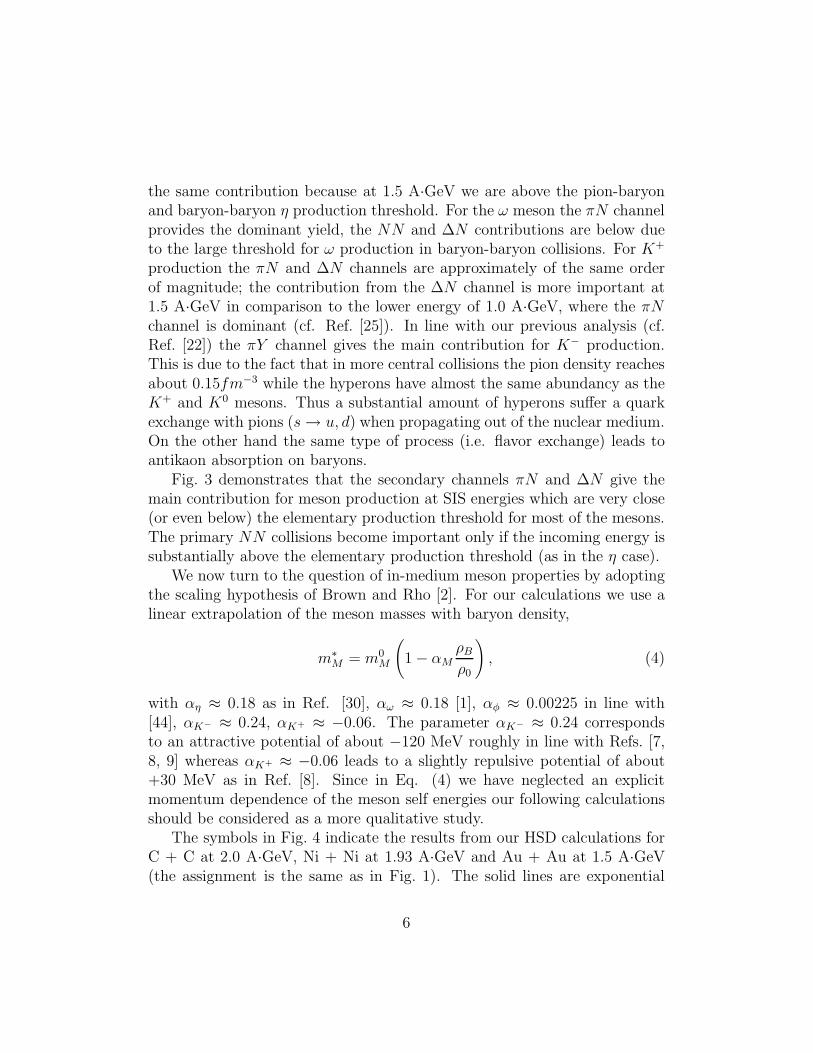
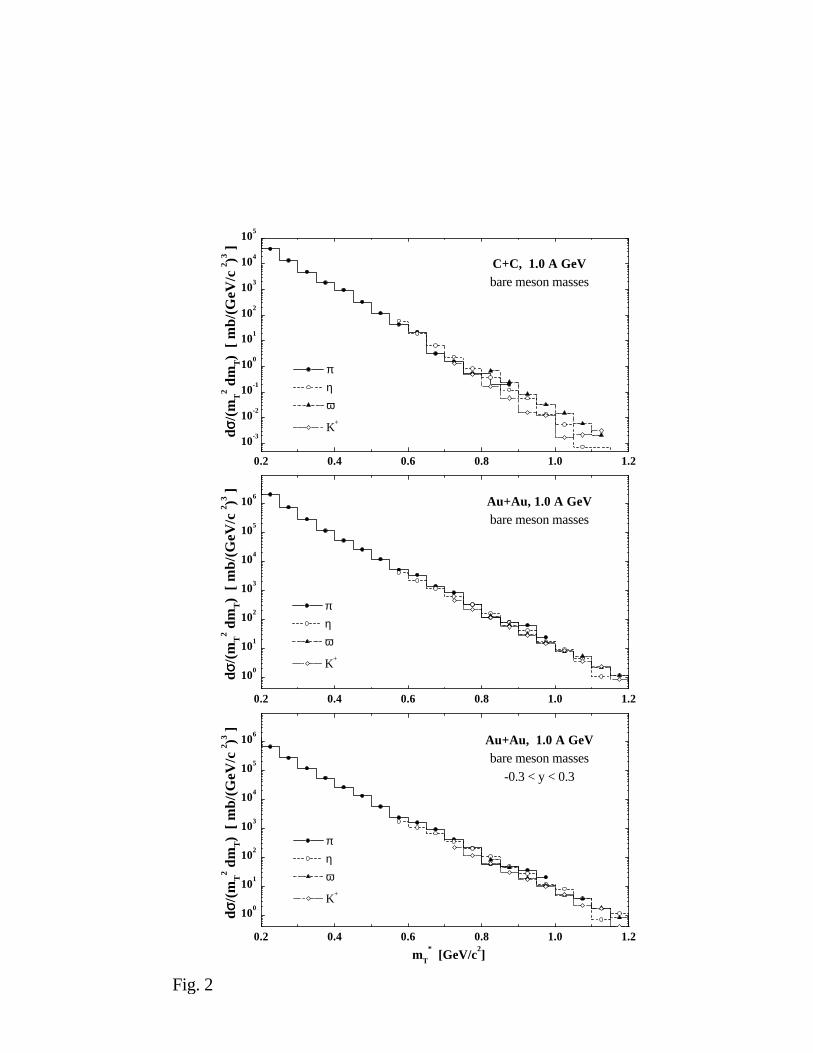
In Fig. 2 we show – again for bare meson masses – our calculations for themT -spectra of π0, η, ω and K+ mesons for C + C (upper part) and Au + Au(middle part) at 1.0 A·GeV. As seen from Fig. 2 the spectra at 1.0 A·GeVshow the same scaling behaviour as in Fig. 1. The lower part of Fig. 2 corre-sponds to calculations for Au + Au at 1.0 A·GeV gating on central rapidity−0.3 ≤ y ≤ 0.3. The rapidity cut decreases the particle yield, however, doesnot ’destroy’ the global scaling behaviour. Thus data at midrapidity providesimilar information.
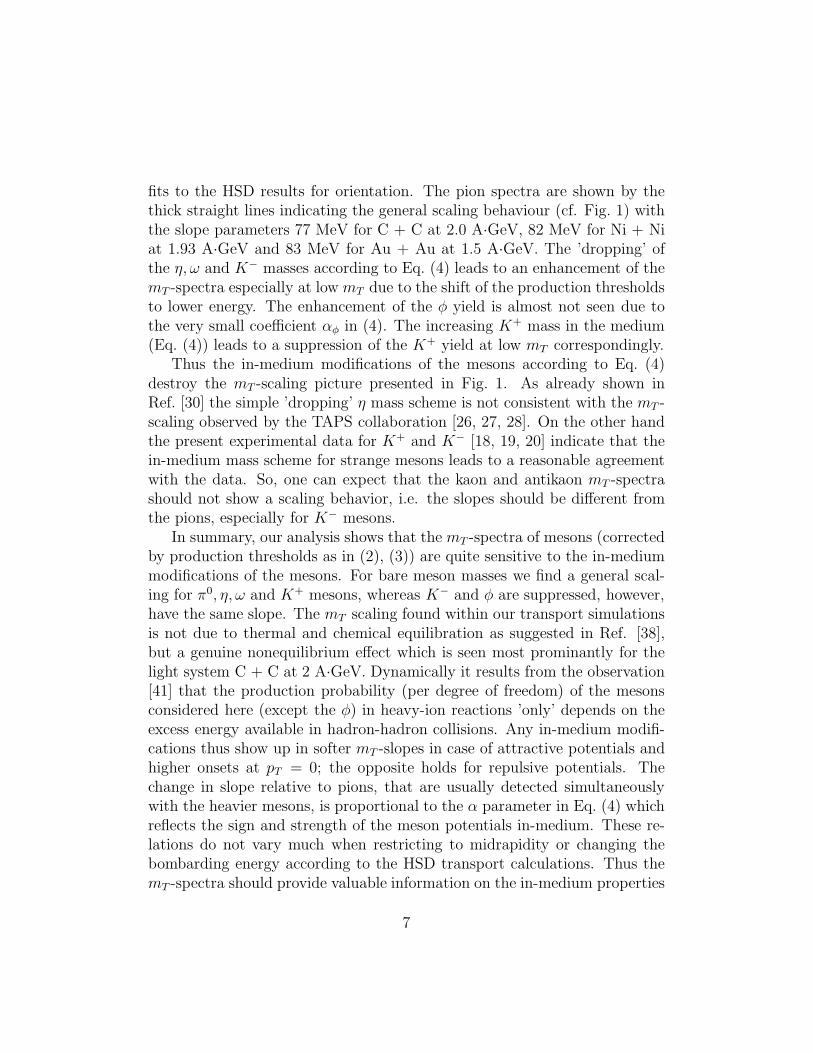
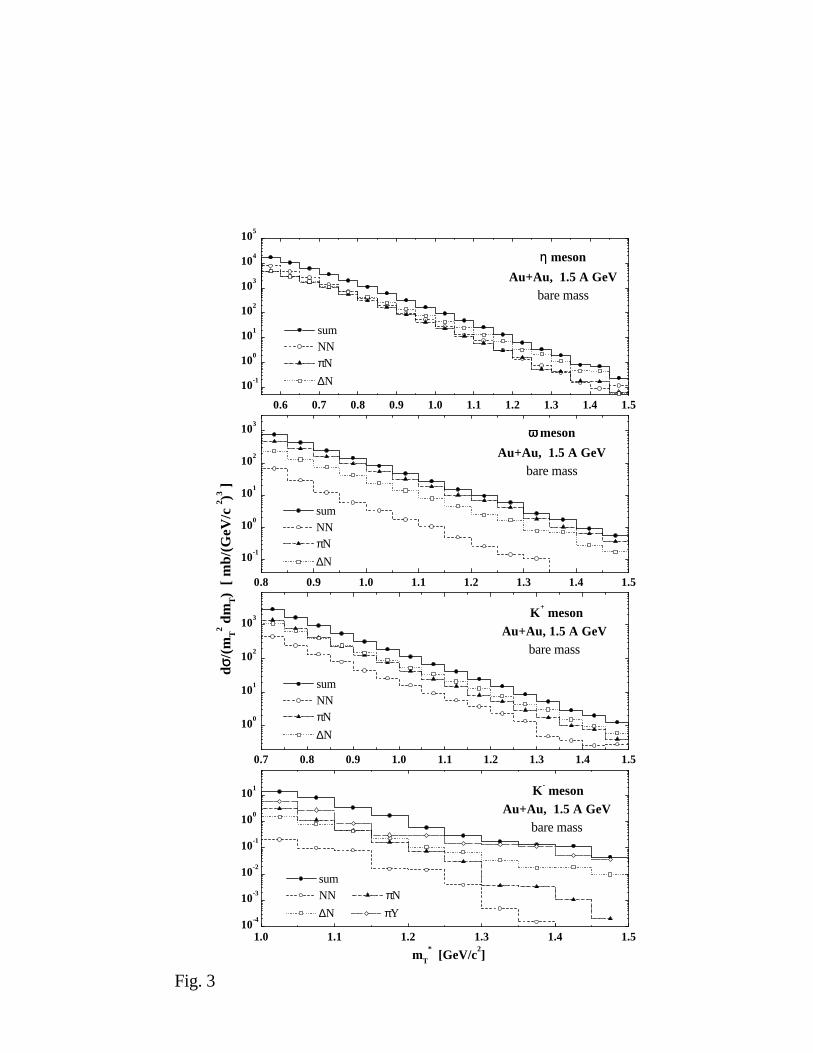
In order to investigate the dynamical origin of the scaling behaviour foundfor bare meson masses more closely, we show in Fig. 3 the channel decom-position for η, ω, K+ and K− spectra for Au + Au at 1.5 A·GeV. The solidlines with solid circles indicate the sum over all contributions, the dashedlines with open circles correspond to the NN production channel, the dot-ted lines with open squares are the ∆N channel, the dot-dashed line withsolid ’up’ triangles show the πN contribution and the short dashed line withopen diamonds in the lower part of Fig. 3 represents the pion-hyperon (πY )channel for K− production.
For η production all included channels (NN, ∆N, πN) give practically
5
the same contribution because at 1.5 A·GeV we are above the pion-baryonand baryon-baryon η production threshold. For the ω meson the πN channelprovides the dominant yield, the NN and ∆N contributions are below dueto the large threshold for ω production in baryon-baryon collisions. For K+
production the πN and ∆N channels are approximately of the same orderof magnitude; the contribution from the ∆N channel is more important at1.5 A·GeV in comparison to the lower energy of 1.0 A·GeV, where the πNchannel is dominant (cf. Ref. [25]). In line with our previous analysis (cf.Ref. [22]) the πY channel gives the main contribution for K− production.This is due to the fact that in more central collisions the pion density reachesabout 0.15fm−3 while the hyperons have almost the same abundancy as theK+ and K0 mesons. Thus a substantial amount of hyperons suffer a quarkexchange with pions (s → u, d) when propagating out of the nuclear medium.On the other hand the same type of process (i.e. flavor exchange) leads toantikaon absorption on baryons.
Fig. 3 demonstrates that the secondary channels πN and ∆N give themain contribution for meson production at SIS energies which are very close(or even below) the elementary production threshold for most of the mesons.The primary NN collisions become important only if the incoming energy issubstantially above the elementary production threshold (as in the η case).
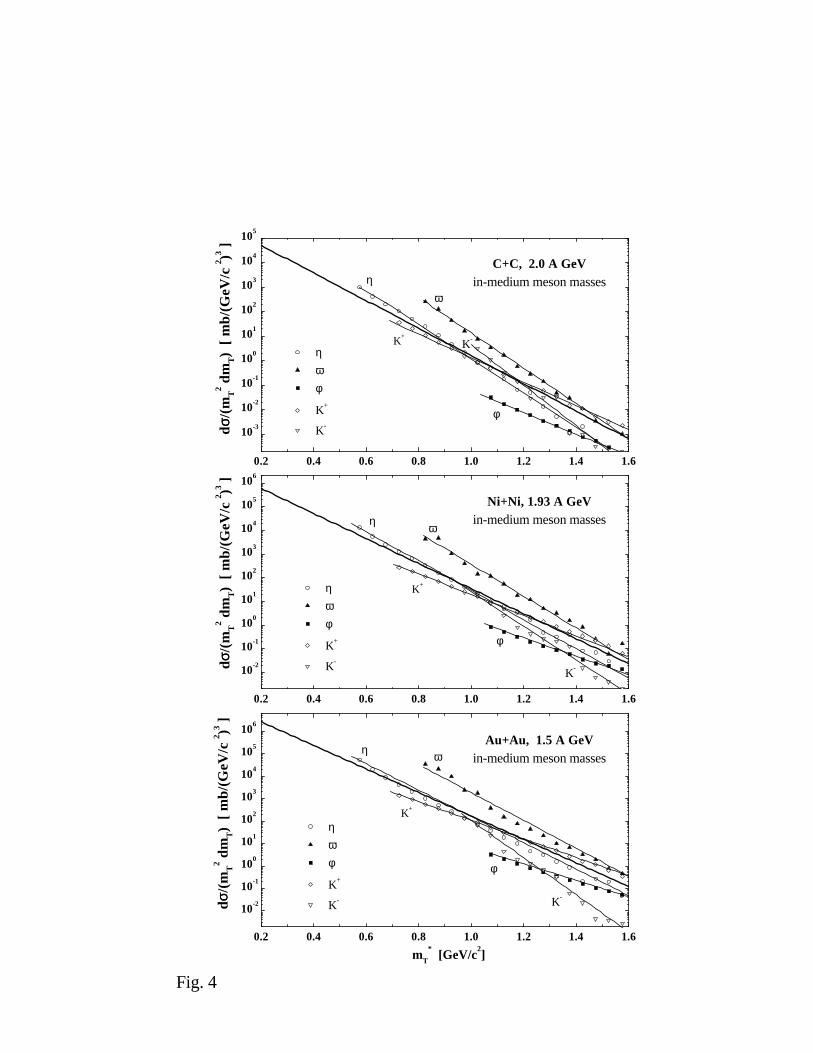
We now turn to the question of in-medium meson properties by adoptingthe scaling hypothesis of Brown and Rho [2]. For our calculations we use alinear extrapolation of the meson masses with baryon density,
m∗
M = m0M
(
1 − αMρB
ρ0
)
, (4)
with αη ≈ 0.18 as in Ref. [30], αω ≈ 0.18 [1], αφ ≈ 0.00225 in line with[44], αK− ≈ 0.24, αK+ ≈ −0.06. The parameter αK− ≈ 0.24 correspondsto an attractive potential of about −120 MeV roughly in line with Refs. [7,8, 9] whereas αK+ ≈ −0.06 leads to a slightly repulsive potential of about+30 MeV as in Ref. [8]. Since in Eq. (4) we have neglected an explicitmomentum dependence of the meson self energies our following calculationsshould be considered as a more qualitative study.
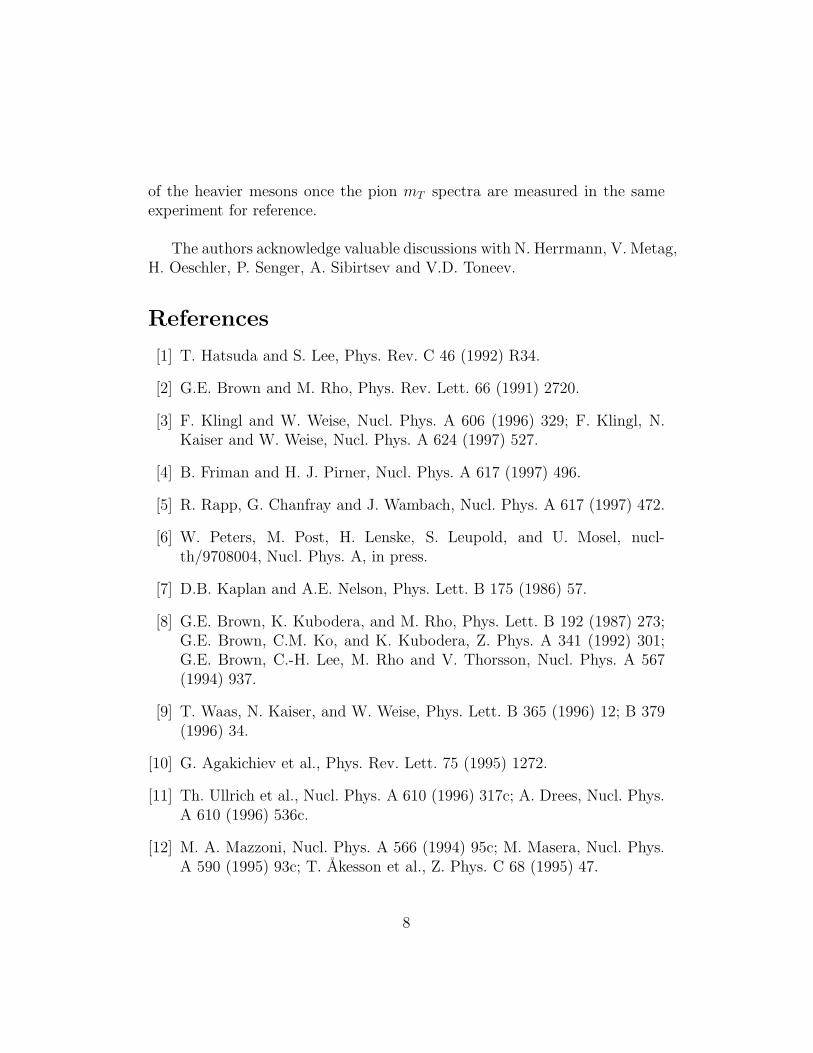
The symbols in Fig. 4 indicate the results from our HSD calculations forC + C at 2.0 A·GeV, Ni + Ni at 1.93 A·GeV and Au + Au at 1.5 A·GeV(the assignment is the same as in Fig. 1). The solid lines are exponential
6
fits to the HSD results for orientation. The pion spectra are shown by thethick straight lines indicating the general scaling behaviour (cf. Fig. 1) withthe slope parameters 77 MeV for C + C at 2.0 A·GeV, 82 MeV for Ni + Niat 1.93 A·GeV and 83 MeV for Au + Au at 1.5 A·GeV. The ’dropping’ ofthe η, ω and K− masses according to Eq. (4) leads to an enhancement of themT -spectra especially at low mT due to the shift of the production thresholdsto lower energy. The enhancement of the φ yield is almost not seen due tothe very small coefficient αφ in (4). The increasing K+ mass in the medium(Eq. (4)) leads to a suppression of the K+ yield at low mT correspondingly.
Thus the in-medium modifications of the mesons according to Eq. (4)destroy the mT -scaling picture presented in Fig. 1. As already shown inRef. [30] the simple ’dropping’ η mass scheme is not consistent with the mT -scaling observed by the TAPS collaboration [26, 27, 28]. On the other handthe present experimental data for K+ and K− [18, 19, 20] indicate that thein-medium mass scheme for strange mesons leads to a reasonable agreementwith the data. So, one can expect that the kaon and antikaon mT -spectrashould not show a scaling behavior, i.e. the slopes should be different fromthe pions, especially for K− mesons.
In summary, our analysis shows that the mT -spectra of mesons (correctedby production thresholds as in (2), (3)) are quite sensitive to the in-mediummodifications of the mesons. For bare meson masses we find a general scal-ing for π0, η, ω and K+ mesons, whereas K− and φ are suppressed, however,have the same slope. The mT scaling found within our transport simulationsis not due to thermal and chemical equilibration as suggested in Ref. [38],but a genuine nonequilibrium effect which is seen most prominantly for thelight system C + C at 2 A·GeV. Dynamically it results from the observation[41] that the production probability (per degree of freedom) of the mesonsconsidered here (except the φ) in heavy-ion reactions ’only’ depends on theexcess energy available in hadron-hadron collisions. Any in-medium modifi-cations thus show up in softer mT -slopes in case of attractive potentials andhigher onsets at pT = 0; the opposite holds for repulsive potentials. Thechange in slope relative to pions, that are usually detected simultaneouslywith the heavier mesons, is proportional to the α parameter in Eq. (4) whichreflects the sign and strength of the meson potentials in-medium. These re-lations do not vary much when restricting to midrapidity or changing thebombarding energy according to the HSD transport calculations. Thus themT -spectra should provide valuable information on the in-medium properties
7
of the heavier mesons once the pion mT spectra are measured in the sameexperiment for reference.
The authors acknowledge valuable discussions with N. Herrmann, V. Metag,H. Oeschler, P. Senger, A. Sibirtsev and V.D. Toneev.
References
[1] T. Hatsuda and S. Lee, Phys. Rev. C 46 (1992) R34.
[2] G.E. Brown and M. Rho, Phys. Rev. Lett. 66 (1991) 2720.
[3] F. Klingl and W. Weise, Nucl. Phys. A 606 (1996) 329; F. Klingl, N.Kaiser and W. Weise, Nucl. Phys. A 624 (1997) 527.
[4] B. Friman and H. J. Pirner, Nucl. Phys. A 617 (1997) 496.
[5] R. Rapp, G. Chanfray and J. Wambach, Nucl. Phys. A 617 (1997) 472.
[6] W. Peters, M. Post, H. Lenske, S. Leupold, and U. Mosel, nucl-th/9708004, Nucl. Phys. A, in press.
[7] D.B. Kaplan and A.E. Nelson, Phys. Lett. B 175 (1986) 57.
[8] G.E. Brown, K. Kubodera, and M. Rho, Phys. Lett. B 192 (1987) 273;G.E. Brown, C.M. Ko, and K. Kubodera, Z. Phys. A 341 (1992) 301;G.E. Brown, C.-H. Lee, M. Rho and V. Thorsson, Nucl. Phys. A 567(1994) 937.
[9] T. Waas, N. Kaiser, and W. Weise, Phys. Lett. B 365 (1996) 12; B 379(1996) 34.
[10] G. Agakichiev et al., Phys. Rev. Lett. 75 (1995) 1272.
[11] Th. Ullrich et al., Nucl. Phys. A 610 (1996) 317c; A. Drees, Nucl. Phys.A 610 (1996) 536c.
[12] M. A. Mazzoni, Nucl. Phys. A 566 (1994) 95c; M. Masera, Nucl. Phys.A 590 (1995) 93c; T. Akesson et al., Z. Phys. C 68 (1995) 47.
8
[13] G.Q. Li, C.M. Ko, and G.E. Brown, Phys. Rev. Lett. 75 (1995) 4007.
[14] W. Cassing, W. Ehehalt, and C. M. Ko, Phys. Lett. B 363 (1995) 35;W. Cassing, W. Ehehalt, and I. Kralik, Phys. Lett. B 377 (1996) 5.
[15] E.L. Bratkovskaya and W. Cassing, Nucl. Phys. A 619 (1997) 413.
[16] ”Quark Matter 96”, Nucl. Phys. A 610 (1996) and Refs. therein.
[17] W. Cassing, E.L. Bratkovskaya, R. Rapp, and J. Wambach, nucl-th/9708020, Phys. Rev. C, in press.
[18] A. Schroter et al., Z. Phys. A 350 (1994) 101.
[19] P. Senger and the KaoS Collaboration, Acta Physica Polonica B 27(1996) 2993; R.Barth et al., Phys. Rev. Lett. 78 (1997) 4007.
[20] J.L. Ritman et al., Z. Phys. A 352 (1995) 355; N. Herrmann, Nucl. Phys.A 610 (1996) 49c.
[21] G.Q. Li, C.M. Ko, and X.S. Fang, Phys. Lett. B 329 (1994) 149.
[22] W. Cassing, E.L. Bratkovskaya, U. Mosel, S. Teis and A. Sibirtsev, Nucl.Phys. A 614 (1997) 415.
[23] G.Q. Li, C.-H. Lee, and G.E. Brown, nucl-th/9706057, Nucl. Phys. A,in press.
[24] G.Q. Li, C.M. Ko and B.A. Li, Phys. Rev. Lett. 74 (1995) 235; G.E.Brown, C.M. Ko and G.Q. Li, nucl-th/9608039.
[25] E.L. Bratkovskaya, W. Cassing and U. Mosel, Nucl. Phys. A 622 (1997)593.
[26] O. Schwalb et al., Phys. Lett. B 321 (1994) 20; F. D. Berg et al., Phys.Rev. Lett. 72 (1994) 977.
[27] R. Averbeck et al., Z. Phys. A 359 (1997) 65.
[28] M. Appenheimer et al., GSI Annual Report 1996, p.58.
9
[29] K. K. Gudima, M. Ploszajczak, V.D. Toneev, Phys. Lett. B 328 (1994)249.
[30] E. L. Bratkovskaya, W. Cassing, R. Rapp, and J. Wambach, nucl-th/9710043.
[31] W. Ehehalt and W. Cassing, Nucl. Phys. A 602 (1996) 449.
[32] Gy. Wolf, G. Batko, W. Cassing et al., Nucl. Phys. A 517 (1990) 615;Gy. Wolf, W. Cassing and U. Mosel, Nucl. Phys. A 552 (1993) 549.
[33] T. Vetter, A. Engel, T. Biro and U. Mosel, Phys. Lett. B 263 (1991)153.
[34] H. Calen et al., Phys. Rev. Lett., in press; S. Haggstrom, Ph.D. Thesis,Univ. of Uppsala, Acta Universitatis Upseliensis 13, 1997.
[35] A. Sibirtsev, W. Cassing and U. Mosel, Z. Phys. A 358 (1997) 357.
[36] A. Sibirtsev and W. Cassing, nucl-th/9712009, Nucl. Phys. A (1997), inpress.
[37] Th. Weidmann, E.L. Bratkovskaya, W. Cassing and U. Mosel, nucl-th/9711004.
[38] J. Clemans, D. Elliott, A. Keranen, and E. Suhonen, nucl-th/9711066.
[39] P. Braun-Munzinger et al., Phys. Lett. B 344 (1995) 43.
[40] P. Braun-Munzinger et al., Phys. Lett. B 365 (1996) 1.
[41] V. Metag, Prog. Part. Nucl. Phys. 30 (1993) 75; GSI-Preprint-97-43,Nucl. Phys. A, in press.
[42] S. Teis, W. Cassing, M. Effenberger et al., Z. Phys. A 356 (1997) 421.
[43] D. Pelte et al., Z. Phys. A 359 (1997) 47.
[44] W.S. Chung, G.Q. Li, and C.M. Ko, nucl-th/9704002, Nucl. Phys. A, inpress.
10
Figure captions
Figure 1: The calculated inclusive transverse-mass spectra of π0 (solid linewith solid circles), η (dashed line with open circles), ω (dot-dashed line withsolid ’up’ triangles), φ (dotted line the solid squares), K+ (short dashedline with open diamonds) and K− (dotted line with open ’down’ triangles)mesons for C + C collisions at 2.0 A·GeV (upper part), Ni + Ni at 1.93 A·GeV(middle part) and Au + Au at 1.5 A·GeV (lower part). The calculations areperformed for bare meson masses.
Figure 2: Inclusive mT -spectra of π0, η, ω and K+ mesons for C + C (upperpart) and Au + Au (middle part) at 1.0 A·GeV. The lower part correspondsto Au + Au at 1.0 A·GeV for a central rapidity bin −0.3 ≤ y ≤ 0.3.
Figure 3: The channel decomposition for η, ω, K+ and K− inclusive mT -spectra for Au + Au at 1.5 A·GeV. The calculations have been performedwith bare meson masses. The solid lines with solid circles indicate the sumover all contributions, the dashed lines with open circles correspond to theNN production channel, the dotted lines with open squares are the ∆Nchannel, the dot-dashed lines with solid ’up’ triangles show the πN contri-butions while the short dashed line with open diamonds is the pion-hyperon(πY ) channel for K− production.
Figure 4: The calculated inclusive transverse-mass spectra of η, ω, φ, K+ andK− mesons with in-medium masses according to Eq. (4). The symbols indi-cate the results from the HSD calculations (the assignment is the same as inFig. 1). The solid lines are exponential fits to the HSD results to guide theeye. The pion yield is shown by straight thick lines.
11
0.2 0.4 0.6 0.8 1.0 1.2 1.4 1.6
10-2
10-1
100
101
102
103
104
105
106
Fig. 1
π η ω φ
K+
K-
Au+Au, 1.5 A GeVbare meson masses
mT
* [GeV/c
2]
0.2 0.4 0.6 0.8 1.0 1.2 1.4 1.6
10-2
10-1
100
101
102
103
104
105
106
dσσ/(
mT
2 dm
T)
[ m
b/(G
eV/c
2 )3 ]
dσσ/(
mT
2 dm
T)
[ m
b/(G
eV/c
2 )3 ]
π η ω φ
K+
K-
Ni+Ni, 1.93 A GeVbare meson masses
dσσ/(
mT
2 dm
T)
[ m
b/(G
eV/c
2 )3 ]
0.2 0.4 0.6 0.8 1.0 1.2 1.4 1.6
10-3
10-2
10-1
100
101
102
103
104
105
π η ω φ
K+
K-
C+C, 2.0 A GeVbare meson masses
0.2 0.4 0.6 0.8 1.0 1.2
100
101
102
103
104
105
106
Fig. 2
dσσ/(
mT
2 dm
T)
[ m
b/(G
eV/c
2 )3 ]
dσσ/(
mT
2 dm
T)
[ m
b/(G
eV/c
2 )3 ]
dσσ/(
mT
2 dm
T)
[ m
b/(G
eV/c
2 )3 ]
π η ω
K+
Au+Au, 1.0 A GeVbare meson masses
-0.3 < y < 0.3
mT
* [GeV/c
2]
0.2 0.4 0.6 0.8 1.0 1.2
100
101
102
103
104
105
106
π η ω
K+
Au+Au, 1.0 A GeVbare meson masses
0.2 0.4 0.6 0.8 1.0 1.2
10-3
10-2
10-1
100
101
102
103
104
105
π η ω
K+
C+C, 1.0 A GeVbare meson masses
1.0 1.1 1.2 1.3 1.4 1.510-4
10-3
10-2
10-1
100
101
sum NN πN
∆N πY
K- meson
Au+Au, 1.5 A GeVbare mass
dσσ/(
mT
2 dm
T)
[ m
b/(G
eV/c
2 )3 ]
mT
* [GeV/c
2]
0.7 0.8 0.9 1.0 1.1 1.2 1.3 1.4 1.5
100
101
102
103
sum NN πN
∆N
K+ meson
Au+Au, 1.5 A GeVbare mass
0.8 0.9 1.0 1.1 1.2 1.3 1.4 1.5
10-1
100
101
102
103
sum NN πN
∆N
ωω meson
Au+Au, 1.5 A GeVbare mass
0.6 0.7 0.8 0.9 1.0 1.1 1.2 1.3 1.4 1.5
10-1
100
101
102
103
104
105
Fig. 3
sum NN πN
∆N
ηη meson
Au+Au, 1.5 A GeVbare mass
0.2 0.4 0.6 0.8 1.0 1.2 1.4 1.6
10-2
10-1
100
101
102
103
104
105
106
Fig. 4
K-
φ
K+
η ω
dσσ/(
mT
2 dm
T)
[ m
b/(G
eV/c
2 )3 ]
dσσ/(
mT
2 dm
T)
[ m
b/(G
eV/c
2 )3 ]
dσσ/(
mT
2 dm
T)
[ m
b/(G
eV/c
2 )3 ]
η ω φ
K+
K-
Au+Au, 1.5 A GeVin-medium meson masses
mT
* [GeV/c
2]
0.2 0.4 0.6 0.8 1.0 1.2 1.4 1.6
10-2
10-1
100
101
102
103
104
105
106
K-
φ
K+
ωη
η ω φ
K+
K-
Ni+Ni, 1.93 A GeVin-medium meson masses
0.2 0.4 0.6 0.8 1.0 1.2 1.4 1.6
10-3
10-2
10-1
100
101
102
103
104
105
K-K+
φ
ηω
η ω φ
K+
K-
C+C, 2.0 A GeVin-medium meson masses


