Embed Size (px)
Citation preview
Biogeochemistry 50: 95-109,2000. . ,, ,, ' "© 2000 KluWerAcademic Publishers. Printed in theNetherlands. /o
Mercury budget of an upland-peatland watershed
D.E GRIGAL, R.K. KOLKA*, J.A. FLECK & E.A. NATER : ;,_z__ i_
D.epartmentof Soil, Water,and Climate, University of Minnesota, St. Paul,MN 55108, U.S.A. _! _;:_;i__:_;_:!I'_I__]Current address:Department of Forestry,Universityof Kentucky,Lexington, KY 40546, ___.: ._._: • _
U.S.A.) " _ _!i _i)
Received8 November 1999; accepted2 December 1999 "_'_.!'_i_ii:_!_..... _::_' . .' '_ i '. " _ '_II _ " ° '
, Key words.',atmosphericdeposition, litterfall, mercury cycling, wetland, throughfall " _;_ _"?:i_ii_-_:"
Abstract. Inputs, outputs, and pool sizes of totalmercury (Hg) were measured in a forested ._,_:_za_6_,_:_, ,__, .10ha,watershedconsisting of a 7 ha hardwood-dominatedupland surroundinga 3 ha conifer.... , .....=...........t _,-
dominated peatland, Hydrologic inputs via throughfall and stemflow,134-0.4/zg m-2 yr-1 -_? _!: 15::!.:--over the entire watershed, were about double precipitation inputs in the open and were signi- ._-.::.;._:/, _:_i:_i_ __.' " •ficantly higher in the peatland than in the upland (19.6 vs. 9.8/zg m-2 yr-1). Inputs of Hg
via litterfall were 12.34-0.7/zg m-2 yr-1 , not different in the peatland and upland (11.7 vs. __i_i__/__:_! " "
12.5 tzgm-2 yr-1). Hydrologic outputs via streamflowwere 2.84-0.3/zg m-2 yr-1 and thecontribution from the peatland was higher despite its smaller area. The sum of Hg inputs were
less than that in the overstory trees, 334-3/zg m-2 above-ground, and much less than either ___' ithat in the upland soil, 52504-520/zg m-2, or in the peat, 39004-100/xg m-2 in the upper 50cm. The annual flux of Hg measured in streamflowand the calculatedannual accumulation in :_ .__ _Z_._-....._.....thepeatland are consistent with values reported by others. A sink for Hg of about 20/xg m-2 _i,_:i_i_"_:_i,_ :"_:_!,,_yr-1 apparently exists in the upland, and could be due to either or both storage in the soil or ":volatilization. _
•
_i.... - .
..... _.o
, Introduction
-° f
Most studiesof mercury (Hg) in the environment have focused on the aquatic _4 /".systembecause of the health-related aspects of methyl-Hg accumulation in _:fish (Fitzgerald et al. 1998; Fleming et al. 1995). Although one source ofHg to aquatic systems is direct deposition from the atmosphere, terrestrial
.systems are the proximate source of much of the atmospherically-deposited•Hg that reaches aquatic systems (Henning et al. 1989; Lindqvist 1991).
• Studies in Minnesota, U.S.A., and similar areas indicate that about 25%of atmospheric Hg deposited on terrestrial basins reaches associated lakes
(Mierle & Ingram 1991; Swain et al. 1992), and contributes between 25 and60% Of the total Hg loading of these lakes. In most watersheds in northernlatitude_,peatlands are an important terrestrial landscape component and playan important role in cycling of Hg (St. Louis et al. 1994; Driscoll et al. 1995; •
1d
..
_
• .

96
Kolka et al. 1999a). In spite of the importance of terrestrial systems to the ....0Hg cycle, there are few studies that have comprehensively examined a singlesystem. We havebeen studying Hg fluxes in a small forested upland/peatlandwatershed in northern Minnesota, and the data provide an overview of Hgcycling in such a system. ,
Methods _,__,
Site " _':_:::; ,
The S2 watershed (9.7 ha) is located on the USDA Forest Service Marcell !_;73: ........_:_iExperimental Forest (MEF), 40 km north of Grand Rapids, Minnesota _:_3_!._-__ _,z_: ,.
(47032 '.N, 93028 ' W). The watershed contains a 3.2 ha black spruce (Picea ,;:;_::_S::-?_i;_:''_'_'_'_'::-_'.......:,:_:ii_"'_.,:•" . ,mariana Mill. B.S.R) Sphagnum peatland, a bog with an outlet pH of :' ; :_'::_'::;;?_:__3.9+0.2, and a 6.5 ha upland dominated by mature trembling aspen (Populus .... I__:;::__'__'. • "
tremuloides Michx.). Upland soils are Warba sandy loams (Glossic Eutrobor- _;
alfs) with about 35% silt plus clay in the surface (Nyberg 1987). The ___1_- i ,watershed has been instrumented and studied in detail, including llydrol- ::_ 'ogy (Boelter & Verry 1977) and elemental cycling (Grigal 1991; Verry & _ _, "-
Timmons 1982), including cycling of lead, an atmospherically-derived heavy ._ ....metal (Urban et,al. 1990). The climate of the MEF is subhumid contin- ii__ _i!__i, -ental, with wide and rapid diurnal and seasonal temperature fluctuations. The '___. _ _
. mean annual air temperature is 2 °C, with extremes of-46 °C and 40 °C ..... _..; ...._ __. ,
Average January and July temperatures are -14 °C and 19 °C, respectively _-_,_(Verry 1984). Mean annual precipitation is 78 cm with 75% occurring in the _?_L"_snow-free period (mid-April to early November). -_ '" - , -_"
Because the upland and the bog are floristically, topographically, and i!i_!_iii__•
pedologically different, these two landscape components were sampled as _ - , /,_-- subunits and the resulting data were weighted by area for the entire watershed. : /
_- ./_In some cases, the lagg, a narrow transition zone that separates upland from obog, was separately sampled. It is only about 5% of the area of the catchment, _ _:and data from it have been proportionally allocated to the upland and bog..Methods have been reported in detail elsewhere (Fleck 1999; Kolka 1996;Kolka et ai. 1999a; Kolka et al. 1999b) and they will only briefly be outlined.
..,
FieM sampling
Atmospheric inputsAtmospheric inputs of Hg in the open and under the forest canopy weremeasured by collectors similar to Swedish IVL bulk collectors (Iverfeldt1991). Throughfall collectors were representatively placed based on a survey
°
_. :- ..
..

97
of canopy and Understory cover from multiple transects (66 points; Kolka "et al. 1999b), five collectors in the upland, five in the bog; and an eleventhcollector was rotated as a duplicate. A twelfth collector was placed in anopening approximately 1.5 km from the $2 watershed where the NationalAtmospheric Deposition Program (NADP) monitors wet deposition of Hg.Fourteen stemflow collectors were also installed in $2, based on a survey ofcanopy species and diameter distributions (Kolka et al. 1999b).
Throughfall and stemflow samples were collected biweekly throughout /the sn0w-free period in 1995 (19 April-14 November) except at the NADP ....._-,
. site where sampling was weekly. Snow samples were collected from the _'open, upland, and bog in both 1995 and 1996 when snow was at or near its _"_......".Tif_ _." , ,
maximum seasonal water content. The deposition of Hg in throughfall was _g_;_,- calculated as a weighted mean, based on the areal proportion of cover types :. ....... ,
represented by each collector. The areal deposition of Hg in stemflow was ......based on the tree distributions. Total deposition to the watershed was based !_!':_"-' ......' ,i " .,on the areal proportions of each landscape component, and spanned over one _/ 7: _?,_;'.t...... , " ,
.... ,. _,.hydrologic year. _..... : '
Litterfall >_L_i. .
Litteffall was sampled in autumn, 1995 (8 August to 15 November).. Sixty __':__'_<'____:' !)i "
circular ,plastic collectors (diameter = 28.5 cm) were located at random _,_.[f__i_V___!_17.' i 'spacings along transects across the watershed. One-third of the collectors, _ _i_'/_;__"_:'_•randomly interspersed, were designated as Hg samplers and the remainder _ _"-,_,:"_
. Were only used to assess litteffall mass. Collectors for Hg were wiped with .....":_...._._ ,_,.:._,.dilute HC1 (10%) and dried with cleanroom wipers. All collectors used nylonnetting; the netting for the Hg samplers was thoroughly cleaned and leachate i
from it was.free of detectable Hg. All components were stored in polyethylenebagsprior to installation. Litter was collected three times, and collections
" from a specific collector were aggregated over time. The mass samples were _r,- transferred from the netting into paper bags. For the Hg samples, both net and
sample were collected in polyethylene bags using the dirty hands/clean hands" technique (St. Louis et al. 1994). All samples were frozen upon return to the '. _
,, 4 ./
lab. jlt
Hydrologic exportTwo sets of upland surface and subsurface runoff plots have been operatingin the watershed since 1971 (Verry & Timmons 1982). Surface runoff iscollected below the forest floor (organic material on the mineral surface) andsubSurface runoff (interflow) is collected at the top of a Bt horizon of low
permeability; both types were sampled on an event basis during 1993-1995.Flow of both components is measured by recording gauges. Runoff in thebog was collected from holes excavated with gloved hands in the acrotelm.
j .. ." . .
. , . .,.
-.

98 J " "
Untreated wood platforms prevented compression of the peat near the holes.Flow at the watershed outlet is monitored by a continually recording streamgauge at a v-notch weir. Flow tends to cease for 2-4 months during thewinter (December-March), providing a hydroperiod of approximately 8 to10 months. Grab samples of streamflow for Hg analysis were collected every
two weeks during the ice-free (flow) period of 1993-1995. All sampling was 7 Idone using a modified clean protocol; a single individual used PVC gloves _ ....and a teflon ladle. Sample teflon bottles were washed with a portion of the 'i'_-_._,::_sample before collection. Flow was partitioned between upland surface runoff ......._: ::: ,
and interfl0w and between upland and bog by hydrograph separation (Dr. . :_....._ :i_ _, ,Dale Nichols, unpublished data), and hydrologic outputs of Hg were based U _i_ii_,:,:on these data (Kolka 1996). ,
¢ ,
Pool sizes • • "
Samples were collected to determine size of pools of Hg in the watershed, •including forest floor (n = 5), surface mineral soil to 25 cm (n = 5), organic .... ' .....-
soil (peat) in the bog at 35 cm depth below hollows (n = 5), aspen leaves _:.
(n = 5) and wood (n = 2), and spruce needles (n = 4) and wood (n = 4). _ _ . .Samples were collected using PVC gloves, and the soil and wood sfimples _ "excluded material in contact with the metal sampling apparatus. All samples "- .
were frozen upon return to the laboratory. _ - •
Laboratory analysis . .:
Analyses of water samples were conducted in a cleanroom (Kolka 1996). >_, __., L_, .... ,,
Mercury was determined by double amalgamation cold vapor atomic fluores- _!_,_:,..cence spectroscopy (CVAFS), similar to the method of Bloom and Crecelius _:_"'...... '
(1983) and U.S. EPA Method 1631 (U.S. Environmental Protection Agency :L?{_I.......,- .,,,,., ..,,
1992), using a Brooks-Rand Model 3 CVAFS analyzer. Samples were - _.oxidized with bromine monochloride (BrC1), and excess BrC1 was reduced by " .:" J"the addition of hydroxylamine hydrochloride (NH2OH-HC1) prior to analysis. ,/ /•Sample aliquots were added to bubblers, Hg+2 was reduced to Hg° by SnC12, " _:and the Hg° was collected on the sample gold trap. Mercury concentrations '.in solution were based on a standard curve developed at the beginning and .
. end of each batch of 12 samples, with correction for the blank for that- batch.
Litter collections were separated into leaves, needles, and other material, .... -" including bark, twigs, and lichen; mass of each component was determined
after oven-drying at 65 °C and data were converted to mass per unit area.Analyses for Hg for litterfall, forest floor, mineral soil, peat, leaves, needles,and wood were conducted in the same laboratory, and using the same instru-mentation as the water samples (Fleck 1999). All samples for Hg analysis

99 ; " '
were freeze-dried and homogenized in a clean room. A subsample wasdigested With equal volumes of sulfuric and nitric acid overnight. If pres-ence of undigested material in solution was indicated by turbidity, the sampleunderwent additional digestion by microwave similar to EPA Method 3052(U.S: Environmental Protection Agency 1999). Mercury in tissue and soilwas expressed as concentration on a dry weight basis. Each batch of 12 -
/
samples included a standard curve at the beginning and end of the ran, and _,_:,_.....
the following minimal set-of QA samples: one blank, one duplicate, onespiked sample, and one known standard reference (NIST Standard Reference _.,_,.
, Material 1515, Apple Leaves). '; _Ti!i_'!i_
Numerical analysis " :!__;: _:::,_<a,:,,:i_,,;
The concexltration of each sample type was applied to the appropriate mass ,,:,_::_ea,_,<_.,5<...........___,:_,....
or volume within each,landscape component. In all cases, uncertainty was -:_' ,,_y>,,_:_,:-:4:;v'.:mathematically propagated by appropriate formulae for products, sums, and .:_ ....."......_ .............................
qUotients, including covariances where they were significant (Freese 1962). ,,.,.z>_?__• .Significance of differences in estimates was determined by one-way analysis- -_iS_,g__'_"_:"......_:_ " "
of variance. Litterfall data for the upland was extrapolated to an annual basis _ 'using information from about 85 km WSW of MEF, where 84% of annual !_ _...... iilitteffall in aspen stands was collected in autumn and the proportion varied
little with site (Perala & Alban 1982). Measured mass of Hg was therefore ,..'4:_,-_:--,_c,._:,_._,"adjusted by 1.2 to determine annual litteffall. Annual litteffall in bogs at MEE ,:::_:_,e,::g_:-:.,. ...._::_:,_,::......w,>,,
, including S2, has been measured (Grigal et al. 1985), and the mass of litter ,. 7: _.collected in the bog was 31% of annual litteffall. Measured mass of Hg in ,. : "
litterfall in the bog was therefore adjusted by 3.2 to determine annual litterfall. _:,.TOdetermine biomass of the upland forest, the basal area of the tree overstory -_7" _',was measured (n = 19 plots) and applied to a regression relating it to biomass " "
• for aspen-dominated forests in the Great Lakes region (from on a published " "data base - Ohmann et al. 1994). Previously reported overstory biomass was ' .' t-
used for the bog forest (Grigal et al. 1985). , _ -/
Results and discussion
,.
• - '.Duplicate analysis.of 193 open precipitation' throughfall, and stemflowsamples had a mean concentration of 37.0 ng L-1 and a pooled standard
' error (SE) of 3.35%. For runoff and streamflow, 120 duplicates provided a•mean concentration of 12.5 ng L-1 and a SE of 2.3% (Kolka 1996). For all
analyses of litter, 99.5% recovery of spikes was achieved and our analyses ofreference material averaged 44.8 ng g-1 compared to the reference value of
444-4 ng g-1. The relative error of duplicates varied with the litter material;
o

100 [J " _ _ "
Table 1. Concentrations of mercury in $2 watershed, Marcell Experimental Forest,Minnesota. Standard error indicated parenthetically, i--
Component - Upland Bog Entire watershed
Rainfall (ng L -1) 9.9 (1.2) 1
Snow (ng L- 1) 3.2 (0.4) 9.4 (1.4) 3.1 (0.7) 1 " //
•Throughfall (ng L -1) 17.5 (1.3) 33.6 (3.6) ,_%,stemflow (ng L -1) 31.2 (3.1) 113 (22) '_: _
Litterfall - leaves/needles (ng g- 1) 38.3 (1.4) 29.7 (2.4) _fJ,: ' ,
Litterfall other (ng g-l) 34.3 (6.9) 126 (19) "'""........?', ......
Overstory stemwood (ng g-l) 1.6 (0.3) 4.9 (0.8) 71;:_,!_:MI,::_Ii:IS:I,"Overstory foliage (ng g- 1) 21.0 (1.2) 21.5 (3.4) _:_:,_;_,,_i,i__',_.....
Forest floor (ng g-1) 84.2 (7.5) ......
Mineral soil/peat (ng g-l) 17.9 (1.9) 44.5 (8.1) ,
, Runoff (ng L -1) 20.6 (1.8) 12.9 (2.2) :_h:?_ ii(_?:_,:!;_!_i:i_i!_%,Streamwater.(ng L -1) 15.1 (1.7) -'::' :.. •
Groundwater (rig L -1) 0.9 (0.2) :;_]
1 Collected in the open. - __;_,(.??'_", • ,,,
needles had a mean coefficient of variation (CV) of 9.5%, deciduous leaves :__-._i;.i;;i .....of 5.7%_ and other material of 15%. :_?_ __#;_,_:_:-_
, Concentration of Hg in rainfall was 9.9 ng L-1 (Table 1), well within the ,• .
wide-range in the literature (St. Louis et al. 1994). The IVL collector in the :;_ ,: :
open and the NADP collector measured nearly identical annual wet Hg depos- ,_,___,
ition in 1995 (6.50/zg m-2 and 6.52/xg m-2, respectively) (Kolka 1996; :i_iiill:_? _ -_,Kolka et al. 1999a), similar to that measured in Michigan, U.S.A. (5.8-9.1 ....7:_i
/zg•m-2; Hoyer et al. 1995), Wisconsin, U.S.A. (6.8-8.7/zg m-2; Fitzgerald - ....-et al. 1991), and Finland (6-11/zg m-2; Mukherjee et al. 1995). Throughfall "_ ," /_
and stemflow (TF-SF) had two to ten times higher concentrations of Hg than . _,_//"rainfall (Table 1), so that hydrologic inputs via TF-SF were 1.5 times higher _:
• in the upland and three times higher in the bog than in the open, both signifi-cant (Table 2). Twice as much Hg was deposited via TF-SF over the entire
, watershed than in the open in 1995 (Table 2) (13.0 vs. 6.5/zg m-2 - prob." < 0.0!). This is agreater difference than that reported for coniferous forests .
, in Sweden (50%, Munthe et al. 1995) and deciduous forests in Tennessee, ,U.S.A. (43%, Lindberg et al. 1994).
Litterfall was considered a flux of Hg from the atmosphere rather than arecycling from root uptake (Fleck et al. 1999; Guentzel 1997; Iverfeldt 1991;Johnson & Lindberg 1995). Sampling captured peak litterfall; 44% of the
litterfall from the upland and 20% from the bog was collected during the first , "
..

101 " ,
Table 2. Mercury flux and pool sizes of $2 watershed, Marcell Experimental Forest,Minnesota. Standard error indicated parenthetically.
Component Upland Bog Entire watershed(/zgm -2) (/zg m-2) (/zgm -2)
Precipitation input (yr-1) 6.5 (0.22) _ mThroughfall and stemflow(yr-1) 9.75 (0.32) 19.6 (0.84) 13.0 (0.35)
Litter input (yr-1) 12.5 (0.85) 11.7 (1.36) 12.3 (0.73)
Overstory 21 (3) 58 (8) 33 (3) _ ..... . ,Soil 5250 (520) 3900 (100) 4800 (350) "n . .. ,,,
•Hydrologic output (yr-1) 2.21 (0.37) 4.04 (0.42) 2.81 (0.28) ,_
Input - output (yr- 1) 20.1 (1.0) 27.3 (1.7) 22.5 (0.8) , ....0 , _ ,
. : ,
...... _ .
) " iw•
o 4
period (8 August to 3 October); 52% and 60% during the second period (3 :_;',l_i:+October to i4 October), and 4% and 20% during the third period (14 October _:_i:_i_i_ii_ _
to 15 November). Although leaf litterfall in the upland had a significantly _i_/:_;_ •
higher Hg concentration than needlefall in the bog (Table 1) (prob. = 0.04), _ .
the other component of miscellaneous material was much higher in the bog
(Table 1) (prob. = 0.01), probably because of the additions of spruce bark . ,......,_,_ _.....
(Pang 1997). Because of the compensating concentrations, inputs of Hg via _-...... . _;
, litterfall were not significantly different between the upland and bog (Table
2) (prob. = 0.64), and were not different over the entire watershed than Hg
deposition via TF-SF (Table 2) (12.3/zg m -2 yr -1 in litterfall vs. 13.0/zg
m -2 yr -1 in TF-SF, prob. = 0.43). When litterfall is considered in studies _ _r,
of Hg flux, an approximate equality with inputs via TF-SF is commonly" observed (Guentzel 1997; Iverfeldt 1991). Although this assumption appears
valid for the $2 watershed as a whole, it is not valid for either of the individual ' _"_
landscape components. Whereas inputs of Hg via TF-SF were only 80% of _ 4 /" litter inputs in the upland (prob. = 0.04), they were about 150% of those inputs _,_
in the bog (prob. < 0.01) (Table 2). Canopy structure clearly plays a major
role in both kinds of inputs. The input of Hg in litterfall was about half that
•estimated by Iverfeldt (1991), 25/zg m -2 yr -1, and similar to that reported by
' Munthe et aL (1995) in Sweden, 10.4/xg m -2 yr -1, although the latter result
• was only for five months.Accurate and precise determination of the pools of Hg in the watershed,
and especially in the soil in the upland and the peat in the bog, require detailed
sampling and analysis. That effort was not made because the pools were
expected to be larger than the fluxes and their relative magnitudes wouldbe sufficient for comparison. The concentration of Hg in aspen wood (1.6 ,
, - , °
• ": _. "oL

\102
ng g.-1) (Table 1) was not different than that reported by Pang (1997) (2.0ng g-l)(prob. = 0.65), and was applied to the upland overstory stemwood.Leaf concentration has not been reported for aspen, although the concentra-tion (21.0 ng g-i) (Table 1) was similar to that reported for sugar maple,
•an associated deciduous broadleaf species (24.2 ng g-1 _ Rasmussen 1994).The measured concentration was applied to the upland leaf biomass. The Hg / iconcentration in black spruce wood (4.9 ng g-l) (Table 1) was lower than that _;_i._-,_.reported by either Mooreet al. (1995 - 10 ng g-l) or Zhang et al. (1995a- 20ng g-!). It was similar, however, to that reported for wood of other conifers,including red pine (3.8 ng g-I _ Fleck et al. 1999) and mixed conifers (5.8 - •,
ngg -1 - Pang 1997). Concentration of Hg in black spruce needles (21.5 ng .....;:;;.....,.g-l) (Table 1) was similar to those reported in Ontario (27 ng g-1 Heyes +_:
-et al. 1998; 15 ng g-1 _ Moore et al. 1995) and Quebec (ca. 23 to 34 ng g-1 - *_-;__: : _;_;-_: , . Q
- Zhang et al. 1995b). Measured concentrations of spruce wood and needles " - "were applied to the appropriate biomass in the bog. _
• The concentrations and mass of Hg in soil had high uncertainty because " "• of the limited number of samples. The concentration of Hg in forest floor _-.
(84.2 ng g-l). (Table 1) was not significantly different from that based on :a _ "regression using forest type, geographic zone, and silt plus clay in the siarface ":, _ " "soil as independent variables (data from forests across the Great Lakes states
from Na'ter and Grigal (1992) - 102.8 ng g-l, prob. = 0.48). Similarly, Hg ;_;;mass in forest floor was lower but not significantly different from that based
on a regression with the same independent variables (690/zg m-2 compared . .' to 844/zg m-z, prob. = 0.58). Concentration and mass of Hg in the surface 25 _'.'_ . i
cm of mineral soil were also lower than estimated (17.9 ng g-i versus 19.5 ng ......" -g-l, 4550/zg m -2 versus 4950/xg m-2), but in neither case were differences i_!!_::.significant (prob. = 0.74, 0.78). The sum of Hg in forest floor and surface ' !!I_Y _ " _"
soil (5250/zg m -2) (Table 2) was similarly lower, but not significantly, than ; !_' _.
estimated (5790/xg m -2, prob. = 0.68). Sum of Hg was slightly lower than " , , if _that for sampled red pine stands in Minnesota (Fleck et al. 1999, 5540/zg . .-m-Z), but higher than that for deciduous forests on sandy soils in east-central _ , I /Minnesota (Grigal et al. 1994, 4020/zg m-2). It was similarly in the range Jof rePorts from Sweden (5600/zg m-2 in forest floor and upper 30 cm ofmineral soil - Lindqvist et al. 1991, 6600/zg m-2 in forest floor and upper
, , 40cm of mineral soil- Aastrup et al. 1991).
Estimation Of mass of Hg in the peat soils of the bog requires detailed. measurement .of both Hg concentration and bulk density with depth (Benoit " ,
et al. 1994). Measured Hg concentrations from a single depth are difficult toextrapolate to other depths or to other sites. Detailed data are available from
Arlberg Bog, a peatland floristically very similar to the bog in $2 and locatedabout f00 km southeast of MEF (Benoit et al. 1994). The Hg concentration
J o
• .
., ,.i;.. +
in $2 peat (44.5 ng g-l) (Table 1) is lower than that reported at a similardepth from Arlberg Bog (approximately 75 ng g-1 _ Benoit et al. 1994), butis well within the range found at that depth in other peatlands (Jensen &Jensen 1991). A more meaningful comparison among peatlands is the rate ofaccumulation of Hg, a function of Hg concentration, bulk density, and rate of
peat accumulation. The peat samples collected at 35 cm in $2 accumulatedbefore human settlement in the area, about 1895 (Urban & Eisenreich 1988).
Computed accumulation rates of Hg in $2 during that period were 6.8/zgm-2 yr-1, almost exactly equal to those reported for Arlberg Bog for the same
.. ;?.... :.,. period (7.0/zg m-2 yr-1 - Benoit et al. 1994), and within the range for the • . .....;,,,,,.,,:" : -same. period in Scandinavia (4 to 12/zg m-2 yr -1 - Jensen & Jensen 1991). :_;/ ..... , 'Because of the proximity, floristic similarity, and similarity in rates of pre- • :/, : _!!!i_;__ "
" industrial Hg accumulation, Arlberg Bog was considered to be a reasonable ii_!ii!_:_i-_.:_:,_i;r_,:_i_.!:;._analog to the bog in $2. The mass of Hg within the surface 50 cm of peat in -,-:_:_'_#'<_:_:,_:---_......Arlberg Bog, accumulated since 1750, is 3880/xg m-2 (Benoit et al. 1994). _:,....::r_,_,_......_;_<, "
That is comparable to other reports of Hg in peatlands in the midcontinent, e> _::.:c.,including an average of 3900/zg m-2.per 50 cm from less-detailed sampling _'_,£i:_ "_ "_'"_; _of 12 peatlands.in northern Minnesota (Grigal & Nord 1983) and 3530/zg ___,,,___ #:: •
m-2 per 50 cm from the Experimental Lakes Area of northwestern Ontario, _ _ii::!I_linearly interpolated from total depth and Hg mass (Moore et al. 1995) _, _
Although concentrations of Hg in runoff from the upland were higher than
from the bog (Table 1 - prob. = 0.05), hydrologic flux of Hg from the upland _,.:_,a:_:_s_,_:.-:,.?_,:_:_;,.:,,--was. only about half that from the bog (Table 2 - prob. = 0.03), primarily __;_-"_" :_}_:-_'?'_
' because of greater volume of runoff from the bog. The hydrologic flux of . -_
Hg from the watershed, 2.8/zg m-2 yr-1 (Table 2), is comparable to other .. .i "reports from forested systems, although measurement techniques differ (1.4 i:_.,..../xgm -2 yr-_ - Lee et al. 1995; 1.5/zg m-2 yr-1 - St. Louis et al. 1996; 3.4 '_ ", . 1_,/zg m-2 yr -1 - Aastrup et al. 1991; 1 to 8/zg m-2 yr-_ - Meili 1991). The Hg
° flux from $2 also falls very near that predicted from its proportion of wetland , ._and upland, based on data from a range of watersheds in Wisconsin, U.S.A., " -" /_
. with varying wetland areas (3.4/zg m-2 yr-1 - Babiarz et al. 1998). Flux of , _Hg from $2 is also very similar to the post-industrial Hg contribution from _the. terrestrial portion of watersheds to lakes, based on sediment analyses ofseven lakes near MEF in northern Minnesota (Swain et al. 1992). That flux,
. 3.3/zg m-2 of terrestrial area yr-1, is within the 95% confidence interval of.our measurement (2.2 to 3.4/zg m-2) ....
• Evaluating the Hg budget for $2 in units of mass per unit area empha-sizes differences in processes between the two landscape components. Theresultant of those processes on the Hg budget of the entire watershed,however, depends on the area of each component. Although input of Hg by , .TF-SF v_as much higher per unit area in the bog than in the upland (Table
°

104 J
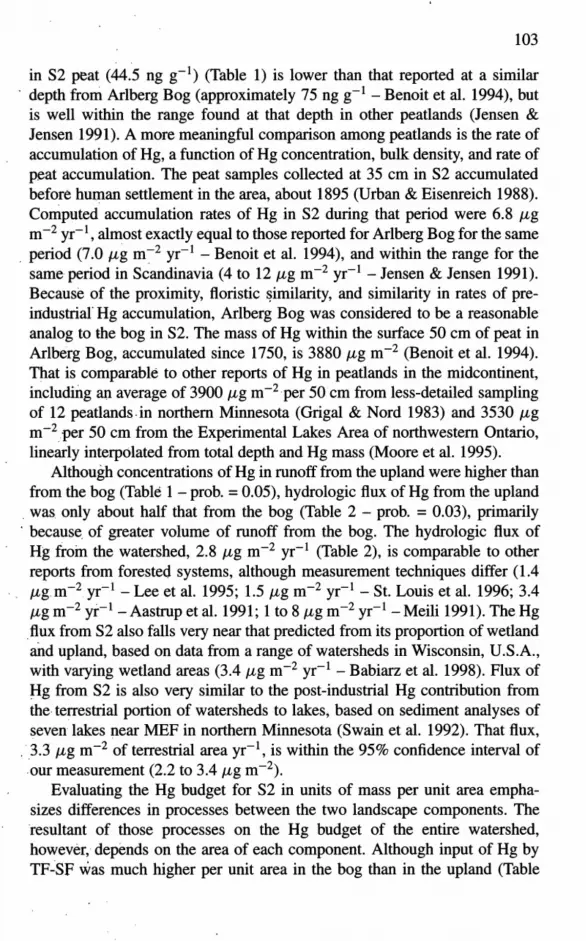
9500
2000 - Upland/Bog1500
O'1•
E Watershed •
0 Precipitation Litterfall Runoff In - Oi_t __=_,_,,.' '
Figure 1. ,Inputs and outputs of Hg into a forested upland/peatland watershed in northern .,, ....
Minnesota. The upland portion of the watershed covers 6.5 ha, and the bog (peatland) 3.2 ha.
• 2), the contribution of each landscape component to total deposition of Hg to ,i:{__i_......:f,.. "the watershed was nearly equal (Figure 1). Small differences in Hg input per ...._, _Unit area via litterfall (Table 2) were further magnified when the area of each s_.,......landscape component was. considered, so that upland litterfall contributed _"_'_ _ "_ -_',
more than twice as much Hg to the watershed than did bog litterfall (Figure i:,;/._ :,.1). Loss of Hg via runoff was also nearly equal for each of the landscape
-components (Figure 1). '.'" /f;"The estimated pool size of Hg in the overstory is marginally greater _ _ /
than the annual inputs of Hg (prob. = 0.07) and much greater than outputs - _:(prob. <0.01) (Table 2). Both inputs and outputs are more than two orders of .... .magnitude smaller than the pool in the soil (Table 2). The difference betweenmeasured inputs and outputs indicates a sizeable net sink of Hg in both upland
• . ' and bog (Table 2). The size of the sink in the bog, 27.3/zg m-2 yr -1 (Table2), is within the confidence interval of the recent rate of Hg accumulationreported for. Arlberg bog (24.5-t-7.9/zg m-2 yr-1) (Benoit et al. 1994). The ,explanation of the sink in the upland, 20/zg Hg m-2 yr-1 (Table 2), is moreUncertain. E.ven if only the Hg deposition actually measured in litterfall onthe upland is considered, disregarding the extrapolation to an annual basis, .a substantial unexplained difference of about 18/xg Hg m-2 yr -1 remains.
: . . _ . . , .
, , ..

Deep le_tching to groundwater is an unlikely pathway of loss (Johnson &Lindberg 1995). Concentrations of Hg in groundwater on the MEF are about1 ngHg L-1 (Table 1, J. Fleck, unpublished data), lower than those reportedin northern Wisconsin (2.8 ng Hg L -1 - Krabbenhoft & Babiarz 1992). If allHg in groundwater were derived from surface processes, the hydrologic fluxto groundwater in northern Minnesota (20 to 30 cm H20 yr -1) would only Iiprovide a sink of about 2.5/zg Hg m-2 yr -1 , far short of the size of the sink _'_in the upland.
A possibleexplanation for this difference between inputs and outputs is .... , ,• simply Hg accumulation in the soil (Aastrup et al. 1991" Hultberg et al. _':__>,:_:_:,_?.::_" _ " ,
' " '._:_, ....
1995; Lindqvist et al. 1991). We have estimated mass of Hg in forest floor ,.,,,._v:_.-.,.,.............and mineral soil of the upland to be,5250/xg Hg m-2 (Table 2), and annual " :::- ::_:__id'_:::• ,.. ;7>;) _,,_.,i,
" changes in this pool at the rate implied by the unexplained difference would _ _7':">{}:a! - ,be less than 0.5% yr-1, virtually impossible to measure. Differences can also _:_.... "be considered over the longer term. Before 1850, estimated atmospheric Hg ';::;::_i;:i!i_)_:ii:;i;i:,¢ii_:" _" "
deposition to the surface of lakes in the region, based on accumulation in 21'_::_!!_ a__i::,_i._,,!.-'.:_:_:.._.• :...., •sediments of lakes that occupy a large proportion of their watersheds, was _ _ i m__i- _....
. _,__ _ Ill_llili,_ ,_ ..
3.7/xg m-2 yr-!.(Swain et al. 1992), and net accumulation in nearby arlberg __ _| { __-YI" " 'Bog was 7/zg m-2 yr -1 (Benoit et al. 1994). The higher accumulation hnd t__i:'_, i, "
hence inferred higher deposition to the bog is reasonable if deposition to _lll '__'___i _!___ :.terrestrial surfaces is enhanced because of the presence of vegetation. Current
rates of accumulation in both lakes and bogs are about 3.5 times higher than _ i_ a _!!ii!_!_i_.i:._,pre-industrial rates (Benoit et al. 1994; Swain et al. 1992), with an average _ _. : _'_+_:_'of about, 18.5/zg m-2 yr-_ [3.5 x (3.7 + 7)/2], very similar to the annual :" ,."... ,difference between Hg inputs and outputs in the upland of $2 (Table 2). If :i';_."soil were wholly accumulating this excess Hg, then from 300 (current rate) to _t_,..,'_1000 years (pre-industrial rate) would be required to accumulate the present :':_ .
pool. These accumulations would be in addition to the background levels of • ......
Hg derived from the geologic substrate. When considered over the long term, ", ,,' /,,/_it would appear that a significant unmeasured sink or loss of Hg from the _ /
. upland must exist or soil levels would be much higher. Many other studies ,
report lower rates of apparent accumulation (e.g., St. Louis et al. 1996 - 2 to J• ,
3/zg m-2 yr -1), but those rates often do not include litterfall as an input.The most likely major unmeasured pathway of loss, both historically and
.at present, isvolatilization, whereby Hg 2+ in soils is converted to Hg° by• , .
reductive processes and then released to the atmosphere. Although there is -• strong circumstantial evidence for this process, it has not been thoroughly
investigated, due in large part to analytical difficulties (Lindberg et al. 1995).Accurate measurement of surface-to-atmosphere fluxes is difficult but imper-ative if we are to understand the global cycle of Hg. A similar conclusion
regarding the importance of volatilization was reached by Johnson and Lind-
.

106
berg" (1995). During the pre-industrial period, annual volatilization losses ....should have approached a steady state with net deposition, ca. 2 to 9/zg m-2yr-1. Based on the higher current annual deposition and concentrations of
Hg in soils, it is probable that current volatilization rates are also higher than
pre-industrial rates. , I
Conclusions ....._.i- e
A comprehensive budget of a forested upland/peatland watershed indicates , _:;_1:7_":!ii_i),,.... ..... 'that fluxes of Hg from the atmosphere are much higher that measured in .::_; .......::_.io:open precipitation collectors because of inputs by both washoff of dryfall :_!:i!_:::._-_.:.:_!:,'_,,_::_;_:,_
(as throughfall and stemflow) and litteffall. Pools of Hg in vegetation and , ::s,%_!_-:,.,;,_: :..: '.especially in soil far exceed annual inputs and outputs. The two landscape I ':::_:_v'_!_' "_: ....
components differ significantly in the magnitude of Hg fluxes and pools. ....':__':'"'::<''_;:_-_:_:_
Although theinputs, outputs, and accumulation are approximately balanced :#:::_:_:::__i'in the peatland, there appears to be an unmeasured sink of Hg in the upland I ..._ ::_:___-.
that is probably related in part to accumulation in soil and in part to volatil- :_::_ ' _:_.... . ,ization. If that is the case, a significant fraction of the Hg annually deposited ,__-)i_ i "
on uplands may be returning to the atmosphere, t "
Acknowledgements , - :
-WeWould like to thank Carissa Pang and Bruce Cook for their helpful discus- ' :"" :_
sions, insights, and data. We would also like to thank Sandy Verry, Art Elling, .::!:;:'7. ' . -_,and Deacon Kylander of the USDA Forest Service for their help in sample _7'::!!.. "collection. Partially supported by a grant from the Legislative Commission ....... •
on Minnesota Resources to the Minnesota Pollution Control Agency, by "".... /,_"grants from the U.S. Geological Survey through the Water Resources Center _" /of the University of Minnesota, and by projects 25-054 and 25-032 of the - ._.University of Minnesota Agricultural Experiment Station. Published as article . .991250077 in the Scientific Journal Series of the Minnesota AgriculturalExperiment Station.
• ,: .
• References "
Aastrup M, JohnsonJ, BringmarkE, BringmarkI & Iverfeld A (1991) Occurrenceandtransportof mercurywithina smallcatchmentarea.Water,Air SoilPollut.56:155-167
BenoitJM,FitzgeraldWF&DammanAWH(1994)Historicalatmosphericmercurydeposi- .tion in themid-continentalU.S.as recordedin an ombrotrophicpeatbog. In:WatrasCJ

,io ,,',,, •107
& Huckabee JW (Eds) Mercury Pollution: Integration and Synthesis (pp 187-202). LewisPublishers, Boca Raton, FL
Babiarz CL, Hurley JP, Benoit JM, Shafer MM, Andren AW & Webb DA. (1998). Seasonalinfluences on partitioning and transport of total and methylmercury in rivers fromcontrasting watersheds. Biogeochem. 41" 237-257.
Bloom, NS &Crecelius EA (1983) Determination of mercury in seawater at subnanogram per Ilitre levels. Mar.Chem. 14:49-59
Boelter DH & Verry ES (1977) Peatland and water. USDA For. Serv. Gen. Tech. Rep. NC-31, ;,:_'Nor. Cen. For. Exp. Sta., St. Paul, MN. _
Driscoll CT, Blette V, Yan C, Schofield CL, Munson R & Holsapple J (1995) The roleOf dissolved organic carbon in the chemistry and bioavailability of mercury in remote . i__ . ......_ _....
• Adirondack lakes. Water, Air Soil Pollut. 80:499-508 .... _!_i_._;_iii 'Fitzgerald WF, Mason RP & Vandal GM (1991) Atmospheric cycling and air-water exchange _ _'_,....... :_ °
of mercury over mid-continental lacustrine regions. Water, Air Soil Pollut. 56:745-767 :,i .....: _i_:_i'_••_LV:Fitzgerald WF, Engstrom DR, Mason RP & Nater EA (1998) The case for atmospheric . '._::i_i_::Tr"i,2_.... _
mercury contami'nation in remote areas. Environ. Sci. Tech. 32:1-7 ,, :._. _..........._._> _, .....Fleck JA (1999) Mercury Transport Through Northern Forested Watersheds. MSc Thesis, .,_ ,_- "
University of Minnesota, St. Paul I '_:'_ _' •:_+'_;"Fleck JA, Grigal DF & Nater EA (1999) Mercury uptake by trees: an observational experiment. I _,_+::-......._::__:_: ,
Water; Air Soil Pollut. 115:513-523 _i __• _i_ii_:_°_ •!_'_i •.
Fleming LE, Watkins S, Kaderman R, Levin B, Ayyar DR, Bizzio M, Stephens D & Bean JA - .ii__:_,r___:_ii_;i__"_ ..........
(1995) Mercury exposure Of humans through food consumption from the Everglades of _ '
Florida. Water, Air Soil PoUut. 80:41-48 _ ..Freese F (1962) Elementary Forest Sampling. USDA Forest Service, Agriculture Handbook " i_
232 I _t"_'::t:_.........:Grigal DF (1991) Elemental dynamics in forested bogs in northern Minnesota. Can. J. Bot. i::_:;:.!i_i_4_:::g::_!I:._.-
69:539-546
Grigal DF, Buttleman CG & Kemik LK (1985) Biomass and productivity of the woody strata ......of forested bogs in northern Minnesota. Can. J. Bot. 63:2416-2424
Gri'gal DF, Nater EA, & Homann PS (1994) Spatial distribution patterns of mercury in an east- _:...
central Minnesota landscape. Ill: Watras CJ & Huckabee JW (Eds) Mercury Pollution: ..... .. _,Integration and Synthesis (pp 305-312). Lewis Publishers, Boca Raton, FL
Grigal DF & Nord WS (1983) Inventory of heavy metals in Minnesota peatlands. Report to : .' Minnesota Department of Natural Resources, Division of Minerals, St. Paul, MN
Guentzel JL (1997) The atmospheric sources, transport and deposition of mercury in Florida. _ " .../J_"
PhD Thesis, University of Florida, Gainesville ., g /
" Henning TA, Brezonik PL, & Engstrom DE (1989) Historical and areal deposition of mercury ,_:in NE Minnesota and Northern Wisconsin Lakes. Final Report to the Minnesota Pollution • ,
Control Agency, St. Paul, MNHeyes A, Moore TR & Rudd JWM (1998) Mercury and methylmercury in decomposing vege-
tationof a pristine and impounded wetland. J. Environ. Qual. 27:591-599' Hoyer M, Burke J & Keeler G (1995) Atmospheric sources, transport and deposition of
mercury in Michigan: Two years of event precipitation. Water, Air Soil Pollut. 80:199-208
' Hultberg H, Munthe J & Iverfeldt/_ (1995) Cycling of methyl mercury and mercury -responses in the forest roof catchment to three years of decreased atmospheric deposition.Water, Air Soil Pollut. 80:415-424
Iverfeldt/_ (1991) Mercury in forest canopy throughfall water and its relation to atmospheric
deposition. Water, Air Soil Pollut. 56:553-564
v " •. • " • ' .
" , " • .. • _

108 J " " '
Jens6n A & Jensen A (1991) Historical deposition rates of mercury in Scandinavia estimatedby dating and measurement of mercury in cores of peat bogs. Water, Air Soil Pollut. 56:769-777
Johnson DW,& Lindberg SE (1995) The biogeochemical cycling of Hg in forests: Alternativemethods for quantifying total deposition and soil emission. Water, Air Soil Pollut. 80:1069-1077
Kolka RK (1996) Hydrologic transport of mercury through forested watersheds. PhD Thesis,University of Minnesota, St. Paul _:_-_,
Kolka RK, Grigal DE Verry ES & Nater EA (1999a) Mercury and organic carbon relationshipsin streams draining forested upland/peatland watersheds. J. Environ. Qual. 28:766-775
Koika RK, Nater EA, Grigal DF & Verry ES (1999b) Atmospheric inputs of mercury andorganic carbon into a forested upland/bog watershed. Water, Air Soil Pollut. 113" 273-294 "
Krabbenhoft DP & Babiarz CL (1992) The role of groundwater transport in aquatic mercury : ........_"_:_='Cycling. Water Resour. Res. 28:3119-3128 _::
.Lee Y-H, Bishop K, Pettersson C, Iveffeldt/_ & Allard B (1995) Subcatchment output of ' ] _:_,_--,_t:, '-__:_, ,mercury and methylmercury at Svartberget in Northern Sweden. Water, Air Soil Pollut. I___:_,._, ..............80:189-198 __ -
Lindberg SE, Kim K-H, Meyers TP & Owens JG (1995) Micrometeorological gradient
approach for quantifying air/surface exchange of mercury vapor: Tests over contaminated I _: ::_;_:_ ........._': '
soils. Environ. Sci. Tech. 29: 126-135 ] -_:G '_.-'_'_,_ .:. ::_,,Lindberg SE, Owens JG & Stratton WJ (1994) Application of throughfall methods to estimate _,_._. v- _,_; ..
dry deposition of mercury. In: Watras CJ & Huckabee JW (Eds) Mercury Pollution: iii j_. : ..
Integration and Synthesis (pp 261-271). Lewis Publishers, Boca Raton, FL I ___;.
.:," "_
Lindqvist O, Johansson K, Aastrup M, Andersson A, Bringmark L, Hovsenius G, Hftkanson :.L, Iverfeldt/_, Meili M & Timm B (1991) Mercury in the Swedish environment - recent ;_:i; ii.
research on causes, consequences and corrective methods. Water, Air Soil Pollut. 55: 1- I _;_ _i!_ __I255 i......... , _'"
' Meili M (1991) The coupling of mercury and organic matter in the biogeochemical cycle - _" " •.towards a mechanistic model for the boreal forest zone. Water, Air Soil Pollut. 56:333-347 ....
Mierle G & Ingram R (1991) The role of humic substances in the mobilization of mercury _ ii!i!!:,_:_.from watersheds. Water, Air Soil Pollut. 56:349-357 , _i_....._. _ . ._.
Moore TR, Bubier JL, Heyes A & Flett RJ (1995) Methyl and total mercury in boreal wetland ' ::__ _;..plants, Experimental Lakes Area, Northwestern Ontario. J. Environ. Qual. 24:845-850 ii_'_
Mukherjee AB, Innanen S & Verta M (1995) An update on the mercury inventory and ....atmospheric mercury fluxes to and from Finland. Water, Air Soil Pollut. 80:255-264 " :" /
Munthe J, Hultberg H & Iverfeldt/_ (1995) Mechanisms of deposition of methylmercury and _ .g /'"mercury to coniferous forests. Water, Air Soil Pollut. 80:363-371 " j_:
Nater EA & Grigal DF (1992) Regional trends in mercury distribution across the Great Lakesstates, north central USA. Nature 358:139-141
Nyberg PR (1987) Soil Survey of Itasca County, Minnesota. USDA Soil Conservation Service., Government Printing Office, Washington, DC
• . Ohmann LE Grigal DE Shirley SR & Berguson WE (1994) Vegetative characteristics offive forest types across a lake states sulfate deposition gradient. USDA Forest Serviced
• Resource Bulletin NC- 154 _"
Pang SM (1997) Mercury in wood and wood fuels. MSc Thesis, University of Minnesota,
Minneapolis, MNPerala DA &Alban DH (1982) Biomass, nutrient distribution and litterfall in Populus, Pinus
and Picea stands on two different soils in Minnesota. Plant and Soil 64:177-192
o
,, , ° ,

109 " "
Rasmussefi PE (1994) Mercury in vegetation of the Precambrian Shield. In: Watras CJ &Huckabee JW (Eds) Mercury Pollution: Integration and Synthesis (pp 417-425). LewisPublishers, BocaRaton, FL
St. Louis VL, Rudd JWM, Kelly CA, Beaty KG, Bloom NS & Flett RJ (1994) Importance ofwetlands as sources of methyl mercury to boreal forest ecosystems. Can. J. Fish Aquat.Sci. 51" 1065-1076
St_ Louis VL, Rudd JWM, Kelly CA, Beaty KG, Flett RJ & Roulet N (1996) Production andlossof methylmercury and loss of total mercury from boreal forest catchments containingdifferent types of wetlands. Environ. Sci. Technol. 30:2719-2729
Swain EB, Engstrom DR, Brigham ME, Henning TA & Brezonik PL (1992) Increasing rates of ___.....atmospheric mercury deposition in midcontinental North America. Science 257" 784-787
* •Urban NR & Eisenreich SJ (1988) Nitrogen cycling in a forested Minnesota bog. Can. J. Bot. : :i_ii_ii!........ '66:435--449 " _'__ _
Urban NR, Eisenreich SJ, Grigal DF & Schurr KT (1990) Mobility and diagenesis of Pb and _-;_i "_:"_i_(:;,_ ,:_:ir -210pb inpeat. Geochimica et Cosmochimica Acta 54:3329-3346 _ ......_'_:_:;': ...... , .
U.S. Environmental Protection Agency (1992) Mercury in Water by Oxidation, Purge and _i_'_!< _ _i,__ o
Trap, and Cold Vapor Atomic Fluorescence Spectrometry (Method 1631, Revision B). :_:_,,:'_' _:_._ ' ."National Service Center for Environmental Publication and Information, Cincinnati, OH _:_.... : _:::__"_::_S'_
U.S. Environmental Protection Agency (1999) Methods for Evaluating Solid Waste (SW 846). _?_ ii?_?:__:_i.......... __ :!!' ,,,MicrowaveAssisted Acid Digestion of Siliceous and Organically Based Matrices (Method :_:_i_:{_ :_ .... .3052). U.S. Gov..Print. Office, Washington, DC _._:_ _ _ ,_,,:_. -
Verry ES (1984) Microtopography and water table fluctuation in a sphagnum mire. Proceed- _' •
ings 7th International Peat Congress, Dublin, Ireland (pp 11-31). 20-23 June. Irish
National Peat Committee for the International Peat Society, FinlandVerry ES & Timmons DR (1982) Waterborne nutrient flow through an upland-peatlandwatershed in Minnesota. Ecology 63(5)" 1456-1467 _:_._:__:'_:_5_: •
Zhang Li, Qi_ J & Planas D (1995a) Mercury concentrations in tree tings of black spruce "_'_'_:_:__--_ _" _'__-:" (Picea mariana Mill. B.S.P.) in boreal Quebec, Canada. Water, Air Soil Pollut. 81" 163.....
173 ' "
zhang Li, Planas D & Qian J (1995b) Mercury concentrations in black spruce (Picea mariana _Mill. B.S.P.) and lichens in boreal Quebec, Canada. Water, Air Soil Pollut. 81" 153-161 ....' ....
.. o


