Embed Size (px)
Citation preview

Mercury Accumulation in Sharks From the Coastal Watersof Southwest Florida
Darren Rumbold • Robert Wasno • Neil Hammerschlag •
Aswani Volety
Received: 6 November 2013 / Accepted: 20 May 2014
� Springer Science+Business Media New York 2014
Abstract As large long-lived predators, sharks are par-
ticularly vulnerable to exposure to methylmercury bio-
magnified through the marine food web. Accordingly,
nonlethal means were used to collect tissues for determining
mercury (Hg) concentrations and stable isotopes of carbon
(d13C) and nitrogen (d15N) from a total of 69 sharks,
comprising 7 species, caught off Southwest Florida from
May 2010 through June 2013. Species included blacknose
(Carcharhinus acronotus), blacktip (C. limbatus), bull (C.
leucas), great hammerhead (Sphyrna mokarran), lemon
(Negaprion brevirostris), sharpnose (Rhizoprionodon ter-
raenovae), and tiger sharks (Galeocerdo cuvier). The sharks
contained Hg concentrations in their muscle tissues ranging
from 0.19 mg/kg (wet-weight basis) in a tiger shark to
4.52 mg/kg in a blacktip shark. Individual differences in
total length and d13C explained much of the intraspecific
variation in Hg concentrations in blacknose, blacktip, and
sharpnose sharks, but similar patterns were not evident for
Hg and d15N. Interspecific differences in Hg concentration
were evident with greater concentrations in slower-grow-
ing, mature blacktip sharks and lower concentrations in
faster-growing, young tiger sharks than other species. These
results are consistent with previous studies reporting age-
dependent growth rate can be an important determinant of
intraspecific and interspecific patterns in Hg accumulation.
The Hg concentrations observed in these sharks, in partic-
ular the blacktip shark, also suggested that Hg may pose a
threat to shark health and fitness.
Many species of shark are long-lived, apex predators, often
occupying the highest trophic levels in marine communities
(Cortes 1999). As such, they are particularly vulnerable to
contaminants, such as methylmercury, that are efficiently
assimilated through diet but eliminated slowly; as a conse-
quence, there is an increase in concentration with increasing
trophic position (i.e., biomagnification). Hg pollution is a
global problem and, not surprisingly, sharks from different
regions from around the globe have been found to contain
high Hg levels in their tissues (Storelli et al. 2003; Garcia-
Hernandez et al. 2007; for review, see Barrera-Garcıa et al.
2012). This is also the case for sharks in the Gulf of Mexico
and coastal waters off Florida (Hueter et al. 1995; Ache et al.
2000; Adams et al. 2003; Evers et al. 2008), where Hg levels
are known to be increased in the marine food web (for
review, see Harris et al. 2012; Thera and Rumbold 2014).
The first advisory in Florida recommending limited con-
sumption of sharks due to Hg was issued on May 13 1991,
after shark sold in retail markets was found to contain Hg
levels as high as 3.9 mg/kg (Florida Department of Health
and Rehabilitative Services 1991; note, all concentrations
reported here are on wet-weight basis). A follow-up survey
completed in 1992 continued to find increased Hg, with
greater levels generally occurring in sharks from the
southern part of the state (Hueter et al. 1995). Currently, the
Florida Department of Health (FDOH) advises that woman
of childbearing age and young children not eat any shark; all
other individuals should limit consumption of smaller sharks
to one meal per month and not eat large sharks [C43 inches
or approximately 109 cm (FDOH 2013)]. This is consistent
D. Rumbold (&) � R. Wasno � A. Volety
Department of Marine and Ecological Sciences, Florida Gulf
Coast University, 10501 FGCU Blvd. South, Fort Myers,
FL 33965, USA
e-mail: [email protected]
N. Hammerschlag
Rosenstiel School of Marine and Atmospheric Science,
University of Miami, 4600 Rickenbacker Causeway, Miami,
FL 33149, USA
123
Arch Environ Contam Toxicol
DOI 10.1007/s00244-014-0050-6

with the joint consumption advisory issued by the United
States Environmental Protection Agency (USEPA) and the
United States Food and Drug Administration (USFDA) in
2004 (USEPA/USFDA 2004).
The health concern about Hg in fish tissues has in the
past focused chiefly on risk to human consumers. Emerging
evidence, however, has shown that increased Hg can
adversely impact the fish themselves, altering growth and
reproduction as well as altering behavior, including subtle
changes in the predator–prey relationship (for review, see
Sandheinrich and Wiener 2011; Depew et al. 2012). These
types of changes may subsequently initiate trophic cas-
cades, ultimately impacting ecosystem structure and func-
tion (Estes et al. 2011). Studies of the effect of Hg on
sharks are just beginning, but results hint at possible neu-
rochemical changes (Nam et al. 2011; Barrera-Garcıa et al.
2012) that may be a precursor to the appearance of more
overt symptoms of neurological damage and altered
behavior. It is therefore important that we better understand
the factors that influence the exposure, accumulation, and
impacts of Hg in sharks.
Accordingly, as part of the larger study on movements
of sharks satellite-tagged off the Gulf Coast of Florida
(Hammerschlag et al. 2012a, b), we collected tissues for
determining Hg using nonlethal means to investigate fac-
tors influencing both intraspecific and interspecific varia-
tion in biomagnified levels. In addition, because they have
proven useful in evaluating diet composition in sharks
(Shiffman et al. 2012), stable isotopes of nitrogen (d15N)
and carbon (d13C) were also measured in the shark tissues
from minimally invasive fin clips.
Methods
Tissue samples were collected from 69 sharks of 7 species
(Table 1) from the coastal waters (\10 km from shore) off
Lee County, Florida, from May 2010 through June 2013.
Sampling sites were selected based on reports from divers
or fisherpersons of shark occurrence and included artificial
reefs of concrete rubble (at a depth of 6–8 m), passes
between barrier islands (a depth of 3–5 m), and within Pine
Island Sound (a depth of 1–2 m). Sharks were captured
using baited drumlines following Gallagher et al. 2014.
Drumlines were left to soak for a period of 1.5 h before
being checked for shark presence.
On capture, sharks were maneuvered into a 2.5-m sling
and raised out of the water for processing before live
release. Mechanical ventilation was then immediately ini-
tiated by inserting an acrylic pipe, attached to a sub-
mersible pump, into the shark’s mouth to pump ambient
water across its gills. Sharks were then measured (e.g.,
precaudal, fork length, and total length, i.e., length from tip
of the snout to the tip of the dorsal caudal lobe) and tagged
with either an identification or satellite tag (for movements
based on satellite tags, see Hammerschlag et al. 2012a, b).
At the same time, a tissue plug (typically \8 mm in depth
and weighing\120 mg) was collected approximately 6 cm
below and lateral on the right side of the first dorsal fin
using a new disposable 8-mm diameter biopsy punch
(Premier Uni-punch, Plymouth Meeting, Pennsylvania) and
placed into a labeled cryovial. A fin clip (2–3 cm in length
and weighing approximately 1 g) was also cut from the
rear tip of the first dorsal fin using scissors and placed into
a labeled scintillation vial (note, in up to five instances the
sample was collected from the second dorsal). Sharks were
then released. Occasionally, smaller sharks were lifted into
the boat or processed in the water according to the same
protocol as described previously. Of the sharks processed
in the water, a few were biopsied on the left side of the
dorsal fin. These collections were performed under permits
from the Florida Fish and Wildlife Conservation Com-
mission (SAL-957 to UM and SAL-11-1347A-SRP to
FGCU) and Institutional Animal Care and Use Committee
Table 1 Mean (±1SD) Hg concentration, total length, isotopic ratios, and other metadata (samples size and % females) of sharks sampled off
SW Florida
Species n Females (%) Total length (cm) Hg (mg/kg) d15N (%) d13C (%)
Blacknose (C. acronotus) 11c 73 109.2 (±8.3)a 1.76 (±0.8)a 10.5 (±0.7)a -13.6 (±1.2)a
Blacktip (C. limbatus) 28 84 148.7 (±22.1)b 2.65 (±0.9)b 11.5 (±0.9)b -13.3 (±0.8)a
Bull (C. leucas) 7 43 185.4 (±29.8)bc 1.48 (±1.2)a 11.3 (±0.8)ab -13.2 (±1.3)a
Great hammerhead (S. mokarran) 4c 83 265.2 (±96.6)bc 1.65 (±0.4) 10.5 (±0.6)ab -12.3 (±1.8)a
Lemon (N. brevirostris) 2 50 247.2 (NA) 1.67 (NA) 11.6 (±0.2) -12.6 (±NA)
Sharpnose (R. terraenovae) 7 17 95.7 (±11.2)a 1.99 (±0.6)ab 10.8 (±0.5)ab -13.6 (±0.6)a
Tiger (G. cuvier) 8 75 246.2 (±31.3)c 0.37 (±0.3)c 11.4 (±1.2)ab -12.7 (±1.2)a
a ANOVA performed on ln[Hg] and did not include hammerhead or lemon sharks due to small sample size. Kruskal–Wallis ANOVA on ranks
was performed where data did not satisfy normality or variance requirementsb Species (where n [ 5) with similar letter designations did not differ significantly (Holm–Sidak or Dunn’s pairwise comparison test, p [ 0.5)c Sample size is for Hg analyses; fin clips (and total length) for isotopes were collected from 12 blacknose and 6 hammerheads
Arch Environ Contam Toxicol
123

(IACUC) Protocols No. 09-187 (UM) and No. 1112-05
(FGCU). In addition, samples were collected from the
carcasses of two sharks (a great hammerhead and bull)
salvaged from Fort Myers Beach. All samples were placed
on ice for transport back to the laboratory where they were
frozen at -20 �C pending analyses (which occurred within
3 months of collection).
In the laboratory, biopsy plugs were thawed and a
subsample of muscle (approximately 50 mg) removed
using care not to include the skin, and processed for Hg
analysis. Total-Hg (includes all forms of Hg) was deter-
mined at FGCU by way of thermal decomposition, gold
amalgamation, and atomic absorption spectrometry
(USEPA Method 7473) with a direct Hg analyzer (Nippon
Model MA-2000, College Station, TX, USA). Because
most Hg is in the form of methylmercury in muscle tissue
of fish, including sharks (Storelli et al. 2003; Nam et al.
2010; Pethybridge et al. 2010), total-Hg is considered
equivalent to methylmercury.
Calibration curves were generated using varying masses
of the following Certified Reference Materials (CRMs;
National Research Council Canada, Institute for National
Measurement Standards, Ottawa, ON, Canada): DOLT-3
(Dogfish Liver) or DORM-3 (Fish Protein) or DORM-4
(Fish Protein). These same CRMs, and in one case IAEA-
086 hair (International Atomic Energy Agency; Vienna,
Austria), were also used for continuing calibration verifi-
cation at the start and at the end of every batch of 20
samples; however, the CRMs used as the continuing cali-
bration verification (CCV) during a given run were dif-
ferent than CRMs used to generate that calibration curve.
The correlation coefficient of initial calibration averaged
0.9995 (C0.9986, n = 5). Percent recovery of continuing
calibration verification check samples was 111 % ± 9.2 %
(n = 17). Relative percent difference (RPD) between lab-
oratory duplicate analyses was 10.5 % ± 7 % (n = 6; note
that fish samples from another project run concurrently
often served as duplicate samples).
To examine aspects of shark diet on mercury accumu-
lation, stable isotope analysis of nitrogen and carbon was
performed on fin clips. Values of d15N can be used as a
tracer because organisms preferentially excrete the lighter
isotope and, as a consequence, the heavier isotope becomes
enriched in consumers relative to their diet. Diet-tissue
discrimination factors are highly variable, however,
depending on the taxon (for review, see Hussey et al.
2012). Unlike 15N, 13C exhibits little enrichment in con-
sumers relative to their diet (i.e., it has a relatively small
diet-tissue discrimination factor, approximately 1 %,).
However, d13C signatures of primary producers are rela-
tively distinct and can often provide information on carbon
source and foraging location (Hobson 1999; Hussey et al.
2012). Collected fin clips were oven-dried at 60 �C for at
least 48 h, then ground with a mortar and pestle into a fine
power for analysis of carbon and nitrogen isotopes by a
contract laboratory using an elemental analyzer interfaced
with an isotope ratio mass spectrometer (IRMS). The
majority of samples (n = 50) were sent to University of
California Davis Stable Isotope Facility (Davis, CA, USA).
In the last year of the study 20 samples were sent to Uni-
versity of South Florida Stable Isotope Laboratory (Tampa,
FL, USA). By convention, isotope ratios were expressed in
d notation as parts per thousand 13C values (%) referenced
to PeeDee Belemnite, and d15N values (%) were refer-
enced to air. Quality-control check samples at UC Davis
included replicate analyses of five internal standard refer-
ence materials (e.g., glutamic acid [G-9]; nylon [G-11];
glutamic acid, enriched [G12]; bovine liver [G-13]; and
USGS-41 glutamic acid [G-17]). Absolute deviations from
the accepted value averaged 0.05 ± 0.046 %(mean ± 1SD) for the d13C standards (n = 173) and
0.13 ± 0.108 % for the d15N standards (n = 175). Qual-
ity-control check samples at the University of South Flor-
ida included two standard reference materials (e.g.,
Elemental Microanalysis [B2155] and International Atomic
Energy Agency [IAEA-N1]). Absolute deviations from the
accepted value averaged 0.047 ± 0.046 % for the d13C
standards (n = 32) and 0.067 ± 0.068 % for the d15N
standards (n = 41). In addition, duplicate samples were
sent to both laboratories to assess precision. RPD among
duplicates averaged 0.7 ± 0.6 % for d13C and 2.5 ± 1.8 %
for d15N (n = 5) at UC Davis and 0.4 ± 0.3 % for d13C
and 0.44 ± 0.34 % for d15N (n = 6; note that muscle tis-
sue from teleosts from another project run concurrently
often served as duplicate samples).
Unless otherwise noted, total-Hg concentration (here-
after designated as [Hg]) was reported in mg/kg on a wet-
weight basis. Ideally, an analysis of covariance
(ANCOVA) or other multivariate techniques would be
used to simultaneously assess the significance of various
factors on the pattern of total-Hg accumulation. The use of
ANCOVA and these other techniques is, however, predi-
cated on several critical assumptions (for review, see Zar
1996), including sufficient sample size and range in the
covariate that was not achieved in this study. Instead, one-
way analysis of variance (ANOVA) was used to assess
interspecific patterns in [Hg], size, and stable isotopes
separately. Assumptions of normality and equal variances
were tested by Kolmorogov–Smirnov and Levene median
test, respectively. Where necessary, [Hg] was natural-log-
transformed (ln) to achieve normality or homogeneity of
variance; similarly, where necessary, d15N was square root-
transformed to satisfy these assumptions. Where transfor-
mations failed to achieve normality, Kruskal–Wallis
ANOVA on ranks was used. Small sample size and skewed
sex ratios precluded examining the effect of sex on Hg
Arch Environ Contam Toxicol
123

levels. Simple linear regression was used to examine how
well the continuous variables, e.g., total length, d15N, and
d13C, explained the variance in [Hg] (based on the coeffi-
cient of determination [R2]). ANOVAs and regressions
were performed only where sample size (n) for a species
was C5 (Table 1). Data analyses were performed using
SigmaStat for Windows Version 3.5 software (Systat
Software).
Results and Discussion
Sharks captured along Florida’s southwest (SW) coast
contained [Hg] in their muscle tissues ranging from
0.19 mg/kg in a tiger shark to 4.52 mg/kg in a blacktip
shark. Concentrations of Hg differed among species
(ANOVA on ln[Hg], F = 28.4; degrees of freedom
[df] = 4,56; p \ 0.001) with average levels significantly
greater in blacktip sharks and lower in tiger sharks than
several other species (Table 1). Average [Hg] in the pres-
ent study was often greater than previous reports for
Florida sharks (Table 2). However, both intraspecific and
interspecific variation in the concentrations of biomagni-
fied contaminants, such as methylmercury, are driven by
complex interactions of myriad biological traits (e.g., diet
composition, trophic position, bioenergetics, age, size, and
growth rate; Wren et al. 1991; Simoneau et al. 2005; Trudel
and Rasmussen 2006). Caution must therefore be exercised
when making either intraspecific or interspecific compari-
sons because even small differences in the distributions of
these traits between sampled populations can create mis-
leading patterns leading to erroneous conclusions. Careful
examination of observed patterns can, however, provide
important insights regarding differences in the biology of
these species (McMeans et al. 2010). Comparing collec-
tions separated in space and time must also be performed
cautiously because levels of biomagnified Hg are spatially
and temporally highly variable (Lowery and Garrett 2005;
Rumbold et al. 2008; Harris et al. 2012). Shark populations
in Florida waters, for example, have been reported to
exhibit spatial patterns in [Hg] (Hueter et al. 1995; Adams
et al. 2003) despite far-ranging movements of individuals
that would suggest exposure is integrated over large areas.
Variation in [Hg] among teleosts (as well as other taxa),
both intraspecific and interspecific, are commonly attrib-
uted to even slight differences in trophic position as indi-
cated by stomach content analysis or differences in d15N
(Mathers and Johansen 1985; Cabana and Rasmussen
1994; Kidd et al. 1995; Vander Zanden and Rasmussen
1996). In the present study, d15N ranged from 8.62 to
14.09 % in sharks pooled across species [a range of
5.47 % (Fig. 1a)] possibly indicating a broad range of
trophic positions. However, as discussed later in the text,
uncertainties remain regarding the interpretation of d15N in
sharks. Mean d15N enrichment for the five species ranged
only from 10.5 to 11.6 %, and although d15N differed
among species (ANOVA on square root-transformed d15N;
F = 3.49, df = 5,61; p = 0.008), only blacknose and
blacktip sharks differed significantly in pairwise compari-
sons (Table 1). The narrow range in average d15N among
these sharks is in agreement with the relatively narrow
range of trophic levels assigned to these species by Cortes
(1999). The interspecific patterns in average d15N
(Table 1) did not correspond perfectly, however, with his
assigned trophic levels (4.0 for sharpnose sharks, 4.1 for
tiger sharks, 4.2 for blacknose, blacktip, and lemon, and 4.3
for hammerhead sharks). Given that these few species were
not trophically very distant and considering the degree of
intraspecific variation, it was not surprising that only one
pairwise comparison in d15N (for the two species with
largest samples sizes) was statistically significant. It was
noteworthy that this difference was between blacknose and
Table 2 Mean Hg levels (mg/kg, ±1SD or, if SD not reported, maximum and sample size) previously reported for shark species caught off
South Florida
Species Hueter et al. (1995)a Ache et al. (2000) Adams et al. (2003) Evers et al. (2008) Present study
SW Florida Gulf of Mexico Charlotte Harbor, Florida Florida Bay SW Florida
Blacknose 0.53 ± 0.13 (n = 2) 0.35 (n = 1) 1.76 ± 0.8 (n = 11)
Blacktip 1.06 ± 0.8 (n = 2) 0.86 ± 0.6 (n = 73)b 0.79 \ 1.6 (n = 12) 3.31 ± 0.6 (n = 4) 2.65 ± 0.9 (n = 28)
Bull 1.11 ± 0.3 (n = 15) 0.97 \ 1.3 (n = 3) 1.47 ± 1.2 (n = 7)
Great hammerhead 1.54 ± 0.5 (n = 4)
Lemon 0.7, \ 1.1 (n = 3) 0.6 ± 0.35 (n = 8) 1.67 \ 1.69 (n = 2)
Sharpnose 1.06, \ 2.3 (n = 81)c 0.56 ± 0.52 (n = 38) 1.99 ± 0.6 (n = 7)
Tiger 0.26 ± 0.2 (n = 3)d 0.37 ± 0.3 (n = 8)
a Hueter et al. (1995) determined Hg as methylmercuryb Grand mean of site means reported by Ache et al. (2000) for multiple sharks caught at 18 locations around Floridac Sharpnose sharks captured in Indian River Lagoon (Adams et al. 2003)d Tiger sharks caught off northeast Florida (Hueter et al. 1995)
Arch Environ Contam Toxicol
123
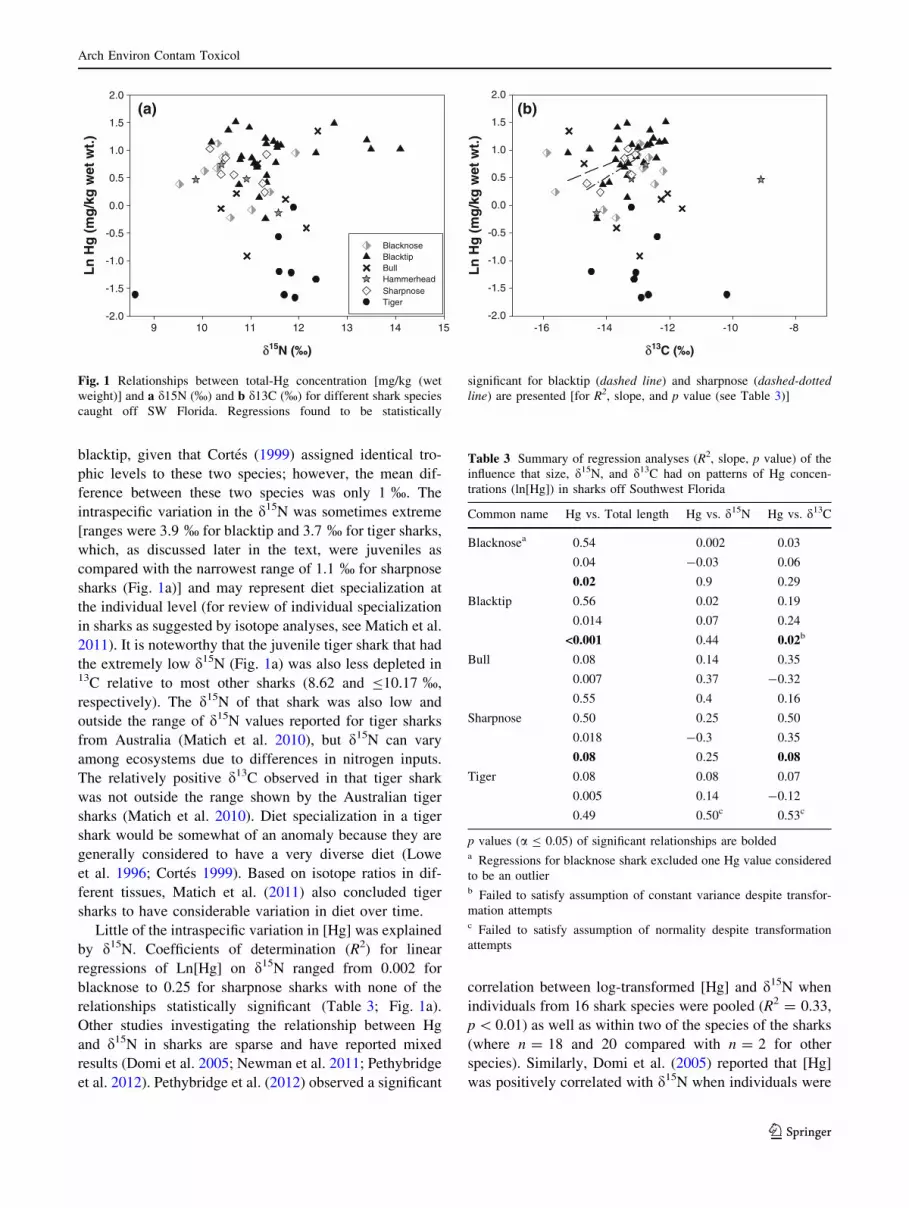
blacktip, given that Cortes (1999) assigned identical tro-
phic levels to these two species; however, the mean dif-
ference between these two species was only 1 %. The
intraspecific variation in the d15N was sometimes extreme
[ranges were 3.9 % for blacktip and 3.7 % for tiger sharks,
which, as discussed later in the text, were juveniles as
compared with the narrowest range of 1.1 % for sharpnose
sharks (Fig. 1a)] and may represent diet specialization at
the individual level (for review of individual specialization
in sharks as suggested by isotope analyses, see Matich et al.
2011). It is noteworthy that the juvenile tiger shark that had
the extremely low d15N (Fig. 1a) was also less depleted in13C relative to most other sharks (8.62 and B10.17 %,
respectively). The d15N of that shark was also low and
outside the range of d15N values reported for tiger sharks
from Australia (Matich et al. 2010), but d15N can vary
among ecosystems due to differences in nitrogen inputs.
The relatively positive d13C observed in that tiger shark
was not outside the range shown by the Australian tiger
sharks (Matich et al. 2010). Diet specialization in a tiger
shark would be somewhat of an anomaly because they are
generally considered to have a very diverse diet (Lowe
et al. 1996; Cortes 1999). Based on isotope ratios in dif-
ferent tissues, Matich et al. (2011) also concluded tiger
sharks to have considerable variation in diet over time.
Little of the intraspecific variation in [Hg] was explained
by d15N. Coefficients of determination (R2) for linear
regressions of Ln[Hg] on d15N ranged from 0.002 for
blacknose to 0.25 for sharpnose sharks with none of the
relationships statistically significant (Table 3; Fig. 1a).
Other studies investigating the relationship between Hg
and d15N in sharks are sparse and have reported mixed
results (Domi et al. 2005; Newman et al. 2011; Pethybridge
et al. 2012). Pethybridge et al. (2012) observed a significant
correlation between log-transformed [Hg] and d15N when
individuals from 16 shark species were pooled (R2 = 0.33,
p \ 0.01) as well as within two of the species of the sharks
(where n = 18 and 20 compared with n = 2 for other
species). Similarly, Domi et al. (2005) reported that [Hg]
was positively correlated with d15N when individuals were
Ln
Hg
(m
g/k
g w
et w
t.)
-2.0
-1.5
-1.0
-0.5
0.0
0.5
1.0
1.5
2.0
9 10 11 12 13 14 15 -16 -14 -12 -10 -8
Ln
Hg
(m
g/k
g w
et w
t.)
-2.0
-1.5
-1.0
-0.5
0.0
0.5
1.0
1.5
2.0
BlacknoseBlacktipBullHammerheadSharpnoseTiger
(b)(a)
δ15N (‰) δ13C (‰)
Fig. 1 Relationships between total-Hg concentration [mg/kg (wet
weight)] and a d15N (%) and b d13C (%) for different shark species
caught off SW Florida. Regressions found to be statistically
significant for blacktip (dashed line) and sharpnose (dashed-dotted
line) are presented [for R2, slope, and p value (see Table 3)]
Table 3 Summary of regression analyses (R2, slope, p value) of the
influence that size, d15N, and d13C had on patterns of Hg concen-
trations (ln[Hg]) in sharks off Southwest Florida
Common name Hg vs. Total length Hg vs. d15N Hg vs. d13C
Blacknosea 0.54 0.002 0.03
0.04 -0.03 0.06
0.02 0.9 0.29
Blacktip 0.56 0.02 0.19
0.014 0.07 0.24
<0.001 0.44 0.02b
Bull 0.08 0.14 0.35
0.007 0.37 -0.32
0.55 0.4 0.16
Sharpnose 0.50 0.25 0.50
0.018 -0.3 0.35
0.08 0.25 0.08
Tiger 0.08 0.08 0.07
0.005 0.14 -0.12
0.49 0.50c 0.53c
p values (a B 0.05) of significant relationships are boldeda Regressions for blacknose shark excluded one Hg value considered
to be an outlierb Failed to satisfy assumption of constant variance despite transfor-
mation attemptsc Failed to satisfy assumption of normality despite transformation
attempts
Arch Environ Contam Toxicol
123

pooled across five species (n = 6 to 8 for each species with
total n = 34); however, only one of the five species
(n = 6) exhibited a significant relationship when consid-
ered alone. Similarly, Newman et al. (2011) observed a
strong relationship between [Hg] and d15N in only one of
three shark species they examined. Nonetheless, the lack of
a significant relationship between Ln[Hg] on d15N for
individuals within any of the species examined in the
present study was perplexing, even more so considering the
variation in Hg apparently explained by trends in d13C.
In the present study, average d13C did not differ among
species (ANOVA on ranks, H = 6.0, df = 5, p = 0.3).
Yet, when Ln[Hg] was regressed on d13C %, both blacktip
and sharpnose sharks exhibited statistically significant,
positive slopes with an R2 as high as 0.50 for the rela-
tionship in the sharpnose sharks (Table 3) despite having
d13C ranges that overlapped other species (Fig. 1b). Values
of d13C typically show a positive relationship (i.e.,
becoming less negative) with increasing salinity (Fry 2002;
Matich et al. 2011). In the present study, values of d13C %ranged from -15.9 to -9.09 % in individual sharks
(Fig. 1b), suggesting coastal food webs (i.e., as opposed to
estuarine/freshwater). This was not a surprise given that
with the exception of bull sharks, which can enter fresh-
water, and juvenile blacktips, which can enter estuaries,
most of these species are marine. All other things being
equal, a positive slope for Ln[Hg] regressed on d13C %could indicate increasing Hg exposure with increasing
marine carbon source, which seems counter-intuitive con-
sidering decreasing gradients in Hg levels in biota from
freshwater to marine that have been observed in SW
Florida estuaries [Rumbold (unpublished data)]. Alterna-
tively, d13C-enrichment has also been reported in organ-
isms that obtain proportionally more carbon from benthic
food webs (Fry 1988; Takai et al. 2002). Given that Hg
methylation has been observed in shelf sediments (Hollweg
et al. 2010), this seems a more plausible explanation for the
positive trends observed in the present study.
Many uncertainties remain, however, regarding the
interpretation of stable isotopes in sharks (for review, see
Hussey et al. 2012; Shiffman et al. 2012). Matich et al.
(2010) recently wrote that ‘‘our understanding and
application of stable isotopes in elasmobranchs is still in
its infancy.’’ Some have argued that additional data on
d15N and diet and trophic position is required in sharks
before we can properly interpret patterns (Fisk et al.
2002; Matich et al. 2010). At this point, interpretation of
both 15N and 13C is thought to be dependent on balance
between the rate of isotope incorporation and turnover
time for the particular tissue analyzed (Matich et al.
2010; Hussey et al. 2012). Turnover rates for d15N and
d13C are slow in sharks relative to those of fish and vary
among tissues (Hussey et al. 2012). Furthermore, there is
no reason to believe that rates of isotope incorporation
correspond to uptake or clearance rates of Hg. The
results of the present study determined [Hg] in muscle
and stable isotopes in fin clips. Because these metaboli-
cally distinct tissues likely require different amounts of
time to reach equilibrium for stable isotopes (Matich
et al. 2010) and Hg, they may not have been in equi-
librium if prey switching had recently occurred (due to
new habitat or ontogenetic shifts). Thus, these results
must be interpreted cautiously.
Body size, because of its ease in measurement, is rou-
tinely assessed as a covariant for explaining intraspecific
and interspecific variation in [Hg] both for its relationship
with trophic position (as discussed later in the text) and as a
proxy for age (in intraspecific comparisons) and other age-
dependent traits (e.g., change in bioenergetics at maturity,
etc.). Because teleosts are gape-limited predators, body size
is an important trait in determining predator–prey rela-
tionships and can result in ontogenetic shifts in diet as the
individual grows larger. Although few shark species are
gape-limited (Wilga et al. 2007), other factors (e.g., hunt-
ing ability, changing energy demands, prey availability,
etc.) can result in size being an important determinant for
diet (Lowe et al. 1996; for review, see Lucifora et al. 2009).
In his extensive review of diet composition and trophic
levels of [149 shark species, Cortes (1999) found a posi-
tive correlation between assigned trophic level and average
total length of species (correlation coefficient, rs, as high as
0.41 when three predominantly zooplanktivorous species
were removed from the analyses). It is not surprising then
that surveys of Hg in sharks have frequently found
increasing levels with increasing body size (Hueter et al.
1995; Adams and McMichael 1999; Lacerda et al. 2000;
Penedo de Pinho et al. 2002; Branco et al. 2007; Cai et al.
2007; Pethybridge et al. 2010).
Although statistical analyses, such as ANCOVA, were
unavailable to make these comparisons for the reasons
outlined in the methods and due to a lack of published
metadata, size can be qualitatively considered when com-
paring [Hg] in sharks of the present study and previous
reports (Table 2). The most robust comparison (due to
large sample size) would have been between blacktips in
the present study and the article by Ache et al. (2000);
however, they did not report sizes and reported mean
concentrations for sharks caught at different locations
(value listed in Table 2 is the grand mean of site means).
Where length could be ascertained in the published reports,
sharks with lower concentrations than the present study
(blacktip and sharpnose: Adams et al. 2003; Lemon and
Sharpnose: Evers et al. 2008; Table 2) were smaller on
average. Sharks with reportedly greater concentrations than
the present study, i.e., blacktip sharks (Evers et al. 2008;
Table 2), were on average larger in size.
Arch Environ Contam Toxicol
123
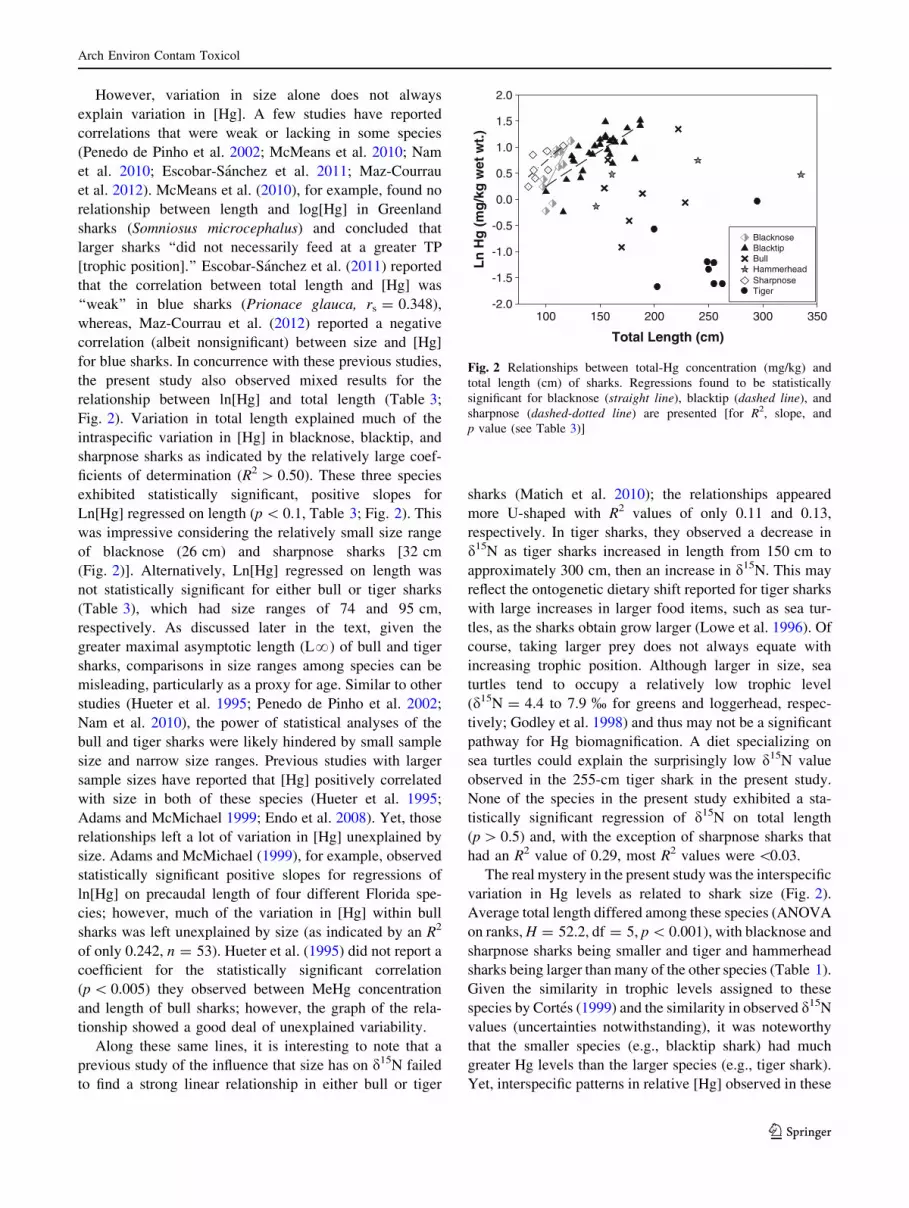
However, variation in size alone does not always
explain variation in [Hg]. A few studies have reported
correlations that were weak or lacking in some species
(Penedo de Pinho et al. 2002; McMeans et al. 2010; Nam
et al. 2010; Escobar-Sanchez et al. 2011; Maz-Courrau
et al. 2012). McMeans et al. (2010), for example, found no
relationship between length and log[Hg] in Greenland
sharks (Somniosus microcephalus) and concluded that
larger sharks ‘‘did not necessarily feed at a greater TP
[trophic position].’’ Escobar-Sanchez et al. (2011) reported
that the correlation between total length and [Hg] was
‘‘weak’’ in blue sharks (Prionace glauca, rs = 0.348),
whereas, Maz-Courrau et al. (2012) reported a negative
correlation (albeit nonsignificant) between size and [Hg]
for blue sharks. In concurrence with these previous studies,
the present study also observed mixed results for the
relationship between ln[Hg] and total length (Table 3;
Fig. 2). Variation in total length explained much of the
intraspecific variation in [Hg] in blacknose, blacktip, and
sharpnose sharks as indicated by the relatively large coef-
ficients of determination (R2 [ 0.50). These three species
exhibited statistically significant, positive slopes for
Ln[Hg] regressed on length (p \ 0.1, Table 3; Fig. 2). This
was impressive considering the relatively small size range
of blacknose (26 cm) and sharpnose sharks [32 cm
(Fig. 2)]. Alternatively, Ln[Hg] regressed on length was
not statistically significant for either bull or tiger sharks
(Table 3), which had size ranges of 74 and 95 cm,
respectively. As discussed later in the text, given the
greater maximal asymptotic length (L?) of bull and tiger
sharks, comparisons in size ranges among species can be
misleading, particularly as a proxy for age. Similar to other
studies (Hueter et al. 1995; Penedo de Pinho et al. 2002;
Nam et al. 2010), the power of statistical analyses of the
bull and tiger sharks were likely hindered by small sample
size and narrow size ranges. Previous studies with larger
sample sizes have reported that [Hg] positively correlated
with size in both of these species (Hueter et al. 1995;
Adams and McMichael 1999; Endo et al. 2008). Yet, those
relationships left a lot of variation in [Hg] unexplained by
size. Adams and McMichael (1999), for example, observed
statistically significant positive slopes for regressions of
ln[Hg] on precaudal length of four different Florida spe-
cies; however, much of the variation in [Hg] within bull
sharks was left unexplained by size (as indicated by an R2
of only 0.242, n = 53). Hueter et al. (1995) did not report a
coefficient for the statistically significant correlation
(p \ 0.005) they observed between MeHg concentration
and length of bull sharks; however, the graph of the rela-
tionship showed a good deal of unexplained variability.
Along these same lines, it is interesting to note that a
previous study of the influence that size has on d15N failed
to find a strong linear relationship in either bull or tiger
sharks (Matich et al. 2010); the relationships appeared
more U-shaped with R2 values of only 0.11 and 0.13,
respectively. In tiger sharks, they observed a decrease in
d15N as tiger sharks increased in length from 150 cm to
approximately 300 cm, then an increase in d15N. This may
reflect the ontogenetic dietary shift reported for tiger sharks
with large increases in larger food items, such as sea tur-
tles, as the sharks obtain grow larger (Lowe et al. 1996). Of
course, taking larger prey does not always equate with
increasing trophic position. Although larger in size, sea
turtles tend to occupy a relatively low trophic level
(d15N = 4.4 to 7.9 % for greens and loggerhead, respec-
tively; Godley et al. 1998) and thus may not be a significant
pathway for Hg biomagnification. A diet specializing on
sea turtles could explain the surprisingly low d15N value
observed in the 255-cm tiger shark in the present study.
None of the species in the present study exhibited a sta-
tistically significant regression of d15N on total length
(p [ 0.5) and, with the exception of sharpnose sharks that
had an R2 value of 0.29, most R2 values were \0.03.
The real mystery in the present study was the interspecific
variation in Hg levels as related to shark size (Fig. 2).
Average total length differed among these species (ANOVA
on ranks, H = 52.2, df = 5, p \ 0.001), with blacknose and
sharpnose sharks being smaller and tiger and hammerhead
sharks being larger than many of the other species (Table 1).
Given the similarity in trophic levels assigned to these
species by Cortes (1999) and the similarity in observed d15N
values (uncertainties notwithstanding), it was noteworthy
that the smaller species (e.g., blacktip shark) had much
greater Hg levels than the larger species (e.g., tiger shark).
Yet, interspecific patterns in relative [Hg] observed in these
Total Length (cm)
100 150 200 250 300 350
Ln
Hg
(m
g/k
g w
et w
t.)
-2.0
-1.5
-1.0
-0.5
0.0
0.5
1.0
1.5
2.0
BlacknoseBlacktipBullHammerheadSharpnoseTiger
Fig. 2 Relationships between total-Hg concentration (mg/kg) and
total length (cm) of sharks. Regressions found to be statistically
significant for blacknose (straight line), blacktip (dashed line), and
sharpnose (dashed-dotted line) are presented [for R2, slope, and
p value (see Table 3)]
Arch Environ Contam Toxicol
123

sharks were generally consistent with previous findings
reported in the literature where these species were caught
contemporaneously from the same locale (i.e., to avoid
confusion with possible spatial patterns or temporal trends in
Hg availability; Table 2 and references therein). Although
sample size was limited, Hueter et al. (1995) reported that
blacktip sharks had levels similar to those of bull sharks and
much greater than those of tiger sharks. Likewise, Adams
et al. (2003) also found sporadically high Hg levels in
individual blacktip sharks; however, mean [Hg] in blacktips
were similar to or lower than that of bull sharks caught in the
same area. In a study off of Australia, Lyle (1986) also found
blacktip sharks (1.85 ± 0.8, n = 15) to have greater Hg
levels than tiger sharks (0.77 ± 0.3, n = 6), even though the
tiger sharks were larger; of the 10 species that Lyle (1986)
collected, blacktip sharks had the highest Hg levels.
Although they did not capture any blacktip sharks, Endo
et al. (2008) found tiger sharks off Japan to have the lowest
mean [Hg] (0.78 ± 0.29 mg/kg) among four species sam-
pled. More recently, Evers et al. (2008) found blacktip
sharks caught in Florida Bay to have much greater [Hg]
compared with three other sympatric species (Table 2);
however, the sample size was small. Clearly, factors other
than size must be playing a larger role in determining the
patterns in tissue [Hg] observed in the present study.
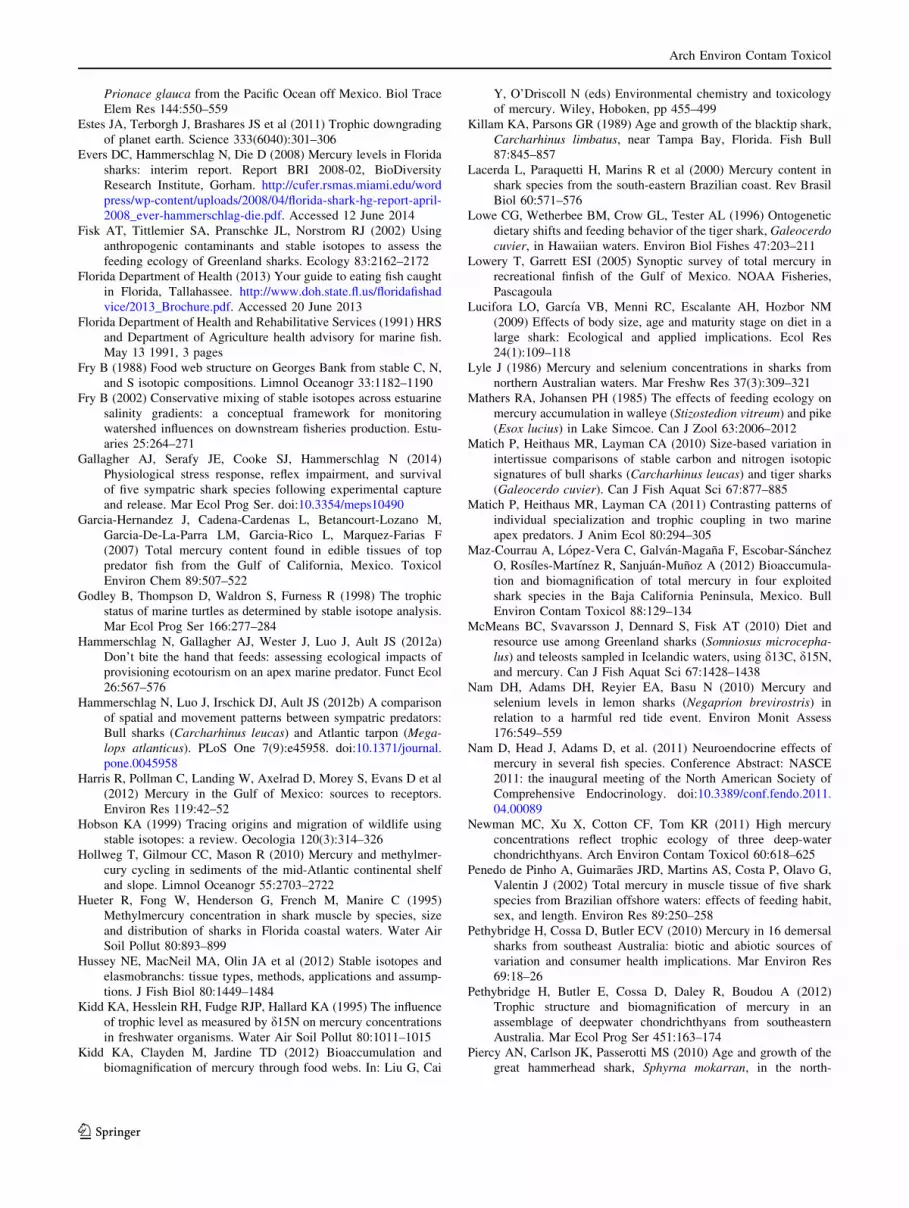
Increased age has long been known to lead to increased
[Hg] in teleosts simply as a result of increased time of
exposure, but age also represents a ‘‘master variable’’
controlling many physiological and morphological changes
that could affect Hg accumulation (Bache et al. 1971; Scott
1974; for review, see Trudel and Rasmussen 2006).
Accordingly, published length-at-age models were used to
gauge the approximate age and growth pattern of the sharks
(Fig. 3); however, it should be noted that uncertainty
regarding a specific age estimate increases dramatically for
individuals that have reached the asymptotic growth phase.
Close examination of the length-at-age models plots
(Fig. 3) shows that these species have very different
growth patterns and that the captured tiger sharks were all
on the exponential segment of the sigmoidal growth curve
(i.e., juveniles), whereas many of the blacktip and black-
nose sharks had reached the asymptote (i.e., mature,
Fig. 3). This suggests that the age-dependent rate of growth
may have influenced both the interspecific and intraspecific
patterns in Hg accumulation. Clearly, the study would have
benefited if we had been able to capture larger, older tiger
sharks that had reached the asymptotic growth phase. We
can, however, look for corroborative evidence in the study
of tiger sharks off of Japan by Endo et al. (2008). They
observed a rapid (exponential) increase in hepatic [Hg] in
the tiger sharks once they reached approximately 270 cm
in length. They concluded that the rapid increase likely
resulted from the continuous intake of Hg as growth rate
slowed at the onset of maturity of the sharks (Endo et al.
2008). Penedo de Pinho et al. (2002) speculated that
younger sharks in their survey also had lower [Hg] than
adults because, in addition to shorter exposures, young
individuals had greater growth rates than adults resulting in
growth dilution. Others have speculated that, in addition to
possible clearance through maternal transfer, observed
differences in [Hg] between male and female sharks might
also be due to sex-specific differences in growth rate (Lyle
1986; Penedo de Pinho et al. 2002; Pethybridge et al.
2010). Although sex effects could not be adequately
assessed in the present study because of the clear bias
toward females in the captured sharks (Table 1), and the
small sample size and the presence of other covariants that
prevented ANCOVA), they should be considered when
making comparisons with other studies that may have had
different sex ratios in sampled populations. A number of
studies of teleosts have also reported a negative correlation
between [Hg] and growth rate because fast-growing fish
dilute their mercury burdens, especially in shorter-lived
species (Simoneau et al. 2005; Adams 2009; Swanson et al.
2006; for review, see Kidd et al. 2012). Rapid growth by
itself would not, however, explain lower [Hg] if the met-
abolic requirements and activity costs associated with this
rapid growth were accompanied by increased consumption
of Hg-contaminated prey. It is instead a balance between
Modeled Age (yrs) 0 5 10 15 20 25 40
Mo
del
ed L
eng
th (
cm)
50
100
150
200
250
300
350
400
Blacktip Female
Blacktip Male
Hammerhead Female
Hammerhead Male
Sharpnose
Blacknose
Bull
Tiger
Fig. 3 Observed lengths of captured sharks (symbols) overlain on
length-at-age models for the different species from the published
literature (Branstetter 1987; Branstetter and Stiles 1987; Branstetter
et al. 1987; Killam and Parsons 1989; Piercy et al. 2010; Barreto et al.
2011)
Arch Environ Contam Toxicol
123

food-consumption rates, food-conversion efficiency (i.e.,
the ratio of growth to consumption rates), and how the
energy budget is allocated (i.e., growth or activity; for
review, see Trudel and Rasmussen 2006).
As stated previously, studies of the effect that Hg has on
sharks have only just begun (Nam et al. 2011; Barrera-Garcıa
et al. 2012). Levels observed in the present study were, how-
ever, much greater than a critical tissue [Hg] suggested for
teleosts (i.e., 0.3 mg/kg, Dillon et al. 2010; Sandheinrich and
Wiener 2011). A recent study by Adams et al. (2010) found
spotted seatrout (Cynoscion nebulosus) in South Florida to
have pathological and biochemical changes associated with
increased [Hg] (0.56 ± 0.15 mg/kg) compared with seatrout
from a reference area. Average [Hg] in blacktip sharks of the
present study were almost 5 times greater than the levels
observed in the seatrout exhibiting pathological changes.
Methylmercury, principally from maternal transfer, is also
known to affect the survival and development of embryo-larval
stages of fish (for review, see Wiener et al. 2003). The early life
stage of fish, as in many other taxa, has been found to be the
most sensitive to the toxic insults of Hg (Wiener et al. 2003). If
this life stage is similarly sensitive in sharks, then species such
as Carcharhinus spp., which are viviparous with a placenta (as
opposed to aplacental species or species that are ovovivipa-
rous), are likely at much greater risk from maternal transfer.
Blacktip sharks are, for example, a viviparous, placental shark.
Although their embryos are lecithotrophic (i.e., nourished by
yolk) for the first 8 weeks, after implantation in the uterine wall
they are thought to have placental connection with the mother
for the remaining 9 months of gestation (Castro 1996). In a
survey of Hg levels in embryos of three Carcharhinid and one
Sphyrnid sharks, Adams and McMichael (1999) found the
highest [Hg] (mean of 0.69 ± 0.08 mg/kg) in four embryos in
a blacktip female (which had a tissue [Hg] of 2.3 mg/kg).
Considering the Hg levels observed in the present study ranged
as high as 4.52 mg/kg in blacktips, this species could be at risk
of toxicity to the embryo-larval stage and, thus, further moni-
toring is warranted.
Acknowledgments Funding for this work was provided by the West
Coast Inland Navigation District and the RJ Dunlap Marine Conser-
vation Program (RJD) at the University of Miami. For field support,
we thank Curt Slonim as well as all RJD and FGCU students, par-
ticularly Matt Nicholson, Samantha Hagen, Katherine Branciforte,
Virginia Ansaldi, and Austin Gallagher. We also thank the two
anonymous reviewers for comments that improved the manuscript.
References
Ache B, Boyle J, Morse C (2000) A survey of the occurrence of
mercury in the fishery resources of the Gulf of Mexico. Prepared
by Battelle for the U.S. EPA Gulf of Mexico Program, Stennis
Space Center, Hancock
Adams DH (2009) Consistently low mercury concentrations in
dolphinfish, Coryphaena hippurus, an oceanic pelagic predator.
Environ Res 109:697–701
Adams DH, McMichael RH Jr (1999) Mercury levels in four species
of sharks from the Atlantic coast of Florida. Fish Bull
97:372–379
Adams DH, McMichael RH Jr, Henderson GE (2003) Mercury levels
in marine and estuarine fishes of Florida 1989-2001. Florida
Marine Research Institute, FMRI Technical Report TR-6, p 57
Adams DH, Sonne C, Basu N et al (2010) Mercury contamination in
spotted seatrout, Cynoscion nebulosus: an assessment of liver,
kidney, blood, and nervous system health. Sci Total Environ
408(23):5808–5816
Bache C, Gutenmann W, Lisk D (1971) Residues of total mercury and
methylmercuric salts in lake trout as a function of age. Science
172:951–952
Barrera-Garcıa A, O’Hara T, Galvan-Magana F, Mendez-Rodrıguez
LC, Castellini JM, Zenteno-Savın T (2012) Oxidative stress
indicators and trace elements in the blue shark (Prionace glauca)
off the east coast of the Mexican Pacific Ocean. Comp Biochem
Physiol C Toxicol Pharmacol 156:59–66
Barreto RR, Lessa RP, Hazin FH, Santana FM (2011) Age and growth
of the blacknose shark, Carcharhinus acronotus (Poey 1860) off
the northeastern Brazilian Coast. Fish Res 110:170–176
Branco V, Vale C, Canario J, Santos MN (2007) Mercury and
selenium in blue shark (Prionace glauca, L. 1758) and swordfish
(Xiphias gladius, L. 1758) from two areas of the Atlantic Ocean.
Environ Pollut 150:373–380
Branstetter S (1987) Age and growth validation of newborn sharks
held in laboratory aquaria, with comments on the life history of
the Atlantic sharpnose shark, Rhizoprionodon terraenovae.
Copeia 2:291–300
Branstetter S, Stiles R (1987) Age and growth estimates of the bull
shark, Carcharhinus leucas, from the northern Gulf of Mexico.
Environ Biol Fishes 20:169–181
Branstetter S, Musick J, Colvocoresses J (1987) A comparison of the
age and growth of the tiger shark, Galeocerdo cuvieri, from off
Virginia and from the northwestern Gulf of Mexico. Fish Bull
85(2):269–279
Cabana G, Rasmussen JB (1994) Modelling food chain structure and
contaminant bioaccumulation using stable nitrogen isotopes.
Nature 372:255–257
Cai Y, Rooker JR, Gill GA, Turner JP (2007) Bioaccumulation of
mercury in pelagic fishes from the northern Gulf of Mexico. Can
J Fish Aquat Sci 64:458–469
Castro JI (1996) Biology of the blacktip shark, Carcharhinus
limbatus, off the southeastern United States. Bull Mar Sci
59:508–522
Cortes E (1999) Standardized diet compositions and trophic levels of
sharks. ICES J Mar Sci 56:707
Depew DC, Basu N, Burgess NM et al (2012) Toxicity of dietary
methylmercury to fish: derivation of ecologically meaningful
threshold concentrations. Environ Toxicol Chem 31:1536–1547
Dillon T, Beckvar N, Kern J (2010) Residue-based mercury dose–
response in fish: an analysis using lethality-equivalent test
endpoints. Environ Toxicol Chem 29:2559–2565
Domi N, Bouquegneau JM, Das K (2005) Feeding ecology of five
commercial shark species of the Celtic Sea through stable
isotope and trace metal analysis. Mar Environ Res 60:551–569
Endo T, Hisamichi Y, Haraguchi K, Kato Y, Ohta C, Koga N (2008)
Hg, Zn and Cu levels in the muscle and liver of tiger sharks
(Galeocerdo cuvier) from the coast of Ishigaki Island, Japan:
relationship between metal concentrations and body length. Mar
Pollut Bull 56:1774–1780
Escobar-Sanchez O, Galvan-Magana F, Rosıles-Martınez R (2011)
Biomagnification of mercury and selenium in blue shark
Arch Environ Contam Toxicol
123
Prionace glauca from the Pacific Ocean off Mexico. Biol Trace
Elem Res 144:550–559
Estes JA, Terborgh J, Brashares JS et al (2011) Trophic downgrading
of planet earth. Science 333(6040):301–306
Evers DC, Hammerschlag N, Die D (2008) Mercury levels in Florida
sharks: interim report. Report BRI 2008-02, BioDiversity
Research Institute, Gorham. http://cufer.rsmas.miami.edu/word
press/wp-content/uploads/2008/04/florida-shark-hg-report-april-
2008_ever-hammerschlag-die.pdf. Accessed 12 June 2014
Fisk AT, Tittlemier SA, Pranschke JL, Norstrom RJ (2002) Using
anthropogenic contaminants and stable isotopes to assess the
feeding ecology of Greenland sharks. Ecology 83:2162–2172
Florida Department of Health (2013) Your guide to eating fish caught
in Florida, Tallahassee. http://www.doh.state.fl.us/floridafishad
vice/2013_Brochure.pdf. Accessed 20 June 2013
Florida Department of Health and Rehabilitative Services (1991) HRS
and Department of Agriculture health advisory for marine fish.
May 13 1991, 3 pages
Fry B (1988) Food web structure on Georges Bank from stable C, N,
and S isotopic compositions. Limnol Oceanogr 33:1182–1190
Fry B (2002) Conservative mixing of stable isotopes across estuarine
salinity gradients: a conceptual framework for monitoring
watershed influences on downstream fisheries production. Estu-
aries 25:264–271
Gallagher AJ, Serafy JE, Cooke SJ, Hammerschlag N (2014)
Physiological stress response, reflex impairment, and survival
of five sympatric shark species following experimental capture
and release. Mar Ecol Prog Ser. doi:10.3354/meps10490
Garcia-Hernandez J, Cadena-Cardenas L, Betancourt-Lozano M,
Garcia-De-La-Parra LM, Garcia-Rico L, Marquez-Farias F
(2007) Total mercury content found in edible tissues of top
predator fish from the Gulf of California, Mexico. Toxicol
Environ Chem 89:507–522
Godley B, Thompson D, Waldron S, Furness R (1998) The trophic
status of marine turtles as determined by stable isotope analysis.
Mar Ecol Prog Ser 166:277–284
Hammerschlag N, Gallagher AJ, Wester J, Luo J, Ault JS (2012a)
Don’t bite the hand that feeds: assessing ecological impacts of
provisioning ecotourism on an apex marine predator. Funct Ecol
26:567–576
Hammerschlag N, Luo J, Irschick DJ, Ault JS (2012b) A comparison
of spatial and movement patterns between sympatric predators:
Bull sharks (Carcharhinus leucas) and Atlantic tarpon (Mega-
lops atlanticus). PLoS One 7(9):e45958. doi:10.1371/journal.
pone.0045958
Harris R, Pollman C, Landing W, Axelrad D, Morey S, Evans D et al
(2012) Mercury in the Gulf of Mexico: sources to receptors.
Environ Res 119:42–52
Hobson KA (1999) Tracing origins and migration of wildlife using
stable isotopes: a review. Oecologia 120(3):314–326
Hollweg T, Gilmour CC, Mason R (2010) Mercury and methylmer-
cury cycling in sediments of the mid-Atlantic continental shelf
and slope. Limnol Oceanogr 55:2703–2722
Hueter R, Fong W, Henderson G, French M, Manire C (1995)
Methylmercury concentration in shark muscle by species, size
and distribution of sharks in Florida coastal waters. Water Air
Soil Pollut 80:893–899
Hussey NE, MacNeil MA, Olin JA et al (2012) Stable isotopes and
elasmobranchs: tissue types, methods, applications and assump-
tions. J Fish Biol 80:1449–1484
Kidd KA, Hesslein RH, Fudge RJP, Hallard KA (1995) The influence
of trophic level as measured by d15N on mercury concentrations
in freshwater organisms. Water Air Soil Pollut 80:1011–1015
Kidd KA, Clayden M, Jardine TD (2012) Bioaccumulation and
biomagnification of mercury through food webs. In: Liu G, Cai
Y, O’Driscoll N (eds) Environmental chemistry and toxicology
of mercury. Wiley, Hoboken, pp 455–499
Killam KA, Parsons GR (1989) Age and growth of the blacktip shark,
Carcharhinus limbatus, near Tampa Bay, Florida. Fish Bull
87:845–857
Lacerda L, Paraquetti H, Marins R et al (2000) Mercury content in
shark species from the south-eastern Brazilian coast. Rev Brasil
Biol 60:571–576
Lowe CG, Wetherbee BM, Crow GL, Tester AL (1996) Ontogenetic
dietary shifts and feeding behavior of the tiger shark, Galeocerdo
cuvier, in Hawaiian waters. Environ Biol Fishes 47:203–211
Lowery T, Garrett ESI (2005) Synoptic survey of total mercury in
recreational finfish of the Gulf of Mexico. NOAA Fisheries,
Pascagoula
Lucifora LO, Garcıa VB, Menni RC, Escalante AH, Hozbor NM
(2009) Effects of body size, age and maturity stage on diet in a
large shark: Ecological and applied implications. Ecol Res
24(1):109–118
Lyle J (1986) Mercury and selenium concentrations in sharks from
northern Australian waters. Mar Freshw Res 37(3):309–321
Mathers RA, Johansen PH (1985) The effects of feeding ecology on
mercury accumulation in walleye (Stizostedion vitreum) and pike
(Esox lucius) in Lake Simcoe. Can J Zool 63:2006–2012
Matich P, Heithaus MR, Layman CA (2010) Size-based variation in
intertissue comparisons of stable carbon and nitrogen isotopic
signatures of bull sharks (Carcharhinus leucas) and tiger sharks
(Galeocerdo cuvier). Can J Fish Aquat Sci 67:877–885
Matich P, Heithaus MR, Layman CA (2011) Contrasting patterns of
individual specialization and trophic coupling in two marine
apex predators. J Anim Ecol 80:294–305
Maz-Courrau A, Lopez-Vera C, Galvan-Magana F, Escobar-Sanchez
O, Rosıles-Martınez R, Sanjuan-Munoz A (2012) Bioaccumula-
tion and biomagnification of total mercury in four exploited
shark species in the Baja California Peninsula, Mexico. Bull
Environ Contam Toxicol 88:129–134
McMeans BC, Svavarsson J, Dennard S, Fisk AT (2010) Diet and
resource use among Greenland sharks (Somniosus microcepha-
lus) and teleosts sampled in Icelandic waters, using d13C, d15N,
and mercury. Can J Fish Aquat Sci 67:1428–1438
Nam DH, Adams DH, Reyier EA, Basu N (2010) Mercury and
selenium levels in lemon sharks (Negaprion brevirostris) in
relation to a harmful red tide event. Environ Monit Assess
176:549–559
Nam D, Head J, Adams D, et al. (2011) Neuroendocrine effects of
mercury in several fish species. Conference Abstract: NASCE
2011: the inaugural meeting of the North American Society of
Comprehensive Endocrinology. doi:10.3389/conf.fendo.2011.
04.00089
Newman MC, Xu X, Cotton CF, Tom KR (2011) High mercury
concentrations reflect trophic ecology of three deep-water
chondrichthyans. Arch Environ Contam Toxicol 60:618–625
Penedo de Pinho A, Guimaraes JRD, Martins AS, Costa P, Olavo G,
Valentin J (2002) Total mercury in muscle tissue of five shark
species from Brazilian offshore waters: effects of feeding habit,
sex, and length. Environ Res 89:250–258
Pethybridge H, Cossa D, Butler ECV (2010) Mercury in 16 demersal
sharks from southeast Australia: biotic and abiotic sources of
variation and consumer health implications. Mar Environ Res
69:18–26
Pethybridge H, Butler E, Cossa D, Daley R, Boudou A (2012)
Trophic structure and biomagnification of mercury in an
assemblage of deepwater chondrichthyans from southeastern
Australia. Mar Ecol Prog Ser 451:163–174
Piercy AN, Carlson JK, Passerotti MS (2010) Age and growth of the
great hammerhead shark, Sphyrna mokarran, in the north-
Arch Environ Contam Toxicol
123

western Atlantic Ocean and Gulf of Mexico. Mar Freshw Res
61:992–998
Rumbold DG, Lange TR, Axelrad DM, Atkeson TD (2008) Ecolog-
ical risk of methylmercury in Everglades National Park, Florida,
USA. Ecotoxicology 17:632–641
Sandheinrich M, Wiener J (2011) Methylmercury in freshwater fish:
recent advances in assessing toxicity of environmentally relevant
exposures. In: Beyer WN, Meador JP (eds) Environmental
contaminants in wildlife: interpreting tissue concentrations, 2nd
edn. Taylor and Francis, Boca Raton
Scott DP (1974) Mercury concentration of white muscle in relation to
age, growth, and condition in four species of fishes from Clay
Lake, Ontario. J Fish Res Board Can 31:1723–1729
Shiffman D, Gallagher A, Boyle M, Hammerschlag-Peyer C,
Hammerschlag N (2012) Stable isotope analysis as a tool for
elasmobranch conservation research: a primer for non-special-
ists. Mar Freshw Res 63:635–643
Simoneau M, Lucotte M, Garceau S, Laliberte D (2005) Fish growth
rates modulate mercury concentrations in walleye (Sander
vitreus) from eastern Canadian lakes. Environ Res 98:73–82
Storelli M, Ceci E, Storelli A, Marcotrigiano G (2003) Polychlori-
nated biphenyl, heavy metal and methylmercury residues in
hammerhead sharks: contaminant status and assessment. Mar
Pollut Bull 46:1035–1039
Swanson HK, Johnston TA, Schindler DW, Bodaly RA, Whittle DM
(2006) Mercury bioaccumulation in forage fish communities
invaded by rainbow smelt (Osmerus mordax). Environ Sci
Technol 40:1439–1446
Takai N, Mishima Y, Yorozu A, Hoshika A (2002) Carbon sources
for demersal fish in the western Seto Inland Sea, Japan,
examined by d13C and d15N analyses. Limnol Oceanogr
47:730–741
Thera JC, Rumbold DG (2014) Biomagnification of mercury through
a subtropical coastal food web off Southwest Florida. Environ
Toxicol Chem 33:65–73. doi:10.1002/etc.2416
Trudel M, Rasmussen JB (2006) Bioenergetics and mercury dynamics
in fish: a modelling perspective. Can J Fish Aquat Sci
63:1890–1902
United States Environmental Protection Agency/United States Food
and Drug Administration (2004) What you need to know about
mercury in fish and shellfish. EPA-823-R-04-005, Washington,
DC. http://www.epa.gov/waterscience/fish/advice/. Accessed 6
June 2008
Vander Zanden MJ, Rasmussen JB (1996) A trophic position model
of pelagic food webs: impact on contaminant bioaccumulation in
lake trout. Ecol Monogr 66(4):451–477
Wiener JG, Krabbenhoft DP, Heinz GH, Scheuhammer AM (2003)
Ecotoxicology of mercury. Handb Ecotoxicol 2:409–463
Wilga CD, Motta PJ, Sanford CP (2007) Evolution and ecology of
feeding in elasmobranchs. Integr Comp Biol 47:55–69
Wren C, Scheider W, Wales D, Muncaster B, Gray I (1991) Relation
between mercury concentrations in walleye (Stizostedion vitreum
vitreum) and northern pike (Esox lucius) in Ontario lakes and
influence of environmental factors. Can J Fish Aquat Sci
48:132–139
Zar JH (1996) Biostatistical analysis, 3rd edn. Prentice-Hall, Upper
Saddle River
Arch Environ Contam Toxicol
123


